WASHINGTON, D. C. 20549
December 31, 2014
Annual Report
Deutsche Variable Series I
(formerly DWS Variable Series I)
Deutsche Bond VIP
(formerly DWS Bond VIP)
Contents
18 Statement of Assets and Liabilities 19 Statement of Operations 20 Statement of Changes in Net Assets 22 Notes to Financial Statements 31 Report of Independent Registered Public Accounting Firm 32 Information About Your Fund's Expenses 35 Advisory Agreement Board Considerations and Fee Evaluation 38 Board Members and Officers |
This report must be preceded or accompanied by a prospectus. To obtain an additional prospectus or summary prospectus, if available, call (800) 728-3337 or your financial representative. We advise you to consider the Fund's objectives, risks, charges and expenses carefully before investing. The summary prospectus and prospectus contain this and other important information about the Fund. Please read the prospectus carefully before you invest.
Bond investments are subject to interest-rate, credit, liquidity and market risks to varying degrees. When interest rates rise, bond prices generally fall. Credit risk refers to the ability of an issuer to make timely payments of principal and interest. Investments in lower-quality ("junk bonds") and non-rated securities present greater risk of loss than investments in higher-quality securities. Investing in derivatives entails special risks relating to liquidity, leverage and credit that may reduce returns and/or increase volatility. Investing in foreign securities, particularly those of emerging markets, presents certain risks, such as currency fluctuations, political and economic changes, and market risks. See the prospectus for details.
Deutsche Asset & Wealth Management represents the asset management and wealth management activities conducted by Deutsche Bank AG or any of its subsidiaries, including the Advisor and DeAWM Distributors, Inc.
NOT FDIC/NCUA INSURED NO BANK GUARANTEE MAY LOSE VALUE NOT A DEPOSIT
NOT INSURED BY ANY FEDERAL GOVERNMENT AGENCY
Performance Summary December 31, 2014 (Unaudited)
Fund performance shown is historical, assumes reinvestment of all dividend and capital gain distributions, and does not guarantee future results. Investment return and principal value fluctuate with changing market conditions so that, when redeemed, shares may be worth more or less than their original cost. Current performance may be lower or higher than the performance data quoted. Please contact your participating insurance company for the Fund's most recent month-end performance. Performance doesn't reflect charges and fees ("contract charges") associated with the separate account that invests in the Fund or any variable life insurance policy or variable annuity contract for which the Fund is an investment option. These charges and fees will reduce returns.
The gross expense ratio of the Fund, as stated in the fee table of the prospectus dated May 1, 2014 is 0.65% for Class A shares and may differ from the expense ratio disclosed in the Financial Highlights table in this report.
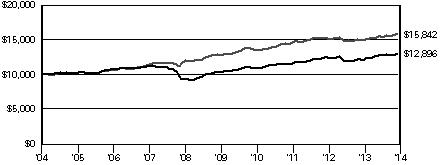
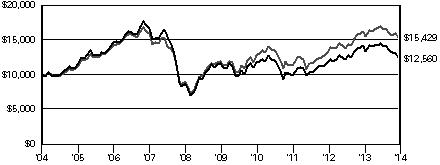
| Growth of an Assumed $10,000 Investment |
| The Barclays U.S. Aggregate Bond Index is an unmanaged index representing domestic taxable investment-grade bonds, with index components for government and corporate securities, mortgage pass-through securities, and asset-backed securities with an average maturity of one year or more. Index returns do not reflect any fees or expenses and it is not possible to invest directly into an index. |
| |
| Yearly periods ended December 31 | | |
| Comparative Results | |
| Deutsche Bond VIP | | 1-Year | | | 3-Year | | | 5-Year | | | 10-Year | |
| Class A | Growth of $10,000 | | $ | 10,663 | | | $ | 11,144 | | | $ | 12,577 | | | $ | 12,896 | |
| Average annual total return | | | 6.63 | % | | | 3.68 | % | | | 4.69 | % | | | 2.58 | % |
| Barclays U.S. Aggregate Bond Index | Growth of $10,000 | | $ | 10,597 | | | $ | 10,820 | | | $ | 12,431 | | | $ | 15,842 | |
| Average annual total return | | | 5.97 | % | | | 2.66 | % | | | 4.45 | % | | | 4.71 | % |
The growth of $10,000 is cumulative.
Management Summary December 31, 2014 (Unaudited)
During the 12-month period ended December 31, 2014, the Fund provided a total return of 6.63% (Class A shares, unadjusted for contract charges), compared with the 5.97% return of its benchmark, the Barclays U.S. Aggregate Bond Index.1
During the period, the U.S. Federal Reserve Board (the Fed) continued to maintain its benchmark short-term rate at or near zero levels, while feeling free to wind down its bond purchases designed to lower longer-term interest rates in view of a gradually improving U.S. economy. Nonetheless, longer-term U.S. Treasury yields declined substantially over the 12-month period, as markets remained comfortable with the pace of the Fed's inevitable unwinding of its extraordinary monetary support. For much of 2014, U.S. assets generally were supported by geopolitical tensions abroad and concern over possible deflation in other major economies. In addition, a sharp decline in energy prices over the second half of 2014 provided a boost to the U.S. consumer and to the economy. Credit-oriented sectors performed well for most of the period, as investors continued to seek higher yields than those available on U.S. Treasuries. However, markets saw an increase in risk aversion and a weakening in credit sentiment late in the period, on heightened fears of deflation globally and the negative impact on Russia and other emerging economies from the slide in oil prices, among other factors.
The Fund's performance vs. the benchmark was driven principally by exposure to more credit-sensitive fixed-income sectors. This included our exposure to investment-grade corporate bonds, as well as to high-yield corporate and emerging-market-bonds, at the expense of agency mortgage-backed and U.S. Treasury securities. However, some of this performance advantage was reversed in the fourth quarter as credit sentiment softened. The Fund's exposures to collateralized mortgage obligations, commercial mortgage-backed securities and asset backed securities benefited from our focus on issues structured to perform relatively well in a falling rate environment. Finally, for much of the period, the Fund was positioned with a higher overall duration and corresponding interest-rate sensitivity than the benchmark, which helped relative returns as rates fell. We remain comfortable with our overall emphasis on earning the higher yields available in credit sectors. With U.S. inflation remaining below target, there would not appear to be any urgency on the part of the Fed to raise rates. That said, there is more room for rates to rise than fall, and we are maintaining a relatively neutral stance with respect to interest-rate sensitivity. Given the heightened geopolitical risks, we expect there could be opportunities to add value in security selection on volatility. We remain cautious with respect to investment-grade corporates given current valuations and company leverage levels, and continue to look for opportunities to rotate into other sectors.
William Chepolis, CFA
John D. Ryan
Gary Russell, CFA
Portfolio Managers
The views expressed reflect those of the portfolio management team only through the end of the period of the report as stated on the cover. The management team's views are subject to change at any time based on market and other conditions and should not be construed as a recommendation. Past performance is no guarantee of future results. Current and future portfolio holdings are subject to risk.
1 The Barclays U.S. Aggregate Bond Index is an unmanaged index representing domestic taxable investment-grade bonds, with index components for government and corporate securities, mortgage pass-through securities, and asset-backed securities with an average maturity of one year or more. Index returns do not reflect any fees or expenses and it is not possible to invest directly into an index.
Portfolio Summary (Unaudited) Asset Allocation (As a % of Total Net Assets) | 12/31/14 | 12/31/13 |
| | | |
| Government & Agency Obligations | 31% | 24% |
| Corporate Bonds | 31% | 40% |
| Mortgage-Backed Securities Pass-Throughs | 18% | 27% |
| Collateralized Mortgage Obligations | 6% | 6% |
| Commercial Mortgage-Backed Securities | 4% | 6% |
| Cash Equivalents and other Assets and Liabilities, net | 4% | –12% |
| Municipal Bonds and Notes | 4% | 7% |
| Asset-Backed | 2% | 2% |
| | 100% | 100% |
Quality (Excludes Cash Equivalents and Securities Lending Collateral) | 12/31/14 | 12/31/13 |
| | | |
| AAA | 53% | 49% |
| AA | 7% | 9% |
| A | 5% | 9% |
| BBB | 17% | 18% |
| BB or Below | 17% | 12% |
| Not Rated | 1% | 3% |
| | 100% | 100% |
| Interest Rate Sensitivity | 12/31/14 | 12/31/13 |
| | | |
| Effective Maturity | 6.7 years | 7.7 years |
| Effective Duration | 4.7 years | 6.2 years |
The quality ratings represent the higher of Moody's Investors Service, Inc. ("Moody's") or Standard & Poor's Corporation ("S&P") credit ratings. The ratings of Moody's and S&P represent their opinions as to the quality of the securities they rate. Credit quality measures a bond issuer's ability to repay interest and principal in a timely manner. Ratings are relative and subjective and are not absolute standards of quality. Credit quality does not remove market risk and is subject to change.
Effective maturity is the weighted average of the maturity date of bonds held by the Fund taking into consideration any available maturity shortening features.
Effective duration is an approximate measure of the Fund's sensitivity to interest rate changes taking into consideration any maturity shortening features.
Portfolio holdings and characteristics are subject to change.
For more complete details about the Fund's investment portfolio, see page 8.
Following the Fund's fiscal first and third quarter-end, a complete portfolio holdings listing is filed with the SEC on Form N-Q. The form will be available on the SEC's Web site at sec.gov, and it also may be reviewed and copied at the SEC's Public Reference Room in Washington, D.C. Information on the operation of the SEC's Public Reference Room may be obtained by calling (800) SEC-0330. The Fund's portfolio holdings are also posted on deutschefunds.com from time to time. Please see the Fund's current prospectus for more information.
Investment Portfolio December 31, 2014 | | | Principal Amount ($)(a) | | | Value ($) | |
| | | | |
| Corporate Bonds 30.9% | |
| Consumer Discretionary 1.5% | |
| AMC Entertainment, Inc., 5.875%, 2/15/2022 | | | | 15,000 | | | | 15,225 | |
| AmeriGas Finance LLC: | |
| 6.75%, 5/20/2020 | | | | 15,000 | | | | 15,450 | |
| 7.0%, 5/20/2022 | | | | 10,000 | | | | 10,350 | |
| Apex Tool Group LLC, 144A, 7.0%, 2/1/2021 | | | | 15,000 | | | | 12,825 | |
| APX Group, Inc., 6.375%, 12/1/2019 | | | 15,000 | | | | 14,363 | |
| Ashton Woods U.S.A. LLC, 144A, 6.875%, 2/15/2021 | | | | 25,000 | | | | 23,812 | |
| Avis Budget Car Rental LLC, 5.5%, 4/1/2023 (b) | | | | 15,000 | | | | 15,300 | |
| Bed Bath & Beyond, Inc.: | |
| 4.915%, 8/1/2034 | | | | 130,000 | | | | 134,144 | |
| 5.165%, 8/1/2044 | | | | 150,000 | | | | 156,943 | |
| Cablevision Systems Corp., 5.875%, 9/15/2022 | | | | 5,000 | | | | 5,063 | |
| Cequel Communications Holdings I LLC: | |
| 144A, 5.125%, 12/15/2021 | | | | 5,000 | | | | 4,850 | |
| 144A, 6.375%, 9/15/2020 | | | | 80,000 | | | | 82,800 | |
| Clear Channel Worldwide Holdings, Inc.: | |
| Series A, 6.5%, 11/15/2022 | | | 15,000 | | | | 15,263 | |
| Series B, 6.5%, 11/15/2022 | | | 25,000 | | | | 25,750 | |
| Series B, 7.625%, 3/15/2020 | | | 75,000 | | | | 78,937 | |
| Columbus International, Inc., 144A, 7.375%, 3/30/2021 | | | | 200,000 | | | | 208,000 | |
| Delphi Corp., 5.0%, 2/15/2023 | | | 20,000 | | | | 21,350 | |
| DISH DBS Corp.: | |
| 4.25%, 4/1/2018 | | | | 15,000 | | | | 15,319 | |
| 5.0%, 3/15/2023 | | | | 20,000 | | | | 19,350 | |
| 7.875%, 9/1/2019 | | | | 90,000 | | | | 102,150 | |
| Hot Topic, Inc., 144A, 9.25%, 6/15/2021 | | | | 10,000 | | | | 10,700 | |
| Live Nation Entertainment, Inc., 144A, 7.0%, 9/1/2020 | | | | 20,000 | | | | 21,100 | |
| MDC Partners, Inc., 144A, 6.75%, 4/1/2020 | | | | 20,000 | | | | 20,600 | |
| Mediacom Broadband LLC: | |
| 5.5%, 4/15/2021 | | | | 5,000 | | | | 5,025 | |
| 6.375%, 4/1/2023 | | | | 10,000 | | | | 10,250 | |
| MGM Resorts International: | |
| 6.625%, 12/15/2021 | | | | 40,000 | | | | 42,000 | |
| 6.75%, 10/1/2020 | | | | 42,000 | | | | 44,100 | |
| 8.625%, 2/1/2019 | | | | 60,000 | | | | 68,025 | |
| Numericable-SFR, 144A, 4.875%, 5/15/2019 | | | | 30,000 | | | | 29,737 | |
| Pinnacle Entertainment, Inc., 6.375%, 8/1/2021 | | | | 10,000 | | | | 10,300 | |
| Quebecor Media, Inc., 5.75%, 1/15/2023 | | | | 15,000 | | | | 15,337 | |
| Sirius XM Radio, Inc., 144A, 5.875%, 10/1/2020 | | | | 10,000 | | | | 10,300 | |
| Springs Industries, Inc., 6.25%, 6/1/2021 | | | | 10,000 | | | | 9,950 | |
| Starz LLC, 5.0%, 9/15/2019 | | | | 10,000 | | | | 10,075 | |
| Taylor Morrison Communities, Inc., 144A, 5.25%, 4/15/2021 | | | 15,000 | | | | 14,775 | |
| Time Warner Cable, Inc., 7.3%, 7/1/2038 | | | | 165,000 | | | | 227,511 | |
| | | Principal Amount ($)(a) | | | Value ($) | |
| | | | | | | | | |
| Viking Cruises Ltd., 144A, 8.5%, 10/15/2022 | | | | 15,000 | | | | 16,237 | |
| | | | | 1,543,266 | |
| Consumer Staples 1.3% | |
| Cencosud SA, 144A, 4.875%, 1/20/2023 | | | | 200,000 | | | | 196,614 | |
| Chiquita Brands International, Inc., 7.875%, 2/1/2021 | | | | 9,000 | | | | 9,675 | |
| JBS Investments GmbH: | |
| 144A, 7.25%, 4/3/2024 | | | | 30,000 | | | | 29,475 | |
| 144A, 7.75%, 10/28/2020 | | | | 200,000 | | | | 207,100 | |
| JBS U.S.A. LLC: | |
| 144A, 7.25%, 6/1/2021 | | | | 30,000 | | | | 30,900 | |
| 144A, 8.25%, 2/1/2020 | | | | 115,000 | | | | 121,037 | |
| Marfrig Overseas Ltd., 144A, 9.5%, 5/4/2020 | | | | 100,000 | | | | 101,000 | |
| Minerva Luxembourg SA, 144A, 7.75%, 1/31/2023 | | | | 250,000 | | | | 245,000 | |
| Post Holdings, Inc., 144A, 6.75%, 12/1/2021 | | | | 5,000 | | | | 4,850 | |
| Reynolds Group Issuer, Inc., 5.75%, 10/15/2020 | | | | 325,000 | | | | 333,125 | |
| Roundy's Supermarkets, Inc., 144A, 10.25%, 12/15/2020 | | | | 5,000 | | | | 4,350 | |
| Smithfield Foods, Inc., 6.625%, 8/15/2022 | | | | 20,000 | | | | 20,900 | |
| | | | | 1,304,026 | |
| Energy 5.5% | |
| Afren PLC, 144A, 10.25%, 4/8/2019 | | | | 500,000 | | | | 325,000 | |
| Antero Resources Finance Corp., 5.375%, 11/1/2021 | | | | 5,000 | | | | 4,838 | |
| Berry Petroleum Co., LLC: | |
| 6.375%, 9/15/2022 | | | | 15,000 | | | | 11,400 | |
| 6.75%, 11/1/2020 | | | | 25,000 | | | | 20,000 | |
| BreitBurn Energy Partners LP, 7.875%, 4/15/2022 | | | | 15,000 | | | | 11,587 | |
| Chaparral Energy, Inc., 7.625%, 11/15/2022 | | | | 25,000 | | | | 16,375 | |
| Crestwood Midstream Partners LP, 6.125%, 3/1/2022 | | | 10,000 | | | | 9,550 | |
| DCP Midstream LLC, 144A, 9.75%, 3/15/2019 | | | | 760,000 | | | | 950,613 | |
| Delek & Avner Tamar Bond Ltd., 144A, 5.082%, 12/30/2023 | | | 500,000 | | | | 498,907 | |
| Ecopetrol SA, 5.875%, 5/28/2045 | | | 450,000 | | | | 416,250 | |
| Endeavor Energy Resources LP, 144A, 7.0%, 8/15/2021 | | | 35,000 | | | | 30,975 | |
| GeoPark Latin America Ltd. Agencia en Chile, 144A, 7.5%, 2/11/2020 | | | 200,000 | | | | 175,000 | |
| Halcon Resources Corp., 8.875%, 5/15/2021 | | | | 25,000 | | | | 18,812 | |
| Inkia Energy Ltd., 144A, 8.375%, 4/4/2021 | | | | 250,000 | | | | 265,000 | |
| Kinder Morgan, Inc.: | |
| 3.05%, 12/1/2019 | | | | 240,000 | | | | 238,092 | |
| 5.55%, 6/1/2045 | | | | 160,000 | | | | 163,877 | |
| Linn Energy LLC, 6.25%, 11/1/2019 | | | 45,000 | | | | 38,025 | |
| MEG Energy Corp., 144A, 7.0%, 3/31/2024 | | | | 30,000 | | | | 27,150 | |
| Midstates Petroleum Co., Inc., 10.75%, 10/1/2020 | | | | 20,000 | | | | 10,600 | |
| | | Principal Amount ($)(a) | | | Value ($) | |
| | | | | | | | | |
| Murphy Oil U.S.A., Inc., 6.0%, 8/15/2023 | | | | 20,000 | | | | 20,900 | |
| Nostrum Oil & Gas Finance BV, 144A, 6.375%, 2/14/2019 | | | 200,000 | | | | 172,000 | |
| Offshore Drilling Holding SA, 144A, 8.625%, 9/20/2020 | | | | 200,000 | | | | 174,000 | |
| Pacific Rubiales Energy Corp., 144A, 5.625%, 1/19/2025 | | | 226,000 | | | | 173,455 | |
| Petroleos de Venezuela SA: | |
| 144A, 9.0%, 11/17/2021 | | | | 200,000 | | | | 87,500 | |
| 144A, 9.75%, 5/17/2035 | | | | 200,000 | | | | 89,000 | |
| Petroleos Mexicanos, 2.251%*, 7/18/2018 | | | | 250,000 | | | | 252,750 | |
| PT Pertamina Persero, 144A, 5.625%, 5/20/2043 | | | | 1,000,000 | | | | 940,000 | |
| Transocean, Inc., 3.8%, 10/15/2022 (b) | | | | 555,000 | | | | 449,730 | |
| | | | | 5,591,386 | |
| Financials 10.2% | |
| Aflac, Inc., 3.625%, 11/15/2024 (b) | | | 230,000 | | | | 234,511 | |
| Banco Continental SAECA, 144A, 8.875%, 10/15/2017 | | | | 200,000 | | | | 210,000 | |
| Banco do Brasil SA, 144A, 9.0%, 6/29/2049 | | | | 200,000 | | | | 186,000 | |
| Bank of China Ltd., 144A, 5.0%, 11/13/2024 | | | | 200,000 | | | | 205,514 | |
| Barclays Bank PLC, 7.625%, 11/21/2022 | | | | 1,090,000 | | | | 1,191,833 | |
| BBVA Bancomer SA, 144A, 6.75%, 9/30/2022 | | | | 150,000 | | | | 165,000 | |
| CBL & Associates LP, (REIT), 4.6%, 10/15/2024 | | | | 410,000 | | | | 415,233 | |
| China Overseas Finance Cayman II Ltd., REG S, 5.5%, 11/10/2020 | | | | 250,000 | | | | 270,229 | |
| CIT Group, Inc., 3.875%, 2/19/2019 | | | 65,000 | | | | 64,838 | |
| Country Garden Holdings Co., Ltd., 144A, 11.125%, 2/23/2018 | | | 200,000 | | | | 212,102 | |
| Credit Agricole SA, 144A, 7.875%, 1/29/2049 | | | | 200,000 | | | | 203,507 | |
| Credito Real SAB de CV, 144A, 7.5%, 3/13/2019 | | | | 200,000 | | | | 202,500 | |
| Development Bank of Kazakhstan JSC, Series 3, REG S, 6.5%, 6/3/2020 | | | 500,000 | | | | 508,750 | |
| E*TRADE Financial Corp., 6.375%, 11/15/2019 | | | | 40,000 | | | | 42,400 | |
| Everest Reinsurance Holdings, Inc., 4.868%, 6/1/2044 | | | 170,000 | | | | 178,043 | |
| Hospitality Properties Trust, (REIT), 5.0%, 8/15/2022 | | | | 380,000 | | | | 400,436 | |
| HSBC Holdings PLC: | |
| 5.625%, 12/29/2049 | | | | 410,000 | | | | 411,435 | |
| 6.375%, 12/29/2049 | | | | 460,000 | | | | 464,600 | |
| International Lease Finance Corp., 6.25%, 5/15/2019 | | | | 5,000 | | | | 5,463 | |
| Macquarie Group Ltd., 144A, 6.0%, 1/14/2020 | | | | 825,000 | | | | 934,456 | |
| Morgan Stanley, Series H, 5.45%, 7/29/2049 | | | | 10,000 | | | | 10,018 | |
| Nationwide Financial Services, Inc., 144A, 5.3%, 11/18/2044 | | | 220,000 | | | | 232,090 | |
| Navient Corp., 5.5%, 1/25/2023 | | | 630,000 | | | | 603,225 | |
| Neuberger Berman Group LLC, 144A, 5.875%, 3/15/2022 | | | 155,000 | | | | 163,137 | |
| Omega Healthcare Investors, Inc., (REIT), 4.95%, 4/1/2024 | | | 505,000 | | | | 525,523 | |
| | | Principal Amount ($)(a) | | | Value ($) | |
| | | | | | | | | |
| QBE Insurance Group Ltd., 144A, 2.4%, 5/1/2018 | | | | 260,000 | | | | 260,027 | |
| Royal Bank of Scotland Group PLC, 6.1%, 6/10/2023 | | | 100,000 | | | | 108,459 | |
| Scentre Group Trust 1, 144A, 3.5%, 2/12/2025 | | | | 535,000 | | | | 537,093 | |
| Schahin II Finance Co. SPV Ltd., 144A, 5.875%, 9/25/2022 (b) | | | 179,867 | | | | 144,568 | |
| Societe Generale SA, 144A, 7.875%, 12/29/2049 | | | | 20,000 | | | | 19,375 | |
| The Goldman Sachs Group, Inc., Series L, 5.7%, 12/29/2049 (b) | | | 15,000 | | | | 15,173 | |
| TIAA Asset Management Finance Co., LLC: | | |
| 144A, 2.95%, 11/1/2019 | | | | 405,000 | | | | 405,784 | |
| 144A, 4.125%, 11/1/2024 | | | | 335,000 | | | | 343,179 | |
| Trust F/1401, (REIT), 144A, 5.25%, 12/15/2024 | | | | 500,000 | | | | 515,050 | |
| | | | | 10,389,551 | |
| Health Care 1.1% | |
| Aviv Healthcare Properties LP, 6.0%, 10/15/2021 | | | | 5,000 | | | | 5,200 | |
| Biomet, Inc.: | |
| 6.5%, 8/1/2020 | | | | 25,000 | | | | 26,750 | |
| 6.5%, 10/1/2020 | | | | 5,000 | | | | 5,275 | |
| Community Health Systems, Inc.: | |
| 5.125%, 8/1/2021 | | | | 5,000 | | | | 5,188 | |
| 6.875%, 2/1/2022 (b) | | | | 10,000 | | | | 10,594 | |
| 7.125%, 7/15/2020 | | | | 125,000 | | | | 133,281 | |
| Endo Finance LLC, 144A, 5.75%, 1/15/2022 | | | | 15,000 | | | | 15,000 | |
| HCA, Inc.: | |
| 6.5%, 2/15/2020 | | | | 235,000 | | | | 263,317 | |
| 7.5%, 2/15/2022 | | | | 190,000 | | | | 217,075 | |
| IMS Health, Inc., 144A, 6.0%, 11/1/2020 | | | | 15,000 | | | | 15,450 | |
| LifePoint Hospitals, Inc, 5.5%, 12/1/2021 | | | | 15,000 | | | | 15,338 | |
| Mallinckrodt International Finance SA, 4.75%, 4/15/2023 | | | 110,000 | | | | 105,600 | |
| Medtronic, Inc., 144A, 4.625%, 3/15/2045 | | | | 150,000 | | | | 162,598 | |
| Par Pharmaceutical Companies, Inc., 7.375%, 10/15/2020 | | | 20,000 | | | | 20,900 | |
| Tenet Healthcare Corp., 6.25%, 11/1/2018 | | | | 60,000 | | | | 65,100 | |
| | | | | 1,066,666 | |
| Industrials 1.6% | |
| ADT Corp.: | |
| 4.125%, 4/15/2019 | | | | 5,000 | | | | 4,950 | |
| 6.25%, 10/15/2021 | | | | 10,000 | | | | 10,275 | |
| Artesyn Embedded Technologies, Inc., 144A, 9.75%, 10/15/2020 | | | 15,000 | | | | 14,213 | |
| Belden, Inc., 144A, 5.5%, 9/1/2022 | | | 25,000 | | | | 24,812 | |
| Bombardier, Inc.: | |
| 144A, 4.75%, 4/15/2019 | | | | 10,000 | | | | 10,038 | |
| 144A, 5.75%, 3/15/2022 | | | | 90,000 | | | | 91,125 | |
| 144A, 6.0%, 10/15/2022 | | | | 15,000 | | | | 15,150 | |
| Covanta Holding Corp., 5.875%, 3/1/2024 | | | | 10,000 | | | | 10,175 | |
| CTP Transportation Products LLC, 144A, 8.25%, 12/15/2019 | | | 15,000 | | | | 15,825 | |
| DigitalGlobe, Inc., 144A, 5.25%, 2/1/2021 | | | | 10,000 | | | | 9,500 | |
| Empresas ICA SAB de CV, 144A, 8.875%, 5/29/2024 | | | | 200,000 | | | | 183,000 | |
| | | Principal Amount ($)(a) | | | Value ($) | |
| | | | | | | | | |
| Florida East Coast Holdings Corp., 144A, 6.75%, 5/1/2019 | | | 5,000 | | | | 4,950 | |
| FTI Consulting, Inc., 6.0%, 11/15/2022 | | | | 15,000 | | | | 15,338 | |
| Garda World Security Corp., 144A, 7.25%, 11/15/2021 | | | | 15,000 | | | | 14,850 | |
| GenCorp, Inc., 7.125%, 3/15/2021 | | | 35,000 | | | | 36,655 | |
| Grupo KUO SAB de CV, 144A, 6.25%, 12/4/2022 | | | | 200,000 | | | | 196,900 | |
| Kenan Advantage Group, Inc., 144A, 8.375%, 12/15/2018 | | | | 35,000 | | | | 36,050 | |
| Meritor, Inc.: | |
| 6.25%, 2/15/2024 | | | | 10,000 | | | | 10,150 | |
| 6.75%, 6/15/2021 | | | | 15,000 | | | | 15,675 | |
| Navios Maritime Holdings, Inc., 144A, 7.375%, 1/15/2022 | | | 45,000 | | | | 41,175 | |
| Noble Group Ltd., 144A, 6.625%, 8/5/2020 | | | | 250,000 | | | | 256,250 | |
| Odebrecht Offshore Drilling Finance Ltd., 144A, 6.75%, 10/1/2022 | | | 188,500 | | | | 172,477 | |
| Oshkosh Corp., 5.375%, 3/1/2022 | | | 8,000 | | | | 8,160 | |
| SBA Communications Corp., 5.625%, 10/1/2019 | | | | 15,000 | | | | 15,338 | |
| Spirit AeroSystems, Inc., 5.25%, 3/15/2022 | | | | 15,000 | | | | 15,263 | |
| Titan International, Inc., 6.875%, 10/1/2020 | | | | 35,000 | | | | 30,800 | |
| TransDigm, Inc., 7.5%, 7/15/2021 | | | 20,000 | | | | 21,300 | |
| United Rentals North America, Inc.: | |
| 6.125%, 6/15/2023 | | | | 5,000 | | | | 5,250 | |
| 7.625%, 4/15/2022 | | | | 85,000 | | | | 93,457 | |
| Votorantim Cimentos SA, 144A, 7.25%, 4/5/2041 | | | | 200,000 | | | | 206,000 | |
| | | | | 1,585,101 | |
| Information Technology 2.0% | |
| ACI Worldwide, Inc., 144A, 6.375%, 8/15/2020 | | | | 5,000 | | | | 5,225 | |
| Activision Blizzard, Inc., 144A, 5.625%, 9/15/2021 | | | | 50,000 | | | | 52,500 | |
| Audatex North America, Inc., 144A, 6.0%, 6/15/2021 | | | | 10,000 | | | | 10,300 | |
| BMC Software Finance, Inc., 144A, 8.125%, 7/15/2021 | | | | 5,000 | | | | 4,700 | |
| CDW LLC, 8.5%, 4/1/2019 | | | | 64,000 | | | | 67,440 | |
| CyrusOne LP, 6.375%, 11/15/2022 | | | 5,000 | | | | 5,337 | |
| Entegris, Inc., 144A, 6.0%, 4/1/2022 | | | | 10,000 | | | | 10,125 | |
| Equinix, Inc., 5.375%, 4/1/2023 | | | 45,000 | | | | 45,000 | |
| First Data Corp.: | |
| 144A, 6.75%, 11/1/2020 | | | | 68,000 | | | | 72,590 | |
| 144A, 7.375%, 6/15/2019 | | | | 190,000 | | | | 199,975 | |
| 144A, 8.75%, 1/15/2022 (PIK) | | | 30,000 | | | | 32,250 | |
| Freescale Semiconductor, Inc., 144A, 6.0%, 1/15/2022 | | | 15,000 | | | | 15,675 | |
| Hughes Satellite Systems Corp.: | |
| 6.5%, 6/15/2019 | | | | 15,000 | | | | 16,087 | |
| 7.625%, 6/15/2021 | | | | 50,000 | | | | 55,000 | |
| KLA-Tencor Corp., 4.65%, 11/1/2024 | | | | 575,000 | | | | 595,267 | |
| NCR Corp.: | |
| 5.875%, 12/15/2021 | | | | 5,000 | | | | 5,138 | |
| 6.375%, 12/15/2023 | | | | 10,000 | | | | 10,400 | |
| Seagate HDD Cayman, 144A, 5.75%, 12/1/2034 | | | | 410,000 | | | | 432,400 | |
| | | Principal Amount ($)(a) | | | Value ($) | |
| | | | | | | | | |
| Tencent Holdings Ltd., 144A, 3.375%, 5/2/2019 | | | | 400,000 | | | | 406,575 | |
| | | | | 2,041,984 | |
| Materials 4.6% | |
| Anglo American Capital PLC: | |
| 144A, 4.125%, 4/15/2021 | | | | 350,000 | | | | 351,176 | |
| 144A, 4.125%, 9/27/2022 (b) | | | 750,000 | | | | 742,672 | |
| ArcelorMittal, 6.125%, 6/1/2018 | | | 500,000 | | | | 533,125 | |
| Berry Plastics Corp., 5.5%, 5/15/2022 | | | | 25,000 | | | | 25,375 | |
| Evraz Group SA, 144A, 6.75%, 4/27/2018 | | | | 400,000 | | | | 333,500 | |
| First Quantum Minerals Ltd.: | |
| 144A, 6.75%, 2/15/2020 | | | | 36,000 | | | | 32,580 | |
| 144A, 7.0%, 2/15/2021 | | | | 31,000 | | | | 27,900 | |
| FMG Resources (August 2006) Pty Ltd., 144A, 6.0%, 4/1/2017 (b) | | | 375,000 | | | | 358,594 | |
| Fresnillo PLC, 144A, 5.5%, 11/13/2023 | | | | 200,000 | | | | 196,000 | |
| Glencore Funding LLC, 144A, 4.125%, 5/30/2023 | | | | 50,000 | | | | 48,788 | |
| GTL Trade Finance, Inc., 144A, 5.893%, 4/29/2024 | | | | 1,000,000 | | | | 965,000 | |
| Hexion U.S. Finance Corp.: | |
| 6.625%, 4/15/2020 | | | | 100,000 | | | | 98,000 | |
| 8.875%, 2/1/2018 | | | | 20,000 | | | | 17,800 | |
| Novelis, Inc., 8.75%, 12/15/2020 | | | 265,000 | | | | 280,900 | |
| Plastipak Holdings, Inc., 144A, 6.5%, 10/1/2021 | | | | 15,000 | | | | 14,925 | |
| Polymer Group, Inc., 7.75%, 2/1/2019 | | | | 58,000 | | | | 60,102 | |
| Turkiye Sise ve Cam Fabrikalari AS, 144A, 4.25%, 5/9/2020 | | | 200,000 | | | | 195,189 | |
| Yamana Gold, Inc., 4.95%, 7/15/2024 | | | | 405,000 | | | | 395,271 | |
| | | | | 4,676,897 | |
| Telecommunication Services 2.9% | |
| B Communications Ltd., 144A, 7.375%, 2/15/2021 | | | | 15,000 | | | | 15,863 | |
| Bharti Airtel International Netherlands BV, 144A, 5.125%, 3/11/2023 | | | | 400,000 | | | | 426,912 | |
| CenturyLink, Inc.: | |
| Series V, 5.625%, 4/1/2020 | | | 5,000 | | | | 5,188 | |
| Series W, 6.75%, 12/1/2023 (b) | | | 10,000 | | | | 10,950 | |
| Cincinnati Bell, Inc., 8.375%, 10/15/2020 | | | | 235,000 | | | | 246,750 | |
| Digicel Group Ltd., 144A, 8.25%, 9/30/2020 | | | | 42,000 | | | | 40,740 | |
| Digicel Ltd., 144A, 8.25%, 9/1/2017 | | | 195,000 | | | | 197,437 | |
| Frontier Communications Corp.: | |
| 7.125%, 1/15/2023 | | | | 110,000 | | | | 111,925 | |
| 8.5%, 4/15/2020 | | | | 55,000 | | | | 61,325 | |
| Intelsat Jackson Holdings SA: | |
| 5.5%, 8/1/2023 | | | | 30,000 | | | | 29,817 | |
| 7.5%, 4/1/2021 | | | | 270,000 | | | | 288,900 | |
| Level 3 Communications, Inc., 8.875%, 6/1/2019 | | | | 80,000 | | | | 84,816 | |
| Level 3 Financing, Inc.: | |
| 6.125%, 1/15/2021 | | | | 10,000 | | | | 10,350 | |
| 7.0%, 6/1/2020 | | | | 100,000 | | | | 105,375 | |
| Millicom International Cellular SA, 144A, 4.75%, 5/22/2020 | | | 200,000 | | | | 188,500 | |
| MTN Mauritius Investments Ltd., 144A, 4.755%, 11/11/2024 | | | 250,000 | | | | 245,000 | |
| | | Principal Amount ($)(a) | | | Value ($) | |
| | | | | | | | | |
| Sprint Communications, Inc.: | |
| 6.0%, 11/15/2022 | | | | 25,000 | | | | 23,000 | |
| 144A, 9.0%, 11/15/2018 | | | | 30,000 | | | | 34,122 | |
| Sprint Corp., 7.125%, 6/15/2024 | | | 15,000 | | | | 13,950 | |
| T-Mobile U.S.A., Inc.: | |
| 6.125%, 1/15/2022 | | | | 5,000 | | | | 5,075 | |
| 6.625%, 11/15/2020 | | | | 175,000 | | | | 178,062 | |
| Turk Telekomunikasyon AS, 144A, 3.75%, 6/19/2019 | | | | 250,000 | | | | 250,750 | |
| Windstream Corp.: | |
| 6.375%, 8/1/2023 | | | | 15,000 | | | | 14,025 | |
| 7.5%, 4/1/2023 | | | | 5,000 | | | | 4,975 | |
| 7.75%, 10/15/2020 | | | | 325,000 | | | | 334,750 | |
| 7.75%, 10/1/2021 | | | | 40,000 | | | | 40,800 | |
| | | | | 2,969,357 | |
| Utilities 0.2% | |
| AES Corp., 8.0%, 10/15/2017 | | | | 3,000 | | | | 3,368 | |
| Majapahit Holding BV, REG S, 7.75%, 10/17/2016 | | | | 100,000 | | | | 109,625 | |
| NRG Energy, Inc., 144A, 6.25%, 5/1/2024 | | | | 45,000 | | | | 45,787 | |
| | | | | 158,780 | |
Total Corporate Bonds (Cost $31,900,498) | | | | 31,327,014 | |
| | |
| Mortgage-Backed Securities Pass-Throughs 18.2% | |
| Federal Home Loan Mortgage Corp.: | |
| 4.0%, 8/1/2039 | | | | 686,154 | | | | 736,597 | |
| 5.5%, with various maturities from 10/1/2023 until 6/1/2035 | | | 1,664,437 | | | | 1,870,202 | |
| 6.5%, 3/1/2026 | | | | 249,894 | | | | 279,372 | |
| Federal National Mortgage Association: | |
| 2.25%*, 9/1/2038 | | | | 48,538 | | | | 52,026 | |
| 4.0%, 3/1/2042 (c) | | | | 10,300,000 | | | | 10,996,859 | |
| 5.0%, with various maturities from 10/1/2033 until 8/1/2040 | | | 1,454,338 | | | | 1,611,464 | |
| 5.5%, with various maturities from 12/1/2032 until 8/1/2037 | | | 1,642,250 | | | | 1,840,004 | |
| 6.0%, with various maturities from 4/1/2024 until 3/1/2025 | | | 465,795 | | | | 527,095 | |
| 6.5%, with various maturities from 3/1/2017 until 12/1/2037 | | | 491,748 | | | | 556,305 | |
Total Mortgage-Backed Securities Pass-Throughs (Cost $18,008,880) | | | | 18,469,924 | |
| | |
| Asset-Backed 2.0% | |
| Automobile Receivables 1.7% | |
| AmeriCredit Automobile Receivables Trust, "E", Series 2011-2, 144A, 5.48%, 9/10/2018 | | | 1,680,575 | | | | 1,720,563 | |
| Miscellaneous 0.3% | |
| Hilton Grand Vacations Trust, "B", Series 2014-AA, 144A, 2.07%, 11/25/2026 | | | 355,017 | | | | 349,222 | |
Total Asset-Backed (Cost $2,128,522) | | | | 2,069,785 | |
| | |
| | | Principal Amount ($)(a) | | | Value ($) | |
| | | | | | | | | |
| Commercial Mortgage-Backed Securities 4.1% | |
| Banc of America Merrill Lynch Commercial Mortgage, Inc., "A2", Series 2007-2, 5.622%*, 4/10/2049 | | | 18,844 | | | | 18,847 | |
| BLCP Hotel Trust, "C", Series 2014-CLRN, 144A, 2.111%*, 8/15/2029 | | | 500,000 | | | | 500,502 | |
| Del Coronado Trust, "M", Series 2013-HDMZ, 144A, 5.161%*, 3/15/2018 | | | | 125,000 | | | | 125,100 | |
| JPMorgan Chase Commercial Mortgage Securities Corp.: | | | | | | | | |
| "C", Series 2012-HSBC, 144A, 4.021%, 7/5/2032 | | | | 230,000 | | | | 240,519 | |
| "A4", Series 2007-C1, 5.716%, 2/15/2051 | | | | 956,036 | | | | 1,028,201 | |
| "F", Series 2007-LD11, 5.787%*, 6/15/2049 | | | | 650,000 | | | | 32,500 | |
| "G", Series 2007-LD11, 144A, 5.787%*, 6/15/2049 | | | 415,019 | | | | 8,300 | |
| LB-UBS Commercial Mortgage Trust, "A4", Series 2007-C6, 5.858%, 7/15/2040 | | | 1,232,161 | | | | 1,300,183 | |
| Merrill Lynch Mortgage Trust, "ASB", Series 2007-C1, 5.835%*, 6/12/2050 | | | | 788,946 | | | | 826,425 | |
| Wachovia Bank Commercial Mortgage Trust, "H", Series 2007-C32, 144A, 5.716%*, 6/15/2049 | | | 770,000 | | | | 83,260 | |
Total Commercial Mortgage-Backed Securities (Cost $5,705,320) | | | | 4,163,837 | |
| | |
| Collateralized Mortgage Obligations 6.0% | |
| Countrywide Home Loans, "A2", Series 2006-1, 6.0%, 3/25/2036 | | | 350,118 | | | | 330,674 | |
| CS First Boston Mortgage Securities Corp., "10A3", Series 2005-10, 6.0%, 11/25/2035 | | | 115,341 | | | | 81,853 | |
| Federal Home Loan Mortgage Corp.: | |
| "ZG", Series 4213, 3.5%, 6/15/2043 | | | | 1,214,947 | | | | 1,217,361 | |
| "JS", Series 3572, Interest Only, 6.639%**, 9/15/2039 | | | 617,635 | | | | 95,892 | |
| Federal National Mortgage Association: | |
| "QD", Series 2005-29, 5.0%, 8/25/2033 | | | | 33,478 | | | | 33,724 | |
| "SI", Series 2007-23, Interest Only, 6.601%**, 3/25/2037 | | | 244,244 | | | | 33,523 | |
| Freddie Mac Structured Agency Credit Risk Debt Notes: | | | | | | | | |
| "M3", Series 2014-DN2, 3.755%*, 4/25/2024 | | | | 500,000 | | | | 460,398 | |
| "M3", Series 2014-DN4, 4.705%*, 10/25/2024 | | | | 240,000 | | | | 235,017 | |
| Government National Mortgage Association: | | | | | | | | |
| "PL", Series 2013-19, 2.5%, 2/20/2043 | | | | 684,500 | | | | 642,598 | |
| "HX", Series 2012-91, 3.0%, 9/20/2040 | | | | 394,649 | | | | 411,465 | |
| "KZ", Series 2014-102, 3.5%, 7/16/2044 | | | | 1,869,242 | | | | 1,918,534 | |
| "EI", Series 2011-162, Interest Only, 4.5%, 5/20/2040 | | | 1,354,755 | | | | 150,748 | |
| "DI", Series 2011-40, Interest Only, 4.5%, 12/20/2040 | | | 2,874,804 | | | | 224,796 | |
| | | Principal Amount ($)(a) | | | Value ($) | |
| | | | | | | | | |
| "IM", Series 2010-87, Interest Only, 4.75%, 3/20/2036 | | | 496,484 | | | | 10,507 | |
| "IN", Series 2009-69, Interest Only, 5.5%, 8/20/2039 | | | 162,284 | | | | 26,841 | |
| "IV", Series 2009-69, Interest Only, 5.5%, 8/20/2039 | | | 319,645 | | | | 55,187 | |
| "IJ", Series 2009-75, Interest Only, 6.0%, 8/16/2039 | | | 134,757 | | | | 24,219 | |
| "AI", Series 2007-38, Interest Only, 6.299%**, 6/16/2037 | | | 83,386 | | | | 13,382 | |
| MASTR Alternative Loans Trust: | |
| "5A1", Series 2005-1, 5.5%, 1/25/2020 | | | | 98,054 | | | | 102,391 | |
| "8A1", Series 2004-3, 7.0%, 4/25/2034 | | | | 8,778 | | | | 9,053 | |
Total Collateralized Mortgage Obligations (Cost $5,945,392) | | | | 6,078,163 | |
| | |
| Government & Agency Obligations 31.4% | |
| Other Government Related (d) 1.8% | |
| Banco de Costa Rica, 144A, 5.25%, 8/12/2018 | | | | 500,000 | | | | 503,750 | |
| New Zealand Local Government Funding Agency, 5.5%, 4/15/2023 | NZD | | | 1,410,000 | | | | 1,180,997 | |
TMK OAO, 144A, 6.75%, 4/3/2020 | | | 250,000 | | | | 140,000 | |
| | | | | 1,824,747 | |
| Sovereign Bonds 5.3% | |
| Republic of Belarus, REG S, 8.75%, 8/3/2015 | | | | 500,000 | | | | 470,850 | |
| Republic of Costa Rica, 144A, 4.25%, 1/26/2023 | | | | 200,000 | | | | 183,000 | |
| Republic of Croatia, 144A, 6.75%, 11/5/2019 | | | | 640,000 | | | | 700,800 | |
| Republic of El Salvador: | |
| 144A, 6.375%, 1/18/2027 | | | | 100,000 | | | | 100,250 | |
| 144A, 7.65%, 6/15/2035 | | | | 200,000 | | | | 212,000 | |
| REG S, 8.25%, 4/10/2032 | | | | 40,000 | | | | 45,600 | |
| Republic of Hungary: | |
| 4.0%, 3/25/2019 | | | | 200,000 | | | | 205,500 | |
| Series 19/A, 6.5%, 6/24/2019 | HUF | | | 11,600,000 | | | | 50,664 | |
| Republic of Italy, REG S, 144A, 4.75%, 9/1/2044 | EUR | | | 850,000 | | | | 1,332,107 | |
| Republic of New Zealand, Series 0427, REG S, 4.5%, 4/15/2027 | NZD | | | 1,130,000 | | | | 940,206 | |
| Republic of Peru, 144A, 5.7%, 8/12/2024 | PEN | | | 300,000 | | | | 100,461 | |
| Republic of Slovenia, 144A, 5.5%, 10/26/2022 | | | | 200,000 | | | | 221,750 | |
| Republic of South Africa: | |
| 5.875%, 9/16/2025 (b) | | | | 100,000 | | | | 112,625 | |
| Series R204, 8.0%, 12/21/2018 | ZAR | | | 1,050,000 | | | | 93,003 | |
| Republic of Sri Lanka, 144A, 5.125%, 4/11/2019 | | | | 200,000 | | | | 201,500 | |
| Republic of Turkey, 5.625%, 3/30/2021 | | | | 250,000 | | | | 274,687 | |
| United Mexican States: | |
| Series M, 4.75%, 6/14/2018 | MXN | | | 1,300,000 | | | | 87,917 | |
| Series M 20, 8.5%, 5/31/2029 | MXN | | | 650,000 | | | | 53,235 | |
| | | | | 5,386,155 | |
| | | Principal Amount ($)(a) | | | Value ($) | |
| | | | | | | | | |
| U.S. Treasury Obligations 24.3% | |
| U.S. Treasury Bills: | |
| 0.035%***, 2/12/2015 (e) | | | | 623,000 | | | | 622,988 | |
| 0.085%***, 6/11/2015 (e) | | | | 181,000 | | | | 180,948 | |
| U.S. Treasury Bonds: | |
| 3.125%, 8/15/2044 | | | | 110,000 | | | | 118,422 | |
| 3.625%, 2/15/2044 | | | | 261,000 | | | | 307,144 | |
| U.S. Treasury Notes: | |
| 0.375%, 4/30/2016 | | | | 1,000,000 | | | | 999,844 | |
| 1.0%, 8/31/2016 (f) (g) | | | | 12,650,000 | | | | 12,744,875 | |
| 1.0%, 9/30/2016 | | | | 1,000,000 | | | | 1,007,344 | |
| 1.625%, 4/30/2019 | | | | 6,640,000 | | | | 6,662,828 | |
| 2.25%, 11/15/2024 | | | | 657,000 | | | | 661,414 | |
| 2.5%, 5/15/2024 | | | | 1,238,000 | | | | 1,275,333 | |
| | | | | 24,581,140 | |
Total Government & Agency Obligations (Cost $31,718,201) | | | | 31,792,042 | |
| | |
| Municipal Bonds and Notes 3.4% | |
| Gwinnett County, GA, Development Authority Revenue, Gwinnett Stadium Project, 6.4%, 1/1/2028 | | | 655,000 | | | | 720,513 | |
| Kentucky, Asset/Liability Commission, General Fund Revenue, 3.165%, 4/1/2018 | | | 1,343,606 | | | | 1,384,492 | |
| Port Authority New York & New Jersey, One Hundred Fiftieth Series, 4.75%, 9/15/2016 | | | 930,000 | | | | 985,521 | |
| Washington, Central Puget Sound Regional Transit Authority, Sales & Use Tax Revenue, Series A, 5.0%, 11/1/2036 | | | 285,000 | | | | 311,673 | |
Total Municipal Bonds and Notes (Cost $3,204,620) | | | | 3,402,199 | |
| | | Shares | | | Value ($) | |
| | | | |
| Preferred Stock 0.0% | |
| Financials | |
| Ally Financial, Inc., Series G, 144A, 7.0% (Cost $27,480) | | | 28 | | | | 28,129 | |
| | |
| Securities Lending Collateral 2.1% | |
| Daily Assets Fund Institutional, 0.10% (h) (i) (Cost $2,108,927) | | | 2,108,927 | | | | 2,108,927 | |
| | |
| Cash Equivalents 14.8% | |
| Central Cash Management Fund, 0.06% (h) (Cost $15,021,340) | | | 15,021,340 | | | | 15,021,340 | |
| | | % of Net Assets | | | Value ($) | |
| | | | |
Total Investment Portfolio (Cost $115,769,180)† | | | 112.9 | | | | 114,461,360 | |
| Other Assets and Liabilities, Net | | | (12.9 | ) | | | (13,061,238 | ) |
| Net Assets | | | 100.0 | | | | 101,400,122 | |
* Floating rate securities' yields vary with a designated market index or market rate, such as the coupon-equivalent of the U.S. Treasury Bill rate. These securities are shown at their current rate as of December 31, 2014.
** These securities are shown at their current rate as of December 31, 2014.
*** Annualized yield at time of purchase; not a coupon rate.
† The cost for federal income tax purposes was $115,768,500. At December 31, 2014, net unrealized depreciation for all securities based on tax cost was $1,307,140. This consisted of aggregate gross unrealized appreciation for all securities in which there was an excess of value over tax cost of $1,990,639 and aggregate gross unrealized depreciation for all securities in which there was an excess of tax cost over value of $3,297,779.
(a) Principal amount stated in U.S. dollars unless otherwise noted.
(b) All or a portion of these securities were on loan. In addition, "Other Assets and Liabilities, Net" may include pending sales that are also on loan. The value of securities loaned at December 31, 2014 amounted to $2,025,780, which is 2.0% of net assets.
(c) When-issued or delayed delivery security included.
(d) Government-backed debt issued by financial companies or government sponsored enterprises.
(e) At December 31, 2014, this security has been pledged, in whole or in part, to cover initial margin requirements for open futures contracts.
(f) At December 31, 2014, this security has been pledged, in whole or in part, as collateral for open centrally cleared swap contracts.
(g) At December 31, 2014, this security has been pledged, in whole or in part, as collateral for open over-the-counter derivatives.
(h) Affiliated fund managed by Deutsche Investment Management Americas Inc. The rate shown is the annualized seven-day yield at period end.
(i) Represents collateral held in connection with securities lending. Income earned by the Fund is net of borrower rebates.
144A: Security exempt from registration under Rule 144A of the Securities Act of 1933. These securities may be resold in transactions exempt from registration, normally to qualified institutional buyers.
Interest Only: Interest Only (IO) bonds represent the "interest only" portion of payments on a pool of underlying mortgages or mortgage-backed securities. IO securities are subject to prepayment risk of the pool of underlying mortgages.
PIK: Denotes that all or a portion of the income is paid in-kind in the form of additional principal.
REG S: Securities sold under Regulation S may not be offered, sold or delivered within the United States or to, or for the account or benefit of, U.S. persons, except pursuant to an exemption from, or in a transaction not subject to, the registration requirements of the Securities Act of 1933.
REIT: Real Estate Investment Trust
Included in the portfolio are investments in mortgage- or asset-backed securities, which are interests in separate pools of mortgages or assets. Effective maturities of these investments may be shorter than stated maturities due to prepayments. Some separate investments in the Federal Home Loan Mortgage Corp. and Federal National Mortgage Association and issues which have similar coupon rates have been aggregated for presentation purposes in this investment portfolio.
At December 31, 2014, open futures contracts purchased were as follows:
| Futures | Currency | Expiration Date | | Contracts | | | Notional Value ($) | | | Unrealized Appreciation ($) | |
| 10 Year U.S. Treasury Note | USD | 3/20/2015 | | | 35 | | | | 4,437,891 | | | | 11,234 | |
| United Kingdom Long Gilt Bond | GBP | 3/27/2015 | | | 5 | | | | 931,498 | | | | 21,441 | |
| Total unrealized appreciation | | | | 32,675 | |
At December 31, 2014, open futures contracts sold were as follows:
| Futures | Currency | Expiration Date | | Contracts | | | Notional Value ($) | | | Unrealized Depreciation ($) | |
| 10 Year Australian Bond | AUD | 3/16/2015 | | | 9 | | | | 941,558 | | | | (14,149 | ) |
| Euro-BTP Italian Government Bond | EUR | 3/6/2015 | | | 18 | | | | 2,953,491 | | | | (20,154 | ) |
| Total unrealized depreciation | | | | (34,303 | ) |
At December 31, 2014, open written options contracts were as follows:
| Options on Interest Rate Swap Contracts | |
| | Swap Effective/ Expiration Date | | Contract Amount | | Option Expiration Date | | Premiums Received ($) | | | Value ($) (j) | |
Call Options Receive Fixed — 4.48% – Pay Floating — LIBOR | 5/9/2016 5/11/2026 | | | 2,000,000 | 1 | 5/5/2016 | | | 22,450 | | | | (3,456 | ) |
Put Options Pay Fixed — 2.48% – Receive Floating — LIBOR | 5/9/2016 5/11/2026 | | | 2,000,000 | 1 | 5/5/2016 | | | 22,450 | | | | (51,774 | ) |
| Pay Fixed — 2.615% – Receive Floating — LIBOR | 12/4/2015 12/4/2045 | | | 2,000,000 | 2 | 12/2/2015 | | | 43,400 | | | | (75,484 | ) |
| Pay Fixed — 2.64% – Receive Floating — LIBOR | 8/10/2015 8/10/2045 | | | 1,800,000 | 1 | 8/6/2015 | | | 16,830 | | | | (59,255 | ) |
| Pay Fixed — 2.675% – Receive Floating — LIBOR | 11/9/2015 11/12/2045 | | | 2,000,000 | 2 | 11/9/2015 | | | 40,100 | | | | (85,510 | ) |
| Pay Fixed — 2.796% – Receive Floating — LIBOR | 6/5/2015 6/5/2045 | | | 1,800,000 | 3 | 6/3/2015 | | | 19,260 | | | | (73,534 | ) |
| Pay Fixed — 2.88% – Receive Floating — LIBOR | 9/30/2015 9/30/2045 | | | 2,000,000 | 4 | 9/28/2015 | | | 41,846 | | | | (121,982 | ) |
| Pay Fixed — 3.005% – Receive Floating — LIBOR | 3/6/2015 3/6/2045 | | | 1,800,000 | 1 | 3/4/2015 | | | 18,900 | | | | (111,186 | ) |
| Pay Fixed — 3.035% – Receive Floating — LIBOR | 2/15/2015 2/3/2045 | | | 1,800,000 | 3 | 1/30/2015 | | | 22,230 | | | | (122,775 | ) |
| Pay Fixed — 3.088% – Receive Floating — LIBOR | 1/28/2015 1/28/2045 | | | 2,000,000 | 5 | 1/26/2015 | | | 20,175 | | | | (154,427 | ) |
| Total Put Options | | | 245,191 | | | | (855,927 | ) |
| Total | | | 267,641 | | | | (859,383 | ) |
(j) Unrealized depreciation on written options on interest rate swap contracts at December 31, 2014 was $591,742.
At December 31, 2014, open interest rate swap contracts were as follows:
| Centrally Cleared Swaps | |
Effective/ Expiration Dates | | Notional Amount ($) | | Cash Flows Paid by the Fund | Cash Flows Received by the Fund | | Value ($) | | | Unrealized Appreciation/ (Depreciation) ($) | |
12/16/2015 9/16/2025 | | | 500,000 | | Floating — LIBOR | Fixed — 2.64% | | | 3,498 | | | | 5 | |
12/16/2015 9/18/2017 | | | 13,600,000 | | Fixed — 1.557% | Floating — LIBOR | | | 16,731 | | | | 101 | |
12/16/2015 9/16/2020 | | | 8,900,000 | | Floating — LIBOR | Fixed — 2.214% | | | (4,754 | ) | | | (14 | ) |
12/16/2015 9/18/2045 | | | 3,600,000 | | Floating — LIBOR | Fixed — 2.998% | | | 125,351 | | | | 67 | |
12/16/2015 9/17/2035 | | | 9,700,000 | | Floating — LIBOR | Fixed — 2.938% | | | 222,717 | | | | 177 | |
| Total net unrealized appreciation | | | | 336 | |
At December 31, 2014, open credit default swap contracts sold were as follows:
| Bilateral Swaps | |
Effective/ Expiration Dates | | Notional Amount ($) (k) | | | Fixed Cash Flows Received | | Underlying Debt Obligation/ Quality Rating (l) | | Value ($) | | | Upfront Payments Paid/ (Received) ($) | | | Unrealized Appreciation ($) | |
6/20/2013 9/20/2018 | | | 15,000 | 6 | | | 5.0 | % | DISH DBS Corp., 6.75%, 6/1/2021, BB– | | | 1,834 | | | | 997 | | | | 837 | |
(k) The maximum potential amount of future undiscounted payments that the Fund could be required to make under a credit default swap contract would be the notional amount of the contract. These potential amounts would be partially offset by any recovery values of the referenced debt obligation or net amounts received from the settlement of buy protection credit default swap contracts entered into by the Fund for the same referenced debt obligation, if any.
(l) The quality ratings represent the higher of Moody's Investors Service, Inc. ("Moody's") or Standard & Poor's Corporation ("S&P") credit ratings and are unaudited.
Counterparties:
1 Nomura International PLC
2 Citigroup, Inc.
3 BNP Paribas
4 Morgan Stanley
5 Barclays Bank PLC
6 Credit Suisse
LIBOR: London Interbank Offered Rate
At December 31, 2014, the Fund had the following open forward foreign currency exchange contracts:
| Contracts to Deliver | | In Exchange For | | Settlement Date | | Unrealized Appreciation ($) | | Counterparty |
| AUD | | | 1,800,000 | | NZD | | | 1,917,212 | | 1/5/2015 | | | 25,722 | | BNP Paribas |
| CAD | | | 2,349,451 | | GBP | | | 1,300,000 | | 1/5/2015 | | | 4,072 | | Societe Generale |
| EUR | | | 1,700,000 | | JPY | | | 251,807,400 | | 1/5/2015 | | | 45,142 | | Barclays Bank PLC |
| EUR | | | 1,600,000 | | USD | | | 2,003,478 | | 1/5/2015 | | | 67,291 | | Barclays Bank PLC |
| USD | | | 19,771 | | JPY | | | 2,369,800 | | 1/5/2015 | | | 15 | | Societe Generale |
| USD | | | 2,569,843 | | NZD | | | 3,300,000 | | 1/5/2015 | | | 2,888 | | Australia & New Zealand Banking Group Ltd. |
| MXN | | | 10,050,000 | | USD | | | 728,777 | | 1/15/2015 | | | 48,234 | | JPMorgan Chase Securities, Inc. |
| CAD | | | 1,552,000 | | USD | | | 1,374,839 | | 1/20/2015 | | | 39,571 | | Societe Generale |
| CAD | | | 1,404,760 | | USD | | | 1,243,067 | | 1/20/2015 | | | 34,477 | | Australia & New Zealand Banking Group Ltd. |
| EUR | | | 1,038,000 | | USD | | | 1,289,725 | | 1/20/2015 | | | 33,416 | | Societe Generale |
| SGD | | | 1,749,000 | | USD | | | 1,375,763 | | 1/20/2015 | | | 56,144 | | Australia & New Zealand Banking Group Ltd. |
| NZD | | | 1,987,400 | | AUD | | | 1,900,000 | | 2/5/2015 | | | 2,667 | | Australia & New Zealand Banking Group Ltd. |
| NZD | | | 2,000,000 | | USD | | | 1,560,786 | | 2/5/2015 | | | 6,520 | | Australia & New Zealand Banking Group Ltd. |
| USD | | | 12,246 | | RUB | | | 818,040 | | 2/17/2015 | | | 940 | | Barclays Bank PLC |
| Total unrealized appreciation | | | | | 367,099 | |
| Contracts to Deliver | | In Exchange For | | Settlement Date | | Unrealized Depreciation ($) | | Counterparty |
| AUD | | | 1,900,000 | | NZD | | | 1,985,741 | | 1/5/2015 | | | (2,461 | ) | Australia & New Zealand Banking Group Ltd. |
| GBP | | | 1,300,000 | | CAD | | | 2,331,251 | | 1/5/2015 | | | (19,735 | ) | UBS AG |
| JPY | | | 254,177,200 | | EUR | | | 1,700,000 | | 1/5/2015 | | | (64,927 | ) | Barclays Bank PLC |
| NZD | | | 1,952,631 | | AUD | | | 1,800,000 | | 1/5/2015 | | | (53,335 | ) | Australia & New Zealand Banking Group Ltd. |
| NZD | | | 2,005,526 | | AUD | | | 1,900,000 | | 1/5/2015 | | | (12,963 | ) | Morgan Stanley |
| NZD | | | 3,300,000 | | USD | | | 2,532,800 | | 1/5/2015 | | | (39,931 | ) | Australia & New Zealand Banking Group Ltd. |
| USD | | | 15,710 | | CAD | | | 18,200 | | 1/5/2015 | | | (46 | ) | Citigroup, Inc. |
| USD | | | 1,949,880 | | EUR | | | 1,600,000 | | 1/5/2015 | | | (13,693 | ) | Societe Generale |
| USD | | | 2,013,325 | | JPY | | | 240,000,000 | | 1/5/2015 | | | (9,564 | ) | UBS AG |
| USD | | | 15,462 | | NZD | | | 19,785 | | 1/5/2015 | | | (38 | ) | Citigroup, Inc. |
| USD | | | 1,476,525 | | MXN | | | 20,100,000 | | 1/15/2015 | | | (115,440 | ) | JPMorgan Chase Securities, Inc. |
| USD | | | 42,357 | | ZAR | | | 480,000 | | 1/15/2015 | | | (965 | ) | Commonwealth Bank of Australia |
| USD | | | 534,543 | | ZAR | | | 6,080,000 | | 1/15/2015 | | | (10,243 | ) | UBS AG |
| USD | | | 492,037 | | ZAR | | | 5,600,000 | | 1/15/2015 | | | (9,128 | ) | Citigroup, Inc. |
| USD | | | 736,507 | | ZAR | | | 8,400,000 | | 1/15/2015 | | | (12,145 | ) | BNP Paribas |
| NZD | | | 2,679,000 | | USD | | | 2,074,898 | | 1/20/2015 | | | (10,208 | ) | Australia & New Zealand Banking Group Ltd. |
| USD | | | 1,240,146 | | CAD | | | 1,404,760 | | 1/20/2015 | | | (31,556 | ) | Societe Generale |
| USD | | | 1,336,056 | | SGD | | | 1,749,000 | | 1/20/2015 | | | (16,438 | ) | BNP Paribas |
| GBP | | | 1,300,000 | | CAD | | | 2,350,438 | | 2/5/2015 | | | (4,069 | ) | Societe Generale |
| USD | | | 34,474 | | ZAR | | | 400,000 | | 2/10/2015 | | | (119 | ) | Citigroup, Inc. |
| RUB | | | 818,040 | | USD | | | 12,708 | | 2/17/2015 | | | (478 | ) | Barclays Bank PLC |
| Total unrealized depreciation | | | | | (427,482 | ) |
| Currency Abbreviations |
AUD Australian Dollar CAD Canadian Dollar EUR Euro GBP British Pound HUF Hungarian Forint JPY Japanese Yen MXN Mexican Peso NZD New Zealand Dollar PEN Peruvian Nuevo Sol RUB Russian Ruble SGD Singapore Dollar USD United States Dollar ZAR South African Rand |
For information on the Fund's policy and additional disclosures regarding futures contracts, written options, credit default swap contracts, interest rate swap contracts and forward foreign currency exchange contracts, please refer to Note B in the accompanying Notes to Financial Statements.
Fair Value Measurements
Various inputs are used in determining the value of the Fund's investments. These inputs are summarized in three broad levels. Level 1 includes quoted prices in active markets for identical securities. Level 2 includes other significant observable inputs (including quoted prices for similar securities, interest rates, prepayment speeds and credit risk). Level 3 includes significant unobservable inputs (including the Fund's own assumptions in determining the fair value of investments). The level assigned to the securities valuations may not be an indication of the risk or liquidity associated with investing in those securities.
The following is a summary of the inputs used as of December 31, 2014 in valuing the Fund's investments. For information on the Fund's policy regarding the valuation of investments, please refer to the Security Valuation section of Note A in the accompanying Notes to Financial Statements.
| Assets | | Level 1 | | | Level 2 | | | Level 3 | | | Total | |
| | |
| Fixed Income Investments (m) | |
| Corporate Bonds | | $ | — | | | $ | 31,327,014 | | | $ | — | | | $ | 31,327,014 | |
| Mortgage-Backed Securities Pass-Throughs | | | — | | | | 18,469,924 | | | | — | | | | 18,469,924 | |
| Asset-Backed | | | — | | | | 2,069,785 | | | | — | | | | 2,069,785 | |
| Commercial Mortgage-Backed Securities | | | — | | | | 4,163,837 | | | | — | | | | 4,163,837 | |
| Collateralized Mortgage Obligations | | | — | | | | 6,078,163 | | | | — | | | | 6,078,163 | |
| Government & Agency Obligations | | | — | | | | 31,792,042 | | | | — | | | | 31,792,042 | |
| Municipal Bonds and Notes | | | — | | | | 3,402,199 | | | | — | | | | 3,402,199 | |
| Preferred Stock | | | — | | | | 28,129 | | | | — | | | | 28,129 | |
| Short-Term Investments (m) | | | 17,130,267 | | | | — | | | | — | | | | 17,130,267 | |
| Derivatives (n) | |
| Futures Contracts | | | 32,675 | | | | — | | | | — | | | | 32,675 | |
| Credit Default Swap Contracts | | | — | | | | 837 | | | | — | | | | 837 | |
| Interest Rate Swap Contracts | | | — | | | | 350 | | | | — | | | | 350 | |
| Forward Foreign Currency Exchange Contracts | | | — | | | | 367,099 | | | | — | | | | 367,099 | |
| Total | | $ | 17,162,942 | | | $ | 97,699,379 | | | $ | — | | | $ | 114,862,321 | |
| Liabilities | | Level 1 | | | Level 2 | | | Level 3 | | | Level 2 | |
| | |
| Derivatives (n) | |
| Futures Contracts | | $ | (34,303 | ) | | $ | — | | | $ | — | | | $ | (34,303 | ) |
| Written Options | | | — | | | | (859,383 | ) | | | — | | | | (859,383 | ) |
| Interest Rate Swap Contracts | | | — | | | | (14 | ) | | | — | | | | (14 | ) |
| Forward Foreign Currency Exchange Contracts | | | — | | | | (427,482 | ) | | | — | | | | (427,482 | ) |
| Total | | $ | (34,303 | ) | | $ | (1,286,879 | ) | | $ | — | | | $ | (1,321,182 | ) |
There have been no transfers between fair value measurement levels during the year ended December 31, 2014.
(m) See Investment Portfolio for additional detailed categorizations.
(n) Derivatives include unrealized appreciation (depreciation) on open futures contracts, credit default swap contracts, interest rate swap contracts, forward foreign currency exchange contracts and written options, at value.
The accompanying notes are an integral part of the financial statements.
Statement of Assets and Liabilities | as of December 31, 2014 | |
| Assets | |
Investments: Investments in non-affiliated securities, at value (cost $98,638,913) — including $2,025,780 of securities loaned | | $ | 97,331,093 | |
| Investment in Daily Assets Fund Institutional (cost $2,108,927)* | | | 2,108,927 | |
| Investment in Central Cash Management Fund (cost $15,021,340) | | | 15,021,340 | |
| Total investments in securities, at value (cost $115,769,180) | | | 114,461,360 | |
| Cash | | | 291,737 | |
| Foreign currency, at value (cost $159,362) | | | 139,167 | |
| Receivable for investments sold | | | 6,647 | |
| Receivable for investments sold — when-issued/delayed delivery securities | | | 4,900,550 | |
| Receivable for Fund shares sold | | | 92,477 | |
| Interest receivable | | | 781,678 | |
| Unrealized appreciation on bilateral swap contracts | | | 837 | |
| Unrealized appreciation on forward foreign currency exchange contracts | | | 367,099 | |
| Upfront payments paid on bilateral swap contracts | | | 997 | |
| Foreign taxes recoverable | | | 1,245 | |
| Other assets | | | 2,238 | |
| Total assets | | | 121,046,032 | |
| Liabilities | |
| Payable upon return of securities loaned | | | 2,108,927 | |
| Payable for investments purchased | | | 203,629 | |
| Payable for investment purchased — when–issued/delayed delivery securities | | | 15,848,342 | |
| Payable for Fund shares redeemed | | | 6,563 | |
| Payable for variation margin on futures contracts | | | 18,639 | |
| Payable for variation margin on centrally cleared swaps | | | 34,515 | |
| Options written, at value (premiums received $267,641) | | | 859,383 | |
| Unrealized depreciation on forward foreign currency exchange contracts | | | 427,482 | |
| Accrued management fee | | | 14,927 | |
| Accrued Trustees' fees | | | 1,564 | |
| Other accrued expenses and payables | | | 121,939 | |
| Total liabilities | | | 19,645,910 | |
| Net assets, at value | | $ | 101,400,122 | |
| Net Assets Consist of | |
| Undistributed net investment income | | | 2,890,836 | |
Net unrealized appreciation (depreciation) on: Investments | | | (1,307,820 | ) |
| Swap contracts | | | 1,173 | |
| Futures | | | (1,628 | ) |
| Foreign currency | | | (81,266 | ) |
| Written options | | | (591,742 | ) |
| Accumulated net realized gain (loss) | | | (14,114,537 | ) |
| Paid-in capital | | | 114,605,106 | |
| Net assets, at value | | $ | 101,400,122 | |
Class A Net Asset Value, offering and redemption price per share ($101,400,122 ÷ 17,886,425 outstanding shares of beneficial interest, $.01 par value, unlimited number of shares authorized) | | $ | 5.67 | |
* Represents collateral on securities loaned.
The accompanying notes are an integral part of the financial statements.
| for the year ended December 31, 2014 | |
| Investment Income | |
Income: Interest | | $ | 3,725,661 | |
| Income distributions — Central Cash Management Fund | | | 4,903 | |
| Securities lending income, including income from Daily Assets Fund Institutional, net of borrower rebates | | | 15,896 | |
| Total income | | | 3,746,460 | |
Expenses: Management fee | | | 405,684 | |
| Administration fee | | | 104,022 | |
| Services to shareholders | | | 2,253 | |
| Custodian fee | | | 44,077 | |
| Professional fees | | | 98,202 | |
| Reports to shareholders | | | 44,180 | |
| Trustees' fees and expenses | | | 5,946 | |
| Other | | | 14,774 | |
| Total expenses before expense reductions | | | 719,138 | |
| Expense reductions | | | (84,123 | ) |
| Total expenses after expense reductions | | | 635,015 | |
| Net investment income | | | 3,111,445 | |
| Realized and Unrealized Gain (Loss) | |
Net realized gain (loss) from: Investments | | | 1,207,687 | |
| Swap contracts | | | 1,057,263 | |
| Futures | | | 764,133 | |
| Written options | | | 138,600 | |
| Foreign currency | | | 436,709 | |
| | | | 3,604,392 | |
Change in net unrealized appreciation (depreciation) on: Investments | | | 906,580 | |
| Swap contracts | | | 18,010 | |
| Futures | | | 5,151 | |
| Written options | | | (670,276 | ) |
| Foreign currency | | | (279,550 | ) |
| | | | (20,085 | ) |
| Net gain (loss) | | | 3,584,307 | |
| Net increase (decrease) in net assets resulting from operations | | $ | 6,695,752 | |
The accompanying notes are an integral part of the financial statements.
Statement of Changes in Net Assets | | | Years Ended December 31, | |
| Increase (Decrease) in Net Assets | | 2014 | | | 2013 | |
Operations: Net investment income | | $ | 3,111,445 | | | $ | 3,746,885 | |
| Net realized gain (loss) | | | 3,604,392 | | | | (1,091,805 | ) |
| Change in net unrealized appreciation (depreciation) | | | (20,085 | ) | | | (6,522,025 | ) |
| Net increase (decrease) in net assets resulting from operations | | | 6,695,752 | | | | (3,866,945 | ) |
Distributions to shareholders from: Net investment income: Class A | | | (3,659,417 | ) | | | (4,386,055 | ) |
Fund share transactions: Class A Proceeds from shares sold | | | 11,004,710 | | | | 5,651,619 | |
| Reinvestment of distributions | | | 3,659,417 | | | | 4,386,055 | |
| Payments for shares redeemed | | | (21,178,745 | ) | | | (87,153,230 | ) |
| Net increase (decrease) in net assets from Class A share transactions | | | (6,514,618 | ) | | | (77,115,556 | ) |
| Increase (decrease) in net assets | | | (3,478,283 | ) | | | (85,368,556 | ) |
| Net assets at beginning of period | | | 104,878,405 | | | | 190,246,961 | |
| Net assets at end of period (including undistributed net investment income of $2,890,836 and $3,120,319, respectively) | | $ | 101,400,122 | | | $ | 104,878,405 | |
| Other Information | |
Class A Shares outstanding at beginning of period | | | 19,030,134 | | | | 32,324,964 | |
| Shares sold | | | 1,948,624 | | | | 1,003,776 | |
| Shares issued to shareholders in reinvestment of distributions | | | 662,938 | | | | 768,136 | |
| Shares redeemed | | | (3,755,271 | ) | | | (15,066,742 | ) |
| Net increase (decrease) in Class A shares | | | (1,143,709 | ) | | | (13,294,830 | ) |
| Shares outstanding at end of period | | | 17,886,425 | | | | 19,030,134 | |
The accompanying notes are an integral part of the financial statements.
| | | Years Ended December 31, | |
| Class A | | | 2014 | | | 2013 | | | 2012 | | | 2011 | | | 2010 | |
| Selected Per Share Data | |
| Net asset value, beginning of period | | $ | 5.51 | | | $ | 5.89 | | | $ | 5.72 | | | $ | 5.66 | | | $ | 5.54 | |
Income (loss) from investment operations: Net investment incomea | | | .17 | | | | .16 | | | | .16 | | | | .22 | | | | .19 | |
| Net realized and unrealized gain (loss) | | | .19 | | | | (.33 | ) | | | .27 | | | | .09 | | | | .18 | |
| Total from investment operations | | | .36 | | | | (.17 | ) | | | .43 | | | | .31 | | | | .37 | |
Less distributions from: Net investment income | | | (.20 | ) | | | (.21 | ) | | | (.26 | ) | | | (.25 | ) | | | (.25 | ) |
| Net asset value, end of period | | $ | 5.67 | | | $ | 5.51 | | | $ | 5.89 | | | $ | 5.72 | | | $ | 5.66 | |
| Total Return (%) | | | 6.63 | b | | | (3.03 | )b | | | 7.77 | | | | 5.68 | | | | 6.79 | |
| Ratios to Average Net Assets and Supplemental Data | |
| Net assets, end of period ($ millions) | | | 101 | | | | 105 | | | | 190 | | | | 112 | | | | 155 | |
| Ratio of expenses before expense reductions (%) | | | .69 | | | | .65 | | | | .58 | | | | .62 | | | | .59 | |
| Ratio of expenses after expense reductions (%) | | | .61 | | | | .56 | | | | .58 | | | | .62 | | | | .59 | |
| Ratio of net investment income (%) | | | 2.99 | | | | 2.88 | | | | 2.81 | | | | 3.86 | | | | 3.42 | |
| Portfolio turnover rate (%) | | | 273 | | | | 418 | | | | 115 | | | | 219 | | | | 357 | |
a Based on average shares outstanding during the period. b Total return would have been lower had certain expenses not been reduced. | |
Notes to Financial Statements
A. Organization and Significant Accounting Policies
Deutsche Variable Series I (formerly DWS Variable Series I) (the "Series") is registered under the Investment Company Act of 1940, as amended (the "1940 Act"), as an open-end, registered management investment company organized as a Massachusetts business trust. The Series consists of five diversified funds: Deutsche Bond VIP, Deutsche Core Equity VIP, Deutsche Capital Growth VIP, Deutsche Global Small Cap VIP and Deutsche International VIP (individually or collectively hereinafter referred to as a "Fund" or the "Funds" and formerly known as DWS Bond VIP, DWS Core Equity VIP, DWS Capital Growth VIP, DWS Global Small Cap Growth VIP and DWS International VIP, respectively). These financial statements report on Deutsche Bond VIP. The Series is intended to be the underlying investment vehicle for variable annuity contracts and variable life insurance policies to be offered by the separate accounts of certain life insurance companies ("Participating Insurance Companies").
The Fund's financial statements are prepared in accordance with accounting principles generally accepted in the United States of America, which require the use of management estimates. Actual results could differ from those estimates. The policies described below are followed consistently by the Fund in the preparation of its financial statements.
Security Valuation. Investments are stated at value determined as of the close of regular trading on the New York Stock Exchange on each day the exchange is open for trading.
Various inputs are used in determining the value of the Fund's investments. These inputs are summarized in three broad levels. Level 1 includes quoted prices in active markets for identical securities. Level 2 includes other significant observable inputs (including quoted prices for similar securities, interest rates, prepayment speeds and credit risk). Level 3 includes significant unobservable inputs (including the Fund's own assumptions in determining the fair value of investments). The level assigned to the securities valuations may not be an indication of the risk or liquidity associated with investing in those securities.
Debt securities are valued at prices supplied by independent pricing services approved by the Trustees of the Series. Such services may use various pricing techniques which take into account appropriate factors such as yield, quality, coupon rate, maturity, type of issue, trading characteristics, prepayment speeds and other data, as well as broker quotes. If the pricing services are unable to provide valuations, debt securities are valued at the average of the most recent reliable bid quotations or evaluated prices, as applicable, obtained from broker-dealers. These securities are generally categorized as Level 2.
Money market instruments purchased with an original or remaining maturity of sixty days or less, maturing at par, are valued at amortized cost, which approximates value, and are categorized as Level 2. Investments in open-end investment companies are valued at their net asset value each business day and are categorized as Level 1.
Futures contracts are generally valued at the settlement prices established each day on the exchange on which they are traded and are categorized as Level 1.
Swap contracts are valued daily based upon prices supplied by a Board approved pricing vendor, if available, and otherwise are valued at the price provided by the broker-dealer. Swap contracts are generally categorized as Level 2.
Forward currency contracts are valued at the prevailing forward exchange rate of the underlying currencies and are categorized as Level 2.
Exchange-traded options are valued at the last sale price or, in the absence of a sale, the mean between the closing bid and asked prices or at the most recent asked price (bid for purchased options) if no bid or asked price are available. Exchange-traded options are generally categorized as Level 1. Over-the-counter written or purchased options are valued at prices supplied by a Board approved pricing vendor, if available, and otherwise are valued at the price provided by the broker-dealer with which the option was traded. Over-the-counter written or purchased options are generally categorized as Level 2.
Securities and other assets for which market quotations are not readily available or for which the above valuation procedures are deemed not to reflect fair value are valued in a manner that is intended to reflect their fair value as determined in accordance with procedures approved by the Trustees and are generally categorized as Level 3. In accordance with the Fund's valuation procedures, factors considered in determining value may include, but are not limited to, the type of the security; the size of the holding; the initial cost of the security; the existence of any contractual restrictions on the security's disposition; the price and extent of public trading in similar securities of the issuer or of comparable companies; quotations or evaluated prices from broker-dealers and/or pricing services; information obtained from the issuer, analysts, and/or the appropriate stock exchange (for exchange-traded securities); an analysis of the company's or issuer's financial statements; an evaluation of the forces that influence the issuer and the market(s) in which the security is purchased and sold; and with respect to debt securities, the maturity, coupon, creditworthiness, currency denomination and the movement of the market in which the security is normally traded. The value determined under these procedures may differ from published values for the same securities.
Disclosure about the classification of fair value measurements is included in a table following the Fund's Investment Portfolio.
Securities Lending. Deutsche Bank AG, as lending agent, lends securities of the Fund to certain financial institutions under the terms of the Security Lending Agreement. The Fund retains the benefits of owning the securities it has loaned and continues to receive interest and dividends generated by the securities and to participate in any changes in their market value. The Fund requires the borrowers of the securities to maintain collateral with the Fund consisting of either cash or liquid, unencumbered assets having a value at least equal to the value of the securities loaned. When the collateral falls below specified amounts, the lending agent will use its best effort to obtain additional collateral on the next business day to meet required amounts under the security lending agreement. The Fund may invest the cash collateral into a joint trading account in an affiliated money market fund pursuant to Exemptive Orders issued by the SEC. The Fund receives compensation for lending its securities either in the form of fees or by earning interest on invested cash collateral net of borrower rebates and fees paid to a lending agent. Either the Fund or the borrower may terminate the loan. There may be risks of delay and costs in recovery of securities or even loss of rights in the collateral should the borrower of the securities fail financially. If the Fund is not able to recover securities lent, the Fund may sell the collateral and purchase a replacement investment in the market, incurring the risk that the value of the replacement security is greater than the value of the collateral. The Fund is also subject to all investment risks associated with the reinvestment of any cash collateral received, including, but not limited to, interest rate, credit and liquidity risk associated with such investments.
As of December 31, 2014, the Fund had securities on loan. The value of the related collateral exceeded the value of the securities loaned at period end.
Foreign Currency Translations. The books and records of the Fund are maintained in U.S. dollars. Investment securities and other assets and liabilities denominated in a foreign currency are translated into U.S. dollars at the prevailing exchange rates at period end. Purchases and sales of investment securities, income and expenses are translated into U.S. dollars at the prevailing exchange rates on the respective dates of the transactions.
Net realized and unrealized gains and losses on foreign currency transactions represent net gains and losses between trade and settlement dates on securities transactions, the acquisition and disposition of foreign currencies, and the difference between the amount of net investment income accrued and the U.S. dollar amount actually received. That portion of both realized and unrealized gains and losses on investments that results from fluctuations in foreign currency exchange rates is not separately disclosed but is included with net realized and unrealized gain/appreciation and loss/depreciation on investments.
When-Issued/Delayed Delivery Securities. The Fund may purchase or sell securities with delivery or payment to occur at a later date beyond the normal settlement period. At the time the Fund enters into a commitment to purchase or sell a security, the transaction is recorded and the value of the transaction is reflected in the net asset value. The price of such security and the date when the security will be delivered and paid for are fixed at the time the transaction is negotiated. The value of the security may vary with market fluctuations. At the time the Fund enters into a purchase transaction it is required to segregate cash or other liquid assets at least equal to the amount of the commitment. Additionally, the Fund may be required to post securities and/or cash collateral in accordance with the terms of the commitment.
Certain risks may arise upon entering into when-issued or delayed delivery transactions from the potential inability of counterparties to meet the terms of their contracts or if the issuer does not issue the securities due to political, economic, or other factors. Additionally, losses may arise due to changes in the value of the underlying securities.
Taxes. The Fund is treated as a separate taxpayer as provided for in the Internal Revenue Code, as amended. It is the Fund's policy to comply with the requirements of the Internal Revenue Code, as amended, which are applicable to regulated investment companies, and to distribute all of its taxable income to the separate accounts of the Participating Insurance Companies which hold its shares.
Additionally, the Fund may be subject to taxes imposed by the governments of countries in which it invests and are generally based on income and/or capital gains earned or repatriated. Estimated tax liabilities on certain foreign securities are recorded on an accrual basis and are reflected as components of interest income or net change in unrealized gain/loss on investments. Tax liabilities realized as a result of security sales are reflected as a component of net realized gain/loss on investments.
Under the Regulated Investment Company Modernization Act of 2010, net capital losses incurred post-enactment may be carried forward indefinitely, and their character is retained as short-term and/or long-term. Previously, net capital losses were carried forward for eight years and treated as short-term losses. As a transition rule, the Act requires that post-enactment net capital losses be used before pre-enactment net capital losses.
At December 31, 2014, the Fund had a net tax basis capital loss carryforward of approximately $14,056,000 of pre-enactment losses, which may be applied against any realized net taxable capital gains of each succeeding year until fully utilized or until December 31, 2017, the expiration date, whichever occurs first, and which may be subject to certain limitations under Section 381–384 of the Internal Revenue Code.
The Fund has reviewed the tax positions for the open tax years as of December 31, 2014 and has determined that no provision for income tax and/or uncertain tax provisions is required in the Fund's financial statements. The Fund's federal tax returns for the prior three fiscal years remain open subject to examination by the Internal Revenue Service.
Distribution of Income and Gains. Distributions from net investment income of the Fund, if any, are declared and distributed to shareholders annually. Net realized gains from investment transactions, in excess of available capital loss carryforwards, would be taxable to the Fund if not distributed, and, therefore, will be distributed to shareholders at least annually. The Fund may also make additional distributions for tax purposes if necessary.
The timing and characterization of certain income and capital gain distributions are determined annually in accordance with federal tax regulations which may differ from accounting principles generally accepted in the United States of America. These differences primarily relate to investments in foreign denominated investments, investments in forward foreign currency exchange contracts, futures contracts, swap contracts and certain securities sold at a loss. As a result, net investment income (loss) and net realized gain (loss) on investment transactions for a reporting period may differ significantly from distributions during such period. Accordingly, the Fund may periodically make reclassifications among certain of its capital accounts without impacting the net asset value of the Fund.
At December 31, 2014, the Fund's components of distributable earnings (accumulated losses) on a tax basis are as follows:
| Undistributed ordinary income* | | $ | 2,869,066 | |
| Capital loss carryforwards | | $ | (14,056,000 | ) |
| Net unrealized appreciation (depreciation) on investments | | $ | (1,307,140 | ) |
In addition, the tax character of distributions paid to shareholders by the Fund is summarized as follows:
| | | Years Ended December 31, | |
| | | 2014 | | | 2013 | |
| Distributions from ordinary income* | | $ | 3,659,417 | | | $ | 4,386,055 | |
* For tax purposes, short-term capital gain distributions are considered ordinary income distributions.
Expenses. Expenses of the Series arising in connection with a specific Fund are allocated to that Fund. Other Series expenses which cannot be directly attributed to a Fund are apportioned among the Funds in the Series based upon the relative net assets or other appropriate measures.
Contingencies. In the normal course of business, the Fund may enter into contracts with service providers that contain general indemnification clauses. The Fund's maximum exposure under these arrangements is unknown as this would involve future claims that may be made against the Fund that have not yet been made. However, based on experience, the Fund expects the risk of loss to be remote.
Other. Investment transactions are accounted for on a trade date plus one basis for daily net asset value calculations. However, for financial reporting purposes, investment transactions are reported on trade date. Interest income is recorded on the accrual basis net of foreign withholding taxes. Realized gains and losses from investment transactions are recorded on an identified cost basis. Proceeds from litigation payments, if any, are included in net realized gain (loss) from investments. All discounts and premiums are accreted/amortized for both tax and financial reporting purposes.
B. Derivative Instruments
Futures Contracts. A futures contract is an agreement between a buyer or seller and an established futures exchange or its clearinghouse in which the buyer or seller agrees to take or make a delivery of a specific amount of a financial instrument at a specified price on a specific date (settlement date). For the year ended December 31, 2014, the Fund invested in interest rate futures to gain exposure to different parts of the yield curve while managing the overall duration. The Fund also entered into interest rate futures contracts for non-hedging purposes to seek to enhance potential gains.
Upon entering into a futures contract, the Fund is required to deposit with a financial intermediary cash or securities ("initial margin") in an amount equal to a certain percentage of the face value indicated in the futures contract. Subsequent payments ("variation margin") are made or received by the Fund dependent upon the daily fluctuations in the value and are recorded for financial reporting purposes as unrealized gains or losses by the Fund. Gains or losses are realized when the contract expires or is closed. Since all futures contracts are exchange traded, counterparty risk is minimized as the exchange's clearinghouse acts as the counterparty, and guarantees the futures against default.
Certain risks may arise upon entering into futures contracts, including the risk that an illiquid market will limit the Fund's ability to close out a futures contract prior to the settlement date and the risk that the futures contract is not well correlated with the security, index or currency to which it relates. Risk of loss may exceed amounts disclosed in the Statement of Assets and Liabilities.
A summary of the open futures contracts as of December 31, 2014, is included in a table following the Fund's Investment Portfolio. For the year ended December 31, 2014, the investment in futures contracts purchased had a total notional value generally indicative of a range from approximately $5,369,000 to $31,610,000, and the investment in futures contracts sold had a total notional value generally indicative of a range from approximately $3,895,000 to $21,371,000.
Options. An option contract is a contract in which the writer (seller) of the option grants the buyer of the option, upon payment of a premium, the right to purchase from (call option), or sell to (put option), the writer a designated instrument at a specified price within a specified period of time. The Fund may write or purchase interest rate swaption agreements which are options to enter into a pre-defined swap agreement. The interest rate swaption agreement will specify whether the buyer of the swaption will be a fixed-rate receiver or a fixed-rate payer upon exercise. Certain options, including options on indices, will require cash settlement by the Fund if exercised. For the year ended December 31, 2014, the Fund entered into options interest rate swaps in order to hedge against potential adverse interest rate movements of portfolio assets.
If the Fund writes a covered call option, the Fund foregoes, in exchange for the premium, the opportunity to profit during the option period from an increase in the market value of the underlying security above the exercise price. If the Fund writes a put option it accepts the risk of a decline in the value of the underlying security below the exercise price. Over-the-counter options have the risk of the potential inability of counterparties to meet the terms of their contracts. The Fund's maximum exposure to purchased options is limited to the premium initially paid. In addition, certain risks may arise upon entering into option contracts including the risk that an illiquid secondary market will limit the Fund's ability to close out an option contract prior to the expiration date and that a change in the value of the option contract may not correlate exactly with changes in the value of the securities or currencies hedged.
There are no open purchased option contracts as of December 31, 2014. A summary of open written option contracts is included in the table following the Fund's Investment Portfolio. For the year ended December 31, 2014, the investment in written options contracts had a total value generally indicative of a range from approximately $60,000 to $859,000.
Swaps. A swap is a contract between two parties to exchange future cash flows at periodic intervals based on the notional amount of the swap. A bilateral swap is a transaction between the fund and a counterparty where cash flows are exchanged between the two parties. A centrally cleared swap is a transaction executed between the fund and a counterparty, then cleared by a clearing member through a central clearinghouse. The central clearinghouse serves as the counterparty, with whom the fund exchanges cash flows.
The value of a swap is adjusted daily, and the change in value, if any, is recorded as unrealized appreciation or depreciation in the Statement of Assets and Liabilities. Gains or losses are realized when the swap expires or is closed. Certain risks may arise when entering into swap transactions including counterparty default; liquidity; or unfavorable changes in interest rates or the value of the underlying reference security, commodity or index. In connection with bilateral swaps, securities and/or cash may be identified as collateral in accordance with the terms of the swap agreement to provide assets of value and recourse in the event of default. The maximum counterparty credit risk is the net present value of the cash flows to be received from or paid to the counterparty over the term of the swap, to the extent that this amount is beneficial to the Fund, in addition to any related collateral posted to the counterparty by the Fund. This risk may be partially reduced by a master netting arrangement between the Fund and the counterparty. Upon entering into a centrally cleared swap, the Fund is required to deposit with a financial intermediary cash or securities ("initial margin") in an amount equal to a certain percentage of the notional amount of the swap. Subsequent payments ("variation margin") are made or received by the Fund dependent upon the daily fluctuations in the value of the swap. In a cleared swap transaction, counterparty risk is minimized as the central clearinghouse acts as the counterparty.
An upfront payment, if any, made by the Fund is recorded as an asset in the Statement of Assets and Liabilities. An upfront payment, if any, received by the Fund is recorded as a liability in the Statement of Assets and Liabilities. Payments received or made at the end of the measurement period are recorded as realized gain or loss in the Statement of Operations.
Credit Default Swaps. Credit default swaps are agreements between a buyer and a seller of protection against predefined credit events for the reference entity. The Fund may enter into credit default swaps to gain exposure to an underlying issuer's credit quality characteristics without directly investing in that issuer or to hedge against the risk of a credit event on debt securities. As a seller of a credit default swap, the Fund is required to pay the par (or other agreed-upon) value of the referenced entity to the counterparty with the occurrence of a credit event by a third party, such as a U.S. or foreign corporate issuer, on the reference entity, which would likely result in a loss to the Fund. In return, the Fund receives from the counterparty a periodic stream of payments over the term of the swap provided that no credit event has occurred. If no credit event occurs, the Fund keeps the stream of payments with no payment obligations. The Fund may also buy credit default swaps, in which case the Fund functions as the counterparty referenced above. This involves the risk that the swap may expire worthless. It also involves counterparty risk that the seller may fail to satisfy its payment obligations to the Fund with the occurrence of a credit event. When the Fund sells a credit default swap, it will cover its commitment. This may be achieved by, among other methods, maintaining cash or liquid assets equal to the aggregate notional value of the reference entities for all outstanding credit default swaps sold by the Fund. For the year ended December 31, 2014, the Fund entered into credit default swap agreements to gain exposure to the underlying issuer's credit quality characteristics.
Under the terms of a credit default swap, the Fund receives or makes periodic payments based on a specified interest rate on a fixed notional amount. These payments are recorded as a realized gain or loss in the Statement of Operations. Payments received or made as a result of a credit event or termination of the swap are recognized, net of a proportional amount of the upfront payment, as realized gains or losses in the Statement of Operations.
A summary of the open credit default swap contracts as of December 31, 2014 is included in a table following the Fund's Investment Portfolio. For the year ended December 31, 2014, the investment in credit default swap contracts sold had a total notional value generally indicative of a range from $15,000 to $65,000.
Interest Rate Swaps. Interest rate swaps are agreements in which the Fund agrees to pay to the counterparty a fixed rate payment in exchange for the counterparty agreeing to pay to the Fund a variable rate payment, or the Fund agrees to receive from the counterparty a fixed rate payment in exchange for the counterparty agreeing to receive from the Fund a variable rate payment. The payment obligations are based on the notional amount of the swap. For the year ended December 31, 2014, the Fund entered into interest rate swap agreements to gain exposure to different parts of the yield curve while managing overall duration.
A summary of the open interest rate swap contracts as of December 31, 2014 is included in a table following the Fund's Investment Portfolio. For the year ended December 31, 2014, the investment in interest rate swap contracts had a total notional amount generally indicative of a range from $26,100,000 to $36,300,000.
Forward Foreign Currency Exchange Contracts. A forward foreign currency exchange contract ("forward currency contract") is a commitment to purchase or sell a foreign currency at the settlement date at a negotiated rate. The Fund is subject to foreign exchange rate risk in its securities denominated in foreign currencies. Changes in exchange rates between foreign currencies and the U.S. dollar may affect the U.S. dollar value of foreign securities or the income or gains received on these securities. To reduce the effect of currency fluctuations, the Fund may enter into forward currency contracts. For the year ended December 31, 2014, the Fund invested in forward currency contracts to hedge its exposure to changes in foreign currency exchange rates on its foreign currency denominated securities. In addition, the Fund also engaged in forward currency contracts for non-hedging purposes to seek to enhance potential gains.
Forward currency contracts are valued at the prevailing forward exchange rate of the underlying currencies and unrealized gain (loss) is recorded daily. On the settlement date of the forward currency contract, the Fund records a realized gain or loss equal to the difference between the value of the contract at the time it was opened and the value of the contract at the time it was closed. Certain risks may arise upon entering into forward currency contracts from the potential inability of counterparties to meet the terms of their contracts. The maximum counterparty credit risk to the Fund is measured by the unrealized gain on appreciated contracts. Additionally, when utilizing forward currency contracts to hedge, the Fund gives up the opportunity to profit from favorable exchange rate movements during the term of the contract.
A summary of the open forward currency contracts as of December 31, 2014, is included in a table following the Fund's Investment Portfolio. For the year ended December 31, 2014, the investment in forward currency contracts U.S. dollars purchased had a total contract value generally indicative of a range from approximately $8,635,000 to $35,842,000, and the investment in forward currency contracts U.S. dollars sold had a total contract value generally indicative of a range from approximately $4,843,000 to $34,885,000.
The investment in forward currency contracts long vs. other foreign currencies sold had a total contract value generally indicative of a range from $0 to approximately $17,983,000.
The following tables summarize the value of the Fund's derivative instruments held as of December 31, 2014 and the related location in the accompanying Statement of Assets and Liabilities, presented by primary underlying risk exposure:
| Asset Derivatives | | Forward Contracts | | | Swap Contracts | | | Futures Contracts | | | Total | |
| Interest Rate Contracts (a) | | $ | — | | | $ | 350 | | | $ | 32,675 | | | $ | 33,025 | |
| Credit Contracts (b) | | | — | | | | 837 | | | | — | | | | 837 | |
| Foreign Exchange Contracts (c) | | | 367,099 | | | | — | | | | — | | | | 367,099 | |
| | | $ | 367,099 | | | $ | 1,187 | | | $ | 32,675 | | | $ | 400,961 | |
Each of the above derivatives is located in the following Statement of Assets and Liabilities accounts: (a) Includes cumulative appreciation of futures contracts and centrally cleared swaps as disclosed in the Investment Portfolio. Unsettled variation margin is disclosed separately within the Statement of Assets and Liabilities. (b) Unrealized appreciation on bilateral swap contracts (c) Unrealized appreciation on forward foreign currency exchange contracts | |
| Liability Derivatives | | Written Options | | | Forward Contracts | | | Swap Contracts | | | Futures Contracts | | | Total | |
| Interest Rate Contracts (a) (b) | | $ | (859,383 | ) | | $ | — | | | $ | (14 | ) | | $ | (34,303 | ) | | $ | (893,700 | ) |
| Foreign Exchange Contracts (c) | | | — | | | | (427,482 | ) | | | — | | | | — | | | | (427,482 | ) |
| | | $ | (859,383 | ) | | $ | (427,482 | ) | | $ | (14 | ) | | $ | (34,303 | ) | | $ | (1,321,182 | ) |
Each of the above derivatives is located in the following Statement of Assets and Liabilities accounts: (a) Options written, at value (b) Includes cumulative depreciation of futures contracts and centrally cleared swaps as disclosed in the Investment Portfolio. Unsettled variation margin is disclosed separately within the Statement of Assets and Liabilities. (c) Unrealized depreciation on forward foreign currency exchange contracts | |
Additionally, the amount of unrealized and realized gains and losses on derivative instruments recognized in Fund earnings during the year ended December 31, 2014 and the related location in the accompanying Statement of Operations is summarized in the following tables by primary underlying risk exposure:
| Realized Gain (Loss) | | Written Options | | | Forward Contracts | | | Swap Contracts | | | Futures Contracts | | | Total | |
| Interest Rate Contract (a) | | $ | 138,600 | | | $ | — | | | $ | 1,051,406 | | | $ | 764,133 | | | $ | 1,954,139 | |
| Credit Contracts (b) | | | — | | | | — | | | | 5,857 | | | | — | | | | 5,857 | |
| Foreign Exchange Contracts (c) | | | — | | | | 491,102 | | | | — | | | | — | | | | 491,102 | |
| | | $ | 138,600 | | | $ | 491,102 | | | $ | 1,057,263 | | | $ | 764,133 | | | $ | 2,451,098 | |
Each of the above derivatives is located in the following Statement of Operations accounts: (a) Net realized gain (loss) from written options, swap contracts and futures, respectively (b) Net realized gain (loss) on swap contracts (c) Net realized gain (loss) from foreign currency (Statement of Operations includes both forward currency contracts and foreign currency transactions) | |
| Change in Net Unrealized Appreciation (Depreciation) | | Written Options | | | Forward Contracts | | | Swap Contracts | | | Futures Contracts | | | Total | |
| Interest Rate Contracts (a) | | $ | (670,276 | ) | | $ | — | | | $ | 22,376 | | | $ | 5,151 | | | $ | (642,749 | ) |
| Credit Contracts (b) | | | — | | | | — | | | | (4,366 | ) | | | — | | | | (4,366 | ) |
| Foreign Exchange Contracts (c) | | | — | | | | (274,953 | ) | | | — | | | | — | | | | (274,953 | ) |
| | | $ | (670,276 | ) | | $ | (274,953 | ) | | $ | 18,010 | | | $ | 5,151 | | | $ | (922,068 | ) |
Each of the above derivatives is located in the following Statement of Operations accounts: (a) Change in net unrealized appreciation (depreciation) on written options, swaps contracts and futures, respectively (b) Change in net unrealized appreciation (depreciation) on swap contracts (c) Change in net unrealized appreciation (depreciation) on foreign currency (Statement of Operations includes both forward currency contracts and foreign currency transactions) | |
As of December 31, 2014, the Fund has transactions subject to enforceable master netting agreements. A reconciliation of the gross amounts on the Statement of Assets and Liabilities to the net amounts by counterparty, including any collateral exposure, is included in the following tables:
| Counterparty | | Gross Amounts of Assets Presented in the Statement of Assets and Liabilities | | | Financial Instruments and Derivatives Available for Offset | | | Cash Collateral Received | | | Non-Cash Collateral Received (a) | | | Net Amount of Derivative Assets | |
| Australia & New Zealand Banking Group Ltd. | | $ | 102,696 | | | $ | (102,696 | ) | | $ | — | | | $ | — | | | $ | — | |
| Barclays Bank PLC | | | 113,373 | | | | (113,373 | ) | | | — | | | | — | | | | — | |
| BNP Paribas | | | 25,722 | | | | (25,722 | ) | | | — | | | | — | | | | — | |
| Credit Suisse | | | 837 | | | | — | | | | — | | | | — | | | | 837 | |
| JPMorgan Chase Securities, Inc. | | | 48,234 | | | | (48,234 | ) | | | — | | | | — | | | | — | |
| Societe Generale | | | 77,074 | | | | (49,318 | ) | | | — | | | | — | | | | 27,756 | |
| | | $ | 367,936 | | | $ | (339,343 | ) | | $ | — | | | $ | — | | | $ | 28,593 | |
| Counterparty | | Gross Amounts of Liabilities Presented in the Statement of Assets and Liabilities | | | Financial Instruments and Derivatives Available for Offset | | | Cash Collateral Pledged | | | Non-Cash Collateral Pledged (a) | | | Net Amount of Derivative Liabilities | |
| Australia & New Zealand Banking Group Ltd. | | $ | 105,935 | | | $ | (102,696 | ) | | $ | — | | | $ | — | | | $ | 3,239 | |
| Barclays Bank PLC | | | 219,832 | | | | (113,373 | ) | | | — | | | | — | | | | 106,459 | |
| BNP Paribas | | | 224,892 | | | | (25,722 | ) | | | — | | | | — | | | | 199,170 | |
| Citigroup, Inc | | | 170,325 | | | | — | | | | — | | | | — | | | | 170,325 | |
| Commonwealth Bank of Australia | | | 965 | | | | — | | | | — | | | | — | | | | 965 | |
| JPMorgan Chase Securities, Inc. | | | 115,440 | | | | (48,234 | ) | | | — | | | | — | | | | 67,206 | |
| Morgan Stanley | | | 134,945 | | | | — | | | | — | | | | — | | | | 134,945 | |
| Nomura International PLC | | | 225,671 | | | | — | | | | — | | | | (225,671 | ) | | | — | |
| Societe Generale | | | 49,318 | | | | (49,318 | ) | | | — | | | | — | | | | — | |
| UBS AG | | | 39,542 | | | | — | | | | — | | | | — | | | | 39,542 | |
| | | $ | 1,286,865 | | | $ | (339,343 | ) | | $ | — | | | $ | (225,671 | ) | | $ | 721,851 | |
(a) The actual collateral pledged may be more than the amount shown.
C. Purchases and Sales of Securities
During the year ended December 31, 2014, purchases and sales of investment securities (excluding short-term investments and U.S. Treasury obligations) aggregated $253,155,011 and $281,087,896, respectively. Purchases and sales of U.S. Treasury obligations aggregated $29,014,283 and $22,935,755, respectively.
For the year ended December 31, 2014, transactions for written options on interest rate swap contracts were as follows:
| | | Contract Amount | | | Premiums | |
| Outstanding, beginning of period | | | 12,000,000 | | | $ | 138,600 | |
| Options written | | | 19,200,000 | | | | 267,641 | |
| Options closed | | | (10,000,000 | ) | | | (123,850 | ) |
| Options expired | | | (2,000,000 | ) | | | (14,750 | ) |
| Outstanding, end of period | | | 19,200,000 | | | $ | 267,641 | |
D. Related Parties
Management Agreement. Under the Investment Management Agreement with Deutsche Investment Management Americas Inc. ("DIMA" or the "Advisor"), an indirect, wholly owned subsidiary of Deutsche Bank AG, the Advisor directs the investments of the Fund in accordance with its investment objectives, policies and restrictions. The Advisor determines the securities, instruments and other contracts relating to investments to be purchased, sold or entered into by the Fund.
Pursuant to the Investment Management Agreement with the Advisor, the Fund pays a monthly management fee based on the Fund's average daily net assets, computed and accrued daily and payable monthly, at the following annual rates:
| First $250 million of average daily net assets | | | .390 | % |
| Next $750 million of average daily net assets | | | .365 | % |
| Over $1 billion of average daily net assets | | | .340 | % |
Accordingly, for the year ended December 31, 2014, the fee pursuant to the Investment Management Agreement was equivalent to an annual rate (exclusive of any applicable waivers/reimbursements) of 0.39% of the Fund's average daily net assets.
For the period from January 1, 2014 through April 30, 2015, the Advisor has contractually agreed to waive its fees and/or reimburse certain operating expenses to the extent necessary to maintain the total annual operating expenses (excluding certain expenses such as extraordinary expenses, taxes, brokerage and interest expense) of Class A at 0.61%.
For the year ended December 31, 2014, fees waived and/or expenses reimbursed were $84,123.
Administration Fee. Pursuant to an Administrative Services Agreement, DIMA provides most administrative services to the Fund. For all services provided under the Administrative Services Agreement, the Fund pays the Advisor an annual fee ("Administration Fee") of 0.10% of the Fund's average daily net assets, computed and accrued daily and payable monthly. For the year ended December 31, 2014, the Administration Fee was $104,022, of which $8,657 is unpaid.
Service Provider Fees. DeAWM Service Company ("DSC"), an affiliate of the Advisor, is the transfer agent, dividend-paying agent and shareholder service agent for the Fund. Pursuant to a sub-transfer agency agreement between DSC and DST Systems, Inc. ("DST"), DSC has delegated certain transfer agent, dividend-paying agent and shareholder service agent functions to DST. DSC compensates DST out of the shareholder servicing fee it receives from the Fund. For the year ended December 31, 2014, the amounts charged to the Fund by DSC aggregated $550, of which $93 is unpaid.
Typesetting and Filing Service Fees. Under an agreement with DIMA, DIMA is compensated for providing typesetting and certain regulatory filing services to the Fund. For the year ended December 31, 2014, the amount charged to the Fund by DIMA included in the Statement of Operations under "Reports to shareholders" aggregated $17,021, of which $6,310 is unpaid.
Trustees' Fees and Expenses. The Fund paid retainer fees to each Trustee not affiliated with the Advisor, plus specified amounts to the Board Chairperson and Vice Chairperson and to each committee Chairperson.
Affiliated Cash Management Vehicles. The Fund may invest uninvested cash balances in Central Cash Management Fund and Deutsche Variable NAV Money Fund, affiliated money market funds which are managed by the Advisor. Each affiliated money market fund seeks to provide a high level of current income consistent with liquidity and the preservation of capital. Each affiliated money market fund is managed in accordance with Rule 2a-7 under the Investment Company Act of 1940, which governs the quality, maturity, diversity and liquidity of instruments in which a money market fund may invest. Central Cash Management Fund seeks to maintain a stable net asset value, and Deutsche Variable NAV Money Fund maintains a floating net asset value. The Fund indirectly bears its proportionate share of the expenses of each affiliated money market fund in which it invests. Central Cash Management Fund does not pay the Advisor an investment management fee. To the extent that Deutsche Variable NAV Money Fund pays an investment management fee to the Advisor, the Advisor will waive an amount of the investment management fee payable to the Advisor by the Fund equal to the amount of the investment management fee payable on the Fund's assets invested in Deutsche Variable NAV Money Fund.
Securities Lending Agent Fees. Deutsche Bank AG serves as securities lending agent for the Fund. For the year ended December 31, 2014, the Fund incurred securities lending agent fees to Deutsche Bank AG in the amount of $1,390.
E. Investing in Emerging Markets
Investing in emerging markets may involve special risks and considerations not typically associated with investing in developed markets. These risks include revaluation of currencies, high rates of inflation or deflation, repatriation restrictions on income and capital, and future adverse political, social and economic developments. Moreover, securities issued in these markets may be less liquid, subject to government ownership controls or delayed settlements and may have prices more volatile or less easily assessed than those of comparable securities of issuers in developed markets.
F. Ownership of the Fund
At December 31, 2014, three participating insurance companies were owners of record of 10% or more of the total outstanding Class A shares of the Fund, owning 47%, 25% and 11%, respectively.
G. Line of Credit
The Fund and other affiliated funds (the "Participants") share in a $400 million revolving credit facility provided by a syndication of banks. The Fund may borrow for temporary or emergency purposes, including the meeting of redemption requests that otherwise might require the untimely disposition of securities. The Participants are charged an annual commitment fee which is allocated based on net assets, among each of the Participants. Interest is calculated at a rate per annum equal to the sum of the Federal Funds Rate plus 1.25 percent plus if LIBOR exceeds the Federal Funds Rate the amount of such excess. The Fund may borrow up to a maximum of 33 percent of its net assets under the agreement. The Fund had no outstanding loans at December 31, 2014.
Report of Independent Registered Public Accounting Firm
To the Trustees of Deutsche Variable Series I and the Shareholders of Deutsche Bond VIP:
In our opinion, the accompanying statement of assets and liabilities, including the investment portfolio, and the related statements of operations and of changes in net assets and the financial highlights present fairly, in all material respects, the financial position of Deutsche Bond VIP (formerly DWS Bond VIP) (the "Fund") at December 31, 2014 and the results of its operations, the changes in its net assets, and the financial highlights for the periods indicated therein, in conformity with accounting principles generally accepted in the United States of America. These financial statements and financial highlights (hereafter referred to as "financial statements") are the responsibility of the Fund's management. Our responsibility is to express an opinion on these financial statements based on our audits. We conducted our audits of these financial statements in accordance with the standards of the Public Company Accounting Oversight Board (United States). Those standards require that we plan and perform the audit to obtain reasonable assurance about whether the financial statements are free of material misstatement. An audit includes examining, on a test basis, evidence supporting the amounts and disclosures in the financial statements, assessing the accounting principles used and significant estimates made by management, and evaluating the overall financial statement presentation. We believe that our audits, which included confirmation of securities at December 31, 2014 by correspondence with the custodian, brokers and transfer agent, and the application of alternative auditing procedures where such confirmations had not been received, provide a reasonable basis for our opinion.
Boston, Massachusetts February 13, 2015 | PricewaterhouseCoopers LLP |
Information About Your Fund's Expenses (Unaudited)
As an investor of the Fund, you incur two types of costs: ongoing expenses and transaction costs. Ongoing expenses include management fees and other Fund expenses. Examples of transaction costs include contract charges, which are not shown in this section. The following tables are intended to help you understand your ongoing expenses (in dollars) of investing in the Fund and to help you compare these expenses with the ongoing expenses of investing in other mutual funds. In the most recent six-month period, the Fund limited these expenses; had it not done so, expenses would have been higher. The example in the table is based on an investment of $1,000 invested at the beginning of the six-month period and held for the entire period (July 1, 2014 to December 31, 2014).
The tables illustrate your Fund's expenses in two ways:
—Actual Fund Return. This helps you estimate the actual dollar amount of ongoing expenses (but not transaction costs) paid on a $1,000 investment in the Fund using the Fund's actual return during the period. To estimate the expenses you paid over the period, simply divide your account value by $1,000 (for example, an $8,600 account value divided by $1,000 = 8.6), then multiply the result by the number in the "Expenses Paid per $1,000" line under the share class you hold.
—Hypothetical 5% Fund Return. This helps you to compare your Fund's ongoing expenses (but not transaction costs) with those of other mutual funds using the Fund's actual expense ratio and a hypothetical rate of return of 5% per year before expenses. Examples using a 5% hypothetical Fund return may be found in the shareholder reports of other mutual funds. The hypothetical account values and expenses may not be used to estimate the actual ending account balance or expenses you paid for the period.
Please note that the expenses shown in these tables are meant to highlight your ongoing expenses only and do not reflect any transaction costs. The "Expenses Paid per $1,000" line of the tables is useful in comparing ongoing expenses only and will not help you determine the relative total expense of owning different funds. If these transaction costs had been included, your costs would have been higher.
Expenses and Value of a $1,000 Investment for the six months ended December 31, 2014 | |
| Actual Fund Return | | Class A | |
| Beginning Account Value 7/1/14 | | $ | 1,000.00 | |
| Ending Account Value 12/31/14 | | $ | 1,007.10 | |
| Expenses Paid per $1,000* | | $ | 3.09 | |
| Hypothetical 5% Fund Return | | Class A | |
| Beginning Account Value 7/1/14 | | $ | 1,000.00 | |
| Ending Account Value 12/31/14 | | $ | 1,022.13 | |
| Expenses Paid per $1,000* | | $ | 3.11 | |
* Expenses are equal to the Fund's annualized expense ratio, multiplied by the average account value over the period, multiplied by 184 (the number of days in the most recent six-month period), then divided by 365.
| Annualized Expense Ratio | Class A |
| Deutsche Variable Series I — Deutsche Bond VIP | .61% |
For more information, please refer to the Fund's prospectus.
These tables do not reflect charges and fees ("contract charges") associated with the separate account that invests in the Fund or any variable life insurance policy or variable annuity contract for which the Fund is an investment option.
For an analysis of the fees associated with an investment in the fund or similar funds, please refer to the current and hypothetical expense calculators for Variable Insurance Products which can be found at deutschefunds.com/EN/resources/calculators.jsp.
Tax Information (Unaudited)
Please consult a tax advisor if you have questions about federal or state income tax laws, or on how to prepare your tax returns. If you have specific questions about your account, please contact your insurance provider.
The Series' policies and procedures for voting proxies for portfolio securities and information about how the Series voted proxies related to its portfolio securities during the 12-month period ended June 30 are available on our Web site — deutschefunds.com (click on "proxy voting"at the bottom of the page) — or on the SEC's Web site — sec.gov. To obtain a written copy of the Series' policies and procedures without charge, upon request, call us toll free at (800) 728-3337.
Advisory Agreement Board Considerations and Fee Evaluation
The Board of Trustees approved the renewal of Deutsche Bond VIP’s investment management agreement (the "Agreement") with Deutsche Investment Management Americas Inc. ("DIMA") in September 2014.
In terms of the process that the Board followed prior to approving the Agreement, shareholders should know that:
— In September 2014, all of the Fund’s Trustees were independent of DIMA and its affiliates.
— The Trustees met frequently during the past year to discuss fund matters and dedicated a substantial amount of time to contract review matters. Over the course of several months, the Board’s Contract Committee, in coordination with the Board’s Fixed Income and Asset Allocation Oversight Committee, reviewed comprehensive materials received from DIMA, independent third parties and independent counsel. These materials included an analysis of the Fund’s performance, fees and expenses, and profitability compiled by a fee consultant retained by the Fund’s Independent Trustees (the "Fee Consultant"). The Board also received extensive information throughout the year regarding performance of the Fund.
— The Independent Trustees regularly meet privately with counsel to discuss contract review and other matters. In addition, the Independent Trustees were advised by the Fee Consultant in the course of their review of the Fund’s contractual arrangements and considered a comprehensive report prepared by the Fee Consultant in connection with their deliberations.
— In connection with reviewing the Agreement, the Board also reviewed the terms of the Fund’s distribution agreement, administrative services agreement, transfer agency agreement and other material service agreements.
— Based on its evaluation of the information provided, the Contract Committee presented its findings and recommendations to the Board. The Board then reviewed the Contract Committee’s findings and recommendations.
In connection with the contract review process, the Contract Committee and the Board considered the factors discussed below, among others. The Board also considered that DIMA and its predecessors have managed the Fund since its inception, and the Board believes that a long-term relationship with a capable, conscientious advisor is in the best interests of the Fund. The Board considered, generally, that shareholders chose to invest or remain invested in the Fund knowing that DIMA managed the Fund, and that the Agreement was approved by the Fund’s shareholders. DIMA is part of Deutsche Bank AG ("DB"), a major global banking institution that is engaged in a wide range of financial services. The Board believes that there are advantages to being part of a global asset management business that offers a wide range of investing expertise and resources, including hundreds of portfolio managers and analysts with research capabilities in many countries throughout the world.
As part of the contract review process, the Board carefully considered the fees and expenses of each Deutsche fund overseen by the Board in light of the fund’s performance. In many cases, this led to the negotiation and implementation of expense caps. As part of these negotiations, the Board indicated that it would consider relaxing these caps in future years following sustained improvements in performance, among other considerations.
In 2012, DB combined its Asset Management (of which DIMA was a part) and Wealth Management divisions into a new Asset and Wealth Management ("AWM") division. DB has advised the Independent Trustees that the U.S. asset management business is a critical and integral part of DB, and that DB will continue to invest in AWM a significant portion of the savings it has realized by combining its Asset and Wealth Management divisions, including ongoing enhancements to AWM’s investment capabilities. DB also has confirmed its commitment to maintaining strong legal and compliance groups within the AWM division.
While shareholders may focus primarily on fund performance and fees, the Fund’s Board considers these and many other factors, including the quality and integrity of DIMA’s personnel and such other issues as back-office operations, fund valuations, and compliance policies and procedures.
Nature, Quality and Extent of Services. The Board considered the terms of the Agreement, including the scope of advisory services provided under the Agreement. The Board noted that, under the Agreement, DIMA provides portfolio management services to the Fund and that, pursuant to a separate administrative services agreement, DIMA provides administrative services to the Fund. The Board considered the experience and skills of senior management and investment personnel, the resources made available to such personnel, the ability of DIMA to attract and retain high-quality personnel, and the organizational depth and stability of DIMA. The Board reviewed the Fund’s performance over short-term and long-term periods and compared those returns to various agreed-upon performance measures, including a market index and a peer universe compiled by the Fee Consultant using information supplied by Morningstar Direct ("Morningstar"), an independent fund data service. The Board also noted that it has put into place a process of identifying "Focus Funds" (e.g., funds performing poorly relative to a peer universe), and receives more frequent reporting and information from DIMA regarding such funds, along with DIMA’s plans to address underperformance. The Board believes this process is an effective manner of identifying and addressing underperforming funds. Based on the information provided, the Board noted that for the one-, three- and five-year periods ended December 31, 2013, the Fund’s performance (Class A shares) was in the 4th quartile, 3rd quartile and 3rd quartile, respectively, of the applicable Morningstar universe (the 1st quartile being the best performers and the 4th quartile being the worst performers). The Board also observed that the Fund has outperformed its benchmark in the three- and five-year periods and has underperformed its benchmark in the one-year period ended December 31, 2013. The Board noted the disappointing investment performance of the Fund in recent periods and continued to discuss with senior management of DIMA the factors contributing to such underperformance and actions being taken to improve performance. The Board observed that the Fund had experienced improved relative performance during the first seven months of 2014. The Board recognized the efforts by DIMA in recent years to enhance its investment platform and improve long-term performance across the Deutsche fund complex.
Fees and Expenses. The Board considered the Fund’s investment management fee schedule, operating expenses and total expense ratios, and comparative information provided by Lipper Inc. ("Lipper") and the Fee Consultant regarding investment management fee rates paid to other investment advisors by similar funds (1st quartile being the most favorable and 4th quartile being the least favorable). With respect to management fees paid to other investment advisors by similar funds, the Board noted that the contractual fee rates paid by the Fund, which include a 0.10% fee paid to DIMA under the Fund’s administrative services agreement, were higher than the median (3rd quartile) of the applicable Lipper peer group (based on Lipper data provided as of December 31, 2013). The Board noted that the Fund’s Class A shares total (net) operating expenses were expected to be higher than the median (3rd quartile) of the applicable Lipper expense universe (based on Lipper data provided as of December 31, 2013) ("Lipper Universe Expenses"). The Board also considered how the Fund’s total (net) operating expenses compared to the total (net) operating expenses of a more customized peer group selected by Lipper (based on such factors as asset size). The Board also noted that the expense limitation agreed to by DIMA helped to ensure that the Fund’s total (net) operating expenses would remain competitive. The Board considered the Fund’s management fee rate as compared to fees charged by DIMA to comparable funds and considered differences between the Fund and the comparable funds.
The information requested by the Board as part of its review of fees and expenses also included information about institutional accounts and funds offered primarily to European investors ("Deutsche Europe funds") managed by DIMA and its affiliates. The Board noted that DIMA indicated that it manages an institutional account comparable to the Fund, but does not manage any comparable Deutsche Europe funds. The Board took note of the differences in services provided to Deutsche U.S. mutual funds ("Deutsche Funds") as compared to institutional accounts and that such differences made comparison difficult.
On the basis of the information provided, the Board concluded that management fees were reasonable and appropriate in light of the nature, quality and extent of services provided by DIMA.
Profitability. The Board reviewed detailed information regarding revenues received by DIMA under the Agreement. The Board considered the estimated costs and pre-tax profits realized by DIMA from advising the Deutsche Funds, as well as estimates of the pre-tax profits attributable to managing the Fund in particular. The Board also received information regarding the estimated enterprise-wide profitability of DIMA and its affiliates with respect to all fund services in totality and by fund. The Board and the Fee Consultant reviewed DIMA’s methodology in allocating its costs to the management of the Fund. Based on the information provided, the Board concluded that the pre-tax profits realized by DIMA in connection with the management of the Fund were not unreasonable.
Economies of Scale. The Board considered whether there are economies of scale with respect to the management of the Fund and whether the Fund benefits from any economies of scale. The Board noted that the Fund’s management fee schedule includes fee breakpoints. The Board concluded that the Fund’s fee schedule represents an appropriate sharing between the Fund and DIMA of such economies of scale as may exist in the management of the Fund at current asset levels.
Other Benefits to DIMA and Its Affiliates. The Board also considered the character and amount of other incidental benefits received by DIMA and its affiliates, including any fees received by DIMA for administrative services provided to the Fund and any fees received by an affiliate of DIMA for distribution services. The Board also considered benefits to DIMA related to brokerage and soft-dollar allocations, including allocating brokerage to pay for research generated by parties other than the executing broker dealers, which pertain primarily to funds investing in equity securities, along with the incidental public relations benefits to DIMA related to Deutsche Funds advertising and cross-selling opportunities among DIMA products and services. The Board concluded that management fees were reasonable in light of these fallout benefits.
Compliance. The Board considered the significant attention and resources dedicated by DIMA to documenting and enhancing its compliance processes in recent years. The Board noted in particular (i) the experience and seniority of DIMA’s and the Fund’s chief compliance officer; (ii) the large number of DIMA compliance personnel; and (iii) the substantial commitment of resources by DIMA and its affiliates to compliance matters.
Based on all of the information considered and the conclusions reached, the Board unanimously determined that the continuation of the Agreement is in the best interests of the Fund. In making this determination, the Board did not give particular weight to any single factor identified above. The Board considered these factors over the course of numerous meetings, certain of which were in executive session with only the Independent Trustees and counsel present. It is possible that individual Trustees may have weighed these factors differently in reaching their individual decisions to approve the continuation of the Agreement.
Board Members and Officers
The following table presents certain information regarding the Board Members and Officers of the fund. Each Board Member's year of birth is set forth in parentheses after his or her name. Unless otherwise noted, (i) each Board Member has engaged in the principal occupation(s) noted in the table for at least the most recent five years, although not necessarily in the same capacity; and (ii) the address of each Independent Board Member is c/o Kenneth C. Froewiss, Chairman, Deutsche Mutual Funds, P.O. Box 390601, Cambridge, MA 02139. Except as otherwise noted below, the term of office for each Board Member is until the election and qualification of a successor, or until such Board Member sooner dies, resigns, is removed or as otherwise provided in the governing documents of the fund. Because the fund does not hold an annual meeting of shareholders, each Board Member will hold office for an indeterminate period. The Board Members may also serve in similar capacities with other funds in the fund complex.
| Independent Board Members |
Name, Year of Birth, Position with the Fund and Length of Time Served1 | | Business Experience and Directorships During the Past Five Years | Number of Funds in Deutsche Fund Complex Overseen | Other Directorships Held by Board Member |
Kenneth C. Froewiss (1945) Chairperson since 2013, and Board Member since 2001 | | Adjunct Professor of Finance, NYU Stern School of Business (September 2009–present; Clinical Professor from 1997–September 2009); Member, Finance Committee, Association for Asian Studies (2002–present); Director, Mitsui Sumitomo Insurance Group (US) (2004–present); prior thereto, Managing Director, J.P. Morgan (investment banking firm) (until 1996) | 105 | — |
William McClayton (1944) Vice Chairperson since 2013, and Board Member since 2004 | | Private equity investor (since October 2009); previously, Managing Director, Diamond Management & Technology Consultants, Inc. (global consulting firm) (2001–2009); Directorship: Board of Managers, YMCA of Metropolitan Chicago; formerly: Senior Partner, Arthur Andersen LLP (accounting) (1966–2001); Trustee, Ravinia Festival | 105 | — |
John W. Ballantine (1946) Board Member since 1999 | | Retired; formerly, Executive Vice President and Chief Risk Management Officer, First Chicago NBD Corporation/The First National Bank of Chicago (1996–1998); Executive Vice President and Head of International Banking (1995–1996); former Directorships: Director and former Chairman of the Board, Healthways, Inc.2 (provider of disease and care management services) (2003–2014); Stockwell Capital Investments PLC (private equity); First Oak Brook Bancshares, Inc. and Oak Brook Bank; Prisma Energy International | 105 | Portland General Electric2 (utility company) (2003– present) |
Henry P. Becton, Jr. (1943) Board Member since 1990 | | Vice Chair and former President, WGBH Educational Foundation. Directorships: Public Radio International; Public Radio Exchange (PRX); North Bennett Street School (Boston); former Directorships: Belo Corporation2 (media company); The PBS Foundation; Association of Public Television Stations; Boston Museum of Science; American Public Television; Concord Academy; New England Aquarium; Mass. Corporation for Educational Telecommunications; Committee for Economic Development; Public Broadcasting Service; Connecticut College | 105 | Lead Director, Becton Dickinson and Company2 (medical technology company) |
Dawn-Marie Driscoll (1946) Board Member since 1987 | | Emeritus Executive Fellow, Center for Business Ethics, Bentley University; formerly: President, Driscoll Associates (consulting firm); Partner, Palmer & Dodge (law firm) (1988–1990); Vice President of Corporate Affairs and General Counsel, Filene's (retail) (1978–1988). Directorships: Director of ICI Mutual Insurance Company (since 2007); Advisory Board, Center for Business Ethics, Bentley University; Trustee and former Chairman of the Board, Southwest Florida Community Foundation (charitable organization); former Directorships: Sun Capital Advisers Trust (mutual funds) (2007–2012), Investment Company Institute (audit, executive, nominating committees) and Independent Directors Council (governance, executive committees) | 105 | — |
Keith R. Fox, CFA (1954) Board Member since 1996 | | Managing General Partner, Exeter Capital Partners (a series of private investment funds) (since 1986). Directorships: Progressive International Corporation (kitchen goods importer and distributor); The Kennel Shop (retailer); former Chairman, National Association of Small Business Investment Companies; former Directorships: BoxTop Media Inc. (advertising); Sun Capital Advisers Trust (mutual funds) (2011–2012) | 105 | — |
Paul K. Freeman (1950) Board Member since 1993 | | Consultant, World Bank/Inter-American Development Bank; Chair, Independent Directors Council; Investment Company Institute (executive and nominating committees); formerly, Chairman of Education Committee of Independent Directors Council; Project Leader, International Institute for Applied Systems Analysis (1998–2001); Chief Executive Officer, The Eric Group, Inc. (environmental insurance) (1986–1998); Directorships: Denver Zoo Foundation (December 2012–present); former Directorships: Prisma Energy International | 105 | — |
Richard J. Herring (1946) Board Member since 1990 | | Jacob Safra Professor of International Banking and Professor, Finance Department, The Wharton School, University of Pennsylvania (since July 1972); Co-Director, Wharton Financial Institutions Center; Co-Chair, U.S. Shadow Financial Regulatory Committee; Executive Director, Financial Economists Roundtable; formerly: Vice Dean and Director, Wharton Undergraduate Division (July 1995–June 2000); Director, Lauder Institute of International Management Studies (July 2000–June 2006) | 105 | Director, Aberdeen Singapore and Japan Funds (since 2007); Independent Director of Barclays Bank Delaware (since September 2010) |
Rebecca W. Rimel (1951) Board Member since 1995 | | President and Chief Executive Officer, The Pew Charitable Trusts (charitable organization) (1994 to present); formerly: Executive Vice President, The Glenmede Trust Company (investment trust and wealth management) (1983–2004); Board Member, Investor Education (charitable organization) (2004–2005); Trustee, Executive Committee, Philadelphia Chamber of Commerce (2001–2007); Director, Viasys Health Care2 (January 2007–June 2007); Trustee, Thomas Jefferson Foundation (charitable organization) (1994–2012) | 105 | Director, Becton Dickinson and Company2 (medical technology company) (2012– present); Director, BioTelemetry Inc.2 (health care) (2009– present) |
William N. Searcy, Jr. (1946) Board Member since 1993 | | Private investor since October 2003; formerly: Pension & Savings Trust Officer, Sprint Corporation2 (telecommunications) (November 1989–September 2003); Trustee, Sun Capital Advisers Trust (mutual funds) (1998–2012) | 105 | — |
Jean Gleason Stromberg (1943) Board Member since 1997 | | Retired. Formerly, Consultant (1997–2001); Director, Financial Markets U.S. Government Accountability Office (1996–1997); Partner, Norton Rose Fulbright, L.L.P. (law firm) (1978–1996). Directorships: The William and Flora Hewlett Foundation (charitable organization); former Directorships: Service Source, Inc. (nonprofit), Mutual Fund Directors Forum (2002–2004), American Bar Retirement Association (funding vehicle for retirement plans) (1987–1990 and 1994–1996) | 105 | — |
Robert H. Wadsworth* (1940) Board Member since 1999 | | President, Robert H. Wadsworth & Associates, Inc. (consulting firm) (1983 to present); Director, The Phoenix Boys Choir Association | 105 | — |
Officers4 |
Name, Year of Birth, Position with the Fund and Length of Time Served5 | | Business Experience and Directorships During the Past Five Years |
Brian E. Binder8 (1972) President and Chief Executive Officer, 2013–present | | Managing Director3 and Head of Fund Administration, Deutsche Asset & Wealth Management (2013–present); formerly: Head of Business Management and Consulting at Invesco, Ltd. (2010–2012); Chief Administrative Officer, Van Kampen Funds Inc. (2008–2010); and Chief Administrative Officer, Morgan Stanley Investment Management Americas Distribution (2003–2008) |
John Millette7 (1962) Vice President and Secretary, 1999–present | | Director,3 Deutsche Asset & Wealth Management |
Melinda Morrow6 (1970) Vice President, 2012–present | | Director,3 Deutsche Asset & Wealth Management |
Paul H. Schubert6 (1963) Chief Financial Officer, 2004–present Treasurer, 2005–present | | Managing Director,3 Deutsche Asset & Wealth Management (since July 2004); formerly: Executive Director, Head of Mutual Fund Services and Treasurer for UBS Family of Funds (1998–2004); Vice President and Director of Mutual Fund Finance at UBS Global Asset Management (1994–1998) |
Caroline Pearson7 (1962) Chief Legal Officer, 2010–present | | Managing Director,3 Deutsche Asset & Wealth Management; formerly: Assistant Secretary for DWS family of funds (1997–2010) |
Robert Kloby6 (1962) Chief Compliance Officer, 2006–present | | Managing Director,3 Deutsche Asset & Wealth Management |
Wayne Salit6 (1967) Anti-Money Laundering Compliance Officer, 2014–present | | Director,3 Deutsche Asset & Wealth Management; formerly: Managing Director, AML Compliance Officer at BNY Mellon (2011–2014); and Director, AML Compliance Officer at Deutsche Bank (2004–2011) |
Hepsen Uzcan7 (1974) Assistant Secretary, 2013–present | | Director,3 Deutsche Asset & Wealth Management |
Paul Antosca7 (1957) Assistant Treasurer, 2007–present | | Director,3 Deutsche Asset & Wealth Management |
Jack Clark7 (1967) Assistant Treasurer, 2007–present | | Director,3 Deutsche Asset & Wealth Management |
Diane Kenneally7 (1966) Assistant Treasurer, 2007–present | | Director,3 Deutsche Asset & Wealth Management |
1 The length of time served represents the year in which the Board Member joined the board of one or more Deutsche funds currently overseen by the Board.
2 A publicly held company with securities registered pursuant to Section 12 of the Securities Exchange Act of 1934.
3 Executive title, not a board directorship.
4 As a result of their respective positions held with the Advisor, these individuals are considered "interested persons" of the Advisor within the meaning of the 1940 Act. Interested persons receive no compensation from the fund.
5 The length of time served represents the year in which the officer was first elected in such capacity for one or more Deutsche funds.
6 Address: 60 Wall Street, New York, NY 10005.
7 Address: One Beacon Street, Boston, MA 02108.
8 Address: 222 South Riverside Plaza, Chicago, IL 60606.
* Robert H. Wadsworth retired from the Board effective December 31, 2014.
The fund's Statement of Additional Information ("SAI") includes additional information about the Board Members. The SAI is available, without charge, upon request. If you would like to request a copy of the SAI, you may do so by calling the following toll-free number: (800) 728-3337.
Notes
DeAWM Distributors, Inc.
222 South Riverside Plaza
Chicago, IL 60606
(800) 621-1148
VS1bond-2 (R-025819-4 2/15)
December 31, 2014
Annual Report
Deutsche Variable Series I
(formerly DWS Variable Series I)
Deutsche Capital Growth VIP
(formerly DWS Capital Growth VIP)
Contents
9 Statement of Assets and Liabilities 10 Statement of Operations 10 Statement of Changes in Net Assets 13 Notes to Financial Statements 17 Report of Independent Registered Public Accounting Firm 18 Information About Your Fund's Expenses 20 Advisory Agreement Board Considerations and Fee Evaluation 22 Board Members and Officers |
This report must be preceded or accompanied by a prospectus. To obtain an additional prospectus or summary prospectus, if available, call (800) 728-3337 or your financial representative. We advise you to consider the Fund's objectives, risks, charges and expenses carefully before investing. The summary prospectus and prospectus contain this and other important information about the Fund. Please read the prospectus carefully before you invest.
The Fund may lend securities to approved institutions. Stocks may decline in value. See the prospectus for details.
Deutsche Asset & Wealth Management represents the asset management and wealth management activities conducted by Deutsche Bank AG or any of its subsidiaries, including the Advisor and DeAWM Distributors, Inc.
NOT FDIC/NCUA INSURED NO BANK GUARANTEE MAY LOSE VALUE NOT A DEPOSIT
NOT INSURED BY ANY FEDERAL GOVERNMENT AGENCY
Performance Summary December 31, 2014 (Unaudited)
Fund performance shown is historical, assumes reinvestment of all dividend and capital gain distributions, and does not guarantee future results. Investment return and principal value fluctuate with changing market conditions so that, when redeemed, shares may be worth more or less than their original cost. Current performance may be lower or higher than the performance data quoted. Please contact your participating insurance company for the Fund's most recent month-end performance. Performance doesn't reflect charges and fees ("contract charges") associated with the separate account that invests in the Fund or any variable life insurance policy or variable annuity contract for which the Fund is an investment option. These charges and fees will reduce returns. While all share classes have the same underlying portfolio, their performance will differ.
The gross expense ratios of the Fund, as stated in the fee table of the prospectus dated May 1, 2014 are 0.50% and 0.83% for Class A and Class B shares, respectively, and may differ from the expense ratios disclosed in the Financial Highlights tables in this report.
| Growth of an Assumed $10,000 Investment |
| The Russell 1000® Growth Index is an unmanaged, capitalization-weighted index containing those securities in the Russell 1000® Index with higher price-to-book ratios and higher forecasted growth values. Index returns do not reflect any fees or expenses and it is not possible to invest directly into an index. |
| |
| Yearly periods ended December 31 | |
| Comparative Results | |
| Deutsche Capital Growth VIP | | 1-Year | | | 3-Year | | | 5-Year | | | 10-Year | |
| Class A | Growth of $10,000 | | $ | 11,297 | | | $ | 17,652 | | | $ | 19,680 | | | $ | 22,278 | |
| Average annual total return | | | 12.97 | % | | | 20.86 | % | | | 14.50 | % | | | 8.34 | % |
| Russell 1000 Growth Index | Growth of $10,000 | | $ | 11,305 | | | $ | 17,393 | | | $ | 20,836 | | | $ | 22,594 | |
| Average annual total return | | | 13.05 | % | | | 20.26 | % | | | 15.81 | % | | | 8.49 | % |
| Deutsche Capital Growth VIP | | 1-Year | | | 3-Year | | | 5-Year | | | 10-Year | |
| Class B | Growth of $10,000 | | $ | 11,267 | | | $ | 17,479 | | | $ | 19,367 | | | $ | 21,544 | |
| Average annual total return | | | 12.67 | % | | | 20.46 | % | | | 14.13 | % | | | 7.98 | % |
| Russell 1000 Growth Index | Growth of $10,000 | | $ | 11,305 | | | $ | 17,393 | | | $ | 20,836 | | | $ | 22,594 | |
| Average annual total return | | | 13.05 | % | | | 20.26 | % | | | 15.81 | % | | | 8.49 | % |
The growth of $10,000 is cumulative.
Management Summary December 31, 2014 (Unaudited)
For the 12 months ended December 31, 2014, the Fund returned 12.97% (Class A shares, unadjusted for contract charges), underperforming the 13.05% return of the Russell 1000® Growth Index.1
The Fund’s performance was helped by our overweight in the health care sector, which comfortably outperformed the broader market during the period, as well as our underweight in energy.2 In terms of stock selection, we delivered the largest margin of outperformance in the consumer staples and consumer discretionary sectors, while we lagged in industrials, energy and financials.3,4
Two of the leading contributors to the Fund’s performance in consumer staples were the food company Hillshire Brands Co.* and the spirits producer Beam, Inc.,* both of which acquired for a premium during the first half of the year. We also benefited from the strong returns of the health care stocks CareFusion Corp.,* Medivation, Inc. and Celgene Corp. Our investments in health care have targeted companies with robust underlying fundamentals and exciting product stories, an approach that has paid off in the past 12 months. Another notable contributor was the technology stock Palo Alto Networks, Inc., an enterprise-security provider that benefited from increased demand amid the growing concerns about cyber security.
Whole Foods Market, Inc. was the largest individual detractor from performance. We have found numerous opportunities in the "healthy living" theme, which seeks to capitalize on Americans’ efforts to eat better and exercise more. Whole Foods, while well-positioned to capitalize on this theme, nonetheless saw its shares decline due to rising competition in the organic-foods space. Splunk, Inc.,* Las Vegas Sands Corp. and Dick’s Sporting Goods, Inc. were also among the Fund’s notable detractors for the year.
We continued to emphasize sectors where we are finding the largest representation of companies positioned to benefit from positive product stories and longer-term, secular growth themes. We found many such opportunities among companies in the health care, consumer discretionary and technology sectors. In technology, for instance, a number of our holdings reflected longer-term growth themes such as data storage, data security and virtualization — all of which should gain an increasing share of enterprise spending as corporations seek to streamline their technology budgets. In health care, we found the most compelling opportunities in biotechnology companies with robust product cycles. At the same time, we maintained underweights in slower-growth sectors — including consumer staples, utilities and telecommunications — where we found valuations to be less compelling.
Owen Fitzpatrick, CFA
Lead Portfolio Manager
Thomas M. Hynes, Jr., CFA
Brendan O'Neill, CFA
Portfolio Managers
The views expressed reflect those of the portfolio management team only through the end of the period of the report as stated on the cover. The management team's views are subject to change at any time based on market and other conditions and should not be construed as a recommendation. Past performance is no guarantee of future results. Current and future portfolio holdings are subject to risk.
1 The Russell 1000 Growth Index is an unmanaged index that consists of those stocks in the Russell 1000® Index that have higher price-to-book ratios and higher forecasted growth values. Index returns do not reflect any fees or expenses and it is not possible to invest directly into an index.
2 "Overweight" means that the Fund holds a higher weighting in a given sector or stock compared with its benchmark index. "Underweight" means that the Fund holds a lower weighting in a given sector or stock.
3 Consumer staples are the industries that manufacture and sell products such as food and beverages, prescription drugs and household products.
4 The consumer discretionary sector represents industries that produce goods and services that are not necessities in everyday life.
* Not held in the portfolio as of December 31, 2014.
Portfolio Summary (Unaudited) Asset Allocation (As a % of Investment Portfolio excluding Securities Lending Collateral) | 12/31/14 | 12/31/13 |
| | | |
| Common Stocks | 99% | 100% |
| Convertible Bonds | 1% | — |
| Cash Equivalents | 0% | 0% |
| | 100% | 100% |
Sector Diversification (As a % of Common Stocks and Convertible Bonds) | 12/31/14 | 12/31/13 |
| | | |
| Information Technology | 28% | 26% |
| Consumer Discretionary | 19% | 21% |
| Health Care | 16% | 15% |
| Industrials | 12% | 13% |
| Consumer Staples | 10% | 10% |
| Financials | 6% | 5% |
| Energy | 4% | 4% |
| Materials | 3% | 5% |
| Telecommunication Services | 1% | 1% |
| Utilities | 1% | 0% |
| | 100% | 100% |
Portfolio holdings and characteristics are subject to change.
For more complete details about the Fund's investment portfolio, see page 6.
Following the Fund's fiscal first and third quarter-end, a complete portfolio holdings listing is filed with the SEC on Form N-Q. The form will be available on the SEC's Web site at sec.gov, and it also may be reviewed and copied at the SEC's Public Reference Room in Washington, D.C. Information on the operation of the SEC's Public Reference Room may be obtained by calling (800) SEC-0330. The Fund's portfolio holdings are also posted on deutschefunds.com from time to time. Please see the Fund's current prospectus for more information.
Investment Portfolio December 31, 2014 | | | Shares | | | Value ($) | |
| | | | |
| Common Stocks 99.2% | |
| Consumer Discretionary 18.9% | |
| Auto Components 0.7% | |
| BorgWarner, Inc. | | | 115,775 | | | | 6,361,836 | |
| Hotels, Restaurants & Leisure 3.0% | |
| Brinker International, Inc. (a) | | | 164,377 | | | | 9,647,286 | |
| Las Vegas Sands Corp. | | | 126,297 | | | | 7,345,434 | |
| Starwood Hotels & Resorts Worldwide, Inc. | | | 120,033 | | | | 9,731,075 | |
| | | | | | | | 26,723,795 | |
| Internet & Catalog Retail 2.0% | |
| Amazon.com, Inc.* (a) | | | 44,685 | | | | 13,867,990 | |
| Expedia, Inc. | | | 52,270 | | | | 4,461,767 | |
| | | | | | | | 18,329,757 | |
| Media 3.5% | |
| Twenty-First Century Fox, Inc. "A" | | | 394,234 | | | | 15,140,557 | |
| Walt Disney Co. (a) | | | 168,547 | | | | 15,875,442 | |
| | | | | | | | 31,015,999 | |
| Specialty Retail 5.5% | |
| Dick's Sporting Goods, Inc. (a) | | | 165,599 | | | | 8,221,991 | |
| GNC Holdings, Inc. "A" | | | 84,772 | | | | 3,980,893 | |
| Home Depot, Inc. | | | 200,869 | | | | 21,085,219 | |
| L Brands, Inc. (a) | | | 183,100 | | | | 15,847,305 | |
| | | | | | | | 49,135,408 | |
| Textiles, Apparel & Luxury Goods 4.2% | |
| NIKE, Inc. "B" | | | 226,318 | | | | 21,760,475 | |
| VF Corp. | | | 206,143 | | | | 15,440,111 | |
| | | | | | | | 37,200,586 | |
| Consumer Staples 10.3% | |
| Beverages 2.2% | |
| PepsiCo, Inc. | | | 203,547 | | | | 19,247,404 | |
| Food & Staples Retailing 3.1% | |
| Costco Wholesale Corp. | | | 114,280 | | | | 16,199,190 | |
| Whole Foods Market, Inc. (a) | | | 222,807 | | | | 11,233,929 | |
| | | | | | | | 27,433,119 | |
| Food Products 3.8% | |
| Mead Johnson Nutrition Co. | | | 127,620 | | | | 12,830,915 | |
| Mondelez International, Inc. "A" | | | 233,445 | | | | 8,479,889 | |
| The WhiteWave Foods Co.* | | | 365,797 | | | | 12,799,237 | |
| | | | | | | | 34,110,041 | |
| Personal Products 1.2% | |
| Estee Lauder Companies, Inc. "A" | | | 145,053 | | | | 11,053,039 | |
| Energy 3.7% | |
| Energy Equipment & Services 1.2% | |
| Schlumberger Ltd. | | | 121,550 | | | | 10,381,586 | |
| Oil, Gas & Consumable Fuels 2.5% | |
| Antero Resources Corp.* (a) | | | 80,133 | | | | 3,251,797 | |
| Continental Resources, Inc.* (a) | | | 85,660 | | | | 3,285,918 | |
| EOG Resources, Inc. | | | 85,183 | | | | 7,842,799 | |
| Pioneer Natural Resources Co. | | | 55,843 | | | | 8,312,230 | |
| | | | | | | | 22,692,744 | |
| Financials 5.7% | |
| Capital Markets 2.8% | |
| Affiliated Managers Group, Inc.* | | | 50,503 | | | | 10,718,757 | |
| Ameriprise Financial, Inc. | | | 57,562 | | | | 7,612,574 | |
| The Charles Schwab Corp. | | | 209,816 | | | | 6,334,345 | |
| | | | | | | | 24,665,676 | |
| | | Shares | | | Value ($) | |
| | | | | | | | | |
| Consumer Finance 1.2% | |
| Capital One Financial Corp. | | | 134,273 | | | | 11,084,236 | |
| Diversified Financial Services 0.9% | |
| Intercontinental Exchange, Inc. | | | 36,120 | | | | 7,920,755 | |
| Real Estate Investment Trusts 0.8% | |
| Crown Castle International Corp. (REIT) | | | 91,268 | | | | 7,182,792 | |
| Health Care 16.4% | |
| Biotechnology 7.0% | |
| Celgene Corp.* (a) | | | 190,933 | | | | 21,357,765 | |
| Cepheid, Inc.* (a) | | | 134,890 | | | | 7,302,945 | |
| Gilead Sciences, Inc.* | | | 145,433 | | | | 13,708,514 | |
| Medivation, Inc.* | | | 98,429 | | | | 9,804,513 | |
| NPS Pharmaceuticals, Inc.* (a) | | | 296,253 | | | | 10,596,970 | |
| | | | | | | | 62,770,707 | |
| Health Care Equipment & Supplies 1.2% | |
| St. Jude Medical, Inc. | | | 161,526 | | | | 10,504,036 | |
| Health Care Providers & Services 3.8% | |
| Express Scripts Holding Co.* | | | 104,050 | | | | 8,809,913 | |
| McKesson Corp. | | | 63,904 | | | | 13,265,192 | |
| Omnicare, Inc. (a) | | | 166,921 | | | | 12,173,549 | |
| | | | | | | | 34,248,654 | |
| Life Sciences Tools & Services 1.7% | |
| Thermo Fisher Scientific, Inc. | | | 118,713 | | | | 14,873,552 | |
| Pharmaceuticals 2.7% | |
| Allergan, Inc. | | | 65,530 | | | | 13,931,023 | |
| Bristol-Myers Squibb Co. | | | 114,431 | | | | 6,754,862 | |
| Shire PLC (ADR) | | | 17,208 | | | | 3,657,388 | |
| | | | | | | | 24,343,273 | |
| Industrials 11.8% | |
| Aerospace & Defense 3.0% | |
| BE Aerospace, Inc.* | | | 87,314 | | | | 5,065,958 | |
| Boeing Co. (a) | | | 97,281 | | | | 12,644,585 | |
| KLX, Inc.* | | | 43,657 | | | | 1,800,851 | |
| TransDigm Group, Inc. | | | 38,760 | | | | 7,610,526 | |
| | | | | | | | 27,121,920 | |
| Commercial Services & Supplies 0.7% | |
| Stericycle, Inc.* (a) | | | 49,208 | | | | 6,450,185 | |
| Electrical Equipment 1.4% | |
| AMETEK, Inc. (a) | | | 236,920 | | | | 12,469,099 | |
| Industrial Conglomerates 1.8% | |
| General Electric Co. | | | 179,839 | | | | 4,544,532 | |
| Roper Industries, Inc. | | | 70,732 | | | | 11,058,948 | |
| | | | | | | | 15,603,480 | |
| Machinery 3.6% | |
| Dover Corp. (a) | | | 71,514 | | | | 5,128,984 | |
| Pall Corp. | | | 109,131 | | | | 11,045,149 | |
| Parker-Hannifin Corp. | | | 119,911 | | | | 15,462,523 | |
| | | | | | | | 31,636,656 | |
| Road & Rail 1.3% | |
| Norfolk Southern Corp. | | | 108,980 | | | | 11,945,298 | |
| Information Technology 27.8% | |
| Communications Equipment 1.1% | |
| Palo Alto Networks, Inc.* (a) | | | 79,093 | | | | 9,694,429 | |
| Internet Software & Services 6.5% | |
| Alibaba Group Holding Ltd. (ADR)* | | | 53,245 | | | | 5,534,285 | |
| Facebook, Inc. "A"* | | | 192,923 | | | | 15,051,853 | |
| | | Shares | | | Value ($) | |
| | | | | | | | | |
| Google, Inc. "A"* | | | 29,806 | | | | 15,816,852 | |
| Google, Inc. "C"* | | | 29,955 | | | | 15,768,312 | |
| LinkedIn Corp. "A"* | | | 26,424 | | | | 6,069,857 | |
| | | | | | | | 58,241,159 | |
| IT Services 3.4% | |
| Cognizant Technology Solutions Corp. "A"* | | | 143,946 | | | | 7,580,196 | |
| Visa, Inc. "A" (a) | | | 86,893 | | | | 22,783,345 | |
| | | | | | | | 30,363,541 | |
| Semiconductors & Semiconductor Equipment 3.5% | |
| Analog Devices, Inc. | | | 168,574 | | | | 9,359,228 | |
| Avago Technologies Ltd. | | | 76,095 | | | | 7,654,396 | |
| Intel Corp. | | | 201,424 | | | | 7,309,677 | |
| NXP Semiconductors NV* | | | 89,383 | | | | 6,828,861 | |
| | | | | | | | 31,152,162 | |
| Software 6.8% | |
| Adobe Systems, Inc.* | | | 127,838 | | | | 9,293,823 | |
| Microsoft Corp. | | | 533,722 | | | | 24,791,387 | |
| Oracle Corp. | | | 370,352 | | | | 16,654,729 | |
| Salesforce.com, Inc.* (a) | | | 170,788 | | | | 10,129,436 | |
| | | | | | | | 60,869,375 | |
| Technology Hardware, Storage & Peripherals 6.5% | |
| Apple, Inc. | | | 441,085 | | | | 48,686,962 | |
| Western Digital Corp. | | | 83,422 | | | | 9,234,816 | |
| | | | | | | | 57,921,778 | |
| Materials 3.5% | |
| Chemicals 2.7% | |
| Dow Chemical Co. | | | 175,745 | | | | 8,015,729 | |
| Ecolab, Inc. | | | 114,524 | | | | 11,970,049 | |
| PPG Industries, Inc. | | | 17,014 | | | | 3,932,786 | |
| | | | | | | | 23,918,564 | |
| Containers & Packaging 0.8% | |
| Ball Corp. | | | 108,849 | | | | 7,420,236 | |
| | | Shares | | | Value ($) | |
| | | | | | | | | |
| Telecommunication Services 0.6% | |
| Diversified Telecommunication Services | |
| Level 3 Communications, Inc.* | | | 96,391 | | | | 4,759,787 | |
| Zayo Group Holdings, Inc.* (a) | | | 22,945 | | | | 701,429 | |
| | | | | | | | 5,461,216 | |
| Utilities 0.5% | |
| Water Utilities | |
| American Water Works Co., Inc. (a) | | | 92,500 | | | | 4,930,250 | |
Total Common Stocks (Cost $558,502,162) | | | | 886,478,343 | |
| | | Principal Amount ($) | | | Value ($) | |
| | | | |
| Convertible Bonds 0.4% | |
| Information Technology | |
| Twitter, Inc., 144A, 0.25%, 9/15/2019 | | | 2,098,000 | | | | 1,822,637 | |
| Workday, Inc., 1.5%, 7/15/2020 | | | 1,903,278 | | | | 2,318,431 | |
Total Convertible Bonds (Cost $4,366,999) | | | | 4,141,068 | |
| | | Shares | | | Value ($) | |
| | | | |
| Securities Lending Collateral 14.9% | |
| Daily Assets Fund Institutional, 0.10% (b) (c) (Cost $133,354,054) | | | 133,354,054 | | | | 133,354,054 | |
| | |
| Cash Equivalents 0.4% | |
| Central Cash Management Fund, 0.06% (b) (Cost $3,306,422) | | | 3,306,422 | | | | 3,306,422 | |
| | | % of Net Assets | | | Value ($) | |
| | | | |
Total Investment Portfolio (Cost $699,529,637)† | | | 114.9 | | | | 1,027,279,887 | |
| Other Assets and Liabilities, Net | | | (14.9 | ) | | | (133,538,375 | ) |
| Net Assets | | | 100.0 | | | | 893,741,512 | |
* Non-income producing security.
† The cost for federal income tax purposes was $699,999,348. At December 31, 2014, net unrealized appreciation for all securities based on tax cost was $327,280,539. This consisted of aggregate gross unrealized appreciation for all securities in which there was an excess of value over tax cost of $335,740,331 and aggregate gross unrealized depreciation for all securities in which there was an excess of tax cost over value of $8,459,792.
(a) All or a portion of these securities were on loan. In addition, "Other Assets and Liabilities, Net" may include pending sales that are also on loan. The value of securities loaned at December 31, 2014 amounted to $129,779,373, which is 14.5% of net assets.
(b) Affiliated fund managed by Deutsche Investment Management Americas Inc. The rate shown is the annualized seven-day yield at period end.
(c) Represents collateral held in connection with securities lending. Income earned by the Fund is net of borrower rebates.
144A: Security exempt from registration under Rule 144A of the Securities Act of 1933. These securities may be resold in transactions exempt from registration, normally to qualified institutional buyers.
ADR: American Depositary Receipt
REIT: Real Estate Investment Trust
Fair Value Measurements
Various inputs are used in determining the value of the Fund's investments. These inputs are summarized in three broad levels. Level 1 includes quoted prices in active markets for identical securities. Level 2 includes other significant observable inputs (including quoted prices for similar securities, interest rates, prepayment speeds and credit risk). Level 3 includes significant unobservable inputs (including the Fund's own assumptions in determining the fair value of investments). The level assigned to the securities valuations may not be an indication of the risk or liquidity associated with investing in those securities.
The following is a summary of the inputs used as of December 31, 2014 in valuing the Fund's investments. For information on the Fund's policy regarding the valuation of investments, please refer to the Security Valuation section of Note A in the accompanying Notes to Financial Statements.
| Assets | | Level 1 | | | Level 2 | | | Level 3 | | | Total | |
| | |
| Common Stocks (d) | | $ | 886,478,343 | | | $ | — | | | $ | — | | | $ | 886,478,343 | |
| Convertible Bonds | | | — | | | | 4,141,068 | | | | — | | | | 4,141,068 | |
| Short-Term Investments (d) | | | 136,660,476 | | | | — | | | | — | | | | 136,660,476 | |
| Total | | $ | 1,023,138,819 | | | $ | 4,141,068 | | | $ | — | | | $ | 1,027,279,887 | |
There have been no transfers between fair value measurement levels during the year ended December 31, 2014.
(d) See Investment Portfolio for additional detailed categorizations.
The accompanying notes are an integral part of the financial statements.
Statement of Assets and Liabilities | as of December 31, 2014 | |
| Assets | |
Investments: Investments in non-affiliated securities, at value (cost $562,869,161) — including $129,779,373 of securities loaned | | $ | 890,619,411 | |
| Investment in Daily Assets Fund Institutional (cost $133,354,054)* | | | 133,354,054 | |
| Investment in Central Cash Management Fund (cost $3,306,422) | | | 3,306,422 | |
| Total investments in securities, at value (cost $699,529,637) | | | 1,027,279,887 | |
| Cash | | | 10,000 | |
| Receivable for Fund shares sold | | | 293,377 | |
| Dividends receivable | | | 825,290 | |
| Interest receivable | | | 27,740 | |
| Other assets | | | 14,495 | |
| Total assets | | | 1,028,450,789 | |
| Liabilities | |
| Payable upon return of securities loaned | | | 133,354,054 | |
| Payable for Fund shares redeemed | | | 869,652 | |
| Accrued management fee | | | 281,972 | |
| Accrued Trustees' fees | | | 11,162 | |
| Other accrued expenses and payables | | | 192,437 | |
| Total liabilities | | | 134,709,277 | |
| Net assets, at value | | $ | 893,741,512 | |
| Net Assets Consist of | |
| Undistributed net investment income | | | 6,242,357 | |
Net unrealized appreciation (depreciation) on Investments | | | 327,750,250 | |
| Accumulated net realized gain (loss) | | | 101,606,458 | |
| Paid-in capital | | | 458,142,447 | |
| Net assets, at value | | $ | 893,741,512 | |
Class A Net Asset Value, offering and redemption price per share ($890,358,124 ÷ 29,731,475 outstanding shares of beneficial interest, $.01 par value, unlimited number of shares authorized) | | $ | 29.95 | |
Class B Net Asset Value, offering and redemption price per share ($3,383,388 ÷ 113,396 outstanding shares of beneficial interest, $.01 par value, unlimited number of shares authorized) | | $ | 29.84 | |
* Represents collateral on securities loaned.
The accompanying notes are an integral part of the financial statements.
Statement of Operations
| for the year ended December 31, 2014 | |
| Investment Income | |
Income: Dividends (net of foreign taxes withheld of $14,055) | | $ | 10,582,219 | |
| Income distributions — Central Cash Management Fund | | | 2,581 | |
| Interest | | | 36,689 | |
| Securities lending income, including income from Daily Assets Fund Institutional, net of borrower rebates | | | 67,802 | |
| Total income | | | 10,689,291 | |
Expenses: Management fee | | | 3,162,834 | |
| Administration fee | | | 849,407 | |
| Services to shareholders | | | 3,617 | |
| Record keeping fee (Class B) | | | 3,358 | |
| Distribution and service fees (Class B) | | | 16,247 | |
| Custodian fee | | | 24,755 | |
| Professional fees | | | 93,369 | |
| Reports to shareholders | | | 53,783 | |
| Trustees' fees and expenses | | | 36,729 | |
| Other | | | 26,992 | |
| Total expenses | | | 4,271,091 | |
| Net investment income (loss) | | | 6,418,200 | |
| Realized and Unrealized Gain (Loss) | |
Net realized gain (loss) from Investments | | | 126,077,955 | |
Change in net unrealized appreciation (depreciation) on: Investments | | | (29,237,278 | ) |
| Foreign currency | | | (4,925 | ) |
| | | | (29,242,203 | ) |
| Net gain (loss) | | | 96,835,752 | |
| Net increase (decrease) in net assets resulting from operations | | $ | 103,253,952 | |
The accompanying notes are an integral part of the financial statements.
Statement of Changes in Net Assets | | | Years Ended December 31, | |
| Increase (Decrease) in Net Assets | | 2014 | | | 2013 | |
Operations: Net investment income (loss) | | $ | 6,418,200 | | | $ | 6,538,509 | |
| Net realized gain (loss) | | | 126,077,955 | | | | 111,903,826 | |
| Change in net unrealized appreciation (depreciation) | | | (29,242,203 | ) | | | 112,661,284 | |
| Net increase (decrease) in net assets resulting from operations | | | 103,253,952 | | | | 231,103,619 | |
Distributions to shareholders from: Net investment income: Class A | | | (5,280,971 | ) | | | (9,616,234 | ) |
| Class B | | | (41,098 | ) | | | (131,767 | ) |
Net realized gains: Class A | | | (48,279,027 | ) | | | — | |
| Class B | | | (767,015 | ) | | | — | |
| Total distributions | | | (54,368,111 | ) | | | (9,748,001 | ) |
Fund share transactions: Class A Proceeds from shares sold | | | 51,156,495 | | | | 14,066,914 | |
| Reinvestment of distributions | | | 53,559,998 | | | | 9,616,234 | |
| Payments for shares redeemed | | | (101,225,789 | ) | | | (105,034,979 | ) |
| Net increase (decrease) in net assets from Class A share transactions | | | 3,490,704 | | | | (81,351,831 | ) |
Class B Proceeds from shares sold | | | 1,318,640 | | | | 760,162 | |
| Reinvestment of distributions | | | 808,113 | | | | 131,767 | |
| Payments for shares redeemed | | | (11,748,491 | ) | | | (3,806,721 | ) |
| Net increase (decrease) in net assets from Class B share transactions | | | (9,621,738 | ) | | | (2,914,792 | ) |
| Increase (decrease) in net assets | | | 42,754,807 | | | | 137,088,995 | |
| Net assets at beginning of period | | | 850,986,705 | | | | 713,897,710 | |
| Net assets at end of period (including undistributed net investment income of $6,242,357 and $6,239,079, respectively) | | $ | 893,741,512 | | | $ | 850,986,705 | |
| Other Information | |
Class A Shares outstanding at beginning of period | | | 29,474,327 | | | | 32,798,165 | |
| Shares sold | | | 1,781,210 | | | | 570,579 | |
| Shares issued to shareholders in reinvestment of distributions | | | 2,074,361 | | | | 419,923 | |
| Shares redeemed | | | (3,598,423 | ) | | | (4,314,340 | ) |
| Net increase (decrease) in Class A shares | | | 257,148 | | | | (3,323,838 | ) |
| Shares outstanding at end of period | | | 29,731,475 | | | | 29,474,327 | |
Class B Shares outstanding at beginning of period | | | 484,326 | | | | 600,771 | |
| Shares sold | | | 46,596 | | | | 31,195 | |
| Shares issued to shareholders in reinvestment of distributions | | | 31,359 | | | | 5,764 | |
| Shares redeemed | | | (448,885 | ) | | | (153,404 | ) |
| Net increase (decrease) in Class B shares | | | (370,930 | ) | | | (116,445 | ) |
| Shares outstanding at end of period | | | 113,396 | | | | 484,326 | |
The accompanying notes are an integral part of the financial statements.
| | | Years Ended December 31, | |
| Class A | | | 2014 | | | 2013 | | | 2012 | | | 2011 | | | 2010 | |
| Selected Per Share Data | |
| Net asset value, beginning of period | | $ | 28.41 | | | $ | 21.38 | | | $ | 18.58 | | | $ | 19.59 | | | $ | 16.93 | |
Income (loss) from investment operations: Net investment income (loss)a | | | .21 | | | | .21 | | | | .28 | | | | .17 | | | | .14 | c |
| Net realized and unrealized gain (loss) | | | 3.18 | | | | 7.12 | | | | 2.70 | | | | (1.03 | ) | | | 2.68 | |
| Total from investment operations | | | 3.39 | | | | 7.33 | | | | 2.98 | | | | (.86 | ) | | | 2.82 | |
Less distributions from: Net investment income | | | (.18 | ) | | | (.30 | ) | | | (.18 | ) | | | (.15 | ) | | | (.16 | ) |
| Net realized gains | | | (1.67 | ) | | | — | | | | — | | | | — | | | | — | |
| Total distributions | | | (1.85 | ) | | | (.30 | ) | | | (.18 | ) | | | (.15 | ) | | | (.16 | ) |
| Net asset value, end of period | | $ | 29.95 | | | $ | 28.41 | | | $ | 21.38 | | | $ | 18.58 | | | $ | 19.59 | |
| Total Return (%) | | | 12.97 | | | | 34.65 | | | | 16.05 | | | | (4.47 | ) | | | 16.71 | b |
| Ratios to Average Net Assets and Supplemental Data | |
| Net assets, end of period ($ millions) | | | 890 | | | | 837 | | | | 701 | | | | 677 | | | | 729 | |
| Ratio of expenses before expense reductions (%) | | | .50 | | | | .50 | | | | .50 | | | | .50 | | | | .51 | |
| Ratio of expenses after expense reductions (%) | | | .50 | | | | .50 | | | | .50 | | | | .50 | | | | .51 | |
| Ratio of net investment income (loss) (%) | | | .76 | | | | .85 | | | | 1.32 | | | | .86 | | | | .78 | c |
| Portfolio turnover rate (%) | | | 47 | | | | 37 | | | | 25 | | | | 47 | | | | 42 | |
a Based on average shares outstanding during the period. b Total return would have been lower had certain expenses not been reduced. c Net investment income per share and ratio of net investment income include non-recurring dividend income amounting to $0.05 per share and 0.28% of average daily net assets for the year ended December 31, 2010. | |
| | | Years Ended December 31, | |
| Class B | | | 2014 | | | 2013 | | | 2012 | | | 2011 | | | 2010 | |
| Selected Per Share Data | |
| Net asset value, beginning of period | | $ | 28.29 | | | $ | 21.29 | | | $ | 18.51 | | | $ | 19.51 | | | $ | 16.86 | |
Income (loss) from investment operations: Net investment income (loss)a | | | .09 | | | | .13 | | | | .20 | | | | .10 | | | | .08 | c |
| Net realized and unrealized gain (loss) | | | 3.22 | | | | 7.10 | | | | 2.69 | | | | (1.02 | ) | | | 2.67 | |
| Total from investment operations | | | 3.31 | | | | 7.23 | | | | 2.89 | | | | (.92 | ) | | | 2.75 | |
Less distributions from: Net investment income | | | (.09 | ) | | | (.23 | ) | | | (.11 | ) | | | (.08 | ) | | | (.10 | ) |
| Net realized gains | | | (1.67 | ) | | | — | | | | — | | | | — | | | | — | |
| Total distributions | | | (1.76 | ) | | | (.23 | ) | | | (.11 | ) | | | (.08 | ) | | | (.10 | ) |
| Net asset value, end of period | | $ | 29.84 | | | $ | 28.29 | | | $ | 21.29 | | | $ | 18.51 | | | $ | 19.51 | |
| Total Return (%) | | | 12.67 | | | | 34.19 | | | | 15.61 | | | | (4.76 | ) | | | 16.33 | b |
| Ratios to Average Net Assets and Supplemental Data | |
| Net assets, end of period ($ millions) | | | 3 | | | | 14 | | | | 13 | | | | 13 | | | | 12 | |
| Ratio of expenses before expense reductions (%) | | | .80 | | | | .83 | | | | .83 | | | | .84 | | | | .85 | |
| Ratio of expenses after expense reductions (%) | | | .80 | | | | .83 | | | | .83 | | | | .84 | | | | .84 | |
| Ratio of net investment income (loss) (%) | | | .33 | | | | .52 | | | | .97 | | | | .52 | | | | .45 | c |
| Portfolio turnover rate (%) | | | 47 | | | | 37 | | | | 25 | | | | 47 | | | | 42 | |
a Based on average shares outstanding during the period. b Total return would have been lower had certain expenses not been reduced. c Net investment income per share and ratio of net investment income include non-recurring dividend income amounting to $0.05 per share and 0.28% of average daily net assets for the year ended December 31, 2010. | |
Notes to Financial Statements
A. Organization and Significant Accounting Policies
Deutsche Variable Series I (formerly DWS Variable Series I) (the "Series") is registered under the Investment Company Act of 1940, as amended (the "1940 Act"), as an open-end, registered management investment company organized as a Massachusetts business trust. The Series consists of five diversified funds: Deutsche Bond VIP, Deutsche Core Equity VIP, Deutsche Capital Growth VIP, Deutsche Global Small Cap VIP and Deutsche International VIP (individually or collectively hereinafter referred to as a "Fund" or the "Funds" and formerly known as DWS Bond VIP, DWS Core Equity VIP, DWS Capital Growth VIP, DWS Global Small Cap Growth VIP and DWS International VIP, respectively). These financial statements report on Deutsche Capital Growth VIP. The Series is intended to be the underlying investment vehicle for variable annuity contracts and variable life insurance policies to be offered by the separate accounts of certain life insurance companies ("Participating Insurance Companies").
Multiple Classes of Shares of Beneficial Interest. The Fund offers two classes of shares (Class A shares and Class B shares). Class B shares are subject to Rule 12b-1 distribution fees under the 1940 Act and record keeping fees equal to an annual rate of 0.25% and up to 0.15%, respectively, of the average daily net assets of the Class B shares of the Fund. Class A shares are not subject to such fees.
Investment income, realized and unrealized gains and losses, and certain fund-level expenses and expense reductions, if any, are borne pro rata on the basis of relative net assets by the holders of all classes of shares, except that each class bears certain expenses unique to that class (including the applicable 12b-1 distribution fees and recordkeeping fees). Differences in class-level expenses may result in payment of different per share dividends by class. All shares have equal rights with respect to voting subject to class-specific arrangements.
The Fund's financial statements are prepared in accordance with accounting principles generally accepted in the United States of America, which require the use of management estimates. Actual results could differ from those estimates. The policies described below are followed consistently by the Fund in the preparation of its financial statements.
Security Valuation. Investments are stated at value determined as of the close of regular trading on the New York Stock Exchange on each day the exchange is open for trading.
Various inputs are used in determining the value of the Fund's investments. These inputs are summarized in three broad levels. Level 1 includes quoted prices in active markets for identical securities. Level 2 includes other significant observable inputs (including quoted prices for similar securities, interest rates, prepayment speeds and credit risk). Level 3 includes significant unobservable inputs (including the Fund's own assumptions in determining the fair value of investments). The level assigned to the securities valuations may not be an indication of the risk or liquidity associated with investing in those securities.
Equity securities are valued at the most recent sale price or official closing price reported on the exchange (U.S. or foreign) or over-the-counter market on which they trade. Securities for which no sales are reported are valued at the calculated mean between the most recent bid and asked quotations on the relevant market or, if a mean cannot be determined, at the most recent bid quotation. Equity securities are generally categorized as Level 1.
Investments in open-end investment companies are valued at their net asset value each business day and are categorized as Level 1.
Debt securities are valued at prices supplied by independent pricing services approved by the Fund's Board. Such services may use various pricing techniques which take into account appropriate factors such as yield, quality, coupon rate, maturity, type of issue, trading characteristics, prepayment speeds and other data, as well as broker quotes. If the pricing services are unable to provide valuations, debt securities are valued at the average of the most recent reliable bid quotations or evaluated prices, as applicable, obtained from broker-dealers. These securities are generally categorized as Level 2.
Securities and other assets for which market quotations are not readily available or for which the above valuation procedures are deemed not to reflect fair value are valued in a manner that is intended to reflect their fair value as determined in accordance with procedures approved by the Trustees and are generally categorized as Level 3. In accordance with the Fund's valuation procedures, factors considered in determining value may include, but are not limited to, the type of the security; the size of the holding; the initial cost of the security; the existence of any contractual restrictions on the security's disposition; the price and extent of public trading in similar securities of the issuer or of comparable companies; quotations or evaluated prices from broker-dealers and/or pricing services; information obtained from the issuer, analysts, and/or the appropriate stock exchange (for exchange-traded securities); an analysis of the company's or issuer's financial statements; an evaluation of the forces that influence the issuer and the market(s) in which the security is purchased and sold; and with respect to debt securities, the maturity, coupon, creditworthiness, currency denomination and the movement of the market in which the security is normally traded. The value determined under these procedures may differ from published values for the same securities.
Disclosure about the classification of fair value measurements is included in a table following the Fund's Investment Portfolio.
Securities Lending. Brown Brothers Harriman & Co., as lending agent, lends securities of the Fund to certain financial institutions under the terms of the Security Lending Agreement. The Fund retains the benefits of owning the securities it has loaned and continues to receive interest and dividends generated by the securities and to participate in any changes in their market value. The Fund requires the borrowers of the securities to maintain collateral with the Fund consisting of either cash or liquid, unencumbered assets having a value at least equal to the value of the securities loaned. When the collateral falls below specified amounts, the lending agent will use its best effort to obtain additional collateral on the next business day to meet required amounts under the security lending agreement. The Fund may invest the cash collateral into a joint trading account in an affiliated money market fund pursuant to Exemptive Orders issued by the SEC. The Fund receives compensation for lending its securities either in the form of fees or by earning interest on invested cash collateral net of borrower rebates and fees paid to a lending agent. Either the Fund or the borrower may terminate the loan. There may be risks of delay and costs in recovery of securities or even loss of rights in the collateral should the borrower of the securities fail financially. If the Fund is not able to recover securities lent, the Fund may sell the collateral and purchase a replacement investment in the market, incurring the risk that the value of the replacement security is greater than the value of the collateral. The Fund is also subject to all investment risks associated with the reinvestment of any cash collateral received, including, but not limited to, interest rate, credit and liquidity risk associated with such investments.
As of December 31, 2014, the Fund had securities on loan. The value of the related collateral exceeded the value of the securities loaned at period end.
Foreign Currency Translations. The books and records of the Fund are maintained in U.S. dollars. Investment securities and other assets and liabilities denominated in a foreign currency are translated into U.S. dollars at the prevailing exchange rates at period end. Purchases and sales of investment securities, income and expenses are translated into U.S. dollars at the prevailing exchange rates on the respective dates of the transactions.
Net realized and unrealized gains and losses on foreign currency transactions represent net gains and losses between trade and settlement dates on securities transactions, the acquisition and disposition of foreign currencies, and the difference between the amount of net investment income accrued and the U.S. dollar amount actually received. That portion of both realized and unrealized gains and losses on investments that results from fluctuations in foreign currency exchange rates is not separately disclosed but is included with net realized and unrealized gain/appreciation and loss/depreciation on investments.
Federal Income Taxes. The Fund is treated as a separate taxpayer as provided for in the Internal Revenue Code, as amended. It is the Fund's policy to comply with the requirements of the Internal Revenue Code, as amended, which are applicable to regulated investment companies, and to distribute all of its taxable income to the separate accounts of the Participating Insurance Companies which hold its shares.
Under the Regulated Investment Company Modernization Act of 2010, net capital losses incurred post-enactment may be carried forward indefinitely, and their character is retained as short-term and/or long-term. Previously, net capital losses were carried forward for eight years and treated as short-term. As a transition rule, the Act requires that post-enactment net capital losses be used before pre-enactment net capital losses.
At December 31, 2014, the Fund had a net tax basis capital loss carryforward of approximately $15,222,000 of pre-enactment losses, all of which was inherited from its merger with other affiliated funds in previous years, which may be applied against any realized net taxable capital gains of each succeeding year until fully utilized or until December 31, 2016, the expiration date, whichever occurs first, and which may be subject to certain limitations under Section 382–384 of the Internal Revenue Code.
The Fund has reviewed the tax positions for the open tax years as of December 31, 2014 and has determined that no provision for income tax and/or uncertain tax provisions is required in the Fund's financial statements. The Fund's federal tax returns for the prior three fiscal years remain open subject to examination by the Internal Revenue Service.
Distribution of Income and Gains. Distributions from net investment income of the Fund, if any, are declared and distributed to shareholders annually. Net realized gains from investment transactions, in excess of available capital loss carryforwards, would be taxable to the Fund if not distributed, and, therefore, will be distributed to shareholders at least annually. The Fund may also make additional distributions for tax purposes if necessary.
The timing and characterization of certain income and capital gain distributions are determined annually in accordance with federal tax regulations which may differ from accounting principles generally accepted in the United States of America. These differences primarily relate to certain securities sold at a loss. As a result, net investment income (loss) and net realized gain (loss) on investment transactions for a reporting period may differ significantly from distributions during such period. Accordingly, the Fund may periodically make reclassifications among certain of its capital accounts without impacting the net asset value of the Fund.
At December 31, 2014, the Fund's components of distributable earnings (accumulated losses) on a tax basis are as follows:
| Undistributed ordinary income* | | $ | 6,242,357 | |
| Undistributed net long-term capital gains | | $ | 117,313,066 | |
| Capital loss carryforwards | | $ | (15,222,000 | ) |
| Net unrealized gain appreciation (depreciation) investments | | $ | 327,280,539 | |
In addition, the tax character of distributions paid to shareholders by the Fund is summarized as follows:
| | | Years Ended December 31, | |
| | | 2014 | | | 2013 | |
| Distributions from ordinary income* | | $ | 5,322,069 | | | $ | 9,748,001 | |
| Distributions from long-term capital gains | | $ | 49,046,042 | | | $ | — | |
* For tax purposes, short-term capital gain distributions are considered ordinary income distributions.
Expenses. Expenses of the Series arising in connection with a specific Fund are allocated to that Fund. Other Series expenses which cannot be directly attributed to a Fund are apportioned among the Funds in the Series based upon the relative net assets or other appropriate measures.
Contingencies. In the normal course of business, the Fund may enter into contracts with service providers that contain general indemnification clauses. The Fund's maximum exposure under these arrangements is unknown as this would involve future claims that may be made against the Fund that have not yet been made. However, based on experience, the Fund expects the risk of loss to be remote.
Other. Investment transactions are accounted for on a trade date plus one basis for daily net asset value calculations. However, for financial reporting purposes, investment transactions are reported on trade date. Interest income is recorded on the accrual basis. Dividend income is recorded on the ex-dividend date net of foreign withholding taxes. Realized gains and losses from investment transactions are recorded on an identified cost basis. Proceeds from litigation payments, if any, are included in net realized gain (loss) from investments.
B. Purchases and Sales of Securities
During the year ended December 31, 2014, purchases and sales of investment securities (excluding short-term investments) aggregated $394,747,775 and $439,260,251, respectively.
C. Related Parties
Management Agreement. Under the Investment Management Agreement with Deutsche Investment Management Americas Inc. ("DIMA" or the "Advisor"), an indirect, wholly owned subsidiary of Deutsche Bank AG, the Advisor directs the investments of the Fund in accordance with its investment objectives, policies and restrictions. The Advisor determines the securities, instruments and other contracts relating to investments to be purchased, sold or entered into by the Fund.
Pursuant to the Investment Management Agreement with the Advisor, the Fund pays a monthly management fee based on the Fund's average daily net assets, computed and accrued daily and payable monthly at the following annual rates:
| First $250 million of average daily net assets | | | .390 | % |
| Next $750 million of average daily net assets | | | .365 | % |
| Over $1 billion of average daily net assets | | | .340 | % |
Accordingly, for the year ended December 31, 2014, the fee pursuant to the Investment Management Agreement was equivalent to an annual rate (exclusive of any applicable waivers/reimbursements) of 0.37% of the Fund's average daily net assets.
For the period from January 1, 2014 through September 30, 2015, the Advisor has contractually agreed to waive all or a portion of its fees and/or reimburse certain operating expenses to the extent necessary to maintain the total annual operating expenses (excluding certain expenses such as extraordinary expenses, taxes, brokerage and interest expense) of each class as follows:
Administration Fee. Pursuant to an Administrative Services Agreement, DIMA provides most administrative services to the Fund. For all services provided under the Administrative Services Agreement, the Fund pays the Advisor an annual fee ("Administration Fee") of 0.10% of the Fund's average daily net assets, computed and accrued daily and payable monthly. For the year ended December 31, 2014, the Administration Fee was $849,407, of which $75,798 is unpaid.
Service Provider Fees. DeAWM Service Company ("DSC"), an affiliate of the Advisor, is the transfer agent, dividend-paying agent and shareholder service agent for the Fund. Pursuant to a sub-transfer agency agreement between DSC and DST Systems, Inc. ("DST"), DSC has delegated certain transfer agent, dividend-paying agent and shareholder service agent functions to DST. DSC compensates DST out of the shareholder servicing fee it receives from the Fund. For the year ended December 31, 2014, the amounts charged to the Fund by DSC were as follows:
| Services to Shareholders | | Total Aggregated | | | Unpaid at December 31, 2014 | |
| Class A | | $ | 783 | | | $ | 142 | |
| Class B | | | 176 | | | | 29 | |
| | | $ | 959 | | | $ | 171 | |
Distribution Service Agreement. DeAWM Distributors, Inc. ("DDI"), also an affiliate of the Advisor, is the Series' Distributor. In accordance with the Master Distribution Plan, DDI receives 12b-1 fees of 0.25% of average daily net assets of Class B shares. Pursuant to the Master Distribution Plan, DDI remits these fees to the Participating Insurance Companies for various costs incurred or paid by these companies in connection with marketing and distribution of Class B shares. For the year ended December 31, 2014, the Distribution Service Fee aggregated $16,247, of which $720 is unpaid.
Typesetting and Filing Service Fees. Under an agreement with DIMA, DIMA is compensated for providing typesetting and certain regulatory filing services to the Fund. For the year ended December 31, 2014, the amount charged to the Fund by DIMA included in the Statement of Operations under "Reports to shareholders" aggregated $15,114, of which $4,205 is unpaid.
Trustees' Fees and Expenses. The Fund paid retainer fees to each Trustee not affiliated with the Advisor, plus specified amounts to the Board Chairperson and Vice Chairperson and to each committee Chairperson.
Affiliated Cash Management Vehicles. The Fund may invest uninvested cash balances in Central Cash Management Fund and Deutsche Variable NAV Money Fund, affiliated money market funds which are managed by the Advisor. Each affiliated money market fund seeks to provide a high level of current income consistent with liquidity and the preservation of capital. Each affiliated money market fund is managed in accordance with Rule 2a-7 under the Investment Company Act of 1940, which governs the quality, maturity, diversity and liquidity of instruments in which a money market fund may invest. Central Cash Management Fund seeks to maintain a stable net asset value, and Deutsche Variable NAV Money Fund maintains a floating net asset value. The Fund indirectly bears its proportionate share of the expenses of each affiliated money market fund in which it invests. Central Cash Management Fund does not pay the Advisor an investment management fee. To the extent that Deutsche Variable NAV Money Fund pays an investment management fee to the Advisor, the Advisor will waive an amount of the investment management fee payable to the Advisor by the Fund equal to the amount of the investment management fee payable on the Fund's assets invested in Deutsche Variable NAV Money Fund.
D. Ownership of the Fund
At December 31, 2014, three participating insurance companies were owners of record of 10% or more of the total outstanding Class A shares of the Fund, each owning 39%, 37% and 12%, respectively. Two participating insurance companies were the owners of record of 10% or more of the total outstanding Class B shares of the Fund, each owning 81% and 10%, respectively.
E. Line of Credit
The Fund and other affiliated funds (the "Participants") share in a $400 million revolving credit facility provided by a syndication of banks. The Fund may borrow for temporary or emergency purposes, including the meeting of redemption requests that otherwise might require the untimely disposition of securities. The Participants are charged an annual commitment fee which is allocated based on net assets, among each of the Participants. Interest is calculated at a rate per annum equal to the sum of the Federal Funds Rate plus 1.25 percent plus if LIBOR exceeds the Federal Funds Rate the amount of such excess. The Fund may borrow up to a maximum of 33 percent of its net assets under the agreement. The Fund had no outstanding loans at December 31, 2014.
Report of Independent Registered Public Accounting Firm
To the Trustees of Deutsche Variable Series I and the Shareholders of Deutsche Capital Growth VIP:
In our opinion, the accompanying statement of assets and liabilities, including the investment portfolio, and the related statements of operations and of changes in net assets and the financial highlights present fairly, in all material respects, the financial position of Deutsche Capital Growth VIP (formerly DWS Capital Growth VIP) (the "Fund") at December 31, 2014 and the results of its operations, the changes in its net assets, and the financial highlights for the periods indicated therein, in conformity with accounting principles generally accepted in the United States of America. These financial statements and financial highlights (hereafter referred to as "financial statements") are the responsibility of the Fund's management. Our responsibility is to express an opinion on these financial statements based on our audits. We conducted our audits of these financial statements in accordance with the standards of the Public Company Accounting Oversight Board (United States). Those standards require that we plan and perform the audit to obtain reasonable assurance about whether the financial statements are free of material misstatement. An audit includes examining, on a test basis, evidence supporting the amounts and disclosures in the financial statements, assessing the accounting principles used and significant estimates made by management, and evaluating the overall financial statement presentation. We believe that our audits, which included confirmation of securities at December 31, 2014 by correspondence with the custodian, brokers and transfer agent, and the application of alternative auditing procedures where such confirmations had not been received, provide a reasonable basis for our opinion.
Boston, Massachusetts February 13, 2015 | PricewaterhouseCoopers LLP |
Information About Your Fund's Expenses (Unaudited)
As an investor of the Fund, you incur two types of costs: ongoing expenses and transaction costs. Ongoing expenses include management fees, distribution and service (12b-1) fees and other Fund expenses. Examples of transaction costs include contract charges, which are not shown in this section. The following tables are intended to help you understand your ongoing expenses (in dollars) of investing in the Fund and to help you compare these expenses with the ongoing expenses of investing in other mutual funds. The example in the table is based on an investment of $1,000 invested at the beginning of the six-month period and held for the entire period (July 1, 2014 to December 31, 2014).
The tables illustrate your Fund's expenses in two ways:
—Actual Fund Return. This helps you estimate the actual dollar amount of ongoing expenses (but not transaction costs) paid on a $1,000 investment in the Fund using the Fund's actual return during the period. To estimate the expenses you paid over the period, simply divide your account value by $1,000 (for example, an $8,600 account value divided by $1,000 = 8.6), then multiply the result by the number in the "Expenses Paid per $1,000" line under the share class you hold.
—Hypothetical 5% Fund Return. This helps you to compare your Fund's ongoing expenses (but not transaction costs) with those of other mutual funds using the Fund's actual expense ratio and a hypothetical rate of return of 5% per year before expenses. Examples using a 5% hypothetical Fund return may be found in the shareholder reports of other mutual funds. The hypothetical account values and expenses may not be used to estimate the actual ending account balance or expenses you paid for the period.
Please note that the expenses shown in these tables are meant to highlight your ongoing expenses only and do not reflect any transaction costs. The "Expenses Paid per $1,000" line of the tables is useful in comparing ongoing expenses only and will not help you determine the relative total expense of owning different funds. If these transaction costs had been included, your costs would have been higher.
Expenses and Value of a $1,000 Investment for the six months ended December 31, 2014 | |
| Actual Fund Return | | Class A | | | Class B | |
| Beginning Account Value 7/1/14 | | $ | 1,000.00 | | | $ | 1,000.00 | |
| Ending Account Value 12/31/14 | | $ | 1,076.20 | | | $ | 1,074.90 | |
| Expenses Paid per $1,000* | | $ | 2.62 | | | $ | 3.92 | |
| Hypothetical 5% Fund Return | | Class A | | | Class B | |
| Beginning Account Value 7/1/14 | | $ | 1,000.00 | | | $ | 1,000.00 | |
| Ending Account Value 12/31/14 | | $ | 1,022.68 | | | $ | 1,021.42 | |
| Expenses Paid per $1,000* | | $ | 2.55 | | | $ | 3.82 | |
* Expenses are equal to the Fund's annualized expense ratio for each share class, multiplied by the average account value over the period, multiplied by 184 (the number of days in the most recent six-month period), then divided by 365.
| Annualized Expense Ratios | Class A | | Class B | |
| Deutsche Variable Series I — Deutsche Capital Growth VIP | .50% | | .75% | |
For more information, please refer to the Fund's prospectus.
These tables do not reflect charges and fees ("contract charges") associated with the separate account that invests in the Fund or any variable life insurance policy or variable annuity contract for which the Fund is an investment option.
For an analysis of the fees associated with an investment in the fund or similar funds, please refer to the current and hypothetical expense calculators for Variable Insurance Products which can be found at deutschefunds.com/EN/resources/calculators.jsp.
Tax Information (Unaudited)
The Fund paid distributions of $1.67 per share from net long-term capital gains during its year ended December 31, 2014.
Pursuant to Section 852 of the Internal Revenue Code, the Fund designates $129,198,000 as capital gain dividends for its year ended December 31, 2014.
For corporate shareholders, 100% of the ordinary dividends (i.e., income dividends plus short-term capital gains) paid during the Fund's fiscal year ended December 31, 2014 qualified for the dividends received deduction.
Please consult a tax advisor if you have questions about federal or state income tax laws, or on how to prepare your tax returns. If you have specific questions about your account, please contact your insurance provider.
The Series' policies and procedures for voting proxies for portfolio securities and information about how the Series voted proxies related to its portfolio securities during the 12-month period ended June 30 are available on our Web site — deutschefunds.com (click on "proxy voting"at the bottom of the page) — or on the SEC's Web site — sec.gov. To obtain a written copy of the Series' policies and procedures without charge, upon request, call us toll free at (800) 728-3337.
Advisory Agreement Board Considerations and Fee Evaluation
The Board of Trustees approved the renewal of Deutsche Capital Growth VIP’s investment management agreement (the "Agreement") with Deutsche Investment Management Americas Inc. ("DIMA") in September 2014.
In terms of the process that the Board followed prior to approving the Agreement, shareholders should know that:
— In September 2014, all of the Fund’s Trustees were independent of DIMA and its affiliates.
— The Trustees met frequently during the past year to discuss fund matters and dedicated a substantial amount of time to contract review matters. Over the course of several months, the Board’s Contract Committee, in coordination with the Board’s Equity Oversight Committee, reviewed comprehensive materials received from DIMA, independent third parties and independent counsel. These materials included an analysis of the Fund’s performance, fees and expenses, and profitability compiled by a fee consultant retained by the Fund’s Independent Trustees (the "Fee Consultant"). The Board also received extensive information throughout the year regarding performance of the Fund.
— The Independent Trustees regularly meet privately with counsel to discuss contract review and other matters. In addition, the Independent Trustees were advised by the Fee Consultant in the course of their review of the Fund’s contractual arrangements and considered a comprehensive report prepared by the Fee Consultant in connection with their deliberations.
— In connection with reviewing the Agreement, the Board also reviewed the terms of the Fund’s Rule 12b-1 plan, distribution agreement, administrative services agreement, transfer agency agreement and other material service agreements.
— Based on its evaluation of the information provided, the Contract Committee presented its findings and recommendations to the Board. The Board then reviewed the Contract Committee’s findings and recommendations.
In connection with the contract review process, the Contract Committee and the Board considered the factors discussed below, among others. The Board also considered that DIMA and its predecessors have managed the Fund since its inception, and the Board believes that a long-term relationship with a capable, conscientious advisor is in the best interests of the Fund. The Board considered, generally, that shareholders chose to invest or remain invested in the Fund knowing that DIMA managed the Fund, and that the Agreement was approved by the Fund’s shareholders. DIMA is part of Deutsche Bank AG ("DB"), a major global banking institution that is engaged in a wide range of financial services. The Board believes that there are advantages to being part of a global asset management business that offers a wide range of investing expertise and resources, including hundreds of portfolio managers and analysts with research capabilities in many countries throughout the world.
As part of the contract review process, the Board carefully considered the fees and expenses of each Deutsche fund overseen by the Board in light of the fund’s performance. In many cases, this led to the negotiation and implementation of expense caps. As part of these negotiations, the Board indicated that it would consider relaxing these caps in future years following sustained improvements in performance, among other considerations.
In 2012, DB combined its Asset Management (of which DIMA was a part) and Wealth Management divisions into a new Asset and Wealth Management ("AWM") division. DB has advised the Independent Trustees that the U.S. asset management business is a critical and integral part of DB, and that DB will continue to invest in AWM a significant portion of the savings it has realized by combining its Asset and Wealth Management divisions, including ongoing enhancements to AWM’s investment capabilities. DB also has confirmed its commitment to maintaining strong legal and compliance groups within the AWM division.
While shareholders may focus primarily on fund performance and fees, the Fund’s Board considers these and many other factors, including the quality and integrity of DIMA’s personnel and such other issues as back-office operations, fund valuations, and compliance policies and procedures.
Nature, Quality and Extent of Services. The Board considered the terms of the Agreement, including the scope of advisory services provided under the Agreement. The Board noted that, under the Agreement, DIMA provides portfolio management services to the Fund and that, pursuant to a separate administrative services agreement, DIMA provides administrative services to the Fund. The Board considered the experience and skills of senior management and investment personnel, the resources made available to such personnel, the ability of DIMA to attract and retain high-quality personnel, and the organizational depth and stability of DIMA. The Board reviewed the Fund’s performance over short-term and long-term periods and compared those returns to various agreed-upon performance measures, including a market index and a peer universe compiled by the Fee Consultant using information supplied by Morningstar Direct ("Morningstar"), an independent fund data service. The Board also noted that it has put into place a process of identifying "Focus Funds" (e.g., funds performing poorly relative to a peer universe), and receives more frequent reporting and information from DIMA regarding such funds, along with DIMA’s plans to address underperformance. The Board believes this process is an effective manner of identifying and addressing underperforming funds. Based on the information provided, the Board noted that for the one-, three- and five-year periods ended December 31, 2013, the Fund’s performance (Class A shares) was in the 3rd quartile, 3rd quartile and 4th quartile, respectively, of the applicable Morningstar universe (the 1st quartile being the best performers and the 4th quartile being the worst performers). The Board also observed that the Fund has outperformed its benchmark in the one-year period and has underperformed its benchmark in the three- and five-year periods ended December 31, 2013.
Fees and Expenses. The Board considered the Fund’s investment management fee schedule, operating expenses and total expense ratios, and comparative information provided by Lipper Inc. ("Lipper") and the Fee Consultant regarding investment management fee rates paid to other investment advisors by similar funds (1st quartile being the most favorable and 4th quartile being the least favorable). With respect to management fees paid to other investment advisors by similar funds, the Board noted that the contractual fee rates paid by the Fund, which include a 0.10% fee paid to DIMA under the Fund’s administrative services agreement, were lower than the median (1st quartile) of the applicable Lipper peer group (based on Lipper data provided as of December 31, 2013). The Board noted that the Fund’s Class A shares total (net) operating expenses were expected to be lower than the median (1st quartile) of the applicable Lipper expense universe (based on Lipper data provided as of December 31, 2013) ("Lipper Universe Expenses"). The Board also reviewed data comparing each share class’s total (net) operating expenses to the applicable Lipper Universe Expenses. The Board also considered how the Fund’s total (net) operating expenses compared to the total (net) operating expenses of a more customized peer group selected by Lipper (based on such factors as asset size). The Board also noted that the expense limitations agreed to by DIMA helped to ensure that the Fund’s total (net) operating expenses would remain competitive. The Board considered the Fund’s management fee rate as compared to fees charged by DIMA to comparable funds and considered differences between the Fund and the comparable funds.
The information requested by the Board as part of its review of fees and expenses also included information about institutional accounts and funds offered primarily to European investors ("Deutsche Europe funds") managed by DIMA and its affiliates. The Board noted that DIMA indicated that it does not manage any institutional accounts or Deutsche Europe funds comparable to the Fund.
On the basis of the information provided, the Board concluded that management fees were reasonable and appropriate in light of the nature, quality and extent of services provided by DIMA.
Profitability. The Board reviewed detailed information regarding revenues received by DIMA under the Agreement. The Board considered the estimated costs and pre-tax profits realized by DIMA from advising the Deutsche U.S. mutual funds ("Deutsche Funds"), as well as estimates of the pre-tax profits attributable to managing the Fund in particular. The Board also received information regarding the estimated enterprise-wide profitability of DIMA and its affiliates with respect to all fund services in totality and by fund. The Board and the Fee Consultant reviewed DIMA’s methodology in allocating its costs to the management of the Fund. Based on the information provided, the Board concluded that the pre-tax profits realized by DIMA in connection with the management of the Fund were not unreasonable.
Economies of Scale. The Board considered whether there are economies of scale with respect to the management of the Fund and whether the Fund benefits from any economies of scale. The Board noted that the Fund’s management fee schedule includes fee breakpoints The Board concluded that the Fund’s fee schedule represents an appropriate sharing between the Fund and DIMA of such economies of scale as may exist in the management of the Fund at current asset levels.
Other Benefits to DIMA and Its Affiliates. The Board also considered the character and amount of other incidental benefits received by DIMA and its affiliates, including any fees received by DIMA for administrative services provided to the Fund and any fees received by an affiliate of DIMA for distribution services. The Board also considered benefits to DIMA related to brokerage and soft-dollar allocations, including allocating brokerage to pay for research generated by parties other than the executing broker dealers, which pertain primarily to funds investing in equity securities, along with the incidental public relations benefits to DIMA related to Deutsche Funds advertising and cross-selling opportunities among DIMA products and services. The Board concluded that management fees were reasonable in light of these fallout benefits.
Compliance. The Board considered the significant attention and resources dedicated by DIMA to documenting and enhancing its compliance processes in recent years. The Board noted in particular (i) the experience and seniority of DIMA’s and the Fund’s chief compliance officer; (ii) the large number of DIMA compliance personnel; and (iii) the substantial commitment of resources by DIMA and its affiliates to compliance matters.
Based on all of the information considered and the conclusions reached, the Board unanimously determined that the continuation of the Agreement is in the best interests of the Fund. In making this determination, the Board did not give particular weight to any single factor identified above. The Board considered these factors over the course of numerous meetings, certain of which were in executive session with only the Independent Trustees and counsel present. It is possible that individual Trustees may have weighed these factors differently in reaching their individual decisions to approve the continuation of the Agreement.
Board Members and Officers
The following table presents certain information regarding the Board Members and Officers of the fund. Each Board Member's year of birth is set forth in parentheses after his or her name. Unless otherwise noted, (i) each Board Member has engaged in the principal occupation(s) noted in the table for at least the most recent five years, although not necessarily in the same capacity; and (ii) the address of each Independent Board Member is c/o Kenneth C. Froewiss, Chairman, Deutsche Mutual Funds, P.O. Box 390601, Cambridge, MA 02139. Except as otherwise noted below, the term of office for each Board Member is until the election and qualification of a successor, or until such Board Member sooner dies, resigns, is removed or as otherwise provided in the governing documents of the fund. Because the fund does not hold an annual meeting of shareholders, each Board Member will hold office for an indeterminate period. The Board Members may also serve in similar capacities with other funds in the fund complex.
| Independent Board Members |
Name, Year of Birth, Position with the Fund and Length of Time Served1 | | Business Experience and Directorships During the Past Five Years | Number of Funds in Deutsche Fund Complex Overseen | Other Directorships Held by Board Member |
Kenneth C. Froewiss (1945) Chairperson since 2013, and Board Member since 2001 | | Adjunct Professor of Finance, NYU Stern School of Business (September 2009–present; Clinical Professor from 1997–September 2009); Member, Finance Committee, Association for Asian Studies (2002–present); Director, Mitsui Sumitomo Insurance Group (US) (2004–present); prior thereto, Managing Director, J.P. Morgan (investment banking firm) (until 1996) | 105 | — |
William McClayton (1944) Vice Chairperson since 2013, and Board Member since 2004 | | Private equity investor (since October 2009); previously, Managing Director, Diamond Management & Technology Consultants, Inc. (global consulting firm) (2001–2009); Directorship: Board of Managers, YMCA of Metropolitan Chicago; formerly: Senior Partner, Arthur Andersen LLP (accounting) (1966–2001); Trustee, Ravinia Festival | 105 | — |
John W. Ballantine (1946) Board Member since 1999 | | Retired; formerly, Executive Vice President and Chief Risk Management Officer, First Chicago NBD Corporation/The First National Bank of Chicago (1996–1998); Executive Vice President and Head of International Banking (1995–1996); former Directorships: Director and former Chairman of the Board, Healthways, Inc.2 (provider of disease and care management services) (2003–2014); Stockwell Capital Investments PLC (private equity); First Oak Brook Bancshares, Inc. and Oak Brook Bank; Prisma Energy International | 105 | Portland General Electric2 (utility company) (2003– present) |
Henry P. Becton, Jr. (1943) Board Member since 1990 | | Vice Chair and former President, WGBH Educational Foundation. Directorships: Public Radio International; Public Radio Exchange (PRX); North Bennett Street School (Boston); former Directorships: Belo Corporation2 (media company); The PBS Foundation; Association of Public Television Stations; Boston Museum of Science; American Public Television; Concord Academy; New England Aquarium; Mass. Corporation for Educational Telecommunications; Committee for Economic Development; Public Broadcasting Service; Connecticut College | 105 | Lead Director, Becton Dickinson and Company2 (medical technology company) |
Dawn-Marie Driscoll (1946) Board Member since 1987 | | Emeritus Executive Fellow, Center for Business Ethics, Bentley University; formerly: President, Driscoll Associates (consulting firm); Partner, Palmer & Dodge (law firm) (1988–1990); Vice President of Corporate Affairs and General Counsel, Filene's (retail) (1978–1988). Directorships: Director of ICI Mutual Insurance Company (since 2007); Advisory Board, Center for Business Ethics, Bentley University; Trustee and former Chairman of the Board, Southwest Florida Community Foundation (charitable organization); former Directorships: Sun Capital Advisers Trust (mutual funds) (2007–2012), Investment Company Institute (audit, executive, nominating committees) and Independent Directors Council (governance, executive committees) | 105 | — |
Keith R. Fox, CFA (1954) Board Member since 1996 | | Managing General Partner, Exeter Capital Partners (a series of private investment funds) (since 1986). Directorships: Progressive International Corporation (kitchen goods importer and distributor); The Kennel Shop (retailer); former Chairman, National Association of Small Business Investment Companies; former Directorships: BoxTop Media Inc. (advertising); Sun Capital Advisers Trust (mutual funds) (2011–2012) | 105 | — |
Paul K. Freeman (1950) Board Member since 1993 | | Consultant, World Bank/Inter-American Development Bank; Chair, Independent Directors Council; Investment Company Institute (executive and nominating committees); formerly, Chairman of Education Committee of Independent Directors Council; Project Leader, International Institute for Applied Systems Analysis (1998–2001); Chief Executive Officer, The Eric Group, Inc. (environmental insurance) (1986–1998); Directorships: Denver Zoo Foundation (December 2012–present); former Directorships: Prisma Energy International | 105 | — |
Richard J. Herring (1946) Board Member since 1990 | | Jacob Safra Professor of International Banking and Professor, Finance Department, The Wharton School, University of Pennsylvania (since July 1972); Co-Director, Wharton Financial Institutions Center; Co-Chair, U.S. Shadow Financial Regulatory Committee; Executive Director, Financial Economists Roundtable; formerly: Vice Dean and Director, Wharton Undergraduate Division (July 1995–June 2000); Director, Lauder Institute of International Management Studies (July 2000–June 2006) | 105 | Director, Aberdeen Singapore and Japan Funds (since 2007); Independent Director of Barclays Bank Delaware (since September 2010) |
Rebecca W. Rimel (1951) Board Member since 1995 | | President and Chief Executive Officer, The Pew Charitable Trusts (charitable organization) (1994 to present); formerly: Executive Vice President, The Glenmede Trust Company (investment trust and wealth management) (1983–2004); Board Member, Investor Education (charitable organization) (2004–2005); Trustee, Executive Committee, Philadelphia Chamber of Commerce (2001–2007); Director, Viasys Health Care2 (January 2007–June 2007); Trustee, Thomas Jefferson Foundation (charitable organization) (1994–2012) | 105 | Director, Becton Dickinson and Company2 (medical technology company) (2012– present); Director, BioTelemetry Inc.2 (health care) (2009– present) |
William N. Searcy, Jr. (1946) Board Member since 1993 | | Private investor since October 2003; formerly: Pension & Savings Trust Officer, Sprint Corporation2 (telecommunications) (November 1989–September 2003); Trustee, Sun Capital Advisers Trust (mutual funds) (1998–2012) | 105 | — |
Jean Gleason Stromberg (1943) Board Member since 1997 | | Retired. Formerly, Consultant (1997–2001); Director, Financial Markets U.S. Government Accountability Office (1996–1997); Partner, Norton Rose Fulbright, L.L.P. (law firm) (1978–1996). Directorships: The William and Flora Hewlett Foundation (charitable organization); former Directorships: Service Source, Inc. (nonprofit), Mutual Fund Directors Forum (2002–2004), American Bar Retirement Association (funding vehicle for retirement plans) (1987–1990 and 1994–1996) | 105 | — |
Robert H. Wadsworth* (1940) Board Member since 1999 | | President, Robert H. Wadsworth & Associates, Inc. (consulting firm) (1983 to present); Director, The Phoenix Boys Choir Association | 105 | — |
Officers4 |
Name, Year of Birth, Position with the Fund and Length of Time Served5 | | Business Experience and Directorships During the Past Five Years |
Brian E. Binder8 (1972) President and Chief Executive Officer, 2013–present | | Managing Director3 and Head of Fund Administration, Deutsche Asset & Wealth Management (2013–present); formerly: Head of Business Management and Consulting at Invesco, Ltd. (2010–2012); Chief Administrative Officer, Van Kampen Funds Inc. (2008–2010); and Chief Administrative Officer, Morgan Stanley Investment Management Americas Distribution (2003–2008) |
John Millette7 (1962) Vice President and Secretary, 1999–present | | Director,3 Deutsche Asset & Wealth Management |
Melinda Morrow6 (1970) Vice President, 2012–present | | Director,3 Deutsche Asset & Wealth Management |
Paul H. Schubert6 (1963) Chief Financial Officer, 2004–present Treasurer, 2005–present | | Managing Director,3 Deutsche Asset & Wealth Management (since July 2004); formerly: Executive Director, Head of Mutual Fund Services and Treasurer for UBS Family of Funds (1998–2004); Vice President and Director of Mutual Fund Finance at UBS Global Asset Management (1994–1998) |
Caroline Pearson7 (1962) Chief Legal Officer, 2010–present | | Managing Director,3 Deutsche Asset & Wealth Management; formerly: Assistant Secretary for DWS family of funds (1997–2010) |
Robert Kloby6 (1962) Chief Compliance Officer, 2006–present | | Managing Director,3 Deutsche Asset & Wealth Management |
Wayne Salit6 (1967) Anti-Money Laundering Compliance Officer, 2014–present | | Director,3 Deutsche Asset & Wealth Management; formerly: Managing Director, AML Compliance Officer at BNY Mellon (2011–2014); and Director, AML Compliance Officer at Deutsche Bank (2004–2011) |
Hepsen Uzcan7 (1974) Assistant Secretary, 2013–present | | Director,3 Deutsche Asset & Wealth Management |
Paul Antosca7 (1957) Assistant Treasurer, 2007–present | | Director,3 Deutsche Asset & Wealth Management |
Jack Clark7 (1967) Assistant Treasurer, 2007–present | | Director,3 Deutsche Asset & Wealth Management |
Diane Kenneally7 (1966) Assistant Treasurer, 2007–present | | Director,3 Deutsche Asset & Wealth Management |
1 The length of time served represents the year in which the Board Member joined the board of one or more Deutsche funds currently overseen by the Board.
2 A publicly held company with securities registered pursuant to Section 12 of the Securities Exchange Act of 1934.
3 Executive title, not a board directorship.
4 As a result of their respective positions held with the Advisor, these individuals are considered "interested persons" of the Advisor within the meaning of the 1940 Act. Interested persons receive no compensation from the fund.
5 The length of time served represents the year in which the officer was first elected in such capacity for one or more Deutsche funds.
6 Address: 60 Wall Street, New York, NY 10005.
7 Address: One Beacon Street, Boston, MA 02108.
8 Address: 222 South Riverside Plaza, Chicago, IL 60606.
* Robert H. Wadsworth retired from the Board effective December 31, 2014.
The fund's Statement of Additional Information ("SAI") includes additional information about the Board Members. The SAI is available, without charge, upon request. If you would like to request a copy of the SAI, you may do so by calling the following toll-free number: (800) 728-3337.
DeAWM Distributors, Inc.
222 South Riverside Plaza
Chicago, IL 60606
(800) 621-1148
VS1capgro-2 (R-025820-4 2/15)
December 31, 2014
Annual Report
Deutsche Variable Series I
(formerly DWS Variable Series I)
Deutsche Core Equity VIP
(formerly DWS Core Equity VIP)
Contents
10 Statement of Assets and Liabilities 11 Statement of Operations 12 Statement of Changes in Net Assets 14 Notes to Financial Statements 18 Report of Independent Registered Public Accounting Firm 19 Information About Your Fund's Expenses 22 Advisory Agreement Board Considerations and Fee Evaluation 25 Board Members and Officers |
This report must be preceded or accompanied by a prospectus. To obtain an additional prospectus or summary prospectus, if available, call (800) 728-3337 or your financial representative. We advise you to consider the Fund's objectives, risks, charges and expenses carefully before investing. The summary prospectus and prospectus contain this and other important information about the Fund. Please read the prospectus carefully before you invest.
Investing in derivatives entails special risks relating to liquidity, leverage and credit that may reduce returns and/or increase volatility. The Fund may lend securities to approved institutions. Fund management could be wrong in its analysis of industries, companies, economic trends and favor a security that underperforms the market. Stocks may decline in value. See the prospectus for details.
Deutsche Asset & Wealth Management represents the asset management and wealth management activities conducted by Deutsche Bank AG or any of its subsidiaries, including the Advisor and DeAWM Distributors, Inc.
NOT FDIC/NCUA INSURED NO BANK GUARANTEE MAY LOSE VALUE NOT A DEPOSIT
NOT INSURED BY ANY FEDERAL GOVERNMENT AGENCY
Performance Summary December 31, 2014 (Unaudited)
Fund performance shown is historical, assumes reinvestment of all dividend and capital gain distributions, and does not guarantee future results. Investment return and principal value fluctuate with changing market conditions so that, when redeemed, shares may be worth more or less than their original cost. Current performance may be lower or higher than the performance data quoted. Please contact your participating insurance company for the Fund's most recent month-end performance. Performance doesn't reflect charges and fees ("contract charges") associated with the separate account that invests in the Fund or any variable life insurance policy or variable annuity contract for which the Fund is an investment option. These charges and fees will reduce returns. While all share classes have the same underlying portfolio, their performance will differ.
The gross expense ratios of the Fund, as stated in the fee table of the prospectus dated May 1, 2014 are 0.56% and 0.76% for Class A and Class B shares, respectively, and may differ from the expense ratios disclosed in the Financial Highlights tables in this report.
| Growth of an Assumed $10,000 Investment |
| The Russell 1000® Index is an unmanaged index that measures the performance of the 1,000 largest companies in the Russell 3000® Index, which represents approximately 92% of the total market capitalization of the Russell 3000 Index. Index returns do not reflect any fees or expenses and it is not possible to invest directly into an index. |
| |
| Yearly periods ended December 31 | |
| Comparative Results | |
| Deutsche Core Equity VIP | | 1-Year | | | 3-Year | | | 5-Year | | | 10-Year | |
| Class A | Growth of $10,000 | | $ | 11,182 | | | $ | 17,785 | | | $ | 20,316 | | | $ | 20,537 | |
| Average annual total return | | | 11.82 | % | | | 21.16 | % | | | 15.23 | % | | | 7.46 | % |
Russell 1000® Index | Growth of $10,000 | | $ | 11,324 | | | $ | 17,549 | | | $ | 20,679 | | | $ | 21,509 | |
| Average annual total return | | | 13.24 | % | | | 20.62 | % | | | 15.64 | % | | | 7.96 | % |
| Deutsche Core Equity VIP | | 1-Year | | | 3-Year | | | 5-Year | | | 10-Year | |
| Class B | Growth of $10,000 | | $ | 11,152 | | | $ | 17,645 | | | $ | 20,056 | | | $ | 20,009 | |
| Average annual total return | | | 11.52 | % | | | 20.84 | % | | | 14.93 | % | | | 7.18 | % |
Russell 1000® Index | Growth of $10,000 | | $ | 11,324 | | | $ | 17,549 | | | $ | 20,679 | | | $ | 21,509 | |
| Average annual total return | | | 13.24 | % | | | 20.62 | % | | | 15.64 | % | | | 7.96 | % |
The growth of $10,000 is cumulative.
Management Summary December 31, 2014 (Unaudited)
The U.S. stock market delivered a gain during the past year, reflecting the continued strength in corporate earnings trends and the health of the country’s economy compared to its major developed-market counterparts. The Fund returned 11.82% (Class A shares, unadjusted for contract charges), underperforming the 13.24% return for the Russell 1000® Index.1
Consistent with our bottom-up approach, individual stock selection was the primary driver of relative performance. Two of the leading contributors to the Fund’s performance were the food company Hillshire Brands Co.* and the spirits producer Beam, Inc.,* both of which were acquired at a premium during the first half of the year. The portfolio holding Allergan, Inc. also was targeted for an acquisition by a rival. Allergan was just one of several holdings in the health care sector that delivered outperformance during the past year, as we also generated strong returns through our positions in CareFusion Corp.,* Medivation, Inc. and Celgene Corp. Our investments in health care have targeted companies with robust underlying fundamentals and exciting product stories, an approach that paid off in the past 12 months. Positions in L Brands Inc., Avago Technologies Ltd. and Extra Space Storage Inc. also contributed positively to performance.
Whole Foods Market, Inc., which lost ground due to rising competition in the organic-foods space, was the largest individual detractor from performance. On a sector basis, our holdings underperformed the benchmark by the widest margin in financials, where positions in Affiliated Managers Group, Inc., Prudential Financial, Inc. and Citigroup, Inc. all hurt the Fund’s relative performance. Information technology also proved to be a challenging sector for the Fund, due in part to the underperformance of Solera Holdings, Inc.* and LinkedIn Corp.* Outside of these sectors, other detractors of note included Fiat Chrysler Automobiles NV and Chevron Corp.
We maintain a focus on stocks with company-specific drivers of growth, as well as those that stand to benefit from longer-term, secular themes. This approach is reflected in the Fund’s modest overweight positions in higher-growth sectors such as consumer discretionary and health care, and its corresponding underweight in slower-growth sectors such as telecommunications and utilities.2 In addition, we have favored stocks with a greater exposure to the strong domestic economy over those with a global focus.
Owen Fitzpatrick, CFA
Lead Portfolio Manager
Thomas M. Hynes, Jr., CFA
Brendan O'Neill, CFA
Pankaj Bhatnagar, PhD
Portfolio Managers
The views expressed reflect those of the portfolio management team only through the end of the period of the report as stated on the cover. The management team's views are subject to change at any time based on market and other conditions and should not be construed as a recommendation. Past performance is no guarantee of future results. Current and future portfolio holdings are subject to risk.
1 The Russell 1000 Index tracks the performance of the 1,000 largest stocks in the Russell 3000® Index, which consists of the 3,000 largest U.S. companies as measured by market capitalization. Index returns do not reflect fees or expenses and it is not possible to invest directly in an index.
2The consumer discretionary sector represents industries that produce goods and services that are not necessities in everyday life.
* Not held in the portfolio as of December 31, 2014.
Portfolio Summary December 31, 2014 (Unaudited) Asset Allocation (As a % of Investment Portfolio excluding Securities Lending Collateral) | 12/31/14 | 12/31/13 |
| | | |
| Common Stocks | 99% | 100% |
| Cash Equivalents | 1% | 0% |
| | 100% | 100% |
Sector Diversification (As a % of Common Stocks and Convertible Bonds) | 12/31/14 | 12/31/13 |
| | | |
| Information Technology | 20% | 18% |
| Health Care | 17% | 16% |
| Financials | 16% | 17% |
| Consumer Discretionary | 13% | 14% |
| Industrials | 11% | 12% |
| Consumer Staples | 9% | 8% |
| Energy | 8% | 10% |
| Materials | 3% | 3% |
| Utilities | 2% | 1% |
| Telecommunication Services | 1% | 1% |
| | 100% | 100% |
Portfolio holdings and characteristics are subject to change.
For more complete details about the Fund's investment portfolio, see page 7.
Following the Fund's fiscal first and third quarter-end, a complete portfolio holdings listing is filed with the SEC on Form N-Q. The form will be available on the SEC's Web site at sec.gov, and it also may be reviewed and copied at the SEC's Public Reference Room in Washington, D.C. Information on the operation of the SEC's Public Reference Room may be obtained by calling (800) SEC-0330. The Fund's portfolio holdings are also posted on deutschefunds.com from time to time. Please see the Fund's current prospectus for more information.
Investment Portfolio December 31, 2014 | | | Shares | | | Value ($) | |
| | | | |
| Common Stocks 99.0% | |
| Consumer Discretionary 12.8% | |
| Auto Components 1.0% | |
| BorgWarner, Inc. | | | 39,736 | | | | 2,183,493 | |
| Hotels, Restaurants & Leisure 1.3% | |
| Las Vegas Sands Corp. | | | 17,001 | | | | 988,778 | |
| Starwood Hotels & Resorts Worldwide, Inc. | | | 25,030 | | | | 2,029,182 | |
| | | | | | | | 3,017,960 | |
| Internet & Catalog Retail 1.5% | |
| Amazon.com, Inc.* | | | 6,882 | | | | 2,135,829 | |
| Expedia, Inc. | | | 13,489 | | | | 1,151,421 | |
| | | | | | | | 3,287,250 | |
| Media 2.0% | |
| Twenty-First Century Fox, Inc. "A" | | | 51,178 | | | | 1,965,491 | |
| Walt Disney Co. (a) | | | 26,386 | | | | 2,485,297 | |
| | | | | | | | 4,450,788 | |
| Specialty Retail 4.1% | |
| Dick's Sporting Goods, Inc. | | | 36,724 | | | | 1,823,346 | |
| Home Depot, Inc. | | | 32,604 | | | | 3,422,442 | |
| L Brands, Inc. | | | 44,196 | | | | 3,825,164 | |
| | | | | | | | 9,070,952 | |
| Textiles, Apparel & Luxury Goods 2.9% | |
| NIKE, Inc. "B" | | | 44,933 | | | | 4,320,308 | |
| VF Corp. | | | 27,294 | | | | 2,044,321 | |
| | | | | | | | 6,364,629 | |
| Consumer Staples 9.3% | |
| Beverages 1.4% | |
| PepsiCo, Inc. | | | 33,284 | | | | 3,147,335 | |
| Food & Staples Retailing 2.9% | |
| Costco Wholesale Corp. | | | 19,824 | | | | 2,810,052 | |
| Kroger Co. | | | 28,492 | | | | 1,829,471 | |
| Whole Foods Market, Inc. (a) | | | 36,671 | | | | 1,848,952 | |
| | | | | | | | 6,488,475 | |
| Food Products 3.1% | |
| ConAgra Foods, Inc. | | | 36,767 | | | | 1,333,907 | |
| Mead Johnson Nutrition Co. | | | 29,220 | | | | 2,937,779 | |
| The WhiteWave Foods Co.* | | | 76,162 | | | | 2,664,908 | |
| | | | | | | | 6,936,594 | |
| Household Products 0.8% | |
| Procter & Gamble Co. | | | 19,756 | | | | 1,799,574 | |
| Personal Products 1.1% | |
| Estee Lauder Companies, Inc. "A" | | | 31,495 | | | | 2,399,919 | |
| Energy 7.6% | |
| Energy Equipment & Services 0.6% | |
| Schlumberger Ltd. | | | 15,527 | | | | 1,326,161 | |
| Oil, Gas & Consumable Fuels 7.0% | |
| Anadarko Petroleum Corp. | | | 24,593 | | | | 2,028,923 | |
| Antero Resources Corp.* (a) | | | 18,761 | | | | 761,321 | |
| California Resources Corp.* | | | 14,282 | | | | 78,694 | |
| Chevron Corp. | | | 40,156 | | | | 4,504,700 | |
| EOG Resources, Inc. | | | 23,684 | | | | 2,180,586 | |
| Occidental Petroleum Corp. | | | 35,706 | | | | 2,878,261 | |
| Phillips 66 | | | 21,399 | | | | 1,534,308 | |
| | | Shares | | | Value ($) | |
| | | | | | | | | |
| Pioneer Natural Resources Co. | | | 10,098 | | | | 1,503,087 | |
| | | | | | | | 15,469,880 | |
| Financials 16.1% | |
| Banks 6.3% | |
| Citigroup, Inc. | | | 111,845 | | | | 6,051,933 | |
| JPMorgan Chase & Co. | | | 71,215 | | | | 4,456,635 | |
| Regions Financial Corp. | | | 325,335 | | | | 3,435,537 | |
| | | | | | | | 13,944,105 | |
| Capital Markets 2.9% | |
| Affiliated Managers Group, Inc.* | | | 18,260 | | | | 3,875,502 | |
| Ameriprise Financial, Inc. | | | 18,866 | | | | 2,495,029 | |
| | | | | | | | 6,370,531 | |
| Consumer Finance 2.0% | |
| Capital One Financial Corp. | | | 55,536 | | | | 4,584,497 | |
| Diversified Financial Services 0.7% | |
| Intercontinental Exchange, Inc. | | | 6,858 | | | | 1,503,891 | |
| Insurance 2.9% | |
| MetLife, Inc. | | | 41,611 | | | | 2,250,739 | |
| Prudential Financial, Inc. | | | 45,994 | | | | 4,160,617 | |
| | | | | | | | 6,411,356 | |
| Real Estate Investment Trusts 1.3% | |
| Prologis, Inc. (REIT) | | | 69,539 | | | | 2,992,263 | |
| Health Care 16.5% | |
| Biotechnology 4.9% | |
| Celgene Corp.* (a) | | | 41,119 | | | | 4,599,571 | |
| Gilead Sciences, Inc.* | | | 22,779 | | | | 2,147,149 | |
| Medivation, Inc.* | | | 19,004 | | | | 1,892,988 | |
| NPS Pharmaceuticals, Inc.* | | | 63,596 | | | | 2,274,829 | |
| | | | | | | | 10,914,537 | |
| Health Care Equipment & Supplies 1.2% | |
| St. Jude Medical, Inc. | | | 42,575 | | | | 2,768,652 | |
| Health Care Providers & Services 3.2% | |
| Express Scripts Holding Co.* | | | 21,276 | | | | 1,801,439 | |
| McKesson Corp. | | | 10,455 | | | | 2,170,249 | |
| Omnicare, Inc. (a) | | | 41,676 | | | | 3,039,431 | |
| | | | | | | | 7,011,119 | |
| Life Sciences Tools & Services 1.9% | |
| Thermo Fisher Scientific, Inc. | | | 33,426 | | | | 4,187,944 | |
| Pharmaceuticals 5.3% | |
| Allergan, Inc. | | | 14,014 | | | | 2,979,236 | |
| Bristol-Myers Squibb Co. | | | 19,359 | | | | 1,142,762 | |
| Merck & Co., Inc. | | | 65,380 | | | | 3,712,930 | |
| Pfizer, Inc. | | | 95,717 | | | | 2,981,585 | |
| Shire PLC (ADR) | | | 4,430 | | | | 941,552 | |
| | | | | | | | 11,758,065 | |
| Industrials 10.9% | |
| Aerospace & Defense 2.3% | |
| Boeing Co. | | | 23,401 | | | | 3,041,662 | |
| TransDigm Group, Inc. | | | 10,053 | | | | 1,973,907 | |
| | | | | | | | 5,015,569 | |
| Electrical Equipment 1.9% | |
| AMETEK, Inc. | | | 60,027 | | | | 3,159,221 | |
| Regal-Beloit Corp. (a) | | | 15,198 | | | | 1,142,890 | |
| | | | | | | | 4,302,111 | |
| | | Shares | | | Value ($) | |
| | | | | | | | | |
| Industrial Conglomerates 3.0% | |
| General Electric Co. | | | 139,180 | | | | 3,517,079 | |
| Roper Industries, Inc. | | | 19,949 | | | | 3,119,026 | |
| | | | | | | | 6,636,105 | |
| Machinery 2.2% | |
| Pall Corp. | | | 24,042 | | | | 2,433,291 | |
| Parker-Hannifin Corp. | | | 19,809 | | | | 2,554,370 | |
| | | | | | | | 4,987,661 | |
| Road & Rail 1.5% | |
| Norfolk Southern Corp. | | | 29,550 | | | | 3,238,975 | |
| Information Technology 19.9% | |
| Communications Equipment 1.0% | |
| Cisco Systems, Inc. | | | 40,974 | | | | 1,139,692 | |
| Palo Alto Networks, Inc.* | | | 8,352 | | | | 1,023,704 | |
| | | | | | | | 2,163,396 | |
| Internet Software & Services 4.0% | |
| Alibaba Group Holding Ltd. (ADR)* | | | 8,666 | | | | 900,744 | |
| Facebook, Inc. "A"* | | | 35,084 | | | | 2,737,254 | |
| Google, Inc. "A"* | | | 4,968 | | | | 2,636,319 | |
| Google, Inc. "C"* | | | 4,986 | | | | 2,624,630 | |
| | | | | | | | 8,898,947 | |
| IT Services 2.5% | |
| Cognizant Technology Solutions Corp. "A"* | | | 31,756 | | | | 1,672,271 | |
| Visa, Inc. "A" (a) | | | 14,911 | | | | 3,909,664 | |
| | | | | | | | 5,581,935 | |
| Semiconductors & Semiconductor Equipment 3.8% | |
| Analog Devices, Inc. | | | 29,473 | | | | 1,636,341 | |
| Avago Technologies Ltd. | | | 14,625 | | | | 1,471,129 | |
| Intel Corp. | | | 105,174 | | | | 3,816,764 | |
| NXP Semiconductor NV* | | | 18,892 | | | | 1,443,349 | |
| | | | | | | | 8,367,583 | |
| Software 4.5% | |
| Intuit, Inc. | | | 17,017 | | | | 1,568,797 | |
| Microsoft Corp. | | | 83,514 | | | | 3,879,226 | |
| Oracle Corp. | | | 67,857 | | | | 3,051,529 | |
| Salesforce.com, Inc.* (a) | | | 24,287 | | | | 1,440,462 | |
| | | | | | | | 9,940,014 | |
| Technology Hardware, Storage & Peripherals 4.1% | |
| Apple, Inc. | | | 65,094 | | | | 7,185,076 | |
| Western Digital Corp. | | | 18,297 | | | | 2,025,478 | |
| | | | | | | | 9,210,554 | |
| | | Shares | | | Value ($) | |
| | | | | | | | | |
| Materials 3.1% | |
| Chemicals 2.0% | |
| Dow Chemical Co. | | | 27,379 | | | | 1,248,756 | |
| Ecolab, Inc. | | | 29,508 | | | | 3,084,176 | |
| | | | | | | | 4,332,932 | |
| Containers & Packaging 1.1% | |
| Sealed Air Corp. | | | 59,959 | | | | 2,544,061 | |
| Telecommunication Services 0.7% | |
| Wireless Telecommunication Services | |
| T-Mobile U.S., Inc.* (a) | | | 55,022 | | | | 1,482,293 | |
| Utilities 2.1% | |
| Electric Utilities 0.8% | |
| NextEra Energy, Inc. | | | 17,016 | | | | 1,808,631 | |
| Water Utilities 1.3% | |
| American Water Works Co., Inc. | | | 53,872 | | | | 2,871,377 | |
Total Common Stocks (Cost $181,931,095) | | | | 219,772,114 | |
| | | Principal Amount ($) | | | Value ($) | |
| | | | |
| Convertible Bonds 0.4% | |
| Consumer Discretionary 0.2% | |
| Fiat Chrysler Automobiles NV, 7.875%, 12/15/2016 | | | 440,000 | | | | 467,808 | |
| Information Technology 0.2% | |
| Twitter, Inc., 144A, 0.25%, 9/15/2019 | | | 544,000 | | | | 472,600 | |
Total Convertible Bonds (Cost $984,000) | | | | 940,408 | |
| | | Shares | | | Value ($) | |
| | | | |
| Securities Lending Collateral 7.9% | |
| Daily Assets Fund Institutional, 0.10% (b) (c) (Cost $17,499,003) | | | 17,499,003 | | | | 17,499,003 | |
| | |
| Cash Equivalents 0.7% | |
| Central Cash Management Fund, 0.06% (b) (Cost $1,599,017) | | | 1,599,017 | | | | 1,599,017 | |
| | | % of Net Assets | | | Value ($) | |
| | | | |
Total Investment Portfolio (Cost $202,013,115)† | | | 108.0 | | | | 239,810,542 | |
| Other Assets and Liabilities, Net | | | (8.0 | ) | | | (17,693,992 | ) |
| Net Assets | | | 100.0 | | | | 222,116,550 | |
* Non-income producing security.
† The cost for federal income tax purposes was $202,102,178. At December 31, 2014, net unrealized appreciation for all securities based on tax cost was $37,708,364. This consisted of aggregate gross unrealized appreciation for all securities in which there was an excess of value over tax cost of $40,452,079 and aggregate gross unrealized depreciation for all securities in which there was an excess of tax cost over value of $2,743,715.
(a) All or a portion of these securities were on loan. In addition, "Other Assets and Liabilities, Net" may include pending sales that are also on loan. The value of securities loaned at December 31, 2014 amounted to $16,973,818, which is 7.6% of net assets.
(b) Affiliated fund managed by Deutsche Investment Management Americas Inc. The rate shown is the annualized seven-day yield at period end.
(c) Represents collateral held in connection with securities lending. Income earned by the Fund is net of borrower rebates.
144A: Security exempt from registration under Rule 144A of the Securities Act of 1933. These securities may be resold in transactions exempt from registration, normally to qualified institutional buyers.
ADR: American Depositary Receipt
REIT: Real Estate Investment Trust
Fair Value Measurements
Various inputs are used in determining the value of the Fund's investments. These inputs are summarized in three broad levels. Level 1 includes quoted prices in active markets for identical securities. Level 2 includes other significant observable inputs (including quoted prices for similar securities, interest rates, prepayment speeds and credit risk). Level 3 includes significant unobservable inputs (including the Fund's own assumptions in determining the fair value of investments). The level assigned to the securities valuations may not be an indication of the risk or liquidity associated with investing in those securities.
The following is a summary of the inputs used as of December 31, 2014 in valuing the Fund's investments. For information on the Fund's policy regarding the valuation of investments, please refer to the Security Valuation section of Note A in the accompanying Notes to Financial Statements.
| Assets | | Level 1 | | | Level 2 | | | Level 3 | | | Total | |
| | |
| Common Stocks (d) | | $ | 219,772,114 | | | $ | — | | | $ | — | | | $ | 219,772,114 | |
| Convertible Bonds (d) | | | — | | | | 940,408 | | | | — | | | | 940,408 | |
| Short-Term Investments (d) | | | 19,098,020 | | | | — | | | | — | | | | 19,098,020 | |
| Total | | $ | 238,870,134 | | | $ | 940,408 | | | $ | — | | | $ | 239,810,542 | |
There have been no transfers between fair value measurement levels during the year ended December 31, 2014.
(d) See Investment Portfolio for additional detailed categorizations.
The accompanying notes are an integral part of the financial statements.
Statement of Assets and Liabilities | as of December 31, 2014 | |
| Assets | |
Investments: Investments in non-affiliated securities, at value (cost $182,915,095) — including $16,973,818 of securities loaned | | $ | 220,712,522 | |
| Investment in Daily Assets Fund Institutional (cost $17,499,003)* | | | 17,499,003 | |
| Investment in Central Cash Management Fund (cost $1,599,017) | | | 1,599,017 | |
| Total investments in securities, at value (cost $202,013,115) | | | 239,810,542 | |
| Receivable for Fund shares sold | | | 279,312 | |
| Dividends receivable | | | 244,876 | |
| Interest receivable | | | 3,334 | |
| Other assets | | | 3,788 | |
| Total assets | | | 240,341,852 | |
| Liabilities | |
| Payable upon return of securities loaned | | | 17,499,003 | |
| Payable for Fund shares redeemed | | | 540,686 | |
| Accrued management fee | | | 74,028 | |
| Accrued Trustees' fees | | | 2,688 | |
| Other accrued expenses and payables | | | 108,897 | |
| Total liabilities | | | 18,225,302 | |
| Net assets, at value | | $ | 222,116,550 | |
| Net Assets Consist of | |
| Undistributed net investment income | | | 1,766,159 | |
| Net unrealized appreciation (depreciation) on investments | | | 37,797,427 | |
| Accumulated net realized gain (loss) | | | 402,587 | |
| Paid-in capital | | | 182,150,377 | |
| Net assets, at value | | $ | 222,116,550 | |
Class A Net Asset Value, offering and redemption price per share ($220,304,295 ÷ 17,268,971 outstanding shares of beneficial interest, $.01 par value, unlimited number of shares authorized) | | $ | 12.76 | |
Class B Net Asset Value, offering and redemption price per share ($1,812,255 ÷ 142,262 outstanding shares of beneficial interest, $.01 par value, unlimited number of shares authorized) | | $ | 12.74 | |
* Represents collateral on securities loaned.
The accompanying notes are an integral part of the financial statements.
Statement of Operations
| for the year ended December 31, 2014 | |
| Investment Income | |
Income: Dividends (net of foreign taxes withheld of $1,475) | | $ | 3,119,757 | |
| Interest | | | 3,617 | |
| Income distributions — Central Cash Management Fund | | | 585 | |
| Securities lending income, including income from Daily Assets Fund Institutional, net of borrower rebates | | | 8,456 | |
| Total income | | | 3,132,415 | |
Expenses: Management fee | | | 858,591 | |
| Administration fee | | | 220,152 | |
| Services to shareholders | | | 2,837 | |
| Distribution service fee (Class B) | | | 4,500 | |
| Custodian fee | | | 24,103 | |
| Professional fees | | | 76,832 | |
| Reports to shareholders | | | 43,238 | |
| Trustees' fees and expenses | | | 11,246 | |
| Other | | | 9,639 | |
| Total expenses | | | 1,251,138 | |
| Net investment income | | | 1,881,277 | |
| Realized and Unrealized Gain (Loss) | |
| Net realized gain (loss) from investments | | | 17,630,326 | |
| Change in net unrealized appreciation (depreciation) on investments | | | 4,906,485 | |
| Net gain (loss) | | | 22,536,811 | |
| Net increase (decrease) in net assets resulting from operations | | $ | 24,418,088 | |
The accompanying notes are an integral part of the financial statements.
Statement of Changes in Net Assets | | | Years Ended December 31, | |
| Increase (Decrease) in Net Assets | | 2014 | | | 2013 | |
Operations: Net investment income | | $ | 1,881,277 | | | $ | 2,438,537 | |
| Net realized gain (loss) | | | 17,630,326 | | | | 48,316,584 | |
| Change in net unrealized appreciation (depreciation) | | | 4,906,485 | | | | 13,479,342 | |
| Net increase (decrease) in net assets resulting from operations | | | 24,418,088 | | | | 64,234,463 | |
Distributions to shareholders from: Net investment income: Class A | | | (2,373,232 | ) | | | (2,931,105 | ) |
| Class B | | | (16,034 | ) | | | (20,449 | ) |
| Total distributions | | | (2,389,266 | ) | | | (2,951,554 | ) |
Fund share transactions: Class A Proceeds from shares sold | | | 9,130,365 | | | | 12,066,669 | |
| Reinvestment of distributions | | | 2,373,232 | | | | 2,931,105 | |
| Payments for shares redeemed | | | (36,253,798 | ) | | | (32,588,778 | ) |
| Net increase (decrease) in net assets from Class A share transactions | | | (24,750,201 | ) | | | (17,591,004 | ) |
Class B Proceeds from shares sold | | | 50,380 | | | | 61,298 | |
| Reinvestment of distributions | | | 16,034 | | | | 20,449 | |
| Payments for shares redeemed | | | (301,019 | ) | | | (347,419 | ) |
| Net increase (decrease) in net assets from Class B share transactions | | | (234,605 | ) | | | (265,672 | ) |
| Increase (decrease) in net assets | | | (2,955,984 | ) | | | 43,426,233 | |
| Net assets at beginning of period | | | 225,072,534 | | | | 181,646,301 | |
| Net assets at end of period (including undistributed net investment income of $1,789,273 and $2,295,256, respectively) | | $ | 222,116,550 | | | $ | 225,072,534 | |
| Other Information | |
Class A Shares outstanding at beginning of period | | | 19,342,719 | | | | 21,101,010 | |
| Shares sold | | | 762,045 | | | | 1,197,826 | |
| Shares issued to shareholders in reinvestment of distributions | | | 210,580 | | | | 308,213 | |
| Shares redeemed | | | (3,046,373 | ) | | | (3,264,330 | ) |
| Net increase (decrease) in Class A shares | | | (2,073,748 | ) | | | (1,758,291 | ) |
| Shares outstanding at end of period | | | 17,268,971 | | | | 19,342,719 | |
Class B Shares outstanding at beginning of period | | | 161,956 | | | | 188,843 | |
| Shares sold | | | 4,074 | | | | 5,908 | |
| Shares issued to shareholders in reinvestment of distributions | | | 1,423 | | | | 2,148 | |
| Shares redeemed | | | (25,191 | ) | | | (34,943 | ) |
| Net increase (decrease) in Class B shares | | | (19,694 | ) | | | (26,887 | ) |
| Shares outstanding at end of period | | | 142,262 | | | | 161,956 | |
The accompanying notes are an integral part of the financial statements.
| | | Years Ended December 31, | |
| Class A | | | 2014 | | | 2013 | | | 2012 | | | 2011 | | | 2010 | |
| Selected Per Share Data | |
| Net asset value, beginning of period | | $ | 11.54 | | | $ | 8.53 | | | $ | 7.46 | | | $ | 7.56 | | | $ | 6.71 | |
Income (loss) from investment operations: Net investment incomea | | | .10 | | | | .12 | | | | .15 | | | | .10 | | | | .09 | |
| Net realized and unrealized gain (loss) | | | 1.25 | | | | 3.03 | | | | 1.03 | | | | (.10 | ) | | | .87 | |
| Total from investment operations | | | 1.35 | | | | 3.15 | | | | 1.18 | | | | .00 | | | | .96 | |
Less distributions from: Net investment income | | | (.13 | ) | | | (.14 | ) | | | (.11 | ) | | | (.10 | ) | | | (.11 | ) |
| Net asset value, end of period | | $ | 12.76 | | | $ | 11.54 | | | $ | 8.53 | | | $ | 7.46 | | | $ | 7.56 | |
| Total Return (%) | | | 11.82 | | | | 37.33 | | | | 15.81 | | | | (.14 | ) | | | 14.40 | b |
| Ratios to Average Net Assets and Supplemental Data | |
| Net assets, end of period ($ millions) | | | 220 | | | | 223 | | | | 180 | | | | 85 | | | | 98 | |
| Ratio of expenses before expense reductions (%) | | | .57 | | | | .56 | | | | .59 | | | | .63 | | | | .63 | |
| Ratio of expenses after expense reductions (%) | | | .57 | | | | .56 | | | | .59 | | | | .63 | | | | .60 | |
| Ratio of net investment income (%) | | | .86 | | | | 1.20 | | | | 1.90 | | | | 1.25 | | | | 1.32 | |
| Portfolio turnover rate (%) | | | 48 | | | | 238 | | | | 307 | | | | 215 | | | | 145 | |
a Based on average shares outstanding during the period. b Total return would have been lower had certain expenses not been reduced. | |
| | | Years Ended December 31, | |
| Class B | | | 2014 | | | 2013 | | | 2012 | | | 2011 | | | 2010 | |
| Selected Per Share Data | |
| Net asset value, beginning of period | | $ | 11.53 | | | $ | 8.51 | | | $ | 7.45 | | | $ | 7.55 | | | $ | 6.70 | |
Income (loss) from investment operations: Net investment incomea | | | .07 | | | | .10 | | | | .11 | | | | .08 | | | | .07 | |
| Net realized and unrealized gain (loss) | | | 1.24 | | | | 3.03 | | | | 1.03 | | | | (.10 | ) | | | .87 | |
| Total from investment operations | | | 1.31 | | | | 3.13 | | | | 1.14 | | | | (.02 | ) | | | .94 | |
Less distributions from: Net investment income | | | (.10 | ) | | | (.11 | ) | | | (.08 | ) | | | (.08 | ) | | | (.09 | ) |
| Net asset value, end of period | | $ | 12.74 | | | $ | 11.53 | | | $ | 8.51 | | | $ | 7.45 | | | $ | 7.55 | |
| Total Return (%) | | | 11.52 | | | | 37.10 | | | | 15.41 | | | | (.40 | ) | | | 14.12 | b |
| Ratios to Average Net Assets and Supplemental Data | |
| Net assets, end of period ($ millions) | | | 2 | | | | 2 | | | | 2 | | | | 2 | | | | 2 | |
| Ratio of expenses before expense reductions (%) | | | .82 | | | | .76 | | | | .90 | | | | .88 | | | | .88 | |
| Ratio of expenses after expense reductions (%) | | | .82 | | | | .76 | | | | .90 | | | | .88 | | | | .85 | |
| Ratio of net investment income (%) | | | .60 | | | | 1.00 | | | | 1.41 | | | | .99 | | | | 1.07 | |
| Portfolio turnover rate (%) | | | 48 | | | | 238 | | | | 307 | | | | 215 | | | | 145 | |
a Based on average shares outstanding during the period. b Total return would have been lower had certain expenses not been reduced. | |
Notes to Financial Statements
A. Organization and Significant Accounting Policies
Deutsche Variable Series I (formerly DWS Variable Series I) (the "Series") is registered under the Investment Company Act of 1940, as amended (the "1940 Act"), as an open-end, registered management investment company organized as a Massachusetts business trust. The Series consists of five diversified funds: Deutsche Bond VIP, Deutsche Core Equity VIP, Deutsche Capital Growth VIP, Deutsche Global Small Cap VIP and Deutsche International VIP (individually or collectively hereinafter referred to as a "Fund" or the "Funds" and formerly known as DWS Bond VIP, DWS Core Equity VIP, DWS Capital Growth VIP, DWS Global Small Cap Growth VIP and DWS International VIP, respectively). These financial statements report on Deutsche Core Equity VIP. The Series is intended to be the underlying investment vehicle for variable annuity contracts and variable life insurance policies to be offered by the separate accounts of certain life insurance companies ("Participating Insurance Companies").
Multiple Classes of Shares of Beneficial Interest. The Fund offers two classes of shares (Class A shares and Class B shares). Class B shares are subject to Rule 12b-1 distribution fees under the 1940 Act and recordkeeping fees equal to an annual rate of 0.25% and up to 0.15%, respectively, of the average daily net assets of the Class B shares of the Fund. Class A shares are not subject to such fees.
Investment income, realized and unrealized gains and losses, and certain fund-level expenses and expense reductions, if any, are borne pro rata on the basis of relative net assets by the holders of all classes of shares, except that each class bears certain expenses unique to that class (including the applicable 12b-1 distribution fees and recordkeeping fees). Differences in class-level expenses may result in payment of different per share dividends by class. All shares have equal rights with respect to voting subject to class-specific arrangements.
The Fund's financial statements are prepared in accordance with accounting principles generally accepted in the United States of America, which require the use of management estimates. Actual results could differ from those estimates. The policies described below are followed consistently by the Fund in the preparation of its financial statements.
Security Valuation. Investments are stated at value determined as of the close of regular trading on the New York Stock Exchange on each day the exchange is open for trading.
Various inputs are used in determining the value of the Fund's investments. These inputs are summarized in three broad levels. Level 1 includes quoted prices in active markets for identical securities. Level 2 includes other significant observable inputs (including quoted prices for similar securities, interest rates, prepayment speeds and credit risk). Level 3 includes significant unobservable inputs (including the Fund's own assumptions in determining the fair value of investments). The level assigned to the securities valuations may not be an indication of the risk or liquidity associated with investing in those securities.
Equity securities are valued at the most recent sale price or official closing price reported on the exchange (U.S. or foreign) or over-the-counter market on which they trade. Securities for which no sales are reported are valued at the calculated mean between the most recent bid and asked quotations on the relevant market or, if a mean cannot be determined, at the most recent bid quotation. Equity securities are generally categorized as Level 1.
Investments in open-end investment companies are valued at their net asset value each business day and are categorized as Level 1.
Debt securities are valued at prices supplied by independent pricing services approved by the Fund's Board. Such services may use various pricing techniques which take into account appropriate factors such as yield, quality, coupon rate, maturity, type of issue, trading characteristics, prepayment speeds and other data, as well as broker quotes. If the pricing services are unable to provide valuations, debt securities are valued at the average of the most recent reliable bid quotations or evaluated prices, as applicable, obtained from broker-dealers are valued at the mean of the most recent bid and ask quotations or evaluated prices, as applicable, obtained from broker-dealers. These securities are generally categorized as Level 2.
Securities and other assets for which market quotations are not readily available or for which the above valuation procedures are deemed not to reflect fair value are valued in a manner that is intended to reflect their fair value as determined in accordance with procedures approved by the Trustees and are generally categorized as Level 3. In accordance with the Fund's valuation procedures, factors used in determining value may include, but are not limited to, the type of the security; the size of the holding; the initial cost of the security; the existence of any contractual restrictions on the security's disposition; the price and extent of public trading in similar securities of the issuer or of comparable companies; quotations or evaluated prices from broker-dealers and/or pricing services; information obtained from the issuer, analysts, and/or the appropriate stock exchange (for exchange-traded securities); an analysis of the company's or issuer's financial statements; an evaluation of the forces that influence the issuer and the market(s) in which the security is purchased and sold; and with respect to debt securities, the maturity, coupon, creditworthiness, currency denomination and the movement of the market in which the security is normally traded. The value determined under these procedures may differ from published values for the same securities.
Disclosure about the classification of fair value measurements is included in a table following the Fund's Investment Portfolio.
Securities Lending. Brown Brothers Harriman & Co., as lending agent, lends securities of the Fund to certain financial institutions under the terms of the Security Lending Agreement. The Fund retains the benefits of owning the securities it has loaned and continues to receive interest and dividends generated by the securities and to participate in any changes in their market value. The Fund requires the borrowers of the securities to maintain collateral with the Fund consisting of either cash or liquid, unencumbered assets having a value at least equal to the value of the securities loaned. When the collateral falls below specified amounts, the lending agent will use its best effort to obtain additional collateral on the next business day to meet required amounts under the security lending agreement. The Fund may invest the cash collateral into a joint trading account in an affiliated money market fund pursuant to Exemptive Orders issued by the SEC. The Fund receives compensation for lending its securities either in the form of fees or by earning interest on invested cash collateral net of borrower rebates and fees paid to a lending agent. Either the Fund or the borrower may terminate the loan. There may be risks of delay and costs in recovery of securities or even loss of rights in the collateral should the borrower of the securities fail financially. If the Fund is not able to recover securities lent, the Fund may sell the collateral and purchase a replacement investment in the market, incurring the risk that the value of the replacement security is greater than the value of the collateral. The Fund is also subject to all investment risks associated with the reinvestment of any cash collateral received, including, but not limited to, interest rate, credit and liquidity risk associated with such investments.
As of December 31, 2014, the Fund had securities on loan. The value of the related collateral exceeded the value of the securities loaned at period end.
Foreign Currency Translations. The books and records of the Fund are maintained in U.S. dollars. Investment securities and other assets and liabilities denominated in a foreign currency are translated into U.S. dollars at the prevailing exchange rates at period end. Purchases and sales of investment securities, income and expenses are translated into U.S. dollars at the prevailing exchange rates on the respective dates of the transactions.
Net realized and unrealized gains and losses on foreign currency transactions represent net gains and losses between trade and settlement dates on securities transactions, the acquisition and disposition of foreign currencies, and the difference between the amount of net investment income accrued and the U.S. dollar amount actually received. That portion of both realized and unrealized gains and losses on investments that results from fluctuations in foreign currency exchange rates is not separately disclosed but is included with net realized and unrealized gain/appreciation and loss/depreciation on investments.
Federal Income Taxes. The Fund is treated as a separate taxpayer as provided for in the Internal Revenue Code, as amended. It is the Fund's policy to comply with the requirements of the Internal Revenue Code, as amended, which are applicable to regulated investment companies, and to distribute all of its taxable income to the separate accounts of the Participating Insurance Companies which hold its shares.
The Fund has reviewed the tax positions for the open tax years as of December 31, 2014 and has determined that no provision for income tax and/or uncertain tax provisions is required in the Fund's financial statements. The Fund's federal tax returns for the prior three fiscal years remain open subject to examination by the Internal Revenue Service.
Distribution of Income and Gains. Distributions from net investment income of the Fund, if any, are declared and distributed to shareholders annually. Net realized gains from investment transactions, in excess of available capital loss carryforwards, would be taxable to the Fund if not distributed, and, therefore, will be distributed to shareholders at least annually. The Fund may also make additional distributions for tax purposes if necessary.
The timing and characterization of certain income and capital gain distributions are determined annually in accordance with federal tax regulations which may differ from accounting principles generally accepted in the United States of America. These differences primarily relate to certain securities sold at a loss. As a result, net investment income (loss) and net realized gain (loss) on investment transactions for a reporting period may differ significantly from distributions during such period. Accordingly, the Fund may periodically make reclassifications among certain of its capital accounts without impacting the net asset value of the Fund.
At December 31, 2014, the Fund's components of distributable earnings (accumulated losses) on a tax basis are as follows:
| Undistributed ordinary income* | | $ | 1,764,715 | |
| Undistributed net long-term capital gains | | $ | 491,648 | |
| Net unrealized appreciation (depreciation) on investments | | $ | 37,708,364 | |
In addition, the tax character of distributions paid to shareholders by the Fund is summarized as follows:
| | | Years Ended December 31, | |
| | | 2014 | | | 2013 | |
| Distributions from ordinary income* | | $ | 2,389,266 | | | $ | 2,951,554 | |
* For tax purposes, short-term capital gain distributions are considered ordinary income distributions.
Expenses. Expenses of the Series arising in connection with a specific Fund are allocated to that Fund. Other Series expenses which cannot be directly attributed to a Fund are apportioned among the Funds in the Series based upon the relative net assets or other appropriate measures.
Contingencies. In the normal course of business, the Fund may enter into contracts with service providers that contain general indemnification clauses. The Fund's maximum exposure under these arrangements is unknown as this would involve future claims that may be made against the Fund that have not yet been made. However, based on experience, the Fund expects the risk of loss to be remote.
Other. Investment transactions are accounted for on a trade date plus one basis for daily net asset value calculations. However, for financial reporting purposes, investment transactions are reported on trade date. Interest income is recorded on the accrual basis. Dividend income is recorded on the ex-dividend date net of foreign withholding taxes. Realized gains and losses from investment transactions are recorded on an identified cost basis. Proceeds from litigation payments, if any, are included in net realized gain (loss) from investments.
B. Purchases and Sales of Securities
During the year ended December 31, 2014, purchases and sales of investment securities (excluding short-term investments) aggregated $106,307,086 and $131,876,491, respectively.
C. Related Parties
Management Agreement. Under the Investment Management Agreement with Deutsche Investment Management Americas Inc. ("DIMA" or the "Advisor"), an indirect, wholly owned subsidiary of Deutsche Bank AG, the Advisor directs the investments of the Fund in accordance with its investment objectives, policies and restrictions. The Advisor determines the securities, instruments and other contracts relating to investments to be purchased, sold or entered into by the Fund.
Pursuant to the Investment Management Agreement with the Advisor, the Fund pays a monthly management fee based on the Fund's average daily net assets, computed and accrued daily and payable monthly, at the following annual rates:
| First $250 million of average daily net assets | | | .390 | % |
| Next $750 million of average daily net assets | | | .365 | % |
| Over $1 billion of average daily net assets | | | .340 | % |
Accordingly, for the year ended December 31, 2014, the fee pursuant to the Investment Management Agreement was equivalent to an annual rate (exclusive of any applicable waivers/reimbursements) of 0.39% of the Fund's average daily net assets.
For the period from January 1, 2014 through September 30, 2014, the Advisor had contractually agreed to waive its fee and/or reimburse certain operating expenses of the Fund to the extent necessary to maintain the total annual operating expenses (excluding certain expenses such as extraordinary expenses, taxes, brokerage and interest expense) of each class as follows:
Effective October 1, 2014 through September 30, 2015, the Advisor has contractually agreed to waive its fees and/or reimburse certain operating expenses of the Fund to the extent necessary to maintain the total annual operating expenses (excluding certain expenses such as extraordinary expenses, taxes, brokerage and interest) of each class as follows:
Administration Fee. Pursuant to an Administrative Services Agreement, DIMA provides most administrative services to the Fund. For all services provided under the Administrative Services Agreement, the Fund pays the Advisor an annual fee ("Administration Fee") of 0.10% of the Fund's average daily net assets, computed and accrued daily and payable monthly. For the year ended December 31, 2014, the Administration Fee was $220,152, of which $18,981 is unpaid.
Service Provider Fees. DeAWM Service Company ("DSC"), an affiliate of the Advisor, is the transfer agent, dividend-paying agent and shareholder service agent for the Fund. Pursuant to a sub-transfer agency agreement between DSC and DST Systems, Inc. ("DST"), DSC has delegated certain transfer agent, dividend-paying agent and shareholder service agent functions to DST. DSC compensates DST out of the shareholder servicing fee it receives from the Fund. For the year ended December 31, 2014, the amounts charged to the Fund by DSC were as follows:
| Services to Shareholders | | Total Aggregated | | | Unpaid at December 31, 2014 | |
| Class A | | $ | 574 | | | $ | 96 | |
| Class B | | | 81 | | | | 14 | |
| | | $ | 655 | | | $ | 110 | |
Distribution Service Agreement. DeAWM Distributors, Inc. ("DDI"), also an affiliate of the Advisor, is the Series' Distributor. In accordance with the Master Distribution Plan, DDI receives 12b-1 fees of 0.25% of average daily net assets of Class B shares. Pursuant to the Master Distribution Plan, DDI remits these fees to the Participating Insurance Companies for various costs incurred or paid by these companies in connection with marketing and distribution of Class B shares. For the year ended December 31, 2014, the Distribution Service Fee aggregated $4,500, of which $385 is unpaid.
Typesetting and Filing Service Fees. Under an agreement with DIMA, DIMA is compensated for providing typesetting and certain regulatory filing services to the Fund. For the year ended December 31, 2014, the amount charged to the Fund by DIMA included in the Statement of Operations under "Reports to shareholders" aggregated $15,253, of which $4,405 is unpaid.
Trustees' Fees and Expenses. The Fund paid retainer fees to each Trustee not affiliated with the Advisor, plus specified amounts to the Board Chairperson and Vice Chairperson and to each committee Chairperson.
Affiliated Cash Management Vehicles. The Fund may invest uninvested cash balances in Central Cash Management Fund and Deutsche Variable NAV Money Fund, affiliated money market funds which are managed by the Advisor. Each affiliated money market fund seeks to provide a high level of current income consistent with liquidity and the preservation of capital. Each affiliated money market fund is managed in accordance with Rule 2a-7 under the Investment Company Act of 1940, which governs the quality, maturity, diversity and liquidity of instruments in which a money market fund may invest. Central Cash Management Fund seeks to maintain a stable net asset value, and Deutsche Variable NAV Money Fund maintains a floating net asset value. The Fund indirectly bears its proportionate share of the expenses of each affiliated money market fund in which it invests. Central Cash Management Fund does not pay the Advisor an investment management fee. To the extent that Deutsche Variable NAV Money Fund pays an investment management fee to the Advisor, the Advisor will waive an amount of the investment management fee payable to the Advisor by the Fund equal to the amount of the investment management fee payable on the Fund's assets invested in Deutsche Variable NAV Money Fund.
D. Ownership of the Fund
At December 31, 2014, two participating insurance companies were owners of record of 10% or more of the total outstanding Class A shares of the Fund, each owning 49% and 33%, respectively. Two participating insurance companies were owners of record of 10% or more of the total outstanding Class B shares of the Fund, each owning 84% and 16%, respectively.
E. Line of Credit
The Fund and other affiliated funds (the "Participants") share in a $400 million revolving credit facility provided by a syndication of banks. The Fund may borrow for temporary or emergency purposes, including the meeting of redemption requests that otherwise might require the untimely disposition of securities. The Participants are charged an annual commitment fee which is allocated based on net assets, among each of the Participants. Interest is calculated at a rate per annum equal to the sum of the Federal Funds Rate plus 1.25 percent plus if LIBOR exceeds the Federal Funds Rate the amount of such excess. The Fund may borrow up to a maximum of 33 percent of its net assets under the agreement. The Fund had no outstanding loans at December 31, 2014.
Report of Independent Registered Public Accounting Firm
To the Trustees of Deutsche Variable Series I and the Shareholders of Deutsche Core Equity VIP:
In our opinion, the accompanying statement of assets and liabilities, including the investment portfolio, and the related statements of operations and of changes in net assets and the financial highlights present fairly, in all material respects, the financial position of Deutsche Core Equity VIP (formerly DWS Core Equity VIP) (the "Fund") at December 31, 2014 and the results of its operations, the changes in its net assets, and the financial highlights for the periods indicated therein, in conformity with accounting principles generally accepted in the United States of America. These financial statements and financial highlights (hereafter referred to as "financial statements") are the responsibility of the Fund's management. Our responsibility is to express an opinion on these financial statements based on our audits. We conducted our audits of these financial statements in accordance with the standards of the Public Company Accounting Oversight Board (United States). Those standards require that we plan and perform the audit to obtain reasonable assurance about whether the financial statements are free of material misstatement. An audit includes examining, on a test basis, evidence supporting the amounts and disclosures in the financial statements, assessing the accounting principles used and significant estimates made by management, and evaluating the overall financial statement presentation. We believe that our audits, which included confirmation of securities at December 31, 2014 by correspondence with the custodian, brokers and transfer agent, and the application of alternative auditing procedures where such confirmations had not been received, provide a reasonable basis for our opinion.
Boston, Massachusetts February 13, 2015 | PricewaterhouseCoopers LLP |
Information About Your Fund's Expenses (Unaudited)
As an investor of the Fund, you incur two types of costs: ongoing expenses and transaction costs. Ongoing expenses include management fees, distribution and service (12b-1) fees and other Fund expenses. Examples of transaction costs include contract charges, which are not shown in this section. The following tables are intended to help you understand your ongoing expenses (in dollars) of investing in the Fund and to help you compare these expenses with the ongoing expenses of investing in other mutual funds. The example in the table is based on an investment of $1,000 invested at the beginning of the six-month period and held for the entire period (July 1, 2014 to December 31, 2014).
The tables illustrate your Fund's expenses in two ways:
—Actual Fund Return. This helps you estimate the actual dollar amount of ongoing expenses (but not transaction costs) paid on a $1,000 investment in the Fund using the Fund's actual return during the period. To estimate the expenses you paid over the period, simply divide your account value by $1,000 (for example, an $8,600 account value divided by $1,000 = 8.6), then multiply the result by the number in the "Expenses Paid per $1,000" line under the share class you hold.
—Hypothetical 5% Fund Return. This helps you to compare your Fund's ongoing expenses (but not transaction costs) with those of other mutual funds using the Fund's actual expense ratio and a hypothetical rate of return of 5% per year before expenses. Examples using a 5% hypothetical Fund return may be found in the shareholder reports of other mutual funds. The hypothetical account values and expenses may not be used to estimate the actual ending account balance or expenses you paid for the period.
Please note that the expenses shown in these tables are meant to highlight your ongoing expenses only and do not reflect any transaction costs. The "Expenses Paid per $1,000" line of the tables is useful in comparing ongoing expenses only and will not help you determine the relative total expense of owning different funds. If these transaction costs had been included, your costs would have been higher.
Expenses and Value of a $1,000 Investment for the six months ended December 31, 2014 | |
| Actual Fund Return | | Class A | | | Class B | |
| Beginning Account Value 7/1/14 | | $ | 1,000.00 | | | $ | 1,000.00 | |
| Ending Account Value 12/31/14 | | $ | 1,058.90 | | | $ | 1,057.30 | |
| Expenses Paid per $1,000* | | $ | 2.91 | | | $ | 4.25 | |
| Hypothetical 5% Portfolio Return | | Class A | | | Class B | |
| Beginning Account Value 7/1/14 | | $ | 1,000.00 | | | $ | 1,000.00 | |
| Ending Account Value 12/31/14 | | $ | 1,022.38 | | | $ | 1,021.07 | |
| Expenses Paid per $1,000* | | $ | 2.85 | | | $ | 4.18 | |
* Expenses are equal to the Fund's annualized expense ratio for each share class, multiplied by the average account value over the period, multiplied by 184 (the number of days in the most recent six-month period), then divided by 365.
| Annualized Expense Ratios | Class A | | Class B | |
| Deutsche Variable Series I — Deutsche Core Equity VIP | .56% | | .82% | |
For more information, please refer to the Fund's prospectus.
These tables do not reflect charges and fees ("contract charges") associated with the separate account that invests in the Fund or any variable life insurance policy or variable annuity contract for which the Fund is an investment option.
For an analysis of the fees associated with an investment in the fund or similar funds, please refer to the current and hypothetical expense calculators for Variable Insurance Products which can be found at deutschefunds.com/EN/resources/calculators.jsp.
Tax Information (Unaudited)
Pursuant to Section 852 of the Internal Revenue Code, the Fund designates $541,000 as capital gain dividends for its year ended December 31, 2014.
For corporate shareholders, 100% of the ordinary dividends (i.e., income dividends plus short-term capital gains) paid during the Fund's fiscal year ended December 31, 2014 qualified for the dividends received deduction.
Please consult a tax advisor if you have questions about federal or state income tax laws, or on how to prepare your tax returns. If you have specific questions about your account, please contact your insurance provider.
The Series' policies and procedures for voting proxies for portfolio securities and information about how the Series voted proxies related to its portfolio securities during the 12-month period ended June 30 are available on our Web site — deutschefunds.com (click on "proxy voting"at the bottom of the page) — or on the SEC's Web site — sec.gov. To obtain a written copy of the Series' policies and procedures without charge, upon request, call us toll free at (800) 728-3337.
Advisory Agreement Board Considerations and Fee Evaluation
The Board of Trustees approved the renewal of Deutsche Core Equity VIP’s investment management agreement (the "Agreement") with Deutsche Investment Management Americas Inc. ("DIMA") in September 2014.
In terms of the process that the Board followed prior to approving the Agreement, shareholders should know that:
— In September 2014, all of the Fund’s Trustees were independent of DIMA and its affiliates.
— The Trustees met frequently during the past year to discuss fund matters and dedicated a substantial amount of time to contract review matters. Over the course of several months, the Board’s Contract Committee, in coordination with the Board’s Equity Oversight Committee, reviewed comprehensive materials received from DIMA, independent third parties and independent counsel. These materials included an analysis of the Fund’s performance, fees and expenses, and profitability compiled by a fee consultant retained by the Fund’s Independent Trustees (the "Fee Consultant"). The Board also received extensive information throughout the year regarding performance of the Fund.
— The Independent Trustees regularly meet privately with counsel to discuss contract review and other matters. In addition, the Independent Trustees were advised by the Fee Consultant in the course of their review of the Fund’s contractual arrangements and considered a comprehensive report prepared by the Fee Consultant in connection with their deliberations.
— In connection with reviewing the Agreement, the Board also reviewed the terms of the Fund’s Rule 12b-1 plan, distribution agreement, administrative services agreement, transfer agency agreement and other material service agreements.
— Based on its evaluation of the information provided, the Contract Committee presented its findings and recommendations to the Board. The Board then reviewed the Contract Committee’s findings and recommendations.
In connection with the contract review process, the Contract Committee and the Board considered the factors discussed below, among others. The Board also considered that DIMA and its predecessors have managed the Fund since its inception, and the Board believes that a long-term relationship with a capable, conscientious advisor is in the best interests of the Fund. The Board considered, generally, that shareholders chose to invest or remain invested in the Fund knowing that DIMA managed the Fund, and that the Agreement was approved by the Fund’s shareholders. DIMA is part of Deutsche Bank AG ("DB"), a major global banking institution that is engaged in a wide range of financial services. The Board believes that there are advantages to being part of a global asset management business that offers a wide range of investing expertise and resources, including hundreds of portfolio managers and analysts with research capabilities in many countries throughout the world.
As part of the contract review process, the Board carefully considered the fees and expenses of each Deutsche fund overseen by the Board in light of the fund’s performance. In many cases, this led to the negotiation and implementation of expense caps. As part of these negotiations, the Board indicated that it would consider relaxing these caps in future years following sustained improvements in performance, among other considerations.
In 2012, DB combined its Asset Management (of which DIMA was a part) and Wealth Management divisions into a new Asset and Wealth Management ("AWM") division. DB has advised the Independent Trustees that the U.S. asset management business is a critical and integral part of DB, and that DB will continue to invest in AWM a significant portion of the savings it has realized by combining its Asset and Wealth Management divisions, including ongoing enhancements to AWM’s investment capabilities. DB also has confirmed its commitment to maintaining strong legal and compliance groups within the AWM division.
While shareholders may focus primarily on fund performance and fees, the Fund’s Board considers these and many other factors, including the quality and integrity of DIMA’s personnel and such other issues as back-office operations, fund valuations, and compliance policies and procedures.
Nature, Quality and Extent of Services. The Board considered the terms of the Agreement, including the scope of advisory services provided under the Agreement. The Board noted that, under the Agreement, DIMA provides portfolio management services to the Fund and that, pursuant to a separate administrative services agreement, DIMA provides administrative services to the Fund. The Board considered the experience and skills of senior management and investment personnel, the resources made available to such personnel, the ability of DIMA to attract and retain high-quality personnel, and the organizational depth and stability of DIMA. The Board reviewed the Fund’s performance over short-term and long-term periods and compared those returns to various agreed-upon performance measures, including a market index and a peer universe compiled by the Fee Consultant using information supplied by Morningstar Direct ("Morningstar"), an independent fund data service. The Board also noted that it has put into place a process of identifying "Focus Funds" (e.g., funds performing poorly relative to a peer universe), and receives more frequent reporting and information from DIMA regarding such funds, along with DIMA’s plans to address underperformance. The Board believes this process is an effective manner of identifying and addressing underperforming funds. Based on the information provided, the Board noted that for the one-, three- and five-year periods ended December 31, 2013, the Fund’s performance (Class A shares) was in the 1st quartile, 1st quartile and 1st quartile, respectively, of the applicable Morningstar universe (the 1st quartile being the best performers and the 4th quartile being the worst performers). The Board also observed that the Fund has outperformed its benchmark in the one-, three- and five-year periods ended December 31, 2013.
Fees and Expenses. The Board considered the Fund’s investment management fee schedule, operating expenses and total expense ratios, and comparative information provided by Lipper Inc. ("Lipper") and the Fee Consultant regarding investment management fee rates paid to other investment advisors by similar funds (1st quartile being the most favorable and 4th quartile being the least favorable). With respect to management fees paid to other investment advisors by similar funds, the Board noted that the contractual fee rates paid by the Fund, which include a 0.10% fee paid to DIMA under the Fund’s administrative services agreement, were lower than the median (1st quartile) of the applicable Lipper peer group (based on Lipper data provided as of December 31, 2013). The Board noted that the Fund’s Class A shares total (net) operating expenses were expected to be lower than the median (1st quartile) of the applicable Lipper expense universe (based on Lipper data provided as of December 31, 2013) ("Lipper Universe Expenses"). The Board also reviewed data comparing each share class’s total (net) operating expenses to the applicable Lipper Universe Expenses. The Board also considered how the Fund’s total (net) operating expenses compared to the total (net) operating expenses of a more customized peer group selected by Lipper (based on such factors as asset size). The Board also noted that the expense limitations agreed to by DIMA helped to ensure that the Fund’s total (net) operating expenses would remain competitive. The Board considered the Fund’s management fee rate as compared to fees charged by DIMA to comparable funds and considered differences between the Fund and the comparable funds.
The information requested by the Board as part of its review of fees and expenses also included information about institutional accounts and funds offered primarily to European investors ("Deutsche Europe funds") managed by DIMA and its affiliates. The Board noted that DIMA indicated that it manages an institutional account comparable to the Fund, but does not manage any comparable Deutsche Europe funds. The Board took note of the differences in services provided to Deutsche U.S. mutual funds ("Deutsche Funds") as compared to institutional accounts and that such differences made comparison difficult.
On the basis of the information provided, the Board concluded that management fees were reasonable and appropriate in light of the nature, quality and extent of services provided by DIMA.
Profitability. The Board reviewed detailed information regarding revenues received by DIMA under the Agreement. The Board considered the estimated costs and pre-tax profits realized by DIMA from advising the Deutsche Funds, as well as estimates of the pre-tax profits attributable to managing the Fund in particular. The Board also received information regarding the estimated enterprise-wide profitability of DIMA and its affiliates with respect to all fund services in totality and by fund. The Board and the Fee Consultant reviewed DIMA’s methodology in allocating its costs to the management of the Fund. Based on the information provided, the Board concluded that the pre-tax profits realized by DIMA in connection with the management of the Fund were not unreasonable.
Economies of Scale. The Board considered whether there are economies of scale with respect to the management of the Fund and whether the Fund benefits from any economies of scale. The Board noted that the Fund’s management fee schedule includes fee breakpoints. The Board concluded that the Fund’s fee schedule represents an appropriate sharing between the Fund and DIMA of such economies of scale as may exist in the management of the Fund at current asset levels.
Other Benefits to DIMA and Its Affiliates. The Board also considered the character and amount of other incidental benefits received by DIMA and its affiliates, including any fees received by DIMA for administrative services provided to the Fund and any fees received by an affiliate of DIMA for distribution services. The Board also considered benefits to DIMA related to brokerage and soft-dollar allocations, including allocating brokerage to pay for research generated by parties other than the executing broker dealers, which pertain primarily to funds investing in equity securities, along with the incidental public relations benefits to DIMA related to Deutsche Funds advertising and cross-selling opportunities among DIMA products and services. The Board concluded that management fees were reasonable in light of these fallout benefits.
Compliance. The Board considered the significant attention and resources dedicated by DIMA to documenting and enhancing its compliance processes in recent years. The Board noted in particular (i) the experience and seniority of DIMA’s and the Fund’s chief compliance officer; (ii) the large number of DIMA compliance personnel; and (iii) the substantial commitment of resources by DIMA and its affiliates to compliance matters.
Based on all of the information considered and the conclusions reached, the Board unanimously determined that the continuation of the Agreement is in the best interests of the Fund. In making this determination, the Board did not give particular weight to any single factor identified above. The Board considered these factors over the course of numerous meetings, certain of which were in executive session with only the Independent Trustees and counsel present. It is possible that individual Trustees may have weighed these factors differently in reaching their individual decisions to approve the continuation of the Agreement.
Board Members and Officers
The following table presents certain information regarding the Board Members and Officers of the fund. Each Board Member's year of birth is set forth in parentheses after his or her name. Unless otherwise noted, (i) each Board Member has engaged in the principal occupation(s) noted in the table for at least the most recent five years, although not necessarily in the same capacity; and (ii) the address of each Independent Board Member is c/o Kenneth C. Froewiss, Chairman, Deutsche Mutual Funds, P.O. Box 390601, Cambridge, MA 02139. Except as otherwise noted below, the term of office for each Board Member is until the election and qualification of a successor, or until such Board Member sooner dies, resigns, is removed or as otherwise provided in the governing documents of the fund. Because the fund does not hold an annual meeting of shareholders, each Board Member will hold office for an indeterminate period. The Board Members may also serve in similar capacities with other funds in the fund complex.
| Independent Board Members |
Name, Year of Birth, Position with the Fund and Length of Time Served1 | | Business Experience and Directorships During the Past Five Years | Number of Funds in Deutsche Fund Complex Overseen | Other Directorships Held by Board Member |
Kenneth C. Froewiss (1945) Chairperson since 2013, and Board Member since 2001 | | Adjunct Professor of Finance, NYU Stern School of Business (September 2009–present; Clinical Professor from 1997–September 2009); Member, Finance Committee, Association for Asian Studies (2002–present); Director, Mitsui Sumitomo Insurance Group (US) (2004–present); prior thereto, Managing Director, J.P. Morgan (investment banking firm) (until 1996) | 105 | — |
William McClayton (1944) Vice Chairperson since 2013, and Board Member since 2004 | | Private equity investor (since October 2009); previously, Managing Director, Diamond Management & Technology Consultants, Inc. (global consulting firm) (2001–2009); Directorship: Board of Managers, YMCA of Metropolitan Chicago; formerly: Senior Partner, Arthur Andersen LLP (accounting) (1966–2001); Trustee, Ravinia Festival | 105 | — |
John W. Ballantine (1946) Board Member since 1999 | | Retired; formerly, Executive Vice President and Chief Risk Management Officer, First Chicago NBD Corporation/The First National Bank of Chicago (1996–1998); Executive Vice President and Head of International Banking (1995–1996); former Directorships: Director and former Chairman of the Board, Healthways, Inc.2 (provider of disease and care management services) (2003–2014); Stockwell Capital Investments PLC (private equity); First Oak Brook Bancshares, Inc. and Oak Brook Bank; Prisma Energy International | 105 | Portland General Electric2 (utility company) (2003– present) |
Henry P. Becton, Jr. (1943) Board Member since 1990 | | Vice Chair and former President, WGBH Educational Foundation. Directorships: Public Radio International; Public Radio Exchange (PRX); North Bennett Street School (Boston); former Directorships: Belo Corporation2 (media company); The PBS Foundation; Association of Public Television Stations; Boston Museum of Science; American Public Television; Concord Academy; New England Aquarium; Mass. Corporation for Educational Telecommunications; Committee for Economic Development; Public Broadcasting Service; Connecticut College | 105 | Lead Director, Becton Dickinson and Company2 (medical technology company) |
Dawn-Marie Driscoll (1946) Board Member since 1987 | | Emeritus Executive Fellow, Center for Business Ethics, Bentley University; formerly: President, Driscoll Associates (consulting firm); Partner, Palmer & Dodge (law firm) (1988–1990); Vice President of Corporate Affairs and General Counsel, Filene's (retail) (1978–1988). Directorships: Director of ICI Mutual Insurance Company (since 2007); Advisory Board, Center for Business Ethics, Bentley University; Trustee and former Chairman of the Board, Southwest Florida Community Foundation (charitable organization); former Directorships: Sun Capital Advisers Trust (mutual funds) (2007–2012), Investment Company Institute (audit, executive, nominating committees) and Independent Directors Council (governance, executive committees) | 105 | — |
Keith R. Fox, CFA (1954) Board Member since 1996 | | Managing General Partner, Exeter Capital Partners (a series of private investment funds) (since 1986). Directorships: Progressive International Corporation (kitchen goods importer and distributor); The Kennel Shop (retailer); former Chairman, National Association of Small Business Investment Companies; former Directorships: BoxTop Media Inc. (advertising); Sun Capital Advisers Trust (mutual funds) (2011–2012) | 105 | — |
Paul K. Freeman (1950) Board Member since 1993 | | Consultant, World Bank/Inter-American Development Bank; Chair, Independent Directors Council; Investment Company Institute (executive and nominating committees); formerly, Chairman of Education Committee of Independent Directors Council; Project Leader, International Institute for Applied Systems Analysis (1998–2001); Chief Executive Officer, The Eric Group, Inc. (environmental insurance) (1986–1998); Directorships: Denver Zoo Foundation (December 2012–present); former Directorships: Prisma Energy International | 105 | — |
Richard J. Herring (1946) Board Member since 1990 | | Jacob Safra Professor of International Banking and Professor, Finance Department, The Wharton School, University of Pennsylvania (since July 1972); Co-Director, Wharton Financial Institutions Center; Co-Chair, U.S. Shadow Financial Regulatory Committee; Executive Director, Financial Economists Roundtable; formerly: Vice Dean and Director, Wharton Undergraduate Division (July 1995–June 2000); Director, Lauder Institute of International Management Studies (July 2000–June 2006) | 105 | Director, Aberdeen Singapore and Japan Funds (since 2007); Independent Director of Barclays Bank Delaware (since September 2010) |
Rebecca W. Rimel (1951) Board Member since 1995 | | President and Chief Executive Officer, The Pew Charitable Trusts (charitable organization) (1994 to present); formerly: Executive Vice President, The Glenmede Trust Company (investment trust and wealth management) (1983–2004); Board Member, Investor Education (charitable organization) (2004–2005); Trustee, Executive Committee, Philadelphia Chamber of Commerce (2001–2007); Director, Viasys Health Care2 (January 2007–June 2007); Trustee, Thomas Jefferson Foundation (charitable organization) (1994–2012) | 105 | Director, Becton Dickinson and Company2 (medical technology company) (2012– present); Director, BioTelemetry Inc.2 (health care) (2009– present) |
William N. Searcy, Jr. (1946) Board Member since 1993 | | Private investor since October 2003; formerly: Pension & Savings Trust Officer, Sprint Corporation2 (telecommunications) (November 1989–September 2003); Trustee, Sun Capital Advisers Trust (mutual funds) (1998–2012) | 105 | — |
Jean Gleason Stromberg (1943) Board Member since 1997 | | Retired. Formerly, Consultant (1997–2001); Director, Financial Markets U.S. Government Accountability Office (1996–1997); Partner, Norton Rose Fulbright, L.L.P. (law firm) (1978–1996). Directorships: The William and Flora Hewlett Foundation (charitable organization); former Directorships: Service Source, Inc. (nonprofit), Mutual Fund Directors Forum (2002–2004), American Bar Retirement Association (funding vehicle for retirement plans) (1987–1990 and 1994–1996) | 105 | — |
Robert H. Wadsworth* (1940) Board Member since 1999 | | President, Robert H. Wadsworth & Associates, Inc. (consulting firm) (1983 to present); Director, The Phoenix Boys Choir Association | 105 | — |
Officers4 |
Name, Year of Birth, Position with the Fund and Length of Time Served5 | | Business Experience and Directorships During the Past Five Years |
Brian E. Binder8 (1972) President and Chief Executive Officer, 2013–present | | Managing Director3 and Head of Fund Administration, Deutsche Asset & Wealth Management (2013–present); formerly: Head of Business Management and Consulting at Invesco, Ltd. (2010–2012); Chief Administrative Officer, Van Kampen Funds Inc. (2008–2010); and Chief Administrative Officer, Morgan Stanley Investment Management Americas Distribution (2003–2008) |
John Millette7 (1962) Vice President and Secretary, 1999–present | | Director,3 Deutsche Asset & Wealth Management |
Melinda Morrow6 (1970) Vice President, 2012–present | | Director,3 Deutsche Asset & Wealth Management |
Paul H. Schubert6 (1963) Chief Financial Officer, 2004–present Treasurer, 2005–present | | Managing Director,3 Deutsche Asset & Wealth Management (since July 2004); formerly: Executive Director, Head of Mutual Fund Services and Treasurer for UBS Family of Funds (1998–2004); Vice President and Director of Mutual Fund Finance at UBS Global Asset Management (1994–1998) |
Caroline Pearson7 (1962) Chief Legal Officer, 2010–present | | Managing Director,3 Deutsche Asset & Wealth Management; formerly: Assistant Secretary for DWS family of funds (1997–2010) |
Robert Kloby6 (1962) Chief Compliance Officer, 2006–present | | Managing Director,3 Deutsche Asset & Wealth Management |
Wayne Salit6 (1967) Anti-Money Laundering Compliance Officer, 2014–present | | Director,3 Deutsche Asset & Wealth Management; formerly: Managing Director, AML Compliance Officer at BNY Mellon (2011–2014); and Director, AML Compliance Officer at Deutsche Bank (2004–2011) |
Hepsen Uzcan7 (1974) Assistant Secretary, 2013–present | | Director,3 Deutsche Asset & Wealth Management |
Paul Antosca7 (1957) Assistant Treasurer, 2007–present | | Director,3 Deutsche Asset & Wealth Management |
Jack Clark7 (1967) Assistant Treasurer, 2007–present | | Director,3 Deutsche Asset & Wealth Management |
Diane Kenneally7 (1966) Assistant Treasurer, 2007–present | | Director,3 Deutsche Asset & Wealth Management |
1 The length of time served represents the year in which the Board Member joined the board of one or more Deutsche funds currently overseen by the Board.
2 A publicly held company with securities registered pursuant to Section 12 of the Securities Exchange Act of 1934.
3 Executive title, not a board directorship.
4 As a result of their respective positions held with the Advisor, these individuals are considered "interested persons" of the Advisor within the meaning of the 1940 Act. Interested persons receive no compensation from the fund.
5 The length of time served represents the year in which the officer was first elected in such capacity for one or more Deutsche funds.
6 Address: 60 Wall Street, New York, NY 10005.
7 Address: One Beacon Street, Boston, MA 02108.
8 Address: 222 South Riverside Plaza, Chicago, IL 60606.
* Robert H. Wadsworth retired from the Board effective December 31, 2014.
The fund's Statement of Additional Information ("SAI") includes additional information about the Board Members. The SAI is available, without charge, upon request. If you would like to request a copy of the SAI, you may do so by calling the following toll-free number: (800) 728-3337.
DeAWM Distributors, Inc.
222 South Riverside Plaza
Chicago, IL 60606
(800) 621-1148
VS1coreq-2 (R-025822-5 2/15)
December 31, 2014
Annual Report
Deutsche Variable Series I
(formerly DWS Variable Series I)
Deutsche Global Small Cap VIP
(formerly DWS Global Small Cap VIP
and DWS Global Small Cap Growth VIP)
Contents
9 Statement of Assets and Liabilities 10 Statement of Operations 10 Statement of Changes in Net Assets # Financial Highlights 13 Notes to Financial Statements 18 Report of Independent Registered Public Accounting Firm 19 Information About Your Fund's Expenses 21 Advisory Agreement Board Considerations and Fee Evaluation 24 Board Members and Officers |
This report must be preceded or accompanied by a prospectus. To obtain an additional prospectus or summary prospectus, if available, call (800) 728-3337 or your financial representative. We advise you to consider the Fund's objectives, risks, charges and expenses carefully before investing. The summary prospectus and prospectus contain this and other important information about the Fund. Please read the prospectus carefully before you invest.
Investing in foreign securities, particularly those of emerging markets, presents certain risks, such as currency fluctuations, political and economic changes, and market risks. The Fund may lend securities to approved institutions. Smaller company stocks tend to be more volatile than medium-sized or large company stocks. Stocks may decline in value. See the prospectus for details.
Deutsche Asset & Wealth Management represents the asset management and wealth management activities conducted by Deutsche Bank AG or any of its subsidiaries, including the Advisor and DeAWM Distributors, Inc.
NOT FDIC/NCUA INSURED NO BANK GUARANTEE MAY LOSE VALUE NOT A DEPOSIT
NOT INSURED BY ANY FEDERAL GOVERNMENT AGENCY
Performance Summary December 31, 2014 (Unaudited)
Fund performance shown is historical, assumes reinvestment of all dividend and capital gain distributions, and does not guarantee future results. Investment return and principal value fluctuate with changing market conditions so that, when redeemed, shares may be worth more or less than their original cost. Current performance may be lower or higher than the performance data quoted. Please contact your participating insurance company for the Fund's most recent month-end performance. Performance doesn't reflect charges and fees ("contract charges") associated with the separate account that invests in the Fund or any variable life insurance policy or variable annuity contract for which the Fund is an investment option. These charges and fees will reduce returns. While all share classes have the same underlying portfolio, their performance will differ.
The gross expense ratios of the Fund, as stated in the fee table of the prospectus dated May 1, 2014 are 1.14% and 1.34% for Class A and Class B shares, respectively, and may differ from the expense ratios disclosed in the Financial Highlights tables in this report.
| Growth of an Assumed $10,000 Investment |
| The S&P® Developed SmallCap comprises the stocks representing the lowest 15% of float-adjusted market cap in each developed country. It Is a subset of the S&P® Global BMI, a comprehensive, rules-based index measuring global stock market performance. Index returns do not reflect any fees or expenses and it is not possible to invest directly into an index. |
| |
| Yearly periods ended December 31 | |
| Comparative Results | |
| Deutsche Global Small Cap VIP | | 1-Year | | | 3-Year | | | 5-Year | | | 10-Year | |
| Class A | Growth of $10,000 | | $ | 9,587 | | | $ | 15,036 | | | $ | 17,157 | | | $ | 20,069 | |
| Average annual total return | | | –4.13 | % | | | 14.56 | % | | | 11.40 | % | | | 7.21 | % |
| S&P Developed Small Cap Index | Growth of $10,000 | | $ | 10,221 | | | $ | 15,998 | | | $ | 18,200 | | | $ | 21,395 | |
| Average annual total return | | | 2.21 | % | | | 16.96 | % | | | 12.72 | % | | | 7.90 | % |
| Deutsche Global Small Cap VIP | | 1-Year | | | 3-Year | | | 5-Year | | | 10-Year | |
| Class B | Growth of $10,000 | | $ | 9,567 | | | $ | 14,927 | | | $ | 16,964 | | | $ | 19,565 | |
| Average annual total return | | | –4.33 | % | | | 14.29 | % | | | 11.15 | % | | | 6.94 | % |
| S&P Developed Small Cap Index | Growth of $10,000 | | $ | 10,221 | | | $ | 15,998 | | | $ | 18,200 | | | $ | 21,395 | |
| Average annual total return | | | 2.21 | % | | | 16.96 | % | | | 12.72 | % | | | 7.90 | % |
The growth of $10,000 is cumulative.
Management Summary December 31, 2014 (Unaudited)
Deutsche Global Small Cap VIP returned –4.13% in 2014 (Class A shares, unadjusted for contract charges), underperforming the 2.21% return of the S&P® Developed SmallCap Index.1
As is typically the case, individual stock selection was the most important factor in fund performance. Although we added value via strong stock selection in Asia and in the consumer staples sector, this was more than offset by the negative impact of stock selection in financials and industrials.2 The Fund’s regional allocation also played a part in its underperformance. Our emphasis on reasonably valued growth stocks led us to hold overweight positions in Europe and Asia.3 As a result, the Fund was affected not just by the underperformance of these markets, but also by the sharp downturn in the euro and the Japanese yen.
Among individual stocks, the top contributors to performance included health care stocks such as Zeltiq Aesthetics, Inc., Flamel Technologies SA and Furiex Pharmaceuticals, Inc.4 Zeltiq has developed a method of non-invasive fat reduction called "CoolSculpting" that has begun to gain traction among dermatologists and plastic surgeons, leading analysts to raise their earnings estimates. Outside of health care, one of our top performers was Kusuri No Aoki Co., Ltd., a Japanese pharmacy chain that has boosted earnings by expanding both its geographic footprint and its product offerings.
Our stock selection in the financial sector detracted from performance, with REXlot Holdings Ltd. and Ocwen Financial Corp.* leading the way on the downside. A position in Constellium NV, a leading supplier of value-added aluminum products that performed very well through the first half of the year, also lost ground due to its high exposure to the slumping European economy.
The Fund remained overweight in the international markets, as we continued to find a higher representation of reasonably valued growth companies overseas. While the strength of the U.S. economy translates to faster earnings growth for many domestic companies, we believe this is already reflected to a large degree in valuations. We continued to hold a modest overweight to Europe, with a focus on companies poised to deliver robust earnings growth despite the weakness in the region’s economy. Many of these stocks saw their 12-month returns pressured by the broader underperformance of the European markets, which we saw as an opportunity to own fast-growing companies at attractive prices. On a sector basis, we found a growing number of ideas in the consumer sector during the second half of the year, as falling oil prices led to an improved outlook for personal spending.
Joseph Axtell, CFA
Portfolio Manager
The views expressed reflect those of the portfolio management team only through the end of the period of the report as stated on the cover. The management team's views are subject to change at any time based on market and other conditions and should not be construed as a recommendation. Past performance is no guarantee of future results. Current and future portfolio holdings are subject to risk.
1 The S&P Developed SmallCap Index tracks the performance of small-capitalization stocks in 22 countries. Index returns do not reflect fees or expenses and it is not possible to invest directly in an index.
2 Consumer staples are the industries that manufacture and sell products such as food and beverages, prescription drugs and household products.
3 "Overweight" means that the Fund holds a higher weighting in a given sector or stock compared with its benchmark index."Underweight" means that the Fund holds a lower weighting in a given sector or stock.
4 Contribution incorporates both a stock’s total return and its weighting in the Fund.
* Not held in the portfolio as of December 31, 2014.
Portfolio Summary (Unaudited) Asset Allocation (As a % of Investment Portfolio excluding Securities Lending Collateral) | 12/31/14 | 12/31/13 |
| | | |
| Common Stocks | 95% | 99% |
| Cash Equivalents | 5% | 1% |
| | 100% | 100% |
Geographical Diversification (As a % of Investment Portfolio excluding Cash Equivalents and Securities Lending Collateral) | 12/31/14 | 12/31/13 |
| | | |
| United States | 47% | 44% |
| Continental Europe | 16% | 18% |
| United Kingdom | 13% | 14% |
| Asia (excluding Japan) | 10% | 11% |
| Japan | 8% | 8% |
| Canada | 3% | 2% |
| Latin America | 1% | 1% |
| Australia | 1% | 0% |
| Other | 1% | 2% |
| | 100% | 100% |
Sector Diversification (As a % of Investment Portfolio excluding Cash Equivalents and Securities Lending Collateral) | 12/31/14 | 12/31/13 |
| | | |
| Consumer Discretionary | 25% | 23% |
| Industrials | 24% | 25% |
| Financials | 15% | 17% |
| Health Care | 14% | 14% |
| Information Technology | 10% | 10% |
| Consumer Staples | 8% | 6% |
| Energy | 3% | 4% |
| Materials | 1% | 1% |
| | 100% | 100% |
Portfolio holdings and characteristics are subject to change.
For more complete details about the Fund's investment portfolio, see page 6.
Following the Fund's fiscal first and third quarter-end, a complete portfolio holdings listing is filed with the SEC on Form N-Q. The form will be available on the SEC's Web site at sec.gov, and it also may be reviewed and copied at the SEC's Public Reference Room in Washington, D.C. Information on the operation of the SEC's Public Reference Room may be obtained by calling (800) SEC-0330. The Fund's portfolio holdings are also posted on deutschefunds.com from time to time. Please see the Fund's current prospectus for more information.
Investment Portfolio December 31, 2014 | | | Shares | | | Value ($) | |
| | | | |
| Common Stocks 94.8% | |
| Australia 0.5% | |
| Austal Ltd.* (Cost $696,239) | | | 541,414 | | | | 662,173 | |
| Bermuda 1.1% | |
| Lazard Ltd. "A" (a) (Cost $731,238) | | | 29,292 | | | | 1,465,479 | |
| Canada 2.7% | |
| Quebecor, Inc. "B" | | | 69,468 | | | | 1,909,802 | |
| SunOpta, Inc.* | | | 153,983 | | | | 1,824,699 | |
| (Cost $2,634,775) | | | | 3,734,501 | |
| China 1.1% | |
| Minth Group Ltd. (Cost $253,136) | | | 735,349 | | | | 1,516,630 | |
| Cyprus 0.5% | |
| Prosafe SE (Cost $1,575,775) | | | 211,552 | | | | 647,245 | |
| Finland 0.6% | |
| Cramo Oyj (Cost $1,182,847) | | | 54,410 | | | | 795,154 | |
| France 2.1% | |
| Flamel Technologies SA (ADR)* | | | 98,152 | | | | 1,681,344 | |
| JC Decaux SA | | | 34,309 | | | | 1,178,146 | |
| (Cost $1,431,524) | | | | 2,859,490 | |
| Germany 4.9% | |
| M.A.X. Automation AG | | | 153,246 | | | | 781,898 | |
| Patrizia Immobilien AG | | | 75,850 | | | | 1,118,678 | |
| Rational AG | | | 3,657 | | | | 1,149,375 | |
| United Internet AG (Registered) | | | 57,417 | | | | 2,603,748 | |
| Vib Vermoegen AG | | | 64,037 | | | | 1,097,847 | |
| (Cost $3,126,391) | | | | 6,751,546 | |
| Hong Kong 4.1% | |
| K Wah International Holdings Ltd. | | | 2,474,090 | | | | 1,309,832 | |
| Playmates Toys Ltd. | | | 3,153,522 | | | | 668,117 | |
| REXLot Holdings Ltd. | | | 15,076,429 | | | | 1,197,890 | |
| Sun Hung Kai & Co., Ltd. (b) | | | 1,302,026 | | | | 993,059 | |
| Techtronic Industries Co., Ltd. | | | 454,179 | | | | 1,455,503 | |
| (Cost $4,146,689) | | | | 5,624,401 | |
| Indonesia 0.7% | |
| PT Arwana Citramulia Tbk (Cost $901,457) | | | 13,160,709 | | | | 917,839 | |
| Ireland 3.2% | |
| Greencore Group PLC | | | 227,537 | | | | 1,007,049 | |
| Paddy Power PLC (c) | | | 16,940 | | | | 1,410,098 | |
| Paddy Power PLC (c) | | | 409 | | | | 33,448 | |
| Ryanair Holdings PLC* | | | 172,074 | | | | 2,039,423 | |
| (Cost $1,651,790) | | | | 4,490,018 | |
| Italy 0.7% | |
| Prysmian SpA (Cost $1,091,058) | | | 56,545 | | | | 1,029,187 | |
| Japan 7.5% | |
| Ai Holdings Corp. | | | 72,317 | | | | 1,276,826 | |
| Avex Group Holdings, Inc. | | | 73,692 | | | | 1,207,549 | |
| Kusuri No Aoki Co., Ltd. | | | 44,895 | | | | 2,441,031 | |
| MISUMI Group, Inc. | | | 28,358 | | | | 931,486 | |
| Nippon Seiki Co., Ltd. | | | 101,964 | | | | 2,299,293 | |
| United Arrows Ltd. | | | 28,757 | | | | 804,215 | |
| | | Shares | | | Value ($) | |
| | | | | | | | | |
| Universal Entertainment Corp. (b) | | | 50,014 | | | | 746,235 | |
| UT Holdings Co., Ltd. | | | 140,224 | | | | 595,161 | |
| (Cost $7,296,372) | | | | 10,301,796 | |
| Malaysia 1.1% | |
| Hartalega Holdings Bhd. | | | 497,544 | | | | 996,310 | |
| Tune Ins Holdings Bhd. | | | 1,232,521 | | | | 594,185 | |
| (Cost $1,234,462) | | | | 1,590,495 | |
| Netherlands 2.5% | |
| Brunel International NV | | | 43,398 | | | | 711,235 | |
| Constellium NV "A"* (d) | | | 98,875 | | | | 1,624,516 | |
| SBM Offshore NV* (b) | | | 88,952 | | | | 1,054,848 | |
| (Cost $4,231,099) | | | | 3,390,599 | |
| Panama 0.8% | |
| Banco Latinoamericano de Comercio Exterior SA "E" (Cost $925,589) | | | 38,354 | | | | 1,154,455 | |
| Philippines 0.8% | |
| Alliance Global Group, Inc. (Cost $656,182) | | | 2,172,150 | | | | 1,084,139 | |
| Singapore 0.9% | |
| Lian Beng Group Ltd. (Cost $974,223) | | | 2,828,193 | | | | 1,290,810 | |
| Switzerland 1.0% | |
| Dufry AG (Registered)* (b) (Cost $1,062,095) | | | 9,129 | | | | 1,353,287 | |
| Taiwan 0.6% | |
| Kinpo Electronics, Inc.* (Cost $743,413) | | | 1,851,124 | | | | 851,259 | |
| Thailand 0.4% | |
| Malee Sampran PCL (Foreign Registered) (Cost $998,514) | | | 613,080 | | | | 512,453 | |
| United Kingdom 12.6% | |
| Arrow Global Group PLC | | | 363,026 | | | | 1,279,957 | |
| Babcock International Group PLC | | | 129,548 | | | | 2,119,528 | |
| Clinigen Healthcare Ltd. | | | 102,427 | | | | 838,673 | |
| Crest Nicholson Holdings PLC | | | 228,740 | | | | 1,377,716 | |
| Domino's Pizza Group PLC | | | 96,305 | | | | 1,054,058 | |
| Hargreaves Lansdown PLC | | | 69,349 | | | | 1,081,269 | |
| HellermannTyton Group PLC | | | 237,370 | | | | 1,160,611 | |
| Howden Joinery Group PLC | | | 221,622 | | | | 1,378,064 | |
| IG Group Holdings PLC | | | 109,476 | | | | 1,220,223 | |
| Jardine Lloyd Thompson Group PLC | | | 55,096 | | | | 764,296 | |
| John Wood Group PLC | | | 81,162 | | | | 746,479 | |
| Monitise PLC* (b) | | | 778,867 | | | | 302,766 | |
| Nanoco Group PLC* | | | 382,198 | | | | 867,391 | |
| Polypipe Group PLC | | | 306,543 | | | | 1,174,726 | |
| Rotork PLC | | | 28,212 | | | | 1,015,216 | |
| Spirax-Sarco Engineering PLC | | | 21,443 | | | | 952,938 | |
| (Cost $12,932,224) | | | | 17,333,911 | |
| United States 44.4% | |
| Advance Auto Parts, Inc. | | | 10,804 | | | | 1,720,861 | |
| Affiliated Managers Group, Inc.* | | | 7,575 | | | | 1,607,718 | |
| Altra Industrial Motion Corp. | | | 24,102 | | | | 684,256 | |
| BE Aerospace, Inc.* | | | 12,747 | | | | 739,581 | |
| | | Shares | | | Value ($) | |
| | | | | | | | | |
| Cancer Genetics, Inc.* | | | 30,760 | | | | 205,477 | |
| Cardtronics, Inc.* | | | 36,954 | | | | 1,425,685 | |
| Casey's General Stores, Inc. | | | 18,483 | | | | 1,669,385 | |
| Cognex Corp.* | | | 22,207 | | | | 917,815 | |
| CONMED Corp. | | | 21,566 | | | | 969,607 | |
| DigitalGlobe, Inc.* | | | 30,247 | | | | 936,750 | |
| Encore Capital Group, Inc.* | | | 35,373 | | | | 1,570,561 | |
| Fox Factory Holding Corp.* | | | 80,139 | | | | 1,300,656 | |
| Gentherm, Inc.* | | | 36,575 | | | | 1,339,376 | |
| Hain Celestial Group, Inc.* | | | 19,416 | | | | 1,131,759 | |
| HeartWare International, Inc.* | | | 12,342 | | | | 906,273 | |
| Jack in the Box, Inc. | | | 21,093 | | | | 1,686,596 | |
| Jarden Corp.* (b) | | | 30,002 | | | | 1,436,472 | |
| Kindred Healthcare, Inc. (b) | | | 59,137 | | | | 1,075,111 | |
| KLX, Inc.* | | | 1 | | | | 21 | |
| Leucadia National Corp. | | | 49,500 | | | | 1,109,790 | |
| Manitowoc Co., Inc. (b) | | | 48,895 | | | | 1,080,579 | |
| Middleby Corp.* | | | 18,754 | | | | 1,858,521 | |
| Molina Healthcare, Inc.* (b) | | | 35,391 | | | | 1,894,480 | |
| Oil States International, Inc.* | | | 17,975 | | | | 878,978 | |
| Pacific Ethanol, Inc.* (b) | | | 58,693 | | | | 606,299 | |
| Pacira Pharmaceuticals, Inc.* | | | 14,692 | | | | 1,302,593 | |
| PAREXEL International Corp.* | | | 23,928 | | | | 1,329,440 | |
| Primoris Services Corp. | | | 54,074 | | | | 1,256,680 | |
| Providence Service Corp.* | | | 47,675 | | | | 1,737,277 | |
| PTC, Inc.* | | | 27,410 | | | | 1,004,576 | |
| Retrophin, Inc.* | | | 69,233 | | | | 847,412 | |
| Roadrunner Transportation Systems, Inc.* | | | 38,048 | | | | 888,421 | |
| Sinclair Broadcast Group, Inc. "A" | | | 45,498 | | | | 1,244,825 | |
| Sunshine Heart, Inc.* | | | 131,907 | | | | 559,286 | |
| Tenneco, Inc.* | | | 27,225 | | | | 1,541,207 | |
| The WhiteWave Foods Co.* | | | 37,668 | | | | 1,318,003 | |
| Thoratec Corp.* | | | 47,072 | | | | 1,527,957 | |
| TiVo, Inc.* | | | 79,937 | | | | 946,454 | |
| TriNet Group, Inc.* | | | 46,336 | | | | 1,449,390 | |
| TriState Capital Holdings, Inc.* | | | 67,982 | | | | 696,136 | |
| Ultra Clean Holdings, Inc.* | | | 95,973 | | | | 890,629 | |
| United Rentals, Inc.* | | | 17,895 | | | | 1,825,469 | |
| Urban Outfitters, Inc.* | | | 36,282 | | | | 1,274,587 | |
| | | Shares | | | Value ($) | |
| | | | | | | | | |
| VeriFone Systems, Inc.* | | | 43,467 | | | | 1,616,972 | |
| WABCO Holdings, Inc.* | | | 16,086 | | | | 1,685,491 | |
| Waddell & Reed Financial, Inc. "A" | | | 29,772 | | | | 1,483,241 | |
| WageWorks, Inc.* | | | 18,592 | | | | 1,200,485 | |
| Zeltiq Aesthetics, Inc.* | | | 101,877 | | | | 2,843,387 | |
| Zions Bancorp. | | | 40,070 | | | | 1,142,396 | |
| Zoe's Kitchen, Inc.* | | | 24,012 | | | | 718,199 | |
| (Cost $42,668,497) | | | | 61,083,120 | |
Total Common Stocks (Cost $93,145,589) | | | | 130,439,987 | |
| | |
| Rights 0.1% | |
| United States | |
| Furiex Pharmaceuticals, Inc.* (Cost $104,334) | | | 10,679 | | | | 104,334 | |
| | |
| Warrants 0.0% | |
| Malaysia | |
| Hartalega Holdings Bhd., Expiration Date 5/29/2015* (Cost $0) | | | 68,733 | | | | 52,683 | |
| | |
| Securities Lending Collateral 5.7% | |
| Daily Assets Fund Institutional, 0.10% (e) (f) (Cost $7,866,134) | | | 7,866,134 | | | | 7,866,134 | |
| | |
| Cash Equivalents 4.9% | |
| Central Cash Management Fund, 0.06% (e) (Cost $6,657,330) | | | 6,657,330 | | | | 6,657,330 | |
| | | % of Net Assets | | | Value ($) | |
| | | | |
Total Investment Portfolio (Cost $107,773,387)† | | | 105.5 | | | | 145,120,468 | |
| Other Assets and Liabilities, Net | | | (5.5 | ) | | | (7,571,281 | ) |
| Net Assets | | | 100.0 | | | | 137,549,187 | |
* Non-income producing security.
† The cost for federal income tax purposes was $110,045,849. At December 31, 2014, net unrealized appreciation for all securities based on tax cost was $35,074,619. This consisted of aggregate gross unrealized appreciation for all securities in which there was an excess of value over tax cost of $44,815,773 and aggregate gross unrealized depreciation for all securities in which there was an excess of tax cost over value of $9,741,154.
(a) Listed on the NASDAQ Stock Market, Inc.
(b) All or a portion of these securities were on loan. In addition, "Other Assets and Liabilities, Net" may include pending sales that are also on loan. The value of securities loaned at December 31, 2014 amounted to $7,494,770, which is 5.4% of net assets.
(c) Securities with the same description are the same corporate entity but trade on different stock exchanges.
(d) Listed on the New York Stock Exchange.
(e) Affiliated fund managed by Deutsche Investment Management Americas Inc. The rate shown is the annualized seven-day yield at period end.
(f) Represents collateral held in connection with securities lending. Income earned by the Fund is net of borrower rebates.
ADR: American Depositary Receipt
Fair Value Measurements
Various inputs are used in determining the value of the Fund's investments. These inputs are summarized in three broad levels. Level 1 includes quoted prices in active markets for identical securities. Level 2 includes other significant observable inputs (including quoted prices for similar securities, interest rates, prepayment speeds and credit risk). Level 3 includes significant unobservable inputs (including the Fund's own assumptions in determining the fair value of investments). The level assigned to the securities valuations may not be an indication of the risk or liquidity associated with investing in those securities.
The following is a summary of the inputs used as of December 31, 2014 in valuing the Fund's investments. For information on the Fund's policy regarding the valuation of investments, please refer to the Security Valuation section of Note A in the accompanying Notes to Financial Statements.
| Assets | | Level 1 | | | Level 2 | | | Level 3 | | | Total | |
| | |
| Common Stocks, Rights & Warrants | |
| Australia | | $ | — | | | $ | 662,173 | | | $ | — | | | $ | 662,173 | |
| Bermuda | | | 1,465,479 | | | | — | | | | — | | | | 1,465,479 | |
| Canada | | | 3,734,501 | | | | — | | | | — | | | | 3,734,501 | |
| China | | | — | | | | 1,516,630 | | | | — | | | | 1,516,630 | |
| Cyprus | | | — | | | | 647,245 | | | | — | | | | 647,245 | |
| Finland | | | — | | | | 795,154 | | | | — | | | | 795,154 | |
| France | | | 1,681,344 | | | | 1,178,146 | | | | — | | | | 2,859,490 | |
| Germany | | | — | | | | 6,751,546 | | | | — | | | | 6,751,546 | |
| Hong Kong | | | — | | | | 5,624,401 | | | | — | | | | 5,624,401 | |
| Indonesia | | | — | | | | 917,839 | | | | — | | | | 917,839 | |
| Ireland | | | — | | | | 4,490,018 | | | | — | | | | 4,490,018 | |
| Italy | | | — | | | | 1,029,187 | | | | — | | | | 1,029,187 | |
| Japan | | | — | | | | 10,301,796 | | | | — | | | | 10,301,796 | |
| Malaysia | | | — | | | | 1,643,178 | | | | — | | | | 1,643,178 | |
| Netherlands | | | 1,624,516 | | | | 1,766,083 | | | | — | | | | 3,390,599 | |
| Panama | | | 1,154,455 | | | | — | | | | — | | | | 1,154,455 | |
| Philippines | | | — | | | | 1,084,139 | | | | — | | | | 1,084,139 | |
| Singapore | | | — | | | | 1,290,810 | | | | — | | | | 1,290,810 | |
| Switzerland | | | — | | | | 1,353,287 | | | | — | | | | 1,353,287 | |
| Taiwan | | | — | | | | 851,259 | | | | — | | | | 851,259 | |
| Thailand | | | — | | | | 512,453 | | | | — | | | | 512,453 | |
| United Kingdom | | | — | | | | 17,333,911 | | | | — | | | | 17,333,911 | |
| United States | | | 61,083,120 | | | | — | | | | 104,334 | | | | 61,187,454 | |
| Short-Term Investments (g) | | | 14,523,464 | | | | — | | | | — | | | | 14,523,464 | |
| Total | | $ | 85,266,879 | | | $ | 59,749,255 | | | $ | 104,334 | | | $ | 145,120,468 | |
There have been no transfers between fair value measurement levels during the year ended December 31, 2014.
(g) See Investment Portfolio for additional detailed categorizations.
The accompanying notes are an integral part of the financial statements.
Statement of Assets and Liabilities | as of December 31, 2014 | |
| Assets | |
Investments: Investments in non-affiliated securities, at value (cost $93,249,923) — including $7,494,770 of securities loaned | | $ | 130,597,004 | |
| Investment in Daily Assets Fund Institutional (cost $7,866,134)* | | | 7,866,134 | |
| Investment in Central Cash Management Fund (cost $6,657,330) | | | 6,657,330 | |
| Total investments in securities, at value (cost $107,773,387) | | | 145,120,468 | |
| Cash | | | 57 | |
| Foreign currency, at value (cost $242,853) | | | 238,902 | |
| Receivable for investments sold | | | 77,264 | |
| Receivable for Fund shares sold | | | 36,208 | |
| Dividends receivable | | | 48,527 | |
| Interest receivable | | | 4,955 | |
| Foreign taxes recoverable | | | 98,344 | |
| Other assets | | | 2,678 | |
| Total assets | | | 145,627,403 | |
| Liabilities | |
| Payable upon return of securities loaned | | | 7,866,134 | |
| Payable for Fund shares redeemed | | | 12,375 | |
| Accrued management fee | | | 83,778 | |
| Accrued Trustees' fees | | | 1,976 | |
| Other accrued expenses and payables | | | 113,953 | |
| Total liabilities | | | 8,078,216 | |
| Net assets, at value | | $ | 137,549,187 | |
| Net Assets Consist of | |
| Distributions in excess of net investment income | | | (353,727 | ) |
Net unrealized appreciation (depreciation) on: Investments | | | 37,347,081 | |
| Foreign currency | | | (10,316 | ) |
| Accumulated net realized gain (loss) | | | 13,491,856 | |
| Paid-in capital | | | 87,074,293 | |
| Net assets, at value | | $ | 137,549,187 | |
Class A Net Asset Value, offering and redemption price per share ($134,772,460 ÷ 9,224,528 outstanding shares of beneficial interest, $.01 par value, unlimited number of shares authorized) | | $ | 14.61 | |
Class B Net Asset Value, offering and redemption price per share ($2,776,727 ÷ 194,372 outstanding shares of beneficial interest, $.01 par value, unlimited number of shares authorized) | | $ | 14.29 | |
* Represents collateral on securities loaned.
The accompanying notes are an integral part of the financial statements.
Statement of Operations
| for the year ended December 31, 2014 | |
| Investment Income | |
Income: Dividends (net of foreign taxes withheld of $76,694) | | $ | 1,789,603 | |
| Income distributions — Central Cash Management Fund | | | 2,209 | |
| Securities lending income, including income from Daily Assets Fund Institutional, net of borrower rebates | | | 65,677 | |
| Total income | | | 1,857,489 | |
Expenses: Management fee | | | 1,329,782 | |
| Administration fee | | | 149,414 | |
| Services to shareholders | | | 1,876 | |
| Distribution service fee (Class B) | | | 7,270 | |
| Record keeping fee (Class B) | | | 698 | |
| Custodian fee | | | 67,184 | |
| Professional fees | | | 75,442 | |
| Reports to shareholders | | | 33,155 | |
| Trustees' fees and expenses | | | 7,680 | |
| Other | | | 27,059 | |
| Total expenses before expense reductions | | | 1,699,560 | |
| Expense reductions | | | (237,192 | ) |
| Total expenses after expense reductions | | | 1,462,368 | |
| Net investment income (loss) | | | 395,121 | |
| Realized and Unrealized Gain (Loss) | |
Net realized gain (loss) from: Investments | | | 14,213,645 | |
| Foreign currency | | | (31,655 | ) |
| | | | 14,181,990 | |
Change in net unrealized appreciation (depreciation) on: Investments | | | (20,720,996 | ) |
| Foreign currency | | | (15,959 | ) |
| | | | (20,736,955 | ) |
| Net gain (loss) | | | (6,554,965 | ) |
| Net increase (decrease) in net assets resulting from operations | | $ | (6,159,844 | ) |
The accompanying notes are an integral part of the financial statements.
Statement of Changes in Net Assets | | | Years Ended December 31, | |
| Increase (Decrease) in Net Assets | | 2014 | | | 2013 | |
Operations: Net investment income (loss) | | $ | 395,121 | | | $ | 392,707 | |
| Net realized gain (loss) | | | 14,181,990 | | | | 17,021,484 | |
| Change in net unrealized appreciation (depreciation) | | | (20,736,955 | ) | | | 25,576,735 | |
| Net increase (decrease) in net assets resulting from operations | | | (6,159,844 | ) | | | 42,990,926 | |
Distributions to shareholders from: Net investment income: Class A | | | (1,278,879 | ) | | | (881,158 | ) |
| Class B | | | (17,935 | ) | | | (8,337 | ) |
Net realized gains: Class A | | | (16,572,319 | ) | | | (9,356,181 | ) |
| Class B | | | (315,539 | ) | | | (145,558 | ) |
| Total distributions | | | (18,184,672 | ) | | | (10,391,234 | ) |
Fund share transactions: Class A Proceeds from shares sold | | | 5,579,529 | | | | 7,422,087 | |
| Reinvestment of distributions | | | 17,851,198 | | | | 10,237,339 | |
| Payments for shares redeemed | | | (18,702,818 | ) | | | (19,526,673 | ) |
| Net increase (decrease) in net assets from Class A share transactions | | | 4,727,909 | | | | (1,867,247 | ) |
Class B Proceeds from shares sold | | | 1,189,539 | | | | 496,180 | |
| Reinvestment of distributions | | | 333,474 | | | | 153,895 | |
| Payments for redeemed | | | (885,837 | ) | | | (384,768 | ) |
| Net increase (decrease) in net assets from Class B share transactions | | | 637,176 | | | | 265,307 | |
| Increase (decrease) in net assets | | | (18,979,431 | ) | | | 30,997,752 | |
| Net assets at beginning of period | | | 156,528,618 | | | | 125,530,866 | |
| Net assets at end of period (including distributions in excess of net investment income and undistributed net investment income of $353,727 and $347,385, respectively) | | $ | 137,549,187 | | | $ | 156,528,618 | |
| Other Information | |
Class A Shares outstanding at beginning of period | | | 8,893,756 | | | | 8,977,791 | |
| Shares sold | | | 350,707 | | | | 479,388 | |
| Shares issued to shareholders in reinvestment of distributions | | | 1,182,981 | | | | 718,410 | |
| Shares redeemed | | | (1,202,916 | ) | | | (1,281,833 | ) |
| Net increase (decrease) in Class A shares | | | 330,772 | | | | (84,035 | ) |
| Shares outstanding at end of period | | | 9,224,528 | | | | 8,893,756 | |
Class B Shares outstanding at beginning of period | | | 154,023 | | | | 136,607 | |
| Shares sold | | | 77,557 | | | | 32,424 | |
| Shares issued to shareholders in reinvestment of distributions | | | 22,563 | | | | 11,000 | |
| Shares redeemed | | | (59,771 | ) | | | (26,008 | ) |
| Net increase (decrease) in Class B shares | | | 40,349 | | | | 17,416 | |
| Shares outstanding at end of period | | | 194,372 | | | | 154,023 | |
The accompanying notes are an integral part of the financial statements.
Financial Highlights
| | | Years Ended December 31, | |
| Class A | | | 2014 | | | 2013 | | | 2012 | | | 2011 | | | 2010 | |
| Selected Per Share Data | |
| Net asset value, beginning of period | | $ | 17.31 | | | $ | 13.78 | | | $ | 12.67 | | | $ | 14.28 | | | $ | 11.32 | |
Income (loss) from investment operations: Net investment income (loss)a | | | .04 | | | | .04 | | | | .09 | | | | .08 | | | | .05 | |
| Net realized and unrealized gain (loss) | | | (.69 | ) | | | 4.66 | | | | 1.83 | | | | (1.45 | ) | | | 2.96 | |
| Total from investment operations | | | (.65 | ) | | | 4.70 | | | | 1.92 | | | | (1.37 | ) | | | 3.01 | |
Less distributions from: Net investment income | | | (.15 | ) | | | (.10 | ) | | | (.09 | ) | | | (.24 | ) | | | (.05 | ) |
| Net realized gains | | | (1.90 | ) | | | (1.07 | ) | | | (.72 | ) | | | — | | | | — | |
| Total distributions | | | (2.05 | ) | | | (1.17 | ) | | | (.81 | ) | | | (.24 | ) | | | (.05 | ) |
| Net asset value, end of period | | $ | 14.61 | | | $ | 17.31 | | | $ | 13.78 | | | $ | 12.67 | | | $ | 14.28 | |
Total Return (%)b | | | (4.13 | ) | | | 35.94 | | | | 15.37 | | | | (9.90 | ) | | | 26.64 | |
| Ratios to Average Net Assets and Supplemental Data | |
| Net assets, end of period ($ millions) | | | 135 | | | | 154 | | | | 124 | | | | 123 | | | | 158 | |
| Ratio of expenses before expense reductions (%) | | | 1.13 | | | | 1.14 | | | | 1.11 | | | | 1.12 | | | | 1.12 | |
| Ratio of expenses after expense reductions (%) | | | .97 | | | | .94 | | | | .98 | | | | 1.00 | | | | 1.04 | |
| Ratio of net investment income (loss) (%) | | | .27 | | | | .28 | | | | .69 | | | | .57 | | | | .42 | |
| Portfolio turnover rate (%) | | | 33 | | | | 39 | | | | 36 | | | | 31 | | | | 39 | |
a Based on average shares outstanding during the period. b Total return would have been lower had certain expenses not been reduced. | |
| | | Years Ended December 31, | |
| Class B | | | 2014 | | | 2013 | | | 2012 | | | 2011 | | | 2010 | |
| Selected Per Share Data | |
| Net asset value, beginning of period | | $ | 16.97 | | | $ | 13.52 | | | $ | 12.45 | | | $ | 14.03 | | | $ | 11.11 | |
Income (loss) from investment operations: Net investment income (loss)a | | | .00 | * | | | .01 | | | | .06 | | | | .05 | | | | .03 | |
| Net realized and unrealized gain (loss) | | | (.67 | ) | | | 4.57 | | | | 1.79 | | | | (1.43 | ) | | | 2.90 | |
| Total from investment operations | | | (.67 | ) | | | 4.58 | | | | 1.85 | | | | (1.38 | ) | | | 2.93 | |
Less distributions from: Net investment income | | | (.11 | ) | | | (.06 | ) | | | (.06 | ) | | | (.20 | ) | | | (.01 | ) |
| Net realized gains | | | (1.90 | ) | | | (1.07 | ) | | | (.72 | ) | | | — | | | | — | |
| Total distributions | | | (2.01 | ) | | | (1.13 | ) | | | (.78 | ) | | | (.20 | ) | | | (.01 | ) |
| Net asset value, end of period | | $ | 14.29 | | | $ | 16.97 | | | $ | 13.52 | | | $ | 12.45 | | | $ | 14.03 | |
Total Return (%)b | | | (4.33 | ) | | | 35.67 | | | | 15.01 | | | | (10.08 | ) | | | 26.38 | |
| Ratios to Average Net Assets and Supplemental Data | |
| Net assets, end of period ($ millions) | | | 3 | | | | 3 | | | | 2 | | | | 2 | | | | 2 | |
| Ratio of expenses before expense reductions (%) | | | 1.41 | | | | 1.34 | | | | 1.43 | | | | 1.38 | | | | 1.34 | |
| Ratio of expenses after expense reductions (%) | | | 1.25 | | | | 1.15 | | | | 1.23 | | | | 1.25 | | | | 1.26 | |
| Ratio of net investment income (loss) (%) | | | .02 | | | | .07 | | | | .44 | | | | .32 | | | | .20 | |
| Portfolio turnover rate (%) | | | 33 | | | | 39 | | | | 36 | | | | 31 | | | | 39 | |
a Based on average shares outstanding during the period. b Total return would have been lower had certain expenses not been reduced. * Amount is less than $.005. | |
Notes to Financial Statements
A. Organization and Significant Accounting Policies
Deutsche Variable Series I (formerly DWS Variable Series I) (the "Series") is registered under the Investment Company Act of 1940, as amended (the "1940 Act"), as an open-end, registered management investment company organized as a Massachusetts business trust. The Series consists of five diversified funds: Deutsche Bond VIP, Deutsche Core Equity VIP, Deutsche Capital Growth VIP, Deutsche Global Small Cap VIP and Deutsche International VIP (individually or collectively hereinafter referred to as a "Fund" or the "Funds" and formerly known as DWS Bond VIP, DWS Core Equity VIP, DWS Capital Growth VIP, DWS Global Small Cap Growth VIP and DWS International VIP, respectively). These financial statements report on Deutsche Global Small Cap VIP. The Series is intended to be the underlying investment vehicle for variable annuity contracts and variable life insurance policies to be offered by the separate accounts of certain life insurance companies ("Participating Insurance Companies").
Multiple Classes of Shares of Beneficial Interest. The Fund offers two classes of shares (Class A shares and Class B shares). Class B shares are subject to Rule 12b-1 distribution fees under the 1940 Act and recordkeeping fees equal to an annual rate of 0.25% and up to 0.15%, respectively, of the average daily net assets of the Class B shares of the Fund. Class A shares are not subject to such fees.
Investment income, realized and unrealized gains and losses, and certain fund-level expenses and expense reductions, if any, are borne pro rata on the basis of relative net assets by the holders of all classes of shares, except that each class bears certain expenses unique to that class (including the applicable 12b-1 distribution fees). Differences in class-level expenses may result in payment of different per share dividends by class. All shares have equal rights with respect to voting subject to class-specific arrangements.
The Fund's financial statements are prepared in accordance with accounting principles generally accepted in the United States of America, which require the use of management estimates. Actual results could differ from those estimates. The policies described below are followed consistently by the Fund in the preparation of its financial statements.
Security Valuation. Investments are stated at value determined as of the close of regular trading on the New York Stock Exchange on each day the exchange is open for trading.
Various inputs are used in determining the value of the Fund's investments. These inputs are summarized in three broad levels. Level 1 includes quoted prices in active markets for identical securities. Level 2 includes other significant observable inputs (including quoted prices for similar securities, interest rates, prepayment speeds and credit risk). Level 3 includes significant unobservable inputs (including the Fund's own assumptions in determining the fair value of investments). The level assigned to the securities valuations may not be an indication of the risk or liquidity associated with investing in those securities.
Equity securities are valued at the most recent sale price or official closing price reported on the exchange (U.S. or foreign) or over-the-counter market on which they trade. Securities for which no sales are reported are valued at the calculated mean between the most recent bid and asked quotations on the relevant market or, if a mean cannot be determined, at the most recent bid quotation. Equity securities are generally categorized as Level 1 securities. For certain international equity securities, in order to adjust for events which may occur between the close of the foreign exchanges and the close of the New York Stock Exchange, a fair valuation model may be used. This fair valuation model takes into account comparisons to the valuation of American Depository Receipts (ADRs), exchange-traded funds, futures contracts and certain indices and these securities are categorized as Level 2.
Investments in open-end investment companies are valued at their net asset value each business day and are categorized as Level 1.
Securities and other assets for which market quotations are not readily available or for which the above valuation procedures are deemed not to reflect fair value are valued in a manner that is intended to reflect their fair value as determined in accordance with procedures approved by the Trustees and are generally categorized as Level 3. In accordance with the Fund's valuation procedures, factors considered in determining value may include, but are not limited to, the type of the security; the size of the holding; the initial cost of the security; the existence of any contractual restrictions on the security's disposition; the price and extent of public trading in similar securities of the issuer or of comparable companies; quotations or evaluated prices from broker-dealers and/or pricing services; information obtained from the issuer, analysts, and/or the appropriate stock exchange (for exchange-traded securities); an analysis of the company's or issuer's financial statements; an evaluation of the forces that influence the issuer and the market(s) in which the security is purchased and sold; and with respect to debt securities, the maturity, coupon, creditworthiness, currency denomination and the movement of the market in which the security is normally traded. The value determined under these procedures may differ from published values for the same securities.
Disclosure about the classification of fair value measurements is included in a table following the Fund's Investment Portfolio.
Securities Lending. Deutsche Bank AG, as lending agent, lends securities of the Fund to certain financial institutions under the terms of the Security Lending Agreement. The Fund retains the benefits of owning the securities it has loaned and continues to receive interest and dividends generated by the securities and to participate in any changes in their market value. The Fund requires the borrowers of the securities to maintain collateral with the Fund consisting of either cash or liquid, unencumbered assets having a value at least equal to the value of the securities loaned. When the collateral falls below specified amounts, the lending agent will use its best effort to obtain additional collateral on the next business day to meet required amounts under the security lending agreement. The Fund may invest the cash collateral into a joint trading account in an affiliated money market fund pursuant to Exemptive Orders issued by the SEC. The Fund receives compensation for lending its securities either in the form of fees or by earning interest on invested cash collateral net of borrower rebates and fees paid to a lending agent. Either the Fund or the borrower may terminate the loan. There may be risks of delay and costs in recovery of securities or even loss of rights in the collateral should the borrower of the securities fail financially. If the Fund is not able to recover securities lent, the Fund may sell the collateral and purchase a replacement investment in the market, incurring the risk that the value of the replacement security is greater than the value of the collateral. The Fund is also subject to all investment risks associated with the reinvestment of any cash collateral received, including, but not limited to, interest rate, credit and liquidity risk associated with such investments.
As of December 31, 2014, the Fund had securities on loan. The value of the related collateral exceeded the value of the securities loaned at period end.
Foreign Currency Translations. The books and records of the Fund are maintained in U.S. dollars. Investment securities and other assets and liabilities denominated in a foreign currency are translated into U.S. dollars at the prevailing exchange rates at period end. Purchases and sales of investment securities, income and expenses are translated into U.S. dollars at the prevailing exchange rates on the respective dates of the transactions.
Net realized and unrealized gains and losses on foreign currency transactions represent net gains and losses between trade and settlement dates on securities transactions, the acquisition and disposition of foreign currencies, and the difference between the amount of net investment income accrued and the U.S. dollar amount actually received. That portion of both realized and unrealized gains and losses on investments that results from fluctuations in foreign currency exchange rates is not separately disclosed but is included with net realized and unrealized gain/appreciation and loss/depreciation on investments.
Taxes. The Fund is treated as a separate taxpayer as provided for in the Internal Revenue Code, as amended. It is the Fund's policy to comply with the requirements of the Internal Revenue Code, as amended, which are applicable to regulated investment companies, and to distribute all of its taxable income to the separate accounts of the Participating Insurance Companies which hold its shares.
Additionally, the Fund may be subject to taxes imposed by the governments of countries in which it invests and are generally based on income and/or capital gains earned or repatriated. Estimated tax liabilities on certain foreign securities are recorded on an accrual basis and are reflected as components of interest income or net change in unrealized gain/loss on investments. Tax liabilities realized as a result of security sales are reflected as a component of net realized gain/loss on investments.
The Fund has reviewed the tax positions for the open tax years as of December 31, 2014 and has determined that no provision for income tax and/or uncertain tax provisions is required in the Fund's financial statements. The Fund's federal tax returns for the prior three fiscal years remain open subject to examination by the Internal Revenue Service.
Distribution of Income and Gains. Distributions from net investment income of the Fund, if any, are declared and distributed to shareholders annually. Net realized gains from investment transactions, in excess of available capital loss carryforwards, would be taxable to the Fund if not distributed, and, therefore, will be distributed to shareholders at least annually. The Fund may also make additional distributions for tax purposes if necessary.
The timing and characterization of certain income and capital gain distributions are determined annually in accordance with federal tax regulations which may differ from accounting principles generally accepted in the United States of America. These differences primarily relate to income received from passive foreign investment companies and certain securities sold at a loss. As a result, net investment income (loss) and net realized gain (loss) on investment transactions for a reporting period may differ significantly from distributions during such period. Accordingly, the Fund may periodically make reclassifications among certain of its capital accounts without impacting the net asset value of the Fund.
At December 31, 2014, the Fund's components of distributable earnings (accumulated losses) on a tax basis are as follows:
| Undistributed ordinary income* | | $ | 1,265,158 | |
| Undistributed long-term capital gains | | $ | 14,142,577 | |
| Net unrealized appreciation (depreciation) on investments | | $ | 35,074,619 | |
In addition, the tax character of distributions paid to shareholders by the Fund is summarized as follows:
| | | Years Ended December 31, | |
| | | 2014 | | | 2013 | |
| Distributions from ordinary Income* | | $ | 2,266,228 | | | $ | 889,495 | |
| Distributions from long-term capital gains | | $ | 15,918,444 | | | $ | 9,501,739 | |
* For tax purposes, short-term capital gain distributions are considered ordinary income distributions.
Expenses. Expenses of the Series arising in connection with a specific Fund are allocated to that Fund. Other Series expenses which cannot be directly attributed to a Fund are apportioned among the Funds in the Series based upon the relative net assets or other appropriate measures.
Contingencies. In the normal course of business, the Fund may enter into contracts with service providers that contain general indemnification clauses. The Fund's maximum exposure under these arrangements is unknown as this would involve future claims that may be made against the Fund that have not yet been made. However, based on experience, the Fund expects the risk of loss to be remote.
Other. Investment transactions are accounted for on a trade date plus one basis for daily net asset value calculations. However, for financial reporting purposes, investment transactions are reported on trade date. Interest income is recorded on the accrual basis net of foreign withholding taxes. Dividend income is recorded on the ex-dividend date net of foreign withholding taxes. Certain dividends from foreign securities may be recorded subsequent to the ex-dividend date as soon as the Fund is informed of such dividends. Realized gains and losses from investment transactions are recorded on an identified cost basis. Proceeds from litigation payments, if any, are included in net realized gain (loss) from investments.
B. Purchases and Sales of Securities
During the year ended December 31, 2014, purchases and sales of investment securities (excluding short-term investments) aggregated $47,245,088 and $62,228,168, respectively.
C. Related Parties
Management Agreement. Under the Investment Management Agreement with Deutsche Investment Management Americas Inc. ("DIMA" or the "Advisor"), an indirect, wholly owned subsidiary of Deutsche Bank AG, the Advisor directs the investments of the Fund in accordance with its investment objectives, policies and restrictions. The Advisor determines the securities, instruments and other contracts relating to investments to be purchased, sold or entered into by the Fund.
Pursuant to the Investment Management Agreement with the Advisor, the Fund pays a monthly management fee based on the Fund's average daily net assets, computed and accrued daily and payable monthly, at the following annual rates:
| First $500 million of average daily net assets | | | .890 | % |
| Next $500 million of average daily net assets | | | .875 | % |
| Next $1 billion of average daily net assets | | | .860 | % |
| Over $2 billion of average daily net assets | | | .845 | % |
Accordingly, for the year ended December 31, 2014, the fee pursuant to the Investment Management agreement was equivalent to an annual rate (exclusive of any applicable waivers/reimbursements) of 0.89% of the Fund's average daily net assets.
For the period from January 1, 2014 through April 30, 2014, the Advisor had contractually agreed to waive all or a portion of its fees and/or reimburse certain operating expenses of the Fund to the extent necessary to maintain the total annual operating expenses (excluding certain expenses such as extraordinary expenses, taxes, brokerage and interest) of each class as follows:
For the period from May 1, 2014 through September 30, 2014, the Advisor had contractually agreed to waive all or a portion of its fees and/or reimburse certain operating expenses of the Fund to the extent necessary to maintain the total annual operating expenses (excluding certain expenses such as extraordinary expenses, taxes, brokerage and interest) of each class as follows:
Effective October 1, 2014 through September 30, 2015, the Advisor had contractually agreed to waive all or a portion of its fees and/or reimburse certain operating expenses of the Fund to the extent necessary to maintain the total annual operating expenses (excluding certain expenses such as extraordinary expenses, taxes, brokerage and interest) of each class as follows:
For the year ended December 31, 2014, fees waived and/or expenses reimbursed for each class are as follows:
| Class A | | $ | 232,584 | |
| Class B | | | 4,608 | |
| | | $ | 237,192 | |
Administration Fee. Pursuant to an Administrative Services Agreement, DIMA provides most administrative services to the Fund. For all services provided under the Administrative Services Agreement, the Fund pays the Advisor an annual fee ("Administration Fee") of 0.10% of the Fund's average daily net assets, computed and accrued daily and payable monthly. For the year ended December 31, 2014, the Administration Fee was $149,414, of which $11,612 is unpaid.
Service Provider Fees. DeAWM Service Company ("DSC"), an affiliate of the Advisor, is the transfer agent, dividend-paying agent and shareholder service agent for the Fund. Pursuant to a sub-transfer agency agreement between DSC and DST Systems, Inc. ("DST"), DSC has delegated certain transfer agent, dividend-paying agent and shareholder service agent functions to DST. DSC compensates DST out of the shareholder servicing fee it receives from the Fund. For the year ended December 31, 2014, the amounts charged to the Fund by DSC were as follows:
| Services to Shareholders | | Total Aggregated | | | Unpaid at December 31, 2014 | |
| Class A | | $ | 446 | | | $ | 76 | |
| Class B | | | 171 | | | | 32 | |
| | | $ | 617 | | | $ | 108 | |
Distribution Service Agreement. DeAWM Distributors, Inc. ("DDI"), also an affiliate of the Advisor, is the Series' Distributor. In accordance with the Master Distribution Plan, DDI receives 12b-1 fees of 0.25% of average daily net assets of Class B shares. Pursuant to the Master Distribution Plan, DDI remits these fees to the Participating Insurance Companies for various costs incurred or paid by these companies in connection with marketing and distribution of Class B shares. For the year ended December 31, 2014, the Distribution Service Fee aggregated $7,270, of which $585 is unpaid.
Typesetting and Filing Service Fees. Under an agreement with DIMA, DIMA is compensated for providing typesetting and certain regulatory filing services to the Fund. For the year ended December 31, 2014, the amount charged to the Fund by DIMA included in the Statement of Operations under "Reports to shareholders" aggregated $15,554, of which $4,410 is unpaid.
Trustees' Fees and Expenses. The Fund paid retainer fees to each Trustee not affiliated with the Advisor, plus specified amounts to the Board Chairperson and Vice Chairperson and to each committee Chairperson.
Affiliated Cash Management Vehicles. The Fund may invest uninvested cash balances in Central Cash Management Fund and Deutsche Variable NAV Money Fund, affiliated money market funds which are managed by the Advisor. Each affiliated money market fund seeks to provide a high level of current income consistent with liquidity and the preservation of capital. Each affiliated money market fund is managed in accordance with Rule 2a-7 under the Investment Company Act of 1940, which governs the quality, maturity, diversity and liquidity of instruments in which a money market fund may invest. Central Cash Management Fund seeks to maintain a stable net asset value, and Deutsche Variable NAV Money Fund maintains a floating net asset value. The Fund indirectly bears its proportionate share of the expenses of each affiliated money market fund in which it invests. Central Cash Management Fund does not pay the Advisor an investment management fee. To the extent that Deutsche Variable NAV Money Fund pays an investment management fee to the Advisor, the Advisor will waive an amount of the investment management fee payable to the Advisor by the Fund equal to the amount of the investment management fee payable on the Fund's assets invested in Deutsche Variable NAV Money Fund.
Securities Lending Agent Fees. Deutsche Bank AG serves as securities lending agent for the Fund. For the year ended December 31, 2014, the Fund incurred securities lending agent fees to Deutsche Bank AG in the amount of $5,757.
D. Ownership of the Fund
At December 31, 2014, four participating insurance companies were owners of record of 10% or more of the total outstanding Class A shares of the Fund, each owning 55%, 15%, 10% and 10%, respectively. Three participating insurance companies were owners of record of 10% or more of the total outstanding Class B shares of the Fund, each owning 69%, 24% and 11%, respectively.
E. Line of Credit
The Fund and other affiliated funds (the "Participants") share in a $400 million revolving credit facility provided by a syndication of banks. The Fund may borrow for temporary or emergency purposes, including the meeting of redemption requests that otherwise might require the untimely disposition of securities. The Participants are charged an annual commitment fee which is allocated based on net assets, among each of the Participants. Interest is calculated at a rate per annum equal to the sum of the Federal Funds Rate plus 1.25 percent plus if LIBOR exceeds the Federal Funds Rate the amount of such excess. The Fund may borrow up to a maximum of 33 percent of its net assets under the agreement. The Fund had no outstanding loans at December 31, 2014.
Report of Independent Registered Public Accounting Firm
To the Trustees of Deutsche Variable Series I and the Shareholders of Deutsche Global Small Cap VIP:
In our opinion, the accompanying statement of assets and liabilities, including the investment portfolio, and the related statements of operations and of changes in net assets and the financial highlights present fairly, in all material respects, the financial position of Deutsche Global Small Cap VIP (formerly DWS Global Small Cap Growth VIP) (the "Fund") at December 31, 2014 and the results of its operations, the changes in its net assets, and the financial highlights for the periods indicated therein, in conformity with accounting principles generally accepted in the United States of America. These financial statements and financial highlights (hereafter referred to as "financial statements") are the responsibility of the Fund's management. Our responsibility is to express an opinion on these financial statements based on our audits. We conducted our audits of these financial statements in accordance with the standards of the Public Company Accounting Oversight Board (United States). Those standards require that we plan and perform the audit to obtain reasonable assurance about whether the financial statements are free of material misstatement. An audit includes examining, on a test basis, evidence supporting the amounts and disclosures in the financial statements, assessing the accounting principles used and significant estimates made by management, and evaluating the overall financial statement presentation. We believe that our audits, which included confirmation of securities at December 31, 2014 by correspondence with the custodian, brokers and transfer agent, and the application of alternative auditing procedures where such confirmations had not been received, provide a reasonable basis for our opinion.
Boston, Massachusetts February 13, 2015 | PricewaterhouseCoopers LLP |
Information About Your Fund's Expenses (Unaudited)
As an investor of the Fund, you incur two types of costs: ongoing expenses and transaction costs. Ongoing expenses include management fees, distribution and service (12b-1) fees and other Fund expenses. Examples of transaction costs include contract charges, which are not shown in this section. The following tables are intended to help you understand your ongoing expenses (in dollars) of investing in the Fund and to help you compare these expenses with the ongoing expenses of investing in other mutual funds. In the most recent six-month period, the Fund limited these expenses; had it not done so, expenses would have been higher. The example in the table is based on an investment of $1,000 invested at the beginning of the six-month period and held for the entire period (July 1, 2014 to December 31, 2014).
The tables illustrate your Fund's expenses in two ways:
—Actual Fund Return. This helps you estimate the actual dollar amount of ongoing expenses (but not transaction costs) paid on a $1,000 investment in the Fund using the Fund's actual return during the period. To estimate the expenses you paid over the period, simply divide your account value by $1,000 (for example, an $8,600 account value divided by $1,000 = 8.6), then multiply the result by the number in the "Expenses Paid per $1,000" line under the share class you hold.
—Hypothetical 5% Fund Return. This helps you to compare your Fund's ongoing expenses (but not transaction costs) with those of other mutual funds using the Fund's actual expense ratio and a hypothetical rate of return of 5% per year before expenses. Examples using a 5% hypothetical Fund return may be found in the shareholder reports of other mutual funds. The hypothetical account values and expenses may not be used to estimate the actual ending account balance or expenses you paid for the period.
Please note that the expenses shown in these tables are meant to highlight your ongoing expenses only and do not reflect any transaction costs. The "Expenses Paid per $1,000" line of the tables is useful in comparing ongoing expenses only and will not help you determine the relative total expense of owning different funds. If these transaction costs had been included, your costs would have been higher.
Expenses and Value of a $1,000 Investment for the six months ended December 31, 2014 | |
| Actual Fund Return | | Class A | | | Class B | |
| Beginning Account Value 7/1/14 | | $ | 1,000.00 | | | $ | 1,000.00 | |
| Ending Account Value 12/31/14 | | $ | 931.80 | | | $ | 930.90 | |
| Expenses Paid per $1,000* | | $ | 4.82 | | | $ | 6.23 | |
| Hypothetical 5% Fund Return | | Class A | | | Class B | |
| Beginning Account Value 7/1/14 | | $ | 1,000.00 | | | $ | 1,000.00 | |
| Ending Account Value 12/31/14 | | $ | 1,020.21 | | | $ | 1,018.75 | |
| Expenses Paid per $1,000* | | $ | 5.04 | | | $ | 6.51 | |
* Expenses are equal to the Fund's annualized expense ratio for each share class, multiplied by the average account value over the period, multiplied by 184 (the number of days in the most recent six-month period), then divided by 365.
| Annualized Expense Ratios | | Class A | | Class B | |
| Deutsche Variable Series I — Deutsche Global Small Cap VIP | | .99% | | 1.28% | |
For more information, please refer to the Fund's prospectus.
These tables do not reflect charges and fees ("contract charges") associated with the separate account that invests in the Fund or any variable life insurance policy or variable annuity contract for which the Fund is an investment option.
For an analysis of the fees associated with an investment in the fund or similar funds, please refer to the current and hypothetical expense calculators for Variable Insurance Products which can be found at deutschefunds.com/EN/resources/calculators.jsp.
Tax Information (Unaudited)
The Fund paid distributions of $1.79 per share from net long-term capital gains during its year ended December 31, 2014.
Pursuant to Section 852 of the Internal Revenue Code, the Fund designates $15,557,000 as capital gain dividends for its year ended December 31, 2014.
For corporate shareholders of the Fund, 8% of the ordinary dividends (i.e., income dividends plus short-term capital gains) paid during the Fund's fiscal year ended December 31, 2014 qualified for the dividends received deduction.
Please consult a tax advisor if you have questions about federal or state income tax laws, or on how to prepare your tax returns. If you have specific questions about your account, please contact your insurance provider.
The Series' policies and procedures for voting proxies for portfolio securities and information about how the Series voted proxies related to its portfolio securities during the 12-month period ended June 30 are available on our Web site — deutschefunds.com (click on "proxy voting"at the bottom of the page) — or on the SEC's Web site — sec.gov. To obtain a written copy of the Series' policies and procedures without charge, upon request, call us toll free at (800) 728-3337.
Advisory Agreement Board Considerations and Fee Evaluation
The Board of Trustees approved the renewal of Deutsche Global Small Cap VIP’s investment management agreement (the "Agreement") with Deutsche Investment Management Americas Inc. ("DIMA") in September 2014.
In terms of the process that the Board followed prior to approving the Agreement, shareholders should know that:
— In September 2014, all of the Fund’s Trustees were independent of DIMA and its affiliates.
— The Trustees met frequently during the past year to discuss fund matters and dedicated a substantial amount of time to contract review matters. Over the course of several months, the Board’s Contract Committee, in coordination with the Board’s Equity Oversight Committee, reviewed comprehensive materials received from DIMA, independent third parties and independent counsel. These materials included an analysis of the Fund’s performance, fees and expenses, and profitability compiled by a fee consultant retained by the Fund’s Independent Trustees (the "Fee Consultant"). The Board also received extensive information throughout the year regarding performance of the Fund.
— The Independent Trustees regularly meet privately with counsel to discuss contract review and other matters. In addition, the Independent Trustees were advised by the Fee Consultant in the course of their review of the Fund’s contractual arrangements and considered a comprehensive report prepared by the Fee Consultant in connection with their deliberations.
— In connection with reviewing the Agreement, the Board also reviewed the terms of the Fund’s Rule 12b-1 plan, distribution agreement, administrative services agreement, transfer agency agreement and other material service agreements.
— Based on its evaluation of the information provided, the Contract Committee presented its findings and recommendations to the Board. The Board then reviewed the Contract Committee’s findings and recommendations.
In connection with the contract review process, the Contract Committee and the Board considered the factors discussed below, among others. The Board also considered that DIMA and its predecessors have managed the Fund since its inception, and the Board believes that a long-term relationship with a capable, conscientious advisor is in the best interests of the Fund. The Board considered, generally, that shareholders chose to invest or remain invested in the Fund knowing that DIMA managed the Fund, and that the Agreement was approved by the Fund’s shareholders. DIMA is part of Deutsche Bank AG ("DB"), a major global banking institution that is engaged in a wide range of financial services. The Board believes that there are advantages to being part of a global asset management business that offers a wide range of investing expertise and resources, including hundreds of portfolio managers and analysts with research capabilities in many countries throughout the world.
As part of the contract review process, the Board carefully considered the fees and expenses of each Deutsche fund overseen by the Board in light of the fund’s performance. In many cases, this led to the negotiation and implementation of expense caps. As part of these negotiations, the Board indicated that it would consider relaxing these caps in future years following sustained improvements in performance, among other considerations.
In 2012, DB combined its Asset Management (of which DIMA was a part) and Wealth Management divisions into a new Asset and Wealth Management ("AWM") division. DB has advised the Independent Trustees that the U.S. asset management business is a critical and integral part of DB, and that DB will continue to invest in AWM a significant portion of the savings it has realized by combining its Asset and Wealth Management divisions, including ongoing enhancements to AWM’s investment capabilities. DB also has confirmed its commitment to maintaining strong legal and compliance groups within the AWM division.
While shareholders may focus primarily on fund performance and fees, the Fund’s Board considers these and many other factors, including the quality and integrity of DIMA’s personnel and such other issues as back-office operations, fund valuations, and compliance policies and procedures.
Nature, Quality and Extent of Services. The Board considered the terms of the Agreement, including the scope of advisory services provided under the Agreement. The Board noted that, under the Agreement, DIMA provides portfolio management services to the Fund and that, pursuant to a separate administrative services agreement, DIMA provides administrative services to the Fund. The Board considered the experience and skills of senior management and investment personnel, the resources made available to such personnel, the ability of DIMA to attract and retain high-quality personnel, and the organizational depth and stability of DIMA. The Board reviewed the Fund’s performance over short-term and long-term periods and compared those returns to various agreed-upon performance measures, including a market index and a peer universe compiled by the Fee Consultant using information supplied by Morningstar Direct ("Morningstar"), an independent fund data service. The Board also noted that it has put into place a process of identifying "Focus Funds" (e.g., funds performing poorly relative to a peer universe), and receives more frequent reporting and information from DIMA regarding such funds, along with DIMA’s plans to address underperformance. The Board believes this process is an effective manner of identifying and addressing underperforming funds. Based on the information provided, the Board noted that for the one-, three- and five-year periods ended December 31, 2013, the Fund’s performance (Class A shares) was in the 1st quartile, 2nd quartile and 1st quartile, respectively, of the applicable Morningstar universe (the 1st quartile being the best performers and the 4th quartile being the worst performers). The Board also observed that the Fund has outperformed its benchmark in the one- and five-year periods and has underperformed its benchmark in the three-year period ended December 31, 2013.
Fees and Expenses. The Board considered the Fund’s investment management fee schedule, operating expenses and total expense ratios, and comparative information provided by Lipper Inc. ("Lipper") and the Fee Consultant regarding investment management fee rates paid to other investment advisors by similar funds (1st quartile being the most favorable and 4th quartile being the least favorable). With respect to management fees paid to other investment advisors by similar funds, the Board noted that the contractual fee rates paid by the Fund, which include a 0.10% fee paid to DIMA under the Fund’s administrative services agreement, were higher than the median (4th quartile) of the applicable Lipper peer group (based on Lipper data provided as of December 31, 2013). The Board noted that the Fund’s Class A shares total (net) operating expenses were expected to be higher than the median (3rd quartile) of the applicable Lipper expense universe (based on Lipper data provided as of December 31, 2013) ("Lipper Universe Expenses"). The Board also reviewed data comparing each share class’s total (net) operating expenses to the applicable Lipper Universe Expenses. The Board also considered how the Fund’s total (net) operating expenses compared to the total (net) operating expenses of a more customized peer group selected by Lipper (based on such factors as asset size). The Board also noted that the expense limitations agreed to by DIMA helped to ensure that the Fund’s total (net) operating expenses would remain competitive. The Board considered the Fund’s management fee rate as compared to fees charged by DIMA to comparable funds and considered differences between the Fund and the comparable funds.
The information requested by the Board as part of its review of fees and expenses also included information about institutional accounts and funds offered primarily to European investors ("Deutsche Europe funds") managed by DIMA and its affiliates. The Board noted that DIMA indicated that it manages an institutional account comparable to the Fund, but does not manage any comparable Deutsche Europe funds. The Board took note of the differences in services provided to Deutsche U.S. mutual funds ("Deutsche Funds") as compared to institutional accounts and that such differences made comparison difficult.
On the basis of the information provided, the Board concluded that management fees were reasonable and appropriate in light of the nature, quality and extent of services provided by DIMA.
Profitability. The Board reviewed detailed information regarding revenues received by DIMA under the Agreement. The Board considered the estimated costs and pre-tax profits realized by DIMA from advising the Deutsche Funds, as well as estimates of the pre-tax profits attributable to managing the Fund in particular. The Board also received information regarding the estimated enterprise-wide profitability of DIMA and its affiliates with respect to all fund services in totality and by fund. The Board and the Fee Consultant reviewed DIMA’s methodology in allocating its costs to the management of the Fund. Based on the information provided, the Board concluded that the pre-tax profits realized by DIMA in connection with the management of the Fund were not unreasonable.
Economies of Scale. The Board considered whether there are economies of scale with respect to the management of the Fund and whether the Fund benefits from any economies of scale. The Board noted that the Fund’s management fee schedule includes fee breakpoints. The Board concluded that the Fund’s fee schedule represents an appropriate sharing between the Fund and DIMA of such economies of scale as may exist in the management of the Fund at current asset levels.
Other Benefits to DIMA and Its Affiliates. The Board also considered the character and amount of other incidental benefits received by DIMA and its affiliates, including any fees received by DIMA for administrative services provided to the Fund and any fees received by an affiliate of DIMA for distribution services. The Board also considered benefits to DIMA related to brokerage and soft-dollar allocations, including allocating brokerage to pay for research generated by parties other than the executing broker dealers, which pertain primarily to funds investing in equity securities, along with the incidental public relations benefits to DIMA related to Deutsche Funds advertising and cross-selling opportunities among DIMA products and services. The Board concluded that management fees were reasonable in light of these fallout benefits.
Compliance. The Board considered the significant attention and resources dedicated by DIMA to documenting and enhancing its compliance processes in recent years. The Board noted in particular (i) the experience and seniority of DIMA’s and the Fund’s chief compliance officer; (ii) the large number of DIMA compliance personnel; and (iii) the substantial commitment of resources by DIMA and its affiliates to compliance matters.
Based on all of the information considered and the conclusions reached, the Board unanimously determined that the continuation of the Agreement is in the best interests of the Fund. In making this determination, the Board did not give particular weight to any single factor identified above. The Board considered these factors over the course of numerous meetings, certain of which were in executive session with only the Independent Trustees and counsel present. It is possible that individual Trustees may have weighed these factors differently in reaching their individual decisions to approve the continuation of the Agreement.
Board Members and Officers
The following table presents certain information regarding the Board Members and Officers of the fund. Each Board Member's year of birth is set forth in parentheses after his or her name. Unless otherwise noted, (i) each Board Member has engaged in the principal occupation(s) noted in the table for at least the most recent five years, although not necessarily in the same capacity; and (ii) the address of each Independent Board Member is c/o Kenneth C. Froewiss, Chairman, Deutsche Mutual Funds, P.O. Box 390601, Cambridge, MA 02139. Except as otherwise noted below, the term of office for each Board Member is until the election and qualification of a successor, or until such Board Member sooner dies, resigns, is removed or as otherwise provided in the governing documents of the fund. Because the fund does not hold an annual meeting of shareholders, each Board Member will hold office for an indeterminate period. The Board Members may also serve in similar capacities with other funds in the fund complex.
| Independent Board Members |
Name, Year of Birth, Position with the Fund and Length of Time Served1 | | Business Experience and Directorships During the Past Five Years | Number of Funds in Deutsche Fund Complex Overseen | Other Directorships Held by Board Member |
Kenneth C. Froewiss (1945) Chairperson since 2013, and Board Member since 2001 | | Adjunct Professor of Finance, NYU Stern School of Business (September 2009–present; Clinical Professor from 1997–September 2009); Member, Finance Committee, Association for Asian Studies (2002–present); Director, Mitsui Sumitomo Insurance Group (US) (2004–present); prior thereto, Managing Director, J.P. Morgan (investment banking firm) (until 1996) | 105 | — |
William McClayton (1944) Vice Chairperson since 2013, and Board Member since 2004 | | Private equity investor (since October 2009); previously, Managing Director, Diamond Management & Technology Consultants, Inc. (global consulting firm) (2001–2009); Directorship: Board of Managers, YMCA of Metropolitan Chicago; formerly: Senior Partner, Arthur Andersen LLP (accounting) (1966–2001); Trustee, Ravinia Festival | 105 | — |
John W. Ballantine (1946) Board Member since 1999 | | Retired; formerly, Executive Vice President and Chief Risk Management Officer, First Chicago NBD Corporation/The First National Bank of Chicago (1996–1998); Executive Vice President and Head of International Banking (1995–1996); former Directorships: Director and former Chairman of the Board, Healthways, Inc.2 (provider of disease and care management services) (2003–2014); Stockwell Capital Investments PLC (private equity); First Oak Brook Bancshares, Inc. and Oak Brook Bank; Prisma Energy International | 105 | Portland General Electric2 (utility company) (2003– present) |
Henry P. Becton, Jr. (1943) Board Member since 1990 | | Vice Chair and former President, WGBH Educational Foundation. Directorships: Public Radio International; Public Radio Exchange (PRX); North Bennett Street School (Boston); former Directorships: Belo Corporation2 (media company); The PBS Foundation; Association of Public Television Stations; Boston Museum of Science; American Public Television; Concord Academy; New England Aquarium; Mass. Corporation for Educational Telecommunications; Committee for Economic Development; Public Broadcasting Service; Connecticut College | 105 | Lead Director, Becton Dickinson and Company2 (medical technology company) |
Dawn-Marie Driscoll (1946) Board Member since 1987 | | Emeritus Executive Fellow, Center for Business Ethics, Bentley University; formerly: President, Driscoll Associates (consulting firm); Partner, Palmer & Dodge (law firm) (1988–1990); Vice President of Corporate Affairs and General Counsel, Filene's (retail) (1978–1988). Directorships: Director of ICI Mutual Insurance Company (since 2007); Advisory Board, Center for Business Ethics, Bentley University; Trustee and former Chairman of the Board, Southwest Florida Community Foundation (charitable organization); former Directorships: Sun Capital Advisers Trust (mutual funds) (2007–2012), Investment Company Institute (audit, executive, nominating committees) and Independent Directors Council (governance, executive committees) | 105 | — |
Keith R. Fox, CFA (1954) Board Member since 1996 | | Managing General Partner, Exeter Capital Partners (a series of private investment funds) (since 1986). Directorships: Progressive International Corporation (kitchen goods importer and distributor); The Kennel Shop (retailer); former Chairman, National Association of Small Business Investment Companies; former Directorships: BoxTop Media Inc. (advertising); Sun Capital Advisers Trust (mutual funds) (2011–2012) | 105 | — |
Paul K. Freeman (1950) Board Member since 1993 | | Consultant, World Bank/Inter-American Development Bank; Chair, Independent Directors Council; Investment Company Institute (executive and nominating committees); formerly, Chairman of Education Committee of Independent Directors Council; Project Leader, International Institute for Applied Systems Analysis (1998–2001); Chief Executive Officer, The Eric Group, Inc. (environmental insurance) (1986–1998); Directorships: Denver Zoo Foundation (December 2012–present); former Directorships: Prisma Energy International | 105 | — |
Richard J. Herring (1946) Board Member since 1990 | | Jacob Safra Professor of International Banking and Professor, Finance Department, The Wharton School, University of Pennsylvania (since July 1972); Co-Director, Wharton Financial Institutions Center; Co-Chair, U.S. Shadow Financial Regulatory Committee; Executive Director, Financial Economists Roundtable; formerly: Vice Dean and Director, Wharton Undergraduate Division (July 1995–June 2000); Director, Lauder Institute of International Management Studies (July 2000–June 2006) | 105 | Director, Aberdeen Singapore and Japan Funds (since 2007); Independent Director of Barclays Bank Delaware (since September 2010) |
Rebecca W. Rimel (1951) Board Member since 1995 | | President and Chief Executive Officer, The Pew Charitable Trusts (charitable organization) (1994 to present); formerly: Executive Vice President, The Glenmede Trust Company (investment trust and wealth management) (1983–2004); Board Member, Investor Education (charitable organization) (2004–2005); Trustee, Executive Committee, Philadelphia Chamber of Commerce (2001–2007); Director, Viasys Health Care2 (January 2007–June 2007); Trustee, Thomas Jefferson Foundation (charitable organization) (1994–2012) | 105 | Director, Becton Dickinson and Company2 (medical technology company) (2012– present); Director, BioTelemetry Inc.2 (health care) (2009– present) |
William N. Searcy, Jr. (1946) Board Member since 1993 | | Private investor since October 2003; formerly: Pension & Savings Trust Officer, Sprint Corporation2 (telecommunications) (November 1989–September 2003); Trustee, Sun Capital Advisers Trust (mutual funds) (1998–2012) | 105 | — |
Jean Gleason Stromberg (1943) Board Member since 1997 | | Retired. Formerly, Consultant (1997–2001); Director, Financial Markets U.S. Government Accountability Office (1996–1997); Partner, Norton Rose Fulbright, L.L.P. (law firm) (1978–1996). Directorships: The William and Flora Hewlett Foundation (charitable organization); former Directorships: Service Source, Inc. (nonprofit), Mutual Fund Directors Forum (2002–2004), American Bar Retirement Association (funding vehicle for retirement plans) (1987–1990 and 1994–1996) | 105 | — |
Robert H. Wadsworth* (1940) Board Member since 1999 | | President, Robert H. Wadsworth & Associates, Inc. (consulting firm) (1983 to present); Director, The Phoenix Boys Choir Association | 105 | — |
Officers4 |
Name, Year of Birth, Position with the Fund and Length of Time Served5 | | Business Experience and Directorships During the Past Five Years |
Brian E. Binder8 (1972) President and Chief Executive Officer, 2013–present | | Managing Director3 and Head of Fund Administration, Deutsche Asset & Wealth Management (2013–present); formerly: Head of Business Management and Consulting at Invesco, Ltd. (2010–2012); Chief Administrative Officer, Van Kampen Funds Inc. (2008–2010); and Chief Administrative Officer, Morgan Stanley Investment Management Americas Distribution (2003–2008) |
John Millette7 (1962) Vice President and Secretary, 1999–present | | Director,3 Deutsche Asset & Wealth Management |
Melinda Morrow6 (1970) Vice President, 2012–present | | Director,3 Deutsche Asset & Wealth Management |
Paul H. Schubert6 (1963) Chief Financial Officer, 2004–present Treasurer, 2005–present | | Managing Director,3 Deutsche Asset & Wealth Management (since July 2004); formerly: Executive Director, Head of Mutual Fund Services and Treasurer for UBS Family of Funds (1998–2004); Vice President and Director of Mutual Fund Finance at UBS Global Asset Management (1994–1998) |
Caroline Pearson7 (1962) Chief Legal Officer, 2010–present | | Managing Director,3 Deutsche Asset & Wealth Management; formerly: Assistant Secretary for DWS family of funds (1997–2010) |
Robert Kloby6 (1962) Chief Compliance Officer, 2006–present | | Managing Director,3 Deutsche Asset & Wealth Management |
Wayne Salit6 (1967) Anti-Money Laundering Compliance Officer, 2014–present | | Director,3 Deutsche Asset & Wealth Management; formerly: Managing Director, AML Compliance Officer at BNY Mellon (2011–2014); and Director, AML Compliance Officer at Deutsche Bank (2004–2011) |
Hepsen Uzcan7 (1974) Assistant Secretary, 2013–present | | Director,3 Deutsche Asset & Wealth Management |
Paul Antosca7 (1957) Assistant Treasurer, 2007–present | | Director,3 Deutsche Asset & Wealth Management |
Jack Clark7 (1967) Assistant Treasurer, 2007–present | | Director,3 Deutsche Asset & Wealth Management |
Diane Kenneally7 (1966) Assistant Treasurer, 2007–present | | Director,3 Deutsche Asset & Wealth Management |
1 The length of time served represents the year in which the Board Member joined the board of one or more Deutsche funds currently overseen by the Board.
2 A publicly held company with securities registered pursuant to Section 12 of the Securities Exchange Act of 1934.
3 Executive title, not a board directorship.
4 As a result of their respective positions held with the Advisor, these individuals are considered "interested persons" of the Advisor within the meaning of the 1940 Act. Interested persons receive no compensation from the fund.
5 The length of time served represents the year in which the officer was first elected in such capacity for one or more Deutsche funds.
6 Address: 60 Wall Street, New York, NY 10005.
7 Address: One Beacon Street, Boston, MA 02108.
8 Address: 222 South Riverside Plaza, Chicago, IL 60606.
* Robert H. Wadsworth retired from the Board effective December 31, 2014.
The fund's Statement of Additional Information ("SAI") includes additional information about the Board Members. The SAI is available, without charge, upon request. If you would like to request a copy of the SAI, you may do so by calling the following toll-free number: (800) 728-3337.
DeAWM Distributors, Inc.
222 South Riverside Plaza
Chicago, IL 60606
(800) 621-1148
VS1glosc-2 (R-025821-4 2/15)
December 31, 2014
Annual Report
Deutsche Variable Series I
(formerly DWS Variable Series I)
Deutsche International VIP
(formerly DWS International VIP)
Contents
8 Statement of Assets and Liabilities 9 Statement of Operations 9 Statement of Changes in Net Assets 12 Notes to Financial Statements 18 Report of Independent Registered Public Accounting Firm 19 Information About Your Fund's Expenses 21 Advisory Agreement Board Considerations and Fee Evaluation 24 Board Members and Officers |
This report must be preceded or accompanied by a prospectus. To obtain an additional prospectus or summary prospectus, if available, call (800) 728-3337 or your financial representative. We advise you to consider the Fund's objectives, risks, charges and expenses carefully before investing. The summary prospectus and prospectus contain this and other important information about the Fund. Please read the prospectus carefully before you invest.
The Fund will be managed on the premise that stocks with lower CROCI® Economic P/E Ratios may outperform stocks with higher CROCI® Economic P/E Ratios over time. This premise may not always be correct and prospective investors should evaluate this assumption prior to investing in the Fund. Investing in derivatives entails special risks relating to liquidity, leverage and credit that may reduce returns and/or increase volatility. Investing in foreign securities, particularly those of emerging markets, presents certain risks, such as currency fluctuations, political and economic changes, and market risks. The Fund may lend securities to approved institutions. Stocks may decline in value. See the prospectus for details.
Deutsche Asset & Wealth Management represents the asset management and wealth management activities conducted by Deutsche Bank AG or any of its subsidiaries, including the Advisor and DeAWM Distributors, Inc.
NOT FDIC/NCUA INSURED NO BANK GUARANTEE MAY LOSE VALUE NOT A DEPOSIT
NOT INSURED BY ANY FEDERAL GOVERNMENT AGENCY
Performance Summary December 31, 2014 (Unaudited)
Fund performance shown is historical, assumes reinvestment of all dividend and capital gain distributions, and does not guarantee future results. Investment return and principal value fluctuate with changing market conditions so that, when redeemed, shares may be worth more or less than their original cost. Current performance may be lower or higher than the performance data quoted. Please contact your participating insurance company for the Fund's most recent month-end performance. Performance doesn't reflect charges and fees ("contract charges") associated with the separate account that invests in the Fund or any variable life insurance policy or variable annuity contract for which the Fund is an investment option. These charges and fees will reduce returns. While all share classes have the same underlying portfolio, their performance will differ.
The gross expense ratios of the Fund, as stated in the fee table of the prospectus dated May 1, 2014 are 1.02% and 1.30% for Class A and Class B shares, respectively, and may differ from the expense ratios disclosed in the Financial Highlights tables in this report.
| Growth of an Assumed $10,000 Investment |
| MSCI EAFE Index is an unmanaged index that tracks international stock performance in the 21 developed markets of Europe, Australasia and the Far East. Returns reflect reinvestment of dividends net of withholding taxes. The index is calculated using closing local market prices and translates into U.S. dollars using the London close foreign exchange rates. Index returns do not reflect any fees or expenses and it is not possible to invest directly into an index. |
| |
| Yearly periods ended December 31 | |
| Comparative Results | |
| Deutsche International VIP | | 1-Year | | | 3-Year | | | 5-Year | | | 10-Year | |
| Class A | Growth of $10,000 | | $ | 8,824 | | | $ | 12,798 | | | $ | 10,838 | | | $ | 12,560 | |
| Average annual total return | | | –11.76 | % | | | 8.57 | % | | | 1.62 | % | | | 2.31 | % |
MSCI EAFE® Index | Growth of $10,000 | | $ | 9,510 | | | $ | 13,698 | | | $ | 12,968 | | | $ | 15,429 | |
| Average annual total return | | | –4.90 | % | | | 11.06 | % | | | 5.33 | % | | | 4.43 | % |
| Deutsche International VIP | | 1-Year | | | 3-Year | | | 5-Year | | | 10-Year | |
| Class B | Growth of $10,000 | | $ | 8,802 | | | $ | 12,689 | | | $ | 10,701 | | | $ | 12,205 | |
| Average annual total return | | | –11.98 | % | | | 8.26 | % | | | 1.37 | % | | | 2.01 | % |
MSCI EAFE® Index | Growth of $10,000 | | $ | 9,510 | | | $ | 13,698 | | | $ | 12,968 | | | $ | 15,429 | |
| Average annual total return | | | –4.90 | % | | | 11.06 | % | | | 5.33 | % | | | 4.43 | % |
The growth of $10,000 is cumulative.
Management Summary December 31, 2014 (Unaudited)
The Fund returned -11.76% (Class A, unadjusted for contract charges) during 2014, underperforming the -4.90% return of its benchmark, the MSCI EAFE Index.1 The muted returns for the international markets reflected concerns about slower-than-expected economic growth in both Europe and Japan during the second half of the year. The energy and materials sectors performed poorly, weighing on the overall return of the broader market. Currencies also played a role in performance, as the sharp declines in the euro and Japanese yen had a negative impact on returns for U.S. dollar-based investors.
The Fund changed its management process and investment team on May 1, 2014.2 During the subsequent eight months, the Fund trailed its benchmark. We believe an important reason for this shortfall was our emphasis on larger, higher-quality companies, which generally lagged their more speculative counterparts during 2014.
Our stock picks delivered the strongest relative performance in the materials sector, where the leading contributors were the Japanese companies Asahi Kasei Corp. and Nitto Denko Corp. The Fund also had a number of strong contributors outside of materials, including Merck KGA, Sekisui House Ltd. and Singapore Airlines Ltd. However, these gains were more than offset by the negative impact of the Fund’s positioning in the energy sector. Not only did the portfolio hold an overweight position in this underperforming group, but it was also hurt by the sizeable underperformance of several individual holdings, including Petrofac Ltd., Transocean Ltd. and OMV AG.3 Stock selection in the industrials sector also played a modest role in the Fund’s underperformance.
The Fund closed the period with overweight positions in the materials, energy and utilities sectors, a reflection of our bottom-up approach. Although the energy and materials sectors underperformed in 2014, we believe both closed the year with attractive valuations vs. the broader market, and we retained our overweight positions. The Fund holds no weighting in financials, and it was underweight in the consumer staples and telecommunications sectors.4
Despite the volatility of the past year, we continue to hold an optimistic longer-term outlook on international equities. We believe corporations’ rising profit margins and declining debt should support continued gains in profitability, and we expect that highly accommodative central-bank policies will boost confidence and provide ongoing support for the markets.
Di Kumble, CFA
Portfolio Manager
The views expressed reflect those of the portfolio management team only through the end of the period of the report as stated on the cover. The management team's views are subject to change at any time based on market and other conditions and should not be construed as a recommendation. Past performance is no guarantee of future results. Current and future portfolio holdings are subject to risk.
1 The Morgan Stanley Capital International (MSCI) Europe, Australasia and Far East (EAFE) Index is an unmanaged index that tracks international stock performance in the 21 developed markets in Europe, Australasia and the Far East. The index is calculated using closing local market prices and translates into U.S. dollars using the London close foreign exchange rates. Index returns do not reflect fees or expenses and it is not possible to invest directly into an index.
2 Portfolio management strives to select approximately fifty stocks with the lowest positive Cash Return on Capital Invested (CROCI®) Economic Price Earnings Ratio from a universe comprising of approximately 330 of the largest equities by market capitalization in the MSCI EAFE Index, excluding financial stocks. The CROCI® Investment Process is based on the belief that the data used in traditional valuations (i.e. accounting data) does not accurately appraise assets, reflect all liabilities or represent the real value of a company. The CROCI® Investment Process seeks to generate data that will enable valuation comparisons on a consistent basis, resulting in an effective and efficient stock selection process targeting investment in real value. The fund is reconstituted on a quarterly basis in accordance with the CROCI® strategy's rules. The regional weighting in the fund is targeted to match the regional weighting of the fund's benchmark, the MSCI EAFE Index.
3 "Underweight" means the Fund holds a lower weighting in a given sector or security than the benchmark. "Overweight" means it holds a higher weighting.
4 Consumer staples are the industries that manufacture and sell products such as food and beverages, prescription drugs and household products.
Portfolio Summary (Unaudited) Asset Allocation (As a % of Investment Portfolio excluding Securities Lending Collateral) | 12/31/14 | 12/31/13 |
| | | |
| Common Stocks | 99% | 97% |
| Cash Equivalents | 1% | 3% |
| | 100% | 100% |
Geographical Diversification
(As a % of Investment Portfolio excluding Cash Equivalents and Securities Lending Collateral) | 12/31/14 | 12/31/13 |
| | | |
| Continental Europe | 44% | 53% |
| United Kingdom | 24% | 15% |
| Japan | 21% | 20% |
| Asia (excluding Japan) | 6% | 4% |
| Australia | 5% | 8% |
| | 100% | 100% |
Sector Diversification
(As a % of Investment Portfolio excluding Cash Equivalents and Securities Lending Collateral) | 12/31/14 | 12/31/13 |
| | | |
| Materials | 23% | 6% |
| Consumer Discretionary | 17% | 14% |
| Industrials | 14% | 13% |
| Health Care | 14% | 9% |
| Energy | 13% | 6% |
| Utilities | 10% | 4% |
| Information Technology | 5% | 5% |
| Consumer Staples | 2% | 9% |
| Telecommunication Services | 2% | 8% |
| Financials | — | 26% |
| | 100% | 100% |
Portfolio holdings and characteristics are subject to change.
For more complete details about the Fund's investment portfolio, see page 6.
Following the Fund's fiscal first and third quarter-end, a complete portfolio holdings listing is filed with the SEC on Form N-Q. The form will be available on the SEC's Web site at sec.gov, and it also may be reviewed and copied at the SEC's Public Reference Room in Washington, D.C. Information on the operation of the SEC's Public Reference Room may be obtained by calling (800) SEC-0330. The Fund's portfolio holdings are also posted on deutschefunds.com from time to time. Please see the Fund's current prospectus for more information.
Investment Portfolio December 31, 2014 | | | Shares | | | Value ($) | |
| | | | |
| Common Stocks 98.7% | |
| Australia 4.9% | |
| BHP Billiton Ltd. | | | 85,804 | | | | 2,036,005 | |
| Origin Energy Ltd. | | | 199,658 | | | | 1,884,184 | |
| Woodside Petroleum Ltd. | | | 72,255 | | | | 2,246,269 | |
| (Cost $8,234,389) | | | | 6,166,458 | |
| Austria 1.7% | |
| OMV AG (Cost $3,550,971) | | | 81,699 | | | | 2,161,891 | |
| Denmark 1.8% | |
| A P Moller-Maersk AS "B" (Cost $2,629,452) | | | 1,121 | | | | 2,228,223 | |
| Finland 1.9% | |
| Fortum Oyj (Cost $2,396,816) | | | 112,893 | | | | 2,439,552 | |
| France 7.9% | |
| Cie Generale des Etablissements Michelin | | | 30,427 | | | | 2,758,585 | |
| GDF Suez | | | 111,176 | | | | 2,596,549 | |
| Sanofi | | | 24,152 | | | | 2,201,115 | |
| Total SA | | | 45,284 | | | | 2,334,808 | |
| (Cost $11,422,092) | | | | 9,891,057 | |
| Germany 10.7% | |
| Continental AG | | | 13,404 | | | | 2,846,373 | |
| E.ON SE | | | 154,663 | | | | 2,655,869 | |
| Hochtief AG | | | 35,126 | | | | 2,481,972 | |
| K+S AG (Registered) | | | 97,769 | | | | 2,714,942 | |
| Merck KGaA | | | 28,744 | | | | 2,726,816 | |
| (Cost $14,859,095) | | | | 13,425,972 | |
| Hong Kong 2.1% | |
| CLP Holdings Ltd. (Cost $2,434,885) | | | 304,960 | | | | 2,646,310 | |
| Japan 21.1% | |
| Asahi Kasei Corp. | | | 318,874 | | | | 2,922,280 | |
| Bridgestone Corp. | | | 77,928 | | | | 2,708,066 | |
| Daiichi Sankyo Co., Ltd. | | | 163,350 | | | | 2,283,712 | |
| Denso Corp. | | | 56,067 | | | | 2,613,036 | |
| Kyocera Corp. | | | 59,386 | | | | 2,721,886 | |
| Nitto Denko Corp. | | | 47,644 | | | | 2,664,419 | |
| Otsuka Holdings Co., Ltd. | | | 73,815 | | | | 2,213,854 | |
| Sekisui House Ltd. | | | 210,890 | | | | 2,762,195 | |
| Sumitomo Metal Mining Co., Ltd. | | | 193,554 | | | | 2,888,180 | |
| Toyota Industries Corp. | | | 55,409 | | | | 2,831,250 | |
| (Cost $24,631,830) | | | | 26,608,878 | |
| Luxembourg 1.6% | |
| Tenaris SA (Cost $3,000,441) | | | 132,802 | | | | 2,005,918 | |
| Netherlands 6.4% | |
| Koninklijke (Royal) KPN NV | | | 836,713 | | | | 2,637,973 | |
| Koninklijke Ahold NV | | | 159,446 | | | | 2,834,318 | |
| Koninklijke DSM NV | | | 42,521 | | | | 2,585,551 | |
| (Cost $8,908,654) | | | | 8,057,842 | |
| | | Shares | | | Value ($) | |
| | | | | | | | | |
| Norway 1.5% | |
| Statoil ASA (Cost $3,214,877) | | | 110,510 | | | | 1,936,625 | |
| Singapore 4.1% | |
| Keppel Corp., Ltd. | | | 345,176 | | | | 2,303,244 | |
| Singapore Airlines Ltd. | | | 331,064 | | | | 2,894,522 | |
| (Cost $5,624,503) | | | | 5,197,766 | |
| Sweden 2.2% | |
| Telefonaktiebolaget LM Ericsson "B" (Cost $2,697,638) | | | 224,447 | | | | 2,718,264 | |
| Switzerland 7.4% | |
| Novartis AG (Registered) | | | 28,284 | | | | 2,601,208 | |
| Swatch Group AG (Bearer) | | | 5,394 | | | | 2,395,138 | |
| Syngenta AG (Registered) | | | 8,390 | | | | 2,694,033 | |
| Transocean Ltd. (a) (b) | | | 88,507 | | | | 1,622,333 | |
| (Cost $11,746,824) | | | | 9,312,712 | |
| United Kingdom 23.4% | |
| Anglo American PLC | | | 122,104 | | | | 2,259,162 | |
| Antofagasta PLC | | | 233,844 | | | | 2,714,995 | |
| AstraZeneca PLC | | | 36,300 | | | | 2,553,547 | |
| Burberry Group PLC | | | 105,831 | | | | 2,681,613 | |
| Centrica PLC | | | 540,530 | | | | 2,326,419 | |
| easyJet PLC | | | 109,868 | | | | 2,835,848 | |
| GlaxoSmithKline PLC | | | 113,245 | | | | 2,422,883 | |
| Petrofac Ltd. | | | 151,607 | | | | 1,644,277 | |
| Rexam PLC | | | 340,782 | | | | 2,395,798 | |
| Rio Tinto PLC | | | 53,049 | | | | 2,444,103 | |
| Rolls-Royce Holdings PLC* | | | 203,637 | | | | 2,743,207 | |
| Smiths Group PLC | | | 141,455 | | | | 2,394,141 | |
| (Cost $35,930,321) | | | | 29,415,993 | |
Total Common Stocks (Cost $141,282,788) | | | | 124,213,461 | |
| | |
| Securities Lending Collateral 1.3% | |
| Daily Assets Fund Institutional, 0.10% (c) (d) (Cost $1,703,259) | | | 1,703,259 | | | | 1,703,259 | |
| | |
| Cash Equivalents 0.8% | |
| Central Cash Management Fund, 0.06% (c) (Cost $965,106) | | | 965,106 | | | | 965,106 | |
| | | % of Net Assets | | | Value ($) | |
| | | | |
Total Investment Portfolio (Cost $143,951,153)† | | | 100.8 | | | | 126,881,826 | |
| Other Assets and Liabilities, Net | | | (0.8 | ) | | | (1,054,519 | ) |
| Net Assets | | | 100.0 | | | | 125,827,307 | |
* Non-income producing security.
† The cost for federal income tax purposes was $144,297,267. At December 31, 2014, net unrealized depreciation for all securities based on tax cost was $17,415,441. This consisted of aggregate gross unrealized appreciation for all securities in which there was an excess of value over tax cost of $3,835,818 and aggregate gross unrealized depreciation for all securities in which there was an excess of tax cost over value of $21,251,259.
(a) All or a portion of these securities were on loan. In addition, "Other Assets and Liabilities, Net" may include pending sales that are also on loan. The value of securities loaned at December 31, 2014 amounted to $1,621,856, which is 1.3% of net assets.
(b) Listed on the New York Stock Exchange.
(c) Affiliated fund managed by Deutsche Investment Management Americas Inc. The rate shown is the annualized seven-day yield at period end.
(d) Represents collateral held in connection with securities lending. Income earned by the Fund is net of borrower rebates.
Fair Value Measurements
Various inputs are used in determining the value of the Fund's investments. These inputs are summarized in three broad levels. Level 1 includes quoted prices in active markets for identical securities. Level 2 includes other significant observable inputs (including quoted prices for similar securities, interest rates, prepayment speeds and credit risk). Level 3 includes significant unobservable inputs (including the Fund's own assumptions in determining the fair value of investments). The level assigned to the securities valuations may not be an indication of the risk or liquidity associated with investing in those securities.
The following is a summary of the inputs used as of December 31, 2014 in valuing the Fund's investments. For information on the Fund's policy regarding the valuation of investments, please refer to the Security Valuation section of Note A in the accompanying Notes to Financial Statements.
| Assets | | Level 1 | | | Level 2 | | | Level 3 | | | Total | |
| | |
| Common Stocks | |
| Australia | | $ | — | | | $ | 6,166,458 | | | $ | — | | | $ | 6,166,458 | |
| Austria | | | — | | | | 2,161,891 | | | | — | | | | 2,161,891 | |
| Denmark | | | — | | | | 2,228,223 | | | | — | | | | 2,228,223 | |
| Finland | | | — | | | | 2,439,552 | | | | — | | | | 2,439,552 | |
| France | | | — | | | | 9,891,057 | | | | — | | | | 9,891,057 | |
| Germany | | | — | | | | 13,425,972 | | | | — | | | | 13,425,972 | |
| Hong Kong | | | — | | | | 2,646,310 | | | | — | | | | 2,646,310 | |
| Japan | | | — | | | | 26,608,878 | | | | — | | | | 26,608,878 | |
| Luxembourg | | | — | | | | 2,005,918 | | | | — | | | | 2,005,918 | |
| Netherlands | | | — | | | | 8,057,842 | | | | — | | | | 8,057,842 | |
| Norway | | | — | | | | 1,936,625 | | | | — | | | | 1,936,625 | |
| Singapore | | | — | | | | 5,197,766 | | | | — | | | | 5,197,766 | |
| Sweden | | | — | | | | 2,718,264 | | | | — | | | | 2,718,264 | |
| Switzerland | | | 1,622,333 | | | | 7,690,379 | | | | — | | | | 9,312,712 | |
| United Kingdom | | | — | | | | 29,415,993 | | | | — | | | | 29,415,993 | |
| Short-Term Investments (e) | | | 2,668,365 | | | | — | | | | — | | | | 2,668,365 | |
| Total | | $ | 4,290,698 | | | $ | 122,591,128 | | | $ | — | | | $ | 126,881,826 | |
There have been no transfers between fair value measurement levels during the year ended December 31, 2014.
(e) See Investment Portfolio for additional detailed categorizations.
The accompanying notes are an integral part of the financial statements.
Statement of Assets and Liabilities | as of December 31, 2014 | |
| Assets | |
Investments: Investments in non-affiliated securities, at value (cost $141,282,788) — including $1,621,856 of securities loaned | | $ | 124,213,461 | |
| Investment in Daily Assets Fund Institutional (cost $1,703,259)* | | | 1,703,259 | |
| Investment in Central Cash Management Fund (cost $965,106) | | | 965,106 | |
| Total investments, at value (cost $143,951,153) | | | 126,881,826 | |
| Foreign currency, at value (cost $122,878) | | | 120,505 | |
| Receivable for investments sold | | | 22,656 | |
| Receivable for Fund shares sold | | | 210,489 | |
| Dividends receivable | | | 92,450 | |
| Interest receivable | | | 8,854 | |
| Foreign taxes recoverable | | | 396,844 | |
| Other assets | | | 3,017 | |
| Total assets | | | 127,736,641 | |
| Liabilities | |
| Payable upon return of securities loaned | | | 1,703,259 | |
| Payable for Fund shares redeemed | | | 20,554 | |
| Accrued management fee | | | 67,509 | |
| Accrued Trustees' fees | | | 2,778 | |
| Other accrued expenses and payables | | | 115,234 | |
| Total liabilities | | | 1,909,334 | |
| Net assets, at value | | $ | 125,827,307 | |
| Net Assets Consist of | |
| Undistributed net investment income | | | 4,945,421 | |
Net unrealized appreciation (depreciation) on: Investments | | | (17,069,327 | ) |
| Foreign currency | | | (22,191 | ) |
| Accumulated net realized gain (loss) | | | (105,732,763 | ) |
| Paid-in capital | | | 243,706,167 | |
| Net assets, at value | | $ | 125,827,307 | |
Class A Net Asset Value, offering and redemption price per share ($125,563,079 ÷ 15,973,456 outstanding shares of beneficial interest, $.01 par value, unlimited number of shares authorized) | | $ | 7.86 | |
Class B Net Asset Value, offering and redemption price per share ($264,228 ÷ 33,566 outstanding shares of beneficial interest, $.01 par value, unlimited number of shares authorized) | | $ | 7.87 | |
* Represents collateral on securities loaned.
The accompanying notes are an integral part of the financial statements.
Statement of Operations
| for the year ended December 31, 2014 | |
| Investment Income | |
Income: Dividends (net of foreign taxes withheld of $390,267) | | $ | 6,373,016 | |
| Interest | | | 207 | |
| Income distributions — Central Cash Management Fund | | | 994 | |
| Securities lending income, including income from Daily Assets Fund Institutional, net of borrower rebates | | | 79,601 | |
| Total income | | | 6,453,818 | |
Expenses: Management fee | | | 1,127,857 | |
| Administration fee | | | 142,767 | |
| Services to shareholders | | | 3,410 | |
| Distribution service fee (Class B) | | | 733 | |
| Custodian fee | | | 48,413 | |
| Professional fees | | | 73,468 | |
| Reports to shareholders | | | 48,585 | |
| Trustees' fees and expenses | | | 8,624 | |
| Other | | | 25,089 | |
| Total expenses before expense reductions | | | 1,478,946 | |
| Expense reductions | | | (85,912 | ) |
| Total expenses after expense reductions | | | 1,393,034 | |
| Net investment income (loss) | | | 5,060,784 | |
| Realized and Unrealized Gain (Loss) | |
Net realized gain (loss) from: Investments | | | 21,681,921 | |
| Futures | | | 94,022 | |
| Foreign currency | | | (38,284 | ) |
| | | | 21,737,659 | |
Change in net unrealized appreciation (depreciation) on: Investments | | | (43,589,032 | ) |
| Futures | | | (151,875 | ) |
| Foreign currency | | | (55,762 | ) |
| | | | (43,796,669 | ) |
| Net gain (loss) | | | (22,059,010 | ) |
| Net increase (decrease) in net assets resulting from operations | | $ | (16,998,226 | ) |
The accompanying notes are an integral part of the financial statements.
Statement of Changes in Net Assets | | | Years Ended December 31, | |
| Increase (Decrease) in Net Assets | | 2014 | | | 2013 | |
Operations: Net investment income (loss) | | $ | 5,060,784 | | | $ | 2,656,367 | |
| Net realized gain (loss) | | | 21,737,659 | | | | 23,022,418 | |
| Change in net unrealized appreciation (depreciation) | | | (43,796,669 | ) | | | 4,153,981 | |
| Net increase (decrease) in net assets resulting from operations | | | (16,998,226 | ) | | | 29,832,766 | |
Distributions to shareholders from: Net investment income: Class A | | | (2,472,725 | ) | | | (7,421,568 | ) |
| Class B | | | (4,273 | ) | | | (14,321 | ) |
| Total distributions | | | (2,476,998 | ) | | | (7,435,889 | ) |
Fund share transactions: Class A Proceeds from shares sold | | | 8,496,800 | | | | 9,888,983 | |
| Reinvestment of distributions | | | 2,472,725 | | | | 7,421,568 | |
| Payments for shares redeemed | | | (17,182,817 | ) | | | (118,556,623 | ) |
| Net increase (decrease) in net assets from Class A share transactions | | | (6,213,292 | ) | | | (101,246,072 | ) |
Class B Proceeds from shares sold | | | 15,844 | | | | 37,829 | |
| Reinvestment of distributions | | | 4,273 | | | | 14,321 | |
| Payments for shares redeemed | | | (21,212 | ) | | | (64,353 | ) |
| Net increase (decrease) in net assets from Class B share transactions | | | (1,095 | ) | | | (12,203 | ) |
| Increase (decrease) in net assets | | | (25,689,611 | ) | | | (78,861,398 | ) |
| Net assets at beginning of period | | | 151,516,918 | | | | 230,378,316 | |
| Net assets at end of period (including undistributed net investment income of $4,945,421 and $2,378,551, respectively) | | $ | 125,827,307 | | | $ | 151,516,918 | |
| Other Information | |
Class A Shares outstanding at beginning of period | | | 16,697,511 | | | | 28,915,018 | |
| Shares sold | | | 980,337 | | | | 1,188,292 | |
| Shares issued to shareholders in reinvestment of distributions | | | 279,089 | | | | 930,021 | |
| Shares redeemed | | | (1,983,481 | ) | | | (14,335,820 | ) |
| Net increase (decrease) in Class A shares | | | (724,055 | ) | | | (12,217,507 | ) |
| Shares outstanding at end of period | | | 15,973,456 | | | | 16,697,511 | |
Class B Shares outstanding at beginning of period | | | 33,679 | | | | 35,208 | |
| Shares sold | | | 1,824 | | | | 4,565 | |
| Shares issued to shareholders in reinvestment of distributions | | | 481 | | | | 1,790 | |
| Shares redeemed | | | (2,418 | ) | | | (7,884 | ) |
| Net increase (decrease) in Class B shares | | | (113 | ) | | | (1,529 | ) |
| Shares outstanding at end of period | | | 33,566 | | | | 33,679 | |
The accompanying notes are an integral part of the financial statements.
| | | Years Ended December 31, | |
| Class A | | | 2014 | | | 2013 | | | 2012 | | | 2011 | | | 2010 | |
| Selected Per Share Data | |
| Net asset value, beginning of period | | $ | 9.06 | | | $ | 7.96 | | | $ | 6.74 | | | $ | 8.22 | | | $ | 8.26 | |
Income (loss) from investment operations: Net investment income (loss)a | | | .31 | b | | | .14 | | | | .22 | | | | .15 | | | | .13 | |
| Net realized and unrealized gain (loss) | | | (1.36 | ) | | | 1.41 | | | | 1.16 | | | | (1.49 | ) | | | (.00 | )* |
| Total from investment operations | | | (1.05 | ) | | | 1.55 | | | | 1.38 | | | | (1.34 | ) | | | .13 | |
Less distributions from: Net investment income | | | (.15 | ) | | | (.45 | ) | | | (.16 | ) | | | (.14 | ) | | | (.17 | ) |
| Net asset value, end of period | | $ | 7.86 | | | $ | 9.06 | | | $ | 7.96 | | | $ | 6.74 | | | $ | 8.22 | |
| Total Return (%) | | | (11.76 | )c | | | 20.23 | c | | | 20.65 | | | | (16.67 | ) | | | 1.62 | c |
| Ratios to Average Net Assets and Supplemental Data | |
| Net assets, end of period ($ millions) | | | 126 | | | | 151 | | | | 230 | | | | 211 | | | | 288 | |
| Ratio of expenses before expense reductions (%) | | | 1.04 | | | | 1.02 | | | | .98 | | | | 1.00 | | | | .99 | |
| Ratio of expenses after expense reductions (%) | | | .98 | | | | 1.01 | | | | .98 | | | | 1.00 | | | | .99 | |
| Ratio of net investment income (loss) (%) | | | 3.55 | b | | | 1.64 | | | | 2.99 | | | | 1.98 | | | | 1.68 | |
| Portfolio turnover rate (%) | | | 135 | | | | 97 | | | | 85 | | | | 174 | | | | 228 | |
a Based on average shares outstanding during the period. b Net investment income per share and the ratio of net investment income include non-recurring dividend income amounting to $0.08 per share and 0.95% of average daily net assets, for the year ended December 31, 2014. c Total return would have been lower had certain expenses not been reduced. * Amount is less than $.005. | |
| | | Years Ended December 31, | |
| Class B | | | 2014 | | | 2013 | | | 2012 | | | 2011 | | | 2010 | |
| Selected Per Share Data | |
| Net asset value, beginning of period | | $ | 9.07 | | | $ | 7.96 | | | $ | 6.75 | | | $ | 8.22 | | | $ | 8.26 | |
Income (loss) from investment operations: Net investment income (loss)a | | | .28 | b | | | .13 | | | | .20 | | | | .13 | | | | .11 | |
| Net realized and unrealized gain (loss) | | | (1.35 | ) | | | 1.41 | | | | 1.15 | | | | (1.48 | ) | | | (.00 | )* |
| Total from investment operations | | | (1.07 | ) | | | 1.54 | | | | 1.35 | | | | (1.35 | ) | | | .11 | |
Less distributions from: Net investment income | | | (.13 | ) | | | (.43 | ) | | | (.14 | ) | | | (.12 | ) | | | (.15 | ) |
| Net asset value, end of period | | $ | 7.87 | | | $ | 9.07 | | | $ | 7.96 | | | $ | 6.75 | | | $ | 8.22 | |
| Total Return (%) | | | (11.98 | )c | | | 20.01 | c | | | 20.13 | | | | (16.77 | ) | | | 1.33 | c |
| Ratios to Average Net Assets and Supplemental Data | |
| Net assets, end of period ($ millions) | | | .26 | | | | .31 | | | | .28 | | | | .24 | | | | .36 | |
| Ratio of expenses before expense reductions (%) | | | 1.31 | | | | 1.30 | | | | 1.26 | | | | 1.28 | | | | 1.26 | |
| Ratio of expenses after expense reductions (%) | | | 1.23 | | | | 1.27 | | | | 1.26 | | | | 1.28 | | | | 1.26 | |
| Ratio of net investment income (loss) (%) | | | 3.26 | b | | | 1.62 | | | | 2.73 | | | | 1.70 | | | | 1.41 | |
| Portfolio turnover rate (%) | | | 135 | | | | 97 | | | | 85 | | | | 174 | | | | 228 | |
a Based on average shares outstanding during the period. b Net investment income per share and the ratio of net investment income include non-recurring dividend income amounting to $0.08 per share and 0.95% of average daily net assets, for the year ended December 31, 2014. c Total return would have been lower had certain expenses not been reduced. * Amount is less than $.005. | |
Notes to Financial Statements
A. Organization and Significant Accounting Policies
Deutsche Variable Series I (formerly DWS Variable Series I) (the "Series") is registered under the Investment Company Act of 1940, as amended (the "1940 Act"), as an open-end, registered management investment company organized as a Massachusetts business trust. The Series consists of five diversified funds: Deutsche Bond VIP, Deutsche Core Equity VIP, Deutsche Capital Growth VIP, Deutsche Global Small Cap VIP and Deutsche International VIP (individually or collectively hereinafter referred to as a "Fund" or the "Funds" and formerly known as DWS Bond VIP, DWS Core Equity VIP, DWS Capital Growth VIP, DWS Global Small Cap Growth VIP and DWS International VIP, respectively). These financial statements report on Deutsche International VIP. The Series is intended to be the underlying investment vehicle for variable annuity contracts and variable life insurance policies to be offered by the separate accounts of certain life insurance companies ("Participating Insurance Companies").
Multiple Classes of Shares of Beneficial Interest. The Fund offers two classes of shares (Class A shares and Class B shares). Class B shares are subject to Rule 12b-1 distribution fees under the 1940 Act and recordkeeping fees equal to an annual rate of 0.25% and up to 0.15%, respectively, of the average daily net assets of the Class B shares of the Fund. Class A shares are not subject to such fees.
Investment income, realized and unrealized gains and losses, and certain fund-level expenses and expense reductions, if any, are borne pro rata on the basis of relative net assets by the holders of all classes of shares, except that each class bears certain expenses unique to that class (including the applicable 12b-1 distribution fees and recordkeeping fees). Differences in class-level expenses may result in payment of different per share dividends by class. All shares have equal rights with respect to voting subject to class-specific arrangements.
The Fund's financial statements are prepared in accordance with accounting principles generally accepted in the United States of America, which require the use of management estimates. Actual results could differ from those estimates. The policies described below are followed consistently by the Fund in the preparation of its financial statements.
Security Valuation. Investments are stated at value determined as of the close of regular trading on the New York Stock Exchange on each day the exchange is open for trading.
Various inputs are used in determining the value of the Fund's investments. These inputs are summarized in three broad levels. Level 1 includes quoted prices in active markets for identical securities. Level 2 includes other significant observable inputs (including quoted prices for similar securities, interest rates, prepayment speeds and credit risk). Level 3 includes significant unobservable inputs (including the Fund's own assumptions in determining the fair value of investments). The level assigned to the securities valuations may not be an indication of the risk or liquidity associated with investing in those securities.
Equity securities are valued at the most recent sale price or official closing price reported on the exchange (U.S. or foreign) or over-the-counter market on which they trade. Securities for which no sales are reported are valued at the calculated mean between the most recent bid and asked quotations on the relevant market or, if a mean cannot be determined, at the most recent bid quotation. Equity securities are generally categorized as Level 1 securities. For certain international equity securities, in order to adjust for events which may occur between the close of the foreign exchanges and the close of the New York Stock Exchange, a fair valuation model may be used. This fair valuation model takes into account comparisons to the valuation of American Depository Receipts (ADRs), exchange-traded funds, futures contracts and certain indices and these securities are categorized as Level 2.
Investments in open-end investment companies are valued at their net asset value each business day and are categorized as Level 1.
Futures contracts are generally valued at the settlement prices established each day on the exchange on which they are traded and are categorized as Level 1.
Securities and other assets for which market quotations are not readily available or for which the above valuation procedures are deemed not to reflect fair value are valued in a manner that is intended to reflect their fair value as determined in accordance with procedures approved by the Trustees and are generally categorized as Level 3. In accordance with the Fund's valuation procedures, factors considered in determining value may include, but are not limited to, the type of the security; the size of the holding; the initial cost of the security; the existence of any contractual restrictions on the security's disposition; the price and extent of public trading in similar securities of the issuer or of comparable companies; quotations or evaluated prices from broker-dealers and/or pricing services; information obtained from the issuer, analysts, and/or the appropriate stock exchange (for exchange-traded securities); an analysis of the company's or issuer's financial statements; an evaluation of the forces that influence the issuer and the market(s) in which the security is purchased and sold; and with respect to debt securities, the maturity, coupon, creditworthiness, currency denomination and the movement of the market in which the security is normally traded. The value determined under these procedures may differ from published values for the same securities.
Disclosure about the classification of fair value measurements is included in a table following the Fund's Investment Portfolio.
Securities Lending. Deutsche Bank AG, as lending agent, lends securities of the Fund to certain financial institutions under the terms of the Security Lending Agreement. The Fund retains the benefits of owning the securities it has loaned and continues to receive interest and dividends generated by the securities and to participate in any changes in their market value. The Fund requires the borrowers of the securities to maintain collateral with the Fund consisting of either cash or liquid, unencumbered assets having a value at least equal to the value of the securities loaned. When the collateral falls below specified amounts, the lending agent will use its best effort to obtain additional collateral on the next business day to meet required amounts under the security lending agreement. The Fund may invest the cash collateral into a joint trading account in an affiliated money market fund pursuant to Exemptive Orders issued by the SEC. The Fund receives compensation for lending its securities either in the form of fees or by earning interest on invested cash collateral net of borrower rebates and fees paid to a lending agent. Either the Fund or the borrower may terminate the loan. There may be risks of delay and costs in recovery of securities or even loss of rights in the collateral should the borrower of the securities fail financially. If the Fund is not able to recover securities lent, the Fund may sell the collateral and purchase a replacement investment in the market, incurring the risk that the value of the replacement security is greater than the value of the collateral. The Fund is also subject to all investment risks associated with the reinvestment of any cash collateral received, including, but not limited to, interest rate, credit and liquidity risk associated with such investments.
As of December 31, 2014, the Fund had securities on loan. The value of the related collateral exceeded the value of the securities loaned at period end.
Foreign Currency Translations. The books and records of the Fund are maintained in U.S. dollars. Investment securities and other assets and liabilities denominated in a foreign currency are translated into U.S. dollars at the prevailing exchange rates at period end. Purchases and sales of investment securities, income and expenses are translated into U.S. dollars at the prevailing exchange rates on the respective dates of the transactions.
Net realized and unrealized gains and losses on foreign currency transactions represent net gains and losses between trade and settlement dates on securities transactions, the acquisition and disposition of foreign currencies, and the difference between the amount of net investment income accrued and the U.S. dollar amount actually received. That portion of both realized and unrealized gains and losses on investments that results from fluctuations in foreign currency exchange rates is not separately disclosed but is included with net realized and unrealized gain/appreciation and loss/depreciation on investments.
Taxes. The Fund is treated as a separate taxpayer as provided for in the Internal Revenue Code, as amended. It is the Fund's policy to comply with the requirements of the Internal Revenue Code, as amended, which are applicable to regulated investment companies, and to distribute all of its taxable income to the separate accounts of the Participating Insurance Companies which hold its shares.
Additionally, the Fund may be subject to taxes imposed by the governments of countries in which it invests and are generally based on income and/or capital gains earned or repatriated. Estimated tax liabilities on certain foreign securities are recorded on an accrual basis and are reflected as components of interest income or net change in unrealized gain/loss on investments. Tax liabilities realized as a result of security sales are reflected as a component of net realized gain/loss on investments.
Under the Regulated Investment Company Modernization Act of 2010, net capital losses incurred post-enactment may be carried forward indefinitely, and their character is retained as short-term and/or long-term. Previously, net capital losses were carried forward for eight years and treated as short-term losses. As a transition rule, the Act requires that post-enactment net capital losses be used before pre-enactment net capital losses.
At December 31, 2014, the Fund had a net tax basis capital loss carryforward of approximately $105,624,000 of pre-enactment losses, which may be applied against any realized net taxable capital gains of each succeeding year until fully utilized or until December 31, 2016 ($6,802,000) and December 31, 2017 ($98,822,000), the respective expiration dates, whichever occurs first.
The Fund has reviewed the tax positions for the open tax years as of December 31, 2014 and has determined that no provision for income tax and/or uncertain tax provisions is required in the Fund's financial statements. The Fund's federal tax returns for the prior three fiscal years remain open subject to examination by the Internal Revenue Service.
Distribution of Income and Gains. Distributions from net investment income of the Fund, if any, are declared and distributed to shareholders annually. Net realized gains from investment transactions, in excess of available capital loss carryforwards, would be taxable to the Fund if not distributed and, therefore, will be distributed to shareholders at least annually. The Fund may also make additional distributions for tax purposes if necessary.
The timing and characterization of certain income and capital gain distributions are determined annually in accordance with federal tax regulations which may differ from accounting principles generally accepted in the United States of America. These differences primarily relate to investments in foreign denominated investments, futures contracts, passive foreign investment companies and certain securities sold at a loss. As a result, net investment income (loss) and net realized gain (loss) on investment transactions for a reporting period may differ significantly from distributions during such period. Accordingly, the Fund may periodically make reclassifications among certain of its capital accounts without impacting the net asset value of the Fund.
At December 31, 2014, the Fund's components of distributable earnings (accumulated losses) on a tax basis are as follows:
| Undistributed ordinary income* | | $ | 5,182,136 | |
| Capital loss carryforwards | | $ | (105,624,000 | ) |
| Net unrealized appreciation (depreciation) on investments | | $ | (17,415,441 | ) |
In addition, the tax character of distributions paid to shareholders by the Fund is summarized as follows:
| | | Years Ended December 31, | |
| | | 2014 | | | 2013 | |
| Distributions from ordinary income* | | $ | 2,476,998 | | | $ | 7,435,889 | |
* For tax purposes, short-term capital gain distributions are considered ordinary income distributions.
Expenses. Expenses of the Series arising in connection with a specific Fund are allocated to that Fund. Other Series expenses which cannot be directly attributed to a Fund are apportioned among the Funds in the Series based upon the relative net assets or other appropriate measures.
Contingencies. In the normal course of business, the Fund may enter into contracts with service providers that contain general indemnification clauses. The Fund's maximum exposure under these arrangements is unknown as this would involve future claims that may be made against the Fund that have not yet been made. However, based on experience, the Fund expects the risk of loss to be remote.
Other. Investment transactions are accounted for on a trade date plus one basis for daily net asset value calculations. However, for financial reporting purposes, investment transactions are reported on trade date. Interest income is recorded on the accrual basis net of foreign withholding taxes. Dividend income is recorded on the ex-dividend date net of foreign withholding taxes. Certain dividends from foreign securities may be recorded subsequent to the ex-dividend date as soon as the Fund is informed of such dividends. Realized gains and losses from investment transactions are recorded on an identified cost basis. Proceeds from litigation payments, if any, are included in net realized gain (loss) from investments.
B. Derivative Instruments
Futures Contracts. A futures contract is an agreement between a buyer or seller and an established futures exchange or its clearinghouse in which the buyer or seller agrees to take or make a delivery of a specific amount of a financial instrument at a specified price on a specific date (settlement date). For the year ended December 31, 2014, the Fund entered into futures contracts to keep cash on hand to meet shareholder redemptions or other needs while maintaining exposure to the stock market.
Upon entering into a futures contract, the Fund is required to deposit with a financial intermediary cash or securities ("initial margin") in an amount equal to a certain percentage of the face value indicated in the futures contract. Subsequent payments ("variation margin") are made or received by the Fund dependent upon the daily fluctuations in the value and are recorded for financial reporting purposes as unrealized gains or losses by the Fund. Gains or losses are realized when the contract expires or is closed. Since all futures contracts are exchange-traded, counterparty risk is minimized as the exchange's clearinghouse acts as the counterparty, and guarantees the futures against default.
Certain risks may arise upon entering into futures contracts, including the risk that an illiquid market will limit the Fund's ability to close out a futures contract prior to the settlement date and the risk that the futures contract is not well correlated with the security, index or currency to which it relates. Risk of loss may exceed amounts disclosed in the Statement of Assets and Liabilities.
There were no open futures contracts at December 31, 2014. For the year ended December 31, 2014, the investment in futures contracts purchased had a total notional value generally indicative of a range from $0 to approximately $4,603,000.
The amount of unrealized and realized gains and losses on derivative instruments recognized in Fund earnings during the year ended December 31, 2014 and the related location in the accompanying Statement of Operations is summarized in the following tables by primary underlying risk exposure:
| Realized Gain (Loss) | | Futures Contracts | |
| Equity Contracts (a) | | $ | 94,022 | |
The above derivative is located in the following Statement of Operations account: (a) Net realized gain (loss) from futures | |
| Change in Net Unrealized Appreciation (Depreciation) | | Futures Contracts | |
| Equity Contracts (a) | | $ | (151,875 | ) |
The above derivative is located in the following Statement of Operations account: (a) Change in net unrealized appreciation (depreciation) on futures | |
C. Purchases and Sales of Securities
During the year ended December 31, 2014, purchases and sales of investment securities (excluding short-term investments) aggregated $189,694,452 and $190,948,321, respectively.
D. Related Parties
Management Agreement. Under the Investment Management Agreement with Deutsche Investment Management Americas Inc. ("DIMA" or the "Advisor"), an indirect, wholly owned subsidiary of Deutsche Bank AG, the Advisor directs the investments of the Fund in accordance with its investment objectives, policies and restrictions. The Advisor determines the securities, instruments and other contracts relating to investments to be purchased, sold or entered into by the Fund.
Pursuant to the Investment Management Agreement with the Advisor, the Fund pays a monthly management fee based on the Fund's average daily net assets, computed and accrued daily and payable monthly, at the following annual rates:
| First $500 million of average daily net assets | | | .790 | % |
| Over $500 million of average daily net assets | | | .640 | % |
Accordingly, for the year ended December 31, 2014, the fee pursuant to the Investment Management Agreement was equivalent to an annual effective rate (exclusive of any applicable waivers/reimbursements) of 0.79% of the Fund's average daily net assets.
For the period from January 1, 2014 through September 30, 2014, the Advisor had contractually agreed to waive all or a portion of its fees and/or reimburse certain operating expenses of the Fund to the extent necessary to maintain the total annual operating expenses (excluding certain expenses such as extraordinary expenses, taxes, brokerage and interest) of each class as follows:
Effective October 1, 2014 through September 30, 2015, the Advisor has contractually agreed to waive its fees and/or reimburse certain operating expenses of the Fund to the extent necessary to maintain the total annual operating expenses (excluding certain expenses such as extraordinary expenses, taxes, brokerage and interest) of each class as follows:
For the year ended December 31, 2014, fees waived and/or expenses reimbursed for each class are as follows:
| Class A | | $ | 85,678 | |
| Class B | | | 234 | |
| | | $ | 85,912 | |
Administration Fee. Pursuant to an Administrative Services Agreement, DIMA provides most administrative services to the Fund. For all services provided under the Administrative Services Agreement, the Fund pays the Advisor an annual fee ("Administration Fee") of 0.10% of the Fund's average daily net assets, computed and accrued daily and payable monthly. For the year ended December 31, 2014, the Administration Fee was $142,767, of which $10,826 is unpaid.
Service Provider Fees. DeAWM Service Company ("DSC"), an affiliate of the Advisor, is the transfer agent, dividend-paying agent and shareholder service agent for the Fund. Pursuant to a sub-transfer agency agreement between DSC and DST Systems, Inc. ("DST"), DSC has delegated certain transfer agent, dividend-paying agent and shareholder service agent functions to DST. DSC compensates DST out of the shareholder servicing fee it receives from the Fund. For the year ended December 31, 2014, the amounts charged to the Fund by DSC were as follows:
| Services to Shareholders | | Total Aggregated | | | Unpaid at December 31, 2014 | |
| Class A | | $ | 681 | | | $ | 124 | |
| Class B | | | 81 | | | | 14 | |
| | | $ | 762 | | | $ | 138 | |
Distribution Service Agreement. DeAWM Distributors, Inc. ("DDI"), also an affiliate of the Advisor, is the Series' Distributor. In accordance with the Master Distribution Plan, DDI receives 12b-1 fees of 0.25% of average daily net assets of Class B shares. Pursuant to the Master Distribution Plan, DDI remits these fees to the Participating Insurance Companies for various costs incurred or paid by these companies in connection with marketing and distribution of Class B shares. For the year ended December 31, 2014, the Distribution Service Fee aggregated $733, of which $57 is unpaid.
Typesetting and Filing Service Fees. Under an agreement with DIMA, DIMA is compensated for providing typesetting and certain regulatory filing services to the Fund. For the year ended December 31, 2014, the amount charged to the Fund by DIMA included in the Statement of Operations under "Reports to shareholders" aggregated $16,471, of which $4,499 is unpaid.
Trustees' Fees and Expenses. The Fund paid retainer fees to each Trustee not affiliated with the Advisor, plus specified amounts to the Board Chairperson and Vice Chairperson and to each committee Chairperson.
Affiliated Cash Management Vehicles. The Fund may invest uninvested cash balances in Central Cash Management Fund and Deutsche Variable NAV Money Fund, affiliated money market funds which are managed by the Advisor. Each affiliated money market fund seeks to provide a high level of current income consistent with liquidity and the preservation of capital. Each affiliated money market fund is managed in accordance with Rule 2a-7 under the Investment Company Act of 1940, which governs the quality, maturity, diversity and liquidity of instruments in which a money market fund may invest. Central Cash Management Fund seeks to maintain a stable net asset value, and Deutsche Variable NAV Money Fund maintains a floating net asset value. The Fund indirectly bears its proportionate share of the expenses of each affiliated money market fund in which it invests. Central Cash Management Fund does not pay the Advisor an investment management fee. To the extent that Deutsche Variable NAV Money Fund pays an investment management fee to the Advisor, the Advisor will waive an amount of the investment management fee payable to the Advisor by the Fund equal to the amount of the investment management fee payable on the Fund's assets invested in Deutsche Variable NAV Money Fund.
Securities Lending Agent Fees. Deutsche Bank AG serves as securities lending agent for the Fund. For the year ended December 31, 2014, the Fund incurred securities lending agent fees to Deutsche Bank AG in the amount of $6,929.
E. Ownership of the Fund
At December 31, 2014, four participating insurance companies were owners of record of 10% or more of the total outstanding Class A shares of the Fund, each owning 27%, 12%, 12% and 12%, respectively. One participating insurance company was the owner of record of 10% or more of the total outstanding Class B shares of the Fund, owning 92%.
F. Line of Credit
The Fund and other affiliated funds (the "Participants") share in a $400 million revolving credit facility provided by a syndication of banks. The Fund may borrow for temporary or emergency purposes, including the meeting of redemption requests that otherwise might require the untimely disposition of securities. The Participants are charged an annual commitment fee which is allocated based on net assets, among each of the Participants. Interest is calculated at a rate per annum equal to the sum of the Federal Funds Rate plus 1.25 percent plus if LIBOR exceeds the Federal Funds Rate the amount of such excess. The Fund may borrow up to a maximum of 33 percent of its net assets under the agreement. The Fund had no outstanding loans at December 31, 2014.
G. Change in Investment Strategy
Effective May 1, 2014, the Fund changed its management process and investment team. Portfolio management intends to select approximately fifty stocks with the lowest positive Cash Return on Capital Invested (CROCI®) Economic Price Earnings Ratio from a universe comprising approximately 330 of the largest equities by market capitalization in the MSCI EAFE Index, excluding financial stocks. The CROCI® Economic Price Earnings Ratio (CROCI® P/E Ratio) is a proprietary measure of company valuation using the same relationship between valuation and return as an accounting P/E ratio (i.e., price/book value divided by return on equity). At times, the number of stocks held in the Fund may differ from fifty stocks as a result of corporate actions, mergers or other events. The CROCI® strategy is supplied by the CROCI® Investment Strategy and Valuation Group, a unit within Deutsche Asset & Wealth Management, through a licensing agreement with the Fund's investment advisor. For a full description of the Fund's investment strategy, please see the Fund's current prospectus dated May 1, 2014.
In addition, effective May 1, 2015 the Fund will change its name to Deutsche CROCI® International VIP.
Report of Independent Registered Public Accounting Firm
To the Trustees of Deutsche Variable Series I and the Shareholders of Deutsche International VIP:
In our opinion, the accompanying statement of assets and liabilities, including the investment portfolio, and the related statements of operations and of changes in net assets and the financial highlights present fairly, in all material respects, the financial position of Deutsche International VIP (formerly DWS International VIP) (the "Fund") at December 31, 2014 and the results of its operations, the changes in its net assets, and the financial highlights for the periods indicated therein, in conformity with accounting principles generally accepted in the United States of America. These financial statements and financial highlights (hereafter referred to as "financial statements") are the responsibility of the Fund's management. Our responsibility is to express an opinion on these financial statements based on our audits. We conducted our audits of these financial statements in accordance with the standards of the Public Company Accounting Oversight Board (United States). Those standards require that we plan and perform the audit to obtain reasonable assurance about whether the financial statements are free of material misstatement. An audit includes examining, on a test basis, evidence supporting the amounts and disclosures in the financial statements, assessing the accounting principles used and significant estimates made by management, and evaluating the overall financial statement presentation. We believe that our audits, which included confirmation of securities at December 31, 2014 by correspondence with the custodian, brokers and transfer agent, and the application of alternative auditing procedures where such confirmations had not been received, provide a reasonable basis for our opinion.
Boston, Massachusetts February 13, 2015 | PricewaterhouseCoopers LLP |
Information About Your Fund's Expenses (Unaudited)
As an investor of the Fund, you incur two types of costs: ongoing expenses and transaction costs. Ongoing expenses include management fees, distribution and service (12b-1) fees and other Fund expenses. Examples of transaction costs include contract charges, which are not shown in this section. The following tables are intended to help you understand your ongoing expenses (in dollars) of investing in the Fund and to help you compare these expenses with the ongoing expenses of investing in other mutual funds. In the most recent six-month period, the Fund limited these expenses; had it not done so, expenses would have been higher. The example in the table is based on an investment of $1,000 invested at the beginning of the six-month period and held for the entire period (July 1, 2014 to December 31, 2014).
The tables illustrate your Fund's expenses in two ways:
—Actual Fund Return. This helps you estimate the actual dollar amount of ongoing expenses (but not transaction costs) paid on a $1,000 investment in the Fund using the Fund's actual return during the period. To estimate the expenses you paid over the period, simply divide your account value by $1,000 (for example, an $8,600 account value divided by $1,000 = 8.6), then multiply the result by the number in the "Expenses Paid per $1,000" line under the share class you hold.
—Hypothetical 5% Fund Return. This helps you to compare your Fund's ongoing expenses (but not transaction costs) with those of other mutual funds using the Fund's actual expense ratio and a hypothetical rate of return of 5% per year before expenses. Examples using a 5% hypothetical Fund return may be found in the shareholder reports of other mutual funds. The hypothetical account values and expenses may not be used to estimate the actual ending account balance or expenses you paid for the period.
Please note that the expenses shown in these tables are meant to highlight your ongoing expenses only and do not reflect any transaction costs. The "Expenses Paid per $1,000" line of the tables is useful in comparing ongoing expenses only and will not help you determine the relative total expense of owning different funds. If these transaction costs had been included, your costs would have been higher.
Expenses and Value of a $1,000 Investment for the six months ended December 31, 2014 | |
| Actual Fund Return | | Class A | | | Class B | |
| Beginning Account Value 7/1/14 | | $ | 1,000.00 | | | $ | 1,000.00 | |
| Ending Account Value 12/31/14 | | $ | 865.60 | | | $ | 864.80 | |
| Expenses Paid per $1,000* | | $ | 4.61 | | | $ | 5.78 | |
| Hypothetical 5% Fund Return | | Class A | | | Class B | |
| Beginning Account Value 7/1/14 | | $ | 1,000.00 | | | $ | 1,000.00 | |
| Ending Account Value 12/31/14 | | $ | 1,020.27 | | | $ | 1,019.00 | |
| Expenses Paid per $1,000* | | $ | 4.99 | | | $ | 6.26 | |
* Expenses are equal to the Fund's annualized expense ratio for each share class, multiplied by the average account value over the period, multiplied by 184 (the number of days in the most recent six-month period), then divided by 365.
| Annualized Expense Ratios | Class A | | Class B | |
| Deutsche Variable Series I — Deutsche International VIP | .98% | | 1.23% | |
For more information, please refer to the Fund's prospectus.
These tables do not reflect charges and fees ("contract charges") associated with the separate account that invests in the Fund or any variable life insurance policy or variable annuity contract for which the Fund is an investment option.
For an analysis of the fees associated with an investment in the fund or similar funds, please refer to the current and hypothetical expense calculators for Variable Insurance Products which can be found at deutschefunds.com/EN/resources/calculators.jsp.
Tax Information (Unaudited)
The Fund paid foreign taxes of $223,331 and earned $4,736,818 of foreign source income during the year ended December 31, 2014. Pursuant to section 853 of the Internal Revenue Code, the Fund designates $0.01 per share as foreign taxes paid and $0.30 per share as income earned from foreign sources for the year ended December 31, 2014.
Please consult a tax advisor if you have questions about federal or state income tax laws, or on how to prepare your tax returns. If you have specific questions about your account, please contact your insurance provider.
The Series' policies and procedures for voting proxies for portfolio securities and information about how the Series voted proxies related to its portfolio securities during the 12-month period ended June 30 are available on our Web site — deutschefunds.com (click on "proxy voting"at the bottom of the page) — or on the SEC's Web site — sec.gov. To obtain a written copy of the Series' policies and procedures without charge, upon request, call us toll free at (800) 728-3337.
Advisory Agreement Board Considerations and Fee Evaluation
The Board of Trustees approved the renewal of Deutsche International VIP’s investment management agreement (the "Agreement") with Deutsche Investment Management Americas Inc. ("DIMA") in September 2014.
In terms of the process that the Board followed prior to approving the Agreement, shareholders should know that:
— In September 2014, all of the Fund’s Trustees were independent of DIMA and its affiliates.
— The Trustees met frequently during the past year to discuss fund matters and dedicated a substantial amount of time to contract review matters. Over the course of several months, the Board’s Contract Committee, in coordination with the Board’s Equity Oversight Committee, reviewed comprehensive materials received from DIMA, independent third parties and independent counsel. These materials included an analysis of the Fund’s performance, fees and expenses, and profitability compiled by a fee consultant retained by the Fund’s Independent Trustees (the "Fee Consultant"). The Board also received extensive information throughout the year regarding performance of the Fund.
— The Independent Trustees regularly meet privately with counsel to discuss contract review and other matters. In addition, the Independent Trustees were advised by the Fee Consultant in the course of their review of the Fund’s contractual arrangements and considered a comprehensive report prepared by the Fee Consultant in connection with their deliberations.
— In connection with reviewing the Agreement, the Board also reviewed the terms of the Fund’s Rule 12b-1 plan, distribution agreement, administrative services agreement, transfer agency agreement and other material service agreements.
— Based on its evaluation of the information provided, the Contract Committee presented its findings and recommendations to the Board. The Board then reviewed the Contract Committee’s findings and recommendations.
In connection with the contract review process, the Contract Committee and the Board considered the factors discussed below, among others. The Board also considered that DIMA and its predecessors have managed the Fund since its inception, and the Board believes that a long-term relationship with a capable, conscientious advisor is in the best interests of the Fund. The Board considered, generally, that shareholders chose to invest or remain invested in the Fund knowing that DIMA managed the Fund, and that the Agreement was approved by the Fund’s shareholders. DIMA is part of Deutsche Bank AG ("DB"), a major global banking institution that is engaged in a wide range of financial services. The Board believes that there are advantages to being part of a global asset management business that offers a wide range of investing expertise and resources, including hundreds of portfolio managers and analysts with research capabilities in many countries throughout the world.
As part of the contract review process, the Board carefully considered the fees and expenses of each Deutsche fund overseen by the Board in light of the fund’s performance. In many cases, this led to the negotiation and implementation of expense caps. As part of these negotiations, the Board indicated that it would consider relaxing these caps in future years following sustained improvements in performance, among other considerations.
In 2012, DB combined its Asset Management (of which DIMA was a part) and Wealth Management divisions into a new Asset and Wealth Management ("AWM") division. DB has advised the Independent Trustees that the U.S. asset management business is a critical and integral part of DB, and that DB will continue to invest in AWM a significant portion of the savings it has realized by combining its Asset and Wealth Management divisions, including ongoing enhancements to AWM’s investment capabilities. DB also has confirmed its commitment to maintaining strong legal and compliance groups within the AWM division.
While shareholders may focus primarily on fund performance and fees, the Fund’s Board considers these and many other factors, including the quality and integrity of DIMA’s personnel and such other issues as back-office operations, fund valuations, and compliance policies and procedures.
Nature, Quality and Extent of Services. The Board considered the terms of the Agreement, including the scope of advisory services provided under the Agreement. The Board noted that, under the Agreement, DIMA provides portfolio management services to the Fund and that, pursuant to a separate administrative services agreement, DIMA provides administrative services to the Fund. The Board considered the experience and skills of senior management and investment personnel, the resources made available to such personnel, the ability of DIMA to attract and retain high-quality personnel, and the organizational depth and stability of DIMA. The Board reviewed the Fund’s performance over short-term and long-term periods and compared those returns to various agreed-upon performance measures, including a market index and a peer universe compiled by the Fee Consultant using information supplied by Morningstar Direct ("Morningstar"), an independent fund data service. The Board also noted that it has put into place a process of identifying "Focus Funds" (e.g., funds performing poorly relative to a peer universe), and receives more frequent reporting and information from DIMA regarding such funds, along with DIMA’s plans to address underperformance. The Board believes this process is an effective manner of identifying and addressing underperforming funds. Based on the information provided, the Board noted that for the one-, three- and five-year periods ended December 31, 2013, the Fund’s performance (Class A shares) was in the 3rd quartile, 4th quartile and 4th quartile, respectively, of the applicable Morningstar universe (the 1st quartile being the best performers and the 4th quartile being the worst performers). The Board also observed that the Fund has underperformed its benchmark in the one-, three- and five-year periods ended December 31, 2013. The Board noted the disappointing investment performance of the Fund in recent periods and continued to discuss with senior management of DIMA the factors contributing to such underperformance and actions being taken to improve performance. The Board recognized the efforts by DIMA in recent years to enhance its investment platform and improve long-term performance across the Deutsche fund complex.
Fees and Expenses. The Board considered the Fund’s investment management fee schedule, operating expenses and total expense ratios, and comparative information provided by Lipper Inc. ("Lipper") and the Fee Consultant regarding investment management fee rates paid to other investment advisors by similar funds (1st quartile being the most favorable and 4th quartile being the least favorable). With respect to management fees paid to other investment advisors by similar funds, the Board noted that the contractual fee rates paid by the Fund, which include a 0.10% fee paid to DIMA under the Fund’s administrative services agreement, were higher than the median (3rd quartile) of the applicable Lipper peer group (based on Lipper data provided as of December 31, 2013). The Board noted that the Fund’s Class A shares total (net) operating expenses were expected to be lower than the median (2nd quartile) of the applicable Lipper expense universe (based on Lipper data provided as of December 31, 2013) ("Lipper Universe Expenses"). The Board also reviewed data comparing each share class’s total (net) operating expenses to the applicable Lipper Universe Expenses. The Board also considered how the Fund’s total (net) operating expenses compared to the total (net) operating expenses of a more customized peer group selected by Lipper (based on such factors as asset size). The Board also noted that the expense limitations agreed to by DIMA helped to ensure that the Fund’s total (net) operating expenses would remain competitive. The Board considered the Fund’s management fee rate as compared to fees charged by DIMA to comparable funds and considered differences between the Fund and the comparable funds.
The information requested by the Board as part of its review of fees and expenses also included information about institutional accounts and funds offered primarily to European investors ("Deutsche Europe funds") managed by DIMA and its affiliates. The Board noted that DIMA indicated that it does not manage any institutional accounts or Deutsche Europe funds comparable to the Fund.
On the basis of the information provided, the Board concluded that management fees were reasonable and appropriate in light of the nature, quality and extent of services provided by DIMA.
Profitability. The Board reviewed detailed information regarding revenues received by DIMA under the Agreement. The Board considered the estimated costs and pre-tax profits realized by DIMA from advising the Deutsche U.S. mutual funds ("Deutsche Funds"), as well as estimates of the pre-tax profits attributable to managing the Fund in particular. The Board also received information regarding the estimated enterprise-wide profitability of DIMA and its affiliates with respect to all fund services in totality and by fund. The Board and the Fee Consultant reviewed DIMA’s methodology in allocating its costs to the management of the Fund. Based on the information provided, the Board concluded that the pre-tax profits realized by DIMA in connection with the management of the Fund were not unreasonable.
Economies of Scale. The Board considered whether there are economies of scale with respect to the management of the Fund and whether the Fund benefits from any economies of scale. The Board noted that the Fund’s management fee schedule includes fee breakpoints. The Board concluded that the Fund’s fee schedule represents an appropriate sharing between the Fund and DIMA of such economies of scale as may exist in the management of the Fund at current asset levels.
Other Benefits to DIMA and Its Affiliates. The Board also considered the character and amount of other incidental benefits received by DIMA and its affiliates, including any fees received by DIMA for administrative services provided to the Fund and any fees received by an affiliate of DIMA for distribution services. The Board also considered benefits to DIMA related to brokerage and soft-dollar allocations, including allocating brokerage to pay for research generated by parties other than the executing broker dealers, which pertain primarily to funds investing in equity securities, along with the incidental public relations benefits to DIMA related to Deutsche Funds advertising and cross-selling opportunities among DIMA products and services. The Board concluded that management fees were reasonable in light of these fallout benefits.
Compliance. The Board considered the significant attention and resources dedicated by DIMA to documenting and enhancing its compliance processes in recent years. The Board noted in particular (i) the experience and seniority of DIMA’s and the Fund’s chief compliance officer; (ii) the large number of DIMA compliance personnel; and (iii) the substantial commitment of resources by DIMA and its affiliates to compliance matters.
Based on all of the information considered and the conclusions reached, the Board unanimously determined that the continuation of the Agreement is in the best interests of the Fund. In making this determination, the Board did not give particular weight to any single factor identified above. The Board considered these factors over the course of numerous meetings, certain of which were in executive session with only the Independent Trustees and counsel present. It is possible that individual Trustees may have weighed these factors differently in reaching their individual decisions to approve the continuation of the Agreement.
Board Members and Officers
The following table presents certain information regarding the Board Members and Officers of the fund. Each Board Member's year of birth is set forth in parentheses after his or her name. Unless otherwise noted, (i) each Board Member has engaged in the principal occupation(s) noted in the table for at least the most recent five years, although not necessarily in the same capacity; and (ii) the address of each Independent Board Member is c/o Kenneth C. Froewiss, Chairman, Deutsche Mutual Funds, P.O. Box 390601, Cambridge, MA 02139. Except as otherwise noted below, the term of office for each Board Member is until the election and qualification of a successor, or until such Board Member sooner dies, resigns, is removed or as otherwise provided in the governing documents of the fund. Because the fund does not hold an annual meeting of shareholders, each Board Member will hold office for an indeterminate period. The Board Members may also serve in similar capacities with other funds in the fund complex.
| Independent Board Members |
Name, Year of Birth, Position with the Fund and Length of Time Served1 | | Business Experience and Directorships During the Past Five Years | Number of Funds in Deutsche Fund Complex Overseen | Other Directorships Held by Board Member |
Kenneth C. Froewiss (1945) Chairperson since 2013, and Board Member since 2001 | | Adjunct Professor of Finance, NYU Stern School of Business (September 2009–present; Clinical Professor from 1997–September 2009); Member, Finance Committee, Association for Asian Studies (2002–present); Director, Mitsui Sumitomo Insurance Group (US) (2004–present); prior thereto, Managing Director, J.P. Morgan (investment banking firm) (until 1996) | 105 | — |
William McClayton (1944) Vice Chairperson since 2013, and Board Member since 2004 | | Private equity investor (since October 2009); previously, Managing Director, Diamond Management & Technology Consultants, Inc. (global consulting firm) (2001–2009); Directorship: Board of Managers, YMCA of Metropolitan Chicago; formerly: Senior Partner, Arthur Andersen LLP (accounting) (1966–2001); Trustee, Ravinia Festival | 105 | — |
John W. Ballantine (1946) Board Member since 1999 | | Retired; formerly, Executive Vice President and Chief Risk Management Officer, First Chicago NBD Corporation/The First National Bank of Chicago (1996–1998); Executive Vice President and Head of International Banking (1995–1996); former Directorships: Director and former Chairman of the Board, Healthways, Inc.2 (provider of disease and care management services) (2003–2014); Stockwell Capital Investments PLC (private equity); First Oak Brook Bancshares, Inc. and Oak Brook Bank; Prisma Energy International | 105 | Portland General Electric2 (utility company) (2003– present) |
Henry P. Becton, Jr. (1943) Board Member since 1990 | | Vice Chair and former President, WGBH Educational Foundation. Directorships: Public Radio International; Public Radio Exchange (PRX); North Bennett Street School (Boston); former Directorships: Belo Corporation2 (media company); The PBS Foundation; Association of Public Television Stations; Boston Museum of Science; American Public Television; Concord Academy; New England Aquarium; Mass. Corporation for Educational Telecommunications; Committee for Economic Development; Public Broadcasting Service; Connecticut College | 105 | Lead Director, Becton Dickinson and Company2 (medical technology company) |
Dawn-Marie Driscoll (1946) Board Member since 1987 | | Emeritus Executive Fellow, Center for Business Ethics, Bentley University; formerly: President, Driscoll Associates (consulting firm); Partner, Palmer & Dodge (law firm) (1988–1990); Vice President of Corporate Affairs and General Counsel, Filene's (retail) (1978–1988). Directorships: Director of ICI Mutual Insurance Company (since 2007); Advisory Board, Center for Business Ethics, Bentley University; Trustee and former Chairman of the Board, Southwest Florida Community Foundation (charitable organization); former Directorships: Sun Capital Advisers Trust (mutual funds) (2007–2012), Investment Company Institute (audit, executive, nominating committees) and Independent Directors Council (governance, executive committees) | 105 | — |
Keith R. Fox, CFA (1954) Board Member since 1996 | | Managing General Partner, Exeter Capital Partners (a series of private investment funds) (since 1986). Directorships: Progressive International Corporation (kitchen goods importer and distributor); The Kennel Shop (retailer); former Chairman, National Association of Small Business Investment Companies; former Directorships: BoxTop Media Inc. (advertising); Sun Capital Advisers Trust (mutual funds) (2011–2012) | 105 | — |
Paul K. Freeman (1950) Board Member since 1993 | | Consultant, World Bank/Inter-American Development Bank; Chair, Independent Directors Council; Investment Company Institute (executive and nominating committees); formerly, Chairman of Education Committee of Independent Directors Council; Project Leader, International Institute for Applied Systems Analysis (1998–2001); Chief Executive Officer, The Eric Group, Inc. (environmental insurance) (1986–1998); Directorships: Denver Zoo Foundation (December 2012–present); former Directorships: Prisma Energy International | 105 | — |
Richard J. Herring (1946) Board Member since 1990 | | Jacob Safra Professor of International Banking and Professor, Finance Department, The Wharton School, University of Pennsylvania (since July 1972); Co-Director, Wharton Financial Institutions Center; Co-Chair, U.S. Shadow Financial Regulatory Committee; Executive Director, Financial Economists Roundtable; formerly: Vice Dean and Director, Wharton Undergraduate Division (July 1995–June 2000); Director, Lauder Institute of International Management Studies (July 2000–June 2006) | 105 | Director, Aberdeen Singapore and Japan Funds (since 2007); Independent Director of Barclays Bank Delaware (since September 2010) |
Rebecca W. Rimel (1951) Board Member since 1995 | | President and Chief Executive Officer, The Pew Charitable Trusts (charitable organization) (1994 to present); formerly: Executive Vice President, The Glenmede Trust Company (investment trust and wealth management) (1983–2004); Board Member, Investor Education (charitable organization) (2004–2005); Trustee, Executive Committee, Philadelphia Chamber of Commerce (2001–2007); Director, Viasys Health Care2 (January 2007–June 2007); Trustee, Thomas Jefferson Foundation (charitable organization) (1994–2012) | 105 | Director, Becton Dickinson and Company2 (medical technology company) (2012– present); Director, BioTelemetry Inc.2 (health care) (2009– present) |
William N. Searcy, Jr. (1946) Board Member since 1993 | | Private investor since October 2003; formerly: Pension & Savings Trust Officer, Sprint Corporation2 (telecommunications) (November 1989–September 2003); Trustee, Sun Capital Advisers Trust (mutual funds) (1998–2012) | 105 | — |
Jean Gleason Stromberg (1943) Board Member since 1997 | | Retired. Formerly, Consultant (1997–2001); Director, Financial Markets U.S. Government Accountability Office (1996–1997); Partner, Norton Rose Fulbright, L.L.P. (law firm) (1978–1996). Directorships: The William and Flora Hewlett Foundation (charitable organization); former Directorships: Service Source, Inc. (nonprofit), Mutual Fund Directors Forum (2002–2004), American Bar Retirement Association (funding vehicle for retirement plans) (1987–1990 and 1994–1996) | 105 | — |
Robert H. Wadsworth* (1940) Board Member since 1999 | | President, Robert H. Wadsworth & Associates, Inc. (consulting firm) (1983 to present); Director, The Phoenix Boys Choir Association | 105 | — |
Officers4 |
Name, Year of Birth, Position with the Fund and Length of Time Served5 | | Business Experience and Directorships During the Past Five Years |
Brian E. Binder8 (1972) President and Chief Executive Officer, 2013–present | | Managing Director3 and Head of Fund Administration, Deutsche Asset & Wealth Management (2013–present); formerly: Head of Business Management and Consulting at Invesco, Ltd. (2010–2012); Chief Administrative Officer, Van Kampen Funds Inc. (2008–2010); and Chief Administrative Officer, Morgan Stanley Investment Management Americas Distribution (2003–2008) |
John Millette7 (1962) Vice President and Secretary, 1999–present | | Director,3 Deutsche Asset & Wealth Management |
Melinda Morrow6 (1970) Vice President, 2012–present | | Director,3 Deutsche Asset & Wealth Management |
Paul H. Schubert6 (1963) Chief Financial Officer, 2004–present Treasurer, 2005–present | | Managing Director,3 Deutsche Asset & Wealth Management (since July 2004); formerly: Executive Director, Head of Mutual Fund Services and Treasurer for UBS Family of Funds (1998–2004); Vice President and Director of Mutual Fund Finance at UBS Global Asset Management (1994–1998) |
Caroline Pearson7 (1962) Chief Legal Officer, 2010–present | | Managing Director,3 Deutsche Asset & Wealth Management; formerly: Assistant Secretary for DWS family of funds (1997–2010) |
Robert Kloby6 (1962) Chief Compliance Officer, 2006–present | | Managing Director,3 Deutsche Asset & Wealth Management |
Wayne Salit6 (1967) Anti-Money Laundering Compliance Officer, 2014–present | | Director,3 Deutsche Asset & Wealth Management; formerly: Managing Director, AML Compliance Officer at BNY Mellon (2011–2014); and Director, AML Compliance Officer at Deutsche Bank (2004–2011) |
Hepsen Uzcan7 (1974) Assistant Secretary, 2013–present | | Director,3 Deutsche Asset & Wealth Management |
Paul Antosca7 (1957) Assistant Treasurer, 2007–present | | Director,3 Deutsche Asset & Wealth Management |
Jack Clark7 (1967) Assistant Treasurer, 2007–present | | Director,3 Deutsche Asset & Wealth Management |
Diane Kenneally7 (1966) Assistant Treasurer, 2007–present | | Director,3 Deutsche Asset & Wealth Management |
1 The length of time served represents the year in which the Board Member joined the board of one or more Deutsche funds currently overseen by the Board.
2 A publicly held company with securities registered pursuant to Section 12 of the Securities Exchange Act of 1934.
3 Executive title, not a board directorship.
4 As a result of their respective positions held with the Advisor, these individuals are considered "interested persons" of the Advisor within the meaning of the 1940 Act. Interested persons receive no compensation from the fund.
5 The length of time served represents the year in which the officer was first elected in such capacity for one or more Deutsche funds.
6 Address: 60 Wall Street, New York, NY 10005.
7 Address: One Beacon Street, Boston, MA 02108.
8 Address: 222 South Riverside Plaza, Chicago, IL 60606.
* Robert H. Wadsworth retired from the Board effective December 31, 2014.
The fund's Statement of Additional Information ("SAI") includes additional information about the Board Members. The SAI is available, without charge, upon request. If you would like to request a copy of the SAI, you may do so by calling the following toll-free number: (800) 728-3337.
DeAWM Distributors, Inc.
222 South Riverside Plaza
Chicago, IL 60606
(800) 621-1148
VS1int-2 (R-025823-4 2/15)
Pursuant to the requirements of the Securities Exchange Act of 1934 and the Investment Company Act of 1940, the registrant has duly caused this report to be signed on its behalf by the undersigned, thereunto duly authorized.
Pursuant to the requirements of the Securities Exchange Act of 1934 and the Investment Company Act of 1940, this report has been signed below by the following persons on behalf of the registrant and in the capacities and on the dates indicated.