WASHINGTON, D. C. 20549
DECEMBER 31, 2012
ANNUAL REPORT
DWS VARIABLE SERIES I
DWS Bond VIP
Contents
18 Statement of Assets and Liabilities 19 Statement of Operations 20 Statement of Changes in Net Assets 22 Notes to Financial Statements 30 Report of Independent Registered Public Accounting Firm 31 Information About Your Fund's Expenses 34 Investment Management Agreement Approval 38 Summary of Management Fee Evaluation by Independent Fee Consultant 40 Board Members and Officers |
This report must be preceded or accompanied by a prospectus. To obtain an additional prospectus or summary prospectus, if available, call (800) 728-3337 or your financial representative. We advise you to consider the Fund's objectives, risks, charges and expenses carefully before investing. The summary prospectus and prospectus contain this and other important information about the Fund. Please read the prospectus carefully before you invest.
Bond investments are subject to interest-rate and credit risks. When interest rates rise, bond prices generally fall. Credit risk refers to the ability of an issuer to make timely payments of principal and interest. Investments in lower-quality ("junk bonds") and non-rated securities present greater risk of loss than investments in higher-quality securities. Investing in derivatives entails special risks relating to liquidity, leverage and credit that may reduce returns and/or increase volatility. Investing in foreign securities, particularly those of emerging markets, presents certain risks, such as currency fluctuations, political and economic changes, and market risks. See the prospectus for details.
DWS Investments is part of the Deutsche Asset & Wealth Management division of Deutsche Bank AG.
NOT FDIC/NCUA INSURED NO BANK GUARANTEE MAY LOSE VALUE NOT A DEPOSIT
NOT INSURED BY ANY FEDERAL GOVERNMENT AGENCY
Performance Summary December 31, 2012 (Unaudited)
Fund performance shown is historical, assumes reinvestment of all dividend and capital gain distributions, and does not guarantee future results. Investment return and principal value fluctuate with changing market conditions so that, when redeemed, shares may be worth more or less than their original cost. Current performance may be lower or higher than the performance data quoted. Please contact your participating insurance company for the Fund's most recent month-end performance. Performance doesn't reflect charges and fees ("contract charges") associated with the separate account that invests in the Fund or any variable life insurance policy or variable annuity contract for which the Fund is an investment option. These charges and fees will reduce returns.
The gross expense ratio of the Fund, as stated in the fee table of the prospectus dated May 1, 2012 is 0.62% for Class A shares and may differ from the expense ratio disclosed in the Financial Highlights table in this report.
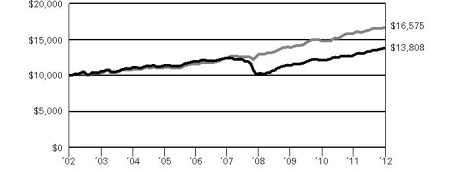
| Growth of an Assumed $10,000 Investment |
| | The Barclays U.S. Aggregate Bond Index is an unmanaged index representing domestic taxable investment-grade bonds, with index components for government and corporate securities, mortgage pass-through securities, and asset-backed securities with an average maturity of one year or more. Index returns do not reflect any fees or expenses and it is not possible to invest directly into an index. |
| |
| |
| Comparative Results | |
| DWS Bond VIP | | 1-Year | | | 3-Year | | | 5-Year | | | 10-Year | |
| Class A | Growth of $10,000 | | $ | 10,777 | | | $ | 12,163 | | | $ | 11,143 | | | $ | 13,808 | |
| Average annual total return | | | 7.77 | % | | | 6.75 | % | | | 2.19 | % | | | 3.28 | % |
| Barclays U.S. Aggregate Bond Index | Growth of $10,000 | | $ | 10,422 | | | $ | 11,974 | | | $ | 13,349 | | | $ | 16,575 | |
| Average annual total return | | | 4.22 | % | | | 6.19 | % | | | 5.95 | % | | | 5.18 | % |
The growth of $10,000 is cumulative.
Management Summary December 31, 2012 (Unaudited)
During the 12-month period ended December 31, 2012, Class A shares of the Fund provided a total return of 7.77% (unadjusted for contract charges), compared with the 4.22% return of its benchmark, the Barclays U.S. Aggregate Bond Index.1
The U.S. Federal Reserve Board (the Fed) continued to maintain its benchmark short-term rate at near-zero levels during this period, and to engage in bond purchases designed to lower longer-term interest rates as it sought to stimulate economic growth. Longer-term U.S. Treasury yields bounced around for most of the period in response to mixed growth signals and sputtering progress on dealing with Europe's debt crisis. Late in the period, fixed-income markets were focused primarily on the run-up to and aftermath of the presidential election, against a backdrop of wrangling over solutions to the country's budgetary dilemma. The net result was that yields finished the period in the same historically low range in which they started. Credit-sensitive sectors generally provided strong returns over most of the period as bonds that trade at a yield advantage vs. U.S. Treasuries were sought by investors.
The portfolio's strong performance vs. the benchmark was driven principally by exposure to more credit-sensitive fixed-income sectors. Our significant weighting of investment-grade corporate bonds at the expense of U.S. Treasury securities was a positive contributor to returns during the year. In addition, our out-of-benchmark exposure to high-yield corporate and emerging-markets holdings outperformed the benchmark by wide margins over the year. We remain comfortable with our overall emphasis on earning the higher yields available in credit sectors. Corporate fundamentals are strong, as reflected in low leverage and significant cash on balance sheets. In addition, interest rates are low and corporate debt markets are liquid, easing refinancing. That said, mixed economic data and political uncertainty in the United States continue to warrant a degree of caution. We are attracted to the incremental yield and diversification benefits offered by emerging-markets debt and are continuing to look for opportunities to add to that position.2 We are maintaining a strong focus on quality and liquidity as we select individual securities within each sector.
William Chepolis, CFA
John D. Ryan
Eric S. Meyer, CFA
Gary Russell, CFA
Ohn Choe, CFA
Portfolio Managers
The views expressed reflect those of the portfolio management team only through the end of the period of the report as stated on the cover. The management team's views are subject to change at any time based on market and other conditions and should not be construed as a recommendation. Past performance is no guarantee of future results. Current and future portfolio holdings are subject to risk.
1 The Barclays U.S. Aggregate Bond Index is an unmanaged index representing domestic taxable investment-grade bonds, with index components for government and corporate securities, mortgage pass-through securities, and asset-backed securities with an average maturity of one year or more. Index returns do not reflect fees or expenses and it is not possible to invest directly into an index.
2 Diversification neither assures a profit nor guarantees against loss.
Portfolio Summary (Unaudited) Asset Allocation (As a % of Total Net Assets) | 12/31/12 | 12/31/11 |
| | | |
| Corporate Bonds | 35% | 28% |
| Mortgage-Backed Securities Pass-Throughs | 34% | 42% |
| Government & Agency Obligations | 22% | 38% |
| Municipal Bonds and Notes | 6% | 7% |
| Commercial Mortgage-Backed Securities | 5% | 7% |
| Collateralized Mortgage Obligations | 5% | 4% |
| Loan Participations and Assignments | 1% | — |
| Asset-Backed | 1% | 3% |
| Cash Equivalents and other Assets and Liabilities, net | -9% | -29% |
| | 100% | 100% |
Quality (Excludes Cash Equivalents and Securities Lending Collateral) | 12/31/12 | 12/31/11 |
| | | |
| AAA | 53% | 64% |
| AA | 7% | 5% |
| A | 8% | 7% |
| BBB | 18% | 15% |
| BB or Below | 11% | 7% |
| Not Rated | 3% | 2% |
| | 100% | 100% |
| Interest Rate Sensitivity | 12/31/12 | 12/31/11 |
| | | |
| Effective Maturity | 7.9 years | 6.9 years |
| Effective Duration | 4.9 years | 4.9 years |
The quality ratings represent the higher of Moody's Investors Service, Inc. ("Moody's") or Standard & Poor's Corporation ("S&P") credit ratings. The ratings of Moody's and S&P represent their opinions as to the quality of the securities they rate. Credit quality measures a bond issuer's ability to repay interest and principal in a timely manner. Ratings are relative and subjective and are not absolute standards of quality. Credit quality does not remove market risk and is subject to change.
Effective maturity is the weighted average of the maturity date of bonds held by the Fund taking into consideration any available maturity shortening features.
Effective duration is an approximate measure of the Fund's sensitivity to interest rate changes taking into consideration any maturity shortening features.
Portfolio holdings and characteristics are subject to change.
For more complete details about the Fund's investment portfolio, see page 7.
Following the Fund's fiscal first and third quarter-end, a complete portfolio holdings listing is filed with the SEC on Form N-Q. The form will be available on the SEC's Web site at www.sec.gov, and it also may be reviewed and copied at the SEC's Public Reference Room in Washington, D.C. Information on the operation of the SEC's Public Reference Room may be obtained by calling (800) SEC-0330. The Fund's portfolio holdings are also posted on www.dws-investments.com from time to time. Please see the Fund's current prospectus for more information.
Investment Portfolio December 31, 2012
| | | Principal Amount ($)(a) | | | Value ($) | |
| | | | |
| Corporate Bonds 35.4% | |
| Consumer Discretionary 3.4% | |
| 313 Group, Inc., 144A, 6.375%, 12/1/2019 | | | | 20,000 | | | | 19,825 | |
| AMC Entertainment, Inc., 8.75%, 6/1/2019 | | | | 170,000 | | | | 188,275 | |
| British Sky Broadcasting Group PLC, 144A, 3.125%, 11/26/2022 | | | | 330,000 | | | | 328,852 | |
| Caesar's Entertainment Operating Co., Inc., 8.5%, 2/15/2020 | | | | 275,000 | | | | 272,937 | |
| CCO Holdings LLC, 6.5%, 4/30/2021 | | | | 410,000 | | | | 442,287 | |
| CDR DB Sub, Inc., 144A, 7.75%, 10/15/2020 | | | | 25,000 | | | | 24,938 | |
| Cequel Communications Holdings I LLC, 144A, 6.375%, 9/15/2020 | | | | 120,000 | | | | 124,950 | |
| Clear Channel Worldwide Holdings, Inc.: | | |
| Series A, 144A, 6.5%, 11/15/2022 | | | | 15,000 | | | | 15,413 | |
| Series B, 144A, 6.5%, 11/15/2022 | | | | 35,000 | | | | 36,312 | |
| Series B, 7.625%, 3/15/2020 | | | | 110,000 | | | | 110,825 | |
| Cox Communications, Inc., 144A, 3.25%, 12/15/2022 | | | | 230,000 | | | | 237,189 | |
| DIRECTV Holdings LLC, 2.4%, 3/15/2017 | | | | 1,050,000 | | | | 1,075,533 | |
| DISH DBS Corp., 7.875%, 9/1/2019 | | | | 135,000 | | | | 159,975 | |
| Griffey Intermediate, Inc., 144A, 7.0%, 10/15/2020 | | | | 40,000 | | | | 40,900 | |
| Hertz Corp., 6.75%, 4/15/2019 | | | | 110,000 | | | | 120,037 | |
| Jo-Ann Stores Holdings, Inc., 144A, 9.75%, 10/15/2019 (PIK) | | | | 25,000 | | | | 25,219 | |
| Levi Strauss & Co., 7.625%, 5/15/2020 (b) | | | | 300,000 | | | | 327,000 | |
| Lowe's Companies, Inc., 1.625%, 4/15/2017 | | | | 750,000 | | | | 767,485 | |
| Macy's Retail Holdings, Inc., 3.875%, 1/15/2022 | | | | 630,000 | | | | 671,497 | |
| Mediacom Broadband LLC, 144A, 6.375%, 4/1/2023 | | | | 15,000 | | | | 15,263 | |
| Mediacom LLC, 9.125%, 8/15/2019 | | | | 130,000 | | | | 143,975 | |
| MGM Resorts International: | |
| 6.625%, 12/15/2021 | | | | 60,000 | | | | 60,000 | |
| 144A, 6.75%, 10/1/2020 | | | | 15,000 | | | | 15,319 | |
| 144A, 8.625%, 2/1/2019 | | | | 155,000 | | | | 172,825 | |
| NBCUniversal Media LLC, 5.15%, 4/30/2020 | | | | 500,000 | | | | 592,727 | |
| Norcraft Companies LP, 10.5%, 12/15/2015 | | | | 100,000 | | | | 100,750 | |
| Penske Automotive Group, Inc., 144A, 5.75%, 10/1/2022 | | | | 40,000 | | | | 41,200 | |
| Petco Holdings, Inc., 144A, 8.5%, 10/15/2017 (PIK) | | | | 10,000 | | | | 10,275 | |
| Quebecor Media, Inc., 144A, 5.75%, 1/15/2023 | | | | 20,000 | | | | 21,075 | |
| | | Principal Amount ($)(a) | | | Value ($) | |
| | | | | | | | | |
| Royal Caribbean Cruises Ltd., 5.25%, 11/15/2022 | | | | 15,000 | | | | 15,863 | |
| Sotheby's, 144A, 5.25%, 10/1/2022 | | | | 20,000 | | | | 20,200 | |
| Unitymedia Hessen GmbH & Co., KG, 144A, 7.5%, 3/15/2019 | EUR | | | 165,000 | | | | 237,938 | |
| Unitymedia KabelBW GmbH, 144A, 9.625%, 12/1/2019 | EUR | | | 50,000 | | | | 73,884 | |
| Viking Cruises Ltd., 144A, 8.5%, 10/15/2022 | | | | 20,000 | | | | 21,600 | |
| | | | | 6,532,343 | |
| Consumer Staples 0.8% | |
| Anadolu Efes Biracilik Ve Malt Sanayii AS, 144A, 3.375%, 11/1/2022 | | | | 500,000 | | | | 492,500 | |
| ConAgra Foods, Inc., 3.25%, 9/15/2022 | | | | 350,000 | | | | 351,554 | |
| Del Monte Corp., 7.625%, 2/15/2019 | | | | 40,000 | | | | 41,700 | |
| JBS U.S.A. LLC, 144A, 8.25%, 2/1/2020 | | | | 170,000 | | | | 180,200 | |
| Kroger Co., 6.9%, 4/15/2038 | | | | 100,000 | | | | 128,907 | |
| Pilgrim's Pride Corp., 7.875%, 12/15/2018 | | | | 170,000 | | | | 172,338 | |
| Smithfield Foods, Inc., 6.625%, 8/15/2022 | | | | 40,000 | | | | 44,200 | |
| Tops Holding Corp., 144A, 8.875%, 12/15/2017 | | | | 10,000 | | | | 10,375 | |
| | | | | 1,421,774 | |
| Energy 3.4% | |
| Access Midstream Partners LP, 4.875%, 5/15/2023 | | | | 25,000 | | | | 25,375 | |
| BreitBurn Energy Partners LP, 144A, 7.875%, 4/15/2022 | | | | 20,000 | | | | 20,750 | |
| Cenovus Energy, Inc., 3.0%, 8/15/2022 | | | | 280,000 | | | | 285,970 | |
| Chaparral Energy, Inc., 144A, 7.625%, 11/15/2022 | | | | 25,000 | | | | 26,000 | |
| Continental Resources, Inc., 5.0%, 9/15/2022 | | | | 15,000 | | | | 16,163 | |
| DCP Midstream LLC, 144A, 9.75%, 3/15/2019 | | | | 760,000 | | | | 1,005,347 | |
| Eagle Rock Energy Partners LP, 8.375%, 6/1/2019 | | | | 50,000 | | | | 51,000 | |
| Enterprise Products Operating LLC, 6.125%, 10/15/2039 | | | | 460,000 | | | | 555,723 | |
| EP Energy LLC, 7.75%, 9/1/2022 | | | | 40,000 | | | | 42,400 | |
| EPE Holdings LLC, 144A, 8.125%, 12/15/2017 (PIK) | | | | 40,000 | | | | 39,650 | |
| FMC Technologies, Inc., 3.45%, 10/1/2022 | | | | 300,000 | | | | 306,193 | |
| Halcon Resources Corp., 144A, 9.75%, 7/15/2020 | | | | 25,000 | | | | 27,000 | |
| Linn Energy LLC, 144A, 6.25%, 11/1/2019 | | | | 225,000 | | | | 226,125 | |
| MEG Energy Corp., 144A, 6.375%, 1/30/2023 | | | | 65,000 | | | | 67,762 | |
| Midstates Petroleum Co., Inc., 144A, 10.75%, 10/1/2020 | | | | 25,000 | | | | 26,563 | |
| Oasis Petroleum, Inc., 6.5%, 11/1/2021 | | | | 115,000 | | | | 122,187 | |
| | | Principal Amount ($)(a) | | | Value ($) | |
| | | | | | | | | |
| Offshore Group Investment Ltd., 144A, 7.5%, 11/1/2019 | | | | 60,000 | | | | 60,600 | |
| ONEOK Partners LP, 6.15%, 10/1/2016 | | | | 878,000 | | | | 1,022,050 | |
| Petroleos Mexicanos, 144A, 5.5%, 6/27/2044 | | | | 500,000 | | | | 550,000 | |
Plains Exploration & Production Co.: | |
| 6.75%, 2/1/2022 | | | | 25,000 | | | | 28,063 | |
| 6.875%, 2/15/2023 | | | | 50,000 | | | | 57,125 | |
| PT Pertamina Persero, 144A, 5.25%, 5/23/2021 | | | | 1,000,000 | | | | 1,115,000 | |
| Quicksilver Resources, Inc., 11.75%, 1/1/2016 | | | | 110,000 | | | | 108,625 | |
| SandRidge Energy, Inc., 7.5%, 3/15/2021 | | | | 50,000 | | | | 53,500 | |
| Shelf Drilling Holdings Ltd., 144A, 8.625%, 11/1/2018 | | | | 30,000 | | | | 30,750 | |
| Swift Energy Co., 144A, 7.875%, 3/1/2022 | | | | 25,000 | | | | 26,125 | |
| Tesoro Corp.: | |
| 4.25%, 10/1/2017 | | | | 20,000 | | | | 20,700 | |
| 5.375%, 10/1/2022 | | | | 15,000 | | | | 15,975 | |
| Transocean, Inc., 3.8%, 10/15/2022 | | | | 555,000 | | | | 568,837 | |
| | | | | 6,501,558 | |
| Financials 14.2% | |
| Akbank TAS, 144A, 5.0%, 10/24/2022 | | | | 250,000 | | | | 263,972 | |
| Ally Financial, Inc., 6.25%, 12/1/2017 | | | | 230,000 | | | | 254,660 | |
| Alphabet Holding Co., Inc., 144A, 7.75%, 11/1/2017 (PIK) | | | | 20,000 | | | | 20,600 | |
| American International Group, Inc., 4.875%, 6/1/2022 | | | | 400,000 | | | | 456,648 | |
| Anglo American Capital PLC, 144A, 4.125%, 9/27/2022 (b) | | | | 750,000 | | | | 783,561 | |
| Banco Bradesco SA, 144A, 5.9%, 1/16/2021 | | | | 500,000 | | | | 545,000 | |
| Banco do Brasil SA, 144A, 5.875%, 1/26/2022 | | | | 250,000 | | | | 275,625 | |
| Bancolombia SA, 5.125%, 9/11/2022 | | | | 500,000 | | | | 520,000 | |
| Bangkok Bank PCL, 144A, 3.875%, 9/27/2022 | | | | 250,000 | | | | 257,750 | |
| Barclays Bank PLC, 7.625%, 11/21/2022 (b) | | | | 1,090,000 | | | | 1,088,637 | |
| BBVA Bancomer SA, 144A, 6.75%, 9/30/2022 | | | | 250,000 | | | | 281,250 | |
| BNP Paribas SA, 2.375%, 9/14/2017 | | | | 740,000 | | | | 750,617 | |
| BOE Merger Corp., 144A, 9.5%, 11/1/2017 (PIK) | | | | 45,000 | | | | 45,000 | |
| Braskem America Finance Co., 144A, 7.125%, 7/22/2041 | | | | 250,000 | | | | 263,125 | |
| Caesar's Operating Escrow LLC, 144A, 9.0%, 2/15/2020 | | | | 25,000 | | | | 25,000 | |
| CIT Group, Inc., 4.25%, 8/15/2017 | | | | 410,000 | | | | 422,194 | |
| CNA Financial Corp., 5.75%, 8/15/2021 | | | | 1,001,000 | | | | 1,174,080 | |
| | | Principal Amount ($)(a) | | | Value ($) | |
| | | | | | | | | |
| Cooperatieve Centrale Raiffeisen-Boerenleenbank BA, 3.95%, 11/9/2022 | | | | 525,000 | | | | 537,618 | |
| Development Bank of Kazakhstan JSC, Series 3, 6.5%, 6/3/2020 | | | | 500,000 | | | | 562,500 | |
| E*TRADE Financial Corp.: | |
| 6.375%, 11/15/2019 | | | | 60,000 | | | | 61,500 | |
| 6.75%, 6/1/2016 | | | | 310,000 | | | | 326,275 | |
| Ford Motor Credit Co., LLC: | |
| 3.0%, 6/12/2017 | | | | 485,000 | | | | 498,301 | |
| 4.25%, 9/20/2022 | | | | 310,000 | | | | 327,789 | |
| 7.0%, 4/15/2015 | | | | 925,000 | | | | 1,031,410 | |
| Fresenius Medical Care U.S. Finance II, Inc., 144A, 5.875%, 1/31/2022 | | | | 15,000 | | | | 16,275 | |
| Fresenius Medical Care U.S. Finance, Inc., 6.875%, 7/15/2017 | | | | 250,000 | | | | 285,000 | |
| General Electric Capital Corp., 2.9%, 1/9/2017 | | | | 1,805,000 | | | | 1,908,502 | |
| Hartford Financial Services Group, Inc., 6.0%, 1/15/2019 | | | | 250,000 | | | | 291,167 | |
| Hexion U.S. Finance Corp.: | |
| 6.625%, 4/15/2020 | | | | 110,000 | | | | 111,925 | |
| 8.875%, 2/1/2018 | | | | 205,000 | | | | 210,638 | |
| ING Bank NV, 144A, 2.0%, 9/25/2015 | | | | 1,310,000 | | | | 1,319,694 | |
| International Lease Finance Corp.: | |
| 6.25%, 5/15/2019 | | | | 10,000 | | | | 10,650 | |
| 8.75%, 3/15/2017 | | | | 185,000 | | | | 213,675 | |
| JPMorgan Chase & Co., 5.125%, 9/15/2014 | | | | 1,100,000 | | | | 1,169,898 | |
| Level 3 Financing, Inc., 144A, 7.0%, 6/1/2020 | | | | 240,000 | | | | 250,800 | |
| Lukoil International Finance BV, 144A, 6.125%, 11/9/2020 | | | | 500,000 | | | | 578,125 | |
| Macquarie Bank Ltd., 144A, 3.45%, 7/27/2015 | | | | 525,000 | | | | 545,943 | |
| Mizuho Corporate Bank Ltd., 144A, 2.95%, 10/17/2022 | | | | 1,000,000 | | | | 987,724 | |
| Nationwide Financial Services, Inc., 144A, 5.375%, 3/25/2021 | | | | 410,000 | | | | 437,433 | |
| Neuberger Berman Group LLC, 144A, 5.875%, 3/15/2022 | | | | 235,000 | | | | 249,100 | |
| Nielsen Finance LLC, 144A, 4.5%, 10/1/2020 | | | | 15,000 | | | | 14,925 | |
| Nordea Bank AB, 144A, 4.25%, 9/21/2022 (b) | | | | 555,000 | | | | 571,646 | |
| Odebrecht Finance Ltd., 144A, 7.125%, 6/26/2042 | | | | 250,000 | | | | 290,000 | |
| PNC Bank NA, 6.875%, 4/1/2018 | | | | 200,000 | | | | 249,821 | |
| PPL Capital Funding, Inc., 3.5%, 12/1/2022 | | | | 420,000 | | | | 427,517 | |
| Principal Financial Group, Inc., 3.3%, 9/15/2022 | | | | 605,000 | | | | 613,730 | |
| Qtel International Finance Ltd., 144A, 3.25%, 2/21/2023 | | | | 750,000 | | | | 749,250 | |
| RBS Citizens Financial Group, Inc., 144A, 4.15%, 9/28/2022 | | | | 550,000 | | | | 561,247 | |
| | | Principal Amount ($)(a) | | | Value ($) | |
| | | | | | | | | |
| Reynolds Group Issuer, Inc.: | |
| 144A, 5.75%, 10/15/2020 | | | | 40,000 | | | | 41,300 | |
| 7.125%, 4/15/2019 | | | | 400,000 | | | | 430,000 | |
| Schaeffler Finance BV, 144A, 7.75%, 2/15/2017 | | | | 335,000 | | | | 371,850 | |
| Serta Simmons Holdings LLC, 144A, 8.125%, 10/1/2020 | | | | 20,000 | | | | 20,000 | |
| Sky Growth Acquisition Corp., 144A, 7.375%, 10/15/2020 | | | | 15,000 | | | | 14,925 | |
| The Goldman Sachs Group, Inc., 6.0%, 6/15/2020 | | | | 880,000 | | | | 1,045,627 | |
| Toll Brothers Finance Corp., 8.91%, 10/15/2017 | | | | 200,000 | | | | 252,534 | |
| Tronox Finance LLC, 144A, 6.375%, 8/15/2020 | | | | 25,000 | | | | 25,250 | |
| Turkiye Garanti Bankasi AS, 144A, 5.25%, 9/13/2022 | | | | 1,000,000 | | | | 1,075,000 | |
| Turkiye Vakiflar Bankasi Tao, 144A, 6.0%, 11/1/2022 | | | | 250,000 | | | | 257,626 | |
| UPCB Finance III Ltd., 144A, 6.625%, 7/1/2020 | | | | 150,000 | | | | 160,688 | |
| WMG Acquisition Corp., 144A, 6.0%, 1/15/2021 | | | | 10,000 | | | | 10,550 | |
| Xstrata Finance Canada Ltd., 144A, 4.0%, 10/25/2022 | | | | 520,000 | | | | 525,621 | |
| | | | | 27,068,768 | |
| Health Care 1.7% | |
| Agilent Technologies, Inc., 3.2%, 10/1/2022 | | | | 300,000 | | | | 303,531 | |
| Amgen, Inc., 5.15%, 11/15/2041 | | | | 520,000 | | | | 585,190 | |
| Biomet, Inc.: | |
| 144A, 6.5%, 8/1/2020 | | | | 35,000 | | | | 37,187 | |
| 144A, 6.5%, 10/1/2020 | | | | 10,000 | | | | 9,938 | |
| Community Health Systems, Inc., 7.125%, 7/15/2020 | | | | 185,000 | | | | 197,487 | |
| Gilead Sciences, Inc., 4.4%, 12/1/2021 | | | | 390,000 | | | | 444,586 | |
| HCA, Inc.: | |
| 6.5%, 2/15/2020 | | | | 350,000 | | | | 393,750 | |
| 7.5%, 2/15/2022 | | | | 285,000 | | | | 326,325 | |
| IMS Health, Inc., 144A, 6.0%, 11/1/2020 | | | | 25,000 | | | | 26,187 | |
| Laboratory Corp. of America Holdings, 3.75%, 8/23/2022 | | | | 265,000 | | | | 281,024 | |
| McKesson Corp., 4.75%, 3/1/2021 | | | | 475,000 | | | | 551,693 | |
| Mylan, Inc., 144A, 7.875%, 7/15/2020 | | | | 10,000 | | | | 11,818 | |
| Tenet Healthcare Corp., 6.25%, 11/1/2018 | | | | 90,000 | | | | 98,775 | |
| | | | | 3,267,491 | |
| Industrials 2.3% | |
| Accuride Corp., 9.5%, 8/1/2018 | | | | 10,000 | | | | 9,650 | |
| ADT Corp., 144A, 3.5%, 7/15/2022 | | | | 455,000 | | | | 442,529 | |
| BE Aerospace, Inc., 6.875%, 10/1/2020 | | | | 80,000 | | | | 89,000 | |
| Belden, Inc., 144A, 5.5%, 9/1/2022 | | | | 35,000 | | | | 35,963 | |
| Bombardier, Inc., 144A, 5.75%, 3/15/2022 (b) | | | | 260,000 | | | | 267,150 | |
| Clean Harbors, Inc., 144A, 5.125%, 6/1/2021 | | | | 25,000 | | | | 25,875 | |
| | | Principal Amount ($)(a) | | | Value ($) | |
| | | | | | | | | |
| CSX Corp., 6.15%, 5/1/2037 | | | | 650,000 | | | | 821,760 | |
| FTI Consulting, Inc., 144A, 6.0%, 11/15/2022 | | | | 20,000 | | | | 20,700 | |
| Huntington Ingalls Industries, Inc., 6.875%, 3/15/2018 | | | | 220,000 | | | | 239,250 | |
| Kenan Advantage Group, Inc., 144A, 8.375%, 12/15/2018 | | | | 40,000 | | | | 40,800 | |
| Masco Corp., 6.125%, 10/3/2016 | | | 800,000 | | | | 883,634 | |
| Navios Maritime Holdings, Inc., 8.875%, 11/1/2017 | | | | 25,000 | | | | 24,938 | |
| Owens Corning, Inc., 4.2%, 12/15/2022 | | | | 190,000 | | | | 193,227 | |
| Ply Gem Industries, Inc., 144A, 9.375%, 4/15/2017 | | | | 15,000 | | | | 15,975 | |
| TransDigm, Inc., 7.75%, 12/15/2018 | | | | 35,000 | | | | 38,719 | |
| Transnet SOC Ltd., 144A, 4.0%, 7/26/2022 | | | | 500,000 | | | | 503,125 | |
| United Rentals North America, Inc.: | |
| 144A, 5.75%, 7/15/2018 | | | | 35,000 | | | | 37,712 | |
| 6.125%, 6/15/2023 | | | | 10,000 | | | | 10,550 | |
| 144A, 7.625%, 4/15/2022 | | | | 125,000 | | | | 139,687 | |
| Voto-Votorantim Ltd., 144A, 6.75%, 4/5/2021 | | | | 500,000 | | | | 586,250 | |
| | | | | 4,426,494 | |
| Information Technology 1.6% | |
| Alliance Data Systems Corp., 144A, 5.25%, 12/1/2017 | | | | 25,000 | | | | 25,375 | |
| CDW LLC, 8.5%, 4/1/2019 | | | | 240,000 | | | | 259,800 | |
| CyrusOne LP, 144A, 6.375%, 11/15/2022 | | | | 10,000 | | | | 10,425 | |
| Equinix, Inc., 7.0%, 7/15/2021 | | | 210,000 | | | | 233,100 | |
| First Data Corp.: | |
| 144A, 6.75%, 11/1/2020 | | | | 155,000 | | | | 156,550 | |
| 144A, 7.375%, 6/15/2019 | | | | 285,000 | | | | 294,975 | |
| Fiserv, Inc., 3.5%, 10/1/2022 | | | | 715,000 | | | | 727,968 | |
| Freescale Semiconductor, Inc., 144A, 9.25%, 4/15/2018 | | | 190,000 | | | | 207,575 | |
| Hewlett-Packard Co., 3.3%, 12/9/2016 | | | | 715,000 | | | | 727,791 | |
| Hughes Satellite Systems Corp.: | |
| 6.5%, 6/15/2019 | | | | 25,000 | | | | 27,562 | |
| 7.625%, 6/15/2021 | | | | 75,000 | | | | 85,312 | |
| IAC/InterActiveCorp., 144A, 4.75%, 12/15/2022 | | | | 20,000 | | | | 19,900 | |
| SunGard Data Systems, Inc., 144A, 6.625%, 11/1/2019 | | | | 25,000 | | | | 25,563 | |
| Xerox Corp., 2.95%, 3/15/2017 | | | 284,000 | | | | 291,391 | |
| | | | | 3,093,287 | |
| Materials 2.8% | |
| Alpek SA de CV, 144A, 4.5%, 11/20/2022 | | | | 250,000 | | | | 260,625 | |
| ArcelorMittal, 6.125%, 6/1/2018 (b) | | | 1,000,000 | | | | 1,013,500 | |
| Corporacion Nacional del Cobre de Chile, 144A, 3.0%, 7/17/2022 | | | 500,000 | | | | 505,553 | |
| Evraz Group SA, 144A, 7.4%, 4/24/2017 | | | | 250,000 | | | | 263,750 | |
| FMG Resources (August 2006) Pty Ltd., 144A, 6.0%, 4/1/2017 | | | | 565,000 | | | | 576,300 | |
| Freeport-McMoRan Copper & Gold, Inc., 3.55%, 3/1/2022 | | | | 790,000 | | | | 783,503 | |
| Huntsman International LLC: | |
| 144A, 4.875%, 11/15/2020 | | | | 25,000 | | | | 25,281 | |
| 8.625%, 3/15/2021 (b) | | | | 105,000 | | | | 119,963 | |
| | | Principal Amount ($)(a) | | | Value ($) | |
| | | | | | | | | |
| IAMGOLD Corp., 144A, 6.75%, 10/1/2020 | | | | 10,000 | | | | 9,750 | |
| Inmet Mining Corp.: | |
| 144A, 7.5%, 6/1/2021 | | | | 60,000 | | | | 62,250 | |
| 144A, 8.75%, 6/1/2020 | | | | 20,000 | | | | 21,850 | |
| Momentive Performance Materials, Inc., 144A, 8.875%, 10/15/2020 | | | | 30,000 | | | | 30,300 | |
| Novelis, Inc., 8.75%, 12/15/2020 | | | | 400,000 | | | | 446,000 | |
| Polymer Group, Inc., 7.75%, 2/1/2019 | | | | 100,000 | | | | 107,250 | |
| Samarco Mineracao SA, 144A, 4.125%, 11/1/2022 | | | | 500,000 | | | | 508,750 | |
| Southern Copper Corp., 5.25%, 11/8/2042 | | | | 500,000 | | | | 500,414 | |
| | | | | 5,235,039 | |
| Telecommunication Services 2.7% | |
| America Movil SAB de CV, Series 12, 6.45%, 12/5/2022 | MXN | | | 2,000,000 | | | | 158,816 | |
| CC Holdings GS V LLC, 144A, 3.849%, 4/15/2023 | | | | 490,000 | | | | 498,482 | |
| Cincinnati Bell, Inc.: | |
| 8.375%, 10/15/2020 | | | | 315,000 | | | | 340,988 | |
| 8.75%, 3/15/2018 | | | | 140,000 | | | | 144,550 | |
| Cricket Communications, Inc., 7.75%, 10/15/2020 | | | | 285,000 | | | | 290,700 | |
| Crown Castle International Corp., 144A, 5.25%, 1/15/2023 | | | | 15,000 | | | | 16,050 | |
| Digicel Group Ltd., 144A, 10.5%, 4/15/2018 | | | | 100,000 | | | | 110,000 | |
| Digicel Ltd., 144A, 8.25%, 9/1/2017 | | | | 395,000 | | | | 422,650 | |
Frontier Communications Corp.: | |
| 7.125%, 1/15/2023 | | | | 65,000 | | | | 68,900 | |
| 7.875%, 4/15/2015 (b) | | | | 332,000 | | | | 371,010 | |
| 8.5%, 4/15/2020 | | | | 420,000 | | | | 483,000 | |
| Intelsat Jackson Holdings SA, 7.5%, 4/1/2021 | | | | 365,000 | | | | 402,413 | |
| Intelsat Luxembourg SA, 11.25%, 2/4/2017 | | | | 225,000 | | | | 237,938 | |
| Level 3 Communications, Inc., 144A, 8.875%, 6/1/2019 | | | | 120,000 | | | | 127,800 | |
| MetroPCS Wireless, Inc., 6.625%, 11/15/2020 | | | | 260,000 | | | | 276,250 | |
| SBA Communications Corp., 144A, 5.625%, 10/1/2019 | | | | 20,000 | | | | 21,000 | |
| Sprint Nextel Corp.: | |
| 6.0%, 12/1/2016 | | | | 375,000 | | | | 407,812 | |
| 8.375%, 8/15/2017 | | | | 90,000 | | | | 104,625 | |
| tw telecom holdings, Inc., 144A, 5.375%, 10/1/2022 | | | | 20,000 | | | | 20,950 | |
| Windstream Corp.: | |
| 7.5%, 6/1/2022 | | | | 15,000 | | | | 15,900 | |
| 7.5%, 4/1/2023 | | | | 10,000 | | | | 10,525 | |
| 7.75%, 10/15/2020 (b) | | | | 495,000 | | | | 534,600 | |
| 7.75%, 10/1/2021 | | | | 30,000 | | | | 32,400 | |
| | | | | 5,097,359 | |
| Utilities 2.5% | |
| Abu Dhabi National Energy Co., 144A, 3.625%, 1/12/2023 | | | | 250,000 | | | | 257,500 | |
| AES Corp., 8.0%, 10/15/2017 | | | | 30,000 | | | | 34,650 | |
| | | Principal Amount ($)(a) | | | Value ($) | |
| | | | | | | | | |
| American Electric Power Co., Inc., Series F, 2.95%, 12/15/2022 | | | | 710,000 | | | | 710,227 | |
| Calpine Corp., 144A, 7.5%, 2/15/2021 | | | | 310,000 | | | | 342,550 | |
| DTE Energy Co., 7.625%, 5/15/2014 | | | | 300,000 | | | | 327,549 | |
Dubai Electricity & Water Authority: | |
| 144A, 7.375%, 10/21/2020 | | | | 250,000 | | | | 307,500 | |
| 144A, 8.5%, 4/22/2015 | | | | 250,000 | | | | 282,500 | |
| Energy Future Competitive Holdings Co., 7.48%, 1/1/2017 | | | | 20,261 | | | | 18,598 | |
| FirstEnergy Solutions Corp., 6.8%, 8/15/2039 | | | | 659,000 | | | | 740,579 | |
| GDF Suez, 144A, 2.875%, 10/10/2022 | | | | 900,000 | | | | 890,812 | |
| Korea Gas Corp., 144A, 2.25%, 7/25/2017 | | | | 500,000 | | | | 505,071 | |
| Majapahit Holding BV, REG S, 7.75%, 10/17/2016 | | | | 100,000 | | | | 118,250 | |
| NRG Energy, Inc., 8.25%, 9/1/2020 | | | | 190,000 | | | | 212,800 | |
| | | | | 4,748,586 | |
Total Corporate Bonds (Cost $64,802,799) | | | | 67,392,699 | |
| | |
| Mortgage-Backed Securities Pass-Throughs 33.8% | |
| Federal Home Loan Mortgage Corp.: | |
| 3.5%, 4/1/2042 | | | | 8,741,962 | | | | 9,386,681 | |
| 4.0%, 8/1/2039 | | | | 970,640 | | | | 1,052,803 | |
| 4.5%, 6/1/2041 | | | | 3,101,479 | | | | 3,333,120 | |
| 5.5%, with various maturities from 10/1/2023 until 8/1/2024 | | | 188,476 | | | | 205,780 | |
| 6.5%, 3/1/2026 | | | | 442,753 | | | | 495,774 | |
Federal National Mortgage Association: | |
| 2.5%, 6/1/2027 (c) | | | | 10,500,000 | | | | 10,979,883 | |
| 2.638%*, 8/1/2037 | | | | 252,065 | | | | 270,485 | |
| 3.5%, 11/1/2041 (c) | | | | 20,000,000 | | | | 21,321,876 | |
| 4.0%, 9/1/2040 | | | | 2,440,564 | | | | 2,641,568 | |
| 4.5%, with various maturities from 10/1/2033 until 5/1/2041 | | | 446,513 | | | | 482,561 | |
| 5.0%, with various maturities from 2/1/2021 until 8/1/2040 | | | 2,451,546 | | | | 2,660,648 | |
| 5.249%*, 9/1/2038 | | | | 165,585 | | | | 177,317 | |
| 5.5%, with various maturities from 12/1/2032 until 4/1/2037 | | | 2,488,349 | | | | 2,718,469 | |
| 6.0%, with various maturities from 4/1/2024 until 3/1/2025 | | | 873,617 | | | | 974,560 | |
| 6.5%, with various maturities from 3/1/2017 until 12/1/2037 | | | 1,082,363 | | | | 1,205,410 | |
| 8.0%, 9/1/2015 | | | | 8,961 | | | | 9,464 | |
Government National Mortgage Association: | |
| 3.0%, with various maturities from 6/1/2042 until 7/1/2042 (c) | | | 4,000,000 | | | | 4,251,875 | |
| 3.5%, 8/20/2042 | | | | 1,979,111 | | | | 2,168,209 | |
Total Mortgage-Backed Securities Pass-Throughs (Cost $63,248,765) | | | | 64,336,483 | |
| | |
| | | Principal Amount ($)(a) | | | Value ($) | |
| | | | | | | | | |
| Asset-Backed 1.0% | |
| Credit Card Receivables | |
| Citibank Omni Master Trust, "A14", Series 2009-A14A, 144A, 2.959%*, 8/15/2018 (Cost $1,842,012) | | | 1,750,000 | | | | 1,820,500 | |
| | |
| Commercial Mortgage-Backed Securities 4.7% | |
| Banc of America Large Loan, Inc., "HLTN", Series 2010-HLTN, 144A, 2.509%*, 11/15/2015 | | | 1,739,417 | | | | 1,735,832 | |
| Banc of America Merrill Lynch Commercial Mortgage, Inc., "A2", Series 2007-2, 5.634%*, 4/10/2049 | | | 50,728 | | | | 51,816 | |
| Bear Stearns Commercial Mortgage Securities, Inc., "A4", Series 2007- PW16, 5.715%*, 6/11/2040 | | | 240,000 | | | | 284,289 | |
| Greenwich Capital Commercial Funding Corp., "A4", Series 2007-GG9, 5.444%, 3/10/2039 | | | 1,750,000 | | | | 2,015,512 | |
JPMorgan Chase Commercial Mortgage Securities Corp.: | |
| "C", Series 2012-HSBC, 144A, 4.021%, 7/5/2032 | | | 230,000 | | | | 241,388 | |
| "A4", Series 2007-C1, 5.716%, 2/15/2051 | | | | 960,000 | | | | 1,137,587 | |
| "F", Series 2007-LD11, 5.812%*, 6/15/2049 | | | | 650,000 | | | | 31,829 | |
| "G", Series 2007-LD11, 144A, 5.812%*, 6/15/2049 | | | 760,000 | | | | 32,339 | |
| "H", Series 2007-LD11, 144A, 5.812%*, 6/15/2049 | | | 460,000 | | | | 8,446 | |
| LB-UBS Commercial Mortgage Trust, "A4", Series 2007-C6, 5.858%, 7/15/2040 | | | 1,315,000 | | | | 1,569,831 | |
| Merrill Lynch Mortgage Trust, "ASB", Series 2007-C1, 5.849%*, 6/12/2050 | | | 1,379,491 | | | | 1,476,871 | |
| PNC Mortgage Acceptance Corp., "J", Series 2000-C2, 144A, 6.22%, 10/12/2033 | | | 200,000 | | | | 192,209 | |
| Wachovia Bank Commercial Mortgage Trust, "H", Series 2007-C32, 144A, 5.737%*, 6/15/2049 | | | 770,000 | | | | 77,678 | |
Total Commercial Mortgage-Backed Securities (Cost $10,515,975) | | | | 8,855,627 | |
| | |
| Collateralized Mortgage Obligations 4.6% | |
| Countrywide Home Loans, "A2", Series 2006-1, 6.0%, 3/25/2036 | | | 485,463 | | | | 433,947 | |
| CS First Boston Mortgage Securities Corp., "10A3", Series 2005-10, 6.0%, 11/25/2035 | | | 143,161 | | | | 94,774 | |
| Federal Home Loan Mortgage Corp.: | |
| "NI", Series 4020, Interest Only, 3.0%, 3/15/2027 | | | 377,378 | | | | 34,763 | |
| "IK", Series 4048, Interest Only, 3.0%, 5/15/2027 | | | 1,862,299 | | | | 172,574 | |
| "LI", Series 3838, Interest Only, 4.5%, 4/15/2022 | | | 1,286,977 | | | | 122,293 | |
| "PE", Series 2898, 5.0%, 5/15/2033 | | | | 232,437 | | | | 239,080 | |
| | | Principal Amount ($)(a) | | | Value ($) | |
| | | | | | | | | |
| Federal National Mortgage Association: | |
| ''IO", Series 2010-143, Interest Only, 5.0%, 12/25/2025 | | | 3,091,690 | | | | 371,700 | |
| "QD", Series 2005-29, 5.0%, 8/25/2033 | | | 435,000 | | | | 449,909 | |
| "EG", Series 2005-22, 5.0%, 11/25/2033 | | | | 701,752 | | | | 726,616 | |
| "TC", Series 2007-77, 5.5%, 9/25/2034 | | | | 255,731 | | | | 261,568 | |
Government National Mortgage Association: | |
| "DI", Series 2012-102, Interest Only, 2.5%, 8/20/2027 | | | 4,841,024 | | | | 533,637 | |
| "HX", Series 2012-91, 3.0%, 9/20/2040 | | | 463,582 | | | | 491,699 | |
| "CI", Series 2010-145, Interest Only, 4.0%, 11/20/2035 | | | 456,721 | | | | 41,813 | |
| "MI", Series 2010-85, Interest Only, 4.5%, 1/20/2036 | | | 2,314,160 | | | | 256,460 | |
| "AI", Series 2011-94, Interest Only, 4.5%, 1/20/2039 | | | 3,784,403 | | | | 330,920 | |
| "GI", Series 2010-89, Interest Only, 4.5%, 5/20/2039 | | | 1,885,978 | | | | 301,193 | |
| "PD", Series 2011-25, 4.5%, 10/16/2039 | | | | 1,000,000 | | | | 1,094,639 | |
| "EI", Series 2010-134, Interest Only, 4.5%, 11/20/2039 | | | 2,510,867 | | | | 419,487 | |
| "EI", Series 2011-162, Interest Only, 4.5%, 5/20/2040 | | | 2,189,187 | | | | 314,871 | |
| "DI", Series 2011-40, Interest Only, 4.5%, 12/20/2040 | | | 5,355,717 | | | | 450,174 | |
| "IM", Series 2010-87, Interest Only, 4.75%, 3/20/2036 | | | 2,397,570 | | | | 313,007 | |
| "JI", Series 2010-67, Interest Only, 5.0%, 10/20/2033 | | | 1,136,261 | | | | 146,776 | |
| "IA", Series 2010-58, Interest Only, 5.0%, 3/20/2039 | | | 3,561,327 | | | | 576,007 | |
| "IN", Series 2009-69, Interest Only, 5.5%, 8/20/2039 | | | 380,011 | | | | 52,695 | |
| "IV", Series 2009-69, Interest Only, 5.5%, 8/20/2039 | | | 754,998 | | | | 105,854 | |
| "IJ", Series 2009-75, Interest Only, 6.0%, 8/16/2039 | | | 284,285 | | | | 44,910 | |
| "D", Series 1996-7, 7.5%, 5/16/2026 | | | 149,046 | | | | 174,604 | |
| MASTR Alternative Loans Trust: | |
| "5A1", Series 2005-1, 5.5%, 1/25/2020 | | | | 202,794 | | | | 207,046 | |
| "8A1", Series 2004-3, 7.0%, 4/25/2034 | | | | 10,168 | | | | 10,258 | |
Total Collateralized Mortgage Obligations (Cost $9,232,161) | | | | 8,773,274 | |
| | |
| Government & Agency Obligations 22.5% | |
| Sovereign Bonds 3.1% | |
| Republic of Belarus, 8.95%, 1/26/2018 | | | | 500,000 | | | | 515,000 | |
| Republic of Croatia, REG S, 6.75%, 11/5/2019 | | | | 850,000 | | | | 974,312 | |
| Republic of El Salvador, REG S, 8.25%, 4/10/2032 | | | | 40,000 | | | | 48,300 | |
| Republic of Hungary, 7.625%, 3/29/2041 | | | | 250,000 | | | | 288,750 | |
| Republic of Lithuania, REG S, 5.125%, 9/14/2017 | | | | 200,000 | | | | 225,500 | |
| | | Principal Amount ($)(a) | | | Value ($) | |
| | | | | | | | | |
| Republic of Panama: | |
| 5.2%, 1/30/2020 | | | | 425,000 | | | | 507,663 | |
| 7.125%, 1/29/2026 | | | | 220,000 | | | | 311,850 | |
| 7.25%, 3/15/2015 | | | | 80,000 | | | | 89,720 | |
| Republic of Poland, 3.0%, 3/17/2023 | | | 350,000 | | | | 349,125 | |
| Republic of Serbia: | |
| REG S, 6.75%, 11/1/2024 | | | | 812,000 | | | | 820,120 | |
| REG S, 7.25%, 9/28/2021 | | | | 300,000 | | | | 345,000 | |
| Russian Federation, REG S, 5.0%, 4/29/2020 | | | | 800,000 | | | | 944,000 | |
| United Mexican States, 4.75%, 3/8/2044 | | | | 500,000 | | | | 565,000 | |
| | | | | 5,984,340 | |
| U.S. Treasury Obligations 19.4% | |
| U.S. Treasury Bill, 0.13%**, 3/7/2013 (d) | | | | 341,000 | | | | 340,980 | |
| U.S. Treasury Bonds: | |
| 3.75%, 8/15/2041 | | | | 2,500,000 | | | | 2,938,280 | |
| 4.75%, 2/15/2037 | | | | 4,000,000 | | | | 5,457,500 | |
| U.S. Treasury Notes: | |
| 1.0%, 8/31/2016 | | | | 22,350,000 | | | | 22,776,036 | |
| 1.5%, 7/31/2016 | | | | 4,250,000 | | | | 4,406,719 | |
| 1.625%, 11/15/2022 | | | | 1,000,000 | | | | 989,062 | |
| | | | | 36,908,577 | |
Total Government & Agency Obligations (Cost $41,315,451) | | | | 42,892,917 | |
| | |
| Loan Participations and Assignments 1.5% | |
| Sovereign Loans | |
| Gazprom Neft OAO, 144A, 4.375%, 9/19/2022 | | | | 500,000 | | | | 511,250 | |
| Novatek OAO, 144A, 4.422%, 12/13/2022 | | | | 250,000 | | | | 251,563 | |
| Rosneft Oil Co., 144A, 4.199%, 3/6/2022 | | | | 250,000 | | | | 254,375 | |
| Russian Agricultural Bank, REG S, 7.75%, 5/29/2018 | | | | 100,000 | | | | 119,125 | |
| Russian Railways, 5.739%, 4/3/2017 | | | | 250,000 | | | | 280,000 | |
| Sberbank of Russia, 144A, 6.125%, 2/7/2022 | | | | 250,000 | | | | 285,625 | |
| Severstal OAO, 144A, 5.9%, 10/17/2022 | | | | 250,000 | | | | 252,812 | |
| VTB Bank OJSC: | |
| 144A, 6.0%, 4/12/2017 | | | | 500,000 | | | | 540,500 | |
| 144A, 6.95%, 10/17/2022 | | | | 400,000 | | | | 430,000 | |
Total Loan Participations and Assignments (Cost $2,835,642) | | | | 2,925,250 | |
| | |
| Municipal Bonds and Notes 5.8% | |
| California, University Revenues, Build America Bonds, 5.946%, 5/15/2045 | | | 600,000 | | | | 738,306 | |
| Chicago, IL, Transit Authority, Sales Tax Receipts Revenue, Build America Bonds, Series B, 6.2%, 12/1/2040 | | | 265,000 | | | | 297,820 | |
| Glendale, AZ, Municipal Property Corp., Excise Tax Revenue, Series B, 6.157%, 7/1/2033, INS: AGMC | | | 420,000 | | | | 482,110 | |
| | | Principal Amount ($)(a) | | | Value ($) | |
| | | | | | | | | |
| Gwinnett County, GA, Development Authority Revenue, Gwinnett Stadium Project, 6.4%, 1/1/2028 | | | 655,000 | | | | 750,813 | |
| Jicarilla, NM, Sales & Special Tax Revenue, Apache Nation Revenue, 144A, 5.2%, 12/1/2013 | | | 300,000 | | | | 300,759 | |
| Kentucky, Asset/Liability Commission, General Fund Revenue, 3.165%, 4/1/2018 | | | 2,075,000 | | | | 2,170,367 | |
| Louisville & Jefferson County, KY, Metropolitan Sewer District & Drain Systems, Build America Bonds, 6.25%, 5/15/2043 | | | 600,000 | | | | 785,334 | |
| Miami-Dade County, FL, Educational Facilities Authority, University of Miami, Series B, 6.1%, 4/1/2015 | | | 525,000 | | | | 537,443 | |
| Michigan, Western Michigan University Revenue, 4.41%, 11/15/2014, INS: AMBAC | | | 320,000 | | | | 325,158 | |
Nashville & Davidson County, TN, Metropolitan Government, Convention Center Authority Revenue, Build America Bonds: | |
| Series B, 6.731%, 7/1/2043 | | | 400,000 | | | | 483,312 | |
| Series A2, 7.431%, 7/1/2043 | | | 250,000 | | | | 314,313 | |
| New Jersey, Economic Development Authority Revenue, Series B, 6.5%, 11/1/2013, INS: AGC | | | 860,000 | | | | 895,062 | |
| New Jersey, State Economic Development Authority Revenue, Series B, 6.5%, 11/1/2014, INS: AGC | | | 585,000 | | | | 634,046 | |
| Port Authority New York & New Jersey, One Hundred Fiftieth Series, 4.75%, 9/15/2016 | | | 930,000 | | | | 1,040,670 | |
| Rhode Island, Convention Center Authority Revenue, Civic Center, Series A, 6.06%, 5/15/2035, INS: AGMC | | | 515,000 | | | | 587,749 | |
| Virgin Islands, Port Authority Marine Revenue, Series B, 5.08%, 9/1/2013, INS: AGMC | | | 315,000 | | | | 316,950 | |
| Washington, Central Puget Sound Regional Transit Authority, Sales & Use Tax Revenue, Series A, 5.0%, 11/1/2036 | | | 285,000 | | | | 321,685 | |
Total Municipal Bonds and Notes (Cost $9,893,822) | | | | 10,981,897 | |
| | |
| Preferred Security 0.0% | |
| Financials | |
| Citigroup, Inc., Series A, 5.95%, 1/30/2023 (e) (Cost $50,000) | | | 50,000 | | | | 50,625 | |
| | | Shares | | | Value ($) | |
| | | | |
| Preferred Stock 0.0% | |
| Financials | |
| Ally Financial, Inc., 144A, 7.0% (Cost $9,687) | | | 10 | | | | 9,822 | |
| | | Contracts | | | Value ($) | |
| | | | |
| Call Options Purchased 0.0% | |
| Options on Exchange-Traded Futures Contracts | |
| 10 Year U.S. Treasury Note Future, Expiration Date 2/22/2013, Strike Price $132.0 (Cost $9,174) | | | 15 | | | | 8,672 | |
| | | Shares | | | Value ($) | |
| | | | |
| Securities Lending Collateral 2.5% | |
| Daily Assets Fund Institutional, 0.20% (f) (g) (Cost $4,764,842) | | | 4,764,842 | | | | 4,764,842 | |
| | |
| | | Shares | | | Value ($) | |
| | | | | | | | | |
| Cash Equivalents 9.1% | |
| Central Cash Management Fund, 0.15% (f) (Cost $17,213,361) | | | 17,213,361 | | | | 17,213,361 | |
| | | % of Net Assets | | | Value ($) | |
| | | | |
Total Investment Portfolio (Cost $225,733,691)† | | | 120.9 | | | | 230,025,969 | |
| Other Assets and Liabilities, Net | | | (20.9 | ) | | | (39,779,008 | ) |
| Net Assets | | | 100.0 | | | | 190,246,961 | |
* Floating rate securities' yields vary with a designated market index or market rate, such as the coupon-equivalent of the U.S. Treasury Bill rate. These securities are shown at their current rate as of December 31, 2012.
** Annualized yield at time of purchase; not a coupon rate.
† The cost for federal income tax purposes was $225,733,691. At December 31, 2012, net unrealized appreciation for all securities based on tax cost was $4,292,278. This consisted of aggregate gross unrealized appreciation for all securities in which there was an excess of value over tax cost of $7,529,657 and aggregate gross unrealized depreciation for all securities in which there was an excess of tax cost over value of $3,237,379.
(a) Principal amount stated in U.S. dollars unless otherwise noted.
(b) All or a portion of these securities were on loan (see Notes to Financial Statements). The value of all securities loaned at December 31, 2012 amounted to $4,611,157, which is 2.4% of net assets.
(c) When-issued or delayed delivery security included.
(d) At December 31, 2012, this security has been pledged, in whole or in part, to cover initial margin requirements for open futures contracts.
(e) Date shown is call date; not a maturity date for the perpetual preferred securities.
(f) Affiliated fund managed by Deutsche Investment Management Americas Inc. The rate shown is the annualized seven-day yield at period end.
(g) Represents collateral held in connection with securities lending. Income earned by the Fund is net of borrower rebates.
144A: Security exempt from registration under Rule 144A of the Securities Act of 1933. These securities may be resold in transactions exempt from registration, normally to qualified institutional buyers.
AGC: Assured Guaranty Corp.
AGMC: Assured Guaranty Municipal Corp.
AMBAC: Ambac Financial Group, Inc.
INS: Insured
Interest Only: Interest Only (IO) bonds represent the "interest only" portion of payments on a pool of underlying mortgages or mortgage-backed securities. IO securities are subject to prepayment risk of the pool of underlying mortgages.
PIK: Denotes that all or a portion of the income is paid in-kind in the form of additional principal.
REG S: Securities sold under Regulation S may not be offered, sold or delivered within the United States or to, or for the account or benefit of, U.S. persons, except pursuant to an exemption from, or in a transaction not subject to, the registration requirements of the Securities Act of 1933.
Included in the Fund are investments in mortgage- or asset-backed securities, which are interests in separate pools of mortgages or assets. Effective maturities of these investments may be shorter than stated maturities due to prepayments. Some separate investments in the Federal Home Loan Mortgage Corp., Federal National Mortgage Association and Government National Mortgage Association issues have similar coupon rates and have been aggregated for presentation purposes in the investment portfolio.
At December 31, 2012, open futures contracts purchased were as follows:
| Futures | Currency | Expiration Date | | Contracts | | | Notional Value ($) | | | Unrealized Appreciation (Depreciation) ($) | |
| 10 Year Canadian Government Bond | CAD | 3/20/2013 | | | 10 | | | | 1,362,622 | | | | (9,593 | ) |
| 10 Year U.S. Treasury Note | USD | 3/19/2013 | | | 111 | | | | 14,738,719 | | | | 16,974 | |
| Federal Republic of Germany Euro-Bond | EUR | 3/7/2013 | | | 10 | | | | 1,922,376 | | | | 18,663 | |
| Ultra Long U.S. Treasury Bond | USD | 3/19/2013 | | | 14 | | | | 2,276,313 | | | | (16,457 | ) |
| United Kingdom Long Gilt Bond | GBP | 3/26/2013 | | | 11 | | | | 2,124,975 | | | | (2,262 | ) |
| Total net unrealized appreciation | | | | 7,325 | |
At December 31, 2012, open written options contracts were as follows:
| Options on Exchange-Traded Futures Contracts | | Contracts | | Expiration Date | | Strike Price ($) | | | Premiums Received ($) | | | Value ($) (h) | |
Put Options 10 Year U.S. Treasury Note Future | | | 15 | | 2/22/2013 | | | 131.0 | | | | 5,826 | | | | (4,921 | ) |
(h) Unrealized appreciation on written options on exchange-traded futures contracts at December 31, 2012 was $905.
| Options on Interest Rate Swap Contracts | Swap Effective/ Expiration Date | | Contract Amount | | Option Expiration Date | | Premiums Received ($) | | | Value ($) (i) | |
Call Options Received Fixed —1.828% - Pay Floating — LIBOR | 11/15/2013 11/15/2043 | | | 5,700,000 | | 11/13/2013 | | | 96,615 | | | | (21,516 | ) |
(i) Unrealized appreciation on written options on interest rate swap contracts at December 31, 2012 was $75,099.
At December 31, 2012, open credit default swap contracts sold were as follows:
Effective/ Expiration Date | | Notional Amount ($) (j) | | | Fixed Cash Flows Received | | Underlying Debt Obligation/ Quality Rating (k) | | Value ($) | | | Upfront Payments Paid/ (Received) ($) | | | Unrealized Appreciation ($) | |
9/20/2012 12/20/2017 | | | 900,000 | 1 | | | 1.0 | % | Kingdom of Spain, 5.5%, 7/30/2017, BBB- | | | (77,077 | ) | | | (101,160 | ) | | | 24,083 | |
9/20/2012 12/20/2017 | | | 1,800,000 | 2 | | | 1.0 | % | Kingdom of Spain, 5.5%, 7/30/2017, BBB- | | | (154,155 | ) | | | (223,577 | ) | | | 69,422 | |
9/20/2012 12/20/2017 | | | 50,000 | 3 | | | 5.0 | % | General Motors Co., 3.3%, 12/20/2017, BB+ | | | 4,569 | | | | 3,693 | | | | 876 | |
| Total unrealized appreciation | | | | 94,381 | |
(j) The maximum potential amount of future undiscounted payments that the Fund could be required to make under a credit default swap contract would be the notional amount of the contract. These potential amounts would be partially offset by any recovery values of the referenced debt obligation or net amounts received from the settlement of buy protection credit default swap contracts entered into by the Fund for the same referenced debt obligation, if any.
(k) The quality ratings represent the higher of Moody's Investors Service, Inc. ("Moody's") or Standard & Poor's Corporation ("S&P") credit ratings and are unaudited.
At December 31, 2012, open interest rate swap contracts were as follows:
Effective/ Expiration Date | | Notional Amount ($) | | Cash Flows Paid by the Fund | Cash Flows Received by the Fund | | Value ($) | | | Upfront Payments Paid/ (Received) ($) | | | Unrealized Appreciation (Depreciation) ($) | |
7/16/2013 7/16/2033 | | | 2,100,000 | 1 | Fixed — 2.322% | Floating — LIBOR | | | 116,900 | | | | — | | | | 116,900 | |
7/16/2013 7/16/2043 | | | 700,000 | 1 | Floating — LIBOR | Fixed — 2.424% | | | (59,957 | ) | | | — | | | | (59,957 | ) |
7/16/2013 7/16/2023 | | | 9,000,000 | 1 | Fixed — 1.858% | Floating — LIBOR | | | 95,545 | | | | — | | | | 95,545 | |
7/16/2013 7/16/2014 | | | 8,200,000 | 1 | Floating — LIBOR | Fixed — 0.515% | | | 11,488 | | | | — | | | | 11,488 | |
7/16/2013 7/16/2018 | | | 7,500,000 | 1 | Fixed — 1.148% | Floating — LIBOR | | | (46,557 | ) | | | — | | | | (46,557 | ) |
| Total net unrealized appreciation | | | | 117,419 | |
Counterparties:
1 Citigroup, Inc.
2 BNP Paribas
3 UBS AG
LIBOR: London Interbank Offered Rate
At December 31, 2012, the Fund had the following open forward foreign currency exchange contracts:
| Contracts to Deliver | | In Exchange For | | Settlement Date | | Unrealized Appreciation ($) | | Counterparty |
| JPY | | | 130,000,000 | | USD | | | 1,562,725 | | 1/4/2013 | | | 62,126 | | BNP Paribas |
| USD | | | 2,914,578 | | EUR | | | 2,250,000 | | 1/7/2013 | | | 55,500 | | BNP Paribas |
| AUD | | | 1,800,000 | | USD | | | 1,883,322 | | 1/10/2013 | | | 15,591 | | Barclays Bank PLC |
| USD | | | 2,873,926 | | EUR | | | 2,200,000 | | 1/14/2013 | | | 30,335 | | Barclays Bank PLC |
| MXN | | | 2,002,288 | | USD | | | 155,768 | | 1/14/2013 | | | 1,077 | | JPMorgan Chase Securities, Inc. |
| EUR | | | 237,500 | | USD | | | 314,664 | | 1/30/2013 | | | 1,104 | | Citigroup, Inc. |
| USD | | | 473,988 | | MXN | | | 6,175,000 | | 2/5/2013 | | | 2,132 | | JPMorgan Chase Securities, Inc. |
| Total unrealized appreciation | | | 167,865 | |
| Contracts to Deliver | | In Exchange For | | Settlement Date | | Unrealized Depreciation ($) | | Counterparty |
| USD | | | 1,585,478 | | JPY | | | 130,000,000 | | 1/4/2013 | | | (84,879 | ) | BNP Paribas |
| EUR | | | 1,500,000 | | USD | | | 1,960,688 | | 1/7/2013 | | | (19,365 | ) | Nomura International PLC |
| EUR | | | 750,000 | | USD | | | 973,833 | | 1/7/2013 | | | (16,193 | ) | BNP Paribas |
| USD | | | 1,887,894 | | AUD | | | 1,800,000 | | 1/10/2013 | | | (20,163 | ) | Barclays Bank PLC |
| USD | | | 155,205 | | MXN | | | 2,002,288 | | 1/14/2013 | | | (514 | ) | JPMorgan Chase Securities, Inc. |
| EUR | | | 2,200,000 | | USD | | | 2,858,601 | | 1/14/2013 | | | (45,660 | ) | BNP Paribas |
| Total unrealized depreciation | | | (186,774 | ) |
| Currency Abbreviations |
AUD Australian Dollar CAD Canadian Dollar EUR Euro GBP Great British Pound JPY Japanese Yen MXN Mexican Peso USD United States Dollar |
For information on the Fund's policy and additional disclosures regarding options purchased, futures contracts, written options, credit default swap contracts, interest rate swap contracts and forward foreign currency exchange contracts, please refer to Note B in the accompanying Notes to Financial Statements.
Fair Value Measurements
Various inputs are used in determining the value of the Fund's investments. These inputs are summarized in three broad levels. Level 1 includes quoted prices in active markets for identical securities. Level 2 includes other significant observable inputs (including quoted prices for similar securities, interest rates, prepayment speeds, and credit risk). Level 3 includes significant unobservable inputs (including the Fund's own assumptions in determining the fair value of investments). The inputs or methodology used for valuing securities are not necessarily an indication of the risk associated with investing in those securities.
The following is a summary of the inputs used as of December 31, 2012 in valuing the Fund's investments. For information on the Fund's policy regarding the valuation of investments, please refer to the Security Valuation section of Note A in the accompanying Notes to Financial Statements.
| Assets | | Level 1 | | | Level 2 | | | Level 3 | | | Total | |
| | |
| Fixed Income Investments (l) | |
| Corporate Bonds | | $ | — | | | $ | 67,392,699 | | | $ | — | | | $ | 67,392,699 | |
| Mortgage-Backed Securities Pass-Throughs | | | — | | | | 64,336,483 | | | | — | | | | 64,336,483 | |
| Asset-Backed | | | — | | | | 1,820,500 | | | | — | | | | 1,820,500 | |
| Commercial Mortgage-Backed Securities | | | — | | | | 8,855,627 | | | | — | | | | 8,855,627 | |
| Collateralized Mortgage Obligations | | | — | | | | 8,773,274 | | | | — | | | | 8,773,274 | |
| Government & Agency Obligations | | | — | | | | 42,892,917 | | | | — | | | | 42,892,917 | |
| Loan Participations and Assignments | | | — | | | | 2,925,250 | | | | — | | | | 2,925,250 | |
| Municipal Bonds and Notes | | | — | | | | 10,981,897 | | | | — | | | | 10,981,897 | |
| Preferred Security | | | — | | | | 50,625 | | | | — | | | | 50,625 | |
| Preferred Stock | | | — | | | | 9,822 | | | | — | | | | 9,822 | |
| Short-Term Investments | | | 21,978,203 | | | | — | | | | — | | | | 21,978,203 | |
| Derivatives (m) | |
| Purchased Options | | | 8,672 | | | | — | | | | — | | | | 8,672 | |
| Futures Contracts | | | 35,637 | | | | — | | | | — | | | | 35,637 | |
| Credit Default Swap Contracts | | | — | | | | 94,381 | | | | — | | | | 94,381 | |
| Interest Rate Swap Contracts | | | — | | | | 223,933 | | | | — | | | | 223,933 | |
| Forward Foreign Currency Exchange Contracts | | | — | | | | 167,865 | | | | — | | | | 167,865 | |
| Total | | $ | 22,022,512 | | | $ | 208,525,273 | | | $ | — | | | $ | 230,547,785 | |
| Liabilities | |
| Derivatives (m) | |
| Written Options | | $ | (4,921 | ) | | $ | (21,516 | ) | | $ | — | | | $ | (26,437 | ) |
| Futures Contracts | | | (28,312 | ) | | | — | | | | — | | | | (28,312 | ) |
| Interest Rate Swap Contracts | | | — | | | | (106,514 | ) | | | — | | | | (106,514 | ) |
| Forward Foreign Currency Exchange Contracts | | | — | | | | (186,774 | ) | | | — | | | | (186,774 | ) |
| Total | | $ | (33,233 | ) | | $ | (314,804 | ) | | $ | — | | | $ | (348,037 | ) |
There have been no transfers between fair value measurement levels during the year ended December 31, 2012.
(l) See Investment Portfolio for additional detailed categorizations.
(m) Derivatives include value of options purchased, unrealized appreciation (depreciation) on open futures contracts, credit default swap contracts, interest rate swap contracts, forward foreign currency exchange contracts and written options, at value.
The accompanying notes are an integral part of the financial statements.
Statement of Assets and Liabilities | as of December 31, 2012 | |
| Assets | |
Investments: Investments in non-affiliated securities, at value (cost $203,755,488) — including $4,611,157 of securities loaned | | $ | 208,047,766 | |
Investment in Daily Assets Fund Institutional (cost $4,764,842)* | | | 4,764,842 | |
| Investment in Central Cash Management Fund (cost $17,213,361) | | | 17,213,361 | |
| Total investments, at value (cost $225,733,691) | | | 230,025,969 | |
| Foreign currency, at value (cost $142,195) | | | 134,501 | |
| Receivable for Fund shares sold | | | 221,344 | |
| Interest receivable | | | 1,659,502 | |
| Unrealized appreciation on swap contracts | | | 318,314 | |
| Unrealized appreciation on forward foreign currency exchange contracts | | | 167,865 | |
| Upfront payments paid on swap contracts | | | 3,693 | |
| Foreign taxes recoverable | | | 816 | |
| Other assets | | | 5,151 | |
| Total assets | | | 232,537,155 | |
| Liabilities | |
| Payable upon return of securities loaned | | | 4,764,842 | |
| Payable for investments purchased — when-issued securities | | | 36,552,215 | |
| Payable for Fund shares redeemed | | | 142,511 | |
| Payable for variation margin on futures contracts | | | 26,967 | |
| Options written, at value (premium received $102,441) | | | 26,437 | |
| Unrealized depreciation on swap contracts | | | 106,514 | |
| Unrealized depreciation on forward foreign currency exchange contracts | | | 186,774 | |
| Upfront payments received on swap contracts | | | 324,737 | |
| Accrued management fee | | | 65,995 | |
| Accrued Trustees' fees | | | 2,201 | |
| Other accrued expenses and payables | | | 91,001 | |
| Total liabilities | | | 42,290,194 | |
| Net assets, at value | | $ | 190,246,961 | |
| Net Assets Consist of | |
| Undistributed net investment income | | | 4,095,360 | |
Net unrealized appreciation (depreciation) on: Investments | | | 4,292,278 | |
| Swap contracts | | | 211,800 | |
| Futures | | | 7,325 | |
| Foreign currency | | | (26,580 | ) |
| Written options | | | 76,004 | |
| Accumulated net realized gain (loss) | | | (79,612,715 | ) |
| Paid-in capital | | | 261,203,489 | |
| Net assets, at value | | $ | 190,246,961 | |
Class A Net Asset Value, offering and redemption price per share ($190,246,961 ÷ 32,324,964 outstanding shares of beneficial interest, $.01 par value, unlimited number of shares authorized) | | $ | 5.89 | |
* Represents collateral on securities loaned.
The accompanying notes are an integral part of the financial statements.
Statement of Operations
| for the year ended December 31, 2012 | |
| Investment Income | |
Income: Interest | | $ | 5,537,911 | |
| Income distributions — Central Cash Management Fund | | | 15,080 | |
| Securities lending income, including income from Daily Assets Fund Institutional, net of borrower rebates | | | 8,764 | |
| Total income | | | 5,561,755 | |
Expenses: Management fee | | | 641,098 | |
| Administration fee | | | 164,384 | |
| Services to shareholders | | | 1,926 | |
| Custodian fee | | | 21,947 | |
| Professional fees | | | 53,845 | |
| Reports to shareholders | | | 41,942 | |
| Trustees' fees and expenses | | | 8,488 | |
| Other | | | 16,160 | |
| Total expenses | | | 949,790 | |
| Net investment income | | | 4,611,965 | |
| Realized and Unrealized Gain (Loss) | |
Net realized gain (loss) from: Investments | | | 8,171,024 | |
| Swap contracts | | | 161,513 | |
| Futures | | | (508,667 | ) |
| Written options | | | 1,780 | |
| Foreign currency | | | (152,411 | ) |
| | | | 7,673,239 | |
Change in net unrealized appreciation (depreciation) on: Investments | | | (651,121 | ) |
| Swap contracts | | | 211,800 | |
| Futures | | | 303,227 | |
| Written options | | | 76,004 | |
| Foreign currency | | | (43,988 | ) |
| | | | (104,078 | ) |
| Net gain (loss) | | | 7,569,161 | |
| Net increase (decrease) in net assets resulting from operations | | $ | 12,181,126 | |
The accompanying notes are an integral part of the financial statements.
Statement of Changes in Net Assets | | | Years Ended December 31, | |
| Increase (Decrease) in Net Assets | | 2012 | | | 2011 | |
Operations: Net investment income | | $ | 4,611,965 | | | $ | 4,587,767 | |
| Net realized gain (loss) | | | 7,673,239 | | | | 997,538 | |
| Change in net unrealized appreciation (depreciation) | | | (104,078 | ) | | | 905,689 | |
| Net increase (decrease) in net assets resulting from operations | | | 12,181,126 | | | | 6,490,994 | |
Distributions to shareholders from: Net investment income: Class A | | | (4,882,203 | ) | | | (4,956,830 | ) |
Fund share transactions: Class A Proceeds from shares sold | | | 33,310,645 | | | | 13,875,163 | |
| Net assets acquired in tax-free reorganization* | | | 78,348,206 | | | | — | |
| Reinvestment of distributions | | | 4,882,203 | | | | 4,956,830 | |
| Payments for shares redeemed | | | (45,528,835 | ) | | | (63,808,031 | ) |
| Net increase (decrease) in net assets from Class A share transactions | | | 71,012,219 | | | | (44,976,038 | ) |
| Increase (decrease) in net assets | | | 78,311,142 | | | | (43,441,874 | ) |
| Net assets at beginning of period | | | 111,935,819 | | | | 155,377,693 | |
| Net assets at end of period (including undistributed net investment income of $4,095,360 and $4,694,271, respectively) | | $ | 190,246,961 | | | $ | 111,935,819 | |
| Other Information | |
Class A Shares outstanding at beginning of period | | | 19,571,536 | | | | 27,458,970 | |
| Shares sold | | | 5,773,870 | | | | 2,449,457 | |
| Shares issued in tax-free reorganization* | | | 13,990,523 | | | | — | |
| Shares issued to shareholders in reinvestment of distributions | | | 873,382 | | | | 891,516 | |
| Shares redeemed | | | (7,884,347 | ) | | | (11,228,407 | ) |
| Net increase (decrease) in Class A shares | | | 12,753,428 | | | | (7,887,434 | ) |
| Shares outstanding at end of period | | | 32,324,964 | | | | 19,571,536 | |
* On April 30, 2012, DWS Core Fixed Income VIP was acquired by the Fund through a tax-free reorganization (see Note H).
The accompanying notes are an integral part of the financial statements.
| | | Years Ended December 31, | |
| Class A | | | 2012 | | | 2011 | | | 2010 | | | 2009 | | | 2008 | |
| Selected Per Share Data | |
| Net asset value, beginning of period | | $ | 5.72 | | | $ | 5.66 | | | $ | 5.54 | | | $ | 5.50 | | | $ | 6.98 | |
Income (loss) from investment operations: Net investment incomea | | | .16 | | | | .22 | | | | .19 | | | | .25 | | | | .37 | |
| Net realized and unrealized gain (loss) | | | .27 | | | | .09 | | | | .18 | | | | .26 | | | | (1.48 | ) |
| Total from investment operations | | | .43 | | | | .31 | | | | .37 | | | | .51 | | | | (1.11 | ) |
Less distributions from: Net investment income | | | (.26 | ) | | | (.25 | ) | | | (.25 | ) | | | (.47 | ) | | | (.37 | ) |
| Net asset value, end of period | | $ | 5.89 | | | $ | 5.72 | | | $ | 5.66 | | | $ | 5.54 | | | $ | 5.50 | |
| Total Return (%) | | | 7.77 | | | | 5.68 | | | | 6.79 | | | | 10.07 | | | | (16.77 | ) |
| Ratios to Average Net Assets and Supplemental Data | |
| Net assets, end of period ($ millions) | | | 190 | | | | 112 | | | | 155 | | | | 159 | | | | 155 | |
| Ratio of expenses (%) | | | .58 | | | | .62 | | | | .59 | | | | .59 | | | | .59 | |
| Ratio of net investment income (%) | | | 2.81 | | | | 3.86 | | | | 3.42 | | | | 4.68 | | | | 5.76 | |
| Portfolio turnover rate (%) | | | 115 | | | | 219 | | | | 357 | | | | 284 | | | | 196 | |
a Based on average shares outstanding during the period. | |
Notes to Financial Statements
A. Organization and Significant Accounting Policies
DWS Variable Series I (the "Series") is registered under the Investment Company Act of 1940, as amended (the "1940 Act"), as an open-end, registered management investment company organized as a Massachusetts business trust. The Series consists of five diversified funds: DWS Bond VIP, DWS Core Equity VIP (formerly DWS Growth & Income VIP), DWS Capital Growth VIP, DWS Global Small Cap Growth VIP and DWS International VIP (individually or collectively hereinafter referred to as a "Fund" or the "Funds"). These financial statements report on DWS Bond VIP. The Series is intended to be the underlying investment vehicle for variable annuity contracts and variable life insurance policies to be offered by the separate accounts of certain life insurance companies ("Participating Insurance Companies").
The Fund's financial statements are prepared in accordance with accounting principles generally accepted in the United States of America, which require the use of management estimates. Actual results could differ from those estimates. The policies described below are followed consistently by the Fund in the preparation of its financial statements.
Security Valuation. Investments are stated at value determined as of the close of regular trading on the New York Stock Exchange on each day the exchange is open for trading.
Various inputs are used in determining the value of the Fund's investments. These inputs are summarized in three broad levels. Level 1 includes quoted prices in active markets for identical securities. Level 2 includes other significant observable inputs (including quoted prices for similar securities, interest rates, prepayment speeds, and credit risk). Level 3 includes significant unobservable inputs (including the Fund's own assumptions in determining the fair value of investments). The inputs or methodology used for valuing securities are not necessarily an indication of the risk associated with investing in those securities.
Debt securities and loan participations and assignments are valued at prices supplied by independent pricing services approved by the Trustees of the Series. If the pricing services are unable to provide valuations, securities are valued at the most recent bid quotation or evaluated price, as applicable, obtained from one or more broker-dealers. Such services may use various pricing techniques which take into account appropriate factors such as yield, quality, coupon rate, maturity, type of issue, trading characteristics and other data, as well as broker quotes. These securities are generally categorized as Level 2.
Money market instruments purchased with an original or remaining maturity of sixty days or less, maturing at par, are valued at amortized cost, which approximates value, and are categorized as Level 2. Investments in open-end investment companies are valued at their net asset value each business day and are categorized as Level 1.
Futures contracts are generally valued at the settlement prices established each day on the exchange on which they are traded and are categorized as Level 1.
Swap contracts are valued daily based upon prices supplied by a Board approved pricing vendor, if available, and otherwise are valued at the price provided by the broker-dealer. Swap contracts are generally categorized as Level 2.
Forward currency contracts are valued at the prevailing forward exchange rate of the underlying currencies and are categorized as Level 2.
Exchange-traded options are valued at the last sale price or, in the absence of a sale, the mean between the closing bid and asked prices or at the most recent asked price (bid for purchased options) if no bid or asked price are available. Exchange-traded options are categorized as Level 1. Over-the-counter written or purchased options are valued at the price provided by the broker-dealer with which the option was traded and are generally categorized as Level 2.
Securities and other assets for which market quotations are not readily available or for which the above valuation procedures are deemed not to reflect fair value are valued in a manner that is intended to reflect their fair value as determined in accordance with procedures approved by the Trustees and are generally categorized as Level 3. In accordance with the Fund's valuation procedures, factors used in determining value may include, but are not limited to, the type of the security; the size of the holding; the initial cost of the security; the existence of any contractual restrictions on the security's disposition; the price and extent of public trading in similar securities of the issuer or of comparable companies; quotations or evaluated prices from broker-dealers and/or pricing services; information obtained from the issuer, analysts, and/or the appropriate stock exchange (for exchange-traded securities); an analysis of the company's or issuer's financial statements; an evaluation of the forces that influence the issuer and the market(s) in which the security is purchased and sold and with respect to debt securities; the maturity, coupon, creditworthiness, currency denomination and the movement of the market in which the security is normally traded. The value determined under these procedures may differ from published values for the same securities.
Disclosure about the classification of fair value measurements is included in a table following the Fund's Investment Portfolio.
New Accounting Pronouncement. In January 2013, Accounting Standard Update 2013-01 (ASU 2013-01), Clarifying the Scope of Disclosures about Offsetting Assets and Liabilities, replaced Accounting Standards Update 2011-11 (ASU 2011-11), Disclosures about Offsetting Assets and Liabilities. ASU 2013-01 is effective for fiscal years beginning on or after January 1, 2013, and interim periods within those annual periods. ASU 2011-11 was intended to enhance disclosure requirements on the offsetting of financial assets and liabilities. The ASU 2013-01 limits the scope of the new balance sheet offsetting disclosures to derivatives, repurchase agreements, and securities lending transactions to the extent that they are (1) offset in the financial statements or (2) subject to an enforceable master netting arrangement or similar agreement. Management is currently evaluating the application of ASU 2013-01 and its impact, if any, on the Fund's financial statements.
Securities Lending. The Fund lends securities to certain financial institutions. The Fund retains beneficial ownership of the securities it has loaned and continues to receive interest and dividends paid by the issuer of securities and to participate in any changes in their market value. The Fund requires the borrowers of the securities to maintain collateral with the Fund consisting of either cash or liquid, unencumbered assets having a value at least equal to the value of the securities loaned. When the collateral falls below specified amounts, the lending agent will use its best effort to obtain additional collateral on the next business day to meet required amounts under the security lending agreement. The Fund may invest the cash collateral into a joint trading account in an affiliated money market fund pursuant to Exemptive Orders issued by the SEC. The Fund receives compensation for lending its securities either in the form of fees or by earning interest on invested cash collateral net of borrower rebates and fees paid to a lending agent. Either the Fund or the borrower may terminate the loan. There may be risks of delay and costs in recovery of securities or even loss of rights in the collateral should the borrower of the securities fail financially. The Fund is also subject to all investment risks associated with the reinvestment of any cash collateral received, including, but not limited to, interest rate, credit and liquidity risk associated with such investments.
Foreign Currency Translations. The books and records of the Fund are maintained in U.S. dollars. Investment securities and other assets and liabilities denominated in a foreign currency are translated into U.S. dollars at the prevailing exchange rates at period end. Purchases and sales of investment securities, income and expenses are translated into U.S. dollars at the prevailing exchange rates on the respective dates of the transactions.
Net realized and unrealized gains and losses on foreign currency transactions represent net gains and losses between trade and settlement dates on securities transactions, the acquisition and disposition of foreign currencies, and the difference between the amount of net investment income accrued and the U.S. dollar amount actually received. That portion of both realized and unrealized gains and losses on investments that results from fluctuations in foreign currency exchange rates is not separately disclosed but is included with net realized and unrealized gain/appreciation and loss/depreciation on investments.
Loan Participations and Assignments. Loan Participations and Assignments are portions of loans originated by banks and sold in pieces to investors. These U.S. dollar-denominated fixed and floating rate loans ("Loans") in which the Fund invests, are arranged between the borrower and one or more financial institutions ("Lenders"). These Loans may take the form of Senior Loans, which are corporate obligations often issued in connection with recapitalizations, acquisitions, leveraged buy-outs and refinancings, and Sovereign Loans, which are debt instruments between a foreign sovereign entity and one or more financial institutions. The Fund invests in such Loans in the form of participations in Loans ("Participations") or assignments of all or a portion of Loans from third parties ("Assignments"). Participations typically result in the Fund having a contractual relationship only with the Lender, not with the borrower. The Fund has the right to receive payments of principal, interest and any fees to which it is entitled from the Lender selling the Participation and only upon receipt by the Lender of the payments from the borrower. In connection with purchasing Participations, the Fund generally has no right to enforce compliance by the borrower with the terms of the loan agreement relating to the Loan, or any rights of set-off against the borrower, and the Fund will not benefit directly from any collateral supporting the Loan in which it has purchased the Participation. As a result, the Fund assumes the credit risk of both the borrower and the Lender that is selling the Participation. Assignments typically result in the Fund having a direct contractual relationship with the borrower, and the Fund may enforce compliance by the borrower with the terms of the loan agreement. Loans held by the Fund generally in the form of Assignments but the Fund may also invest in Participations. All Loan Participations and Assignments involve interest rate risk, liquidity risk and credit risk, including the potential default or insolvency of the borrower.
When-Issued/Delayed Delivery Securities. The Fund may purchase or sell securities with delivery or payment to occur at a later date beyond the normal settlement period. At the time the Fund enters into a commitment to purchase or sell a security, the transaction is recorded and the value of the transaction is reflected in the net asset value. The price of such security and the date when the security will be delivered and paid for are fixed at the time the transaction is negotiated. The value of the security may vary with market fluctuations. At the time the Fund enters into a purchase transaction it is required to segregate cash or other liquid assets at least equal to the amount of the commitment.
Certain risks may arise upon entering into when-issued or delayed delivery transactions from the potential inability of counterparties to meet the terms of their contracts or if the issuer does not issue the securities due to political, economic, or other factors. Additionally, losses may arise due to changes in the value of the underlying securities.
Federal Income Taxes. The Fund is treated as a separate taxpayer as provided for in the Internal Revenue Code, as amended. It is the Fund's policy to comply with the requirements of the Internal Revenue Code, as amended, which are applicable to regulated investment companies, and to distribute all of its taxable income to the separate accounts of the Participating Insurance Companies which hold its shares.
Under the Regulated Investment Company Modernization Act of 2010, net capital losses incurred post-enactment may be carried forward indefinitely, and their character is retained as short-term and/or long-term. Previously, net capital losses were carried forward for eight years and treated as short-term losses. As a transition rule, the Act requires that post-enactment net capital losses be used before pre-enactment net capital losses.
At December 31, 2012, the Fund had a net tax basis capital loss carryforward of approximately $79,389,000 of pre-enactment losses, including $45,070,000 inherited from its merger with DWS Core Fixed Income VIP in fiscal year 2012, which may be applied against any realized net taxable capital gains of each succeeding year until fully utilized or until December 31, 2016 ($45,070,000) and December 31, 2017 ($34,319,000), the respective expiration dates, whichever occurs first, and which may be subject to certain limitations under Sections 381-384 of the Internal Revenue Code.
The Fund has reviewed the tax positions for the open tax years as of December 31, 2012 and has determined that no provision for income tax is required in the Fund's financial statements. The Fund's federal tax returns for the prior three fiscal years remain open subject to examination by the Internal Revenue Service.
Distribution of Income and Gains. The Fund will declare and distribute dividends from its net investment income, if any, annually, although additional distributions may be made if necessary. Net realized gains from investment transactions, in excess of available capital loss carryforwards, would be taxable to the Fund if not distributed, and, therefore, will be distributed to shareholders at least annually.
The timing and characterization of certain income and capital gain distributions are determined annually in accordance with federal tax regulations which may differ from accounting principles generally accepted in the United States of America. These differences primarily relate to investments in foreign denominated investments, investments in forward foreign currency exchange contracts, futures contracts, swap contracts and certain securities sold at a loss. As a result, net investment income (loss) and net realized gain (loss) on investment transactions for a reporting period may differ significantly from distributions during such period. Accordingly, the Fund may periodically make reclassifications among certain of its capital accounts without impacting the net asset value of the Fund.
At December 31, 2012, the Fund's components of distributable earnings (accumulated losses) on a tax basis are as follows:
| Undistributed ordinary income* | | $ | 4,261,535 | |
| Capital loss carryforwards | | $ | (79,389,000 | ) |
| Net unrealized appreciation (depreciation) on investments | | $ | 4,292,278 | |
In addition, the tax character of distributions paid to shareholders by the Fund is summarized as follows:
| | | Years Ended December 31, | |
| | | 2012 | | | 2011 | |
| Distributions from ordinary income* | | $ | 4,882,203 | | | $ | 4,956,830 | |
* For tax purposes, short-term capital gain distributions are considered ordinary income distributions.
Expenses. Expenses of the Series arising in connection with a specific Fund are allocated to that Fund. Other Series expenses which cannot be directly attributed to a Fund are apportioned among the Funds in the Series based upon the relative net assets or other appropriate measures.
Contingencies. In the normal course of business, the Fund may enter into contracts with service providers that contain general indemnification clauses. The Fund's maximum exposure under these arrangements is unknown as this would involve future claims that may be made against the Fund that have not yet been made. However, based on experience, the Fund expects the risk of loss to be remote.
Other. Investment transactions are accounted for on a trade date plus one basis for daily net asset value calculations. However, for financial reporting purposes, investment transactions are reported on trade date. Interest income is recorded on the accrual basis net of foreign withholding taxes. Realized gains and losses from investment transactions are recorded on an identified cost basis and may include proceeds from litigation. All discounts and premiums are accreted/amortized for both tax and financial reporting purposes.
B. Derivative Instruments
Futures Contracts. A futures contract is an agreement between a buyer or seller and an established futures exchange or its clearinghouse in which the buyer or seller agrees to take or make a delivery of a specific amount of a financial instrument at a specified price on a specific date (settlement date). For the year ended December 31, 2012, the Fund invested in interest rate futures to gain exposure to different parts of the yield curve while managing the overall duration. The Fund also entered into interest rate futures and currency futures contracts for non-hedging purposes to seek to enhance potential gains.
Upon entering into a futures contract, the Fund is required to deposit with a financial intermediary cash or securities ("initial margin") in an amount equal to a certain percentage of the face value indicated in the futures contract. Subsequent payments ("variation margin") are made or received by the Fund dependent upon the daily fluctuations in the value and are recorded for financial reporting purposes as unrealized gains or losses by the Fund. Gains or losses are realized when the contract expires or is closed. Since all futures contracts are exchange traded, counterparty risk is minimized as the exchange's clearinghouse acts as the counterparty, and guarantees the futures against default.
Certain risks may arise upon entering into futures contracts, including the risk that an illiquid market will limit the Fund's ability to close out a futures contract prior to the settlement date and the risk that the futures contract is not well correlated with the security, index or currency to which it relates. Risk of loss may exceed amounts disclosed in the Statement of Assets and Liabilities.
A summary of the open futures contracts as of December 31, 2012, is included in a table following the Fund's Investment Portfolio. For the year ended December 31, 2012, the investment in futures contracts purchased had a total notional value generally indicative of a range from approximately $892,000 to $22,425,000, and the investment in futures contracts sold had a total notional value generally indicative of a range from $0 to approximately $49,190,000.
Options. An option contract is a contract in which the writer (seller) of the option grants the buyer of the option, upon payment of a premium, the right to purchase from (call option), or sell to (put option), the writer a designated instrument at a specified price within a specified period of time. Certain options, including options on indices, will require cash settlement by the Fund if exercised. For the year ended December 31, 2012, the Fund entered into options on interest rate futures and on interest rate swaps in order to hedge against potential adverse interest rate movements of portfolio assets.
If the Fund writes a covered call option, the Fund foregoes, in exchange for the premium, the opportunity to profit during the option period from an increase in the market value of the underlying security above the exercise price. If the Fund writes a put option it accepts the risk of a decline in the value of the underlying security below the exercise price. Over-the-counter options have the risk of the potential inability of counterparties to meet the terms of their contracts. The Fund's maximum exposure to purchased options is limited to the premium initially paid. In addition, certain risks may arise upon entering into option contracts including the risk that an illiquid secondary market will limit the Fund's ability to close out an option contract prior to the expiration date and that a change in the value of the option contract may not correlate exactly with changes in the value of the securities or currencies hedged.
A summary of the open purchased option contracts as of December 31, 2012 is included in the Fund's Investment Portfolio. A summary of open written option contracts is included in the table following the Fund's Investment Portfolio. For the year ended December 31, 2012, the investment in written options contracts had a total value generally indicative of a range from $0 to approximately $102,000, and purchased option contracts had a total value generally indicative of a range from $0 to approximately $9,000.
Credit Default Swap Contracts. A credit default swap is a contract between a buyer and a seller of protection against pre-defined credit events for the reference entity. The Fund may enter into credit default swap contracts to gain exposure to an underlying issuer's credit quality characteristics without directly investing in that issuer or to hedge against the risk of a credit event on debt securities. As a seller in the credit default swap contract, the Fund is required to pay the par (or other agreed-upon) value of the referenced entity to the counterparty with the occurrence of a credit event by a third party, such as a U.S. or foreign corporate issuer, on the reference entity, which would likely result in a loss to the Fund. In return, the Fund receives from the counterparty a periodic stream of payments over the term of the contract provided that no credit event has occurred. If no credit event occurs, the Fund keeps the stream of payments with no payment obligations. The Fund may also buy credit default swap contracts, in which case the Fund functions as the counterparty referenced above. This involves the risk that the contract may expire worthless. It also involves counterparty risk that the seller may fail to satisfy its payment obligations to the Fund with the occurrence of a credit event. When the Fund sells a credit default swap contract it will cover its commitment. This may be achieved by, among other methods, maintaining cash or liquid assets equal to the aggregate notional value of the reference entities for all outstanding credit default swap contracts sold by the Fund. For the year ended December 31, 2012, the Fund entered into credit default swap contracts to gain exposure to the underlying issuer's credit quality characteristics and hedge the risk of default on Fund securities.
The value of the credit default swap is adjusted daily and the change in value, if any, is recorded daily as unrealized appreciation or depreciation in the Statement of Assets and Liabilities. An upfront payment, if any, made by the Fund is recorded as an asset in the Statement of Assets and Liabilities. An upfront payment, if any, received by the Fund is recorded as a liability in the Statement of Assets and Liabilities. Under the terms of the credit default swap contracts, the Fund receives or makes quarterly payments based on a specified interest rate on a fixed notional amount. These payments are recorded as a realized gain or loss in the Statement of Operations. Payments received or made as a result of a credit event or termination of the contract are recognized, net of a proportional amount of the upfront payment, as realized gains or losses in the Statement of Operations.
A summary of the open credit default swap contracts as of December 31, 2012 is included in a table following the Fund's Investment Portfolio. For the year ended December 31, 2012, the investment in credit default swap contracts purchased had a total notional value generally indicative of a range from $0 to $24,492,000 and the investment in credit default swap contracts sold had a total notional value generally indicative of a range from $0 to $2,750,000.
Interest Rate Swap Contracts. For the year ended December 31, 2012, the Fund entered into interest rate swap transactions to gain exposure to different parts of the yield curve while managing overall duration. The use of interest rate swaps is a highly specialized activity that involves investment techniques and risks different from those associated with ordinary portfolio security transactions. In an interest rate swap, the Fund agrees to pay to the other party to the interest rate swap (which is known as the "counterparty") a fixed rate payment in exchange for the counterparty agreeing to pay to the Fund a variable rate payment, or the Fund agrees to receive from the counterparty a fixed rate payment in exchange for the counterparty agreeing to receive from the Fund a variable rate payment. In addition, both the Fund and counterparty may agree to exchange variable rate payments based on different indices. The payment obligations are based on the notional amount of the swap. Certain risks may arise when entering into swap transactions including counterparty default, liquidity or unfavorable changes in interest rates. In connection with these agreements, securities and or cash may be identified as collateral in accordance with the terms of the swap agreements to provide assets of value and recourse in the event of default. The maximum counterparty credit risk is the net present value of the cash flows to be received from or paid to the counterparty over the term of the interest rate swap contract, to the extent that this amount is beneficial to the Fund, in addition to any related collateral posted to the counterparty by the Fund. This risk may be partially reduced by a master netting arrangement between the Fund and the counterparty. The value of the swap is adjusted daily and the change in value, if any, is recorded as unrealized appreciation or depreciation in the Statement of Assets and Liabilities. An upfront payment, if any, made by the Fund is recorded as an asset in the Statement of Assets and Liabilities. An upfront payment, if any, received by the Fund is recorded as a liability in the Statement of Assets and Liabilities. Payments received or made at the end of the measurement period are recorded as realized gain or loss in the Statement of Operations.
A summary of the open interest rate swap contracts as of December 31, 2012 is included in a table following the Fund's Investment Portfolio. For the year ended December 31, 2012, the investment in interest rate swap contracts had a total notional amount generally indicative of a range from $0 to $27,500,000.
Forward Foreign Currency Exchange Contracts. A forward foreign currency exchange contract ("forward currency contract") is a commitment to purchase or sell a foreign currency at the settlement date at a negotiated rate. The Fund is subject to foreign exchange rate risk in its securities denominated in foreign currencies. Changes in exchange rates between foreign currencies and the U.S. dollar may affect the U.S. dollar value of foreign securities or the income or gains received on these securities. To reduce the effect of currency fluctuations, the Fund may enter into forward currency contracts. For the year ended December 31, 2012, the Fund invested in forward currency contracts to hedge its exposure to changes in foreign currency exchange rates on its foreign currency denominated securities. In addition, the Fund also engaged in forward currency contracts for non-hedging purposes to seek to enhance potential gains.
Forward currency contracts are valued at the prevailing forward exchange rate of the underlying currencies and unrealized gain (loss) is recorded daily. On the settlement date of the forward currency contract, the Fund records a realized gain or loss equal to the difference between the value of the contract at the time it was opened and the value of the contract at the time it was closed. Certain risks may arise upon entering into forward currency contracts from the potential inability of counterparties to meet the terms of their contracts. The maximum counterparty credit risk to the Fund is measured by the unrealized gain on appreciated contracts. Additionally, when utilizing forward currency contracts to hedge, the Fund gives up the opportunity to profit from favorable exchange rate movements during the term of the contract.
A summary of the open forward currency contracts as of December 31, 2012, is included in a table following the Fund's Investment Portfolio. For the year ended December 31, 2012, the investment in forward currency contracts U.S. dollars purchased had a total contract value generally indicative of a range from approximately $27,000 to $13,995,000, and the investment in forward currency contracts U.S. dollars sold had a total contract value generally indicative of a range from approximately $1,111,000 to $9,891,000.
The following tables summarize the value of the Fund's derivative instruments held as of December 31, 2012 and the related location in the accompanying Statement of Assets and Liabilities, presented by primary underlying risk exposure:
| Asset Derivatives | | Purchased Options | | | Forward Contracts | | | Swap Contracts | | | Futures Contracts | | | Total | |
| Interest Rate Contracts (a) (b) | | $ | 8,672 | | | $ | — | | | $ | 223,933 | | | $ | 35,637 | | | $ | 268,242 | |
| Credit Contracts (a) | | | — | | | | — | | | | 94,381 | | | | — | | | | 94,381 | |
| Foreign Exchange Contracts (c) | | | — | | | | 167,865 | | | | — | | | | — | | | | 167,865 | |
| | | $ | 8,672 | | | $ | 167,865 | | | $ | 318,314 | | | $ | 35,637 | | | $ | 530,488 | |
Each of the above derivatives is located in the following Statement of Assets and Liabilities accounts:
(a) Investments in securities, at value (includes purchased options) and unrealized appreciation on swap contracts
(b) Includes cumulative appreciation of futures contracts as disclosed in the Investment Portfolio. Unsettled variation margin is disclosed separately within the Statement of Assets and Liabilities.
(c) Unrealized appreciation on forward foreign currency exchange contracts
| Liability Derivatives | | Written
Options | | | Forward Contracts | | | Swap
Contracts | | | Futures Contracts | | | Total | |
| Interest Rate Contracts (a) (b) | | $ | (26,437 | ) | | $ | — | | | $ | (106,514 | ) | | $ | (28,312 | ) | | $ | (161,263 | ) |
| Foreign Exchange Contracts (c) | | | — | | | | (186,774 | ) | | | — | | | | — | | | | (186,774 | ) |
| | | $ | (26,437 | ) | | $ | (186,774 | ) | | $ | (106,514 | ) | | $ | (28,312 | ) | | $ | (348,037 | ) |
Each of the above derivatives is located in the following Statement of Assets and Liabilities accounts:
(a) Options written, at value and unrealized depreciation on swap contracts
(b) Includes cumulative depreciation of futures contracts as disclosed in the Investment Portfolio. Unsettled variation margin is disclosed separately within the Statement of Assets and Liabilities.
(c) Unrealized depreciation on forward foreign currency exchange contracts
Additionally, the amount of unrealized and realized gains and losses on derivative instruments recognized in Fund earnings during the year ended December 31, 2012 and the related location in the accompanying Statement of Operations is summarized in the following tables by primary underlying risk exposure:
| Realized Gain (Loss) | | Purchased Options | | | Written
Options | | | Forward Contracts | | | Swap Contracts | | | Futures Contracts | | | Total | |
| Interest Rate Contracts (a) | | $ | (1,031 | ) | | $ | 1,780 | | | $ | — | | | $ | — | | | $ | (593,054 | ) | | $ | (592,305 | ) |
| Credit Contracts (b) | | | — | | | | — | | | | — | | | | 161,513 | | | | — | | | | 161,513 | |
| Foreign Exchange Contracts (c) | | | — | | | | — | | | | (138,879 | ) | | | — | | | | 84,387 | | | | (54,492 | ) |
| | | $ | (1,031 | ) | | $ | 1,780 | | | $ | (138,879 | ) | | $ | 161,513 | | | $ | (508,667 | ) | | $ | (485,284 | ) |
Each of the above derivatives is located in the following Statement of Operations accounts:
(a) Net realized gain (loss) from investments (includes purchased options), written options, swap contracts and futures, respectively
(b) Net realized gain (loss) from swap contracts
(c) Net realized gain (loss) from foreign currency (Statement of Operations includes both forward currency contracts and foreign currency transactions)
| Change in Net Unrealized Appreciation (Depreciation) | | Purchased Options | | | Written
Options | | | Forward Contracts | | | Swap
Contracts | | | Futures Contracts | | | Total | |
| Interest Rate Contracts (a) | | $ | 502 | | | $ | 76,004 | | | $ | — | | | $ | 117,419 | | | $ | 324,326 | | | $ | 518,251 | |
| Credit Contracts (b) | | | — | | | | — | | | | — | | | | 94,381 | | | | — | | | | 94,381 | |
| Foreign Exchange Contracts (c) | | | — | | | | — | | | | (40,370 | ) | | | — | | | | (21,099 | ) | | | (61,469 | ) |
| | | $ | 502 | | | $ | 76,004 | | | $ | (40,370 | ) | | $ | 211,800 | | | $ | 303,227 | | | $ | 551,163 | |
Each of the above derivatives is located in the following Statement of Operations accounts:
(a) Change in net unrealized appreciation (depreciation) on investments (includes purchased options), written options, swaps contracts and futures, respectively.
(b) Change in net unrealized appreciation (depreciation) on swap contracts
(c) Change in net unrealized appreciation (depreciation) on foreign currency (Statement of Operations includes both forward currency contracts and foreign currency transactions)
C. Purchases and Sales of Securities
During the year ended December 31, 2012, purchases and sales of investment securities (excluding short-term investments and U.S. Treasury obligations) aggregated $167,642,496 and $203,233,138, respectively. Purchases and sales of U.S. Treasury obligations aggregated $50,027,543 and $47,042,681, respectively.
For the year ended December 31, 2012, transactions for written options on interest rate swap contracts and futures contracts were as follows:
| | | Contracts/ Contract Amount | | | Premium | |
| Outstanding, beginning of period | | | — | | | $ | — | |
| Options written | | | 5,700,025 | | | | 106,325 | |
| Options closed | | | (5 | ) | | | (1,942 | ) |
| Options expired | | | (5 | ) | | | (1,942 | ) |
| Outstanding, end of period | | | 5,700,015 | | | $ | 102,441 | |
D. Related Parties
Management Agreement. Under the Investment Management Agreement with Deutsche Investment Management Americas Inc. ("DIMA" or the "Advisor"), an indirect, wholly owned subsidiary of Deutsche Bank AG, the Advisor directs the investments of the Fund in accordance with its investment objectives, policies and restrictions. The Advisor determines the securities, instruments and other contracts relating to investments to be purchased, sold or entered into by the Fund.
Pursuant to the Investment Management Agreement with the Advisor, the Fund pays a monthly management fee based on the Fund's average daily net assets, computed and accrued daily and payable monthly, at the following annual rates:
| First $250 million of average daily net assets | | | .390 | % |
| Next $750 million of average daily net assets | | | .365 | % |
| Over $1 billion of average daily net assets | | | .340 | % |
Accordingly, for the year ended December 31, 2012, the fee pursuant to the Investment Management Agreement was equivalent to an annual effective rate of 0.39% of the Fund's average daily net assets.
For the period from October 1, 2012 through September 30, 2013, the Advisor has contractually agreed to waive its fees and/or reimburse certain operating expenses to the extent necessary to maintain the operating expenses (excluding certain expenses such as extraordinary expenses, taxes, brokerage and interest expense) of Class A at 0.55%.
Administration Fee. Pursuant to an Administrative Services Agreement, DIMA provides most administrative services to the Fund. For all services provided under the Administrative Services Agreement, the Fund pays the Advisor an annual fee ("Administration Fee") of 0.10% of the Fund's average daily net assets, computed and accrued daily and payable monthly. For the year ended December 31, 2012, the Administration Fee was $164,384, of which $16,349 is unpaid.
Service Provider Fees. DWS Investments Service Company ("DISC"), an affiliate of the Advisor, is the transfer agent, dividend-paying agent and shareholder service agent for the Fund. Pursuant to a sub-transfer agency agreement between DISC and DST Systems, Inc. ("DST"), DISC has delegated certain transfer agent, dividend-paying agent and shareholder service agent functions to DST. DISC compensates DST out of the shareholder servicing fee it receives from the Fund. For the year ended December 31, 2012, the amounts charged to the Fund by DISC aggregated $609, of which $155 is unpaid.
Typesetting and Filing Service Fees. Under an agreement with DIMA, DIMA is compensated for providing typesetting and certain regulatory filing services to the Fund. For the year ended December 31, 2012, the amount charged to the Fund by DIMA included in the Statement of Operations under "reports to shareholders" aggregated $17,575, of which $5,684 is unpaid.
Trustees' Fees and Expenses. The Fund paid retainer fees to each Trustee not affiliated with the Advisor, plus specified amounts to the Board Chairperson and to each committee Chairperson.
Affiliated Cash Management Vehicle. The Fund may invest uninvested cash balances in Central Cash Management Fund, which is managed by the Advisor. The Fund indirectly bears its proportionate share of the expenses of Central Cash Management Fund. Central Cash Management Fund does not pay the Advisor an investment management fee. Central Cash Management Fund seeks a high level of current income consistent with liquidity and the preservation of capital.
Securities Lending Agent Fees. Effective November 29, 2012, Deutsche Bank AG serves as securities lending agent for the Fund. For the period from November 29, 2012 through December 31, 2012, the Fund incurred securities lending agent fees to Deutsche Bank AG in the amount of $102.
E. Investing in Emerging Markets
Investing in emerging markets may involve special risks and considerations not typically associated with investing in developed markets. These risks include revaluation of currencies, high rates of inflation or deflation, repatriation restrictions on income and capital, and future adverse political, social and economic developments. Moreover, securities issued in these markets may be less liquid, subject to government ownership controls or delayed settlements and may have prices more volatile or less easily assessed than those of comparable securities of issuers in developed markets.
F. Ownership of the Fund
Three participating insurance companies were owners of record of 10% or more of the total outstanding Class A shares of the Fund, owning 30%, 26% and 17%, respectively.
G. Line of Credit
The Fund and other affiliated funds (the "Participants") share in a $375 million revolving credit facility provided by a syndication of banks. The Fund may borrow for temporary or emergency purposes, including the meeting of redemption requests that otherwise might require the untimely disposition of securities. The Participants are charged an annual commitment fee which is allocated based on net assets, among each of the Participants. Interest is calculated at a rate per annum equal to the sum of the Federal Funds Rate plus 1.25 percent plus if LIBOR exceeds the Federal Funds Rate the amount of such excess. The Fund may borrow up to a maximum of 33 percent of its net assets under the agreement. The Fund had no outstanding loans at December 31, 2012.
H. Acquisition of Assets
On April 30, 2012, the Fund acquired all of the net assets of DWS Core Fixed Income VIP pursuant to a plan of reorganization approved by the Board of Trustees on November 18, 2011. The acquisition was accomplished by a tax-free exchange of 8,800,059 Class A shares of DWS Core Fixed Income VIP for 13,990,523 Class A shares of the Fund outstanding on April 30, 2012. DWS Core Fixed Income VIP's net assets at that date, $78,348,206, including $2,794,520 of net unrealized appreciation, were combined with those of the Fund. The aggregate net assets of the Fund immediately before the acquisition were $109,635,421. The combined net assets of the Fund immediately following the acquisition were $187,983,627.
The financial statements reflect the operations of the Fund for the period prior to the acquisition and the combined portfolio for the period subsequent to the fund merger. Assuming the acquisition had been completed on January 1, 2012, the Fund's pro forma results of operations for the year ended December 31, 2012, are as follows:
| | | Total Aggregated | |
| Net investment income* | | $ | 5,319,871 | |
| Net gain (loss) on investments | | $ | 9,024,159 | |
| Net increase (decrease) in net assets resulting from operations | | $ | 14,344,030 | |
* Net investment income includes $26,856 of pro forma eliminated expenses.
Because the combined investment portfolio has been managed as a single integrated Fund since the acquisition was completed, it is not practicable to separate the amounts of revenue and earnings of DWS Core Fixed Income VIP that have been included in the Fund's Statement of Operations since April 30, 2012.
Report of Independent Registered Public Accounting Firm
To the Trustees of DWS Variable Series I and the Shareholders of DWS Bond VIP:
In our opinion, the accompanying statement of assets and liabilities, including the investment portfolio, and the related statements of operations and of changes in net assets and the financial highlights present fairly, in all material respects, the financial position of DWS Bond VIP (the "Fund") at December 31, 2012 and the results of its operations, the changes in its net assets, and the financial highlights for the periods indicated therein, in conformity with accounting principles generally accepted in the United States of America. These financial statements and financial highlights (hereafter referred to as "financial statements") are the responsibility of the Fund's management. Our responsibility is to express an opinion on these financial statements based on our audits. We conducted our audits of these financial statements in accordance with the standards of the Public Company Accounting Oversight Board (United States). Those standards require that we plan and perform the audit to obtain reasonable assurance about whether the financial statements are free of material misstatement. An audit includes examining, on a test basis, evidence supporting the amounts and disclosures in the financial statements, assessing the accounting principles used and significant estimates made by management, and evaluating the overall financial statement presentation. We believe that our audits, which included confirmation of securities at December 31, 2012 by correspondence with the custodians and brokers, provide a reasonable basis for our opinion.
Boston, Massachusetts February 14, 2013 | PricewaterhouseCoopers LLP |
Information About Your Fund's Expenses (Unaudited)
As an investor of the Fund, you incur two types of costs: ongoing expenses and transaction costs. Ongoing expenses include management fees and other Fund expenses. Examples of transaction costs include contract charges, redemption fees and account maintenance fees, which are not shown in this section. The following tables are intended to help you understand your ongoing expenses (in dollars) of investing in the Fund and to help you compare these expenses with the ongoing expenses of investing in other mutual funds. The example in the table is based on an investment of $1,000 invested at the beginning of the six-month period and held for the entire period (July 1, 2012 to December 31, 2012).
The tables illustrate your Fund's expenses in two ways:
•Actual Fund Return. This helps you estimate the actual dollar amount of ongoing expenses (but not transaction costs) paid on a $1,000 investment in the Fund using the Fund's actual return during the period. To estimate the expenses you paid over the period, simply divide your account value by $1,000 (for example, an $8,600 account value divided by $1,000 = 8.6), then multiply the result by the number in the "Expenses Paid per $1,000" line under the share class you hold.
• Hypothetical 5% Fund Return. This helps you to compare your Fund's ongoing expenses (but not transaction costs) with those of other mutual funds using the Fund's actual expense ratio and a hypothetical rate of return of 5% per year before expenses. Examples using a 5% hypothetical Fund return may be found in the shareholder reports of other mutual funds. The hypothetical account values and expenses may not be used to estimate the actual ending account balance or expenses you paid for the period.
Please note that the expenses shown in these tables are meant to highlight your ongoing expenses only and do not reflect any transaction costs. The "Expenses Paid per $1,000" line of the tables is useful in comparing ongoing expenses only and will not help you determine the relative total expense of owning different funds. If these transaction costs had been included, your costs would have been higher.
Expenses and Value of a $1,000 Investment for the six months ended December 31, 2012 | |
| Actual Fund Return | | Class A | |
| Beginning Account Value 7/1/12 | | $ | 1,000.00 | |
| Ending Account Value 12/31/12 | | $ | 1,038.80 | |
| Expenses Paid per $1,000* | | $ | 2.82 | |
| Hypothetical 5% Fund Return | | Class A | |
| Beginning Account Value 7/1/12 | | $ | 1,000.00 | |
| Ending Account Value 12/31/12 | | $ | 1,022,37 | |
| Expenses Paid per $1,000* | | $ | 2.80 | |
* Expenses are equal to the Fund's annualized expense ratio, multiplied by the average account value over the period, multiplied by 184 (the number of days in the most recent six-month period), then divided by 366.
| Annualized Expense Ratio | Class A |
| DWS Variable Series I — DWS Bond VIP | .55% |
For more information, please refer to the Fund's prospectus.
These tables do not reflect charges and fees ("contract charges") associated with the separate account that invests in the Fund or any variable life insurance policy or variable annuity contract for which the Fund is an investment option.
Tax Information (Unaudited)
Please consult a tax advisor if you have questions about federal or state income tax laws, or on how to prepare your tax returns. If you have specific questions about your account, please contact your insurance provider.
The Series' policies and procedures for voting proxies for portfolio securities and information about how the Series voted proxies related to its portfolio securities during the 12-month period ended June 30 are available on our Web site — www.dws-investments.com (click on "proxy voting"at the bottom of the page) — or on the SEC's Web site — www.sec.gov. To obtain a written copy of the Series' policies and procedures without charge, upon request, call us toll free at (800) 728-3337.
Investment Management Agreement Approval
The Board of Trustees approved the renewal of DWS Bond VIP's investment management agreement (the "Agreement") with Deutsche Investment Management Americas Inc. ("DWS") in September 2012.
In terms of the process that the Board followed prior to approving the Agreement, shareholders should know that:
• In September 2012, all of the Fund's Trustees were independent of DWS and its affiliates.
• The Trustees met frequently during the past year to discuss fund matters and dedicated a substantial amount of time to contract review matters. Over the course of several months, the Board's Contract Committee, in coordination with the Board's Fixed Income and Quant Oversight Committee, reviewed comprehensive materials received from DWS, independent third parties and independent counsel. These materials included an analysis of the Fund's performance, fees and expenses, and profitability compiled by the Fund's independent fee consultant. The Board also received extensive information throughout the year regarding performance of the Fund.
• The Independent Trustees regularly meet privately with their independent counsel to discuss contract review and other matters. In addition, the Independent Trustees were also advised by the Fund's independent fee consultant in the course of their review of the Fund's contractual arrangements and considered a comprehensive report prepared by the independent fee consultant in connection with their deliberations (the "IFC Report").
• In connection with reviewing the Agreement, the Board also reviewed the terms of the Fund's distribution agreement, administrative services agreement, transfer agency agreement and other material service agreements.
• Based on its evaluation of the information provided, the Contract Committee presented its findings and recommendations to the Board. The Board then reviewed the Contract Committee's findings and recommendations.
In connection with the contract review process, the Contract Committee and the Board considered the factors discussed below, among others. The Board also considered that DWS and its predecessors have managed the Fund since its inception, and the Board believes that a long-term relationship with a capable, conscientious advisor is in the best interests of the Fund. The Board considered, generally, that shareholders chose to invest or remain invested in the Fund knowing that DWS managed the Fund, and that the Agreement was approved by the Fund's shareholders. DWS is part of Deutsche Bank, a major global banking institution that is engaged in a wide range of financial services. The Board believes that there are advantages to being part of a global asset management business that offers a wide range of investing expertise and resources, including hundreds of portfolio managers and analysts with research capabilities in many countries throughout the world.
As part of the contract review process, the Board carefully considered the fees and expenses of each DWS fund overseen by the Board in light of the fund's performance. In many cases, this led to a negotiation with DWS of lower expense caps for the coming year than had previously been in place. As part of these negotiations, the Board indicated that it would consider relaxing these new lower caps in future years following sustained improvements in performance, among other considerations.
In June 2012, Deutsche Bank ("DB"), DWS's parent company, announced that DB's new management team had concluded the strategic review of its global asset management business announced in late 2011 by DB's prior management team, and would combine its Asset Management (of which DWS is a part) and Wealth Management divisions. Prior to approving the investment management agreements, the Independent Trustees were apprised of the expected management and structure of the new combined Asset & Wealth Management division ("AWM") and DWS. DB also advised the Independent Trustees that the U.S. asset management business is a critical and integral part of DB and AWM, and that DB would be reinvesting a significant portion of the substantial savings it expects to realize by combining its Asset Management and Wealth Management divisions into a combined AWM division, including enhancements to its investment capabilities. DB also confirmed its commitment to maintaining strong legal and compliance groups within the combined division.
While shareholders may focus primarily on fund performance and fees, the Fund's Board considers these and many other factors, including the quality and integrity of DWS's personnel and such other issues as back-office operations, fund valuations, and compliance policies and procedures.
Nature, Quality and Extent of Services. The Board considered the terms of the Agreement, including the scope of advisory services provided under the Agreement. The Board noted that, under the Agreement, DWS provides portfolio management services to the Fund and that, pursuant to a separate administrative services agreement, DWS provides administrative services to the Fund. The Board considered the experience and skills of senior management and investment personnel, the resources made available to such personnel, the ability of DWS to attract and retain high-quality personnel, and the organizational depth and stability of DWS. The Board reviewed the Fund's performance over short-term and long-term periods and compared those returns to various agreed-upon performance measures, including market indices and a peer universe compiled by the independent fee consultant using information supplied by Lipper Inc. ("Lipper"), an independent fund data service. The Board also noted that it has put into place a process of identifying "Focus Funds" (e.g., funds performing poorly relative to their benchmark or a peer universe compiled by an independent fund data service), and receives more frequent reporting and information from DWS regarding such funds, along with DWS's remedial plans to address underperformance. The Board believes this process is an effective manner of identifying and addressing underperforming funds. Based on the information provided, the Board noted that for each of the one-, three- and five-year periods ended December 31, 2011, the Fund's performance (Class A shares) was in the 4th quartile of the applicable Lipper universe (the 1st quartile being the best performers and the 4th quartile being the worst performers). The Board also observed that the Fund has underperformed its benchmark in the one- and five-year periods and has outperformed its benchmark in the three-year period ended December 31, 2011. The Board noted the disappointing investment performance of the Fund in recent periods and continued to discuss with senior management of DWS the factors contributing to such underperformance and actions being taken to improve performance. The Board recognized that DWS has made changes in its investment personnel and processes in recent years in an effort to improve long-term performance.
Fees and Expenses. The Board considered the Fund's investment management fee schedule, operating expenses and total expense ratios, and comparative information provided by Lipper and the independent fee consultant regarding investment management fee rates paid to other investment advisors by similar funds (1st quartile being the most favorable and 4th quartile being the least favorable). With respect to management fees paid to other investment advisors by similar funds, the Board noted that the contractual fee rates paid by the Fund, which include a 0.10% fee paid to DWS under the Fund's administrative services agreement, were approximately at the median of the applicable Lipper peer group (based on Lipper data provided as of December 31, 2011). The Board noted that the Fund's Class A shares total (net) operating expenses were expected to be lower than the median (2nd quartile) of the applicable Lipper expense universe (based on Lipper data provided as of December 31, 2011) ("Lipper Universe Expenses"). The Board considered the Fund's management fee rate as compared to fees charged by DWS and certain of its affiliates for comparable mutual funds and considered differences in fund and fee structures between the DWS Funds. The Board also considered how the Fund's total (net) operating expenses compared to the total (net) operating expenses of a more customized peer group selected by Lipper (based on such factors as asset size).
The Board also noted that the expense limitation agreed to by DWS helped to ensure that the Fund's total (net) operating expenses would remain competitive.
The information considered by the Board as part of its review of management fees included information regarding fees charged by DWS and its affiliates to similar institutional accounts and to similar funds offered primarily to European investors ("DWS Europe funds"), in each case as applicable. The Board observed that advisory fee rates for institutional accounts generally were lower than the management fees charged by similarly managed DWS U.S. mutual funds ("DWS Funds"), but also took note of the differences in services provided to DWS Funds as compared to institutional accounts. In the case of DWS Europe funds, the Board observed that fee rates for DWS Europe funds generally were higher than for similarly managed DWS Funds, but noted that differences in the types of services provided to DWS Funds relative to DWS Europe funds made it difficult to compare such fees.
On the basis of the information provided, the Board concluded that management fees were reasonable and appropriate in light of the nature, quality and extent of services provided by DWS.
Profitability. The Board reviewed detailed information regarding revenues received by DWS under the Agreement. The Board considered the estimated costs and pre-tax profits realized by DWS from advising the DWS Funds, as well as estimates of the pre-tax profits attributable to managing the Fund in particular. The Board also received information regarding the estimated enterprise-wide profitability of DWS and its affiliates with respect to all fund services in totality and by fund. The Board and the independent fee consultant reviewed DWS's methodology in allocating its costs to the management of the Fund. Based on the information provided, the Board concluded that the pre-tax profits realized by DWS in connection with the management of the Fund were not unreasonable. The Board also reviewed information regarding the profitability of certain similar investment management firms. The Board noted that while information regarding the profitability of such firms is limited (and in some cases is not necessarily prepared on a comparable basis), DWS and its affiliates' overall profitability with respect to the DWS fund complex (after taking into account distribution and other services provided to the funds by DWS and its affiliates) was lower than the overall profitability levels of many comparable firms for which such data was available.
Economies of Scale. The Board considered whether there are economies of scale with respect to the management of the Fund and whether the Fund benefits from any economies of scale. The Board noted that the Fund's management fee schedule includes fee breakpoints. The Board concluded that the Fund's fee schedule represents an appropriate sharing between the Fund and DWS of such economies of scale as may exist in the management of the Fund at current asset levels.
Other Benefits to DWS and Its Affiliates. The Board also considered the character and amount of other incidental benefits received by DWS and its affiliates, including any fees received by DWS for administrative services provided to the Fund and any fees received by an affiliate of DWS for distribution services. The Board also considered benefits to DWS related to brokerage and soft-dollar allocations, including allocating brokerage to pay for research generated by parties other than the executing broker dealers, which pertain primarily to funds investing in equity securities, along with the incidental public relations benefits to DWS related to DWS Funds advertising and cross-selling opportunities among DWS products and services. The Board concluded that management fees were reasonable in light of these fallout benefits.
Compliance. The Board considered the significant attention and resources dedicated by DWS to documenting and enhancing its compliance processes in recent years. The Board noted in particular (i) the experience and seniority of both DWS's chief compliance officer and the Fund's chief compliance officer; (ii) the large number of DWS compliance personnel; and (iii) the substantial commitment of resources by DWS and its affiliates to compliance matters.
Based on all of the information considered and the conclusions reached, the Board unanimously determined that the continuation of the Agreement is in the best interests of the Fund. In making this determination, the Board did not give particular weight to any single factor identified above. The Board considered these factors over the course of numerous meetings, certain of which were in executive session with only the Independent Trustees and their counsel present. It is possible that individual Trustees may have weighed these factors differently in reaching their individual decisions to approve the continuation of the Agreement.
Summary of Management Fee Evaluation by Independent Fee Consultant
September 17, 2012
Pursuant to an Order entered into by Deutsche Investment Management Americas and affiliates (collectively, "DeAM") with the Attorney General of New York, I, Thomas H. Mack, have been appointed the Independent Fee Consultant for the DWS Funds (formerly the DWS Scudder Funds). My duties include preparing an annual written evaluation of the management fees DeAM charges the Funds, considering among other factors the management fees charged by other mutual fund companies for like services, management fees DeAM charges other clients for like services, DeAM's costs of supplying services under the management agreements and related profit margins, possible economies of scale if a Fund grows larger, and the nature and quality of DeAM's services, including fund performance. This report summarizes my evaluation for 2012, including my qualifications, the evaluation process for each of the DWS Funds, consideration of certain complex-level factors, and my conclusions. I served in substantially the same capacity in 2007, 2008, 2009, 2010 and 2011.
Qualifications
For more than 35 years I have served in various professional capacities within the investment management business. I have held investment analysis and advisory positions, including securities analyst, portfolio strategist and director of investment policy with a large investment firm. I have also performed business management functions, including business development, financial management and marketing research and analysis.
Since 1991, I have been an independent consultant within the asset management industry. I have provided services to over 125 client organizations, including investment managers, mutual fund boards, product distributors and related organizations. Over the past ten years I have completed a number of assignments for mutual fund boards, specifically including assisting boards with management contract renewal.
I hold a Master of Business Administration degree, with highest honors, from Harvard University and Master of Science and Bachelor of Science (highest honors) degrees from the University of California at Berkeley. I am an independent director and audit committee financial expert for two closed-end mutual funds and have served in various leadership and financial oversight capacities with non-profit organizations.
Evaluation of Fees for each DWS Fund
My work focused primarily on evaluating, fund-by-fund, the fees charged to each of the 103 mutual fund portfolios in the DWS Fund family. For each Fund, I considered each of the key factors mentioned above, as well as any other relevant information. In doing so I worked closely with the Funds' Independent Directors in their annual contract renewal process, as well as in their approval of contracts for several new funds (documented separately).
In evaluating each Fund's fees, I reviewed comprehensive materials provided by or on behalf of DeAM, including expense information prepared by Lipper Analytical, comparative performance information, profitability data, manager histories, and other materials. I also accessed certain additional information from the Lipper and Morningstar databases and drew on my industry knowledge and experience.
To facilitate evaluating this considerable body of information, I prepared for each Fund a document summarizing the key data elements in each area as well as additional analytics discussed below. This made it possible to consider each key data element in the context of the others.
In the course of contract renewal, DeAM agreed to implement a number of fee and expense adjustments requested by the Independent Directors which will favorably impact future fees and expenses, and my evaluation includes the effects of these changes.
Fees and Expenses Compared with Other Funds
The competitive fee and expense evaluation for each fund focused on two primary comparisons:
The Fund's contractual management fee (the advisory fee plus the administration fee where applicable) compared with those of a group of typically 12-15 funds in the same Lipper investment category (e.g. Large Capitalization Growth) having similar distribution arrangements and being of similar size.
The Fund's total expenses compared with a broader universe of funds from the same Lipper investment category and having similar distribution arrangements.
These two comparisons provide a view of not only the level of the fee compared with funds of similar scale but also the total expense the Fund bears for all the services it receives, in comparison with the investment choices available in the Fund's investment category and distribution channel. The principal figure-of-merit used in these comparisons was the subject Fund's percentile ranking against peers.
DeAM's Fees for Similar Services to Others
DeAM provided management fee schedules for all of its US domiciled fund and non-fund investment management accounts in any of the investment categories where there is a DWS Fund. These similar products included the other DWS Funds, non-fund pooled accounts, institutional accounts and sub-advisory accounts. Using this information, I calculated for each Fund the fee that would be charged to each similar product, at the subject Fund's asset level.
Evaluating information regarding non-fund products is difficult because there are varying levels of services required for different types of accounts, with mutual funds generally requiring considerably more regulatory and administrative types of service as well as having more frequent cash flows than other types of accounts. Also, while mutual fund fees for similar fund products can be expected to be similar, there will be some differences due to different pricing conditions in different distribution channels (e.g. retail funds versus those used in variable insurance products), differences in underlying investment processes and other factors.
Costs and Profit Margins
DeAM provided a detailed profitability analysis for each Fund. After making some adjustments so that the presentation would be more comparable to the available industry figures, I reviewed profit margins from investment management alone, from investment management plus other fund services (excluding distribution) provided to the Funds by DeAM (principally shareholder services), and DeAM profits from all sources, including distribution. A later section comments on overall profitability.
Economies of Scale
Economies of scale — an expected decline in management cost per dollar of fund assets as fund assets grow — are very rarely quantified and documented because of inherent difficulties in collecting and analyzing relevant data. However, in virtually every investment category that I reviewed, larger funds tend to have lower fees and lower total expenses than smaller funds. To see how each DWS Fund compares with this industry observation, I reviewed:
The trend in Fund assets over the last five years and the accompanying trend in total expenses. This shows if the Fund has grown and, if so, whether total expense (management fees as well as other expenses) have declined as a percent of assets.
Whether the Fund has break-points in its management fee schedule, the extent of the fee reduction built into the schedule and the asset levels where the breaks take effect, and in the case of a sub-advised Fund how the Fund's break-points compare with those of the sub-advisory fee schedule.
How the Fund's contractual fee schedule compares with trends in the industry data. To accomplish this, I constructed a chart showing how actual latest-fiscal-year contractual fees of the Fund and of other similar funds relate to average fund assets, with the subject Fund's contractual fee schedule superimposed.
Quality of Service — Performance
The quality-of-service evaluation focused on investment performance, which is the principal result of the investment management service. Each Fund's performance was reviewed over the past 1, 3, 5 and 10 years, as applicable, and compared with that of other funds in the same investment category and with a suitable market index.
In addition, I calculated and reviewed risk-adjusted returns relative to an index of similar mutual funds' returns and a suitable market index. The risk-adjusted returns analysis provides a way of determining the extent to which the Fund's return comparisons are mainly the product of investment value-added (or lack thereof) or alternatively taking considerably more or less risk than is typical in its investment category.
I also received and considered the history of portfolio manager changes for each Fund, as this provided an important context for evaluating the performance results.
Complex-Level Considerations
While this evaluation was conducted mainly at the individual fund level, there are some issues relating to the reasonableness of fees that can alternatively be considered across the whole fund complex:
I reviewed DeAM's profitability analysis for all DWS Funds, with a view toward determining if the allocation procedures used were reasonable and how profit levels compared with public data for other investment managers.
I considered whether DeAM and affiliates receive any significant ancillary or "fallout" benefits that should be considered in interpreting the direct profitability results. These would be situations where serving as the investment manager of the Funds is beneficial to another part of the Deutsche Bank organization.
I considered how aggregated DWS Fund expenses had varied over the years, by asset class and in the context of trends in asset levels.
I considered how aggregated DWS Fund performance measures relative to appropriate peers had varied by asset class and over time.
I reviewed the structure of the DeAM organization, trends in staffing levels, and information on compensation of investment management and other professionals compared with industry data.
Findings
Based on the process and analysis discussed above, which included reviewing a wide range of information from management and external data sources and considering among other factors the fees DeAM charges other clients, the fees charged by other fund managers, DeAM's costs and profits associated with managing the Funds, economies of scale, possible fall-out benefits, and the nature and quality of services provided, in my opinion the management fees charged the DWS Funds are reasonable.
Thomas H. Mack
President, Thomas H. Mack & Co., Inc.
Board Members and Officers
The following table presents certain information regarding the Board Members and Officers of the fund. Each Board Member's year of birth is set forth in parentheses after his or her name. Unless otherwise noted, (i) each Board Member has engaged in the principal occupation(s) noted in the table for at least the most recent five years, although not necessarily in the same capacity; and (ii) the address of each Independent Board Member is c/o Kenneth C. Froewiss, Chairman, DWS Mutual Funds, P.O. Box 78, Short Hills, NJ 07078. Except as otherwise noted below, the term of office for each Board Member is until the election and qualification of a successor, or until such Board Member sooner dies, resigns, is removed or as otherwise provided in the governing documents of the fund. Because the fund does not hold an annual meeting of shareholders, each Board Member will hold office for an indeterminate period. The Board Members may also serve in similar capacities with other funds in the fund complex.
| Independent Board Members |
Name, Year of Birth, Position with the Fund and Length of Time Served1 | | Business Experience and Directorships During the Past Five Years | Number of Funds in DWS Fund Complex Overseen |
Other Directorships Held by Board Member |
Kenneth C. Froewiss (1945) Chairperson since 2013,9 and Board Member since 2001 | | Adjunct Professor of Finance, NYU Stern School of Business (September 2009-present; Clinical Professor from 1997-September 2009); Member, Finance Committee, Association for Asian Studies (2002-present); Director, Mitsui Sumitomo Insurance Group (US) (2004-present); prior thereto, Managing Director, J.P. Morgan (investment banking firm) (until 1996) | 103 | — |
William McClayton (1944) Vice Chairperson since 2013,9 and Board Member since 2004 | | Private equity investor (since October 2009); previously, Managing Director, Diamond Management & Technology Consultants, Inc. (global consulting firm) (2001-2009); Directorship: Board of Managers, YMCA of Metropolitan Chicago; formerly: Senior Partner, Arthur Andersen LLP (accounting) (1966-2001); Trustee, Ravinia Festival | 103 | — |
John W. Ballantine (1946) Board Member since 1999 | | Retired; formerly, Executive Vice President and Chief Risk Management Officer, First Chicago NBD Corporation/The First National Bank of Chicago (1996-1998); Executive Vice President and Head of International Banking (1995-1996). Directorships: Stockwell Capital Investments PLC (private equity); former Directorships: First Oak Brook Bancshares, Inc. and Oak Brook Bank; Prisma Energy International | 103 | Chairman of the Board, Healthways, Inc.2 (provider of disease and care management services) (2003- present); Portland General Electric2 (utility company) (2003-present) |
Henry P. Becton, Jr. (1943) Board Member since 1990 | | Vice Chair and former President, WGBH Educational Foundation. Directorships: Public Radio International; Public Radio Exchange (PRX); The PBS Foundation; North Bennett Street School (Boston); former Directorships: Association of Public Television Stations; Boston Museum of Science; American Public Television; Concord Academy; New England Aquarium; Mass. Corporation for Educational Telecommunications; Committee for Economic Development; Public Broadcasting Service; Connecticut College | 103 | Lead Director, Becton Dickinson and Company2 (medical technology company); Lead Director, Belo Corporation2 (media company) |
Dawn-Marie Driscoll (1946) Board Member since 1987 | | President, Driscoll Associates (consulting firm); Emeritus Executive Fellow, Center for Business Ethics, Bentley University; formerly, Partner, Palmer & Dodge (1988-1990); Vice President of Corporate Affairs and General Counsel, Filene's (1978-1988). Directorships: Director of ICI Mutual Insurance Company (since 2007); Advisory Board, Center for Business Ethics, Bentley University; Trustee, Southwest Florida Community Foundation (charitable organization); former Directorships: Sun Capital Advisers Trust (mutual funds) (2007-2012), Investment Company Institute (audit, executive, nominating committees) and Independent Directors Council (governance, executive committees) | 103 | — |
Keith R. Fox, CFA (1954) Board Member since 1996 | | Managing General Partner, Exeter Capital Partners (a series of private investment funds) (since 1986). Directorships: Progressive International Corporation (kitchen goods importer and distributor); The Kennel Shop (retailer); former Chairman, National Association of Small Business Investment Companies; former Directorships: BoxTop Media Inc. (advertising); Sun Capital Advisers Trust (mutual funds) (2011-2012) | 103 | — |
Paul K. Freeman (1950) Board Member since 1993, and Chairperson (2009-Jan. 8, 2013) | | Consultant, World Bank/Inter-American Development Bank; Executive and Governing Council of the Independent Directors Council (Chairman of Education Committee); formerly: Project Leader, International Institute for Applied Systems Analysis (1998-2001); Chief Executive Officer, The Eric Group, Inc. (environmental insurance) (1986-1998); Directorships: Denver Zoo Foundation (December 2012-present); former Directorships: Prisma Energy International | 103 | — |
Richard J. Herring (1946) Board Member since 1990 | | Jacob Safra Professor of International Banking and Professor, Finance Department, The Wharton School, University of Pennsylvania (since July 1972); Co-Director, Wharton Financial Institutions Center (since July 2000); Co-Chair, U.S. Shadow Financial Regulatory Committee; Executive Director, Financial Economists Roundtable; formerly: Vice Dean and Director, Wharton Undergraduate Division (July 1995-June 2000); Director, Lauder Institute of International Management Studies (July 2000-June 2006) | 103 | Director, Japan Equity Fund, Inc. (since September 2007), Thai Capital Fund, Inc. (since 2007), Singapore Fund, Inc. (since September 2007), Independent Director of Barclays Bank Delaware (since September 2010) |
Rebecca W. Rimel (1951) Board Member since 1995 | | President and Chief Executive Officer, The Pew Charitable Trusts (charitable organization) (1994 to present); Trustee, Washington College (2011-2013); formerly: Executive Vice President, The Glenmede Trust Company (investment trust and wealth management) (1983-2004); Board Member, Investor Education (charitable organization) (2004-2005); Trustee, Executive Committee, Philadelphia Chamber of Commerce (2001-2007); Director, Viasys Health Care2 (January 2007-June 2007); Trustee, Pro Publica (charitable organization) (2007-2010); Trustee, Thomas Jefferson Foundation (charitable organization) (1994-2012) | 103 | Director, Becton Dickinson and Company2 (medical technology company) (2012-present); Director, CardioNet, Inc.2 (health care) (2009-present) |
William N. Searcy, Jr. (1946) Board Member since 1993 | | Private investor since October 2003; formerly: Pension & Savings Trust Officer, Sprint Corporation2 (telecommunications) (November 1989-September 2003); Trustee, Sun Capital Advisers Trust (mutual funds) (1998-2012) | 103 | — |
Jean Gleason Stromberg (1943) Board Member since 1997 | | Retired. Formerly, Consultant (1997-2001); Director, Financial Markets U.S. Government Accountability Office (1996-1997); Partner, Fulbright & Jaworski, L.L.P. (law firm) (1978-1996). Directorships: The William and Flora Hewlett Foundation; former Directorships: Service Source, Inc., Mutual Fund Directors Forum (2002-2004), American Bar Retirement Association (funding vehicle for retirement plans) (1987-1990 and 1994-1996) | 103 | — |
Robert H. Wadsworth (1940) Board Member since 1999 | | President, Robert H. Wadsworth & Associates, Inc. (consulting firm) (1983 to present); Director, National Horizon, Inc. (non-profit organization); Director and Treasurer, The Phoenix Boys Choir Association | 106 | — |
Interested Board Member and Officer4 |
Name, Year of Birth, Position with the Fund and Length of Time Served1,6 | | Business Experience and Directorships During the Past Five Years | Number of Funds in DWS Fund Complex Overseen |
Other Directorships Held by Board Member |
Michael J. Woods5 (1967) Board Member since 2013,9 and Executive Vice President since 20139 | | Managing Director,3 Deutsche Asset & Wealth Management (2009-present); Head of the Americas Asset Management Business for Deutsche Bank, Member of the Asset and Wealth Management ("AWM") Extended Executive Committee, AWM Global Client Group Executive Committee and the AWM Active Asset Management Executive Committee; CEO and US Regional Head of DWS Investments; formerly: Sr. VP, Head of the Financial Intermediaries and Investments Group of Evergreen Investments (2007-2009), CEO and Vice Chairman of Board of Directors of XTF Global Asset Management (2006-2007), Managing Director — US Head of Sub-Advisory and Investment Only Business at Citigroup Asset Management (2000-2006). Mr. Woods is currently a board member of The Children's Village, The Big Brothers Big Sisters Organization, and The Mutual Fund Education Alliance. | 39 | — |
Officers4 |
Name, Year of Birth, Position with the Fund and Length of Time Served6 | | Business Experience and Directorships During the Past Five Years |
W. Douglas Beck, CFA7 (1967) President, 2011-present | | Managing Director,3 Deutsche Asset & Wealth Management (2006-present); President of DWS family of funds and Head of Product Management, U.S. for DWS Investments; formerly: Executive Director, Head of Product Management (2002-2006) and President (2005-2006) of the UBS Funds at UBS Global Asset Management; Co-Head of Manager Research/Managed Solutions Group, Merrill Lynch (1998-2002) |
John Millette8 (1962) Vice President and Secretary, 1999-present | | Director,3 Deutsche Asset & Wealth Management |
Paul H. Schubert7 (1963) Chief Financial Officer, 2004-present Treasurer, 2005-present | | Managing Director,3 Deutsche Asset & Wealth Management (since July 2004); formerly: Executive Director, Head of Mutual Fund Services and Treasurer for UBS Family of Funds (1998-2004); Vice President and Director of Mutual Fund Finance at UBS Global Asset Management (1994-1998) |
Caroline Pearson8 (1962) Chief Legal Officer, 2010-present | | Managing Director,3 Deutsche Asset & Wealth Management; formerly: Assistant Secretary for DWS family of funds (1997-2010) |
Melinda Morrow7 (1970) Vice President, 2012-present | | Director,3 Deutsche Asset & Wealth Management |
Hepsen Uzcan8 (1974) Assistant Secretary, since 20139 | | Vice President, Deutsche Asset & Wealth Management |
Paul Antosca8 (1957) Assistant Treasurer, 2007-present | | Director,3 Deutsche Asset & Wealth Management |
Jack Clark8 (1967) Assistant Treasurer, 2007-present | | Director,3 Deutsche Asset & Wealth Management |
Diane Kenneally8 (1966) Assistant Treasurer, 2007-present | | Director,3 Deutsche Asset & Wealth Management |
John Caruso7 (1965) Anti-Money Laundering Compliance Officer, 2010-present | | Managing Director,3 Deutsche Asset & Wealth Management |
Robert Kloby7 (1962) Chief Compliance Officer, 2006-present | | Managing Director,3 Deutsche Asset & Wealth Management |
1 The length of time served represents the year in which the Board Member joined the board of one or more DWS funds currently overseen by the Board.
2 A publicly held company with securities registered pursuant to Section 12 of the Securities Exchange Act of 1934.
3 Executive title, not a board directorship.
4 As a result of their respective positions held with the Advisor, these individuals are considered "interested persons" of the Advisor within the meaning of the 1940 Act. Interested persons receive no compensation from the fund.
5 The mailing address of Mr. Woods is 60 Wall Street, New York, New York 10005. Mr. Woods is an interested Board Member by virtue of his positions with Deutsche Asset & Wealth Management. As an interested person, Mr. Woods receives no compensation from the fund. Mr. Woods is a board member of the following trusts and corporations: Cash Account Trust, DWS Market Trust, DWS Money Funds, DWS State Tax-Free Income Series, DWS Target Fund, DWS Value Series, Inc., DWS Variable Series II, Investors Cash Trust, Tax-Exempt California Money Market Fund, DWS Global High Income Fund, Inc., DWS High Income Opportunities Fund, Inc., DWS High Income Trust, DWS Multi-Market Income Trust, DWS Municipal Income Trust, DWS Strategic Income Trust and DWS Strategic Municipal Income Trust.
6 The length of time served represents the year in which the officer was first elected in such capacity for one or more DWS funds.
7 Address: 60 Wall Street, New York, NY 10005.
8 Address: One Beacon Street, Boston, MA 02108.
9 Effective as of January 9, 2013.
The fund's Statement of Additional Information ("SAI") includes additional information about the Board Members. The SAI is available, without charge, upon request. If you would like to request a copy of the SAI, you may do so by calling the following toll-free number: (800) 728-3337.
Notes
DWS Investments Distributors, Inc.
222 South Riverside Plaza
Chicago, IL 60606
(800) 621-1148
VS1bond-2 (R-025819-2 2/13)
DECEMBER 31, 2012
ANNUAL REPORT
DWS VARIABLE SERIES I
DWS Capital Growth VIP
Contents
11 Statement of Assets and Liabilities 12 Statement of Operations 13 Statement of Changes in Net Assets 15 Notes to Financial Statements 20 Report of Independent Registered Public Accounting Firm 21 Information About Your Fund's Expenses 24 Investment Management Agreement Approval 27 Summary of Management Fee Evaluation by Independent Fee Consultant 29 Board Members and Officers |
This report must be preceded or accompanied by a prospectus. To obtain an additional prospectus or summary prospectus, if available, call (800) 728-3337 or your financial representative. We advise you to consider the Fund's objectives, risks, charges and expenses carefully before investing. The summary prospectus and prospectus contain this and other important information about the Fund. Please read the prospectus carefully before you invest.
The Fund may lend securities to approved institutions. Stocks may decline in value. See the prospectus for details.
DWS Investments is part of the Deutsche Asset & Wealth Management division of Deutsche Bank AG.
NOT FDIC/NCUA INSURED NO BANK GUARANTEE MAY LOSE VALUE NOT A DEPOSIT
NOT INSURED BY ANY FEDERAL GOVERNMENT AGENCY
Performance Summary December 31, 2012 (Unaudited)
Fund performance shown is historical, assumes reinvestment of all dividend and capital gain distributions, and does not guarantee future results. Investment return and principal value fluctuate with changing market conditions so that, when redeemed, shares may be worth more or less than their original cost. Current performance may be lower or higher than the performance data quoted. Please contact your participating insurance company for the Fund's most recent month-end performance. Performance doesn't reflect charges and fees ("contract charges") associated with the separate account that invests in the Fund or any variable life insurance policy or variable annuity contract for which the Fund is an investment option. These charges and fees will reduce returns. While all share classes have the same underlying portfolio, their performance will differ.
The gross expense ratios of the Fund, as stated in the fee table of the prospectus dated May 1, 2012 are 0.50% and 0.84% for Class A and Class B shares, respectively, and may differ from the expense ratios disclosed in the Financial Highlights tables in this report.
| Growth of an Assumed $10,000 Investment |
| The Russell 1000® Growth Index is an unmanaged, capitalization-weighted index containing those securities in the Russell 1000® Index with higher price-to-book ratios and higher forecasted growth values. Index returns do not reflect any fees or expenses and it is not possible to invest directly into an index. |
| |
| Yearly periods ended December 31 | |
| Comparative Results | |
| DWS Capital Growth VIP | | 1-Year | | | 3-Year | | | 5-Year | | | 10-Year | |
| Class A | Growth of $10,000 | | $ | 11,605 | | | $ | 12,938 | | | $ | 11,001 | | | $ | 20,068 | |
| Average annual total return | | | 16.05 | % | | | 8.97 | % | | | 1.93 | % | | | 7.21 | % |
| Russell 1000 Growth Index | Growth of $10,000 | | $ | 11,526 | | | $ | 13,807 | | | $ | 11,663 | | | $ | 20,651 | |
| Average annual total return | | | 15.26 | % | | | 11.35 | % | | | 3.12 | % | | | 7.52 | % |
| DWS Capital Growth VIP | | 1-Year | | | 3-Year | | | 5-Year | | | 10-Year | |
| Class B | Growth of $10,000 | | $ | 11,561 | | | $ | 12,809 | | | $ | 10,822 | | | $ | 19,390 | |
| Average annual total return | | | 15.61 | % | | | 8.60 | % | | | 1.59 | % | | | 6.85 | % |
| Russell 1000 Growth Index | Growth of $10,000 | | $ | 11,526 | | | $ | 13,807 | | | $ | 11,663 | | | $ | 20,651 | |
| Average annual total return | | | 15.26 | % | | | 11.35 | % | | | 3.12 | % | | | 7.52 | % |
The growth of $10,000 is cumulative.
Management Summary December 31, 2012 (Unaudited)
For the 12 months ended December 31, 2012, the Class A shares of the Fund returned 16.05% (unadjusted for contract charges), outperforming the 15.26% return of the Russell 1000® Growth Index.1 During the Fund's most recent fiscal year ended December 31, 2012, top-down judgments regarding the degree of risk facing the global economy dictated many investors' purchase and sale decisions. In the second quarter 2012, worries that Greece might soon exit the Eurozone spurred a new round of market volatility. During July, investors responded positively to the European Central Bank president's declaration that he would do "whatever is necessary" to preserve the euro. In the fourth quarter 2012, large-cap stocks initially faltered, then attempted to rally from mid-November through the end of December 2012 as positive economic reports including rising employment, consumer spending and business capital expenditures boosted equities. A positive revision to third-quarter U.S. GDP — along with some signs that China's economy is reaccelerating — added to the favorable momentum.
In 2012, we placed less emphasis on sector allocation which resulted in the majority of the Fund's outperformance coming from stock selection. In particular, stock selection in technology and consumer staples contributed to returns. An underweight to consumer staples, the second-worst-performing sector during the period, also was additive.2 In contrast, stock selection in the consumer discretionary, energy and industrials sectors detracted from performance.3 In addition, the Fund's cash position was subtractive during 2012's strong market rallies.
We believe accommodative monetary policy around the globe should continue to support equity prices. Equity valuations continue to appear attractive to us, and we look for respectable returns for large-cap stocks through the remainder of 2013. As such, we have begun to favor more cyclical issues when considering additions to the portfolio. More generally, we continue to be cautious and to focus our attention on stock selection as we search for strong product stories in individual companies.
Owen Fitzpatrick, CFA
Lead Portfolio Manager
Thomas M. Hynes, Jr., CFA
Brendan O'Neill, CFA
Portfolio Managers
The views expressed reflect those of the portfolio management team only through the end of the period of the report as stated on the cover. The management team's views are subject to change at any time based on market and other conditions and should not be construed as a recommendation. Past performance is no guarantee of future results. Current and future portfolio holdings are subject to risk.
1 The Russell 1000 Growth Index is an unmanaged index that consists of those stocks in the Russell 1000® Index that have higher price-to-book ratios and higher forecasted growth values.
Index returns do not reflect any fees or expenses and it is not possible to invest directly into an index.
2 "Overweight" means the Fund holds a higher weighting in a given sector or security than the benchmark. "Underweight" means the Fund holds a lower weighting.
3 The consumer discretionary sector represents industries that produce goods and services that are not necessities in everyday life, whereas the consumer staples sector represents industries that produce goods and services that are essential in everyday life.
Portfolio Summary (Unaudited) Asset Allocation (As a % of Investment Portfolio excluding Securities Lending Collateral) | 12/31/12 | 12/31/11 |
| | | |
| Common Stocks | 97% | 98% |
| Cash Equivalents | 3% | 2% |
| | 100% | 100% |
Sector Diversification (As a % of Common Stocks) | 12/31/12 | 12/31/11 |
| | | |
| Information Technology | 32% | 31% |
| Consumer Discretionary | 16% | 13% |
| Health Care | 13% | 10% |
| Industrials | 13% | 14% |
| Consumer Staples | 13% | 10% |
| Financials | 5% | 5% |
| Energy | 5% | 12% |
| Materials | 3% | 4% |
| Utilities | 0% | 1% |
| | 100% | 100% |
Portfolio holdings and characteristics are subject to change.
For more complete details about the Fund's investment portfolio, see page 7.
Following the Fund's fiscal first and third quarter-end, a complete portfolio holdings listing is filed with the SEC on Form N-Q. The form will be available on the SEC's Web site at www.sec.gov, and it also may be reviewed and copied at the SEC's Public Reference Room in Washington, D.C. Information on the operation of the SEC's Public Reference Room may be obtained by calling (800) SEC-0330. The Fund's portfolio holdings are also posted on www.dws-investments.com from time to time. Please see the Fund's current prospectus for more information.
Investment Portfolio December 31, 2012 | | | Shares | | | Value ($) | |
| | | | |
| Common Stocks 96.8% | |
| Consumer Discretionary 15.6% | |
| Auto Components 0.7% | |
| BorgWarner, Inc.* (a) | | | 70,641 | | | | 5,059,308 | |
| Hotels, Restaurants & Leisure 2.7% | |
| McDonald's Corp. | | | 80,463 | | | | 7,097,641 | |
| Starwood Hotels & Resorts Worldwide, Inc. | | | 146,482 | | | | 8,402,208 | |
| Wynn Resorts Ltd. (a) | | | 32,843 | | | | 3,694,509 | |
| | | | | | | | 19,194,358 | |
| Internet & Catalog Retail 0.5% | |
| Amazon.com, Inc.* | | | 14,228 | | | | 3,573,220 | |
| Media 3.1% | |
| Comcast Corp. "A" | | | 365,073 | | | | 13,646,429 | |
| News Corp. "A" | | | 342,514 | | | | 8,747,807 | |
| | | | | | | | 22,394,236 | |
| Multiline Retail 0.7% | |
| Dollar General Corp.* (a) | | | 116,802 | | | | 5,149,800 | |
| Specialty Retail 4.6% | |
| Bed Bath & Beyond, Inc.* (a) | | | 115,691 | | | | 6,468,284 | |
| Dick's Sporting Goods, Inc. (a) | | | 149,072 | | | | 6,781,285 | |
| GNC Holdings, Inc. "A" (a) | | | 103,447 | | | | 3,442,716 | |
| Limited Brands, Inc. (a) | | | 223,462 | | | | 10,516,122 | |
| Sally Beauty Holdings, Inc.* | | | 223,122 | | | | 5,258,986 | |
| | | | | | | | 32,467,393 | |
| Textiles, Apparel & Luxury Goods 3.3% | |
| Coach, Inc. (a) | | | 129,961 | | | | 7,214,135 | |
| NIKE, Inc. "B" | | | 311,670 | | | | 16,082,172 | |
| | | | | | | | 23,296,307 | |
| Consumer Staples 11.9% | |
| Beverages 3.1% | |
| Beam, Inc. (a) | | | 159,837 | | | | 9,764,442 | |
| PepsiCo, Inc. | | | 179,495 | | | | 12,282,843 | |
| | | | | | | | 22,047,285 | |
| Food & Staples Retailing 5.3% | |
| Costco Wholesale Corp. (a) | | | 176,695 | | | | 17,452,165 | |
| Wal-Mart Stores, Inc. | | | 86,950 | | | | 5,932,599 | |
| Whole Foods Market, Inc. | | | 156,599 | | | | 14,302,187 | |
| | | | | | | | 37,686,951 | |
| Food Products 3.5% | |
| Hillshire Brands Co. | | | 201,740 | | | | 5,676,963 | |
| Kraft Foods Group, Inc. | | | 96,479 | | | | 4,386,900 | |
| Mead Johnson Nutrition Co. | | | 117,548 | | | | 7,745,238 | |
| Mondelez International, Inc. "A" | | | 289,438 | | | | 7,371,986 | |
| | | | | | | | 25,181,087 | |
| Energy 5.0% | |
| Energy Equipment & Services 2.3% | |
| Cameron International Corp.* | | | 69,853 | | | | 3,943,901 | |
| Schlumberger Ltd. (a) | | | 183,470 | | | | 12,712,636 | |
| | | | | | | | 16,656,537 | |
| Oil, Gas & Consumable Fuels 2.7% | |
| Anadarko Petroleum Corp. | | | 117,851 | | | | 8,757,508 | |
| Concho Resources, Inc.* (a) | | | 33,162 | | | | 2,671,530 | |
| EOG Resources, Inc. (a) | | | 61,025 | | | | 7,371,210 | |
| | | | | | | | 18,800,248 | |
| | | Shares | | | Value ($) | |
| | | | | | | | | |
| Financials 5.0% | |
| Capital Markets 2.3% | |
| Ameriprise Financial, Inc. (a) | | | 70,240 | | | | 4,399,131 | |
| T. Rowe Price Group, Inc. (a) | | | 186,485 | | | | 12,145,768 | |
| | | | | | | | 16,544,899 | |
| Consumer Finance 1.2% | |
| Discover Financial Services | | | 217,945 | | | | 8,401,780 | |
| Real Estate Investment Trusts 1.4% | |
| American Tower Corp. (REIT) | | | 130,916 | | | | 10,115,880 | |
| Real Estate Management & Development 0.1% | |
| Realogy Holdings Corp.* | | | 17,668 | | | | 741,349 | |
| Health Care 12.8% | |
| Biotechnology 6.1% | |
| Celgene Corp.* | | | 226,435 | | | | 17,824,963 | |
| Cepheid, Inc.* (a) | | | 162,529 | | | | 5,495,106 | |
| Gilead Sciences, Inc.* (a) | | | 192,023 | | | | 14,104,089 | |
| Medivation, Inc.* (a) | | | 124,989 | | | | 6,394,437 | |
| | | | | | | | 43,818,595 | |
| Health Care Equipment & Supplies 1.8% | |
| CareFusion Corp.* (a) | | | 241,641 | | | | 6,906,100 | |
| St. Jude Medical, Inc. (a) | | | 159,074 | | | | 5,748,934 | |
| | | | | | | | 12,655,034 | |
| Health Care Providers & Services 3.6% | |
| Express Scripts Holding Co.* | | | 289,419 | | | | 15,628,626 | |
| McKesson Corp. | | | 101,769 | | | | 9,867,522 | |
| | | | | | | | 25,496,148 | |
| Life Sciences Tools & Services 1.3% | |
| Thermo Fisher Scientific, Inc. | | | 143,264 | | | | 9,137,378 | |
| Industrials 12.1% | |
| Aerospace & Defense 1.2% | |
| TransDigm Group, Inc. | | | 61,616 | | | | 8,401,958 | |
| Commercial Services & Supplies 0.8% | |
| Stericycle, Inc.* (a) | | | 60,039 | | | | 5,599,837 | |
| Electrical Equipment 3.4% | |
| AMETEK, Inc. | | | 289,146 | | | | 10,863,215 | |
| Regal-Beloit Corp. (a) | | | 53,501 | | | | 3,770,215 | |
| Roper Industries, Inc. | | | 86,310 | | | | 9,621,839 | |
| | | | | | | | 24,255,269 | |
| Industrial Conglomerates 2.1% | |
| General Electric Co. | | | 724,118 | | | | 15,199,237 | |
| Machinery 3.5% | |
| Dover Corp. (a) | | | 120,593 | | | | 7,924,166 | |
| Parker Hannifin Corp. (a) | | | 134,298 | | | | 11,423,388 | |
| SPX Corp. | | | 76,580 | | | | 5,372,087 | |
| | | | | | | | 24,719,641 | |
| Road & Rail 1.1% | |
| Norfolk Southern Corp. | | | 132,996 | | | | 8,224,473 | |
| Information Technology 31.1% | |
| Communications Equipment 3.8% | |
| QUALCOMM, Inc. | | | 435,732 | | | | 27,024,099 | |
| Computers & Peripherals 10.8% | |
| Apple, Inc. | | | 109,535 | | | | 58,385,441 | |
| EMC Corp.* (a) | | | 751,602 | | | | 19,015,531 | |
| | | | | | | | 77,400,972 | |
| | | Shares | | | Value ($) | |
| | | | | | | | | |
| Internet Software & Services 3.8% | |
| eBay, Inc.* | | | 138,280 | | | | 7,055,046 | |
| Google, Inc. "A"* | | | 27,796 | | | | 19,717,648 | |
| | | | | | | | 26,772,694 | |
| IT Services 3.9% | |
| Accenture PLC "A" | | | 234,254 | | | | 15,577,891 | |
| International Business Machines Corp. | | | 63,958 | | | | 12,251,155 | |
| | | | | | | | 27,829,046 | |
| Semiconductors & Semiconductor Equipment 1.3% | |
| Broadcom Corp. "A"* | | | 54,590 | | | | 1,812,934 | |
| Skyworks Solutions, Inc.* | | | 106,065 | | | | 2,153,119 | |
| Texas Instruments, Inc. (a) | | | 178,682 | | | | 5,528,421 | |
| | | | | | | | 9,494,474 | |
| Software 7.5% | |
| Check Point Software Technologies Ltd.* (a) | | | 147,666 | | | | 7,034,808 | |
| Citrix Systems, Inc.* | | | 142,068 | | | | 9,340,971 | |
| Microsoft Corp. | | | 548,328 | | | | 14,656,808 | |
| Oracle Corp. | | | 583,957 | | | | 19,457,447 | |
| Solera Holdings, Inc. (a) | | | 62,902 | | | | 3,363,370 | |
| | | | | | | | 53,853,404 | |
| Materials 3.0% | |
| Chemicals 2.8% | |
| Ecolab, Inc. (a) | | | 139,762 | | | | 10,048,888 | |
| LyondellBasell Industries NV "A" | | | 34,467 | | | | 1,967,721 | |
| Monsanto Co. | | | 83,024 | | | | 7,858,221 | |
| | | | | | | | 19,874,830 | |
| | | Shares | | | Value ($) | |
| | | | | | | | | |
| Metals & Mining 0.2% | |
| Freeport-McMoRan Copper & Gold, Inc. | | | 52,048 | | | | 1,780,042 | |
| Utilities 0.3% | |
| Water Utilities | |
| American Water Works Co., Inc. | | | 63,592 | | | | 2,361,171 | |
Total Common Stocks (Cost $446,882,308) | | | | 691,208,940 | |
| | |
| Securities Lending Collateral 21.2% | |
| Daily Assets Fund Institutional, 0.20% (b) (c) (Cost $151,176,983) | | | 151,176,983 | | | | 151,176,983 | |
| | |
| Cash Equivalents 3.2% | |
| Central Cash Management Fund, 0.15% (b) (Cost $23,030,911) | | | 23,030,911 | | | | 23,030,911 | |
| | | % of Net Assets | | | Value ($) | |
| | | | |
Total Investment Portfolio (Cost $621,090,202)† | | | 121.2 | | | | 865,416,834 | |
| Other Assets and Liabilities, Net | | | (21.2 | ) | | | (151,519,124 | ) |
| Net Assets | | | 100.0 | | | | 713,897,710 | |
* Non-income producing security.
† The cost for federal income tax purposes was $623,428,752. At December 31, 2012, net unrealized appreciation for all securities based on tax cost was $241,988,082. This consisted of aggregate gross unrealized appreciation for all securities in which there was an excess of value over tax cost of $254,158,941 and aggregate gross unrealized depreciation for all securities in which there was an excess of tax cost over value of $12,170,859.
(a) All or a portion of these securities were on loan (see Notes to Financial Statements). The value of all securities loaned at December 31, 2012 amounted to $150,644,497, which is 21.1% of net assets.
(b) Affiliated fund managed by Deutsche Investment Management Americas Inc. The rate shown is the annualized seven-day yield at period end.
(c) Represents collateral held in connection with securities lending. Income earned by the Fund is net of borrower rebates.
REIT: Real Estate Investment Trust
Fair Value Measurements
Various inputs are used in determining the value of the Fund's investments. These inputs are summarized in three broad levels. Level 1 includes quoted prices in active markets for identical securities. Level 2 includes other significant observable inputs (including quoted prices for similar securities, interest rates, prepayment speeds, and credit risk). Level 3 includes significant unobservable inputs (including the Fund's own assumptions in determining the fair value of investments). The inputs or methodology used for valuing securities are not necessarily an indication of the risk associated with investing in those securities.
The following is a summary of the inputs used as of December 31, 2012 in valuing the Fund's investments. For information on the Fund's policy regarding the valuation of investments, please refer to the Security Valuation section of Note A in the accompanying Notes to Financial Statements.
| Assets | | Level 1 | | | Level 2 | | | Level 3 | | | Total | |
| | |
| Common Stocks (d) | | $ | 691,208,940 | | | $ | — | | | $ | — | | | $ | 691,208,940 | |
| Short-Term Investments (d) | | | 174,207,894 | | | | — | | | | — | | | | 174,207,894 | |
| Total | | $ | 865,416,834 | | | $ | — | | | $ | — | | | $ | 865,416,834 | |
There have been no transfers between fair value measurement levels during the year ended December 31, 2012.
(d) See Investment Portfolio for additional detailed categorizations.
The accompanying notes are an integral part of the financial statements.
Statement of Assets and Liabilities | as of December 31, 2012 | |
| Assets | |
Investments: Investments in non-affiliated securities, at value (cost $446,882,308) — including $150,644,497 of securities loaned | | $ | 691,208,940 | |
| Investment in Daily Assets Fund Institutional (cost $151,176,983)* | | | 151,176,983 | |
| Investment in Central Cash Management Fund (cost $23,030,911) | | | 23,030,911 | |
| Total investments in securities, at value (cost $621,090,202) | | | 865,416,834 | |
| Cash | | | 10,000 | |
| Foreign currency, at value (cost $5,289) | | | 5,247 | |
| Receivable for Fund shares sold | | | 44,054 | |
| Dividends receivable | | | 573,501 | |
| Interest receivable | | | 9,472 | |
| Foreign taxes recoverable | | | 29,756 | |
| Other assets | | | 11,906 | |
| Total assets | | | 866,100,770 | |
| Liabilities | |
| Payable upon return of securities loaned | | | 151,176,983 | |
| Payable for Fund shares redeemed | | | 610,373 | |
| Accrued management fee | | | 226,889 | |
| Accrued Trustees' fees | | | 6,714 | |
| Other accrued expenses and payables | | | 182,101 | |
| Total liabilities | | | 152,203,060 | |
| Net assets, at value | | $ | 713,897,710 | |
| Net Assets Consist of | |
| Undistributed net investment income | | | 9,558,891 | |
Net unrealized appreciation (depreciation) on: Investments | | | 244,326,632 | |
| Foreign currency | | | 4,537 | |
| Accumulated net realized gain (loss) | | | (89,025,259 | ) |
| Paid-in capital | | | 549,032,909 | |
| Net assets, at value | | $ | 713,897,710 | |
Class A Net Asset Value, offering and redemption price per share ($701,108,561 ÷ 32,798,165 outstanding shares of beneficial interest, $.01 par value, unlimited number of shares authorized) | | $ | 21.38 | |
Class B Net Asset Value, offering and redemption price per share ($12,789,149 ÷ 600,771 outstanding shares of beneficial interest, $.01 par value, unlimited number of shares authorized) | | $ | 21.29 | |
* Represents collateral on securities loaned.
The accompanying notes are an integral part of the financial statements.
Statement of Operations
| for the year ended December 31, 2012 | |
| Investment Income | |
Income: Dividends | | $ | 13,183,677 | |
| Income distributions — Central Cash Management Fund | | | 19,678 | |
| Securities lending income, including income from Daily Assets Fund Institutional, net of borrower rebates | | | 217,006 | |
| Total income | | | 13,420,361 | |
Expenses: Management fee | | | 2,749,559 | |
| Administration fee | | | 736,181 | |
| Services to shareholders | | | 4,364 | |
| Distribution service fee (Class B) | | | 33,949 | |
| Record keeping fee (Class B) | | | 11,267 | |
| Custodian fee | | | 16,716 | |
| Professional fees | | | 50,004 | |
| Reports to shareholders | | | 68,810 | |
| Trustees' fees and expenses | | | 29,040 | |
| Other | | | 27,277 | |
| Total expenses | | | 3,727,167 | |
| Net investment income (loss) | | | 9,693,194 | |
| Realized and Unrealized Gain (Loss) | |
| Net realized gain (loss) from: | | | | |
| Investments | | | 39,819,957 | |
| Foreign currency | | | 2,634 | |
| | | | 39,822,591 | |
Change in net unrealized appreciation (depreciation) on: Investments | | | 58,819,166 | |
| Foreign currency | | | (1,273 | ) |
| | | | 58,817,893 | |
| Net gain (loss) | | | 98,640,484 | |
| Net increase (decrease) in net assets resulting from operations | | $ | 108,333,678 | |
The accompanying notes are an integral part of the financial statements.
Statement of Changes in Net Assets | | | Years Ended December 31, | |
| Increase (Decrease) in Net Assets | | 2012 | | | 2011 | |
Operations: Net investment income (loss) | | $ | 9,693,194 | | | $ | 6,429,336 | |
| Net realized gain (loss) | | | 39,822,591 | | | | 28,062,634 | |
| Change in net unrealized appreciation (depreciation) | | | 58,817,893 | | | | (77,914,193 | ) |
| Net increase (decrease) in net assets resulting from operations | | | 108,333,678 | | | | (43,422,223 | ) |
Distributions to shareholders from: Net investment income: Class A | | | (6,353,433 | ) | | | (5,283,454 | ) |
| Class B | | | (73,349 | ) | | | (48,050 | ) |
| Total distributions | | | (6,426,782 | ) | | | (5,331,504 | ) |
Fund share transactions: Class A Proceeds from shares sold | | | 16,829,443 | | | | 10,917,405 | |
Net assets acquired in tax-free reorganization* | | | — | | | | 126,872,037 | |
| Reinvestment of distributions | | | 6,353,433 | | | | 5,283,454 | |
| Payments for shares redeemed | | | (99,466,658 | ) | | | (146,734,714 | ) |
| Net increase (decrease) in net assets from Class A share transactions | | | (76,283,782 | ) | | | (3,661,818 | ) |
Class B Proceeds from shares sold | | | 580,173 | | | | 822,574 | |
Net assets acquired in tax-free reorganization* | | | — | | | | 3,304,909 | |
| Reinvestment of distributions | | | 73,349 | | | | 48,050 | |
| Payments for shares redeemed | | | (2,697,364 | ) | | | (2,497,610 | ) |
| Net increase (decrease) in net assets from Class B share transactions | | | (2,043,842 | ) | | | 1,677,923 | |
| Increase (decrease) in net assets | | | 23,579,272 | | | | (50,737,622 | ) |
| Net assets at beginning of period | | | 690,318,438 | | | | 741,056,060 | |
| Net assets at end of period (including undistributed net investment income of $9,558,891 and $6,289,845, respectively) | | $ | 713,897,710 | | | $ | 690,318,438 | |
| Other Information | |
Class A Shares outstanding at beginning of period | | | 36,451,466 | | | | 37,210,167 | |
| Shares sold | | | 801,185 | | | | 556,745 | |
| Shares issued in tax-free reorganization* | | | — | | | | 6,079,145 | |
| Shares issued to shareholders in reinvestment of distributions | | | 298,283 | | | | 254,870 | |
| Shares redeemed | | | (4,752,769 | ) | | | (7,649,461 | ) |
| Net increase (decrease) in Class A shares | | | (3,653,301 | ) | | | (758,701 | ) |
| Shares outstanding at end of period | | | 32,798,165 | | | | 36,451,466 | |
Class B Shares outstanding at beginning of period | | | 698,290 | | | | 623,731 | |
| Shares sold | | | 28,055 | | | | 43,180 | |
| Shares issued in tax-free reorganization* | | | — | | | | 158,668 | |
| Shares issued to shareholders in reinvestment of distributions | | | 3,450 | | | | 2,322 | |
| Shares redeemed | | | (129,024 | ) | | | (129,611 | ) |
| Net increase (decrease) in Class B shares | | | (97,519 | ) | | | 74,559 | |
| Shares outstanding at end of period | | | 600,771 | | | | 698,290 | |
* On April 29, 2011, DWS Health Care VIP and DWS Technology VIP were acquired by the Fund through a tax-free reorganization (see Note F).
The accompanying notes are an integral part of the financial statements.
| | | Years Ended December 31, | |
| Class A | | | 2012 | | | 2011 | | | 2010 | | | 2009 | | | 2008 | |
| Selected Per Share Data | |
| Net asset value, beginning of period | | $ | 18.58 | | | $ | 19.59 | | | $ | 16.93 | | | $ | 13.55 | | | $ | 20.41 | |
Income (loss) from investment operations: Net investment income (loss)a | | | .28 | | | | .17 | | | | .14 | c | | | .14 | | | | .16 | |
| Net realized and unrealized gain (loss) | | | 2.70 | | | | (1.03 | ) | | | 2.68 | | | | 3.43 | | | | (6.83 | ) |
| Total from investment operations | | | 2.98 | | | | (.86 | ) | | | 2.82 | | | | 3.57 | | | | (6.67 | ) |
Less distributions from: Net investment income | | | (.18 | ) | | | (.15 | ) | | | (.16 | ) | | | (.19 | ) | | | (.19 | ) |
| Net asset value, end of period | | $ | 21.38 | | | $ | 18.58 | | | $ | 19.59 | | | $ | 16.93 | | | $ | 13.55 | |
| Total Return (%) | | | 16.05 | | | | (4.47 | ) | | | 16.71 | b | | | 26.87 | b | | | (32.98 | )b |
| Ratios to Average Net Assets and Supplemental Data | |
| Net assets, end of period ($ millions) | | | 701 | | | | 677 | | | | 729 | | | | 715 | | | | 594 | |
| Ratio of expenses before expense reductions (%) | | | .50 | | | | .50 | | | | .51 | | | | .51 | | | | .50 | |
| Ratio of expenses after expense reductions (%) | | | .50 | | | | .50 | | | | .51 | | | | .49 | | | | .49 | |
| Ratio of net investment income (loss) (%) | | | 1.32 | | | | .86 | | | | .78 | c | | | .98 | | | | .89 | |
| Portfolio turnover rate (%) | | | 25 | | | | 47 | | | | 42 | | | | 76 | | | | 21 | |
a Based on average shares outstanding during the period. b Total return would have been lower had certain expenses not been reduced. c Net investment income per share and ratio of net investment income include non-recurring dividend income amounting to $0.05 per share and 0.28% of average daily net assets for the year ended December 31, 2010. | |
| | | | | | Years Ended December 31, | |
| Class B | | | 2012 | | | 2011 | | | 2010 | | | 2009 | | | 2008 | |
| Selected Per Share Data | |
| Net asset value, beginning of period | | $ | 18.51 | | | $ | 19.51 | | | $ | 16.86 | | | $ | 13.49 | | | $ | 20.31 | |
Income (loss) from investment operations: Net investment income (loss)a | | | .20 | | | | .10 | | | | .08 | c | | | .09 | | | | .10 | |
| Net realized and unrealized gain (loss) | | | 2.69 | | | | (1.02 | ) | | | 2.67 | | | | 3.43 | | | | (6.81 | ) |
| Total from investment operations | | | 2.89 | | | | (.92 | ) | | | 2.75 | | | | 3.52 | | | | (6.71 | ) |
Less distributions from: Net investment income | | | (.11 | ) | | | (.08 | ) | | | (.10 | ) | | | (.15 | ) | | | (.11 | ) |
| Net asset value, end of period | | $ | 21.29 | | | $ | 18.51 | | | $ | 19.51 | | | $ | 16.86 | | | $ | 13.49 | |
| Total Return (%) | | | 15.61 | | | | (4.76 | ) | | | 16.33 | b | | | 26.49 | b | | | (33.20 | )b |
| Ratios to Average Net Assets and Supplemental Data | |
| Net assets, end of period ($ millions) | | | 13 | | | | 13 | | | | 12 | | | | 12 | | | | 10 | |
| Ratio of expenses before expense reductions (%) | | | .83 | | | | .84 | | | | .85 | | | | .85 | | | | .85 | |
| Ratio of expenses after expense reductions (%) | | | .83 | | | | .84 | | | | .84 | | | | .82 | | | | .82 | |
| Ratio of net investment income (loss) (%) | | | .97 | | | | .52 | | | | .45 | c | | | .65 | | | | .56 | |
| Portfolio turnover rate (%) | | | 25 | | | | 47 | | | | 42 | | | | 76 | | | | 21 | |
a Based on average shares outstanding during the period. b Total return would have been lower had certain expenses not been reduced. c Net investment income per share and ratio of net investment income include non-recurring dividend income amounting to $0.05 per share and 0.28% of average daily net assets for the year ended December 31, 2010. | |
Notes to Financial Statements
A. Organization and Significant Accounting Policies
DWS Variable Series I (the "Series") is registered under the Investment Company Act of 1940, as amended (the "1940 Act"), as an open-end, registered management investment company organized as a Massachusetts business trust. The Series consists of five diversified funds: DWS Bond VIP, DWS Core Equity VIP (formerly DWS Growth & Income VIP), DWS Capital Growth VIP, DWS Global Small Cap Growth VIP and DWS International VIP (individually or collectively hereinafter referred to as a "Fund" or the "Funds"). These financial statements report on DWS Capital Growth VIP. The Series is intended to be the underlying investment vehicle for variable annuity contracts and variable life insurance policies to be offered by the separate accounts of certain life insurance companies ("Participating Insurance Companies").
Multiple Classes of Shares of Beneficial Interest. The Fund offers two classes of shares (Class A shares and Class B shares). Class B shares are subject to Rule 12b-1 distribution fees under the 1940 Act and record keeping fees equal to an annual rate of 0.25% and up to 0.15%, respectively, of the average daily net assets of the Class B shares of the Fund. Class A shares are not subject to such fees.
Investment income, realized and unrealized gains and losses, and certain fund-level expenses and expense reductions, if any, are borne pro rata on the basis of relative net assets by the holders of all classes of shares, except that each class bears certain expenses unique to that class (including the applicable 12b-1 distribution fees and recordkeeping fees). Differences in class-level expenses may result in payment of different per share dividends by class. All shares have equal rights with respect to voting subject to class-specific arrangements.
The Fund's financial statements are prepared in accordance with accounting principles generally accepted in the United States of America, which require the use of management estimates. Actual results could differ from those estimates. The policies described below are followed consistently by the Fund in the preparation of its financial statements.
Security Valuation. Investments are stated at value determined as of the close of regular trading on the New York Stock Exchange on each day the exchange is open for trading.
Various inputs are used in determining the value of the Fund's investments. These inputs are summarized in three broad levels. Level 1 includes quoted prices in active markets for identical securities. Level 2 includes other significant observable inputs (including quoted prices for similar securities, interest rates, prepayment speeds, and credit risk). Level 3 includes significant unobservable inputs (including the Fund's own assumptions in determining the fair value of investments). The inputs or methodology used for valuing securities are not necessarily an indication of the risk associated with investing in those securities.
Equity securities are valued at the most recent sale price or official closing price reported on the exchange (U.S. or foreign) or over-the-counter market on which they trade and are categorized as Level 1 securities. Securities for which no sales are reported are valued at the calculated mean between the most recent bid and asked quotations on the relevant market or, if a mean cannot be determined, at the most recent bid quotation.
Investments in open-end investment companies are valued at their net asset value each business day and are categorized as Level 1.
Securities and other assets for which market quotations are not readily available or for which the above valuation procedures are deemed not to reflect fair value are valued in a manner that is intended to reflect their fair value as determined in accordance with procedures approved by the Trustees and are generally categorized as Level 3. In accordance with the Fund's valuation procedures, factors used in determining value may include, but are not limited to, the type of the security; the size of the holding; the initial cost of the security; the existence of any contractual restrictions on the security's disposition; the price and extent of public trading in similar securities of the issuer or of comparable companies; quotations or evaluated prices from broker-dealers and/or pricing services; information obtained from the issuer, analysts, and/or the appropriate stock exchange (for exchange-traded securities); an analysis of the company's or issuer's financial statements; an evaluation of the forces that influence the issuer and the market(s) in which the security is purchased and sold and with respect to debt securities; the maturity, coupon, creditworthiness, currency denomination and the movement of the market in which the security is normally traded. The value determined under these procedures may differ from published values for the same securities.
Disclosure about the classification of fair value measurements is included in a table following the Fund's Investment Portfolio.
New Accounting Pronouncement. In January 2013, Accounting Standard Update 2013-01 (ASU 2013-01), Clarifying the Scope of Disclosures about Offsetting Assets and Liabilities, replaced Accounting Standards Update 2011-11 (ASU 2011-11), Disclosures about Offsetting Assets and Liabilities. ASU 2013-01 is effective for fiscal years beginning on or after January 1, 2013, and interim periods within those annual periods. ASU 2011-11 was intended to enhance disclosure requirements on the offsetting of financial assets and liabilities. The ASU 2013-01 limits the scope of the new balance sheet offsetting disclosures to derivatives, repurchase agreements, and securities lending transactions to the extent that they are (1) offset in the financial statements or (2) subject to an enforceable master netting arrangement or similar agreement. Management is currently evaluating the application of ASU 2013-01 and its impact, if any, on the Fund's financial statements.
Securities Lending. The Fund lends securities to certain financial institutions. The Fund retains beneficial ownership of the securities it has loaned and continues to receive interest and dividends paid by the issuer of securities and to participate in any changes in their market value. The Fund requires the borrowers of the securities to maintain collateral with the Fund consisting of either cash or liquid, unencumbered assets having a value at least equal to the value of the securities loaned. When the collateral falls below specified amounts, the lending agent will use its best effort to obtain additional collateral on the next business day to meet required amounts under the security lending agreement. The Fund may invest the cash collateral into a joint trading account in an affiliated money market fund pursuant to Exemptive Orders issued by the SEC. The Fund receives compensation for lending its securities either in the form of fees or by earning interest on invested cash collateral net of borrower rebates and fees paid to a lending agent. Either the Fund or the borrower may terminate the loan. There may be risks of delay and costs in recovery of securities or even loss of rights in the collateral should the borrower of the securities fail financially. The Fund is also subject to all investment risks associated with the reinvestment of any cash collateral received, including, but not limited to, interest rate, credit and liquidity risk associated with such investments.
Foreign Currency Translations. The books and records of the Fund are maintained in U.S. dollars. Investment securities and other assets and liabilities denominated in a foreign currency are translated into U.S. dollars at the prevailing exchange rates at period end. Purchases and sales of investment securities, income and expenses are translated into U.S. dollars at the prevailing exchange rates on the respective dates of the transactions.
Net realized and unrealized gains and losses on foreign currency transactions represent net gains and losses between trade and settlement dates on securities transactions, the acquisition and disposition of foreign currencies, and the difference between the amount of net investment income accrued and the U.S. dollar amount actually received. That portion of both realized and unrealized gains and losses on investments that results from fluctuations in foreign currency exchange rates is not separately disclosed but is included with net realized and unrealized gain/appreciation and loss/depreciation on investments.
Federal Income Taxes. The Fund is treated as a separate taxpayer as provided for in the Internal Revenue Code, as amended. It is the Fund's policy to comply with the requirements of the Internal Revenue Code, as amended, which are applicable to regulated investment companies, and to distribute all of its taxable income to the separate accounts of the Participating Insurance Companies which hold its shares.
Under the Regulated Investment Company Modernization Act of 2010, net capital losses incurred post-enactment may be carried forward indefinitely, and their character is retained as short-term and/or long-term. Previously, net capital losses were carried forward for eight years and treated as short-term. As a transition rule, the Act requires that post-enactment net capital losses be used before pre-enactment net capital losses.
At December 31, 2012, the Fund had a net tax basis capital loss carryforward of approximately $86,678,000 of pre-enactment losses, including $48,520,000 inherited from its merger with other affiliated funds in previous years, which may be applied against any realized net taxable capital gains of each year until fully utilized or until December 31, 2015 ($6,855,000), December 31, 2016 ($41,665,000) and December 31, 2017 ($38,158,000), the respective expiration dates, whichever occurs first, and which may be subject to certain limitations under Section 382-384 of the Internal Revenue Code.
The Fund has reviewed the tax positions for the open tax years as of December 31, 2012 and has determined that no provision for income tax is required in the Fund's financial statements. The Fund's federal tax returns for the prior three fiscal years remain open subject to examination by the Internal Revenue Service.
Distribution of Income and Gains. The Fund will declare and distribute dividends from its net investment income, if any, annually, although additional distributions may be made if necessary. Net realized gains from investment transactions, in excess of available capital loss carryforwards, would be taxable to the Fund if not distributed, and, therefore, will be distributed to shareholders at least annually.
The timing and characterization of certain income and capital gain distributions are determined annually in accordance with federal tax regulations which may differ from accounting principles generally accepted in the United States of America. These differences primarily relate to certain securities sold at a loss. As a result, net investment income (loss) and net realized gain (loss) on investment transactions for a reporting period may differ significantly from distributions during such period. Accordingly, the Fund may periodically make reclassifications among certain of its capital accounts without impacting the net asset value of the Fund.
At December 31, 2012, the Fund's components of distributable earnings (accumulated losses) on a tax basis are as follows:
| Undistributed ordinary income* | | $ | 9,558,891 | |
| Capital loss carryforwards | | $ | (86,678,000 | ) |
| Net unrealized gain appreciation (depreciation) investments | | $ | 241,988,082 | |
In addition, the tax character of distributions paid to shareholders by the Fund is summarized as follows:
| | | Years Ended December 31, | |
| | | 2012 | | | 2011 | |
| Distributions from ordinary income* | | $ | 6,426,782 | | | $ | 5,331,504 | |
* For tax purposes, short-term capital gain distributions are considered ordinary income distributions.
Expenses. Expenses of the Series arising in connection with a specific Fund are allocated to that Fund. Other Series expenses which cannot be directly attributed to a Fund are apportioned among the Funds in the Series based upon the relative net assets or other appropriate measures.
Contingencies. In the normal course of business, the Fund may enter into contracts with service providers that contain general indemnification clauses. The Fund's maximum exposure under these arrangements is unknown as this would involve future claims that may be made against the Fund that have not yet been made. However, based on experience, the Fund expects the risk of loss to be remote.
Other. Investment transactions are accounted for on a trade date plus one basis for daily net asset value calculations. However, for financial reporting purposes, investment transactions are reported on trade date. Interest income is recorded on the accrual basis. Dividend income is recorded on the ex-dividend date net of foreign withholding taxes. Certain dividends from foreign securities may be recorded subsequent to the ex-dividend date as soon as the Fund is informed of such dividends. Realized gains and losses from investment transactions are recorded on an identified cost basis and may include proceeds from litigation.
B. Purchases and Sales of Securities
During the year ended December 31, 2012, purchases and sales of investment securities (excluding short-term investments) aggregated $182,475,011 and $271,411,640, respectively.
C. Related Parties
Management Agreement. Under the Investment Management Agreement with Deutsche Investment Management Americas Inc. ("DIMA" or the "Advisor"), an indirect, wholly owned subsidiary of Deutsche Bank AG, the Advisor directs the investments of the Fund in accordance with its investment objectives, policies and restrictions. The Advisor determines the securities, instruments and other contracts relating to investments to be purchased, sold or entered into by the Fund.
Pursuant to the Investment Management Agreement with the Advisor, the Fund pays a monthly management fee based on the Fund's average daily net assets, computed and accrued daily and payable monthly at the following annual rates:
| First $250 million of average daily net assets | | | .390 | % |
| Next $750 million of average daily net assets | | | .365 | % |
| Over $1 billion of average daily net assets | | | .340 | % |
Accordingly, for the year ended December 31, 2012, the fee pursuant to the Investment Management Agreement was equivalent to an annual effective rate of 0.37% of the Fund's average daily net assets.
Effective October 1, 2012 through September 30, 2013 the Advisor has contractually agreed to waive all or a portion of its fees and/or reimburse certain operating expenses of the Fund to the extent necessary to maintain the operating expenses (excluding certain expenses such as extraordinary expenses, taxes, brokerage and interest) of each class as follows:
Administration Fee. Pursuant to an Administrative Services Agreement, DIMA provides most administrative services to the Fund. For all services provided under the Administrative Services Agreement, the Fund pays the Advisor an annual fee ("Administration Fee") of 0.10% of the Fund's average daily net assets, computed and accrued daily and payable monthly. For the year ended December 31, 2012, the Administration Fee was $736,181, of which $60,711 is unpaid.
Service Provider Fees. DWS Investments Service Company ("DISC"), an affiliate of the Advisor, is the transfer agent, dividend-paying agent and shareholder service agent for the Fund. Pursuant to a sub-transfer agency agreement between DISC and DST Systems, Inc. ("DST"), DISC has delegated certain transfer agent, dividend-paying agent and shareholder service agent functions to DST. DISC compensates DST out of the shareholder servicing fee it receives from the Fund. For the year ended December 31, 2012, the amounts charged to the Fund by DISC were as follows:
| Services to Shareholders | | Total Aggregated | | | Unpaid at December 31, 2012 | |
| Class A | | $ | 719 | | | $ | 178 | |
| Class B | | | 147 | | | | 36 | |
| | | $ | 866 | | | $ | 214 | |
Distribution Service Agreement. DWS Investments Distributors, Inc. ("DIDI"), also an affiliate of the Advisor, is the Series' Distributor. In accordance with the Master Distribution Plan, DIDI receives 12b-1 fees of 0.25% of average daily net assets of Class B shares. Pursuant to the Master Distribution Plan, DIDI remits these fees to the Participating Insurance Companies for various costs incurred or paid by these companies in connection with marketing and distribution of Class B shares. For the year ended December 31, 2012, the Distribution Service Fee aggregated $33,949, of which $2,045 is unpaid.
Typesetting and Filing Service Fees. Under an agreement with DIMA, DIMA is compensated for providing typesetting and certain regulatory filing services to the Fund. For the year ended December 31, 2012, the amount charged to the Fund by DIMA included in the Statement of Operations under "reports to shareholders" aggregated $15,866, of which $4,295 is unpaid.
Trustees' Fees and Expenses. The Fund paid retainer fees to each Trustee not affiliated with the Advisor, plus specified amounts to the Board Chairperson and to each committee Chairperson.
Affiliated Cash Management Vehicle. The Fund may invest uninvested cash balances in Central Cash Management Fund, which is managed by the Advisor. The Fund indirectly bears its proportionate share of the expenses of Central Cash Management Fund. Central Cash Management Fund does not pay the Advisor an investment management fee. Central Cash Management Fund seeks a high level of current income consistent with liquidity and the preservation of capital.
D. Ownership of the Fund
Three participating insurance companies were owners of record of 10% or more of the total outstanding Class A shares of the Fund, each owning 38%, 26% and 13%.
E. Line of Credit
The Fund and other affiliated funds (the "Participants") share in a $375 million revolving credit facility provided by a syndication of banks. The Fund may borrow for temporary or emergency purposes, including the meeting of redemption requests that otherwise might require the untimely disposition of securities. The Participants are charged an annual commitment fee which is allocated based on net assets, among each of the Participants. Interest is calculated at a rate per annum equal to the sum of the Federal Funds Rate plus 1.25 percent plus if LIBOR exceeds the Federal Funds Rate the amount of such excess. The Fund may borrow up to a maximum of 33 percent of its net assets under the agreement. The Fund had no outstanding loans at December 31, 2012.
F. Acquisition of Assets
On April 29, 2011, the Fund acquired all of the net assets of DWS Health Care VIP and DWS Technology VIP pursuant to a plan of reorganization approved by shareholders on April 11, 2011. The purpose of the transaction was to combine three funds managed by DWS with comparable investment objectives and strategies.
The acquisition was accomplished by a tax-free exchange as follows:
| | | Class A shares | | | Class B shares | |
| DWS Health Care VIP | | | 5,605,448 | | | | 377,495 | |
| DWS Technology VIP | | | 6,613,518 | | | | 10,454 | |
The above shares were exchanged for the following shares outstanding on the date acquired of the DWS Capital Growth VIP Fund:
| | | Class A shares | | | Class B shares | |
| DWS Health Care VIP | | | 2,358,210 | | | | 152,955 | |
| DWS Technology VIP | | | 3,720,935 | | | | 5,713 | |
The net assets at the acquired date were as follows:
| DWS Health Care VIP | | $ | 52,398,965 | |
| DWS Technology VIP | | $ | 77,777,981 | |
The net unrealized appreciation included in the net assets above were as follows:
| DWS Health Care VIP | | $ | 4,928,832 | |
| DWS Technology VIP | | $ | 13,786,078 | |
The aggregate net assets of DWS Capital Growth VIP immediately before the acquisition were $754,712,975. The combined net assets of DWS Capital Growth VIP immediately following the acquisition were $884,889,921.
Report of Independent Registered Public Accounting Firm
To the Trustees of DWS Variable Series I and the Shareholders of DWS Capital Growth VIP:
In our opinion, the accompanying statement of assets and liabilities, including the investment portfolio, and the related statements of operations and of changes in net assets and the financial highlights present fairly, in all material respects, the financial position of DWS Capital Growth VIP (the "Fund") at December 31, 2012 and the results of its operations, the changes in its net assets, and the financial highlights for the periods indicated therein, in conformity with accounting principles generally accepted in the United States of America. These financial statements and financial highlights (hereafter referred to as "financial statements") are the responsibility of the Fund's management. Our responsibility is to express an opinion on these financial statements based on our audits. We conducted our audits of these financial statements in accordance with the standards of the Public Company Accounting Oversight Board (United States). Those standards require that we plan and perform the audit to obtain reasonable assurance about whether the financial statements are free of material misstatement. An audit includes examining, on a test basis, evidence supporting the amounts and disclosures in the financial statements, assessing the accounting principles used and significant estimates made by management, and evaluating the overall financial statement presentation. We believe that our audits, which included confirmation of securities at December 31, 2012 by correspondence with the custodians and brokers, provide a reasonable basis for our opinion.
Boston, Massachusetts February 14, 2013 | PricewaterhouseCoopers LLP |
Information About Your Fund's Expenses (Unaudited)
As an investor of the Fund, you incur two types of costs: ongoing expenses and transaction costs. Ongoing expenses include management fees, distribution and service (12b-1) fees and other Fund expenses. Examples of transaction costs include contract charges and account maintenance fees, which are not shown in this section. The following tables are intended to help you understand your ongoing expenses (in dollars) of investing in the Fund and to help you compare these expenses with the ongoing expenses of investing in other mutual funds. The example in the table is based on an investment of $1,000 invested at the beginning of the six-month period and held for the entire period (July 1, 2012 to December 31, 2012).
The tables illustrate your Fund's expenses in two ways:
•Actual Fund Return. This helps you estimate the actual dollar amount of ongoing expenses (but not transaction costs) paid on a $1,000 investment in the Fund using the Fund's actual return during the period. To estimate the expenses you paid over the period, simply divide your account value by $1,000 (for example, an $8,600 account value divided by $1,000 = 8.6), then multiply the result by the number in the "Expenses Paid per $1,000" line under the share class you hold.
• Hypothetical 5% Fund Return. This helps you to compare your Fund's ongoing expenses (but not transaction costs) with those of other mutual funds using the Fund's actual expense ratio and a hypothetical rate of return of 5% per year before expenses. Examples using a 5% hypothetical Fund return may be found in the shareholder reports of other mutual funds. The hypothetical account values and expenses may not be used to estimate the actual ending account balance or expenses you paid for the period.
Please note that the expenses shown in these tables are meant to highlight your ongoing expenses only and do not reflect any transaction costs. The "Expenses Paid per $1,000" line of the tables is useful in comparing ongoing expenses only and will not help you determine the relative total expense of owning different funds. If these transaction costs had been included, your costs would have been higher.
Expenses and Value of a $1,000 Investment for the six months ended December 31, 2012 | |
| Actual Fund Return | | Class A | | | Class B | |
| Beginning Account Value 7/1/12 | | $ | 1,000.00 | | | $ | 1,000.00 | |
| Ending Account Value 12/31/12 | | $ | 1,047.50 | | | $ | 1,045.70 | |
| Expenses Paid per $1,000* | | $ | 2.57 | | | $ | 4.27 | |
| Hypothetical 5% Fund Return | | Class A | | | Class B | |
| Beginning Account Value 7/1/12 | | $ | 1,000.00 | | | $ | 1,000.00 | |
| Ending Account Value 12/31/12 | | $ | 1,022.62 | | | $ | 1,020.96 | |
| Expenses Paid per $1,000* | | $ | 2.54 | | | $ | 4.22 | |
* Expenses are equal to the Fund's annualized expense ratio for each share class, multiplied by the average account value over the period, multiplied by 184 (the number of days in the most recent six-month period), then divided by 366.
| Annualized Expense Ratios | Class A | | Class B | |
| DWS Variable Series I — DWS Capital Growth VIP | .50% | | .83% | |
For more information, please refer to the Fund's prospectus.
These tables do not reflect charges and fees ("contract charges") associated with the separate account that invests in the Fund or any variable life insurance policy or variable annuity contract for which the Fund is an investment option.
Tax Information (Unaudited)
For corporate shareholders, 100% of the ordinary dividends (i.e., income dividends plus short-term capital gains) paid during the Fund's fiscal year ended December 31, 2012 qualified for the dividends received deduction.
Please consult a tax advisor if you have questions about federal or state income tax laws, or on how to prepare your tax returns. If you have specific questions about your account, please contact your insurance provider.
The Series' policies and procedures for voting proxies for portfolio securities and information about how the Series voted proxies related to its portfolio securities during the 12-month period ended June 30 are available on our Web site — www.dws-investments.com (click on "proxy voting"at the bottom of the page) — or on the SEC's Web site — www.sec.gov. To obtain a written copy of the Series' policies and procedures without charge, upon request, call us toll free at (800) 728-3337.
Investment Management Agreement Approval
The Board of Trustees approved the renewal of DWS Capital Growth VIP's investment management agreement (the "Agreement") with Deutsche Investment Management Americas Inc. ("DWS") in September 2012.
In terms of the process that the Board followed prior to approving the Agreement, shareholders should know that:
• In September 2012, all of the Fund's Trustees were independent of DWS and its affiliates.
• The Trustees met frequently during the past year to discuss fund matters and dedicated a substantial amount of time to contract review matters. Over the course of several months, the Board's Contract Committee, in coordination with the Board's Equity Oversight Committee, reviewed comprehensive materials received from DWS, independent third parties and independent counsel. These materials included an analysis of the Fund's performance, fees and expenses, and profitability compiled by the Fund's independent fee consultant. The Board also received extensive information throughout the year regarding performance of the Fund.
• The Independent Trustees regularly meet privately with their independent counsel to discuss contract review and other matters. In addition, the Independent Trustees were also advised by the Fund's independent fee consultant in the course of their review of the Fund's contractual arrangements and considered a comprehensive report prepared by the independent fee consultant in connection with their deliberations (the "IFC Report").
• In connection with reviewing the Agreement, the Board also reviewed the terms of the Fund's Rule 12b-1 plan, distribution agreement, administrative services agreement, transfer agency agreement and other material service agreements.
• Based on its evaluation of the information provided, the Contract Committee presented its findings and recommendations to the Board. The Board then reviewed the Contract Committee's findings and recommendations.
In connection with the contract review process, the Contract Committee and the Board considered the factors discussed below, among others. The Board also considered that DWS and its predecessors have managed the Fund since its inception, and the Board believes that a long-term relationship with a capable, conscientious advisor is in the best interests of the Fund. The Board considered, generally, that shareholders chose to invest or remain invested in the Fund knowing that DWS managed the Fund, and that the Agreement was approved by the Fund's shareholders. DWS is part of Deutsche Bank, a major global banking institution that is engaged in a wide range of financial services. The Board believes that there are advantages to being part of a global asset management business that offers a wide range of investing expertise and resources, including hundreds of portfolio managers and analysts with research capabilities in many countries throughout the world.
As part of the contract review process, the Board carefully considered the fees and expenses of each DWS fund overseen by the Board in light of the fund's performance. In many cases, this led to a negotiation with DWS of lower expense caps for the coming year than had previously been in place. As part of these negotiations, the Board indicated that it would consider relaxing these new lower caps in future years following sustained improvements in performance, among other considerations.
In June 2012, Deutsche Bank ("DB"), DWS's parent company, announced that DB's new management team had concluded the strategic review of its global asset management business announced in late 2011 by DB's prior management team, and would combine its Asset Management (of which DWS is a part) and Wealth Management divisions. Prior to approving the investment management agreements, the Independent Trustees were apprised of the expected management and structure of the new combined Asset & Wealth Management division ("AWM") and DWS. DB also advised the Independent Trustees that the U.S. asset management business is a critical and integral part of DB and AWM, and that DB would be reinvesting a significant portion of the substantial savings it expects to realize by combining its Asset Management and Wealth Management divisions into a combined AWM division, including enhancements to its investment capabilities. DB also confirmed its commitment to maintaining strong legal and compliance groups within the combined division.
While shareholders may focus primarily on fund performance and fees, the Fund's Board considers these and many other factors, including the quality and integrity of DWS's personnel and such other issues as back-office operations, fund valuations, and compliance policies and procedures.
Nature, Quality and Extent of Services. The Board considered the terms of the Agreement, including the scope of advisory services provided under the Agreement. The Board noted that, under the Agreement, DWS provides portfolio management services to the Fund and that, pursuant to a separate administrative services agreement, DWS provides administrative services to the Fund. The Board considered the experience and skills of senior management and investment personnel, the resources made available to such personnel, the ability of DWS to attract and retain high-quality personnel, and the organizational depth and stability of DWS. The Board reviewed the Fund's performance over short-term and long-term periods and compared those returns to various agreed-upon performance measures, including market indices and a peer universe compiled by the independent fee consultant using information supplied by Lipper Inc. ("Lipper"), an independent fund data service. The Board also noted that it has put into place a process of identifying "Focus Funds" (e.g., funds performing poorly relative to their benchmark or a peer universe compiled by an independent fund data service), and receives more frequent reporting and information from DWS regarding such funds, along with DWS's remedial plans to address underperformance. The Board believes this process is an effective manner of identifying and addressing underperforming funds. Based on the information provided, the Board noted that for the one-, three- and five-year periods ended December 31, 2011, the Fund's performance (Class A shares) was in the 3rd quartile, 4th quartile and 2nd quartile, respectively, of the applicable Lipper universe (the 1st quartile being the best performers and the 4th quartile being the worst performers). The Board also observed that the Fund has underperformed its benchmark in each of the one-, three- and five-year periods ended December 31, 2011. The Board noted the disappointing investment performance of the Fund in recent periods and continued to discuss with senior management of DWS the factors contributing to such underperformance and actions being taken to improve performance. The Board observed that the Fund had experienced improved relative performance during the first seven months of 2012. The Board recognized that DWS has made changes in its processes in recent years in an effort to improve long-term performance.
Fees and Expenses. The Board considered the Fund's investment management fee schedule, operating expenses and total expense ratios, and comparative information provided by Lipper and the independent fee consultant regarding investment management fee rates paid to other investment advisors by similar funds (1st quartile being the most favorable and 4th quartile being the least favorable). With respect to management fees paid to other investment advisors by similar funds, the Board noted that the contractual fee rates paid by the Fund, which include a 0.10% fee paid to DWS under the Fund's administrative services agreement, were lower than the median (1st quartile) of the applicable Lipper peer group (based on Lipper data provided as of December 31, 2011). The Board noted that the Fund's Class A shares total (net) operating expenses were expected to be lower than the median (1st quartile) of the applicable Lipper expense universe (based on Lipper data provided as of December 31, 2011) ("Lipper Universe Expenses"). The Board also reviewed data comparing each share class's total (net) operating expenses to the applicable Lipper Universe Expenses. The Board considered the Fund's management fee rate as compared to fees charged by DWS and certain of its affiliates for comparable mutual funds and considered differences in fund and fee structures between the DWS Funds. The Board also considered how the Fund's total (net) operating expenses compared to the total (net) operating expenses of a more customized peer group selected by Lipper (based on such factors as asset size).
The information considered by the Board as part of its review of management fees included information regarding fees charged by DWS and its affiliates to similar institutional accounts and to similar funds offered primarily to European investors ("DWS Europe funds"), in each case as applicable. The Board observed that advisory fee rates for institutional accounts generally were lower than the management fees charged by similarly managed DWS U.S. mutual funds ("DWS Funds"), but also took note of the differences in services provided to DWS Funds as compared to institutional accounts. In the case of DWS Europe funds, the Board observed that fee rates for DWS Europe funds generally were higher than for similarly managed DWS Funds, but noted that differences in the types of services provided to DWS Funds relative to DWS Europe funds made it difficult to compare such fees.
On the basis of the information provided, the Board concluded that management fees were reasonable and appropriate in light of the nature, quality and extent of services provided by DWS.
Profitability. The Board reviewed detailed information regarding revenues received by DWS under the Agreement. The Board considered the estimated costs and pre-tax profits realized by DWS from advising the DWS Funds, as well as estimates of the pre-tax profits attributable to managing the Fund in particular. The Board also received information regarding the estimated enterprise-wide profitability of DWS and its affiliates with respect to all fund services in totality and by fund. The Board and the independent fee consultant reviewed DWS's methodology in allocating its costs to the management of the Fund. Based on the information provided, the Board concluded that the pre-tax profits realized by DWS in connection with the management of the Fund were not unreasonable. The Board also reviewed information regarding the profitability of certain similar investment management firms. The Board noted that while information regarding the profitability of such firms is limited (and in some cases is not necessarily prepared on a comparable basis), DWS and its affiliates' overall profitability with respect to the DWS fund complex (after taking into account distribution and other services provided to the funds by DWS and its affiliates) was lower than the overall profitability levels of many comparable firms for which such data was available.
Economies of Scale. The Board considered whether there are economies of scale with respect to the management of the Fund and whether the Fund benefits from any economies of scale. The Board noted that the Fund's management fee schedule includes fee breakpoints. The Board concluded that the Fund's fee schedule represents an appropriate sharing between the Fund and DWS of such economies of scale as may exist in the management of the Fund at current asset levels.
Other Benefits to DWS and Its Affiliates. The Board also considered the character and amount of other incidental benefits received by DWS and its affiliates, including any fees received by DWS for administrative services provided to the Fund and any fees received by an affiliate of DWS for distribution services. The Board also considered benefits to DWS related to brokerage and soft-dollar allocations, including allocating brokerage to pay for research generated by parties other than the executing broker dealers, which pertain primarily to funds investing in equity securities, along with the incidental public relations benefits to DWS related to DWS Funds advertising and cross-selling opportunities among DWS products and services. The Board concluded that management fees were reasonable in light of these fallout benefits.
Compliance. The Board considered the significant attention and resources dedicated by DWS to documenting and enhancing its compliance processes in recent years. The Board noted in particular (i) the experience and seniority of both DWS's chief compliance officer and the Fund's chief compliance officer; (ii) the large number of DWS compliance personnel; and (iii) the substantial commitment of resources by DWS and its affiliates to compliance matters.
Based on all of the information considered and the conclusions reached, the Board unanimously determined that the continuation of the Agreement is in the best interests of the Fund. In making this determination, the Board did not give particular weight to any single factor identified above. The Board considered these factors over the course of numerous meetings, certain of which were in executive session with only the Independent Trustees and their counsel present. It is possible that individual Trustees may have weighed these factors differently in reaching their individual decisions to approve the continuation of the Agreement.
Summary of Management Fee Evaluation by Independent Fee Consultant
September 17, 2012
Pursuant to an Order entered into by Deutsche Investment Management Americas and affiliates (collectively, "DeAM") with the Attorney General of New York, I, Thomas H. Mack, have been appointed the Independent Fee Consultant for the DWS Funds (formerly the DWS Scudder Funds). My duties include preparing an annual written evaluation of the management fees DeAM charges the Funds, considering among other factors the management fees charged by other mutual fund companies for like services, management fees DeAM charges other clients for like services, DeAM's costs of supplying services under the management agreements and related profit margins, possible economies of scale if a Fund grows larger, and the nature and quality of DeAM's services, including fund performance. This report summarizes my evaluation for 2012, including my qualifications, the evaluation process for each of the DWS Funds, consideration of certain complex-level factors, and my conclusions. I served in substantially the same capacity in 2007, 2008, 2009, 2010 and 2011.
Qualifications
For more than 35 years I have served in various professional capacities within the investment management business. I have held investment analysis and advisory positions, including securities analyst, portfolio strategist and director of investment policy with a large investment firm. I have also performed business management functions, including business development, financial management and marketing research and analysis.
Since 1991, I have been an independent consultant within the asset management industry. I have provided services to over 125 client organizations, including investment managers, mutual fund boards, product distributors and related organizations. Over the past ten years I have completed a number of assignments for mutual fund boards, specifically including assisting boards with management contract renewal.
I hold a Master of Business Administration degree, with highest honors, from Harvard University and Master of Science and Bachelor of Science (highest honors) degrees from the University of California at Berkeley. I am an independent director and audit committee financial expert for two closed-end mutual funds and have served in various leadership and financial oversight capacities with non-profit organizations.
Evaluation of Fees for each DWS Fund
My work focused primarily on evaluating, fund-by-fund, the fees charged to each of the 103 mutual fund portfolios in the DWS Fund family. For each Fund, I considered each of the key factors mentioned above, as well as any other relevant information. In doing so I worked closely with the Funds' Independent Directors in their annual contract renewal process, as well as in their approval of contracts for several new funds (documented separately).
In evaluating each Fund's fees, I reviewed comprehensive materials provided by or on behalf of DeAM, including expense information prepared by Lipper Analytical, comparative performance information, profitability data, manager histories, and other materials. I also accessed certain additional information from the Lipper and Morningstar databases and drew on my industry knowledge and experience.
To facilitate evaluating this considerable body of information, I prepared for each Fund a document summarizing the key data elements in each area as well as additional analytics discussed below. This made it possible to consider each key data element in the context of the others.
In the course of contract renewal, DeAM agreed to implement a number of fee and expense adjustments requested by the Independent Directors which will favorably impact future fees and expenses, and my evaluation includes the effects of these changes.
Fees and Expenses Compared with Other Funds
The competitive fee and expense evaluation for each fund focused on two primary comparisons:
The Fund's contractual management fee (the advisory fee plus the administration fee where applicable) compared with those of a group of typically 12-15 funds in the same Lipper investment category (e.g. Large Capitalization Growth) having similar distribution arrangements and being of similar size.
The Fund's total expenses compared with a broader universe of funds from the same Lipper investment category and having similar distribution arrangements.
These two comparisons provide a view of not only the level of the fee compared with funds of similar scale but also the total expense the Fund bears for all the services it receives, in comparison with the investment choices available in the Fund's investment category and distribution channel. The principal figure-of-merit used in these comparisons was the subject Fund's percentile ranking against peers.
DeAM's Fees for Similar Services to Others
DeAM provided management fee schedules for all of its US domiciled fund and non-fund investment management accounts in any of the investment categories where there is a DWS Fund. These similar products included the other DWS Funds, non-fund pooled accounts, institutional accounts and sub-advisory accounts. Using this information, I calculated for each Fund the fee that would be charged to each similar product, at the subject Fund's asset level.
Evaluating information regarding non-fund products is difficult because there are varying levels of services required for different types of accounts, with mutual funds generally requiring considerably more regulatory and administrative types of service as well as having more frequent cash flows than other types of accounts. Also, while mutual fund fees for similar fund products can be expected to be similar, there will be some differences due to different pricing conditions in different distribution channels (e.g. retail funds versus those used in variable insurance products), differences in underlying investment processes and other factors.
Costs and Profit Margins
DeAM provided a detailed profitability analysis for each Fund. After making some adjustments so that the presentation would be more comparable to the available industry figures, I reviewed profit margins from investment management alone, from investment management plus other fund services (excluding distribution) provided to the Funds by DeAM (principally shareholder services), and DeAM profits from all sources, including distribution. A later section comments on overall profitability.
Economies of Scale
Economies of scale — an expected decline in management cost per dollar of fund assets as fund assets grow — are very rarely quantified and documented because of inherent difficulties in collecting and analyzing relevant data. However, in virtually every investment category that I reviewed, larger funds tend to have lower fees and lower total expenses than smaller funds. To see how each DWS Fund compares with this industry observation, I reviewed:
The trend in Fund assets over the last five years and the accompanying trend in total expenses. This shows if the Fund has grown and, if so, whether total expense (management fees as well as other expenses) have declined as a percent of assets.
Whether the Fund has break-points in its management fee schedule, the extent of the fee reduction built into the schedule and the asset levels where the breaks take effect, and in the case of a sub-advised Fund how the Fund's break-points compare with those of the sub-advisory fee schedule.
How the Fund's contractual fee schedule compares with trends in the industry data. To accomplish this, I constructed a chart showing how actual latest-fiscal-year contractual fees of the Fund and of other similar funds relate to average fund assets, with the subject Fund's contractual fee schedule superimposed.
Quality of Service — Performance
The quality-of-service evaluation focused on investment performance, which is the principal result of the investment management service. Each Fund's performance was reviewed over the past 1, 3, 5 and 10 years, as applicable, and compared with that of other funds in the same investment category and with a suitable market index.
In addition, I calculated and reviewed risk-adjusted returns relative to an index of similar mutual funds' returns and a suitable market index. The risk-adjusted returns analysis provides a way of determining the extent to which the Fund's return comparisons are mainly the product of investment value-added (or lack thereof) or alternatively taking considerably more or less risk than is typical in its investment category.
I also received and considered the history of portfolio manager changes for each Fund, as this provided an important context for evaluating the performance results.
Complex-Level Considerations
While this evaluation was conducted mainly at the individual fund level, there are some issues relating to the reasonableness of fees that can alternatively be considered across the whole fund complex:
I reviewed DeAM's profitability analysis for all DWS Funds, with a view toward determining if the allocation procedures used were reasonable and how profit levels compared with public data for other investment managers.
I considered whether DeAM and affiliates receive any significant ancillary or "fallout" benefits that should be considered in interpreting the direct profitability results. These would be situations where serving as the investment manager of the Funds is beneficial to another part of the Deutsche Bank organization.
I considered how aggregated DWS Fund expenses had varied over the years, by asset class and in the context of trends in asset levels.
I considered how aggregated DWS Fund performance measures relative to appropriate peers had varied by asset class and over time.
I reviewed the structure of the DeAM organization, trends in staffing levels, and information on compensation of investment management and other professionals compared with industry data.
Findings
Based on the process and analysis discussed above, which included reviewing a wide range of information from management and external data sources and considering among other factors the fees DeAM charges other clients, the fees charged by other fund managers, DeAM's costs and profits associated with managing the Funds, economies of scale, possible fall-out benefits, and the nature and quality of services provided, in my opinion the management fees charged the DWS Funds are reasonable.
Thomas H. Mack
President, Thomas H. Mack & Co., Inc.
Board Members and Officers
The following table presents certain information regarding the Board Members and Officers of the fund. Each Board Member's year of birth is set forth in parentheses after his or her name. Unless otherwise noted, (i) each Board Member has engaged in the principal occupation(s) noted in the table for at least the most recent five years, although not necessarily in the same capacity; and (ii) the address of each Independent Board Member is c/o Kenneth C. Froewiss, Chairman, DWS Mutual Funds, P.O. Box 78, Short Hills, NJ 07078. Except as otherwise noted below, the term of office for each Board Member is until the election and qualification of a successor, or until such Board Member sooner dies, resigns, is removed or as otherwise provided in the governing documents of the fund. Because the fund does not hold an annual meeting of shareholders, each Board Member will hold office for an indeterminate period. The Board Members may also serve in similar capacities with other funds in the fund complex.
| Independent Board Members |
Name, Year of Birth, Position with the Fund and Length of Time Served1 | | Business Experience and Directorships During the Past Five Years | Number of Funds in DWS Fund Complex Overseen |
Other Directorships Held by Board Member |
Kenneth C. Froewiss (1945) Chairperson since 2013,9 and Board Member since 2001 | | Adjunct Professor of Finance, NYU Stern School of Business (September 2009-present; Clinical Professor from 1997-September 2009); Member, Finance Committee, Association for Asian Studies (2002-present); Director, Mitsui Sumitomo Insurance Group (US) (2004-present); prior thereto, Managing Director, J.P. Morgan (investment banking firm) (until 1996) | 103 | — |
William McClayton (1944) Vice Chairperson since 2013,9 and Board Member since 2004 | | Private equity investor (since October 2009); previously, Managing Director, Diamond Management & Technology Consultants, Inc. (global consulting firm) (2001-2009); Directorship: Board of Managers, YMCA of Metropolitan Chicago; formerly: Senior Partner, Arthur Andersen LLP (accounting) (1966-2001); Trustee, Ravinia Festival | 103 | — |
John W. Ballantine (1946) Board Member since 1999 | | Retired; formerly, Executive Vice President and Chief Risk Management Officer, First Chicago NBD Corporation/The First National Bank of Chicago (1996-1998); Executive Vice President and Head of International Banking (1995-1996). Directorships: Stockwell Capital Investments PLC (private equity); former Directorships: First Oak Brook Bancshares, Inc. and Oak Brook Bank; Prisma Energy International | 103 | Chairman of the Board, Healthways, Inc.2 (provider of disease and care management services) (2003- present); Portland General Electric2 (utility company) (2003-present) |
Henry P. Becton, Jr. (1943) Board Member since 1990 | | Vice Chair and former President, WGBH Educational Foundation. Directorships: Public Radio International; Public Radio Exchange (PRX); The PBS Foundation; North Bennett Street School (Boston); former Directorships: Association of Public Television Stations; Boston Museum of Science; American Public Television; Concord Academy; New England Aquarium; Mass. Corporation for Educational Telecommunications; Committee for Economic Development; Public Broadcasting Service; Connecticut College | 103 | Lead Director, Becton Dickinson and Company2 (medical technology company); Lead Director, Belo Corporation2 (media company) |
Dawn-Marie Driscoll (1946) Board Member since 1987 | | President, Driscoll Associates (consulting firm); Emeritus Executive Fellow, Center for Business Ethics, Bentley University; formerly, Partner, Palmer & Dodge (1988-1990); Vice President of Corporate Affairs and General Counsel, Filene's (1978-1988). Directorships: Director of ICI Mutual Insurance Company (since 2007); Advisory Board, Center for Business Ethics, Bentley University; Trustee, Southwest Florida Community Foundation (charitable organization); former Directorships: Sun Capital Advisers Trust (mutual funds) (2007-2012), Investment Company Institute (audit, executive, nominating committees) and Independent Directors Council (governance, executive committees) | 103 | — |
Keith R. Fox, CFA (1954) Board Member since 1996 | | Managing General Partner, Exeter Capital Partners (a series of private investment funds) (since 1986). Directorships: Progressive International Corporation (kitchen goods importer and distributor); The Kennel Shop (retailer); former Chairman, National Association of Small Business Investment Companies; former Directorships: BoxTop Media Inc. (advertising); Sun Capital Advisers Trust (mutual funds) (2011-2012) | 103 | — |
Paul K. Freeman (1950) Board Member since 1993, and Chairperson (2009-Jan. 8, 2013) | | Consultant, World Bank/Inter-American Development Bank; Executive and Governing Council of the Independent Directors Council (Chairman of Education Committee); formerly: Project Leader, International Institute for Applied Systems Analysis (1998-2001); Chief Executive Officer, The Eric Group, Inc. (environmental insurance) (1986-1998); Directorships: Denver Zoo Foundation (December 2012-present); former Directorships: Prisma Energy International | 103 | — |
Richard J. Herring (1946) Board Member since 1990 | | Jacob Safra Professor of International Banking and Professor, Finance Department, The Wharton School, University of Pennsylvania (since July 1972); Co-Director, Wharton Financial Institutions Center (since July 2000); Co-Chair, U.S. Shadow Financial Regulatory Committee; Executive Director, Financial Economists Roundtable; formerly: Vice Dean and Director, Wharton Undergraduate Division (July 1995-June 2000); Director, Lauder Institute of International Management Studies (July 2000-June 2006) | 103 | Director, Japan Equity Fund, Inc. (since September 2007), Thai Capital Fund, Inc. (since 2007), Singapore Fund, Inc. (since September 2007), Independent Director of Barclays Bank Delaware (since September 2010) |
Rebecca W. Rimel (1951) Board Member since 1995 | | President and Chief Executive Officer, The Pew Charitable Trusts (charitable organization) (1994 to present); Trustee, Washington College (2011-2013); formerly: Executive Vice President, The Glenmede Trust Company (investment trust and wealth management) (1983-2004); Board Member, Investor Education (charitable organization) (2004-2005); Trustee, Executive Committee, Philadelphia Chamber of Commerce (2001-2007); Director, Viasys Health Care2 (January 2007-June 2007); Trustee, Pro Publica (charitable organization) (2007-2010); Trustee, Thomas Jefferson Foundation (charitable organization) (1994-2012) | 103 | Director, Becton Dickinson and Company2 (medical technology company) (2012-present); Director, CardioNet, Inc.2 (health care) (2009-present) |
William N. Searcy, Jr. (1946) Board Member since 1993 | | Private investor since October 2003; formerly: Pension & Savings Trust Officer, Sprint Corporation2 (telecommunications) (November 1989-September 2003); Trustee, Sun Capital Advisers Trust (mutual funds) (1998-2012) | 103 | — |
Jean Gleason Stromberg (1943) Board Member since 1997 | | Retired. Formerly, Consultant (1997-2001); Director, Financial Markets U.S. Government Accountability Office (1996-1997); Partner, Fulbright & Jaworski, L.L.P. (law firm) (1978-1996). Directorships: The William and Flora Hewlett Foundation; former Directorships: Service Source, Inc., Mutual Fund Directors Forum (2002-2004), American Bar Retirement Association (funding vehicle for retirement plans) (1987-1990 and 1994-1996) | 103 | — |
Robert H. Wadsworth (1940) Board Member since 1999 | | President, Robert H. Wadsworth & Associates, Inc. (consulting firm) (1983 to present); Director, National Horizon, Inc. (non-profit organization); Director and Treasurer, The Phoenix Boys Choir Association | 106 | — |
Interested Board Member and Officer4 |
Name, Year of Birth, Position with the Fund and Length of Time Served1,6 | | Business Experience and Directorships During the Past Five Years | Number of Funds in DWS Fund Complex Overseen |
Other Directorships Held by Board Member |
Michael J. Woods5 (1967) Board Member since 2013,9 and Executive Vice President since 20139 | | Managing Director,3 Deutsche Asset & Wealth Management (2009-present); Head of the Americas Asset Management Business for Deutsche Bank, Member of the Asset and Wealth Management ("AWM") Extended Executive Committee, AWM Global Client Group Executive Committee and the AWM Active Asset Management Executive Committee; CEO and US Regional Head of DWS Investments; formerly: Sr. VP, Head of the Financial Intermediaries and Investments Group of Evergreen Investments (2007-2009), CEO and Vice Chairman of Board of Directors of XTF Global Asset Management (2006-2007), Managing Director — US Head of Sub-Advisory and Investment Only Business at Citigroup Asset Management (2000-2006). Mr. Woods is currently a board member of The Children's Village, The Big Brothers Big Sisters Organization, and The Mutual Fund Education Alliance. | 39 | — |
Officers4 |
Name, Year of Birth, Position with the Fund and Length of Time Served6 | | Business Experience and Directorships During the Past Five Years |
W. Douglas Beck, CFA7 (1967) President, 2011-present | | Managing Director,3 Deutsche Asset & Wealth Management (2006-present); President of DWS family of funds and Head of Product Management, U.S. for DWS Investments; formerly: Executive Director, Head of Product Management (2002-2006) and President (2005-2006) of the UBS Funds at UBS Global Asset Management; Co-Head of Manager Research/Managed Solutions Group, Merrill Lynch (1998-2002) |
John Millette8 (1962) Vice President and Secretary, 1999-present | | Director,3 Deutsche Asset & Wealth Management |
Paul H. Schubert7 (1963) Chief Financial Officer, 2004-present Treasurer, 2005-present | | Managing Director,3 Deutsche Asset & Wealth Management (since July 2004); formerly: Executive Director, Head of Mutual Fund Services and Treasurer for UBS Family of Funds (1998-2004); Vice President and Director of Mutual Fund Finance at UBS Global Asset Management (1994-1998) |
Caroline Pearson8 (1962) Chief Legal Officer, 2010-present | | Managing Director,3 Deutsche Asset & Wealth Management; formerly: Assistant Secretary for DWS family of funds (1997-2010) |
Melinda Morrow7 (1970) Vice President, 2012-present | | Director,3 Deutsche Asset & Wealth Management |
Hepsen Uzcan8 (1974) Assistant Secretary, since 20139 | | Vice President, Deutsche Asset & Wealth Management |
Paul Antosca8 (1957) Assistant Treasurer, 2007-present | | Director,3 Deutsche Asset & Wealth Management |
Jack Clark8 (1967) Assistant Treasurer, 2007-present | | Director,3 Deutsche Asset & Wealth Management |
Diane Kenneally8 (1966) Assistant Treasurer, 2007-present | | Director,3 Deutsche Asset & Wealth Management |
John Caruso7 (1965) Anti-Money Laundering Compliance Officer, 2010-present | | Managing Director,3 Deutsche Asset & Wealth Management |
Robert Kloby7 (1962) Chief Compliance Officer, 2006-present | | Managing Director,3 Deutsche Asset & Wealth Management |
1 The length of time served represents the year in which the Board Member joined the board of one or more DWS funds currently overseen by the Board.
2 A publicly held company with securities registered pursuant to Section 12 of the Securities Exchange Act of 1934.
3 Executive title, not a board directorship.
4 As a result of their respective positions held with the Advisor, these individuals are considered "interested persons" of the Advisor within the meaning of the 1940 Act. Interested persons receive no compensation from the fund.
5 The mailing address of Mr. Woods is 60 Wall Street, New York, New York 10005. Mr. Woods is an interested Board Member by virtue of his positions with Deutsche Asset & Wealth Management. As an interested person, Mr. Woods receives no compensation from the fund. Mr. Woods is a board member of the following trusts and corporations: Cash Account Trust, DWS Market Trust, DWS Money Funds, DWS State Tax-Free Income Series, DWS Target Fund, DWS Value Series, Inc., DWS Variable Series II, Investors Cash Trust, Tax-Exempt California Money Market Fund, DWS Global High Income Fund, Inc., DWS High Income Opportunities Fund, Inc., DWS High Income Trust, DWS Multi-Market Income Trust, DWS Municipal Income Trust, DWS Strategic Income Trust and DWS Strategic Municipal Income Trust.
6 The length of time served represents the year in which the officer was first elected in such capacity for one or more DWS funds.
7 Address: 60 Wall Street, New York, NY 10005.
8 Address: One Beacon Street, Boston, MA 02108.
9 Effective as of January 9, 2013.
The fund's Statement of Additional Information ("SAI") includes additional information about the Board Members. The SAI is available, without charge, upon request. If you would like to request a copy of the SAI, you may do so by calling the following toll-free number: (800) 728-3337.
Notes
DWS Investments Distributors, Inc.
222 South Riverside Plaza
Chicago, IL 60606
(800) 621-1148
VS1capgro-2 (R-025820-2 2/13)
DECEMBER 31, 2012
ANNUAL REPORT
DWS VARIABLE SERIES I
DWS Core Equity VIP
(formerly DWS Growth & Income VIP)
Contents
11 Statement of Assets and Liabilities 12 Statement of Operations 13 Statement of Changes in Net Assets 16 Notes to Financial Statements 21 Report of Independent Registered Public Accounting Firm 22 Information About Your Fund's Expenses 24 Investment Management Agreement Approval 27 Summary of Management Fee Evaluation by Independent Fee Consultant 29 Board Members and Officers |
This report must be preceded or accompanied by a prospectus. To obtain an additional prospectus or summary prospectus, if available, call (800) 728-3337 or your financial representative. We advise you to consider the Fund's objectives, risks, charges and expenses carefully before investing. The summary prospectus and prospectus contain this and other important information about the Fund. Please read the prospectus carefully before you invest.
Investing in derivatives entails special risks relating to liquidity, leverage and credit that may reduce returns and/or increase volatility. The Fund may lend securities to approved institutions. Fund management could be wrong in its analysis of industries, companies, economic trends and favor a security that underperforms the market. Stocks may decline in value. See the prospectus for details.
DWS Investments is part of the Deutsche Asset & Wealth Management division of Deutsche Bank AG.
NOT FDIC/NCUA INSURED NO BANK GUARANTEE MAY LOSE VALUE NOT A DEPOSIT
NOT INSURED BY ANY FEDERAL GOVERNMENT AGENCY
Performance Summary December 31, 2012 (Unaudited)
Fund performance shown is historical, assumes reinvestment of all dividend and capital gain distributions, and does not guarantee future results. Investment return and principal value fluctuate with changing market conditions so that, when redeemed, shares may be worth more or less than their original cost. Current performance may be lower or higher than the performance data quoted. Please contact your participating insurance company for the Fund's most recent month-end performance. Performance doesn't reflect charges and fees ("contract charges") associated with the separate account that invests in the Fund or any variable life insurance policy or variable annuity contract for which the Fund is an investment option. These charges and fees will reduce returns. While all share classes have the same underlying portfolio, their performance will differ.
The gross expense ratios of the Fund, as stated in the fee table of the prospectus dated May 1, 2012 are 0.63% and 0.88% for Class A and Class B shares, respectively, and may differ from the expense ratios disclosed in the Financial Highlights tables in this report.
| Growth of an Assumed $10,000 Investment |
| The Russell 1000® Index is an unmanaged index that measures the performance of the 1,000 largest companies in the Russell 3000® Index, which represents approximately 92% of the total market capitalization of the Russell 3000 Index. Index returns do not reflect any fees or expenses and it is not possible to invest directly into an index. |
| |
| Yearly periods ended December 31 | |
| Comparative Results | |
| DWS Core Equity VIP | | 1-Year | | | 3-Year | | | 5-Year | | | 10-Year | |
| Class A | Growth of $10,000 | | $ | 11,581 | | | $ | 13,229 | | | $ | 10,948 | | | $ | 18,672 | |
| Average annual total return | | | 15.81 | % | | | 9.78 | % | | | 1.83 | % | | | 6.44 | % |
Russell 1000® Index | Growth of $10,000 | | $ | 11,642 | | | $ | 13,719 | | | $ | 10,995 | | | $ | 20,649 | |
| Average annual total return | | | 16.42 | % | | | 11.12 | % | | | 1.92 | % | | | 7.52 | % |
| DWS Core Equity VIP | | 1-Year | | | 3-Year | | | 5-Year | | | 10-Year | |
| Class B | Growth of $10,000 | | $ | 11,541 | | | $ | 13,118 | | | $ | 10,818 | | | $ | 18,181 | |
| Average annual total return | | | 15.41 | % | | | 9.47 | % | | | 1.59 | % | | | 6.16 | % |
Russell 1000® Index | Growth of $10,000 | | $ | 11,642 | | | $ | 13,719 | | | $ | 10,995 | | | $ | 20,649 | |
| Average annual total return | | | 16.42 | % | | | 11.12 | % | | | 1.92 | % | | | 7.52 | % |
The growth of $10,000 is cumulative.
Management Summary December 31, 2012 (Unaudited)
U.S. equities performed very well during 2012, based on the 16.42% return of the Russell 1000® Index.1 While economic instability overseas and uncertainty related to the U.S. elections and "fiscal cliff" led to periodic market volatility, these factors were outweighed by the combination of favorable central bank policy, steady (albeit slow) economic growth and robust corporate earnings.
Class A shares of the Fund delivered a positive total return of 15.81% (unadjusted for contract charges) during the annual period, but it modestly underperformed the benchmark. Although we believe our systematic approach to stock selection is effective over the long term, we were unable to keep pace with the market during the past year — a time characterized by choppy market conditions and rapid shifts in investor sentiment.
We generated substantial outperformance in the energy sector through our overweight positions in refining stocks, which rallied due to the rising spread between the cost of the primary input (crude oil) and the price they can command for their various outputs (unleaded gas, diesel fuel, etc.).2 Tesoro Corp., Valero Energy Corp. and Western Refining, Inc. were among our strongest contributors in this area.
Our relative performance compared to the benchmark was also boosted by our underweight positions in a sizeable number of mega-cap stocks that lagged the broader market in 2012, among them Exxon Mobil Corp., Johnson & Johnson, Hewlett-Packard Co. and McDonald's Corp.*
Consumers' rapid shift from personal computers (PCs) to mobile devices took a bite out of Fund performance in 2012. Not only were we hurt by an underweight in Apple, Inc., but also overweights in PC and PC supply-chain companies such as Dell, Inc.,* Microsoft Corp. and Seagate Technology PLC.* Weak stock selection in the health care, consumer staples and utilities sectors also proved to be key factors in our underperformance.
While we foresee a generally positive backdrop for equities in 2013 thanks to the extremely supportive policies of the U.S. Federal Reserve Board (the Fed), we also believe elevated market volatility is likely in the first half of the year. Even after the fiscal cliff is resolved, there is still likely to be a great deal of haggling regarding specific elements of tax policy as we move through the first half of the year. In addition, the odds of periodic, disruptive headlines from overseas remain high. In this potentially uneven market environment, we believe our steady, disciplined approach should help us identify attractive individual stocks for the portfolio.
Robert Wang
Russell Shtern, CFA
Portfolio Managers, QS Investors, LLC, Subadvisor to the Fund
The views expressed reflect those of the portfolio management team only through the end of the period of the report as stated on the cover. The management team's views are subject to change at any time based on market and other conditions and should not be construed as a recommendation. Past performance is no guarantee of future results. Current and future portfolio holdings are subject to risk.
1 The Russell 1000® Index is an unmanaged index that measures the performance of the 1,000 largest companies in the Russell 3000® Index, which represents approximately 92% of the total market capitalization of the Russell 3000 Index.
Index returns do not reflect fees or expenses and it is not possible to invest directly into an index.
2 "Overweight" means the Fund holds a higher weighting in a given sector or security than the benchmark. "Underweight" means the Fund holds a lower weighting.
* Not held in the portfolio as of December 31, 2012.
Portfolio Summary (Unaudited) Asset Allocation (As a % of Investment Portfolio excluding Securities Lending Collateral) | 12/31/12 | 12/31/11 |
| | | |
| Common Stocks | 99% | 99% |
| Cash Equivalents | 1% | 1% |
| | 100% | 100% |
Sector Diversification (As a % of Common Stocks) | 12/31/12 | 12/31/11 |
| | | |
| Information Technology | 18% | 20% |
| Financials | 16% | 17% |
| Consumer Discretionary | 13% | 10% |
| Energy | 12% | 13% |
| Health Care | 12% | 14% |
| Consumer Staples | 12% | 9% |
| Industrials | 8% | 9% |
| Materials | 6% | 6% |
| Telecommunication Services | 2% | 1% |
| Utilities | 1% | 1% |
| | 100% | 100% |
Portfolio holdings and characteristics are subject to change.
For more complete details about the Fund's investment portfolio, see page 6.
Following the Fund's fiscal first and third quarter-end, a complete portfolio holdings listing is filed with the SEC on Form N-Q. The form will be available on the SEC's Web site at www.sec.gov, and it also may be reviewed and copied at the SEC's Public Reference Room in Washington, D.C. Information on the operation of the SEC's Public Reference Room may be obtained by calling (800) SEC-0330. The Fund's portfolio holdings are also posted on www.dws-investments.com from time to time. Please see the Fund's current prospectus for more information.
Investment Portfolio December 31, 2012 | | | Shares | | | Value ($) | |
| | | | |
| Common Stocks 99.2% | |
| Consumer Discretionary 12.8% | |
| Automobiles 1.8% | |
| General Motors Co.* (a) | | | 113,800 | | | | 3,280,854 | |
| Hotels, Restaurants & Leisure 0.7% | |
| Brinker International, Inc. | | | 2,200 | | | | 68,178 | |
| Marriott Vacations Worldwide Corp.* | | | 1,900 | | | | 79,173 | |
| Melco Crown Entertainment Ltd. (ADR)* | | | 11,700 | | | | 197,028 | |
| Six Flags Entertainment Corp. | | | 8,800 | | | | 538,560 | |
| Starbucks Corp. | | | 6,900 | | | | 369,978 | |
| Yum! Brands, Inc. | | | 700 | | | | 46,480 | |
| | | | | | | | 1,299,397 | |
| Household Durables 1.1% | |
| M.D.C. Holdings, Inc. (a) | | | 6,200 | | | | 227,912 | |
| Ryland Group, Inc. | | | 8,800 | | | | 321,200 | |
| Sony Corp. (ADR) | | | 23,400 | | | | 262,080 | |
| Whirlpool Corp. | | | 11,500 | | | | 1,170,125 | |
| | | | | | | | 1,981,317 | |
| Internet & Catalog Retail 1.4% | |
| Expedia, Inc. (a) | | | 40,400 | | | | 2,482,580 | |
| Leisure Equipment & Products 0.2% | |
| Polaris Industries, Inc. (a) | | | 4,000 | | | | 336,600 | |
| Media 3.7% | |
| Comcast Corp. "A" | | | 54,600 | | | | 2,040,948 | |
| Comcast Corp. Special "A" (a) | | | 54,700 | | | | 1,966,465 | |
| Gannett Co., Inc. (a) | | | 98,300 | | | | 1,770,383 | |
| Lions Gate Entertainment Corp.* (a) | | | 13,800 | | | | 226,320 | |
| McGraw-Hill Companies, Inc. | | | 12,700 | | | | 694,309 | |
| | | | | | | | 6,698,425 | |
| Multiline Retail 0.8% | |
| Dillard's, Inc. "A" | | | 5,215 | | | | 436,861 | |
| Macy's, Inc. | | | 25,300 | | | | 987,206 | |
| | | | | | | | 1,424,067 | |
| Specialty Retail 3.1% | |
| Aaron's, Inc. | | | 7,900 | | | | 223,412 | |
| Home Depot, Inc. | | | 10,000 | | | | 618,500 | |
| The Gap, Inc. | | | 89,200 | | | | 2,768,768 | |
| TJX Companies, Inc. | | | 50,200 | | | | 2,130,990 | |
| | | | | | | | 5,741,670 | |
| Consumer Staples 11.6% | |
| Beverages 2.1% | |
| Anheuser-Busch InBev NV (ADR) | | | 27,700 | | | | 2,421,257 | |
| Diageo PLC (ADR) | | | 8,300 | | | | 967,614 | |
| PepsiCo, Inc. | | | 5,000 | | | | 342,150 | |
| | | | | | | | 3,731,021 | |
| Food & Staples Retailing 3.3% | |
| Costco Wholesale Corp. | | | 28,000 | | | | 2,765,560 | |
| CVS Caremark Corp. | | | 45,600 | | | | 2,204,760 | |
| Wal-Mart Stores, Inc. | | | 16,200 | | | | 1,105,326 | |
| | | | | | | | 6,075,646 | |
| | | Shares | | | Value ($) | |
| | | | | | | | | |
| Food Products 1.6% | |
| Bunge Ltd. (a) | | | 12,800 | | | | 930,432 | |
| Dean Foods Co.* (a) | | | 31,300 | | | | 516,763 | |
| Nestle SA (ADR) (Registered) | | | 3,800 | | | | 247,646 | |
| Tyson Foods, Inc. "A" (a) | | | 61,200 | | | | 1,187,280 | |
| | | | | | | | 2,882,121 | |
| Household Products 2.4% | |
| Kimberly-Clark Corp. (a) | | | 13,000 | | | | 1,097,590 | |
| Procter & Gamble Co. | | | 48,800 | | | | 3,313,032 | |
| | | | | | | | 4,410,622 | |
| Tobacco 2.2% | |
| Altria Group, Inc. | | | 25,900 | | | | 813,778 | |
| Lorillard, Inc. | | | 2,100 | | | | 245,007 | |
| Philip Morris International, Inc. | | | 34,600 | | | | 2,893,944 | |
| | | | | | | | 3,952,729 | |
| Energy 12.0% | |
| Energy Equipment & Services 0.2% | |
| Exterran Holdings, Inc.* | | | 3,400 | | | | 74,528 | |
| Transocean Ltd. | | | 5,200 | | | | 232,180 | |
| | | | | | | | 306,708 | |
| Oil, Gas & Consumable Fuels 11.8% | |
| ConocoPhillips | | | 59,800 | | | | 3,467,802 | |
| CVR Energy, Inc.* (a) | | | 9,700 | | | | 473,263 | |
| Delek U.S. Holdings, Inc. | | | 8,900 | | | | 225,348 | |
| Exxon Mobil Corp. | | | 8,600 | | | | 744,330 | |
| HollyFrontier Corp. | | | 61,200 | | | | 2,848,860 | |
| Marathon Oil Corp. | | | 31,700 | | | | 971,922 | |
| Marathon Petroleum Corp. | | | 42,200 | | | | 2,658,600 | |
| Phillips 66 | | | 50,900 | | | | 2,702,790 | |
| Statoil ASA (ADR) | | | 52,300 | | | | 1,309,592 | |
| Suncor Energy, Inc. | | | 8,300 | | | | 273,734 | |
| Tesoro Corp. (a) | | | 67,500 | | | | 2,973,375 | |
| Valero Energy Corp. | | | 16,200 | | | | 552,744 | |
| Western Refining, Inc. (a) | | | 74,200 | | | | 2,091,698 | |
| Williams Companies, Inc. | | | 3,300 | | | | 108,042 | |
| | | | | | | | 21,402,100 | |
| Financials 15.9% | |
| Capital Markets 1.7% | |
| BlackRock, Inc. (a) | | | 3,500 | | | | 723,485 | |
| Franklin Resources, Inc. | | | 7,600 | | | | 955,320 | |
| T. Rowe Price Group, Inc. | | | 20,200 | | | | 1,315,626 | |
| | | | | | | | 2,994,431 | |
| Commercial Banks 2.2% | |
| East West Bancorp., Inc. | | | 6,100 | | | | 131,089 | |
| HSBC Holdings PLC (ADR) (a) | | | 5,000 | | | | 265,350 | |
| IBERIABANK Corp. | | | 500 | | | | 24,560 | |
| KeyCorp | | | 163,300 | | | | 1,374,986 | |
| Royal Bank of Canada | | | 6,600 | | | | 397,980 | |
| Zions Bancorp. (a) | | | 80,600 | | | | 1,724,840 | |
| | | | | | | | 3,918,805 | |
| Consumer Finance 1.1% | |
| Capital One Financial Corp. | | | 2,500 | | | | 144,825 | |
| Discover Financial Services | | | 49,100 | | | | 1,892,805 | |
| | | | | | | | 2,037,630 | |
| | | Shares | | | Value ($) | |
| | | | | | | | | |
| Diversified Financial Services 3.8% | |
| Citigroup, Inc. | | | 70,800 | | | | 2,800,848 | |
| JPMorgan Chase & Co. | | | 66,100 | | | | 2,906,417 | |
| Moody's Corp. (a) | | | 22,700 | | | | 1,142,264 | |
| | | | | | | | 6,849,529 | |
| Insurance 5.0% | |
| ACE Ltd. | | | 3,700 | | | | 295,260 | |
| Aflac, Inc. (a) | | | 59,000 | | | | 3,134,080 | |
| Allstate Corp. | | | 50,400 | | | | 2,024,568 | |
| Chubb Corp. | | | 19,800 | | | | 1,491,336 | |
| Cincinnati Financial Corp. | | | 2,300 | | | | 90,068 | |
| CNO Financial Group, Inc. (a) | | | 6,600 | | | | 61,578 | |
| Everest Re Group Ltd. | | | 3,300 | | | | 362,835 | |
| Fidelity National Financial, Inc. "A" (a) | | | 4,600 | | | | 108,330 | |
| First American Financial Corp. | | | 12,700 | | | | 305,943 | |
| MBIA, Inc.* | | | 2,600 | | | | 20,410 | |
| PartnerRe Ltd. | | | 7,100 | | | | 571,479 | |
| Progressive Corp. (a) | | | 26,300 | | | | 554,930 | |
| The Travelers Companies, Inc. | | | 2,000 | | | | 143,640 | |
| | | | | | | | 9,164,457 | |
| Real Estate Investment Trusts 2.1% | |
| American Tower Corp. (REIT) | | | 7,300 | | | | 564,071 | |
| CBL & Associates Properties, Inc. (REIT) (a) | | | 14,400 | | | | 305,424 | |
| Highwoods Properties, Inc. (REIT) | | | 1,300 | | | | 43,485 | |
| Ryman Hospitality Properties, Inc. (REIT) (a) | | | 6,648 | | | | 255,682 | |
| Weyerhaeuser Co. (REIT) | | | 97,600 | | | | 2,715,232 | |
| | | | | | | | 3,883,894 | |
| Thrifts & Mortgage Finance 0.0% | |
| Ocwen Financial Corp.* | | | 2,400 | | | | 83,016 | |
| Health Care 11.6% | |
| Biotechnology 2.5% | |
| Alexion Pharmaceuticals, Inc.* | | | 8,100 | | | | 759,861 | |
| Amgen, Inc. (a) | | | 33,100 | | | | 2,857,192 | |
| Celgene Corp.* | | | 2,000 | | | | 157,440 | |
| Onyx Pharmaceuticals, Inc.* (a) | | | 10,500 | | | | 793,065 | |
| | | | | | | | 4,567,558 | |
| Health Care Equipment & Supplies 0.4% | |
| Boston Scientific Corp.* (a) | | | 85,800 | | | | 491,634 | |
| Teleflex, Inc. | | | 1,000 | | | | 71,310 | |
| Zimmer Holdings, Inc. | | | 3,500 | | | | 233,310 | |
| | | | | | | | 796,254 | |
| Health Care Providers & Services 4.3% | |
| Aetna, Inc. (a) | | | 25,200 | | | | 1,166,760 | |
| Centene Corp.* | | | 1,000 | | | | 41,000 | |
| CIGNA Corp. | | | 25,700 | | | | 1,373,922 | |
| Express Scripts Holding Co.* | | | 4,700 | | | | 253,800 | |
| Health Net, Inc.* | | | 11,600 | | | | 281,880 | |
| Humana, Inc. | | | 13,200 | | | | 905,916 | |
| McKesson Corp. | | | 12,300 | | | | 1,192,608 | |
| UnitedHealth Group, Inc. | | | 34,100 | | | | 1,849,584 | |
| WellCare Health Plans, Inc.* | | | 4,700 | | | | 228,843 | |
| WellPoint, Inc. (a) | | | 7,000 | | | | 426,440 | |
| | | | | | | | 7,720,753 | |
| Life Sciences Tools & Services 0.1% | |
| Thermo Fisher Scientific, Inc. | | | 3,400 | | | | 216,852 | |
| Pharmaceuticals 4.3% | |
| Abbott Laboratories | | | 45,400 | | | | 2,973,700 | |
| Allergan, Inc. | | | 7,900 | | | | 724,667 | |
| | | Shares | | | Value ($) | |
| | | | | | | | | |
| AstraZeneca PLC (ADR) | | | 5,200 | | | | 245,804 | |
| Eli Lilly & Co. | | | 13,700 | | | | 675,684 | |
| Johnson & Johnson | | | 11,700 | | | | 820,170 | |
| Merck & Co., Inc. | | | 5,000 | | | | 204,700 | |
| Mylan, Inc.* (a) | | | 13,100 | | | | 359,988 | |
| Novo Nordisk AS (ADR) | | | 10,000 | | | | 1,632,100 | |
| Sanofi (ADR) | | | 3,800 | | | | 180,044 | |
| | | | | | | | 7,816,857 | |
| Industrials 8.1% | |
| Aerospace & Defense 4.9% | |
| Alliant Techsystems, Inc. | | | 5,700 | | | | 353,172 | |
| Boeing Co. | | | 30,500 | | | | 2,298,480 | |
| General Dynamics Corp. | | | 5,500 | | | | 380,985 | |
| Huntington Ingalls Industries, Inc. (a) | | | 7,100 | | | | 307,714 | |
| Lockheed Martin Corp. | | | 15,800 | | | | 1,458,182 | |
| Northrop Grumman Corp. (a) | | | 28,400 | | | | 1,919,272 | |
| Raytheon Co. (a) | | | 35,800 | | | | 2,060,648 | |
| Triumph Group, Inc. | | | 1,700 | | | | 111,010 | |
| | | | | | | | 8,889,463 | |
| Air Freight & Logistics 0.2% | |
| United Parcel Service, Inc. "B" | | | 5,900 | | | | 435,007 | |
| Airlines 1.1% | |
| Alaska Air Group, Inc.* | | | 14,800 | | | | 637,732 | |
| Ryanair Holdings PLC (ADR) | | | 2,300 | | | | 78,844 | |
| Southwest Airlines Co. (a) | | | 29,400 | | | | 301,056 | |
| U.S. Airways Group, Inc.* (a) | | | 48,300 | | | | 652,050 | |
| United Continental Holdings, Inc.* | | | 16,000 | | | | 374,080 | |
| | | | | | | | 2,043,762 | |
| Commercial Services & Supplies 0.1% | |
| Avery Dennison Corp. (a) | | | 4,700 | | | | 164,124 | |
| Construction & Engineering 0.1% | |
| Quanta Services, Inc.* | | | 8,800 | | | | 240,152 | |
| Industrial Conglomerates 0.4% | |
| Koninklijke Philips Electronics NV | | | 25,600 | | | | 679,424 | |
| Machinery 1.2% | |
| ITT Corp. | | | 32,100 | | | | 753,066 | |
| Oshkosh Corp.* | | | 27,600 | | | | 818,340 | |
| Terex Corp.* (a) | | | 19,900 | | | | 559,389 | |
| | | | | | | | 2,130,795 | |
| Trading Companies & Distributors 0.1% | |
| United Rentals, Inc.* | | | 2,400 | | | | 109,248 | |
| Information Technology 17.6% | |
| Communications Equipment 5.5% | |
| Brocade Communications Systems, Inc.* | | | 104,800 | | | | 558,584 | |
| Cisco Systems, Inc. | | | 197,400 | | | | 3,878,910 | |
| Harris Corp. | | | 6,700 | | | | 328,032 | |
| QUALCOMM, Inc. | | | 47,200 | | | | 2,927,344 | |
| Research In Motion Ltd.* (a) | | | 194,900 | | | | 2,315,412 | |
| | | | | | | | 10,008,282 | |
| Computers & Peripherals 0.6% | |
| Apple, Inc. | | | 300 | | | | 159,909 | |
| EMC Corp.* | | | 22,100 | | | | 559,130 | |
| Hewlett-Packard Co. | | | 8,500 | | | | 121,125 | |
| SanDisk Corp.* | | | 5,000 | | | | 217,800 | |
| | | | | | | | 1,057,964 | |
| | | Shares | | | Value ($) | |
| | | | | | | | | |
| Electronic Equipment, Instruments & Components 0.2% | |
| Ingram Micro, Inc. "A"* | | | 15,000 | | | | 253,800 | |
| Vishay Intertechnology, Inc.* (a) | | | 4,200 | | | | 44,646 | |
| | | | | | | | 298,446 | |
| Internet Software & Services 2.6% | |
| Akamai Technologies, Inc.* (a) | | | 29,000 | | | | 1,186,390 | |
| AOL, Inc.* | | | 63,900 | | | | 1,892,079 | |
| eBay, Inc.* | | | 14,100 | | | | 719,382 | |
| IAC/InterActiveCorp. | | | 21,400 | | | | 1,012,220 | |
| | | | | | | | 4,810,071 | |
| IT Services 4.2% | |
| Accenture PLC "A" | | | 4,900 | | | | 325,850 | |
| Cognizant Technology Solutions Corp. "A"* | | | 3,600 | | | | 266,580 | |
| Computer Sciences Corp. (a) | | | 56,300 | | | | 2,254,815 | |
| CoreLogic, Inc.* | | | 31,300 | | | | 842,596 | |
| Heartland Payment Systems, Inc. (a) | | | 3,500 | | | | 103,250 | |
| Lender Processing Services, Inc. | | | 12,800 | | | | 315,136 | |
| Visa, Inc. "A" (a) | | | 23,000 | | | | 3,486,340 | |
| | | | | | | | 7,594,567 | |
| Semiconductors & Semiconductor Equipment 1.6% | |
| First Solar, Inc.* (a) | | | 54,000 | | | | 1,667,520 | |
| Kulicke & Soffa Industries, Inc.* | | | 33,900 | | | | 406,461 | |
| Micron Technology, Inc.* (a) | | | 118,400 | | | | 751,840 | |
| RF Micro Devices, Inc.* | | | 28,700 | | | | 128,576 | |
| | | | | | | | 2,954,397 | |
| Software 2.9% | |
| Activision Blizzard, Inc. (a) | | | 19,200 | | | | 203,904 | |
| Cadence Design Systems, Inc.* | | | 26,700 | | | | 360,717 | |
| Microsoft Corp. | | | 94,400 | | | | 2,523,312 | |
| Solarwinds, Inc.* (a) | | | 22,500 | | | | 1,180,125 | |
| Symantec Corp.* | | | 52,000 | | | | 978,120 | |
| | | | | | | | 5,246,178 | |
| Materials 5.5% | |
| Chemicals 3.4% | |
| CF Industries Holdings, Inc. | | | 14,500 | | | | 2,945,820 | |
| Georgia Gulf Corp. (a) | | | 19,200 | | | | 792,576 | |
| LyondellBasell Industries NV "A" | | | 11,400 | | | | 650,826 | |
| Monsanto Co. | | | 18,500 | | | | 1,751,025 | |
| | | | | | | | 6,140,247 | |
| Construction Materials 0.3% | |
| Cemex SAB de CV (ADR) (a) | | | 45,700 | | | | 451,059 | |
| Eagle Materials, Inc. | | | 2,900 | | | | 169,650 | |
| | | | | | | | 620,709 | |
| | | Shares | | | Value ($) | |
| | | | | | | | | |
| Containers & Packaging 0.1% | |
| Bemis Co., Inc. (a) | | | 4,400 | | | | 147,224 | |
| Metals & Mining 1.0% | |
| AngloGold Ashanti Ltd. (ADR) | | | 14,100 | | | | 442,317 | |
| Kinross Gold Corp. | | | 138,200 | | | | 1,343,304 | |
| | | | | | | | 1,785,621 | |
| Paper & Forest Products 0.7% | |
| Louisiana-Pacific Corp.* (a) | | | 70,800 | | | | 1,367,856 | |
| Telecommunication Services 2.6% | |
| Diversified Telecommunication Services 1.4% | |
| AT&T, Inc. | | | 31,400 | | | | 1,058,494 | |
| Verizon Communications, Inc. | | | 34,100 | | | | 1,475,507 | |
| | | | | | | | 2,534,001 | |
| Wireless Telecommunication Services 1.2% | |
| Sprint Nextel Corp.* (a) | | | 369,400 | | | | 2,094,498 | |
| Telephone & Data Systems, Inc. | | | 6,200 | | | | 137,268 | |
| | | | | | | | 2,231,766 | |
| Utilities 1.5% | |
| Electric Utilities 0.6% | |
| Duke Energy Corp. | | | 12,300 | | | | 784,740 | |
| NV Energy, Inc. | | | 11,900 | | | | 215,866 | |
| | | | | | | | 1,000,606 | |
| Independent Power Producers & Energy Traders 0.0% | |
| NRG Energy, Inc. | | | 3,125 | | | | 71,846 | |
| Multi-Utilities 0.9% | |
| Ameren Corp. | | | 24,600 | | | | 755,712 | |
| Consolidated Edison, Inc. (a) | | | 15,900 | | | | 883,086 | |
| | | | | | | | 1,638,798 | |
Total Common Stocks (Cost $160,837,579) | | | | 180,256,447 | |
| | |
| Securities Lending Collateral 21.4% | |
| Daily Assets Fund Institutional, 0.20% (b) (c) (Cost $38,894,571) | | | 38,894,571 | | | | 38,894,571 | |
| | |
| Cash Equivalents 0.7% | |
| Central Cash Management Fund, 0.15% (b) (Cost $1,232,525) | | | 1,232,525 | | | | 1,232,525 | |
| | | % of Net Assets | | | Value ($) | |
| | | | |
Total Investment Portfolio (Cost $200,964,675)† | | | 121.3 | | | | 220,383,543 | |
| Other Assets and Liabilities, Net | | | (21.3 | ) | | | (38,737,242 | ) |
| Net Assets | | | 100.0 | | | | 181,646,301 | |
* Non-income producing security.
† The cost for federal income tax purposes was $202,255,598. At December 31, 2012, net unrealized appreciation for all securities based on tax cost was $18,127,945. This consisted of aggregate gross unrealized appreciation for all securities in which there was an excess of value over tax cost of $20,498,690 and aggregate gross unrealized depreciation for all securities in which there was an excess of tax cost over value of $2,370,745.
(a) All or a portion of these securities were on loan (see Notes to Financial Statements). The value of all securities loaned at December 31, 2012 amounted to $38,861,026, which is 21.4% of net assets.
(b) Affiliated fund managed by Deutsche Investment Management Americas Inc. The rate shown is the annualized seven-day yield at period end.
(c) Represents collateral held in connection with securities lending. Income earned by the Fund is net of borrower rebates.
ADR: American Depositary Receipt
REIT: Real Estate Investment Trust
At December 31, 2012, open futures contracts purchased were as follows:
| Futures | Currency | Expiration Date | | Contracts | | | Notional Value ($) | | | Unrealized Depreciation ($) | |
| S&P 500 E-Mini Index | USD | 3/15/2013 | | | 19 | | | | 1,349,095 | | | | (7,268 | ) |
| Currency Abbreviation |
| USD United States Dollar |
For information on the Fund's policy and additional disclosures regarding futures contracts, please refer to the Derivatives section of Note B in the accompanying Notes to Financial Statements.
Fair Value Measurements
Various inputs are used in determining the value of the Fund's investments. These inputs are summarized in three broad levels. Level 1 includes quoted prices in active markets for identical securities. Level 2 includes other significant observable inputs (including quoted prices for similar securities, interest rates, prepayment speeds, and credit risk). Level 3 includes significant unobservable inputs (including the Fund's own assumptions in determining the fair value of investments). The inputs or methodology used for valuing securities are not necessarily an indication of the risk associated with investing in those securities.
The following is a summary of the inputs used as of December 31, 2012 in valuing the Fund's investments. For information on the Fund's policy regarding the valuation of investments, please refer to the Security Valuation section of Note A in the accompanying Notes to Financial Statements.
| Assets | | Level 1 | | | Level 2 | | | Level 3 | | | Total | |
| | |
| Common Stocks (d) | | $ | 180,256,447 | | | $ | — | | | $ | — | | | $ | 180,256,447 | |
| Short-Term Investments (d) | | | 40,127,096 | | | | — | | | | — | | | | 40,127,096 | |
| Total | | $ | 220,383,543 | | | $ | — | | | $ | — | | | $ | 220,383,543 | |
| Liabilities | |
Derivatives (e) Futures Contracts | | $ | (7,268 | ) | | $ | — | | | $ | — | | | $ | (7,268 | ) |
| Total | | $ | (7,268 | ) | | $ | — | | | $ | — | | | $ | (7,268 | ) |
There have been no transfers between fair value measurement levels during the year ended December 31, 2012.
(d) See Investment Portfolio for additional detailed categorizations.
(e) Derivatives include unrealized appreciation (depreciation) on open futures contracts.
The accompanying notes are an integral part of the financial statements.
Statement of Assets and Liabilities | as of December 31, 2012 | |
| Assets | |
Investments: Investments in non-affiliated securities, at value (cost $160,837,579) — including $38,861,026 of securities loaned | | $ | 180,256,447 | |
| Investment in Daily Assets Fund Institutional (cost $38,894,571)* | | | 38,894,571 | |
| Investment in Central Cash Management Fund (cost $1,232,525) | | | 1,232,525 | |
| Total investments in securities, at value (cost $200,964,675) | | | 220,383,543 | |
| Deposit with broker for futures contracts | | | 199,504 | |
| Receivable for Fund shares sold | | | 104,403 | |
| Dividends receivable | | | 196,247 | |
| Interest receivable | | | 14,622 | |
| Foreign taxes recoverable | | | 1,475 | |
| Other assets | | | 3,332 | |
| Total assets | | | 220,903,126 | |
| Liabilities | |
| Payable upon return of securities loaned | | | 38,894,571 | |
| Payable for Fund shares redeemed | | | 189,785 | |
| Payable for variation margin on futures contracts | | | 7,268 | |
| Accrued management fee | | | 60,180 | |
| Accrued Trustees' fees | | | 1,677 | |
| Other accrued expenses and payables | | | 103,344 | |
| Total liabilities | | | 39,256,825 | |
| Net assets, at value | | $ | 181,646,301 | |
| Net Assets Consist of | |
| Undistributed net investment income | | | 2,843,728 | |
Net unrealized appreciation (depreciation) on: Investments | | | 19,418,868 | |
| Futures | | | (7,268 | ) |
| Accumulated net realized gain (loss) | | | (65,592,626 | ) |
| Paid-in capital | | | 224,983,599 | |
| Net assets, at value | | $ | 181,646,301 | |
Class A Net Asset Value, offering and redemption price per share ($180,038,389 ÷ 21,101,010 outstanding shares of beneficial interest, $.01 par value, unlimited number of shares authorized) | | $ | 8.53 | |
Class B Net Asset Value, offering and redemption price per share ($1,607,912 ÷ 188,843 outstanding shares of beneficial interest, $.01 par value, unlimited number of shares authorized) | | $ | 8.51 | |
* Represents collateral on securities loaned.
The accompanying notes are an integral part of the financial statements.
Statement of Operations
| for the year ended December 31, 2012 | |
| Investment Income | |
Income: Dividends (net of foreign taxes withheld of $16,511) | | $ | 3,679,562 | |
| Income distributions — Central Cash Management Fund | | | 1,871 | |
| Securities lending income, including income from Daily Assets Fund Institutional, net of borrower rebates | | | 99,878 | |
| Total income | | | 3,781,311 | |
Expenses: Management fee | | | 593,402 | |
| Administration fee | | | 152,154 | |
| Services to shareholders | | | 2,379 | |
| Record keeping fee (Class B) | | | 946 | |
| Distribution service fee (Class B) | | | 4,068 | |
| Custodian fee | | | 27,896 | |
| Professional fees | | | 55,515 | |
| Reports to shareholders | | | 49,716 | |
| Trustees' fees and expenses | | | 7,837 | |
| Other | | | 9,710 | |
| Total expenses | | | 903,623 | |
| Net investment income | | | 2,877,688 | |
| Realized and Unrealized Gain (Loss) | |
Net realized gain (loss) from: Investments | | | 14,470,237 | |
| Futures | | | 356,099 | |
| Foreign currency | | | 64 | |
| | | | 14,826,400 | |
Change in net unrealized appreciation (depreciation) on: Investments | | | (1,103,603 | ) |
| Futures | | | (30,001 | ) |
| Foreign currency | | | (18 | ) |
| | | | (1,133,622 | ) |
| Net gain (loss) | | | 13,692,778 | |
| Net increase (decrease) in net assets resulting from operations | | $ | 16,570,466 | |
The accompanying notes are an integral part of the financial statements.
Statement of Changes in Net Assets | | | Years Ended December 31, | |
| Increase (Decrease) in Net Assets | | 2012 | | | 2011 | |
Operations: Net investment income | | $ | 2,877,688 | | | $ | 1,190,417 | |
| Net realized gain (loss) | | | 14,826,400 | | | | 5,787,003 | |
| Change in net unrealized appreciation (depreciation) | | | (1,133,622 | ) | | | (6,735,551 | ) |
| Net increase (decrease) in net assets resulting from operations | | | 16,570,466 | | | | 241,869 | |
Distributions to shareholders from: Net investment income: Class A | | | (1,157,831 | ) | | | (1,231,321 | ) |
| Class B | | | (17,067 | ) | | | (19,225 | ) |
| Total distributions | | | (1,174,898 | ) | | | (1,250,546 | ) |
Fund share transactions: Class A Proceeds from shares sold | | | 5,653,743 | | | | 6,626,996 | |
| Net assets acquired in tax-free reorganization* | | | 103,303,156 | | | | — | |
| Reinvestment of distributions | | | 1,157,831 | | | | 1,231,321 | |
| Payments for shares redeemed | | | (30,735,177 | ) | | | (19,720,206 | ) |
| Net increase (decrease) in net assets from Class A share transactions | | | 79,379,553 | | | | (11,861,889 | ) |
Class B Proceeds from shares sold | | | 52,927 | | | | 79,702 | |
| Net assets acquired in tax-free reorganization* | | | 34,921 | | | | — | |
| Reinvestment of distributions | | | 17,067 | | | | 19,225 | |
| Payments for shares redeemed | | | (312,213 | ) | | | (429,706 | ) |
| Net increase (decrease) in net assets from Class B share transactions | | | (207,298 | ) | | | (330,779 | ) |
| Increase (decrease) in net assets | | | 94,567,823 | | | | (13,201,345 | ) |
| Net assets at beginning of period | | | 87,078,478 | | | | 100,279,823 | |
| Net assets at end of period (including undistributed net investment income of $2,843,728 and $1,129,614, respectively) | | $ | 181,646,301 | | | $ | 87,078,478 | |
| Other Information | |
Class A Shares outstanding at beginning of period | | | 11,456,872 | | | | 13,004,152 | |
| Shares sold | | | 703,069 | | | | 857,669 | |
| Shares issued in tax-free reorganization* | | | 12,597,547 | | | | — | |
| Shares issued to shareholders in reinvestment of distributions | | | 141,027 | | | | 148,352 | |
| Shares redeemed | | | (3,797,505 | ) | | | (2,553,301 | ) |
| Net increase (decrease) in Class A shares | | | 9,644,138 | | | | (1,547,280 | ) |
| Shares outstanding at end of period | | | 21,101,010 | | | | 11,456,872 | |
Class B Shares outstanding at beginning of period | | | 214,502 | | | | 256,466 | |
| Shares sold | | | 6,501 | | | | 10,552 | |
| Shares issued in tax-free reorganization* | | | 4,259 | | | | — | |
| Shares issued to shareholders in reinvestment of distributions | | | 2,076 | | | | 2,316 | |
| Shares redeemed | | | (38,495 | ) | | | (54,832 | ) |
| Net increase (decrease) in Class B shares | | | (25,659 | ) | | | (41,964 | ) |
| Shares outstanding at end of period | | | 188,843 | | | | 214,502 | |
* On April 30, 2012, DWS Blue Chip VIP was acquired by the Fund through a tax-free reorganization (see Note G).
The accompanying notes are an integral part of the financial statements.
| | | Years Ended December 31, | |
| Class A | | | 2012 | | | 2011 | | | 2010 | | | 2009 | | | 2008 | |
| Selected Per Share Data | |
| Net asset value, beginning of period | | $ | 7.46 | | | $ | 7.56 | | | $ | 6.71 | | | $ | 5.12 | | | $ | 10.81 | |
Income (loss) from investment operations: Net investment incomea | | | .15 | | | | .10 | | | | .09 | | | | .10 | | | | .10 | |
| Net realized and unrealized gain (loss) | | | 1.03 | | | | (.10 | ) | | | .87 | | | | 1.61 | | | | (3.45 | ) |
| Total from investment operations | | | 1.18 | | | | .00 | | | | .96 | | | | 1.71 | | | | (3.35 | ) |
Less distributions from: Net investment income | | | (.11 | ) | | | (.10 | ) | | | (.11 | ) | | | (.12 | ) | | | (.18 | ) |
| Net realized gains | | | — | | | | — | | | | — | | | | — | | | | (2.16 | ) |
| Total distributions | | | (.11 | ) | | | (.10 | ) | | | (.11 | ) | | | (.12 | ) | | | (2.34 | ) |
| Net asset value, end of period | | $ | 8.53 | | | $ | 7.46 | | | $ | 7.56 | | | $ | 6.71 | | | $ | 5.12 | |
| Total Return (%) | | | 15.81 | | | | (.14 | ) | | | 14.40 | b | | | 34.15 | b | | | (38.31 | )b |
| Ratios to Average Net Assets and Supplemental Data | |
| Net assets, end of period ($ millions) | | | 180 | | | | 85 | | | | 98 | | | | 101 | | | | 94 | |
| Ratio of expenses before expense reductions (%) | | | .59 | | | | .63 | | | | .63 | | | | .63 | | | | .60 | |
| Ratio of expenses after expense reductions (%) | | | .59 | | | | .63 | | | | .60 | | | | .54 | | | | .54 | |
| Ratio of net investment income (%) | | | 1.90 | | | | 1.25 | | | | 1.32 | | | | 1.74 | | | | 1.34 | |
| Portfolio turnover rate (%) | | | 307 | | | | 215 | | | | 145 | | | | 82 | | | | 130 | |
a Based on average shares outstanding during the period. b Total return would have been lower had certain expenses not been reduced. | |
| | | Years Ended December 31, | |
| Class B | | | 2012 | | | 2011 | | | 2010 | | | 2009 | | | 2008 | |
| Selected Per Share Data | |
| Net asset value, beginning of period | | $ | 7.45 | | | $ | 7.55 | | | $ | 6.70 | | | $ | 5.12 | | | $ | 10.77 | |
Income (loss) from investment operations: Net investment incomea | | | .11 | | | | .08 | | | | .07 | | | | .08 | | | | .08 | |
| Net realized and unrealized gain (loss) | | | 1.03 | | | | (.10 | ) | | | .87 | | | | 1.60 | | | | (3.42 | ) |
| Total from investment operations | | | 1.14 | | | | (.02 | ) | | | .94 | | | | 1.68 | | | | (3.34 | ) |
Less distributions from: Net investment income | | | (.08 | ) | | | (.08 | ) | | | (.09 | ) | | | (.10 | ) | | | (.15 | ) |
| Net realized gains | | | — | | | | — | | | | — | | | | — | | | | (2.16 | ) |
| Total distributions | | | (.08 | ) | | | (.08 | ) | | | (.09 | ) | | | (.10 | ) | | | (2.31 | ) |
| Net asset value, end of period | | $ | 8.51 | | | $ | 7.45 | | | $ | 7.55 | | | $ | 6.70 | | | $ | 5.12 | |
| Total Return (%) | | | 15.41 | | | | (.40 | ) | | | 14.12 | b | | | 33.64 | b | | | (38.29 | )b |
| Ratios to Average Net Assets and Supplemental Data | |
| Net assets, end of period ($ millions) | | | 2 | | | | 2 | | | | 2 | | | | 2 | | | | 2 | |
| Ratio of expenses before expense reductions (%) | | | .90 | | | | .88 | | | | .88 | | | | .89 | | | | .82 | |
| Ratio of expenses after expense reductions (%) | | | .90 | | | | .88 | | | | .85 | | | | .80 | | | | .77 | |
| Ratio of net investment income (%) | | | 1.41 | | | | .99 | | | | 1.07 | | | | 1.48 | | | | 1.12 | |
| Portfolio turnover rate (%) | | | 307 | | | | 215 | | | | 145 | | | | 82 | | | | 130 | |
a Based on average shares outstanding during the period. b Total return would have been lower had certain expenses not been reduced. | |
Notes to Financial Statements
A. Organization and Significant Accounting Policies
DWS Variable Series I (the "Series") is registered under the Investment Company Act of 1940, as amended (the "1940 Act"), as an open-end, registered management investment company organized as a Massachusetts business trust. The Series consists of five diversified funds: DWS Bond VIP, DWS Core Equity VIP (formerly DWS Growth & Income VIP), DWS Capital Growth VIP, DWS Global Small Cap Growth VIP and DWS International VIP (individually or collectively hereinafter referred to as a "Fund" or the "Funds"). These financial statements report on DWS Core Equity VIP. The Series is intended to be the underlying investment vehicle for variable annuity contracts and variable life insurance policies to be offered by the separate accounts of certain life insurance companies ("Participating Insurance Companies").
Multiple Classes of Shares of Beneficial Interest. The Fund offers two classes of shares (Class A shares and Class B shares). Class B shares are subject to Rule 12b-1 distribution fees under the 1940 Act and recordkeeping fees equal to an annual rate of 0.25% and up to 0.15%, respectively, of the average daily net assets of the Class B shares of the Fund. Class A shares are not subject to such fees.
Investment income, realized and unrealized gains and losses, and certain fund-level expenses and expense reductions, if any, are borne pro rata on the basis of relative net assets by the holders of all classes of shares, except that each class bears certain expenses unique to that class (including the applicable 12b-1 distribution fees and recordkeeping fees). Differences in class-level expenses may result in payment of different per share dividends by class. All shares have equal rights with respect to voting subject to class-specific arrangements.
The Fund's financial statements are prepared in accordance with accounting principles generally accepted in the United States of America, which require the use of management estimates. Actual results could differ from those estimates. The policies described below are followed consistently by the Fund in the preparation of its financial statements.
Security Valuation. Investments are stated at value determined as of the close of regular trading on the New York Stock Exchange on each day the exchange is open for trading.
Various inputs are used in determining the value of the Fund's investments. These inputs are summarized in three broad levels. Level 1 includes quoted prices in active markets for identical securities. Level 2 includes other significant observable inputs (including quoted prices for similar securities, interest rates, prepayment speeds, and credit risk). Level 3 includes significant unobservable inputs (including the Fund's own assumptions in determining the fair value of investments). The inputs or methodology used for valuing securities are not necessarily an indication of the risk associated with investing in those securities.
Equity securities are valued at the most recent sale price or official closing price reported on the exchange (U.S. or foreign) or over-the-counter market on which they trade and are categorized as Level 1 securities. Securities for which no sales are reported are valued at the calculated mean between the most recent bid and asked quotations on the relevant market or, if a mean cannot be determined, at the most recent bid quotation.
Investments in open-end investment companies are valued at their net asset value each business day and are categorized as Level 1.
Futures contracts are generally valued at the settlement prices established each day on the exchange on which they are traded and are categorized as Level 1.
Securities and other assets for which market quotations are not readily available or for which the above valuation procedures are deemed not to reflect fair value are valued in a manner that is intended to reflect their fair value as determined in accordance with procedures approved by the Trustees and are generally categorized as Level 3. In accordance with the Fund's valuation procedures, factors used in determining value may include, but are not limited to, the type of the security; the size of the holding; the initial cost of the security; the existence of any contractual restrictions on the security's disposition; the price and extent of public trading in similar securities of the issuer or of comparable companies; quotations or evaluated prices from broker-dealers and/or pricing services; information obtained from the issuer, analysts, and/or the appropriate stock exchange (for exchange-traded securities); an analysis of the company's or issuer's financial statements; an evaluation of the forces that influence the issuer and the market(s) in which the security is purchased and sold and with respect to debt securities; the maturity, coupon, creditworthiness, currency denomination and the movement of the market in which the security is normally traded. The value determined under these procedures may differ from published values for the same securities.
Disclosure about the classification of fair value measurements is included in a table following the Fund's Investment Portfolio.
New Accounting Pronouncement. In January 2013, Accounting Standard Update 2013-01 (ASU 2013-01), Clarifying the Scope of Disclosures about Offsetting Assets and Liabilities, replaced Accounting Standards Update 2011-11 (ASU 2011-11), Disclosures about Offsetting Assets and Liabilities. ASU 2013-01 is effective for fiscal years beginning on or after January 1, 2013, and interim periods within those annual periods. ASU 2011-11 was intended to enhance disclosure requirements on the offsetting of financial assets and liabilities. The ASU 2013-01 limits the scope of the new balance sheet offsetting disclosures to derivatives, repurchase agreements, and securities lending transactions to the extent that they are (1) offset in the financial statements or (2) subject to an enforceable master netting arrangement or similar agreement. Management is currently evaluating the application of ASU 2013-01 and its impact, if any, on the Fund's financial statements.
Securities Lending. The Fund lends securities to certain financial institutions. The Fund retains beneficial ownership of the securities it has loaned and continues to receive interest and dividends paid by the issuer of securities and to participate in any changes in their market value. The Fund requires the borrowers of the securities to maintain collateral with the Fund consisting of either cash or liquid, unencumbered assets having a value at least equal to the value of the securities loaned. When the collateral falls below specified amounts, the lending agent will use its best effort to obtain additional collateral on the next business day to meet required amounts under the security lending agreement. The Fund may invest the cash collateral into a joint trading account in an affiliated money market fund pursuant to Exemptive Orders issued by the SEC. The Fund receives compensation for lending its securities either in the form of fees or by earning interest on invested cash collateral net of borrower rebates and fees paid to a lending agent. Either the Fund or the borrower may terminate the loan. There may be risks of delay and costs in recovery of securities or even loss of rights in the collateral should the borrower of the securities fail financially. The Fund is also subject to all investment risks associated with the reinvestment of any cash collateral received, including, but not limited to, interest rate, credit and liquidity risk associated with such investments.
Foreign Currency Translations. The books and records of the Fund are maintained in U.S. dollars. Investment securities and other assets and liabilities denominated in a foreign currency are translated into U.S. dollars at the prevailing exchange rates at period end. Purchases and sales of investment securities, income and expenses are translated into U.S. dollars at the prevailing exchange rates on the respective dates of the transactions.
Net realized and unrealized gains and losses on foreign currency transactions represent net gains and losses between trade and settlement dates on securities transactions, the acquisition and disposition of foreign currencies, and the difference between the amount of net investment income accrued and the U.S. dollar amount actually received. That portion of both realized and unrealized gains and losses on investments that results from fluctuations in foreign currency exchange rates is not separately disclosed but is included with net realized and unrealized gain/appreciation and loss/depreciation on investments.
Federal Income Taxes. The Fund is treated as a separate taxpayer as provided for in the Internal Revenue Code, as amended. It is the Fund's policy to comply with the requirements of the Internal Revenue Code, as amended, which are applicable to regulated investment companies, and to distribute all of its taxable income to the separate accounts of the Participating Insurance Companies which hold its shares.
Under the Regulated Investment Company Modernization Act of 2010, net capital losses incurred post-enactment may be carried forward indefinitely, and their character is retained as short-term and/or long-term. Previously, net capital losses were carried forward for eight years and treated as short-term losses. As a transition rule, the Act requires that post-enactment net capital losses be used before pre-enactment net capital losses.
At December 31, 2012, the Fund had a net tax basis capital loss carryforward of approximately $63,882,000 of pre-enactment losses, including $27,700,000 inherited from its merger with DWS Blue Chip VIP in fiscal year 2012, which may be applied against any realized net taxable capital gains of each succeeding year until fully utilized or until December 31, 2016 ($34,761,000) and December 31, 2017 ($29,121,000), the respective expiration dates, whichever occurs first, and which may be subject to certain limitations under Sections 381-384 of the Internal Revenue Code.
In addition, from November 1, 2012 through December 31, 2012, the Fund elects to defer qualified late year net short-term realized capital losses of approximately $427,000 and treat them as arising in the fiscal year ending December 31, 2013.
The Fund has reviewed the tax positions for the open tax years as of December 31, 2012 and has determined that no provision for income tax is required in the Fund's financial statements. The Fund's federal tax returns for the prior three fiscal years remain open subject to examination by the Internal Revenue Service.
Distribution of Income and Gains. The Fund will declare and distribute dividends from its net investment income, if any, annually, although additional distributions may be made if necessary. Net realized gains from investment transactions, in excess of available capital loss carryforwards, would be taxable to the Fund if not distributed, and, therefore, will be distributed to shareholders at least annually.
The timing and characterization of certain income and capital gain distributions are determined annually in accordance with federal tax regulations which may differ from accounting principles generally accepted in the United States of America. These differences primarily relate to futures contracts and certain securities sold at a loss. As a result, net investment income (loss) and net realized gain (loss) on investment transactions for a reporting period may differ significantly from distributions during such period. Accordingly, the Fund may periodically make reclassifications among certain of its capital accounts without impacting the net asset value of the Fund.
At December 31, 2012, the Fund's components of distributable earnings (accumulated losses) on a tax basis are as follows:
| Undistributed ordinary income* | | $ | 2,843,728 | |
| Capital loss carryforwards | | $ | (63,882,000 | ) |
| Net unrealized appreciation (depreciation) on investments | | $ | 18,127,945 | |
In addition, the tax character of distributions paid to shareholders by the Fund is summarized as follows:
| | | Years Ended December 31, | |
| | | 2012 | | | 2011 | |
| Distributions from ordinary income* | | $ | 1,174,898 | | | $ | 1,250,546 | |
* For tax purposes, short-term capital gain distributions are considered ordinary income distributions.
Expenses. Expenses of the Series arising in connection with a specific Fund are allocated to that Fund. Other Series expenses which cannot be directly attributed to a Fund are apportioned among the Funds in the Series based upon the relative net assets or other appropriate measures.
Contingencies. In the normal course of business, the Fund may enter into contracts with service providers that contain general indemnification clauses. The Fund's maximum exposure under these arrangements is unknown as this would involve future claims that may be made against the Fund that have not yet been made. However, based on experience, the Fund expects the risk of loss to be remote.
Other. Investment transactions are accounted for on a trade date plus one basis for daily net asset value calculations. However, for financial reporting purposes, investment transactions are reported on trade date. Interest income is recorded on the accrual basis. Dividend income is recorded on the ex-dividend date net of foreign withholding taxes. Realized gains and losses from investment transactions are recorded on an identified cost basis and may include proceeds from litigation.
B. Derivative Instruments
Futures Contracts. A futures contract is an agreement between a buyer or seller and an established futures exchange or its clearinghouse in which the buyer or seller agrees to take or make a delivery of a specific amount of a financial instrument at a specified price on a specific date (settlement date). For the year ended December 31, 2012, the Fund entered into futures contracts in circumstances where portfolio management believed they offered an economic means of gaining exposure to a particular asset class or to keep cash on hand to meet shareholder redemptions or other needs while maintaining exposure to the market.
Upon entering into a futures contract, the Fund is required to deposit with a financial intermediary cash or securities ("initial margin") in an amount equal to a certain percentage of the face value indicated in the futures contract. Subsequent payments ("variation margin") are made or received by the Fund dependent upon the daily fluctuations in the value and are recorded for financial reporting purposes as unrealized gains or losses by the Fund. Gains or losses are realized when the contract expires or is closed. Since all futures contracts are exchange traded, counterparty risk is minimized as the exchange's clearinghouse acts as the counterparty, and guarantees the futures against default.
Certain risks may arise upon entering into futures contracts, including the risk that an illiquid market will limit the Fund's ability to close out a futures contract prior to the settlement date and the risk that the futures contract is not well correlated with the security, index or currency to which it relates. Risk of loss may exceed amounts disclosed in the Statement of Assets and Liabilities.
A summary of the open futures contracts as of December 31, 2012, is included in a table following the Fund's Investment Portfolio. For the year ended December 31, 2012, the investment in futures contracts purchased had a total notional value generally indicative of a range from approximately $631,000 to $2,848,000.
The following table summarizes the value of the Fund's derivative instruments held as of December 31, 2012 and the related location in the accompanying Statement of Assets and Liabilities, presented by primary underlying risk exposure:
| Liability Derivative | | Futures Contracts | |
| Equity Contracts (a) | | $ | (7,268 | ) |
The above derivative is located in the following Statement of Assets and Liabilities account:
(a) Includes cumulative depreciation of futures contracts as disclosed in the Investment Portfolio. Unsettled variation margin is disclosed separately within the Statement of Assets and Liabilities.
Additionally, the amount of unrealized and realized gains and losses on derivative instruments recognized in Fund earnings during the year ended December 31, 2012 and the related location in the accompanying Statement of Operations is summarized in the following tables by primary underlying risk exposure:
| Realized Gain (Loss) | | Futures Contracts | |
| Equity Contracts (a) | | $ | 356,099 | |
The above derivative is located in the following Statement of Operations account:
(a) Net realized gain (loss) from futures
| Change in Net Unrealized Appreciation (Depreciation) | | Futures Contracts | |
| Equity Contracts (a) | | $ | (30,001 | ) |
The above derivative is located in the following Statement of Operations account:
(a) Change in net unrealized appreciation (depreciation) on futures
C. Purchases and Sales of Securities
During the year ended December 31, 2012, purchases and sales of investment securities (excluding short-term investments) aggregated $469,419,308 and $490,931,036, respectively.
D. Related Parties
Management Agreement. Under the Investment Management Agreement with Deutsche Investment Management Americas Inc. ("DIMA" or the "Advisor"), an indirect, wholly owned subsidiary of Deutsche Bank AG, the Advisor directs the investments of the Fund in accordance with its investment objectives, policies and restrictions. The Advisor determines the securities, instruments and other contracts relating to investments to be purchased, sold or entered into by the Fund or delegates such responsibility to the Fund's subadvisor.
QS Investors, LLC ("QS Investors") serves as subadvisor. As a subadvisor to the Fund, QS Investors makes investment decisions and buys and sells securities for the Fund. QS Investors is paid by the Advisor for the services QS Investors provides to the Fund.
Pursuant to the Investment Management Agreement with the Advisor, the Fund pays a monthly management fee based on the Fund's average daily net assets, computed and accrued daily and payable monthly, at the following annual rates:
| First $250 million of average daily net assets | | | .390 | % |
| Next $750 million of average daily net assets | | | .365 | % |
| Over $1 billion of average daily net assets | | | .340 | % |
Accordingly, for the year ended December 31, 2012, the fee pursuant to the Investment Management Agreement was equivalent to an annual effective rate of 0.39% of the Fund's average daily net assets.
Administration Fee. Pursuant to an Administrative Services Agreement, DIMA provides most administrative services to the Fund. For all services provided under the Administrative Services Agreement, the Fund pays the Advisor an annual fee ("Administration Fee") of 0.10% of the Fund's average daily net assets, computed and accrued daily and payable monthly. For the year ended December 31, 2012, the Administration Fee was $152,154, of which $15,431 is unpaid.
Service Provider Fees. DWS Investments Service Company ("DISC"), an affiliate of the Advisor, is the transfer agent, dividend-paying agent and shareholder service agent for the Fund. Pursuant to a sub-transfer agency agreement between DISC and DST Systems, Inc. ("DST"), DISC has delegated certain transfer agent, dividend-paying agent and shareholder service agent functions to DST. DISC compensates DST out of the shareholder servicing fee it receives from the Fund. For the year ended December 31, 2012, the amounts charged to the Fund by DISC were as follows:
| Services to Shareholders | | Total Aggregated | | | Unpaid at December 31, 2012 | |
| Class A | | $ | 527 | | | $ | 134 | |
| Class B | | | 81 | | | | 20 | |
| | | $ | 608 | | | $ | 154 | |
Distribution Service Agreement. DWS Investments Distributors, Inc. ("DIDI"), also an affiliate of the Advisor, is the Series' Distributor. In accordance with the Master Distribution Plan, DIDI receives 12b-1 fees of 0.25% of average daily net assets of Class B shares. Pursuant to the Master Distribution Plan, DIDI remits these fees to the Participating Insurance Companies for various costs incurred or paid by these companies in connection with marketing and distribution of Class B shares. For the year ended December 31, 2012, the Distribution Service Fee aggregated $4,068, of which $501 is unpaid.
Typesetting and Filing Service Fees. Under an agreement with DIMA, DIMA is compensated for providing typesetting and certain regulatory filing services to the Fund. For the year ended December 31, 2012, the amount charged to the Fund by DIMA included in the Statement of Operations under "reports to shareholders" aggregated $19,086, of which $5,375 is unpaid.
Trustees' Fees and Expenses. The Fund paid retainer fees to each Trustee not affiliated with the Advisor, plus specified amounts to the Board Chairperson and to each committee Chairperson.
Affiliated Cash Management Vehicle. The Fund may invest uninvested cash balances in Central Cash Management Fund, which is managed by the Advisor. The Fund indirectly bears its proportionate share of the expenses of Central Cash Management Fund. Central Cash Management Fund does not pay the Advisor an investment management fee. Central Cash Management Fund seeks a high level of current income consistent with liquidity and the preservation of capital.
E. Ownership of the Fund
Two participating insurance companies were owners of record of 10% or more of the total outstanding Class A shares of the Fund, each owning 41% and 35%.
F. Line of Credit
The Fund and other affiliated funds (the "Participants") share in a $375 million revolving credit facility provided by a syndication of banks. The Fund may borrow for temporary or emergency purposes, including the meeting of redemption requests that otherwise might require the untimely disposition of securities. The Participants are charged an annual commitment fee which is allocated based on net assets, among each of the Participants. Interest is calculated at a rate per annum equal to the sum of the Federal Funds Rate plus 1.25 percent plus if LIBOR exceeds the Federal Funds Rate the amount of such excess. The Fund may borrow up to a maximum of 33 percent of its net assets under the agreement. The Fund had no outstanding loans at December 31, 2012.
G. Acquisition of Assets
On April 30, 2012, the Fund acquired all of the net assets of DWS Blue Chip VIP pursuant to a plan of reorganization approved by the Board of Trustees on November 18, 2011. The acquisition was accomplished by a tax-free exchange of 8,967,004 Class A shares and 3,018 Class B shares of DWS Blue Chip VIP for 12,597,547 Class A shares and 4,259 Class B shares of the Fund, respectively, outstanding on April 30, 2012. DWS Blue Chip VIP's net assets at that date, $103,338,077, including $13,470,096 of net unrealized appreciation, were combined with those of the Fund. The aggregate net assets of the Fund immediately before the acquisition were $92,542,116. The combined net assets of the Fund immediately following the acquisition were $195,880,193.
The financial statements reflect the operations of the Fund for the period prior to the acquisition and the combined portfolio for the period subsequent to the portfolio merger. Assuming the acquisition had been completed on January 1, 2012, the Fund's pro forma results of operations for the year ended December 31, 2012, are as follows:
| | | Total Aggregated | |
| Net investment income* | | $ | 3,204,806 | |
| Net gain (loss) on investments | | $ | 24,022,861 | |
| Net increase (decrease) in net assets resulting from operations | | $ | 27,227,667 | |
* Net investment income includes $51,419 of pro forma eliminated expenses.
Because the combined investment portfolio has been managed as a single integrated Fund since the acquisition was completed, it is not practicable to separate the amounts of revenue and earnings of DWS Blue Chip VIP that have been included in the Fund's Statement of Operations since April 30, 2012.
Report of Independent Registered Public Accounting Firm
To the Trustees of DWS Variable Series I and the Shareholders of DWS Core Equity VIP:
In our opinion, the accompanying statement of assets and liabilities, including the investment portfolio, and the related statements of operations and of changes in net assets and the financial highlights present fairly, in all material respects, the financial position of DWS Core Equity VIP (formerly DWS Growth & Income VIP) (the "Fund") at December 31, 2012 and the results of its operations, the changes in its net assets, and the financial highlights for the periods indicated therein, in conformity with accounting principles generally accepted in the United States of America. These financial statements and financial highlights (hereafter referred to as "financial statements") are the responsibility of the Fund's management. Our responsibility is to express an opinion on these financial statements based on our audits. We conducted our audits of these financial statements in accordance with the standards of the Public Company Accounting Oversight Board (United States). Those standards require that we plan and perform the audit to obtain reasonable assurance about whether the financial statements are free of material misstatement. An audit includes examining, on a test basis, evidence supporting the amounts and disclosures in the financial statements, assessing the accounting principles used and significant estimates made by management, and evaluating the overall financial statement presentation. We believe that our audits, which included confirmation of securities at December 31, 2012 by correspondence with the custodians and brokers, provide a reasonable basis for our opinion.
Boston, Massachusetts February 14, 2013 | PricewaterhouseCoopers LLP |
Information About Your Fund's Expenses (Unaudited)
As an investor of the Fund, you incur two types of costs: ongoing expenses and transaction costs. Ongoing expenses include management fees, distribution and service (12b-1) fees and other Fund expenses. Examples of transaction costs include contract charges, redemption fees and account maintenance fees, which are not shown in this section. The following tables are intended to help you understand your ongoing expenses (in dollars) of investing in the Fund and to help you compare these expenses with the ongoing expenses of investing in other mutual funds. The example in the table is based on an investment of $1,000 invested at the beginning of the six-month period and held for the entire period (July 1, 2012 to December 31, 2012).
The tables illustrate your Fund's expenses in two ways:
•Actual Fund Return. This helps you estimate the actual dollar amount of ongoing expenses (but not transaction costs) paid on a $1,000 investment in the Fund using the Fund's actual return during the period. To estimate the expenses you paid over the period, simply divide your account value by $1,000 (for example, an $8,600 account value divided by $1,000 = 8.6), then multiply the result by the number in the "Expenses Paid per $1,000" line under the share class you hold.
• Hypothetical 5% Fund Return. This helps you to compare your Fund's ongoing expenses (but not transaction costs) with those of other mutual funds using the Fund's actual expense ratio and a hypothetical rate of return of 5% per year before expenses. Examples using a 5% hypothetical Fund return may be found in the shareholder reports of other mutual funds. The hypothetical account values and expenses may not be used to estimate the actual ending account balance or expenses you paid for the period.
Please note that the expenses shown in these tables are meant to highlight your ongoing expenses only and do not reflect any transaction costs. The "Expenses Paid per $1,000" line of the tables is useful in comparing ongoing expenses only and will not help you determine the relative total expense of owning different funds. If these transaction costs had been included, your costs would have been higher.
Expenses and Value of a $1,000 Investment for the six months ended December 31, 2012 | |
| Actual Fund Return | | Class A | | | Class B | |
| Beginning Account Value 7/1/12 | | $ | 1,000.00 | | | $ | 1,000.00 | |
| Ending Account Value 12/31/12 | | $ | 1,090.80 | | | $ | 1,089.60 | |
| Expenses Paid per $1,000* | | $ | 3.05 | | | $ | 4.99 | |
| Hypothetical 5% Portfolio Return | | Class A | | | Class B | |
| Beginning Account Value 7/1/12 | | $ | 1,000.00 | | | $ | 1,000.00 | |
| Ending Account Value 12/31/12 | | $ | 1,022.22 | | | $ | 1,020.36 | |
| Expenses Paid per $1,000* | | $ | 2.95 | | | $ | 4.82 | |
* Expenses are equal to the Fund's annualized expense ratio for each share class, multiplied by the average account value over the period, multiplied by 184 (the number of days in the most recent six-month period), then divided by 366.
| Annualized Expense Ratios | Class A | | Class B | |
| DWS Variable Series I — DWS Core Equity VIP | .58% | | .95% | |
For more information, please refer to the Fund's prospectus.
These tables do not reflect charges and fees ("contract charges") associated with the separate account that invests in the Fund or any variable life insurance policy or variable annuity contract for which the Fund is an investment option.
Tax Information (Unaudited)
For corporate shareholders, 100% of the ordinary dividends (i.e., income dividends plus short-term capital gains) paid during the Fund's fiscal year ended December 31, 2012 qualified for the dividends received deduction.
Please consult a tax advisor if you have questions about federal or state income tax laws, or on how to prepare your tax returns. If you have specific questions about your account, please contact your insurance provider.
The Series' policies and procedures for voting proxies for portfolio securities and information about how the Series voted proxies related to its portfolio securities during the 12-month period ended June 30 are available on our Web site — www.dws-investments.com (click on "proxy voting"at the bottom of the page) — or on the SEC's Web site — www.sec.gov. To obtain a written copy of the Series' policies and procedures without charge, upon request, call us toll free at (800) 728-3337.
Investment Management Agreement Approval
The Board of Trustees approved the renewal of DWS Core Equity VIP's investment management agreement (the "Agreement") with Deutsche Investment Management Americas Inc. ("DWS") and sub-advisory agreement (the "Sub-Advisory Agreement" and together with the Agreement, the "Agreements") between DWS and QS Investors, LLC ("QS Investors") in September 2012.
In terms of the process that the Board followed prior to approving the Agreements, shareholders should know that:
• In September 2012, all of the Fund's Trustees were independent of DWS and its affiliates.
• The Trustees met frequently during the past year to discuss fund matters and dedicated a substantial amount of time to contract review matters. Over the course of several months, the Board's Contract Committee, in coordination with the Board's Fixed Income and Quant Oversight Committee, reviewed comprehensive materials received from DWS, independent third parties and independent counsel. These materials included an analysis of the Fund's performance, fees and expenses, and profitability compiled by the Fund's independent fee consultant. The Board also received extensive information throughout the year regarding performance of the Fund.
• The Independent Trustees regularly meet privately with their independent counsel to discuss contract review and other matters. In addition, the Independent Trustees were also advised by the Fund's independent fee consultant in the course of their review of the Fund's contractual arrangements and considered a comprehensive report prepared by the independent fee consultant in connection with their deliberations (the "IFC Report").
• In connection with reviewing the Agreements, the Board also reviewed the terms of the Fund's Rule 12b-1 plan, distribution agreement, administrative services agreement, transfer agency agreement and other material service agreements.
• Based on its evaluation of the information provided, the Contract Committee presented its findings and recommendations to the Board. The Board then reviewed the Contract Committee's findings and recommendations.
In connection with the contract review process, the Contract Committee and the Board considered the factors discussed below, among others. The Board also considered that DWS and its predecessors have managed the Fund since its inception, and the Board believes that a long-term relationship with a capable, conscientious advisor is in the best interests of the Fund. The Board considered, generally, that shareholders chose to invest or remain invested in the Fund knowing that DWS managed the Fund, and that the Agreement was approved by the Fund's shareholders. DWS is part of Deutsche Bank, a major global banking institution that is engaged in a wide range of financial services. The Board believes that there are advantages to being part of a global asset management business that offers a wide range of investing expertise and resources, including hundreds of portfolio managers and analysts with research capabilities in many countries throughout the world.
As part of the contract review process, the Board carefully considered the fees and expenses of each DWS fund overseen by the Board in light of the fund's performance. In many cases, this led to a negotiation with DWS of lower expense caps for the coming year than had previously been in place. As part of these negotiations, the Board indicated that it would consider relaxing these new lower caps in future years following sustained improvements in performance, among other considerations.
In June 2012, Deutsche Bank ("DB"), DWS's parent company, announced that DB's new management team had concluded the strategic review of its global asset management business announced in late 2011 by DB's prior management team, and would combine its Asset Management (of which DWS is a part) and Wealth Management divisions. Prior to approving the investment management agreements, the Independent Trustees were apprised of the expected management and structure of the new combined Asset & Wealth Management division ("AWM") and DWS. DB also advised the Independent Trustees that the U.S. asset management business is a critical and integral part of DB and AWM, and that DB would be reinvesting a significant portion of the substantial savings it expects to realize by combining its Asset Management and Wealth Management divisions into a combined AWM division, including enhancements to its investment capabilities. DB also confirmed its commitment to maintaining strong legal and compliance groups within the combined division.
While shareholders may focus primarily on fund performance and fees, the Fund's Board considers these and many other factors, including the quality and integrity of DWS's and QS Investors's personnel and such other issues as back-office operations, fund valuations, and compliance policies and procedures.
Nature, Quality and Extent of Services. The Board considered the terms of the Agreements, including the scope of advisory services provided under the Agreements. The Board noted that, under the Agreements, DWS and QS Investors provide portfolio management services to the Fund and that, pursuant to a separate administrative services agreement, DWS provides administrative services to the Fund. The Board considered the experience and skills of senior management and investment personnel, the resources made available to such personnel, the ability of DWS to attract and retain high-quality personnel, and the organizational depth and stability of DWS. The Board also requested and received information regarding DWS's oversight of Fund sub-advisors, including QS Investors. The Board reviewed the Fund's performance over short-term and long-term periods and compared those returns to various agreed-upon performance measures, including market indices and a peer universe compiled by the independent fee consultant using information supplied by Lipper Inc. ("Lipper"), an independent fund data service. The Board also noted that it has put into place a process of identifying "Focus Funds" (e.g., funds performing poorly relative to their benchmark or a peer universe compiled by an independent fund data service), and receives more frequent reporting and information from DWS regarding such funds, along with DWS's remedial plans to address underperformance. The Board believes this process is an effective manner of identifying and addressing underperforming funds. Based on the information provided, the Board noted that for the one-, three- and five-year periods ended December 31, 2011, the Fund's performance (Class A shares) was in the 1st quartile, 2nd quartile and 3rd quartile, respectively, of the applicable Lipper universe (the 1st quartile being the best performers and the 4th quartile being the worst performers). The Board also observed that the Fund has underperformed its benchmark in the one- and five-year periods and has outperformed its benchmark in the three-year period ended December 31, 2011.
Fees and Expenses. The Board considered the Fund's investment management fee schedule, sub-advisory fee schedule, operating expenses and total expense ratios, and comparative information provided by Lipper and the independent fee consultant regarding investment management fee rates paid to other investment advisors by similar funds (1st quartile being the most favorable and 4th quartile being the least favorable). With respect to management fees paid to other investment advisors by similar funds, the Board noted that the contractual fee rates paid by the Fund, which include a 0.10% fee paid to DWS under the Fund's administrative services agreement, were lower than the median (1st quartile) of the applicable Lipper peer group (based on Lipper data provided as of December 31, 2011). With respect to the sub-advisory fee paid to QS Investors, the Board noted that the fee is paid by DWS out of its fee and not directly by the Fund. The Board noted that the Fund's Class A shares total (net) operating expenses were expected to be lower than the median (1st quartile) of the applicable Lipper expense universe (based on Lipper data provided as of December 31, 2011) ("Lipper Universe Expenses"). The Board also reviewed data comparing each share class's total (net) operating expenses to the applicable Lipper Universe Expenses. The Board considered the Fund's management fee rate as compared to fees charged by DWS and certain of its affiliates for comparable mutual funds and considered differences in fund and fee structures between the DWS Funds. The Board also considered how the Fund's total (net) operating expenses compared to the total (net) operating expenses of a more customized peer group selected by Lipper (based on such factors as asset size).
The information considered by the Board as part of its review of management fees included information regarding fees charged by DWS and its affiliates to similar institutional accounts and to similar funds offered primarily to European investors ("DWS Europe funds"), in each case as applicable. The Board observed that advisory fee rates for institutional accounts generally were lower than the management fees charged by similarly managed DWS U.S. mutual funds ("DWS Funds"), but also took note of the differences in services provided to DWS Funds as compared to institutional accounts. In the case of DWS Europe funds, the Board observed that fee rates for DWS Europe funds generally were higher than for similarly managed DWS Funds, but noted that differences in the types of services provided to DWS Funds relative to DWS Europe funds made it difficult to compare such fees.
On the basis of the information provided, the Board concluded that management fees were reasonable and appropriate in light of the nature, quality and extent of services provided by DWS and QS Investors.
Profitability. The Board reviewed detailed information regarding revenues received by DWS under the Agreement. The Board considered the estimated costs and pre-tax profits realized by DWS from advising the DWS Funds, as well as estimates of the pre-tax profits attributable to managing the Fund in particular. The Board also received information regarding the estimated enterprise-wide profitability of DWS and its affiliates with respect to all fund services in totality and by fund. The Board and the independent fee consultant reviewed DWS's methodology in allocating its costs to the management of the Fund. Based on the information provided, the Board concluded that the pre-tax profits realized by DWS in connection with the management of the Fund were not unreasonable. The Board also reviewed information regarding the profitability of certain similar investment management firms. The Board noted that while information regarding the profitability of such firms is limited (and in some cases is not necessarily prepared on a comparable basis), DWS and its affiliates' overall profitability with respect to the DWS fund complex (after taking into account distribution and other services provided to the funds by DWS and its affiliates) was lower than the overall profitability levels of many comparable firms for which such data was available. The Board did not consider the profitability of QS Investors with respect to the Fund. The Board noted that DWS pays QS Investors's fee out of its management fee, and its understanding that the Fund's sub-advisory fee schedule was the product of an arm's length negotiation with DWS.
Economies of Scale. The Board considered whether there are economies of scale with respect to the management of the Fund and whether the Fund benefits from any economies of scale. The Board noted that the Fund's management fee schedule includes fee breakpoints. The Board concluded that the Fund's fee schedule represents an appropriate sharing between the Fund and DWS of such economies of scale as may exist in the management of the Fund at current asset levels.
Other Benefits to DWS and QS Investors and Their Affiliates. The Board also considered the character and amount of other incidental benefits received by DWS and QS Investors and their affiliates, including any fees received by DWS for administrative services provided to the Fund and any fees received by an affiliate of DWS for distribution services. The Board also considered benefits to DWS and QS Investors related to brokerage and soft-dollar allocations, including allocating brokerage to pay for research generated by parties other than the executing broker dealers, which pertain primarily to funds investing in equity securities, along with the incidental public relations benefits to DWS and QS Investors related to DWS Funds advertising and cross-selling opportunities among DWS products and services. The Board concluded that management fees were reasonable in light of these fallout benefits.
Compliance. The Board considered the significant attention and resources dedicated by DWS to documenting and enhancing its compliance processes in recent years. The Board noted in particular (i) the experience and seniority of both DWS's chief compliance officer and the Fund's chief compliance officer; (ii) the large number of DWS compliance personnel; and (iii) the substantial commitment of resources by DWS and its affiliates to compliance matters. The Board also considered the attention and resources dedicated by DWS to the oversight of the investment sub-advisor's compliance program and compliance with the applicable fund policies and procedures.
Based on all of the information considered and the conclusions reached, the Board unanimously determined that the continuation of the Agreements is in the best interests of the Fund. In making this determination, the Board did not give particular weight to any single factor identified above. The Board considered these factors over the course of numerous meetings, certain of which were in executive session with only the Independent Trustees and their counsel present. It is possible that individual Trustees may have weighed these factors differently in reaching their individual decisions to approve the continuation of the Agreements.
Summary of Management Fee Evaluation by Independent Fee Consultant
September 17, 2012
Pursuant to an Order entered into by Deutsche Investment Management Americas and affiliates (collectively, "DeAM") with the Attorney General of New York, I, Thomas H. Mack, have been appointed the Independent Fee Consultant for the DWS Funds (formerly the DWS Scudder Funds). My duties include preparing an annual written evaluation of the management fees DeAM charges the Funds, considering among other factors the management fees charged by other mutual fund companies for like services, management fees DeAM charges other clients for like services, DeAM's costs of supplying services under the management agreements and related profit margins, possible economies of scale if a Fund grows larger, and the nature and quality of DeAM's services, including fund performance. This report summarizes my evaluation for 2012, including my qualifications, the evaluation process for each of the DWS Funds, consideration of certain complex-level factors, and my conclusions. I served in substantially the same capacity in 2007, 2008, 2009, 2010 and 2011.
Qualifications
For more than 35 years I have served in various professional capacities within the investment management business. I have held investment analysis and advisory positions, including securities analyst, portfolio strategist and director of investment policy with a large investment firm. I have also performed business management functions, including business development, financial management and marketing research and analysis.
Since 1991, I have been an independent consultant within the asset management industry. I have provided services to over 125 client organizations, including investment managers, mutual fund boards, product distributors and related organizations. Over the past ten years I have completed a number of assignments for mutual fund boards, specifically including assisting boards with management contract renewal.
I hold a Master of Business Administration degree, with highest honors, from Harvard University and Master of Science and Bachelor of Science (highest honors) degrees from the University of California at Berkeley. I am an independent director and audit committee financial expert for two closed-end mutual funds and have served in various leadership and financial oversight capacities with non-profit organizations.
Evaluation of Fees for each DWS Fund
My work focused primarily on evaluating, fund-by-fund, the fees charged to each of the 103 mutual fund portfolios in the DWS Fund family. For each Fund, I considered each of the key factors mentioned above, as well as any other relevant information. In doing so I worked closely with the Funds' Independent Directors in their annual contract renewal process, as well as in their approval of contracts for several new funds (documented separately).
In evaluating each Fund's fees, I reviewed comprehensive materials provided by or on behalf of DeAM, including expense information prepared by Lipper Analytical, comparative performance information, profitability data, manager histories, and other materials. I also accessed certain additional information from the Lipper and Morningstar databases and drew on my industry knowledge and experience.
To facilitate evaluating this considerable body of information, I prepared for each Fund a document summarizing the key data elements in each area as well as additional analytics discussed below. This made it possible to consider each key data element in the context of the others.
In the course of contract renewal, DeAM agreed to implement a number of fee and expense adjustments requested by the Independent Directors which will favorably impact future fees and expenses, and my evaluation includes the effects of these changes.
Fees and Expenses Compared with Other Funds
The competitive fee and expense evaluation for each fund focused on two primary comparisons:
The Fund's contractual management fee (the advisory fee plus the administration fee where applicable) compared with those of a group of typically 12-15 funds in the same Lipper investment category (e.g. Large Capitalization Growth) having similar distribution arrangements and being of similar size.
The Fund's total expenses compared with a broader universe of funds from the same Lipper investment category and having similar distribution arrangements.
These two comparisons provide a view of not only the level of the fee compared with funds of similar scale but also the total expense the Fund bears for all the services it receives, in comparison with the investment choices available in the Fund's investment category and distribution channel. The principal figure-of-merit used in these comparisons was the subject Fund's percentile ranking against peers.
DeAM's Fees for Similar Services to Others
DeAM provided management fee schedules for all of its US domiciled fund and non-fund investment management accounts in any of the investment categories where there is a DWS Fund. These similar products included the other DWS Funds, non-fund pooled accounts, institutional accounts and sub-advisory accounts. Using this information, I calculated for each Fund the fee that would be charged to each similar product, at the subject Fund's asset level.
Evaluating information regarding non-fund products is difficult because there are varying levels of services required for different types of accounts, with mutual funds generally requiring considerably more regulatory and administrative types of service as well as having more frequent cash flows than other types of accounts. Also, while mutual fund fees for similar fund products can be expected to be similar, there will be some differences due to different pricing conditions in different distribution channels (e.g. retail funds versus those used in variable insurance products), differences in underlying investment processes and other factors.
Costs and Profit Margins
DeAM provided a detailed profitability analysis for each Fund. After making some adjustments so that the presentation would be more comparable to the available industry figures, I reviewed profit margins from investment management alone, from investment management plus other fund services (excluding distribution) provided to the Funds by DeAM (principally shareholder services), and DeAM profits from all sources, including distribution. A later section comments on overall profitability.
Economies of Scale
Economies of scale — an expected decline in management cost per dollar of fund assets as fund assets grow — are very rarely quantified and documented because of inherent difficulties in collecting and analyzing relevant data. However, in virtually every investment category that I reviewed, larger funds tend to have lower fees and lower total expenses than smaller funds. To see how each DWS Fund compares with this industry observation, I reviewed:
The trend in Fund assets over the last five years and the accompanying trend in total expenses. This shows if the Fund has grown and, if so, whether total expense (management fees as well as other expenses) have declined as a percent of assets.
Whether the Fund has break-points in its management fee schedule, the extent of the fee reduction built into the schedule and the asset levels where the breaks take effect, and in the case of a sub-advised Fund how the Fund's break-points compare with those of the sub-advisory fee schedule.
How the Fund's contractual fee schedule compares with trends in the industry data. To accomplish this, I constructed a chart showing how actual latest-fiscal-year contractual fees of the Fund and of other similar funds relate to average fund assets, with the subject Fund's contractual fee schedule superimposed.
Quality of Service — Performance
The quality-of-service evaluation focused on investment performance, which is the principal result of the investment management service. Each Fund's performance was reviewed over the past 1, 3, 5 and 10 years, as applicable, and compared with that of other funds in the same investment category and with a suitable market index.
In addition, I calculated and reviewed risk-adjusted returns relative to an index of similar mutual funds' returns and a suitable market index. The risk-adjusted returns analysis provides a way of determining the extent to which the Fund's return comparisons are mainly the product of investment value-added (or lack thereof) or alternatively taking considerably more or less risk than is typical in its investment category.
I also received and considered the history of portfolio manager changes for each Fund, as this provided an important context for evaluating the performance results.
Complex-Level Considerations
While this evaluation was conducted mainly at the individual fund level, there are some issues relating to the reasonableness of fees that can alternatively be considered across the whole fund complex:
I reviewed DeAM's profitability analysis for all DWS Funds, with a view toward determining if the allocation procedures used were reasonable and how profit levels compared with public data for other investment managers.
I considered whether DeAM and affiliates receive any significant ancillary or "fallout" benefits that should be considered in interpreting the direct profitability results. These would be situations where serving as the investment manager of the Funds is beneficial to another part of the Deutsche Bank organization.
I considered how aggregated DWS Fund expenses had varied over the years, by asset class and in the context of trends in asset levels.
I considered how aggregated DWS Fund performance measures relative to appropriate peers had varied by asset class and over time.
I reviewed the structure of the DeAM organization, trends in staffing levels, and information on compensation of investment management and other professionals compared with industry data.
Findings
Based on the process and analysis discussed above, which included reviewing a wide range of information from management and external data sources and considering among other factors the fees DeAM charges other clients, the fees charged by other fund managers, DeAM's costs and profits associated with managing the Funds, economies of scale, possible fall-out benefits, and the nature and quality of services provided, in my opinion the management fees charged the DWS Funds are reasonable.
Thomas H. Mack
President, Thomas H. Mack & Co., Inc.
Board Members and Officers
The following table presents certain information regarding the Board Members and Officers of the fund. Each Board Member's year of birth is set forth in parentheses after his or her name. Unless otherwise noted, (i) each Board Member has engaged in the principal occupation(s) noted in the table for at least the most recent five years, although not necessarily in the same capacity; and (ii) the address of each Independent Board Member is c/o Kenneth C. Froewiss, Chairman, DWS Mutual Funds, P.O. Box 78, Short Hills, NJ 07078. Except as otherwise noted below, the term of office for each Board Member is until the election and qualification of a successor, or until such Board Member sooner dies, resigns, is removed or as otherwise provided in the governing documents of the fund. Because the fund does not hold an annual meeting of shareholders, each Board Member will hold office for an indeterminate period. The Board Members may also serve in similar capacities with other funds in the fund complex.
| Independent Board Members |
Name, Year of Birth, Position with the Fund and Length of Time Served1 | | Business Experience and Directorships During the Past Five Years | Number of Funds in DWS Fund Complex Overseen |
Other Directorships Held by Board Member |
Kenneth C. Froewiss (1945) Chairperson since 2013,9 and Board Member since 2001 | | Adjunct Professor of Finance, NYU Stern School of Business (September 2009-present; Clinical Professor from 1997-September 2009); Member, Finance Committee, Association for Asian Studies (2002-present); Director, Mitsui Sumitomo Insurance Group (US) (2004-present); prior thereto, Managing Director, J.P. Morgan (investment banking firm) (until 1996) | 103 | — |
William McClayton (1944) Vice Chairperson since 2013,9 and Board Member since 2004 | | Private equity investor (since October 2009); previously, Managing Director, Diamond Management & Technology Consultants, Inc. (global consulting firm) (2001-2009); Directorship: Board of Managers, YMCA of Metropolitan Chicago; formerly: Senior Partner, Arthur Andersen LLP (accounting) (1966-2001); Trustee, Ravinia Festival | 103 | — |
John W. Ballantine (1946) Board Member since 1999 | | Retired; formerly, Executive Vice President and Chief Risk Management Officer, First Chicago NBD Corporation/The First National Bank of Chicago (1996-1998); Executive Vice President and Head of International Banking (1995-1996). Directorships: Stockwell Capital Investments PLC (private equity); former Directorships: First Oak Brook Bancshares, Inc. and Oak Brook Bank; Prisma Energy International | 103 | Chairman of the Board, Healthways, Inc.2 (provider of disease and care management services) (2003- present); Portland General Electric2 (utility company) (2003-present) |
Henry P. Becton, Jr. (1943) Board Member since 1990 | | Vice Chair and former President, WGBH Educational Foundation. Directorships: Public Radio International; Public Radio Exchange (PRX); The PBS Foundation; North Bennett Street School (Boston); former Directorships: Association of Public Television Stations; Boston Museum of Science; American Public Television; Concord Academy; New England Aquarium; Mass. Corporation for Educational Telecommunications; Committee for Economic Development; Public Broadcasting Service; Connecticut College | 103 | Lead Director, Becton Dickinson and Company2 (medical technology company); Lead Director, Belo Corporation2 (media company) |
Dawn-Marie Driscoll (1946) Board Member since 1987 | | President, Driscoll Associates (consulting firm); Emeritus Executive Fellow, Center for Business Ethics, Bentley University; formerly, Partner, Palmer & Dodge (1988-1990); Vice President of Corporate Affairs and General Counsel, Filene's (1978-1988). Directorships: Director of ICI Mutual Insurance Company (since 2007); Advisory Board, Center for Business Ethics, Bentley University; Trustee, Southwest Florida Community Foundation (charitable organization); former Directorships: Sun Capital Advisers Trust (mutual funds) (2007-2012), Investment Company Institute (audit, executive, nominating committees) and Independent Directors Council (governance, executive committees) | 103 | — |
Keith R. Fox, CFA (1954) Board Member since 1996 | | Managing General Partner, Exeter Capital Partners (a series of private investment funds) (since 1986). Directorships: Progressive International Corporation (kitchen goods importer and distributor); The Kennel Shop (retailer); former Chairman, National Association of Small Business Investment Companies; former Directorships: BoxTop Media Inc. (advertising); Sun Capital Advisers Trust (mutual funds) (2011-2012) | 103 | — |
Paul K. Freeman (1950) Board Member since 1993, and Chairperson (2009-Jan. 8, 2013) | | Consultant, World Bank/Inter-American Development Bank; Executive and Governing Council of the Independent Directors Council (Chairman of Education Committee); formerly: Project Leader, International Institute for Applied Systems Analysis (1998-2001); Chief Executive Officer, The Eric Group, Inc. (environmental insurance) (1986-1998); Directorships: Denver Zoo Foundation (December 2012-present); former Directorships: Prisma Energy International | 103 | — |
Richard J. Herring (1946) Board Member since 1990 | | Jacob Safra Professor of International Banking and Professor, Finance Department, The Wharton School, University of Pennsylvania (since July 1972); Co-Director, Wharton Financial Institutions Center (since July 2000); Co-Chair, U.S. Shadow Financial Regulatory Committee; Executive Director, Financial Economists Roundtable; formerly: Vice Dean and Director, Wharton Undergraduate Division (July 1995-June 2000); Director, Lauder Institute of International Management Studies (July 2000-June 2006) | 103 | Director, Japan Equity Fund, Inc. (since September 2007), Thai Capital Fund, Inc. (since 2007), Singapore Fund, Inc. (since September 2007), Independent Director of Barclays Bank Delaware (since September 2010) |
Rebecca W. Rimel (1951) Board Member since 1995 | | President and Chief Executive Officer, The Pew Charitable Trusts (charitable organization) (1994 to present); Trustee, Washington College (2011-2013); formerly: Executive Vice President, The Glenmede Trust Company (investment trust and wealth management) (1983-2004); Board Member, Investor Education (charitable organization) (2004-2005); Trustee, Executive Committee, Philadelphia Chamber of Commerce (2001-2007); Director, Viasys Health Care2 (January 2007-June 2007); Trustee, Pro Publica (charitable organization) (2007-2010); Trustee, Thomas Jefferson Foundation (charitable organization) (1994-2012) | 103 | Director, Becton Dickinson and Company2 (medical technology company) (2012-present); Director, CardioNet, Inc.2 (health care) (2009-present) |
William N. Searcy, Jr. (1946) Board Member since 1993 | | Private investor since October 2003; formerly: Pension & Savings Trust Officer, Sprint Corporation2 (telecommunications) (November 1989-September 2003); Trustee, Sun Capital Advisers Trust (mutual funds) (1998-2012) | 103 | — |
Jean Gleason Stromberg (1943) Board Member since 1997 | | Retired. Formerly, Consultant (1997-2001); Director, Financial Markets U.S. Government Accountability Office (1996-1997); Partner, Fulbright & Jaworski, L.L.P. (law firm) (1978-1996). Directorships: The William and Flora Hewlett Foundation; former Directorships: Service Source, Inc., Mutual Fund Directors Forum (2002-2004), American Bar Retirement Association (funding vehicle for retirement plans) (1987-1990 and 1994-1996) | 103 | — |
Robert H. Wadsworth (1940) Board Member since 1999 | | President, Robert H. Wadsworth & Associates, Inc. (consulting firm) (1983 to present); Director, National Horizon, Inc. (non-profit organization); Director and Treasurer, The Phoenix Boys Choir Association | 106 | — |
Interested Board Member and Officer4 |
Name, Year of Birth, Position with the Fund and Length of Time Served1,6 | | Business Experience and Directorships During the Past Five Years | Number of Funds in DWS Fund Complex Overseen |
Other Directorships Held by Board Member |
Michael J. Woods5 (1967) Board Member since 2013,9 and Executive Vice President since 20139 | | Managing Director,3 Deutsche Asset & Wealth Management (2009-present); Head of the Americas Asset Management Business for Deutsche Bank, Member of the Asset and Wealth Management ("AWM") Extended Executive Committee, AWM Global Client Group Executive Committee and the AWM Active Asset Management Executive Committee; CEO and US Regional Head of DWS Investments; formerly: Sr. VP, Head of the Financial Intermediaries and Investments Group of Evergreen Investments (2007-2009), CEO and Vice Chairman of Board of Directors of XTF Global Asset Management (2006-2007), Managing Director — US Head of Sub-Advisory and Investment Only Business at Citigroup Asset Management (2000-2006). Mr. Woods is currently a board member of The Children's Village, The Big Brothers Big Sisters Organization, and The Mutual Fund Education Alliance. | 39 | — |
Officers4 |
Name, Year of Birth, Position with the Fund and Length of Time Served6 | | Business Experience and Directorships During the Past Five Years |
W. Douglas Beck, CFA7 (1967) President, 2011-present | | Managing Director,3 Deutsche Asset & Wealth Management (2006-present); President of DWS family of funds and Head of Product Management, U.S. for DWS Investments; formerly: Executive Director, Head of Product Management (2002-2006) and President (2005-2006) of the UBS Funds at UBS Global Asset Management; Co-Head of Manager Research/Managed Solutions Group, Merrill Lynch (1998-2002) |
John Millette8 (1962) Vice President and Secretary, 1999-present | | Director,3 Deutsche Asset & Wealth Management |
Paul H. Schubert7 (1963) Chief Financial Officer, 2004-present Treasurer, 2005-present | | Managing Director,3 Deutsche Asset & Wealth Management (since July 2004); formerly: Executive Director, Head of Mutual Fund Services and Treasurer for UBS Family of Funds (1998-2004); Vice President and Director of Mutual Fund Finance at UBS Global Asset Management (1994-1998) |
Caroline Pearson8 (1962) Chief Legal Officer, 2010-present | | Managing Director,3 Deutsche Asset & Wealth Management; formerly: Assistant Secretary for DWS family of funds (1997-2010) |
Melinda Morrow7 (1970) Vice President, 2012-present | | Director,3 Deutsche Asset & Wealth Management |
Hepsen Uzcan8 (1974) Assistant Secretary, since 20139 | | Vice President, Deutsche Asset & Wealth Management |
Paul Antosca8 (1957) Assistant Treasurer, 2007-present | | Director,3 Deutsche Asset & Wealth Management |
Jack Clark8 (1967) Assistant Treasurer, 2007-present | | Director,3 Deutsche Asset & Wealth Management |
Diane Kenneally8 (1966) Assistant Treasurer, 2007-present | | Director,3 Deutsche Asset & Wealth Management |
John Caruso7 (1965) Anti-Money Laundering Compliance Officer, 2010-present | | Managing Director,3 Deutsche Asset & Wealth Management |
Robert Kloby7 (1962) Chief Compliance Officer, 2006-present | | Managing Director,3 Deutsche Asset & Wealth Management |
1 The length of time served represents the year in which the Board Member joined the board of one or more DWS funds currently overseen by the Board.
2 A publicly held company with securities registered pursuant to Section 12 of the Securities Exchange Act of 1934.
3 Executive title, not a board directorship.
4 As a result of their respective positions held with the Advisor, these individuals are considered "interested persons" of the Advisor within the meaning of the 1940 Act. Interested persons receive no compensation from the fund.
5 The mailing address of Mr. Woods is 60 Wall Street, New York, New York 10005. Mr. Woods is an interested Board Member by virtue of his positions with Deutsche Asset & Wealth Management. As an interested person, Mr. Woods receives no compensation from the fund. Mr. Woods is a board member of the following trusts and corporations: Cash Account Trust, DWS Market Trust, DWS Money Funds, DWS State Tax-Free Income Series, DWS Target Fund, DWS Value Series, Inc., DWS Variable Series II, Investors Cash Trust, Tax-Exempt California Money Market Fund, DWS Global High Income Fund, Inc., DWS High Income Opportunities Fund, Inc., DWS High Income Trust, DWS Multi-Market Income Trust, DWS Municipal Income Trust, DWS Strategic Income Trust and DWS Strategic Municipal Income Trust.
6 The length of time served represents the year in which the officer was first elected in such capacity for one or more DWS funds.
7 Address: 60 Wall Street, New York, NY 10005.
8 Address: One Beacon Street, Boston, MA 02108.
9 Effective as of January 9, 2013.
The fund's Statement of Additional Information ("SAI") includes additional information about the Board Members. The SAI is available, without charge, upon request. If you would like to request a copy of the SAI, you may do so by calling the following toll-free number: (800) 728-3337.
DWS Investments Distributors, Inc.
222 South Riverside Plaza
Chicago, IL 60606
(800) 621-1148
VS1coreq-2 (R-025822-2 2/13)
DECEMBER 31, 2012
ANNUAL REPORT
DWS VARIABLE SERIES I
DWS Global Small Cap Growth VIP
Contents
10 Statement of Assets and Liabilities 11 Statement of Operations 12 Statement of Changes in Net Assets 15 Notes to Financial Statements 20 Report of Independent Registered Public Accounting Firm 21 Information About Your Fund's Expenses 23 Investment Management Agreement Approval 26 Summary of Management Fee Evaluation by Independent Fee Consultant 28 Board Members and Officers |
This report must be preceded or accompanied by a prospectus. To obtain an additional prospectus or summary prospectus, if available, call (800) 728-3337 or your financial representative. We advise you to consider the Fund's objectives, risks, charges and expenses carefully before investing. The summary prospectus and prospectus contain this and other important information about the Fund. Please read the prospectus carefully before you invest.
Investing in foreign securities, particularly those of emerging markets, presents certain risks, such as currency fluctuations, political and economic changes, and market risks. The Fund may lend securities to approved institutions. Smaller company stocks tend to be more volatile than medium-sized or large company stocks. Stocks may decline in value. See the prospectus for details.
DWS Investments is part of the Deutsche Asset & Wealth Management division of Deutsche Bank AG.
NOT FDIC/NCUA INSURED NO BANK GUARANTEE MAY LOSE VALUE NOT A DEPOSIT
NOT INSURED BY ANY FEDERAL GOVERNMENT AGENCY
Performance Summary December 31, 2012 (Unaudited)
Fund performance shown is historical, assumes reinvestment of all dividend and capital gain distributions, and does not guarantee future results. Investment return and principal value fluctuate with changing market conditions so that, when redeemed, shares may be worth more or less than their original cost. Current performance may be lower or higher than the performance data quoted. Please contact your participating insurance company for the Fund's most recent month-end performance. Performance doesn't reflect charges and fees ("contract charges") associated with the separate account that invests in the Fund or any variable life insurance policy or variable annuity contract for which the Fund is an investment option. These charges and fees will reduce returns. While all share classes have the same underlying portfolio, their performance will differ.
The gross expense ratios of the Fund, as stated in the fee table of the prospectus dated May 1, 2012 are 1.12% and 1.38% for Class A and Class B shares, respectively, and may differ from the expense ratios disclosed in the Financial Highlights tables in this report.
| Growth of an Assumed $10,000 Investment |
| The S&P® Developed SmallCap comprises the stocks representing the lowest 15% of float-adjusted market cap in each developed country. It Is a subset of the S&P® Global BMI, a comprehensive, rules-based index measuring global stock market performance. Index returns do not reflect any fees or expenses and it is not possible to invest directly into an index. |
| |
| Yearly periods ended December 31 | |
| Comparative Results | |
| DWS Global Small Cap Growth VIP | | 1-Year | | | 3-Year | | | 5-Year | | | 10-Year | |
| Class A | Growth of $10,000 | | $ | 11,537 | | | $ | 13,164 | | | $ | 9,762 | | | $ | 28,317 | |
| Average annual total return | | | 15.37 | % | | | 9.60 | % | | | -0.48 | % | | | 10.97 | % |
| S&P Developed SmallCap Index | Growth of $10,000 | | $ | 11,805 | | | $ | 13,430 | | | $ | 10,534 | | | $ | 28,742 | |
| Average annual total return | | | 18.05 | % | | | 10.33 | % | | | 1.05 | % | | | 11.14 | % |
| DWS Global Small Cap Growth VIP | | 1-Year | | | 3-Year | | | 5-Year | | | 10-Year | |
| Class B | Growth of $10,000 | | $ | 11,501 | | | $ | 13,070 | | | $ | 9,618 | | | $ | 27,610 | |
| Average annual total return | | | 15.01 | % | | | 9.33 | % | | | -0.78 | % | | | 10.69 | % |
| S&P Developed SmallCap Index | Growth of $10,000 | | $ | 11,805 | | | $ | 13,430 | | | $ | 10,534 | | | $ | 28,742 | |
| Average annual total return | | | 18.05 | % | | | 10.33 | % | | | 1.05 | % | | | 11.14 | % |
The growth of $10,000 is cumulative.
Management Summary December 31, 2012 (Unaudited)
DWS Global Small Cap Growth VIP returned 15.37% in 2012 (Class A shares, unadjusted for contract charges), underperforming the 18.05% return of the S&P® Developed SmallCap Index.1
During the year, our stock selection had a negative impact on performance, owing to weak selection within the consumer discretionary, health care and technology sectors.2 Among the contribution of individual stocks, our most notable detractors were Universal Entertainment Corp. and Questcor Pharmaceuticals, Inc.3* On the plus side, we added value through our sector allocations — most notably our underweight positions in the materials and utilities sectors — as well as our positions in Pacira Pharmaceuticals, Inc., the Chinese real-estate company K Wah International Holdings Ltd. and the Irish gaming company Paddy Power PLC.4
In a sign that merger and acquisition (M&A) activity has returned to the markets, six Fund holdings were taken over at a premium during 2012. Among the stocks that were acquired were Ancestry.com, Inc.,* the on-line family history Web site that was acquired by a private equity fund, and FSI International, Inc.,* a semiconductor equipment company that was bought out by Tokyo Electron Ltd.* We expect that trends in merger and acquisition (M&A) activity will remain strong, as cash-rich corporations and private equity funds continue to seek attractively valued small-cap growth companies.
We continue to hold a positive outlook for the global equity market as we move into 2013, even though the debate about U.S. fiscal policy could lead to periodic volatility in the first half of the year. The economic cycle has shown signs of an upswing, and while we don't necessarily foresee strong corporate earnings for the market as a whole, we currently believe there are a number of attractive investment opportunities, especially for companies such as us, who focus on individual stock selection. In addition, small-cap valuations remained below historical averages outside of the United States, meaning that there could be room for additional upside despite the strong performance of the past year.
Given our favorable outlook for the economy and the global equity markets, during the second half of the year we gradually adopted a greater emphasis on cyclical (economically sensitive) stocks, such as those in the industrials sector, and we trimmed our positions in the more defensive areas of the market, such as health care. On a regional basis, we continued to find growth stocks in both Europe and Asia trading at more compelling valuations than those in the United States. As a result, we maintained overweights in both regions and held an underweight position in the U.S. market.
We currently continue to diversify between potentially steady, defensive growth stocks on one hand and higher-beta, faster-growth names on the other.5,6
Joseph Axtell, CFA
Portfolio Manager
The views expressed reflect those of the portfolio management team only through the end of the period of the report as stated on the cover. The management team's views are subject to change at any time based on market and other conditions and should not be construed as a recommendation. Past performance is no guarantee of future results. Current and future portfolio holdings are subject to risk.
1 The S&P® Developed SmallCap comprises the stocks representing the lowest 15% of float-adjusted market cap in each developed country. It Is a subset of the S&P® Global BMI, a comprehensive, rules-based index measuring global stock market performance.
2 The consumer discretionary sector represents industries that produce goods and services that are not necessities in everyday life.
3 Contribution incorporates both a stock's total return and its weighting in the Fund.
4 "Overweight" means the Fund holds a higher weighting in a given sector or security than the benchmark. "Underweight" means the Fund holds a lower weighting.
5 Beta measures a security's sensitivity to the movements of the fund's benchmark or the market as a whole. A beta of greater than one indicates more volatility than the benchmark or market, while a beta of less than one indicates less volatility.
6 Diversification neither assures a profit nor guarantees against loss.
* Not held in the portfolio as of December 31, 2012.
Portfolio Summary (Unaudited) Asset Allocation (As a % of Investment Portfolio excluding Securities Lending Collateral) | 12/31/12 | 12/31/11 |
| | | |
| Common Stocks | 99% | 99% |
| Cash Equivalents | 1% | 1% |
| | 100% | 100% |
Geographical Diversification (As a % of Investment Portfolio excluding Cash Equivalents and Securities Lending Collateral) | 12/31/12 | 12/31/11 |
| | | |
| United States | 42% | 45% |
| Continental Europe | 24% | 22% |
| Asia (excluding Japan) | 10% | 10% |
| United Kingdom | 9% | 11% |
| Japan | 8% | 7% |
| Canada | 3% | 1% |
| Latin America | 1% | 1% |
| Australia | 1% | 1% |
| Middle East | 1% | 1% |
| Other | 1% | 1% |
| | 100% | 100% |
Sector Diversification (As a % of Investment Portfolio excluding Cash Equivalents and Securities Lending Collateral) | 12/31/12 | 12/31/11 |
| | | |
| Industrials | 27% | 23% |
| Consumer Discretionary | 21% | 20% |
| Health Care | 14% | 20% |
| Financials | 13% | 10% |
| Information Technology | 9% | 12% |
| Energy | 7% | 8% |
| Consumer Staples | 6% | 5% |
| Materials | 3% | 2% |
| | 100% | 100% |
Portfolio holdings and characteristics are subject to change.
For more complete details about the Fund's investment portfolio, see page 6.
Following the Fund's fiscal first and third quarter-end, a complete portfolio holdings listing is filed with the SEC on Form N-Q. The form will be available on the SEC's Web site at www.sec.gov, and it also may be reviewed and copied at the SEC's Public Reference Room in Washington, D.C. Information on the operation of the SEC's Public Reference Room may be obtained by calling (800) SEC-0330. The Fund's portfolio holdings are also posted on www.dws-investments.com from time to time. Please see the Fund's current prospectus for more information.
Investment Portfolio December 31, 2012 | | | Shares | | | Value ($) | |
| | | | |
| Common Stocks 98.7% | |
| Australia 0.6% | |
| Austal Ltd.* | | | 306,363 | | | | 179,516 | |
| Sunshine Heart, Inc.* (a) | | | 86,380 | | | | 526,054 | |
| (Cost $1,189,853) | | | | 705,570 | |
| Austria 1.9% | |
| AMS AG | | | 5,734 | | | | 614,918 | |
| Andritz AG | | | 27,269 | | | | 1,751,984 | |
| (Cost $1,777,675) | | | | 2,366,902 | |
| Bermuda 1.3% | |
| Energy XXI (Bermuda) Ltd. (b) | | | 19,214 | | | | 618,499 | |
| Lazard Ltd. "A" (a) | | | 32,993 | | | | 984,511 | |
| (Cost $1,428,422) | | | | 1,603,010 | |
| Brazil 0.9% | |
| Fleury SA (Cost $1,184,833) | | | 102,307 | | | | 1,153,326 | |
| Canada 1.6% | |
| Americas Petrogas, Inc.* | | | 192,584 | | | | 580,830 | |
| Fortress Paper Ltd. "A"* | | | 19,448 | | | | 157,391 | |
| SunOpta, Inc.* | | | 222,575 | | | | 1,253,097 | |
| (Cost $2,836,422) | | | | 1,991,318 | |
| Channel Islands 0.8% | |
| Randgold Resources Ltd. (ADR) (Cost $600,244) | | | 10,103 | | | | 1,002,723 | |
| China 1.6% | |
| Charm Communications, Inc. (ADR) | | | 108,380 | | | | 437,855 | |
| Minth Group Ltd. | | | 1,391,554 | | | | 1,609,462 | |
| (Cost $1,809,876) | | | | 2,047,317 | |
| Cyprus 0.7% | |
| ProSafe SE (Cost $603,860) | | | 95,272 | | | | 819,398 | |
| Denmark 0.7% | |
| GN Store Nord AS (Cost $729,902) | | | 56,778 | | | | 832,845 | |
| France 1.2% | |
| Flamel Technologies SA (ADR)* | | | 161,320 | | | | 488,799 | |
| JC Decaux SA | | | 41,153 | | | | 993,183 | |
| (Cost $3,032,187) | | | | 1,481,982 | |
| Germany 5.0% | |
| Fresenius Medical Care AG & Co. KGaA | | | 24,102 | | | | 1,665,260 | |
| Gerresheimer AG* | | | 12,927 | | | | 684,380 | |
| M.A.X. Automation AG | | | 217,300 | | | | 1,105,279 | |
| Rational AG | | | 4,636 | | | | 1,335,161 | |
| United Internet AG (Registered) | | | 71,715 | | | | 1,547,968 | |
| (Cost $2,494,291) | | | | 6,338,048 | |
| Gibraltar 0.3% | |
| Bwin.Party Digital Entertainment PLC (Cost $864,797) | | | 209,531 | | | | 379,334 | |
| Hong Kong 3.7% | |
| K Wah International Holdings Ltd. | | | 3,860,033 | | | | 1,883,677 | |
| REXLot Holdings Ltd. | | | 20,422,633 | | | | 1,559,478 | |
| Techtronic Industries Co., Ltd. | | | 641,975 | | | | 1,232,177 | |
| (Cost $3,109,842) | | | | 4,675,332 | |
| | | Shares | | | Value ($) | |
| | | | | | | | | |
| Ireland 4.6% | |
| C&C Group PLC (c) | | | 120,694 | | | | 743,798 | |
| C&C Group PLC (c) | | | 185,737 | | | | 1,142,546 | |
| Paddy Power PLC | | | 29,212 | | | | 2,407,796 | |
| Ryanair Holdings PLC (c) | | | 2,200 | | | | 13,401 | |
| Ryanair Holdings PLC (c) | | | 245,507 | | | | 1,529,533 | |
| (Cost $2,438,344) | | | | 5,837,074 | |
| Israel 0.7% | |
| Allot Communications Ltd.* (a) | | | 11,823 | | | | 210,686 | |
| EZchip Semiconductor Ltd.* (a) (b) | | | 18,342 | | | | 606,570 | |
| (Cost $925,030) | | | | 817,256 | |
| Italy 0.7% | |
| Prysmian SpA (Cost $776,260) | | | 43,156 | | | | 873,137 | |
| Japan 8.4% | |
| Avex Group Holdings, Inc. | | | 28,410 | | | | 570,711 | |
| Hajime Construction Co., Ltd. | | | 38,329 | | | | 1,420,238 | |
| Japan Exchange Group, Inc. (b) | | | 15,200 | | | | 758,791 | |
| Kusuri No Aoki Co., Ltd. (b) | | | 22,815 | | | | 1,230,769 | |
| Medical System Network Co., Ltd. | | | 117,061 | | | | 540,887 | |
| MISUMI Group, Inc. | | | 46,469 | | | | 1,261,084 | |
| Nippon Seiki Co., Ltd. | | | 100,890 | | | | 1,083,765 | |
| OSG Corp. | | | 66,786 | | | | 927,194 | |
| Sumikin Bussan Corp. | | | 407,782 | | | | 1,054,645 | |
| United Arrows Ltd. | | | 43,506 | | | | 999,675 | |
| Universal Entertainment Corp. | | | 40,910 | | | | 701,733 | |
| (Cost $9,853,142) | | | | 10,549,492 | |
| Korea 1.4% | |
| DGB Financial Group, Inc. | | | 87,306 | | | | 1,191,234 | |
| Interojo Co., Ltd.* | | | 46,204 | | | | 623,058 | |
| (Cost $1,895,361) | | | | 1,814,292 | |
| Luxembourg 0.8% | |
| L'Occitane International SA (Cost $588,634) | | | 300,039 | | | | 954,090 | |
| Malaysia 0.8% | |
| Hartalega Holdings Bhd. (Cost $595,736) | | | 680,121 | | | | 1,052,866 | |
| Netherlands 4.1% | |
| Brunel International NV | | | 22,825 | | | | 1,104,648 | |
| Chicago Bridge & Iron Co. NV (d) | | | 20,728 | | | | 960,743 | |
| Koninklijke Vopak NV | | | 26,234 | | | | 1,849,751 | |
| SBM Offshore NV* | | | 84,575 | | | | 1,198,719 | |
| (Cost $2,353,918) | | | | 5,113,861 | |
| Philippines 1.2% | |
| Alliance Global Group, Inc. (Cost $950,628) | | | 3,675,271 | | | | 1,502,012 | |
| Singapore 1.6% | |
| Lian Beng Group Ltd. | | | 1,915,990 | | | | 640,849 | |
| UOB-Kay Hian Holdings Ltd. | | | 220,360 | | | | 294,612 | |
| Yongnam Holdings Ltd. | | | 5,381,892 | | | | 1,058,976 | |
| (Cost $1,997,189) | | | | 1,994,437 | |
| Switzerland 2.5% | |
| Dufry AG (Registered)* | | | 10,330 | | | | 1,366,898 | |
| Partners Group Holding AG | | | 7,929 | | | | 1,831,373 | |
| (Cost $1,689,711) | | | | 3,198,271 | |
| | | Shares | | | Value ($) | |
| | | | | | | | | |
| United Kingdom 9.3% | |
| ARM Holdings PLC | | | 70,218 | | | | 897,872 | |
| Ashmore Group PLC | | | 234,071 | | | | 1,353,473 | |
| Babcock International Group PLC | | | 153,039 | | | | 2,374,972 | |
| Burberry Group PLC | | | 43,776 | | | | 896,294 | |
| Domino's Pizza Group PLC | | | 124,098 | | | | 1,015,906 | |
| Filtrona PLC | | | 37,577 | | | | 338,986 | |
| Hargreaves Lansdown PLC | | | 82,882 | | | | 921,000 | |
| IG Group Holdings PLC | | | 128,107 | | | | 937,955 | |
| John Wood Group PLC | | | 87,220 | | | | 1,030,562 | |
| Rotork PLC | | | 38,802 | | | | 1,609,159 | |
| Serco Group PLC | | | 37,911 | | | | 326,380 | |
| (Cost $6,015,630) | | | | 11,702,559 | |
| United States 42.3% | |
| Advance Auto Parts, Inc. | | | 12,086 | | | | 874,422 | |
| Aecom Technology Corp.* | | | 34,480 | | | | 820,624 | |
| Aeropostale, Inc.* | | | 51,413 | | | | 668,883 | |
| Affiliated Managers Group, Inc.* | | | 9,514 | | | | 1,238,247 | |
| Altra Holdings, Inc. | | | 29,279 | | | | 645,602 | |
| Applied Industrial Technologies, Inc. | | | 22,210 | | | | 933,042 | |
| Approach Resources, Inc.* (b) | | | 24,637 | | | | 616,171 | |
| Ascena Retail Group, Inc.* | | | 31,888 | | | | 589,609 | |
| athenahealth, Inc.* (b) | | | 9,356 | | | | 687,198 | |
| BE Aerospace, Inc.* | | | 38,888 | | | | 1,921,067 | |
| BorgWarner, Inc.* | | | 12,633 | | | | 904,776 | |
| Cardtronics, Inc.* | | | 26,700 | | | | 633,858 | |
| Catamaran Corp.* | | | 25,195 | | | | 1,186,937 | |
| Centene Corp.* | | | 16,903 | | | | 693,023 | |
| Cognex Corp. | | | 30,625 | | | | 1,127,613 | |
| CONMED Corp. | | | 28,686 | | | | 801,774 | |
| Deckers Outdoor Corp.* (b) | | | 17,478 | | | | 703,839 | |
| Derma Sciences, Inc.* (b) | | | 59,900 | | | | 665,489 | |
| Dresser-Rand Group, Inc.* | | | 26,444 | | | | 1,484,566 | |
| Green Mountain Coffee Roasters, Inc.* (b) | | | 33,549 | | | | 1,387,587 | |
| Guess?, Inc. | | | 29,951 | | | | 734,998 | |
| Hain Celestial Group, Inc.* | | | 10,432 | | | | 565,623 | |
| Harris Corp. (b) | | | 22,354 | | | | 1,094,452 | |
| Haynes International, Inc. | | | 15,606 | | | | 809,483 | |
| HeartWare International, Inc.* (b) | | | 9,729 | | | | 816,750 | |
| Hi-Tech Pharmacal Co., Inc. | | | 27,139 | | | | 949,322 | |
| Informatica Corp.* | | | 20,577 | | | | 623,895 | |
| Jarden Corp. | | | 25,416 | | | | 1,314,007 | |
| Jefferies Group, Inc. | | | 55,023 | | | | 1,021,777 | |
| Joy Global, Inc. | | | 8,798 | | | | 561,136 | |
| Manitowoc Co., Inc. | | | 90,535 | | | | 1,419,589 | |
| MICROS Systems, Inc.* | | | 11,031 | | | | 468,156 | |
| NIC, Inc. | | | 65,820 | | | | 1,075,499 | |
| NxStage Medical, Inc.* | | | 63,679 | | | | 716,389 | |
| | | Shares | | | Value ($) | |
| | | | | | | | | |
| Ocwen Financial Corp.* | | | 25,609 | | | | 885,815 | |
| Oil States International, Inc.* | | | 15,628 | | | | 1,118,027 | |
| Pacira Pharmaceuticals, Inc.* (b) | | | 119,140 | | | | 2,081,376 | |
| Parametric Technology Corp.* | | | 30,835 | | | | 694,096 | |
| Roadrunner Transportation Systems, Inc.* | | | 18,486 | | | | 335,336 | |
| Rockwood Holdings, Inc. | | | 15,311 | | | | 757,282 | |
| Rosetta Resources, Inc.* | | | 13,680 | | | | 620,525 | |
| Sauer-Danfoss, Inc. | | | 15,759 | | | | 841,058 | |
| Schweitzer-Mauduit International, Inc. | | | 33,098 | | | | 1,291,815 | |
| Signature Bank* | | | 16,073 | | | | 1,146,648 | |
| Stericycle, Inc.* | | | 6,734 | | | | 628,080 | |
| Tenneco, Inc.* | | | 26,267 | | | | 922,234 | |
| Thoratec Corp.* | | | 41,168 | | | | 1,544,623 | |
| TIBCO Software, Inc.* | | | 21,027 | | | | 462,804 | |
| TiVo, Inc.* | | | 72,127 | | | | 888,605 | |
| TreeHouse Foods, Inc.* | | | 19,325 | | | | 1,007,412 | |
| United Rentals, Inc.* | | | 20,772 | | | | 945,541 | |
| Urban Outfitters, Inc.* | | | 33,265 | | | | 1,309,310 | |
| VeriFone Systems, Inc.* | | | 19,782 | | | | 587,130 | |
| WABCO Holdings, Inc.* | | | 20,069 | | | | 1,308,298 | |
| Waddell & Reed Financial, Inc. "A" | | | 33,493 | | | | 1,166,226 | |
| WageWorks, Inc.* | | | 48,650 | | | | 865,970 | |
| Zions Bancorp. (b) | | | 43,060 | | | | 921,484 | |
| (Cost $39,674,268) | | | | 53,085,098 | |
Total Common Stocks (Cost $91,416,055) | | | | 123,891,550 | |
| | |
| Warrants 0.0% | |
| Malaysia | |
| Hartalega Holdings Bhd., Expiration Date 5/29/2015* (Cost $0) | | | 68,733 | | | | 16,152 | |
| | |
| Securities Lending Collateral 8.5% | |
| Daily Assets Fund Institutional, 0.20% (e) (f) (Cost $10,651,154) | | | 10,651,154 | | | | 10,651,154 | |
| | |
| Cash Equivalents 1.3% | |
| Central Cash Management Fund, 0.15% (e) (Cost $1,607,690) | | | 1,607,690 | | | | 1,607,690 | |
| | | % of Net Assets | | | Value ($) | |
| | | | |
Total Investment Portfolio (Cost $103,674,899)† | | | 108.5 | | | | 136,166,546 | |
| Other Assets and Liabilities, Net | | | (8.5 | ) | | | (10,635,680 | ) |
| Net Assets | | | 100.0 | | | | 125,530,866 | |
* Non-income producing security.
† The cost for federal income tax purposes was $104,250,095. At December 31, 2012, net unrealized appreciation for all securities based on tax cost was $31,916,451. This consisted of aggregate gross unrealized appreciation for all securities in which there was an excess of value over tax cost of $39,670,769 and aggregate gross unrealized depreciation for all securities in which there was an excess of tax cost over value of $7,754,318.
(a) Listed on the NASDAQ Stock Market, Inc.
(b) All or a portion of these securities were on loan (see Notes to Financial Statements). The value of all securities loaned at December 31, 2012 amounted to $9,975,959, which is 7.9% of net assets.
(c) Securities with the same description are the same corporate entity but trade on different stock exchanges.
(d) Listed on the New York Stock Exchange.
(e) Affiliated fund managed by Deutsche Investment Management Americas Inc. The rate shown is the annualized seven-day yield at period end.
(f) Represents collateral held in connection with securities lending. Income earned by the Fund is net of borrower rebates.
ADR: American Depositary Receipt
Fair Value Measurements
Various inputs are used in determining the value of the Fund's investments. These inputs are summarized in three broad levels. Level 1 includes quoted prices in active markets for identical securities. Level 2 includes other significant observable inputs (including quoted prices for similar securities, interest rates, prepayment speeds, and credit risk). Level 3 includes significant unobservable inputs (including the Fund's own assumptions in determining the fair value of investments). The inputs or methodology used for valuing securities are not necessarily an indication of the risk associated with investing in those securities.
The following is a summary of the inputs used as of December 31, 2012 in valuing the Fund's investments. For information on the Fund's policy regarding the valuation of investments, please refer to the Security Valuation section of Note A in the accompanying Notes to Financial Statements.
| Assets | | Level 1 | | | Level 2 | | | Level 3 | | | Total | |
| | |
| Common Stocks & Warrants | |
| Australia | | $ | 526,054 | | | $ | 179,516 | | | $ | — | | | $ | 705,570 | |
| Austria | | | — | | | | 2,366,902 | | | | — | | | | 2,366,902 | |
| Bermuda | | | 1,603,010 | | | | — | | | | — | | | | 1,603,010 | |
| Brazil | | | 1,153,326 | | | | — | | | | — | | | | 1,153,326 | |
| Canada | | | 1,991,318 | | | | — | | | | — | | | | 1,991,318 | |
| Channel Islands | | | 1,002,723 | | | | — | | | | — | | | | 1,002,723 | |
| China | | | 437,855 | | | | 1,609,462 | | | | — | | | | 2,047,317 | |
| Cyprus | | | — | | | | 819,398 | | | | — | | | | 819,398 | |
| Denmark | | | — | | | | 832,845 | | | | — | | | | 832,845 | |
| France | | | 488,799 | | | | 993,183 | | | | — | | | | 1,481,982 | |
| Germany | | | — | | | | 6,338,048 | | | | — | | | | 6,338,048 | |
| Gibraltar | | | — | | | | 379,334 | | | | — | | | | 379,334 | |
| Hong Kong | | | — | | | | 4,675,332 | | | | — | | | | 4,675,332 | |
| Ireland | | | — | | | | 5,837,074 | | | | — | | | | 5,837,074 | |
| Israel | | | 817,256 | | | | — | | | | — | | | | 817,256 | |
| Italy | | | — | | | | 873,137 | | | | — | | | | 873,137 | |
| Japan | | | — | | | | 10,549,492 | | | | — | | | | 10,549,492 | |
| Korea | | | — | | | | 1,814,292 | | | | — | | | | 1,814,292 | |
| Luxembourg | | | — | | | | 954,090 | | | | — | | | | 954,090 | |
| Malaysia | | | — | | | | 1,052,866 | | | | 16,152 | | | | 1,069,018 | |
| Netherlands | | | 960,743 | | | | 4,153,118 | | | | — | | | | 5,113,861 | |
| Philippines | | | — | | | | 1,502,012 | | | | — | | | | 1,502,012 | |
| Singapore | | | — | | | | 1,994,437 | | | | — | | | | 1,994,437 | |
| Switzerland | | | — | | | | 3,198,271 | | | | — | | | | 3,198,271 | |
| United Kingdom | | | — | | | | 11,702,559 | | | | — | | | | 11,702,559 | |
| United States | | | 53,085,098 | | | | — | | | | — | | | | 53,085,098 | |
| Short-Term Investments (g) | | | 12,258,844 | | | | — | | | | — | | | | 12,258,844 | |
| Total | | $ | 74,325,026 | | | $ | 61,825,368 | | | $ | 16,152 | | | $ | 136,166,546 | |
There have been no transfers between fair value measurement levels during the year ended December 31, 2012.
(g) See Investment Portfolio for additional detailed categorizations.
The accompanying notes are an integral part of the financial statements.
Statement of Assets and Liabilities | as of December 31, 2012 | |
| Assets | |
Investments: Investments in non-affiliated securities, at value (cost $91,416,055) — including $9,975,959 of securities loaned | | $ | 123,907,702 | |
| Investment in Daily Assets Fund Institutional (cost $10,651,154)* | | | 10,651,154 | |
| Investment in Central Cash Management Fund (cost $1,607,690) | | | 1,607,690 | |
| Total investments in securities, at value (cost $103,674,899) | | | 136,166,546 | |
| Cash | | | 5,141 | |
| Foreign currency, at value (cost $259,965) | | | 262,502 | |
| Receivable for investments sold | | | 58,664 | |
| Receivable for Fund shares sold | | | 1,517 | |
| Dividends receivable | | | 40,119 | |
| Interest receivable | | | 15,453 | |
| Foreign taxes recoverable | | | 66,093 | |
| Due from Advisor | | | 888 | |
| Other assets | | | 2,473 | |
| Total assets | | | 136,619,396 | |
| Liabilities | |
| Payable upon return of securities loaned | | | 10,651,154 | |
| Payable for Fund shares redeemed | | | 283,446 | |
| Accrued management fee | | | 79,374 | |
| Accrued Trustees' fees | | | 2,243 | |
| Other accrued expenses and payables | | | 72,313 | |
| Total liabilities | | | 11,088,530 | |
| Net assets, at value | | $ | 125,530,866 | |
| Net Assets Consist of | |
| Undistributed net investment income | | | 838,969 | |
Net unrealized appreciation (depreciation) on: Investments | | | 32,491,647 | |
| Foreign currency | | | 5,338 | |
| Accumulated net realized gain (loss) | | | 8,883,764 | |
| Paid-in capital | | | 83,311,148 | |
| Net assets, at value | | $ | 125,530,866 | |
Class A Net Asset Value, offering and redemption price per share ($123,683,637 ÷ 8,977,791 outstanding shares of beneficial interest, $.01 par value, unlimited number of shares authorized) | | $ | 13.78 | |
Class B Net Asset Value, offering and redemption price per share ($1,847,229 ÷ 136,607 outstanding shares of beneficial interest, $.01 par value, unlimited number of shares authorized) | | $ | 13.52 | |
* Represents collateral on securities loaned.
The accompanying notes are an integral part of the financial statements.
Statement of Operations
| for the year ended December 31, 2012 | |
| Investment Income | |
Income: Dividends (net of foreign taxes withheld of $80,019) | | $ | 1,981,254 | |
| Income distributions — Central Cash Management Fund | | | 3,239 | |
| Securities lending income, including income from Daily Assets Fund Institutional, net of borrower rebates | | | 110,747 | |
| Total income | | | 2,095,240 | |
Expenses: Management fee | | | 1,119,237 | |
| Administration fee | | | 125,757 | |
| Services to shareholders | | | 2,617 | |
| Distribution service fee (Class B) | | | 4,723 | |
| Record keeping fee (Class B) | | | 1,170 | |
| Custodian fee | | | 28,448 | |
| Professional fees | | | 53,322 | |
| Reports to shareholders | | | 30,467 | |
| Trustees' fees and expenses | | | 6,811 | |
| Other | | | 26,213 | |
| Total expenses before expense reductions | | | 1,398,765 | |
| Expense reductions | | | (164,156 | ) |
| Total expenses after expense reductions | | | 1,234,609 | |
| Net investment income (loss) | | | 860,631 | |
| Realized and Unrealized Gain (Loss) | |
Net realized gain (loss) from: Investments | | | 9,556,971 | |
| Foreign currency | | | (17,063 | ) |
| | | | 9,539,908 | |
Change in net unrealized appreciation (depreciation) on: Investments | | | 7,636,799 | |
| Foreign currency | | | 21,056 | |
| | | | 7,657,855 | |
| Net gain (loss) | | | 17,197,763 | |
| Net increase (decrease) in net assets resulting from operations | | $ | 18,058,394 | |
The accompanying notes are an integral part of the financial statements.
Statement of Changes in Net Assets | | | Years Ended December 31, | |
| Increase (Decrease) in Net Assets | | 2012 | | | 2011 | |
Operations: Net investment income (loss) | | $ | 860,631 | | | $ | 834,776 | |
| Net realized gain (loss) | | | 9,539,908 | | | | 18,183,138 | |
| Change in net unrealized appreciation (depreciation) | | | 7,657,855 | | | | (33,281,372 | ) |
| Net increase (decrease) in net assets resulting from operations | | | 18,058,394 | | | | (14,263,458 | ) |
Distributions to shareholders from: Net investment income: Class A | | | (847,848 | ) | | | (2,513,532 | ) |
| Class B | | | (8,192 | ) | | | (31,935 | ) |
Net realized gains: Class A | | | (6,623,008 | ) | | | — | |
| Class B | | | (104,904 | ) | | | — | |
| Total distributions | | | (7,583,952 | ) | | | (2,545,467 | ) |
Fund share transactions: Class A Proceeds from shares sold | | | 3,854,918 | | | | 8,812,558 | |
| Reinvestment of distributions | | | 7,470,856 | | | | 2,513,532 | |
| Payments for shares redeemed | | | (21,145,077 | ) | | | (29,308,758 | ) |
| Net increase (decrease) in net assets from Class A share transactions | | | (9,819,303 | ) | | | (17,982,668 | ) |
Class B Proceeds from shares sold | | | 79,415 | | | | 118,378 | |
| Reinvestment of distributions | | | 113,096 | | | | 31,935 | |
| Payments for redeemed | | | (365,396 | ) | | | (327,414 | ) |
| Net increase (decrease) in net assets from Class B share transactions | | | (172,885 | ) | | | (177,101 | ) |
| Increase (decrease) in net assets | | | 482,254 | | | | (34,968,694 | ) |
| Net assets at beginning of period | | | 125,048,612 | | | | 160,017,306 | |
| Net assets at end of period (including undistributed net investment income of $838,969 and $821,499, respectively) | | $ | 125,530,866 | | | $ | 125,048,612 | |
| Other Information | |
Class A Shares outstanding at beginning of period | | | 9,718,286 | | | | 11,043,518 | |
| Shares sold | | | 294,057 | | | | 635,010 | |
| Shares issued to shareholders in reinvestment of distributions | | | 561,297 | | | | 165,582 | |
| Shares redeemed | | | (1,595,849 | ) | | | (2,125,824 | ) |
| Net increase (decrease) in Class A shares | | | (740,495 | ) | | | (1,325,232 | ) |
| Shares outstanding at end of period | | | 8,977,791 | | | | 9,718,286 | |
Class B Shares outstanding at beginning of period | | | 150,330 | | | | 163,772 | |
| Shares sold | | | 6,256 | | | | 8,664 | |
| Shares issued to shareholders in reinvestment of distributions | | | 8,640 | | | | 2,139 | |
| Shares redeemed | | | (28,619 | ) | | | (24,245 | ) |
| Net increase (decrease) in Class B shares | | | (13,723 | ) | | | (13,442 | ) |
| Shares outstanding at end of period | | | 136,607 | | | | 150,330 | |
The accompanying notes are an integral part of the financial statements.
| | | Years Ended December 31, | |
| Class A | | | 2012 | | | 2011 | | | 2010 | | | 2009 | | | 2008 | |
| Selected Per Share Data | |
| Net asset value, beginning of period | | $ | 12.67 | | | $ | 14.28 | | | $ | 11.32 | | | $ | 7.79 | | | $ | 18.28 | |
Income (loss) from investment operations: Net investment income (loss)a | | | .09 | | | | .08 | | | | .05 | | | | .04 | | | | .20 | c |
| Net realized and unrealized gain (loss) | | | 1.83 | | | | (1.45 | ) | | | 2.96 | | | | 3.64 | | | | (8.18 | ) |
| Total from investment operations | | | 1.92 | | | | (1.37 | ) | | | 3.01 | | | | 3.68 | | | | (7.98 | ) |
Less distributions from: Net investment income | | | (.09 | ) | | | (.24 | ) | | | (.05 | ) | | | (.15 | ) | | | (.04 | ) |
| Net realized gains | | | (.72 | ) | | | — | | | | — | | | | — | | | | (2.47 | ) |
| Total distributions | | | (.81 | ) | | | (.24 | ) | | | (.05 | ) | | | (.15 | ) | | | (2.51 | ) |
| Net asset value, end of period | | $ | 13.78 | | | $ | 12.67 | | | $ | 14.28 | | | $ | 11.32 | | | $ | 7.79 | |
Total Return (%)b | | | 15.37 | | | | (9.90 | ) | | | 26.64 | | | | 48.20 | | | | (49.96 | ) |
| Ratios to Average Net Assets and Supplemental Data | |
| Net assets, end of period ($ millions) | | | 124 | | | | 123 | | | | 158 | | | | 139 | | | | 117 | |
| Ratio of expenses before expense reductions (%) | | | 1.11 | | | | 1.12 | | | | 1.12 | | | | 1.11 | | | | 1.11 | |
| Ratio of expenses after expense reductions (%) | | | .98 | | | | 1.00 | | | | 1.04 | | | | .99 | | | | .99 | |
| Ratio of net investment income (loss) (%) | | | .69 | | | | .57 | | | | .42 | | | | .47 | | | | 1.53 | c |
| Portfolio turnover rate (%) | | | 36 | | | | 31 | | | | 39 | | | | 53 | | | | 21 | |
a Based on average shares outstanding during the period. b Total return would have been lower had certain expenses not been reduced. c Net investment income per share and the ratio of net investment income include non-recurring dividend income amounting to $0.05 per share and 0.37% of average daily net assets for the year ended December 31, 2008. | |
| | | Years Ended December 31, | |
| Class B | | | 2012 | | | 2011 | | | 2010 | | | 2009 | | | 2008 | |
| Selected Per Share Data | |
| Net asset value, beginning of period | | $ | 12.45 | | | $ | 14.03 | | | $ | 11.11 | | | $ | 7.65 | | | $ | 18.03 | |
Income (loss) from investment operations: Net investment income (loss)a | | | .06 | | | | .05 | | | | .03 | | | | .02 | | | | .16 | c |
| Net realized and unrealized gain (loss) | | | 1.79 | | | | (1.43 | ) | | | 2.90 | | | | 3.57 | | | | (8.07 | ) |
| Total from investment operations | | | 1.85 | | | | (1.38 | ) | | | 2.93 | | | | 3.59 | | | | (7.91 | ) |
Less distributions from: Net investment income | | | (.06 | ) | | | (.20 | ) | | | (.01 | ) | | | (.13 | ) | | | — | |
| Net realized gains | | | (.72 | ) | | | — | | | | — | | | | — | | | | (2.47 | ) |
| Total distributions | | | (.78 | ) | | | (.20 | ) | | | (.01 | ) | | | (.13 | ) | | | (2.47 | ) |
| Net asset value, end of period | | $ | 13.52 | | | $ | 12.45 | | | $ | 14.03 | | | $ | 11.11 | | | $ | 7.65 | |
Total Return (%)b | | | 15.01 | | | | (10.08 | ) | | | 26.38 | | | | 47.66 | | | | (50.16 | ) |
| Ratios to Average Net Assets and Supplemental Data | |
| Net assets, end of period ($ millions) | | | 2 | | | | 2 | | | | 2 | | | | 7 | | | | 5 | |
| Ratio of expenses before expense reductions (%) | | | 1.43 | | | | 1.38 | | | | 1.34 | | | | 1.42 | | | | 1.42 | |
| Ratio of expenses after expense reductions (%) | | | 1.23 | | | | 1.25 | | | | 1.26 | | | | 1.30 | | | | 1.30 | |
| Ratio of net investment income (loss) (%) | | | .44 | | | | .32 | | | | .20 | | | | .16 | | | | 1.21 | c |
| Portfolio turnover rate (%) | | | 36 | | | | 31 | | | | 39 | | | | 53 | | | | 21 | |
a Based on average shares outstanding during the period. b Total return would have been lower had certain expenses not been reduced. c Net investment income per share and the ratio of net investment income include non-recurring dividend income amounting to $0.05 per share and 0.37% of average daily net assets for the year ended December 31, 2008. | |
Notes to Financial Statements
A. Organization and Significant Accounting Policies
DWS Variable Series I (the "Series") is registered under the Investment Company Act of 1940, as amended (the "1940 Act"), as an open-end, registered management investment company organized as a Massachusetts business trust. The Series consists of five diversified funds: DWS Bond VIP, DWS Core Equity VIP (formerly DWS Growth & Income VIP), DWS Capital Growth VIP, DWS Global Small Cap Growth VIP and DWS International VIP (individually or collectively hereinafter referred to as a "Fund" or the "Funds"). These financial statements report on DWS Global Small Cap Growth VIP. The Series is intended to be the underlying investment vehicle for variable annuity contracts and variable life insurance policies to be offered by the separate accounts of certain life insurance companies ("Participating Insurance Companies").
Multiple Classes of Shares of Beneficial Interest. The Fund offers two classes of shares (Class A shares and Class B shares). Class B shares are subject to Rule 12b-1 distribution fees under the 1940 Act and recordkeeping fees equal to an annual rate of 0.25% and up to 0.15%, respectively, of the average daily net assets of the Class B shares of the Fund. Class A shares are not subject to such fees.
Investment income, realized and unrealized gains and losses, and certain fund-level expenses and expense reductions, if any, are borne pro rata on the basis of relative net assets by the holders of all classes of shares, except that each class bears certain expenses unique to that class (including the applicable 12b-1 distribution fees). Differences in class-level expenses may result in payment of different per share dividends by class. All shares have equal rights with respect to voting subject to class-specific arrangements.
The Fund's financial statements are prepared in accordance with accounting principles generally accepted in the United States of America, which require the use of management estimates. Actual results could differ from those estimates. The policies described below are followed consistently by the Fund in the preparation of its financial statements.
Security Valuation. Investments are stated at value determined as of the close of regular trading on the New York Stock Exchange on each day the exchange is open for trading.
Various inputs are used in determining the value of the Fund's investments. These inputs are summarized in three broad levels. Level 1 includes quoted prices in active markets for identical securities. Level 2 includes other significant observable inputs (including quoted prices for similar securities, interest rates, prepayment speeds, and credit risk). Level 3 includes significant unobservable inputs (including the Fund's own assumptions in determining the fair value of investments). The inputs or methodology used for valuing securities are not necessarily an indication of the risk associated with investing in those securities.
Equity securities are valued at the most recent sale price or official closing price reported on the exchange (U.S. or foreign) or over-the-counter market on which they trade and are categorized as Level 1 securities. Securities for which no sales are reported are valued at the calculated mean between the most recent bid and asked quotations on the relevant market or, if a mean cannot be determined, at the most recent bid quotation. For certain international equity securities, in order to adjust for events which may occur between the close of the foreign exchanges and the close of the New York Stock Exchange, a fair valuation model may be used. This fair valuation model takes into account comparisons to the valuation of American Depository Receipts (ADRs), exchange-traded funds, futures contracts and certain indices and these securities are categorized as Level 2.
Investments in open-end investment companies are valued at their net asset value each business day and are categorized as Level 1.
Securities and other assets for which market quotations are not readily available or for which the above valuation procedures are deemed not to reflect fair value are valued in a manner that is intended to reflect their fair value as determined in accordance with procedures approved by the Trustees and are generally categorized as Level 3. In accordance with the Fund's valuation procedures, factors used in determining value may include, but are not limited to, the type of the security; the size of the holding; the initial cost of the security; the existence of any contractual restrictions on the security's disposition; the price and extent of public trading in similar securities of the issuer or of comparable companies; quotations or evaluated prices from broker-dealers and/or pricing services; information obtained from the issuer, analysts, and/or the appropriate stock exchange (for exchange-traded securities); an analysis of the company's or issuer's financial statements; an evaluation of the forces that influence the issuer and the market(s) in which the security is purchased and sold and with respect to debt securities; the maturity, coupon, creditworthiness, currency denomination and the movement of the market in which the security is normally traded. The value determined under these procedures may differ from published values for the same securities.
Disclosure about the classification of fair value measurements is included in a table following the Fund's Investment Portfolio.
New Accounting Pronouncement. In January 2013, Accounting Standard Update 2013-01 (ASU 2013-01), Clarifying the Scope of Disclosures about Offsetting Assets and Liabilities, replaced Accounting Standards Update 2011-11 (ASU 2011-11), Disclosures about Offsetting Assets and Liabilities. ASU 2013-01 is effective for fiscal years beginning on or after January 1, 2013, and interim periods within those annual periods. ASU 2011-11 was intended to enhance disclosure requirements on the offsetting of financial assets and liabilities. The ASU 2013-01 limits the scope of the new balance sheet offsetting disclosures to derivatives, repurchase agreements, and securities lending transactions to the extent that they are (1) offset in the financial statements or (2) subject to an enforceable master netting arrangement or similar agreement. Management is currently evaluating the application of ASU 2013-01 and its impact, if any, on the Fund's financial statements.
Securities Lending. The Fund lends securities to certain financial institutions. The Fund retains beneficial ownership of the securities it has loaned and continues to receive interest and dividends paid by the issuer of securities and to participate in any changes in their market value. The Fund requires the borrowers of the securities to maintain collateral with the Fund consisting of either cash or liquid, unencumbered assets having a value at least equal to the value of the securities loaned. When the collateral falls below specified amounts, the lending agent will use its best effort to obtain additional collateral on the next business day to meet required amounts under the security lending agreement. The Fund may invest the cash collateral into a joint trading account in an affiliated money market fund pursuant to Exemptive Orders issued by the SEC. The Fund receives compensation for lending its securities either in the form of fees or by earning interest on invested cash collateral net of borrower rebates and fees paid to a lending agent. Either the Fund or the borrower may terminate the loan. There may be risks of delay and costs in recovery of securities or even loss of rights in the collateral should the borrower of the securities fail financially. The Fund is also subject to all investment risks associated with the reinvestment of any cash collateral received, including, but not limited to, interest rate, credit and liquidity risk associated with such investments.
Foreign Currency Translations. The books and records of the Fund are maintained in U.S. dollars. Investment securities and other assets and liabilities denominated in a foreign currency are translated into U.S. dollars at the prevailing exchange rates at period end. Purchases and sales of investment securities, income and expenses are translated into U.S. dollars at the prevailing exchange rates on the respective dates of the transactions.
Net realized and unrealized gains and losses on foreign currency transactions represent net gains and losses between trade and settlement dates on securities transactions, the acquisition and disposition of foreign currencies, and the difference between the amount of net investment income accrued and the U.S. dollar amount actually received. That portion of both realized and unrealized gains and losses on investments that results from fluctuations in foreign currency exchange rates is not separately disclosed but is included with net realized and unrealized gain/appreciation and loss/depreciation on investments.
Taxes. The Fund is treated as a separate taxpayer as provided for in the Internal Revenue Code, as amended. It is the Fund's policy to comply with the requirements of the Internal Revenue Code, as amended, which are applicable to regulated investment companies, and to distribute all of its taxable income to the separate accounts of the Participating Insurance Companies which hold its shares.
Additionally, the Fund may be subject to taxes imposed by the governments of countries in which it invests and are generally based on income and/or capital gains earned or repatriated. Estimated tax liabilities on certain foreign securities are recorded on an accrual basis and are reflected as components of interest income or net change in unrealized gain/loss on investments. Tax liabilities realized as a result of security sales are reflected as a component of net realized gain/loss on investments.
Under the Regulated Investment Company Modernization Act of 2010, net capital losses incurred post-enactment may be carried forward indefinitely, and their character is retained as short-term and/or long-term. Previously, net capital losses were carried forward for eight years and treated as short-term losses. As a transition rule, the Act requires that post-enactment net capital losses be used before pre-enactment net capital losses.
The Fund has reviewed the tax positions for the open tax years as of December 31, 2012 and has determined that no provision for income tax is required in the Fund's financial statements. The Fund's federal tax returns for the prior three fiscal years remain open subject to examination by the Internal Revenue Service.
Distribution of Income and Gains. The Fund will declare and distribute dividends from its net investment income, if any, annually, although additional distributions may be made if necessary. Net realized gains from investment transactions, in excess of available capital loss carryforwards, would be taxable to the Fund if not distributed, and, therefore, will be distributed to shareholders at least annually.
The timing and characterization of certain income and capital gain distributions are determined annually in accordance with federal tax regulations which may differ from accounting principles generally accepted in the United States of America. These differences primarily relate to investments in foreign denominated investments, passive foreign investment companies and certain securities sold at a loss. As a result, net investment income (loss) and net realized gain (loss) on investment transactions for a reporting period may differ significantly from distributions during such period. Accordingly, the Fund may periodically make reclassifications among certain of its capital accounts without impacting the net asset value of the Fund.
At December 31, 2012, the Fund's components of distributable earnings (accumulated losses) on a tax basis are as follows:
| Undistributed ordinary income* | | $ | 838,969 | |
| Undistributed long-term capital gains | | $ | 9,458,962 | |
| Net unrealized appreciation (depreciation) on investments | | $ | 31,916,451 | |
In addition, the tax character of distributions paid to shareholders by the Fund is summarized as follows:
| | | Years Ended December 31, | |
| | | 2012 | | | 2011 | |
| Distributions from ordinary Income* | | $ | 856,040 | | | $ | 2,545,467 | |
| Distributions from long-term capital gains | | $ | 6,727,912 | | | $ | — | |
* For tax purposes, short-term capital gain distributions are considered ordinary income distributions.
Expenses. Expenses of the Series arising in connection with a specific Fund are allocated to that Fund. Other Series expenses which cannot be directly attributed to a Fund are apportioned among the Funds in the Series based upon the relative net assets or other appropriate measures.
Contingencies. In the normal course of business, the Fund may enter into contracts with service providers that contain general indemnification clauses. The Fund's maximum exposure under these arrangements is unknown as this would involve future claims that may be made against the Fund that have not yet been made. However, based on experience, the Fund expects the risk of loss to be remote.
Other. Investment transactions are accounted for on a trade date plus one basis for daily net asset value calculations. However, for financial reporting purposes, investment transactions are reported on trade date. Interest income is recorded on the accrual basis net of foreign withholding taxes. Dividend income is recorded on the ex-dividend date net of foreign withholding taxes. Certain dividends from foreign securities may be recorded subsequent to the ex-dividend date as soon as the Fund is informed of such dividends. Realized gains and losses from investment transactions are recorded on an identified cost basis and may include proceeds from litigation.
B. Purchases and Sales of Securities
During the year ended December 31, 2012, purchases and sales of investment securities (excluding short-term investments) aggregated $44,173,342 and $61,083,557, respectively.
C. Related Parties
Management Agreement. Under the Investment Management Agreement with Deutsche Investment Management Americas Inc. ("DIMA" or the "Advisor"), an indirect, wholly owned subsidiary of Deutsche Bank AG, the Advisor directs the investments of the Fund in accordance with its investment objectives, policies and restrictions. The Advisor determines the securities, instruments and other contracts relating to investments to be purchased, sold or entered into by the Fund.
Pursuant to the Investment Management Agreement with the Advisor, the Fund pays a monthly management fee based on the Fund's average daily net assets, computed and accrued daily and payable monthly, at the following annual rates:
| First $500 million of average daily net assets | | | .890 | % |
| Next $500 million of average daily net assets | | | .875 | % |
| Next $1 billion of average daily net assets | | | .860 | % |
| Over $2 billion of average daily net assets | | | .845 | % |
For the period from January 1, 2012 through September 30, 2012, the Advisor has contractually agreed to waive all or a portion of its fees and/or reimburse certain operating expenses of the Fund to the extent necessary to maintain the operating expenses (excluding certain expenses such as extraordinary expenses, taxes, brokerage and interest) of each class as follows:
Effective October 1, 2012 through September 30, 2013, the Advisor has contractually agreed to waive all or a portion of its fees and/or reimburse certain operating expenses of the Fund to the extent necessary to maintain the operating expenses (excluding certain expenses such as extraordinary expenses, taxes, brokerage and interest) of each class as follows:
Accordingly, for the year ended December 31, 2012, the Advisor waived a portion of its management fee pursuant to the Investment Management Agreement aggregating $162,407, and the amount charged aggregated $956,830, which was equivalent to an annual effective rate of 0.76% of the Fund's average daily net assets.
Administration Fee. Pursuant to an Administrative Services Agreement, DIMA provides most administrative services to the Fund. For all services provided under the Administrative Services Agreement, the Fund pays the Advisor an annual fee ("Administration Fee") of 0.10% of the Fund's average daily net assets, computed and accrued daily and payable monthly. For the year ended December 31, 2012, the Administration Fee was $125,757, of which $10,553 is unpaid.
Service Provider Fees. DWS Investments Service Company ("DISC"), an affiliate of the Advisor, is the transfer agent, dividend-paying agent and shareholder service agent for the Fund. Pursuant to a sub-transfer agency agreement between DISC and DST Systems, Inc. ("DST"), DISC has delegated certain transfer agent, dividend-paying agent and shareholder service agent functions to DST. DISC compensates DST out of the shareholder servicing fee it receives from the Fund. For the year ended December 31, 2012, the amounts charged to the Fund by DISC were as follows:
| Services to Shareholders | | Total Aggregated | | | Waived | |
| Class A | | $ | 440 | | | $ | 440 | |
| Class B | | | 136 | | | | 136 | |
| | | $ | 576 | | | $ | 576 | |
For the year ended December 31, 2012, the Advisor reimbursed the Fund $1,170 of record keeping expenses for Class B shares.
Distribution Service Agreement. DWS Investments Distributors, Inc. ("DIDI"), also an affiliate of the Advisor, is the Series' Distributor. In accordance with the Master Distribution Plan, DIDI receives 12b-1 fees of 0.25% of average daily net assets of Class B shares. Pursuant to the Master Distribution Plan, DIDI remits these fees to the Participating Insurance Companies for various costs incurred or paid by these companies in connection with marketing and distribution of Class B shares. For the year ended December 31, 2012, the Distribution Service Fee aggregated $4,723, of which $3 was waived and $391 is unpaid.
Typesetting and Filing Service Fees. Under an agreement with DIMA, DIMA is compensated for providing typesetting and certain regulatory filing services to the Fund. For the year ended December 31, 2012, the amount charged to the Fund by DIMA included in the Statement of Operations under "reports to shareholders" aggregated $17,672, of which $5,488 is unpaid.
Trustees' Fees and Expenses. The Fund paid retainer fees to each Trustee not affiliated with the Advisor, plus specified amounts to the Board Chairperson and to each committee Chairperson.
Affiliated Cash Management Vehicle. The Fund may invest uninvested cash balances in Central Cash Management Fund, which is managed by the Advisor. The Fund indirectly bears its proportionate share of the expenses of Central Cash Management Fund. Central Cash Management Fund does not pay the Advisor an investment management fee. Central Cash Management Fund seeks a high level of current income consistent with liquidity and the preservation of capital.
Securities Lending Agent Fees. Deutsche Bank AG serves as securities lending agent for the Fund. For the year ended December 31, 2012, the Fund incurred securities lending agent fees to Deutsche Bank AG in the amount of $12,240.
D. Investing in Emerging Markets
Investing in emerging markets may involve special risks and considerations not typically associated with investing in developed markets. These risks include revaluation of currencies, high rates of inflation or deflation, repatriation restrictions on income and capital, and future adverse political, social and economic developments. Moreover, securities issued in these markets may be less liquid, subject to government ownership controls or delayed settlements and may have prices more volatile or less easily assessed than those of comparable securities of issuers in developed markets.
E. Ownership of the Fund
Three participating insurance companies were owners of record of 10% or more of the total outstanding Class A shares of the Fund, each owning 49%, 17% and 10%.
F. Line of Credit
The Fund and other affiliated funds (the "Participants") share in a $375 million revolving credit facility provided by a syndication of banks. The Fund may borrow for temporary or emergency purposes, including the meeting of redemption requests that otherwise might require the untimely disposition of securities. The Participants are charged an annual commitment fee which is allocated based on net assets, among each of the Participants. Interest is calculated at a rate per annum equal to the sum of the Federal Funds Rate plus 1.25 percent plus if LIBOR exceeds the Federal Funds Rate the amount of such excess. The Fund may borrow up to a maximum of 33 percent of its net assets under the agreement. The Fund had no outstanding loans at December 31, 2012.
Report of Independent Registered Public Accounting Firm
To the Trustees of DWS Variable Series I and the Shareholders of DWS Global Small Cap Growth VIP:
In our opinion, the accompanying statement of assets and liabilities, including the investment portfolio, and the related statements of operations and of changes in net assets and the financial highlights present fairly, in all material respects, the financial position of DWS Global Small Cap Growth VIP (the "Fund") at December 31, 2012 and the results of its operations, the changes in its net assets, and the financial highlights for the periods indicated therein, in conformity with accounting principles generally accepted in the United States of America. These financial statements and financial highlights (hereafter referred to as "financial statements") are the responsibility of the Fund's management. Our responsibility is to express an opinion on these financial statements based on our audits. We conducted our audits of these financial statements in accordance with the standards of the Public Company Accounting Oversight Board (United States). Those standards require that we plan and perform the audit to obtain reasonable assurance about whether the financial statements are free of material misstatement. An audit includes examining, on a test basis, evidence supporting the amounts and disclosures in the financial statements, assessing the accounting principles used and significant estimates made by management, and evaluating the overall financial statement presentation. We believe that our audits, which included confirmation of securities at December 31, 2012 by correspondence with the custodians and brokers, provide a reasonable basis for our opinion.
Boston, Massachusetts February 14, 2013 | PricewaterhouseCoopers LLP |
Information About Your Fund's Expenses (Unaudited)
As an investor of the Fund, you incur two types of costs: ongoing expenses and transaction costs. Ongoing expenses include management fees, distribution and service (12b-1) fees and other Fund expenses. Examples of transaction costs include contract charges, redemption fees and account maintenance fees, which are not shown in this section. The following tables are intended to help you understand your ongoing expenses (in dollars) of investing in the Fund and to help you compare these expenses with the ongoing expenses of investing in other mutual funds. In the most recent six-month period, the Fund limited these expenses; had it not done so, expenses would have been higher. The example in the table is based on an investment of $1,000 invested at the beginning of the six-month period and held for the entire period (July 1, 2012 to December 31, 2012).
The tables illustrate your Fund's expenses in two ways:
•Actual Fund Return. This helps you estimate the actual dollar amount of ongoing expenses (but not transaction costs) paid on a $1,000 investment in the Fund using the Fund's actual return during the period. To estimate the expenses you paid over the period, simply divide your account value by $1,000 (for example, an $8,600 account value divided by $1,000 = 8.6), then multiply the result by the number in the "Expenses Paid per $1,000" line under the share class you hold.
• Hypothetical 5% Fund Return. This helps you to compare your Fund's ongoing expenses (but not transaction costs) with those of other mutual funds using the Fund's actual expense ratio and a hypothetical rate of return of 5% per year before expenses. Examples using a 5% hypothetical Fund return may be found in the shareholder reports of other mutual funds. The hypothetical account values and expenses may not be used to estimate the actual ending account balance or expenses you paid for the period.
Please note that the expenses shown in these tables are meant to highlight your ongoing expenses only and do not reflect any transaction costs. The "Expenses Paid per $1,000" line of the tables is useful in comparing ongoing expenses only and will not help you determine the relative total expense of owning different funds. If these transaction costs had been included, your costs would have been higher.
Expenses and Value of a $1,000 Investment for the six months ended December 31, 2012 | |
| Actual Fund Return | | Class A | | | Class B | |
| Beginning Account Value 7/1/12 | | $ | 1,000.00 | | | $ | 1,000.00 | |
| Ending Account Value 12/31/12 | | $ | 1,120.30 | | | $ | 1,118.30 | |
| Expenses Paid per $1,000* | | $ | 5.12 | | | $ | 6.50 | |
| Hypothetical 5% Fund Return | | Class A | | | Class B | |
| Beginning Account Value 7/1/12 | | $ | 1,000.00 | | | $ | 1,000.00 | |
| Ending Account Value 12/31/12 | | $ | 1,020.31 | | | $ | 1,019.00 | |
| Expenses Paid per $1,000* | | $ | 4.88 | | | $ | 6.19 | |
* Expenses are equal to the Fund's annualized expense ratio for each share class, multiplied by the average account value over the period, multiplied by 184 (the number of days in the most recent six-month period), then divided by 366.
| Annualized Expense Ratios | Class A | | Class B | |
| DWS Variable Series I — DWS Global Small Cap Growth VIP | .96% | | 1.22% | |
For more information, please refer to the Fund's prospectus.
These tables do not reflect charges and fees ("contract charges") associated with the separate account that invests in the Fund or any variable life insurance policy or variable annuity contract for which the Fund is an investment option.
Tax Information (Unaudited)
The Fund paid distributions of $0.717 per share from net long-term capital gains during its year ended December 31, 2012, of which 100% represents 15% rate gains.
Pursuant to Section 852 of the Internal Revenue Code, the Fund designates $10,421,000 as capital gain dividends for its year ended December 31, 2012, of which 100% represents 15% rate gains.
For corporate shareholders of the Fund, 24% of the ordinary dividends (i.e., income dividends plus short-term capital gains) paid during the Fund's fiscal year ended December 31, 2012 qualified for the dividends received deduction.
Please consult a tax advisor if you have questions about federal or state income tax laws, or on how to prepare your tax returns. If you have specific questions about your account, please contact your insurance provider.
The Series' policies and procedures for voting proxies for portfolio securities and information about how the Series voted proxies related to its portfolio securities during the 12-month period ended June 30 are available on our Web site — www.dws-investments.com (click on "proxy voting"at the bottom of the page) — or on the SEC's Web site — www.sec.gov. To obtain a written copy of the Series' policies and procedures without charge, upon request, call us toll free at (800) 728-3337.
Investment Management Agreement Approval
The Board of Trustees approved the renewal of DWS Global Small Cap Growth VIP's investment management agreement (the "Agreement") with Deutsche Investment Management Americas Inc. ("DWS") in September 2012.
In terms of the process that the Board followed prior to approving the Agreement, shareholders should know that:
• In September 2012, all of the Fund's Trustees were independent of DWS and its affiliates.
• The Trustees met frequently during the past year to discuss fund matters and dedicated a substantial amount of time to contract review matters. Over the course of several months, the Board's Contract Committee, in coordination with the Board's Equity Oversight Committee, reviewed comprehensive materials received from DWS, independent third parties and independent counsel. These materials included an analysis of the Fund's performance, fees and expenses, and profitability compiled by the Fund's independent fee consultant. The Board also received extensive information throughout the year regarding performance of the Fund.
• The Independent Trustees regularly meet privately with their independent counsel to discuss contract review and other matters. In addition, the Independent Trustees were also advised by the Fund's independent fee consultant in the course of their review of the Fund's contractual arrangements and considered a comprehensive report prepared by the independent fee consultant in connection with their deliberations (the "IFC Report").
• In connection with reviewing the Agreement, the Board also reviewed the terms of the Fund's Rule 12b-1 plan, distribution agreement, administrative services agreement, transfer agency agreement and other material service agreements.
• Based on its evaluation of the information provided, the Contract Committee presented its findings and recommendations to the Board. The Board then reviewed the Contract Committee's findings and recommendations.
In connection with the contract review process, the Contract Committee and the Board considered the factors discussed below, among others. The Board also considered that DWS and its predecessors have managed the Fund since its inception, and the Board believes that a long-term relationship with a capable, conscientious advisor is in the best interests of the Fund. The Board considered, generally, that shareholders chose to invest or remain invested in the Fund knowing that DWS managed the Fund, and that the Agreement was approved by the Fund's shareholders. DWS is part of Deutsche Bank, a major global banking institution that is engaged in a wide range of financial services. The Board believes that there are advantages to being part of a global asset management business that offers a wide range of investing expertise and resources, including hundreds of portfolio managers and analysts with research capabilities in many countries throughout the world.
As part of the contract review process, the Board carefully considered the fees and expenses of each DWS fund overseen by the Board in light of the fund's performance. In many cases, this led to a negotiation with DWS of lower expense caps for the coming year than had previously been in place. As part of these negotiations, the Board indicated that it would consider relaxing these new lower caps in future years following sustained improvements in performance, among other considerations.
In June 2012, Deutsche Bank ("DB"), DWS's parent company, announced that DB's new management team had concluded the strategic review of its global asset management business announced in late 2011 by DB's prior management team, and would combine its Asset Management (of which DWS is a part) and Wealth Management divisions. Prior to approving the investment management agreements, the Independent Trustees were apprised of the expected management and structure of the new combined Asset & Wealth Management division ("AWM") and DWS. DB also advised the Independent Trustees that the U.S. asset management business is a critical and integral part of DB and AWM, and that DB would be reinvesting a significant portion of the substantial savings it expects to realize by combining its Asset Management and Wealth Management divisions into a combined AWM division, including enhancements to its investment capabilities. DB also confirmed its commitment to maintaining strong legal and compliance groups within the combined division.
While shareholders may focus primarily on fund performance and fees, the Fund's Board considers these and many other factors, including the quality and integrity of DWS's personnel and such other issues as back-office operations, fund valuations, and compliance policies and procedures.
Nature, Quality and Extent of Services. The Board considered the terms of the Agreement, including the scope of advisory services provided under the Agreement. The Board noted that, under the Agreement, DWS provides portfolio management services to the Fund and that, pursuant to a separate administrative services agreement, DWS provides administrative services to the Fund. The Board considered the experience and skills of senior management and investment personnel, the resources made available to such personnel, the ability of DWS to attract and retain high-quality personnel, and the organizational depth and stability of DWS. The Board reviewed the Fund's performance over short-term and long-term periods and compared those returns to various agreed-upon performance measures, including market indices and a peer universe compiled by the independent fee consultant using information supplied by Lipper Inc. ("Lipper"), an independent fund data service. The Board also noted that it has put into place a process of identifying "Focus Funds" (e.g., funds performing poorly relative to their benchmark or a peer universe compiled by an independent fund data service), and receives more frequent reporting and information from DWS regarding such funds, along with DWS's remedial plans to address underperformance. The Board believes this process is an effective manner of identifying and addressing underperforming funds. Based on the information provided, the Board noted that for the one-, three- and five-year periods ended December 31, 2011, the Fund's performance (Class A shares) was in the 3rd quartile, 1st quartile and 3rd quartile, respectively, of the applicable Lipper universe (the 1st quartile being the best performers and the 4th quartile being the worst performers). The Board also observed that the Fund has underperformed its benchmark in the one- and five-year periods and has outperformed its benchmark in the three-year period ended December 31, 2011.
Fees and Expenses. The Board considered the Fund's investment management fee schedule, operating expenses and total expense ratios, and comparative information provided by Lipper and the independent fee consultant regarding investment management fee rates paid to other investment advisors by similar funds (1st quartile being the most favorable and 4th quartile being the least favorable). With respect to management fees paid to other investment advisors by similar funds, the Board noted that the contractual fee rates paid by the Fund, which include a 0.10% fee paid to DWS under the Fund's administrative services agreement, were higher than the median (4th quartile) of the applicable Lipper peer group (based on Lipper data provided as of December 31, 2011). The Board noted that the Fund's Class A shares total (net) operating expenses were expected to be higher than the median (3rd quartile) of the applicable Lipper expense universe (based on Lipper data provided as of December 31, 2011) ("Lipper Universe Expenses"). The Board also reviewed data comparing each share class's total (net) operating expenses to the applicable Lipper Universe Expenses. The Board considered the Fund's management fee rate as compared to fees charged by DWS and certain of its affiliates for comparable mutual funds and considered differences in fund and fee structures between the DWS Funds. The Board also considered how the Fund's total (net) operating expenses compared to the total (net) operating expenses of a more customized peer group selected by Lipper (based on such factors as asset size).
The Board also noted that the expense limitations agreed to by DWS helped to ensure that the Fund's total (net) operating expenses would remain competitive.
The information considered by the Board as part of its review of management fees included information regarding fees charged by DWS and its affiliates to similar institutional accounts and to similar funds offered primarily to European investors ("DWS Europe funds"), in each case as applicable. The Board observed that advisory fee rates for institutional accounts generally were lower than the management fees charged by similarly managed DWS U.S. mutual funds ("DWS Funds"), but also took note of the differences in services provided to DWS Funds as compared to institutional accounts. In the case of DWS Europe funds, the Board observed that fee rates for DWS Europe funds generally were higher than for similarly managed DWS Funds, but noted that differences in the types of services provided to DWS Funds relative to DWS Europe funds made it difficult to compare such fees.
On the basis of the information provided, the Board concluded that management fees were reasonable and appropriate in light of the nature, quality and extent of services provided by DWS.
Profitability. The Board reviewed detailed information regarding revenues received by DWS under the Agreement. The Board considered the estimated costs and pre-tax profits realized by DWS from advising the DWS Funds, as well as estimates of the pre-tax profits attributable to managing the Fund in particular. The Board also received information regarding the estimated enterprise-wide profitability of DWS and its affiliates with respect to all fund services in totality and by fund. The Board and the independent fee consultant reviewed DWS's methodology in allocating its costs to the management of the Fund. Based on the information provided, the Board concluded that the pre-tax profits realized by DWS in connection with the management of the Fund were not unreasonable. The Board also reviewed information regarding the profitability of certain similar investment management firms. The Board noted that while information regarding the profitability of such firms is limited (and in some cases is not necessarily prepared on a comparable basis), DWS and its affiliates' overall profitability with respect to the DWS fund complex (after taking into account distribution and other services provided to the funds by DWS and its affiliates) was lower than the overall profitability levels of many comparable firms for which such data was available.
Economies of Scale. The Board considered whether there are economies of scale with respect to the management of the Fund and whether the Fund benefits from any economies of scale. The Board noted that the Fund's management fee schedule includes fee breakpoints. The Board concluded that the Fund's fee schedule represents an appropriate sharing between the Fund and DWS of such economies of scale as may exist in the management of the Fund at current asset levels.
Other Benefits to DWS and Its Affiliates. The Board also considered the character and amount of other incidental benefits received by DWS and its affiliates, including any fees received by DWS for administrative services provided to the Fund and any fees received by an affiliate of DWS for distribution services. The Board also considered benefits to DWS related to brokerage and soft-dollar allocations, including allocating brokerage to pay for research generated by parties other than the executing broker dealers, which pertain primarily to funds investing in equity securities, along with the incidental public relations benefits to DWS related to DWS Funds advertising and cross-selling opportunities among DWS products and services. The Board concluded that management fees were reasonable in light of these fallout benefits.
Compliance. The Board considered the significant attention and resources dedicated by DWS to documenting and enhancing its compliance processes in recent years. The Board noted in particular (i) the experience and seniority of both DWS's chief compliance officer and the Fund's chief compliance officer; (ii) the large number of DWS compliance personnel; and (iii) the substantial commitment of resources by DWS and its affiliates to compliance matters.
Based on all of the information considered and the conclusions reached, the Board unanimously determined that the continuation of the Agreement is in the best interests of the Fund. In making this determination, the Board did not give particular weight to any single factor identified above. The Board considered these factors over the course of numerous meetings, certain of which were in executive session with only the Independent Trustees and their counsel present. It is possible that individual Trustees may have weighed these factors differently in reaching their individual decisions to approve the continuation of the Agreement.
Summary of Management Fee Evaluation by Independent Fee Consultant
September 17, 2012
Pursuant to an Order entered into by Deutsche Investment Management Americas and affiliates (collectively, "DeAM") with the Attorney General of New York, I, Thomas H. Mack, have been appointed the Independent Fee Consultant for the DWS Funds (formerly the DWS Scudder Funds). My duties include preparing an annual written evaluation of the management fees DeAM charges the Funds, considering among other factors the management fees charged by other mutual fund companies for like services, management fees DeAM charges other clients for like services, DeAM's costs of supplying services under the management agreements and related profit margins, possible economies of scale if a Fund grows larger, and the nature and quality of DeAM's services, including fund performance. This report summarizes my evaluation for 2012, including my qualifications, the evaluation process for each of the DWS Funds, consideration of certain complex-level factors, and my conclusions. I served in substantially the same capacity in 2007, 2008, 2009, 2010 and 2011.
Qualifications
For more than 35 years I have served in various professional capacities within the investment management business. I have held investment analysis and advisory positions, including securities analyst, portfolio strategist and director of investment policy with a large investment firm. I have also performed business management functions, including business development, financial management and marketing research and analysis.
Since 1991, I have been an independent consultant within the asset management industry. I have provided services to over 125 client organizations, including investment managers, mutual fund boards, product distributors and related organizations. Over the past ten years I have completed a number of assignments for mutual fund boards, specifically including assisting boards with management contract renewal.
I hold a Master of Business Administration degree, with highest honors, from Harvard University and Master of Science and Bachelor of Science (highest honors) degrees from the University of California at Berkeley. I am an independent director and audit committee financial expert for two closed-end mutual funds and have served in various leadership and financial oversight capacities with non-profit organizations.
Evaluation of Fees for each DWS Fund
My work focused primarily on evaluating, fund-by-fund, the fees charged to each of the 103 mutual fund portfolios in the DWS Fund family. For each Fund, I considered each of the key factors mentioned above, as well as any other relevant information. In doing so I worked closely with the Funds' Independent Directors in their annual contract renewal process, as well as in their approval of contracts for several new funds (documented separately).
In evaluating each Fund's fees, I reviewed comprehensive materials provided by or on behalf of DeAM, including expense information prepared by Lipper Analytical, comparative performance information, profitability data, manager histories, and other materials. I also accessed certain additional information from the Lipper and Morningstar databases and drew on my industry knowledge and experience.
To facilitate evaluating this considerable body of information, I prepared for each Fund a document summarizing the key data elements in each area as well as additional analytics discussed below. This made it possible to consider each key data element in the context of the others.
In the course of contract renewal, DeAM agreed to implement a number of fee and expense adjustments requested by the Independent Directors which will favorably impact future fees and expenses, and my evaluation includes the effects of these changes.
Fees and Expenses Compared with Other Funds
The competitive fee and expense evaluation for each fund focused on two primary comparisons:
The Fund's contractual management fee (the advisory fee plus the administration fee where applicable) compared with those of a group of typically 12-15 funds in the same Lipper investment category (e.g. Large Capitalization Growth) having similar distribution arrangements and being of similar size.
The Fund's total expenses compared with a broader universe of funds from the same Lipper investment category and having similar distribution arrangements.
These two comparisons provide a view of not only the level of the fee compared with funds of similar scale but also the total expense the Fund bears for all the services it receives, in comparison with the investment choices available in the Fund's investment category and distribution channel. The principal figure-of-merit used in these comparisons was the subject Fund's percentile ranking against peers.
DeAM's Fees for Similar Services to Others
DeAM provided management fee schedules for all of its US domiciled fund and non-fund investment management accounts in any of the investment categories where there is a DWS Fund. These similar products included the other DWS Funds, non-fund pooled accounts, institutional accounts and sub-advisory accounts. Using this information, I calculated for each Fund the fee that would be charged to each similar product, at the subject Fund's asset level.
Evaluating information regarding non-fund products is difficult because there are varying levels of services required for different types of accounts, with mutual funds generally requiring considerably more regulatory and administrative types of service as well as having more frequent cash flows than other types of accounts. Also, while mutual fund fees for similar fund products can be expected to be similar, there will be some differences due to different pricing conditions in different distribution channels (e.g. retail funds versus those used in variable insurance products), differences in underlying investment processes and other factors.
Costs and Profit Margins
DeAM provided a detailed profitability analysis for each Fund. After making some adjustments so that the presentation would be more comparable to the available industry figures, I reviewed profit margins from investment management alone, from investment management plus other fund services (excluding distribution) provided to the Funds by DeAM (principally shareholder services), and DeAM profits from all sources, including distribution. A later section comments on overall profitability.
Economies of Scale
Economies of scale — an expected decline in management cost per dollar of fund assets as fund assets grow — are very rarely quantified and documented because of inherent difficulties in collecting and analyzing relevant data. However, in virtually every investment category that I reviewed, larger funds tend to have lower fees and lower total expenses than smaller funds. To see how each DWS Fund compares with this industry observation, I reviewed:
The trend in Fund assets over the last five years and the accompanying trend in total expenses. This shows if the Fund has grown and, if so, whether total expense (management fees as well as other expenses) have declined as a percent of assets.
Whether the Fund has break-points in its management fee schedule, the extent of the fee reduction built into the schedule and the asset levels where the breaks take effect, and in the case of a sub-advised Fund how the Fund's break-points compare with those of the sub-advisory fee schedule.
How the Fund's contractual fee schedule compares with trends in the industry data. To accomplish this, I constructed a chart showing how actual latest-fiscal-year contractual fees of the Fund and of other similar funds relate to average fund assets, with the subject Fund's contractual fee schedule superimposed.
Quality of Service — Performance
The quality-of-service evaluation focused on investment performance, which is the principal result of the investment management service. Each Fund's performance was reviewed over the past 1, 3, 5 and 10 years, as applicable, and compared with that of other funds in the same investment category and with a suitable market index.
In addition, I calculated and reviewed risk-adjusted returns relative to an index of similar mutual funds' returns and a suitable market index. The risk-adjusted returns analysis provides a way of determining the extent to which the Fund's return comparisons are mainly the product of investment value-added (or lack thereof) or alternatively taking considerably more or less risk than is typical in its investment category.
I also received and considered the history of portfolio manager changes for each Fund, as this provided an important context for evaluating the performance results.
Complex-Level Considerations
While this evaluation was conducted mainly at the individual fund level, there are some issues relating to the reasonableness of fees that can alternatively be considered across the whole fund complex:
I reviewed DeAM's profitability analysis for all DWS Funds, with a view toward determining if the allocation procedures used were reasonable and how profit levels compared with public data for other investment managers.
I considered whether DeAM and affiliates receive any significant ancillary or "fallout" benefits that should be considered in interpreting the direct profitability results. These would be situations where serving as the investment manager of the Funds is beneficial to another part of the Deutsche Bank organization.
I considered how aggregated DWS Fund expenses had varied over the years, by asset class and in the context of trends in asset levels.
I considered how aggregated DWS Fund performance measures relative to appropriate peers had varied by asset class and over time.
I reviewed the structure of the DeAM organization, trends in staffing levels, and information on compensation of investment management and other professionals compared with industry data.
Findings
Based on the process and analysis discussed above, which included reviewing a wide range of information from management and external data sources and considering among other factors the fees DeAM charges other clients, the fees charged by other fund managers, DeAM's costs and profits associated with managing the Funds, economies of scale, possible fall-out benefits, and the nature and quality of services provided, in my opinion the management fees charged the DWS Funds are reasonable.
Thomas H. Mack
President, Thomas H. Mack & Co., Inc.
Board Members and Officers
The following table presents certain information regarding the Board Members and Officers of the fund. Each Board Member's year of birth is set forth in parentheses after his or her name. Unless otherwise noted, (i) each Board Member has engaged in the principal occupation(s) noted in the table for at least the most recent five years, although not necessarily in the same capacity; and (ii) the address of each Independent Board Member is c/o Kenneth C. Froewiss, Chairman, DWS Mutual Funds, P.O. Box 78, Short Hills, NJ 07078. Except as otherwise noted below, the term of office for each Board Member is until the election and qualification of a successor, or until such Board Member sooner dies, resigns, is removed or as otherwise provided in the governing documents of the fund. Because the fund does not hold an annual meeting of shareholders, each Board Member will hold office for an indeterminate period. The Board Members may also serve in similar capacities with other funds in the fund complex.
| Independent Board Members |
Name, Year of Birth, Position with the Fund and Length of Time Served1 | | Business Experience and Directorships During the Past Five Years | Number of Funds in DWS Fund Complex Overseen |
Other Directorships Held by Board Member |
Kenneth C. Froewiss (1945) Chairperson since 2013,9 and Board Member since 2001 | | Adjunct Professor of Finance, NYU Stern School of Business (September 2009-present; Clinical Professor from 1997-September 2009); Member, Finance Committee, Association for Asian Studies (2002-present); Director, Mitsui Sumitomo Insurance Group (US) (2004-present); prior thereto, Managing Director, J.P. Morgan (investment banking firm) (until 1996) | 103 | — |
William McClayton (1944) Vice Chairperson since 2013,9 and Board Member since 2004 | | Private equity investor (since October 2009); previously, Managing Director, Diamond Management & Technology Consultants, Inc. (global consulting firm) (2001-2009); Directorship: Board of Managers, YMCA of Metropolitan Chicago; formerly: Senior Partner, Arthur Andersen LLP (accounting) (1966-2001); Trustee, Ravinia Festival | 103 | — |
John W. Ballantine (1946) Board Member since 1999 | | Retired; formerly, Executive Vice President and Chief Risk Management Officer, First Chicago NBD Corporation/The First National Bank of Chicago (1996-1998); Executive Vice President and Head of International Banking (1995-1996). Directorships: Stockwell Capital Investments PLC (private equity); former Directorships: First Oak Brook Bancshares, Inc. and Oak Brook Bank; Prisma Energy International | 103 | Chairman of the Board, Healthways, Inc.2 (provider of disease and care management services) (2003- present); Portland General Electric2 (utility company) (2003-present) |
Henry P. Becton, Jr. (1943) Board Member since 1990 | | Vice Chair and former President, WGBH Educational Foundation. Directorships: Public Radio International; Public Radio Exchange (PRX); The PBS Foundation; North Bennett Street School (Boston); former Directorships: Association of Public Television Stations; Boston Museum of Science; American Public Television; Concord Academy; New England Aquarium; Mass. Corporation for Educational Telecommunications; Committee for Economic Development; Public Broadcasting Service; Connecticut College | 103 | Lead Director, Becton Dickinson and Company2 (medical technology company); Lead Director, Belo Corporation2 (media company) |
Dawn-Marie Driscoll (1946) Board Member since 1987 | | President, Driscoll Associates (consulting firm); Emeritus Executive Fellow, Center for Business Ethics, Bentley University; formerly, Partner, Palmer & Dodge (1988-1990); Vice President of Corporate Affairs and General Counsel, Filene's (1978-1988). Directorships: Director of ICI Mutual Insurance Company (since 2007); Advisory Board, Center for Business Ethics, Bentley University; Trustee, Southwest Florida Community Foundation (charitable organization); former Directorships: Sun Capital Advisers Trust (mutual funds) (2007-2012), Investment Company Institute (audit, executive, nominating committees) and Independent Directors Council (governance, executive committees) | 103 | — |
Keith R. Fox, CFA (1954) Board Member since 1996 | | Managing General Partner, Exeter Capital Partners (a series of private investment funds) (since 1986). Directorships: Progressive International Corporation (kitchen goods importer and distributor); The Kennel Shop (retailer); former Chairman, National Association of Small Business Investment Companies; former Directorships: BoxTop Media Inc. (advertising); Sun Capital Advisers Trust (mutual funds) (2011-2012) | 103 | — |
Paul K. Freeman (1950) Board Member since 1993, and Chairperson (2009-Jan. 8, 2013) | | Consultant, World Bank/Inter-American Development Bank; Executive and Governing Council of the Independent Directors Council (Chairman of Education Committee); formerly: Project Leader, International Institute for Applied Systems Analysis (1998-2001); Chief Executive Officer, The Eric Group, Inc. (environmental insurance) (1986-1998); Directorships: Denver Zoo Foundation (December 2012-present); former Directorships: Prisma Energy International | 103 | — |
Richard J. Herring (1946) Board Member since 1990 | | Jacob Safra Professor of International Banking and Professor, Finance Department, The Wharton School, University of Pennsylvania (since July 1972); Co-Director, Wharton Financial Institutions Center (since July 2000); Co-Chair, U.S. Shadow Financial Regulatory Committee; Executive Director, Financial Economists Roundtable; formerly: Vice Dean and Director, Wharton Undergraduate Division (July 1995-June 2000); Director, Lauder Institute of International Management Studies (July 2000-June 2006) | 103 | Director, Japan Equity Fund, Inc. (since September 2007), Thai Capital Fund, Inc. (since 2007), Singapore Fund, Inc. (since September 2007), Independent Director of Barclays Bank Delaware (since September 2010) |
Rebecca W. Rimel (1951) Board Member since 1995 | | President and Chief Executive Officer, The Pew Charitable Trusts (charitable organization) (1994 to present); Trustee, Washington College (2011-2013); formerly: Executive Vice President, The Glenmede Trust Company (investment trust and wealth management) (1983-2004); Board Member, Investor Education (charitable organization) (2004-2005); Trustee, Executive Committee, Philadelphia Chamber of Commerce (2001-2007); Director, Viasys Health Care2 (January 2007-June 2007); Trustee, Pro Publica (charitable organization) (2007-2010); Trustee, Thomas Jefferson Foundation (charitable organization) (1994-2012) | 103 | Director, Becton Dickinson and Company2 (medical technology company) (2012-present); Director, CardioNet, Inc.2 (health care) (2009-present) |
William N. Searcy, Jr. (1946) Board Member since 1993 | | Private investor since October 2003; formerly: Pension & Savings Trust Officer, Sprint Corporation2 (telecommunications) (November 1989-September 2003); Trustee, Sun Capital Advisers Trust (mutual funds) (1998-2012) | 103 | — |
Jean Gleason Stromberg (1943) Board Member since 1997 | | Retired. Formerly, Consultant (1997-2001); Director, Financial Markets U.S. Government Accountability Office (1996-1997); Partner, Fulbright & Jaworski, L.L.P. (law firm) (1978-1996). Directorships: The William and Flora Hewlett Foundation; former Directorships: Service Source, Inc., Mutual Fund Directors Forum (2002-2004), American Bar Retirement Association (funding vehicle for retirement plans) (1987-1990 and 1994-1996) | 103 | — |
Robert H. Wadsworth (1940) Board Member since 1999 | | President, Robert H. Wadsworth & Associates, Inc. (consulting firm) (1983 to present); Director, National Horizon, Inc. (non-profit organization); Director and Treasurer, The Phoenix Boys Choir Association | 106 | — |
Interested Board Member and Officer4 |
Name, Year of Birth, Position with the Fund and Length of Time Served1,6 | | Business Experience and Directorships During the Past Five Years | Number of Funds in DWS Fund Complex Overseen |
Other Directorships Held by Board Member |
Michael J. Woods5 (1967) Board Member since 2013,9 and Executive Vice President since 20139 | | Managing Director,3 Deutsche Asset & Wealth Management (2009-present); Head of the Americas Asset Management Business for Deutsche Bank, Member of the Asset and Wealth Management ("AWM") Extended Executive Committee, AWM Global Client Group Executive Committee and the AWM Active Asset Management Executive Committee; CEO and US Regional Head of DWS Investments; formerly: Sr. VP, Head of the Financial Intermediaries and Investments Group of Evergreen Investments (2007-2009), CEO and Vice Chairman of Board of Directors of XTF Global Asset Management (2006-2007), Managing Director — US Head of Sub-Advisory and Investment Only Business at Citigroup Asset Management (2000-2006). Mr. Woods is currently a board member of The Children's Village, The Big Brothers Big Sisters Organization, and The Mutual Fund Education Alliance. | 39 | — |
Officers4 |
Name, Year of Birth, Position with the Fund and Length of Time Served6 | | Business Experience and Directorships During the Past Five Years |
W. Douglas Beck, CFA7 (1967) President, 2011-present | | Managing Director,3 Deutsche Asset & Wealth Management (2006-present); President of DWS family of funds and Head of Product Management, U.S. for DWS Investments; formerly: Executive Director, Head of Product Management (2002-2006) and President (2005-2006) of the UBS Funds at UBS Global Asset Management; Co-Head of Manager Research/Managed Solutions Group, Merrill Lynch (1998-2002) |
John Millette8 (1962) Vice President and Secretary, 1999-present | | Director,3 Deutsche Asset & Wealth Management |
Paul H. Schubert7 (1963) Chief Financial Officer, 2004-present Treasurer, 2005-present | | Managing Director,3 Deutsche Asset & Wealth Management (since July 2004); formerly: Executive Director, Head of Mutual Fund Services and Treasurer for UBS Family of Funds (1998-2004); Vice President and Director of Mutual Fund Finance at UBS Global Asset Management (1994-1998) |
Caroline Pearson8 (1962) Chief Legal Officer, 2010-present | | Managing Director,3 Deutsche Asset & Wealth Management; formerly: Assistant Secretary for DWS family of funds (1997-2010) |
Melinda Morrow7 (1970) Vice President, 2012-present | | Director,3 Deutsche Asset & Wealth Management |
Hepsen Uzcan8 (1974) Assistant Secretary, since 20139 | | Vice President, Deutsche Asset & Wealth Management |
Paul Antosca8 (1957) Assistant Treasurer, 2007-present | | Director,3 Deutsche Asset & Wealth Management |
Jack Clark8 (1967) Assistant Treasurer, 2007-present | | Director,3 Deutsche Asset & Wealth Management |
Diane Kenneally8 (1966) Assistant Treasurer, 2007-present | | Director,3 Deutsche Asset & Wealth Management |
John Caruso7 (1965) Anti-Money Laundering Compliance Officer, 2010-present | | Managing Director,3 Deutsche Asset & Wealth Management |
Robert Kloby7 (1962) Chief Compliance Officer, 2006-present | | Managing Director,3 Deutsche Asset & Wealth Management |
1 The length of time served represents the year in which the Board Member joined the board of one or more DWS funds currently overseen by the Board.
2 A publicly held company with securities registered pursuant to Section 12 of the Securities Exchange Act of 1934.
3 Executive title, not a board directorship.
4 As a result of their respective positions held with the Advisor, these individuals are considered "interested persons" of the Advisor within the meaning of the 1940 Act. Interested persons receive no compensation from the fund.
5 The mailing address of Mr. Woods is 60 Wall Street, New York, New York 10005. Mr. Woods is an interested Board Member by virtue of his positions with Deutsche Asset & Wealth Management. As an interested person, Mr. Woods receives no compensation from the fund. Mr. Woods is a board member of the following trusts and corporations: Cash Account Trust, DWS Market Trust, DWS Money Funds, DWS State Tax-Free Income Series, DWS Target Fund, DWS Value Series, Inc., DWS Variable Series II, Investors Cash Trust, Tax-Exempt California Money Market Fund, DWS Global High Income Fund, Inc., DWS High Income Opportunities Fund, Inc., DWS High Income Trust, DWS Multi-Market Income Trust, DWS Municipal Income Trust, DWS Strategic Income Trust and DWS Strategic Municipal Income Trust.
6 The length of time served represents the year in which the officer was first elected in such capacity for one or more DWS funds.
7 Address: 60 Wall Street, New York, NY 10005.
8 Address: One Beacon Street, Boston, MA 02108.
9 Effective as of January 9, 2013.
The fund's Statement of Additional Information ("SAI") includes additional information about the Board Members. The SAI is available, without charge, upon request. If you would like to request a copy of the SAI, you may do so by calling the following toll-free number: (800) 728-3337.
DWS Investments Distributors, Inc.
222 South Riverside Plaza
Chicago, IL 60606
(800) 621-1148
VS1gloscg-2 (R-025821-2 2/13)
DECEMBER 31, 2012
ANNUAL REPORT
DWS VARIABLE SERIES I
DWS International VIP
Contents
10 Statement of Assets and Liabilities 11 Statement of Operations 12 Statement of Changes in Net Assets 14 Notes to Financial Statements 19 Report of Independent Registered Public Accounting Firm 20 Information About Your Fund's Expenses 23 Investment Management Agreement Approval 26 Summary of Management Fee Evaluation by Independent Fee Consultant 28 Board Members and Officers |
This report must be preceded or accompanied by a prospectus. To obtain an additional prospectus or summary prospectus, if available, call (800) 728-3337 or your financial representative. We advise you to consider the Fund's objectives, risks, charges and expenses carefully before investing. The summary prospectus and prospectus contain this and other important information about the Fund. Please read the prospectus carefully before you invest.
Investing in derivatives entails special risks relating to liquidity, leverage and credit that may reduce returns and/or increase volatility. Investing in foreign securities, particularly those of emerging markets, presents certain risks, such as currency fluctuations, political and economic changes, and market risks. The Fund may lend securities to approved institutions. Stocks may decline in value. See the prospectus for details.
DWS Investments is part of the Deutsche Asset & Wealth Management division of Deutsche Bank AG.
NOT FDIC/NCUA INSURED NO BANK GUARANTEE MAY LOSE VALUE NOT A DEPOSIT
NOT INSURED BY ANY FEDERAL GOVERNMENT AGENCY
Performance Summary December 31, 2012 (Unaudited)
Fund performance shown is historical, assumes reinvestment of all dividend and capital gain distributions, and does not guarantee future results. Investment return and principal value fluctuate with changing market conditions so that, when redeemed, shares may be worth more or less than their original cost. Current performance may be lower or higher than the performance data quoted. Please contact your participating insurance company for the Fund's most recent month-end performance. Performance doesn't reflect charges and fees ("contract charges") associated with the separate account that invests in the Fund or any variable life insurance policy or variable annuity contract for which the Fund is an investment option. These charges and fees will reduce returns. While all share classes have the same underlying portfolio, their performance will differ.
The gross expense ratios of the Fund, as stated in the fee table of the prospectus dated May 1, 2012 are 1.00% and 1.28% for Class A and Class B shares, respectively, and may differ from the expense ratios disclosed in the Financial Highlights tables in this report.
| Growth of an Assumed $10,000 Investment |
| The Morgan Stanley Capital International (MSCI) Europe, Australasia and Far East (EAFE®) Index is an unmanaged index that tracks international stock performance in the 21 developed markets in Europe, Australasia and the Far East. The index is calculated using closing local market prices and translates into U.S. dollars using the London close foreign exchange rates. Index returns do not reflect any fees or expenses and it is not possible to invest directly into an index. |
| |
| Yearly periods ended December 31 | |
| Comparative Results | |
| DWS International VIP | | 1-Year | | | 3-Year | | | 5-Year | | | 10-Year | |
| Class A | Growth of $10,000 | | $ | 12,065 | | | $ | 10,216 | | | $ | 7,064 | | | $ | 17,626 | |
| Average annual total return | | | 20.65 | % | | | 0.72 | % | | | -6.71 | % | | | 5.83 | % |
MSCI EAFE® Index | Growth of $10,000 | | $ | 11,732 | | | $ | 11,106 | | | $ | 8,287 | | | $ | 22,021 | |
| Average annual total return | | | 17.32 | % | | | 3.56 | % | | | -3.69 | % | | | 8.21 | % |
| DWS International VIP | | 1-Year | | | 3-Year | | | 5-Year | | | 10-Year | |
| Class B | Growth of $10,000 | | $ | 12,013 | | | $ | 10,131 | | | $ | 6,967 | | | $ | 17,127 | |
| Average annual total return | | | 20.13 | % | | | 0.43 | % | | | -6.97 | % | | | 5.53 | % |
MSCI EAFE® Index | Growth of $10,000 | | $ | 11,732 | | | $ | 11,106 | | | $ | 8,287 | | | $ | 22,021 | |
| Average annual total return | | | 17.32 | % | | | 3.56 | % | | | -3.69 | % | | | 8.21 | % |
The growth of $10,000 is cumulative.
Management Summary December 31, 2012 (Unaudited)
The Class A shares of the Fund returned 20.65% (unadjusted for contract charges) during 2012, outperforming the 17.32% return of the MSCI EAFE Index.
International equities performed very well during 2012, returning 17.32% as measured by the Fund's benchmark, the MSCI EAFE Index.1 Even though the foreign markets have their share of challenges — including recessionary conditions in Europe and Japan as well as slowing growth in China — investors responded favorably to the stimulus provided by the European Central Bank (ECB), together with ECB President Mario Draghi's pledge to do "whatever it takes" to hold the Eurozone together.
We utilize a proprietary investment process designed to identify attractive investment candidates, generated by more than 5,000 equity analysts around the globe who collectively cover over 10,000 securities. Through the quality of these analysts' fundamental research, this process seeks to identify investments that may offer the potential for price appreciation.
The nature of our approach means that stock selection will typically be the most important driver of the Fund's relative performance. Our stock selection process worked best in the technology, industrials and consumer discretionary sectors during 2012, while it was least effective in health care and utilities. While we do not target specific sector allocations, our bottom-up process leads us to take over- and underweight positions in certain sectors.2 During the past year, our overweight in utilities hurt performance, while our underweight in energy was a substantial positive.
In terms of individual stocks, our top contributor was the French technology company Dassault Systemes SA, which reported strong earnings and double-digit revenue growth.3 Also making positive contributions were the German media company Deutsche Post AG and the financial companies ING Groep NV and BOC Hong Kong (Holdings) Ltd. Our leading individual detractors were the Israeli and Swedish telecommunications companies Bezeq International Ltd.* and TeliaSonera AB, respectively, the Japanese industrial conglomerate Mitsui & Co., Ltd., and the Swedish utility Fortum Oyj.
While 2013 is unlikely to bring returns on the level of what we witnessed during the past year, we believe the backdrop for international equities remains favorable. The European Central Bank and the Bank of Japan provided aggressive stimulus to their respective economies and financial markets, and China's new government is likely to enact stimulus programs of its own in the year ahead. On the other hand, however, economic growth remained slow in many regions and negative in others, and the potential for headline risk remains high. We believe our disciplined, systematic approach can continue to add value in this potentially volatile environment.
Thomas Voecking
Anna Wallentin
Juergen Foerster
Johannes Prix, PhD,
Portfolio Managers
The views expressed reflect those of the portfolio management team only through the end of the period of the report as stated on the cover. The management team's views are subject to change at any time based on market and other conditions and should not be construed as a recommendation. Past performance is no guarantee of future results. Current and future portfolio holdings are subject to risk.
1 The Morgan Stanley Capital International (MSCI) Europe, Australasia and Far East (EAFE) Index is an unmanaged index that tracks international stock performance in the 21 developed markets in Europe, Australasia and the Far East. The index is calculated using closing local market prices and translates into U.S. dollars using the London close foreign exchange rates.
Index returns do not reflect fees or expenses and it is not possible to invest directly into an index.
2 "Overweight" means the Fund holds a higher weighting in a given sector or security than the benchmark. "Underweight" means the Fund holds a lower weighting.
3 Contribution incorporates both a stock's total return and its weighting in the Fund.
* Not held in the portfolio as of December 31, 2012.
Portfolio Summary (Unaudited) Asset Allocation (As a % of Investment Portfolio excluding Securities Lending Collateral) | 12/31/12 | 12/31/11 |
| | | |
| Common Stocks | 100% | 97% |
| Cash Equivalents | 0% | 2% |
| Preferred Stocks | — | 1% |
| | 100% | 100% |
Geographical Diversification
(As a % of Investment Portfolio excluding Cash Equivalents and Securities Lending Collateral) | 12/31/12 | 12/31/11 |
| | | |
| Continental Europe | 50% | 45% |
| Japan | 24% | 21% |
| United Kingdom | 13% | 15% |
| Asia (excluding Japan) | 6% | 9% |
| Australia | 6% | 9% |
| Other | 1% | 1% |
| | 100% | 100% |
Sector Diversification (As a % of Investment Portfolio excluding Cash Equivalents and Securities Lending Collateral) | 12/31/12 | 12/31/11 |
| | | |
| Financials | 27% | 27% |
| Industrials | 21% | 11% |
| Utilities | 12% | 6% |
| Consumer Discretionary | 11% | 8% |
| Telecommunication Services | 10% | 7% |
| Information Technology | 7% | 11% |
| Materials | 6% | 4% |
| Energy | 4% | 6% |
| Consumer Staples | 2% | 8% |
| Health Care | 0% | 12% |
| | 100% | 100% |
Portfolio holdings and characteristics are subject to change.
For more complete details about the Fund's investment portfolio, see page 7.
Following the Fund's fiscal first and third quarter-end, a complete portfolio holdings listing is filed with the SEC on Form N-Q. The form will be available on the SEC's Web site at www.sec.gov, and it also may be reviewed and copied at the SEC's Public Reference Room in Washington, D.C. Information on the operation of the SEC's Public Reference Room may be obtained by calling (800) SEC-0330. The Fund's portfolio holdings are also posted on www.dws-investments.com from time to time. Please see the Fund's current prospectus for more information.
Investment Portfolio December 31, 2012 | | | Shares | | | Value ($) | |
| | | | |
| Common Stocks 98.2% | |
| Australia 5.5% | |
| Asciano Ltd. | | | 62,000 | | | | 302,998 | |
| Australia & New Zealand Banking Group Ltd. | | | 42,700 | | | | 1,117,924 | |
| BHP Billiton Ltd. | | | 102,500 | | | | 4,002,943 | |
| Lend Lease Group | | | 73,000 | | | | 711,200 | |
| National Australia Bank Ltd. | | | 156,807 | | | | 4,100,939 | |
| Newcrest Mining Ltd. | | | 92,992 | | | | 2,171,080 | |
| Westpac Banking Corp. | | | 7,455 | | | | 203,808 | |
| (Cost $12,948,935) | | | | 12,610,892 | |
| Austria 0.3% | |
| Erste Group Bank AG* (Cost $439,909) | | | 19,000 | | | | 607,535 | |
| Finland 2.6% | |
| Fortum Oyj (Cost $5,950,772) | | | 315,000 | | | | 5,923,740 | |
| France 6.0% | |
| Dassault Systemes SA | | | 63,800 | | | | 7,142,108 | |
| Publicis Groupe | | | 18,200 | | | | 1,090,466 | |
| Safran SA (a) | | | 55,400 | | | | 2,417,412 | |
| Unibail-Rodamco SE (REIT) | | | 13,000 | | | | 3,182,484 | |
| (Cost $10,248,873) | | | | 13,832,470 | |
| Germany 15.7% | |
| Adidas AG | | | 116,600 | | | | 10,391,182 | |
| Allianz SE (Registered) | | | 9,500 | | | | 1,316,098 | |
| BASF SE | | | 68,800 | | | | 6,466,603 | |
| Beiersdorf AG | | | 30,400 | | | | 2,483,979 | |
| Deutsche Post AG (Registered) | | | 436,700 | | | | 9,575,666 | |
| Hannover Rueckversicherung AG (Registered) | | | 29,700 | | | | 2,311,689 | |
| SAP AG | | | 46,550 | | | | 3,728,959 | |
| (Cost $28,791,257) | | | | 36,274,176 | |
| Hong Kong 5.6% | |
| BOC Hong Kong (Holdings) Ltd. | | | 3,385,000 | | | | 10,619,703 | |
| Noble Group Ltd. | | | 1,770,000 | | | | 1,706,801 | |
| Orient Overseas International Ltd. | | | 72,000 | | | | 474,547 | |
| (Cost $11,615,469) | | | | 12,801,051 | |
| Italy 5.6% | |
| Snam SpA | | | 2,683,000 | | | | 12,476,111 | |
| UniCredit SpA* | | | 70,000 | | | | 345,666 | |
| (Cost $13,536,752) | | | | 12,821,777 | |
| Japan 23.4% | |
| Bridgestone Corp. | | | 172,100 | | | | 4,461,022 | |
| Canon, Inc. (a) | | | 156,900 | | | | 6,153,958 | |
| Central Japan Railway Co. | | | 21,000 | | | | 1,703,849 | |
| FANUC Corp. | | | 53,700 | | | | 9,986,258 | |
| Fast Retailing Co., Ltd. | | | 28,300 | | | | 7,187,449 | |
| Honda Motor Co., Ltd. | | | 28,992 | | | | 1,068,599 | |
| JGC Corp. | | | 115,000 | | | | 3,582,508 | |
| Marubeni Corp. | | | 716,000 | | | | 5,130,922 | |
| Mitsubishi Estate Co., Ltd. | | | 217,000 | | | | 5,187,669 | |
| Mitsui & Co., Ltd. | | | 286,000 | | | | 4,278,641 | |
| Nabtesco Corp. (a) | | | 163,900 | | | | 3,627,047 | |
| | | Shares | | | Value ($) | |
| | | | | | | | | |
| Nissan Motor Co., Ltd. | | | 87,000 | | | | 825,756 | |
| Sumitomo Realty & Development Co., Ltd. | | | 24,000 | | | | 797,455 | |
| (Cost $47,989,289) | | | | 53,991,133 | |
| Netherlands 7.0% | |
| ING Groep NV (CVA)* | | | 836,857 | | | | 8,002,606 | |
| Royal Dutch Shell PLC "B" | | | 231,500 | | | | 8,193,328 | |
| (Cost $14,348,348) | | | | 16,195,934 | |
| Norway 2.8% | |
| DnB ASA (Cost $6,181,247) | | | 509,000 | | | | 6,488,185 | |
| Singapore 1.2% | |
| United Overseas Bank Ltd. | | | 159,000 | | | | 2,604,170 | |
| Wilmar International Ltd. | | | 100,000 | | | | 276,381 | |
| (Cost $2,887,682) | | | | 2,880,551 | |
| Sweden 7.6% | |
| Swedbank AB "A" | | | 243,000 | | | | 4,781,850 | |
| TeliaSonera AB | | | 1,884,000 | | | | 12,832,878 | |
| (Cost $17,073,122) | | | | 17,614,728 | |
| Switzerland 1.8% | |
| Credit Suisse Group AG (Registered)* | | | 19,400 | | | | 486,772 | |
| Swiss Life Holding AG (Registered)* | | | 3,700 | | | | 493,816 | |
| Zurich Insurance Group AG* | | | 12,000 | | | | 3,208,700 | |
| (Cost $4,023,002) | | | | 4,189,288 | |
| United Kingdom 13.1% | |
| Barclays PLC | | | 256,000 | | | | 1,105,506 | |
| Capita PLC | | | 368,200 | | | | 4,559,276 | |
| Centrica PLC | | | 1,818,000 | | | | 9,876,090 | |
| Inmarsat PLC | | | 326,000 | | | | 3,146,924 | |
| Old Mutual PLC | | | 1,120,000 | | | | 3,326,734 | |
| SABMiller PLC | | | 49,300 | | | | 2,320,456 | |
| Vodafone Group PLC | | | 2,325,000 | | | | 5,847,065 | |
| (Cost $27,797,169) | | | | 30,182,051 | |
Total Common Stocks (Cost $203,831,826) | | | | 226,413,511 | |
| | |
| Securities Lending Collateral 5.4% | |
| Daily Assets Fund Institutional, 0.20% (b) (c) (Cost $12,398,074) | | | 12,398,074 | | | | 12,398,074 | |
| | |
| Cash Equivalents 0.1% | |
| Central Cash Management Fund, 0.15% (b) (Cost $155,659) | | | 155,659 | | | | 155,659 | |
| | | % of Net Assets | | | Value ($) | |
| | | | |
Total Investment Portfolio (Cost $216,385,559)† | | | 103.7 | | | | 238,967,244 | |
| Other Assets and Liabilities, Net | | | (3.7 | ) | | | (8,588,928 | ) |
| Net Assets | | | 100.0 | | | | 230,378,316 | |
* Non-income producing security.
† The cost for federal income tax purposes was $217,729,633. At December 31, 2012, net unrealized appreciation for all securities based on tax cost was $21,237,611. This consisted of aggregate gross unrealized appreciation for all securities in which there was an excess of value over tax cost of $26,033,003 and aggregate gross unrealized depreciation for all securities in which there was an excess of tax cost over value of $4,795,392.
(a) All or a portion of these securities were on loan (see Notes to Financial Statements). The value of all securities loaned at December 31, 2012 amounted to $11,886,500, which is 5.2% of net assets.
(b) Affiliated fund managed by Deutsche Investment Management Americas Inc. The rate shown is the annualized seven-day yield at period end.
(c) Represents collateral held in connection with securities lending. Income earned by the Fund is net of borrower rebates.
CVA: Certificaten Van Aandelen (Certificate of Stock)
REIT: Real Estate Investment Trust
At December 31, 2012, open futures contracts purchased were as follows:
| Futures | Currency | Expiration Date | | Contracts | | | Notional Value ($) | | | Unrealized Appreciation ($) | |
| S&P 500 E-Mini Index | USD | 3/15/2013 | | | 65 | | | | 4,615,325 | | | | 34,938 | |
| Currency Abbreviation |
| USD United States Dollar |
For information on the Fund's policy and additional disclosures regarding futures contracts, please refer to the Derivatives section of Note B in the accompanying Notes to Financial Statements.
Fair Value Measurements
Various inputs are used in determining the value of the Fund's investments. These inputs are summarized in three broad levels. Level 1 includes quoted prices in active markets for identical securities. Level 2 includes other significant observable inputs (including quoted prices for similar securities, interest rates, prepayment speeds, and credit risk). Level 3 includes significant unobservable inputs (including the Fund's own assumptions in determining the fair value of investments). The inputs or methodology used for valuing securities are not necessarily an indication of the risk associated with investing in those securities.
The following is a summary of the inputs used as of December 31, 2012 in valuing the Fund's investments. For information on the Fund's policy regarding the valuation of investments, please refer to the Security Valuation section of Note A in the accompanying Notes to Financial Statements.
| Assets | | Level 1 | | | Level 2 | | | Level 3 | | | Total | |
| | |
Common Stocks (d) | |
| Australia | | $ | — | | | $ | 12,610,892 | | | $ | — | | | $ | 12,610,892 | |
| Austria | | | — | | | | 607,535 | | | | — | | | | 607,535 | |
| Finland | | | — | | | | 5,923,740 | | | | — | | | | 5,923,740 | |
| France | | | — | | | | 13,832,470 | | | | — | | | | 13,832,470 | |
| Germany | | | — | | | | 36,274,176 | | | | — | | | | 36,274,176 | |
| Hong Kong | | | — | | | | 12,801,051 | | | | — | | | | 12,801,051 | |
| Italy | | | — | | | | 12,821,777 | | | | — | | | | 12,821,777 | |
| Japan | | | — | | | | 53,991,133 | | | | — | | | | 53,991,133 | |
| Netherlands | | | — | | | | 16,195,934 | | | | — | | | | 16,195,934 | |
| Norway | | | — | | | | 6,488,185 | | | | — | | | | 6,488,185 | |
| Singapore | | | — | | | | 2,880,551 | | | | — | | | | 2,880,551 | |
| Sweden | | | — | | | | 17,614,728 | | | | — | | | | 17,614,728 | |
| Switzerland | | | — | | | | 4,189,288 | | | | — | | | | 4,189,288 | |
| United Kingdom | | | — | | | | 30,182,051 | | | | — | | | | 30,182,051 | |
| Short-Term Investments (d) | | | 12,553,733 | | | | — | | | | — | | | | 12,553,733 | |
Derivatives (e) Futures Contracts | | | 34,938 | | | | — | | | | — | | | | 34,938 | |
| Total | | $ | 12,588,671 | | | $ | 226,413,511 | | | $ | — | | | $ | 239,002,182 | |
There have been no transfers between fair value measurement levels during the year ended December 31, 2012.
(d) See Investment Portfolio for additional detailed categorizations.
(e) Derivatives include unrealized appreciation (depreciation) on futures contracts.
The accompanying notes are an integral part of the financial statements.
Statement of Assets and Liabilities | as of December 31, 2012 | |
| Assets | |
Investments: Investments in non-affiliated securities, at value (cost $203,831,826) — including $11,886,500 of securities loaned | | $ | 226,413,511 | |
| Investment in Daily Assets Fund Institutional (cost $12,398,074)* | | | 12,398,074 | |
| Investment in Central Cash Management Fund (cost $155,659) | | | 155,659 | |
| Total investments, at value (cost $216,385,559) | | | 238,967,244 | |
| Foreign currency, at value (cost $3,565,682) | | | 3,478,967 | |
| Deposit with broker for futures contracts | | | 227,500 | |
| Receivable for Fund shares sold | | | 11,017 | |
| Dividends receivable | | | 292,740 | |
| Interest receivable | | | 4,085 | |
| Receivable for variation margin on futures contracts | | | 117,326 | |
| Foreign taxes recoverable | | | 205,132 | |
| Other assets | | | 3,840 | |
| Total assets | | | 243,307,851 | |
| Liabilities | |
| Cash overdraft | | | 86,774 | |
| Payable for Fund shares redeemed | | | 187,269 | |
| Payable upon return of securities loaned | | | 12,398,074 | |
| Accrued Trustees' fees | | | 4,158 | |
| Accrued management fee | | | 151,741 | |
| Other accrued expenses and payables | | | 101,519 | |
| Total liabilities | | | 12,929,535 | |
| Net assets, at value | | $ | 230,378,316 | |
| Net Assets Consist of | |
| Undistributed net investment income | | | 6,524,406 | |
Net unrealized appreciation (depreciation) on: Investments | | | 22,581,685 | |
| Futures | | | 34,938 | |
| Foreign currency | | | (65,453 | ) |
| Accumulated net realized gain (loss) | | | (149,876,089 | ) |
| Paid-in capital | | | 351,178,829 | |
| Net assets, at value | | $ | 230,378,316 | |
Class A Net Asset Value, offering and redemption price per share ($230,097,968 ÷ 28,915,018 outstanding shares of beneficial interest, $.01 par value, unlimited number of shares authorized) | | $ | 7.96 | |
Class B Net Asset Value, offering and redemption price per share ($280,348 ÷ 35,208 outstanding shares of beneficial interest, $.01 par value, unlimited number of shares authorized) | | $ | 7.96 | |
* Represents collateral on securities loaned.
The accompanying notes are an integral part of the financial statements.
Statement of Operations
| for the year ended December 31, 2012 | |
| Investment Income | |
Income: Dividends (net of foreign taxes withheld of $607,054) | | $ | 8,296,755 | |
| Interest | | | 552 | |
| Income distributions — Central Cash Management Fund | | | 5,440 | |
| Securities lending income, including income from Daily Assets Fund Institutional, net of borrower rebates | | | 403,081 | |
| Total income | | | 8,705,828 | |
Expenses: Management fee | | | 1,734,101 | |
| Administration fee | | | 219,506 | |
| Services to shareholders | | | 2,496 | |
| Custodian fee | | | 45,646 | |
| Distribution service fee (Class B) | | | 651 | |
| Professional fees | | | 68,929 | |
| Reports to shareholders | | | 38,966 | |
| Trustees' fees and expenses | | | 10,847 | |
| Other | | | 24,652 | |
| Total expenses | | | 2,145,794 | |
| Net investment income (loss) | | | 6,560,034 | |
| Realized and Unrealized Gain (Loss) | |
Net realized gain (loss) from: Investments | | | (20,112,403 | ) |
| Futures | | | 1,540,750 | |
| Foreign currency | | | (110,930 | ) |
| | | | (18,682,583 | ) |
Change in net unrealized appreciation (depreciation) on: Investments | | | 53,415,788 | |
| Futures | | | (139,437 | ) |
| Foreign currency | | | 105,412 | |
| | | | 53,381,763 | |
| Net gain (loss) | | | 34,699,180 | |
| Net increase (decrease) in net assets resulting from operations | | $ | 41,259,214 | |
The accompanying notes are an integral part of the financial statements.
Statement of Changes in Net Assets | | | Years Ended December 31, | |
| Increase (Decrease) in Net Assets | | 2012 | | | 2011 | |
Operations: Net investment income (loss) | | $ | 6,560,034 | | | $ | 5,039,870 | |
| Net realized gain (loss) | | | (18,682,583 | ) | | | 19,998,084 | |
| Change in net unrealized appreciation (depreciation) | | | 53,381,763 | | | | (67,950,795 | ) |
| Net increase (decrease) in net assets resulting from operations | | | 41,259,214 | | | | (42,912,841 | ) |
Distributions to shareholders from: Net investment income: Class A | | | (4,756,093 | ) | | | (4,647,186 | ) |
| Class B | | | (4,778 | ) | | | (4,542 | ) |
| Total distributions | | | (4,760,871 | ) | | | (4,651,728 | ) |
Fund share transactions: Class A Proceeds from shares sold | | | 8,058,394 | | | | 8,968,575 | |
| Reinvestment of distributions | | | 4,756,093 | | | | 4,647,186 | |
| Payments for shares redeemed | | | (29,986,864 | ) | | | (43,581,738 | ) |
| Net increase (decrease) in net assets from Class A share transactions | | | (17,172,377 | ) | | | (29,965,977 | ) |
Class B Proceeds from shares sold | | | 38,387 | | | | 17,120 | |
| Reinvestment of distributions | | | 4,778 | | | | 4,542 | |
| Payments for shares redeemed | | | (40,070 | ) | | | (100,644 | ) |
| Net increase (decrease) in net assets from Class B share transactions | | | 3,095 | | | | (78,982 | ) |
| Increase (decrease) in net assets | | | 19,329,061 | | | | (77,609,528 | ) |
| Net assets at beginning of period | | | 211,049,255 | | | | 288,658,783 | |
| Net assets at end of period (including undistributed net investment income of $6,524,406 and $4,638,574, respectively) | | $ | 230,378,316 | | | $ | 211,049,255 | |
| Other Information | |
Class A Shares outstanding at beginning of period | | | 31,267,358 | | | | 35,091,522 | |
| Shares sold | | | 1,102,311 | | | | 1,212,691 | |
| Shares issued to shareholders in reinvestment of distributions | | | 650,628 | | | | 539,116 | |
| Shares redeemed | | | (4,105,279 | ) | | | (5,575,971 | ) |
| Net increase (decrease) in Class A shares | | | (2,352,340 | ) | | | (3,824,164 | ) |
| Shares outstanding at end of period | | | 28,915,018 | | | | 31,267,358 | |
Class B Shares outstanding at beginning of period | | | 34,893 | | | | 44,527 | |
| Shares sold | | | 5,248 | | | | 2,218 | |
| Shares issued to shareholders in reinvestment of distributions | | | 652 | | | | 526 | |
| Shares redeemed | | | (5,585 | ) | | | (12,378 | ) |
| Net increase (decrease) in Class B shares | | | 315 | | | | (9,634 | ) |
| Shares outstanding at end of period | | | 35,208 | | | | 34,893 | |
The accompanying notes are an integral part of the financial statements.
| | | Years Ended December 31, | |
| Class A | | | 2012 | | | 2011 | | | 2010 | | | 2009 | | | 2008 | |
| Selected Per Share Data | |
| Net asset value, beginning of period | | $ | 6.74 | | | $ | 8.22 | | | $ | 8.26 | | | $ | 6.52 | | | $ | 15.01 | |
Income (loss) from investment operations: Net investment income (loss)a | | | .22 | | | | .15 | | | | .13 | | | | .12 | | | | .29 | c |
| Net realized and unrealized gain (loss) | | | 1.16 | | | | (1.49 | ) | | | (.00 | )* | | | 1.93 | | | | (6.46 | ) |
| Total from investment operations | | | 1.38 | | | | (1.34 | ) | | | .13 | | | | 2.05 | | | | (6.17 | ) |
Less distributions from: Net investment income | | | (.16 | ) | | | (.14 | ) | | | (.17 | ) | | | (.31 | ) | | | (.17 | ) |
| Net realized gains | | | — | | | | — | | | | — | | | | — | | | | (2.15 | ) |
| Total distributions | | | (.16 | ) | | | (.14 | ) | | | (.17 | ) | | | (.31 | ) | | | (2.32 | ) |
| Net asset value, end of period | | $ | 7.96 | | | $ | 6.74 | | | $ | 8.22 | | | $ | 8.26 | | | $ | 6.52 | |
| Total Return (%) | | | 20.65 | | | | (16.67 | ) | | | 1.62 | b | | | 33.52 | | | | (48.21 | )b,d |
| Ratios to Average Net Assets and Supplemental Data | |
| Net assets, end of period ($ millions) | | | 230 | | | | 211 | | | | 288 | | | | 344 | | | | 297 | |
| Ratio of expenses before expense reductions (%) | | | .98 | | | | 1.00 | | | | .99 | | | | .94 | | | | 1.01 | |
| Ratio of expenses after expense reductions (%) | | | .98 | | | | 1.00 | | | | .99 | | | | .94 | | | | .97 | |
| Ratio of net investment income (loss) (%) | | | 2.99 | | | | 1.98 | | | | 1.68 | | | | 1.69 | | | | 2.74 | c |
| Portfolio turnover rate (%) | | | 85 | | | | 174 | | | | 228 | | | | 81 | | | | 123 | |
a Based on average shares outstanding during the period. b Total return would have been lower had certain expenses not been reduced. c Net investment income per share and the ratio of net investment income include non-recurring dividend income amounting to $0.09 per share and 0.82% of average daily net assets for the year ended December 31, 2008. d Includes a reimbursement from the Advisor to reimburse the effect of losses incurred as the result of certain operation errors during the period. Excluding this reimbursement, total return would have been 0.06% lower. * Amount is less than $.005. | |
| | | Years Ended December 31, | |
| Class B | | | 2012 | | | 2011 | | | 2010 | | | 2009 | | | 2008 | |
| Selected Per Share Data | |
| Net asset value, beginning of period | | $ | 6.75 | | | $ | 8.22 | | | $ | 8.26 | | | $ | 6.52 | | | $ | 14.98 | |
Income (loss) from investment operations: Net investment income (loss)a | | | .20 | | | | .13 | | | | .11 | | | | .10 | | | | .23 | c |
| Net realized and unrealized gain (loss) | | | 1.15 | | | | (1.48 | ) | | | (.00 | )* | | | 1.94 | | | | (6.43 | ) |
| Total from investment operations | | | 1.35 | | | | (1.35 | ) | | | .11 | | | | 2.04 | | | | (6.20 | ) |
Less distributions from: Net investment income | | | (.14 | ) | | | (.12 | ) | | | (.15 | ) | | | (.30 | ) | | | (.11 | ) |
| Net realized gains | | | — | | | | — | | | | — | | | | — | | | | (2.15 | ) |
| Total distributions | | | (.14 | ) | | | (.12 | ) | | | (.15 | ) | | | (.30 | ) | | | (2.26 | ) |
| Net asset value, end of period | | $ | 7.96 | | | $ | 6.75 | | | $ | 8.22 | | | $ | 8.26 | | | $ | 6.52 | |
| Total Return (%) | | | 20.13 | | | | (16.77 | ) | | | 1.33 | b | | | 32.89 | | | | (48.25 | )b,d |
| Ratios to Average Net Assets and Supplemental Data | |
| Net assets, end of period ($ millions) | | | .28 | | | | .24 | | | | .36 | | | | .50 | | | | .40 | |
| Ratio of expenses before expense reductions (%) | | | 1.26 | | | | 1.28 | | | | 1.26 | | | | 1.22 | | | | 1.33 | |
| Ratio of expenses after expense reductions (%) | | | 1.26 | | | | 1.28 | | | | 1.26 | | | | 1.22 | | | | 1.28 | |
| Ratio of net investment income (loss) (%) | | | 2.73 | | | | 1.70 | | | | 1.41 | | | | 1.42 | | | | 2.42 | c |
| Portfolio turnover rate (%) | | | 85 | | | | 174 | | | | 228 | | | | 81 | | | | 123 | |
a Based on average shares outstanding during the period. b Total return would have been lower had certain expenses not been reduced. c Net investment income per share and the ratio of net investment income include non-recurring dividend income amounting to $0.09 per share and 0.82% of average daily net assets for the year ended December 31, 2008. d Includes a reimbursement from the Advisor to reimburse the effect of losses incurred as the result of certain operation errors during the period. Excluding this reimbursement, total return would have been 0.06% lower. * Amount is less than $.005. | |
Notes to Financial Statements
A. Organization and Significant Accounting Policies
DWS Variable Series I (the "Series") is registered under the Investment Company Act of 1940, as amended (the "1940 Act"), as an open-end, registered management investment company organized as a Massachusetts business trust. The Series consists of five diversified funds: DWS Bond VIP, DWS Core Equity VIP (formerly DWS Growth & Income VIP), DWS Capital Growth VIP, DWS Global Small Cap Growth VIP and DWS International VIP (individually or collectively hereinafter referred to as a "Fund" or the "Funds"). These financial statements report on DWS International VIP. The Series is intended to be the underlying investment vehicle for variable annuity contracts and variable life insurance policies to be offered by the separate accounts of certain life insurance companies ("Participating Insurance Companies").
Multiple Classes of Shares of Beneficial Interest. The Fund offers two classes of shares (Class A shares and Class B shares). Class B shares are subject to Rule 12b-1 distribution fees under the 1940 Act and recordkeeping fees equal to an annual rate of 0.25% and up to 0.15%, respectively, of the average daily net assets of the Class B shares of the Fund. Class A shares are not subject to such fees.
Investment income, realized and unrealized gains and losses, and certain fund-level expenses and expense reductions, if any, are borne pro rata on the basis of relative net assets by the holders of all classes of shares, except that each class bears certain expenses unique to that class (including the applicable 12b-1 distribution fees and recordkeeping fees). Differences in class-level expenses may result in payment of different per share dividends by class. All shares have equal rights with respect to voting subject to class-specific arrangements.
The Fund's financial statements are prepared in accordance with accounting principles generally accepted in the United States of America, which require the use of management estimates. Actual results could differ from those estimates. The policies described below are followed consistently by the Fund in the preparation of its financial statements.
Security Valuation. Investments are stated at value determined as of the close of regular trading on the New York Stock Exchange on each day the exchange is open for trading.
Various inputs are used in determining the value of the Fund's investments. These inputs are summarized in three broad levels. Level 1 includes quoted prices in active markets for identical securities. Level 2 includes other significant observable inputs (including quoted prices for similar securities, interest rates, prepayment speeds, and credit risk). Level 3 includes significant unobservable inputs (including the Fund's own assumptions in determining the fair value of investments). The inputs or methodology used for valuing securities are not necessarily an indication of the risk associated with investing in those securities.
Equity securities are valued at the most recent sale price or official closing price reported on the exchange (U.S. or foreign) or over-the-counter market on which they trade and are categorized as Level 1 securities. Securities for which no sales are reported are valued at the calculated mean between the most recent bid and asked quotations on the relevant market or, if a mean cannot be determined, at the most recent bid quotation. For certain international equity securities, in order to adjust for events which may occur between the close of the foreign exchanges and the close of the New York Stock Exchange, a fair valuation model may be used. This fair valuation model takes into account comparisons to the valuation of American Depository Receipts (ADRs), exchange-traded funds, futures contracts and certain indices and these securities are categorized as Level 2.
Investments in open-end investment companies are valued at their net asset value each business day and are categorized as Level 1.
Futures contracts are generally valued at the settlement prices established each day on the exchange on which they are traded and are categorized as Level 1.
Securities and other assets for which market quotations are not readily available or for which the above valuation procedures are deemed not to reflect fair value are valued in a manner that is intended to reflect their fair value as determined in accordance with procedures approved by the Trustees and are generally categorized as Level 3. In accordance with the Fund's valuation procedures, factors used in determining value may include, but are not limited to, the type of the security; the size of the holding; the initial cost of the security; the existence of any contractual restrictions on the security's disposition; the price and extent of public trading in similar securities of the issuer or of comparable companies; quotations or evaluated prices from broker-dealers and/or pricing services; information obtained from the issuer, analysts, and/or the appropriate stock exchange (for exchange-traded securities); an analysis of the company's or issuer's financial statements; an evaluation of the forces that influence the issuer and the market(s) in which the security is purchased and sold and with respect to debt securities; the maturity, coupon, creditworthiness, currency denomination and the movement of the market in which the security is normally traded. The value determined under these procedures may differ from published values for the same securities.
Disclosure about the classification of fair value measurements is included in a table following the Fund's Investment Portfolio.
New Accounting Pronouncement. In January 2013, Accounting Standard Update 2013-01 (ASU 2013-01), Clarifying the Scope of Disclosures about Offsetting Assets and Liabilities, replaced Accounting Standards Update 2011-11 (ASU 2011-11), Disclosures about Offsetting Assets and Liabilities. ASU 2013-01 is effective for fiscal years beginning on or after January 1, 2013, and interim periods within those annual periods. ASU 2011-11 was intended to enhance disclosure requirements on the offsetting of financial assets and liabilities. The ASU 2013-01 limits the scope of the new balance sheet offsetting disclosures to derivatives, repurchase agreements, and securities lending transactions to the extent that they are (1) offset in the financial statements or (2) subject to an enforceable master netting arrangement or similar agreement. Management is currently evaluating the application of ASU 2013-01 and its impact, if any, on the Fund's financial statements.
Securities Lending. The Fund lends securities to certain financial institutions. The Fund retains beneficial ownership of the securities it has loaned and continues to receive interest and dividends paid by the issuer of securities and to participate in any changes in their market value. The Fund requires the borrowers of the securities to maintain collateral with the Fund consisting of either cash or liquid, unencumbered assets having a value at least equal to the value of the securities loaned. When the collateral falls below specified amounts, the lending agent will use its best effort to obtain additional collateral on the next business day to meet required amounts under the security lending agreement. The Fund may invest the cash collateral into a joint trading account in an affiliated money market fund pursuant to Exemptive Orders issued by the SEC. The Fund receives compensation for lending its securities either in the form of fees or by earning interest on invested cash collateral net of borrower rebates and fees paid to a lending agent. Either the Fund or the borrower may terminate the loan. There may be risks of delay and costs in recovery of securities or even loss of rights in the collateral should the borrower of the securities fail financially. The Fund is also subject to all investment risks associated with the reinvestment of any cash collateral received, including, but not limited to, interest rate, credit and liquidity risk associated with such investments.
Foreign Currency Translations. The books and records of the Fund are maintained in U.S. dollars. Investment securities and other assets and liabilities denominated in a foreign currency are translated into U.S. dollars at the prevailing exchange rates at period end. Purchases and sales of investment securities, income and expenses are translated into U.S. dollars at the prevailing exchange rates on the respective dates of the transactions.
Net realized and unrealized gains and losses on foreign currency transactions represent net gains and losses between trade and settlement dates on securities transactions, the acquisition and disposition of foreign currencies, and the difference between the amount of net investment income accrued and the U.S. dollar amount actually received. That portion of both realized and unrealized gains and losses on investments that results from fluctuations in foreign currency exchange rates is not separately disclosed but is included with net realized and unrealized gain/appreciation and loss/depreciation on investments.
Taxes. The Fund is treated as a separate taxpayer as provided for in the Internal Revenue Code, as amended. It is the Fund's policy to comply with the requirements of the Internal Revenue Code, as amended, which are applicable to regulated investment companies, and to distribute all of its taxable income to the separate accounts of the Participating Insurance Companies which hold its shares.
Additionally, the Fund may be subject to taxes imposed by the governments of countries in which it invests and are generally based on income and/or capital gains earned or repatriated. Estimated tax liabilities on certain foreign securities are recorded on an accrual basis and are reflected as components of interest income or net change in unrealized gain/loss on investments. Tax liabilities realized as a result of security sales are reflected as a component of net realized gain/loss on investments.
Under the Regulated Investment Company Modernization Act of 2010, net capital losses incurred post-enactment may be carried forward indefinitely, and their character is retained as short-term and/or long-term. Previously, net capital losses were carried forward for eight years and treated as short-term losses. As a transition rule, the Act requires that post-enactment net capital losses be used before pre-enactment net capital losses.
At December 31, 2012, the Fund had a net tax basis capital loss carryforward of approximately $149,313,000, including $124,587,000 of pre-enactment losses which may be applied against any realized net taxable capital gains of each succeeding year until fully utilized or until December 31, 2016 ($25,765,000) and December 31, 2017 ($98,822,000), the respective expiration dates, whichever occurs first; and approximately $24,726,000 of post-enactment losses, which may be applied against realized net taxable capital gains indefinitely, including short-term losses ($15,693,000) and long-term losses ($9,033,000).
The Fund has reviewed the tax positions for the open tax years as of December 31, 2012 and has determined that no provision for income tax is required in the Fund's financial statements. The Fund's federal tax returns for the prior three fiscal years remain open subject to examination by the Internal Revenue Service.
Distribution of Income and Gains. The Fund will declare and distribute dividends from its net investment income, if any, annually, although additional distributions may be made if necessary. Net realized gains from investment transactions, in excess of available capital loss carryforwards, would be taxable to the Fund if not distributed and, therefore, will be distributed to shareholders at least annually.
The timing and characterization of certain income and capital gain distributions are determined annually in accordance with federal tax regulations which may differ from accounting principles generally accepted in the United States of America. These differences primarily relate to investments in foreign denominated investments, futures contracts, passive foreign investment companies and certain securities sold at a loss. As a result, net investment income (loss) and net realized gain (loss) on investment transactions for a reporting period may differ significantly from distributions during such period. Accordingly, the Fund may periodically make reclassifications among certain of its capital accounts without impacting the net asset value of the Fund.
At December 31, 2012, the Fund's components of distributable earnings (accumulated losses) on a tax basis are as follows:
| Undistributed ordinary income* | | $ | 7,340,630 | |
| Capital loss carryforwards | | $ | (149,313,000 | ) |
| Net unrealized appreciation (depreciation) on investments | | $ | 21,237,611 | |
In addition, the tax character of distributions paid to shareholders by the Fund is summarized as follows:
| | | Years Ended December 31, | |
| | | 2012 | | | 2011 | |
| Distributions from ordinary income* | | $ | 4,760,871 | | | $ | 4,651,728 | |
* For tax purposes, short-term capital gain distributions are considered ordinary income distributions.
Expenses. Expenses of the Series arising in connection with a specific Fund are allocated to that Fund. Other Series expenses which cannot be directly attributed to a Fund are apportioned among the Funds in the Series based upon the relative net assets or other appropriate measures.
Contingencies. In the normal course of business, the Fund may enter into contracts with service providers that contain general indemnification clauses. The Fund's maximum exposure under these arrangements is unknown as this would involve future claims that may be made against the Fund that have not yet been made. However, based on experience, the Fund expects the risk of loss to be remote.
Other. Investment transactions are accounted for on a trade date plus one basis for daily net asset value calculations. However, for financial reporting purposes, investment transactions are reported on trade date. Interest income is recorded on the accrual basis net of foreign withholding taxes. Dividend income is recorded on the ex-dividend date net of foreign withholding taxes. Certain dividends from foreign securities may be recorded subsequent to the ex-dividend date as soon as the Fund is informed of such dividends. Realized gains and losses from investment transactions are recorded on an identified cost basis and may include proceeds from litigation.
B. Derivative Instruments
Futures Contracts. A futures contract is an agreement between a buyer or seller and an established futures exchange or its clearinghouse in which the buyer or seller agrees to take or make a delivery of a specific amount of a financial instrument at a specified price on a specific date (settlement date). For the year ended December 31, 2012, the Fund entered into futures contracts to keep cash on hand to meet shareholder redemptions or other needs while maintaining exposure to the market.
Upon entering into a futures contract, the Fund is required to deposit with a financial intermediary cash or securities ("initial margin") in an amount equal to a certain percentage of the face value indicated in the futures contract. Subsequent payments ("variation margin") are made or received by the Fund dependent upon the daily fluctuations in the value and are recorded for financial reporting purposes as unrealized gains or losses by the Fund. Gains or losses are realized when the contract expires or is closed. Since all futures contracts are exchange-traded, counterparty risk is minimized as the exchange's clearinghouse acts as the counterparty, and guarantees the futures against default.
Certain risks may arise upon entering into futures contracts, including the risk that an illiquid market will limit the Fund's ability to close out a futures contract prior to the settlement date and the risk that the futures contract is not well correlated with the security, index or currency to which it relates. Risk of loss may exceed amounts disclosed in the Statement of Assets and Liabilities.
A summary of the open futures contracts as of December 31, 2012 is included in a table following the Fund's Investment Portfolio. For the year ended December 31, 2012, the investment in futures contracts purchased had a total notional value generally indicative of a range from approximately $4,615,000 to $10,851,000.
| Asset Derivative | | Futures Contracts | |
| Equity Contracts (a) | | $ | 34,938 | |
The above derivative is located in the following Statement of Assets and Liabilities account:
(a) Includes cumulative appreciation of futures contracts as disclosed in the Investment Portfolio. Unsettled variation margin is disclosed separately within the Statement of Assets and Liabilities.
Additionally, the amount of unrealized and realized gains and losses on derivative instruments recognized in Fund earnings during the year ended December 31, 2012 and the related location in the accompanying Statement of Operations is summarized in the following tables by primary underlying risk exposure:
| Realized Gain (Loss) | | Futures Contracts | |
| Equity Contracts (a) | | $ | 1,540,750 | |
The above derivative is located in the following Statement of Operations account:
(a) Net realized gain (loss) from futures
| Change in Net Unrealized Appreciation (Depreciation) | | Futures Contracts | |
| Equity Contracts (a) | | $ | (139,437 | ) |
The above derivative is located in the following Statement of Operations account:
(a) Change in net unrealized appreciation (depreciation) on futures
C. Purchases and Sales of Securities
During the year ended December 31, 2012, purchases and sales of investment securities (excluding short-term investments) aggregated $179,983,322 and $189,174,664, respectively.
D. Related Parties
Management Agreement. Under the Investment Management Agreement with Deutsche Investment Management Americas Inc. ("DIMA" or the "Advisor"), an indirect, wholly owned subsidiary of Deutsche Bank AG, the Advisor directs the investments of the Fund in accordance with its investment objectives, policies and restrictions. The Advisor determines the securities, instruments and other contracts relating to investments to be purchased, sold or entered into by the Fund.
Pursuant to the Investment Management Agreement with the Advisor, the Fund pays a monthly management fee based on the Fund's average daily net assets, computed and accrued daily and payable monthly, at the following annual rates:
| First $500 million of average daily net assets | | | .790 | % |
| Over $500 million of average daily net assets | | | .640 | % |
Accordingly, for the year ended December 31, 2012, the fee pursuant to the Investment Management Agreement was equivalent to an annualized effective rate of 0.79% of the Fund's average daily net assets.
Effective October 1, 2012 through September 30, 2013 the Advisor has contractually agreed to waive all or a portion of its fees and/or reimburse certain operating expenses of the Fund to the extent necessary to maintain the operating expenses (excluding certain expenses such as extraordinary expenses, taxes, brokerage and interest) of each class as follows:
Administration Fee. Pursuant to an Administrative Services Agreement, DIMA provides most administrative services to the Fund. For all services provided under the Administrative Services Agreement, the Fund pays the Advisor an annual fee ("Administration Fee") of 0.10% of the Fund's average daily net assets, computed and accrued daily and payable monthly. For the year ended December 31, 2012, the Administration Fee was $219,506, of which $19,208 is unpaid.
Service Provider Fees. DWS Investments Service Company ("DISC"), an affiliate of the Advisor, is the transfer agent, dividend-paying agent and shareholder service agent for the Fund. Pursuant to a sub-transfer agency agreement between DISC and DST Systems, Inc. ("DST"), DISC has delegated certain transfer agent, dividend-paying agent and shareholder service agent functions to DST. DISC compensates DST out of the shareholder servicing fee it receives from the Fund. For the year ended December 31, 2012, the amounts charged to the Fund by DISC were as follows:
| Services to Shareholders | | Total Aggregated | | | Unpaid at December 31, 2012 | |
| Class A | | $ | 692 | | | $ | 173 | |
| Class B | | | 82 | | | | 20 | |
| | | $ | 774 | | | $ | 193 | |
Distribution Service Agreement. DWS Investments Distributors, Inc. ("DIDI"), also an affiliate of the Advisor, is the Series' Distributor. In accordance with the Master Distribution Plan, DIDI receives 12b-1 fees of 0.25% of average daily net assets of Class B shares. Pursuant to the Master Distribution Plan, DIDI remits these fees to the Participating Insurance Companies for various costs incurred or paid by these companies in connection with marketing and distribution of Class B shares. For the year ended December 31, 2012, the Distribution Service Fee aggregated $651, of which $58 is unpaid.
Typesetting and Filing Service Fees. Under an agreement with DIMA, DIMA is compensated for providing typesetting and certain regulatory filing services to the Fund. For the year ended December 31, 2012, the amount charged to the Fund by DIMA included in the Statement of Operations under "reports to shareholders" aggregated $17,634, of which $4,957 is unpaid.
Trustees' Fees and Expenses. The Fund paid retainer fees to each Trustee not affiliated with the Advisor, plus specified amounts to the Board Chairperson and to each committee Chairperson.
Affiliated Cash Management Vehicle. The Fund may invest uninvested cash balances in Central Cash Management Fund, which is managed by the Advisor. The Fund indirectly bears its proportionate share of the expenses of Central Cash Management Fund. Central Cash Management Fund does not pay the Advisor an investment management fee. Central Cash Management Fund seeks a high level of current income consistent with liquidity and the preservation of capital.
Securities Lending Agent Fees. Deutsche Bank AG serves as securities lending agent for the Fund. For the year ended December 31, 2012, the Fund incurred securities lending agent fees to Deutsche Bank AG in the amount of $43,544.
E. Ownership of the Fund
Two participating insurance companies were owners of record of 10% or more of the total outstanding Class A shares of the Fund, each owning 41% and 13%.
F. Line of Credit
The Fund and other affiliated funds (the "Participants") share in a $375 million revolving credit facility provided by a syndication of banks. The Fund may borrow for temporary or emergency purposes, including the meeting of redemption requests that otherwise might require the untimely disposition of securities. The Participants are charged an annual commitment fee which is allocated based on net assets, among each of the Participants. Interest is calculated at a rate per annum equal to the sum of the Federal Funds Rate plus 1.25 percent plus if LIBOR exceeds the Federal Funds Rate the amount of such excess. The Fund may borrow up to a maximum of 33 percent of its net assets under the agreement. The Fund had no outstanding loans at December 31, 2012.
Report of Independent Registered Public Accounting Firm
To the Trustees of DWS Variable Series I and the Shareholders of DWS International VIP:
In our opinion, the accompanying statement of assets and liabilities, including the investment portfolio, and the related statements of operations and of changes in net assets and the financial highlights present fairly, in all material respects, the financial position of DWS International VIP (the "Fund") at December 31, 2012 and the results of its operations, the changes in its net assets, and the financial highlights for the periods indicated therein, in conformity with accounting principles generally accepted in the United States of America. These financial statements and financial highlights (hereafter referred to as "financial statements") are the responsibility of the Fund's management. Our responsibility is to express an opinion on these financial statements based on our audits. We conducted our audits of these financial statements in accordance with the standards of the Public Company Accounting Oversight Board (United States). Those standards require that we plan and perform the audit to obtain reasonable assurance about whether the financial statements are free of material misstatement. An audit includes examining, on a test basis, evidence supporting the amounts and disclosures in the financial statements, assessing the accounting principles used and significant estimates made by management, and evaluating the overall financial statement presentation. We believe that our audits, which included confirmation of securities at December 31, 2012 by correspondence with the custodians and brokers, provide a reasonable basis for our opinion.
Boston, Massachusetts February 14, 2013 | PricewaterhouseCoopers LLP |
Information About Your Fund's Expenses (Unaudited)
As an investor of the Fund, you incur two types of costs: ongoing expenses and transaction costs. Ongoing expenses include management fees, distribution and service (12b-1) fees and other Fund expenses. Examples of transaction costs include contract charges, redemption fees and account maintenance fees, which are not shown in this section. The following tables are intended to help you understand your ongoing expenses (in dollars) of investing in the Fund and to help you compare these expenses with the ongoing expenses of investing in other mutual funds. The example in the table is based on an investment of $1,000 invested at the beginning of the six-month period and held for the entire period (July 1, 2012 to December 31, 2012).
The tables illustrate your Fund's expenses in two ways:
•Actual Fund Return. This helps you estimate the actual dollar amount of ongoing expenses (but not transaction costs) paid on a $1,000 investment in the Fund using the Fund's actual return during the period. To estimate the expenses you paid over the period, simply divide your account value by $1,000 (for example, an $8,600 account value divided by $1,000 = 8.6), then multiply the result by the number in the "Expenses Paid per $1,000" line under the share class you hold.
• Hypothetical 5% Fund Return. This helps you to compare your Fund's ongoing expenses (but not transaction costs) with those of other mutual funds using the Fund's actual expense ratio and a hypothetical rate of return of 5% per year before expenses. Examples using a 5% hypothetical Fund return may be found in the shareholder reports of other mutual funds. The hypothetical account values and expenses may not be used to estimate the actual ending account balance or expenses you paid for the period.
Please note that the expenses shown in these tables are meant to highlight your ongoing expenses only and do not reflect any transaction costs. The "Expenses Paid per $1,000" line of the tables is useful in comparing ongoing expenses only and will not help you determine the relative total expense of owning different funds. If these transaction costs had been included, your costs would have been higher.
Expenses and Value of a $1,000 Investment for the six months ended December 31, 2012 | |
| Actual Fund Return | | Class A | | | Class B | |
| Beginning Account Value 7/1/12 | | $ | 1,000.00 | | | $ | 1,000.00 | |
| Ending Account Value 12/31/12 | | $ | 1,145.30 | | | $ | 1,143.70 | |
| Expenses Paid per $1,000* | | $ | 5.07 | | | $ | 6.63 | |
| Hypothetical 5% Fund Return | | Class A | | | Class B | |
| Beginning Account Value 7/1/12 | | $ | 1,000.00 | | | $ | 1,000.00 | |
| Ending Account Value 12/31/12 | | $ | 1,020.41 | | | $ | 1,018.95 | |
| Expenses Paid per $1,000* | | $ | 4.77 | | | $ | 6.24 | |
* Expenses are equal to the Fund's annualized expense ratio for each share class, multiplied by the average account value over the period, multiplied by 184 (the number of days in the most recent six-month period), then divided by 366.
| Annualized Expense Ratios | Class A | | Class B | |
| DWS Variable Series I — DWS International VIP | .94% | | 1.23% | |
For more information, please refer to the Fund's prospectus.
These tables do not reflect charges and fees ("contract charges") associated with the separate account that invests in the Fund or any variable life insurance policy or variable annuity contract for which the Fund is an investment option.
Tax Information (Unaudited)
Please consult a tax advisor if you have questions about federal or state income tax laws, or on how to prepare your tax returns. If you have specific questions about your account, please contact your insurance provider.
The Series' policies and procedures for voting proxies for portfolio securities and information about how the Series voted proxies related to its portfolio securities during the 12-month period ended June 30 are available on our Web site — www.dws-investments.com (click on "proxy voting"at the bottom of the page) — or on the SEC's Web site — www.sec.gov. To obtain a written copy of the Series' policies and procedures without charge, upon request, call us toll free at (800) 728-3337.
Investment Management Agreement Approval
The Board of Trustees approved the renewal of DWS International VIP's investment management agreement (the "Agreement") with Deutsche Investment Management Americas Inc. ("DWS") in September 2012.
In terms of the process that the Board followed prior to approving the Agreement, shareholders should know that:
• In September 2012, all of the Fund's Trustees were independent of DWS and its affiliates.
• The Trustees met frequently during the past year to discuss fund matters and dedicated a substantial amount of time to contract review matters. Over the course of several months, the Board's Contract Committee, in coordination with the Board's Equity Oversight Committee, reviewed comprehensive materials received from DWS, independent third parties and independent counsel. These materials included an analysis of the Fund's performance, fees and expenses, and profitability compiled by the Fund's independent fee consultant. The Board also received extensive information throughout the year regarding performance of the Fund.
• The Independent Trustees regularly meet privately with their independent counsel to discuss contract review and other matters. In addition, the Independent Trustees were also advised by the Fund's independent fee consultant in the course of their review of the Fund's contractual arrangements and considered a comprehensive report prepared by the independent fee consultant in connection with their deliberations (the "IFC Report").
• In connection with reviewing the Agreement, the Board also reviewed the terms of the Fund's Rule 12b-1 plan, distribution agreement, administrative services agreement, transfer agency agreement and other material service agreements.
• Based on its evaluation of the information provided, the Contract Committee presented its findings and recommendations to the Board. The Board then reviewed the Contract Committee's findings and recommendations.
In connection with the contract review process, the Contract Committee and the Board considered the factors discussed below, among others. The Board also considered that DWS and its predecessors have managed the Fund since its inception, and the Board believes that a long-term relationship with a capable, conscientious advisor is in the best interests of the Fund. The Board considered, generally, that shareholders chose to invest or remain invested in the Fund knowing that DWS managed the Fund, and that the Agreement was approved by the Fund's shareholders. DWS is part of Deutsche Bank, a major global banking institution that is engaged in a wide range of financial services. The Board believes that there are advantages to being part of a global asset management business that offers a wide range of investing expertise and resources, including hundreds of portfolio managers and analysts with research capabilities in many countries throughout the world.
As part of the contract review process, the Board carefully considered the fees and expenses of each DWS fund overseen by the Board in light of the fund's performance. In many cases, this led to a negotiation with DWS of lower expense caps for the coming year than had previously been in place. As part of these negotiations, the Board indicated that it would consider relaxing these new lower caps in future years following sustained improvements in performance, among other considerations.
In June 2012, Deutsche Bank ("DB"), DWS's parent company, announced that DB's new management team had concluded the strategic review of its global asset management business announced in late 2011 by DB's prior management team, and would combine its Asset Management (of which DWS is a part) and Wealth Management divisions. Prior to approving the investment management agreements, the Independent Trustees were apprised of the expected management and structure of the new combined Asset & Wealth Management division ("AWM") and DWS. DB also advised the Independent Trustees that the U.S. asset management business is a critical and integral part of DB and AWM, and that DB would be reinvesting a significant portion of the substantial savings it expects to realize by combining its Asset Management and Wealth Management divisions into a combined AWM division, including enhancements to its investment capabilities. DB also confirmed its commitment to maintaining strong legal and compliance groups within the combined division.
While shareholders may focus primarily on fund performance and fees, the Fund's Board considers these and many other factors, including the quality and integrity of DWS's personnel and such other issues as back-office operations, fund valuations, and compliance policies and procedures.
Nature, Quality and Extent of Services. The Board considered the terms of the Agreement, including the scope of advisory services provided under the Agreement. The Board noted that, under the Agreement, DWS provides portfolio management services to the Fund and that, pursuant to a separate administrative services agreement, DWS provides administrative services to the Fund. The Board considered the experience and skills of senior management and investment personnel, the resources made available to such personnel, the ability of DWS to attract and retain high-quality personnel, and the organizational depth and stability of DWS. The Board reviewed the Fund's performance over short-term and long-term periods and compared those returns to various agreed-upon performance measures, including market indices and a peer universe compiled by the independent fee consultant using information supplied by Lipper Inc. ("Lipper"), an independent fund data service. The Board also noted that it has put into place a process of identifying "Focus Funds" (e.g., funds performing poorly relative to their benchmark or a peer universe compiled by an independent fund data service), and receives more frequent reporting and information from DWS regarding such funds, along with DWS's remedial plans to address underperformance. The Board believes this process is an effective manner of identifying and addressing underperforming funds. Based on the information provided, the Board noted that for each of the one-, three- and five-year periods ended December 31, 2011, the Fund's performance (Class A shares) was in the 4th quartile of the applicable Lipper universe (the 1st quartile being the best performers and the 4th quartile being the worst performers). The Board also observed that the Fund has underperformed its benchmark in each of the one-, three- and five-year periods ended December 31, 2011. The Board noted the disappointing investment performance of the Fund in recent periods and continued to discuss with senior management of DWS the factors contributing to such underperformance and actions being taken to improve performance. The Board observed that the Fund had experienced improved relative performance during the first seven months of 2012. The Board recognized that DWS has made significant changes in the Fund's management structure, including the introduction of a new portfolio management team and investment process in April 2011.
Fees and Expenses. The Board considered the Fund's investment management fee schedule, operating expenses and total expense ratios, and comparative information provided by Lipper and the independent fee consultant regarding investment management fee rates paid to other investment advisors by similar funds (1st quartile being the most favorable and 4th quartile being the least favorable). With respect to management fees paid to other investment advisors by similar funds, the Board noted that the contractual fee rates paid by the Fund, which include a 0.10% fee paid to DWS under the Fund's administrative services agreement, were higher than the median (3rd quartile) of the applicable Lipper peer group (based on Lipper data provided as of December 31, 2011). The Board noted that the Fund's Class A shares total (net) operating expenses were expected to be higher than the median (3rd quartile) of the applicable Lipper expense universe (based on Lipper data provided as of December 31, 2011) ("Lipper Universe Expenses"). The Board also reviewed data comparing each share class's total (net) operating expenses to the applicable Lipper Universe Expenses. The Board considered the Fund's management fee rate as compared to fees charged by DWS and certain of its affiliates for comparable mutual funds and considered differences in fund and fee structures between the DWS Funds. The Board also considered how the Fund's total (net) operating expenses compared to the total (net) operating expenses of a more customized peer group selected by Lipper (based on such factors as asset size).
The information considered by the Board as part of its review of management fees included information regarding fees charged by DWS and its affiliates to similar institutional accounts and to similar funds offered primarily to European investors ("DWS Europe funds"), in each case as applicable. The Board observed that advisory fee rates for institutional accounts generally were lower than the management fees charged by similarly managed DWS U.S. mutual funds ("DWS Funds"), but also took note of the differences in services provided to DWS Funds as compared to institutional accounts. In the case of DWS Europe funds, the Board observed that fee rates for DWS Europe funds generally were higher than for similarly managed DWS Funds, but noted that differences in the types of services provided to DWS Funds relative to DWS Europe funds made it difficult to compare such fees.
On the basis of the information provided, the Board concluded that management fees were reasonable and appropriate in light of the nature, quality and extent of services provided by DWS.
Profitability. The Board reviewed detailed information regarding revenues received by DWS under the Agreement. The Board considered the estimated costs and pre-tax profits realized by DWS from advising the DWS Funds, as well as estimates of the pre-tax profits attributable to managing the Fund in particular. The Board also received information regarding the estimated enterprise-wide profitability of DWS and its affiliates with respect to all fund services in totality and by fund. The Board and the independent fee consultant reviewed DWS's methodology in allocating its costs to the management of the Fund. Based on the information provided, the Board concluded that the pre-tax profits realized by DWS in connection with the management of the Fund were not unreasonable. The Board also reviewed information regarding the profitability of certain similar investment management firms. The Board noted that while information regarding the profitability of such firms is limited (and in some cases is not necessarily prepared on a comparable basis), DWS and its affiliates' overall profitability with respect to the DWS fund complex (after taking into account distribution and other services provided to the funds by DWS and its affiliates) was lower than the overall profitability levels of many comparable firms for which such data was available.
Economies of Scale. The Board considered whether there are economies of scale with respect to the management of the Fund and whether the Fund benefits from any economies of scale. The Board noted that the Fund's management fee schedule includes fee breakpoints. The Board concluded that the Fund's fee schedule represents an appropriate sharing between the Fund and DWS of such economies of scale as may exist in the management of the Fund at current asset levels.
Other Benefits to DWS and Its Affiliates. The Board also considered the character and amount of other incidental benefits received by DWS and its affiliates, including any fees received by DWS for administrative services provided to the Fund and any fees received by an affiliate of DWS for distribution services. The Board also considered benefits to DWS related to brokerage and soft-dollar allocations, including allocating brokerage to pay for research generated by parties other than the executing broker dealers, which pertain primarily to funds investing in equity securities, along with the incidental public relations benefits to DWS related to DWS Funds advertising and cross-selling opportunities among DWS products and services. The Board concluded that management fees were reasonable in light of these fallout benefits.
Compliance. The Board considered the significant attention and resources dedicated by DWS to documenting and enhancing its compliance processes in recent years. The Board noted in particular (i) the experience and seniority of both DWS's chief compliance officer and the Fund's chief compliance officer; (ii) the large number of DWS compliance personnel; and (iii) the substantial commitment of resources by DWS and its affiliates to compliance matters.
Based on all of the information considered and the conclusions reached, the Board unanimously determined that the continuation of the Agreement is in the best interests of the Fund. In making this determination, the Board did not give particular weight to any single factor identified above. The Board considered these factors over the course of numerous meetings, certain of which were in executive session with only the Independent Trustees and their counsel present. It is possible that individual Trustees may have weighed these factors differently in reaching their individual decisions to approve the continuation of the Agreement.
Summary of Management Fee Evaluation by Independent Fee Consultant
September 17, 2012
Pursuant to an Order entered into by Deutsche Investment Management Americas and affiliates (collectively, "DeAM") with the Attorney General of New York, I, Thomas H. Mack, have been appointed the Independent Fee Consultant for the DWS Funds (formerly the DWS Scudder Funds). My duties include preparing an annual written evaluation of the management fees DeAM charges the Funds, considering among other factors the management fees charged by other mutual fund companies for like services, management fees DeAM charges other clients for like services, DeAM's costs of supplying services under the management agreements and related profit margins, possible economies of scale if a Fund grows larger, and the nature and quality of DeAM's services, including fund performance. This report summarizes my evaluation for 2012, including my qualifications, the evaluation process for each of the DWS Funds, consideration of certain complex-level factors, and my conclusions. I served in substantially the same capacity in 2007, 2008, 2009, 2010 and 2011.
Qualifications
For more than 35 years I have served in various professional capacities within the investment management business. I have held investment analysis and advisory positions, including securities analyst, portfolio strategist and director of investment policy with a large investment firm. I have also performed business management functions, including business development, financial management and marketing research and analysis.
Since 1991, I have been an independent consultant within the asset management industry. I have provided services to over 125 client organizations, including investment managers, mutual fund boards, product distributors and related organizations. Over the past ten years I have completed a number of assignments for mutual fund boards, specifically including assisting boards with management contract renewal.
I hold a Master of Business Administration degree, with highest honors, from Harvard University and Master of Science and Bachelor of Science (highest honors) degrees from the University of California at Berkeley. I am an independent director and audit committee financial expert for two closed-end mutual funds and have served in various leadership and financial oversight capacities with non-profit organizations.
Evaluation of Fees for each DWS Fund
My work focused primarily on evaluating, fund-by-fund, the fees charged to each of the 103 mutual fund portfolios in the DWS Fund family. For each Fund, I considered each of the key factors mentioned above, as well as any other relevant information. In doing so I worked closely with the Funds' Independent Directors in their annual contract renewal process, as well as in their approval of contracts for several new funds (documented separately).
In evaluating each Fund's fees, I reviewed comprehensive materials provided by or on behalf of DeAM, including expense information prepared by Lipper Analytical, comparative performance information, profitability data, manager histories, and other materials. I also accessed certain additional information from the Lipper and Morningstar databases and drew on my industry knowledge and experience.
To facilitate evaluating this considerable body of information, I prepared for each Fund a document summarizing the key data elements in each area as well as additional analytics discussed below. This made it possible to consider each key data element in the context of the others.
In the course of contract renewal, DeAM agreed to implement a number of fee and expense adjustments requested by the Independent Directors which will favorably impact future fees and expenses, and my evaluation includes the effects of these changes.
Fees and Expenses Compared with Other Funds
The competitive fee and expense evaluation for each fund focused on two primary comparisons:
The Fund's contractual management fee (the advisory fee plus the administration fee where applicable) compared with those of a group of typically 12-15 funds in the same Lipper investment category (e.g. Large Capitalization Growth) having similar distribution arrangements and being of similar size.
The Fund's total expenses compared with a broader universe of funds from the same Lipper investment category and having similar distribution arrangements.
These two comparisons provide a view of not only the level of the fee compared with funds of similar scale but also the total expense the Fund bears for all the services it receives, in comparison with the investment choices available in the Fund's investment category and distribution channel. The principal figure-of-merit used in these comparisons was the subject Fund's percentile ranking against peers.
DeAM's Fees for Similar Services to Others
DeAM provided management fee schedules for all of its US domiciled fund and non-fund investment management accounts in any of the investment categories where there is a DWS Fund. These similar products included the other DWS Funds, non-fund pooled accounts, institutional accounts and sub-advisory accounts. Using this information, I calculated for each Fund the fee that would be charged to each similar product, at the subject Fund's asset level.
Evaluating information regarding non-fund products is difficult because there are varying levels of services required for different types of accounts, with mutual funds generally requiring considerably more regulatory and administrative types of service as well as having more frequent cash flows than other types of accounts. Also, while mutual fund fees for similar fund products can be expected to be similar, there will be some differences due to different pricing conditions in different distribution channels (e.g. retail funds versus those used in variable insurance products), differences in underlying investment processes and other factors.
Costs and Profit Margins
DeAM provided a detailed profitability analysis for each Fund. After making some adjustments so that the presentation would be more comparable to the available industry figures, I reviewed profit margins from investment management alone, from investment management plus other fund services (excluding distribution) provided to the Funds by DeAM (principally shareholder services), and DeAM profits from all sources, including distribution. A later section comments on overall profitability.
Economies of Scale
Economies of scale — an expected decline in management cost per dollar of fund assets as fund assets grow — are very rarely quantified and documented because of inherent difficulties in collecting and analyzing relevant data. However, in virtually every investment category that I reviewed, larger funds tend to have lower fees and lower total expenses than smaller funds. To see how each DWS Fund compares with this industry observation, I reviewed:
The trend in Fund assets over the last five years and the accompanying trend in total expenses. This shows if the Fund has grown and, if so, whether total expense (management fees as well as other expenses) have declined as a percent of assets.
Whether the Fund has break-points in its management fee schedule, the extent of the fee reduction built into the schedule and the asset levels where the breaks take effect, and in the case of a sub-advised Fund how the Fund's break-points compare with those of the sub-advisory fee schedule.
How the Fund's contractual fee schedule compares with trends in the industry data. To accomplish this, I constructed a chart showing how actual latest-fiscal-year contractual fees of the Fund and of other similar funds relate to average fund assets, with the subject Fund's contractual fee schedule superimposed.
Quality of Service — Performance
The quality-of-service evaluation focused on investment performance, which is the principal result of the investment management service. Each Fund's performance was reviewed over the past 1, 3, 5 and 10 years, as applicable, and compared with that of other funds in the same investment category and with a suitable market index.
In addition, I calculated and reviewed risk-adjusted returns relative to an index of similar mutual funds' returns and a suitable market index. The risk-adjusted returns analysis provides a way of determining the extent to which the Fund's return comparisons are mainly the product of investment value-added (or lack thereof) or alternatively taking considerably more or less risk than is typical in its investment category.
I also received and considered the history of portfolio manager changes for each Fund, as this provided an important context for evaluating the performance results.
Complex-Level Considerations
While this evaluation was conducted mainly at the individual fund level, there are some issues relating to the reasonableness of fees that can alternatively be considered across the whole fund complex:
I reviewed DeAM's profitability analysis for all DWS Funds, with a view toward determining if the allocation procedures used were reasonable and how profit levels compared with public data for other investment managers.
I considered whether DeAM and affiliates receive any significant ancillary or "fallout" benefits that should be considered in interpreting the direct profitability results. These would be situations where serving as the investment manager of the Funds is beneficial to another part of the Deutsche Bank organization.
I considered how aggregated DWS Fund expenses had varied over the years, by asset class and in the context of trends in asset levels.
I considered how aggregated DWS Fund performance measures relative to appropriate peers had varied by asset class and over time.
I reviewed the structure of the DeAM organization, trends in staffing levels, and information on compensation of investment management and other professionals compared with industry data.
Findings
Based on the process and analysis discussed above, which included reviewing a wide range of information from management and external data sources and considering among other factors the fees DeAM charges other clients, the fees charged by other fund managers, DeAM's costs and profits associated with managing the Funds, economies of scale, possible fall-out benefits, and the nature and quality of services provided, in my opinion the management fees charged the DWS Funds are reasonable.
Thomas H. Mack
President, Thomas H. Mack & Co., Inc.
Board Members and Officers
The following table presents certain information regarding the Board Members and Officers of the fund. Each Board Member's year of birth is set forth in parentheses after his or her name. Unless otherwise noted, (i) each Board Member has engaged in the principal occupation(s) noted in the table for at least the most recent five years, although not necessarily in the same capacity; and (ii) the address of each Independent Board Member is c/o Kenneth C. Froewiss, Chairman, DWS Mutual Funds, P.O. Box 78, Short Hills, NJ 07078. Except as otherwise noted below, the term of office for each Board Member is until the election and qualification of a successor, or until such Board Member sooner dies, resigns, is removed or as otherwise provided in the governing documents of the fund. Because the fund does not hold an annual meeting of shareholders, each Board Member will hold office for an indeterminate period. The Board Members may also serve in similar capacities with other funds in the fund complex.
| Independent Board Members |
Name, Year of Birth, Position with the Fund and Length of Time Served1 | | Business Experience and Directorships During the Past Five Years | Number of Funds in DWS Fund Complex Overseen |
Other Directorships Held by Board Member |
Kenneth C. Froewiss (1945) Chairperson since 2013,9 and Board Member since 2001 | | Adjunct Professor of Finance, NYU Stern School of Business (September 2009-present; Clinical Professor from 1997-September 2009); Member, Finance Committee, Association for Asian Studies (2002-present); Director, Mitsui Sumitomo Insurance Group (US) (2004-present); prior thereto, Managing Director, J.P. Morgan (investment banking firm) (until 1996) | 103 | — |
William McClayton (1944) Vice Chairperson since 2013,9 and Board Member since 2004 | | Private equity investor (since October 2009); previously, Managing Director, Diamond Management & Technology Consultants, Inc. (global consulting firm) (2001-2009); Directorship: Board of Managers, YMCA of Metropolitan Chicago; formerly: Senior Partner, Arthur Andersen LLP (accounting) (1966-2001); Trustee, Ravinia Festival | 103 | — |
John W. Ballantine (1946) Board Member since 1999 | | Retired; formerly, Executive Vice President and Chief Risk Management Officer, First Chicago NBD Corporation/The First National Bank of Chicago (1996-1998); Executive Vice President and Head of International Banking (1995-1996). Directorships: Stockwell Capital Investments PLC (private equity); former Directorships: First Oak Brook Bancshares, Inc. and Oak Brook Bank; Prisma Energy International | 103 | Chairman of the Board, Healthways, Inc.2 (provider of disease and care management services) (2003- present); Portland General Electric2 (utility company) (2003-present) |
Henry P. Becton, Jr. (1943) Board Member since 1990 | | Vice Chair and former President, WGBH Educational Foundation. Directorships: Public Radio International; Public Radio Exchange (PRX); The PBS Foundation; North Bennett Street School (Boston); former Directorships: Association of Public Television Stations; Boston Museum of Science; American Public Television; Concord Academy; New England Aquarium; Mass. Corporation for Educational Telecommunications; Committee for Economic Development; Public Broadcasting Service; Connecticut College | 103 | Lead Director, Becton Dickinson and Company2 (medical technology company); Lead Director, Belo Corporation2 (media company) |
Dawn-Marie Driscoll (1946) Board Member since 1987 | | President, Driscoll Associates (consulting firm); Emeritus Executive Fellow, Center for Business Ethics, Bentley University; formerly, Partner, Palmer & Dodge (1988-1990); Vice President of Corporate Affairs and General Counsel, Filene's (1978-1988). Directorships: Director of ICI Mutual Insurance Company (since 2007); Advisory Board, Center for Business Ethics, Bentley University; Trustee, Southwest Florida Community Foundation (charitable organization); former Directorships: Sun Capital Advisers Trust (mutual funds) (2007-2012), Investment Company Institute (audit, executive, nominating committees) and Independent Directors Council (governance, executive committees) | 103 | — |
Keith R. Fox, CFA (1954) Board Member since 1996 | | Managing General Partner, Exeter Capital Partners (a series of private investment funds) (since 1986). Directorships: Progressive International Corporation (kitchen goods importer and distributor); The Kennel Shop (retailer); former Chairman, National Association of Small Business Investment Companies; former Directorships: BoxTop Media Inc. (advertising); Sun Capital Advisers Trust (mutual funds) (2011-2012) | 103 | — |
Paul K. Freeman (1950) Board Member since 1993, and Chairperson (2009-Jan. 8, 2013) | | Consultant, World Bank/Inter-American Development Bank; Executive and Governing Council of the Independent Directors Council (Chairman of Education Committee); formerly: Project Leader, International Institute for Applied Systems Analysis (1998-2001); Chief Executive Officer, The Eric Group, Inc. (environmental insurance) (1986-1998); Directorships: Denver Zoo Foundation (December 2012-present); former Directorships: Prisma Energy International | 103 | — |
Richard J. Herring (1946) Board Member since 1990 | | Jacob Safra Professor of International Banking and Professor, Finance Department, The Wharton School, University of Pennsylvania (since July 1972); Co-Director, Wharton Financial Institutions Center (since July 2000); Co-Chair, U.S. Shadow Financial Regulatory Committee; Executive Director, Financial Economists Roundtable; formerly: Vice Dean and Director, Wharton Undergraduate Division (July 1995-June 2000); Director, Lauder Institute of International Management Studies (July 2000-June 2006) | 103 | Director, Japan Equity Fund, Inc. (since September 2007), Thai Capital Fund, Inc. (since 2007), Singapore Fund, Inc. (since September 2007), Independent Director of Barclays Bank Delaware (since September 2010) |
Rebecca W. Rimel (1951) Board Member since 1995 | | President and Chief Executive Officer, The Pew Charitable Trusts (charitable organization) (1994 to present); Trustee, Washington College (2011-2013); formerly: Executive Vice President, The Glenmede Trust Company (investment trust and wealth management) (1983-2004); Board Member, Investor Education (charitable organization) (2004-2005); Trustee, Executive Committee, Philadelphia Chamber of Commerce (2001-2007); Director, Viasys Health Care2 (January 2007-June 2007); Trustee, Pro Publica (charitable organization) (2007-2010); Trustee, Thomas Jefferson Foundation (charitable organization) (1994-2012) | 103 | Director, Becton Dickinson and Company2 (medical technology company) (2012-present); Director, CardioNet, Inc.2 (health care) (2009-present) |
William N. Searcy, Jr. (1946) Board Member since 1993 | | Private investor since October 2003; formerly: Pension & Savings Trust Officer, Sprint Corporation2 (telecommunications) (November 1989-September 2003); Trustee, Sun Capital Advisers Trust (mutual funds) (1998-2012) | 103 | — |
Jean Gleason Stromberg (1943) Board Member since 1997 | | Retired. Formerly, Consultant (1997-2001); Director, Financial Markets U.S. Government Accountability Office (1996-1997); Partner, Fulbright & Jaworski, L.L.P. (law firm) (1978-1996). Directorships: The William and Flora Hewlett Foundation; former Directorships: Service Source, Inc., Mutual Fund Directors Forum (2002-2004), American Bar Retirement Association (funding vehicle for retirement plans) (1987-1990 and 1994-1996) | 103 | — |
Robert H. Wadsworth (1940) Board Member since 1999 | | President, Robert H. Wadsworth & Associates, Inc. (consulting firm) (1983 to present); Director, National Horizon, Inc. (non-profit organization); Director and Treasurer, The Phoenix Boys Choir Association | 106 | — |
Interested Board Member and Officer4 |
Name, Year of Birth, Position with the Fund and Length of Time Served1,6 | | Business Experience and Directorships During the Past Five Years | Number of Funds in DWS Fund Complex Overseen |
Other Directorships Held by Board Member |
Michael J. Woods5 (1967) Board Member since 2013,9 and Executive Vice President since 20139 | | Managing Director,3 Deutsche Asset & Wealth Management (2009-present); Head of the Americas Asset Management Business for Deutsche Bank, Member of the Asset and Wealth Management ("AWM") Extended Executive Committee, AWM Global Client Group Executive Committee and the AWM Active Asset Management Executive Committee; CEO and US Regional Head of DWS Investments; formerly: Sr. VP, Head of the Financial Intermediaries and Investments Group of Evergreen Investments (2007-2009), CEO and Vice Chairman of Board of Directors of XTF Global Asset Management (2006-2007), Managing Director — US Head of Sub-Advisory and Investment Only Business at Citigroup Asset Management (2000-2006). Mr. Woods is currently a board member of The Children's Village, The Big Brothers Big Sisters Organization, and The Mutual Fund Education Alliance. | 39 | — |
Officers4 |
Name, Year of Birth, Position with the Fund and Length of Time Served6 | | Business Experience and Directorships During the Past Five Years |
W. Douglas Beck, CFA7 (1967) President, 2011-present | | Managing Director,3 Deutsche Asset & Wealth Management (2006-present); President of DWS family of funds and Head of Product Management, U.S. for DWS Investments; formerly: Executive Director, Head of Product Management (2002-2006) and President (2005-2006) of the UBS Funds at UBS Global Asset Management; Co-Head of Manager Research/Managed Solutions Group, Merrill Lynch (1998-2002) |
John Millette8 (1962) Vice President and Secretary, 1999-present | | Director,3 Deutsche Asset & Wealth Management |
Paul H. Schubert7 (1963) Chief Financial Officer, 2004-present Treasurer, 2005-present | | Managing Director,3 Deutsche Asset & Wealth Management (since July 2004); formerly: Executive Director, Head of Mutual Fund Services and Treasurer for UBS Family of Funds (1998-2004); Vice President and Director of Mutual Fund Finance at UBS Global Asset Management (1994-1998) |
Caroline Pearson8 (1962) Chief Legal Officer, 2010-present | | Managing Director,3 Deutsche Asset & Wealth Management; formerly: Assistant Secretary for DWS family of funds (1997-2010) |
Melinda Morrow7 (1970) Vice President, 2012-present | | Director,3 Deutsche Asset & Wealth Management |
Hepsen Uzcan8 (1974) Assistant Secretary, since 20139 | | Vice President, Deutsche Asset & Wealth Management |
Paul Antosca8 (1957) Assistant Treasurer, 2007-present | | Director,3 Deutsche Asset & Wealth Management |
Jack Clark8 (1967) Assistant Treasurer, 2007-present | | Director,3 Deutsche Asset & Wealth Management |
Diane Kenneally8 (1966) Assistant Treasurer, 2007-present | | Director,3 Deutsche Asset & Wealth Management |
John Caruso7 (1965) Anti-Money Laundering Compliance Officer, 2010-present | | Managing Director,3 Deutsche Asset & Wealth Management |
Robert Kloby7 (1962) Chief Compliance Officer, 2006-present | | Managing Director,3 Deutsche Asset & Wealth Management |
1 The length of time served represents the year in which the Board Member joined the board of one or more DWS funds currently overseen by the Board.
2 A publicly held company with securities registered pursuant to Section 12 of the Securities Exchange Act of 1934.
3 Executive title, not a board directorship.
4 As a result of their respective positions held with the Advisor, these individuals are considered "interested persons" of the Advisor within the meaning of the 1940 Act. Interested persons receive no compensation from the fund.
5 The mailing address of Mr. Woods is 60 Wall Street, New York, New York 10005. Mr. Woods is an interested Board Member by virtue of his positions with Deutsche Asset & Wealth Management. As an interested person, Mr. Woods receives no compensation from the fund. Mr. Woods is a board member of the following trusts and corporations: Cash Account Trust, DWS Market Trust, DWS Money Funds, DWS State Tax-Free Income Series, DWS Target Fund, DWS Value Series, Inc., DWS Variable Series II, Investors Cash Trust, Tax-Exempt California Money Market Fund, DWS Global High Income Fund, Inc., DWS High Income Opportunities Fund, Inc., DWS High Income Trust, DWS Multi-Market Income Trust, DWS Municipal Income Trust, DWS Strategic Income Trust and DWS Strategic Municipal Income Trust.
6 The length of time served represents the year in which the officer was first elected in such capacity for one or more DWS funds.
7 Address: 60 Wall Street, New York, NY 10005.
8 Address: One Beacon Street, Boston, MA 02108.
9 Effective as of January 9, 2013.
The fund's Statement of Additional Information ("SAI") includes additional information about the Board Members. The SAI is available, without charge, upon request. If you would like to request a copy of the SAI, you may do so by calling the following toll-free number: (800) 728-3337.
Notes
DWS Investments Distributors, Inc.
222 South Riverside Plaza
Chicago, IL 60606
(800) 621-1148
VS1int-2 (R-025823-2 2/13)
Pursuant to the requirements of the Securities Exchange Act of 1934 and the Investment Company Act of 1940, the registrant has duly caused this report to be signed on its behalf by the undersigned, thereunto duly authorized.
Pursuant to the requirements of the Securities Exchange Act of 1934 and the Investment Company Act of 1940, this report has been signed below by the following persons on behalf of the registrant and in the capacities and on the dates indicated.