UNITED STATES
SECURITIES AND EXCHANGE COMMISSION
WASHINGTON, D. C. 20549
FORM N-CSR
Investment Company Act file number | 811-04257 |
DWS Variable Series I
(Exact Name of Registrant as Specified in Charter)
345 Park Avenue
New York, NY 10154-0004
(Address of Principal Executive Offices) (Zip Code)
Registrant’s Telephone Number, including Area Code: (212) 454-7190
Paul Schubert
345 Park Avenue
New York, NY 10154-0004
(Name and Address of Agent for Service)
Date of fiscal year end: | 12/31 |
Date of reporting period: | 12/31/09 |
ITEM 1. REPORT TO STOCKHOLDERS
December 31, 2009
ANNUAL REPORT
DWS VARIABLE SERIES I

DWS Bond VIP
DWS Growth & Income VIP
DWS Capital Growth VIP
DWS Global Opportunities VIP
DWS International VIP
DWS Health Care VIP

Contents
Performance Summary, Information About Your Portfolio's Expenses, Management Summary, Portfolio Summary, Investment Portfolio, Financial Statements and Financial Highlights for:
4 DWS Bond VIP 20 DWS Growth & Income VIP 35 DWS Capital Growth VIP 46 DWS Global Opportunities VIP 59 DWS International VIP 70 DWS Health Care VIP 81 Notes to Financial Statements 91 Report of Independent Registered Public Accounting Firm 92 Tax Information 92 Proxy Voting 93 Investment Management Agreement Approval 108 Summary of Management Fee Evaluation by Independent Fee Consultant 111 Board Members and Officers |
This report must be preceded or accompanied by a prospectus. To obtain an additional prospectus or summary prospectus, if available, call (800) 778-1482 or your financial representative. We advise you to consider the Portfolio's objectives, risks, charges and expenses carefully before investing. The summary prospectus and prospectus contain this and other important information about the Portfolio. Please read the prospectus carefully before you invest.
Investments in variable portfolios involve risk. Some portfolios have more risk than others. These include portfolios that allow exposure to or otherwise concentrate investments in certain sectors, geographic regions, security types, market capitalization or foreign securities (e.g., political or economic instability, which can be accentuated in Emerging Market countries). Please read the prospectus for specific details regarding its investments and risk profile.
DWS Investments is part of Deutsche Bank's Asset Management division and, within the US, represents the retail asset management activities of Deutsche Bank AG, Deutsche Bank Trust Company Americas, Deutsche Investment Management Americas Inc. and DWS Trust Company.
NOT FDIC/NCUA INSURED NO BANK GUARANTEE MAY LOSE VALUE NOT A DEPOSIT
NOT INSURED BY ANY FEDERAL GOVERNMENT AGENCY
Performance Summary December 31, 2009
DWS Bond VIP
All performance shown is historical, assumes reinvestment of all dividend and capital gain distributions, and does not guarantee future results. Investment return and principal value fluctuate with changing market conditions so that, when redeemed, shares may be worth more or less than their original cost. Current performance may be lower or higher than the performance data quoted. Please contact your participating insurance company for the Portfolio's most recent month-end performance. Performance doesn't reflect charges and fees ("contract charges") associated with the separate account that invests in the Portfolio or any variable life insurance policy or variable annuity contract for which the Portfolio is an investment option. These charges and fees will reduce returns.
The gross expense ratio of the Portfolio, as stated in the fee table of the prospectus dated May 1, 2009 is 0.59% for Class A shares and may differ from the expense ratio disclosed in the Financial Highlights table in this report.
Portfolio returns during 5-year and 10-year periods shown reflect a fee waiver and/or expense reimbursement. Without this waiver/reimbursement, returns would have been lower.
Risk Considerations
Investments by the Portfolio in lower-rated bonds present greater risk to principal and income than investments in higher-quality securities. This Portfolio invests in individual bonds whose yields and market values fluctuate so that your investment may be worth more or less than its original cost. Bond investments are subject to interest-rate risk such that when interest rates rise, the prices of the bonds, and thus the value of the investment, can decline and the investor can lose principal value. Additionally, investing in foreign securities presents certain risks, such as currency fluctuation and changes in political/economic conditions and market risks. All of these factors may result in greater share price volatility. In the current market environment, mortgage-backed securities are experiencing increased volatility. Please see this Portfolio's prospectus for specific details regarding its investments and risk profile.
Growth of an Assumed $10,000 Investment |
[] DWS Bond VIP — Class A [] Barclays Capital US Aggregate Bond Index | The Barclays Capital US Aggregate Bond Index is an unmanaged, market-value-weighted measure of Treasury issues, agency issues, corporate bond issues and mortgage securities. Index returns, unlike portfolio returns, do not reflect any fees or expenses. It is not possible to invest directly into an index. |
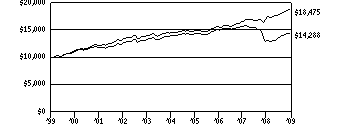 | |
Yearly periods ended December 31 | |
Comparative Results |
DWS Bond VIP | 1-Year | 3-Year | 5-Year | 10-Year |
Class A | Growth of $10,000 | $11,007 | $9,544 | $10,254 | $14,288 |
Average annual total return | 10.07% | -1.55% | .50% | 3.63% |
Barclays Capital US Aggregate Bond Index | Growth of $10,000 | $10,593 | $11,925 | $12,744 | $18,475 |
Average annual total return | 5.93% | 6.04% | 4.97% | 6.33% |
The growth of $10,000 is cumulative.
Information About Your Portfolio's Expenses
DWS Bond VIP
As an investor of the Portfolio, you incur two types of costs: ongoing expenses and transaction costs. Ongoing expenses include management fees, distribution and service (12b-1) fees and other Portfolio expenses. Examples of transaction costs include contract charges, redemption fees and account maintenance fees, which are not shown in this section. The following tables are intended to help you understand your ongoing expenses (in dollars) of investing in the Portfolio and to help you compare these expenses with the ongoing expenses of investing in other mutual funds. The example in the table is based on an investment of $1,000 invested at the beginning of the six-month period and held for the entire period (July 1, 2009 to December 31, 2009).
The tables illustrate your Portfolio's expenses in two ways:
• Actual Portfolio Return. This helps you estimate the actual dollar amount of ongoing expenses (but not transaction costs) paid on a $1,000 investment in the Portfolio using the Portfolio's actual return during the period. To estimate the expenses you paid over the period, simply divide your account value by $1,000 (for example, an $8,600 account value divided by $1,000 = 8.6), then multiply the result by the number in the "Expenses Paid per $1,000" line under the share class you hold.
• Hypothetical 5% Portfolio Return. This helps you to compare your Portfolio's ongoing expenses (but not transaction costs) with those of other mutual funds using the Portfolio's actual expense ratio and a hypothetical rate of return of 5% per year before expenses. Examples using a 5% hypothetical Portfolio return may be found in the shareholder reports of other mutual funds. The hypothetical account values and expenses may not be used to estimate the actual ending account balance or expenses you paid for the period.
Please note that the expenses shown in these tables are meant to highlight your ongoing expenses only and do not reflect any transaction costs. The "Expenses Paid per $1,000" line of the tables is useful in comparing ongoing expenses only and will not help you determine the relative total expense of owning different funds. If these transaction costs had been included, your costs would have been higher.
Expenses and Value of a $1,000 Investment for the six months ended December 31, 2009 |
Actual Portfolio Return | Class A |
Beginning Account Value 7/1/09 | $ 1,000.00 |
Ending Account Value 12/31/09 | $1,055.20 |
Expenses Paid per $1,000* | $ 2.90 |
Hypothetical 5% Portfolio Return | Class A |
Beginning Account Value 7/1/09 | $ 1,000.00 |
Ending Account Value 12/31/09 | $1,022.38 |
Expenses Paid per $1,000* | $ 2.85 |
* Expenses are equal to the Portfolio's annualized expense ratio for each share class, multiplied by the average account value over the period, multiplied by the number of days in the most recent six-month period, then divided by 365.
Annualized Expense Ratio | Class A |
DWS Variable Series I — DWS Bond VIP | .56% |
For more information, please refer to the Portfolio's prospectus.
These tables do not reflect charges and fees ("contract charges") associated with the separate account that invests in the Portfolio or any variable life insurance policy or variable annuity contract for which the Portfolio is an investment option.
Management Summary December 31, 2009
DWS Bond VIP
Just prior to the 12-month period, the US Federal Reserve Board (the Fed) cut the benchmark federal funds rate to basically zero as it sought to provide market participants with liquidity, and Treasury yields fell dramatically. As 2009 progressed, there was a strong flow of assets into beaten-down credit-sensitive sectors, as investors sought alternatives to historically low yields available on cash and other low risk alternatives. Increasing optimism about economic recovery also contributed to the shift in investor preferences away from Treasuries and toward credit sectors. Corporations took advantage of improved liquidity and low interest rates to issue a large volume of bonds. Within corporates, financial issues did especially well, as the largest banks were able to raise capital and return TARP funds to the government. Troubled commercial mortgage-backed securities (CMBS) and asset-backed securities experienced especially sharp rallies during the year. The government continued to support the residential mortgage market, and mortgage-backed securities provided positive returns despite concerns over rising delinquencies.
During the 12-month period ended December 31, 2009, the Portfolio provided a total return of 10.07% (Class A shares, unadjusted for contract charges) compared with the 5.93% return of its benchmark, the Barclays Capital US Aggregate Bond Index.
The Portfolio's performance versus the benchmark is principally the result of exposure to more credit-sensitive fixed-income sectors. Our modest high-yield corporate and emerging-market holdings added significantly to performance as credit sentiment rebounded in 2009 and both sectors provided returns well into double digits. Within the domestic portion of the Portfolio, we began in March to reposition the Portfolio to favor higher-quality fixed-income sectors that trade at yield spreads versus Treasuries. In particular, we shifted into high-quality corporate bonds that benefited from improved economic conditions as the period progressed. Late in the year, we trimmed corporate holdings in favor of government-backed issues as we believed corporates had rallied to price levels that no longer represented attractive value. In addition, we shifted the Portfolio's Treasury allocation in the direction of Treasury inflation-protected securities (TIPS) as the market has begun to refocus on inflation in view of a strengthening economy and rising US budget deficits.
The following portfolio managers handle the day-to-day management of the portfolio's investment portfolio: |
Kenneth R. Bowling, CFA
Jamie Guenther, CFA | John Brennan
Bruce Harley, CFA, CEBS | J. Richard Robben, CFA
David Vignolo, CFA | J. Kevin Horsley, CFA, CPA
Stephen Willer, CFA |
The Barclays Capital US Aggregate Bond Index is an unmanaged, market-value-weighted measure of Treasury issues, agency issues, corporate bond issues and mortgage securities. Index returns, unlike portfolio returns, do not reflect any fees or expenses. It is not possible to invest directly into an index.
Portfolio management market commentary is as of December 31, 2009, and may not come to pass. This information is subject to change at any time based on market and other conditions. Past performance does not guarantee future results. Current and future portfolio holdings are subject to risk.
Portfolio Summary
DWS Bond VIP
Asset Allocation (As a % of Investment Portfolio excluding Securities Lending Collateral) | 12/31/09 | 12/31/08 |
| | |
Mortgage-Backed Securities Pass-Throughs | 32% | 20% |
Government & Agency Obligations | 24% | 12% |
Corporate Bonds | 24% | 24% |
Cash Equivalents | 10% | 6% |
Commercial Mortgage-Backed Securities | 3% | 9% |
Municipal Bonds and Notes | 3% | 5% |
Collateralized Mortgage Obligations | 3% | 21% |
Asset-Backed | 1% | 1% |
Preferred Securities | — | 2% |
| 100% | 100% |
Quality (Excludes Securities Lending Collateral) | 12/31/09 | 12/31/08 |
| | |
US Government & Treasury Obligations | 53% | 38% |
AAA* | 13% | 26% |
AA | 6% | 8% |
A | 8% | 8% |
BBB | 14% | 15% |
BB or Below | 6% | 3% |
Not Rated | — | 2% |
| 100% | 100% |
Effective Maturity (Excludes Cash Equivalents and Securities Lending Collateral) | 12/31/09 | 12/31/08 |
| | |
Under 1 year | 11% | 10% |
1-4.99 years | 38% | 47% |
5-9.99 years | 43% | 27% |
10-14.99 years | 1% | 7% |
15+ years | 7% | 9% |
| 100% | 100% |
* Category includes cash equivalents
Weighted average effective maturity: 7.88 and 7.43 years, respectively.
Asset allocation, quality and effective maturity are subject to change.
The quality ratings represent the lower of Moody's Investors Service, Inc. ("Moody's") or Standard & Poor's Corporation ("S&P") credit ratings. The ratings of Moody's and S&P represent their opinions as to the quality of the securities they rate. Ratings are relative and subjective and are not absolute standards of quality. The Portfolio's credit quality does not remove market risk.
For more complete details about the Portfolio's investment portfolio, see page 8. A complete list of portfolio holdings of the Portfolio is posted as of the month end on www.dws-investments.com on or about the 15th day of the following month. More frequent posting of portfolio holdings information may be made from time to time on www.dws-investments.com.
Following the Portfolio's fiscal first and third quarter-end, a complete portfolio holdings listing is filed with the SEC on Form N-Q. The form will be available on the SEC's Web site at www.sec.gov, and it also may be reviewed and copied at the SEC's Public Reference Room in Washington, D.C. Information on the operation of the SEC's Public Reference Room may be obtained by calling (800) SEC-0330.
Investment Portfolio December 31, 2009
DWS Bond VIP
| Principal Amount ($)(a) | Value ($) |
| |
Corporate Bonds 28.5% |
Consumer Discretionary 3.2% |
Comcast Cable Communications Holdings, Inc., 9.455%, 11/15/2022 | | 235,000 | 302,244 |
Comcast Cable Holdings LLC, 10.125%, 4/15/2022 | | 168,000 | 215,766 |
DirecTV Holdings LLC, 144A, 4.75%, 10/1/2014 | | 600,000 | 611,602 |
Goodyear Tire & Rubber Co., 10.5%, 5/15/2016 (b) | | 300,000 | 331,500 |
News America, Inc., 6.4%, 12/15/2035 | | 360,000 | 369,662 |
TCI Communications, Inc., 8.75%, 8/1/2015 | | 511,000 | 605,428 |
Time Warner Cable, Inc.: |
| 6.75%, 7/1/2018 (b) | | 250,000 | 274,641 |
| 6.75%, 6/15/2039 | | 275,000 | 288,009 |
| 7.3%, 7/1/2038 | | 40,000 | 44,345 |
Time Warner, Inc., 7.7%, 5/1/2032 | | 305,000 | 358,172 |
Viacom, Inc., 6.25%, 4/30/2016 | | 775,000 | 844,659 |
Yum! Brands, Inc., 6.875%, 11/15/2037 | | 750,000 | 810,370 |
| 5,056,398 |
Consumer Staples 1.7% |
Anheuser-Busch InBev Worldwide, Inc., 144A, 7.75%, 1/15/2019 | | 750,000 | 878,096 |
ConAgra Foods, Inc., 7.0%, 4/15/2019 | | 450,000 | 509,313 |
CVS Caremark Corp.: |
| 6.125%, 9/15/2039 | | 500,000 | 495,550 |
| 6.25%, 6/1/2027 | | 332,000 | 337,627 |
Dr. Pepper Snapple Group, Inc., 6.12%, 5/1/2013 | | 500,000 | 547,209 |
| 2,767,795 |
Energy 2.8% |
Anadarko Petroleum Corp., 6.45%, 9/15/2036 | | 320,000 | 334,198 |
Cenovus Energy, Inc.: |
| 144A, 5.7%, 10/15/2019 | | 186,000 | 194,010 |
| 144A, 6.75%, 11/15/2039 | | 315,000 | 343,367 |
DCP Midstream LLC, 144A, 9.75%, 3/15/2019 | | 600,000 | 738,273 |
Devon Energy Corp., 6.3%, 1/15/2019 | | 675,000 | 751,584 |
Enterprise Products Operating LLC: | |
| 6.125%, 10/15/2039 | | 460,000 | 444,394 |
| Series L, 6.3%, 9/15/2017 (b) | | 350,000 | 376,783 |
Kinder Morgan Energy Partners LP, 6.95%, 1/15/2038 | | 510,000 | 543,539 |
ONEOK Partners LP, 8.625%, 3/1/2019 (b) | | 560,000 | 675,804 |
| 4,401,952 |
| Principal Amount ($)(a) | Value ($) |
| |
Financials 12.7% |
American Express Co., 7.0%, 3/19/2018 | | 988,000 | 1,088,057 |
Bank of America Corp.: |
| 5.75%, 12/1/2017 | | 710,000 | 727,053 |
| 6.5%, 8/1/2016 | | 175,000 | 188,181 |
| 7.625%, 6/1/2019 (b) | | 1,130,000 | 1,307,237 |
Barclays Bank PLC: |
| Series 1, 5.0%, 9/22/2016 | | 270,000 | 275,889 |
| 5.2%, 7/10/2014 | | 300,000 | 318,002 |
Capital One Bank USA NA, 8.8%, 7/15/2019 | | 400,000 | 472,667 |
Citigroup, Inc.: |
| 6.125%, 5/15/2018 (b) | | 700,000 | 703,786 |
| 8.125%, 7/15/2039 | | 645,000 | 727,977 |
| 8.5%, 5/22/2019 | | 432,000 | 498,853 |
Commonwealth Bank of Australia, 144A, 5.0%, 10/15/2019 (b) | | 375,000 | 372,312 |
Discover Bank, 8.7%, 11/18/2019 | | 710,000 | 760,661 |
ESI Tractebel Acquisition Corp., Series B, 7.99%, 12/30/2011 | | 79,000 | 78,605 |
Ford Motor Credit Co., LLC, 7.8%, 6/1/2012 | | 1,500,000 | 1,516,130 |
General Electric Capital Corp.: |
| 5.625%, 5/1/2018 | | 1,204,000 | 1,233,788 |
| 6.0%, 8/7/2019 | | 355,000 | 368,498 |
Hartford Financial Services Group, Inc., 5.95%, 10/15/2036 | | 300,000 | 249,878 |
Holcim US Finance Sarl & Cie SCS, 144A, 6.0%, 12/30/2019 | | 215,000 | 223,792 |
JPMorgan Chase & Co.: |
| 5.125%, 9/15/2014 | | 435,000 | 458,822 |
| 5.375%, 1/15/2014 (b) | | 300,000 | 321,173 |
KazMunaiGaz Finance Sub BV, 144A, 11.75%, 1/23/2015 | | 800,000 | 964,000 |
MetLife, Inc., Series A, 6.817%, 8/15/2018 | | 400,000 | 445,503 |
Morgan Stanley: |
| Series F, 6.625%, 4/1/2018 | | 475,000 | 513,555 |
| 7.3%, 5/13/2019 | | 470,000 | 527,777 |
PNC Bank NA, 6.875%, 4/1/2018 | | 200,000 | 212,284 |
Principal Financial Group, Inc., 7.875%, 5/15/2014 | | 600,000 | 662,216 |
Prudential Financial, Inc.: |
| Series B, 5.1%, 9/20/2014 (b) | | 150,000 | 156,395 |
| 6.2%, 1/15/2015 | | 100,000 | 107,587 |
| 7.375%, 6/15/2019 (b) | | 120,000 | 134,540 |
Red Arrow International Leasing PLC, "A", 8.375%, 6/30/2012 | RUB | 1,866,459 | 60,494 |
Royal Bank of Scotland PLC, 144A, 4.875%, 8/25/2014 (b) | | 825,000 | 836,290 |
Simon Property Group LP, (REIT), 6.75%, 5/15/2014 (b) | | 240,000 | 255,763 |
Telefonica Emisiones SAU, 5.877%, 7/15/2019 (b) | | 345,000 | 369,781 |
| Principal Amount ($)(a) | Value ($) |
| |
The Goldman Sachs Group, Inc.: |
| 6.0%, 5/1/2014 (b) | | 375,000 | 410,163 |
| 7.5%, 2/15/2019 (b) | | 650,000 | 757,772 |
Toll Brothers Finance Corp., 8.91%, 10/15/2017 | | 350,000 | 397,374 |
Wachovia Corp., Series G, 5.5%, 5/1/2013 | | 700,000 | 743,633 |
Westpac Banking Corp., 4.875%, 11/19/2019 | | 762,000 | 752,098 |
| 20,198,586 |
Health Care 1.9% |
Express Scripts, Inc.: |
| 6.25%, 6/15/2014 | | 385,000 | 420,085 |
| 7.25%, 6/15/2019 | | 120,000 | 136,342 |
McKesson Corp., 7.5%, 2/15/2019 (b) | | 350,000 | 415,059 |
Medco Health Solutions, Inc., 7.125%, 3/15/2018 | | 715,000 | 803,759 |
Merck & Co., Inc.: |
| 5.0%, 6/30/2019 (b) | | 500,000 | 519,720 |
| 5.85%, 6/30/2039 (b) | | 111,000 | 116,813 |
Quest Diagnostics, Inc., 6.95%, 7/1/2037 | | 300,000 | 334,216 |
Zimmer Holdings, Inc., 4.625%, 11/30/2019 | | 220,000 | 218,003 |
| 2,963,997 |
Industrials 1.2% |
Allied Waste North America, Inc., 6.875%, 6/1/2017 | | 1,150,000 | 1,220,437 |
Waste Management, Inc., 6.375%, 3/11/2015 | | 600,000 | 664,880 |
| 1,885,317 |
Information Technology 0.8% |
Cisco Systems, Inc.: |
| 4.45%, 1/15/2020 (b) | | 480,000 | 470,872 |
| 5.5%, 1/15/2040 | | 570,000 | 545,040 |
Xerox Corp., 5.625%, 12/15/2019 | | 250,000 | 249,651 |
| 1,265,563 |
Materials 1.0% |
Corporacion Nacional del Cobre — Codelco, REG S, 7.5%, 1/15/2019 | | 600,000 | 703,444 |
Dow Chemical Co., 5.9%, 2/15/2015 | | 750,000 | 805,932 |
Pliant Corp., 11.85%, 6/15/2009* | | 7 | 6 |
| 1,509,382 |
Telecommunication Services 2.3% |
American Tower Corp., 144A, 4.625%, 4/1/2015 | | 400,000 | 404,582 |
CenturyTel, Inc.: |
| Series Q, 6.15%, 9/15/2019 | | 220,000 | 224,922 |
| Series P, 7.6%, 9/15/2039 (b) | | 250,000 | 256,209 |
Cincinnati Bell, Inc., 8.375%, 1/15/2014 (b) | | 300,000 | 305,250 |
Frontier Communications Corp., 8.125%, 10/1/2018 | | 1,000,000 | 1,012,500 |
MetroPCS Wireless, Inc., 9.25%, 11/1/2014 | | 300,000 | 303,750 |
Qwest Communications International, Inc., 144A, 8.0%, 10/1/2015 (b) | | 750,000 | 770,625 |
| Principal Amount ($)(a) | Value ($) |
| |
Verizon Communications, Inc., 6.35%, 4/1/2019 (b) | | 100,000 | 110,323 |
Windstream Corp., 8.625%, 8/1/2016 | | 300,000 | 305,250 |
| 3,693,411 |
Utilities 0.9% |
DTE Energy Co., 7.625%, 5/15/2014 | | 152,000 | 169,686 |
Energy Future Competitive Holdings Co., 7.48%, 1/1/2017 | | 29,224 | 18,569 |
FirstEnergy Solutions Corp., 6.8%, 8/15/2039 (b) | | 167,000 | 168,669 |
Majapahit Holding BV, REG S, 7.75%, 10/17/2016 | | 100,000 | 106,041 |
NRG Energy, Inc., 7.375%, 1/15/2017 | | 300,000 | 300,750 |
Sempra Energy, 6.5%, 6/1/2016 | | 650,000 | 704,931 |
| 1,468,646 |
Total Corporate Bonds (Cost $41,570,615) | 45,211,047 |
|
Mortgage-Backed Securities Pass-Throughs 39.1% |
Federal Home Loan Mortgage Corp.: | |
| 4.5%, 12/1/2034 | | 951,081 | 955,242 |
| 5.5%, with various maturities from 10/1/2023 until 8/1/2024 | | 544,484 | 574,686 |
| 5.526%**, 2/1/2038 | | 738,625 | 769,146 |
| 6.0%, 2/1/2036 | | 2,413,367 | 2,570,707 |
| 6.5%, with various maturities from 3/1/2026 until 12/1/2036 | | 2,428,028 | 2,600,616 |
| 7.0%, 1/1/2038 | | 299,706 | 327,745 |
Federal National Mortgage Association: | |
| 4.239%**, 3/1/2036 | | 560,823 | 589,552 |
| 4.5%, with various maturities from 6/1/2020 until 6/1/2038 (c) | | 14,360,679 | 14,448,684 |
| 5.0%, with various maturities from 2/1/2021 until 5/1/2036 (c) | | 14,574,008 | 14,945,026 |
| 5.005%**, 8/1/2037 | | 348,633 | 365,017 |
| 5.095%**, 9/1/2038 | | 446,050 | 466,653 |
| 5.447%**, 1/1/2038 | | 934,258 | 982,955 |
| 5.5%, with various maturities from 12/1/2032 until 4/1/2037 (c) | | 16,544,382 | 17,326,604 |
| 6.0%, with various maturities from 4/1/2024 until 12/1/2035 (c) | | 1,005,666 | 1,078,344 |
| 6.5%, with various maturities from 3/1/2017 until 9/1/2038 | | 1,377,611 | 1,484,366 |
| 8.0%, 9/1/2015 | | 22,332 | 24,465 |
Government National Mortgage Association, 5.0%, 2/1/2038 (c) | | 2,500,000 | 2,571,680 |
Total Mortgage-Backed Securities Pass-Throughs (Cost $61,144,473) | 62,081,488 |
|
| Principal Amount ($)(a) | Value ($) |
| |
Asset-Backed 1.0% |
Automobile Receivables 0.3% |
Household Automotive Trust, "A4", Series 2006-1, 5.52%, 3/18/2013 | | 500,000 | 514,841 |
Credit Card Receivables 0.6% |
MBNA Credit Card Master Note Trust, "A", Series 2002-A2, 5.6%, 7/17/2014 | EUR | 600,000 | 888,299 |
Home Equity Loans 0.1% |
First Franklin Mortgage Loan Asset-Backed Certificates, "A2A", Series 2007-FFC, 0.381%**, 6/25/2027 | | 450,037 | 185,710 |
Total Asset-Backed (Cost $1,802,034) | 1,588,850 |
|
Commercial Mortgage-Backed Securities 4.0% |
Banc of America Commercial Mortgage, Inc.: | |
| "A4", Series 2007-3, 5.658%**, 6/10/2049 | | 600,000 | 501,503 |
| "A4", Series 2007-2, 5.689%**, 4/10/2049 | | 1,600,000 | 1,378,862 |
| "A4", Series 2007-4, 5.744%**, 2/10/2051 | | 600,000 | 529,203 |
Greenwich Capital Commercial Funding Corp., "A5", Series 2005-GG5, 5.224%, 4/10/2037 | | 1,300,000 | 1,231,373 |
GS Mortgage Securities Corp. II: | |
| "J", Series 2007-GG10, 144A, 5.805%**, 8/10/2045 | | 1,096,000 | 41,901 |
| "K", Series 2007-GG10, 144A, 5.805%**, 8/10/2045 | | 767,000 | 7,670 |
JPMorgan Chase Commercial Mortgage Securities Corp.: | |
| "E", Series 2007-LD11, 5.818%**, 6/15/2049 | | 590,000 | 72,902 |
| "F", Series 2007-LD11, 5.818%**, 6/15/2049 | | 650,000 | 72,114 |
| "G", Series 2007-LD11, 144A, 5.818%**, 6/15/2049 | | 760,000 | 76,596 |
| "H", Series 2007-LD11, 144A, 5.818%**, 6/15/2049 | | 460,000 | 22,680 |
Merrill Lynch Mortgage Trust, "ASB", Series 2007-C1, 5.828%**, 6/12/2050 | | 590,000 | 566,662 |
Wachovia Bank Commercial Mortgage Trust: | |
| "APB", Series 2007-C30, 5.294%, 12/15/2043 | | 610,000 | 574,245 |
| "ABP", Series 2007-C32, 5.74%**, 6/15/2049 | | 1,175,000 | 1,116,458 |
| "H", Series 2007-C32, 144A, 5.74%**, 6/15/2049 | | 770,000 | 88,168 |
Total Commercial Mortgage-Backed Securities (Cost $10,170,299) | 6,280,337 |
|
| Principal Amount ($)(a) | Value ($) |
| |
Collateralized Mortgage Obligations 3.2% |
Countrywide Home Loans, "A2", Series 2006-1, 6.0%, 3/25/2036 | | 747,867 | 575,156 |
CS First Boston Mortgage Securities Corp., "10A3", Series 2005-10, 6.0%, 11/25/2035 | | 177,666 | 106,361 |
Federal Home Loan Mortgage Corp.: | |
| "PD", Series 2774, 5.0%, 8/15/2032 | | 1,010,000 | 1,060,163 |
| "PE", Series 2898, 5.0%, 5/15/2033 | | 335,000 | 349,221 |
| "KG", Series 2987, 5.0%, 12/15/2034 | | 1,470,000 | 1,530,929 |
Federal National Mortgage Association: | |
| "EG", Series 2005-22, 5.0%, 11/25/2033 | | 750,000 | 780,493 |
| "PG", Series 2002-3, 5.5%, 2/25/2017 | | 308,452 | 326,493 |
| "TC", Series 2007-77, 5.5%, 9/25/2034 | | 370,000 | 394,385 |
MASTR Alternative Loans Trust, "8A1", Series 2004-3, 7.0%, 4/25/2034 | | 16,005 | 14,337 |
Structured Asset Securities Corp., "2A1", Series 2003-1, 6.0%, 2/25/2018 | | 2,491 | 2,515 |
Total Collateralized Mortgage Obligations (Cost $5,080,899) | 5,140,053 |
|
Government & Agency Obligations 29.0% |
Other Government Related 7.1% |
Citigroup, Inc., FDIC Guaranteed, 2.125%, 4/30/2012 | | 2,000,000 | 2,021,416 |
General Electric Capital Corp., Series G, FDIC Guaranteed, 3.0%, 12/9/2011 | | 3,000,000 | 3,092,466 |
JPMorgan Chase & Co., FDIC Guaranteed, 3.125%, 12/1/2011 (b) | | 3,000,000 | 3,104,946 |
Regions Bank, FDIC Guaranteed, 3.25%, 12/9/2011 | | 3,000,000 | 3,113,064 |
| 11,331,892 |
Sovereign Bonds 4.8% |
Government of Ukraine: |
| REG S, 6.58%, 11/21/2016 | | 500,000 | 382,500 |
| REG S, 6.75%, 11/14/2017 | | 390,000 | 296,400 |
Republic of Argentina: |
| GDP Linked Note,
12/15/2035 | | 410,000 | 25,786 |
| 8.28%, 12/31/2033 | | 1,015,122 | 758,803 |
Republic of Egypt, 9.1%, 9/20/2012 | EGP | 230,000 | 41,830 |
Republic of El Salvador, REG S, 8.25%, 4/10/2032 | | 40,000 | 41,600 |
Republic of Indonesia, REG S, 8.5%, 10/12/2035 | | 100,000 | 119,750 |
Republic of Panama: |
| 7.125%, 1/29/2026 | | 220,000 | 248,050 |
| 7.25%, 3/15/2015 | | 80,000 | 91,000 |
| Principal Amount ($)(a) | Value ($) |
| |
Republic of Peru: |
| 6.55%, 3/14/2037 (b) | | 1,200,000 | 1,248,000 |
| 7.125%, 3/30/2019 | | 600,000 | 690,000 |
Republic of Philippines: |
| 7.75%, 1/14/2031 | | 100,000 | 112,750 |
| 9.5%, 2/2/2030 | | 60,000 | 79,650 |
Republic of Poland, 6.375%, 7/15/2019 | | 210,000 | 228,413 |
Republic of Serbia, REG S, 6.75%, 11/1/2024 | | 90,000 | 88,425 |
Republic of Uruguay, 6.875%, 9/28/2025 | | 500,000 | 525,000 |
Republic of Venezuela, REG S, 7.75%, 10/13/2019 | | 750,000 | 477,188 |
State of Qatar: |
| 144A, 6.4%, 1/20/2040 | | 400,000 | 402,000 |
| REG S, 9.75%, 6/15/2030 | | 140,000 | 198,100 |
United Mexican States, 5.625%, 1/15/2017 | | 1,500,000 | 1,563,750 |
| 7,618,995 |
US Government Sponsored Agency 0.7% |
Federal National Mortgage Association, 6.625%, 11/15/2030 (b) | | 950,000 | 1,141,718 |
US Treasury Obligations 16.4% |
US Treasury Bill, 0.19%***, 3/18/2010 (d) | | 969,000 | 968,902 |
US Treasury Bond, 4.75%, 2/15/2037 (b) | | 500,000 | 510,937 |
US Treasury Inflation-Indexed Note, 1.875%, 7/15/2019 (b) | | 4,555,890 | 4,728,873 |
US Treasury Notes: |
| 2.375%, 9/30/2014 (b) | | 18,000,000 | 17,848,080 |
| 3.125%, 5/15/2019 (b) | | 2,000,000 | 1,894,062 |
| 25,950,854 |
Total Government & Agency Obligations (Cost $46,285,392) | 46,043,459 |
|
Loan Participations and Assignments 0.3% |
Sovereign Loans |
Gazprom, 144A, 8.125%, 7/31/2014 (b) | | 205,000 | 217,300 |
Gazprombank, 7.25%, 2/22/2010 | RUB | 2,000,000 | 65,086 |
Russian Agricultural Bank, REG S, 7.75%, 5/29/2018 | | 100,000 | 109,125 |
Total Loan Participations and Assignments (Cost $383,781) | 391,511 |
|
| Principal Amount ($)(a) | Value ($) |
| |
Municipal Bonds and Notes 3.9% |
Florida, State Board of Education, Capital Outlay 2006, Series E, 5.0%, 6/1/2035 | 465,000 | 483,721 |
Gwinnett County, GA, Development Authority Revenue, Gwinnett Stadium Project, 6.4%, 1/1/2028 | 655,000 | 700,608 |
Jicarilla, NM, Sales & Special Tax Revenue, Apache Nation Revenue, 144A, 5.2%, 12/1/2013 | 560,000 | 543,133 |
Los Angeles, CA, Community Development Agency Tax Allocation Revenue, Adelante Eastside Project, Series C, 6.49%, 9/1/2037 (e) | 320,000 | 258,688 |
McLennan County, TX, Junior College, 5.0%, 8/15/2032 (e) | 340,000 | 349,428 |
New Jersey, Economic Development Authority Revenue, Series B, 6.5%, 11/1/2013 (e) | 860,000 | 963,716 |
Port Authority New York & New Jersey, One Hundred Fiftieth Series, 4.75%, 9/15/2016 | 930,000 | 929,247 |
Rhode Island, Convention Center Authority Revenue, Civic Center, Series A, 6.06%, 5/15/2035 (e) | 515,000 | 488,987 |
Virgin Islands, Port Authority Marine Revenue, Series B, 5.08%, 9/1/2013 (e) | 1,165,000 | 1,176,708 |
Washington, Central Puget Sound Regional Transit Authority, Sales & Use Tax Revenue, Series A, 5.0%, 11/1/2036 | 285,000 | 296,497 |
Total Municipal Bonds and Notes (Cost $6,088,015) | 6,190,733 |
|
Shares
| Value ($) |
| |
Preferred Stock 0.0% |
Financials |
Ford Motor Credit Co., LLC, 7.375% (Cost $24,692) | 1,180 | 24,544 |
|
Securities Lending Collateral 24.7% |
Daily Assets Fund Institutional, 0.17% (f) (g) (Cost $39,197,180) | 39,197,180 | 39,197,180 |
|
Cash Equivalents 12.3% |
Central Cash Management Fund, 0.14% (f) (Cost $19,483,957) | 19,483,957 | 19,483,957 |
| % of Net Assets | Value ($) |
| |
Total Investment Portfolio (Cost $231,231,337)+ | 146.0 | 231,633,159 |
Other Assets and Liabilities, Net | (46.0) | (72,959,083) |
Net Assets | 100.0 | 158,674,076 |
* Non-income producing security. Issuer has defaulted on the payment of principal or interest or has filed for bankruptcy. The following table represents bonds that are in default:
Security | Coupon | Maturity Date | Principal Amount ($) | Acquisition Cost ($) | Value ($) |
Pliant Corp. | 11.85% | 6/15/2009 | 7 | 8 | 6 |
** Floating rate notes are securities whose yields vary with a designated market index or market rate, such as the coupon-equivalent of the US Treasury bill rate. These securities are shown at their current rate as of December 31, 2009.
*** Annualized yield at time of purchase; not a coupon rate.
+ The cost for federal income tax purposes was $231,246,532. At December 31, 2009, net unrealized appreciation for all securities based on tax cost was $386,627. This consisted of aggregate gross unrealized appreciation for all securities in which there was an excess of value over tax cost of $6,003,669 and aggregate gross unrealized depreciation for all securities in which there was an excess of tax cost over value of $5,617,042.
(a) Principal amount stated in US dollars unless otherwise noted.
(b) All or a portion of these securities were on loan (see Notes to Financial Statements). The value of all securities loaned at December 31, 2009 amounted to $37,963,374, which is 23.9% of net assets.
(c) When-issued or delayed delivery security included.
(d) At December 31, 2009, this security has been pledged, in whole or in part, to cover initial margin requirements for open futures contracts.
(e) Bond is insured by one of these companies:
Insurance Coverage | As a % of Total Investment Portfolio |
Assured Guaranty Corp. | 0.4 |
Assured Guaranty Insurance Co. | 0.7 |
Financial Guaranty Insurance Co. | 0.2 |
Radian | 0.1 |
Many insurers who have traditionally guaranteed payment of municipal issues have been downgraded by the major rating agencies.
(f) Affiliated fund managed by Deutsche Investment Management Americas Inc. The rate shown is the annualized seven-day yield at period end.
(g) Represents collateral held in connection with securities lending. Income earned by the Portfolio is net of borrower rebates.
144A: Security exempt from registration under Rule 144A of the Securities Act of 1933. These securities may be resold in transactions exempt from registration, normally to qualified institutional buyers.
FDIC: Federal Deposit Insurance Corp.
GDP: Gross Domestic Product
LIBOR: Represents the London InterBank Offered Rate.
REG S: Securities sold under Regulation S may not be offered, sold or delivered within the United States or to, or for the account or benefit of, US persons, except pursuant to an exemption from, or in a transaction not subject to, the registration requirements of the Securities Act of 1933.
REIT: Real Estate Investment Trust
Included in the portfolio are investments in mortgage or asset-backed securities which are interests in separate pools of mortgages or assets. Effective maturities of these investments may be shorter than stated maturities due to prepayments. Some separate investments in the Federal Home Loan Mortgage Corp. and Federal National Mortgage Association issues have similar coupon rates and have been aggregated for presentation purposes in the investment portfolio.
At December 31, 2009, open futures contracts sold were as follows:
Futures | Currency | Expiration Date | Contracts | Notional Value ($) | Unrealized Appreciation (Depreciation) ($) |
10 Year US Treasury Note | USD | 3/22/2010 | 165 | 19,049,766 | 367,542 |
2 Year US Treasury Note | USD | 3/31/2010 | 79 | 17,084,984 | 93,639 |
Canadian Dollar Currency | USD | 3/16/2010 | 18 | 1,721,160 | (12,066) |
Japanesse Yen Currency | USD | 3/15/2010 | 10 | 1,342,500 | 107,481 |
Total net unrealized appreciation | 556,596 |
As of December 31, 2009, the Portfolio had the following open forward foreign currency exchange contracts:
Contracts to Deliver | | In Exchange For | | Settlement Date | | Unrealized Appreciation ($) | | Counterparty |
RUB | 3,600,000 | | USD | 119,802 | | 2/12/2010 | | 1,841 | | Citigroup, Inc. |
Currency Abbreviations |
EGP Egyptian Pound EUR Euro RUB Russian Ruble USD United States Dollar |
For information on the Portfolio's policy and additional disclosures regarding futures contracts and forward foreign currency exchange contracts, please refer to the Derivatives section of Note A in the accompanying Notes to Financial Statements.
Fair Value Measurements
Various inputs are used in determining the value of the Portfolio's investments. These inputs are summarized in three broad levels. Level 1 includes quoted prices in active markets for identical securities. Level 2 includes other significant observable inputs (including quoted prices for similar securities, interest rates, prepayment speeds, and credit risk). Level 3 includes significant unobservable inputs (including the Portfolio's own assumptions in determining the fair value of investments). The inputs or methodology used for valuing securities are not necessarily an indication of the risk associated with investing in those securities.
The following is a summary of the inputs used as of December 31, 2009 in valuing the Portfolio's investments. For information on the Portfolio's policy regarding the valuation of investments, please refer to the Security Valuation section of Note A in the accompanying Notes to the Financial Statements.
Assets | Level 1 | Level 2 | Level 3 | Total |
Fixed Income (h) | | | | |
Corporate Bonds | $ — | $ 45,211,047 | $ — | $ 45,211,047 |
Mortgage-Backed Securities Pass-Throughs | — | 62,081,488 | — | 62,081,488 |
Asset-Backed | — | 1,588,850 | — | 1,588,850 |
Commercial Mortgage-Backed Securities | — | 6,280,337 | — | 6,280,337 |
Collateralized Mortgage Obligations | — | 5,140,053 | — | 5,140,053 |
Government & Agency Obligations | — | 45,032,727 | 41,830 | 45,074,557 |
Loan Participations and Assignments | — | 391,511 | — | 391,511 |
Municipal Bonds and Notes | — | 6,190,733 | — | 6,190,733 |
Preferred Stock | 24,544 | — | — | 24,544 |
Short-Term Investments (h) | 58,681,137 | 968,902 | — | 59,650,039 |
Derivatives (i) | 556,596 | 1,841 | — | 558,437 |
Total | $ 59,262,277 | $ 172,887,489 | $ 41,830 | $ 232,191,596 |
(h) See Investment Portfolio for additional detailed categorizations.
(i) Derivatives include unrealized appreciation (depreciation) on open futures contracts and forward foreign currency exchange contracts.
The following is a reconciliation of the Portfolio's Level 3 investments for which significant unobservable inputs were used in determining value:
Level 3 Reconciliation | Corporate Bonds | Government & Agency Obligations | Preferred Stock | Total |
Balance as of December 31, 2008 | $ 32,540 | $ 96,418 | $ 220,679 | $ 349,637 |
Realized gains (loss) | (1,842) | (25,653) | (349,351) | (376,846) |
Change in unrealized appreciation (depreciation) | 43,090 | 36,967 | 306,872 | 386,929 |
Amortization premium/discount | — | (202) | — | (202) |
Net purchases (sales) | (13,294) | (65,700) | (178,200) | (257,194) |
Net transfers in (out) of Level 3 | (60,494) | — | — | (60,494) |
Balance as of December 31, 2009 | $ — | $ 41,830 | $ — | $ 41,830 |
Net change in unrealized appreciation (depreciation) from investments still held as of December 31, 2009 | $ — | $ 3,209 | $ — | $ 3,209 |
The accompanying notes are an integral part of the financial statements.
Financial Statements
Statement of Assets and Liabilities as of December 31, 2009 |
Assets |
Investments: Investments in securities, at value (cost $172,550,200), including $37,963,374 of securities loaned | $ 172,952,022 |
Investment in Daily Assets Fund Institutional (cost $39,197,180)* | 39,197,180 |
Investment in Central Cash Management Fund (cost $19,483,957) | 19,483,957 |
Total investments, at value (cost $231,231,337) | 231,633,159 |
Cash | 10,014 |
Foreign currency, at value (cost $76,855) | 77,823 |
Receivable for investments sold | 15,147,175 |
Dividends receivable | 544 |
Interest receivable | 1,521,979 |
Receivable for Portfolio shares sold | 39,435 |
Receivable for daily variation margin on open futures contracts | 35,433 |
Foreign taxes recoverable | 5,183 |
Unrealized appreciation on forward foreign currency exchange contracts | 1,841 |
Other assets | 3,224 |
Total assets | 248,475,810 |
Liabilities |
Payable for Portfolio shares redeemed | 58,506 |
Payable upon return of securities loaned | 39,197,180 |
Payable for investments purchased — when-issued/delayed delivery securities | 50,438,150 |
Accrued management fee | 49,889 |
Other accrued expenses and payables | 58,009 |
Total liabilities | 89,801,734 |
Net assets, at value | $ 158,674,076 |
Net Assets Consist of |
Undistributed net investment income | 6,639,923 |
Net unrealized appreciation (depreciation) on: Investments | 401,822 |
Futures | 556,596 |
Foreign currency | 2,777 |
Accumulated net realized gain (loss) | (43,387,143) |
Paid-in capital | 194,460,101 |
Net assets, at value | $ 158,674,076 |
Class A Net Asset Value, offering and redemption price per share ($158,674,076 ÷ 28,638,100 outstanding shares of beneficial interest, $.01 par value, unlimited number of shares authorized) | $ 5.54 |
* Represents collateral on securities loaned.
The accompanying notes are an integral part of the financial statements.
Statement of Operations for the year ended December 31, 2009 |
Investment Income |
Dividends | $ 23,778 |
Interest (net of foreign taxes withheld of $244) | 7,843,009 |
Income distributions — affiliated cash management vehicles | 61,065 |
Securities lending income, including income from Daily Assets Fund Institutional, net of borrower rebates | 60,886 |
Total Income | 7,988,738 |
Expenses: Management fee | 590,867 |
Administration fee | 151,504 |
Custodian fee | 22,721 |
Services to shareholders | 7,070 |
Professional fees | 57,428 |
Trustees' fees and expenses | 5,776 |
Reports to shareholders | 36,309 |
Other | 20,813 |
Total expenses | 892,488 |
Net investment income | 7,096,250 |
Realized and Unrealized Gain (Loss) |
Net realized gain (loss) from: Investments | (21,017,132) |
Futures | (1,231,373) |
Foreign currency | (36,253) |
| (22,284,758) |
Change in net unrealized appreciation (depreciation) on: Investments | 28,883,150 |
Futures | 556,596 |
Foreign currency | 532 |
| 29,440,278 |
Net gain (loss) | 7,155,520 |
Net increase (decrease) in net assets resulting from operations | $ 14,251,770 |
The accompanying notes are an integral part of the financial statements.
Statement of Changes in Net Assets |
| Years Ended December 31, |
Increase (Decrease) in Net Assets | 2009 | 2008 |
Operations: Net investment income | $ 7,096,250 | $ 11,548,151 |
Net realized gain (loss) | (22,284,758) | (19,565,062) |
Change in net unrealized appreciation (depreciation) | 29,440,278 | (26,282,991) |
Net increase (decrease) in net assets resulting from operations | 14,251,770 | (34,299,902) |
Distributions to shareholders from: Net investment income: Class A | (11,985,798) | (10,882,399) |
Class B | — | (31,809) |
Total distributions | (11,985,798) | (10,914,208) |
Portfolio share transactions: Class A Proceeds from shares sold | 21,968,991 | 21,447,131 |
Reinvestment of distributions | 11,985,798 | 10,882,399 |
Cost of shares redeemed | (32,370,197) | (61,233,965) |
Net increase (decrease) in net assets from Class A share transactions | 1,584,592 | (28,904,435) |
Class B* Proceeds from shares sold | — | 292,257 |
Reinvestment of distributions | — | 31,809 |
Cost of shares redeemed | — | (890,260) |
Net increase (decrease) in net assets from Class B share transactions | — | (566,194) |
Increase (decrease) in net assets | 3,850,564 | (74,684,739) |
Net assets at beginning of period | 154,823,512 | 229,508,251 |
Net assets at end of period (including undistributed net investment income of $6,639,923 and $11,846,280, respectively) | $ 158,674,076 | $ 154,823,512 |
Other Information |
Class A Shares outstanding at beginning of period | 28,147,936 | 32,791,859 |
Shares sold | 4,088,614 | 3,262,319 |
Shares issued to shareholders in reinvestment of distributions | 2,364,063 | 1,674,215 |
Shares redeemed | (5,962,513) | (9,580,457) |
Net increase (decrease) in Class A shares | 490,164 | (4,643,923) |
Shares outstanding at end of period | 28,638,100 | 28,147,936 |
Class B* Shares outstanding at beginning of period | — | 87,887 |
Shares sold | — | 42,354 |
Shares issued to shareholders in reinvestment of distributions | — | 4,894 |
Shares redeemed | — | (135,135) |
Net increase (decrease) in Class B shares | — | (87,887) |
Shares outstanding at end of period | — | — |
* On May 22, 2008 Class B shares were liquidated.
The accompanying notes are an integral part of the financial statements.
Financial Highlights
Class A Years Ended December 31, | 2009 | 2008 | 2007 | 2006 | 2005 |
Selected Per Share Data |
Net asset value, beginning of period | $ 5.50 | $ 6.98 | $ 7.03 | $ 6.99 | $ 7.13 |
Income (loss) from investment operations: Net investment incomea | .25 | .37 | .35 | .33 | .29 |
Net realized and unrealized gain (loss) | .26 | (1.48) | (.06) | (.01) | (.10) |
Total from investment operations | .51 | (1.11) | .29 | .32 | .19 |
Less distributions from: Net investment income | (.47) | (.37) | (.34) | (.27) | (.26) |
Net realized gains | — | — | — | (.01) | (.07) |
Total distributions | (.47) | (.37) | (.34) | (.28) | (.33) |
Net asset value, end of period | $ 5.54 | $ 5.50 | $ 6.98 | $ 7.03 | $ 6.99 |
Total Return (%) | 10.07 | (16.77) | 4.18 | 4.72b | 2.60 |
Ratios to Average Net Assets and Supplemental Data |
Net assets, end of period ($ millions) | 159 | 155 | 229 | 218 | 209 |
Ratio of expenses before expense reductions (%) | .59 | .59 | .61 | .66 | .68 |
Ratio of expenses after expense reductions (%) | .59 | .59 | .61 | .62 | .68 |
Ratio of net investment income (%) | 4.68 | 5.76 | 5.03 | 4.82 | 4.11 |
Portfolio turnover rate (%) | 284 | 196 | 185 | 186 | 197 |
a Based on average shares outstanding during the period. b Total return would have been lower had certain expenses not been reduced. |
Performance Summary December 31, 2009
DWS Growth & Income VIP
All performance shown is historical, assumes reinvestment of all dividend and capital gain distributions, and does not guarantee future results. Investment return and principal value fluctuate with changing market conditions so that, when redeemed, shares may be worth more or less than their original cost. Current performance may be lower or higher than the performance data quoted. Please contact your participating insurance company for the Portfolio's most recent month-end performance. Performance doesn't reflect charges and fees ("contract charges") associated with the separate account that invests in the Portfolio or any variable life insurance policy or variable annuity contract for which the Portfolio is an investment option. These charges and fees will reduce returns. While all share classes have the same underlying portfolio, their performance will differ.
The gross expense ratios of the Portfolio, as stated in the fee table of the prospectus dated May 1, 2009 are 0.60% and 0.82% for Class A and Class B shares, respectively, and may differ from the expense ratios disclosed in the Financial Highlights tables in this report.
Portfolio returns during all periods shown reflect a fee waiver and/or expense reimbursement. Without this waiver/reimbursement, returns would have been lower.
Risk Considerations
The Portfolio is subject to stock market risk, meaning stocks in the Portfolio may decline in value for extended periods of time due to the activities and financial prospects of individual companies, or due to general market and economic conditions. Please read this Portfolio's prospectus for specific information regarding its investments and risk profile.
Growth of an Assumed $10,000 Investment |
[] DWS Growth & Income VIP — Class A [] Russell 1000® Index | The Russell 1000® Index is an unmanaged index that measures the performance of the 1,000 largest companies in the Russell 3000 Index, which represents approximately 92% of the total market capitalization of the Russell 3000 Index. Index returns assume the reinvestment of dividends and, unlike portfolio returns, do not reflect any fees or expenses. It is not possible to invest directly into an index. |
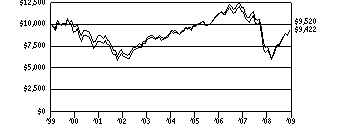 | |
Yearly periods ended December 31 | |
Comparative Results |
DWS Growth & Income VIP | 1-Year | 3-Year | 5-Year | 10-Year |
Class A | Growth of $10,000 | $13,415 | $8,388 | $10,109 | $9,422 |
Average annual total return | 34.15% | -5.69% | .22% | -.59% |
Russell 1000 Index | Growth of $10,000 | $12,843 | $8,477 | $10,401 | $9,520 |
Average annual total return | 28.43% | -5.36% | .79% | -.49% |
DWS Growth & Income VIP | 1-Year | 3-Year | 5-Year | 10-Year |
Class B | Growth of $10,000 | $13,364 | $8,329 | $9,976 | $9,170 |
Average annual total return | 33.64% | -5.91% | -.05% | -.86% |
Russell 1000 Index | Growth of $10,000 | $12,843 | $8,477 | $10,401 | $9,520 |
Average annual total return | 28.43% | -5.36% | .79% | -.49% |
The growth of $10,000 is cumulative.
Information About Your Portfolio's Expenses
DWS Growth & Income VIP
As an investor of the Portfolio, you incur two types of costs: ongoing expenses and transaction costs. Ongoing expenses include management fees, distribution and service (12b-1) fees and other Portfolio expenses. Examples of transaction costs include contract charges, redemption fees and account maintenance fees, which are not shown in this section. The following tables are intended to help you understand your ongoing expenses (in dollars) of investing in the Portfolio and to help you compare these expenses with the ongoing expenses of investing in other mutual funds. In the most recent six-month period, the Portfolio limited these expenses; had it not done so, expenses would have been higher. The example in the table is based on an investment of $1,000 invested at the beginning of the six-month period and held for the entire period (July 1, 2009 to December 31, 2009).
The tables illustrate your Portfolio's expenses in two ways:
• Actual Portfolio Return. This helps you estimate the actual dollar amount of ongoing expenses (but not transaction costs) paid on a $1,000 investment in the Portfolio using the Portfolio's actual return during the period. To estimate the expenses you paid over the period, simply divide your account value by $1,000 (for example, an $8,600 account value divided by $1,000 = 8.6), then multiply the result by the number in the "Expenses Paid per $1,000" line under the share class you hold.
• Hypothetical 5% Portfolio Return. This helps you to compare your Portfolio's ongoing expenses (but not transaction costs) with those of other mutual funds using the Portfolio's actual expense ratio and a hypothetical rate of return of 5% per year before expenses. Examples using a 5% hypothetical Portfolio return may be found in the shareholder reports of other mutual funds. The hypothetical account values and expenses may not be used to estimate the actual ending account balance or expenses you paid for the period.
Please note that the expenses shown in these tables are meant to highlight your ongoing expenses only and do not reflect any transaction costs. The "Expenses Paid per $1,000" line of the tables is useful in comparing ongoing expenses only and will not help you determine the relative total expense of owning different funds. If these transaction costs had been included, your costs would have been higher.
Expenses and Value of a $1,000 Investment for the six months ended December 31, 2009 |
Actual Portfolio Return | Class A | | Class B | |
Beginning Account Value 7/1/09 | $ 1,000.00 | | $ 1,000.00 | |
Ending Account Value 12/31/09 | $ 1,249.50 | | $ 1,247.70 | |
Expenses Paid per $1,000* | $ 3.06 | | $ 4.48 | |
Hypothetical 5% Portfolio Return | Class A | | Class B | |
Beginning Account Value 7/1/09 | $ 1,000.00 | | $ 1,000.00 | |
Ending Account Value 12/31/09 | $1,022.48 | | $ 1,021.22 | |
Expenses Paid per $1,000* | $ 2.75 | | $ 4.02 | |
* Expenses are equal to the Portfolio's annualized expense ratio for each share class, multiplied by the average account value over the period, multiplied by the number of days in the most recent six-month period, then divided by 365.
Annualized Expense Ratios | Class A | | Class B | |
DWS Variable Series I — DWS Growth & Income VIP | .54% | | .79% | |
For more information, please refer to the Portfolio's prospectus.
These tables do not reflect charges and fees ("contract charges") associated with the separate account that invests in the Portfolio or any variable life insurance policy or variable annuity contract for which the Portfolio is an investment option.
Management Summary December 31, 2009
DWS Growth & Income VIP
The Portfolio's strategy — which is to use a blend of quantitative insights and fundamental research to select the most attractive stocks based on growth, valuation, market sentiment and other factors — worked well during the past year.1 While the index returned 28.43%, the Portfolio's return was more than five percentage points better at 34.15% (Class A shares, unadjusted for contract charges). We are pleased that the Portfolio outpaced its benchmark during the past year, a time that proved challenging to many of those who focus on fundamentally sound, reasonably valued companies. We believe this helps illustrate the potential value of a disciplined, quantitative approach.
Consistent with the Portfolio's bottom-up strategy, virtually all of its outperformance was the result of our effective individual stock selection. We generated the strongest returns in the materials sector, where we held nine stocks that generated a substantial amount of returns. Our most notable winners were the chemical producer Ashland, Inc. and the coal companies Walter Energy, Inc. and Cliffs Natural Resources, Inc. Stock selection within financials also made a substantial positive contribution to the fund's return. Here, our performance was helped by our positions in Bank of America Corp., JPMorgan Chase & Co. and SunTrust Banks, Inc.,* all of which outpaced the broader sector by a wide margin. The energy, utilities and industrials sectors were also areas in which the strategy outperformed.
At a time of strong relative performance for the Portfolio, health care and consumer staples were our only areas of meaningful underperformance. Among the leading detractors in health care were Gilead Sciences, Inc., which lost ground as one of its key drugs failed to gain FDA approval, and the large-cap pharmaceutical companies Merck & Co., Inc.* and Eli Lilly & Co. The primary detractor in consumer staples was our overweight in the supermarket Kroger Co., which lost ground on concerns that Wal-Mart is cutting into its market share.2
The past year was a remarkable time for the US stock market, as the rapid recovery in investor optimism led to an exceptional rally.
Robert Wang
James B. Francis, CFA
Portfolio Managers
The Russell 1000 Index is an unmanaged index that measures the performance of the 1,000 largest companies in the Russell 3000® Index, which represents approximately 92% of the total market capitalization of the Russell 3000 Index.
Index returns assume the reinvestment of dividends and, unlike portfolio returns, do not reflect any fees or expenses. It is not possible to invest directly into an index.
1 "Valuation" refers to the price investors pay for a given security. An asset can be undervalued, meaning that it trades for less than its intrinsic value, or overvalued, which means that it trades at a more expensive price than its underlying worth.
2 "Overweight" means the portfolio holds a higher weighting in a given sector or security than the benchmark. "Underweight" means the portfolio holds a lower weighting.
* Not held in the portfolio as of December 31, 2009.
Portfolio management market commentary is as of December 31, 2009, and may not come to pass. This information is subject to change at any time based on market and other conditions. Past performance does not guarantee future results. Current and future portfolio holdings are subject to risk.
Portfolio Summary
DWS Growth & Income VIP
Asset Allocation (As a % of Investment Portfolio Excluding Securities Lending Collateral) | 12/31/09 | 12/31/08 |
| | |
Common Stocks | 98% | 97% |
Government & Agency Obligation | 1% | 1% |
Cash Equivalents | 1% | 2% |
| 100% | 100% |
Sector Diversification (As a % of Common Stocks) | 12/31/09 | 12/31/08 |
| | |
Information Technology | 19% | 16% |
Health Care | 14% | 16% |
Industrials | 13% | 14% |
Consumer Discretionary | 12% | 10% |
Financials | 11% | 11% |
Consumer Staples | 11% | 13% |
Energy | 9% | 12% |
Materials | 5% | 2% |
Telecommunication Services | 4% | 4% |
Utilities | 2% | 2% |
| 100% | 100% |
Asset allocation and sector diversification are subject to change.
For more complete details about the Portfolio's investment portfolio, see page 24. A complete list of portfolio holdings of the Portfolio is posted as of the month end on www.dws-investments.com on or about the 15th day of the following month. More frequent posting of portfolio holdings information may be made from time to time on www.dws-investments.com.
Following the Portfolio's fiscal first and third quarter-end, a complete portfolio holdings listing is filed with the SEC on Form N-Q. The form will be available on the SEC's Web site at www.sec.gov, and it also may be reviewed and copied at the SEC's Public Reference Room in Washington, D.C. Information on the operation of the SEC's Public Reference Room may be obtained by calling (800) SEC-0330.
Investment Portfolio December 31, 2009
DWS Growth & Income VIP
|
Shares
| Value ($) |
| |
Common Stocks 98.6% |
Consumer Discretionary 11.5% |
Automobiles 0.4% |
Ford Motor Co.* (a) | 43,800 | 438,000 |
Distributors 0.1% |
Genuine Parts Co. | 1,500 | 56,940 |
Diversified Consumer Services 0.2% |
Career Education Corp.* | 2,200 | 51,282 |
Corinthian Colleges, Inc.* (a) | 14,600 | 201,042 |
| 252,324 |
Hotels Restaurants & Leisure 1.1% |
McDonald's Corp. | 18,700 | 1,167,628 |
Household Durables 1.5% |
Garmin Ltd. (a) | 39,600 | 1,215,720 |
Leggett & Platt, Inc. | 11,900 | 242,760 |
Ryland Group, Inc. | 2,100 | 41,370 |
| 1,499,850 |
Internet & Catalog Retail 0.9% |
Amazon.com, Inc.* | 4,400 | 591,888 |
Priceline.com, Inc.* | 1,600 | 349,600 |
| 941,488 |
Media 3.6% |
Comcast Corp. "A" | 70,500 | 1,188,630 |
DISH Network Corp. "A" | 9,200 | 191,084 |
Gannett Co., Inc. | 20,500 | 304,425 |
McGraw-Hill Companies, Inc. | 12,800 | 428,928 |
Time Warner Cable, Inc. | 18,646 | 771,758 |
Time Warner, Inc. (a) | 28,700 | 836,318 |
| 3,721,143 |
Multiline Retail 0.4% |
Macy's, Inc. | 22,400 | 375,424 |
Specialty Retail 3.2% |
Advance Auto Parts, Inc. (a) | 7,800 | 315,744 |
Barnes & Noble, Inc. (a) | 18,600 | 354,702 |
Group 1 Automotive, Inc.* | 3,300 | 93,555 |
Gymboree Corp.* (a) | 3,600 | 156,564 |
Ross Stores, Inc. | 18,700 | 798,677 |
The Gap, Inc. | 18,400 | 385,480 |
TJX Companies, Inc. | 32,000 | 1,169,600 |
| 3,274,322 |
Textiles, Apparel & Luxury Goods 0.1% |
Wolverine World Wide, Inc. | 3,400 | 92,548 |
Consumer Staples 11.1% |
Beverages 0.5% |
Coca-Cola Enterprises, Inc. | 24,500 | 519,400 |
Food & Staples Retailing 2.6% |
Kroger Co. | 44,900 | 921,797 |
Sysco Corp. | 10,500 | 293,370 |
Wal-Mart Stores, Inc. | 26,500 | 1,416,425 |
| 2,631,592 |
Food Products 2.8% |
Archer-Daniels-Midland Co. | 56,400 | 1,765,884 |
Bunge Ltd. (a) | 3,500 | 223,405 |
Campbell Soup Co. | 10,800 | 365,040 |
Darling International, Inc.* | 1,500 | 12,570 |
Fresh Del Monte Produce, Inc.* | 6,600 | 145,860 |
|
Shares
| Value ($) |
| |
The Hershey Co. | 7,500 | 268,425 |
Tyson Foods, Inc. "A" | 8,800 | 107,976 |
| 2,889,160 |
Household Products 3.0% |
Colgate-Palmolive Co. | 19,900 | 1,634,785 |
Kimberly-Clark Corp. | 20,100 | 1,280,571 |
Procter & Gamble Co. | 3,500 | 212,205 |
| 3,127,561 |
Personal Products 0.7% |
Herbalife Ltd. | 10,400 | 421,928 |
Mead Johnson Nutrition Co. "A" | 5,400 | 235,980 |
| 657,908 |
Tobacco 1.5% |
Lorillard, Inc. | 6,200 | 497,426 |
Philip Morris International, Inc. | 22,500 | 1,084,275 |
| 1,581,701 |
Energy 9.2% |
Energy Equipment & Services 2.3% |
FMC Technologies, Inc.* | 1,900 | 109,896 |
Helix Energy Solutions Group, Inc.* | 11,500 | 135,125 |
Helmerich & Payne, Inc. | 4,700 | 187,436 |
Hercules Offshore, Inc.* | 6,700 | 32,026 |
Noble Corp. | 28,600 | 1,164,020 |
Oceaneering International, Inc.* | 3,000 | 175,560 |
Oil States International, Inc.* | 9,100 | 357,539 |
Rowan Companies, Inc.* | 11,600 | 262,624 |
| 2,424,226 |
Oil, Gas & Consumable Fuels 6.9% |
Anadarko Petroleum Corp. | 3,800 | 237,196 |
BP PLC (ADR) | 7,000 | 405,790 |
Chevron Corp. | 1,600 | 123,184 |
Cimarex Energy Co. | 14,500 | 768,065 |
ConocoPhillips | 36,400 | 1,858,948 |
Encore Acquisition Co.* | 14,900 | 715,498 |
EXCO Resources, Inc. | 4,500 | 95,535 |
ExxonMobil Corp. | 3,100 | 211,389 |
Mariner Energy, Inc.* | 25,700 | 298,377 |
Murphy Oil Corp. | 18,500 | 1,002,700 |
Newfield Exploration Co.* | 9,400 | 453,362 |
Occidental Petroleum Corp. | 3,500 | 284,725 |
Peabody Energy Corp. | 4,300 | 194,403 |
Quicksilver Resources, Inc.* (a) | 12,200 | 183,122 |
W&T Offshore, Inc. | 4,000 | 46,800 |
Williams Companies, Inc. | 9,000 | 189,720 |
| 7,068,814 |
Financials 11.1% |
Capital Markets 1.1% |
Bank of New York Mellon Corp. | 25,200 | 704,844 |
Franklin Resources, Inc. | 3,300 | 347,655 |
UBS AG (Registered)* (a) | 7,300 | 113,223 |
| 1,165,722 |
Commercial Banks 1.2% |
Comerica, Inc. | 3,500 | 103,495 |
HSBC Holdings PLC (ADR) | 2,700 | 154,143 |
Huntington Bancshares, Inc. | 26,500 | 96,725 |
KeyCorp | 12,600 | 69,930 |
Marshall & Ilsley Corp. | 60,200 | 328,090 |
|
Shares
| Value ($) |
| |
Popular, Inc. | 26,100 | 58,986 |
Regions Financial Corp. (a) | 81,500 | 431,135 |
| 1,242,504 |
Consumer Finance 2.0% |
Capital One Financial Corp. | 29,100 | 1,115,694 |
Discover Financial Services | 64,400 | 947,324 |
| 2,063,018 |
Diversified Financial Services 3.3% |
Bank of America Corp. (a) | 64,800 | 975,888 |
Citigroup, Inc. | 166,000 | 549,460 |
JPMorgan Chase & Co. | 43,200 | 1,800,144 |
PHH Corp.* | 4,400 | 70,884 |
| 3,396,376 |
Insurance 3.1% |
ACE Ltd.* | 25,200 | 1,270,080 |
Aflac, Inc. | 1,800 | 83,250 |
Allied World Assurance Co. Holdings Ltd. | 3,100 | 142,817 |
Arch Capital Group Ltd.* | 2,200 | 157,410 |
Berkshire Hathaway, Inc. "B"* | 300 | 985,800 |
Everest Re Group Ltd. | 1,400 | 119,952 |
Old Republic International Corp. | 13,700 | 137,548 |
The Travelers Companies, Inc. | 6,100 | 304,146 |
| 3,201,003 |
Real Estate Investment Trusts 0.3% |
Essex Property Trust, Inc. (REIT) | 1,200 | 100,380 |
Public Storage (REIT) | 1,000 | 81,450 |
Rayonier, Inc. (REIT) | 1,200 | 50,592 |
Walter Investment Management Corp. (REIT) | 3,205 | 45,928 |
| 278,350 |
Real Estate Management & Development 0.1% |
The St. Joe Co.* (a) | 2,200 | 63,558 |
Health Care 14.2% |
Biotechnology 1.9% |
Gilead Sciences, Inc.* | 36,400 | 1,575,392 |
Myriad Genetics, Inc.* | 5,100 | 133,110 |
PDL BioPharma, Inc. (a) | 45,500 | 312,130 |
| 2,020,632 |
Health Care Equipment & Supplies 0.6% |
Baxter International, Inc. | 9,900 | 580,932 |
Health Care Providers & Services 6.5% |
Aetna, Inc. | 44,800 | 1,420,160 |
Amedisys, Inc.* (a) | 6,400 | 310,784 |
AmerisourceBergen Corp. | 8,100 | 211,167 |
Coventry Health Care, Inc.* | 20,000 | 485,800 |
Express Scripts, Inc.* | 400 | 34,580 |
Humana, Inc.* | 7,700 | 337,953 |
Kindred Healthcare, Inc.* | 2,800 | 51,688 |
Magellan Health Services, Inc.* | 2,800 | 114,044 |
McKesson Corp. | 23,800 | 1,487,500 |
Medco Health Solutions, Inc.* | 28,900 | 1,846,999 |
UnitedHealth Group, Inc. | 10,600 | 323,088 |
Universal Health Services, Inc. "B" | 3,000 | 91,500 |
| 6,715,263 |
Pharmaceuticals 5.2% |
Abbott Laboratories | 16,200 | 874,638 |
Eli Lilly & Co. | 43,500 | 1,553,385 |
Johnson & Johnson | 5,900 | 380,019 |
Pfizer, Inc. | 121,300 | 2,206,447 |
Watson Pharmaceuticals, Inc.* | 8,800 | 348,568 |
| 5,363,057 |
|
Shares
| Value ($) |
| |
Industrials 12.4% |
Aerospace & Defense 5.6% |
Alliant Techsystems, Inc.* | 1,700 | 150,059 |
Goodrich Corp. | 12,300 | 790,275 |
Honeywell International, Inc. | 6,420 | 251,664 |
ITT Corp. | 3,900 | 193,986 |
L-3 Communications Holdings, Inc. | 1,300 | 113,035 |
Lockheed Martin Corp. | 21,400 | 1,612,490 |
Northrop Grumman Corp. | 30,900 | 1,725,765 |
Raytheon Co. | 18,100 | 932,512 |
| 5,769,786 |
Air Freight & Logistics 0.8% |
United Parcel Service, Inc. "B" | 14,300 | 820,391 |
Airlines 0.2% |
Alaska Air Group, Inc.* | 2,600 | 89,856 |
Allegiant Travel Co.* | 900 | 42,453 |
UAL Corp.* (a) | 4,800 | 61,968 |
| 194,277 |
Commercial Services & Supplies 0.5% |
R.R. Donnelley & Sons Co. | 18,900 | 420,903 |
The Brink's Co. | 2,700 | 65,718 |
| 486,621 |
Construction & Engineering 1.7% |
EMCOR Group, Inc.* (a) | 13,700 | 368,530 |
Fluor Corp. | 13,400 | 603,536 |
Jacobs Engineering Group, Inc.* | 7,500 | 282,075 |
KBR, Inc. | 6,000 | 114,000 |
Shaw Group, Inc.* | 10,800 | 310,500 |
Tutor Perini Corp.* | 3,100 | 56,048 |
| 1,734,689 |
Electrical Equipment 0.3% |
GrafTech International Ltd.* | 19,800 | 307,890 |
Hubbell, Inc. "B" | 800 | 37,840 |
| 345,730 |
Industrial Conglomerates 0.3% |
Tyco International Ltd.* | 7,700 | 274,736 |
Machinery 1.4% |
Cummins, Inc. | 4,000 | 183,440 |
Ingersoll-Rand PLC | 3,300 | 117,942 |
Navistar International Corp.* | 11,600 | 448,340 |
Oshkosh Corp. | 12,700 | 470,281 |
Trinity Industries, Inc. (a) | 10,900 | 190,096 |
| 1,410,099 |
Professional Services 0.5% |
Manpower, Inc. | 9,400 | 513,052 |
Road & Rail 0.8% |
Con-way, Inc. | 1,800 | 62,838 |
Ryder System, Inc. | 19,300 | 794,581 |
| 857,419 |
Trading Companies & Distributors 0.3% |
MSC Industrial Direct Co., Inc. "A" | 1,100 | 51,700 |
W.W. Grainger, Inc. | 2,900 | 280,807 |
| 332,507 |
Information Technology 19.1% |
Communications Equipment 0.9% |
Cisco Systems, Inc.* | 1,800 | 43,092 |
Harris Corp. | 8,100 | 385,155 |
InterDigital, Inc.* | 4,000 | 106,160 |
QUALCOMM, Inc. | 7,900 | 365,454 |
| 899,861 |
|
Shares
| Value ($) |
| |
Computers & Peripherals 6.8% |
Apple, Inc.* | 8,300 | 1,750,138 |
Dell, Inc.* | 31,700 | 455,212 |
International Business Machines Corp. | 24,600 | 3,220,140 |
NCR Corp.* | 16,700 | 185,871 |
QLogic Corp.* | 10,200 | 192,474 |
Western Digital Corp.* | 28,400 | 1,253,860 |
| 7,057,695 |
Electronic Equipment, Instruments & Components 3.9% |
Amphenol Corp. "A" | 2,500 | 115,450 |
Arrow Electronics, Inc.* | 13,600 | 402,696 |
Avnet, Inc.* | 21,300 | 642,408 |
Flextronics International Ltd.* | 119,200 | 871,352 |
Ingram Micro, Inc. "A"* | 15,700 | 273,965 |
Jabil Circuit, Inc. | 55,500 | 964,035 |
Tech Data Corp.* | 6,700 | 312,622 |
Tyco Electronics Ltd. | 16,700 | 409,985 |
Vishay Intertechnology, Inc.* | 3,400 | 28,390 |
| 4,020,903 |
Internet Software & Services 1.3% |
AOL, Inc.* | 2,609 | 60,737 |
Google, Inc. "A"* | 2,116 | 1,311,878 |
| 1,372,615 |
IT Services 2.3% |
Accenture PLC "A" | 20,300 | 842,450 |
Broadridge Financial Solutions, Inc. | 3,700 | 83,472 |
Computer Sciences Corp.* | 16,000 | 920,480 |
Global Payments, Inc. | 3,800 | 204,668 |
SAIC, Inc.* | 16,200 | 306,828 |
| 2,357,898 |
Semiconductors & Semiconductor Equipment 0.3% |
Texas Instruments, Inc. | 12,200 | 317,932 |
Software 3.6% |
BMC Software, Inc.* | 900 | 36,090 |
Check Point Software Technologies Ltd.* | 8,200 | 277,816 |
Microsoft Corp. | 97,975 | 2,987,258 |
Symantec Corp.* | 23,230 | 415,585 |
| 3,716,749 |
Materials 4.6% |
Chemicals 1.3% |
Ashland, Inc. | 8,200 | 324,884 |
Cytec Industries, Inc. | 1,800 | 65,556 |
Eastman Chemical Co. | 3,400 | 204,816 |
Huntsman Corp. | 11,000 | 124,190 |
Lubrizol Corp. | 4,900 | 357,455 |
Terra Industries, Inc. | 3,900 | 125,541 |
W.R. Grace & Co.* | 3,300 | 83,655 |
| 1,286,097 |
Containers & Packaging 0.1% |
Bemis Co., Inc. | 2,300 | 68,195 |
Rock-Tenn Co. "A" | 1,500 | 75,615 |
| 143,810 |
Metals & Mining 1.4% |
Cliffs Natural Resources, Inc. | 14,700 | 677,523 |
Reliance Steel & Aluminum Co. | 3,500 | 151,270 |
Walter Energy, Inc. | 8,400 | 632,604 |
| 1,461,397 |
|
Shares
| Value ($) |
| |
Paper & Forest Products 1.8% |
International Paper Co. | 66,900 | 1,791,582 |
MeadWestvaco Corp. | 2,800 | 80,164 |
| 1,871,746 |
Telecommunication Services 3.8% |
Diversified Telecommunication Services |
AT&T, Inc. | 97,780 | 2,740,773 |
Verizon Communications, Inc. | 35,700 | 1,182,741 |
| 3,923,514 |
Utilities 1.6% |
Electric Utilities 0.3% |
Edison International | 7,400 | 257,372 |
Exelon Corp. | 1,600 | 78,192 |
| 335,564 |
Gas Utilities 0.1% |
ONEOK, Inc. | 3,400 | 151,538 |
Independent Power Producers & Energy Traders 0.8% |
AES Corp.* | 36,900 | 491,139 |
Mirant Corp.* | 4,700 | 71,769 |
NRG Energy, Inc.* | 9,341 | 220,541 |
| 783,449 |
Multi-Utilities 0.4% |
Dominion Resources, Inc. (a) | 6,900 | 268,548 |
NiSource, Inc. | 9,100 | 139,958 |
| 408,506 |
Total Common Stocks (Cost $88,717,098) | 101,659,025 |
| Principal Amount ($) | Value ($) |
| |
Government & Agency Obligation 0.8% |
US Treasury Obligation |
US Treasury Bill, 0.19%**, 3/18/2010 (b) (Cost $762,694) | 763,000 | 762,923 |
|
Shares
| Value ($) |
| |
Securities Lending Collateral 6.4% |
Daily Assets Fund Institutional, 0.17% (c) (d) (Cost $6,605,450) | 6,605,450 | 6,605,450 |
|
Cash Equivalents 0.6% |
Central Cash Management Fund, 0.14% (c) (Cost $655,143) | 655,143 | 655,143 |
| % of Net Assets | Value ($) |
| |
Total Investment Portfolio (Cost $96,740,385)+ | 106.4 | 109,682,541 |
Other Assets and Liabilities, Net | (6.4) | (6,590,104) |
Net Assets | 100.0 | 103,092,437 |
* Non-income producing security.
** Annualized yield at time of purchase; not a coupon rate.
+ The cost for federal income tax purposes was $98,038,774. At December 31, 2009, net unrealized appreciation for all securities based on tax cost was $11,643,767. This consisted of aggregate gross unrealized appreciation for all securities in which there was an excess of value over tax cost of $15,303,333 and aggregate gross unrealized depreciation for all securities in which there was an excess of tax cost over value of $3,659,566.
(a) All or a portion of these securities were on loan (see Notes to Financial Statements). The value of all securities loaned at December 31, 2009 amounted to $6,339,220, which is 6.1% of net assets.
(b) At December 31, 2009, this security has been pledged, in whole or in part, to cover initial margin requirements for open futures contracts.
(c) Affiliated fund managed by Deutsche Investment Management Americas Inc. The rate shown is the annualized seven-day yield at period end.
(d) Represents collateral held in connection with securities lending. Income earned by the Portfolio is net of borrower rebates.
ADR: American Depositary Receipt
REIT: Real Estate Investment Trust
At December 31, 2009, open futures contracts purchased were as follows:
Futures | Currency | Expiration Date | Contracts | Notional Value ($) | Unrealized Appreciation ($) |
S&P E-Mini 500 Index | USD | 3/19/2010 | 21 | 1,166,235 | 7,773 |
Currency Abbreviations |
USD United States Dollar |
For information on the Portfolio's policy and additional disclosures regarding futures contracts, please refer to the Derivatives section of Note A in the accompanying Notes to Financial Statements.
Fair Value Measurements
Various inputs are used in determining the value of the Portfolio's investments. These inputs are summarized in three broad levels. Level 1 includes quoted prices in active markets for identical securities. Level 2 includes other significant observable inputs (including quoted prices for similar securities, interest rates, prepayment speeds, and credit risk). Level 3 includes significant unobservable inputs (including the Portfolio's own assumptions in determining the fair value of investments). The inputs or methodology used for valuing securities are not necessarily an indication of the risk associated with investing in those securities.
The following is a summary of the inputs used as of December 31, 2009 in valuing the Portfolio's investments. For information on the Portfolio's policy regarding the valuation of investments, please refer to the Security Valuation section of Note A in the accompanying Notes to the Financial Statements.
Assets | Level 1 | Level 2 | Level 3 | Total |
Common Stocks and/or Other Equity Investments (e) | $ 101,659,025 | $ — | $ — | $ 101,659,025 |
Short-Term Investments (e) | 7,260,593 | 762,923 | — | 8,023,516 |
Derivatives (f) | 7,773 | — | — | 7,773 |
Total | $ 108,927,391 | $ 762,923 | $ — | $ 109,690,314 |
(e) See Investment Portfolio for additional detailed categorizations.
(f) Derivatives include unrealized appreciation (depreciation) on open futures contracts.
The accompanying notes are an integral part of the financial statements.
Financial Statements
Statement of Assets and Liabilities as of December 31, 2009 |
Assets |
Investments: Investments in securities, at value (cost $89,479,792), including $6,339,220 of securities loaned | $ 102,421,948 |
Investment in Daily Assets Fund Institutional (cost $6,605,450)* | 6,605,450 |
Investment in Central Cash Management Fund (cost $655,143) | 655,143 |
Total investments, at value (cost $96,740,385) | 109,682,541 |
Cash | 9,927 |
Foreign currency, at value (cost $1,794) | 1,756 |
Dividends receivable | 83,854 |
Interest receivable | 9,291 |
Receivable for Portfolio shares sold | 91,331 |
Foreign taxes recoverable | 666 |
Other assets | 2,015 |
Total assets | 109,881,381 |
Liabilities |
Payable for Portfolio shares redeemed | 50,578 |
Payable for daily variation margin on open futures contracts | 12,335 |
Payable upon return of securities loaned | 6,605,450 |
Accrued management fee | 70,607 |
Accrued distribution service fee (Class B) | 439 |
Other accrued expenses and payables | 49,535 |
Total liabilities | 6,788,944 |
Net assets, at value | $ 103,092,437 |
Net Assets Consist of |
Undistributed net investment income | 1,542,732 |
Net unrealized appreciation (depreciation) on: Investments | 12,942,156 |
Futures | 7,773 |
Foreign currency | (39) |
Accumulated net realized gain (loss) | (58,573,990) |
Paid-in capital | 147,173,805 |
Net assets, at value | $ 103,092,437 |
Class A Net Asset Value, offering and redemption price per share ($101,019,398 ÷ 15,048,001 outstanding shares of beneficial interest, $.01 par value, unlimited number of shares authorized) | $ 6.71 |
Class B Net Asset Value, offering and redemption price per share ($2,073,039 ÷ 309,228 outstanding shares of beneficial interest, $.01 par value, unlimited number of shares authorized) | $ 6.70 |
* Represents collateral on securities loaned.
The accompanying notes are an integral part of the financial statements.
Statement of Operations for the year ended December 31, 2009 |
Investment Income |
Income: Dividends (net of foreign taxes withheld of $6,319) | $ 1,972,178 |
Interest | 1,157 |
Income distributions — affiliated cash management vehicles | 8,930 |
Securities lending income, including income from Daily Assets Fund Institutional, net of borrower rebates | 131,785 |
Total Income | 2,114,050 |
Expenses: Management fee | 362,304 |
Administration fee | 92,899 |
Custodian fee | 20,879 |
Distribution service fee (Class B) | 4,623 |
Services to shareholders | 3,738 |
Trustees' fees and expenses | 4,231 |
Audit and tax fees | 45,060 |
Reports to shareholders | 25,895 |
Legal fees | 19,507 |
Other | 11,752 |
Total expenses before expense reductions | 590,888 |
Expense reductions | (84,395) |
Total expenses after expense reductions | 506,493 |
Net investment income (loss) | 1,607,557 |
Realized and Unrealized Gain (Loss) |
Net realized gain (loss) from: Investments | (17,920,694) |
Futures | 446,975 |
| (17,473,719) |
Change in net unrealized appreciation (depreciation) on: Investments | 42,917,846 |
Futures | (34,096) |
Foreign currency | 268 |
| 42,884,018 |
Net gain (loss) | 25,410,299 |
Net increase (decrease) in net assets resulting from operations | $ 27,017,856 |
The accompanying notes are an integral part of the financial statements.
Statement of Changes in Net Assets |
Increase (Decrease) in Net Assets | Years Ended December 31, |
2009 | 2008 |
Operations: Net investment income (loss) | $ 1,607,557 | $ 2,027,933 |
Net realized gain (loss) | (17,473,719) | (29,199,764) |
Change in net unrealized appreciation (depreciation) | 42,884,018 | (40,800,532) |
Net increase (decrease) in net assets resulting from operations | 27,017,856 | (67,972,363) |
Distributions to shareholders from: Net investment income: Class A | (1,967,417) | (3,050,163) |
Class B | (35,839) | (190,157) |
Net realized gains: Class A | — | (35,948,939) |
Class B | — | (2,803,004) |
Total distributions | (2,003,256) | (41,992,263) |
Portfolio share transactions: Class A Proceeds from shares sold | 5,456,883 | 5,212,323 |
Reinvestment of distributions | 1,967,417 | 38,999,102 |
Cost of shares redeemed | (25,400,088) | (40,183,360) |
Net increase (decrease) in net assets from Class A share transactions | (17,975,788) | 4,028,065 |
Class B Proceeds from shares sold | 93,741 | 295,876 |
Reinvestment of distributions | 35,839 | 2,993,161 |
Cost of shares redeemed | (431,050) | (11,145,692) |
Net increase (decrease) in net assets from Class B share transactions | (301,470) | (7,856,655) |
Increase (decrease) in net assets | 6,737,342 | (113,793,216) |
Net assets at beginning of period | 96,355,095 | 210,148,311 |
Net assets at end of period (including undistributed net investment income of $1,542,732 and $1,938,429, respectively) | $ 103,092,437 | $ 96,355,095 |
Other Information |
Class A Shares outstanding at beginning of period | 18,437,278 | 18,082,818 |
Shares sold | 954,520 | 749,218 |
Shares issued to shareholders in reinvestment of distributions | 399,070 | 5,038,643 |
Shares redeemed | (4,742,867) | (5,433,401) |
Net increase (decrease) in Class A shares | (3,389,277) | 354,460 |
Shares outstanding at end of period | 15,048,001 | 18,437,278 |
Class B Shares outstanding at beginning of period | 364,787 | 1,355,326 |
Shares sold | 16,377 | 42,150 |
Shares issued to shareholders in reinvestment of distributions | 7,270 | 387,214 |
Shares redeemed | (79,206) | (1,419,903) |
Net increase (decrease) in Class B shares | (55,559) | (990,539) |
Shares outstanding at end of period | 309,228 | 364,787 |
The accompanying notes are an integral part of the financial statements.
Financial Highlights
Class A Years Ended December 31, | 2009 | 2008 | 2007 | 2006 | 2005 |
Selected Per Share Data |
Net asset value, beginning of period | $ 5.12 | $ 10.81 | $ 10.94 | $ 9.72 | $ 9.29 |
Income (loss) from investment operations: Net investment income (loss)a | .10 | .10 | .13 | .13c | .10 |
Net realized and unrealized gain (loss) | 1.61 | (3.45) | .02 | 1.19 | .45 |
Total from investment operations | 1.71 | (3.35) | .15 | 1.32 | .55 |
Less distributions from: Net investment income | (.12) | (.18) | (.13) | (.10) | (.12) |
Net realized gains | — | (2.16) | (.15) | — | — |
Total distributions | (.12) | (2.34) | (.28) | (.10) | (.12) |
Net asset value, end of period | $ 6.71 | $ 5.12 | $ 10.81 | $ 10.94 | $ 9.72 |
Total Return (%)b | 34.15 | (38.31) | 1.36 | 13.63c | 6.07 |
Ratios to Average Net Assets and Supplemental Data |
Net assets, end of period ($ millions) | 101 | 94 | 196 | 280 | 294 |
Ratio of expenses before expense reductions (%) | .63 | .60 | .57 | .56 | .57 |
Ratio of expenses after expense reductions (%) | .54 | .54 | .56 | .54 | .54 |
Ratio of net investment income (loss) (%) | 1.74 | 1.34 | 1.18 | 1.24c | 1.10 |
Portfolio turnover rate (%) | 82 | 130 | 310 | 105 | 115 |
a Based on average shares outstanding during the period. b Total return would have been lower had certain expenses not been reduced. c Includes non-recurring income from the Advisor recorded as a result of an administrative proceeding regarding disclosure of brokerage allocation practices in connection with sales of DWS Funds. The non-recurring income resulted in an increase in net investment income of $0.007 per share and an increase in the ratio of net investment income of 0.07%. Excluding this non-recurring income, total return would have been 0.06% lower. |
Class B Years Ended December 31, | 2009 | 2008 | 2007 | 2006 | 2005 |
Selected Per Share Data |
Net asset value, beginning of period | $ 5.12 | $ 10.77 | $ 10.90 | $ 9.68 | $ 9.25 |
Income (loss) from investment operations: Net investment income (loss)a | .08 | .08 | .09 | .09c | .07 |
Net realized and unrealized gain (loss) | 1.60 | (3.42) | .02 | 1.19 | .45 |
Total from investment operations | 1.68 | (3.34) | .11 | 1.28 | .52 |
Less distributions from: Net investment income | (.10) | (.15) | (.09) | (.06) | (.09) |
Net realized gains | — | (2.16) | (.15) | — | — |
Total distributions | (.10) | (2.31) | (.24) | (.06) | (.09) |
Net asset value, end of period | $ 6.70 | $ 5.12 | $ 10.77 | $ 10.90 | $ 9.68 |
Total Return (%)b | 33.64 | (38.29) | 1.00 | 13.28c | 5.73 |
Ratios to Average Net Assets and Supplemental Data |
Net assets, end of period ($ millions) | 2 | 2 | 15 | 52 | 47 |
Ratio of expenses before expense reductions (%) | .89 | .82 | .95 | .94 | .95 |
Ratio of expenses after expense reductions (%) | .80 | .77 | .92 | .89 | .89 |
Ratio of net investment income (loss) (%) | 1.48 | 1.12 | .82 | .89c | .75 |
Portfolio turnover rate (%) | 82 | 130 | 310 | 105 | 115 |
a Based on average shares outstanding during the period. b Total return would have been lower had certain expenses not been reduced. c Includes non-recurring income from the Advisor recorded as a result of an administrative proceeding regarding disclosure of brokerage allocation practices in connection with sales of DWS Funds. The non-recurring income resulted in an increase in net investment income of $0.007 per share and an increase in the ratio of net investment income of 0.07%. Excluding this non-recurring income, total return would have been 0.06% lower. |
Performance Summary December 31, 2009
DWS Capital Growth VIP
All performance shown is historical, assumes reinvestment of all dividend and capital gain distributions, and does not guarantee future results. Investment return and principal value fluctuate with changing market conditions so that, when redeemed, shares may be worth more or less than their original cost. Current performance may be lower or higher than the performance data quoted. Please contact your participating insurance company for the Portfolio's most recent month-end performance. Performance doesn't reflect charges and fees ("contract charges") associated with the separate account that invests in the Portfolio or any variable life insurance policy or variable annuity contract for which the Portfolio is an investment option. These charges and fees will reduce returns. While all share classes have the same underlying portfolio, their performance will differ.
The gross expense ratios of the Portfolio, as stated in the fee table of the prospectus dated May 1, 2009 are 0.50% and 0.85% for Class A and Class B shares, respectively, and may differ from the expense ratios disclosed in the Financial Highlights tables in this report.
Portfolio returns during all periods shown reflect a fee waiver and/or expense reimbursement. Without this waiver/reimbursement, returns would have been lower.
Risk Considerations
The Portfolio is subject to stock market risk, meaning stocks in the Portfolio may decline in value for extended periods of time due to the activities and financial prospects of individual companies, or due to general market and economic conditions. Please read this Portfolio's prospectus for specific information regarding its investments and risk profile.
Growth of an Assumed $10,000 Investment |
[] DWS Capital Growth VIP — Class A [] Russell 1000® Growth Index [] S&P 500® Index | The Russell 1000® Growth Index is an unmanaged, capitalization-weighted index containing those securities in the Russell 1000 Index with higher price-to-book ratios and higher forecasted growth values. On April 1, 2009 the Russell 1000® Growth Index replaced the S&P 500® Index as the Portfolio's benchmark index because the Advisor believes that it more accurately reflects the Portfolio's investment strategy. The Standard & Poor's 500® (S&P 500) Index is an unmanaged, capitalization-weighted index of 500 stocks. The index is designed to measure performance of the broad domestic economy through changes in the aggregate market value of 500 stocks representing all major industries. Index returns assume the reinvestment of dividends and, unlike portfolio returns, do not reflect any fees or expenses. It is not possible to invest directly into an index. |
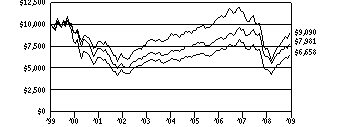 | |
Yearly periods ended December 31 | |
Comparative Results |
DWS Capital Growth VIP | 1-Year | 3-Year | 5-Year | 10-Year |
Class A | Growth of $10,000 | $12,687 | $9,573 | $11,320 | $7,981 |
Average annual total return | 26.87% | -1.44% | 2.51% | -2.23% |
Russell 1000 Growth Index | Growth of $10,000 | $13,721 | $9,445 | $10,844 | $6,658 |
Average annual total return | 37.21% | -1.89% | 1.63% | -3.99% |
S&P 500 Index | Growth of $10,000 | $12,646 | $8,405 | $10,211 | $9,090 |
Average annual total return | 26.46% | -5.63% | .42% | -.95% |
DWS Capital Growth VIP | 1-Year | 3-Year | 5-Year | 10-Year |
Class B | Growth of $10,000 | $12,649 | $9,477 | $11,124 | $7,721 |
Average annual total return | 26.49% | -1.77% | 2.15% | -2.55% |
Russell 1000 Growth Index | Growth of $10,000 | $13,721 | $9,445 | $10,844 | $6,658 |
Average annual total return | 37.21% | -1.89% | 1.63% | -3.99% |
S&P 500 Index | Growth of $10,000 | $12,646 | $8,405 | $10,211 | $9,090 |
Average annual total return | 26.46% | -5.63% | .42% | -.95% |
The growth of $10,000 is cumulative.
Information About Your Portfolio's Expenses
DWS Capital Growth VIP
As an investor of the Portfolio, you incur two types of costs: ongoing expenses and transaction costs. Ongoing expenses include management fees, distribution and service (12b-1) fees and other Portfolio expenses. Examples of transaction costs include contract charges, redemption fees and account maintenance fees, which are not shown in this section. The following tables are intended to help you understand your ongoing expenses (in dollars) of investing in the Portfolio and to help you compare these expenses with the ongoing expenses of investing in other mutual funds. In the most recent six-month period, the Portfolio limited these expenses; had it not done so, expenses would have been higher. The example in the table is based on an investment of $1,000 invested at the beginning of the six-month period and held for the entire period (July 1, 2009 to December 31, 2009).
The tables illustrate your Portfolio's expenses in two ways:
• Actual Portfolio Return. This helps you estimate the actual dollar amount of ongoing expenses (but not transaction costs) paid on a $1,000 investment in the Portfolio using the Portfolio's actual return during the period. To estimate the expenses you paid over the period, simply divide your account value by $1,000 (for example, an $8,600 account value divided by $1,000 = 8.6), then multiply the result by the number in the "Expenses Paid per $1,000" line under the share class you hold.
• Hypothetical 5% Portfolio Return. This helps you to compare your Portfolio's ongoing expenses (but not transaction costs) with those of other mutual funds using the Portfolio's actual expense ratio and a hypothetical rate of return of 5% per year before expenses. Examples using a 5% hypothetical Portfolio return may be found in the shareholder reports of other mutual funds. The hypothetical account values and expenses may not be used to estimate the actual ending account balance or expenses you paid for the period.
Please note that the expenses shown in these tables are meant to highlight your ongoing expenses only and do not reflect any transaction costs. The "Expenses Paid per $1,000" line of the tables is useful in comparing ongoing expenses only and will not help you determine the relative total expense of owning different funds. If these transaction costs had been included, your costs would have been higher.
Expenses and Value of a $1,000 Investment for the six months ended December 31, 2009 |
Actual Portfolio Return | Class A | | Class B | |
Beginning Account Value 7/1/09 | $ 1,000.00 | | $ 1,000.00 | |
Ending Account Value 12/31/09 | $ 1,193.10 | | $ 1,191.50 | |
Expenses Paid per $1,000* | $ 2.71 | | $ 4.53 | |
Hypothetical 5% Portfolio Return | Class A | | Class B | |
Beginning Account Value 7/1/09 | $ 1,000.00 | | $ 1,000.00 | |
Ending Account Value 12/31/09 | $ 1,022.74 | | $ 1,021.07 | |
Expenses Paid per $1,000* | $ 2.50 | | $ 4.18 | |
* Expenses are equal to the Portfolio's annualized expense ratio for each share class, multiplied by the average account value over the period, multiplied by the number of days in the most recent six-month period, then divided by 365.
Annualized Expense Ratios | Class A | | Class B | |
DWS Variable Series I — DWS Capital Growth VIP | .49% | | .82% | |
For more information, please refer to the Portfolio's prospectus.
These tables do not reflect charges and fees ("contract charges") associated with the separate account that invests in the Portfolio or any variable life insurance policy or variable annuity contract for which the Portfolio is an investment option.
Management Summary December 31, 2009
DWS Capital Growth VIP
DWS Capital Growth VIP's most recent fiscal year ended December 31, 2009 constituted a tale of two markets, as equities continued to endure intense volatility due to the financial crisis and the global recession during the first two months of the period, but began to stage a strong rally following the market low on March 9, 2009. During 2009, earnings for many high-profile companies exceeded expectations, surprising analysts after several months of disappointing results. As hope emerged that the economic downturn had finally ended, economic statistics improved. Government programs that helped to restore global liquidity contributed to the market's bounce back. In addition, US gross domestic product (GDP, the value of goods and services in an economy) began the year with a quarter-over-quarter decline of -6.4%, but — fueled by global fiscal stimulus — rebounded in the third quarter to +2.8%. Many analysts remain cautious, however, as US unemployment remains at 10%, with a large number of people unable to find a job or the level of job that they want.
For the 12 months ended December 31, 2009, the Portfolio returned 26.87% (Class A shares, unadjusted for contract charges), compared with the 37.21% return of the Russell 1000® Growth Index, the Portfolio's benchmark.
During the period, stock selection and sector allocation detracted from performance. The largest positive contribution to Portfolio performance came from the industrials sector, where we added to our position as the stock market rally gained momentum in the second and third quarters. In the information technology sector, several companies that are benefiting from the trend to handheld communications were additive to performance. The largest detractor from relative return came from the Portfolio's overweight position in health care stocks.1 The sector underperformed the broader market over much of the period as worries concerning the elements of possible health care legislation beset these stocks. The Portfolio's holdings within biotechnology were also negative for relative performance. Going forward, we will continue to seek high-quality companies that we believe will outperform in the long run, with lower overall risk.
Owen Fitzpatrick, CFA
Lead Portfolio Manager
Thomas M. Hynes, Jr., CFA
Brendan O'Neill, CFA
Portfolio Managers
The Russell 1000® Growth Index is an unmanaged, capitalization-weighted index containing those securities in the Russell 1000® Index with higher price-to-book ratios and higher forecasted growth values. On April 1, 2009 the Russell 1000 Growth Index replaced the S&P 500® Index as the Portfolio's benchmark index because the Advisor believes that it more accurately reflects the Portfolio's investment strategy. The Standard & Poor's 500® (S&P 500) Index is an unmanaged, capitalization-weighted index of 500 stocks. The index is designed to measure performance of the broad domestic economy through changes in the aggregate market value of 500 stocks representing all major industries.
Index returns assume reinvestment of dividends and, unlike portfolio returns, do not reflect any fees or expenses. It is not possible to invest directly into an index.
1 "Overweight" means the portfolio holds a higher weighting in a given sector or security than the benchmark. "Underweight" means the portfolio holds a lower weighting.
Portfolio management market commentary is as of December 31, 2009, and may not come to pass. This information is subject to change at any time based on market and other conditions. Past performance does not guarantee future results. Current and future portfolio holdings are subject to risk.
Portfolio Summary
DWS Capital Growth VIP
Asset Allocation (As a % of Investment Portfolio excluding Securities Lending Collateral) | 12/31/09 | 12/31/08 |
| | |
Common Stocks | 99% | 97% |
Cash Equivalents | 1% | 3% |
| 100% | 100% |
Sector Diversification (As a % of Common Stocks) | 12/31/09 | 12/31/08 |
| | |
Information Technology | 34% | 22% |
Health Care | 17% | 22% |
Industrials | 12% | 10% |
Consumer Discretionary | 11% | 8% |
Consumer Staples | 8% | 15% |
Energy | 6% | 10% |
Materials | 5% | 8% |
Financials | 4% | 3% |
Telecommunication Services | 2% | 1% |
Utilities | 1% | 1% |
| 100% | 100% |
Asset allocation and sector diversification are subject to change.
For more complete details about the Portfolio's investment portfolio, see page 39. A complete list of portfolio holdings of the Portfolio is posted as of the month end on www.dws-investments.com on or about the 15th day of the following month. More frequent posting of portfolio holdings information may be made from time to time on www.dws-investments.com.
Following the Portfolio's fiscal first and third quarter-end, a complete portfolio holdings listing is filed with the SEC on Form N-Q. The form will be available on the SEC's Web site at www.sec.gov, and it also may be reviewed and copied at the SEC's Public Reference Room in Washington, D.C. Information on the operation of the SEC's Public Reference Room may be obtained by calling (800) SEC-0330.
Investment Portfolio December 31, 2009
DWS Capital Growth VIP
|
Shares
| Value ($) |
| |
Common Stocks 99.0% |
Consumer Discretionary 11.3% |
Hotels Restaurants & Leisure 2.5% |
Darden Restaurants, Inc. | 175,800 | 6,165,306 |
Marriott International, Inc. "A" (a) | 264,811 | 7,216,100 |
McDonald's Corp. | 80,200 | 5,007,688 |
| 18,389,094 |
Media 1.7% |
Scripps Networks Interactive "A" | 299,200 | 12,416,800 |
Multiline Retail 2.5% |
Dollar General Corp.* | 90,900 | 2,038,887 |
Kohl's Corp.* | 147,700 | 7,965,461 |
Nordstrom, Inc. (a) | 207,300 | 7,790,334 |
| 17,794,682 |
Specialty Retail 2.4% |
Limited Brands, Inc. (a) | 553,300 | 10,645,492 |
TJX Companies, Inc. (a) | 179,000 | 6,542,450 |
| 17,187,942 |
Textiles, Apparel & Luxury Goods 2.2% |
NIKE, Inc. "B" (a) | 244,415 | 16,148,499 |
Consumer Staples 8.3% |
Beverages 2.2% |
PepsiCo, Inc. | 260,625 | 15,846,000 |
Food & Staples Retailing 2.8% |
Sysco Corp. (a) | 303,400 | 8,476,996 |
Wal-Mart Stores, Inc. | 224,600 | 12,004,870 |
| 20,481,866 |
Household Products 3.3% |
Church & Dwight Co., Inc. (a) | 85,100 | 5,144,295 |
Colgate-Palmolive Co. | 101,040 | 8,300,436 |
Energizer Holdings, Inc.* (a) | 172,700 | 10,583,056 |
| 24,027,787 |
Energy 6.2% |
Energy Equipment & Services 2.9% |
Cameron International Corp.* (a) | 146,000 | 6,102,800 |
Schlumberger Ltd. (a) | 126,800 | 8,253,412 |
Transocean Ltd.* | 83,572 | 6,919,762 |
| 21,275,974 |
Oil, Gas & Consumable Fuels 3.3% |
Alpha Natural Resources, Inc.* | 174,800 | 7,582,824 |
Anadarko Petroleum Corp. | 94,100 | 5,873,722 |
ExxonMobil Corp. | 81,900 | 5,584,761 |
Occidental Petroleum Corp. | 58,395 | 4,750,433 |
| 23,791,740 |
Financials 3.9% |
Capital Markets 1.9% |
T. Rowe Price Group, Inc. (a) | 265,300 | 14,127,225 |
Diversified Financial Services 2.0% |
IntercontinentalExchange, Inc.* (a) | 80,800 | 9,073,840 |
JPMorgan Chase & Co. | 123,200 | 5,133,744 |
| 14,207,584 |
Health Care 16.9% |
Biotechnology 7.8% |
Amgen, Inc.* | 167,600 | 9,481,132 |
Celgene Corp.* (a) | 441,170 | 24,564,346 |
|
Shares
| Value ($) |
| |
Gilead Sciences, Inc.* | 420,805 | 18,212,440 |
Myriad Genetics, Inc.* | 178,800 | 4,666,680 |
| 56,924,598 |
Health Care Equipment & Supplies 2.5% |
Edwards Lifesciences Corp.* | 112,100 | 9,735,885 |
St. Jude Medical, Inc.* | 232,100 | 8,536,638 |
| 18,272,523 |
Health Care Providers & Services 4.8% |
Express Scripts, Inc.* | 172,900 | 14,947,205 |
Laboratory Corp. of America Holdings* (a) | 103,300 | 7,730,972 |
UnitedHealth Group, Inc. | 394,500 | 12,024,360 |
| 34,702,537 |
Pharmaceuticals 1.8% |
Abbott Laboratories | 158,200 | 8,541,218 |
Johnson & Johnson | 63,706 | 4,103,303 |
| 12,644,521 |
Industrials 11.9% |
Aerospace & Defense 4.9% |
Rockwell Collins, Inc. (a) | 249,000 | 13,784,640 |
TransDigm Group, Inc. | 163,600 | 7,769,364 |
United Technologies Corp. | 196,500 | 13,639,065 |
| 35,193,069 |
Commercial Services & Supplies 1.1% |
Stericycle, Inc.* (a) | 146,400 | 8,076,888 |
Electrical Equipment 3.4% |
AMETEK, Inc. (a) | 359,300 | 13,739,632 |
Roper Industries, Inc. (a) | 211,500 | 11,076,255 |
| 24,815,887 |
Machinery 1.1% |
Parker Hannifin Corp. (a) | 144,500 | 7,785,660 |
Road & Rail 1.4% |
Norfolk Southern Corp. (a) | 199,700 | 10,468,274 |
Information Technology 33.6% |
Communications Equipment 7.6% |
Cisco Systems, Inc.* | 1,267,155 | 30,335,691 |
QUALCOMM, Inc. | 541,870 | 25,066,906 |
| 55,402,597 |
Computers & Peripherals 9.9% |
Apple, Inc.* (a) | 157,254 | 33,158,578 |
EMC Corp.* | 756,015 | 13,207,582 |
Hewlett-Packard Co. | 316,000 | 16,277,160 |
International Business Machines Corp. | 71,210 | 9,321,389 |
| 71,964,709 |
Internet Software & Services 3.3% |
Google, Inc. "A"* (a) | 39,025 | 24,194,720 |
IT Services 1.0% |
Accenture PLC "A" (a) | 181,400 | 7,528,100 |
Semiconductors & Semiconductor Equipment 5.0% |
Broadcom Corp. "A"* (a) | 567,000 | 17,832,150 |
Intel Corp. | 908,790 | 18,539,315 |
| 36,371,465 |
|
Shares
| Value ($) |
| |
Software 6.8% |
Check Point Software Technologies Ltd.* (a) | 176,200 | 5,969,656 |
Microsoft Corp. (a) | 772,380 | 23,549,866 |
Oracle Corp. | 803,255 | 19,711,878 |
| 49,231,400 |
Materials 4.7% |
Chemicals |
Celanese Corp. "A" | 159,300 | 5,113,530 |
Monsanto Co. | 221,945 | 18,144,004 |
The Mosaic Co. (a) | 187,200 | 11,181,457 |
| 34,438,991 |
Telecommunication Services 1.7% |
Wireless Telecommunication Services |
American Tower Corp. "A"* | 279,700 | 12,085,837 |
Utilities 0.5% |
Electric Utilities |
FPL Group, Inc. (a) | 75,000 | 3,961,500 |
Total Common Stocks (Cost $521,126,042) | 719,758,469 |
|
Shares
| Value ($) |
| |
Securities Lending Collateral 31.3% |
Daily Assets Fund Institutional, 0.17% (b) (c) (Cost $228,041,689) | 228,041,689 | 228,041,689 |
|
Cash Equivalents 1.1% |
Central Cash Management Fund, 0.14% (b) (Cost $7,806,725) | 7,806,725 | 7,806,725 |
| % of Net Assets | Value ($) |
| |
Total Investment Portfolio (Cost $756,974,456)+ | 131.4 | 955,606,883 |
Other Assets and Liabilities, Net | (31.4) | (228,484,046) |
Net Assets | 100.0 | 727,122,837 |
* Non-income producing security.
+ The cost for federal income tax purposes was $759,750,255. At December 31, 2009, net unrealized appreciation for all securities based on tax cost was $195,856,628. This consisted of aggregate gross unrealized appreciation for all securities in which there was an excess of value over tax cost of $200,332,150 and aggregate gross unrealized depreciation for all securities in which there was an excess of tax cost over value of $4,475,522.
(a) All or a portion of these securities were on loan (see Notes to Financial Statements). The value of all securities loaned at December 31, 2009 amounted to $220,915,066, which is 30.4% of net assets.
(b) Affiliated fund managed by Deutsche Investment Management Americas Inc. The rate shown is the annualized seven-day yield at period end.
(c) Represents collateral held in connection with securities lending. Income earned by the Portfolio is net of borrower rebates.
Fair Value Measurements
Various inputs are used in determining the value of the Portfolio's investments. These inputs are summarized in three broad levels. Level 1 includes quoted prices in active markets for identical securities. Level 2 includes other significant observable inputs (including quoted prices for similar securities, interest rates, prepayment speeds, and credit risk). Level 3 includes significant unobservable inputs (including the Portfolio's own assumptions in determining the fair value of investments). The inputs or methodology used for valuing securities are not necessarily an indication of the risk associated with investing in those securities.
The following is a summary of the inputs used as of December 31, 2009 in valuing the Portfolio's investments. For information on the Portfolio's policy regarding the valuation of investments, please refer to the Security Valuation section of Note A in the accompanying Notes to the Financial Statements.
Assets | Level 1 | Level 2 | Level 3 | Total |
Common Stocks and/or Other Equity Investments (d) | $ 719,758,469 | $ — | $ — | $ 719,758,469 |
Short-Term Investments (d) | 235,848,414 | — | — | 235,848,414 |
Total | $ 955,606,883 | $ — | $ — | $ 955,606,883 |
(d) See Investment Portfolio for additional detailed categorizations.
The accompanying notes are an integral part of the financial statements.
Financial Statements
Statement of Assets and Liabilities as of December 31, 2009 |
Assets |
Investments: Investments in securities, at value (cost $521,126,042), including $220,915,066 of securities loaned | $ 719,758,469 |
Investment in Daily Assets Fund Institutional (cost $228,041,689)* | 228,041,689 |
Investment in Central Cash Management Fund (cost $7,806,725) | 7,806,725 |
Total investments, at value (cost $756,974,456) | 955,606,883 |
Foreign currency, at value (cost $127,567) | 137,057 |
Receivable for Portfolio shares sold | 16,344 |
Dividends receivable | 395,397 |
Interest receivable | 13,898 |
Foreign taxes recoverable | 72,707 |
Due from Advisor | 1,391 |
Other assets | 17,007 |
Total assets | 956,260,684 |
Liabilities |
Payable for Portfolio shares redeemed | 615,512 |
Payable upon return of securities loaned | 228,041,689 |
Accrued management fee | 282,978 |
Accrued distribution service fee (Class B) | 1,914 |
Other accrued expenses and payables | 195,754 |
Total liabilities | 229,137,847 |
Net assets, at value | $ 727,122,837 |
Net Assets Consist of |
Undistributed net investment income | 6,123,423 |
Net unrealized appreciation (depreciation) on: Investments | 198,632,427 |
Foreign currency | 17,138 |
Accumulated net realized gain (loss) | (258,259,136) |
Paid-in capital | 780,608,985 |
Net assets, at value | $ 727,122,837 |
Class A Net Asset Value, offering and redemption price per share ($714,888,113 ÷ 42,229,316 outstanding shares of beneficial interest, $.01 par value, unlimited number of shares authorized) | $ 16.93 |
Class B Net Asset Value, offering and redemption price per share ($12,234,724 ÷ 725,636 outstanding shares of beneficial interest, $.01 par value, unlimited number of shares authorized) | $ 16.86 |
* Represents collateral on securities loaned.
The accompanying notes are an integral part of the financial statements.
Statement of Operations for the year ended December 31, 2009 |
Investment Income |
Income: Dividends (net of foreign taxes withheld of $7,807) | $ 8,947,719 |
Interest | 3,385 |
Income distributions — affiliated cash management vehicles | 53,857 |
Securities lending income, including income from Daily Assets Fund Institutional, net of borrower rebates | 487,978 |
Total Income | 9,492,939 |
Expenses: Management fee | 2,425,388 |
Administration fee | 647,367 |
Custodian fee | 53,457 |
Distribution service fee (Class B) | 27,575 |
Record keeping fee (Class B) | 10,003 |
Services to shareholders | 16,017 |
Professional fees | 104,446 |
Trustees' fees and expenses | 9,724 |
Reports to shareholders | 30,822 |
Other | 24,310 |
Total expenses before expense reductions | 3,349,109 |
Expense reductions | (155,440) |
Total expenses after expense reductions | 3,193,669 |
Net investment income (loss) | 6,299,270 |
Realized and Unrealized Gain (Loss) |
Net realized gain (loss) from: Investments | (29,080,732) |
Foreign currency | 78 |
Payments by affiliates (see Note G) | 559 |
| (29,080,095) |
Change in net unrealized appreciation (depreciation) on: Investments | 184,130,299 |
Foreign currency | 11,335 |
| 184,141,634 |
Net gain (loss) | 155,061,539 |
Net increase (decrease) in net assets resulting from operations | $ 161,360,809 |
The accompanying notes are an integral part of the financial statements.
Statement of Changes in Net Assets |
| Years Ended December 31, |
2009 | 2008 |
Operations: Net investment income (loss) | $ 6,299,270 | $ 7,814,207 |
Net realized gain (loss) | (29,080,095) | 23,172,997 |
Change in net unrealized appreciation (depreciation) | 184,141,634 | (355,389,503) |
Net increase (decrease) in net assets resulting from operations | 161,360,809 | (324,402,299) |
Distributions to shareholders from: Net investment income: Class A | (7,997,037) | (9,355,147) |
Class B | (116,634) | (96,190) |
Total distributions | (8,113,671) | (9,451,337) |
Portfolio share transactions: Class A Proceeds from shares sold | 18,231,110 | 23,952,264 |
Net assets acquired in tax-free reorganization* | 66,828,943 | — |
Reinvestment of distributions | 7,997,037 | 9,355,147 |
Cost of shares redeemed | (122,840,820) | (169,314,485) |
Net increase (decrease) in net assets from Class A share transactions | (29,783,730) | (136,007,074) |
Class B Proceeds from shares sold | 1,745,917 | 1,473,846 |
Reinvestment of distributions | 116,634 | 96,190 |
Cost of shares redeemed | (2,624,791) | (4,263,172) |
Net increase (decrease) in net assets from Class B share transactions | (762,240) | (2,693,136) |
Increase (decrease) in net assets | 122,701,168 | (472,553,846) |
Net assets at beginning of period | 604,421,669 | 1,076,975,515 |
Net assets at end of period (including undistributed net investment income of $6,123,423 and $7,945,917, respectively) | $ 727,122,837 | $ 604,421,669 |
Other Information |
Class A Shares outstanding at beginning of period | 43,844,542 | 51,857,448 |
Shares sold | 1,329,558 | 1,366,508 |
Shares issued in tax-free reorganization* | 5,009,687 | — |
Shares issued to shareholders in reinvestment of distributions | 644,923 | 468,930 |
Shares redeemed | (8,599,394) | (9,848,344) |
Net increase (decrease) in Class A shares | (1,615,226) | (8,012,906) |
Shares outstanding at end of period | 42,229,316 | 43,844,542 |
Class B Shares outstanding at beginning of period | 777,803 | 920,834 |
Shares sold | 124,580 | 89,671 |
Shares issued to shareholders in reinvestment of distributions | 9,421 | 4,831 |
Shares redeemed | (186,168) | (237,533) |
Net increase (decrease) in Class B shares | (52,167) | (143,031) |
Shares outstanding at end of period | 725,636 | 777,803 |
* On April 24, 2009 DWS Janus Growth & Income VIP was acquired by the Portfolio through a tax-free reorganization (see Note H).
The accompanying notes are an integral part of the financial statements.
Financial Highlights
Class A Years Ended December 31, | 2009 | 2008 | 2007 | 2006 | 2005 |
Selected Per Share Data |
Net asset value, beginning of period | $ 13.55 | $ 20.41 | $18.24 | $ 16.90 | $ 15.67 |
Income (loss) from investment operations: Net investment income (loss)a | .14 | .16 | .17d | .13c | .10 |
Net realized and unrealized gain (loss) | 3.43 | (6.83) | 2.12 | 1.31 | 1.29 |
Total from investment operations | 3.57 | (6.67) | 2.29 | 1.44 | 1.39 |
Less distributions from: Net investment income | (.19) | (.19) | (.12) | (.10) | (.16) |
Net asset value, end of period | $ 16.93 | $ 13.55 | $ 20.41 | $ 18.24 | $ 16.90 |
Total Return (%)b | 26.87 | (32.98) | 12.59 | 8.53c | 8.96 |
Ratios to Average Net Assets and Supplemental Data |
Net assets, end of period ($ millions) | 715 | 594 | 1,058 | 1,131 | 1,031 |
Ratio of expenses before expense reductions (%) | .51 | .50 | .53 | .52 | .50 |
Ratio of expenses after expense reductions (%) | .49 | .49 | .52 | .49 | .49 |
Ratio of net investment income (loss) (%) | .98 | .89 | .86d | .73c | .61 |
Portfolio turnover rate (%) | 76 | 21 | 30 | 16 | 17 |
a Based on average shares outstanding during the period. b Total return would have been lower had certain expenses not been reduced. c Includes non-recurring income from the Advisor recorded as a result of an administrative proceeding regarding disclosure of brokerage allocation practices in connection with sales of DWS Funds. The non-recurring income resulted in an increase in net investment income of $0.007 per share and an increase in the ratio of net investment income of 0.04%. Excluding this non-recurring income, total return would have been 0.03% lower. d Net investment income per share and ratio of net investment income include non-recurring dividend income amounting to $0.03 per share and 0.17% of average daily net assets, respectively. |
Class B Years Ended December 31, | 2009 | 2008 | 2007 | 2006 | 2005 |
Selected Per Share Data |
Net asset value, beginning of period | $ 13.49 | $ 20.31 | $ 18.15 | $ 16.81 | $ 15.59 |
Income (loss) from investment operations: Net investment income (loss)a | .09 | .10 | .09d | .06c | .04 |
Net realized and unrealized gain (loss) | 3.43 | (6.81) | 2.12 | 1.31 | 1.28 |
Total from investment operations | 3.52 | (6.71) | 2.21 | 1.37 | 1.32 |
Less distributions from: Net investment income | (.15) | (.11) | (.05) | (.03) | (.10) |
Net asset value, end of period | $ 16.86 | $ 13.49 | $ 20.31 | $ 18.15 | $ 16.81 |
Total Return (%)b | 26.49 | (33.20) | 12.18 | 8.17c | 8.51 |
Ratios to Average Net Assets and Supplemental Data |
Net assets, end of period ($ millions) | 12 | 10 | 19 | 107 | 73 |
Ratio of expenses before expense reductions (%) | .85 | .85 | .94 | .91 | .89 |
Ratio of expenses after expense reductions (%) | .82 | .82 | .90 | .86 | .86 |
Ratio of net investment income (loss) (%) | .65 | .56 | .48d | .36c | .24 |
Portfolio turnover rate (%) | 76 | 21 | 30 | 16 | 17 |
a Based on average shares outstanding during the period. b Total return would have been lower had certain expenses not been reduced. c Includes non-recurring income from the Advisor recorded as a result of an administrative proceeding regarding disclosure of brokerage allocation practices in connection with sales of DWS Funds. The non-recurring income resulted in an increase in net investment income of $0.007 per share and an increase in the ratio of net investment income of 0.04%. Excluding this non-recurring income, total return would have been 0.03% lower. d Net investment income per share and ratio of net investment income include non-recurring dividend income amounting to $0.03 per share and 0.17% of average daily net assets, respectively. |
Performance Summary December 31, 2009
DWS Global Opportunities VIP
All performance shown is historical, assumes reinvestment of all dividend and capital gain distributions, and does not guarantee future results. Investment return and principal value fluctuate with changing market conditions so that, when redeemed, shares may be worth more or less than their original cost. Current performance may be lower or higher than the performance data quoted. Please contact your participating insurance company for the Portfolio's most recent month-end performance. Performance doesn't reflect charges and fees ("contract charges") associated with the separate account that invests in the Portfolio or any variable life insurance policy or variable annuity contract for which the Portfolio is an investment option. These charges and fees will reduce returns. While all share classes have the same underlying portfolio, their performance will differ.
The gross expense ratios of the Portfolio, as stated in the fee table of the prospectus dated May 1, 2009 are 1.11% and 1.42% for Class A and Class B shares, respectively, and may differ from the expense ratios disclosed in the Financial Highlights tables in this report.
Portfolio returns during all periods shown reflect a fee waiver and/or reimbursement. Without this waiver/reimbursement, returns would have been lower.
Risk Considerations
This Portfolio is subject to stock market risk. Investing in foreign securities presents certain risks, such as currency fluctuations, political and economic changes and market risks. Additionally, stocks of small-sized companies involve greater risk as they often have limited product lines, markets, or financial resources and may be sensitive to erratic and abrupt market movements more so than securities of larger, more-established companies. All of these factors may result in greater share price volatility. Please read this Portfolio's prospectus for specific details regarding its investments and risk profile.
Growth of an Assumed $10,000 Investment |
[] DWS Global Opportunities VIP — Class A [] S&P® Developed SmallCap Index | The S&P® Developed SmallCap Index is an unmanaged index of small-capitalization stocks within 26 countries around the globe. Index returns assume the reinvestment of dividends net of withholding tax and, unlike portfolio returns, do not reflect any fees or expenses. It is not possible to invest directly into an index. |
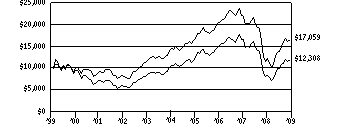 | |
Yearly periods ended December 31 | |
Comparative Results |
DWS Global Opportunities VIP | 1-Year | 3-Year | 5-Year | 10-Year |
Class A | Growth of $10,000 | $14,820 | $8,107 | $11,697 | $12,308 |
Average annual total return | 48.20% | -6.75% | 3.19% | 2.10% |
S&P Developed SmallCap Index | Growth of $10,000 | $13,943 | $8,318 | $11,751 | $17,059 |
Average annual total return | 39.43% | -5.96% | 3.28% | 5.49% |
DWS Global Opportunities VIP | 1-Year | 3-Year | 5-Year | 10-Year |
Class B | Growth of $10,000 | $14,766 | $8,015 | $11,534 | $11,985 |
Average annual total return | 47.66% | -7.11% | 2.89% | 1.83% |
S&P Developed SmallCap Index | Growth of $10,000 | $13,943 | $8,318 | $11,751 | $17,059 |
Average annual total return | 39.43% | -5.96% | 3.28% | 5.49% |
The growth of $10,000 is cumulative.
The accompanying notes are an integral part of the financial statements.
Information About Your Portfolio's Expenses
DWS Global Opportunities VIP
As an investor of the Portfolio, you incur two types of costs: ongoing expenses and transaction costs. Ongoing expenses include management fees, distribution and service (12b-1) fees and other Portfolio expenses. Examples of transaction costs include contract charges, redemption fees and account maintenance fees, which are not shown in this section. The following tables are intended to help you understand your ongoing expenses (in dollars) of investing in the Portfolio and to help you compare these expenses with the ongoing expenses of investing in other mutual funds. In the most recent six-month period, the Portfolio limited these expenses; had it not done so, expenses would have been higher. The example in the table is based on an investment of $1,000 invested at the beginning of the six-month period and held for the entire period (July 1, 2009 to December 31, 2009).
The tables illustrate your Portfolio's expenses in two ways:
• Actual Portfolio Return. This helps you estimate the actual dollar amount of ongoing expenses (but not transaction costs) paid on a $1,000 investment in the Portfolio using the Portfolio's actual return during the period. To estimate the expenses you paid over the period, simply divide your account value by $1,000 (for example, an $8,600 account value divided by $1,000 = 8.6), then multiply the result by the number in the "Expenses Paid per $1,000" line under the share class you hold.
• Hypothetical 5% Portfolio Return. This helps you to compare your Portfolio's ongoing expenses (but not transaction costs) with those of other mutual funds using the Portfolio's actual expense ratio and a hypothetical rate of return of 5% per year before expenses. Examples using a 5% hypothetical Portfolio return may be found in the shareholder reports of other mutual funds. The hypothetical account values and expenses may not be used to estimate the actual ending account balance or expenses you paid for the period.
Please note that the expenses shown in these tables are meant to highlight your ongoing expenses only and do not reflect any transaction costs. The "Expenses Paid per $1,000" line of the tables is useful in comparing ongoing expenses only and will not help you determine the relative total expense of owning different funds. If these transaction costs had been included, your costs would have been higher.
Expenses and Value of a $1,000 Investment for the six months ended December 31, 2009 |
Actual Portfolio Return | Class A | | Class B | |
Beginning Account Value 7/1/09 | $ 1,000.00 | | $ 1,000.00 | |
Ending Account Value 12/31/09 | $ 1,237.20 | | $ 1,235.80 | |
Expenses Paid per $1,000* | $ 5.70 | | $ 7.50 | |
Hypothetical 5% Portfolio Return | Class A | | Class B | |
Beginning Account Value 7/1/09 | $ 1,000.00 | | $ 1,000.00 | |
Ending Account Value 12/31/09 | $ 1,020.11 | | $ 1,018.50 | |
Expenses Paid per $1,000* | $ 5.14 | | $ 6.77 | |
* Expenses are equal to the Portfolio's annualized expense ratio for each share class, multiplied by the average account value over the period, multiplied by the number of days in the most recent six-month period, then divided by 365.
Annualized Expense Ratios | Class A | | Class B | |
DWS Variable Series I — DWS Global Opportunities VIP | 1.01% | | 1.33% | |
For more information, please refer to the Portfolio's prospectus.
These tables do not reflect charges and fees ("contract charges") associated with the separate account that invests in the Portfolio or any variable life insurance policy or variable annuity contract for which the Portfolio is an investment option.
Management Summary December 31, 2009
DWS Global Opportunities VIP
DWS Global Opportunities VIP generated a total return of 48.20% in 2009, outperforming the 39.43% return of its benchmark, the S&P® Developed SmallCap Index, by a wide margin.
A key factor in the Portfolio's outperformance was our effort to strike a balance between growth and risk. In the early part of the period, we took a defensive approach as we awaited greater clarity on the extent of the global financial crisis. In February, March and April 2009, with stocks at multiyear lows and historically cheap valuations, we decided to take on more risk. The result was that we were able to participate fully in equities' strong upside during the spring and summer rather than having to "chase" the rising market. We believe this balanced approach, which helps keep us from being caught flat-footed by shifts in the market environment, is critical in effectively managing a small-cap growth portfolio.
We generated the largest degree of outperformance in financials, where our return outpaced the gain for the financial stocks in the benchmark. The Portfolio's performance was helped by both strong stock selection and an underweight position.1 Our top contributors in financials were REXLot Holdings Ltd., Ashmore Group PLC and Midland Holdings Ltd. Our performance was similarly strong in consumer staples, where our gain was well ahead of the return of the broader sector. Here, our top-performing holding was Green Mountain Coffee Roasters, Inc., which gained over 200%. Our stock selection was least effective in health care, due in part to positions in Fresenius Medical Care AG & Co. KGaA and Thoratec Corp.
Joseph Axtell, CFA
Portfolio Manager
The S&P® Developed SmallCap Index is an unmanaged index of small-capitalization stocks within 26 countries around the globe.
Index returns assume the reinvestment of dividends net of withholding tax and, unlike portfolio returns, do not reflect any fees or expenses. It is not possible to invest directly into an index.
1 "Overweight" means the portfolio holds a higher weighting in a given sector or security than the benchmark. "Underweight" means the portfolio holds a lower weighting.
Portfolio management market commentary is as of December 31, 2009, and may not come to pass. This information is subject to change at any time based on market and other conditions. Past performance does not guarantee future results. Current and future portfolio holdings are subject to risk.
Portfolio Summary
DWS Global Opportunities VIP
Asset Allocation (As a % of Investment Portfolio excluding Securities Lending Collateral) | 12/31/09 | 12/31/08 |
| | |
Common Stocks | 97% | 99% |
Cash Equivalents | 2% | 1% |
Participatory Notes | 1% | — |
| 100% | 100% |
Geographical Diversification (As a % of Investment Portfolio excluding Cash Equivalents and Securities Lending Collateral) | 12/31/09 | 12/31/08 |
| | |
United States | 40% | 41% |
Continental Europe | 27% | 35% |
Pacific Basin | 13% | 5% |
Japan | 8% | 7% |
United Kingdom | 7% | 8% |
Canada | 2% | 1% |
Latin America | 1% | 1% |
Australia | 1% | 1% |
Other | 1% | 1% |
| 100% | 100% |
Sector Diversification (As a % of Investment Portfolio excluding Cash Equivalents and Securities Lending Collateral) | 12/31/09 | 12/31/08 |
| | |
Industrials | 18% | 20% |
Information Technology | 16% | 18% |
Consumer Discretionary | 16% | 10% |
Health Care | 16% | 21% |
Financials | 12% | 12% |
Energy | 10% | 9% |
Materials | 6% | 1% |
Consumer Staples | 5% | 5% |
Utilities | 1% | 4% |
| 100% | 100% |
Asset allocation, geographical diversification and sector diversification are subject to change.
For more complete details about the Portfolio's investment portfolio, see page 50. A complete list of portfolio holdings of the Portfolio is posted as of the month end on www.dws-investments.com on or about the 15th day of the following month. More frequent posting of portfolio holdings information may be made from time to time on www.dws-investments.com.
Following the Portfolio's fiscal first and third quarter-end, a complete portfolio holdings listing is filed with the SEC on Form N-Q. The form will be available on the SEC's Web site at www.sec.gov, and it also may be reviewed and copied at the SEC's Public Reference Room in Washington, D.C. Information on the operation of the SEC's Public Reference Room may be obtained by calling (800) SEC-0330.
Investment Portfolio December 31, 2009
DWS Global Opportunities VIP
|
Shares
| Value ($) |
| |
Common Stocks 97.4% |
Australia 0.6% |
Austal Ltd. (Cost $833,605) | 436,371 | 907,563 |
Austria 1.5% |
IMMOEAST AG* | 89,111 | 488,526 |
Intercell AG* | 11,862 | 438,898 |
Wienerberger AG* (a) | 67,031 | 1,216,717 |
(Cost $1,366,683) | 2,144,141 |
Bermuda 0.7% |
Lazard Ltd. "A" (Cost $691,804) | 28,300 | 1,074,551 |
Brazil 1.3% |
Diagnosticos da America SA | 33,900 | 1,100,514 |
Fleury SA* | 76,900 | 812,287 |
(Cost $1,495,293) | 1,912,801 |
Canada 1.2% |
CAE, Inc. | 88,681 | 743,637 |
SunOpta, Inc.* | 298,600 | 1,003,296 |
(Cost $3,467,239) | 1,746,933 |
Channel Islands 0.6% |
Randgold Resources Ltd. (ADR) (a) (b) (Cost $635,910) | 10,700 | 846,584 |
China 2.5% |
Minth Group Ltd. | 1,153,500 | 1,699,863 |
Shanda Games Ltd. (ADR)* (a) | 33,100 | 337,289 |
VanceInfo Technologies, Inc. (ADR) (a) | 80,300 | 1,542,563 |
(Cost $1,568,076) | 3,579,715 |
Cyprus 0.7% |
Prosafe Production Public Ltd.* (c) | 176,023 | 377,104 |
Prosafe SE (c) | 108,863 | 689,396 |
(Cost $1,386,572) | 1,066,500 |
France 2.7% |
Financiere Marc de Lacharriere SA | 14,359 | 798,773 |
Flamel Technologies SA (ADR)* (a) | 176,900 | 1,309,060 |
JC Decaux SA* | 52,648 | 1,276,475 |
Meetic* | 20,683 | 563,366 |
(Cost $4,987,198) | 3,947,674 |
Germany 5.8% |
Fresenius Medical Care AG & Co. KGaA | 79,607 | 4,215,046 |
M.A.X. Automation AG | 273,215 | 926,033 |
Rational AG (a) | 7,384 | 1,250,848 |
SGL Carbon SE* | 26,500 | 788,788 |
United Internet AG (Registered)* | 96,943 | 1,282,020 |
(Cost $4,129,307) | 8,462,735 |
Gibraltar 0.5% |
PartyGaming PLC* (Cost $788,874) | 189,604 | 792,362 |
Greece 1.7% |
Alpha Bank AE* | 95,970 | 1,110,270 |
Hellenic Exchanges SA | 63,600 | 659,160 |
Jumbo SA | 54,215 | 688,670 |
(Cost $2,744,464) | 2,458,100 |
|
Shares
| Value ($) |
| |
Hong Kong 6.7% |
Dah Sing Banking Group Ltd.* | 217,000 | 323,699 |
Inspur International Ltd. | 7,345,000 | 1,040,430 |
K Wah International Holdings Ltd. | 2,145,000 | 791,511 |
Kingboard Chemical Holdings Ltd. | 393,140 | 1,559,069 |
Midland Holdings Ltd. | 2,342,357 | 2,008,165 |
REXLot Holdings Ltd. (d) | 16,025,000 | 1,788,897 |
Tianneng Power International Ltd. | 1,466,000 | 674,569 |
Wing Hang Bank Ltd. | 165,200 | 1,535,058 |
(Cost $5,931,142) | 9,721,398 |
Ireland 4.3% |
Anglo Irish Bank Corp., Ltd.* | 225,606 | 0 |
C&C Group PLC (e) | 149,879 | 644,572 |
C&C Group PLC (e) | 188,378 | 812,965 |
FBD Holdings PLC | 23,700 | 234,511 |
ICON PLC (ADR)* | 46,900 | 1,019,137 |
Norkom Group PLC* | 292,633 | 601,798 |
Paddy Power PLC | 41,261 | 1,462,279 |
Ryanair Holdings PLC* (e) | 2,200 | 10,301 |
Ryanair Holdings PLC* (e) | 312,536 | 1,476,443 |
(Cost $5,133,818) | 6,262,006 |
Italy 0.8% |
Prysmian SpA (Cost $1,172,322) | 65,175 | 1,140,869 |
Japan 7.3% |
Dai-ichi Seiko Co., Ltd. | 19,900 | 836,750 |
Daiseki Co., Ltd. (a) | 44,500 | 895,969 |
FP Corp. | 13,900 | 626,788 |
Internet Initiative Japan, Inc. (a) | 347 | 619,337 |
Megane Top Co., Ltd. | 65,400 | 710,683 |
Nidec Corp. | 16,100 | 1,480,397 |
Nippon Seiki Co., Ltd. | 70,000 | 797,251 |
Nitori Co., Ltd. | 11,600 | 863,136 |
Shinko Plantech Co., Ltd. | 146,900 | 1,480,632 |
So-net M3, Inc. (a) | 238 | 717,231 |
Sumitomo Realty & Development Co., Ltd. | 48,000 | 900,263 |
Universal Entertainment Corp.* (a) | 60,500 | 752,764 |
(Cost $8,270,184) | 10,681,201 |
Korea 1.5% |
Korean Air Lines Co., Ltd.* | 26,400 | 1,237,969 |
S&T Dynamics Co., Ltd.* | 63,520 | 891,580 |
(Cost $1,842,926) | 2,129,549 |
Netherlands 3.7% |
Chicago Bridge & Iron Co. NV (NY Registered Shares)* (a) | 50,200 | 1,015,044 |
Koninklijke Vopak NV | 17,377 | 1,372,882 |
QIAGEN NV* (a) | 65,300 | 1,458,686 |
SBM Offshore NV | 77,839 | 1,523,083 |
(Cost $3,135,235) | 5,369,695 |
Singapore 0.9% |
Venture Corp., Ltd. (Cost $744,263) | 207,000 | 1,298,071 |
Spain 1.7% |
Grifols SA | 36,465 | 635,423 |
Tecnicas Reunidas SA | 14,698 | 840,790 |
Telvent GIT SA | 27,000 | 1,052,460 |
(Cost $2,150,802) | 2,528,673 |
|
Shares
| Value ($) |
| |
Switzerland 2.3% |
Advanced Digital Broadcast Holdings SA (ADB Group) (Registered)* | 11,792 | 587,101 |
Nobel Biocare Holding AG (Registered) | 43,292 | 1,448,890 |
Partners Group Holding AG | 10,300 | 1,297,276 |
(Cost $2,161,101) | 3,333,267 |
Taiwan 1.4% |
Compal Electronics, Inc. | 971,145 | 1,335,171 |
Siliconware Precision Industries Co. | 538,743 | 723,752 |
(Cost $1,115,439) | 2,058,923 |
United Arab Emirates 0.5% |
Lamprell PLC (Cost $791,325) | 253,965 | 749,391 |
United Kingdom 7.2% |
Aegis Group PLC | 287,441 | 549,619 |
ARM Holdings PLC | 575,608 | 1,645,945 |
Ashmore Group PLC | 331,498 | 1,441,060 |
Babcock International Group PLC | 142,329 | 1,364,104 |
ICAP PLC | 74,518 | 516,417 |
John Wood Group PLC | 128,118 | 632,887 |
Michael Page International PLC | 254,391 | 1,542,404 |
Northgate PLC* | 182,822 | 639,326 |
Rotork PLC | 40,826 | 781,394 |
Serco Group PLC | 156,242 | 1,328,316 |
(Cost $8,464,643) | 10,441,472 |
United States 39.3% |
Advance Auto Parts, Inc. | 25,350 | 1,026,168 |
Aecom Technology Corp.* | 50,168 | 1,379,620 |
Aeropostale, Inc.* | 37,600 | 1,280,280 |
Affiliated Managers Group, Inc.* (a) | 10,400 | 700,440 |
Allegheny Energy, Inc. | 72,600 | 1,704,648 |
Alpha Natural Resources, Inc.* | 28,000 | 1,214,640 |
American Eagle Outfitters, Inc. | 54,500 | 925,410 |
Atlas Air Worldwide Holdings, Inc.* | 31,600 | 1,177,100 |
BE Aerospace, Inc.* | 49,200 | 1,156,200 |
BioMarin Pharmaceutical, Inc.* (a) | 22,400 | 421,344 |
BPZ Resources, Inc.* (a) (f) | 90,100 | 855,950 |
Cameron International Corp.* | 15,900 | 664,620 |
Capella Education Co.* (a) | 9,000 | 677,700 |
Carter's, Inc.* | 53,700 | 1,409,625 |
Central European Distribution Corp.* (g) | 36,600 | 1,039,806 |
Chattem, Inc.* | 3,700 | 345,210 |
Cliffs Natural Resources, Inc. | 29,300 | 1,350,437 |
Commercial Metals Co. | 41,600 | 651,040 |
Darling International, Inc.* | 87,700 | 734,926 |
Deckers Outdoor Corp.* | 14,000 | 1,424,080 |
Diamond Foods, Inc. (a) | 34,300 | 1,219,022 |
Dresser-Rand Group, Inc.* | 32,800 | 1,036,808 |
Edwards Lifesciences Corp.* | 10,300 | 894,555 |
EXCO Resources, Inc. | 51,800 | 1,099,714 |
FTI Consulting, Inc.* (a) | 40,550 | 1,912,338 |
Green Mountain Coffee Roasters, Inc.* (a) | 14,350 | 1,169,095 |
Harris Corp. | 24,300 | 1,155,465 |
|
Shares
| Value ($) |
| |
Itron, Inc.* | 28,000 | 1,891,960 |
Jefferies Group, Inc.* (a) | 55,100 | 1,307,523 |
Joy Global, Inc. | 34,675 | 1,788,883 |
Lam Research Corp.* | 21,000 | 823,410 |
Lexmark International, Inc. "A"* (a) | 30,500 | 792,390 |
Life Technologies Corp.* | 29,400 | 1,535,562 |
ManTech International Corp. "A"* | 11,000 | 531,080 |
Martin Marietta Materials, Inc. (a) | 7,500 | 670,575 |
Merge Healthcare, Inc.* | 122,625 | 412,020 |
Metabolix, Inc.* | 47,800 | 529,146 |
MiddleBrook Pharmaceuticals, Inc.* (a) | 326,934 | 166,736 |
MSCI, Inc. "A"* | 24,731 | 786,446 |
Mylan, Inc.* (a) | 27,900 | 514,197 |
NxStage Medical, Inc.* | 145,300 | 1,213,255 |
Owens & Minor, Inc. | 27,300 | 1,171,989 |
Owens-Illinois, Inc.* | 31,500 | 1,035,405 |
Rovi Corp.* | 24,300 | 774,441 |
Schawk, Inc. | 31,500 | 428,400 |
Schweitzer-Mauduit International, Inc. | 32,300 | 2,272,305 |
Somanetics Corp.* | 58,300 | 1,023,165 |
Stericycle, Inc.* (a) | 15,900 | 877,203 |
Thoratec Corp.* (a) | 64,800 | 1,744,416 |
TiVo, Inc.* | 66,300 | 674,934 |
Ultra Petroleum Corp.* | 54,600 | 2,722,356 |
Urban Outfitters, Inc.* (a) | 43,900 | 1,536,061 |
Vista Gold Corp.* | 153,800 | 376,810 |
Waddell & Reed Financial, Inc. "A" | 32,300 | 986,442 |
(Cost $39,017,740) | 57,213,351 |
Total Common Stocks (Cost $104,025,965) | 141,867,525 |
|
Participatory Note 0.5% |
Indonesia |
PT AKR Corporindo Tbk (issuer Merrill Lynch International & Co.), Expiration Date 11/6/2014* (Cost $769,216) | 6,135,000 | 761,967 |
|
Securities Lending Collateral 13.5% |
Daily Assets Fund Institutional, 0.17% (h) (i) (Cost $19,662,787) | 19,662,787 | 19,662,787 |
|
Cash Equivalents 2.2% |
Central Cash Management Fund, 0.14% (h) (Cost $3,241,782) | 3,241,782 | 3,241,782 |
| % of Net Assets | Value ($) |
| |
Total Investment Portfolio (Cost $127,699,750)+ | 113.6 | 165,534,061 |
Other Assets and Liabilities, Net | (13.6) | (19,812,099) |
Net Assets | 100.0 | 145,721,962 |
* Non-income producing security.
+ The cost for federal income tax purposes was $129,036,147. At December 31, 2009, net unrealized appreciation for all securities based on tax cost was $36,497,914. This consisted of aggregate gross unrealized appreciation for all securities in which there was an excess of value over tax cost of $46,500,847 and aggregate gross unrealized depreciation for all securities in which there was an excess of tax cost over value of $10,002,933.
(a) All or a portion of these securities were on loan (see Notes to Financial Statements). The value of all securities loaned at December 31, 2009 amounted to $18,848,596, which is 12.9% of net assets.
(b) Security is listed in country of domicile. Significant business activities of the company are in Africa.
(c) Security is listed in country of domicile. Significant business activities of the company are in Norway.
(d) Security is listed in country of domicile. Significant business activities of the company are in China.
(e) Securities with the same description are the same corporate entity but trade on different stock exchanges.
(f) Security is listed in country of domicile. Significant business activities of company are in Peru and Ecuador.
(g) Security is listed in country of domicile. Sigificant business activities of company are in Poland.
(h) Affiliated fund managed by Deutsche Investment Management Americas Inc. The rate shown is the annualized seven-day yield at period end.
(i) Represents collateral held in connection with securities lending. Income earned by the Portfolio is net of borrower rebates.
ADR: American Depositary Receipt
Fair Value Measurements
Various inputs are used in determining the value of the Portfolio's investments. These inputs are summarized in three broad levels. Level 1 includes quoted prices in active markets for identical securities. Level 2 includes other significant observable inputs (including quoted prices for similar securities, interest rates, prepayment speeds, and credit risk). Level 3 includes significant unobservable inputs (including the Portfolio's own assumptions in determining the fair value of investments). The inputs or methodology used for valuing securities are not necessarily an indication of the risk associated with investing in those securities.
The following is a summary of the inputs used as of December 31, 2009 in valuing the Portfolio's investments. For information on the Portfolio's policy regarding the valuation of investments, please refer to the Security Valuation section of Note A in the accompanying Notes to the Financial Statements.
Assets | Level 1 | Level 2 | Level 3 | Total |
Common Stocks | | | | |
Australia | $ — | $ 907,563 | $ — | $ 907,563 |
Austria | — | 2,144,141 | — | 2,144,141 |
Bermuda | 1,074,551 | — | — | 1,074,551 |
Brazil | 1,912,801 | — | — | 1,912,801 |
Canada | 1,746,933 | — | — | 1,746,933 |
Channel Islands | 846,584 | — | — | 846,584 |
China | 1,879,852 | 1,699,863 | — | 3,579,715 |
Cyprus | — | 1,066,500 | — | 1,066,500 |
France | 1,309,060 | 2,638,614 | — | 3,947,674 |
Germany | — | 8,462,735 | — | 8,462,735 |
Gibraltar | — | 792,362 | — | 792,362 |
Greece | — | 2,458,100 | — | 2,458,100 |
Hong Kong | — | 9,721,398 | — | 9,721,398 |
Ireland | 1,019,137 | 5,242,869 | — | 6,262,006 |
Italy | — | 1,140,869 | — | 1,140,869 |
Japan | — | 10,681,201 | — | 10,681,201 |
Korea | — | 2,129,549 | — | 2,129,549 |
Netherlands | 1,015,044 | 4,354,651 | — | 5,369,695 |
Singapore | — | 1,298,071 | — | 1,298,071 |
Spain | 1,052,460 | 1,476,213 | — | 2,528,673 |
Switzerland | — | 3,333,267 | — | 3,333,267 |
Taiwan | — | 2,058,923 | — | 2,058,923 |
United Arab Emirates | — | 749,391 | — | 749,391 |
United Kingdom | — | 10,441,472 | — | 10,441,472 |
United States | 57,213,351 | — | — | 57,213,351 |
Participatory Note | — | 761,967 | — | 761,967 |
Short-Term Investments (j) | 22,904,569 | — | — | 22,904,569 |
Total | $ 91,974,342 | $ 73,559,719 | $ — | $ 165,534,061 |
(j) See Investment Portfolio for additional detailed categorizations.
The accompanying notes are an integral part of the financial statements.
Financial Statements
Statement of Assets and Liabilities as of December 31, 2009 |
Assets |
Investments: Investments in securities, at value (cost $104,795,181), including $18,848,596 of securities loaned | $ 142,629,492 |
Investment in Daily Assets Fund Institutional (cost $19,662,787)* | 19,662,787 |
Investment in Central Cash Management Fund (cost $3,241,782) | 3,241,782 |
Total investments, at value (cost $127,699,750) | 165,534,061 |
Foreign currency, at value (cost $10,456) | 10,410 |
Receivable for investments sold | 344,090 |
Receivable for Portfolio shares sold | 1,236 |
Dividends receivable | 49,234 |
Interest receivable | 9,812 |
Foreign taxes recoverable | 32,635 |
Other assets | 2,914 |
Total assets | 165,984,392 |
Liabilities |
Payable for investments purchased | 45,382 |
Payable for Portfolio shares redeemed | 381,921 |
Payable upon return of securities loaned | 19,662,787 |
Accrued management fee | 119,903 |
Accrued distribution service fee (Class B) | 1,361 |
Other accrued expenses and payables | 51,076 |
Total liabilities | 20,262,430 |
Net assets, at value | $ 145,721,962 |
Net Assets Consist of |
Undistributed net investment income | 165,912 |
Net unrealized appreciation (depreciation) on: Investments | 37,834,311 |
Foreign currency | 1,268 |
Accumulated net realized gain (loss) | (23,262,207) |
Paid-in capital | 130,982,678 |
Net assets, at value | $ 145,721,962 |
Class A Net Asset Value, offering and redemption price per share ($139,209,415 ÷ 12,301,988 outstanding shares of beneficial interest, $.01 par value, unlimited number of shares authorized) | $ 11.32 |
Class B Net Asset Value, offering and redemption price per share ($6,512,547 ÷ 586,186 outstanding shares of beneficial interest, $.01 par value, unlimited number of shares authorized) | $ 11.11 |
* Represents collateral on securities loaned.
The accompanying notes are an integral part of the financial statements.
Statement of Operations for the year ended December 31, 2009 |
Investment Income |
Income: Dividends (net of foreign taxes withheld of $110,247) | $ 1,625,927 |
Income distributions — affiliated cash management vehicles | 7,655 |
Securities lending income, including income from Daily Assets Fund Institutional, net of borrower rebates | 214,228 |
Other income | 2,132 |
Total Income | 1,849,942 |
Expenses: Management fee | 1,126,004 |
Administration fee | 126,517 |
Custodian fee | 29,996 |
Distribution service fee (Class B) | 13,933 |
Services to shareholders | 5,982 |
Record keeping fee (Class B) | 3,560 |
Professional fees | 59,745 |
Trustees' fees and expenses | 4,225 |
Reports to shareholders | 24,039 |
Other | 28,144 |
Total expenses before expense reductions | 1,422,145 |
Expense reductions | (154,823) |
Total expenses after expense reductions | 1,267,322 |
Net investment income (loss) | 582,620 |
Realized and Unrealized Gain (Loss) |
Net realized gain (loss) from: Investments | (7,218,071) |
Foreign currency | (49,296) |
| (7,267,367) |
Change in net unrealized appreciation (depreciation) on: Investments | 55,597,871 |
Foreign currency | 2,183 |
| 55,600,054 |
Net gain (loss) | 48,332,687 |
Net increase (decrease) in net assets resulting from operations | $ 48,915,307 |
The accompanying notes are an integral part of the financial statements.
Statement of Changes in Net Assets |
Increase (Decrease) in Net Assets | Years Ended December 31, |
2009 | 2008 |
Operations: Net investment income (loss) | $ 582,620 | $ 3,472,658 |
Net realized gain (loss) | (7,267,367) | (11,414,417) |
Change in net unrealized appreciation (depreciation) | 55,600,054 | (135,433,278) |
Net increase (decrease) in net assets resulting from operations | 48,915,307 | (143,375,037) |
Distributions to shareholders from: Net investment income: Class A | (2,053,958) | (606,759) |
Class B | (80,052) | — |
Net realized gains: Class A | — | (38,799,742) |
Class B | — | (1,584,503) |
Total distributions | (2,134,010) | (40,991,004) |
Portfolio share transactions: Class A Proceeds from shares sold | 8,747,386 | 9,798,954 |
Reinvestment of distributions | 2,053,958 | 39,406,501 |
Cost of shares redeemed | (33,699,813) | (64,901,647) |
Net increase (decrease) in net assets from Class A share transactions | (22,898,469) | (15,696,192) |
Class B Proceeds from shares sold | 692,203 | 887,328 |
Reinvestment of distributions | 80,052 | 1,584,503 |
Cost of shares redeemed | (1,476,946) | (2,362,537) |
Net increase (decrease) in net assets from Class B share transactions | (704,691) | 109,294 |
Increase (decrease) in net assets | 23,178,137 | (199,952,939) |
Net assets at beginning of period | 122,543,825 | 322,496,764 |
Net assets at end of period (including undistributed net investment income of $165,912 and $298,854, respectively) | $ 145,721,962 | $ 122,543,825 |
Other Information |
Class A Shares outstanding at beginning of period | 15,069,861 | 16,980,253 |
Shares sold | 905,526 | 754,392 |
Shares issued to shareholders in reinvestment of distributions | 264,685 | 2,730,873 |
Shares redeemed | (3,938,084) | (5,395,657) |
Net increase (decrease) in Class A shares | (2,767,873) | (1,910,392) |
Shares outstanding at end of period | 12,301,988 | 15,069,861 |
Class B Shares outstanding at beginning of period | 669,567 | 673,793 |
Shares sold | 75,308 | 67,771 |
Shares issued to shareholders in reinvestment of distributions | 10,492 | 111,428 |
Shares redeemed | (169,181) | (183,425) |
Net increase (decrease) in Class B shares | (83,381) | (4,226) |
Shares outstanding at end of period | 586,186 | 669,567 |
The accompanying notes are an integral part of the financial statements.
Financial Highlights
Class A Years Ended December 31, | 2009 | 2008 | 2007 | 2006 | 2005 |
Selected Per Share Data |
Net asset value, beginning of period | $ 7.79 | $ 18.28 | $ 18.15 | $ 15.00 | $ 12.77 |
Income (loss) from investment operations: Net investment income (loss)a | .04 | .20d | .08d | .03c | .04 |
Net realized and unrealized gain (loss) | 3.64 | (8.18) | 1.61 | 3.28 | 2.27 |
Total from investment operations | 3.68 | (7.98) | 1.69 | 3.31 | 2.31 |
Less distributions from: Net investment income | (.15) | (.04) | (.23) | (.16) | (.08) |
Net realized gains | — | (2.47) | (1.33) | — | — |
Total distributions | (.15) | (2.51) | (1.56) | (.16) | (.08) |
Net asset value, end of period | $ 11.32 | $ 7.79 | $ 18.28 | $ 18.15 | $ 15.00 |
Total Return (%) | 48.20b | (49.96)b | 9.33b | 22.08c | 18.19 |
Ratios to Average Net Assets and Supplemental Data |
Net assets, end of period ($ millions) | 139 | 117 | 310 | 331 | 285 |
Ratio of expenses before expense reductions (%) | 1.11 | 1.11 | 1.14 | 1.12 | 1.17 |
Ratio of expenses after expense reductions (%) | .99 | .99 | 1.12 | 1.12 | 1.17 |
Ratio of net investment income (loss) (%) | .47 | 1.53d | .45d | .16c | .32 |
Portfolio turnover rate (%) | 53 | 21 | 19 | 28 | 30 |
a Based on average shares outstanding during the period. b Total return would have been lower had certain expenses not been reduced. c Includes non-recurring income from the Advisor recorded as a result of an administrative proceeding regarding disclosure of brokerage allocation practices in connection with sales of DWS Funds. The non-recurring income resulted in an increase in net investment income of $0.002 per share and an increase in the ratio of net investment income of 0.01%. Excluding this non-recurring income, total return would have been 0.01% lower. d Net investment income per share and the ratio of net investment income include non-recurring dividend income amounting to $0.05 and $0.02 per share and 0.37% and 0.09% of average daily net assets for the years ended December 31, 2008 and 2007, respectively. |
Class B Years Ended December 31, | 2009 | 2008 | 2007 | 2006 | 2005 |
Selected Per Share Data |
Net asset value, beginning of period | $ 7.65 | $ 18.03 | $ 17.93 | $ 14.84 | $ 12.62 |
Income (loss) from investment operations: Net investment income (loss)a | .02 | .16e | .01e | (.00)b,d | .03 |
Net realized and unrealized gain (loss) | 3.57 | (8.07) | 1.61 | 3.24 | 2.24 |
Total from investment operations | 3.59 | (7.91) | 1.62 | 3.24 | 2.27 |
Less distributions from: Net investment income | (.13) | — | (.19) | (.15) | (.05) |
Net realized gains | — | (2.47) | (1.33) | — | — |
Total distributions | (.13) | (2.47) | (1.52) | (.15) | (.05) |
Net asset value, end of period | $ 11.11 | $ 7.65 | $ 18.03 | $ 17.93 | $ 14.84 |
Total Return (%)c | 47.66 | (50.16) | 8.92 | 21.88d | 18.06 |
Ratios to Average Net Assets and Supplemental Data |
Net assets, end of period ($ millions) | 7 | 5 | 12 | 37 | 33 |
Ratio of expenses before expense reductions (%) | 1.42 | 1.42 | 1.53 | 1.51 | 1.54 |
Ratio of expenses after expense reductions (%) | 1.30 | 1.30 | 1.50 | 1.31 | 1.24 |
Ratio of net investment income (loss) (%) | .16 | 1.21e | .07e | (.03)d | .25 |
Portfolio turnover rate (%) | 53 | 21 | 19 | 28 | 30 |
a Based on average shares outstanding during the period. b Amount is less than $.005. c Total return would have been lower had certain expenses not been reduced. d Includes non-recurring income from the Advisor recorded as a result of an administrative proceeding regarding disclosure of brokerage allocation practices in connection with sales of DWS Funds. The non-recurring income resulted in an increase in net investment income of $0.002 per share and an increase in the ratio of net investment income of 0.01%. Excluding this non-recurring income, total return would have been 0.01% lower. e Net investment income per share and the ratio of net investment income include non-recurring dividend income amounting to $0.05 and $0.02 per share and 0.37% and 0.09% of average daily net assets for the years ended December 31, 2008 and 2007, respectively. |
Performance Summary December 31, 2009
DWS International VIP
All performance shown is historical, assumes reinvestment of all dividend and capital gain distributions, and does not guarantee future results. Investment return and principal value fluctuate with changing market conditions so that, when redeemed, shares may be worth more or less than their original cost. Current performance may be lower or higher than the performance data quoted. Please contact your participating insurance company for the Portfolio's most recent month-end performance. Performance doesn't reflect charges and fees ("contract charges") associated with the separate account that invests in the Portfolio or any variable life insurance policy or variable annuity contract for which the Portfolio is an investment option. These charges and fees will reduce returns. While all share classes have the same underlying portfolio, their performance will differ.
The gross expense ratios of the Portfolio, as stated in the fee table of the prospectus dated May 1, 2009 are 1.01% and 1.33% for Class A and Class B shares, respectively, and may differ from the expense ratios disclosed in the Financial Highlights tables in this report.
Portfolio returns for the 3-year, 5-year and 10-year periods shown reflect a fee waiver and/or reimbursement. Without this waiver/reimbursement, returns would have been lower.
Risk Considerations
This Portfolio is subject to stock market risk. Investing in foreign securities presents certain risks, such as currency fluctuation, political and economic changes and market risks. This may result in greater share price volatility. Derivatives may be more volatile and less liquid than traditional securities, and the Portfolio could suffer losses on an underlying Portfolio's derivative position. Investing in securities of emerging markets presents certain risks, such as currency fluctuation, political and economic changes and market risks. Please read this Portfolio's prospectus for specific details regarding its investments and risk profile.
Growth of an Assumed $10,000 Investment |
[] DWS International VIP — Class A [] MSCI EAFE® Index | The Morgan Stanley Capital International (MSCI) Europe, Australasia and Far East (EAFE®) Index is an unmanaged index that tracks international stock performance in the 21 developed markets in Europe, Australasia and the Far East. The index is calculated using closing local market prices and translates into US dollars using the London close foreign exchange rates. Index returns assume the reinvestment of dividends net of withholding tax and, unlike portfolio returns, do not reflect any fees or expenses. It is not possible to invest directly into an index. |
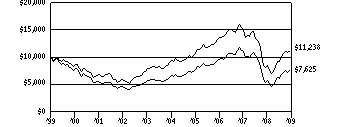 | |
Yearly periods ended December 31 | |
Comparative Results |
DWS International VIP | 1-Year | 3-Year | 5-Year | 10-Year |
Class A | Growth of $10,000 | $13,352 | $7,923 | $11,589 | $7,625 |
Average annual total return | 33.52% | -7.47% | 2.99% | -2.68% |
MSCI EAFE® Index | Growth of $10,000 | $13,178 | $8,295 | $11,898 | $11,238 |
Average annual total return | 31.78% | -6.04% | 3.54% | 1.17% |
DWS International VIP | 1-Year | 3-Year | 5-Year | 10-Year |
Class B | Growth of $10,000 | $13,289 | $7,857 | $11,405 | $7,435 |
Average annual total return | 32.89% | -7.72% | 2.66% | -2.92% |
MSCI EAFE® Index | Growth of $10,000 | $13,178 | $8,295 | $11,898 | $11,238 |
Average annual total return | 31.78% | -6.04% | 3.54% | 1.17% |
The growth of $10,000 is cumulative.
Information About Your Portfolio's Expenses
DWS International VIP
As an investor of the Portfolio, you incur two types of costs: ongoing expenses and transaction costs. Ongoing expenses include management fees, distribution and service (12b-1) fees and other Portfolio expenses. Examples of transaction costs include contract charges, redemption fees and account maintenance fees, which are not shown in this section. The following tables are intended to help you understand your ongoing expenses (in dollars) of investing in the Portfolio and to help you compare these expenses with the ongoing expenses of investing in other mutual funds. The example in the table is based on an investment of $1,000 invested at the beginning of the six-month period and held for the entire period (July 1, 2009 to December 31, 2009).
The tables illustrate your Portfolio's expenses in two ways:
• Actual Portfolio Return. This helps you estimate the actual dollar amount of ongoing expenses (but not transaction costs) paid on a $1,000 investment in the Portfolio using the Portfolio's actual return during the period. To estimate the expenses you paid over the period, simply divide your account value by $1,000 (for example, an $8,600 account value divided by $1,000 = 8.6), then multiply the result by the number in the "Expenses Paid per $1,000" line under the share class you hold.
• Hypothetical 5% Portfolio Return. This helps you to compare your Portfolio's ongoing expenses (but not transaction costs) with those of other mutual funds using the Portfolio's actual expense ratio and a hypothetical rate of return of 5% per year before expenses. Examples using a 5% hypothetical Portfolio return may be found in the shareholder reports of other mutual funds. The hypothetical account values and expenses may not be used to estimate the actual ending account balance or expenses you paid for the period.
Please note that the expenses shown in these tables are meant to highlight your ongoing expenses only and do not reflect any transaction costs. The "Expenses Paid per $1,000" line of the tables is useful in comparing ongoing expenses only and will not help you determine the relative total expense of owning different funds. If these transaction costs had been included, your costs would have been higher.
Expenses and Value of a $1,000 Investment for the six months ended December 31, 2009 |
Actual Portfolio Return | Class A | | Class B | |
Beginning Account Value 7/1/09 | $ 1,000.00 | | $ 1,000.00 | |
Ending Account Value 12/31/09 | $ 1,242.10 | | $ 1,240.20 | |
Expenses Paid per $1,000* | $ 5.43 | | $ 7.00 | |
Hypothetical 5% Portfolio Return | Class A | | Class B | |
Beginning Account Value 7/1/09 | $ 1,000.00 | | $ 1,000.00 | |
Ending Account Value 12/31/09 | $ 1,020.37 | | $ 1,018.95 | |
Expenses Paid per $1,000* | $ 4.89 | | $ 6.31 | |
* Expenses are equal to the Portfolio's annualized expense ratio for each share class, multiplied by the average account value over the period, multiplied by the number of days in the most recent six-month period, then divided by 365.
Annualized Expense Ratios | Class A | | Class B | |
DWS Variable Series I — DWS International VIP | .96% | | 1.24% | |
For more information, please refer to the Portfolio's prospectus.
These tables do not reflect charges and fees ("contract charges") associated with the separate account that invests in the Portfolio or any variable life insurance policy or variable annuity contract for which the Portfolio is an investment option.
Management Summary December 31, 2009
DWS International VIP
International equities delivered a strong performance in 2009, as signs of improving economic growth overseas — particularly in the emerging markets — sparked a robust recovery from the bear market of 2008. DWS International VIP (Class A shares, unadjusted for contract charges) performed very well in this environment, with a total return of 33.52% — ahead of the 31.78% return of the Portfolio's benchmark, the MSCI EAFE® Index.
We added the most value via our well-timed asset allocation shifts in the financial sector. The Portfolio held an underweight in financials through the first half of the period, which dampened the effect of the sector's extremely poor performance during that time.1 We maintained the underweight in financials until late in the first quarter, when we began to increase the Portfolio's weighting in the sector. This decision enabled us to capitalize on the subsequent rally, boosting the Portfolio's return. Among our top performers in financials were Sberbank, BNP Paribas and IMMOEAST AG.
Energy was the second-strongest sector in the Portfolio, thanks to our positions in Saipem SpA and Petroleo Brasiliero SA ("Petrobras").* Our stock selections in utilities and industrials were additional sources of outperformance. The Portfolio's top performers in the two sectors were Fortum Oyj and Compagnie de Saint-Gobain, respectively.
While we generated positive absolute results in all 10 sectors, our stock picks fell short of the benchmark in health care, consumer staples and information technology. Additionally, we were hurt by holding an underweight in the outperforming consumer discretionary sector. The largest individual detractors in the Portfolio during 2009 were China Mobile Ltd., Nintendo Co., Ltd. and Seven & I Holdings Co., Ltd.
We strived to maintain a balance in the Portfolio. While focused on companies with strong balance sheets, stable dividends and higher visibility regarding earnings and revenues, we looked for opportunities in companies with exposure to longer-term trends such as infrastructure expansion, the rising importance of alternative energy, and the growth of China and Russia. Overall, we believe an approach that emphasizes fundamental research and individual stock selection will hold the Portfolio in good stead as the global investment picture sorts itself out in the coming year.
Nikolaus Poehlmann, CFA
Lead Portfolio Manager
Michael Sieghart, CFA
Portfolio Manager (through December 31, 2009)
Udo Rosendahl
Mark Schumann
Andreas Wendelken
Portfolio Managers
The Morgan Stanley Capital International (MSCI) Europe, Australasia and Far East (EAFE®) Index is an unmanaged index that tracks international stock performance in the 21 developed markets in Europe, Australasia and the Far East. The index is calculated using closing local market prices and translates into US dollars using the London close foreign exchange rates.
Index returns assume the reinvestment of dividends net of withholding tax and, unlike portfolio returns, do not reflect any fees or expenses. It is not possible to invest directly into an index.
1 "Overweight" means the portfolio holds a higher weighting in a given sector or security than the benchmark. "Underweight" means the portfolio holds a lower weighting.
* Not held in the portfolio as of December 31, 2009.
Portfolio management market commentary is as of December 31, 2009, and may not come to pass. This information is subject to change at any time based on market and other conditions. Past performance does not guarantee future results. Current and future portfolio holdings are subject to risk.
Portfolio Summary
DWS International VIP
Asset Allocation (As a % of Investment Portfolio excluding Securities Lending Collateral) | 12/31/09 | 12/31/08 |
| | |
Common Stocks | 93% | 93% |
Cash Equivalents | 4% | 2% |
Exchange-Traded Funds | 3% | 5% |
| 100% | 100% |
Geographical Diversification
(As a % of Investment Portfolio excluding Cash Equivalents and Securities Lending Collateral) | 12/31/09 | 12/31/08 |
| | |
Continental Europe | 63% | 62% |
Japan | 18% | 22% |
United Kingdom | 9% | 8% |
Pacific Basin | 6% | 5% |
Australia | 4% | — |
Latin America | — | 2% |
Other | — | 1% |
| 100% | 100% |
Sector Diversification (As a % of Common Stocks and Rights) | 12/31/09 | 12/31/08 |
| | |
Financials | 24% | 20% |
Materials | 15% | 8% |
Energy | 13% | 11% |
Industrials | 13% | 8% |
Consumer Discretionary | 9% | — |
Health Care | 8% | 22% |
Telecommunication Services | 5% | 12% |
Utilities | 5% | 4% |
Consumer Staples | 5% | 10% |
Information Technology | 3% | 5% |
| 100% | 100% |
Asset allocation, geographical diversification and sector diversification are subject to change.
For more complete details about the Portfolio's investment portfolio, see page 63. A complete list of portfolio holdings of the Portfolio is posted as of the month end on www.dws-investments.com on or about the 15th day of the following month. More frequent posting of portfolio holdings information may be made from time to time on www.dws-investments.com.
Following the Portfolio's fiscal first and third quarter-end, a complete portfolio holdings listing is filed with the SEC on Form N-Q. The form will be available on the SEC's Web site at www.sec.gov, and it also may be reviewed and copied at the SEC's Public Reference Room in Washington, D.C. Information on the operation of the SEC's Public Reference Room may be obtained by calling (800) SEC-0330.
Investment Portfolio December 31, 2009
DWS International VIP
|
Shares
| Value ($) |
| |
Common Stocks 92.2% |
Australia 3.7% |
BHP Billiton Ltd. | 208,059 | 7,967,364 |
Woodside Petroleum Ltd. | 109,869 | 4,617,749 |
(Cost $7,976,257) | 12,585,113 |
Austria 5.5% |
bwin Interactive Entertainment AG* | 86,285 | 5,141,307 |
IMMOEAST AG* (a) | 782,889 | 4,291,971 |
Intercell AG* | 144,663 | 5,352,577 |
Voestalpine AG | 118,116 | 4,307,079 |
(Cost $12,659,585) | 19,092,934 |
Belgium 0.7% |
Fortis* (Cost $1,774,799) | 616,475 | 2,283,952 |
China 3.4% |
China Life Insurance Co., Ltd. "H" | 1,569,606 | 7,690,617 |
PetroChina Co., Ltd. "H" | 3,501,126 | 4,171,219 |
(Cost $9,434,982) | 11,861,836 |
Denmark 2.5% |
A P Moller — Maersk AS "B" | 541 | 3,783,058 |
Carlsberg AS "B" | 67,085 | 4,950,647 |
(Cost $10,447,729) | 8,733,705 |
Finland 1.9% |
Fortum Oyj (Cost $9,432,855) | 241,978 | 6,555,431 |
France 7.8% |
Alstom SA | 48,626 | 3,378,460 |
AXA SA | 165,126 | 3,905,270 |
BNP Paribas | 77,585 | 6,122,513 |
Compagnie de Saint-Gobain | 68,351 | 3,668,921 |
Electricite de France | 72,865 | 4,335,862 |
Total SA | 83,005 | 5,319,089 |
(Cost $18,749,161) | 26,730,115 |
Germany 10.4% |
BASF SE | 102,791 | 6,375,761 |
Bayer AG | 76,126 | 6,084,379 |
Daimler AG (Registered) | 149,232 | 7,973,018 |
Deutsche Telekom AG (Registered) | 325,523 | 4,807,650 |
E.ON AG | 149,997 | 6,262,025 |
Fresenius Medical Care AG & Co. KGaA | 83,451 | 4,418,579 |
(Cost $19,772,177) | 35,921,412 |
Hong Kong 2.0% |
China Mobile Ltd. (Cost $8,363,475) | 754,333 | 7,031,225 |
Ireland 1.6% |
CRH PLC (Cost $4,278,650) | 206,746 | 5,600,268 |
Italy 2.8% |
Saipem SpA (a) | 179,179 | 6,155,295 |
UniCredit SpA* | 1,092,405 | 3,633,753 |
(Cost $6,415,378) | 9,789,048 |
Japan 14.2% |
Canon, Inc. | 137,146 | 5,797,856 |
FANUC Ltd. | 49,700 | 4,621,370 |
KOMATSU Ltd. | 394,777 | 8,230,317 |
Mitsubishi Corp. | 237,868 | 5,914,074 |
Mitsui & Co., Ltd. | 371,366 | 5,257,470 |
|
Shares
| Value ($) |
| |
Nintendo Co., Ltd. | 19,382 | 4,594,818 |
Seven & I Holdings Co., Ltd. | 121,683 | 2,469,811 |
Shin-Etsu Chemical Co., Ltd. | 94,124 | 5,305,348 |
Toyota Motor Corp. | 156,664 | 6,582,372 |
(Cost $44,093,970) | 48,773,436 |
Luxembourg 1.9% |
ArcelorMittal (Cost $3,741,492) | 142,706 | 6,472,419 |
Netherlands 2.3% |
ING Groep NV (CVA)* (Cost $6,955,433) | 808,754 | 7,818,366 |
Russia 5.8% |
Gazprom (ADR) | 247,900 | 6,179,546 |
Gazprom OAO (ADR) | 59,357 | 1,513,603 |
LUKOIL (ADR) | 56,894 | 3,186,907 |
Sberbank | 3,203,369 | 8,959,048 |
(Cost $16,719,986) | 19,839,104 |
Spain 5.4% |
Banco Santander SA | 521,392 | 8,566,415 |
Grifols SA | 266,506 | 4,644,017 |
Telefonica SA | 196,184 | 5,467,952 |
(Cost $12,332,837) | 18,678,384 |
Sweden 0.9% |
Hennes & Mauritz AB "B" (Cost $2,082,830) | 54,673 | 3,025,462 |
Switzerland 10.9% |
ABB Ltd. (Registered)* | 259,032 | 4,954,085 |
Compagnie Financiere Richemont SA "A" | 134,194 | 4,490,278 |
Credit Suisse Group AG (Registered) | 106,337 | 5,237,218 |
Nestle SA (Registered) | 156,335 | 7,595,192 |
Novartis AG (Registered) | 89,125 | 4,855,729 |
UBS AG (Registered)* | 179,150 | 2,752,088 |
Xstrata PLC* | 434,837 | 7,659,092 |
(Cost $22,463,090) | 37,543,682 |
United Kingdom 8.5% |
BG Group PLC | 311,256 | 5,573,905 |
BP PLC | 532,664 | 5,151,491 |
HSBC Holdings PLC | 511,181 | 5,833,767 |
Lloyds Banking Group PLC | 9,498,023 | 7,624,953 |
Rio Tinto PLC | 95,627 | 5,153,948 |
(Cost $25,328,672) | 29,338,064 |
Total Common Stocks (Cost $243,023,358) | 317,673,956 |
|
Rights 0.0% |
Australia |
Woodside Petroleum Ltd., Expiration Date 1/29/2010* (Cost $0) | 9,155 | 41,940 |
|
Exchange-Traded Fund 3.5% |
Japan |
iShares MSCI Japan Index Fund (a) (Cost $13,969,305) | 1,220,454 | 11,887,222 |
|
|
Shares
| Value ($) |
| |
Securities Lending Collateral 4.4% |
Daily Assets Fund Institutional, 0.17% (b) (c) (Cost $15,194,791) | 15,194,791 | 15,194,791 |
|
Cash Equivalents 3.5% |
Central Cash Management Fund, 0.14% (b) (Cost $12,183,363) | 12,183,363 | 12,183,363 |
| % of Net Assets | Value ($) |
| |
Total Investment Portfolio (Cost $284,370,817)+ | 103.6 | 356,981,272 |
Other Assets and Liabilities, Net | (3.6) | (12,544,990) |
Net Assets | 100.0 | 344,436,282 |
* Non-income producing security.
+ The cost for federal income tax purposes was $291,517,741. At December 31, 2009, net unrealized appreciation for all securities based on tax cost was $65,463,531. This consisted of aggregate gross unrealized appreciation for all securities in which there was an excess of value over tax cost of $87,468,492 and aggregate gross unrealized depreciation for all securities in which there was an excess of tax cost over value of $22,004,961.
(a) All or a portion of these securities were on loan (see Notes to Financial Statements). The value of all securities loaned at December 31, 2009 amounted to $14,420,174, which is 4.2% of net assets.
(b) Affiliated fund managed by Deutsche Investment Management Americas Inc. The rate shown is the annualized seven-day yield at period end.
(c) Represents collateral held in connection with securities lending. Income earned by the Portfolio is net of borrower rebates.
ADR: American Depositary Receipt
CVA: Certificaten Van Aandelen
MSCI: Morgan Stanley Capital International
Fair Value Measurements
Various inputs are used in determining the value of the Portfolio's investments. These inputs are summarized in three broad levels. Level 1 includes quoted prices in active markets for identical securities. Level 2 includes other significant observable inputs (including quoted prices for similar securities, interest rates, prepayment speeds, and credit risk). Level 3 includes significant unobservable inputs (including the Portfolio's own assumptions in determining the fair value of investments). The inputs or methodology used for valuing securities are not necessarily an indication of the risk associated with investing in those securities.
The following is a summary of the inputs used as of December 31, 2009 in valuing the Portfolio's investments. For information on the Portfolio's policy regarding the valuation of investments, please refer to the Security Valuation section of Note A in the accompanying Notes to the Financial Statements.
Assets | Level 1 | Level 2 | Level 3 | Total |
Common Stock and/or Other Equity Investments (d) | | | | |
Australia | $ — | $ 12,627,053 | $ — | $ 12,627,053 |
Austria | — | 19,092,934 | — | 19,092,934 |
Belgium | — | 2,283,952 | — | 2,283,952 |
China | — | 11,861,836 | — | 11,861,836 |
Denmark | — | 8,733,705 | — | 8,733,705 |
Finland | — | 6,555,431 | — | 6,555,431 |
France | — | 26,730,115 | — | 26,730,115 |
Germany | — | 35,921,412 | — | 35,921,412 |
Hong Kong | — | 7,031,225 | — | 7,031,225 |
Ireland | — | 5,600,268 | — | 5,600,268 |
Italy | — | 9,789,048 | — | 9,789,048 |
Japan | — | 48,773,436 | — | 48,773,436 |
Luxembourg | — | 6,472,419 | — | 6,472,419 |
Netherlands | — | 7,818,366 | — | 7,818,366 |
Russia | 3,186,907 | 16,652,197 | — | 19,839,104 |
Spain | — | 18,678,384 | — | 18,678,384 |
Sweden | — | 3,025,462 | — | 3,025,462 |
Switzerland | — | 37,543,682 | — | 37,543,682 |
United Kingdom | — | 29,338,064 | — | 29,338,064 |
Exchange-Traded Fund | 11,887,222 | — | — | 11,887,222 |
Short-Term Investments (d) | 27,378,154 | — | — | 27,378,154 |
Total | $ 42,452,283 | $ 314,528,989 | $ — | $ 356,981,272 |
(d) See Investment Portfolio for additional detailed categorizations.
The accompanying notes are an integral part of the financial statements.
Financial Statements
Statement of Assets and Liabilities as of December 31, 2009 |
Assets |
Investments: Investments in securities, at value (cost $256,992,663), including $14,420,174 of securities loaned | $ 329,603,118 |
Investment in Daily Assets Fund Institutional (cost $15,194,791)* | 15,194,791 |
Investment in Central Cash Management Fund (cost $12,183,363) | 12,183,363 |
Total investments, at value (cost $284,370,817) | 356,981,272 |
Cash | 1,914 |
Foreign currency, at value (cost $2,420,462) | 2,406,218 |
Receivable for investments sold | 318,449 |
Dividends receivable | 166,660 |
Interest receivable | 4,998 |
Receivable for Portfolio shares sold | 88,235 |
Foreign taxes recoverable | 126,673 |
Other assets | 6,973 |
Total assets | 360,101,392 |
Liabilities |
Payable for Portfolio shares redeemed | 160,395 |
Payable upon return of securities loaned | 15,194,791 |
Accrued management fee | 216,064 |
Accrued distribution service fee (Class B) | 99 |
Other accrued expenses and payables | 93,761 |
Total liabilities | 15,665,110 |
Net assets, at value | $ 344,436,282 |
Net Assets Consist of |
Undistributed net investment income | 4,263,585 |
Net unrealized appreciation (depreciation) on: Investments | 72,610,455 |
Foreign currency | (6,299) |
Accumulated net realized gain (loss) | (182,351,664) |
Paid-in capital | 449,920,205 |
Net assets, at value | $ 344,436,282 |
Class A Net Asset Value, offering and redemption price per share ($343,970,103 ÷ 41,648,336 outstanding shares of beneficial interest, $.01 par value, unlimited number of shares authorized) | $ 8.26 |
Class B Net Asset Value, offering and redemption price per share ($466,179 ÷ 56,405 outstanding shares of beneficial interest, $.01 par value, unlimited number of shares authorized) | $ 8.26 |
* Represents collateral on securities loaned.
The accompanying notes are an integral part of the financial statements.
Statement of Operations for the year ended December 31, 2009 |
Investment Income |
Income: Dividends (net of foreign taxes withheld of $956,597) | $ 7,502,055 |
Interest | 1,843 |
Income distributions — affiliated cash management vehicles | 29,727 |
Securities lending income, including income from Daily Assets Fund Institutional, net of borrower rebates | 403,009 |
Total Income | 7,936,634 |
Expenses: Management fee | 2,382,840 |
Administration fee | 301,625 |
Distribution service fee (Class B) | 1,028 |
Services to shareholders | 12,162 |
Professional fees | 52,094 |
Trustees' fees and expenses | 4,899 |
Reports to shareholders | 60,262 |
Other | 27,799 |
Total expenses | 2,842,709 |
Net investment income (loss) | 5,093,925 |
Realized and Unrealized Gain (Loss) |
Net realized gain (loss) from: Investments | (61,638,967) |
Foreign currency | (1,347,986) |
| (62,986,953) |
Change in net unrealized appreciation (depreciation) on: Investments | 145,295,138 |
Foreign currency | 15,855 |
| 145,310,993 |
Net gain (loss) | 82,324,040 |
Net increase (decrease) in net assets resulting from operations | $ 87,417,965 |
The accompanying notes are an integral part of the financial statements.
Statement of Changes in Net Assets |
Increase (Decrease) in Net Assets | Years Ended December 31, |
2009 | 2008 |
Operations: Net investment income (loss) | $ 5,093,925 | $ 14,193,685 |
Net realized gain (loss) | (62,986,953) | (117,783,796) |
Change in net unrealized appreciation (depreciation) | 145,310,993 | (202,811,438) |
Net increase (decrease) in net assets resulting from operations | 87,417,965 | (306,401,549) |
Distributions to shareholders from: Net investment income: Class A | (13,459,468) | (7,239,383) |
Class B | (17,118) | (82,273) |
Net realized gains: Class A | — | (94,147,000) |
Class B | — | (1,663,249) |
Total distributions | (13,476,586) | (103,131,905) |
Portfolio share transactions: Class A Proceeds from shares sold | 14,392,350 | 22,286,975 |
Reinvestment of distributions | 13,459,468 | 101,386,383 |
Cost of shares redeemed | (55,084,882) | (121,263,622) |
Net increase (decrease) in net assets from Class A share transactions | (27,233,064) | 2,409,736 |
Class B Proceeds from shares sold | 18,639 | 338,048 |
Reinvestment of distributions | 17,118 | 1,745,522 |
Cost of shares redeemed | (67,424) | (11,371,669) |
Net increase (decrease) in net assets from Class B share transactions | (31,667) | (9,288,099) |
Increase (decrease) in net assets | 46,676,648 | (416,411,817) |
Net assets at beginning of period | 297,759,634 | 714,171,451 |
Net assets at end of period (including undistributed net investment income of $4,263,585 and $13,320,593, respectively) | $ 344,436,282 | $ 297,759,634 |
Other Information |
Class A Shares outstanding at beginning of period | 45,605,566 | 46,761,118 |
Shares sold | 2,028,682 | 2,117,696 |
Shares issued to shareholders in reinvestment of distributions | 2,308,657 | 8,413,808 |
Shares redeemed | (8,294,569) | (11,687,056) |
Net increase (decrease) in Class A shares | (3,957,230) | (1,155,552) |
Shares outstanding at end of period | 41,648,336 | 45,605,566 |
Class B Shares outstanding at beginning of period | 60,497 | 818,856 |
Shares sold | 2,856 | 26,121 |
Shares issued to shareholders in reinvestment of distributions | 2,931 | 144,736 |
Shares redeemed | (9,879) | (929,216) |
Net increase (decrease) in Class B shares | (4,092) | (758,359) |
Shares outstanding at end of period | 56,405 | 60,497 |
The accompanying notes are an integral part of the financial statements.
Financial Highlights
Class A Years Ended December 31, | 2009 | 2008 | 2007 | 2006 | 2005 |
Selected Per Share Data |
Net asset value, beginning of period | $ 6.52 | $ 15.01 | $ 13.42 | $ 10.85 | $ 9.50 |
Income (loss) from investment operations: Net investment income (loss)a | .12 | .29c | .21c | .28c | .15 |
Net realized and unrealized gain (loss) | 1.93 | (6.46) | 1.73 | 2.51 | 1.36 |
Total from investment operations | 2.05 | (6.17) | 1.94 | 2.79 | 1.51 |
Less distributions from: Net investment income | (.31) | (.17) | (.35) | (.22) | (.16) |
Net realized gains | — | (2.15) | — | — | — |
Total distributions | (.31) | (2.32) | (.35) | (.22) | (.16) |
Net asset value, end of period | $ 8.26 | $ 6.52 | $ 15.01 | $ 13.42 | $ 10.85 |
Total Return (%) | 33.52 | (48.21)b,d | 14.59 | 25.91 | 16.17 |
Ratios to Average Net Assets and Supplemental Data |
Net assets, end of period ($ millions) | 344 | 297 | 702 | 702 | 558 |
Ratio of expenses before expense reductions (%) | .94 | 1.01 | .98 | .98 | 1.02 |
Ratio of expenses after expense reductions (%) | .94 | .97 | .98 | .98 | 1.02 |
Ratio of net investment income (loss) (%) | 1.69 | 2.74c | 1.48c | 2.32c | 1.59 |
Portfolio turnover rate (%) | 81 | 123 | 108 | 105 | 59 |
a Based on average shares outstanding during the period. b Total return would have been lower had certain expenses not been reduced. c Net investment income per share and the ratio of net investment income include non-recurring dividend income amounting to $0.09, $0.05 and $0.11 per share and 0.82%, 0.33% and 0.92% of average daily net assets for the years ended December 31, 2008, 2007 and 2006, respectively. d Includes a reimbursement from the Advisor to reimburse the effect of losses incurred as the result of certain operation errors during the period. Excluding this reimbursement, total return would have been 0.06% lower. |
Class B Years Ended December 31, | 2009 | 2008 | 2007 | 2006 | 2005 |
Selected Per Share Data |
Net asset value, beginning of period | $ 6.52 | $ 14.98 | $ 13.38 | $ 10.82 | $ 9.48 |
Income (loss) from investment operations: Net investment income (loss)a | .10 | .23c | .16c | .24c | .12 |
Net realized and unrealized gain (loss) | 1.94 | (6.43) | 1.73 | 2.50 | 1.35 |
Total from investment operations | 2.04 | (6.20) | 1.89 | 2.74 | 1.47 |
Less distributions from: Net investment income | (.30) | (.11) | (.29) | (.18) | (.13) |
Net realized gains | — | (2.15) | — | — | — |
Total distributions | (.30) | (2.26) | (.29) | (.18) | (.13) |
Net asset value, end of period | $ 8.26 | $ 6.52 | $ 14.98 | $ 13.38 | $ 10.82 |
Total Return (%) | 32.89 | (48.25)b,d | 14.25b | 25.44b | 15.71b |
Ratios to Average Net Assets and Supplemental Data |
Net assets, end of period ($ millions) | .50 | .40 | 12 | 51 | 40 |
Ratio of expenses before expense reductions (%) | 1.22 | 1.33 | 1.41 | 1.37 | 1.41 |
Ratio of expenses after expense reductions (%) | 1.22 | 1.28 | 1.39 | 1.36 | 1.37 |
Ratio of net investment income (loss) (%) | 1.42 | 2.42c | 1.07c | 1.94c | 1.24 |
Portfolio turnover rate (%) | 81 | 123 | 108 | 105 | 59 |
a Based on average shares outstanding during the period. b Total return would have been lower had certain expenses not been reduced. c Net investment income per share and the ratio of net investment income include non-recurring dividend income amounting to $0.09, $0.05 and $0.11 per share and 0.82%, 0.33% and 0.92% of average daily net assets for the years ended December 31, 2008, 2007 and 2006, respectively. d Includes a reimbursement from the Advisor to reimburse the effect of losses incurred as the result of certain operation errors during the period. Excluding this reimbursement, total return would have been 0.06% lower. |
Performance Summary December 31, 2009
DWS Health Care VIP
All performance shown is historical, assumes reinvestment of all dividend and capital gain distributions, and does not guarantee future results. Investment return and principal value fluctuate with changing market conditions so that, when redeemed, shares may be worth more or less then their original cost. Current performance may be lower or higher than the performance data quoted. Please contact your participating insurance company for the Portfolio's most recent month-end performance. Performance doesn't reflect charges and fees ("contract charges") associated with the separate account that invests in the Portfolio or any variable life insurance policy or variable annuity contract for which the Portfolio is an investment option. These charges and fees will reduce returns. While all share classes have the same underlying portfolio, their performance will differ.
The gross expense ratios of the Portfolio, as stated in the fee table of the prospectus dated May 1, 2009 are 0.92% and 1.27% for Class A and Class B shares, respectively, and may differ from the expense ratios disclosed in the Financial Highlights tables in this report.
Risk Considerations
This Portfolio is subject to stock market risk. The Portfolio may focus its investments on certain industry sectors, thereby increasing its vulnerability to any single industry or regulatory development. All of these factors may result in greater share price volatility. Please read this Portfolio's prospectus for specific details regarding its investments and risk profile.
Growth of an Assumed $10,000 Investment |
[] DWS Health Care VIP — Class A [] S&P 500® Index [] S&P® North American Health Care Sector Index | The Standard & Poor's® 500 (S&P 500) Index is an unmanaged, capitalization-weighted index of 500 stocks. The index is designed to measure performance of the broad domestic economy through changes in the aggregate market value of 500 stocks representing all major industries. The S&P® North American Health Care Sector Index (name changed from The S&P GSSI Healthcare Sector Index, effective March 31, 2008) is an unmanaged, market-capitalization weighted index of 123 stocks designed to measure the performance of companies in the health care sector. Index returns assume the reinvestment of dividends and, unlike portfolio returns, do not reflect any fees or expenses. It is not possible to invest directly into an index. |
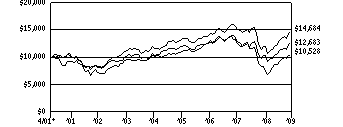 | |
Yearly periods ended December 31 | |
Comparative Results |
DWS Health Care VIP | 1-Year | 3-Year | 5-Year | Life of Portfolio* |
Class A | Growth of $10,000 | $12,219 | $10,623 | $12,237 | $14,684 |
Average annual total return | 22.19% | 2.03% | 4.12% | 4.52% |
S&P 500 Index | Growth of $10,000 | $12,646 | $8,405 | $10,211 | $10,528 |
Average annual total return | 26.46% | -5.63% | .42% | .60% |
S&P North American Health Care Sector Index | Growth of $10,000 | $12,249 | $10,133 | $11,977 | $12,683 |
Average annual total return | 22.49% | .44% | 3.67% | 2.78% |
DWS Health Care VIP | 1-Year | 3-Year | 5-Year | Life of Class** |
Class B | Growth of $10,000 | $12,180 | $10,518 | $12,022 | $17,699 |
Average annual total return | 21.80% | 1.70% | 3.75% | 7.91% |
S&P 500 Index | Growth of $10,000 | $12,646 | $8,405 | $10,211 | $13,070 |
Average annual total return | 26.46% | -5.63% | .42% | 3.63% |
S&P North American Health Care Sector Index | Growth of $10,000 | $12,249 | $10,133 | $11,977 | $15,185 |
Average annual total return | 22.49% | .44% | 3.67% | 5.72% |
The growth of $10,000 is cumulative.
* The Portfolio commenced operations on May 1, 2001. Index returns began on April 30, 2001.
** The Portfolio commenced offering Class B shares on July 1, 2002. Index returns began on June 30, 2002.
Information About Your Portfolio's Expenses
DWS Health Care VIP
As an investor of the Portfolio, you incur two types of costs: ongoing expenses and transaction costs. Ongoing expenses include management fees, distribution and service (12b-1) fees and other Portfolio expenses. Examples of transaction costs include contract charges, redemption fees and account maintenance fees, which are not shown in this section. The following tables are intended to help you understand your ongoing expenses (in dollars) of investing in the Portfolio and to help you compare these expenses with the ongoing expenses of investing in other mutual funds. The example in the table is based on an investment of $1,000 invested at the beginning of the six-month period and held for the entire period (July 1, 2009 to December 31, 2009).
The tables illustrate your Portfolio's expenses in two ways:
• Actual Portfolio Return. This helps you estimate the actual dollar amount of ongoing expenses (but not transaction costs) paid on a $1,000 investment in the Portfolio using the Portfolio's actual return during the period. To estimate the expenses you paid over the period, simply divide your account value by $1,000 (for example, an $8,600 account value divided by $1,000 = 8.6), then multiply the result by the number in the "Expenses Paid per $1,000" line under the share class you hold.
• Hypothetical 5% Portfolio Return. This helps you to compare your Portfolio's ongoing expenses (but not transaction costs) with those of other mutual funds using the Portfolio's actual expense ratio and a hypothetical rate of return of 5% per year before expenses. Examples using a 5% hypothetical Portfolio return may be found in the shareholder reports of other mutual funds. The hypothetical account values and expenses may not be used to estimate the actual ending account balance or expenses you paid for the period.
Please note that the expenses shown in these tables are meant to highlight your ongoing expenses only and do not reflect any transaction costs. The "Expenses Paid per $1,000" line of the tables is useful in comparing ongoing expenses only and will not help you determine the relative total expense of owning different funds. If these transaction costs had been included, your costs would have been higher.
Expenses and Value of a $1,000 Investment for the six months ended December 31, 2009 |
Actual Portfolio Return | Class A | | Class B | |
Beginning Account Value 7/1/09 | $ 1,000.00 | | $ 1,000.00 | |
Ending Account Value 12/31/09 | $ 1,190.00 | | $ 1,188.90 | |
Expenses Paid per $1,000* | $ 5.19 | | $ 7.34 | |
Hypothetical 5% Portfolio Return | Class A | | Class B | |
Beginning Account Value 7/1/09 | $ 1,000.00 | | $ 1,000.00 | |
Ending Account Value 12/31/09 | $ 1,020.47 | | $ 1,018.50 | |
Expenses Paid per $1,000* | $ 4.79 | | $ 6.77 | |
* Expenses are equal to the Portfolio's annualized expense ratio for each share class, multiplied by the average account value over the period, multiplied by the number of days in the most recent six-month period, then divided by 365.
Annualized Expense Ratios | Class A | | Class B | |
DWS Variable Series I — DWS Health Care VIP | .94% | | 1.33% | |
For more information, please refer to the Portfolio's prospectus.
These tables do not reflect charges and fees ("contract charges") associated with the separate account that invests in the Portfolio or any variable life insurance policy or variable annuity contract for which the Portfolio is an investment option.
Management Summary December 31, 2009
DWS Health Care VIP
After underperforming the broader market for most of the calendar year, due to investor preference for companies more closely tied to global economic recovery as well as the overhang of health care reform legislation, health care stocks began to show signs of life in November. We attribute the change in investor sentiment to the perception that health care reform legislation will be more moderate in nature than previously anticipated. For its most recent fiscal year ended December 31, 2009, DWS Health Care VIP posted a 22.19% total return (Class A shares, unadjusted for contract charges). In comparison, the S&P® 500 Index returned 26.46% and the S&P® North American Health Care Sector Index returned 22.49%.
Our overweight to several specialty pharmaceuticals stocks contributed significantly to performance during the quarter. Salix Pharmaceuticals, Ltd. appreciated meaningfully following positive clinical data for its drug to treat irritable bowel syndrome.1 Shire PLC shares benefited from Genzyme's manufacturing woes, as Shire has a competing drug under development for which the FDA has fast-tracked the approval process in order to meet patient needs. The largest detractor from relative performance during the period came from the Portfolio's underweight position in Merck & Co., Inc. Shares of Merck recovered from weakness earlier in 2009, as prescriptions for the company's Vytorin/Zetia cholesterol franchise appear to have stabilized, and investors anticipated the opportunities emerging from the closing of Merck's merger with Schering-Plough.
We believe health care reform legislation if enacted, will be manageable for most health care companies, as the expansion of insurance coverage to uninsured individuals will likely mitigate the possible negative impacts of lower pricing and/or reimbursement. In addition, we believe that health care stocks could benefit from investor rotation out of stock market sectors that have dramatically outperformed in 2009. Longer term, we believe that health care stocks remain attractive based on favorable global demographic trends and the continuing emergence of new technologies.
The following person is responsible for the day-to-day management of the Portfolio:
Leefin Lai, CFA
Portfolio Manager
The following person serves as consultant to the Advisor:
Thomas E. Bucher, CFA
Consultant
The Standard & Poor's® 500 (S&P 500) Index is an unmanaged, capitalization-weighted index of 500 stocks. The index is designed to measure performance of the broad domestic economy through changes in the aggregate market value of 500 stocks representing all major industries.
The S&P® North American Health Care Sector Index (name changed from The S&P GSSI Healthcare Sector Index, effective March 31, 2008) is an unmanaged, market-capitalization weighted index of 123 stocks designed to measure the performance of companies in the health care sector.
Index returns assume the reinvestment of dividends and, unlike portfolio returns, do not reflect any fees or expenses. It is not possible to invest directly into an index.
1 "Overweight" means the portfolio holds a higher weighting in a given sector or security than the benchmark. "Underweight" means the portfolio holds a lower weighting.
Portfolio management market commentary is as of December 31, 2009, and may not come to pass. This information is subject to change at any time based on market and other conditions. Past performance does not guarantee future results. Current and future portfolio holdings are subject to risk.
Portfolio Summary
DWS Health Care VIP
Asset Allocation (As a % of Investment Portfolio excluding Securities Lending Collateral) | 12/31/09 | 12/31/08 |
| | |
Common Stocks | 100% | 98% |
Cash Equivalents | — | 2% |
| 100% | 100% |
Industry Diversification (As a % of Common Stocks) | 12/31/09 | 12/31/08 |
| | |
Pharmaceuticals | 34% | 31% |
Biotechnology | 23% | 26% |
Medical Supply & Specialty | 20% | 20% |
Health Care Services | 17% | 17% |
Life Sciences Equipment | 6% | 6% |
| 100% | 100% |
Asset allocation and industry diversification are subject to change.
For more complete details about the Portfolio's investment portfolio, see page 74. A complete list of portfolio holdings of the Portfolio is posted as of the month end on www.dws-investments.com on or about the 15th day of the following month. More frequent posting of portfolio holdings information may be made from time to time on www.dws-investments.com.
Following the Portfolio's fiscal first and third quarter-end, a complete portfolio holdings listing is filed with the SEC on Form N-Q. The form will be available on the SEC's Web site at www.sec.gov, and it also may be reviewed and copied at the SEC's Public Reference Room in Washington, D.C. Information on the operation of the SEC's Public Reference Room may be obtained by calling (800) SEC-0330.
Investment Portfolio December 31, 2009
DWS Health Care VIP
|
Shares
| Value ($) |
| |
Common Stocks 99.5% |
Health Care 99.5% |
Biotechnology 23.0% |
Acorda Therapeutics, Inc.* | 8,600 | 216,892 |
Alexion Pharmaceuticals, Inc.* | 20,400 | 995,928 |
Allos Therapeutics, Inc.* | 22,300 | 146,511 |
AMAG Pharmaceuticals, Inc.* | 5,200 | 197,756 |
Amgen, Inc.* | 24,950 | 1,411,421 |
Amylin Pharmaceuticals, Inc.* | 9,100 | 129,129 |
Biogen Idec, Inc.* | 9,520 | 509,320 |
BioMarin Pharmaceutical, Inc.* | 33,400 | 628,254 |
Celera Corp.* | 25,300 | 174,823 |
Celgene Corp.* | 22,260 | 1,239,437 |
Cephalon, Inc.* (a) | 6,500 | 405,665 |
Cepheid, Inc.* (a) | 11,600 | 144,768 |
Dendreon Corp.* (a) | 9,400 | 247,032 |
Exelixis, Inc.* | 22,200 | 163,614 |
Gen-Probe, Inc.* | 6,400 | 274,560 |
Genzyme Corp.* | 16,100 | 789,061 |
Gilead Sciences, Inc.* | 27,700 | 1,198,856 |
Human Genome Sciences, Inc.* | 14,400 | 440,640 |
ImmunoGen, Inc.* | 13,500 | 106,110 |
Incyte Corp.* (a) | 38,500 | 350,735 |
InterMune, Inc.* | 8,400 | 109,536 |
Myriad Genetics, Inc.* | 9,700 | 253,170 |
OSI Pharmaceuticals, Inc.* | 7,000 | 217,210 |
Regeneron Pharmaceuticals, Inc.* | 12,700 | 307,086 |
Rigel Pharmaceuticals, Inc.* (a) | 10,600 | 100,806 |
United Therapeutics Corp.* | 8,700 | 458,055 |
Vertex Pharmaceuticals, Inc.* | 18,700 | 801,295 |
| 12,017,670 |
Health Care Services 16.8% |
Aetna, Inc. | 17,300 | 548,410 |
Allscripts-Misys Healthcare Solutions, Inc.* | 20,200 | 408,646 |
Cardinal Health, Inc. | 14,100 | 454,584 |
Cerner Corp.* (a) | 4,200 | 346,248 |
CIGNA Corp. | 11,300 | 398,551 |
CVS Caremark Corp. | 20,131 | 648,420 |
Express Scripts, Inc.* | 10,400 | 899,080 |
Fresenius Medical Care AG & Co. KGaA | 15,297 | 809,948 |
Laboratory Corp. of America Holdings* | 6,200 | 464,008 |
McKesson Corp. | 14,700 | 918,750 |
MedAssets, Inc.* | 6,700 | 142,107 |
Medco Health Solutions, Inc.* | 14,268 | 911,868 |
Quality Systems, Inc. (a) | 4,300 | 269,997 |
Quest Diagnostics, Inc. | 7,100 | 428,698 |
UnitedHealth Group, Inc. | 28,600 | 871,728 |
WellPoint, Inc.* | 4,600 | 268,134 |
| 8,789,177 |
|
Shares
| Value ($) |
| |
Life Sciences Tools & Services 6.0% |
Illumina, Inc.* (a) | 7,300 | 223,745 |
Life Technologies Corp.* | 19,229 | 1,004,331 |
Mettler-Toledo International, Inc.* | 2,800 | 293,972 |
PerkinElmer, Inc. | 13,300 | 273,847 |
Pharmaceutical Product Development, Inc. | 11,600 | 271,904 |
Thermo Fisher Scientific, Inc.* | 16,900 | 805,961 |
Waters Corp.* | 4,300 | 266,428 |
| 3,140,188 |
Medical Supply & Specialty 19.9% |
Alcon, Inc. | 4,300 | 706,705 |
Baxter International, Inc. | 26,600 | 1,560,888 |
Beckman Coulter, Inc. | 5,800 | 379,552 |
Becton, Dickinson & Co. | 10,800 | 851,688 |
C.R. Bard, Inc. | 4,700 | 366,130 |
Covidien PLC | 27,400 | 1,312,186 |
Hologic, Inc.* | 19,100 | 276,950 |
Kinetic Concepts, Inc.* | 3,600 | 135,540 |
Masimo Corp.* | 14,700 | 447,174 |
Medtronic, Inc. | 34,900 | 1,534,902 |
ResMed, Inc.* | 5,500 | 287,485 |
St. Jude Medical, Inc.* | 13,700 | 503,886 |
Stryker Corp. | 10,900 | 549,033 |
Varian Medical Systems, Inc.* | 5,600 | 262,360 |
Wright Medical Group, Inc.* | 15,200 | 288,040 |
Zimmer Holdings, Inc.* | 16,000 | 945,760 |
| 10,408,279 |
Pharmaceuticals 33.8% |
Abbott Laboratories | 31,400 | 1,695,286 |
Allergan, Inc. | 8,900 | 560,789 |
American Oriental Bioengineering, Inc.* (a) | 30,600 | 142,290 |
Auxilium Pharmaceuticals, Inc.* | 7,500 | 224,850 |
Biovail Corp. | 26,300 | 367,148 |
Bristol-Myers Squibb Co. (a) | 43,600 | 1,100,900 |
Cardiome Pharma Corp.* | 20,400 | 90,780 |
Eli Lilly & Co. | 15,400 | 549,934 |
Forest Laboratories, Inc.* | 15,000 | 481,650 |
Johnson & Johnson | 29,200 | 1,880,772 |
Merck & Co., Inc. | 73,083 | 2,670,453 |
Merck KGaA | 2,262 | 211,426 |
Mylan, Inc.* (a) | 55,100 | 1,015,493 |
Novartis AG (Registered) | 14,474 | 788,576 |
Pfizer, Inc. | 198,850 | 3,617,081 |
Roche Holding AG (Genusschein) | 7,252 | 1,233,683 |
Salix Pharmaceuticals Ltd.* | 15,600 | 396,240 |
Shire PLC (ADR) | 9,000 | 528,300 |
XenoPort, Inc.* | 7,400 | 137,343 |
| 17,692,994 |
Total Common Stocks (Cost $40,070,389) | 52,048,308 |
|
Securities Lending Collateral 7.6% |
Daily Assets Fund Institutional, 0.17% (b) (c) (Cost $3,987,825) | 3,987,825 | 3,987,825 |
|
|
Shares
| Value ($) |
| |
Cash Equivalents 0.2% |
Central Cash Management Fund, 0.14% (b) (Cost $126,803) | 126,803 | 126,803 |
| % of Net Assets | Value ($) |
| |
Total Investment Portfolio (Cost $44,185,017)+ | 107.3 | 56,162,936 |
Other Assets and Liabilities, Net | (7.3) | (3,830,726) |
Net Assets | 100.0 | 52,332,210 |
* Non-income producing security.
+ The cost for federal income tax purposes was $44,642,624. At December 31, 2009, net unrealized appreciation for all securities based on tax cost was $11,520,312. This consisted of aggregate gross unrealized appreciation for all securities in which there was an excess of value over tax cost of $13,583,839 and aggregate gross unrealized depreciation for all securities in which there was an excess of tax cost over value of $2,063,527.
(a) All or a portion of these securities were on loan (see Notes to Financial Statements). The value of all securities loaned at December 31, 2009 amounted to $3,848,286, which is 7.4% of net assets.
(b) Affiliated fund managed by Deutsche Investment Management Americas Inc. The rate shown is the annualized seven-day yield at period end.
(c) Represents collateral held in connection with securities lending. Income earned by the Portfolio is net of borrower rebates.
ADR: American Depositary Receipt
Fair Value Measurements
Various inputs are used in determining the value of the Portfolio's investments. These inputs are summarized in three broad levels. Level 1 includes quoted prices in active markets for identical securities. Level 2 includes other significant observable inputs (including quoted prices for similar securities, interest rates, prepayment speeds, and credit risk). Level 3 includes significant unobservable inputs (including the Portfolio's own assumptions in determining the fair value of investments). The inputs or methodology used for valuing securities are not necessarily an indication of the risk associated with investing in those securities.
The following is a summary of the inputs used as of December 31, 2009 in valuing the Portfolio's investments. For information on the Portfolio's policy regarding the valuation of investments, please refer to the Security Valuation section of Note A in the accompanying Notes to the Financial Statements.
Assets | Level 1 | Level 2 | Level 3 | Total |
Common Stock and/or Other Equity Investments Biotechnology | $ 12,017,670 | $ — | $ — | $ 12,017,670 |
Health Care Services | 7,979,229 | 809,948 | — | 8,789,177 |
Life Sciences Tools & Specialty | 3,140,188 | — | — | 3,140,188 |
Medical Supply & Specialty | 10,408,279 | — | — | 10,408,279 |
Pharmaceuticals | 15,459,309 | 2,233,685 | — | 17,692,994 |
Short-Term Investments (d) | 4,114,628 | — | — | 4,114,628 |
Total | $ 53,119,303 | $ 3,043,633 | $ — | $ 56,162,936 |
(d) See Investment Portfolio for additional detailed categorizations.
The accompanying notes are an integral part of the financial statements.
Financial Statements
Statement of Assets and Liabilities as of December 31, 2009 |
Assets |
Investments: Investments in securities, at value (cost $40,070,389), including $3,848,286 of securities loaned | $ 52,048,308 |
Investment in Daily Assets Fund Institutional (cost $3,987,825)* | 3,987,825 |
Investment in Central Cash Management Fund (cost $126,803) | 126,803 |
Total investments, at value (cost $44,185,017) | 56,162,936 |
Foreign currency, at value (cost $218,109) | 213,946 |
Dividends receivable | 62,602 |
Interest receivable | 533 |
Receivable for Portfolio shares sold | 207 |
Foreign taxes recoverable | 26,781 |
Other assets | 985 |
Total assets | 56,467,990 |
Liabilities |
Payable for Portfolio shares redeemed | 58,779 |
Payable upon return of securities loaned | 3,987,825 |
Accrued management fee | 29,137 |
Accrued distribution service fee (Class B) | 653 |
Other accrued expenses and payables | 59,386 |
Total liabilities | 4,135,780 |
Net assets, at value | $ 52,332,210 |
Net Assets Consist of |
Net unrealized appreciation (depreciation) on: Investments | 11,977,919 |
Foreign currency | (4,128) |
Accumulated net realized gain (loss) | 2,975,088 |
Paid-in capital | 37,383,331 |
Net assets, at value | $ 52,332,210 |
Class A Net Asset Value, offering and redemption price per share ($49,254,955 ÷ 4,392,554 outstanding shares of beneficial interest, $.01 par value, unlimited number of shares authorized) | $ 11.21 |
Class B Net Asset Value, offering and redemption price per share ($3,077,255 ÷ 281,083 outstanding shares of beneficial interest, $.01 par value, unlimited number of shares authorized) | $ 10.95 |
* Represents collateral on securities loaned.
The accompanying notes are an integral part of the financial statements.
Statement of Operations for the year ended December 31, 2009 |
Investment Income |
Income: Dividends (net of foreign taxes withheld of $23,682) | $ 436,518 |
Income distributions — affiliated cash management vehicle | 4,573 |
Securities lending income, including income from Daily Assets Fund Institutional, net of borrower rebates | 26,123 |
Total Income | 467,214 |
Expenses: Management fee | 353,859 |
Administration fee | 53,212 |
Custodian fee | 17,040 |
Distribution service fee (Class B) | 7,929 |
Services to shareholders | 2,172 |
Record keeping fee (Class B) | 4,272 |
Audit and tax fees | 28,888 |
Trustees' fees and expenses | 2,998 |
Legal fees | 23,009 |
Reports to shareholders | 9,685 |
Other | 18,462 |
Total expenses | 521,526 |
Net investment income (loss) | (54,312) |
Realized and Unrealized Gain (Loss) |
Net realized gain (loss) from: Investments | 4,341,178 |
Foreign currency | 18,857 |
| 4,360,035 |
Change in net unrealized appreciation (depreciation) on: Investments | 5,464,088 |
Foreign currency | (5,062) |
| 5,459,026 |
Net gain (loss) | 9,819,061 |
Net increase (decrease) in net assets resulting from operations | $ 9,764,749 |
The accompanying notes are an integral part of the financial statements.
Statement of Changes in Net Assets |
Increase (Decrease) in Net Assets | Years Ended December 31, |
2009 | 2008 |
Operations: Net investment income (loss) | $ (54,312) | $ 692,947 |
Net realized gain (loss) | 4,360,035 | (91,546) |
Change in net unrealized appreciation (depreciation) | 5,459,026 | (24,365,986) |
Net increase (decrease) in net assets resulting from operations | 9,764,749 | (23,764,585) |
Distributions to shareholders from: Net investment income: Class A | (711,488) | (269,428) |
Class B | (35,875) | — |
Net realized gains: Class A | (673,607) | (14,518,785) |
Class B | (45,473) | (789,529) |
Total distributions | (1,466,443) | (15,577,742) |
Portfolio share transactions: Class A Proceeds from shares sold | 3,080,971 | 15,385,334 |
Reinvestment of distributions | 1,385,095 | 14,788,213 |
Cost of shares redeemed | (23,233,574) | (31,046,167) |
Net increase (decrease) in net assets from Class A share transactions | (18,767,508) | (872,620) |
Class B Proceeds from shares sold | 467,768 | 674,757 |
Reinvestment of distributions | 81,348 | 789,529 |
Cost of shares redeemed | (1,479,410) | (1,414,568) |
Net increase (decrease) in net assets from Class B share transactions | (930,294) | 49,718 |
Increase (decrease) in net assets | (11,399,496) | (40,165,229) |
Net assets at beginning of period | 63,731,706 | 103,896,935 |
Net assets at end of period (including undistributed net investment income of $0 and $724,957, respectively) | $ 52,332,210 | $ 63,731,706 |
Other Information |
Class A Shares outstanding at beginning of period | 6,373,629 | 6,708,658 |
Shares sold | 320,687 | 1,209,692 |
Shares issued to shareholders in reinvestment of distributions | 164,892 | 1,271,557 |
Shares redeemed | (2,466,654) | (2,816,278) |
Net increase (decrease) in Class A shares | (1,981,075) | (335,029) |
Shares outstanding at end of period | 4,392,554 | 6,373,629 |
Class B Shares outstanding at beginning of period | 379,018 | 376,902 |
Shares sold | 50,217 | 56,147 |
Shares issued to shareholders in reinvestment of distributions | 9,896 | 69,318 |
Shares redeemed | (158,048) | (123,349) |
Net increase (decrease) in Class B shares | (97,935) | 2,116 |
Shares outstanding at end of period | 281,083 | 379,018 |
The accompanying notes are an integral part of the financial statements.
Financial Highlights
Class A Years Ended December 31, | 2009 | 2008 | 2007 | 2006 | 2005 |
Selected Per Share Data |
Net asset value, beginning of period | $ 9.45 | $ 14.68 | $ 13.77 | $ 13.02 | $ 12.00 |
Income (loss) from investment operations: Net investment income (loss)a | (.01) | .09c | .03c | (.01)b | (.02) |
Net realized and unrealized gain (loss) | 2.02 | (3.08) | 1.75 | .81 | 1.04 |
Total from investment operations | 2.01 | (2.99) | 1.78 | .80 | 1.02 |
Less distributions from: Net investment income | (.13) | (.04) | — | — | — |
Net realized gains | (.12) | (2.20) | (.87) | (.05) | — |
Total distributions | (.25) | (2.24) | (.87) | (.05) | — |
Net asset value, end of period | $ 11.21 | $ 9.45 | $ 14.68 | $ 13.77 | $ 13.02 |
Total Return (%) | 22.19 | (23.20) | 13.20 | 6.17b | 8.50 |
Ratios to Average Net Assets and Supplemental Data |
Net assets, end of period ($ millions) | 49 | 60 | 98 | 101 | 109 |
Ratio of expenses (%) | .96 | .92 | .93 | .89 | .88 |
Ratio of net investment income (loss) (%) | (.08) | .79c | .19c | (.03)b | (.18) |
Portfolio turnover rate (%) | 31 | 24 | 37 | 47 | 43 |
a Based on average shares outstanding during the period. b Includes non-recurring income from the Advisor recorded as a result of an administrative proceeding regarding disclosure of brokerage allocation practices in connection with sales of DWS Funds. The non-recurring income resulted in an increase in net investment income of $0.003 per share and an increase in the ratio of net investment income of 0.02%. Excluding this non-recurring income, total return would have been 0.02% lower. c Net investment income per share and ratio of net investment income include non-recurring dividend income amounting to $0.03 and $0.02 per share and 0.28% and 0.13% of average daily net assets for the years ended December 31, 2008 and 2007, respectively. |
Class B Years Ended December 31, | 2009 | 2008 | 2007 | 2006 | 2005 |
Selected Per Share Data |
Net asset value, beginning of period | $ 9.23 | $ 14.40 | $ 13.55 | $ 12.87 | $ 11.91 |
Income (loss) from investment operations: Net investment income (loss)a | (.04) | .05c | (.03)c | (.06)b | (.07) |
Net realized and unrealized gain (loss) | 1.98 | (3.02) | 1.75 | .79 | 1.03 |
Total from investment operations | 1.94 | (2.97) | 1.72 | .73 | .96 |
Less distributions from: Net investment incomea | (.10) | — | — | — | — |
Net realized gains | (.12) | (2.20) | (.87) | (.05) | — |
Total distributions | (.22) | (2.20) | (.87) | (.05) | — |
Net asset value, end of period | $ 10.95 | $ 9.23 | $ 14.40 | $ 13.55 | $ 12.87 |
Total Return (%) | 21.80 | (23.50) | 12.88 | 5.77b | 8.06 |
Ratios to Average Net Assets and Supplemental Data |
Net assets, end of period ($ millions) | 3 | 3 | 5 | 21 | 23 |
Ratio of expenses (%) | 1.34 | 1.27 | 1.34 | 1.28 | 1.27 |
Ratio of net investment income (loss) (%) | (.46) | .43c | (.22)c | (.42)b | (.57) |
Portfolio turnover rate (%) | 31 | 24 | 37 | 47 | 43 |
a Based on average shares outstanding during the period. b Includes non-recurring income from the Advisor recorded as a result of an administrative proceeding regarding disclosure of brokerage allocation practices in connection with sales of DWS Funds. The non-recurring income resulted in an increase in net investment income of $0.003 per share and an increase in the ratio of net investment income of 0.02%. Excluding this non-recurring income, total return would have been 0.02% lower. c Net investment income per share and ratio of net investment income include non-recurring dividend income amounting to $0.03 and $0.02 per share and 0.28% and 0.13% of average daily net assets for the year ended December 31, 2008 and 2007, respectively. |
Notes to Financial Statements
A. Organization and Significant Accounting Policies
DWS Variable Series I (the "Series") is registered under the Investment Company Act of 1940, as amended (the "1940 Act"), as an open-end, registered management investment company organized as a Massachusetts business trust. The Series consists of six diversified portfolios: DWS Bond VIP, DWS Growth & Income VIP, DWS Capital Growth VIP, DWS Global Opportunities VIP, DWS International VIP and DWS Health Care VIP (individually or collectively hereinafter referred to as a "Portfolio" or the "Portfolios"). The Series is intended to be the underlying investment vehicle for variable annuity contracts and variable life insurance policies to be offered by the separate accounts of certain life insurance companies ("Participating Insurance Companies").
Multiple Classes of Shares of Beneficial Interest. DWS Bond VIP offers one class of shares (Class A shares). DWS Growth & Income VIP, DWS Capital Growth VIP, DWS Global Opportunities VIP, DWS International VIP and DWS Health Care VIP each offer two classes of shares (Class A shares and Class B shares). Class B shares are subject to Rule 12b-1 distribution fees under the 1940 Act and record keeping fees equal to an annual rate of 0.25% and up to 0.15%, respectively, of the average daily net assets of the Class B shares of the applicable Portfolio. Class A shares are not subject to such fees.
Investment income, realized and unrealized gains and losses, and certain portfolio-level expenses and expense reductions, if any, are borne pro rata on the basis of relative net assets by the holders of all classes of shares, except that each class bears certain expenses unique to that class (including the applicable 12b-1 distribution fees and record keeping fees). Differences in class-level expenses may result in payment of different per share dividends by class. All shares have equal rights with respect to voting subject to class-specific arrangements.
The Series' financial statements are prepared in accordance with accounting principles generally accepted in the United States of America, which require the use of management estimates. Actual results could differ from those estimates. The policies described below are followed consistently by the Series in the preparation of the financial statements for its Portfolios.
Security Valuation. Investments are stated at value determined as of the close of regular trading on the New York Stock Exchange on each day the exchange is open for trading. Equity securities are valued at the most recent sale price or official closing price reported on the exchange (US or foreign) or over-the-counter market on which they trade. Securities for which no sales are reported are valued at the calculated mean between the most recent bid and asked quotations on the relevant market or, if a mean cannot be determined, at the most recent bid quotation.
Debt securities are valued by independent pricing services approved by the Trustees of the Series. If the pricing services are unable to provide valuations, securities are valued at the most recent bid quotation or evaluated price, as applicable, obtained from one or more broker-dealers. Such services may use various pricing techniques which take into account appropriate factors such as yield, quality, coupon rate, maturity, type of issue, trading characteristics and other data, as well as broker quotes.
Money market instruments purchased with an original or remaining maturity of sixty days or less, maturing at par, are valued at amortized cost. Investments in open-end investment companies are valued at their net asset value each business day.
Exchange-traded funds ("ETFs") are valued at the most recent sale price or official closing price reported on the exchange on which the ETFs are traded most extensively. ETFs for which no sales are reported are valued at the calculated mean between the most recent bid and asked quotations on the relevant market or, if a mean cannot be determined, at the most recent bid quotation.
Securities and other assets for which market quotations are not readily available or for which the above valuation procedures are deemed not to reflect fair value are valued in a manner that is intended to reflect their fair value as determined in accordance with procedures approved by the Trustees. The Series may use a fair valuation model to value international equity securities in order to adjust for events which may occur between the close of the foreign exchanges and the close of the New York Stock Exchange. In accordance with each Portfolio's valuation procedures, factors used in determining value may include, but are not limited to, the type of the security, the size of the holding, the initial cost of the security, the existence of any contractual restrictions on the security's disposition, the price and extent of public trading in similar securities of the issuer or of comparable companies, quotations or evaluated prices from broker-dealers and/or pricing services, information obtained from the issuer, analysts, and/or the appropriate stock exchange (for exchange-traded securities), an analysis of the company's or issuer's financial statements, an evaluation of the forces that influence the issuer and the market(s) in which the security is purchased and sold and with respect to debt securities, the maturity, coupon, creditworthiness, currency denomination, and the movement of the market in which the security is normally traded. The value determined under these procedures may differ from published values for the same securities.
Securities Lending. Each Portfolio may lend securities to certain financial institutions. The Portfolio retains beneficial ownership of the securities it has loaned and continues to receive interest and dividends paid by the issuer of securities and to participate in any changes in their market value. The Portfolio requires the borrowers of the securities to maintain collateral with the Portfolio consisting of either cash or liquid, unencumbered assets having a value at least equal to the value of the securities loaned. When the collateral falls below specified amounts, the lending agents will use their best efforts to obtain additional collateral on the next business day to meet required amounts under the security lending agreement. The Portfolio may invest the cash collateral into a joint trading account in an affiliated money market fund pursuant to Exemptive Orders issued by the SEC. The Portfolio receives compensation for lending its securities either in the form of fees or by earning interest on invested cash collateral net of borrower rebates and fees paid to a lending agent. Either the Portfolio or the borrower may terminate the loan. There may be risks of delay and costs in recovery of securities or even loss of rights in the collateral should the borrower of the securities fail financially. The Portfolio is also subject to all investment risks associated with the reinvestment of any cash collateral received, including, but not limited to, interest rate, credit and liquidity risk associated with such investments.
Foreign Currency Translations. The books and records of the Portfolios are maintained in US dollars. Investment securities and other assets and liabilities denominated in a foreign currency are translated into US dollars at the prevailing exchange rates at period end. Purchases and sales of investment securities, income and expenses are translated into US dollars at the prevailing exchange rates on the respective dates of the transactions.
Net realized and unrealized gains and losses on foreign currency transactions represent net gains and losses between trade and settlement dates on securities transactions, the disposition of forward foreign currency exchange contracts and foreign currencies, and the difference between the amount of net investment income accrued and the US dollar amount actually received. That portion of both realized and unrealized gains and losses on investments that results from fluctuations in foreign currency exchange rates is not separately disclosed but is included with net realized and unrealized gain/appreciation and loss/depreciation on investments.
Mortgage Dollar Rolls. DWS Bond VIP may enter into mortgage dollar rolls in which the Portfolio sells to a bank or broker/dealer (the "counterparty") mortgage-backed securities for delivery in the current month and simultaneously contracts to repurchase similar, but not identical, securities on a fixed date. The counterparty receives all principal and interest payments, including prepayments, made on the security while it is the holder. The Portfolio receives compensation as consideration for entering into the commitment to repurchase. The compensation is paid in the form of a lower price for the security upon its repurchase, or alternatively, a fee. Mortgage dollar rolls may be renewed with a new sale and repurchase price and a cash settlement made at each renewal without physical delivery of the securities subject to the contract.
Certain risks may arise upon entering into mortgage dollar rolls from the potential inability of counterparties to meet the terms of their commitments. Additionally, the value of such securities may change adversely before the Portfolio is able to repurchase them. There can be no assurance that the Portfolio's use of the cash that it receives from a mortgage dollar roll will provide a return that exceeds its costs.
When-Issued/Delayed Securities. DWS Bond VIP may purchase securities with delivery or payment to occur at a later date beyond the normal settlement period. At the time the Portfolio enters into a commitment to purchase a security, the transaction is recorded and the value of the security is reflected in the net asset value. The price of such security and the date when the security will be delivered and paid for are fixed at the time the transaction is negotiated. The value of the security may vary with market fluctuations. No interest accrues to the Portfolio until payment takes place. At the time the Portfolio enters into this type of transaction it is required to segregate cash or other liquid assets at least equal to the amount of the commitment.
Certain risks may arise upon entering into when-issued or delayed delivery securities from the potential inability of counterparties to meet the terms of their contracts or if the issuer does not issue the securities due to political, economic, or other factors. Additionally, losses may arise due to changes in the value of the underlying securities.
Derivatives. Authoritative accounting guidance requires that disclosures about the Portfolio's derivative and hedging activities and derivatives accounted for as hedging instruments must be disclosed separately from derivatives that do not qualify for hedge accounting. Because investment companies account for their derivatives at fair value and record any changes in fair value in current period earnings, the Portfolio's derivatives are not accounted for as hedging instruments. As such, even though the Portfolio may use derivatives in an attempt to achieve an economic hedge, the Portfolio's derivatives are not considered to be hedging instruments. The disclosure below is presented in accordance with authoritative accounting guidance.
Futures Contracts. A futures contract is an agreement between a buyer or seller and an established futures exchange or its clearinghouse in which the buyer or seller agrees to take or make a delivery of a specific amount of a financial instrument at a specified price on a specific date (settlement date). During the year, DWS Bond VIP and DWS Growth & Income VIP invested in future contracts. DWS Growth & Income VIP enters into futures contracts in circumstances where portfolio management believes they offer an economic means of gaining exposure to a particular asset class or to keep cash on hand to meet shareholder redemptions or other needs while maintaining exposure to the market. DWS Bond VIP invests in interest rate futures to gain exposure to different parts of the yield curve while managing the overall duration. DWS Bond VIP also enters into currency futures contracts for non-hedging purposes to seek to enhance potential gains.
Futures contracts are valued at the most recent settlement price. Upon entering into a futures contract, the Portfolio is required to deposit with a financial intermediary cash or securities ("initial margin") in an amount equal to a certain percentage of the face value indicated in the futures contract. Subsequent payments ("variation margin") are made or received by the Portfolio dependent upon the daily fluctuations in the value and are recorded for financial reporting purposes as unrealized gains or losses by the Portfolio. Gains or losses are realized when the contract expires or is closed. Since all futures contracts are exchange traded, counterparty risk is minimized as the exchange's clearinghouse acts as the counterparty, and guarantees the futures against default.
Certain risks may arise upon entering into futures contracts, including the risk that an illiquid market will limit the Portfolio's ability to close out a futures contract prior to the settlement date and that a change in the value of a futures contract may not correlate exactly with the changes in the value of the underlying hedged security, index or currency. Risk of loss may exceed amounts recognized on the Statement of Assets and Liabilities.
A summary of the open future contracts as of December 31, 2009 is included in a table following DWS Bond VIP and DWS Growth & Income VIP's Investment Portfolios. For the year ended December 31, 2009, DWS Bond VIP and DWS Growth & Income VIP invested in futures contracts with total notional values ranging from $0 to approximately $43,725,000 and $1,166,000 to $2,838,000, respectively.
Forward Foreign Currency Exchange Contracts. A forward foreign currency exchange contract ("forward currency contract") is a commitment to purchase or sell a foreign currency at the settlement date at a negotiated rate. Each Portfolio is subject to foreign exchange rate risk in its securities denominated in foreign currencies. Changes in exchange rates between foreign currencies and the US dollar may affect the US dollar value of foreign securities or the income or gains received on these securities. To reduce the effect of currency fluctuations, each Portfolio may enter into forward foreign currency exchange contracts. During the year, DWS Bond VIP invested in forward foreign currency contracts to hedge its exposure to changes in foreign currency exchange rates on its foreign currency denominated securities.
Forward currency contracts are valued at the prevailing forward exchange rate of the underlying currencies and unrealized gain (loss) is recorded daily. Certain risks may arise upon entering into forward currency contracts from the potential inability of counterparties to meet the terms of their contracts. The maximum counterparty credit risk to the Portfolio is measured by the unrealized gain on appreciated contracts. Additionally, when utilizing forward currency contracts to hedge, the Portfolio gives up the opportunity to profit from favorable exchange rate movements during the term of the contract.
A summary of the open forward foreign currency exchange contracts as of December 31, 2009 is included in a table following DWS Bond VIP's Investment Portfolio. For the year ended December 31, 2009, the Portfolio invested in forward foreign currency exchange contracts with total values ranging from approximately $107,000 to $3,032,000.
The following tables summarize the value of DWS Bond VIP and DWS Growth & Income VIP's derivative instruments held as of December 31, 2009 and the related location on the accompanying Statement of Assets and Liabilities, presented by primary underlying risk exposure:
DWS Bond VIP
Asset Derivatives | Forward Contracts | Futures Contracts | Total |
Foreign Exchange Contracts (a) (b) | $ 1,841 | $ 95,415 | $ 97,256 |
Interest Rate Contracts (b) | — | 461,181 | 461,181 |
| $ 1,841 | $ 556,596 | $ 558,437 |
Each of the above derivatives is located in the following Statement of Assets and Liabilities accounts:
(a) Unrealized appreciation on forward foreign currency exchange contracts
(b) Net unrealized appreciation (depreciation) on futures. Asset of Receivable for daily variation margin on open futures contracts reflects unsettled variation margin.
Additionally, the amount of unrealized and realized gains and losses on derivative instruments recognized in Portfolio earnings during the year ended December 31, 2009 and the related location on the accompanying Statement of Operations is summarized in the following tables by primary underlying risk exposure:
Realized Gain (Loss) | Forward Contracts | Futures Contracts | Total |
Foreign Exchange Contracts (a) (b) | $ (72) | $ 801,296 | $ 801,224 |
Interest Rate Contracts (b) | — | (2,032,669) | (2,032,669) |
| $ (72) | $ (1,231,373) | $ (1,231,445) |
Each of the above derivatives is located in the following Statement of Operations accounts:
(a) Net realized gain (loss) from foreign currency (Statement of Operations includes both forward currency contracts and foreign currency transactions)
(b) Net realized gain (loss) from futures
Change in Net Unrealized Appreciation (Depreciation) | Forward Contracts | Futures Contracts | Total |
Foreign Exchange Contracts (a) (b) | $ (2,355) | $ 95,415 | $ 93,060 |
Interest Rate Contracts (b) | — | 461,181 | 461,181 |
| $ (2,355) | $ 556,596 | $ 554,241 |
Each of the above derivatives is located in the following Statement of Operations accounts:
(a) Change in net unrealized appreciation (depreciation) on foreign currency (Statement of Operations includes both forward currency contracts and foreign currency transactions)
(b) Change in net unrealized appreciation (depreciation) on futures
DWS Growth & Income VIP
Liability Derivatives | Futures Contracts |
Equity Contracts (a) | $ 7,773 |
The above derivative is located in the following Statement of Assets and Liabilities account:
(a) Net unrealized appreciation (depreciation) on futures. Liability of Payable for daily variation margin on open futures contracts reflects unsettled variation margin.
Additionally, the amount of unrealized and realized gains and losses on derivative instruments recognized in Portfolio earnings during the year ended December 31, 2009 and the related location on the accompanying Statement of Operations is summarized in the following tables by primary underlying risk exposure:
Realized Gain (Loss) | Futures Contracts |
Equity Contracts (a) | $ 446,975 |
The above derivative is located in the following Statement of Operations account:
(a) Net realized gain (loss) from futures
Change in Net Unrealized Appreciation (Depreciation) | Futures Contracts |
Equity Contracts (a) | $ (34,096) |
The above derivative is located in the following Statement of Operations account:
(a) Change in net unrealized appreciation (depreciation) on futures
Taxes. Each Portfolio is treated as a separate taxpayer as provided for in the Internal Revenue Code, as amended. It is each Portfolio's policy to comply with the requirements of the Internal Revenue Code, as amended, which are applicable to regulated investment companies, and to distribute all of its taxable income to the separate accounts of the Participating Insurance Companies which hold its shares.
Additionally, based on the Series' understanding of the tax rules and rates related to income, gains and transactions for the foreign jurisdictions in which each Portfolio invests, each Portfolio will provide for foreign taxes, and where appropriate, deferred foreign taxes.
At December 31, 2009, the following Portfolios had an approximate net tax basis capital loss carryforward which may be applied against any realized net taxable capital gains of each succeeding year until fully utilized or until the following expiration dates, whichever occurs first:
Portfolio | Capital Loss Carryforwards ($) | Expiration
Date | Capital Loss Carryforwards Expired($) |
DWS Bond VIP | 42,815,000 | 12/31/2014-12/31/2017 | — |
DWS Growth & Income VIP | 57,014,000 | 12/31/2010-12/31/2017 | — |
DWS Capital Growth VIP | 256,579,000 | 12/31/2010-12/31/2017 | 37,498,000 |
DWS Global Opportunities VIP | 22,316,000 | 12/31/2016-12/31/2017 | — |
DWS International VIP | 176,529,000 | 12/31/2016-12/31/2017 | — |
In addition, from November 1, 2009 through December 31, 2009, DWS Growth & Income VIP and DWS International VIP incurred approximately $254,000 and $961,000, respectively, of net realized capital losses. As permitted by tax regulations, the Portfolios intend to elect to defer these losses and treat them as arising in the fiscal year ended December 31, 2010.
At December 31, 2009, DWS Growth & Income VIP had a net tax basis capital loss carryforward of approximately $57,014,000, including $4,777,000 inherited from its merger with SVS II Focus Value & Growth, which may be applied against any realized net taxable capital gains of each succeeding year until fully utilized or until December 31, 2017 (the expiration date), whichever occurs first, subject to certain limitations under Sections 381-384 of the Internal Revenue Code.
At December 31, 2009, DWS Capital Growth VIP had a net tax basis capital loss carryforward of approximately $256,579,000 including $27,075,000 inherited from its merger with DWS Janus Growth & Income VIP in fiscal year 2009 and $229,513,000 inherited from its mergers with affiliated funds in fiscal years 2005 and 2006 which may be applied against any realized net taxable capital gains of each succeeding year until fully utilized and which may be subject to certain limitations under Sections 382-384 of the Internal Revenue Code. Due to these limitations (under Sections 382-384 of the Internal Revenue Code), approximately $2,473,000 of the inherited capital loss carryforwards cannot be used by the funds, and is not included in the capital loss carryforward of $256,579,000 disclosed above.
During the year ended December 31, 2009, DWS Capital Growth VIP lost $37,498,000 through expiration.
Each Portfolio has reviewed the tax positions for the open tax years as of December 31, 2009 and has determined that no provision for income tax is required in each Portfolio's financial statements. Each of the Portfolio's federal tax returns for the prior three fiscal years remains open subject to examination by the Internal Revenue Service.
Distribution of Income and Gains. Each Portfolio will declare and distribute dividends from their net investment income, if any, annually, although additional distributions may be made if necessary. Net realized gains from investment transactions, in excess of available capital loss carryforwards, would be taxable to each Portfolio if not distributed, and, therefore, will be distributed to shareholders at least annually.
The timing and characterization of certain income and capital gains distributions are determined annually in accordance with federal tax regulations which may differ from accounting principles generally accepted in the United States of America. These differences primarily relate to investments in foreign denominated investments, investments in forward foreign currency exchange contracts, passive foreign investment companies, post October loss deferrals and certain securities sold at a loss. As a result, net investment income (loss) and net realized gain (loss) on investment transactions for a reporting period may differ significantly from distributions during such period. Accordingly, each Portfolio may periodically make reclassifications among certain of its capital accounts without impacting the net asset value of the Portfolio.
At December 31, 2009, the Portfolios' components of distributable earnings (accumulated losses) on a tax-basis are as follows:
Portfolio | Undistributed Ordinary Income ($)* | Undistributed Net Long-Term Capital Gains ($) | Capital Loss Carryforwards ($) | Net Unrealized Gain (Loss) on Investments ($) |
DWS Bond VIP | 6,641,764 | — | (42,815,000) | 386,627 |
DWS Growth & Income VIP | 1,542,732 | — | (57,014,000) | 11,643,767 |
DWS Capital Growth VIP | 6,141,554 | — | (256,579,000) | 195,856,628 |
DWS Global Opportunities VIP | 555,712 | — | (22,316,000) | 36,497,914 |
DWS International VIP | 6,548,545 | — | (176,529,000) | 65,463,531 |
DWS Health Care VIP | 74,397 | 3,358,298 | — | 11,520,312 |
In addition, the tax character of distributions paid to shareholders by the Portfolios is summarized as follows:
| Distributions from Ordinary Income ($)* Years Ended December 31, | Distributions from Long-Term Capital Gains ($) Years Ended December 31, |
Portfolio | 2009 | 2008 | 2009 | 2008 |
DWS Bond VIP | 11,985,798 | 10,914,208 | — | — |
DWS Growth & Income VIP | 2,003,256 | 15,760,111 | — | 26,232,152 |
DWS Capital Growth VIP | 8,113,671 | 9,451,337 | — | — |
DWS Global Opportunities VIP | 2,134,010 | 979,171 | — | 40,011,833 |
DWS International VIP | 13,476,586 | 7,386,477 | — | 95,745,428 |
DWS Health Care VIP | 724,315 | 3,006,032 | 742,128 | 12,571,710 |
* For tax purposes, short-term capital gains distributions are considered ordinary income distributions.
Expenses. Expenses of the Series arising in connection with a specific Portfolio are allocated to that Portfolio. Other Series expenses which cannot be directly attributed to a Portfolio are apportioned among the Portfolios in the Series.
Contingencies. In the normal course of business, each Portfolio may enter into contracts with service providers that contain general indemnification clauses. Each Portfolio's maximum exposure under these arrangements is unknown as this would involve future claims that may be made against each Portfolio that have not yet been made. However, based on experience, each Portfolio expects the risk of loss to be remote.
Other. For each Portfolio, investment transactions are accounted for on a trade date plus one basis for daily net asset value calculations. However, for financial reporting purposes, investment transactions are reported on trade date. Interest income is recorded on the accrual basis net of foreign withholding taxes. Dividend income is recorded on the ex-dividend date net of foreign withholding taxes. Certain dividends from foreign securities may be recorded subsequent to the ex-dividend date as soon as the Portfolio is informed of such dividends. Realized gains and losses from investment transactions are recorded on an identified cost basis. All discounts and premiums are accreted/amortized for both tax and financial reporting purposes.
B. Purchases and Sales of Securities
During the year ended December 31, 2009, purchases and sales of investment securities (excluding short-term investments) were as follows:
Portfolio | Purchases ($) | Sales ($) |
DWS Bond VIP excluding US Treasury Obligations | 363,453,498 | 351,698,090 |
US Treasury Obligations | 74,771,473 | 66,751,900 |
DWS Growth & Income VIP | 73,380,763 | 90,220,270 |
DWS Capital Growth VIP | 481,115,761 | 570,371,875 |
DWS Global Opportunities VIP | 65,821,101 | 91,641,908 |
DWS International VIP | 237,744,779 | 283,244,304 |
DWS Health Care VIP | 16,091,698 | 36,491,936 |
C. Related Parties
Under the Investment Management Agreement with Deutsche Investment Management Americas Inc. ("DIMA" or the "Advisor"), an indirect, wholly owned subsidiary of Deutsche Bank AG, the Advisor directs the investments of the Portfolios in accordance with their investment objectives, policies and restrictions. The Advisor determines the securities, instruments and other contracts relating to investments to be purchased, sold or entered into by the Portfolios.
Under the Investment Management Agreement with the Advisor, the Portfolios pay a monthly management fee, based on the average daily net assets of each Portfolio, computed and accrued daily and payable monthly, at the annual rates shown below:
Portfolio | Annual Management Fee Rate |
DWS Bond VIP first $250 million of average daily net assets | .390% |
next $750 million of average daily net assets | .365% |
over $1 billion of average daily net assets | .340% |
DWS Growth & Income VIP first $250 million of average daily net assets | .390% |
next $750 million of average daily net assets | .365% |
over $1 billion of average daily net assets | .340% |
DWS Capital Growth VIP first $250 million of average daily net assets | .390% |
next $750 million of average daily net assets | .365% |
over $1 billion of average daily net assets | .340% |
DWS Global Opportunities VIP first $500 million of average daily net assets | .890% |
next $500 million of average daily net assets | .875% |
next $1 billion of average daily net assets | .860% |
over $2 billion of average daily net assets | .845% |
DWS International VIP first $500 million of average daily net assets | .790% |
over $500 million of average daily net assets | .640% |
DWS Health Care VIP first $250 million of average daily net assets | .665% |
next $750 million of average daily net assets | .640% |
next $1.5 billion of average daily net assets | .615% |
next $2.5 billion of average daily net assets | .595% |
next $2.5 billion of average daily net assets | .565% |
next $2.5 billion of average daily net assets | .555% |
next $2.5 billion of average daily net assets | .545% |
over $12.5 billion of average daily net assets | .535% |
For the period from January 1, 2009 through September 30, 2009, the Advisor, the underwriter and accounting agent contractually agreed to waive a portion of their fee to the extent necessary to maintain the operating expenses of each class (excluding certain expenses such as extraordinary expenses, taxes, brokerage and interest) as follows:
Portfolio | Annual Rate |
DWS Global Opportunities VIP Class A | .95% |
DWS Global Opportunities VIP Class B | 1.35% |
DWS Health Care VIP Class B | 1.49% |
In addition, for the period from October 1, 2009 through September 30, 2010, the Advisor, the underwriter and accounting agent contractually agreed to waive a portion of their fee to the extent necessary to maintain the operating expenses of each class (excluding certain expenses such as extraordinary expenses, taxes, brokerage and interest) as follows:
Portfolio | Annual Rate |
DWS Global Opportunities VIP Class A | 1.06% |
DWS Global Opportunities VIP Class B | 1.46% |
In addition, for the period from January 1, 2009 through April 30, 2010, the Advisor, the underwriter and accounting agent contractually agreed to waive a portion of their fee to the extent necessary to maintain the operating expenses of each class (excluding certain expenses such as extraordinary expenses, taxes, brokerage and interest) as follows:
Portfolio | Annual Rate |
DWS Growth & Income VIP Class A | .54% |
DWS Growth & Income VIP Class B | .87% |
DWS Capital Growth VIP Class A | .49% |
DWS Capital Growth VIP Class B | .82% |
DWS International VIP Class A | .96% |
DWS International VIP Class B | 1.29% |
In addition, for the period from January 1, 2009 through April 27, 2010, the Advisor has contractually agreed to waive 0.01% of the management fee for DWS Growth & Income VIP.
Accordingly, for the year ended December 31, 2009, the total management fee, management fee waived and effective management fee rate are as follows:
Portfolio | Total Aggregated ($) | Waived ($) | Annual Effective Rate |
DWS Bond VIP | 590,867 | — | .39% |
DWS Growth & Income VIP | 362,304 | 83,784 | .30% |
DWS Capital Growth VIP | 2,425,388 | 153,029 | .35% |
DWS Global Opportunities VIP | 1,126,004 | 154,222 | .77% |
DWS International VIP | 2,382,840 | — | .79% |
DWS Health Care VIP | 353,859 | — | .67% |
In addition, for the year ended December 31, 2009, the Advisor waived record keeping expenses of Class B shares of the Portfolio as follows:
Portfolio | Waived ($) |
DWS Capital Growth VIP | 1,212 |
On January 26, 2010, the Advisor announced its intention to transition members of DWS Growth & Income VIP's portfolio management team who are part of its Quantitative Strategies Group out of DIMA into two separate independent investment advisory firms that are not affiliated with DIMA. In order for DWS Growth & Income VIP to continue to benefit from the investment expertise offered by the affected portfolio managers, DIMA has recommended to the Portfolio's Board of Trustees the approval of a sub-advisory agreement between DIMA and each newly created investment advisory firm (the "Sub-Advisory Agreement"). The Sub-Advisory Agreement is subject to Board approval. If approved, the transition is expected to be completed during the second quarter 2010.
Administration Fee. Pursuant to an Administrative Services Agreement, DIMA provides most administrative services to the Series. For all services provided under the Administrative Services Agreement, each Portfolio pays the Advisor an annual fee ("Administration Fee") of 0.10% of each Portfolio's average daily net assets, computed and accrued daily and payable monthly. For the year ended December 31, 2009, the Administration Fee was as follows:
Portfolio | Total Aggregated ($) | Unpaid at December 31, 2009 ($) |
DWS Bond VIP | 151,504 | 13,599 |
DWS Growth & Income VIP | 92,899 | 8,763 |
DWS Capital Growth VIP | 647,367 | 61,538 |
DWS Global Opportunities VIP | 126,517 | 12,233 |
DWS International VIP | 301,625 | 29,259 |
DWS Health Care VIP | 53,212 | 4,440 |
Service Provider Fees. DWS Investments Service Company ("DISC"), an affiliate of the Advisor, is the transfer agent, dividend-paying agent and shareholder service agent for the Series. Pursuant to a sub-transfer agency agreement between DISC and DST Systems, Inc. ("DST"), DISC has delegated certain transfer agent, dividend-paying agent and shareholder service agent functions to DST. DISC compensates DST out of the shareholder servicing fee it receives from each Portfolio. For the year ended December 31, 2009, the amounts charged to the Portfolios by DISC were as follows:
Portfolio | Total Aggregated ($) | Waived ($) | Unpaid at December 31, 2009 ($) |
DWS Bond VIP Class A | 711 | — | 119 |
DWS Growth & Income VIP Class A | 611 | 611 | — |
DWS Growth & Income VIP Class B | 98 | — | 16 |
DWS Capital Growth VIP Class A | 1,051 | 1,051 | — |
DWS Capital Growth VIP Class B | 148 | 148 | — |
DWS Global Opportunities VIP Class A | 601 | 601 | — |
DWS Global Opportunities VIP Class B | 120 | — | 24 |
DWS International VIP Class A | 936 | — | 142 |
DWS International VIP Class B | 98 | — | 16 |
DWS Health Care VIP Class A | 255 | — | 24 |
DWS Health Care VIP Class B | 62 | — | 18 |
DWS Investments Distributors, Inc. ("DIDI"), also an affiliate of the Advisor, is the Series' Distributor. In accordance with the Master Distribution Plan, DIDI receives 12b-1 fees of 0.25% of average daily net assets of Class B shares. Pursuant to the Master Distribution Plan, DIDI remits these fees to the Participating Insurance Companies for various costs incurred or paid by these companies in connection with marketing and distribution of Class B shares. These fees are detailed in each Portfolio's Statement of Operations.
Typesetting and Filing Service Fees. Under an agreement with DIMA, DIMA is compensated for providing typesetting and certain regulatory filing services to the Portfolios. For the year ended December 31, 2009, the amount charged to the Portfolios by DIMA included in the Statement of Operations under "reports to shareholders" was as follows:
Portfolio | Total Aggregated ($) | Unpaid at December 31, 2009 ($) |
DWS Bond VIP | 6,833 | 2,121 |
DWS Growth & Income VIP | 7,266 | 2,130 |
DWS Capital Growth VIP | 19,089 | 3,268 |
DWS Global Opportunities VIP | 8,846 | 2,172 |
DWS International VIP | 8,064 | 2,148 |
DWS Health Care VIP | 9,061 | 3,497 |
Trustees' Fees and Expenses. Each Portfolio paid each Trustee not affiliated with the Advisor retainer fees plus specified amounts for various committee services and for the Board Chairperson.
Affiliated Cash Management Vehicles. The Portfolio may invest uninvested cash balances in affiliated funds managed by the Advisor. Affiliated cash management vehicles do not pay the Advisor a management fee. The Portfolio currently invests in Central Cash Management Fund. Prior to October 2, 2009, the Portfolio invested in Cash Management QP Trust ("QP Trust"). Effective October 2, 2009, QP Trust merged into Central Cash Management Fund. Central Cash Management Fund seeks to provide a high level of current income consistent with liquidity and the preservation of capital.
D. Investing in Emerging Markets
The DWS Bond VIP, DWS Global Opportunities VIP and DWS International VIP may invest in emerging markets. Investing in emerging markets may involve special risks and considerations not typically associated with investing in the United States of America. These risks include revaluation of currencies, high rates of inflation, repatriation restrictions on income and capital, and future adverse political, social and economic developments. Moreover, securities issued in these markets may be less liquid, subject to government ownership controls or delayed settlements and may have prices more volatile than those of comparable securities of issuers in the United States of America.
E. Ownership of the Portfolios
At the end of the year, the beneficial ownership in the Portfolios was as follows:
DWS Bond VIP: One participating insurance company was an owner of record of 10% or more of the total outstanding Class A shares of the Portfolio, owning 60%.
DWS Growth & Income VIP: Three participating insurance companies were owners of record of 10% or more of the total outstanding Class A shares of the Portfolio, each owning 34%, 26% and 16%. Two participating insurance companies were owners of record of 10% or more of the total outstanding Class B shares of the Portfolio, owning 87% and 11%.
DWS Capital Growth VIP: Three participating insurance companies were owners of record of 10% or more of the total outstanding Class A shares of the Portfolio, each owning 41%, 23% and 13%. Two participating insurance companies were owners of record of 10% or more of the total outstanding Class B shares of the Portfolio, each owning 86% and 13%.
DWS Global Opportunities VIP: Three participating insurance companies were owners of record of 10% or more of the total outstanding Class A shares of the Portfolio, each owning 47%,20% and 12%. Two participating insurance companies were owners of record of 10% or more of the total outstanding Class B shares of the Portfolio, each owning 64% and 35%.
DWS International VIP: Two participating insurance companies were owners of record of 10% or more of the total outstanding Class A shares of the Portfolio, each owning 39% and 13%. Three participating insurance companies were owners of record of 10% or more of the total outstanding Class B shares of the Portfolio, each owning 66%, 18% and 16%.
DWS Health Care VIP: Two participating insurance companies were owners of record of 10% or more of the total outstanding Class A shares of the Portfolio, each owning 68% and 23%. One participating insurance company was an owner of record of 10% or more of the total outstanding Class B shares of the Portfolio, owning 99%.
F. Line of Credit
The Series and other affiliated funds (the "Participants") share in a $450 million revolving credit facility provided by a syndication of banks. Each Portfolio may borrow for temporary or emergency purposes, including the meeting of redemption requests that otherwise might require the untimely disposition of securities. The Participants are charged an annual commitment fee which is allocated based on net assets, among each of the Participants. Interest is calculated at a rate per annum equal to the sum of the Federal Funds Rate plus 1.25 percent plus if LIBOR exceeds the Federal Funds Rate the amount of such excess. Each Portfolio may borrow up to a maximum of 33 percent of its net assets under the agreement.
G. Payments Made by Affiliates
During the year ended December 31, 2009, the Advisor fully reimbursed DWS Capital Growth VIP $559 for losses incurred on trades executed incorrectly. The amount of the losses was less than 0.01% of the Portfolio's average net asset, thus having no impact on the Portfolio's total return.
H. Acquisition of Assets
On April 24, 2009, DWS Capital Growth VIP acquired all of the net assets of DWS Janus Growth & Income VIP pursuant to a plan of reorganization approved by shareholders on April 20, 2009. The purpose of the transaction was to combine two funds managed by DWS with comparable investment objectives and strategies. The acquisition was accomplished by a tax-free exchange of 9,556,588 Class A shares of DWS Janus Growth & Income VIP for 5,009,687 Class A shares of DWS Capital Growth VIP outstanding on April 24, 2009. DWS Janus Growth & Income VIP's net assets at that date, $66,828,943, including $510,610 of net unrealized appreciation, were combined with those of DWS Capital Growth VIP. The aggregate net assets of DWS Capital Growth VIP immediately before the acquisition were $572,408,860. The combined net assets of DWS Capital Growth VIP immediately following the acquisition were $639,237,803.
The financial statements reflect the operations of DWS Capital Growth VIP for the period prior to the acquisition and the combined fund for the period subsequent to the portfolio merger. Assuming the acquisition had been completed on January 1, 2009, DWS Capital Growth VIP pro forma results of operations for the year ended December 31, 2009, are as follows:
Net investment income* | $ 6,472,345 |
Net gain (loss) on investments | $ 158,160,836 |
Net increase (decrease) in net assets resulting from operations | $ 164,633,181 |
* Net investment income includes $63,410 of pro forma eliminated expenses.
Because the combined investment portfolios have been managed as a single integrated portfolio since the acquisition was completed, it is not practicable to separate the amounts of revenue and earnings of DWS Janus Growth & Income VIP that have been included in DWS Capital Growth VIP's Statement of Operations since April 24, 2009.
I. Review for Subsequent Events
Management has reviewed the events and transactions for subsequent events from January 1, 2010 through February 12, 2010, the date the financial statements were available to be issued, and has determined that there were no material events that would require disclosure in the Series' financial statements through this date.
Report of Independent Registered Public Accounting Firm
To the Trustees and Shareholders of DWS Variable Series I:
In our opinion, the accompanying statements of assets and liabilities, including the investment portfolios, and the related statements of operations and of changes in net assets and the financial highlights present fairly, in all material respects, the financial position of the six Portfolios (identified in Note A) of DWS Variable Series I (the "Series") at December 31, 2009 and the results of each of their operations, the changes in each of their net assets, and the financial highlights for each of the periods indicated therein, in conformity with accounting principles generally accepted in the United States of America. These financial statements and financial highlights (hereafter referred to as "financial statements") are the responsibility of the Series' management. Our responsibility is to express an opinion on these financial statements based on our audits. We conducted our audits of these financial statements in accordance with the standards of the Public Company Accounting Oversight Board (United States). Those standards require that we plan and perform the audit to obtain reasonable assurance about whether the financial statements are free of material misstatement. An audit includes examining, on a test basis, evidence supporting the amounts and disclosures in the financial statements, assessing the accounting principles used and significant estimates made by management, and evaluating the overall financial statement presentation. We believe that our audits, which included confirmation of securities at December 31, 2009 by correspondence with the custodians and brokers, provide a reasonable basis for our opinion.
PricewaterhouseCoopers LLP
Boston, Massachusetts
February 12, 2010
Tax Information (Unaudited)
DWS Health Care VIP paid distributions of $0.12 per share from net long-term capital gains during the year ended December 31, 2009, of which 100% represents 15% rate gains.
Pursuant to Section 852 of the Internal Revenue Code, DWS Health Care VIP designates approximately $3,694,000 as capital gain dividends for its year ended December 31, 2009, of which 100% represents 15% rate gains.
For corporate shareholders of DWS Growth & Income VIP, DWS Capital Growth VIP, DWS Global Opportunities VIP and DWS Health Care VIP, 100%, 100%, 13% and 65%, respectively, of the ordinary dividends (i.e., income dividends plus short-term capital gains) paid during the Portfolios' fiscal year ended December 31, 2009 qualified for the dividends received deduction.
DWS International VIP paid foreign taxes of $812,000 and earned $5,943,000 of foreign source income during the year ended December 31, 2009. Pursuant to Section 853 of the Internal Revenue Code, DWS International VIP designates $0.02 per share as foreign taxes paid and $0.14 per share as income earned from foreign sources for the year ended December 31, 2009.
Please consult a tax advisor if you have questions about federal or state income tax laws, or on how to prepare your tax returns. If you have specific questions about your account, please call (800) 728-3337.
Proxy Voting
The Series' policies and procedures for voting proxies for portfolio securities and information about how the Series voted proxies related to its portfolio securities during the 12-month period ended June 30 are available on our Web site — www.dws-investments.com (click on "proxy voting" at the bottom of the page) — or on the SEC's Web site — www.sec.gov. To obtain a written copy of the Series' policies and procedures without charge, upon request, call us toll free at (800) 621-1048.
Investment Management Agreement Approval
DWS Bond VIP
The Board of Trustees, including the Independent Trustees, approved the renewal of your Fund's investment management agreement (the "Agreement") with Deutsche Investment Management Americas Inc. ("DWS") in September 2009.
In terms of the process that the Board followed prior to approving the Agreement, shareholders should know that:
• In September 2009, all but one of the Fund's Trustees were independent of DWS and its affiliates.
• The Trustees meet frequently to discuss fund matters. Each year, the Trustees dedicate substantial time to contract review matters. Over the course of several months, the Board's Contract Committee, in coordination with the Board's Fixed Income and Quant Oversight Committee, reviewed comprehensive materials received from DWS, independent third parties and independent counsel. These materials included an analysis of the Fund's performance, fees and expenses, and profitability compiled by the Fund's independent fee consultant. The Board also received extensive information throughout the year regarding performance of the Fund.
• The Independent Trustees regularly meet privately with their independent counsel to discuss contract review and other matters. In addition, the Independent Trustees were also advised by the Fund's independent fee consultant in the course of their review of the Fund's contractual arrangements and considered a comprehensive report prepared by the independent fee consultant in connection with their deliberations (the "IFC Report").
• In connection with reviewing the Agreement, the Board also reviewed the terms of the Fund's administrative services agreement, transfer agency agreement and other material service agreements.
• Based on its evaluation of the information provided, the Contract Committee presented its findings and recommendations to the Independent Trustees as a group. The Independent Trustees reviewed the Contract Committee's findings and recommendations and presented their recommendations to the full Board.
In connection with the contract review process, the Contract Committee and the Board considered the factors discussed below, among others. The Board also considered that DWS and its predecessors have managed the Fund since its inception, and the Board believes that a long-term relationship with a capable, conscientious advisor is in the best interests of the Fund. The Board considered, generally, that shareholders chose to invest or remain invested in the Fund knowing that DWS managed the Fund, and that the Agreement was approved by the Fund's shareholders. DWS is part of Deutsche Bank, a major global banking institution that is engaged in a wide range of financial services. The Board believes that there are significant advantages to being part of a global asset management business that offers a wide range of investing expertise and resources, including hundreds of portfolio managers and analysts with research capabilities in many countries throughout the world.
While shareholders may focus primarily on fund performance and fees, the Fund's Board considers these and many other factors, including the quality and integrity of DWS's personnel and such other issues as back-office operations, fund valuations, and compliance policies and procedures.
Nature, Quality and Extent of Services. The Board considered the terms of the Agreement, including the scope of advisory services provided under the Agreement. The Board noted that, under the Agreement, DWS provides portfolio management services to the Fund and that, pursuant to a separate administrative services agreement, DWS provides administrative services to the Fund. The Board considered the experience and skills of senior management and investment personnel, the resources made available to such personnel, the ability of DWS to attract and retain high-quality personnel, and the organizational depth and stability of DWS. The Board reviewed the Fund's performance over short-term and long-term periods and compared those returns to various agreed-upon performance measures, including market indices and a peer universe compiled by the independent fee consultant using information supplied by Lipper Inc. ("Lipper"). The Board also noted that it has put into place a process of identifying "Focus Funds" (e.g., funds performing poorly relative to their benchmark or a peer universe compiled by Lipper), and receives more frequent reporting and information from DWS regarding such funds, along with DWS's remedial plans to address underperformance. The Board believes this process is an effective manner of identifying and addressing underperforming funds. Based on the information provided, the Board noted that for each of the one-, three- and five-year periods ended December 31, 2008, the Fund's performance (Class A shares) was in the 4th quartile of the applicable Lipper universe (the 1st quartile being the best performers and the 4th quartile being the worst performers). The Board also observed that the Fund has underperformed its benchmark in each of the one-, three- and five-year periods ended December 31, 2008. The Board noted the disappointing investment performance of the Fund in recent periods and continued to discuss with senior management of DWS the factors contributing to such underperformance and actions being taken to improve performance. The Board recognized that DWS has made significant changes in the Fund's management structure, including the termination of Aberdeen Asset Management, Inc. and Aberdeen Asset Management Investment Services Limited as the Fund's sub-advisor and sub-sub-advisor, respectively, and the introduction of a new portfolio management team in December 2008.
On the basis of this evaluation and the ongoing review of investment results by the Board, the Board concluded that the nature, quality and extent of services provided by DWS historically have been and continue to be satisfactory.
Fees and Expenses. The Board considered the Fund's investment management fee schedule, operating expenses and total expense ratios, and comparative information provided by Lipper and the independent fee consultant regarding investment management fee rates paid to other investment advisors by similar funds (1st quartile being the most favorable and 4th quartile being the least favorable). With respect to management fees paid to other investment advisors by similar funds, the Board noted that the contractual fee rates paid by the Fund, which include a 0.10% fee paid to DWS under the Fund's administrative services agreement, were at the median (2nd quartile) of the applicable Lipper peer group (based on Lipper data provided as of December 31, 2008). The Board also reviewed data comparing the Fund's total (net) operating expenses to the applicable Lipper expense universe. The Board concluded that the comparative Lipper operating expense data was of limited utility, as it likely significantly understated the current expense ratios of many peer funds due to the substantial declines in net assets as a result of market losses and net redemptions that many funds experienced between mid-September 2008 and March 2009 and that were not reflected in the data.
The information considered by the Board as part of its review of management fees included information regarding fees charged by DWS and its affiliates to similar institutional accounts and to similar funds managed by the same portfolio management teams but offered primarily to European investors ("DWS Europe funds"), in each case as applicable. The Board observed that advisory fee rates for institutional accounts generally were lower than the management fees charged by similarly managed DWS US mutual funds ("DWS Funds"), but also took note of the differences in services provided to DWS Funds as compared to institutional accounts. In the case of DWS Europe funds, the Board observed that fee rates for DWS Europe funds generally were higher than for similarly managed DWS Funds, but noted that differences in the types of services provided to DWS Funds relative to DWS Europe funds made it difficult to compare such fees.
On the basis of the information provided, the Board concluded that management fees were reasonable and appropriate in light of the nature, quality and extent of services provided by DWS.
Profitability. The Board reviewed detailed information regarding revenues received by DWS under the Agreement. The Board considered the estimated costs and pre-tax profits realized by DWS from advising the DWS Funds, as well as estimates of the pre-tax profits attributable to managing the Fund in particular. The Board also received information regarding the estimated enterprise-wide profitability of DWS and its affiliates with respect to all fund services in totality and by fund. The Board reviewed DWS's methodology in allocating its costs to the management of the Fund. Based on the information provided, the Board concluded that the pre-tax profits realized by DWS in connection with the management of the Fund were not unreasonable. The Board also reviewed information regarding the profitability of certain similar investment management firms. The Board noted that while information regarding the profitability of such firms is limited (and in some cases is not necessarily prepared on a comparable basis), DWS and its affiliates' overall profitability with respect to the DWS fund complex (after taking into account distribution and other services provided to the funds by DWS and its affiliates) was lower than the overall profitability levels of many comparable firms for which such data was available.
Economies of Scale. The Board considered whether there are economies of scale with respect to the management of the Fund and whether the Fund benefits from any economies of scale. The Board noted that the Fund's management fee schedule includes fee breakpoints. The Board concluded that the Fund's fee schedule represents an appropriate sharing between the Fund and DWS of such economies of scale as may exist in the management of the Fund at current asset levels.
Other Benefits to DWS and Its Affiliates. The Board also considered the character and amount of other incidental benefits received by DWS and its affiliates, including any fees received by DWS for administrative services provided to the Fund. The Board also considered benefits to DWS related to brokerage and soft-dollar allocations, including allocating brokerage to pay for research generated by parties other than the executing broker dealers, which pertain primarily to funds investing in equity securities, along with the incidental public relations benefits to DWS related to DWS Funds advertising and cross-selling opportunities among DWS products and services. The Board concluded that management fees were reasonable in light of these fallout benefits.
Compliance. The Board considered the significant attention and resources dedicated by DWS to documenting and enhancing its compliance processes in recent years. The Board noted in particular (i) the experience and seniority of both DWS's chief compliance officer and the Fund's chief compliance officer; (ii) the large number of DWS compliance personnel; and (iii) the substantial commitment of resources by DWS and its affiliates to compliance matters.
Based on all of the information considered and the conclusions reached, the Board unanimously (including the Independent Trustees) determined that the continuation of the Agreement is in the best interests of the Fund. In making this determination, the Board did not give particular weight to any single factor identified above. The Board considered these factors over the course of numerous meetings, certain of which were in executive session with only the Independent Trustees and their counsel present. It is possible that individual Trustees may have weighed these factors differently in reaching their individual decisions to approve the continuation of the Agreement.
DWS Growth & Income VIP
The Board of Trustees, including the Independent Trustees, approved the renewal of your Fund's investment management agreement (the "Agreement") with Deutsche Investment Management Americas Inc. ("DWS") in September 2009.
In terms of the process that the Board followed prior to approving the Agreement, shareholders should know that:
• In September 2009, all but one of the Fund's Trustees were independent of DWS and its affiliates.
• The Trustees meet frequently to discuss fund matters. Each year, the Trustees dedicate substantial time to contract review matters. Over the course of several months, the Board's Contract Committee, in coordination with the Board's Fixed Income and Quant Oversight Committee, reviewed comprehensive materials received from DWS, independent third parties and independent counsel. These materials included an analysis of the Fund's performance, fees and expenses, and profitability compiled by the Fund's independent fee consultant. The Board also received extensive information throughout the year regarding performance of the Fund.
• The Independent Trustees regularly meet privately with their independent counsel to discuss contract review and other matters. In addition, the Independent Trustees were also advised by the Fund's independent fee consultant in the course of their review of the Fund's contractual arrangements and considered a comprehensive report prepared by the independent fee consultant in connection with their deliberations (the "IFC Report").
• In connection with reviewing the Agreement, the Board also reviewed the terms of the Fund's Rule 12b-1 plan, distribution agreement, administrative services agreement, transfer agency agreement and other material service agreements.
• Based on its evaluation of the information provided, the Contract Committee presented its findings and recommendations to the Independent Trustees as a group. The Independent Trustees reviewed the Contract Committee's findings and recommendations and presented their recommendations to the full Board.
In connection with the contract review process, the Contract Committee and the Board considered the factors discussed below, among others. The Board also considered that DWS and its predecessors have managed the Fund since its inception, and the Board believes that a long-term relationship with a capable, conscientious advisor is in the best interests of the Fund. The Board considered, generally, that shareholders chose to invest or remain invested in the Fund knowing that DWS managed the Fund, and that the Agreement was approved by the Fund's shareholders. DWS is part of Deutsche Bank, a major global banking institution that is engaged in a wide range of financial services. The Board believes that there are significant advantages to being part of a global asset management business that offers a wide range of investing expertise and resources, including hundreds of portfolio managers and analysts with research capabilities in many countries throughout the world.
While shareholders may focus primarily on fund performance and fees, the Fund's Board considers these and many other factors, including the quality and integrity of DWS's personnel and such other issues as back-office operations, fund valuations, and compliance policies and procedures.
Nature, Quality and Extent of Services. The Board considered the terms of the Agreement, including the scope of advisory services provided under the Agreement. The Board noted that, under the Agreement, DWS provides portfolio management services to the Fund and that, pursuant to a separate administrative services agreement, DWS provides administrative services to the Fund. The Board considered the experience and skills of senior management and investment personnel, the resources made available to such personnel, the ability of DWS to attract and retain high-quality personnel, and the organizational depth and stability of DWS. The Board reviewed the Fund's performance over short-term and long-term periods and compared those returns to various agreed-upon performance measures, including market indices and a peer universe compiled by the independent fee consultant using information supplied by Lipper Inc. ("Lipper"). The Board also noted that it has put into place a process of identifying "Focus Funds" (e.g., funds performing poorly relative to their benchmark or a peer universe compiled by Lipper), and receives more frequent reporting and information from DWS regarding such funds, along with DWS's remedial plans to address underperformance. The Board believes this process is an effective manner of identifying and addressing underperforming funds. Based on the information provided, the Board noted that for the one-, three- and five-year periods ended December 31, 2008, the Fund's performance (Class A shares) was in the 3rd quartile, 3rd quartile and 4th quartile, respectively, of the applicable Lipper universe (the 1st quartile being the best performers and the 4th quartile being the worst performers). The Board also observed that the Fund has underperformed its benchmark in each of the one-, three- and five-year periods ended December 31, 2008.
On the basis of this evaluation and the ongoing review of investment results by the Board, the Board concluded that the nature, quality and extent of services provided by DWS historically have been and continue to be satisfactory.
Fees and Expenses. The Board considered the Fund's investment management fee schedule, operating expenses and total expense ratios, and comparative information provided by Lipper and the independent fee consultant regarding investment management fee rates paid to other investment advisors by similar funds (1st quartile being the most favorable and 4th quartile being the least favorable). With respect to management fees paid to other investment advisors by similar funds, the Board noted that the contractual fee rates paid by the Fund, which include a 0.10% fee paid to DWS under the Fund's administrative services agreement, were lower than the median (1st quartile) of the applicable Lipper peer group (based on Lipper data provided as of December 31, 2008). The Board also reviewed data comparing each share class's total (net) operating expenses to the applicable Lipper expense universe. The Board concluded that the comparative Lipper operating expense data was of limited utility, as it likely significantly understated the current expense ratios of many peer funds due to the substantial declines in net assets as a result of market losses and net redemptions that many funds experienced between mid-September 2008 and March 2009 and that were not reflected in the data. The Board also noted that the expense limitations agreed to by DWS helped to ensure that the Fund's total (net) operating expenses would remain competitive.
The information considered by the Board as part of its review of management fees included information regarding fees charged by DWS and its affiliates to similar institutional accounts and to similar funds managed by the same portfolio management teams but offered primarily to European investors ("DWS Europe funds"), in each case as applicable. The Board observed that advisory fee rates for institutional accounts generally were lower than the management fees charged by similarly managed DWS US mutual funds ("DWS Funds"), but also took note of the differences in services provided to DWS Funds as compared to institutional accounts. In the case of DWS Europe funds, the Board observed that fee rates for DWS Europe funds generally were higher than for similarly managed DWS Funds, but noted that differences in the types of services provided to DWS Funds relative to DWS Europe funds made it difficult to compare such fees.
On the basis of the information provided, the Board concluded that management fees were reasonable and appropriate in light of the nature, quality and extent of services provided by DWS.
Profitability. The Board reviewed detailed information regarding revenues received by DWS under the Agreement. The Board considered the estimated costs and pre-tax profits realized by DWS from advising the DWS Funds, as well as estimates of the pre-tax profits attributable to managing the Fund in particular. The Board also received information regarding the estimated enterprise-wide profitability of DWS and its affiliates with respect to all fund services in totality and by fund. The Board reviewed DWS's methodology in allocating its costs to the management of the Fund. Based on the information provided, the Board concluded that the pre-tax profits realized by DWS in connection with the management of the Fund were not unreasonable. The Board also reviewed information regarding the profitability of certain similar investment management firms. The Board noted that while information regarding the profitability of such firms is limited (and in some cases is not necessarily prepared on a comparable basis), DWS and its affiliates' overall profitability with respect to the DWS fund complex (after taking into account distribution and other services provided to the funds by DWS and its affiliates) was lower than the overall profitability levels of many comparable firms for which such data was available.
Economies of Scale. The Board considered whether there are economies of scale with respect to the management of the Fund and whether the Fund benefits from any economies of scale. The Board noted that the Fund's management fee schedule includes fee breakpoints. The Board concluded that the Fund's fee schedule represents an appropriate sharing between the Fund and DWS of such economies of scale as may exist in the management of the Fund at current asset levels.
Other Benefits to DWS and Its Affiliates. The Board also considered the character and amount of other incidental benefits received by DWS and its affiliates, including any fees received by DWS for administrative services provided to the Fund and any fees received by an affiliate of DWS for distribution services. The Board also considered benefits to DWS related to brokerage and soft-dollar allocations, including allocating brokerage to pay for research generated by parties other than the executing broker dealers, which pertain primarily to funds investing in equity securities, along with the incidental public relations benefits to DWS related to DWS Funds advertising and cross-selling opportunities among DWS products and services. The Board concluded that management fees were reasonable in light of these fallout benefits.
Compliance. The Board considered the significant attention and resources dedicated by DWS to documenting and enhancing its compliance processes in recent years. The Board noted in particular (i) the experience and seniority of both DWS's chief compliance officer and the Fund's chief compliance officer; (ii) the large number of DWS compliance personnel; and (iii) the substantial commitment of resources by DWS and its affiliates to compliance matters.
Based on all of the information considered and the conclusions reached, the Board unanimously (including the Independent Trustees) determined that the continuation of the Agreement is in the best interests of the Fund. In making this determination, the Board did not give particular weight to any single factor identified above. The Board considered these factors over the course of numerous meetings, certain of which were in executive session with only the Independent Trustees and their counsel present. It is possible that individual Trustees may have weighed these factors differently in reaching their individual decisions to approve the continuation of the Agreement.
DWS Capital Growth VIP
The Board of Trustees, including the Independent Trustees, approved the renewal of your Fund's investment management agreement (the "Agreement") with Deutsche Investment Management Americas Inc. ("DWS") in September 2009.
In terms of the process that the Board followed prior to approving the Agreement, shareholders should know that:
• In September 2009, all but one of the Fund's Trustees were independent of DWS and its affiliates.
• The Trustees meet frequently to discuss fund matters. Each year, the Trustees dedicate substantial time to contract review matters. Over the course of several months, the Board's Contract Committee, in coordination with the Board's Equity Oversight Committee, reviewed comprehensive materials received from DWS, independent third parties and independent counsel. These materials included an analysis of the Fund's performance, fees and expenses, and profitability compiled by the Fund's independent fee consultant. The Board also received extensive information throughout the year regarding performance of the Fund.
• The Independent Trustees regularly meet privately with their independent counsel to discuss contract review and other matters. In addition, the Independent Trustees were also advised by the Fund's independent fee consultant in the course of their review of the Fund's contractual arrangements and considered a comprehensive report prepared by the independent fee consultant in connection with their deliberations (the "IFC Report").
• In connection with reviewing the Agreement, the Board also reviewed the terms of the Fund's Rule 12b-1 plan, distribution agreement, administrative services agreement, transfer agency agreement and other material service agreements.
• Based on its evaluation of the information provided, the Contract Committee presented its findings and recommendations to the Independent Trustees as a group. The Independent Trustees reviewed the Contract Committee's findings and recommendations and presented their recommendations to the full Board.
In connection with the contract review process, the Contract Committee and the Board considered the factors discussed below, among others. The Board also considered that DWS and its predecessors have managed the Fund since its inception, and the Board believes that a long-term relationship with a capable, conscientious advisor is in the best interests of the Fund. The Board considered, generally, that shareholders chose to invest or remain invested in the Fund knowing that DWS managed the Fund, and that the Agreement was approved by the Fund's shareholders. DWS is part of Deutsche Bank, a major global banking institution that is engaged in a wide range of financial services. The Board believes that there are significant advantages to being part of a global asset management business that offers a wide range of investing expertise and resources, including hundreds of portfolio managers and analysts with research capabilities in many countries throughout the world.
While shareholders may focus primarily on fund performance and fees, the Fund's Board considers these and many other factors, including the quality and integrity of DWS's personnel and such other issues as back-office operations, fund valuations, and compliance policies and procedures.
Nature, Quality and Extent of Services. The Board considered the terms of the Agreement, including the scope of advisory services provided under the Agreement. The Board noted that, under the Agreement, DWS provides portfolio management services to the Fund and that, pursuant to a separate administrative services agreement, DWS provides administrative services to the Fund. The Board considered the experience and skills of senior management and investment personnel, the resources made available to such personnel, the ability of DWS to attract and retain high-quality personnel, and the organizational depth and stability of DWS. The Board reviewed the Fund's performance over short-term and long-term periods and compared those returns to various agreed-upon performance measures, including market indices and a peer universe compiled by the independent fee consultant using information supplied by Lipper Inc. ("Lipper"). The Board also noted that it has put into place a process of identifying "Focus Funds" (e.g., funds performing poorly relative to their benchmark or a peer universe compiled by Lipper), and receives more frequent reporting and information from DWS regarding such funds, along with DWS's remedial plans to address underperformance. The Board believes this process is an effective manner of identifying and addressing underperforming funds. Based on the information provided, the Board noted that for each of the one-, three- and five-year periods ended December 31, 2008, the Fund's performance (Class A shares) was in the 1st quartile respectively, of the applicable Lipper universe (the 1st quartile being the best performers and the 4th quartile being the worst performers). The Board also observed that the Fund has outperformed its benchmark in each of the one-, three- and five-year periods ended December 31, 2008.
On the basis of this evaluation and the ongoing review of investment results by the Board, the Board concluded that the nature, quality and extent of services provided by DWS historically have been and continue to be satisfactory.
Fees and Expenses. The Board considered the Fund's investment management fee schedule, operating expenses and total expense ratios, and comparative information provided by Lipper and the independent fee consultant regarding investment management fee rates paid to other investment advisors by similar funds (1st quartile being the most favorable and 4th quartile being the least favorable). With respect to management fees paid to other investment advisors by similar funds, the Board noted that the contractual fee rates paid by the Fund, which include a 0.10% fee paid to DWS under the Fund's administrative services agreement, were lower than the median (1st quartile) of the applicable Lipper peer group (based on Lipper data provided as of December 31, 2008). The Board also reviewed data comparing each share class's total (net) operating expenses to the applicable Lipper expense universe. The Board concluded that the comparative Lipper operating expense data was of limited utility, as it likely significantly understated the current expense ratios of many peer funds due to the substantial declines in net assets as a result of market losses and net redemptions that many funds experienced between mid-September 2008 and March 2009 and that were not reflected in the data. The Board also noted that the expense limitations agreed to by DWS helped to ensure that the Fund's total (net) operating expenses would remain competitive.
The information considered by the Board as part of its review of management fees included information regarding fees charged by DWS and its affiliates to similar institutional accounts and to similar funds managed by the same portfolio management teams but offered primarily to European investors ("DWS Europe funds"), in each case as applicable. The Board observed that advisory fee rates for institutional accounts generally were lower than the management fees charged by similarly managed DWS US mutual funds ("DWS Funds"), but also took note of the differences in services provided to DWS Funds as compared to institutional accounts. In the case of DWS Europe funds, the Board observed that fee rates for DWS Europe funds generally were higher than for similarly managed DWS Funds, but noted that differences in the types of services provided to DWS Funds relative to DWS Europe funds made it difficult to compare such fees.
On the basis of the information provided, the Board concluded that management fees were reasonable and appropriate in light of the nature, quality and extent of services provided by DWS.
Profitability. The Board reviewed detailed information regarding revenues received by DWS under the Agreement. The Board considered the estimated costs and pre-tax profits realized by DWS from advising the DWS Funds, as well as estimates of the pre-tax profits attributable to managing the Fund in particular. The Board also received information regarding the estimated enterprise-wide profitability of DWS and its affiliates with respect to all fund services in totality and by fund. The Board reviewed DWS's methodology in allocating its costs to the management of the Fund. Based on the information provided, the Board concluded that the pre-tax profits realized by DWS in connection with the management of the Fund were not unreasonable. The Board also reviewed information regarding the profitability of certain similar investment management firms. The Board noted that while information regarding the profitability of such firms is limited (and in some cases is not necessarily prepared on a comparable basis), DWS and its affiliates' overall profitability with respect to the DWS fund complex (after taking into account distribution and other services provided to the funds by DWS and its affiliates) was lower than the overall profitability levels of many comparable firms for which such data was available.
Economies of Scale. The Board considered whether there are economies of scale with respect to the management of the Fund and whether the Fund benefits from any economies of scale. The Board noted that the Fund's management fee schedule includes fee breakpoints. The Board concluded that the Fund's fee schedule represents an appropriate sharing between the Fund and DWS of such economies of scale as may exist in the management of the Fund at current asset levels.
Other Benefits to DWS and Its Affiliates. The Board also considered the character and amount of other incidental benefits received by DWS and its affiliates, including any fees received by DWS for administrative services provided to the Fund and any fees received by an affiliate of DWS for distribution services. The Board also considered benefits to DWS related to brokerage and soft-dollar allocations, including allocating brokerage to pay for research generated by parties other than the executing broker dealers, which pertain primarily to funds investing in equity securities, along with the incidental public relations benefits to DWS related to DWS Funds advertising and cross-selling opportunities among DWS products and services. The Board concluded that management fees were reasonable in light of these fallout benefits.
Compliance. The Board considered the significant attention and resources dedicated by DWS to documenting and enhancing its compliance processes in recent years. The Board noted in particular (i) the experience and seniority of both DWS's chief compliance officer and the Fund's chief compliance officer; (ii) the large number of DWS compliance personnel; and (iii) the substantial commitment of resources by DWS and its affiliates to compliance matters.
Based on all of the information considered and the conclusions reached, the Board unanimously (including the Independent Trustees) determined that the continuation of the Agreement is in the best interests of the Fund. In making this determination, the Board did not give particular weight to any single factor identified above. The Board considered these factors over the course of numerous meetings, certain of which were in executive session with only the Independent Trustees and their counsel present. It is possible that individual Trustees may have weighed these factors differently in reaching their individual decisions to approve the continuation of the Agreement.
DWS Global Opportunities VIP
The Board of Trustees, including the Independent Trustees, approved the renewal of your Fund's investment management agreement (the "Agreement") with Deutsche Investment Management Americas Inc. ("DWS") in September 2009.
In terms of the process that the Board followed prior to approving the Agreement, shareholders should know that:
• In September 2009, all but one of the Fund's Trustees were independent of DWS and its affiliates.
• The Trustees meet frequently to discuss fund matters. Each year, the Trustees dedicate substantial time to contract review matters. Over the course of several months, the Board's Contract Committee, in coordination with the Board's Equity Oversight Committee, reviewed comprehensive materials received from DWS, independent third parties and independent counsel. These materials included an analysis of the Fund's performance, fees and expenses, and profitability compiled by the Fund's independent fee consultant. The Board also received extensive information throughout the year regarding performance of the Fund.
• The Independent Trustees regularly meet privately with their independent counsel to discuss contract review and other matters. In addition, the Independent Trustees were also advised by the Fund's independent fee consultant in the course of their review of the Fund's contractual arrangements and considered a comprehensive report prepared by the independent fee consultant in connection with their deliberations (the "IFC Report").
• In connection with reviewing the Agreement, the Board also reviewed the terms of the Fund's Rule 12b-1 plan, distribution agreement, administrative services agreement, transfer agency agreement and other material service agreements.
• Based on its evaluation of the information provided, the Contract Committee presented its findings and recommendations to the Independent Trustees as a group. The Independent Trustees reviewed the Contract Committee's findings and recommendations and presented their recommendations to the full Board.
In connection with the contract review process, the Contract Committee and the Board considered the factors discussed below, among others. The Board also considered that DWS and its predecessors have managed the Fund since its inception, and the Board believes that a long-term relationship with a capable, conscientious advisor is in the best interests of the Fund. The Board considered, generally, that shareholders chose to invest or remain invested in the Fund knowing that DWS managed the Fund, and that the Agreement was approved by the Fund's shareholders. DWS is part of Deutsche Bank, a major global banking institution that is engaged in a wide range of financial services. The Board believes that there are significant advantages to being part of a global asset management business that offers a wide range of investing expertise and resources, including hundreds of portfolio managers and analysts with research capabilities in many countries throughout the world.
While shareholders may focus primarily on fund performance and fees, the Fund's Board considers these and many other factors, including the quality and integrity of DWS's personnel and such other issues as back-office operations, fund valuations, and compliance policies and procedures.
Nature, Quality and Extent of Services. The Board considered the terms of the Agreement, including the scope of advisory services provided under the Agreement. The Board noted that, under the Agreement, DWS provides portfolio management services to the Fund and that, pursuant to a separate administrative services agreement, DWS provides administrative services to the Fund. The Board considered the experience and skills of senior management and investment personnel, the resources made available to such personnel, the ability of DWS to attract and retain high-quality personnel, and the organizational depth and stability of DWS. The Board reviewed the Fund's performance over short-term and long-term periods and compared those returns to various agreed-upon performance measures, including market indices and a peer universe compiled by the independent fee consultant using information supplied by Lipper Inc. ("Lipper"). The Board also noted that it has put into place a process of identifying "Focus Funds" (e.g., funds performing poorly relative to their benchmark or a peer universe compiled by Lipper), and receives more frequent reporting and information from DWS regarding such funds, along with DWS's remedial plans to address underperformance. The Board believes this process is an effective manner of identifying and addressing underperforming funds. Based on the information provided, the Board noted that for the one-, three- and five-year periods ended December 31, 2008, the Fund's performance (Class A shares) was in the 4th quartile, 4th quartile and 2nd quartile, respectively, of the applicable Lipper universe (the 1st quartile being the best performers and the 4th quartile being the worst performers). The Board also observed that the Fund has underperformed its benchmark in each of the one-, three- and five-year periods ended December 31, 2008. The Board observed that there were significant limitations to the usefulness of the comparative data provided by Lipper, noting that the applicable Lipper universe for the Fund included funds that pursue substantially different investment programs as compared to that pursued by the Fund. As a result, the Board gave increased weight to the Fund's performance relative to its benchmark than some of the additional comparative data. The Board noted the disappointing investment performance of the Fund in recent periods and continued to discuss with senior management of DWS the factors contributing to such underperformance and actions being taken to improve performance. The Board observed that the Fund had experienced improved relative performance during the first seven months of 2009. The Board recognized that DWS has made significant changes in its investment personnel and processes in recent years in an effort to improve long-term performance.
On the basis of this evaluation and the ongoing review of investment results by the Board, the Board concluded that the nature, quality and extent of services provided by DWS historically have been and continue to be satisfactory.
Fees and Expenses. The Board considered the Fund's investment management fee schedule, operating expenses and total expense ratios, and comparative information provided by Lipper and the independent fee consultant regarding investment management fee rates paid to other investment advisors by similar funds (1st quartile being the most favorable and 4th quartile being the least favorable). With respect to management fees paid to other investment advisors by similar funds, the Board noted that the contractual fee rates paid by the Fund, which include a 0.10% fee paid to DWS under the Fund's administrative services agreement, were higher than the median (4th quartile) of the applicable Lipper peer group (based on Lipper data provided as of December 31, 2008). The Board also reviewed data comparing each share class's total (net) operating expenses to the applicable Lipper expense universe. The Board concluded that the comparative Lipper operating expense data was of limited utility, as it likely significantly understated the current expense ratios of many peer funds due to the substantial declines in net assets as a result of market losses and net redemptions that many funds experienced between mid-September 2008 and March 2009 and that were not reflected in the data. The Trustees also observed that the Lipper universe for the Fund included funds that pursue substantially different investment programs as compared to that pursued by the Fund. The Board also noted that the expense limitations agreed to by DWS helped to ensure that the Fund's total (net) operating expenses would remain competitive.
The information considered by the Board as part of its review of management fees included information regarding fees charged by DWS and its affiliates to similar institutional accounts and to similar funds managed by the same portfolio management teams but offered primarily to European investors ("DWS Europe funds"), in each case as applicable. The Board observed that advisory fee rates for institutional accounts generally were lower than the management fees charged by similarly managed DWS US mutual funds ("DWS Funds"), but also took note of the differences in services provided to DWS Funds as compared to institutional accounts. In the case of DWS Europe funds, the Board observed that fee rates for DWS Europe funds generally were higher than for similarly managed DWS Funds, but noted that differences in the types of services provided to DWS Funds relative to DWS Europe funds made it difficult to compare such fees.
On the basis of the information provided, the Board concluded that management fees were reasonable and appropriate in light of the nature, quality and extent of services provided by DWS.
Profitability. The Board reviewed detailed information regarding revenues received by DWS under the Agreement. The Board considered the estimated costs and pre-tax profits realized by DWS from advising the DWS Funds, as well as estimates of the pre-tax profits attributable to managing the Fund in particular. The Board also received information regarding the estimated enterprise-wide profitability of DWS and its affiliates with respect to all fund services in totality and by fund. The Board reviewed DWS's methodology in allocating its costs to the management of the Fund. Based on the information provided, the Board concluded that the pre-tax profits realized by DWS in connection with the management of the Fund were not unreasonable. The Board also reviewed information regarding the profitability of certain similar investment management firms. The Board noted that while information regarding the profitability of such firms is limited (and in some cases is not necessarily prepared on a comparable basis), DWS and its affiliates' overall profitability with respect to the DWS fund complex (after taking into account distribution and other services provided to the funds by DWS and its affiliates) was lower than the overall profitability levels of many comparable firms for which such data was available.
Economies of Scale. The Board considered whether there are economies of scale with respect to the management of the Fund and whether the Fund benefits from any economies of scale. The Board noted that the Fund's management fee schedule includes fee breakpoints. The Board concluded that the Fund's fee schedule represents an appropriate sharing between the Fund and DWS of such economies of scale as may exist in the management of the Fund at current asset levels.
Other Benefits to DWS and Its Affiliates. The Board also considered the character and amount of other incidental benefits received by DWS and its affiliates, including any fees received by DWS for administrative services provided to the Fund and any fees received by an affiliate of DWS for distribution services. The Board also considered benefits to DWS related to brokerage and soft-dollar allocations, including allocating brokerage to pay for research generated by parties other than the executing broker dealers, which pertain primarily to funds investing in equity securities, along with the incidental public relations benefits to DWS related to DWS Funds advertising and cross-selling opportunities among DWS products and services. The Board concluded that management fees were reasonable in light of these fallout benefits.
Compliance. The Board considered the significant attention and resources dedicated by DWS to documenting and enhancing its compliance processes in recent years. The Board noted in particular (i) the experience and seniority of both DWS's chief compliance officer and the Fund's chief compliance officer; (ii) the large number of DWS compliance personnel; and (iii) the substantial commitment of resources by DWS and its affiliates to compliance matters.
Based on all of the information considered and the conclusions reached, the Board unanimously (including the Independent Trustees) determined that the continuation of the Agreement is in the best interests of the Fund. In making this determination, the Board did not give particular weight to any single factor identified above. The Board considered these factors over the course of numerous meetings, certain of which were in executive session with only the Independent Trustees and their counsel present. It is possible that individual Trustees may have weighed these factors differently in reaching their individual decisions to approve the continuation of the Agreement.
DWS International VIP
The Board of Trustees, including the Independent Trustees, approved the renewal of your Fund's investment management agreement (the "Agreement") with Deutsche Investment Management Americas Inc. ("DWS") in September 2009.
In terms of the process that the Board followed prior to approving the Agreement, shareholders should know that:
• In September 2009, all but one of the Fund's Trustees were independent of DWS and its affiliates.
• The Trustees meet frequently to discuss fund matters. Each year, the Trustees dedicate substantial time to contract review matters. Over the course of several months, the Board's Contract Committee, in coordination with the Board's Equity Oversight Committee, reviewed comprehensive materials received from DWS, independent third parties and independent counsel. These materials included an analysis of the Fund's performance, fees and expenses, and profitability compiled by the Fund's independent fee consultant. The Board also received extensive information throughout the year regarding performance of the Fund.
• The Independent Trustees regularly meet privately with their independent counsel to discuss contract review and other matters. In addition, the Independent Trustees were also advised by the Fund's independent fee consultant in the course of their review of the Fund's contractual arrangements and considered a comprehensive report prepared by the independent fee consultant in connection with their deliberations (the "IFC Report").
• In connection with reviewing the Agreement, the Board also reviewed the terms of the Fund's Rule 12b-1 plan, distribution agreement, administrative services agreement, transfer agency agreement and other material service agreements.
• Based on its evaluation of the information provided, the Contract Committee presented its findings and recommendations to the Independent Trustees as a group. The Independent Trustees reviewed the Contract Committee's findings and recommendations and presented their recommendations to the full Board.
In connection with the contract review process, the Contract Committee and the Board considered the factors discussed below, among others. The Board also considered that DWS and its predecessors have managed the Fund since its inception, and the Board believes that a long-term relationship with a capable, conscientious advisor is in the best interests of the Fund. The Board considered, generally, that shareholders chose to invest or remain invested in the Fund knowing that DWS managed the Fund, and that the Agreement was approved by the Fund's shareholders. DWS is part of Deutsche Bank, a major global banking institution that is engaged in a wide range of financial services. The Board believes that there are significant advantages to being part of a global asset management business that offers a wide range of investing expertise and resources, including hundreds of portfolio managers and analysts with research capabilities in many countries throughout the world.
While shareholders may focus primarily on fund performance and fees, the Fund's Board considers these and many other factors, including the quality and integrity of DWS's personnel and such other issues as back-office operations, fund valuations, and compliance policies and procedures.
Nature, Quality and Extent of Services. The Board considered the terms of the Agreement, including the scope of advisory services provided under the Agreement. The Board noted that, under the Agreement, DWS provides portfolio management services to the Fund and that, pursuant to a separate administrative services agreement, DWS provides administrative services to the Fund. The Board considered the experience and skills of senior management and investment personnel, the resources made available to such personnel, the ability of DWS to attract and retain high-quality personnel, and the organizational depth and stability of DWS. The Board reviewed the Fund's performance over short-term and long-term periods and compared those returns to various agreed-upon performance measures, including market indices and a peer universe compiled by the independent fee consultant using information supplied by Lipper Inc. ("Lipper"). The Board also noted that it has put into place a process of identifying "Focus Funds" (e.g., funds performing poorly relative to their benchmark or a peer universe compiled by Lipper), and receives more frequent reporting and information from DWS regarding such funds, along with DWS's remedial plans to address underperformance. The Board believes this process is an effective manner of identifying and addressing underperforming funds. Based on the information provided, the Board noted that for each of the one-, three- and five-year periods ended December 31, 2008, the Fund's performance (Class A shares) was in the 4th quartile of the applicable Lipper universe (the 1st quartile being the best performers and the 4th quartile being the worst performers). The Board also observed that the Fund has underperformed its benchmark in each of the one-, three- and five-year periods ended December 31, 2008. The Board noted the disappointing investment performance of the Fund in recent periods and continued to discuss with senior management of DWS the factors contributing to such underperformance and actions being taken to improve performance. The Board observed that the Fund had experienced improved relative performance during the first seven months of 2009. The Board recognized that DWS has made significant changes in the Fund's management structure, including the introduction of two new portfolio managers in July 2009.
On the basis of this evaluation and the ongoing review of investment results by the Board, the Board concluded that the nature, quality and extent of services provided by DWS historically have been and continue to be satisfactory.
Fees and Expenses. The Board considered the Fund's investment management fee schedule, operating expenses and total expense ratios, and comparative information provided by Lipper and the independent fee consultant regarding investment management fee rates paid to other investment advisors by similar funds (1st quartile being the most favorable and 4th quartile being the least favorable). With respect to management fees paid to other investment advisors by similar funds, the Board noted that the contractual fee rates paid by the Fund, which include a 0.10% fee paid to DWS under the Fund's administrative services agreement, were lower than the median (2nd quartile) of the applicable Lipper peer group (based on Lipper data provided as of December 31, 2008). The Board also reviewed data comparing each share class's total (net) operating expenses to the applicable Lipper expense universe. The Board concluded that the comparative Lipper operating expense data was of limited utility, as it likely significantly understated the current expense ratios of many peer funds due to the substantial declines in net assets as a result of market losses and net redemptions that many funds experienced between mid-September 2008 and March 2009 and that were not reflected in the data. The Board also noted that the expense limitations agreed to by DWS helped to ensure that the Fund's total (net) operating expenses would remain competitive.
The information considered by the Board as part of its review of management fees included information regarding fees charged by DWS and its affiliates to similar institutional accounts and to similar funds managed by the same portfolio management teams but offered primarily to European investors ("DWS Europe funds"), in each case as applicable. The Board observed that advisory fee rates for institutional accounts generally were lower than the management fees charged by similarly managed DWS US mutual funds ("DWS Funds"), but also took note of the differences in services provided to DWS Funds as compared to institutional accounts. In the case of DWS Europe funds, the Board observed that fee rates for DWS Europe funds generally were higher than for similarly managed DWS Funds, but noted that differences in the types of services provided to DWS Funds relative to DWS Europe funds made it difficult to compare such fees.
On the basis of the information provided, the Board concluded that management fees were reasonable and appropriate in light of the nature, quality and extent of services provided by DWS.
Profitability. The Board reviewed detailed information regarding revenues received by DWS under the Agreement. The Board considered the estimated costs and pre-tax profits realized by DWS from advising the DWS Funds, as well as estimates of the pre-tax profits attributable to managing the Fund in particular. The Board also received information regarding the estimated enterprise-wide profitability of DWS and its affiliates with respect to all fund services in totality and by fund. The Board reviewed DWS's methodology in allocating its costs to the management of the Fund. Based on the information provided, the Board concluded that the pre-tax profits realized by DWS in connection with the management of the Fund were not unreasonable. The Board also reviewed information regarding the profitability of certain similar investment management firms. The Board noted that while information regarding the profitability of such firms is limited (and in some cases is not necessarily prepared on a comparable basis), DWS and its affiliates' overall profitability with respect to the DWS fund complex (after taking into account distribution and other services provided to the funds by DWS and its affiliates) was lower than the overall profitability levels of many comparable firms for which such data was available.
Economies of Scale. The Board considered whether there are economies of scale with respect to the management of the Fund and whether the Fund benefits from any economies of scale. The Board noted that the Fund's management fee schedule includes fee breakpoints. The Board concluded that the Fund's fee schedule represents an appropriate sharing between the Fund and DWS of such economies of scale as may exist in the management of the Fund at current asset levels.
Other Benefits to DWS and Its Affiliates. The Board also considered the character and amount of other incidental benefits received by DWS and its affiliates, including any fees received by DWS for administrative services provided to the Fund and any fees received by an affiliate of DWS for distribution services. The Board also considered benefits to DWS related to brokerage and soft-dollar allocations, including allocating brokerage to pay for research generated by parties other than the executing broker dealers, which pertain primarily to funds investing in equity securities, along with the incidental public relations benefits to DWS related to DWS Funds advertising and cross-selling opportunities among DWS products and services. The Board concluded that management fees were reasonable in light of these fallout benefits.
Compliance. The Board considered the significant attention and resources dedicated by DWS to documenting and enhancing its compliance processes in recent years. The Board noted in particular (i) the experience and seniority of both DWS's chief compliance officer and the Fund's chief compliance officer; (ii) the large number of DWS compliance personnel; and (iii) the substantial commitment of resources by DWS and its affiliates to compliance matters.
Based on all of the information considered and the conclusions reached, the Board unanimously (including the Independent Trustees) determined that the continuation of the Agreement is in the best interests of the Fund. In making this determination, the Board did not give particular weight to any single factor identified above. The Board considered these factors over the course of numerous meetings, certain of which were in executive session with only the Independent Trustees and their counsel present. It is possible that individual Trustees may have weighed these factors differently in reaching their individual decisions to approve the continuation of the Agreement.
DWS Health Care VIP
The Board of Trustees, including the Independent Trustees, approved the renewal of your Fund's investment management agreement (the "Agreement") with Deutsche Investment Management Americas Inc. ("DWS") in September 2009.
In terms of the process that the Board followed prior to approving the Agreement, shareholders should know that:
• In September 2009, all but one of the Fund's Trustees were independent of DWS and its affiliates.
• The Trustees meet frequently to discuss fund matters. Each year, the Trustees dedicate substantial time to contract review matters. Over the course of several months, the Board's Contract Committee, in coordination with the Board's Equity Oversight Committee, reviewed comprehensive materials received from DWS, independent third parties and independent counsel. These materials included an analysis of the Fund's performance, fees and expenses, and profitability compiled by the Fund's independent fee consultant. The Board also received extensive information throughout the year regarding performance of the Fund.
• The Independent Trustees regularly meet privately with their independent counsel to discuss contract review and other matters. In addition, the Independent Trustees were also advised by the Fund's independent fee consultant in the course of their review of the Fund's contractual arrangements and considered a comprehensive report prepared by the independent fee consultant in connection with their deliberations (the "IFC Report").
• In connection with reviewing the Agreement, the Board also reviewed the terms of the Fund's Rule 12b-1 plan, distribution agreement, administrative services agreement, transfer agency agreement and other material service agreements.
• Based on its evaluation of the information provided, the Contract Committee presented its findings and recommendations to the Independent Trustees as a group. The Independent Trustees reviewed the Contract Committee's findings and recommendations and presented their recommendations to the full Board.
In connection with the contract review process, the Contract Committee and the Board considered the factors discussed below, among others. The Board also considered that DWS and its predecessors have managed the Fund since its inception, and the Board believes that a long-term relationship with a capable, conscientious advisor is in the best interests of the Fund. The Board considered, generally, that shareholders chose to invest or remain invested in the Fund knowing that DWS managed the Fund, and that the Agreement was approved by the Fund's shareholders. DWS is part of Deutsche Bank, a major global banking institution that is engaged in a wide range of financial services. The Board believes that there are significant advantages to being part of a global asset management business that offers a wide range of investing expertise and resources, including hundreds of portfolio managers and analysts with research capabilities in many countries throughout the world.
While shareholders may focus primarily on fund performance and fees, the Fund's Board considers these and many other factors, including the quality and integrity of DWS's personnel and such other issues as back-office operations, fund valuations, and compliance policies and procedures.
Nature, Quality and Extent of Services. The Board considered the terms of the Agreement, including the scope of advisory services provided under the Agreement. The Board noted that, under the Agreement, DWS provides portfolio management services to the Fund and that, pursuant to a separate administrative services agreement, DWS provides administrative services to the Fund. The Board considered the experience and skills of senior management and investment personnel, the resources made available to such personnel, the ability of DWS to attract and retain high-quality personnel, and the organizational depth and stability of DWS. The Board reviewed the Fund's performance over short-term and long-term periods and compared those returns to various agreed-upon performance measures, including market indices and a peer universe compiled by the independent fee consultant using information supplied by Lipper Inc. ("Lipper"). The Board also noted that it has put into place a process of identifying "Focus Funds" (e.g., funds performing poorly relative to their benchmark or a peer universe compiled by Lipper), and receives more frequent reporting and information from DWS regarding such funds, along with DWS's remedial plans to address underperformance. The Board believes this process is an effective manner of identifying and addressing underperforming funds. Based on the information provided, the Board noted that for the one-, three- and five-year periods ended December 31, 2008, the Fund's performance (Class A shares) was in the 1st quartile, 1st quartile and 2nd quartile, respectively, of the applicable Lipper universe (the 1st quartile being the best performers and the 4th quartile being the worst performers). The Board also observed that the Fund has outperformed its benchmark in each of the one-, three- and five-year periods ended December 31, 2008.
On the basis of this evaluation and the ongoing review of investment results by the Board, the Board concluded that the nature, quality and extent of services provided by DWS historically have been and continue to be satisfactory.
Fees and Expenses. The Board considered the Fund's investment management fee schedule, operating expenses and total expense ratios, and comparative information provided by Lipper and the independent fee consultant regarding investment management fee rates paid to other investment advisors by similar funds (1st quartile being the most favorable and 4th quartile being the least favorable). With respect to management fees paid to other investment advisors by similar funds, the Board noted that the contractual fee rates paid by the Fund, which include a 0.10% fee paid to DWS under the Fund's administrative services agreement, were at the median (2nd quartile) of the applicable Lipper peer group (based on Lipper data provided as of December 31, 2008). The Board also reviewed data comparing each share class's total (net) operating expenses to the applicable Lipper expense universe. The Board concluded that the comparative Lipper operating expense data was of limited utility, as it likely significantly understated the current expense ratios of many peer funds due to the substantial declines in net assets as a result of market losses and net redemptions that many funds experienced between mid-September 2008 and March 2009 and that were not reflected in the data.
The information considered by the Board as part of its review of management fees included information regarding fees charged by DWS and its affiliates to similar institutional accounts and to similar funds managed by the same portfolio management teams but offered primarily to European investors ("DWS Europe funds"), in each case as applicable. The Board observed that advisory fee rates for institutional accounts generally were lower than the management fees charged by similarly managed DWS US mutual funds ("DWS Funds"), but also took note of the differences in services provided to DWS Funds as compared to institutional accounts. In the case of DWS Europe funds, the Board observed that fee rates for DWS Europe funds generally were higher than for similarly managed DWS Funds, but noted that differences in the types of services provided to DWS Funds relative to DWS Europe funds made it difficult to compare such fees.
On the basis of the information provided, the Board concluded that management fees were reasonable and appropriate in light of the nature, quality and extent of services provided by DWS.
Profitability. The Board reviewed detailed information regarding revenues received by DWS under the Agreement. The Board considered the estimated costs and pre-tax profits realized by DWS from advising the DWS Funds, as well as estimates of the pre-tax profits attributable to managing the Fund in particular. The Board also received information regarding the estimated enterprise-wide profitability of DWS and its affiliates with respect to all fund services in totality and by fund. The Board reviewed DWS's methodology in allocating its costs to the management of the Fund. Based on the information provided, the Board concluded that the pre-tax profits realized by DWS in connection with the management of the Fund were not unreasonable. The Board also reviewed information regarding the profitability of certain similar investment management firms. The Board noted that while information regarding the profitability of such firms is limited (and in some cases is not necessarily prepared on a comparable basis), DWS and its affiliates' overall profitability with respect to the DWS fund complex (after taking into account distribution and other services provided to the funds by DWS and its affiliates) was lower than the overall profitability levels of many comparable firms for which such data was available.
Economies of Scale. The Board considered whether there are economies of scale with respect to the management of the Fund and whether the Fund benefits from any economies of scale. The Board noted that the Fund's management fee schedule includes fee breakpoints. The Board concluded that the Fund's fee schedule represents an appropriate sharing between the Fund and DWS of such economies of scale as may exist in the management of the Fund at current asset levels.
Other Benefits to DWS and Its Affiliates. The Board also considered the character and amount of other incidental benefits received by DWS and its affiliates, including any fees received by DWS for administrative services provided to the Fund and any fees received by an affiliate of DWS for distribution services. The Board also considered benefits to DWS related to brokerage and soft-dollar allocations, including allocating brokerage to pay for research generated by parties other than the executing broker dealers, which pertain primarily to funds investing in equity securities, along with the incidental public relations benefits to DWS related to DWS Funds advertising and cross-selling opportunities among DWS products and services. The Board concluded that management fees were reasonable in light of these fallout benefits.
Compliance. The Board considered the significant attention and resources dedicated by DWS to documenting and enhancing its compliance processes in recent years. The Board noted in particular (i) the experience and seniority of both DWS's chief compliance officer and the Fund's chief compliance officer; (ii) the large number of DWS compliance personnel; and (iii) the substantial commitment of resources by DWS and its affiliates to compliance matters.
Based on all of the information considered and the conclusions reached, the Board unanimously (including the Independent Trustees) determined that the continuation of the Agreement is in the best interests of the Fund. In making this determination, the Board did not give particular weight to any single factor identified above. The Board considered these factors over the course of numerous meetings, certain of which were in executive session with only the Independent Trustees and their counsel present. It is possible that individual Trustees may have weighed these factors differently in reaching their individual decisions to approve the continuation of the Agreement.
Summary of Management Fee Evaluation by Independent Fee Consultant
October 9, 2009, As Revised November 20, 2009
Pursuant to an Order entered into by Deutsche Investment Management Americas and affiliates (collectively, "DeAM") with the Attorney General of New York, I, Thomas H. Mack, have been appointed the Independent Fee Consultant for the DWS Funds (formerly the DWS Scudder Funds). My duties include preparing an annual written evaluation of the management fees DeAM charges the Funds, considering among other factors the management fees charged by other mutual fund companies for like services, management fees DeAM charges other clients for like services, DeAM's costs of supplying services under the management agreements and related profit margins, possible economies of scale if a Fund grows larger, and the nature and quality of DeAM's services, including fund performance. This report summarizes my evaluation for 2009, including my qualifications, the evaluation process for each of the DWS Funds, consideration of certain complex-level factors, and my conclusions. I served in substantially the same capacity in 2007 and 2008.
Qualifications
For more than 35 years I have served in various professional capacities within the investment management business. I have held investment analysis and advisory positions, including securities analyst, portfolio strategist and director of investment policy with a large investment firm. I have also performed business management functions, including business development, financial management and marketing research and analysis.
Since 1991, I have been an independent consultant within the asset management industry. I have provided services to over 125 client organizations, including investment managers, mutual fund boards, product distributors and related organizations. Over the past ten years I have completed a number of assignments for mutual fund boards, specifically including assisting boards with management contract renewal.
I hold a Master of Business Administration degree, with highest honors, from Harvard University and Master of Science and Bachelor of Science (highest honors) degrees from the University of California at Berkeley. I am an independent director and audit committee financial expert for two closed-end mutual funds and serve in various leadership and financial oversight capacities with non-profit organizations.
Evaluation of Fees for each DWS Fund
My work focused primarily on evaluating, fund-by-fund, the fees charged to each of the 124 publicly offered Fund portfolios in the DWS Fund family. For each Fund, I considered each of the key factors mentioned above, as well as any other relevant information. In doing so I worked closely with the Funds' Independent Directors in their annual contract renewal process, as well as in their approval of contracts for several new funds (documented separately).
In evaluating each Fund's fees, I reviewed comprehensive materials provided by or on behalf of DeAM, including expense information prepared by Lipper Analytical, comparative performance information, profitability data, manager histories, and other materials. I also accessed certain additional information from the Lipper, Strategic Insight, and Morningstar databases and drew on my industry knowledge and experience.
To facilitate evaluating this considerable body of information, I prepared for each Fund a document summarizing the key data elements in each area as well as additional analytics discussed below. This made it possible to consider each key data element in the context of the others.
In the course of contract renewal, DeAM agreed to implement a number of fee and expense adjustments requested by the Independent Directors which will favorably impact future fees and expenses, and my evaluation includes the effects of these changes.
Fees and Expenses Compared with Other Funds
The competitive fee and expense evaluation for each fund focused on two primary comparisons:
The Fund's contractual management fee (the advisory fee plus the administration fee where applicable) compared with those of a group of typically 12-15 funds in the same Lipper investment category (e.g. Large Capitalization Growth) having similar distribution arrangements and being of similar size.
The Fund's total expenses compared with a broader universe of funds from the same Lipper investment category and having similar distribution arrangements.
These two comparisons provide a view of not only the level of the fee compared with funds of similar scale but also the total expense the Fund bears for all the services it receives, in comparison with the investment choices available in the Fund's investment category and distribution channel. The principal figure-of-merit used in these comparisons was the subject Fund's percentile ranking against peers.
DeAM's Fees for Similar Services to Others
DeAM provided management fee schedules for all of its US domiciled fund and non-fund investment management accounts in any of the investment categories where there is a DWS Fund. These similar products included the other DWS Funds, non-fund pooled accounts, institutional accounts and sub-advisory accounts. Using this information, I calculated for each Fund the fee that would be charged to each similar product, at the subject Fund's asset level.
Evaluating information regarding non-fund products is difficult because there are varying levels of services required for different types of accounts, with mutual funds generally requiring considerably more regulatory and administrative types of service as well as having more frequent cash flows than other types of accounts. Also, while mutual fund fees for similar fund products can be expected to be similar, there will be some differences due to different pricing conditions in different distribution channels (e.g. retail funds versus those used in variable insurance products), differences in underlying investment processes and other factors.
Costs and Profit Margins
DeAM provided a detailed profitability analysis for each Fund. After making some adjustments so that the presentation would be more comparable to the available industry figures, I reviewed profit margins from investment management alone, from investment management plus other fund services (excluding distribution) provided to the Funds by DeAM (principally shareholder services), and DeAM profits from all sources, including distribution. A later section comments on overall profitability.
Economies of Scale
Economies of scale — an expected decline in management cost per dollar of fund assets as fund assets grow — are very rarely quantified and documented because of inherent difficulties in collecting and analyzing relevant data. However, in virtually every investment category that I reviewed, larger funds tend to have lower fees and lower total expenses than smaller funds. To see how each DWS Fund compares with this industry observation, I reviewed:
The trend in Fund assets over the last five years and the accompanying trend in total expenses. This shows if the Fund has grown and, if so, whether total expense (management fees as well as other expenses) have declined as a percent of assets.
Whether the Fund has break-points in its management fee schedule, the extent of the fee reduction built into the schedule and the asset levels where the breaks take effect, and in the case of a sub-advised Fund how the Fund's break-points compare with those of the sub-advisory fee schedule.
How the Fund's contractual fee schedule compares with trends in the industry data. To accomplish this, I constructed a chart showing how actual latest-fiscal-year contractual fees of the Fund and of other similar funds relate to average fund assets, with the subject Fund's contractual fee schedule superimposed.
Quality of Service — Performance
The quality-of-service evaluation focused on investment performance, which is the principal result of the investment management service. Each Fund's performance was reviewed over the past 1, 3, 5 and 10 years, as applicable, and compared with that of other funds in the same investment category and with a suitable market index.
In addition, I calculated and reviewed risk-adjusted returns relative to an index of similar mutual funds' returns and a suitable market index. The risk-adjusted returns analysis provides a way of determining the extent to which the Fund's return comparisons are mainly the product of investment value-added (or lack thereof) or alternatively taking considerably more or less risk than is typical in its investment category.
I also received and considered the history of portfolio manager changes for each Fund, as this provided an important context for evaluating the performance results.
Complex-Level Considerations
While this evaluation was conducted mainly at the individual fund level, there are some issues relating to the reasonableness of fees that can alternatively be considered across the whole fund complex:
I reviewed DeAM's profitability analysis for all DWS Funds, with a view toward determining if the allocation procedures used were reasonable and how profit levels compared with public data for other investment managers.
I considered whether DeAM and affiliates receive any significant ancillary or "fall-out" benefits that should be considered in interpreting the direct profitability results. These would be situations where serving as the investment manager of the Funds is beneficial to another part of the Deutsche Bank organization.
I considered how aggregated DWS Fund expenses had varied over the years, by asset class and in the context of trends in asset levels.
I reviewed the structure of the DeAM organization, trends in staffing levels, and information on compensation of investment management and other professionals compared with industry data.
Findings
Based on the process and analysis discussed above, which included reviewing a wide range of information from management and external data sources and considering among other factors the fees DeAM charges other clients, the fees charged by other fund managers, DeAM's costs and profits associated with managing the Funds, economies of scale, possible fall-out benefits, and the nature and quality of services provided, in my opinion the management fees charged the DWS Funds are reasonable.

Thomas H. Mack
Board Members and Officers
The following table presents certain information regarding the Board Members and Officers of the Trust as of December 31, 2009. Each Board Member's year of birth is set forth in parentheses after his or her name. Unless otherwise noted, (i) each Board Member has engaged in the principal occupation(s) noted in the table for at least the most recent five years, although not necessarily in the same capacity; and (ii) the address of each Independent Board Member is c/o Paul K. Freeman, Independent Chairman, DWS Funds, PO Box 101833, Denver, CO 80250-1833. Except as otherwise noted below, the term of office for each Board Member is until the election and qualification of a successor, or until such Board Member sooner dies, resigns, is removed or as otherwise provided in the governing documents of the fund. Because the fund does not hold an annual meeting of shareholders, each Board Member will hold office for an indeterminate period. The Board Members may also serve in similar capacities with other funds in the fund complex. The Length of Time Served represents the year in which the Board Member joined the board of one or more DWS funds now overseen by the Board.
Independent Board Members |
Name, Year of Birth, Position with the Fund and Length of Time Served1 | Business Experience and Directorships During the Past Five Years | Number of Funds in DWS Fund Complex Overseen |
Paul K. Freeman (1950) Chairperson since 2009 Board Member since 1993 | Consultant, World Bank/Inter-American Development Bank; Governing Council of the Independent Directors Council (governance, education committees); formerly, Project Leader, International Institute for Applied Systems Analysis (1998-2001); Chief Executive Officer, The Eric Group, Inc. (environmental insurance) (1986-1998) | 126 |
John W. Ballantine (1946) Board Member since 1999 | Retired; formerly, Executive Vice President and Chief Risk Management Officer, First Chicago NBD Corporation/The First National Bank of Chicago (1996-1998); Executive Vice President and Head of International Banking (1995-1996). Directorships: Healthways, Inc. (provider of disease and care management services); Portland General Electric (utility company); Stockwell Capital Investments PLC (private equity). Former Directorships: First Oak Brook Bancshares, Inc. and Oak Brook Bank; Prisma Energy International | 126 |
Henry P. Becton, Jr. (1943) Board Member since 1990 | Vice Chair and former President, WGBH Educational Foundation. Directorships: Association of Public Television Stations; Lead Director, Becton Dickinson and Company3 (medical technology company); Lead Director, Belo Corporation3 (media company); Public Radio International; Public Radio Exchange (PRX); The PBS Foundation. Former Directorships: Boston Museum of Science; American Public Television; Concord Academy; New England Aquarium; Mass. Corporation for Educational Telecommunications; Committee for Economic Development; Public Broadcasting Service | 126 |
Dawn-Marie Driscoll (1946) Board Member since 1987 | President, Driscoll Associates (consulting firm); Executive Fellow, Center for Business Ethics, Bentley University; formerly, Partner, Palmer & Dodge (1988-1990); Vice President of Corporate Affairs and General Counsel, Filene's (1978-1988). Directorships: Trustee of 20 open-end mutual funds managed by Sun Capital Advisers, Inc. (since 2007); Director of ICI Mutual Insurance Company (since 2007); Advisory Board, Center for Business Ethics, Bentley University; Trustee, Southwest Florida Community Foundation (charitable organization). Former Directorships: Investment Company Institute (audit, executive, nominating committees) and Independent Directors Council (governance, executive committees) | 126 |
Keith R. Fox (1954) Board Member since 1996 | Managing General Partner, Exeter Capital Partners (a series of private investment funds). Directorships: Progressive Holding Corporation (kitchen goods importer and distributor); Box Top Media Inc. (advertising); The Kennel Shop (retailer); former Chairman, National Association of Small Business Investment Companies | 126 |
Kenneth C. Froewiss (1945) Board Member since 2001 | Adjunct Professor of Finance, NYU Stern School of Business (September 2009-present; Clinical Professor from 1997-September 2009); Member, Finance Committee, Association for Asian Studies (2002-present); Director, Mitsui Sumitomo Insurance Group (US) (2004-present); prior thereto, Managing Director, J.P. Morgan (investment banking firm) (until 1996) | 126 |
Richard J. Herring (1946) Board Member since 1990 | Jacob Safra Professor of International Banking and Professor, Finance Department, The Wharton School, University of Pennsylvania (since July 1972); Co-Director, Wharton Financial Institutions Center (since July 2000); Director, Japan Equity Fund, Inc. (since September 2007), Thai Capital Fund, Inc. (since September 2007), Singapore Fund, Inc. (since September 2007). Formerly, Vice Dean and Director, Wharton Undergraduate Division (July 1995-June 2000); Director, Lauder Institute of International Management Studies (July 2000-June 2006) | 126 |
William McClayton (1944) Board Member since 2004 | Private equity investor (since October 2009); previously, Managing Director, Diamond Management & Technology Consultants, Inc. (global consulting firm) (2001-2009); Directorship: Board of Managers, YMCA of Metropolitan Chicago; formerly: Senior Partner, Arthur Andersen LLP (accounting) (1966-2001); Trustee, Ravinia Festival | 126 |
Rebecca W. Rimel (1951) Board Member since 1995 | President and Chief Executive Officer, The Pew Charitable Trusts (charitable organization) (1994 to present); Trustee, Thomas Jefferson Foundation (charitable organization) (1994 to present); Trustee, Executive Committee, Philadelphia Chamber of Commerce (2001-2007); Trustee, Pro Publica (2007-present) (charitable organization); Director, CardioNet, Inc.2 (2009-present) (health care). Formerly, Executive Vice President, The Glenmede Trust Company (investment trust and wealth management) (1983-2004); Board Member, Investor Education (charitable organization) (2004-2005); Director, Viasys Health Care2 (January 2007-June 2007) | 126 |
William N. Searcy, Jr. (1946) Board Member since 1993 | Private investor since October 2003; Trustee of 20 open-end mutual funds managed by Sun Capital Advisers, Inc. (since October 1998). Formerly, Pension & Savings Trust Officer, Sprint Corporation2 (telecommunications) (November 1989-September 2003) | 126 |
Jean Gleason Stromberg (1943) Board Member since 1997 | Retired. Formerly, Consultant (1997-2001); Director, Financial Markets US Government Accountability Office (1996-1997); Partner, Fulbright & Jaworski, L.L.P. (law firm) (1978-1996). Directorships: The William and Flora Hewlett Foundation; Business Leadership Council, Wellesley College. Former Directorships: Service Source, Inc., Mutual Fund Directors Forum (2002-2004), American Bar Retirement Association (funding vehicle for retirement plans) (1987-1990 and 1994-1996) | 126 |
Robert H. Wadsworth (1940) Board Member since 1999 | President, Robert H. Wadsworth & Associates, Inc. (consulting firm) (1983 to present); Director, The Phoenix Boys Choir Association | 129 |
Officers4 |
Name, Year of Birth, Position with the Fund and Length of Time Served5 | Principal Occupation(s) During Past 5 Years and Other Directorships Held |
Michael G. Clark6 (1965) President, 2006-present | Managing Director3, Deutsche Asset Management (2006-present); President of DWS family of funds; Director, ICI Mutual Insurance Company (since October 2007); formerly, Director of Fund Board Relations (2004-2006) and Director of Product Development (2000-2004), Merrill Lynch Investment Managers; Senior Vice President Operations, Merrill Lynch Asset Management (1999-2000) |
John Millette7 (1962) Vice President and Secretary, 1999-present | Director3, Deutsche Asset Management |
Paul H. Schubert6 (1963) Chief Financial Officer, 2004-present Treasurer, 2005-present | Managing Director3, Deutsche Asset Management (since July 2004); formerly, Executive Director, Head of Mutual Fund Services and Treasurer for UBS Family of Funds (1998-2004); Vice President and Director of Mutual Fund Finance at UBS Global Asset Management (1994-1998) |
Caroline Pearson7 (1962) Assistant Secretary, 1997-present | Managing Director3, Deutsche Asset Management |
Rita Rubin8 (1970) Assistant Secretary, 2009-present | Vice President and Counsel, Deutsche Asset Management (since October 2007); formerly, Vice President, Morgan Stanley Investment Management (2004-2007); Attorney, Shearman & Sterling LLP (2004); Director and Associate General Counsel, UBS Global Asset Management (US) Inc. (2001-2004) |
Paul Antosca7 (1957) Assistant Treasurer, 2007-present | Director3, Deutsche Asset Management (since 2006); Vice President, The Manufacturers Life Insurance Company (U.S.A.) (1990-2006) |
Jack Clark7 (1967) Assistant Treasurer, 2007-present | Director3, Deutsche Asset Management (since 2007); formerly, Vice President, State Street Corporation (2002-2007) |
Diane Kenneally7 (1966) Assistant Treasurer, 2007-present | Director3, Deutsche Asset Management |
Jason Vazquez8 (1972) Anti-Money Laundering Compliance Officer, 2007-present | Vice President, Deutsche Asset Management (since 2006); formerly, AML Operations Manager for Bear Stearns (2004-2006), Supervising Compliance Principal and Operations Manager for AXA Financial (1999-2004) |
Robert Kloby8 (1962) Chief Compliance Officer, 2006-present | Managing Director3, Deutsche Asset Management |
J. Christopher Jackson8 (1951) Chief Legal Officer, 2006-present | Director3, Deutsche Asset Management (2006-present); formerly, Director, Senior Vice President, General Counsel and Assistant Secretary, Hansberger Global Investors, Inc. (1996-2006); Director, National Society of Compliance Professionals (2002-2005) (2006-2009) |
1 The length of time served represents the year in which the Board Member joined the board of one or more DWS funds currently overseen by the Board.
2 A publicly held company with securities registered pursuant to Section 12 of the Securities Exchange Act of 1934.
3 Executive title, not a board directorship.
4 As a result of their respective positions held with the Advisor, these individuals are considered "interested persons" of the Advisor within the meaning of the 1940 Act. Interested persons receive no compensation from the fund.
5 The length of time served represents the year in which the officer was first elected in such capacity for one or more DWS funds.
6 Address: 345 Park Avenue, New York, New York 10154.
7 Address: One Beacon Street, Boston, MA 02108.
8 Address: 280 Park Avenue, New York, New York 10017.
The fund's Statement of Additional Information ("SAI") includes additional information about the Board Members. The SAI is available, without charge, upon request. If you would like to request a copy of the SAI, you may do so by calling the following toll-free number: (800) 621-1048.
Notes


DWS Investments is part of Deutsche Bank's Asset Management division and, within the US, represents the retail asset management activities of Deutsche Bank AG, Deutsche Bank Trust Company Americas, Deutsche Investment Management Americas Inc. and DWS Trust Company.
The views expressed in this report reflect those of the portfolio managers only through the end of the period of the report as stated on the cover. The managers' views are subject to change at any time based on market and other conditions and should not be construed as a recommendation.
This information must be preceded or accompanied by a current prospectus.
Portfolio changes should not be considered recommendations for action by individual investors.
DWS Investments Distributors, Inc.
222 South Riverside Plaza
Chicago, IL 60606
(800) 778-1482
VS1-2 (R-15793-1 2/10)
ITEM 2. | CODE OF ETHICS |
| |
| As of the end of the period, December 31, 2009, DWS Variable Series I has a code of ethics, as defined in Item 2 of Form N-CSR, that applies to its Principal Executive Officer and Principal Financial Officer. There have been no amendments to, or waivers from, a provision of the code of ethics during the period covered by this report that would require disclosure under Item 2. A copy of the code of ethics is filed as an exhibit to this Form N-CSR. |
| |
ITEM 3. | AUDIT COMMITTEE FINANCIAL EXPERT |
| |
| The fund’s audit committee is comprised solely of trustees who are "independent" (as such term has been defined by the Securities and Exchange Commission ("SEC") in regulations implementing Section 407 of the Sarbanes-Oxley Act (the "Regulations")). The fund’s Board of Trustees has determined that there are several "audit committee financial experts" (as such term has been defined by the Regulations) serving on the fund’s audit committee including Mr. William McClayton, the chair of the fund’s audit committee. An “audit committee financial expert” is not an “expert” for any purpose, including for purposes of Section 11 of the Securities Act of 1933 and the designation or identification of a person as an “audit committee financial expert” does not impose on such person any duties, obligations or liability that are greater than the duties, obligations and liability imposed on such person as a member of the audit committee and board of directors in the absence of such designation or identification. |
| |
ITEM 4. | PRINCIPAL ACCOUNTANT FEES AND SERVICES |
| |
DWS VARIABLE SERIES I
FORM N-CSR DISCLOSURE RE: AUDIT FEES
The following table shows the amount of fees that PricewaterhouseCoopers, LLP (“PWC”), the Fund’s independent registered public accounting firm, billed to the Fund during the Fund’s last two fiscal years. The Audit Committee approved in advance all audit services and non-audit services that PWC provided to the Fund.
Services that the Fund’s Independent Registered Public Accounting Firm Billed to the Fund
Fiscal Year
Ended
December 31, | Audit Fees Billed to Fund | Audit-Related
Fees Billed to Fund | Tax Fees Billed to Fund | All
Other Fees Billed to Fund |
2009 | $183,474 | $0 | $0 | $0 |
2008 | $195,675 | $0 | $0 | $0 |
Services that the Fund’s Independent Registered Public Accounting Firm Billed to the Adviser and Affiliated Fund Service Providers
The following table shows the amount of fees billed by PWC to Deutsche Investment Management Americas Inc. (“DeIM” or the “Adviser”), and any entity controlling, controlled by or under common control with DeIM (“Control Affiliate”) that provides ongoing services to the Fund (“Affiliated Fund Service Provider”), for engagements directly related to the Fund’s operations and financial reporting, during the Fund’s last two fiscal years.
Fiscal Year
December 31, | Audit-Related
Fees Billed to Adviser and Affiliated Fund Service Providers | Tax Fees Billed to Adviser and Affiliated Fund Service Providers | All
Other Fees Billed to Adviser and Affiliated Fund Service Providers |
2009 | $2,000 | $0 | $0 |
2008 | $0 | $19,000 | $0 |
The “Audit-Related Fees” were billed for services in connection with the agreed-upon procedures and the above “Tax Fees” were billed in connection with tax compliance and tax planning.
Non-Audit Services
The following table shows the amount of fees that PWC billed during the Fund’s last two fiscal years for non-audit services. The Audit Committee pre-approved all non-audit services that PWC provided to the Adviser and any Affiliated Fund Service Provider that related directly to the Fund’s operations and financial reporting. The Audit Committee requested and received information from PWC about any non-audit services that PWC rendered during the Fund’s last fiscal year to the Adviser and any Affiliated Fund Service Provider. The Committee considered this information in evaluating PWC’s independence.
Fiscal Year
Ended
December 31, | Total
Non-Audit Fees Billed to Fund (A) | Total Non-Audit Fees billed to Adviser and Affiliated Fund Service Providers (engagements related directly to the operations and financial reporting of the Fund) (B) | Total Non-Audit Fees billed to Adviser and Affiliated Fund Service Providers (all other engagements) (C) | Total of (A), (B)
and (C) |
2009 | $0 | $0 | $100,000 | $100,000 |
2008 | $0 | $19,000 | $0 | $19,000 |
All other engagement fees were billed for services in connection with an internal control review of a sub-advisor.
Audit Committee Pre-Approval Policies and Procedures. Generally, each Fund’s Audit Committee must pre approve (i) all services to be performed for a Fund by a Fund’s Independent Registered Public Accounting Firm and (ii) all non-audit services to be performed by a Fund’s Independent Registered Public Accounting Firm for the DIMA Entities with respect to operations and financial reporting of the Fund, except that the Chairperson or Vice Chairperson of each Fund’s Audit Committee may grant the pre-approval for non-audit services described in items (i) and (ii) above for non-prohibited services for engagements of less than $100,000. All such delegated pre approvals shall be presented to each Fund’s Audit Committee no later than the next Audit Committee meeting.
There were no amounts that were approved by the Audit Committee pursuant to the de minimis exception under Rule 2-01 of Regulation S-X.
According to the registrant’s principal Independent Registered Public Accounting Firm, all of the principal Independent Registered Public Accounting Firm's hours spent on auditing the registrant's financial statements were attributed to work performed by full-time permanent employees of the principal Independent Registered Public Accounting Firm.
***
PwC advised the Fund's Audit Committee that PwC has identified two matters that it determined to be inconsistent with the SEC's auditor independence rules. In the first instance, an employee of PwC had power of attorney over an account which included DWS funds. The employee did not perform any audit services for the DWS Funds, but did work on a non audit project for Deutsche Bank AG. In the second instance, an employee of PwC served as a nominee shareholder (effectively equivalent to a Trustee) of various companies/trusts since 2001. Some of these companies held shares of Aberdeen, a sub advisor to certain DWS Funds, and of certain funds sponsored by subsidiaries of Deutsche Bank AG. The trustee relationship has ceased. PwC informed the Audit Committee that these matters could have constituted an investment in an affiliate of an audit client in violation of the Rule 2-01(c)(1) of Regulation S-X. PwC advised the Audit Committee that PwC believes its independence had not been impacted as it related to the audits of the Fund. In reaching this conclusion, PwC noted that during the time of its audit, the engagement team was not aware of the investment and that PwC does not believe these situations affected PwC's ability to act objectively and impartially and to issue a report on financial statements as the funds' independent auditor.
| |
ITEM 5. | AUDIT COMMITTEE OF LISTED REGISTRANTS |
| |
| Not Applicable |
| |
ITEM 6. | SCHEDULE OF INVESTMENTS |
| |
| Not Applicable |
| |
ITEM 7. | DISCLOSURE OF PROXY VOTING POLICIES AND PROCEDURES FOR CLOSED-END MANAGEMENT INVESTMENT COMPANIES |
| |
| Not applicable. |
| |
ITEM 8. | PORTFOLIO MANAGERS OF CLOSED-END MANAGEMENT INVESTMENT COMPANIES |
| |
| Not applicable. |
| |
ITEM 9. | PURCHASES OF EQUITY SECURITIES BY CLOSED-END MANAGEMENT INVESTMENT COMPANY AND AFFILIATED PURCHASERS |
| |
| Not Applicable. |
| |
ITEM 10. | SUBMISSION OF MATTERS TO A VOTE OF SECURITY HOLDERS |
| |
| There were no material changes to the procedures by which shareholders may recommend nominees to the Fund’s Board. The primary function of the Nominating and Governance Committee is to identify and recommend individuals for membership on the Board and oversee the administration of the Board Governance Guidelines. Shareholders may recommend candidates for Board positions by forwarding their correspondence by U.S. mail or courier service to Paul K. Freeman, Independent Chairman, DWS Funds, P.O. Box 101833, Denver, CO 80250-1833. |
| |
ITEM 11. | CONTROLS AND PROCEDURES |
| |
| (a) The Chief Executive and Financial Officers concluded that the Registrant’s Disclosure Controls and Procedures are effective based on the evaluation of the Disclosure Controls and Procedures as of a date within 90 days of the filing date of this report. |
| |
| (b) There have been no changes in the registrant’s internal control over financial reporting that occurred during the second fiscal quarter of the period covered by this report that has materially affected, or is reasonably likely to materially affect, the registrant’s internal controls over financial reporting. |
| |
ITEM 12. | EXHIBITS |
| |
| (a)(1) Code of Ethics pursuant to Item 2 of Form N-CSR is filed and attached hereto as EX-99.CODE ETH. |
| |
| (a)(2) Certification pursuant to Rule 30a-2(a) under the Investment Company Act of 1940 (17 CFR 270.30a-2(a)) is filed and attached hereto as Exhibit 99.CERT. |
| |
| (b) Certification pursuant to Rule 30a-2(b) under the Investment Company Act of 1940 (17 CFR 270.30a-2(b)) is furnished and attached hereto as Exhibit 99.906CERT. |
Form N-CSR Item F
SIGNATURES
Pursuant to the requirements of the Securities Exchange Act of 1934 and the Investment Company Act of 1940, the registrant has duly caused this report to be signed on its behalf by the undersigned, thereunto duly authorized.
Registrant: | DWS Variable Series I |
| |
| |
By: | /s/Michael G. Clark Michael G. Clark President |
| |
Date: | February 19, 2010 |
Pursuant to the requirements of the Securities Exchange Act of 1934 and the Investment Company Act of 1940, this report has been signed below by the following persons on behalf of the registrant and in the capacities and on the dates indicated.
Registrant: | DWS Variable Series I |
| |
| |
By: | /s/Michael G. Clark Michael G. Clark President |
| |
Date: | February 19, 2010 |
| |
| |
By: | /s/Paul Schubert Paul Schubert Chief Financial Officer and Treasurer |
| |
Date: | February 19, 2010 |