UNITED STATES
SECURITIES AND EXCHANGE COMMISSION
Washington, D.C. 20549
FORM N-CSR
CERTIFIED SHAREHOLDER REPORT OF REGISTERED
MANAGEMENT INVESTMENT COMPANIES
Investment Company Act file number | 811-4279 |
|
Securian Funds Trust |
(Exact name of registrant as specified in charter) |
|
400 Robert Street North St. Paul, Minnesota | | 55101-2098 |
(Address of principal executive offices) | | (Zip code) |
|
David Dimitri, Esq. 400 Robert Street North St. Paul, Minnesota 55101-2098 |
(Name and address of agent for service) |
|
Registrant’s telephone number, including area code: | (651) 665-3500 | |
|
Date of fiscal year end: | December 31 | |
|
Date of reporting period: | June 30, 2017 | |
| | | | | | | | |
ITEM 1. REPORT TO STOCKHOLDERS.
Filed herewith.

Semi-Annual Report
June 30, 2017
Offered in Minnesota Life Insurance Company and
Securian Life Insurance Company Variable Products
SFT Advantus Bond Fund
SFT Advantus Dynamic Managed Volatility Fund
SFT Advantus Government Money Market Fund
SFT Advantus Index 400 Mid-Cap Fund
SFT Advantus Index 500 Fund
SFT Advantus International Bond Fund
SFT Advantus Managed Volatility Equity Fund
SFT Advantus Mortgage Securities Fund
SFT Advantus Real Estate Securities Fund
SFT IvySM Growth Fund
SFT IvySM Small Cap Growth Fund
SFT Pyramis® Core Equity Fund
SFT T. Rowe Price Value Fund
Financial security
for the long run ®

Securian Funds Trust
Supplement dated June 29, 2017 to the Prospectus of Securian Funds Trust dated May 1, 2017.
Effective June 1, 2017, Jeremy Gogos, Ph. D. will become an additional portfolio manager for the SFT Advantus Dynamic Managed Volatility Fund and the SFT Advantus Managed Volatility Equity Fund.
The text on page 12, under the caption "SFT Advantus Dynamic Managed Volatility Fund: Management," is replaced by the following:
SFT Advantus Dynamic Managed Volatility Fund: Management
The Fund is advised by Advantus Capital. The following individuals serve as the Fund's primary portfolio managers:
Name and Title | | Primary Manager Since | |
David M. Kuplic
Executive Vice President and Portfolio
Manager, Advantus Capital | | May 1, 2013 | |
Craig M. Stapleton
Vice President and Portfolio Manager,
Advantus Capital | | May 1, 2013 | |
Jeremy Gogos, Ph. D.
Associate Portfolio Manager,
Advantus Capital | | June 1, 2017 | |
The text on page 37, under the caption "SFT Advantus Managed Volatility Equity Fund: Management," is replaced by the following:
SFT Advantus Managed Volatility Equity Fund: Management
The Fund is advised by Advantus Capital. The following individuals serve as the Fund's primary portfolio managers:
Name and Title | | Primary Manager Since | |
David M. Kuplic
Executive Vice President and Portfolio
Manager, Advantus Capital | | November 18, 2015 | |
Craig M. Stapleton
Vice President and Portfolio Manager,
Advantus Capital | | November 18, 2015 | |
Jeremy Gogos, Ph. D.
Associate Portfolio Manager,
Advantus Capital | | June 1, 2017 | |
Please retain this supplement for future reference.
F89336 06-2017
The text relating to the SFT Advantus Dynamic Managed Volatility Fund and the SFT Advantus Managed Volatility Equity Fund starting on page 119, under the caption "Portfolio Managers," is replaced by the following:
Portfolio Managers
Fund | | Portfolio Manager
and Title | | Primary Portfolio
Manager Since | | Business Experience During
Past Five Years | |
SFT Advantus
Dynamic
Managed
Volatility | | David M. Kuplic
Executive Vice President
and Portfolio Manager,
Advantus Capital | | May 1, 2013
| | Executive Vice President and Director
since July 2007, Advantus Capital,
and President, Securian Funds Trust
since July 2011 | |
| | | Craig M. Stapleton
Vice President and
Portfolio Manager,
Advantus Capital
| | May 1, 2013
| | Vice President and Portfolio Manager
since 2012, previously Portfolio
Manager since June 2012, Associate
Portfolio Manager 2010-2012, and
Quantitative Research Analyst 2005-
2010, Advantus Capital | |
| | | Jeremy Gogos, Ph. D.
Associate Portfolio
Manager, Advantus Capital
| | June 1, 2017
| | Associate Portfolio Manager since
June 2017, previously Quantitative
Research Analyst since 2013,
Advantus Capital | |
SFT Advantus
Managed
Volatility
Equity | | David M. Kuplic
Executive Vice President
and Portfolio Manager,
Advantus Capital | | November 18, 2015
| | Executive Vice President and Director
since July 2007, Advantus Capital,
and President, Securian Funds Trust
since July 2011 | |
| | | Craig M. Stapleton
Vice President and
Portfolio Manager,
Advantus Capital
| | November 18, 2015
| | Vice President and Portfolio Manager
since 2012, previously Portfolio
Manager since June 2012, Associate
Portfolio Manager 2010-2012, and
Quantitative Research Analyst 2005-
2010, Advantus Capital | |
| | | Jeremy Gogos, Ph. D.
Associate Portfolio
Manager, Advantus Capital
| | June 1, 2017
| | Associate Portfolio Manager since
June 2017, previously Quantitative
Research Analyst since 2013,
Advantus Capital | |
TABLE OF CONTENTS
| | | Page No. | |
Fund Reviews | |
SFT Advantus Bond Fund | | | 1 | | |
SFT Advantus Dynamic Managed Volatility Fund | | | 2 | | |
SFT Advantus Government Money Market Fund | | | 3 | | |
SFT Advantus Index 400 Mid-Cap Fund | | | 4 | | |
SFT Advantus Index 500 Fund | | | 5 | | |
SFT Advantus International Bond Fund | | | 6 | | |
SFT Advantus Managed Volatility Equity Fund | | | 7 | | |
SFT Advantus Mortgage Securities Fund | | | 8 | | |
SFT Advantus Real Estate Securities Fund | | | 9 | | |
SFT IvySM Growth Fund | | | 10 | | |
SFT IvySM Small Cap Growth Fund | | | 11 | | |
SFT Pyramis® Core Equity Fund | | | 12 | | |
SFT T. Rowe Price Value Fund | | | 13 | | |
Investments In Securities | |
SFT Advantus Bond Fund | | | 14 | | |
SFT Advantus Dynamic Managed Volatility Fund | | | 20 | | |
SFT Advantus Government Money Market Fund | | | 26 | | |
SFT Advantus Index 400 Mid-Cap Fund | | | 27 | | |
SFT Advantus Index 500 Fund | | | 33 | | |
SFT Advantus International Bond Fund | | | 40 | | |
SFT Advantus Managed Volatility Equity Fund | | | 47 | | |
SFT Advantus Mortgage Securities Fund | | | 48 | | |
SFT Advantus Real Estate Securities Fund | | | 52 | | |
SFT IvySM Growth Fund | | | 53 | | |
SFT IvySM Small Cap Growth Fund | | | 55 | | |
SFT Pyramis® Core Equity Fund | | | 57 | | |
SFT T. Rowe Price Value Fund | | | 59 | | |
Financial Statements | |
Statements of Assets and Liabilities | | | 62 | | |
Statements of Operations | | | 64 | | |
Statements of Changes in Net Assets | | | 66 | | |
Financial Highlights | | | 71 | | |
Notes to Financial Statements | | | 84 | | |
Fund Expense Examples | | | 101 | | |
Proxy Voting and Quarterly Holdings Information | | | 102 | | |
Statement Regarding Basis for Approval of Advisory Contracts | | | 104 | | |
Trustees and Executive Officers | | | 107 | | |
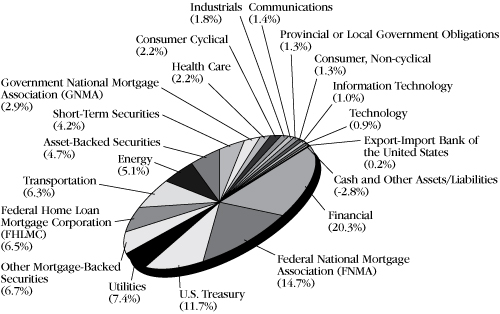
SFT Advantus Bond Fund
Fund Objective
The SFT Advantus Bond Fund seeks as high a level of long-term total return as is consistent with prudent investment risk. Preservation of capital is a secondary objective. The SFT Advantus Bond Fund invests in long-term, fixed income, high quality debt instruments. The risks incurred by investing in debt instruments include, but are not limited to, reinvestment of prepaid debt obligations at lower rates of return, and the inability to reinvest at higher interest rates when debt obligations are prepaid more slowly than expected. In addition, the net asset value of the SFT Advantus Bond Fund may fluctuate in response to changes in interest rates and is not guaranteed.
Performance Update
The Fund's performance for the six-month period ended June 30, 2017, for each class of shares offered was as follows:
Class 1 | | | 3.15 percent* | | |
Class 2 | | | 3.02 percent* | | |
The Fund's benchmark, the Bloomberg Barclays U.S. Aggregate Bond Index, returned 2.27 percent for the same period.
Sector Diversification (shown as a percentage of net assets)
*The results shown are past performance and are not an indication of future performance. Current performance may be lower or higher. The investment returns and principal value of an investment will fluctuate so that shares upon redemption may be worth more or less than their original cost. Performance figures of the Fund do not reflect charges pursuant to the terms of the variable life insurance policies and variable annuity contracts funded by separate accounts that invest in the Fund's shares. When such charges are deducted, actual investment performance in a variable policy or contract will be lower.
The Bloomberg Barclays U.S. Aggregate Bond Index is an unmanaged benchmark composite representing average market-weighted performance of U.S. Treasury and agency securities, investment-grade corporate bonds and mortgage-backed securities with maturities greater than one year.
1
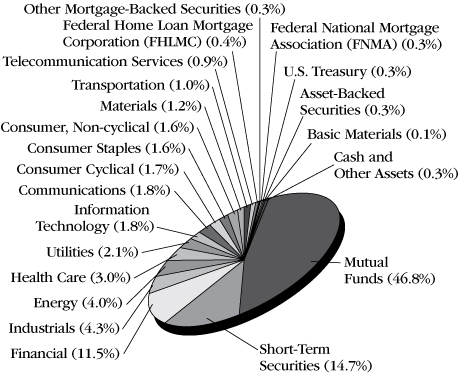
SFT Advantus Dynamic Managed Volatility Fund
Fund Objective
The SFT Advantus Dynamic Managed Volatility Fund seeks to maximize risk adjusted total return relative to its blended benchmark index comprised of 60 percent S&P 500 Index and 40 percent Barclays U.S. Aggregate Bond Index (collectively, the Blended Benchmark Index).
The SFT Advantus Dynamic Managed Volatility Fund invests primarily in Class 1 shares of SFT Advantus Index 500 Fund for equity exposure, in a basket of fixed income securities for fixed income exposure and certain derivative instruments. The Fund is subject to risks associated with such investments as described in detail in the prospectus. The net asset value of the Fund will fluctuate and is not guaranteed. It is possible to lose money by investing in the Fund. There is no assurance that efforts to manage Fund volatility will achieve the desired results.
Performance Update
For the six-month period ended June 30, 2017, the Fund had a net return of 7.71 percent*. This return reflects the waiver, reimbursement or payment of certain Fund expenses by its investment advisor.** The blended benchmark index, which is comprised of 60 percent of the S&P® 500 Index and 40 percent of the Bloomberg Barclays U.S. Aggregate Bond Index returned 6.48 percent over the same period. The S&P® 500 Index and the Bloomberg Barclays U.S. Aggregate Bond Index returned 9.34 percent and 2.27 percent over the same period, respectively.
Sector Diversification (shown as a percentage of net assets)
*The results shown are past performance and are not an indication of future performance. Current performance may be lower or higher. The investment returns and principal value of an investment will fluctuate so that shares upon redemption may be worth more or less than their original cost. Performance figures of the Fund do not reflect charges pursuant to the terms of the variable life insurance policies and variable annuity contracts funded by separate accounts that invest in the Fund's shares. When such charges are deducted, actual investment performance in a variable policy or contract will be lower.
**Advantus Capital Management Inc. (Advantus Capital) and the Securian Funds Trust, on behalf of the SFT Advantus Dynamic Managed Volatility Fund (the "Fund"), have entered into an Expense Limitation Agreement, dated May 1, 2013, which limits the operating expenses of the Fund, excluding certain expenses (such as interest expense, acquired fund fees, cash overdraft fees, taxes, brokerage commissions, other expenditures which are capitalized in accordance with the generally accepted accounting principles, and other extraordinary expenses not incurred in the ordinary course of the Fund's business), to 0.80% of the Fund's average daily net assets through April 30, 2018. The Agreement renews annually for a full year each year thereafter unless terminated by Advantus Capital upon at least 30 days' notice prior to the end of a contract term. The Fund is authorized to reimburse Advantus Capital for management fees previously waived and/or for the cost of expenses previously paid by Advantus Capital pursuant to this agreement, provided that such reimbursement will not cause the Fund to exceed any limits in effect at the time of such reimbursement. The Fund's ability to reimburse Advantus Capital in this manner only applies to fees waived or reimbursements made by Advantus Capital within the three fiscal years prior to the date of such reimbursement. As of June 30, 2017 Advantus Capital has waived $1,577,060 pursuant to the agreement, of which $1,311,188 was eligible for recovery as of such date. To the extent that the Fund makes such reimbursements to Advantus Capital, the amount of the reimbursements will be reflected in the financial statements in the Fund's shareholder reports and in Other Expenses under Fees and Expenses of the Fund.
The Blended Benchmark Index is comprised of 60 percent of the S&P 500 Index and 40 percent of the Bloomberg Barclays U.S. Aggregate Bond Index.
The S&P 500 Index is a broad, unmanaged index of 500 common stocks which are representative of the U.S. stock market overall. The Bloomberg Barclays U.S. Aggregate Bond Index is an unmanaged benchmark composite representing average market-weighted performance of U.S. Treasury and agency securities, investment-grade corporate bonds and mortgage-backed securities with maturities greater than one year.
2
SFT Advantus Government Money Market Fund
Fund Objective
The SFT Advantus Government Money Market Fund seeks maximum current income to the extent consistent with liquidity and the preservation of capital. The Fund invests at least 99.5% of its total assets in cash, government securities, and/or repurchase agreements that are collateralized fully (i.e., collateralized by cash or government securities).
Investment in the SFT Advantus Government Money Market Fund is neither insured nor guaranteed by the U.S. Government, and there can be no assurance that the Fund will be able to maintain a stable net asset value of $1.00 per share. It is possible to lose money by investing in the Fund.
Performance Update
For the six-month period ended June 30, 2017, the Fund had a net return of 0.00 percent*. This return reflects the waiver, reimbursement or payment of certain Fund expenses by its investment advisor and principal underwriter.** The Fund's benchmark, the Bloomberg Barclays U.S. Treasury Bill 1-3 Month, returned 0.31 percent for the same period.
*The results shown are past performance and are not an indication of future performance. Current performance may be lower or higher. The investment returns and principal value of an investment will fluctuate so that shares upon redemption may be worth more or less than their original cost. Investment in the SFT Advantus Government Money Market Fund is neither insured nor guaranteed by the U.S. Government or any other agency, and there can be no assurance that the Fund will be able to maintain a stable net asset value of $1.00 per share. Shares upon redemption may be worth more or less than their original cost. Performance figures of the Fund do not reflect charges pursuant to the terms of the variable life insurance policies and variable annuity contracts funded by separate accounts that invest in the Fund's shares. When such charges are deducted, actual investment performance in a variable policy or contract will be lower.
**Effective May 1, 2012, the Board of Trustees of Securian Funds Trust approved a Restated Net Investment Income Maintenance Agreement among Securian Funds Trust (on behalf of SFT Advantus Government Money Market Fund), Advantus Capital and Securian Financial Services, Inc. (Securian Financial). A similar agreement was previously approved by the Board of Directors of Advantus Series Fund, Inc., the Trust's predecessor, effective October 29, 2009. Under such Agreement, Advantus Capital agrees to waive, reimburse or pay SFT Advantus Government Money Market Fund expenses so that the Fund's daily net investment income does not fall below zero. Securian Financial may also waive its Rule 12b-1 fees. Advantus Capital and Securian Financial each has the option under the Agreement to recover the full amount waived, reimbursed or paid (the "Expense Waiver") on any day on which the Fund's net investment income exceeds zero. On any day, however, the Expense Waiver does not constitute an obligation of the Fund unless Advantus Capital or Securian Financial has expressly exercised its right to recover a specified portion of the Expense Waiver on that day, in which case such specified portion is then due and payable by the Fund. In addition, the right of Advantus Capital and/or Securian Financial to recover the Expense Waiver is subject to the following limitations: (1) if a repayment of the Expense Waiver by the Fund would cause the Fund's net investment income to fall below zero, such repayment is deferred until a date when repayment would not cause the Fund's net investment income to fall below zero; (2) the right to recover any portion of the Expense Waiver expires three years after the effective date of that portion of the Expense Waiver; and (3) any repayment of the Expense Waiver by the Fund cannot cause the Fund's expense ratio to exceed 1.25%. As of June 30, 2017, Advantus Capital and Securian Financial have collectively waived $4,631,950 pursuant to the Agreement, including expenses waived under the prior agreement with Advantus Series Fund, Inc., of which $1,505,097 was eligible for recovery as of such date. If Advantus Capital and Securian Financial exercise their rights to be paid such waived amounts, the Fund's future yield will be negatively affected for an indefinite period. The Agreement is effective through April 30, 2018, and shall continue in effect thereafter, provided such continuance is specifically approved by Advantus Capital, Securian Financial, and a majority of the Trust's independent Trustees.
The Bloomberg Barclays U.S. Treasury Bill 1-3 Month is a market value-weighted index of investment-grade fixed-rate public obligations of the U.S. Treasury with maturities of three months, excluding zero coupons.
3
SFT Advantus Index 400 Mid-Cap Fund
Fund Objective
The SFT Advantus Index 400 Mid-Cap Fund seeks to provide investment results generally corresponding to the aggregate price and dividend performance of publicly traded common stocks that comprise the Standard & Poor's MidCap 400 Index (S&P 400). It is designed to provide an economical and convenient means of maintaining a diversified portfolio in this equity security area as part of an over-all investment strategy. The risks incurred by investing in the SFT Advantus Index 400 Mid-Cap Fund include, but are not limited to, the risk that the Fund may not be able to replicate the performance of the S&P 400, and the risk of declines in the market for mid-cap stocks or in the equity markets generally.
Performance Update
The Fund's performance for the six-month period ended June 30, 2017, for each class of shares offered was as follows:
Class 1 | | | 5.84 percent* | | |
Class 2 | | | 5.71 percent* | | |
The Fund's benchmark, the Standard and Poor's MidCap 400® Index, returned 5.99 percent for the same period.
Sector Diversification (shown as a percentage of net assets)

"Standard & Poor's®", "S&P®", "Standard & Poor's MidCap 400" and "S&P MidCap 400" are trademarks of the S&P Global, Inc. and have been licensed for use by the Securian Funds Trust—Advantus Index 400 Mid-Cap Fund. The Fund is not sponsored, endorsed, sold or promoted by Standard & Poor's and Standard & Poor's makes no representation regarding the advisability of investing in the Fund.
*The results shown are past performance and are not an indication of future performance. Current performance may be lower or higher. The investment returns and principal value of an investment will fluctuate so that shares upon redemption may be worth more or less than their original cost. Performance figures of the Fund do not reflect charges pursuant to the terms of the variable life insurance policies and variable annuity contracts funded by separate accounts that invest in the Fund's shares. When such charges are deducted, actual investment performance in a variable policy or contract will be lower.
S&P MidCap 400 Index consists of 400 domestic stocks chosen for market size (median market capitalization of about $3.9 billion), liquidity and industry group representation. It is a market-weighted index (stock price times shares outstanding), with each stock affecting the index in proportion to its market value.
4
SFT Advantus Index 500 Fund
Fund Objective
The SFT Advantus Index 500 Fund seeks investment results that correspond generally to the price and yield performance of the common stocks included in the Standard and Poor's 500 Index (S&P 500). It is designed to provide an economical and convenient means of maintaining a broad position in the equity market as part of an overall investment strategy. The risks incurred by investing in the SFT Advantus Index 500 Fund include, but are not limited to, the risk that the Fund may not be able to replicate the performance of the S&P 500, and the risk of declines in the equity markets generally.
Performance Update
The Fund's performance for the six-month period ended June 30, 2017, for each class of shares offered was as follows:
Class 1 | | | 9.22 percent* | | |
Class 2 | | | 9.08 percent* | | |
The Fund's benchmark, the Standard & Poor's 500® Index, returned 9.34 percent for the same period.
Sector Diversification (shown as a percentage of net assets)
"Standard & Poor's®", "S&P®", "Standard & Poor's 500" and "S&P 500" are trademarks of the S&P Global, Inc. and have been licensed for use by Securian Funds Trust—Advantus Index 500 Fund. The Fund is not sponsored, endorsed, sold or promoted by Standard & Poor's and Standard & Poor's makes no representation regarding the advisability of investing in the Fund.
*The results shown are past performance and are not an indication of future performance. Current performance may be lower or higher. The investment returns and principal value of an investment will fluctuate so that shares upon redemption may be worth more or less than their original cost. Performance figures of the Fund do not reflect charges pursuant to the terms of the variable life insurance policies and variable annuity contracts funded by separate accounts that invest in the Fund's shares. When such charges are deducted, actual investment performance in a variable policy or contract will be lower.
The S&P 500 Index is a broad, unmanaged index of 500 common stocks which are representative of the U.S. stock market overall.
5
SFT Advantus International Bond Fund
Fund Objective
The SFT Advantus International Bond Fund seeks to maximize current income consistent with protection of principal. The Fund pursues its objective by investing primarily in debt securities issued by issuers located anywhere in the world. While Advantus Capital Management, Inc. acts as the investment adviser for the Fund, Franklin Advisers, Inc. provides investment advice to the SFT Advantus International Bond Fund under a sub-advisory agreement. Investment risks associated with international investing in addition to other risks include currency fluctuations, political and economic instability, and differences in accounting standards when investing in foreign markets.
Performance Update
The Fund's performance for the six-month period ended June 30, 2017, for each class of shares offered was as follows:
Class 1 | | | 2.63 percent* | | |
Class 2 | | | 2.51 percent* | | |
The Fund's benchmark, the Citigroup World Government Bond Index, returned 4.49 percent for the same period.
Country Diversification (shown as a percentage of net assets)

Currency Diversification (shown as a percentage of net assets)
African | | | 3.46 | % | |
Ghana Cedi | | | 1.78 | % | |
South African Rand | | | 1.68 | % | |
Americas | | | 151.96 | % | |
United States Dollar | | | 109.00 | % | |
Mexican Peso | | | 23.70 | % | |
Brazilian Real | | | 14.03 | % | |
Argentine Peso | | | 4.85 | % | |
Chilian Peso | | | 0.38 | % | |
Asia Pacific | | | -17.59 | % | |
Indonesian Rupiah | | | 10.89 | % | |
Indian Rupee | | | 7.65 | % | |
Philippine Peso | | | 2.29 | % | |
Malaysian Ringgit | | | 0.89 | % | |
South Korean Won | | | -0.11 | % | |
Australian Dollar | | | -9.04 | % | |
Japanese Yen | | | -30.16 | % | |
Europe | | | -37.83 | % | |
Polish Zloty | | | 0.06 | % | |
Euro | | | -37.89 | % | |
*A negative figure reflects net "short" exposure, designed to benefit if the value of the associated currency decreases. Conversely, the Fund's value would potentially decline if the value of the associated currency increases.
*The results shown are past performance and are not an indication of future performance. Current performance may be lower or higher. The investment returns and principal value of an investment will fluctuate so that shares upon redemption may be worth more or less than their original cost. Performance figures of the Fund do not reflect charges pursuant to the terms of the variable life insurance policies and variable annuity contracts funded by separate accounts that invest in the Fund's shares. When such charges are deducted, actual investment performance in a variable policy or contract will be lower.
The Citigroup World Government Bond Index is a market capitalization weighted index consisting of the government bond markets from over twenty countries. Country eligibility is determined based upon market capitalization and investability criteria. The index includes all fixed-rate bonds with a remaining maturity of one year or longer and with amounts outstanding of at least the equivalent of U.S. $25 million. Government securities typically exclude floating or variable rate bonds, U.S./Canadian savings bonds and private placements. Each bond must have a minimum rating of BBB-/Baa3 by S&P or Moody's.
6
SFT Advantus Managed Volatility Equity Fund
Fund Objective
The SFT Advantus Managed Volatility Equity Fund seeks to maximize risk-adjusted total return relative to its blended benchmark index, comprised of 60% S&P 500® Low Volatility Index, 20% S&P BMI International Developed Low Volatility Index and 20% Barclays U.S. 3 Month Treasury Bellwether Index (collectively, the Blended Benchmark Index).
Performance Update
For the six-month period ended June 30, 2017, the Fund had a net return of 8.32 percent*. This return reflects the waiver, reimbursement or payment of certain Fund expenses by its investment advisor.** The blended benchmark index, which is comprised of 60 percent of the S&P 500® Low Volatility Index, 20 percent S&P 500® BMI International Developed Low Volatility Index and 20 percent of the Bloomberg Barclays U.S. 3-Month Treasury Bellwether Index, returned 8.21 percent over the same period. The S&P 500® Low Volatility Index, S&P 500® BMI International Developed Low Volatility Index and the Bloomberg Barclays U.S. 3-Month Treasury Bellwether Index returned 8.87, 14.38, and 0.31 percent over the same period, respectively.
Sector Diversification (shown as a percentage of net assets)

*The results shown are past performance and are not an indication of future performance. Current performance may be lower or higher. The investment returns and principal value of an investment will fluctuate so that shares upon redemption may be worth more or less than their original cost. Performance figures of the Fund do not reflect charges pursuant to the terms of the variable life insurance policies and variable annuity contracts funded by separate accounts that invest in the Fund's shares. When such charges are deducted, actual investment performance in a variable policy or contract will be lower.
**Advantus Capital Management Inc. (Advantus Capital) and the Securian Funds Trust, on behalf of the SFT Advantus Managed Volatility Equity Fund (the "Fund"), have entered into an Expense Limitation Agreement, dated November 18, 2015, which limits the operating expenses of the Fund, excluding certain expenses (such as interest expense, acquired fund fees, cash overdraft fees, taxes, brokerage commissions, other expenditures which are capitalized in accordance with the generally accepted accounting principles, and other extraordinary expenses not incurred in the ordinary course of the Fund's business), to 0.80% of the Fund's average daily net assets through November 17, 2018. The Agreement renews annually for a full year each year thereafter unless terminated by Advantus Capital upon at least 30 days' notice prior to the end of a contract term. The Fund is authorized to reimburse Advantus Capital for management fees previously waived and/or for the cost of expenses previously paid by Advantus Capital pursuant to this agreement, provided that such reimbursement will not cause the Fund to exceed any limits in effect at the time of such reimbursement. The Fund's ability to reimburse Advantus Capital in this manner only applies to fees waived or reimbursements made by Advantus Capital within the three fiscal years prior to the date of such reimbursement. As of June 30, 2017, Advantus Capital has waived $564,405 pursuant to the agreement, all of which was eligible for recovery as of such date. To the extent that the Fund makes such reimbursements to Advantus Capital, the amount of the reimbursements will be reflected in the financial statements in the Fund's shareholder reports and in Other Expenses under Fees and Expenses of the Fund. The Blended Benchmark Index is comprised of 60 percent of the S&P 500 Low Volatility Index, 20% S&P 500 BMI International Developed Low Volatility Index and 20% Bloomberg Barclays U.S. 3 Month Treasury Bellwether Index. The S&P 500 Low Volatility Index measures performance of the 100 least volatile stocks in the S&P 500. The S&P 500 BMI International Developed Low Volatility Index measures the performance of the 200 least volatile stocks in the S&P Developed Market large/midcap universe. Constituents are weighted relative to the inverse of their corresponding volatility, with the least volatile stocks receiving the highest weights. The Bloomberg Barclays U.S. 3-Month Treasury Bellwether Index tracks the market for the on-the-run 3 month Treasury bill issued by the U.S. government.
7
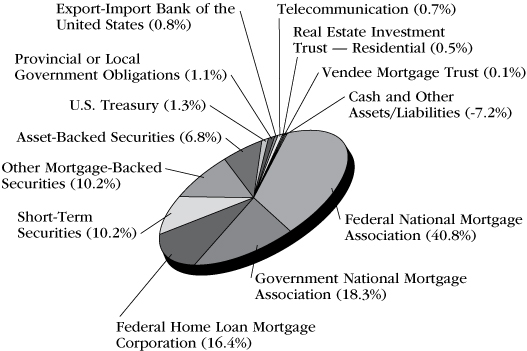
SFT Advantus Mortgage Securities Fund
Fund Objective
The SFT Advantus Mortgage Securities Fund seeks a high level of current income consistent with prudent investment risk. The SFT Advantus Mortgage Securities Fund will invest primarily in mortgage-related securities. The risks incurred by investing in mortgage-related securities include, but are not limited to, reinvestment of prepaid loans at low rates of return, and the inability to reinvest at higher interest rates when mortgages are prepaid more slowly than expected. In addition, the net asset value of the SFT Advantus Mortgage Securities Fund may fluctuate in response to changes in interest rates and is not guaranteed.
Performance Update
The Fund's performance for the six-month period ended June 30, 2017, for each class of shares offered was as follows:
Class 1 | | | 1.31 percent* | | |
Class 2 | | | 1.19 percent* | | |
The Fund's benchmark, the Bloomberg Barclays U.S. Mortgage-Backed Securities Index, returned 1.35 percent for the same period.
Sector Diversification (shown as a percentage of net assets)
*The results shown are past performance and are not an indication of future performance. Current performance may be lower or higher. The investment returns and principal value of an investment will fluctuate so that shares upon redemption may be worth more or less than their original cost. Performance figures of the Fund do not reflect charges pursuant to the terms of the variable life insurance policies and variable annuity contracts funded by separate accounts that invest in the Fund's shares. When such charges are deducted, actual investment performance in a variable policy or contract will be lower.
The Bloomberg Barclays U.S. Mortgage-Backed Securities Index is an unmanaged benchmark composite which includes all fixed-rate securities backed by mortgage pools of the Government National Mortgage Association (GNMA), Federal Home Loan Mortgage Corporation (FHLMC) and Federal National Mortgage Association (FNMA).
8
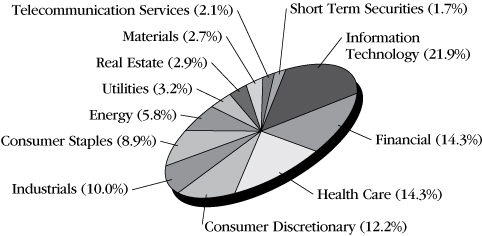
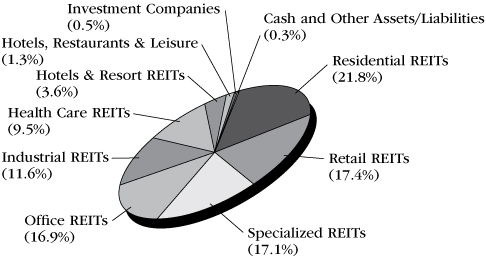
SFT Advantus Real Estate Securities Fund
Fund Objective
The SFT Advantus Real Estate Securities Fund seeks above-average income and long-term growth of capital. The Fund intends to pursue its objective by investing primarily in equity securities of companies in the real estate industry. Investment risks associated with investing in the SFT Advantus Real Estate Securities Fund, in addition to other risks, include rental income fluctuations, depreciation, property tax value changes, and differences in real estate market value.
Performance Update
The Fund's performance for the six-month period ended June 30, 2017, for each class of shares offered was as follows:
Class 1 | | | 3.20 percent* | | |
Class 2 | | | 3.07 percent* | | |
The Fund's benchmark, the Wilshire U.S. Real Estate Securities Index, returned 2.42 percent for the same period.
Sector Diversification (shown as a percentage of net assets)
*The results shown are past performance and are not an indication of future performance. Current performance may be lower or higher. The investment returns and principal value of an investment will fluctuate so that shares upon redemption may be worth more or less than their original cost. Performance figures of the Fund do not reflect charges pursuant to the terms of the variable life insurance policies and variable annuity contracts funded by separate accounts that invest in the Fund's shares. When such charges are deducted, actual investment performance in a variable policy or contract will be lower.
The Wilshire U.S. Real Estate Securities Index is a market capitalization-weighted index of equity securities whose primary business is equity ownership of commercial real estate (REITs).
9
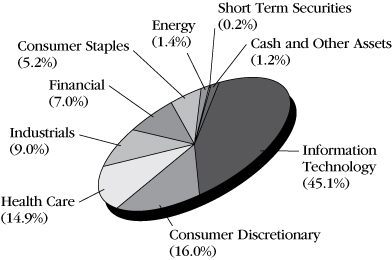
SFT IvySM Growth Fund
Fund Objective
The SFT IvySM Growth Fund seeks to provide growth of capital. The Fund pursues its objective by investing primarily in a diversified portfolio of common stocks issued by large capitalization companies. While Advantus Capital Management, Inc. acts as the investment adviser for the Fund, Waddell & Reed Investment Management Company (WRIMCO) provides investment advice to the Fund under a sub-advisory agreement. The risks incurred by investing in the Fund include, but are not limited to, the risk of declines in the market for large cap stocks or in the equity markets generally.
Performance Update
For the six-month period ended June 30, 2017, the Fund had a net return of 13.14 percent*. The Fund's benchmark, the Russell 1000 Growth Index, returned 13.99 percent for the same period.
Sector Diversification (shown as a percentage of net assets)
'Ivy' is the registered service mark of Ivy Funds Distributor, Inc., an affiliate of the Waddell & Reed Investment Management Company, the Fund's sub-adviser.
*The results shown are past performance and are not an indication of future performance. Current performance may be lower or higher. The investment returns and principal value of an investment will fluctuate so that shares upon redemption may be worth more or less than their original cost. Performance figures of the Fund do not reflect charges pursuant to the terms of the variable life insurance policies and variable annuity contracts funded by separate accounts that invest in the Fund's shares. When such charges are deducted, actual investment performance in a variable policy or contract will be lower.
The Russell 1000 Growth Index is an unmanaged index that measures the performance of those Russell 1000 Index companies with higher price-to-book ratios and higher forecasted growth values. The index measures the performance of the 1,000 largest companies in the Russel 3000 Index, which measures the performance of the 3,000 largest U.S. companies based on total market capitalization.
10
SFT IvySM Small Cap Growth Fund
Fund Objective
The SFT IvySM Small Cap Growth Fund seeks to provide growth of capital. The Fund pursues its objective by investing primarily in a diversified portfolio of common stocks issued by small capitalization companies. While Advantus Capital Management, Inc. acts as the investment adviser for the Fund, Waddell & Reed Investment Management Company (WRIMCO) provides investment advice to the Fund under a sub-advisory agreement. The risks incurred by investing in the Fund include, but are not limited to, the risk of declines in the market for small cap stocks or in the equity markets generally.
Performance Update
For the six-month period ended June 30, 2017, the Fund had a net return of 14.22 percent*. The Fund's benchmark, the Russell 2000 Growth Index, returned 9.97 percent for the same period.
Sector Diversification (shown as a percentage of net assets)

'Ivy' is the registered service mark of Ivy Funds Distributor, Inc., an affiliate of the Waddell & Reed Investment Management Company, the Fund's sub-adviser.
*The results shown are past performance and are not an indication of future performance. Current performance may be lower or higher. The investment returns and principal value of an investment will fluctuate so that shares upon redemption may be worth more or less than their original cost. Performance figures of the Fund do not reflect charges pursuant to the terms of the variable life insurance policies and variable annuity contracts funded by separate accounts that invest in the Fund's shares. When such charges are deducted, actual investment performance in a variable policy or contract will be lower.
The Russell 2000 Growth Index is an unmanaged index of those Russell 2000 Index growth companies with higher price-to-book ratios and higher forecasted growth values. The index is broad-based, comprised of 2,000 of the smallest U.S.-domiciled company common stocks based on total market capitalization.
11
SFT Pyramis® Core Equity Fund
Fund Objective
The SFT Pyramis® Core Equity Fund seeks long-term capital appreciation. The Fund pursues its objective by investing primarily in a diversified portfolio of common stocks. While Advantus Capital Management, Inc. acts as the investment adviser for the Fund, Pyramis Global Advisors, LLC (Pyramis) provides investment advice to the Fund under a sub-advisory agreement. Risks associated with investing in the Fund include, but are not limited to, issuer-specific market volatility and risk of declines in the equity markets generally.
Performance Update
The Fund's performance for the six-month period ended June 30, 2017, for each class of shares offered was as follows:
Class 1 | | | 9.27 percent* | | |
Class 2 | | | 9.13 percent* | | |
The Fund's benchmark, the S&P 500® Index, returned 9.34 percent for the same period.
Sector Diversification (shown as a percentage of net assets)

'Pyramis' is a registered trademark of FMR LLC. Used with permission.
*The results shown are past performance and are not an indication of future performance. Current performance may be lower or higher. The investment returns and principal value of an investment will fluctuate so that shares upon redemption may be worth more or less than their original cost. Performance figures of the Fund do not reflect charges pursuant to the terms of the variable life insurance policies and variable annuity contracts funded by separate accounts that invest in the Fund's shares. When such charges are deducted, actual investment performance in a variable policy or contract will be lower.
The S&P 500 Index is a broad, unmanaged index of 500 common stocks which are representative of the U.S. stock market overall.
12
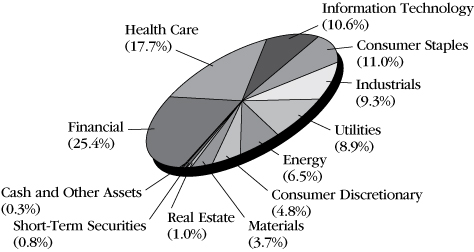
SFT T. Rowe Price Value Fund
Fund Objective
The SFT T. Rowe Price Value Fund seeks to provide long-term capital appreciation by investing in common stocks believed to be undervalued. Income is a secondary objective. The Fund pursues its objective by taking a value approach to investment selection. Holdings consist primarily of large cap stocks, but may also include stocks of mid-cap and small-cap companies. While Advantus Capital Management, Inc. acts as the investment adviser for the Fund, T. Rowe Price Associates, Inc. (T. Rowe Price) provides investment advice to the Fund under a sub-advisory agreement. The Fund's value approach to investing carries the risk that the market will not recognize a security's intrinsic value for a long time or that a stock judged to be undervalued may actually be appropriately priced at a low level.
Performance Update
For the six-month period ended June 30, 2017, the Fund had a net return of 8.43 percent*. The Fund's benchmark, the S&P 500® Index, returned 9.34 percent for the same period.
Sector Diversification (shown as a percentage of net assets)
*The results shown are past performance and are not an indication of future performance. Current performance may be lower or higher. The investment returns and principal value of an investment will fluctuate so that shares upon redemption may be worth more or less than their original cost. Performance figures of the Fund do not reflect charges pursuant to the terms of the variable life insurance policies and variable annuity contracts funded by separate accounts that invest in the Fund's shares. When such charges are deducted, actual investment performance in a variable policy or contract will be lower.
The S&P 500 Index is a broad, unmanaged index of 500 common stocks which are representative of the U.S. stock market overall.
13
SFT Advantus Bond Fund
Investments in Securities
(Percentages of each investment category relate to total net assets)
| | | Principal | | Value(a) | |
Long-Term Debt Securities (98.6%) | |
Government Obligations (37.3%) | |
Other Government Obligations (1.3%) | |
Provincial or Local Government
Obligations (1.3%) | |
Douglas County Public
Utility District No. 1,
5.450%, 09/01/40 | | $ | 1,185,000 | | | $ | 1,383,274 | | |
Port Authority of
New York & New Jersey
4.458%, 10/01/62 | | | 1,150,000 | | | | 1,258,491 | | |
4.926%, 10/01/51 | | | 2,055,000 | | | | 2,415,550 | | |
| | | | | | 5,057,315 | | |
U.S. Government Agencies and
Obligations (36.0%) | |
Export-Import Bank of the
United States (0.2%) | |
Tagua Leasing LLC,
1.732%, 09/18/24 | | | 630,422 | | | | 616,793 | | |
Federal Home Loan Mortgage Corporation
(FHLMC) (6.5%) | |
2.500%, 03/01/28 | | | 552,813 | | | | 559,642 | | |
3.000%, 08/01/42 | | | 559,522 | | | | 561,518 | | |
3.000%, 04/01/43 | | | 1,012,342 | | | | 1,016,294 | | |
3.000%, 07/01/45 | | | 841,520 | | | | 840,245 | | |
3.416%, 09/25/24 (b) | | | 1,000,000 | | | | 1,027,285 | | |
3.500%, 10/01/25 | | | 244,404 | | | | 255,843 | | |
3.500%, 08/01/42 | | | 598,434 | | | | 618,764 | | |
3.500%, 05/25/45 | | | 1,054,955 | | | | 1,061,606 | | |
3.500%, 03/01/46 | | | 1,613,327 | | | | 1,658,710 | | |
4.000%, 02/01/20 | | | 319,800 | | | | 331,150 | | |
4.000%, 09/01/40 | | | 556,580 | | | | 592,555 | | |
4.000%, 10/01/40 | | | 378,396 | | | | 399,335 | | |
4.000%, 11/01/40 | | | 2,054,015 | | | | 2,193,055 | | |
4.000%, 02/01/41 | | | 444,852 | | | | 472,964 | | |
4.000%, 08/01/41 | | | 595,485 | | | | 630,804 | | |
4.000%, 07/01/42 | | | 502,064 | | | | 530,131 | | |
4.500%, 01/01/41 | | | 621,042 | | | | 667,852 | | |
4.500%, 02/01/41 | | | 491,612 | | | | 528,206 | | |
4.500%, 03/01/41 | | | 624,690 | | | | 675,228 | | |
4.500%, 04/01/41 | | | 760,120 | | | | 825,092 | | |
4.516%, 10/25/27 (b) | | | 1,750,000 | | | | 1,956,301 | | |
5.000%, 04/01/35 | | | 140,047 | | | | 152,024 | | |
5.000%, 08/01/35 | | | 43,692 | | | | 47,670 | | |
5.000%, 11/01/35 | | | 112,510 | | | | 122,498 | | |
5.000%, 11/01/39 | | | 411,883 | | | | 455,912 | | |
5.000%, 03/01/40 | | | 2,222,952 | | | | 2,456,049 | | |
5.000%, 04/01/40 | | | 359,145 | | | | 394,051 | | |
5.000%, 08/01/40 | | | 222,079 | | | | 243,095 | | |
5.500%, 12/01/17 | | | 3,250 | | | | 3,263 | | |
5.500%, 06/01/20 | | | 27,498 | | | | 28,203 | | |
5.500%, 10/01/20 | | | 82,830 | | | | 86,436 | | |
5.500%, 11/01/23 | | | 108,031 | | | | 119,020 | | |
5.500%, 05/01/34 | | | 758,986 | | | | 863,041 | | |
5.500%, 10/01/34 | | | 269,599 | | | | 300,853 | | |
5.500%, 07/01/35 | | | 373,323 | | | | 418,561 | | |
5.500%, 10/01/35 | | | 365,207 | | | | 410,702 | | |
5.500%, 12/01/38 | | | 223,809 | | | | 247,146 | | |
6.000%, 11/01/33 | | | 305,591 | | | | 350,726 | | |
| | | Principal | | Value(a) | |
6.500%, 09/01/32 | | $ | 66,148 | | | $ | 77,021 | | |
6.500%, 06/01/36 | | | 304,542 | | | | 346,394 | | |
7.000%, 12/01/37 | | | 60,534 | | | | 65,480 | | |
| | | | | | 24,590,725 | | |
Federal National Mortgage Association
(FNMA) (14.7%) | |
2.500%, 11/01/27 | | | 482,722 | | | | 485,614 | | |
2.500%, 07/01/28 | | | 627,398 | | | | 634,620 | | |
2.500%, 02/25/32 (c) | | | 340,000 | | | | 341,766 | | |
2.898%, 06/25/27 | | | 675,000 | | | | 670,293 | | |
3.000%, 06/01/22 | | | 248,424 | | | | 255,148 | | |
3.000%, 11/01/27 | | | 102,760 | | | | 105,757 | | |
3.000%, 07/18/32 (c) | | | 4,380,000 | | | | 4,495,317 | | |
3.000%, 03/01/42 | | | 547,016 | | | | 549,333 | | |
3.000%, 04/01/43 | | | 657,874 | | | | 660,656 | | |
3.000%, 05/01/43 | | | 1,317,555 | | | | 1,323,063 | | |
3.000%, 06/01/43 | | | 336,996 | | | | 338,422 | | |
3.000%, 09/01/43 | | | 800,367 | | | | 803,470 | | |
3.000%, 02/25/47 (c) | | | 2,000,000 | | | | 1,997,304 | | |
3.500%, 11/01/25 | | | 327,716 | | | | 341,831 | | |
3.500%, 01/01/26 | | | 329,387 | | | | 343,574 | | |
3.500%, 11/01/40 | | | 482,729 | | | | 499,355 | | |
3.500%, 01/01/41 | | | 417,700 | | | | 431,521 | | |
3.500%, 02/01/41 | | | 302,774 | | | | 314,269 | | |
3.500%, 04/01/41 | | | 506,907 | | | | 523,677 | | |
3.500%, 11/01/41 | | | 2,648,181 | | | | 2,735,375 | | |
3.500%, 01/01/42 | | | 2,450,460 | | | | 2,528,232 | | |
3.500%, 04/01/42 | | | 2,613,989 | | | | 2,697,403 | | |
3.500%, 08/01/42 | | | 1,827,846 | | | | 1,887,653 | | |
3.500%, 01/01/43 | | | 418,558 | | | | 431,878 | | |
3.500%, 03/01/43 | | | 1,510,714 | | | | 1,562,640 | | |
3.500%, 05/01/43 | | | 1,352,830 | | | | 1,398,936 | | |
3.500%, 05/01/45 | | | 1,453,918 | | | | 1,498,774 | | |
3.500%, 10/01/45 | | | 779,192 | | | | 800,774 | | |
3.500%, 07/25/46 (c) | | | 3,800,000 | | | | 3,902,867 | | |
4.000%, 04/01/41 | | | 1,446,048 | | | | 1,536,451 | | |
4.000%, 08/01/41 | | | 470,880 | | | | 496,819 | | |
4.000%, 09/01/41 | | | 756,620 | | | | 803,271 | | |
4.000%, 04/01/44 | | | 2,940,070 | | | | 3,092,114 | | |
4.000%, 08/01/44 | | | 316,849 | | | | 334,025 | | |
4.000%, 05/25/46 (c) | | | 1,100,000 | | | | 1,156,332 | | |
4.500%, 05/01/35 | | | 154,672 | | | | 166,667 | | |
4.500%, 07/01/35 | | | 456,942 | | | | 491,420 | | |
4.500%, 06/01/39 | | | 282,756 | | | | 306,883 | | |
4.500%, 04/01/41 | | | 1,901,912 | | | | 2,071,288 | | |
4.500%, 07/01/41 | | | 1,746,799 | | | | 1,887,922 | | |
5.000%, 05/01/18 | | | 3,660 | | | | 3,748 | | |
5.000%, 06/01/18 | | | 8,855 | | | | 9,068 | | |
5.000%, 07/01/18 | | | 18,188 | | | | 18,625 | | |
5.000%, 07/01/23 | | | 101,765 | | | | 111,095 | | |
5.000%, 11/01/33 | | | 61,250 | | | | 67,186 | | |
5.000%, 05/01/34 | | | 19,163 | | | | 21,032 | | |
5.000%, 12/01/34 | | | 272,931 | | | | 299,477 | | |
5.000%, 04/01/35 | | | 66,990 | | | | 73,547 | | |
5.000%, 08/01/35 | | | 98,491 | | | | 108,059 | | |
5.000%, 04/01/38 | | | 230,268 | | | | 254,887 | | |
5.000%, 12/01/39 | | | 334,037 | | | | 372,452 | | |
5.000%, 04/01/41 | | | 386,847 | | | | 427,966 | | |
5.500%, 09/01/17 | | | 403 | | | | 403 | | |
5.500%, 02/01/18 | | | 6,955 | | | | 6,990 | | |
5.500%, 03/01/18 | | | 12,798 | | | | 12,882 | | |
See accompanying notes to financial statements.
14
SFT Advantus Bond Fund
Investments in Securities – continued
| | | Principal | | Value(a) | |
5.500%, 04/01/33 | | $ | 457,239 | | | $ | 515,079 | | |
5.500%, 12/01/33 | | | 112,922 | | | | 127,380 | | |
5.500%, 01/01/34 | | | 155,640 | | | | 174,363 | | |
5.500%, 02/01/34 | | | 174,373 | | | | 196,268 | | |
5.500%, 03/01/34 | | | 294,220 | | | | 333,507 | | |
5.500%, 04/01/34 | | | 141,711 | | | | 158,630 | | |
5.500%, 09/01/34 | | | 56,291 | | | | 62,664 | | |
5.500%, 02/01/35 | | | 197,293 | | | | 220,854 | | |
5.500%, 04/01/35 | | | 349,121 | | | | 390,328 | | |
5.500%, 06/01/35 | | | 40,167 | | | | 44,477 | | |
5.500%, 08/01/35 | | | 154,988 | | | | 173,539 | | |
5.500%, 10/01/35 | | | 440,824 | | | | 502,339 | | |
5.500%, 11/01/35 | | | 104,942 | | | | 117,641 | | |
5.500%, 12/01/35 | | | 84,329 | | | | 94,483 | | |
5.500%, 12/01/39 | | | 137,561 | | | | 153,886 | | |
6.000%, 09/01/17 | | | 3,809 | | | | 3,813 | | |
6.000%, 08/01/23 | | | 85,223 | | | | 90,986 | | |
6.000%, 10/01/32 | | | 317,570 | | | | 365,805 | | |
6.000%, 11/01/32 | | | 236,397 | | | | 271,920 | | |
6.000%, 03/01/33 | | | 321,404 | | | | 367,830 | | |
6.000%, 04/01/33 | | | 14,673 | | | | 16,523 | | |
6.000%, 12/01/33 | | | 107,042 | | | | 122,247 | | |
6.000%, 01/01/36 | | | 75,595 | | | | 86,539 | | |
6.000%, 08/01/37 | | | 45,374 | | | | 51,113 | | |
6.000%, 09/01/37 | | | 102,569 | | | | 117,199 | | |
6.000%, 10/01/38 | | | 237,659 | | | | 275,235 | | |
6.000%, 12/01/38 | | | 139,039 | | | | 157,968 | | |
6.000%, 06/01/40 | | | 55,594 | | | | 63,055 | | |
6.500%, 12/01/31 | | | 92,128 | | | | 105,778 | | |
6.500%, 02/01/32 | | | 31,647 | | | | 36,395 | | |
6.500%, 04/01/32 | | | 137,347 | | | | 158,567 | | |
6.500%, 05/01/32 | | | 42,357 | | | | 47,803 | | |
6.500%, 07/01/32 | | | 105,650 | | | | 121,164 | | |
6.500%, 08/01/32 | | | 158,908 | | | | 179,570 | | |
6.500%, 09/01/32 | | | 109,424 | | | | 125,953 | | |
6.500%, 10/01/32 | | | 163,128 | | | | 186,267 | | |
6.500%, 11/01/37 | | | 79,116 | | | | 88,985 | | |
7.000%, 07/01/31 | | | 83,866 | | | | 98,026 | | |
7.000%, 09/01/31 | | | 165,490 | | | | 191,979 | | |
7.000%, 11/01/31 | | | 232,940 | | | | 264,609 | | |
7.000%, 02/01/32 | | | 40,282 | | | | 45,306 | | |
7.000%, 03/01/32 | | | 26,438 | | | | 30,904 | | |
7.000%, 07/01/32 | | | 70,159 | | | | 78,602 | | |
7.500%, 04/01/31 | | | 95,423 | | | | 106,780 | | |
7.500%, 05/01/31 | | | 29,382 | | | | 33,009 | | |
| | | | | | 55,845,499 | | |
Government National Mortgage Association
(GNMA) (2.9%) | |
0.011%, 06/17/45 (b) (d) (i) | | | 392,881 | | | | 149 | | |
3.000%, 03/15/45 | | | 1,336,786 | | | | 1,352,221 | | |
3.000%, 03/20/45 | | | 1,085,654 | | | | 1,097,745 | | |
3.000%, 04/15/45 | | | 1,636,802 | | | | 1,655,700 | | |
3.000%, 02/20/47 (c) | | | 1,000,000 | | | | 1,010,078 | | |
3.250%, 11/20/35 | | | 395,401 | | | | 408,428 | | |
3.500%, 10/20/43 | | | 792,651 | | | | 824,498 | | |
3.500%, 02/20/45 | | | 535,031 | | | | 554,759 | | |
3.500%, 03/20/45 | | | 599,133 | | | | 621,224 | | |
3.500%, 04/20/46 | | | 1,330,478 | | | | 1,379,263 | | |
3.750%, 03/20/46 | | | 819,602 | | | | 856,652 | | |
5.000%, 12/15/39 | | | 33,206 | | | | 37,056 | | |
5.000%, 01/15/40 | | | 523,489 | | | | 573,319 | | |
5.500%, 07/15/38 | | | 264,093 | | | | 298,209 | | |
| | | Principal | | Value(a) | |
5.500%, 10/15/38 | | $ | 297,404 | | | $ | 341,338 | | |
8.500%, 10/15/22 | | | 11,819 | | | | 11,862 | | |
| | | | | | 11,022,501 | | |
U.S. Treasury (11.7%) | |
U.S. Treasury Bond
3.000%, 02/15/47 | | | 9,975,000 | | | | 10,289,831 | | |
5.375%, 02/15/31 (e) | | | 5,115,000 | | | | 6,874,478 | | |
U.S. Treasury Note
0.750%, 10/31/18 | | | 550,000 | | | | 545,746 | | |
0.750%, 07/15/19 | | | 700,000 | | | | 690,949 | | |
0.875%, 10/15/18 | | | 10,000 | | | | 9,942 | | |
0.875%, 05/15/19 | | | 370,000 | | | | 366,575 | | |
1.000%, 11/15/19 | | | 200,000 | | | | 197,898 | | |
1.375%, 01/15/20 | | | 1,000,000 | | | | 997,500 | | |
1.375%, 02/15/20 | | | 2,629,000 | | | | 2,620,682 | | |
1.500%, 06/15/20 | | | 375,000 | | | | 374,473 | | |
1.750%, 05/31/22 | | | 9,915,000 | | | | 9,856,908 | | |
2.000%, 04/30/24 | | | 2,740,000 | | | | 2,719,557 | | |
2.375%, 05/15/27 | | | 9,045,000 | | | | 9,102,237 | | |
| | | | | | 44,646,776 | | |
Total government obligations
(cost: $137,747,103) | | | | | 141,779,609 | | |
Asset-Backed Securities (4.7%) | |
Asset-Backed Securities (4.7%) | |
CarMax Auto Owner Trust,
2.160%, 08/16/21 | | | 1,300,000 | | | | 1,301,848 | | |
Chrysler Capital Auto
Receivables Trust,
2.930%, 08/17/20 (f) | | | 600,000 | | | | 602,632 | | |
Commonbond Student
Loan Trust,
2.550%, 05/25/41 (f) | | | 940,000 | | | | 936,046 | | |
Conseco Financial Corp.,
6.400%, 10/15/18 | | | 6,449 | | | | 6,451 | | |
CountryPlace Manufactured
Housing Contract Trust,
5.200%, 12/15/35 (b) (f) | | | 1,607,726 | | | | 1,663,511 | | |
Countrywide Asset-Backed
Certificates,
5.934%, 05/25/37 (b) | | | 1,426,454 | | | | 1,407,493 | | |
CSMC Trust,
3.500%, 06/25/47 (b) (f) (i) | | | 2,025,000 | | | | 2,001,428 | | |
Earnest Student Loan
Program LLC
2.720%, 01/25/41 (f) | | | 833,088 | | | | 834,761 | | |
3.020%, 05/25/34 (f) | | | 1,313,947 | | | | 1,323,975 | | |
FAN Engine
Securitization, Ltd.,
3.000%, 10/15/19 (f) (g) (h) (i) | | | 312,626 | | | | 314,537 | | |
Foursight Capital
Automobile Receivables
Trust,
3.710%, 01/18/22 (f) | | | 1,200,000 | | | | 1,190,581 | | |
GMAC Mortgage Corp.
Loan Trust,
5.952%, 08/25/37 (j) | | | 2,845,836 | | | | 2,952,299 | | |
Invitation Homes
2015-SFR3 Trust,
2.509%, 08/17/32 (b) (f) | | | 956,183 | | | | 960,544 | | |
See accompanying notes to financial statements.
15
SFT Advantus Bond Fund
Investments in Securities – continued
| | | Principal | | Value(a) | |
TCF Auto Receivables
Owner Trust,
2.060%, 04/15/20 (f) | | $ | 1,567,879 | | | $ | 1,570,804 | | |
Trip Rail Master
Funding LLC,
2.863%, 04/15/44 (f) | | | 372,829 | | | | 366,546 | | |
Wheels SPV 2 LLC,
1.870%, 05/20/25 (f) | | | 450,000 | | | | 447,547 | | |
Total asset-backed securities
(cost: $17,755,998) | | | | | 17,881,003 | | |
Other Mortgage-Backed Securities (6.7%) | |
Collateralized Mortgage Obligations/Mortgage
Revenue Bonds (0.8%) | |
Credit-Based Asset
Servicing and
Securitization LLC,
6.250%, 10/25/36 (f) (j) | | | 582,980 | | | | 594,308 | | |
GS Mortgage-Backed
Securities Trust,
3.141%, 07/25/44 (b) (f) | | | 2,526,005 | | | | 2,415,508 | | |
JPMorgan Mortgage Trust,
3.142%, 11/25/33 (b) | | | 243,672 | | | | 236,621 | | |
Mellon Residential
Funding Corp.,
6.750%, 06/25/28 | | | 7,014 | | | | 7,091 | | |
| | | | | | 3,253,528 | | |
Commercial Mortgage-Backed Securities (5.9%) | |
7 WTC Depositor LLC Trust,
4.082%, 03/13/31 (f) | | | 335,381 | | | | 338,498 | | |
Aventura Mall Trust
2013-AVM,
3.867%, 12/05/32 (b) (f) | | | 1,000,000 | | | | 1,041,864 | | |
Banc of America
Re-Remic Trust,
4.325%, 08/15/46 (b) (f) | | | 1,350,000 | | | | 1,435,759 | | |
Citigroup Commercial
Mortgage Trust,
3.008%, 01/12/30 (b) (f) | | | 725,000 | | | | 726,020 | | |
Hometown Commercial
Mortgage
5.506%, 11/11/38 (f) (g) (i) | | | 33,532 | | | | 29,128 | | |
6.057%, 06/11/39 (f) (g) (i) | | | 207,011 | | | | 150,596 | | |
JPMCC Commercial
Mortgage Securities Trust,
3.723%, 03/15/50 | | | 1,000,000 | | | | 1,047,180 | | |
Merrill Lynch Mortgage
Investors, Inc.,
6.250%, 12/10/29 (b) | | | 163,728 | | | | 163,140 | | |
Morgan Stanley
Capital I Trust
3.201%, 08/05/34 (f) | | | 860,000 | | | | 866,107 | | |
3.451%, 08/05/34 (f) | | | 550,000 | | | | 551,657 | | |
Multi Security Asset Trust,
5.880%, 11/28/35 (b) (f) (g) (i) | | | 1,316,199 | | | | 1,337,622 | | |
One Market Plaza Trust,
3.614%, 02/10/32 (f) | | | 2,000,000 | | | | 2,081,160 | | |
UBS Commercial
Mortgage Trust,
3.724%, 06/15/50 | | | 4,000,000 | | | | 4,074,347 | | |
Vornado DP LLC,
4.004%, 09/13/28 (f) | | | 1,475,000 | | | | 1,559,920 | | |
| | | Principal | | Value(a) | |
Wells Fargo Commercial
Mortgage Trust
2.814%, 08/15/49 | | $ | 2,165,000 | | | $ | 2,093,962 | | |
3.184%, 04/15/50 | | | 1,544,000 | | | | 1,553,827 | | |
3.637%, 06/15/48 | | | 1,280,000 | | | | 1,330,310 | | |
3.640%, 12/15/59 | | | 1,560,000 | | | | 1,617,932 | | |
WF-RBS Commercial
Mortgage Trust,
3.667%, 11/15/44 | | | 345,000 | | | | 362,006 | | |
| | | | | | 22,361,035 | | |
Total other mortgage-backed securities
(cost: $25,812,255) | | | | | 25,614,563 | | |
Corporate Obligations (49.9%) | |
Communications (1.4%) | |
Telecommunication (0.5%) | |
Crown Castle Towers LLC,
3.222%, 05/15/42 (f) | | | 1,950,000 | | | | 1,997,463 | | |
Telephone Services (0.6%) | |
SBA Tower Trust,
2.240%, 04/15/43 (f) | | | 2,440,000 | | | | 2,438,825 | | |
Telephone — Integrated (0.3%) | |
AT&T, Inc.,
4.500%, 03/09/48 | | | 1,069,000 | | | | 1,000,236 | | |
Consumer Cyclical (2.2%) | |
Auto/Truck Parts &
Equipment — Original (1.8%) | |
General Motors Financial
Co., Inc.
2.400%, 05/09/19 | | | 1,675,000 | | | | 1,679,481 | | |
2.569%, 10/04/19 (b) | | | 3,275,000 | | | | 3,311,706 | | |
3.950%, 04/13/24 | | | 2,000,000 | | | | 2,028,404 | | |
| | | | | | 7,019,591 | | |
Hotels & Motels (0.4%) | |
Wyndham Worldwide Corp.,
4.150%, 04/01/24 | | | 1,375,000 | | | | 1,412,313 | | |
Consumer, Non-cyclical (1.3%) | |
Drugstore Chains (1.3%) | |
CVS Pass-Through Trust
5.298%, 01/11/27 (f) | | | 1,026,424 | | | | 1,107,409 | | |
5.880%, 01/10/28 | | | 420,047 | | | | 470,698 | | |
6.036%, 12/10/28 | | | 2,283,910 | | | | 2,576,362 | | |
6.943%, 01/10/30 | | | 609,864 | | | | 724,328 | | |
| | | | | | 4,878,797 | | |
Energy (5.1%) | |
Oil, Gas & Consumable Fuels (0.3%) | |
Marathon Petroleum Corp.,
5.850%, 12/15/45 | | | 1,070,000 | | | | 1,084,810 | | |
Pipelines (4.8%) | |
Buckeye Partners L.P.,
5.600%, 10/15/44 | | | 3,000,000 | | | | 3,097,041 | | |
Enbridge, Inc.,
6.000%, 01/15/77 (b) (h) | | | 1,100,000 | | | | 1,155,000 | | |
Enterprise Products
Operating LLC,
7.034%, 01/15/68 (b) | | | 1,835,000 | | | | 1,879,040 | | |
See accompanying notes to financial statements.
16
SFT Advantus Bond Fund
Investments in Securities – continued
| | | Principal | | Value(a) | |
NuStar Logistics L.P.,
8.150%, 04/15/18 | | $ | 2,986,000 | | | $ | 3,120,370 | | |
Sabine Pass
Liquefaction LLC,
5.750%, 05/15/24 | | | 3,000,000 | | | | 3,340,536 | | |
Sunoco Logistics Partners
Operations L.P.,
6.850%, 02/15/40 | | | 2,150,000 | | | | 2,420,204 | | |
Tennessee Gas
Pipeline Co. LLC,
8.375%, 06/15/32 | | | 1,850,000 | | | | 2,301,533 | | |
Transcanada Trust,
5.875%, 08/15/76 (b) (h) | | | 775,000 | | | | 841,030 | | |
| | | | | | 18,154,754 | | |
Financial (20.3%) | |
Banks (11.6%) | |
Bank of America Corp.
4.000%, 01/22/25 | | | 1,650,000 | | | | 1,678,735 | | |
5.875%, 01/05/21 | | | 765,000 | | | | 850,249 | | |
3.950%, 04/21/25 | | | 780,000 | | | | 790,328 | | |
Barclays PLC,
2.780%, 01/10/23 (b) (h) | | | 3,300,000 | | | | 3,366,115 | | |
Capital One Financial Corp.,
5.550%, 06/01/20 (b) | | | 2,915,000 | | | | 3,060,750 | | |
Capital One NA/Mclean VA,
2.001%, 09/13/19 (b) | | | 3,000,000 | | | | 3,013,329 | | |
Citigroup, Inc.
4.400%, 06/10/25 | | | 1,500,000 | | | | 1,562,851 | | |
5.950%, 05/15/25 (b) | | | 2,050,000 | | | | 2,196,636 | | |
Compass Bank,
3.875%, 04/10/25 | | | 2,500,000 | | | | 2,490,300 | | |
Discover Bank
3.100%, 06/04/20 | | | 2,250,000 | | | | 2,292,847 | | |
3.450%, 07/27/26 | | | 1,900,000 | | | | 1,837,669 | | |
8.700%, 11/18/19 | | | 322,000 | | | | 363,834 | | |
HSBC Holdings PLC,
3.262%, 03/13/23 (b) (h) | | | 1,875,000 | | | | 1,910,529 | | |
Huntington Bancshares, Inc.,
3.150%, 03/14/21 | | | 1,500,000 | | | | 1,529,586 | | |
JPMorgan Chase & Co.,
5.000%, 07/01/19 (b) | | | 1,700,000 | | | | 1,738,250 | | |
Morgan Stanley
2.373%, 05/08/24 (b) | | | 3,600,000 | | | | 3,618,587 | | |
3.125%, 07/27/26 | | | 800,000 | | | | 777,798 | | |
5.450%, 07/15/19 (b) | | | 1,870,000 | | | | 1,936,385 | | |
5.500%, 07/28/21 | | | 740,000 | | | | 820,553 | | |
Standard Chartered PLC,
7.750%, 04/02/23 (b) (f) (h) | | | 1,050,000 | | | | 1,127,437 | | |
Suntrust Banks, Inc.,
5.050%, 06/15/22 (b) | | | 2,000,000 | | | | 2,030,000 | | |
The Goldman Sachs
Group, Inc.,
2.196%, 04/25/19 (b) | | | 2,415,000 | | | | 2,441,391 | | |
US Bancorp,
5.300%, 04/15/27 (b) | | | 1,550,000 | | | | 1,650,750 | | |
Wells Fargo & Co.,
3.000%, 10/23/26 | | | 1,100,000 | | | | 1,071,133 | | |
| | | | | | 44,156,042 | | |
| | | Principal | | Value(a) | |
Diversified Financial Services (1.8%) | |
Block Financial LLC,
4.125%, 10/01/20 | | $ | 2,050,000 | | | $ | 2,115,799 | | |
Raymond James
Financial, Inc.,
4.950%, 07/15/46 | | | 2,425,000 | | | | 2,631,646 | | |
The Charles Schwab Corp.,
4.625%, 03/01/22 (b) | | | 2,200,000 | | | | 2,246,750 | | |
| | | | | | 6,994,195 | | |
Insurance (4.9%) | |
Great-West Lifeco Finance
Delaware LP,
4.150%, 06/03/47 (f) | | | 1,400,000 | | | | 1,402,087 | | |
Liberty Mutual Group, Inc.,
6.500%, 05/01/42 (f) | | | 1,805,000 | | | | 2,336,910 | | |
Nuveen Finance LLC
2.950%, 11/01/19 (f) | | | 1,345,000 | | | | 1,364,223 | | |
4.125%, 11/01/24 (f) | | | 1,150,000 | | | | 1,189,787 | | |
Peachtree Corners
Funding Trust,
3.976%, 02/15/25 (f) | | | 1,825,000 | | | | 1,851,995 | | |
Teachers Insurance &
Annuity Association,
4.270%, 05/15/47 (f) | | | 2,500,000 | | | | 2,559,273 | | |
The Chubb Corp.,
3.408%, 03/29/67 (b) | | | 4,000,000 | | | | 3,970,000 | | |
The Hartford Financial
Services Group, Inc.,
3.307%, 02/12/67 (b) (f) | | | 1,500,000 | | | | 1,456,875 | | |
Unum Group,
5.750%, 08/15/42 | | | 1,975,000 | | | | 2,342,269 | | |
| | | | | | 18,473,419 | | |
Real Estate Investment Trust — Health Care (1.4%) | |
Omega Healthcare
Investors, Inc.,
4.500%, 01/15/25 | | | 975,000 | | | | 987,248 | | |
Physicians Realty L.P.,
4.300%, 03/15/27 | | | 1,275,000 | | | | 1,292,123 | | |
Ventas Realty L.P.,
3.100%, 01/15/23 | | | 3,000,000 | | | | 3,010,017 | | |
| | | | | | 5,289,388 | | |
Real Estate Investment Trust — Hotels (0.6%) | |
Hospitality Properties Trust
4.500%, 06/15/23 | | | 700,000 | | | | 733,606 | | |
4.500%, 03/15/25 | | | 450,000 | | | | 461,857 | | |
4.650%, 03/15/24 | | | 920,000 | | | | 957,440 | | |
| | | | | | 2,152,903 | | |
Health Care (2.2%) | |
Health Care Providers & Services (1.2%) | |
Express Scripts Holding Co.,
3.000%, 07/15/23 | | | 1,700,000 | | | | 1,688,313 | | |
NYU Hospitals Center,
4.428%, 07/01/42 | | | 1,480,000 | | | | 1,524,631 | | |
Sinai Health System,
3.034%, 01/20/36 | | | 1,495,000 | | | | 1,479,468 | | |
| | | | | | 4,692,412 | | |
See accompanying notes to financial statements.
17
SFT Advantus Bond Fund
Investments in Securities – continued
| | | Principal | | Value(a) | |
Medical Products/Supplies (0.8%) | |
Bio-Rad Laboratories, Inc.,
4.875%, 12/15/20 | | $ | 2,700,000 | | | $ | 2,901,039 | | |
Pharmaceuticals (0.2%) | |
Teva Pharmaceutical
Finance Netherlands III BV,
2.800%, 07/21/23 (h) | | | 900,000 | | | | 875,381 | | |
Industrials (1.8%) | |
Aerospace & Defense (0.5%) | |
Newell Brands, Inc.,
5.000%, 11/15/23 | | | 2,000,000 | | | | 2,140,152 | | |
Electrical Equipment (0.4%) | |
Keysight Technologies, Inc.,
3.300%, 10/30/19 | | | 1,500,000 | | | | 1,527,900 | | |
Machinery (0.9%) | |
Siemens
Financieringsmaatschappij
NV,
1.860%, 03/16/22 (b) (f) (h) | | | 3,275,000 | | | | 3,305,978 | | |
Information Technology (1.0%) | |
Electronic Equipment, Instruments &
Components (0.5%) | |
Tech Data Corp.,
3.700%, 02/15/22 | | | 1,835,000 | | | | 1,872,456 | | |
Software (0.5%) | |
Microsoft Corp.,
4.500%, 02/06/57 | | | 1,800,000 | | | | 1,981,796 | | |
Technology (0.9%) | |
Computers (0.9%) | |
Dell International
LLC/EMC Corp,
8.350%, 07/15/46 (f) | | | 980,000 | | | | 1,264,771 | | |
Dell International
LLC/EMC Corp.,
5.450%, 06/15/23 (f) | | | 1,790,000 | | | | 1,942,454 | | |
| | | | | | 3,207,225 | | |
Transportation (6.3%) | |
Airlines (5.1%) | |
Air Canada 2015 -1 Class C
Pass Through Trust,
5.000%, 03/15/20 (f) (h) | | | 2,600,000 | | | | 2,645,500 | | |
America West Airlines
2000-1 Pass Through Trust,
8.057%, 01/02/22 | | | 527,608 | | | | 603,847 | | |
American Airlines 2013-1
Class B Pass Through Trust,
5.625%, 07/15/22 (f) | | | 1,876,202 | | | | 1,964,384 | | |
American Airlines 2013-2
Class B Pass Through Trust,
5.600%, 01/15/22 (f) | | | 1,303,682 | | | | 1,360,718 | | |
American Airlines 2015-1
Class B Pass Through Trust,
3.700%, 11/01/24 | | | 1,734,465 | | | | 1,717,120 | | |
American Airlines 2016-1
Class B Pass Through Trust,
5.250%, 07/15/25 | | | 528,233 | | | | 549,996 | | |
| | | Principal | | Value(a) | |
British Airways PLC,
5.625%, 12/20/21 (f) | | $ | 459,942 | | | $ | 480,639 | | |
Continental Airlines 2009-2
Class A Pass Through Trust,
7.250%, 05/10/21 | | | 1,301,722 | | | | 1,441,657 | | |
Continental Airlines 2012-1
Class B Pass Through Trust,
6.250%, 10/11/21 | | | 891,884 | | | | 943,167 | | |
Delta Air Lines 2012-1
Class A Pass Through Trust,
4.750%, 11/07/21 | | | 520,688 | | | | 545,421 | | |
Delta Air Lines 2012-1
Class B Pass Through Trust,
6.875%, 05/07/19 (f) | | | 1,340,931 | | | | 1,424,739 | | |
Delta Air Lines 2015-1
Class B Pass Through Trust,
4.250%, 01/30/25 | | | 1,072,609 | | | | 1,102,105 | | |
United Airlines 2014-1
Class B Pass Through Trust,
4.750%, 10/11/23 | | | 570,773 | | | | 591,464 | | |
United Airlines 2014-2
Class B Pass Through Trust,
4.625%, 03/03/24 | | | 2,358,473 | | | | 2,429,227 | | |
Virgin Australia 2013-1A
Pass Through Trust,
5.000%, 04/23/25 (f) (h) | | | 1,128,897 | | | | 1,176,875 | | |
Virgin Australia 2013-1B
Pass Through Trust,
6.000%, 04/23/22 (f) (h) | | | 532,124 | | | | 545,427 | | |
| | | | | | 19,522,286 | | |
Transport — Rail (1.2%) | |
BNSF Funding Trust I,
6.613%, 12/15/55 (b) | | | 3,785,000 | | | | 4,358,882 | | |
Utilities (7.4%) | |
Electric Companies (0.9%) | |
Dominion Energy Gas
Holdings LLC,
2.500%, 12/15/19 | | | 1,270,000 | | | | 1,278,490 | | |
Indianapolis Power &
Light Co.,
4.700%, 09/01/45 (f) | | | 1,900,000 | | | | 2,053,917 | | |
| | | | | | 3,332,407 | | |
Electric Utilities (5.2%) | |
Cleco Corporate
Holdings LLC
3.743%, 05/01/26 | | | 1,125,000 | | | | 1,128,287 | | |
4.973%, 05/01/46 | | | 1,000,000 | | | | 1,064,429 | | |
Dominion Energy, Inc.,
5.750%, 10/01/54 (b) | | | 1,800,000 | | | | 1,926,000 | | |
El Paso Electric Co.,
5.000%, 12/01/44 | | | 1,165,000 | | | | 1,255,239 | | |
Exelon Corp.,
3.497%, 06/01/22 | | | 1,750,000 | | | | 1,787,872 | | |
Exelon Generation Co. LLC,
3.400%, 03/15/22 | | | 3,900,000 | | | | 3,969,712 | | |
FirstEnergy Corp.,
4.850%, 07/15/47 | | | 850,000 | | | | 862,331 | | |
IPALCO Enterprises, Inc.,
3.450%, 07/15/20 | | | 1,400,000 | | | | 1,417,500 | | |
See accompanying notes to financial statements.
18
SFT Advantus Bond Fund
Investments in Securities – continued
| | | Shares/
Principal | | Value(a) | |
Pacific Gas & Electric Co.,
1.402%, 11/30/17 (b) | | $ | 1,400,000 | | | $ | 1,400,337 | | |
PPL Capital Funding, Inc.,
3.961%, 03/30/67 (b) | | | 2,500,000 | | | | 2,409,375 | | |
Southern Power Co.,
4.950%, 12/15/46 | | | 2,450,000 | | | | 2,529,978 | | |
| | | | | | 19,751,060 | | |
Gas Utilities (1.3%) | |
Brooklyn Union Gas Co.,
4.504%, 03/10/46 (f) | | | 1,300,000 | | | | 1,405,099 | | |
Southern Co. Gas
Capital Corp.
3.875%, 11/15/25 | | | 2,630,000 | | | | 2,702,059 | | |
4.400%, 05/30/47 | | | 775,000 | | | | 790,447 | | |
| | | | | | 4,897,605 | | |
Total corporate obligations
(cost: $183,495,824) | | | | | 189,419,315 | | |
Total long-term debt securities
(cost: $364,811,180) | | | | | 374,694,490 | | |
Short-Term Securities (4.2%) | |
Investment Companies (4.2%) | |
State Street Institutional
U.S. Government Money
Market Fund, current
rate 0.880% (k) | | | 15,989,883 | | | | 15,989,883 | | |
Total short-term securities
(cost: $15,989,883) | | | | | 15,989,883 | | |
Total investments in securities
(cost: $380,801,063) (l) | | | | | 390,684,373 | | |
Liabilities in excess of cash
and other assets (-2.8%) | | | | | (10,657,677 | ) | |
Total net assets (100.0%) | | | | $ | 380,026,696 | | |
Investments in Securities Legend
(a) Securities are valued by procedures described in Note 2 of the Notes to Financial Statements.
(b) Variable rate security.
(c) Security is issued on a when-issued or forward commitment basis. As of June 30, 2017 the total cost of investments issued on a when-issued or forward commitment basis was $12,964,423.
(d) Interest-only security that entitles holders to receive only interest on the underlying mortgages. The principal amount of the underlying pool represents the notional amount on which current interest is calculated. The yield to maturity of an interest-only security is sensitive to the rate of principal payments on the underlying mortgage assets. The rate disclosed represents the market yield based upon the current cost basis and estimated timing and amount of future cash flows.
(e) Fully or partially pledged as initial margin deposits on open futures contracts.
Holdings of Open Futures Contracts
On June 30, 2017, securities with an aggregate market value of $403,195 have been pledged to cover margin requirements for the following open futures contracts:
Type | | Expiration | | Number of
Contracts | | Position
Type | | Unrealized
Appreciation/
(Depreciation) | |
U.S. Long
Bond | | September 2017 | | | 14 | | | Long | | $ | 15,378 | | |
2 Year U.S.
Treasury
Note | | September 2017 | | | 3 | | | Long | | | (993 | ) | |
5 Year U.S.
Treasury
Note | | September 2017 | | | 169 | | | Long | | | (46,711 | ) | |
10 Year U.S.
Treasury
Note | | September 2017 | | | 129 | | | Short | | | 42,941 | | |
| | | | | | 315 | | | | | $ | 10,615 | | |
(f) Security sold within terms of a private placement memorandum exempt from registration under Section 144A of the Securities Act of 1933, as amended, and may be sold only to dealers in that program. This security has been determined to be liquid unless otherwise indicated.
(g) Illiquid security. (See Note 3 of the Notes to Financial Statements.)
(h) Foreign security: The Fund held 4.5% of net assets in foreign securities at June 30, 2017.
(i) These securities are being fair-valued according to procedures approved by the Board of Trustees.
(j) Step rate security.
(k) All or a portion of the security segregated to cover when-issued purchase commitments outstanding or extended settlement trades as of June 30, 2017.
(l) At June 30, 2017 the cost of securities for federal income tax purposes was $381,824,559. The aggregate unrealized appreciation and depreciation of investments in securities based on this cost were:
Gross unrealized appreciation | | $ | 10,884,332 | | |
Gross unrealized depreciation | | | (2,024,518 | ) | |
Net unrealized appreciation | | $ | 8,859,814 | | |
See accompanying notes to financial statements.
19
SFT Advantus Dynamic Managed Volatility Fund
Investments in Securities
(Percentages of each investment category relate to total net assets)
| | | Principal | | Value(a) | |
Long-Term Debt Securities (38.2%) | |
Government Obligations (1.0%) | |
U.S. Government Agencies and
Obligations (1.0%) | |
Federal Home Loan Mortgage
Corporation (FHLMC) (0.4%) | |
3.000%, 09/01/43 | | $ | 174,673 | | | $ | 175,331 | | |
3.500%, 10/01/44 | | | 294,113 | | | | 302,674 | | |
3.500%, 11/01/44 | | | 292,999 | | | | 301,332 | | |
3.500%, 12/01/44 | | | 308,009 | | | | 316,673 | | |
| | | | | | 1,096,010 | | |
Federal National Mortgage Association
(FNMA) (0.3%) | |
3.000%, 04/01/43 | | | 263,695 | | | | 264,812 | | |
3.000%, 05/01/43 | | | 116,332 | | | | 116,815 | | |
3.000%, 06/01/43 | | | 333,816 | | | | 335,190 | | |
3.500%, 08/01/42 | | | 147,407 | | | | 152,230 | | |
3.500%, 02/01/43 | | | 164,399 | | | | 170,550 | | |
| | | | | | 1,039,597 | | |
U.S. Treasury (0.3%) | |
U.S. Treasury Note,
0.625%, 04/30/18 (b) | | | 1,000,000 | | | | 994,688 | | |
Total government obligations
(cost: $3,101,516) | | | | | 3,130,295 | | |
Asset-Backed Security (0.3%) | |
Longtrain Leasing III
LLC 2015-1A Class A2,
4.060%, 01/15/45 (c) (d) | | | 1,000,000 | | | | 991,423 | | |
Total asset-backed securities
(cost: $999,578) | | | | | 991,423 | | |
Other Mortgage-Backed Securities (0.3%) | |
Commercial Mortgage-Backed Securities (0.3%) | |
CSMC Mortgage Trust,
4.276%, 11/15/37 (d) (e) | | | 1,000,000 | | | | 1,051,553 | | |
Total other mortgage-backed securities
(cost: $1,008,273) | | | | | 1,051,553 | | |
Corporate Obligations (36.6%) | |
Basic Materials (0.1%) | |
Mining (0.1%) | |
BHP Billiton Finance USA, Ltd.,
2.875%, 02/24/22 (f) | | | 196,000 | | | | 199,985 | | |
Communications (1.8%) | |
Cable/Satellite TV (0.7%) | |
Comcast Corp.
4.200%, 08/15/34 | | | 500,000 | | | | 529,476 | | |
4.650%, 07/15/42 | | | 250,000 | | | | 274,106 | | |
6.400%, 05/15/38 | | | 1,000,000 | | | | 1,329,907 | | |
| | | | | | 2,133,489 | | |
Media (0.7%) | |
CBS Corp.,
3.500%, 01/15/25 | | | 750,000 | | | | 760,077 | | |
4.000%, 01/15/26 | | | 250,000 | | | | 258,693 | | |
| | | Principal | | Value(a) | |
Time Warner, Inc.,
4.850%, 07/15/45 | | $ | 1,000,000 | | | $ | 1,029,684 | | |
Viacom, Inc.,
5.625%, 09/15/19 | | | 250,000 | | | | 266,954 | | |
| | | | | | 2,315,408 | | |
Telecommunication (0.3%) | |
Crown Castle Towers LLC,
3.663%, 05/15/25 (d) | | | 1,000,000 | | | | 1,035,000 | | |
Wireless Telecommunication Services (0.1%) | |
Rogers Communications, Inc.,
4.100%, 10/01/23 (f) | | | 250,000 | | | | 265,175 | | |
Consumer Cyclical (1.7%) | |
Auto/Truck Parts & Equipment — Original (0.5%) | |
Ford Motor Co.,
5.291%, 12/08/46 | | | 1,500,000 | | | | 1,539,480 | | |
Food & Staples Retailing (0.3%) | |
The Kroger Co.,
4.450%, 02/01/47 | | | 1,000,000 | | | | 963,907 | | |
Home Furnishings (0.3%) | |
Harman International
Industries, Inc.,
4.150%, 05/15/25 | | | 1,000,000 | | | | 1,039,508 | | |
Retail (0.6%) | |
AutoZone, Inc.,
3.250%, 04/15/25 | | | 1,000,000 | | | | 982,482 | | |
Target Corp.,
3.500%, 07/01/24 (b) | | | 750,000 | | | | 776,830 | | |
Wal-Mart Stores, Inc.,
1.950%, 12/15/18 (b) | | | 250,000 | | | | 251,705 | | |
| | | | | | 2,011,017 | | |
Consumer Staples (1.6%) | |
Beverages (0.2%) | |
The Coca-Cola Co.,
3.200%, 11/01/23 (b) | | | 500,000 | | | | 518,856 | | |
Consumer Products — Miscellaneous (0.2%) | |
Johnson (S.C.) & Son, Inc.,
3.350%, 09/30/24 (d) | | | 750,000 | | | | 762,501 | | |
Food Products (0.6%) | |
General Mills, Inc.,
4.150%, 02/15/43 | | | 1,000,000 | | | | 1,001,037 | | |
Kellogg Co.,
4.500%, 04/01/46 | | | 1,000,000 | | | | 1,028,328 | | |
| | | | | | 2,029,365 | | |
Household Products (0.3%) | |
Kimberly-Clark Corp.,
3.900%, 05/04/47 | | | 1,000,000 | | | | 1,022,660 | | |
Personal Care (0.3%) | |
The Estee Lauder Cos., Inc.,
4.150%, 03/15/47 | | | 1,000,000 | | | | 1,046,788 | | |
See accompanying notes to financial statements.
20
SFT Advantus Dynamic Managed Volatility Fund
Investments in Securities – continued
| | | Principal | | Value(a) | |
Consumer, Non-cyclical (1.6%) | |
Commercial Service — Finance (0.1%) | |
Moody's Corp.,
4.875%, 02/15/24 | | $ | 250,000 | | | $ | 275,219 | | |
Diagnostic Equipment (0.6%) | |
Abbott Laboratories
3.875%, 09/15/25 | | | 750,000 | | | | 771,396 | | |
4.750%, 11/30/36 | | | 1,000,000 | | | | 1,088,462 | | |
4.750%, 04/15/43 | | | 250,000 | | | | 264,550 | | |
| | | | | | 2,124,408 | | |
Drugstore Chains (0.1%) | |
CVS Pass-Through Trust,
6.943%, 01/10/30 | | | 185,934 | | | | 220,832 | | |
Food (0.6%) | |
Flowers Foods, Inc.,
3.500%, 10/01/26 | | | 1,000,000 | | | | 981,148 | | |
Tyson Foods, Inc.,
5.150%, 08/15/44 | | | 1,000,000 | | | | 1,128,532 | | |
| | | | | | 2,109,680 | | |
Pharmaceuticals (0.2%) | |
Novartis Capital Corp.,
3.400%, 05/06/24 | | | 500,000 | | | | 521,760 | | |
Energy (4.0%) | |
Oil, Gas & Consumable Fuels (1.6%) | |
Apache Corp.,
3.250%, 04/15/22 | | | 181,000 | | | | 183,638 | | |
Chevron Corp.,
3.191%, 06/24/23 | | | 250,000 | | | | 258,746 | | |
EOG Resources, Inc.,
2.625%, 03/15/23 | | | 250,000 | | | | 246,753 | | |
Marathon Petroleum Corp.,
3.625%, 09/15/24 | | | 750,000 | | | | 757,831 | | |
Noble Energy, Inc.,
3.900%, 11/15/24 | | | 1,000,000 | | | | 1,027,564 | | |
Phillips 66,
4.650%, 11/15/34 (b) | | | 1,000,000 | | | | 1,052,564 | | |
Total Capital International SA,
3.750%, 04/10/24 (f) | | | 750,000 | | | | 792,229 | | |
Valero Energy Corp.,
3.650%, 03/15/25 | | | 1,000,000 | | | | 1,019,651 | | |
| | | | | | 5,338,976 | | |
Pipelines (2.4%) | |
Columbia Pipeline
Group, Inc.,
4.500%, 06/01/25 | | | 1,000,000 | | | | 1,064,488 | | |
Enbridge Energy
Partners L.P.,
6.500%, 04/15/18 | | | 250,000 | | | | 258,868 | | |
Energy Transfer L.P.,
4.900%, 03/15/35 | | | 1,000,000 | | | | 972,400 | | |
Enterprise Products
Operating LLC,
5.750%, 03/01/35 | | | 250,000 | | | | 283,495 | | |
Florida Gas Transmission
Co. LLC,
4.350%, 07/15/25 (d) | | | 1,000,000 | | | | 1,054,433 | | |
| | | Principal | | Value(a) | |
Kinder Morgan, Inc.,
5.300%, 12/01/34 | | $ | 750,000 | | | $ | 772,236 | | |
Plains All American Pipeline
L.P./PAA Finance Corp.,
3.850%, 10/15/23 | | | 250,000 | | | | 251,666 | | |
Southern Natural
Gas Co. LLC,
4.800%, 03/15/47 (c) (d) | | | 500,000 | | | | 529,115 | | |
Spectra Energy Partners L.P.,
2.950%, 09/25/18 | | | 250,000 | | | | 252,815 | | |
Sunoco Logistics Partners
Operations L.P.,
4.250%, 04/01/24 | | | 1,000,000 | | | | 1,011,441 | | |
Tesoro Logistics LP,
5.250%, 01/15/25 | | | 500,000 | | | | 525,000 | | |
Williams Partners L.P.
3.750%, 06/15/27 | | | 500,000 | | | | 494,912 | | |
4.300%, 03/04/24 | | | 500,000 | | | | 520,087 | | |
| | | | | | 7,990,956 | | |
Financial (11.5%) | |
Banks (3.8%) | |
Associated Banc-Corp,
4.250%, 01/15/25 | | | 750,000 | | | | 764,947 | | |
Astoria Financial Corp.,
3.500%, 06/08/20 | | | 1,000,000 | | | | 1,005,447 | | |
Bank of America Corp.
3.950%, 04/21/25 | | | 1,000,000 | | | | 1,013,241 | | |
4.244%, 04/24/38 (e) | | | 1,000,000 | | | | 1,039,853 | | |
5.700%, 01/24/22 | | | 250,000 | | | | 282,491 | | |
Bank of Montreal,
2.375%, 01/25/19 (f) | | | 250,000 | | | | 252,248 | | |
Capital One Financial Corp.,
4.750%, 07/15/21 | | | 250,000 | | | | 269,729 | | |
Citigroup, Inc.,
3.300%, 04/27/25 | | | 750,000 | | | | 750,223 | | |
Credit Suisse Group
Funding Guernsey, Ltd.,
2.750%, 03/26/20 (f) | | | 600,000 | | | | 604,718 | | |
Discover Bank
3.100%, 06/04/20 | | | 1,000,000 | | | | 1,019,043 | | |
4.250%, 03/13/26 | | | 500,000 | | | | 513,565 | | |
HSBC Bank USA NA,
4.875%, 08/24/20 | | | 250,000 | | | | 268,880 | | |
JPMorgan Chase & Co.
3.125%, 01/23/25 | | | 1,000,000 | | | | 994,147 | | |
4.500%, 01/24/22 | | | 250,000 | | | | 270,712 | | |
KeyBank NA,
3.180%, 05/22/22 | | | 1,000,000 | | | | 1,018,330 | | |
PNC Bank NA,
3.800%, 07/25/23 | | | 250,000 | | | | 262,598 | | |
SunTrust Bank,
2.750%, 05/01/23 | | | 250,000 | | | | 249,218 | | |
Synchrony Bank,
3.000%, 06/15/22 | | | 1,000,000 | | | | 995,488 | | |
The Goldman Sachs
Group, Inc.,
3.850%, 01/26/27 | | | 1,000,000 | | | | 1,017,308 | | |
| | | | | | 12,592,186 | | |
See accompanying notes to financial statements.
21
SFT Advantus Dynamic Managed Volatility Fund
Investments in Securities – continued
| | | Principal | | Value(a) | |
Capital Markets (0.3%) | |
The Bank of New York
Mellon Corp.,
3.442%, 02/07/28 (e) | | $ | 1,000,000 | | | $ | 1,014,780 | | |
Diversified Banks (0.3%) | |
Bank of America Corp.,
4.183%, 11/25/27 | | | 1,000,000 | | | | 1,017,085 | | |
Diversified Financial Services (1.4%) | |
American Express
Credit Corp.,
3.300%, 05/03/27 | | | 1,000,000 | | | | 999,173 | | |
CME Group, Inc.,
3.000%, 03/15/25 | | | 1,000,000 | | | | 1,008,934 | | |
Discover Financial Services,
3.750%, 03/04/25 | | | 1,000,000 | | | | 988,071 | | |
Eaton Vance Corp.,
3.500%, 04/06/27 | | | 1,000,000 | | | | 1,009,631 | | |
TD Ameritrade
Holding Corp.,
2.950%, 04/01/22 | | | 700,000 | | | | 716,307 | | |
| | | | | | 4,722,116 | | |
Insurance (2.4%) | |
American Financial
Group, Inc.,
4.500%, 06/15/47 | | | 1,000,000 | | | | 1,017,635 | | |
Assured Guaranty US
Holdings, Inc.,
5.000%, 07/01/24 | | | 500,000 | | | | 536,065 | | |
First American
Financial Corp.,
4.600%, 11/15/24 | | | 750,000 | | | | 767,128 | | |
Liberty Mutual Group, Inc.,
4.250%, 06/15/23 (d) | | | 750,000 | | | | 797,914 | | |
Manulife Financial Corp.,
4.150%, 03/04/26 (f) | | | 750,000 | | | | 792,671 | | |
Marsh & McLennan
Cos., Inc.,
4.350%, 01/30/47 | | | 1,000,000 | | | | 1,068,700 | | |
Metropolitan Life
Global Funding I,
3.875%, 04/11/22 (d) | | | 250,000 | | | | 264,632 | | |
Old Republic
International Corp.,
4.875%, 10/01/24 | | | 750,000 | | | | 802,249 | | |
StanCorp Financial
Group, Inc.,
5.000%, 08/15/22 | | | 750,000 | | | | 810,260 | | |
The Hanover Insurance
Group, Inc.,
4.500%, 04/15/26 | | | 1,000,000 | | | | 1,042,927 | | |
| | | | | | 7,900,181 | | |
Property / Casualty Insurance (0.3%) | |
Arch Capital Finance LLC,
4.011%, 12/15/26 | | | 1,000,000 | | | | 1,031,559 | | |
| | | Principal | | Value(a) | |
Real Estate Investment Trust — Diversified (0.3%) | |
Retail Properties of
America, Inc.,
4.000%, 03/15/25 | | $ | 1,000,000 | | | $ | 958,766 | | |
Real Estate Investment Trust — Health Care (0.9%) | |
Healthcare Realty Trust, Inc.,
3.875%, 05/01/25 | | | 1,000,000 | | | | 1,007,981 | | |
Healthcare Trust of America
Holdings L.P.,
3.750%, 07/01/27 | | | 1,000,000 | | | | 988,456 | | |
Physicians Realty L.P.,
4.300%, 03/15/27 | | | 1,000,000 | | | | 1,013,430 | | |
| | | | | | 3,009,867 | | |
Real Estate Investment Trust — Office Property (0.2%) | |
Alexandria Real Estate
Equities, Inc.,
4.500%, 07/30/29 | | | 500,000 | | | | 530,004 | | |
Real Estate Investment Trust — Residential (0.2%) | |
UDR, Inc.,
4.000%, 10/01/25 | | | 750,000 | | | | 775,640 | | |
Real Estate Investment Trust — Shopping Centers (0.1%) | |
Retail Opportunity
Investments Partnership L.P.,
5.000%, 12/15/23 | | | 250,000 | | | | 259,357 | | |
Real Estate Investment Trust — Single Tenant (0.4%) | |
Select Income REIT,
4.500%, 02/01/25 | | | 750,000 | | | | 751,099 | | |
Tanger Properties L.P.,
3.875%, 12/01/23 | | | 500,000 | | | | 510,153 | | |
| | | | | | 1,261,252 | | |
Real Estate Investment Trust — Storage (0.2%) | |
CubeSmart L.P.,
4.375%, 12/15/23 | | | 500,000 | | | | 528,056 | | |
Specialized REITs (0.7%) | |
American Tower Corp.,
3.375%, 10/15/26 | | | 1,000,000 | | | | 978,391 | | |
Essex Portfolio L.P.,
3.500%, 04/01/25 | | | 1,000,000 | | | | 999,775 | | |
HCP, Inc.,
4.250%, 11/15/23 | | | 250,000 | | | | 262,131 | | |
| | | | | | 2,240,297 | | |
Health Care (3.0%) | |
Biotechnology (0.4%) | |
Amgen, Inc.,
5.700%, 02/01/19 | | | 250,000 | | | | 265,013 | | |
Celgene Corp.,
3.875%, 08/15/25 | | | 1,000,000 | | | | 1,044,351 | | |
| | | | | | 1,309,364 | | |
Health Care Equipment & Supplies (0.3%) | |
Zimmer Biomet Holdings, Inc.,
3.550%, 04/01/25 | | | 1,000,000 | | | | 1,010,088 | | |
See accompanying notes to financial statements.
22
SFT Advantus Dynamic Managed Volatility Fund
Investments in Securities – continued
| | | Principal | | Value(a) | |
Health Care Providers & Services (0.5%) | |
Laboratory Corp. of
America Holdings,
4.000%, 11/01/23 | | $ | 250,000 | | | $ | 260,171 | | |
UnitedHealth Group, Inc.
2.750%, 02/15/23 | | | 250,000 | | | | 251,866 | | |
3.750%, 07/15/25 (b) | | | 1,000,000 | | | | 1,053,252 | | |
| | | | | | 1,565,289 | | |
Pharmaceuticals (1.8%) | |
AbbVie, Inc.,
3.600%, 05/14/25 | | | 1,000,000 | | | | 1,020,064 | | |
Allergan Funding SCS,
3.800%, 03/15/25 (f) | | | 670,000 | | | | 693,014 | | |
Bristol-Myers Squibb Co.,
3.250%, 11/01/23 (b) | | | 500,000 | | | | 516,973 | | |
Cardinal Health, Inc.,
3.750%, 09/15/25 | | | 1,000,000 | | | | 1,039,161 | | |
Eli Lilly & Co.,
3.950%, 05/15/47 | | | 1,000,000 | | | | 1,032,534 | | |
Mead Johnson Nutrition Co.,
5.900%, 11/01/39 | | | 1,000,000 | | | | 1,246,036 | | |
Mylan, Inc.,
4.200%, 11/29/23 | | | 500,000 | | | | 523,569 | | |
| | | | | | 6,071,351 | | |
Industrials (4.3%) | |
Aerospace & Defense (0.8%) | |
Harris Corp.,
3.832%, 04/27/25 | | | 1,000,000 | | | | 1,032,042 | | |
Rockwell Collins, Inc.,
3.700%, 12/15/23 (b) | | | 500,000 | | | | 520,372 | | |
United Technologies Corp.,
4.050%, 05/04/47 | | | 1,000,000 | | | | 1,024,306 | | |
| | | | | | 2,576,720 | | |
Air Freight & Logistics (0.3%) | |
FedEx Corp.,
4.400%, 01/15/47 | | | 1,000,000 | | | | 1,028,552 | | |
Building Products (0.3%) | |
CRH America Finance, Inc.,
4.400%, 05/09/47 (c) (d) | | | 1,000,000 | | | | 1,026,805 | | |
Electrical Equipment (0.6%) | |
Flex. Ltd.,
4.750%, 06/15/25 (f) | | | 1,000,000 | | | | 1,062,182 | | |
Trimble, Inc.,
4.750%, 12/01/24 | | | 750,000 | | | | 800,860 | | |
| | | | | | 1,863,042 | | |
Electronic Parts Distributions (0.4%) | |
Avnet, Inc.,
3.750%, 12/01/21 | | | 1,500,000 | | | | 1,524,231 | | |
Environmental Control (0.3%) | |
Waste Management, Inc.,
3.900%, 03/01/35 | | | 1,000,000 | | | | 1,032,338 | | |
| | | Principal | | Value(a) | |
Machinery (0.5%) | |
Caterpillar Financial
Services Corp.,
3.750%, 11/24/23 | | $ | 750,000 | | | $ | 795,704 | | |
CNH Industrial Capital LLC,
3.875%, 07/16/18 | | | 750,000 | | | | 762,375 | | |
| | | | | | 1,558,079 | | |
Miscellaneous Manufacturing (0.4%) | |
Textron, Inc.
3.875%, 03/01/25 | | | 750,000 | | | | 770,420 | | |
4.300%, 03/01/24 | | | 500,000 | | | | 530,954 | | |
| | | | | | 1,301,374 | | |
Road & Rail (0.1%) | |
Kansas City Southern,
4.300%, 05/15/43 | | | 250,000 | | | | 246,474 | | |
Tools-Hand Held (0.2%) | |
Stanley Black & Decker, Inc.,
2.451%, 11/17/18 | | | 800,000 | | | | 807,790 | | |
Transportation (0.1%) | |
Burlington Northern
Santa Fe LLC,
3.750%, 04/01/24 | | | 350,000 | | | | 370,969 | | |
Trucking & Leasing (0.3%) | |
GATX Corp.,
3.250%, 03/30/25 | | | 1,000,000 | | | | 978,321 | | |
Information Technology (1.8%) | |
Communications Equipment (0.5%) | |
Juniper Networks, Inc.,
4.500%, 03/15/24 | | | 500,000 | | | | 531,093 | | |
QUALCOMM, Inc.,
4.650%, 05/20/35 | | | 1,000,000 | | | | 1,089,777 | | |
| | | | | | 1,620,870 | | |
Computers (0.3%) | |
Apple, Inc.,
4.375%, 05/13/45 (b) | | | 1,000,000 | | | | 1,081,161 | | |
Internet Software & Services (0.3%) | |
eBay, Inc.,
3.450%, 08/01/24 | | | 750,000 | | | | 754,876 | | |
IT Services (0.4%) | |
The Western Union Co.,
3.350%, 05/22/19 | | | 500,000 | | | | 509,597 | | |
Total System Services, Inc.,
4.800%, 04/01/26 | | | 750,000 | | | | 816,409 | | |
| | | | | | 1,326,006 | | |
Software (0.3%) | |
Fiserv, Inc.,
3.850%, 06/01/25 | | | 1,000,000 | | | | 1,038,803 | | |
See accompanying notes to financial statements.
23
SFT Advantus Dynamic Managed Volatility Fund
Investments in Securities – continued
| | | Principal | | Value(a) | |
Materials (1.2%) | |
Chemicals (0.9%) | |
Potash Corp. of
Saskatchewan, Inc.,
3.000%, 04/01/25 (f) | | $ | 1,000,000 | | | $ | 966,153 | | |
The Dow Chemical Co.,
3.500%, 10/01/24 | | | 750,000 | | | | 770,270 | | |
The Mosaic Co.,
5.450%, 11/15/33 | | | 200,000 | | | | 211,006 | | |
The Sherwin-Williams Co.,
3.950%, 01/15/26 (c) (d) | | | 1,000,000 | | | | 1,031,910 | | |
| | | | | | 2,979,339 | | |
Construction Materials (0.3%) | |
Vulcan Materials Co.,
4.500%, 06/15/47 | | | 1,000,000 | | | | 1,011,179 | | |
Telecommunication Services (0.9%) | |
Diversified Telecommunication Services (0.9%) | |
AT&T, Inc.
4.350%, 06/15/45 | | | 250,000 | | | | 232,028 | | |
4.500%, 05/15/35 | | | 1,000,000 | | | | 983,792 | | |
4.600%, 02/15/21 | | | 750,000 | | | | 799,900 | | |
Verizon Communications, Inc.,
5.250%, 03/16/37 | | | 1,000,000 | | | | 1,074,991 | | |
| | | | | | 3,090,711 | | |
Transportation (1.0%) | |
Airlines (0.7%) | |
American Airlines 2015-2
Class A Pass Through Trust,
4.000%, 09/22/27 | | | 952,668 | | | | 994,347 | | |
British Airways 2013-1
Class A Pass Through Trust,
4.625%, 06/20/24 (d) | | | 864,023 | | | | 928,194 | | |
United Airlines 2013-1
Class A Pass Through Trust,
4.300%, 08/15/25 | | | 219,310 | | | | 233,017 | | |
| | | | | | 2,155,558 | | |
Transport — Rail (0.3%) | |
Norfolk Southern Corp.,
3.850%, 01/15/24 | | | 500,000 | | | | 528,802 | | |
Union Pacific Corp.,
3.750%, 03/15/24 (b) | | | 500,000 | | | | 528,583 | | |
| | | | | | 1,057,385 | | |
Utilities (2.1%) | |
Electric Utilities (1.5%) | |
Arizona Public Service Co.,
4.350%, 11/15/45 | | | 1,000,000 | | | | 1,078,528 | | |
Entergy Louisiana LLC,
3.300%, 12/01/22 | | | 250,000 | | | | 255,492 | | |
Great Plains Energy, Inc.,
4.850%, 04/01/47 | | | 500,000 | | | | 514,495 | | |
Oglethorpe Power Corp.,
4.250%, 04/01/46 | | | 800,000 | | | | 755,905 | | |
Oklahoma Gas & Electric Co.,
4.150%, 04/01/47 | | | 1,000,000 | | | | 1,043,137 | | |
PPL Capital Funding, Inc.,
3.400%, 06/01/23 | | | 250,000 | | | | 256,925 | | |
| | | Shares/
Principal | | Value(a) | |
Southern California Edison Co.,
4.000%, 04/01/47 | | $ | 1,000,000 | | | $ | 1,045,866 | | |
| | | | | | 4,950,348 | | |
Electric — Integrated (0.1%) | |
Berkshire Hathaway
Energy Co.,
3.750%, 11/15/23 | | | 250,000 | | | | 262,975 | | |
Multi-Utilities (0.4%) | |
Dominion Energy Gas
Holdings LLC,
3.550%, 11/01/23 | | | 250,000 | | | | 256,423 | | |
National Fuel Gas Co.,
5.200%, 07/15/25 | | | 1,000,000 | | | | 1,065,023 | | |
| | | | | | 1,321,446 | | |
Water Utilities (0.1%) | |
Aquarion Co.,
4.000%, 08/15/24 (c) (d) | | | 500,000 | | | | 520,868 | | |
Total corporate obligations
(cost: $117,448,398) | | | | | 120,748,428 | | |
Total long-term debt securities
(cost: $122,557,765) | | | | | 125,921,699 | | |
Purchased Option (0.0%) | |
Call Option Purchased (0.0%) | |
CBOE SPX Volatility Index,
15.000%, 07/19/17 | | | 2,250 | | | | 112,500 | | |
Total purchased options
(cost: $126,000) | | | | | 112,500 | | |
Mutual Funds (46.8%) | |
Investment Companies (46.8%) | |
iShares iBoxx $ Investment
Grade Corporate Bond ETF | | | 44,500 | | | | 5,362,695 | | |
SFT Advantus
Index 500 Fund (g) | | | 14,224,618 | | | | 135,865,941 | | |
SPDR S&P 500 ETF Trust (b) | | | 36,170 | | | | 8,745,906 | | |
Vanguard S&P 500 ETF | | | 20,175 | | | | 4,480,060 | | |
Total mutual funds
(cost: $123,653,386) | | | | | 154,454,602 | | |
Short-Term Securities (14.7%) | |
Investment Companies (14.7%) | |
State Street Institutional
U.S. Government Money
Market Fund, current
rate 0.880% | | | 48,531,906 | | | | 48,531,906 | | |
Total short-term securities
(cost: $48,531,906) | | | | | 48,531,906 | | |
Total investments in securities
(cost: $294,869,057) (h) | | | | | 329,020,707 | | |
Cash and other assets in
excess of liabilities (0.3%) | | | | | 1,030,154 | | |
Total net assets (100.0%) | | | | $ | 330,050,861 | | |
See accompanying notes to financial statements.
24
SFT Advantus Dynamic Managed Volatility Fund
Investments in Securities – continued
Investments in Securities Legend
(a) Securities are valued by procedures described in Note 2 of the Notes to Financial Statements.
(b) Fully or partially pledged as initial margin deposits on open futures or options contracts.
Holdings of Open Futures Contracts
On June 30, 2017, securities with an aggregate market value of $11,111,118 have been pledged to cover margin requirements for the following open futures contracts:
Type | | Expiration | | Number of
Contracts | | Position
Type | | Unrealized
Appreciation/
(Depreciation) | |
10 Year U.S.
Treasury
Note | | September 2017 | | | 200 | | | Short | | $ | 246,263 | | |
S&P 500®
Index Future | | September 2017 | | | 176 | | | Long | | | (493,356 | ) | |
| | | | | | 376 | | | | | $ | (247,093 | ) | |
(c) Illiquid security. (See Note 3.)
(d) Security sold within terms of a private placement memorandum exempt from registration under Section 144A of the Securities Act of 1933, as amended, and may be sold only to dealers in that program. This security has been determined to be liquid unless otherwise indicated.
(e) Variable rate security.
(f) Foreign security: The Fund held 1.7% of net assets in foreign securities at June 30, 2017.
(g) Affiliated security.
(h) At June 30, 2017 the cost of securities for federal income tax purposes was $294,894,666. The aggregate unrealized appreciation and depreciation of investments in securities based on this cost were:
Gross unrealized appreciation | | $ | 34,485,729 | | |
Gross unrealized depreciation | | | (359,688 | ) | |
Net unrealized appreciation | | $ | 34,126,041 | | |
See accompanying notes to financial statements.
25
SFT Advantus Government Money Market Fund
Investments in Securities
(Percentages of each investment category relate to total net assets)
| | | Principal | | Value(a) | |
U.S. Government Obligations (100.0%) | |
Discount Notes (47.3%) | |
Federal Home Loan Bank
0.864%, 07/21/17 (b) | | $ | 2,500,000 | | | $ | 2,498,819 | | |
0.869%, 07/26/17 (b) | | | 8,000,000 | | | | 7,995,250 | | |
0.883%, 07/19/17 (b) | | | 5,900,000 | | | | 5,897,435 | | |
0.885%, 07/12/17 (b) | | | 4,300,000 | | | | 4,298,855 | | |
0.930%, 08/02/17 (b) | | | 4,000,000 | | | | 3,996,747 | | |
0.935%, 08/03/17 (b) | | | 4,500,000 | | | | 4,496,205 | | |
1.042%, 09/29/17 (b) | | | 4,000,000 | | | | 3,989,750 | | |
| | | | | | 33,173,061 | | |
U.S. Treasury (52.7%) | |
U.S. Treasury Note
1.080%, 07/31/17 (c) | | | 9,800,000 | | | | 9,800,689 | | |
1.171%, 10/31/17 (c) | | | 19,600,000 | | | | 19,611,614 | | |
1.275%, 01/31/18 (c) | | | 7,500,000 | | | | 7,513,854 | | |
| | | | | | 36,926,157 | | |
Total U.S. government obligations
(cost: $70,099,218) | | | | | 70,099,218 | | |
| | | Shares | | Value(a) | |
Investment Companies (0.2%) | |
State Street Institutional
US Government Money
Market Fund, 0.880% | | | 138,815 | | | $ | 138,815 | | |
Total investment companies
(cost: $138,815) | | | | | 138,815 | | |
Total investments in securities
(cost: $70,238,033) (d) | | | | | 70,238,033 | | |
Liabilities in excess of cash
and other assets (-0.2%) | | | | | (142,578 | ) | |
Total net assets (100.0%) | | | | $ | 70,095,455 | | |
Investments in Securities Legend
(a) Securities are valued by procedures described in Note 2 of the Notes to Financial Statements.
(b) Rate represents annualized yield at date of purchase.
(c) Variable rate security.
(d) Also represents the cost of securities for federal income tax purposes at June 30, 2017.
See accompanying notes to financial statements.
26
SFT Advantus Index 400 Mid-Cap Fund
Investments in Securities
(Percentages of each investment category relate to total net assets)
| | | Shares | | Value(a) | |
Common Stocks (96.7%) | |
Consumer Discretionary (11.3%) | |
Auto Components (0.6%) | |
Cooper Tire & Rubber Co. | | | 6,643 | | | $ | 239,813 | | |
Dana, Inc. | | | 18,249 | | | | 407,500 | | |
Gentex Corp. | | | 36,266 | | | | 687,966 | | |
| | | | | | 1,335,279 | | |
Automobiles (0.3%) | |
Thor Industries, Inc. | | | 6,027 | | | | 629,942 | | |
Distributors (0.3%) | |
Pool Corp. | | | 5,269 | | | | 619,476 | | |
Diversified Consumer Services (0.8%) | |
Adtalem Global Education, Inc. | | | 7,194 | | | | 273,012 | | |
Graham Holdings Co. – Class B | | | 618 | | | | 370,584 | | |
Service Corp. International/US | | | 23,732 | | | | 793,835 | | |
Sotheby's (b) | | | 5,785 | | | | 310,481 | | |
| | | | | | 1,747,912 | | |
Hotels, Restaurants & Leisure (2.7%) | |
Brinker International, Inc. | | | 6,171 | | | | 235,115 | | |
Buffalo Wild Wings, Inc. (b) | | | 2,038 | | | | 258,215 | | |
Churchill Downs, Inc. | | | 1,556 | | | | 285,215 | | |
Cracker Barrel Old
Country Store, Inc. | | | 3,099 | | | | 518,308 | | |
Domino's Pizza, Inc. | | | 6,053 | | | | 1,280,391 | | |
Dunkin' Brands Group, Inc. | | | 11,634 | | | | 641,266 | | |
International Speedway
Corp. — Class A | | | 3,115 | | | | 116,968 | | |
Jack in the Box, Inc. | | | 3,671 | | | | 361,593 | | |
Panera Bread Co. — Class A (b) | | | 2,761 | | | | 868,721 | | |
Papa John's International, Inc. | | | 3,301 | | | | 236,880 | | |
Texas Roadhouse, Inc. | | | 8,141 | | | | 414,784 | | |
The Cheesecake Factory, Inc. | | | 5,583 | | | | 280,825 | | |
The Wendy's Co. | | | 24,170 | | | | 374,877 | | |
| | | | | | 5,873,158 | | |
Household Durables (1.7%) | |
CalAtlantic Group, Inc. | | | 9,732 | | | | 344,026 | | |
Helen of Troy, Ltd. (b) | | | 3,364 | | | | 316,552 | | |
KB Home | | | 10,490 | | | | 251,445 | | |
NVR, Inc. (b) | | | 447 | | | | 1,077,543 | | |
Tempur Sealy
International, Inc. (b) | | | 5,892 | | | | 314,574 | | |
Toll Brothers, Inc. | | | 18,680 | | | | 738,047 | | |
TRI Pointe Group, Inc. (b) | | | 20,080 | | | | 264,855 | | |
Tupperware Brands Corp. | | | 6,387 | | | | 448,559 | | |
| | | | | | 3,755,601 | | |
Internet & Direct Marketing Retail (0.1%) | |
HSN, Inc. | | | 3,990 | | | | 127,281 | | |
Leisure Equipment & Products (0.6%) | |
Brunswick Corp. | | | 11,274 | | | | 707,218 | | |
Polaris Industries, Inc. | | | 7,396 | | | | 682,133 | | |
| | | | | | 1,389,351 | | |
| | | Shares | | Value(a) | |
Media (1.5%) | |
AMC Networks, Inc. —
Class A (b) | | | 6,957 | | | $ | 371,573 | | |
Cable One, Inc. | | | 628 | | | | 446,445 | | |
Cinemark Holdings, Inc. | | | 13,374 | | | | 519,580 | | |
John Wiley & Sons, Inc. —
Class A | | | 5,653 | | | | 298,196 | | |
Live Nation Entertainment,
Inc. (b) | | | 16,831 | | | | 586,560 | | |
Meredith Corp. | | | 4,583 | | | | 272,459 | | |
TEGNA, Inc. | | | 27,106 | | | | 390,598 | | |
The New York Times Co. —
Class A | | | 15,422 | | | | 272,970 | | |
| | | | | | 3,158,381 | | |
Multiline Retail (0.2%) | |
Big Lots, Inc. | | | 5,605 | | | | 270,721 | | |
Dillard's, Inc. — Class A | | | 2,740 | | | | 158,071 | | |
| | | | | | 428,792 | | |
Specialty Retail (1.9%) | |
Aaron's, Inc. | | | 7,939 | | | | 308,827 | | |
American Eagle Outfitters, Inc. | | | 21,001 | | | | 253,062 | | |
Cabela's, Inc. (b) | | | 6,479 | | | | 384,982 | | |
Chico's FAS, Inc. | | | 16,347 | | | | 153,989 | | |
Dick's Sporting Goods, Inc. | | | 11,080 | | | | 441,316 | | |
GameStop Corp. — Class A | | | 12,784 | | | | 276,262 | | |
Kate Spade & Co. (b) | | | 16,196 | | | | 299,464 | | |
Murphy USA, Inc. (b) | | | 4,385 | | | | 324,972 | | |
Office Depot, Inc. | | | 65,223 | | | | 367,858 | | |
Sally Beauty Holdings, Inc. (b) | | | 17,350 | | | | 351,338 | | |
The Michaels Cos., Inc. (b) | | | 13,354 | | | | 247,316 | | |
Urban Outfitters, Inc. (b) | | | 11,157 | | | | 206,851 | | |
Williams-Sonoma, Inc. | | | 10,062 | | | | 488,007 | | |
| | | | | | 4,104,244 | | |
Textiles, Apparel & Luxury Goods (0.6%) | |
Carter's, Inc. | | | 6,109 | | | | 543,396 | | |
Deckers Outdoor Corp. (b) | | | 3,989 | | | | 272,289 | | |
Skechers U.S.A., Inc. —
Class A (b) | | | 16,890 | | | | 498,255 | | |
| | | | | | 1,313,940 | | |
Consumer Staples (3.6%) | |
Beverages (0.1%) | |
The Boston Beer Co., Inc. —
Class A (b) | | | 1,130 | | | | 149,329 | | |
Food & Staples Retailing (0.5%) | |
Casey's General Stores, Inc. | | | 4,916 | | | | 526,553 | | |
Sprouts Farmers Market, Inc. (b) | | | 16,316 | | | | 369,884 | | |
United Natural Foods, Inc. (b) | | | 6,376 | | | | 233,999 | | |
| | | | | | 1,130,436 | | |
Food Products (2.3%) | |
Dean Foods Co. | | | 11,473 | | | | 195,041 | | |
Flowers Foods, Inc. | | | 23,244 | | | | 402,354 | | |
Ingredion, Inc. | | | 9,049 | | | | 1,078,731 | | |
Lamb Weston Holdings, Inc. | | | 17,518 | | | | 771,493 | | |
Lancaster Colony Corp. | | | 2,457 | | | | 301,277 | | |
Post Holdings, Inc. (b) | | | 8,366 | | | | 649,620 | | |
See accompanying notes to financial statements.
27
SFT Advantus Index 400 Mid-Cap Fund
Investments in Securities – continued
| | | Shares | | Value(a) | |
Snyder's-Lance, Inc. | | | 10,857 | | | $ | 375,869 | | |
The Hain Celestial Group, Inc. (b) | | | 13,059 | | | | 506,951 | | |
Tootsie Roll Industries, Inc. | | | 2,191 | | | | 76,356 | | |
TreeHouse Foods, Inc. (b) | | | 7,172 | | | | 585,881 | | |
| | | | | | 4,943,573 | | |
Household Products (0.2%) | |
Energizer Holdings, Inc. | | | 7,806 | | | | 374,844 | | |
Personal Products (0.5%) | |
Avon Products, Inc. (b) | | | 55,528 | | | | 211,006 | | |
Edgewell Personal Care Co. (b) | | | 7,249 | | | | 551,069 | | |
Nu Skin Enterprises, Inc. | | | 6,190 | | | | 388,980 | | |
| | | | | | 1,151,055 | | |
Energy (2.6%) | |
Energy Equipment & Services (1.0%) | |
Diamond Offshore Drilling,
Inc. (b) | | | 8,142 | | | | 88,178 | | |
Dril-Quip, Inc. (b) | | | 4,740 | | | | 231,312 | | |
Ensco PLC — Class A (c) | | | 38,327 | | | | 197,767 | | |
Nabors Industries, Ltd. | | | 36,080 | | | | 293,691 | | |
Oceaneering International, Inc. | | | 12,404 | | | | 283,307 | | |
Oil States International, Inc. (b) | | | 6,477 | | | | 175,851 | | |
Patterson-UTI Energy, Inc. | | | 20,873 | | | | 421,426 | | |
Rowan Cos., PLC — Class A (b) | | | 15,919 | | | | 163,011 | | |
Superior Energy Services,
Inc. (b) | | | 19,294 | | | | 201,236 | | |
| | | | | | 2,055,779 | | |
Oil, Gas & Consumable Fuels (1.6%) | |
Consol Energy, Inc. (b) | | | 22,362 | | | | 334,088 | | |
Gulfport Energy Corp. (b) | | | 20,081 | | | | 296,195 | | |
HollyFrontier Corp. | | | 22,390 | | | | 615,053 | | |
Matador Resources Co. (b) | | | 11,762 | | | | 251,354 | | |
PBF Energy, Inc. Class A | | | 13,847 | | | | 308,234 | | |
QEP Resources, Inc. (b) | | | 30,362 | | | | 306,656 | | |
SM Energy Co. | | | 12,360 | | | | 204,311 | | |
Southwestern Energy Co. (b) | | | 63,800 | | | | 387,904 | | |
World Fuel Services Corp. | | | 8,718 | | | | 335,207 | | |
WPX Energy, Inc. (b) | | | 50,195 | | | | 484,884 | | |
| | | | | | 3,523,886 | | |
Financial (15.9%) | |
Capital Markets (3.0%) | |
Eaton Vance Corp. | | | 14,515 | | | | 686,850 | | |
Factset Research Systems, Inc. | | | 4,966 | | | | 825,250 | | |
Federated Investors, Inc. —
Class B | | | 11,712 | | | | 330,864 | | |
Janus Henderson Group
PLC (b) (c) | | | 22,771 | | | | 753,941 | | |
Legg Mason, Inc. | | | 10,770 | | | | 410,983 | | |
MarketAxess Holdings, Inc. | | | 4,818 | | | | 968,900 | | |
MSCI, Inc. | | | 11,431 | | | | 1,177,279 | | |
SEI Investments Co. | | | 16,830 | | | | 905,117 | | |
Stifel Financial Corp. (b) | | | 8,625 | | | | 396,577 | | |
| | | | | | 6,455,761 | | |
Commercial Banks (7.9%) | |
Associated Banc-Corp. | | | 19,229 | | | | 484,571 | | |
BancorpSouth, Inc. | | | 10,493 | | | | 320,037 | | |
Bank of Hawaii Corp. | | | 5,360 | | | | 444,719 | | |
Bank of the Ozarks, Inc. | | | 15,330 | | | | 718,517 | | |
| | | Shares | | Value(a) | |
Canadian Imperial Bank of
Commerce (c) | | | 1 | | | $ | 42 | | |
Cathay General Bancorp | | | 9,473 | | | | 359,500 | | |
Chemical Financial Corp. | | | 8,978 | | | | 434,625 | | |
Commerce Bancshares, Inc. | | | 11,032 | | | | 626,949 | | |
Cullen/Frost Bankers, Inc. | | | 7,165 | | | | 672,865 | | |
East West Bancorp, Inc. | | | 18,240 | | | | 1,068,499 | | |
First Horizon National Corp. | | | 29,513 | | | | 514,117 | | |
FNB Corp. | | | 40,789 | | | | 577,572 | | |
Fulton Financial Corp. | | | 22,069 | | | | 419,311 | | |
Hancock Holding Co. | | | 10,670 | | | | 522,830 | | |
Home BancShares, Inc. | | | 15,934 | | | | 396,757 | | |
International Bancshares Corp. | | | 7,335 | | | | 257,092 | | |
MB Financial, Inc. | | | 8,995 | | | | 396,140 | | |
PacWest Bancorp | | | 15,132 | | | | 706,664 | | |
Pinnacle Financial Partners, Inc. | | | 9,143 | | | | 574,180 | | |
Prosperity Bancshares, Inc. | | | 8,772 | | | | 563,513 | | |
Signature Bank (b) | | | 6,774 | | | | 972,272 | | |
SVB Financial Group (b) | | | 6,598 | | | | 1,159,862 | | |
Synovus Financial Corp. | | | 15,439 | | | | 683,021 | | |
TCF Financial Corp. | | | 21,617 | | | | 344,575 | | |
Texas Capital Bancshares, Inc. (b) | | | 6,257 | | | | 484,292 | | |
Trustmark Corp. | | | 8,550 | | | | 274,968 | | |
UMB Financial Corp. | | | 5,512 | | | | 412,628 | | |
Umpqua Holdings Corp. | | | 27,824 | | | | 510,849 | | |
United Bankshares, Inc. | | | 13,236 | | | | 518,851 | | |
Valley National Bancorp | | | 33,308 | | | | 393,368 | | |
Webster Financial Corp. | | | 11,640 | | | | 607,841 | | |
Wintrust Financial Corp. | | | 7,026 | | | | 537,068 | | |
| | | | | | 16,958,095 | | |
Consumer Finance (0.3%) | |
SLM Corp. (b) | | | 54,416 | | | | 625,784 | | |
Insurance (4.2%) | |
Alleghany Corp. (b) | | | 1,969 | | | | 1,171,161 | | |
American Financial Group, Inc. | | | 9,258 | | | | 919,968 | | |
Aspen Insurance Holdings, Ltd. (c) | | | 7,561 | | | | 376,916 | | |
Brown & Brown, Inc. | | | 14,520 | | | | 625,376 | | |
CNO Financial Group, Inc. | | | 21,627 | | | | 451,572 | | |
First American Financial Corp. | | | 13,922 | | | | 622,174 | | |
Genworth Financial, Inc. —
Class A (b) | | | 62,989 | | | | 237,469 | | |
Kemper Corp. | | | 6,139 | | | | 236,965 | | |
Mercury General Corp. | | | 4,572 | | | | 246,888 | | |
Old Republic International Corp. | | | 30,947 | | | | 604,395 | | |
Primerica, Inc. | | | 5,744 | | | | 435,108 | | |
Reinsurance Group of America, Inc. | | | 8,129 | | | | 1,043,682 | | |
RenaissanceRe Holdings, Ltd. (c) | | | 5,128 | | | | 713,048 | | |
The Hanover Insurance Group, Inc. | | | 5,347 | | | | 473,905 | | |
WR Berkley Corp. | | | 12,243 | | | | 846,848 | | |
| | | | | | 9,005,475 | | |
Thrifts & Mortgage Finance (0.5%) | |
New York Community Bancorp, Inc. | | | 61,740 | | | | 810,646 | | |
Washington Federal, Inc. | | | 11,291 | | | | 374,861 | | |
| | | | | | 1,185,507 | | |
Health Care (8.8%) | |
Biotechnology (0.7%) | |
Bioverativ, Inc. (b) | | | 13,654 | | | | 821,561 | | |
United Therapeutics Corp. (b) | | | 5,657 | | | | 733,883 | | |
| | | | | | 1,555,444 | | |
See accompanying notes to financial statements.
28
SFT Advantus Index 400 Mid-Cap Fund
Investments in Securities – continued
| | | Shares | | Value(a) | |
Health Care Equipment & Supplies (3.5%) | |
ABIOMED, Inc. (b) | | | 5,184 | | | $ | 742,867 | | |
Globus Medical, Inc. (b) | | | 9,109 | | | | 301,963 | | |
Halyard Health, Inc. (b) | | | 5,875 | | | | 230,770 | | |
Hill-Rom Holdings, Inc. | | | 7,514 | | | | 598,190 | | |
LivaNova PLC (b) (c) | | | 5,451 | | | | 333,656 | | |
Masimo Corp. (b) | | | 5,745 | | | | 523,829 | | |
NuVasive, Inc. (b) | | | 6,378 | | | | 490,596 | | |
ResMed, Inc. | | | 17,904 | | | | 1,394,184 | | |
STERIS PLC (c) | | | 10,722 | | | | 873,843 | | |
Teleflex, Inc. | | | 5,750 | | | | 1,194,620 | | |
West Pharmaceutical
Services, Inc. | | | 9,280 | | | | 877,146 | | |
| | | | | | 7,561,664 | | |
Health Care Providers & Services (2.2%) | |
Acadia Healthcare Co., Inc. (b) | | | 9,646 | | | | 476,319 | | |
HealthSouth Corp. | | | 11,302 | | | | 547,017 | | |
LifePoint Health, Inc. (b) | | | 5,014 | | | | 336,690 | | |
Mednax, Inc. (b) | | | 11,742 | | | | 708,864 | | |
Molina Healthcare, Inc. (b) | | | 5,349 | | | | 370,044 | | |
Owens & Minor, Inc. | | | 7,715 | | | | 248,346 | | |
Tenet Healthcare Corp. (b) | | | 10,123 | | | | 195,779 | | |
VCA, Inc. (b) | | | 10,260 | | | | 947,101 | | |
WellCare Health Plans, Inc. (b) | | | 5,672 | | | | 1,018,464 | | |
| | | | | | 4,848,624 | | |
Health Care Technology (0.4%) | |
Allscripts Healthcare
Solutions, Inc. (b) | | | 22,909 | | | | 292,319 | | |
Medidata Solutions, Inc. (b) | | | 7,010 | | | | 548,182 | | |
| | | | | | 840,501 | | |
Life Sciences Tools & Services (1.3%) | |
Bio-Rad Laboratories, Inc. —
Class A (b) | | | 2,627 | | | | 594,516 | | |
Bio-Techne Corp. | | | 4,677 | | | | 549,548 | | |
Charles River Laboratories
International, Inc. (b) | | | 5,965 | | | | 603,360 | | |
INC Research Holdings, Inc. —
Class A (b) | | | 6,830 | | | | 399,555 | | |
PAREXEL International Corp. (b) | | | 6,408 | | | | 556,919 | | |
| | | | | | 2,703,898 | | |
Pharmaceuticals (0.7%) | |
Akorn, Inc. (b) | | | 11,007 | | | | 369,175 | | |
Catalent, Inc. (b) | | | 15,775 | | | | 553,702 | | |
Endo International PLC (b) (c) | | | 25,068 | | | | 280,010 | | |
Prestige Brands Holdings, Inc. (b) | | | 6,677 | | | | 352,612 | | |
| | | | | | 1,555,499 | | |
Industrials (14.8%) | |
Aerospace & Defense (1.7%) | |
Curtiss-Wright Corp. | | | 5,586 | | | | 512,683 | | |
Esterline Technologies Corp. (b) | | | 3,801 | | | | 360,335 | | |
Huntington Ingalls Industries, Inc. | | | 5,794 | | | | 1,078,611 | | |
KLX, Inc. (b) | | | 6,529 | | | | 326,450 | | |
Orbital ATK, Inc. | | | 7,277 | | | | 715,765 | | |
Teledyne Technologies, Inc. (b) | | | 4,509 | | | | 575,574 | | |
| | | | | | 3,569,418 | | |
| | | Shares | | Value(a) | |
Airlines (0.4%) | |
JetBlue Airways Corp. (b) | | | 42,124 | | | $ | 961,691 | | |
Building Products (0.9%) | |
AO Smith Corp. | | | 18,592 | | | | 1,047,288 | | |
Lennox International, Inc. | | | 4,849 | | | | 890,470 | | |
| | | | | | 1,937,758 | | |
Commercial Services & Supplies (1.5%) | |
Clean Harbors, Inc. (b) | | | 6,572 | | | | 366,915 | | |
Copart, Inc. (b) | | | 25,879 | | | | 822,693 | | |
Deluxe Corp. | | | 6,111 | | | | 423,004 | | |
Herman Miller, Inc. | | | 7,547 | | | | 229,429 | | |
HNI Corp. | | | 5,535 | | | | 220,681 | | |
MSA Safety, Inc. | | | 3,912 | | | | 317,537 | | |
Pitney Bowes, Inc. | | | 23,544 | | | | 355,514 | | |
Rollins, Inc. | | | 12,109 | | | | 492,957 | | |
| | | | | | 3,228,730 | | |
Construction & Engineering (1.1%) | |
AECOM (b) | | | 19,660 | | | | 635,608 | | |
Dycom Industries, Inc. (b) | | | 3,923 | | | | 351,187 | | |
EMCOR Group, Inc. | | | 7,478 | | | | 488,912 | | |
Granite Construction, Inc. | | | 4,973 | | | | 239,897 | | |
KBR, Inc. | | | 18,072 | | | | 275,056 | | |
Valmont Industries, Inc. | | | 2,884 | | | | 431,446 | | |
| | | | | | 2,422,106 | | |
Electrical Equipment (1.1%) | |
Belden, Inc. | | | 5,301 | | | | 399,854 | | |
EnerSys | | | 5,460 | | | | 395,577 | | |
Hubbell, Inc. | | | 6,462 | | | | 731,304 | | |
Regal Beloit Corp. | | | 5,634 | | | | 459,453 | | |
Woodward, Inc. | | | 6,962 | | | | 470,492 | | |
| | | | | | 2,456,680 | | |
Industrial Conglomerates (0.4%) | |
Carlisle Cos., Inc. | | | 8,155 | | | | 777,987 | | |
Machinery (4.7%) | |
AGCO Corp. | | | 8,425 | | | | 567,761 | | |
Crane Co. | | | 6,337 | | | | 503,031 | | |
Donaldson Co., Inc. | | | 16,677 | | | | 759,471 | | |
Graco, Inc. | | | 7,013 | | | | 766,381 | | |
IDEX Corp. | | | 9,634 | | | | 1,088,738 | | |
ITT, Inc. | | | 11,193 | | | | 449,735 | | |
Kennametal, Inc. | | | 10,167 | | | | 380,449 | | |
Lincoln Electric Holdings, Inc. | | | 7,807 | | | | 718,947 | | |
Nordson Corp. | | | 6,752 | | | | 819,153 | | |
Oshkosh Corp. | | | 9,442 | | | | 650,365 | | |
Terex Corp. | | | 12,321 | | | | 462,037 | | |
The Timken Co. | | | 8,838 | | | | 408,758 | | |
The Toro Co. | | | 13,581 | | | | 941,027 | | |
Trinity Industries, Inc. | | | 19,211 | | | | 538,484 | | |
Wabtec Corp. | | | 10,903 | | | | 997,624 | | |
| | | | | | 10,051,961 | | |
Marine (0.2%) | |
Kirby Corp. (b) | | | 6,795 | | | | 454,246 | | |
See accompanying notes to financial statements.
29
SFT Advantus Index 400 Mid-Cap Fund
Investments in Securities – continued
| | | Shares | | Value(a) | |
Professional Services (0.8%) | �� |
Dun & Bradstreet Corp. | | | 4,630 | | | $ | 500,735 | | |
FTI Consulting, Inc. (b) | | | 5,166 | | | | 180,603 | | |
Manpowergroup, Inc. | | | 8,468 | | | | 945,452 | | |
| | | | | | 1,626,790 | | |
Road & Rail (1.3%) | |
Avis Budget Group, Inc. (b) | | | 10,634 | | | | 289,989 | | |
Genesee & Wyoming, Inc. —
Class A (b) | | | 7,748 | | | | 529,886 | | |
Landstar System, Inc. | | | 5,249 | | | | 449,314 | | |
Old Dominion Freight Line, Inc. | | | 8,743 | | | | 832,683 | | |
Ryder System, Inc. | | | 6,761 | | | | 486,657 | | |
Werner Enterprises, Inc. | | | 5,630 | | | | 165,241 | | |
| | | | | | 2,753,770 | | |
Trading Companies & Distributors (0.7%) | |
GATX Corp. | | | 4,858 | | | | 312,224 | | |
MSC Industrial Direct Co. —
Class A | | | 5,642 | | | | 484,986 | | |
Now, Inc. (b) | | | 13,592 | | | | 218,559 | | |
Watsco, Inc. | | | 3,888 | | | | 599,530 | | |
| | | | | | 1,615,299 | | |
Information Technology (17.0%) | |
Communications Equipment (1.5%) | |
ARRIS International PLC (b) | | | 23,706 | | | | 664,242 | | |
Brocade Communications
Systems, Inc. | | | 51,765 | | | | 652,757 | | |
Ciena Corp. (b) | | | 17,897 | | | | 447,783 | | |
InterDigital, Inc. | | | 4,392 | | | | 339,502 | | |
NetScout Systems, Inc. (b) | | | 11,579 | | | | 398,317 | | |
Plantronics, Inc. | | | 4,148 | | | | 216,982 | | |
ViaSat, Inc. (b) | | | 6,683 | | | | 442,414 | | |
| | | | | | 3,161,997 | | |
Computers & Peripherals (0.5%) | |
3D Systems Corp. (b) | | | 13,649 | | | | 255,236 | | |
Diebold Nixdorf, Inc. | | | 9,528 | | | | 266,784 | | |
NCR Corp. (b) | | | 15,300 | | | | 624,852 | | |
| | | | | | 1,146,872 | | |
Electronic Equipment, Instruments &
Components (4.1%) | |
Arrow Electronics, Inc. (b) | | | 11,216 | | | | 879,559 | | |
Avnet, Inc. | | | 15,779 | | | | 613,487 | | |
Cognex Corp. | | | 10,918 | | | | 926,938 | | |
Coherent, Inc. (b) | | | 3,144 | | | | 707,369 | | |
IPG Photonics Corp. (b) | | | 4,796 | | | | 695,900 | | |
Jabil , Inc. | | | 23,013 | | | | 671,749 | | |
Keysight Technologies, Inc. (b) | | | 23,317 | | | | 907,731 | | |
Knowles Corp. (b) | | | 11,256 | | | | 190,452 | | |
Littelfuse, Inc. | | | 2,842 | | | | 468,930 | | |
National Instruments Corp. | | | 13,415 | | | | 539,551 | | |
SYNNEX Corp. | | | 3,732 | | | | 447,691 | | |
Tech Data Corp. (b) | | | 4,377 | | | | 442,077 | | |
Trimble, Inc. (b) | | | 31,926 | | | | 1,138,800 | | |
Vishay Intertechnology, Inc. | | | 16,922 | | | | 280,905 | | |
| | | | | | 8,911,139 | | |
| | | Shares | | Value(a) | |
Internet Software & Services (0.8%) | |
Cars.com, Inc. (b) | | | 9,035 | | | $ | 240,602 | | |
j2 Global, Inc. | | | 6,067 | | | | 516,241 | | |
LogMeIn, Inc. | | | 6,631 | | | | 692,940 | | |
WebMD Health Corp. (b) | | | 4,731 | | | | 277,473 | | |
| | | | | | 1,727,256 | | |
IT Services (3.4%) | |
Acxiom Corp. (b) | | | 9,895 | | | | 257,072 | | |
Broadridge Financial
Solutions, Inc. | | | 14,843 | | | | 1,121,537 | | |
Convergys Corp. | | | 11,883 | | | | 282,578 | | |
CoreLogic, Inc. (b) | | | 10,685 | | | | 463,515 | | |
DST Systems, Inc. | | | 7,797 | | | | 481,075 | | |
Jack Henry & Associates, Inc. | | | 9,803 | | | | 1,018,238 | | |
Leidos Holdings, Inc. | | | 18,113 | | | | 936,261 | | |
MAXIMUS, Inc. | | | 8,183 | | | | 512,501 | | |
NeuStar, Inc. — Class A (b) | | | 6,961 | | | | 232,149 | | |
Sabre Corp. | | | 25,979 | | | | 565,563 | | |
Science Applications
International Corp. | | | 5,471 | | | | 379,797 | | |
Teradata Corp. (b) | | | 16,523 | | | | 487,263 | | |
WEX, Inc. (b) | | | 4,824 | | | | 502,999 | | |
| | | | | | 7,240,548 | | |
Office Electronics (0.3%) | |
Zebra Technologies Corp. —
Class A (b) | | | 6,661 | | | | 669,564 | | |
Semiconductors & Semiconductor
Equipment (2.4%) | |
Cirrus Logic, Inc. (b) | | | 8,124 | | | | 509,537 | | |
Cree, Inc. (b) | | | 12,282 | | | | 302,751 | | |
Cypress Semiconductor Corp. | | | 41,589 | | | | 567,690 | | |
First Solar, Inc. (b) | | | 9,874 | | | | 393,775 | | |
Integrated Device Technology,
Inc. (b) | | | 16,789 | | | | 432,988 | | |
Microsemi Corp. (b) | | | 14,578 | | | | 682,251 | | |
Monolithic Power Systems, Inc. | | | 4,750 | | | | 457,900 | | |
Silicon Laboratories, Inc. (b) | | | 5,363 | | | | 366,561 | | |
Synaptics, Inc. (b) | | | 4,330 | | | | 223,904 | | |
Teradyne, Inc. | | | 25,116 | | | | 754,234 | | |
Versum Materials, Inc. | | | 13,719 | | | | 445,868 | | |
| | | | | | 5,137,459 | | |
Software (3.9%) | |
ACI Worldwide, Inc. (b) | | | 14,902 | | | | 333,358 | | |
Blackbaud, Inc. | | | 6,080 | | | | 521,360 | | |
Cadence Design Systems, Inc. (b) | | | 35,298 | | | | 1,182,130 | | |
CDK Global, Inc. | | | 18,330 | | | | 1,137,560 | | |
CommVault Systems, Inc. (b) | | | 5,267 | | | | 297,322 | | |
Fair Isaac Corp. | | | 3,877 | | | | 540,493 | | |
Fortinet, Inc. (b) | | | 18,860 | | | | 706,118 | | |
Manhattan Associates, Inc. (b) | | | 8,766 | | | | 421,294 | | |
PTC, Inc. (b) | | | 14,584 | | | | 803,870 | | |
Take-Two Interactive
Software, Inc. (b) | | | 13,109 | | | | 961,938 | | |
The Ultimate Software
Group, Inc. (b) | | | 3,798 | | | | 797,808 | | |
Tyler Technologies, Inc. (b) | | | 4,291 | | | | 753,800 | | |
| | | | | | 8,457,051 | | |
See accompanying notes to financial statements.
30
SFT Advantus Index 400 Mid-Cap Fund
Investments in Securities – continued
| | | Shares | | Value(a) | |
Technology Hardware & Equipment (0.1%) | |
VeriFone Systems, Inc. (b) | | | 14,090 | | | $ | 255,029 | | |
Materials (7.4%) | |
Chemicals (2.9%) | |
Ashland Global Holdings, Inc. | | | 7,856 | | | | 517,789 | | |
Cabot Corp. | | | 7,863 | | | | 420,120 | | |
Minerals Technologies, Inc. | | | 4,386 | | | | 321,055 | | |
NewMarket Corp. | | | 1,205 | | | | 554,879 | | |
Olin Corp. | | | 20,944 | | | | 634,184 | | |
PolyOne Corp. | | | 10,321 | | | | 399,836 | | |
RPM International, Inc. | | | 16,864 | | | | 919,931 | | |
Sensient Technologies Corp. | | | 5,579 | | | | 449,277 | | |
The Chemours Co. | | | 23,287 | | | | 883,043 | | |
The Scotts Miracle-Gro Co. —
Class A | | | 5,565 | | | | 497,845 | | |
Valvoline, Inc. | | | 25,817 | | | | 612,379 | | |
| | | | | | 6,210,338 | | |
Construction Materials (0.3%) | |
Eagle Materials, Inc. | | | 6,098 | | | | 563,577 | | |
Containers & Packaging (1.9%) | |
Aptargroup, Inc. | | | 7,880 | | | | 684,457 | | |
Bemis Co., Inc. | | | 11,608 | | | | 536,870 | | |
Greif, Inc. — Class A | | | 3,205 | | | | 178,775 | | |
Owens-Illinois, Inc. (b) | | | 20,539 | | | | 491,293 | | |
Packaging Corp. of America | | | 11,893 | | | | 1,324,761 | | |
Silgan Holdings, Inc. | | | 9,467 | | | | 300,861 | | |
Sonoco Products Co. | | | 12,546 | | | | 645,115 | | |
| | | | | | 4,162,132 | | |
Metals & Mining (1.9%) | |
Allegheny Technologies, Inc. | | | 13,738 | | | | 233,683 | | |
Carpenter Technology Corp. | | | 5,882 | | | | 220,163 | | |
Commercial Metals Co. | | | 14,616 | | | | 283,989 | | |
Compass Minerals
International, Inc. | | | 4,227 | | | | 276,023 | | |
Reliance Steel & Aluminum Co. | | | 9,201 | | | | 669,925 | | |
Royal Gold, Inc. | | | 8,249 | | | | 644,824 | | |
Steel Dynamics, Inc. | | | 30,524 | | | | 1,093,065 | | |
United States Steel Corp. | | | 22,049 | | | | 488,165 | | |
Worthington Industries, Inc. | | | 5,525 | | | | 277,466 | | |
| | | | | | 4,187,303 | | |
Paper & Forest Products (0.4%) | |
Domtar Corp. | | | 7,901 | | | | 303,556 | | |
Louisiana-Pacific Corp. (b) | | | 18,273 | | | | 440,562 | | |
| | | | | | 744,118 | | |
Real Estate (9.5%) | |
Diversified Real Estate Activities (0.1%) | |
Alexander & Baldwin, Inc. | | | 5,807 | | | | 240,294 | | |
Health Care REITs (1.4%) | |
Care Capital Properties, Inc. | | | 10,610 | | | | 283,287 | | |
Healthcare Realty Trust, Inc. | | | 14,699 | | | | 501,971 | | |
Medical Properties Trust, Inc. | | | 45,952 | | | | 591,402 | | |
Omega Healthcare Investors, Inc. | | | 24,846 | | | | 820,415 | | |
Quality Care Properties, Inc. (b) | | | 11,816 | | | | 216,351 | | |
Senior Housing Properties Trust | | | 29,988 | | | | 612,955 | | |
| | | | | | 3,026,381 | | |
| | | Shares | | Value(a) | |
Hotels & Resort REITs (0.5%) | |
Hospitality Properties Trust | | | 20,737 | | | $ | 604,484 | | |
LaSalle Hotel Properties | | | 14,293 | | | | 425,931 | | |
| | | | | | 1,030,415 | | |
Industrial REITs (1.4%) | |
DCT Industrial Trust, Inc. | | | 11,604 | | | | 620,118 | | |
Duke Realty Corp. | | | 44,891 | | | | 1,254,703 | | |
First Industrial Realty Trust, Inc. | | | 14,805 | | | | 423,719 | | |
Liberty Property Trust | | | 18,584 | | | | 756,555 | | |
| | | | | | 3,055,095 | | |
Office REITs (1.6%) | |
Corporate Office Properties Trust | | | 12,533 | | | | 439,031 | | |
Cousins Properties, Inc. | | | 52,883 | | | | 464,842 | | |
Douglas Emmett, Inc. | | | 18,521 | | | | 707,687 | | |
Highwoods Properties, Inc. | | | 12,879 | | | | 653,094 | | |
Kilroy Realty Corp. | | | 12,408 | | | | 932,461 | | |
Mack-Cali Realty Corp. | | | 11,342 | | | | 307,822 | | |
| | | | | | 3,504,937 | | |
Real Estate Management & Development (0.3%) | |
Jones Lang LaSalle, Inc. | | | 5,693 | | | | 711,625 | | |
Residential REITs (1.0%) | |
American Campus
Communities, Inc. | | | 16,926 | | | | 800,600 | | |
Camden Property Trust | | | 11,064 | | | | 946,083 | | |
Education Realty Trust, Inc. | | | 9,238 | | | | 357,972 | | |
| | | | | | 2,104,655 | | |
Retail REITs (1.1%) | |
National Retail Properties, Inc. | | | 18,751 | | | | 733,164 | | |
Tanger Factory Outlet
Centers, Inc. | | | 12,177 | | | | 316,359 | | |
Taubman Centers, Inc. | | | 7,648 | | | | 455,438 | | |
Urban Edge Properties | | | 12,488 | | | | 296,340 | | |
Washington Prime Group, Inc. | | | 23,398 | | | | 195,841 | | |
Weingarten Realty Investors | | | 14,911 | | | | 448,821 | | |
| | | | | | 2,445,963 | | |
Specialized REITs (2.1%) | |
CoreCivic, Inc. | | | 14,915 | | | | 411,356 | | |
CyrusOne, Inc. | | | 9,856 | | | | 549,472 | | |
EPR Properties | | | 8,088 | | | | 581,285 | | |
Lamar Advertising Co. —
Class A | | | 10,504 | | | | 772,779 | | |
Life Storage, Inc. | | | 5,852 | | | | 433,633 | | |
Potlatch Corp. | | | 5,091 | | | | 232,659 | | |
Rayonier, Inc. | | | 16,263 | | | | 467,886 | | |
The GEO Group, Inc. | | | 15,671 | | | | 463,391 | | |
Uniti Group, Inc. | | | 19,934 | | | | 501,141 | | |
| | | | | | 4,413,602 | | |
Telecommunication Services (0.2%) | |
Diversified Telecommunication Services (0.1%) | |
Frontier Communications Corp. | | | 148,094 | | | | 171,789 | | |
Wireless Telecommunication Services (0.1%) | |
Telephone & Data Systems, Inc. | | | 11,841 | | | | 328,588 | | |
See accompanying notes to financial statements.
31
SFT Advantus Index 400 Mid-Cap Fund
Investments in Securities – continued
| | | Shares | | Value(a) | |
Utilities (5.6%) | |
Electric Utilities (1.4%) | |
Great Plains Energy, Inc. | | | 27,219 | | | $ | 796,972 | | |
Hawaiian Electric Industries, Inc. | | | 13,729 | | | | 444,545 | | |
IDACORP, Inc. | | | 6,352 | | | | 542,143 | | |
PNM Resources, Inc. | | | 10,055 | | | | 384,604 | | |
Westar Energy, Inc. | | | 17,932 | | | | 950,755 | | |
| | | | | | 3,119,019 | | |
Gas Utilities (2.4%) | |
Atmos Energy Corp. | | | 13,292 | | | | 1,102,572 | | |
Energen Corp. (b) | | | 12,254 | | | | 604,980 | | |
National Fuel Gas Co. | | | 10,783 | | | | 602,123 | | |
New Jersey Resources Corp. | | | 10,912 | | | | 433,206 | | |
ONE GAS, Inc. | | | 6,588 | | | | 459,908 | | |
Southwest Gas Holdings, Inc. | | | 5,988 | | | | 437,483 | | |
UGI Corp. | | | 21,855 | | | | 1,058,001 | | |
WGL Holdings, Inc. | | | 6,458 | | | | 538,791 | | |
| | | | | | 5,237,064 | | |
Multi-Utilities (1.4%) | |
Black Hills Corp. | | | 6,735 | | | | 454,410 | | |
MDU Resources Group, Inc. | | | 24,656 | | | | 645,987 | | |
NorthWestern Corp. | | | 6,091 | | | | 371,673 | | |
OGE Energy Corp. | | | 25,211 | | | | 877,091 | | |
Vectren Corp. | | | 10,472 | | | | 611,984 | | |
| | | | | | 2,961,145 | | |
Water Utilities (0.4%) | |
Aqua America, Inc. | | | 22,421 | | | | 746,619 | | |
Total common stocks
(cost: $147,743,352) | | | | | 208,636,521 | | |
Short-Term Securities (3.4%) | |
Investment Companies (3.4%) | |
State Street Institutional
U.S. Government Money
Market Fund, current
rate 0.880% | | | 7,299,223 | | | | 7,299,223 | | |
Total short-term securities
(cost: $7,299,223) | | | | | 7,299,223 | | |
Total investments in securities
(cost: $155,042,575) (d) | | | | | 215,935,744 | | |
Liabilities in excess of cash and
other assets (-0.1%) | | | | | (214,600 | ) | |
Total net assets (100.0%) | | | | $ | 215,721,144 | | |
Investments in Securities Legend
(a) Securities are valued by procedures described in Note 2 of the Notes to Financial Statements.
(b) Non-income producing security.
(c) Foreign security: The Fund held 1.6% of net assets in foreign securities at June 30, 2017.
(d) At June 30, 2017 the cost of securities for federal income tax purposes was $155,427,698. The aggregate unrealized appreciation and depreciation of investments in securities based on this cost were:
Gross unrealized appreciation | | $ | 69,850,562 | | |
Gross unrealized depreciation | | | (9,342,516 | ) | |
Net unrealized appreciation | | $ | 60,508,046 | | |
Holdings of Open Futures Contracts
On June 30, 2017, cash in the amount of $243,200 has been pledged to cover margin requirements for the following open futures contracts:
Type | | Expiration | | Number of
Contracts | | Position
Type | | Unrealized
Appreciation/
(Depreciation) | |
S&P Mid
400®
E-Mini
Index
Future | | September 2017 | | | 38 | | | Long | | $ | 628 | | |
| | | | | | 38 | | | | | $ | 628 | | |
See accompanying notes to financial statements.
32
SFT Advantus Index 500 Fund
Investments in Securities
(Percentages of each investment category relate to total net assets)
| | | Shares | | Value(a) | |
Common Stocks (98.3%) | |
Consumer Discretionary (12.2%) | |
Auto Components (0.2%) | |
BorgWarner, Inc. | | | 7,517 | | | $ | 318,420 | | |
Delphi Automotive PLC (b) | | | 10,087 | | | | 884,126 | | |
The Goodyear Tire & Rubber Co. | | | 9,446 | | | | 330,232 | | |
| | | | | | 1,532,778 | | |
Automobiles (0.5%) | |
Ford Motor Co. | | | 147,772 | | | | 1,653,569 | | |
General Motors Co. | | | 51,885 | | | | 1,812,343 | | |
Harley-Davidson, Inc. | | | 6,527 | | | | 352,588 | | |
| | | | | | 3,818,500 | | |
Distributors (0.1%) | |
Genuine Parts Co. | | | 5,545 | | | | 514,354 | | |
LKQ Corp. (c) | | | 11,637 | | | | 383,439 | | |
| | | | | | 897,793 | | |
Diversified Consumer Services (0.0%) | |
H&R Block, Inc. | | | 7,756 | | | | 239,738 | | |
Hotels, Restaurants & Leisure (1.7%) | |
Carnival Corp. | | | 15,769 | | | | 1,033,973 | | |
Chipotle Mexican Grill, Inc. (c) | | | 1,149 | | | | 478,099 | | |
Darden Restaurants, Inc. | | | 4,658 | | | | 421,270 | | |
Hilton Worldwide Holdings, Inc. | | | 7,741 | | | | 478,781 | | |
Marriott International, Inc. –
Class A | | | 11,739 | | | | 1,177,539 | | |
McDonald's Corp. | | | 30,796 | | | | 4,716,715 | | |
Royal Caribbean Cruises, Ltd. | | | 6,325 | | | | 690,880 | | |
Starbucks Corp. | | | 54,713 | | | | 3,190,315 | | |
Wyndham Worldwide Corp. | | | 3,935 | | | | 395,113 | | |
Wynn Resorts, Ltd. | | | 3,042 | | | | 407,993 | | |
Yum! Brands, Inc. | | | 12,499 | | | | 921,926 | | |
| | | | | | 13,912,604 | | |
Household Durables (0.6%) | |
DR Horton, Inc. | | | 12,913 | | | | 446,402 | | |
Garmin, Ltd. (b) | | | 4,318 | | | | 220,348 | | |
Leggett & Platt, Inc. | | | 4,996 | | | | 262,440 | | |
Lennar Corp. – Class A | | | 7,607 | | | | 405,605 | | |
Mohawk Industries, Inc. (c) | | | 2,380 | | | | 575,222 | | |
Newell Brands, Inc. | | | 18,225 | | | | 977,225 | | |
PulteGroup, Inc. | | | 10,728 | | | | 263,158 | | |
Stanley Black & Decker, Inc. | | | 5,835 | | | | 821,160 | | |
Whirlpool Corp. | | | 2,828 | | | | 541,901 | | |
| | | | | | 4,513,461 | | |
Internet & Catalog Retail (2.7%) | |
Amazon.com, Inc. (c) | | | 15,022 | | | | 14,541,296 | | |
Expedia, Inc. | | | 4,557 | | | | 678,765 | | |
Netflix, Inc. (c) | | | 16,328 | | | | 2,439,566 | | |
The Priceline Group, Inc. (c) | | | 1,876 | | | | 3,509,096 | | |
TripAdvisor, Inc. (c) | | | 4,130 | | | | 157,766 | | |
| | | | | | 21,326,489 | | |
Leisure Equipment & Products (0.1%) | |
Hasbro, Inc. | | | 4,199 | | | | 468,230 | | |
Mattel, Inc. | | | 12,890 | | | | 277,522 | | |
| | | | | | 745,752 | | |
| | | Shares | | Value(a) | |
Media (3.0%) | |
CBS Corp. – Class B | | | 13,917 | | | $ | 887,626 | | |
Charter Communications,
Inc. – Class A (c) | | | 8,161 | | | | 2,749,033 | | |
Comcast Corp. – Class A | | | 178,814 | | | | 6,959,441 | | |
Discovery Communications,
Inc. – Class A (c) | | | 5,809 | | | | 150,046 | | |
Discovery Communications,
Inc. – Class C (c) | | | 7,965 | | | | 200,798 | | |
DISH Network Corp. –
Class A (c) | | | 8,580 | | | | 538,481 | | |
News Corp. – Class A | | | 14,392 | | | | 197,170 | | |
News Corp. – Class B | | | 4,430 | | | | 62,685 | | |
Omnicom Group, Inc. | | | 8,771 | | | | 727,116 | | |
Scripps Networks Interactive,
Inc. – Class A | | | 3,542 | | | | 241,954 | | |
The Interpublic Group of
Cos., Inc. | | | 14,896 | | | | 366,442 | | |
The Walt Disney Co. | | | 54,964 | | | | 5,839,925 | | |
Time Warner, Inc. | | | 29,274 | | | | 2,939,402 | | |
Twenty-First Century Fox,
Inc. – Class A | | | 39,759 | | | | 1,126,770 | | |
Twenty-First Century Fox,
Inc. – Class B | | | 18,322 | | | | 510,634 | | |
Viacom, Inc. – Class B | | | 13,310 | | | | 446,817 | | |
| | | | | | 23,944,340 | | |
Multiline Retail (0.4%) | |
Dollar General Corp. | | | 9,519 | | | | 686,225 | | |
Dollar Tree, Inc. (c) | | | 8,902 | | | | 622,428 | | |
Kohl's Corp. | | | 6,441 | | | | 249,073 | | |
Macy's, Inc. | | | 11,471 | | | | 266,586 | | |
Nordstrom, Inc. | | | 4,195 | | | | 200,647 | | |
Target Corp. | | | 20,844 | | | | 1,089,933 | | |
| | | | | | 3,114,892 | | |
Specialty Retail (2.2%) | |
Advance Auto Parts, Inc. | | | 2,753 | | | | 320,972 | | |
AutoNation, Inc. (c) | | | 2,409 | | | | 101,563 | | |
AutoZone, Inc. (c) | | | 1,135 | | | | 647,472 | | |
Bed Bath & Beyond, Inc. | | | 5,484 | | | | 166,714 | | |
Best Buy Co., Inc. | | | 10,024 | | | | 574,676 | | |
CarMax, Inc. (c) | | | 6,968 | | | | 439,402 | | |
Foot Locker, Inc. | | | 4,870 | | | | 239,994 | | |
L Brands, Inc. | | | 9,085 | | | | 489,591 | | |
Lowe's Cos., Inc. | | | 32,420 | | | | 2,513,523 | | |
O'Reilly Automotive, Inc. (c) | | | 3,477 | | | | 760,559 | | |
Ross Stores, Inc. | | | 14,799 | | | | 854,346 | | |
Signet Jewelers, Ltd. | | | 2,533 | | | | 160,187 | | |
Staples, Inc. | | | 24,599 | | | | 247,712 | | |
The Gap, Inc. | | | 8,288 | | | | 182,253 | | |
The Home Depot, Inc. | | | 45,171 | | | | 6,929,231 | | |
The TJX Cos., Inc. | | | 24,304 | | | | 1,754,020 | | |
Tiffany & Co. | | | 4,076 | | | | 382,614 | | |
Tractor Supply Co. | | | 4,830 | | | | 261,834 | | |
Ulta Salon Cosmetics &
Fragrance, Inc. (c) | | | 2,218 | | | | 637,320 | | |
| | | | | | 17,663,983 | | |
Textiles, Apparel & Luxury Goods (0.7%) | |
Coach, Inc. | | | 10,610 | | | | 502,277 | | |
See accompanying notes to financial statements.
33
SFT Advantus Index 500 Fund
Investments in Securities – continued
| | | Shares | | Value(a) | |
Hanesbrands, Inc. | | | 13,758 | | | $ | 318,635 | | |
Michael Kors Holdings,
Ltd. (b) (c) | | | 5,888 | | | | 213,440 | | |
NIKE, Inc. – Class B | | | 50,070 | | | | 2,954,130 | | |
PVH Corp. | | | 2,890 | | | | 330,905 | | |
Ralph Lauren Corp. | | | 2,033 | | | | 150,035 | | |
Under Armour, Inc. –
Class A (c) | | | 6,953 | | | | 151,297 | | |
Under Armour, Inc. –
Class C (c) | | | 6,892 | | | | 138,943 | | |
VF Corp. | | | 12,104 | | | | 697,191 | | |
| | | | | | 5,456,853 | | |
Consumer Staples (8.9%) | |
Beverages (2.1%) | |
Brown-Forman Corp. –
Class B | | | 6,610 | | | | 321,246 | | |
Constellation Brands, Inc. –
Class A | | | 6,452 | | | | 1,249,946 | | |
Dr Pepper Snapple Group, Inc. | | | 6,972 | | | | 635,219 | | |
Molson Coors Brewing Co. –
Class B | | | 6,920 | | | | 597,473 | | |
Monster Beverage Corp. (c) | | | 15,136 | | | | 751,957 | | |
PepsiCo, Inc. | | | 53,972 | | | | 6,233,226 | | |
The Coca-Cola Co. | | | 145,285 | | | | 6,516,032 | | |
| | | | | | 16,305,099 | | |
Food & Staples Retailing (1.9%) | |
Costco Wholesale Corp. | | | 16,556 | | | | 2,647,801 | | |
CVS Health Corp. | | | 38,492 | | | | 3,097,066 | | |
Sysco Corp. | | | 18,603 | | | | 936,289 | | |
The Kroger Co. | | | 34,480 | | | | 804,074 | | |
Wal-Mart Stores, Inc. | | | 55,809 | | | | 4,223,625 | | |
Walgreens Boots Alliance, Inc. | | | 32,238 | | | | 2,524,558 | | |
Whole Foods Market, Inc. | | | 12,020 | | | | 506,162 | | |
| | | | | | 14,739,575 | | |
Food Products (1.3%) | |
Archer-Daniels-Midland Co. | | | 21,561 | | | | 892,194 | | |
Campbell Soup Co. | | | 7,154 | | | | 373,081 | | |
Conagra Brands, Inc. | | | 15,272 | | | | 546,127 | | |
General Mills, Inc. | | | 21,767 | | | | 1,205,892 | | |
Hormel Foods Corp. | | | 10,112 | | | | 344,920 | | |
Kellogg Co. | | | 9,454 | | | | 656,675 | | |
McCormick & Co., Inc. | | | 4,254 | | | | 414,807 | | |
Mondelez International,
Inc. – Class A | | | 57,326 | | | | 2,475,910 | | |
The Hershey Co. | | | 5,280 | | | | 566,914 | | |
The JM Smucker Co. | | | 4,381 | | | | 518,404 | | |
The Kraft Heinz Co. | | | 22,524 | | | | 1,928,955 | | |
Tyson Foods, Inc. – Class A | | | 10,885 | | | | 681,728 | | |
| | | | | | 10,605,607 | | |
Household Products (1.7%) | |
Church & Dwight Co., Inc. | | | 9,417 | | | | 488,554 | | |
Clorox Co. | | | 4,833 | | | | 643,949 | | |
Colgate-Palmolive Co. | | | 33,373 | | | | 2,473,940 | | |
Kimberly-Clark Corp. | | | 13,392 | | | | 1,729,041 | | |
The Procter & Gamble Co. | | | 96,633 | | | | 8,421,566 | | |
| | | | | | 13,757,050 | | |
| | | Shares | | Value(a) | |
Personal Care (0.1%) | |
The Estee Lauder Cos., Inc. –
Class A | | | 8,434 | | | $ | 809,495 | | |
Personal Products (0.0%) | |
Coty, Inc. – Class A | | | 17,755 | | | | 333,084 | | |
Tobacco (1.8%) | |
Altria Group, Inc. | | | 72,982 | | | | 5,434,970 | | |
Philip Morris International, Inc. | | | 58,682 | | | | 6,892,201 | | |
Reynolds American, Inc. | | | 31,186 | | | | 2,028,337 | | |
| | | | | | 14,355,508 | | |
Energy (5.8%) | |
Energy Equipment & Services (0.9%) | |
Baker Hughes, Inc. | | | 16,034 | | | | 874,014 | | |
Halliburton Co. | | | 32,786 | | | | 1,400,290 | | |
Helmerich & Payne, Inc. | | | 4,036 | | | | 219,316 | | |
National Oilwell Varco, Inc. | | | 14,266 | | | | 469,922 | | |
Schlumberger, Ltd. | | | 52,498 | | | | 3,456,469 | | |
TechnipFMC PLC (b) (c) | | | 17,571 | | | | 477,931 | | |
Transocean, Ltd. (b) (c) | | | 14,683 | | | | 120,841 | | |
| | | | | | 7,018,783 | | |
Oil, Gas & Consumable Fuels (4.9%) | |
Anadarko Petroleum Corp. | | | 21,152 | | | | 959,032 | | |
Apache Corp. | | | 14,305 | | | | 685,639 | | |
Cabot Oil & Gas Corp. | | | 17,588 | | | | 441,107 | | |
Chesapeake Energy Corp. (c) | | | 28,796 | | | | 143,116 | | |
Chevron Corp. | | | 71,581 | | | | 7,468,046 | | |
Cimarex Energy Co. | | | 3,540 | | | | 332,795 | | |
Concho Resources, Inc. (c) | | | 5,628 | | | | 683,971 | | |
ConocoPhillips | | | 46,700 | | | | 2,052,932 | | |
Devon Energy Corp. | | | 19,802 | | | | 633,070 | | |
EOG Resources, Inc. | | | 21,811 | | | | 1,974,332 | | |
EQT Corp. | | | 6,528 | | | | 382,475 | | |
Exxon Mobil Corp. | | | 160,095 | | | | 12,924,469 | | |
Hess Corp. | | | 10,206 | | | | 447,737 | | |
Kinder Morgan, Inc. | | | 72,538 | | | | 1,389,828 | | |
Marathon Oil Corp. | | | 32,038 | | | | 379,650 | | |
Marathon Petroleum Corp. | | | 19,599 | | | | 1,025,616 | | |
Murphy Oil Corp. | | | 6,054 | | | | 155,164 | | |
Newfield Exploration Co. (c) | | | 7,444 | | | | 211,856 | | |
Noble Energy, Inc. | | | 17,169 | | | | 485,883 | | |
Occidental Petroleum Corp. | | | 28,887 | | | | 1,729,465 | | |
Phillips 66 | | | 16,574 | | | | 1,370,504 | | |
Pioneer Natural Resources Co. | | | 6,415 | | | | 1,023,706 | | |
Range Resources Corp. | | | 7,035 | | | | 163,001 | | |
Tesoro Corp. | | | 5,710 | | | | 534,456 | | |
The Williams Cos., Inc. | | | 31,218 | | | | 945,281 | | |
Valero Energy Corp. | | | 16,897 | | | | 1,139,871 | | |
| | | | | | 39,683,002 | | |
Financial (14.3%) | |
Capital Markets (2.9%) | |
Affiliated Managers Group, Inc. | | | 2,169 | | | | 359,750 | | |
Ameriprise Financial, Inc. | | | 5,744 | | | | 731,154 | | |
BlackRock, Inc. | | | 4,615 | | | | 1,949,422 | | |
CBOE Holdings, Inc. | | | 3,450 | | | | 315,330 | | |
CME Group, Inc. | | | 12,864 | | | | 1,611,087 | | |
E*Trade Financial Corp. (c) | | | 10,351 | | | | 393,649 | | |
Franklin Resources, Inc. | | | 12,931 | | | | 579,180 | | |
Intercontinental Exchange, Inc. | | | 22,369 | | | | 1,474,565 | | |
See accompanying notes to financial statements.
34
SFT Advantus Index 500 Fund
Investments in Securities – continued
| | | Shares | | Value(a) | |
Invesco, Ltd. | | | 15,303 | | | $ | 538,513 | | |
Moody's Corp. | | | 6,240 | | | | 759,283 | | |
Morgan Stanley | | | 53,815 | | | | 2,397,996 | | |
Nasdaq, Inc. | | | 4,304 | | | | 307,693 | | |
Northern Trust Corp. | | | 8,158 | | | | 793,039 | | |
Raymond James Financial, Inc. | | | 4,851 | | | | 389,147 | | |
S&P Global, Inc. | | | 9,706 | | | | 1,416,979 | | |
State Street Corp. | | | 13,362 | | | | 1,198,972 | | |
T Rowe Price Group, Inc. | | | 9,113 | | | | 676,276 | | |
The Bank of New York
Mellon Corp. | | | 39,255 | | | | 2,002,790 | | |
The Charles Schwab Corp. | | | 45,973 | | | | 1,975,000 | | |
The Goldman Sachs Group, Inc. | | | 13,832 | | | | 3,069,321 | | |
| | | | | | 22,939,146 | | |
Commercial Banks (6.4%) | |
Bank of America Corp. | | | 376,008 | | | | 9,121,954 | | |
BB&T Corp. | | | 30,605 | | | | 1,389,773 | | |
Citigroup, Inc. | | | 104,025 | | | | 6,957,192 | | |
Citizens Financial Group, Inc. | | | 19,138 | | | | 682,844 | | |
Comerica, Inc. | | | 6,671 | | | | 488,584 | | |
Fifth Third Bancorp | | | 28,347 | | | | 735,888 | | |
Huntington Bancshares, Inc. | | | 41,074 | | | | 555,320 | | |
JPMorgan Chase & Co. | | | 134,234 | | | | 12,268,988 | | |
KeyCorp | | | 41,413 | | | | 776,080 | | |
M&T Bank Corp. | | | 5,790 | | | | 937,690 | | |
People's United Financial, Inc. | | | 12,922 | | | | 228,203 | | |
Regions Financial Corp. | | | 45,417 | | | | 664,905 | | |
SunTrust Banks, Inc. | | | 18,266 | | | | 1,036,047 | | |
The PNC Financial Services
Group, Inc. | | | 18,283 | | | | 2,282,998 | | |
US Bancorp | | | 59,853 | | | | 3,107,568 | | |
Wells Fargo & Co. | | | 169,930 | | | | 9,415,821 | | |
Zions Bancorporation | | | 7,557 | | | | 331,828 | | |
| | | | | | 50,981,683 | | |
Consumer Finance (0.7%) | |
American Express Co. | | | 28,366 | | | | 2,389,552 | | |
Capital One Financial Corp. | | | 18,253 | | | | 1,508,063 | | |
Discover Financial Services | | | 14,364 | | | | 893,297 | | |
Navient Corp. | | | 10,765 | | | | 179,237 | | |
Synchrony Financial | | | 29,101 | | | | 867,792 | | |
| | | | | | 5,837,941 | | |
Diversified Financial Services (0.0%) | |
Leucadia National Corp. | | | 12,184 | | | | 318,734 | | |
Insurance (4.3%) | |
Aflac, Inc. | | | 14,994 | | | | 1,164,734 | | |
American International
Group, Inc. | | | 33,229 | | | | 2,077,477 | | |
Aon PLC (b) | | | 9,902 | | | | 1,316,471 | | |
Arthur J Gallagher & Co. | | | 6,775 | | | | 387,869 | | |
Assurant, Inc. | | | 2,040 | | | | 211,527 | | |
Berkshire Hathaway, Inc. –
Class B (c) | | | 71,768 | | | | 12,155,346 | | |
Chubb, Ltd. (b) | | | 17,653 | | | | 2,566,393 | | |
Cincinnati Financial Corp. | | | 5,664 | | | | 410,357 | | |
Everest Re Group, Ltd. (b) | | | 1,552 | | | | 395,124 | | |
Hartford Financial Services
Group, Inc. | | | 13,879 | | | | 729,619 | | |
Lincoln National Corp. | | | 8,443 | | | | 570,578 | | |
Loews Corp. | | | 10,354 | | | | 484,671 | | |
| | | Shares | | Value(a) | |
Marsh & McLennan Cos., Inc. | | | 19,432 | | | $ | 1,514,919 | | |
MetLife, Inc. | | | 40,822 | | | | 2,242,761 | | |
Principal Financial Group, Inc. | | | 10,094 | | | | 646,722 | | |
Prudential Financial, Inc. | | | 16,174 | | | | 1,749,056 | | |
The Allstate Corp. | | | 13,736 | | | | 1,214,812 | | |
The Progressive Corp. | | | 21,932 | | | | 966,982 | | |
The Travelers Cos., Inc. | | | 10,510 | | | | 1,329,830 | | |
Torchmark Corp. | | | 4,094 | | | | 313,191 | | |
Unum Group | | | 8,592 | | | | 400,645 | | |
Willis Towers Watson PLC (b) | | | 4,808 | | | | 699,372 | | |
XL Group, Ltd. (b) | | | 9,877 | | | | 432,612 | | |
| | | | | | 33,981,068 | | |
Health Care (14.3%) | |
Biotechnology (2.9%) | |
AbbVie, Inc. | | | 60,132 | | | | 4,360,171 | | |
Alexion Pharmaceuticals,
Inc. (c) | | | 8,437 | | | | 1,026,530 | | |
Amgen, Inc. | | | 27,804 | | | | 4,788,683 | | |
Biogen, Inc. (c) | | | 8,071 | | | | 2,190,147 | | |
Celgene Corp. (c) | | | 29,512 | | | | 3,832,723 | | |
Gilead Sciences, Inc. | | | 49,371 | | | | 3,494,479 | | |
Incyte Corp. (c) | | | 6,426 | | | | 809,098 | | |
Regeneron Pharmaceuticals,
Inc. (c) | | | 2,885 | | | | 1,416,939 | | |
Vertex Pharmaceuticals, Inc. (c) | | | 9,400 | | | | 1,211,378 | | |
| | | | | | 23,130,148 | | |
Health Care Equipment & Supplies (2.8%) | |
Abbott Laboratories | | | 65,550 | | | | 3,186,385 | | |
Align Technology, Inc. (c) | | | 2,853 | | | | 428,292 | | |
Baxter International, Inc. | | | 18,413 | | | | 1,114,723 | | |
Becton Dickinson and Co. | | | 8,641 | | | | 1,685,945 | | |
Boston Scientific Corp. (c) | | | 51,723 | | | | 1,433,762 | | |
CR Bard, Inc. | | | 2,810 | | | | 888,269 | | |
Danaher Corp. | | | 23,043 | | | | 1,944,599 | | |
DENTSPLY SIRONA, Inc. | | | 8,652 | | | | 560,996 | | |
Edwards Lifesciences Corp. (c) | | | 7,927 | | | | 937,288 | | |
Hologic, Inc. (c) | | | 10,494 | | | | 476,218 | | |
IDEXX Laboratories, Inc. (c) | | | 3,390 | | | | 547,214 | | |
Intuitive Surgical, Inc. (c) | | | 1,394 | | | | 1,303,906 | | |
Medtronic PLC (b) | | | 51,720 | | | | 4,590,150 | | |
Stryker Corp. | | | 11,726 | | | | 1,627,334 | | |
The Cooper Cos., Inc. | | | 1,840 | | | | 440,533 | | |
Varian Medical Systems, Inc. (c) | | | 3,427 | | | | 353,632 | | |
Zimmer Biomet Holdings, Inc. | | | 7,629 | | | | 979,564 | | |
| | | | | | 22,498,810 | | |
Health Care Providers & Services (2.8%) | |
Aetna, Inc. | | | 12,591 | | | | 1,911,691 | | |
AmerisourceBergen Corp. | | | 6,234 | | | | 589,300 | | |
Anthem, Inc. | | | 10,075 | | | | 1,895,410 | | |
Cardinal Health, Inc. | | | 11,949 | | | | 931,066 | | |
Centene Corp. (c) | | | 6,525 | | | | 521,217 | | |
Cigna Corp. | | | 9,645 | | | | 1,614,476 | | |
DaVita, Inc. (c) | | | 5,876 | | | | 380,530 | | |
Envision Healthcare Corp. (c) | | | 4,340 | | | | 271,988 | | |
Express Scripts Holding Co. (c) | | | 22,425 | | | | 1,431,612 | | |
HCA Healthcare, Inc. (c) | | | 10,813 | | | | 942,894 | | |
Henry Schein, Inc. (c) | | | 3,004 | | | | 549,792 | | |
Humana, Inc. | | | 5,453 | | | | 1,312,101 | | |
Laboratory Corp. of America
Holdings (c) | | | 3,889 | | | | 599,450 | | |
See accompanying notes to financial statements.
35
SFT Advantus Index 500 Fund
Investments in Securities – continued
| | | Shares | | Value(a) | |
McKesson Corp. | | | 7,934 | | | $ | 1,305,460 | | |
Patterson Cos., Inc. | | | 3,027 | | | | 142,118 | | |
Quest Diagnostics, Inc. | | | 5,167 | | | | 574,364 | | |
UnitedHealth Group, Inc. | | | 36,393 | | | | 6,747,990 | | |
Universal Health Services,
Inc. – Class B | | | 3,414 | | | | 416,781 | | |
| | | | | | 22,138,240 | | |
Health Care Technology (0.1%) | |
Cerner Corp. (c) | | | 11,031 | | | | 733,231 | | |
Life Sciences Tools & Services (0.7%) | |
Agilent Technologies, Inc. | | | 12,109 | | | | 718,185 | | |
Illumina, Inc. (c) | | | 5,482 | | | | 951,236 | | |
Mettler-Toledo International,
Inc. (c) | | | 1,002 | | | | 589,717 | | |
PerkinElmer, Inc. | | | 4,091 | | | | 278,761 | | |
Thermo Fisher Scientific, Inc. | | | 14,809 | | | | 2,583,726 | | |
Waters Corp. (c) | | | 3,082 | | | | 566,595 | | |
| | | | | | 5,688,220 | | |
Pharmaceuticals (5.0%) | |
Allergan PLC | | | 12,699 | | | | 3,087,000 | | |
Bristol-Myers Squibb Co. | | | 62,244 | | | | 3,468,236 | | |
Eli Lilly & Co. | | | 36,686 | | | | 3,019,258 | | |
Johnson & Johnson | | | 101,780 | | | | 13,464,476 | | |
Mallinckrodt PLC (c) | | | 3,753 | | | | 168,172 | | |
Merck & Co., Inc. | | | 103,341 | | | | 6,623,125 | | |
Mylan NV (c) | | | 17,398 | | | | 675,390 | | |
Perrigo Co. PLC (b) | | | 5,382 | | | | 406,448 | | |
Pfizer, Inc. | | | 225,480 | | | | 7,573,873 | | |
Zoetis, Inc. | | | 18,523 | | | | 1,155,465 | | |
| | | | | | 39,641,443 | | |
Industrials (10.0%) | |
Aerospace & Defense (2.2%) | |
Arconic, Inc. | | | 16,611 | | | | 376,239 | | |
General Dynamics Corp. | | | 10,715 | | | | 2,122,641 | | |
L3 Technologies, Inc. | | | 2,935 | | | | 490,380 | | |
Lockheed Martin Corp. | | | 9,405 | | | | 2,610,922 | | |
Northrop Grumman Corp. | | | 6,624 | | | | 1,700,447 | | |
Raytheon Co. | | | 10,998 | | | | 1,775,957 | | |
Rockwell Collins, Inc. | | | 6,151 | | | | 646,347 | | |
The Boeing Co. | | | 21,209 | | | | 4,194,080 | | |
TransDigm Group, Inc. | | | 1,894 | | | | 509,240 | | |
United Technologies Corp. | | | 28,153 | | | | 3,437,763 | | |
| | | | | | 17,864,016 | | |
Air Freight & Logistics (0.7%) | |
CH Robinson Worldwide, Inc. | | | 5,277 | | | | 362,424 | | |
Expeditors International of
Washington, Inc. | | | 6,755 | | | | 381,522 | | |
FedEx Corp. | | | 9,339 | | | | 2,029,645 | | |
United Parcel Service, Inc. –
Class B | | | 26,023 | | | | 2,877,884 | | |
| | | | | | 5,651,475 | | |
Airlines (0.6%) | |
Alaska Air Group, Inc. | | | 4,700 | | | | 421,872 | | |
American Airlines Group, Inc. | | | 18,611 | | | | 936,506 | | |
Delta Air Lines, Inc. | | | 27,721 | | | | 1,489,727 | | |
Southwest Airlines Co. | | | 22,845 | | | | 1,419,588 | | |
| | | Shares | | Value(a) | |
United Continental Holdings,
Inc. (c) | | | 10,646 | | | $ | 801,111 | | |
| | | | | | 5,068,804 | | |
Building Products (0.3%) | |
Allegion PLC (b) | | | 3,591 | | | | 291,302 | | |
Fortune Brands Home &
Security, Inc. | | | 5,800 | | | | 378,392 | | |
Johnson Controls
International PLC | | | 35,444 | | | | 1,536,852 | | |
Masco Corp. | | | 12,051 | | | | 460,469 | | |
| | | | | | 2,667,015 | | |
Commercial Services & Supplies (0.3%) | |
Avery Dennison Corp. | | | 3,311 | | | | 292,593 | | |
Cintas Corp. | | | 3,274 | | | | 412,655 | | |
Republic Services, Inc. | | | 8,671 | | | | 552,603 | | |
Stericycle, Inc. (c) | | | 3,182 | | | | 242,850 | | |
Waste Management, Inc. | | | 15,289 | | | | 1,121,448 | | |
| | | | | | 2,622,149 | | |
Construction & Engineering (0.1%) | |
Fluor Corp. | | | 5,202 | | | | 238,147 | | |
Jacobs Engineering Group, Inc. | | | 4,492 | | | | 244,320 | | |
Quanta Services, Inc. (c) | | | 5,592 | | | | 184,089 | | |
| | | | | | 666,556 | | |
Electrical Equipment (0.6%) | |
Acuity Brands, Inc. | | | 1,680 | | | | 341,511 | | |
AMETEK, Inc. | | | 8,607 | | | | 521,326 | | |
Eaton Corp. PLC | | | 16,900 | | | | 1,315,327 | | |
Emerson Electric Co. | | | 24,350 | | | | 1,451,747 | | |
Rockwell Automation, Inc. | | | 4,843 | | | | 784,372 | | |
| | | | | | 4,414,283 | | |
Industrial Conglomerates (2.4%) | |
3M Co. | | | 22,617 | | | | 4,708,633 | | |
General Electric Co. | | | 329,038 | | | | 8,887,316 | | |
Honeywell International, Inc. | | | 28,802 | | | | 3,839,019 | | |
Roper Technologies, Inc. | | | 3,874 | | | | 896,947 | | |
Textron, Inc. | | | 10,047 | | | | 473,214 | | |
| | | | | | 18,805,129 | | |
Machinery (1.5%) | |
Caterpillar, Inc. | | | 22,265 | | | | 2,392,597 | | |
Cummins, Inc. | | | 5,868 | | | | 951,907 | | |
Deere & Co. | | | 11,117 | | | | 1,373,950 | | |
Dover Corp. | | | 5,902 | | | | 473,458 | | |
Flowserve Corp. | | | 4,926 | | | | 228,714 | | |
Fortive Corp. | | | 11,321 | | | | 717,185 | | |
Illinois Tool Works, Inc. | | | 11,732 | | | | 1,680,609 | | |
Ingersoll-Rand PLC | | | 9,673 | | | | 884,015 | | |
PACCAR, Inc. | | | 13,244 | | | | 874,634 | | |
Parker Hannifin Corp. | | | 5,091 | | | | 813,644 | | |
Pentair PLC (b) | | | 6,301 | | | | 419,269 | | |
Snap-On, Inc. | | | 2,243 | | | | 354,394 | | |
Xylem, Inc. | | | 6,716 | | | | 372,268 | | |
| | | | | | 11,536,644 | | |
Professional Services (0.3%) | |
Equifax, Inc. | | | 4,536 | | | | 623,337 | | |
IHS Markit, Ltd. (b) (c) | | | 11,990 | | | | 528,040 | | |
See accompanying notes to financial statements.
36
SFT Advantus Index 500 Fund
Investments in Securities – continued
| | | Shares | | Value(a) | |
Nielsen Holdings PLC | | | 12,604 | | | $ | 487,271 | | |
Robert Half International, Inc. | | | 4,768 | | | | 228,530 | | |
United Rentals, Inc. (c) | | | 3,175 | | | | 357,854 | | |
Verisk Analytics, Inc. (c) | | | 5,743 | | | | 484,537 | | |
| | | | | | 2,709,569 | | |
Road & Rail (0.9%) | |
CSX Corp. | | | 34,861 | | | | 1,902,016 | | |
JB Hunt Transport Services, Inc. | | | 3,190 | | | | 291,502 | | |
Kansas City Southern | | | 3,986 | | | | 417,135 | | |
Norfolk Southern Corp. | | | 10,979 | | | | 1,336,144 | | |
Union Pacific Corp. | | | 30,507 | | | | 3,322,518 | | |
| | | | | | 7,269,315 | | |
Trading Companies & Distributors (0.1%) | |
Fastenal Co. | | | 10,872 | | | | 473,258 | | |
WW Grainger, Inc. | | | 2,074 | | | | 374,419 | | |
| | | | | | 847,677 | | |
Information Technology (21.9%) | |
Communications Equipment (1.0%) | |
Cisco Systems, Inc. | | | 188,915 | | | | 5,913,040 | | |
F5 Networks, Inc. (c) | | | 2,460 | | | | 312,568 | | |
Harris Corp. | | | 4,606 | | | | 502,422 | | |
Juniper Networks, Inc. | | | 14,390 | | | | 401,193 | | |
Motorola Solutions, Inc. | | | 6,106 | | | | 529,634 | | |
| | | | | | 7,658,857 | | |
Computers & Peripherals (3.7%) | |
Apple, Inc. (d) | | | 196,993 | | | | 28,370,932 | | |
NetApp, Inc. | | | 10,178 | | | | 407,629 | | |
Western Digital Corp. | | | 11,028 | | | | 977,081 | | |
| | | | | | 29,755,642 | | |
Electronic Equipment, Instruments &
Components (0.5%) | |
Amphenol Corp. – Class A | | | 11,547 | | | | 852,400 | | |
Corning, Inc. | | | 34,768 | | | | 1,044,778 | | |
FLIR Systems, Inc. | | | 5,072 | | | | 175,796 | | |
Seagate Technology PLC | | | 11,146 | | | | 431,907 | | |
TE Connectivity, Ltd. (b) | | | 13,414 | | | | 1,055,413 | | |
| | | | | | 3,560,294 | | |
Internet Software & Services (4.5%) | |
Akamai Technologies, Inc. (c) | | | 6,462 | | | | 321,872 | | |
Alphabet, Inc. – Class A (c) | | | 11,210 | | | | 10,421,713 | | |
Alphabet, Inc. – Class C (c) | | | 11,276 | | | | 10,246,839 | | |
eBay, Inc. (c) | | | 38,031 | | | | 1,328,043 | | |
Facebook, Inc. – Class A (c) | | | 89,342 | | | | 13,488,855 | | |
VeriSign, Inc. (c) | | | 3,274 | | | | 304,351 | | |
| | | | | | 36,111,673 | | |
IT Services (3.8%) | |
Accenture PLC – Class A (b) | | | 23,428 | | | | 2,897,575 | | |
Alliance Data Systems Corp. | | | 2,103 | | | | 539,819 | | |
Automatic Data Processing, Inc. | | | 16,904 | | | | 1,731,984 | | |
Cognizant Technology Solutions
Corp. – Class A | | | 22,253 | | | | 1,477,599 | | |
CSRA, Inc. | | | 5,407 | | | | 171,672 | | |
DXC Technology Co. | | | 10,698 | | | | 820,751 | | |
Fidelity National Information
Services, Inc. | | | 12,498 | | | | 1,067,329 | | |
| | | Shares | | Value(a) | |
Fiserv, Inc. (c) | | | 7,993 | | | $ | 977,864 | | |
Gartner, Inc. – Class A (c) | | | 3,410 | | | | 421,169 | | |
Global Payments, Inc. | | | 5,700 | | | | 514,824 | | |
International Business
Machines Corp. | | | 32,302 | | | | 4,969,017 | | |
Mastercard, Inc. – Class A | | | 35,440 | | | | 4,304,188 | | |
Paychex, Inc. | | | 12,035 | | | | 685,273 | | |
PayPal Holdings, Inc. (c) | | | 42,209 | | | | 2,265,357 | | |
The Western Union Co. | | | 17,805 | | | | 339,185 | | |
Total System Services, Inc. | | | 6,238 | | | | 363,363 | | |
Visa, Inc. – Class A | | | 69,756 | | | | 6,541,718 | | |
| | | | | | 30,088,687 | | |
Office Electronics (0.0%) | |
Xerox Corp. | | | 7,998 | | | | 229,782 | | |
Semiconductors & Semiconductor
Equipment (3.3%) | |
Advanced Micro Devices, Inc. (c) | | | 29,263 | | | | 365,202 | | |
Analog Devices, Inc. | | | 13,888 | | | | 1,080,486 | | |
Applied Materials, Inc. | | | 40,602 | | | | 1,677,269 | | |
Broadcom, Ltd. | | | 15,213 | | | | 3,545,390 | | |
Intel Corp. | | | 177,918 | | | | 6,002,953 | | |
KLA-Tencor Corp. | | | 5,939 | | | | 543,478 | | |
Lam Research Corp. | | | 6,062 | | | | 857,349 | | |
Microchip Technology, Inc. | | | 8,601 | | | | 663,825 | | |
Micron Technology, Inc. (c) | | | 39,222 | | | | 1,171,169 | | |
NVIDIA Corp. | | | 22,481 | | | | 3,249,853 | | |
Qorvo, Inc. (c) | | | 4,737 | | | | 299,947 | | |
QUALCOMM, Inc. | | | 55,821 | | | | 3,082,436 | | |
Skyworks Solutions, Inc. | | | 6,957 | | | | 667,524 | | |
Texas Instruments, Inc. | | | 37,643 | | | | 2,895,876 | | |
Xilinx, Inc. | | | 9,322 | | | | 599,591 | | |
| | | | | | 26,702,348 | | |
Software (4.8%) | |
Activision Blizzard, Inc. | | | 26,139 | | | | 1,504,822 | | |
Adobe Systems, Inc. (c) | | | 18,691 | | | | 2,643,655 | | |
ANSYS, Inc. (c) | | | 3,230 | | | | 393,026 | | |
Autodesk, Inc. (c) | | | 7,285 | | | | 734,474 | | |
CA, Inc. | | | 11,791 | | | | 406,436 | | |
Citrix Systems, Inc. (c) | | | 5,711 | | | | 454,481 | | |
Electronic Arts, Inc. (c) | | | 11,694 | | | | 1,236,290 | | |
Intuit, Inc. | | | 9,168 | | | | 1,217,602 | | |
Microsoft Corp. | | | 291,701 | | | | 20,106,950 | | |
Oracle Corp. | | | 113,488 | | | | 5,690,288 | | |
Red Hat, Inc. (c) | | | 6,744 | | | | 645,738 | | |
Salesforce.com, Inc. (c) | | | 25,263 | | | | 2,187,776 | | |
Symantec Corp. | | | 22,980 | | | | 649,185 | | |
Synopsys, Inc. (c) | | | 5,679 | | | | 414,170 | | |
| | | | | | 38,284,893 | | |
Technology Hardware Storage &
Peripherals (0.3%) | |
Hewlett Packard Enterprise Co. | | | 62,901 | | | | 1,043,528 | | |
HP, Inc. | | | 63,600 | | | | 1,111,728 | | |
| | | | | | 2,155,256 | | |
Materials (2.7%) | |
Chemicals (2.1%) | |
Air Products & Chemicals, Inc. | | | 8,190 | | | | 1,171,662 | | |
Albemarle Corp. | | | 4,150 | | | | 437,991 | | |
CF Industries Holdings, Inc. | | | 8,743 | | | | 244,454 | | |
See accompanying notes to financial statements.
37
SFT Advantus Index 500 Fund
Investments in Securities – continued
| | | Shares | | Value(a) | |
Eastman Chemical Co. | | | 5,464 | | | $ | 458,921 | | |
Ecolab, Inc. | | | 9,851 | | | | 1,307,720 | | |
EI du Pont de Nemours & Co. | | | 32,697 | | | | 2,638,975 | | |
FMC Corp. | | | 5,003 | | | | 365,469 | | |
International Flavors &
Fragrances, Inc. | | | 3,004 | | | | 405,540 | | |
LyondellBasell Industries
NV – Class A | | | 12,421 | | | | 1,048,208 | | |
Monsanto Co. | | | 16,578 | | | | 1,962,172 | | |
PPG Industries, Inc. | | | 9,653 | | | | 1,061,444 | | |
Praxair, Inc. | | | 10,765 | | | | 1,426,901 | | |
The Dow Chemical Co. | | | 42,466 | | | | 2,678,331 | | |
The Mosaic Co. | | | 13,184 | | | | 300,991 | | |
The Sherwin-Williams Co. | | | 3,116 | | | | 1,093,591 | | |
| | | | | | 16,602,370 | | |
Construction Materials (0.1%) | |
Martin Marietta Materials, Inc. | | | 2,422 | | | | 539,089 | | |
Vulcan Materials Co. | | | 4,992 | | | | 632,386 | | |
| | | | | | 1,171,475 | | |
Containers & Packaging (0.3%) | |
Ball Corp. | | | 13,170 | | | | 555,906 | | |
International Paper Co. | | | 15,538 | | | | 879,606 | | |
Sealed Air Corp. | | | 7,398 | | | | 331,134 | | |
WestRock Co. | | | 9,427 | | | | 534,134 | | |
| | | | | | 2,300,780 | | |
Metals & Mining (0.2%) | |
Freeport-McMoRan, Inc. (c) | | | 50,291 | | | | 603,995 | | |
Newmont Mining Corp. | | | 20,062 | | | | 649,808 | | |
Nucor Corp. | | | 11,967 | | | | 692,531 | | |
| | | | | | 1,946,334 | | |
Real Estate (2.9%) | |
Health Care REITs (0.3%) | |
HCP, Inc. | | | 17,660 | | | | 564,414 | | |
Ventas, Inc. | | | 13,401 | | | | 931,101 | | |
Welltower, Inc. | | | 13,834 | | | | 1,035,475 | | |
| | | | | | 2,530,990 | | |
Hotels & Resort REITs (0.1%) | |
Host Hotels & Resorts, Inc. | | | 27,881 | | | | 509,386 | | |
Industrial REITs (0.1%) | |
ProLogis, Inc. | | | 19,980 | | | | 1,171,627 | | |
Office REITs (0.3%) | |
Alexandria Real Estate
Equities, Inc. | | | 3,471 | | | | 418,151 | | |
Boston Properties, Inc. | | | 5,850 | | | | 719,667 | | |
SL Green Realty Corp. | | | 3,833 | | | | 405,532 | | |
Vornado Realty Trust | | | 6,499 | | | | 610,256 | | |
| | | | | | 2,153,606 | | |
Real Estate Services (0.1%) | |
CBRE Group, Inc. – Class A (c) | | | 11,305 | | | | 411,502 | | |
Residential REITs (0.5%) | |
Apartment Investment &
Management Co. – Class A | | | 5,857 | | | | 251,675 | | |
AvalonBay Communities, Inc. | | | 5,225 | | | | 1,004,088 | | |
Equity Residential | | | 13,846 | | | | 911,482 | | |
| | | Shares | | Value(a) | |
Essex Property Trust, Inc. | | | 2,490 | | | $ | 640,602 | | |
Mid-America Apartment
Communities, Inc. | | | 4,290 | | | | 452,080 | | |
UDR, Inc. | | | 10,056 | | | | 391,883 | | |
| | | | | | 3,651,810 | | |
Retail REITs (0.5%) | |
Federal Realty Investment Trust | | | 2,700 | | | | 341,253 | | |
GGP, Inc. | | | 22,009 | | | | 518,532 | | |
Kimco Realty Corp. | | | 15,985 | | | | 293,325 | | |
Realty Income Corp. | | | 10,284 | | | | 567,471 | | |
Regency Centers Corp. | | | 5,530 | | | | 346,399 | | |
Simon Property Group, Inc. | | | 11,796 | | | | 1,908,121 | | |
The Macerich Co. | | | 4,463 | | | | 259,122 | | |
| | | | | | 4,234,223 | | |
Specialized REITs (1.0%) | |
American Tower Corp. | | | 16,058 | | | | 2,124,795 | | |
Crown Castle International Corp. | | | 13,832 | | | | 1,385,690 | | |
Digital Realty Trust, Inc. | | | 6,010 | | | | 678,829 | | |
Equinix, Inc. | | | 2,949 | | | | 1,265,593 | | |
Extra Space Storage, Inc. | | | 4,720 | | | | 368,160 | | |
Iron Mountain, Inc. | | | 9,259 | | | | 318,139 | | |
Public Storage | | | 5,711 | | | | 1,190,915 | | |
Weyerhaeuser Co. | | | 28,312 | | | | 948,452 | | |
| | | | | | 8,280,573 | | |
Telecommunication Services (2.1%) | |
Diversified Telecommunication Services (2.1%) | |
AT&T, Inc. | | | 232,287 | | | | 8,764,188 | | |
CenturyLink, Inc. | | | 20,636 | | | | 492,788 | | |
Level 3 Communications, Inc. (c) | | | 10,982 | | | | 651,233 | | |
Verizon Communications, Inc. | | | 154,129 | | | | 6,883,401 | | |
| | | | | | 16,791,610 | | |
Utilities (3.2%) | |
Electric Utilities (1.9%) | |
Alliant Energy Corp. | | | 8,590 | | | | 345,060 | | |
American Electric Power
Co., Inc. | | | 18,497 | | | | 1,284,987 | | |
Duke Energy Corp. | | | 26,439 | | | | 2,210,036 | | |
Edison International | | | 12,313 | | | | 962,753 | | |
Entergy Corp. | | | 6,779 | | | | 520,424 | | |
Eversource Energy | | | 11,887 | | | | 721,660 | | |
Exelon Corp. | | | 34,990 | | | | 1,262,089 | | |
FirstEnergy Corp. | | | 16,685 | | | | 486,535 | | |
NextEra Energy, Inc. | | | 17,665 | | | | 2,475,396 | | |
PG&E Corp. | | | 19,237 | | | | 1,276,760 | | |
Pinnacle West Capital Corp. | | | 4,150 | | | | 353,414 | | |
PPL Corp. | | | 25,720 | | | | 994,335 | | |
The Southern Co. | | | 37,494 | | | | 1,795,213 | | |
Xcel Energy, Inc. | | | 19,111 | | | | 876,813 | | |
| | | | | | 15,565,475 | | |
Gas Utilities (0.1%) | |
ONEOK, Inc. | | | 14,368 | | | | 749,435 | | |
Independent Power Producers &
Energy Traders (0.1%) | |
AES Corp. | | | 24,846 | | | | 276,039 | | |
NRG Energy, Inc. | | | 11,901 | | | | 204,935 | | |
| | | | | | 480,974 | | |
See accompanying notes to financial statements.
38
SFT Advantus Index 500 Fund
Investments in Securities – continued
| | | Shares | | Value(a) | |
Multi-Utilities (1.0%) | |
Ameren Corp. | | | 9,104 | | | $ | 497,716 | | |
CenterPoint Energy, Inc. | | | 16,273 | | | | 445,555 | | |
CMS Energy Corp. | | | 10,549 | | | | 487,891 | | |
Consolidated Edison, Inc. | | | 11,494 | | | | 928,945 | | |
Dominion Energy, Inc. | | | 23,727 | | | | 1,818,200 | | |
DTE Energy Co. | | | 6,820 | | | | 721,488 | | |
NiSource, Inc. | | | 12,169 | | | | 308,606 | | |
Public Service Enterprise
Group, Inc. | | | 19,103 | | | | 821,620 | | |
SCANA Corp. | | | 5,351 | | | | 358,570 | | |
Sempra Energy | | | 9,448 | | | | 1,065,262 | | |
WEC Energy Group, Inc. | | | 11,928 | | | | 732,140 | | |
| | | | | | 8,185,993 | | |
Water Utilities (0.1%) | |
American Water Works Co., Inc. | | | 6,720 | | | | 523,824 | | |
Total common stocks
(cost: $321,848,850) | | | | | 784,595,101 | | |
Short-Term Securities (1.7%) | |
Investment Companies (1.7%) | |
State Street Institutional
U.S. Government Money
Market Fund, current
rate 0.880% | | | 13,694,155 | | | | 13,694,155 | | |
Total short-term securities
(cost: $13,694,155) | | | | | 13,694,155 | | |
Total investments in securities
(cost: $335,543,005) (e) | | | | | 798,289,256 | | |
Liabilities in excess of cash
and other assets (0.0%) | | | | | (163,740 | ) | |
Total net assets (100.0%) | | | | $ | 798,125,516 | | |
Investments in Securities Legend
(a) Securities are valued by procedures described in Note 2 of the Notes to Financial Statements.
(b) Foreign security: The Fund held 2.2% of net assets in foreign securities at June 30, 2017.
(c) Non-income producing security.
(d) Fully or partially pledged as initial margin deposits on open futures contracts.
Holdings of Open Futures Contracts
On June 30, 2017, securities with an aggregate market value of $5,040,700 have been pledged to cover margin requirements for the following open futures contracts:
Type | | Expiration | | Number of
Contracts | | Position
Type | | Unrealized
Appreciation/
(Depreciation) | |
S&P 500®
E-Mini Index
Future | | September 2017 | | | 104 | | | Long | | $ | (59,330 | ) | |
| | | | | | 104 | | | | | $ | (59,330 | ) | |
(e) At June 30, 2017 the cost of securities for federal income tax purposes was $338,269,770. The aggregate unrealized
appreciation and depreciation of investments in securities based on this cost were:
Gross unrealized appreciation | | $ | 467,188,039 | | |
Gross unrealized depreciation | | | (7,168,553 | ) | |
Net unrealized appreciation | | $ | 460,019,486 | | |
See accompanying notes to financial statements.
39
SFT Advantus International Bond Fund
Investments in Securities
(Percentages of each investment category relate to total net assets)
| | | Principal(b) | | Value(a) | |
Long-Term Debt Securities (47.9%) | |
Argentina (4.6%) | |
Government (4.6%) | |
Argentine Bonos
del Tesoro (ARS)
15.500%, 10/17/26 | | | 38,676,000 | | | $ | 2,603,952 | | |
16.000%, 10/17/23 | | | 8,404,000 | | | | 544,046 | | |
18.200%, 10/03/21 | | | 27,672,000 | | | | 1,767,061 | | |
21.200%, 09/19/18 | | | 1,700,000 | | | | 103,207 | | |
22.750%, 03/05/18 | | | 101,000 | | | | 6,122 | | |
| | | | | | 5,024,388 | | |
Brazil (13.7%) | |
Government (13.7%) | |
Brazil Letras do Tesouro
Nacional (BRL)
13.771%, 07/01/20 (c) | | | 9,928,000 | | | | 2,262,044 | | |
18.576%, 01/01/19 (c) | | | 8,180,000 | | | | 2,172,469 | | |
19.097%, 07/01/19 (c) | | | 12,580,000 | | | | 3,186,156 | | |
Brazil Notas do Tesouro
Nacional Serie B (BRL)
6.000%, 05/15/19 | | | 80,000 | | | | 73,936 | | |
6.000%, 08/15/22 | | | 134,000 | | | | 123,165 | | |
6.000%, 05/15/23 | | | 186,000 | | | | 171,132 | | |
6.000%, 08/15/24 | | | 110,000 | | | | 102,023 | | |
6.000%, 05/15/45 | | | 970,000 | | | | 913,096 | | |
Brazil Notas do Tesouro
Nacional Serie F (BRL)
10.000%, 01/01/21 | | | 4,840,000 | | | | 1,462,898 | | |
10.000%, 01/01/23 | | | 5,209,000 | | | | 1,555,039 | | |
10.000%, 01/01/25 | | | 6,720,000 | | | | 1,981,181 | | |
10.000%, 01/01/27 | | | 4,044,000 | | | | 1,185,795 | | |
| | | | | | 15,188,934 | | |
Ghana (1.7%) | |
Government (1.7%) | |
Ghana Government
Bond (GHS)
18.750%, 01/24/22 | | | 960,000 | | | | 221,769 | | |
19.000%, 11/02/26 | | | 2,890,000 | | | | 691,761 | | |
19.750%, 03/25/24 | | | 960,000 | | | | 231,585 | | |
19.750%, 03/15/32 | | | 2,890,000 | | | | 692,404 | | |
21.500%, 03/09/20 | | | 50,000 | | | | 12,061 | | |
24.500%, 06/21/21 | | | 50,000 | | | | 13,156 | | |
24.750%, 03/01/21 | | | 50,000 | | | | 13,120 | | |
24.750%, 07/19/21 | | | 50,000 | | | | 13,314 | | |
| | | | | | 1,889,170 | | |
Indonesia (10.8%) | |
Government (10.8%) | |
Indonesia Treasury
Bond (IDR)
6.125%, 05/15/28 | | | 228,000,000 | | | | 15,883 | | |
7.000%, 05/15/27 | | | 57,457,000,000 | | | | 4,365,051 | | |
8.375%, 03/15/24 | | | 21,929,000,000 | | | | 1,786,279 | | |
8.375%, 09/15/26 | | | 25,590,000,000 | | | | 2,117,859 | | |
8.750%, 05/15/31 | | | 13,084,000,000 | | | | 1,106,900 | | |
9.000%, 03/15/29 | | | 5,228,000,000 | | | | 446,727 | | |
9.500%, 07/15/23 | | | 18,680,000,000 | | | | 1,582,283 | | |
10.000%, 09/15/24 | | | 1,959,000,000 | | | | 172,437 | | |
| | | Principal(b) | | Value(a) | |
10.000%, 02/15/28 | | | 76,000,000 | | | $ | 6,899 | | |
10.250%, 07/15/22 | | | 2,658,000,000 | | | | 228,007 | | |
10.500%, 08/15/30 | | | 1,070,000,000 | | | | 101,118 | | |
11.500%, 09/15/19 | | | 466,000,000 | | | | 38,424 | | |
| | | | | | 11,967,867 | | |
Mexico (8.8%) | |
Government (8.8%) | |
Mexican Bonos (MXN)
4.750%, 06/14/18 | | | 54,850,000 | | | | 2,969,850 | | |
5.000%, 12/11/19 | | | 100,870,000 | | | | 5,370,482 | | |
7.750%, 12/14/17 | | | 5,000,000 | | | | 277,159 | | |
8.500%, 12/13/18 | | | 13,490,000 | | | | 762,300 | | |
Mexican Udibonos (MXN)
2.500%, 12/10/20 | | | 1,587,390 | | | | 86,007 | | |
3.500%, 12/14/17 | | | 2,875,707 | | | | 159,699 | | |
4.000%, 06/13/19 | | | 1,984,238 | | | | 111,425 | | |
| | | | | | 9,736,922 | | |
Philippines (1.3%) | |
Government (1.3%) | |
Philippine Government
Bond (PHP)
2.125%, 05/23/18 | | | 23,158,000 | | | | 455,400 | | |
3.375%, 08/20/20 | | | 1,600,000 | | | | 31,123 | | |
3.875%, 11/22/19 | | | 41,660,000 | | | | 826,628 | | |
5.000%, 08/18/18 | | | 3,500,000 | | | | 70,598 | | |
5.875%, 01/31/18 | | | 2,470,000 | | | | 49,707 | | |
| | | | | | 1,433,456 | | |
Serbia (0.2%) | |
Government (0.2%) | |
Republic of Serbia (USD)
5.250%, 11/21/17 (d) | | | 200,000 | | | | 202,314 | | |
South Africa (1.6%) | |
Government (1.6%) | |
Republic of South Africa
Government Bond (ZAR)
6.250%, 03/31/36 | | | 3,256,000 | | | | 175,426 | | |
7.000%, 02/28/31 | | | 3,649,000 | | | | 227,794 | | |
8.000%, 01/31/30 | | | 5,063,000 | | | | 349,679 | | |
8.250%, 03/31/32 | | | 6,519,000 | | | | 448,575 | | |
8.500%, 01/31/37 | | | 1,553,000 | | | | 105,320 | | |
8.875%, 02/28/35 | | | 2,851,000 | | | | 202,174 | | |
10.500%, 12/21/26 | | | 3,552,000 | | | | 300,697 | | |
| | | | | | 1,809,665 | | |
South Korea (4.7%) | |
Government (4.7%) | |
Korea Treasury
Bond (KRW)
1.375%, 09/10/21 | | | 708,200,000 | | | | 606,461 | | |
1.500%, 06/10/19 | | | 2,690,600,000 | | | | 2,344,880 | | |
1.875%, 03/10/22 | | | 200,000,000 | | | | 174,565 | | |
2.000%, 03/10/21 | | | 2,212,310,000 | | | | 1,944,364 | | |
4.250%, 06/10/21 | | | 139,300,000 | | | | 132,416 | | |
| | | | | | 5,202,686 | | |
See accompanying notes to financial statements.
40
SFT Advantus International Bond Fund
Investments in Securities – continued
| | | Shares/
Principal(b) | | Value(a) | |
Ukraine (0.5%) | |
Government (0.5%) | |
Ukraine Government
International Bond (USD)
0.000%, 05/31/40 (d) (e) | | | 1,369,000 | | | $ | 531,665 | | |
Total long-term debt securities
(cost: $49,164,163) | | | | | 52,987,067 | | |
Short-Term Securities (40.3%) | |
Mexico (14.9%) | |
Mexican Cetes (MXN)
5.205%, 07/20/17 (c) | | | 22,248,700 | | | | 1,224,531 | | |
5.447%, 07/06/17 (c) | | | 11,284,200 | | | | 622,747 | | |
6.140%, 09/14/17 (c) | | | 31,386,000 | | | | 1,708,410 | | |
6.150%, 11/09/17 (c) | | | 36,486,600 | | | | 1,963,792 | | |
6.752%, 08/17/17 (c) | | | 3,633,100 | | | | 198,868 | | |
6.753%, 08/03/17 (c) | | | 40,230,000 | | | | 2,208,569 | | |
6.768%, 08/31/17 (c) | | | 9,044,300 | | | | 493,681 | | |
6.986%, 02/01/18 (c) | | | 1,160,800 | | | | 61,449 | | |
7.016%, 01/04/18 (c) | | | 4,226,000 | | | | 224,955 | | |
7.020%, 10/12/17 (c) | | | 23,368,100 | | | | 1,264,839 | | |
7.022%, 09/28/17 (c) | | | 8,729,300 | | | | 474,003 | | |
7.041%, 08/24/17 (c) | | | 4,264,100 | | | | 233,127 | | |
7.118%, 10/26/17 (c) | | | 41,284,400 | | | | 2,228,339 | | |
7.184%, 03/01/18 (c) | | | 18,967,900 | | | | 998,553 | | |
7.199%, 11/23/17 (c) | | | 15,583,100 | | | | 836,892 | | |
7.288%, 12/07/17 (c) | | | 9,825,800 | | | | 526,220 | | |
7.316%, 04/26/18 (c) | | | 22,781,700 | | | | 1,186,213 | | |
| | | | | | 16,455,188 | | |
Philippines (1.0%) | |
Philippine Treasury Bill (PHP)
1.352%, 09/27/17 (c) | | | 55,340,000 | | | | 1,089,507 | | |
United States (21.7%) | |
Federal Home Loan Bank,
0.566%, 07/03/17 (c) | | | 24,005,000 | | | | 24,005,000 | | |
Investment Companies (2.7%) | |
United States (2.7%) | |
State Street Institutional
U.S. Government Money
Market Fund (USD),
current rate 0.880% | | | 3,007,564 | | | | 3,007,564 | | |
Total short-term securities
(cost: $44,015,821) | | | | | 44,557,259 | | |
Total investments in securities
(cost: $93,179,984) (f) | | | | | 97,544,326 | | |
Cash and other assets in
excess of liabilities (11.8%) | | | | | 13,088,639 | | |
Total net assets (100.0%) | | | | $ | 110,632,965 | | |
See accompanying notes to financial statements.
41
SFT Advantus International Bond Fund
Investments in Securities – continued
Foreign Forward Currency Contracts
On June 30, 2017, International Bond Fund had entered into forward foreign currency contracts that obligate the Fund to deliver currencies at specified future dates. Unrealized appreciation and depreciation on these contracts is included in the accompanying financial statements. The terms of the open contracts were as follows:
Exchange
Date | | Currency to be
delivered – SELL | | Currency to be
received – BUY | | Unrealized
Gain (Loss) | | Counterparty | |
07/03/17 | | | 487,331 | | | USD | | | | | 325,240,000 | | | CLP | | | | $ | 1,954 | | | DBK | |
07/03/17 | | | 325,240,000 | | | CLP | | | | | 490,403 | | | USD | | | | | 1,118 | | | DBK | |
07/03/17 | | | 1,381,186 | | | USD | | | | | 154,900,000 | | | JPY | | | | | (2,581 | ) | | JPM | |
07/03/17 | | | 154,900,000 | | | JPY | | | | | 1,396,439 | | | USD | | | | | 17,835 | | | JPM | |
07/05/17 | | | 485,214 | | | EUR | | | | | 520,319 | | | USD | | | | | (33,092 | ) | | DBK | |
07/05/17 | | | 554,066 | | | USD | | | | | 485,214 | | | EUR | | | | | (655 | ) | | DBK | |
07/07/17 | | | 13,000 | | | EUR | | | | | 14,644 | | | USD | | | | | (184 | ) | | DBK | |
07/07/17 | | | 82,000,000 | | | CLP | | | | | 126,020 | | | USD | | | | | 2,666 | | | JPM | |
07/07/17 | | | 124,261 | | | USD | | | | | 82,000,000 | | | CLP | | | | | (907 | ) | | JPM | |
07/10/17 | | | 262,390 | | | EUR | | | | | 280,831 | | | USD | | | | | (18,513 | ) | | BOA | |
07/10/17 | | | 1,578,954 | | | EUR | | | | | 1,690,112 | | | USD | | | | | (111,215 | ) | | HSB | |
07/10/17 | | | 366,500 | | | EUR | | | | | 392,331 | | | USD | | | | | (25,785 | ) | | JPM | |
07/10/17 | | | 30,600 | | | EUR | | | | | 32,764 | | | USD | | | | | (2,146 | ) | | SCB | |
07/11/17 | | | 62,600,000 | | | JPY | | | | | 542,854 | | | USD | | | | | (14,432 | ) | | BCB | |
07/11/17 | | | 805,000 | | | EUR | | | | | 861,575 | | | USD | | | | | (56,843 | ) | | BOA | |
07/11/17 | | | 264,198 | | | USD | | | | | 174,503,000 | | | CLP | | | | | (1,713 | ) | | GSC | |
07/11/17 | | | 10,873,000 | | | JPY | | | | | 94,174 | | | USD | | | | | (2,621 | ) | | GSC | |
07/12/17 | | | 133,550 | | | EUR | | | | | 150,067 | | | USD | | | | | (2,306 | ) | | DBK | |
07/12/17 | | | 3,206,080 | | | EUR | | | | | 3,412,872 | | | USD | | | | | (245,105 | ) | | SCB | |
07/13/17 | | | 33,230,000 | | | JPY | | | | | 289,494 | | | USD | | | | | (6,356 | ) | | BCB | |
07/13/17 | | | 9,980,000 | | | JPY | | | | | 86,634 | | | USD | | | | | (2,219 | ) | | CIT | |
07/13/17 | | | 254,066 | | | USD | | | | | 1,023,987 | | | MYR | | | | | (15,600 | ) | | HSB | |
07/13/17 | | | 35,690,000 | | | JPY | | | | | 309,960 | | | USD | | | | | (7,792 | ) | | HSB | |
07/13/17 | | | 1,435,863 | | | EUR | | | | | 1,531,032 | | | USD | | | | | (107,300 | ) | | JPM | |
07/14/17 | | | 253,138 | | | USD | | | | | 1,023,565 | | | MYR | | | | | (14,780 | ) | | DBK | |
07/14/17 | | | 286,880 | | | USD | | | | | 1,160,000 | | | MYR | | | | | (16,750 | ) | | DBK | |
07/14/17 | | | 21,600,000 | | | JPY | | | | | 211,102 | | | USD | | | | | 18,788 | | | JPM | |
07/17/17 | | | 59,243 | | | USD | | | | | 3,868,000 | | | INR | | | | | 510 | | | JPS | |
07/17/17 | | | 317,000 | | | EUR | | | | | 345,191 | | | USD | | | | | (16,583 | ) | | SCB | |
07/18/17 | | | 31,599,000 | | | CLP | | | | | 47,740 | | | USD | | | | | 217 | | | DBK | |
07/18/17 | | | 185,955 | | | USD | | | | | 122,948,000 | | | CLP | | | | | (1,048 | ) | | DBK | |
07/18/17 | | | 82,000 | | | EUR | | | | | 87,328 | | | USD | | | | | (6,259 | ) | | GSC | |
07/18/17 | | | 891,000 | | | EUR | | | | | 948,826 | | | USD | | | | | (68,073 | ) | | JPM | |
07/18/17 | | | 636,000 | | | EUR | | | | | 677,276 | | | USD | | | | | (48,591 | ) | | JPM | |
07/18/17 | | | 41,350 | | | EUR | | | | | 44,060 | | | USD | | | | | (3,133 | ) | | UBS | |
07/20/17 | | | 58,134 | | | USD | | | | | 232,000 | | | MYR | | | | | (4,120 | ) | | DBK | |
07/20/17 | | | 180,514 | | | EUR | | | | | 813,000 | | | MYR | | | | | (16,761 | ) | | DBK | |
07/20/17 | | | 486,033 | | | USD | | | | | 31,697,000 | | | INR | | | | | 3,448 | | | DBK | |
07/20/17 | | | 154,226 | | | USD | | | | | 101,735,000 | | | CLP | | | | | (1,229 | ) | | DBK | |
07/20/17 | | | 88,301,000 | | | CLP | | | | | 133,718 | | | USD | | | | | 925 | | | DBK | |
07/20/17 | | | 45,710,000 | | | JPY | | | | | 406,275 | | | USD | | | | | (803 | ) | | SCB | |
07/24/17 | | | 10,020,000 | | | JPY | | | | | 87,702 | | | USD | | | | | (1,548 | ) | | DBK | |
07/24/17 | | | 815,540 | | | EUR | | | | | 880,188 | | | USD | | | | | (50,874 | ) | | DBK | |
07/24/17 | | | 444,000,000 | | | KRW | | | | | 389,269 | | | USD | | | | | 1,015 | | | HSB | |
07/24/17 | | | 366,140 | | | USD | | | | | 23,887,000 | | | INR | | | | | 2,553 | | | JPS | |
07/24/17 | | | 2,392,617 | | | USD | | | | | 156,094,362 | | | INR | | | | | 16,682 | | | JPS | |
07/25/17 | | | 32,786,000 | | | JPY | | | | | 314,012 | | | USD | | | | | 21,971 | | | CIT | |
07/25/17 | | | 51,000,000 | | | JPY | | | | | 453,900 | | | USD | | | | | (383 | ) | | JPM | |
07/27/17 | | | 507,467 | | | USD | | | | | 32,918,166 | | | INR | | | | | 434 | | | DBK | |
07/27/17 | | | 184,000 | | | EUR | | | | | 201,377 | | | USD | | | | | (8,719 | ) | | GSC | |
07/27/17 | | | 52,800,000 | | | JPY | | | | | 469,732 | | | USD | | | | | (623 | ) | | GSC | |
07/27/17 | | | 17,600,000 | | | JPY | | | | | 156,688 | | | USD | | | | | (97 | ) | | JPM | |
07/27/17 | | | 1,296,562 | | | USD | | | | | 84,095,000 | | | INR | | | | | 956 | | | JPS | |
07/28/17 | | | 307,648 | | | USD | | | | | 20,094,000 | | | INR | | | | | 2,348 | | | HSB | |
07/31/17 | | | 60,350,000 | | | JPY | | | | | 581,046 | | | USD | | | | | 43,344 | | | BCB | |
07/31/17 | | | 2,701,600 | | | EUR | | | | | 2,953,497 | | | USD | | | | | (131,894 | ) | | BOA | |
07/31/17 | | | 50,203,538 | | | JPY | | | | | 483,591 | | | USD | | | | | 36,292 | | | DBK | |
07/31/17 | | | 207,232 | | | EUR | | | | | 226,693 | | | USD | | | | | (9,978 | ) | | DBK | |
07/31/17 | | | 64,982,551 | | | JPY | | | | | 569,772 | | | USD | | | | | (9,204 | ) | | HSB | |
07/31/17 | | | 907,599 | | | USD | | | | | 58,640,000 | | | INR | | | | | (3,277 | ) | | JPS | |
08/02/17 | | | 536,000,000 | | | KRW | | | | | 475,895 | | | USD | | | | | 7,078 | | | HSB | |
08/02/17 | | | 535,000 | | | EUR | | | | | 583,960 | | | USD | | | | | (27,105 | ) | | JPM | |
See accompanying notes to financial statements.
42
SFT Advantus International Bond Fund
Investments in Securities – continued
Exchange
Date | | Currency to be
delivered – SELL | | Currency to be
received – BUY | | Unrealized
Gain (Loss) | | Counterparty | |
08/03/17 | | | 699,000 | | | EUR | | | | | 766,293 | | | USD | | | | $ | (32,130 | ) | | BOA | |
08/08/17 | | | 76,884 | | | EUR | | | | | 84,515 | | | USD | | | | | (3,327 | ) | | CIT | |
08/08/17 | | | 820,000 | | | EUR | | | | | 901,262 | | | USD | | | | | (35,611 | ) | | DBK | |
08/08/17 | | | 296,624 | | | USD | | | | | 19,213,833 | | | INR | | | | | (610 | ) | | DBK | |
08/08/17 | | | 39,027 | | | USD | | | | | 2,528,000 | | | INR | | | | | (80 | ) | | DBK | |
08/08/17 | | | 51,000 | | | EUR | | | | | 56,075 | | | USD | | | | | (2,194 | ) | | GSC | |
08/09/17 | | | 2,906,000 | | | EUR | | | | | 3,198,983 | | | USD | | | | | (121,375 | ) | | DBK | |
08/09/17 | | | 210,000 | | | EUR | | | | | 231,172 | | | USD | | | | | (8,771 | ) | | DBK | |
08/10/17 | | | 75,000 | | | EUR | | | | | 82,538 | | | USD | | | | | (3,161 | ) | | GSC | |
08/10/17 | | | 158,000 | | | EUR | | | | | 173,553 | | | USD | | | | | (6,985 | ) | | HSB | |
08/15/17 | | | 15,430,000 | | | JPY | | | | | 155,131 | | | USD | | | | | 17,567 | | | BCB | |
08/15/17 | | | 1,179,300 | | | EUR | | | | | 1,286,451 | | | USD | | | | | (61,416 | ) | | BOA | |
08/15/17 | | | 3,074,985 | | | EUR | | | | | 3,355,178 | | | USD | | | | | (159,342 | ) | | CIT | |
08/15/17 | | | 1,435,650 | | | EUR | | | | | 1,566,633 | | | USD | | | | | (74,227 | ) | | DBK | |
08/15/17 | | | 107,000 | | | EUR | | | | | 116,587 | | | USD | | | | | (5,707 | ) | | GSC | |
08/16/17 | | | 115,000 | | | EUR | | | | | 126,195 | | | USD | | | | | (5,249 | ) | | DBK | |
08/16/17 | | | 244,182 | | | USD | | | | | 15,917,000 | | | INR | | | | | 785 | | | DBK | |
08/16/17 | | | 336,000 | | | EUR | | | | | 368,478 | | | USD | | | | | (15,569 | ) | | GSC | |
08/16/17 | | | 21,480,270 | | | JPY | | | | | 191,039 | | | USD | | | | | (473 | ) | | GSC | |
08/16/17 | | | 394,103 | | | USD | | | | | 25,664,000 | | | INR | | | | | 873 | | | HSB | |
08/16/17 | | | 8,030,000 | | | JPY | | | | | 71,396 | | | USD | | | | | (197 | ) | | JPM | |
08/16/17 | | | 890,000 | | | EUR | | | | | 975,879 | | | USD | | | | | (41,389 | ) | | JPM | |
08/16/17 | | | 160,000 | | | EUR | | | | | 175,525 | | | USD | | | | | (7,355 | ) | | SCB | |
08/17/17 | | | 38,749 | | | EUR | | | | | 42,696 | | | USD | | | | | (1,596 | ) | | BOA | |
08/17/17 | | | 153,000 | | | EUR | | | | | 168,568 | | | USD | | | | | (6,320 | ) | | GSC | |
08/17/17 | | | 758,000,000 | | | KRW | | | | | 672,851 | | | USD | | | | | 9,671 | | | HSB | |
08/17/17 | | | 1,375,000,000 | | | KRW | | | | | 1,217,461 | | | USD | | | | | 14,462 | | | HSB | |
08/18/17 | | | 51,438,000 | | | JPY | | | | | 520,838 | | | USD | | | | | 62,192 | | | DBK | |
08/18/17 | | | 372,556 | | | USD | | | | | 24,082,000 | | | INR | | | | | (2,023 | ) | | JPS | |
08/21/17 | | | 1,464,000,000 | | | KRW | | | | | 1,282,973 | | | USD | | | | | 2,030 | | | CIT | |
08/21/17 | | | 16,425 | | | EUR | | | | | 18,337 | | | USD | | | | | (442 | ) | | JPM | |
08/22/17 | | | 96,755,000 | | | JPY | | | | | 981,288 | | | USD | | | | | 118,426 | | | HSB | |
08/22/17 | | | 1,514,253 | | | EUR | | | | | 1,691,701 | | | USD | | | | | (39,618 | ) | | HSB | |
08/22/17 | | | 69,639,000 | | | JPY | | | | | 706,324 | | | USD | | | | | 85,283 | | | JPM | |
08/23/17 | | | 119,438 | | | EUR | | | | | 134,248 | | | USD | | | | | (2,318 | ) | | BOA | |
08/23/17 | | | 642,000 | | | EUR | | | | | 722,000 | | | USD | | | | | (12,068 | ) | | JPM | |
08/23/17 | | | 33,313 | | | EUR | | | | | 37,422 | | | USD | | | | | (668 | ) | | UBS | |
08/24/17 | | | 23,068,000 | | | JPY | | | | | 233,549 | | | USD | | | | | 27,811 | | | BCB | |
08/24/17 | | | 22,797,000 | | | JPY | | | | | 231,141 | | | USD | | | | | 27,820 | | | DBK | |
08/28/17 | | | 154,000 | | | EUR | | | | | 173,119 | | | USD | | | | | (3,011 | ) | | GSC | |
08/28/17 | | | 65,692,000 | | | JPY | | | | | 664,949 | | | USD | | | | | 78,957 | | | JPM | |
08/28/17 | | | 145,982 | | | USD | | | | | 9,556,000 | | | INR | | | | | 858 | | | JPS | |
08/30/17 | | | 469,918 | | | EUR | | | | | 528,517 | | | USD | | | | | (8,984 | ) | | BCB | |
08/30/17 | | | 131,855 | | | EUR | | | | | 148,245 | | | USD | | | | | (2,574 | ) | | BOA | |
08/30/17 | | | 38,472,000 | | | JPY | | | | | 390,414 | | | USD | | | | | 47,203 | | | DBK | |
08/30/17 | | | 33,447,000 | | | JPY | | | | | 338,738 | | | USD | | | | | 40,356 | | | JPM | |
08/30/17 | | | 743,770 | | | EUR | | | | | 835,648 | | | USD | | | | | (15,089 | ) | | SCB | |
08/30/17 | | | 616,157 | | | EUR | | | | | 694,544 | | | USD | | | | | (10,227 | ) | | UBS | |
08/31/17 | | | 54,600,000 | | | JPY | | | | | 490,355 | | | USD | | | | | 3,244 | | | BCB | |
08/31/17 | | | 54,300 | | | EUR | | | | | 61,078 | | | USD | | | | | (1,034 | ) | | DBK | |
08/31/17 | | | 535,000 | | | EUR | | | | | 601,091 | | | USD | | | | | (10,883 | ) | | SCB | |
09/01/17 | | | 73,808,000 | | | JPY | | | | | 732,949 | | | USD | | | | | 74,448 | | | HSB | |
09/05/17 | | | 1,449,000,000 | | | KRW | | | | | 1,295,717 | | | USD | | | | | 27,612 | | | HSB | |
09/06/17 | | | 228,417 | | | EUR | | | | | 257,271 | | | USD | | | | | (4,091 | ) | | UBS | |
09/07/17 | | | 1,494,000,000 | | | KRW | | | | | 1,319,730 | | | USD | | | | | 12,206 | | | GSC | |
09/07/17 | | | 158,417 | | | EUR | | | | | 178,968 | | | USD | | | | | (2,308 | ) | | UBS | |
09/08/17 | | | 335,000 | | | EUR | | | | | 377,507 | | | USD | | | | | (5,854 | ) | | BCB | |
09/08/17 | | | 262,390 | | | EUR | | | | | 296,855 | | | USD | | | | | (3,414 | ) | | BOA | |
09/11/17 | | | 57,903,900 | | | JPY | | | | | 512,100 | | | USD | | | | | (4,750 | ) | | BCB | |
09/13/17 | | | 55,874 | | | EUR | | | | | 62,750 | | | USD | | | | | (1,208 | ) | | CIT | |
09/13/17 | | | 22,100,000 | | | JPY | | | | | 194,347 | | | USD | | | | | (2,937 | ) | | DBK | |
09/14/17 | | | 253,619 | | | USD | | | | | 16,470,000 | | | INR | | | | | (1,089 | ) | | DBK | |
09/14/17 | | | 294,000 | | | EUR | | | | | 331,441 | | | USD | | | | | (5,114 | ) | | MSC | |
09/15/17 | | | 602,000 | | | EUR | | | | | 677,759 | | | USD | | | | | (11,416 | ) | | HSB | |
09/15/17 | | | 116,000 | | | EUR | | | | | 130,758 | | | USD | | | | | (2,040 | ) | | JPM | |
09/18/17 | | | 327,271 | | | EUR | | | | | 370,013 | | | USD | | | | | (4,713 | ) | | JPM | |
09/18/17 | | | 437,000 | | | EUR | | | | | 494,728 | | | USD | | | | | (5,638 | ) | | MSC | |
09/19/17 | | | 16,430 | | | EUR | | | | | 18,416 | | | USD | | | | | (398 | ) | | JPM | |
See accompanying notes to financial statements.
43
SFT Advantus International Bond Fund
Investments in Securities – continued
Exchange
Date | | Currency to be
delivered – SELL | | Currency to be
received – BUY | | Unrealized
Gain (Loss) | | Counterparty | |
09/20/17 | | | 1,017,000,000 | | | KRW | | | | | 888,037 | | | USD | | | | $ | (2,188 | ) | | CIT | |
09/21/17 | | | 22,560,000 | | | JPY | | | | | 201,638 | | | USD | | | | | 168 | | | BCB | |
09/25/17 | | | 42,092,130 | | | JPY | | | | | 381,921 | | | USD | | | | | 5,948 | | | BCB | |
09/25/17 | | | 29,650,000 | | | JPY | | | | | 265,786 | | | USD | | | | | 947 | | | MSC | |
09/25/17 | | | 524,000 | | | EUR | | | | | 587,194 | | | USD | | | | | (13,021 | ) | | MSC | |
09/29/17 | | | 9,763,000 | | | JPY | | | | | 88,607 | | | USD | | | | | 1,385 | | | JPM | |
09/29/17 | | | 911,815 | | | EUR | | | | | 1,041,735 | | | USD | | | | | (2,936 | ) | | BCB | |
10/05/17 | | | 485,214 | | | EUR | | | | | 556,686 | | | USD | | | | | 587 | | | DBK | |
10/12/17 | | | 29,920,000 | | | JPY | | | | | 271,120 | | | USD | | | | | 3,643 | | | SCB | |
10/16/17 | | | 763,000,000 | | | KRW | | | | | 682,164 | | | USD | | | | | 13,958 | | | CIT | |
10/24/17 | | | 27,530,000 | | | JPY | | | | | 254,603 | | | USD | | | | | 8,343 | | | BCB | |
10/25/17 | | | 76,625 | | | USD | | | | | 5,058,000 | | | INR | | | | | 528 | | | DBK | |
11/02/17 | | | 59,108 | | | USD | | | | | 3,868,000 | | | INR | | | | | (166 | ) | | JPS | |
11/08/17 | | | 166,768 | | | USD | | | | | 10,920,000 | | | INR | | | | | (490 | ) | | HSB | |
11/09/17 | | | 13,826,020 | | | JPY | | | | | 134,722 | | | USD | | | | | 10,946 | | | CIT | |
11/14/17 | | | 34,439,000 | | | JPY | | | | | 335,735 | | | USD | | | | | 27,344 | | | CIT | |
11/14/17 | | | 13,582,000 | | | JPY | | | | | 132,635 | | | USD | | | | | 11,012 | | | JPM | |
11/15/17 | | | 1,020,000,000 | | | KRW | | | | | 900,980 | | | USD | | | | | 7,033 | | | CIT | |
11/15/17 | | | 19,620,000 | | | JPY | | | | | 173,403 | | | USD | | | | | (2,297 | ) | | GSC | |
11/15/17 | | | 3,040,000 | | | AUD | | | | | 2,240,875 | | | USD | | | | | (87,055 | ) | | JPM | |
11/16/17 | | | 14,665,000 | | | JPY | | | | | 138,452 | | | USD | | | | | 7,118 | | | CIT | |
11/16/17 | | | 563,000,000 | | | KRW | | | | | 497,702 | | | USD | | | | | 4,265 | | | CIT | |
11/16/17 | | | 100,685,000 | | | JPY | | | | | 899,126 | | | USD | | | | | (2,569 | ) | | JPM | |
11/16/17 | | | 13,769,800 | | | JPY | | | | | 122,433 | | | USD | | | | | (884 | ) | | SCB | |
11/20/17 | | | 97,530,600 | | | JPY | | | | | 866,515 | | | USD | | | | | (7,107 | ) | | CIT | |
11/21/17 | | | 45,867,000 | | | JPY | | | | | 427,569 | | | USD | | | | | 16,698 | | | DBK | |
11/27/17 | | | 11,968,000 | | | JPY | | | | | 108,603 | | | USD | | | | | 1,362 | | | HSB | |
11/27/17 | | | 52,556,000 | | | JPY | | | | | 482,409 | | | USD | | | | | 11,475 | | | SCB | |
12/08/17 | | | 46,300,000 | | | JPY | | | | | 426,832 | | | USD | | | | | 11,725 | | | CIT | |
12/11/17 | | | 69,400,000 | | | JPY | | | | | 639,631 | | | USD | | | | | 17,324 | | | HSB | |
12/12/17 | | | 91,710,000 | | | JPY | | | | | 818,982 | | | USD | | | | | (3,420 | ) | | CIT | |
12/13/17 | | | 17,886,000 | | | JPY | | | | | 163,264 | | | USD | | | | | 2,865 | | | CIT | |
12/13/17 | | | 66,670,000 | | | JPY | | | | | 610,065 | | | USD | | | | | 12,176 | | | HSB | |
12/13/17 | | | 61,770,000 | | | JPY | | | | | 547,504 | | | USD | | | | | (6,441 | ) | | JPM | |
12/18/17 | | | 26,000,000 | | | JPY | | | | | 238,496 | | | USD | | | | | 5,272 | | | JPM | |
12/18/17 | | | 18,200,000 | | | JPY | | | | | 167,711 | | | USD | | | | | 4,454 | | | MSC | |
12/19/17 | | | 67,301 | | | USD | | | | | 4,419,000 | | | INR | | | | | (355 | ) | | CIT | |
12/20/17 | | | 607,000,000 | | | KRW | | | | | 544,834 | | | USD | | | | | 12,382 | | | DBK | |
12/29/17 | | | 154,900,000 | | | JPY | | | | | 1,392,034 | | | USD | | | | | 1,782 | | | JPM | |
02/09/18 | | | 14,673,000 | | | JPY | | | | | 133,105 | | | USD | | | | | 1,125 | | | CIT | |
02/13/18 | | | 61,530,000 | | | JPY | | | | | 560,523 | | | USD | | | | | 6,958 | | | CIT | |
02/16/18 | | | 15,430,000 | | | JPY | | | | | 138,628 | | | USD | | | | | (212 | ) | | DBK | |
02/16/18 | | | 100,310,000 | | | JPY | | | | | 899,117 | | | USD | | | | | (3,479 | ) | | JPM | |
02/22/18 | | | 403,000 | | | AUD | | | | | 297,668 | | | USD | | | | | (10,568 | ) | | CIT | |
02/27/18 | | | 65,472,000 | | | JPY | | | | | 592,239 | | | USD | | | | | 2,778 | | | HSB | |
02/28/18 | | | 22,848,000 | | | JPY | | | | | 207,278 | | | USD | | | | | 1,561 | | | JPM | |
03/05/18 | | | 44,000,000 | | | JPY | | | | | 394,447 | | | USD | | | | | (1,820 | ) | | JPM | |
03/06/18 | | | 20,800,000 | | | JPY | | | | | 185,334 | | | USD | | | | | (2,003 | ) | | HSB | |
03/09/18 | | | 149,300 | | | AUD | | | | | 112,112 | | | USD | | | | | (2,060 | ) | | CIT | |
03/09/18 | | | 74,100 | | | AUD | | | | | 55,640 | | | USD | | | | | (1,025 | ) | | CIT | |
03/13/18 | | | 1,971,000 | | | AUD | | | | | 1,463,773 | | | USD | | | | | (43,411 | ) | | CIT | |
03/13/18 | | | 2,955,000 | | | AUD | | | | | 2,186,700 | | | USD | | | | | (72,928 | ) | | JPM | |
03/16/18 | | | 370,000 | | | AUD | | | | | 275,780 | | | USD | | | | | (7,142 | ) | | JPM | |
03/20/18 | | | 4,111,000 | | | AUD | | | | | 3,085,922 | | | USD | | | | | (57,413 | ) | | JPM | |
03/22/18 | | | 28,159,000 | | | JPY | | | | | 254,893 | | | USD | | | | | 1,065 | | | DBK | |
03/23/18 | | | 77,666,000 | | | JPY | | | | | 702,558 | | | USD | | | | | 2,432 | | | CIT | |
04/11/18 | | | 7,000,000,000 | | | KRW | | | | | 6,224,435 | | | USD | | | | | 72,698 | | | HSB | |
04/13/18 | | | 12,300,000 | | | JPY | | | | | 113,244 | | | USD | | | | | 2,241 | | | CIT | |
04/18/18 | | | 22,030,000 | | | JPY | | | | | 202,897 | | | USD | | | | | 4,030 | | | BOA | |
04/23/18 | | | 29,220,000 | | | JPY | | | | | 272,823 | | | USD | | | | | 8,978 | | | JPM | |
04/24/18 | | | 142,170,490 | | | JPY | | | | | 1,324,808 | | | USD | | | | | 40,995 | | | JPM | |
05/15/18 | | | 22,910,000 | | | JPY | | | | | 204,828 | | | USD | | | | | (2,290 | ) | | HSB | |
05/15/18 | | | 14,666,000 | | | JPY | | | | | 130,971 | | | USD | | | | | (1,617 | ) | | SCB | |
05/18/18 | | | 74,624,550 | | | JPY | | | | | 669,819 | | | USD | | | | | (4,935 | ) | | BOA | |
05/18/18 | | | 97,530,600 | | | JPY | | | | | 874,898 | | | USD | | | | | (6,972 | ) | | CIT | |
05/18/18 | | | 610,000,000 | | | KRW | | | | | 549,104 | | | USD | | | | | 12,462 | | | DBK | |
05/21/18 | | | 74,400,375 | | | JPY | | | | | 677,676 | | | USD | | | | | 4,838 | | | BOA | |
05/21/18 | | | 74,662,400 | | | JPY | | | | | 681,537 | | | USD | | | | | 6,330 | | | HSB | |
See accompanying notes to financial statements.
44
SFT Advantus International Bond Fund
Investments in Securities – continued
Exchange
Date | | Currency to be
delivered – SELL | | Currency to be
received – BUY | | Unrealized
Gain (Loss) | | Counterparty | |
05/22/18 | | | 74,602,500 | | | JPY | | | | | 683,674 | | | USD | | | | $ | 8,971 | | | BOA | |
05/22/18 | | | 41,201,000 | | | JPY | | | | | 377,584 | | | USD | | | | | 4,963 | | | JPM | |
05/25/18 | | | 64,764,000 | | | JPY | | | | | 593,077 | | | USD | | | | | 7,257 | | | BOA | |
06/18/18 | | | 46,950,000 | | | JPY | | | | | 437,354 | | | USD | | | | | 12,110 | | | HSB | |
06/19/18 | | | 46,870,000 | | | JPY | | | | | 432,157 | | | USD | | | | | 7,614 | | | DBK | |
06/20/18 | | | 35,200,000 | | | JPY | | | | | 322,256 | | | USD | | | | | 3,401 | | | CIT | |
06/22/18 | | | 46,960,000 | | | JPY | | | | | 428,233 | | | USD | | | | | 2,804 | | | DBK | |
| | | | | | | | | | | | | | | | | | | $ | (954,705 | ) | | | | | |
At June 30, 2017, the Fund had the following interest rate swap contracts outstanding.
Interest Rate Swap Contracts
Description | | Counterparty | | Expiration
Date | | Notional
Amount | | Unrealized
Appreciation | | Unrealized
Depreciation | |
Centrally Cleared Swaps | |
Receive Floating Rate 3-Month USD LIBOR
Pay Fixed Rate 1.816% | | CIT | | 02/03/25 | | $ | 440,000 | | | $ | 7,751 | | | $ | — | | |
Receive Floating Rate 3-Month USD LIBOR
Pay Fixed Rate 1.914% | | CIT | | 01/22/25 | | | 1,760,000 | | | | 17,247 | | | | — | | |
Receive Floating Rate 3-Month USD LIBOR
Pay Fixed Rate 1.936% | | CIT | | 01/29/25 | | | 320,000 | | | | 2,682 | | | | — | | |
Receive Floating Rate 3-Month USD LIBOR
Pay Fixed Rate 1.941% | | CIT | | 01/30/25 | | | 270,000 | | | | 2,182 | | | | — | | |
Receive Floating Rate 3-Month USD LIBOR
Pay Fixed Rate 1.969% | | CIT | | 01/23/25 | | | 2,200,000 | | | | 12,462 | | | | — | | |
Receive Floating Rate 3-Month USD LIBOR
Pay Fixed Rate 1.973% | | CIT | | 01/27/25 | | | 1,300,000 | | | | 7,268 | | | | — | | |
Receive Floating Rate 3-Month USD LIBOR
Pay Fixed Rate 1.977% | | CIT | | 03/27/25 | | | 750,000 | | | | 5,623 | | | | — | | |
Receive Floating Rate 3-Month USD LIBOR
Pay Fixed Rate 1.985% | | CIT | | 03/27/25 | | | 750,000 | | | | 5,214 | | | | — | | |
Receive Floating Rate 3-Month USD LIBOR
Pay Fixed Rate 2.378% | | CIT | | 11/18/46 | | | 3,200,000 | | | | 103,941 | | | | — | | |
Receive Floating Rate 3-Month USD LIBOR
Pay Fixed Rate 2.537% | | CIT | | 04/13/47 | | | 1,700,000 | | | | — | | | | (5,901 | ) | |
Receive Floating Rate 3-Month USD LIBOR
Pay Fixed Rate 2.695% | | CIT | | 05/09/24 | | | 4,260,000 | | | | — | | | | (170,278 | ) | |
Receive Floating Rate 3-Month USD LIBOR
Pay Fixed Rate 2.731% | | CIT | | 07/07/24 | | | 1,250,000 | | | | — | | | | (64,314 | ) | |
Receive Floating Rate 3-Month USD LIBOR
Pay Fixed Rate 2.793% | | CIT | | 03/13/47 | | | 2,000,000 | | | | — | | | | (128,972 | ) | |
Receive Floating Rate 3-Month USD LIBOR
Pay Fixed Rate 3.387% | | CIT | | 05/09/44 | | | 2,028,000 | | | | — | | | | (347,042 | ) | |
Net unrealized appreciation (depreciation) | | | | | | | | $ | 164,370 | | | $ | (716,507 | ) | |
Investments in Securities Legend
(a) Securities are valued by procedures described in Note 2 of the Notes to Financial Statements.
(b) Principal amounts for foreign debt securities are denominated in the currencies indicated. United States debt securities are denominated in U.S. Dollars.
(c) Rate represents annualized yield at date of purchase.
(d) Security sold within terms of a private placement memorandum exempt from registration under Section 144A of the Securities Act of 1933, as amended, and may be sold only to dealers in that program. This security has been determined to be liquid unless otherwise indicated.
(e) Variable rate security.
(f) At June 30, 2017 the cost of securities for federal income tax purposes was $93,179,984. The aggregate unrealized appreciation and depreciation of investments in securities based on this cost were:
Gross unrealized appreciation | | $ | 5,290,033 | | |
Gross unrealized depreciation | | | (925,691 | ) | |
Net unrealized appreciation | | $ | 4,364,342 | | |
See accompanying notes to financial statements.
45
SFT Advantus International Bond Fund
Investments in Securities – continued
Currency Legend
ARS Argentine Peso
AUD Australian Dollar
BRL Brazilian Real
CLP Chilean Peso
EUR Euro
GHS Ghanaian Cedi
IDR Indonesian Rupiah
INR Indian Rupee
JPY Japanese Yen
KRW South Korean Won
MXN Mexican Peso
MYR Malaysian Ringgit
PHP Philippine Peso
USD United States Dollar
ZAR South African Rand
Counterparty Legend
BCB Barclays Bank PLC
BOA Bank of America Merrill Lynch
CIT Citibank NA
DBK Deutsche Bank AG
GSC Goldman Sachs
HSB HSBC Bank PLC
JPM JPMorgan Chase Bank NA
JPS JPMorgan Chase (Singapore)
MSC Morgan Stanley and Co., Inc.
SCB Standard Chartered Bank
UBS UBS AG
See accompanying notes to financial statements.
46
SFT Advantus Managed Volatility Equity Fund
Investments in Securities
(Percentages of each investment category relate to total net assets)
| | | Shares/
Contracts | | Value(a) | |
Mutual Funds (90.3%) | |
Investment Companies (90.3%) | |
iShares Core High
Dividend ETF | | | 479,307 | | | $ | 39,844,791 | | |
iShares Edge MSCI
Minimum Volatility
EAFE ETF | | | 798,433 | | | | 55,283,501 | | |
iShares Edge MSCI
Minimum Volatility
Emerging Markets ETF | | | 240,325 | | | | 13,314,005 | | |
iShares Edge MSCI
Minimum Volatility
USA ETF (b) | | | 1,449,497 | | | | 70,923,888 | | |
iShares MSCI Germany ETF | | | 291,162 | | | | 8,813,474 | | |
iShares Short Maturity
Bond ETF | | | 220,000 | | | | 11,059,400 | | |
Total mutual funds
(cost: $186,711,676) | | | | | 199,239,059 | | |
Purchased Option (0.0%) | |
Put Option Purchased (0.0%) | |
S&P 500 Index,
2,300, 07/21/17 | | | 20,000 | | | | 59,000 | | |
Total purchased options
(cost: $123,988) | | | | | 59,000 | | |
Short-Term Securities (10.9%) | |
Investment Companies (10.9%) | |
State Street Institutional
U.S. Government
Money Market Fund,
current rate 0.880% | | | 24,005,126 | | | | 24,005,126 | | |
Total short-term securities
(cost: $24,005,126) | | | | | 24,005,126 | | |
Total investments in securities
(cost: $210,840,790) (c) | | | | | 223,303,185 | | |
Liabilities in excess of cash
and other assets (-1.2%) | | | | | (2,548,240 | ) | |
Total net assets (100.0%) | | | | $ | 220,754,945 | | |
Investments in Securities Legend
(a) Securities are valued by procedures described in Note 2 of the Notes to Financial Statements.
(b) Fully or partially pledged as initial margin deposits on open futures contracts.
Holdings of Open Futures Contracts
On June 30, 2017, securities with an aggregate market value of $978,600 have been pledged to cover margin requirements for the following open futures contracts:
Type | | Expiration | | Number of
Contracts | | Position
Type | | Unrealized
Appreciation/
(Depreciation) | |
S&P 500®
E-Mini
Index
Future | | September 2017 | | | 142 | | | Long | | $ | (80,558 | ) | |
| | | | | | 142 | | | | | $ | (80,558 | ) | |
(c) At June 30, 2017 the cost of securities for federal income tax purposes was $210,859,958. The aggregate unrealized appreciation and depreciation of investments in securities based on this cost were:
Gross unrealized appreciation | | $ | 12,508,215 | | |
Gross unrealized depreciation | | | (64,988 | ) | |
Net unrealized appreciation | | $ | 12,443,227 | | |
Holdings of Open Written Contracts
Put Options
Written | | Contracts | | Expiration
Date | | Exercise
Price | | Value(a) | |
S&P 500 Index | | | 200 | | | July 2017 | | | 2,190.00 | | | $ | (20,500 | ) | |
See accompanying notes to financial statements.
47
SFT Advantus Mortgage Securities Fund
Investments in Securities
(Percentages of each investment category relate to total net assets)
| | | Principal | | Value(a) | |
Long-Term Debt Securities (97.0%) | |
Government Obligations (78.8%) | |
Other Government Obligations (1.1%) | |
Provincial or Local Government
Obligations (1.1%) | |
Ohio State Water
Development Authority,
4.817%, 12/01/30 | | $ | 250,000 | | | $ | 283,255 | | |
Texas A&M University,
4.000%, 05/15/31 | | | 325,000 | | | | 343,002 | | |
Utility Debt Securitization
Authority,
3.435%, 12/15/25 | | | 355,000 | | | | 368,138 | | |
| | | | | | 994,395 | | |
U.S. Government Agencies and
Obligations (77.7%) | |
Export-Import Bank of the United
States (0.8%) | |
DY7 Leasing LLC,
2.578%, 12/10/25 | | | 177,083 | | | | 178,489 | | |
Export Leasing 2009 LLC,
1.859%, 08/28/21 | | | 111,878 | | | | 111,280 | | |
Helios Leasing I LLC
1.825%, 05/16/25 | | | 103,654 | | | | 101,490 | | |
2.018%, 05/29/24 | | | 159,172 | | | | 157,701 | | |
Union 16 Leasing LLC,
1.863%, 01/22/25 | | | 167,384 | | | | 164,420 | | |
| | | | | | 713,380 | | |
Federal Home Loan Mortgage Corporation
(FHLMC) (16.4%) | |
1.645%, 01/25/23 (b) | | | 397,375 | | | | 398,620 | | |
2.500%, 03/01/28 | | | 165,844 | | | | 167,893 | | |
2.500%, 04/01/28 | | | 262,787 | | | | 266,084 | | |
2.516%, 03/25/29 (b) | | | 500,000 | | | | 505,642 | | |
3.000%, 08/01/42 | | | 126,241 | | | | 126,691 | | |
3.000%, 12/01/42 | | | 264,387 | | | | 265,287 | | |
3.000%, 01/01/43 | | | 357,914 | | | | 359,321 | | |
3.000%, 02/01/43 | | | 837,819 | | | | 842,611 | | |
3.000%, 04/01/43 | | | 337,447 | | | | 338,765 | | |
3.000%, 10/25/46 | | | 383,260 | | | | 379,465 | | |
3.416%, 02/25/24 (b) | | | 267,104 | | | | 274,588 | | |
3.416%, 09/25/24 (b) | | | 500,000 | | | | 513,642 | | |
3.500%, 10/01/25 | | | 122,202 | | | | 127,921 | | |
3.500%, 05/01/32 | | | 298,182 | | | | 311,269 | | |
3.500%, 03/01/42 | | | 1,138,857 | | | | 1,177,285 | | |
3.500%, 08/01/42 | | | 299,217 | | | | 309,382 | | |
3.500%, 12/01/44 | | | 1,370,639 | | | | 1,409,195 | | |
3.500%, 05/25/45 | | | 685,721 | | | | 690,044 | | |
3.500%, 11/01/46 | | | 425,480 | | | | 438,088 | | |
4.000%, 09/01/40 | | | 371,053 | | | | 395,036 | | |
4.000%, 03/01/41 | | | 430,839 | | | | 459,936 | | |
4.000%, 01/01/45 | | | 1,033,310 | | | | 1,087,567 | | |
4.016%, 05/25/28 (b) | | | 217,480 | | | | 225,168 | | |
4.500%, 04/01/23 | | | 44,226 | | | | 47,366 | | |
4.500%, 09/01/40 | | | 274,933 | | | | 295,620 | | |
4.500%, 01/01/41 | | | 310,521 | | | | 333,926 | | |
4.500%, 03/01/41 | | | 312,345 | | | | 337,614 | | |
4.516%, 10/25/27 (b) | | | 250,000 | | | | 279,472 | | |
5.000%, 03/01/23 | | | 35,859 | | | | 38,925 | | |
| | | Principal | | Value(a) | |
5.000%, 05/01/29 | | $ | 54,222 | | | $ | 58,994 | | |
5.000%, 08/01/35 | | | 48,084 | | | | 52,462 | | |
5.000%, 11/01/35 | | | 46,827 | | | | 50,984 | | |
5.000%, 11/01/39 | | | 505,378 | | | | 559,401 | | |
5.000%, 03/01/40 | | | 355,087 | | | | 393,823 | | |
5.500%, 06/01/20 | | | 18,332 | | | | 18,802 | | |
5.500%, 10/01/20 | | | 59,336 | | | | 60,469 | | |
5.500%, 11/01/23 | | | 108,031 | | | | 119,020 | | |
5.500%, 05/01/34 | | | 178,084 | | | | 202,495 | | |
5.916%, 04/25/28 (b) | | | 400,000 | | | | 460,279 | | |
6.000%, 09/01/22 | | | 68,647 | | | | 73,267 | | |
6.000%, 11/01/33 | | | 158,195 | | | | 181,560 | | |
6.250%, 12/15/23 | | | 68,308 | | | | 73,763 | | |
6.500%, 11/01/32 | | | 52,574 | | | | 60,605 | | |
| | | | | | 14,768,347 | | |
Federal National Mortgage Association
(FNMA) (40.8%) | |
2.500%, 03/01/27 | | | 440,599 | | | | 446,683 | | |
2.500%, 11/01/27 | | | 205,157 | | | | 206,386 | | |
2.500%, 03/01/28 | | | 467,984 | | | | 473,531 | | |
2.898%, 06/25/27 | | | 675,000 | | | | 670,293 | | |
3.000%, 09/01/22 | | | 146,516 | | | | 150,482 | | |
3.000%, 11/01/27 | | | 205,520 | | | | 211,515 | | |
3.000%, 06/01/28 | | | 274,431 | | | | 282,666 | | |
3.000%, 07/01/32 (c) | | | 1,700,000 | | | | 1,744,758 | | |
3.000%, 03/01/42 | | | 136,754 | | | | 137,333 | | |
3.000%, 09/01/42 | | | 188,258 | | | | 189,168 | | |
3.000%, 03/01/43 | | | 135,653 | | | | 136,435 | | |
3.000%, 04/01/43 | | | 549,772 | | | | 552,101 | | |
3.000%, 05/01/43 | | | 740,414 | | | | 743,477 | | |
3.000%, 09/01/43 | | | 208,468 | | | | 209,276 | | |
3.000%, 01/01/46 | | | 515,348 | | | | 515,299 | | |
3.000%, 07/01/47 (c) | | | 1,725,000 | | | | 1,722,674 | | |
3.500%, 11/01/25 | | | 72,420 | | | | 75,539 | | |
3.500%, 01/01/26 | | | 164,693 | | | | 171,787 | | |
3.500%, 12/01/32 | | | 271,722 | | | | 283,812 | | |
3.500%, 11/01/40 | | | 241,365 | | | | 249,677 | | |
3.500%, 01/01/41 | | | 410,151 | | | | 423,457 | | |
3.500%, 02/01/41 | | | 887,838 | | | | 916,664 | | |
3.500%, 11/01/41 | | | 415,401 | | | | 429,078 | | |
3.500%, 12/01/41 | | | 778,494 | | | | 803,292 | | |
3.500%, 01/01/42 | | | 1,837,845 | | | | 1,896,174 | | |
3.500%, 05/01/42 | | | 555,098 | | | | 573,105 | | |
3.500%, 08/01/42 | | | 524,769 | | | | 541,939 | | |
3.500%, 01/01/43 | | | 322,314 | | | | 332,571 | | |
3.500%, 02/01/43 | | | 657,595 | | | | 682,198 | | |
3.500%, 03/01/43 | | | 302,143 | | | | 312,528 | | |
3.500%, 05/01/43 | | | 1,133,705 | | | | 1,170,884 | | |
3.500%, 06/01/45 | | | 1,776,248 | | | | 1,831,048 | | |
3.500%, 10/01/45 | | | 233,757 | | | | 240,232 | | |
3.500%, 01/01/46 | | | 467,479 | | | | 481,312 | | |
3.500%, 01/01/47 | | | 982,894 | | | | 1,011,600 | | |
3.500%, 07/01/47 (c) | | | 1,275,000 | | | | 1,309,515 | | |
4.000%, 06/25/23 | | | 149,995 | | | | 154,164 | | |
4.000%, 12/01/40 | | | 179,590 | | | | 189,575 | | |
4.000%, 04/01/41 | | | 152,715 | | | | 162,257 | | |
4.000%, 11/01/41 | | | 352,468 | | | | 371,927 | | |
4.000%, 06/01/42 | | | 925,991 | | | | 980,729 | | |
4.000%, 09/01/43 | | | 573,953 | | | | 604,225 | | |
4.000%, 10/01/43 | | | 1,358,229 | | | | 1,448,920 | | |
4.000%, 01/01/44 | | | 309,057 | | | | 329,685 | | |
See accompanying notes to financial statements.
48
SFT Advantus Mortgage Securities Fund
Investments in Securities – continued
| | | Principal | | Value(a) | |
4.000%, 08/01/44 | | $ | 243,730 | | | $ | 256,942 | | |
4.000%, 07/01/47 (c) | | | 720,000 | | | | 756,872 | | |
4.500%, 04/01/21 | | | 3,694 | | | | 3,818 | | |
4.500%, 11/01/23 | | | 38,972 | | | | 41,800 | | |
4.500%, 04/01/25 | | | 79,285 | | | | 83,648 | | |
4.500%, 05/25/34 | | | 537,000 | | | | 608,450 | | |
4.500%, 05/01/35 | | | 222,674 | | | | 239,944 | | |
4.500%, 07/01/35 | | | 196,316 | | | | 211,128 | | |
4.500%, 09/01/37 | | | 246,625 | | | | 265,867 | | |
5.000%, 05/01/18 | | | 17,201 | | | | 17,615 | | |
5.000%, 10/01/20 | | | 46,219 | | | | 48,288 | | |
5.000%, 06/25/23 | | | 144,435 | | | | 151,635 | | |
5.000%, 11/01/33 | | | 212,224 | | | | 232,794 | | |
5.000%, 03/01/34 | | | 452,787 | | | | 496,776 | | |
5.000%, 05/01/34 | | | 49,761 | | | | 54,618 | | |
5.000%, 12/01/34 | | | 43,053 | | | | 47,240 | | |
5.000%, 04/01/35 | | | 66,990 | | | | 73,547 | | |
5.000%, 07/01/35 | | | 416,501 | | | | 457,174 | | |
5.000%, 03/01/38 | | | 120,492 | | | | 132,911 | | |
5.000%, 06/01/39 | | | 178,416 | | | | 198,381 | | |
5.000%, 12/01/39 | | | 288,942 | | | | 322,171 | | |
5.000%, 06/01/40 | | | 98,650 | | | | 108,978 | | |
5.000%, 04/01/41 | | | 193,424 | | | | 213,983 | | |
5.500%, 02/01/18 | | | 7,518 | | | | 7,557 | | |
5.500%, 03/01/18 | | | 16,158 | | | | 16,263 | | |
5.500%, 08/01/23 | | | 61,673 | | | | 68,261 | | |
5.500%, 02/01/24 | | | 87,985 | | | | 97,383 | | |
5.500%, 04/01/33 | | | 326,599 | | | | 367,913 | | |
5.500%, 05/01/33 | | | 17,919 | | | | 19,960 | | |
5.500%, 01/01/34 | | | 50,839 | | | | 56,958 | | |
5.500%, 02/01/34 | | | 30,398 | | | | 34,080 | | |
5.500%, 04/01/34 | | | 76,066 | | | | 85,129 | | |
5.500%, 05/01/34 | | | 17,900 | | | | 20,041 | | |
5.500%, 09/01/34 | | | 187,638 | | | | 208,881 | | |
5.500%, 10/01/34 | | | 76,981 | | | | 86,306 | | |
5.500%, 01/01/35 | | | 128,965 | | | | 144,940 | | |
5.500%, 02/01/35 | | | 240,115 | | | | 269,073 | | |
5.500%, 06/01/35 | | | 13,681 | | | | 15,323 | | |
5.500%, 08/01/35 | | | 65,539 | | | | 73,383 | | |
5.500%, 10/01/35 | | | 50,306 | | | | 57,329 | | |
5.500%, 11/01/35 | | | 11,706 | | | | 13,100 | | |
5.500%, 09/01/36 | | | 181,909 | | | | 203,807 | | |
5.500%, 05/01/38 | | | 2,806 | | | | 3,106 | | |
6.000%, 09/01/32 | | | 18,632 | | | | 21,275 | | |
6.000%, 10/01/32 | | | 315,538 | | | | 363,730 | | |
6.000%, 11/01/32 | | | 239,965 | | | | 275,999 | | |
6.000%, 03/01/33 | | | 284,298 | | | | 325,704 | | |
6.000%, 04/01/33 | | | 37,013 | | | | 41,679 | | |
6.000%, 12/01/33 | | | 67,579 | | | | 77,158 | | |
6.000%, 08/01/34 | | | 63,028 | | | | 71,553 | | |
6.000%, 09/01/34 | | | 37,898 | | | | 43,241 | | |
6.000%, 11/01/34 | | | 17,787 | | | | 20,037 | | |
6.000%, 12/01/34 | | | 158,258 | | | | 180,751 | | |
6.000%, 11/01/36 | | | 21,337 | | | | 24,302 | | |
6.000%, 01/01/37 | | | 187,410 | | | | 213,012 | | |
6.000%, 08/01/37 | | | 45,374 | | | | 51,113 | | |
6.000%, 09/01/37 | | | 69,485 | | | | 79,395 | | |
6.000%, 12/01/37 | | | 31,749 | | | | 35,798 | | |
6.000%, 12/01/38 | | | 84,570 | | | | 96,084 | | |
6.500%, 11/01/23 | | | 56,742 | | | | 61,760 | | |
6.500%, 02/01/32 | | | 244,862 | | | | 281,905 | | |
6.500%, 04/01/32 | | | 84,319 | | | | 97,346 | | |
6.500%, 05/01/32 | | | 30,255 | | | | 34,145 | | |
6.500%, 07/01/32 | | | 285,750 | | | | 326,076 | | |
| | | Principal | | Value(a) | |
6.500%, 09/01/32 | | $ | 874 | | | $ | 966 | | |
6.500%, 09/01/34 | | | 22,686 | | | | 25,581 | | |
6.500%, 11/01/34 | | | 9,778 | | | | 11,135 | | |
6.500%, 03/01/35 | | | 119,564 | | | | 136,047 | | |
6.500%, 02/01/36 | | | 15,551 | | | | 17,200 | | |
6.500%, 09/01/37 | | | 119,163 | | | | 134,605 | | |
7.000%, 09/01/31 | | | 120,791 | | | | 136,047 | | |
7.000%, 11/01/31 | | | 22,837 | | | | 25,942 | | |
7.000%, 02/01/32 | | | 87,595 | | | | 101,921 | | |
7.000%, 07/01/32 | | | 16,815 | | | | 18,939 | | |
7.000%, 10/01/37 | | | 16,366 | | | | 17,278 | | |
7.500%, 07/25/22 | | | 74,763 | | | | 79,779 | | |
7.500%, 04/01/31 | | | 32,004 | | | | 35,812 | | |
| | | | | | 36,706,659 | | |
Government National Mortgage Association
(GNMA) (18.3%) | |
0.000%, 03/16/42 (b) (d) (e) | | | 1,106,380 | | | | — | | |
0.011%, 06/17/45 (b) (d) (i) | | | 274,592 | | | | 104 | | |
0.643%, 07/16/40 (b) (d) | | | 220,522 | | | | 229 | | |
1.000%, 12/20/42 | | | 174,233 | | | | 165,243 | | |
3.000%, 09/20/42 | | | 527,599 | | | | 534,968 | | |
3.000%, 09/20/44 | | | 195,177 | | | | 197,542 | | |
3.000%, 03/15/45 | | | 541,616 | | | | 547,869 | | |
3.000%, 04/15/45 | | | 1,373,866 | | | | 1,389,728 | | |
3.000%, 05/15/45 | | | 171,943 | | | | 173,928 | | |
3.000%, 07/01/47 (c) | | | 350,000 | | | | 353,527 | | |
3.250%, 04/20/33 | | | 204,735 | | | | 211,773 | | |
3.250%, 03/20/35 | | | 1,216,762 | | | | 1,258,570 | | |
3.250%, 11/20/35 | | | 317,240 | | | | 327,693 | | |
3.250%, 01/20/36 | | | 1,175,151 | | | | 1,213,868 | | |
3.500%, 11/15/40 | | | 116,558 | | | | 121,046 | | |
3.500%, 10/20/43 | | | 386,031 | | | | 401,541 | | |
3.500%, 02/20/45 | | | 642,037 | | | | 665,710 | | |
3.500%, 03/20/45 | | | 984,978 | | | | 1,021,296 | | |
3.500%, 04/20/45 | | | 1,249,499 | | | | 1,295,570 | | |
3.500%, 04/20/46 | | | 310,445 | | | | 321,828 | | |
3.500%, 07/01/47 (c) | | | 600,000 | | | | 621,469 | | |
3.750%, 03/20/46 | | | 293,594 | | | | 306,866 | | |
4.000%, 07/20/31 | | | 481,798 | | | | 511,285 | | |
4.000%, 04/20/39 | | | 346,675 | | | | 367,605 | | |
4.000%, 12/20/40 | | | 1,012,920 | | | | 1,079,267 | | |
4.000%, 01/15/41 | | | 69,921 | | | | 73,795 | | |
4.000%, 02/15/41 | | | 479,379 | | | | 510,213 | | |
4.000%, 10/15/41 | | | 365,622 | | | | 385,835 | | |
4.000%, 12/20/44 | | | 205,813 | | | | 216,746 | | |
4.500%, 06/15/40 | | | 348,549 | | | | 380,595 | | |
5.000%, 05/15/33 | | | 109,748 | | | | 120,622 | | |
5.000%, 12/15/39 | | | 91,318 | | | | 101,904 | | |
5.000%, 01/15/40 | | | 785,233 | | | | 859,978 | | |
5.000%, 07/15/40 | | | 380,819 | | | | 417,082 | | |
5.500%, 07/15/38 | | | 138,189 | | | | 156,041 | | |
5.500%, 10/15/38 | | | 156,657 | | | | 179,799 | | |
| | | | | | 16,491,135 | | |
U.S. Treasury (1.3%) | |
U.S. Treasury Bond,
3.000%, 02/15/47 | | | 550,000 | | | | 567,359 | | |
U.S. Treasury Note
2.125%, 03/31/24 | | | 400,000 | | | | 400,297 | | |
2.250%, 02/15/27 (l) | | | 150,000 | | | | 149,303 | | |
| | | | | | 1,116,959 | | |
See accompanying notes to financial statements.
49
SFT Advantus Mortgage Securities Fund
Investments in Securities – continued
| | | Principal | | Value(a) | |
Vendee Mortgage Trust (0.1%) | |
Vendee Mortgage Trust,
7.793%, 02/15/25 | | $ | 55,894 | | | $ | 60,768 | | |
Total government obligations
(cost: $70,620,616) | | | | | 70,851,643 | | |
Asset-Backed Securities (6.8%) | |
Bear Stearns Asset Backed
Securities Trust,
2.191%, 02/25/34 (b) | | | 361,951 | | | | 337,974 | | |
Capital One Multi-Asset
Execution Trust,
1.889%, 01/18/22 (b) | | | 275,000 | | | | 276,063 | | |
CarMax Auto Owner Trust,
1.880%, 11/15/19 | | | 350,000 | | | | 350,337 | | |
CDC Mortgage Capital Trust,
2.316%, 03/25/34 (b) | | | 206,668 | | | | 198,535 | | |
Chase Funding Trust
1.776%, 02/25/33 (b) | | | 155,233 | | | | 138,990 | | |
1.856%, 08/25/32 (b) | | | 122,337 | | | | 112,138 | | |
Chesapeake Funding II LLC,
3.710%, 05/15/29 (f) | | | 100,000 | | | | 99,803 | | |
Commonbond Student
Loan Trust,
5.280%, 05/25/41 (f) | | | 250,000 | | | | 249,305 | | |
CountryPlace Manufactured
Housing Contract Trust,
5.200%, 12/15/35 (b) (f) | | | 229,021 | | | | 236,967 | | |
Credit-Based Asset
Servicing and
Securitization LLC,
6.250%, 10/25/36 (f) (g) | | | 226,465 | | | | 230,866 | | |
CSMC Trust,
3.500%, 06/25/47 (b) (f) (i) | | | 525,000 | | | | 518,889 | | |
Entergy Gulf States
Reconstruction
Funding 1 LLC,
5.930%, 06/29/22 | | | 500,000 | | | | 542,001 | | |
FAN Engine Securitization,
Ltd., 3.000%,
10/15/19 (e) (f) (h) (i) | | | 83,609 | | | | 84,121 | | |
FirstEnergy Ohio PIRB
Special Purpose Trust,
1.726%, 01/15/22 | | | 183,271 | | | | 182,730 | | |
Foursight Capital
Automobile
Receivables Trust
2.340%, 01/15/21 (f) | | | 176,533 | | | | 176,721 | | |
3.710%, 01/18/22 (f) | | | 285,000 | | | | 282,763 | | |
Invitation Homes
2014-SFR2 Trust,
2.309%, 09/17/31 (b) (f) | | | 205,228 | | | | 205,613 | | |
Invitation Homes
2015-SFR3 Trust,
2.509%, 08/17/32 (b) (f) | | | 619,607 | | | | 622,432 | | |
Lehman ABS Manufactured
Housing Contract Trust,
5.873%, 04/15/40 | | | 80,683 | | | | 82,629 | | |
Morgan Stanley Dean
Witter Capital I, Inc.,,
1.776%, 08/25/32 (b) | | | 178,343 | | | | 167,902 | | |
Origen Manufactured
Housing Contract Trust,
5.910%, 01/15/37 | | | 376,189 | | | | 387,857 | | |
| | | Principal | | Value(a) | |
Saxon Asset Securities Trust,
1.756%, 03/25/35 (b) | | $ | 270,238 | | | $ | 249,485 | | |
SoFi Professional
Loan Program,
2.266%, 04/25/35 (b) (f) | | | 159,519 | | | | 161,011 | | |
Trip Rail Master
Funding LLC,
2.863%, 04/15/44 (f) | | | 186,414 | | | | 183,273 | | |
Total asset-backed securities
(cost: $6,081,374) | | | | | 6,078,405 | | |
Other Mortgage-Backed Securities (10.2%) | |
Collateralized Mortgage Obligations/
Mortgage Revenue Bonds (1.5%) | |
Bear Stearns Mortgage
Securities, Inc.,
8.000%, 11/25/29 (i) | | | 149,397 | | | | 102,307 | | |
GS Mortgage-Backed
Securities Trust,
3.141%, 07/25/44 (b) (f) | | | 399,684 | | | | 382,201 | | |
Impac CMB Trust,
2.041%, 09/25/34 (b) | | | 321,723 | | | | 293,806 | | |
Impac Secured Assets
CMN Owner Trust,
2.116%, 11/25/34 (b) | | | 230,000 | | | | 224,879 | | |
JP Morgan Mortgage Trust,
3.380%, 10/25/46 (b) (f) (i) | | | 344,526 | | | | 331,673 | | |
Prudential Home
Mortgage Securities
7.817%, 09/28/24 (b) (f) | | | 1,158 | | | | 1,048 | | |
7.900%, 04/28/22 (f) | | | 12,719 | | | | 12,015 | | |
Structured Asset Mortgage
Investments, Inc.,
1.386%, 05/02/30 (b) (i) | | | 11,094 | | | | 2,000 | | |
| | | | | | 1,349,929 | | |
Commercial Mortgage-Backed
Securities (8.7%) | |
7 WTC Depositor LLC Trust,
4.082%, 03/13/31 (f) | | | 106,506 | | | | 107,496 | | |
BANK 2017-BNK4,
3.625%, 05/15/50 | | | 350,000 | | | | 363,094 | | |
CFCRE Commercial
Mortgage Trust,
3.839%, 12/10/54 | | | 500,000 | | | | 522,733 | | |
Citigroup Commercial
Mortgage Trust
3.008%, 01/12/30 (b) (f) | | | 280,000 | | | | 280,394 | | |
3.209%, 05/10/49 | | | 375,000 | | | | 377,961 | | |
CSMC Trust,
3.304%, 09/15/37 (f) | | | 400,000 | | | | 408,060 | | |
Hometown Commercial
Mortgage,
5.506%, 11/11/38 (e) (f) (i) | | | 17,763 | | | | 15,430 | | |
Irvine Core Office Trust,
2.068%, 05/15/48 (f) | | | 313,553 | | | | 311,286 | | |
JP Morgan Chase
Commercial Mortgage
Securities Trust,
3.648%, 12/15/49 (b) | | | 400,000 | | | | 416,426 | | |
JPMorgan Chase
Commercial Mortgage
Securities Corp., 2.134%,
12/05/27 (b) (d) (e) (f) | | | 3,391,809 | | | | 138,999 | | |
See accompanying notes to financial statements.
50
SFT Advantus Mortgage Securities Fund
Investments in Securities – continued
| | | Shares/
Principal | | Value(a) | |
Morgan Stanley Bank of
America Merrill
Lynch Trust,
3.720%, 12/15/49 | | $ | 225,000 | | | $ | 235,543 | | |
Morgan Stanley
Capital I Trust,
3.451%, 08/05/34 (f) | | | 150,000 | | | | 150,452 | | |
Multi Security Asset Trust,
5.880%, 11/28/35 (b) (e) (f) (i) | | | 869,911 | | | | 884,448 | | |
One Market Plaza Trust,
3.614%, 02/10/32 (f) | | | 500,000 | | | | 520,290 | | |
UBS Commercial
Mortgage Trust,
3.724%, 06/15/50 | | | 1,500,000 | | | | 1,527,880 | | |
Wells Fargo Commercial
Mortgage Trust
2.814%, 08/15/49 | | | 540,000 | | | | 522,281 | | |
3.096%, 06/15/49 | | | 400,000 | | | | 398,518 | | |
3.637%, 06/15/48 | | | 625,000 | | | | 649,565 | | |
| | | | | | 7,830,856 | | |
Total other mortgage-backed securities
(cost: $9,275,731) | | | | | 9,180,785 | | |
Corporate Obligations (1.2%) | |
Communications (0.7%) | |
Telecommunication (0.7%) | |
Crown Castle Towers LLC,
3.222%, 05/15/22 (f) | | | 425,000 | | | | 435,345 | | |
SBA Tower Trust,
2.240%, 04/16/18 (f) | | | 220,000 | | | | 219,894 | | |
| | | | | | 655,239 | | |
Financial (0.5%) | |
Real Estate Investment Trust —
Residential (0.5%) | |
UDR, Inc.,
4.000%, 10/01/25 | | | 400,000 | | | | 413,674 | | |
Total corporate obligations
(cost: $1,044,217) | | | | | 1,068,913 | | |
Total long-term debt securities
(cost: $87,021,938) | | | | | 87,179,746 | | |
Short-Term Securities (10.2%) | |
Investment Companies (10.2%) | |
Federated Government
Obligations Fund,
current rate 0.830% (j) | | | 2,300,000 | | | | 2,300,000 | | |
State Street Institutional
U.S. Government
Money Market Fund,
current rate 0.880% (j) | | | 4,583,850 | | | | 4,583,850 | | |
STIT-Government & Agency
Portfolio, current rate
0.890% (j) | | | 2,300,000 | | | | 2,300,000 | | |
Total short-term securities
(cost: $9,183,850) | | | | | 9,183,850 | | |
Total investments in securities
(cost: $96,205,788) (k) | | | | | 96,363,596 | | |
Liabilities in excess of cash
and other assets (-7.2%) | | | | | (6,432,039 | ) | |
Total net assets (100.0%) | | | | $ | 89,931,557 | | |
Investments in Securities Legend
(a) Securities are valued by procedures described in Note 2 of the Notes to Financial Statements.
(b) Variable rate security.
(c) Security is issued on a when-issued or forward commitment basis. As of June 30, 2017 the total cost of investments issued on a when-issued or forward commitment basis was $6,542,340.
(d) Interest-only security that entitles holders to receive only interest on the underlying mortgages. The principal amount of the underlying pool represents the notional amount on which current interest is calculated. The yield to maturity of an interest-only security is sensitive to the rate of principal payments on the underlying mortgage assets. The rate disclosed represents the market yield based upon the current cost basis and estimated timing and amount of future cash flows.
(e) Illiquid security. (See Note 5.)
(f) Security sold within terms of a private placement memorandum exempt from registration under Section 144A of the Securities Act of 1933, as amended, and may be sold only to dealers in that program. This security has been determined to be liquid unless otherwise indicated.
(g) Step rate security.
(h) Foreign security: The Fund held 0.1% of net assets in foreign securities at June 30, 2017.
(i) These securities are being fair-valued according to procedures approved by the Board of Trustees.
(j) All or a portion of the security segregated to cover when-issued purchase commitments outstanding or extended settlement trades as of June 30, 2017.
(k) At June 30, 2017 the cost of securities for federal income tax purposes was $96,683,583. The aggregate unrealized appreciation and depreciation of investments in securities based on this cost were:
Gross unrealized appreciation | | $ | 1,171,358 | | |
Gross unrealized depreciation | | | (1,491,346 | ) | |
Net unrealized depreciation | | $ | (319,988 | ) | |
(l) Fully or partially pledged as initial margin deposits on open futures contracts.
Holdings of Open Futures Contracts
On June 30, 2017, securities with an aggregate market value of $99,535 have been pledged to cover margin requirements for the following open futures contracts:
Type | | Expiration | | Number of
Contracts | | Position
Type | | Unrealized
Appreciation/
(Depreciation) | |
10 Year
U.S. Treasury
Note | | September 2017 | | | 14 | | | Long | | $ | (4,855 | ) | |
| | | | | | 14 | | | | | $ | (4,855 | ) | |
See accompanying notes to financial statements.
51
SFT Advantus Real Estate Securities Fund
Investments in Securities
(Percentages of each investment category relate to total net assets)
| | | Shares | | Value(a) | |
Common Stocks (99.2%) | |
Consumer Discretionary (1.3%) | |
Hotels, Restaurants & Leisure (1.3%) | |
Hilton Worldwide
Holdings, Inc. | | | 29,400 | | | $ | 1,818,390 | | |
Real Estate (97.9%) | |
Health Care REITs (9.5%) | |
HCP, Inc. | | | 73,200 | | | | 2,339,472 | | |
Healthcare Trust of
America, Inc. – Class A | | | 54,300 | | | | 1,689,273 | | |
Physicians Realty Trust | | | 100,300 | | | | 2,020,042 | | |
Ventas, Inc. | | | 47,796 | | | | 3,320,866 | | |
Welltower, Inc. | | | 50,200 | | | | 3,757,470 | | |
| | | | | | 13,127,123 | | |
Hotels & Resort REITs (3.6%) | |
Apple Hospitality REIT, Inc. | | | 68,400 | | | | 1,279,764 | | |
Host Hotels & Resorts, Inc. | | | 114,846 | | | | 2,098,237 | | |
Sunstone Hotel Investors, Inc. | | | 95,000 | | | | 1,531,400 | | |
| | | | | | 4,909,401 | | |
Industrial REITs (11.6%) | |
Duke Realty Corp. | | | 141,500 | | | | 3,954,925 | | |
First Industrial Realty Trust, Inc. | | | 21,700 | | | | 621,054 | | |
Liberty Property Trust | | | 62,500 | | | | 2,544,375 | | |
ProLogis, Inc. | | | 126,881 | | | | 7,440,302 | | |
Rexford Industrial Realty, Inc. | | | 51,000 | | | | 1,399,440 | | |
| | | | | | 15,960,096 | | |
Office REITs (16.9%) | |
Alexandria Real Estate
Equities, Inc. | | | 36,700 | | | | 4,421,249 | | |
Boston Properties, Inc. | | | 21,483 | | | | 2,642,839 | | |
Brandywine Realty Trust | | | 185,800 | | | | 3,257,074 | | |
Corporate Office Properties Trust | | | 83,000 | | | | 2,907,490 | | |
Highwoods Properties, Inc. | | | 36,100 | | | | 1,830,631 | | |
Hudson Pacific Properties, Inc. | | | 24,900 | | | | 851,331 | | |
Kilroy Realty Corp. | | | 45,436 | | | | 3,414,515 | | |
SL Green Realty Corp. | | | 18,971 | | | | 2,007,132 | | |
Vornado Realty Trust | | | 20,386 | | | | 1,914,245 | | |
| | | | | | 23,246,506 | | |
Residential REITs (21.8%) | |
American Campus
Communities, Inc. | | | 21,900 | | | | 1,035,870 | | |
American Homes 4 Rent –
Class A | | | 106,200 | | | | 2,396,934 | | |
Apartment Investment &
Management Co. – Class A | | | 34,718 | | | | 1,491,833 | | |
AvalonBay Communities, Inc. | | | 20,426 | | | | 3,925,264 | | |
Equity Residential | | | 69,100 | | | | 4,548,853 | | |
Essex Property Trust, Inc. | | | 15,216 | | | | 3,914,620 | | |
Invitation Homes, Inc. | | | 75,000 | | | | 1,622,250 | | |
Mid-America Apartment
Communities, Inc. | | | 44,500 | | | | 4,689,410 | | |
Sun Communities, Inc. | | | 34,100 | | | | 2,990,229 | | |
UDR, Inc. | | | 87,400 | | | | 3,405,978 | | |
| | | | | | 30,021,241 | | |
Retail REITs (17.4%) | |
Agree Realty Corp. | | | 38,600 | | | | 1,770,582 | | |
Brixmor Property Group, Inc. | | | 110,900 | | | | 1,982,892 | | |
Federal Realty Investment Trust | | | 5,300 | | | | 669,867 | | |
| | | Shares | | Value(a) | |
GGP, Inc. | | | 153,500 | | | $ | 3,616,460 | | |
Kimco Realty Corp. | | | 115,100 | | | | 2,112,085 | | |
National Retail Properties, Inc. | | | 32,000 | | | | 1,251,200 | | |
Regency Centers Corp. | | | 54,214 | | | | 3,395,965 | | |
Simon Property Group, Inc. | | | 56,879 | | | | 9,200,747 | | |
| | | | | | 23,999,798 | | |
Specialized REITs (17.1%) | |
CubeSmart | | | 49,621 | | | | 1,192,889 | | |
CyrusOne, Inc. | | | 44,000 | | | | 2,453,000 | | |
Digital Realty Trust, Inc. | | | 26,500 | | | | 2,993,175 | | |
DuPont Fabros Technology, Inc. | | | 9,700 | | | | 593,252 | | |
EPR Properties | | | 25,400 | | | | 1,825,498 | | |
Equinix, Inc. | | | 17,834 | | | | 7,653,639 | | |
Extra Space Storage, Inc. | | | 42,200 | | | | 3,291,600 | | |
Public Storage | | | 16,600 | | | | 3,461,598 | | |
| | | | | | 23,464,651 | | |
Total common stocks
(cost: $130,070,708) | | | | | 136,547,206 | | |
Short-Term Securities (0.5%) | |
Investment Companies (0.5%) | |
State Street Institutional
U.S. Government
Money Market Fund,
current rate 0.880% | | | 650,266 | | | | 650,266 | | |
Total short-term securities
(cost: $650,266) | | | | | 650,266 | | |
Total investments in securities
(cost: $130,720,974) (b) | | | | | 137,197,472 | | |
Cash and other assets in
excess of liabilities (0.3%) | | | | | 418,086 | | |
Total net assets (100.0%) | | | | $ | 137,615,558 | | |
Investments in Securities Legend
(a) Securities are valued by procedures described in Note 2 of the Notes to Financial Statements.
(b) At June 30, 2017 the cost of securities for federal income tax purposes was $131,360,784. The aggregate unrealized appreciation and depreciation of investments in securities based on this cost were:
Gross unrealized appreciation | | $ | 10,108,598 | | |
Gross unrealized depreciation | | | (4,271,910 | ) | |
Net unrealized appreciation | | $ | 5,836,688 | | |
See accompanying notes to financial statements.
52
SFT IvySM Growth Fund
Investments in Securities
(Percentages of each investment category relate to total net assets)
| | | Shares | | Value(a) | |
Common Stocks (98.6%) | |
Consumer Discretionary (16.7%) | |
Automobiles (1.4%) | |
Ferrari NV (b) | | | 75,129 | | | $ | 6,462,597 | | |
Hotels, Restaurants & Leisure (0.4%) | |
Starbucks Corp. | | | 30,987 | | | | 1,806,852 | | |
Household Durables (0.7%) | |
Stanley Black & Decker, Inc. | | | 23,900 | | | | 3,363,447 | | |
Internet & Catalog Retail (6.9%) | |
Amazon.com, Inc. (c) | | | 20,116 | | | | 19,472,288 | | |
The Priceline Group, Inc. (c) | | | 6,900 | | | | 12,906,588 | | |
| | | | | | 32,378,876 | | |
Media (2.0%) | |
Comcast Corp. – Class A | | | 244,700 | | | | 9,523,724 | | |
Specialty Retail (5.3%) | |
O'Reilly Automotive, Inc. (c) | | | 15,900 | | | | 3,477,966 | | |
The Home Depot, Inc. | | | 123,600 | | | | 18,960,240 | | |
Ulta Salon Cosmetics &
Fragrance, Inc. (c) | | | 7,700 | | | | 2,212,518 | | |
| | | | | | 24,650,724 | | |
Consumer Staples (5.2%) | |
Food & Staples Retailing (1.1%) | |
Costco Wholesale Corp. | | | 33,100 | | | | 5,293,683 | | |
Tobacco (4.1%) | |
Philip Morris International, Inc. | | | 162,200 | | | | 19,050,390 | | |
Energy (1.4%) | |
Energy Equipment & Services (1.4%) | |
Halliburton Co. | | | 154,215 | | | | 6,586,523 | | |
Financial (7.0%) | |
Capital Markets (7.0%) | |
CME Group, Inc. | | | 116,200 | | | | 14,552,888 | | |
S&P Global, Inc. | | | 56,795 | | | | 8,291,502 | | |
The Charles Schwab Corp. | | | 231,900 | | | | 9,962,424 | | |
| | | | | | 32,806,814 | | |
Health Care (14.9%) | |
Biotechnology (7.3%) | |
Alexion Pharmaceuticals,
Inc. (c) | | | 16,600 | | | | 2,019,722 | | |
Celgene Corp. (c) | | | 139,449 | | | | 18,110,242 | | |
Shire PLC, ADR (b) | | | 41,645 | | | | 6,882,669 | | |
Vertex Pharmaceuticals,
Inc. (c) | | | 56,034 | | | | 7,221,101 | | |
| | | | | | 34,233,734 | | |
Health Care Equipment & Supplies (5.6%) | |
Danaher Corp. | | | 83,700 | | | | 7,063,443 | | |
DexCom, Inc. (c) | | | 69,800 | | | | 5,105,870 | | |
Edwards Lifesciences Corp. (c) | | | 59,241 | | | | 7,004,656 | | |
Intuitive Surgical, Inc. (c) | | | 7,500 | | | | 7,015,275 | | |
| | | | | | 26,189,244 | | |
| | | Shares | | Value(a) | |
Pharmaceuticals (2.0%) | |
Allergan PLC | | | 29,719 | | | $ | 7,224,392 | | |
Bristol-Myers Squibb Co. | | | 39,000 | | | | 2,173,080 | | |
| | | | | | 9,397,472 | | |
Industrials (8.3%) | |
Aerospace & Defense (4.2%) | |
Lockheed Martin Corp. | | | 45,401 | | | | 12,603,772 | | |
Northrop Grumman Corp. | | | 27,802 | | | | 7,137,051 | | |
| | | | | | 19,740,823 | | |
Electrical Equipment (0.5%) | |
Rockwell Automation, Inc. | | | 14,600 | | | | 2,364,616 | | |
Machinery (1.9%) | |
Caterpillar, Inc. | | | 34,100 | | | | 3,664,386 | | |
Nordson Corp. | | | 19,800 | | | | 2,402,136 | | |
Parker Hannifin Corp. | | | 17,800 | | | | 2,844,796 | | |
| | | | | | 8,911,318 | | |
Road & Rail (1.7%) | |
Union Pacific Corp. | | | 71,742 | | | | 7,813,421 | | |
Information Technology (45.1%) | |
Computers & Peripherals (3.5%) | |
Apple, Inc. | | | 114,221 | | | | 16,450,108 | | |
Internet Software & Services (9.4%) | |
Alphabet, Inc. – Class A (c) | | | 15,200 | | | | 14,131,136 | | |
Alphabet, Inc. – Class C (c) | | | 12,744 | | | | 11,580,855 | | |
Facebook, Inc. – Class A (c) | | | 123,459 | | | | 18,639,840 | | |
| | | | | | 44,351,831 | | |
IT Services (11.2%) | |
FleetCor Technologies,
Inc. (c) | | | 21,100 | | | | 3,042,831 | | |
Mastercard, Inc. – Class A | | | 163,900 | | | | 19,905,655 | | |
PayPal Holdings, Inc. (c) | | | 222,000 | | | | 11,914,740 | | |
Visa, Inc. – Class A | | | 188,000 | | | | 17,630,640 | | |
| | | | | | 52,493,866 | | |
Semiconductors & Semiconductor Equipment (7.8%) | |
Applied Materials, Inc. | | | 117,800 | | | | 4,866,318 | | |
Lam Research Corp. | | | 123,338 | | | | 17,443,694 | | |
Microchip Technology, Inc. | | | 183,929 | | | | 14,195,640 | | |
| | | | | | 36,505,652 | | |
Software (13.2%) | |
Adobe Systems, Inc. (c) | | | 106,800 | | | | 15,105,792 | | |
Electronic Arts, Inc. (c) | | | 112,200 | | | | 11,861,784 | | |
Microsoft Corp. | | | 289,400 | | | | 19,948,342 | | |
Salesforce.com, Inc. (c) | | | 171,952 | | | | 14,891,043 | | |
| | | | | | 61,806,961 | | |
Total common stocks
(cost: $360,954,142) | | | | | 462,182,676 | | |
See accompanying notes to financial statements.
53
SFT IvySM Growth Fund
Investments in Securities – continued
| | | Shares | | Value(a) | |
Short-Term Securities (0.2%) | |
Investment Companies (0.2%) | |
State Street Institutional
U.S. Government Money
Market Fund, current
rate 0.880% | | | 1,043,945 | | | $ | 1,043,945 | | |
Total short-term securities
(cost: $1,043,945) | | | | | 1,043,945 | | |
Total investments in securities
(cost: $361,998,087) (d) | | | | | 463,226,621 | | |
Cash and other assets in
excess of liabilities (1.2%) | | | | | 5,778,846 | | |
Total net assets (100.0%) | | | | $ | 469,005,467 | | |
Investments in Securities Legend
(a) Securities are valued by procedures described in Note 2 of the Notes to Financial Statements.
(b) Foreign security: The Fund held 2.8% of net assets in foreign securities at June 30, 2017.
(c) Non-income producing security.
(d) At June 30, 2017 the cost of securities for federal income tax purposes was $362,504,446. The aggregate unrealized appreciation and depreciation of investments in securities based on this cost were:
Gross unrealized appreciation | | $ | 106,977,406 | | |
Gross unrealized depreciation | | | (6,255,231 | ) | |
Net unrealized appreciation | | $ | 100,722,175 | | |
See accompanying notes to financial statements.
54
SFT IvySM Small Cap Growth Fund
Investments in Securities
(Percentages of each investment category relate to total net assets)
| | | Shares | | Value(a) | |
Common Stocks (97.2%) | |
Consumer Discretionary (16.3%) | |
Distributors (1.8%) | |
Pool Corp. | | | 27,397 | | | $ | 3,221,065 | | |
Hotels, Restaurants & Leisure (7.4%) | |
Dave & Buster's
Entertainment, Inc. (b) | | | 47,200 | | | | 3,139,272 | | |
Hilton Grand Vacations,
Inc. (b) | | | 59,600 | | | | 2,149,176 | | |
Texas Roadhouse, Inc. | | | 51,600 | | | | 2,629,020 | | |
Vail Resorts, Inc. | | | 13,000 | | | | 2,636,790 | | |
Wingstop, Inc. | | | 76,633 | | | | 2,367,960 | | |
| | | | | | 12,922,218 | | |
Household Durables (1.3%) | |
Installed Building
Products, Inc. (b) | | | 42,100 | | | | 2,229,195 | | |
Internet & Catalog Retail (0.3%) | |
Blue Apron Holdings, Inc. (b) | | | 45,400 | | | | 424,036 | | |
Leisure Equipment & Products (0.5%) | |
Nautilus, Inc. (b) | | | 43,900 | | | | 840,685 | | |
Multiline Retail (0.9%) | |
Ollie's Bargain Outlet
Holdings, Inc. (b) | | | 38,100 | | | | 1,623,060 | | |
Specialty Retail (4.1%) | |
Burlington Stores, Inc. (b) | | | 28,000 | | | | 2,575,720 | | |
Five Below, Inc. (b) | | | 49,400 | | | | 2,438,878 | | |
Monro Muffler Brake, Inc. | | | 18,000 | | | | 751,500 | | |
Party City Holdco, Inc. (b) | | | 94,723 | | | | 1,482,415 | | |
| | | | | | 7,248,513 | | |
Consumer Staples (0.9%) | |
Food Products (0.9%) | |
Snyder's-Lance, Inc. | | | 48,253 | | | | 1,670,519 | | |
Energy (3.0%) | |
Energy Equipment & Services (2.7%) | |
Forum Energy
Technologies, Inc. (b) | | | 6,900 | | | | 107,640 | | |
Keane Group, Inc. (b) | | | 64,700 | | | | 1,035,200 | | |
RPC, Inc. | | | 135,200 | | | | 2,732,392 | | |
US Silica Holdings, Inc. | | | 21,800 | | | | 773,682 | | |
| | | | | | 4,648,914 | | |
Oil, Gas & Consumable Fuels (0.3%) | |
PDC Energy, Inc. (b) | | | 13,800 | | | | 594,918 | | |
Financial (6.7%) | |
Commercial Banks (5.5%) | |
Ameris Bancorp | | | 30,500 | | | | 1,470,100 | | |
Cathay General Bancorp | | | 23,600 | | | | 895,620 | | |
Home BancShares, Inc. | | | 108,700 | | | | 2,706,630 | | |
SVB Financial Group (b) | | | 13,900 | | | | 2,443,481 | | |
Western Alliance Bancorp (b) | | | 43,000 | | | | 2,115,600 | | |
| | | | | | 9,631,431 | | |
| | | Shares | | Value(a) | |
Thrifts & Mortgage Finance (1.2%) | |
LendingTree, Inc. (b) | | | 12,617 | | | $ | 2,172,647 | | |
Health Care (18.2%) | |
Health Care Equipment & Supplies (8.0%) | |
Inogen, Inc. (b) | | | 22,555 | | | | 2,152,198 | | |
iRhythm Technologies,
Inc. (b) | | | 25,274 | | | | 1,073,892 | | |
K2M Group Holdings,
Inc. (b) | | | 100,202 | | | | 2,440,921 | | |
Nevro Corp. (b) | | | 29,068 | | | | 2,163,531 | | |
NuVasive, Inc. (b) | | | 25,156 | | | | 1,935,000 | | |
NxStage Medical, Inc. (b) | | | 75,200 | | | | 1,885,264 | | |
Penumbra, Inc. (b) | | | 25,804 | | | | 2,264,301 | | |
| | | | | | 13,915,107 | | |
Health Care Providers & Services (9.0%) | |
Acadia Healthcare
Co., Inc. (b) | | | 79,373 | | | | 3,919,439 | | |
AMN Healthcare Services,
Inc. (b) | | | 117,745 | | | | 4,597,942 | | |
Envision Healthcare
Corp. (b) | | | 27,600 | | | | 1,729,692 | | |
HealthEquity, Inc. (b) | | | 73,400 | | | | 3,657,522 | | |
Teladoc, Inc. (b) | | | 55,364 | | | | 1,921,131 | | |
| | | | | | 15,825,726 | | |
Life Sciences Tools & Services (1.2%) | |
Cambrex Corp. (b) | | | 36,300 | | | | 2,168,925 | | |
Industrials (19.8%) | |
Aerospace & Defense (3.8%) | |
Hexcel Corp. | | | 50,500 | | | | 2,665,895 | | |
Mercury Systems, Inc. (b) | | | 96,200 | | | | 4,049,058 | | |
| | | | | | 6,714,953 | | |
Air Freight & Logistics (2.3%) | |
XPO Logistics, Inc. (b) | | | 63,900 | | | | 4,129,857 | | |
Building Products (0.7%) | |
JELD-WEN Holding, Inc. (b) | | | 35,620 | | | | 1,156,225 | | |
Commercial Services & Supplies (1.4%) | |
Healthcare Services
Group, Inc. | | | 37,800 | | | | 1,770,174 | | |
The Brink's Co. | | | 10,400 | | | | 696,800 | | |
| | | | | | 2,466,974 | | |
Construction & Engineering (1.8%) | |
Dycom Industries, Inc. (b) | | | 34,500 | | | | 3,088,440 | | |
Electrical Equipment (1.4%) | |
Woodward, Inc. | | | 35,500 | | | | 2,399,090 | | |
Machinery (4.1%) | |
John Bean Technologies
Corp. | | | 29,100 | | | | 2,851,800 | | |
RBC Bearings, Inc. (b) | | | 12,083 | | | | 1,229,566 | | |
The Timken Co. | | | 23,898 | | | | 1,105,283 | | |
The Toro Co. | | | 29,800 | | | | 2,064,842 | | |
| | | | | | 7,251,491 | | |
See accompanying notes to financial statements.
55
SFT IvySM Small Cap Growth Fund
Investments in Securities – continued
| | | Shares | | Value(a) | |
Road & Rail (1.2%) | |
Knight Transportation, Inc. | | | 55,600 | | | $ | 2,059,980 | | |
Trading Companies & Distributors (3.1%) | |
Beacon Roofing Supply,
Inc. (b) | | | 36,700 | | | | 1,798,300 | | |
Watsco, Inc. | | | 23,691 | | | | 3,653,152 | | |
| | | | | | 5,451,452 | | |
Information Technology (28.1%) | |
Communications Equipment (1.0%) | |
Lumentum Holdings,
Inc. (b) | | | 30,100 | | | | 1,717,205 | | |
Electronic Equipment, Instruments & Components (2.2%) | |
Fabrinet (b) (c) | | | 52,700 | | | | 2,248,182 | | |
Tech Data Corp. (b) | | | 15,600 | | | | 1,575,600 | | |
| | | | | | 3,823,782 | | |
Internet Software & Services (2.9%) | |
Five9, Inc. (b) | | | 70,800 | | | | 1,523,616 | | |
Q2 Holdings, Inc. (b) | | | 51,594 | | | | 1,906,398 | | |
Shopify, Inc. Class A (b) (c) | | | 18,600 | | | | 1,616,340 | | |
| | | | | | 5,046,354 | | |
IT Services (3.1%) | |
Booz Allen Hamilton
Holding Corp. | | | 105,635 | | | | 3,437,363 | | |
InterXion Holding NV (b) (c) | | | 42,900 | | | | 1,963,962 | | |
| | | | | | 5,401,325 | | |
Semiconductors & Semiconductor Equipment (4.5%) | |
MACOM Technology
Solutions Holdings,
Inc. (b) | | | 21,600 | | | | 1,204,632 | | |
MaxLinear, Inc. (b) | | | 47,600 | | | | 1,327,564 | | |
Monolithic Power Systems, Inc. | | | 23,200 | | | | 2,236,480 | | |
Power Integrations, Inc. | | | 44,132 | | | | 3,217,223 | | |
| | | | | | 7,985,899 | | |
Software (14.4%) | |
BroadSoft, Inc. (b) | | | 59,900 | | | | 2,578,695 | | |
Ellie Mae, Inc. (b) | | | 19,200 | | | | 2,110,272 | | |
Globant SA (b) (c) | | | 46,800 | | | | 2,032,992 | | |
HubSpot, Inc. (b) | | | 37,800 | | | | 2,485,350 | | |
Manhattan Associates,
Inc. (b) | | | 13,959 | | | | 670,870 | | |
Paycom Software, Inc. (b) | | | 46,855 | | | | 3,205,351 | | |
Proofpoint, Inc. (b) | | | 34,344 | | | | 2,982,089 | | |
The Ultimate Software
Group, Inc. (b) | | | 20,122 | | | | 4,226,827 | | |
Tyler Technologies, Inc. (b) | | | 17,299 | | | | 3,038,915 | | |
Varonis Systems, Inc. (b) | | | 1,200 | | | | 44,640 | | |
Zendesk, Inc. (b) | | | 66,500 | | | | 1,847,370 | | |
| | | | | | 25,223,371 | | |
| | | Shares | | Value(a) | |
Materials (2.4%) | |
Construction Materials (2.4%) | |
Eagle Materials, Inc. | | | 11,600 | | | $ | 1,072,072 | | |
Summit Materials, Inc.
Class A (b) | | | 63,200 | | | | 1,824,584 | | |
US Concrete, Inc. (b) | | | 16,300 | | | | 1,280,365 | | |
| | | | | | 4,177,021 | | |
Real Estate (1.8%) | |
Real Estate Services (1.8%) | |
RE/MAX Holdings, Inc.
Class A | | | 56,700 | | | | 3,178,035 | | |
Total common stocks
(cost: $138,803,276) | | | | | 170,408,413 | | |
Short-Term Securities (3.3%) | |
Investment Companies (3.3%) | |
State Street Institutional
U.S. Government Money
Market Fund, current
rate 0.880% | | | 5,747,552 | | | | 5,747,552 | | |
Total short-term securities
(cost: $5,747,552) | | | | | 5,747,552 | | |
Total investments in securities
(cost: $144,550,828) (d) | | | | | 176,155,965 | | |
Liabilities in excess of cash
and other assets (-0.5%) | | | | | (843,745 | ) | |
Total net assets (100.0%) | | | | $ | 175,312,220 | | |
Investments in Securities Legend
(a) Securities are valued by procedures described in Note 2 of the Notes to Financial Statements.
(b) Non-income producing security.
(c) Foreign security: The Fund held 4.5% of net assets in foreign securities at June 30, 2017.
(d) At June 30, 2017 the cost of securities for federal income tax purposes was $144,639,407. The aggregate unrealized appreciation and depreciation of investments in securities based on this cost were:
Gross unrealized appreciation | | $ | 33,756,060 | | |
Gross unrealized depreciation | | | (2,239,502 | ) | |
Net unrealized appreciation | | $ | 31,516,558 | | |
See accompanying notes to financial statements.
56
SFT Pyramis® Core Equity Fund
Investments in Securities
(Percentages of each investment category relate to total net assets)
| | | Shares | | Value(a) | |
Common Stocks (99.0%) | |
Consumer Discretionary (12.3%) | |
Auto Components (0.5%) | |
Delphi Automotive PLC (b) | | | 6,700 | | | $ | 587,255 | | |
Hotels, Restaurants & Leisure (0.9%) | |
Starbucks Corp. | | | 19,160 | | | | 1,117,220 | | |
Household Durables (2.3%) | |
Mohawk Industries, Inc. (c) | | | 2,630 | | | | 635,644 | | |
Newell Brands, Inc. | | | 37,795 | | | | 2,026,568 | | |
| | | | | | 2,662,212 | | |
Internet & Catalog Retail (2.0%) | |
Amazon.com, Inc. (c) | | | 2,380 | | | | 2,303,840 | | |
Media (4.0%) | |
Comcast Corp. – Class A | | | 40,960 | | | | 1,594,163 | | |
The Walt Disney Co. | | | 15,140 | | | | 1,608,625 | | |
Time Warner, Inc. | | | 10,390 | | | | 1,043,260 | | |
Viacom, Inc. – Class B | | | 13,370 | | | | 448,831 | | |
| | | | | | 4,694,879 | | |
Specialty Retail (1.5%) | |
The Home Depot, Inc. | | | 11,230 | | | | 1,722,682 | | |
Textiles, Apparel & Luxury Goods (1.1%) | |
NIKE, Inc. – Class B | | | 21,280 | | | | 1,255,520 | | |
Consumer Staples (8.9%) | |
Beverages (2.4%) | |
Constellation Brands,
Inc. – Class A | | | 8,180 | | | | 1,584,711 | | |
Molson Coors Brewing
Co. – Class B | | | 14,240 | | | | 1,229,482 | | |
| | | | | | 2,814,193 | | |
Food & Staples Retailing (1.4%) | |
CVS Health Corp. | | | 19,760 | | | | 1,589,890 | | |
Food Products (1.9%) | |
Mondelez International,
Inc. – Class A | | | 25,310 | | | | 1,093,139 | | |
The Kraft Heinz Co. | | | 13,810 | | | | 1,182,688 | | |
| | | | | | 2,275,827 | | |
Personal Care (0.9%) | |
The Estee Lauder Cos.,
Inc. – Class A | | | 10,850 | | | | 1,041,383 | | |
Personal Products (0.8%) | |
Coty, Inc. – Class A | | | 47,090 | | | | 883,408 | | |
Tobacco (1.5%) | |
Altria Group, Inc. | | | 23,810 | | | | 1,773,131 | | |
Energy (6.0%) | |
Energy Equipment & Services (0.8%) | |
Halliburton Co. | | | 20,830 | | | | 889,649 | | |
| | | Shares | | Value(a) | |
Oil, Gas & Consumable Fuels (5.2%) | |
Concho Resources, Inc. (c) | | | 3,530 | | | $ | 429,001 | | |
EOG Resources, Inc. | | | 16,080 | | | | 1,455,562 | | |
Hess Corp. | | | 21,610 | | | | 948,031 | | |
Occidental Petroleum Corp. | | | 16,710 | | | | 1,000,428 | | |
Pioneer Natural Resources Co. | | | 14,380 | | | | 2,294,760 | | |
| | | | | | 6,127,782 | | |
Financial (14.6%) | |
Capital Markets (2.7%) | |
CME Group, Inc. | | | 15,030 | | | | 1,882,357 | | |
The Goldman Sachs
Group, Inc. | | | 5,730 | | | | 1,271,487 | | |
| | | | | | 3,153,844 | | |
Commercial Banks (6.9%) | |
Citigroup, Inc. | | | 50,020 | | | | 3,345,338 | | |
Huntington Bancshares, Inc. | | | 93,700 | | | | 1,266,824 | | |
KeyCorp | | | 69,270 | | | | 1,298,120 | | |
Regions Financial Corp. | | | 126,020 | | | | 1,844,933 | | |
Wells Fargo & Co. | | | 5,540 | | | | 306,971 | | |
| | | | | | 8,062,186 | | |
Consumer Finance (1.9%) | |
Capital One Financial Corp. | | | 12,930 | | | | 1,068,276 | | |
Discover Financial Services | | | 18,830 | | | | 1,171,038 | | |
| | | | | | 2,239,314 | | |
Insurance (3.1%) | |
Hartford Financial Services
Group, Inc. | | | 23,930 | | | | 1,258,000 | | |
The Progressive Corp. | | | 22,590 | | | | 995,993 | | |
Torchmark Corp. | | | 16,760 | | | | 1,282,140 | | |
| | | | | | 3,536,133 | | |
Health Care (14.2%) | |
Biotechnology (2.9%) | |
Alexion Pharmaceuticals,
Inc. (c) | | | 10,310 | | | | 1,254,418 | | |
BioMarin Pharmaceutical,
Inc. (c) | | | 10,680 | | | | 969,958 | | |
Vertex Pharmaceuticals,
Inc. (c) | | | 9,220 | | | | 1,188,181 | | |
| | | | | | 3,412,557 | | |
Health Care Equipment & Supplies (4.6%) | |
Boston Scientific Corp. (c) | | | 41,000 | | | | 1,136,520 | | |
Danaher Corp. | | | 31,540 | | | | 2,661,660 | | |
Zimmer Biomet Holdings, Inc. | | | 11,700 | | | | 1,502,280 | | |
| | | | | | 5,300,460 | | |
Health Care Providers & Services (1.6%) | |
Humana, Inc. | | | 7,990 | | | | 1,922,554 | | |
Life Sciences Tools & Services (1.2%) | |
Agilent Technologies, Inc. | | | 22,690 | | | | 1,345,744 | | |
Pharmaceuticals (3.9%) | |
Bristol-Myers Squibb Co. | | | 31,050 | | | | 1,730,106 | | |
Merck & Co., Inc. | | | 44,540 | | | | 2,854,569 | | |
| | | | | | 4,584,675 | | |
See accompanying notes to financial statements.
57
SFT Pyramis® Core Equity Fund
Investments in Securities – continued
| | | Shares | | Value(a) | |
Industrials (10.3%) | |
Aerospace & Defense (4.7%) | |
Lockheed Martin Corp. | | | 6,450 | | | $ | 1,790,584 | | |
The Boeing Co. | | | 8,190 | | | | 1,619,573 | | |
United Technologies Corp. | | | 16,610 | | | | 2,028,247 | | |
| | | | | | 5,438,404 | | |
Air Freight & Logistics (1.1%) | |
FedEx Corp. | | | 5,650 | | | | 1,227,914 | | |
Building Products (1.0%) | |
Fortune Brands Home &
Security, Inc. | | | 18,520 | | | | 1,208,245 | | |
Machinery (2.5%) | |
Fortive Corp. | | | 16,645 | | | | 1,054,461 | | |
Ingersoll-Rand PLC | | | 19,900 | | | | 1,818,661 | | |
| | | | | | 2,873,122 | | |
Road & Rail (1.0%) | |
CSX Corp. | | | 21,760 | | | | 1,187,226 | | |
Information Technology (22.2%) | |
Computers & Peripherals (2.6%) | |
Apple, Inc. | | | 21,030 | | | | 3,028,740 | | |
Electronic Equipment, Instruments & Components (0.6%) | |
Corning, Inc. | | | 24,180 | | | | 726,609 | | |
Internet Software & Services (5.2%) | |
Alphabet, Inc. – Class A (c) | | | 5,430 | | | | 5,048,163 | | |
Facebook, Inc. – Class A (c) | | | 6,630 | | | | 1,000,997 | | |
| | | | | | 6,049,160 | | |
IT Services (5.4%) | |
Fidelity National
Information Services, Inc. | | | 24,550 | | | | 2,096,570 | | |
PayPal Holdings, Inc. (c) | | | 32,670 | | | | 1,753,399 | | |
Visa, Inc. – Class A | | | 26,470 | | | | 2,482,356 | | |
| | | | | | 6,332,325 | | |
Semiconductors & Semiconductor Equipment (5.5%) | |
Broadcom, Ltd. | | | 9,460 | | | | 2,204,653 | | |
Intel Corp. | | | 65,390 | | | | 2,206,259 | | |
Micron Technology, Inc. (c) | | | 40,920 | | | | 1,221,871 | | |
NXP Semiconductor
NV (b) (c) | | | 6,840 | | | | 748,638 | | |
| | | | | | 6,381,421 | | |
Software (2.9%) | |
Adobe Systems, Inc. (c) | | | 7,770 | | | | 1,098,989 | | |
Salesforce.com, Inc. (c) | | | 25,640 | | | | 2,220,424 | | |
| | | | | | 3,319,413 | | |
Materials (2.7%) | |
Chemicals (2.2%) | |
Albemarle Corp. | | | 6,030 | | | | 636,406 | | |
Ecolab, Inc. | | | 7,080 | | | | 939,870 | | |
LyondellBasell Industries
NV – Class A | | | 11,810 | | | | 996,646 | | |
| | | | | | 2,572,922 | | |
| | | Shares | | Value(a) | |
Construction Materials (0.5%) | |
Eagle Materials, Inc. | | | 6,740 | | | $ | 622,911 | | |
Real Estate (2.7%) | |
Office REITs (1.0%) | |
Boston Properties, Inc. | | | 9,010 | | | | 1,108,410 | | |
Residential REITs (0.5%) | |
UDR, Inc. | | | 15,690 | | | | 611,439 | | |
Specialized REITs (1.2%) | |
Public Storage | | | 6,900 | | | | 1,438,857 | | |
Telecommunication Services (2.1%) | |
Diversified Telecommunication Services (2.0%) | |
AT&T, Inc. | | | 39,400 | | | | 1,486,562 | | |
Verizon Communications, Inc. | | | 18,030 | | | | 805,220 | | |
| | | | | | 2,291,782 | | |
Wireless Telecommunication Services (0.1%) | |
T-Mobile US, Inc. (c) | | | 2,580 | | | | 156,399 | | |
Utilities (3.0%) | |
Electric Utilities (3.0%) | |
American Electric Power
Co., Inc. | | | 30,460 | | | | 2,116,056 | | |
PG&E Corp. | | | 21,220 | | | | 1,408,372 | | |
| | | | | | 3,524,428 | | |
Total common stocks
(cost: $100,051,698) | | | | | 115,396,065 | | |
Short-Term Securities (1.3%) | |
Investment Companies (1.3%) | |
State Street Institutional
U.S. Government Money
Market Fund, current
rate 0.880% | | | 1,462,219 | | | | 1,462,219 | | |
Total short-term securities
(cost: $1,462,219) | | | | | 1,462,219 | | |
Total investments in securities
(cost: $101,513,917) (d) | | | | | 116,858,284 | | |
Liabilities in excess of cash
and other assets (-0.3%) | | | | | (403,707 | ) | |
Total net assets (100.0%) | | | | $ | 116,454,577 | | |
Investments in Securities Legend
(a) Securities are valued by procedures described in Note 2 of the Notes to Financial Statements.
(b) Foreign security: The Fund held 1.1% of net assets in foreign securities at June 30, 2017.
(c) Non-income producing security.
(d) At June 30, 2017 the cost of securities for federal income tax purposes was $102,031,560. The aggregate unrealized appreciation and depreciation of investments in securities based on this cost were:
Gross unrealized appreciation | | $ | 17,361,512 | | |
Gross unrealized depreciation | | | (2,534,788 | ) | |
Net unrealized appreciation | | $ | 14,826,724 | | |
See accompanying notes to financial statements.
58
SFT T. Rowe Price Value Fund
Investments in Securities
(Percentages of each investment category relate to total net assets)
| | | Shares | | Value(a) | |
Common Stocks (98.3%) | |
Consumer Discretionary (4.8%) | |
Auto Components (0.3%) | |
Delphi Automotive PLC (b) | | | 3,127 | | | $ | 274,082 | | |
Magna International, Inc. (b) | | | 7,300 | | | | 338,209 | | |
| | | | | | 612,291 | | |
Hotels, Restaurants & Leisure (0.8%) | |
Las Vegas Sands Corp. | | | 10,756 | | | | 687,201 | | |
Norwegian Cruise Line
Holdings, Ltd. (c) | | | 21,482 | | | | 1,166,258 | | |
| | | | | | 1,853,459 | | |
Household Durables (0.4%) | |
Lennar Corp. – Class A | | | 15,850 | | | | 845,122 | | |
Media (2.3%) | |
Comcast Corp. – Class A | | | 39,200 | | | | 1,525,664 | | |
Liberty Global
PLC – Class C (b) (c) | | | 26,547 | | | | 827,735 | | |
Twenty-First Century Fox,
Inc. – Class B | | | 94,800 | | | | 2,642,076 | | |
| | | | | | 4,995,475 | | |
Specialty Retail (1.0%) | |
AutoZone, Inc. (c) | | | 840 | | | | 479,186 | | |
Lowe's Cos., Inc. | | | 21,200 | | | | 1,643,636 | | |
| | | | | | 2,122,822 | | |
Consumer Staples (11.0%) | |
Beverages (0.3%) | |
PepsiCo, Inc. | | | 6,700 | | | | 773,783 | | |
Food & Staples Retailing (1.7%) | |
CVS Health Corp. | | | 18,000 | | | | 1,448,280 | | |
Wal-Mart Stores, Inc. | | | 23,200 | | | | 1,755,776 | | |
Walgreens Boots
Alliance, Inc. | | | 6,110 | | | | 478,474 | | |
| | | | | | 3,682,530 | | |
Food Products (4.2%) | |
Bunge, Ltd. | | | 15,674 | | | | 1,169,281 | | |
Mondelez International,
Inc. – Class A | | | 3,854 | | | | 166,454 | | |
Tyson Foods, Inc. – Class A | | | 125,132 | | | | 7,837,017 | | |
| | | | | | 9,172,752 | | |
Household Products (0.7%) | |
The Procter & Gamble Co. | | | 17,200 | | | | 1,498,980 | | |
Tobacco (4.1%) | |
British American Tobacco
PLC (b) | | | 19,409 | | | | 1,319,560 | | |
Philip Morris International,
Inc. | | | 65,400 | | | | 7,681,230 | | |
| | | | | | 9,000,790 | | |
| | | Shares | | Value(a) | |
Energy (6.5%) | |
Oil, Gas & Consumable Fuels (6.5%) | |
| BP PLC ADR (b) | | | 31,400 | | | $ | 1,088,010 | | |
Enbridge, Inc. (b) | | | 24,291 | | | | 967,025 | | |
EOG Resources, Inc. | | | 36,219 | | | | 3,278,544 | | |
Marathon Petroleum Corp. | | | 31,880 | | | | 1,668,280 | | |
Occidental Petroleum Corp. | | | 30,490 | | | | 1,825,436 | | |
TOTAL SA ADR (b) | | | 48,473 | | | | 2,403,776 | | |
TransCanada Corp. (b) | | | 63,312 | | | | 3,018,083 | | |
| | | | | | 14,249,154 | | |
Financial (25.4%) | |
Capital Markets (6.0%) | |
Ameriprise Financial, Inc. | | | 10,256 | | | | 1,305,486 | | |
Intercontinental
Exchange, Inc. | | | 19,900 | | | | 1,311,808 | | |
Morgan Stanley | | | 108,876 | | | | 4,851,515 | | |
State Street Corp. | | | 30,798 | | | | 2,763,505 | | |
The Bank of New York
Mellon Corp. | | | 58,274 | | | | 2,973,139 | | |
| | | | | | 13,205,453 | | |
Commercial Banks (12.7%) | |
Citigroup, Inc. | | | 70,548 | | | | 4,718,250 | | |
Fifth Third Bancorp | | | 50,127 | | | | 1,301,297 | | |
JPMorgan Chase & Co. | | | 119,199 | | | | 10,894,789 | | |
KeyCorp | | | 83,433 | | | | 1,563,534 | | |
The PNC Financial Services
Group, Inc. | | | 16,488 | | | | 2,058,856 | | |
US Bancorp | | | 49,600 | | | | 2,575,232 | | |
Wells Fargo & Co. | | | 86,975 | | | | 4,819,285 | | |
| | | | | | 27,931,243 | | |
Consumer Finance (0.6%) | |
Synchrony Financial | | | 43,837 | | | | 1,307,219 | | |
Insurance (6.1%) | |
American International
Group, Inc. | | | 32,111 | | | | 2,007,580 | | |
Chubb, Ltd. (b) | | | 16,163 | | | | 2,349,777 | | |
Marsh & McLennan Cos., Inc. | | | 26,270 | | | | 2,048,009 | | |
MetLife, Inc. | | | 49,951 | | | | 2,744,308 | | |
Willis Towers Watson PLC (b) | | | 7,100 | | | | 1,032,766 | | |
XL Group, Ltd. (b) | | | 71,200 | | | | 3,118,560 | | |
| | | | | | 13,301,000 | | |
Health Care (17.5%) | |
Biotechnology (0.3%) | |
Gilead Sciences, Inc. | | | 10,637 | | | | 752,887 | | |
Health Care Equipment & Supplies (5.3%) | |
Abbott Laboratories | | | 36,418 | | | | 1,770,279 | | |
Becton Dickinson and Co. | | | 12,035 | | | | 2,348,149 | | |
Danaher Corp. | | | 15,847 | | | | 1,337,328 | | |
Hologic, Inc. (c) | | | 39,800 | | | | 1,806,124 | | |
Medtronic PLC (b) | | | 48,733 | | | | 4,325,054 | | |
| | | | | | 11,586,934 | | |
See accompanying notes to financial statements.
59
SFT T. Rowe Price Value Fund
Investments in Securities – continued
| | | Shares | | Value(a) | |
Health Care Providers & Services (4.1%) | |
Aetna, Inc. | | | 27,086 | | | $ | 4,112,467 | | |
Anthem, Inc. | | | 15,045 | | | | 2,830,416 | | |
HCA Healthcare, Inc. (c) | | | 24,590 | | | | 2,144,248 | | |
| | | | | | 9,087,131 | | |
Life Sciences Tools & Services (1.8%) | |
Agilent Technologies, Inc. | | | 37,846 | | | | 2,244,646 | | |
Thermo Fisher Scientific, Inc. | | | 9,281 | | | | 1,619,256 | | |
| | | | | | 3,863,902 | | |
Pharmaceuticals (6.0%) | |
Allergan PLC | | | 1,200 | | | | 291,708 | | |
Johnson & Johnson | | | 25,400 | | | | 3,360,166 | | |
Merck & Co., Inc. | | | 77,246 | | | | 4,950,696 | | |
Mylan NV (c) | | | 28,100 | | | | 1,090,842 | | |
Perrigo Co. PLC (b) | | | 11,803 | | | | 891,363 | | |
Pfizer, Inc. | | | 75,624 | | | | 2,540,210 | | |
| | | | | | 13,124,985 | | |
Industrials (9.3%) | |
Aerospace & Defense (2.7%) | |
Rockwell Collins, Inc. | | | 18,371 | | | | 1,930,425 | | |
The Boeing Co. | | | 15,366 | | | | 3,038,626 | | |
United Technologies Corp. | | | 7,200 | | | | 879,192 | | |
| | | | | | 5,848,243 | | |
Airlines (1.6%) | |
American Airlines
Group, Inc. | | | 45,015 | | | | 2,265,155 | | |
United Continental
Holdings, Inc. (c) | | | 15,900 | | | | 1,196,475 | | |
| | | | | | 3,461,630 | | |
Building Products (1.9%) | |
Fortune Brands Home &
Security, Inc. | | | 12,800 | | | | 835,072 | | |
Johnson Controls
International PLC | | | 76,579 | | | | 3,320,466 | | |
| | | | | | 4,155,538 | | |
Commercial Services & Supplies (0.4%) | |
Stericycle, Inc. (c) | | | 11,682 | | | | 891,570 | | |
Industrial Conglomerates (1.9%) | |
General Electric Co. | | | 4,100 | | | | 110,741 | | |
Honeywell International, Inc. | | | 18,100 | | | | 2,412,549 | | |
Roper Technologies, Inc. | | | 7,711 | | | | 1,785,328 | | |
| | | | | | 4,308,618 | | |
Machinery (0.8%) | |
Illinois Tool Works, Inc. | | | 3,200 | | | | 458,400 | | |
Pentair PLC (b) | | | 14,563 | | | | 969,022 | | |
Stanley Black & Decker, Inc. | | | 2,200 | | | | 309,606 | | |
| | | | | | 1,737,028 | | |
Information Technology (10.6%) | |
Communications Equipment (1.6%) | |
Cisco Systems, Inc. | | | 73,600 | | | | 2,303,680 | | |
Harris Corp. | | | 10,075 | | | | 1,098,981 | | |
| | | | | | 3,402,661 | | |
| | | Shares | | Value(a) | |
Computers & Peripherals (1.0%) | |
Apple, Inc. | | | 10,562 | | | $ | 1,521,139 | | |
Western Digital Corp. | | | 8,097 | | | | 717,394 | | |
| | | | | | 2,238,533 | | |
Electronic Equipment, Instruments & Components (0.4%) | |
Keysight Technologies,
Inc. (c) | | | 4,000 | | | | 155,720 | | |
TE Connectivity, Ltd. (b) | | | 9,098 | | | | 715,831 | | |
| | | | | | 871,551 | | |
Semiconductors & Semiconductor Equipment (3.3%) | |
Applied Materials, Inc. | | | 36,500 | | | | 1,507,815 | | |
Broadcom, Ltd. | | | 13,485 | | | | 3,142,679 | | |
QUALCOMM, Inc. | | | 46,400 | | | | 2,562,208 | | |
| | | | | | 7,212,702 | | |
Software (4.2%) | |
Microsoft Corp. | | | 115,500 | | | | 7,961,415 | | |
Red Hat, Inc. (c) | | | 2,125 | | | | 203,469 | | |
Synopsys, Inc. (c) | | | 15,300 | | | | 1,115,829 | | |
| | | | | | 9,280,713 | | |
Technology Hardware Storage & Peripherals (0.1%) | |
Hewlett Packard
Enterprise Co. | | | 12,000 | | | | 199,080 | | |
Materials (3.7%) | |
Chemicals (1.6%) | |
CF Industries Holdings, Inc. | | | 48,600 | | | | 1,358,856 | | |
EI du Pont de Nemours & Co. | | | 27,900 | | | | 2,251,809 | | |
| | | | | | 3,610,665 | | |
Containers & Packaging (2.1%) | |
Ball Corp. | | | 56,362 | | | | 2,379,040 | | |
International Paper Co. | | | 39,540 | | | | 2,238,359 | | |
| | | | | | 4,617,399 | | |
Real Estate (1.0%) | |
Diversified REITs (0.5%) | |
VEREIT, Inc. | | | 130,454 | | | | 1,061,896 | | |
Specialized REITs (0.5%) | |
Weyerhaeuser Co. | | | 36,500 | | | | 1,222,750 | | |
Utilities (8.5%) | |
Electric Utilities (6.9%) | |
American Electric Power
Co., Inc. | | | 40,250 | | | | 2,796,167 | | |
Eversource Energy | | | 20,781 | | | | 1,261,615 | | |
Exelon Corp. | | | 81,850 | | | | 2,952,329 | | |
NextEra Energy, Inc. | | | 14,821 | | | | 2,076,867 | | |
PG&E Corp. | | | 65,897 | | | | 4,373,584 | | |
The Southern Co. | | | 21,900 | | | | 1,048,572 | | |
Westar Energy, Inc. | | | 13,200 | | | | 699,864 | | |
| | | | | | 15,208,998 | | |
Gas Utilities (0.2%) | |
Atmos Energy Corp. | | | 4,640 | | | | 384,888 | | |
See accompanying notes to financial statements.
60
SFT T. Rowe Price Value Fund
Investments in Securities – continued
| | | Shares | | Value(a) | |
Multi-Utilities (1.4%) | |
DTE Energy Co. | | | 11,100 | | | $ | 1,174,269 | | |
NiSource, Inc. | | | 22,600 | | | | 573,136 | | |
Sempra Energy | | | 10,800 | | | | 1,217,700 | | |
| | | | | | 2,965,105 | | |
Total common stocks
(cost: $190,109,760) | | | | | 215,647,480 | | |
Preferred Stocks (0.6%) | |
Utilities (0.4%) | |
Electric Utilities (0.4%) | |
NextEra Energy, Inc. | | | 16,937 | | | | 914,768 | | |
Health Care (0.2%) | |
Health Care Equipment & Supplies (0.2%) | |
Becton Dickinson and Co. (c) | | | 8,949 | | | | 490,226 | | |
Total preferred stocks
(cost: $1,286,451) | | | | | 1,404,994 | | |
Short-Term Securities (0.8%) | |
Investment Companies (0.8%) | |
State Street Institutional
U.S. Government Money
Market Fund, current
rate 0.880% | | | 1,031,550 | | | | 1,031,550 | | |
T. Rowe Price Reserve
Investment Fund, current
rate 0.000% | | | 732,847 | | | | 732,847 | | |
Total short-term securities
(cost: $1,764,397) | | | | | 1,764,397 | | |
Total investments in securities
(cost: $193,160,608) (d) | | | | | 218,816,871 | | |
Cash and other assets in
excess of liabilities (0.3%) | | | | | 613,767 | | |
Total net assets (100.0%) | | | | $ | 219,430,638 | | |
Investments in Securities Legend
(a) Securities are valued by procedures described in Note 2 of the Notes to Financial Statements.
(b) Foreign security: The Fund held 10.8% of net assets in foreign securities at June 30, 2017.
(c) Non-income producing security.
(d) At June 30, 2017 the cost of securities for federal income tax purposes was $194,129,950. The aggregate unrealized appreciation and depreciation of investments in securities based on this cost were:
Gross unrealized appreciation | | $ | 26,738,796 | | |
Gross unrealized depreciation | | | (2,051,875 | ) | |
Net unrealized appreciation | | $ | 24,686,921 | | |
See accompanying notes to financial statements.
61
Securian Funds Trust
Statements of Assets and Liabilities
June 30, 2017
(Unaudited)
| | | SFT Advantus
Bond
Fund | | SFT Advantus
Dynamic
Managed
Volatility
Fund | | SFT Advantus
Government
Money
Market
Fund | | SFT Advantus
Index 400
Mid-Cap
Fund | | SFT Advantus
Index 500
Fund | | SFT Advantus
International
Bond
Fund | | SFT Advantus
Managed
Volatility
Equity
Fund | |
Assets | | | | | | | | | | | | | | | | | | | | | | | | | | | | | |
Investments in securities, at market value – see
accompanying schedule for detailed listing* | |
Unaffiliated issuers | | $ | 390,684,373 | | | $ | 193,154,766 | | | $ | 70,238,033 | | | $ | 215,935,744 | | | $ | 798,289,256 | | | $ | 97,544,634 | | | $ | 223,303,185 | | |
Affiliated issuers (note 8) | | | – | | | | 135,865,941 | | | | – | | | | – | | | | – | | | | – | | | | – | | |
Cash on demand deposit^,^^^ | | | 82,583 | | | | – | | | | – | | | | 243,200 | | | | 6,150 | | | | 2,537,052 | | | | – | | |
Foreign currency on deposit^^ | | | – | | | | – | | | | – | | | | – | | | | – | | | | 2,523 | | | | – | | |
Receivable: | |
Fund shares sold | | | 100 | | | | – | | | | – | | | | 152 | | | | 1,102 | | | | – | | | | 217,526 | | |
| Investment securities sold (including paydowns) | | | – | | | | – | | | | – | | | | 11,306 | | | | – | | | | 11,412,694 | | | | – | | |
| Investment securities sold on a forward-commitment basis (note 2) | | | 2,094,124 | | | | – | | | | – | | | | – | | | | – | | | | – | | | | – | | |
Dividends and accrued interest | | | 2,705,503 | | | | 1,227,302 | | | | 70,434 | | | | 219,266 | | | | 784,372 | | | | 838,671 | | | | 12,018 | | |
Refundable foreign income taxes withheld | | | – | | | | – | | | | – | | | | – | | | | – | | | | 68,617 | | | | – | | |
Adviser (note 4) | | | – | | | | 46,965 | | | | – | | | | – | | | | – | | | | – | | | | 34,515 | | |
Variation margin | | | – | | | | 95,850 | | | | – | | | | 4,560 | | | | 4,680 | | | | – | | | | 6,390 | | |
Unrealized appreciation on forward foreign currency contracts | | | – | | | | – | | | | – | | | | – | | | | – | | | | 1,248,289 | | | | – | | |
Prepaid expenses | | | 3,065 | | | | 3,065 | | | | 3,065 | | | | 3,064 | | | | 3,064 | | | | 3,065 | | | | 3,093 | | |
Total assets | | | 395,569,748 | | | | 330,393,889 | | | | 70,311,532 | | | | 216,417,292 | | | | 799,088,624 | | | | 113,655,545 | | | | 223,576,727 | | |
Liabilities | | | | | | | | | | | | | | | | | | | | | | | | | | | | | |
Payable: | |
Fund shares repurchased | | | 162,760 | | | | 41,659 | | | | 121,041 | | | | 33,737 | | | | 298,054 | | | | 27,848 | | | | – | | |
Investment securities purchased | | | – | | | | – | | | | – | | | | 530,064 | | | | 335,307 | | | | – | | | | 2,594,741 | | |
Investment securities purchased on a forward-commitment basis (note 2) | | | 15,074,637 | | | | – | | | | – | | | | – | | | | – | | | | – | | | | – | | |
Adviser | | | 210,261 | | | | 247,154 | | | | 41,450 | | | | 73,622 | | | | 236,586 | | | | 95,958 | | | | 169,316 | | |
Variation margin | | | 922 | | | | – | | | | – | | | | – | | | | – | | | | 486,917 | | | | – | | |
Accrued expenses | | | 94,472 | | | | 54,215 | | | | 53,586 | | | | 58,725 | | | | 93,161 | | | | 208,863 | | | | 37,225 | | |
Unrealized depreciation on forward foreign currency contracts | | | – | | | | – | | | | – | | | | – | | | | – | | | | 2,202,994 | | | | – | | |
Put options written at value (premiums of $55,400 for SFT Advantus
Managed Volatility Equity Fund) | | | – | | | | – | | | | – | | | | – | | | | – | | | | – | | | | 20,500 | | |
Total liabilities | | | 15,543,052 | | | | 343,028 | | | | 216,077 | | | | 696,148 | | | | 963,108 | | | | 3,022,580 | | | | 2,821,782 | | |
Net assets applicable to outstanding capital stock | | $ | 380,026,696 | | | $ | 330,050,861 | | | $ | 70,095,455 | | | $ | 215,721,144 | | | $ | 798,125,516 | | | $ | 110,632,965 | | | $ | 220,754,945 | | |
Net Assets Consist of: | |
Paid in capital** | | $ | 329,332,041 | | | $ | 285,068,734 | | | $ | 70,093,389 | | | $ | 46,074,028 | | | $ | 163,755,479 | | | $ | 110,086,339 | | | $ | 201,987,788 | | |
Retained earnings (deficit) | | | 50,694,655 | | | | 44,982,127 | | | | 2,066 | | | | 169,647,116 | | | | 634,370,037 | | | | – | | | | 18,767,157 | | |
Undistributed net investment income (loss) | | | – | | | | – | | | | – | | | | – | | | | – | | | | (2,766,909 | ) | | | – | | |
Accumulated net realized gain (loss) | | | – | | | | – | | | | – | | | | – | | | | – | | | | 492,240 | | | | – | | |
Net unrealized appreciation (depreciation) on: | |
Investments | | | – | | | | – | | | | – | | | | – | | | | – | | | | 4,364,650 | | | | – | | |
Foreign currency and forward currency transactions | | | – | | | | – | | | | – | | | | – | | | | – | | | | (991,218 | ) | | | – | | |
Swaps | | | – | | | | – | | | | – | | | | – | | | | – | | | | (552,137 | ) | | | – | | |
Net assets | | $ | 380,026,696 | | | $ | 330,050,861 | | | $ | 70,095,455 | | | $ | 215,721,144 | | | $ | 798,125,516 | | | $ | 110,632,965 | | | $ | 220,754,945 | | |
Net assets by class: | |
Class 1 | | $ | 2,384,878 | | | $ | N/A | | | $ | N/A | | | $ | 5,046,039 | | | $ | 147,386,185 | | | $ | 1,191,190 | | | $ | N/A | | |
Class 2 | | | 377,641,818 | | | | 330,050,861 | | | | 70,095,455 | | | | 210,675,105 | | | | 650,739,331 | | | | 109,441,775 | | | | 220,754,945 | | |
Net asset value per share of outstanding capital stock by class: | |
Class 1 | | | 2.328 | | | | N/A | | | | N/A | | | | 4.525 | | | | 9.552 | | | | 2.565 | | | | N/A | | |
Class 2 | | | 2.279 | | | | 13.152 | | | | 1.000 | | | | 4.430 | | | | 9.351 | | | | 2.511 | | | | 11.355 | | |
* Identified cost | |
Unaffiliated issuers | | $ | 380,801,063 | | | $ | 187,869,057 | | | $ | 70,238,033 | | | $ | 155,042,575 | | | $ | 335,543,005 | | | $ | 93,179,984 | | | $ | 210,840,790 | | |
Affiliated issuers | | | – | | | | 107,000,000 | | | | – | | | | – | | | | – | | | | – | | | | – | | |
** Shares outstanding by class: | | | | | | | | | | | | | | | |
Class 1 | | | 1,024,391 | | | | N/A | | | | N/A | | | | 1,115,148 | | | | 15,430,734 | | | | 464,423 | | | | N/A | | |
Class 2 | | | 165,682,153 | | | | 25,094,756 | | | | 70,095,455 | | | | 47,553,272 | | | | 69,589,885 | | | | 43,584,878 | | | | 19,441,296 | | |
^ Collateral for Open Swaps Contracts | | $ | – | | | $ | – | | | $ | – | | | $ | – | | | $ | – | | | $ | 1,963,670 | | | $ | – | | |
^^ Foreign currency on deposit (cost) | | $ | – | | | $ | – | | | $ | – | | | $ | – | | | $ | – | | | $ | 2,558 | | | $ | – | | |
^^^ Cash collateral for Open Futures Contracts | | $ | – | | | $ | – | | | $ | – | | | $ | 243,200 | | | $ | – | | | $ | – | | | $ | – | | |
See accompanying notes to financial statements.
62
| | | SFT Advantus
Mortgage
Securities
Fund | | SFT Advantus
Real Estate
Securities
Fund | | SFT
IvySM Growth
Fund | | SFT
IvySM Small
Cap Growth
Fund | | SFT
Pyramis® Core
Equity
Fund | | SFT
T. Rowe Price
Value
Fund | |
Assets | | | | | | | | | | | | | | | | | | | | | | | | | |
Investments in securities, at market value – see
accompanying schedule for detailed listing* | |
Unaffiliated issuers | | $ | 96,363,596 | | | $ | 137,197,472 | | | $ | 463,226,621 | | | $ | 176,155,965 | | | $ | 116,858,284 | | | $ | 218,816,871 | | |
Affiliated issuers (note 8) | | | – | | | | – | | | | – | | | | – | | | | – | | | | – | | |
Cash on demand deposit^,^^^ | | | 44,313 | | | | – | | | | – | | | | – | | | | – | | | | – | | |
Foreign currency on deposit^^ | | | – | | | | – | | | | – | | | | – | | | | – | | | | – | | |
Receivable: | |
Fund shares sold | | | – | | | | 232 | | | | – | | | | – | | | | – | | | | – | | |
| Investment securities sold (including paydowns) | | | 52 | | | | 203,471 | | | | 6,427,360 | | | | 582,353 | | | | 309,962 | | | | 2,364,078 | | |
| Investment securities sold on a forward-commitment basis (note 2) | | | 529,627 | | | | – | | | | – | | �� | | – | | | | – | | | | – | | |
Dividends and accrued interest | | | 261,069 | | | | 400,621 | | | | 222,529 | | | | 29,117 | | | | 119,379 | | | | 299,653 | | |
Refundable foreign income taxes withheld | | | – | | | | – | | | | – | | | | – | | | | 1,608 | | | | 28,369 | | |
Adviser (note 4) | | | – | | | | – | | | | – | | | | – | | | | – | | | | – | | |
Variation margin | | | – | | | | – | | | | – | | | | – | | | | – | | | | – | | |
Unrealized appreciation on forward foreign currency contracts | | | – | | | | – | | | | – | | | | – | | | | – | | | | – | | |
Prepaid expenses | | | 3,065 | | | | 3,065 | | | | 3,065 | | | | 3,065 | | | | 3,064 | | | | 3,064 | | |
Total assets | | | 97,201,722 | | | | 137,804,861 | | | | 469,879,575 | | | | 176,770,500 | | | | 117,292,297 | | | | 221,512,035 | | |
Liabilities | | | | | | | | | | | | | | | | | | | | | | | | | |
Payable: | |
Fund shares repurchased | | | 74,381 | | | | 31,301 | | | | 449,510 | | | | 145,084 | | | | 184,933 | | | | 7,761 | | |
Investment securities purchased | | | – | | | | – | | | | – | | | | 1,113,258 | | | | 516,516 | | | | 1,854,649 | | |
Investment securities purchased on a forward-commitment basis (note 2) | | | 7,079,799 | | | | – | | | | – | | | | – | | | | – | | | | – | | |
Adviser | | | 53,761 | | | | 112,105 | | | | 366,408 | | | | 161,365 | | | | 90,139 | | | | 170,173 | | |
Variation margin | | | 3,938 | | | | – | | | | – | | | | – | | | | – | | | | – | | |
Accrued expenses | | | 58,286 | | | | 45,897 | | | | 58,190 | | | | 38,573 | | | | 46,132 | | | | 48,814 | | |
Unrealized depreciation on forward foreign currency contracts | | | – | | | | – | | | | – | | | | – | | | | – | | | | – | | |
Put options written at value (premiums of $55,400 for SFT Advantus
Managed Volatility Equity Fund) | | | – | | | | – | | | | – | | | | – | | | | – | | | | – | | |
Total liabilities | | | 7,270,165 | | | | 189,303 | | | | 874,108 | | | | 1,458,280 | | | | 837,720 | | | | 2,081,397 | | |
Net assets applicable to outstanding capital stock | | $ | 89,931,557 | | | $ | 137,615,558 | | | $ | 469,005,467 | | | $ | 175,312,220 | | | $ | 116,454,577 | | | $ | 219,430,638 | | |
Net Assets Consist of: | |
Paid in capital** | | $ | 105,937,695 | | | $ | 46,888,738 | | | $ | 317,327,048 | | | $ | 115,241,896 | | | $ | 84,093,991 | | | $ | 167,130,006 | | |
Retained earnings (deficit) | | | (16,006,138 | ) | | | 90,726,820 | | | | 151,678,419 | | | | 60,070,324 | | | | 32,360,586 | | | | 52,300,632 | | |
Undistributed net investment income (loss) | | | – | | | | – | | | | – | | | | – | | | | – | | | | – | | |
Accumulated net realized gain (loss) | | | – | | | | – | | | | – | | | | – | | | | – | | | | – | | |
Net unrealized appreciation (depreciation) on: | |
Investments | | | – | | | | – | | | | – | | | | – | | | | – | | | | – | | |
Foreign currency and forward currency transactions | | | – | | | | – | | | | – | | | | – | | | | – | | | | – | | |
Swaps | | | – | | | | – | | | | – | | | | – | | | | – | | | | – | | |
Net assets | | $ | 89,931,557 | | | $ | 137,615,558 | | | $ | 469,005,467 | | | $ | 175,312,220 | | | $ | 116,454,577 | | | $ | 219,430,638 | | |
Net assets by class: | |
Class 1 | | $ | 252,466 | | | $ | 3,327,946 | | | $ | N/A | | | $ | N/A | | | $ | 786,859 | | | $ | N/A | | |
Class 2 | | | 89,679,091 | | | | 134,287,612 | | | | 469,005,467 | | | | 175,312,220 | | | | 115,667,718 | | | | 219,430,638 | | |
Net asset value per share of outstanding capital stock by class: | |
Class 1 | | | 1.949 | | | | 4.670 | | | | N/A | | | | N/A | | | | 12.931 | | | | N/A | | |
Class 2 | | | 1.908 | | | | 4.572 | | | | 13.712 | | | | 14.405 | | | | 12.829 | | | | 12.738 | | |
* Identified cost | |
Unaffiliated issuers | | $ | 96,205,788 | | | $ | 130,720,974 | | | $ | 361,998,087 | | | $ | 144,550,828 | | | $ | 101,513,917 | | | $ | 193,160,608 | | |
Affiliated issuers | | | – | | | | – | | | | – | | | | – | | | | – | | | | – | | |
** Shares outstanding by class: | | | | | | | | | | | | | |
Class 1 | | | 129,538 | | | | 712,574 | | | | N/A | | | | N/A | | | | 60,853 | | | | N/A | | |
Class 2 | | | 47,000,732 | | | | 29,370,936 | | | | 34,203,058 | | | | 12,170,540 | | | | 9,016,314 | | | | 17,226,725 | | |
^ Collateral for Open Swaps Contracts | | $ | – | | | $ | – | | | $ | – | | | $ | – | | | $ | – | | | $ | – | | |
^^ Foreign currency on deposit (cost) | | $ | – | | | $ | – | | | $ | – | | | $ | – | | | $ | – | | | $ | – | | |
^^^ Cash collateral for Open Futures Contracts | | $ | – | | | $ | – | | | $ | – | | | $ | – | | | $ | – | | | $ | – | | |
63
Securian Funds Trust
Statements of Operations
Six months ended June 30, 2017
(Unaudited)
| | | SFT Advantus
Bond
Fund | | SFT Advantus
Dynamic
Managed
Volatility
Fund | | SFT Advantus
Government
Money
Market
Fund | | SFT Advantus
Index 400
Mid-Cap
Fund | | SFT Advantus
Index 500
Fund | | SFT Advantus
International
Bond
Fund | | SFT Advantus
Managed
Volatility
Equity
Fund | |
Income: | |
Interest1 | | $ | 6,460,847 | | | $ | 2,159,318 | | | $ | 254,735 | | | $ | – | | | $ | – | | | $ | 2,861,810 | | | $ | – | | |
Dividends | | | 52,676 | | | | 317,339 | | | | 1,929 | | | | 1,659,184 | | | | 7,912,658 | | | | 30,756 | | | | 2,805,968 | | |
Foreign tax withholding | | | – | | | | – | | | | – | | | | (607 | ) | | | – | | | | (67,518 | ) | | | – | | |
Total investment income | | | 6,513,523 | | | | 2,476,657 | | | | 256,664 | | | | 1,658,577 | | | | 7,912,658 | | | | 2,825,048 | | | | 2,805,968 | | |
Expenses (note 4): | |
Investment advisory fee | | | 747,856 | | | | 998,725 | | | | 109,586 | | | | 164,487 | | | | 580,204 | | | | 332,218 | | | | 680,800 | | |
Rule 12b-1 fees | | | 464,640 | | | | 384,125 | | | | 91,322 | | | | 268,300 | | | | 791,383 | | | | 136,993 | | | | 261,846 | | |
Audit and accounting services | | | 100,293 | | | | 61,104 | | | | 67,743 | | | | 52,201 | | | | 89,141 | | | | 70,748 | | | | 44,328 | | |
Administrative services fee | | | 24,197 | | | | 15,596 | | | | 23,730 | | | | 12,380 | | | | 12,380 | | | | 41,899 | | | | 14,797 | | |
Legal fees | | | 13,910 | | | | 14,381 | | | | 12,983 | | | | 10,118 | | | | 14,169 | | | | 12,435 | | | | 10,169 | | |
Custodian fees | | | 9,623 | | | | 7,416 | | | | 5,926 | | | | 9,158 | | | | 8,691 | | | | 60,264 | | | | 6,947 | | |
Printing and shareholder reports | | | 5,843 | | | | 5,843 | | | | 5,843 | | | | 5,843 | | | | 5,843 | | | | 5,843 | | | | 5,843 | | |
Trustee's fees | | | 9,575 | | | | 9,575 | | | | 9,575 | | | | 9,575 | | | | 9,575 | | | | 9,575 | | | | 9,575 | | |
S&P Licensing fee | | | – | | | | 25 | | | | – | | | | 9,998 | | | | 27,264 | | | | – | | | | 2 | | |
Insurance | | | 3,829 | | | | 3,829 | | | | 3,829 | | | | 3,829 | | | | 3,829 | | | | 3,829 | | | | 3,740 | | |
Other | | | 8,022 | | | | 1,770 | | | | 2,708 | | | | 4,643 | | | | 12,880 | | | | 3,076 | | | | 3,017 | | |
Total expenses before fees waived | | | 1,387,788 | | | | 1,502,389 | | | | 333,245 | | | | 550,532 | | | | 1,555,359 | | | | 676,880 | | | | 1,041,064 | | |
Less fees waived (note 4) | | | – | | | | (272,818 | ) | | | (77,228 | ) | | | – | | | | – | | | | – | | | | (203,098 | ) | |
Total expenses net of fees waived | | | 1,387,788 | | | | 1,229,571 | | | | 256,017 | | | | 550,532 | | | | 1,555,359 | | | | 676,880 | | | | 837,966 | | |
Net investment income | | | 5,125,735 | | | | 1,247,086 | | | | 647 | | | | 1,108,045 | | | | 6,357,299 | | | | 2,148,168 | | | | 1,968,002 | | |
Realized and unrealized gains (losses) on investments and
foreign currencies: | |
Investments (note 3) | |
Unaffiliated issuers | | | 1,964,206 | | | | (1,115,918 | ) | | | – | | | | 11,384,814 | | | | 8,125,415 | | | | (1,391,138 | ) | | | 613,377 | | |
Written options transactions | | | – | | | | 101,223 | | | | – | | | | – | | | | – | | | | – | | | | 105,731 | | |
Swaps | | | – | | | | – | | | | – | | | | – | | | | – | | | | (128,773 | ) | | | – | | |
Foreign currency transactions | | | – | | | | – | | | | – | | | | – | | | | – | | | | 1,496,716 | | | | – | | |
Net increase from litigation payments | | | 459 | | | | – | | | | – | | | | 649 | | | | 2,360 | | | | 4,845 | | | | – | | |
Futures transactions | | | (29,810 | ) | | | 8,483,628 | | | | – | | | | 313,804 | | | | 1,045,096 | | | | – | | | | 1,543,756 | | |
Net change in unrealized appreciation or depreciation on: | |
Investments | |
Unaffiliated issuers | | | 4,152,202 | | | | 4,155,596 | | | | – | | | | (886,419 | ) | | | 51,904,349 | | | | 6,514,625 | | | | 12,800,474 | | |
Affiliated issuers (note 8) | | | – | | | | 11,465,355 | | | | – | | | | – | | | | – | | | | – | | | | – | | |
Options written | | | – | | | | (34,774 | ) | | | – | | | | – | | | | – | | | | – | | | | 34,900 | | |
Swaps | | | – | | | | – | | | | – | | | | – | | | | – | | | | (256,606 | ) | | | – | | |
Translation of assets and liabilities in foreign currency | | | – | | | | – | | | | – | | | | 67 | | | | – | | | | (5,603,516 | ) | | | – | | |
Futures transactions | | | 10,193 | | | | (1,755,547 | ) | | | – | | | | 289,953 | | | | (206,530 | ) | | | – | | | | (369,669 | ) | |
Net gains (losses) on investments | | | 6,097,250 | | | | 21,299,563 | | | | – | | | | 11,102,868 | | | | 60,870,690 | | | | 636,153 | | | | 14,728,569 | | |
Net increase (decrease) in net assets resulting from
operations | | $ | 11,222,985 | | | $ | 22,546,649 | | | $ | 647 | | | $ | 12,210,913 | | | $ | 67,227,989 | | | $ | 2,784,321 | | | $ | 16,696,571 | | |
1 All income is from unaffiliated issuers.
See accompanying notes to financial statements.
64
| | SFT Advantus
Mortgage
Securities
Fund | | SFT Advantus
Real Estate
Securities
Fund | | SFT
IvySM Growth
Fund | | SFT
IvySM Small
Cap Growth
Fund | | SFT
Pyramis® Core
Equity
Fund | | SFT
T. Rowe Price
Value
Fund | |
Income: | |
Interest1 | | $ | 1,254,778 | | | $ | – | | | $ | 20,229 | | | $ | 29,654 | | | $ | 2,275 | | | $ | 2,816 | | |
Dividends | | | 23,452 | | | | 2,307,717 | | | | 2,648,182 | | | | 342,145 | | | | 905,071 | | | | 2,462,541 | | |
Foreign tax withholding | | | – | | | | – | | | | (50,644 | ) | | | – | | | | (1,624 | ) | | | (46,774 | ) | |
Total investment income | | | 1,278,230 | | | | 2,307,717 | | | | 2,617,767 | | | | 371,799 | | | | 905,722 | | | | 2,418,583 | | |
Expenses (note 4): | |
Investment advisory fee | | | 180,617 | | | | 493,680 | | | | 1,551,340 | | | | 712,565 | | | | 376,584 | | | | 718,675 | | |
Rule 12b-1 fees | | | 112,553 | | | | 172,426 | | | | 578,858 | | | | 209,578 | | | | 143,905 | | | | 268,162 | | |
Audit and accounting services | | | 52,268 | | | | 50,756 | | | | 64,471 | | | | 44,073 | | | | 47,557 | | | | 44,979 | | |
Administrative services fee | | | 22,799 | | | | 12,380 | | | | 12,380 | | | | 12,380 | | | | 12,380 | | | | 12,808 | | |
Legal fees | | | 13,949 | | | | 10,118 | | | | 10,118 | | | | 10,118 | | | | 10,118 | | | | 10,118 | | |
Custodian fees | | | 6,972 | | | | 6,559 | | | | 6,960 | | | | 7,081 | | | | 13,128 | | | | 20,707 | | |
Printing and shareholder reports | | | 5,843 | | | | 5,843 | | | | 5,843 | | | | 5,531 | | | | 5,843 | | | | 5,844 | | |
Trustee's fees | | | 9,575 | | | | 9,575 | | | | 9,575 | | | | 9,575 | | | | 9,575 | | | | 9,575 | | |
S&P Licensing fee | | | – | | | | – | | | | – | | | | – | | | | – | | | | – | | |
Insurance | | | 3,829 | | | | 3,829 | | | | 3,829 | | | | 3,829 | | | | 3,829 | | | | 3,829 | | |
Other | | | 2,976 | | | | 4,095 | | | | 8,856 | | | | 4,029 | | | | 3,696 | | | | 4,867 | | |
Total expenses before fees waived | | | 411,381 | | | | 769,261 | | | | 2,252,230 | | | | 1,018,759 | | | | 626,615 | | | | 1,099,564 | | |
Less fees waived (note 4) | | | – | | | | – | | | | – | | | | – | | | | – | | | | – | | |
Total expenses net of fees waived | | | 411,381 | | | | 769,261 | | | | 2,252,230 | | | | 1,018,759 | | | | 626,615 | | | | 1,099,564 | | |
Net investment income | | | 866,849 | | | | 1,538,456 | | | | 365,537 | | | | (646,960 | ) | | | 279,107 | | | | 1,319,019 | | |
Realized and unrealized gains (losses) on investments and
foreign currencies: | |
Investments (note 3) | |
Unaffiliated issuers | | | 184,645 | | | | 4,984,350 | | | | 15,586,525 | | | | 9,092,073 | | | | 4,265,125 | | | | 9,968,209 | | |
Written options transactions | | | – | | | | – | | | | – | | | | – | | | | – | | | | – | | |
Swaps | | | – | | | | – | | | | – | | | | – | | | | – | | | | – | | |
Foreign currency transactions | | | – | | | | – | | | | 620 | | | | – | | | | – | | | | 355 | | |
Net increase from litigation payments | | | – | | | | – | | | | – | | | | – | | | | – | | | | – | | |
Futures transactions | | | 18,455 | | | | – | | | | – | | | | – | | | | – | | | | – | | |
Net change in unrealized appreciation or depreciation on: | |
Investments | |
Unaffiliated issuers | | | 13,832 | | | | (2,237,748 | ) | | | 40,890,990 | | | | 13,983,128 | | | | 5,651,683 | | | | 6,204,117 | | |
Affiliated issuers (note 8) | | | – | | | | – | | | | – | | | | – | | | | – | | | | – | | |
Options written | | | – | | | | – | | | | – | | | | – | | | | – | | | | – | | |
Swaps | | | – | | | | – | | | | – | | | | – | | | | – | | | | – | | |
Translation of assets and liabilities in foreign currency | | | – | | | | – | | | | (253 | ) | | | – | | | | – | | | | 1,253 | | |
Futures transactions | | | (4,855 | ) | | | – | | | | – | | | | – | | | | – | | | | – | | |
Net gains (losses) on investments | | | 212,077 | | | | 2,746,602 | | | | 56,477,882 | | | | 23,075,201 | | | | 9,916,808 | | | | 16,173,934 | | |
Net increase (decrease) in net assets resulting from
operations | | $ | 1,078,926 | | | $ | 4,285,058 | | | $ | 56,843,419 | | | $ | 22,428,241 | | | $ | 10,195,915 | | | $ | 17,492,953 | | |
65
Securian Funds Trust
Statements of Changes in Net Assets
Six months ended June 30, 2017 and year ended December 31, 2016
(Unaudited)
| | | SFT Advantus
Bond
Fund | | SFT Advantus
Dynamic
Managed
Volatility
Fund | | SFT Advantus
Government
Money
Market
Fund | |
| | | 2017 | | 2016 | | 2017 | | 2016 | | 2017 | | 2016 | |
Operations: | |
Net investment income | | $ | 5,125,735 | | | $ | 10,257,605 | | | $ | 1,247,086 | | | $ | 1,836,988 | | | $ | 647 | | | $ | – | | |
Net realized gains (losses) on investments | | | 1,934,855 | | | | 2,981,626 | | | | 7,468,933 | | | | 809,167 | | | | – | | | | 41,658 | | |
Net change in unrealized appreciation or
depreciation of investments | | | 4,162,395 | | | | 3,526,165 | | | | 13,830,630 | | | | 17,592,027 | | | | – | | | | – | | |
Net increase in net assets resulting
from operations | | | 11,222,985 | | | | 16,765,396 | | | | 22,546,649 | | | | 20,238,182 | | | | 647 | | | | 41,658 | | |
Distributions from: | |
Net investment income | |
Class 2 | | | – | | | | – | | | | – | | | | – | | | | (647 | ) | | | – | | |
Capital stock transactions: | |
Proceeds from sales | |
Class 1 | | | 311,861 | | | | 1,071,196 | | | | – | | | | – | | | | – | | | | – | | |
Class 2 | | | 5,507,546 | | | | 9,479,053 | | | | 28,263,103 | | | | 64,812,698 | | | | 11,088,000 | | | | 25,360,844 | | |
Shares issued as a result of reinvested
distributions | |
Class 2 | | | – | | | | – | | | | – | | | | – | | | | 647 | | | | – | | |
Payments for redemption of shares | |
Class 1 | | | (108,752 | ) | | | (5,524,161 | ) | | | – | | | | – | | | | – | | | | – | | |
Class 2 | | | (7,175,359 | ) | | | (40,699,918 | ) | | | (1,758,964 | ) | | | (8,037,442 | ) | | | (18,787,986 | ) | | | (36,436,264 | ) | |
Increase (decrease) in net assets from
capital stock transactions | | | (1,464,704 | ) | | | (35,673,830 | ) | | | 26,504,139 | | | | 56,775,256 | | | | (7,699,339 | ) | | | (11,075,420 | ) | |
Total increase (decrease) in net assets | | | 9,758,281 | | | | (18,908,434 | ) | | | 49,050,788 | | | | 77,013,438 | | | | (7,699,339 | ) | | | (11,033,762 | ) | |
Net assets at beginning of period | | | 370,268,415 | | | | 389,176,849 | | | | 281,000,073 | | | | 203,986,635 | | | | 77,794,794 | | | | 88,828,556 | | |
Net assets at end of period | | $ | 380,026,696 | | | $ | 370,268,415 | | | $ | 330,050,861 | | | $ | 281,000,073 | | | $ | 70,095,455 | | | $ | 77,794,794 | | |
Undistributed net investment income (loss) | | | – | | | | – | | | | – | | | | – | | | | – | | | | – | | |
Capital share transactions: | |
Proceeds from sales | |
Class 1 | | | 135,914 | | | | 476,305 | | | | – | | | | – | | | | – | | | | – | | |
Class 2 | | | 2,465,835 | | | | 4,276,897 | | | | 2,218,517 | | | | 5,546,365 | | | | 11,088,000 | | | | 25,360,844 | | |
Net change from capital transactions | | | 2,601,749 | | | | 4,753,202 | | | | 2,218,517 | | | | 5,546,365 | | | | 11,088,000 | | | | 25,360,844 | | |
Shares issued as a result of reinvested
distributions: | |
Class 2 | | | – | | | | – | | | | – | | | | – | | | | 647 | | | | – | | |
Payments for redemption of shares | |
Class 1 | | | (47,591 | ) | | | (2,434,351 | ) | | | – | | | | – | | | | – | | | | – | | |
Class 2 | | | (3,185,534 | ) | | | (18,517,648 | ) | | | (136,823 | ) | | | (704,549 | ) | | | (18,787,986 | ) | | | (36,436,264 | ) | |
Net change from capital transactions | | | (3,233,125 | ) | | | (20,951,999 | ) | | | (136,823 | ) | | | (704,549 | ) | | | (18,787,986 | ) | | | (36,436,264 | ) | |
See accompanying notes to financial statements.
66
| | | SFT Advantus
Index 400
Mid-Cap
Fund | | SFT Advantus
Index 500
Fund | |
| | | 2017 | | 2016 | | 2017 | | 2016 | |
Operations: | |
Net investment income | | $ | 1,108,045 | | | $ | 2,154,803 | | | $ | 6,357,299 | | | $ | 12,315,556 | | |
Net realized gains (losses) on investments | | | 11,699,267 | | | | 24,002,929 | | | | 9,172,871 | | | | 18,407,677 | | |
Net change in unrealized appreciation or
depreciation of investments | | | (596,399 | ) | | | 11,220,259 | | | | 51,697,819 | | | | 46,532,642 | | |
Net increase in net assets resulting
from operations | | | 12,210,913 | | | | 37,377,991 | | | | 67,227,989 | | | | 77,255,875 | | |
Distributions from: | |
Net investment income | |
Class 2 | | | – | | | | – | | | | – | | | | – | | |
Capital stock transactions: | |
Proceeds from sales | |
Class 1 | | | 630,985 | | | | 2,482,226 | | | | 2,237,407 | | | | 39,781,486 | | |
Class 2 | | | 2,504,957 | | | | 15,063,744 | | | | 4,348,929 | | | | 19,868,185 | | |
Shares issued as a result of reinvested
distributions | |
Class 2 | | | – | | | | – | | | | – | | | | – | | |
Payments for redemption of shares | |
Class 1 | | | (133,110 | ) | | | (16,796,206 | ) | | | (169,458 | ) | | | (30,547,533 | ) | |
Class 2 | | | (18,190,305 | ) | | | (21,994,165 | ) | | | (18,329,452 | ) | | | (50,827,160 | ) | |
Increase (decrease) in net assets from
capital stock transactions | | | (15,187,473 | ) | | | (21,244,401 | ) | | | (11,912,574 | ) | | | (21,725,022 | ) | |
Total increase (decrease) in net assets | | | (2,976,560 | ) | | | 16,133,590 | | | | 55,315,415 | | | | 55,530,853 | | |
Net assets at beginning of period | | | 218,697,704 | | | | 202,564,114 | | | | 742,810,101 | | | | 687,279,248 | | |
Net assets at end of period | | $ | 215,721,144 | | | $ | 218,697,704 | | | $ | 798,125,516 | | | $ | 742,810,101 | | |
Undistributed net investment income (loss) | | | – | | | | – | | | | – | | | | – | | |
Capital share transactions: | |
Proceeds from sales | |
Class 1 | | | 141,801 | | | | 656,440 | | | | 239,907 | | | | 4,902,663 | | |
Class 2 | | | 577,215 | | | | 3,859,189 | | | | 481,267 | | | | 2,470,698 | | |
Net change from capital transactions | | | 719,016 | | | | 4,515,629 | | | | 721,174 | | | | 7,373,361 | | |
Shares issued as a result of reinvested
distributions: | |
Class 2 | | | – | | | | – | | | | – | | | | – | | |
Payments for redemption of shares | |
Class 1 | | | (30,080 | ) | | | (4,394,872 | ) | | | (18,667 | ) | | | (3,770,199 | ) | |
Class 2 | | | (4,181,094 | ) | | | (5,895,049 | ) | | | (2,024,895 | ) | | | (6,344,595 | ) | |
Net change from capital transactions | | | (4,211,174 | ) | | | (10,289,921 | ) | | | (2,043,562 | ) | | | (10,114,794 | ) | |
67
Securian Funds Trust
Statements of Changes in Net Assets – continued
Six months ended June 30, 2017 and year ended December 31, 2016
(Unaudited)
| | | SFT Advantus
International
Bond
Fund | | SFT Advantus
Managed
Volatility Equity
Fund | | SFT Advantus
Mortgage
Securities
Fund | |
| | | 2017 | | 2016 | | 2017 | | 2016 | | 2017 | | 2016 | |
Operations: | |
Net investment income | | $ | 2,148,168 | | | $ | 2,660,438 | | | $ | 1,968,002 | | | $ | 2,708,194 | | | $ | 866,849 | | | $ | 1,730,720 | | |
Net realized gains (losses) on investments | | | (18,350 | ) | | | (11,053,944 | ) | | | 2,262,864 | | | | (760,203 | ) | | | 203,100 | | | | 43,490 | | |
Net change in unrealized appreciation or
depreciation of investments | | | 654,503 | | | | 11,699,367 | | | | 12,465,705 | | | | (25,929 | ) | | | 8,977 | | | | (477,313 | ) | |
Net increase in net assets resulting
from operations | | | 2,784,321 | | | | 3,305,861 | | | | 16,696,571 | | | | 1,922,062 | | | | 1,078,926 | | | | 1,296,897 | | |
Capital stock transactions: | |
Proceeds from sales | |
Class 1 | | | 99,039 | | | | 192,546 | | | | – | | | | – | | | | 24,408 | | | | 110,281 | | |
Class 2 | | | 1,505,004 | | | | 2,867,716 | | | | 28,213,778 | | | | 173,343,080 | | | | 1,330,966 | | | | 4,985,962 | | |
Shares issued as a result of reinvested
distributions | |
Class 2 | | | – | | | | – | | | | – | | | | – | | | | – | | | | – | | |
Payments for redemption of shares | |
Class 1 | | | (34,664 | ) | | | (116,726 | ) | | | – | | | | – | | | | (44,621 | ) | | | (778,863 | ) | |
Class 2 | | | (4,726,201 | ) | | | (8,775,824 | ) | | | (24,293,188 | ) | | | (641,406 | ) | | | (3,987,751 | ) | | | (8,499,819 | ) | |
Increase (decrease) in net assets from
capital stock transactions | | | (3,156,822 | ) | | | (5,832,288 | ) | | | 3,920,590 | | | | 172,701,674 | | | | (2,676,998 | ) | | | (4,182,439 | ) | |
Total increase (decrease) in net assets | | | (372,501 | ) | | | (2,526,427 | ) | | | 20,617,161 | | | | 174,623,736 | | | | (1,598,072 | ) | | | (2,885,542 | ) | |
Net assets at beginning of period | | | 111,005,466 | | | | 113,531,893 | | | | 200,137,784 | | | | 25,514,048 | | | | 91,529,629 | | | | 94,415,171 | | |
Net assets at end of period | | $ | 110,632,965 | | | $ | 111,005,466 | | | $ | 220,754,945 | | | $ | 200,137,784 | | | $ | 89,931,557 | | | $ | 91,529,629 | | |
Undistributed net investment income (loss) | | | (2,766,909 | ) | | | (4,915,077 | ) | | | – | | | | – | | | | – | | | | – | | |
Capital share transactions: | |
Proceeds from sales | |
Class 1 | | | 38,734 | | | | 80,466 | | | | – | | | | – | | | | 12,608 | | | | 57,106 | | |
Class 2 | | | 603,258 | | | | 1,224,266 | | | | 2,559,109 | | | | 16,619,423 | | | | 703,525 | | | | 2,624,654 | | |
Net change from capital transactions | | | 641,992 | | | | 1,304,732 | | | | 2,559,109 | | | | 16,619,423 | | | | 716,133 | | | | 2,681,760 | | |
Shares issued as a result of reinvested
distributions: | |
Class 2 | | | – | | | | – | | | | – | | | | – | | | | – | | | | – | | |
Payments for redemption of shares | |
Class 1 | | | (13,468 | ) | | | (48,297 | ) | | | – | | | | – | | | | (22,966 | ) | | | (399,174 | ) | |
Class 2 | | | (1,886,514 | ) | | | (3,722,946 | ) | | | (2,209,804 | ) | | | (62,561 | ) | | | (2,100,365 | ) | | | (4,469,887 | ) | |
Net change from capital transactions | | | (1,899,982 | ) | | | (3,771,243 | ) | | | (2,209,804 | ) | | | (62,561 | ) | | | (2,123,331 | ) | | | (4,869,061 | ) | |
See accompanying notes to financial statements.
68
| | | SFT Advantus
Real Estate
Securities
Fund | | SFT IvySM
Growth
Fund | | SFT IvySM
Small Cap
Growth
Fund | |
| | | 2017 | | 2016 | | 2017 | | 2016 | | 2017 | | 2016 | |
Operations: | |
Net investment income | | $ | 1,538,456 | | | $ | 2,148,779 | | | $ | 365,537 | | | $ | 1,290,382 | | | $ | (646,960 | ) | | $ | (1,022,702 | ) | |
Net realized gains (losses) on investments | | | 4,984,350 | | | | 19,378,674 | | | | 15,587,145 | | | | 18,696,419 | | | | 9,092,073 | | | | 13,489,268 | | |
Net change in unrealized appreciation or
depreciation of investments | | | (2,237,748 | ) | | | (14,560,817 | ) | | | 40,890,737 | | | | (16,646,407 | ) | | | 13,983,128 | | | | 16,850,153 | | |
Net increase in net assets resulting
from operations | | | 4,285,058 | | | | 6,966,636 | | | | 56,843,419 | | | | 3,340,394 | | | | 22,428,241 | | | | 29,316,719 | | |
Capital stock transactions: | |
Proceeds from sales | |
Class 1 | | | 377,819 | | | | 1,216,024 | | | | – | | | | – | | | | – | | | | – | | |
Class 2 | | | 11,135,210 | | | | 6,915,526 | | | | 1,058,581 | | | | 1,697,051 | | | | 758,803 | | | | 3,486,016 | | |
Shares issued as a result of reinvested
distributions | |
Class 2 | | | – | | | | – | | | | – | | | | – | | | | – | | | | – | | |
Payments for redemption of shares | |
Class 1 | | | (233,683 | ) | | | (5,480,644 | ) | | | – | | | | – | | | | – | | | | – | | |
Class 2 | | | (24,172,380 | ) | | | (15,300,382 | ) | | | (27,881,133 | ) | | | (45,133,736 | ) | | | (11,169,217 | ) | | | (14,973,753 | ) | |
Increase (decrease) in net assets from
capital stock transactions | | | (12,893,034 | ) | | | (12,649,476 | ) | | | (26,822,552 | ) | | | (43,436,685 | ) | | | (10,410,414 | ) | | | (11,487,737 | ) | |
Total increase (decrease) in net assets | | | (8,607,976 | ) | | | (5,682,840 | ) | | | 30,020,867 | | | | (40,096,291 | ) | | | 12,017,827 | | | | 17,828,982 | | |
Net assets at beginning of period | | | 146,223,534 | | | | 151,906,374 | | | | 438,984,600 | | | | 479,080,891 | | | | 163,294,393 | | | | 145,465,411 | | |
Net assets at end of period | | $ | 137,615,558 | | | $ | 146,223,534 | | | $ | 469,005,467 | | | $ | 438,984,600 | | | $ | 175,312,220 | | | $ | 163,294,393 | | |
Undistributed net investment income (loss) | | | – | | | | – | | | | – | | | | – | | | | – | | | | – | | |
Capital share transactions: | |
Proceeds from sales | |
Class 1 | | | 82,326 | | | | 271,256 | | | | – | | | | – | | | | – | | | | – | | |
Class 2 | | | 2,461,448 | | | | 1,555,728 | | | | 80,723 | | | | 149,149 | | | | 54,873 | | | | 291,775 | | |
Net change from capital transactions | | | 2,543,774 | | | | 1,826,984 | | | | 80,723 | | | | 149,149 | | | | 54,873 | | | | 291,775 | | |
Shares issued as a result of reinvested
distributions: | |
Class 2 | | | – | | | | – | | | | – | | | | – | | | | – | | | | – | | |
Payments for redemption of shares | |
Class 1 | | | (51,439 | ) | | | (1,150,736 | ) | | | – | | | | – | | | | – | | | | – | | |
Class 2 | | | (5,358,548 | ) | | | (3,450,344 | ) | | | (2,096,677 | ) | | | (3,815,228 | ) | | | (832,444 | ) | | | (1,311,293 | ) | |
Net change from capital transactions | | | (5,409,987 | ) | | | (4,601,080 | ) | | | (2,096,677 | ) | | | (3,815,228 | ) | | | (832,444 | ) | | | (1,311,293 | ) | |
69
Securian Funds Trust
Statements of Changes in Net Assets – continued
Six months ended June 30, 2017 and year ended December 31, 2016
(Unaudited)
| | | SFT
Pyramis®
Core Equity
Fund | | SFT
T. Rowe Price
Value
Fund | |
| | | 2017 | | 2016 | | 2017 | | 2016 | |
Operations: | |
Net investment income | | $ | 279,107 | | | $ | 649,241 | | | $ | 1,319,019 | | | $ | 3,218,733 | | |
Net realized gains (losses) on investments | | | 4,265,125 | | | | (870,564 | ) | | | 9,968,564 | | | | 4,653,139 | | |
Net change in unrealized appreciation or
depreciation of investments | | | 5,651,683 | | | | 5,750,668 | | | | 6,205,370 | | | | 12,604,688 | | |
Net increase in net assets resulting
from operations | | | 10,195,915 | | | | 5,529,345 | | | | 17,492,953 | | | | 20,476,560 | | |
Capital stock transactions: | |
Proceeds from sales | |
Class 1 | | | 58,178 | | | | 140,311 | | | | – | | | | – | | |
Class 2 | | | 167,392 | | | | 900,567 | | | | 10,374,306 | | | | 2,353,560 | | |
Shares issued as a result of reinvested
distributions | |
Class 2 | | | – | | | | – | | | | – | | | | – | | |
Payments for redemption of shares | |
Class 1 | | | (32,391 | ) | | | (65,854 | ) | | | – | | | | – | | |
Class 2 | | | (8,429,168 | ) | | | (20,893,360 | ) | | | (16,949,404 | ) | | | (22,014,912 | ) | |
Increase (decrease) in net assets from
capital stock transactions | | | (8,235,989 | ) | | | (19,918,336 | ) | | | (6,575,098 | ) | | | (19,661,352 | ) | |
Total increase (decrease) in net assets | | | 1,959,926 | | | | (14,388,991 | ) | | | 10,917,855 | | | | 815,208 | | |
Net assets at beginning of period | | | 114,494,651 | | | | 128,883,642 | | | | 208,512,783 | | | | 207,697,575 | | |
Net assets at end of period | | $ | 116,454,577 | | | $ | 114,494,651 | | | $ | 219,430,638 | | | $ | 208,512,783 | | |
Undistributed net investment income (loss) | | | – | | | | – | | | | – | | | | – | | |
Capital share transactions: | |
Proceeds from sales | |
Class 1 | | | 4,635 | | | | 12,504 | | | | – | | | | – | | |
Class 2 | | | 13,755 | | | | 83,279 | | | | 849,418 | | | | 217,525 | | |
Net change from capital transactions | | | 18,390 | | | | 95,783 | | | | 849,418 | | | | 217,525 | | |
Shares issued as a result of reinvested
distributions: | |
Class 2 | | | – | | | | – | | | | – | | | | – | | |
Payments for redemption of shares | |
Class 1 | | | (2,559 | ) | | | (5,857 | ) | | | – | | | | – | | |
Class 2 | | | (678,069 | ) | | | (1,843,703 | ) | | | (1,372,677 | ) | | | (2,030,629 | ) | |
Net change from capital transactions | | | (680,628 | ) | | | (1,849,560 | ) | | | (1,372,677 | ) | | | (2,030,629 | ) | |
See accompanying notes to financial statements.
70
Securian Funds Trust
Financial Highlights
SFT Advantus Bond Fund
| | | Class 1 Shares | |
| | | Six months
ended
June 30,
2017 | |
Year ended December 31, | |
| | | (unaudited) | | 2016 | | 2015 | | 2014 | | 2013 | | 2012 | |
Net asset value, beginning of period | | $ | 2.257 | | | $ | 2.157 | | | $ | 2.148 | | | $ | 2.016 | | | $ | 2.024 | | | $ | 1.880 | | |
Income from investment operations: | |
Net investment income (a) | | | .034 | | | | .066 | | | | .066 | | | | .064 | | | | .060 | | | | .055 | | |
Net gains (losses) (both realized
and unrealized) | | | .037 | | | | .034 | | | | (.057 | ) | | | .068 | | | | (.068 | ) | | | .089 | | |
Total from investment operations | | | .071 | | | | .100 | | | | .009 | | | | .132 | | | | (.008 | ) | | | .144 | | |
Net asset value, end of period | | $ | 2.328 | | | $ | 2.257 | | | $ | 2.157 | | | $ | 2.148 | | | $ | 2.016 | | | $ | 2.024 | | |
Total return (b) | | | 3.15 | % | | | 4.63 | % | | | 0.41 | % | | | 6.56 | % | | | (0.40 | )% | | | 7.69 | % | |
Net assets, end of period (in thousands) | | $ | 2,385 | | | $ | 2,113 | | | $ | 6,243 | | | $ | 5,402 | | | $ | 4,414 | | | $ | 3,156 | | |
Ratios to average net assets: | |
Expenses (c) | | | .49 | %(d) | | | .49 | % | | | .49 | % | | | .49 | % | | | .51 | % | | | .51 | % | |
Net investment income | | | 2.99 | %(d) | | | 2.97 | % | | | 3.03 | % | | | 3.07 | % | | | 2.96 | % | | | 2.77 | % | |
Portfolio turnover rate (excluding
short-term securities) | | | 102.5 | %(e) | | | 249.6 | % | | | 179.3 | % | | | 193.5 | % | | | 235.8 | % | | | 205.5 | % | |
| | | Class 2 Shares | |
| | | Six months
ended
June 30,
2017 | |
Year ended December 31, | |
| | | (unaudited) | | 2016 | | 2015 | | 2014 | | 2013 | | 2012 | |
Net asset value, beginning of period | | $ | 2.212 | | | $ | 2.120 | | | $ | 2.117 | | | $ | 1.991 | | | $ | 2.004 | | | $ | 1.866 | | |
Income from investment operations: | |
Net investment income (a) | | | .031 | | | | .059 | | | | .059 | | | | .058 | | | | .054 | | | | .047 | | |
Net gains (losses) (both realized
and unrealized) | | | .036 | | | | .033 | | | | (.056 | ) | | | .068 | | | | (.067 | ) | | | .091 | | |
Total from investment operations | | | .067 | | | | .092 | | | | .003 | | | | .126 | | | | (.013 | ) | | | .138 | | |
Net asset value, end of period | | $ | 2.279 | | | $ | 2.212 | | | $ | 2.120 | | | $ | 2.117 | | | $ | 1.991 | | | $ | 2.004 | | |
Total return (b) | | | 3.02 | % | | | 4.37 | % | | | 0.16 | % | | | 6.29 | % | | | (0.65 | )% | | | 7.42 | % | |
Net assets, end of period (in thousands) | | $ | 377,642 | | | $ | 368,156 | | | $ | 382,934 | | | $ | 368,926 | | | $ | 356,034 | | | $ | 360,115 | | |
Ratios to average net assets: | |
Expenses (c) | | | .74 | %(d) | | | .74 | % | | | .74 | % | | | .74 | % | | | .76 | % | | | .76 | % | |
Net investment income | | | 2.74 | %(d) | | | 2.68 | % | | | 2.78 | % | | | 2.82 | % | | | 2.71 | % | | | 2.41 | % | |
Portfolio turnover rate (excluding
short-term securities) | | | 102.5 | %(e) | | | 249.6 | % | | | 179.3 | % | | | 193.5 | % | | | 235.8 | % | | | 205.5 | % | |
(a) Based on average shares outstanding during the year.
(b) Total return figures are based on a share outstanding throughout the period and assume reinvestment of distributions at net asset value. Total return figures do not reflect charges pursuant to the terms of the variable life insurance policies and variable annuity contracts funded by separate accounts that invest in the Fund's shares. For periods less than one year, total return presented has not been annualized.
(c) In addition to fees and expenses which the Fund bears directly, the Fund indirectly bears a pro rata share of the fees and expenses of the acquired funds in which it invests. Such indirect expenses are not included in the above reported expense ratios.
(d) Adjusted to an annual basis.
(e) Not annualized.
71
Securian Funds Trust
Financial Highlights – continued
SFT Advantus Dynamic Managed Volatility Fund
| | | Class 2 Shares | |
| | | Six months
ended
June 30,
2017 | |
Year ended December 31, | |
| | | (unaudited) | | 2016 | | 2015 | | 2014 | | 2013 (a) | |
Net asset value, beginning of period | | $ | 12.210 | | | $ | 11.226 | | | $ | 11.603 | | | $ | 10.731 | | | $ | 10.000 | | |
Income from investment operations: | |
Net investment income (b) | | | .052 | | | | .091 | | | | .082 | | | | .039 | | | | .008 | | |
Net gains (losses) (both realized and unrealized) | | | .890 | | | | .893 | | | | (.459 | ) | | | .833 | | | | .723 | | |
Total from investment operations | | | .942 | | | | .984 | | | | (.377 | ) | | | .872 | | | | .731 | | |
Net asset value, end of period | | $ | 13.152 | | | $ | 12.210 | | | $ | 11.226 | | | $ | 11.603 | | | $ | 10.731 | | |
Total return (c) | | | 7.71 | % | | | 8.77 | % | | | (3.25 | )% | | | 8.12 | % | | | 7.31 | % | |
Net assets, end of period (in thousands) | | $ | 330,051 | | | $ | 281,000 | | | $ | 203,987 | | | $ | 131,047 | | | $ | 52,931 | | |
Ratios to average net assets: | |
Expenses before waiver (d) | | | .98 | %(e) | | | 1.00 | % | | | 1.02 | % | | | 1.19 | % | | | 1.37 | %(e) | |
Expenses net of waiver (d)(f) | | | .80 | %(e) | | | .80 | % | | | .80 | % | | | .80 | % | | | .80 | %(e) | |
Net investment income | | | .81 | %(e) | | | .79 | % | | | .71 | % | | | .35 | % | | | .12 | %(e) | |
Portfolio turnover rate (excluding short-term securities) | | | 0.5 | %(g) | | | 1.4 | % | | | 5.1 | % | | | 1.5 | % | | | 32.1 | %(g) | |
(a) The Fund commenced operations on May 1, 2013.
(b) Based on average shares outstanding during the year.
(c) Total return figures are based on a share outstanding throughout the period and assume reinvestment of distributions at net asset value. Total return figures do not reflect charges pursuant to the terms of the variable life insurance policies and variable annuity contracts funded by separate accounts that invest in the Fund's shares. For periods less than one year, total return presented has not been annualized.
(d) In addition to fees and expenses which the Fund bears directly, the Fund indirectly bears a pro rata share of the fees and expenses of the acquired funds in which it invests. Such indirect expenses are not included in the above reported expense ratios.
(e) Adjusted to an annual basis.
(f) Ratio is net of fees waived by the advisor and distributor (see note 4).
(g) Not annualized.
72
Securian Funds Trust
Financial Highlights – continued
SFT Advantus Government Money Market Fund
| | | Class 2 Shares | |
| | | Six months
ended
June 30,
2017 | |
Year ended December 31, | |
| | | (unaudited) | | 2016 | | 2015 | | 2014 | | 2013 | | 2012 | |
Net asset value, beginning of period | | $ | 1.000 | | | $ | 1.000 | | | $ | 1.000 | | | $ | 1.000 | | | $ | 1.000 | | | $ | 1.000 | | |
Income from investment operations: | |
Net investment income (a) | | | – | | | | – | | | | – | | | | – | | | | – | | | | – | | |
Total from investment operations | | | – | | | | – | | | | – | | | | – | | | | – | | | | – | | |
Net asset value, end of period | | $ | 1.000 | | | $ | 1.000 | | | $ | 1.000 | | | $ | 1.000 | | | $ | 1.000 | | | $ | 1.000 | | |
Total return (b) | | | – | % | | | – | % | | | – | % | | | – | % | | | – | % | | | – | % | |
Net assets, end of period (in thousands) | | $ | 70,095 | | | $ | 77,795 | | | $ | 88,829 | | | $ | 86,904 | | | $ | 89,423 | | | $ | 95,858 | | |
Ratios to average net assets: | |
| Expenses before waiver (c) | | | .91 | %(d) | | | .91 | % | | | .85 | % | | | .83 | % | | | .86 | % | | | .83 | % | |
Expenses net of waiver (c)(e) | | | .70 | %(d) | | | .36 | % | | | .12 | % | | | .10 | % | | | .13 | % | | | .17 | % | |
Net investment income | | | – | % | | | – | % | | | – | % | | | – | % | | | – | % | | | – | % | |
(a) Based on average shares outstanding during the year.
(b) Total return figures are based on a share outstanding throughout the period and assume reinvestment of distributions at net asset value. Total return figures do not reflect charges pursuant to the terms of the variable life insurance policies and variable annuity contracts funded by separate accounts that invest in the Fund's shares. For periods less than one year, total return presented has not been annualized.
(c) In addition to fees and expenses which the Fund bears directly, the Fund indirectly bears a pro rata share of the fees and expenses of the acquired funds in which it invests. Such indirect expenses are not included in the above reported expense ratios.
(d) Adjusted to an annual basis.
(e) Ratio is net of fees waived by the advisor and distributor (see note 4).
73
Securian Funds Trust
Financial Highlights – continued
SFT Advantus Index 400 Mid-Cap Fund
| | | Class 1 Shares | |
| | | Six months
ended
June 30,
2017 | |
Year ended December 31, | |
| | | (unaudited) | | 2016 | | 2015 | | 2014 | | 2013 | | 2012 | |
Net asset value, beginning of period | | $ | 4.275 | | | $ | 3.553 | | | $ | 3.640 | | | $ | 3.324 | | | $ | 2.497 | | | $ | 2.124 | | |
Income from investment operations: | |
Net investment income (a) | | | .028 | | | | .045 | | | | .046 | | | | .040 | | | | .034 | | | | .040 | | |
Net gains (losses) (both realized
and unrealized) | | | .222 | | | | .677 | | | | (.133 | ) | | | .276 | | | | .793 | | | | .333 | | |
Total from investment operations | | | .250 | | | | .722 | | | | (.087 | ) | | | .316 | | | | .827 | | | | .373 | | |
Net asset value, end of period | | $ | 4.525 | | | $ | 4.275 | | | $ | 3.553 | | | $ | 3.640 | | | $ | 3.324 | | | $ | 2.497 | | |
Total return (b) | | | 5.84 | % | | | 20.34 | % | | | (2.39 | )% | | | 9.51 | % | | | 33.11 | % | | | 17.54 | % | |
Net assets, end of period (in thousands) | | $ | 5,046 | | | $ | 4,290 | | | $ | 16,847 | | | $ | 15,418 | | | $ | 12,802 | | | $ | 6,656 | | |
Ratios to average net assets: | |
Expenses (c) | | | .26 | %(d) | | | .26 | % | | | .26 | % | | | .25 | % | | | .28 | % | | | .31 | % | |
Net investment income | | | 1.27 | %(d) | | | 1.24 | % | | | 1.24 | % | | | 1.15 | % | | | 1.15 | % | | | 1.65 | % | |
Portfolio turnover rate (excluding
short-term securities) | | | 11.3 | %(e) | | | 18.5 | % | | | 16.1 | % | | | 12.0 | % | | | 9.3 | % | | | 8.0 | % | |
| | | Class 2 Shares | |
| | | Six months
ended
June 30,
2017 | |
Year ended December 31, | |
| | | (unaudited) | | 2016 | | 2015 | | 2014 | | 2013 | | 2012 | |
Net asset value, beginning of period | | $ | 4.191 | | | $ | 3.491 | | | $ | 3.586 | | | $ | 3.283 | | | $ | 2.472 | | | $ | 2.109 | | |
Income from investment operations: | |
Net investment income (a) | | | .022 | | | | .039 | | | | .036 | | | | .030 | | | | .025 | | | | .023 | | |
Net gains (losses) (both realized
and unrealized) | | | .217 | | | | .661 | | | | (.131 | ) | | | .273 | | | | .786 | | | | .340 | | |
Total from investment operations | | | .239 | | | | .700 | | | | (.095 | ) | | | .303 | | | | .811 | | | | .363 | | |
Net asset value, end of period | | $ | 4.430 | | | $ | 4.191 | | | $ | 3.491 | | | $ | 3.586 | | | $ | 3.283 | | | $ | 2.472 | | |
Total return (b) | | | 5.71 | % | | | 20.04 | % | | | (2.63 | )% | | | 9.24 | % | | | 32.78 | % | | | 17.24 | % | |
Net assets, end of period (in thousands) | | $ | 210,675 | | | $ | 214,408 | | | $ | 185,717 | | | $ | 218,305 | | | $ | 215,884 | | | $ | 180,588 | | |
Ratios to average net assets: | |
Expenses (c) | | | .51 | %(d) | | | .51 | % | | | .51 | % | | | .50 | % | | | .53 | % | | | .56 | % | |
Net investment income | | | 1.00 | %(d) | | | 1.06 | % | | | .98 | % | | | .89 | % | | | .87 | % | | | .99 | % | |
Portfolio turnover rate (excluding
short-term securities) | | | 11.3 | %(e) | | | 18.5 | % | | | 16.1 | % | | | 12.0 | % | | | 9.3 | % | | | 8.0 | % | |
(a) Based on average shares outstanding during the year.
(b) Total return figures are based on a share outstanding throughout the period and assume reinvestment of distributions at net asset value. Total return figures do not reflect charges pursuant to the terms of the variable life insurance policies and variable annuity contracts funded by separate accounts that invest in the Fund's shares. For periods less than one year, total return presented has not been annualized.
(c) In addition to fees and expenses which the Fund bears directly, the Fund indirectly bears a pro rata share of the fees and expenses of the acquired funds in which it invests. Such indirect expenses are not included in the above reported expense ratios.
(d) Adjusted to an annual basis.
(e) Not annualized.
74
Securian Funds Trust
Financial Highlights – continued
SFT Advantus Index 500 Fund
| | | Class 1 Shares | |
| | | Six months
ended
June 30,
2017 | |
Year ended December 31, | |
| | | (unaudited) | | 2016 | | 2015 | | 2014 | | 2013 | | 2012 | |
Net asset value, beginning of period | | $ | 8.745 | | | $ | 7.829 | | | $ | 7.737 | | | $ | 6.822 | | | $ | 5.167 | | | $ | 4.465 | | |
Income from investment operations: | |
Net investment income (a) | | | .085 | | | | .164 | | | | .147 | | | | .132 | | | | .115 | | | | .111 | | |
Net gains (losses) (both realized
and unrealized) | | | .722 | | | | .752 | | | | (.055 | ) | | | .783 | | | | 1.540 | | | | .591 | | |
Total from investment operations | | | .807 | | | | .916 | | | | .092 | | | | .915 | | | | 1.655 | | | | .702 | | |
Net asset value, end of period | | $ | 9.552 | | | $ | 8.745 | | | $ | 7.829 | | | $ | 7.737 | | | $ | 6.822 | | | $ | 5.167 | | |
Total return (b) | | | 9.22 | % | | | 11.72 | % | | | 1.18 | % | | | 13.41 | % | | | 32.04 | % | | | 15.71 | % | |
Net assets, end of period (in thousands) | | $ | 147,386 | | | $ | 133,014 | | | $ | 110,210 | | | $ | 60,909 | | | $ | 36,387 | | | $ | 11,524 | | |
Ratios to average net assets: | |
Expenses (c) | | | .20 | %(d) | | | .20 | % | | | .21 | % | | | .21 | % | | | .22 | % | | | .24 | % | |
Net investment income | | | 1.85 | %(d) | | | 2.02 | % | | | 1.88 | % | | | 1.83 | % | | | 1.88 | % | | | 2.19 | % | |
Portfolio turnover rate (excluding
short-term securities) | | | 1.4 | %(e) | | | 6.5 | % | | | 6.1 | % | | | 4.8 | % | | | 4.5 | % | | | 2.6 | % | |
| | | Class 2 Shares | |
| | | Six months
ended
June 30,
2017 | |
Year ended December 31, | |
| | | (unaudited) | | 2016 | | 2015 | | 2014 | | 2013 | | 2012 | |
Net asset value, beginning of period | | $ | 8.573 | | | $ | 7.693 | | | $ | 7.622 | | | $ | 6.737 | | | $ | 5.115 | | | $ | 4.432 | | |
Income from investment operations: | |
Net investment income (a) | | | .072 | | | | .141 | | | | .124 | | | | .110 | | | | .095 | | | | .088 | | |
Net gains (losses) (both realized
and unrealized) | | | .706 | | | | .739 | | | | (.053 | ) | | | .775 | | | | 1.527 | | | | .595 | | |
Total from investment operations | | | .778 | | | | .880 | | | | .071 | | | | .885 | | | | 1.622 | | | | .683 | | |
Net asset value, end of period | | $ | 9.351 | | | $ | 8.573 | | | $ | 7.693 | | | $ | 7.622 | | | $ | 6.737 | | | $ | 5.115 | | |
Total return (b) | | | 9.08 | % | | | 11.44 | % | | | 0.93 | % | | | 13.13 | % | | | 31.71 | % | | | 15.42 | % | |
Net assets, end of period (in thousands) | | $ | 650,739 | | | $ | 609,796 | | | $ | 577,069 | | | $ | 585,532 | | | $ | 540,439 | | | $ | 432,694 | | |
Ratios to average net assets: | |
Expenses (c) | | | .45 | %(d) | | | .45 | % | | | .46 | % | | | .46 | % | | | .47 | % | | | .49 | % | |
Net investment income | | | 1.60 | %(d) | | | 1.77 | % | | | 1.61 | % | | | 1.56 | % | | | 1.59 | % | | | 1.80 | % | |
Portfolio turnover rate (excluding
short-term securities) | | | 1.4 | %(e) | | | 6.5 | % | | | 6.1 | % | | | 4.8 | % | | | 4.5 | % | | | 2.6 | % | |
(a) Based on average shares outstanding during the year.
(b) Total return figures are based on a share outstanding throughout the period and assume reinvestment of distributions at net asset value. Total return figures do not reflect charges pursuant to the terms of the variable life insurance policies and variable annuity contracts funded by separate accounts that invest in the Fund's shares. For periods less than one year, total return presented has not been annualized.
(c) In addition to fees and expenses which the Fund bears directly, the Fund indirectly bears a pro rata share of the fees and expenses of the acquired funds in which it invests. Such indirect expenses are not included in the above reported expense ratios.
(d) Adjusted to an annual basis.
(e) Not annualized.
75
Securian Funds Trust
Financial Highlights – continued
SFT Advantus International Bond Fund
| | | Class 1 Shares | |
| | | Six months
ended
June 30,
2017 | |
Year ended December 31, | |
| | | (unaudited) | | 2016 | | 2015 | | 2014 | | 2013 | | 2012 | |
Net asset value, beginning of period | | $ | 2.499 | | | $ | 2.418 | | | $ | 2.517 | | | $ | 2.468 | | | $ | 2.464 | | | $ | 2.115 | | |
Income from investment operations: | |
Net investment income (a) | | | .052 | | | | .064 | | | | .063 | | | | .074 | | | | .078 | | | | .086 | | |
Net gains (losses) (both realized
and unrealized) | | | .014 | | | | .017 | | | | (.162 | ) | | | (.025 | ) | | | (.074 | ) | | | .263 | | |
Total from investment operations | | | .066 | | | | .081 | | | | (.099 | ) | | | .049 | | | | .004 | | | | .349 | | |
Net asset value, end of period | | $ | 2.565 | | | $ | 2.499 | | | $ | 2.418 | | | $ | 2.517 | | | $ | 2.468 | | | $ | 2.464 | | |
Total return (b) | | | 2.63 | % | | | 3.35 | % | | | (3.92 | )% | | | 1.96 | % | | | 0.17 | % | | | 16.49 | % | |
Net assets, end of period (in thousands) | | $ | 1,191 | | | $ | 1,097 | | | $ | 984 | | | $ | 938 | | | $ | 756 | | | $ | 606 | | |
Ratios to average net assets: | |
Expenses (c) | | | .98 | %(d) | | | 1.00 | % | | | .89 | % | | | .86 | % | | | .87 | % | | | .94 | % | |
Net investment income | | | 4.13 | %(d) | | | 2.67 | % | | | 2.55 | % | | | 2.93 | % | | | 3.18 | % | | | 3.76 | % | |
Portfolio turnover rate (excluding
short-term securities) | | | 35.0 | %(e) | | | 54.0 | % | | | 42.4 | % | | | 19.3 | % | | | 17.7 | % | | | 38.8 | % | |
| | | Class 2 Shares | |
| | | Six months
ended
June 30,
2017 | |
Year ended December 31, | |
| | | (unaudited) | | 2016 | | 2015 | | 2014 | | 2013 | | 2012 | |
Net asset value, beginning of period | | $ | 2.450 | | | $ | 2.376 | | | $ | 2.479 | | | $ | 2.438 | | | $ | 2.440 | | | $ | 2.100 | | |
Income from investment operations: | |
Net investment income (a) | | | .048 | | | | .057 | | | | .056 | | | | .067 | | | | .071 | | | | .079 | | |
Net gains (losses) (both realized
and unrealized) | | | .013 | | | | .017 | | | | (.159 | ) | | | (.026 | ) | | | (.073 | ) | | | .261 | | |
Total from investment operations | | | .061 | | | | .074 | | | | (.103 | ) | | | .041 | | | | (.002 | ) | | | .340 | | |
Net asset value, end of period | | $ | 2.511 | | | $ | 2.450 | | | $ | 2.376 | | | $ | 2.479 | | | $ | 2.438 | | | $ | 2.440 | | |
Total return (b) | | | 2.51 | % | | | 3.09 | % | | | (4.16 | )% | | | 1.70 | % | | | (0.08 | )% | | | 16.20 | % | |
Net assets, end of period (in thousands) | | $ | 109,442 | | | $ | 109,908 | | | $ | 112,548 | | | $ | 124,174 | | | $ | 128,885 | | | $ | 127,590 | | |
Ratios to average net assets: | |
Expenses (c) | | | 1.23 | %(d) | | | 1.24 | % | | | 1.14 | % | | | 1.11 | % | | | 1.12 | % | | | 1.19 | % | |
Net investment income | | | 3.88 | %(d) | | | 2.42 | % | | | 2.29 | % | | | 2.69 | % | | | 2.92 | % | | | 3.51 | % | |
Portfolio turnover rate (excluding
short-term securities) | | | 35.0 | %(e) | | | 54.0 | % | | | 42.4 | % | | | 19.3 | % | | | 17.7 | % | | | 38.8 | % | |
(a) Based on average shares outstanding during the year.
(b) Total return figures are based on a share outstanding throughout the period and assume reinvestment of distributions at net asset value. Total return figures do not reflect charges pursuant to the terms of the variable life insurance policies and variable annuity contracts funded by separate accounts that invest in the Fund's shares. For periods less than one year, total return presented has not been annualized.
(c) In addition to fees and expenses which the Fund bears directly, the Fund indirectly bears a pro rata share of the fees and expenses of the acquired funds in which it invests. Such indirect expenses are not included in the above reported expense ratios.
(d) Adjusted to an annual basis.
(e) Not annualized.
76
Securian Funds Trust
Financial Highlights – continued
SFT Advantus Managed Volatility Equity Fund
| | | Class 2 Shares | |
| | | Six months
ended
June 30,
2017 | | Year ended
December 31, | |
| | | (unaudited) | | 2016 | | 2015 (a) | |
Net asset value, beginning of period | | $ | 10.483 | | | $ | 10.064 | | | $ | 10.000 | | |
Income from investment operations: | |
Net investment income (b) | | | .103 | | | | .253 | | | | .066 | | |
Net gains (losses) (both realized and unrealized) | | | .769 | | | | .166 | | | | (.002 | ) | |
Total from investment operations | | | .872 | | | | .419 | | | | .064 | | |
Net asset value, end of period | | $ | 11.355 | | | $ | 10.483 | | | $ | 10.064 | | |
Total return (c) | | | 8.32 | % | | | 4.16 | % | | | 0.64 | % | |
Net assets, end of period (in thousands) | | $ | 220,755 | | | $ | 200,138 | | | $ | 25,514 | | |
Ratios to average net assets: | |
Expenses before waiver (d) | | | .99 | %(e) | | | 1.09 | % | | | 2.28 | %(e) | |
Expenses net of waiver (d)(f) | | | .80 | %(e) | | | .80 | % | | | .80 | %(e) | |
Net investment income | | | 1.88 | %(e) | | | 2.43 | % | | | 5.53 | %(e) | |
Portfolio turnover rate (excluding short-term securities) | | | 9.9 | %(g) | | | 8.5 | % | | | – | %(g) | |
(a) The Fund commenced operations on November 18, 2015.
(b) Based on average shares outstanding during the year.
(c) Total return figures are based on a share outstanding throughout the period and assume reinvestment of distributions at net asset value. Total return figures do not reflect charges pursuant to the terms of the variable life insurance policies and variable annuity contracts funded by separate accounts that invest in the Fund's shares. For periods less than one year, total return presented has not been annualized.
(d) In addition to fees and expenses which the Fund bears directly, the Fund indirectly bears a pro rata share of the fees and expenses of the acquired funds in which it invests. Such indirect expenses are not included in the above reported expense ratios.
(e) Adjusted to an annual basis.
(f) Ratio is net of fees waived by the advisor and distributor (see note 4).
(g) Not annualized.
77
Securian Funds Trust
Financial Highlights – continued
SFT Advantus Mortgage Securities Fund
| | | Class 1 Shares | |
| | | Six months
ended
June 30,
2017 | |
Year ended December 31, | |
| | | (unaudited) | | 2016 | | 2015 | | 2014 | | 2013 | | 2012 | |
Net asset value, beginning of period | | $ | 1.924 | | | $ | 1.894 | | | $ | 1.835 | | | $ | 1.731 | | | $ | 1.761 | | | $ | 1.698 | | |
Income from investment operations: | |
Net investment income (a) | | | .021 | | | | .042 | | | | .042 | | | | .031 | | | | .029 | | | | .038 | | |
Net gains (losses) (both realized
and unrealized) | | | .004 | | | | (.012 | ) | | | .017 | | | | .073 | | | | (.059 | ) | | | .025 | | |
Total from investment operations | | | .025 | | | | .030 | | | | .059 | | | | .104 | | | | (.030 | ) | | | .063 | | |
Net asset value, end of period | | $ | 1.949 | | | $ | 1.924 | | | $ | 1.894 | | | $ | 1.835 | | | $ | 1.731 | | | $ | 1.761 | | |
Total return (b) | | | 1.31 | % | | | 1.58 | % | | | 3.21 | % | | | 6.03 | % | | | (1.73 | )% | | | 3.75 | % | |
Net assets, end of period (in thousands) | | $ | 252 | | | $ | 269 | | | $ | 913 | | | $ | 813 | | | $ | 985 | | | $ | 521 | | |
Ratios to average net assets: | |
Expenses (c) | | | .66 | %(d) | | | .65 | % | | | .64 | % | | | .63 | % | | | .68 | % | | | .68 | % | |
Net investment income | | | 2.17 | %(d) | | | 2.18 | % | | | 2.25 | % | | | 1.73 | % | | | 1.67 | % | | | 2.18 | % | |
Portfolio turnover rate (excluding
short-term securities) | | | 87.4 | %(e) | | | 85.8 | % | | | 141.4 | % | | | 232.2 | % | | | 370.7 | % | | | 231.3 | % | |
| | | Class 2 Shares | |
| | | Six months
ended
June 30,
2017 | |
Year ended December 31, | |
| | | (unaudited) | | 2016 | | 2015 | | 2014 | | 2013 | | 2012 | |
Net asset value, beginning of period | | $ | 1.886 | | | $ | 1.861 | | | $ | 1.808 | | | $ | 1.709 | | | $ | 1.744 | | | $ | 1.685 | | |
Income from investment operations: | |
Net investment income (a) | | | .018 | | | | .035 | | | | .037 | | | | .026 | | | | .025 | | | | .034 | | |
Net gains (losses) (both realized
and unrealized) | | | .004 | | | | (.010 | ) | | | .016 | | | | .073 | | | | (.060 | ) | | | .025 | | |
Total from investment operations | | | .022 | | | | .025 | | | | .053 | | | | .099 | | | | (.035 | ) | | | .059 | | |
Net asset value, end of period | | $ | 1.908 | | | $ | 1.886 | | | $ | 1.861 | | | $ | 1.808 | | | $ | 1.709 | | | $ | 1.744 | | |
Total return (b) | | | 1.19 | % | | | 1.32 | % | | | 2.95 | % | | | 5.76 | % | | | (1.98 | )% | | | 3.49 | % | |
Net assets, end of period (in thousands) | | $ | 89,679 | | | $ | 91,261 | | | $ | 93,502 | | | $ | 97,348 | | | $ | 95,570 | | | $ | 96,902 | | |
Ratios to average net assets: | |
Expenses (c) | | | .91 | %(d) | | | .90 | % | | | .89 | % | | | .88 | % | | | .93 | % | | | .93 | % | |
Net investment income | | | 1.92 | %(d) | | | 1.83 | % | | | 2.00 | % | | | 1.48 | % | | | 1.44 | % | | | 1.98 | % | |
Portfolio turnover rate (excluding
short-term securities) | | | 87.4 | %(e) | | | 85.8 | % | | | 141.4 | % | | | 232.2 | % | | | 370.7 | % | | | 231.3 | % | |
(a) Based on average shares outstanding during the year.
(b) Total return figures are based on a share outstanding throughout the period and assume reinvestment of distributions at net asset value. Total return figures do not reflect charges pursuant to the terms of the variable life insurance policies and variable annuity contracts funded by separate accounts that invest in the Fund's shares. For periods less than one year, total return presented has not been annualized.
(c) In addition to fees and expenses which the Fund bears directly, the Fund indirectly bears a pro rata share of the fees and expenses of the acquired funds in which it invests. Such indirect expenses are not included in the above reported expense ratios.
(d) Adjusted to an annual basis.
(e) Not annualized.
78
Securian Funds Trust
Financial Highlights – continued
SFT Advantus Real Estate Securities Fund
| | | Class 1 Shares | |
| | | Six months
ended
June 30,
2017 | |
Year ended December 31, | |
| | | (unaudited) | | 2016 | | 2015 | | 2014 | | 2013 | | 2012 | |
Net asset value, beginning of period | | $ | 4.526 | | | $ | 4.324 | | | $ | 4.108 | | | $ | 3.143 | | | $ | 3.100 | | | $ | 2.623 | | |
Income from investment operations: | |
Net investment income (a) | | | .056 | | | | .074 | | | | .066 | | | | .062 | | | | .050 | | | | .052 | | |
Net gains (losses) (both realized
and unrealized) | | | .088 | | | | .128 | | | | .150 | | | | .903 | | | | (.007 | ) | | | .425 | | |
Total from investment operations | | | .144 | | | | .202 | | | | .216 | | | | .965 | | | | .043 | | | | .477 | | |
Net asset value, end of period | | $ | 4.670 | | | $ | 4.526 | | | $ | 4.324 | | | $ | 4.108 | | | $ | 3.143 | | | $ | 3.100 | | |
Total return (b) | | | 3.20 | % | | | 4.66 | % | | | 5.25 | % | | | 30.70 | % | | | 1.40 | % | | | 18.20 | % | |
Net assets, end of period (in thousands) | | $ | 3,328 | | | $ | 3,085 | | | $ | 6,750 | | | $ | 5,489 | | | $ | 3,713 | | | $ | 2,522 | | |
Ratios to average net assets: | |
Expenses (c) | | | .85 | %(d) | | | .82 | % | | | .84 | % | | | .85 | % | | | .90 | % | | | .93 | % | |
Net investment income | | | 2.47 | %(d) | | | 1.68 | % | | | 1.59 | % | | | 1.70 | % | | | 1.55 | % | | | 1.75 | % | |
Portfolio turnover rate (excluding
short-term securities) | | | 39.0 | %(e) | | | 78.0 | % | | | 65.8 | % | | | 85.4 | % | | | 39.8 | % | | | 47.6 | % | |
| | | Class 2 Shares | |
| | | Six months
ended
June 30,
2017 | |
Year ended December 31, | |
| | | (unaudited) | | 2016 | | 2015 | | 2014 | | 2013 | | 2012 | |
Net asset value, beginning of period | | $ | 4.436 | | | $ | 4.249 | | | $ | 4.047 | | | $ | 3.104 | | | $ | 3.069 | | | $ | 2.603 | | |
Income from investment operations: | |
Net investment income (a) | | | .048 | | | | .063 | | | | .053 | | | | .050 | | | | .038 | | | | .034 | | |
Net gains (losses) (both realized
and unrealized) | | | .088 | | | | .124 | | | | .149 | | | | .893 | | | | (.003 | ) | | | .432 | | |
Total from investment operations | | | .136 | | | | .187 | | | | .202 | | | | .943 | | | | .035 | | | | .466 | | |
Net asset value, end of period | | $ | 4.572 | | | $ | 4.436 | | | $ | 4.249 | | | $ | 4.047 | | | $ | 3.104 | | | $ | 3.069 | | |
Total return (b) | | | 3.07 | % | | | 4.40 | % | | | 4.99 | % | | | 30.37 | % | | | 1.15 | % | | | 17.90 | % | |
Net assets, end of period (in thousands) | | $ | 134,288 | | | $ | 143,139 | | | $ | 145,156 | | | $ | 141,391 | | | $ | 112,753 | | | $ | 108,327 | | |
Ratios to average net assets: | |
Expenses (c) | | | 1.10 | %(d) | | | 1.08 | % | | | 1.09 | % | | | 1.10 | % | | | 1.15 | % | | | 1.18 | % | |
Net investment income | | | 2.18 | %(d) | | | 1.43 | % | | | 1.30 | % | | | 1.40 | % | | | 1.18 | % | | | 1.16 | % | |
Portfolio turnover rate (excluding
short-term securities) | | | 39.0 | %(e) | | | 78.0 | % | | | 65.8 | % | | | 85.4 | % | | | 39.8 | % | | | 47.6 | % | |
(a) Based on average shares outstanding during the year.
(b) Total return figures are based on a share outstanding throughout the period and assume reinvestment of distributions at net asset value. Total return figures do not reflect charges pursuant to the terms of the variable life insurance policies and variable annuity contracts funded by separate accounts that invest in the Fund's shares. For periods less than one year, total return presented has not been annualized.
(c) In addition to fees and expenses which the Fund bears directly, the Fund indirectly bears a pro rata share of the fees and expenses of the acquired funds in which it invests. Such indirect expenses are not included in the above reported expense ratios.
(d) Adjusted to an annual basis.
(e) Not annualized.
79
Securian Funds Trust
Financial Highlights – continued
SFT IvySM Growth Fund
| | | Class 2 Shares | |
| | | Six months
ended
June 30,
2017 | | Year ended December 31, | |
| | | (unaudited) | | 2016 | | 2015 | | 2014 (a) | |
Net asset value, beginning of period | | $ | 12.120 | | | $ | 12.012 | | | $ | 11.253 | | | $ | 10.000 | | |
Income from investment operations: | |
Net investment income (b) | | | .010 | | | | .034 | | | | .001 | | | | .011 | | |
Net gains (both realized and unrealized) | | | 1.582 | | | | .074 | | | | .758 | | | | 1.242 | | |
Total from investment operations | | | 1.592 | | | | .108 | | | | .759 | | | | 1.253 | | |
Net asset value, end of period | | $ | 13.712 | | | $ | 12.120 | | | $ | 12.012 | | | $ | 11.253 | | |
Total return (c) | | | 13.14 | % | | | 0.91 | % | | | 6.74 | % | | | 12.53 | % | |
Net assets, end of period (in thousands) | | $ | 469,005 | | | $ | 438,985 | | | $ | 479,081 | | | $ | 500,575 | | |
Ratios to average net assets: | |
Expenses (d) | | | .97 | %(e) | | | .98 | % | | | .97 | % | | | .96 | %(e) | |
Net investment income | | | .16 | %(e) | | | .29 | % | | | .01 | % | | | .15 | %(e) | |
Portfolio turnover rate (excluding short-term securities) | | | 23.3 | %(f) | | | 52.5 | % | | | 31.6 | % | | | 44.7 | %(f) | |
(a) The Fund commenced operations on May 1, 2014.
(b) Based on average shares outstanding during the year.
(c) Total return figures are based on a share outstanding throughout the period and assume reinvestment of distributions at net asset value. Total return figures do not reflect charges pursuant to the terms of the variable life insurance policies and variable annuity contracts funded by separate accounts that invest in the Fund's shares. For periods less than one year, total return presented has not been annualized.
(d) In addition to fees and expenses which the Fund bears directly, the Fund indirectly bears a pro rata share of the fees and expenses of the acquired funds in which it invests. Such indirect expenses are not included in the above reported expense ratios.
(e) Adjusted to an annual basis.
(f) Not annualized.
80
Securian Funds Trust
Financial Highlights – continued
SFT IvySM Small Cap Growth Fund
| | | Class 2 Shares | |
| | | Six months
ended
June 30,
2017 | | Year ended December 31, | |
| | | (unaudited) | | 2016 | | 2015 | | 2014 (a) | |
Net asset value, beginning of period | | $ | 12.611 | | | $ | 10.414 | | | $ | 10.810 | | | $ | 10.000 | | |
Income from investment operations: | |
Net investment income (b) | | | (.052 | ) | | | (.076 | ) | | | (.090 | ) | | | (.048 | ) | |
Net gains (losses) (both realized and unrealized) | | | 1.846 | | | | 2.273 | | | | (.306 | ) | | | .858 | | |
Total from investment operations | | | 1.794 | | | | 2.197 | | | | (.396 | ) | | | .810 | | |
Net asset value, end of period | | $ | 14.405 | | | $ | 12.611 | | | $ | 10.414 | | | $ | 10.810 | | |
Total return (c) | | | 14.22 | % | | | 21.10 | % | | | (3.66 | )% | | | 8.10 | % | |
Net assets, end of period (in thousands) | | $ | 175,312 | | | $ | 163,294 | | | $ | 145,465 | | | $ | 182,284 | | |
Ratios to average net assets: | |
Expenses (d) | | | 1.21 | %(e) | | | 1.24 | % | | | 1.19 | % | | | 1.22 | %(e) | |
Net investment income | | | (.77 | )%(e) | | | (.68 | )% | | | (.80 | )% | | | (.71 | )%(e) | |
Portfolio turnover rate (excluding short-term securities) | | | 33.1 | %(f) | | | 99.2 | % | | | 65.4 | % | | | 115.8 | %(f) | |
(a) The Fund commenced operations on May 1, 2014.
(b) Based on average shares outstanding during the year.
(c) Total return figures are based on a share outstanding throughout the period and assume reinvestment of distributions at net asset value. Total return figures do not reflect charges pursuant to the terms of the variable life insurance policies and variable annuity contracts funded by separate accounts that invest in the Fund's shares. For periods less than one year, total return presented has not been annualized.
(d) In addition to fees and expenses which the Fund bears directly, the Fund indirectly bears a pro rata share of the fees and expenses of the acquired funds in which it invests. Such indirect expenses are not included in the above reported expense ratios.
(e) Adjusted to an annual basis.
(f) Not annualized.
81
Securian Funds Trust
Financial Highlights – continued
SFT Pyramis® Core Equity Fund
| | | Class 1 Shares | |
| | | Six months
ended
June 30,
2017 | | Year ended December 31, | |
| | | (unaudited) | | 2016 | | 2015 | | 2014 (a) | |
Net asset value, beginning of period | | $ | 11.834 | | | $ | 11.261 | | | $ | 11.148 | | | $ | 10.000 | | |
Income from investment operations: | |
Net investment income (b) | | | .046 | | | | .089 | | | | .075 | | | | .053 | | |
Net gains (both realized and unrealized) | | | 1.051 | | | | .484 | | | | .038 | | | | 1.095 | | |
Total from investment operations | | | 1.097 | | | | .573 | | | | .113 | | | | 1.148 | | |
Net asset value, end of period | | $ | 12.931 | | | $ | 11.834 | | | $ | 11.261 | | | $ | 11.148 | | |
Total return (c) | | | 9.27 | % | | | 5.09 | % | | | 1.01 | % | | | 11.48 | % | |
Net assets, end of period (in thousands) | | $ | 787 | | | $ | 696 | | | $ | 587 | | | $ | 663 | | |
Ratios to average net assets: | |
Expenses (d) | | | .83 | %(e) | | | .80 | % | | | .78 | % | | | .86 | %(e) | |
Net investment income | | | .74 | %(e) | | | .80 | % | | | .66 | % | | | .74 | %(e) | |
Portfolio turnover rate (excluding short-term securities) | | | 34.4 | %(f) | | | 88.8 | % | | | 84.6 | % | | | 54.2 | %(f) | |
| | | Class 2 Shares | |
| | | Six months
ended
June 30,
2017 | | Year ended December 31, | |
| | | (unaudited) | | 2016 | | 2015 | | 2014 (a) | |
Net asset value, beginning of period | | $ | 11.755 | | | $ | 11.214 | | | $ | 11.129 | | | $ | 10.000 | | |
Income from investment operations: | |
Net investment income (b) | | | .030 | | | | .060 | | | | .046 | | | | .035 | | |
Net gains (both realized and unrealized) | | | 1.044 | | | | .481 | | | | .039 | | | | 1.094 | | |
Total from investment operations | | | 1.074 | | | | .541 | | | | .085 | | | | 1.129 | | |
Net asset value, end of period | | $ | 12.829 | | | $ | 11.755 | | | $ | 11.214 | | | $ | 11.129 | | |
Total return (c) | | | 9.13 | % | | | 4.83 | % | | | 0.76 | % | | | 11.29 | % | |
Net assets, end of period (in thousands) | | $ | 115,668 | | | $ | 113,799 | | | $ | 128,297 | | | $ | 141,272 | | |
Ratios to average net assets: | |
Expenses (d) | | | 1.08 | %(e) | | | 1.05 | % | | | 1.03 | % | | | 1.11 | %(e) | |
Net investment income | | | .48 | %(e) | | | .54 | % | | | .41 | % | | | .49 | %(e) | |
Portfolio turnover rate (excluding short-term securities) | | | 34.4 | %(f) | | | 88.8 | % | | | 84.6 | % | | | 54.2 | %(f) | |
(a) The Fund commenced operations on May 1, 2014.
(b) Based on average shares outstanding during the year.
(c) Total return figures are based on a share outstanding throughout the period and assume reinvestment of distributions at net asset value. Total return figures do not reflect charges pursuant to the terms of the variable life insurance policies and variable annuity contracts funded by separate accounts that invest in the Fund's shares. For periods less than one year, total return presented has not been annualized.
(d) In addition to fees and expenses which the Fund bears directly, the Fund indirectly bears a pro rata share of the fees and expenses of the acquired funds in which it invests. Such indirect expenses are not included in the above reported expense ratios.
(e) Adjusted to an annual basis.
(f) Not annualized.
82
Securian Funds Trust
Financial Highlights – continued
SFT T. Rowe Price Value Fund
| | | Class 2 Shares | |
| | | Six months
ended
June 30,
2017 | | Year ended December 31, | |
| | | (unaudited) | | 2016 | | 2015 | | 2014 (a) | |
Net asset value, beginning of period | | $ | 11.747 | | | $ | 10.617 | | | $ | 10.836 | | | $ | 10.000 | | |
Income from investment operations: | |
Net investment income (b) | | | .075 | | | | .173 | | | | .119 | | | | .077 | | |
Net gains (losses) (both realized and unrealized) | | | .916 | | | | .957 | | | | (.338 | ) | | | .759 | | |
Total from investment operations | | | .991 | | | | 1.130 | | | | (.219 | ) | | | .836 | | |
Net asset value, end of period | | $ | 12.738 | | | $ | 11.747 | | | $ | 10.617 | | | $ | 10.836 | | |
Total return (c) | | | 8.43 | % | | | 10.65 | % | | | (2.02 | )% | | | 8.36 | % | |
Net assets, end of period (in thousands) | | $ | 219,431 | | | $ | 208,513 | | | $ | 207,698 | | | $ | 233,202 | | |
Ratios to average net assets: | |
Expenses (d) | | | 1.02 | %(e) | | | 1.03 | % | | | 1.01 | % | | | 1.02 | %(e) | |
Net investment income | | | 1.23 | %(e) | | | 1.59 | % | | | 1.10 | % | | | 1.10 | %(e) | |
Portfolio turnover rate (excluding short-term securities) | | | 45.4 | %(f) | | | 102.9 | % | | | 65.0 | % | | | 105.1 | %(f) | |
(a) The Fund commenced operations on May 1, 2014.
(b) Based on average shares outstanding during the year.
(c) Total return figures are based on a share outstanding throughout the period and assume reinvestment of distributions at net asset value. Total return figures do not reflect charges pursuant to the terms of the variable life insurance policies and variable annuity contracts funded by separate accounts that invest in the Fund's shares. For periods less than one year, total return presented has not been annualized.
(d) In addition to fees and expenses which the Fund bears directly, the Fund indirectly bears a pro rata share of the fees and expenses of the acquired funds in which it invests. Such indirect expenses are not included in the above reported expense ratios.
(e) Adjusted to an annual basis.
(f) Not annualized.
83
Securian Funds Trust
Notes to Financial Statements
(1) Organization
Securian Funds Trust (the "Trust") is a Delaware statutory trust registered under the Investment Company Act of 1940, as amended (the "1940 Act") as a no-load, diversified open-end management investment company, except that SFT Advantus International Bond Fund operates as a non-diversified, open-end management investment company. The Trust is a series trust that includes the Funds and share classes listed below:
Fund Name | | Share Class 1 | | Share Class 2 | |
SFT Advantus Bond Fund | | | P | | | | P | | |
SFT Advantus Dynamic Managed Volatility Fund | | | NA | | | | P | | |
SFT Advantus Government Money Market Fund | | | NA | | | | P | | |
SFT Advantus Index 400 Mid-Cap Fund | | | P | | | | P | | |
SFT Advantus Index 500 Fund | | | P | | | | P | | |
SFT Advantus International Bond Fund | | | P | | | | P | | |
SFT Advantus Managed Volatility Equity Fund | | | NA | | | | P | | |
SFT Advantus Mortgage Securities Fund | | | P | | | | P | | |
SFT Advantus Real Estate Securities Fund | | | P | | | | P | | |
SFT IvySM Growth Fund | | | NA | | | | P | | |
SFT IvySM Small Cap Growth Fund | | | NA | | | | P | | |
SFT Pyramis® Core Equity Fund | | | P | | | | P | | |
SFT T. Rowe Price Value Fund | | | NA | | | | P | | |
Advantus Capital Management, Inc. ("Advantus Capital"), a wholly-owned subsidiary of Securian Financial Group, Inc. ("Securian Financial Group"), serves as the investment adviser to each of the Funds in the Trust pursuant to an investment advisory agreement between Advantus Capital and the Trust. The Trust's prospectus provides a detailed description of each Fund's investment objective, policies and strategies.
Class 2 shares are subject to a 12b-1 distribution fee. Both classes of shares have identical voting, dividend, liquidation and other rights, and the same terms and conditions, except that Class 1 shares are not subject to a 12b-1 distribution fee. Income, expenses (other than Rule 12b-1 fees) and realized and unrealized gains or losses are allocated to each class of shares based upon their relative net assets.
The Trust accounts for the assets, liabilities and operations of each Fund separately. Shares of the Trust are not offered directly to the public, but sold only to Minnesota Life Insurance Company ("Minnesota Life") and Securian Life Insurance Company ("Securian Life") in connection with Minnesota Life and Securian Life variable life insurance policies and variable annuity contracts, and to certain other separate accounts of life insurance affiliates of Minnesota Life and Securian Life, and may also be offered to certain qualified plans.
(2) Summary of Significant Accounting Policies
The Funds are investment companies and follow accounting and reporting guidance under Financial Accounting Standards Board (FASB) Accounting Standards Codification (ASC) Topic 946, "Financial Services – Investment Companies." The significant accounting policies followed consistently by the Trust are as follows:
Use of Estimates
The preparation of financial statements in conformity with U.S. generally accepted accounting principles (GAAP) requires management to make estimates and assumptions that affect the reported amounts of assets and liabilities, including disclosure of contingent assets and liabilities, as of the balance sheet date and the reported amounts of revenue and expenses during the reporting period. Actual results could differ from those estimates.
Investments in Securities
Each Fund's net asset value is generally calculated as of the close of normal trading on the New York Stock Exchange (typically 3:00 p.m. Central Time). Investments in securities traded on a U.S. or foreign securities exchange are valued at the last sale price on that exchange prior to the time when assets are valued; securities
84
Securian Funds Trust
Notes to Financial Statements – continued
(2) Summary of Significant Accounting Policies – (continued)
traded in the over-the-counter market and listed securities for which no sale was reported on that date are valued on the basis of the last current bid price, by an independent pricing service or at a price deemed best to reflect fair value quoted by dealers who make markets in these securities. The pricing service may use models that price securities based on current yields and relative security characteristics, such as coupon rate, maturity date, issuer credit quality and prepayment speeds, as applicable. When market quotations are not readily available, securities are valued at fair value as determined in good faith by the Advantus Capital Valuation Committee ("the Valuation Committee") under the supervision of the Trust's Board of Trustees ("the Board") and in accordance with Board-approved valuation policies and procedures. The Board has delegated the daily oversight of the securities valuation function to the Valuation Committee whose members ensure the valuations comply with the valuation policies and affirms the reasonableness of the fair valuation determinations. The fair valued securities are reviewed by the Board at their quarterly meetings.
A Fund's investments will also be valued at fair value by the Valuation Committee if Advantus Capital determines that an event impacting the value of an investment occurred after the close of the security's primary exchange or market (for example, a foreign exchange or market) and before the time the Fund's net asset value is calculated. If a significant event impacting the value of a security or group of securities occurs, the Valuation Committee is immediately notified and the members meet promptly to determine whether fair value pricing is needed in accordance with the Fund's valuation procedures and, if so, to approve the pricing methodology to be used.
Short-term securities, with the exception of those held in the SFT Advantus Government Money Market Fund, are valued at market value. Pursuant to Rule 2a-7 of the 1940 Act, all securities in the SFT Advantus Government Money Market Fund are valued at amortized cost, which approximates market value, in order to attempt to maintain a constant net asset value of $1.00 per share. However, there is no assurance the SFT Advantus Government Money Market Fund will maintain the $1.00 net asset value.
Security transactions are accounted for on the date the securities are purchased or sold. Realized gains and losses are calculated using the first in, first out basis. Paydowns of securities are recorded as receivables as of the due date, which varies by the issuer. Dividend income is recognized on the ex-dividend date or upon dividend notification for certain foreign securities, and interest income, including amortization of bond premium and accretion of bond discount computed on an effective yield basis, is accrued daily.
Foreign Currency Translations and Forward Foreign Currency Contracts
Securities and other assets and liabilities denominated in foreign currencies are translated daily into U.S. dollars at the closing rate of exchange. Foreign currency amounts related to the purchase or sale of securities, income and expenses are translated at the exchange rate on the transaction date. The Fund isolates the portion of the results of operations resulting from changes in foreign exchange rates on investments from the fluctuations arising from changes in market prices of securities.
Net realized foreign exchange gains or losses arise from sales and maturities of short-term securities, sales of foreign currencies, currency gains or losses realized between trade and settlement dates on security transactions, the difference between the amounts of dividends, interest and foreign withholding taxes recorded on the Fund's books and the U.S. dollar equivalent of the amounts actually received or paid. Net unrealized foreign exchange gains and losses arise from changes in the value of assets and liabilities, other than investments in securities, resulting from changes in the exchange rates.
SFT Advantus International Bond Fund may enter into forward foreign currency exchange contracts for operational purposes and to protect against adverse exchange rate fluctuations. A forward foreign currency contract is an agreement between the Fund and a counterparty to buy or sell a foreign currency at a specific exchange rate on a future date. SFT Advantus International Bond Fund may also enter into these contracts for
85
Securian Funds Trust
Notes to Financial Statements – continued
(2) Summary of Significant Accounting Policies – (continued)
purposes of increasing exposure to a foreign currency or to shift exposure to foreign currency fluctuations from one country to another. The net U.S. dollar value of foreign currency underlying all contractual commitments held by SFT Advantus International Bond Fund and the resulting unrealized appreciation or depreciation are determined using foreign currency exchange rates from an independent pricing service. SFT Advantus International Bond Fund is subject to the credit risk that the other party will not complete the obligations of the contract. The fair values of the forward foreign currency exchange contracts are obtained from an independent pricing source.
Futures Transactions
To gain exposure to, or for protection from market changes, the Funds (excluding the SFT Advantus Government Money Market Fund) may buy and sell financial futures contracts traded on any U.S. or foreign exchange. The Funds may also buy and write put and call options on these futures contracts. Risks of entering into futures contracts and related options include the possibility of an illiquid market and that a change in the value of the contract or option may not correlate with changes in the value of the underlying securities.
Upon entering into a futures contract, a Fund is required to deposit either cash or securities in an amount (initial margin) equal to a certain percentage of the contract value as determined by each relevant clearing agency and is aggregated at a Futures Commission Merchant ("FCM") which is registered with the Commodity Futures Trading Commission or the applicable regulator. Subsequent payments (variation margin) are made or received by a Fund each day. The variation margin payments are equal to the daily changes in the contract value and are recorded as unrealized gains and losses. A Fund recognizes a realized gain or loss when the contract is closed or expired. In the event of default, counterparty risk is significantly reduced as creditors to the FCM do not have claim to a Fund's assets in the segregated account. For a listing of open futures contracts see the Investments in Securities for each Fund.
Interest Rate Swaps
The SFT Advantus International Bond Fund may enter into interest rate swap contracts primarily to manage interest rate risk. An interest rate swap is an agreement between the Fund and a counterparty to exchange interest rate cash flows during the life of the agreement. Each party's payment obligation is computed based on different interest rates, applied to a notional amount. Interest rate swaps often exchange payments based on a fixed rate for payments linked to a floating rate (i.e. LIBOR).
These agreements are executed on a registered exchange ("centrally cleared interest rate swaps"), significantly reducing risk from counterparty default. Upon entering into an interest rate swap contract, a Fund is required to pledge an initial margin, and the daily change in fair value is accounted for as a variation margin payable or receivable on the Statement of Assets and Liabilities. Over the term of the contract, contractually required payments to be paid and to be received are accrued daily and recorded as unrealized appreciation and depreciation until the payments are made, at which time they are realized.
Options Transactions
Each Fund (excluding the SFT Advantus Government Money Market Fund) may write (i.e., sell) covered call and secured put options and purchase and sell put and call options written by others. An option is a type of derivative financial instrument. The Funds may invest in derivative financial instruments, including options, in order to manage risk or gain exposure to various other investments or markets. The risk in writing a call option is that the Fund gives up the opportunity for profit if the market price of the security increases. The risk in writing a put option is that a Fund may incur a loss if the market price of the security decreases and the option is exercised. The risk in buying an option is that the Fund pays a premium whether or not the option is exercised. The Fund also has the additional risk of not being able to enter into a closing transaction if a liquid secondary market does not exist.
86
Securian Funds Trust
Notes to Financial Statements – continued
(2) Summary of Significant Accounting Policies – (continued)
Option contracts are valued daily and unrealized appreciation or depreciation is recorded. The Fund will realize a gain or loss upon expiration or closing of the option transaction. When an option is exercised, the proceeds on sales for a written call option, the purchase cost for a written put option, or the cost of a security for a purchased put or call option is adjusted by the amount of premium received or paid. The Funds designate collateral consisting of cash, U.S. government securities or other liquid assets sufficient to collateralize the market value of written options.
Repurchase Agreements
Each Fund may enter into repurchase agreements with respect to securities. A repurchase agreement is a transaction in which a Fund acquires a security and simultaneously commits to resell that security to the seller (a bank or securities dealer) at an agreed-upon price on an agreed-upon date. Each Fund requires at all times that the repurchase agreement be collateralized by cash, U.S. Government securities, U.S. Government agencies securities or corporate securities having a value equal to, or in excess of, the value of the repurchase agreement. If the seller of the agreement defaults on its obligation to repurchase the underlying securities at a time when the value of those securities has declined, a Fund may incur a loss upon disposition of the securities. Repurchase agreements are carried at amortized cost. At June 30, 2017, no Funds were invested in repurchase agreements.
Federal Taxes
Each Fund, other than SFT Advantus Dynamic Managed Volatility Fund, SFT Advantus International Bond Fund, SFT Advantus Managed Volatility Equity Fund, and SFT T. Rowe Price Value Fund, qualifies for federal income tax purposes as a partnership under the Internal Revenue Code of 1986, as amended (the "Code"). A Fund is treated, for federal income tax purposes, as a partnership if it has more than one shareholder. A Fund's election to be treated as a partnership is not expected to result in any material adverse federal income tax consequences to any owner of a variable annuity contract or variable life insurance policy, or in the tax treatment of any such contract or policy. As a partnership, a Fund is not subject to income tax, and any income, gains, deductions or losses of the Fund will instead pass through and be taken into account for federal income tax purposes by its partners, which will be Minnesota Life and Securian Life through their respective separate accounts. SFT Advantus Dynamic Managed Volatility Fund, SFT Advantus Managed Volatility Equity Fund and SFT T. Rowe Price Value Fund are treated as disregarded entities for federal income tax purposes. While the Trust anticipates that each Fund other than SFT Advantus Dynamic Managed Volatility Fund, SFT Advantus Managed Volatility Equity Fund, and SFT T. Rowe Price Value Fund will always have two shareholders, Minnesota Life and Securian Life, a wholly owned subsidiary of Minnesota Life, such ownership could change and accordingly a Fund may at some time have only one shareholder and would be treated as a disregarded entity for federal income tax purposes. A disregarded entity is disregarded for federal income tax purposes as an entity separate from its owner, and the owner is treated as directly owning the assets of the disregarded entity and takes into account for federal income tax purposes the income, gains, deductions and losses relating to those assets.
Effective January 1, 2016, SFT Advantus International Bond Fund elected to qualify and intends to continue to qualify as a regulated investment company for federal income tax purposes. The Fund's policy is to comply with the requirements of subchapter M of the Internal Revenue Code that are applicable to regulated investment companies and to distribute all (or a sufficient amount) its taxable income and net capital gain to its shareholders. Therefore, no income tax provision is required.
The FASB, Accounting Standards Codification 740, Income Taxes (ASC 740), provides guidance for how uncertain tax positions should be recognized, measured, presented, and disclosed in the financial statements. The Funds have evaluated the implications of ASC 740 for all open tax years, and have determined there is no impact to the Funds' financial statements as of the six months ended June 30, 2017. The Funds' federal and
87
Securian Funds Trust
Notes to Financial Statements – continued
(2) Summary of Significant Accounting Policies – (continued)
state income returns for which the applicable statutes of limitations have not expired (2014, 2015 and 2016) remain subject to examination by the Internal Revenue Service and states department of revenue.
Net investment income (loss) and net realized gains (losses) may differ for financial statement and tax purposes primarily because of temporary book-to-tax differences.
Distributions to Shareholders
Distributions to shareholders from net investment income and realized gains (if any) for the SFT Advantus Government Money Market Fund are declared daily and reinvested at month-end in additional shares of capital stock. Distributions to shareholders from net investment income and realized gains (if any) for the SFT Advantus International Bond Fund are generally declared and reinvested in additional shares of capital stock on an annual basis. The SFT Advantus International Bond Fund uses consent dividends in place of regular distributions. The Funds within the partnership are not required to distribute taxable income, and Funds other than SFT Advantus Government Money Market Fund and SFT International Bond Fund will not distribute taxable income.
Securities Purchased on a When-Issued Basis
Delivery and payment for securities which have been purchased by a Fund on a forward commitment or when-issued basis can take place a month or more after the transaction date. During this period, such securities are subject to market fluctuations. As of June 30, 2017, the SFT Advantus Bond Fund and SFT Advantus Mortgage Securities Fund had entered into outstanding, when-issued or forward commitments at fair value of $12,903,664 and $6,508,815, respectively. The Funds have segregated assets to cover such when-issued and forward commitments.
Money Market Fund Reform
In July 2014, the Securities and Exchange Commission adopted amendments to the rules that govern money market funds ("Rule 2a-7"). In response to the amendments, effective April 29, 2016, the Fund has changed its name to the SFT Advantus Government Money Market Fund and converted to a 'government' money market fund, as defined under Rule 2a-7. As a result, on and after April 29, 2016, the Fund will invest at least 99.5% of its total assets in cash, government securities, and/or repurchase agreements that are collateralized fully (i.e., collateralized by cash or government securities), as required by Rule 2a-7. It is expected that the Fund's future total returns will be lower than its historical returns due to the conversion to a government money market fund.
Cross-Trades
The Funds are permitted to purchase and sell securities ("cross-trade") from and to other Funds within the Trust as well as outside of the Trust, where both accounts are managed by the same sub-adviser pursuant to "Cross-Trading" procedures adopted by the Board. These procedures have been designed to ensure that any cross-trade of securities by a respective Fund from and to another fund that is or could be considered an affiliate of the Funds under certain limited circumstances by virtue of having a common investment adviser, common officer, or common trustee complies with Rule 17a-7 of the 1940 Act. Further, as defined under these procedures, each cross-trade is effected at the current market price to save costs where allowed. Pursuant to these procedures, for the period ended June 30, 2017, the Funds engaged in the following cross-trades, which resulted in the following net realized gains (losses):
| | Purchases | | Sales | | Net Realized
Gains (Losses) | |
SFT Advantus International Bond Fund | | $ | — | | | $ | 7,920,000 | | | $ | 24,407 | | |
SFT T. Rowe Price Value Fund | | | 292,624 | | | | — | | | | — | | |
88
Securian Funds Trust
Notes to Financial Statements – continued
(3) Investment Security Transactions
The cost of purchases and proceeds from sales of investment securities, other than temporary investments in short-term securities, for the six months ended June 30, 2017 were as follows:
| | | Non-U.S. Government | | U.S. Government* | |
| | | Purchases | | Sales | | Purchases | | Sales | |
SFT Advantus Bond Fund | | $ | 165,385,783 | | | $ | 154,760,248 | | | $ | 244,160,798 | | | $ | 240,367,646 | | |
SFT Advantus Dynamic Managed Volatility Fund | | | 26,420,595 | | | | 1,123,452 | | | | – | | | | 161,529 | | |
SFT Advantus Index 400 Mid-Cap Fund | | | 23,469,061 | | | | 26,348,633 | | | | – | | | | – | | |
SFT Advantus Index 500 Fund | | | 10,919,996 | | | | 14,631,285 | | | | – | | | | – | | |
SFT Advantus International Bond Fund | | | 21,665,457 | | | | 30,590,862 | | | | – | | | | – | | |
SFT Advantus Managed Volatility Equity Fund | | | 24,224,246 | | | | 18,758,810 | | | | – | | | | – | | |
SFT Advantus Mortgage Securities Fund | | | 12,724,303 | | | | 11,400,680 | | | | 69,116,036 | | | | 73,025,347 | | |
SFT Advantus Real Estate Securities Fund | | | 54,222,589 | | | | 63,413,595 | | | | – | | | | – | | |
SFT IvySM Growth Fund | | | 106,852,857 | | | | 136,537,580 | | | | – | | | | – | | |
SFT IvySM Small Cap Growth Fund | | | 54,032,358 | | | | 63,554,625 | | | | – | | | | – | | |
SFT Pyramis® Core Equity Fund | | | 39,630,674 | | | | 46,900,471 | | | | – | | | | – | | |
SFT T. Rowe Price Value Fund | | | 97,158,339 | | | | 101,700,543 | | | | – | | | | – | | |
* Includes U.S. government-sponsored enterprise securities.
(4) Expenses and Related Party Transactions
The Funds have an investment advisory agreement with Advantus Capital, a wholly-owned subsidiary of Securian Financial Group. Under the advisory agreement, Advantus Capital manages the Funds' investments and provides research, statistical and advisory services and pays related office rental and executive expenses and salaries.
Each Fund of the Trust pays Advantus Capital an annual fee, based on average daily net assets, in the following amounts:
| | | Annual Fee on Net Assets | |
SFT Advantus Bond Fund | | 0.40% of net assets to $1 billion; and 0.35% of net assets exceeding $1 billion | |
SFT Advantus Dynamic Managed Volatility Fund | |
0.65% of all assets | |
SFT Advantus Government Money Market Fund | |
0.30% of net assets to $1 billion; and 0.25% of net assets exceeding $1 billion | |
SFT Advantus Index 400 Mid-Cap Fund | | 0.15% of net assets to $1 billion; and 0.10% of net assets exceeding $1 billion | |
SFT Advantus Index 500 Fund | | 0.15% of net assets to $1 billion; and 0.10% of net assets exceeding $1 billion | |
SFT Advantus International Bond Fund | | 0.60% of net assets to $1 billion; and 0.55% of net assets exceeding $1 billion | |
SFT Advantus Managed Volatility Equity Fund | | 0.65% of all assets | |
SFT Advantus Mortgage Securities Fund | | 0.40% of net assets to $1 billion; and 0.35% of net assets exceeding $1 billion | |
SFT Advantus Real Estate Securities Fund | | 0.70% of net assets to $1 billion; and 0.65% of net assets exceeding $1 billion | |
SFT IvySM Growth Fund | | 0.67% of net assets to $500 million; and 0.625% of next $300 million of net assets; and 0.60% of next $200 million of net assets; and 0.50% of net assets exceeding $1 billion | |
SFT IvySM Small Cap Growth Fund | | 0.85% of net assets to $1 billion; and 0.80% of next $2 billion of net assets; and 0.76% of net assets exceeding $3 billion | |
SFT Pyramis® Core Equity Fund | | 0.65% of all assets | |
SFT T. Rowe Price Value Fund | | 0.67% of net assets to $1 billion; and 0.65% of next $1.5 billion of net assets; and 0.60% of net assets exceeding $2.5 billion | |
89
Securian Funds Trust
Notes to Financial Statements – continued
(4) Expenses and Related Party Transactions – (continued)
Advantus Capital has a sub-advisory agreement with Franklin Advisers, Inc. ("Franklin"), a registered investment Advisor for the SFT Advantus International Bond Fund, under which Advantus Capital pays Franklin an annual fee of 0.37% based on average daily net assets.
Advantus Capital has a sub-advisory agreement with Waddell & Reed Investment Management Company ("WRIMCO"), a registered investment Advisor for the SFT IvySM Growth Fund and the SFT IvySM Small Cap Growth Fund, under which Advantus Capital pays WRIMCO an annual fee ranging from 0.33% to 0.55% and 0.40% to 0.82% respectively, based on average daily net assets.
Advantus Capital has a sub-advisory agreement with Pyramis Global Advisors, LLC ("Pyramis"), a registered investment Advisor for the SFT Pyramis® Core Equity Fund, under which Advantus Capital pays Pyramis an annual fee ranging from 0.31% to 0.33% based on average daily net assets.
Advantus Capital has a sub-advisory agreement with T. Rowe Price Associates, Inc. ("T. Rowe Price"), a registered investment Advisor for the SFT T. Rowe Price Value Fund, under which Advantus Capital pays T. Rowe Price an annual fee ranging from 0.30% to 0.50% based on average daily net assets.
The Trust bears certain other operating expenses including independent trustees' fees, federal registration fees, printing and shareholder report expenses, legal fees, audit fees, custodian fees, compensation paid to the Trust's Chief Compliance Officer, and other miscellaneous expenses. Each Fund will pay all expenses directly related to its individual operations. Operating expenses not attributable to a specific Fund are generally allocated based upon the proportionate daily net assets of each Fund.
Administrative Services Fee
The Trust has an agreement with Securian Financial Group under which Securian Financial Group provides accounting, legal and other administrative services. Each Fund reimburses Securian Financial Group quarterly for the actual costs incurred in performing such services, as determined in accordance with Securian Financial Group's customary cost accounting procedures consistently applied. Total quarterly administrative fees by Fund range from $4,616 to $23,764.
Accounting Services
The Trust has an agreement with State Street Bank and Trust Company ("State Street") in which State Street provides daily fund accounting and investment administration services. In 2017, these fees ranged from .01% to .05% of net assets depending on the size and makeup of the respective Fund. The fees are based upon a calculation of multiple factors including base fees, size of assets, and certain other fees.
Distribution Fees
The Trust has adopted a Rule 12b-1 Distribution Plan which covers all of its Class 2 shares ("Covered Funds"). Each Covered Fund pays distribution fees at the annual rate of .25% of the average daily net assets of the Covered Fund. These fees are paid out of the Covered Fund's assets, which reduces a Covered Fund's net assets as do other Covered Fund expenses. The fees are paid to Securian Financial Services, Inc. ("Securian Financial"), the Trust's underwriter, to pay for distribution-related expenses and activities in connection with the distribution of the Covered Fund's shares. Securian Financial may also use the fees to pay insurance companies, dealers or others for certain non-distribution services as provided for in the Distribution Plan.
Net Investment Income Maintenance Agreement for the SFT Advantus Government Money Market Fund
Effective May 1, 2012, the Board of Trustees of the Trust approved a Restated Net Investment Income Maintenance Agreement among Securian Funds Trust (on behalf of SFT Advantus Government Money Market Fund), Advantus Capital and Securian Financial. Under such Agreement, Advantus Capital agrees to waive, reimburse or pay SFT Advantus Government Money Market Fund expenses so that the Fund's daily net
90
Securian Funds Trust
Notes to Financial Statements – continued
(4) Expenses and Related Party Transactions – (continued)
investment income does not fall below zero. Securian Financial may also waive its Rule 12b-1 fees. Advantus Capital and Securian Financial each has the option under the Agreement to recover the full amount waived, reimbursed or paid (the "Expense Waiver") on any day on which the Fund's net investment income exceeds zero. On any day, however, the Expense Waiver does not constitute an obligation of the Fund unless Advantus Capital or Securian Financial has expressly exercised its right to recover a specified portion of the Expense Waiver on that day, in which case such specified portion is then due and payable by the Fund. In addition, the right of Advantus Capital and/or Securian Financial to recover the Expense Waiver is subject to the following limitations: (1) if a repayment of the Expense Waiver by the Fund would cause the Fund's net investment income to fall below zero, such repayment is deferred until a date when repayment would not cause the Fund's net investment income to fall below zero; (2) the right to recover any portion of the Expense Waiver expires three years after the effective date of that portion of the Expense Waiver; and (3) any repayment of the Expense Waiver by the Fund cannot cause the Fund's expense ratio to exceed 1.25%. For the six months ended June 30, 2017, the advisory, 12b-1 distribution and other fee waivers totaled $46,918, $30,310 and $0 respectively. These amounts are reflected as fees waived in the accompanying Statement of Operations. As of June 30, 2017, Advantus Capital and Securian Financial have collectively waived a cumulative total of $4,631,950 pursuant to the Agreement, including expenses waived under the prior agreement with Advantus Series Fund, Inc., of which $1,505,097 was eligible for recovery by Advantus Capital and Securian Financial as of such date. Amounts subject to potential recovery for the periods ended June 30, 2018 and 2019 are $852,153, and $300,636, respectively. If Advantus Capital and Securian Financial exercise their rights to be paid such waived amounts, the Fund's future yield will be negatively affected for an indefinite period. The Agreement shall continue in effect following April 30, 2018, provided such continuance is specifically approved by a majority of the Trust's independent Trustees.
SFT Advantus Dynamic Managed Volatility Fund Expense Waivers
Advantus Capital and the Trust, on behalf of the SFT Advantus Dynamic Managed Volatility Fund, have entered into an Expense Limitation Agreement, dated May 1, 2013, which limits the operating expenses of the Fund, excluding certain expenses (such as interest expense, acquired fund fees, cash overdraft fees, taxes, brokerage commissions, other expenditures which are capitalized in accordance with GAAP, and other extraordinary expenses not incurred in the ordinary course of the Fund's business), to 0.80% of the Fund's average daily net assets through April 30, 2018. The Agreement renews annually for a full year each year thereafter unless terminated by Advantus Capital upon at least 30 days' notice prior to the end of a contract term. The Fund is authorized to reimburse Advantus Capital for management fees previously waived and/or for the cost of expenses previously paid by Advantus Capital pursuant to this agreement, provided that such reimbursement will not cause the Fund to exceed any limits in effect at the time of such reimbursement. The Fund's ability to reimburse Advantus Capital in this manner only applies to fees waived or reimbursements made by Advantus Capital within the three fiscal years prior to the date of such reimbursement. For the six months ended June 30, 2017, the advisory waivers totaled $272,818. This amount is reflected as fees waived in the accompanying Statements of Operations. As of June 30, 2017, Advantus Capital has waived a cumulative total of $1,577,060 pursuant to the Agreement, of which $1,311,188, was eligible for recovery by Advantus Capital and Securian Financial as of such date. Amounts subject to potential recovery for the periods ended June 30, 2018 and 2019 are $956,636 and $506,890 respectively. To the extent that the Fund makes such reimbursements to Advantus Capital, the amount of the reimbursements will be reflected in the financial statements in the Fund's shareholder reports and in Other Expenses under Fees and Expenses of the Fund in the prospectus.
SFT Advantus Managed Volatility Equity Fund Expense Waivers
Advantus Capital and the Trust, on behalf of the SFT Advantus Managed Volatility Equity Fund, have entered into an Expense Limitation Agreement, dated November 18, 2015, which limits the operating expenses of the Fund, excluding certain expenses (such as interest expense, acquired fund fees, cash overdraft fees, taxes,
91
Securian Funds Trust
Notes to Financial Statements – continued
(4) Expenses and Related Party Transactions – (continued)
brokerage commissions, other expenditures which are capitalized in accordance with GAAP, and other extraordinary expenses not incurred in the ordinary course of the Fund's business), to 0.80% of the Fund's average daily net assets through November 17, 2017. The Agreement renews annually for a full year each year thereafter unless terminated by Advantus Capital upon at least 30 days' notice prior to the end of a contract term. The Fund is authorized to reimburse Advantus Capital for management fees previously waived and/or for the cost of expenses previously paid by Advantus Capital pursuant to this agreement, provided that such reimbursement will not cause the Fund to exceed any limits in effect at the time of such reimbursement. The Fund's ability to reimburse Advantus Capital in this manner only applies to fees waived or reimbursements made by Advantus Capital within the three fiscal years prior to the date of such reimbursement. For the six months ended June 30, 2017, the advisory waivers totaled $203,098. This amount is reflected as fees waived in the accompanying Statement of Operations. As of June 30, 2017, Advantus Capital has waived a cumulative total of $564,405 pursuant to the Agreement, all of which was eligible for recovery by Advantus Capital and Securian Financial as of such date. Amounts subject to potential recovery for the years ended June 30, 2018 and 2019 are $564,405 and $393,318 respectively. To the extent that the Fund makes such reimbursements to Advantus Capital, the amount of the reimbursements will be reflected in the financial statements in the Fund's shareholder reports and in Other Expenses under Fees and Expenses of the Fund in the prospectus.
(5) Illiquid Securities
Each Fund currently limits investments in illiquid securities to 15% of net assets at the time of purchase, except for the SFT Advantus Government Money Market Fund which limits its investment in illiquid securities to 5% of net assets. At June 30, 2017, the SFT Advantus Bond Fund, SFT Advantus Dynamic Managed Volatility Fund, and SFT Advantus Mortgage Securities Fund held illiquid securities of $1,831,883, $4,100,121, and $1,122,998, respectively, which represent 0.5%, 1.2%, and 1.2% of net assets, respectively. Pursuant to guidelines adopted by the Trust's Board of Trustees, certain unregistered securities are determined to be liquid and are not included within the percent limitations specified above.
The following is a list of illiquid securities by fund, including acquisition date and cost, as of June 30, 2017:
Security | | Acquisition
Date | | Cost | |
SFT Advantus Bond Fund | | | |
FAN Engine Securitization, Ltd. | | 10/18/2013 | | $ | 312,626 | | |
Hometown Commercial Mortgage | | Various | | | 240,795 | | |
Multi Security Asset Trust | | Various | | | 1,300,595 | | |
| | | | | $ | 1,854,016 | | |
SFT Advantus Dynamic Managed Volatility Fund | |
Aquarion Co. | | 08/19/2014 | | $ | 498,409 | | |
CRH America Finance, Inc. | | 05/02/2017 | | | 994,234 | | |
Longtrain Leasing III LLC, 2015 – 1A Class A2 | | 01/23/2015 | | | 999,578 | | |
Southern Natural Gas Co, LLC | | 03/07/2017 | | | 498,586 | | |
The Sherwin-Williams Co. | | 05/31/2017 | | | 1,031,199 | | |
| | | | | $ | 4,022,006 | | |
SFT Advantus Mortgage Securities Fund | |
FAN Engine Securitization, Ltd. | | 10/18/2013 | | $ | 83,609 | | |
Government National Mortgage Association (GNMA) | | 06/17/2003 | | | 533,196 | | |
Hometown Commercial Mortgage | | 11/28/2006 | | | 17,911 | | |
JPMorgan Chase Commercial Mortgage Securities Corp. | | 03/22/2010 | | | 143,347 | | |
Multi Security Asset Trust | | Various | | | 858,571 | | |
| | | | | $ | 1,636,634 | | |
92
Securian Funds Trust
Notes to Financial Statements – continued
(6) Fair Value Measurement
The Trust has established a three-tier hierarchy to maximize the use of observable market data and minimize the use of unobservable inputs. The hierarchy also establishes a classification of fair value measurements for disclosure purposes. Inputs refer broadly to the assumption that market participants would use in pricing the asset or liability. Inputs may be observable or unobservable. Observable inputs include information market participants would use in pricing the asset or liability based on market data obtained from sources independent of the reporting entity. Unobservable inputs reflect the Trust's estimates about the assumptions market participants would use in valuing the financial asset and liability based on the best information available in the circumstances. Level 1 includes unadjusted quoted prices in active markets for identical assets and liabilities. Level 2 includes other significant observable market-based inputs (including quoted prices for similar securities, interest rates, credit risk and prepayment speed). Level 3 includes unobservable inputs, which may include the advisor's own assumptions in determining the fair value of an investment or are based on independent non-binding broker quotes. Other financial instruments are derivative instruments not reflected in total investments, such as futures, forwards, swaps, and written options.
The following is a summary of the levels used for the period ended June 30, 2017, in valuing the Fund's assets and liabilities (please see the Investments in Securities for each Fund for a listing of all securities within each category):
| | | Fair Value Measurement at
June 30, 2017 using | |
Fund | | Level 1 | | Level 2 | | Level 3 | | Total | |
SFT Advantus Bond Fund | |
Assets | |
Government Obligations | | $ | – | | | $ | 141,779,609 | | | $ | – | | | $ | 141,779,609 | | |
Asset-Backed Securities | | | – | | | | 17,881,003 | | | | – | | | | 17,881,003 | | |
Other Mortgage-Backed Securities | | | – | | | | 25,614,563 | | | | – | | | | 25,614,563 | | |
Corporate Obligations | | | – | | | | 189,419,315 | | | | – | | | | 189,419,315 | | |
Investment Companies | | | 15,989,883 | | | | – | | | | – | | | | 15,989,883 | | |
Total Investments | | | 15,989,883 | | | | 374,694,490 | | | | – | | | | 390,684,373 | | |
Other Financial Instruments*
Futures Contracts | | | 58,319 | | | | – | | | | – | | | | 58,319 | | |
Liabilities | |
Other Financial Instruments*
Futures Contracts | | | (47,704 | ) | | | – | | | | – | | | | (47,704 | ) | |
SFT Advantus Dynamic Managed Volatility Fund | |
Assets | |
Government Obligations | | | – | | | | 3,130,295 | | | | – | | | | 3,130,295 | | |
Asset-Backed Securities | | | – | | | | 991,423 | | | | – | | | | 991,423 | | |
Other Mortgage-Backed Securities | | | – | | | | 1,051,553 | | | | – | | | | 1,051,553 | | |
Corporate Obligations | | | – | | | | 120,748,428 | | | | – | | | | 120,748,428 | | |
Purchased Options | | | 112,500 | | | | – | | | | – | | | | 112,500 | | |
Investment Companies | | | 202,986,508 | | | | – | | | | – | | | | 202,986,508 | | |
Total Investments | | | 203,099,008 | | | | 125,921,699 | | | | – | | | | 329,020,707 | | |
Other Financial Instruments*
Futures Contracts | | | 246,263 | | | | – | | | | – | | | | 246,263 | | |
Liabilities | |
Other Financial Instruments*
Futures Contracts | | | (493,356 | ) | | | – | | | | – | | | | (493,356 | ) | |
93
Securian Funds Trust
Notes to Financial Statements – continued
(6) Fair Value Measurement – (continued)
| | | Fair Value Measurement at
June 30, 2017 using | | | |
Fund | | Level 1 | | Level 2 | | Level 3 | | Total | |
SFT Advantus Government Money Market Fund | |
Assets | |
U.S. Government Obligations | | $ | – | | | $ | 70,099,218 | | | $ | – | | | $ | 70,099,218 | | |
Investment Companies | | | 138,815 | | | | – | | | | – | | | | 138,815 | | |
Total Investments | | | 138,815 | | | | 70,099,218 | | | | – | | | | 70,238,033 | | |
SFT Advantus Index 400 Mid-Cap Fund | |
Assets | |
Common Stocks | | | 208,636,521 | | | | – | | | | – | | | | 208,636,521 | | |
Investment Companies | | | 7,299,223 | | | | – | | | | – | | | | 7,299,223 | | |
Total Investments | | | 215,935,744 | | | | – | | | | – | | | | 215,935,744 | | |
Other Financial Instruments*
Futures Contracts | | | 628 | | | | – | | | | – | | | | 628 | | |
SFT Advantus Index 500 Fund | |
Assets | |
Common Stocks | | | 784,595,101 | | | | – | | | | – | | | | 784,595,101 | | |
Investment Companies | | | 13,694,155 | | | | – | | | | – | | | | 13,694,155 | | |
Total Investments | | | 798,289,256 | | | | – | | | | – | | | | 798,289,256 | | |
Liabilities | |
Other Financial Instruments*
Futures Contracts | | | (59,330 | ) | | | – | | | | – | | | | (59,330 | ) | |
SFT Advantus International Bond Fund | |
Assets | |
Long-Term Debt Securities | | | – | | | | 52,987,067 | | | | – | | | | 52,987,067 | | |
Short-Term Debt Securities | | | – | | | | 41,549,695 | | | | – | | | | 41,549,695 | | |
Investment Companies | | | 3,007,564 | | | | – | | | | – | | | | 3,007,564 | | |
Total Investments | | | 3,007,564 | | | | 94,536,762 | | | | – | | | | 97,544,326 | | |
Other Financial Instruments*
Forward Foreign Currency Contracts | | | – | | | | 1,248,289 | | | | – | | | | 1,248,289 | | |
Interest Rate Swap Contracts | | | – | | | | 164,370 | | | | – | | | | 164,370 | | |
Liabilities | |
Other Financial Instruments*
Forward Foreign Currency Contracts | | | – | | | | (2,202,994 | ) | | | – | | | | (2,202,994 | ) | |
Interest Rate Swap Contracts | | | – | | | | (716,507 | ) | | | – | | | | (716,507 | ) | |
SFT Advantus Managed Volatility Equity Fund | |
Assets | |
Investment Companies | | | 223,244,185 | | | | – | | | | – | | | | 223,244,185 | | |
Purchased Options | | | 59,000 | | | | – | | | | – | | | | 59,000 | | |
Total Investments | | | 223,303,185 | | | | – | | | | – | | | | 223,303,185 | | |
Liabilities | |
Other Financial Instruments*
Futures Contracts | | | (80,558 | ) | | | – | | | | – | | | | (80,558 | ) | |
Written Options | | | (20,500 | ) | | | – | | | | – | | | | (20,500 | ) | |
SFT Advantus Mortgage Securities Fund | |
Assets | |
Government Obligations | | | – | | | | 70,851,643 | | | | – | | | | 70,851,643 | | |
Asset-Backed Securities | | | – | | | | 6,078,405 | | | | – | | | | 6,078,405 | | |
Other Mortgage-Backed Securities | | | – | | | | 9,180,785 | | | | – | | | | 9,180,785 | | |
Corporate Obligations | | | – | | | | 1,068,913 | | | | – | | | | 1,068,913 | | |
Short-Term Securities | | | 9,183,850 | | | | – | | | | – | | | | 9,183,850 | | |
Total Investments | | | 9,183,850 | | | | 87,179,746 | | | | – | | | | 96,363,596 | | |
94
Securian Funds Trust
Notes to Financial Statements – continued
(6) Fair Value Measurement – (continued)
| | | Fair Value Measurement at
June 30, 2017 using | | | |
Fund | | Level 1 | | Level 2 | | Level 3 | | Total | |
Liabilities | |
Other Financial Instruments*
Futures Contracts | | $ | (4,855 | ) | | $ | – | | | $ | – | | | $ | (4,855 | ) | |
SFT Advantus Real Estate Securities Fund | |
Assets | |
Common Stocks | | | 136,547,206 | | | | – | | | | – | | | | 136,547,206 | | |
Investment Companies | | | 650,266 | | | | – | | | | – | | | | 650,266 | | |
Total Investments | | | 137,197,472 | | | | – | | | | – | | | | 137,197,472 | | |
SFT IvySM Growth Fund | |
Assets | |
Common Stocks | | | 462,182,676 | | | | – | | | | – | | | | 462,182,676 | | |
Investment Companies | | | 1,043,945 | | | | – | | | | – | | | | 1,043,945 | | |
Total Investments | | | 463,226,621 | | | | – | | | | – | | | | 463,226,621 | | |
SFT IvySM Small Cap Growth Fund | |
Assets | |
Common Stocks | | | 170,408,413 | | | | – | | | | – | | | | 170,408,413 | | |
Investment Companies | | | 5,747,552 | | | | – | | | | – | | | | 5,747,552 | | |
Total Investments | | | 176,155,965 | | | | – | | | | – | | | | 176,155,965 | | |
SFT Pyramis® Core Equity Fund | |
Assets | |
Common Stocks | | | 115,396,065 | | | | – | | | | – | | | | 115,396,065 | | |
Investment Companies | | | 1,462,219 | | | | – | | | | – | | | | 1,462,219 | | |
Total Investments | | | 116,858,284 | | | | – | | | | – | | | | 116,858,284 | | |
SFT T. Rowe Price Value Fund | |
Assets | |
Common Stocks | | | 215,647,480 | | | | – | | | | – | | | | 215,647,480 | | |
Preferred Stocks | | | 1,404,994 | | | | – | | | | – | | | | 1,404,994 | | |
Investment Companies | | | 1,764,397 | | | | – | | | | – | | | | 1,764,397 | | |
Total Investments | | | 218,816,871 | | | | – | | | | – | | | | 218,816,871 | | |
* Investments in Other Financial Instruments are derivatives instruments reflected in the Investments in Securities. All derivatives currently held are reflected at the gross unrealized appreciation (depreciation) on the instruments.
Level 2 Measurements:
Government obligations comprised of U.S. Treasury, agency and government guaranteed fixed maturity securities – These securities are principally valued using the market approach. Valuation is based primarily on quoted prices in markets that are not active or using matrix pricing or other similar techniques using standard market observable inputs such as the benchmark U.S. Treasury yield curve, the spread of the U.S. Treasury curve for the identical security and comparable securities that are actively traded.
Asset-backed and other mortgage-backed securities comprised of RMBS, CMBS and ABS fixed maturity securities – These securities are principally valued using the market approach. Valuation is based primarily on matrix pricing or other similar techniques using standard market inputs including spreads for actively traded securities, spreads off benchmark yields, expected prepayment speeds and volumes, current and forecasted loss severity, rating, weighted average coupon, weighted average maturity, average delinquency rates, geographic region, debt-service coverage ratios and issuance-specific information including: collateral type, payment terms of the underlying assets, payment priority within the tranche, structure of the security, deal performance and vintage of loans, etc.
95
Securian Funds Trust
Notes to Financial Statements – continued
(6) Fair Value Measurement – (continued)
Corporate obligations comprised of U.S. corporate and foreign corporate fixed maturity securities – These securities are principally valued using the market and income approaches. Valuation is based primarily on quoted prices in markets that are not active, or using matrix pricing or other similar techniques that use standard market observable inputs such as benchmark yields, spreads off benchmark yields, new issuances, issuer rating, duration, and trades of identical or comparable securities. Investment grade privately placed securities are valued using discounted cash flow methodologies using standard market observable inputs, and inputs derived from, or corroborated by, market observable data including market yield curve, duration, call provisions, observable prices and spreads for similar publicly traded or privately traded issues that incorporate the credit quality and industry sector of the issuer.
Long-term and short-term debt securities comprised of foreign government and state and political subdivision fixed maturity securities – These securities are principally valued using the market approach. Valuation is based primarily on matrix pricing or other similar techniques using standard market observable inputs including benchmark U.S. Treasury or other yields, issuer ratings, broker-dealer quotes, issuer spreads and reported trades of similar securities, including those within the same sub-sector or with a similar maturity or credit rating.
Forward Foreign Currency and Interest Rate Swap Contracts – These derivatives are traded in the over-the-counter derivative market and are principally valued using market price quotations or industry recognized modeling techniques. The significant inputs to the models are observable in the market or can be derived from or corroborated by observable market data. These significant inputs may include interest rates, foreign currency exchange rates, interest rate curves, contractual terms, market prices, and measures of volatility.
The Funds' policy is to recognize transfers between the levels as of the end of the period. There were no transfers of financial assets between Levels 1 and 2 during the period.
(7) Derivative Instruments Reporting
The Trust provides, when applicable, disclosures of the location, by line item, of fair value amounts in the statement of financial position and the location, by line item, of amounts of gains and losses reported in the statement of financial performance. Generally the derivative instruments outstanding as of period end are disclosed in the Investments in Securities. The volume of derivative activity is indicative for all Funds as of period end June 30, 2017.
Equity derivatives were purchased or sold to manage the SFT Advantus Index 500 and SFT Advantus Index 400 Mid-Cap Funds' shareholder liquidity and to attempt to replicate intended stock investments to maintain fully invested Funds. Equity index options are utilized by the SFT Advantus Dynamic Managed Volatility Fund and the SFT Advantus Managed Volatility Equity Fund to manage the equity exposure while attempting to reduce the volatility and risk of the Funds.
The SFT Advantus Real Estate Securities Fund includes as a non-principal investment strategy the writing (selling) of covered call options. Generally, the strategy will write call options near a price target for the stock. The goal of the covered call strategy is to enhance income of the Fund through the receipt of premium income from the sale of the call, and to decrease volatility of the overall Fund.
Interest rate derivatives are used both to manage the average duration of a Fund's fixed income portfolio, as well as to hedge against the effects of interest rate changes on a portfolio's current or intended investments.
Foreign exchange derivatives were used to attempt to hedge against the effects of exchange rate changes within the SFT Advantus International Bond Fund's current or intended investments in foreign securities, as well as, to more efficiently obtain exposure to foreign currencies or to take advantage of cross currency markets in order to benefit from valuation differentials and shifts in pricing within the currency markets.
96
Securian Funds Trust
Notes to Financial Statements – continued
(7) Derivative Instruments Reporting – (continued)
The tables below detail the risk exposure of each of the Funds from derivative instruments:
| | | | Risk Exposure | |
| Fund | | Instrument
Type | | Total Value at
June 30, 2017 | | Statement of Assets and
Liabilities Location | | Equity | | Interest
Rate | | Foreign
Exchange | |
SFT Advantus Bond Fund
| | Futures
| | $ | 58,319
| | | Variation margin
receivable* | | $ | –
| | | $ | 58,319
| | | $ | –
| | |
| | Futures
| | | (47,704
| ) | | Variation margin
payable* | | | –
| | | | (47,704
| ) | | | –
| | |
SFT Advantus Dynamic
Managed Volatility Fund | | Futures
| | | 246,263
| | | Variation margin
receivable* | | | –
| | | | 246,263
| | | | –
| | |
| | | Futures
| | | (493,356
| ) | | Variation margin
payable* | | | (493,356
| ) | | | –
| | | | –
| | |
SFT Advantus Index 400
Mid-Cap Fund | | Futures
| | | 628
| | | Variation margin
receivable* | | | 628
| | | | –
| | | | –
| | |
| SFT Advantus Index 500 Fund | | Futures
| | | (59,330
| ) | | Variation margin
payable* | | | (59,330
| ) | | | –
| | | | –
| | |
SFT Advantus International
Bond Fund
| | Foreign
Currency
Forwards
| | | 1,248,289
| | | Unrealized
appreciation on
forward foreign
currency contracts | | | –
| | | | – | | | | 1,248,289
| | |
| | | Foreign
Currency
Forwards
| | | (2,202,994
| ) | | Unrealized
depreciation on
forward foreign
currency contracts | | | –
| | | | – | | | | (2,202,994
| ) | |
| | | Swaps
| | | 164,370
| | | Variation margin
receivable* | | | –
| | | | 164,370
| | | | –
| | |
| | | Swaps
| | | (716,507
| ) | | Variation margin
payable* | | | –
| | | | (716,507
| ) | | | –
| | |
SFT Advantus Managed
Volatility Equity Fund | | Options
| | | (20,500
| ) | | Put Options
Written | | | (20,500
| ) | | | –
| | | | –
| | |
| | | Futures
| | | (80,558
| ) | | Variation margin
payable* | | | (80,558
| ) | | | –
| | | | –
| | |
SFT Advantus Mortgage
Securities Fund | | Futures
| | | (4,855
| ) | | Variation margin
payable* | | | –
| | | | (4,855
| ) | | | –
| | |
* Includes cumulative appreciation/depreciation of futures contracts and swaps as reported in the notes to the Schedules of Investments in Securities. Only current day's variation margin is reported within the Statement of Assets and Liabilities.
| | | | Realized Gain (Loss) on Derivatives
Recognized in Income | |
| Fund | | Instrument
Type | | Realized Gain
(Loss) on
Derivatives for
Period Ended
June 30, 2017 | | Statement of
Operations Location | | Equity | | Interest
Rate | | Foreign
Exchange | |
| SFT Advantus Bond Fund | | Futures | | $ | (29,810 | ) | | Net realized gains
(losses) from
futures transactions | | $ | – | | | $ | (29,810 | ) | | $ | – | | |
97
Securian Funds Trust
Notes to Financial Statements – continued
(7) Derivative Instruments Reporting – (continued)
| | | | Realized Gain (Loss) on Derivatives
Recognized in Income | |
| Fund | | Instrument
Type | | Realized Gain
(Loss) on
Derivatives for
Period Ended
June 30, 2017 | | Statement of
Operations Location | | Equity | | Interest
Rate | | Foreign
Exchange | |
SFT Advantus Dynamic
Managed Volatility Fund | | Futures | | $ | 8,483,628 | | | Net realized gains
(losses) from
futures transactions | | $ | 9,003,263 | | | $ | (519,635 | ) | | $ | – | | |
| | Purchased
Options | | | (972,326 | ) | | Net realized gains
(losses) on
investments | | | (972,326 | ) | | | – | | | | – | | |
| | Written
Options | | | 101,223 | | | Net realized gains
(losses) from
written options
transactions | | | 101,223 | | | | – | | | | – | | |
SFT Advantus Index 400
Mid-Cap Fund | | Futures | | | 313,804 | | | Net realized gains
(losses) from
futures transactions | | | 313,804 | | | | – | | | | – | | |
| SFT Advantus Index 500 Fund | | Futures | | | 1,045,096 | | | Net realized gains
(losses) from
futures transactions | | | 1,045,096 | | | | – | | | | – | | |
SFT Advantus International
Bond Fund | | Foreign
Currency
Forwards | | | 1,496,716 | | | Net realized gains
(losses) from
foreign currency
transactions | | | – | | | | – | | | | 1,496,716 | | |
| | Swaps | | | (128,773 | ) | | Net realized gains
(losses) from swaps | | | – | | | | (128,773 | ) | | | – | | |
SFT Advantus Managed
Volatility Equity Fund | | Futures | | | 1,543,756 | | | Net realized gains
(losses) from
futures transactions | | | 1,543,756 | | | | – | | | | – | | |
| | Written
Options | | | 105,731 | | | Net realized gains
(losses) from
written options
transactions | | | 105,731 | | | | – | | | | – | | |
SFT Advantus Mortgage
Securities Fund | | Futures | | | 18,455 | | | Net realized gains
(losses) from
futures transactions | | | – | | | | 18,455 | | | | – | | |
| | | | Unrealized Appreciation (Depreciation)
on Derivatives Recognized in Income | |
| Fund | | Instrument
Type | | Unrealized
Appreciation
(Depreciation) on
Derivatives for
Period Ended
June 30, 2017 | | Statement of
Operations Location | | Equity | | Interest
Rate | | Foreign
Exchange | |
| SFT Advantus Bond Fund | | Futures | | $ | 10,193 | | | Net change in
unrealized
appreciation or
depreciation on
futures transactions | | $ | – | | | $ | 10,193 | | | $ | – | | |
98
Securian Funds Trust
Notes to Financial Statements – continued
(7) Derivative Instruments Reporting – (continued)
| | | | Unrealized Appreciation (Depreciation)
on Derivatives Recognized in Income | |
| Fund | | Instrument
Type | | Unrealized
Appreciation
(Depreciation) on
Derivatives for
Period Ended
June 30, 2017 | | Statement of
Operations Location | | Equity | | Interest
Rate | | Foreign
Exchange | |
SFT Advantus Dynamic
Managed Volatility Fund | | Futures | | $ | (1,755,547 | ) | | Net change in
unrealized
appreciation or
depreciation on
futures transactions | | $ | (1,864,922 | ) | | $ | 109,375 | | | $ | – | | |
| | Purchased
Options | | | 18,516 | | | Net change in
unrealized
appreciation or
depreciation on
investments | | | 18,516 | | | | – | | | | – | | |
| | Written
Options | | | (34,774 | ) | | Net change in
unrealized
appreciation or
depreciation on
written options | | | (34,774 | ) | | | – | | | | – | | |
SFT Advantus Index 400
Mid-Cap Fund | | Futures | | | 289,953 | | | Net change in
unrealized
appreciation or
depreciation on
futures transactions | | | 289,953 | | | | – | | | | – | | |
| SFT Advantus Index 500 Fund | | Futures | | | (206,530 | ) | | Net change in
unrealized
appreciation or
depreciation on
futures transactions | | | (206,530 | ) | | | – | | | | – | | |
SFT Advantus International
Bond Fund | | Foreign
Currency
Forwards | | | (5,603,516 | ) | | Net change in
unrealized
appreciation or
depreciation on
foreign currency
transactions | | | – | | | | – | | | | (5,603,516 | ) | |
| | Swaps | | | (256,606 | ) | | Net change in
unrealized
appreciation or
depreciation on
swaps transactions | | | – | | | | (256,606 | ) | | | – | | |
SFT Advantus Managed
Volatility Equity Fund | | Futures | | | (369,669 | ) | | Net change in
unrealized
appreciation or
depreciation on
futures transactions | | | (369,669 | ) | | | – | | | | – | | |
| | Written
Options | | | 34,900 | | | Net change in
unrealized
appreciation or
depreciation on
written options | | | 34,900 | | | | – | | | | – | | |
SFT Advantus Mortgage
Securities Fund | | Futures | | | (4,855 | ) | | Net change in
unrealized
appreciation or
depreciation on
futures transactions | | | (4,855 | ) | | | – | | | | – | | |
99
Securian Funds Trust
Notes to Financial Statements – continued
(7) Derivative Instruments Reporting – (continued)
The Funds may be exposed to credit-related losses in the event of nonperformance by counterparties to derivative financial instruments. The Funds manage credit risk related to derivatives by entering into transactions with highly rated counterparties. Generally, the current credit exposure of the derivative contracts is limited to the positive estimated fair value of derivative contracts at the reporting date after taking into consideration the existence of netting arrangements and any collateral received pursuant to credit support annexes. Because exchange traded derivatives are purchased through regulated exchanges and positions are settled regularly, the Funds have minimal exposure to credit-related losses in the event of nonperformance by counterparties to such derivative instruments. For the six months ended June 30, 2017 none of the Funds' derivatives were subject to master netting arrangements.
Option Contracts Written
Contracts and premium amounts associated with options contracts written by the Funds during the period ended June 30, 2017 are as follows:
Fund | | Options
outstanding at
December 31,
2016 | | Written | | Closed | | Exercised | | Expired | | Options
outstanding at
June 30,
2017 | |
SFT Advantus Dynamic Managed Volatility Fund | |
Premium Amount | | $ | 54,479 | | | $ | 50,137 | | | $ | 54,479 | | | $ | – | | | $ | 50,137 | | | $ | – | | |
Number of Contracts | | | 261 | | | | 266 | | | | 261 | | | | – | | | | 266 | | | | – | | |
SFT Advantus Managed Volatility Equity Fund | |
Premium Amount | | $ | – | | | $ | 161,131 | | | $ | – | | | $ | – | | | $ | 105,731 | | | $ | 55,400 | | |
Number of Contracts | | | – | | | | 776 | | | | – | | | | – | | | | 576 | | | | 200 | | |
(8) Affiliated Ownership
The SFT Advantus Dynamic Managed Volatility Fund invests in underlying securities and other investment companies, of which certain underlying funds (the "affiliated underlying funds") may be deemed to be under common control with the SFT Advantus Dynamic Managed Volatility Fund because they share the same investment advisor, Advantus Capital, and because they are overseen by the same Board of Trustees. The SFT Advantus Dynamic Managed Volatility Fund will achieve its equity exposure by investing primarily in Class 1 Shares of the SFT Advantus Index 500 Fund, an affiliated fund in the Trust that seeks investment results that correspond generally to the price and yield performance of the common stocks included in the Standard & Poor's 500 Index. A summary of all transactions with the affiliated SFT Advantus Index 500 Fund as of June 30, 2017 are as follows:
Fund/Underlying Fund | | Balance
of Shares
Held at
December 31,
2016 | | Gross
Additions | | Gross
Sales | | Balance
of Shares
Held at
June 30,
2017 | | Value at
June 30,
2017 | | Realized
Gain
(Loss) | | Distributions
Received | |
SFT Advantus Dynamic Managed
Volatility Fund | | | | | | | | | | | | | | | |
SFT Advantus Index 500 Fund | | | 14,224,618 | | | | – | | | | – | | | | 14,224,618 | | | $ | 135,865,941 | | | $ | – | | | $ | – | | |
(9) Investment Company Reporting Modernization
In October 2016, the U.S. Securities and Exchange Commission adopted new rules and amended existing rules intended to modernize the reporting and disclosure of information by registered investment companies. The amendments to Regulation S-X will require standardized, enhanced disclosures about derivatives in investment company financial statements, as well as other provisions. The compliance date for the amendments to Regulation S-X is August 1, 2017. Management is currently evaluating the impact that the adoption of the amendments to Regulations S-X will have on the Funds' financial statements and related disclosures.
(10) Subsequent Events
Management has evaluated subsequent events for the Trust through the date of the filing, and has concluded there are no events that require disclosure.
100
Securian Funds Trust
Other Information
(unaudited)
Fund Expenses Paid by Shareholders
Shareholders of the Trust incur two types of costs: (1) transaction costs, including sales charges (loads) on purchase payments, reinvested dividends, or other distributions; redemption fees; (the Trust does not impose transaction costs, but you will incur such costs in connection with the variable life insurance policies and variable annuity contracts that invest in the Funds) and exchange fees; and (2) ongoing costs, including management fees; distribution and/or service (12b-1) fees; and other Trust expenses. The examples below are intended to help you understand your ongoing costs (in dollars) of investing in the Funds and to compare these costs with the ongoing costs of investing in other mutual funds.
The examples below are based on an investment of $1,000 invested at the beginning of the period and held for the entire period, January 01, 2017 through June 30, 2017. Expenses paid during the period in the tables below are equal to the Fund's annualized expense ratio, multiplied by the average account value over the period, multiplied by number of days in most recent fiscal half-year divided by 365 to reflect the one-half year period.
Actual Expenses
The table below provides information about actual account values and actual expenses for the Funds. You may use the information in this table, together with the amount you invested, to estimate the expenses that you paid over the period. Simply divide your account value by $1,000 (for example, an $8,600 account value divided by $1,000 = 8.6), then multiply the result by the number in the table for the fund you own under the heading entitled "Expenses Paid During Period" to estimate the expenses you paid on your account during this period.
| | | Actual Expenses | |
| | | CLASS 1 | | CLASS 2 | |
| | | Beginning
Account
Value | | Ending
Account
Value | | Annual
Expense
Ratio | | Expenses
Paid During
Period | | Ending
Account
Value | | Annual
Expense
Ratio | | Expenses
Paid During
Period | |
SFT Advantus Bond Fund | | $ | 1,000 | | | $ | 1,031.50 | | | | 0.49 | % | | $ | 2.47 | | | $ | 1,030.20 | | | | 0.74 | % | | $ | 3.72 | | |
SFT Advantus Dynamic
Managed Volatility Fund | | | 1,000 | | | | NA | | | | NA | | | | NA | | | | 1,077.10 | | | | 0.80 | % | | | 4.12 | | |
SFT Advantus Government
Money Market Fund | | | 1,000 | | | | NA | | | | NA | | | | NA | | | | 1,000.00 | | | | 0.70 | % | | | 3.47 | | |
SFT Advantus Index 400
Mid-Cap Fund | | | 1,000 | | | | 1,058.40 | | | | 0.26 | % | | | 1.33 | | | | 1,057.10 | | | | 0.51 | % | | | 2.60 | | |
SFT Advantus Index 500 Fund | | | 1,000 | | | | 1,092.20 | | | | 0.20 | % | | | 1.04 | | | | 1,090.80 | | | | 0.45 | % | | | 2.33 | | |
SFT Advantus International
Bond Fund | | | 1,000 | | | | 1,026.30 | | | | 0.98 | % | | | 4.92 | | | | 1,025.10 | | | | 1.23 | % | | | 6.18 | | |
SFT Advantus Managed
Volatility Equity Fund | | | 1,000 | | | | NA | | | | NA | | | | NA | | | | 1,083.20 | | | | 0.80 | % | | | 4.13 | | |
SFT Advantus Mortgage
Securities Fund | | | 1,000 | | | | 1,013.10 | | | | 0.66 | % | | | 3.29 | | | | 1,011.90 | | | | 0.91 | % | | | 4.54 | | |
SFT Advantus Real Estate
Securities Fund | | | 1,000 | | | | 1,032.00 | | | | 0.85 | % | | | 4.28 | | | | 1,030.70 | | | | 1.10 | % | | | 5.54 | | |
SFT IvySM Growth Fund | | | 1,000 | | | | NA | | | | NA | | | | NA | | | | 1,131.40 | | | | 0.97 | % | | | 5.13 | | |
SFT IvySM Small Cap Growth
Fund | | | 1,000 | | | | NA | | | | NA | | | | NA | | | | 1,142.20 | | | | 1.21 | % | | | 6.43 | | |
SFT Pyramis® Core Equity
Fund | | | 1,000 | | | | 1,092.70 | | | | 0.83 | % | | | 4.31 | | | | 1,091.30 | | | | 1.08 | % | | | 5.60 | | |
SFT T. Rowe Price Value Fund | | | 1,000 | | | | NA | | | | NA | | | | NA | | | | 1,084.30 | | | | 1.02 | % | | | 5.27 | | |
101
Securian Funds Trust
Other Information – continued
(unaudited)
Hypothetical Example for Comparison Purposes
The table below also provides information about hypothetical account values and hypothetical expenses based on the Funds' actual expense ratios and an assumed rate of return of 5% per year before expenses, which are not the Funds' actual returns. The hypothetical account values and expenses may not be used to estimate the actual ending account balance or expenses you paid for the period. You may use this information to compare the ongoing costs of investing in the Funds' and other funds. To do so, compare the 5% hypothetical example of the funds you own with the 5% hypothetical examples that appear in the shareholder reports of other similar funds.
| | | Hypothetical Expenses | |
| | | CLASS 1 | | CLASS 2 | |
| | | Beginning
Account
Value | | Ending
Account
Value | | Annual
Expense
Ratio | | Expenses
Paid During
Period | | Ending
Account
Value | | Annual
Expense
Ratio | | Expenses
Paid During
Period | |
SFT Advantus Bond Fund | | $ | 1,000 | | | $ | 1,022.36 | | | | 0.49 | % | | $ | 2.46 | | | $ | 1,021.12 | | | | 0.74 | % | | $ | 3.71 | | |
SFT Advantus Dynamic
Managed Volatility Fund | | | 1,000 | | | | NA | | | | NA | | | | NA | | | | 1,020.83 | | | | 0.80 | % | | | 4.01 | | |
SFT Advantus Government
Money Market Fund | | | 1,000 | | | | NA | | | | NA | | | | NA | | | | 1,021.32 | | | | 0.70 | % | | | 3.51 | | |
SFT Advantus Index 400
Mid-Cap Fund | | | 1,000 | | | | 1,023.51 | | | | 0.26 | % | | | 1.30 | | | | 1,022.27 | | | | 0.51 | % | | | 2.56 | | |
SFT Advantus Index 500 Fund | | | 1,000 | | | | 1,023.80 | | | | 0.20 | % | | | 1.00 | | | | 1,022.56 | | | | 0.45 | % | | | 2.26 | | |
SFT Advantus International
Bond Fund | | | 1,000 | | | | 1,019.93 | | | | 0.98 | % | | | 4.91 | | | | 1,018.7 | | | | 1.23 | % | | | 6.16 | | |
SFT Advantus Managed
Volatility Equity Fund | | | 1,000 | | | | NA | | | | NA | | | | NA | | | | 1,020.83 | | | | 0.80 | % | | | 4.01 | | |
SFT Advantus Mortgage
Securities Fund | | | 1,000 | | | | 1,021.52 | | | | 0.66 | % | | | 3.31 | | | | 1,020.28 | | | | 0.91 | % | | | 4.56 | | |
SFT Advantus Real Estate
Securities Fund | | | 1,000 | | | | 1,020.58 | | | | 0.85 | % | | | 4.26 | | | | 1,019.34 | | | | 1.10 | % | | | 5.51 | | |
SFT IvySM Growth Fund | | | 1,000 | | | | NA | | | | NA | | | | NA | | | | 1,019.98 | | | | 0.97 | % | | | 4.86 | | |
SFT IvySM Small Cap Growth
Fund | | | 1,000 | | | | NA | | | | NA | | | | NA | | | | 1,018.79 | | | | 1.21 | % | | | 6.06 | | |
SFT Pyramis® Core Equity
Fund | | | 1,000 | | | | 1,020.68 | | | | 0.83 | % | | | 4.16 | | | | 1,019.44 | | | | 1.08 | % | | | 5.41 | | |
SFT T. Rowe Price Value Fund | | | 1,000 | | | | NA | | | | NA | | | | NA | | | | 1,019.74 | | | | 1.02 | % | | | 5.11 | | |
Please note that the expenses shown in both tables are meant to highlight your ongoing costs only and do not reflect any transactional costs, such as sales charges (loads), redemption fees, or exchange fees. Therefore, the information provided in the hypothetical example table is useful in comparing ongoing costs only, and will not help you determine the relative total costs of owning different funds. In addition, if these transactional costs were included, your costs would have been higher.
Proxy Voting Policies and Procedures
A description of the policies and procedures that Advantus Capital uses to vote proxies related to each Fund's portfolio securities is set forth in the Trust's Statement of Additional Information which is available without charge, upon request, by calling, toll-free, 800-995-3850 or on the Securities and Exchange Commission's website at www.sec.gov. The Trust will provide this document within three business days of receipt of a request, by first-class mail or other means designed to ensure equally prompt delivery.
102
Securian Funds Trust
Other Information – continued
(unaudited)
Proxy Voting Record
The Trust's proxy voting record for the 12 month period ended December 31 is available by calling, toll-free, 866-330-7355 or on the Securities and Exchange Commission's website at www.sec.gov no later than August 31 each year. The Trust will also provide this information, within three business days of receipt of a request, by first-class mail or other means designed to ensure equally prompt delivery.
Availability of Quarterly Schedule of Investments
The Trust files its complete schedule of investment holdings with the SEC for the first and third quarters of each fiscal year on Form N-Q. Form N-Q is available to shareholders without charge on the SEC's website at www.sec.gov. Form N-Q may also be reviewed and copied at the Commission's Public Reference Room in Washington, DC. More information of the operation of the Public Reference Room may be obtained by calling 1-800-SEC-0330.
103
Securian Funds Trust
Statement Regarding Basis for Approval of Advisory Contracts
Each year, the Board of Trustees of Securian Funds Trust (the "Trust") votes on the renewal of the Trust's Investment Advisory Agreement with Advantus Capital Management, Inc. ("Advantus"). The Board most recently unanimously reapproved the Investment Advisory Agreement on January 26, 2017. At this meeting, the Board of Trustees also reapproved the Investment Sub-Advisory Agreements between Advantus and Franklin Advisers, Inc. (for the International Bond Fund), between Advantus and Waddell & Reed Investment Management Company (for Ivy Growth Fund) between Advantus and Waddell & Reed Investment Management Company (for Ivy Small Cap Growth Fund), between Advantus and FIAM LLC (for Pyramis Core Equity Fund) and between Advantus and T. Rowe Price Associates, Inc. (for T. Rowe Price Value Fund). Collectively, the Funds managed by sub-advisers are referred to as the "Sub-Advised Funds".
Trustees receive a variety of information throughout the year about each Fund's investment performance, adherence to investment policies, expenses, sales and redemptions, regulatory compliance and management. Trustees meet at least once each year with each Fund's portfolio management team (or, in the case of the Sub-Advised Funds, representatives of such team). Trustees also receive frequent updates on industry developments and best practices, changes in Advantus' organization and staffing, brokerage allocation and other matters. Trustees evaluated all information available to them on a Fund-by-Fund basis.
The Trustees also reviewed a memorandum from independent legal counsel outlining their legal duties and responsibilities in connection with this annual review and met alone with independent legal counsel.
Management Fee and Other Expenses
The Trustees reviewed the January 2016 report prepared by Broadridge Financial Solutions, Inc. ("Broadridge") containing comparisons of each Fund's investment management, non-management and total expenses with industry peers independently selected by Broadridge. At the Trustees' direction, the 2016 report was supplemented by Advantus with updated, publicly available information.
Based on this information, the Trustees concluded that the advisory fee payable by each Fund to Advantus is fair and reasonable. The Trustees also concluded that the advisory fees payable by the Managed Volatility and Managed Volatility Equity Funds are for services that are in addition to, rather than duplicative of, services provided pursuant to the advisory agreement of any other fund in which the Managed Volatility and Managed Volatility Equity Funds invest.
Fees Charged to Other Advisory Clients of Advantus
The Trustees observed that Advantus' advisory fees for non-fund institutional clients are generally lower than the advisory fees charged to a Fund with a similar strategy. The Trustees concluded, however, that the higher fees charged to the Funds are justified by the additional services provided by Advantus in managing the Funds (including the provision of office facilities, officers, administration and compliance, the coordination of Trust board, committee and vendor functions, regulatory filings and the performance of most Trust operations).
Costs of Services Provided and Profitability to Advantus
The Trustees review quarterly Board reports on Advantus' profitability in managing each Fund. The Trustees recognized that comparative profitability information is not generally ascertainable. Nonetheless, the Trustees did not view Advantus' profitability from any Fund as excessive.
Investment Results
The Trustees review a quarterly report comparing each Fund's investment performance for the most recently completed calendar quarter and one, three, five and (where applicable) ten year periods then ended with Broadridge peer groups and with one or more benchmark indices.
104
Securian Funds Trust
Statement Regarding Basis for Approval of Advisory Contracts – continued
The Trustees noted that Bond Fund outperformed the Broadridge peer group average for the most recent quarter and for the 1, 3 and 5-year periods ended December 31, 2016, that Mortgage Securities Fund had underperformed its peers and benchmark during the most recent quarter and 1-year period ended December 31, 2016, but was in the top quintile of its Broadridge peer group for the 3 and 5-year periods, and that International Bond Fund was in the top quintile of its peer group for the most recent quarter, in approximately the middle of its peer group 1 and 3-year periods, and in approximately the top third and quarter of its peer group for the 5 and 10-year periods, respectively. The Trustees also noted that Real Estate Securities Fund slightly underperformed its peer group for the most recent quarter and significantly underperformed its peer group for the most recent 1-year period, but performed in the second highest quintile of its peer group performance for the 3 and 5-year periods. The Trustees then noted that the Index 400 and Index 500 Funds continue to perform in line with their respective benchmarks, and that the Money Market Fund's performance is in-line with its peer group for all relevant periods. The Trustees then observed that the Managed Volatility Fund and the Managed Volatility Equity Fund performed consistently with their objectives and were competitive with their peers. With respect to the Sub-Advised Funds, the Trustees noted that Ivy Growth Fund underperformed its benchmark, and performed in the third quintile of its peer group for the most recent quarter and for the one-year period ended December 31, 2016, that Ivy Small Cap Growth Fund had somewhat underperformed its benchmark but performed in line with its peers during the most recent quarter and had posted first quintile performance during the year ended December 31, 2016, and that each of Pyramis Core Equity Fund and T. Rowe Price Value Fund had substantially underperformed its peer group and benchmark during the most recent quarter and 1-year period. The Trustees reviewed attribution analyses and portfolio positioning on all Funds, particularly the Funds with more recent underperformance. Based on the foregoing, the Trustees concluded that reapproving the Funds' Investment Advisory Agreement and each Sub-Advised Fund's Investment Subadvisory Agreement were in the best interests of each Fund and its shareholders.
Ancillary Benefits to Advantus and Its Affiliates
The Trustees also considered that Advantus and its affiliates benefit from certain soft-dollar arrangements. The Trustees noted that Advantus' profitability would be somewhat lower if it had to pay for these benefits out of its own assets. The Trustees also noted that Securian Financial Services, Inc. (the Trust's distributor) receives 12b-1 fees from the Funds. The Trustees also noted that Minnesota Life Insurance Company, an affiliate of Advantus, benefits by performing certain legal, compliance and other administrative services for the Trust, in return for a reimbursement of costs it incurs in connection with its provision of such services. The Trustees also recognize that Advantus and its affiliates derive reputational and other benefits from their association with the Funds and Trust.
Nature, Extent and Quality of Services Provided by Advantus
In addition to investment management services, Advantus provides the Trust with office space, administrative and other services (exclusive of, and in addition to, any such services provided by other Trust services providers) and executive and other personnel as are necessary for its operations. Advantus pays all of the compensation of management Trustees, officers and employees of the Trust (except that each Fund pays an equitable share of the compensation expense of the Trust's Chief Compliance Officer). The Trustees considered the quality and scope of services provided by Advantus under the Advisory Agreement and concluded that Advantus has provided commendable executive and administrative management and other services during and prior to the last year.
Investment Sub-Advisory Agreements
At the January 26, 2017 meeting, the Trustees also unanimously reapproved the Investment Sub-Advisory Agreements for the Sub-Advised Funds. In addition to the Trustees' review of the Sub-Advised Funds' investment performance and expense ratios (as set forth above), the Trustees also requested and evaluated other
105
Securian Funds Trust
Statement Regarding Basis for Approval of Advisory Contracts – continued
information, including a report on each sub-adviser's organization and current staffing, a report on brokerage allocation practices and related soft dollar arrangements, assurances that each Sub-Advised Fund will be managed in accordance with its stated investment objectives, policies and limitations, assurances that all disclosures relating to the sub-adviser reflected in the Trust's registration statement are complete and accurate, and assurance that the sub-adviser will operate in full compliance with applicable laws, regulations and exemptive orders. The Trustees also reviewed a summary of each sub-adviser's code of ethics and compliance program. The Trustees requested, but did not receive, an analysis of each sub-adviser's profitability in managing the Fund. However, the Trustees noted that Advantus is unaffiliated with each sub-adviser and that the Investment Sub-Advisory Agreements were negotiated on an "arm's-length" basis.
The Trustees also reviewed the allocation of duties and responsibilities with respect to each Sub-Advised Fund between Advantus and the Fund's sub-adviser. The Trustees noted that Advantus is responsible for the selection, monitoring and oversight of each sub-adviser, the fulfillment or oversight of substantially all of each Sub-Advised Fund's legal and regulatory requirements, the preparation for and facilitation of all Board of Trustee, Audit Committee and Governance Committee meetings, and many other requirements. Based on this review, the Trustees concluded that the allocation of the overall advisory fee of each Sub-Advised Fund between Advantus and the Sub-Adviser is fair and appropriate. The Trustees also concluded that the portion of each Sub-Advised Fund's overall advisory fee that is retained by Advantus represents fair and appropriate compensation to Advantus for its retained duties and responsibilities.
Based on the foregoing factors, the Trustees concluded that reapproving each Investment Sub-Advisory Agreement was in the best interest of each Sub-Advised Fund and its shareholders.
106
Securian Funds Trust
Trustees and Executive Officers
(unaudited)
Under Delaware law, the Board of Trustees of the Trust has overall responsibility for managing the Trust in good faith and in a manner reasonably believed to be in the best interests of the Trust. The Trustees meet periodically throughout the year to oversee the Trust's activities, review contractual arrangements with companies that provide services to the Trust, and review the performance of the Trust and its Funds. One of the four current Trustees is considered an "interested person" (as defined in the Investment Company Act of 1940) of the Trust. The other three Trustees, because they are not interested persons of the Trust, are considered independent ("Independent Trustees") and are not employees or officers of, and have no financial interest in, the Trust's investment adviser, Advantus Capital Management, Inc. or its affiliated companies, including Minnesota Life Insurance Company. 75% of the Board of Trustees is required to be comprised of Independent Trustees.
Only executive officers and other officers who perform policy-making functions with the Trust are listed. None of the Trustees is a director of any public company (a company required to file reports under the Securities Exchange Act of 1934) or of any registered investment companies other than the Trust. Each Trustee serves for an indefinite term, until his or her resignation, death or removal.
Position with Trust
Name, Address(1) and Length of Principal Occupation(s)
and Year of Birth, Time Served(2) During Past 5 Years
Independent Trustees
Julie K. Getchell 1954 Trustee since 2011
Retired; Senior Financial Consultant to Cargill's Controller's Group, Animal Nutrition Business and Tartan Program from April 2009 to July 2012; Chief Financial Officer/Senior Managing Director, La Crosse Global Fund Services from May 2005 to April 2009; Consultant, Black River Asset Management, from October 2004 to May 2005; Chief Financial Officer, Prestige Resorts & Destinations, LTD. from 2001 to 2003; Chief Operating Officer, Insight Investment Management, Inc., from 1996 to 2000; Chief Financial Officer, Insight Investment Management, Inc., from 1991 to 1996; Chartered Financial Analyst; CPA—inactive
Linda L. Henderson 1949 Trustee since 2007
Retired; Professional Advisor, Carlson School of Management, University of Minnesota, 2004 to May 2007; Senior Vice President, Director of Fixed Income Research and Strategies, RBC Dain Rauscher Investments, 1985 to 2004; Chartered Financial Analyst
William C. Melton 1947 Trustee since 2002
Retired; member, State of Minnesota Council of Economic Advisors from 1988 to 1994, and again from 2010 to the present; various senior positions at American Express Financial Advisors (formerly Investors Diversified Services and, thereafter, IDS/American Express) from 1982 through 1997, including Chief Economist and, thereafter, Chief International Economist
Interested Trustee and Principal Executive Officer
David M. Kuplic 1957 Trustee since 2016 and President since 2011
Senior Vice President, Minnesota Life Insurance Company since June 2007; Executive Vice President and Director, Advantus Capital Management, Inc. since July 2007; Senior Vice President and Director, Advantus Capital Management, Inc., February 2006 to July 2007; President and Director, MCM Funding 1997-1, Inc. (entity holding legal title to mortgages beneficially owned by certain clients of Advantus Capital) since July 2007; Vice President, MCM Funding 1997-1, Inc., June 2004 to July 2007; President and Director, MCM Funding 1998-1, Inc. (entity holding legal title to mortgages beneficially owned by certain clients of Advantus Capital) since July 2007; Vice President, MCM Funding 1998-1, Inc., June 2004 to July 2007; Senior Vice President, Securian Financial Group, Inc. since June 2007; President and Director, MIMLIC Funding, Inc. (entity holding legal title to bonds beneficially owned by certain clients of Advantus Capital) since July 2007; Senior
107
Securian Funds Trust
Trustees and Executive Officers – continued
(unaudited)
Vice President, Securian Life Insurance Company since June 2007; President and Director, Marketview Properties, LLC (entity holding real estate assets) since January 2010; President and Director, Marketview Properties II, LLC (entity holding real estate assets) since March 2010; President, Marketview Properties IV, LLC
Other Executive Officers(3)
Gary M. Kleist 1959 Vice President and Treasurer since 2003
Financial Vice President, Chief of Operations and Director, Advantus Capital Management, Inc. since December 1997; Second Vice President, Minnesota Life Insurance Company since February 2000; Vice President and Secretary/Treasurer, MIMLIC Funding, Inc. (entity holding legal title to bonds beneficially owned by certain clients of Advantus Capital) since July 2003; Financial Vice President, MCM Funding 1997-1, Inc. since October 1998 and MCM Funding 1998-1, Inc. (entities holding legal title to mortgages beneficially owned by certain clients of Advantus Capital) since August 1998; Second Vice President, Securian Financial Group, Inc. since February 2000; Second Vice President, Securian Life Insurance Company since June 2007; Financial Vice President, Marketview Properties, LLC since January 2010 and Marketview Properties II, LLC (entities holding certain real estate assets) since March 2010; Financial Vice President, Marketview Properties IV, LLC
Daniel H. Kruse 1963 Vice President since 2017
Vice President, Minnesota Life Insurance Company since February 2015; Vice President, Securian Life Insurance Company since February 2015; Vice President, Securian Financial Group since 2015; Second Vice President, Minnesota Life Insurance Company, February 2008 to January 2015; Second Vice President, Securian Life Insurance Company, February 2008 to January 2015; Second Vice President, Securian Financial Group, February 2008 to January 2015
Michael J. Radmer 1945 Secretary since 1998
Senior Counsel with the law firm of Dorsey & Whitney LLP since January 2016; Partner from 1976 to December 2015
Dorsey & Whitney LLP
50 South Sixth Street
Minneapolis, Minnesota 55402
(1) Unless otherwise noted, the address of each Trustee and officer is the address of the Trust: 400 Robert Street North, St. Paul, Minnesota 55101.
(2) The years reflect when a person became a director or officer of Advantus Series Fund, the predecessor to the Trust.
(3) Although not a 'corporate' officer of the Trust, Todd L. Spicer, 1978, served as the Trust's Chief Compliance Officer from September 2016 through May 2017. Mr. Spicer also served as Vice President and Chief Compliance Officer, Advantus Capital Management, Inc. from September 2016 through May 2017. Gary Kleist, Vice President and Treasurer of the Trust, served as interim Chief Compliance Officer of the Trust from June 2017 through July 2017. Effective August 1, 2017, Michael Steinert, 1975, will serve as the Trust's Chief Compliance Officer. Mr. Steinert will also serve as Vice President and Chief Compliance Officer of Advantus Capital Management, Inc.
108
(This page has been left blank intentionally.)
109
(This page has been left blank intentionally.)
110
This offering is available through Securian Financial Services, Inc., a registered broker/dealer. Securian Financial Services, Inc. is the distributor of Minnesota Life and Securian Life variable insurance products.
This report may be used as sales literature in connection with the offer or sale of variable annuity or variable life insurance contracts funded by Securian Funds Trust ("Trust") if preceded or accompanied by (a) the current prospectus for the Trust and such contracts and (b) the current applicable variable annuity or variable life performance report.

Securian Financial Services, Inc.
www.securian.com
Securities Dealer, Member FINRA/SIPC.
Registered Investment Advisor
400 Robert Street North, St. Paul, MN 55101-2098
1.888.237.1838
F34490 Rev 8-2017
Minnesota Life Insurance Company
A Securian Company
Securian Life Insurance Company
A New York admitted insurer
400 Robert Street North
St. Paul, MN 55101-2098
PRESORTED STANDARD
U.S. POSTAGE PAID
CAROL STREAM, IL
PERMIT NO. 1480

©2017 Securian Funds Trust All rights reserved.
F34490 Rev 8-2017
Call 1-800-995-3850 to receive your financial documents electronically. It's fast and convenient.
ITEM 2. CODE OF ETHICS.
Filed herewith as Exhibit 12(a)(1). During the period covered by this report, there has been no amendment to the code of ethics that relates to any element of the code of ethics definition set forth in paragraph (b) of Item 2 of Form N-CSR, nor has the registrant granted a waiver, including an implicit waiver, from a provision of the code of ethics to the registrant’s principal executive officer, principal financial officer, principal accounting officer or controller, or persons performing similar functions that relates to one or more of the items set forth in paragraph (b) of Item 2 of Form N-CSR.
ITEM 3. AUDIT COMMITTEE FINANCIAL EXPERT.
The Board of Trustees of the Trust has determined that Julie K. Getchell, a member of the Board’s Audit Committee, possesses the technical attributes identified in Instruction 2(b) of Item 3 to Form N-CSR to qualify as an “audit committee financial expert,” and has designated Ms. Getchell as the Audit Committee’s financial expert. Ms. Getchell is an “independent” Trustee pursuant to paragraph (a)(2) of Item 3 to Form N-CSR.
ITEM 4. PRINCIPAL ACCOUNTANT FEES AND SERVICES.
Not applicable at this time. Required only for annual reports on Form N-CSR.
ITEM 5. AUDIT COMMITTEE OF LISTED REGISTRANTS.
Not applicable.
ITEM 6. SCHEDULE OF INVESTMENTS.
Not applicable. Schedule I — Investments in Securities of Unaffiliated Issuers is included as part of the report to shareholders filed under Item 1 of this Form N-CSR.
ITEM 7. DISCLOSURE OF PROXY VOTING POLICIES AND PROCEDURES FOR CLOSED-END MANAGEMENT INVESTMENT COMPANIES.
Not applicable.
ITEM 8. PORTFOLIO MANAGERS OF CLOSED-END MANAGEMENT INVESTMENT COMPANIES.
Not applicable.
ITEM 9. PURCHASES OF EQUITY SECURITIES BY CLOSED-END MANAGEMENT INVESTMENT COMPANY AND AFFILIATED PURCHASERS.
Not applicable.
ITEM 10. SUBMISSION OF MATTERS TO A VOTE OF SECURITY HOLDERS
The registrant has a governance committee of its board of trustees, the members of which are all trustees who are not “interested persons” of the registrant, as defined in Section 2(a)(19) of the Investment Company Act of 1940 (“independent trustees”). The governance committee, which operates in accordance with a separate governance committee charter approved by the board of trustees, selects and recommends to the board of trustees individuals for nomination as independent trustees. The names of potential independent director candidates are drawn from a number of sources, including recommendations from management of Advantus Capital Management, Inc., the registrant’s investment adviser. Each candidate is evaluated by the governance committee with respect to the relevant business and industry experience that would enable the candidate to serve effectively as an independent director, as well as his or her compatibility with respect to business philosophy and style. The members of the governance committee may conduct an in-person interview of each viable candidate using a standardized questionnaire. When all of the viable candidates have been evaluated and interviewed, the governance committee determines which of the viable candidates should be presented to the board of trustees for selection to become a member of the board of trustees.
Inasmuch as the registrant does not hold annual meetings of shareholders and meetings of shareholders occur only intermittently, the governance committee does not at present consider nominees recommended by shareholders.
ITEM 11. CONTROLS AND PROCEDURES.
(a) Based upon their evaluation of the registrant’s disclosure controls and procedures as conducted within 90 days of the filing date of this Form N-CSR, the registrant’s principal financial officer and principal executive officer have concluded that those disclosure controls and procedures provide reasonable assurance that the material information required to be disclosed by the registrant on this report is recorded, processed, summarized and reported within the time periods specified in the Securities and Exchange Commission’s rules and forms.
(b) There were no changes in the registrant’s internal controls over financial reporting (as defined in Rule 30a-3(d) under the Investment Company Act of 1940) that occurred during the second fiscal quarter of the period covered by this report that has materially affected, or is reasonably likely to materially affect, the registrant’s internal control over financial reporting.
ITEM 12. EXHIBITS.
(a) File the exhibits listed below as part of this Form. Letter or number the exhibits in the sequence indicated.
(1) Any code of ethics, or amendment thereto, that is the subject of the disclosure required by Item 2, to the extent that the registrant intends to satisfy the Item 2 requirements through filing of an exhibit:
Exhibit 99.CODE ETH attached hereto.
(2) A separate certification for each principal executive officer and principal financial officer of the registrant as required by Rule 30a-2 under the Investment Company Act of 1940 (17 CFR 270.30a-2):
Exhibit 99.CERT attached hereto.
(3) Any written solicitation to purchase securities under Rule 23c-1 under the Investment Company Act of 1940 sent or given during the period covered by this report by or on behalf of the registrant to 10 or more persons:
Not applicable.
(b) If the report is filed under Section 13(a) or 15(d) of the Securities Exchange Act of 1934, provide the certifications required by Rule 30a-2(b) under the Investment Company Act of 1940 (17 CFR 270.30a-2(b)), Rule 13a-14(b) or Rule 15d-14 under the Securities Exchange Act of 1934 (17 CFR 240.13a-14(b) or 240.15d-14(b)) and Section 1350 of Chapter 63 of Title 18 of the United States Code (18 U.S.C. 1350) as an exhibit. A certification furnished pursuant to this paragraph will not be deemed “filed” for the purposes of Section 18 of the Securities Exchange Act of 1934 (15 U.S.C. 78r), or otherwise subject to the liability of that section. Such certification will not be deemed to be incorporated by reference into any filing under the Securities Act of 1933 or the Securities Exchange Act of 1934, except to the extent that the registrant specifically incorporates it by reference:
Exhibit 99.906 CERT attached hereto
SIGNATURES
Pursuant to the requirements of the Securities Exchange Act of 1934 and the Investment Company Act of 1940, the registrant has duly caused this report to be signed on its behalf by the undersigned, thereunto duly authorized.
(Registrant) Securian Funds Trust
By (Signature and Title) | /s/ David M. Kuplic | |
| David M. Kuplic, President | |
Date: August 22, 2017
Pursuant to the requirements of the Securities Exchange Act of 1934 and the Investment Company Act of 1940, this report has been signed below by the following persons on behalf of the registrant and in the capacities and on the dates indicated.
By (Signature and Title) | /s/ David M. Kuplic | |
| David M. Kuplic, President (Principal Executive Officer) |
| | |
By (Signature and Title) | /s/ Gary M. Kleist | |
| Gary M. Kleist, Treasurer (Principal Financial Officer) |
| |
Date: August 22, 2017 | |