UNITED STATES
SECURITIES AND EXCHANGE COMMISSION
Washington, D.C. 20549
FORM N-CSR
CERTIFIED SHAREHOLDER REPORT OF REGISTERED
MANAGEMENT INVESTMENT COMPANIES
Investment Company Act file number | 811-4279 |
|
Securian Funds Trust |
(Exact name of registrant as specified in charter) |
|
400 Robert Street North St. Paul, Minnesota | | 55101-2098 |
(Address of principal executive offices) | | (Zip code) |
|
David M. Dimitri, Esq.
400 Robert Street North
St. Paul, Minnesota 55101-2098 |
(Name and address of agent for service) |
|
Registrant’s telephone number, including area code: | (651) 665-3500 | |
|
Date of fiscal year end: | December 31 | |
|
Date of reporting period: | December 31, 2017 | |
| | | | | | | | |
ITEM 1. REPORT TO STOCKHOLDERS.
Filed herewith.

Annual Report
December 31, 2017
Offered in Minnesota Life Insurance Company and
Securian Life Insurance Company Variable Products
SFT Advantus Bond Fund
SFT Advantus Dynamic Managed Volatility Fund
SFT Advantus Government Money Market Fund
SFT Advantus Index 400 Mid-Cap Fund
SFT Advantus Index 500 Fund
SFT Advantus International Bond Fund
SFT Advantus Managed Volatility Equity Fund
SFT Advantus Mortgage Securities Fund
SFT Advantus Real Estate Securities Fund
SFT IvySM Growth Fund
SFT IvySM Small Cap Growth Fund
SFT T. Rowe Price Value Fund
SFT Wellington Core Equity Fund
(formerly SFT Pyramis® Core Equity Fund)
Financial security
for the long run ®

Securian Funds Trust
Supplement dated December 18, 2017 to the Prospectus of Securian Funds Trust dated May 1, 2017.
This Supplement describes portfolio manager changes for the SFT Advantus Bond Fund, SFT Advantus Dynamic Managed Volatility Fund, SFT Advantus Government Money Market Fund, SFT Advantus Managed Volatility Equity Fund and the SFT Advantus Mortgage Securities Fund.
The text on page 5, under the caption "SFT Advantus Bond Fund: Management," is replaced by the following:
SFT Advantus Bond Fund: Management
The Fund is advised by Advantus Capital. The following individuals serve as the Fund's primary portfolio managers:
Name and Title | | Primary Manager Since | |
Thomas B. Houghton
Vice President and Portfolio Manager,
Advantus Capital | | April 29, 2005 | |
David W. Land
Vice President and Portfolio Manager,
Advantus Capital | | April 29, 2005 | |
Daniel A. Henken
Vice President and Portfolio Manager,
Advantus Capital | | December 1, 2017 | |
The text on page 12, under the caption "SFT Advantus Dynamic Managed Volatility Fund: Management," is replaced by the following:
SFT Advantus Dynamic Managed Volatility Fund: Management
The Fund is advised by Advantus Capital. The following individuals serve as the Fund's primary portfolio managers:
Name and Title | | Primary Manager Since | |
Craig M. Stapleton
Vice President and Portfolio Manager,
Advantus Capital | | May 1, 2013 | |
Jeremy P. Gogos, Ph. D.
Portfolio Manager,
Advantus Capital | | June 1, 2017 | |
Merlin L. Erickson
Vice President and Portfolio Manager,
Advantus Capital | | December 1, 2017 | |
Please retain this supplement for future reference.
F90716 12-2017
The text on page 16, under the caption "SFT Advantus Government Money Market Fund: Management," is replaced by the following:
SFT Advantus Government Money Market Fund: Management
The Fund is advised by Advantus Capital. The following individuals serve as the Fund's primary portfolio managers:
Name and Title | | Primary Manager Since | |
Thomas B. Houghton
Vice President and Portfolio Manager,
Advantus Capital | | August 18, 2003 | |
Lena S. Harhaj
Portfolio Manager,
Advantus Capital | | April 29, 2016 | |
The text on page 37, under the caption "SFT Advantus Managed Volatility Equity Fund: Management," is replaced by the following:
SFT Advantus Managed Volatility Equity Fund: Management
The Fund is advised by Advantus Capital. The following individuals serve as the Fund's primary portfolio managers:
Name and Title | | Primary Manager Since | |
Craig M. Stapleton
Vice President and Portfolio Manager,
Advantus Capital | | November 18, 2015 | |
Jeremy P. Gogos, Ph. D.
Portfolio Manager,
Advantus Capital | | June 1, 2017 | |
Merlin L. Erickson
Vice President and Portfolio Manager,
Advantus Capital | | December 1, 2017 | |
The text on page 43, under the caption "SFT Advantus Mortgage Securities Fund: Management," is replaced by the following:
SFT Advantus Mortgage Securities Fund: Management
The Fund is advised by Advantus Capital. The following individuals serve as the Fund's primary portfolio managers:
Name and Title | | Primary Manager Since | |
David W. Land
Vice President and Portfolio Manager,
Advantus Capital | | April 5, 2004 | |
Lena S. Harhaj
Portfolio Manager,
Advantus Capital | | December 1, 2017 | |
The text relating to the SFT Advantus Bond Fund, the SFT Advantus Dynamic Managed Volatility Fund, the SFT Advantus Government Money Market Fund, the SFT Advantus Managed Volatility Equity Fund, and the SFT Advantus Mortgage Securities Fund starting on page 119, under the caption "Portfolio Managers," is replaced by the following:
| Fund | | Portfolio Manager
and Title | | Primary Portfolio
Manager Since | | Business Experience During
Past Five Years | |
SFT Advantus
Bond
| | Thomas B. Houghton
Vice President and
Portfolio Manager,
Advantus Capital | | April 29, 2005
| | Vice President and Portfolio Manager
since August 2003, Advantus Capital
| |
| | | David W. Land
Vice President and
Portfolio Manager,
Advantus Capital | | April 29, 2005
| | Vice President and Portfolio Manager
since April 2004, Advantus Capital
| |
| | | Daniel A. Henken
Vice President and
Portfolio Manager,
Advantus Capital | | December 1, 2017
| | Vice President and Portfolio Manager
since December 2017, previously
Investment Officer since
August 2010, Advantus Capital | |
SFT Advantus
Dynamic
Managed
Volatility
| | Craig M. Stapleton
Vice President and
Portfolio Manager,
Advantus Capital
| | May 1, 2013
| | Vice President and Portfolio Manager
since December 2012, previously
Portfolio Manager since June 2012,
Associate Portfolio Manager
2010-2012, and Quantitative
Research Analyst 2005-2010,
Advantus Capital | |
| | | Jeremy P. Gogos, Ph. D.
Portfolio Manager,
Advantus Capital
| | June 1, 2017
| | Portfolio Manager since
December 2017, previously Associate
Portfolio Manager since June 2017,
and Quantitative Research Analyst
2013-2017, Advantus Capital | |
| | | Merlin L. Erickson
Vice President and
Portfolio Manager,
Advantus Capital
| | December 1, 2017
| | Vice President and Portfolio Manager
since December 2017, previously
Vice President and Senior Quantitative
Analyst since November 2007,
Advantus Capital | |
SFT Advantus
Government
Money Market
| | Thomas B. Houghton
Vice President and
Portfolio Manager,
Advantus Capital | | August 18, 2003
| | Vice President and Portfolio Manager
since August 2003, Advantus Capital
| |
| | | Lena S. Harhaj
Portfolio Manager,
Advantus Capital
| | April 29, 2016
| | Portfolio Manager since
December 2017, previously Total
Return Portfolio Analyst since
April 2016, Senior Investment Analyst
2013-2016, and Associate Mortgage
Analyst 2010-2013, Advantus Capital | |
SFT Advantus
Managed
Volatility
Equity
| | Craig M. Stapleton
Vice President and
Portfolio Manager,
Advantus Capital
| | May 1, 2013
| | Vice President and Portfolio Manager
since December 2012, previously
Portfolio Manager since June 2012,
Associate Portfolio Manager
2010-2012, and Quantitative
Research Analyst 2005-2010,
Advantus Capital | |
| Fund | | Portfolio Manager
and Title | | Primary Portfolio
Manager Since | | Business Experience During
Past Five Years | |
| | | Jeremy P. Gogos, Ph. D.
Portfolio Manager,
Advantus Capital
| | June 1, 2017
| | Portfolio Manager since
December 2017, previously Associate
Portfolio Manager since June 2017,
and Quantitative Research Analyst
2013-2017, Advantus Capital | |
| | | Merlin L. Erickson
Vice President and
Portfolio Manager,
Advantus Capital
| | December 1, 2017
| | Vice President and Portfolio Manager
since December 2017, previously
Vice President and Senior Quantitative
Analyst since November 2007,
Advantus Capital | |
SFT Advantus
Mortgage
Securities
| | David W. Land
Vice President and
Portfolio Manager,
Advantus Capital | | April 5, 2004
| | Vice President and Portfolio Manager
since April 2004, Advantus Capital
| |
| | | Lena S. Harhaj
Portfolio Manager,
Advantus Capital
| | December 1, 2017
| | Portfolio Manager since
December 2017, previously Total
Return Portfolio Analyst since
April 2016, Senior Investment Analyst
2013-2016, and Associate Mortgage
Analyst 2010-2013, Advantus Capital | |
TABLE OF CONTENTS
| | | Page No. | |
Letter from the President | | | 1 | | |
Portfolio Manager Reviews | |
SFT Advantus Bond Fund | | | 2 | | |
SFT Advantus Dynamic Managed Volatility Fund | | | 6 | | |
SFT Advantus Government Money Market Fund | | | 10 | | |
SFT Advantus Index 400 Mid-Cap Fund | | | 12 | | |
SFT Advantus Index 500 Fund | | | 14 | | |
SFT Advantus International Bond Fund | | | 16 | | |
SFT Advantus Managed Volatility Equity Fund | | | 22 | | |
SFT Advantus Mortgage Securities Fund | | | 26 | | |
SFT Advantus Real Estate Securities Fund | | | 30 | | |
SFT IvySM Growth Fund | | | 33 | | |
SFT IvySM Small Cap Growth Fund | | | 36 | | |
SFT T. Rowe Price Value Fund | | | 39 | | |
SFT Wellington Core Equity Fund (formerly SFT Pyramis® Core Equity Fund) | | | 41 | | |
Report of Independent Registered Public Accounting Firm | | | 45 | | |
Investments In Securities | |
SFT Advantus Bond Fund | | | 46 | | |
SFT Advantus Dynamic Managed Volatility Fund | | | 53 | | |
SFT Advantus Government Money Market Fund | | | 59 | | |
SFT Advantus Index 400 Mid-Cap Fund | | | 60 | | |
SFT Advantus Index 500 Fund | | | 66 | | |
SFT Advantus International Bond Fund | | | 73 | | |
SFT Advantus Managed Volatility Equity Fund | | | 80 | | |
SFT Advantus Mortgage Securities Fund | | | 81 | | |
SFT Advantus Real Estate Securities Fund | | | 86 | | |
SFT IvySM Growth Fund | | | 87 | | |
SFT IvySM Small Cap Growth Fund | | | 89 | | |
SFT T. Rowe Price Value Fund | | | 91 | | |
SFT Wellington Core Equity Fund (formerly SFT Pyramis® Core Equity Fund) | | | 94 | | |
Financial Statements | |
Statements of Assets and Liabilities | | | 96 | | |
Statements of Operations | | | 98 | | |
Statements of Changes in Net Assets | | | 100 | | |
Financial Highlights | | | 105 | | |
Notes to Financial Statements | | | 118 | | |
Fund Expense Examples | | | 136 | | |
Proxy Voting and Quarterly Holdings Information | | | 137 | | |
Trustees and Executive Officers | | | 142 | | |
Letter from the President

From a market perspective, 2017 was a very good year. Soaring equity values and stable credit markets led to strong returns for investors. The Goldilocks scenario of moderate growth and low inflation was the perfect setting for the market. Add to this the pro-business policies of the Trump administration, and it became difficult to find a market sector that wasn't aligned for success. The U.S. Federal Reserve (Fed) also played a part, raising short-term rates at a measured pace, so as to keep the economy humming along, yet removing the threat of an economic contraction.
As we look forward into 2018, we continue to see many of the same forces at work. The Fed has indicated that they will raise short-term rates two or three times, attempting to maintain job growth without overstimulating. President Trump signed tax legislation that is expected to foster growth, yet keep the national deficit in check. With the tax cut, businesses seem inclined to use some of the savings to bolster their capital spending and to provide workers a moderate pay increase. All of this suggests that 2018 will also be a good year for investors.
While all looks good, many risks remain. Finding and maintaining the right level of economic growth is very difficult and the risk that the Fed becomes too cautious and allows growth to accelerate too rapidly is real. Accelerating wage growth could become a factor leading to higher inflation and rising long-term rates. On the equity side, the recent euphoria could dip as the bounce from the tax cut and business expansion gets fully reflected in prices. If earnings growth experiences a pull-back, equity prices would likely move down.
As we balance the currently favorable economic forces against the risk of a pull-back, we remain optimistic but cautious. We concede that the current environment could shift and market conditions become more volatile as the year unfolds. That said, we believe the underlying economic fundamentals will remain in place, leading to a prosperous year. As always, we believe the best tactic is to position for the long-term and use investment diversification to reduce your risk.
Sincerely,

David Kuplic
President, Securian Funds Trust
1


David Land, CFA, Thomas Houghton, CFA
and Daniel Henken, CFA Portfolio Managers
The SFT Advantus Bond Fund seeks as high a level of long-term total return as is consistent with prudent investment risk. Preservation of capital is a secondary objective. The SFT Advantus Bond Fund invests in long-term, fixed income, high quality debt instruments. The risks incurred by investing in debt instruments include, but are not limited to, reinvestment of prepaid debt obligations at lower rates of return, and the inability to reinvest at higher interest rates when debt obligations are prepaid more slowly than expected. In addition, the net asset value of the SFT Advantus Bond Fund may fluctuate in response to changes in interest rates and is not guaranteed.
SFT Advantus Bond Fund
How did the Fund perform during the period?
The Fund's Class 2 shares generated a net return of 4.69 percent over the 12 months ending December 31, 2017, outperforming the Bloomberg Barclays U.S. Aggregate Bond Index, which returned 3.54 percent over the same period.
What influenced the Fund's return during the past 12 months?
Throughout 2017, the markets were focused on the Trump administration and its policies. The economy did well, with average GDP for the year around 2.3 percent, and above long-term growth average of over 3 percent in the second through fourth quarters. Investor and business optimism were strong, and the markets reacted positively to the passage of the tax reform measure.
The U.S. Federal Reserve (Fed) increased its Fed funds rate three times in 2017. This pushed yields in the short end up as well, but longer term yields moved little on the lack of breakout inflation or growth. The difference in yields between the two and ten-year U.S. Treasury has narrowed to just over 50 basis points, down from its traditional 100-point spread.
Stocks moved steadily higher and spreads steadily tighter for most of the year. Spreads on investment grade corporate bonds reached their tightest levels in ten years at the end of 2017. With spreads at or near post-crisis tights, investors appear to remain comfortable buying corporate bonds and other forms of spread product.
What other market conditions or events influenced the Fund's return during the past 12 months?
Tax reform was a focus for Washington and Wall Street during the fourth quarter. By repeatedly reaching new all-time highs, the markets celebrated the December passage of the most significant tax changes in 30 years. Under the new tax regime, undoubtedly some sectors of the economy will fare better than others. We expect the tax law's limits on deducting interest expenses will help investment grade corporate bonds and may hurt lower quality (high yield) issues. Companies will need to rely less on debt, which could help strengthen balance sheets.
Low interest rates abroad are drawing foreign investors into the bond market. Foreign buyers are seeking income opportunities in U.S. corporate bonds as well as U.S. equities. The U.S. corporate bond market is three times the size of Europe's. Foreign buyers, who had focused on U.S. Treasuries, may be seeking to invest in utility company stocks—attracted by their potential stability.
What strategies and techniques did you employ that specifically affected Fund performance?
We maintained an overweight exposure to corporate bonds and the securitized sector throughout the year. Tightening corporate and securitized spreads benefitted the Fund's performance. We finished the year with about five percent more corporate exposure than the start of 2017.
Throughout the year, we kept our interest rate position roughly neutral-to-short relative to the Fund's index. We kept the duration of the Fund slightly short of its benchmark.
What industries or sectors did you emphasize during the past 12 months and what is your outlook going forward?
During the year we reduced the Fund's exposure to the industrial sector. Spreads in this sector tightened the most of any sector in the benchmark and we find less value in
2
industrials. In the financial sector, we believe the banking sector remains attractive overall and we increased the Fund's overweight exposure during the year. We added to the Fund's positions in the utility sector, which remains the Fund's largest overweight sector relative to its benchmark. The Fund remains overweight in pipelines. We continue to like the stable cash flow profile of the business, but sold several positions that reached their valuation targets. The Fund remains overweight in the corporate bond sector relative to its benchmark, but with spreads at post-crisis tights, it has become more difficult to find attractive relative value.
We actively managed positons in the securitized sector and the Fund remains overweight in asset-backed securities, commercial mortgage-backed securities (CMBS) and non-Agency MBS. We added to the Fund's positions in non-Agency MBS during the fourth quarter. The underwriting in this sector has remained disciplined since the housing crisis and we feel the U.S. housing cycle has longer to run relative to the corporate credit cycle. We also added to the Fund's positions in CMBS as new AAA-rated tranches were issued during the quarter and represented attractive value to us.
Going forward, we expect slow and steady growth, low inflation and a lack of market volatility. Tax reform should keep the expansion going, but it could also increase inflation and spur accelerated economic growth, which could prompt the Fed to respond. Treasury markets already appear to reflect potential inflation risk, as well as prospects for greater growth, following the passage of the tax bill.
Central Bank policies here and in Europe have the potential to upset the apple cart. Janet Yellen wraps up her term as Fed chair, with Jerome Powell ready to take over in February. We believe Powell will likely follow a path similar to Yellen's, although he may be slightly more aggressive about raising interest rates. Four vacancies on the Fed's board of governors await filling. The new occupants could affect future Fed policy as much as the change at the top. The December Fed meeting minutes projected three rate raises in 2018. For now, interest rate futures pricing indicates the market expects the Fed to raise rates only twice in 2018. If concerns grow that the Fed will raise rates at a quicker pace than currently anticipated, it could put a dent in the markets.
The European Central Bank (ECB) is also tilting more hawkish. It announced a slowdown in monthly bond purchases in October, and rising inflation and increased growth forecasts make it unlikely that the ECB will continue its quantitative easing program past its currently planned end in September 2018. Rates could finally start to rise in Europe and could start to drive up rates here. The equity markets clearly anticipate another year of market gains.
The bond market's outlook, as reflected in the yields of two and ten-year U.S. Treasuries, is more pessimistic. We believe U.S. Treasury yields didn't increase in 2017 due to concerns about low economic growth, low volatility and lack of inflation. We expect the yield curve will continue to flatten unless the economy grows more than anticipated.
Geopolitical issues could shake things up in 2018—the North Korea situation, rivalry between Saudi Arabia and Iran, the political landscape in Japan, and the Russia investigation here in the United States all have the potential to upset the economic apple cart. Market volatility has been low for some time. We can't dismiss that an unforeseen "black swan" event could bring volatility back, but our forecast indicates good things for the economy and markets in 2018.
3
Ten Largest Holdings^
| Security description | | Market
value | | % of bond
portfolio | |
U.S. Treasury Note 2.000%, 10/31/22 | | $ | 17,535,903 | | | | 4.6 | % | |
U.S. Treasury Bond 2.750%, 08/15/47 | | | 6,823,519 | | | | 1.8 | % | |
U.S. Treasury Bond 5.375%, 02/15/31 | | | 6,796,356 | | | | 1.8 | % | |
U.S. Treasury Note 2.250%, 10/31/24 | | | 5,549,303 | | | | 1.5 | % | |
Federal National Mortgage Association
3.000%, 01/01/33 | | | 4,461,270 | | | | 1.2 | % | |
PPL Capital Funding, Inc.
Series A 4.358%, 03/30/67 | | | 4,443,750 | | | | 1.2 | % | |
BNSF Funding Trust I 6.613%, 12/15/55 | | | 4,362,213 | | | | 1.1 | % | |
UBS Commercial Mortgage Trust
Series 2017-C1, Class AS 3.724%, 06/15/50 | | | 4,057,921 | | | | 1.1 | % | |
The Chubb Corp. 3.609%, 04/15/37 | | | 3,970,000 | | | | 1.0 | % | |
U.S. Treasury Note 2.000%, 11/30/22 | | | 3,963,594 | | | | 1.0 | % | |
| | $ | 61,963,829 | | | | 16.3 | % | |
^Excludes short-term investments.
Sector Diversification (shown as a percentage of net assets)
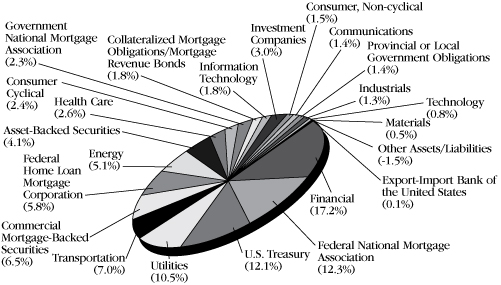
Asset Quality (shown as a percentage of investments)
(Unaudited)

4
Comparison of Change in Investment Value*
A Hypothetical $10,000 Investment in SFT Advantus Bond Fund,
Bloomberg Barclays U.S. Aggregate Bond Index, and Consumer Price Index
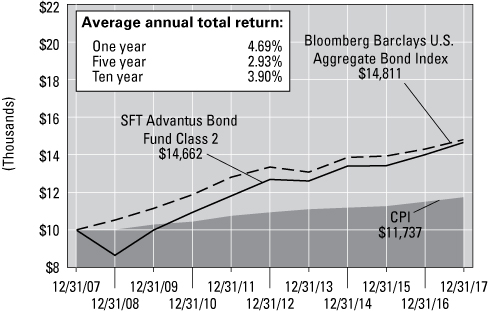
On the chart above you can see how the SFT Advantus Bond Fund's Class 2 shares total return compared to the Bloomberg Barclays U.S. Aggregate Bond Index and the Consumer Price Index. The three lines represent the total return of a hypothetical $10,000 investment made on December 31, 2007 through December 31, 2017, assuming reinvestment of distributions, if any.
*The results shown are past performance and are not an indication of future performance. Current performance may be lower or higher. The investment returns and principal value of an investment will fluctuate so that shares upon redemption may be worth more or less than their original cost. Performance figures of the Fund do not reflect charges pursuant to the terms of the variable life insurance policies and variable annuity contracts funded by separate accounts that invest in the Fund's shares. When such charges are deducted, actual investment performance in a variable policy or contract will be lower.
The Bloomberg Barclays U.S. Aggregate Bond Index is an unmanaged benchmark composite representing average market-weighted performance of U.S. Treasury and agency securities, investment-grade corporate bonds and mortgage-backed securities with maturities greater than one year.
5


Craig M. Stapleton, CFA, FRM, Jeremy Gogos, Ph.D., CFA and
Merlin Erickson Portfolio Managers
The SFT Advantus Dynamic Managed Volatility Fund seeks to maximize risk-adjusted total return relative to its blended benchmark index comprised of 60 percent S&P 500 Index and 40 percent Bloomberg Barclays U.S. Aggregate Bond Index (collectively, the Blended Benchmark Index).
The SFT Advantus Dynamic Managed Volatility Fund invests primarily in Class 1 shares of SFT Advantus Index 500 Fund, an affiliated fund of the Securian Funds Trust, for equity exposure, in a basket of fixed income securities for fixed income exposure and certain derivative instruments. The Fund is subject to risks associated with such investments as described in detail in the prospectus. The net asset value of the Fund will fluctuate and is not guaranteed. It is possible to lose money by investing in the Fund. There is no assurance that efforts to manage Fund volatility will achieve the desired results.
SFT Advantus Dynamic Managed Volatility Fund
How did the Fund perform during the period?
The Fund's Class 2 shares generated a total net return of 17.94 percent over the 12 months ending December 31, 2017. The blended benchmark index, which is comprised of the S&P 500® Index, weighted 60 percent, and the Bloomberg Barclays U.S. Aggregate Bond Index, weighted 40 percent, returned 14.21 percent with a volatility of 3.79 percent over the same period.
What influenced the Fund's return during the past 12 months?
The Dynamic overlay strategy has essentially two sides: the Fund should carry more equity exposure in low volatility periods and less equity exposure in high volatility periods. Given that the S&P 500® Index realized volatility for 2017 was 6.69 percent, the second lowest of the 89 calendar years in the index's history, the Fund averaged a 79 percent equity allocation. This equity overweight, combined with very strong equity returns, was by far the largest driver of Fund performance this year.
What other market conditions or events influenced the Fund's return during the past 12 months?
There were numerous events this past year that could have rattled financial markets: North Korean missile tests, the U.S. Federal Reserve (Fed) hiking rates while other central banks are still in quantitative easing mode, hurricanes, and of course the lack of policy progress out of Washington until the very end of the year. The market shrugged off all these potential obstacles and marched steadily upward through all of 2017. The S&P 500® Index did not have a down month, and its largest one-day loss was only -1.8 percent. It returned 21.8 percent for the year. Therefore, from an equity perspective, the solid return combined with extremely low volatility made for a nearly ideal year.
On the fixed income side, the 10-year U.S. Treasury yield made a round trip over the course of 2017. It started the year at 2.44, ended the year at 2.40, and had a maximum and minimum of 2.63 and 2.04, respectively. Corporate spreads ended the year modestly lower than they started it. Thus, as previously mentioned, the equity portion of the Fund drove the Fund's return this year.
What strategies and techniques did you employ that specifically affected Fund performance?
Throughout the year, the Fund tactically purchased long positions in call options on the Chicago Board Options Exchange (CBOE) Volatility Index (VIX) futures, and long S&P 500® put spreads, as additional hedges for managing the risk of the Fund. We believe that these options provide a great tool for managing risk, and were attractively priced relative to historical valuations. These hedges reduced the volatility of the Fund's returns while helping to protect the Fund against quick market sell-offs.
What industries or sectors did you emphasize during the past 12 months, and what is your outlook going forward?
The Fund's equity exposure is pure S&P 500®. On the fixed income side, the only notable overweight was to Financials.
Over the next several months, we expect continued low equity volatility and further price appreciation in the stock market. The Republican-controlled government in Washington passed, just before the end of the year, a tax reform bill that drastically reduced the U.S. corporate tax rate. In general, this lower tax rate will increase the
6
earnings of most companies and, by extension, we anticipate equity investors enthusiastically using said earnings growth as justification for pouring more money into the market.
It is worth noting that the Fed began to taper its balance sheet in October, starting at $10B per month. Each quarter, that amount will increase by $10B, until it reaches $50B per month. Despite this slight increase in the supply of U.S. Treasury and agency/mortgage-backed securities, the U.S. 2-year to 10-year spread actually decreased over the final quarter of 2017, from 85 basis points to 52 basis points. This move was largely due to the upward move of the 2- year rate. The stagnant 10-year rate suggests the domestic bond market is still not pricing in a material pickup in inflation, nor excessive economic growth. With the European Central Bank (ECB) and Bank of Japan (BOJ) continuing quantitative easing, we do not believe the Fed balance sheet unwind will materially increase mid-term and longer interest rates, domestically or internationally.
Ultimately, our view can be distilled down to a conflict between short-term and long-term economic effects. In the short term, the recent action from Washington—tax reform and numerous deregulation efforts across federal agencies—should continue to be supportive of equity valuations. The same can be said for the ongoing monetary policies from the ECB and the BOJ, which are set to continue until at least September 2018.
If any of the central bank plans change unexpectedly, we anticipate some reaction, most likely negative, in the equity market. Further, as we transition to considering longer time frames, we are much less optimistic. Global debt to GDP is still very close to the peak of Q3 2016, and as one considers the prospects of accelerating global growth, central bank policy normalization, or both, it is difficult to imagine how that debt is serviced in an environment of rising rates. In particular, corporations in America and abroad are saddled with a huge debt burden after years of issuance to take advantage of artificially low interest rates. It is unclear whether there will be enough earnings growth and inflation to make this debt load manageable as interest rates rise. In the face of this, it is difficult to imagine positive equity scenarios beyond a few years.
In a tactical sense, we will continue to use our volatility metrics to inform the equity allocations of the Fund. We will aim to de-risk from our current equity overweight when we believe volatility will be high, and to tactically carry equity hedges to mitigate tail risk until then.
7
*The results shown are past performance and are not an indication of future performance. Current performance may be lower or higher. The investment returns and principal value of an investment will fluctuate so that shares upon redemption may be worth more or less than their original cost. Performance figures of the Fund do not reflect charges pursuant to the terms of the variable life insurance policies and variable annuity contracts funded by separate accounts that invest in the Fund's shares. When such charges are deducted, actual investment performance in a variable policy or contract will be lower.
Advantus Capital Management Inc. (Advantus Capital) and the Securian Funds Trust, on behalf of the SFT Advantus Dynamic Managed Volatility Fund (the "Fund"), have entered into an Expense Limitation Agreement, dated May 1, 2013, which limits the operating expenses of the Fund, excluding certain expenses (such as interest expense, acquired fund fees, cash overdraft fees, taxes, brokerage commissions, other expenditures which are capitalized in accordance with the generally accepted accounting principles, and other extraordinary expenses not incurred in the ordinary course of the Fund's business), to 0.80% of the Fund's average daily net assets through April 30, 2019. The Agreement renews annually for a full year each year thereafter unless terminated by Advantus Capital upon at least 30 days' notice prior to the end of a
Ten Largest Holdings^
| Security description | | Market
value | | % of
Long-Term
portfolio | |
SPDR S&P 500 ETF Trust | | $ | 9,652,326 | | | | 3.1 | % | |
iShares iBoxx $ Investment Grade
Corporate Bond ETF | | | 5,409,420 | | | | 1.7 | % | |
Vanguard S&P 500 ETF | | | 4,948,726 | | | | 1.6 | % | |
Southern Natural Gas Co. LLC,
4.800%, 03/15/47 | | | 1,649,532 | | | | 0.5 | % | |
Ford Motor Co., 5.291%, 12/08/46 | | | 1,632,313 | | | | 0.5 | % | |
Avnet, Inc., 3.750%, 12/01/21 | | | 1,521,576 | | | | 0.5 | % | |
Comcast Corp., 6.400%, 05/15/38 | | | 1,350,383 | | | | 0.4 | % | |
Mead Johnson Nutrition Co., 5.900%, 11/01/39 | | | 1,268,713 | | | | 0.4 | % | |
Tyson Foods, Inc., 5.150%, 08/15/44 | | | 1,170,265 | | | | 0.4 | % | |
Apple, Inc., 4.375%, 05/13/45 | | | 1,126,568 | | | | 0.4 | % | |
| | $ | 29,729,822 | | | | 9.5 | % | |
^Does not include short-term investments or investments in Class 1 shares of the SFT Advantus Index 500 Fund, an affiliated Fund in Securian Funds Trust, which provides the Fund with its primary equity exposure.
Sector Diversification (shown as a percentage of net assets)
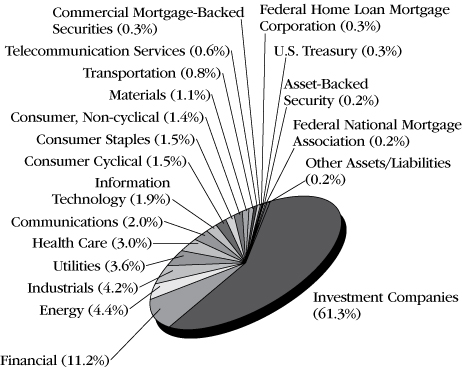
8
Asset Quality (shown as a percentage of investments)
(Unaudited)

Comparison of Change in Investment Value*
A Hypothetical $10,000 Investment in SFT Advantus Dynamic Managed Volatility Fund,
the Blended Benchmark Index, and Consumer Price Index
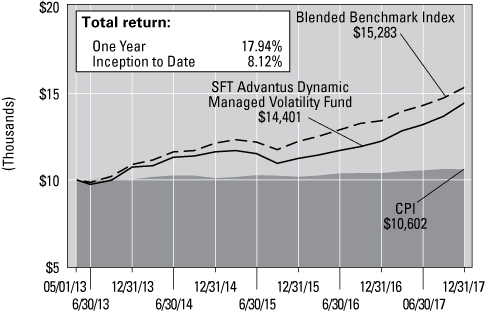
On the chart above you can see how the SFT Advantus Dynamic Managed Volatility Fund's shares total return compared to its Blended Benchmark, comprised of 60 percent of the S&P 500 Index and 40 percent of the Bloomberg Barclays U.S. Aggregate Bond Index, and the Consumer Price Index. The three lines represent the total return of a hypothetical $10,000 investment made on May 1, 2013 through December 31, 2017, assuming reinvestment of distributions, if any.
contract term. The Fund is authorized to reimburse Advantus Capital for management fees previously waived and/or for the cost of expenses previously paid by Advantus Capital pursuant to this agreement, provided that such reimbursement will not cause the Fund to exceed any limits in effect at the time of such reimbursement. The Fund's ability to reimburse Advantus Capital in this manner only applies to fees waived or reimbursements made by Advantus Capital within the three fiscal years prior to the date of such reimbursement. As of December 31, 2017, Advantus Capital has waived $1,906,287 pursuant to the agreement. To the extent that the Fund makes such reimbursements to Advantus Capital, the amount of the reimbursements will be reflected in the financial statements in the Fund's shareholder reports and in Other Expenses under Fees and Expenses of the Fund.
The Blended Benchmark Index is comprised of 60 percent of the S&P 500 Index and 40 percent of the Bloomberg Barclays U.S. Aggregate Bond Index.
The S&P 500 Index is a broad, unmanaged index of 500 common stocks which are representative of the U.S. stock market overall. The Bloomberg Barclays U.S. Aggregate Bond Index is an unmanaged benchmark composite representing the average market-weighted performance of U.S. Treasury and agency securities, investment grade corporate bonds and mortgage-backed securities with maturities greater than one year.
9


Thomas Houghton, CFA and Lena Harhaj, CFA Portfolio Managers
The SFT Advantus Government Money Market Fund seeks maximum current income to the extent consistent with liquidity and the preservation of capital.
It invests at least 99.5 percent of its total assets in cash, government securities, and /or repurchase agreements that are collateralized fully.
Investment in the SFT Advantus Government Money Market Fund is neither insured nor guaranteed by the U.S. Government, and there can be no assurance that the Fund will be able to maintain a stable net asset value of $1.00 per share. It is possible to lose money by investing in the Fund.
SFT Advantus Government Money Market Fund
How did the Fund perform during the period?
The Fund returned 0.13 percent over the twelve months ending December 31, 2017, while the three-month U.S. Treasury bill returned 0.87 percent for the same period.
What influenced the Fund's return during the past 12 months?
The return on the Fund for the year was 0.90 percent before expenses, higher than the return of the three-month U.S. Treasury bill, but not enough to compensate for the fund management expenses.
What other market conditions or events influenced the Fund's performance during the past 12 months?
Since the transition to a U.S. Government Only Fund in 2016, investments consist of primarily short-term discount notes issued by the Federal Home Loan Bank, Fannie Mae and Freddie Mac as well as U.S. Treasury bills and U.S. Treasury floating rate notes.
The U.S. Federal Reserve (Fed) hiked rates three times during 2017. However, yield premiums on agency discount notes collapsed as investors looked for yield. In fact, spreads between agency discount notes with maturities greater than 90 days and the three-month U.S. Treasury bill are negative. Investors can still earn a modest spread premium on agency discount notes that mature within three months. During the year, the Fund continued to invest in U.S. Treasury floating rate notes to take advantage of rising rates.
What strategies and techniques did you employ that affected Fund performance?
The Fund's performance this year was driven by the declining excess spread of agency discount notes over U.S. Treasury Bills and by the Fund's use of U.S. Treasury floating rate notes, whose yields rose along with short-term interest rates.
What industries or sectors did you emphasize during the past 12 months, and what is your outlook going forward?
We expect slow and steady growth, low inflation and a lack of market volatility. Tax reform should keep the expansion going, but it could also increase inflation and spur accelerated economic growth, which could prompt the Fed to respond. Treasury markets already appear to reflect potential inflation risk, as well as prospects for greater growth, following the passage of the tax bill.
Central Bank policies here and in Europe have the potential to upset the apple cart. Janet Yellen wraps up her term as Fed chair, with Jerome Powell ready to take over in February. We believe Powell will likely follow a path similar to Yellen's, although he may be slightly more aggressive about raising interest rates. Four vacancies on the Fed's board of governors await filling. The new occupants could affect future Fed policy as much as the change at the top. The December Fed meeting minutes projected three rate raises in 2018. For now, interest rate futures pricing indicates the market expects the Fed to raise rates only twice in 2018. If concerns grow that the Fed will raise rates at a quicker pace than currently anticipated, it could put a dent in the markets.
10
The results are past performance and are not an indication of future performance. Current performance may be lower or higher. The investment returns and principal value of an investment will fluctuate so that shares upon redemption may be worth more or less than their original cost. Investment in the SFT Advantus Government Money Market Fund is neither insured nor guaranteed by the U.S. Government or any other agency, and there can be no assurance that the Fund will be able to maintain a stable net asset value of $1.00 per share. Shares upon redemption may be worth more or less than their original cost.
Performance figures of the Fund do not reflect changes pursuant to the terms of the variable life insurance policies and variable annuity contracts funded by separate accounts that invest in the Fund's shares. When such charges are deducted, actual investment performance in a variable policy or contract will be lower.
Effective May 1, 2012, the Board of Trustees of Securian Funds Trust approved a Restated Net Investment Income Maintenance Agreement among Securian Funds Trust (on behalf of SFT Advantus Government Money Market Fund), Advantus Capital and Securian Financial Services, Inc. (Securian Financial). A similar agreement was previously approved by the Board of Directors of Advantus Series Fund, Inc., the Trust's predecessor, effective October 29, 2009. Under such Agreement, Advantus Capital agrees to waive, reimburse or pay Money Market Fund expenses so that the Fund's daily net investment income does not fall below zero. Securian Financial may also waive its Rule 12b-1 fees. Advantus capital and Securian Financial each has the option under the Agreement to recover the full amount waived, reimbursed or paid (the "Expense Waiver") on any day on which the Fund's net investment income exceeds zero. On any day, however, the Expense Waiver does not constitute an obligation of the Fund unless Advantus Capital or Securian Financial has expressly exercised its rights to recover a specified portion of the Expense Waiver on that day, in which case such specified portion is then due and payable by the Fund. In addition, the right of Advantus and/or Securian Financial to recover the Expense Waiver is subject to the following limitations: (1) if a repayment of the Expense Waiver by the Fund would cause the Fund's net investment income to fall below zero, such repayment is deferred until a date when repayment would cause the Fund's net investment income to fall below zero; (2) the right to recover any portion of the Expense Waiver expires three years after the effective date of that portion of the Expense Waiver; and (3) any repayment of the Expense Waiver by the Fund cannot cause the Fund's expense ratio to exceed 1.25%. as of December 31, 2017, Advantus Capital and Securian Financial have collectively waived $4,631,950 pursuant to the Agreement, including expenses waived under the prior agreement with Advantus Series Fund, Inc., of which $1,176,744 was eligible for recovery as of such date. If Advantus Capital and Securian Financial exercise their rights to be paid such waived amounts, the Fund's future yield will be negatively affected for an indefinite period. The Agreement shall continue in effect following April 30, 2018, provided such continuance is specifically approved by a majority of the Trust's independent Trustees.
Effective November 1, 2017, Advantus Capital and Securian Funds Trust, on behalf of the SFT Advantus Government Money Market Fund, entered into an Expense Limitation Agreement which limits the operating expenses of the Fund, excluding certain expenses, (such as interest expense, acquired fund fees, cash overdraft fees, taxes brokerage commissions, other expenditures which are capitalized in accordance with GAAP, and other extraordinary expenses not incurred in the ordinary course of the Funds' business),to 0.70% of the Fund's Average daily net assets through April 30, 2019.
The Agreement renews annually for a full year each year thereafter unless terminated by Advantus Capital upon at least 30 days' notice prior to the end of the contract term. The Fund is authorized to reimburse Advantus Capital for management fees previously waived and/or for the cost of expenses previously paid by Advantus Capital pursuant to this agreement, provided that such reimbursement will not cause any Fund to exceed any limits in effect at the time of such reimbursement.
The Fund's ability to reimburse Advantus Capital in this manner only applies to fees waived or reimbursements made by Advantus Capital within the three fiscal years prior to the date of such reimbursement. To the extent that the Fund makes such reimbursements to Advantus Capital, the amount of the reimbursements will be reflected in the financial statements in the Funds' shareholder reports and in Other Expenses under Fees and Expenses of the Fund in the prospectus.
As of December 31, 2017, Advantus Capital has waived $26,980 pursuant to the agreement, all of which was eligible for recovery as of such date. To the extent that the Fund makes such reimbursements to Advantus Capital, the amount of the reimbursements will be reflected in the financial statements in the Fund's shareholder reports and in Other Expenses under Fees and Expenses to the Fund.
11

James Seifert Portfolio Manager
The SFT Advantus Index 400 Mid-Cap Fund seeks to provide investment results generally corresponding to the aggregate price and dividend performance of publicly traded common stocks that comprise the Standard & Poor's MidCap 400 Index (S&P 400). It is designed to provide an economical and convenient means of maintaining a diversified portfolio in this equity security area as part of an overall investment strategy. The risks incurred by investing in the SFT Advantus Index 400 Mid-Cap Fund include, but are not limited to, the risk that the Fund may not be able to replicate the performance of the S&P 400, and the risk of declines in the market for mid-cap stocks or in the equity markets generally.
SFT Advantus Index 400 Mid-Cap Fund
How did the Fund perform during the period?
The Fund's Class 2 shares generated a total net return of 15.61 percent over the 12 months ending December 31, 2017, while the S&P MidCap 400® Index returned 16.24 percent over the same period.
What influenced the Fund's return during the past 12 months?
The Securian Funds Trust Advantus Index 400 Mid-Cap Fund is passively managed. The Fund is fully invested and holds all names at published free float adjusted index weights. The Fund seeks investment results that correspond generally to the price and yield performance, before fees and expenses, of the S&P MidCap 400® Index.
Eight of the nine sectors posted positive annual returns. The capital goods sector led all sectors with a 12-month return of 31.5 percent. Technology names followed with an annual return of 27.1 percent. Decile segments consist of 50 names; in terms of size, decile 1 (consisting of the largest names and representing 27.7 percent of the weight in the index), ended the period with a return of 27.7 percent. Decile ten, (representing the 50 smallest market cap names in the index with a 4 percent weight) lagged in terms of annual decile return with a 6.1 percent gain.
What other market conditions or events influenced the Fund's performance during the past 12 months?
Tax reform was a focus for Washington and Wall Street during the last half of 2017. By repeatedly reaching new all-time highs, the markets celebrated the passage of the most significant tax changes in 30 years.
Retail, industrial and financial corporations will benefit from the corporate tax rate dropping from 35 percent to 21 percent. Financial firms will also likely benefit from regulatory relief, which should increase profitability.
What will affect the Fund going forward?
Expect slow and steady growth, low inflation and a lack of market volatility in the months ahead. Tax reform should keep the expansion going, but it could also increase inflation, which may prompt the Fed to respond if the inflation outpaces desired expectations. Geopolitical issues could disrupt this economic outlook and bring back volatility in a big way.
12
Ten Largest Holdings^
| Security description | | Market
value | | % of stock
portfolio | |
Take-Two Interactive Software, Inc. | | $ | 1,542,080 | | | | 0.7 | % | |
| SVB Financial Group | | | 1,518,570 | | | | 0.7 | % | |
NVR, Inc. | | | 1,515,551 | | | | 0.7 | % | |
MSCI, Inc. | | | 1,403,582 | | | | 0.6 | % | |
Teleflex, Inc. | | | 1,380,453 | | | | 0.6 | % | |
Huntington Ingalls Industries, Inc. | | | 1,318,270 | | | | 0.6 | % | |
Cognex Corp. | | | 1,304,482 | | | | 0.6 | % | |
Broadridge Financial Solutions, Inc. | | | 1,300,276 | | | | 0.6 | % | |
Trimble, Inc. | | | 1,260,206 | | | | 0.6 | % | |
Steel Dynamics, Inc. | | | 1,258,749 | | | | 0.6 | % | |
| | $ | 13,802,219 | | | | 6.3 | % | |
^Excludes short-term investments.
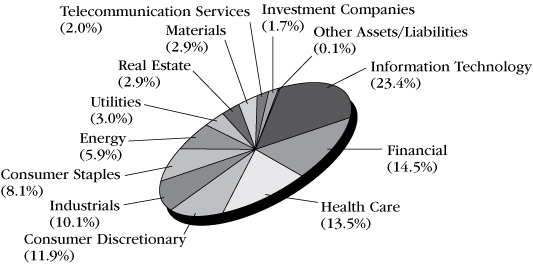
Sector Diversification (shown as a percentage of net assets)

Comparison of Change in Investment Value*
A Hypothetical $10,000 Investment in SFT Advantus Index 400 Mid-Cap Fund,
S&P MidCap 400® Index, and Consumer Price Index
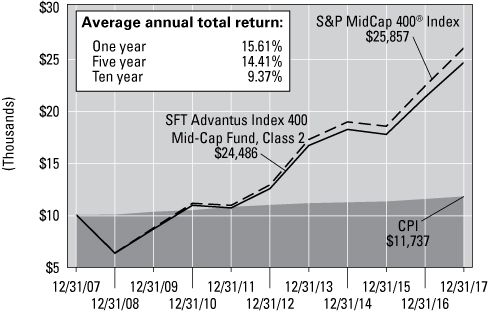
On the chart above you can see how the SFT Advantus Index 400 Mid-Cap Fund's Class 2 shares total return compared to the S&P MidCap 400 Index and the Consumer Price Index. The three lines represent the total return of a hypothetical $10,000 investment made on December 31, 2007 through December 31, 2017, assuming reinvestment of distributions, if any.
"Standard & Poor's®", "S&P®", "Standard & Poor's MidCap 400" and "S&P MidCap 400" are trademarks of the S&P Global, Inc. and have been licensed for use by the Securian Funds Trust—SFT Advantus Index 400 Mid-Cap Fund. The Fund is not sponsored, endorsed, sold or promoted by Standard & Poor's and Standard & Poor's makes no representation regarding the advisability of investing in the Fund.
*The results shown are past performance and are not an indication of future performance. Current performance may be lower or higher. The investment returns and principal value of an investment will fluctuate so that shares upon redemption may be worth more or less than their original cost. Performance figures of the Fund do not reflect charges pursuant to the terms of the variable life insurance policies and variable annuity contracts funded by separate accounts that invest in the Fund's shares. When such charges are deducted, actual investment performance in a variable policy or contract will be lower.
S&P MidCap 400 Index consists of 400 domestic stocks chosen for market size (median market capitalization of about $4.1 billion), liquidity and industry group representation. It is a market-weighted index (stock price times shares outstanding), with each stock affecting the index in proportion to its market value.
13

James Seifert Portfolio Manager
The SFT Advantus Index 500 Fund seeks investment results that correspond generally to the price and yield performance of the common stocks included in the Standard and Poor's Corporation 500 Composite Stock Index (S&P 500). It is designed to provide an economical and convenient means of maintaining a broad position in the equity market as part of an overall investment strategy. The risks incurred by investing in the SFT Advantus Index 500 Fund include, but are not limited to, the risk that the Fund may not be able to replicate the performance of the S&P 500, and the risk of declines in the equity markets generally.
SFT Advantus Index 500 Fund
How did the Fund perform during the period?
The Fund's Class 2 shares generated a total net return of 21.23 percent over the 12 months ending December 31, 2017, while the S&P 500® Index returned 21.83 percent over the same period.
What influenced the Fund's return during the past 12 months?
The Securian Funds Trust Advantus Index 500 Fund is passively managed. The Fund is fully invested and holds all names at published float adjusted index weights. The Fund seeks investment results that correspond generally to the price and yield performance, before fees and expenses, of the S&P 500® Index.
Eight of the nine sectors invested in posted positive annual returns. The technology sector led all sectors with a 12-month return of 37.0 percent. Material and services names followed with an annual return of 29.4 percent. The energy sector was the only sector that ended the year with a negative return of -1.5 percent. Decile segments consist of 50 names; in terms of size, decile 1, (consisting of the mega-cap names and representing 48.1 percent of the weight in the index), ended the period with a return of 22.1 percent. Decile ten (representing the 50 smallest market cap names in the index with a 1.4 percent weight) lagged in terms of annual decile return with a 6.6 percent gain. All other deciles ended the year with positive double-digit returns.
What other market conditions or events influenced the Fund's performance during the past 12 months?
Tax reform was a focus for Washington and Wall Street during the last half of 2017. By repeatedly reaching new all-time highs, the markets celebrated the passage of the most significant tax changes in 30 years.
Retail, industrial and financial corporations will benefit from the corporate tax rate dropping from 35 percent to 21 percent. Financial firms will also likely benefit from regulatory relief, which should increase profitability.
What will affect the Fund going forward?
Expect slow and steady growth, low inflation and a lack of market volatility in the months ahead. Tax reform should keep the expansion going, but it could also increase inflation, which may prompt the U.S. Federal Reserve to respond if the inflation outpaces desired expectations. Geopolitical issues could disrupt this economic outlook and bring higher volatility back to the market in 2018.
14
Ten Largest Holdings^
| Security description | | Market
value | | % of stock
portfolio | |
Apple, Inc. | | $ | 32,786,959 | | | | 3.8 | % | |
Microsoft Corp. | | | 24,901,378 | | | | 2.9 | % | |
Amazon.com, Inc. | | | 17,684,725 | | | | 2.1 | % | |
Facebook, Inc.—Class A | | | 15,879,635 | | | | 1.8 | % | |
Berkshire Hathaway, Inc.—Class B | | | 14,394,142 | | | | 1.7 | % | |
Johnson & Johnson | | | 14,164,115 | | | | 1.6 | % | |
JPMorgan Chase & Co. | | | 14,001,547 | | | | 1.6 | % | |
Exxon Mobil Corp. | | | 13,373,367 | | | | 1.6 | % | |
Alphabet, Inc.—Class C | | | 11,924,774 | | | | 1.4 | % | |
Alphabet, Inc.—Class A | | | 11,850,750 | | | | 1.4 | % | |
| | $ | 170,961,392 | | | | 19.9 | % | |
^Excludes short-term investments.
Sector Diversification (shown as a percentage of net assets)
Comparison of Change in Investment Value*
A Hypothetical $10,000 Investment in SFT Advantus Index 500 Fund,
S&P 500® Index, and Consumer Price Index
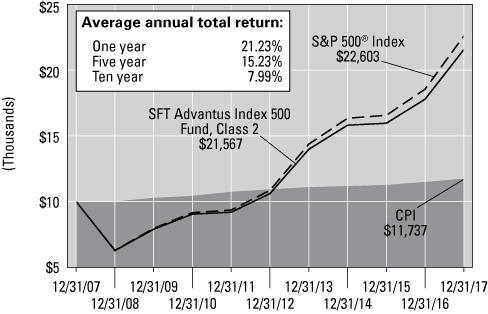
On the chart above you can see how the SFT Advantus Index 500 Fund's Class 2 shares total return compared to the S&P 500 Index (as adjusted for dividend reinvestment) and the Consumer Price Index. The three lines represent the total return of a hypothetical $10,000 investment made on December 31, 2007 through December 31, 2017, assuming reinvestment of distributions, if any.
"Standard & Poor's®", "S&P®", "Standard & Poor's 500" and "S&P 500" are trademarks of the S&P Global, Inc. and have been licensed for use by Securian Funds Trust—SFT Advantus Index 500 Fund. The Fund is not sponsored, endorsed, sold or promoted by Standard & Poor's and Standard & Poor's makes no representation regarding the advisability of investing in the Fund.
*The results shown are past performance and are not an indication of future performance. Current performance may be lower or higher. The investment returns and principal value of an investment will fluctuate so that shares upon redemption may be worth more or less than their original cost. Performance figures of the Fund do not reflect charges pursuant to the terms of the variable life insurance policies and variable annuity contracts funded by separate accounts that invest in the Fund's shares. When such charges are deducted, actual investment performance in a variable policy or contract will be lower.
The S&P 500 Index is a broad, unmanaged index of 500 common stocks which are representative of the U.S. stock market overall.
15


Michael Hasenstab, Ph.D. and Christine Zhu Portfolio Managers Franklin Advisers, Inc.
The SFT Advantus International Bond Fund seeks to maximize current income consistent with protection of principal. The Fund pursues its objective by investing primarily in debt securities issued by issuers located anywhere in the world. While Advantus Capital Management, Inc. acts as the investment adviser for the Fund, Franklin Advisers, Inc. provides investment advice to the SFT Advantus International Bond Fund under a sub-advisory agreement. Investment risks associated with international investing in addition to other risks include currency fluctuations, political and economic instability, and differences in accounting standards when investing in foreign markets.
SFT Advantus International Bond Fund
How did the Fund perform during the period?
The Fund's Class 2 shares generated a net return of 1.12 percent over the 12 months ending December 31, 2017, underperforming the Citigroup World Government Bond Index, which returned 7.49 percent over the same period.
What influenced the Fund's return during the past 12 months?
The Fund underperformed its benchmark index in 2017 primarily due to currency positions. Interest-rate strategies contributed to relative results, while sovereign credit exposures had a largely neutral effect. Among currencies, the Fund's underweighted positions in the euro, the Japanese yen and the Australian dollar detracted from relative performance. However, overweighted currency positions in Latin America (the Mexican peso and Brazilian real) and Asia ex Japan (Indian rupee) contributed to relative results. The Fund maintained a defensive approach regarding interest rates in developed markets, while holding duration exposures in select emerging markets. Select overweighted duration exposures in Asia ex Japan (Indonesia) and Latin America (Brazil) contributed to relative performance, while underweighted duration exposure in the United States detracted.
What other market conditions or events influenced the Fund's return during the last 12 months?
The U.S. Federal Reserve (Fed) raised the federal funds target rate three times during 2017. U.S. Treasury (UST) yields initially rose significantly in the weeks leading up to its March 15 meeting, with the 10-year UST note reaching its highest yield of the reporting period on the day before the meeting, at 2.63 percent. The Fed hiked the federal funds target rate 25 basis points to a range of 0.75 percent to 1.00 percent, as largely expected by markets. However, yields declined during the second half of the month on U.S. policy uncertainties and less hawkish-sounding language than anticipated in the Fed's forward guidance. The Fed raised its policy rate 25 basis points (to a range of 1.00 percent to 1.25 percent) at its June 14 meeting and appeared more committed to tightening policy than it has been in recent years, specifically stating its intentions to begin unwinding its balance sheet later in the year, while remaining on course for three rate hikes in 2017 and highlighting the need to strengthen financial market stability. However, it was not until the last week of June that markets began to react to the renewed determination from the Fed—only after similar comments on potential policy direction were made by the heads of the European Central Bank (ECB), Bank of England and Bank of Canada.
During the second half of 2017, the Fed raised the federal funds target rate another 25 bps in December to a range of 1.25 percent to 1.50 percent. The Fed also began unwinding its nearly U.S. $4.5 trillion balance sheet in October, allowing around U.S. $6 billion in USTs and U.S. $4 billion in mortgage-backed securities (MBS) to begin rolling off each month as they matured. That volume was scheduled to increase in January 2018 to U.S. $12 billion in USTs and U.S. $8 billion in MBS per month. President Donald Trump nominated Jerome Powell to be the next Fed chair, scheduled to replace Janet Yellen in February 2018. Markets have appeared to view Powell as a mainstream continuation of the Yellen/Bernanke Fed, though Powell brings more private sector experience and more support for deregulation. The 10-year UST note finished the year at 2.41 percent. Overall, we continue to expect UST yields to rise with growing inflation pressures in an environment of economic resilience and exceptionally strong U.S. labor markets.
16
In Europe, UK Prime Minister Theresa May formally triggered Article 50 to begin the Brexit process on March 29 in a written letter to Donald Tusk, president of the European Council, largely spurring a protracted decline in the yield on 10-year British Gilts. In April, the ECB reduced its pace of monthly quantitative easing (QE) purchases to €60 billion from its previous €80 billion a month pace, but kept policy rates unchanged. In early May, Emmanuel Macron won the French presidential election over Marine Le Pen, resulting in strengthening European market sentiment, appreciation of the euro and a rise in European bond yields.
Europe largely remained in a state of optimism during the much of the year, driven by the cyclical upswing in eurozone growth as well as the political refortifying after French President Emmanuel Macron's victory in May. However, Angela Merkel's win in the German election in September came with new uncertainties around forming a coalition with the Free Democrats (FDP) and the Greens, and dissolving the grand coalition between her center-right Christian Democratic Union (CDU) party and the Social Democrat (SPD). In Europe, yields moderately increased while the euro strengthened against the U.S. dollar during the year. We expect widening rate differentials between rising yields in the U.S. and the low to negative yields in the eurozone to depreciate the euro against the U.S. dollar. The ECB is scheduled to reduce the pace of its bond-buying program in January 2018 to €30 billion per month, down from the December pace of €60 billion per month. ECB President Mario Draghi has continued to indicate that rates are not likely to be hiked until QE ends, implying that rates would likely remain unchanged in 2018. Overall, we expect accommodative effects to continue in Europe for the upcoming year. Additionally, we continue to see ongoing risks to the political cohesion across Europe as populist movements continue to influence the political discourse. In Germany, Angela Merkel's efforts to form a coalition government remain unfulfilled at the end of 2017, complicating the political mandates in Europe. The euro continues to be vulnerable to unresolved structural and political risks across Europe, in our view.
In Japan, Prime Minister Shinzo Abe's political mandate remained strong after his political coalition maintained its supermajority in October elections. We expect Abenomics programs to continue as planned with Abe's ongoing political strength. The Bank of Japan (BOJ) continued with its QE program throughout 2017 as short-term yields in Japan remained negative. Rising UST yields should produce a more effective environment for the BOJ to actively deploy additional monetary accommodation that weakens the yen, as it continues to target a 0.0 percent yield on the 10-year Japanese government bond. We expect the Japanese yen to weaken on widening rate differentials with the U.S.
Across emerging markets, yields declined in specific areas of Latin America and Asia, notably Indonesia and Brazil during the year, but rose in other countries, such as India and Mexico. Global currencies broadly strengthened against a weakened U.S. dollar during 2017, with some notable exceptions such as the depreciations of the Argentine peso and Ghanaian cedi. Overall, we continue to see a number of local-currency markets that we believe remain undervalued, particularly in India, Indonesia, Mexico and Colombia. We also see attractive risk-adjusted yields in places like Brazil and Argentina. On the whole, we expect select currencies to appreciate over the medium term, particularly in countries with economic resilience and relatively higher, maintainable rate differentials.
17
What strategies and techniques did you employ that affected the Fund's performance?
On the whole, we have continued to position our strategies for rising rates by maintaining low portfolio duration and aiming at a negative correlation with UST returns. We have also continued to actively seek select duration exposures in emerging markets that can offer positive real yields without taking undue interest-rate risk, favoring countries that have solid underlying fundamentals and prudent fiscal and monetary policies. When investing globally, investment opportunities may take time to materialize, which may require weathering short-term volatility as the longer-term investing theses develop.
We remained positioned in a number of emerging markets, with notable local-currency duration exposures in Brazil, Argentina, Colombia, Indonesia and India, and notable currency exposure to the Mexican peso. We adjusted specific positions during 2017, notably increasing our local-currency exposures in India in April and exiting much of our local-currency exposures in Malaysia. We continued to hold net-negative positions in the euro and Japanese yen based on our expectations for widening rate differentials with the U.S. as the Fed tightens policy while the ECB and BOJ continue with monetary accommodation. The short positions in the euro and yen represent directional views on the currencies, as well as hedges against broad strengthening of the U.S. dollar. The short euro position is also a hedge against euro-skeptic political risks and unresolved structural risks in Europe. We also continued to hold net-negative positioning in the Australian dollar based on the Reserve Bank of Australia's continued leanings towards accommodative rates, and as a partial hedge against potential economic risks in China as well as broad-based beta risk across emerging markets.
What sectors did you emphasize during the fiscal year, and what is your outlook for the next 12 months?
We anticipate a rise in UST yields and a reversal of U.S. dollar weakness as the Fed moves towards tightening policy while U.S. inflation pressures begin to pick up. We expect the Fed's balance sheet unwinding to put additional upward pressure on yields. Several major buyers of USTs have pulled back from the UST market in recent years, including foreign governments and central banks in Asia, notably the People's Bank of China. Major oil producing countries have also pulled back, becoming net borrowers instead of net lenders as they were when oil prices were above U.S. $100 per barrel. The Fed will now be added to that list of diminishing demand, as it unwinds its UST positions at a pace of U.S. $6 billion per month, raising that pace by U.S. $6 billion every three months until reaching a pace of U.S. $30 billion per month. That transfers much of the proportional demand for USTs to price-sensitive domestic investors, which we expect to add to the upward pressure on yields.
Markets have appeared to place a lot of focus on the speed and extent of rate hikes, in our view, but not placed enough attention on the balance sheet unwinding—an unprecedented event for the UST and MBS markets. Investors who are holding longer duration exposures are taking on a lot of asymmetric risk, in our opinion, particularly in an environment of economic resilience and growing inflation pressures.
Outside of the developed markets, we continue to see a subset of countries with domestically strong economies that have demonstrated their resilience to global shocks, including potential increases in trade costs. We are focused on specific emerging markets that are less externally vulnerable and more domestically driven, and that have responsible, credible central banks that consistently respond with appropriate monetary policies. Certainly, 20 years ago it may have been difficult for many of these countries to weather a protectionist trade shock, a commodity price shock and an exchange rate
18
shock all at the same time, but today several countries have greatly reduced those external vulnerabilities.
In 2017, we saw notable strength across a number of local-currency emerging markets. Some positive tailwinds developed from foreign investment returning to several undervalued markets. A lot of foreign capital had left in prior years—when it came back the valuations in those asset categories tended to come back quickly as well. Nonetheless, we are still in the initial phases of emerging market resurgence, and there is still a lot of room to strengthen given how far valuations dropped in prior years, particularly during the selloffs in 2016.
In the major developed economies, we anticipate continued monetary accommodation and low rates in Japan and the eurozone while rates rise in the U.S.—those increasing rate differentials should depreciate the yen and euro against the U.S. dollar, in our view. Despite the eurozone being in a cyclical upswing, we continue to have a negative view on the euro not only because of ongoing monetary accommodation, but also because of persistent populist risks.
Overall, we continue to maintain low portfolio duration while aiming at a negative correlation with UST returns. We also continue to hold select local currency duration exposures in countries that we believe have healthy fundamentals and significantly higher yields than those available in developed markets. Looking ahead, we anticipate rising inflation pressures in the U.S. to drive UST yields higher. We also expect depreciations of the euro and Japanese yen against the U.S. dollar and currency appreciation across a select subset of emerging markets.
19
Ten Largest Holdings^
| Security description | | Market
value | | % of bond
portfolio | |
Mexican Bonos 5.000%, 12/11/19 | | $ | 4,907,317 | | | | 8.8 | % | |
Indonesia Treasury Bond 7.000%, 05/15/27 | | | 3,795,278 | | | | 6.8 | % | |
Mexican Bonos 4.750%, 06/14/18 | | | 2,855,253 | | | | 5.1 | % | |
Korea Treasury Bond 3.375%, 09/10/23 | | | 2,675,488 | | | | 4.8 | % | |
Korea Treasury Bond 1.500%, 06/10/19 | | | 2,495,011 | | | | 4.5 | % | |
Korea Treasury Bond 3.000%, 09/10/24 | | | 2,337,296 | | | | 4.2 | % | |
Mexican Bonos 8.000%, 06/11/20 | | | 2,314,990 | | | | 4.2 | % | |
Korea Treasury Bond 2.000%, 09/10/22 | | | 2,180,738 | | | | 3.9 | % | |
Indonesia Treasury Bond 8.375%, 09/15/26 | | | 2,131,053 | | | | 3.8 | % | |
Argentine Bonos del Tesoro 15.500%, 10/17/26 | | | 2,071,223 | | | | 3.7 | % | |
| | $ | 27,763,647 | | | | 49.8 | % | |
^Excludes short-term investments.
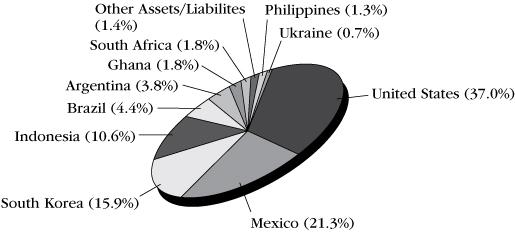
Country Diversification (shown as a percentage of net assets)
Currency Diversification (shown as a percentage of net assets)
African | | | 3.72 | % | |
South African Rand (ZAR) | | | 1.88 | % | |
Ghana Cedi (GHS) | | | 1.84 | % | |
Americas | | | 154.52 | % | |
United States Dollar (USD) | | | 115.77 | % | |
Mexican Peso (MXN) | | | 21.07 | % | |
Brazilian Real (BRL) | | | 13.38 | % | |
Argentine Peso (ARS) | | | 4.30 | % | |
Asia Pacific* | | | -17.81 | % | |
Indonesian Rupiah (IDR) | | | 10.78 | % | |
Indian Rupee (INR) | | | 10.19 | % | |
Philippine Peso (PHP) | | | 1.34 | % | |
Republic of Korea Won (KRW)* | | | -0.14 | % | |
Australian Dollar (AUD)* | | | -9.40 | % | |
Japanese Yen (JPY)* | | | -30.58 | % | |
Europe* | | | -40.45 | % | |
Euro (EUR)* | | | -40.45 | % | |
*A negative figure reflects net "short" exposure, designed to benefit if the value of the associated currency decreases. Conversely, the Fund's value would potentially decline if the value of the associated currency increases.
20
Comparison of Change in Investment Value*
A Hypothetical $10,000 Investment in SFT Advantus International Bond Fund,
Citigroup World Government Bond Index, and Consumer Price Index
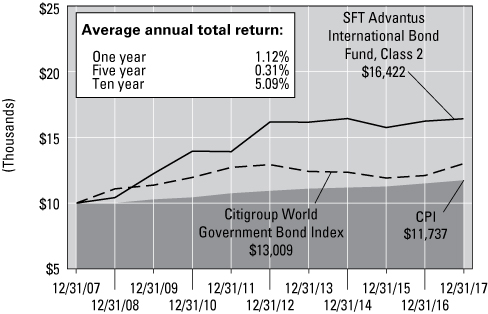
On the chart above you can see how the SFT Advantus International Bond Fund's Class 2 shares total return compared to the Citigroup World Government Bond Index, and the Consumer Price Index. The three lines represent the total return of a hypothetical $10,000 investment made on December 31, 2007 through December 31, 2017, assuming reinvestment of distributions, if any.
*The results shown are past performance and are not an indication of future performance. Current performance may be lower or higher. The investment returns and principal value of an investment will fluctuate so that shares upon redemption may be worth more or less than their original cost. Performance figures of the Fund do not reflect charges pursuant to the terms of the variable life insurance policies and variable annuity contracts funded by separate accounts that invest in the Fund's shares. When such charges are deducted, actual investment performance in a variable policy or contract will be lower.
The Citigroup World Government Bond Index is a market capitalization weighted index consisting of the government bond markets from over twenty countries. Country eligibility is determined based upon market capitalization and investability criteria. The index includes all fixed-rate bonds with a remaining maturity of one year or longer and with amounts outstanding of at least the equivalent of U.S. $25 million. Government securities typically exclude floating or variable rate bonds, U.S./Canadian savings bonds and private placements. Each bond must have a minimum rating of BBB-/Baa3 by S&P or Moody's.
21


Craig M. Stapleton, CFA, FRM, Jeremy Gogos, Ph.D., CFA and Merlin Erickson Portfolio Managers
The SFT Advantus Managed Volatility Equity Fund seeks to maximize risk-adjusted total return relative to its blended benchmark index comprised of 60 percent S&P 500® Low Volatility Index, 20% S&P 500® BMI International Developed Low Volatility Index and 20% Bloomberg Barclays U.S. 3 Month Treasury Bellwether Index (collectively, the Blended Benchmark Index).
The SFT Advantus Managed Volatility Equity Fund invests at least 80% of its assets in equity securities. Equity securities include those that are equity-based, such as ETFs that invest primarily in U.S. and foreign equity securities. The Fund is subject to risks associated with such investments as described in detail in the prospectus. The net asset value of the Fund will fluctuate and is not guaranteed. It is possible to lose money by investing in the Fund. There is no assurance that efforts to manage Fund volatility will achieve the desired results.
SFT Advantus Managed Volatility Equity Fund
How did the Fund perform during the period?
The Fund generated a total net return of 16.33 percent, with a volatility of 4.81 percent, for the 12 months ending December 31, 2017. The blended benchmark index, which is comprised of the S&P 500® Low Volatility Index, weighted 60 percent, the S&P 500® BMI International Developed Low Volatility Index, weighted 20 percent, and the Bloomberg Barclays U.S. 3-Month Treasury Bellwether Index, weighted 20 percent, returned 14.99 percent, with a volatility of 4.02 percent, over the same period.
What influenced the Fund's return during the past 12 months?
The Managed Volatility Equity overlay strategy has essentially two sides: the Fund should carry more equity exposure in low volatility periods, and less equity exposure in high volatility periods. Given that the S&P 500® Index realized volatility for 2017 was 6.69 percent, the second-lowest of the 89 calendar years in the index's history, the Fund averaged a 92.6 percent equity allocation. This equity overweight contributed approximately 1.4 percent of additional portfolio return.
What other market conditions or events influenced the Fund's performance during the past 12 months?
There were numerous events this past year that could have rattled financial markets: North Korean missile tests, the U.S. Federal Reserve (Fed) hiking rates while other central banks are still in quantitative easing mode, hurricanes, and of course the lack of policy progress out of Washington until the very end of the year. The market shrugged off all these potential obstacles and marched steadily upward through all of 2017. The S&P 500® Index did not have a down month, and its largest one-day loss was only -1.8 percent. It returned 21.8 percent for the year. So, from an equity perspective, the solid return combined with extremely low volatility made for a nearly ideal year.
The Fund's international holdings outperformed the benchmark's international component on an absolute basis, with the former returning 23.7 percent, and the latter 22.8 percent. This better performance was driven largely by the Fund's higher exposures to Japan and Switzerland, the equity markets of which returned 21.3 percent and 17.9 percent, respectively, in USD terms.
What strategies and techniques did you employ that affected Fund performance?
Throughout the year, the Fund tactically purchased long positions in call options on the Chicago Board Options Exchange (CBOE) Volatility Index (VIX) futures, and long S&P 500® put spreads, as additional hedges for managing the risk of the Fund. We believe that these options provide a great tool for managing risk, and were attractively priced relative to historical valuations. These hedges reduced the volatility of the Fund's returns while helping to protect the Fund against quick market sell-offs.
What industries or sectors did you emphasize during the past 12 months, and what is your outlook going forward?
This Fund is a passive allocation to equity ETFs. In terms of the sector exposures the ETFs provide, the largest benefit came from having modestly higher Information Technology exposure than the benchmark, which contributed approximately 1.6 percent of additional return. The largest performance drag came from being underweight in Financials, which cost 1.6 percent of relative performance.
22
Over the next several months, we expect continued low equity volatility and further price appreciation in the stock market. The Republican-controlled government in Washington passed, just before the end of the year, a tax reform bill that drastically reduced the U.S. corporate tax rate. In general, this lower tax rate will increase the earnings of most companies and, by extension, we anticipate equity investors enthusiastically using said earnings growth as justification for pouring more money into the market.
It is worth noting that the Fed began to taper its balance sheet in October, starting at $10B per month. Each quarter, that amount will increase by $10B, until it reaches $50B per month. Despite this slight increase in the supply of U.S. Treasury and agency/mortgage-backed securities, the U.S. 2-year to 10-year spread actually decreased over the final quarter of 2017, from 85 basis points to 52 basis points. This move was largely due to the upward move of the 2-year rate. The stagnant 10-year rate suggests the domestic bond market is still not pricing in a material pickup in inflation, nor excessive economic growth. With the European Central Bank (ECB) and Bank of Japan (BOJ) continuing quantitative easing, we do not believe the Fed balance sheet unwind will materially increase mid-term and longer interest rates, domestically or internationally.
Ultimately, our view can be distilled down to a conflict between short-term and long-term economic effects. In the short term, the recent action from Washington—tax reform and numerous deregulation efforts across federal agencies should continue to be supportive of equity valuations. The same can be said for the ongoing monetary policies from the ECB and the BOJ, which are set to continue until at least September 2018.
If any of the central bank plans change unexpectedly, we anticipate some reaction, most likely negative, in the equity market. Further, as we transition to considering longer time frames, we are much less optimistic. Global debt to GDP is still very close to the peak of Q3 2016, and as one considers the prospects of accelerating global growth, central bank policy normalization, or both, it is difficult to imagine how that debt is serviced in an environment of rising rates. In particular, corporations in America and abroad are saddled with a huge debt burden after years of issuance to take advantage of artificially low interest rates. It is unclear whether there will be enough earnings growth and inflation to make this debt load manageable as interest rates rise. In the face of this, it is difficult to imagine positive equity scenarios beyond a few years.
In a tactical sense, we will continue to use our volatility metrics to inform the equity allocations of the Fund. We will aim to de-risk from our current equity overweight when we believe volatility will be high, and to tactically carry equity hedges to mitigate tail risk until then.
23
*The results shown are past performance and are not an indication of future performance. Current performance may be lower or higher. The investment returns and principal value of an investment will fluctuate so that shares upon redemption may be worth more or less than their original cost. Performance figures of the Fund do not reflect charges pursuant to the terms of the variable life insurance policies and variable annuity contracts funded by separate accounts that invest in the Fund's shares. When such charges are deducted, actual investment performance in a variable policy or contract will be lower.
Advantus Capital Management, Inc. (Advantus Capital) and the Securian Funds Trust, on behalf of the SFT Advantus Managed Volatility Equity Fund (the "Fund"), have entered into an Expense Limitation Agreement, dated November 18, 2015, which limits the operating expenses of the Fund, excluding certain expenses (such as interest expense, acquired fund fees, cash overdraft fees, taxes, brokerage commissions, other expenditures which are capitalized in accordance with the generally accepted accounting principles, and other extraordinary expenses not incurred in the ordinary course of the Fund's business), to 0.80% of the Fund's average daily net assets through April 30, 2019. The Agreement renews annually for a full year each year thereafter unless terminated by Advantus Capital upon at least 30 days' notice prior to the end of a
Ten Largest Holdings^
| Security description | | Market
value | | % of
long-term
portfolio | |
iShares Edge MSCI Minimum Volatility
USA ETF | | $ | 83,557,707 | | | | 35.5 | % | |
iShares Edge MSCI Minimum Volatility
EAFE ETF | | | 65,325,347 | | | | 27.7 | % | |
iShares Core High Dividend ETF | | | 47,147,006 | | | | 20.0 | % | |
iShares Edge MSCI Minimum Volatility
Emerging Markets ETF | | | 15,901,196 | | | | 6.8 | % | |
iShares Short Maturity Bond ETF | | | 13,058,515 | | | | 5.5 | % | |
iShares MSCI Germany ETF | | | 10,367,025 | | | | 4.4 | % | |
| | $ | 235,356,796 | | | | 100.0 | % | |
^Excludes short-term investments.
Sector Diversification (shown as a percentage of net assets)

24
Comparison of Change in Investment Value*
A Hypothetical $10,000 Investment in SFT Advantus Managed Volatility Equity Fund,
the Blended Benchmark Index, and Consumer Price Index
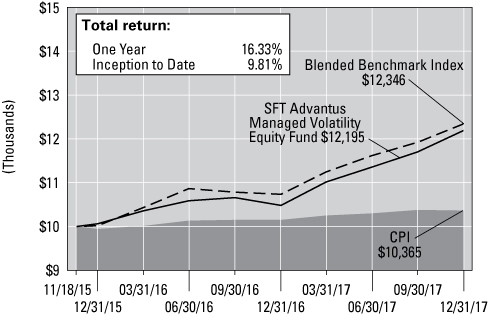
On the chart above you can see how the SFT Advantus Managed Volatility Equity Fund's shares total return compared to its Blended Benchmark, comprised of 60 percent of the S&P 500® Low Volatility Index, 20% S&P 500® BMI International Developed Low Volatility Index and 20% Bloomberg Barclays U.S. 3 Month Treasury Bellwether Index and the Consumer Price Index. The three lines represent the total return of a hypothetical $10,000 investment made on November 18, 2015 through December 31, 2017, assuming reinvestment of distributions, if any.
contract term. The Fund is authorized to reimburse Advantus Capital for management fees previously waived and/or for the cost of expenses previously paid by Advantus Capital pursuant to this agreement, provided that such reimbursement will not cause the Fund to exceed any limits in effect at the time of such reimbursement. The Fund's ability to reimburse Advantus Capital in this manner only applies to fees waived or reimbursements made by Advantus Capital within the three fiscal years prior to the date of such reimbursement. As of December 31, 2017, Advantus Capital has waived $782,484 pursuant to the agreement. To the extent that the Fund makes such reimbursements to Advantus Capital, the amount of the reimbursements will be reflected in the financial statements in the Fund's shareholder reports and in Other Expenses under Fees and Expenses of the Fund.
The Blended Benchmark Index is comprised of 60 percent of the S&P 500® Low Volatility Index, 20% S&P 500® BMI International Developed Low Volatility Index and 20% Bloomberg Barclays U.S. 3 Month Treasury Bellwether Index.
The S&P 500® Low Volatility Index measures performance of the 100 least volatile stocks in the S&P 500. The S&P 500® BMI International Developed Low Volatility Index measures the performance of the 200 least volatile stocks in the S&P Developed Market large/midcap universe. Constituents are weighted relative to the inverse of their corresponding volatility, with the least volatile stocks receiving the highest weights. The Bloomberg Barclays U.S. 3 Month Treasury Bellwether Index tracks the market for the on-the-run 3 month Treasury bill issued by the U.S. government.
25


David Land, CFA and Lena Harhaj, CFA Portfolio Managers
The SFT Advantus Mortgage Securities Fund seeks a high level of current income consistent with prudent investment risk. The SFT Advantus Mortgage Securities Fund will invest primarily in mortgage-related securities. The risks incurred by investing in mortgage-related securities include, but are not limited to, reinvestment of prepaid loans at low rates of return, and the inability to reinvest at higher interest rates when mortgages are prepaid more slowly than expected. In addition, the net asset value of the SFT Advantus Mortgage Securities Fund may fluctuate in response to changes in interest rates and is not guaranteed.
SFT Advantus Mortgage Securities Fund
How did the Fund perform during the period?
The Fund's Class 2 shares generated a net return of 1.96 percent over the 12 months ending December 31, 2017, underperforming the Bloomberg Barclays U.S. MBS Index, which returned 2.47 percent over the same period.
What influenced the Fund's return during the past 12 months?
The primary driver of performance was the rise in interest rates across the front-end yield curve, with long-term rates staying anchored. The U.S. Federal Reserve (Fed) raised rates three times in 2017 and announced it would begin reducing its balance sheet holding of U.S. Treasuries and mortgages. Recall that during the Great Recession the Fed expanded their balance sheet from slightly under a trillion dollars to over four trillion to provide the markets with liquidity. The Fed believes, and rightfully so, the economy has recovered sufficiently to withdrawal this extraordinary accommodation.
A sizable portion of the Fed's balance sheet, approximately $1.7 trillion, is invested in agency mortgage-backed securities. Consequently, the Fed's gradual reduction of its balance sheet should influence the valuation of agency mortgage-backed securities.
What other market conditions or events influenced the Fund's return during the past 12 months?
The fundamental underpinnings of the mortgage market continue to be strong. Home prices continued to appreciate across the country. Harvard's Joint Center for Housing reported the number of homeowners underwater on their mortgages fell to 3.2 million. At the peak in 2011, 12.1 million homeowners owed more on their homes than they were worth. New and existing home sales continue to rebound, and we anticipate the trend will continue. Housing can continue to expand at the current pace for some time, in our opinion.
Commercial real estate fundamentals, excluding retail properties, are solid. It seemed like each quarter another retailer would announce a round of store closures. Consumers are shopping online more and visiting physical stores less. Many investors are eschewing commercial mortgage-backed securities (CMBS) transactions that have large exposures to retail properties. This year CMBS transactions had lower loan-to-value ratios than previous years. However, this positive trend is somewhat offset by an increase in interest-only lending.
What strategies and techniques did you employ that specifically affected Fund performance?
The Fund invests the majority of its assets in agency mortgage-backed securities and to a lesser extent in CMBS, asset-backed securities (ABS), and corporate obligations. The CMBS, ABS, and corporate obligations provide the Fund with cash flow stability that is difficult to replicate with agency mortgage-backed securities. During the year, we reduced the Fund's allocation to agency mortgage-backed securities because we believed the Fed trimming its balance sheet would weigh on the market. The Fund increased its allocation to collateralized mortgage obligations (CMOs), ABS, and CMBS. Within CMOs, the Fund added exposures to non-agency mortgages. The strong fundamentals underpinning the housing market and improved underwriting standards make the Fund's manager comfortable with these positions.
26
What industries or sectors did you emphasize during the past 12 months and what is your outlook going forward?
Last year we mentioned inflation and growth could surprise to the upside, and those concerns remain. Clearly, the Fed has concerns. The Fed is tightening monetary policy by raising short-term rates and withdrawing quantitative easing. Consequently, the Fund is generally short its benchmark duration.
The Fed was a meaningful player in the mortgage-backed securities market for the last decade. The market will have to contend with the Fed unwinding its holdings of agency mortgages. Consequently, we believe ABS and CMBS will offer better value in 2018.
The housing market will face several crosswinds in 2018. First, mortgage rates are poised to move higher, and while the increase is unlikely to significantly affect homebuyers, it will influence homeowners looking to refinance their existing mortgages. Second, the supply of new homes for sale is tight by historical standards and first time homebuyers often struggle to find an affordable house. New home construction should accelerate and provide a boost to the economy. Finally, the new tax law changes may shift consumer preferences on owning versus renting.
27
Ten Largest Holdings^
| Security description | | Market
value | | % of bond
portfolio | |
Federal National Mortgage Association
3.500%, 01/01/48 | | $ | 3,157,160 | | | | 3.8 | % | |
Federal National Mortgage Association
3.000%, 01/01/48 | | | 1,875,000 | | | | 2.3 | % | |
Federal National Mortgage Association
3.500%, 01/01/42 | | | 1,737,905 | | | | 2.1 | % | |
Federal National Mortgage Association
3.000%, 01/01/33 | | | 1,731,543 | | | | 2.1 | % | |
Federal National Mortgage Association
3.500%, 06/01/45 | | | 1,617,068 | | | | 1.9 | % | |
UBS Commercial Mortgage Trust
Series 2017-C1, Class AS 3.724%, 06/15/50 | | | 1,521,720 | | | | 1.8 | % | |
Government National Mortgage Association
3.000%, 04/15/45 | | | 1,370,106 | | | | 1.6 | % | |
Federal National Mortgage Association
4.000%, 10/01/43 | | | 1,348,890 | | | | 1.6 | % | |
Federal Home Loan Mortgage Corporation
3.500%, 12/01/44 | | | 1,289,012 | | | | 1.6 | % | |
Government National Mortgage Association
3.250%, 03/20/35 | | | 1,194,752 | | | | 1.4 | % | |
| | $ | 16,843,156 | | | | 20.2 | % | |
^Excludes short-term investments.
Sector Diversification (shown as a percentage of net assets)

28
Asset Quality (shown as a percentage of investments)
(Unaudited)

Comparison of Change in Investment Value*
A Hypothetical $10,000 Investment in SFT Advantus Mortgage Securities Fund,
Bloomberg Barclays U.S. Mortgage-Backed Securities Index, and Consumer Price Index
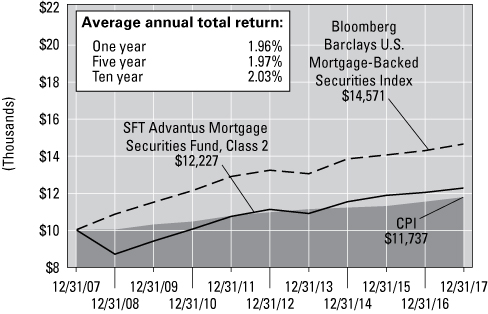
On the chart above you can see how the SFT Advantus Mortgage Securities Fund's Class 2 shares total return compared to the Bloomberg Barclays U.S. Mortgage-Backed Securities Index and the Consumer Price Index. The three lines represent the total return of a hypothetical $10,000 investment made on December 31, 2007 through December 31, 2017, assuming reinvestment of distributions, if any.
*The results shown are past performance and are not an indication of future performance. Current performance may be lower or higher. The investment returns and principal value of an investment will fluctuate so that shares upon redemption may be worth more or less than their original cost. Performance figures of the Fund do not reflect charges pursuant to the terms of the variable life insurance policies and variable annuity contracts funded by separate accounts that invest in the Fund's shares. When such charges are deducted, actual investment performance in a variable policy or contract will be lower.
The Bloomberg Barclays U.S. Mortgage-Backed Securities Index is an unmanaged benchmark composite which includes all fixed-rate securities backed by mortgage pools of the Government National Mortgage Association (GNMA), Federal Home Loan Mortgage Corporation (FHLMC) and Federal National Mortgage Association (FNMA).
29


Matthew Richmond and Lowell Bolken, CFA Portfolio Managers
The SFT Advantus Real Estate Securities Fund seeks above-average income and long-term growth of capital. The Fund intends to pursue its objective by investing primarily in equity securities of companies in the real estate industry. Investment risks associated with investing in the SFT Advantus Real Estate Securities Fund, in addition to other risks, include rental income fluctuations, depreciation, property tax value changes, and differences in real estate market value.
SFT Advantus Real Estate Securities Fund
How did the Fund perform during the period?
The Fund's Class 2 shares generated a total net return of 5.37 percent over the 12 months ending December 31, 2017, outperforming the Wilshire US Real Estate Securities Index, which returned 4.84 percent over the same period.
What influenced the Fund's return during the past 12 months?
Real estate stocks delivered positive returns again in 2017, but failed to keep pace with broader equities, such as the S&P 500. Real estate investment trusts (REITs) were roughly sideways for the duration of the year, with dividends driving a substantial amount of the year's returns.
What other market conditions or events influenced the Fund's return during the last 12 months?
In addition to fundamentals, macro events like tax reform, U.S. Federal Reserve (Fed) policy in the United States, and geopolitical uncertainty on the Korean Peninsula drove stock prices. As the prospect of tax reform became increasingly more likely in the second half of the year, and as the Fed continued to project more rate increases, REITs' relative performance continued to lag that of sectors that are better positioned for a rising rate cycle.
Common themes among the Fund's holdings were investment in companies we believe own well-located, high-quality properties, feature stable balance sheets, exhibit improving property fundamentals, and have above-average cash-flow growth prospects. Those characteristics have typically driven above-average stock price performance and did so again in 2017.
From a property-type perspective, the Fund was overweight in owners of warehouses, urban-centric office buildings, single-family homes and data centers, yet avoided health care, storage, shopping center and mall REITs.
What strategies and techniques did you employ that affected Fund performance?
U.S. commercial real estate conditions remain broadly steady. Most property types maintained pricing power with occupancy hovering near peak levels and rents increasing. Industrial REITs reached all-time high occupancy levels in 2017 and continue to drive rents higher on the back of an improving economy and increased demand for e-commerce distribution space. In the latter half of the year, hotels saw greater pricing power driven largely by increasing leisure demand, while storage and apartment REITs' pricing power fell as they battled increased supply. Retail REITs fought a series of store closures that in many cases led to lower occupancies but rent levels held steady and increased in higher quality properties. Demand for datacenter space continues to grow at a double digit pace, driven by increased cloud usage and virtualization and artificial intelligence needs.
What industries or sectors did you emphasize during the fiscal year, and what is your outlook going forward?
Significant contributors to performance included overweight positions relative to the benchmark within industrial and data center REITs—each of which experienced strong demand and rental rate growth—and underweight positions to mall and shopping center REITs. Favorable stock selection in life science and technology office REITs and manufactured home REITs also added to performance, as did an overweight position to hotel operators.
30
Being underweight to single family home REITs early in the year was a detractor from relative performance versus the benchmark, while stock selection within the health care, industrial and shopping center REIT sectors also detracted from performance.
The recently passed tax reform should spur accelerated economic growth and keep the expansion going, but it could also increase inflation, all of which will likely promote additional demand for commercial real estate and keep the current cycle on an upward trajectory. Indeed, we've been dealing with inflation across the real estate sector in the form of materials and construction labor costs for quite some time.
With regard to the current commercial real estate cycle, we continue to see stable operating conditions across the sector with few material concerns on the horizon. Bank lending, commercial construction, equity allocations, and overall pricing metrics remain much healthier than was often the case in previous cycle peaks. As we have previously suggested, simply moving into the later stages of this recovery does not mean the sector's fundamentals will turn negative. In fact, the prospect for re-acceleration of earnings growth for 2019 appears quite plausible if current expectations for corporate earnings materialize.
We continue to believe that REIT share price performance will be heavily influenced by macro events, with support coming from an improving economy and GDP growth while potentially rising borrowing costs, such as a rising 10-year U.S. Treasury yield, could offer resistance. Should expectations for economic growth promote a sharp, sustained rise in U.S. Treasuries, REIT stock prices will likely struggle. Of course, with public market vacillations, sometimes overreactions create unique opportunities. We will be sharply mindful in our effort to identify those unique opportunities as they present themselves.
Valuations of private market transactions continue to support REIT valuations, suggesting REITs currently trade at a discount to net asset value. Meanwhile, REIT pricing compared to broader fixed income and equity markets also looks attractive compared to historic averages. Significant fundraising in real estate private equity funds suggests further support for real estate valuation.
31
*The results shown are past performance and are not an indication of future performance. Current performance may be lower or higher. The investment returns and principal value of an investment will fluctuate so that shares upon redemption may be worth more or less than their original cost. Performance figures of the Fund do not reflect charges pursuant to the terms of the variable life insurance policies and variable annuity contracts funded by separate accounts that invest in the Fund's shares. When such charges are deducted, actual investment performance in a variable policy or contract will be lower.
The Wilshire US Real Estate Securities Index is a market capitalization-weighted index of equity securities whose primary business is equity ownership of commercial real estate (REITs).
Ten Largest Holdings^
| Security description | | Market
value | | % of stock
portfolio | |
Simon Property Group, Inc. | | $ | 10,008,835 | | | | 7.5 | % | |
Equinix, Inc. | | | 7,040,320 | | | | 5.3 | % | |
ProLogis, Inc. | | | 6,456,225 | | | | 4.8 | % | |
Alexandria Real Estate Equities, Inc. | | | 5,628,429 | | | | 4.2 | % | |
Digital Realty Trust, Inc. | | | 5,148,280 | | | | 3.9 | % | |
AvalonBay Communities, Inc. | | | 5,089,323 | | | | 3.8 | % | |
SL Green Realty Corp. | | | 4,417,807 | | | | 3.3 | % | |
Duke Realty Corp. | | | 3,896,472 | | | | 2.9 | % | |
Sun Communities, Inc. | | | 3,887,482 | | | | 2.9 | % | |
Host Hotels & Resorts, Inc. | | | 3,800,203 | | | | 2.8 | % | |
| | $ | 55,373,376 | | | | 41.4 | % | |
^Excludes short-term investments.
Sector Diversification (shown as a percentage of net assets)
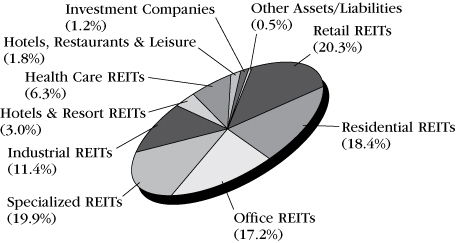
Comparison of Change in Investment Value*
A Hypothetical $10,000 Investment in SFT Advantus Real Estate Securities Fund,
Wilshire US Real Estate Securities Index, and Consumer Price Index

On the chart above you can see how the SFT Advantus Real Estate Securities Fund's Class 2 shares total return compared to the Wilshire US Real Estate Securities Index and the Consumer Price Index. The three lines represent the total return of a hypothetical $10,000 investment made on December 31, 2007 through December 31, 2017, assuming reinvestment of distributions, if any.
32


Daniel P. Becker, CFA and Bradley M. Klapmeyer CFA Portfolio Managers Waddell & Reed Investment Management Company
The SFT IvySM Growth Fund seeks to provide growth of capital. The Fund pursues its objective by investing primarily in a diversified portfolio of common stocks issued by large capitalization companies. While Advantus Capital Management, Inc. acts as the investment adviser for the Fund, Waddell & Reed Investment Management Company (WRIMCO) provides investment advice to the Fund under a sub-advisory agreement. The risks incurred by investing in the Fund include, but are not limited to, the risk of declines in the market for large cap stocks or in the equity markets generally.
SFT IvySM Growth Fund
How did the Fund perform during the period?
The Fund's Class 2 shares generated a net return of 29.22 percent over the 12 months ending December 31, 2017, while the Russell 1000 Growth Index, returned 30.21 percent over the same period.
What influenced the Fund's return during the past 12 months?
Equities again outperformed most asset classes during the fourth quarter of 2017 as a number of positive catalysts coalesced to cap a very strong year. Growth styles of all market capitalization ranges led the market for the year but trailed value styles in the quarter. The style change was abrupt particularly after Thanksgiving, when many laggard stocks became leaders and vice versa.
What other market conditions or events influenced the Fund's return during the last 12 months?
During most of 2017, the lack of legislative policy progress out of Washington, D.C. was a factor in the positive tailwinds to growth stocks. The Republican success at passing tax reform catalyzed a belief that economic growth may accelerate, generated a strong positive response to stocks and industries that are more domestic in their profit pool, and provided a headwind to our performance during the last few weeks of the year. Similar to the many quick and violent rotations we have seen in the past few years, we expect a moderation in this rotation since faster economic growth may be a positive across most stocks and investment styles.
The global economic backdrop remains strong and stable. Gross domestic product growth continues to hover around three percent, with most economies around the world accelerating or improving. Most exciting is the resurgence in business sentiment for manufacturing industries and signs of capital spending acceleration, as many of these industries have been constrained by a long period of slow growth. Most, if not all, industries are now participating in one of the longest economic recoveries on record. In short, the global economic picture appears better today than it has in many years.
What strategies and techniques did you employ that affected Fund performance?
Technology stocks were the standout performers over the past year. Stocks such as Facebook, Inc., Amazon.com, Inc., Adobe Systems, Inc., MasterCard, Inc., Lam Research Corp. and Paypal, Inc. performed well. Financial stocks generally performed well throughout the year as the global economy accelerated. This generated a gentle bias up in interest rates that tend to be positive for financial stocks. The Fund's financial stocks such as Charles Schwab Corp., CME Group, Inc. and S&P Global, Inc. performed well for most of the year. Stocks in the industrials and capital goods sectors also performed well, as emerging market economies accelerated, helping to boost demand for energy and industrials materials and goods. Caterpillar, Inc. and Parker Hannifin Corp. performed well over the period.
Not all sectors performed well last year, even as the index increased more than 30 percent. Health care stocks, most notably biotechnology and large pharmaceutical stocks, performed poorly. Fund positions in Shire Pharmaceuticals plc, Allergan plc, Alexion Pharmaceuticals, Inc. and DexCom, Inc. did not perform well and were either sold or reduced during the period. Alexion was the only position held as of year-end. Health care stocks typically do not perform well as global economies accelerate, and
33
although the Fund held an underweight position in its health care exposure, specific stocks underperformed in excess of our expectations due to heightened competition for their respective products.
Consumer staples is a sector we currently find unattractive, as valuations are high and growth prospects low. Our single position, Phillip Morris International, Inc., which provided a positive contribution for the year, did not perform well overall, especially in the second half of 2017. O'Reilly Automotive (no longer a holding), an automotive parts aftermarket retailer, did not perform as well as hoped due to especially warm weather over the past two years that diminished the propensity of cars and trucks to require service and parts.
What industries or sectors did you emphasize during the period, and what is your outlook going forward?
The Fund's investment process has remained steadfast and consistent over time—focusing on companies with structurally-advantaged business models that we believe can generate superior levels of profitability and growth over the long term.
Investor consensus remains generally optimistic on U.S. and global economic growth, as excesses seem difficult to find. We believe U.S. economic growth will now likely accelerate and remain in the three percent range for the foreseeable future. Faster economic growth likely should eventually lead to higher interest rates, a tighter employment market and possibly higher inflation. While higher inflation may be welcomed, we are a bit unsure of how the equity markets may deal with it given the current state of fixed-income markets globally. Should bond prices fall marginally, this may be a positive for equity markets in 2018 and beyond. A sharp correction in the bond market, on the other hand, might have a ripple effect across equity markets.
Over the past several quarters, our biggest concern has been an economic change that might dramatically accelerate the business cycle, leading to corporate enthusiasm, tighter labor markets and eventual recession as the cycle comes to an end. We have since changed our opinion and now believe we are starting another stage of the economic cycle. We think that the more robust global growth conditions may lead to increased profits, potentially broadening and deepening the global bull market in stocks. We expect the recent rotation to subside and technology to reemerge, as these stocks are one of the more cyclical areas of the economy and should do well as the economy accelerates.
Within the Fund, our allocation to technology remains notably overweight, reflecting our belief that valuations, particularly based on cash flow generation, remain fairly reasonable. We continue to have a high exposure in financials as we expect tax reform benefits, combined with higher interest rates, to intersect to produce robust profit growth. We remain concerned and underweight the defensive areas of the market, such as consumer staples and real estate investment trusts, as we still view valuations and profit outlooks as elevated and correlated to low bond yields globally.
34
Ten Largest Holdings^
| Security description | | Market
value | | % of stock
portfolio | |
Apple, Inc. | | $ | 23,509,601 | | | | 4.7 | % | |
Microsoft Corp. | | | 23,420,852 | | | | 4.7 | % | |
The Home Depot, Inc. | | | 23,160,566 | | | | 4.6 | % | |
PayPal Holdings, Inc. | | | 23,028,336 | | | | 4.6 | % | |
Mastercard, Inc.—Class A | | | 21,810,976 | | | | 4.4 | % | |
Amazon.com, Inc. | | | 21,653,907 | | | | 4.3 | % | |
Visa, Inc.—Class A | | | 20,284,158 | | | | 4.0 | % | |
Facebook, Inc.—Class A | | | 20,109,205 | | | | 4.0 | % | |
CME Group, Inc. | | | 18,928,080 | | | | 3.8 | % | |
Caterpillar, Inc. | | | 18,184,732 | | | | 3.6 | % | |
| | $ | 214,090,413 | | | | 42.7 | % | |
^Excludes short-term investments.
Sector Diversification (shown as a percentage of net assets)

Comparison of Change in Investment Value*
A Hypothetical $10,000 Investment in SFT IvySM Growth Fund,
the Russell 1000 Growth Index, and Consumer Price Index

On the chart above you can see how the SFT IvySM Growth Fund's shares total return compared to the Russell 1000 Growth Index and the Consumer Price Index. The three lines represent the total return of a hypothetical $10,000 investment made on May 1, 2014 through December 31, 2017, assuming reinvestment of distributions, if any.
'Ivy' is the registered service mark of Ivy Funds Distributor, Inc., an affiliate of the Waddell & Reed Investment Management Company, the Fund's sub-adviser.
*The results shown are past performance and are not an indication of future performance. Current performance may be lower or higher. The investment returns and principal value of an investment will fluctuate so that shares upon redemption may be worth more or less than their original cost. Performance figures of the Fund do not reflect charges pursuant to the terms of the variable life insurance policies and variable annuity contracts funded by separate accounts that invest in the Fund's shares. When such charges are deducted, actual investment performance in a variable policy or contract will be lower.
The Russell 1000 Growth Index is an unmanaged index that measures the performance of those Russell 1000 Index companies with higher price-to-book ratios and higher forecasted growth values. The index measures the performance of the 1,000 largest companies in the Russell 3000 Index, which measures the performance of the 3,000 largest U.S. companies based on total market capitalization.
35


Timothy J. Miller CFA
Kenneth G. McQuade CFA
Bradley P. Halverson CFA
Portfolio Managers Waddell & Reed Investment Management Company
The SFT IvySM Small Cap Growth Fund seeks to provide growth of capital. The Fund pursues its objective by investing primarily in a diversified portfolio of common stocks issued by small capitalization companies. While Advantus Capital Management, Inc. acts as the investment adviser for the Fund, Waddell & Reed Investment Management Company (WRIMCO) provides investment advice to the Fund under a sub-advisory agreement. The risks incurred by investing in the Fund include, but are not limited to, the risk of declines in the market for small cap stocks or in the equity markets generally.
SFT IvySM Small Cap Growth Fund
How did the Fund perform during the period?
The Fund's Class 2 shares generated a net return of 25.30 percent over the 12 months ending December 31, 2017, outperforming the Russell 2000 Growth Index, which returned 22.17 percent over the same period.
What influenced the Fund's return during the past 12 months?
Index performance for 2017 was led by the health care sector, specifically by biotechnology and pharmaceutical stocks. Biotechs were up 50 percent for the year and make up nearly 10 percent of the benchmark. The Fund, however, only held about a 3 percent position in the biotech sector, which caused a performance drag versus the index for the period. Medical device stocks held in the Fund helped offset some of the biotech shortfall. Inogen, Inc., IRhythm Technologies, Inc., and Penumbra, Inc. were all significant contributors along with health care technology companies Teledoc, Inc. and HealthEquity, Inc. The health care sector was the only significant underperformer in the Fund for the year.
What other market conditions or events influenced the Fund's return during the past 12 months?
The stock market delivered another strong return for investors in 2017. In the small-cap space, growth stocks significantly outperformed value stocks. Earnings growth was rewarded by investors for the year and the valuation multiples were supported by the continued low level of interest rates. The gain for small-cap growth, as measured by the Russell 2000 Growth Index, was realized in a fairly steady fashion throughout the measurement period. The index marched forward in the first half of the year and then paused in late summer after a failed attempt by the new administration to modify health care policy. Nevertheless, positive regulatory easing encouraged investors and the economic data remained quite healthy. Real gross domestic product (GDP) data growth jumped from 1.2 percent in the first quarter to more than 3.0 percent in both the second and third quarters. Auto sales continued to surprise on the upside, housing data strengthened throughout the year, and employment growth remained strong. The setback in the summer, however, was short-lived as the administration and Congress committed to delivering a reduction in corporate and individual tax rates. The market responded favorably to the news and reached new highs as the year ended. For the measurement period, the Russell 2000 Growth Index was up 22.2 percent.
What strategies and techniques did you employ that affected Fund performance?
Sectors contributing to performance during the measurement included industrials, consumer discretionary and technology. Significant winners in these groups included XPO Logistics, Inc., Shopify, Paycom Software, Inc., Mercury Computer Systems. Inc., Hilton Grand Vacations, Inc., Vail Resorts and Burlington Stores, Inc. (Shopify and Vail Resorts are no longer holdings.) In the technology sector, the Fund's overweight in software was once again an important contributor. The consumer discretionary and industrials sectors rallied sharply in the second half of the year as investors gained comfort in the acceleration of the economy. Consumer stocks also rallied from an overdone overhang of the Amazon competitive threat, with many retailers and apparel companies reporting strong holiday sales results. The hotels, resorts and cruise lines industry was also robust during the period, which accounted for the strength in Vail Resorts and Hilton Grand Vacations. Finally, the Fund had an overweight exposure to the housing complex, which included a variety of companies that provide building
36
supplies, technology, real estate services and maintenance/service equipment such as pool supplies and HVAC systems. Most of these stocks were positive contributors for the period reflecting the growth in the domestic housing market.
What industries or sectors did you emphasize during the period, and what is your outlook going forward?
The Fund's strategy will continue to be driven by a disciplined focus on the growth companies that meet our criteria: they serve large market opportunities, have a defensible leadership position, strong management, and a financial model that will deliver high returns on invested capital. While the lion's share of these companies are in the technology, health care and consumer growth areas of the market, they also exist in some of the cyclical areas of the economy such as industrials, energy and financials.
For the coming year, the current macroeconomic factors should continue to be a tailwind for the markets. This momentum should boost the cyclical growth areas such as industrials, financials and energy. The Fund has good exposure in all of these sectors with a focus on the high-quality growth companies. In the traditional growth areas, technology and the consumer sectors are more of a focus, whereas health care is an underweight position. After a strong run by the biotechnology stocks in 2017, we expect more modest performance in 2018.
The Fund's health care focus is on products and services that benefit from moves away from hospitals and toward new technologies that aid more minimally invasive procedures that can be utilized in office or home settings. In technology, software will continue to be an overweight for the Fund along with the highest quality semiconductor and technology services names. The consumer sectors surprised many over the holidays with good results. They have easier comparisons in 2018, so we will focus on new ideas in this area.
37
'Ivy' is the registered service mark of Ivy Funds Distributor, Inc., an affiliate of the Waddell & Reed Investment Management Company, the Fund's sub-adviser.
*The results shown are past performance and are not an indication of future performance. Current performance may be lower or higher. The investment returns and principal value of an investment will fluctuate so that shares upon redemption may be worth more or less than their original cost. Performance figures of the Fund do not reflect charges pursuant to the terms of the variable life insurance policies and variable annuity contracts funded by separate accounts that invest in the Fund's shares. When such charges are deducted, actual investment performance in a variable policy or contract will be lower.
The Russell 2000 Growth Index is an unmanaged index of those Russell 2000 Index growth companies with higher price-to-book ratios and higher forecasted growth values. The index is broad-based, comprised of 2,000 of the smallest U.S.-domiciled company common stocks based on total market capitalization.
Ten Largest Holdings^
| Security description | | Market
value | | % of stock
portfolio | |
XPO Logistics, Inc. | | $ | 5,724,375 | | | | 3.2 | % | |
AMN Healthcare Services, Inc. | | | 5,353,229 | | | | 2.9 | % | |
Mercury Systems, Inc. | | | 4,832,035 | | | | 2.7 | % | |
Beacon Roofing Supply, Inc. | | | 4,474,486 | | | | 2.5 | % | |
The Ultimate Software Group, Inc. | | | 3,954,764 | | | | 2.2 | % | |
Booz Allen Hamilton Holding Corp. | | | 3,940,163 | | | | 2.2 | % | |
Dycom Industries, Inc. | | | 3,755,191 | | | | 2.1 | % | |
Installed Building Products, Inc. | | | 3,375,674 | | | | 1.9 | % | |
Burlington Stores, Inc. | | | 3,371,022 | | | | 1.9 | % | |
HealthEquity, Inc. | | | 3,350,188 | | | | 1.8 | % | |
| | $ | 42,131,127 | | | | 23.4 | % | |
^Excludes short-term investments.
Sector Diversification (shown as a percentage of net assets)
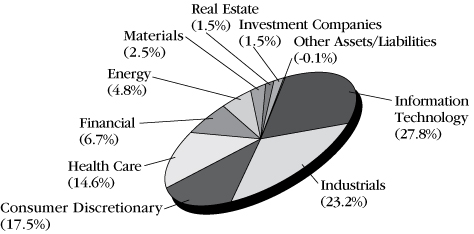
Comparison of Change in Investment Value*
A Hypothetical $10,000 Investment in SFT IvySM Small Cap Growth Fund,
the Russell 2000 Growth Index, and Consumer Price Index

On the chart above you can see how the SFT IvySM Small Cap Growth Fund's shares total return compared to the Russell 2000 Growth Index and the Consumer Price Index. The three lines represent the total return of a hypothetical $10,000 investment made on May 1, 2014 through December 31, 2017, assuming reinvestment of distributions, if any.
38

Mark Finn, CFA, CPA Portfolio Manager T. Rowe Price
The SFT T. Rowe Price Value Fund seeks to provide long-term capital appreciation by investing in common stocks believed to be undervalued. Income is a secondary objective. The Fund pursues its objective by taking a value approach to investment selection. Holdings consist primarily of large cap stocks, but may also include stocks of mid-cap and small-cap companies. While Advantus Capital Management, Inc. acts as the investment adviser for the Fund, T. Rowe Price Associates, Inc. (T. Rowe Price) provides investment advice to the Fund under a sub-advisory agreement. The Fund's value approach to investing carries the risk that the market will not recognize a security's intrinsic value for a long time or that a stock judged to be undervalued may actually be appropriately priced at a low level.
SFT T. Rowe Price Value Fund
How did the Fund perform during the period?
The Fund's Class 2 shares generated a total net return of 18.61 percent over the 12 months ending December 31, 2017, underperforming the S&P 500® Index, which returned 21.83 percent over the same period.
What influenced the Fund's return during the past 12 months?
Broadly speaking, stock selection contributed and sector allocation detracted from relative results.
What other market conditions or events influenced the Fund's return during the last 12 months?
U.S. stocks posted strong returns in 2017, buoyed by solid corporate earnings and economic growth. Throughout the year, hopes that President Trump's proposals for lower tax rates, reduced regulation, and increased infrastructure spending would be enacted supported the market. While the U.S. Federal Reserve (Fed) raised its interest rate target three times in 2017, the Fed's moves were widely expected and did not disrupt equity markets. In the closing weeks of the year, Congress passed and President Trump signed legislation that reduces tax rates for corporations and closely held businesses, reduces marginal tax rates for individuals at most income levels, and changes the limits for various individual tax deductions. Most major stock indexes finished the year near record levels amid expectations that the new tax law would add to economic growth in 2018.
What strategies and techniques did you employ that affected Fund performance?
Information technology was the largest detractor during the period due primarily to the Fund's underweight allocation to the sector, which was the top-performing sector in the benchmark. Stock selection in the sector also had a negative impact on relative performance.
The Fund's financial stocks underperformed their benchmark peers, and sector weighting also had a negative impact.
Overweighting the utilities sector hindered relative results for the Fund, and stock selection also hurt, but to a lesser extent within the sector.
The biggest contributor to relative returns was the consumer staples sector. Despite a detracting overweight, stock selection in the sector overcame to add excess returns.
Overweighting the energy sector was detrimental, as it was the second-weakest sector in the benchmark. However, stock selection in the sector contributed excess returns to offset the negative impact of sector allocation.
The Fund did not hold derivatives for the time period 12/31/2016 through 12/31/2017.
What industries or sectors did you emphasize during the fiscal year, and what is your outlook going forward?
Looking ahead, we believe stocks could continue their slow, steady ascent. We expect the federal tax cuts to boost U.S. economic activity, and we are identifying reasonably priced potential beneficiaries in some of the more cyclical areas of the market. We are also finding opportunities to buy shares of strong companies that are well positioned for longer-term growth but that face near-term headwinds, although persistently high valuations present a challenge. In this environment, and with sector valuation anomalies appearing limited, we see increased opportunities for strong stock selection, driven by our fundamental analysis.
39
*The results shown are past performance and are not an indication of future performance. Current performance may be lower or higher. The investment returns and principal value of an investment will fluctuate so that shares upon redemption may be worth more or less than their original cost. Performance figures of the Fund do not reflect charges pursuant to the terms of the variable life insurance policies and variable annuity contracts funded by separate accounts that invest in the Fund's shares. When such charges are deducted, actual investment performance in a variable policy or contract will be lower.
The S&P 500® Index is a broad, unmanaged index of 500 common stocks which are representative of the U.S. stock market overall.
Ten Largest Holdings^
| Security description | | Market
value | | % of stock
portfolio | |
JPMorgan Chase & Co. | | $ | 11,431,779 | | | | 5.1 | % | |
Tyson Foods, Inc.—Class A | | | 10,260,057 | | | | 4.6 | % | |
Microsoft Corp. | | | 9,743,006 | | | | 4.3 | % | |
Wells Fargo & Co. | | | 6,951,265 | | | | 3.1 | % | |
Citigroup, Inc. | | | 4,780,694 | | | | 2.1 | % | |
Merck & Co., Inc. | | | 4,689,880 | | | | 2.1 | % | |
Philip Morris International, Inc. | | | 4,687,585 | | | | 2.1 | % | |
Aetna, Inc. | | | 4,299,776 | | | | 1.9 | % | |
Verizon Communications, Inc. | | | 4,244,986 | | | | 1.9 | % | |
Wal-Mart Stores, Inc. | | | 4,088,250 | | | | 1.8 | % | |
| | $ | 65,177,278 | | | | 29.0 | % | |
^Excludes short-term investments.
Sector Diversification (shown as a percentage of net assets)

Comparison of Change in Investment Value*
A Hypothetical $10,000 Investment in SFT T. Rowe Price Value Fund,
S&P 500® Index, and Consumer Price Index
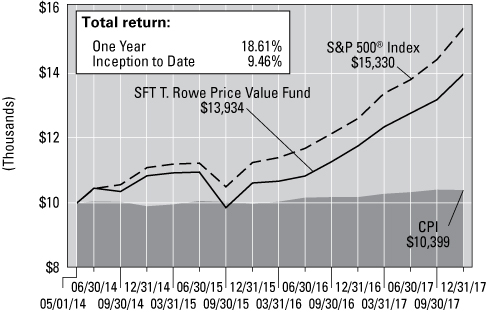
On the chart above you can see how the SFT T. Rowe Price Value's shares total return compared to the S&P 500® Index and the Consumer Price Index. The three lines represent the total return of a hypothetical $10,000 investment made on May 1, 2014 through December 31, 2017, assuming reinvestment of distributions, if any.
40


Mammen Chally, CFA, David A. Siegle, CFA and Douglas W. McLane, CFA
The SFT Wellington Core Equity Fund seeks growth of capital. The Fund pursues its objective by investing primarily in a diversified portfolio of common stocks. While Advantus Capital Management, Inc. acts as the investment adviser for the Fund, Wellington Management, LLC provides investment advice to the Fund under a sub-advisory agreement. Wellington Management, LLC became the sub-adviser for the Fund on November 20, 2017. Risks associated with investing in the Fund include, but are not limited to, issuer-specific market volatility and risk of declines in the equity markets generally.
SFT Wellington Core Equity Fund
(formerly SFT Pyramis® Core Equity Fund)
The SFT Wellington Core Equity Fund was managed by FIAM LLC ("Pyramis") from January 1, 2017—November 19, 2017 and by Wellington Management (Wellington) from November 20, 2017—December 31, 2017.
How did the Fund perform during the period?
The Fund's Class 2 shares generated a total net return of 21.12 percent over the 12 months ending December 31, 2017, compared to the S&P 500 Index, which returned 21.83 percent over the same period.
What influenced the Fund's return during the past 12 months?
Pyramis: The Industrials and Information Technology sectors contributed the most to relative performance. In the Industrials sector, the underweight in industrial conglomerate General Electric (GE) and overweight in aircraft manufacturer Boeing were the lead contributors to relative performance. Shares in GE declined more than 40 percent during the year with notable downward movements after the company made a number of announcements, including senior management changes, quarterly earnings reports that fell short of market expectations, reduced fiscal year earnings and cash flow guidance, and a 50 percent dividend cut. Boeing shares soared after management reported quarterly earnings and cash results that beat market expectations by a wide margin, driven by strong demand and cost controls. Subsequently, management raised its 2017 fiscal year earnings guidance. In the Information Technology sector, the overweights in software company Adobe Systems and semiconductor manufacturer Micron Technology helped performance. Shares in Adobe Systems rose as the company posted record quarterly results and issued quarterly guidance that beat analysts' estimates, driven by solid performance in its Creative Cloud and Marketing Cloud businesses as well as improvements in operating margins. Additionally, the company hosted an investor day during which management laid out plans for profit growth and issued 2018 fiscal year revenue and earnings guidance that topped analysts' expectations, sending shares higher. Shares in Micron Technology jumped after the company reported quarterly results and issued quarterly guidance that surpassed consensus estimates, driven by strong DRAM and NAND sales and pricing power.
Among individual holdings, the underweight position in Exxon Mobil and overweight in medical device manufacturer C.R. Bard were among the largest contributors to relative performance. Exxon Mobil shares declined after the company reported disappointing quarterly results driven by a $2 billion write-down of its Rocky Mountain natural gas assets. C.R. Bard shares rose sharply after Becton Dickinson offered to acquire the company in a $24 billion cash-and-stock deal. In conjunction with the takeout announcement, C.R. Bard reported quarterly results that topped analysts' expectations driven by strong performance in the vascular and urology business segments.
The Consumer Discretionary and Consumer Staples sectors detracted the most from relative performance. In the Consumer Discretionary sector, the overweights in diversified consumer product company Newell Brands and in discount retailer Target detracted from relative performance. Shares in Newell Brands fell sharply after the company reported quarterly revenue and earnings results that missed consensus estimates due to lower order rates from many brick-and-mortar retailers and elevated
41
commodity costs related to recent hurricanes. Subsequently, management reduced fiscal year earnings guidance. Target shares fell after the company posted disappointing quarterly results and guidance due to weakness in same-store sales as consumer behavior shifts towards online shopping. In the Consumer Staples sector, the overweights in food retailer Kroger and brewer Molson Coors Brewing Company were the largest detractors from sector performance for the period. Kroger shares dropped after management cut fiscal year guidance due to tightening competition. Additionally, news of Amazon's acquisition of competitor Whole Foods Market sent shares even lower as investors expect the deal to bring about massive change in the food retail industry. Shares in Molson Coors Brewing Company fell on earnings results that missed consensus estimates, raising investor concerns surrounding cost savings following the recent MillerCoors and Miller acquisitions. Concerns heightened again when management lowered EBITDA (Earnings Before Interest, Taxes, Depreciation and Amortization) guidance, sending shares lower.
Among individual holdings, the overweights in exploration and production companies Hess and Pioneer Natural Resources detracted from relative performance. Hess shares fell after management issued disappointing 2017 fiscal year capital spending and production guidance due to delays in ramping up operations in the Bakken region. Decreasing oil prices also weighed on the stock throughout the first half of the year. Despite reporting second-quarter results that topped consensus estimates, shares in Pioneer Natural Resources fell sharply after management reduced 2017 fiscal year production guidance due to oil well completion delays and an unexpected increase in the gas-to-oil ratio of the production stream.
Wellington: During the period, sector allocation, a fall-out of our bottom-up stock selection process was the primary driver of underperformance, while stock selection partially offset relative results. Strong stock selection in utilities (not holding Edison International and Duke Energy), consumer staples (Altria Group and Costco), and consumer discretionary (Comcast and Dollar Tree) was countered by weaker selection in materials (Crown Holdings and not holding Freeport McMoRan), information technology (LAM Research and Workday), and financials (XL Group and not holding Wells Fargo). From an allocation perspective, our underweight to energy and overweight to utilities detracted from relative results, while our underweight to real estate contributed.
What other market conditions or events influenced the Fund's return during the past 12 months?
Pyramis: The year 2017 was defined by a near-perfect backdrop of steady global growth, low inflation, and accommodative monetary policies, which led to remarkably low levels of market volatility and helped fuel a broad-based rally in asset prices. Non-U.S. equities outperformed the U.S. stock market for the first calendar year in the past five, while strong tech sector returns helped growth and emerging-market stocks lead the way. All bond categories posted positive returns for the year. Tax reform and deregulation seemed to invigorate U.S. equity markets, while heightened geopolitical risks coming primarily from North Korea had minimal impact on equity markets during the period. At the end of the year, the global expansionary cycle continued to show positive momentum, with few regions or countries giving any signals of recessionary risk.
Wellington: U.S. equities rose for the fourteenth consecutive month, ending 2017 with a 21.8 percent gain. The positive result reflected solid U.S. economic momentum buoyed by robust consumer and business spending. Tax reform dominated the market narrative, as President Donald Trump signed a U.S. $1.5 trillion tax reform bill into law. The legislation included the most sweeping changes to the tax code since 1986 and represented a major victory for Republicans. Corporations stand to benefit considerably,
42
as the corporate tax rate was slashed to 21 percent from 35 percent, starting in 2019. Debate over the 2018 budget was postponed to January after Congress narrowly averted a shutdown by passing a stop-gap spending bill to keep the government funded until January 19, 2018. In a widely anticipated move, the Fed raised the benchmark federal funds rate by 25 bps, to a range of 1.25 percent to 1.50 percent, citing labor market strength and a solid rate of economic growth. The Fed also increased its estimate for economic growth in 2018 to 2.5 percent, from 2.1 percent in September.
What strategies and techniques did you employ that affected Fund performance?
Wellington: Over the period, the fund slightly increased exposure to financials, health care, and industrials, while we decreased exposure to consumer staples. We established a new position in Continental Resources, a U.S.-based petroleum and natural gas exploration and production company, which did not have an effect on relative performance during the period. We also established a new position in salesforce.com, a U.S.-based leader in cloud-based sales, service, and marketing applications. Our overweight position detracted from relative performance during the period.
What industries or sectors did you emphasize during the past 12 months, and what is your outlook going forward?
Wellington: During the period the fund was most overweight utilities, health care, and financials and most underweight the energy and real estate sectors.
We believe the U.S. economy appears healthy and is growing at a good pace. We continue to find attractively valued stocks with the characteristics we seek. We remain consistent in adhering to our disciplined portfolio construction process that allows us to assess risk, weight individual positions accordingly, and in the process build a portfolio that focuses largely on stock selection for generating benchmark relative outperformance.
43
*The results shown are past performance and are not an indication of future performance. Current performance may be lower or higher. The investment returns and principal value of an investment will fluctuate so that shares upon redemption may be worth more or less than their original cost. Performance figures of the Fund do not reflect charges pursuant to the terms of the variable life insurance policies and variable annuity contracts funded by separate accounts that invest in the Fund's shares. When such charges are deducted, actual investment performance in a variable policy or contract will be lower.
The S&P 500® Index is a broad, unmanaged index of 500 common stocks which are representative of the U.S. stock market overall.
Ten Largest Holdings^
| Security description | | Market
value | | % of stock
portfolio | |
Apple, Inc. | | $ | 3,761,137 | | | | 3.2 | % | |
Bank of America Corp. | | | 3,560,142 | | | | 3.0 | % | |
JPMorgan Chase & Co. | | | 3,482,501 | | | | 2.9 | % | |
Alphabet, Inc.—Class A | | | 3,288,715 | | | | 2.8 | % | |
The PNC Financial Services Group, Inc. | | | 2,974,683 | | | | 2.5 | % | |
Facebook, Inc.—Class A | | | 2,937,177 | | | | 2.5 | % | |
Mastercard, Inc.—Class A | | | 2,931,389 | | | | 2.5 | % | |
Comcast Corp.—Class A | | | 2,760,086 | | | | 2.3 | % | |
UnitedHealth Group, Inc. | | | 2,561,966 | | | | 2.2 | % | |
NextEra Energy, Inc. | | | 2,468,895 | | | | 2.1 | % | |
| | $ | 30,726,691 | | | | 26.0 | % | |
^Excludes short-term investments.
Sector Diversification (shown as a percentage of net assets)
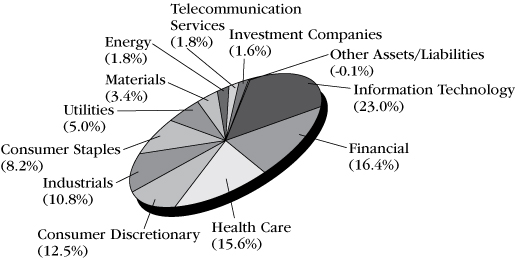
Comparison of Change in Investment Value*
A Hypothetical $10,000 Investment in SFT Wellington Core Equity Fund,
S&P 500® Index, and Consumer Price Index

On the chart above you can see how the SFT Wellington Core Equity Fund's Class 2 shares total return compared to the S&P 500® Index and the Consumer Price Index. The three lines represent the total return of a hypothetical $10,000 investment made on May 1, 2014 through December 31, 2017, assuming reinvestment of distributions, if any.
44
Report of Independent Registered Public Accounting Firm
To the Shareholders and Board of Trustees
Securian Funds Trust:
Opinion on the Financial Statements
We have audited the accompanying statement of assets and liabilities of SFT Advantus Bond Fund, SFT Advantus Dynamic Managed Volatility Fund, SFT Advantus Government Money Market Fund, SFT Advantus Index 400 Mid-Cap Fund, SFT Advantus Index 500 Fund, SFT Advantus International Bond Fund, SFT Advantus Managed Volatility Equity Fund, SFT Advantus Mortgage Securities Fund, SFT Advantus Real Estate Securities Fund, SFT Ivy Growth Fund, SFT Ivy Small Cap Growth Fund, SFT T. Rowe Price Value Fund, and SFT Wellington Core Equity Fund (formerly SFT Pyramis Core Equity Fund) (collectively, the Funds), including the schedule of investments in securities, as of December 31, 2017, the related statement of operations for the year then ended, the statements of changes in net assets for each of the years in the two-year period then ended, and the related notes (collectively, the financial statements) and the financial highlights for each of the years or periods in the five-year period then ended. In our opinion, the financial statements and financial highlights present fairly, in all material respects, the financial position of the Funds as of December 31, 2017, the results of its operations for the year then ended, the changes in its net assets for each of the years in the two-year period then ended, and the financial highlights for each of the years or periods in the five-year period then ended, in conformity with U.S. generally accepted accounting principles.
Basis for Opinion
These financial statements and financial highlights are the responsibility of the Funds' management. Our responsibility is to express an opinion on these financial statements and financial highlights based on our audits. We are a public accounting firm registered with the Public Company Accounting Oversight Board (United States) (PCAOB) and are required to be independent with respect to the Funds in accordance with the U.S. federal securities laws and the applicable rules and regulations of the Securities and Exchange Commission and the PCAOB.
We conducted our audits in accordance with the standards of the PCAOB. Those standards require that we plan and perform the audit to obtain reasonable assurance about whether the financial statements and financial highlights are free of material misstatement, whether due to error or fraud. Our audits included performing procedures to assess the risks of material misstatement of the financial statements and financial highlights, whether due to error or fraud, and performing procedures that respond to those risks. Such procedures included examining, on a test basis, evidence regarding the amounts and disclosures in the financial statements and financial highlights. Such procedures also included confirmation of securities owned as of December 31, 2017, by correspondence with custodians and brokers. Our audits also included evaluating the accounting principles used and significant estimates made by management, as well as evaluating the overall presentation of the financial statements and financial highlights. We believe that our audits provide a reasonable basis for our opinion.
KPMG LLP
We have served as the auditor of one or more Securian Funds Trust investment companies since 1985.
Minneapolis, Minnesota
February 26, 2018
45
SFT Advantus Bond Fund
Investments in Securities
(Percentages of each investment category relate to total net assets)
| | | Principal | | Value(a) | |
Long-Term Debt Securities (98.5%) | |
Government Obligations (34.0%) | |
Other Government
Obligations (1.4%) | |
Provincial or Local Government
Obligations (1.4%) | |
Douglas County Public
Utility District No. 1,
5.450%, 09/01/40 | | $ | 1,185,000 | | | $ | 1,431,563 | | |
Port Authority of
New York & New Jersey
4.458%, 10/01/62 | | | 1,150,000 | | | | 1,327,939 | | |
4.926%, 10/01/51 | | | 2,055,000 | | | | 2,539,199 | | |
| | | | | | 5,298,701 | | |
U.S. Government Agencies and
Obligations (32.6%) | |
Export-Import Bank of the
United States (0.1%) | |
Tagua Leasing LLC,
1.732%, 09/18/24 | | | 589,600 | | | | 574,598 | | |
Federal Home Loan Mortgage Corporation
(FHLMC) (5.8%) | |
2.500%, 03/01/28 | | | 507,774 | | | | 510,242 | | |
3.000%, 08/01/42 | | | 520,393 | | | | 523,180 | | |
3.000%, 04/01/43 | | | 940,553 | | | | 945,974 | | |
3.000%, 07/01/45 | | | 795,538 | | | | 796,453 | | |
3.500%, 10/01/25 | | | 214,676 | | | | 223,264 | | |
3.500%, 08/01/42 | | | 552,568 | | | | 571,028 | | |
3.500%, 05/25/45 | | | 922,385 | | | | 930,976 | | |
3.500%, 03/01/46 | | | 1,487,999 | | | | 1,530,314 | | |
3.752%, 09/25/24 (1-Month
USD LIBOR + 2.200%) (b) | | | 953,993 | | | | 984,309 | | |
4.000%, 02/01/20 | | | 219,067 | | | | 225,478 | | |
4.000%, 09/01/40 | | | 548,653 | | | | 581,281 | | |
4.000%, 10/01/40 | | | 373,854 | | | | 394,646 | | |
4.000%, 11/01/40 | | | 1,889,996 | | | | 2,008,755 | | |
4.000%, 02/01/41 | | | 415,097 | | | | 438,916 | | |
4.000%, 08/01/41 | | | 571,372 | | | | 603,298 | | |
4.000%, 07/01/42 | | | 459,076 | | | | 481,955 | | |
4.500%, 01/01/41 | | | 527,828 | | | | 562,749 | | |
4.500%, 02/01/41 | | | 445,015 | | | | 474,841 | | |
4.500%, 03/01/41 | | | 547,589 | | | | 589,260 | | |
4.500%, 04/01/41 | | | 693,840 | | | | 749,631 | | |
5.000%, 04/01/35 | | | 137,698 | | | | 147,969 | | |
5.000%, 08/01/35 | | | 38,896 | | | | 42,182 | | |
5.000%, 11/01/35 | | | 99,279 | | | | 107,357 | | |
5.000%, 11/01/39 | | | 358,623 | | | | 392,488 | | |
5.000%, 03/01/40 | | | 2,070,785 | | | | 2,268,652 | | |
5.000%, 04/01/40 | | | 336,524 | | | | 366,674 | | |
5.000%, 08/01/40 | | | 193,741 | | | | 210,861 | | |
5.500%, 06/01/20 | | | 22,097 | | | | 22,534 | | |
5.500%, 10/01/20 | | | 62,221 | | | | 64,125 | | |
5.500%, 11/01/23 | | | 93,154 | | | | 101,754 | | |
5.500%, 05/01/34 | | | 683,808 | | | | 772,698 | | |
5.500%, 10/01/34 | | | 262,556 | | | | 293,731 | | |
5.500%, 07/01/35 | | | 329,458 | | | | 366,119 | | |
5.500%, 10/01/35 | | | 337,885 | | | | 377,812 | | |
5.500%, 12/01/38 | | | 181,407 | | | | 199,682 | | |
6.000%, 11/01/33 | | | 275,804 | | | | 314,980 | | |
| | | Principal | | Value(a) | |
6.352%, 05/25/28 (1-Month
USD LIBOR + 4.800%) (b) | | $ | 1,500,000 | | | $ | 1,764,897 | | |
6.500%, 09/01/32 | | | 57,337 | | | | 66,298 | | |
6.500%, 06/01/36 | | | 268,875 | | | | 310,077 | | |
7.000%, 12/01/37 | | | 59,809 | | | | 66,112 | | |
| | | | | | 22,383,552 | | |
Federal National Mortgage Association
(FNMA) (12.3%) | |
2.500%, 11/01/27 | | | 442,982 | | | | 442,605 | | |
2.500%, 07/01/28 | | | 565,103 | | | | 567,756 | | |
3.000%, 06/01/22 | | | 205,125 | | | | 209,042 | | |
3.000%, 11/01/27 | | | 93,004 | | | | 94,993 | | |
3.000%, 01/01/33 (c) | | | 4,380,000 | | | | 4,461,270 | | |
3.000%, 03/01/42 | | | 513,757 | | | | 516,533 | | |
3.000%, 04/01/43 | | | 614,117 | | | | 617,436 | | |
3.000%, 05/01/43 | | | 1,238,119 | | | | 1,244,811 | | |
3.000%, 06/01/43 | | | 312,698 | | | | 314,388 | | |
3.000%, 09/01/43 | | | 755,595 | | | | 759,445 | | |
3.000%, 01/01/48 (c) | | | 2,000,000 | | | | 2,000,000 | | |
3.500%, 11/01/25 | | | 287,597 | | | | 297,811 | | |
3.500%, 01/01/26 | | | 289,129 | | | | 299,398 | | |
3.500%, 11/01/40 | | | 446,484 | | | | 462,448 | | |
3.500%, 01/01/41 | | | 391,846 | | | | 404,917 | | |
3.500%, 02/01/41 | | | 288,617 | | | | 299,299 | | |
3.500%, 04/01/41 | | | 478,976 | | | | 494,952 | | |
3.500%, 11/01/41 | | | 2,425,074 | | | | 2,509,012 | | |
3.500%, 01/01/42 | | | 2,244,531 | | | | 2,317,207 | | |
3.500%, 04/01/42 | | | 2,396,364 | | | | 2,474,492 | | |
3.500%, 08/01/42 | | | 1,695,510 | | | | 1,751,510 | | |
3.500%, 01/01/43 | | | 394,054 | | | | 406,879 | | |
3.500%, 03/01/43 | | | 1,400,959 | | | | 1,451,065 | | |
3.500%, 05/01/43 | | | 1,267,730 | | | | 1,312,378 | | |
3.500%, 05/01/45 | | | 1,329,891 | | | | 1,370,219 | | |
3.500%, 10/01/45 | | | 727,992 | | | | 747,844 | | |
4.000%, 04/01/41 | | | 1,359,099 | | | | 1,439,846 | | |
4.000%, 08/01/41 | | | 432,009 | | | | 453,705 | | |
4.000%, 09/01/41 | | | 676,032 | | | | 715,019 | | |
4.000%, 04/01/44 | | | 2,841,406 | | | | 2,975,182 | | |
4.000%, 08/01/44 | | | 314,074 | | | | 331,428 | | |
4.000%, 01/01/48 (c) | | | 1,100,000 | | | | 1,150,313 | | |
4.500%, 05/01/35 | | | 148,675 | | | | 158,949 | | |
4.500%, 07/01/35 | | | 435,539 | | | | 465,341 | | |
4.500%, 06/01/39 | | | 242,014 | | | | 259,995 | | |
4.500%, 04/01/41 | | | 1,763,430 | | | | 1,909,067 | | |
4.500%, 07/01/41 | | | 1,603,024 | | | | 1,717,493 | | |
5.000%, 05/01/18 | | | 1,145 | | | | 1,165 | | |
5.000%, 06/01/18 | | | 3,148 | | | | 3,205 | | |
5.000%, 07/01/18 | | | 6,674 | | | | 6,794 | | |
5.000%, 07/01/23 | | | 87,318 | | | | 93,741 | | |
5.000%, 11/01/33 | | | 54,232 | | | | 58,908 | | |
5.000%, 05/01/34 | | | 17,516 | | | | 19,030 | | |
5.000%, 12/01/34 | | | 243,404 | | | | 264,405 | | |
5.000%, 04/01/35 | | | 59,625 | | | | 64,771 | | |
5.000%, 08/01/35 | | | 84,317 | | | | 91,254 | | |
5.000%, 04/01/38 | | | 205,718 | | | | 226,321 | | |
5.000%, 12/01/39 | | | 308,070 | | | | 339,304 | | |
5.000%, 04/01/41 | | | 341,935 | | | | 373,141 | | |
5.500%, 02/01/18 | | | 733 | | | | 733 | | |
5.500%, 03/01/18 | | | 1,709 | | | | 1,709 | | |
5.500%, 04/01/33 | | | 423,810 | | | | 472,543 | | |
5.500%, 12/01/33 | | | 100,020 | | | | 111,555 | | |
See accompanying notes to financial statements.
46
SFT Advantus Bond Fund
Investments in Securities – continued
| | | Principal | | Value(a) | |
5.500%, 01/01/34 | | $ | 140,362 | | | $ | 155,761 | | |
5.500%, 02/01/34 | | | 154,232 | | | | 171,725 | | |
5.500%, 03/01/34 | | | 280,019 | | | | 314,905 | | |
5.500%, 04/01/34 | | | 128,405 | | | | 142,392 | | |
5.500%, 09/01/34 | | | 55,127 | | | | 61,266 | | |
5.500%, 02/01/35 | | | 193,336 | | | | 215,058 | | |
5.500%, 04/01/35 | | | 302,614 | | | | 335,203 | | |
5.500%, 06/01/35 | | | 39,443 | | | | 43,264 | | |
5.500%, 08/01/35 | | | 135,745 | | | | 150,587 | | |
5.500%, 10/01/35 | | | 396,434 | | | | 447,165 | | |
5.500%, 11/01/35 | | | 93,844 | | | | 104,076 | | |
5.500%, 12/01/35 | | | 74,863 | | | | 83,039 | | |
5.500%, 12/01/39 | | | 118,904 | | | | 131,688 | | |
6.000%, 08/01/23 | | | 72,700 | | | | 76,417 | | |
6.000%, 10/01/32 | | | 282,385 | | | | 322,325 | | |
6.000%, 11/01/32 | | | 213,307 | | | | 243,609 | | |
6.000%, 03/01/33 | | | 296,001 | | | | 338,503 | | |
6.000%, 04/01/33 | | | 14,355 | | | | 16,049 | | |
6.000%, 12/01/33 | | | 101,050 | | | | 114,930 | | |
6.000%, 01/01/36 | | | 55,418 | | | | 62,240 | | |
6.000%, 08/01/37 | | | 44,648 | | | | 50,367 | | |
6.000%, 09/01/37 | | | 85,573 | | | | 97,243 | | |
6.000%, 10/01/38 | | | 209,787 | | | | 240,918 | | |
6.000%, 12/01/38 | | | 123,839 | | | | 140,002 | | |
6.000%, 06/01/40 | | | 49,090 | | | | 55,376 | | |
6.500%, 12/01/31 | | | 82,651 | | | | 93,819 | | |
6.500%, 02/01/32 | | | 29,700 | | | | 33,841 | | |
6.500%, 04/01/32 | | | 123,303 | | | | 140,302 | | |
6.500%, 05/01/32 | | | 34,738 | | | | 38,506 | | |
6.500%, 07/01/32 | | | 95,853 | | | | 109,357 | | |
6.500%, 08/01/32 | | | 146,610 | | | | 166,530 | | |
6.500%, 09/01/32 | | | 100,254 | | | | 112,731 | | |
6.500%, 10/01/32 | | | 145,745 | | | | 166,061 | | |
6.500%, 11/01/37 | | | 72,886 | | | | 81,647 | | |
7.000%, 07/01/31 | | | 79,220 | | | | 91,789 | | |
7.000%, 09/01/31 | | | 161,182 | | | | 186,059 | | |
7.000%, 11/01/31 | | | 226,500 | | | | 253,423 | | |
7.000%, 02/01/32 | | | 39,130 | | | | 43,346 | | |
7.000%, 03/01/32 | | | 22,967 | | | | 26,480 | | |
7.000%, 07/01/32 | | | 68,221 | | | | 75,677 | | |
7.500%, 04/01/31 | | | 92,497 | | | | 101,996 | | |
7.500%, 05/01/31 | | | 22,446 | | | | 24,607 | | |
| | | | | | 47,392,906 | | |
Government National Mortgage Association
(GNMA) (2.3%) | |
0.011%, 06/17/45 (b) (d) | | | 386,823 | | | | 130 | | |
3.000%, 03/15/45 | | | 1,206,990 | | | | 1,217,304 | | |
3.000%, 03/20/45 | | | 975,357 | | | | 985,468 | | |
3.000%, 04/15/45 | | | 1,618,492 | | | | 1,632,322 | | |
3.250%, 11/20/35 | | | 377,628 | | | | 389,484 | | |
3.500%, 10/20/43 | | | 716,421 | | | | 744,613 | | |
3.500%, 02/20/45 | | | 472,872 | | | | 489,588 | | |
3.500%, 03/20/45 | | | 523,766 | | | | 542,281 | | |
3.500%, 04/20/46 | | | 1,070,437 | | | | 1,107,356 | | |
3.750%, 03/20/46 | | | 694,404 | | | | 721,396 | | |
5.000%, 12/15/39 | | | 30,848 | | | | 33,981 | | |
5.000%, 01/15/40 | | | 491,075 | | | | 531,311 | | |
5.500%, 07/15/38 | | | 218,411 | | | | 241,323 | | |
5.500%, 10/15/38 | | | 275,109 | | | | 310,523 | | |
8.500%, 10/15/22 | | | 10,900 | | | | 10,938 | | |
| | | | | | 8,958,018 | | |
| | | Principal | | Value(a) | |
U.S. Treasury (12.1%) | |
U.S. Treasury Bond
2.750%, 08/15/47 | | $ | 6,815,000 | | | $ | 6,823,519 | | |
5.375%, 02/15/31 (e) | | | 5,115,000 | | | | 6,796,356 | | |
U.S. Treasury Note
0.875%, 05/15/19 | | | 370,000 | | | | 365,129 | | |
1.000%, 11/15/19 | | | 200,000 | | | | 196,781 | | |
1.375%, 01/15/20 | | | 1,000,000 | | | | 989,688 | | |
1.375%, 02/15/20 | | | 2,629,000 | | | | 2,600,040 | | |
1.500%, 06/15/20 | | | 375,000 | | | | 371,221 | | |
1.500%, 07/15/20 | | | 1,250,000 | | | | 1,236,621 | | |
2.000%, 10/31/22 | | | 17,690,000 | | | | 17,535,903 | | |
2.000%, 11/30/22 | | | 4,000,000 | | | | 3,963,594 | | |
2.250%, 10/31/24 | | | 5,575,000 | | | | 5,549,303 | | |
| | | | | | 46,428,155 | | |
Total government obligations
(cost: $127,507,206) | | | | | 131,035,930 | | |
Asset-Backed Securities (4.1%) | |
Bank of The West Auto Trust,
3.210%, 04/15/25 (f) | | | 743,000 | | | | 736,118 | | |
CarMax Auto Owner Trust,
2.160%, 08/16/21 | | | 1,300,000 | | | | 1,296,455 | | |
Commonbond Student
Loan Trust,
2.550%, 05/25/41 (f) | | | 833,520 | | | | 829,061 | | |
Conseco Finance Corp.,
6.400%, 10/15/18 | | | 2,687 | | | | 2,687 | | |
CountryPlace Manufactured
Housing Contract Trust,
5.200%, 12/15/35 (b) (f) | | | 1,479,253 | | | | 1,526,245 | | |
Countrywide Asset-Backed
Certificates,
5.934%, 05/25/37 (b) | | | 1,391,790 | | | | 1,385,422 | | |
Earnest Student Loan
Program LLC
3.020%, 05/25/34 (f) | | | 1,082,370 | | | | 1,089,127 | | |
2.720%, 01/25/41 (f) | | | 817,615 | | | | 815,321 | | |
FAN Engine
Securitization, Ltd.,
3.000%, 10/15/19 (f) (g) (h) (i) | | | 245,634 | | | | 245,804 | | |
Foursight Capital
Automobile Receivables
Trust,
3.710%, 01/18/22 (f) | | | 1,200,000 | | | | 1,188,269 | | |
GMAC Mortgage Corp.
Loan Trust,
5.952%, 08/25/37 (j) | | | 2,545,761 | | | | 2,637,253 | | |
Invitation Homes
2015-SFR3 Trust,
2.760%, 08/17/32
(1-Month LIBOR +
1.300%) (b) (f) | | | 949,794 | | | | 955,731 | | |
Progress Residential Trust,
3.565%, 08/17/34 (f) | | | 1,050,000 | | | | 1,041,996 | | |
TCF Auto Receivables
Owner Trust,
2.060%, 04/15/20 (f) | | | 621,275 | | | | 621,352 | | |
Towd Point Mortgage Trust,
3.750%, 04/25/55 (b) (f) | | | 805,000 | | | | 830,559 | | |
Wheels SPV 2 LLC,
1.870%, 05/20/25 (f) | | | 450,000 | | | | 447,183 | | |
Total asset-backed
securities (cost: $15,523,297) | | | | | 15,648,583 | | |
See accompanying notes to financial statements.
47
SFT Advantus Bond Fund
Investments in Securities – continued
| | | Principal | | Value(a) | |
Other Mortgage-Backed Securities (8.3%) | |
Collateralized Mortgage Obligations/Mortgage
Revenue Bonds (1.8%) | |
Credit-Based Asset
Servicing and
Securitization LLC,
6.250%, 10/25/36 (f) (j) | | $ | 369,825 | | | $ | 374,127 | | |
CSMC Trust,
3.500%, 06/25/47 (b) (f) | | | 2,025,000 | | | | 2,002,290 | | |
GS Mortgage-Backed
Securities Trust,
3.129%, 07/25/44 (b) (f) | | | 2,491,276 | | | | 2,393,285 | | |
JPMorgan Mortgage Trust,
3.579%, 11/25/33 (b) | | | 215,968 | | | | 210,939 | | |
Mellon Residential
Funding Corp.,
6.750%, 06/25/28 | | | 6,692 | | | | 6,760 | | |
Seasoned Credit Risk
Transfer Trust
4.000%, 08/25/56 (b) (f) | | | 1,000,000 | | | | 998,112 | | |
4.000%, 07/25/56 (b) (f) | | | 1,030,000 | | | | 1,023,562 | | |
| | | | | | 7,009,075 | | |
Commercial Mortgage-Backed Securities (6.5%) | |
7 WTC Depositor LLC Trust,
4.082%, 03/13/31 (f) | | | 200,720 | | | | 201,565 | | |
Aventura Mall Trust
2013-AVM,
3.743%, 12/05/32 (b) (f) | | | 1,000,000 | | | | 1,022,236 | | |
Banc of America
Re-Remic Trust,
4.185%, 08/15/46 (b) (f) | | | 1,350,000 | | | | 1,464,699 | | |
BB-UBS Trust,
4.026%, 11/05/36 (b) (f) | | | 500,000 | | | | 501,724 | | |
Hometown Commercial
Mortgage
5.506%, 11/11/38 (f) (h) | | | 33,298 | | | | 27,605 | | |
6.057%, 06/11/39 (f) (h) | | | 54,058 | | | | 35,708 | | |
JPMCC Commercial
Mortgage Securities
Trust,
3.723%, 03/15/50 | | | 1,000,000 | | | | 1,047,458 | | |
Merrill Lynch Mortgage
Investors, Inc.,
6.250%, 12/10/29 (b) | | | 128,931 | | | | 128,254 | | |
Morgan Stanley Capital I
Trust
3.201%, 08/05/34 (f) | | | 860,000 | | | | 867,631 | | |
3.451%, 08/05/34 (f) | | | 550,000 | | | | 545,919 | | |
One Market Plaza Trust,
3.614%, 02/10/32 (f) | | | 2,000,000 | | | | 2,059,376 | | |
UBS Commercial Mortgage
Trust
3.724%, 06/15/50 | | | 4,000,000 | | | | 4,057,921 | | |
3.580%, 12/15/50 | | | 3,000,000 | | | | 3,096,751 | | |
4.061%, 12/15/50 (b) | | | 1,505,000 | | | | 1,558,325 | | |
Vornado DP LLC,
4.004%, 09/13/28 (f) | | | 1,475,000 | | | | 1,527,357 | | |
Wells Fargo Commercial
Mortgage Trust
3.637%, 06/15/48 | | | 1,280,000 | | | | 1,330,223 | | |
3.184%, 04/15/50 | | | 1,544,000 | | | | 1,559,793 | | |
2.814%, 08/15/49 | | | 2,165,000 | | | | 2,088,154 | | |
3.640%, 12/15/59 | | | 1,560,000 | | | | 1,618,489 | | |
| | | Principal | | Value(a) | |
WF-RBS Commercial
Mortgage Trust,
3.667%, 11/15/44 | | $ | 345,000 | | | $ | 357,097 | | |
| | | | | | 25,096,285 | | |
Total other mortgage-backed securities
(cost: $32,343,870) | | | | | 32,105,360 | | |
Corporate Obligations (52.1%) | |
Communications (1.4%) | |
Telecommunication (0.5%) | |
Crown Castle Towers LLC,
3.222%, 05/15/22 (f) | | | 1,950,000 | | | | 1,969,558 | | |
Telephone Services (0.6%) | |
SBA Tower Trust,
2.240%, 04/10/18 (f) | | | 2,440,000 | | | | 2,440,304 | | |
Telephone — Integrated (0.3%) | |
AT&T, Inc., 5.150%, 02/14/50 | | | 1,100,000 | | | | 1,113,711 | | |
Consumer Cyclical (2.4%) | |
Auto/Truck Parts &
Equipment — Original (2.4%) | |
General Motors
Financial Co., Inc.
2.400%, 05/09/19 | | | 1,675,000 | | | | 1,675,406 | | |
2.606%, 10/04/19 (3-Month
USD LIBOR + 1.270%) (b) | | | 3,275,000 | | | | 3,318,045 | | |
3.950%, 04/13/24 | | | 2,000,000 | | | | 2,058,980 | | |
Nissan Motor Acceptance
Corp., 2.150%, 09/28/20 (f) | | | 2,000,000 | | | | 1,983,469 | | |
| | | | | | 9,035,900 | | |
Consumer, Non-cyclical (1.5%) | |
Consumer Products —
Miscellaneous (0.2%) | |
Newell Brands, Inc.,
5.000%, 11/15/23 | | | 860,000 | | | | 907,661 | | |
Drugstore Chains (1.3%) | |
CVS Pass-Through Trust
5.298%, 01/11/27 (f) | | | 1,206,631 | | | | 1,282,408 | | |
5.880%, 01/10/28 | | | 405,490 | | | | 444,605 | | |
6.036%, 12/10/28 | | | 2,212,950 | | | | 2,460,108 | | |
6.943%, 01/10/30 | | | 594,386 | | | | 695,105 | | |
| | | | | | 4,882,226 | | |
Energy (5.1%) | |
Oil & Gas (0.5%) | |
Baker Hughes a GE Co.
LLC/Baker Hughes
Co-Obligor, Inc.
3.337%, 12/15/27 (f) | | | 1,375,000 | | | | 1,372,692 | | |
4.080%, 12/15/47 (f) (h) | | | 415,000 | | | | 422,082 | | |
| | | | | | 1,794,774 | | |
Oil, Gas & Consumable Fuels (0.7%) | |
Marathon Petroleum Corp.,
5.850%, 12/15/45 | | | 2,270,000 | | | | 2,614,751 | | |
Pipelines (3.9%) | |
Andeavor Logistics
L.P./Tesoro Logistics
Finance Corp.,
3.500%, 12/01/22 | | | 1,025,000 | | | | 1,023,055 | | |
See accompanying notes to financial statements.
48
SFT Advantus Bond Fund
Investments in Securities – continued
| | | Principal | | Value(a) | |
Enterprise Products
Operating LLC, | |
4.258%, 06/01/67
(3-Month USD LIBOR +
2.778%) (b) | | $ | 2,180,000 | | | $ | 2,138,580 | | |
NuStar Logistics L.P.,
8.400%, 04/15/18 | | | 2,986,000 | | | | 3,034,522 | | |
Sabine Pass Liquefaction LLC,
5.750%, 05/15/24 | | | 3,000,000 | | | | 3,334,443 | | |
Sunoco Logistics Partners
Operations L.P.
5.400%, 10/01/47 | | | 850,000 | | | | 855,740 | | |
6.850%, 02/15/40 | | | 2,150,000 | | | | 2,407,841 | | |
Tennessee Gas
Pipeline Co. LLC,
8.375%, 06/15/32 | | | 1,850,000 | | | | 2,410,088 | | |
| | | | | | 15,204,269 | | |
Financial (17.2%) | |
Banks (8.9%) | |
Bank of America Corp.
3.950%, 04/21/25 | | | 780,000 | | | | 806,612 | | |
4.000%, 01/22/25 | | | 1,650,000 | | | | 1,716,597 | | |
Barclays PLC, | |
2.975%, 01/10/23
(3-Month USD
LIBOR + 1.625%) (b) (g) | | | 3,300,000 | | | | 3,390,402 | | |
Capital One NA/Mclean VA, | |
2.329%, 09/13/19
(3-Month USD
LIBOR + 0.765%) (b) | | | 3,000,000 | | | | 3,013,953 | | |
Citigroup, Inc.,
4.400%, 06/10/25 | | | 1,500,000 | | | | 1,583,301 | | |
Compass Bank,
3.875%, 04/10/25 | | | 2,500,000 | | | | 2,507,966 | | |
Discover Bank
3.450%, 07/27/26 | | | 1,900,000 | | | | 1,875,587 | | |
8.700%, 11/18/19 | | | 322,000 | | | | 354,063 | | |
HSBC Holdings PLC, | |
3.262%, 03/13/23
(3-Month USD
LIBOR + 1.055%) (b) (g) | | | 1,875,000 | | | | 1,901,101 | | |
JPMorgan Chase & Co., | |
5.000%, 07/01/19
(3-Month USD
LIBOR + 3.320%) (b) | | | 1,700,000 | | | | 1,729,546 | | |
Morgan Stanley | |
2.617%, 05/08/24
(3-Month USD
LIBOR + 1.220%) (b) | | | 3,600,000 | | | | 3,675,703 | | |
3.125%, 07/27/26 | | | 800,000 | | | | 789,064 | | |
5.450%, 07/15/19
(3-Month USD
LIBOR + 3.610%) (b) | | | 1,870,000 | | | | 1,919,555 | | |
5.500%, 07/28/21 | | | 740,000 | | | | 809,440 | | |
Suntrust Banks, Inc., | |
5.050%, 06/15/22
(3-Month USD
LIBOR + 3.102%) (b) | | | 1,160,000 | | | | 1,174,500 | | |
Synovus Financial Corp.,
3.125%, 11/01/22 | | | 3,100,000 | | | | 3,074,270 | | |
The Goldman Sachs
Group, Inc.,
2.160%, 10/31/22 (b) | | | 2,125,000 | | | | 2,127,761 | | |
| | | Principal | | Value(a) | |
US Bancorp, | |
5.300%, 04/15/27
(3-Month USD
LIBOR + 2.914%) (b) | | $ | 800,000 | | | $ | 866,040 | | |
Wells Fargo & Co.,
3.000%, 10/23/26 | | | 1,100,000 | | | | 1,078,172 | | |
| | | | | | 34,393,633 | | |
Diversified Financial Services (1.6%) | |
Block Financial LLC,
4.125%, 10/01/20 | | | 2,050,000 | | | | 2,113,030 | | |
Raymond James
Financial, Inc.,
4.950%, 07/15/46 | | | 1,400,000 | | | | 1,582,776 | | |
The Charles Schwab Corp., | |
4.625%, 03/01/22
(3-Month USD
LIBOR + 3.315%) (b) | | | 2,200,000 | | | | 2,244,000 | | |
| | | | | | 5,939,806 | | |
Insurance (5.1%) | |
Great-West Life & Annuity
Insurance Capital L.P. II, | |
3.957%, 05/16/46
(3-Month USD
LIBOR + 2.538%) (b) (f) | | | 3,150,000 | | | | 3,114,563 | | |
Liberty Mutual Group, Inc., | |
4.494%, 03/15/37
(3-Month USD
LIBOR + 2.905%) (b) (f) | | | 3,250,000 | | | | 3,185,000 | | |
Nuveen Finance LLC
2.950%, 11/01/19 (f) | | | 1,345,000 | | | | 1,357,859 | | |
4.125%, 11/01/24 (f) | | | 1,150,000 | | | | 1,213,662 | | |
Peachtree Corners
Funding Trust,
3.976%, 02/15/25 (f) | | | 1,825,000 | | | | 1,879,109 | | |
Teachers Insurance &
Annuity Association
of America,
4.270%, 05/15/47 (f) | | | 2,500,000 | | | | 2,643,852 | | |
The Chubb Corp., | |
3.609%, 04/15/37
(3-Month USD
LIBOR + 2.250%) (b) | | | 4,000,000 | | | | 3,970,000 | | |
Unum Group,
5.750%, 08/15/42 | | | 1,975,000 | | | | 2,416,688 | | |
| | | | | | 19,780,733 | | |
Real Estate Investment Trust — Health Care (1.0%) | |
Physicians Realty L.P.,
4.300%, 03/15/27 | | | 1,275,000 | | | | 1,297,274 | | |
Ventas Realty L.P.,
3.100%, 01/15/23 | | | 2,500,000 | | | | 2,500,374 | | |
| | | | | | 3,797,648 | | |
Real Estate Investment Trust — Hotels (0.6%) | |
Hospitality Properties Trust
4.500%, 06/15/23 | | | 700,000 | | | | 731,932 | | |
4.500%, 03/15/25 | | | 450,000 | | | | 467,072 | | |
4.650%, 03/15/24 | | | 920,000 | | | | 966,851 | | |
| | | | | | 2,165,855 | | |
See accompanying notes to financial statements.
49
SFT Advantus Bond Fund
Investments in Securities – continued
| | | Principal | | Value(a) | |
Health Care (2.6%) | |
Health Care Providers & Services (1.9%) | |
Anthem, Inc.
2.950%, 12/01/22 | | $ | 1,235,000 | | | $ | 1,235,517 | | |
4.375%, 12/01/47 | | | 950,000 | | | | 1,010,080 | | |
Express Scripts Holding Co.,
2.229%, 11/30/20 (b) | | | 2,000,000 | | | | 2,000,893 | | |
NYU Hospitals Center,
4.428%, 07/01/42 | | | 1,480,000 | | | | 1,597,047 | | |
Sinai Health System,
3.034%, 01/20/36 | | | 1,465,000 | | | | 1,462,356 | | |
| | | | | | 7,305,893 | | |
Medical Products/Supplies (0.7%) | |
Bio-Rad Laboratories, Inc.,
4.875%, 12/15/20 | | | 2,700,000 | | | | 2,857,553 | | |
Industrials (1.3%) | |
Electrical Equipment (0.4%) | |
Keysight Technologies, Inc.,
3.300%, 10/30/19 | | | 1,500,000 | | | | 1,514,193 | | |
Machinery (0.9%) | |
Siemens
Financieringsmaatschappij NV,
2.210%, 03/16/22
3-Month USD
(LIBOR + 0.610%) (b) (f) (g) | | | 3,275,000 | | | | 3,304,468 | | |
Information Technology (1.8%) | |
Electronic Equipment, Instruments &
Components (0.5%) | |
Tech Data Corp.,
3.700%, 02/15/22 | | | 1,835,000 | | | | 1,840,690 | | |
Software (0.5%) | |
Microsoft Corp.,
4.500%, 02/06/57 | | | 1,800,000 | | | | 2,131,423 | | |
Technology Hardware Storage &
Peripherals (0.8%) | |
Hewlett Packard
Enterprise Co.,
2.100%, 10/04/19 (f) | | | 3,000,000 | | | | 2,979,466 | | |
Materials (0.5%) | |
Chemicals (0.5%) | |
The Mosaic Co.
3.250%, 11/15/22 | | | 1,550,000 | | | | 1,536,441 | | |
4.050%, 11/15/27 | | | 465,000 | | | | 466,219 | | |
| | | | | | 2,002,660 | | |
Technology (0.8%) | |
Computers (0.8%) | |
Dell International
LLC/EMC Corp,
8.350%, 07/15/46 (f) | | | 980,000 | | | | 1,262,772 | | |
Dell International
LLC/EMC Corp.,
5.450%, 06/15/23 (f) | | | 1,790,000 | | | | 1,934,344 | | |
| | | | | | 3,197,116 | | |
| | | Principal | | Value(a) | |
Transportation (7.0%) | |
Airlines (5.9%) | |
Air Canada 2015 -1 Class C
Pass Through Trust,
5.000%, 03/15/20 (f) (g) | | $ | 2,600,000 | | | $ | 2,658,240 | | |
Air Canada 2017-1 Class A
Pass Through Trust,
3.550%, 01/15/30 (f) (g) | | | 2,175,000 | | | | 2,174,750 | | |
America West Airlines
2000-1 Pass Through Trust,
8.057%, 07/02/20 | | | 509,366 | | | | 571,814 | | |
American Airlines 2013-1
Class B Pass Through Trust,
5.625%, 01/15/21 (f) | | | 1,822,975 | | | | 1,895,894 | | |
American Airlines 2013-2
Class B Pass Through Trust,
5.600%, 07/15/20 (f) | | | 1,238,028 | | | | 1,279,378 | | |
American Airlines 2015-1
Class B Pass Through Trust,
3.700%, 05/01/23 | | | 1,642,131 | | | | 1,638,026 | | |
American Airlines 2016-1
Class B Pass Through Trust,
5.250%, 01/15/24 | | | 497,759 | | | | 525,085 | | |
British Airways 2013-1
Class B Pass Through Trust,
5.625%, 06/20/20 (f) | | | 383,285 | | | | 396,776 | | |
Continental Airlines 2009-2
Class A Pass Through Trust,
7.250%, 11/10/19 | | | 1,260,192 | | | | 1,358,645 | | |
Continental Airlines 2012-1
Class B Pass Through Trust,
6.250%, 04/11/20 | | | 815,869 | | | | 855,194 | | |
Delta Air Lines 2012-1
Class A Pass Through Trust,
4.750%, 05/07/20 | | | 451,650 | | | | 469,716 | | |
Delta Air Lines 2012-1
Class B Pass Through Trust,
6.875%, 05/07/19 (f) | | | 1,118,553 | | | | 1,166,092 | | |
Delta Air Lines 2015-1
Class B Pass Through Trust,
4.250%, 07/30/23 | | | 1,032,625 | | | | 1,065,566 | | |
Hawaiian Airlines 2013-1
Class B Pass Through
Certificates,
4.950%, 01/15/22 | | | 813,378 | | | | 838,796 | | |
United Airlines 2014-1
Class B Pass Through Trust,
4.750%, 04/11/22 | | | 539,020 | | | | 557,455 | | |
United Airlines 2014-2
Class B Pass Through Trust,
4.625%, 09/03/22 | | | 2,230,665 | | | | 2,294,462 | | |
US Airways 2012-2 Class B
Pass Through Trust,
6.750%, 06/03/21 | | | 1,382,112 | | | | 1,501,112 | | |
Virgin Australia 2013-1A
Pass Through Trust,
5.000%, 10/23/23 (f) (g) | | | 920,347 | | | | 957,161 | | |
Virgin Australia 2013-1B
Pass Through Trust,
6.000%, 10/23/20 (f) (g) | | | 409,465 | | | | 418,678 | | |
| | | | | | 22,622,840 | | |
See accompanying notes to financial statements.
50
SFT Advantus Bond Fund
Investments in Securities – continued
| | | Principal | | Value(a) | |
Transport — Rail (1.1%) | |
BNSF Funding Trust I,
6.613%, 12/15/55
(3-Month USD
LIBOR + 2.350%) (b) | | $ | 3,785,000 | | | $ | 4,362,213 | | |
Utilities (10.5%) | |
Electric Companies (0.9%) | |
Dominion Energy
Gas Holdings LLC,
2.500%, 12/15/19 | | | 1,270,000 | | | | 1,271,995 | | |
Indianapolis Power &
Light Co.,
4.700%, 09/01/45 (f) | | | 1,900,000 | | | | 2,158,454 | | |
| | | | | | 3,430,449 | | |
Electric Utilities (7.7%) | |
Avangrid, Inc.,
3.150%, 12/01/24 | | | 1,925,000 | | | | 1,914,929 | | |
Cleco Corporate
Holdings LLC
3.743%, 05/01/26 | | | 1,125,000 | | | | 1,129,181 | | |
4.973%, 05/01/46 | | | 1,000,000 | | | | 1,103,295 | | |
Dominion Energy, Inc.,
5.750%, 10/01/54
(3-Month USD
LIBOR + 3.057%) (b) | | | 1,800,000 | | | | 1,944,000 | | |
El Paso Electric Co.,
5.000%, 12/01/44 | | | 1,165,000 | | | | 1,285,594 | | |
Entergy Mississippi, Inc.,
3.250%, 12/01/27 | | | 1,100,000 | | | | 1,097,092 | | |
Entergy Texas, Inc.,
3.450%, 12/01/27 | | | 1,885,000 | | | | 1,910,175 | | |
Exelon Corp.,
3.497%, 06/01/22 | | | 1,750,000 | | | | 1,783,425 | | |
FirstEnergy
Transmission LLC,
5.450%, 07/15/44 (f) | | | 2,000,000 | | | | 2,375,640 | | |
IPALCO Enterprises, Inc.
3.450%, 07/15/20 | | | 1,400,000 | | | | 1,414,000 | | |
3.700%, 09/01/24 (f) | | | 1,175,000 | | | | 1,173,932 | | |
Oncor Electric Delivery
Co. LLC,
3.800%, 09/30/47 (f) | | | 1,875,000 | | | | 1,947,934 | | |
Pennsylvania Electric Co.,
3.250%, 03/15/28 (f) | | | 1,225,000 | | | | 1,205,346 | | |
PPL Capital Funding, Inc.,
4.358%, 03/30/67
(3-Month USD
LIBOR + 2.665%) (b) | | | 4,500,000 | | | | 4,443,750 | | |
Southern Power Co.,
4.950%, 12/15/46 | | | 2,450,000 | | | | 2,687,382 | | |
The Cleveland Electric
Illuminating Co.,
3.500%, 04/01/28 (f) | | | 2,400,000 | | | | 2,402,621 | | |
| | | | | | 29,818,296 | | |
Gas Utilities (1.9%) | |
Boston Gas Co.,
3.150%, 08/01/27 (f) | | | 800,000 | | | | 797,427 | | |
NiSource Finance Corp.,
3.950%, 03/30/48 | | | 2,750,000 | | | | 2,817,100 | | |
| | | Shares/
Principal | | Value(a) | |
Southern Co. Gas
Capital Corp.
3.875%, 11/15/25 | | $ | 2,630,000 | | | $ | 2,713,873 | | |
4.400%, 05/30/47 | | | 775,000 | | | | 830,302 | | |
| | | | | | 7,158,702 | | |
Total corporate obligations
(cost: $194,962,051) | | | | | 200,566,791 | | |
Total long-term debt securities
(cost: $370,336,424) | | | | | 379,356,664 | | |
Short-Term Securities (3.0%) | |
Investment Companies (3.0%) | |
State Street Institutional
U.S. Government Money
Market Fund, current
rate 1.210% (k) | | | 11,618,459 | | | | 11,618,459 | | |
Total short-term securities
(cost: $11,618,459) | | | | | 11,618,459 | | |
Total investments in securities
(cost: $381,954,883) (l) | | | | | 390,975,123 | | |
Liabilities in excess of cash
and other assets (-1.5%) | | | | | (5,669,740 | ) | |
Total net assets (100.0%) | | | | $ | 385,305,383 | | |
See accompanying notes to financial statements.
51
SFT Advantus Bond Fund
Investments in Securities – continued
Investments in Securities Legend
(a) Securities are valued by procedures described in Note 2 of the Notes to Financial Statements.
(b) Variable rate security.
(c) Security is issued on a when-issued or forward commitment basis. As of December 31, 2017 the total cost of investments issued on a when-issued or forward commitment basis was $7,635,351.
(d) Interest-only security that entitles holders to receive only interest on the underlying mortgages. The principal amount of the underlying pool represents the notional amount on which current interest is calculated. The yield to maturity of an interest-only security is sensitive to the rate of principal payments on the underlying mortgage assets. The rate disclosed represents the market yield based upon the current cost basis and estimated timing and amount of future cash flows.
(e) Fully or partially pledged as initial margin deposits on open futures contracts.
Holdings of Open Futures Contracts
On December 31, 2017, securities with an aggregate market value of $398,613 have been pledged to cover margin requirements for the following open futures contracts:
Type | | Expiration | | Number of
Contracts | | Position
Type | | Notional
Amount | | Market
Value | | Unrealized
Appreciation/
(Depreciation) | |
10 Year U.S. Ultra | | March 2018 | | | 170 | | | Short | | | (22,700,867 | ) | | $ | (22,705,625 | ) | | $ | (4,758 | ) | |
5 Year U.S. Treasury Note | | March 2018 | | | 20 | | | Long | | | 2,334,434 | | | | 2,323,281 | | | | (11,153 | ) | |
U.S. Long Bond | | March 2018 | | | 250 | | | Long | | | 38,039,309 | | | | 38,250,000 | | | | 210,691 | | |
U.S. Ultra Bond | | March 2018 | | | 100 | | | Short | | | (16,504,015 | ) | | | (16,765,625 | ) | | | (261,610 | ) | |
| | | | | | | | | | | $ | 1,102,031 | | | $ | (66,830 | ) | |
(f) Security sold within terms of a private placement memorandum exempt from registration under Section 144A of the Securities Act of 1933, as amended, and may be sold only to dealers in that program. This security has been determined to be liquid unless otherwise indicated.
(g) Foreign security: The Fund held 3.9% of net assets in foreign securities at December 31, 2017.
(h) Illiquid security. (See Note 5.)
(i) These securities are being fair-valued according to procedures approved by the Board of Trustees.
(j) Step rate security.
(k) All or a portion of the security segregated to cover when-issued purchase commitments outstanding or extended settlement trades as of December 31, 2017.
(l) At December 31, 2017 the cost of investments for federal income tax purposes was $382,048,627. The aggregate unrealized appreciation and depreciation of investments based on this cost were:
Gross unrealized appreciation | | $ | 10,758,103 | | |
Gross unrealized depreciation | | | (1,898,437 | ) | |
Net unrealized appreciation | | $ | 8,859,666 | | |
See accompanying notes to financial statements.
52
SFT Advantus Dynamic Managed Volatility Fund
Investments in Securities
(Percentages of each investment category relate to total net assets)
| | | Principal | | Value(a) | |
Long-Term Debt Securities (38.5%) | |
Government Obligations (0.8%) | |
U.S. Government Agencies and
Obligations (0.8%) | |
Federal Home Loan Mortgage
Corporation (FHLMC) (0.3%) | |
3.000%, 09/01/43 | | $ | 162,218 | | | $ | 163,129 | | |
3.500%, 10/01/44 | | | 269,924 | | | | 277,995 | | |
3.500%, 11/01/44 | | | 266,686 | | | | 274,506 | | |
3.500%, 12/01/44 | | | 281,493 | | | | 289,666 | | |
| | | | | | 1,005,296 | | |
Federal National Mortgage Association
(FNMA) (0.2%) | |
3.000%, 04/01/43 | | | 246,706 | | | | 248,039 | | |
3.000%, 05/01/43 | | | 107,592 | | | | 108,173 | | |
3.000%, 06/01/43 | | | 315,749 | | | | 317,439 | | |
3.500%, 08/01/42 | | | 136,735 | | | | 141,251 | | |
3.500%, 02/01/43 | | | 152,289 | | | | 157,834 | | |
| | | | | | 972,736 | | |
U.S. Treasury (0.3%) | |
U.S. Treasury Note,
0.625%, 04/30/18 (b) | | | 1,000,000 | | | | 997,416 | | |
Total government obligations
(cost: $2,944,426) | | | | | 2,975,448 | | |
Asset-Backed Security (0.2%) | |
Longtrain Leasing III LLC
2015-1A Class A2,
4.060%, 01/15/45 (c) (d) | | | 1,000,000 | | | | 1,024,110 | | |
Total asset-backed securities
(cost: $999,582) | | | | | 1,024,110 | | |
Other Mortgage-Backed Securities (0.3%) | |
Commercial Mortgage-Backed Securities (0.3%) | |
CSMC Mortgage Trust,
4.138%, 11/15/37 (d) (e) | | | 1,000,000 | | | | 1,045,607 | | |
Total other mortgage-backed securities
(cost: $1,007,978) | | | | | 1,045,607 | | |
Corporate Obligations (37.2%) | |
Basic Materials (0.0%) | |
Mining (0.0%) | |
BHP Billiton Finance USA, Ltd.,
2.875%, 02/24/22 (f) | | | 122,000 | | | | 123,408 | | |
Communications (2.0%) | |
Cable/Satellite TV (0.6%) | |
Comcast Corp.
4.200%, 08/15/34 (b) | | | 500,000 | | | | 534,244 | | |
4.650%, 07/15/42 | | | 250,000 | | | | 281,410 | | |
6.400%, 05/15/38 (b) | | | 1,000,000 | | | | 1,350,383 | | |
| | | | | | 2,166,037 | | |
Internet & Catalog Retail (0.3%) | |
Amazon.com, Inc.,
3.875%, 08/22/37 (d) | | | 1,000,000 | | | | 1,061,099 | | |
| | | Principal | | Value(a) | |
Media (0.6%) | |
CBS Corp.
3.500%, 01/15/25 | | $ | 750,000 | | | $ | 752,775 | | |
4.000%, 01/15/26 | | | 250,000 | | | | 255,496 | | |
Time Warner, Inc.,
4.850%, 07/15/45 | | | 1,000,000 | | | | 1,050,234 | | |
Viacom, Inc.,
5.625%, 09/15/19 | | | 250,000 | | | | 261,586 | | |
| | | | | | 2,320,091 | | |
Telecommunication (0.2%) | |
Crown Castle Towers LLC,
3.663%, 05/15/45 (d) | | | 1,000,000 | | | | 1,017,090 | | |
Telephone — Integrated (0.2%) | |
AT&T, Inc.,
4.100%, 02/15/28 (d) | | | 803,000 | | | | 805,657 | | |
Wireless Telecommunication Services (0.1%) | |
Rogers Communications, Inc.,
4.100%, 10/01/23 (f) | | | 250,000 | | | | 262,328 | | |
Consumer Cyclical (1.5%) | |
Auto/Truck Parts & Equipment-Original (0.4%) | |
Ford Motor Co.,
5.291%, 12/08/46 | | | 1,500,000 | | | | 1,632,313 | | |
Food & Staples Retailing (0.3%) | |
The Kroger Co.,
4.450%, 02/01/47 | | | 1,000,000 | | | | 998,487 | | |
Home Furnishings (0.3%) | |
Harman International
Industries, Inc.,
4.150%, 05/15/25 | | | 1,000,000 | | | | 1,033,945 | | |
Retail (0.5%) | |
AutoZone, Inc.,
3.250%, 04/15/25 | | | 1,000,000 | | | | 996,179 | | |
Target Corp.,
3.500%, 07/01/24 | | | 750,000 | | | | 781,919 | | |
Wal-Mart Stores, Inc.,
1.950%, 12/15/18 (b) | | | 250,000 | | | | 250,052 | | |
| | | | | | 2,028,150 | | |
Consumer Staples (1.5%) | |
Beverages (0.1%) | |
The Coca-Cola Co.,
3.200%, 11/01/23 (b) | | | 500,000 | | | | 519,183 | | |
Consumer Products — Miscellaneous (0.2%) | |
Johnson (S.C.) & Son, Inc.,
3.350%, 09/30/24 (d) | | | 750,000 | | | | 771,678 | | |
Food Products (0.6%) | |
Archer-Daniels-Midland Co.,
3.750%, 09/15/47 | | | 1,000,000 | | | | 1,019,569 | | |
General Mills, Inc.,
4.150%, 02/15/43 | | | 1,000,000 | | | | 1,013,611 | | |
| | | | | | 2,033,180 | | |
Household Products (0.3%) | |
Kimberly-Clark Corp.,
3.900%, 05/04/47 | | | 1,000,000 | | | | 1,058,873 | | |
See accompanying notes to financial statements.
53
SFT Advantus Dynamic Managed Volatility Fund
Investments in Securities – continued
| | | Principal | | Value(a) | |
Personal Care (0.3%) | |
The Estee Lauder Cos., Inc.,
4.150%, 03/15/47 | | $ | 1,000,000 | | | $ | 1,095,246 | | |
Consumer, Non-cyclical (1.4%) | |
Commercial Service — Finance (0.1%) | |
Moody's Corp.,
4.875%, 02/15/24 | | | 250,000 | | | | 274,605 | | |
Diagnostic Equipment (0.6%) | |
Abbott Laboratories
3.875%, 09/15/25 | | | 750,000 | | | | 775,742 | | |
4.750%, 11/30/36 | | | 1,000,000 | | | | 1,123,601 | | |
4.750%, 04/15/43 | | | 250,000 | | | | 277,576 | | |
| | | | | | 2,176,919 | | |
Drugstore Chains (0.1%) | |
CVS Pass-Through Trust,
6.943%, 01/10/30 | | | 181,215 | | | | 211,922 | | |
Food (0.5%) | |
Flowers Foods, Inc.,
3.500%, 10/01/26 | | | 1,000,000 | | | | 980,739 | | |
Tyson Foods, Inc.,
5.150%, 08/15/44 | | | 1,000,000 | | | | 1,170,265 | | |
| | | | | | 2,151,004 | | |
Pharmaceuticals (0.1%) | |
Novartis Capital Corp.,
3.400%, 05/06/24 | | | 500,000 | | | | 519,983 | | |
Energy (4.4%) | |
Oil & Gas (0.3%) | |
Baker Hughes a GE Co.
LLC/Baker Hughes
Co-Obligor, Inc.,
3.337%, 12/15/27 (d) | | | 1,000,000 | | | | 998,321 | | |
Oil, Gas & Consumable Fuels (1.4%) | |
Apache Corp.,
3.250%, 04/15/22 | | | 181,000 | | | | 182,367 | | |
Chevron Corp.,
3.191%, 06/24/23 (b) | | | 250,000 | | | | 256,906 | | |
EOG Resources, Inc.,
2.625%, 03/15/23 | | | 250,000 | | | | 247,132 | | |
Marathon Petroleum Corp.,
3.625%, 09/15/24 | | | 750,000 | | | | 764,872 | | |
Noble Energy, Inc.,
3.900%, 11/15/24 | | | 1,000,000 | | | | 1,028,184 | | |
Phillips 66,
4.650%, 11/15/34 | | | 1,000,000 | | | | 1,095,650 | | |
Total Capital International SA,
3.750%, 04/10/24 (f) | | | 750,000 | | | | 795,258 | | |
Valero Energy Corp.,
3.650%, 03/15/25 | | | 1,000,000 | | | | 1,026,860 | | |
| | | | | | 5,397,229 | | |
Pipelines (2.7%) | |
Andeavor Logistics
LP/Tesoro Logistics
Finance Corp.,
5.250%, 01/15/25 | | | 500,000 | | | | 525,850 | | |
| | | Principal | | Value(a) | |
Columbia Pipeline
Group, Inc.,
4.500%, 06/01/25 | | $ | 1,000,000 | | | $ | 1,064,741 | | |
Enbridge Energy Partners L.P.,
6.500%, 04/15/18 | | | 250,000 | | | | 253,313 | | |
Energy Transfer L.P.,
4.900%, 03/15/35 | | | 1,000,000 | | | | 989,194 | | |
Enterprise Products
Operating LLC,
5.750%, 03/01/35 | | | 250,000 | | | | 292,206 | | |
Florida Gas Transmission
Co. LLC,
4.350%, 07/15/25 (d) | | | 1,000,000 | | | | 1,068,093 | | |
Kinder Morgan, Inc.,
5.300%, 12/01/34 | | | 750,000 | | | | 800,073 | | |
Magellan Midstream
Partners L.P.,
4.200%, 10/03/47 | | | 1,000,000 | | | | 1,008,311 | | |
Plains All American Pipeline
L.P./PAA Finance Corp.,
3.850%, 10/15/23 | | | 250,000 | | | | 248,813 | | |
Southern Natural Gas
Co. LLC,
4.800%, 03/15/47 (d) | | | 1,500,000 | | | | 1,649,532 | | |
Spectra Energy
Partners L.P.,
2.950%, 09/25/18 | | | 250,000 | | | | 251,502 | | |
Sunoco Logistics Partners
Operations L.P.,
4.250%, 04/01/24 | | | 1,000,000 | | | | 1,019,475 | | |
Williams Partners L.P.
3.750%, 06/15/27 | | | 500,000 | | | | 501,039 | | |
4.300%, 03/04/24 | | | 500,000 | | | | 523,677 | | |
| | | | | | 10,195,819 | | |
Financial (11.2%) | |
Banks (4.0%) | |
Associated Banc-Corp.,
4.250%, 01/15/25 | | | 750,000 | | | | 772,238 | | |
Astoria Financial Corp.,
3.500%, 06/08/20 | | | 1,000,000 | | | | 1,003,895 | | |
Bank of America Corp.
3.950%, 04/21/25 | | | 1,000,000 | | | | 1,034,119 | | |
4.183%, 11/25/27 | | | 1,000,000 | | | | 1,044,266 | | |
4.244%, 04/24/38 (3-Month
USD LIBOR + 1.814%) (e) | | | 1,000,000 | | | | 1,084,531 | | |
5.700%, 01/24/22 | | | 250,000 | | | | 278,694 | | |
Bank of Montreal,
2.375%, 01/25/19 (f) | | | 250,000 | | | | 250,740 | | |
Capital One Financial Corp.,
4.750%, 07/15/21 | | | 250,000 | | | | 267,120 | | |
Citigroup, Inc.,
3.300%, 04/27/25 | | | 750,000 | | | | 756,993 | | |
Credit Suisse Group
Funding Guernsey, Ltd.,
2.750%, 03/26/20 (f) | | | 600,000 | | | | 602,339 | | |
Discover Bank
3.100%, 06/04/20 | | | 1,000,000 | | | | 1,011,868 | | |
4.250%, 03/13/26 | | | 500,000 | | | | 521,474 | | |
HSBC Bank USA NA,
4.875%, 08/24/20 | | | 250,000 | | | | 264,385 | | |
See accompanying notes to financial statements.
54
SFT Advantus Dynamic Managed Volatility Fund
Investments in Securities – continued
| | | Principal | | Value(a) | |
JPMorgan Chase & Co.
3.125%, 01/23/25 | | $ | 1,000,000 | | | $ | 1,005,514 | | |
4.500%, 01/24/22 | | | 250,000 | | | | 267,513 | | |
KeyBank NA,
3.180%, 10/15/27 | | | 1,000,000 | | | | 1,007,477 | | |
PNC Bank NA
2.450%, 07/28/22 | | | 1,000,000 | | | | 991,589 | | |
3.800%, 07/25/23 | | | 250,000 | | | | 261,109 | | |
SunTrust Bank,
2.750%, 05/01/23 | | | 250,000 | | | | 247,711 | | |
Synchrony Bank,
3.000%, 06/15/22 | | | 1,000,000 | | | | 995,928 | | |
The Goldman Sachs
Group, Inc.,
3.850%, 01/26/27 | | | 1,000,000 | | | | 1,026,657 | | |
| | | | | | 14,696,160 | | |
Capital Markets (0.5%) | |
E*TRADE Financial Corp.,
2.950%, 08/24/22 | | | 1,000,000 | | | | 991,558 | | |
The Bank of New York
Mellon Corp., | |
3.442%, 02/07/28
(3-Month USD LIBOR +
1.069%) (e) | | | 1,000,000 | | | | 1,022,146 | | |
| | | | | | 2,013,704 | | |
Diversified Financial Services (1.3%) | |
American Express Credit Corp.,
3.300%, 05/03/27 | | | 1,000,000 | | | | 1,014,772 | | |
CME Group, Inc.,
3.000%, 03/15/25 | | | 1,000,000 | | | | 1,011,377 | | |
Discover Financial Services,
3.750%, 03/04/25 | | | 1,000,000 | | | | 1,006,602 | | |
Eaton Vance Corp.,
3.500%, 04/06/27 | | | 1,000,000 | | | | 1,023,452 | | |
TD Ameritrade Holding Corp.,
2.950%, 04/01/22 | | | 700,000 | | | | 708,383 | | |
| | | | | | 4,764,586 | | |
Insurance (2.4%) | |
American Financial Group, Inc.,
4.500%, 06/15/47 | | | 1,000,000 | | | | 1,039,831 | | |
Assured Guaranty US
Holdings, Inc.,
5.000%, 07/01/24 | | | 500,000 | | | | 538,703 | | |
First American
Financial Corp.,
4.600%, 11/15/24 | | | 750,000 | | | | 776,240 | | |
Liberty Mutual Group, Inc.,
4.250%, 06/15/23 (d) | | | 750,000 | | | | 790,299 | | |
Manulife Financial Corp.,
4.150%, 03/04/26 (f) | | | 750,000 | | | | 796,514 | | |
Marsh & McLennan
Cos., Inc.,
4.350%, 01/30/47 | | | 1,000,000 | | | | 1,107,679 | | |
Metropolitan Life Global
Funding I,
3.875%, 04/11/22 (d) | | | 250,000 | | | | 262,164 | | |
Old Republic
International Corp.,
4.875%, 10/01/24 | | | 750,000 | | | | 803,354 | | |
| | | Principal | | Value(a) | |
Pacific Life Insurance Co., | |
4.300%, 10/24/67
(3-Month USD LIBOR +
2.796%) (c) (d) (e) | | $ | 1,000,000 | | | $ | 1,003,100 | | |
StanCorp Financial
Group, Inc.,
5.000%, 08/15/22 | | | 750,000 | | | | 804,083 | | |
The Hanover Insurance
Group, Inc.,
4.500%, 04/15/26 | | | 1,000,000 | | | | 1,040,236 | | |
| | | | | | 8,962,203 | | |
Property / Casualty Insurance (0.3%) | |
Arch Capital Finance LLC,
4.011%, 12/15/26 | | | 1,000,000 | | | | 1,041,124 | | |
Real Estate Investment Trust — Diversified (0.3%) | |
Retail Properties of
America, Inc.,
4.000%, 03/15/25 | | | 1,000,000 | | | | 961,666 | | |
Real Estate Investment Trust — Health Care (0.8%) | |
Healthcare Realty Trust, Inc.,
3.875%, 05/01/25 | | | 1,000,000 | | | | 1,013,214 | | |
Healthcare Trust of America
Holdings L.P.,
3.750%, 07/01/27 | | | 1,000,000 | | | | 995,942 | | |
Physicians Realty L.P.,
4.300%, 03/15/27 | | | 1,000,000 | | | | 1,017,470 | | |
| | | | | | 3,026,626 | | |
Real Estate Investment Trust — Office Property (0.1%) | |
Alexandria Real Estate
Equities, Inc.,
4.500%, 07/30/29 | | | 500,000 | | | | 530,019 | | |
Real Estate Investment Trust — Residential (0.2%) | |
UDR, Inc.,
4.000%, 10/01/25 | | | 750,000 | | | | 782,002 | | |
Real Estate Investment Trust — Shopping Centers (0.1%) | |
Retail Opportunity
Investments
Partnership L.P.,
5.000%, 12/15/23 | | | 250,000 | | | | 260,613 | | |
Real Estate Investment Trust — Single Tenant (0.3%) | |
Select Income REIT,
4.500%, 02/01/25 | | | 750,000 | | | | 756,410 | | |
Tanger Properties L.P.,
3.875%, 12/01/23 | | | 500,000 | | | | 509,651 | | |
| | | | | | 1,266,061 | | |
Real Estate Investment Trust — Storage (0.1%) | |
CubeSmart L.P.,
4.375%, 12/15/23 | | | 500,000 | | | | 525,703 | | |
Specialized REITs (0.8%) | |
American Tower Corp.,
3.375%, 10/15/26 | | | 1,000,000 | | | | 982,484 | | |
Essex Portfolio L.P.,
3.500%, 04/01/25 | | | 1,000,000 | | | | 1,008,575 | | |
See accompanying notes to financial statements.
55
SFT Advantus Dynamic Managed Volatility Fund
Investments in Securities – continued
| | | Principal | | Value(a) | |
Goodman US Finance
Four LLC,
4.500%, 10/15/37 (c) (d) | | $ | 500,000 | | | $ | 516,730 | | |
HCP, Inc.,
4.250%, 11/15/23 | | | 250,000 | | | | 262,395 | | |
| | | | | | 2,770,184 | | |
Health Care (3.0%) | |
Biotechnology (0.4%) | |
Amgen, Inc.,
5.700%, 02/01/19 | | | 250,000 | | | | 259,488 | | |
Celgene Corp.,
3.875%, 08/15/25 | | | 1,000,000 | | | | 1,035,087 | | |
| | | | | | 1,294,575 | | |
Health Care Providers & Services (1.0%) | |
Aetna, Inc.,
3.875%, 08/15/47 | | | 1,000,000 | | | | 985,518 | | |
Anthem, Inc.,
4.375%, 12/01/47 | | | 1,000,000 | | | | 1,063,242 | | |
Laboratory Corp. of
America Holdings,
4.000%, 11/01/23 | | | 250,000 | | | | 259,541 | | |
UnitedHealth Group, Inc.
2.750%, 02/15/23 | | | 250,000 | | | | 250,495 | | |
3.750%, 07/15/25 (b) | | | 1,000,000 | | | | 1,054,025 | | |
| | | | | | 3,612,821 | | |
Pharmaceuticals (1.6%) | |
AbbVie, Inc.,
3.600%, 05/14/25 | | | 1,000,000 | | | | 1,028,076 | | |
Allergan Funding SCS,
3.800%, 03/15/25 (f) | | | 670,000 | | | | 682,091 | | |
Bristol-Myers Squibb Co.,
3.250%, 11/01/23 | | | 500,000 | | | | 518,313 | | |
Cardinal Health, Inc.,
3.750%, 09/15/25 | | | 1,000,000 | | | | 1,018,151 | | |
Eli Lilly & Co.,
3.950%, 05/15/47 | | | 1,000,000 | | | | 1,073,670 | | |
Mead Johnson Nutrition Co.,
5.900%, 11/01/39 | | | 1,000,000 | | | | 1,268,713 | | |
Mylan, Inc.,
4.200%, 11/29/23 | | | 500,000 | | | | 518,245 | | |
| | | | | | 6,107,259 | | |
Industrials (4.2%) | |
Aerospace & Defense (0.7%) | |
Harris Corp.,
3.832%, 04/27/25 | | | 1,000,000 | | | | 1,036,333 | | |
Rockwell Collins, Inc.,
3.700%, 12/15/23 | | | 500,000 | | | | 518,602 | | |
United Technologies Corp.,
4.050%, 05/04/47 | | | 1,000,000 | | | | 1,046,679 | | |
| | | | | | 2,601,614 | | |
Air Freight & Logistics (0.3%) | |
FedEx Corp.,
4.400%, 01/15/47 | | | 1,000,000 | | | | 1,067,026 | | |
Building Products (0.3%) | |
CRH America Finance, Inc.,
4.400%, 05/09/47 (d) | | | 1,000,000 | | | | 1,052,026 | | |
| | | Principal | | Value(a) | |
Electrical Equipment (0.5%) | |
Flex. Ltd.,
4.750%, 06/15/25 (f) | | $ | 1,000,000 | | | $ | 1,069,891 | | |
Trimble, Inc.,
4.750%, 12/01/24 | | | 750,000 | | | | 809,421 | | |
| | | | | | 1,879,312 | | |
Electronic Parts Distributions (0.4%) | |
Avnet, Inc.,
3.750%, 12/01/21 | | | 1,500,000 | | | | 1,521,576 | | |
Environmental Control (0.3%) | |
Waste Management, Inc.,
3.900%, 03/01/35 | | | 1,000,000 | | | | 1,048,366 | | |
Industrial Conglomerates (0.3%) | |
3M Co.,
3.625%, 10/15/47 | | | 1,000,000 | | | | 1,026,271 | | |
Machinery (0.2%) | |
Caterpillar Financial
Services Corp.,
3.750%, 11/24/23 | | | 750,000 | | | | 789,001 | | |
Miscellaneous Manufacturing (0.6%) | |
Carlisle Cos., Inc.,
3.750%, 12/01/27 | | | 1,000,000 | | | | 1,010,387 | | |
Textron, Inc.
3.875%, 03/01/25 | | | 750,000 | | | | 777,450 | | |
4.300%, 03/01/24 | | | 500,000 | | | | 528,753 | | |
| | | | | | 2,316,590 | | |
Road & Rail (0.1%) | |
Kansas City Southern,
4.300%, 05/15/43 | | | 250,000 | | | | 262,801 | | |
Tools-Hand Held (0.2%) | |
Stanley Black & Decker, Inc.,
2.451%, 11/17/18 | | | 800,000 | | | | 802,416 | | |
Transportation (0.1%) | |
Burlington Northern
Santa Fe LLC,
3.750%, 04/01/24 | | | 350,000 | | | | 370,475 | | |
Trucking & Leasing (0.2%) | |
GATX Corp.,
3.250%, 03/30/25 | | | 1,000,000 | | | | 990,327 | | |
Information Technology (1.9%) | |
Communications Equipment (0.4%) | |
Juniper Networks, Inc.,
4.500%, 03/15/24 | | | 500,000 | | | | 520,289 | | |
QUALCOMM, Inc.,
4.650%, 05/20/35 | | | 1,000,000 | | | | 1,076,156 | | |
| | | | | | 1,596,445 | | |
Computers (0.3%) | |
Apple, Inc.,
4.375%, 05/13/45 (b) | | | 1,000,000 | | | | 1,126,568 | | |
Internet Software & Services (0.2%) | |
eBay, Inc.,
3.450%, 08/01/24 | | | 750,000 | | | | 762,228 | | |
See accompanying notes to financial statements.
56
SFT Advantus Dynamic Managed Volatility Fund
Investments in Securities – continued
| | | Principal | | Value(a) | |
IT Services (0.4%) | |
The Western Union Co.,
3.350%, 05/22/19 | | $ | 500,000 | | | $ | 505,411 | | |
Total System Services, Inc.,
4.800%, 04/01/26 | | | 750,000 | | | | 811,420 | | |
| | | | | | 1,316,831 | | |
Software (0.6%) | |
Fiserv, Inc.,
3.850%, 06/01/25 | | | 1,000,000 | | | | 1,043,183 | | |
Oracle Corp.,
3.800%, 11/15/37 | | | 1,000,000 | | | | 1,048,771 | | |
| | | | | | 2,091,954 | | |
Materials (1.1%) | |
Chemicals (0.8%) | |
Potash Corp. of
Saskatchewan, Inc.,
3.000%, 04/01/25 (f) | | | 1,000,000 | | | | 980,091 | | |
The Dow Chemical Co.,
3.500%, 10/01/24 | | | 750,000 | | | | 771,633 | | |
The Mosaic Co.,
5.450%, 11/15/33 | | | 200,000 | | | | 217,811 | | |
The Sherwin-Williams Co.,
3.950%, 01/15/26 | | | 1,000,000 | | | | 1,042,832 | | |
| | | | | | 3,012,367 | | |
Construction Materials (0.3%) | |
Vulcan Materials Co.,
4.500%, 06/15/47 | | | 1,000,000 | | | | 1,021,008 | | |
Telecommunication Services (0.6%) | |
Diversified Telecommunication Services (0.6%) | |
AT&T, Inc.
4.350%, 06/15/45 | | | 250,000 | | | | 230,650 | | |
4.500%, 05/15/35 | | | 1,000,000 | | | | 994,066 | | |
Verizon Communications, Inc.,
5.250%, 03/16/37 | | | 1,000,000 | | | | 1,099,682 | | |
| | | | | | 2,324,398 | | |
Transportation (0.8%) | |
Airlines (0.5%) | |
American Airlines 2015-2
Class A Pass Through Trust,
4.000%, 03/22/29 | | | 928,983 | | | | 959,733 | | |
British Airways 2013-1
Class A Pass Through Trust,
4.625%, 12/20/25 (d) | | | 837,534 | | | | 886,949 | | |
United Airlines 2013-1
Class A Pass Through Trust,
4.300%, 02/15/27 | | | 213,081 | | | | 224,853 | | |
| | | | | | 2,071,535 | | |
Transport — Rail (0.3%) | |
Norfolk Southern Corp.,
3.850%, 01/15/24 | | | 500,000 | | | | 527,554 | | |
Union Pacific Corp.,
3.750%, 03/15/24 | | | 500,000 | | | | 528,455 | | |
| | | | | | 1,056,009 | | |
| | | Principal | | Value(a) | |
Utilities (3.6%) | |
Electric Utilities (2.3%) | |
Ameren Illinois Co.,
3.700%, 12/01/47 | | $ | 1,000,000 | | | $ | 1,023,220 | | |
Arizona Public Service Co.,
4.350%, 11/15/45 | | | 1,000,000 | | | | 1,117,621 | | |
Duke Energy Progress LLC,
3.600%, 09/15/47 | | | 1,000,000 | | | | 1,002,493 | | |
Entergy Louisiana LLC,
3.300%, 12/01/22 | | | 250,000 | | | | 255,468 | | |
Northern States Power Co.
3.600%, 09/15/47 | | | 1,000,000 | | | | 1,017,541 | | |
3.750%, 12/01/47 | | | 1,000,000 | | | | 1,008,499 | | |
Oglethorpe Power Corp.,
4.250%, 04/01/46 | | | 800,000 | | | | 800,737 | | |
Oklahoma Gas & Electric Co.,
4.150%, 04/01/47 | | | 1,000,000 | | | | 1,088,011 | | |
PPL Capital Funding, Inc.,
3.400%, 06/01/23 | | | 250,000 | | | | 255,048 | | |
Southern California
Edison Co.,
4.000%, 04/01/47 | | | 1,000,000 | | | | 1,074,069 | | |
| | | | | | 8,642,707 | | |
Electric — Integrated (0.1%) | |
Berkshire Hathaway
Energy Co.,
3.750%, 11/15/23 | | | 250,000 | | | | 260,330 | | |
Gas Utilities (0.4%) | |
ONEOK, Inc.,
4.000%, 07/13/27 | | | 500,000 | | | | 506,764 | | |
Washington Gas Light Co.,
3.796%, 09/15/46 | | | 1,000,000 | | | | 1,026,195 | | |
| | | | | | 1,532,959 | | |
Multi-Utilities (0.4%) | |
Dominion Energy Gas
Holdings LLC,
3.550%, 11/01/23 | | | 250,000 | | | | 255,181 | | |
National Fuel Gas Co.,
5.200%, 07/15/25 | | | 1,000,000 | | | | 1,072,602 | | |
| | | | | | 1,327,783 | | |
Water Utilities (0.4%) | |
American Water
Capital Corp.,
3.750%, 09/01/47 | | | 1,000,000 | | | | 1,031,873 | | |
Aquarion Co.,
4.000%, 08/15/24 (c) (d) | | | 500,000 | | | | 521,410 | | |
| | | | | | 1,553,283 | | |
Total corporate obligations
(cost: $134,071,758) | | | | | 138,892,079 | | |
Total long-term debt securities
(cost: $139,023,744) | | | | | 143,937,244 | | |
Purchased Option (0.0%) | |
Call Option Purchased (0.0%) | |
CBOE SPX Volatility Index,
$15.00, 01/17/18
(cost: $56,442) | | | | | 52,148 | | |
See accompanying notes to financial statements.
57
SFT Advantus Dynamic Managed Volatility Fund
Investments in Securities – continued
| | | Shares/
Principal | | Value(a) | |
Mutual Funds (45.9%) | |
Investment Companies (45.9%) | |
iShares iBoxx $ Investment
Grade Corporate Bond ETF | | $ | 44,500 | | | $ | 5,409,420 | | |
SFT Advantus
Index 500 Fund (g) | | | 14,224,618 | | | | 151,194,190 | | |
SPDR S&P 500 ETF Trust (b) | | | 36,170 | | | | 9,652,326 | | |
Vanguard S&P 500 ETF | | | 20,175 | | | | 4,948,726 | | |
Total mutual funds
(cost: $123,653,386) | | | | | 171,204,662 | | |
Short-Term Securities (15.4%) | |
Investment Companies (15.4%) | |
State Street Institutional
U.S. Government Money
Market Fund, current
rate 1.210% | | | 57,319,471 | | | | 57,319,471 | | |
Total short-term securities
(cost: $57,319,471) | | | | | 57,319,471 | | |
Total investments in securities
(cost: $320,053,043) (h) | | | | | 372,513,525 | | |
Cash and other assets in
excess of liabilities (0.2%) | | | | | 610,408 | | |
Total net assets (100.0%) | | | | $ | 373,123,933 | | |
Investments in Securities Legend
(a) Securities are valued by procedures described in Note 2 of the Notes to Financial Statements.
(b) Fully or partially pledged as initial margin deposits on open futures contracts.
Holdings of Open Futures Contracts
On December 31, 2017, securities with an aggregate market value of $12,680,010 have been pledged to cover margin requirements for the following open futures contracts:
Type | | Expiration | | Number of
Contracts | | Position
Type | | Notional
Amount | | Market
Value | | Unrealized
Appreciation/
(Depreciation)(a) | |
10 Year U.S. Treasury Note | | March 2018 | | | 200 | | | Short | | | (24,852,513 | ) | | $ | (24,809,375 | ) | | $ | 43,138 | | |
S&P 500® Index Future | | March 2018 | | | 192 | | | Long | | | 127,702,207 | | | | 128,448,000 | | | | 745,793 | | |
| | | | | | | | | | | $ | 103,638,625 | | | $ | 788,931 | | |
(c) Illiquid security. (See Note 5.)
(d) Security sold within terms of a private placement memorandum exempt from registration under Section 144A of the Securities Act of 1933, as amended, and may be sold only to dealers in that program. This security has been determined to be liquid unless otherwise indicated.
(e) Variable rate security.
(f) Foreign security: The Fund held 1.5% of net assets in foreign securities at December 31, 2017.
(g) Affiliated security.
(h) At December 31, 2017 the cost of investments for federal income tax purposes was $320,867,583. The aggregate unrealized appreciation and depreciation of investments based on this cost were:
Gross unrealized appreciation | | $ | 52,619,763 | | |
Gross unrealized depreciation | | | (184,890 | ) | |
Net unrealized appreciation | | $ | 52,434,873 | | |
Holdings of Options Contracts
Purchased Options | | Contracts | | Expiration Date | | Notional Amount | | Exercise Price | | Value(a) | |
Call – CBOE SPX Volatility Index | | | 1,227 | | | January 2018 | | $ | 122,700 | | | | 15.00 | | | $ | 52,148 | | |
See accompanying notes to financial statements.
58
SFT Advantus Government Money Market Fund
Investments in Securities
(Percentages of each investment category relate to total net assets)
| | | Principal | | Value(a) | |
Short-Term Investments (100.3%) | |
U.S. Government Obligations (99.4%) | |
Discount Notes (45.4%) | |
Federal Farm Credit Bank,
1.193%, 03/20/18 (b) | | $ | 930,000 | | | $ | 927,643 | | |
Federal Home Loan Bank
1.128%, 01/17/18 (b) | | | 20,000,000 | | | | 19,990,133 | | |
1.331%, 03/16/18 (b) | | | 2,000,000 | | | | 1,994,573 | | |
1.079%, 01/05/18 (b) | | | 2,000,000 | | | | 1,999,764 | | |
1.159%, 01/26/18 (b) | | | 4,500,000 | | | | 4,496,447 | | |
1.228%, 01/05/18 (b) | | | 961,000 | | | | 960,871 | | |
| | | | | | 30,369,431 | | |
Federal Home Loan Mortgage
Corporation (FHLMC) (2.2%) | |
Federal Home Loan Mortgage
Corporation,
1.120%, 02/02/18 (b) | | | 1,500,000 | | | | 1,498,533 | | |
U.S. Treasury (51.8%) | |
U.S. Treasury Bill
1.379%, 03/22/18 | | | 1,500,000 | | | | 1,495,483 | | |
1.118%, 02/22/18 | | | 6,700,000 | | | | 6,689,388 | | |
U.S. Treasury Note | |
1.640%, 04/30/18
(3-Month U.S. Treasury
Money Market Yield +
0.190%) (c) | | | 5,000,000 | | | | 5,004,111 | | |
1.624%, 07/31/18
(3-Month U.S. Treasury
Money Market Yield +
0.174%) (c) | | | 10,000,000 | | | | 10,012,754 | | |
1.722%, 01/31/18
(3-Month U.S. Treasury
Money Market Yield +
0.272%) (c) | | | 11,500,000 | | | | 11,503,118 | | |
| | | | | | 34,704,854 | | |
Total U.S. government obligations
(cost: $66,572,818) | | | | | 66,572,818 | | |
| | | Shares | | Value(a) | |
Investment Companies (0.9%) | |
State Street Institutional
U.S. Government Money
Market Fund,
current rate 1.210% | | | 634,005 | | | $ | 634,005 | | |
Total investment companies
(cost: $634,005) | | | | | 634,005 | | |
Total short-term investments
(cost: $67,206,823) | | | | | 67,206,823 | | |
Total investments in securities
(cost: $67,206,823) (d) | | | | | 67,206,823 | | |
Liabilities in excess of cash
and other assets (-0.3%) | | | | | (226,505 | ) | |
Total net assets (100.0%) | | | | $ | 66,980,318 | | |
Investments in Securities Legend
(a) Securities are valued by procedures described in Note 2 of the Notes to Financial Statements.
(b) Rate represents annualized yield at date of purchase.
(c) Variable rate security.
(d) Also represents the cost of investments for federal income tax purposes at December 31, 2017.
See accompanying notes to financial statements.
59
SFT Advantus Index 400 Mid-Cap Fund
Investments in Securities
(Percentages of each investment category relate to total net assets)
| | |
Shares | | Value(a) | |
Common Stocks (96.8%) | |
Consumer Discretionary (11.8%) | |
Auto Components (0.9%) | |
Cooper Tire & Rubber Co. | | | 6,315 | | | $ | 223,235 | | |
Dana, Inc. | | | 17,843 | | | | 571,154 | | |
Delphi Technologies PLC (b) (c) | | | 10,955 | | | | 574,809 | | |
Gentex Corp. | | | 34,968 | | | | 732,580 | | |
| | | | | | 2,101,778 | | |
Automobiles (0.4%) | |
Thor Industries, Inc. | | | 6,036 | | | | 909,746 | | |
Distributors (0.3%) | |
Pool Corp. | | | 4,947 | | | | 641,379 | | |
Diversified Consumer Services (0.8%) | |
Adtalem Global Education, Inc. (b) | | | 7,472 | | | | 314,197 | | |
Graham Holdings Co. – Class B | | | 618 | | | | 345,060 | | |
Service Corp. International/US | | | 23,090 | | | | 861,719 | | |
Sotheby's (b) | | | 4,591 | | | | 236,896 | | |
| | | | | | 1,757,872 | | |
Hotels, Restaurants & Leisure (2.5%) | |
Brinker International, Inc. | | | 5,701 | | | | 221,427 | | |
Buffalo Wild Wings, Inc. (b) | | | 1,838 | | | | 287,371 | | |
Churchill Downs, Inc. | | | 1,556 | | | | 362,081 | | |
Cracker Barrel Old Country
Store, Inc. | | | 2,955 | | | | 469,520 | | |
Domino's Pizza, Inc. | | | 5,386 | | | | 1,017,738 | | |
Dunkin' Brands Group, Inc. | | | 11,125 | | | | 717,229 | | |
ILG, Inc. | | | 12,987 | | | | 369,870 | | |
International Speedway
Corp. – Class A | | | 3,012 | | | | 120,028 | | |
Jack in the Box, Inc. | | | 3,624 | | | | 355,551 | | |
Papa John's International, Inc. | | | 3,150 | | | | 176,746 | | |
Six Flags Entertainment Corp. | | | 9,597 | | | | 638,872 | | |
Texas Roadhouse, Inc. | | | 8,057 | | | | 424,443 | | |
The Cheesecake Factory, Inc. | | | 5,244 | | | | 252,656 | | |
The Wendy's Co. | | | 22,373 | | | | 367,365 | | |
| | | | | | 5,780,897 | | |
Household Durables (2.1%) | |
CalAtlantic Group, Inc. | | | 9,376 | | | | 528,712 | | |
Helen of Troy, Ltd. (b) | | | 3,358 | | | | 323,543 | | |
KB Home | | | 10,367 | | | | 331,226 | | |
NVR, Inc. (b) | | | 432 | | | | 1,515,551 | | |
Tempur Sealy International,
Inc. (b) | | | 5,672 | | | | 355,578 | | |
Toll Brothers, Inc. | | | 18,127 | | | | 870,458 | | |
TRI Pointe Group, Inc. (b) | | | 18,528 | | | | 332,022 | | |
Tupperware Brands Corp. | | | 6,267 | | | | 392,941 | | |
| | | | | | 4,650,031 | | |
Leisure Equipment & Products (0.7%) | |
Brunswick Corp. | | | 10,800 | | | | 596,376 | | |
Polaris Industries, Inc. | | | 7,164 | | | | 888,264 | | |
| | | | | | 1,484,640 | | |
Media (1.4%) | |
AMC Networks, Inc. – Class A (b) | | | 6,205 | | | | 335,566 | | |
Cable One, Inc. | | | 628 | | | | 441,704 | | |
| | |
Shares | | Value(a) | |
Cinemark Holdings, Inc. | | | 13,054 | | | $ | 454,540 | | |
John Wiley & Sons, Inc. –
Class A | | | 5,489 | | | | 360,902 | | |
Live Nation Entertainment,
Inc. (b) | | | 16,503 | | | | 702,533 | | |
Meredith Corp. | | | 4,872 | | | | 321,796 | | |
TEGNA, Inc. | | | 26,495 | | | | 373,050 | | |
The New York Times Co. –
Class A | | | 15,505 | | | | 286,842 | | |
| | | | | | 3,276,933 | | |
Multiline Retail (0.2%) | |
Big Lots, Inc. | | | 5,228 | | | | 293,552 | | |
Dillard's, Inc. – Class A | | | 2,540 | | | | 152,527 | | |
| | | | | | 446,079 | | |
Specialty Retail (1.8%) | |
Aaron's, Inc. | | | 7,669 | | | | 305,610 | | |
American Eagle Outfitters, Inc. | | | 20,716 | | | | 389,461 | | |
AutoNation, Inc. (b) | | | 7,305 | | | | 374,966 | | |
Bed Bath & Beyond, Inc. | | | 17,643 | | | | 387,969 | | |
Dick's Sporting Goods, Inc. | | | 10,185 | | | | 292,717 | | |
GameStop Corp. – Class A | | | 12,477 | | | | 223,962 | | |
Murphy USA, Inc. (b) | | | 3,985 | | | | 320,235 | | |
Office Depot, Inc. | | | 63,570 | | | | 225,038 | | |
Sally Beauty Holdings, Inc. (b) | | | 15,819 | | | | 296,764 | | |
The Michaels Cos., Inc. (b) | | | 13,598 | | | | 328,936 | | |
Urban Outfitters, Inc. (b) | | | 9,866 | | | | 345,902 | | |
Williams-Sonoma, Inc. | | | 9,572 | | | | 494,872 | | |
| | | | | | 3,986,432 | | |
Textiles, Apparel & Luxury Goods (0.7%) | |
Carter's, Inc. | | | 5,828 | | | | 684,732 | | |
Deckers Outdoor Corp. (b) | | | 3,889 | | | | 312,092 | | |
Skechers U.S.A., Inc. –
Class A (b) | | | 16,495 | | | | 624,171 | | |
| | | | | | 1,620,995 | | |
Consumer Staples (3.7%) | |
Beverages (0.1%) | |
The Boston Beer Co., Inc. –
Class A (b) | | | 1,030 | | | | 196,833 | | |
Food & Staples Retailing (0.5%) | |
Casey's General Stores, Inc. | | | 4,709 | | | | 527,126 | | |
Sprouts Farmers Market, Inc. (b) | | | 15,243 | | | | 371,167 | | |
United Natural Foods, Inc. (b) | | | 6,259 | | | | 308,381 | | |
| | | | | | 1,206,674 | | |
Food Products (2.5%) | |
Dean Foods Co. | | | 11,217 | | | | 129,668 | | |
Flowers Foods, Inc. | | | 22,719 | | | | 438,704 | | |
Ingredion, Inc. | | | 8,851 | | | | 1,237,370 | | |
Lamb Weston Holdings, Inc. | | | 18,003 | | | | 1,016,269 | | |
Lancaster Colony Corp. | | | 2,357 | | | | 304,548 | | |
Post Holdings, Inc. (b) | | | 8,144 | | | | 645,249 | | |
Sanderson Farms, Inc. | | | 2,430 | | | | 337,235 | | |
Snyder's-Lance, Inc. | | | 10,563 | | | | 528,995 | | |
The Hain Celestial Group, Inc. (b) | | | 12,784 | | | | 541,914 | | |
Tootsie Roll Industries, Inc. | | | 2,322 | | | | 84,521 | | |
TreeHouse Foods, Inc. (b) | | | 7,047 | | | | 348,545 | | |
| | | | | | 5,613,018 | | |
See accompanying notes to financial statements.
60
SFT Advantus Index 400 Mid-Cap Fund
Investments in Securities – continued
| | |
Shares | | Value(a) | |
Household Products (0.2%) | |
Energizer Holdings, Inc. | | | 7,481 | | | $ | 358,938 | | |
Personal Products (0.4%) | |
Avon Products, Inc. (b) (c) | | | 54,194 | | | | 116,517 | | |
Edgewell Personal Care Co. (b) | | | 6,899 | | | | 409,732 | | |
Nu Skin Enterprises, Inc. – Class A | | | 6,095 | | | | 415,862 | | |
| | | | | | 942,111 | | |
Energy (3.9%) | |
Energy Equipment & Services (1.5%) | |
Core Laboratories NV (c) | | | 5,433 | | | | 595,185 | | |
Diamond Offshore Drilling,
Inc. (b) | | | 7,943 | | | | 147,660 | | |
Dril-Quip, Inc. (b) | | | 4,640 | | | | 221,328 | | |
Ensco PLC — Class A (c) | | | 53,704 | | | | 317,391 | | |
Nabors Industries, Ltd. | | | 39,118 | | | | 267,176 | | |
Oceaneering International, Inc. | | | 12,103 | | | | 255,858 | | |
Patterson-UTI Energy, Inc. | | | 27,398 | | | | 630,428 | | |
Rowan Cos., PLC — Class A (b) | | | 13,994 | | | | 219,146 | | |
Superior Energy Services,
Inc. (b) | | | 18,855 | | | | 181,574 | | |
Transocean, Ltd. (b) (c) | | | 48,181 | | | | 514,573 | | |
| | | | | | 3,350,319 | | |
Oil, Gas & Consumable Fuels (2.4%) | |
Callon Petroleum Co. (b) | | | 24,860 | | | | 302,049 | | |
CNX Resources Corp. (b) | | | 25,507 | | | | 373,167 | | |
Gulfport Energy Corp. (b) | | | 20,295 | | | | 258,964 | | |
HollyFrontier Corp. | | | 21,835 | | | | 1,118,389 | | |
Matador Resources Co. (b) | | | 11,888 | | | | 370,073 | | |
Murphy Oil Corp. | | | 19,980 | | | | 620,379 | | |
PBF Energy, Inc. – Class A | | | 13,553 | | | | 480,454 | | |
QEP Resources, Inc. (b) | | | 29,675 | | | | 283,990 | | |
SM Energy Co. | | | 12,648 | | | | 279,268 | | |
Southwestern Energy Co. (b) | | | 63,115 | | | | 352,182 | | |
World Fuel Services Corp. | | | 8,328 | | | | 234,350 | | |
WPX Energy, Inc. (b) | | | 49,003 | | | | 689,472 | | |
| | | | | | 5,362,737 | | |
Financial (16.7%) | |
Capital Markets (3.4%) | |
Eaton Vance Corp. | | | 14,515 | | | | 818,501 | | |
Factset Research
Systems, Inc. | | | 4,817 | | | | 928,525 | | |
Federated Investors,
Inc. – Class B | | | 11,681 | | | | 421,450 | | |
Interactive Brokers Group,
Inc. Class A | | | 4,800 | | | | 284,208 | | |
Janus Henderson Group
PLC (c) | | | 22,216 | | | | 849,984 | | |
Legg Mason, Inc. | | | 10,531 | | | | 442,091 | | |
MarketAxess Holdings, Inc. | | | 4,629 | | | | 933,901 | | |
MSCI, Inc. | | | 11,092 | | | | 1,403,582 | | |
SEI Investments Co. | | | 16,098 | | | | 1,156,802 | | |
Stifel Financial Corp. | | | 8,433 | | | | 502,270 | | |
| | | | | | 7,741,314 | | |
Commercial Banks (8.2%) | |
Associated Banc-Corp. | | | 18,619 | | | | 472,923 | | |
BancorpSouth Bank | | | 10,347 | | | | 325,413 | | |
Bank of Hawaii Corp. | | | 5,232 | | | | 448,382 | | |
Bank of the Ozarks, Inc. | | | 14,956 | | | | 724,618 | | |
| | |
Shares | | Value(a) | |
Cathay General Bancorp | | | 9,357 | | | $ | 394,585 | | |
Chemical Financial Corp. | | | 8,765 | | | | 468,665 | | |
Commerce Bancshares, Inc. | | | 11,566 | | | | 645,862 | | |
Cullen/Frost Bankers, Inc. | | | 7,079 | | | | 670,027 | | |
East West Bancorp, Inc. | | | 17,803 | | | | 1,082,956 | | |
First Horizon National Corp. | | | 39,979 | | | | 799,180 | | |
FNB Corp. | | | 39,812 | | | | 550,202 | | |
Fulton Financial Corp. | | | 21,569 | | | | 386,085 | | |
Hancock Holding Co. | | | 10,491 | | | | 519,305 | | |
Home BancShares, Inc. | | | 19,470 | | | | 452,678 | | |
International Bancshares Corp. | | | 6,673 | | | | 264,918 | | |
MB Financial, Inc. | | | 10,325 | | | | 459,669 | | |
PacWest Bancorp | | | 15,881 | | | | 800,402 | | |
Pinnacle Financial Partners, Inc. | | | 9,085 | | | | 602,336 | | |
Prosperity Bancshares, Inc. | | | 8,558 | | | | 599,659 | | |
Signature Bank (b) | | | 6,612 | | | | 907,563 | | |
Sterling Bancorp | | | 27,677 | | | | 680,854 | | |
SVB Financial Group (b) | | | 6,496 | | | | 1,518,570 | | |
Synovus Financial Corp. | | | 14,727 | | | | 706,012 | | |
TCF Financial Corp. | | | 21,176 | | | | 434,108 | | |
Texas Capital
Bancshares, Inc. (b) | | | 6,112 | | | | 543,357 | | |
Trustmark Corp. | | | 8,343 | | | | 265,808 | | |
UMB Financial Corp. | | | 5,405 | | | | 388,728 | | |
Umpqua Holdings Corp. | | | 27,123 | | | | 564,158 | | |
United Bankshares, Inc. | | | 12,931 | | | | 449,352 | | |
Valley National Bancorp | | | 32,541 | | | | 365,110 | | |
Webster Financial Corp. | | | 11,340 | | | | 636,854 | | |
Wintrust Financial Corp. | | | 6,888 | | | | 567,365 | | |
| | | | | | 18,695,704 | | |
Consumer Finance (0.3%) | |
SLM Corp. (b) | | | 53,195 | | | | 601,104 | | |
Insurance (4.3%) | |
Alleghany Corp. (b) | | | 1,869 | | | | 1,114,092 | | |
American Financial Group, Inc. | | | 8,465 | | | | 918,791 | | |
Aspen Insurance
Holdings, Ltd. (c) | | | 7,317 | | | | 297,070 | | |
Brown & Brown, Inc. | | | 14,251 | | | | 733,356 | | |
CNO Financial Group, Inc. | | | 20,663 | | | | 510,169 | | |
First American Financial Corp. | | | 13,637 | | | | 764,217 | | |
Genworth Financial, Inc. –
Class A (b) | | | 61,479 | | | | 191,200 | | |
Kemper Corp. | | | 6,020 | | | | 414,778 | | |
Mercury General Corp. | | | 4,472 | | | | 238,984 | | |
Old Republic International
Corp. | | | 30,218 | | | | 646,061 | | |
Primerica, Inc. | | | 5,450 | | | | 553,448 | | |
Reinsurance Group of
America, Inc. | | | 7,932 | | | | 1,236,837 | | |
RenaissanceRe Holdings,
Ltd. (c) | | | 4,930 | | | | 619,159 | | |
The Hanover Insurance
Group, Inc. | | | 5,220 | | | | 564,178 | | |
WR Berkley Corp. | | | 11,851 | | | | 849,124 | | |
| | | | | | 9,651,464 | | |
Thrifts & Mortgage Finance (0.5%) | |
New York Community
Bancorp, Inc. | | | 60,236 | | | | 784,272 | | |
Washington Federal, Inc. | | | 10,739 | | | | 367,811 | | |
| | | | | | 1,152,083 | | |
See accompanying notes to financial statements.
61
SFT Advantus Index 400 Mid-Cap Fund
Investments in Securities – continued
| | |
Shares | | Value(a) | |
Health Care (7.3%) | |
Biotechnology (0.7%) | |
Bioverativ, Inc. (b) | | | 13,322 | | | $ | 718,322 | | |
United Therapeutics Corp. (b) | | | 5,322 | | | | 787,390 | | |
| | | | | | 1,505,712 | | |
Health Care Equipment & Supplies (3.0%) | |
ABIOMED, Inc. (b) | | | 5,173 | | | | 969,472 | | |
Globus Medical, Inc. (b) | | | 8,928 | | | | 366,941 | | |
Halyard Health, Inc. (b) | | | 5,763 | | | | 266,135 | | |
Hill-Rom Holdings, Inc. | | | 8,107 | | | | 683,339 | | |
LivaNova PLC (b) (c) | | | 5,340 | | | | 426,773 | | |
Masimo Corp. (b) | | | 5,855 | | | | 496,504 | | |
NuVasive, Inc. (b) | | | 6,277 | | | | 367,142 | | |
STERIS PLC (c) | | | 10,475 | | | | 916,248 | | |
Teleflex, Inc. | | | 5,548 | | | | 1,380,453 | | |
West Pharmaceutical
Services, Inc. | | | 9,145 | | | | 902,337 | | |
| | | | | | 6,775,344 | | |
Health Care Providers & Services (1.6%) | |
Acadia Healthcare Co., Inc. (b) | | | 10,060 | | | | 328,258 | | |
Encompass Health Corp. | | | 12,161 | | | | 600,875 | | |
LifePoint Health, Inc. (b) | | | 4,854 | | | | 241,729 | | |
Mednax, Inc. (b) | | | 11,535 | | | | 616,430 | | |
Molina Healthcare, Inc. (b) | | | 5,414 | | | | 415,146 | | |
Owens & Minor, Inc. | | | 7,544 | | | | 142,431 | | |
Tenet Healthcare Corp. (b) | | | 9,945 | | | | 150,766 | | |
WellCare Health Plans, Inc. (b) | | | 5,483 | | | | 1,102,686 | | |
| | | | | | 3,598,321 | | |
Health Care Technology (0.3%) | |
Allscripts Healthcare
Solutions, Inc. (b) | | | 22,254 | | | | 323,796 | | |
Medidata Solutions, Inc. (b) | | | 7,200 | | | | 456,264 | | |
| | | | | | 780,060 | | |
Life Sciences Tools & Services (0.9%) | |
Bio-Rad Laboratories, Inc. –
Class A (b) | | | 2,427 | | | | 579,252 | | |
Bio-Techne Corp. | | | 4,614 | | | | 597,744 | | |
Charles River Laboratories
International, Inc. (b) | | | 5,833 | | | | 638,422 | | |
INC Research Holdings, Inc. –
Class A (b) | | | 6,940 | | | | 302,584 | | |
| | | | | | 2,118,002 | | |
Pharmaceuticals (0.8%) | |
Akorn, Inc. (b) | | | 11,553 | | | | 372,353 | | |
Catalent, Inc. (b) | | | 16,364 | | | | 672,233 | | |
Endo International PLC (b) (c) | | | 24,752 | | | | 191,828 | | |
Mallinckrodt PLC (b) (c) | | | 11,701 | | | | 263,975 | | |
Prestige Brands Holdings, Inc. (b) | | | 6,532 | | | | 290,086 | | |
| | | | | | 1,790,475 | | |
Industrials (15.5%) | |
Aerospace & Defense (1.9%) | |
Curtiss-Wright Corp. | | | 5,435 | | | | 662,255 | | |
Esterline Technologies Corp. (b) | | | 3,235 | | | | 241,655 | | |
Huntington Ingalls
Industries, Inc. | | | 5,593 | | | | 1,318,270 | | |
KLX, Inc. (b) | | | 6,329 | | | | 431,954 | | |
| | |
Shares | | Value(a) | |
Orbital ATK, Inc. | | | 7,105 | | | $ | 934,307 | | |
Teledyne Technologies, Inc. (b) | | | 4,364 | | | | 790,539 | | |
| | | | | | 4,378,980 | | |
Airlines (0.4%) | |
JetBlue Airways Corp. (b) | | | 39,494 | | | | 882,296 | | |
Building Products (0.4%) | |
Lennox International, Inc. | | | 4,630 | | | | 964,244 | | |
Commercial Services & Supplies (1.8%) | |
Clean Harbors, Inc. (b) | | | 6,381 | | | | 345,850 | | |
Copart, Inc. (b) | | | 24,769 | | | | 1,069,773 | | |
Deluxe Corp. | | | 5,927 | | | | 455,431 | | |
Herman Miller, Inc. | | | 7,362 | | | | 294,848 | | |
HNI Corp. | | | 5,348 | | | | 206,272 | | |
MSA Safety, Inc. | | | 4,169 | | | | 323,181 | | |
Pitney Bowes, Inc. | | | 22,999 | | | | 257,129 | | |
Rollins, Inc. | | | 11,813 | | | | 549,659 | | |
The Brink's Co. | | | 6,217 | | | | 489,278 | | |
| | | | | | 3,991,421 | | |
Construction & Engineering (1.3%) | |
AECOM (b) | | | 19,414 | | | | 721,230 | | |
Dycom Industries, Inc. (b) | | | 3,810 | | | | 424,548 | | |
EMCOR Group, Inc. | | | 7,244 | | | | 592,197 | | |
Granite Construction, Inc. | | | 4,873 | | | | 309,094 | | |
KBR, Inc. | | | 17,253 | | | | 342,127 | | |
Valmont Industries, Inc. | | | 2,784 | | | | 461,727 | | |
| | | | | | 2,850,923 | | |
Electrical Equipment (1.1%) | |
Belden, Inc. | | | 5,194 | | | | 400,821 | | |
EnerSys | | | 5,188 | | | | 361,240 | | |
Hubbell, Inc. | | | 6,737 | | | | 911,786 | | |
Regal Beloit Corp. | | | 5,456 | | | | 417,930 | | |
Woodward, Inc. | | | 6,788 | | | | 519,553 | | |
| | | | | | 2,611,330 | | |
Industrial Conglomerates (0.4%) | |
Carlisle Cos., Inc. | | | 7,635 | | | | 867,718 | | |
Machinery (4.8%) | |
AGCO Corp. | | | 8,122 | | | | 580,154 | | |
Crane Co. | | | 6,213 | | | | 554,324 | | |
Donaldson Co., Inc. | | | 16,000 | | | | 783,200 | | |
Graco, Inc. | | | 20,739 | | | | 937,817 | | |
IDEX Corp. | | | 9,410 | | | | 1,241,838 | | |
ITT, Inc. | | | 10,838 | | | | 578,424 | | |
Kennametal, Inc. | | | 9,982 | | | | 483,229 | | |
Lincoln Electric Holdings, Inc. | | | 7,613 | | | | 697,198 | | |
Nordson Corp. | | | 6,253 | | | | 915,439 | | |
Oshkosh Corp. | | | 9,258 | | | | 841,459 | | |
Terex Corp. | | | 9,840 | | | | 474,485 | | |
The Timken Co. | | | 8,412 | | | | 413,450 | | |
The Toro Co. | | | 13,273 | | | | 865,798 | | |
Trinity Industries, Inc. | | | 18,695 | | | | 700,315 | | |
Wabtec Corp. | | | 10,523 | | | | 856,888 | | |
| | | | | | 10,924,018 | | |
Marine (0.2%) | |
Kirby Corp. (b) | | | 6,617 | | | | 442,015 | | |
See accompanying notes to financial statements.
62
SFT Advantus Index 400 Mid-Cap Fund
Investments in Securities – continued
| | |
Shares | | Value(a) | |
Professional Services (0.7%) | |
Dun & Bradstreet Corp. | | | 4,551 | | | $ | 538,884 | | |
Manpowergroup, Inc. | | | 8,162 | | | | 1,029,310 | | |
| | | | | | 1,568,194 | | |
Road & Rail (1.8%) | |
Avis Budget Group, Inc. (b) | | | 8,825 | | | | 387,241 | | |
Genesee & Wyoming, Inc. –
Class A (b) | | | 7,596 | | | | 598,033 | | |
Knight-Swift Transportation
Holdings, Inc. | | | 15,779 | | | | 689,858 | | |
Landstar System, Inc. | | | 5,163 | | | | 537,468 | | |
Old Dominion Freight Line, Inc. | | | 8,421 | | | | 1,107,782 | | |
Ryder System, Inc. | | | 6,521 | | | | 548,873 | | |
Werner Enterprises, Inc. | | | 5,524 | | | | 213,503 | | |
| | | | | | 4,082,758 | | |
Trading Companies & Distributors (0.7%) | |
GATX Corp. | | | 4,717 | | | | 293,209 | | |
MSC Industrial Direct
Co. – Class A | | | 5,486 | | | | 530,277 | | |
Now, Inc. (b) | | | 13,261 | | | | 146,269 | | |
Watsco, Inc. | | | 3,758 | | | | 639,010 | | |
| | | | | | 1,608,765 | | |
Information Technology (16.7%) | |
Communications Equipment (1.0%) | |
ARRIS International PLC (b) (c) | | | 21,741 | | | | 558,526 | | |
Ciena Corp. (b) | | | 17,574 | | | | 367,824 | | |
InterDigital, Inc. | | | 4,275 | | | | 325,541 | | |
NetScout Systems, Inc. (b) | | | 10,733 | | | | 326,820 | | |
Plantronics, Inc. | | | 4,072 | | | | 205,147 | | |
ViaSat, Inc. (b) | | | 6,670 | | | | 499,250 | | |
| | | | | | 2,283,108 | | |
Computers & Peripherals (0.3%) | |
3D Systems Corp. (b) | | | 14,024 | | | | 121,167 | | |
Diebold Nixdorf, Inc. | | | 9,303 | | | | 152,104 | | |
NCR Corp. (b) | | | 15,002 | | | | 509,918 | | |
| | | | | | 783,189 | | |
Electronic Equipment, Instruments &
Components (4.4%) | |
Arrow Electronics, Inc. (b) | | | 10,835 | | | | 871,242 | | |
Avnet, Inc. | | | 14,894 | | | | 590,100 | | |
Cognex Corp. | | | 21,329 | | | | 1,304,482 | | |
Coherent, Inc. (b) | | | 3,034 | | | | 856,255 | | |
IPG Photonics Corp. (b) | | | 4,622 | | | | 989,709 | | |
Jabil , Inc. | | | 21,757 | | | | 571,121 | | |
Keysight Technologies, Inc. (b) | | | 22,831 | | | | 949,770 | | |
Knowles Corp. (b) | | | 11,013 | | | | 161,451 | | |
Littelfuse, Inc. | | | 2,797 | | | | 553,303 | | |
National Instruments Corp. | | | 13,205 | | | | 549,724 | | |
SYNNEX Corp. | | | 3,593 | | | | 488,468 | | |
Tech Data Corp. (b) | | | 4,275 | | | | 418,822 | | |
Trimble, Inc. (b) | | | 31,009 | | | | 1,260,206 | | |
Vishay Intertechnology, Inc. | | | 16,243 | | | | 337,042 | | |
| | | | | | 9,901,695 | | |
| | |
Shares | | Value(a) | |
Internet Software & Services (0.6%) | |
Cars.com, Inc. (b) | | | 8,815 | | | $ | 254,224 | | |
j2 Global, Inc. | | | 5,962 | | | | 447,329 | | |
LogMeIn, Inc. | | | 6,488 | | | | 742,876 | | |
| | | | | | 1,444,429 | | |
IT Services (3.4%) | |
Acxiom Corp. (b) | | | 9,757 | | | | 268,903 | | |
Broadridge Financial
Solutions, Inc. | | | 14,355 | | | | 1,300,276 | | |
Convergys Corp. | | | 11,382 | | | | 267,477 | | |
CoreLogic, Inc. (b) | | | 10,146 | | | | 468,847 | | |
DST Systems, Inc. | | | 7,417 | | | | 460,373 | | |
Jack Henry & Associates, Inc. | | | 9,512 | | | | 1,112,524 | | |
Leidos Holdings, Inc. | | | 17,515 | | | | 1,130,944 | | |
MAXIMUS, Inc. | | | 8,022 | | | | 574,215 | | |
Sabre Corp. | | | 25,689 | | | | 526,624 | | |
Science Applications
International Corp. | | | 5,325 | | | | 407,735 | | |
Teradata Corp. (b) | | | 14,903 | | | | 573,169 | | |
WEX, Inc. (b) | | | 4,915 | | | | 694,145 | | |
| | | | | | 7,785,232 | | |
Office Electronics (0.3%) | |
Zebra Technologies Corp. –
Class A (b) | | | 6,551 | | | | 679,994 | | |
Semiconductors & Semiconductor
Equipment (3.0%) | |
Cirrus Logic, Inc. (b) | | | 7,841 | | | | 406,634 | | |
Cree, Inc. (b) | | | 12,087 | | | | 448,911 | | |
Cypress Semiconductor Corp. | | | 41,097 | | | | 626,318 | | |
First Solar, Inc. (b) | | | 10,033 | | | | 677,428 | | |
Integrated Device Technology,
Inc. (b) | | | 16,361 | | | | 486,413 | | |
Microsemi Corp. (b) | | | 14,478 | | | | 747,789 | | |
MKS Instruments, Inc. | | | 6,650 | | | | 628,425 | | |
Monolithic Power Systems, Inc. | | | 4,704 | | | | 528,542 | | |
Silicon Laboratories, Inc. (b) | | | 5,242 | | | | 462,869 | | |
Synaptics, Inc. (b) | | | 4,130 | | | | 164,952 | | |
Teradyne, Inc. | | | 24,160 | | | | 1,011,579 | | |
Versum Materials, Inc. | | | 13,400 | | | | 507,190 | | |
| | | | | | 6,697,050 | | |
Software (3.6%) | |
ACI Worldwide, Inc. (b) | | | 14,605 | | | | 331,095 | | |
Blackbaud, Inc. | | | 5,923 | | | | 559,664 | | |
CDK Global, Inc. | | | 16,177 | | | | 1,153,097 | | |
CommVault Systems, Inc. (b) | | | 5,267 | | | | 276,517 | | |
Fair Isaac Corp. | | | 3,693 | | | | 565,768 | | |
Fortinet, Inc. (b) | | | 18,420 | | | | 804,770 | | |
Manhattan Associates, Inc. (b) | | | 8,489 | | | | 420,545 | | |
PTC, Inc. (b) | | | 14,239 | | | | 865,304 | | |
Take-Two Interactive
Software, Inc. (b) | | | 14,047 | | | | 1,542,080 | | |
The Ultimate Software
Group, Inc. (b) | | | 3,483 | | | | 760,095 | | |
Tyler Technologies, Inc. (b) | | | 4,291 | | | | 759,721 | | |
| | | | | | 8,038,656 | | |
Technology Hardware & Equipment (0.1%) | |
VeriFone Systems, Inc. (b) | | | 13,819 | | | | 244,735 | | |
See accompanying notes to financial statements.
63
SFT Advantus Index 400 Mid-Cap Fund
Investments in Securities – continued
| | |
Shares | | Value(a) | |
Materials (6.9%) | |
Chemicals (2.8%) | |
Ashland Global Holdings, Inc. | | | 7,654 | | | $ | 544,965 | | |
Cabot Corp. | | | 7,630 | | | | 469,932 | | |
Minerals Technologies, Inc. | | | 4,286 | | | | 295,091 | | |
NewMarket Corp. | | | 1,105 | | | | 439,116 | | |
Olin Corp. | | | 20,478 | | | | 728,607 | | |
PolyOne Corp. | | | 9,952 | | | | 432,912 | | |
RPM International, Inc. | | | 16,447 | | | | 862,152 | | |
Sensient Technologies Corp. | | | 5,354 | | | | 391,645 | | |
The Chemours Co. | | | 22,806 | | | | 1,141,668 | | |
The Scotts Miracle-Gro Co. –
Class A | | | 5,036 | | | | 538,802 | | |
Valvoline, Inc. | | | 24,957 | | | | 625,422 | | |
| | | | | | 6,470,312 | | |
Construction Materials (0.3%) | |
Eagle Materials, Inc. | | | 5,989 | | | | 678,554 | | |
Containers & Packaging (1.2%) | |
Aptargroup, Inc. | | | 7,672 | | | | 661,940 | | |
Bemis Co., Inc. | | | 11,184 | | | | 534,483 | | |
Greif, Inc. – Class A | | | 3,105 | | | | 188,101 | | |
Owens-Illinois, Inc. (b) | | | 20,075 | | | | 445,063 | | |
Silgan Holdings, Inc. | | | 9,108 | | | | 267,684 | | |
Sonoco Products Co. | | | 12,242 | | | | 650,540 | | |
| | | | | | 2,747,811 | | |
Metals & Mining (2.2%) | |
Allegheny Technologies, Inc. (b) | | | 15,502 | | | | 374,218 | | |
Carpenter Technology Corp. | | | 5,766 | | | | 294,008 | | |
Commercial Metals Co. | | | 14,268 | | | | 304,194 | | |
Compass Minerals
International, Inc. | | | 4,127 | | | | 298,176 | | |
Reliance Steel & Aluminum Co. | | | 8,980 | | | | 770,394 | | |
Royal Gold, Inc. | | | 8,061 | | | | 661,969 | | |
Steel Dynamics, Inc. | | | 29,185 | | | | 1,258,749 | | |
United States Steel Corp. | | | 21,512 | | | | 757,007 | | |
Worthington Industries, Inc. | | | 5,506 | | | | 242,595 | | |
| | | | | | 4,961,310 | | |
Paper & Forest Products (0.4%) | |
Domtar Corp. | | | 7,722 | | | | 382,393 | | |
Louisiana-Pacific Corp. (b) | | | 17,844 | | | | 468,584 | | |
| | | | | | 850,977 | | |
Real Estate (8.8%) | |
Diversified REITs (0.1%) | |
Alexander & Baldwin, Inc. | | | 5,693 | | | | 157,924 | | |
Health Care REITs (1.1%) | |
Healthcare Realty Trust, Inc. | | | 15,382 | | | | 494,070 | | |
Medical Properties Trust, Inc. | | | 44,853 | | | | 618,074 | | |
Omega Healthcare Investors, Inc. | | | 24,396 | | | | 671,866 | | |
Quality Care Properties, Inc. (b) | | | 11,554 | | | | 159,561 | | |
Senior Housing Properties Trust | | | 29,268 | | | | 560,482 | | |
| | | | | | 2,504,053 | | |
Hotels & Resort REITs (0.4%) | |
Hospitality Properties Trust | | | 20,242 | | | | 604,224 | | |
LaSalle Hotel Properties | | | 13,945 | | | | 391,436 | | |
| | | | | | 995,660 | | |
| | |
Shares | | Value(a) | |
Industrial REITs (0.8%) | |
DCT Industrial Trust, Inc. | | | 11,471 | | | $ | 674,265 | | |
First Industrial Realty
Trust, Inc. | | | 14,761 | | | | 464,529 | | |
Liberty Property Trust | | | 18,157 | | | | 780,932 | | |
| | | | | | 1,919,726 | | |
Office REITs (1.7%) | |
Corporate Office Properties
Trust | | | 12,268 | | | | 358,226 | | |
Cousins Properties, Inc. | | | 51,730 | | | | 478,502 | | |
Douglas Emmett, Inc. | | | 19,627 | | | | 805,885 | | |
Highwoods Properties, Inc. | | | 12,717 | | | | 647,422 | | |
JBG SMITH Properties | | | 11,501 | | | | 399,430 | | |
Kilroy Realty Corp. | | | 12,117 | | | | 904,534 | | |
Mack-Cali Realty Corp. | | | 11,066 | | | | 238,583 | | |
| | | | | | 3,832,582 | | |
Real Estate Management & Development (0.4%) | |
Jones Lang LaSalle, Inc. | | | 5,587 | | | | 832,072 | | |
Residential REITs (0.9%) | |
American Campus
Communities, Inc. | | | 16,803 | | | | 689,427 | | |
Camden Property Trust | | | 11,413 | | | | 1,050,681 | | |
Education Realty Trust, Inc. | | | 9,238 | | | | 322,591 | | |
| | | | | | 2,062,699 | | |
Retail REITs (1.1%) | |
National Retail Properties, Inc. | | | 18,728 | | | | 807,739 | | |
Tanger Factory Outlet
Centers, Inc. | | | 11,643 | | | | 308,656 | | |
Taubman Centers, Inc. | | | 7,478 | | | | 489,285 | | |
Urban Edge Properties | | | 13,037 | | | | 332,313 | | |
Washington Prime Group, Inc. | | | 22,880 | | | | 162,905 | | |
Weingarten Realty Investors | | | 14,710 | | | | 483,518 | | |
| | | | | | 2,584,416 | | |
Specialized REITs (2.3%) | |
CoreCivic, Inc. | | | 14,559 | | | | 327,578 | | |
CoreSite Realty Corp. | | | 4,211 | | | | 479,633 | | |
CyrusOne, Inc. | | | 11,244 | | | | 669,355 | | |
EPR Properties | | | 7,893 | | | | 516,676 | | |
Lamar Advertising Co. – Class A | | | 10,347 | | | | 768,161 | | |
Life Storage, Inc. | | | 5,731 | | | | 510,460 | | |
Potlatch Corp. | | | 4,991 | | | | 249,051 | | |
Rayonier, Inc. | | | 15,880 | | | | 502,285 | | |
Sabra Health Care REIT, Inc. | | | 21,952 | | | | 412,039 | | |
The GEO Group, Inc. | | | 15,277 | | | | 360,537 | | |
Uniti Group, Inc. | | | 20,313 | | | | 361,368 | | |
| | | | | | 5,157,143 | | |
Telecommunication Services (0.1%) | |
Wireless Telecommunication Services (0.1%) | |
Telephone & Data
Systems, Inc. | | | 11,299 | | | | 314,112 | | |
Utilities (5.4%) | |
Electric Utilities (1.4%) | |
Great Plains Energy, Inc. | | | 26,562 | | | | 856,359 | | |
Hawaiian Electric Industries, Inc. | | | 13,399 | | | | 484,374 | | |
IDACORP, Inc. | | | 6,206 | | | | 566,980 | | |
See accompanying notes to financial statements.
64
SFT Advantus Index 400 Mid-Cap Fund
Investments in Securities – continued
| | |
Shares | | Value(a) | |
PNM Resources, Inc. | | | 9,810 | | | $ | 396,815 | | |
Westar Energy, Inc. | | | 17,495 | | | | 923,736 | | |
| | | | | | 3,228,264 | | |
Gas Utilities (2.3%) | |
Atmos Energy Corp. | | | 13,649 | | | | 1,172,312 | | |
Energen Corp. (b) | | | 11,971 | | | | 689,170 | | |
National Fuel Gas Co. | | | 10,541 | | | | 578,806 | | |
New Jersey Resources Corp. | | | 10,699 | | | | 430,100 | | |
ONE GAS, Inc. | | | 6,437 | | | | 471,575 | | |
Southwest Gas Holdings, Inc. | | | 5,879 | | | | 473,142 | | |
UGI Corp. | | | 21,327 | | | | 1,001,303 | | |
WGL Holdings, Inc. | | | 6,325 | | | | 542,938 | | |
| | | | | | 5,359,346 | | |
Multi-Utilities (1.3%) | |
Black Hills Corp. | | | 6,587 | | | | 395,945 | | |
MDU Resources Group, Inc. | | | 24,055 | | | | 646,598 | | |
NorthWestern Corp. | | | 5,985 | | | | 357,305 | | |
OGE Energy Corp. | | | 24,597 | | | | 809,487 | | |
Vectren Corp. | | | 10,223 | | | | 664,699 | | |
| | | | | | 2,874,034 | | |
Water Utilities (0.4%) | |
Aqua America, Inc. | | | 21,886 | | | | 858,588 | | |
Total common stocks
(cost: $147,953,976) | | | | | 219,517,328 | | |
Short-Term Securities (3.2%) | |
Investment Companies (3.2%) | |
State Street Institutional
U.S. Government Money
Market Fund, current
rate 1.210% | | | 7,169,663 | | | | 7,169,663 | | |
Total short-term securities
(cost: $7,169,663) | | | | | 7,169,663 | | |
Total investments in securities
(cost: $155,123,639) (d) | | | | | 226,686,991 | | |
Cash and other assets in
excess of liabilities (0.0%) | | | | | 26,501 | | |
Total net assets (100.0%) | | | | $ | 226,713,492 | | |
Investments in Securities Legend
(a) Securities are valued by procedures described in Note 2 of the Notes to Financial Statements.
(b) Non-income producing security.
(c) Foreign security: The Fund held 2.8% of net assets in foreign securities at December 31, 2017.
(d) At December 31, 2017 the cost of investments for federal income tax purposes was $155,618,618. The aggregate unrealized appreciation and depreciation of investments based on this cost were:
Gross unrealized appreciation | | $ | 80,364,369 | | |
Gross unrealized depreciation | | | (9,280,024 | ) | |
Net unrealized appreciation | | $ | 71,084,345 | | |
Holdings of Open Futures Contracts
On December 31, 2017, cash in the amount of $222,000 has been pledged to cover margin requirements for the following open futures contracts:
Type | | Expiration | | Number of
Contracts | | Position
Type | | Notional
Amount | | Market
Value | | Unrealized
Appreciation/
(Depreciation)(a) | |
S&P Mid 400® E-Mini Index Future | | March 2018 | | | 37 | | | Long | | | 7,022,907 | | | $ | 7,038,880 | | | $ | 15,973 | | |
See accompanying notes to financial statements.
65
SFT Advantus Index 500 Fund
Investments in Securities
(Percentages of each investment category relate to total net assets)
| | |
Shares | | Value(a) | |
Common Stocks (98.2%) | |
Consumer Discretionary (11.9%) | |
Auto Components (0.2%) | |
Aptiv PLC (b) | | | 9,987 | | | $ | 847,197 | | |
BorgWarner, Inc. | | | 7,417 | | | | 378,935 | | |
Delphi Technologies PLC (b) (c) | | | 1 | | | | 53 | | |
The Goodyear Tire & Rubber Co. | | | 9,295 | | | | 300,321 | | |
| | | | | | 1,526,506 | | |
Automobiles (0.5%) | |
Ford Motor Co. | | | 147,220 | | | | 1,838,778 | | |
General Motors Co. | | | 48,238 | | | | 1,977,276 | | |
Harley-Davidson, Inc. | | | 6,316 | | | | 321,358 | | |
| | | | | | 4,137,412 | | |
Distributors (0.1%) | |
Genuine Parts Co. | | | 5,545 | | | | 526,830 | | |
LKQ Corp. (c) | | | 11,661 | | | | 474,253 | | |
| | | | | | 1,001,083 | | |
Diversified Consumer Services (0.0%) | |
H&R Block, Inc. | | | 7,863 | | | | 206,168 | | |
Hotels, Restaurants & Leisure (1.8%) | |
Carnival Corp. | | | 15,340 | | | | 1,018,116 | | |
Chipotle Mexican Grill, Inc. (c) | | | 944 | | | | 272,844 | | |
Darden Restaurants, Inc. | | | 4,658 | | | | 447,261 | | |
Marriott International, Inc. –
Class A | | | 11,556 | | | | 1,568,496 | | |
McDonald's Corp. | | | 30,082 | | | | 5,177,714 | | |
MGM Resorts International | | | 19,226 | | | | 641,956 | | |
Norwegian Cruise Line Holdings,
Ltd. (c) | | | 6,690 | | | | 356,243 | | |
Royal Caribbean Cruises, Ltd. | | | 6,472 | | | | 771,980 | | |
Starbucks Corp. | | | 53,689 | | | | 3,083,359 | | |
Wyndham Worldwide Corp. | | | 3,835 | | | | 444,361 | | |
Wynn Resorts, Ltd. | | | 3,042 | | | | 512,851 | | |
Yum! Brands, Inc. | | | 12,716 | | | | 1,037,753 | | |
| | | | | | 15,332,934 | | |
Household Durables (0.4%) | |
DR Horton, Inc. | | | 12,811 | | | | 654,258 | | |
Garmin, Ltd. (b) | | | 4,173 | | | | 248,586 | | |
Leggett & Platt, Inc. | | | 4,896 | | | | 233,686 | | |
Lennar Corp. – Class A | | | 7,716 | | | | 487,960 | | |
Mohawk Industries, Inc. (c) | | | 2,380 | | | | 656,642 | | |
Newell Brands, Inc. | | | 18,434 | | | | 569,610 | | |
PulteGroup, Inc. | | | 10,205 | | | | 339,316 | | |
Whirlpool Corp. | | | 2,728 | | | | 460,050 | | |
| | | | | | 3,650,108 | | |
Internet & Catalog Retail (2.8%) | |
Amazon.com, Inc. (c) | | | 15,122 | | | | 17,684,725 | | |
Expedia, Inc. | | | 4,657 | | | | 557,769 | | |
Netflix, Inc. (c) | | | 16,329 | | | | 3,134,515 | | |
The Priceline Group, Inc. (c) | | | 1,876 | | | | 3,260,000 | | |
TripAdvisor, Inc. (c) | | | 4,030 | | | | 138,874 | | |
| | | | | | 24,775,883 | | |
| | |
Shares | | Value(a) | |
Leisure Equipment & Products (0.1%) | |
Hasbro, Inc. | | | 4,299 | | | $ | 390,736 | | |
Mattel, Inc. | | | 12,890 | | | | 198,248 | | |
| | | | | | 588,984 | | |
Media (2.7%) | |
CBS Corp. – Class B | | | 13,593 | | | | 801,987 | | |
Charter Communications,
Inc. – Class A (c) | | | 7,318 | | | | 2,458,555 | | |
Comcast Corp. – Class A | | | 176,007 | | | | 7,049,080 | | |
Discovery Communications,
Inc. – Class A (c) | | | 5,811 | | | | 130,050 | | |
Discovery Communications,
Inc. – Class C (c) | | | 7,644 | | | | 161,824 | | |
DISH Network Corp. –
Class A (c) | | | 8,600 | | | | 410,650 | | |
News Corp. – Class A | | | 14,452 | | | | 234,267 | | |
News Corp. – Class B | | | 4,580 | | | | 76,028 | | |
Omnicom Group, Inc. | | | 8,671 | | | | 631,509 | | |
Scripps Networks Interactive,
Inc. – Class A | | | 3,542 | | | | 302,416 | | |
The Interpublic Group of
Cos., Inc. | | | 14,664 | | | | 295,626 | | |
The Walt Disney Co. | | | 56,991 | | | | 6,127,102 | | |
Time Warner, Inc. | | | 29,380 | | | | 2,687,389 | | |
Twenty-First Century Fox,
Inc. – Class A | | | 39,772 | | | | 1,373,327 | | |
Twenty-First Century Fox,
Inc. – Class B | | | 16,519 | | | | 563,628 | | |
Viacom, Inc. – Class B | | | 13,313 | | | | 410,174 | | |
| | | | | | 23,713,612 | | |
Multiline Retail (0.5%) | |
Dollar General Corp. | | | 9,799 | | | | 911,405 | | |
Dollar Tree, Inc. (c) | | | 8,902 | | | | 955,274 | | |
Kohl's Corp. | | | 6,341 | | | | 343,872 | | |
Macy's, Inc. | | | 11,494 | | | | 289,534 | | |
Nordstrom, Inc. | | | 4,377 | | | | 207,382 | | |
Target Corp. | | | 20,444 | | | | 1,333,971 | | |
| | | | | | 4,041,438 | | |
Specialty Retail (2.2%) | |
Advance Auto Parts, Inc. | | | 2,753 | | | | 274,447 | | |
AutoZone, Inc. (c) | | | 1,055 | | | | 750,495 | | |
Best Buy Co., Inc. | | | 9,596 | | | | 657,038 | | |
CarMax, Inc. (c) | | | 6,868 | | | | 440,445 | | |
Foot Locker, Inc. | | | 4,580 | | | | 214,710 | | |
L Brands, Inc. | | | 9,286 | | | | 559,203 | | |
Lowe's Cos., Inc. | | | 31,426 | | | | 2,920,732 | | |
O'Reilly Automotive, Inc. (c) | | | 3,209 | | | | 771,893 | | |
Ross Stores, Inc. | | | 14,538 | | | | 1,166,675 | | |
Signet Jewelers, Ltd. | | | 2,274 | | | | 128,595 | | |
The Gap, Inc. | | | 8,188 | | | | 278,883 | | |
The Home Depot, Inc. | | | 44,065 | | | | 8,351,639 | | |
The TJX Cos., Inc. | | | 23,933 | | | | 1,829,917 | | |
Tiffany & Co. | | | 3,840 | | | | 399,168 | | |
Tractor Supply Co. | | | 4,730 | | | | 353,568 | | |
Ulta Salon Cosmetics &
Fragrance, Inc. (c) | | | 2,218 | | | | 496,078 | | |
| | | | | | 19,593,486 | | |
See accompanying notes to financial statements.
66
SFT Advantus Index 500 Fund
Investments in Securities – continued
| | |
Shares | | Value(a) | |
Textiles, Apparel & Luxury Goods (0.7%) | |
Hanesbrands, Inc. | | | 13,658 | | | $ | 285,589 | | |
Michael Kors Holdings,
Ltd. (b) (c) | | | 5,702 | | | | 358,941 | | |
NIKE, Inc. – Class B | | | 49,581 | | | | 3,101,291 | | |
PVH Corp. | | | 2,890 | | | | 396,537 | | |
Ralph Lauren Corp. | | | 2,033 | | | | 210,802 | | |
Tapestry, Inc. | | | 10,730 | | | | 474,588 | | |
Under Armour, Inc. –
Class A (c) | | | 6,953 | | | | 100,332 | | |
Under Armour, Inc. –
Class C (c) | | | 6,901 | | | | 91,921 | | |
VF Corp. | | | 12,288 | | | | 909,312 | | |
| | | | | | 5,929,313 | | |
Consumer Staples (8.1%) | |
Beverages (2.0%) | |
Brown-Forman Corp. –
Class B | | | 7,365 | | | | 505,755 | | |
Constellation Brands, Inc. –
Class A | | | 6,552 | | | | 1,497,591 | | |
Dr Pepper Snapple Group, Inc. | | | 6,835 | | | | 663,405 | | |
Molson Coors Brewing Co. –
Class B | | | 6,920 | | | | 567,924 | | |
Monster Beverage Corp. (c) | | | 15,501 | | | | 981,058 | | |
PepsiCo, Inc. | | | 53,632 | | | | 6,431,550 | | |
The Coca-Cola Co. | | | 144,697 | | | | 6,638,698 | | |
| | | | | | 17,285,981 | | |
Food & Staples Retailing (1.8%) | |
Costco Wholesale Corp. | | | 16,456 | | | | 3,062,791 | | |
CVS Health Corp. | | | 38,137 | | | | 2,764,933 | | |
Sysco Corp. | | | 18,088 | | | | 1,098,484 | | |
The Kroger Co. | | | 33,565 | | | | 921,359 | | |
Wal-Mart Stores, Inc. | | | 55,233 | | | | 5,454,259 | | |
Walgreens Boots Alliance, Inc. | | | 32,668 | | | | 2,372,350 | | |
| | | | | | 15,674,176 | | |
Food Products (1.2%) | |
Archer-Daniels-Midland Co. | | | 21,059 | | | | 844,045 | | |
Campbell Soup Co. | | | 7,195 | | | | 346,152 | | |
Conagra Brands, Inc. | | | 15,414 | | | | 580,645 | | |
General Mills, Inc. | | | 21,446 | | | | 1,271,533 | | |
Hormel Foods Corp. | | | 10,112 | | | | 367,976 | | |
Kellogg Co. | | | 9,347 | | | | 635,409 | | |
McCormick & Co., Inc. | | | 4,473 | | | | 455,843 | | |
Mondelez International,
Inc. – Class A | | | 56,070 | | | | 2,399,796 | | |
The Hershey Co. | | | 5,280 | | | | 599,333 | | |
The JM Smucker Co. | | | 4,272 | | | | 530,753 | | |
The Kraft Heinz Co. | | | 22,529 | | | | 1,751,855 | | |
Tyson Foods, Inc. – Class A | | | 11,229 | | | | 910,335 | | |
| | | | | | 10,693,675 | | |
Household Products (1.6%) | |
Church & Dwight Co., Inc. | | | 9,430 | | | | 473,103 | | |
Clorox Co. | | | 4,833 | | | | 718,860 | | |
Colgate-Palmolive Co. | | | 33,132 | | | | 2,499,809 | | |
Kimberly-Clark Corp. | | | 13,289 | | | | 1,603,451 | | |
The Procter & Gamble Co. | | | 96,152 | | | | 8,834,446 | | |
| | | | | | 14,129,669 | | |
| | |
Shares | | Value(a) | |
Personal Care (0.1%) | |
The Estee Lauder Cos., Inc. –
Class A | | | 8,434 | | | $ | 1,073,142 | | |
Personal Products (0.0%) | |
Coty, Inc. – Class A | | | 17,817 | | | | 354,380 | | |
Tobacco (1.3%) | |
Altria Group, Inc. | | | 72,005 | | | | 5,141,877 | | |
Philip Morris International, Inc. | | | 58,607 | | | | 6,191,830 | | |
| | | | | | 11,333,707 | | |
Energy (5.9%) | |
Energy Equipment & Services (0.8%) | |
Baker Hughes a GE Co. | | | 16,157 | | | | 511,207 | | |
Halliburton Co. | | | 32,925 | | | | 1,609,045 | | |
Helmerich & Payne, Inc. | | | 4,036 | | | | 260,887 | | |
National Oilwell Varco, Inc. | | | 14,266 | | | | 513,861 | | |
Schlumberger, Ltd. | | | 52,264 | | | | 3,522,071 | | |
TechnipFMC PLC (b) | | | 16,519 | | | | 517,210 | | |
| | | | | | 6,934,281 | | |
Oil, Gas & Consumable Fuels (5.1%) | |
Anadarko Petroleum Corp. | | | 20,646 | | | | 1,107,452 | | |
Andeavor | | | 5,430 | | | | 620,866 | | |
Apache Corp. | | | 14,305 | | | | 603,957 | | |
Cabot Oil & Gas Corp. | | | 17,396 | | | | 497,526 | | |
Chesapeake Energy Corp. (c) | | | 34,289 | | | | 135,784 | | |
Chevron Corp. | | | 71,672 | | | | 8,972,618 | | |
Cimarex Energy Co. | | | 3,540 | | | | 431,915 | | |
Concho Resources, Inc. (c) | | | 5,628 | | | | 845,438 | | |
ConocoPhillips | | | 45,112 | | | | 2,476,198 | | |
Devon Energy Corp. | | | 19,830 | | | | 820,962 | | |
EOG Resources, Inc. | | | 21,819 | | | | 2,354,488 | | |
EQT Corp. | | | 9,238 | | | | 525,827 | | |
Exxon Mobil Corp. | | | 159,892 | | | | 13,373,367 | | |
Hess Corp. | | | 10,106 | | | | 479,732 | | |
Kinder Morgan, Inc. | | | 72,472 | | | | 1,309,569 | | |
Marathon Oil Corp. | | | 32,061 | | | | 542,793 | | |
Marathon Petroleum Corp. | | | 18,430 | | | | 1,216,011 | | |
Newfield Exploration Co. (c) | | | 7,444 | | | | 234,709 | | |
Noble Energy, Inc. | | | 18,301 | | | | 533,291 | | |
Occidental Petroleum Corp. | | | 28,876 | | | | 2,127,006 | | |
Phillips 66 | | | 16,162 | | | | 1,634,786 | | |
Pioneer Natural Resources Co. | | | 6,415 | | | | 1,108,833 | | |
Range Resources Corp. | | | 8,493 | | | | 144,891 | | |
The Williams Cos., Inc. | | | 31,197 | | | | 951,197 | | |
Valero Energy Corp. | | | 16,512 | | | | 1,517,618 | | |
| | | | | | 44,566,834 | | |
Financial (14.5%) | |
Capital Markets (3.0%) | |
Affiliated Managers Group, Inc. | | | 2,069 | | | | 424,662 | | |
Ameriprise Financial, Inc. | | | 5,640 | | | | 955,811 | | |
BlackRock, Inc. | | | 4,715 | | | | 2,422,143 | | |
CBOE Global Markets, Inc. | | | 4,242 | | | | 528,511 | | |
CME Group, Inc. | | | 12,864 | | | | 1,878,787 | | |
E*Trade Financial Corp. (c) | | | 10,151 | | | | 503,185 | | |
Franklin Resources, Inc. | | | 12,276 | | | | 531,919 | | |
Intercontinental Exchange, Inc. | | | 22,035 | | | | 1,554,790 | | |
Invesco, Ltd. | | | 15,303 | | | | 559,172 | | |
Moody's Corp. | | | 6,240 | | | | 921,086 | | |
Morgan Stanley | | | 52,529 | | | | 2,756,197 | | |
See accompanying notes to financial statements.
67
SFT Advantus Index 500 Fund
Investments in Securities – continued
| | |
Shares | | Value(a) | |
Nasdaq, Inc. | | | 4,304 | | | $ | 330,676 | | |
Northern Trust Corp. | | | 8,058 | | | | 804,914 | | |
Raymond James Financial, Inc. | | | 4,851 | | | | 433,194 | | |
S&P Global, Inc. | | | 9,606 | | | | 1,627,256 | | |
State Street Corp. | | | 13,966 | | | | 1,363,221 | | |
T Rowe Price Group, Inc. | | | 9,143 | | | | 959,375 | | |
The Bank of New York Mellon Corp. | | | 38,641 | | | | 2,081,204 | | |
The Charles Schwab Corp. | | | 45,021 | | | | 2,312,729 | | |
The Goldman Sachs Group, Inc. | | | 13,237 | | | | 3,372,258 | | |
| | | | | | 26,321,090 | | |
Commercial Banks (6.5%) | |
Bank of America Corp. | | | 366,045 | | | | 10,805,648 | | |
BB&T Corp. | | | 29,769 | | | | 1,480,115 | | |
Citigroup, Inc. | | | 99,771 | | | | 7,423,960 | | |
Citizens Financial Group, Inc. | | | 18,565 | | | | 779,359 | | |
Comerica, Inc. | | | 6,571 | | | | 570,428 | | |
Fifth Third Bancorp | | | 26,624 | | | | 807,772 | | |
Huntington Bancshares, Inc. | | | 40,789 | | | | 593,888 | | |
JPMorgan Chase & Co. | | | 130,929 | | | | 14,001,547 | | |
KeyCorp | | | 40,580 | | | | 818,499 | | |
M&T Bank Corp. | | | 5,690 | | | | 972,933 | | |
People's United Financial, Inc. | | | 13,065 | | | | 244,315 | | |
Regions Financial Corp. | | | 43,771 | | | | 756,363 | | |
SunTrust Banks, Inc. | | | 17,952 | | | | 1,159,520 | | |
The PNC Financial Services
Group, Inc. | | | 17,925 | | | | 2,586,398 | | |
US Bancorp | | | 59,489 | | | | 3,187,421 | | |
Wells Fargo & Co. | | | 167,234 | | | | 10,146,087 | | |
Zions Bancorporation | | | 7,457 | | | | 379,039 | | |
| | | | | | 56,713,292 | | |
Consumer Finance (0.8%) | |
American Express Co. | | | 27,185 | | | | 2,699,742 | | |
Capital One Financial Corp. | | | 18,291 | | | | 1,821,418 | | |
Discover Financial Services | | | 13,712 | | | | 1,054,727 | | |
Navient Corp. | | | 9,924 | | | | 132,188 | | |
Synchrony Financial | | | 27,759 | | | | 1,071,775 | | |
| | | | | | 6,779,850 | | |
Diversified Financial Services (0.0%) | |
Leucadia National Corp. | | | 11,810 | | | | 312,847 | | |
Insurance (4.2%) | |
Aflac, Inc. | | | 14,766 | | | | 1,296,159 | | |
American International
Group, Inc. | | | 33,881 | | | | 2,018,630 | | |
Aon PLC (b) | | | 9,430 | | | | 1,263,620 | | |
Arthur J Gallagher & Co. | | | 6,775 | | | | 428,722 | | |
Assurant, Inc. | | | 2,040 | | | | 205,714 | | |
Berkshire Hathaway, Inc. –
Class B (c) | | | 72,617 | | | | 14,394,142 | | |
Brighthouse Financial, Inc. (c) | | | 3,604 | | | | 211,339 | | |
Chubb, Ltd. (b) | | | 17,506 | | | | 2,558,152 | | |
Cincinnati Financial Corp. | | | 5,564 | | | | 417,133 | | |
Everest Re Group, Ltd. (b) | | | 1,552 | | | | 343,395 | | |
Hartford Financial Services
Group, Inc. | | | 13,460 | | | | 757,529 | | |
Lincoln National Corp. | | | 8,232 | | | | 632,794 | | |
Loews Corp. | | | 10,354 | | | | 518,011 | | |
Marsh & McLennan Cos., Inc. | | | 19,178 | | | | 1,560,897 | | |
MetLife, Inc. | | | 39,708 | | | | 2,007,636 | | |
Principal Financial Group, Inc. | | | 10,094 | | | | 712,233 | | |
| | |
Shares | | Value(a) | |
Prudential Financial, Inc. | | | 15,961 | | | $ | 1,835,196 | | |
The Allstate Corp. | | | 13,492 | | | | 1,412,747 | | |
The Progressive Corp. | | | 21,946 | | | | 1,235,999 | | |
The Travelers Cos., Inc. | | | 10,280 | | | | 1,394,379 | | |
Torchmark Corp. | | | 3,994 | | | | 362,296 | | |
Unum Group | | | 8,388 | | | | 460,417 | | |
Willis Towers Watson PLC (b) | | | 4,951 | | | | 746,066 | | |
XL Group, Ltd. (b) | | | 9,602 | | | | 337,606 | | |
| | | | | | 37,110,812 | | |
Health Care (13.5%) | |
Biotechnology (2.7%) | |
AbbVie, Inc. | | | 60,153 | | | | 5,817,397 | | |
Alexion Pharmaceuticals,
Inc. (c) | | | 8,437 | | | | 1,008,981 | | |
Amgen, Inc. | | | 27,447 | | | | 4,773,033 | | |
Biogen, Inc. (c) | | | 8,053 | | | | 2,565,444 | | |
Celgene Corp. (c) | | | 29,709 | | | | 3,100,431 | | |
Gilead Sciences, Inc. | | | 49,291 | | | | 3,531,207 | | |
Incyte Corp. (c) | | | 6,609 | | | | 625,938 | | |
Regeneron Pharmaceuticals,
Inc. (c) | | | 2,985 | | | | 1,122,241 | | |
Vertex Pharmaceuticals, Inc. (c) | | | 9,500 | | | | 1,423,670 | | |
| | | | | | 23,968,342 | | |
Health Care Equipment & Supplies (2.7%) | |
Abbott Laboratories | | | 65,681 | | | | 3,748,415 | | |
Align Technology, Inc. (c) | | | 2,714 | | | | 603,024 | | |
Baxter International, Inc. | | | 18,855 | | | | 1,218,787 | | |
Becton Dickinson and Co. | | | 10,068 | | | | 2,155,078 | | |
Boston Scientific Corp. (c) | | | 51,817 | | | | 1,284,543 | | |
Danaher Corp. | | | 23,098 | | | | 2,143,956 | | |
Dentsply Sirona, Inc. | | | 8,667 | | | | 570,549 | | |
Edwards Lifesciences Corp. (c) | | | 7,927 | | | | 893,452 | | |
Hologic, Inc. (c) | | | 10,394 | | | | 444,344 | | |
IDEXX Laboratories, Inc. (c) | | | 3,283 | | | | 513,396 | | |
Intuitive Surgical, Inc. (c) | | | 4,209 | | | | 1,536,033 | | |
Medtronic PLC (b) | | | 51,077 | | | | 4,124,468 | | |
ResMed, Inc. | | | 5,360 | | | | 453,938 | | |
Stryker Corp. | | | 12,100 | | | | 1,873,564 | | |
The Cooper Cos., Inc. | | | 1,840 | | | | 400,899 | | |
Varian Medical Systems, Inc. (c) | | | 3,427 | | | | 380,911 | | |
Zimmer Biomet Holdings, Inc. | | | 7,629 | | | | 920,591 | | |
| | | | | | 23,265,948 | | |
Health Care Providers & Services (2.7%) | |
Aetna, Inc. | | | 12,305 | | | | 2,219,699 | | |
AmerisourceBergen Corp. | | | 6,099 | | | | 560,010 | | |
Anthem, Inc. | | | 9,689 | | | | 2,180,122 | | |
Cardinal Health, Inc. | | | 11,849 | | | | 725,988 | | |
Centene Corp. (c) | | | 6,525 | | | | 658,242 | | |
Cigna Corp. | | | 9,304 | | | | 1,889,549 | | |
DaVita, Inc. (c) | | | 5,653 | | | | 408,429 | | |
Envision Healthcare Corp. (c) | | | 4,544 | | | | 157,041 | | |
Express Scripts Holding Co. (c) | | | 21,371 | | | | 1,595,132 | | |
HCA Healthcare, Inc. (c) | | | 10,688 | | | | 938,834 | | |
Henry Schein, Inc. (c) | | | 5,908 | | | | 412,851 | | |
Humana, Inc. | | | 5,453 | | | | 1,352,726 | | |
Laboratory Corp. of America
Holdings (c) | | | 3,889 | | | | 620,334 | | |
McKesson Corp. | | | 7,834 | | | | 1,221,712 | | |
Patterson Cos., Inc. | | | 3,027 | | | | 109,366 | | |
Quest Diagnostics, Inc. | | | 5,167 | | | | 508,898 | | |
See accompanying notes to financial statements.
68
SFT Advantus Index 500 Fund
Investments in Securities – continued
| | |
Shares | | Value(a) | |
UnitedHealth Group, Inc. | | | 36,568 | | | $ | 8,061,781 | | |
Universal Health Services,
Inc. – Class B | | | 3,314 | | | | 375,642 | | |
| | | | | | 23,996,356 | | |
Health Care Technology (0.1%) | |
Cerner Corp. (c) | | | 11,848 | | | | 798,437 | | |
Life Sciences Tools & Services (0.8%) | |
Agilent Technologies, Inc. | | | 12,144 | | | | 813,284 | | |
Illumina, Inc. (c) | | | 5,482 | | | | 1,197,762 | | |
IQVIA Holdings, Inc. (c) | | | 5,494 | | | | 537,863 | | |
Mettler-Toledo International,
Inc. (c) | | | 1,002 | | | | 620,759 | | |
PerkinElmer, Inc. | | | 4,091 | | | | 299,134 | | |
Thermo Fisher Scientific, Inc. | | | 15,154 | | | | 2,877,441 | | |
Waters Corp. (c) | | | 2,982 | | | | 576,093 | | |
| | | | | | 6,922,336 | | |
Pharmaceuticals (4.5%) | |
Allergan PLC | | | 12,575 | | | | 2,057,018 | | |
Bristol-Myers Squibb Co. | | | 61,685 | | | | 3,780,057 | | |
Eli Lilly & Co. | | | 36,560 | | | | 3,087,857 | | |
Johnson & Johnson | | | 101,375 | | | | 14,164,115 | | |
Merck & Co., Inc. | | | 103,210 | | | | 5,807,627 | | |
Mylan NV (c) | | | 20,171 | | | | 853,435 | | |
Perrigo Co. PLC (b) | | | 4,889 | | | | 426,125 | | |
Pfizer, Inc. | | | 224,926 | | | | 8,146,820 | | |
Zoetis, Inc. | | | 18,323 | | | | 1,319,989 | | |
| | | | | | 39,643,043 | | |
Industrials (10.1%) | |
Aerospace & Defense (2.4%) | |
Arconic, Inc. | | | 15,898 | | | | 433,220 | | |
General Dynamics Corp. | | | 10,476 | | | | 2,131,342 | | |
L3 Technologies, Inc. | | | 2,935 | | | | 580,690 | | |
Lockheed Martin Corp. | | | 9,405 | | | | 3,019,475 | | |
Northrop Grumman Corp. | | | 6,624 | | | | 2,032,972 | | |
Raytheon Co. | | | 10,898 | | | | 2,047,189 | | |
Rockwell Collins, Inc. | | | 6,151 | | | | 834,199 | | |
The Boeing Co. | | | 21,126 | | | | 6,230,269 | | |
TransDigm Group, Inc. | | | 1,894 | | | | 520,130 | | |
United Technologies Corp. | | | 28,042 | | | | 3,577,318 | | |
| | | | | | 21,406,804 | | |
Air Freight & Logistics (0.7%) | |
CH Robinson Worldwide, Inc. | | | 5,277 | | | | 470,128 | | |
Expeditors International of
Washington, Inc. | | | 6,655 | | | | 430,512 | | |
FedEx Corp. | | | 9,339 | | | | 2,330,454 | | |
United Parcel Service, Inc. –
Class B | | | 25,908 | | | | 3,086,938 | | |
| | | | | | 6,318,032 | | |
Airlines (0.5%) | |
Alaska Air Group, Inc. | | | 4,600 | | | | 338,146 | | |
American Airlines Group, Inc. | | | 16,069 | | | | 836,070 | | |
Delta Air Lines, Inc. | | | 24,751 | | | | 1,386,056 | | |
Southwest Airlines Co. | | | 20,600 | | | | 1,348,270 | | |
United Continental Holdings,
Inc. (c) | | | 9,502 | | | | 640,435 | | |
| | | | | | 4,548,977 | | |
| | |
Shares | | Value(a) | |
Building Products (0.3%) | |
Allegion PLC (b) | | | 3,591 | | | $ | 285,700 | | |
AO Smith Corp. | | | 5,460 | | | | 334,589 | | |
Fortune Brands Home &
Security, Inc. | | | 5,811 | | | | 397,705 | | |
Johnson Controls
International PLC (b) | | | 34,921 | | | | 1,330,839 | | |
Masco Corp. | | | 11,851 | | | | 520,733 | | |
| | | | | | 2,869,566 | | |
Commercial Services & Supplies (0.4%) | |
Avery Dennison Corp. | | | 3,311 | | | | 380,302 | | |
Cintas Corp. | | | 3,274 | | | | 510,187 | | |
Republic Services, Inc. | | | 8,571 | | | | 579,485 | | |
Stericycle, Inc. (c) | | | 3,182 | | | | 216,344 | | |
Waste Management, Inc. | | | 15,074 | | | | 1,300,886 | | |
| | | | | | 2,987,204 | | |
Construction & Engineering (0.1%) | |
Fluor Corp. | | | 5,202 | | | | 268,683 | | |
Jacobs Engineering Group, Inc. | | | 4,492 | | | | 296,293 | | |
Quanta Services, Inc. (c) | | | 5,838 | | | | 228,324 | | |
| | | | | | 793,300 | | |
Electrical Equipment (0.6%) | |
Acuity Brands, Inc. | | | 1,580 | | | | 278,080 | | |
AMETEK, Inc. | | | 8,721 | | | | 632,011 | | |
Eaton Corp. PLC (b) | | | 16,626 | | | | 1,313,620 | | |
Emerson Electric Co. | | | 24,218 | | | | 1,687,753 | | |
Rockwell Automation, Inc. | | | 4,843 | | | | 950,923 | | |
| | | | | | 4,862,387 | | |
Industrial Conglomerates (1.9%) | |
3M Co. | | | 22,547 | | | | 5,306,887 | | |
General Electric Co. | | | 327,239 | | | | 5,710,321 | | |
Honeywell International, Inc. | | | 28,775 | | | | 4,412,934 | | |
Roper Technologies, Inc. | | | 3,874 | | | | 1,003,366 | | |
Textron, Inc. | | | 9,847 | | | | 557,242 | | |
| | | | | | 16,990,750 | | |
Machinery (1.7%) | |
Caterpillar, Inc. | | | 22,450 | | | | 3,537,671 | | |
Cummins, Inc. | | | 5,868 | | | | 1,036,524 | | |
Deere & Co. | | | 12,031 | | | | 1,882,972 | | |
Dover Corp. | | | 5,902 | | | | 596,043 | | |
Flowserve Corp. | | | 4,929 | | | | 207,659 | | |
Fortive Corp. | | | 11,472 | | | | 829,999 | | |
Illinois Tool Works, Inc. | | | 11,632 | | | | 1,940,799 | | |
Ingersoll-Rand PLC (b) | | | 9,428 | | | | 840,883 | | |
PACCAR, Inc. | | | 13,267 | | | | 943,018 | | |
Parker Hannifin Corp. | | | 5,091 | | | | 1,016,062 | | |
Pentair PLC (b) | | | 6,201 | | | | 437,915 | | |
Snap-On, Inc. | | | 2,143 | | | | 373,525 | | |
Stanley Black & Decker, Inc. | | | 5,835 | | | | 990,141 | | |
Xylem, Inc. | | | 6,716 | | | | 458,031 | | |
| | | | | | 15,091,242 | | |
Professional Services (0.3%) | |
Equifax, Inc. | | | 4,536 | | | | 534,885 | | |
IHS Markit, Ltd. (b) (c) | | | 13,664 | | | | 616,929 | | |
Nielsen Holdings PLC (b) | | | 12,604 | | | | 458,786 | | |
Robert Half International, Inc. | | | 4,668 | | | | 259,261 | | |
See accompanying notes to financial statements.
69
SFT Advantus Index 500 Fund
Investments in Securities – continued
| | |
Shares | | Value(a) | |
United Rentals, Inc. (c) | | | 3,175 | | | $ | 545,814 | | |
Verisk Analytics, Inc. (c) | | | 5,846 | | | | 561,216 | | |
| | | | | | 2,976,891 | | |
Road & Rail (0.9%) | |
CSX Corp. | | | 33,724 | | | | 1,855,157 | | |
JB Hunt Transport Services, Inc. | | | 3,190 | | | | 366,786 | | |
Kansas City Southern | | | 3,886 | | | | 408,885 | | |
Norfolk Southern Corp. | | | 10,840 | | | | 1,570,716 | | |
Union Pacific Corp. | | | 29,704 | | | | 3,983,307 | | |
| | | | | | 8,184,851 | | |
Trading Companies & Distributors (0.1%) | |
Fastenal Co. | | | 10,772 | | | | 589,121 | | |
WW Grainger, Inc. | | | 1,974 | | | | 466,357 | | |
| | | | | | 1,055,478 | | |
Information Technology (23.4%) | |
Communications Equipment (1.0%) | |
Cisco Systems, Inc. | | | 186,546 | | | | 7,144,712 | | |
F5 Networks, Inc. (c) | | | 2,360 | | | | 309,679 | | |
Harris Corp. | | | 4,505 | | | | 638,133 | | |
Juniper Networks, Inc. | | | 14,147 | | | | 403,190 | | |
Motorola Solutions, Inc. | | | 6,106 | | | | 551,616 | | |
| | | | | | 9,047,330 | | |
Computers & Peripherals (3.9%) | |
Apple, Inc. (d) | | | 193,742 | | | | 32,786,959 | | |
NetApp, Inc. | | | 10,179 | | | | 563,102 | | |
Western Digital Corp. | | | 11,161 | | | | 887,634 | | |
| | | | | | 34,237,695 | | |
Electronic Equipment, Instruments &
Components (0.5%) | |
Amphenol Corp. – Class A | | | 11,447 | | | | 1,005,046 | | |
Corning, Inc. | | | 32,793 | | | | 1,049,048 | | |
FLIR Systems, Inc. | | | 5,229 | | | | 243,776 | | |
Seagate Technology PLC (b) | | | 10,826 | | | | 452,960 | | |
TE Connectivity, Ltd. (b) | | | 13,292 | | | | 1,263,272 | | |
| | | | | | 4,014,102 | | |
Internet Software & Services (4.8%) | |
Akamai Technologies, Inc. (c) | | | 6,362 | | | | 413,785 | | |
Alphabet, Inc. – Class A (c) | | | 11,250 | | | | 11,850,750 | | |
Alphabet, Inc. – Class C (c) | | | 11,396 | | | | 11,924,774 | | |
eBay, Inc. (c) | | | 36,657 | | | | 1,383,435 | | |
Facebook, Inc. – Class A (c) | | | 89,990 | | | | 15,879,635 | | |
VeriSign, Inc. (c) | | | 3,174 | | | | 363,233 | | |
| | | | | | 41,815,612 | | |
IT Services (4.0%) | |
Accenture PLC – Class A (b) | | | 23,345 | | | | 3,573,886 | | |
Alliance Data Systems Corp. | | | 1,816 | | | | 460,320 | | |
Automatic Data Processing, Inc. | | | 16,715 | | | | 1,958,831 | | |
Cognizant Technology Solutions
Corp. – Class A | | | 22,253 | | | | 1,580,408 | | |
CSRA, Inc. | | | 6,149 | | | | 183,978 | | |
DXC Technology Co. | | | 10,698 | | | | 1,015,240 | | |
Fidelity National Information
Services, Inc. | | | 12,598 | | | | 1,185,346 | | |
Fiserv, Inc. (c) | | | 7,893 | | | | 1,035,009 | | |
Gartner, Inc. – Class A (c) | | | 3,410 | | | | 419,942 | | |
| | |
Shares | | Value(a) | |
Global Payments, Inc. | | | 6,005 | | | $ | 601,941 | | |
International Business
Machines Corp. | | | 32,489 | | | | 4,984,462 | | |
Mastercard, Inc. – Class A | | | 35,023 | | | | 5,301,081 | | |
Paychex, Inc. | | | 12,067 | | | | 821,521 | | |
PayPal Holdings, Inc. (c) | | | 42,632 | | | | 3,138,568 | | |
The Western Union Co. | | | 17,331 | | | | 329,462 | | |
Total System Services, Inc. | | | 6,238 | | | | 493,364 | | |
Visa, Inc. – Class A | | | 68,431 | | | | 7,802,503 | | |
| | | | | | 34,885,862 | | |
Office Electronics (0.0%) | |
Xerox Corp. | | | 7,998 | | | | 233,142 | | |
Semiconductors & Semiconductor
Equipment (3.8%) | |
Advanced Micro Devices, Inc. (c) | | | 30,945 | | | | 318,115 | | |
Analog Devices, Inc. | | | 13,910 | | | | 1,238,407 | | |
Applied Materials, Inc. | | | 40,243 | | | | 2,057,222 | | |
Broadcom, Ltd. | | | 15,413 | | | | 3,959,600 | | |
Intel Corp. | | | 176,598 | | | | 8,151,764 | | |
KLA-Tencor Corp. | | | 5,939 | | | | 624,011 | | |
Lam Research Corp. | | | 6,162 | | | | 1,134,239 | | |
Microchip Technology, Inc. | | | 8,754 | | | | 769,302 | | |
Micron Technology, Inc. (c) | | | 43,517 | | | | 1,789,419 | | |
NVIDIA Corp. | | | 22,867 | | | | 4,424,764 | | |
Qorvo, Inc. (c) | | | 4,737 | | | | 315,484 | | |
QUALCOMM, Inc. | | | 55,573 | | | | 3,557,783 | | |
Skyworks Solutions, Inc. | | | 6,957 | | | | 660,567 | | |
Texas Instruments, Inc. | | | 37,140 | | | | 3,878,902 | | |
Xilinx, Inc. | | | 9,469 | | | | 638,400 | | |
| | | | | | 33,517,979 | | |
Software (5.2%) | |
Activision Blizzard, Inc. | | | 28,531 | | | | 1,806,583 | | |
Adobe Systems, Inc. (c) | | | 18,659 | | | | 3,269,803 | | |
ANSYS, Inc. (c) | | | 3,230 | | | | 476,716 | | |
Autodesk, Inc. (c) | | | 8,245 | | | | 864,323 | | |
CA, Inc. | | | 11,791 | | | | 392,405 | | |
Cadence Design Systems, Inc. (c) | | | 10,654 | | | | 445,550 | | |
Citrix Systems, Inc. (c) | | | 5,414 | | | | 476,432 | | |
Electronic Arts, Inc. (c) | | | 11,594 | | | | 1,218,066 | | |
Intuit, Inc. | | | 9,168 | | | | 1,446,527 | | |
Microsoft Corp. | | | 291,108 | | | | 24,901,378 | | |
Oracle Corp. | | | 114,964 | | | | 5,435,498 | | |
Red Hat, Inc. (c) | | | 6,644 | | | | 797,944 | | |
Salesforce.com, Inc. (c) | | | 25,893 | | | | 2,647,041 | | |
Symantec Corp. | | | 23,394 | | | | 656,436 | | |
Synopsys, Inc. (c) | | | 5,679 | | | | 484,078 | | |
| | | | | | 45,318,780 | | |
Technology Hardware Storage &
Peripherals (0.2%) | |
Hewlett Packard Enterprise Co. | | | 60,187 | | | | 864,286 | | |
HP, Inc. | | | 63,026 | | | | 1,324,176 | | |
| | | | | | 2,188,462 | | |
Materials (2.9%) | |
Chemicals (2.2%) | |
Air Products & Chemicals, Inc. | | | 8,190 | | | | 1,343,815 | | |
Albemarle Corp. | | | 4,150 | | | | 530,744 | | |
CF Industries Holdings, Inc. | | | 8,743 | | | | 371,927 | | |
DowDuPont, Inc. | | | 88,299 | | | | 6,288,655 | | |
See accompanying notes to financial statements.
70
SFT Advantus Index 500 Fund
Investments in Securities – continued
| | |
Shares | | Value(a) | |
Eastman Chemical Co. | | | 5,364 | | | $ | 496,921 | | |
Ecolab, Inc. | | | 9,851 | | | | 1,321,807 | | |
FMC Corp. | | | 5,003 | | | | 473,584 | | |
International Flavors &
Fragrances, Inc. | | | 3,004 | | | | 458,440 | | |
LyondellBasell Industries
NV – Class A | | | 12,208 | | | | 1,346,787 | | |
Monsanto Co. | | | 16,578 | | | | 1,935,979 | | |
PPG Industries, Inc. | | | 9,553 | | | | 1,115,981 | | |
Praxair, Inc. | | | 10,765 | | | | 1,665,130 | | |
The Mosaic Co. | | | 13,184 | | | | 338,301 | | |
The Sherwin-Williams Co. | | | 3,116 | | | | 1,277,685 | | |
| | | | | | 18,965,756 | | |
Construction Materials (0.1%) | |
Martin Marietta Materials, Inc. | | | 2,422 | | | | 535,359 | | |
Vulcan Materials Co. | | | 4,992 | | | | 640,823 | | |
| | | | | | 1,176,182 | | |
Containers & Packaging (0.3%) | |
Ball Corp. | | | 13,170 | | | | 498,485 | | |
International Paper Co. | | | 15,580 | | | | 902,705 | | |
Packaging Corp. of America | | | 3,560 | | | | 429,158 | | |
Sealed Air Corp. | | | 6,747 | | | | 332,627 | | |
WestRock Co. | | | 9,554 | | | | 603,908 | | |
| | | | | | 2,766,883 | | |
Metals & Mining (0.3%) | |
Freeport-McMoRan, Inc. (c) | | | 50,800 | | | | 963,168 | | |
Newmont Mining Corp. | | | 20,125 | | | | 755,090 | | |
Nucor Corp. | | | 11,967 | | | | 760,862 | | |
| | | | | | 2,479,120 | | |
Real Estate (2.9%) | |
Health Care REITs (0.2%) | |
HCP, Inc. | | | 17,701 | | | | 461,642 | | |
Ventas, Inc. | | | 13,401 | | | | 804,194 | | |
Welltower, Inc. | | | 13,975 | | | | 891,186 | | |
| | | | | | 2,157,022 | | |
Hotels & Resort REITs (0.1%) | |
Hilton Worldwide Holdings, Inc. | | | 7,541 | | | | 602,225 | | |
Host Hotels & Resorts, Inc. | | | 27,925 | | | | 554,311 | | |
| | | | | | 1,156,536 | | |
Industrial REITs (0.2%) | |
Duke Realty Corp. | | | 13,340 | | | | 362,981 | | |
ProLogis, Inc. | | | 19,980 | | | | 1,288,910 | | |
| | | | | | 1,651,891 | | |
Office REITs (0.2%) | |
Alexandria Real Estate Equities, Inc. | | | 3,612 | | | | 471,691 | | |
Boston Properties, Inc. | | | 5,850 | | | | 760,676 | | |
SL Green Realty Corp. | | | 3,723 | | | | 375,762 | | |
Vornado Realty Trust | | | 6,499 | | | | 508,092 | | |
| | | | | | 2,116,221 | | |
Real Estate Services (0.1%) | |
CBRE Group, Inc. – Class A (c) | | | 11,305 | | | | 489,620 | | |
| | |
Shares | | Value(a) | |
Residential REITs (0.4%) | |
Apartment Investment &
Management Co. – Class A | | | 5,857 | | | $ | 256,010 | | |
AvalonBay Communities, Inc. | | | 5,225 | | | | 932,192 | | |
Equity Residential | | | 13,866 | | | | 884,235 | | |
Essex Property Trust, Inc. | | | 2,490 | | | | 601,011 | | |
Mid-America Apartment
Communities, Inc. | | | 4,290 | | | | 431,402 | | |
UDR, Inc. | | | 10,056 | | | | 387,357 | | |
| | | | | | 3,492,207 | | |
Retail REITs (0.5%) | |
Federal Realty Investment Trust | | | 2,700 | | | | 358,587 | | |
GGP, Inc. | | | 23,555 | | | | 550,951 | | |
Kimco Realty Corp. | | | 15,985 | | | | 290,128 | | |
Realty Income Corp. | | | 10,633 | | | | 606,294 | | |
Regency Centers Corp. | | | 5,530 | | | | 382,565 | | |
Simon Property Group, Inc. | | | 11,692 | | | | 2,007,984 | | |
The Macerich Co. | | | 3,995 | | | | 262,392 | | |
| | | | | | 4,458,901 | | |
Specialized REITs (1.1%) | |
American Tower Corp. | | | 16,158 | | | | 2,305,262 | | |
Crown Castle International Corp. | | | 15,330 | | | | 1,701,783 | | |
Digital Realty Trust, Inc. | | | 7,697 | | | | 876,688 | | |
Equinix, Inc. | | | 2,949 | | | | 1,336,546 | | |
Extra Space Storage, Inc. | | | 4,720 | | | | 412,764 | | |
Iron Mountain, Inc. | | | 10,673 | | | | 402,692 | | |
Public Storage | | | 5,711 | | | | 1,193,599 | | |
SBA Communications Corp. (c) | | | 4,490 | | | | 733,486 | | |
Weyerhaeuser Co. | | | 28,483 | | | | 1,004,311 | | |
| | | | | | 9,967,131 | | |
Telecommunication Services (2.0%) | |
Diversified Telecommunication Services (2.0%) | |
AT&T, Inc. | | | 231,691 | | | | 9,008,146 | | |
CenturyLink, Inc. | | | 36,708 | | | | 612,289 | | |
Verizon Communications, Inc. | | | 153,934 | | | | 8,147,727 | | |
| | | | | | 17,768,162 | | |
Utilities (3.0%) | |
Electric Utilities (1.7%) | |
Alliant Energy Corp. | | | 8,691 | | | | 370,324 | | |
American Electric Power
Co., Inc. | | | 18,497 | | | | 1,360,824 | | |
Duke Energy Corp. | | | 26,426 | | | | 2,222,691 | | |
Edison International | | | 12,213 | | | | 772,350 | | |
Entergy Corp. | | | 6,801 | | | | 553,533 | | |
Eversource Energy | | | 11,887 | | | | 751,021 | | |
Exelon Corp. | | | 36,228 | | | | 1,427,746 | | |
FirstEnergy Corp. | | | 16,786 | | | | 513,987 | | |
NextEra Energy, Inc. | | | 17,765 | | | | 2,774,715 | | |
PG&E Corp. | | | 19,351 | | | | 867,505 | | |
Pinnacle West Capital Corp. | | | 4,150 | | | | 353,497 | | |
PPL Corp. | | | 25,779 | | | | 797,860 | | |
The Southern Co. | | | 37,871 | | | | 1,821,216 | | |
Xcel Energy, Inc. | | | 19,160 | | | | 921,788 | | |
| | | | | | 15,509,057 | | |
Gas Utilities (0.1%) | |
ONEOK, Inc. | | | 14,468 | | | | 773,315 | | |
See accompanying notes to financial statements.
71
SFT Advantus Index 500 Fund
Investments in Securities – continued
| | |
Shares | | Value(a) | |
Independent Power Producers &
Energy Traders (0.1%) | |
AES Corp. | | | 24,919 | | | $ | 269,873 | | |
NRG Energy, Inc. | | | 11,308 | | | | 322,052 | | |
| | | | | | 591,925 | | |
Multi-Utilities (1.0%) | |
Ameren Corp. | | | 9,104 | | | | 537,045 | | |
CenterPoint Energy, Inc. | | | 16,173 | | | | 458,666 | | |
CMS Energy Corp. | | | 10,549 | | | | 498,968 | | |
Consolidated Edison, Inc. | | | 11,654 | | | | 990,007 | | |
Dominion Energy, Inc. | | | 24,283 | | | | 1,968,380 | | |
DTE Energy Co. | | | 6,720 | | | | 735,571 | | |
NiSource, Inc. | | | 12,708 | | | | 326,214 | | |
Public Service Enterprise
Group, Inc. | | | 19,003 | | | | 978,655 | | |
SCANA Corp. | | | 5,351 | | | | 212,863 | | |
Sempra Energy | | | 9,448 | | | | 1,010,180 | | |
WEC Energy Group, Inc. | | | 11,828 | | | | 785,734 | | |
| | | | | | 8,502,283 | | |
Water Utilities (0.1%) | |
American Water Works Co., Inc. | | | 6,720 | | | | 614,813 | | |
Total common stocks
(cost: $325,763,112) | | | | | 860,356,596 | | |
| | |
Shares | | Value(a) | |
Short-Term Securities (1.7%) | |
Investment Companies (1.7%) | |
State Street Institutional
U.S. Government Money
Market Fund, current
rate 1.210% | | | 14,777,164 | | | | 14,777,164 | | |
Total short-term securities
(cost: $14,777,164) | | | | | 14,777,164 | | |
Total investments in securities
(cost: $340,540,276) (e) | | | | | 875,133,760 | | |
Cash and other assets in
excess of liabilities (0.1%) | | | | | 802,930 | | |
Total net assets (100.0%) | | | | $ | 875,936,690 | | |
Investments in Securities Legend
(a) Securities are valued by procedures described in Note 2 of the Notes to Financial Statements.
(b) Foreign security: The Fund held 2.6% of net assets in foreign securities at December 31, 2017.
(c) Non-income producing security.
(d) Fully or partially pledged as initial margin deposits on open futures contracts.
Holdings of Open Futures Contracts
On December 31, 2017, securities with an aggregate market value of $5,923,050 have been pledged to cover margin requirements for the following open futures contracts:
Type | | Expiration | | Number of
Contracts | | Position
Type | | Notional
Amount | | Market
Value | | Unrealized
Appreciation/
(Depreciation)(a) | |
S&P 500® E-Mini Index Future | | March 2018 | | | 104 | | | Long | | $ | 13,818,942 | | | $ | 13,915,200 | | | $ | 96,258 | | |
(e) At December 31, 2017 the cost of investments for federal income tax purposes was $343,398,236. The aggregate unrealized appreciation and depreciation of investments based on this cost were:
Gross unrealized appreciation | | $ | 539,037,918 | | |
Gross unrealized depreciation | | | (7,206,136 | ) | |
Net unrealized appreciation | | $ | 531,831,782 | | |
See accompanying notes to financial statements.
72
SFT Advantus International Bond Fund
Investments in Securities
(Percentages of each investment category relate to total net assets)
| | | Principal(b) | | Value(a) | |
Long-Term Debt Securities (51.4%) | |
Argentina (3.8%) | |
Government (3.8%) | |
Argentine Bonos
del Tesoro (ARS)
15.500%, 10/17/26 | | | 38,676,000 | | | $ | 2,071,223 | | |
16.000%, 10/17/23 | | | 8,404,000 | | | | 440,674 | | |
18.200%, 10/03/21 | | | 27,672,000 | | | | 1,511,135 | | |
21.200%, 09/19/18 | | | 1,700,000 | | | | 87,816 | | |
22.750%, 03/05/18 | | | 101,000 | | | | 5,329 | | |
| | | | | | 4,116,177 | | |
Brazil (4.4%) | |
Government (4.4%) | |
Brazil Letras do Tesouro
Nacional (BRL)
8.558%, 07/01/20 (c) | | | 728,000 | | | | 178,718 | | |
9.246%, 07/01/21 (c) | | | 4,460,000 | | | | 986,513 | | |
Brazil Notas do Tesouro
Nacional Serie B (BRL)
18.779%, 05/15/19 | | | 80,000 | | | | 76,494 | | |
18.779%, 08/15/22 | | | 134,000 | | | | 129,174 | | |
18.779%, 05/15/23 | | | 186,000 | | | | 178,982 | | |
18.779%, 08/15/24 | | | 110,000 | | | | 106,078 | | |
Brazil Notas do Tesouro
Nacional Serie F (BRL)
10.000%, 01/01/21 | | | 4,840,000 | | | | 1,502,850 | | |
10.000%, 01/01/23 | | | 5,209,000 | | | | 1,589,493 | | |
| | | | | | 4,748,302 | | |
Ghana (1.8%) | |
Government (1.8%) | |
Ghana Government
Bond (GHS)
18.750%, 01/24/22 | | | 960,000 | | | | 223,887 | | |
19.000%, 11/02/26 | | | 2,890,000 | | | | 701,459 | | |
19.750%, 03/25/24 | | | 960,000 | | | | 234,205 | | |
19.750%, 03/15/32 | | | 2,890,000 | | | | 695,123 | | |
21.500%, 03/09/20 | | | 50,000 | | | | 11,921 | | |
24.500%, 06/21/21 | | | 50,000 | | | | 13,161 | | |
24.750%, 03/01/21 | | | 50,000 | | | | 13,071 | | |
24.750%, 07/19/21 | | | 50,000 | | | | 13,280 | | |
| | | | | | 1,906,107 | | |
Indonesia (10.6%) | |
Government (10.6%) | |
Indonesia Treasury
Bond (IDR)
6.125%, 05/15/28 | | | 228,000,000 | | | | 16,361 | | |
7.000%, 05/15/27 | | | 49,134,000,000 | | | | 3,795,278 | | |
8.375%, 03/15/24 | | | 21,929,000,000 | | | | 1,797,008 | | |
8.375%, 09/15/26 | | | 25,590,000,000 | | | | 2,131,053 | | |
8.750%, 05/15/31 | | | 13,084,000,000 | | | | 1,123,483 | | |
9.000%, 03/15/29 | | | 5,228,000,000 | | | | 454,800 | | |
9.500%, 07/15/23 | | | 18,680,000,000 | | | | 1,581,158 | | |
10.000%, 09/15/24 | | | 1,959,000,000 | | | | 172,336 | | |
10.000%, 02/15/28 | | | 76,000,000 | | | | 6,990 | | |
10.250%, 07/15/22 | | | 2,658,000,000 | | | | 226,786 | | |
10.500%, 08/15/30 | | | 1,070,000,000 | | | | 102,450 | | |
11.500%, 09/15/19 | | | 466,000,000 | | | | 37,588 | | |
| | | | | | 11,445,291 | | |
| | | Principal(b) | | Value(a) | |
Mexico (11.1%) | |
Government (11.1%) | |
Mexican Bonos (MXN)
4.750%, 06/14/18 | | | 56,610,000 | | | $ | 2,855,253 | | |
5.000%, 12/11/19 | | | 100,870,000 | | | | 4,907,317 | | |
6.500%, 06/10/21 | | | 20,100,000 | | | | 992,235 | | |
8.000%, 06/11/20 | | | 44,930,000 | | | | 2,314,990 | | |
8.500%, 12/13/18 | | | 13,490,000 | | | | 694,353 | | |
Mexican Udibonos (MXN)
2.500%, 12/10/20 | | | 1,637,936 | | | | 81,510 | | |
4.000%, 06/13/19 | | | 2,047,420 | | | | 105,460 | | |
| | | | | | 11,951,118 | | |
Philippines (1.3%) | |
Government (1.3%) | |
Philippine Government
Bond (PHP)
2.125%, 05/23/18 | | | 23,158,000 | | | | 462,196 | | |
3.375%, 08/20/20 | | | 1,600,000 | | | | 31,283 | | |
3.875%, 11/22/19 | | | 41,660,000 | | | | 830,755 | | |
5.000%, 08/18/18 | | | 3,500,000 | | | | 70,916 | | |
5.875%, 01/31/18 | | | 2,470,000 | | | | 49,552 | | |
| | | | | | 1,444,702 | | |
South Africa (1.8%) | |
Government (1.8%) | |
Republic of South Africa
Government Bond (ZAR)
6.250%, 03/31/36 | | | 3,256,000 | | | | 189,240 | | |
7.000%, 02/28/31 | | | 3,649,000 | | | | 245,438 | | |
8.000%, 01/31/30 | | | 5,063,000 | | | | 374,286 | | |
8.250%, 03/31/32 | | | 6,519,000 | | | | 481,975 | | |
8.500%, 01/31/37 | | | 1,553,000 | | | | 112,830 | | |
8.875%, 02/28/35 | | | 2,851,000 | | | | 216,477 | | |
10.500%, 12/21/26 | | | 3,552,000 | | | | 320,455 | | |
| | | | | | 1,940,701 | | |
South Korea (15.9%) | |
Government (15.9%) | |
Korea Treasury
Bond (KRW)
1.375%, 09/10/21 | | | 708,200,000 | | | | 640,068 | | |
1.500%, 06/10/19 | | | 2,690,600,000 | | | | 2,495,011 | | |
1.875%, 03/10/22 | | | 200,000,000 | | | | 183,343 | | |
2.000%, 03/10/21 | | | 2,212,310,000 | | | | 2,050,824 | | |
2.000%, 09/10/22 | | | 2,371,000,000 | | | | 2,180,738 | | |
3.000%, 03/10/23 | | | 967,000,000 | | | | 929,322 | | |
3.000%, 09/10/24 | | | 2,419,000,000 | | | | 2,337,296 | | |
3.375%, 09/10/23 | | | 2,729,000,000 | | | | 2,675,488 | | |
3.500%, 03/10/24 | | | 1,785,000,000 | | | | 1,769,318 | | |
3.750%, 06/10/22 | | | 1,792,000,000 | | | | 1,770,840 | | |
4.250%, 06/10/21 | | | 139,300,000 | | | | 138,519 | | |
| | | | | | 17,170,767 | | |
Ukraine (0.7%) | |
Government (0.7%) | |
Ukraine Government
International Bond (USD)
0.000%, 05/31/40 (d) (e) | | | 1,369,000 | | | | 753,218 | | |
Total long-term debt securities
(cost: $54,154,924) | | | | | 55,476,383 | | |
See accompanying notes to financial statements.
73
SFT Advantus International Bond Fund
Investments in Securities – continued
| | | Shares/
Principal(b) | | Value(a) | |
Short-Term Securities (47.2%) | |
Mexico (10.2%) | |
Mexican Cetes (MXN)
6.986%, 02/01/18 (c) | | | 1,160,800 | | | $ | 58,925 | | |
7.016%, 01/04/18 (c) | | | 4,226,000 | | | | 215,733 | | |
7.077%, 03/01/18 (c) | | | 6,464,000 | | | | 326,287 | | |
7.209%, 03/01/18 (c) | | | 24,020,300 | | | | 1,212,487 | | |
7.219%, 01/04/18 (c) | | | 1,794,000 | | | | 91,582 | | |
7.219%, 03/15/18 (c) | | | 12,010,200 | | | | 604,540 | | |
7.219%, 03/28/18 (c) | | | 30,883,200 | | | | 1,550,482 | | |
7.229%, 03/01/18 (c) | | | 5,922,900 | | | | 298,974 | | |
7.229%, 03/28/18 (c) | | | 4,284,800 | | | | 215,117 | | |
7.229%, 04/12/18 (c) | | | 23,432,700 | | | | 1,172,887 | | |
7.249%, 03/01/18 (c) | | | 6,581,000 | | | | 332,193 | | |
7.249%, 04/12/18 (c) | | | 24,020,300 | | | | 1,202,298 | | |
7.280%, 05/10/18 (c) | | | 81,600 | | | | 4,061 | | |
7.290%, 05/10/18 (c) | | | 8,913,600 | | | | 443,655 | | |
7.290%, 05/24/18 (c) | | | 122,300 | | | | 6,070 | | |
7.300%, 04/26/18 (c) | | | 4,935,700 | | | | 246,355 | | |
7.310%, 04/26/18 (c) | | | 5,053,300 | | | | 252,225 | | |
7.310%, 05/24/18 (c) | | | 492,500 | | | | 24,444 | | |
7.310%, 08/16/18 (c) | | | 13,725,900 | | | | 669,904 | | |
7.320%, 06/21/18 (c) | | | 7,591,300 | | | | 374,647 | | |
7.325%, 04/26/18 (c) | | | 12,792,700 | | | | 638,520 | | |
7.336%, 08/16/18 (c) | | | 1,882,000 | | | | 91,853 | | |
7.341%, 10/11/18 (c) | | | 204,800 | | | | 9,885 | | |
7.371%, 08/16/18 (c) | | | 2,711,200 | | | | 132,322 | | |
7.371%, 10/11/18 (c) | | | 9,688,700 | | | | 467,660 | | |
7.422%, 06/07/18 (c) | | | 380,000 | | | | 18,808 | | |
7.432%, 12/06/18 (c) | | | 410,000 | | | | 19,574 | | |
7.564%, 06/21/18 (c) | | | 6,117,100 | | | | 301,892 | | |
| | | | | | 10,983,380 | | |
United States (32.0%) | |
Federal Home Loan Bank (USD)
0.913%, 01/02/18 (c) | | | 7,645,000 | | | | 7,645,000 | | |
1.014%, 01/02/18 (c) | | | 1,310,000 | | | | 1,310,000 | | |
1.065%, 01/02/18 (c) | | | 7,645,000 | | | | 7,645,000 | | |
U.S. Treasury Bill (USD)
1.307%, 03/08/18 (c) | | | 18,000,000 | | | | 17,957,953 | | |
| | | | | | 34,557,953 | | |
Investment Companies (5.0%) | |
United States (5.0%) | |
State Street Institutional
U.S. Government Money
Market Fund (USD),
current rate 1.210% | | | 5,436,158 | | | | 5,436,158 | | |
Total short-term securities
(cost: $51,404,353) | | | | | 50,977,491 | | |
Total investments in securities
(cost: $105,559,277) (f) | | | | | 106,453,874 | | |
Cash and other assets in
excess of liabilities (1.4%) | | | | | 1,549,054 | | |
Total net assets (100.0%) | | | | $ | 108,002,928 | | |
See accompanying notes to financial statements.
74
SFT Advantus International Bond Fund
Investments in Securities – continued
Foreign Forward Currency Contracts
On December 31, 2017, International Bond Fund had entered into forward foreign currency contracts that obligate the Fund to deliver currencies at specified future dates. Unrealized appreciation and depreciation on these contracts is included in the accompanying financial statements. The terms of the open contracts were as follows:
Exchange
Date | | Currency to be
delivered – SELL | | Currency to be
received – BUY | | Unrealized
Gain (Loss)(a) | | Counterparty | |
01/08/18 | | | 805,000 | | | EUR | | | | | 951,421 | | | USD | | | | $ | (15,487 | ) | | BOA | |
01/08/18 | | | 366,500 | | | EUR | | | | | 433,388 | | | USD | | | | | (6,826 | ) | | JPM | |
01/08/18 | | | 30,600 | | | EUR | | | | | 36,162 | | | USD | | | | | (593 | ) | | SCB | |
01/08/18 | | | 228,417 | | | EUR | | | | | 270,039 | | | USD | | | | | (4,319 | ) | | UBS | |
01/10/18 | | | 335,000 | | | EUR | | | | | 396,176 | | | USD | | | | | (6,246 | ) | | BCB | |
01/10/18 | | | 1,578,954 | | | EUR | | | | | 1,867,350 | | | USD | | | | | (29,385 | ) | | HSB | |
01/10/18 | | | 717,932 | | | EUR | | | | | 835,234 | | | USD | | | | | (27,188 | ) | | JPM | |
01/10/18 | | | 3,206,080 | | | EUR | | | | | 3,776,762 | | | USD | | | | | (74,574 | ) | | SCB | |
01/11/18 | | | 62,600,000 | | | JPY | | | | | 554,706 | | | USD | | | | | (1,186 | ) | | BCB | |
01/11/18 | | | 10,873,000 | | | JPY | | | | | 96,301 | | | USD | | | | | (253 | ) | | GSC | |
01/11/18 | | | 239,311 | | | EUR | | | | | 282,943 | | | USD | | | | | (4,548 | ) | | JPM | |
01/12/18 | | | 58,526 | | | USD | | | | | 3,868,000 | | | INR | | | | | 2,019 | | | JPS | |
01/16/18 | | | 33,230,000 | | | JPY | | | | | 293,468 | | | USD | | | | | (1,692 | ) | | BCB | |
01/16/18 | | | 119,438 | | | EUR | | | | | 140,698 | | | USD | | | | | (2,827 | ) | | BOA | |
01/16/18 | | | 9,980,000 | | | JPY | | | | | 88,121 | | | USD | | | | | (525 | ) | | CIT | |
01/16/18 | | | 763,000,000 | | | KRW | | | | | 667,308 | | | USD | | | | | (45,789 | ) | | CIT | |
01/16/18 | | | 717,825 | | | EUR | | | | | 849,804 | | | USD | | | | | (12,783 | ) | | DBK | |
01/16/18 | | | 35,690,000 | | | JPY | | | | | 314,977 | | | USD | | | | | (2,035 | ) | | HSB | |
01/16/18 | | | 602,000 | | | EUR | | | | | 717,084 | | | USD | | | | | (6,320 | ) | | HSB | |
01/16/18 | | | 21,600,000 | | | JPY | | | | | 192,027 | | | USD | | | | | 168 | | | JPM | |
01/16/18 | | | 116,000 | | | EUR | | | | | 138,221 | | | USD | | | | | (1,172 | ) | | JPM | |
01/16/18 | | | 160,000 | | | EUR | | | | | 188,310 | | | USD | | | | | (3,957 | ) | | SCB | |
01/17/18 | | | 38,749 | | | EUR | | | | | 46,239 | | | USD | | | | | (327 | ) | | BOA | |
01/17/18 | | | 78,270 | | | EUR | | | | | 92,714 | | | USD | | | | | (1,346 | ) | | GSC | |
01/18/18 | | | 168,000 | | | EUR | | | | | 199,372 | | | USD | | | | | (2,531 | ) | | GSC | |
01/18/18 | | | 935,351 | | | EUR | | | | | 1,110,200 | | | USD | | | | | (13,908 | ) | | JPM | |
01/18/18 | | | 365,500 | | | EUR | | | | | 431,206 | | | USD | | | | | (8,054 | ) | | MSC | |
01/18/18 | | | 41,350 | | | EUR | | | | | 49,052 | | | USD | | | | | (642 | ) | | UBS | |
01/22/18 | | | 317,259 | | | EUR | | | | | 374,736 | | | USD | | | | | (6,633 | ) | | JPM | |
01/22/18 | | | 45,710,000 | | | JPY | | | | | 412,266 | | | USD | | | | | 6,132 | | | SCB | |
01/23/18 | | | 484,812 | | | USD | | | | | 31,697,000 | | | INR | | | | | 10,763 | | | DBK | |
01/23/18 | | | 2,752,009 | | | USD | | | | | 179,981,362 | | | INR | | | | | 61,959 | | | JPS | |
01/23/18 | | | 1,283,403 | | | USD | | | | | 84,095,000 | | | INR | | | | | 31,403 | | | JPS | |
01/24/18 | | | 27,530,000 | | | JPY | | | | | 244,184 | | | USD | | | | | (446 | ) | | BCB | |
01/24/18 | | | 10,020,000 | | | JPY | | | | | 90,199 | | | USD | | | | | 1,162 | | | DBK | |
01/24/18 | | | 815,540 | | | EUR | | | | | 966,749 | | | USD | | | | | (13,703 | ) | | DBK | |
01/25/18 | | | 32,786,000 | | | JPY | | | | | 296,590 | | | USD | | | | | 5,242 | | | CIT | |
01/25/18 | | | 51,000,000 | | | JPY | | | | | 461,240 | | | USD | | | | | 8,036 | | | JPM | |
01/29/18 | | | 50,203,538 | | | JPY | | | | | 453,035 | | | USD | | | | | 6,819 | | | DBK | |
01/29/18 | | | 184,000 | | | EUR | | | | | 218,165 | | | USD | | | | | (3,105 | ) | | GSC | |
01/29/18 | | | 306,311 | | | USD | | | | | 20,094,000 | | | INR | | | | | 7,656 | | | HSB | |
01/29/18 | | | 17,600,000 | | | JPY | | | | | 159,231 | | | USD | | | | | 2,799 | | | JPM | |
01/29/18 | | | 894,005 | | | USD | | | | | 58,640,000 | | | INR | | | | | 22,240 | | | JPS | |
01/30/18 | | | 207,232 | | | EUR | | | | | 244,225 | | | USD | | | | | (4,997 | ) | | DBK | |
01/30/18 | | | 77,000 | | | EUR | | | | | 90,770 | | | USD | | | | | (1,832 | ) | | GSC | |
01/30/18 | | | 59,162 | | | USD | | | | | 3,868,000 | | | INR | | | | | 1,269 | | | JPS | |
01/31/18 | | | 60,350,000 | | | JPY | | | | | 546,550 | | | USD | | | | | 10,096 | | | BCB | |
01/31/18 | | | 1,381,733 | | | EUR | | | | | 1,655,005 | | | USD | | | | | (6,790 | ) | | BCB | |
01/31/18 | | | 2,701,600 | | | EUR | | | | | 3,150,876 | | | USD | | | | | (98,310 | ) | | BOA | |
01/31/18 | | | 64,982,551 | | | JPY | | | | | 587,280 | | | USD | | | | | 9,648 | | | HSB | |
01/31/18 | | | 633,107 | | | EUR | | | | | 755,455 | | | USD | | | | | (5,976 | ) | | SCB | |
02/01/18 | | | 145,184 | | | USD | | | | | 9,556,000 | | | INR | | | | | 4,081 | | | JPS | |
02/02/18 | | | 535,000 | | | EUR | | | | | 626,067 | | | USD | | | | | (17,445 | ) | | JPM | |
02/05/18 | | | 699,000 | | | EUR | | | | | 818,082 | | | USD | | | | | (22,836 | ) | | BOA | |
02/05/18 | | | 631,764 | | | EUR | | | | | 739,227 | | | USD | | | | | (20,804 | ) | | DBK | |
02/06/18 | | | 262,390 | | | EUR | | | | | 307,700 | | | USD | | | | | (7,982 | ) | | BOA | |
02/07/18 | | | 76,884 | | | EUR | | | | | 89,846 | | | USD | | | | | (2,658 | ) | | CIT | |
02/07/18 | | | 820,000 | | | EUR | | | | | 957,744 | | | USD | | | | | (28,855 | ) | | DBK | |
02/08/18 | | | 241,973 | | | USD | | | | | 15,917,000 | | | INR | | | | | 6,445 | | | DBK | |
02/08/18 | | | 330,523 | | | USD | | | | | 21,741,833 | | | INR | | | | | 8,803 | | | DBK | |
02/08/18 | | | 167,331 | | | USD | | | | | 10,920,000 | | | INR | | | | | 3,099 | | | HSB | |
See accompanying notes to financial statements.
75
SFT Advantus International Bond Fund
Investments in Securities – continued
Exchange
Date | | Currency to be
delivered – SELL | | Currency to be
received – BUY | | Unrealized
Gain (Loss)(a) | | Counterparty | |
02/09/18 | | | 14,673,000 | | | JPY | | | | | 133,105 | | | USD | | | | $ | 2,620 | | | CIT | |
02/09/18 | | | 3,116,000 | | | EUR | | | | | 3,626,635 | | | USD | | | | | (122,870 | ) | | DBK | |
02/12/18 | | | 158,000 | | | EUR | | | | | 184,208 | | | USD | | | | | (5,947 | ) | | HSB | |
02/12/18 | | | 239,310 | | | EUR | | | | | 283,476 | | | USD | | | | | (4,537 | ) | | JPM | |
02/13/18 | | | 61,530,000 | | | JPY | | | | | 560,523 | | | USD | | | | | 13,242 | | | CIT | |
02/14/18 | | | 3,074,985 | | | EUR | | | | | 3,602,314 | | | USD | | | | | (98,901 | ) | | CIT | |
02/14/18 | | | 11,479,667 | | | JPY | | | | | 101,684 | | | USD | | | | | (428 | ) | | CIT | |
02/14/18 | | | 890,000 | | | EUR | | | | | 1,043,512 | | | USD | | | | | (27,740 | ) | | JPM | |
02/15/18 | | | 15,430,000 | | | JPY | | | | | 141,547 | | | USD | | | | | 4,291 | | | BCB | |
02/15/18 | | | 115,000 | | | EUR | | | | | 134,875 | | | USD | | | | | (3,554 | ) | | DBK | |
02/15/18 | | | 107,000 | | | EUR | | | | | 125,548 | | | USD | | | | | (3,250 | ) | | GSC | |
02/15/18 | | | 8,030,000 | | | JPY | | | | | 74,339 | | | USD | | | | | 2,909 | | | JPM | |
02/15/18 | | | 1,520,000 | | | AUD | | | | | 1,160,710 | | | USD | | | | | (28,119 | ) | | JPM | |
02/15/18 | | | 369,583 | | | USD | | | | | 24,082,000 | | | INR | | | | | 5,912 | | | JPS | |
02/16/18 | | | 589,650 | | | EUR | | | | | 696,934 | | | USD | | | | | (12,882 | ) | | BOA | |
02/16/18 | | | 15,430,000 | | | JPY | | | | | 138,628 | | | USD | | | | | 1,366 | | | DBK | |
02/16/18 | | | 21,480,270 | | | JPY | | | | | 198,104 | | | USD | | | | | 7,021 | | | GSC | |
02/16/18 | | | 100,310,000 | | | JPY | | | | | 899,117 | | | USD | | | | | 6,782 | | | JPM | |
02/20/18 | | | 563,000,000 | | | KRW | | | | | 503,195 | | | USD | | | | | (23,606 | ) | | CIT | |
02/20/18 | | | 508,500,000 | | | KRW | | | | | 455,666 | | | USD | | | | | (20,140 | ) | | CIT | |
02/20/18 | | | 51,438,000 | | | JPY | | | | | 469,303 | | | USD | | | | | 11,638 | | | DBK | |
02/20/18 | | | 78,460 | | | EUR | | | | | 93,124 | | | USD | | | | | (1,347 | ) | | GSC | |
02/20/18 | | | 168,000 | | | EUR | | | | | 199,093 | | | USD | | | | | (3,190 | ) | | GSC | |
02/20/18 | | | 317,259 | | | EUR | | | | | 375,374 | | | USD | | | | | (6,627 | ) | | JPM | |
02/20/18 | | | 317,000 | | | EUR | | | | | 376,369 | | | USD | | | | | (5,320 | ) | | SCB | |
02/21/18 | | | 1,464,000,000 | | | KRW | | | | | 1,288,925 | | | USD | | | | | (80,991 | ) | | CIT | |
02/22/18 | | | 403,000 | | | AUD | | | | | 297,668 | | | USD | | | | | (17,518 | ) | | CIT | |
02/22/18 | | | 96,755,000 | | | JPY | | | | | 889,292 | | | USD | | | | | 28,343 | | | HSB | |
02/22/18 | | | 1,514,253 | | | EUR | | | | | 1,795,904 | | | USD | | | | | (27,570 | ) | | HSB | |
02/22/18 | | | 69,639,000 | | | JPY | | | | | 642,889 | | | USD | | | | | 23,224 | | | JPM | |
02/22/18 | | | 642,000 | | | EUR | | | | | 758,773 | | | USD | | | | | (14,328 | ) | | JPM | |
02/22/18 | | | 33,313 | | | EUR | | | | | 39,432 | | | USD | | | | | (684 | ) | | UBS | |
02/26/18 | | | 22,797,000 | | | JPY | | | | | 210,440 | | | USD | | | | | 7,550 | | | DBK | |
02/27/18 | | | 65,472,000 | | | JPY | | | | | 592,239 | | | USD | | | | | 9,518 | | | HSB | |
02/27/18 | | | 524,000 | | | EUR | | | | | 617,835 | | | USD | | | | | (13,351 | ) | | MSC | |
02/28/18 | | | 54,600,000 | | | JPY | | | | | 506,522 | | | USD | | | | | 20,543 | | | BCB | |
02/28/18 | | | 131,855 | | | EUR | | | | | 157,751 | | | USD | | | | | (1,084 | ) | | BOA | |
02/28/18 | | | 38,472,000 | | | JPY | | | | | 355,639 | | | USD | | | | | 13,211 | | | DBK | |
02/28/18 | | | 1,494,000,000 | | | KRW | | | | | 1,336,434 | | | USD | | | | | (61,881 | ) | | DBK | |
02/28/18 | | | 54,300 | | | EUR | | | | | 64,861 | | | USD | | | | | (550 | ) | | DBK | |
02/28/18 | | | 77,000 | | | EUR | | | | | 92,342 | | | USD | | | | | (414 | ) | | GSC | |
02/28/18 | | | 65,692,000 | | | JPY | | | | | 606,770 | | | USD | | | | | 22,065 | | | JPM | |
02/28/18 | | | 33,447,000 | | | JPY | | | | | 308,834 | | | USD | | | | | 11,132 | | | JPM | |
02/28/18 | | | 22,848,000 | | | JPY | | | | | 207,278 | | | USD | | | | | 3,914 | | | JPM | |
02/28/18 | | | 645,663 | | | EUR | | | | | 771,697 | | | USD | | | | | (6,084 | ) | | SCB | |
02/28/18 | | | 616,157 | | | EUR | | | | | 740,430 | | | USD | | | | | (1,807 | ) | | UBS | |
03/01/18 | | | 73,808,000 | | | JPY | | | | | 675,836 | | | USD | | | | | 18,861 | | | HSB | |
03/05/18 | | | 75,000 | | | EUR | | | | | 89,531 | | | USD | | | | | (842 | ) | | GSC | |
03/05/18 | | | 1,449,000,000 | | | KRW | | | | | 1,341,294 | | | USD | | | | | (15,130 | ) | | HSB | |
03/05/18 | | | 44,000,000 | | | JPY | | | | | 394,447 | | | USD | | | | | 2,725 | | | JPM | |
03/06/18 | | | 20,800,000 | | | JPY | | | | | 185,334 | | | USD | | | | | 144 | | | HSB | |
03/06/18 | | | 158,417 | | | EUR | | | | | 188,566 | | | USD | | | | | (2,334 | ) | | UBS | |
03/07/18 | | | 262,390 | | | EUR | | | | | 311,969 | | | USD | | | | | (4,248 | ) | | BOA | |
03/07/18 | | | 51,000 | | | EUR | | | | | 60,689 | | | USD | | | | | (773 | ) | | GSC | |
03/09/18 | | | 74,100 | | | AUD | | | | | 55,640 | | | USD | | | | | (2,310 | ) | | CIT | |
03/09/18 | | | 149,300 | | | AUD | | | | | 112,112 | | | USD | | | | | (4,648 | ) | | CIT | |
03/12/18 | | | 239,310 | | | EUR | | | | | 283,939 | | | USD | | | | | (4,565 | ) | | JPM | |
03/13/18 | | | 1,971,000 | | | AUD | | | | | 1,463,773 | | | USD | | | | | (77,618 | ) | | CIT | |
03/13/18 | | | 55,874 | | | EUR | | | | | 66,314 | | | USD | | | | | (1,050 | ) | | CIT | |
03/13/18 | | | 22,100,000 | | | JPY | | | | | 204,759 | | | USD | | | | | 7,907 | | | DBK | |
03/13/18 | | | 717,825 | | | EUR | | | | | 852,568 | | | USD | | | | | (12,878 | ) | | DBK | |
03/13/18 | | | 2,955,000 | | | AUD | | | | | 2,186,700 | | | USD | | | | | (124,214 | ) | | JPM | |
03/14/18 | | | 253,404 | | | USD | | | | | 16,470,000 | | | INR | | | | | 2,479 | | | DBK | |
03/14/18 | | | 607,000,000 | | | KRW | | | | | 557,853 | | | USD | | | | | (10,415 | ) | | DBK | |
03/15/18 | | | 317,259 | | | EUR | | | | | 375,318 | | | USD | | | | | (7,239 | ) | | JPM | |
03/16/18 | | | 589,650 | | | EUR | | | | | 697,025 | | | USD | | | | | (14,037 | ) | | BOA | |
03/16/18 | | | 370,000 | | | AUD | | | | | 275,780 | | | USD | | | | | (13,570 | ) | | JPM | |
03/19/18 | | | 22,560,000 | | | JPY | | | | | 205,809 | | | USD | | | | | 4,782 | | | BCB | |
See accompanying notes to financial statements.
76
SFT Advantus International Bond Fund
Investments in Securities – continued
Exchange
Date | | Currency to be
delivered – SELL | | Currency to be
received – BUY | | Unrealized
Gain (Loss)(a) | | Counterparty | |
03/19/18 | | | 67,786 | | | USD | | | | | 4,419,000 | | | INR | | | | $ | 824 | | | CIT | |
03/19/18 | | | 78,270 | | | EUR | | | | | 92,880 | | | USD | | | | | (1,526 | ) | | GSC | |
03/19/18 | | | 365,500 | | | EUR | | | | | 432,719 | | | USD | | | | | (8,133 | ) | | MSC | |
03/20/18 | | | 508,500,000 | | | KRW | | | | | 449,821 | | | USD | | | | | (26,260 | ) | | CIT | |
03/20/18 | | | 4,111,000 | | | AUD | | | | | 3,085,922 | | | USD | | | | | (128,936 | ) | | JPM | |
03/22/18 | | | 28,159,000 | | | JPY | | | | | 254,893 | | | USD | | | | | 3,927 | | | DBK | |
03/23/18 | | | 77,666,000 | | | JPY | | | | | 702,558 | | | USD | | | | | 10,318 | | | CIT | |
03/26/18 | | | 42,092,130 | | | JPY | | | | | 381,207 | | | USD | | | | | 5,967 | | | BCB | |
03/26/18 | | | 29,650,000 | | | JPY | | | | | 268,423 | | | USD | | | | | 4,101 | | | MSC | |
03/30/18 | | | 9,763,000 | | | JPY | | | | | 87,130 | | | USD | | | | | 73 | | | JPM | |
04/10/18 | | | 29,920,000 | | | JPY | | | | | 268,221 | | | USD | | | | | 1,241 | | | SCB | |
04/11/18 | | | 57,903,900 | | | JPY | | | | | 518,955 | | | USD | | | | | 2,241 | | | BCB | |
04/11/18 | | | 7,000,000,000 | | | KRW | | | | | 6,224,435 | | | USD | | | | | (331,906 | ) | | HSB | |
04/13/18 | | | 12,300,000 | | | JPY | | | | | 113,244 | | | USD | | | | | 3,470 | | | CIT | |
04/18/18 | | | 22,030,000 | | | JPY | | | | | 202,897 | | | USD | | | | | 6,228 | | | BOA | |
04/23/18 | | | 29,220,000 | | | JPY | | | | | 272,823 | | | USD | | | | | 11,888 | | | JPM | |
04/24/18 | | | 142,170,490 | | | JPY | | | | | 1,324,808 | | | USD | | | | | 55,148 | | | JPM | |
04/25/18 | | | 76,376 | | | USD | | | | | 5,058,000 | | | INR | | | | | 1,792 | | | DBK | |
04/27/18 | | | 496,728 | | | USD | | | | | 32,918,166 | | | INR | | | | | 11,872 | | | DBK | |
04/27/18 | | | 52,800,000 | | | JPY | | | | | 467,907 | | | USD | | | | | (3,710 | ) | | GSC | |
04/30/18 | | | 536,000,000 | | | KRW | | | | | 476,148 | | | USD | | | | | (26,195 | ) | | HSB | |
05/09/18 | | | 13,826,020 | | | JPY | | | | | 122,205 | | | USD | | | | | (1,379 | ) | | CIT | |
05/14/18 | | | 11,479,666 | | | JPY | | | | | 102,206 | | | USD | | | | | (436 | ) | | CIT | |
05/14/18 | | | 13,582,000 | | | JPY | | | | | 121,062 | | | USD | | | | | (377 | ) | | JPM | |
05/15/18 | | | 1,020,000,000 | | | KRW | | | | | 916,195 | | | USD | | | | | (40,229 | ) | | CIT | |
05/15/18 | | | 19,620,000 | | | JPY | | | | | 174,698 | | | USD | | | | | (738 | ) | | GSC | |
05/15/18 | | | 22,910,000 | | | JPY | | | | | 204,828 | | | USD | | | | | (27 | ) | | HSB | |
05/15/18 | | | 1,520,000 | | | AUD | | | | | 1,160,148 | | | USD | | | | | (28,391 | ) | | JPM | |
05/15/18 | | | 14,666,000 | | | JPY | | | | | 130,971 | | | USD | | | | | (168 | ) | | SCB | |
05/16/18 | | | 14,665,000 | | | JPY | | | | | 130,517 | | | USD | | | | | (621 | ) | | CIT | |
05/16/18 | | | 384,180 | | | USD | | | | | 25,664,000 | | | INR | | | | | 11,419 | | | HSB | |
05/16/18 | | | 100,685,000 | | | JPY | | | | | 896,803 | | | USD | | | | | (3,548 | ) | | JPM | |
05/16/18 | | | 13,769,800 | | | JPY | | | | | 122,504 | | | USD | | | | | (629 | ) | | SCB | |
05/17/18 | | | 2,133,000,000 | | | KRW | | | | | 1,908,298 | | | USD | | | | | (91,885 | ) | | HSB | |
05/18/18 | | | 74,624,550 | | | JPY | | | | | 669,819 | | | USD | | | | | 2,428 | | | BOA | |
05/18/18 | | | 97,530,600 | | | JPY | | | | | 874,898 | | | USD | | | | | 2,651 | | | CIT | |
05/18/18 | | | 610,000,000 | | | KRW | | | | | 549,104 | | | USD | | | | | (22,931 | ) | | DBK | |
05/21/18 | | | 74,400,375 | | | JPY | | | | | 677,676 | | | USD | | | | | 12,171 | | | BOA | |
05/21/18 | | | 97,530,600 | | | JPY | | | | | 871,797 | | | USD | | | | | (606 | ) | | CIT | |
05/21/18 | | | 45,867,000 | | | JPY | | | | | 410,406 | | | USD | | | | | 129 | | | DBK | |
05/21/18 | | | 74,662,400 | | | JPY | | | | | 681,537 | | | USD | | | | | 13,688 | | | HSB | |
05/22/18 | | | 74,602,500 | | | JPY | | | | | 683,674 | | | USD | | | | | 16,321 | | | BOA | |
05/22/18 | | | 23,068,000 | | | JPY | | | | | 207,499 | | | USD | | | | | 1,145 | | | CIT | |
05/22/18 | | | 41,201,000 | | | JPY | | | | | 377,584 | | | USD | | | | | 9,022 | | | JPM | |
05/24/18 | | | 2,437,324 | | | USD | | | | | 161,582,400 | | | INR | | | | | 50,955 | | | JPS | |
05/24/18 | | | 52,556,000 | | | JPY | | | | | 472,674 | | | USD | | | | | 2,480 | | | SCB | |
05/25/18 | | | 64,764,000 | | | JPY | | | | | 593,077 | | | USD | | | | | 13,630 | | | BOA | |
05/29/18 | | | 11,968,000 | | | JPY | | | | | 107,703 | | | USD | | | | | 599 | | | HSB | |
06/04/18 | | | 9,862,666 | | | USD | | | | | 32,387,023 | | | BRL | | | | | (256,878 | ) | | JPM | |
06/08/18 | | | 46,300,000 | | | JPY | | | | | 416,866 | | | USD | | | | | 2,271 | | | CIT | |
06/11/18 | | | 34,700,000 | | | JPY | | | | | 311,162 | | | USD | | | | | 384 | | | HSB | |
06/12/18 | | | 91,710,000 | | | JPY | | | | | 816,805 | | | USD | | | | | (4,612 | ) | | CIT | |
06/13/18 | | | 17,886,000 | | | JPY | | | | | 159,440 | | | USD | | | | | (768 | ) | | CIT | |
06/13/18 | | | 66,670,000 | | | JPY | | | | | 594,260 | | | USD | | | | | (2,917 | ) | | HSB | |
06/13/18 | | | 61,770,000 | | | JPY | | | | | 550,665 | | | USD | | | | | (2,622 | ) | | JPM | |
06/15/18 | | | 26,000,000 | | | JPY | | | | | 232,247 | | | USD | | | | | (669 | ) | | JPM | |
06/18/18 | | | 46,950,000 | | | JPY | | | | | 437,354 | | | USD | | | | | 16,688 | | | HSB | |
06/18/18 | | | 18,200,000 | | | JPY | | | | | 162,700 | | | USD | | | | | (369 | ) | | MSC | |
06/19/18 | | | 46,870,000 | | | JPY | | | | | 432,157 | | | USD | | | | | 12,182 | | | DBK | |
06/19/18 | | | 154,900,000 | | | JPY | | | | | 1,394,603 | | | USD | | | | | 6,635 | | | JPM | |
06/20/18 | | | 35,200,000 | | | JPY | | | | | 322,256 | | | USD | | | | | 6,830 | | | CIT | |
06/22/18 | | | 46,960,000 | | | JPY | | | | | 428,233 | | | USD | | | | | 7,376 | | | DBK | |
08/14/18 | | | 11,479,667 | | | JPY | | | | | 102,795 | | | USD | | | | | (443 | ) | | CIT | |
09/11/18 | | | 34,700,000 | | | JPY | | | | | 313,033 | | | USD | | | | | 383 | | | HSB | |
| | | | | | | | | | | $ | (1,644,890 | ) | | | |
See accompanying notes to financial statements.
77
SFT Advantus International Bond Fund
Investments in Securities – continued
At December 31, 2017, the Fund had the following interest rate swap contracts outstanding.
Interest Rate Swap Contracts
| | | | | Payment
Frequency | | Maturity | | Notional | | Upfront
Payments/ | | Unrealized
Appreciation/ | | Market Value | |
Description | | Counter-party | | (Pay/Rec) | | Date | | Amount | | (Receipts) | | (Depreciation)(a) | | Asset | | Liability | |
Centrally Cleared Swaps | |
Receive Floating Rate 3-Month
USD LIBOR Pay Fixed Rate 1.816% | | CIT | | Quarterly/
Semi-Annual | | 02/03/25 | | | 440,000 | | | $ | — | | | $ | 12,043 | | | $ | 12,043 | | | $ | — | | |
Receive Floating Rate 3-Month
USD LIBOR Pay Fixed Rate 1.914% | | CIT | | Quarterly/
Semi-Annual | | 01/22/25 | | | 1,760,000 | | | | — | | | | 35,599 | | | | 35,599 | | | | — | | |
Receive Floating Rate 3-Month
USD LIBOR Pay Fixed Rate 1.936% | | CIT | | Quarterly/
Semi-Annual | | 01/29/25 | | | 320,000 | | | | — | | | | 6,039 | | | | 6,039 | | | | — | | |
Receive Floating Rate 3-Month
USD LIBOR Pay Fixed Rate 1.941% | | CIT | | Quarterly/
Semi-Annual | | 01/30/25 | | | 270,000 | | | | — | | | | 5,019 | | | | 5,019 | | | | — | | |
Receive Floating Rate 3-Month
USD LIBOR Pay Fixed Rate 1.969% | | CIT | | Quarterly/
Semi-Annual | | 01/23/25 | | | 2,200,000 | | | | — | | | | 35,973 | | | | 35,973 | | | | — | | |
Receive Floating Rate 3-Month
USD LIBOR Pay Fixed Rate 1.973% | | CIT | | Quarterly/
Semi-Annual | | 01/27/25 | | | 1,300,000 | | | | — | | | | 21,049 | | | | 21,049 | | | | — | | |
Receive Floating Rate 3-Month
USD LIBOR Pay Fixed Rate 1.977% | | CIT | | Quarterly/
Semi-Annual | | 03/27/25 | | | 750,000 | | | | — | | | | 13,362 | | | | 13,362 | | | | — | | |
Receive Floating Rate 3-Month
USD LIBOR Pay Fixed Rate 1.985% | | CIT | | Quarterly/
Semi-Annual | | 03/27/25 | | | 750,000 | | | | — | | | | 12,980 | | | | 12,980 | | | | — | | |
Receive Floating Rate 3-Month
USD LIBOR Pay Fixed Rate 2.378% | | CIT | | Quarterly/
Semi-Annual | | 11/18/46 | | | 3,200,000 | | | | — | | | | 108,226 | | | | 108,226 | | | | — | | |
Receive Floating Rate 3-Month
USD LIBOR Pay Fixed Rate 2.537% | | GSC | | Quarterly/
Semi-Annual | | 04/13/47 | | | 1,700,000 | | | | — | | | | (2,662 | ) | | | — | | | | (2,662 | ) | |
Receive Floating Rate 3-Month
USD LIBOR Pay Fixed Rate 2.695% | | CIT | | Quarterly/
Semi-Annual | | 05/09/24 | | | 4,260,000 | | | | — | | | | (108,234 | ) | | | — | | | | (108,234 | ) | |
Receive Floating Rate 3-Month
USD LIBOR Pay Fixed Rate 2.731% | | CIT | | Quarterly/
Semi-Annual | | 07/07/24 | | | 1,250,000 | | | | — | | | | (45,566 | ) | | | — | | | | (45,566 | ) | |
Receive Floating Rate 3-Month
USD LIBOR Pay Fixed Rate 2.793% | | CIT | | Quarterly/
Semi-Annual | | 03/13/47 | | | 2,000,000 | | | | — | | | | (124,448 | ) | | | — | | | | (124,448 | ) | |
Receive Floating Rate 3-Month
USD LIBOR Pay Fixed Rate 3.387% | | CIT | | Quarterly/
Semi-Annual | | 05/09/44 | | | 2,028,000 | | | | — | | | | (336,183 | ) | | | — | | | | (336,183 | ) | |
Net unrealized appreciation
(depreciation) | | | | | | | | | | $ | — | | | $ | (366,803 | ) | | $ | 250,290 | | | $ | (617,093 | ) | |
Investments in Securities Legend
(a) Securities are valued by procedures described in Note 2 of the Notes to Financial Statements.
(b) Principal amounts for foreign debt securities are denominated in the currencies indicated. United States debt securities are denominated in U.S. Dollars.
(c) Rate represents annualized yield at date of purchase.
(d) Variable rate security.
(e) Security sold within terms of a private placement memorandum exempt from registration under Section 144A of the Securities Act of 1933, as amended, and may be sold only to dealers in that program. This security has been determined to be liquid unless otherwise indicated.
(f) At December 31, 2017 the cost of investments for federal income tax purposes was $103,914,388. The aggregate unrealized appreciation and depreciation of investments based on this cost were:
Gross unrealized appreciation | | $ | 3,406,046 | | |
Gross unrealized depreciation | | | (2,878,253 | ) | |
Net unrealized appreciation | | $ | 527,793 | | |
See accompanying notes to financial statements.
78
SFT Advantus International Bond Fund
Investments in Securities – continued
Currency Legend
ARS Argentine Peso
AUD Australian Dollar
BRL Brazilian Real
EUR Euro
GHS Ghanaian Cedi
IDR Indonesian Rupiah
INR Indian Rupee
JPY Japanese Yen
KRW South Korean Won
MXN Mexican Peso
PHP Philippine Peso
USD United States Dollar
ZAR South African Rand
Counterparty Legend
BCB Barclays Bank PLC
BOA Bank of America Merrill Lynch
CIT Citibank NA
DBK Deutsche Bank AG
GSC Goldman Sachs
HSB HSBC Bank PLC
JPM JPMorgan Chase Bank NA
JPS JPMorgan Chase (Singapore)
MSC Morgan Stanley and Co., Inc.
SCB Standard Chartered Bank
UBS UBS AG
See accompanying notes to financial statements.
79
SFT Advantus Managed Volatility Equity Fund
Investments in Securities
(Percentages of each investment category relate to total net assets)
| | |
Shares | | Value(a) | |
Mutual Funds (90.0%) | |
Investment Companies (90.0%) | |
iShares Core High
Dividend ETF | | | 523,042 | | | $ | 47,147,006 | | |
iShares Edge MSCI
Minimum Volatility
EAFE ETF | | | 895,113 | | | | 65,325,347 | | |
iShares Edge MSCI
Minimum Volatility
Emerging Markets ETF | | | 261,705 | | | | 15,901,196 | | |
iShares Edge MSCI
Minimum Volatility
USA ETF (b) | | | 1,583,132 | | | | 83,557,707 | | |
iShares MSCI Germany ETF | | | 313,962 | | | | 10,367,025 | | |
iShares Short Maturity
Bond ETF | | | 260,545 | | | | 13,058,515 | | |
Total mutual funds
(cost: $208,245,296) | | | | | 235,356,796 | | |
Purchased Options (0.1%) | |
Put Option Purchased (0.1%) | |
S&P 500 Index,
$2,525.00, 01/19/18
(cost: $97,855) | | | | | 60,450 | | |
| | |
Shares | | Value(a) | |
Short-Term Securities (10.9%) | |
Investment Companies (10.9%) | |
State Street Institutional
U.S. Government
Money Market Fund,
current rate 1.210% | | | 28,578,017 | | | | 28,578,017 | | |
Total short-term securities
(cost: $28,578,017) | | | | | 28,578,017 | | |
Total investments in securities
(cost: $236,921,168) (c) | | | | | 263,995,263 | | |
Liabilities in excess of cash
and other assets (-1.0%) | | | | | (2,514,624 | ) | |
Total net assets (100.0%) | | | | $ | 261,480,639 | | |
Investments in Securities Legend
(a) Securities are valued by procedures described in Note 2 of the Notes to Financial Statements.
(b) Fully or partially pledged as initial margin deposits on open futures contracts.
Holdings of Open Futures Contracts
On December 31, 2017, securities with an aggregate market value of $2,454,270 have been pledged to cover margin requirements for the following open futures contracts:
Type | | Expiration | | Number of
Contracts | | Position
Type | | Notional
Amount | | Market
Value | | Unrealized
Appreciation/
(Depreciation)(a) | |
S&P 500® E-Mini Index Future | | March 2018 | | | 162 | | | Long | | $ | 21,527,072 | | | $ | 21,675,600 | | | $ | 148,528 | | |
(c) At December 31, 2017 the cost of investments for federal income tax purposes was $237,063,514. The aggregate unrealized appreciation and depreciation of investments based on this cost were:
Gross unrealized appreciation | | $ | 27,102,027 | | |
Gross unrealized depreciation | | | (47,099 | ) | |
Net unrealized appreciation | | $ | 27,054,928 | | |
Holdings of Options Contracts
Purchased Options | | Contracts | | Expiration Date | | Notional Amount | | Exercise Price | | Value(a) | |
Put – S&P 500 Index | | | 195 | | | January 2018 | | $ | 19,500 | | | | 2,525.00 | | | $ | 60,450 | | |
Written Options | | Contracts | | Expiration Date | | Notional Amount | | Exercise Price | | Value(a) | |
Put – S&P 500 Index | | | 195 | | | January 2018 | | $ | 19,500 | | | | 2,395.00 | | | $ | (25,350 | ) | |
See accompanying notes to financial statements.
80
SFT Advantus Mortgage Securities Fund
Investments in Securities
(Percentages of each investment category relate to total net assets)
| | | Principal | | Value(a) | |
Long-Term Debt Securities (94.7%) | |
Government Obligations (75.1%) | |
Other Government Obligations (1.1%) | |
Provincial or Local Government
Obligations (1.1%) | |
Ohio State Water
Development Authority,
4.817%, 12/01/30 | | $ | 250,000 | | | $ | 282,577 | | |
Texas A&M University,
4.000%, 05/15/31 | | | 325,000 | | | | 341,874 | | |
Utility Debt Securitization
Authority, 3.435%, 12/15/25 | | | 355,000 | | | | 365,235 | | |
| | | | | | 989,686 | | |
U.S. Government Agencies and
Obligations (74.0%) | |
Export-Import Bank of the United
States (0.7%) | |
DY7 Leasing LLC,
2.578%, 12/10/25 | | | 166,667 | | | | 166,927 | | |
Export Leasing 2009 LLC,
1.859%, 08/28/21 | | | 98,796 | | | | 97,965 | | |
Helios Leasing I LLC
1.825%, 05/16/25 | | | 97,616 | | | | 95,150 | | |
2.018%, 05/29/24 | | | 148,525 | | | | 146,421 | | |
Union 16 Leasing LLC,
1.863%, 01/22/25 | | | 157,255 | | | | 153,802 | | |
| | | | | | 660,265 | | |
Federal Home Loan Mortgage Corporation
(FHLMC) (15.7%) | |
1.893%, 01/25/23 (1-Month
LIBOR + 0.650%) (b) | | | 250,336 | | | | 251,260 | | |
2.278%, 10/25/29 (1-Month
USD LIBOR + 0.950%) (b) | | | 450,000 | | | | 408,148 | | |
2.500%, 03/01/28 | | | 152,332 | | | | 153,072 | | |
2.500%, 04/01/28 | | | 236,557 | | | | 237,752 | | |
2.852%, 03/25/29 (1-Month
USD LIBOR + 1.300%) (b) | | | 500,000 | | | | 507,454 | | |
3.000%, 08/01/42 | | | 117,412 | | | | 118,041 | | |
3.000%, 12/01/42 | | | 246,783 | | | | 248,079 | | |
3.000%, 01/01/43 | | | 331,115 | | | | 333,009 | | |
3.000%, 02/01/43 | | | 778,572 | | | | 782,954 | | |
3.000%, 04/01/43 | | | 313,518 | | | | 315,325 | | |
3.000%, 10/25/46 | | | 365,862 | | | | 362,982 | | |
3.500%, 10/01/25 | | | 107,338 | | | | 111,632 | | |
3.500%, 05/01/32 | | | 279,329 | | | | 290,717 | | |
3.500%, 03/01/42 | | | 1,055,556 | | | | 1,090,784 | | |
3.500%, 08/01/42 | | | 276,284 | | | | 285,514 | | |
3.500%, 12/01/44 | | | 1,252,643 | | | | 1,289,012 | | |
3.500%, 05/25/45 | | | 599,550 | | | | 605,135 | | |
3.500%, 11/01/46 | | | 407,126 | | | | 419,266 | | |
3.528%, 02/25/24 (1-Month
USD LIBOR + 2.200%) (b) | | | 227,556 | | | | 234,434 | | |
3.752%, 09/25/24 (1-Month
USD LIBOR + 2.200%) (b) | | | 476,997 | | | | 492,154 | | |
4.000%, 09/01/40 | | | 365,769 | | | | 387,520 | | |
4.000%, 03/01/41 | | | 399,894 | | | | 424,547 | | |
4.000%, 01/01/45 | | | 913,503 | | | | 955,354 | | |
4.352%, 05/25/28 (1-Month
USD LIBOR + 2.800%) (b) | | | 169,648 | | | | 175,416 | | |
| | | Principal | | Value(a) | |
4.500%, 04/01/23 | | $ | 38,818 | | | $ | 41,252 | | |
4.500%, 09/01/40 | | | 238,981 | | | | 254,965 | | |
4.500%, 01/01/41 | | | 263,914 | | | | 281,375 | | |
4.500%, 03/01/41 | | | 273,795 | | | | 294,630 | | |
5.000%, 03/01/23 | | | 30,686 | | | | 32,975 | | |
5.000%, 05/01/29 | | | 40,527 | | | | 43,550 | | |
5.000%, 08/01/35 | | | 42,806 | | | | 46,423 | | |
5.000%, 11/01/35 | | | 41,320 | | | | 44,682 | | |
5.000%, 11/01/39 | | | 440,029 | | | | 481,581 | | |
5.000%, 03/01/40 | | | 334,880 | | | | 368,293 | | |
5.500%, 06/01/20 | | | 14,731 | | | | 15,023 | | |
5.500%, 10/01/20 | | | 50,671 | | | | 51,527 | | |
5.500%, 11/01/23 | | | 93,154 | | | | 101,754 | | |
5.500%, 05/01/34 | | | 160,423 | | | | 181,276 | | |
6.000%, 09/01/22 | | | 55,553 | | | | 58,382 | | |
6.000%, 11/01/33 | | | 142,775 | | | | 163,055 | | |
6.028%, 04/25/28 (1-Month
USD LIBOR + 4.700%) (b) | | | 400,000 | | | | 472,499 | | |
6.250%, 12/15/23 | | | 59,072 | | | | 62,939 | | |
6.352%, 05/25/28 (1-Month
USD LIBOR + 4.800%) (b) | | | 200,000 | | | | 235,320 | | |
6.500%, 11/01/32 | | | 43,327 | | | | 48,895 | | |
| | | | | | 13,759,957 | | |
Federal National Mortgage Association
(FNMA) (40.4%) | |
2.500%, 03/01/27 | | | 393,746 | | | | 396,437 | | |
2.500%, 11/01/27 | | | 188,267 | | | | 188,107 | | |
2.500%, 03/01/28 | | | 420,615 | | | | 422,721 | | |
3.000%, 09/01/22 | | | 124,081 | | | | 126,450 | | |
3.000%, 11/01/27 | | | 186,008 | | | | 189,986 | | |
3.000%, 06/01/28 | | | 246,970 | | | | 252,565 | | |
3.000%, 01/01/33 (c) | | | 1,700,000 | | | | 1,731,543 | | |
3.000%, 03/01/42 | | | 128,439 | | | | 129,133 | | |
3.000%, 09/01/42 | | | 172,855 | | | | 173,789 | | |
3.000%, 03/01/43 | | | 125,925 | | | | 126,724 | | |
3.000%, 04/01/43 | | | 512,710 | | | | 515,480 | | |
3.000%, 05/01/43 | | | 702,411 | | | | 706,171 | | |
3.000%, 09/01/43 | | | 196,806 | | | | 197,809 | | |
3.000%, 01/01/46 | | | 509,329 | | | | 509,873 | | |
3.000%, 01/01/48 (c) | | | 1,875,000 | | | | 1,875,000 | | |
3.500%, 11/01/25 | | | 63,554 | | | | 65,812 | | |
3.500%, 01/01/26 | | | 144,565 | | | | 149,699 | | |
3.500%, 12/01/32 | | | 245,158 | | | | 255,083 | | |
3.500%, 11/01/40 | | | 223,242 | | | | 231,224 | | |
3.500%, 01/01/41 | | | 398,107 | | | | 411,170 | | |
3.500%, 02/01/41 | | | 829,077 | | | | 856,077 | | |
3.500%, 11/01/41 | | | 380,404 | | | | 393,570 | | |
3.500%, 12/01/41 | | | 720,803 | | | | 744,292 | | |
3.500%, 01/01/42 | | | 1,683,398 | | | | 1,737,905 | | |
3.500%, 05/01/42 | | | 527,447 | | | | 545,067 | | |
3.500%, 08/01/42 | | | 486,775 | | | | 502,853 | | |
3.500%, 01/01/43 | | | 303,445 | | | | 313,321 | | |
3.500%, 02/01/43 | | | 609,154 | | | | 631,336 | | |
3.500%, 03/01/43 | | | 280,192 | | | | 290,213 | | |
3.500%, 05/01/43 | | | 1,046,436 | | | | 1,081,308 | | |
3.500%, 06/01/45 | | | 1,569,475 | | | | 1,617,068 | | |
3.500%, 10/01/45 | | | 218,398 | | | | 224,353 | | |
3.500%, 01/01/46 | | | 425,091 | | | | 437,917 | | |
3.500%, 01/01/47 | | | 954,804 | | | | 982,134 | | |
3.500%, 01/01/48 (c) | | | 3,075,000 | | | | 3,157,160 | | |
4.000%, 06/25/23 | | | 127,909 | | | | 130,627 | | |
See accompanying notes to financial statements.
81
SFT Advantus Mortgage Securities Fund
Investments in Securities – continued
| | | Principal | | Value(a) | |
4.000%, 12/01/40 | | $ | 164,909 | | | $ | 173,231 | | |
4.000%, 04/01/41 | | | 145,318 | | | | 153,937 | | |
4.000%, 11/01/41 | | | 320,408 | | | | 336,509 | | |
4.000%, 06/01/42 | | | 834,288 | | | | 880,569 | | |
4.000%, 09/01/43 | | | 516,823 | | | | 541,392 | | |
4.000%, 10/01/43 | | | 1,269,173 | | | | 1,348,890 | | |
4.000%, 01/01/44 | | | 287,531 | | | | 305,591 | | |
4.000%, 08/01/44 | | | 241,596 | | | | 254,945 | | |
4.000%, 01/01/48 (c) | | | 370,000 | | | | 386,923 | | |
4.500%, 04/01/21 | | | 3,021 | | | | 3,094 | | |
4.500%, 11/01/23 | | | 33,614 | | | | 35,791 | | |
4.500%, 04/01/25 | | | 68,797 | | | | 72,590 | | |
4.500%, 05/25/34 | | | 537,000 | | | | 599,201 | | |
4.500%, 05/01/35 | | | 214,040 | | | | 228,831 | | |
4.500%, 07/01/35 | | | 187,121 | | | | 199,924 | | |
4.500%, 09/01/37 | | | 223,424 | | | | 238,958 | | |
5.000%, 05/01/18 | | | 5,381 | | | | 5,478 | | |
5.000%, 10/01/20 | | | 38,479 | | | | 39,598 | | |
5.000%, 06/25/23 | | | 121,888 | | | | 127,758 | | |
5.000%, 11/01/33 | | | 187,909 | | | | 204,112 | | |
5.000%, 03/01/34 | | | 405,666 | | | | 440,633 | | |
5.000%, 05/01/34 | | | 44,877 | | | | 48,749 | | |
5.000%, 12/01/34 | | | 38,395 | | | | 41,708 | | |
5.000%, 04/01/35 | | | 59,625 | | | | 64,771 | | |
5.000%, 07/01/35 | | | 373,170 | | | | 405,355 | | |
5.000%, 03/01/38 | | | 111,296 | | | | 121,429 | | |
5.000%, 06/01/39 | | | 172,462 | | | | 189,652 | | |
5.000%, 12/01/39 | | | 266,480 | | | | 293,498 | | |
5.000%, 06/01/40 | | | 90,027 | | | | 98,304 | | |
5.000%, 04/01/41 | | | 170,968 | | | | 186,570 | | |
5.202%, 09/25/29 (1-Month
USD LIBOR + 3.650%) (b) | | | 250,000 | | | | 270,489 | | |
5.500%, 02/01/18 | | | 792 | | | | 792 | | |
5.500%, 03/01/18 | | | 2,158 | | | | 2,158 | | |
5.500%, 08/01/23 | | | 52,957 | | | | 57,967 | | |
5.500%, 02/01/24 | | | 76,505 | | | | 83,742 | | |
5.500%, 04/01/33 | | | 302,721 | | | | 337,531 | | |
5.500%, 05/01/33 | | | 16,686 | | | | 18,508 | | |
5.500%, 01/01/34 | | | 45,829 | | | | 50,855 | | |
5.500%, 02/01/34 | | | 28,110 | | | | 31,180 | | |
5.500%, 04/01/34 | | | 72,095 | | | | 79,944 | | |
5.500%, 05/01/34 | | | 13,490 | | | | 14,832 | | |
5.500%, 09/01/34 | | | 183,758 | | | | 204,220 | | |
5.500%, 10/01/34 | | | 73,672 | | | | 81,779 | | |
5.500%, 01/01/35 | | | 111,415 | | | | 123,700 | | |
5.500%, 02/01/35 | | | 219,181 | | | | 243,735 | | |
5.500%, 06/01/35 | | | 13,001 | | | | 14,421 | | |
5.500%, 08/01/35 | | | 57,402 | | | | 63,678 | | |
5.500%, 10/01/35 | | | 40,662 | | | | 45,111 | | |
5.500%, 11/01/35 | | | 9,083 | | | | 9,984 | | |
5.500%, 09/01/36 | | | 165,334 | | | | 183,413 | | |
5.500%, 05/01/38 | | | 2,770 | | | | 3,032 | | |
5.952%, 01/25/24 (1-Month
USD LIBOR + 4.400%) (b) | | | 100,000 | | | | 114,099 | | |
6.000%, 09/01/32 | | | 18,008 | | | | 20,572 | | |
6.000%, 10/01/32 | | | 278,348 | | | | 317,642 | | |
6.000%, 11/01/32 | | | 217,666 | | | | 248,613 | | |
6.000%, 03/01/33 | | | 255,209 | | | | 291,271 | | |
6.000%, 04/01/33 | | | 36,211 | | | | 40,484 | | |
6.000%, 12/01/33 | | | 65,878 | | | | 74,850 | | |
6.000%, 08/01/34 | | | 61,836 | | | | 70,106 | | |
6.000%, 09/01/34 | | | 33,726 | | | | 38,231 | | |
6.000%, 11/01/34 | | | 17,458 | | | | 19,514 | | |
6.000%, 12/01/34 | | | 142,936 | | | | 162,344 | | |
| | | Principal | | Value(a) | |
6.000%, 11/01/36 | | $ | 15,962 | | | $ | 17,913 | | |
6.000%, 01/01/37 | | | 161,405 | | | | 182,329 | | |
6.000%, 08/01/37 | | | 44,648 | | | | 50,367 | | |
6.000%, 09/01/37 | | | 57,971 | | | | 65,877 | | |
6.000%, 12/01/37 | | | 31,264 | | | | 35,162 | | |
6.000%, 12/01/38 | | | 75,325 | | | | 85,156 | | |
6.500%, 11/01/23 | | | 45,343 | | | | 47,949 | | |
6.500%, 02/01/32 | | | 232,451 | | | | 264,600 | | |
6.500%, 04/01/32 | | | 75,697 | | | | 86,133 | | |
6.500%, 05/01/32 | | | 24,813 | | | | 27,504 | | |
6.500%, 07/01/32 | | | 258,476 | | | | 292,451 | | |
6.500%, 09/01/34 | | | 22,289 | | | | 24,787 | | |
6.500%, 11/01/34 | | | 8,262 | | | | 9,357 | | |
6.500%, 03/01/35 | | | 108,701 | | | | 123,410 | | |
6.500%, 02/01/36 | | | 15,336 | | | | 16,999 | | |
6.500%, 09/01/37 | | | 102,313 | | | | 113,437 | | |
7.000%, 09/01/31 | | | 116,381 | | | | 129,145 | | |
7.000%, 11/01/31 | | | 22,206 | | | | 24,845 | | |
7.000%, 02/01/32 | | | 82,918 | | | | 95,509 | | |
7.000%, 07/01/32 | | | 16,423 | | | | 18,227 | | |
7.000%, 10/01/37 | | | 16,198 | | | | 16,963 | | |
7.500%, 07/25/22 | | | 61,676 | | | | 64,974 | | |
7.500%, 04/01/31 | | | 31,022 | | | | 34,208 | | |
| | | | | | 35,474,067 | | |
Government National Mortgage Association
(GNMA) (16.9%) | |
0.011%, 06/17/45 (b) (d) | | | 270,358 | | | | 91 | | |
0.643%, 07/16/40 (b) (d) | | | 216,139 | | | | 228 | | |
1.000%, 12/20/42 | | | 153,159 | | | | 143,139 | | |
3.000%, 09/20/42 | | | 477,949 | | | | 484,447 | | |
3.000%, 09/20/44 | | | 175,027 | | | | 177,134 | | |
3.000%, 03/15/45 | | | 517,590 | | | | 522,013 | | |
3.000%, 04/15/45 | | | 1,358,498 | | | | 1,370,106 | | |
3.000%, 05/15/45 | | | 126,671 | | | | 127,753 | | |
3.250%, 04/20/33 | | | 194,499 | | | | 200,890 | | |
3.250%, 03/20/35 | | | 1,156,812 | | | | 1,194,752 | | |
3.250%, 11/20/35 | | | 302,980 | | | | 312,493 | | |
3.250%, 01/20/36 | | | 1,127,492 | | | | 1,162,902 | | |
3.500%, 11/15/40 | | | 114,884 | | | | 119,526 | | |
3.500%, 10/20/43 | | | 348,906 | | | | 362,636 | | |
3.500%, 02/20/45 | | | 567,446 | | | | 587,505 | | |
3.500%, 03/20/45 | | | 861,074 | | | | 891,513 | | |
3.500%, 04/20/45 | | | 1,089,828 | | | | 1,128,152 | | |
3.500%, 04/20/46 | | | 249,769 | | | | 258,383 | | |
3.500%, 01/01/48 (c) | | | 600,000 | | | | 620,250 | | |
3.750%, 03/20/46 | | | 248,746 | | | | 258,415 | | |
4.000%, 07/20/31 | | | 449,963 | | | | 473,117 | | |
4.000%, 04/20/39 | | | 300,751 | | | | 316,101 | | |
4.000%, 12/20/40 | | | 942,024 | | | | 999,088 | | |
4.000%, 01/15/41 | | | 62,939 | | | | 66,041 | | |
4.000%, 02/15/41 | | | 447,809 | | | | 474,034 | | |
4.000%, 10/15/41 | | | 325,034 | | | | 341,002 | | |
4.000%, 12/20/44 | | | 179,424 | | | | 188,057 | | |
4.500%, 06/15/40 | | | 304,914 | | | | 327,082 | | |
5.000%, 05/15/33 | | | 97,309 | | | | 105,507 | | |
5.000%, 12/15/39 | | | 84,831 | | | | 93,449 | | |
5.000%, 01/15/40 | | | 736,613 | | | | 796,966 | | |
5.000%, 07/15/40 | | | 375,581 | | | | 406,661 | | |
5.500%, 07/15/38 | | | 114,286 | | | | 126,274 | | |
5.500%, 10/15/38 | | | 144,913 | | | | 163,568 | | |
| | | | | | 14,799,275 | | |
See accompanying notes to financial statements.
82
SFT Advantus Mortgage Securities Fund
Investments in Securities – continued
| | | Principal | | Value(a) | |
U.S. Treasury (0.2%) | |
U.S. Treasury Note,
2.250%, 02/15/27 (e) | | $ | 150,000 | | | $ | 148,031 | | |
Vendee Mortgage Trust (0.1%) | |
Vendee Mortgage Trust,
7.793%, 02/15/25 | | | 49,165 | | | | 52,716 | | |
Total government obligations
(cost: $65,368,225) | | | | | 65,883,997 | | |
Asset-Backed Securities (6.8%) | |
Bank of The West Auto Trust,
3.210%, 04/15/25 (f) | | | 150,000 | | | | 148,611 | | |
Bear Stearns Asset Backed
Securities Trust, | |
2.303%, 02/25/34 (1-Month
USD LIBOR + 0.975%) (b) | | | 361,951 | | | | 345,765 | | |
CarMax Auto Owner Trust,
1.880%, 11/15/19 | | | 350,000 | | | | 349,986 | | |
Chase Funding Trust | |
1.888%, 02/25/33 (1-Month
USD LIBOR + 0.560%) (b) | | | 155,233 | | | | 146,098 | | |
1.968%, 08/25/32 (1-Month
USD LIBOR + 0.640%) (b) | | | 120,225 | | | | 117,845 | | |
Chesapeake Funding II LLC
3.260%, 11/15/29 (f) | | | 125,000 | | | | 124,387 | | |
3.380%, 08/15/29 (f) | | | 275,000 | | | | 274,727 | | |
3.710%, 05/15/29 (f) | | | 100,000 | | | | 100,934 | | |
Commonbond Student
Loan Trust,
5.280%, 05/25/41 (f) | | | 250,000 | | | | 253,844 | | |
CountryPlace Manufactured
Housing Contract Trust,
5.200%, 12/15/35 (b) (f) | | | 434,083 | | | | 447,872 | | |
Credit-Based Asset
Servicing and
Securitization LLC,
6.250%, 10/25/36 (f) (g) | | | 143,663 | | | | 145,334 | | |
Earnest Student Loan
Program LLC,
2.650%, 01/25/41 (f) | | | 422,821 | | | | 420,652 | | |
Entergy Gulf States
Reconstruction
Funding 1 LLC,
5.930%, 06/29/22 | | | 482,654 | | | | 512,302 | | |
FAN Engine Securitization,
Ltd.,
3.000%, 10/15/19 (f) (h) (i) (j) | | | 65,693 | | | | 65,738 | | |
FirstEnergy Ohio PIRB
Special Purpose Trust,
1.726%, 01/15/22 | | | 150,304 | | | | 149,804 | | |
Foursight Capital
Automobile
Receivables Trust
2.340%, 01/15/21 (f) | | | 122,361 | | | | 122,203 | | |
3.710%, 01/18/22 (f) | | | 285,000 | | | | 282,214 | | |
Invitation Homes
2015-SFR3 Trust,
2.760%, 08/17/32 (1-Month
LIBOR + 1.300%) (b) (f) | | | 615,466 | | | | 619,313 | | |
Lehman ABS Manufactured
Housing Contract Trust,
5.873%, 04/15/40 | | | 55,689 | | | | 56,668 | | |
| | | Principal | | Value(a) | |
Morgan Stanley Dean
Witter Capital I, Inc.,
1.889%, 08/25/32 (1-Month
USD LIBOR + 0.560%) (b) | | $ | 178,343 | | | $ | 168,264 | | |
Progress Residential Trust,
3.565%, 08/17/34 (f) | | | 475,000 | | | | 471,379 | | |
Saxon Asset Securities Trust,
1.868%, 03/25/35 (1-Month
USD LIBOR + 0.540%) (b) | | | 270,238 | | | | 258,997 | | |
Towd Point Mortgage Trust,
3.750%, 04/25/55 (b) (f) | | | 350,000 | | | | 361,113 | | |
Total asset-backed securities
(cost: $5,920,481) | | | | | 5,944,050 | | |
Other Mortgage-Backed Securities (11.6%) | |
Collateralized Mortgage Obligations/
Mortgage Revenue Bonds (4.3%) | |
Agate Bay Mortgage Trust,
3.822%, 01/25/45 (b) (f) | | | 257,682 | | | | 259,319 | | |
Bear Stearns Mortgage
Securities, Inc.,
8.000%, 11/25/29 | | | 149,397 | | | | 120,293 | | |
CSMC Trust,
3.500%, 06/25/47 (b) (f) | | | 525,000 | | | | 519,112 | | |
GS Mortgage-Backed
Securities Trust,
3.129%, 07/25/44 (b) (f) | | | 394,189 | | | | 378,684 | | |
JP Morgan Mortgage Trust
3.653%, 05/25/43 (b) (f) | | | 384,928 | | | | 380,240 | | |
3.427%, 06/25/29 (b) (f) | | | 294,141 | | | | 296,971 | | |
3.370%, 10/25/46 (b) (f) | | | 336,644 | | | | 320,986 | | |
Prudential Home
Mortgage Securities
7.784%, 09/28/24 (b) (f) | | | 946 | | | | 875 | | |
7.900%, 04/28/22 (f) | | | 10,561 | | | | 10,160 | | |
Seasoned Credit Risk
Transfer Trust
4.000%, 08/25/56 (b) (f) | | | 200,000 | | | | 199,622 | | |
4.000%, 07/25/56 (b) (f) | | | 472,000 | | | | 469,050 | | |
Sequoia Mortgage Trust
3.874%, 01/25/45 (b) (f) | | | 390,338 | | | | 389,845 | | |
3.714%, 07/25/45 (b) (f) | | | 470,037 | | | | 474,117 | | |
Structured Asset Mortgage
Investments, Inc.,
1.249%, 05/02/30 (b) | | | 10,903 | | | | 1,880 | | |
| | | | | | 3,821,154 | | |
Commercial Mortgage-Backed
Securities (7.3%) | |
7 WTC Depositor LLC Trust,
4.082%, 03/13/31 (f) | | | 63,742 | | | | 64,011 | | |
BB-UBS Trust,
4.026%, 11/05/36 (b) (f) | | | 500,000 | | | | 491,535 | | |
CFCRE Commercial
Mortgage Trust,
3.839%, 12/10/54 | | | 500,000 | | | | 522,011 | | |
Citigroup Commercial
Mortgage Trust,
3.209%, 05/10/49 | | | 375,000 | | | | 378,215 | | |
CSMC Trust,
3.304%, 09/15/37 (f) | | | 400,000 | | | | 407,782 | | |
See accompanying notes to financial statements.
83
SFT Advantus Mortgage Securities Fund
Investments in Securities – continued
| | | Principal | | Value(a) | |
Hometown Commercial
Mortgage,
5.506%, 11/11/38 (f) (h) | | $ | 17,639 | | | $ | 14,623 | | |
Irvine Core Office Trust,
2.068%, 05/15/48 (f) | | | 289,041 | | | | 284,551 | | |
JPMorgan Chase
Commercial Mortgage
Securities Corp.,
1.871%, 12/05/27 (b) (d) (f) (h) | | | 3,358,098 | | | | 111,283 | | |
Morgan Stanley Bank of
America Merrill
Lynch Trust,
3.720%, 12/15/49 | | | 225,000 | | | | 235,368 | | |
Morgan Stanley
Capital I Trust,
3.451%, 08/05/34 (f) | | | 150,000 | | | | 148,887 | | |
One Market Plaza Trust,
3.614%, 02/10/32 (f) | | | 500,000 | | | | 514,844 | | |
UBS Commercial
Mortgage Trust
3.724%, 06/15/50 | | | 1,500,000 | | | | 1,521,720 | | |
3.580%, 12/15/50 | | | 500,000 | | | | 516,125 | | |
Wells Fargo Commercial
Mortgage Trust
3.637%, 06/15/48 | | | 625,000 | | | | 649,523 | | |
2.814%, 08/15/49 | | | 540,000 | | | | 520,833 | | |
| | | | | | 6,381,311 | | |
Total other mortgage-backed securities
(cost: $10,358,468) | | | | | 10,202,465 | | |
Corporate Obligations (1.2%) | |
Communications (0.7%) | |
Telecommunication (0.7%) | |
Crown Castle Towers LLC,
3.222%, 05/15/22 (f) | | | 425,000 | | | | 429,263 | | |
SBA Tower Trust,
2.240%, 04/10/18 (f) | | | 220,000 | | | | 220,027 | | |
| | | | | | 649,290 | | |
Financial (0.5%) | |
Real Estate Investment Trust —
Residential (0.5%) | |
UDR, Inc.,
4.000%, 10/01/25 | | | 400,000 | | | | 417,068 | | |
Total corporate obligations
(cost: $1,044,258) | | | | | 1,066,358 | | |
Total long-term debt securities
(cost: $82,691,432) | | | | | 83,096,870 | | |
| | |
Shares | | Value(a) | |
Short-Term Securities (14.1%) | |
Investment Companies (13.7%) | |
Federated Government
Obligations Fund,
current rate 1.160% (k) | | | 2,300,000 | | | $ | 2,300,000 | | |
State Street Institutional
U.S. Government
Money Market Fund,
current rate 1.210% (k) | | | 7,443,129 | | | | 7,443,129 | | |
STIT-Government & Agency
Portfolio, current rate
1.174% (k) | | | 2,300,000 | | | | 2,300,000 | | |
| | | | | | 12,043,129 | | |
U.S. Government Obligations (0.4%) | |
U.S. Treasury Bill,
current rate 1.303% | | | 300,000 | | | | 299,223 | | |
Total short-term securities
(cost: $12,342,349) | | | | | 12,342,352 | | |
Total investments in securities
(cost: $95,033,781) (l) | | | | | 95,439,222 | | |
Liabilities in excess of cash
and other assets (-8.8%) | | | | | (7,717,616 | ) | |
Total net assets (100.0%) | | | | $ | 87,721,606 | | |
See accompanying notes to financial statements.
84
SFT Advantus Mortgage Securities Fund
Investments in Securities – continued
Investments in Securities Legend
(a) Securities are valued by procedures described in Note 2 of the Notes to Financial Statements.
(b) Variable rate security.
(c) Security is issued on a when-issued or forward commitment basis. As of December 31, 2017 the total cost of investments issued on a when-issued or forward commitment basis was $7,785,342.
(d) Interest-only security that entitles holders to receive only interest on the underlying mortgages. The principal amount of the underlying pool represents the notional amount on which current interest is calculated. The yield to maturity of an interest-only security is sensitive to the rate of principal payments on the underlying mortgage assets. The rate disclosed represents the market yield based upon the current cost basis and estimated timing and amount of future cash flows.
(e) Fully or partially pledged as initial margin deposits on open futures contracts.
Holdings of Open Futures Contracts
On December 31, 2017, securities with an aggregate market value of $98,688 have been pledged to cover margin requirements for the following open futures contracts:
Type | | Expiration | | Number of
Contracts | | Position
Type | | Notional
Amount | | Market
Value | | Unrealized
Appreciation/
(Depreciation)(a) | |
10 Year U.S. Ultra | | March 2018 | | | 35 | | | Short | | $ | (4,673,708 | ) | | $ | (4,674,687 | ) | | $ | (979 | ) | |
U.S. Long Bond | | March 2018 | | | 25 | | | Long | | | 3,802,421 | | | | 3,825,000 | | | | 22,579 | | |
U.S. Ultra Bond | | March 2018 | | | 3 | | | Short | | | (495,120 | ) | | | (502,969 | ) | | | (7,849 | ) | |
| | | | | | | | | | | $ | (1,352,656 | ) | | $ | 13,751 | | |
(f) Security sold within terms of a private placement memorandum exempt from registration under Section 144A of the Securities Act of 1933, as amended, and may be sold only to dealers in that program. This security has been determined to be liquid unless otherwise indicated.
(g) Step rate security.
(h) Illiquid security. (See Note 5.)
(i) Foreign security: The Fund held 0.1% of net assets in foreign securities at December 31, 2017.
(j) These securities are being fair-valued according to procedures approved by the Board of Trustees.
(k) All or a portion of the security segregated to cover when-issued purchase commitments outstanding or extended settlement trades as of December 31, 2017.
(l) At December 31, 2017 the cost of investments for federal income tax purposes was $95,069,985. The aggregate unrealized appreciation and depreciation of investments based on this cost were:
Gross unrealized appreciation | | $ | 1,324,806 | | |
Gross unrealized depreciation | | | (941,818 | ) | |
Net unrealized appreciation | | $ | 382,988 | | |
See accompanying notes to financial statements.
85
SFT Advantus Real Estate Securities Fund
Investments in Securities
(Percentages of each investment category relate to total net assets)
| | |
Shares | | Value(a) | |
Common Stocks (98.3%) | |
Consumer Discretionary (1.8%) | |
Hilton Worldwide
Holdings, Inc. | | | 31,100 | | | $ | 2,483,646 | | |
Real Estate (96.5%) | |
Health Care REITs (6.3%) | |
HCP, Inc. | | | 27,800 | | | | 725,024 | | |
Healthcare Trust of
America, Inc. – Class A | | | 62,300 | | | | 1,871,492 | | |
Physicians Realty Trust | | | 34,300 | | | | 617,057 | | |
Ventas, Inc. | | | 27,496 | | | | 1,650,035 | | |
Welltower, Inc. | | | 57,500 | | | | 3,666,775 | | |
| | | | | | 8,530,383 | | |
Hotels & Resort REITs (3.0%) | |
Apple Hospitality REIT, Inc. | | | 78,800 | | | | 1,545,268 | | |
RLJ Lodging Trust | | | 44,200 | | | | 971,074 | | |
Sunstone Hotel Investors, Inc. | | | 91,900 | | | | 1,519,107 | | |
| | | | | | 4,035,449 | | |
Industrial REITs (11.4%) | |
Duke Realty Corp. | | | 143,200 | | | | 3,896,472 | | |
First Industrial Realty Trust, Inc. | | | 69,200 | | | | 2,177,724 | | |
Liberty Property Trust | | | 68,100 | | | | 2,928,981 | | |
ProLogis, Inc. | | | 100,081 | | | | 6,456,225 | | |
| | | | | | 15,459,402 | | |
Office REITs (17.2%) | |
Alexandria Real Estate
Equities, Inc. | | | 43,100 | | | | 5,628,429 | | |
Boston Properties, Inc. | | | 19,083 | | | | 2,481,363 | | |
Brandywine Realty Trust | | | 160,900 | | | | 2,926,771 | | |
Corporate Office Properties Trust | | | 68,900 | | | | 2,011,880 | | |
Highwoods Properties, Inc. | | | 43,800 | | | | 2,229,858 | | |
Kilroy Realty Corp. | | | 49,936 | | | | 3,727,722 | | |
SL Green Realty Corp. | | | 43,771 | | | | 4,417,807 | | |
| | | | | | 23,423,830 | | |
Residential REITs (18.4%) | |
American Homes 4 Rent –
Class A | | | 106,700 | | | | 2,330,328 | | |
AvalonBay Communities, Inc. | | | 28,526 | | | | 5,089,323 | | |
Camden Property Trust | | | 30,800 | | | | 2,835,448 | | |
Equity Lifestyle Properties, Inc. | | | 5,300 | | | | 471,806 | | |
Equity Residential | | | 24,600 | | | | 1,568,742 | | |
Essex Property Trust, Inc. | | | 5,116 | | | | 1,234,849 | | |
Invitation Homes, Inc. | | | 109,200 | | | | 2,573,844 | | |
Mid-America Apartment
Communities, Inc. | | | 20,400 | | | | 2,051,424 | | |
Sun Communities, Inc. | | | 41,900 | | | | 3,887,482 | | |
UDR, Inc. | | | 77,400 | | | | 2,981,448 | | |
| | | | | | 25,024,694 | | |
Retail REITs (20.3%) | |
Agree Realty Corp. | | | 36,900 | | | | 1,898,136 | | |
Brixmor Property Group, Inc. | | | 70,500 | | | | 1,315,530 | | |
Federal Realty Investment Trust | | | 15,200 | | | | 2,018,712 | | |
GGP, Inc. | | | 115,300 | | | | 2,696,867 | | |
Kimco Realty Corp. | | | 96,800 | | | | 1,756,920 | | |
National Retail Properties, Inc. | | | 40,200 | | | | 1,733,826 | | |
| | |
Shares | | Value(a) | |
Realty Income Corp. | | | 31,600 | | | $ | 1,801,832 | | |
Regency Centers Corp. | | | 42,914 | | | | 2,968,791 | | |
Simon Property Group, Inc. | | | 58,279 | | | | 10,008,835 | | |
The Macerich Co. | | | 21,600 | | | | 1,418,688 | | |
| | | | | | 27,618,137 | | |
Specialized REITs (19.9%) | |
CubeSmart | | | 8,121 | | | | 234,859 | | |
CyrusOne, Inc. | | | 43,900 | | | | 2,613,367 | | |
Digital Realty Trust, Inc. | | | 45,200 | | | | 5,148,280 | | |
Equinix, Inc. | | | 15,534 | | | | 7,040,320 | | |
Extra Space Storage, Inc. | | | 32,200 | | | | 2,815,890 | | |
Host Hotels & Resorts, Inc. | | | 191,446 | | | | 3,800,203 | | |
Public Storage | | | 17,800 | | | | 3,720,200 | | |
STORE Capital Corp. | | | 67,200 | | | | 1,749,888 | | |
| | | | | | 27,123,007 | | |
Total common stocks
(cost: $126,266,149) | | | | | 133,698,548 | | |
Short-Term Securities (1.2%) | |
Investment Companies (1.2%) | |
State Street Institutional
U.S. Government
Money Market Fund,
current rate 1.210% | | | 1,612,358 | | | | 1,612,358 | | |
Total short-term securities
(cost: $1,612,358) | | | | | 1,612,358 | | |
Total investments in securities
(cost: $127,878,507) (b) | | | | | 135,310,906 | | |
Cash and other assets in
excess of liabilities (0.5%) | | | | | 644,259 | | |
Total net assets (100.0%) | | | | $ | 135,955,165 | | |
Investments in Securities Legend
(a) Securities are valued by procedures described in Note 2 of the Notes to Financial Statements.
(b) At December 31, 2017 the cost of investments for federal income tax purposes was $128,856,445. The aggregate unrealized appreciation and depreciation of securities based on this cost were:
Gross unrealized appreciation | | $ | 8,895,596 | | |
Gross unrealized depreciation | | | (2,441,135 | ) | |
Net unrealized appreciation | | $ | 6,454,461 | | |
See accompanying notes to financial statements.
86
SFT IvySM Growth Fund
Investments in Securities
(Percentages of each investment category relate to total net assets)
| | | Shares | | Value(a) | |
Common Stocks (99.3%) | |
Consumer Discretionary (13.0%) | |
Automobiles (1.8%) | |
Ferrari NV (b) | | | 86,229 | | | $ | 9,040,248 | | |
Internet & Catalog Retail (4.9%) | |
Amazon.com, Inc. (c) | | | 18,516 | | | | 21,653,907 | | |
The Priceline Group, Inc. (c) | | | 1,900 | | | | 3,301,706 | | |
| | | | | | 24,955,613 | | |
Media (1.7%) | |
Comcast Corp. – Class A | | | 209,800 | | | | 8,402,490 | | |
Specialty Retail (4.6%) | |
The Home Depot, Inc. | | | 122,200 | | | | 23,160,566 | | |
Consumer Staples (1.5%) | |
Tobacco (1.5%) | |
Philip Morris International, Inc. | | | 70,400 | | | | 7,437,760 | | |
Energy (1.9%) | |
Energy Equipment & Services (1.9%) | |
Halliburton Co. | | | 198,915 | | | | 9,720,976 | | |
Financial (10.6%) | |
Capital Markets (8.9%) | |
CME Group, Inc. | | | 129,600 | | | | 18,928,080 | | |
S&P Global, Inc. | | | 59,495 | | | | 10,078,453 | | |
The Charles Schwab Corp. | | | 314,900 | | | | 16,176,413 | | |
| | | | | | 45,182,946 | | |
Commercial Banks (1.7%) | |
Citigroup, Inc. | | | 113,000 | | | | 8,408,330 | | |
Health Care (9.9%) | |
Biotechnology (2.3%) | |
Alexion Pharmaceuticals,
Inc. (c) | | | 26,800 | | | | 3,205,012 | | |
Celgene Corp. (c) | | | 64,249 | | | | 6,705,026 | | |
Vertex Pharmaceuticals,
Inc. (c) | | | 10,634 | | | | 1,593,611 | | |
| | | | | | 11,503,649 | | |
Health Care Equipment & Supplies (3.2%) | |
Danaher Corp. | | | 79,200 | | | | 7,351,344 | | |
Edwards Lifesciences Corp. (c) | | | 8,641 | | | | 973,927 | | |
Intuitive Surgical, Inc. (c) | | | 21,300 | | | | 7,773,222 | | |
| | | | | | 16,098,493 | | |
Health Care Providers & Services (2.0%) | |
UnitedHealth Group, Inc. | | | 45,000 | | | | 9,920,700 | | |
Pharmaceuticals (2.4%) | |
Bristol-Myers Squibb Co. | | | 37,000 | | | | 2,267,360 | | |
Zoetis, Inc. | | | 140,000 | | | | 10,085,600 | | |
| | | | | | 12,352,960 | | |
| | | Shares | | Value(a) | |
Industrials (14.6%) | |
Aerospace & Defense (4.2%) | |
Lockheed Martin Corp. | | | 41,301 | | | $ | 13,259,686 | | |
Northrop Grumman Corp. | | | 26,302 | | | | 8,072,347 | | |
| | | | | | 21,332,033 | | |
Electrical Equipment (0.5%) | |
Rockwell Automation, Inc. | | | 13,900 | | | | 2,729,265 | | |
Machinery (6.8%) | |
Caterpillar, Inc. | | | 115,400 | | | | 18,184,732 | | |
Parker Hannifin Corp. | | | 16,800 | | | | 3,352,944 | | |
Stanley Black & Decker, Inc. | | | 73,600 | | | | 12,489,184 | | |
| | | | | | 34,026,860 | | |
Road & Rail (3.1%) | |
JB Hunt Transport Services, Inc. | | | 63,500 | | | | 7,301,230 | | |
Union Pacific Corp. | | | 60,342 | | | | 8,091,862 | | |
| | | | | | 15,393,092 | | |
Information Technology (46.9%) | |
Computers & Peripherals (4.7%) | |
Apple, Inc. | | | 138,921 | | | | 23,509,601 | | |
Internet Software & Services (9.1%) | |
Alphabet, Inc. – Class A (c) | | | 12,500 | | | | 13,167,500 | | |
Alphabet, Inc. – Class C (c) | | | 12,144 | | | | 12,707,481 | | |
Facebook, Inc. – Class A (c) | | | 113,959 | | | | 20,109,205 | | |
| | | | | | 45,984,186 | | |
IT Services (13.7%) | |
FleetCor Technologies, Inc. (c) | | | 19,900 | | | | 3,829,357 | | |
Mastercard, Inc. – Class A | | | 144,100 | | | | 21,810,976 | | |
PayPal Holdings, Inc. (c) | | | 312,800 | | | | 23,028,336 | | |
Visa, Inc. – Class A | | | 177,900 | | | | 20,284,158 | | |
| | | | | | 68,952,827 | | |
Semiconductors & Semiconductor Equipment (5.8%) | |
Applied Materials, Inc. | | | 111,300 | | | | 5,689,656 | | |
Lam Research Corp. | | | 75,438 | | | | 13,885,873 | | |
Microchip Technology, Inc. | | | 111,029 | | | | 9,757,228 | | |
| | | | | | 29,332,757 | | |
Software (13.6%) | |
Adobe Systems, Inc. (c) | | | 101,100 | | | | 17,716,764 | | |
Electronic Arts, Inc. (c) | | | 106,100 | | | | 11,146,866 | | |
Microsoft Corp. | | | 273,800 | | | | 23,420,852 | | |
Salesforce.com, Inc. (c) | | | 162,452 | | | | 16,607,468 | | |
| | | | | | 68,891,950 | | |
Real Estate (0.9%) | |
Specialized REITs (0.9%) | |
American Tower Corp. | | | 31,800 | | | | 4,536,906 | | |
Total common stocks
(cost: $351,771,748) | | | | | 500,874,208 | | |
See accompanying notes to financial statements.
87
SFT IvySM Growth Fund
Investments in Securities – continued
| | | Shares | | Value(a) | |
Short-Term Securities (0.7%) | |
Investment Companies (0.7%) | |
State Street Institutional
U.S. Government Money
Market Fund, current
rate 1.210% | | | 3,500,595 | | | $ | 3,500,595 | | |
Total short-term securities
(cost: $3,500,595) | | | | | 3,500,595 | | |
Total investments in securities
(cost: $355,272,343) (d) | | | | | 504,374,803 | | |
Cash and other assets in
excess of liabilities (0.0%) | | | | | 62,458 | | |
Total net assets (100.0%) | | | | $ | 504,437,261 | | |
Investments in Securities Legend
(a) Securities are valued by procedures described in Note 2 of the Notes to Financial Statements.
(b) Foreign security: The Fund held 1.8% of net assets in foreign securities at December 31, 2017.
(c) Non-income producing security.
(d) At December 31, 2017 the cost of investments for federal income tax purposes was $355,344,085. The aggregate unrealized appreciation and depreciation of investments based on this cost were:
Gross unrealized appreciation | | $ | 151,969,306 | | |
Gross unrealized depreciation | | | (2,938,588 | ) | |
Net unrealized appreciation | | $ | 149,030,718 | | |
See accompanying notes to financial statements.
88
SFT IvySM Small Cap Growth Fund
Investments in Securities
(Percentages of each investment category relate to total net assets)
| | | Shares | | Value(a) | |
Common Stocks (98.6%) | |
Consumer Discretionary (17.5%) | |
Auto Components (1.2%) | |
Visteon Corp. (b) | | | 17,516 | | | $ | 2,191,952 | | |
Distributors (1.7%) | |
Pool Corp. | | | 24,402 | | | | 3,163,719 | | |
Hotels, Restaurants & Leisure (5.7%) | |
Dave & Buster's
Entertainment, Inc. (b) | | | 39,600 | | | | 2,184,732 | | |
Hilton Grand Vacations,
Inc. (b) | | | 66,300 | | | | 2,781,285 | | |
Texas Roadhouse, Inc. | | | 51,000 | | | | 2,686,680 | | |
Wingstop, Inc. | | | 70,733 | | | | 2,757,172 | | |
| | | | | | 10,409,869 | | |
Household Durables (1.8%) | |
Installed Building
Products, Inc. (b) | | | 44,446 | | | | 3,375,674 | | |
Media (0.6%) | |
Nexstar Media Group, Inc. –
Class A | | | 13,900 | | | | 1,086,980 | | |
Multiline Retail (1.1%) | |
Ollie's Bargain Outlet
Holdings, Inc. (b) | | | 37,300 | | | | 1,986,225 | | |
Specialty Retail (5.4%) | |
At Home Group, Inc. (b) | | | 21,800 | | | | 662,502 | | |
Burlington Stores, Inc. (b) | | | 27,400 | | | | 3,371,022 | | |
Caleres, Inc. | | | 48,032 | | | | 1,608,112 | | |
Five Below, Inc. (b) | | | 48,300 | | | | 3,203,256 | | |
The Children's Place, Inc. | | | 7,700 | | | | 1,119,195 | | |
| | | | | | 9,964,087 | | |
Energy (4.8%) | |
Energy Equipment & Services (2.7%) | |
Keane Group, Inc. (b) | | | 103,600 | | | | 1,969,436 | | |
RPC, Inc. | | | 117,400 | | | | 2,997,222 | | |
| | | | | | 4,966,658 | | |
Oil, Gas & Consumable Fuels (2.1%) | |
Centennial Resource
Development, Inc. – Class A (b) | | | 106,872 | | | | 2,116,065 | | |
Jagged Peak Energy, Inc. (b) | | | 41,400 | | | | 653,292 | | |
PDC Energy, Inc. (b) | | | 22,500 | | | | 1,159,650 | | |
| | | | | | 3,929,007 | | |
Financial (6.7%) | |
Capital Markets (0.7%) | |
LPL Financial Holdings, Inc. | | | 24,200 | | | | 1,382,788 | | |
Commercial Banks (5.4%) | |
Ameris Bancorp | | | 43,500 | | | | 2,096,700 | | |
CBTX, Inc. | | | 3,600 | | | | 106,776 | | |
Heritage Financial Corp. | | | 8,600 | | | | 264,880 | | |
Home BancShares, Inc. | | | 92,500 | | | | 2,150,625 | | |
SVB Financial Group (b) | | | 9,000 | | | | 2,103,930 | | |
Western Alliance Bancorp (b) | | | 56,200 | | | | 3,182,044 | | |
| | | | | | 9,904,955 | | |
| | | Shares | | Value(a) | |
Thrifts & Mortgage Finance (0.6%) | |
LendingTree, Inc. (b) | | | 3,017 | | | $ | 1,027,137 | | |
Health Care (14.6%) | |
Health Care Equipment & Supplies (6.5%) | |
Inogen, Inc. (b) | | | 18,355 | | | | 2,185,714 | | |
iRhythm Technologies, Inc. (b) | | | 29,300 | | | | 1,642,265 | | |
K2M Group Holdings, Inc. (b) | | | 111,114 | | | | 2,000,052 | | |
Nevro Corp. (b) | | | 26,751 | | | | 1,846,889 | | |
Novocure, Ltd. (b) (c) | | | 54,100 | | | | 1,092,820 | | |
Penumbra, Inc. (b) | | | 22,811 | | | | 2,146,515 | | |
Tactile Systems Technology,
Inc. (b) | | | 34,500 | | | | 999,810 | | |
| | | | | | 11,914,065 | | |
Health Care Providers & Services (7.5%) | |
Acadia Healthcare
Co., Inc. (b) | | | 79,246 | | | | 2,585,797 | | |
AMN Healthcare Services,
Inc. (b) | | | 108,695 | | | | 5,353,229 | | |
HealthEquity, Inc. (b) | | | 71,800 | | | | 3,350,188 | | |
Teladoc, Inc. (b) | | | 72,764 | | | | 2,535,825 | | |
| | | | | | 13,825,039 | | |
Pharmaceuticals (0.6%) | |
Aerie Pharmaceuticals, Inc. (b) | | | 13,991 | | | | 835,962 | | |
Optinose, Inc. (b) | | | 18,081 | | | | 341,731 | | |
| | | | | | 1,177,693 | | |
Industrials (23.2%) | |
Aerospace & Defense (3.9%) | |
Hexcel Corp. | | | 37,600 | | | | 2,325,560 | | |
Mercury Systems, Inc. (b) | | | 94,100 | | | | 4,832,035 | | |
| | | | | | 7,157,595 | | |
Air Freight & Logistics (3.7%) | |
Air Transport Services
Group, Inc. (b) | | | 46,100 | | | | 1,066,754 | | |
XPO Logistics, Inc. (b) | | | 62,500 | | | | 5,724,375 | | |
| | | | | | 6,791,129 | | |
Building Products (0.8%) | |
JELD-WEN Holding, Inc. (b) | | | 37,949 | | | | 1,494,052 | | |
Commercial Services & Supplies (2.0%) | |
Healthcare Services Group, Inc. | | | 27,000 | | | | 1,423,440 | | |
The Brink's Co. | | | 27,700 | | | | 2,179,990 | | |
| | | | | | 3,603,430 | | |
Construction & Engineering (2.0%) | |
Dycom Industries, Inc. (b) | | | 33,700 | | | | 3,755,191 | | |
Electrical Equipment (1.6%) | |
Woodward, Inc. | | | 38,000 | | | | 2,908,520 | | |
Machinery (3.9%) | |
John Bean Technologies Corp. | | | 29,800 | | | | 3,301,840 | | |
RBC Bearings, Inc. (b) | | | 13,883 | | | | 1,754,811 | | |
The Timken Co. | | | 42,698 | | | | 2,098,607 | | |
| | | | | | 7,155,258 | | |
See accompanying notes to financial statements.
89
SFT IvySM Small Cap Growth Fund
Investments in Securities – continued
| | | Shares | | Value(a) | |
Road & Rail (1.3%) | |
Knight-Swift Transportation
Holdings, Inc. | | | 54,400 | | | $ | 2,378,368 | | |
Trading Companies & Distributors (4.0%) | |
Beacon Roofing Supply, Inc. (b) | | | 70,177 | | | | 4,474,486 | | |
Watsco, Inc. | | | 17,506 | | | | 2,976,720 | | |
| | | | | | 7,451,206 | | |
Information Technology (27.8%) | |
Communications Equipment (0.8%) | |
Lumentum Holdings, Inc. (b) | | | 29,500 | | | | 1,442,550 | | |
Electronic Equipment, Instruments & Components (0.4%) | |
Fabrinet (b) (c) | | | 23,800 | | | | 683,060 | | |
Internet Software & Services (4.2%) | |
Envestnet, Inc. (b) | | | 25,500 | | | | 1,271,175 | | |
Five9, Inc. (b) | | | 92,900 | | | | 2,311,352 | | |
Mimecast, Ltd. (b) | | | 48,500 | | | | 1,390,495 | | |
New Relic, Inc. (b) | | | 16,000 | | | | 924,320 | | |
Q2 Holdings, Inc. (b) | | | 50,394 | | | | 1,857,019 | | |
| | | | | | 7,754,361 | | |
IT Services (3.5%) | |
Booz Allen Hamilton
Holding Corp. | | | 103,335 | | | | 3,940,163 | | |
InterXion Holding NV (b) (c) | | | 44,500 | | | | 2,622,385 | | |
| | | | | | 6,562,548 | | |
Semiconductors & Semiconductor Equipment (4.2%) | |
Integrated Device
Technology, Inc. (b) | | | 67,700 | | | | 2,012,721 | | |
Monolithic Power Systems, Inc. | | | 22,700 | | | | 2,550,572 | | |
Power Integrations, Inc. | | | 43,132 | | | | 3,172,359 | | |
| | | | | | 7,735,652 | | |
Software (14.7%) | |
BroadSoft, Inc. (b) | | | 46,200 | | | | 2,536,380 | | |
Ellie Mae, Inc. (b) | | | 20,900 | | | | 1,868,460 | | |
Globant SA (b) (c) | | | 45,800 | | | | 2,127,868 | | |
HubSpot, Inc. (b) | | | 35,800 | | | | 3,164,720 | | |
Paycom Software, Inc. (b) | | | 39,255 | | | | 3,153,354 | | |
Proofpoint, Inc. (b) | | | 31,944 | | | | 2,836,947 | | |
The Ultimate Software
Group, Inc. (b) | | | 18,122 | | | | 3,954,764 | | |
Tyler Technologies, Inc. (b) | | | 16,899 | | | | 2,991,968 | | |
Varonis Systems, Inc. (b) | | | 41,500 | | | | 2,014,825 | | |
Zendesk, Inc. (b) | | | 71,000 | | | | 2,402,640 | | |
| | | | | | 27,051,926 | | |
Materials (2.5%) | |
Construction Materials (2.0%) | |
Summit Materials, Inc. –
Class A (b) | | | 75,965 | | | | 2,388,334 | | |
U.S. Concrete, Inc. (b) | | | 17,030 | | | | 1,424,560 | | |
| | | | | | 3,812,894 | | |
Paper & Forest Products (0.5%) | |
KapStone Paper and
Packaging Corp. | | | 38,619 | | | | 876,265 | | |
| | | Shares | | Value(a) | |
Real Estate (1.5%) | |
Real Estate Services (1.5%) | |
RE/MAX Holdings, Inc. – Class A | | | 55,400 | | | $ | 2,686,900 | | |
Total common stocks
(cost: $137,008,989) | | | | | 181,606,753 | | |
Short-Term Securities (1.5%) | |
Investment Companies (1.5%) | |
State Street Institutional
U.S. Government Money
Market Fund, current
rate 1.210% | | | 2,847,807 | | | | 2,847,807 | | |
Total short-term securities
(cost: $2,847,807) | | | | | 2,847,807 | | |
Total investments in securities
(cost: $139,856,796) (d) | | | | | 184,454,560 | | |
Liabilities in excess of cash
and other assets (-0.1%) | | | | | (221,696 | ) | |
Total net assets (100.0%) | | | | $ | 184,232,864 | | |
Investments in Securities Legend
(a) Securities are valued by procedures described in Note 2 of the Notes to Financial Statements.
(b) Non-income producing security.
(c) Foreign security: The Fund held 3.5% of net assets in foreign securities at December 31, 2017.
(d) At December 31, 2017 the cost of investments for federal income tax purposes was $139,926,745. The aggregate unrealized appreciation and depreciation of investments based on this cost were:
Gross unrealized appreciation | | $ | 46,626,502 | | |
Gross unrealized depreciation | | | (2,098,687 | ) | |
Net unrealized appreciation | | $ | 44,527,815 | | |
See accompanying notes to financial statements.
90
SFT T. Rowe Price Value Fund
Investments in Securities
(Percentages of each investment category relate to total net assets)
| | | Shares | | Value(a) | |
Common Stocks (98.7%) | |
Consumer Discretionary (4.2%) | |
Auto Components (0.7%) | |
Magna International, Inc. (b) | | | 28,571 | | | $ | 1,619,119 | | |
Hotels, Restaurants & Leisure (0.7%) | |
Norwegian Cruise Line
Holdings, Ltd. (c) | | | 28,982 | | | | 1,543,291 | | |
Household Durables (0.6%) | |
Lennar Corp. – Class A | | | 20,689 | | | | 1,308,372 | | |
Internet & Catalog Retail (0.3%) | |
The Priceline Group, Inc. (c) | | | 430 | | | | 747,228 | | |
Media (1.5%) | |
Charter Communications,
Inc. – Class A (c) | | | 2,170 | | | | 729,033 | | |
Comcast Corp. – Class A | | | 14,700 | | | | 588,735 | | |
Twenty-First Century Fox,
Inc. – Class B | | | 59,200 | | | | 2,019,904 | | |
| | | | | | 3,337,672 | | |
Specialty Retail (0.4%) | |
L Brands, Inc. | | | 15,162 | | | | 913,056 | | |
Consumer Staples (10.0%) | |
Food & Staples Retailing (2.3%) | |
CVS Health Corp. | | | 16,500 | | | | 1,196,250 | | |
Wal-Mart Stores, Inc. | | | 41,400 | | | | 4,088,250 | | |
| | | | | | 5,284,500 | | |
Food Products (4.9%) | |
Bunge, Ltd. | | | 12,974 | | | | 870,296 | | |
Tyson Foods, Inc. – Class A | | | 126,558 | | | | 10,260,057 | | |
| | | | | | 11,130,353 | | |
Tobacco (2.8%) | |
British American Tobacco
PLC (b) | | | 23,183 | | | | 1,573,685 | | |
Philip Morris International,
Inc. | | | 44,369 | | | | 4,687,585 | | |
| | | | | | 6,261,270 | | |
Energy (7.9%) | |
Oil, Gas & Consumable Fuels (7.9%) | |
Andeavor | | | 10,660 | | | | 1,218,864 | | |
Canadian Natural
Resources, Ltd. (b) | | | 17,370 | | | | 620,456 | | |
Chevron Corp. | | | 17,651 | | | | 2,209,729 | | |
Devon Energy Corp. | | | 8,500 | | | | 351,900 | | |
Encana Corp. (b) | | | 12,600 | | | | 167,958 | | |
EOG Resources, Inc. | | | 28,912 | | | | 3,119,894 | | |
Marathon Petroleum Corp. | | | 25,780 | | | | 1,700,964 | | |
Noble Energy, Inc. | | | 26,281 | | | | 765,828 | | |
Occidental Petroleum Corp. | | | 26,372 | | | | 1,942,562 | | |
TOTAL SA ADR (b) | | | 34,681 | | | | 1,917,166 | | |
TransCanada Corp. (b) | | | 78,971 | | | | 3,841,150 | | |
| | | | | | 17,856,471 | | |
| | | Shares | | Value(a) | |
Financial (24.5%) | |
Capital Markets (4.4%) | |
Ameriprise Financial, Inc. | | | 1,956 | | | $ | 331,483 | | |
Intercontinental
Exchange, Inc. | | | 25,200 | | | | 1,778,112 | | |
Morgan Stanley | | | 74,576 | | | | 3,913,003 | | |
State Street Corp. | | | 18,198 | | | | 1,776,307 | | |
The Bank of New York
Mellon Corp. | | | 39,274 | | | | 2,115,298 | | |
| | | | | | 9,914,203 | | |
Commercial Banks (14.4%) | |
Citigroup, Inc. | | | 64,248 | | | | 4,780,694 | | |
Fifth Third Bancorp | | | 68,327 | | | | 2,073,041 | | |
JPMorgan Chase & Co. | | | 106,899 | | | | 11,431,779 | | |
KeyCorp | | | 118,333 | | | | 2,386,777 | | |
The PNC Financial Services
Group, Inc. | | | 20,188 | | | | 2,912,926 | | |
US Bancorp | | | 38,200 | | | | 2,046,756 | | |
Wells Fargo & Co. | | | 114,575 | | | | 6,951,265 | | |
| | | | | | 32,583,238 | | |
Consumer Finance (0.6%) | |
Synchrony Financial | | | 36,566 | | | | 1,411,813 | | |
Diversified Financial Services (0.3%) | |
Voya Financial, Inc. | | | 12,645 | | | | 625,548 | | |
Insurance (4.8%) | |
American International
Group, Inc. | | | 24,811 | | | | 1,478,239 | | |
Chubb, Ltd. (b) | | | 26,263 | | | | 3,837,812 | | |
Marsh & McLennan Cos., Inc. | | | 25,070 | | | | 2,040,447 | | |
MetLife, Inc. | | | 14,651 | | | | 740,755 | | |
Willis Towers Watson PLC (b) | | | 7,200 | | | | 1,084,968 | | |
XL Group, Ltd. (b) | | | 48,756 | | | | 1,714,261 | | |
| | | | | | 10,896,482 | | |
Health Care (16.4%) | |
Biotechnology (0.8%) | |
Biogen, Inc. (c) | | | 1,434 | | | | 456,829 | | |
Gilead Sciences, Inc. | | | 18,237 | | | | 1,306,499 | | |
| | | | | | 1,763,328 | | |
Health Care Equipment & Supplies (6.2%) | |
Abbott Laboratories | | | 26,618 | | | | 1,519,089 | | |
Becton Dickinson and Co. | | | 12,961 | | | | 2,774,432 | | |
Boston Scientific Corp. (c) | | | 11,100 | | | | 275,169 | | |
Danaher Corp. | | | 23,247 | | | | 2,157,786 | | |
Hologic, Inc. (c) | | | 31,500 | | | | 1,346,625 | | |
Medtronic PLC (b) | | | 38,888 | | | | 3,140,206 | | |
Stryker Corp. | | | 12,540 | | | | 1,941,694 | | |
The Cooper Cos., Inc. | | | 3,800 | | | | 827,944 | | |
| | | | | | 13,982,945 | | |
Health Care Providers & Services (3.4%) | |
Aetna, Inc. | | | 23,836 | | | | 4,299,776 | | |
Anthem, Inc. | | | 10,445 | | | | 2,350,229 | | |
Express Scripts Holding Co. (c) | | | 6,400 | | | | 477,696 | | |
HCA Healthcare, Inc. (c) | | | 6,255 | | | | 549,439 | | |
| | | | | | 7,677,140 | | |
See accompanying notes to financial statements.
91
SFT T. Rowe Price Value Fund
Investments in Securities – continued
| | | Shares | | Value(a) | |
Life Sciences Tools & Services (1.1%) | |
Agilent Technologies, Inc. | | | 23,446 | | | $ | 1,570,179 | | |
Thermo Fisher Scientific, Inc. | | | 5,672 | | | | 1,076,999 | | |
| | | | | | 2,647,178 | | |
Pharmaceuticals (4.9%) | |
GlaxoSmithKline PLC (b) | | | 21,742 | | | | 388,967 | | |
Johnson & Johnson | | | 13,900 | | | | 1,942,108 | | |
Merck & Co., Inc. | | | 83,346 | | | | 4,689,880 | | |
Perrigo Co. PLC (b) | | | 11,632 | | | | 1,013,845 | | |
Pfizer, Inc. | | | 83,324 | | | | 3,017,995 | | |
| | | | | | 11,052,795 | | |
Industrials (9.2%) | |
Aerospace & Defense (1.8%) | |
The Boeing Co. | | | 10,266 | | | | 3,027,546 | | |
United Technologies Corp. | | | 7,600 | | | | 969,532 | | |
| | | | | | 3,997,078 | | |
Air Freight & Logistics (1.0%) | |
United Parcel Service, Inc. –
Class B | | | 18,565 | | | | 2,212,020 | | |
Airlines (1.8%) | |
American Airlines
Group, Inc. | | | 38,715 | | | | 2,014,341 | | |
Delta Air Lines, Inc. | | | 39,286 | | | | 2,200,016 | | |
| | | | | | 4,214,357 | | |
Building Products (1.5%) | |
Fortune Brands Home &
Security, Inc. | | | 14,000 | | | | 958,160 | | |
Johnson Controls
International PLC (b) | | | 65,179 | | | | 2,483,972 | | |
| | | | | | 3,442,132 | | |
Commercial Services & Supplies (0.4%) | |
Stericycle, Inc. (c) | | | 12,382 | | | | 841,852 | | |
Industrial Conglomerates (1.7%) | |
Honeywell International, Inc. | | | 16,200 | | | | 2,484,432 | | |
Roper Technologies, Inc. | | | 5,211 | | | | 1,349,649 | | |
| | | | | | 3,834,081 | | |
Machinery (0.9%) | |
Stanley Black & Decker, Inc. | | | 11,600 | | | | 1,968,404 | | |
Road & Rail (0.1%) | |
CSX Corp. | | | 4,600 | | | | 253,046 | | |
Information Technology (12.1%) | |
Communications Equipment (1.6%) | |
Cisco Systems, Inc. | | | 51,300 | | | | 1,964,790 | | |
Harris Corp. | | | 10,875 | | | | 1,540,444 | | |
| | | | | | 3,505,234 | | |
Computers & Peripherals (0.4%) | |
Apple, Inc. | | | 5,862 | | | | 992,026 | | |
| | | Shares | | Value(a) | |
Electronic Equipment, Instruments & Components (0.9%) | |
Keysight Technologies,
Inc. (c) | | | 29,500 | | | $ | 1,227,200 | | |
TE Connectivity, Ltd. (b) | | | 8,352 | | | | 793,774 | | |
| | | | | | 2,020,974 | | |
Semiconductors & Semiconductor Equipment (3.3%) | |
Applied Materials, Inc. | | | 16,532 | | | | 845,116 | | |
Broadcom, Ltd. | | | 12,042 | | | | 3,093,590 | | |
QUALCOMM, Inc. | | | 46,675 | | | | 2,988,133 | | |
Texas Instruments, Inc. | | | 5,900 | | | | 616,196 | | |
| | | | | | 7,543,035 | | |
Software (5.9%) | |
Microsoft Corp. | | | 113,900 | | | | 9,743,006 | | |
Symantec Corp. | | | 65,236 | | | | 1,830,522 | | |
Synopsys, Inc. (c) | | | 19,951 | | | | 1,700,624 | | |
| | | | | | 13,274,152 | | |
Materials (3.4%) | |
Chemicals (1.6%) | |
CF Industries Holdings, Inc. | | | 28,700 | | | | 1,220,898 | | |
DowDuPont, Inc. | | | 32,332 | | | | 2,302,685 | | |
PPG Industries, Inc. | | | 1,136 | | | | 132,708 | | |
| | | | | | 3,656,291 | | |
Construction Materials (0.0%) | |
Vulcan Materials Co. | | | 596 | | | | 76,508 | | |
Containers & Packaging (1.7%) | |
Ball Corp. | | | 30,062 | | | | 1,137,847 | | |
International Paper Co. | | | 45,798 | | | | 2,653,536 | | |
| | | | | | 3,791,383 | | |
Metals & Mining (0.1%) | |
Steel Dynamics, Inc. | | | 4,352 | | | | 187,702 | | |
Real Estate (1.2%) | |
Specialized REITs (1.2%) | |
Crown Castle International
Corp. | | | 16,800 | | | | 1,864,968 | | |
Weyerhaeuser Co. | | | 27,700 | | | | 976,702 | | |
| | | | | | 2,841,670 | | |
Telecommunication Services (1.9%) | |
Diversified Telecommunication Services (1.9%) | |
Verizon Communications, Inc. | | | 80,200 | | | | 4,244,986 | | |
Utilities (7.9%) | |
Electric Utilities (6.0%) | |
American Electric Power
Co., Inc. | | | 36,150 | | | | 2,659,555 | | |
Entergy Corp. | | | 9,800 | | | | 797,622 | | |
Eversource Energy | | | 26,581 | | | | 1,679,388 | | |
Exelon Corp. | | | 13,807 | | | | 544,134 | | |
NextEra Energy, Inc. | | | 18,321 | | | | 2,861,557 | | |
PG&E Corp. | | | 22,187 | | | | 994,643 | | |
The Southern Co. | | | 47,700 | | | | 2,293,893 | | |
Westar Energy, Inc. | | | 30,900 | | | | 1,631,520 | | |
| | | | | | 13,462,312 | | |
See accompanying notes to financial statements.
92
SFT T. Rowe Price Value Fund
Investments in Securities – continued
| | | Shares | | Value(a) | |
Gas Utilities (0.2%) | |
Atmos Energy Corp. | | | 5,540 | | | $ | 475,831 | | |
Multi-Utilities (1.7%) | |
DTE Energy Co. | | | 12,100 | | | | 1,324,466 | | |
NiSource, Inc. | | | 28,400 | | | | 729,028 | | |
Sempra Energy | | | 17,100 | | | | 1,828,332 | | |
| | | | | | 3,881,826 | | |
Total common stocks
(cost: $193,398,602) | | | | | 223,272,902 | | |
Preferred Stocks (0.7%) | |
Health Care (0.3%) | |
Becton Dickinson and Co.,
6.125% | | | 8,949 | | | | 518,147 | | |
Utilities (0.4%) | |
NextEra Energy, Inc.,
6.123% | | | 16,937 | | | | 951,860 | | |
Total preferred stocks
(cost: $1,286,451) | | | | | 1,470,007 | | |
Short-Term Securities (0.6%) | |
Investment Companies (0.6%) | |
State Street Institutional
U.S. Government Money
Market Fund, current
rate 1.210% | | | 499,981 | | | | 499,981 | | |
T. Rowe Price Reserve
Investment Fund, current
rate 1.250% | | | 946,805 | | | | 946,805 | | |
Total short-term securities
(cost: $1,446,786) | | | | | 1,446,786 | | |
Total investments in securities
(cost: $196,131,839) (d) | | | | | 226,189,695 | | |
Cash and other assets in
excess of liabilities (0.0%) | | | | | 25,160 | | |
Total net assets (100.0%) | | | | $ | 226,214,855 | | |
Investments in Securities Legend
(a) Securities are valued by procedures described in Note 2 of the Notes to Financial Statements.
(b) Foreign security: The Fund held 10.8% of net assets in foreign securities at December 31, 2017.
(c) Non-income producing security.
(d) At December 31, 2017 the cost of investments for federal income tax purposes was $197,339,342. The aggregate unrealized appreciation and depreciation of investments based on this cost were:
Gross unrealized appreciation | | $ | 31,029,208 | | |
Gross unrealized depreciation | | | (2,178,855 | ) | |
Net unrealized appreciation | | $ | 28,850,353 | | |
See accompanying notes to financial statements.
93
SFT Wellington Core Equity Fund
(formerly SFT Pyramis® Core Equity Fund)
Investments in Securities
(Percentages of each investment category relate to total net assets)
| | | Shares | | Value(a) | |
Common Stocks (98.5%) | |
Consumer Discretionary (12.5%) | |
Hotels, Restaurants & Leisure (2.1%) | |
Aramark | | | 34,944 | | | $ | 1,493,506 | | |
Starbucks Corp. | | | 18,734 | | | | 1,075,894 | | |
| | | | | | 2,569,400 | | |
Internet & Catalog Retail (1.3%) | |
The Priceline Group, Inc. (b) | | | 879 | | | | 1,527,473 | | |
Media (2.3%) | |
Comcast Corp. – Class A | | | 68,916 | | | | 2,760,086 | | |
Multiline Retail (1.4%) | |
Dollar Tree, Inc. (b) | | | 15,844 | | | | 1,700,220 | | |
Specialty Retail (2.4%) | |
O'Reilly Automotive, Inc. (b) | | | 4,695 | | | | 1,129,335 | | |
The TJX Cos., Inc. | | | 23,764 | | | | 1,816,996 | | |
| | | | | | 2,946,331 | | |
Textiles, Apparel & Luxury Goods (3.0%) | |
NIKE, Inc. – Class B | | | 30,786 | | | | 1,925,664 | | |
VF Corp. | | | 22,820 | | | | 1,688,680 | | |
| | | | | | 3,614,344 | | |
Consumer Staples (8.2%) | |
Beverages (2.4%) | |
Constellation Brands, Inc. –
Class A | | | 6,067 | | | | 1,386,734 | | |
Monster Beverage Corp. (b) | | | 23,377 | | | | 1,479,530 | | |
| | | | | | 2,866,264 | | |
Food & Staples Retailing (1.4%) | |
Costco Wholesale Corp. | | | 9,028 | | | | 1,680,291 | | |
Household Products (1.6%) | |
Colgate-Palmolive Co. | | | 25,606 | | | | 1,931,973 | | |
Personal Care (1.3%) | |
The Estee Lauder Cos.,
Inc. – Class A | | | 12,104 | | | | 1,540,113 | | |
Tobacco (1.5%) | |
Altria Group, Inc. | | | 26,226 | | | | 1,872,799 | | |
Energy (1.8%) | |
Oil, Gas & Consumable Fuels (1.8%) | |
Continental Resources, Inc. (b) | | | 4,600 | | | | 243,662 | | |
EOG Resources, Inc. | | | 17,789 | | | | 1,919,611 | | |
| | | | | | 2,163,273 | | |
Financial (16.4%) | |
Commercial Banks (9.7%) | |
Bank of America Corp. | | | 120,601 | | | | 3,560,142 | | |
Fifth Third Bancorp | | | 33,856 | | | | 1,027,191 | | |
JPMorgan Chase & Co. | | | 32,565 | | | | 3,482,501 | | |
| | | Shares | | Value(a) | |
M&T Bank Corp. | | | 4,255 | | | $ | 727,562 | | |
The PNC Financial Services
Group, Inc. | | | 20,616 | | | | 2,974,683 | | |
| | | | | | 11,772,079 | | |
Consumer Finance (2.5%) | |
Capital One Financial Corp. | | | 16,125 | | | | 1,605,728 | | |
Synchrony Financial | | | 36,394 | | | | 1,405,172 | | |
| | | | | | 3,010,900 | | |
Insurance (4.2%) | |
Chubb, Ltd. (c) | | | 16,492 | | | | 2,409,976 | | |
The Allstate Corp. | | | 14,294 | | | | 1,496,724 | | |
XL Group, Ltd. (c) | | | 33,149 | | | | 1,165,519 | | |
| | | | | | 5,072,219 | | |
Health Care (15.6%) | |
Health Care Equipment & Supplies (5.3%) | |
Abbott Laboratories | | | 24,016 | | | | 1,370,593 | | |
Baxter International, Inc. | | | 24,311 | | | | 1,571,463 | | |
Danaher Corp. | | | 10,065 | | | | 934,233 | | |
Hologic, Inc. (b) | | | 18,445 | | | | 788,524 | | |
Medtronic PLC (c) | | | 21,349 | | | | 1,723,932 | | |
| | | | | | 6,388,745 | | |
Health Care Providers & Services (4.4%) | |
Aetna, Inc. | | | 8,563 | | | | 1,544,679 | | |
Laboratory Corp. of
America Holdings (b) | | | 7,767 | | | | 1,238,914 | | |
UnitedHealth Group, Inc. | | | 11,621 | | | | 2,561,966 | | |
| | | | | | 5,345,559 | | |
Life Sciences Tools & Services (1.2%) | |
Thermo Fisher Scientific, Inc. | | | 7,813 | | | | 1,483,532 | | |
Pharmaceuticals (4.7%) | |
Allergan PLC | | | 6,852 | | | | 1,120,850 | | |
Bristol-Myers Squibb Co. | | | 21,736 | | | | 1,331,982 | | |
Eli Lilly & Co. | | | 20,502 | | | | 1,731,599 | | |
Merck & Co., Inc. | | | 27,094 | | | | 1,524,580 | | |
| | | | | | 5,709,011 | | |
Industrials (10.8%) | |
Aerospace & Defense (2.5%) | |
General Dynamics Corp. | | | 4,652 | | | | 946,449 | | |
The Boeing Co. | | | 7,032 | | | | 2,073,807 | | |
| | | | | | 3,020,256 | | |
Air Freight & Logistics (1.5%) | |
FedEx Corp. | | | 7,342 | | | | 1,832,123 | | |
Building Products (0.7%) | |
Fortune Brands Home &
Security, Inc. | | | 11,284 | | | | 772,277 | | |
Commercial Services & Supplies (1.0%) | |
Republic Services, Inc. | | | 18,396 | | | | 1,243,754 | | |
See accompanying notes to financial statements.
94
SFT Wellington Core Equity Fund
(formerly SFT Pyramis® Core Equity Fund)
Investments in Securities – continued
| | | Shares | | Value(a) | |
Electrical Equipment (1.5%) | |
AMETEK, Inc. | | | 25,329 | | | $ | 1,835,593 | | |
Machinery (2.4%) | |
Illinois Tool Works, Inc. | | | 9,314 | | | | 1,554,041 | | |
Snap-On, Inc. | | | 7,627 | | | | 1,329,386 | | |
| | | | | | 2,883,427 | | |
Professional Services (1.2%) | |
Equifax, Inc. | | | 5,358 | | | | 631,815 | | |
IHS Markit, Ltd. (b) (c) | | | 17,946 | | | | 810,262 | | |
| | | | | | 1,442,077 | | |
Information Technology (23.0%) | |
Communications Equipment (0.9%) | |
Motorola Solutions, Inc. | | | 11,615 | | | | 1,049,299 | | |
Computers & Peripherals (4.4%) | |
Apple, Inc. | | | 22,225 | | | | 3,761,137 | | |
NetApp, Inc. | | | 28,960 | | | | 1,602,067 | | |
| | | | | | 5,363,204 | | |
Electronic Equipment, Instruments & Components (0.6%) | |
CDW Corp. | | | 10,646 | | | | 739,790 | | |
Internet Software & Services (7.9%) | |
Alphabet, Inc. – Class A (b) | | | 3,122 | | | | 3,288,715 | | |
Alphabet, Inc. – Class C (b) | | | 744 | | | | 778,522 | | |
eBay, Inc. (b) | | | 28,917 | | | | 1,091,327 | | |
Facebook, Inc. – Class A (b) | | | 16,645 | | | | 2,937,177 | | |
GoDaddy, Inc. – Class A (b) | | | 29,371 | | | | 1,476,774 | | |
| | | | | | 9,572,515 | | |
IT Services (3.3%) | |
Mastercard, Inc. – Class A | | | 19,367 | | | | 2,931,389 | | |
Total System Services, Inc. | | | 13,140 | | | | 1,039,243 | | |
| | | | | | 3,970,632 | | |
Semiconductors & Semiconductor Equipment (2.5%) | |
Lam Research Corp. | | | 5,380 | | | | 990,297 | | |
QUALCOMM, Inc. | | | 15,946 | | | | 1,020,863 | | |
Teradyne, Inc. | | | 23,006 | | | | 963,261 | | |
| | | | | | 2,974,421 | | |
Software (3.4%) | |
Microsoft Corp. | | | 27,762 | | | | 2,374,762 | | |
Salesforce.com, Inc. (b) | | | 9,419 | | | | 962,904 | | |
Workday, Inc. – Class A (b) | | | 7,707 | | | | 784,110 | | |
| | | | | | 4,121,776 | | |
Materials (3.4%) | |
Chemicals (2.3%) | |
DowDuPont, Inc. | | | 18,332 | | | | 1,305,605 | | |
Ecolab, Inc. | | | 11,067 | | | | 1,484,970 | | |
| | | | | | 2,790,575 | | |
Containers & Packaging (1.1%) | |
Crown Holdings, Inc. (b) | | | 24,854 | | | | 1,398,038 | | |
Telecommunication Services (1.8%) | |
Diversified Telecommunication Services (1.8%) | |
Verizon Communications, Inc. | | | 41,127 | | | | 2,176,852 | | |
| | | Shares | | Value(a) | |
Utilities (5.0%) | |
Electric Utilities (5.0%) | |
American Electric
Power Co., Inc. | | | 27,473 | | | $ | 2,021,189 | | |
NextEra Energy, Inc. | | | 15,807 | | | | 2,468,895 | | |
Pinnacle West Capital Corp. | | | 17,780 | | | | 1,514,500 | | |
| | | | | | 6,004,584 | | |
Total common stocks
(cost: $109,219,928) | | | | | 119,145,805 | | |
Short-Term Securities (1.6%) | |
Investment Companies (1.6%) | |
State Street Institutional
U.S. Government Money
Market Fund, current
rate 1.210% | | | 1,901,657 | | | | 1,901,657 | | |
Total short-term securities
(cost: $1,901,657) | | | | | 1,901,657 | | |
Total investments in securities
(cost: $111,121,585) (d) | | | | | 121,047,462 | | |
Liabilities in excess of cash
and other assets (-0.1%) | | | | | (156,199 | ) | |
Total net assets (100.0%) | | | | $ | 120,891,263 | | |
Investments in Securities Legend
(a) Securities are valued by procedures described in Note 2 of the Notes to Financial Statements.
(b) Non-income producing security.
(c) Foreign security: The Fund held 6.0% of net assets in foreign securities at December 31, 2017.
(d) At December 31, 2017 the cost of investments for federal income tax purposes was $111,201,256. The aggregate unrealized appreciation and depreciation of investments based on this cost were:
Gross unrealized appreciation | | $ | 10,511,218 | | |
Gross unrealized depreciation | | | (665,012 | ) | |
Net unrealized appreciation | | $ | 9,846,206 | | |
See accompanying notes to financial statements.
95
Securian Funds Trust
Statements of Assets and Liabilities
December 31, 2017
| | | SFT Advantus
Bond
Fund | | SFT Advantus
Dynamic
Managed
Volatility
Fund | | SFT Advantus
Government
Money
Market
Fund | | SFT Advantus
Index 400
Mid-Cap
Fund | | SFT Advantus
Index 500
Fund | | SFT Advantus
International
Bond
Fund | | SFT Advantus
Managed
Volatility
Equity
Fund | |
Assets | | | | | | | | | | | | | | | | | | | | | | | | | | | | | |
Investments in securities, at market value – see
accompanying schedule for detailed listing* | |
Unaffiliated issuers | | $ | 390,975,123 | | | $ | 221,319,335 | | | $ | 67,206,823 | | | $ | 226,686,991 | | | $ | 875,133,760 | | | $ | 106,453,874 | | | $ | 263,995,263 | | |
Affiliated issuers (note 8) | | | – | | | | 151,194,190 | | | | – | | | | – | | | | – | | | | – | | | | – | | |
Cash on demand deposit^,^^^ | | | – | | | | – | | | | – | | | | 233,032 | | | | 4,868 | | | | 2,458,375 | | | | – | | |
Foreign currency on deposit^^ | | | – | | | | – | | | | – | | | | – | | | | – | | | | 392,760 | | | | – | | |
Receivable: | |
Fund shares sold | | | – | | | | 40,693 | | | | – | | | | 713 | | | | 2,560 | | | | – | | | | 250,717 | | |
Investment securities sold (including paydowns) | | | – | | | | – | | | | – | | | | 156,944 | | | | 935,115 | | | | – | | | | – | | |
Investment securities sold on a when-issued or forward – commitment
basis (note 2) | | | 1,842,109 | | | | – | | | | – | | | | – | | | | – | | | | – | | | | – | | |
Dividends and accrued interest | | | 2,612,562 | | | | 1,338,959 | | | | 69,179 | | | | 312,492 | | | | 871,285 | | | | 743,374 | | | | – | | |
Refundable foreign income taxes withheld | | | – | | | | – | | | | – | | | | – | | | | – | | | | 55,086 | | | | – | | |
Adviser (note 4) | | | – | | | | 66,769 | | | | 13,773 | | | | – | | | | – | | | | – | | | | 35,349 | | |
Unrealized appreciation on forward foreign currency contracts | | | – | | | | – | | | | – | | | | – | | | | – | | | | 750,495 | | | | – | | |
Prepaid expenses | | | 7,005 | | | | 7,005 | | | | 7,005 | | | | 7,005 | | | | 8,581 | | | | 7,005 | | | | 11,578 | | |
Total assets | | | 395,436,799 | | | | 373,966,951 | | | | 67,296,780 | | | | 227,397,177 | | | | 876,956,169 | | | | 110,860,969 | | | | 264,292,907 | | |
Liabilities | | | | | | | | | | | | | | | | | | | | | | | | | | | | | |
Due to custodian | | | – | | | | – | | | | – | | | | – | | | | – | | | | – | | | | – | | |
Payable: | |
Fund shares repurchased | | | 349,375 | | | | – | | | | 231,827 | | | | 231,000 | | | | 319,476 | | | | 81,259 | | | | – | | |
Investment securities purchased | | | – | | | �� | – | | | | – | | | | 284,225 | | | | 308,681 | | | | – | | | | 2,469,994 | | |
Investment securities purchased on a when-issued or forward – commitment
basis (note 2) | | | 9,477,460 | | | | – | | | | – | | | | – | | | | – | | | | – | | | | – | | |
Adviser | | | 217,706 | | | | 285,581 | | | | 45,939 | | | | 80,637 | | | | 266,077 | | | | 103,604 | | | | 207,847 | | |
Variation margin on futures | | | 19,375 | | | | 506,225 | | | | – | | | | 42,920 | | | | 50,321 | | | | – | | | | 76,924 | | |
| Variation margin on swaps - | | | – | | | | – | | | | – | | | | – | | | | – | | | | 47,141 | | | | – | | |
Accrued expenses | | | 67,500 | | | | 51,212 | | | | 38,696 | | | | 44,903 | | | | 74,924 | | | | 230,652 | | | | 32,153 | | |
Unrealized depreciation on forward foreign currency contracts | | | – | | | | – | | | | – | | | | – | | | | – | | | | 2,395,385 | | | | – | | |
Put options written at value (premiums of $38,845 for SFT Advantus
Managed Volatility Equity Fund) | | | – | | | | – | | | | – | | | | – | | | | – | | | | – | | | | 25,350 | | |
Total liabilities | | | 10,131,416 | | | | 843,018 | | | | 316,462 | | | | 683,685 | | | | 1,019,479 | | | | 2,858,041 | | | | 2,812,268 | | |
Net assets applicable to outstanding capital stock | | $ | 385,305,383 | | | $ | 373,123,933 | | | $ | 66,980,318 | | | $ | 226,713,492 | | | $ | 875,936,690 | | | $ | 108,002,928 | | | $ | 261,480,639 | | |
Net Assets Consist of: | |
Paid in capital** | | $ | 328,436,784 | | | $ | 296,435,765 | | | $ | 66,978,252 | | | $ | 37,188,167 | | | $ | 153,273,198 | | | $ | 106,510,874 | | | $ | 225,482,540 | | |
Retained earnings (deficit) | | | 56,868,599 | | | | 76,688,168 | | | | 2,066 | | | | 189,525,325 | | | | 722,663,492 | | | | – | | | | 35,998,099 | | |
Undistributed net investment income (loss) | | | – | | | | – | | | | – | | | | – | | | | – | | | | 1,644,889 | | | | – | | |
Accumulated net realized gain (loss) | | | – | | | | – | | | | – | | | | – | | | | – | | | | 1,136,728 | | | | – | | |
Net unrealized appreciation (depreciation) on: | |
Investments | | | – | | | | – | | | | – | | | | – | | | | – | | | | 755,439 | | | | – | | |
Foreign currency and forward currency transactions | | | – | | | | – | | | | – | | | | – | | | | – | | | | (1,678,199 | ) | | | – | | |
Swaps | | | – | | | | – | | | | – | | | | – | | | | – | | | | (366,803 | ) | | | – | | |
Net assets | | $ | 385,305,383 | | | $ | 373,123,933 | | | $ | 66,980,318 | | | $ | 226,713,492 | | | $ | 875,936,690 | | | $ | 108,002,928 | | | $ | 261,480,639 | | |
Net assets by class: | |
Class 1 | | $ | 2,607,852 | | | $ | N/A | | | $ | N/A | | | $ | 6,378,220 | | | $ | 167,661,301 | | | $ | 1,133,941 | | | $ | N/A | | |
Class 2 | | | 382,697,531 | | | | 373,123,933 | | | | 66,980,318 | | | | 220,335,272 | | | | 708,275,389 | | | | 106,868,987 | | | | 261,480,639 | | |
Net asset value per share of outstanding capital stock by class: | |
Class 1 | | | 2.368 | | | | N/A | | | | N/A | | | | 4.955 | | | | 10.629 | | | | 2.533 | | | | N/A | | |
Class 2 | | | 2.316 | | | | 14.401 | | | | 1.000 | | | | 4.845 | | | | 10.393 | | | | 2.477 | | | | 12.195 | | |
* Identified cost | |
Unaffiliated issuers | | $ | 381,954,883 | | | $ | 213,053,043 | | | $ | 67,206,823 | | | $ | 155,123,639 | | | $ | 340,540,276 | | | $ | 105,559,277 | | | $ | 236,921,168 | | |
Affiliated issuers | | | – | | | | 107,000,000 | | | | – | | | | – | | | | – | | | | – | | | | – | | |
** Shares outstanding by class: | |
Class 1 | | | 1,100,958 | | | | N/A | | | | N/A | | | | 1,287,185 | | | | 15,773,873 | | | | 447,587 | | | | N/A | | |
Class 2 | | | 165,229,175 | | | | 25,909,898 | | | | 66,980,318 | | | | 45,473,462 | | | | 68,149,693 | | | | 43,142,662 | | | | 21,441,789 | | |
^ Collateral for Open Swaps and Forward Foreign Currency Contracts | | $ | – | | | $ | – | | | $ | – | | | $ | – | | | $ | – | | | $ | 2,450,466 | | | $ | – | | |
^^ Foreign currency on deposit (cost) | | $ | – | | | $ | – | | | $ | – | | | $ | – | | | $ | – | | | $ | 417,635 | | | $ | – | | |
^^^ Cash collateral for Open Futures Contracts | | $ | – | | | $ | – | | | $ | – | | | $ | 222,000 | | | $ | – | | | $ | – | | | $ | – | | |
1 Formerly SFT Pyramis® Core Equity Fund
See accompanying notes to financial statements.
96
| | | SFT Advantus
Mortgage
Securities
Fund | | SFT Advantus
Real Estate
Securities
Fund | | SFT
IvySM Growth
Fund | | SFT
IvySM Small
Cap Growth
Fund | | SFT
T. Rowe Price
Value
Fund | | SFT
Wellington
Core Equity
Fund1 | |
Assets | | | | | | | | | | | | | | | | | | | | | | | | | |
Investments in securities, at market value – see
accompanying schedule for detailed listing* | |
Unaffiliated issuers | | $ | 95,439,222 | | | $ | 135,310,906 | | | $ | 504,374,803 | | | $ | 184,454,560 | | | $ | 226,189,695 | | | $ | 121,047,462 | | |
Affiliated issuers (note 8) | | | – | | | | – | | | | – | | | | – | | | | – | | | | – | | |
Cash on demand deposit^,^^^ | | | – | | | | – | | | | – | | | | – | | | | – | | | | – | | |
Foreign currency on deposit^^ | | | – | | | | – | | | | – | | | | – | | | | – | | | | – | | |
Receivable: | |
Fund shares sold | | | – | | | | – | | | | – | | | | – | | | | 78,902 | | | | – | | |
Investment securities sold (including paydowns) | | | – | | | | 813,515 | | | | – | | | | – | | | | 198,902 | | | | – | | |
Investment securities sold on a when-issued or forward – commitment
basis (note 2) | | | – | | | | – | | | | – | | | | – | | | | – | | | | – | | |
Dividends and accrued interest | | | 240,880 | | | | 626,703 | | | | 604,645 | | | | 19,374 | | | | 341,475 | | | | 112,572 | | |
Refundable foreign income taxes withheld | | | – | | | | – | | | | – | | | | – | | | | 20,394 | | | | – | | |
Adviser (note 4) | | | – | | | | – | | | | – | | | | – | | | | – | | | | – | | |
Unrealized appreciation on forward foreign currency contracts | | | – | | | | – | | | | – | | | | – | | | | – | | | | – | | |
Prepaid expenses | | | 7,005 | | | | 7,005 | | | | 7,005 | | | | 7,157 | | | | 7,005 | | | | 7,005 | | |
Total assets | | | 95,687,107 | | | | 136,758,129 | | | | 504,986,453 | | | | 184,481,091 | | | | 226,836,373 | | | | 121,167,039 | | |
Liabilities | | | | | | | | | | | | | | | | | | | | | | | | | |
Due to custodian | | | 424 | | | | – | | | | – | | | | – | | | | – | | | | – | | |
Payable: | |
Fund shares repurchased | | | 79,067 | | | | 42,333 | | | | 105,293 | | | | 40,034 | | | | – | | | | 26,012 | | |
Investment securities purchased | | | – | | | | 610,182 | | | | – | | | | – | | | | 399,353 | | | | 116,678 | | |
Investment securities purchased on a when-issued or forward – commitment
basis (note 2) | | | 7,785,342 | | | | – | | | | – | | | | – | | | | – | | | | – | | |
Adviser | | | 52,426 | | | | 113,532 | | | | 399,320 | | | | 175,830 | | | | 183,922 | | | | 97,456 | | |
Variation margin on futures | | | 4,125 | | | | – | | | | – | | | | – | | | | – | | | | – | | |
| Variation margin on swaps - | | | – | | | | – | | | | – | | | | – | | | | – | | | | – | | |
Accrued expenses | | | 44,117 | | | | 36,917 | | | | 44,579 | | | | 32,363 | | | | 38,243 | | | | 35,630 | | |
Unrealized depreciation on forward foreign currency contracts | | | – | | | | – | | | | – | | | | – | | | | – | | | | – | | |
Put options written at value (premiums of $38,845 for SFT Advantus
Managed Volatility Equity Fund) | | | – | | | | – | | | | – | | | | – | | | | – | | | | – | | |
Total liabilities | | | 7,965,501 | | | | 802,964 | | | | 549,192 | | | | 248,227 | | | | 621,518 | | | | 275,776 | | |
Net assets applicable to outstanding capital stock | | $ | 87,721,606 | | | $ | 135,955,165 | | | $ | 504,437,261 | | | $ | 184,232,864 | | | $ | 226,214,855 | | | $ | 120,891,263 | | |
Net Assets Consist of: | |
Paid in capital** | | $ | 103,041,862 | | | $ | 42,203,286 | | | $ | 287,727,840 | | | $ | 107,707,433 | | | $ | 153,918,226 | | | $ | 76,214,935 | | |
Retained earnings (deficit) | | | (15,320,256 | ) | | | 93,751,879 | | | | 216,709,421 | | | | 76,525,431 | | | | 72,296,629 | | | | 44,676,328 | | |
Undistributed net investment income (loss) | | | – | | | | – | | | | – | | | | – | | | | – | | | | – | | |
Accumulated net realized gain (loss) | | | – | | | | – | | | | – | | | | – | | | | – | | | | – | | |
Net unrealized appreciation (depreciation) on: | |
Investments | | | – | | | | – | | | | – | | | | – | | | | – | | | | – | | |
Foreign currency and forward currency transactions | | | – | | | | – | | | | – | | | | – | | | | – | | | | – | | |
Swaps | | | – | | | | – | | | | – | | | | – | | | | – | | | | – | | |
Net assets | | $ | 87,721,606 | | | $ | 135,955,165 | | | $ | 504,437,261 | | | $ | 184,232,864 | | | $ | 226,214,855 | | | $ | 120,891,263 | | |
Net assets by class: | |
Class 1 | | $ | 262,936 | | | $ | 3,582,948 | | | $ | N/A | | | $ | N/A | | | $ | N/A | | | $ | 706,384 | | |
Class 2 | | | 87,458,670 | | | | 132,372,217 | | | | 504,437,261 | | | | 184,232,864 | | | | 226,214,855 | | | | 120,184,879 | | |
Net asset value per share of outstanding capital stock by class: | |
Class 1 | | | 1.966 | | | | 4.781 | | | | N/A | | | | N/A | | | | N/A | | | | 14.369 | | |
Class 2 | | | 1.923 | | | | 4.674 | | | | 15.662 | | | | 15.802 | | | | 13.933 | | | | 14.238 | | |
* Identified cost | |
Unaffiliated issuers | | $ | 95,033,781 | | | $ | 127,878,507 | | | $ | 355,272,343 | | | $ | 139,856,796 | | | $ | 196,131,839 | | | $ | 111,121,585 | | |
Affiliated issuers | | | – | | | | – | | | | – | | | | – | | | | – | | | | – | | |
** Shares outstanding by class: | |
Class 1 | | | 133,717 | | | | 749,490 | | | | N/A | | | | N/A | | | | N/A | | | | 49,161 | | |
Class 2 | | | 45,488,841 | | | | 28,320,311 | | | | 32,208,674 | | | | 11,658,878 | | | | 16,235,342 | | | | 8,441,246 | | |
^ Collateral for Open Swaps and Forward Foreign Currency Contracts | | $ | – | | | $ | – | | | $ | – | | | $ | – | | | $ | – | | | $ | – | | |
^^ Foreign currency on deposit (cost) | | $ | – | | | $ | – | | | $ | – | | | $ | – | | | $ | – | | | $ | – | | |
^^^ Cash collateral for Open Futures Contracts | | $ | – | | | $ | – | | | $ | – | | | $ | – | | | $ | – | | | $ | – | | |
97
Securian Funds Trust
Statements of Operations
Year ended December 31, 2017
| | | SFT Advantus
Bond
Fund | | SFT Advantus
Dynamic
Managed
Volatility
Fund | | SFT Advantus
Government
Money
Market
Fund | | SFT Advantus
Index 400
Mid-Cap
Fund | | SFT Advantus
Index 500
Fund | | SFT Advantus
International
Bond
Fund | | SFT Advantus
Managed
Volatility
Equity
Fund | |
Income: | |
Interest1 | | $ | 13,025,437 | | | $ | 4,724,410 | | | $ | 648,392 | | | $ | – | | | $ | – | | | $ | 5,609,945 | | | $ | – | | |
Dividends | | | 130,010 | | | | 779,645 | | | | 4,393 | | | | 3,214,942 | | | | 16,253,154 | | | | 53,640 | | | | 5,153,068 | | |
Foreign tax withholding | | | – | | | | – | | | | – | | | | (1,528 | ) | | | (111 | ) | | | (184,169 | ) | | | – | | |
Total investment income | | | 13,155,447 | | | | 5,504,055 | | | | 652,785 | | | | 3,213,414 | | | | 16,253,043 | | | | 5,479,416 | | | | 5,153,068 | | |
Expenses (note 4): | |
Investment advisory fee | | | 1,524,342 | | | | 2,137,953 | | | | 216,808 | | | | 330,470 | | | | 1,208,273 | | | | 665,137 | | | | 1,467,127 | | |
Rule 12b-1 fees | | | 946,800 | | | | 822,290 | | | | 180,673 | | | | 537,837 | | | | 1,640,758 | | | | 274,248 | | | | 564,279 | | |
Audit and accounting services | | | 208,576 | | | | 153,886 | | | | 142,265 | | | | 111,687 | | | | 193,753 | | | | 156,661 | | | | 86,805 | | |
Administrative services fee | | | 49,231 | | | | 31,804 | | | | 47,817 | | | | 25,200 | | | | 25,200 | | | | 84,368 | | | | 29,801 | | |
Legal fees | | | 29,258 | | | | 29,400 | | | | 21,459 | | | | 18,339 | | | | 36,401 | | | | 17,811 | | | | 18,075 | | |
Custodian fees | | | 14,940 | | | | 14,038 | | | | 9,977 | | | | 22,514 | | | | 19,585 | | | | 111,120 | | | | 14,062 | | |
Printing and shareholder reports | | | 12,520 | | | | 13,969 | | | | 13,450 | | | | 12,385 | | | | 12,385 | | | | 12,525 | | | | 13,613 | | |
Trustee's fees | | | 19,308 | | | | 19,308 | | | | 19,308 | | | | 19,308 | | | | 19,308 | | | | 19,308 | | | | 19,308 | | |
S&P Licensing fee | | | – | | | | – | | | | – | | | | 22,156 | | | | 59,594 | | | | – | | | | – | | |
Insurance | | | 8,294 | | | | 8,294 | | | | 8,295 | | | | 8,294 | | | | 8,294 | | | | 8,294 | | | | 8,146 | | |
Other | | | 15,704 | | | | 2,676 | | | | 5,037 | | | | 8,663 | | | | 26,170 | | | | 5,663 | | | | 5,568 | | |
Total expenses before fees waived | | | 2,828,973 | | | | 3,233,618 | | | | 665,089 | | | | 1,116,853 | | | | 3,249,721 | | | | 1,355,135 | | | | 2,226,784 | | |
Less fees waived (note 4) | | | – | | | | (602,045 | ) | | | (104,208 | ) | | | – | | | | – | | | | – | | | | (421,177 | ) | |
Total expenses net of fees waived | | | 2,828,973 | | | | 2,631,573 | | | | 560,881 | | | | 1,116,853 | | | | 3,249,721 | | | | 1,355,135 | | | | 1,805,607 | | |
Net investment income | | | 10,326,474 | | | | 2,872,482 | | | | 91,904 | | | | 2,096,561 | | | | 13,003,322 | | | | 4,124,281 | | | | 3,347,461 | | |
Realized gains (losses) on investments and foreign
currencies: | |
Investments (note 3) | |
Unaffiliated issuers | | | 3,850,913 | | | | (1,648,413 | ) | | | – | | | | 19,147,588 | | | | 16,808,858 | | | | 1,990,164 | | | | (121,031 | ) | |
Written options transactions | | | – | | | | 101,223 | | | | – | | | | – | | | | – | | | | – | | | | 307,649 | | |
Swaps | | | – | | | | – | | | | – | | | | – | | | | – | | | | (261,906 | ) | | | – | | |
Foreign forward currency contracts | | | – | | | | – | | | | – | | | | – | | | | – | | | | (667,943 | ) | | | – | | |
Foreign currency transactions | | | – | | | | – | | | | – | | | | (211 | ) | | | – | | | | (435,607 | ) | | | – | | |
Net increase from litigation payments | | | 39,418 | | | | – | | | | – | | | | 735 | | | | 4,265 | | | | 4,845 | | | | – | | |
Futures transactions | | | (41,756 | ) | | | 19,751,912 | | | | – | | | | 755,387 | | | | 2,004,359 | | | | – | | | | 3,108,348 | | |
Net change in unrealized appreciation or depreciation on: | |
Investments | |
Unaffiliated issuers | | | 3,289,132 | | | | 7,136,179 | | | | – | | | | 9,783,764 | | | | 123,751,582 | | | | 2,905,414 | | | | 27,412,174 | | |
Affiliated issuers (note 8) | | | – | | | | 26,793,604 | | | | – | | | | – | | | | – | | | | – | | | | – | | |
Options written | | | – | | | | (34,774 | ) | | | – | | | | – | | | | – | | | | – | | | | 13,495 | | |
Swaps | | | – | | | | – | | | | – | | | | – | | | | – | | | | (71,272 | ) | | | – | | |
Translation of assets and liabilities in foreign currency | | | – | | | | – | | | | – | | | | – | | | | – | | | | (20,785 | ) | | | – | | |
Foreign forward currency contracts | | | – | | | | – | | | | – | | | | – | | | | – | | | | (6,269,712 | ) | | | – | | |
Futures transactions | | | (67,252 | ) | | | (719,523 | ) | | | – | | | | 305,298 | | | | (50,942 | ) | | | – | | | | (140,583 | ) | |
Net gains (losses) on investments | | | 7,070,455 | | | | 51,380,208 | | | | – | | | | 29,992,561 | | | | 142,518,122 | | | | (2,826,802 | ) | | | 30,580,052 | | |
Net increase (decrease) in net assets resulting from
operations | | $ | 17,396,929 | | | $ | 54,252,690 | | | $ | 91,904 | | | $ | 32,089,122 | | | $ | 155,521,444 | | | $ | 1,297,479 | | | $ | 33,927,513 | | |
1 All income is from unaffiliated issuers.
2 Formerly SFT Pyramis® Core Equity Fund
See accompanying notes to financial statements.
98
| | | SFT Advantus
Mortgage
Securities
Fund | | SFT Advantus
Real Estate
Securities
Fund | | SFT
IvySM Growth
Fund | | SFT
IvySM Small
Cap Growth
Fund | | SFT
T. Rowe
Price Value
Fund | | SFT
Wellington
Core Equity
Fund2 | |
Income: | |
Interest1 | | $ | 2,488,232 | | | $ | – | | | $ | 39,487 | | | $ | 48,759 | | | $ | 6,809 | | | $ | 3,340 | | |
Dividends | | | 65,938 | | | | 3,685,185 | | | | 5,430,409 | | | | 705,071 | | | | 4,995,260 | | | | 1,761,204 | | |
Foreign tax withholding | | | – | | | | – | | | | (54,804 | ) | | | – | | | | (123,461 | ) | | | (7,830 | ) | |
Total investment income | | | 2,554,170 | | | | 3,685,185 | | | | 5,415,092 | | | | 753,830 | | | | 4,878,608 | | | | 1,756,714 | | |
Expenses (note 4): | |
Investment advisory fee | | | 359,823 | | | | 974,903 | | | | 3,213,778 | | | | 1,465,443 | | | | 1,469,692 | | | | 763,082 | | |
Rule 12b-1 fees | | | 224,235 | | | | 339,960 | | | | 1,199,307 | | | | 431,013 | | | | 548,392 | | | | 291,569 | | |
Audit and accounting services | | | 109,051 | | | | 105,578 | | | | 138,674 | | | | 94,605 | | | | 95,128 | | | | 100,495 | | |
Administrative services fee | | | 46,458 | | | | 25,201 | | | | 25,201 | | | | 25,201 | | | | 26,029 | | | | 25,201 | | |
Legal fees | | | 32,666 | | | | 18,339 | | | | 18,339 | | | | 18,339 | | | | 18,339 | | | | 39,610 | | |
Custodian fees | | | 14,179 | | | | 13,696 | | | | 14,321 | | | | 17,163 | | | | 47,504 | | | | 19,794 | | |
Printing and shareholder reports | | | 12,585 | | | | 12,385 | | | | 12,424 | | | | 11,322 | | | | 12,424 | | | | 13,674 | | |
Trustee's fees | | | 19,308 | | | | 19,308 | | | | 19,308 | | | | 19,308 | | | | 19,308 | | | | 19,308 | | |
S&P Licensing fee | | | – | | | | – | | | | – | | | | – | | | | – | | | | – | | |
Insurance | | | 8,294 | | | | 8,294 | | | | 8,294 | | | | 8,294 | | | | 8,294 | | | | 8,294 | | |
Other | | | 5,414 | | | | 7,706 | | | | 18,113 | | | | 8,386 | | | | 10,087 | | | | 7,742 | | |
Total expenses before fees waived | | | 832,013 | | | | 1,525,370 | | | | 4,667,759 | | | | 2,099,074 | | | | 2,255,197 | | | | 1,288,769 | | |
Less fees waived (note 4) | | | – | | | | – | | | | – | | | | – | | | | – | | | | – | | |
Total expenses net of fees waived | | | 832,013 | | | | 1,525,370 | | | | 4,667,759 | | | | 2,099,074 | | | | 2,255,197 | | | | 1,288,769 | | |
Net investment income | | | 1,722,157 | | | | 2,159,815 | | | | 747,333 | | | | (1,345,244 | ) | | | 2,623,411 | | | | 467,945 | | |
Realized gains (losses) on investments and foreign
currencies: | |
Investments (note 3) | |
Unaffiliated issuers | | | (278,276 | ) | | | 6,432,149 | | | | 32,361,805 | | | | 13,252,837 | | | | 24,257,608 | | | | 21,810,519 | | |
Written options transactions | | | – | | | | – | | | | – | | | | – | | | | – | | | | – | | |
Swaps | | | – | | | | – | | | | – | | | | – | | | | – | | | | – | | |
Foreign forward currency contracts | | | – | | | | – | | | | – | | | | – | | | | – | | | | – | | |
Foreign currency transactions | | | – | | | | – | | | | 620 | | | | – | | | | 401 | | | | – | | |
Net increase from litigation payments | | | 38,773 | | | | – | | | | – | | | | – | | | | – | | | | – | | |
Futures transactions | | | 6,938 | | | | – | | | | – | | | | – | | | | – | | | | – | | |
Net change in unrealized appreciation or depreciation on: | |
Investments | |
Unaffiliated issuers | | | 261,465 | | | | (1,281,847 | ) | | | 88,764,916 | | | | 26,975,755 | | | | 10,605,710 | | | | 233,193 | | |
Affiliated issuers (note 8) | | | – | | | | – | | | | – | | | | – | | | | – | | | | – | | |
Options written | | | – | | | | – | | | | – | | | | – | | | | – | | | | – | | |
Swaps | | | – | | | | – | | | | – | | | | – | | | | – | | | | – | | |
Translation of assets and liabilities in foreign currency | | | – | | | | – | | | | (253 | ) | | | – | | | | 1,820 | | | | – | | |
Foreign forward currency contracts | | | – | | | | – | | | | – | | | | – | | | | – | | | | – | | |
Futures transactions | | | 13,751 | | | | – | | | | – | | | | – | | | | – | | | | – | | |
Net gains (losses) on investments | | | 42,651 | | | | 5,150,302 | | | | 121,127,088 | | | | 40,228,592 | | | | 34,865,539 | | | | 22,043,712 | | |
Net increase (decrease) in net assets resulting from
operations | | $ | 1,764,808 | | | $ | 7,310,117 | | | $ | 121,874,421 | | | $ | 38,883,348 | | | $ | 37,488,950 | | | $ | 22,511,657 | | |
99
Securian Funds Trust
Statements of Changes in Net Assets
Year ended December 31, 2017 and year ended December 31, 2016
| | | SFT Advantus
Bond
Fund | | SFT Advantus
Dynamic
Managed
Volatility
Fund | | SFT Advantus
Government
Money
Market
Fund | |
| | | 2017 | | 2016 | | 2017 | | 2016 | | 2017 | | 2016 | |
Operations: | |
Net investment income | | $ | 10,326,474 | | | $ | 10,257,605 | | | $ | 2,872,482 | | | $ | 1,836,988 | | | $ | 91,904 | | | $ | – | | |
Net realized gains (losses) on investments | | | 3,848,575 | | | | 2,981,626 | | | | 18,204,722 | | | | 809,167 | | | | – | | | | 41,658 | | |
Net change in unrealized appreciation or
depreciation of investments | | | 3,221,880 | | | | 3,526,165 | | | | 33,175,486 | | | | 17,592,027 | | | | – | | | | – | | |
Net increase (decrease) in net assets
resulting from operations | | | 17,396,929 | | | | 16,765,396 | | | | 54,252,690 | | | | 20,238,182 | | | | 91,904 | | | | 41,658 | | |
Distributions to shareholders: | |
From net investment income | |
Class 2 | | | – | | | | – | | | | – | | | | – | | | | (91,904 | ) | | | – | | |
Decrease in net assets from distributions | | | – | | | | – | | | | – | | | | – | | | | (91,904 | ) | | | – | | |
Capital stock transactions: | |
Proceeds from sales | |
Class 1 | | | 626,191 | | | | 1,071,196 | | | | – | | | | – | | | | – | | | | – | | |
Class 2 | | | 14,703,357 | | | | 9,479,053 | | | | 44,777,384 | | | | 64,812,698 | | | | 20,785,779 | | | | 25,360,844 | | |
Value of distributions reinvested | |
Class 2 | | | – | | | | – | | | | – | | | | – | | | | 91,904 | | | | – | | |
Payments for redemption of shares | |
Class 1 | | | (242,838 | ) | | | (5,524,161 | ) | | | – | | | | – | | | | – | | | | – | | |
Class 2 | | | (17,446,671 | ) | | | (40,699,918 | ) | | | (6,906,214 | ) | | | (8,037,442 | ) | | | (31,692,159 | ) | | | (36,436,264 | ) | |
Increase (decrease) in net assets from
capital stock transactions | | | (2,359,961 | ) | | | (35,673,830 | ) | | | 37,871,170 | | | | 56,775,256 | | | | (10,814,476 | ) | | | (11,075,420 | ) | |
Total increase (decrease) in net assets | | | 15,036,968 | | | | (18,908,434 | ) | | | 92,123,860 | | | | 77,013,438 | | | | (10,814,476 | ) | | | (11,033,762 | ) | |
Net assets at beginning of period | | | 370,268,415 | | | | 389,176,849 | | | | 281,000,073 | | | | 203,986,635 | | | | 77,794,794 | | | | 88,828,556 | | |
Net assets at end of period | | $ | 385,305,383 | | | $ | 370,268,415 | | | $ | 373,123,933 | | | $ | 281,000,073 | | | $ | 66,980,318 | | | $ | 77,794,794 | | |
Undistributed net investment income (loss) | | | – | | | | – | | | | – | | | | – | | | | – | | | | – | | |
Capital share transactions: | |
Proceeds from sales | |
Class 1 | | | 269,388 | | | | 476,305 | | | | – | | | | – | | | | – | | | | – | | |
Class 2 | | | 6,471,805 | | | | 4,276,897 | | | | 3,410,058 | | | | 5,546,365 | | | | 20,785,779 | | | | 25,360,844 | | |
Issued on reinvestment of distributions | |
Class 2 | | | – | | | | – | | | | – | | | | – | | | | 91,904 | | | | – | | |
Payments for redemption of shares | |
Class 1 | | | (104,498 | ) | | | (2,434,351 | ) | | | – | | | | – | | | | – | | | | – | | |
Class 2 | | | (7,644,483 | ) | | | (18,517,648 | ) | | | (513,222 | ) | | | (704,549 | ) | | | (31,692,159 | ) | | | (36,436,264 | ) | |
Net change from capital transactions | | | (1,007,788 | ) | | | (16,198,797 | ) | | | 2,896,836 | | | | 4,841,816 | | | | (10,814,476 | ) | | | (11,075,420 | ) | |
See accompanying notes to financial statements.
100
| | | SFT Advantus
Index 400
Mid-Cap
Fund | | SFT Advantus
Index 500
Fund | |
| | | 2017 | | 2016 | | 2017 | | 2016 | |
Operations: | |
Net investment income | | $ | 2,096,561 | | | $ | 2,154,803 | | | $ | 13,003,322 | | | $ | 12,315,556 | | |
Net realized gains (losses) on investments | | | 19,903,499 | | | | 24,002,929 | | | | 18,817,482 | | | | 18,407,677 | | |
Net change in unrealized appreciation or
depreciation of investments | | | 10,089,062 | | | | 11,220,259 | | | | 123,700,640 | | | | 46,532,642 | | |
Net increase (decrease) in net assets
resulting from operations | | | 32,089,122 | | | | 37,377,991 | | | | 155,521,444 | | | | 77,255,875 | | |
Distributions to shareholders: | |
From net investment income | |
Class 2 | | | – | | | | – | | | | – | | | | – | | |
Decrease in net assets from distributions | | | – | | | | – | | | | – | | | | – | | |
Capital stock transactions: | |
Proceeds from sales | |
Class 1 | | | 1,499,601 | | | | 2,482,226 | | | | 5,775,147 | | | | 39,781,486 | | |
Class 2 | | | 4,898,352 | | | | 15,063,744 | | | | 13,635,718 | | | | 19,868,185 | | |
Value of distributions reinvested | |
Class 2 | | | – | | | | – | | | | – | | | | – | | |
Payments for redemption of shares | |
Class 1 | | | (199,990 | ) | | | (16,796,206 | ) | | | (274,673 | ) | | | (30,547,533 | ) | |
Class 2 | | | (30,271,297 | ) | | | (21,994,165 | ) | | | (41,531,047 | ) | | | (50,827,160 | ) | |
Increase (decrease) in net assets from
capital stock transactions | | | (24,073,334 | ) | | | (21,244,401 | ) | | | (22,394,855 | ) | | | (21,725,022 | ) | |
Total increase (decrease) in net assets | | | 8,015,788 | | | | 16,133,590 | | | | 133,126,589 | | | | 55,530,853 | | |
Net assets at beginning of period | | | 218,697,704 | | | | 202,564,114 | | | | 742,810,101 | | | | 687,279,248 | | |
Net assets at end of period | | $ | 226,713,492 | | | $ | 218,697,704 | | | $ | 875,936,690 | | | $ | 742,810,101 | | |
Undistributed net investment income (loss) | | | – | | | | – | | | | – | | | | – | | |
Capital share transactions: | |
Proceeds from sales | |
Class 1 | | | 328,196 | | | | 656,440 | | | | 593,588 | | | | 4,902,663 | | |
Class 2 | | | 1,113,440 | | | | 3,859,189 | | | | 1,423,520 | | | | 2,470,698 | | |
Issued on reinvestment of distributions | |
Class 2 | | | – | | | | – | | | | – | | | | – | | |
Payments for redemption of shares | |
Class 1 | | | (44,438 | ) | | | (4,394,872 | ) | | | (29,209 | ) | | | (3,770,199 | ) | |
Class 2 | | | (6,797,130 | ) | | | (5,895,049 | ) | | | (4,407,339 | ) | | | (6,344,595 | ) | |
Net change from capital transactions | | | (5,399,932 | ) | | | (5,774,292 | ) | | | (2,419,440 | ) | | | (2,741,433 | ) | |
101
Securian Funds Trust
Statements of Changes in Net Assets – continued
Year ended December 31, 2017 and year ended December 31, 2016
| | | SFT Advantus
International
Bond
Fund | | SFT Advantus
Managed
Volatility Equity
Fund | | SFT Advantus
Mortgage
Securities
Fund | |
| | | 2017 | | 2016 | | 2017 | | 2016 | | 2017 | | 2016 | |
Operations: | |
Net investment income | | $ | 4,124,281 | | | $ | 2,660,438 | | | $ | 3,347,461 | | | $ | 2,708,194 | | | $ | 1,722,157 | | | $ | 1,730,720 | | |
| Net realized gains (losses) on investments | | | 629,553 | | | | (11,053,944 | ) | | | 3,294,966 | | | | (760,203 | ) | | | (232,565 | ) | | | 43,490 | | |
Net change in unrealized appreciation or
depreciation of investments | | | (3,456,355 | ) | | | 11,699,367 | | | | 27,285,086 | | | | (25,929 | ) | | | 275,216 | | | | (477,313 | ) | |
Net increase (decrease) in net assets
resulting from operations | | | 1,297,479 | | | | 3,305,861 | | | | 33,927,513 | | | | 1,922,062 | | | | 1,764,808 | | | | 1,296,897 | | |
Distributions to shareholders: | |
From net investment income | |
Class 2 | | | – | | | | – | | | | – | | | | – | | | | – | | | | – | | |
Decrease in net assets from distributions | | | – | | | | – | | | | – | | | | – | | | | – | | | | – | | |
Capital stock transactions: | |
Proceeds from sales | |
Class 1 | | | 199,736 | | | | 192,546 | | | | – | | | | – | | | | 46,632 | | | | 110,281 | | |
Class 2 | | | 3,523,068 | | | | 2,867,716 | | | | 54,031,240 | | | | 173,343,080 | | | | 2,321,219 | | | | 4,985,962 | | |
Value of distributions reinvested | |
Class 2 | | | – | | | | – | | | | – | | | | – | | | | – | | | | – | | |
Payments for redemption of shares | |
Class 1 | | | (177,606 | ) | | | (116,726 | ) | | | – | | | | – | | | | (58,630 | ) | | | (778,863 | ) | |
Class 2 | | | (7,845,215 | ) | | | (8,775,824 | ) | | | (26,615,898 | ) | | | (641,406 | ) | | | (7,882,052 | ) | | | (8,499,819 | ) | |
Increase (decrease) in net assets from
capital stock transactions | | | (4,300,017 | ) | | | (5,832,288 | ) | | | 27,415,342 | | | | 172,701,674 | | | | (5,572,831 | ) | | | (4,182,439 | ) | |
Total increase (decrease) in net assets | | | (3,002,538 | ) | | | (2,526,427 | ) | | | 61,342,855 | | | | 174,623,736 | | | | (3,808,023 | ) | | | (2,885,542 | ) | |
Net assets at beginning of period | | | 111,005,466 | | | | 113,531,893 | | | | 200,137,784 | | | | 25,514,048 | | | | 91,529,629 | | | | 94,415,171 | | |
Net assets at end of period | | $ | 108,002,928 | | | $ | 111,005,466 | | | $ | 261,480,639 | | | $ | 200,137,784 | | | $ | 87,721,606 | | | $ | 91,529,629 | | |
| Undistributed net investment income (loss) | | | 1,644,889 | | | | (4,915,077 | ) | | | – | | | | – | | | | – | | | | – | | |
Capital share transactions: | |
Proceeds from sales | |
Class 1 | | | 77,984 | | | | 80,466 | | | | – | | | | – | | | | 23,922 | | | | 57,106 | | |
Class 2 | | | 1,406,182 | | | | 1,224,266 | | | | 4,755,843 | | | | 16,619,423 | | | | 1,219,474 | | | | 2,624,654 | | |
Issued on reinvestment of distributions | |
Class 2 | | | – | | | | – | | | | – | | | | – | | | | – | | | | – | | |
Payments for redemption of shares | |
Class 1 | | | (69,554 | ) | | | (48,297 | ) | | | – | | | | – | | | | (30,102 | ) | | | (399,174 | ) | |
Class 2 | | | (3,131,653 | ) | | | (3,722,946 | ) | | | (2,406,045 | ) | | | (62,561 | ) | | | (4,128,205 | ) | | | (4,469,887 | ) | |
Net change from capital transactions | | | (1,717,041 | ) | | | (2,466,511 | ) | | | 2,349,798 | | | | 16,556,862 | ) | | | (2,914,911 | ) | | | (2,187,301 | ) | |
See accompanying notes to financial statements.
102
| | | SFT Advantus
Real Estate
Securities
Fund | | SFT IvySM
Growth
Fund | | SFT IvySM
Small Cap
Growth
Fund | |
| | | 2017 | | 2016 | | 2017 | | 2016 | | 2017 | | 2016 | |
Operations: | |
Net investment income | | $ | 2,159,815 | | | $ | 2,148,779 | | | $ | 747,333 | | | $ | 1,290,382 | | | $ | (1,345,244 | ) | | $ | (1,022,702 | ) | |
| Net realized gains (losses) on investments | | | 6,432,149 | | | | 19,378,674 | | | | 32,362,425 | | | | 18,696,419 | | | | 13,252,837 | | | | 13,489,268 | | |
Net change in unrealized appreciation or
depreciation of investments | | | (1,281,847 | ) | | | (14,560,817 | ) | | | 88,764,663 | | | | (16,646,407 | ) | | | 26,975,755 | | | | 16,850,153 | | |
Net increase (decrease) in net assets
resulting from operations | | | 7,310,117 | | | | 6,966,636 | | | | 121,874,421 | | | | 3,340,394 | | | | 38,883,348 | | | | 29,316,719 | | |
Distributions to shareholders: | |
From net investment income | |
Class 2 | | | – | | | | – | | | | – | | | | – | | | | – | | | | – | | |
Decrease in net assets from distributions | | | – | | | | – | | | | – | | | | – | | | | – | | | | – | | |
Capital stock transactions: | |
Proceeds from sales | |
Class 1 | | | 739,204 | | | | 1,216,024 | | | | – | | | | – | | | | – | | | | – | | |
Class 2 | | | 12,579,024 | | | | 6,915,526 | | | | 1,677,876 | | | | 1,697,051 | | | | 1,550,904 | | | | 3,486,016 | | |
Value of distributions reinvested | |
Class 2 | | | – | | | | – | | | | – | | | | – | | | | – | | | | – | | |
Payments for redemption of shares | |
Class 1 | | | (422,188 | ) | | | (5,480,644 | ) | | | – | | | | – | | | | – | | | | – | | |
Class 2 | | | (30,474,526 | ) | | | (15,300,382 | ) | | | (58,099,636 | ) | | | (45,133,736 | ) | | | (19,495,781 | ) | | | (14,973,753 | ) | |
Increase (decrease) in net assets from
capital stock transactions | | | (17,578,486 | ) | | | (12,649,476 | ) | | | (56,421,760 | ) | | | (43,436,685 | ) | | | (17,944,877 | ) | | | (11,487,737 | ) | |
Total increase (decrease) in net assets | | | (10,268,369 | ) | | | (5,682,840 | ) | | | 65,452,661 | | | | (40,096,291 | ) | | | 20,938,471 | | | | 17,828,982 | | |
Net assets at beginning of period | | | 146,223,534 | | | | 151,906,374 | | | | 438,984,600 | | | | 479,080,891 | | | | 163,294,393 | | | | 145,465,411 | | |
Net assets at end of period | | $ | 135,955,165 | | | $ | 146,223,534 | | | $ | 504,437,261 | | | $ | 438,984,600 | | | $ | 184,232,864 | | | $ | 163,294,393 | | |
| Undistributed net investment income (loss) | | | – | | | | – | | | | – | | | | – | | | | – | | | | – | | |
Capital share transactions: | |
Proceeds from sales | |
Class 1 | | | 158,943 | | | | 271,256 | | | | – | | | | – | | | | – | | | | – | | |
Class 2 | | | 2,775,497 | | | | 1,555,728 | | | | 123,273 | | | | 149,149 | | | | 108,507 | | | | 291,775 | | |
Issued on reinvestment of distributions | |
Class 2 | | | – | | | | – | | | | – | | | | – | | | | – | | | | – | | |
Payments for redemption of shares | |
Class 1 | | | (91,140 | ) | | | (1,150,736 | ) | | | – | | | | – | | | | – | | | | – | | |
Class 2 | | | (6,723,222 | ) | | | (3,450,344 | ) | | | (4,133,610 | ) | | | (3,815,228 | ) | | | (1,397,740 | ) | | | (1,311,293 | ) | |
Net change from capital transactions | | | (3,879,922 | ) | | | (2,774,096 | ) | | | (4,010,337 | ) | | | (3,666,079 | ) | | | (1,289,233 | ) | | | (1,019,518 | ) | |
103
Securian Funds Trust
Statements of Changes in Net Assets – continued
Year ended December 31, 2017 and year ended December 31, 2016
| | | SFT
T. Rowe Price
Value Fund | | SFT
Wellington
Core Equity Fund1 | |
| | | 2017 | | 2016 | | 2017 | | 2016 | |
Operations: | |
Net investment income | | $ | 2,623,411 | | | $ | 3,218,733 | | | $ | 467,945 | | | $ | 649,241 | | |
Net realized gains (losses) on investments | | | 24,258,009 | | | | 4,653,139 | | | | 21,810,519 | | | | (870,564 | ) | |
Net change in unrealized appreciation or
depreciation of investments | | | 10,607,530 | | | | 12,604,688 | | | | 233,193 | | | | 5,750,668 | | |
Net increase (decrease) in net assets
resulting from operations | | | 37,488,950 | | | | 20,476,560 | | | | 22,511,657 | | | | 5,529,345 | | |
Distributions to shareholders: | |
From net investment income | |
Class 2 | | | – | | | | – | | | | – | | | | – | | |
Decrease in net assets from distributions | | | – | | | | – | | | | – | | | | – | | |
Capital stock transactions: | |
Proceeds from sales | |
Class 1 | | | – | | | | – | | | | 136,444 | | | | 140,311 | | |
Class 2 | | | 10,721,941 | | | | 2,353,560 | | | | 371,896 | | | | 900,567 | | |
Value of distributions reinvested | |
Class 2 | | | – | | | | – | | | | – | | | | – | | |
Payments for redemption of shares | |
Class 1 | | | – | | | | – | | | | (273,237 | ) | | | (65,854 | ) | |
Class 2 | | | (30,508,819 | ) | | | (22,014,912 | ) | | | (16,350,148 | ) | | | (20,893,360 | ) | |
Increase (decrease) in net assets from
capital stock transactions | | | (19,786,878 | ) | | | (19,661,352 | ) | | | (16,115,045 | ) | | | (19,918,336 | ) | |
Total increase (decrease) in net assets | | | 17,702,072 | | | | 815,208 | | | | 6,396,612 | | | | (14,388,991 | ) | |
Net assets at beginning of period | | | 208,512,783 | | | | 207,697,575 | | | | 114,494,651 | | | | 128,883,642 | | |
Net assets at end of period | | $ | 226,214,855 | | | $ | 208,512,783 | | | $ | 120,891,263 | | | $ | 114,494,651 | | |
Undistributed net investment income (loss) | | | – | | | | – | | | | – | | | | – | | |
Capital share transactions: | |
Proceeds from sales | |
Class 1 | | | – | | | | – | | | | 10,383 | | | | 12,504 | | |
Class 2 | | | 875,479 | | | | 217,525 | | | | 29,187 | | | | 83,279 | | |
Issued on reinvestment of distributions | |
Class 2 | | | – | | | | – | | | | – | | | | – | | |
Payments for redemption of shares | |
Class 1 | | | – | | | | – | | | | (19,999 | ) | | | (5,857 | ) | |
Class 2 | | | (2,390,120 | ) | | | (2,030,629 | ) | | | (1,268,569 | ) | | | (1,843,703 | ) | |
Net change from capital transactions | | | (1,514,641 | ) | | | (1,813,104 | ) | | | (1,248,998 | ) | | | (1,753,777 | ) | |
1 Formerly SFT Pyramis® Core Equity Fund
See accompanying notes to financial statements.
104
Securian Funds Trust
Financial Highlights
SFT Advantus Bond Fund
| | | Class 1 Shares | |
| | | Year ended December 31, | |
| | | 2017 | | 2016 | | 2015 | | 2014 | | 2013 | |
Net asset value, beginning of period | | $ | 2.257 | | | $ | 2.157 | | | $ | 2.148 | | | $ | 2.016 | | | $ | 2.024 | | |
Income from investment operations: | |
Net investment income (a) | | | .069 | | | | .066 | | | | .066 | | | | .064 | | | | .060 | | |
Net gains (losses) (both realized and unrealized) | | | .042 | | | | .034 | | | | (.057 | ) | | | .068 | | | | (.068 | ) | |
Total from investment operations | | | .111 | | | | .100 | | | | .009 | | | | .132 | | | | (.008 | ) | |
Net asset value, end of period | | $ | 2.368 | | | $ | 2.257 | | | $ | 2.157 | | | $ | 2.148 | | | $ | 2.016 | | |
Total return (b) | | | 4.95 | % | | | 4.63 | % | | | 0.41 | % | | | 6.56 | % | | | (0.40 | )% | |
Net assets, end of period (in thousands) | | $ | 2,608 | | | $ | 2,113 | | | $ | 6,243 | | | $ | 5,402 | | | $ | 4,414 | | |
Ratios to average net assets: | |
Expenses (c) | | | .49 | % | | | .49 | % | | | .49 | % | | | .49 | % | | | .51 | % | |
Net investment income | | | 2.96 | % | | | 2.97 | % | | | 3.03 | % | | | 3.07 | % | | | 2.96 | % | |
Portfolio turnover rate (excluding short-term securities) | | | 159.8 | % | | | 249.6 | % | | | 179.3 | % | | | 193.5 | % | | | 235.8 | % | |
| | | Class 2 Shares | |
| | | Year ended December 31, | |
| | | 2017 | | 2016 | | 2015 | | 2014 | | 2013 | |
Net asset value, beginning of period | | $ | 2.212 | | | $ | 2.120 | | | $ | 2.117 | | | $ | 1.991 | | | $ | 2.004 | | |
Income from investment operations: | |
Net investment income (a) | | | .062 | | | | .059 | | | | .059 | | | | .058 | | | | .054 | | |
Net gains (losses) (both realized and unrealized) | | | .042 | | | | .033 | | | | (.056 | ) | | | .068 | | | | (.067 | ) | |
Total from investment operations | | | .104 | | | | .092 | | | | .003 | | | | .126 | | | | (.013 | ) | |
Net asset value, end of period | | $ | 2.316 | | | $ | 2.212 | | | $ | 2.120 | | | $ | 2.117 | | | $ | 1.991 | | |
Total return (b) | | | 4.69 | % | | | 4.37 | % | | | 0.16 | % | | | 6.29 | % | | | (0.65 | )% | |
Net assets, end of period (in thousands) | | $ | 382,697 | | | $ | 368,156 | | | $ | 382,934 | | | $ | 368,926 | | | $ | 356,034 | | |
Ratios to average net assets: | |
Expenses (c) | | | .74 | % | | | .74 | % | | | .74 | % | | | .74 | % | | | .76 | % | |
Net investment income | | | 2.71 | % | | | 2.68 | % | | | 2.78 | % | | | 2.82 | % | | | 2.71 | % | |
Portfolio turnover rate (excluding short-term securities) | | | 159.8 | % | | | 249.6 | % | | | 179.3 | % | | | 193.5 | % | | | 235.8 | % | |
(a) Based on average shares outstanding during the year.
(b) Total return figures are based on a share outstanding throughout the period and assume reinvestment of distributions at net asset value. Total return figures do not reflect charges pursuant to the terms of the variable life insurance policies and variable annuity contracts funded by separate accounts that invest in the Fund's shares. For periods less than one year, total return presented has not been annualized.
(c) In addition to fees and expenses which the Fund bears directly, the Fund indirectly bears a pro rata share of the fees and expenses of the acquired funds in which it invests. Such indirect expenses are not included in the above reported expense ratios.
105
Securian Funds Trust
Financial Highlights – continued
SFT Advantus Dynamic Managed Volatility Fund
| | | Class 2 Shares | |
| | | Year or period ended December 31, | |
| | | 2017 | | 2016 | | 2015 | | 2014 | | 2013(a) | |
Net asset value, beginning of period | | $ | 12.210 | | | $ | 11.226 | | | $ | 11.603 | | | $ | 10.731 | | | $ | 10.000 | | |
Income from investment operations: | |
| Net investment income (b) | | | 0.116 | | | | .091 | | | | .082 | | | | .039 | | | | .008 | | |
| Net realized and unrealized gain(loss) on investments | | | 2.075 | | | | .893 | | | | (.459 | ) | | | .833 | | | | .723 | | |
Total from investment operations | | | 2.191 | | | | .984 | | | | (.377 | ) | | | .872 | | | | .731 | | |
Net asset value, end of period | | $ | 14.401 | | | $ | 12.210 | | | $ | 11.226 | | | $ | 11.603 | | | $ | 10.731 | | |
Total return (c) | | | 17.94 | % | | | 8.77 | % | | | (3.25 | )% | | | 8.12 | % | | | 7.31 | % | |
Net assets, end of period (in thousands) | | $ | 373,124 | | | $ | 281,000 | | | $ | 203,987 | | | $ | 131,047 | | | $ | 52,931 | | |
Ratios to average net assets: | |
Expenses before waiver (d) | | | .98 | % | | | 1.00 | % | | | 1.02 | % | | | 1.19 | % | | | 1.37 | %(e) | |
Expenses net of waiver (d)(f) | | | .80 | % | | | .80 | % | | | .80 | % | | | .80 | % | | | .80 | %(e) | |
Net investment income | | | .87 | % | | | .79 | % | | | .71 | % | | | .35 | % | | | .12 | %(e) | |
Portfolio turnover rate (excluding short-term securities) | | | 1.7 | % | | | 1.4 | % | | | 5.1 | % | | | 1.5 | % | | | 32.1 | % | |
(a) The Fund commenced operations on May 1, 2013.
(b) Based on average shares outstanding during the year or period.
(c) Total return figures are based on a share outstanding throughout the period and assume reinvestment of distributions at net asset value. Total return figures do not reflect charges pursuant to the terms of the variable life insurance policies and variable annuity contracts funded by separate accounts that invest in the Fund's shares. For periods less than one year, total return presented has not been annualized.
(d) In addition to fees and expenses which the Fund bears directly, the Fund indirectly bears a pro rata share of the fees and expenses of the acquired funds in which it invests. Such indirect expenses are not included in the above reported expense ratios.
(e) Adjusted to an annual basis.
(f) Ratio is net of fees waived by the advisor and distributor (see note 4).
106
Securian Funds Trust
Financial Highlights – continued
SFT Advantus Government Money Market Fund
| | | Class 2 Shares | |
| | | Year ended December 31, | |
| | | 2017 | | 2016 | | 2015 | | 2014 | | 2013 | |
Net asset value, beginning of period | | $ | 1.000 | | | $ | 1.000 | | | $ | 1.000 | | | $ | 1.000 | | | $ | 1.000 | | |
Income from investment operations: | |
Net investment income (a) | | | .001 | | | | – | | | | – | | | | – | | | | – | | |
Net realized and unrealized gain(loss) on investments | | | – | | | | – | | | | – | | | | – | | | | – | | |
Total from investment operations | | | 1.001 | | | | 1.000 | | | | 1.000 | | | | 1.000 | | | | 1.000 | | |
Less distributions: | |
Distributions from net investment income | | | (.001 | ) | | | – | | | | – | | | | – | | | | – | | |
Net asset value, end of period | | $ | 1.000 | | | $ | 1.000 | | | $ | 1.000 | | | $ | 1.000 | | | $ | 1.000 | | |
Total return (b) | | | 0.13 | % | | | – | % | | | – | % | | | – | % | | | – | % | |
Net assets, end of period (in thousands) | | $ | 66,980 | | | $ | 77,795 | | | $ | 88,829 | | | $ | 86,904 | | | $ | 89,423 | | |
Ratios to average net assets: | |
Expenses before waiver | | | .92 | % | | | .91 | % | | | .85 | % | | | .83 | % | | | .86 | % | |
| Expenses net of waiver (c)(d) | | | .78 | % | | | .36 | % | | | .12 | % | | | .10 | % | | | .13 | % | |
Net investment income | | | .13 | % | | | – | % | | | – | % | | | – | % | | | – | % | |
(a) Based on average shares outstanding during the year.
(b) Total return figures are based on a share outstanding throughout the period and assume reinvestment of distributions at net asset value. Total return figures do not reflect charges pursuant to the terms of the variable life insurance policies and variable annuity contracts funded by separate accounts that invest in the Fund's shares. For periods less than one year, total return presented has not been annualized.
(c) In addition to fees and expenses which the Fund bears directly, the Fund indirectly bears a pro rata share of the fees and expenses of the acquired funds in which it invests. Such indirect expenses are not included in the above reported expense ratios.
(d) Ratio is net of fees waived by the advisor and distributor (see note 4).
107
Securian Funds Trust
Financial Highlights – continued
SFT Advantus Index 400 Mid-Cap Fund
| | | Class 1 Shares | |
| | | Year ended December 31, | |
| | | 2017 | | 2016 | | 2015 | | 2014 | | 2013 | |
Net asset value, beginning of period | | $ | 4.275 | | | $ | 3.553 | | | $ | 3.640 | | | $ | 3.324 | | | $ | 2.497 | | |
Income from investment operations: | |
| Net investment income (a) | | | .055 | | | | .045 | | | | .046 | | | | .040 | | | | .034 | | |
Net realized and unrealized gain(loss) on investments | | | .625 | | | | .677 | | | | (.133 | ) | | | .276 | | | | .793 | | |
Total from investment operations | | | .680 | | | | .722 | | | | (.087 | ) | | | .316 | | | | .827 | | |
Net asset value, end of period | | $ | 4.955 | | | $ | 4.275 | | | $ | 3.553 | | | $ | 3.640 | | | $ | 3.324 | | |
Total return (b) | | | 15.90 | % | | | 20.34 | % | | | (2.39 | )% | | | 9.51 | % | | | 33.11 | % | |
Net assets, end of period (in thousands) | | $ | 6,378 | | | $ | 4,290 | | | $ | 16,847 | | | $ | 15,418 | | | $ | 12,802 | | |
Ratios to average net assets: | |
Expenses (c) | | | .26 | % | | | .26 | % | | | .26 | % | | | .25 | % | | | .28 | % | |
| Net investment income | | | 1.21 | % | | | 1.24 | % | | | 1.24 | % | | | 1.15 | % | | | 1.15 | % | |
Portfolio turnover rate (excluding short-term securities) | | | 16.6 | % | | | 18.5 | % | | | 16.1 | % | | | 12.0 | % | | | 9.3 | % | |
| | | Class 2 Shares | |
| | | Year ended December 31, | |
| | | 2017 | | 2016 | | 2015 | | 2014 | | 2013 | |
Net asset value, beginning of period | | $ | 4.191 | | | $ | 3.491 | | | $ | 3.586 | | | $ | 3.283 | | | $ | 2.472 | | |
Income from investment operations: | |
Net investment income (a) | | | .042 | | | | .039 | | | | .036 | | | | .030 | | | | .025 | | |
Net realized and unrealized gain(loss) on investments | | | .612 | | | | .661 | | | | (.131 | ) | | | .273 | | | | .786 | | |
Total from investment operations | | | .654 | | | | .700 | | | | (.095 | ) | | | .303 | | | | .811 | | |
Net asset value, end of period | | $ | 4.845 | | | $ | 4.191 | | | $ | 3.491 | | | $ | 3.586 | | | $ | 3.283 | | |
Total return (b) | | | 15.61 | % | | | 20.04 | % | | | (2.63 | )% | | | 9.24 | % | | | 32.78 | % | |
Net assets, end of period (in thousands) | | $ | 220,335 | | | $ | 214,408 | | | $ | 185,717 | | | $ | 218,305 | | | $ | 215,884 | | |
Ratios to average net assets: | |
Expenses (c) | | | .51 | % | | | .51 | % | | | .51 | % | | | .50 | % | | | .53 | % | |
| Net investment income | | | .95 | % | | | 1.06 | % | | | .98 | % | | | .89 | % | | | .87 | % | |
Portfolio turnover rate (excluding short-term securities) | | | 16.6 | % | | | 18.5 | % | | | 16.1 | % | | | 12.0 | % | | | 9.3 | % | |
(a) Based on average shares outstanding during the year.
(b) Total return figures are based on a share outstanding throughout the period and assume reinvestment of distributions at net asset value. Total return figures do not reflect charges pursuant to the terms of the variable life insurance policies and variable annuity contracts funded by separate accounts that invest in the Fund's shares. For periods less than one year, total return presented has not been annualized.
(c) In addition to fees and expenses which the Fund bears directly, the Fund indirectly bears a pro rata share of the fees and expenses of the acquired funds in which it invests. Such indirect expenses are not included in the above reported expense ratios.
108
Securian Funds Trust
Financial Highlights – continued
SFT Advantus Index 500 Fund
| | | Class 1 Shares | |
| | | Year ended December 31, | |
| | | 2017 | | 2016 | | 2015 | | 2014 | | 2013 | |
Net asset value, beginning of period | | $ | 8.745 | | | $ | 7.829 | | | $ | 7.737 | | | $ | 6.822 | | | $ | 5.167 | | |
Income from investment operations: | |
Net investment income (a) | | | .175 | | | | .160 | | | | .147 | | | | .132 | | | | .115 | | |
Net realized and unrealized gain(loss) on investments | | | 1.709 | | | | .756 | | | | (.055 | ) | | | .783 | | | | 1.540 | | |
Total from investment operations | | | 1.884 | | | | .916 | | | | .092 | | | | .915 | | | | 1.655 | | |
Net asset value, end of period | | $ | 10.629 | | | $ | 8.745 | | | $ | 7.829 | | | $ | 7.737 | | | $ | 6.822 | | |
Total return (b) | | | 21.54 | % | | | 11.72 | % | | | 1.18 | % | | | 13.41 | % | | | 32.04 | % | |
Net assets, end of period (in thousands) | | $ | 167,661 | | | $ | 133,014 | | | $ | 110,210 | | | $ | 60,909 | | | $ | 36,387 | | |
Ratios to average net assets: | |
Expenses (c) | | | .20 | % | | | .20 | % | | | .21 | % | | | .21 | % | | | .22 | % | |
Net investment income | | | 1.82 | % | | | 1.97 | % | | | 1.88 | % | | | 1.83 | % | | | 1.88 | % | |
Portfolio turnover rate (excluding short-term securities) | | | 2.7 | % | | | 3.5 | % | | | 6.1 | % | | | 4.8 | % | | | 4.5 | % | |
| | | Class 2 Shares | |
| | | Year ended December 31, | |
| | | 2017 | | 2016 | | 2015 | | 2014 | | 2013 | |
Net asset value, beginning of period | | $ | 8.573 | | | $ | 7.693 | | | $ | 7.622 | | | $ | 6.737 | | | $ | 5.115 | | |
Income from investment operations: | |
Net investment income (a) | | | .148 | | | | .136 | | | | .124 | | | | .110 | | | | .095 | | |
Net realized and unrealized gain(loss) on investments | | | 1.672 | | | | .744 | | | | (.053 | ) | | | .775 | | | | 1.527 | | |
Total from investment operations | | | 1.820 | | | | .880 | | | | .071 | | | | .885 | | | | 1.622 | | |
Net asset value, end of period | | $ | 10.393 | | | $ | 8.573 | | | $ | 7.693 | | | $ | 7.622 | | | $ | 6.737 | | |
Total return (b) | | | 21.23 | % | | | 11.44 | % | | | 0.93 | % | | | 13.13 | % | | | 31.71 | % | |
Net assets, end of period (in thousands) | | $ | 708,275 | | | $ | 609,796 | | | $ | 577,069 | | | $ | 585,532 | | | $ | 540,439 | | |
Ratios to average net assets: | |
Expenses (c) | | | .45 | % | | | .45 | % | | | .46 | % | | | .46 | % | | | .47 | % | |
Net investment income | | | 1.57 | % | | | 1.72 | % | | | 1.61 | % | | | 1.56 | % | | | 1.59 | % | |
Portfolio turnover rate (excluding short-term securities) | | | 2.7 | % | | | 3.5 | % | | | 6.1 | % | | | 4.8 | % | | | 4.5 | % | |
(a) Based on average shares outstanding during the year.
(b) Total return figures are based on a share outstanding throughout the period and assume reinvestment of distributions at net asset value. Total return figures do not reflect charges pursuant to the terms of the variable life insurance policies and variable annuity contracts funded by separate accounts that invest in the Fund's shares. For periods less than one year, total return presented has not been annualized.
(c) In addition to fees and expenses which the Fund bears directly, the Fund indirectly bears a pro rata share of the fees and expenses of the acquired funds in which it invests. Such indirect expenses are not included in the above reported expense ratios.
109
Securian Funds Trust
Financial Highlights – continued
SFT Advantus International Bond Fund
| | | Class 1 Shares | |
| | | Year ended December 31, | |
| | | 2017 | | 2016 | | 2015 | | 2014 | | 2013 | |
Net asset value, beginning of period | | $ | 2.499 | | | $ | 2.418 | | | $ | 2.517 | | | $ | 2.468 | | | $ | 2.464 | | |
Income from investment operations: | |
Net investment income (a) | | | .102 | | | | .064 | | | | .063 | | | | .074 | | | | .078 | | |
Net realized and unrealized gain(loss) on investments | | | (.068 | ) | | | .017 | | | | (.162 | ) | | | (.025 | ) | | | (.074 | ) | |
Total from investment operations | | | .034 | | | | .081 | | | | (.099 | ) | | | .049 | | | | .004 | | |
Net asset value, end of period | | $ | 2.533 | | | $ | 2.499 | | | $ | 2.418 | | | $ | 2.517 | | | $ | 2.468 | | |
Total return (b) | | | 1.38 | % | | | 3.35 | % | | | (3.92 | )% | | | 1.96 | % | | | 0.17 | % | |
Net assets, end of period (in thousands) | | $ | 1,134 | | | $ | 1,097 | | | $ | 984 | | | $ | 938 | | | $ | 756 | | |
Ratios to average net assets: | |
Expenses (c) | | | .98 | % | | | 1.00 | % | | | .89 | % | | | .86 | % | | | .87 | % | |
Net investment income | | | 3.97 | % | | | 2.67 | % | | | 2.55 | % | | | 2.93 | % | | | 3.18 | % | |
Portfolio turnover rate (excluding short-term securities) | | | 58.7 | % | | | 54.0 | % | | | 42.4 | % | | | 19.3 | % | | | 17.7 | % | |
| | | Class 2 Shares | |
| | | Year ended December 31, | |
| | | 2017 | | 2016 | | 2015 | | 2014 | | 2013 | |
Net asset value, beginning of period | | $ | 2.450 | | | $ | 2.376 | | | $ | 2.479 | | | $ | 2.438 | | | $ | 2.440 | | |
Income from investment operations: | |
Net investment income (a) | | | .093 | | | | .057 | | | | .056 | | | | .067 | | | | .071 | | |
Net realized and unrealized gain(loss) on investments | | | (.066 | ) | | | .017 | | | | (.159 | ) | | | (.026 | ) | | | (.073 | ) | |
Total from investment operations | | | .027 | | | | .074 | | | | (.103 | ) | | | .041 | | | | (.002 | ) | |
Net asset value, end of period | | $ | 2.477 | | | $ | 2.450 | | | $ | 2.376 | | | $ | 2.479 | | | $ | 2.438 | | |
Total return (b) | | | 1.12 | % | | | 3.09 | % | | | (4.16 | )% | | | 1.70 | % | | | (0.08 | )% | |
Net assets, end of period (in thousands) | | $ | 106,869 | | | $ | 109,908 | | | $ | 112,548 | | | $ | 124,174 | | | $ | 128,885 | | |
Ratios to average net assets: | |
Expenses (c) | | | 1.23 | % | | | 1.24 | % | | | 1.14 | % | | | 1.11 | % | | | 1.12 | % | |
Net investment income | | | 3.72 | % | | | 2.42 | % | | | 2.29 | % | | | 2.69 | % | | | 2.92 | % | |
Portfolio turnover rate (excluding short-term securities) | | | 58.7 | % | | | 54.0 | % | | | 42.4 | % | | | 19.3 | % | | | 17.7 | % | |
(a) Based on average shares outstanding during the year.
(b) Total return figures are based on a share outstanding throughout the period and assume reinvestment of distributions at net asset value. Total return figures do not reflect charges pursuant to the terms of the variable life insurance policies and variable annuity contracts funded by separate accounts that invest in the Fund's shares. For periods less than one year, total return presented has not been annualized.
(c) In addition to fees and expenses which the Fund bears directly, the Fund indirectly bears a pro rata share of the fees and expenses of the acquired funds in which it invests. Such indirect expenses are not included in the above reported expense ratios.
110
Securian Funds Trust
Financial Highlights – continued
SFT Advantus Managed Volatility Equity Fund
| | | Class 2 Shares | |
| | | Year or period ended December 31, | |
| | | 2017 | | 2016 | | 2015(a) | |
Net asset value, beginning of period | | $ | 10.483 | | | $ | 10.064 | | | $ | 10.000 | | |
Income from investment operations: | |
Net investment income (b) | | | .169 | | | | .253 | | | | .066 | | |
Net realized and unrealized gain(loss) on investments | | | 1.543 | | | | .166 | | | | (.002 | ) | |
Total from investment operations | | | 1.712 | | | | .419 | | | | .064 | | |
Net asset value, end of period | | $ | 12.195 | | | $ | 10.483 | | | $ | 10.064 | | |
Total return (c) | | | 16.33 | % | | | 4.16 | % | | | 0.64 | % | |
Net assets, end of period (in thousands) | | $ | 261,481 | | | $ | 200,138 | | | $ | 25,514 | | |
Ratios to average net assets: | |
Expenses before waiver (d) | | | .99 | % | | | 1.09 | % | | | 2.28 | %(e) | |
Expenses net of waiver (f) | | | .80 | % | | | .80 | % | | | .80 | %(e) | |
Net investment income | | | 1.48 | % | | | 2.43 | % | | | 5.53 | %(e) | |
Portfolio turnover rate (excluding short-term securities) | | | 9.2 | % | | | 8.5 | % | | | – | % | |
(a) The Fund commenced operations on November 18, 2015.
(b) Based on average shares outstanding during the year or period.
(c) Total return figures are based on a share outstanding throughout the period and assume reinvestment of distributions at net asset value. Total return figures do not reflect charges pursuant to the terms of the variable life insurance policies and variable annuity contracts funded by separate accounts that invest in the Fund's shares. For periods less than one year, total return presented has not been annualized.
(d) In addition to fees and expenses which the Fund bears directly, the Fund indirectly bears a pro rata share of the fees and expenses of the acquired funds in which it invests. Such indirect expenses are not included in the above reported expense ratios.
(e) Adjusted to an annual basis.
(f) Ratio is net of fees waived by the advisor and distributor (see note 4).
111
Securian Funds Trust
Financial Highlights – continued
SFT Advantus Mortgage Securities Fund
| | | Class 1 Shares | |
| | | Year ended December 31, | |
| | | 2017 | | 2016 | | 2015 | | 2014 | | 2013 | |
Net asset value, beginning of period | | $ | 1.924 | | | $ | 1.894 | | | $ | 1.835 | | | $ | 1.731 | | | $ | 1.761 | | |
Income from investment operations: | |
Net investment income (a) | | | .042 | | | | .042 | | | | .042 | | | | .031 | | | | .029 | | |
Net realized and unrealized gain(loss) on investments | | | – | | | | (.012 | ) | | | .017 | | | | .073 | | | | (.059 | ) | |
Total from investment operations | | | .042 | | | | .030 | | | | .059 | | | | .104 | | | | (.030 | ) | |
Net asset value, end of period | | $ | 1.966 | | | $ | 1.924 | | | $ | 1.894 | | | $ | 1.835 | | | $ | 1.731 | | |
Total return (b) | | | 2.22 | % | | | 1.58 | % | | | 3.21 | % | | | 6.03 | % | | | (1.73 | )% | |
Net assets, end of period (in thousands) | | $ | 263 | | | $ | 269 | | | $ | 913 | | | $ | 813 | | | $ | 985 | | |
Ratios to average net assets: | |
Expenses (c) | | | .68 | % | | | .65 | % | | | .64 | % | | | .63 | % | | | .68 | % | |
Net investment income | | | 2.16 | % | | | 2.18 | % | | | 2.25 | % | | | 1.73 | % | | | 1.67 | % | |
Portfolio turnover rate (excluding short-term securities) | | | 157.9 | % | | | 85.8 | % | | | 141.4 | % | | | 232.2 | % | | | 370.7 | % | |
| | | Class 2 Shares | |
| | | Year ended December 31, | |
| | | 2017 | | 2016 | | 2015 | | 2014 | | 2013 | |
Net asset value, beginning of period | | $ | 1.886 | | | $ | 1.861 | | | $ | 1.808 | | | $ | 1.709 | | | $ | 1.744 | | |
Income from investment operations: | |
Net investment income (a) | | | .037 | | | | .035 | | | | .037 | | | | .026 | | | | .025 | | |
Net realized and unrealized gain(loss) on investments | | | – | | | | (.010 | ) | | | .016 | | | | .073 | | | | (.060 | ) | |
Total from investment operations | | | .037 | | | | .025 | | | | .053 | | | | .099 | | | | (.035 | ) | |
Net asset value, end of period | | $ | 1.923 | | | $ | 1.886 | | | $ | 1.861 | | | $ | 1.808 | | | $ | 1.709 | | |
Total return (b) | | | 1.96 | % | | | 1.32 | % | | | 2.95 | % | | | 5.76 | % | | | (1.98 | )% | |
Net assets, end of period (in thousands) | | $ | 87,459 | | | $ | 91,261 | | | $ | 93,502 | | | $ | 97,348 | | | $ | 95,570 | | |
Ratios to average net assets: | |
Expenses (c) | | | .93 | % | | | .90 | % | | | .89 | % | | | .88 | % | | | .93 | % | |
Net investment income | | | 1.91 | % | | | 1.83 | % | | | 2.00 | % | | | 1.48 | % | | | 1.44 | % | |
Portfolio turnover rate (excluding short-term securities) | | | 157.9 | % | | | 85.8 | % | | | 141.4 | % | | | 232.2 | % | | | 370.7 | % | |
(a) Based on average shares outstanding during the year.
(b) Total return figures are based on a share outstanding throughout the period and assume reinvestment of distributions at net asset value. Total return figures do not reflect charges pursuant to the terms of the variable life insurance policies and variable annuity contracts funded by separate accounts that invest in the Fund's shares. For periods less than one year, total return presented has not been annualized.
(c) In addition to fees and expenses which the Fund bears directly, the Fund indirectly bears a pro rata share of the fees and expenses of the acquired funds in which it invests. Such indirect expenses are not included in the above reported expense ratios.
112
Securian Funds Trust
Financial Highlights – continued
SFT Advantus Real Estate Securities Fund
| | | Class 1 Shares | |
| | | Year ended December 31, | |
| | | 2017 | | 2016 | | 2015 | | 2014 | | 2013 | |
Net asset value, beginning of period | | $ | 4.526 | | | $ | 4.324 | | | $ | 4.108 | | | $ | 3.143 | | | $ | 3.100 | | |
Income from investment operations: | |
Net investment income (a) | | | .081 | | | | .074 | | | | .066 | | | | .062 | | | | .050 | | |
Net realized and unrealized gain(loss) on investments | | | .174 | | | | .128 | | | | .150 | | | | .903 | | | | (.007 | ) | |
Total from investment operations | | | .255 | | | | .202 | | | | .216 | | | | .965 | | | | .043 | | |
Net asset value, end of period | | $ | 4.781 | | | $ | 4.526 | | | $ | 4.324 | | | $ | 4.108 | | | $ | 3.143 | | |
Total return (b) | | | 5.63 | % | | | 4.66 | % | | | 5.25 | % | | | 30.70 | % | | | 1.40 | % | |
Net assets, end of period (in thousands) | | $ | 3,583 | | | $ | 3,085 | | | $ | 6,750 | | | $ | 5,489 | | | $ | 3,713 | | |
Ratios to average net assets: | |
Expenses (c) | | | .85 | % | | | .82 | % | | | .84 | % | | | .85 | % | | | .90 | % | |
| Net investment income | | | 1.75 | % | | | 1.68 | % | | | 1.59 | % | | | 1.70 | % | | | 1.55 | % | |
Portfolio turnover rate (excluding short-term securities) | | | 75.4 | % | | | 78.0 | % | | | 65.8 | % | | | 85.4 | % | | | 39.8 | % | |
| | | Class 2 Shares | |
| | | Year ended December 31, | |
| | | 2017 | | 2016 | | 2015 | | 2014 | | 2013 | |
Net asset value, beginning of period | | $ | 4.436 | | | $ | 4.249 | | | $ | 4.047 | | | $ | 3.104 | | | $ | 3.069 | | |
Income from investment operations: | |
Net investment income (a) | | | .070 | | | | .063 | | | | .053 | | | | .050 | | | | .038 | | |
Net realized and unrealized gain(loss) on investments | | | .168 | | | | .124 | | | | .149 | | | | .893 | | | | (.003 | ) | |
Total from investment operations | | | .238 | | | | .187 | | | | .202 | | | | .943 | | | | .035 | | |
Net asset value, end of period | | $ | 4.674 | | | $ | 4.436 | | | $ | 4.249 | | | $ | 4.047 | | | $ | 3.104 | | |
Total return (b) | | | 5.37 | % | | | 4.40 | % | | | 4.99 | % | | | 30.37 | % | | | 1.15 | % | |
Net assets, end of period (in thousands) | | $ | 132,372 | | | $ | 143,139 | | | $ | 145,156 | | | $ | 141,391 | | | $ | 112,753 | | |
Ratios to average net assets: | |
Expenses (c) | | | 1.10 | % | | | 1.08 | % | | | 1.09 | % | | | 1.10 | % | | | 1.15 | % | |
| Net investment income | | | 1.55 | % | | | 1.43 | % | | | 1.30 | % | | | 1.40 | % | | | 1.18 | % | |
Portfolio turnover rate (excluding short-term securities) | | | 75.4 | % | | | 78.0 | % | | | 65.8 | % | | | 85.4 | % | | | 39.8 | % | |
(a) Based on average shares outstanding during the year.
(b) Total return figures are based on a share outstanding throughout the period and assume reinvestment of distributions at net asset value. Total return figures do not reflect charges pursuant to the terms of the variable life insurance policies and variable annuity contracts funded by separate accounts that invest in the Fund's shares. For periods less than one year, total return presented has not been annualized.
(c) In addition to fees and expenses which the Fund bears directly, the Fund indirectly bears a pro rata share of the fees and expenses of the acquired funds in which it invests. Such indirect expenses are not included in the above reported expense ratios.
113
Securian Funds Trust
Financial Highlights – continued
SFT IvySM Growth Fund
| | | Class 2 Shares | |
| | | Year or period ended December 31, | |
| | | 2017 | | 2016 | | 2015 | | 2014(a) | |
Net asset value, beginning of period | | $ | 12.120 | | | $ | 12.012 | | | $ | 11.253 | | | $ | 10.000 | | |
Income from investment operations: | |
Net investment income (b) | | | .022 | | | | .034 | | | | .001 | | | | .011 | | |
Net realized and unrealized gain on investments | | | 3.520 | | | | .074 | | | | .758 | | | | 1.242 | | |
Total from investment operations | | | 3.542 | | | | .108 | | | | .759 | | | | 1.253 | | |
Net asset value, end of period | | $ | 15.662 | | | $ | 12.120 | | | $ | 12.012 | | | $ | 11.253 | | |
Total return (c) | | | 29.22 | % | | | 0.91 | % | | | 6.74 | % | | | 12.53 | % | |
Net assets, end of period (in thousands) | | $ | 504,437 | | | $ | 438,985 | | | $ | 479,081 | | | $ | 500,575 | | |
Ratios to average net assets: | |
Expenses (d) | | | .97 | % | | | .98 | % | | | .97 | % | | | .96 | %(e) | |
Net investment income | | | .16 | % | | | .29 | % | | | .01 | % | | | .15 | %(e) | |
Portfolio turnover rate (excluding short-term securities) | | | 40.5 | % | | | 52.5 | % | | | 31.6 | % | | | 44.7 | % | |
(a) The Fund commenced operations on May 1, 2014.
(b) Based on average shares outstanding during the year or period.
(c) Total return figures are based on a share outstanding throughout the period and assume reinvestment of distributions at net asset value. Total return figures do not reflect charges pursuant to the terms of the variable life insurance policies and variable annuity contracts funded by separate accounts that invest in the Fund's shares. For periods less than one year, total return presented has not been annualized.
(d) In addition to fees and expenses which the Fund bears directly, the Fund indirectly bears a pro rata share of the fees and expenses of the acquired funds in which it invests. Such indirect expenses are not included in the above reported expense ratios.
(e) Adjusted to an annual basis.
114
Securian Funds Trust
Financial Highlights – continued
SFT IvySM Small Cap Growth Fund
| | | Class 2 Shares | |
| | | Year or period ended December 31, | |
| | | 2017 | | 2016 | | 2015 | | 2014(a) | |
Net asset value, beginning of period | | $ | 12.611 | | | $ | 10.414 | | | $ | 10.810 | | | $ | 10.000 | | |
Income from investment operations: | |
Net investment income (b) | | | (.111 | ) | | | (.076 | ) | | | (.090 | ) | | | (.048 | ) | |
Net realized and unrealized gain(loss) on investments | | | 3.302 | | | | 2.273 | | | | (.306 | ) | | | .858 | | |
Total from investment operations | | | 3.191 | | | | 2.197 | | | | (.396 | ) | | | .810 | | |
Net asset value, end of period | | $ | 15.802 | | | $ | 12.611 | | | $ | 10.414 | | | $ | 10.810 | | |
Total return (c) | | | 25.30 | % | | | 21.10 | % | | | (3.66 | )% | | | 8.10 | % | |
Net assets, end of period (in thousands) | | $ | 184,233 | | | $ | 163,294 | | | $ | 145,465 | | | $ | 182,284 | | |
Ratios to average net assets: | |
Expenses (d) | | | 1.22 | % | | | 1.24 | % | | | 1.19 | % | | | 1.22 | %(e) | |
Net investment income | | | (.78 | )% | | | (.68 | )% | | | (.80 | )% | | | (.71 | )%(e) | |
Portfolio turnover rate (excluding short-term securities) | | | 54.4 | % | | | 99.2 | % | | | 65.4 | % | | | 115.8 | % | |
(a) The Fund commenced operations on May 1, 2014.
(b) Based on average shares outstanding during the year or period.
(c) Total return figures are based on a share outstanding throughout the period and assume reinvestment of distributions at net asset value. Total return figures do not reflect charges pursuant to the terms of the variable life insurance policies and variable annuity contracts funded by separate accounts that invest in the Fund's shares. For periods less than one year, total return presented has not been annualized.
(d) In addition to fees and expenses which the Fund bears directly, the Fund indirectly bears a pro rata share of the fees and expenses of the acquired funds in which it invests. Such indirect expenses are not included in the above reported expense ratios.
(e) Adjusted to an annual basis.
115
Securian Funds Trust
Financial Highlights – continued
SFT T. Rowe Price Value Fund
| | | Class 2 Shares | |
| | | Year or period ended December 31, | |
| | | 2017 | | 2016 | | 2015 | | 2014(a) | |
Net asset value, beginning of period | | $ | 11.747 | | | $ | 10.617 | | | $ | 10.836 | | | $ | 10.000 | | |
Income from investment operations: | |
Net investment income (b) | | | .153 | | | | .173 | | | | .119 | | | | .077 | | |
Net gains (losses) (both realized and unrealized) | | | 2.033 | | | | .957 | | | | (.338 | ) | | | .759 | | |
Total from investment operations | | | 2.186 | | | | 1.130 | | | | (.219 | ) | | | .836 | | |
Net asset value, end of period | | $ | 13.933 | | | $ | 11.747 | | | $ | 10.617 | | | $ | 10.836 | | |
Total return (c) | | | 18.61 | % | | | 10.65 | % | | | (2.02 | )% | | | 8.36 | % | |
Net assets, end of period (in thousands) | | $ | 226,215 | | | $ | 208,513 | | | $ | 207,698 | | | $ | 233,202 | | |
Ratios to average net assets: | |
Expenses (d) | | | 1.03 | % | | | 1.03 | % | | | 1.01 | % | | | 1.02 | %(e) | |
Net investment income | | | 1.20 | % | | | 1.59 | % | | | 1.10 | % | | | 1.10 | %(e) | |
Portfolio turnover rate (excluding short-term securities) | | | 90.4 | % | | | 102.9 | % | | | 65.0 | % | | | 105.1 | % | |
(a) The Fund commenced operations on May 1, 2014.
(b) Based on average shares outstanding during the year or period.
(c) Total return figures are based on a share outstanding throughout the period and assume reinvestment of distributions at net asset value. Total return figures do not reflect charges pursuant to the terms of the variable life insurance policies and variable annuity contracts funded by separate accounts that invest in the Fund's shares. For periods less than one year, total return presented has not been annualized.
(d) In addition to fees and expenses which the Fund bears directly, the Fund indirectly bears a pro rata share of the fees and expenses of the acquired funds in which it invests. Such indirect expenses are not included in the above reported expense ratios.
(e) Adjusted to an annual basis.
116
Securian Funds Trust
Financial Highlights – continued
SFT Wellington Core Equity Fund
(Formerly SFT Pyramis® Core Equity Fund)
| | | Class 1 Shares | |
| | | Year or period ended December 31, | |
| | | 2017 | | 2016 | | 2015 | | 2014(a) | |
Net asset value, beginning of period | | $ | 11.834 | | | $ | 11.261 | | | $ | 11.148 | | | $ | 10.000 | | |
Income from investment operations: | |
Net investment income (b) | | | .084 | | | | .089 | | | | .075 | | | | .053 | | |
Net realized and unrealized gain on investments | | | 2.451 | | | | .484 | | | | .038 | | | | 1.095 | | |
Total from investment operations | | | 2.535 | | | | .573 | | | | .113 | | | | 1.148 | | |
Net asset value, end of period | | $ | 14.369 | | | $ | 11.834 | | | $ | 11.261 | | | $ | 11.148 | | |
Total return (c) | | | 21.42 | % | | | 5.09 | % | | | 1.01 | % | | | 11.48 | % | |
Net assets, end of period (in thousands) | | $ | 706 | | | $ | 696 | | | $ | 587 | | | $ | 663 | | |
Ratios to average net assets: | |
Expenses (d) | | | .85 | % | | | .80 | % | | | .78 | % | | | .86 | %(e) | |
Net investment income | | | .64 | % | | | .80 | % | | | .66 | % | | | .74 | %(e) | |
Portfolio turnover rate (excluding short-term securities) | | | 138.0 | % | | | 88.8 | % | | | 84.6 | % | | | 54.2 | % | |
| | | Class 2 Shares | |
| | | Year or period ended December 31, | |
| | | 2017 | | 2016 | | 2015 | | 2014(a) | |
Net asset value, beginning of period | | $ | 11.755 | | | $ | 11.214 | | | $ | 11.129 | | | $ | 10.000 | | |
Income from investment operations: | |
Net investment income (b) | | | .051 | | | | .060 | | | | .046 | | | | .035 | | |
Net realized and unrealized gain on investments | | | 2.432 | | | | .481 | | | | .039 | | | | 1.094 | | |
Total from investment operations | | | 2.483 | | | | .541 | | | | .085 | | | | 1.129 | | |
Net asset value, end of period | | $ | 14.238 | | | $ | 11.755 | | | $ | 11.214 | | | $ | 11.129 | | |
Total return (c) | | | 21.12 | % | | | 4.83 | % | | | 0.76 | % | | | 11.29 | % | |
Net assets, end of period (in thousands) | | $ | 120,185 | | | $ | 113,799 | | | $ | 128,297 | | | $ | 141,272 | | |
Ratios to average net assets: | |
Expenses (d) | | | 1.10 | % | | | 1.05 | % | | | 1.03 | % | | | 1.11 | %(e) | |
Net investment income | | | .40 | % | | | .54 | % | | | .41 | % | | | .49 | %(e) | |
Portfolio turnover rate (excluding short-term securities) | | | 138.0 | % | | | 88.8 | % | | | 84.6 | % | | | 54.2 | % | |
(a) The Fund commenced operations on May 1, 2014.
(b) Based on average shares outstanding during the year or period.
(c) Total return figures are based on a share outstanding throughout the period and assume reinvestment of distributions at net asset value. Total return figures do not reflect charges pursuant to the terms of the variable life insurance policies and variable annuity contracts funded by separate accounts that invest in the Fund's shares. For periods less than one year, total return presented has not been annualized.
(d) In addition to fees and expenses which the Fund bears directly, the Fund indirectly bears a pro rata share of the fees and expenses of the acquired funds in which it invests. Such indirect expenses are not included in the above reported expense ratios.
(e) Adjusted to an annual basis.
117
Securian Funds Trust
Notes to Financial Statements
(1) Organization
Securian Funds Trust (the "Trust") is a Delaware statutory trust registered under the Investment Company Act of 1940, as amended (the "1940 Act") as a no-load, diversified open-end management investment company, except that SFT Advantus International Bond Fund operates as a non-diversified, open-end management investment company. The Trust is a series trust that includes the Funds and share classes listed below:
Fund Name | | Share Class 1 | | Share Class 2 | |
SFT Advantus Bond Fund | | | P | | | | P | | |
SFT Advantus Dynamic Managed Volatility Fund | | | NA | | | | P | | |
SFT Advantus Government Money Market Fund | | | NA | | | | P | | |
SFT Advantus Index 400 Mid-Cap Fund | | | P | | | | P | | |
SFT Advantus Index 500 Fund | | | P | | | | P | | |
SFT Advantus International Bond Fund | | | P | | | | P | | |
SFT Advantus Managed Volatility Equity Fund | | | NA | | | | P | | |
SFT Advantus Mortgage Securities Fund | | | P | | | | P | | |
SFT Advantus Real Estate Securities Fund | | | P | | | | P | | |
SFT IvySM Growth Fund | | | NA | | | | P | | |
SFT IvySM Small Cap Growth Fund | | | NA | | | | P | | |
SFT T. Rowe Price Value Fund | | | NA | | | | P | | |
SFT Wellington Core Equity Fund | | | P | | | | P | | |
Advantus Capital Management, Inc. ("Advantus Capital"), a wholly-owned subsidiary of Securian Financial Group, Inc. ("Securian Financial Group"), serves as the investment adviser to each of the Funds in the Trust pursuant to an investment advisory agreement between Advantus Capital and the Trust. The Trust's prospectus provides a detailed description of each Fund's investment objective, policies and strategies.
Class 2 shares are subject to a 12b-1 distribution fee. Both classes of shares have identical voting, dividend, liquidation and other rights, and the same terms and conditions, except that Class 1 shares are not subject to a 12b-1 distribution fee. Income, expenses (other than Rule 12b-1 fees) and realized and unrealized gains or losses are allocated to each class of shares based upon their relative net assets.
The Trust accounts for the assets, liabilities and operations of each Fund separately. Shares of the Trust are not offered directly to the public, but sold only to Minnesota Life Insurance Company ("Minnesota Life") and Securian Life Insurance Company ("Securian Life") in connection with Minnesota Life and Securian Life variable life insurance policies and variable annuity contracts, and to certain other separate accounts of life insurance affiliates of Minnesota Life and Securian Life, and may also be offered to certain qualified plans.
(2) Summary of Significant Accounting Policies
The Funds are investment companies and follow accounting and reporting guidance under Financial Accounting Standards Board (FASB) Accounting Standards Codification (ASC) Topic 946, "Financial Services—Investment Companies." The significant accounting policies followed consistently by the Trust are as follows:
Use of Estimates
The preparation of financial statements in conformity with U.S. generally accepted accounting principles (GAAP) requires management to make estimates and assumptions that affect the reported amounts of assets and liabilities, including disclosure of contingent assets and liabilities, as of the balance sheet date and the reported amounts of revenue and expenses during the reporting period. Actual results could differ from those estimates.
Investments in Securities
Each Fund's net asset value is generally calculated as of the close of normal trading on the New York Stock Exchange (typically 3:00 p.m. Central Time). Investments in securities traded on a U.S. or foreign securities
118
Securian Funds Trust
Notes to Financial Statements – continued
(2) Summary of Significant Accounting Policies – (continued)
exchange are valued at the last sale price on that exchange prior to the time when assets are valued; securities traded in the over-the-counter market and listed securities for which no sale was reported on that date are valued on the basis of the last current bid price, by an independent pricing service or at a price deemed best to reflect fair value quoted by dealers who make markets in these securities. The pricing service may use models that price securities based on current yields and relative security characteristics, such as coupon rate, maturity date, issuer credit quality and prepayment speeds, as applicable. When market quotations are not readily available, securities are valued at fair value as determined in good faith by the Advantus Capital Valuation Committee (the "Valuation Committee") under the supervision of the Trust's Board of Trustees (the "Board") and in accordance with Board-approved valuation policies and procedures. The Board has delegated the daily oversight of the securities valuation function to the Valuation Committee whose members ensure the valuations comply with the valuation policies and affirms the reasonableness of the fair valuation determinations. The fair valued securities are reviewed by the Board at their quarterly meetings.
A Fund's investments will also be valued at fair value by the Valuation Committee if Advantus Capital determines that an event impacting the value of an investment occurred after the close of the security's primary exchange or market (for example, a foreign exchange or market) and before the time the Fund's net asset value is calculated. If a significant event impacting the value of a security or group of securities occurs, the Valuation Committee is immediately notified and the members meet promptly to determine whether fair value pricing is needed in accordance with the Fund's valuation procedures and, if so, to approve the pricing methodology to be used.
Short-term securities, with the exception of those held in the SFT Advantus Government Money Market Fund, are valued at market value. Pursuant to Rule 2a-7 of the 1940 Act, all securities in the SFT Advantus Government Money Market Fund are valued at amortized cost, which approximates market value, in order to attempt to maintain a constant net asset value of $1.00 per share. However, there is no assurance the SFT Advantus Government Money Market Fund will maintain the $1.00 net asset value.
Security transactions are accounted for on the date the securities are purchased or sold. Realized gains and losses are calculated using the first in, first out basis. Paydowns of securities are recorded as receivables as of the due date, which varies by the issuer. Dividend income is recognized on the ex-dividend date or upon dividend notification for certain foreign securities, and interest income, including amortization of bond premium and accretion of bond discount computed on an effective yield basis, is accrued daily.
Foreign Currency Translations and Forward Foreign Currency Contracts
Securities and other assets and liabilities denominated in foreign currencies are translated daily into U.S. dollars at the closing rate of exchange. Foreign currency amounts related to the purchase or sale of securities, income and expenses are translated at the exchange rate on the transaction date. The Fund isolates the portion of the results of operations resulting from changes in foreign exchange rates on investments from the fluctuations arising from changes in market prices of securities.
Net realized foreign exchange gains or losses arise from sales and maturities of short-term securities, sales of foreign currencies, currency gains or losses realized between trade and settlement dates on security transactions, the difference between the amounts of dividends, interest and foreign withholding taxes recorded on the Fund's books and the U.S. dollar equivalent of the amounts actually received or paid. Net unrealized foreign exchange gains and losses arise from changes in the value of assets and liabilities, other than investments in securities, resulting from changes in the exchange rates.
SFT Advantus International Bond Fund may enter into forward foreign currency exchange contracts for operational purposes and to protect against adverse exchange rate fluctuations. A forward foreign currency contract is an agreement between the Fund and a counterparty to buy or sell a foreign currency at a specific exchange rate on a
119
Securian Funds Trust
Notes to Financial Statements – continued
(2) Summary of Significant Accounting Policies – (continued)
future date. SFT Advantus International Bond Fund may also enter into these contracts for purposes of increasing exposure to a foreign currency or to shift exposure to foreign currency fluctuations from one country to another. The net U.S. dollar value of foreign currency underlying all contractual commitments held by SFT Advantus International Bond Fund and the resulting unrealized appreciation or depreciation are determined using foreign currency exchange rates from an independent pricing service. SFT Advantus International Bond Fund is subject to the credit risk that the other party will not complete the obligations of the contract. The fair values of the forward foreign currency exchange contracts are obtained from an independent pricing source.
Futures Transactions
To gain exposure to, or for protection from market changes, the Funds (excluding the SFT Advantus Government Money Market Fund) may buy and sell financial futures contracts traded on any U.S. or foreign exchange. The Funds may also buy and write put and call options on these futures contracts. Risks of entering into futures contracts and related options include the possibility of an illiquid market and that a change in the value of the contract or option may not correlate with changes in the value of the underlying securities.
Upon entering into a futures contract, a Fund is required to deposit either cash or securities in an amount (initial margin) equal to a certain percentage of the contract value as determined by each relevant clearing agency and is aggregated at a Futures Commission Merchant ("FCM") which is registered with the Commodity Futures Trading Commission or the applicable regulator. Subsequent payments (variation margin) are made or received by a Fund each day. The variation margin payments are equal to the daily changes in the contract value and are recorded as unrealized gains and losses. A Fund recognizes a realized gain or loss when the contract is closed or expired. In the event of default, counterparty risk is significantly reduced as creditors to the FCM do not have claim to a Fund's assets in the segregated account. For a listing of open futures contracts see the Investments in Securities for each Fund.
Interest Rate Swaps
The SFT Advantus International Bond Fund may enter into interest rate swap contracts primarily to manage interest rate risk. An interest rate swap is an agreement between the Fund and a counterparty to exchange interest rate cash flows during the life of the agreement. Each party's payment obligation is computed based on different interest rates, applied to a notional amount. Interest rate swaps often exchange payments based on a fixed rate for payments linked to a floating rate (i.e. LIBOR).
These agreements are executed on a registered exchange ("centrally cleared interest rate swaps"), significantly reducing risk from counterparty default. Upon entering into an interest rate swap contract, a Fund is required to pledge an initial margin, and the daily change in fair value is accounted for as a variation margin payable or receivable on the Statement of Assets and Liabilities. Over the term of the contract, contractually required payments to be paid and to be received are accrued daily and recorded as unrealized appreciation and depreciation until the payments are made.
Options Transactions
Each Fund (excluding the SFT Advantus Government Money Market Fund) may write (i.e., sell) covered call and secured put options and purchase and sell put and call options written by others. An option is a type of derivative financial instrument. The Funds may invest in derivative financial instruments, including options, in order to manage risk or gain exposure to various other investments or markets. The risk in writing a call option is that the Fund gives up the opportunity for profit if the market price of the security increases. The risk in writing a put option is that a Fund may incur a loss if the market price of the security decreases and the option is exercised. The risk in buying an option is that the Fund pays a premium whether or not the option is exercised. The Fund also has the additional risk of not being able to enter into a closing transaction if a liquid secondary market does not exist.
120
Securian Funds Trust
Notes to Financial Statements – continued
(2) Summary of Significant Accounting Policies – (continued)
Option contracts are valued daily and unrealized appreciation or depreciation is recorded. The Fund will realize a gain or loss upon expiration or closing of the option transaction. When an option is exercised, the proceeds on sales for a written call option, the purchase cost for a written put option, or the cost of a security for a purchased put or call option is adjusted by the amount of premium received or paid. The Funds designate collateral consisting of cash, U.S. government securities or other liquid assets sufficient to collateralize the market value of written options.
Repurchase Agreements
Each Fund may enter into repurchase agreements with respect to securities. A repurchase agreement is a transaction in which a Fund acquires a security and simultaneously commits to resell that security to the seller (a bank or securities dealer) at an agreed-upon price on an agreed-upon date. Each Fund requires at all times that the repurchase agreement be collateralized by cash, U.S. Government securities, U.S. Government agencies securities or corporate securities having a value equal to, or in excess of, the value of the repurchase agreement. If the seller of the agreement defaults on its obligation to repurchase the underlying securities at a time when the value of those securities has declined, a Fund may incur a loss upon disposition of the securities. Repurchase agreements are carried at amortized cost. At December 31, 2017, no Funds were invested in repurchase agreements.
Federal Taxes
Each Fund, other than SFT Advantus Dynamic Managed Volatility Fund, SFT Advantus International Bond Fund, SFT Advantus Managed Volatility Equity Fund, and SFT T. Rowe Price Value Fund, qualifies for federal income tax purposes as a partnership under the Internal Revenue Code of 1986, as amended (the "Code"). A Fund is treated, for federal income tax purposes, as a partnership if it has more than one shareholder. A Fund's election to be treated as a partnership is not expected to result in any material adverse federal income tax consequences to any owner of a variable annuity contract or variable life insurance policy, or in the tax treatment of any such contract or policy. As a partnership, a Fund is not subject to income tax, and any income, gains, deductions or losses of the Fund will instead pass through and be taken into account for federal income tax purposes by its partners, which will be Minnesota Life and Securian Life through their respective separate accounts. SFT Advantus Dynamic Managed Volatility Fund, SFT Advantus Managed Volatility Equity Fund and SFT T. Rowe Price Value Fund are treated as disregarded entities for federal income tax purposes. While the Trust anticipates that each Fund other than SFT Advantus Dynamic Managed Volatility Fund, SFT Advantus Managed Volatility Equity Fund, and SFT T. Rowe Price Value Fund will always have two shareholders, Minnesota Life and Securian Life, a wholly owned subsidiary of Minnesota Life, such ownership could change and accordingly a Fund may at some time have only one shareholder and would be treated as a disregarded entity for federal income tax purposes. A disregarded entity is disregarded for federal income tax purposes as an entity separate from its owner, and the owner is treated as directly owning the assets of the disregarded entity and takes into account for federal income tax purposes the income, gains, deductions and losses relating to those assets.
Effective January 1, 2016, SFT Advantus International Bond Fund elected to qualify and intends to continue to qualify as a regulated investment company for federal income tax purposes. The Fund 's policy is to comply with the requirements of subchapter M of the Internal Revenue Code that are applicable to regulated investment companies and to distribute all (or a sufficient amount) its taxable income and net capital gain to its shareholders. Therefore, no income tax provision is required.
The FASB ASC 740, "Income Taxes" (ASC 740), provides guidance for how uncertain tax positions should be recognized, measured, presented, and disclosed in the financial statements. The Funds have evaluated the implications of ASC 740 for all open tax years, and have determined there is no impact to the Funds' financial statements as of the year ended December 31, 2017. The Funds' federal and state income returns for which the
121
Securian Funds Trust
Notes to Financial Statements – continued
(2) Summary of Significant Accounting Policies – (continued)
applicable statutes of limitations have not expired (2014, 2015, 2016 and 2017) remain subject to examination by the Internal Revenue Service and states department of revenue.
Net investment income (loss) and net realized gains (losses) may differ for financial statement and tax purposes primarily because of temporary book-to-tax differences.
Capital Loss Carryforwards
As of December 31, 2017, the Funds had no realized capital loss carryforwards, for U.S. federal income tax purposes, available to be used to offset future capital gains.
Distributions to Shareholders
Distributions to shareholders from net investment income and realized gains (if any) for the SFT Advantus Government Money Market Fund are declared daily and reinvested at month-end in additional shares of capital stock. Distributions to shareholders from net investment income and realized gains (if any) for the SFT Advantus International Bond Fund are generally declared and reinvested in additional shares of capital stock on an annual basis. The SFT Advantus International Bond Fund uses consent dividends in place of regular distributions. The Funds that are structured as a partnership for tax purposes are not required to distribute taxable income, and Funds other than SFT Advantus Government Money Market Fund and SFT Advantus International Bond Fund will not distribute taxable income.
The federal income tax character of distributions paid to shareholders during the fiscal year ended December 31, 2017 was as follows:
Fund | | Ordinary
Income | | Long-Term
Capital Gain | |
SFT Advantus International Bond Fund | | $ | — | | | $ | — | | |
At December 31, 2017, as a result of permanent book-to-tax difference, the following reclassification adjustments were made on the Statements of Assets and Liabilities:
Fund | | Paid-In
Capital | | Undistributed
Net Investment
Income | | Accumulated
Net Realized
Gain (Loss) | |
SFT Advantus International Bond Fund | | $ | (2,345,213 | ) | | $ | 2,435,685 | | | $ | (90,472 | ) | |
Distributable Earnings
As of December 31, 2017, the components of distributable earnings on a federal income tax basis were:
Fund | | Undistributed
Ordinary
Income | | Undistributed
Long-Term
Capital Gains | | Unrealized
Appreciation/
(Depreciation) | | Post
October
Capital/
Late Year
Ordinary
Loss | | Capital Loss
Carryforward | |
SFT Advantus International Bond Fund | | $ | — | | | $ | 1,136,728 | | | $ | 355,325 | | | $ | — | | | $ | — | | |
For the year ended December 31, 2017, the following funds are designating the following items with regard to earnings for the year:
| | | Foreign Tax Credit | |
SFT Advantus International Bond Fund | | $ | 204,206 | | |
Securities Purchased on a When-Issued or Forward Commitment Basis
Delivery and payment for securities which have been purchased by a Fund on a forward commitment or when-issued basis can take place a month or more after the transaction date. During this period, such securities are subject to market fluctuations. As of December 31, 2017, the SFT Advantus Bond Fund and SFT Advantus
122
Securian Funds Trust
Notes to Financial Statements – continued
(2) Summary of Significant Accounting Policies – (continued)
Mortgage Securities Fund had entered into outstanding, when-issued or forward commitments at fair value of $7,611,583 and $7,770,876, respectively. The Funds have segregated assets to cover such when-issued and forward commitments.
Money Market Fund Reform
In July 2014, the Securities and Exchange Commission adopted amendments to the rules that govern money market funds ("Rule 2a-7"). In response to the amendments, effective April 29, 2016, the Fund has changed its name to the SFT Advantus Government Money Market Fund and converted to a 'government' money market fund, as defined under Rule 2a-7. As a result, on and after April 29, 2016, the Fund will invest at least 99.5% of its total assets in cash, government securities, and/or repurchase agreements that are collateralized fully (i.e., collateralized by cash or government securities), as required by Rule 2a-7. It is expected that the Fund's future total returns will be lower than its historical returns due to the conversion to a government money market fund.
Cross-Trades
The Funds are permitted to purchase and sell securities ("cross-trade") from and to other Funds within the Trust as well as outside of the Trust, where both accounts are managed by the same sub-adviser pursuant to "Cross-Trading" procedures adopted by the Board. These procedures have been designed to ensure that any cross-trade of securities by a respective Fund from and to another fund that is or could be considered an affiliate of the Funds under certain limited circumstances by virtue of having a common investment adviser, common officer, or common trustee complies with Rule 17a-7 of the 1940 Act. Further, as defined under these procedures, each cross-trade is effected at the current market price to save costs where allowed. Pursuant to these procedures, for the period ended December 31, 2017, the Funds engaged in the following cross-trades, which resulted in the following net realized gains (losses):
| | | Purchases | | Sales | | Net Realized
Gains (Losses) | |
SFT Advantus International Bond Fund | | $ | — | | | $ | 548,252 | | | $ | 24,407 | | |
| SFT T. Rowe Price Value Fund | | | 449,641 | | | | 108,617 | | | | (6,429 | ) | |
SFT Wellington Core Equity Fund | | | 8,361,642 | | | | 5,393,254 | | | | 485,148 | | |
(3) Investment Security Transactions
The cost of purchases and proceeds from sales of investment securities, other than temporary investments in short-term securities, for the year ended December 31, 2017 were as follows:
| | | Non-U.S. Government | | U.S. Government* | |
| | | Purchases | | Sales | | Purchases | | Sales | |
SFT Advantus Bond Fund | | $ | 172,810,401 | | | $ | 146,688,952 | | | $ | 441,077,102 | | | $ | 446,139,381 | | |
SFT Advantus Dynamic Managed Volatility Fund | | | 46,428,520 | | | | 4,516,136 | | | | — | | | | 317,581 | | |
SFT Advantus Index 400 Mid-Cap Fund | | | 35,094,334 | | | | 45,256,419 | | | | — | | | | — | | |
SFT Advantus Index 500 Fund | | | 21,514,781 | | | | 28,293,884 | | | | — | | | | — | | |
SFT Advantus International Bond Fund | | | 35,432,181 | | | | 44,436,372 | | | | — | | | | — | | |
SFT Advantus Managed Volatility Equity Fund | | | 45,757,866 | | | | 18,758,810 | | | | — | | | | — | | |
| SFT Advantus Mortgage Securities Fund | | | 20,542,766 | | | | 17,277,705 | | | | 117,208,897 | | | | 125,257,324 | | |
SFT Advantus Real Estate Securities Fund | | | 102,904,205 | | | | 116,202,992 | | | | — | | | | — | | |
SFT IvySM Growth Fund | | | 191,886,251 | | | | 247,528,647 | | | | — | | | | — | | |
SFT IvySM Small Cap Growth Fund | | | 91,887,106 | | | | 107,364,425 | | | | — | | | | — | | |
SFT T. Rowe Price Value Fund | | | 196,947,437 | | | | 212,490,239 | | | | — | | | | — | | |
SFT Wellington Core Equity Fund | | | 160,144,319 | | | | 175,791,279 | | | | — | | | | — | | |
* Includes U.S. government-sponsored enterprise securities.
123
Securian Funds Trust
Notes to Financial Statements – continued
(4) Expenses and Related Party Transactions
The Funds have an investment advisory agreement with Advantus Capital, a wholly-owned subsidiary of Securian Financial Group. Under the advisory agreement, Advantus Capital manages the Funds' investments and provides research, statistical and advisory services and pays related office rental and executive expenses and salaries.
Each Fund of the Trust pays Advantus Capital an annual fee, based on average daily net assets, in the following amounts:
| | | Annual Fee on Net Assets | |
SFT Advantus Bond Fund | | 0.40% of net assets to $1 billion; and 0.35% of net assets exceeding $1 billion | |
SFT Advantus Dynamic Managed Volatility
Fund | |
0.65% of all assets | |
SFT Advantus Government Money Market
Fund | |
0.30% of net assets to $1 billion; and 0.25% of net assets exceeding $1 billion | |
SFT Advantus Index 400 Mid-Cap Fund | | 0.15% of net assets to $1 billion; and 0.10% of net assets exceeding $1 billion | |
SFT Advantus Index 500 Fund | | 0.15% of net assets to $1 billion; and 0.10% of net assets exceeding $1 billion | |
SFT Advantus International Bond Fund | | 0.60% of net assets to $1 billion; and 0.55% of net assets exceeding $1 billion | |
SFT Advantus Managed Volatility Equity Fund | | 0.65% of all assets | |
SFT Advantus Mortgage Securities Fund | | 0.40% of net assets to $1 billion; and 0.35% of net assets exceeding $1 billion | |
SFT Advantus Real Estate Securities Fund | | 0.70% of net assets to $1 billion; and 0.65% of net assets exceeding $1 billion | |
SFT IvySM Growth Fund | | 0.67% of net assets to $500 million; and 0.625% of next $300 million of net assets; and 0.60% of next $200 million of net assets; and 0.50% of net assets exceeding $1 billion | |
SFT IvySM Small Cap Growth Fund | | 0.85% of net assets to $1 billion; and 0.80% of next $2 billion of net assets; and 0.76% of net assets exceeding $3 billion | |
SFT T. Rowe Price Value Fund | | 0.67% of net assets to $1 billion; and 0.65% of next $1.5 billion of net assets; and 0.60% of net assets exceeding $2.5 billion | |
SFT Wellington Core Equity Fund | | 0.65% of all assets | |
Advantus Capital has a sub-advisory agreement with Franklin Advisers, Inc. ("Franklin"), a Registered Investment Advisor for the SFT Advantus International Bond Fund, under which Advantus Capital pays Franklin an annual fee of 0.37% based on average daily net assets.
Advantus Capital has a sub-advisory agreement with Waddell & Reed Investment Management Company ("WRIMCO"), a Registered Investment Advisor for the SFT IvySM Growth Fund and the SFT IvySM Small Cap Growth Fund, under which Advantus Capital pays WRIMCO an annual fee ranging from 0.33% to 0.55% and 0.40% to 0.82% respectively, based on average daily net assets.
Advantus Capital has a sub-advisory agreement with T. Rowe Price Associates, Inc. ("T. Rowe Price"), a Registered Investment Advisor for the SFT T. Rowe Price Value Fund, under which Advantus Capital pays T. Rowe Price an annual fee ranging from 0.30% to 0.50% based on average daily net assets.
Advantus Capital has a sub-advisory agreement with Wellington Management Company LLP ("Wellington Management"), a Registered Investment Advisor for the SFT Wellington Core Equity Fund, under which Advantus Capital pays Wellington Management an annual fee ranging from 0.28% to 0.31% based on average daily net assets. Wellington Management began sub-advising the Fund on November 20, 2017. Prior to
124
Securian Funds Trust
Notes to Financial Statements – continued
(4) Expenses and Related Party Transactions – (continued)
November 20, 2017, Advantus Capital had a sub-advisory agreement with FIAM LLC ("Pyramis") under which Advantus Capital paid an annual fee ranging from 0.31% to 0.33% based on average net assets.
The Trust bears certain other operating expenses including independent trustees' fees, federal registration fees, printing and shareholder report expenses, legal fees, audit fees, custodian fees, compensation paid to the Trust's Chief Compliance Officer, and other miscellaneous expenses. Each Fund will pay all expenses directly related to its individual operations. Operating expenses not attributable to a specific Fund are generally allocated based upon the proportionate daily net assets of each Fund.
Administrative Services Fee
The Trust has an agreement with Securian Financial Group under which Securian Financial Group provides accounting, legal and other administrative services. Each Fund reimburses Securian Financial Group quarterly for the actual costs incurred in performing such services, as determined in accordance with Securian Financial Group's customary cost accounting procedures consistently applied. Total quarterly administrative fees by Fund range from $4,610 to $23,760.
Accounting Services
The Trust has an agreement with State Street Bank and Trust Company ("State Street") in which State Street provides daily fund accounting and investment administration services. In 2017, these fees ranged from .01% to .05% of net assets depending on the size and makeup of the respective Fund. The fees are based upon a calculation of multiple factors including base fees, size of assets, and certain other fees.
Distribution Fees
The Trust has adopted a Rule 12b-1 Distribution Plan which covers all of its Class 2 shares ("Covered Funds"). Each Covered Fund pays distribution fees at the annual rate of .25% of the average daily net assets of the Covered Fund. These fees are paid out of the Covered Fund's assets, which reduces a Covered Fund's net assets as do other Covered Fund expenses. The fees are paid to Securian Financial Services, Inc. ("Securian Financial"), the Trust's underwriter, to pay for distribution-related expenses and activities in connection with the distribution of the Covered Fund's shares. Securian Financial may also use the fees to pay insurance companies, dealers or others for certain non-distribution services as provided for in the distribution plan.
Net Investment Income Maintenance Agreement for the SFT Advantus Government Money Market Fund
Effective May 1, 2012, the Board of Trustees of the Trust approved a Restated Net Investment Income Maintenance Agreement among Securian Funds Trust (on behalf of SFT Advantus Government Money Market Fund), Advantus Capital and Securian Financial. Under such Agreement, Advantus Capital agrees to waive, reimburse or pay SFT Advantus Government Money Market Fund expenses so that the Fund's daily net investment income does not fall below zero. Securian Financial may also waive its Rule 12b-1 fees. Advantus Capital and Securian Financial each has the option under the Agreement to recover the full amount waived, reimbursed or paid (the "Expense Waiver") on any day on which the Fund's net investment income exceeds zero. On any day, however, the Expense Waiver does not constitute an obligation of the Fund unless Advantus Capital or Securian Financial has expressly exercised its right to recover a specified portion of the Expense Waiver on that day, in which case such specified portion is then due and payable by the Fund. In addition, the right of Advantus Capital and/or Securian Financial to recover the Expense Waiver is subject to the following limitations: (1) if a repayment of the Expense Waiver by the Fund would cause the Fund's net investment income to fall below zero, such repayment is deferred until a date when repayment would not cause the Fund's net investment income to fall below zero; (2) the right to recover any portion of the Expense Waiver expires three years after the effective date of that portion of the Expense Waiver; and (3) any repayment of the Expense Waiver by the Fund cannot cause the Fund's expense ratio to exceed 1.25%. For the year ended December 31, 2017, the advisory, 12b-1 distribution and other fee waivers totaled $46,918, $30,310 and $0 respectively. These amounts are reflected as fees waived in the accompanying
125
Securian Funds Trust
Notes to Financial Statements – continued
(4) Expenses and Related Party Transactions – (continued)
Statement of Operations. As of December 31, 2017, Advantus Capital and Securian Financial have collectively waived a cumulative total of $4,631,950 pursuant to the Agreement, including expenses waived under the prior agreement with Advantus Series Fund, Inc., of which $1,176,744 was eligible for recovery by Advantus Capital and Securian Financial as of such date. Amounts subject to potential recovery for the periods ended December 31, 2018 and 2019 are $533,550, and $77,228, respectively. If Advantus Capital and Securian Financial exercise their rights to be paid such waived amounts, the Fund's future yield will be negatively affected for an indefinite period. The Agreement shall continue in effect following April 30, 2018, provided such continuance is specifically approved by a majority of the Trust's independent Trustees.
SFT Advantus Dynamic Managed Volatility Fund, SFT Advantus Government Money Market Fund, and SFT Advantus Managed Volatility Fund Expense Waivers
Advantus Capital and the Trust, on behalf of SFT Advantus Dynamic Managed Volatility, SFT Advantus Government Money Market, and SFT Advantus Managed Volatility Funds, have entered into Expense Limitation Agreements which limit the operating expenses of these Funds, excluding certain expenses (such as interest expense, acquired fund fees, cash overdraft fees, taxes, brokerage commissions, other expenditures which are capitalized in accordance with GAAP, and other extraordinary expenses not incurred in the ordinary course of the Funds' business), through April 30, 2019.
The Agreements renew annually for a full year each year thereafter unless terminated by Advantus Capital upon at least 30 days' notice prior to the end of a contract term. The Funds are authorized to reimburse Advantus Capital for management fees previously waived and/or for the cost of expenses previously paid by Advantus Capital pursuant to this agreement, provided that such reimbursement will not cause any Fund to exceed any limits in effect at the time of such reimbursement. Each Fund's ability to reimburse Advantus Capital in this manner only applies to fees waived or reimbursements made by Advantus Capital within the three years prior to the date of such reimbursement. To the extent that the Fund makes such reimbursements to Advantus Capital, the amount of the reimbursements will be reflected in the financial statements in the Funds' shareholder reports and in Other Expenses under Fees and Expenses of the Fund in the prospectus.
As of December 31, 2017, the amounts waived and eligible for recovery are as follows:
| | | | | | | | | Recoverable through December 31, | | | |
Fund | | Agreement
Date | | Expense
Limit | | Advisory Fees
Waived for
Year Ended
December 31, 2017* | | 2017 | | 2018 | | 2019 | |
SFT Advantus Dynamic
Managed Volatility Fund | | May 1, 2013 | | | 0.80 | % | | $ | 602,045 | | | $ | 1,466,313 | | | $ | 1,067,191 | | | $ | 602,045 | | |
SFT Advantus Government
Money Market Fund | | November 1, 2017 | | | 0.70 | % | | $ | 26,980 | | | $ | 26,980 | | | $ | 26,980 | | | $ | 26,980 | | |
SFT Advantus Managed
Volatility Equity Fund | | November 18, 2015 | | | 0.80 | % | | $ | 421,177 | | | $ | 782,484 | | | $ | 744,688 | | | $ | 421,177 | | |
* This amount is reflected in fees waived in the accompanying Statements of Operations.
(5) Illiquid Securities
Each Fund currently limits investments in illiquid securities to 15% of net assets at the time of purchase, except for the SFT Advantus Government Money Market Fund which limits its investment in illiquid securities to 5% of net assets. At December 31, 2017, the SFT Advantus Bond Fund, SFT Advantus Dynamic Managed Volatility Fund, and SFT Advantus Mortgage Securities Fund held illiquid securities of $731,199, $3,065,350, and $191,644, respectively, which represent 0.2%, 0.8%, and 0.2% of net assets, respectively. Pursuant to guidelines adopted by the Trust's Board of Trustees, certain unregistered securities are determined to be liquid and are not included within the percent limitations specified above.
126
Securian Funds Trust
Notes to Financial Statements – continued
(5) Illiquid Securities – (continued)
The following is a list of illiquid securities by fund, including acquisition date and cost, as of December 31, 2017:
Security | | Acquisition
Date | | Cost | |
SFT Advantus Bond Fund | |
Baker Hughes Inc. | | 12/06/2017 | | $ | 415,000 | | |
FAN Engine Securitization, Ltd. | | 10/18/2013 | | | 245,634 | | |
Hometown Commercial Mortgage | | Various | | | 87,603 | | |
| | | | | $ | 748,237 | | |
SFT Advantus Dynamic Managed Volatility Fund | |
Aquarion Co. | | 08/19/2014 | | $ | 498,507 | | |
Goodman US Finance Four LLC | | 09/26/2017 | | | 499,207 | | |
Longtrain Leasing III LLC, 2015 – 1A Class A2 | | 01/23/2015 | | | 999,582 | | |
Pacific Life Insurance Co. | | 10/17/2017 | | | 999,161 | | |
| | | | | $ | 2,996,457 | | |
SFT Advantus Mortgage Securities Fund | |
FAN Engine Securitization, Ltd. | | 10/18/2013 | | $ | 65,693 | | |
Hometown Commercial Mortgage | | 11/28/2006 | | | 17,784 | | |
JPMorgan Chase Commercial Mortgage Securities Corp. | | 03/22/2010 | | | 114,489 | | |
| | | | | $ | 197,966 | | |
(6) Fair Value Measurement
The Trust has established a three-tier hierarchy to maximize the use of observable market data and minimize the use of unobservable inputs. The hierarchy also establishes a classification of fair value measurements for disclosure purposes. Inputs refer broadly to the assumption that market participants would use in pricing the asset or liability. Inputs may be observable or unobservable. Observable inputs include information market participants would use in pricing the asset or liability based on market data obtained from sources independent of the reporting entity. Unobservable inputs reflect the Trust's estimates about the assumptions market participants would use in valuing the financial asset and liability based on the best information available in the circumstances. Level 1 includes unadjusted quoted prices in active markets for identical assets and liabilities. Level 2 includes other significant observable market-based inputs (including quoted prices for similar securities, interest rates, credit risk and prepayment speed). Level 3 includes unobservable inputs, which may include the advisor's own assumptions in determining the fair value of an investment or are based on independent non-binding broker quotes. Other financial instruments are derivative instruments not reflected in total investments, such as futures, forwards, swaps, and written options.
The following is a summary of the levels used for the year ended December 31, 2017, in valuing the Fund's assets and liabilities (please see the Investments in Securities for each Fund for a listing of all securities within each category):
| | | Fair Value Measurement at
December 31, 2017 using | |
Fund | | Level 1 | | Level 2 | | Level 3 | | Total | |
SFT Advantus Bond Fund | |
Assets | |
Government Obligations | | $ | – | | | $ | 131,035,930 | | | $ | – | | | $ | 131,035,930 | | |
Asset-Backed Securities | | | – | | | | 15,648,583 | | | | – | | | | 15,648,583 | | |
Other Mortgage-Backed Securities | | | – | | | | 32,105,360 | | | | – | | | | 32,105,360 | | |
Corporate Obligations | | | – | | | | 200,566,791 | | | | – | | | | 200,566,791 | | |
Investment Companies | | | 11,618,459 | | | | – | | | | – | | | | 11,618,459 | | |
Total Investments | | | 11,618,459 | | | | 379,356,664 | | | | – | | | | 390,975,123 | | |
Other Financial Instruments* | |
Futures Contracts | | | 210,691 | | | | – | | | | – | | | | 210,691 | | |
127
Securian Funds Trust
Notes to Financial Statements – continued
(6) Fair Value Measurement – (continued)
| | | Fair Value Measurement at
December 31, 2017 using | |
Fund | | Level 1 | | Level 2 | | Level 3 | | Total | |
Liabilities | |
Other Financial Instruments* | |
Futures Contracts | | $ | (277,521 | ) | | $ | – | | | $ | – | | | $ | (277,521 | ) | |
SFT Advantus Dynamic Managed Volatility Fund | |
Assets | |
Government Obligations | | | – | | | | 2,975,448 | | | | – | | | | 2,975,448 | | |
Asset-Backed Securities | | | – | | | | 1,024,110 | | | | – | | | | 1,024,110 | | |
Other Mortgage-Backed Securities | | | – | | | | 1,045,607 | | | | – | | | | 1,045,607 | | |
Corporate Obligations | | | – | | | | 138,892,079 | | | | – | | | | 138,892,079 | | |
Purchased Options | | | 52,148 | | | | – | | | | – | | | | 52,148 | | |
Investment Companies | | | 228,524,133 | | | | – | | | | – | | | | 228,524,133 | | |
| Total Investments | | | 228,576,281 | | | | 143,937,244 | | | | – | | | | 372,513,525 | | |
Other Financial Instruments* | |
Futures Contracts | | | 788,931 | | | | – | | | | – | | | | 788,931 | | |
SFT Advantus Government Money Market Fund | |
Assets | |
U.S. Government Obligations | | | – | | | | 66,572,818 | | | | – | | | | 66,572,818 | | |
Investment Companies | | | 634,005 | | | | – | | | | – | | | | 634,005 | | |
Total Investments | | | 634,005 | | | | 66,572,818 | | | | – | | | | 67,206,823 | | |
SFT Advantus Index 400 Mid-Cap Fund | |
Assets | |
Common Stocks | | | 219,517,328 | | | | – | | | | – | | | | 219,517,328 | | |
Investment Companies | | | 7,169,663 | | | | – | | | | – | | | | 7,169,663 | | |
Total Investments | | | 226,686,991 | | | | – | | | | – | | | | 226,686,991 | | |
Other Financial Instruments* | |
Futures Contracts | | | 15,973 | | | | – | | | | – | | | | 15,973 | | |
SFT Advantus Index 500 Fund | |
Assets | |
Common Stocks | | | 860,356,596 | | | | – | | | | – | | | | 860,356,596 | | |
Investment Companies | | | 14,777,164 | | | | – | | | | – | | | | 14,777,164 | | |
Total Investments | | | 875,133,760 | | | | – | | | | – | | | | 875,133,760 | | |
Other Financial Instruments* | |
Futures Contracts | | | 96,258 | | | | – | | | | – | | | | 96,258 | | |
SFT Advantus International Bond Fund | |
Assets | |
Long-Term Debt Securities | | | – | | | | 55,476,383 | | | | – | | | | 55,476,383 | | |
Short-Term Debt Securities | | | – | | | | 45,541,333 | | | | – | | | | 45,541,333 | | |
Investment Companies | | | 5,436,158 | | | | – | | | | – | | | | 5,436,158 | | |
Total Investments | | | 5,436,158 | | | | 101,017,716 | | | | – | | | | 106,453,874 | | |
Other Financial Instruments* | |
Forward Foreign Currency Contracts | | | – | | | | 750,495 | | | | – | | | | 750,495 | | |
Interest Rate Swap Contracts | | | – | | | | 250,290 | | | | – | | | | 250,290 | | |
Liabilities | |
Other Financial Instruments* | |
Forward Foreign Currency Contracts | | | – | | | | (2,395,385 | ) | | | – | | | | (2,395,385 | ) | |
Interest Rate Swap Contracts | | | – | | | | (617,093 | ) | | | – | | | | (617,093 | ) | |
128
Securian Funds Trust
Notes to Financial Statements – continued
(6) Fair Value Measurement – (continued)
| | | Fair Value Measurement at
December 31, 2017 using | |
Fund | | Level 1 | | Level 2 | | Level 3 | | Total | |
SFT Advantus Managed Volatility Equity Fund | |
Assets | |
Investment Companies | | $ | 263,934,813 | | | $ | – | | | $ | – | | | $ | 263,934,813 | | |
Purchased Options | | | 60,450 | | | | – | | | | – | | | | 60,450 | | |
| Total Investments | | | 263,995,263 | | | | – | | | | – | | | | 263,995,263 | | |
Other Financial Instruments* | |
Futures Contracts | | | 148,528 | | | | – | | | | – | | | | 148,528 | | |
Liabilities | |
Other Financial Instruments* | |
Written Options | | | (25,350 | ) | | | – | | | | – | | | | (25,350 | ) | |
SFT Advantus Mortgage Securities Fund | |
Assets | |
Government Obligations | | | – | | | | 65,883,997 | | | | – | | | | 65,883,997 | | |
Asset-Backed Securities | | | – | | | | 5,944,050 | | | | – | | | | 5,944,050 | | |
Other Mortgage-Backed Securities | | | – | | | | 10,202,465 | | | | – | | | | 10,202,465 | | |
Corporate Obligations | | | – | | | | 1,066,358 | | | | – | | | | 1,066,358 | | |
Short-Term Securities | | | 12,342,352 | | | | – | | | | – | | | | 12,342,352 | | |
Total Investments | | | 12,342,352 | | | | 83,096,870 | | | | – | | | | 95,439,222 | | |
Other Financial Instruments* | |
Futures Contracts | | | 22,579 | | | | – | | | | – | | | | 22,579 | | |
Liabilities | |
Other Financial Instruments* | |
Futures Contracts | | | (8,828 | ) | | | – | | | | – | | | | (8,828 | ) | |
SFT Advantus Real Estate Securities Fund | |
Assets | |
Common Stocks | | | 133,698,548 | | | | – | | | | – | | | | 133,698,548 | | |
Investment Companies | | | 1,612,358 | | | | – | | | | – | | | | 1,612,358 | | |
Total Investments | | | 135,310,906 | | | | – | | | | – | | | | 135,310,906 | | |
SFT IvySM Growth Fund | |
Assets | |
Common Stocks | | | 500,874,208 | | | | – | | | | – | | | | 500,874,208 | | |
Investment Companies | | | 3,500,595 | | | | – | | | | – | | | | 3,500,595 | | |
Total Investments | | | 504,374,803 | | | | – | | | | – | | | | 504,374,803 | | |
SFT IvySM Small Cap Growth Fund | |
Assets | |
Common Stocks | | | 181,606,753 | | | | – | | | | – | | | | 181,606,753 | | |
Investment Companies | | | 2,847,807 | | | | – | | | | – | | | | 2,847,807 | | |
Total Investments | | | 184,454,560 | | | | – | | | | – | | | | 184,454,560 | | |
SFT T. Rowe Price Value Fund | |
Assets | |
Common Stocks | | | 223,272,902 | | | | – | | | | – | | | | 223,272,902 | | |
Preferred Stocks | | | 1,470,007 | | | | – | | | | – | | | | 1,470,007 | | |
Investment Companies | | | 1,446,786 | | | | – | | | | – | | | | 1,446,786 | | |
Total Investments | | | 226,189,695 | | | | – | | | | – | | | | 226,189,695 | | |
SFT Wellington Core Equity Fund | |
Assets | |
Common Stocks | | | 119,145,805 | | | | – | | | | – | | | | 119,145,805 | | |
Investment Companies | | | 1,901,657 | | | | – | | | | – | | | | 1,901,657 | | |
Total Investments | | | 121,047,462 | | | | – | | | | – | | | | 121,047,462 | | |
* Investments in Other Financial Instruments are derivatives instruments reflected in the Investments in Securities. All derivatives currently held are reflected at the gross unrealized appreciation (depreciation) on the instruments.
129
Securian Funds Trust
Notes to Financial Statements – continued
(6) Fair Value Measurement – (continued)
Level 2 Measurements:
Government obligations comprised of U.S. Treasury, agency and government guaranteed fixed maturity securities – These securities are principally valued using the market approach. Valuation is based primarily on quoted prices in markets that are not active or using matrix pricing or other similar techniques using standard market observable inputs such as the benchmark U.S. Treasury yield curve, the spread of the U.S. Treasury curve for the identical security and comparable securities that are actively traded.
Asset-backed and other mortgage-backed securities comprised of RMBS, CMBS and ABS fixed maturity securities – These securities are principally valued using the market approach. Valuation is based primarily on matrix pricing or other similar techniques using standard market inputs including spreads for actively traded securities, spreads off benchmark yields, expected prepayment speeds and volumes, current and forecasted loss severity, rating, weighted average coupon, weighted average maturity, average delinquency rates, geographic region, debt-service coverage ratios and issuance-specific information including: collateral type, payment terms of the underlying assets, payment priority within the tranche, structure of the security, deal performance and vintage of loans, etc.
Corporate obligations comprised of U.S. corporate and foreign corporate fixed maturity securities – These securities are principally valued using the market and income approaches. Valuation is based primarily on quoted prices in markets that are not active, or using matrix pricing or other similar techniques that use standard market observable inputs such as benchmark yields, spreads off benchmark yields, new issuances, issuer rating, duration, and trades of identical or comparable securities. Investment grade privately placed securities are valued using discounted cash flow methodologies using standard market observable inputs, and inputs derived from, or corroborated by, market observable data including market yield curve, duration, call provisions, observable prices and spreads for similar publicly traded or privately traded issues that incorporate the credit quality and industry sector of the issuer.
Long-term and short-term debt securities comprised of foreign government and state and political subdivision fixed maturity securities – These securities are principally valued using the market approach. Valuation is based primarily on matrix pricing or other similar techniques using standard market observable inputs including benchmark U.S. Treasury or other yields, issuer ratings, broker-dealer quotes, issuer spreads and reported trades of similar securities, including those within the same sub-sector or with a similar maturity or credit rating.
Forward Foreign Currency and Interest Rate Swap Contracts – These derivatives are traded in the over-the-counter derivative market and are principally valued using market price quotations or industry recognized modeling techniques. The significant inputs to the models are observable in the market or can be derived from or corroborated by observable market data. These significant inputs may include interest rates, foreign currency exchange rates, interest rate curves, contractual terms, market prices, and measures of volatility.
The Funds' policy is to recognize transfers between the levels as of the end of the period. There were no transfers of financial assets between Levels 1 and 2 during the period.
(7) Derivative Instruments Reporting
The Trust provides, when applicable, disclosures of the location, by line item, of fair value amounts in the statement of financial position and the location, by line item, of amounts of gains and losses reported in the statement of financial performance. Generally, the derivative instruments outstanding as of period end are disclosed in the Investments in Securities. The volume of derivative activity is indicative for all funds with the exception of futures contracts in the SFT Advantus Dynamic Managed Volatility Fund. The volume of futures contracts for the SFT Advantus Dynamic Managed Volatility Fund ranged from $110,390,900 to $152,554,720 of base notional value averaging $133,824,814.
Equity derivatives were purchased or sold to manage the SFT Advantus Index 500 and SFT Advantus Index 400 Mid-Cap Funds' shareholder liquidity and to attempt to replicate intended stock investments to maintain fully
130
Securian Funds Trust
Notes to Financial Statements – continued
(7) Derivative Instruments Reporting – (continued)
invested Funds. Equity index options are utilized by the SFT Advantus Dynamic Managed Volatility Fund and the SFT Advantus Managed Volatility Equity Fund to manage the equity exposure while attempting to reduce the volatility and risk of the Funds.
Interest rate derivatives are used both to manage the average duration of a Fund's fixed income portfolio, as well as to hedge against the effects of interest rate changes on a portfolio's current or intended investments.
Foreign exchange derivatives were used to attempt to hedge against the effects of exchange rate changes within the SFT Advantus International Bond Fund's current or intended investments in foreign securities, as well as, to more efficiently obtain exposure to foreign currencies or to take advantage of cross currency markets in order to benefit from valuation differentials and shifts in pricing within the currency markets.
The tables below detail the risk exposure of each of the Funds from derivative instruments:
| | | | | Risk Exposure | |
Fund | | Instrument
Type | | Total Value at
December 31, 2017 | | Statement of Assets and
Liabilities Location | | Equity | | Interest
Rate | | Foreign
Exchange | |
SFT Advantus Bond Fund
| | Futures
| | $ | 210,691
| | | Variation margin
receivable* | | $ | –
| | | $ | 210,691
| | | $ | –
| | |
| | | Futures
| | | (277,521
| ) | | Variation margin
payable* | | | –
| | | | (277,521
| ) | | | –
| | |
SFT Advantus Dynamic
Managed Volatility Fund | | Futures
| | | 788,931
| | | Variation margin
receivable* | | | 745,793
| | | | 43,138
| | | | –
| | |
| | | Options
| | | 52,148
| | | Call Options
Purchased | | | 52,148
| | | | –
| | | | –
| | |
SFT Advantus Index 400
Mid-Cap Fund | | Futures
| | | 15,973
| | | Variation margin
receivable * | | | 15,973
| | | | –
| | | | –
| | |
SFT Advantus Index 500 Fund
| | Futures
| | | 96,258
| | | Variation margin
receivable* | | | 96,258
| | | | –
| | | | –
| | |
SFT Advantus International
Bond Fund
| | Foreign
Currency
Forwards
| | | 750,495
| | | Unrealized
appreciation on
forward foreign
currency contracts | | | –
| | | | –
| | | | 750,495
| | |
| | | Foreign
Currency
Forwards
| | | (2,395,385
| ) | | Unrealized
depreciation on
forward foreign
currency contracts | | | –
| | | | –
| | | | (2,395,385
| ) | |
| | | Swaps
| | | 250,290
| | | Variation margin
receivable* | | | –
| | | | 250,290
| | | | –
| | |
| | | Swaps
| | | (617,093
| ) | | Variation margin
payable* | | | –
| | | | (617,093
| ) | | | –
| | |
SFT Advantus Managed
Volatility Equity Fund | | Options
| | | (25,350
| ) | | Put Options
Written | | | (25,350
| ) | | | –
| | | | –
| | |
| | | Options
| | | 60,450
| | | Put Options
Purchased | | | 60,450
| | | | –
| | | | –
| | |
| | | Futures
| | | 148,528
| | | Variation margin
payable* | | | 148,528
| | | | –
| | | | –
| | |
SFT Advantus Mortgage
Securities Fund | | Futures
| | | 22,579 | | | Variation margin
receivable* | | | –
| | | | 22,579
| | | | –
| | |
| | | Futures
| | | (8,828
| ) | | Variation margin
payable* | | | –
| | | | (8,828
| ) | | | –
| | |
* Includes cumulative appreciation/depreciation of futures contracts and swaps as reported in the notes to the Schedules of Investments in Securities. Only current day's variation margin is reported within the Statement of Assets and Liabilities.
131
Securian Funds Trust
Notes to Financial Statements – continued
(7) Derivative Instruments Reporting – (continued)
| | | | | Realized Gain (Loss) on Derivatives
Recognized in Income | |
Fund | | Instrument
Type | | Realized Gain
(Loss) on
Derivatives for
Year Ended
December 31, 2017 | | Statement of
Operations Location | | Equity | | Interest
Rate | | Foreign
Exchange | |
SFT Advantus Bond Fund
| | Futures
| | $ | (41,756
| ) | | Net realized gains
(losses) from
futures transactions | | $ | –
| | | $ | (41,756
| ) | | $ | –
| | |
SFT Advantus Dynamic
Managed Volatility Fund
| | Futures
| | | 19,751,912
| | | Net realized gains
(losses) from
futures transactions | | | 19,872,433
| | | | (120,521
| ) | | | –
| | |
| | | Purchased
Options
| | | (1,616,658
| ) | | Net realized gains
(losses) from
investments | | | (1,616,658
| ) | | | –
| | | | –
| | |
| | | Written
Options
| | | 101,223
| | | Net realized gains
(losses) from
written options | | | 101,223
| | | | –
| | | | –
| | |
SFT Advantus Index 400
Mid-Cap Fund
| | Futures
| | | 755,387
| | | Net realized gains
(losses) from
futures transactions | | | 755,387
| | | | –
| | | | –
| | |
SFT Advantus Index 500
Fund
| | Futures
| | | 2,004,359
| | | Net realized gains
(losses) from
futures transactions | | | 2,004,359
| | | | –
| | | | –
| | |
SFT Advantus International
Bond Fund
| | Foreign
Currency
Forwards | | | (667,943
| ) | | Net realized gains
(losses) from foreign
currency transactions | | | –
| | | | –
| | | | (667,943
| ) | |
| | | Swaps
| | | (261,906
| ) | | Net realized gains
(losses) from swaps | | | –
| | | | (261,906
| ) | | | –
| | |
SFT Advantus Managed
Volatility Equity Fund
| | Futures
| | | 3,108,348
| | | Net realized gains
(losses) from
futures transactions | | | 3,108,348
| | | | –
| | | | –
| | |
| | | Purchased
Options
| | | (1,856,735
| ) | | Net realized gains
(losses) from
investments | | | (1,856,735
| ) | | | –
| | | | –
| | |
| | | Written
Options
| | | 307,649
| | | Net realized gains
(losses) from
written options | | | 307,649
| | | | –
| | | | –
| | |
SFT Advantus Mortgage
Securities Fund | | Futures
| | | 6,938
| | | Net realized gains
(losses) from | | | —
| | | | 6,938
| | | | –
| | |
| | | | | | | | | | | futures transactions | | | | | | | | | | | | | |
132
Securian Funds Trust
Notes to Financial Statements – continued
(7) Derivative Instruments Reporting – (continued)
| | | | | Unrealized Appreciation (Depreciation)
on Derivatives Recognized in Income | |
Fund | | Instrument
Type | | Net Change in
Unrealized
Appreciation
(Depreciation) on
Derivatives for
Year Ended
December 31, 2017 | | Statement of
Operations Location | | Equity | | Interest
Rate | | Foreign
Exchange | |
SFT Advantus Bond Fund
| | Futures
| | $ | (67,252
| ) | | Net change in
unrealized
appreciation or
depreciation on
futures transactions | | $ | –
| | | $ | (67,252
| ) | | $ | –
| | |
SFT Advantus Dynamic
Managed Volatility Fund
| | Futures
| | | (719,523
| ) | | Net change in
unrealized
appreciation or
depreciation on
futures transactions | | | (625,773
| ) | | | (93,750
| ) | | | –
| | |
| | | Purchased
Options
| | | 27,722
| | | Net change in
unrealized
appreciation or
depreciation on
investments | | | 27,722
| | | | –
| | | | –
| | |
| | | Written
Options
| | | (34,774
| ) | | Net change in
unrealized
appreciation or
depreciation on
written options | | | (34,774
| ) | | | –
| | | | –
| | |
SFT Advantus Index 400
Mid-Cap Fund
| | Futures
| | | 305,298
| | | Net change in
unrealized
appreciation or
depreciation on
futures transactions | | | 305,298
| | | | –
| | | | –
| | |
SFT Advantus Index 500
Fund
| | Futures
| | | (50,942
| ) | | Net change in
unrealized
appreciation or
depreciation on
futures transactions | | | (50,942
| ) | | | –
| | | | –
| | |
SFT Advantus International
Bond Fund
| | Foreign
Currency
Forwards
| | | (6,269,712
| ) | | Net change in
unrealized
appreciation or
depreciation on
foreign currency
transactions | | | –
| | | | –
| | | | (6,269,712
| ) | |
| | | Swaps
| | | (71,272
| ) | | Net change in
unrealized
appreciation or
depreciation on
swaps | | | –
| | | | (71,272
| ) | | | –
| | |
133
Securian Funds Trust
Notes to Financial Statements – continued
(7) Derivative Instruments Reporting – (continued)
| | | | | Unrealized Appreciation (Depreciation)
on Derivatives Recognized in Income | |
Fund | | Instrument
Type | | Net Change in
Unrealized
Appreciation
(Depreciation) on
Derivatives for
Year Ended
December 31, 2017 | | Statement of
Operations Location | | Equity | | Interest
Rate | | Foreign
Exchange | |
SFT Advantus Managed
Volatility Equity Fund
| | Futures
| | $ | (140,583
| ) | | Net change in
unrealized
appreciation or
depreciation on
futures transactions | | $ | (140,583
| ) | | $ | –
| | | $ | –
| | |
| | | Purchased
Options
| | | (172,527
| ) | | Net change in
unrealized
appreciation or
depreciation on
investments | | | (172,527
| ) | | | –
| | | | –
| | |
| | | Written
Options
| | | 13,495
| | | Net change in
unrealized
appreciation or
depreciation on
written options | | | 13,495
| | | | –
| | | | –
| | |
SFT Advantus Mortgage
Securities Fund
| | Futures
| | | 13,751
| | | Net change in
unrealized
appreciation or
depreciation on
futures transactions | | | –
| | | | 13,751
| | | | –
| | |
The Funds may be exposed to credit-related losses in the event of nonperformance by counterparties to derivative financial instruments. The Funds manage credit risk related to derivatives by entering into transactions with highly rated counterparties. Generally, the current credit exposure of the derivative contracts is limited to the positive estimated fair value of derivative contracts at the reporting date after taking into consideration the existence of master netting arrangements and any collateral received pursuant to credit support annexes. Because exchange traded and centrally cleared derivatives are purchased through regulated exchanges and positions are settled regularly, the Funds have minimal exposure to credit-related losses in the event of nonperformance by counterparties to such derivative instruments. For the year ended December 31, 2017 none of the Funds' derivatives were subject to master netting arrangements.
134
Securian Funds Trust
Notes to Financial Statements – continued
The SFT Advantus Dynamic Managed Volatility Fund invests in underlying securities and other investment companies, of which certain underlying funds (the "affiliated underlying funds") may be deemed to be under common control with the SFT Advantus Dynamic Managed Volatility Fund because they share the same investment advisor, Advantus Capital, and because they are overseen by the same Board of Trustees. The SFT Advantus Dynamic Managed Volatility Fund will achieve its equity exposure by investing primarily in Class 1 Shares of the SFT Advantus Index 500 Fund, an affiliated fund in the Trust that seeks investment results that correspond generally to the price and yield performance of the common stocks included in the Standard & Poor's 500 Index. A summary of all transactions with the affiliated SFT Advantus Index 500 Fund for the period ended December 31, 2017 are as follows:
Fund/Underlying Fund | | Balance
of Shares
Held at
December 31,
2016 | | Gross
Additions | | Gross
Sales | | Balance
of Shares
Held at
December 31,
2017 | | Value at
December 31,
2017 | | Realized
Gain
(Loss) | | Net change in
Unrealized
Appreciation
(Depreciation) | | Distributions
Received | |
SFT Advantus
Dynamic Managed
Volatility Fund | |
SFT Advantus
Index 500 Fund | | | 14,224,618 | | | | – | | | | – | | | | 14,224,618 | | | $ | 151,194,190 | | | $ | – | | | $ | 26,793,604 | | | $ | – | | |
(9) Subsequent Events
Management has evaluated subsequent events for the Trust through the date of the filing, and has concluded there are no events that require disclosure.
135
Securian Funds Trust
Other Information
(unaudited)
Fund Expenses Paid by Shareholders
Shareholders of the Trust incur two types of costs: (1) transaction costs, including sales charges (loads) on purchase payments, reinvested dividends, or other distributions; redemption fees; (the Trust does not impose transaction costs, but you will incur such costs in connection with the variable life insurance policies and variable annuity contracts that invest in the Funds) and exchange fees; and (2) ongoing costs, including management fees; distribution and/or service (12b-1) fees; and other Trust expenses. The examples below are intended to help you understand your ongoing costs (in dollars) of investing in the Funds and to compare these costs with the ongoing costs of investing in other mutual funds.
The examples below are based on an investment of $1,000 invested at the beginning of the period and held for the entire period, July 01, 2017 through December 31, 2017. Expenses paid during the period in the tables below are equal to the Fund's annualized expense ratio, multiplied by the average account value over the period, multiplied by number of days in most recent fiscal half-year divided by 365 to reflect the one-half year period.
Actual Expenses
The table below provides information about actual account values and actual expenses for the Funds. You may use the information in this table, together with the amount you invested, to estimate the expenses that you paid over the period. Simply divide your account value by $1,000 (for example, an $8,600 account value divided by $1,000 = 8.6), then multiply the result by the number in the table for the fund you own under the heading entitled "Expenses Paid During Period" to estimate the expenses you paid on your account during this period.
| | | Actual Expenses | |
| | | CLASS 1 | | CLASS 2 | |
| | | Beginning
Account
Value | | Ending
Account
Value | | Annual
Expense
Ratio | | Expenses
Paid During
Period | | Ending
Account
Value | | Annual
Expense
Ratio | | Expenses
Paid During
Period | |
SFT Advantus Bond Fund | | $ | 1,000 | | | $ | 1,017.40 | | | | 0.49 | % | | $ | 2.49 | | | $ | 1,016.20 | | | | 0.74 | % | | $ | 3.76 | | |
SFT Advantus Dynamic
Managed Volatility Fund | | | 1,000 | | | | NA | | | | NA | | | | NA | | | | 1,094.90 | | | | 0.80 | % | | | 4.22 | | |
SFT Advantus Government
Money Market Fund | | | 1,000 | | | | NA | | | | NA | | | | NA | | | | 1,001.30 | | | | 0.85 | % | | | 4.29 | | |
SFT Advantus Index 400
Mid-Cap Fund | | | 1,000 | | | | 1,095.10 | | | | 0.27 | % | | | 1.43 | | | | 1,093.70 | | | | 0.52 | % | | | 2.74 | | |
SFT Advantus Index 500 Fund | | | 1,000 | | | | 1,112.80 | | | | 0.20 | % | | | 1.07 | | | | 1,111.40 | | | | 0.45 | % | | | 2.39 | | |
SFT Advantus International
Bond Fund | | | 1,000 | | | | 987.70 | | | | 0.98 | % | | | 4.91 | | | | 986.50 | | | | 1.23 | % | | | 6.16 | | |
SFT Advantus Managed
Volatility Equity Fund | | | 1,000 | | | | NA | | | | NA | | | | NA | | | | 1,073.90 | | | | 0.80 | % | | | 4.18 | | |
SFT Advantus Mortgage
Securities Fund | | | 1,000 | | | | 1,008.90 | | | | 0.69 | % | | | 3.49 | | | | 1,007.70 | | | | 0.94 | % | | | 4.76 | | |
SFT Advantus Real Estate
Securities Fund | | | 1,000 | | | | 1,023.60 | | | | 0.86 | % | | | 4.39 | | | | 1,022.30 | | | | 1.11 | % | | | 5.66 | | |
SFT IvySM Growth Fund | | | 1,000 | | | | NA | | | | NA | | | | NA | | | | 1,142.10 | | | | 0.97 | % | | | 5.24 | | |
SFT IvySM Small Cap Growth
Fund | | | 1,000 | | | | NA | | | | NA | | | | NA | | | | 1,097.00 | | | | 1.22 | % | | | 6.45 | | |
SFT T. Rowe Price Value
Fund | | | 1,000 | | | | NA | | | | NA | | | | NA | | | | 1,093.90 | | | | 1.03 | % | | | 5.44 | | |
SFT Wellington Core Equity
Fund | | | 1,000 | | | | 1,111.20 | | | | 0.86 | % | | | 4.58 | | | | 1,109.80 | | | | 1.12 | % | | | 5.96 | | |
136
Securian Funds Trust
Other Information – continued
(unaudited)
Hypothetical Example for Comparison Purposes
The table below also provides information about hypothetical account values and hypothetical expenses based on the Funds' actual expense ratios and an assumed rate of return of 5% per year before expenses, which are not the Funds' actual returns. The hypothetical account values and expenses may not be used to estimate the actual ending account balance or expenses you paid for the period. You may use this information to compare the ongoing costs of investing in the Funds' and other funds. To do so, compare the 5% hypothetical example of the funds you own with the 5% hypothetical examples that appear in the shareholder reports of other similar funds.
| | | Hypothetical Expenses | |
| | | CLASS 1 | | CLASS 2 | |
| | | Beginning
Account
Value | | Ending
Account
Value | | Annual
Expense
Ratio | | Expenses
Paid During
Period | | Ending
Account
Value | | Annual
Expense
Ratio | | Expenses
Paid During
Period | |
SFT Advantus Bond Fund | | $ | 1,000 | | | $ | 1,022.74 | | | | 0.49 | % | | $ | 2.50 | | | $ | 1,021.48 | | | | 0.74 | % | | $ | 3.77 | | |
SFT Advantus Dynamic
Managed Volatility Fund | | | 1,000 | | | | NA | | | | NA | | | | NA | | | | 1,021.17 | | | | 0.80 | % | | | 4.08 | | |
SFT Advantus Government
Money Market Fund | | | 1,000 | | | | NA | | | | NA | | | | NA | | | | 1,020.92 | | | | 0.85 | % | | | 4.33 | | |
SFT Advantus Index 400
Mid-Cap Fund | | | 1,000 | | | | 1,023.84 | | | | 0.27 | % | | | 1.38 | | | | 1,022.58 | | | | 0.52 | % | | | 2.65 | | |
SFT Advantus Index 500 Fund | | | 1,000 | | | | 1,024.20 | | | | 0.20 | % | | | 1.02 | | | | 1,022.94 | | | | 0.45 | % | | | 2.29 | | |
SFT Advantus International
Bond Fund | | | 1,000 | | | | 1,020.27 | | | | 0.98 | % | | | 4.99 | | | | 1,019.00 | | | | 1.23 | % | | | 6.26 | | |
SFT Advantus Managed
Volatility Equity Fund | | | 1,000 | | | | NA | | | | NA | | | | NA | | | | 1,021.17 | | | | 0.80 | % | | | 4.08 | | |
SFT Advantus Mortgage
Securities Fund | | | 1,000 | | | | 1,021.73 | | | | 0.69 | % | | | 3.52 | | | | 1,020.47 | | | | 0.94 | % | | | 4.79 | | |
SFT Advantus Real Estate
Securities Fund | | | 1,000 | | | | 1,020.87 | | | | 0.86 | % | | | 4.38 | | | | 1,019.61 | | | | 1.11 | % | | | 5.65 | | |
SFT IvySM Growth Fund | | | 1,000 | | | | NA | | | | NA | | | | NA | | | | 1,020.32 | | | | 0.97 | % | | | 4.94 | | |
SFT IvySM Small Cap Growth
Fund | | | 1,000 | | | | NA | | | | NA | | | | NA | | | | 1,019.06 | | | | 1.22 | % | | | 6.21 | | |
SFT T. Rowe Price Value Fund | | | 1,000 | | | | NA | | | | NA | | | | NA | | | | 1,020.01 | | | | 1.03 | % | | | 5.24 | | |
SFT Wellington Core Equity
Fund | | | 1,000 | | | | 1,020.87 | | | | 0.86 | % | | | 4.38 | | | | 1,019.56 | | | | 1.12 | % | | | 5.70 | | |
Please note that the expenses shown in both tables are meant to highlight your ongoing costs only and do not reflect any transactional costs, such as sales charges (loads), redemption fees, or exchange fees. Therefore, the information provided in the hypothetical example table is useful in comparing ongoing costs only, and will not help you determine the relative total costs of owning different funds. In addition, if these transactional costs were included, your costs would have been higher.
Proxy Voting Policies and Procedures
A description of the policies and procedures that Advantus Capital uses to vote proxies related to each Fund's portfolio securities is set forth in the Trust's Statement of Additional Information which is available without charge, upon request, by calling, toll-free, 800-995-3850 or on the Securities and Exchange Commission's website at www.sec.gov. The Trust will provide this document within three business days of receipt of a request, by first-class mail or other means designed to ensure equally prompt delivery.
137
Securian Funds Trust
Other Information – continued
(unaudited)
Proxy Voting Record
The Trust's proxy voting record for the 12 month period ended December 31 is available by calling, toll-free, 866-330-7355 or on the Securities and Exchange Commission's website at www.sec.gov no later than August 31 each year. The Trust will also provide this information, within three business days of receipt of a request, by first-class mail or other means designed to ensure equally prompt delivery.
Availability of Quarterly Schedule of Investments
The Trust files its complete schedule of investment holdings with the SEC for the first and third quarters of each fiscal year on Form N-Q. Form N-Q is available to shareholders without charge on the SEC's website at www.sec.gov. Form N-Q may also be reviewed and copied at the Commission's Public Reference Room in Washington, DC. More information of the operation of the Public Reference Room may be obtained by calling 1-800-SEC-0330.
138
Securian Funds Trust
Statement Regarding Basis for Approval of a New Sub-Advisory Agreement for SFT Pyramis Core Equity Fund (now named "SFT Wellington Core Equity Fund")
(unaudited)
At a meeting held on July 27, 2017, the Board of Trustees of the Trust considered the recommendation of Advantus Capital Management Inc. (the "Adviser") that Wellington Management Company LLP ("Wellington") replace FIAM LLC ("FIAM") as the sub-adviser to the Fund and unanimously approved the Wellington Agreement. At the meeting, the Board reviewed materials furnished by the Adviser and by Wellington pertaining to Wellington and the Wellington Agreement. The Board also met personally with and received a presentation from Mammen Chally, CFA, the person to serve as lead portfolio manager for the Fund.
The Adviser, as manager of all of the Funds of the Trust, is charged with researching and recommending sub-advisers for the Fund. The Adviser has adopted policies and procedures to assist it in the process of analyzing each sub-adviser with expertise in particular asset classes for purposes of making the recommendation that a specific investment adviser be selected. The Board reviews and considers the information provided by the Adviser in deciding which investment advisers to approve. The Trustees also receive frequent updates on industry and regulatory developments and best practices. After an investment adviser becomes a sub-adviser, a similarly rigorous process is instituted by the Adviser to monitor the investment performance and other responsibilities of the sub-adviser.
As part of its ongoing obligation to monitor and evaluate the performance of the Fund's sub-adviser, the Adviser recently completed a review of FIAM's management of the Fund. The Adviser's review and evaluation of FIAM focused primarily on the performance of the Fund.
The Board, including a majority of the independent Trustees, with the assistance of independent counsel to the independent Trustees, considered whether to approve the Wellington Agreement in light of its experience in governing the Fund and working with the Adviser and the sub-advisers on matters relating to the Fund. The independent Trustees are those Trustees who are not "interested persons" of the Trust or the Fund within the meaning of the 1940 Act, and are not employees of or affiliated with the Trust, Fund, the Adviser, FIAM, or Wellington.
Prior to voting, the Board reviewed the Adviser's recommendation that it approve the Wellington Agreement with independent legal counsel and received from such counsel an oral summary of the legal standards for consideration of the proposed approval. In its deliberations, the Board considered all factors that the Trustees believed were relevant. The Board based its decision to approve the Wellington Agreement on the totality of the circumstances and relevant factors, and with a view to past and future long-term considerations.
The Trustees also requested and evaluated other information, including information on Wellington's organization and current staffing, performance information, and information on brokerage allocation practices and soft dollar arrangements. The Trustees also requested and reviewed a summary of Wellington's code of ethics and overall compliance program.
The Trustees reviewed the terms of the Wellington Agreement. In reaching their determination with respect to the approval of the Wellington Agreement, the Trustees met in private session with independent legal counsel at which no representatives of the Adviser, Wellington or their respective affiliates were present.
In their deliberations, the Trustees did not identify any particular information that was all-important or controlling, and each Trustee may have attributed different weights to the various factors. The Trustees evaluated all information available to them regarding the Fund.
139
Securian Funds Trust
Statement Regarding Basis for Approval of a New Sub-Advisory Agreement for SFT Pyramis Core Equity Fund (now named "SFT Wellington Core Equity Fund") – continued
(unaudited)
The material factors and conclusions that formed the basis for the Trustees' approval of the Wellington Agreement (including the appropriateness of the fees payable to Wellington by the Adviser thereunder) were separately discussed by the Trustees. The Trustees determined that the overall arrangements between the Fund and Wellington, as provided in the Wellington Agreement, are fair and reasonable in light of the services performed, expenses incurred and such other matters as the Trustees considered relevant in the exercise of their reasonable judgment.
The Board approved the termination of the FIAM Agreement and determined that the Wellington Agreement was reasonable and in the best interests of the Fund and approved Wellington as the Fund's new sub-adviser, effective on or about November 15, 2017. The Board's decision to approve the Wellington Agreement reflects the exercise of its business judgment on whether to approve new arrangements and continue existing arrangements.
A rule adopted by the SEC under the 1940 Act requires a discussion of certain factors relating to the selection of investment advisers and sub-advisers and the approval of advisory and sub-advisory fees. The factors enumerated by the SEC in the rule are set forth below in italics followed by the Board's conclusions regarding each factor.
(1) The nature, extent, and quality of services provided by the Sub-Adviser.
In deciding to approve Wellington as the Fund's sub-adviser, the Board considered the experience and track record of Wellington's investment management personnel. The Board also noted Wellington's investment infrastructure as well as the risk profiles of its investment process. Specifically, the Board determined that, based upon the Adviser's report, the proposed change to Wellington as the sub-adviser likely would benefit the Fund and its shareholders.
In reviewing the other various matters listed above, the Board concluded that Wellington is a recognized firm capable of competently managing the Fund; that the nature, extent, and quality of services that Wellington could provide were at a level at least equal to the services that could be provided by FIAM; that the services contemplated by the Wellington Agreement are substantially similar to those provided under the FIAM Agreement; that the Wellington Agreement contains provisions generally comparable to those of other sub-advisory agreements for other mutual funds; and that Wellington was staffed with a number of qualified personnel and had significant research capabilities.
(2) The investment performance of the Sub-Adviser.
The Board received information on the investment returns of Wellington's Disciplined US Equity Composite, which strategy will be used by Wellington as the sub-adviser to the Fund. Gross investment return information included annual returns for 2008 through 2016, and year-to-date through June 30, 2017, and annualized one, three, five and since inception annualized returns. It was noted that for each of the three and five year annualized returns, and the annualized returns since inception (May 1, 2007), the Disciplined US Equity Composite out-performed the S&P 500 index.
On the basis of the information presented, the Board concluded that Wellington's performance in managing portfolios with main strategies substantially similar to that of the Fund has been strong.
140
Securian Funds Trust
Statement Regarding Basis for Approval of a New Sub-Advisory Agreement for SFT Pyramis Core Equity Fund (now named "SFT Wellington Core Equity Fund") – continued
(unaudited)
(3) The costs of services to be provided and profits to be realized by Wellington from its relationship with the Fund.
The Adviser, on behalf of the Board, requested, but did not receive, an analysis of Wellington's profitability in managing the Fund. The Board noted that sub-advisers such as Wellington sometimes do not disclose this proprietary information, and further noted that the Wellington Agreement (including Wellington's fees) had been negotiated by the Adviser on an arm's length basis.
The Board compared the fee schedule in the Wellington Agreement to the fee schedule in the FIAM Agreement. The Board noted that the fee schedule in the FIAM Agreement is somewhat higher than the fee schedule in the Wellington Agreement (33 to 31 basis points versus 31 to 28 basis points). The Board also noted that fees paid to Wellington will be paid by the Adviser out of the fees it receives from the Fund and that the fees payable by shareholders of the Fund will not change. Based upon its review, the Board concluded that the fees proposed to be paid to Wellington were reasonable. Information comparing the fees under the Wellington Agreement and the FIAM Agreement is set forth in this information statement.
(4) and (5) The extent to which economies of scale would be realized as the Fund grows, and whether fee levels reflect these economies of scale.
The Board noted that the fee schedule in the Wellington Agreement contains "breakpoints" to reduce the fee rate based upon the size of the Fund's assets. The Board noted that the fee schedule in the FIAM Agreement also included breakpoints. As is consistent with past changes in sub-advisors pursuant to the manager-of-managers exemptive order, the costs associated with the change from FIAM to Wellington (such as the cost of preparing and mailing this information statement) will be borne by the Fund.
141
Securian Funds Trust
Trustees and Executive Officers
(unaudited)
Under Delaware law, the Board of Trustees of the Trust has overall responsibility for managing the Trust in good faith and in a manner reasonably believed to be in the best interests of the Trust. The Trustees meet periodically throughout the year to oversee the Trust's activities, review contractual arrangements with companies that provide services to the Trust, and review the performance of the Trust and its Funds. One of the four current Trustees is considered an "interested person" (as defined in the Investment Company Act of 1940) of the Trust. The other three Trustees, because they are not interested persons of the Trust, are considered independent ("Independent Trustees") and are not employees or officers of, and have no financial interest in, the Trust's investment adviser, Advantus Capital Management, Inc. or its affiliated companies, including Minnesota Life Insurance Company. 75% of the Board of Trustees is required to be comprised of Independent Trustees.
Only executive officers and other officers who perform policy-making functions with the Trust are listed. None of the Trustees is a director of any public company (a company required to file reports under the Securities Exchange Act of 1934) or of any registered investment companies other than the Trust. Each Trustee serves for an indefinite term, until his or her resignation, death or removal.
Position with Trust
Name, Address(1) and Length of Principal Occupation(s)
and Year of Birth, Time Served(2) During Past 5 Years
Independent Trustees
Julie K. Getchell 1954 Trustee since 2011
Retired; Senior Financial Consultant Cargill, 2009-2012; Chief Financial Officer, La Grosse Global Fund Services, 2007-2009; Senior Managing Director, Black River Asset Management, 2005-2007; Consultant, Black River Asset Management, 2004-2005; Chief Financial Officer, Prestige Resorts & Destinations, 2001-2003; Chief Operating Officer, Insight Investment Management, Inc., 1991-1996; Chartered Financial Analyst; CPA—inactive
Linda L. Henderson 1949 Trustee since 2007
Retired: Professional Adviser, Carlson School of Management, working with faculty and MBA students managing Carlson Growth Fund. Semi-retirement, 2004-2007. RBC Wealth Management (formerly Dain Bosworth and Dain Rauscher) 1985-2004. Senior Vice President and Director of Fixed Income Research and Strategies, 2000-2004. Director of Retail Fixed Income. 1996-2000. Director of Financial Services, 1994-1996. Manager of the Investment Management Group, 1992-1994. Consultant, Investment Management Group, 1991-1992. Investment Executive, 1985-1991. Assistant Professor of Business Administration/Finance, University of Wisconsin-River Falls, 1980-1985. Chartered Financial Analyst
William C. Melton 1947 Trustee since 2002
Retired; member, State of Minnesota Council of Economic Advisors from 1988 to 1994, and again from 2010 to the present; various senior positions at American Express Financial Advisors (formerly Investors Diversified Services and, thereafter, IDS/American Express) from 1982 through 1997, including Chief Economist and, thereafter, Chief International Economist
Interested Trustee and Principal Executive Officer
David M. Kuplic 1957 Trustee since 2016 and President since 2011
Senior Vice President, Minnesota Life Insurance Company since June 2007; President, Advantus Capital Management, Inc. since 2017; Executive Vice President and Director, Advantus Capital Management, Inc. since July 2007; Senior Vice President and Director, Advantus Capital Management, Inc., February 2006 to July 2007; Senior Vice President, Securian Financial Group, Inc. since June 2007; President and Director, MIMLIC Funding, Inc. (entity holding legal title to bonds beneficially owned by certain clients of Advantus Capital) since July 2007; Senior Vice President, Securian Life Insurance Company since June 2007; President and Director,
142
Securian Funds Trust
Trustees and Executive Officers – continued
(unaudited)
Marketview Properties, LLC (entity holding real estate assets) since January 2010; President and Director, Marketview Properties II, LLC (entity holding real estate assets) since March 2010; President and Director, Marketview Properties III, LLC since January 2012; President, Marketview Properties IV, LLC since January 2012
Other Executive Officers(3)
Gary M. Kleist 1959 Vice President and Treasurer since 2003
Financial Vice President, Chief of Operations and Director, Advantus Capital Management, Inc. since December 1997; Second Vice President, Minnesota Life Insurance Company since February 2000; Second Vice President, Securian Financial Group, Inc. since February 2000; Second Vice President, Securian Life Insurance Company since June 2007; Financial Vice President, Marketview Properties, LLC since January 2010; Financial Vice President, Marketview Properties II, LLC (entities holding certain real estate assets) since March 2010; Financial Vice President, Marketview Properties III, LLC since January 2012; Financial Vice President, Marketview Properties IV, LLC since January 2012
Daniel H. Kruse 1963 Vice President since 2017
Vice President, Minnesota Life Insurance Company since February 2015; Vice President, Securian Life Insurance Company since February 2015; Vice President, Securian Financial Group since 2015; Second Vice President, Minnesota Life Insurance Company, February 2008 to January 2015; Second Vice President, Securian Life Insurance Company, February 2008 to January 2015; Second Vice President, Securian Financial Group, February 2008 to January 2015
Michael J. Radmer 1945 Secretary since 1998
Senior Counsel with the law firm of Dorsey & Whitney LLP since January 2016; Partner from 1976 to December 2015
Dorsey & Whitney LLP
50 South Sixth Street
Minneapolis, Minnesota 55402
(1) Unless otherwise noted, the address of each Trustee and officer is the address of the Trust: 400 Robert Street North, St. Paul, Minnesota 55101.
(2) The years reflect when a person became a director or officer of Advantus Series Fund, the predecessor to the Trust.
(3) Although not a 'corporate' officer of the Trust, Todd L. Spicer, 1978, served as the Trust's Chief Compliance Officer from September 2016 through May 2017. Mr. Spicer also served as Vice President and Chief Compliance Officer, Advantus Capital Management, Inc. from September 2016 through May 2017. Gary Kleist, Vice President and Treasurer of the Trust, served as interim Chief Compliance Officer of the Trust from June 2017 through July 2017. Effective August 1, 2017, Michael Steinert, 1975, serves as the Trust's Chief Compliance Officer. Mr. Steinert also serves as Vice President and Chief Compliance Officer of Advantus Capital Management, Inc.
143
(This page has been left blank intentionally.)
This offering is available through Securian Financial Services, Inc., a registered broker/dealer. Securian Financial Services, Inc. is the distributor of Minnesota Life and Securian Life variable insurance products.
This report may be used as sales literature in connection with the offer or sale of variable annuity or variable life insurance contracts funded by Securian Funds Trust ("Trust") if preceded or accompanied by (a) the current prospectus for the Trust and such contracts and (b) the current applicable variable annuity or variable life performance report.

Securian Financial Services, Inc.
www.securian.com
Securities Dealer, Member FINRA/SIPC.
Registered Investment Advisor
400 Robert Street North, St. Paul, MN 55101-2098
1.888.237.1838
F38897 Rev 2-2018
Minnesota Life Insurance Company
A Securian Company
Securian Life Insurance Company
A New York admitted insurer
400 Robert Street North
St. Paul, MN 55101-2098
PRESORTED STANDARD
U.S. POSTAGE PAID
CAROL STREAM, IL
PERMIT NO. 1480

©2016 Securian Funds Trust All rights reserved.
F38897 Rev 2-2018
Call 1-800-995-3850 to receive your financial documents electronically. It's fast and convenient.
ITEM 2. CODE OF ETHICS.
Filed herewith as Exhibit 12(a)(1). During the period covered by this report, there has been no amendment to the code of ethics that relates to any element of the code of ethics definition set forth in paragraph (b) of Item 2 of Form N-CSR, nor has the registrant granted a waiver, including an implicit waiver, from a provision of the code of ethics to the registrant’s principal executive officer, principal financial officer, principal accounting officer or controller, or persons performing similar functions that relates to one or more of the items set forth in paragraph (b) of Item 2 of form N-CSR.
ITEM 3. AUDIT COMMITTEE FINANCIAL EXPERT.
The Board of Trustees of the Trust has determined that Julie K. Getchell, a member of the Board’s Audit Committee, possesses the technical attributes identified in Instruction 2(b) of Item 3 to Form N-CSR to qualify as an “audit committee financial expert,” and has designated Ms.
Getchell as the Audit Committee’s financial expert. Ms. Getchell is an “independent” Trustee pursuant to paragraph (a)(2) of Item 3 to Form N-CSR.
ITEM 4. PRINCIPAL ACCOUNTANT FEES AND SERVICES.
(a) Audit Fees
The aggregate fees billed for each of the last two fiscal years for professional services rendered by the principal accountant to the registrant for the audit of the registrant’s annual financial statements or services that are normally provided by the accountant in connection with statutory and regulatory filings or engagements for those fiscal years were as follows:
2017 | | 2016 | |
$ | 346,616 | | $ | 354,119 | |
| | | | | |
(b) Audit-Related Fees
The aggregate fees billed in each of the last two fiscal years for assurance and related services rendered by the principal accountant to the registrant that are reasonably related to the performance of the audit of the registrant’s financial statements and are not reported under paragraph (a) of this Item 4 were as follows:
There were no fees billed in each of the last two fiscal years for assurance and related services rendered by the principal accountant to the registrant’s investment adviser or to any entity controlling, controlled by or under common control with the investment adviser that provides ongoing services to the registrant that were required to be pre-approved by the audit committee pursuant to paragraph (c)(7)(ii) of Rule 2-01 of Regulation S-X.
(c) Tax Fees
The aggregate fees billed in each of the last two fiscal years for professional services rendered by the principal accountant to the registrant for tax compliance, tax advice, tax planning and tax return preparation were as follows:
There were no fees billed in each of the last two fiscal years for professional services rendered by the principal accountant to the investment adviser or to any entity controlling, controlled by or under common control with the investment adviser that provides ongoing services to the registrant for tax compliance, tax advice and tax planning that were required to be pre-approved by the audit committee pursuant to paragraph (c)(7)(ii) of Rule 2-01 of Regulation S-X.
(d) All Other Fees
The aggregate fees billed in each of the last two fiscal years for products and services provided by the principal accountant to the registrant, other than the services reported in paragraphs (a) — (c) of this Item 4 were as follows:
There were no fees billed in each of the last two fiscal years for products and services provided by the principal accountant to the investment adviser or to any entity controlling, controlled by or under common control with the investment adviser that provides ongoing services to the registrant, other than the services reported in paragraphs (a) — (c) of this Item 4, that were required to be pre-approved by the audit committee pursuant to paragraph (c)(7)(ii) of Rule 2-01 of Regulation S-X.
(e)(1) Registrant’s audit committee has adopted the following pre-approval policies and procedures in accordance with paragraph (c)(7) of Rule 2-01 of Regulation S-X:
SECURIAN FUNDS TRUST
AUDIT COMMITTEE POLICY
Regarding Pre-Approval of Services Provided by the Independent Auditor
The Audit Committee (the “Committee”) of the Securian Funds Trust (the “Trust”) has responsibility for ensuring that all services performed by the independent audit firm (the “Auditor”) for the Trust do not impair the Auditor’s independence. This review is intended to provide reasonable oversight without removing management from its responsibility for day-to-day operations. In this regard, the Committee should:
· Understand the nature of the professional services expected to be provided and their impact on the Auditor’s independence and audit quality
· Examine and evaluate the safeguards put into place by the Trust and the Auditor to safeguard independence
· Meet semi-annually with the engagement partner of the Auditor
· Consider approving categories of service that are not deemed to impair independence for a one-year period
It is important that a qualitative rather than a mere quantitative evaluation be performed by the Committee in discharging its responsibilities.
Policy for Audit and Non-Audit Services Provided to the Trust
On an annual basis, the Committee will review and consider whether to pre-approve the financial plan for audit fees as well as categories of audit-related and non-audit services that may be performed by the Auditor directly for the Trust. At least annually the Committee will receive a report from the Auditor of all audit and non-audit services, which were approved during the year.
The engagement of the Auditor for any non-audit service requires the written pre-approval of the Trust’s Treasurer, and all non-audit services performed by the Auditor will be disclosed in the required SEC periodic filings.
In connection with the Committee review and pre-approval responsibilities, the review by the Committee will consist of the following:
Audit Services
The categories of audit services and related fees to be reviewed and considered for pre-approval annually by the Committee or its delegate include the following:
· Annual Trust financial statement audits
· SEC and regulatory filings and consents
Audit-related Services
In addition, the following categories of audit-related services are deemed to be consistent with the role of the Auditor and, as such, will be considered for pre-approval by the Committee or its delegate, on an annual basis.
· Accounting consultations
· Trust merger support services
· Other accounting related matters
· Agreed Upon Procedure Reports
· Attestation Reports
· Other Internal Control Reports
Notwithstanding any annual pre-approval of these categories of services, individual projects with an estimated fee of $20,000 or more are subject to pre-approval by the Committee on a case-by-case basis. Individual projects with an estimated fee of less than $20,000 are subject to pre-approval by the then-serving Chair of the Committee on a case-by-case basis. The Chair shall thereafter report to the full Committee on any such matters at the Committee’s next regularly scheduled meeting.
Tax Services
The following categories of tax services are deemed to be consistent with the role of the Auditor and, as such, will be considered for pre-approval by the Committee or its delegate, on an annual basis.
· Tax compliance services related to the filing or amendment of the following:
· Federal, state and local income tax compliance; and,
· Sales and use tax compliance
· Timely RIC qualification reviews
· Tax distribution analysis and planning
· Tax authority examination services
· Tax appeals support services
· Accounting methods studies
· Trust merger support services
· Tax consulting services and related projects
Notwithstanding any annual pre-approval of these categories of services, individual projects with an estimated fee of $20,000 or more are subject to pre-approval by the Committee on a case-by-case basis. Individual projects with an estimated fee of less than $20,000 are subject to pre-approval by the then-serving Chair of the Committee on a case-by-case basis. The Chair shall thereafter report to the full Committee on any such matters at the Committee’s next regularly scheduled meeting.
Other Non-audit Services
The SEC auditor independence rules adopted in response to the Sarbanes-Oxley Act specifically allow certain non-audit services. Because of the nature of these services, none of these services may be commenced by the Auditor without the prior approval of the Committee. The Committee may delegate this responsibility to one or more of the Committee members, with the decisions presented to the full Committee at the next scheduled meeting.
Proscribed Services
In accordance with SEC rules on independence, the Auditor is prohibited from performing services in the following categories of non-audit services:
· Management functions
· Accounting and bookkeeping services
· Internal audit services
· Financial information systems design and implementation
· �� Valuation services supporting the financial statements
· Actuarial services supporting the financial statements
· Executive recruitment
· Expert services (e.g., litigation support)
· Investment banking
Policy for Pre approval of Non-Audit Services Provided to Other Affiliated Entities
The Committee is also responsible for pre-approving certain non-audit services provided to Advantus Capital Management Inc. (“Advantus”) and any other entity under common control with Advantus that provides ongoing services to the Trust. The only non-audit services provided to these entities which require pre-approval are those services that relate directly to the operations and financial reporting of the Trust.
Although the Committee is not required to pre-approve all services provided to Advantus and affiliated service providers, the Committee will annually receive a report from the Auditor on the aggregate fees for all services provided to Advantus and its affiliates.

(e)(2) None of the services provided to the registrant described in paragraphs (b) — (d) of this Item 4 were pre-approved by the audit committee pursuant to paragraph (c)(7)(i)(C) of Rule 2-01 of Regulation S-X.
(f) No disclosures are required by this Item 4(f).
(g) The aggregate non-audit fees billed for each of the last two fiscal years by the registrant’s accountant for services rendered to the registrant and to the registrant’s investment adviser (not including any sub-adviser whose role is primarily portfolio management and is subcontracted with or overseen by another investment adviser) and any entity controlling, controlled by or under common control with the adviser that provides ongoing services to the registrant were as follows:
(h) The registrant’s audit committee has considered that the provision of the non-audit services rendered to the registrant’s investment adviser (not including any sub-adviser whose role is primarily portfolio management and is subcontracted with or overseen by another investment adviser) and any entity controlling, controlled by or under common control with the adviser that provides ongoing services to the registrant that were not pre-approved pursuant to paragraph (c)(7)(ii) of Rule 2-01 of Regulation S-X is compatible with maintaining the principal accountant’s independence.
ITEM 5. AUDIT COMMITTEE OF LISTED REGISTRANTS.
Not applicable.
ITEM 6. SCHEDULE OF INVESTMENTS.
Not applicable. Schedule I — Investments in Securities of Unaffiliated Issuers is included as part of the report to shareholders filed under Item 1 of this Form N-CSR.
ITEM 7. DISCLOSURE OF PROXY VOTING POLICIES AND PROCEDURES FOR CLOSED-END MANAGEMENT INVESTMENT COMPANIES.
Not applicable.
ITEM 8. PORTFOLIO MANAGERS OF CLOSED-END MANAGEMENT INVESTMENT COMPANIES.
Not applicable.
ITEM 9. PURCHASES OF EQUITY SECURITIES BY CLOSED-END MANAGEMENT INVESTMENT COMPANY AND AFFILIATED PURCHASERS
Not applicable.
ITEM 10. SUBMISSION OF MATTERS TO A VOTE OF SECURITY HOLDERS
The registrant has a governance committee of its board of trustees, the members of which are all trustees who are not “interested persons” of the registrant, as defined in Section 2(a)(19) of the Investment Company Act of 1940 (“independent trustees”). The governance committee, which operates in accordance with a separate governance committee charter approved by the board of trustees, selects and recommends to the board of trustees individuals for nomination as independent trustees. The names of potential independent trustee candidates are drawn from a number of sources, including recommendations from management of Advantus Capital Management, Inc., the registrant’s investment adviser. Each candidate is evaluated by the governance committee with respect to the relevant business and industry experience that would enable the candidate to serve effectively as an independent trustee, as well as his or her compatibility with respect to business philosophy and style. The members of the governance committee may conduct an in-person interview of each viable candidate using a standardized questionnaire. When all of the viable candidates have been evaluated and interviewed, the governance committee determines which of the viable candidates should be presented to the board of trustees for selection to become a member of the board of trustees.
Inasmuch as the registrant does not hold annual meetings of shareholders and meetings of shareholders occur only intermittently, the governance committee does not at present consider nominees recommended by shareholders.
ITEM 11. CONTROLS AND PROCEDURES.
(a) Based upon their evaluation of the registrant’s disclosure controls and procedures as conducted within 90 days of the filing date of this Form N-CSR, the registrant’s principal financial officer and principal executive officer have concluded that those disclosure controls and procedures provide reasonable assurance that the material information required to be disclosed by the registrant on this report is recorded, processed, summarized and reported within the time periods specified in the Securities and Exchange Commission’s rules and forms.
(b) There were no changes in the registrant’s internal controls over financial reporting (as defined in Rule 30a-3(d) under the Investment Company Act of 1940) that occurred during the second fiscal quarter of the period covered by this report that has materially affected, or is reasonably likely to materially affect, the registrant’s internal control over financial reporting.
ITEM 12. EXHIBITS.
(a) File the exhibits listed below as part of this Form. Letter or number the exhibits in the sequence indicated.
(1) Any code of ethics, or amendment thereto, that is the subject of the disclosure required by Item 2, to the extent that the registrant intends to satisfy the Item 2 requirements through filing of an exhibit:
Exhibit 99.CODE ETH attached hereto.
(2) A separate certification for each principal executive officer and principal financial officer of the registrant as required by Rule 30a-2 under the Investment Company Act of 1940 (17 CFR 270.30a-2):
Exhibit 99.CERT attached hereto.
(3) Any written solicitation to purchase securities under Rule 23c-1 under the Investment Company Act of 1940 sent or given during the period covered by this report by or on behalf of the registrant to 10 or more persons:
Not applicable.
(b) If the report is filed under Section 13(a) or 15(d) of the Securities Exchange Act of 1934, provide the certifications required by Rule 30a-2(b) under the Investment Company Act of 1940 (17 CFR 270.30a-2(b)), Rule 13a-14(b) or Rule 15d-14 under the Securities Exchange Act of 1934 (17 CFR 240.13a-14(b) or 240.15d-14(b)) and Section 1350 of Chapter 63 of Title 18 of the United States Code (18 U.S.C. 1350) as an exhibit. A certification furnished pursuant to this paragraph will not be deemed “filed” for the purposes of Section 18 of the Securities Exchange Act of 1934 (15 U.S.C. 78r), or otherwise subject to the liability of that section. Such certification will not be deemed to be incorporated by reference into any filing under the Securities Act of 1933 or the Securities Exchange Act of 1934, except to the extent that the registrant specifically incorporates it by reference:
Exhibit 99.906 CERT attached hereto
SIGNATURES
Pursuant to the requirements of the Securities Exchange Act of 1934 and the Investment Company Act of 1940, the registrant has duly caused this report to be signed on its behalf by the undersigned, thereunto duly authorized.
(Registrant) Securian Funds Trust
By (Signature and Title) | /s/ David M. Kuplic | |
| David M. Kuplic, President |
Date: February 19, 2018
Pursuant to the requirements of the Securities Exchange Act of 1934 and the Investment Company Act of 1940, this report has been signed below by the following persons on behalf of the registrant and in the capacities and on the dates indicated.
By (Signature and Title) | /s/ David M. Kuplic | |
| David M. Kuplic, President (Principal Executive Officer) |
By (Signature and Title) | /s/ Gary M. Kleist | |
| Gary M. Kleist, Treasurer (Principal Financial Officer) |
Date: February 19, 2018