UNITED STATES
SECURITIES AND EXCHANGE COMMISSION
Washington, D.C. 20549
FORM N-CSR
CERTIFIED SHAREHOLDER REPORT OF REGISTERED
MANAGEMENT INVESTMENT COMPANIES
Investment Company Act file number | 811-4279 | |||||||
| ||||||||
Securian Funds Trust | ||||||||
(Exact name of registrant as specified in charter) | ||||||||
| ||||||||
400 Robert Street North St. Paul, Minnesota |
| 55101-2098 | ||||||
(Address of principal executive offices) |
| (Zip code) | ||||||
| ||||||||
David M. Dimitri, Esq. 400 Robert Street North St. Paul, Minnesota 55101-2098 | ||||||||
(Name and address of agent for service) | ||||||||
| ||||||||
Registrant’s telephone number, including area code: | (651) 665-3500 |
| ||||||
| ||||||||
Date of fiscal year end: | December 31 |
| ||||||
| ||||||||
Date of reporting period: | December 31, 2019 |
| ||||||
ITEM 1. REPORT TO STOCKHOLDERS.
Filed herewith.
SECURIAN FUNDS TRUST
Offered in Minnesota Life
Insurance Company and
Securian Life Insurance
Company variable products
Annual report
December 31, 2019
SFT Core Bond Fund
SFT Dynamic Managed Volatility Fund
SFT Government Money Market Fund
SFT Index 400 Mid-Cap Fund
SFT Index 500 Fund
SFT International Bond Fund
SFT IvySM Growth Fund
SFT IvySM Small Cap Growth Fund
SFT Managed Volatility Equity Fund
SFT Real Estate Securities Fund
SFT T. Rowe Price Value Fund
SFT Wellington Core Equity Fund
(This page has been left blank intentionally.)
TABLE OF CONTENTS
Page No. | |||||||
Letter from the President | 1 | ||||||
Portfolio Manager Reviews | |||||||
| SFT Core Bond Fund | 2 | ||||||
SFT Dynamic Managed Volatility Fund | 6 | ||||||
SFT Government Money Market Fund | 11 | ||||||
SFT lndex 400 Mid-Cap Fund | 13 | ||||||
| SFT lndex 500 Fund | 16 | ||||||
SFT lnternational Bond Fund | 19 | ||||||
SFT IvySM Growth Fund | 24 | ||||||
SFT IvySM Small Cap Growth Fund | 27 | ||||||
SFT Managed Volatility Equity Fund | 31 | ||||||
SFT Real Estate Securities Fund | 36 | ||||||
SFT T. Rowe Price Value Fund | 39 | ||||||
SFT Wellington Core Equity Fund | 42 | ||||||
Report of Independent Registered Public Accounting Firm | 46 | ||||||
Investments In Securities | |||||||
| SFT Core Bond Fund | 47 | ||||||
SFT Dynamic Managed Volatility Fund | 55 | ||||||
SFT Government Money Market Fund | 62 | ||||||
SFT lndex 400 Mid-Cap Fund | 63 | ||||||
| SFT lndex 500 Fund | 69 | ||||||
SFT lnternational Bond Fund | 76 | ||||||
SFT IvySM Growth Fund | 83 | ||||||
SFT IvySM Small Cap Growth Fund | 85 | ||||||
SFT Managed Volatility Equity Fund | 87 | ||||||
SFT Real Estate Securities Fund | 88 | ||||||
SFT T. Rowe Price Value Fund | 89 | ||||||
SFT Wellington Core Equity Fund | 92 | ||||||
Financial Statements | |||||||
Statements of Assets and Liabilities | 94 | ||||||
Statements of Operations | 96 | ||||||
Statements of Changes in Net Assets | 98 | ||||||
Financial Highlights | 103 | ||||||
Notes to Financial Statements | 115 | ||||||
Fund Expense Examples | 132 | ||||||
Proxy Voting and Quarterly Holdings Information | 134 | ||||||
Trustees and Executive Officers | 135 | ||||||
Letter from the President

2019 returns across asset classes were almost universally positive, a stark contrast to the story of 2018. While strong returns early in the year were a make up for a dismal fourth quarter 2018, market action in the last quarter of this year was an unambiguous scramble for returns. The success of the Federal Reserve's (Fed) mid-cycle adjustment convinced investors that they can have their cake and eat it too, in the form of lower rates and strong stock returns. After a strong recovery in the first quarter, the S&P 500® Index struggled to sustain new highs during the second and third quarters of the year. And yet, the fourth quarter marked a definite breakout as the S&P 500® Index gained over 8 percent, led by cyclical sectors like technology and banks, as investors shunned income producers like REITs and utilities. The S&P 500® Index produced a total return of over 30 percent this year. Bonds delivered strong returns as well, as rates for long treasury securities fell by over 60 basis points during 2019.
We think that the economy continued to slow in the fourth quarter, but is poised to do modestly better in 2020. The consumer continues to drive growth with low unemployment and higher wages supporting spending. While the stage is set for stronger growth in corporate America, the turn hasn't happened yet. Manufacturing continues to struggle, with weakness in energy and trade putting a damper on investment. The outlook looks brighter for 2020 as shocks from tariffs and a shakeout in energy recede. Earnings should improve on more stable global growth and easier comparisons. With unemployment at a nearly 50-year low, a recession next year seems unlikely.
While we can identify many strengths, these factors are tempered by real risks. A trade deal is good, but it's unlikely to produce steadily expanding global flows. Labor markets are tight, corporate margins peaked in 2018, and corporate leverage is high. Populism remains on the rise, and we believe that political risks will remain elevated. Late cycle growth of around 2 percent is good but provides little room for error. With valuations stretched, we continue to think that bursts of volatility are likely in the coming year, placing a premium on risk management and investment discipline. As always, we believe the best tactic is to position for the long-term and use investment diversification to reduce risk.
Sincerely,

David Kuplic
President, Securian Funds Trust
1
Performance Update


Thomas Houghton, CFA,
Daniel Henken, CFA and Lena Harhaj, CFA Portfolio Managers
The SFT Core Bond Fund seeks as high a level of long-term total return as is consistent with prudent investment risk. Preservation of capital is a secondary objective. The SFT Core Bond Fund invests in long-term, fixed income, high quality debt instruments. The risks incurred by investing in debt instruments include, but are not limited to, reinvestment of prepaid debt obligations at lower rates of return, and the inability to reinvest at higher interest rates when debt obligations are prepaid more slowly than expected. In addition, the net asset value of the SFT Core Bond Fund may fluctuate in response to changes in interest rates and is not guaranteed.
SFT Core Bond Fund
How did the Portfolio perform during the period?
The Fund's Class 2 shares generated a total net return of 8.90 percent over the 12 months ending December 31, 2019, outperforming the Bloomberg Barclays U.S. Aggregate Bond Index which returned 8.72 percent over the same period.
What influenced the Fund's return during the past 12 months?
2019 returns across asset classes were almost universally positive in contrast to the story in 2018. While strong returns early in the year were a make up for a dismal end to 2018, market action in the fourth quarter was an unambiguous scramble for returns. The success of the Fed's mid-cycle adjustment convinced investors that they can have lower rates and strong stock returns. After a strong recovery in the first quarter, the S&P 500® struggled to sustain new highs during the second and third quarters of the year. The fourth quarter marked a definite breakout as the S&P 500® gained over 8 percent, led by cyclical sectors like technology and banks as investors shunned income producers like REITs and utilities.
The S&P 500® index produced a total return of over 30 percent this year. Bonds delivered strong returns as well, as rates for long treasury securities fell by over 60 bp during 2019. Credit spreads fell to near post-crisis lows, and the investment grade corporate and the high yield-bonds joined long treasuries in producing solid double digit returns (14-15 percent). Even commodities added to the party, delivering a return of over 11 percent for the year.
What other market conditions or events influenced the Fund's performance during the past 12 months?
Earlier this year, we acknowledged that if the Fed's early interest rate cuts were effective, conditions would be good for risk assets. This scenario certainly was realized. The US treasury yield curve regained its normal positive slope as short rates followed the decline in the federal funds rate and longer rates rose during the fourth quarter. The market is pricing in a return to a Goldilocks economy where both growth and inflation are measured. This sets the stage for continued demand for risk assets.
What strategies and techniques did you employ that specifically affected Fund performance?
The decision to underweight Treasuries and agency passthroughs in favor of spread sectors was the primary driver of excess returns. In addition, strong security selection within financial and utilities was a contributor of excess returns. The Fund's duration exposure was approximately two-tenths of a year shorter than the Bloomberg Barclays U.S. Aggregate Bond Index, on average in 2019, which detracted from excess returns.
What will affect the Fund going forward?
We think that the economy continued to slow in fourth quarter of 2019 but is poised to do modestly better in 2020. The consumer continues to drive growth with low unemployment and higher wages supporting spending. While the stage is set for stronger growth in corporate America, the turn hasn't happened yet. Manufacturing continues to struggle, with weakness in energy and trade putting a damper on investment. The outlook looks brighter for 2020 as shocks from tariffs and a shakeout in energy recede. Earnings should improve on more stable global growth and easier prior earnings comparisons. With unemployment at a nearly 50-year low, a recession next year seems unlikely.
2
While we can identify many strengths, these factors are tempered by real risks. A trade deal is good, but it's unlikely to produce steadily expanding global flows. Labor markets are tight, corporate margins peaked in 2018, and corporate leverage is high. Populism remains on the rise, and we believe that political risks will remain elevated. Late cycle growth of around 2 percent is good but provides little room for error. The Fed Reserve's three rate cuts in 2019 used dry powder, increasing concerns about how policy makers will counter the next downturn. With valuations stretched, we continue to think that bursts of volatility are likely in the coming year, placing a premium on risk management and investment discipline.
3
Ten Largest Holdings^
| Security description | Market value | % of net assets | |||||||||
U.S. Treasury Bond 3.000%, 02/15/49 | $ | 11,955,661 | 2.5 | % | |||||||
U.S. Treasury Note 1.625%, 11/30/26 | 10,959,516 | 2.2 | % | ||||||||
| Federal National Mortgage Association 3.500%, 01/14/50 | 8,466,291 | 1.7 | % | ||||||||
U.S. Treasury Note 1.750%, 11/15/29 | 8,205,978 | 1.7 | % | ||||||||
U.S. Treasury Bond 2.875%, 05/15/49 | 7,515,328 | 1.5 | % | ||||||||
U.S. Treasury Bond 5.375%, 02/15/31 | 6,869,885 | 1.4 | % | ||||||||
| UBS Commercial Mortgage Trust 3.724%, 06/15/50 | 5,766,471 | 1.2 | % | ||||||||
U.S. Treasury Note 1.500%, 11/30/24 | 5,078,600 | 1.0 | % | ||||||||
| Bank of America Corp. 3.974%, 02/07/30 (3-Month USD LIBOR + 1.210%) | 4,435,387 | 0.9 | % | ||||||||
| Invitation Homes 2018-SFR4 Trust, 3.137%, 01/17/38 (1-Month USD LIBOR + 1.400%) | 4,299,992 | 0.9 | % | ||||||||
$ | 73,553,109 | 15.0 | % | ||||||||
^Excludes short-term investments.
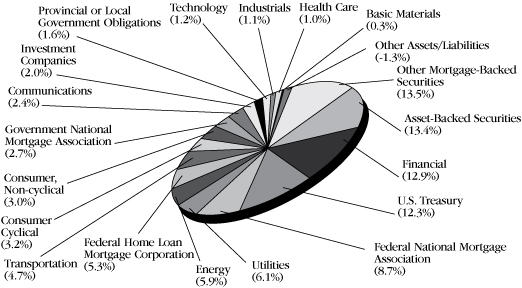
Sector Diversification (shown as a percentage of net assets)
4
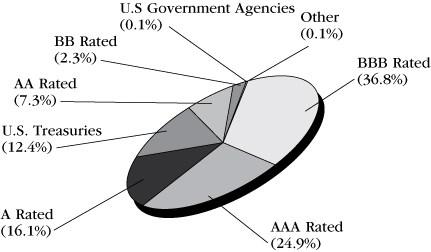
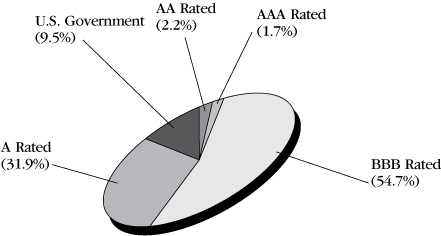
Asset Quality (shown as a percentage of investments)
(Unaudited)
Comparison of Change in Investment Value*
A Hypothetical $10,000 Investment in SFT Core Bond Fund,
Bloomberg Barclays U.S. Aggregate Bond Index and Consumer Price Index
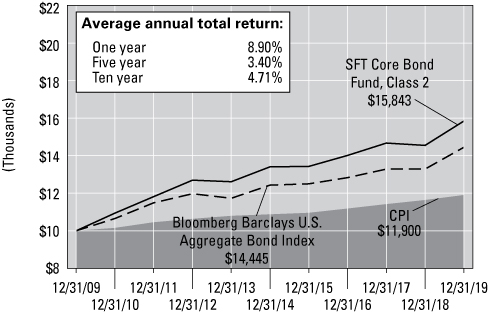
On the chart above you can see how the SFT Bond Fund's Class 2 shares total return compared to the Bloomberg Barclays U.S. Aggregate Bond Index and the Consumer Price Index. The three lines represent the total return of a hypothetical $10,000 investment made on December 31, 2009 through December 31, 2019, assuming reinvestment of distributions, if any.
*The results shown are past performance and are not an indication of future performance. Current performance may be lower or higher. The investment returns and principal value of an investment will fluctuate so that shares upon redemption may be worth more or less than their original cost. Performance figures of the Fund do not reflect charges pursuant to the terms of the variable life insurance policies and variable annuity contracts funded by separate accounts that invest in the Fund's shares. When such charges are deducted, actual investment performance in a variable policy or contract will be lower.
The Bloomberg Barclays U.S. Aggregate Bond Index is an unmanaged benchmark composite representing average market-weighted performance of U.S. Treasury and agency securities, investment-grade corporate bonds and mortgage-backed securities with maturities greater than one year.
5
Performance Update


Craig M. Stapleton, CFA, FRM, Jeremy Gogos, Ph.D., CFA and Merlin Erickson Portfolio Managers
The SFT Dynamic Managed Volatility Fund seeks to maximize risk-adjusted total return relative to its blended benchmark index comprised of 60 percent S&P 500® Index and 40 percent Bloomberg Barclays U.S. Aggregate Bond Index (collectively, the Blended Benchmark Index).
The SFT Dynamic Managed Volatility Fund invests primarily in Class 1 shares of SFT Index 500 Fund, an affiliated fund of the Securian Funds Trust, for equity exposure, in a basket of fixed income securities for fixed income exposure and certain derivative instruments. The Fund is subject to risks associated with such investments as described in detail in the prospectus. The net asset value of the Fund will fluctuate and is not guaranteed. It is possible to lose money by investing in the Fund. There is no assurance that efforts to manage Fund volatility will achieve the desired results.
SFT Dynamic Managed Volatility Fund
How did the Portfolio perform during the period?
The Fund generated a total net return of 20.81 percent, with a volatility of 7.36 percent, over the 12 months ending December 31, 2019, underperforming the blended benchmark index, which is comprised of 60 percent S&P 500® Index and 40 percent Bloomberg Barclays U.S. Aggregate Bond Index which returned 22.18 percent with a volatility of 6.97 percent, over the same period.
What influenced the Fund's return during the past 12 months?
Our general view of the current market is that it is definitely late cycle, and so over the course of 2019, we generally expressed the Fund's target equity allocation as either a combination of cash equity, S&P futures, and call options, or overweight cash equity and S&P futures combined with some level of tail risk hedging, with both approaches intended to prevent full participation in a deep market selloff.
The realized volatility on the S&P 500® for 2019 was 12.47 percent, a 38th percentile value in the index's 92-year history. On a one-month basis, realized volatility ranged from 4.98 percent to 31.18 percent. As a result, the Fund's equity exposure in cash equity and S&P futures ranged from 28.2 percent to 80.3 percent, and the maximum total equity exposure in the period was approximately 83 percent. Our cash equity positions and derivatives trading returned 32.98 percent in absolute terms, modestly outperforming the S&P 500®. That absolute return translates to 15.66 percent of portfolio return, underperforming the benchmark equity portion, which returned 18.45 percent. One should think of this differential as a result of being underweight equity, on average, for the year. On the fixed income side, our portfolio investments contributed 5.28 percent of portfolio return, outperforming the benchmark fixed income return of 3.74 percent.
What other market conditions or events influenced the Fund's performance during the past 12 months?
2019 was an excellent year across most risk assets. The S&P 500® returned 28.88 percent (price return), with 12.47 percent realized volatility. This is a return per risk of 2.32, which ranks as the 12th best return per risk in the 92-year S&P 500® history. Other major equity indexes produced impressive calendar-year returns as well. And it should be noted that these returns occurred in a year where earnings contracted on a year-over-year basis during first, second, and third quarter, and analysts are projecting the same in the fourth quarter.
As a reminder, September 30, 2018 was the last quarter end before the bear market flirtation of late 2018, and it was also close to the local maximum of the S&P 500® before that roughly 20 percent drawdown. Thus, the impressive 2019 calendar year return for the domestic equity market is largely retracing ground lost at the end of 2018, and we interpret the longer-term outperformance of safe-haven assets as a sign of investor caution.
Further, we would point to the pivot in central bank policy as a major driver of risk asset performance in 2019. The equity market clearly demonstrated in 2018 that it could not digest the Federal Reserve hiking rates and winding down its balance sheet. As a result, both efforts were reversed. The Fed began cutting rates on July 31st, and executed three cuts total during the year, bringing their policy rate down by 75 basis points. The Fed also began expanding its balance sheet in September, adding about $410 billion in holdings by the end of 2019.
6
In addition to the equity market turbulence of late 2018, another macroeconomic factor that likely drove monetary policy was the inversion of the U.S. yield curve. The 10Y-3M spread briefly went negative in March, and then went deeply negative at the end of May. This situation persisted through October 11th, when the 10Y-3M spread returned to positive territory thanks to the aforementioned Fed rate cuts.
There were numerous other events during the year which could have affected the markets and the Fund, but which proved to have no impact:
• Chinese gross domestic product (GDP) growth continued to decline, falling to 6.0 percent in third quarter, which is below the nadir of the Great Financial Crisis (6.4 percent)
• Various Federal agencies and the House of Representatives investigated President Trump, and numerous associates of his, culminating in multiple arrests and the impeachment of the President in late December
• Multiple geopolitical events (North Korean weapons tests, attacks on oil tankers in the Gulf of Oman, etc.)
• U.S.-China trade war
Again, our view is that the switch to monetary easing by the Federal Reserve, European Central Bank (ECB), and People's Bank of China during 2019 is the primary reason why risk markets proved so resilient in the face of what would otherwise be a rather challenging economic and geopolitical backdrop.
What strategies and techniques did you employ that specifically affected Fund performance?
Throughout the year, the Fund held a core long position in cash equity that tracks the S&P 500®. In addition, the Fund had long and short positions in S&P 500® futures, S&P 500® call options, S&P 500® put options, and Chicago Board Options Exchange (CBOE) Volatility Index (VIX) put options. These derivative positions were held either as expressions of the target equity allocation of the Fund given prevailing volatility, or as supplemental hedges for managing the Fund's risk.
What will affect the Fund going forward?
In our view, 2019 marks a new low point in government fiscal responsibility and general financial rationality. To briefly reiterate a few key points:
• The S&P 500® returned 31.49 percent in a year where earnings declined year-over-year for the first three quarters, and will most likely contract again in fourth quarter.
• GDP growth was flat to modestly down in the U.S., the Eurozone, and China.
• The U.S. federal deficit topped $1 trillion in November, and at the same time, the total federal debt topped $23 trillion, a new record both in terms of raw dollars, and as a percentage of GDP.
• The Federal Reserve only managed to hike the upper bound of its policy rate to 2.5 percent, and shrink its balance sheet to $3.7 trillion, before having to reverse course; for context, these stats were 5.25 percent and $0.9 trillion, going into the Great Financial Crisis.
• Total global debt is expected to top $257 trillion in 2020, and grew by almost 4 percent in the first three quarters of 2019.
7
Many market observers breathed a sigh of relief when the yield curve normalized in October, because the optimistic interpretation of this normalization would be that the Fed has struck the correct balance between monetary tightening and easing to sustain the current economic expansion and bull market. But for historical perspective, consider that there have been seven recessions since 1962 (the beginning of the 10Y-3M interest rate data series). All seven have been preceded by a yield curve inversion, and five of those seven saw a brief normalization before the recession set in. Thus, the historical odds do not recommend optimism simply because the yield curve has normalized somewhat.
Going forward, we expect that the Fed's obvious willingness to preemptively ease monetary policy will continue to backstop equity valuations on the downside, as well as foster a temporary environment of moderate realized volatility. The anticipated "Phase One" agreement in the U.S.-China trade war could also provide a brief reprieve from volatility escalating.
But ultimately, central banks have very limited monetary policy ammunition to work with; the ECB and Bank of Japan are already at the zero rate bound, and the Fed has only 1.75 percent in rate cuts before it also hits the zero bound. Given this limited room for central bank maneuvers, we are extremely skeptical that monetary policy will have the ability to mitigate the next recession when it does arrive.
In terms of returns, most fundamental market valuation metrics, price/earnings, Shiller price/earnings, market cap to GDP (the so-called "Buffett Indicator"), and so on, ended 2019 quite high by historical standards. The levels of these metrics suggest low-to-negative long-term equity returns going forward. In the short term, this equity mania—and we do regard 2019 as manic market behavior—can persist for a handful of years.
In a tactical sense, we will continue to use our volatility metrics to inform the equity allocations of the Fund. We will increase equity exposure if we believe volatility will decrease, decrease equity exposure if we believe volatility will increase, and in the event that we are overweight equity, we will carry some form of tail risk hedge for the foreseeable future.
8
Ten Largest Holdings^
| Security description | Market value | % of net assets | |||||||||
U.S. Treasury Note, 2.625%, 12/15/21 | $ | 15,297,656 | 2.6 | % | |||||||
SPDR S&P 500 ETF Trust | 11,641,677 | 2.0 | % | ||||||||
Vanguard S&P 500 ETF | 5,967,765 | 1.0 | % | ||||||||
| iShares iBoxx $ Investment Grade Corporate Bond ETF | 5,694,220 | 1.0 | % | ||||||||
U.S. Treasury Note, 2.000%, 01/31/20 | 2,500,661 | 0.4 | % | ||||||||
Regions Financial Corp., 3.800%, 08/14/23 | 2,117,324 | 0.4 | % | ||||||||
Southern Natural Gas Co. LLC 4.80% 03/15/47 | 1,704,212 | 0.3 | % | ||||||||
United Technologies Corp. 4.125%, 11/16/28 | 1,687,641 | 0.3 | % | ||||||||
| Welltower, Inc. 4.125% 03/15/29 | 1,635,090 | 0.3 | % | ||||||||
Capital One Financial Corp. 4.250%, 04/30/25 | 1,633,230 | 0.3 | % | ||||||||
$ | 49,879,476 | 8.6 | % | ||||||||
^Does not include short-term investments of investments in Class 1 shares of the SFT Index 500 Fund, an affiliated Fund in Securian Funds Trust, which provides the SFT Dynamic Managed Volatility Fund with its primary equity exposure.
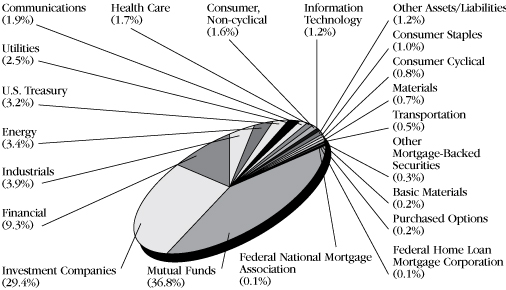
Sector Diversification (shown as a percentage of net assets)
*The results shown are past performance and are not an indication of future performance. Current performance may be lower or higher. The investment returns and principal value of an investment will fluctuate so that shares upon redemption may be worth more or less than their original cost. Performance figures of the Fund do not reflect charges pursuant to the terms of the variable life insurance policies and variable annuity contracts funded by separate accounts that invest in the Fund's shares. When such charges are deducted, actual investment performance in a variable policy or contract will be lower.
Securian Asset Management, Inc. (Securian AM) and the Securian Funds Trust, on behalf of the SFT Dynamic Managed Volatility Fund (the "Fund"), have entered into an Expense Limitation Agreement, dated May 1, 2013, which limits the operating expenses of the Fund, excluding certain expenses (such as interest expense, acquired fund fees, cash overdraft fees, taxes, brokerage commissions, other expenditures which are capitalized in accordance with the generally accepted accounting principles, and other extraordinary expenses not incurred in the ordinary course of the Fund's business), to 0.80% of the Fund's average daily net assets through April 30, 2021. The Agreement renews annually for a full year each year thereafter unless terminated by Securian AM upon at least 30 days' notice prior to the end of a contract term. The Fund is authorized to reimburse Securian AM for
9
management fees previously waived and/or for the cost of expenses previously paid by Securian AM pursuant to this agreement, provided that such reimbursement will not cause the Fund to exceed any limits in effect at the time of such reimbursement. The Fund's ability to reimburse Securian AM in this manner only applies to fees waived or reimbursements made by Securian AM within the three fiscal years prior to the date of such reimbursement. As of December 31, 2019, Securian AM has waived $3,098,828 pursuant to the agreement. To the extent that the Fund makes such reimbursements to Securian AM, the amount of the reimbursements will be reflected in the financial statements in the Fund's shareholder reports and in Other Expenses under Fees and Expenses of the Fund.
The Blended Benchmark Index is comprised of 60 percent of the S&P 500® Index and 40 percent of the Bloomberg Barclays U.S. Aggregate Bond Index.
The S&P 500® Index is a broad, unmanaged index of 500 common stocks which are representative of the U.S. stock market overall. The Bloomberg Barclays U.S. Aggregate Bond Index is an unmanaged benchmark composite representing the average market-weighted performance of U.S. Treasury and agency securities, investment grade corporate bonds and mortgage-backed securities with maturities greater than one year.
Asset Quality (shown as a percentage of fixed income investments)
(Unaudited)
Comparison of Change in Investment Value*
A Hypothetical $10,000 Investment in SFT Dynamic Managed Volatility Fund,
the Blended Benchmark Index and Consumer Price Index
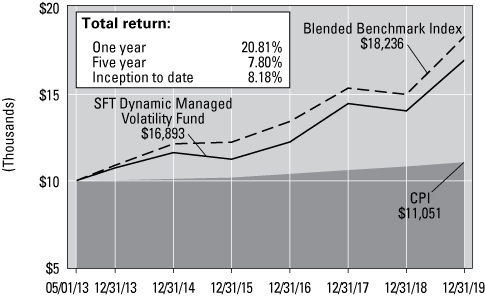
On the chart above you can see how the SFT Dynamic Managed Volatility Fund's shares total return compared to its Blended Benchmark, comprised of 60 percent of the S&P 500® Index and 40 percent of the Bloomberg Barclays U.S. Aggregate Bond Index, and the Consumer Price Index. The three lines represent the total return of a hypothetical $10,000 investment made on May 1, 2013 through December 31, 2019, assuming reinvestment of distributions, if any.
10
Performance Update


Thomas Houghton, CFA and Lena Harhaj, CFA Portfolio Managers
The SFT Government Money Market Fund seeks maximum current income to the extent consistent with liquidity and the preservation of capital.
It invests at least 99.5 percent of its total assets in cash, government securities, and /or repurchase agreements that are collateralized fully.
Investment in the SFT Government Money Market Fund is neither insured nor guaranteed by the U.S. Government, and there can be no assurance that the Fund will be able to maintain a stable net asset value of $1.00 per share. It is possible to lose money by investing in the Fund.
SFT Government Money Market Fund
How did the Portfolio perform during the period?
The Fund generated a total net return of 1.50 percent over the 12 months ending December 31, 2019, underperforming the three-month Treasury Bill which returned 2.30 percent over the same period.
What other market conditions or events influenced the Fund's performance during the past 12 months?
The U.S. Treasury yield curve regained its normal positive slope as short rates followed the decline in the Federal Funds Rate and longer rates rose during the fourth quarter. The market is pricing in a return to a Goldilocks economy where both growth and inflation are measured. This sets the stage for continued demand for risk assets.
What strategies and techniques did you employ that specifically affected Fund performance?
With the front end of the yield curve inverted for much of 2019, the Fund increased allocations to shorter dated instruments as well as decreasing allocations to floating rate Treasury notes.
What will affect the Fund going forward?
We think that the economy continued to slow in fourth quarter of 2019 but is poised to do modestly better in 2020. The consumer continues to drive growth with low unemployment and higher wages supporting spending. While the stage is set for stronger growth in corporate America, the turn hasn't happened yet. Manufacturing continues to struggle, with weakness in energy and trade putting a damper on investment. The outlook looks brighter for 2020 as shocks from tariffs and a shakeout in energy recede. Earnings should improve on more stable global growth and easier comparisons. With unemployment at a nearly 50-year low, a recession next year seems unlikely.
While we can identify many strengths, these factors are tempered by real risks. A trade deal is good, but it's unlikely to produce steadily expanding global flows. Labor markets are tight, corporate margins peaked in 2018, and corporate leverage is high. Populism remains on the rise, and we believe that political risks will remain elevated. Late cycle growth of around 2 percent is good but provides little room for error. The Fed Reserve's three rate cuts in 2019 used dry powder, increasing concerns about how policy makers will counter the next downturn. With valuations stretched, we continue to think that bursts of volatility are likely in the coming year, placing a premium on risk management and investment discipline.
11
The results shown are past performance and are not an indication of future performance. Current performance may be lower or higher. The investment returns and principal value of an investment will fluctuate so that shares upon redemption may be worth more or less than their original cost. Investment in the SFT Government Money Market Fund is neither insured nor guaranteed by the U.S. Government or any other agency, and there can be no assurance that the Fund will be able to maintain a stable net asset value of $1.00 per share. Shares upon redemption may be worth more or less than their original cost. Performance figures of the Fund do not reflect charges pursuant to the terms of the variable life insurance policies and variable annuity contracts funded by separate accounts that invest in the Fund's shares. When such charges are deducted, actual investment performance in a variable policy or contract will be lower.
The Bloomberg Barclays U.S. Treasury Bill 1-3 Month Index is a market value-weighted index of investment-grade fixed-rate public obligations of the U.S. Treasury with maturities of three months, excluding zero coupons.
Effective May 1, 2012, the Board of Trustees of Securian Funds Trust approved a Restated Net Investment Income Maintenance Agreement among Securian Funds Trust (on behalf of SFT Government Money Market Fund), Securian Asset Management, Inc. (Securian AM) and Securian Financial Services, Inc. (Securian Financial). A similar agreement was previously approved by the Board of Directors of Advantus Series Fund, Inc., the Trust's predecessor, effective October 29, 2009. Under such Agreement, Securian AM agrees to waive, reimburse or pay SFT Government Money Market Fund expenses so that the Fund's daily net investment income does not fall below zero. Securian Financial may also waive its Rule 12b-1 fees. Securian AM and Securian Financial each has the option under the Agreement to recover the full amount waived, reimbursed or paid (the "Expense Waiver") on any day on which the Fund's net investment income exceeds zero. On any day, however, the Expense Waiver does not constitute an obligation of the Fund unless Securian AM or Securian Financial has expressly exercised its right to recover a specified portion of the Expense Waiver on that day, in which case such specified portion is then due and payable by the Fund. In addition, the right of Securian AM and/or Securian Financial to recover the Expense Waiver is subject to the following limitations: (1) if a repayment of the Expense Waiver by the Fund would cause the Fund's net investment income to fall below zero, such repayment is deferred until a date when repayment would not cause the Fund's net investment income to fall below zero; (2) the right to recover any portion of the Expense Waiver expires three years after the effective date of that portion of the Expense Waiver; and (3) any repayment of the Expense Waiver by the Fund cannot cause the Fund's expense ratio to exceed 1.25%. As of December 31, 2019, Securian AM and Securian Financial have collectively waived $4,631,950 pursuant to the Agreement, including expenses waived under the prior agreement with Advantus Series Fund, Inc., of which $77,228 was eligible for recovery as of such date. If Securian AM and Securian Financial exercise their rights to be paid such waived amounts, the Fund's future yield will be negatively affected for an indefinite period. The Agreement is effective through April 30, 2021, and shall continue in effect thereafter, provided such continuance is specifically approved by Securian AM, Securian Financial, and a majority of the Trust's independent Trustees.
Effective November 1, 2017, Securian AM and Securian Funds Trust, on behalf of the SFT Government Money Market Fund, entered into an Expense Limitation Agreement which limits the operating expenses of the Fund, excluding certain expenses, (such as interest expense, acquired fund fees, cash overdraft fees, taxes, brokerage commissions, other expenditures which are capitalized in accordance with GAAP, and other extraordinary expenses not incurred in the ordinary course of the Funds' business), to 0.70% of the Fund's Average daily net assets through April 30, 2021.
The Agreement renews annually for a full year each year thereafter unless terminated by Securian AM upon at least 30 days' notice prior to the end of the contract term. The Fund is authorized to reimburse Securian AM for management fees previously waived and/or for the cost of expenses previously paid by Securian AM pursuant to this agreement, provided that such reimbursement will not cause any Fund to exceed any limits in effect at the time of such reimbursement.
The Fund's ability to reimburse Securian AM in this manner only applies to fees waived or reimbursements made by Securian AM within the three fiscal years prior to the date of such reimbursement. To the extent that the Fund makes such reimbursements to Securian AM, the amount of the reimbursements will be reflected in the financial statements in the Funds' shareholder reports and in Other Expenses under Fees and Expenses of the Fund in the prospectus.
As of December 31, 2019, Securian AM has waived $296,069 pursuant to the agreement, all of which was eligible for recovery as of such date. To the extent that the Fund makes such reimbursements to Securian AM, the amount of the reimbursements will be reflected in the financial statements in the Fund's shareholder reports and in Other Expenses under Fees and Expenses to the Fund.
12
Performance Update

James Seifert Portfolio Manager
The SFT Index 400 Mid-Cap Fund seeks to provide investment results generally corresponding to the aggregate price and dividend performance of publicly traded common stocks that comprise the Standard & Poor's MidCap 400® Index (S&P 400®). It is designed to provide an economical and convenient means of maintaining a diversified portfolio in this equity security area as part of an overall investment strategy. The risks incurred by investing in the SFT Index 400 Mid-Cap Fund include, but are not limited to, the risk that the Fund may not be able to replicate the performance of the S&P 400®, and the risk of declines in the market for mid-cap stocks or in the equity markets generally.
SFT Index 400 Mid-Cap Fund
How did the Portfolio perform during the period?
The Fund's Class 2 shares generated a total net return of 25.51 percent over the 12 months ending December 31, 2019. The S&P MidCap 400® Index returned 26.20 percent over the same period.
What influenced the Fund's return during the past 12 months?
The SFT Index 400 Mid-Cap Fund is passively managed. The portfolio is fully invested and holds all names at published free-float adjusted index weights. The Fund seeks investment results that correspond generally to the price and yield performance, before fees and expenses, of the S&P 400® Index.
All sectors posted positive annual returns. The durable goods sector led all sectors with a 12 month return of 37.76 percent. Technology names followed with an annual return of 36.43 percent. In terms of size, decile one, (decile segments consist of 40 names) consisting of the largest names and representing 21.03 percent of the weight in the index, ended the period with a return of 30.2 percent. However, decile six, stocks with market caps between 3 and 3.5 billion, ended the year with the strongest return: 31.3 percent.
What other market conditions or events influenced the Fund's performance during the past 12 months?
Returns across asset classes were almost universally positive in 2019, a stark contrast to the story of 2018. The success of the Federal Reserve's (Fed) mid-cycle adjustment convinced investors that they can have their cake and eat it too in the form of lower rates and strong stock returns. After a strong recovery in the first quarter the broader market, including the S&P 400® index, struggled to sustain new highs during the second and third quarters of the year. The fourth quarter marked a definite breakout as the S&P 400® gained over 7 percent.
What will affect the Fund going forward?
We think that the economy continued to slow in fourth quarter but is poised to do modestly better in 2020. The consumer continues to drive growth with low unemployment and higher wages supporting spending. While the stage is set for stronger growth in corporate America, the turn hasn't happened yet. Manufacturing continues to struggle, with weakness in energy and trade putting a damper on investment. The outlook appears brighter for 2020 as shocks from tariffs and a shakeout in energy recede. Earnings should improve on more stable global growth and easier comparisons. With unemployment at a nearly 50-year low, a recession next year seems unlikely.
The big question on investors' minds is whether this year's extraordinary returns are justified or if we've simply pulled future returns forward. Earlier this year, we acknowledged that if the Fed's insurance cuts were effective, conditions would be good for risk assets. This scenario certainly was realized. The U.S. Treasury yield curve regained its normal positive slope as short rates followed the decline in the federal funds rate and longer rates rose during the fourth quarter. The market is pricing in a return to a Goldilocks economy where both growth and inflation are measured. This sets the stage for continued demand for risk assets. Adding to the allure, net issuance is likely to be down in many asset classes, and retail investors have dry powder to increase their risk profiles. The Fed is on hold, and the record expansion is set to extend through next year.
13
Rhetoric around Brexit and trade has become more positive, calming markets in the near term. U.S. assets remain in demand in a low-growth, low-interest-rate world.
While we can identify many strengths, these factors are tempered by real risks. A trade deal is good, but it's unlikely to produce steadily expanding global flows. Labor markets are tight, corporate margins peaked in 2018, and corporate leverage is high. Populism remains on the rise, and we believe that political risks will remain elevated. Late cycle growth of around 2 percent is good but provides little room for error. The Fed's three rate cuts in 2019 used dry powder, increasing concerns about how policy makers will counter the next downturn. With valuations stretched, we continue to think that bursts of volatility are likely in the coming year, placing a premium on risk management and investment discipline.
14
Ten Largest Holdings^
| Security description | Market value | % of net assets | |||||||||
Teledyne Technologies, Inc. | $ | 1,307,842 | 0.7 | % | |||||||
Domino's Pizza, Inc. | 1,256,791 | 0.6 | % | ||||||||
Tyler Technologies, Inc. | 1,200,980 | 0.6 | % | ||||||||
Alleghany Corp. | 1,184,963 | 0.6 | % | ||||||||
Teradyne, Inc. | 1,173,073 | 0.6 | % | ||||||||
West Pharmaceutical Services, Inc. | 1,150,175 | 0.6 | % | ||||||||
Fair Isaac Corp. | 1,123,291 | 0.6 | % | ||||||||
Medical Properties Trust, Inc. | 1,121,384 | 0.6 | % | ||||||||
Trimble, Inc. | 1,066,263 | 0.5 | % | ||||||||
Factset Research Systems, Inc. | 1,064,883 | 0.5 | % | ||||||||
$ | 11,649,645 | 5.9 | % | ||||||||
^Excludes short-term investments.
Sector Diversification (shown as a percentage of net assets)

Comparison of Change in Investment Value*
A Hypothetical $10,000 Investment in SFT Index 400 Mid-Cap Fund,
S&P MidCap 400® Index and Consumer Price Index
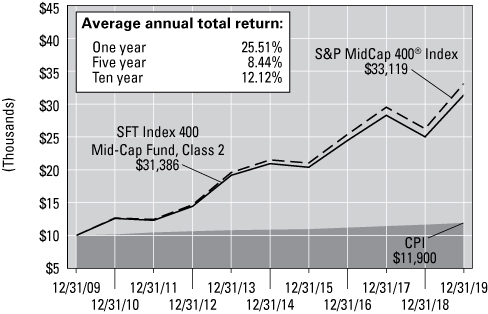
On the chart above you can see how the SFT Index 400 Mid-Cap Fund's Class 2 shares total return compared to the S&P MidCap 400® Index and the Consumer Price Index. The three lines represent the total return of a hypothetical $10,000 investment made on December 31, 2009 through December 31, 2019, assuming reinvestment of distributions, if any.
"Standard & Poor's®", "S&P®", "Standard & Poor's MidCap 400" and "S&P MidCap 400" are trademarks of the S&P Global, Inc. and have been licensed for use by the Securian Funds Trust—SFT Index 400 Mid-Cap Fund. The Fund is not sponsored, endorsed, sold or promoted by Standard & Poor's and Standard & Poor's makes no representation regarding the advisability of investing in the Fund.
*The results shown are past performance and are not an indication of future performance. Current performance may be lower or higher. The investment returns and principal value of an investment will fluctuate so that shares upon redemption may be worth more or less than their original cost. Performance figures of the Fund do not reflect charges pursuant to the terms of the variable life insurance policies and variable annuity contracts funded by separate accounts that invest in the Fund's shares. When such charges are deducted, actual investment performance in a variable policy or contract will be lower.
S&P MidCap 400® Index consists of 400 domestic stocks chosen for market size (median market capitalization of about $4.3 billion), liquidity and industry group representation. It is a market-weighted index (stock price times shares outstanding), with each stock affecting the index in proportion to its market value.
15
Performance Update

James Seifert Portfolio Manager
The SFT Index 500 Fund seeks investment results that correspond generally to the price and yield performance of the common stocks included in the Standard and Poor's Corporation 500® Composite Stock Index (S&P 500®). It is designed to provide an economical and convenient means of maintaining a broad position in the equity market as part of an overall investment strategy. The risks incurred by investing in the SFT Index 500 Fund include, but are not limited to, the risk that the Fund may not be able to replicate the performance of the S&P 500®, and the risk of declines in the equity markets generally.
SFT Index 500 Fund
How did the Portfolio perform during the period?
The Fund's Class 2 shares generated a total net return of 30.88 percent over the 12 months ending December 31, 2019. The S&P 500® Index returned 31.49 percent over the same period.
What influenced the Fund's return during the past 12 months?
The SFT Index 500 Fund is passively managed. The portfolio is fully invested and holds all names at published float adjusted index weights. The fund seeks investment results that correspond generally to the price and yield performance, before fees and expenses, of the S&P 500® Index.
All sectors posted positive double-digit annual returns. The technology sector led all sectors with a 12 month return of 43.3 percent. Capital goods names followed with an annual return of 37.7 percent. In terms of size, decile one, (decile segments consist of 50 names) consisting of the mega-cap names and representing 51 percent of the weight in the index, ended the period with a return of 31.7 percent. However, decile six, stocks with market caps between 14.6 and 18.5 billion, ended the year with the strongest return: 37.2 percent.
What other market conditions or events influenced the Fund's performance during the past 12 months?
Returns across asset classes were almost universally positive in 2019, a stark contrast to the story of 2018. The success of the Federal Reserve's (Fed) mid-cycle adjustment convinced investors that they can have their cake and eat it too in the form of lower rates and strong stock returns. After a strong recovery in the first quarter, the S&P 500® struggled to sustain new highs during the second and third quarters of the year. The fourth quarter marked a definite breakout as the S&P 500® gained over 8 percent, led by cyclical sectors like technology and banks, as investors shunned income producers like REITs and utilities. The S&P 500® produced a total return of over 30 percent this year.
What will affect the Fund going forward?
We think that the economy continued to slow in fourth quarter but is poised to do modestly better in 2020. The consumer continues to drive growth with low unemployment and higher wages supporting spending. While the stage is set for stronger growth in corporate America, the turn hasn't happened yet. Manufacturing continues to struggle, with weakness in energy and trade putting a damper on investment. The outlook appears brighter for 2020 as shocks from tariffs and a shakeout in energy recede. Earnings should improve on more stable global growth and easier comparisons. With unemployment at a nearly 50-year low, a recession next year seems unlikely.
The big question on investors' minds is whether this year's extraordinary returns are justified or if we've simply pulled future returns forward. Earlier this year, we acknowledged that if the Fed's insurance cuts were effective, conditions would be good for risk assets. This scenario certainly was realized. The U.S. Treasury yield curve regained its normal positive slope as short rates followed the decline in the federal funds rate and longer rates rose during the fourth quarter. The market is pricing in a return to a Goldilocks economy where both growth and inflation are measured. This sets the stage for continued demand for risk assets. Adding to the allure, net issuance is likely to be down in many asset classes, and retail investors have dry powder to increase their risk profiles. The Fed is on hold, and the record expansion is set to extend through next year.
16
Rhetoric around Brexit and trade has become more positive, calming markets in the near term. U.S. assets remain in demand in a low-growth, low-interest-rate world.
While we can identify many strengths, these factors are tempered by real risks. A trade deal is good, but it's unlikely to produce steadily expanding global flows. Labor markets are tight, corporate margins peaked in 2018, and corporate leverage is high. Populism remains on the rise, and we believe that political risks will remain elevated. Late cycle growth of around 2 percent is good but provides little room for error. The Fed's three rate cuts in 2019 used dry powder, increasing concerns about how policy makers will counter the next downturn. With valuations stretched, we continue to think that bursts of volatility are likely in the coming year, placing a premium on risk management and investment discipline.
17
"Standard & Poor's®", "S&P®", "Standard & Poor's 500" and "S&P 500" are trademarks of the S&P Global, Inc. and have been licensed for use by Securian Funds Trust—SFT Index 500 Fund. The Fund is not sponsored, endorsed, sold or promoted by Standard & Poor's and Standard & Poor's makes no representation regarding the advisability of investing in the Fund.
*The results shown are past performance and are not an indication of future performance. Current performance may be lower or higher. The investment returns and principal value of an investment will fluctuate so that shares upon redemption may be worth more or less than their original cost. Performance figures of the Fund do not reflect charges pursuant to the terms of the variable life insurance policies and variable annuity contracts funded by separate accounts that invest in the Fund's shares. When such charges are deducted, actual investment performance in a variable policy or contract will be lower.
The S&P 500® Index is a broad, unmanaged index of 500 common stocks which are representative of the U.S. stock market overall.
Ten Largest Holdings^
| Security description | Market value | % of total net assets | |||||||||
Apple, Inc. | $ | 41,160,920 | 4.5 | % | |||||||
Microsoft Corp. | 40,374,985 | 4.4 | % | ||||||||
Amazon.com, Inc. | 25,829,108 | 2.8 | % | ||||||||
Facebook, Inc.—Class A | 16,576,400 | 1.8 | % | ||||||||
Berkshire Hathaway, Inc.—Class B | 14,868,592 | 1.6 | % | ||||||||
JPMorgan Chase & Co. | 14,673,383 | 1.6 | % | ||||||||
Alphabet, Inc.—Class A | 13,487,657 | 1.5 | % | ||||||||
Alphabet, Inc.—Class C | 13,411,648 | 1.5 | % | ||||||||
Johnson & Johnson | 12,884,114 | 1.4 | % | ||||||||
Visa, Inc. | 10,794,855 | 1.2 | % | ||||||||
$ | 204,061,662 | 22.3 | % | ||||||||
^Excludes short-term investments.
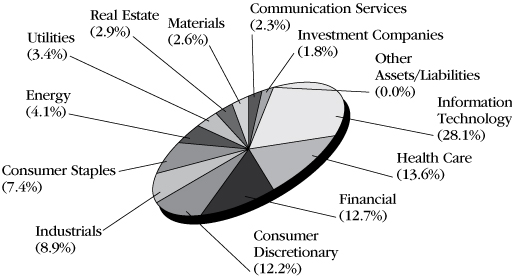
Sector Diversification (shown as a percentage of net assets)
Comparison of Change in Investment Value*
A Hypothetical $10,000 Investment in SFT Index 500 Fund,
S&P 500® Index and Consumer Price Index
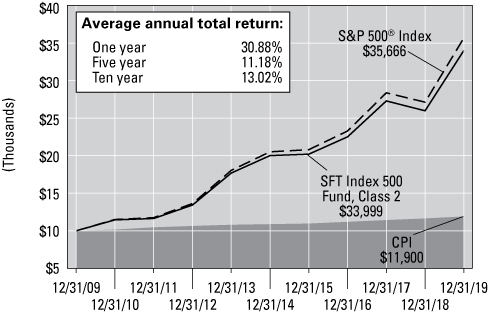
On the chart above you can see how the SFT Index 500 Fund's Class 2 shares total return compared to the S&P 500® Index (as adjusted for dividend reinvestment) and the Consumer Price Index. The three lines represent the total return of a hypothetical $10,000 investment made on December 31, 2009 through December 31, 2019, assuming reinvestment of distributions, if any.
18
Performance Update


Michael Hasenstab, Ph.D. and Christine Zhu Portfolio Managers Franklin Advisers, Inc.
The SFT International Bond Fund seeks to maximize current income consistent with protection of principal. The Fund pursues its objective by investing primarily in debt securities issued by issuers located anywhere in the world. While Securian Asset Management, Inc. (Securian AM) acts as the investment adviser for the Fund, Franklin Advisers, Inc. provides investment advice to the SFT International Bond Fund under a sub-advisory agreement. Investment risks associated with international investing in addition to other risks include currency fluctuations, political and economic instability, and differences in accounting standards when investing in foreign markets.
SFT International Bond Fund
How did the Portfolio perform during the period?
The Fund's Class 2 shares generated a total net return of 1.68 percent over the 12 months ending December 31, 2019, underperforming the FTSE World Government Bond Index, which returned 5.90 percent over the same period.
What influenced the Fund's return during the past 12 months?
In calendar year 2019, the Fund's relative underperformance was primarily due to interest-rate strategies. Currency positions contributed to relative results, while sovereign credit exposures had a largely neutral effect. The Fund maintained a defensive approach regarding interest rates in developed markets, while holding duration exposures in select emerging markets. Underweighted duration exposures in the United States and Japan detracted from relative performance, as did select underweighted duration exposures in Europe. However, select overweighted duration exposures in Asia ex Japan (Indonesia) and Latin America (Brazil) contributed to relative results. Among currencies, the Fund's net-negative position in the euro contributed to relative performance, as did its overweighted position in the Indonesian rupiah. However, overweighted currency positions in Latin America detracted from relative results (the Argentine peso detracted, while the Mexican peso contributed).
What other market conditions or events influenced the Fund's performance during the past 12 months?
Global financial markets started 2019 on a positive note, with rallies in risk assets through much of the first quarter after a volatile end to 2018. However, escalating trade tensions between the U.S. and China sporadically resurfaced throughout the year, leading to broad resurgences in global risk aversion that intermittently affected market valuations. Both the U.S. Federal Reserve (Fed) and the European Central Bank (ECB) increasingly cited trade uncertainties and global risks as policy concerns, as the Fed built a case for rate cuts and the ECB signalled that monetary accommodation could expand later in the year.
The Fed took a dovish turn at its January meeting, halting its series of rate hikes from 2018 and removing its prior statement that "some further gradual increases in the target range for the Federal Funds Rate" would be consistent with economic activity and inflation objectives. Policy guidance turned even further dovish at the March meeting as the Fed kept rates unchanged and moderately downgraded U.S. growth forecasts for 2019 and 2020. The Fed ultimately kept the federal funds target rate unchanged at its May and June meetings before cutting rates (by 25 basis points [bps]) for the first time in more than a decade at its July meeting. In August, the Fed discontinued its monthly pace of balance sheet unwinding, two months earlier than originally forecast. It then consecutively cut rates 25 bps at its September and October meetings (to a range of 1.50 to 1.75 percent), before signalling that it would likely keep rates unchanged going forward, barring a material change in the economic outlook.
The shifts in forward guidance from the Fed affected the shape of the U.S. Treasury (UST) yield curve throughout the year. A yield curve inversion from the three-month UST bill to the 10-year UST note took hold in May, reaching a low of 50 bps of spread inversion in late August. However, updated forward guidance from the Fed in September and October enabled the curve to steepen, erasing the inversion as the front end rallied lower while longer-term UST yields rose. The curve continued to steepen through the end of the year, as the Fed kept rates unchanged at its December meeting with the first 10-0 consensus policy vote since May. The updated dot plot in December indicated that a strong majority of Fed officials expected rates to remain unchanged through the end of the upcoming year.
19
In Europe, the ECB kept its policy rate unchanged (0.0 percent main refinancing operations, -0.40 percent deposit facility) for most of the reporting period, but delivered on its anticipated stimulus package at its 12 September meeting, dropping the deposit rate to -0.5 percent and scheduling the re-start of its quantitative easing (QE) programme in November, at a pace of €20 billion in bond purchases per month. Mario Draghi kept rates unchanged at his final meeting as ECB president in October. Christine Lagarde took over as ECB president in November and held her first policy meeting in December, keeping rates and the QE programme unchanged, as largely expected. During the reporting period, it appeared Lagarde would maintain continuity with the policy framework she inherited from her predecessor, indicating her support for negative rates by commenting that the ECB has "done the right thing to act in favour of jobs and growth rather than the protection of savers." We expected the euro to weaken against the U.S. dollar during the period on continued monetary accommodation from the ECB, as well as unresolved structural vulnerabilities in the eurozone.
The Bank of Japan (BOJ) kept monetary policy unchanged during the reporting period, retaining its 0.0 percent yield target on the 10-year Japanese government bond and its -0.1 percent target on the overnight rate. However, BOJ Governor Haruhiko Kuroda increasingly indicated a willingness to cut rates at future meetings if there were risks to achieving the 2.0 percent inflation target. We expected monetary policy to remain highly accommodative during the reporting period, but our expectations for weakness in the Japanese yen against the U.S. dollar shifted to expectations for strength on softer policy divergence between the Fed and BOJ, and the yen's potential to strengthen as a perceived safe haven during periods of risk aversion, given Japan's strong external balances.
A number of central banks around the world followed the dovish directions of the Fed and the ECB in 2019, taking the opportunity to cut their own domestic rates. Notably, Mexico and Indonesia cut their policy rates by 100 bps, India cut by 135 bps and Brazil cut by 200 bps. Overall, sovereign bond yields declined across much of the world during the reporting period. The yield on the 10-year UST note finished the period 77 bps lower at 1.92 percent and the yield on the 10-year German Bund fell 43 bps to finish at -0.19 percent, after reaching its lowest level on record in August (-0.71 percent). On the whole, long duration exposures tended to perform well in most markets, while currency valuations were more idiosyncratic to individual country dynamics.
What strategies and techniques did you employ that specifically affected Fund performance?
We continued to maintain low overall portfolio duration, while positioning for steepening of the U.S. Treasury (UST) yield curve. We continued to hold negative duration exposure to longer-term USTs through interest-rate swaps. Outside of the developed markets, we held select duration exposures in specific countries that we believe have economic resiliencies to external shocks and attractive risk/return profiles in their debt markets. We continued to focus on markets with relatively higher yields and macro environments that can support stable yields or declining domestic yields.
We continued to hold currency exposures in countries that we believe have strong growth fundamentals and compelling interest-rate differentials. We continued to hold a net-negative position in the euro as a macro hedge against a broadly strengthening U.S. dollar and as a directional view on the currency. The short euro position is also a hedge against euroskeptic political risks and unresolved structural risks across Europe. We also continued to hold net-negative positioning in the Australian dollar to hedge broad-based beta risk across emerging markets. We moved to a net-positive exposure in the Japanese yen in June as policy divergence between the U.S. Federal Reserve (Fed) and the Bank of Japan (BOJ) softened, and because the yen shows potential for additional strength should global
20
risk aversion deepen in the quarters ahead. We added new exposures to the Norwegian krone and Swedish krona in July as we believe the currencies are fundamentally undervalued and show potential to rally as perceived safe havens within Europe should global financial market risks increase. We added exposure to the Swiss franc in December.
We continued to selectively invest in sovereign credit opportunities in emerging markets, with a particular focus on credit exposures in economies with compelling growth indicators. However, we continued to have a significantly greater allocation to local-currency sovereign bonds.
What will affect the Fund going forward?
A number of factors are currently shaping financial markets, notably including geopolitical risks and trade tensions, populism and political polarization, unrestrained deficit spending in the developed world, low rates and underappreciated inflation risks, and overvaluations in many risk assets. Financial markets remain vulnerable to a number of risks associated with these factors, in our view. We continue to position our strategies for potential market corrections that could come from a financial market shock triggered by any combination of distorted asset prices and/or geopolitical events. We continue to maintain negative duration exposure to longer-term USTs to hedge rate risks, and we have de-risked specific emerging market exposures in our portfolios. We have also increased our long exposures to perceived safe-haven assets, including the Japanese yen, Norwegian krone, Swedish krona and Swiss franc.
We have also continued to maintain net-negative positions in the Australian dollar and the euro. The negative exposure to the Australian dollar is intended to hedge against broad-based beta risks in emerging markets, as the currency shares emerging market risk factors, including linkages to China's economy and commodity markets. Our net-negative position in the euro is intended to hedge against broad-based U.S. dollar strength and against political and structural vulnerabilities in the eurozone. Additionally, we moved to a net-positive position in the Japanese yen in June as the outlook for policy divergence between the Fed and the BOJ has softened, and because the yen shows potential to strengthen should global risk aversion deepen in the quarters ahead.
In Europe, growth continues to show signs of moderation, with weakness in manufacturing and investment. Overall, we continue to expect the euro to weaken against the U.S. dollar given the differences in projected growth and the rate differentials between the U.S. and the eurozone, as well as the likelihood for ongoing monetary accommodation from the ECB. The euro also remains vulnerable to unresolved structural and political risks across Europe, notably including debt sustainability and banking concerns in Italy, as well as unrest in France over the government's social reform agenda. Brexit negotiations also continue to add economic and political uncertainty for the eurozone.
In emerging markets, we continue to see a subset of countries with domestically strong economies that have demonstrated their resiliencies to global shocks, including potential trade disruptions. We are focused on specific countries that are less externally vulnerable and more domestically driven, and that have orthodox fiscal and monetary policies.
Overall, we continue to maintain low portfolio duration and negative duration exposure to longer-term USTs. We expect rising debt issuance, rising deficit spending and rising underlying inflation pressures to drive longer-term yields higher. We also continue to hold select local-currency positions in countries that we view as having healthy or improving fundamentals, along with attractive risk-adjusted yields. We continue to prefer specific countries that are less externally dependent and more domestically driven, and that have responsible, credible central banks that consistently respond with appropriate monetary policies. In our view, select local-currency markets show attractive levels of undervaluation and compelling yields.
21
Ten Largest Holdings^
| Security description | Market value | % of bond portfolio | |||||||||
U.S. Treasury Note 1.125% 08/31/2021 | $ | 13,610,451 | 13.6 | % | |||||||
U.S. Treasury Note 1.125% 07/31/2021 | 9,102,576 | 9.1 | % | ||||||||
| Brazil Notas do Tesouro Nacional Serie F (BRL) 10.000%, 01/01/27 | 8,338,742 | 8.3 | % | ||||||||
U.S. Treasury Note 1.500% 08/31/2021 | 4,544,887 | 4.5 | % | ||||||||
Korea Treasury Bond (KRW) 4.250%, 06/10/21 | 4,120,279 | 4.1 | % | ||||||||
U.S. Treasury Note 1.500% 09/30/2021 | 3,570,552 | 3.6 | % | ||||||||
| Indonesia Treasury Bond (IDR) 7.000%, 05/15/27 | 3,196,777 | 3.2 | % | ||||||||
| Korea Treasury Bond (KRW) 3.375%, 09/10/23 | 2,518,674 | 2.5 | % | ||||||||
Mexican Bonos 8.000%, 06/11/20 | 2,391,825 | 2.4 | % | ||||||||
Mexican Bonos 7.250%, 12/09/21 | 2,356,178 | 2.3 | % | ||||||||
$ | 53,750,941 | 53.6 | % | ||||||||
^Excludes short-term investments.
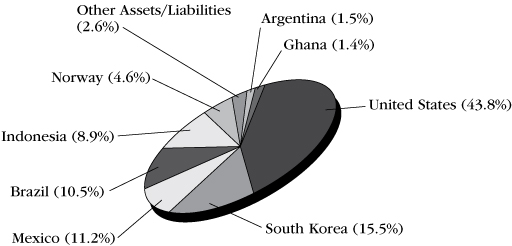
Country Diversification (shown as a percentage of net assets)
Currency Diversification (shown as a percentage of net assets)
African | 1.44 | % | |||||
Ghana Cedi (GHS) | 1.44 | % | |||||
Americas | 92.34 | % | |||||
United States Dollar (USD) | 78.89 | % | |||||
Mexican Peso (MXN) | 2.58 | % | |||||
Brazilian Real (BRL) | 9.09 | % | |||||
Argentine Peso (ARS) | 1.78 | % | |||||
Asia Pacific | 21.55 | % | |||||
Japanese Yen (JPY) | 28.37 | % | |||||
Indonesian Rupiah (IDR) | 8.95 | % | |||||
Republic of Korea Won (KRW) | 0.13 | % | |||||
Australian Dollar (AUD)* | -15.90 | % | |||||
Europe | -15.33 | % | |||||
Norwegian Krone (NOK) | 4.99 | % | |||||
Swiss Franc (CHF) | 5.25 | % | |||||
Swedish Krona (SEK) | 4.82 | % | |||||
Euro (EUR)* | -33.39 | % | |||||
*A negative figure reflects net "short" exposure, designed to benefit if the value of the associated currency decreases. Conversely, the Fund's value would potentially decline if the value of the associated currency increases.
22
Comparison of Change in Investment Value*
A Hypothetical $10,000 Investment in SFT International Bond Fund,
FTSE World Government Bond Index and Consumer Price Index
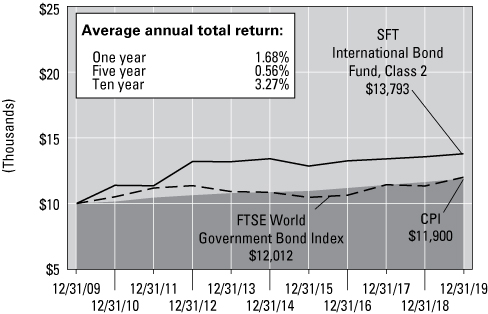
On the chart above you can see how the SFT International Bond Fund's Class 2 shares total return compared to the FTSE World Government Bond Index, and the Consumer Price Index. The three lines represent the total return of a hypothetical $10,000 investment made on December 31, 2009 through December 31, 2019, assuming reinvestment of distributions, if any.
*The results shown are past performance and are not an indication of future performance. Current performance may be lower or higher. The investment returns and principal value of an investment will fluctuate so that shares upon redemption may be worth more or less than their original cost. Performance figures of the Fund do not reflect charges pursuant to the terms of the variable life insurance policies and variable annuity contracts funded by separate accounts that invest in the Fund's shares. When such charges are deducted, actual investment performance in a variable policy or contract will be lower.
The FTSE World Government Bond Index is a market capitalization weighted index consisting of the government bond markets from over twenty countries. Country eligibility is determined based upon market capitalization and investability criteria. The index includes all fixed-rate bonds with a remaining maturity of one year or longer and with amounts outstanding of at least the equivalent of U.S. $25 million. Government securities typically exclude floating or variable rate bonds, U.S./Canadian savings bonds and private placements. Each bond must have a minimum rating of BBB-/Baa3 by S&P or Moody's.
23
Performance Update

Bradley M. Klapmeyer, CFA Portfolio Manager Ivy Investment Management Company
The SFT IvySM Growth Fund seeks to provide growth of capital. The Fund pursues its objective by investing primarily in a diversified portfolio of common stocks issued by large capitalization companies. While Securian Asset Management, Inc. acts as the investment adviser for the Fund, Ivy Investment Management Company (IICO) provides investment advice to the Fund under a sub-advisory agreement. The risks incurred by investing in the Fund include, but are not limited to, the risk of declines in the market for large cap stocks or in the equity markets generally.
SFT IvySM Growth Fund
How did the Portfolio perform during the period?
The Fund generated a total net return of 36.49 percent over the 12 months ending December 31, 2019, outperforming the Russell 1000 Growth Index which returned 36.39 percent over the same period.
What influenced the Fund's return during the past 12 months?
Stock selection drove positive attribution in industrials, consumer discretionary, consumer staples, information technology and real estate. Despite the strong absolute and relative performance there were a few notable detractors as well, including financials, communications services and health care. Even though the Fund held a minimal amount, cash was a detractor given the strong absolute gains during the measurement period.
What other market conditions or events influenced the Fund's performance during the past 12 months?
The Russell 1000 Growth Index, the Fund's benchmark, gained a remarkable 36.39 percent during the measurement period, which followed rather unimpressive equity market returns in 2018. Markets gains started early in the calendar year as there was a recovery from a downdraft that occurred during fourth quarter of 2018. There were fundamental factors driving the strong market returns as well, the most notable being accommodative Federal Reserve (Fed) interest rate policy and the de-escalation of the trade war with China. Over the past decade, the Russell 1000 Growth Index is up over 300 percent, marking an exceptionally strong decade of appreciation for growth-style investments.
Economic data points throughout the calendar year were generally mixed with housing and labor (employment), performing well. However, the manufacturing economy moved into contraction territory as orders and production both weakened materially. We saw similar manufacturing trends globally as well.
The market clearly had a cloud of negative sentiment hanging over valuations at the start of 2019 that slowly cleared to allow beams of more optimistic sentiment drive returns toward the back half the calendar year. One of the more notable events during the year was the aggressive low quality, deep value rotation that occurred in early September. This rotation marked a clear change in narrative from concern on an economic slowdown to one of optimism, looking forward to better growth prospects on the horizon. This sentiment shift appeared to be trigged by a confluence of factors, including many that were aforementioned—global central bank policy (easing), trade rhetoric (de-escalation) and global economic data points (slightly better). This rotation came at the expense of momentum, as the market sold the high-performing stocks.
Looking at the return by the index, factor performance showed that risk (beta) and quality (Return on Assets, Return on Capital and Return on Equity) factors were key factors driving performance during the calendar year. Value (low enterprise value to earnings before interest, tax, depreciation and amortization "EBITDA", low price to cash flow) and growth (five-year projected earnings per share growth and earnings per share estimate revisions) were the key lagging factors during the measurement period.
What strategies and techniques did you employ that specifically affected Fund performance?
From a high level, the Fund outperformed for much of the measurement period but did struggle during the latter months of the year. For a large portion of 2019, investors were concerned about slowing growth and potential looming recessionary conditions. This sentiment backdrop meant that investors favored stable, less volatile growth stocks with
24
long-term visibility into growth prospects. The Fund's key philosophy is to look for enduring, structurally advantaged business models that have strong long-term growth prospects, which were stocks that the market favored much of the year. These stocks were rewarded for these characteristics with higher valuations on average than the market. Stocks in the Fund that had exceptional returns partly due to this market dynamic, but also due to strong company-specific fundamentals, included such names as CoStar Group, Verisk Analytics, Verisign, Adobe, and MasterCard.
During the closing months of 2019, many of these same securities, despite continued strong underlying results, saw their valuations compress as investors shifted to a more positive narrative around accelerating growth thus favoring cheaper and more economically sensitive securities. At times, these rotations included strong returns for low-quality names that had been set aside as investors worried if those businesses could weather a no-growth economy. This rotation reduced the extent of full-year outperformance as many of the names that worked well for much of the year saw notable relative underperformance in those ending months. The stocks that perform well only in a period of favorable macroeconomic sentiment did well during the same time frame. These periods are difficult for the Fund as it remains positioned toward high quality, competitively advantaged business models that we believe perform well through-cycle and are unlikely to have significant exposure to securities that perform well during such intense rotations.
What will affect the Fund going forward?
We believe there is still room for the "accelerating global growth" narrative to push cyclical, cheaper stocks higher. A change in sentiment can be a strong tailwind for a group of stocks that was set aside during a period of economic fears. This move will likely be supported by improvements in global manufacturing data around the world, as many of those indices have bottomed or are near a bottom entering 2020. Global accommodative monetary policy will likely stimulate some level of incremental economic growth during 2020.
This reversion to mean may support that positive narrative temporarily, but sustained improvements in earnings growth would be required for sustained outperformance of value-style securities. We are somewhat skeptical that the fourth mini-cycle of this decade long bull market will create enough economic momentum to sustain a durable rally in value. More likely is continued mediocre growth that is unable to resuscitate structurally challenged businesses without an overall stronger environment in which to operate. We think a modest growth environment is positive for our style of investing and good for active management as there will be more dispersion and separation between contributors and detractors.
Excesses, such as consumer debt, manufacturing inventories, corporate debt coverage, and business investment, are just not apparent this cycle. While this suggests limited excesses to worry about on the downside, this could also remove the catalysts for upside momentum as there are less economic input troughing and bouncing off a bottom. Sometimes a sharp correction sows the seeds for a strong growth recovery. The ability to create a strong growth cycle from monetary policy or fiscal stimulus may be waning in an environment of decent housing, low unemployment, rational business investment and appropriate inventories.
We exited the year with the Fund positioned for moderately improving economic growth. As always, our goal is to select stocks based on three- to five-year growth prospects rather than near-term revisions arising from macro factors. As valuation spreads between cyclicals and non-cyclicals compress, our goal is to sift through those adjustments and add exposure to long-term stories where current valuation understates our view of the company's long-term prospects.
25
'Ivy' is the registered service mark of Ivy Funds Distributor, Inc., an affiliate of IICO.
*The results shown are past performance and are not an indication of future performance. Current performance may be lower or higher. The investment returns and principal value of an investment will fluctuate so that shares upon redemption may be worth more or less than their original cost. Performance figures of the Fund do not reflect charges pursuant to the terms of the variable life insurance policies and variable annuity contracts funded by separate accounts that invest in the Fund's shares. When such charges are deducted, actual investment performance in a variable policy or contract will be lower.
The Russell 1000 Growth Index is an unmanaged index that measures the performance of those Russell 1000 Index companies with higher price-to-book ratios and higher forecasted growth values. The index measures the performance of the 1,000 largest companies in the Russell 3000 Index, which measures the performance of the 3,000 largest U.S. companies based on total market capitalization.
Ten Largest Holdings^
| Security description | Market value | % of net assets | |||||||||
Microsoft Corp. | $ | 49,693,162 | 9.1 | % | |||||||
Apple, Inc. | 33,583,870 | 6.2 | % | ||||||||
Alphabet, Inc.—Class A | 27,177,562 | 5.0 | % | ||||||||
Visa, Inc. | 25,815,581 | 4.7 | % | ||||||||
Amazon.com, Inc. | 24,336,053 | 4.5 | % | ||||||||
Facebook, Inc.—Class A | 16,658,295 | 3.1 | % | ||||||||
The Coca-Cola Co. | 16,392,290 | 3.0 | % | ||||||||
Booking Holdings, Inc. | 15,411,190 | 2.8 | % | ||||||||
Cerner Corp. | 15,289,852 | 2.8 | % | ||||||||
Motorola Solutions, Inc. | 15,035,490 | 2.8 | % | ||||||||
$ | 239,393,345 | 44.0 | % | ||||||||
^Excludes short-term investments.
Sector Diversification (shown as a percentage of net assets)
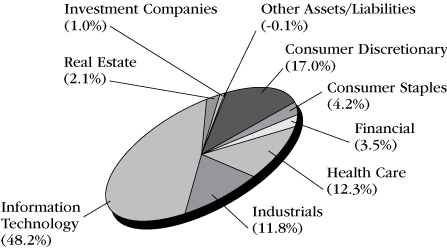
Comparison of Change in Investment Value*
A Hypothetical $10,000 Investment in SFT IvySM Growth Fund,
the Russell 1000 Growth Index and Consumer Price Index
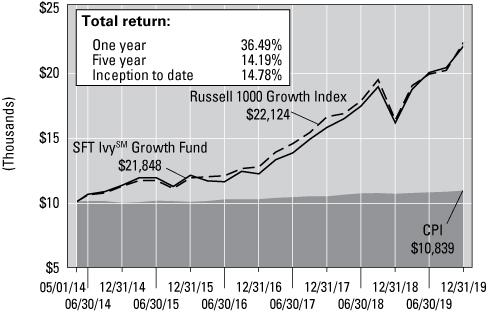
On the chart above you can see how the SFT IvySM Growth Fund's shares total return compared to the Russell 1000 Growth Index and the Consumer Price Index. The three lines represent the total return of a hypothetical $10,000 investment made on May 1, 2014 through December 31, 2019, assuming reinvestment of distributions, if any.
26
Performance Update


Timothy J. Miller, CFA
Kenneth G. McQuade, CFA
Bradley P. Halverson, CFA
Portfolio Managers Ivy Investment Management Company
The SFT IvySM Small Cap Growth Fund seeks to provide growth of capital. The Fund pursues its objective by investing primarily in a diversified portfolio of common stocks issued by small capitalization companies. While Securian Asset Management, Inc. acts as the investment adviser for the Fund, Ivy Investment Management Company (IICO) provides investment advice to the Fund under a sub-advisory agreement. The risks incurred by investing in the Fund include, but are not limited to, the risk of declines in the market for small cap stocks or in the equity markets generally.
SFT IvySM Small Cap Growth Fund
How did the Portfolio perform during the period?
The Fund generated a total net return of 23.66 percent over the 12 months ending December 31, 2019, underperforming the Russell 2000 Growth Index which returned 28.48 percent over the same period.
What influenced the Fund's return during the past 12 months?
The Fund had significant outperformance through June during the market's initial rally. The outperformance during this first half was attributable to the information technology, consumer discretionary, and industrial sectors. Within those sectors, the software stocks were leaders in information technology; housing, internet retail and specialty retail stocks led consumer discretionary; and machinery, aerospace and truckers led the industrial sector. Notable winners included Paycom Software, Inc., Booz Allen Hamilton Holding Corporation, Carvana Group, LLC and JBT Corporation.
The second half of the year proved challenging for the Fund, accounting for the underperformance for the year. Two general factors accounted for the shortfall. First, the environment for growth managers during the second half of the year was quite unfavorable, with the index performance being driven by more speculative biotechnology stocks and a rally in low-quality cyclical stocks. These groups do not generally fit our investment process, and are therefore underexposed in the Fund. Fortunately, history shows these periods of outperformance from these groups are short-lived, and in the case of the cyclical stocks, tend to do best coming out of a recession, which is not the environment that exists. The second factor was a slate of stock-specific issues that led to outsized negative reactions from the market given the prevailing sentiment against growth stocks. Among these were shortfalls from CareDx, Inc., Merit Medical Systems, Inc., Pluralsight, Inc. and Grand Canyon Education, Inc.
What other market conditions or events influenced the Fund's performance during the past 12 months?
A strong domestic stock market year across the board for the year ended December 31, 2019 was led by mid- and large-capitalization stocks, but small-cap stocks also delivered healthy returns for the period. For the year, small-cap growth stocks outperformed small-cap value stocks. The profile of performance for the year was divided into three segments driven by macro factors influencing the market.
The first segment was a strong move upward from the beginning of the year until early May. Economic activity remained strong while the U.S. Federal Reserve (Fed) turned dovish allowing interest rates to decline and risk assets to perform well. This momentum was halted in May as the U.S. raised tariffs on $250 billion of Chinese imports, as well as threatening tariffs on Mexico, triggering renewed fear of harmful trade disputes. Issues related to the United Kingdom's pending exit from the European Union also raised concerns about the global economic direction. The result was an initial sharp correction followed by a flattish pattern through the summer.
The final period was another sharp rally from early October through the end of the year. The Fed cut interest rates for the first time in years in reaction to an inverted yield curve, which sparked recession fears. The markets responded favorably as the whole term structure of rates continued to fall and as signs of trade progress were evident.
The second half of the fiscal year was particularly challenging for the small-cap growth segment of the market. Biotechnology stocks were the best performers by a wide margin.
27
The industry accounted for 13 percent of the Russell 2000 Growth Index, the Fund's benchmark, when the index was rebalanced. This group advanced a whopping 32 percent in the fourth quarter, accounting for one-third of the benchmark's return for that period.
Another headwind for growth stocks was a sharp rotation to lower quality and value stocks during the period. This latter move was in response to the combination of the Fed lowering short-term rates and a China trade agreement, igniting a rally in many depressed cyclical stocks such as machinery, materials and automobiles.
What strategies and techniques did you employ that specifically affected Fund performance?
The Fund's investment process focuses on growth companies in the small-cap universe we believe have the potential to become mid-cap stocks over a period of years. We want to own companies with the ability to pursue large markets, and have business models with identifiable competitive advantages over peers. Some of the metrics we use to assess these qualifying candidates are strong management teams, the sustainability of their profitability and the capacity to balance above-average returns and below-average volatility over time.
One common characteristic of many of the Fund's holdings is a tilt toward innovation, particularly in the health care and information technology sectors. Our largest weightings are in these two sectors and combine to make up about half of the Fund's portfolio composition.
Information technology was a notable contributor to performance during 2019. The Fund was overweight the sector, which outperformed the benchmark, and stock selection exceeded the sector performance. Software was a key contributor, with cloud adoption and automation driving companies globally to enable workforces to become increasingly mobile while making their operations more efficient. Paycom Software, Inc., Proofpoint, Inc., Globant SA and Five9, Inc. positively contributed during the year, delivering consistent results. Conversely, detractors Pluralsight, Inc. and New Relic, Inc. had sales force execution challenges, which modestly offset the overall positive contribution. We remain overweight information technology and continue to focus on identifying companies attached to strong secular trends that can deliver multi-year outperformance.
Within the health care sector, the Fund underperformed the benchmark for the year due primarily to the previously noted performance within the biotechnology segment. This industry produced a 44 percent annual return, which was the best performing segment within the health care sector, and one of the best segments anywhere.
"Medicare-for-all" spurred concerns periodically throughout the year and will likely do the same in 2020 as the presidential election nears. However, the pressures on drug pricing will probably maintain greater fundamental risks for health care stocks. We believe we are less exposed to drug pricing risk due to our investment process, but all health care can be subject to the rhetoric of regulation changes. Meanwhile, most Americans still have access to health care insurance so the percentage of insured patients should remain stable while any significant regulation enactment should be nonexistent until after the November election.
We finished the year in line with industrials. The Fund benefitted from the continued economic growth, housing related strengths and a strong aerospace cycle. Factors detracting from performance include the pressures of trade wars, tight labor and delays
28
in a new aerospace platform. With an economy still buoyed with low interest rates, low taxes and strong business sentiment, manufacturing is expected to continue to grow, especially if trade relationships improve. We remain invested in multiple specialty industrial segments anticipated to have greater growth than GDP with overweight exposure to aerospace and defense, building supplies and transportation.
What will affect the Fund going forward?
The macro headwinds faced in the second half of the year should ease as we move through 2020. Small-cap stocks in general should benefit from better earnings growth. Interest rate declines are likely behind us at this point, but they are not expected to rise significantly in 2020, a scenario that is beneficial for growth stocks.
The 2020 elections undoubtedly will generate some volatility for the market and certain sectors, but ultimately it is the companies that deliver or exceed expectations that will prevail. Our focus remains on identifying the companies best positioned to capitalize on large market opportunities for sustained multi-year growth.
29
'Ivy' is the registered service mark of Ivy Funds Distributor, Inc., an affiliate of IICO.
*The results shown are past performance and are not an indication of future performance. Current performance may be lower or higher. The investment returns and principal value of an investment will fluctuate so that shares upon redemption may be worth more or less than their original cost. Performance figures of the Fund do not reflect charges pursuant to the terms of the variable life insurance policies and variable annuity contracts funded by separate accounts that invest in the Fund's shares. When such charges are deducted, actual investment performance in a variable policy or contract will be lower.
The Russell 2000 Growth Index is an unmanaged index of those Russell 2000 Index growth companies with higher price-to-book ratios and higher forecasted growth values. The index is broad-based, comprised of 2,000 of the smallest U.S.-domiciled company common stocks based on total market capitalization.
Ten Largest Holdings^
| Security description | Market value | % of stock portfolio | |||||||||
Teladoc Health, Inc. | $ | 5,960,111 | 3.4 | % | |||||||
Nexstar Media Group, Inc. | 4,369,908 | 2.5 | % | ||||||||
Mercury Systems, Inc. | 3,827,312 | 2.2 | % | ||||||||
Five9, Inc. | 3,648,018 | 2.1 | % | ||||||||
Insulet Corp. | 3,599,309 | 2.0 | % | ||||||||
Proofpoint, Inc. | 3,578,611 | 2.0 | % | ||||||||
Monolithic Power Systems, Inc. | 3,451,096 | 2.0 | % | ||||||||
Globant SA | 3,400,281 | 1.9 | % | ||||||||
Clean Harbors, Inc. | 3,326,757 | 1.9 | % | ||||||||
Varonis Systems, Inc. | 3,303,064 | 1.9 | % | ||||||||
$ | 38,464,467 | 21.9 | % | ||||||||
^Excludes short-term investments.
Sector Diversification (shown as a percentage of net assets)
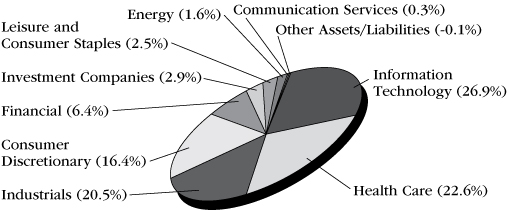
Comparison of Change in Investment Value*
A Hypothetical $10,000 Investment in SFT IvySM Small Cap Growth Fund,
the Russell 2000 Growth Index and Consumer Price Index
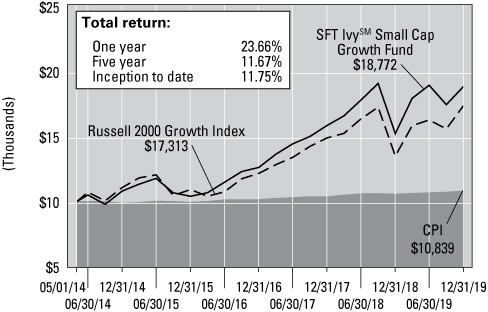
On the chart above you can see how the SFT IvySM Small Cap Growth Fund's shares total return compared to the Russell 2000 Growth Index and the Consumer Price Index. The three lines represent the total return of a hypothetical $10,000 investment made on May 1, 2014 through December 31, 2019, assuming reinvestment of distributions, if any.
30
Performance Update


Craig M. Stapleton, CFA, FRM, Jeremy Gogos, Ph.D., CFA and Merlin Erickson Portfolio Managers
The SFT Managed Volatility Equity Fund seeks to maximize risk-adjusted total return relative to its blended benchmark index comprised of 60 percent S&P 500® Low Volatility Index, 20% S&P 500® BMI International Developed Low Volatility Index and 20% Bloomberg Barclays U.S. 3-Month Treasury Bellwether Index (collectively, the Blended Benchmark Index).
The SFT Managed Volatility Equity Fund invests at least 80% of its assets in equity securities. Equity securities include those that are equity-based, such as ETFs that invest primarily in U.S. and foreign equity securities. The Fund is subject to risks associated with such investments as described in detail in the prospectus. The net asset value of the Fund will fluctuate and is not guaranteed. It is possible to lose money by investing in the Fund. There is no assurance that efforts to manage Fund volatility will achieve the desired results.
SFT Managed Volatility Equity Fund
How did the Portfolio perform during the period?
The Fund generated a total net return of 16.67 percent, with a volatility of 7.74 percent, for the year ending December 31, 2019. The blended benchmark index, which is comprised of 60 percent S&P 500® Low Volatility Index, 20 percent S&P 500® BMI International Developed Low Volatility Index, and 20 percent Bloomberg Barclays U.S. 3-Month Treasury Bellwether Index, returned 21.34 percent, with a volatility of 6.33 percent, over the same period.
What influenced the Fund's return during the past 12 months?
Our general view of the current market is that it is definitely late cycle, and so over the course of 2019, we generally expressed the Fund's target equity allocation as either a combination of cash equity, S&P futures, and call options, or overweight cash equity and S&P futures combined with some level of tail risk hedging, with both approaches intended to prevent full participation in a deep market selloff.
The realized volatility on the S&P 500® for 2019 was 12.47 percent, a 38th percentile value in the index's 92-year history. On a one-month basis, realized volatility ranged from 4.98 percent to 31.18 percent, and the Chicago Board Options Exchange (CBOE) Volatility Index (VIX) ranged from 11.54 to 25.45, with a one-year average of 15.39. As a result, the Fund's equity exposure in cash equity and S&P futures ranged from 51.3 percent to 99.7 percent. Our cash equity positions and derivatives trading returned 17.13 percent in portfolio terms, underperforming the benchmark equity portion, which produced 21.24 percent return. This performance disparity was primarily driven by the idiosyncratic sector and country exposure differences between the vehicles the Fund uses to represent "domestic low volatility equity" and "international low volatility equity", and the indexes in the benchmark that represent the same thematic equity exposure.
One final point about the Fund performance in 2019: all told, our risk management and hedging detracted from performance by -1.02 percent. Obviously in such a strong bull market year, almost any risk management efforts will detract from performance. But, we call out here that the performance drag was significantly less than, for example, buying a 10 percent out of the money Put on December 31, 2018, which would have cost approximately 4.2 percent of the equity value an investor wanted to protect. This 10 percent out of the money put option is roughly equivalent to the level of protection our strategy endeavors to provide.
What other market conditions or events influenced the Fund's performance during the past 12 months?
2019 was an excellent year across most risk assets. The S&P 500® returned 28.88 percent (price return), with 12.47 percent realized volatility. This is a return per risk of 2.32, which ranks as the 12th best return per risk in the 92-year S&P 500® history. Other major equity indexes produced impressive calendar-year returns as well. And it should be noted that these returns occurred in a year where earnings contracted on a year-over-year basis during first, second, and third quarter, and analysts are projecting the same in the fourth quarter.
As a reminder, September 30, 2018 was the last quarter end before the bear market flirtation of late 2018, and it was also close to the local maximum of the S&P 500® before that roughly 20 percent drawdown. Thus, the impressive 2019 calendar year return for the domestic equity market is largely retracing ground lost at the end of 2018,
31
and we interpret the longer-term outperformance of safe-haven assets as a sign of investor caution.
Further, we would point to the pivot in central bank policy as a major driver of risk asset performance in 2019. The equity market clearly demonstrated in 2018 that it could not digest the Federal Reserve hiking rates and winding down its balance sheet. As a result, both efforts were reversed. The Fed began cutting rates on July 31st, and executed three cuts total during the year, bringing their policy rate down by 75 basis points. The Fed also began expanding its balance sheet in September, adding about $410 billion in holdings by the end of 2019.
In addition to the equity market turbulence of late 2018, another macroeconomic factor that likely drove monetary policy was the inversion of the U.S. yield curve. The 10Y-3M spread briefly went negative in March, and then went deeply negative at the end of May. This situation persisted through October 11, when the 10Y-3M spread returned to positive territory thanks to the aforementioned Fed rate cuts.
There were numerous other events during the year which could have affected the markets and the Fund, but which proved to have no impact:
• Chinese gross domestic product (GDP) growth continued to decline, falling to 6.0 percent in third quarter, which is below the nadir of the Great Financial Crisis (6.4 percent)
• Various Federal agencies and the House of Representatives investigated President Trump, and numerous associates of his, culminating in multiple arrests and the impeachment of the President in late December
• Multiple geopolitical events (North Korean weapons tests, attacks on oil tankers in the Gulf of Oman, etc.)
• U.S.-China trade war
Again, our view is that the switch to monetary easing by the Federal Reserve, European Central Bank (ECB), and People's Bank of China during 2019 is the primary reason why risk markets proved so resilient in the face of what would otherwise be a rather challenging economic and geopolitical backdrop.
What strategies and techniques did you employ that specifically affected Fund performance?
Throughout the year, the Fund held a core long position in cash equity that represents low volatility domestic and international equity. In addition, the Fund had long and short positions in S&P 500 futures, S&P 500 call options, S&P 500 put options, Chicago Board Options Exchange (CBOE) Volatility Index (VIX) call options, and VIX put options. These derivative positions were held either as expressions of the target equity allocation of the Fund given prevailing volatility, or as supplemental hedges for managing the Fund's risk.
What will affect the Fund going forward?
In our view, 2019 marks a new low point in government fiscal responsibility and general financial rationality. To briefly reiterate a few key points:
• The S&P 500® returned 31.49 percent in a year where earnings declined year-over-year for the first three quarters, and will most likely contract again in fourth quarter.
• GDP growth was flat to modestly down in the U.S., the Eurozone, and China.
32
• The U.S. federal deficit topped $1 trillion in November, and at the same time, the total federal debt topped $23 trillion, a new record both in terms of raw dollars, and as a percentage of GDP.
• The Federal Reserve only managed to hike the upper bound of its policy rate to 2.5 percent, and shrink its balance sheet to $3.7 trillion, before having to reverse course; for context, these stats were 5.25 percent and $0.9 trillion, going into the Great Financial Crisis.
• Total global debt is expected to top $257 trillion in 2020, and grew by almost 4 percent in the first three quarters of 2019.
Many market observers breathed a sigh of relief when the yield curve normalized in October, because the optimistic interpretation of this normalization would be that the Fed has struck the correct balance between monetary tightening and easing to sustain the current economic expansion and bull market. But for historical perspective, consider that there have been seven recessions since 1962 (the beginning of the 10Y-3M interest rate data series). All seven have been preceded by a yield curve inversion, and five of those seven saw a brief normalization before the recession set in. Thus, the historical odds do not recommend optimism simply because the yield curve has normalized somewhat.
Going forward, we expect that the Fed's obvious willingness to preemptively ease monetary policy will continue to backstop equity valuations on the downside, as well as foster a temporary environment of moderate realized volatility. The anticipated "Phase One" agreement in the U.S.-China trade war could also provide a brief reprieve from volatility escalating. But ultimately, central banks have very limited monetary policy ammunition to work with; the ECB and Bank of Japan are already at the zero-rate bound, and the Fed has only 1.75 percent in rate cuts before it also hits the zero bound. Given this limited room for central bank maneuvers, we are extremely skeptical that monetary policy will have the ability to mitigate the next recession when it does arrive.
In terms of returns, most fundamental market valuation metrics, price/earnings, Shiller price/earnings, market cap to GDP (the so-called "Buffett Indicator"), and so on, ended 2019 quite high by historical standards. The levels of these metrics suggest low-to-negative long-term equity returns going forward. In the short term, this equity mania—and we do regard 2019 as manic market behavior—can persist for a handful of years.
In a tactical sense, we will continue to use our volatility metrics to inform the equity allocations of the Fund. We will increase equity exposure if we believe volatility will decrease, decrease equity exposure if we believe volatility will increase, and in the event that we are overweight equity, we will carry some form of tail risk hedge for the foreseeable future.
33
*The results shown are past performance and are not an indication of future performance. Current performance may be lower or higher. The investment returns and principal value of an investment will fluctuate so that shares upon redemption may be worth more or less than their original cost. Performance figures of the Fund do not reflect charges pursuant to the terms of the variable life insurance policies and variable annuity contracts funded by separate accounts that invest in the Fund's shares. When such charges are deducted, actual investment performance in a variable policy or contract will be lower.
Securian Asset Management, Inc. (Securian AM) and the Securian Funds Trust, on behalf of the SFT Managed Volatility Equity Fund (the "Fund"), have entered into an Expense Limitation Agreement, dated November 18, 2015, which limits the operating expenses of the Fund, excluding certain expenses (such as interest expense, acquired fund fees, cash overdraft fees, taxes, brokerage commissions, other expenditures which are capitalized in accordance with the generally accepted accounting principles, and other extraordinary expenses not incurred in the ordinary course of the Fund's business), to 0.80% of the Fund's average daily net assets through April 30, 2021. The Agreement renews annually for a full year each year thereafter unless terminated by Securian AM upon at least 30 days' notice prior to the end of a contract term.
Ten Largest Holdings^
| Security description | Market value | % of market value | |||||||||
| iShares Edge MSCI Minimum Volatility USA ETF | $ | 125,868,819 | 32.2 | % | |||||||
| iShares Edge MSCI Minimum Volatility EAFE ETF | 97,283,123 | 24.9 | % | ||||||||
iShares Core High Dividend ETF | 70,782,709 | 18.1 | % | ||||||||
| iShares Edge MSCI Minimum Volatility Emerging Markets ETF | 22,666,517 | 5.8 | % | ||||||||
iShares Short Maturity Bond ETF | 19,494,236 | 5.0 | % | ||||||||
iShares MSCI Germany ETF | 15,568,241 | 4.0 | % | ||||||||
U.S. Treasury Note, 2.000% 01/31/20 | 3,500,926 | 0.9 | % | ||||||||
$ | 355,164,571 | 90.9 | % | ||||||||
^Excludes short-term investments.
Sector Diversification (shown as a percentage of net assets)
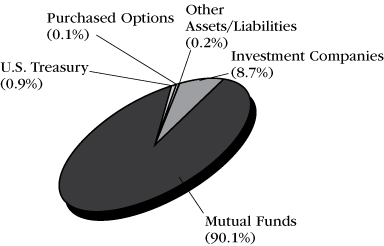
34
Comparison of Change in Investment Value*
A Hypothetical $10,000 Investment in SFT Managed Volatility Equity Fund,
the Blended Benchmark Index and Consumer Price Index
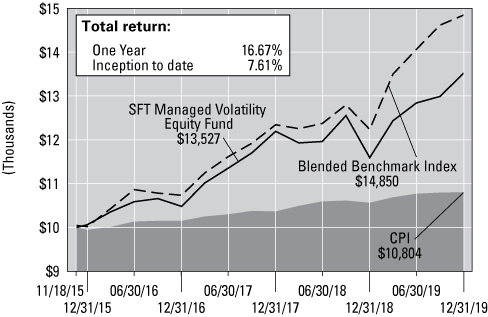
On the chart above you can see how the SFT Managed Volatility Equity Fund's shares total return compared to its Blended Benchmark, comprised of 60 percent of the S&P 500® Low Volatility Index, 20% S&P 500® BMI International Developed Low Volatility Index and 20% Bloomberg Barclays U.S. 3 Month Treasury Bellwether Index and the Consumer Price Index. The three lines represent the total return of a hypothetical $10,000 investment made on November 18, 2015 through December 31, 2019, assuming reinvestment of distributions, if any.
The Fund is authorized to reimburse Securian AM for management fees previously waived and/or for the cost of expenses previously paid by Securian AM pursuant to this agreement, provided that such reimbursement will not cause the Fund to exceed any limits in effect at the time of such reimbursement. The Fund's ability to reimburse Securian AM in this manner only applies to fees waived or reimbursements made by Securian AM within the three fiscal years prior to the date of such reimbursement. As of December 31, 2019, Securian AM has waived $1,631,213 pursuant to the agreement. To the extent that the Fund makes such reimbursements to Securian AM, the amount of the reimbursements will be reflected in the financial statements in the Fund's shareholder reports and in Other Expenses under Fees and Expenses of the Fund.
The Blended Benchmark Index is comprised of 60 percent of the S&P 500® Low Volatility Index, 20% S&P 500® BMI International Developed Low Volatility Index and 20% Bloomberg Barclays U.S. 3-Month Treasury Bellwether Index.
The S&P 500® Low Volatility Index measures performance of the 100 least volatile stocks in the S&P 500®. The S&P 500® BMI International Developed Low Volatility Index measures the performance of the 200 least volatile stocks in the S&P Developed Market large/midcap universe. Constituents are weighted relative to the inverse of their corresponding volatility, with the least volatile stocks receiving the highest weights. The Bloomberg Barclays U.S. 3-Month Treasury Bellwether Index tracks the market for the on-the-run 3-month Treasury bill issued by the U.S. government.
35
Performance Update


Matthew Richmond, Lowell Bolken, CFA and Joshua Klaetsch Portfolio Managers
The SFT Real Estate Securities Fund seeks above-average income and long-term growth of capital. The Fund intends to pursue its objective by investing primarily in equity securities of companies in the real estate industry. Investment risks associated with investing in the SFT Real Estate Securities Fund, in addition to other risks, include rental income fluctuations, depreciation, property tax value changes, and differences in real estate market value.
SFT Real Estate Securities Fund
How did the Portfolio perform during the period?
The Fund's Class 2 shares generated a total net return of 24.56 percent over the 12 months ending December 31, 2019, underperforming the FTSE NAREIT Equity REITs Index which returned 26.00 percent over the same period.
What influenced the Fund's return during the past 12 months?
Real estate stocks delivered significantly positive returns for the year ending December 31, 2019 but failed to keep pace with the broader S&P 500® Index. Real estate investment trusts (REITs), similar to the broader market were consistently positive throughout the year with very little volatility.
The Fund delivered a sharply positive total return for the year but trailed its benchmark and peer group. Our investment philosophy consistently favors companies we believe own well-located, high-quality properties that feature stable balance sheets, exhibit improving property fundamentals and have above-average cash flow growth prospects. Those characteristics have shown over time to likely result in favorable performance.
What other market conditions or events influenced the Fund's performance during the past 12 months?
Industrial REITs once again recorded all-time high occupancy levels in 2019, driven by a seemingly insatiable demand for e-commerce shopping and same-day delivery. The shift in consumer preferences has had a pronounced impact on "bricks & mortar" retailers and retail property owners. Another year of significant store closures and bankruptcy filings resulted in dismal performance for mall REITs, whose returns lagged the index by over 30 percent. Unprecedented demand for datacenter space shows no signs of diminishing, driven by increased cloud storage, virtualization and artificial intelligence needs.
Single family rental REITs also delivered solid performance. A limited supply of affordable and available inventory, coupled with growing demand for non-apartment residences by Millennials, drove nearly sector leading returns for single family rental REITs. Office REITs also delivered above average returns. Occupancies remain relatively stable, and new office construction has been robust. Today's office tenants are flocking to modern, more functional space that affords a more enjoyable and efficient environment for their employees.
What strategies and techniques did you employ that specifically affected Fund performance?
We increased the Fund's holdings in more defensively oriented companies toward the end of 2018 and again in early 2019. Most notably we increased exposure to owners of both net lease and health care properties. These types of companies tend to offer above-average dividends and feature very low, but stable cash flow growth. In early 2019 market participants shifted to a decidedly "risk on" posture. Our defensive positioning caused the Portfolio's index-relative performance to lag amid considerable uncertainty regarding the economic impact of the tariff wars and U.S. Federal Reserve (Fed) action.
From a property-type perspective, the Fund was overweight in owners of warehouses, data centers, single family homes and medical office/life science properties. We were consistently underweight in shopping center and mall REITs, as well as hotel owners. Significant contributors to performance included stock selection within office building ownership groups. We avoided exposure to owners of New York City offices given weak
36
operating fundamentals. The Fund's positioning in office is primarily tilted to biomedical and West Coast-focused owners.
An overweighting to single family REITs also was a significant positive contributor to index-relative performance. Steady demand and enhanced cost controls led to these companies posting well above average earnings growth throughout the year. Within multifamily, once again, the manufactured housing companies delivered above average performance.
Warehouse owners proved to be a modest detractor to relative performance. Burgeoning e-commerce activity has produced record demand for warehouse space, but new supply has begun to outstrip demand, leading to reduced rental rate and net income growth for the companies. That combination typically has resulted in sub-par stock price performance and we believe a correction is due. We reduced our exposure to warehouse owners after a period of strong performance left these companies with what we believe are unsustainably inflated valuation levels.
What will affect the Fund going forward?
We believe the economy is poised to do modestly better in 2020. The consumer continues to drive growth with low unemployment and higher wages supporting spending. Although the stage is set for stronger growth in corporate America, the turn has not fully materialized due to weakness in the manufacturing and energy sectors. Still, the outlook appears brighter for 2020 as the shock from recent tariffs recedes. Corporate earnings should improve amid more stable global growth and easier year-over-year comparisons. In addition, a recession next year seems unlikely given economic fundamentals like unemployment at a nearly 50-year low.
Macroeconomic conditions remain favorable for real estate operators and we see few, if any, conditions within the real estate markets that would disrupt a continued expansion. The current real estate recovery is entering its 11th year, and many believe we are in a Goldilocks period for the sector. Occupancies across most every property segment remain at historically high levels, and speculative construction continues to be held in check with few exceptions. We believe 2020 earnings growth for REITs will approach 5 percent as landlords enjoy the benefit of contractual lease obligations from their tenants and the current ultra-low interest rate environment is providing a refinancing boost to the expense structure. This expected earnings growth should set the stage for another solid year of dividend increases across the sector.
Within the commercial real estate sector, we broadly expect stable operating trends to continue across the sector, with the recognition that today's occupancy levels and tempered rental rate increases will result in modest earnings growth. We remain optimistic as we see few material concerns emerging, as in previous cycles. Bank lending, commercial construction, equity allocations, and overall pricing metrics remain much healthier than was often the case in previous cycle peaks. Ultra-low interest rates, continued favorable operating conditions, and dependable cash flows have emboldened investors to see real estate as a relative "safe haven" in today's low-growth, low-rate environment.
37
*The results shown are past performance and are not an indication of future performance. Current performance may be lower or higher. The investment returns and principal value of an investment will fluctuate so that shares upon redemption may be worth more or less than their original cost. Performance figures of the Fund do not reflect charges pursuant to the terms of the variable life insurance policies and variable annuity contracts funded by separate accounts that invest in the Fund's shares. When such charges are deducted, actual investment performance in a variable policy or contract will be lower.
FTSE NAREIT Equity REITs Index is a broad-based index consisting of real estate investment trusts.
Ten Largest Holdings^
| Security description | Market value | % of net assets | |||||||||
ProLogis, Inc. | $ | 8,439,864 | 6.3 | % | |||||||
Equinix, Inc. | 7,607,946 | 5.7 | % | ||||||||
Alexandria Real Estate Equities, Inc. | 6,369,807 | 4.7 | % | ||||||||
Digital Realty Trust, Inc. | 5,136,846 | 3.8 | % | ||||||||
Duke Realty Corp. | 5,134,627 | 3.8 | % | ||||||||
Invitation Homes, Inc. | 5,004,990 | 3.7 | % | ||||||||
AvalonBay Communities, Inc. | 4,597,882 | 3.4 | % | ||||||||
VICI Properties, Inc. | 4,458,475 | 3.3 | % | ||||||||
Simon Property Group, Inc. | 4,033,688 | 3.0 | % | ||||||||
Healthpeak Properties, Inc. | 3,967,497 | 3.0 | % | ||||||||
$ | 54,751,622 | 40.7 | % | ||||||||
^Excludes short-term investments.
Sector Diversification (shown as a percentage of net assets)
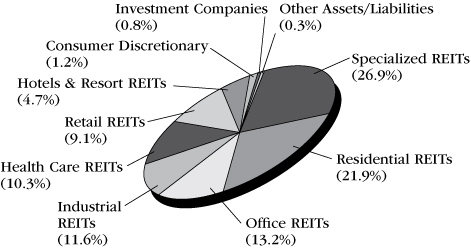
Comparison of Change in Investment Value*
A Hypothetical $10,000 Investment in SFT Real Estate Securities Fund,
FTSE NAREIT Equity REITs Index, and Consumer Price Index
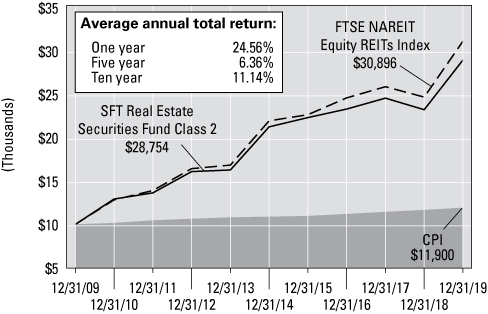
On the chart above you can see how the SFT Real Estate Securities Fund's Class 2 shares total return compared to the FTSE NAREIT Equity REITs Index and the Consumer Price Index. The three lines represent the total return of a hypothetical $10,000 investment made on December 31, 2009 through December 31, 2019, assuming reinvestment of distributions, if any.
38
Performance Update

Mark Finn, CFA, CPA Portfolio Manager T. Rowe Price
The SFT T. Rowe Price Value Fund seeks to provide long-term capital appreciation by investing in common stocks believed to be undervalued. Income is a secondary objective. The Fund pursues its objective by taking a value approach to investment selection. Holdings consist primarily of large cap stocks, but may also include stocks of mid-cap and small-cap companies. While Securian Asset Management, Inc. acts as the investment adviser for the Fund, T. Rowe Price Associates, Inc. (T. Rowe Price) provides investment advice to the Fund under a sub-advisory agreement. The Fund's value approach to investing carries the risk that the market will not recognize a security's intrinsic value for a long time or that a stock judged to be undervalued may actually be appropriately priced at a low level.
SFT T. Rowe Price Value Fund
How did the Portfolio perform during the period?
The Fund generated a total net return of 25.86 percent over the 12 months ending December 31, 2019, underperforming the Russel 1000 Value Index which returned 26.54 percent over the same period.
What influenced the Fund's return during the past 12 months?
Broadly speaking, sector allocation and stock selection detracted from relative results.
What other market conditions or events influenced the Fund's performance during the past 12 months?
U.S. stocks surged in 2019, with several major indexes hitting all-time highs in the second half of the year. The Federal Reserve's decision to keep rates steady in the first half of the year and then reduce them three times starting in July was a major driver of market performance. Trade discussions between the U.S. and China also drove market sentiment. Speculation arose numerous times during the year that the two countries were "close" to reaching an agreement, though occasional tensions seemed to reduce its likelihood. A preliminary "phase one" trade deal was not officially struck until December. As part of the agreement, the U.S. would lower or cancel the scheduled tariff rate on various Chinese goods. The agreement would also require "structural reforms and other changes to China's economic and trade regime in the areas of intellectual property, technology transfer, agriculture, financial services, and currency and foreign exchange."
What strategies and techniques did you employ that specifically affected Fund performance?
The largest detractor during the period was the information technology sector, where an underweight allocation and security selection weighed on relative results. Despite finishing higher over the course of the year, shares of Cisco Systems underperformed the sector as macro-related factors led to management revising guidance downward.
Our overweight in health care also detracted from performance during the period, and stock selection in the sector also hurt. Shares of Pfizer traded lower following the company's decision to spinoff Upjohn, the company's off-patent drug business, into a standalone firm, which is scheduled to ultimately merge with Mylan.
Stock choices within the financials sector hindered relative results, as well.
On the other end of the spectrum, stock selection in consumer staples contributed to relative results during the period. Shares of Tyson Foods continued to benefit from the ongoing effects of African Swine Fever, which has caused global protein prices to rise, and the re-opening of the Chinese market to U.S. poultry sales later in the year.
Holdings in the utilities sector also added relative value, although an overweight exposure pulled back returns. Within the sector, shares of NextEra Energy led performance, as the company benefited from strong renewable energy bookings as well as the market's expectation for another positive outcome from NextEra's planned January 2021 rate case regulatory filing.
What will affect the Fund going forward?
While we continue to be cautious, we are now more constructive on the U.S. economic cycle. Hard economic data remains weak, but economic indicators appear to be bottoming. Moreover, the Federal Reserve's accommodative monetary policy and a
39
warming in U.S.-China trade relations have provided an improved operating environment for U.S. businesses.
Amid this rapidly evolving environment, we have positioned the portfolio with more market-like cyclical exposure compared to recent years. We continue to favor fundamentally sound companies with durable earnings profiles and high-quality balance sheets that stand to outperform in the event of market turbulence. At the same time, we believe companies more exposed to the economic cycle should benefit from a rebound in economic activity in the coming year and have added to high-quality companies in those areas.
40
Ten Largest Holdings^
| Security description | Market value | % of net assets | |||||||||
JPMorgan Chase & Co. | $ | 9,048,733 | 4.5 | % | |||||||
Microsoft Corp. | 7,865,130 | 3.9 | % | ||||||||
NextEra Energy, Inc. | 7,558,298 | 3.8 | % | ||||||||
American International Group, Inc. | 7,245,897 | 3.6 | % | ||||||||
General Electric Co. | 6,834,172 | 3.4 | % | ||||||||
Danaher Corp. | 6,746,828 | 3.4 | % | ||||||||
Wells Fargo & Co. | 4,716,323 | 2.3 | % | ||||||||
Tyson Foods, Inc. | 4,712,322 | 2.3 | % | ||||||||
ProLogis, Inc. | 4,397,900 | 2.2 | % | ||||||||
Sempra Energy | 4,373,379 | 2.2 | % | ||||||||
$ | 63,498,982 | 31.6 | % | ||||||||
^Excludes short-term investments.
Sector Diversification (shown as a percentage of net assets)
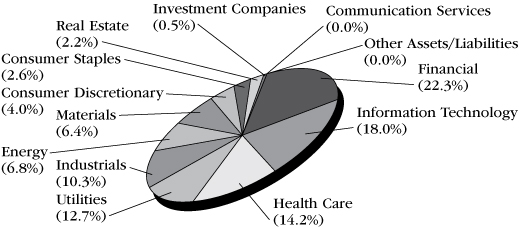
Comparison of Change in Investment Value*
A Hypothetical $10,000 Investment in SFT T. Rowe Price Value Fund,
the Russell 1000 Value Index and Consumer Price Index
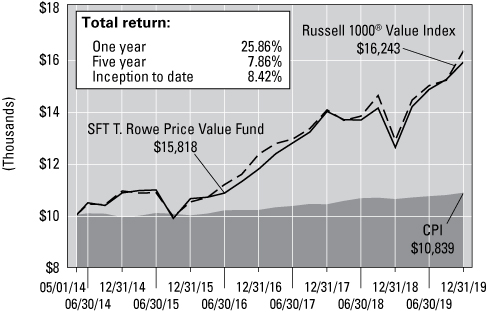
On the chart above you can see how the SFT T. Rowe Price Value Fund's shares total return compared to the Russell 1000 Value Index and the Consumer Price Index. The three lines represent the total return of a hypothetical $10,000 investment made on May 1, 2014 through December 31, 2019, assuming reinvestment of distributions, if any.
*The results shown are past performance and are not an indication of future performance. Current performance may be lower or higher. The investment returns and principal value of an investment will fluctuate so that shares upon redemption may be worth more or less than their original cost. Performance figures of the Fund do not reflect charges pursuant to the terms of the variable life insurance policies and variable annuity contracts funded by separate accounts that invest in the Fund's shares. When such charges are deducted, actual investment performance in a variable policy or contract will be lower.
Russell 1000 Value Index measures the performance of those Russell 1000 companies with lower price-to-book ratios and lower forecasted growth values.
41
Performance Update


Mammen Chally, CFA, David A. Siegle, CFA and Douglas W. McLane, CFA Portfolio Managers Wellington Management Company LLC
The SFT Wellington Core Equity Fund seeks growth of capital. The Fund pursues its objective by investing primarily in a diversified portfolio of common stocks. While Securian Asset Management, Inc. acts as the investment adviser for the Fund, Wellington Management Company LLP provides investment advice to the Fund under a sub-advisory agreement. Risks associated with investing in the Fund include, but are not limited to, issuer-specific market volatility and risk of declines in the equity markets generally.
SFT Wellington Core Equity Fund
How did the Fund perform during the period?
The Fund's Class 2 shares generated a total net return of 33.73 percent over the period ending December 31, 2019, outperforming the S&P 500® Index, which returned 31.49 percent over the same period.
What influenced the Fund's return during the past 12 months?
During the period, security selection was the primary driver of outperformance, while sector allocation, a fall-out of our bottom-up stock selection process, slightly detracted. Strong stock selection in industrials (overweight to Fortune Brands, underweight to Boeing), health care (not owning Pfizer and Johnson & Johnson), and financials (not owning Berkshire Hathaway, overweight to Bank of America) was partially offset by weaker selection in energy (overweights to Continental Resources and EOG Resources) and communication services (overweight to Verizon, underweight to Facebook). From an allocation perspective, our overweight to health care and underweight to information technology detracted from relative results, while our underweight to energy partially offset results.
What other market conditions or events influenced the Fund's performance during the past 12 months?
U.S. equities, as measured by the S&P 500® Index, posted positive results over the trailing 12-month period ending 31 December 2019. During the first quarter of 2019, U.S. equities rallied to their largest quarterly gain since 2009, buoyed by a dovish shift in U.S. Federal Reserve (Fed) policy and guidance, optimism for a U.S.-China trade deal, relatively strong fourth-quarter earnings, and corporate buybacks. By the summer of 2019, unresolved U.S. trade frictions with China, Mexico, Japan, and the EU unsettled markets and raised concerns about the potential risks to U.S. economic growth from increasing cost pressures, supply chain disruptions, and waning business confidence and investment plans. In the third quarter of 2019, U.S. equities rose for the third consecutive quarter with the U.S. economy remaining resilient despite elevated geopolitical uncertainties and slowing global growth. U.S.-China trade relations were particularly volatile in the absence of meaningful compromises on key structural issues, and expectations for a protracted trade war and the potential for a longer-term decoupling of the world's two largest economies has eroded consumer and business confidence and curtailed capital spending. The Fed lowered its benchmark interest rate in July and September by a combined 0.50 percent in effort to sustain economic expansion and mitigate the risks of moderating growth and trade frictions. U.S. equities surged in the fourth quarter, as stocks benefitted from waning recession fears, improved trade sentiment, and accommodative Fed policies. In October, the Fed lowered interest rates for the final time in 2019 by 0.25 percent. Trade tensions were volatile during the quarter but eased in December after the U.S. and China reached a phase one trade agreement. The U.S. House of Representatives voted to impeach President Trump; however, markets were unaffected given that the Republican-led Senate is unlikely to support his impeachment.
What strategies and techniques did you employ that affected Fund performance?
Over the period, the Fund slightly increased exposure to information technology and consumer staples while we decreased exposure to health care and consumer discretionary. We established a new position in Raytheon, a technology and innovation
42
leader in defense, civil government and cybersecurity solutions. Defense remains a structurally attractive industry with government spending increasing worldwide. Raytheon has the leading missile defense technology which has seen renewed interest worldwide and in the U.S. as a key pillar to defense strategy. Raytheon's pipeline is broad, stretching to both domestic and international customers with key franchises, such as the Patriot.
We eliminated our position in Boeing, a leader in the manufacture of commercial jetliners and defense space and security systems. Earlier in the year, Boeing grounded their 737 Max jets due to two fatal crashes. We subsequently eliminated the position as the potential range of outcomes remains large as there are several significant issues that need to be resolved related to the 737 Max jet. These issues include technical remediation, liability, potential impacts to the backlog and customer relationships.
What will affect the Fund going forward?
As we look into 2020, many of the constructive fundamental drivers of U.S. economic growth in 2019 persist. Labor markets remain healthy—wage gains continue to bolster consumer confidence, but we believe they should not trigger outsized inflation due to continued productivity improvements. The U.S. housing market has turned the corner after six quarters of negative growth, responding to rate cuts by the Fed. Moving forward, we expect Fed action is likely to be more gradual, having now achieved targeted levels of inflation. If true, we expect this should also result in less volatility for the U.S. dollar.
The team believes that trade negotiations between the U.S. and China will remain vitally important to markets. The period ended with encouraging progress—the "List 4" tariffs slated for December implementation were delayed, and indications that forward progress for a "Phase 1" agreement were in place. Additionally, the passage of the tri-party USMCA (United States-Mexico-Canada Agreement—replacement for NAFTA) deal by the U.S. House of Representatives and an expected ratification by the U.S. Senate provides important certainty to North American supply chains.
As the new year begins, U.S. politics will first be dominated by a historic Presidential impeachment trial in the U.S. Senate, before yielding to a rapid succession of Democratic primaries which will provide more certainty into both the eventual Democratic candidate as well as the main platform issues to be put forward by that party in the Presidential election. We expect the outcome at the ballot box could warrant future action in the Fund, however, given the wide range of possible outcomes at this point, this bears more monitoring than action at this time.
43
Ten Largest Holdings^
| Security description | Market value | % of stock portfolio | |||||||||
Apple, Inc. | $ | 4,540,123 | 3.6 | % | |||||||
Microsoft Corp. | 4,065,033 | 3.3 | % | ||||||||
JPMorgan Chase & Co. | 3,554,700 | 2.8 | % | ||||||||
Alphabet, Inc.—Class A | 3,316,330 | 2.7 | % | ||||||||
Bank of America Corp. | 3,300,854 | 2.6 | % | ||||||||
The Procter & Gamble Co. | 3,049,433 | 2.4 | % | ||||||||
Mastercard, Inc. | 2,498,303 | 2.0 | % | ||||||||
NextEra Energy, Inc. | 2,361,060 | 1.9 | % | ||||||||
UnitedHealth Group, Inc. | 2,337,435 | 1.9 | % | ||||||||
The PNC Financial Services Group, Inc. | 2,210,237 | 1.8 | % | ||||||||
$ | 31,233,508 | 25.0 | % | ||||||||
^Excludes short-term investments.
Sector Diversification (shown as a percentage of net assets)
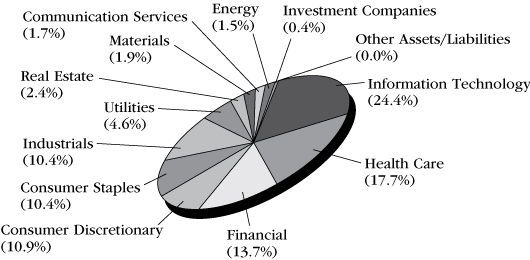
44
Comparison of Change in Investment Value*
A Hypothetical $10,000 Investment in SFT Wellington Core Equity Fund,
the S&P 500® Index and Consumer Price Index
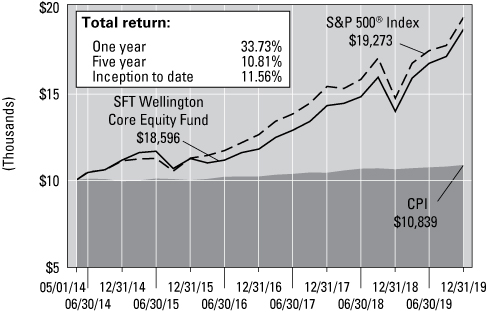
On the chart above you can see how the SFT Wellington Core Equity Fund's Class 2 shares total return compared to the S&P 500® Index and the Consumer Price Index. The three lines represent the total return of a hypothetical $10,000 investment made on May 1, 2014 through December 31, 2019, assuming reinvestment of distributions, if any.
*The results shown are past performance and are not an indication of future performance. Current performance may be lower or higher. The investment returns and principal value of an investment will fluctuate so that shares upon redemption may be worth more or less than their original cost. Performance figures of the Fund do not reflect charges pursuant to the terms of the variable life insurance policies and variable annuity contracts funded by separate accounts that invest in the Fund's shares. When such charges are deducted, actual investment performance in a variable policy or contract will be lower.
The S&P 500® Index is a broad, unmanaged index of 500 common stocks which are representative of the U.S. stock market overall.
45
Report of Independent Registered Public Accounting Firm
To the Shareholders and Board of Trustees
Securian Funds Trust:
Opinion on the Financial Statements
We have audited the accompanying statements of assets and liabilities of SFT Core Bond Fund, SFT Dynamic Managed Volatility Fund, SFT Government Money Market Fund, SFT Index 400 Mid-Cap Fund, SFT Index 500 Fund, SFT International Bond Fund, SFT Ivy GrowthSM Fund, SFT IvySM Small Cap Growth Fund, SFT Managed Volatility Equity Fund, SFT Real Estate Securities Fund, SFT T. Rowe Price Value Fund, and SFT Wellington Core Equity Fund (collectively, the Funds), including the schedules of investments in securities, as of December 31, 2019, the related statements of operations for the year then ended, the statements of changes in net assets for each of the years in the two-year period then ended, and the related notes (collectively, the financial statements) and the financial highlights for each of the years or periods in the five-year period then ended. In our opinion, the financial statements and financial highlights of each Fund present fairly, in all material respects, the financial position of each Fund as of December 31, 2019, the results of its operations for the year then ended, the changes in its net assets for each of the years in the two-year period then ended, and the financial highlights for each of the years or periods in the five-year period then ended, in conformity with U.S. generally accepted accounting principles.
Basis for Opinion
These financial statements are the responsibility of the Funds' management. Our responsibility is to express an opinion on these financial statements based on our audits. We are a public accounting firm registered with the PCAOB and are required to be independent with respect to the Funds in accordance with the U.S. federal securities laws and the applicable rules and regulations of the Securities and Exchange Commission and the PCAOB.
We conducted our audits in accordance with the standards of the PCAOB. Those standards require that we plan and perform the audit to obtain reasonable assurance about whether the financial statements and financial highlights are free of material misstatement, whether due to error or fraud. Our audits included performing procedures to assess the risks of material misstatement of the financial statements and financial highlights, whether due to error or fraud, and performing procedures that respond to those risks. Such procedures included examining, on a test basis, evidence regarding the amounts and disclosures in the financial statements and financial highlights. Such procedures also included confirmation of securities owned as of December 31, 2019, by correspondence with the custodian and brokers, or other appropriate auditing procedures. Our audits also included evaluating the accounting principles used and significant estimates made by management, as well as evaluating the overall presentation of the financial statements and financial highlights. We believe that our audits provide a reasonable basis for our opinion.
We have served as the auditor of one or more Securian Funds Trust investment companies since 1985.
Minneapolis, Minnesota
February 20, 2020
46
SFT Core Bond Fund
Investments in Securities
December 31, 2019
(Percentages of each investment category relate to total net assets)
Principal | Value(a) | ||||||||||
Long-Term Debt Securities (99.3%) | |||||||||||
Government Obligations (30.6%) | |||||||||||
Other Government Obligations (1.6%) | |||||||||||
| Provincial or Local Government Obligations (1.6%) | |||||||||||
| Douglas County Public Utility District No. 1, 5.450%, 09/01/40 | $ | 1,185,000 | $ | 1,520,272 | |||||||
| Municipal Electric Authority of Georgia, 6.655%, 04/01/57 | 1,188,000 | 1,636,363 | |||||||||
| Ohio State Water Development Authority, 4.817%, 12/01/30 | 250,000 | 292,647 | |||||||||
| Port Authority of New York & New Jersey 4.458%, 10/01/62 | 1,150,000 | 1,409,440 | |||||||||
4.926%, 10/01/51 | 2,055,000 | 2,662,150 | |||||||||
| Texas A&M University, 4.000%, 05/15/31 | 325,000 | 348,881 | |||||||||
7,869,753 | |||||||||||
| U.S. Government Agencies and Obligations (29.0%) | |||||||||||
| Federal Home Loan Mortgage Corporation (FHLMC) (5.3%) | |||||||||||
| 2.347%, 01/25/23 (1-Month USD LIBOR + 0.650%) (b) | 72,395 | 72,377 | |||||||||
2.500%, 03/01/28 | 429,070 | 436,236 | |||||||||
2.500%, 04/01/28 | 151,290 | 153,607 | |||||||||
| 2.742%, 10/25/29 (1-Month USD LIBOR + 0.950%) (b) | 450,000 | 424,202 | |||||||||
3.000%, 08/01/42 | 494,064 | 509,079 | |||||||||
3.000%, 12/01/42 | 192,175 | 198,016 | |||||||||
3.000%, 01/01/43 | 255,264 | 263,103 | |||||||||
3.000%, 02/01/43 | 602,709 | 623,484 | |||||||||
3.000%, 04/01/43 | 985,505 | 1,015,109 | |||||||||
3.000%, 10/25/46 | 291,027 | 294,101 | |||||||||
3.500%, 10/01/25 | 180,569 | 187,081 | |||||||||
3.500%, 05/01/32 | 214,288 | 224,132 | |||||||||
3.500%, 03/01/42 | 834,080 | 882,478 | |||||||||
3.500%, 08/01/42 | 628,439 | 664,923 | |||||||||
3.500%, 05/25/45 | 1,058,245 | 1,077,797 | |||||||||
4.000%, 09/01/40 | 733,363 | 786,652 | |||||||||
4.000%, 11/01/40 | 1,387,495 | 1,497,198 | |||||||||
4.000%, 02/01/41 | 312,320 | 334,987 | |||||||||
4.000%, 03/01/41 | 300,371 | 323,743 | |||||||||
4.500%, 04/01/23 | 19,128 | 20,117 | |||||||||
4.500%, 09/01/40 | 175,920 | 191,036 | |||||||||
4.500%, 01/01/41 | 575,179 | 624,643 | |||||||||
4.500%, 02/01/41 | 338,891 | 368,028 | |||||||||
4.500%, 03/01/41 | 639,358 | 694,259 | |||||||||
4.500%, 04/01/41 | 495,869 | 543,953 | |||||||||
5.000%, 03/01/23 | 13,140 | 14,017 | |||||||||
5.000%, 05/01/29 | 24,405 | 26,222 | |||||||||
5.000%, 04/01/35 | 90,311 | 96,384 | |||||||||
5.000%, 08/01/35 | 55,532 | 61,242 | |||||||||
5.000%, 11/01/35 | 100,556 | 109,236 | |||||||||
5.000%, 11/01/39 | 557,500 | 619,943 | |||||||||
5.000%, 04/01/40 | 231,915 | 255,255 | |||||||||
5.000%, 08/01/40 | 138,113 | 152,351 | |||||||||
Principal | Value(a) | ||||||||||
| 5.242%, 10/25/29 (1-Month USD LIBOR + 3.450%) (b) | $ | 4,000,000 | $ | 4,260,600 | |||||||
5.500%, 06/01/20 | 3,425 | 3,427 | |||||||||
5.500%, 10/01/20 | 23,084 | 23,162 | |||||||||
5.500%, 11/01/23 | 93,202 | 100,186 | |||||||||
5.500%, 05/01/34 | 624,851 | 702,218 | |||||||||
5.500%, 10/01/34 | 185,250 | 207,665 | |||||||||
5.500%, 07/01/35 | 232,360 | 260,662 | |||||||||
5.500%, 10/01/35 | 233,424 | 262,412 | |||||||||
5.500%, 12/01/38 | 124,196 | 139,307 | |||||||||
6.000%, 09/01/22 | 20,991 | 21,630 | |||||||||
6.000%, 11/01/33 | 310,453 | 355,793 | |||||||||
6.250%, 12/15/23 | 29,130 | 30,711 | |||||||||
| 6.342%, 10/25/24 (1-Month USD LIBOR + 4.550%) (b) | 149,166 | 159,961 | |||||||||
6.500%, 09/01/32 | 40,008 | 46,245 | |||||||||
6.500%, 11/01/32 | 29,474 | 33,804 | |||||||||
6.500%, 06/01/36 | 184,754 | 217,145 | |||||||||
| 6.592%, 05/25/28 (1-Month USD LIBOR + 4.800%) (b) | 1,700,000 | 1,832,205 | |||||||||
7.000%, 12/01/37 | 39,236 | 44,749 | |||||||||
| 7.342%, 07/25/28 (1-Month USD LIBOR + 5.550%) (b) | 3,000,000 | 3,308,493 | |||||||||
25,755,366 | |||||||||||
| Federal National Mortgage Association (FNMA) (8.7%) | |||||||||||
2.500%, 03/01/27 | 245,772 | 249,853 | |||||||||
2.500%, 11/01/27 | 413,709 | 418,488 | |||||||||
2.500%, 03/01/28 | 278,073 | 282,134 | |||||||||
2.500%, 07/01/28 | 374,308 | 380,555 | |||||||||
3.000%, 06/01/22 | 73,208 | 75,013 | |||||||||
3.000%, 09/01/22 | 48,585 | 49,783 | |||||||||
3.000%, 11/01/27 | 180,329 | 185,049 | |||||||||
3.000%, 06/01/28 | 149,245 | 154,325 | |||||||||
3.000%, 09/01/42 | 138,615 | 142,828 | |||||||||
3.000%, 01/01/46 | 483,703 | 495,655 | |||||||||
3.500%, 11/01/25 | 195,686 | 202,775 | |||||||||
3.500%, 01/01/26 | 242,111 | 250,878 | |||||||||
3.500%, 12/01/32 | 177,631 | 185,777 | |||||||||
3.500%, 11/01/40 | 518,100 | 551,138 | |||||||||
3.500%, 01/01/41 | 595,839 | 628,614 | |||||||||
3.500%, 02/01/41 | 833,928 | 882,037 | |||||||||
3.500%, 04/01/41 | 313,847 | 330,904 | |||||||||
3.500%, 11/01/41 | 2,203,249 | 2,345,601 | |||||||||
3.500%, 12/01/41 | 551,922 | 581,787 | |||||||||
3.500%, 05/01/42 | 212,233 | 224,501 | |||||||||
3.500%, 01/01/43 | 529,100 | 557,672 | |||||||||
3.500%, 02/01/43 | 463,962 | 497,327 | |||||||||
3.500%, 05/01/43 | 1,702,454 | 1,810,262 | |||||||||
3.500%, 01/14/50 (c) | 8,230,000 | 8,466,291 | |||||||||
4.000%, 06/25/23 | 59,639 | 60,106 | |||||||||
4.000%, 12/01/40 | 117,719 | 126,240 | |||||||||
4.000%, 04/01/41 | 1,161,198 | 1,245,787 | |||||||||
4.000%, 09/01/41 | 480,881 | 515,591 | |||||||||
4.000%, 11/01/41 | 234,093 | 250,809 | |||||||||
4.000%, 06/01/42 | 622,641 | 667,744 | |||||||||
4.000%, 09/01/43 | 376,995 | 400,477 | |||||||||
4.500%, 04/01/21 | 947 | 978 | |||||||||
4.500%, 04/01/25 | 35,139 | 36,957 | |||||||||
4.500%, 05/25/34 | 537,000 | 591,175 | |||||||||
See accompanying notes to financial statements.
47
SFT Core Bond Fund
Investments in Securities – continued
Principal | Value(a) | ||||||||||
4.500%, 05/01/35 | $ | 232,990 | $ | 252,754 | |||||||
4.500%, 07/01/35 | 402,095 | 430,311 | |||||||||
4.500%, 09/01/37 | 161,889 | 174,863 | |||||||||
4.500%, 06/01/39 | 161,987 | 175,806 | |||||||||
4.500%, 04/01/41 | 1,396,675 | 1,544,266 | |||||||||
4.500%, 07/01/41 | 1,231,735 | 1,337,334 | |||||||||
4.500%, 07/01/47 | 412,555 | 447,038 | |||||||||
5.000%, 10/01/20 | 7,690 | 7,945 | |||||||||
5.000%, 06/25/23 | 56,408 | 58,464 | |||||||||
5.000%, 07/01/23 | 41,663 | 44,450 | |||||||||
5.000%, 11/01/33 | 172,637 | 190,152 | |||||||||
5.000%, 03/01/34 | 174,150 | 191,674 | |||||||||
5.000%, 05/01/34 | 41,647 | 45,875 | |||||||||
5.000%, 12/01/34 | 195,671 | 215,635 | |||||||||
5.000%, 07/01/35 | 172,559 | 190,158 | |||||||||
5.000%, 08/01/35 | 54,097 | 59,522 | |||||||||
5.000%, 03/01/38 | 89,441 | 98,481 | |||||||||
5.000%, 04/01/38 | 114,711 | 127,896 | |||||||||
5.000%, 06/01/39 | 109,036 | 121,952 | |||||||||
5.000%, 12/01/39 | 416,703 | 467,674 | |||||||||
5.000%, 06/01/40 | 60,497 | 66,643 | |||||||||
5.000%, 04/01/41 | 377,374 | 419,577 | |||||||||
| 5.442%, 09/25/29 (1-Month USD LIBOR + 3.650%) (b) | 250,000 | 263,323 | |||||||||
5.500%, 08/01/23 | 25,098 | 26,971 | |||||||||
5.500%, 02/01/24 | 38,956 | 41,877 | |||||||||
5.500%, 04/01/33 | 537,212 | 599,175 | |||||||||
5.500%, 05/01/33 | 11,542 | 12,982 | |||||||||
5.500%, 12/01/33 | 65,403 | 73,611 | |||||||||
5.500%, 01/01/34 | 130,978 | 147,421 | |||||||||
5.500%, 02/01/34 | 137,992 | 154,400 | |||||||||
5.500%, 03/01/34 | 216,808 | 242,580 | |||||||||
5.500%, 04/01/34 | 132,484 | 148,885 | |||||||||
5.500%, 05/01/34 | 4,808 | 5,171 | |||||||||
5.500%, 09/01/34 | 196,304 | 216,777 | |||||||||
5.500%, 10/01/34 | 53,183 | 59,812 | |||||||||
5.500%, 01/01/35 | 88,566 | 99,540 | |||||||||
5.500%, 02/01/35 | 228,157 | 252,812 | |||||||||
5.500%, 04/01/35 | 240,857 | 270,591 | |||||||||
5.500%, 06/01/35 | 39,078 | 42,229 | |||||||||
5.500%, 08/01/35 | 134,839 | 151,098 | |||||||||
5.500%, 10/01/35 | 322,167 | 363,051 | |||||||||
5.500%, 11/01/35 | 66,966 | 75,515 | |||||||||
5.500%, 09/01/36 | 120,235 | 135,261 | |||||||||
5.500%, 12/01/39 | 81,502 | 91,534 | |||||||||
6.000%, 08/01/23 | 31,442 | 32,542 | |||||||||
6.000%, 09/01/32 | 12,528 | 14,266 | |||||||||
6.000%, 10/01/32 | 434,675 | 497,680 | |||||||||
6.000%, 11/01/32 | 369,286 | 422,867 | |||||||||
6.000%, 03/01/33 | 377,329 | 431,403 | |||||||||
6.000%, 04/01/33 | 23,640 | 26,046 | |||||||||
6.000%, 12/01/33 | 115,994 | 132,857 | |||||||||
6.000%, 08/01/34 | 38,139 | 42,820 | |||||||||
6.000%, 09/01/34 | 21,037 | 23,790 | |||||||||
6.000%, 11/01/34 | 12,786 | 14,181 | |||||||||
6.000%, 12/01/34 | 99,142 | 113,634 | |||||||||
6.000%, 11/01/36 | 12,404 | 14,200 | |||||||||
6.000%, 01/01/37 | 121,962 | 139,574 | |||||||||
6.000%, 08/01/37 | 77,963 | 89,152 | |||||||||
6.000%, 12/01/37 | 6,109 | 6,719 | |||||||||
6.000%, 10/01/38 | 150,571 | 173,913 | |||||||||
| 6.092%, 02/25/25 (1-Month USD LIBOR + 4.300%) (b) | 1,680,898 | 1,789,491 | |||||||||
Principal | Value(a) | ||||||||||
| 6.192%, 01/25/24 (1-Month USD LIBOR + 4.400%) (b) | $ | 95,041 | $ | 103,289 | |||||||
| 6.242%, 01/25/29 (1-Month USD LIBOR + 4.450%) (b) | 2,083,353 | 2,200,393 | |||||||||
6.500%, 11/01/23 | 23,756 | 24,795 | |||||||||
6.500%, 12/01/31 | 61,806 | 71,404 | |||||||||
6.500%, 02/01/32 | 186,490 | 215,906 | |||||||||
6.500%, 04/01/32 | 135,219 | 154,772 | |||||||||
6.500%, 05/01/32 | 34,990 | 38,837 | |||||||||
6.500%, 07/01/32 | 269,063 | 308,771 | |||||||||
6.500%, 08/01/32 | 106,511 | 122,622 | |||||||||
6.500%, 09/01/32 | 71,321 | 82,176 | |||||||||
6.500%, 10/01/32 | 92,606 | 106,038 | |||||||||
6.500%, 09/01/34 | 10,049 | 11,207 | |||||||||
6.500%, 11/01/34 | 5,551 | 6,420 | |||||||||
6.500%, 03/01/35 | 75,894 | 86,418 | |||||||||
6.500%, 02/01/36 | 14,400 | 15,983 | |||||||||
6.500%, 09/01/37 | 64,493 | 71,784 | |||||||||
6.500%, 11/01/37 | 40,960 | 47,457 | |||||||||
7.000%, 07/01/31 | 53,847 | 63,211 | |||||||||
7.000%, 09/01/31 | 168,402 | 192,733 | |||||||||
7.000%, 11/01/31 | 186,356 | 212,015 | |||||||||
7.000%, 02/01/32 | 91,069 | 104,986 | |||||||||
7.000%, 03/01/32 | 16,636 | 19,659 | |||||||||
7.000%, 07/01/32 | 70,942 | 80,667 | |||||||||
7.000%, 10/01/37 | 15,455 | 16,272 | |||||||||
7.500%, 07/25/22 | 13,555 | 13,939 | |||||||||
7.500%, 04/01/31 | 85,770 | 95,921 | |||||||||
7.500%, 05/01/31 | 20,325 | 22,753 | |||||||||
42,443,760 | |||||||||||
| Government National Mortgage Association (GNMA) (2.7%) | |||||||||||
0.004%, 06/17/45 (b) (d) | 354,968 | 38 | |||||||||
0.643%, 07/16/40 (b) (d) | 22,589 | – | |||||||||
1.000%, 12/20/42 | 109,199 | 102,308 | |||||||||
3.000%, 03/15/45 | 1,273,034 | 1,311,034 | |||||||||
3.000%, 04/15/45 | 2,240,684 | 2,307,576 | |||||||||
3.000%, 05/15/45 | 120,800 | 124,392 | |||||||||
3.250%, 04/20/33 | 145,859 | 151,019 | |||||||||
3.250%, 03/20/35 | 1,072,074 | 1,110,039 | |||||||||
3.250%, 11/20/35 | 573,418 | 592,880 | |||||||||
3.250%, 01/20/36 | 995,649 | 1,029,443 | |||||||||
3.500%, 11/15/40 | 71,708 | 75,448 | |||||||||
3.500%, 04/20/46 | 746,458 | 773,116 | |||||||||
3.750%, 03/20/46 | 905,707 | 948,873 | |||||||||
4.000%, 07/20/31 | 333,121 | 347,655 | |||||||||
4.000%, 04/20/39 | 233,111 | 243,306 | |||||||||
4.000%, 12/20/40 | 712,897 | 768,573 | |||||||||
4.000%, 01/15/41 | 45,089 | 48,022 | |||||||||
4.000%, 02/15/41 | 332,438 | 359,422 | |||||||||
4.000%, 10/15/41 | 229,161 | 244,140 | |||||||||
4.000%, 12/20/44 | 120,906 | 128,053 | |||||||||
4.500%, 06/15/40 | 224,632 | 246,843 | |||||||||
5.000%, 05/15/33 | 71,022 | 78,638 | |||||||||
5.000%, 12/15/39 | 86,022 | 95,799 | |||||||||
5.000%, 01/15/40 | 926,063 | 1,021,051 | |||||||||
5.000%, 07/15/40 | 233,664 | 259,420 | |||||||||
5.500%, 07/15/38 | 229,476 | 257,597 | |||||||||
5.500%, 10/15/38 | 322,273 | 361,210 | |||||||||
8.500%, 10/15/22 | 6,588 | 6,607 | |||||||||
12,992,502 | |||||||||||
See accompanying notes to financial statements.
48
SFT Core Bond Fund
Investments in Securities – continued
Principal | Value(a) | ||||||||||
U.S. Treasury (12.3%) | |||||||||||
| U.S. Treasury Bond 2.875%, 05/15/49 | $ | 6,800,000 | $ | 7,515,328 | |||||||
3.000%, 02/15/49 | 10,570,000 | 11,955,661 | |||||||||
5.375%, 02/15/31 (e) | 5,115,000 | 6,869,885 | |||||||||
| U.S. Treasury Note 1.250%, 02/29/20 | 1,250,000 | 1,249,171 | |||||||||
1.375%, 04/30/20 | 1,000,000 | 999,060 | |||||||||
1.375%, 05/31/20 | 550,000 | 549,355 | |||||||||
1.500%, 11/30/21 | 2,500,000 | 2,496,680 | |||||||||
1.500%, 11/30/24 | 5,120,000 | 5,078,600 | |||||||||
1.625%, 11/30/26 | 11,100,000 | 10,959,516 | |||||||||
1.750%, 12/31/20 | 4,000,000 | 4,003,750 | |||||||||
1.750%, 11/15/29 | 8,325,000 | 8,205,978 | |||||||||
2.250%, 02/15/27 (e) | 150,000 | 154,213 | |||||||||
2.750%, 02/15/28 | 200,000 | 213,227 | |||||||||
60,250,424 | |||||||||||
Vendee Mortgage Trust (0.0%) | |||||||||||
| Vendee Mortgage Trust, 7.793%, 02/15/25 | 25,262 | 27,308 | |||||||||
| Total government obligations (cost: $144,879,805) | 149,339,113 | ||||||||||
Asset-Backed Securities (13.4%) | |||||||||||
| Bank of The West Auto Trust, 3.210%, 04/15/25 (f) | 2,293,000 | 2,300,850 | |||||||||
| Bear Stearns Asset Backed Securities Trust, 2.767%, 02/25/34 (1-Month USD LIBOR + 0.975%) (b) | 361,951 | 362,100 | |||||||||
| CarMax Auto Owner Trust, 2.950%, 11/15/23 | 1,950,000 | 1,969,673 | |||||||||
| Chase Funding Trust 2.352%, 02/25/33 (1-Month USD LIBOR + 0.560%) (b) | 155,233 | 150,297 | |||||||||
| 2.432%, 08/25/32 (1-Month USD LIBOR + 0.640%) (b) | 120,225 | 118,041 | |||||||||
| Chesapeake Funding II LLC 3.260%, 11/15/29 (f) | 375,000 | 377,038 | |||||||||
3.380%, 08/15/29 (f) | 275,000 | 276,565 | |||||||||
3.570%, 04/15/30 (f) | 1,200,000 | 1,222,870 | |||||||||
3.710%, 05/15/29 (f) | 1,885,000 | 1,909,619 | |||||||||
| Commonbond Student Loan Trust 2.550%, 05/25/41 (f) | 418,133 | 415,242 | |||||||||
5.280%, 05/25/41 (f) | 57,046 | 59,414 | |||||||||
| Commonbond Student Loan Trust 2018-A-GS 2.292%, 02/25/44 (1-Month USD LIBOR + 0.500%) (b) (f) | 801,996 | 788,820 | |||||||||
3.210%, 02/25/44 (f) | 1,947,532 | 1,970,886 | |||||||||
| Commonbond Student Loan Trust 2019-A-GS, 2.540%, 01/25/47 (f) | 4,337,408 | 4,297,005 | |||||||||
| Earnest Student Loan Program LLC 2.650%, 01/25/41 (f) | 178,590 | 178,396 | |||||||||
2.720%, 01/25/41 (f) | 317,042 | 316,704 | |||||||||
3.020%, 05/25/34 (f) | 422,499 | 422,069 | |||||||||
| Entergy Gulf States Reconstruction Funding 1 LLC, 5.930%, 06/29/22 | 219,794 | 225,020 | |||||||||
Principal | Value(a) | ||||||||||
| Exeter Automobile Receivables Trust 2015-3, 6.550%, 10/17/22 (f) | $ | 2,000,000 | $ | 2,018,199 | |||||||
| Exeter Automobile Receivables Trust 2016-2, 8.250%, 04/17/23 (f) | 1,800,000 | 1,876,524 | |||||||||
| FirstEnergy Ohio PIRB Special Purpose Trust, 1.726%, 01/15/22 | 16,726 | 16,721 | |||||||||
| Foursight Capital Automobile Receivables Trust 3.710%, 01/18/22 (f) | 1,485,000 | 1,489,652 | |||||||||
5.280%, 08/15/24 (f) | 3,850,000 | 3,943,519 | |||||||||
| GM Financial Consumer Automobile Receivables Trust, 2.770%, 07/17/23 | 800,000 | 803,071 | |||||||||
| Home Partners of America 2018-1 Trust, 2.637%, 07/17/37 (1-Month USD LIBOR + 0.900%) (b) (f) | 1,777,468 | 1,777,185 | |||||||||
| Invitation Homes 2018-SFR1 Trust 2.987%, 03/17/37 (1-Month USD LIBOR + 1.250%) (b) (f) | 3,500,000 | 3,491,450 | |||||||||
| 3.187%, 03/17/37 (1-Month USD LIBOR + 1.450%) (b) (f) | 1,000,000 | 998,055 | |||||||||
| Invitation Homes 2018-SFR3 Trust 2.737%, 07/17/37 (1-Month USD LIBOR + 1.000%) (b) (f) | 2,034,293 | 2,034,767 | |||||||||
| 3.387%, 07/17/37 (1-Month USD LIBOR + 1.650%) (b) (f) | 1,500,000 | 1,505,136 | |||||||||
| Invitation Homes 2018-SFR4 Trust, 3.137%, 01/17/38 (1-Month USD LIBOR + 1.400%) (b) (f) | 4,300,000 | 4,299,992 | |||||||||
| Invitation Homes Trust, 3.020%, 06/17/37 (1-Month USD LIBOR + 1.280%)(b) (f) | 1,500,000 | 1,498,468 | |||||||||
| Morgan Stanley Dean Witter Capital I, Inc., 2.352%, 08/25/32 (1-Month USD LIBOR + 0.560%) (b) | 178,343 | 173,292 | |||||||||
| Progress Residential 2018-SFR1 Trust, 3.684%, 03/17/35 (f) | 500,000 | 501,928 | |||||||||
| Progress Residential 2019-SFR2 Trust, 3.446%, 05/17/36 (f) | 2,500,000 | 2,517,039 | |||||||||
| Progress Residential Trust, 3.565%, 08/17/34 (f) | 1,525,000 | 1,534,417 | |||||||||
| Saxon Asset Securities Trust, 2.332%, 03/25/35 (1-Month USD LIBOR + 0.540%) (b) | 270,238 | 255,965 | |||||||||
| Sofi Professional Loan Program 2017-F LLC, 2.840%, 01/25/41 (f) | 1,500,000 | 1,511,808 | |||||||||
| Sofi Professional Loan Program 2018-A LLC, 2.950%, 02/25/42 (f) | 1,200,000 | 1,211,232 | |||||||||
| Towd Point Mortgage Trust 3.000%, 06/25/58 (b) (f) | 3,697,081 | 3,751,521 | |||||||||
3.750%, 04/25/55 (b) (f) | 1,455,000 | 1,512,294 | |||||||||
4.491%, 11/25/57 (b) (f) | 3,154,000 | 3,322,663 | |||||||||
See accompanying notes to financial statements.
49
SFT Core Bond Fund
Investments in Securities – continued
Principal | Value(a) | ||||||||||
| Volvo Financial Equipment LLC Series 2018-1, 3.060%, 12/15/25 (f) | $ | 1,300,000 | $ | 1,309,149 | |||||||
| Westlake Automobile Receivables Trust 2017-1, 5.050%, 08/15/24 (f) | 725,000 | 735,979 | |||||||||
| Westlake Automobile Receivables Trust 2017-2, 4.630%, 07/15/24 (f) | 850,000 | 866,598 | |||||||||
| Westlake Automobile Receivables Trust 2018-1, 2.920%, 05/15/23 (f) | 3,000,000 | 3,007,950 | |||||||||
| Total asset-backed securities (cost: $65,031,466) | 65,325,183 | ||||||||||
Other Mortgage-Backed Securities (13.5%) | |||||||||||
| Collateralized Mortgage Obligations/Mortgage Revenue Bonds (7.1%) | |||||||||||
| Agate Bay Mortgage Trust, 3.807%, 01/25/45 (b) (f) | 244,118 | 249,669 | |||||||||
| Bear Stearns Mortgage Securities, Inc., 8.000%, 11/25/29 | 70,824 | 43,839 | |||||||||
| Bellemeade Re 2018-1, Ltd., 3.392%, 04/25/28 (1-Month USD LIBOR + 1.600%) (b) (f) (g) | 1,728,743 | 1,731,105 | |||||||||
| Bellemeade Re 2018-3, Ltd., 3.642%, 10/25/28 (1-Month USD LIBOR + 1.850%) (b) (f) (g) | 3,800,000 | 3,807,203 | |||||||||
| Citigroup Mortgage Loan Trust, Inc., 3.000%, 09/25/64 (b) (f) | 401,861 | 404,243 | |||||||||
| COLT 2018-3 Mortgage Loan Trust, 3.692%, 10/26/48 (b) (f) | 1,170,829 | 1,176,973 | |||||||||
| COLT 2019-2 Mortgage Loan Trust, 3.337%, 05/25/49 (b) (f) | 2,760,330 | 2,764,732 | |||||||||
| CSMC Trust 3.327%, 08/25/43 (b) (f) | 3,475,217 | 3,501,029 | |||||||||
3.500%, 06/25/47 (b) (f) | 2,550,000 | 2,599,279 | |||||||||
| GS Mortgage-Backed Securities Trust, 3.115%, 07/25/44 (b) (f) | 2,667,636 | 2,605,895 | |||||||||
| JP Morgan Mortgage Trust 3.366%, 10/25/46 (b) (f) | 303,610 | 303,408 | |||||||||
3.405%, 06/25/29 (b) (f) | 218,732 | 221,219 | |||||||||
3.637%, 05/25/43 (b) (f) | 333,268 | 337,074 | |||||||||
4.091%, 11/25/33 (b) | 111,937 | 111,078 | |||||||||
| MRFC Mortgage Pass- Through Trust Series 1998-2, 6.750%, 06/25/28 | 5,322 | 5,414 | |||||||||
| Prudential Home Mortgage Securities 7.667%, 09/28/24 (b) (f) | 448 | 423 | |||||||||
7.900%, 04/28/22 (f) | 699 | 690 | |||||||||
| PSMC Trust, 3.500%, 02/25/48 (b) (f) | 3,369,465 | 3,420,270 | |||||||||
| Radnor RE 2019-1, Ltd., 3.742%, 02/25/29 (1-Month USD LIBOR + 1.950%) (b) (f) (g) | 1,138,000 | 1,136,613 | |||||||||
Principal | Value(a) | ||||||||||
| Seasoned Credit Risk Transfer Trust 4.000%, 07/25/56 (b) | $ | 2,602,000 | $ | 2,611,588 | |||||||
4.000%, 08/25/56 (b) (f) | 1,200,000 | 1,212,929 | |||||||||
| Sequoia Mortgage Trust 3.184%, 11/25/30 (b) (f) | 598,154 | 598,519 | |||||||||
3.523%, 06/25/43 (b) | 1,783,462 | 1,800,407 | |||||||||
3.707%, 07/25/45 (b) (f) | 443,047 | 453,039 | |||||||||
3.877%, 01/25/45 (b) (f) | 368,005 | 376,322 | |||||||||
| Structured Asset Mortgage Investments, Inc., 0.712%, 05/02/30 (b) | 10,003 | 993 | |||||||||
| WinWater Mortgage Loan Trust 2015-4, 3.766%, 06/20/45 (b) (f) | 2,848,428 | 2,929,940 | |||||||||
34,403,893 | |||||||||||
| Commercial Mortgage-Backed Securities (6.4%) | |||||||||||
| BAMLL Commercial Mortgage Securities Trust 2014-520M, 4.185%, 08/15/46 (b) (f) | 1,350,000 | 1,517,872 | |||||||||
| BB-UBS Trust, 4.026%, 11/05/36 (b) (f) | 1,000,000 | 1,024,624 | |||||||||
| CFCRE Commercial Mortgage Trust, 3.839%, 12/10/54 | 500,000 | 538,299 | |||||||||
| Citigroup Commercial Mortgage Trust 2018-TBR, 2.570%, 12/15/36 (1-Month USD LIBOR + 0.830%) (b) (f) | 4,000,000 | 3,980,132 | |||||||||
| CSMC Trust, 3.304%, 09/15/37 (f) | 400,000 | 407,069 | |||||||||
| Hometown Commercial Mortgage, 6.057%, 06/11/39 (f) | 28,292 | 13,670 | |||||||||
| Irvine Core Office Trust, 2.068%, 05/15/48 (f) | 186,571 | 185,852 | |||||||||
| JPMCC Commercial Mortgage Securities Trust, 3.723%, 03/15/50 | 1,000,000 | 1,073,026 | |||||||||
| Morgan Stanley Bank of America Merrill Lynch Trust, 3.720%, 12/15/49 | 225,000 | 241,295 | |||||||||
| Morgan Stanley Capital I Trust, 3.451%, 08/05/34 (f) | 700,000 | 712,485 | |||||||||
| One Market Plaza Trust, 3.614%, 02/10/32 (f) | 2,500,000 | 2,559,364 | |||||||||
| UBS Commercial Mortgage Trust 3.580%, 12/15/50 | 3,500,000 | 3,738,447 | |||||||||
3.724%, 06/15/50 | 5,500,000 | 5,766,471 | |||||||||
4.061%, 12/15/50 (b) | 1,505,000 | 1,611,269 | |||||||||
| Vornado DP LLC, 4.004%, 09/13/28 (f) | 1,475,000 | 1,480,339 | |||||||||
| Wells Fargo Commercial Mortgage Trust 2.814%, 08/15/49 | 2,705,000 | 2,690,754 | |||||||||
3.184%, 04/15/50 | 1,544,000 | 1,602,103 | |||||||||
3.637%, 06/15/48 | 1,905,000 | 2,022,038 | |||||||||
31,165,109 | |||||||||||
| Total other mortgage-backed securities (cost: $64,986,170) | 65,569,002 | ||||||||||
See accompanying notes to financial statements.
50
SFT Core Bond Fund
Investments in Securities – continued
Principal | Value(a) | ||||||||||
Corporate Obligations (41.8%) | |||||||||||
Basic Materials (0.3%) | |||||||||||
Chemicals (0.3%) | |||||||||||
| Albemarle Corp., 2.941%, 11/15/22 (3-Month USD LIBOR + 1.050%) (b) (f) | $ | 1,530,000 | $ | 1,532,838 | |||||||
Communications (2.4%) | |||||||||||
Media (0.8%) | |||||||||||
| NBCUniversal Media LLC, 4.375%, 04/01/21 | 4,000,000 | 4,125,455 | |||||||||
Telecommunication (1.6%) | |||||||||||
AT&T, Inc., 4.850%, 07/15/45 | 3,350,000 | 3,826,226 | |||||||||
| Crown Castle Towers LLC, 3.222%, 05/15/42 (f) | 2,375,000 | 2,400,451 | |||||||||
| Verizon Communications, Inc., 3.010%, 05/15/25 (3-Month USD LIBOR + 1.100%) (b) | 1,500,000 | 1,534,377 | |||||||||
7,761,054 | |||||||||||
Consumer Cyclical (3.2%) | |||||||||||
Auto/Truck Parts & Equipment — Original (3.2%) | |||||||||||
| Ford Motor Credit Co. LLC 2.459%, 03/27/20 | 1,325,000 | 1,325,408 | |||||||||
5.750%, 02/01/21 | 2,190,000 | 2,260,710 | |||||||||
5.875%, 08/02/21 | 1,045,000 | 1,094,038 | |||||||||
| General Motors Financial Co., Inc. 2.862%, 04/09/21 (3-Month USD LIBOR + 0.850%) (b) | 1,650,000 | 1,653,244 | |||||||||
4.200%, 11/06/21 | 3,250,000 | 3,369,569 | |||||||||
| Hyundai Capital America 2.850%, 11/01/22 (f) | 3,000,000 | 3,033,434 | |||||||||
3.250%, 09/20/22 (f) | 625,000 | 637,073 | |||||||||
| Lear Corp., 5.250%, 01/15/25 | 1,915,000 | 1,968,670 | |||||||||
15,342,146 | |||||||||||
Consumer, Non-cyclical (3.0%) | |||||||||||
Agricultural Products (0.7%) | |||||||||||
| Altria Group, Inc. 5.800%, 02/14/39 | 955,000 | 1,123,572 | |||||||||
5.950%, 02/14/49 | 1,875,000 | 2,273,379 | |||||||||
3,396,951 | |||||||||||
Beverages (0.3%) | |||||||||||
| Bacardi, Ltd., 5.300%, 05/15/48 (f) (g) | 1,325,000 | 1,539,489 | |||||||||
Drugstore Chains (0.9%) | |||||||||||
| CVS Pass-Through Trust 5.298%, 01/11/27 (f) | 979,747 | 1,046,738 | |||||||||
5.880%, 01/10/28 | 342,802 | 378,331 | |||||||||
6.036%, 12/10/28 | 2,068,006 | 2,310,376 | |||||||||
6.943%, 01/10/30 | 526,831 | 617,218 | |||||||||
4,352,663 | |||||||||||
Health Care Products (0.8%) | |||||||||||
| Boston Scientific Corp., 4.700%, 03/01/49 | 3,125,000 | 3,802,914 | |||||||||
Pharmaceuticals (0.3%) | |||||||||||
| McKesson Corp., 3.650%, 11/30/20 | 1,275,000 | 1,292,817 | |||||||||
Principal | Value(a) | ||||||||||
Energy (5.9%) | |||||||||||
Oil & Gas (0.6%) | |||||||||||
| Occidental Petroleum Corp., 3.155%, 08/13/21 (3-Month USD LIBOR + 1.250%) (b) | $ | 2,960,000 | $ | 2,975,716 | |||||||
Oil, Gas & Consumable Fuels (0.6%) | |||||||||||
| Marathon Petroleum Corp., 5.850%, 12/15/45 | 2,270,000 | 2,606,843 | |||||||||
Pipelines (4.7%) | |||||||||||
| Boardwalk Pipelines L.P., 4.800%, 05/03/29 | 2,375,000 | 2,545,926 | |||||||||
| Cheniere Corpus Christi Holdings LLC, 5.875%, 03/31/25 | 2,250,000 | 2,530,035 | |||||||||
| Cheniere Energy Partners L.P., 5.250%, 10/01/25 | 2,000,000 | 2,084,180 | |||||||||
| El Paso Natural Gas Co. LLC, 8.375%, 06/15/32 | 675,000 | 943,525 | |||||||||
| Enterprise Products Operating LLC, 4.684%, 06/01/67 (3-Month USD LIBOR + 2.778%) (b) | 2,180,000 | 2,061,299 | |||||||||
| EQM Midstream Partners L.P., 6.500%, 07/15/48 | 975,000 | 914,452 | |||||||||
| MPLX L.P. 2.985%, 09/09/22 (3-Month USD LIBOR + 1.100%) (b) | 2,230,000 | 2,238,911 | |||||||||
5.250%, 01/15/25 (f) | 2,450,000 | 2,573,341 | |||||||||
5.500%, 02/15/49 | 1,700,000 | 1,931,344 | |||||||||
| Sunoco Logistics Partners Operations L.P., 6.850%, 02/15/40 | 2,150,000 | 2,579,826 | |||||||||
| Tennessee Gas Pipeline Co. LLC, 8.375%, 06/15/32 | 1,850,000 | 2,583,954 | |||||||||
22,986,793 | |||||||||||
Financial (12.9%) | |||||||||||
Banks (9.0%) | |||||||||||
| American Express Credit Corp., 2.944%, 09/14/20 (3-Month USD LIBOR + 1.050%) (b) | 1,890,000 | 1,900,687 | |||||||||
| Bank of America Corp., 3.974%, 02/07/30 (3-Month USD LIBOR + 1.210%) (b) | 4,040,000 | 4,435,387 | |||||||||
| Barclays PLC, 3.635%, 01/10/23 (3-Month USD LIBOR + 1.630% ) (b) (g) | 3,300,000 | 3,341,860 | |||||||||
| BBVA USA 3.500%, 06/11/21 | 850,000 | 864,742 | |||||||||
3.875%, 04/10/25 | 2,500,000 | 2,626,447 | |||||||||
| Citibank NA, 2.499%, 05/20/22 (3-Month USD LIBOR + 0.600%) (b) | 3,650,000 | 3,663,683 | |||||||||
| Citigroup, Inc., 4.400%, 06/10/25 | 1,500,000 | 1,630,637 | |||||||||
See accompanying notes to financial statements.
51
SFT Core Bond Fund
Investments in Securities – continued
Principal | Value(a) | ||||||||||
| Citizens Bank NA/Providence, 2.911%, 03/29/23 (3-Month USD LIBOR + 0.950%) (b) | $ | 3,150,000 | $ | 3,186,687 | |||||||
| Discover Bank, 3.450%, 07/27/26 | 1,900,000 | 1,973,470 | |||||||||
| HSBC Holdings PLC, 3.262%, 03/13/23 (3-Month USD LIBOR + 1.060%) (b) (g) | 1,875,000 | 1,917,864 | |||||||||
| JPMorgan Chase & Co. 3.540%, 05/01/28 (3-Month USD LIBOR + 1.380%) (b) | 1,500,000 | 1,593,786 | |||||||||
| 5.229%, 04/01/20 (3-Month USD LIBOR + 3.320%) (b) | 1,700,000 | 1,712,750 | |||||||||
| 5.406%, 01/30/20 (3-Month USD LIBOR + 3.470%) (b) | 734,000 | 740,606 | |||||||||
| Morgan Stanley 3.125%, 07/27/26 | 800,000 | 826,033 | |||||||||
5.500%, 07/28/21 | 740,000 | 779,537 | |||||||||
| Regions Financial Corp., 3.800%, 08/14/23 | 1,675,000 | 1,773,259 | |||||||||
| Synovus Financial Corp., 3.125%, 11/01/22 | 2,580,000 | 2,607,606 | |||||||||
| The Goldman Sachs Group, Inc., 2.707%, 10/31/22 (3-Month USD LIBOR + 0.780%) (b) | 1,050,000 | 1,057,237 | |||||||||
| Truist Bank, 2.494%, 05/17/22 (3-Month USD LIBOR + 0.590%) (b) | 2,850,000 | 2,863,625 | |||||||||
| Truist Financial Corp., 5.050%, 12/15/24 (3-Month USD LIBOR + 3.102%) (b) | 1,000,000 | 1,020,000 | |||||||||
| US Bancorp 3.000%, 07/30/29 | 765,000 | 790,224 | |||||||||
| 5.300%, 04/15/27 (3-Month USD LIBOR + 2.914%) (b) | 800,000 | 883,000 | |||||||||
| Wells Fargo & Co., 3.000%, 10/23/26 | 1,100,000 | 1,127,394 | |||||||||
| Zions Bancorp NA, 3.500%, 08/27/21 | 650,000 | 665,225 | |||||||||
43,981,746 | |||||||||||
Diversified Financial Services (1.3%) | |||||||||||
| Block Financial LLC, 4.125%, 10/01/20 | 2,050,000 | 2,076,099 | |||||||||
| DY7 Leasing LLC, 2.578%, 12/10/25 | 62,853 | 63,985 | |||||||||
| Export Leasing 2009 LLC, 1.859%, 08/28/21 | 45,186 | 45,228 | |||||||||
| Helios Leasing I LLC 1.825%, 05/16/25 | 72,896 | 72,569 | |||||||||
2.018%, 05/29/24 | 104,859 | 105,087 | |||||||||
| Pine Street Trust I, 4.572%, 02/15/29 (f) | 1,450,000 | 1,561,843 | |||||||||
| The Charles Schwab Corp., 4.625%, 03/01/22 (3-Month USD LIBOR + 3.315%) (b) | 2,200,000 | 2,271,500 | |||||||||
| Union 16 Leasing LLC, 1.863%, 01/22/25 | 115,843 | 115,573 | |||||||||
6,311,884 | |||||||||||
Insurance (2.1%) | |||||||||||
| AXA Equitable Holdings, Inc., 5.000%, 04/20/48 | 2,270,000 | 2,443,220 | |||||||||
Principal | Value(a) | ||||||||||
| Reinsurance Group of America, Inc., 3.900%, 05/15/29 | $ | 1,300,000 | $ | 1,387,139 | |||||||
| Teachers Insurance & Annuity Association of America, 4.270%, 05/15/47 (f) | 2,500,000 | 2,843,608 | |||||||||
| Unum Group 4.000%, 06/15/29 | 1,050,000 | 1,102,858 | |||||||||
5.750%, 08/15/42 | 1,975,000 | 2,232,202 | |||||||||
10,009,027 | |||||||||||
Real Estate Investment Trust — Office Property (0.4%) | |||||||||||
| SL Green Operating Partnership L.P., 2.884%, 08/16/21 (3-Month USD LIBOR + 0.980%) (b) | 2,000,000 | 2,000,413 | |||||||||
Real Estate Investment Trust — Residential (0.1%) | |||||||||||
UDR, Inc., 4.000%, 10/01/25 | 400,000 | 432,039 | |||||||||
Health Care (1.0%) | |||||||||||
Health Care Providers & Services (0.6%) | |||||||||||
| NYU Langone Hospitals, 4.428%, 07/01/42 | 1,480,000 | 1,667,992 | |||||||||
| Sinai Health System, 3.034%, 01/20/36 | 1,345,000 | 1,398,081 | |||||||||
3,066,073 | |||||||||||
Medical Products/Supplies (0.4%) | |||||||||||
| Bio-Rad Laboratories, Inc., 4.875%, 12/15/20 | 1,985,000 | 2,034,129 | |||||||||
Industrials (1.1%) | |||||||||||
Machinery (0.4%) | |||||||||||
| Wabtec Corp., 3.194%, 09/15/21 (3-Month USD LIBOR + 1.300%) (b) | 1,925,000 | 1,925,292 | |||||||||
Transportation (0.7%) | |||||||||||
| AP Moller – Maersk AS, 4.500%, 06/20/29 (f) (g) | 975,000 | 1,039,853 | |||||||||
| CSX Corp. 4.250%, 11/01/66 | 1,085,000 | 1,160,744 | |||||||||
4.300%, 03/01/48 | 630,000 | 715,729 | |||||||||
4.750%, 11/15/48 | 625,000 | 758,455 | |||||||||
3,674,781 | |||||||||||
Technology (1.2%) | |||||||||||
Computers (1.2%) | |||||||||||
| Dell International LLC/ EMC Corp. 4.900%, 10/01/26 (f) | 1,800,000 | 1,982,159 | |||||||||
5.300%, 10/01/29 (f) | 1,475,000 | 1,663,193 | |||||||||
| International Business Machines Corp., 2.800%, 05/13/21 | 2,280,000 | 2,310,606 | |||||||||
5,955,958 | |||||||||||
See accompanying notes to financial statements.
52
SFT Core Bond Fund
Investments in Securities – continued
Principal | Value(a) | ||||||||||
Transportation (4.7%) | |||||||||||
Airlines (4.7%) | |||||||||||
| Air Canada 2013-1 Class B Pass Through Trust, 5.375%, 11/15/22 (f) (g) | $ | 740,112 | $ | 760,910 | |||||||
| Air Canada 2015-1 Class C Pass Through Trust, 5.000%, 03/15/20 (f) (g) | 2,600,000 | 2,609,093 | |||||||||
| Air Canada 2017-1 Class A Pass Through Trust, 3.550%, 07/15/31 (f) (g) | 2,063,640 | 2,090,183 | |||||||||
| America West Airlines 2000-1 Pass Through Trust, 8.057%, 01/02/22 | 436,595 | 449,179 | |||||||||
| American Airlines 2013-1 Class B Pass Through Trust, 5.625%, 07/15/22 (f) | 1,179,425 | 1,201,338 | |||||||||
| American Airlines 2013-2 Class B Pass Through Trust, 5.600%, 01/15/22 (f) | 842,449 | 856,108 | |||||||||
| American Airlines 2015-1 Class B Pass Through Trust, 3.700%, 11/01/24 | 1,285,323 | 1,294,465 | |||||||||
| American Airlines 2016-1 Class B Pass Through Trust, 5.250%, 07/15/25 | 1,054,313 | 1,115,231 | |||||||||
| British Airways 2013-1 Class B Pass Through Trust, 5.625%, 12/20/21 (f) | 76,657 | 77,182 | |||||||||
| British Airways 2019-1 Class A Pass Through Trust, 3.350%, 12/15/30 (f) | 1,460,000 | 1,503,916 | |||||||||
| Continental Airlines 2012-1 Class B Pass Through Trust, 6.250%, 10/11/21 | 511,811 | 515,957 | |||||||||
| Delta Air Lines 2012-1 Class A Pass Through Trust, 4.750%, 11/07/21 | 279,175 | 281,483 | |||||||||
| Delta Air Lines 2015-1 Class B Pass Through Trust, 4.250%, 01/30/25 | 1,349,373 | 1,405,684 | |||||||||
| Hawaiian Airlines 2013-1 Class B Pass Through Certificates, 4.950%, 07/15/23 | 1,904,871 | 1,940,137 | |||||||||
| United Airlines 2014-1 Class B Pass Through Trust, 4.750%, 10/11/23 | 412,834 | 426,164 | |||||||||
| United Airlines 2014-2 Class B Pass Through Trust, 4.625%, 03/03/24 | 1,723,223 | 1,776,814 | |||||||||
| United Airlines 2016-1 Class B Pass Through Trust, 3.650%, 07/07/27 | 1,019,688 | 1,035,970 | |||||||||
| United Airlines 2019-2 Class B Pass Through Trust, 3.500%, 11/01/29 | 1,515,000 | 1,530,212 | |||||||||
| US Airways 2012-2 Class B Pass Through Trust, 6.750%, 12/03/22 | 1,206,117 | 1,266,122 | |||||||||
| US Airways 2013-1 Class B Pass Through Trust, 5.375%, 05/15/23 | 1,062,791 | 1,105,916 | |||||||||
23,242,064 | |||||||||||
| Shares/ Principal | Value(a) | ||||||||||
Utilities (6.1%) | |||||||||||
Electric Companies (0.4%) | |||||||||||
| Indianapolis Power & Light Co., 4.700%, 09/01/45 (f) | $ | 1,900,000 | $ | 2,197,658 | |||||||
Electric Utilities (4.9%) | |||||||||||
| Cleco Corporate Holdings LLC, 3.743%, 05/01/26 | 1,125,000 | 1,162,554 | |||||||||
| Entergy Mississippi LLC, 3.250%, 12/01/27 | 1,100,000 | 1,146,125 | |||||||||
| Entergy Texas, Inc., 3.450%, 12/01/27 | 1,885,000 | 1,951,446 | |||||||||
| Eversource Energy, 3.800%, 12/01/23 | 2,400,000 | 2,527,917 | |||||||||
| FirstEnergy Transmission LLC, 5.450%, 07/15/44 (f) | 2,000,000 | 2,523,386 | |||||||||
| IPALCO Enterprises, Inc. 3.450%, 07/15/20 | 1,400,000 | 1,406,055 | |||||||||
3.700%, 09/01/24 | 1,175,000 | 1,215,581 | |||||||||
| MidAmerican Energy Co., 4.250%, 07/15/49 | 1,750,000 | 2,100,922 | |||||||||
| Mississippi Power Co., 2.597%, 03/27/20 (3-Month USD LIBOR + 0.650%) (b) | 642,000 | 642,240 | |||||||||
| PPL Capital Funding, Inc., 4.626%, 03/30/67 (3-Month USD LIBOR + 2.665%) (b) | 2,175,000 | 2,076,580 | |||||||||
| Southern Power Co., 4.950%, 12/15/46 | 2,450,000 | 2,722,207 | |||||||||
| Vistra Operations Co. LLC, 3.550%, 07/15/24 (f) | 1,175,000 | 1,190,296 | |||||||||
| Xcel Energy, Inc., 3.500%, 12/01/49 | 3,040,000 | 3,090,784 | |||||||||
23,756,093 | |||||||||||
Gas Utilities (0.8%) | |||||||||||
| Southern Co. Gas Capital Corp. 3.875%, 11/15/25 | 2,605,000 | 2,806,363 | |||||||||
4.400%, 05/30/47 | 775,000 | 857,877 | |||||||||
3,664,240 | |||||||||||
| Total corporate obligations (cost: $195,646,915) | 203,967,076 | ||||||||||
| Total long-term debt securities (cost: $470,544,356) | 484,200,374 | ||||||||||
Short-Term Securities (2.0%) | |||||||||||
Investment Companies (2.0%) | |||||||||||
| State Street Institutional U.S. Government Money Market Fund, current rate 1.530% (h) | 9,991,288 | 9,991,288 | |||||||||
| Total short-term securities (cost: $9,991,288) | 9,991,288 | ||||||||||
| Total investments in securities (cost: $480,535,644) (i) | 494,191,662 | ||||||||||
| Liabilities in excess of cash and other assets (-1.3%) | (6,313,965 | ) | |||||||||
Total net assets (100.0%) | $ | 487,877,697 | |||||||||
See accompanying notes to financial statements.
53
SFT Core Bond Fund
Investments in Securities – continued
Investments in Securities Legend
(a) Securities are valued by procedures described in Note 2 of the Notes to Financial Statements.
(b) Variable rate security.
(c) Security is issued on a when-issued or forward commitment basis. As of December 31, 2019 the total cost of investments issued on a when-issued or forward commitment basis was $8,447,323.
(d) Interest-only security that entitles holders to receive only interest on the underlying mortgages. The principal amount of the underlying pool represents the notional amount on which current interest is calculated. The yield to maturity of an interest-only security is sensitive to the rate of principal payments on the underlying mortgage assets. The rate disclosed represents the market yield based upon the current cost basis and estimated timing and amount of future cash flows.
(e) Fully or partially pledged as initial margin deposits on open futures contracts.
Holdings of Open Futures Contracts
On December 31, 2019, securities with an aggregate market value of $774,352 have been pledged to cover margin requirements for the following open futures contracts:
Description | Expiration Date | Number of Contracts | Position Type | Notional Amount | Market Value | Unrealized Appreciation/ (Depreciation)(a) | |||||||||||||||||||||
5 Year U.S. Treasury Note | March 2020 | 217 | Long | $ | 25,835,392 | $ | 25,738,234 | $ | (97,158 | ) | |||||||||||||||||
10 Year U.S. Ultra | March 2020 | 146 | Short | (20,796,639 | ) | (20,542,656 | ) | 253,983 | |||||||||||||||||||
U.S. Long Bond | March 2020 | 268 | Long | 42,688,064 | 41,782,875 | (905,189 | ) | ||||||||||||||||||||
U.S. Ultra Bond | March 2020 | 63 | Short | (11,825,132 | ) | (11,444,344 | ) | 380,788 | |||||||||||||||||||
$ | 35,534,109 | $ | (367,576 | ) | |||||||||||||||||||||||
(f) Security sold within terms of a private placement memorandum exempt from registration under Section 144A of the Securities Act of 1933, as amended, and may be sold only to dealers in that program. This security has been determined to be liquid unless otherwise indicated.
(g) Foreign security: The Fund held 4.1% of net assets in foreign securities at December 31, 2019.
(h) All or a portion of the security segregated to cover when-issued purchase commitments outstanding or extended settlement trades as of December 31, 2019.
(i) At December 31, 2019 the cost of investments for federal income tax purposes was $480,325,732. The aggregate unrealized appreciation and depreciation of investments based on this cost were:
Gross unrealized appreciation | $ | 16,105,235 | |||||
Gross unrealized depreciation | (2,606,881 | ) | |||||
Net unrealized appreciation | $ | 13,498,354 | |||||
See accompanying notes to financial statements.
54
SFT Dynamic Managed Volatility Fund
Investments in Securities
December 31, 2019
(Percentages of each investment category relate to total net assets)
Principal | Value(a) | ||||||||||
Long-Term Debt Securities (31.9%) | |||||||||||
Government Obligations (2.9%) | |||||||||||
| U.S. Government Agencies and Obligations (2.9%) | |||||||||||
| Federal Home Loan Mortgage Corporation (FHLMC) (0.1%) | |||||||||||
3.000%, 09/01/43 | $ | 123,064 | $ | 126,846 | |||||||
3.500%, 10/01/44 | 199,596 | 209,005 | |||||||||
3.500%, 11/01/44 | 195,489 | 204,585 | |||||||||
3.500%, 12/01/44 | 206,339 | 215,881 | |||||||||
756,317 | |||||||||||
| Federal National Mortgage Association (FNMA) (0.1%) | |||||||||||
3.000%, 04/01/43 | 195,402 | 201,272 | |||||||||
3.000%, 05/01/43 | 79,937 | 82,328 | |||||||||
3.000%, 06/01/43 | 247,969 | 255,360 | |||||||||
3.500%, 08/01/42 | 103,532 | 109,544 | |||||||||
3.500%, 02/01/43 | 115,990 | 124,332 | |||||||||
772,836 | |||||||||||
U.S. Treasury (2.7%) | |||||||||||
| U.S. Treasury Note, 2.625%, 12/15/21 | 15,000,000 | 15,297,656 | |||||||||
| Total government obligations (cost: $16,430,796) | 16,826,809 | ||||||||||
Other Mortgage-Backed Securities (0.3%) | |||||||||||
Commercial Mortgage-Backed Securities (0.3%) | |||||||||||
| Bank 2019-BNK18, 3.584%, 05/15/62 | 1,500,000 | 1,614,151 | |||||||||
| Total other mortgage-backed securities (cost: $1,544,712) | 1,614,151 | ||||||||||
Corporate Obligations (28.7%) | |||||||||||
Basic Materials (0.2%) | |||||||||||
Chemicals (0.2%) | |||||||||||
| Nutrien, Ltd., 3.000%, 04/01/25 (b) | 1,000,000 | 1,020,566 | |||||||||
Mining (0.0%) | |||||||||||
| BHP Billiton Finance USA, Ltd., 2.875%, 02/24/22 (b) | 122,000 | 124,373 | |||||||||
Communications (1.9%) | |||||||||||
Cable/Satellite TV (0.4%) | |||||||||||
| Comcast Corp. 4.200%, 08/15/34 (c) | 500,000 | 570,644 | |||||||||
4.650%, 07/15/42 (c) | 250,000 | 300,604 | |||||||||
6.400%, 05/15/38 | 1,000,000 | 1,409,637 | |||||||||
2,280,885 | |||||||||||
Diversified Telecommunication Services (0.7%) | |||||||||||
| AT&T, Inc. 4.350%, 06/15/45 | 250,000 | 269,903 | |||||||||
4.500%, 05/15/35 | 1,000,000 | 1,114,328 | |||||||||
4.850%, 07/15/45 | 1,000,000 | 1,142,157 | |||||||||
| Verizon Communications, Inc., 5.250%, 03/16/37 | 1,000,000 | 1,255,929 | |||||||||
3,782,317 | |||||||||||
Principal | Value(a) | ||||||||||
Internet & Catalog Retail (0.2%) | |||||||||||
| Amazon.com, Inc., 3.875%, 08/22/37 | $ | 1,000,000 | $ | 1,136,585 | |||||||
Media (0.2%) | |||||||||||
| ViacomCBS, Inc. 3.500%, 01/15/25 | 750,000 | 784,882 | |||||||||
4.000%, 01/15/26 | 250,000 | 267,875 | |||||||||
1,052,757 | |||||||||||
Telecommunication (0.3%) | |||||||||||
| Crown Castle Towers LLC, 3.663%, 05/15/45 (d) | 1,000,000 | 1,037,556 | |||||||||
| Vodafone Group PLC, 4.125%, 05/30/25 (b) | 500,000 | 543,137 | |||||||||
1,580,693 | |||||||||||
Telephone — Integrated (0.1%) | |||||||||||
AT&T, Inc., 4.100%, 02/15/28 | 803,000 | 873,783 | |||||||||
Wireless Telecommunication Services (0.0%) | |||||||||||
| Rogers Communications, Inc., 4.100%, 10/01/23 (b) | 250,000 | 267,546 | |||||||||
Consumer Cyclical (0.8%) | |||||||||||
Auto/Truck Parts & Equipment — Original (0.1%) | |||||||||||
| Harley-Davidson Financial Services, Inc., 3.550%, 05/21/21 (d) | 575,000 | 585,652 | |||||||||
Food & Staples Retailing (0.2%) | |||||||||||
| The Kroger Co., 4.450%, 02/01/47 | 1,000,000 | 1,062,241 | |||||||||
Home Furnishings (0.2%) | |||||||||||
| Harman International Industries, Inc., 4.150%, 05/15/25 | 1,000,000 | 1,066,274 | |||||||||
Retail (0.3%) | |||||||||||
| AutoZone, Inc., 3.250%, 04/15/25 | 1,000,000 | 1,042,714 | |||||||||
| Target Corp., 3.500%, 07/01/24 (c) | 750,000 | 802,804 | |||||||||
1,845,518 | |||||||||||
Consumer Staples (1.0%) | |||||||||||
Beverages (0.1%) | |||||||||||
| The Coca-Cola Co., 3.200%, 11/01/23 (c) | 500,000 | 524,448 | |||||||||
Consumer Products — Miscellaneous (0.1%) | |||||||||||
| Johnson (S.C.) & Son, Inc., 3.350%, 09/30/24 (d) | 750,000 | 776,941 | |||||||||
Food Products (0.4%) | |||||||||||
| Archer-Daniels-Midland Co., 3.750%, 09/15/47 | 1,000,000 | 1,095,350 | |||||||||
| General Mills, Inc., 4.150%, 02/15/43 | 1,000,000 | 1,075,014 | |||||||||
2,170,364 | |||||||||||
See accompanying notes to financial statements.
55
SFT Dynamic Managed Volatility Fund
Investments in Securities – continued
Principal | Value(a) | ||||||||||
Household Products (0.2%) | |||||||||||
| Kimberly-Clark Corp., 3.900%, 05/04/47 | $ | 1,000,000 | $ | 1,121,815 | |||||||
Personal Care (0.2%) | |||||||||||
| The Estee Lauder Cos., Inc., 4.150%, 03/15/47 | 1,000,000 | 1,164,617 | |||||||||
Consumer, Non-cyclical (1.6%) | |||||||||||
Beverages (0.2%) | |||||||||||
| Anheuser-Busch InBev Worldwide, Inc., 4.375%, 04/15/38 | 1,000,000 | 1,123,382 | |||||||||
Commercial Service — Finance (0.1%) | |||||||||||
| Moody's Corp., 4.875%, 02/15/24 | 250,000 | 274,935 | |||||||||
Diagnostic Equipment (0.4%) | |||||||||||
| Abbott Laboratories 3.875%, 09/15/25 | 750,000 | 816,966 | |||||||||
4.750%, 11/30/36 | 1,000,000 | 1,254,148 | |||||||||
4.750%, 04/15/43 | 250,000 | 314,919 | |||||||||
2,386,033 | |||||||||||
Drugstore Chains (0.0%) | |||||||||||
| CVS Pass-Through Trust, 6.943%, 01/10/30 | 160,619 | 188,176 | |||||||||
Food (0.4%) | |||||||||||
| Mars, Inc., 3.950%, 04/01/49 (d) | 1,000,000 | 1,132,000 | |||||||||
| Tyson Foods, Inc., 5.150%, 08/15/44 | 1,000,000 | 1,220,938 | |||||||||
2,352,938 | �� | ||||||||||
Pharmaceuticals (0.5%) | |||||||||||
| Bristol-Myers Squibb Co., 3.875%, 08/15/25 (d) | 1,000,000 | 1,081,024 | |||||||||
| Novartis Capital Corp., 3.400%, 05/06/24 (c) | 500,000 | 529,525 | |||||||||
| Takeda Pharmaceutical Co., Ltd., 5.000%, 11/26/28 (b) | 1,000,000 | 1,165,091 | |||||||||
2,775,640 | |||||||||||
Energy (3.4%) | |||||||||||
Oil & Gas (0.7%) | |||||||||||
| Baker Hughes a GE Co. LLC / Baker Hughes Co-Obligor, Inc., 3.337%, 12/15/27 | 1,000,000 | 1,043,939 | |||||||||
| BP Capital Markets America, Inc., 4.234%, 11/06/28 | 1,000,000 | 1,131,053 | |||||||||
| Cimarex Energy Co., 3.900%, 05/15/27 | 1,000,000 | 1,037,430 | |||||||||
| Valero Energy Corp., 4.350%, 06/01/28 | 1,000,000 | 1,101,887 | |||||||||
4,314,309 | |||||||||||
Oil, Gas & Consumable Fuels (1.0%) | |||||||||||
Apache Corp., 3.250%, 04/15/22 | 74,000 | 75,404 | |||||||||
| Chevron Corp., 3.191%, 06/24/23 (c) | 250,000 | 260,266 | |||||||||
| EOG Resources, Inc., 2.625%, 03/15/23 | 250,000 | 254,656 | |||||||||
Principal | Value(a) | ||||||||||
| Marathon Petroleum Corp., 3.625%, 09/15/24 | $ | 750,000 | $ | 787,833 | |||||||
| Noble Energy, Inc., 3.900%, 11/15/24 | 1,000,000 | 1,057,141 | |||||||||
| Phillips 66, 4.650%, 11/15/34 | 1,000,000 | 1,175,320 | |||||||||
| Total Capital International SA, 3.750%, 04/10/24 (b) | 750,000 | 803,336 | |||||||||
| Valero Energy Corp., 3.650%, 03/15/25 | 1,000,000 | 1,063,781 | |||||||||
5,477,737 | |||||||||||
Pipelines (1.7%) | |||||||||||
| Columbia Pipeline Group, Inc., 4.500%, 06/01/25 | 1,000,000 | 1,097,251 | |||||||||
| Energy Transfer Operating L.P., 4.900%, 03/15/35 | 1,000,000 | 1,050,490 | |||||||||
| Enterprise Products Operating LLC, 5.750%, 03/01/35 | 250,000 | 301,483 | |||||||||
| Florida Gas Transmission Co. LLC, 4.350%, 07/15/25 (d) | 1,000,000 | 1,078,360 | |||||||||
| Kinder Morgan, Inc., 5.300%, 12/01/34 | 750,000 | 883,591 | |||||||||
| Magellan Midstream Partners L.P., 4.200%, 10/03/47 | 1,000,000 | 1,067,464 | |||||||||
MPLX L.P., 5.250%, 01/15/25 | 500,000 | 525,172 | |||||||||
| Plains All American Pipeline L.P./PAA Finance Corp., 3.850%, 10/15/23 | 250,000 | 258,911 | |||||||||
| Southern Natural Gas Co. LLC, 4.800%, 03/15/47 (d) | 1,500,000 | 1,704,212 | |||||||||
| Sunoco Logistics Partners Operations L.P., 4.250%, 04/01/24 | 1,000,000 | 1,051,690 | |||||||||
| The Williams Cos., Inc. 3.750%, 06/15/27 | 500,000 | 521,530 | |||||||||
4.300%, 03/04/24 | 500,000 | 533,645 | |||||||||
10,073,799 | |||||||||||
Financial (9.3%) | |||||||||||
Banks (3.9%) | |||||||||||
| Associated Banc-Corp., 4.250%, 01/15/25 | 750,000 | 792,899 | |||||||||
| Bank of America Corp. 3.950%, 04/21/25 | 1,000,000 | 1,067,957 | |||||||||
4.183%, 11/25/27 | 1,000,000 | 1,084,447 | |||||||||
| 4.244%, 04/24/38 (3-Month USD LIBOR + 1.814%) (e) | 1,000,000 | 1,152,919 | |||||||||
5.700%, 01/24/22 | 250,000 | 268,301 | |||||||||
| Barclays Bank PLC, 2.650%, 01/11/21 (b) | 1,000,000 | 1,006,541 | |||||||||
| Capital One Financial Corp. 4.250%, 04/30/25 | 1,500,000 | 1,633,230 | |||||||||
4.750%, 07/15/21 | 250,000 | 260,362 | |||||||||
| Citigroup, Inc. 3.300%, 04/27/25 | 750,000 | 787,696 | |||||||||
| 3.980%, 03/20/30 (3-Month USD LIBOR + 1.338%) (e) | 1,000,000 | 1,094,810 | |||||||||
See accompanying notes to financial statements.
56
SFT Dynamic Managed Volatility Fund
Investments in Securities – continued
Principal | Value(a) | ||||||||||
| Credit Suisse Group Funding Guernsey, Ltd., 2.750%, 03/26/20 (b) | $ | 600,000 | $ | 600,743 | |||||||
| Discover Bank 3.100%, 06/04/20 | 1,000,000 | 1,003,722 | |||||||||
4.250%, 03/13/26 | 500,000 | 540,119 | |||||||||
| Fifth Third Bank, 3.950%, 07/28/25 | 1,000,000 | 1,086,962 | |||||||||
| HSBC Bank USA NA, 4.875%, 08/24/20 | 250,000 | 254,310 | |||||||||
| JPMorgan Chase & Co. 3.125%, 01/23/25 | 1,000,000 | 1,043,637 | |||||||||
4.500%, 01/24/22 | 250,000 | 262,506 | |||||||||
| KeyBank NA, 3.180%, 10/15/27 | 1,000,000 | 1,020,282 | |||||||||
| PNC Bank NA | |||||||||||
2.450%, 07/28/22 | 1,000,000 | 1,013,663 | |||||||||
3.800%, 07/25/23 | 250,000 | 262,659 | |||||||||
4.050%, 07/26/28 | 1,000,000 | 1,097,664 | |||||||||
| Regions Financial Corp., 3.800%, 08/14/23 | 2,000,000 | 2,117,324 | |||||||||
| Sterling Bancorp, 3.500%, 06/08/20 | 1,000,000 | 1,002,911 | |||||||||
| Synchrony Bank, 3.000%, 06/15/22 | 1,000,000 | 1,019,616 | |||||||||
| The Goldman Sachs Group, Inc., 3.850%, 01/26/27 | 1,000,000 | 1,064,548 | |||||||||
| Truist Bank, 2.750%, 05/01/23 | 250,000 | 254,518 | |||||||||
22,794,346 | |||||||||||
Capital Markets (0.4%) | |||||||||||
| E*TRADE Financial Corp., 2.950%, 08/24/22 | 1,000,000 | 1,018,835 | |||||||||
| The Bank of New York Mellon Corp., 3.442%, 02/07/28 (3-Month USD LIBOR + 1.069%) (e) | 1,000,000 | 1,061,106 | |||||||||
2,079,941 | |||||||||||
Diversified Financial Services (1.1%) | |||||||||||
| American Express Credit Corp., 3.300%, 05/03/27 | 1,000,000 | 1,062,322 | |||||||||
| CME Group, Inc., 3.000%, 03/15/25 | 1,000,000 | 1,038,995 | |||||||||
| Discover Financial Services, 3.750%, 03/04/25 | 1,000,000 | 1,059,315 | |||||||||
| Eaton Vance Corp., 3.500%, 04/06/27 | 1,000,000 | 1,049,733 | |||||||||
| Pine Street Trust I, 4.572%, 02/15/29 (d) | 1,500,000 | 1,615,700 | |||||||||
| TD Ameritrade Holding Corp., 2.950%, 04/01/22 | 700,000 | 715,611 | |||||||||
6,541,676 | |||||||||||
Insurance (1.6%) | |||||||||||
| American Financial Group, Inc., 4.500%, 06/15/47 | 1,000,000 | 1,082,276 | |||||||||
| Assured Guaranty US Holdings, Inc., 5.000%, 07/01/24 | 500,000 | 556,242 | |||||||||
Principal | Value(a) | ||||||||||
| First American Financial Corp., 4.600%, 11/15/24 | $ | 750,000 | $ | 802,673 | |||||||
| Liberty Mutual Group, Inc., 4.250%, 06/15/23 (d) | 750,000 | 797,024 | |||||||||
| Manulife Financial Corp., 4.150%, 03/04/26 (b) | 750,000 | 825,629 | |||||||||
| Marsh & McLennan Cos., Inc., 4.350%, 01/30/47 | 1,000,000 | 1,152,061 | |||||||||
| Metropolitan Life Global Funding I, 3.875%, 04/11/22 (d) | 250,000 | 260,492 | |||||||||
| Old Republic International Corp., 4.875%, 10/01/24 | 750,000 | 822,510 | |||||||||
| Pacific Life Insurance Co., 4.300%, 10/24/67 (3-Month USD LIBOR + 2.796%) (d) (e) | 1,000,000 | 1,067,500 | |||||||||
| StanCorp Financial Group, Inc., 5.000%, 08/15/22 | 750,000 | 794,062 | |||||||||
| The Hanover Insurance Group, Inc., 4.500%, 04/15/26 | 1,000,000 | 1,078,401 | |||||||||
9,238,870 | |||||||||||
Property / Casualty Insurance (0.2%) | |||||||||||
| Arch Capital Finance LLC, 4.011%, 12/15/26 | 1,000,000 | 1,098,430 | |||||||||
Real Estate Investment Trust — Diversified (0.2%) | |||||||||||
| Retail Properties of America, Inc., 4.000%, 03/15/25 | 1,000,000 | 1,021,862 | |||||||||
Real Estate Investment Trust — Health Care (0.8%) | |||||||||||
| Healthcare Realty Trust, Inc., 3.875%, 05/01/25 | 1,000,000 | 1,052,519 | |||||||||
| Healthcare Trust of America Holdings L.P., 3.750%, 07/01/27 | 1,000,000 | 1,056,226 | |||||||||
| Physicians Realty L.P., 4.300%, 03/15/27 | 1,000,000 | 1,069,299 | |||||||||
| Welltower, Inc., 4.125%, 03/15/29 | 1,500,000 | 1,635,090 | |||||||||
4,813,134 | |||||||||||
Real Estate Investment Trust — Office Property (0.1%) | |||||||||||
| Alexandria Real Estate Equities, Inc., 4.500%, 07/30/29 | 500,000 | 563,914 | |||||||||
Real Estate Investment Trust — Residential (0.1%) | |||||||||||
| UDR, Inc., 4.000%, 10/01/25 | 750,000 | 810,073 | |||||||||
Real Estate Investment Trust — Shopping Centers (0.1%) | |||||||||||
| Retail Opportunity Investments Partnership L.P., 5.000%, 12/15/23 | 250,000 | 264,082 | |||||||||
Real Estate Investment Trust — Single Tenant (0.2%) | |||||||||||
| Office Properties Income Trust, 4.500%, 02/01/25 | 750,000 | 784,097 | |||||||||
See accompanying notes to financial statements.
57
SFT Dynamic Managed Volatility Fund
Investments in Securities – continued
Principal | Value(a) | ||||||||||
| Tanger Properties L.P., 3.875%, 12/01/23 | $ | 500,000 | $ | 514,803 | |||||||
1,298,900 | |||||||||||
Real Estate Investment Trust — Storage (0.1%) | |||||||||||
| CubeSmart L.P., 4.375%, 12/15/23 | 500,000 | 532,422 | |||||||||
Specialized REITs (0.5%) | |||||||||||
| American Tower Corp., 3.375%, 10/15/26 | 1,000,000 | 1,039,760 | |||||||||
| Essex Portfolio L.P., 3.500%, 04/01/25 | 1,000,000 | 1,049,940 | |||||||||
| Goodman US Finance Four LLC, 4.500%, 10/15/37 (d) | 500,000 | 537,546 | |||||||||
| Healthpeak Properties, Inc., 4.250%, 11/15/23 | 250,000 | 266,798 | |||||||||
2,894,044 | |||||||||||
Health Care (1.7%) | |||||||||||
Health Care Providers & Services (0.6%) | |||||||||||
| Aetna, Inc., 3.875%, 08/15/47 | 1,000,000 | 1,017,221 | |||||||||
| Anthem, Inc., 4.375%, 12/01/47 | 1,000,000 | 1,104,122 | |||||||||
| Laboratory Corp. of America Holdings, 4.000%, 11/01/23 | 250,000 | 264,611 | |||||||||
| UnitedHealth Group, Inc. 2.750%, 02/15/23 (c) | 250,000 | 255,022 | |||||||||
3.750%, 07/15/25 (c) | 1,000,000 | 1,080,260 | |||||||||
3,721,236 | |||||||||||
Pharmaceuticals (1.1%) | |||||||||||
| AbbVie, Inc., 3.600%, 05/14/25 | 1,000,000 | 1,056,475 | |||||||||
| Allergan Funding SCS, 3.800%, 03/15/25 (b) | 670,000 | 704,108 | |||||||||
| Bristol-Myers Squibb Co., 3.250%, 11/01/23 | 500,000 | 523,517 | |||||||||
| Cardinal Health, Inc., 3.750%, 09/15/25 | 1,000,000 | 1,062,834 | |||||||||
| Eli Lilly & Co., 3.950%, 05/15/47 | 1,000,000 | 1,134,089 | |||||||||
| Mead Johnson Nutrition Co., 5.900%, 11/01/39 | 1,000,000 | 1,334,275 | |||||||||
| Mylan, Inc., 4.200%, 11/29/23 | 500,000 | 529,450 | |||||||||
6,344,748 | |||||||||||
Industrials (3.9%) | |||||||||||
Aerospace & Defense (0.9%) | |||||||||||
| General Dynamics Corp., 3.500%, 05/15/25 | 1,000,000 | 1,071,675 | |||||||||
| L3Harris Technologies, Inc., 3.832%, 04/27/25 | 1,000,000 | 1,067,250 | |||||||||
| Rockwell Collins, Inc., 3.700%, 12/15/23 | 500,000 | 527,146 | |||||||||
| United Technologies Corp. 4.050%, 05/04/47 | 1,000,000 | 1,147,151 | |||||||||
4.125%, 11/16/28 | 1,500,000 | 1,687,641 | |||||||||
5,500,863 | |||||||||||
Principal | Value(a) | ||||||||||
Air Freight & Logistics (0.2%) | |||||||||||
| FedEx Corp., 4.400%, 01/15/47 | $ | 1,000,000 | $ | 1,004,610 | |||||||
Building Products (0.2%) | |||||||||||
| CRH America Finance, Inc., 4.400%, 05/09/47 (d) | 1,000,000 | 1,060,066 | |||||||||
Containers & Packaging (0.2%) | |||||||||||
| Amcor Finance USA, Inc., 4.500%, 05/15/28 | 1,000,000 | 1,069,596 | |||||||||
Electrical Equipment (0.2%) | |||||||||||
| Flex. Ltd., 4.750%, 06/15/25 (b) | 1,000,000 | 1,089,052 | |||||||||
Electronic Parts Distributions (0.3%) | |||||||||||
| Avnet, Inc., 3.750%, 12/01/21 | 1,500,000 | 1,539,458 | |||||||||
Environmental Control (0.4%) | |||||||||||
| Republic Services, Inc., 3.950%, 05/15/28 | 1,000,000 | 1,101,995 | |||||||||
| Waste Management, Inc., 3.900%, 03/01/35 | 1,000,000 | 1,102,391 | |||||||||
2,204,386 | |||||||||||
Industrial Conglomerates (0.2%) | |||||||||||
| 3M Co., 3.625%, 10/15/47 | 1,000,000 | 1,039,158 | |||||||||
Machinery (0.3%) | |||||||||||
| Caterpillar Financial Services Corp. 2.850%, 05/17/24 | 1,000,000 | 1,034,094 | |||||||||
3.750%, 11/24/23 (c) | 750,000 | 800,585 | |||||||||
1,834,679 | |||||||||||
Miscellaneous Manufacturing (0.4%) | |||||||||||
| Carlisle Cos., Inc., 3.750%, 12/01/27 | 1,000,000 | 1,047,366 | |||||||||
| Textron, Inc. 3.875%, 03/01/25 | 750,000 | 795,113 | |||||||||
4.300%, 03/01/24 | 500,000 | 536,725 | |||||||||
2,379,204 | |||||||||||
Road & Rail (0.0%) | |||||||||||
| Kansas City Southern, 4.300%, 05/15/43 | 250,000 | 272,779 | |||||||||
Transportation (0.2%) | |||||||||||
| Burlington Northern Santa Fe LLC, 3.750%, 04/01/24 | 350,000 | 373,327 | |||||||||
| Penske Truck Leasing Co. L.P. / PTL Finance Corp., 3.900%, 02/01/24 (d) | 1,000,000 | 1,050,676 | |||||||||
1,424,003 | |||||||||||
Trucking & Leasing (0.4%) | |||||||||||
| GATX Corp. 3.250%, 03/30/25 | 1,000,000 | 1,028,961 | |||||||||
4.550%, 11/07/28 | 1,000,000 | 1,094,115 | |||||||||
2,123,076 | |||||||||||
See accompanying notes to financial statements.
58
SFT Dynamic Managed Volatility Fund
Investments in Securities – continued
Principal | Value(a) | ||||||||||
Information Technology (1.2%) | |||||||||||
Communications Equipment (0.3%) | |||||||||||
| Juniper Networks, Inc., 4.500%, 03/15/24 | $ | 500,000 | $ | 541,193 | |||||||
| QUALCOMM, Inc., 4.650%, 05/20/35 | 1,000,000 | 1,188,874 | |||||||||
1,730,067 | |||||||||||
Computers (0.2%) | |||||||||||
| Apple, Inc., 4.375%, 05/13/45 (c) | 1,000,000 | 1,214,319 | |||||||||
Interactive Media & Services (0.1%) | |||||||||||
| eBay, Inc., 3.450%, 08/01/24 | 750,000 | 784,755 | |||||||||
IT Services (0.2%) | |||||||||||
| Global Payments, Inc., 4.800%, 04/01/26 | 750,000 | 834,834 | |||||||||
Software (0.4%) | |||||||||||
| Fiserv, Inc., 3.850%, 06/01/25 | 1,000,000 | 1,067,088 | |||||||||
| Oracle Corp., 3.800%, 11/15/37 | 1,000,000 | 1,092,958 | |||||||||
2,160,046 | |||||||||||
Materials (0.7%) | |||||||||||
Chemicals (0.5%) | |||||||||||
| The Dow Chemical Co., 3.500%, 10/01/24 | 750,000 | 787,691 | |||||||||
| The Mosaic Co., 5.450%, 11/15/33 | 200,000 | 227,037 | |||||||||
| The Sherwin-Williams Co., 3.950%, 01/15/26 | 1,000,000 | 1,070,267 | |||||||||
| Yara International ASA, 4.750%, 06/01/28 (b) (d) | 1,000,000 | 1,086,985 | |||||||||
3,171,980 | |||||||||||
Construction Materials (0.2%) | |||||||||||
| Vulcan Materials Co., 4.500%, 06/15/47 | 1,000,000 | 1,099,489 | |||||||||
Transportation (0.5%) | |||||||||||
Airlines (0.3%) | |||||||||||
| American Airlines 2015-2 Class A Pass Through Trust, 4.000%, 03/22/29 | 834,239 | 879,929 | |||||||||
| British Airways 2013-1 Class A Pass Through Trust, 4.625%, 12/20/25 (d) | 718,053 | 759,963 | |||||||||
| United Airlines 2013-1 Class A Pass Through Trust, 4.300%, 02/15/27 | 188,162 | 201,650 | |||||||||
1,841,542 | |||||||||||
Transport — Rail (0.2%) | |||||||||||
| Norfolk Southern Corp., 3.850%, 01/15/24 | 500,000 | 530,662 | |||||||||
| Union Pacific Corp., 3.750%, 03/15/24 | 500,000 | 530,502 | |||||||||
1,061,164 | |||||||||||
| Shares/ Principal | Value(a) | ||||||||||
Utilities (2.5%) | |||||||||||
Electric Utilities (1.2%) | |||||||||||
| Ameren Illinois Co., 3.700%, 12/01/47 | $ | 1,000,000 | $ | 1,073,811 | |||||||
| Arizona Public Service Co., 4.350%, 11/15/45 | 1,000,000 | 1,152,174 | |||||||||
| Duke Energy Progress LLC, 3.600%, 09/15/47 | 1,000,000 | 1,048,997 | |||||||||
| Entergy Louisiana LLC, 3.300%, 12/01/22 | 250,000 | 257,232 | |||||||||
| Northern States Power Co., 3.750%, 12/01/47 | 1,000,000 | 1,043,359 | |||||||||
| Oglethorpe Power Corp., 4.250%, 04/01/46 | 800,000 | 804,767 | |||||||||
| Oklahoma Gas & Electric Co., 4.150%, 04/01/47 | 1,000,000 | 1,088,445 | |||||||||
| PPL Capital Funding, Inc., 3.400%, 06/01/23 | 250,000 | 258,124 | |||||||||
6,726,909 | |||||||||||
Electric — Integrated (0.1%) | |||||||||||
| Berkshire Hathaway Energy Co., 3.750%, 11/15/23 | 250,000 | 265,567 | |||||||||
Gas Utilities (0.7%) | |||||||||||
| National Fuel Gas Co., 4.750%, 09/01/28 | 1,000,000 | 1,071,095 | |||||||||
| ONEOK, Inc. 4.000%, 07/13/27 | 500,000 | 532,536 | |||||||||
4.350%, 03/15/29 | 1,500,000 | 1,624,781 | |||||||||
| Washington Gas Light Co., 3.796%, 09/15/46 | 1,000,000 | 1,043,223 | |||||||||
4,271,635 | |||||||||||
Multi-Utilities (0.2%) | |||||||||||
| Dominion Energy Gas Holdings LLC, 3.550%, 11/01/23 | 250,000 | 259,249 | |||||||||
| National Fuel Gas Co., 5.200%, 07/15/25 | 1,000,000 | 1,106,442 | |||||||||
1,365,691 | |||||||||||
Water Utilities (0.3%) | |||||||||||
| American Water Capital Corp., 3.750%, 09/01/47 | 1,000,000 | 1,059,019 | |||||||||
| Aquarion Co., 4.000%, 08/15/24 (d) | 500,000 | 525,923 | |||||||||
1,584,942 | |||||||||||
| Total corporate obligations (cost: $154,101,180) | 166,075,872 | ||||||||||
| Total long-term debt securities (cost: $172,076,688) | 184,516,832 | ||||||||||
Mutual Funds (36.8%) | |||||||||||
Investment Companies (36.8%) | |||||||||||
| iShares iBoxx $ Investment Grade Corporate Bond ETF | 44,500 | 5,694,220 | |||||||||
SFT Index 500 Fund (f) | 14,224,618 | 189,313,819 | |||||||||
SPDR S&P 500 ETF Trust (c) | 36,170 | 11,641,677 | |||||||||
Vanguard S&P 500 ETF | 20,175 | 5,967,765 | |||||||||
| Total mutual funds (cost: $123,653,386) | 212,617,481 | ||||||||||
See accompanying notes to financial statements.
59
SFT Dynamic Managed Volatility Fund
Investments in Securities – continued
| Shares/ Principal | Value(a) | ||||||||||
Short-Term Securities (29.9%) | |||||||||||
Investment Companies (29.4%) | |||||||||||
| State Street Institutional U.S. Government Money Market Fund, current rate 1.530% | $ | 170,162,399 | $ | 170,162,399 | |||||||
U.S. Government Obligations (0.5%) | |||||||||||
| U.S. Treasury Note, current rate 2.000%, 01/31/20 | 2,500,000 | 2,500,661 | |||||||||
| Total short-term securities (cost: $172,661,353) | 172,663,060 | ||||||||||
| Total investments excluding purchased options (98.6%) (cost: $468,391,427) | 569,797,373 | ||||||||||
| Total purchased options outstanding (0.2%) (cost: $1,054,425) | 1,004,400 | ||||||||||
| Total investments in securities (cost: $469,445,852) (g) | 570,801,773 | ||||||||||
| Cash and other assets in excess of liabilities (1.2%) | 7,002,951 | ||||||||||
Total net assets (100.0%) | $ | 577,804,724 | |||||||||
Investments in Securities Legend
(a) Securities are valued by procedures described in Note 2 of the Notes to Financial Statements.
(b) Foreign security: The Fund held 1.6% of net assets in foreign securities at December 31, 2019.
(c) Fully or partially pledged as initial margin deposits on open futures contracts.
Holdings of Open Futures Contracts
On December 31, 2019, securities with an aggregate market value of $16,831,113 have been pledged to cover margin requirements for the following open futures contracts:
Description | Expiration Date | Number of Contracts | Position Type | Notional Amount | Market Value | Unrealized Appreciation/ (Depreciation)(a) | |||||||||||||||||||||
10 Year U.S. Treasury Note | March 2020 | 83 | Short | $ | (10,753,900 | ) | $ | (10,659,015 | ) | $ | 94,885 | ||||||||||||||||
10 Year U.S. Ultra | March 2020 | 35 | Short | (4,991,285 | ) | (4,924,610 | ) | 66,675 | |||||||||||||||||||
2 Year U.S. Treasury Note | March 2020 | 150 | Long | 32,338,856 | 32,325,001 | (13,855 | ) | ||||||||||||||||||||
S&P Mid 500® E-Mini Index Future | March 2020 | 1,587 | Long | 251,368,319 | 256,387,785 | 5,019,466 | |||||||||||||||||||||
U.S. Long Bond | March 2020 | 2 | Long | 319,630 | 311,812 | (7,818 | ) | ||||||||||||||||||||
U.S. Ultra Bond | March 2020 | 24 | Short | (4,521,750 | ) | (4,359,750 | ) | 162,000 | |||||||||||||||||||
$ | 269,081,223 | $ | 5,321,353 | ||||||||||||||||||||||||
(d) Security sold within terms of a private placement memorandum exempt from registration under Section 144A of the Securities Act of 1933, as amended, and may be sold only to dealers in that program. This security has been determined to be liquid unless otherwise indicated.
(e) Variable rate security.
(f) Affiliated security.
(g) At December 31, 2019 the cost of investments for federal income tax purposes was $474,742,790. The aggregate unrealized appreciation and depreciation of investments based on this cost were:
Gross unrealized appreciation | $ | 101,383,743 | |||||
Gross unrealized depreciation | (3,407 | ) | |||||
Net unrealized appreciation | $ | 101,380,336 | |||||
See accompanying notes to financial statements.
60
SFT Dynamic Managed Volatility Fund
Investments in Securities – continued
Put Options Purchased:
The Fund had the following put options purchased open at December 31, 2019:
Description | Exercise Price | Expiration Date | Number of Contracts | Notional Amount | Value(a) | ||||||||||||||||||
S&P 500 Index | $ | 3,095 | January 2020 | 180 | $ | 18,000 | $ | 357,300 | |||||||||||||||
S&P 500 Index | 3,085 | January 2020 | 180 | 18,000 | 333,900 | ||||||||||||||||||
S&P 500 Index | 3,105 | January 2020 | 180 | 18,000 | 313,200 | ||||||||||||||||||
$ | 1,004,400 | ||||||||||||||||||||||
See accompanying notes to financial statements.
61
SFT Government Money Market Fund
Investments in Securities
December 31, 2019
(Percentages of each investment category relate to total net assets)
Principal | Value(a) | ||||||||||
Short-Term Investments (100.4%) | |||||||||||
U.S. Government Obligations (85.4%) | |||||||||||
Discount Notes (85.4%) | |||||||||||
| Federal Home Loan Bank 0.502%, 01/29/20 (b) | $ | 50,000,000 | $ | 49,938,167 | |||||||
0.889%, 03/25/20 (b) | 7,000,000 | 6,969,947 | |||||||||
1.244%, 02/25/20 (b) | 16,800,000 | 16,759,446 | |||||||||
1.406%, 02/25/20 (b) | 10,000,000 | 9,975,785 | |||||||||
1.505%, 03/25/20 (b) | 38,500,000 | 38,357,614 | |||||||||
1.507%, 03/25/20 (b) | 27,000,000 | 26,900,019 | |||||||||
1.553%, 04/09/20 (b) | 12,000,000 | 11,949,675 | |||||||||
Total U.S. government obligations | 160,850,653 | ||||||||||
Shares | Value(a) | ||||||||||
Investment Companies (15.0%) | |||||||||||
| State Street Institutional U.S. Government Money Market Fund, current rate 1.530% | 28,312,054 | $ | 28,312,054 | ||||||||
| Total short-term investments (cost: $189,162,707) | 189,162,707 | ||||||||||
| Total investments in securities (cost: $189,162,707) (c) | 189,162,707 | ||||||||||
| Liabilities in excess of cash and other assets (-0.4%) | (811,761 | ) | |||||||||
Total net assets (100.0%) | $ | 188,350,946 | |||||||||
Investments in Securities Legend
(a) Securities are valued by procedures described in Note 2 of the Notes to Financial Statements.
(b) Rate represents annualized yield at date of purchase.
(c) Also represents the cost of securities for federal income tax purposes at December 31, 2019.
See accompanying notes to financial statements.
62
SFT Index 400 Mid-Cap Fund
Investments in Securities
December 31, 2019
(Percentages of each investment category relate to total net assets)
Shares | Value(a) | ||||||||||
Common Stocks (94.6%) | |||||||||||
Communication Services (0.1%) | |||||||||||
Wireless Telecommunication Services (0.1%) | |||||||||||
Telephone & Data Systems, Inc. | 10,022 | $ | 254,859 | ||||||||
Consumer Discretionary (14.5%) | |||||||||||
Auto Components (1.4%) | |||||||||||
Adient PLC (b) (c) | 8,932 | 189,805 | |||||||||
Dana, Inc. | 14,775 | 268,905 | |||||||||
Delphi Technologies PLC (b) | 8,836 | 113,366 | |||||||||
Gentex Corp. | 25,970 | 752,610 | |||||||||
Lear Corp. | 5,649 | 775,043 | |||||||||
The Goodyear Tire & Rubber Co. | 23,875 | 371,376 | |||||||||
Visteon Corp. (c) | 2,900 | 251,111 | |||||||||
2,722,216 | |||||||||||
Automobiles (0.2%) | |||||||||||
Thor Industries, Inc. | 5,612 | 416,915 | |||||||||
Distributors (0.4%) | |||||||||||
Pool Corp. | 4,141 | 879,466 | |||||||||
Diversified Consumer Services (1.0%) | |||||||||||
| Adtalem Global Education, Inc. (c) | 5,543 | 193,839 | |||||||||
| Graham Holdings Co. – Class B | 458 | 292,657 | |||||||||
| Grand Canyon Education, Inc. (c) | 4,951 | 474,256 | |||||||||
| Service Corp. International/US | 18,764 | 863,707 | |||||||||
WW International, Inc. (c) | 4,717 | 180,237 | |||||||||
2,004,696 | |||||||||||
Hotels, Restaurants & Leisure (4.2%) | |||||||||||
Boyd Gaming Corp. | 8,201 | 245,538 | |||||||||
Brinker International, Inc. | 3,790 | 159,180 | |||||||||
Caesars Entertainment Corp. (c) | 57,299 | 779,266 | |||||||||
Choice Hotels International, Inc. | 3,261 | 337,285 | |||||||||
Churchill Downs, Inc. | 3,596 | 493,371 | |||||||||
| Cracker Barrel Old Country Store, Inc. | 2,494 | 383,428 | |||||||||
Domino's Pizza, Inc. | 4,278 | 1,256,791 | |||||||||
Dunkin' Brands Group, Inc. | 8,481 | 640,655 | |||||||||
Eldorado Resorts, Inc. (c) | 6,677 | 398,216 | |||||||||
Jack in the Box, Inc. | 2,428 | 189,457 | |||||||||
| Marriott Vacations Worldwide Corp. | 3,841 | 494,567 | |||||||||
Papa John's International, Inc. | 2,175 | 137,351 | |||||||||
Penn National Gaming, Inc. (c) | 11,185 | 285,889 | |||||||||
| Scientific Games Corp. – Class A (c) | 5,504 | 147,397 | |||||||||
Six Flags Entertainment Corp. | 8,039 | 362,639 | |||||||||
Texas Roadhouse, Inc. | 6,684 | 376,443 | |||||||||
The Cheesecake Factory, Inc. | 4,160 | 161,658 | |||||||||
The Wendy's Co. | 18,893 | 419,613 | |||||||||
Wyndham Destinations, Inc. | 9,311 | 481,286 | |||||||||
Wyndham Hotels & Resorts, Inc. | 9,770 | 613,654 | |||||||||
8,363,684 | |||||||||||
Shares | Value(a) | ||||||||||
Household Durables (1.0%) | |||||||||||
Helen of Troy, Ltd. (b) (c) | 2,604 | $ | 468,173 | ||||||||
KB Home | 8,772 | 300,616 | |||||||||
| Tempur Sealy International, Inc. (c) | 4,664 | 406,048 | |||||||||
Toll Brothers, Inc. | 13,263 | 524,021 | |||||||||
TRI Pointe Group, Inc. (c) | 14,294 | 222,701 | |||||||||
1,921,559 | |||||||||||
Internet & Catalog Retail (0.7%) | |||||||||||
Etsy, Inc. (c) | 12,164 | 538,865 | |||||||||
GrubHub, Inc. (c) | 9,377 | 456,097 | |||||||||
TripAdvisor, Inc. | 10,786 | 327,679 | |||||||||
1,322,641 | |||||||||||
Leisure Equipment & Products (0.8%) | |||||||||||
Brunswick Corp. | 8,374 | 502,272 | |||||||||
Mattel, Inc. (c) | 35,594 | 482,299 | |||||||||
Polaris, Inc. | 5,860 | 595,962 | |||||||||
1,580,533 | |||||||||||
Media (1.4%) | |||||||||||
AMC Networks, Inc. – Class A (c) | 4,481 | 177,000 | |||||||||
Cable One, Inc. | 528 | 785,912 | |||||||||
Cinemark Holdings, Inc. | 10,944 | 370,454 | |||||||||
John Wiley & Sons, Inc. – Class A | 4,468 | 216,787 | |||||||||
Meredith Corp. | 4,057 | 131,731 | |||||||||
TEGNA, Inc. | 22,267 | 371,636 | |||||||||
The New York Times Co. – Class A | 14,758 | 474,765 | |||||||||
| World Wrestling Entertainment, Inc. – Class A | 4,834 | 313,582 | |||||||||
2,841,867 | |||||||||||
Multiline Retail (0.2%) | |||||||||||
Dillard's, Inc. – Class A | 946 | 69,512 | |||||||||
| Ollie's Bargain Outlet Holdings, Inc. (c) | 5,573 | 363,973 | |||||||||
433,485 | |||||||||||
Specialty Retail (2.2%) | |||||||||||
Aaron's, Inc. | 6,893 | 393,659 | |||||||||
American Eagle Outfitters, Inc. | 16,305 | 239,684 | |||||||||
AutoNation, Inc. (c) | 5,999 | 291,731 | |||||||||
Bed Bath & Beyond, Inc. | 12,993 | 224,779 | |||||||||
Dick's Sporting Goods, Inc. | 6,528 | 323,071 | |||||||||
Five Below, Inc. (c) | 5,675 | 725,605 | |||||||||
Foot Locker, Inc. | 10,988 | 428,422 | |||||||||
Murphy USA, Inc. (c) | 2,968 | 347,256 | |||||||||
RH (c) | 1,678 | 358,270 | |||||||||
Sally Beauty Holdings, Inc. (c) | 11,942 | 217,942 | |||||||||
Urban Outfitters, Inc. (c) | 7,217 | 200,416 | |||||||||
Williams-Sonoma, Inc. | 7,967 | 585,096 | |||||||||
4,335,931 | |||||||||||
Textiles, Apparel & Luxury Goods (1.0%) | |||||||||||
Carter's, Inc. | 4,532 | 495,529 | |||||||||
Columbia Sportswear Co. | 2,981 | 298,666 | |||||||||
Deckers Outdoor Corp. (c) | 2,872 | 484,966 | |||||||||
Skechers U.S.A., Inc. – Class A (c) | 13,747 | 593,733 | |||||||||
1,872,894 | |||||||||||
See accompanying notes to financial statements.
63
SFT Index 400 Mid-Cap Fund
Investments in Securities – continued
Shares | Value(a) | ||||||||||
Consumer Staples (2.5%) | |||||||||||
Beverages (0.2%) | |||||||||||
| The Boston Beer Co., Inc. – Class A (c) | 930 | $ | 351,400 | ||||||||
Food & Staples Retailing (0.4%) | |||||||||||
Casey's General Stores, Inc. | 3,814 | 606,388 | |||||||||
Sprouts Farmers Market, Inc. (c) | 12,128 | 234,677 | |||||||||
841,065 | |||||||||||
Food Products (1.5%) | |||||||||||
Flowers Foods, Inc. | 19,760 | 429,583 | |||||||||
Ingredion, Inc. | 6,822 | 634,105 | |||||||||
Lancaster Colony Corp. | 2,053 | 328,685 | |||||||||
Post Holdings, Inc. (c) | 6,823 | 744,389 | |||||||||
Sanderson Farms, Inc. | 2,018 | 355,612 | |||||||||
The Hain Celestial Group, Inc. (c) | 8,225 | 213,480 | |||||||||
Tootsie Roll Industries, Inc. | 1,650 | 56,331 | |||||||||
TreeHouse Foods, Inc. (c) | 5,730 | 277,905 | |||||||||
3,040,090 | |||||||||||
Household Products (0.2%) | |||||||||||
Energizer Holdings, Inc. | 6,547 | 328,790 | |||||||||
Personal Products (0.2%) | |||||||||||
Edgewell Personal Care Co. (c) | 5,519 | 170,868 | |||||||||
Nu Skin Enterprises, Inc. – Class A | 5,662 | 232,029 | |||||||||
402,897 | |||||||||||
Energy (2.0%) | |||||||||||
Energy Equipment & Services (0.5%) | |||||||||||
Apergy Corp. (c) | 7,936 | 268,078 | |||||||||
Core Laboratories NV (b) | 4,502 | 169,590 | |||||||||
Patterson-UTI Energy, Inc. | 19,971 | 209,695 | |||||||||
Transocean, Ltd. (b) (c) | 59,045 | 406,230 | |||||||||
1,053,593 | |||||||||||
Oil, Gas & Consumable Fuels (1.5%) | |||||||||||
Antero Midstream Corp. | 30,492 | 231,434 | |||||||||
Chesapeake Energy Corp. (c) | 120,370 | 99,378 | |||||||||
CNX Resources Corp. (c) | 19,155 | 169,522 | |||||||||
EQT Corp. | 26,244 | 286,060 | |||||||||
Equitrans Midstream Corp. | 20,921 | 279,505 | |||||||||
Matador Resources Co. (c) | 11,256 | 202,270 | |||||||||
Murphy Oil Corp. | 15,334 | 410,951 | |||||||||
PBF Energy, Inc. – Class A | 10,457 | 328,036 | |||||||||
World Fuel Services Corp. | 6,683 | 290,176 | |||||||||
WPX Energy, Inc. (c) | 42,783 | 587,838 | |||||||||
2,885,170 | |||||||||||
Financial (15.9%) | |||||||||||
Capital Markets (2.5%) | |||||||||||
Affiliated Managers Group, Inc. | 5,058 | 428,615 | |||||||||
Eaton Vance Corp. | 11,615 | 542,304 | |||||||||
Evercore, Inc. – Class A | 4,012 | 299,937 | |||||||||
Factset Research Systems, Inc. | 3,969 | 1,064,883 | |||||||||
| Federated Investors, Inc. – Class B | 9,863 | 321,435 | |||||||||
| Interactive Brokers Group, Inc. – Class A | 7,862 | 366,527 | |||||||||
Janus Henderson Group PLC (b) | 15,975 | 390,589 | |||||||||
Legg Mason, Inc. | 8,359 | 300,172 | |||||||||
SEI Investments Co. | 12,957 | 848,424 | |||||||||
Stifel Financial Corp. | 7,019 | 425,702 | |||||||||
4,988,588 | |||||||||||
Shares | Value(a) | ||||||||||
Commercial Banks (6.9%) | |||||||||||
Associated Banc-Corp. | 16,358 | $ | 360,530 | ||||||||
BancorpSouth Bank | 9,850 | 309,389 | |||||||||
Bank of Hawaii Corp. | 4,114 | 391,488 | |||||||||
Bank OZK | 12,410 | 378,567 | |||||||||
Cathay General Bancorp | 7,766 | 295,496 | |||||||||
Commerce Bancshares, Inc. | 10,647 | 723,357 | |||||||||
Cullen/Frost Bankers, Inc. | 5,815 | 568,591 | |||||||||
East West Bancorp, Inc. | 14,950 | 728,065 | |||||||||
First Financial Bankshares, Inc. | 13,946 | 489,505 | |||||||||
First Horizon National Corp. | 31,946 | 529,026 | |||||||||
FNB Corp. | 33,357 | 423,634 | |||||||||
Fulton Financial Corp. | 16,849 | 293,678 | |||||||||
Hancock Whitney Corp. | 8,953 | 392,858 | |||||||||
Home BancShares, Inc. | 15,928 | 313,145 | |||||||||
International Bancshares Corp. | 5,889 | 253,639 | |||||||||
PacWest Bancorp | 12,263 | 469,305 | |||||||||
Pinnacle Financial Partners, Inc. | 7,388 | 472,832 | |||||||||
Prosperity Bancshares, Inc. | 9,691 | 696,686 | |||||||||
Signature Bank | 5,543 | 757,229 | |||||||||
Sterling Bancorp | 20,742 | 437,241 | |||||||||
Synovus Financial Corp. | 15,044 | 589,725 | |||||||||
TCF Financial Corp. | 15,749 | 737,053 | |||||||||
| Texas Capital Bancshares, Inc. (c) | 5,118 | 290,549 | |||||||||
Trustmark Corp. | 6,581 | 227,110 | |||||||||
UMB Financial Corp. | 4,379 | 300,575 | |||||||||
Umpqua Holdings Corp. | 22,607 | 400,144 | |||||||||
United Bankshares, Inc. | 10,423 | 402,953 | |||||||||
Valley National Bancorp | 40,211 | 460,416 | |||||||||
Webster Financial Corp. | 9,448 | 504,145 | |||||||||
Wintrust Financial Corp. | 5,781 | 409,873 | |||||||||
13,606,804 | |||||||||||
Consumer Finance (0.6%) | |||||||||||
FirstCash, Inc. | 4,357 | 351,305 | |||||||||
Green Dot Corp. – Class A (c) | 4,846 | 112,912 | |||||||||
Navient Corp. | 19,968 | 273,162 | |||||||||
SLM Corp. | 43,340 | 386,159 | |||||||||
1,123,538 | |||||||||||
Diversified Financial Services (0.3%) | |||||||||||
Jefferies Financial Group, Inc. | 25,859 | 552,607 | |||||||||
Diversified REITs (0.2%) | |||||||||||
PS Business Parks, Inc. | 2,077 | 342,435 | |||||||||
Insurance (4.9%) | |||||||||||
Alleghany Corp. (c) (d) | 1,482 | 1,184,963 | |||||||||
American Financial Group, Inc. | 7,644 | 838,165 | |||||||||
Brighthouse Financial, Inc. (c) | 11,217 | 440,043 | |||||||||
Brown & Brown, Inc. | 24,007 | 947,796 | |||||||||
CNO Financial Group, Inc. | 15,516 | 281,305 | |||||||||
First American Financial Corp. | 11,529 | 672,371 | |||||||||
| Genworth Financial, Inc. – Class A (c) | 51,670 | 227,348 | |||||||||
Kemper Corp. | 6,396 | 495,690 | |||||||||
Mercury General Corp. | 2,714 | 132,253 | |||||||||
| Old Republic International Corp. | 29,295 | 655,329 | |||||||||
Primerica, Inc. | 4,245 | 554,227 | |||||||||
| Reinsurance Group of America, Inc. | 6,411 | 1,045,378 | |||||||||
See accompanying notes to financial statements.
64
SFT Index 400 Mid-Cap Fund
Investments in Securities – continued
Shares | Value(a) | ||||||||||
| RenaissanceRe Holdings, Ltd. (b) | 4,581 | $ | 897,968 | ||||||||
RLI Corp. | 4,100 | 369,082 | |||||||||
| Selective Insurance Group, Inc. | 6,059 | 394,986 | |||||||||
| The Hanover Insurance Group, Inc. | 4,003 | 547,090 | |||||||||
9,683,994 | |||||||||||
Thrifts & Mortgage Finance (0.5%) | |||||||||||
LendingTree, Inc. (c) | 810 | 245,786 | |||||||||
| New York Community Bancorp, Inc. | 47,978 | 576,696 | |||||||||
Washington Federal, Inc. | 8,043 | 294,776 | |||||||||
1,117,258 | |||||||||||
Health Care (9.2%) | |||||||||||
Biotechnology (1.1%) | |||||||||||
| Arrowhead Pharmaceuticals, Inc. (c) | 10,277 | 651,870 | |||||||||
Exelixis, Inc. (c) | 31,193 | 549,621 | |||||||||
| Ligand Pharmaceuticals, Inc. (c) | 1,803 | 188,035 | |||||||||
Repligen Corp. (c) | 4,811 | 445,017 | |||||||||
United Therapeutics Corp. (c) | 4,449 | 391,868 | |||||||||
2,226,411 | |||||||||||
Health Care Equipment & Supplies (3.2%) | |||||||||||
Avanos Medical, Inc. (c) | 4,849 | 163,411 | |||||||||
Cantel Medical Corp. | 3,813 | 270,342 | |||||||||
| Globus Medical, Inc. – Class A (c) | 7,851 | 462,267 | |||||||||
Haemonetics Corp. (c) | 5,167 | 593,688 | |||||||||
Hill-Rom Holdings, Inc. | 6,831 | 775,524 | |||||||||
ICU Medical, Inc. (c) | 1,993 | 372,930 | |||||||||
| Integra LifeSciences Holdings Corp. (c) | 7,265 | 423,404 | |||||||||
LivaNova PLC (b) (c) | 4,920 | 371,116 | |||||||||
Masimo Corp. (c) | 5,089 | 804,367 | |||||||||
NuVasive, Inc. (c) | 5,299 | 409,825 | |||||||||
Penumbra, Inc. (c) | 3,320 | 545,376 | |||||||||
| West Pharmaceutical Services, Inc. | 7,651 | 1,150,175 | |||||||||
6,342,425 | |||||||||||
Health Care Providers & Services (2.3%) | |||||||||||
Acadia Healthcare Co., Inc. (c) | 9,084 | 301,770 | |||||||||
Amedisys, Inc. (c) | 3,338 | 557,179 | |||||||||
Chemed Corp. | 1,652 | 725,658 | |||||||||
Encompass Health Corp. | 10,122 | 701,151 | |||||||||
HealthEquity, Inc. (c) | 7,226 | 535,230 | |||||||||
Mednax, Inc. (c) | 8,636 | 239,994 | |||||||||
Molina Healthcare, Inc. (c) | 6,406 | 869,230 | |||||||||
Patterson Cos., Inc. | 8,821 | 180,654 | |||||||||
Tenet Healthcare Corp. (c) | 10,632 | 404,335 | |||||||||
4,515,201 | |||||||||||
Health Care Technology (0.1%) | |||||||||||
| Allscripts Healthcare Solutions, Inc. (c) | 16,668 | 163,597 | |||||||||
Shares | Value(a) | ||||||||||
Life Sciences Tools & Services (1.8%) | |||||||||||
| Bio-Rad Laboratories, Inc. – Class A (c) | 2,230 | $ | 825,167 | ||||||||
Bio-Techne Corp. | 3,949 | 866,845 | |||||||||
| Charles River Laboratories International, Inc. (c) | 5,063 | 773,424 | |||||||||
PRA Health Sciences, Inc. (c) | 6,514 | 724,031 | |||||||||
Syneos Health, Inc. (c) | 6,341 | 377,131 | |||||||||
3,566,598 | |||||||||||
Pharmaceuticals (0.7%) | |||||||||||
Catalent, Inc. (c) | 15,020 | 845,626 | |||||||||
Nektar Therapeutics (c) | 18,060 | 389,825 | |||||||||
| Prestige Consumer Healthcare, Inc. (c) | 5,112 | 207,036 | |||||||||
1,442,487 | |||||||||||
Industrials (15.1%) | |||||||||||
Aerospace & Defense (1.4%) | |||||||||||
Axon Enterprise, Inc. (c) | 6,047 | 443,124 | |||||||||
Curtiss-Wright Corp. | 4,433 | 624,565 | |||||||||
Mercury Systems, Inc. (c) | 5,650 | 390,472 | |||||||||
Teledyne Technologies, Inc. (c) | 3,774 | 1,307,842 | |||||||||
2,766,003 | |||||||||||
Air Freight & Logistics (0.4%) | |||||||||||
XPO Logistics, Inc. (c) | 9,463 | 754,201 | |||||||||
Airlines (0.3%) | |||||||||||
JetBlue Airways Corp. (c) | 29,637 | 554,805 | |||||||||
Building Products (1.1%) | |||||||||||
Lennox International, Inc. | 3,656 | 891,954 | |||||||||
Owens Corning | 11,168 | 727,260 | |||||||||
Resideo Technologies, Inc. (c) | 12,608 | 150,414 | |||||||||
Trex Co., Inc. (c) | 5,961 | 535,775 | |||||||||
2,305,403 | |||||||||||
Commercial Services & Supplies (1.8%) | |||||||||||
Clean Harbors, Inc. (c) | 5,231 | 448,558 | |||||||||
Deluxe Corp. | 4,322 | 215,754 | |||||||||
Healthcare Services Group, Inc. | 7,589 | 184,565 | |||||||||
Herman Miller, Inc. | 6,026 | 250,983 | |||||||||
HNI Corp. | 4,348 | 162,876 | |||||||||
KAR Auction Services, Inc. | 13,220 | 288,064 | |||||||||
MSA Safety, Inc. | 3,695 | 466,900 | |||||||||
Stericycle, Inc. (c) | 9,353 | 596,815 | |||||||||
Tetra Tech, Inc. | 5,569 | 479,825 | |||||||||
The Brink's Co. | 5,087 | 461,289 | |||||||||
3,555,629 | |||||||||||
Construction & Engineering (1.4%) | |||||||||||
AECOM (c) | 16,126 | 695,515 | |||||||||
Dycom Industries, Inc. (c) | 3,167 | 149,324 | |||||||||
EMCOR Group, Inc. | 5,723 | 493,895 | |||||||||
Fluor Corp. | 14,390 | 271,683 | |||||||||
KBR, Inc. | 14,548 | 443,714 | |||||||||
MasTec, Inc. (c) | 6,154 | 394,841 | |||||||||
Valmont Industries, Inc. | 2,244 | 336,106 | |||||||||
2,785,078 | |||||||||||
Electrical Equipment (1.7%) | |||||||||||
Acuity Brands, Inc. | 4,039 | 557,382 | |||||||||
Belden, Inc. | 3,908 | 214,940 | |||||||||
EnerSys | 4,307 | 322,293 | |||||||||
Hubbell, Inc. | 5,544 | 819,514 | |||||||||
See accompanying notes to financial statements.
65
SFT Index 400 Mid-Cap Fund
Investments in Securities – continued
Shares | Value(a) | ||||||||||
nVent Electric PLC (b) | 15,975 | $ | 408,640 | ||||||||
Regal Beloit Corp. | 4,203 | 359,819 | |||||||||
Woodward, Inc. | 5,838 | 691,453 | |||||||||
3,374,041 | |||||||||||
Industrial Conglomerates (0.5%) | |||||||||||
Carlisle Cos., Inc. | 5,872 | 950,324 | |||||||||
Machinery (3.9%) | |||||||||||
AGCO Corp. | 6,435 | 497,104 | |||||||||
Colfax Corp. (c) | 8,567 | 311,667 | |||||||||
Crane Co. | 5,186 | 447,967 | |||||||||
Donaldson Co., Inc. | 12,992 | 748,599 | |||||||||
Graco, Inc. | 17,121 | 890,292 | |||||||||
ITT, Inc. | 9,003 | 665,412 | |||||||||
Kennametal, Inc. | 8,455 | 311,905 | |||||||||
Lincoln Electric Holdings, Inc. | 6,278 | 607,271 | |||||||||
Nordson Corp. | 5,308 | 864,355 | |||||||||
Oshkosh Corp. | 6,987 | 661,320 | |||||||||
Terex Corp. | 6,695 | 199,377 | |||||||||
The Timken Co. | 6,959 | 391,861 | |||||||||
The Toro Co. | 10,944 | 871,908 | |||||||||
Trinity Industries, Inc. | 10,076 | 223,183 | |||||||||
7,692,221 | |||||||||||
Marine (0.3%) | |||||||||||
Kirby Corp. (c) | 6,114 | 547,386 | |||||||||
Professional Services (0.8%) | |||||||||||
ASGN, Inc. (c) | 5,388 | 382,386 | |||||||||
FTI Consulting, Inc. (c) | 3,890 | 430,468 | |||||||||
Insperity, Inc. | 3,860 | 332,114 | |||||||||
Manpowergroup, Inc. | 6,053 | 587,746 | |||||||||
1,732,714 | |||||||||||
Road & Rail (0.8%) | |||||||||||
Avis Budget Group, Inc. (c) | 5,835 | 188,120 | |||||||||
| Knight-Swift Transportation Holdings, Inc. | 12,613 | 452,050 | |||||||||
Landstar System, Inc. | 4,011 | 456,733 | |||||||||
Ryder System, Inc. | 5,433 | 295,066 | |||||||||
Werner Enterprises, Inc. | 4,494 | 163,537 | |||||||||
1,555,506 | |||||||||||
Trading Companies & Distributors (0.7%) | |||||||||||
GATX Corp. | 3,603 | 298,509 | |||||||||
| MSC Industrial Direct Co., Inc. – Class A | 4,569 | 358,529 | |||||||||
Now, Inc. (c) | 11,169 | 125,540 | |||||||||
Watsco, Inc. | 3,383 | 609,447 | |||||||||
1,392,025 | |||||||||||
Information Technology (14.5%) | |||||||||||
Communications Equipment (1.0%) | |||||||||||
Ciena Corp. (c) | 15,881 | 677,960 | |||||||||
InterDigital, Inc. | 3,129 | 170,499 | |||||||||
Lumentum Holdings, Inc. (c) | 7,878 | 624,726 | |||||||||
NetScout Systems, Inc. (c) | 6,761 | 162,737 | |||||||||
ViaSat, Inc. (c) | 5,877 | 430,167 | |||||||||
2,066,089 | |||||||||||
Computers & Peripherals (0.2%) | |||||||||||
NCR Corp. (c) | 13,099 | 460,561 | |||||||||
Shares | Value(a) | ||||||||||
| Electronic Equipment, Instruments & Components (3.5%) | |||||||||||
Arrow Electronics, Inc. (c) | 8,361 | $ | 708,511 | ||||||||
Avnet, Inc. | 10,364 | 439,848 | |||||||||
Cognex Corp. | 17,544 | 983,166 | |||||||||
Coherent, Inc. (c) | 2,488 | 413,879 | |||||||||
II-VI, Inc. (c) | 8,888 | 299,259 | |||||||||
Jabil, Inc. | 14,261 | 589,407 | |||||||||
Littelfuse, Inc. | 2,550 | 487,815 | |||||||||
National Instruments Corp. | 12,109 | 512,695 | |||||||||
SYNNEX Corp. | 4,239 | 545,983 | |||||||||
Tech Data Corp. (c) | 3,693 | 530,315 | |||||||||
Trimble, Inc. (c) | 25,576 | 1,066,263 | |||||||||
Vishay Intertechnology, Inc. | 13,587 | 289,267 | |||||||||
6,866,408 | |||||||||||
Interactive Media & Services (0.5%) | |||||||||||
j2 Global, Inc. | 4,721 | 442,405 | |||||||||
LogMeIn, Inc. | 5,011 | 429,643 | |||||||||
Yelp, Inc. (c) | 6,558 | 228,415 | |||||||||
1,100,463 | |||||||||||
IT Services (2.3%) | |||||||||||
| CACI International, Inc. – Class A (c) | 2,581 | 645,224 | |||||||||
CoreLogic, Inc. (c) | 8,163 | 356,805 | |||||||||
LiveRamp Holdings, Inc. (c) | 6,917 | 332,500 | |||||||||
MAXIMUS, Inc. | 6,520 | 485,023 | |||||||||
Perspecta, Inc. | 14,116 | 373,227 | |||||||||
Sabre Corp. | 28,117 | 630,945 | |||||||||
| Science Applications International Corp. | 4,988 | 434,056 | |||||||||
Teradata Corp. (c) | 11,549 | 309,167 | |||||||||
WEX, Inc. (c) | 4,489 | 940,266 | |||||||||
4,507,213 | |||||||||||
Semiconductors & Semiconductor Equipment (3.9%) | |||||||||||
Cabot Microelectronics Corp. | 2,988 | 431,228 | |||||||||
Cirrus Logic, Inc. (c) | 5,931 | 488,774 | |||||||||
Cree, Inc. (c) | 10,998 | 507,558 | |||||||||
Cypress Semiconductor Corp. | 37,914 | 884,534 | |||||||||
First Solar, Inc. (c) | 7,772 | 434,921 | |||||||||
MKS Instruments, Inc. | 5,552 | 610,775 | |||||||||
Monolithic Power Systems, Inc. | 4,172 | 742,699 | |||||||||
Semtech Corp. (c) | 6,800 | 359,720 | |||||||||
Silicon Laboratories, Inc. (c) | 4,496 | 521,446 | |||||||||
SolarEdge Technologies, Inc. (c) | 4,970 | 472,597 | |||||||||
Synaptics, Inc. (c) | 3,414 | 224,539 | |||||||||
Teradyne, Inc. | 17,203 | 1,173,073 | |||||||||
Universal Display Corp. | 4,398 | 906,296 | |||||||||
7,758,160 | |||||||||||
Software (3.1%) | |||||||||||
ACI Worldwide, Inc. (c) | 11,867 | 449,581 | |||||||||
Blackbaud, Inc. | 5,001 | 398,080 | |||||||||
CDK Global, Inc. | 12,462 | 681,422 | |||||||||
Ceridian HCM Holding, Inc. (c) | 10,280 | 697,806 | |||||||||
CommVault Systems, Inc. (c) | 4,312 | 192,488 | |||||||||
Fair Isaac Corp. (c) | 2,998 | 1,123,291 | |||||||||
Manhattan Associates, Inc. (c) | 6,560 | 523,160 | |||||||||
PTC, Inc. (c) | 10,654 | 797,878 | |||||||||
Tyler Technologies, Inc. (c) | 4,003 | 1,200,980 | |||||||||
6,064,686 | |||||||||||
See accompanying notes to financial statements.
66
SFT Index 400 Mid-Cap Fund
Investments in Securities – continued
Shares | Value(a) | ||||||||||
Leisure and Consumer Staples (0.2%) | |||||||||||
Food & Staples Retailing (0.1%) | |||||||||||
| BJ's Wholesale Club Holdings, Inc. (c) | 12,510 | $ | 284,477 | ||||||||
Food Products (0.1%) | |||||||||||
Pilgrim's Pride Corp. (c) | 5,331 | 174,404 | |||||||||
Materials (5.8%) | |||||||||||
Chemicals (2.4%) | |||||||||||
Ashland Global Holdings, Inc. | 6,178 | 472,802 | |||||||||
Cabot Corp. | 5,849 | 277,944 | |||||||||
Ingevity Corp. (c) | 4,242 | 370,666 | |||||||||
Minerals Technologies, Inc. | 3,537 | 203,837 | |||||||||
NewMarket Corp. | 828 | 402,839 | |||||||||
Olin Corp. | 16,392 | 282,762 | |||||||||
PolyOne Corp. | 7,875 | 289,721 | |||||||||
RPM International, Inc. | 13,313 | 1,021,906 | |||||||||
Sensient Technologies Corp. | 4,290 | 283,526 | |||||||||
The Chemours Co. | 16,785 | 303,641 | |||||||||
The Scotts Miracle-Gro Co. | 4,087 | 433,958 | |||||||||
Valvoline, Inc. | 19,341 | 414,091 | |||||||||
4,757,693 | |||||||||||
Construction Materials (0.2%) | |||||||||||
Eagle Materials, Inc. | 4,259 | 386,121 | |||||||||
Containers & Packaging (1.0%) | |||||||||||
Aptargroup, Inc. | 6,544 | 756,617 | |||||||||
Greif, Inc. – Class A | 2,624 | 115,981 | |||||||||
O-I Glass, Inc. | 15,977 | 190,605 | |||||||||
Silgan Holdings, Inc. | 7,960 | 247,397 | |||||||||
Sonoco Products Co. | 10,276 | 634,235 | |||||||||
1,944,835 | |||||||||||
Metals & Mining (1.9%) | |||||||||||
| Allegheny Technologies, Inc. (c) | 12,944 | 267,423 | |||||||||
Carpenter Technology Corp. | 4,845 | 241,184 | |||||||||
Commercial Metals Co. | 12,134 | 270,224 | |||||||||
| Compass Minerals International, Inc. | 3,415 | 208,178 | |||||||||
| Reliance Steel & Aluminum Co. | 6,815 | 816,165 | |||||||||
Royal Gold, Inc. | 6,701 | 819,197 | |||||||||
Steel Dynamics, Inc. | 22,118 | 752,897 | |||||||||
United States Steel Corp. | 17,456 | 199,173 | |||||||||
Worthington Industries, Inc. | 3,744 | 157,922 | |||||||||
3,732,363 | |||||||||||
Paper & Forest Products (0.3%) | |||||||||||
Domtar Corp. | 5,852 | 223,781 | |||||||||
Louisiana-Pacific Corp. | 12,057 | 357,731 | |||||||||
581,512 | |||||||||||
Real Estate (10.5%) | |||||||||||
Diversified REITs (0.1%) | |||||||||||
Alexander & Baldwin, Inc. | 6,945 | 145,567 | |||||||||
Health Care REITs (1.4%) | |||||||||||
Healthcare Realty Trust, Inc. | 13,729 | 458,137 | |||||||||
Medical Properties Trust, Inc. | 53,121 | 1,121,384 | |||||||||
| Omega Healthcare Investors, Inc. | 22,366 | 947,200 | |||||||||
| Senior Housing Properties Trust (c) | 24,423 | 206,130 | |||||||||
2,732,851 | |||||||||||
Shares | Value(a) | ||||||||||
Hotels & Resort REITs (0.7%) | |||||||||||
Park Hotels & Resorts, Inc. | 24,575 | $ | 635,755 | ||||||||
Pebblebrook Hotel Trust | 13,411 | 359,549 | |||||||||
Service Properties Trust | 16,894 | 411,031 | |||||||||
1,406,335 | |||||||||||
Industrial REITs (1.0%) | |||||||||||
EastGroup Properties, Inc. | 3,996 | 530,150 | |||||||||
First Industrial Realty Trust, Inc. | 13,022 | 540,543 | |||||||||
Liberty Property Trust | 16,197 | 972,630 | |||||||||
2,043,323 | |||||||||||
Office REITs (1.9%) | |||||||||||
Corporate Office Properties Trust | 11,504 | 337,988 | |||||||||
Cousins Properties, Inc. | 15,066 | 620,719 | |||||||||
Douglas Emmett, Inc. | 16,921 | 742,832 | |||||||||
Highwoods Properties, Inc. | 10,650 | 520,891 | |||||||||
JBG SMITH Properties | 12,117 | 483,347 | |||||||||
Kilroy Realty Corp. | 10,012 | 840,007 | |||||||||
Mack-Cali Realty Corp. | 9,294 | 214,970 | |||||||||
3,760,754 | |||||||||||
Real Estate Management & Development (0.5%) | |||||||||||
Jones Lang LaSalle, Inc. | 5,345 | 930,511 | |||||||||
Residential REITs (0.9%) | |||||||||||
| American Campus Communities, Inc. | 14,106 | 663,406 | |||||||||
Camden Property Trust | 9,941 | 1,054,740 | |||||||||
1,718,146 | |||||||||||
Retail REITs (1.7%) | |||||||||||
Brixmor Property Group, Inc. | 30,577 | 660,769 | |||||||||
National Retail Properties, Inc. | 17,620 | 944,784 | |||||||||
Spirit Realty Capital, Inc. | 10,238 | 503,505 | |||||||||
Tanger Factory Outlet Centers, Inc. | 9,536 | 140,465 | |||||||||
Taubman Centers, Inc. | 6,250 | 194,313 | |||||||||
The Macerich Co. | 11,311 | 304,492 | |||||||||
Urban Edge Properties | 11,822 | 226,746 | |||||||||
Weingarten Realty Investors | 12,417 | 387,907 | |||||||||
3,362,981 | |||||||||||
Specialized REITs (2.3%) | |||||||||||
CoreCivic, Inc. | 12,226 | 212,488 | |||||||||
CoreSite Realty Corp. | 3,827 | 429,083 | |||||||||
CyrusOne, Inc. | 11,621 | 760,362 | |||||||||
EPR Properties | 8,046 | 568,369 | |||||||||
Lamar Advertising Co. – Class A | 8,817 | 787,005 | |||||||||
Life Storage, Inc. | 4,739 | 513,139 | |||||||||
PotlatchDeltic Corp. | 6,870 | 297,265 | |||||||||
Rayonier, Inc. | 13,275 | 434,889 | |||||||||
Sabra Health Care REIT, Inc. | 19,885 | 424,346 | |||||||||
The GEO Group, Inc. | 12,450 | 206,795 | |||||||||
4,633,741 | |||||||||||
Utilities (4.3%) | |||||||||||
Electric Utilities (1.0%) | |||||||||||
ALLETE, Inc. | 5,259 | 426,873 | |||||||||
Hawaiian Electric Industries, Inc. | 11,187 | 524,223 | |||||||||
IDACORP, Inc. | 5,128 | 547,670 | |||||||||
PNM Resources, Inc. | 8,163 | 413,946 | |||||||||
1,912,712 | |||||||||||
See accompanying notes to financial statements.
67
SFT Index 400 Mid-Cap Fund
Investments in Securities – continued
Shares | Value(a) | ||||||||||
Gas Utilities (1.6%) | |||||||||||
National Fuel Gas Co. | 8,854 | $ | 412,065 | ||||||||
New Jersey Resources Corp. | 9,804 | 436,964 | |||||||||
ONE Gas, Inc. | 5,371 | 502,565 | |||||||||
Southwest Gas Holdings, Inc. | 5,535 | 420,494 | |||||||||
Spire, Inc. | 5,171 | 430,796 | |||||||||
UGI Corp. | 21,457 | 968,998 | |||||||||
3,171,882 | |||||||||||
Multi-Utilities (1.2%) | |||||||||||
Black Hills Corp. | 6,235 | 489,697 | |||||||||
MDU Resources Group, Inc. | 20,551 | 610,570 | |||||||||
NorthWestern Corp. | 5,133 | 367,882 | |||||||||
OGE Energy Corp. | 20,550 | 913,859 | |||||||||
2,382,008 | |||||||||||
Water Utilities (0.5%) | |||||||||||
Aqua America, Inc. | 22,158 | 1,040,096 | |||||||||
| Total common stocks (cost: $136,637,627) | 187,416,922 | ||||||||||
Short-Term Securities (5.3%) | |||||||||||
Investment Companies (5.3%) | |||||||||||
| State Street Institutional U.S. Government Money Market Fund, current rate 1.530% | 10,486,442 | 10,486,442 | |||||||||
| Total short-term securities (cost: $10,486,442) | 10,486,442 | ||||||||||
| Total investments in securities (cost: $147,124,069) (e) | 197,903,364 | ||||||||||
| Cash and other assets in excess of liabilities (0.1%) | 292,513 | ||||||||||
Total net assets (100.0%) | $ | 198,195,877 | |||||||||
Investments in Securities Legend
(a) Securities are valued by procedures described in Note 2 of the Notes to Financial Statements.
(b) Foreign security: The Fund held 1.7% of net assets in foreign securities at December 31, 2019.
(c) Non-income producing security.
(d) Fully or partially pledged as initial margin deposits on open futures contracts.
Holdings of Open Futures Contracts
On December 31, 2019, securities with an aggregate market value of $1,050,635 have been pledged to cover margin requirements for the following open futures contracts:
Description | Expiration Date | Number of Contracts | Position Type | Notional Amount | Market Value | Unrealized Appreciation/ (Depreciation)(a) | |||||||||||||||||||||
S&P Mid 400® E-Mini Future | March 2020 | 51 | Long | $ | 10,367,517 | $ | 10,530,480 | $ | 162,963 | ||||||||||||||||||
(e) At December 31, 2019 the cost of investments for federal income tax purposes was $147,705,706. The aggregate unrealized appreciation and depreciation of investments based on this cost were:
Gross unrealized appreciation | $ | 60,921,887 | |||||
Gross unrealized depreciation | (10,561,266 | ) | |||||
Net unrealized appreciation | $ | 50,360,621 | |||||
See accompanying notes to financial statements.
68
SFT Index 500 Fund
Investments in Securities
December 31, 2019
(Percentages of each investment category relate to total net assets)
Shares | Value(a) | ||||||||||
Common Stocks (98.2%) | |||||||||||
Communication Services (2.3%) | |||||||||||
Diversified Telecommunication Services (2.0%) | |||||||||||
AT&T, Inc. | 245,156 | $ | 9,580,697 | ||||||||
CenturyLink, Inc. | 32,901 | 434,622 | |||||||||
Verizon Communications, Inc. | 138,797 | 8,522,136 | |||||||||
18,537,455 | |||||||||||
Media (0.2%) | |||||||||||
Fox Corp. – Class A | 11,814 | 437,945 | |||||||||
Fox Corp. – Class B | 5,358 | 195,031 | |||||||||
ViacomCBS, Inc. – Class B | 18,094 | 759,405 | |||||||||
1,392,381 | |||||||||||
Wireless Telecommunication Services (0.1%) | |||||||||||
T-Mobile US, Inc. (b) | 10,527 | 825,527 | |||||||||
Consumer Discretionary (12.2%) | |||||||||||
Auto Components (0.1%) | |||||||||||
Aptiv PLC (c) | 8,512 | 808,385 | |||||||||
BorgWarner, Inc. | 6,842 | 296,806 | |||||||||
1,105,191 | |||||||||||
Automobiles (0.3%) | |||||||||||
Ford Motor Co. | 130,684 | 1,215,361 | |||||||||
General Motors Co. | 42,135 | 1,542,141 | |||||||||
Harley-Davidson, Inc. | 5,168 | 192,198 | |||||||||
2,949,700 | |||||||||||
Distributors (0.1%) | |||||||||||
Genuine Parts Co. | 4,810 | 510,966 | |||||||||
LKQ Corp. (b) | 10,260 | 366,282 | |||||||||
877,248 | |||||||||||
Diversified Consumer Services (0.0%) | |||||||||||
H&R Block, Inc. | 6,552 | 153,841 | |||||||||
Hotels & Resort REITs (0.1%) | |||||||||||
| Hilton Worldwide Holdings, Inc. | 9,469 | 1,050,207 | |||||||||
Hotels, Restaurants & Leisure (1.7%) | |||||||||||
Carnival Corp. (c) | 13,360 | 679,089 | |||||||||
| Chipotle Mexican Grill, Inc. (b) | 859 | 719,078 | |||||||||
Darden Restaurants, Inc. | 4,128 | 449,993 | |||||||||
Las Vegas Sands Corp. | 11,286 | 779,186 | |||||||||
| Marriott International, Inc. – Class A | 9,089 | 1,376,347 | |||||||||
McDonald's Corp. | 25,274 | 4,994,395 | |||||||||
MGM Resorts International | 17,282 | 574,972 | |||||||||
| Norwegian Cruise Line Holdings, Ltd. (b) (c) | 7,140 | 417,047 | |||||||||
| Royal Caribbean Cruises, Ltd. (c) | 5,776 | 771,154 | |||||||||
Starbucks Corp. | 39,634 | 3,484,621 | |||||||||
Wynn Resorts, Ltd. | 3,255 | 452,022 | |||||||||
Yum! Brands, Inc. | 10,129 | 1,020,294 | |||||||||
15,718,198 | |||||||||||
Shares | Value(a) | ||||||||||
Household Durables (0.4%) | |||||||||||
DR Horton, Inc. | 11,213 | $ | 591,486 | ||||||||
Garmin, Ltd. (c) | 4,856 | 473,751 | |||||||||
Leggett & Platt, Inc. | 4,319 | 219,535 | |||||||||
Lennar Corp. – Class A | 9,392 | 523,980 | |||||||||
Mohawk Industries, Inc. (b) | 2,013 | 274,533 | |||||||||
Newell Brands, Inc. | 12,709 | 244,267 | |||||||||
NVR, Inc. (b) | 125 | 476,051 | |||||||||
PulteGroup, Inc. | 8,549 | 331,701 | |||||||||
Whirlpool Corp. | 2,135 | 314,976 | |||||||||
3,450,280 | |||||||||||
Internet & Catalog Retail (3.7%) | |||||||||||
Amazon.com, Inc. (b) | 13,978 | 25,829,108 | |||||||||
Booking Holdings, Inc. (b) | 1,430 | 2,936,834 | |||||||||
Expedia Group, Inc. | 4,701 | 508,366 | |||||||||
Netflix, Inc. (b) | 14,718 | 4,762,303 | |||||||||
34,036,611 | |||||||||||
Leisure Equipment & Products (0.1%) | |||||||||||
Hasbro, Inc. | 4,235 | 447,258 | |||||||||
Media (2.3%) | |||||||||||
| Charter Communications, Inc. – Class A (b) | 5,262 | 2,552,491 | |||||||||
Comcast Corp. – Class A | 152,356 | 6,851,449 | |||||||||
Discovery, Inc. – Class A (b) | 5,212 | 170,641 | |||||||||
Discovery, Inc. – Class C (b) | 11,256 | 343,195 | |||||||||
| DISH Network Corp. – Class A (b) | 8,527 | 302,453 | |||||||||
| Live Nation Entertainment, Inc. (b) | 4,729 | 337,982 | |||||||||
News Corp. – Class A | 12,964 | 183,311 | |||||||||
News Corp. – Class B | 3,993 | 57,938 | |||||||||
Omnicom Group, Inc. | 7,212 | 584,316 | |||||||||
| The Interpublic Group of Cos., Inc. | 12,917 | 298,383 | |||||||||
The Walt Disney Co. | 60,456 | 8,743,751 | |||||||||
20,425,910 | |||||||||||
Multiline Retail (0.5%) | |||||||||||
Dollar General Corp. | 8,541 | 1,332,225 | |||||||||
Dollar Tree, Inc. (b) | 7,954 | 748,074 | |||||||||
Kohl's Corp. | 5,249 | 267,437 | |||||||||
Macy's, Inc. | 10,284 | 174,828 | |||||||||
Nordstrom, Inc. | 3,593 | 147,061 | |||||||||
Target Corp. | 17,006 | 2,180,339 | |||||||||
4,849,964 | |||||||||||
Specialty Retail (2.2%) | |||||||||||
Advance Auto Parts, Inc. | 2,299 | 368,208 | |||||||||
AutoZone, Inc. (b) | 825 | 982,831 | |||||||||
Best Buy Co., Inc. | 7,642 | 670,968 | |||||||||
CarMax, Inc. (b) | 5,466 | 479,204 | |||||||||
L Brands, Inc. | 7,704 | 139,596 | |||||||||
Lowe's Cos., Inc. | 25,723 | 3,080,587 | |||||||||
O'Reilly Automotive, Inc. (b) | 2,572 | 1,127,205 | |||||||||
Ross Stores, Inc. | 12,140 | 1,413,339 | |||||||||
The Gap, Inc. | 7,100 | 125,528 | |||||||||
The Home Depot, Inc. | 36,609 | 7,994,673 | |||||||||
The TJX Cos., Inc. | 40,640 | 2,481,478 | |||||||||
See accompanying notes to financial statements.
69
SFT Index 500 Fund
Investments in Securities – continued
Shares | Value(a) | ||||||||||
Tiffany & Co. | 3,654 | $ | 488,357 | ||||||||
Tractor Supply Co. | 3,909 | 365,257 | |||||||||
| Ulta Salon Cosmetics & Fragrance, Inc. (b) | 1,978 | 500,711 | |||||||||
20,217,942 | |||||||||||
Textiles, Apparel & Luxury Goods (0.7%) | |||||||||||
Capri Holdings, Ltd. (b) (c) | 4,995 | 190,559 | |||||||||
Hanesbrands, Inc. | 12,053 | 178,987 | |||||||||
NIKE, Inc. – Class B | 41,817 | 4,236,480 | |||||||||
PVH Corp. | 2,492 | 262,034 | |||||||||
Ralph Lauren Corp. | 1,633 | 191,420 | |||||||||
Tapestry, Inc. | 9,260 | 249,742 | |||||||||
| Under Armour, Inc. – Class A (b) | 6,224 | 134,439 | |||||||||
| Under Armour, Inc. – Class C (b) | 6,433 | 123,385 | |||||||||
VF Corp. | 10,975 | 1,093,769 | |||||||||
6,660,815 | |||||||||||
Consumer Staples (7.4%) | |||||||||||
Beverages (1.8%) | |||||||||||
| Brown-Forman Corp. – Class B | 6,018 | 406,817 | |||||||||
| Constellation Brands, Inc. – Class A | 5,622 | 1,066,774 | |||||||||
| Molson Coors Brewing Co. – Class B | 6,214 | 334,935 | |||||||||
Monster Beverage Corp. (b) | 12,811 | 814,139 | |||||||||
PepsiCo, Inc. | 46,797 | 6,395,746 | |||||||||
The Coca-Cola Co. | 129,370 | 7,160,629 | |||||||||
16,179,040 | |||||||||||
Food & Staples Retailing (1.8%) | |||||||||||
Costco Wholesale Corp. | 14,884 | 4,374,705 | |||||||||
CVS Health Corp. | 43,618 | 3,240,381 | |||||||||
Sysco Corp. | 17,123 | 1,464,701 | |||||||||
The Kroger Co. | 26,852 | 778,440 | |||||||||
| Walgreens Boots Alliance, Inc. | 25,161 | 1,483,493 | |||||||||
Walmart, Inc. | 47,608 | 5,657,735 | |||||||||
16,999,455 | |||||||||||
Food Products (1.1%) | |||||||||||
Archer-Daniels-Midland Co. | 18,623 | 863,176 | |||||||||
Campbell Soup Co. | 5,669 | 280,162 | |||||||||
Conagra Brands, Inc. | 16,257 | 556,640 | |||||||||
General Mills, Inc. | 20,187 | 1,081,216 | |||||||||
Hormel Foods Corp. | 9,234 | 416,546 | |||||||||
Kellogg Co. | 8,259 | 571,192 | |||||||||
Lamb Weston Holdings, Inc. | 4,897 | 421,289 | |||||||||
McCormick & Co., Inc. | 4,136 | 702,003 | |||||||||
| Mondelez International, Inc. – Class A | 48,320 | 2,661,466 | |||||||||
The Hershey Co. | 5,007 | 735,929 | |||||||||
The JM Smucker Co. | 3,833 | 399,130 | |||||||||
The Kraft Heinz Co. | 20,816 | 668,818 | |||||||||
Tyson Foods, Inc. – Class A | 9,906 | 901,842 | |||||||||
10,259,409 | |||||||||||
Household Products (1.7%) | |||||||||||
Church & Dwight Co., Inc. | 8,206 | 577,210 | |||||||||
Colgate-Palmolive Co. | 28,743 | 1,978,668 | |||||||||
Shares | Value(a) | ||||||||||
Kimberly-Clark Corp. | 11,470 | $ | 1,577,698 | ||||||||
The Clorox Co. | 4,227 | 649,014 | |||||||||
The Procter & Gamble Co. | 83,693 | 10,453,256 | |||||||||
15,235,846 | |||||||||||
Personal Care (0.2%) | |||||||||||
| The Estee Lauder Cos., Inc. – Class A | 7,436 | 1,535,831 | |||||||||
Personal Products (0.0%) | |||||||||||
Coty, Inc. – Class A | 9,887 | 111,229 | |||||||||
Tobacco (0.8%) | |||||||||||
Altria Group, Inc. | 62,694 | 3,129,058 | |||||||||
| Philip Morris International, Inc. | 52,201 | 4,441,783 | |||||||||
7,570,841 | |||||||||||
Energy (4.1%) | |||||||||||
Energy Equipment & Services (0.4%) | |||||||||||
Baker Hughes Co. | 21,721 | 556,709 | |||||||||
Halliburton Co. | 29,445 | 720,519 | |||||||||
Helmerich & Payne, Inc. | 3,578 | 162,549 | |||||||||
National Oilwell Varco, Inc. | 12,872 | 322,444 | |||||||||
Schlumberger, Ltd. (c) | 46,391 | 1,864,918 | |||||||||
TechnipFMC PLC (c) | 14,008 | 300,331 | |||||||||
3,927,470 | |||||||||||
Oil, Gas & Consumable Fuels (3.7%) | |||||||||||
Apache Corp. | 12,538 | 320,847 | |||||||||
Cabot Oil & Gas Corp. | 13,690 | 238,343 | |||||||||
Chevron Corp. | 63,458 | 7,647,323 | |||||||||
Cimarex Energy Co. | 3,410 | 178,991 | |||||||||
Concho Resources, Inc. | 6,659 | 583,129 | |||||||||
ConocoPhillips | 36,824 | 2,394,665 | |||||||||
Devon Energy Corp. | 12,987 | 337,272 | |||||||||
Diamondback Energy, Inc. | 5,380 | 499,587 | |||||||||
EOG Resources, Inc. | 19,509 | 1,634,074 | |||||||||
Exxon Mobil Corp. | 141,996 | 9,908,481 | |||||||||
Hess Corp. | 8,600 | 574,566 | |||||||||
HollyFrontier Corp. | 4,982 | 252,637 | |||||||||
Kinder Morgan, Inc. | 65,347 | 1,383,396 | |||||||||
Marathon Oil Corp. | 26,845 | 364,555 | |||||||||
Marathon Petroleum Corp. | 21,791 | 1,312,908 | |||||||||
Noble Energy, Inc. | 15,977 | 396,869 | |||||||||
Occidental Petroleum Corp. | 29,969 | 1,235,022 | |||||||||
Phillips 66 | 14,913 | 1,661,457 | |||||||||
| Pioneer Natural Resources Co. | 5,518 | 835,260 | |||||||||
The Williams Cos., Inc. | 40,644 | 964,076 | |||||||||
Valero Energy Corp. | 13,781 | 1,290,591 | |||||||||
34,014,049 | |||||||||||
Financial (12.7%) | |||||||||||
Capital Markets (2.6%) | |||||||||||
Ameriprise Financial, Inc. | 4,252 | 708,298 | |||||||||
BlackRock, Inc. | 3,949 | 1,985,162 | |||||||||
CBOE Global Markets, Inc. | 3,754 | 450,480 | |||||||||
CME Group, Inc. | 12,038 | 2,416,267 | |||||||||
E*Trade Financial Corp. | 7,541 | 342,135 | |||||||||
Franklin Resources, Inc. | 9,360 | 243,173 | |||||||||
| Intercontinental Exchange, Inc. | 18,688 | 1,729,574 | |||||||||
See accompanying notes to financial statements.
70
SFT Index 500 Fund
Investments in Securities – continued
Shares | Value(a) | ||||||||||
Invesco, Ltd. (c) | 12,490 | $ | 224,570 | ||||||||
MarketAxess Holdings, Inc. | 1,269 | 481,091 | |||||||||
Moody's Corp. | 5,469 | 1,298,395 | |||||||||
Morgan Stanley | 41,283 | 2,110,387 | |||||||||
MSCI, Inc. | 2,847 | 735,039 | |||||||||
Nasdaq, Inc. | 3,875 | 415,013 | |||||||||
Northern Trust Corp. | 7,111 | 755,473 | |||||||||
| Raymond James Financial, Inc. | 4,154 | 371,617 | |||||||||
S&P Global, Inc. | 8,180 | 2,233,549 | |||||||||
State Street Corp. | 12,203 | 965,257 | |||||||||
T Rowe Price Group, Inc. | 7,818 | 952,545 | |||||||||
| The Bank of New York Mellon Corp. | 28,163 | 1,417,444 | |||||||||
The Charles Schwab Corp. | 38,368 | 1,824,782 | |||||||||
| The Goldman Sachs Group, Inc. | 10,695 | 2,459,101 | |||||||||
24,119,352 | |||||||||||
Commercial Banks (5.5%) | |||||||||||
Bank of America Corp. | 271,689 | 9,568,887 | |||||||||
Citigroup, Inc. | 73,268 | 5,853,381 | |||||||||
Citizens Financial Group, Inc. | 14,589 | 592,459 | |||||||||
Comerica, Inc. | 4,837 | 347,055 | |||||||||
Fifth Third Bancorp | 23,816 | 732,104 | |||||||||
First Republic Bank | 5,655 | 664,180 | |||||||||
Huntington Bancshares, Inc. | 34,659 | 522,658 | |||||||||
JPMorgan Chase & Co. | 105,261 | 14,673,383 | |||||||||
KeyCorp | 33,055 | 669,033 | |||||||||
M&T Bank Corp. | 4,393 | 745,712 | |||||||||
| People's United Financial, Inc. | 14,824 | 250,526 | |||||||||
Regions Financial Corp. | 32,373 | 555,521 | |||||||||
SVB Financial Group (b) | 1,732 | 434,801 | |||||||||
| The PNC Financial Services Group, Inc. | 14,705 | 2,347,359 | |||||||||
Truist Financial Corp. | 44,980 | 2,533,274 | |||||||||
US Bancorp | 47,698 | 2,828,014 | |||||||||
Wells Fargo & Co. | 129,163 | 6,948,969 | |||||||||
Zions Bancorp NA | 5,720 | 296,982 | |||||||||
50,564,298 | |||||||||||
Consumer Finance (0.7%) | |||||||||||
American Express Co. | 22,518 | 2,803,266 | |||||||||
Capital One Financial Corp. | 15,629 | 1,608,380 | |||||||||
Discover Financial Services | 10,520 | 892,306 | |||||||||
Synchrony Financial | 19,951 | 718,436 | |||||||||
6,022,388 | |||||||||||
Insurance (3.9%) | |||||||||||
Aflac, Inc. | 24,633 | 1,303,086 | |||||||||
| American International Group, Inc. | 29,143 | 1,495,910 | |||||||||
Aon PLC (c) | 7,828 | 1,630,494 | |||||||||
Arthur J Gallagher & Co. | 6,255 | 595,664 | |||||||||
Assurant, Inc. | 2,055 | 269,369 | |||||||||
| Berkshire Hathaway, Inc. – Class B (b) | 65,645 | 14,868,592 | |||||||||
Chubb, Ltd. (c) | 15,210 | 2,367,589 | |||||||||
Cincinnati Financial Corp. | 5,106 | 536,896 | |||||||||
Everest Re Group, Ltd. (c) | 1,352 | 374,288 | |||||||||
Globe Life, Inc. | 3,274 | 344,589 | |||||||||
Shares | Value(a) | ||||||||||
| Hartford Financial Services Group, Inc. | 12,055 | $ | 732,582 | ||||||||
Lincoln National Corp. | 6,629 | 391,177 | |||||||||
Loews Corp. | 8,584 | 450,574 | |||||||||
Marsh & McLennan Cos., Inc. | 16,920 | 1,885,057 | |||||||||
MetLife, Inc. | 26,233 | 1,337,096 | |||||||||
| Principal Financial Group, Inc. | 8,616 | 473,880 | |||||||||
Prudential Financial, Inc. | 13,413 | 1,257,335 | |||||||||
The Allstate Corp. | 10,872 | 1,222,556 | |||||||||
The Progressive Corp. | 19,553 | 1,415,442 | |||||||||
The Travelers Cos., Inc. | 8,653 | 1,185,028 | |||||||||
Unum Group | 6,913 | 201,583 | |||||||||
| Willis Towers Watson PLC (c) | 4,336 | 875,612 | |||||||||
WR Berkley Corp. | 4,869 | 336,448 | |||||||||
35,550,847 | |||||||||||
Health Care (13.6%) | |||||||||||
Biotechnology (2.0%) | |||||||||||
AbbVie, Inc. | 49,601 | 4,391,672 | |||||||||
| Alexion Pharmaceuticals, Inc. (b) | 7,426 | 803,122 | |||||||||
Amgen, Inc. | 19,941 | 4,807,177 | |||||||||
Biogen, Inc. (b) | 6,056 | 1,796,997 | |||||||||
Gilead Sciences, Inc. | 42,458 | 2,758,921 | |||||||||
Incyte Corp. (b) | 6,000 | 523,920 | |||||||||
| Regeneron Pharmaceuticals, Inc. (b) | 2,686 | 1,008,539 | |||||||||
| Vertex Pharmaceuticals, Inc. (b) | 8,640 | 1,891,728 | |||||||||
17,982,076 | |||||||||||
Health Care Equipment & Supplies (3.5%) | |||||||||||
Abbott Laboratories | 59,313 | 5,151,927 | |||||||||
ABIOMED, Inc. (b) | 1,525 | 260,150 | |||||||||
Align Technology, Inc. (b) | 2,443 | 681,695 | |||||||||
Baxter International, Inc. | 17,063 | 1,426,808 | |||||||||
Becton Dickinson and Co. | 9,075 | 2,468,128 | |||||||||
Boston Scientific Corp. (b) | 46,726 | 2,112,950 | |||||||||
Danaher Corp. | 21,462 | 3,293,988 | |||||||||
Dentsply Sirona, Inc. | 7,436 | 420,803 | |||||||||
| Edwards Lifesciences Corp. (b) | 6,991 | 1,630,930 | |||||||||
Hologic, Inc. (b) | 8,985 | 469,107 | |||||||||
IDEXX Laboratories, Inc. (b) | 2,894 | 755,710 | |||||||||
Intuitive Surgical, Inc. (b) | 3,875 | 2,290,706 | |||||||||
Medtronic PLC (c) | 44,983 | 5,103,321 | |||||||||
ResMed, Inc. | 4,829 | 748,350 | |||||||||
STERIS PLC (c) | 2,845 | 433,635 | |||||||||
Stryker Corp. | 10,786 | 2,264,413 | |||||||||
Teleflex, Inc. | 1,554 | 584,988 | |||||||||
The Cooper Cos., Inc. | 1,666 | 535,269 | |||||||||
| Varian Medical Systems, Inc. (b) | 3,061 | 434,692 | |||||||||
| Zimmer Biomet Holdings, Inc. | 6,901 | 1,032,942 | |||||||||
32,100,512 | |||||||||||
Health Care Providers & Services (2.5%) | |||||||||||
AmerisourceBergen Corp. | 5,012 | 426,120 | |||||||||
Anthem, Inc. | 8,499 | 2,566,953 | |||||||||
Cardinal Health, Inc. | 9,815 | 496,443 | |||||||||
See accompanying notes to financial statements.
71
SFT Index 500 Fund
Investments in Securities – continued
Shares | Value(a) | ||||||||||
Centene Corp. (b) | 13,803 | $ | 867,795 | ||||||||
Cigna Corp. | 12,532 | 2,562,669 | |||||||||
DaVita, Inc. (b) | 2,955 | 221,714 | |||||||||
HCA Healthcare, Inc. | 8,840 | 1,306,640 | |||||||||
Henry Schein, Inc. (b) | 4,883 | 325,794 | |||||||||
Humana, Inc. | 4,441 | 1,627,715 | |||||||||
| Laboratory Corp. of America Holdings (b) | 3,284 | 555,554 | |||||||||
McKesson Corp. | 6,047 | 836,421 | |||||||||
Quest Diagnostics, Inc. | 4,527 | 483,438 | |||||||||
UnitedHealth Group, Inc. | 31,857 | 9,365,321 | |||||||||
| Universal Health Services, Inc. – Class B | 2,730 | 391,646 | |||||||||
| WellCare Health Plans, Inc. (b) | 1,691 | 558,385 | |||||||||
22,592,608 | |||||||||||
Health Care Technology (0.1%) | |||||||||||
Cerner Corp. | 10,541 | 773,604 | |||||||||
Life Sciences Tools & Services (1.0%) | |||||||||||
Agilent Technologies, Inc. | 10,303 | 878,949 | |||||||||
Illumina, Inc. (b) | 4,942 | 1,639,459 | |||||||||
IQVIA Holdings, Inc. (b) | 6,024 | 930,768 | |||||||||
| Mettler-Toledo International, Inc. (b) | 827 | 656,043 | |||||||||
PerkinElmer, Inc. | 3,734 | 362,571 | |||||||||
| Thermo Fisher Scientific, Inc. | 13,463 | 4,373,725 | |||||||||
Waters Corp. (b) | 2,144 | 500,946 | |||||||||
9,342,461 | |||||||||||
Pharmaceuticals (4.5%) | |||||||||||
Allergan PLC (c) | 11,027 | 2,108,032 | |||||||||
Bristol-Myers Squibb Co. | 78,671 | 5,049,891 | |||||||||
Eli Lilly & Co. | 28,355 | 3,726,698 | |||||||||
Johnson & Johnson | 88,326 | 12,884,114 | |||||||||
Merck & Co., Inc. | 85,443 | 7,771,041 | |||||||||
Mylan NV (b) (c) | 17,241 | 346,544 | |||||||||
Perrigo Co. PLC (c) | 4,473 | 231,075 | |||||||||
Pfizer, Inc. | 185,725 | 7,276,705 | |||||||||
Zoetis, Inc. | 15,953 | 2,111,379 | |||||||||
41,505,479 | |||||||||||
Industrials (8.9%) | |||||||||||
Aerospace & Defense (2.4%) | |||||||||||
Arconic, Inc. | 12,921 | 397,579 | |||||||||
General Dynamics Corp. | 7,865 | 1,386,993 | |||||||||
| Huntington Ingalls Industries, Inc. | 1,389 | 348,472 | |||||||||
L3Harris Technologies, Inc. | 7,406 | 1,465,425 | |||||||||
Lockheed Martin Corp. | 8,354 | 3,252,881 | |||||||||
Northrop Grumman Corp. | 5,290 | 1,819,601 | |||||||||
Raytheon Co. | 9,362 | 2,057,206 | |||||||||
The Boeing Co. | 17,971 | 5,854,233 | |||||||||
TransDigm Group, Inc. | 1,669 | 934,640 | |||||||||
United Technologies Corp. | 27,267 | 4,083,506 | |||||||||
21,600,536 | |||||||||||
Air Freight & Logistics (0.5%) | |||||||||||
CH Robinson Worldwide, Inc. | 4,450 | 347,990 | |||||||||
| Expeditors International of Washington, Inc. | 5,639 | 439,955 | |||||||||
Shares | Value(a) | ||||||||||
FedEx Corp. | 8,067 | $ | 1,219,811 | ||||||||
| United Parcel Service, Inc. – Class B | 23,475 | 2,747,983 | |||||||||
4,755,739 | |||||||||||
Airlines (0.3%) | |||||||||||
Alaska Air Group, Inc. | 4,043 | 273,913 | |||||||||
| American Airlines Group, Inc. | 13,084 | 375,249 | |||||||||
Delta Air Lines, Inc. | 19,317 | 1,129,658 | |||||||||
Southwest Airlines Co. | 15,895 | 858,012 | |||||||||
| United Airlines Holdings, Inc. (b) | 7,303 | 643,322 | |||||||||
3,280,154 | |||||||||||
Building Products (0.3%) | |||||||||||
Allegion PLC (c) | 3,138 | 390,806 | |||||||||
AO Smith Corp. | 4,550 | 216,762 | |||||||||
| Fortune Brands Home & Security, Inc. | 4,602 | 300,695 | |||||||||
| Johnson Controls International PLC (c) | 25,888 | 1,053,900 | |||||||||
Masco Corp. | 9,534 | 457,537 | |||||||||
2,419,700 | |||||||||||
Commercial Services & Supplies (0.4%) | |||||||||||
Avery Dennison Corp. | 2,830 | 370,221 | |||||||||
Cintas Corp. | 2,791 | 751,002 | |||||||||
Copart, Inc. (b) | 6,877 | 625,395 | |||||||||
Republic Services, Inc. | 7,016 | 628,844 | |||||||||
Rollins, Inc. | 4,633 | 153,630 | |||||||||
Waste Management, Inc. | 13,120 | 1,495,155 | |||||||||
4,024,247 | |||||||||||
Construction & Engineering (0.1%) | |||||||||||
Jacobs Engineering Group, Inc. | 4,554 | 409,086 | |||||||||
Quanta Services, Inc. | 4,679 | 190,482 | |||||||||
599,568 | |||||||||||
Electrical Equipment (0.5%) | |||||||||||
AMETEK, Inc. | 7,676 | 765,604 | |||||||||
Eaton Corp. PLC (c) | 13,873 | 1,314,051 | |||||||||
Emerson Electric Co. | 20,443 | 1,558,983 | |||||||||
Rockwell Automation, Inc. | 3,933 | 797,101 | |||||||||
4,435,739 | |||||||||||
Industrial Conglomerates (1.4%) | |||||||||||
3M Co. | 19,338 | 3,411,610 | |||||||||
General Electric Co. | 293,099 | 3,270,985 | |||||||||
Honeywell International, Inc. | 23,980 | 4,244,460 | |||||||||
Roper Technologies, Inc. | 3,496 | 1,238,388 | |||||||||
Textron, Inc. | 7,635 | 340,521 | |||||||||
12,505,964 | |||||||||||
Machinery (1.6%) | |||||||||||
Caterpillar, Inc. | 18,547 | 2,739,021 | |||||||||
Cummins, Inc. | 5,142 | 920,212 | |||||||||
Deere & Co. | 10,584 | 1,833,784 | |||||||||
Dover Corp. | 4,889 | 563,506 | |||||||||
Flowserve Corp. | 4,309 | 214,459 | |||||||||
Fortive Corp. | 9,825 | 750,532 | |||||||||
IDEX Corp. | 2,549 | 438,428 | |||||||||
See accompanying notes to financial statements.
72
SFT Index 500 Fund
Investments in Securities – continued
Shares | Value(a) | ||||||||||
Illinois Tool Works, Inc. | 9,795 | $ | 1,759,476 | ||||||||
Ingersoll-Rand PLC (c) | 8,021 | 1,066,151 | |||||||||
PACCAR, Inc. | 11,543 | 913,051 | |||||||||
Parker Hannifin Corp. | 4,317 | 888,525 | |||||||||
Pentair PLC (c) | 5,549 | 254,533 | |||||||||
Snap-On, Inc. | 1,855 | 314,237 | |||||||||
Stanley Black & Decker, Inc. | 5,101 | 845,440 | |||||||||
Wabtec Corp. | 6,022 | 468,512 | |||||||||
Xylem, Inc. | 5,951 | 468,879 | |||||||||
14,438,746 | |||||||||||
Professional Services (0.3%) | |||||||||||
Equifax, Inc. | 4,063 | 569,307 | |||||||||
IHS Markit, Ltd. (b) (c) | 13,383 | 1,008,409 | |||||||||
Nielsen Holdings PLC (c) | 11,856 | 240,677 | |||||||||
Robert Half International, Inc. | 3,852 | 243,254 | |||||||||
United Rentals, Inc. (b) | 2,493 | 415,758 | |||||||||
Verisk Analytics, Inc. | 5,496 | 820,773 | |||||||||
3,298,178 | |||||||||||
Road & Rail (1.0%) | |||||||||||
CSX Corp. | 26,097 | 1,888,379 | |||||||||
| JB Hunt Transport Services, Inc. | 2,871 | 335,275 | |||||||||
Kansas City Southern | 3,281 | 502,518 | |||||||||
Norfolk Southern Corp. | 8,751 | 1,698,832 | |||||||||
Old Dominion Freight Line, Inc. | 2,200 | 417,516 | |||||||||
Union Pacific Corp. | 23,298 | 4,212,045 | |||||||||
9,054,565 | |||||||||||
Trading Companies & Distributors (0.1%) | |||||||||||
Fastenal Co. | 19,176 | 708,553 | |||||||||
WW Grainger, Inc. | 1,486 | 503,041 | |||||||||
1,211,594 | |||||||||||
Information Technology (28.1%) | |||||||||||
Communications Equipment (0.9%) | |||||||||||
Arista Networks, Inc. (b) | 1,829 | 372,019 | |||||||||
Cisco Systems, Inc. | 142,370 | 6,828,065 | |||||||||
F5 Networks, Inc. (b) | 2,021 | 282,233 | |||||||||
Juniper Networks, Inc. | 11,232 | 276,644 | |||||||||
Motorola Solutions, Inc. | 5,750 | 926,555 | |||||||||
8,685,516 | |||||||||||
Computers & Peripherals (4.6%) | |||||||||||
Apple, Inc. (d) | 140,170 | 41,160,920 | |||||||||
NetApp, Inc. | 7,659 | 476,773 | |||||||||
Western Digital Corp. | 9,950 | 631,527 | |||||||||
42,269,220 | |||||||||||
Electronic Equipment, Instruments & Components (0.6%) | |||||||||||
Amphenol Corp. – Class A | 9,899 | 1,071,369 | |||||||||
CDW Corp. | 4,864 | 694,774 | |||||||||
Corning, Inc. | 25,811 | 751,358 | |||||||||
FLIR Systems, Inc. | 4,458 | 232,128 | |||||||||
IPG Photonics Corp. (b) | 1,198 | 173,614 | |||||||||
Keysight Technologies, Inc. (b) | 6,305 | 647,082 | |||||||||
Seagate Technology PLC (c) | 7,758 | 461,601 | |||||||||
TE Connectivity, Ltd. (c) | 11,192 | 1,072,641 | |||||||||
5,104,567 | |||||||||||
Shares | Value(a) | ||||||||||
Interactive Media & Services (5.0%) | |||||||||||
| Akamai Technologies, Inc. (b) | 5,423 | $ | 468,439 | ||||||||
Alphabet, Inc. – Class A (b) | 10,070 | 13,487,657 | |||||||||
Alphabet, Inc. – Class C (b) | 10,031 | 13,411,648 | |||||||||
eBay, Inc. | 25,663 | 926,691 | |||||||||
Facebook, Inc. – Class A (b) | 80,762 | 16,576,400 | |||||||||
Twitter, Inc. (b) | 25,986 | 832,851 | |||||||||
45,703,686 | |||||||||||
IT Services (5.2%) | |||||||||||
Accenture PLC – Class A (c) | 21,313 | 4,487,878 | |||||||||
Alliance Data Systems Corp. | 1,377 | 154,499 | |||||||||
| Automatic Data Processing, Inc. | 14,487 | 2,470,034 | |||||||||
| Broadridge Financial Solutions, Inc. | 3,841 | 474,517 | |||||||||
| Cognizant Technology Solutions Corp. – Class A | 18,376 | 1,139,680 | |||||||||
DXC Technology Co. | 8,591 | 322,936 | |||||||||
| Fidelity National Information Services, Inc. | 20,621 | 2,868,175 | |||||||||
Fiserv, Inc. (b) | 19,188 | 2,218,708 | |||||||||
FleetCor Technologies, Inc. (b) | 2,910 | 837,265 | |||||||||
Gartner, Inc. (b) | 3,030 | 466,923 | |||||||||
Global Payments, Inc. | 10,086 | 1,841,300 | |||||||||
| International Business Machines Corp. | 29,680 | 3,978,307 | |||||||||
Jack Henry & Associates, Inc. | 2,588 | 376,994 | |||||||||
Leidos Holdings, Inc. | 4,444 | 435,023 | |||||||||
Mastercard, Inc. – Class A | 29,793 | 8,895,892 | |||||||||
Paychex, Inc. | 10,651 | 905,974 | |||||||||
PayPal Holdings, Inc. (b) | 39,406 | 4,262,547 | |||||||||
The Western Union Co. | 14,070 | 376,795 | |||||||||
VeriSign, Inc. (b) | 3,501 | 674,573 | |||||||||
Visa, Inc. – Class A | 57,450 | 10,794,855 | |||||||||
47,982,875 | |||||||||||
Office Electronics (0.1%) | |||||||||||
| Zebra Technologies Corp. – Class A (b) | 1,810 | 462,347 | |||||||||
Semiconductors & Semiconductor Equipment (4.2%) | |||||||||||
| Advanced Micro Devices, Inc. (b) | 37,373 | 1,713,926 | |||||||||
Analog Devices, Inc. | 12,318 | 1,463,871 | |||||||||
Applied Materials, Inc. | 30,953 | 1,889,371 | |||||||||
Broadcom, Inc. | 13,382 | 4,228,980 | |||||||||
Intel Corp. | 145,986 | 8,737,262 | |||||||||
KLA Corp. | 5,253 | 935,927 | |||||||||
Lam Research Corp. | 4,858 | 1,420,479 | |||||||||
| Maxim Integrated Products, Inc. | 9,019 | 554,759 | |||||||||
Microchip Technology, Inc. | 8,002 | 837,969 | |||||||||
Micron Technology, Inc. (b) | 37,106 | 1,995,561 | |||||||||
NVIDIA Corp. | 20,572 | 4,840,592 | |||||||||
Qorvo, Inc. (b) | 3,859 | 448,531 | |||||||||
QUALCOMM, Inc. | 38,316 | 3,380,621 | |||||||||
Skyworks Solutions, Inc. | 5,672 | 685,631 | |||||||||
Texas Instruments, Inc. | 31,385 | 4,026,382 | |||||||||
Xilinx, Inc. | 8,391 | 820,388 | |||||||||
37,980,250 | |||||||||||
See accompanying notes to financial statements.
73
SFT Index 500 Fund
Investments in Securities – continued
Shares | Value(a) | ||||||||||
Software (7.3%) | |||||||||||
Activision Blizzard, Inc. | 25,684 | $ | 1,526,143 | ||||||||
Adobe, Inc. (b) | 16,319 | 5,382,169 | |||||||||
ANSYS, Inc. (b) | 2,927 | 753,439 | |||||||||
Autodesk, Inc. (b) | 7,381 | 1,354,118 | |||||||||
| Cadence Design Systems, Inc. (b) | 9,317 | 646,227 | |||||||||
Citrix Systems, Inc. | 4,136 | 458,682 | |||||||||
Electronic Arts, Inc. (b) | 9,799 | 1,053,491 | |||||||||
Fortinet, Inc. (b) | 4,770 | 509,245 | |||||||||
Intuit, Inc. | 8,743 | 2,290,054 | |||||||||
Microsoft Corp. | 256,024 | 40,374,985 | |||||||||
NortonLifeLock, Inc. | 19,242 | 491,056 | |||||||||
Oracle Corp. | 72,706 | 3,851,964 | |||||||||
Salesforce.com, Inc. (b) | 29,768 | 4,841,468 | |||||||||
ServiceNow, Inc. (b) | 6,400 | 1,806,848 | |||||||||
Synopsys, Inc. (b) | 5,052 | 703,238 | |||||||||
| Take-Two Interactive Software, Inc. (b) | 3,804 | 465,724 | |||||||||
66,508,851 | |||||||||||
Technology Hardware Storage & Peripherals (0.2%) | |||||||||||
Hewlett Packard Enterprise Co. | 43,426 | 688,736 | |||||||||
HP, Inc. | 49,716 | 1,021,664 | |||||||||
Xerox Holdings Corp. | 6,239 | 230,032 | |||||||||
1,940,432 | |||||||||||
Materials (2.6%) | |||||||||||
Chemicals (1.9%) | |||||||||||
| Air Products & Chemicals, Inc. | 7,407 | 1,740,571 | |||||||||
Albemarle Corp. | 3,462 | 252,865 | |||||||||
Celanese Corp. | 4,056 | 499,375 | |||||||||
CF Industries Holdings, Inc. | 7,239 | 345,590 | |||||||||
Corteva, Inc. | 25,075 | 741,217 | |||||||||
Dow, Inc. | 24,884 | 1,361,901 | |||||||||
DuPont de Nemours, Inc. | 24,861 | 1,596,076 | |||||||||
Eastman Chemical Co. | 4,505 | 357,066 | |||||||||
Ecolab, Inc. | 8,415 | 1,624,011 | |||||||||
FMC Corp. | 4,284 | 427,629 | |||||||||
| International Flavors & Fragrances, Inc. | 3,589 | 463,053 | |||||||||
Linde PLC (c) | 18,028 | 3,838,161 | |||||||||
| LyondellBasell Industries NV – Class A (c) | 8,577 | 810,355 | |||||||||
PPG Industries, Inc. | 7,943 | 1,060,311 | |||||||||
The Mosaic Co. | 11,734 | 253,924 | |||||||||
The Sherwin-Williams Co. | 2,760 | 1,610,570 | |||||||||
16,982,675 | |||||||||||
Construction Materials (0.1%) | |||||||||||
| Martin Marietta Materials, Inc. | 2,099 | 586,964 | |||||||||
Vulcan Materials Co. | 4,447 | 640,324 | |||||||||
1,227,288 | |||||||||||
Containers & Packaging (0.3%) | |||||||||||
Amcor PLC (c) | 54,372 | 589,392 | |||||||||
Ball Corp. | 10,978 | 709,947 | |||||||||
International Paper Co. | 13,105 | 603,485 | |||||||||
Packaging Corp. of America | 3,182 | 356,352 | |||||||||
Shares | Value(a) | ||||||||||
Sealed Air Corp. | 5,094 | $ | 202,894 | ||||||||
WestRock Co. | 8,650 | 371,172 | |||||||||
2,833,242 | |||||||||||
Metals & Mining (0.3%) | |||||||||||
Freeport-McMoRan, Inc. | 48,673 | 638,590 | |||||||||
Newmont Goldcorp Corp. | 27,462 | 1,193,224 | |||||||||
Nucor Corp. | 10,091 | 567,921 | |||||||||
2,399,735 | |||||||||||
Real Estate (2.9%) | |||||||||||
Health Care REITs (0.3%) | |||||||||||
Healthpeak Properties, Inc. | 16,610 | 572,547 | |||||||||
Ventas, Inc. | 12,425 | 717,419 | |||||||||
Welltower, Inc. | 13,523 | 1,105,911 | |||||||||
2,395,877 | |||||||||||
Hotels & Resort REITs (0.0%) | |||||||||||
Host Hotels & Resorts, Inc. | 24,068 | 446,461 | |||||||||
Industrial REITs (0.3%) | |||||||||||
Duke Realty Corp. | 12,335 | 427,655 | |||||||||
ProLogis, Inc. | 21,116 | 1,882,280 | |||||||||
2,309,935 | |||||||||||
Office REITs (0.2%) | |||||||||||
| Alexandria Real Estate Equities, Inc. | 3,912 | 632,101 | |||||||||
Boston Properties, Inc. | 4,832 | 666,139 | |||||||||
SL Green Realty Corp. | 2,670 | 245,320 | |||||||||
Vornado Realty Trust | 5,224 | 347,396 | |||||||||
1,890,956 | |||||||||||
Real Estate Services (0.1%) | |||||||||||
| CBRE Group, Inc. – Class A (b) | 11,206 | 686,816 | |||||||||
Residential REITs (0.4%) | |||||||||||
| Apartment Investment & Management Co. – Class A | 4,904 | 253,292 | |||||||||
AvalonBay Communities, Inc. | 4,695 | 984,541 | |||||||||
Equity Residential | 11,718 | 948,220 | |||||||||
Essex Property Trust, Inc. | 2,210 | 664,901 | |||||||||
| Mid-America Apartment Communities, Inc. | 3,833 | 505,419 | |||||||||
UDR, Inc. | 9,744 | 455,045 | |||||||||
3,811,418 | |||||||||||
Retail REITs (0.4%) | |||||||||||
| Federal Realty Investment Trust | 2,343 | 301,615 | |||||||||
Kimco Realty Corp. | 14,089 | 291,783 | |||||||||
Realty Income Corp. | 10,937 | 805,291 | |||||||||
Regency Centers Corp. | 5,532 | 349,014 | |||||||||
Simon Property Group, Inc. | 10,254 | 1,527,436 | |||||||||
3,275,139 | |||||||||||
Specialized REITs (1.2%) | |||||||||||
American Tower Corp. | 14,881 | 3,419,952 | |||||||||
| Crown Castle International Corp. | 13,976 | 1,986,689 | |||||||||
Digital Realty Trust, Inc. | 7,003 | 838,539 | |||||||||
See accompanying notes to financial statements.
74
SFT Index 500 Fund
Investments in Securities – continued
Shares | Value(a) | ||||||||||
Equinix, Inc. | 2,852 | $ | 1,664,713 | ||||||||
Extra Space Storage, Inc. | 4,320 | 456,278 | |||||||||
Iron Mountain, Inc. | 9,551 | 304,390 | |||||||||
Public Storage | 5,047 | 1,074,809 | |||||||||
SBA Communications Corp. | 3,802 | 916,244 | |||||||||
Weyerhaeuser Co. | 24,941 | 753,218 | |||||||||
11,414,832 | |||||||||||
Utilities (3.4%) | |||||||||||
Electric Utilities (2.0%) | |||||||||||
Alliant Energy Corp. | 7,984 | 436,884 | |||||||||
| American Electric Power Co., Inc. | 16,499 | 1,559,321 | |||||||||
Duke Energy Corp. | 24,393 | 2,224,886 | |||||||||
Edison International | 11,937 | 900,169 | |||||||||
Entergy Corp. | 6,683 | 800,623 | |||||||||
Evergy, Inc. | 7,648 | 497,808 | |||||||||
Eversource Energy | 10,778 | 916,884 | |||||||||
Exelon Corp. | 32,561 | 1,484,456 | |||||||||
FirstEnergy Corp. | 18,052 | 877,327 | |||||||||
NextEra Energy, Inc. | 16,430 | 3,978,689 | |||||||||
Pinnacle West Capital Corp. | 3,775 | 339,486 | |||||||||
PPL Corp. | 24,179 | 867,543 | |||||||||
The Southern Co. | 35,137 | 2,238,227 | |||||||||
Xcel Energy, Inc. | 17,527 | 1,112,789 | |||||||||
18,235,092 | |||||||||||
Gas Utilities (0.2%) | |||||||||||
Atmos Energy Corp. | 3,973 | 444,420 | |||||||||
ONEOK, Inc. | 13,782 | 1,042,884 | |||||||||
1,487,304 | |||||||||||
Independent Power Producers & Energy Traders (0.1%) | |||||||||||
AES Corp. | 22,216 | 442,098 | |||||||||
NRG Energy, Inc. | 8,404 | 334,059 | |||||||||
776,157 | |||||||||||
Shares | Value(a) | ||||||||||
Multi-Utilities (1.0%) | |||||||||||
Ameren Corp. | 8,163 | $ | 626,918 | ||||||||
CenterPoint Energy, Inc. | 16,782 | 457,645 | |||||||||
CMS Energy Corp. | 9,439 | 593,147 | |||||||||
Consolidated Edison, Inc. | 11,165 | 1,010,097 | |||||||||
Dominion Energy, Inc. | 27,529 | 2,279,952 | |||||||||
DTE Energy Co. | 6,447 | 837,272 | |||||||||
NiSource, Inc. | 12,450 | 346,608 | |||||||||
| Public Service Enterprise Group, Inc. | 16,897 | 997,768 | |||||||||
Sempra Energy | 9,460 | 1,433,001 | |||||||||
WEC Energy Group, Inc. | 10,503 | 968,692 | |||||||||
9,551,100 | |||||||||||
Water Utilities (0.1%) | |||||||||||
| American Water Works Co., Inc. | 6,072 | 745,945 | |||||||||
| Total common stocks (cost: $324,752,055) | 897,817,769 | ||||||||||
Short-Term Securities (1.8%) | |||||||||||
Investment Companies (1.8%) | |||||||||||
| State Street Institutional U.S. Government Money Market Fund, current rate 1.530% | 16,354,388 | 16,354,388 | |||||||||
| Total short-term securities (cost: $16,354,388) | 16,354,388 | ||||||||||
| Total investments in securities (cost: $341,106,443) (e) | 914,172,157 | ||||||||||
| Cash and other assets in excess of liabilities (0.0%) | 231,629 | ||||||||||
Total net assets (100.0%) | $ | 914,403,786 | |||||||||
Investments in Securities Legend
(a) Securities are valued by procedures described in Note 2 of the Notes to Financial Statements.
(b) Non-income producing security.
(c) Foreign security: The Fund held 3.9% of net assets in foreign securities at December 31, 2019.
(d) Fully or partially pledged as initial margin deposits on open futures contracts.
Holdings of Open Futures Contracts
On December 31, 2019, securities with an aggregate market value of $10,277,750 have been pledged to cover margin requirements for the following open futures contracts:
Description | Expiration Date | Number of Contracts | Position Type | Notional Amount | Market Value | Unrealized Appreciation/ (Depreciation)(a) | |||||||||||||||||||||
S&P Mid 500® E-Mini Index Future | March 2020 | 95 | Long | $ | 15,010,592 | $ | 15,347,725 | $ | 337,133 | ||||||||||||||||||
(e) At December 31, 2019 the cost of investments for federal income tax purposes was $343,992,072. The aggregate unrealized appreciation and depreciation of investments based on this cost were:
Gross unrealized appreciation | $ | 580,470,075 | |||||
Gross unrealized depreciation | (9,952,857 | ) | |||||
Net unrealized appreciation | $ | 570,517,218 | |||||
See accompanying notes to financial statements.
75
SFT International Bond Fund
Investments in Securities
December 31, 2019
(Percentages of each investment category relate to total net assets)
Principal(b) | Value(a) | ||||||||||
Long-Term Debt Securities (80.5%) | |||||||||||
Argentina (1.4%) | |||||||||||
Government (1.4%) | |||||||||||
| Argentina POM Politica Monetaria (ARS) 56.590%, 06/21/20 (c) | 945,620 | $ | 8,219 | ||||||||
| Argentina Treasury Bill (ARS) 3.539%, 04/28/20 (d) | 11,126,400 | 168,887 | |||||||||
3.594%, 07/29/20 (d) | 9,988,300 | 140,973 | |||||||||
3.649%, 05/28/20 (d) | 678,400 | 9,033 | |||||||||
3.755%, 03/30/20 (d) | 28,716,100 | 340,293 | |||||||||
3.781%, 08/27/20 (d) | 2,015,890 | 22,815 | |||||||||
3.839%, 10/29/20 (d) | 4,101,240 | 43,140 | |||||||||
| Argentine Bonos del Tesoro (ARS) | |||||||||||
15.500%, 10/17/26 | 59,411,000 | 253,163 | |||||||||
16.000%, 10/17/23 | 29,346,000 | 132,361 | |||||||||
18.200%, 10/03/21 | 28,501,000 | 142,002 | |||||||||
| Bonos de la Nacion Argentina con Ajuste por CER (ARS) | |||||||||||
4.000%, 03/06/20 | 58,000 | 1,156 | |||||||||
| Bonos De La Nacion Argentina En Moneda Dua (USD) | |||||||||||
4.500%, 02/13/20 | 369,000 | 189,666 | |||||||||
1,451,708 | |||||||||||
Brazil (10.5%) | |||||||||||
Government (10.5%) | |||||||||||
| Brazil Letras do Tesouro Nacional (BRL) 1.202%, 04/01/21 (d) | 340,000 | 79,816 | |||||||||
1.232%, 01/01/22 (d) | 3,100,000 | 695,300 | |||||||||
| Brazil Notas do Tesouro Nacional Serie F (BRL) 10.000%, 01/01/23 | 5,209,000 | 1,439,023 | |||||||||
10.000%, 01/01/27 | 28,530,000 | 8,338,742 | |||||||||
10,552,881 | |||||||||||
Ghana (1.4%) | |||||||||||
Government (1.4%) | |||||||||||
| Ghana Government Bond (GHS) 18.750%, 01/24/22 | 960,000 | 162,082 | |||||||||
19.000%, 11/02/26 | 2,890,000 | 460,783 | |||||||||
19.750%, 03/25/24 | 960,000 | 160,862 | |||||||||
19.750%, 03/15/32 | 2,890,000 | 459,531 | |||||||||
21.500%, 03/09/20 | 100,000 | 17,695 | |||||||||
24.500%, 06/21/21 | 50,000 | 9,244 | |||||||||
24.750%, 03/01/21 | 100,000 | 18,629 | |||||||||
24.750%, 07/19/21 | 160,000 | 29,889 | |||||||||
| Republic of Ghana Government Bonds (GHS) 16.250%, 05/17/21 | 130,000 | 22,044 | |||||||||
16.500%, 03/22/21 | 100,000 | 17,142 | |||||||||
17.600%, 11/28/22 | 50,000 | 8,109 | |||||||||
18.250%, 09/21/20 | 50,000 | 8,832 | |||||||||
1,374,842 | |||||||||||
Principal(b) | Value(a) | ||||||||||
Indonesia (8.9%) | |||||||||||
Government (8.9%) | |||||||||||
| Indonesia Treasury Bond (IDR) 6.125%, 05/15/28 | 228,000,000 | $ | 15,471 | ||||||||
7.000%, 05/15/27 | 44,554,000,000 | 3,196,777 | |||||||||
8.375%, 03/15/24 | 21,929,000,000 | 1,692,310 | |||||||||
8.375%, 09/15/26 | 25,590,000,000 | 1,982,379 | |||||||||
9.000%, 03/15/29 | 2,228,000,000 | 178,988 | |||||||||
9.500%, 07/15/23 | 18,680,000,000 | 1,472,106 | |||||||||
10.000%, 09/15/24 | 1,959,000,000 | 159,894 | |||||||||
10.000%, 02/15/28 | 76,000,000 | 6,443 | |||||||||
10.250%, 07/15/22 | 2,658,000,000 | 209,559 | |||||||||
8,913,927 | |||||||||||
Mexico (9.4%) | |||||||||||
Government (9.4%) | |||||||||||
| Mexican Bonos (MXN) 6.500%, 06/10/21 | 20,100,000 | 1,060,263 | |||||||||
6.500%, 06/09/22 | 41,440,000 | 2,181,679 | |||||||||
7.250%, 12/09/21 | 44,130,000 | 2,356,178 | |||||||||
8.000%, 06/11/20 | 44,930,000 | 2,391,825 | |||||||||
8.000%, 12/07/23 | 14,450,000 | 797,023 | |||||||||
10.000%, 12/05/24 | 9,340,000 | 561,365 | |||||||||
Mexican Udibonos (MXN) | |||||||||||
2.500%, 12/10/20 | 1,766,129 | 92,544 | |||||||||
9,440,877 | |||||||||||
Norway (3.8%) | |||||||||||
Government (3.8%) | |||||||||||
| Norway Government Bond (NOK) 1.750%, 03/13/25 | 3,215,000 | 372,308 | |||||||||
2.000%, 05/24/23 | 10,130,000 | 1,175,026 | |||||||||
3.000%, 03/14/24 | 8,492,000 | 1,028,921 | |||||||||
3.750%, 05/25/21 | 10,567,000 | 1,242,455 | |||||||||
3,818,710 | |||||||||||
South Korea (11.3%) | |||||||||||
Government (11.3%) | |||||||||||
| Korea Treasury Bond (KRW) 3.000%, 03/10/23 | 967,000,000 | 875,845 | |||||||||
3.000%, 09/10/24 | 2,419,000,000 | 2,233,047 | |||||||||
3.375%, 09/10/23 | 2,729,000,000 | 2,518,674 | |||||||||
3.500%, 03/10/24 | 1,785,000,000 | 1,666,884 | |||||||||
4.250%, 06/10/21 | 4,577,300,000 | 4,120,279 | |||||||||
11,414,729 | |||||||||||
United States (33.8%) | |||||||||||
Government (33.8%) | |||||||||||
| U.S. Treasury Note (USD) 1.125%, 07/31/21 | 9,171,000 | 9,102,576 | |||||||||
1.125%, 08/31/21 | 13,716,000 | 13,610,451 | |||||||||
1.125%, 09/30/21 | 965,000 | 957,235 | |||||||||
1.500%, 08/31/21 | 4,552,000 | 4,544,887 | |||||||||
1.500%, 09/30/21 | 3,576,000 | 3,570,552 | |||||||||
See accompanying notes to financial statements.
76
SFT International Bond Fund
Investments in Securities – continued
Principal(b) | Value(a) | ||||||||||
2.125%, 12/31/21 | 1,091,000 | $ | 1,102,464 | ||||||||
2.625%, 07/15/21 | 1,049,000 | 1,065,309 | |||||||||
33,953,474 | |||||||||||
| Total long-term debt securities (cost: $87,018,803) | 80,921,148 | ||||||||||
Short-Term Securities (16.9%) | |||||||||||
Argentina (0.1%) | |||||||||||
| Argentina Treasury Bill (ARS) 3.512%, 04/08/20 (d) | 1,943,050 | 30,506 | |||||||||
3.546%, 05/13/20 (d) | 869,600 | 12,415 | |||||||||
3.547%, 05/13/20 (d) | 221,935 | 3,335 | |||||||||
3.687%, 02/26/20 (d) | 1,307,100 | 16,810 | |||||||||
3.756%, 03/11/20 (d) | 819,500 | 9,717 | |||||||||
4.114%, 04/08/20 (d) | 1,314,600 | 10,268 | |||||||||
4.344%, 05/13/20 (d) | 443,785 | 2,648 | |||||||||
4.997%, 02/26/20 (d) | 460,100 | 1,308 | |||||||||
6.096%, 03/11/20 (d) | 228,000 | 185 | |||||||||
87,192 | |||||||||||
Mexico (1.8%) | |||||||||||
| Mexico Cetes (MXN) 2.477%, 01/02/20 (d) | 15,640,700 | 827,917 | |||||||||
2.488%, 04/02/20 (d) | 18,029,600 | 937,157 | |||||||||
1,765,074 | |||||||||||
| Shares/ Principal(b) | Value(a) | ||||||||||
Norway (0.8%) | |||||||||||
| Norway Treasury Bill (NOK) 1.823%, 09/16/20 (d) | 1,039,000 | $ | 117,179 | ||||||||
1.824%, 06/17/20 (d) | 1,736,000 | 196,418 | |||||||||
1.825%, 03/18/20 (d) | 4,420,000 | 501,729 | |||||||||
815,326 | |||||||||||
South Korea (4.2%) | |||||||||||
| Korea Monetary Stabilization Bond (KRW) 2.140%, 06/02/20 | 4,830,000,000 | 4,189,940 | |||||||||
Investment Companies (10.0%) | |||||||||||
United States (10.0%) | |||||||||||
| State Street Institutional U.S. Government Money Market Fund (USD), current rate 1.530% | 10,067,135 | 10,067,135 | |||||||||
| Total short-term securities (cost: $16,735,731) | 16,924,667 | ||||||||||
| Total investments in securities (cost: $103,754,534) (e) | 97,845,815 | ||||||||||
| Cash and other assets in excess of liabilities (2.6%) | 2,569,314 | ||||||||||
Total net assets (100.0%) | $ | 100,415,129 | |||||||||
Foreign Forward Currency Contracts
On December 31, 2019, SFT International Bond Fund had entered into forward foreign currency contracts that obligate the Fund to deliver currencies at specified future dates. Unrealized appreciation and depreciation on these contracts is included in the accompanying financial statements. The terms of the open contracts were as follows:
| Settlement Date | Currency to be delivered – SELL | Currency to be received – BUY | Unrealized Appreciation(a) | Unrealized Depreciation(a) | Counterparty | ||||||||||||||||||||||||||
01/03/20 | 217,989 | USD | 1,990,000 | NOK | $ | 8,474 | $ | – | DBK | ||||||||||||||||||||||
01/03/20 | 1,990,000 | NOK | 216,559 | USD | – | (9,905 | ) | DBK | |||||||||||||||||||||||
01/14/20 | 1,680,000 | AUD | 123,226,303 | JPY | – | (14,201 | ) | JPM | |||||||||||||||||||||||
01/14/20 | 1,680,000 | AUD | 123,226,303 | JPY | – | (32,684 | ) | JPM | |||||||||||||||||||||||
01/15/20 | 998,750 | AUD | 699,739 | USD | – | (2,537 | ) | JPM | |||||||||||||||||||||||
01/15/20 | 681,184 | USD | 998,750 | AUD | 21,092 | – | JPM | ||||||||||||||||||||||||
01/17/20 | 178,211 | USD | 160,000 | EUR | 1,542 | – | SCB | ||||||||||||||||||||||||
01/17/20 | 160,000 | EUR | 177,778 | USD | – | (1,975 | ) | SCB | |||||||||||||||||||||||
01/29/20 | 514,234,382 | KRW | 438,505 | USD | – | (6,600 | ) | CIT | |||||||||||||||||||||||
02/03/20 | 409,635 | USD | 366,500 | EUR | 2,545 | – | JPM | ||||||||||||||||||||||||
02/03/20 | 366,500 | EUR | 414,233 | USD | 2,053 | – | JPM | ||||||||||||||||||||||||
02/04/20 | 2,186,700 | BRL | 531,178 | USD | – | (11,876 | ) | JPM | |||||||||||||||||||||||
02/10/20 | 610,000,000 | KRW | 505,553 | USD | – | (22,666 | ) | DBK | |||||||||||||||||||||||
02/10/20 | 578,963 | EUR | 636,165 | CHF | 17,502 | – | UBS | ||||||||||||||||||||||||
02/10/20 | 578,963 | EUR | 636,165 | CHF | – | (10,308 | ) | UBS | |||||||||||||||||||||||
02/12/20 | 568,383 | EUR | 624,335 | CHF | 17,267 | – | GSC | ||||||||||||||||||||||||
02/12/20 | 568,383 | EUR | 624,335 | CHF | – | (10,408 | ) | GSC | |||||||||||||||||||||||
02/12/20 | 2,133,000,000 | KRW | 1,832,947 | USD | – | (14,237 | ) | HSB | |||||||||||||||||||||||
02/13/20 | 703,797 | EUR | 7,513,600 | SEK | 28,721 | – | DBK | ||||||||||||||||||||||||
02/13/20 | 703,797 | EUR | 7,513,600 | SEK | – | (16,430 | ) | DBK | |||||||||||||||||||||||
02/21/20 | 1,071,500,000 | KRW | 920,454 | USD | – | (7,805 | ) | CIT | |||||||||||||||||||||||
02/21/20 | 2,070,688 | AUD | 148,181,504 | JPY | – | (24,482 | ) | JPM | |||||||||||||||||||||||
02/21/20 | 2,070,688 | AUD | 148,181,504 | JPY | – | (65,889 | ) | JPM | |||||||||||||||||||||||
02/24/20 | 353,923 | USD | 317,000 | EUR | 3,058 | – | SCB | ||||||||||||||||||||||||
02/24/20 | 317,000 | EUR | 355,785 | USD | – | (1,196 | ) | SCB | |||||||||||||||||||||||
02/25/20 | 1,300,431 | AUD | 92,969,461 | JPY | – | (16,646 | ) | CIT | |||||||||||||||||||||||
02/25/20 | 1,300,431 | AUD | 92,969,461 | JPY | – | (40,849 | ) | CIT | |||||||||||||||||||||||
02/25/20 | 917,461 | EUR | 108,263,728 | JPY | – | (19,385 | ) | HSB | |||||||||||||||||||||||
See accompanying notes to financial statements.
77
SFT International Bond Fund
Investments in Securities – continued
| Settlement Date | Currency to be delivered – SELL | Currency to be received – BUY | Unrealized Appreciation(a) | Unrealized Depreciation(a) | Counterparty | ||||||||||||||||||||||||||
02/25/20 | 917,461 | EUR | 108,263,728 | JPY | $ | – | $ | (14,910 | ) | HSB | |||||||||||||||||||||
02/26/20 | 1,178,873 | USD | 123,816,900 | JPY | – | (36,356 | ) | CIT | |||||||||||||||||||||||
02/26/20 | 435,531,237 | KRW | 362,505 | USD | – | (14,879 | ) | CIT | |||||||||||||||||||||||
02/26/20 | 123,816,900 | JPY | 1,179,164 | USD | 36,646 | – | CIT | ||||||||||||||||||||||||
02/26/20 | 544,686 | USD | 4,877,500 | NOK | 10,524 | – | DBK | ||||||||||||||||||||||||
02/26/20 | 4,877,500 | NOK | 530,798 | USD | – | (24,413 | ) | DBK | |||||||||||||||||||||||
02/27/20 | 803,047 | USD | 84,427,200 | JPY | – | (23,953 | ) | CIT | |||||||||||||||||||||||
02/27/20 | 84,427,200 | JPY | 792,477 | USD | 13,384 | – | CIT | ||||||||||||||||||||||||
02/27/20 | 793,674 | USD | 83,444,600 | JPY | – | (23,649 | ) | JPM | |||||||||||||||||||||||
02/28/20 | 773,049 | USD | 690,867 | EUR | 5,148 | – | BCB | ||||||||||||||||||||||||
02/28/20 | 690,867 | EUR | 776,358 | USD | – | (1,839 | ) | BCB | |||||||||||||||||||||||
02/28/20 | 1,553,029 | USD | 162,134,000 | JPY | – | (56,775 | ) | CIT | |||||||||||||||||||||||
02/28/20 | 514,234,381 | KRW | 428,011 | USD | – | (17,604 | ) | CIT | |||||||||||||||||||||||
02/28/20 | 616,157 | EUR | 693,346 | USD | – | (697 | ) | CIT | |||||||||||||||||||||||
02/28/20 | 681,488 | USD | 616,157 | EUR | 12,555 | – | CIT | ||||||||||||||||||||||||
02/28/20 | 162,134,000 | JPY | 1,521,961 | USD | 25,706 | – | CIT | ||||||||||||||||||||||||
03/03/20 | 2,741,800 | BRL | 663,964 | USD | – | (16,113 | ) | JPM | |||||||||||||||||||||||
03/06/20 | 1,710,250 | AUD | 122,483,887 | JPY | – | (22,601 | ) | CIT | |||||||||||||||||||||||
03/06/20 | 1,710,250 | AUD | 122,483,887 | JPY | – | (50,680 | ) | CIT | |||||||||||||||||||||||
03/06/20 | 607,000,000 | KRW | 504,866 | USD | – | (21,284 | ) | DBK | |||||||||||||||||||||||
03/06/20 | 357,096 | USD | 37,884,840 | JPY | – | (7,338 | ) | HSB | |||||||||||||||||||||||
03/06/20 | 37,884,840 | JPY | 361,348 | USD | 11,591 | – | HSB | ||||||||||||||||||||||||
03/06/20 | 339,518 | USD | 35,981,110 | JPY | – | (7,337 | ) | JPM | |||||||||||||||||||||||
03/06/20 | 35,981,110 | JPY | 342,014 | USD | 9,832 | – | JPM | ||||||||||||||||||||||||
03/09/20 | 725,882 | EUR | 808,887 | USD | – | (9,264 | ) | DBK | |||||||||||||||||||||||
03/09/20 | 810,092 | USD | 725,882 | EUR | 8,059 | – | DBK | ||||||||||||||||||||||||
03/10/20 | 371,660 | EUR | 414,141 | USD | – | (4,788 | ) | BOA | |||||||||||||||||||||||
03/10/20 | 415,496 | USD | 371,660 | EUR | 3,433 | – | BOA | ||||||||||||||||||||||||
03/10/20 | 9,800,000,000 | KRW | 8,228,380 | USD | – | (267,621 | ) | HSB | |||||||||||||||||||||||
03/12/20 | 1,285,000 | AUD | 94,641,535 | JPY | 3,458 | – | HSB | ||||||||||||||||||||||||
03/12/20 | 1,285,000 | AUD | 94,641,535 | JPY | – | (34,218 | ) | HSB | |||||||||||||||||||||||
03/12/20 | 1,520,000 | AUD | 113,430,851 | JPY | 2,221 | – | JPM | ||||||||||||||||||||||||
03/12/20 | 1,520,000 | AUD | 113,430,851 | JPY | – | (24,925 | ) | JPM | |||||||||||||||||||||||
03/13/20 | 703,543 | EUR | 7,513,700 | SEK | 29,864 | – | DBK | ||||||||||||||||||||||||
03/13/20 | 703,543 | EUR | 7,513,700 | SEK | – | (17,575 | ) | DBK | |||||||||||||||||||||||
03/13/20 | 650,000 | AUD | 48,327,825 | JPY | 973 | – | HSB | ||||||||||||||||||||||||
03/13/20 | 650,000 | AUD | 48,327,825 | JPY | – | (12,317 | ) | HSB | |||||||||||||||||||||||
03/20/20 | 508,500,000 | KRW | 431,976 | USD | – | (9,036 | ) | CIT | |||||||||||||||||||||||
03/23/20 | 445,547 | USD | 3,983,500 | NOK | 7,920 | – | DBK | ||||||||||||||||||||||||
03/23/20 | 3,983,500 | NOK | 436,806 | USD | – | (16,660 | ) | DBK | |||||||||||||||||||||||
03/23/20 | 91,792 | USD | 82,147 | EUR | 878 | – | GSC | ||||||||||||||||||||||||
03/23/20 | 82,147 | EUR | 92,068 | USD | – | (601 | ) | GSC | |||||||||||||||||||||||
03/23/20 | 1,072,855 | USD | 113,905,000 | JPY | – | (20,213 | ) | HSB | |||||||||||||||||||||||
03/23/20 | 999,174 | USD | 106,255,510 | JPY | – | (17,224 | ) | HSB | |||||||||||||||||||||||
03/23/20 | 220,160,510 | JPY | 2,101,841 | USD | 67,249 | – | HSB | ||||||||||||||||||||||||
03/23/20 | 701,364 | USD | 74,598,450 | JPY | – | (11,970 | ) | JPM | |||||||||||||||||||||||
03/23/20 | 700,162 | USD | 74,438,000 | JPY | – | (12,251 | ) | JPM | |||||||||||||||||||||||
03/23/20 | 149,036,450 | JPY | 1,417,974 | USD | 40,667 | – | JPM | ||||||||||||||||||||||||
03/24/20 | 333,181 | USD | 2,996,000 | NOK | 7,872 | – | DBK | ||||||||||||||||||||||||
03/24/20 | 2,996,000 | NOK | 326,038 | USD | – | (15,015 | ) | DBK | |||||||||||||||||||||||
03/24/20 | 367,214 | USD | 38,681,250 | JPY | – | (9,723 | ) | JPM | |||||||||||||||||||||||
03/24/20 | 38,681,250 | JPY | 368,044 | USD | 10,553 | – | JPM | ||||||||||||||||||||||||
03/25/20 | 917,485 | EUR | 108,465,086 | JPY | – | (2,840 | ) | HSB | |||||||||||||||||||||||
03/25/20 | 917,485 | EUR | 108,465,086 | JPY | – | (29,816 | ) | HSB | |||||||||||||||||||||||
03/31/20 | 386,058 | USD | 345,433 | EUR | 3,821 | – | BCB | ||||||||||||||||||||||||
03/31/20 | 345,433 | EUR | 382,738 | USD | – | (7,141 | ) | BCB | |||||||||||||||||||||||
03/31/20 | 764,780 | EUR | 90,121,510 | JPY | – | (3,728 | ) | CIT | |||||||||||||||||||||||
03/31/20 | 764,780 | EUR | 90,121,510 | JPY | – | (26,205 | ) | CIT | |||||||||||||||||||||||
03/31/20 | 721,491 | USD | 645,663 | EUR | 7,248 | – | SCB | ||||||||||||||||||||||||
03/31/20 | 645,663 | EUR | 715,744 | USD | – | (12,995 | ) | SCB | |||||||||||||||||||||||
04/06/20 | 57,690,000 | MXN | 2,832,392 | USD | – | (180,640 | ) | HSB | |||||||||||||||||||||||
04/08/20 | 415,330 | USD | 371,425 | EUR | 4,089 | – | BOA | ||||||||||||||||||||||||
04/08/20 | 371,425 | EUR | 412,716 | USD | – | (6,703 | ) | BOA | |||||||||||||||||||||||
04/08/20 | 4,213,000 | MXN | 209,776 | USD | – | (10,196 | ) | CIT | |||||||||||||||||||||||
04/08/20 | 811,432 | USD | 725,882 | EUR | 8,246 | – | DBK | ||||||||||||||||||||||||
04/08/20 | 725,882 | EUR | 807,326 | USD | – | (12,352 | ) | DBK | |||||||||||||||||||||||
04/08/20 | 51,000 | EUR | 56,684 | USD | – | (906 | ) | GSC | |||||||||||||||||||||||
04/08/20 | 57,046 | USD | 51,000 | EUR | 544 | – | GSC | ||||||||||||||||||||||||
See accompanying notes to financial statements.
78
SFT International Bond Fund
Investments in Securities – continued
| Settlement Date | Currency to be delivered – SELL | Currency to be received – BUY | Unrealized Appreciation(a) | Unrealized Depreciation(a) | Counterparty | ||||||||||||||||||||||||||
04/09/20 | 228,417 | EUR | 254,136 | USD | $ | – | $ | (3,811 | ) | UBS | |||||||||||||||||||||
04/09/20 | 255,840 | USD | 228,417 | EUR | 2,107 | – | UBS | ||||||||||||||||||||||||
04/14/20 | 374,704 | USD | 335,000 | EUR | 3,720 | – | BCB | ||||||||||||||||||||||||
04/14/20 | 335,000 | EUR | 372,433 | USD | – | (5,990 | ) | BCB | |||||||||||||||||||||||
04/15/20 | 133,832 | USD | 119,438 | EUR | 1,096 | – | BOA | ||||||||||||||||||||||||
04/15/20 | 119,438 | EUR | 133,253 | USD | – | (1,674 | ) | BOA | |||||||||||||||||||||||
04/15/20 | 691,290 | EUR | 7,513,700 | SEK | 41,046 | – | DBK | ||||||||||||||||||||||||
04/15/20 | 691,290 | EUR | 7,513,700 | SEK | – | (15,313 | ) | DBK | |||||||||||||||||||||||
04/15/20 | 78,270 | EUR | 87,316 | USD | – | (1,104 | ) | GSC | |||||||||||||||||||||||
04/15/20 | 107,000 | EUR | 119,717 | USD | – | (1,160 | ) | GSC | |||||||||||||||||||||||
04/15/20 | 207,323 | USD | 185,270 | EUR | 1,975 | – | GSC | ||||||||||||||||||||||||
04/23/20 | 82,167 | EUR | 92,774 | USD | – | (93 | ) | GSC | |||||||||||||||||||||||
04/23/20 | 91,991 | USD | 82,167 | EUR | 877 | – | GSC | ||||||||||||||||||||||||
04/27/20 | 1,281,031 | USD | 1,144,253 | EUR | 12,547 | – | HSB | ||||||||||||||||||||||||
04/27/20 | 1,514,253 | EUR | 1,704,958 | USD | – | (6,905 | ) | HSB | |||||||||||||||||||||||
04/29/20 | 1,416,728 | EUR | 1,590,815 | USD | – | (10,987 | ) | BOA | |||||||||||||||||||||||
04/29/20 | 1,267,317 | USD | 1,131,434 | EUR | 11,922 | – | BOA | ||||||||||||||||||||||||
04/29/20 | 104,034 | EUR | 116,905 | USD | – | (719 | ) | GSC | |||||||||||||||||||||||
04/29/20 | 116,515 | USD | 104,034 | EUR | 1,110 | – | GSC | ||||||||||||||||||||||||
04/29/20 | 633,107 | EUR | 711,368 | USD | – | (4,445 | ) | SCB | |||||||||||||||||||||||
04/30/20 | 1,416,728 | EUR | 1,591,197 | USD | – | (10,701 | ) | BOA | |||||||||||||||||||||||
04/30/20 | 764,780 | EUR | 92,515,436 | JPY | 6,802 | – | CIT | ||||||||||||||||||||||||
04/30/20 | 764,780 | EUR | 92,515,436 | JPY | – | (14,687 | ) | CIT | |||||||||||||||||||||||
04/30/20 | 130,740 | EUR | 146,808 | USD | – | (1,020 | ) | DBK | |||||||||||||||||||||||
04/30/20 | 37,500 | EUR | 42,108 | USD | – | (294 | ) | GSC | |||||||||||||||||||||||
04/30/20 | 42,002 | USD | 37,500 | EUR | 399 | – | GSC | ||||||||||||||||||||||||
05/05/20 | 2,480,100 | BRL | 598,322 | USD | – | (14,918 | ) | JPM | |||||||||||||||||||||||
05/08/20 | 579,454 | EUR | 636,165 | CHF | 21,617 | – | UBS | ||||||||||||||||||||||||
05/08/20 | 579,454 | EUR | 636,165 | CHF | – | (14,403 | ) | UBS | |||||||||||||||||||||||
05/12/20 | 568,870 | EUR | 624,335 | CHF | 21,396 | – | GSC | ||||||||||||||||||||||||
05/12/20 | 568,870 | EUR | 624,335 | CHF | – | (14,506 | ) | GSC | |||||||||||||||||||||||
05/13/20 | 705,850 | EUR | 7,513,700 | SEK | 26,073 | – | DBK | ||||||||||||||||||||||||
05/13/20 | 705,850 | EUR | 7,513,700 | SEK | – | (17,056 | ) | DBK | |||||||||||||||||||||||
05/14/20 | 158,000 | EUR | 176,082 | USD | – | (2,719 | ) | HSB | |||||||||||||||||||||||
05/15/20 | 250,000,000 | KRW | 216,385 | USD | – | (845 | ) | CIT | |||||||||||||||||||||||
05/21/20 | 2,070,688 | AUD | 147,680,397 | JPY | – | (17,332 | ) | JPM | |||||||||||||||||||||||
05/21/20 | 2,070,688 | AUD | 147,680,397 | JPY | – | (73,506 | ) | JPM | |||||||||||||||||||||||
05/21/20 | 2,070,688 | AUD | 152,662,761 | JPY | 8,509 | – | JPM | ||||||||||||||||||||||||
05/21/20 | 2,070,688 | AUD | 152,662,761 | JPY | – | (53,146 | ) | JPM | |||||||||||||||||||||||
05/21/20 | 186,735 | EUR | 209,250 | USD | – | (2,158 | ) | JPM | |||||||||||||||||||||||
05/22/20 | 917,461 | EUR | 108,332,262 | JPY | – | (14,379 | ) | HSB | |||||||||||||||||||||||
05/22/20 | 917,461 | EUR | 108,332,262 | JPY | – | (19,769 | ) | HSB | |||||||||||||||||||||||
05/22/20 | 917,461 | EUR | 110,198,103 | JPY | 7,556 | – | HSB | ||||||||||||||||||||||||
05/22/20 | 917,461 | EUR | 110,198,103 | JPY | – | (24,402 | ) | HSB | |||||||||||||||||||||||
05/22/20 | 626,305 | EUR | 700,875 | USD | – | (8,222 | ) | JPM | |||||||||||||||||||||||
05/26/20 | 130,792 | EUR | 146,304 | USD | – | (1,813 | ) | DBK | |||||||||||||||||||||||
05/26/20 | 777,081 | USD | 83,443,000 | JPY | – | (3,116 | ) | JPM | |||||||||||||||||||||||
05/27/20 | 524,000 | EUR | 583,784 | USD | – | (9,663 | ) | BNP | |||||||||||||||||||||||
05/27/20 | 599,000 | EUR | 668,005 | USD | – | (10,382 | ) | MSC | |||||||||||||||||||||||
05/29/20 | 345,433 | EUR | 386,533 | USD | – | (4,728 | ) | BCB | |||||||||||||||||||||||
05/29/20 | 1,494,000,000 | KRW | 1,281,523 | USD | – | (17,225 | ) | DBK | |||||||||||||||||||||||
06/04/20 | 35,002 | EUR | 39,225 | USD | – | (435 | ) | JPM | |||||||||||||||||||||||
06/05/20 | 3,236,680 | EUR | 3,627,836 | USD | – | (39,788 | ) | SCB | |||||||||||||||||||||||
06/08/20 | 359,168 | USD | 37,884,850 | JPY | – | (7,513 | ) | HSB | |||||||||||||||||||||||
06/08/20 | 37,884,850 | JPY | 363,247 | USD | 11,592 | – | HSB | ||||||||||||||||||||||||
06/08/20 | 341,516 | USD | 35,981,110 | JPY | – | (7,532 | ) | JPM | |||||||||||||||||||||||
06/08/20 | 35,981,110 | JPY | 343,818 | USD | 9,834 | – | JPM | ||||||||||||||||||||||||
06/12/20 | 1,285,000 | AUD | 94,357,550 | JPY | 8,070 | – | HSB | ||||||||||||||||||||||||
06/12/20 | 1,285,000 | AUD | 94,357,550 | JPY | – | (38,619 | ) | HSB | |||||||||||||||||||||||
06/12/20 | 660,000 | AUD | 48,934,710 | JPY | 3,355 | – | HSB | ||||||||||||||||||||||||
06/12/20 | 660,000 | AUD | 48,934,710 | JPY | – | (14,674 | ) | HSB | |||||||||||||||||||||||
06/12/20 | 1,160,000 | AUD | 85,201,420 | JPY | 7,287 | – | JPM | ||||||||||||||||||||||||
06/12/20 | 1,160,000 | AUD | 85,201,420 | JPY | – | (34,654 | ) | JPM | |||||||||||||||||||||||
06/12/20 | 1,170,000 | AUD | 86,849,802 | JPY | 5,955 | – | JPM | ||||||||||||||||||||||||
06/12/20 | 1,170,000 | AUD | 86,849,802 | JPY | – | (25,074 | ) | JPM | |||||||||||||||||||||||
06/12/20 | 650,000 | AUD | 48,145,435 | JPY | 3,301 | – | JPM | ||||||||||||||||||||||||
06/12/20 | 650,000 | AUD | 48,145,435 | JPY | – | (14,892 | ) | JPM | |||||||||||||||||||||||
06/15/20 | 716,000 | EUR | 7,513,700 | SEK | 13,011 | – | DBK | ||||||||||||||||||||||||
See accompanying notes to financial statements.
79
SFT International Bond Fund
Investments in Securities – continued
| Settlement Date | Currency to be delivered – SELL | Currency to be received – BUY | Unrealized Appreciation(a) | Unrealized Depreciation(a) | Counterparty | ||||||||||||||||||||||||||
06/15/20 | 716,000 | EUR | 7,513,700 | SEK | $ | – | $ | (15,820 | ) | DBK | |||||||||||||||||||||
06/15/20 | 702,639 | EUR | 7,513,600 | SEK | 33,412 | – | DBK | ||||||||||||||||||||||||
06/15/20 | 702,639 | EUR | 7,513,600 | SEK | – | (21,084 | ) | DBK | |||||||||||||||||||||||
06/15/20 | 816,451 | USD | 7,471,300 | NOK | 34,204 | – | JPM | ||||||||||||||||||||||||
06/15/20 | 35,002 | EUR | 40,677 | USD | 990 | – | JPM | ||||||||||||||||||||||||
06/16/20 | 816,447 | USD | 7,425,800 | NOK | 29,029 | – | JPM | ||||||||||||||||||||||||
06/17/20 | 3,195,000 | MXN | 157,304 | USD | – | (7,841 | ) | CIT | |||||||||||||||||||||||
06/17/20 | 4,238,000 | MXN | 208,180 | USD | – | (10,877 | ) | CIT | |||||||||||||||||||||||
06/17/20 | 7,012,000 | MXN | 345,024 | USD | – | (17,416 | ) | CIT | |||||||||||||||||||||||
06/19/20 | 844,042 | USD | 7,607,100 | NOK | 22,082 | – | JPM | ||||||||||||||||||||||||
06/22/20 | 705,410 | USD | 74,598,450 | JPY | – | (12,422 | ) | JPM | |||||||||||||||||||||||
06/22/20 | 74,598,450 | JPY | 713,347 | USD | 20,359 | – | JPM | ||||||||||||||||||||||||
06/24/20 | 1,800,566 | USD | 188,517,750 | JPY | – | (49,118 | ) | BNP | |||||||||||||||||||||||
06/30/20 | 764,780 | EUR | 90,106,214 | JPY | 593 | – | CIT | ||||||||||||||||||||||||
06/30/20 | 764,780 | EUR | 90,106,214 | JPY | – | (31,072 | ) | CIT | |||||||||||||||||||||||
07/23/20 | 20,675 | EUR | 23,475 | USD | – | (20 | ) | UBS | |||||||||||||||||||||||
07/23/20 | 23,304 | USD | 20,675 | EUR | 191 | – | UBS | ||||||||||||||||||||||||
08/10/20 | 579,913 | EUR | 636,165 | CHF | 25,948 | – | UBS | ||||||||||||||||||||||||
08/10/20 | 579,913 | EUR | 636,165 | CHF | – | (18,650 | ) | UBS | |||||||||||||||||||||||
08/12/20 | 569,337 | EUR | 624,335 | CHF | 25,555 | – | GSC | ||||||||||||||||||||||||
08/12/20 | 569,337 | EUR | 624,335 | CHF | – | (18,618 | ) | GSC | |||||||||||||||||||||||
08/21/20 | 2,070,687 | AUD | 147,163,551 | JPY | – | (10,204 | ) | JPM | |||||||||||||||||||||||
08/21/20 | 2,070,687 | AUD | 147,163,551 | JPY | – | (81,091 | ) | JPM | |||||||||||||||||||||||
08/24/20 | 1,296,969 | AUD | 92,057,085 | JPY | – | (7,703 | ) | CIT | |||||||||||||||||||||||
08/24/20 | 1,296,969 | AUD | 92,057,085 | JPY | – | (50,493 | ) | CIT | |||||||||||||||||||||||
08/24/20 | 917,461 | EUR | 108,413,824 | JPY | – | (9,072 | ) | HSB | |||||||||||||||||||||||
08/24/20 | 917,461 | EUR | 108,413,824 | JPY | – | (24,918 | ) | HSB | |||||||||||||||||||||||
08/31/20 | 982,926 | USD | 101,585,000 | JPY | – | (35,548 | ) | CIT | |||||||||||||||||||||||
08/31/20 | 30,820,000 | JPY | 292,500 | USD | 5,074 | – | CIT | ||||||||||||||||||||||||
09/21/20 | 738,811 | USD | 6,665,800 | NOK | 20,039 | – | JPM | ||||||||||||||||||||||||
09/30/20 | 764,780 | EUR | 92,785,786 | JPY | 19,058 | – | CIT | ||||||||||||||||||||||||
09/30/20 | 764,780 | EUR | 92,785,786 | JPY | – | (25,068 | ) | CIT | |||||||||||||||||||||||
09/30/20 | 764,780 | EUR | 90,136,805 | JPY | 4,901 | – | CIT | ||||||||||||||||||||||||
09/30/20 | 764,780 | EUR | 90,136,805 | JPY | – | (35,656 | ) | CIT | |||||||||||||||||||||||
10/05/20 | 18,750 | EUR | 20,980 | USD | – | (424 | ) | GSC | |||||||||||||||||||||||
10/05/20 | 21,203 | USD | 18,750 | EUR | 202 | – | GSC | ||||||||||||||||||||||||
10/07/20 | 43,020,000 | MXN | 2,061,601 | USD | – | (127,968 | ) | HSB | |||||||||||||||||||||||
10/08/20 | 4,323,000 | MXN | 209,785 | USD | – | (10,213 | ) | CIT | |||||||||||||||||||||||
10/09/20 | 3,247,000 | MXN | 157,343 | USD | – | (7,876 | ) | CIT | |||||||||||||||||||||||
10/13/20 | 3,694,000 | MXN | 178,442 | USD | – | (9,426 | ) | CIT | |||||||||||||||||||||||
10/13/20 | 7,130,000 | MXN | 345,008 | USD | – | (17,607 | ) | CIT | |||||||||||||||||||||||
10/13/20 | 1,578,954 | EUR | 1,774,334 | USD | – | (29,026 | ) | HSB | |||||||||||||||||||||||
10/15/20 | 15,933,000 | MXN | 773,304 | USD | – | (36,805 | ) | CIT | |||||||||||||||||||||||
10/15/20 | 347,550 | EUR | 392,043 | USD | – | (4,950 | ) | DBK | |||||||||||||||||||||||
10/16/20 | 294,825 | EUR | 333,683 | USD | – | (3,106 | ) | BOA | |||||||||||||||||||||||
10/16/20 | 14,589,000 | MXN | 714,597 | USD | – | (27,082 | ) | CIT | |||||||||||||||||||||||
10/16/20 | 602,000 | EUR | 681,028 | USD | – | (6,658 | ) | HSB | |||||||||||||||||||||||
10/26/20 | 815,540 | EUR | 928,427 | USD | – | (3,767 | ) | DBK | |||||||||||||||||||||||
11/09/20 | 580,358 | EUR | 636,165 | CHF | 30,199 | – | UBS | ||||||||||||||||||||||||
11/09/20 | 580,358 | EUR | 636,165 | CHF | – | (22,844 | ) | UBS | |||||||||||||||||||||||
11/12/20 | 569,752 | EUR | 624,335 | CHF | 29,779 | – | GSC | ||||||||||||||||||||||||
11/12/20 | 569,752 | EUR | 624,335 | CHF | – | (22,754 | ) | GSC | |||||||||||||||||||||||
$ | 967,507 | $ | (2,846,999 | ) | |||||||||||||||||||||||||||
See accompanying notes to financial statements.
80
SFT International Bond Fund
Investments in Securities – continued
At December 31, 2019, the Fund had the following interest rate swap contracts outstanding.
Interest Rate Swap Contracts
Description | Counter-party | Payment Frequency (Pay/Rec) | Maturity Date | Notional Amount | Value | Upfront Payments/ (Receipts) | Unrealized Appreciation/ (Depreciation)(a) | ||||||||||||||||||||||||
Centrally Cleared Swaps | |||||||||||||||||||||||||||||||
| Receive Floating Rate 3-Month USD LIBOR Pay Fixed Rate 2.378% | CIT | Quarterly/ Semi-Annually | 11/18/46 | $ | 3,200,000 | $ | (197,029 | ) | $ | – | $ | (197,029 | ) | ||||||||||||||||||
| Receive Floating Rate 3-Month USD LIBOR Pay Fixed Rate 2.537% | GSC | Quarterly/ Semi-Annually | 04/13/47 | 1,700,000 | (164,613 | ) | – | (164,613 | ) | ||||||||||||||||||||||
| Receive Floating Rate 3-Month USD LIBOR Pay Fixed Rate 2.793% | CIT | Quarterly/ Semi-Annually | 03/13/47 | 2,000,000 | (316,121 | ) | – | (316,121 | ) | ||||||||||||||||||||||
| Receive Floating Rate 3-Month USD LIBOR Pay Fixed Rate 2.979% | CIT | Quarterly/ Semi-Annually | 02/20/48 | 1,514,000 | (308,618 | ) | – | (308,618 | ) | ||||||||||||||||||||||
| Receive Floating Rate 3-Month USD LIBOR Pay Fixed Rate 3.002% | HSB | Quarterly/ Semi-Annually | 02/22/48 | 1,514,000 | (316,139 | ) | – | (316,139 | ) | ||||||||||||||||||||||
| Receive Floating Rate 3-Month USD LIBOR Pay Fixed Rate 3.019% | HSB | Quarterly/ Semi-Annually | 02/23/48 | 1,514,000 | (321,384 | ) | – | (321,384 | ) | ||||||||||||||||||||||
Net unrealized appreciation (depreciation) | $ | (1,623,904 | ) | $ | – | $ | (1,623,904 | ) | |||||||||||||||||||||||
Investments in Securities Legend
(a) Securities are valued by procedures described in Note 2 of the Notes to Investments in Securities.
(b) Principal amounts for foreign debt securities are denominated in the currencies indicated. United States debt securities are denominated in U.S. Dollars.
(c) Variable rate security.
(d) Rate represents annualized yield at date of purchase.
(e) At December 31, 2019 the cost of investments for federal income tax purposes was $101,882,994. The aggregate unrealized appreciation and depreciation of investments based on this cost were:
Gross unrealized appreciation | $ | 2,714,859 | |||||
Gross unrealized depreciation | (10,255,434 | ) | |||||
Net unrealized depreciation | $ | (7,540,575 | ) | ||||
See accompanying notes to financial statements.
81
SFT International Bond Fund
Investments in Securities – continued
Currency Legend
ARS Argentine Peso
AUD Australian Dollar
BRL Brazilian Real
CHF Swiss Franc
EUR Euro
GHS Ghanaian Cedi
IDR Indonesian Rupiah
JPY Japanese Yen
KRW South Korean Won
MXN Mexican Peso
NOK Norwegian Krone
SEK Swedish Krona
USD United States Dollar
Counterparty Legend
BCB Barclays Bank PLC
BNP BNP Paribas SA
BOA Bank of America Merrill Lynch
CIT Citibank NA
DBK Deutsche Bank AG
GSC Goldman Sachs
HSB HSBC Bank PLC
JPM JPMorgan Chase Bank NA
MSC Morgan Stanley and Co., Inc.
SCB Standard Chartered Bank
UBS UBS AG
See accompanying notes to financial statements.
82
SFT IvySM Growth Fund
Investments in Securities
December 31, 2019
(Percentages of each investment category relate to total net assets)
Shares | Value(a) | ||||||||||
Common Stocks (99.1%) | |||||||||||
Consumer Discretionary (17.0%) | |||||||||||
Automobiles (1.9%) | |||||||||||
Ferrari NV (b) | 61,787 | $ | 10,228,220 | ||||||||
Internet & Catalog Retail (7.3%) | |||||||||||
Amazon.com, Inc. (c) | 13,170 | 24,336,053 | |||||||||
Booking Holdings, Inc. (c) | 7,504 | 15,411,190 | |||||||||
39,747,243 | |||||||||||
Media (1.3%) | |||||||||||
The Walt Disney Co. | 51,356 | 7,427,618 | |||||||||
Specialty Retail (2.2%) | |||||||||||
Home Depot, Inc. (The) | 54,522 | 11,906,514 | |||||||||
Textiles, Apparel & Luxury Goods (4.3%) | |||||||||||
NIKE, Inc. – Class B | 132,384 | 13,411,823 | |||||||||
VF Corp. | 100,939 | 10,059,581 | |||||||||
23,471,404 | |||||||||||
Consumer Staples (4.2%) | |||||||||||
Beverages (3.0%) | |||||||||||
The Coca-Cola Co. | 296,157 | 16,392,290 | |||||||||
Personal Care (1.2%) | |||||||||||
| The Estee Lauder Cos., Inc. – Class A | 30,597 | 6,319,504 | |||||||||
Financial (3.5%) | |||||||||||
Capital Markets (3.5%) | |||||||||||
CME Group, Inc. | 51,572 | 10,351,532 | |||||||||
S&P Global, Inc. | 31,607 | 8,630,291 | |||||||||
18,981,823 | |||||||||||
Health Care (12.3%) | |||||||||||
Biotechnology (1.5%) | |||||||||||
Vertex Pharmaceuticals, Inc. (c) | 36,789 | 8,054,952 | |||||||||
Health Care Equipment & Supplies (3.5%) | |||||||||||
Danaher Corp. | 71,001 | 10,897,233 | |||||||||
Intuitive Surgical, Inc. (c) | 13,550 | 8,010,083 | |||||||||
18,907,316 | |||||||||||
Health Care Providers & Services (1.8%) | |||||||||||
UnitedHealth Group, Inc. | 34,196 | 10,052,940 | |||||||||
Health Care Technology (2.8%) | |||||||||||
Cerner Corp. | 208,337 | 15,289,852 | |||||||||
Life Sciences Tools & Services (1.2%) | |||||||||||
Illumina, Inc. (c) | 20,149 | 6,684,229 | |||||||||
Pharmaceuticals (1.5%) | |||||||||||
Zoetis, Inc. | 61,534 | 8,144,025 | |||||||||
Industrials (11.8%) | |||||||||||
Aerospace & Defense (2.6%) | |||||||||||
Northrop Grumman Corp. | 23,137 | 7,958,434 | |||||||||
The Boeing Co. | 19,085 | 6,217,130 | |||||||||
14,175,564 | |||||||||||
Shares | Value(a) | ||||||||||
Machinery (4.0%) | |||||||||||
Caterpillar, Inc. | 63,752 | $ | 9,414,895 | ||||||||
Stanley Black & Decker, Inc. | 74,513 | 12,349,785 | |||||||||
21,764,680 | |||||||||||
Professional Services (2.6%) | |||||||||||
CoStar Group, Inc. (c) | 11,100 | 6,641,130 | |||||||||
Verisk Analytics, Inc. | 52,269 | 7,805,852 | |||||||||
14,446,982 | |||||||||||
Road & Rail (2.6%) | |||||||||||
JB Hunt Transport Services, Inc. | 63,516 | 7,417,398 | |||||||||
Union Pacific Corp. | 35,892 | 6,488,915 | |||||||||
13,906,313 | |||||||||||
Information Technology (48.2%) | |||||||||||
Communications Equipment (2.8%) | |||||||||||
Motorola Solutions, Inc. | 93,307 | 15,035,490 | |||||||||
Computers & Peripherals (6.2%) | |||||||||||
Apple, Inc. | 114,367 | 33,583,870 | |||||||||
Interactive Media & Services (9.1%) | |||||||||||
Alphabet, Inc. – Class A (c) | 20,291 | 27,177,562 | |||||||||
Alphabet, Inc. – Class C (c) | 4,434 | 5,928,347 | |||||||||
Facebook, Inc. – Class A (c) | 81,161 | 16,658,295 | |||||||||
49,764,204 | |||||||||||
IT Services (12.3%) | |||||||||||
| Broadridge Financial Solutions, Inc. | 59,099 | 7,301,091 | |||||||||
FleetCor Technologies, Inc. (c) | 23,938 | 6,887,441 | |||||||||
Gartner, Inc. (c) | 21,427 | 3,301,901 | |||||||||
Mastercard, Inc. – Class A | 24,374 | 7,277,833 | |||||||||
PayPal Holdings, Inc. (c) | 94,436 | 10,215,142 | |||||||||
VeriSign, Inc. (c) | 31,146 | 6,001,211 | |||||||||
Visa, Inc. – Class A | 137,390 | 25,815,581 | |||||||||
66,800,200 | |||||||||||
Semiconductors & Semiconductor Equipment (2.2%) | |||||||||||
NVIDIA Corp. | 51,127 | 12,030,183 | |||||||||
Software (15.6%) | |||||||||||
Adobe, Inc. (c) | 44,555 | 14,694,685 | |||||||||
Electronic Arts, Inc. (c) | 94,041 | 10,110,348 | |||||||||
Intuit, Inc. | 41,097 | 10,764,537 | |||||||||
Microsoft Corp. | 315,112 | 49,693,162 | |||||||||
85,262,732 | |||||||||||
Real Estate (2.1%) | |||||||||||
Specialized REITs (2.1%) | |||||||||||
American Tower Corp. | 18,987 | 4,363,592 | |||||||||
Equinix, Inc. | 12,502 | 7,297,418 | |||||||||
11,661,010 | |||||||||||
| Total common stocks (cost: $371,062,482) | 540,039,158 | ||||||||||
See accompanying notes to financial statements.
83
SFT IvySM Growth Fund
Investments in Securities – continued
Shares | Value(a) | ||||||||||
Short-Term Securities (1.0%) | |||||||||||
Investment Companies (1.0%) | |||||||||||
| State Street Institutional U.S. Government Money Market Fund, current rate 1.530% | 5,205,439 | $ | 5,205,439 | ||||||||
| Total short-term securities (cost: $5,205,439) | 5,205,439 | ||||||||||
| Total investments in securities (cost: $376,267,921) (d) | 545,244,597 | ||||||||||
| Liabilities in excess of cash and other assets (-0.1%) | (401,903 | ) | |||||||||
Total net assets (100.0%) | $ | 544,842,694 | |||||||||
Investments in Securities Legend
(a) Securities are valued by procedures described in Note 2 of the Notes to Financial Statements.
(b) Foreign security: The Fund held 1.9% of net assets in foreign securities at December 31, 2019.
(c) Non-income producing security.
(d) At December 31, 2019 the cost of investments for federal income tax purposes was $376,419,354. The aggregate unrealized appreciation and depreciation of investments based on this cost were:
Gross unrealized appreciation | $ | 171,133,800 | |||||
Gross unrealized depreciation | (2,308,557 | ) | |||||
Net unrealized appreciation | $ | 168,825,243 | |||||
See accompanying notes to financial statements.
84
SFT IvySM Small Cap Growth Fund
Investments in Securities
December 31, 2019
(Percentages of each investment category relate to total net assets)
Shares | Value(a) | ||||||||||
Common Stocks (97.2%) | |||||||||||
Communication Services (0.3%) | |||||||||||
Media (0.3%) | |||||||||||
Gray Television, Inc. (b) | 23,522 | $ | 504,312 | ||||||||
Consumer Discretionary (16.4%) | |||||||||||
Auto Components (0.9%) | |||||||||||
Fox Factory Holding Corp. (b) | 23,667 | 1,646,513 | |||||||||
Distributors (1.0%) | |||||||||||
Pool Corp. | 8,587 | 1,823,707 | |||||||||
Diversified Consumer Services (1.7%) | |||||||||||
Grand Canyon Education, Inc. (b) | 32,063 | 3,071,315 | |||||||||
Hotels, Restaurants & Leisure (4.5%) | |||||||||||
Churchill Downs, Inc. | 14,590 | 2,001,748 | |||||||||
Hilton Grand Vacations, Inc. (b) | 60,003 | 2,063,503 | |||||||||
PlayAGS, Inc. (b) | 69,093 | 838,098 | |||||||||
Wingstop, Inc. | 35,269 | 3,041,246 | |||||||||
7,944,595 | |||||||||||
Household Durables (2.5%) | |||||||||||
| Installed Building Products, Inc. (b) | 43,671 | 3,007,622 | |||||||||
TopBuild Corp. (b) | 12,941 | 1,333,958 | |||||||||
4,341,580 | |||||||||||
Leisure Equipment & Products (2.2%) | |||||||||||
| Malibu Boats, Inc. – Class A (b) | 31,934 | 1,307,697 | |||||||||
| SeaWorld Entertainment, Inc. (b) | 78,555 | 2,490,979 | |||||||||
3,798,676 | |||||||||||
Media (2.5%) | |||||||||||
| Nexstar Media Group, Inc. – Class A | 37,270 | 4,369,908 | |||||||||
Multiline Retail (0.5%) | |||||||||||
| Ollie's Bargain Outlet Holdings, Inc. (b) | 14,749 | 963,257 | |||||||||
Specialty Retail (0.6%) | |||||||||||
Boot Barn Holdings, Inc. (b) | 22,863 | 1,018,090 | |||||||||
Energy (1.6%) | |||||||||||
Energy Equipment & Services (0.9%) | |||||||||||
Cactus, Inc. – Class A | 25,277 | 867,507 | |||||||||
Dril-Quip, Inc. (b) | 16,464 | 772,326 | |||||||||
1,639,833 | |||||||||||
Oil, Gas & Consumable Fuels (0.7%) | |||||||||||
Matador Resources Co. (b) | 71,180 | 1,279,104 | |||||||||
Financial (6.4%) | |||||||||||
Capital Markets (2.9%) | |||||||||||
Hamilton Lane, Inc. – Class A | 21,972 | 1,309,531 | |||||||||
Houlihan Lokey, Inc. | 16,354 | 799,220 | |||||||||
LPL Financial Holdings, Inc. | 32,704 | 3,016,944 | |||||||||
5,125,695 | |||||||||||
Shares | Value(a) | ||||||||||
Commercial Banks (1.2%) | |||||||||||
| Seacoast Banking Corp. of Florida (b) | 67,070 | $ | 2,050,330 | ||||||||
Insurance (1.2%) | |||||||||||
eHealth, Inc. (b) | 22,497 | 2,161,512 | |||||||||
Thrifts & Mortgage Finance (1.1%) | |||||||||||
Essent Group, Ltd. (c) | 36,651 | 1,905,485 | |||||||||
Health Care (22.6%) | |||||||||||
Biotechnology (3.6%) | |||||||||||
CareDx, Inc. (b) | 141,698 | 3,056,426 | |||||||||
Veracyte, Inc. (b) | 35,061 | 978,903 | |||||||||
Vericel Corp. (b) | 136,414 | 2,373,603 | |||||||||
6,408,932 | |||||||||||
Health Care Equipment & Supplies (7.6%) | |||||||||||
Insulet Corp. (b) | 21,024 | 3,599,309 | |||||||||
iRhythm Technologies, Inc. (b) | 13,663 | 930,314 | |||||||||
Novocure, Ltd. (b) (c) | 15,166 | 1,278,039 | |||||||||
Penumbra, Inc. (b) | 13,441 | 2,207,953 | |||||||||
STAAR Surgical Co. (b) | 60,615 | 2,131,829 | |||||||||
| Tactile Systems Technology, Inc. (b) | 47,133 | 3,181,949 | |||||||||
13,329,393 | |||||||||||
Health Care Providers & Services (10.1%) | |||||||||||
| AMN Healthcare Services, Inc. (b) | 41,497 | 2,585,678 | |||||||||
HealthEquity, Inc. (b) | 28,988 | 2,147,141 | |||||||||
HMS Holdings Corp. (b) | 75,114 | 2,223,374 | |||||||||
LHC Group, Inc. (b) | 19,238 | 2,650,227 | |||||||||
PetIQ, Inc. (b) | 92,113 | 2,307,431 | |||||||||
Teladoc Health, Inc. (b) | 71,191 | 5,960,111 | |||||||||
17,873,962 | |||||||||||
Health Care Technology (1.3%) | |||||||||||
Omnicell, Inc. (b) | 27,566 | 2,252,693 | |||||||||
Industrials (20.5%) | |||||||||||
Aerospace & Defense (3.5%) | |||||||||||
Hexcel Corp. | 31,742 | 2,327,006 | |||||||||
Mercury Systems, Inc. (b) | 55,380 | 3,827,312 | |||||||||
6,154,318 | |||||||||||
Air Freight & Logistics (1.4%) | |||||||||||
| Air Transport Services Group, Inc. (b) | 104,814 | 2,458,937 | |||||||||
Building Products (1.2%) | |||||||||||
PGT Innovations, Inc. (b) | 90,022 | 1,342,228 | |||||||||
Trex Co., Inc. (b) | 9,940 | 893,407 | |||||||||
2,235,635 | |||||||||||
Commercial Services & Supplies (3.7%) | |||||||||||
Clean Harbors, Inc. (b) | 38,796 | 3,326,757 | |||||||||
The Brink's Co. | 34,949 | 3,169,175 | |||||||||
6,495,932 | |||||||||||
See accompanying notes to financial statements.
85
SFT IvySM Small Cap Growth Fund
Investments in Securities – continued
Shares | Value(a) | ||||||||||
Electrical Equipment (3.1%) | |||||||||||
EnerSys | 30,344 | $ | 2,270,642 | ||||||||
Woodward, Inc. | 26,933 | 3,189,944 | |||||||||
5,460,586 | |||||||||||
Machinery (5.8%) | |||||||||||
Crane Co. | 25,239 | 2,180,145 | |||||||||
John Bean Technologies Corp. | 28,184 | 3,175,209 | |||||||||
RBC Bearings, Inc. (b) | 13,108 | 2,075,521 | |||||||||
The Timken Co. | 49,881 | 2,808,799 | |||||||||
10,239,674 | |||||||||||
Road & Rail (1.3%) | |||||||||||
| Knight-Swift Transportation Holdings, Inc. | 64,960 | 2,328,167 | |||||||||
Trading Companies & Distributors (0.5%) | |||||||||||
GMS, Inc. (b) | 35,116 | 950,941 | |||||||||
Information Technology (26.9%) | |||||||||||
Communications Equipment (1.2%) | |||||||||||
Viavi Solutions, Inc. (b) | 140,975 | 2,114,625 | |||||||||
Electronic Equipment, Instruments & Components (1.2%) | |||||||||||
Coherent, Inc. (b) | 12,957 | 2,155,397 | |||||||||
Interactive Media & Services (6.7%) | |||||||||||
Envestnet, Inc. (b) | 30,460 | 2,120,930 | |||||||||
Five9, Inc. (b) | 55,627 | 3,648,018 | |||||||||
Mimecast, Ltd. (b) (c) | 69,544 | 3,016,819 | |||||||||
Q2 Holdings, Inc. (b) | 36,873 | 2,989,663 | |||||||||
11,775,430 | |||||||||||
IT Services (3.9%) | |||||||||||
| Booz Allen Hamilton Holding Corp. | 27,709 | 1,970,941 | |||||||||
| Evo Payments, Inc. – Class A (b) | 67,442 | 1,781,143 | |||||||||
InterXion Holding NV (b) (c) | 37,828 | 3,170,365 | |||||||||
6,922,449 | |||||||||||
Semiconductors & Semiconductor Equipment (2.8%) | |||||||||||
Enphase Energy, Inc. (b) | 55,442 | 1,448,699 | |||||||||
| Monolithic Power Systems, Inc. | 19,386 | 3,451,096 | |||||||||
4,899,795 | |||||||||||
Software (11.1%) | |||||||||||
8x8, Inc. (b) | 100,281 | 1,835,142 | |||||||||
Globant SA (b) (c) | 32,063 | 3,400,281 | |||||||||
HubSpot, Inc. (b) | 14,104 | 2,235,484 | |||||||||
Paycom Software, Inc. (b) | 6,822 | 1,806,193 | |||||||||
Pluralsight, Inc. – Class A (b) | 102,019 | 1,755,747 | |||||||||
Proofpoint, Inc. (b) | 31,178 | 3,578,611 | |||||||||
Smartsheet, Inc. – Class A (b) | 37,959 | 1,705,118 | |||||||||
Varonis Systems, Inc. (b) | 42,505 | 3,303,064 | |||||||||
19,619,640 | |||||||||||
Shares | Value(a) | ||||||||||
Leisure and Consumer Staples (2.5%) | |||||||||||
Food Products (2.5%) | |||||||||||
J&J Snack Foods Corp. | 11,497 | $ | 2,118,552 | ||||||||
Nomad Foods, Ltd. (b) (c) | 99,926 | 2,235,345 | |||||||||
4,353,897 | |||||||||||
| Total common stocks (cost: $130,881,543) | 171,674,315 | ||||||||||
Short-Term Securities (2.9%) | |||||||||||
Investment Companies (2.9%) | |||||||||||
| State Street Institutional U.S. Government Money Market Fund, current rate 1.530% | 5,175,411 | 5,175,411 | |||||||||
| Total short-term securities (cost: $5,175,411) | 5,175,411 | ||||||||||
| Total investments in securities (cost: $136,056,954) (d) | 176,849,726 | ||||||||||
| Liabilities in excess of cash and other assets (-0.1%) | (128,550 | ) | |||||||||
Total net assets (100.0%) | $ | 176,721,176 | |||||||||
Investments in Securities Legend
(a) Securities are valued by procedures described in Note 2 of the Notes to Financial Statements.
(b) Non-income producing security.
(c) Foreign security: The Fund held 8.5% of net assets in foreign securities at December 31, 2019.
(d) At December 31, 2019 the cost of investments for federal income tax purposes was $136,394,998. The aggregate unrealized appreciation and depreciation of investments based on this cost were:
Gross unrealized appreciation | $ | 45,635,830 | |||||
Gross unrealized depreciation | (5,181,102 | ) | |||||
Net unrealized appreciation | $ | 40,454,728 | |||||
See accompanying notes to financial statements.
86
SFT Managed Volatility Equity Fund
Investments in Securities
December 31, 2019
(Percentages of each investment category relate to total net assets)
Shares | Value(a) | ||||||||||
Mutual Funds (90.1%) | |||||||||||
Investment Companies (90.1%) | |||||||||||
| iShares Core High Dividend ETF | 721,757 | $ | 70,782,709 | ||||||||
| iShares Edge MSCI Minimum Volatility EAFE ETF | 1,305,113 | 97,283,123 | |||||||||
| iShares Edge MSCI Minimum Volatility Emerging Markets ETF | 386,405 | 22,666,517 | |||||||||
| iShares Edge MSCI Minimum Volatility USA ETF | 1,918,732 | 125,868,819 | |||||||||
iShares MSCI Germany ETF | 529,532 | 15,568,241 | |||||||||
| iShares Short Maturity Bond ETF | 387,945 | 19,494,236 | |||||||||
| Total mutual funds (cost: $293,842,783) | 351,663,645 | ||||||||||
Short-Term Securities (9.6%) | |||||||||||
Investment Companies (8.7%) | |||||||||||
| State Street Institutional U.S. Government Money Market Fund, current rate 1.530% | 34,104,177 | 34,104,177 | |||||||||
Principal | Value(a) | ||||||||||
U.S. Government Obligations (0.9%) | |||||||||||
| U.S. Treasury Note, 2.000%, 01/31/20 (b) | $ | 3,500,000 | $ | 3,500,926 | |||||||
| Total short-term securities (cost: $37,602,712) | 37,605,103 | ||||||||||
| Total investments excluding purchased options (cost: $331,445,495) | 389,268,748 | ||||||||||
| Total purchased options outstanding (0.1%) (cost: $361,530) | 340,380 | ||||||||||
| Total investments in securities (cost: $331,807,025) (c) | 389,609,128 | ||||||||||
| Cash and other assets in excess of liabilities (0.2%) | 868,858 | ||||||||||
Total net assets (100.0%) | $ | 390,477,986 | |||||||||
Investments in Securities Legend
(a) Securities are valued by procedures described in Note 2 of the Notes to Financial Statements.
(b) Fully or partially pledged as initial margin deposits on open futures contracts.
Holdings of Open Futures Contracts
On December 31, 2019, securities with an aggregate market value of $2,750,727 have been pledged to cover margin requirements for the following open futures contracts:
Description | Expiration Date | Number of Contracts | Position Type | Notional Amount | Market Value | Unrealized Appreciation/ (Depreciation)(a) | |||||||||||||||||||||
S&P Mid 500® E-Mini Index Future | March 2020 | 337 | Long | $ | 53,008,695 | $ | 54,444,035 | $ | 1,435,340 | ||||||||||||||||||
(c) At December 31, 2019 the cost of investments for federal income tax purposes was $333,240,382. The aggregate unrealized appreciation and depreciation of investments based on this cost were:
Gross unrealized appreciation | $ | 57,804,086 | |||||
Gross unrealized depreciation | — | ||||||
Net unrealized appreciation | $ | 57,804,086 | |||||
Put Options Purchased:
The Fund had the following put options purchased open at December 31, 2019:
Description | Exercise Price | Expiration Date | Number of Contracts | Notional Amount | Value(a) | ||||||||||||||||||
S&P 500 Index | $ | 3,095 | January 2020 | 61 | $ | 6,100 | $ | 121,085 | |||||||||||||||
S&P 500 Index | 3,085 | January 2020 | 61 | 6,100 | 113,155 | ||||||||||||||||||
S&P 500 Index | 3,105 | January 2020 | 61 | 6,100 | 106,140 | ||||||||||||||||||
$ | 340,380 | ||||||||||||||||||||||
See accompanying notes to financial statements.
87
SFT Real Estate Securities Fund
Investments in Securities
December 31, 2019
(Percentages of each investment category relate to total net assets)
Shares | Value(a) | ||||||||||
Common Stocks (98.9%) | |||||||||||
Consumer Discretionary (1.2%) | |||||||||||
| Marriott International, Inc. – Class A | 10,900 | $ | 1,650,587 | ||||||||
Real Estate (97.7%) | |||||||||||
Health Care REITs (10.3%) | |||||||||||
| Healthcare Trust of America, Inc. – Class A | 52,700 | 1,595,756 | |||||||||
Healthpeak Properties, Inc. | 115,100 | 3,967,497 | |||||||||
| Omega Healthcare Investors, Inc. | 50,100 | 2,121,735 | |||||||||
Physicians Realty Trust | 65,900 | 1,248,146 | |||||||||
Ventas, Inc. | 22,796 | 1,316,241 | |||||||||
Welltower, Inc. | 44,000 | 3,598,320 | |||||||||
13,847,695 | |||||||||||
Hotels & Resort REITs (4.7%) | |||||||||||
Host Hotels & Resorts, Inc. | 203,546 | 3,775,778 | |||||||||
Park Hotels & Resorts, Inc. | 88,100 | 2,279,147 | |||||||||
Pebblebrook Hotel Trust | 10,700 | 286,867 | |||||||||
6,341,792 | |||||||||||
Industrial REITs (11.6%) | |||||||||||
Duke Realty Corp. | 148,100 | 5,134,627 | |||||||||
| First Industrial Realty Trust, Inc. | 47,500 | 1,971,725 | |||||||||
ProLogis, Inc. | 94,681 | 8,439,864 | |||||||||
15,546,216 | |||||||||||
Office REITs (13.2%) | |||||||||||
| Alexandria Real Estate Equities, Inc. | 39,422 | 6,369,807 | |||||||||
Boston Properties, Inc. | 21,683 | 2,989,218 | |||||||||
Cousins Properties, Inc. | 70,350 | 2,898,420 | |||||||||
Douglas Emmett, Inc. | 60,300 | 2,647,170 | |||||||||
Kilroy Realty Corp. | 29,636 | 2,486,461 | |||||||||
Vornado Realty Trust | 4,100 | 272,650 | |||||||||
17,663,726 | |||||||||||
Residential REITs (21.9%) | |||||||||||
| American Homes 4 Rent – Class A | 139,800 | 3,664,158 | |||||||||
| Apartment Investment & Management Co. – Class A | 32,300 | 1,668,295 | |||||||||
| AvalonBay Communities, Inc. | 21,926 | 4,597,882 | |||||||||
Camden Property Trust | 24,600 | 2,610,060 | |||||||||
| Equity Lifestyle Properties, Inc. | 9,400 | 661,666 | |||||||||
Equity Residential | 27,700 | 2,241,484 | |||||||||
Essex Property Trust, Inc. | 8,716 | 2,622,296 | |||||||||
Invitation Homes, Inc. | 167,000 | 5,004,990 | |||||||||
Sun Communities, Inc. | 24,600 | 3,692,460 | |||||||||
UDR, Inc. | 56,900 | 2,657,230 | |||||||||
29,420,521 | |||||||||||
Shares | Value(a) | ||||||||||
Retail REITs (9.1%) | |||||||||||
Agree Realty Corp. | 22,400 | $ | 1,571,808 | ||||||||
Brixmor Property Group, Inc. | 21,400 | 462,454 | |||||||||
Realty Income Corp. | 10,200 | 751,026 | |||||||||
Regency Centers Corp. | 15,214 | 959,851 | |||||||||
Simon Property Group, Inc. | 27,079 | 4,033,688 | |||||||||
Spirit Realty Capital, Inc. | 35,900 | 1,765,562 | |||||||||
The Macerich Co. | 44,700 | 1,203,324 | |||||||||
Weingarten Realty Investors | 48,400 | 1,512,016 | |||||||||
12,259,729 | |||||||||||
Specialized REITs (26.9%) | |||||||||||
| Crown Castle International Corp. | 14,900 | 2,118,035 | |||||||||
CubeSmart | 30,400 | 956,992 | |||||||||
Digital Realty Trust, Inc. | 42,900 | 5,136,846 | |||||||||
EPR Properties | 18,200 | 1,285,648 | |||||||||
Equinix, Inc. | 13,034 | 7,607,946 | |||||||||
Extra Space Storage, Inc. | 18,900 | 1,996,218 | |||||||||
| Four Corners Property Trust, Inc. | 48,900 | 1,378,491 | |||||||||
| Gaming and Leisure Properties, Inc. | 31,300 | 1,347,465 | |||||||||
Public Storage | 12,100 | 2,576,816 | |||||||||
| QTS Realty Trust, Inc. – Class A | 49,300 | 2,675,511 | |||||||||
STORE Capital Corp. | 53,900 | 2,007,236 | |||||||||
VEREIT, Inc. | 271,800 | 2,511,432 | |||||||||
VICI Properties, Inc. | 174,500 | 4,458,475 | |||||||||
36,057,111 | |||||||||||
| Total common stocks (cost: $117,007,115) | 132,787,377 | ||||||||||
Short-Term Securities (0.8%) | |||||||||||
Investment Companies (0.8%) | |||||||||||
| State Street Institutional U.S. Government Money Market Fund, current rate 1.530% | 1,013,055 | 1,013,055 | |||||||||
| Total short-term securities (cost: $1,013,055) | 1,013,055 | ||||||||||
| Total investments in securities (cost: $118,020,170) (b) | 133,800,432 | ||||||||||
| Cash and other assets in excess of liabilities (0.3%) | 407,629 | ||||||||||
Total net assets (100.0%) | $ | 134,208,061 | |||||||||
Investments in Securities Legend
(a) Securities are valued by procedures described in Note 2 of the Notes to Financial Statements.
(b) At December 31, 2019 the cost of investments for federal income tax purposes was $118,553,158. The aggregate unrealized appreciation and depreciation of investments based on this cost were:
Gross unrealized appreciation | $ | 17,371,160 | |||||
| Gross unrealized depreciation | (2,123,886 | ) | |||||
Net unrealized appreciation | $ | 15,247,274 | |||||
See accompanying notes to financial statements.
88
SFT T. Rowe Price Value Fund
Investments in Securities
December 31, 2019
(Percentages of each investment category relate to total net assets)
Shares | Value(a) | ||||||||||
Common Stocks (98.0%) | |||||||||||
Communication Services (0.0%) | |||||||||||
Diversified Telecommunication Services (0.0%) | |||||||||||
AT&T, Inc. | 326 | $ | 12,740 | ||||||||
Consumer Discretionary (4.0%) | |||||||||||
Hotels, Restaurants & Leisure (1.3%) | |||||||||||
Las Vegas Sands Corp. | 10,498 | 724,782 | |||||||||
| Royal Caribbean Cruises, Ltd. (b) | 9,718 | 1,297,450 | |||||||||
Wynn Resorts, Ltd. | 4,500 | 624,915 | |||||||||
2,647,147 | |||||||||||
Media (1.4%) | |||||||||||
The Walt Disney Co. | 19,868 | 2,873,509 | |||||||||
Multiline Retail (1.2%) | |||||||||||
Dollar Tree, Inc. (c) | 25,700 | 2,417,085 | |||||||||
Specialty Retail (0.0%) | |||||||||||
Ross Stores, Inc. | 150 | 17,463 | |||||||||
Textiles, Apparel & Luxury Goods (0.1%) | |||||||||||
VF Corp. | 1,600 | 159,456 | |||||||||
Consumer Staples (2.6%) | |||||||||||
Food Products (2.6%) | |||||||||||
Conagra Brands, Inc. | 15,580 | 533,459 | |||||||||
Tyson Foods, Inc. – Class A | 51,761 | 4,712,322 | |||||||||
5,245,781 | |||||||||||
Energy (6.8%) | |||||||||||
Energy Equipment & Services (1.4%) | |||||||||||
Halliburton Co. | 51,100 | 1,250,417 | |||||||||
Schlumberger, Ltd. (b) | 39,899 | 1,603,940 | |||||||||
2,854,357 | |||||||||||
Oil, Gas & Consumable Fuels (5.4%) | |||||||||||
| BP PLC ADR (b) | 14,028 | 529,417 | |||||||||
ConocoPhillips | 18,913 | 1,229,912 | |||||||||
Continental Resources, Inc. | 9,319 | 319,642 | |||||||||
Devon Energy Corp. | 19,223 | 499,221 | |||||||||
EOG Resources, Inc. | 30,489 | 2,553,759 | |||||||||
Marathon Petroleum Corp. | 8,100 | 488,025 | |||||||||
Noble Energy, Inc. | 20,929 | 519,876 | |||||||||
Occidental Petroleum Corp. | 34,903 | 1,438,353 | |||||||||
| Pioneer Natural Resources Co. | 5,700 | 862,809 | |||||||||
TC Energy Corp. (b) | 44,395 | 2,366,697 | |||||||||
TOTAL SA ADR (b) | 904 | 49,991 | |||||||||
10,857,702 | |||||||||||
Financial (22.3%) | |||||||||||
Capital Markets (4.0%) | |||||||||||
CME Group, Inc. | 616 | 123,643 | |||||||||
| Intercontinental Exchange, Inc. | 9,158 | 847,573 | |||||||||
Morgan Stanley | 83,700 | 4,278,744 | |||||||||
State Street Corp. | 16,300 | 1,289,330 | |||||||||
The Charles Schwab Corp. | 32,130 | 1,528,103 | |||||||||
8,067,393 | |||||||||||
Shares | Value(a) | ||||||||||
Commercial Banks (8.0%) | |||||||||||
Citigroup, Inc. | 13,819 | $ | 1,104,000 | ||||||||
Fifth Third Bancorp | 41,709 | 1,282,135 | |||||||||
JPMorgan Chase & Co. | 64,912 | 9,048,733 | |||||||||
Wells Fargo & Co. | 87,664 | 4,716,323 | |||||||||
16,151,191 | |||||||||||
Consumer Finance (1.4%) | |||||||||||
Ally Financial, Inc. | 16,000 | 488,960 | |||||||||
American Express Co. | 10,391 | 1,293,575 | |||||||||
Capital One Financial Corp. | 10,092 | 1,038,568 | |||||||||
2,821,103 | |||||||||||
Diversified Financial Services (1.1%) | |||||||||||
AXA Equitable Holdings, Inc. | 83,499 | 2,069,105 | |||||||||
Insurance (7.8%) | |||||||||||
| American International Group, Inc. | 141,163 | 7,245,897 | |||||||||
Chubb, Ltd. (b) | 22,715 | 3,535,817 | |||||||||
| Marsh & McLennan Cos., Inc. | 17,541 | 1,954,243 | |||||||||
MetLife, Inc. | 17,700 | 902,169 | |||||||||
| Willis Towers Watson PLC (b) | 10,408 | 2,101,791 | |||||||||
15,739,917 | |||||||||||
Health Care (14.0%) | |||||||||||
Biotechnology (2.0%) | |||||||||||
AbbVie, Inc. | 35,073 | 3,105,363 | |||||||||
Biogen, Inc. (c) | 3,200 | 949,536 | |||||||||
4,054,899 | |||||||||||
| Health Care Equipment & Supplies (7.2%) | |||||||||||
Becton Dickinson and Co. | 5,166 | 1,404,997 | |||||||||
Boston Scientific Corp. (c) | 42,023 | 1,900,280 | |||||||||
Danaher Corp. | 43,959 | 6,746,828 | |||||||||
Envista Holdings Corp. (b) (c) | 23,505 | 696,681 | |||||||||
Medtronic PLC (b) | 16,828 | 1,909,137 | |||||||||
Stryker Corp. | 3,713 | 779,507 | |||||||||
Zimmer Biomet Holdings, Inc. | 6,518 | 975,614 | |||||||||
14,413,044 | |||||||||||
Health Care Providers & Services (1.1%) | |||||||||||
Anthem, Inc. | 4,083 | 1,233,189 | |||||||||
UnitedHealth Group, Inc. | 3,031 | 891,053 | |||||||||
2,124,242 | |||||||||||
Life Sciences Tools & Services (1.9%) | |||||||||||
| Thermo Fisher Scientific, Inc. | 12,070 | 3,921,181 | |||||||||
Pharmaceuticals (1.8%) | |||||||||||
| Elanco Animal Health, Inc. (c) | 27,417 | 807,431 | |||||||||
Johnson & Johnson | 3,903 | 569,331 | |||||||||
Merck & Co., Inc. | 12,230 | 1,112,318 | |||||||||
Pfizer, Inc. | 27,100 | 1,061,778 | |||||||||
3,550,858 | |||||||||||
See accompanying notes to financial statements.
89
SFT T. Rowe Price Value Fund
Investments in Securities – continued
Shares | Value(a) | ||||||||||
Industrials (10.1%) | |||||||||||
Aerospace & Defense (0.3%) | |||||||||||
The Boeing Co. | 2,150 | $ | 700,384 | ||||||||
Air Freight & Logistics (1.0%) | |||||||||||
| United Parcel Service, Inc. – Class B | 16,958 | 1,985,103 | |||||||||
Construction & Engineering (0.6%) | |||||||||||
| Jacobs Engineering Group, Inc. | 13,897 | 1,248,368 | |||||||||
Industrial Conglomerates (4.5%) | |||||||||||
3M Co. | 2,300 | 405,766 | |||||||||
General Electric Co. | 612,381 | 6,834,172 | |||||||||
Honeywell International, Inc. | 2,874 | 508,698 | |||||||||
Roper Technologies, Inc. | 3,502 | 1,240,513 | |||||||||
8,989,149 | |||||||||||
Machinery (2.0%) | |||||||||||
Caterpillar, Inc. | 8,049 | 1,188,676 | |||||||||
Cummins, Inc. | 2,300 | 411,608 | |||||||||
Deere & Co. | 11,400 | 1,975,164 | |||||||||
Dover Corp. | 2,700 | 311,202 | |||||||||
Stanley Black & Decker, Inc. | 1,200 | 198,888 | |||||||||
4,085,538 | |||||||||||
Professional Services (0.6%) | |||||||||||
United Rentals, Inc. (c) | 6,900 | 1,150,713 | |||||||||
Road & Rail (1.1%) | |||||||||||
Norfolk Southern Corp. | 4,599 | 892,804 | |||||||||
Union Pacific Corp. | 6,900 | 1,247,451 | |||||||||
2,140,255 | |||||||||||
Information Technology (17.7%) | |||||||||||
Communications Equipment (1.2%) | |||||||||||
Cisco Systems, Inc. | 6,400 | 306,944 | |||||||||
Motorola Solutions, Inc. | 13,243 | 2,133,977 | |||||||||
2,440,921 | |||||||||||
Electronic Equipment, Instruments & Components (1.1%) | |||||||||||
| Keysight Technologies, Inc. (c) | 19,863 | 2,038,540 | |||||||||
TE Connectivity, Ltd. (b) | 1,596 | 152,960 | |||||||||
2,191,500 | |||||||||||
Interactive Media & Services (0.7%) | |||||||||||
Alphabet, Inc. – Class C (c) | 1,038 | 1,387,827 | |||||||||
IT Services (0.1%) | |||||||||||
| Fidelity National Information Services, Inc. | 2,087 | 290,281 | |||||||||
Semiconductors & Semiconductor Equipment (9.7%) | |||||||||||
Applied Materials, Inc. | 45,700 | 2,789,528 | |||||||||
| ASML Holding NV (b) | 1,603 | 474,392 | |||||||||
Broadcom, Inc. | 9,970 | 3,150,719 | |||||||||
Micron Technology, Inc. (c) | 38,639 | 2,078,005 | |||||||||
NVIDIA Corp. | 400 | 94,120 | |||||||||
NXP Semiconductors NV (b) | 30,029 | 3,821,491 | |||||||||
QUALCOMM, Inc. | 45,949 | 4,054,080 | |||||||||
Skyworks Solutions, Inc. | 3,500 | 423,080 | |||||||||
Texas Instruments, Inc. | 13,612 | 1,746,284 | |||||||||
Xilinx, Inc. | 8,300 | 811,491 | |||||||||
19,443,190 | |||||||||||
Shares | Value(a) | ||||||||||
Software (4.9%) | |||||||||||
Microsoft Corp. | 49,874 | $ | 7,865,130 | ||||||||
Synopsys, Inc. (c) | 8,541 | 1,188,907 | |||||||||
VMware, Inc. – Class A (c) | 5,600 | 850,024 | |||||||||
9,904,061 | |||||||||||
Materials (6.4%) | |||||||||||
Chemicals (4.0%) | |||||||||||
| Air Products & Chemicals, Inc. | 100 | 23,499 | |||||||||
CF Industries Holdings, Inc. | 32,546 | 1,553,746 | |||||||||
Eastman Chemical Co. | 8,460 | 670,540 | |||||||||
Linde PLC (b) | 20,100 | 4,279,290 | |||||||||
PPG Industries, Inc. | 11,300 | 1,508,437 | |||||||||
8,035,512 | |||||||||||
Containers & Packaging (1.4%) | |||||||||||
International Paper Co. | 13,377 | 616,011 | |||||||||
Packaging Corp. of America | 20,410 | 2,285,716 | |||||||||
2,901,727 | |||||||||||
Metals & Mining (1.0%) | |||||||||||
Freeport-McMoRan, Inc. | 146,861 | 1,926,816 | |||||||||
Real Estate (2.2%) | |||||||||||
Industrial REITs (2.2%) | |||||||||||
ProLogis, Inc. | 49,337 | 4,397,900 | |||||||||
Utilities (11.9%) | |||||||||||
Electric Utilities (8.8%) | |||||||||||
| American Electric Power Co., Inc. | 7,776 | 734,910 | |||||||||
Edison International | 54,699 | 4,124,851 | |||||||||
Entergy Corp. | 23,016 | 2,757,317 | |||||||||
NextEra Energy, Inc. | 31,212 | 7,558,298 | |||||||||
The Southern Co. | 39,500 | 2,516,150 | |||||||||
17,691,526 | |||||||||||
Multi-Utilities (3.1%) | |||||||||||
Ameren Corp. | 2,473 | 189,926 | |||||||||
CenterPoint Energy, Inc. | 40,800 | 1,112,616 | |||||||||
NiSource, Inc. | 23,078 | 642,492 | |||||||||
Sempra Energy | 28,871 | 4,373,379 | |||||||||
6,318,413 | |||||||||||
| Total common stocks (cost: $174,405,686) | 197,227,357 | ||||||||||
Preferred Stocks (1.5%) | |||||||||||
Health Care (0.2%) | |||||||||||
| Becton Dickinson and Co. Series A, 6.125% | 7,299 | 477,793 | |||||||||
Industrials (0.2%) | |||||||||||
| Fortive Corp. Series A, 5.000% | 316 | 307,392 | |||||||||
Information Technology (0.3%) | |||||||||||
| Broadcom, Inc. Series A, 8.000% | 466 | 548,934 | |||||||||
Utilities (0.8%) | |||||||||||
Sempra Energy Series A, 6.000% | 4,348 | 521,847 | |||||||||
See accompanying notes to financial statements.
90
SFT T. Rowe Price Value Fund
Investments in Securities – continued
Shares | Value(a) | ||||||||||
Sempra Energy Series B, 6.750% | 2,130 | $ | 253,619 | ||||||||
| The Southern Co. Series 2019, 6.750% | 16,130 | 869,407 | |||||||||
1,644,873 | |||||||||||
| Total Preferred Stocks (cost: $2,610,132) | 2,978,992 | ||||||||||
Short-Term Securities (0.5%) | |||||||||||
Investment Companies (0.5%) | |||||||||||
| State Street Institutional U.S. Government Money Market Fund, current rate 1.530% | 516,047 | 516,047 | |||||||||
| T. Rowe Price Reserve Investment Fund, current rate 1.600% | 464,225 | 464,225 | |||||||||
| Total short-term securities (cost: $980,272) | 980,272 | ||||||||||
| Total investments in securities (cost: $177,996,090) (d) | 201,186,621 | ||||||||||
| Liabilities in excess of cash and other assets (0.0%) | (8,873 | ) | |||||||||
Total net assets (100.0%) | $ | 201,177,748 | |||||||||
Investments in Securities Legend
(a) Securities are valued by procedures described in Note 2 of the Notes to Financial Statements.
(b) Foreign security: The Fund held 11.3% of net assets in foreign securities at December 31, 2019.
(c) Non-income producing security.
(d) At December 31, 2019 the cost of investments for federal income tax purposes was $179,884,141. The aggregate unrealized appreciation and depreciation of investments based on this cost were:
Gross unrealized appreciation | $ | 22,034,744 | |||||
| Gross unrealized depreciation | (732,264 | ) | |||||
Net unrealized appreciation | $ | 21,302,480 | |||||
See accompanying notes to financial statements.
91
SFT Wellington Core Equity Fund
Investments in Securities
December 31, 2019
(Percentages of each investment category relate to total net assets)
Shares | Value(a) | ||||||||||
Common Stocks (99.6%) | |||||||||||
Communication Services (1.7%) | |||||||||||
Diversified Telecommunication Services (1.7%) | |||||||||||
Verizon Communications, Inc. | 35,023 | $ | 2,150,412 | ||||||||
Consumer Discretionary (10.9%) | |||||||||||
Hotels & Resort REITs (1.2%) | |||||||||||
| Hilton Worldwide Holdings, Inc. | 13,619 | 1,510,483 | |||||||||
Hotels, Restaurants & Leisure (1.7%) | |||||||||||
McDonald's Corp. | 10,637 | 2,101,978 | |||||||||
Internet & Catalog Retail (1.3%) | |||||||||||
Amazon.com, Inc. (b) | 850 | 1,570,664 | |||||||||
Media (1.7%) | |||||||||||
The Walt Disney Co. | 14,790 | 2,139,078 | |||||||||
Specialty Retail (1.2%) | |||||||||||
The TJX Cos., Inc. | 25,572 | 1,561,426 | |||||||||
Textiles, Apparel & Luxury Goods (3.8%) | |||||||||||
NIKE, Inc. – Class B | 17,176 | 1,740,101 | |||||||||
PVH Corp. | 13,522 | 1,421,838 | |||||||||
VF Corp. | 15,268 | 1,521,609 | |||||||||
4,683,548 | |||||||||||
Consumer Staples (10.4%) | |||||||||||
Beverages (2.1%) | |||||||||||
| Constellation Brands, Inc. – Class A | 7,471 | 1,417,623 | |||||||||
Monster Beverage Corp. (b) | 19,353 | 1,229,883 | |||||||||
2,647,506 | |||||||||||
Food & Staples Retailing (3.0%) | |||||||||||
Costco Wholesale Corp. | 5,589 | 1,642,719 | |||||||||
Walmart, Inc. | 18,004 | 2,139,595 | |||||||||
3,782,314 | |||||||||||
Food Products (1.4%) | |||||||||||
Kellogg Co. | 24,912 | 1,722,914 | |||||||||
Household Products (3.9%) | |||||||||||
Colgate-Palmolive Co. | 26,184 | 1,802,507 | |||||||||
The Procter & Gamble Co. | 24,415 | 3,049,433 | |||||||||
4,851,940 | |||||||||||
Energy (1.5%) | |||||||||||
Oil, Gas & Consumable Fuels (1.5%) | |||||||||||
Continental Resources, Inc. | 19,700 | 675,710 | |||||||||
EOG Resources, Inc. | 14,886 | 1,246,851 | |||||||||
1,922,561 | |||||||||||
Financial (13.7%) | |||||||||||
Commercial Banks (8.1%) | |||||||||||
Bank of America Corp. | 93,721 | 3,300,854 | |||||||||
Fifth Third Bancorp | 35,078 | 1,078,298 | |||||||||
JPMorgan Chase & Co. | 25,500 | 3,554,700 | |||||||||
Shares | Value(a) | ||||||||||
| The PNC Financial Services Group, Inc. | 13,846 | $ | 2,210,237 | ||||||||
10,144,089 | |||||||||||
Consumer Finance (2.2%) | |||||||||||
American Express Co. | 10,718 | 1,334,284 | |||||||||
Capital One Financial Corp. | 13,918 | 1,432,301 | |||||||||
2,766,585 | |||||||||||
Insurance (3.4%) | |||||||||||
| Athene Holding, Ltd. – Class A (b) (c) | 16,743 | 787,423 | |||||||||
Chubb, Ltd. (c) | 12,986 | 2,021,401 | |||||||||
The Allstate Corp. | 12,671 | 1,424,854 | |||||||||
4,233,678 | |||||||||||
Health Care (17.7%) | |||||||||||
Health Care Equipment & Supplies (7.6%) | |||||||||||
Abbott Laboratories | 19,050 | 1,654,683 | |||||||||
Baxter International, Inc. | 24,018 | 2,008,385 | |||||||||
Becton Dickinson and Co. | 3,778 | 1,027,503 | |||||||||
Danaher Corp. | 8,461 | 1,298,594 | |||||||||
Hologic, Inc. (b) | 25,552 | 1,334,070 | |||||||||
Medtronic PLC (c) | 18,933 | 2,147,949 | |||||||||
9,471,184 | |||||||||||
Health Care Providers & Services (4.3%) | |||||||||||
Anthem, Inc. | 5,633 | 1,701,335 | |||||||||
| Laboratory Corp. of America Holdings (b) | 7,947 | 1,344,394 | |||||||||
UnitedHealth Group, Inc. | 7,951 | 2,337,435 | |||||||||
5,383,164 | |||||||||||
Life Sciences Tools & Services (1.6%) | |||||||||||
Thermo Fisher Scientific, Inc. | 5,976 | 1,941,423 | |||||||||
Pharmaceuticals (4.2%) | |||||||||||
Allergan PLC (c) | 6,302 | 1,204,753 | |||||||||
Eli Lilly & Co. | 16,191 | 2,127,983 | |||||||||
Merck & Co., Inc. | 21,304 | 1,937,599 | |||||||||
5,270,335 | |||||||||||
Industrials (10.4%) | |||||||||||
Aerospace & Defense (1.5%) | |||||||||||
Raytheon Co. | 8,758 | 1,924,483 | |||||||||
Building Products (1.3%) | |||||||||||
| Fortune Brands Home & Security, Inc. | 25,382 | 1,658,460 | |||||||||
Commercial Services & Supplies (1.1%) | |||||||||||
Republic Services, Inc. | 15,489 | 1,388,279 | |||||||||
Electrical Equipment (1.2%) | |||||||||||
AMETEK, Inc. | 14,908 | 1,486,924 | |||||||||
Machinery (2.2%) | |||||||||||
Illinois Tool Works, Inc. | 9,182 | 1,649,363 | |||||||||
Snap-On, Inc. | 6,252 | 1,059,089 | |||||||||
2,708,452 | |||||||||||
See accompanying notes to financial statements.
92
SFT Wellington Core Equity Fund
Investments in Securities – continued
Shares | Value(a) | ||||||||||
Professional Services (1.6%) | |||||||||||
Equifax, Inc. | 6,660 | $ | 933,199 | ||||||||
IHS Markit, Ltd. (b) (c) | 14,702 | 1,107,796 | |||||||||
2,040,995 | |||||||||||
Road & Rail (1.5%) | |||||||||||
Norfolk Southern Corp. | 6,560 | 1,273,493 | |||||||||
Uber Technologies, Inc. (b) | 18,559 | 551,944 | |||||||||
1,825,437 | |||||||||||
Information Technology (24.4%) | |||||||||||
Communications Equipment (1.4%) | |||||||||||
Motorola Solutions, Inc. | 10,534 | 1,697,449 | |||||||||
Computers & Peripherals (3.6%) | |||||||||||
Apple, Inc. | 15,461 | 4,540,123 | |||||||||
Electronic Equipment, Instruments & Components (1.1%) | |||||||||||
CDW Corp. | 9,388 | 1,340,982 | |||||||||
Interactive Media & Services (4.5%) | |||||||||||
Alphabet, Inc. – Class A (b) | 2,476 | 3,316,330 | |||||||||
Facebook, Inc. – Class A (b) | 6,158 | 1,263,929 | |||||||||
GoDaddy, Inc. – Class A (b) | 15,675 | 1,064,646 | |||||||||
5,644,905 | |||||||||||
IT Services (4.9%) | |||||||||||
Global Payments, Inc. | 9,279 | 1,693,974 | |||||||||
Leidos Holdings, Inc. | 19,136 | 1,873,223 | |||||||||
Mastercard, Inc. – Class A | 8,367 | 2,498,303 | |||||||||
6,065,500 | |||||||||||
Semiconductors & Semiconductor Equipment (3.2%) | |||||||||||
Micron Technology, Inc. (b) | 19,143 | 1,029,511 | |||||||||
ON Semiconductor Corp. (b) | 32,661 | 796,275 | |||||||||
QUALCOMM, Inc. | 8,554 | 754,719 | |||||||||
Teradyne, Inc. | 20,950 | 1,428,580 | |||||||||
4,009,085 | |||||||||||
Software (5.7%) | |||||||||||
Microsoft Corp. | 25,777 | 4,065,033 | |||||||||
Salesforce.com, Inc. (b) | 8,725 | 1,419,034 | |||||||||
| SS&C Technologies Holdings, Inc. | 16,227 | 996,338 | |||||||||
Workday, Inc. – Class A (b) | 3,763 | 618,825 | |||||||||
7,099,230 | |||||||||||
Materials (1.9%) | |||||||||||
Chemicals (1.9%) | |||||||||||
Ecolab, Inc. | 5,620 | 1,084,604 | |||||||||
PPG Industries, Inc. | 9,630 | 1,285,508 | |||||||||
2,370,112 | |||||||||||
Real Estate (2.4%) | |||||||||||
Office REITs (1.2%) | |||||||||||
Boston Properties, Inc. | 10,665 | 1,470,277 | |||||||||
Specialized REITs (1.2%) | |||||||||||
American Tower Corp. | 6,541 | 1,503,253 | |||||||||
Shares | Value(a) | ||||||||||
Utilities (4.6%) | |||||||||||
Electric Utilities (4.6%) | |||||||||||
| American Electric Power Co., Inc. | 21,945 | $ | 2,074,022 | ||||||||
NextEra Energy, Inc. | 9,750 | 2,361,060 | |||||||||
Pinnacle West Capital Corp. | 14,564 | 1,309,740 | |||||||||
5,744,822 | |||||||||||
| Total common stocks (cost: $92,839,747) | 124,374,050 | ||||||||||
Short-Term Securities (0.4%) | |||||||||||
Investment Companies (0.4%) | |||||||||||
| State Street Institutional U.S. Government Money Market Fund, current rate 1.530% | 561,232 | 561,232 | |||||||||
| Total short-term securities (cost: $561,232) | 561,232 | ||||||||||
| Total investments in securities (cost: $93,400,979) (d) | 124,935,282 | ||||||||||
| Liabilities in excess of cash and other assets (0.0%) | (54,010 | ) | |||||||||
Total net assets (100.0%) | $ | 124,881,272 | |||||||||
Investments in Securities Legend
(a) Securities are valued by procedures described in Note 2 of the Notes to Financial Statements.
(b) Non-income producing security.
(c) Foreign security: The Fund held 5.8% of net assets in foreign securities at December 31, 2019.
(d) At December 31, 2019 the cost of investments for federal income tax purposes was $93,441,376. The aggregate unrealized appreciation and depreciation of investments based on this cost were:
Gross unrealized appreciation | $ | 32,527,371 | |||||
Gross unrealized depreciation | (1,033,465 | ) | |||||
Net unrealized appreciation | $ | 31,493,906 | |||||
See accompanying notes to financial statements.
93
Securian Funds Trust
Statements of Assets and Liabilities
December 31, 2019
| SFT Core Bond Fund | SFT Dynamic Managed Volatility Fund | SFT Government Money Market Fund | SFT Index 400 Mid-Cap Fund | SFT Index 500 Fund | SFT International Bond Fund | ||||||||||||||||||||||
Assets | |||||||||||||||||||||||||||
| Investments in securities, at market value – see accompanying schedule for detailed listing* | |||||||||||||||||||||||||||
Unaffiliated issuers | $ | 494,191,662 | $ | 381,487,954 | $ | 189,162,707 | $ | 197,903,364 | $ | 914,172,157 | $ | 97,845,815 | |||||||||||||||
Affiliated issuers (note 8) | – | 189,313,819 | – | – | – | – | |||||||||||||||||||||
Cash on demand deposit | 120 | – | – | 504,366 | – | – | |||||||||||||||||||||
| Due from broker1 | – | 5,000,000 | – | 153,410 | 300,815 | 3,217,351 | |||||||||||||||||||||
Foreign currency on deposit2 | – | – | – | – | – | 343,363 | |||||||||||||||||||||
Receivable: | |||||||||||||||||||||||||||
Fund shares sold | 2,413 | 66,591 | – | 1,840 | 7,442 | 50 | |||||||||||||||||||||
Investment securities sold (including paydowns) | 16,635 | – | – | – | – | – | |||||||||||||||||||||
Dividends and accrued interest | 2,831,656 | 1,810,000 | 51,294 | 222,574 | 929,150 | 1,040,386 | |||||||||||||||||||||
Refundable foreign income taxes withheld | – | – | – | – | – | 52,691 | |||||||||||||||||||||
Adviser (note 4) | – | 21,882 | – | – | – | – | |||||||||||||||||||||
Variation margin on swap contracts | – | – | – | – | – | 112,844 | |||||||||||||||||||||
| Variation margin on futures contracts | 729 | 578,193 | – | 9,690 | 36,575 | – | |||||||||||||||||||||
Unrealized appreciation on forward foreign currency contracts | – | – | – | – | – | 967,507 | |||||||||||||||||||||
Prepaid expenses | 17,644 | 7,744 | 9,205 | 12,312 | 27,130 | 10,066 | |||||||||||||||||||||
| Total assets | 497,060,859 | 578,286,183 | 189,223,206 | 198,807,556 | 915,473,269 | 103,590,073 | |||||||||||||||||||||
Liabilities | |||||||||||||||||||||||||||
Due to custodian | – | – | – | – | 300,815 | – | |||||||||||||||||||||
Payable: | |||||||||||||||||||||||||||
Fund shares repurchased | 314,417 | – | 709,192 | 109,876 | 384,033 | 42,595 | |||||||||||||||||||||
Investment securities purchased | – | – | – | 358,270 | – | – | |||||||||||||||||||||
| Investment securities purchased on a when-issued or forward – commitment basis (note 2) | 8,457,725 | – | – | – | – | – | |||||||||||||||||||||
Adviser | 283,474 | 396,754 | 99,140 | 71,010 | 265,943 | 91,684 | |||||||||||||||||||||
| Variation margin on futures contracts | – | – | – | – | – | – | |||||||||||||||||||||
Accrued expenses | 127,546 | 84,705 | 63,928 | 72,523 | 118,692 | 193,666 | |||||||||||||||||||||
Unrealized depreciation on forward foreign currency contracts | – | – | – | – | – | 2,846,999 | |||||||||||||||||||||
| Total liabilities | 9,183,162 | 481,459 | 872,260 | 611,679 | 1,069,483 | 3,174,944 | |||||||||||||||||||||
Net assets applicable to outstanding capital stock | $ | 487,877,697 | $ | 577,804,724 | $ | 188,350,946 | $ | 198,195,877 | $ | 914,403,786 | $ | 100,415,129 | |||||||||||||||
Net Assets Consist of: | |||||||||||||||||||||||||||
Paid in capital** | $ | 394,295,762 | $ | 422,156,370 | $ | 188,348,880 | $ | (12,187,460 | ) | $ | (3,389,294 | ) | $ | 103,611,397 | |||||||||||||
Total distributable earnings | 93,581,935 | 155,648,354 | 2,066 | 210,383,337 | 917,793,080 | (3,196,268 | ) | ||||||||||||||||||||
Net assets | $ | 487,877,697 | $ | 577,804,724 | $ | 188,350,946 | $ | 198,195,877 | $ | 914,403,786 | $ | 100,415,129 | |||||||||||||||
Net assets by class: | |||||||||||||||||||||||||||
Class 1 | $ | 5,060,380 | $ | N/A | $ | N/A | $ | 12,088,473 | $ | 224,410,060 | $ | 1,395,680 | |||||||||||||||
Class 2 | 482,817,317 | 577,804,724 | 188,350,946 | 186,107,404 | 689,993,726 | 99,019,449 | |||||||||||||||||||||
Net asset value per share of outstanding capital stock by class: | |||||||||||||||||||||||||||
Class 1 | 2.571 | N/A | N/A | 5.527 | 13.309 | 2.620 | |||||||||||||||||||||
Class 2 | 2.501 | 16.892 | 1.000 | 5.377 | 12.949 | 2.549 | |||||||||||||||||||||
* Identified cost: | |||||||||||||||||||||||||||
Unaffiliated issuers | $ | 480,535,644 | $ | 362,445,852 | $ | 189,162,707 | $ | 147,124,069 | $ | 341,106,443 | $ | 103,754,534 | |||||||||||||||
Affiliated issuers | – | 107,000,000 | – | – | – | – | |||||||||||||||||||||
** Shares outstanding by class: | |||||||||||||||||||||||||||
Class 1 | 1,968,425 | N/A | N/A | 2,187,273 | 16,861,672 | 532,676 | |||||||||||||||||||||
Class 2 | 193,035,278 | 34,205,082 | 188,350,946 | 34,610,288 | 53,285,285 | 38,843,944 | |||||||||||||||||||||
| 1 Collateral for the initial margin on open swaps and foreign currency contracts | $ | – | $ | – | $ | – | $ | – | $ | – | $ | 3,217,350 | |||||||||||||||
| 2 Foreign currency on deposit (cost) | $ | – | $ | – | $ | – | $ | – | $ | – | $ | 444,036 | |||||||||||||||
See accompanying notes to financial statements.
94
| SFT IvySM Growth Fund | SFT IvySM Small Cap Growth Fund | SFT Managed Volatility Equity Fund | SFT Real Estate Securities Fund | SFT T. Rowe Price Value Fund | SFT Wellington Core Equity Fund | ||||||||||||||||||||||
Assets | |||||||||||||||||||||||||||
| Investments in securities, at market value – see accompanying schedule for detailed listing* | |||||||||||||||||||||||||||
Unaffiliated issuers | $ | 545,244,597 | $ | 176,849,726 | $ | 389,609,128 | $ | 133,800,432 | $ | 201,186,621 | $ | 124,935,282 | |||||||||||||||
Affiliated issuers (note 8) | – | – | – | – | – | – | |||||||||||||||||||||
Cash on demand deposit | – | – | – | – | – | – | |||||||||||||||||||||
| Due from broker1 | – | – | 1,650,000 | – | – | – | |||||||||||||||||||||
Foreign currency on deposit2 | – | – | – | – | – | – | |||||||||||||||||||||
Receivable: | |||||||||||||||||||||||||||
Fund shares sold | – | – | – | 724 | – | – | |||||||||||||||||||||
Investment securities sold (including paydowns) | – | 305,673 | – | – | 1,304,711 | – | |||||||||||||||||||||
Dividends and accrued interest | 357,964 | 34,853 | 72,551 | 597,186 | 302,388 | 124,062 | |||||||||||||||||||||
Refundable foreign income taxes withheld | – | – | – | – | 4,236 | – | |||||||||||||||||||||
Adviser (note 4) | – | – | 18,954 | – | – | – | |||||||||||||||||||||
Variation margin on swap contracts | – | – | – | – | – | – | |||||||||||||||||||||
| Variation margin on futures contracts | – | – | 129,745 | – | – | – | |||||||||||||||||||||
Unrealized appreciation on forward foreign currency contracts | – | – | – | – | – | – | |||||||||||||||||||||
Prepaid expenses | 18,904 | 11,899 | 15,175 | 10,527 | 11,947 | 10,161 | |||||||||||||||||||||
| Total assets | 545,621,465 | 177,202,151 | 391,495,553 | 134,408,869 | 202,809,903 | 125,069,505 | |||||||||||||||||||||
Liabilities | |||||||||||||||||||||||||||
Due to custodian | – | – | – | – | – | – | |||||||||||||||||||||
Payable: | |||||||||||||||||||||||||||
Fund shares repurchased | 275,292 | 156,251 | 18,253 | 31,040 | 18,894 | 31,967 | |||||||||||||||||||||
Investment securities purchased | – | 102,661 | 683,356 | – | 1,371,515 | – | |||||||||||||||||||||
| Investment securities purchased on a when-issued or forward – commitment basis (note 2) | – | – | – | – | – | – | |||||||||||||||||||||
Adviser | 425,810 | 171,526 | 269,103 | 112,826 | 162,318 | 100,879 | |||||||||||||||||||||
| Variation margin on futures contracts | – | – | – | – | – | – | |||||||||||||||||||||
Accrued expenses | 77,669 | 50,537 | 46,855 | 56,942 | 79,428 | 55,387 | |||||||||||||||||||||
Unrealized depreciation on forward foreign currency contracts | – | – | – | – | – | – | |||||||||||||||||||||
| Total liabilities | 778,771 | 480,975 | 1,017,567 | 200,808 | 1,632,155 | 188,233 | |||||||||||||||||||||
Net assets applicable to outstanding capital stock | $ | 544,842,694 | $ | 176,721,176 | $ | 390,477,986 | $ | 134,208,061 | $ | 201,177,748 | $ | 124,881,272 | |||||||||||||||
Net Assets Consist of: | |||||||||||||||||||||||||||
Paid in capital** | $ | 154,812,874 | $ | 68,076,069 | $ | 317,136,695 | $ | 18,656,454 | $ | 103,777,254 | $ | 48,468,461 | |||||||||||||||
Total distributable earnings | 390,029,820 | 108,645,107 | 73,341,291 | 115,551,607 | 97,400,494 | 76,412,811 | |||||||||||||||||||||
Net assets | $ | 544,842,694 | $ | 176,721,176 | $ | 390,477,986 | $ | 134,208,061 | $ | 201,177,748 | $ | 124,881,272 | |||||||||||||||
Net assets by class: | |||||||||||||||||||||||||||
Class 1 | $ | N/A | $ | N/A | $ | N/A | $ | 5,858,425 | $ | N/A | $ | 1,250,802 | |||||||||||||||
Class 2 | 544,842,694 | 176,721,176 | 390,477,986 | 128,349,636 | 201,177,748 | 123,630,470 | |||||||||||||||||||||
Net asset value per share of outstanding capital stock by class: | |||||||||||||||||||||||||||
Class 1 | N/A | N/A | N/A | 5.661 | N/A | 18.861 | |||||||||||||||||||||
Class 2 | 21.848 | 18.772 | 13.527 | 5.508 | 15.818 | 18.596 | |||||||||||||||||||||
* Identified cost: | |||||||||||||||||||||||||||
Unaffiliated issuers | $ | 376,267,921 | $ | 136,056,954 | $ | 331,807,025 | $ | 118,020,170 | $ | 177,996,090 | $ | 93,400,979 | |||||||||||||||
Affiliated issuers | – | – | – | – | – | – | |||||||||||||||||||||
** Shares outstanding by class: | |||||||||||||||||||||||||||
Class 1 | N/A | N/A | N/A | 1,034,854 | N/A | 66,316 | |||||||||||||||||||||
Class 2 | 24,937,896 | 9,413,973 | 28,865,973 | 23,304,176 | 12,718,068 | 6,648,220 | |||||||||||||||||||||
| 1 Collateral for the initial margin on open swaps and foreign currency contracts | $ | – | $ | – | $ | – | $ | – | $ | – | $ | – | |||||||||||||||
| 2 Foreign currency on deposit (cost) | $ | – | $ | – | $ | – | $ | – | $ | – | $ | – | |||||||||||||||
95
Securian Funds Trust
Statements of Operations
Year ended December 31, 2019
| SFT Core Bond Fund | SFT Dynamic Managed Volatility Fund | SFT Government Money Market Fund | SFT Index 400 Mid-Cap Fund | SFT Index 500 Fund | SFT International Bond Fund | ||||||||||||||||||||||
Income: | |||||||||||||||||||||||||||
Interest1 | $ | 16,423,358 | $ | 6,869,967 | $ | 1,580,866 | $ | – | $ | 29 | $ | 5,795,098 | |||||||||||||||
Dividends1 | 515,875 | 2,990,227 | 366,121 | 3,359,744 | 17,935,163 | 75,189 | |||||||||||||||||||||
Foreign tax withholding | – | – | – | (3,745 | ) | (2 | ) | (186,302 | ) | ||||||||||||||||||
Total investment income | 16,939,233 | 9,860,194 | 1,946,987 | 3,355,999 | 17,935,190 | 5,683,985 | |||||||||||||||||||||
Expenses (note 4): | |||||||||||||||||||||||||||
Investment advisory fee | 1,877,359 | 2,886,762 | 283,946 | 309,054 | 1,335,749 | 623,751 | |||||||||||||||||||||
Rule 12b-1 fees | 1,162,596 | 1,244,852 | 236,621 | 490,135 | 1,735,074 | 256,589 | |||||||||||||||||||||
Audit and accounting services | 261,219 | 200,723 | 139,126 | 139,827 | 239,924 | 152,289 | |||||||||||||||||||||
Administrative services fee | 65,306 | 41,557 | 53,445 | 31,565 | 31,565 | 82,241 | |||||||||||||||||||||
Legal fees | 15,514 | 22,000 | 22,499 | 22,499 | 36,701 | 30,912 | |||||||||||||||||||||
Custodian fees | 21,742 | 15,130 | 9,910 | 17,434 | 20,565 | 106,239 | |||||||||||||||||||||
Printing and shareholder reports | 11,286 | 10,834 | 10,834 | 10,834 | 10,834 | 10,834 | |||||||||||||||||||||
Trustee's fees | 20,400 | 20,400 | 20,400 | 20,400 | 20,400 | 20,400 | |||||||||||||||||||||
S&P Licensing fee | – | – | – | 22,499 | 60,499 | – | |||||||||||||||||||||
Insurance | 9,074 | 9,074 | 9,074 | 9,074 | 9,074 | 9,074 | |||||||||||||||||||||
Other | 16,594 | 13,019 | 5,414 | 10,946 | 29,882 | 17,773 | |||||||||||||||||||||
Total expenses before fees waived | 3,461,090 | 4,464,351 | 791,269 | 1,084,267 | 3,530,267 | 1,310,102 | |||||||||||||||||||||
Less fees waived (note 4) | – | (471,221 | ) | (128,729 | ) | – | – | – | |||||||||||||||||||
Total expenses net of fees waived | 3,461,090 | 3,993,130 | 662,540 | 1,084,267 | 3,530,267 | 1,310,102 | |||||||||||||||||||||
Net investment income | 13,478,143 | 5,867,064 | 1,284,447 | 2,271,732 | 14,404,923 | 4,373,883 | |||||||||||||||||||||
| Realized gains (losses) on investments and foreign currencies: | |||||||||||||||||||||||||||
Investments (note 3) | |||||||||||||||||||||||||||
Unaffiliated issuers | 6,925,663 | 7,658,454 | – | 18,410,002 | 88,073,868 | (247,293 | ) | ||||||||||||||||||||
Written options contracts | – | (433,395 | ) | – | – | – | – | ||||||||||||||||||||
Swap contracts | – | – | – | – | – | (1,056,250 | ) | ||||||||||||||||||||
Foreign forward currency contracts | – | – | – | – | – | 4,095,973 | |||||||||||||||||||||
Foreign currency transactions | – | – | – | – | – | (57,164 | ) | ||||||||||||||||||||
Net increase from litigation payments | – | – | – | 974 | 1,919 | – | |||||||||||||||||||||
Futures contracts | 2,563,258 | 8,087,862 | – | 1,333,848 | 2,210,006 | – | |||||||||||||||||||||
Net change in unrealized appreciation or depreciation on: | |||||||||||||||||||||||||||
Investments | |||||||||||||||||||||||||||
Unaffiliated issuers, net of foreign capital gains tax2 | 17,475,870 | 20,740,413 | – | 22,695,878 | 127,788,548 | (849,221 | ) | ||||||||||||||||||||
Affiliated issuers (note 8) | – | 45,016,748 | – | – | – | – | |||||||||||||||||||||
Written options contracts | – | – | – | – | – | – | |||||||||||||||||||||
Swap contracts | – | – | – | – | – | (1,809,465 | ) | ||||||||||||||||||||
Translation of assets and liabilities in foreign currency | – | – | – | – | – | (113,668 | ) | ||||||||||||||||||||
Foreign forward currency contracts | – | – | – | – | – | (2,584,109 | ) | ||||||||||||||||||||
Futures contracts | (1,257,646 | ) | 4,866,991 | – | 707,757 | 772,601 | – | ||||||||||||||||||||
Net gains (losses) on investments | 25,707,145 | 85,937,073 | – | 43,148,459 | 218,846,942 | (2,621,197 | ) | ||||||||||||||||||||
| Net increase (decrease) in net assets resulting from operations | $ | 39,185,288 | $ | 91,804,137 | $ | 1,284,447 | $ | 45,420,191 | $ | 233,251,865 | $ | 1,752,686 | |||||||||||||||
1 All income is from unaffiliated issuers. | |||||||||||||||||||||||||||
| 2 Change in unrealized appreciation or depreciation on deferred foreign capital gains tax | $ | – | $ | – | $ | – | $ | – | $ | – | $ | (35,442 | ) | ||||||||||||||
See accompanying notes to financial statements.
96
| SFT IvySM Growth Fund | SFT IvySM Small Cap Growth Fund | SFT Managed Volatility Equity Fund | SFT Real Estate Securities Fund | SFT T. Rowe Price Value Fund | SFT Wellington Core Equity Fund | ||||||||||||||||||||||
Income: | |||||||||||||||||||||||||||
Interest1 | $ | 34,894 | $ | 21,923 | $ | 77,795 | $ | – | $ | 14,105 | $ | 226 | |||||||||||||||
Dividends1 | 4,882,503 | 746,926 | 10,234,985 | 3,606,144 | 4,692,145 | 1,853,597 | |||||||||||||||||||||
Foreign tax withholding | (16,592 | ) | – | – | – | (89,735 | ) | (11,540 | ) | ||||||||||||||||||
Total investment income | 4,900,805 | 768,849 | 10,312,780 | 3,606,144 | 4,616,515 | 1,842,283 | |||||||||||||||||||||
Expenses (note 4): | |||||||||||||||||||||||||||
Investment advisory fee | 3,454,241 | 1,576,265 | 2,012,490 | 927,691 | 1,323,655 | 758,020 | |||||||||||||||||||||
Rule 12b-1 fees | 1,292,239 | 463,607 | 867,149 | 318,537 | 493,901 | 289,003 | |||||||||||||||||||||
Audit and accounting services | 172,925 | 114,324 | 119,325 | 127,924 | 115,726 | 122,325 | |||||||||||||||||||||
Administrative services fee | 31,565 | 31,565 | 31,590 | 31,565 | 31,569 | 31,565 | |||||||||||||||||||||
Legal fees | 20,588 | 22,499 | 22,499 | 22,499 | 22,499 | 22,499 | |||||||||||||||||||||
Custodian fees | 13,294 | 16,861 | 14,650 | 12,494 | 51,874 | 19,695 | |||||||||||||||||||||
Printing and shareholder reports | 10,834 | 10,834 | 10,834 | 10,834 | 10,834 | 10,834 | |||||||||||||||||||||
Trustee's fees | 20,400 | 20,400 | 20,400 | 20,400 | 20,400 | 20,400 | |||||||||||||||||||||
S&P Licensing fee | – | – | – | – | – | – | |||||||||||||||||||||
Insurance | 9,074 | 9,074 | 9,074 | 9,074 | 9,074 | 9,074 | |||||||||||||||||||||
Other | 18,113 | 8,915 | 14,214 | 7,312 | 9,714 | 6,915 | |||||||||||||||||||||
Total expenses before fees waived | 5,043,273 | 2,274,344 | 3,122,225 | 1,488,330 | 2,089,246 | 1,290,330 | |||||||||||||||||||||
Less fees waived (note 4) | – | – | (344,250 | ) | – | – | – | ||||||||||||||||||||
Total expenses net of fees waived | 5,043,273 | 2,274,344 | 2,777,975 | 1,488,330 | 2,089,246 | 1,290,330 | |||||||||||||||||||||
Net investment income | (142,468 | ) | (1,505,495 | ) | 7,534,805 | 2,117,814 | 2,527,269 | 551,953 | |||||||||||||||||||
| Realized gains (losses) on investments and foreign currencies: | |||||||||||||||||||||||||||
Investments (note 3) | |||||||||||||||||||||||||||
Unaffiliated issuers | 72,857,334 | 11,870,330 | 2,104,388 | 8,412,649 | 10,492,723 | 5,172,577 | |||||||||||||||||||||
Written options contracts | – | – | (960,520 | ) | – | – | – | ||||||||||||||||||||
Swap contracts | – | – | – | – | – | – | |||||||||||||||||||||
Foreign forward currency contracts | – | – | – | – | – | – | |||||||||||||||||||||
Foreign currency transactions | – | – | – | – | 1,216 | – | |||||||||||||||||||||
Net increase from litigation payments | – | – | – | 53,973 | – | 39,933 | |||||||||||||||||||||
Futures contracts | – | – | (6,524,124 | ) | – | – | – | ||||||||||||||||||||
Net change in unrealized appreciation or depreciation on: | |||||||||||||||||||||||||||
Investments | |||||||||||||||||||||||||||
Unaffiliated issuers, net of foreign capital gains tax2 | 84,915,152 | 26,987,819 | 46,473,275 | 17,952,628 | 31,861,438 | 27,656,503 | |||||||||||||||||||||
Affiliated issuers (note 8) | – | – | – | – | – | – | |||||||||||||||||||||
Written options contracts | – | – | (179,854 | ) | – | – | – | ||||||||||||||||||||
Swap contracts | – | – | – | – | – | – | |||||||||||||||||||||
Translation of assets and liabilities in foreign currency | – | – | – | – | 263 | – | |||||||||||||||||||||
Foreign forward currency contracts | – | – | – | – | – | – | |||||||||||||||||||||
Futures contracts | – | – | 4,140,160 | – | – | – | |||||||||||||||||||||
Net gains (losses) on investments | 157,772,486 | 38,858,149 | 45,053,325 | 26,419,250 | 42,355,640 | 32,869,013 | |||||||||||||||||||||
| Net increase (decrease) in net assets resulting from operations | $ | 157,630,018 | $ | 37,352,654 | $ | 52,588,130 | $ | 28,537,064 | $ | 44,882,909 | $ | 33,420,966 | |||||||||||||||
1 All income is from unaffiliated issuers. | |||||||||||||||||||||||||||
| 2 Change in unrealized appreciation or depreciation on deferred foreign capital gains tax | $ | – | $ | – | $ | – | $ | – | $ | – | $ | – | |||||||||||||||
97
Securian Funds Trust
Statements of Changes in Net Assets
Year ended December 31, 2019 and year ended December 31, 2018
| SFT Core Bond Fund | SFT Dynamic Managed Volatility Fund | SFT Government Money Market Fund | |||||||||||||||||||||||||
2019 | 2018 | 2019 | 2018 | 2019 | 2018 | ||||||||||||||||||||||
Operations: | |||||||||||||||||||||||||||
Net investment income | $ | 13,478,143 | $ | 11,530,612 | $ | 5,867,064 | $ | 4,485,521 | $ | 1,284,447 | $ | 815,669 | |||||||||||||||
Net realized gains (losses) on investments | 9,488,921 | (3,445,722 | ) | 15,312,921 | (133,181 | ) | – | – | |||||||||||||||||||
| Net change in unrealized appreciation or depreciation of investments | 16,218,224 | (10,556,842 | ) | 70,624,152 | (17,196,291 | ) | – | – | |||||||||||||||||||
| Net increase (decrease) in net assets resulting from operations | 39,185,288 | (2,471,952 | ) | 91,804,137 | (12,843,951 | ) | 1,284,447 | 815,669 | |||||||||||||||||||
Distributions to shareholders: | |||||||||||||||||||||||||||
From distributable earnings | |||||||||||||||||||||||||||
Class 2 | – | – | – | – | (1,284,447 | ) | (815,669 | ) | |||||||||||||||||||
Decrease in net assets from distributions | – | – | – | – | (1,284,447 | ) | (815,669 | ) | |||||||||||||||||||
Capital stock transactions: | |||||||||||||||||||||||||||
| Proceeds from shares issued in Reorganization1 | |||||||||||||||||||||||||||
Class 1 | – | 269,847 | – | – | – | – | |||||||||||||||||||||
Class 2 | – | 79,462,708 | – | – | – | – | |||||||||||||||||||||
Proceeds from sales | |||||||||||||||||||||||||||
Class 1 | 1,334,322 | 1,033,774 | – | – | – | – | |||||||||||||||||||||
Class 2 | 49,742,319 | 8,005,851 | 79,500,104 | 61,641,256 | 139,146,640 | 37,762,506 | |||||||||||||||||||||
Value of distributions reinvested | |||||||||||||||||||||||||||
Class 2 | – | – | – | – | 1,284,447 | 815,669 | |||||||||||||||||||||
Payments for redemption of shares | |||||||||||||||||||||||||||
Class 1 | (270,848 | ) | (264,722 | ) | – | – | – | – | |||||||||||||||||||
Class 2 | (39,982,740 | ) | (33,471,533 | ) | (8,732,213 | ) | (6,688,542 | ) | (24,840,919 | ) | (32,797,715 | ) | |||||||||||||||
| Increase (decrease) in net assets from capital stock transactions | 10,823,053 | 55,035,925 | 70,767,891 | 54,952,714 | 115,590,168 | 5,780,460 | |||||||||||||||||||||
Total increase (decrease) in net assets | 50,008,341 | 52,563,973 | 162,572,028 | 42,108,763 | 115,590,168 | 5,780,460 | |||||||||||||||||||||
Net assets at beginning of period | 437,869,356 | 385,305,383 | 415,232,696 | 373,123,933 | 72,760,778 | 66,980,318 | |||||||||||||||||||||
Net assets at end of period | $ | 487,877,697 | $ | 437,869,356 | $ | 577,804,724 | $ | 415,232,696 | $ | 188,350,946 | $ | 72,760,778 | |||||||||||||||
Capital share transactions: | |||||||||||||||||||||||||||
| Shares issued in Reorganization1 | |||||||||||||||||||||||||||
Class 1 | – | 115,977 | – | – | – | – | |||||||||||||||||||||
Class 2 | – | 35,007,094 | – | – | – | – | |||||||||||||||||||||
Proceeds from sales | |||||||||||||||||||||||||||
Class 1 | 530,425 | 442,411 | – | – | – | – | |||||||||||||||||||||
Class 2 | 20,409,568 | 3,502,008 | 5,065,468 | 4,247,252 | 139,146,640 | 37,762,506 | |||||||||||||||||||||
Issued on reinvestment of distributions | |||||||||||||||||||||||||||
Class 2 | – | – | – | – | 1,284,447 | 815,669 | |||||||||||||||||||||
Payments for redemption of shares | |||||||||||||||||||||||||||
Class 1 | (107,768 | ) | (113,578 | ) | – | – | – | – | |||||||||||||||||||
Class 2 | (16,439,579 | ) | (14,672,988 | ) | (555,947 | ) | (461,589 | ) | (24,840,919 | ) | (32,797,715 | ) | |||||||||||||||
Net change from capital transactions | 4,392,646 | 24,280,924 | 4,509,521 | 3,785,663 | 115,590,168 | 5,780,460 | |||||||||||||||||||||
1 Refer to Note 1 – Fund Reorganization for further details.
See accompanying notes to financial statements.
98
| SFT Index 400 Mid-Cap Fund | SFT Index 500 Fund | ||||||||||||||||||
2019 | 2018 | 2019 | 2018 | ||||||||||||||||
Operations: | |||||||||||||||||||
Net investment income | $ | 2,271,732 | $ | 2,310,284 | $ | 14,404,923 | $ | 13,657,721 | |||||||||||
Net realized gains (losses) on investments | 19,744,824 | 17,168,239 | 90,285,793 | 38,068,046 | |||||||||||||||
| Net change in unrealized appreciation or depreciation of investments | 23,403,635 | (44,040,702 | ) | 128,561,149 | (89,848,044 | ) | |||||||||||||
| Net increase (decrease) in net assets resulting from operations | 45,420,191 | (24,562,179 | ) | 233,251,865 | (38,122,277 | ) | |||||||||||||
Distributions to shareholders: | |||||||||||||||||||
From distributable earnings | |||||||||||||||||||
Class 2 | – | – | – | – | |||||||||||||||
Decrease in net assets from distributions | – | – | – | – | |||||||||||||||
Capital stock transactions: | |||||||||||||||||||
| Proceeds from shares issued in Reorganization1 | |||||||||||||||||||
Class 1 | – | – | – | – | |||||||||||||||
Class 2 | – | – | – | – | |||||||||||||||
Proceeds from sales | |||||||||||||||||||
Class 1 | 2,617,325 | 3,278,231 | 8,781,974 | 5,933,442 | |||||||||||||||
Class 2 | 5,969,796 | 3,481,381 | 21,035,749 | 14,922,154 | |||||||||||||||
Value of distributions reinvested | |||||||||||||||||||
Class 2 | – | – | – | – | |||||||||||||||
Payments for redemption of shares | |||||||||||||||||||
Class 1 | (344,997 | ) | (925,372 | ) | (576,895 | ) | (1,574,676 | ) | |||||||||||
Class 2 | (45,831,458 | ) | (17,620,533 | ) | (142,875,851 | ) | (62,308,389 | ) | |||||||||||
| Increase (decrease) in net assets from capital stock transactions | (37,589,334 | ) | (11,786,293 | ) | (113,635,023 | ) | (43,027,469 | ) | |||||||||||
Total increase (decrease) in net assets | 7,830,857 | (36,348,472 | ) | 119,616,842 | (81,149,746 | ) | |||||||||||||
Net assets at beginning of period | 190,365,020 | 226,713,492 | 794,786,944 | 875,936,690 | |||||||||||||||
Net assets at end of period | $ | 198,195,877 | $ | 190,365,020 | $ | 914,403,786 | $ | 794,786,944 | |||||||||||
Capital share transactions: | |||||||||||||||||||
| Shares issued in Reorganization1 | |||||||||||||||||||
Class 1 | – | – | – | – | |||||||||||||||
Class 2 | – | – | – | – | |||||||||||||||
Proceeds from sales | |||||||||||||||||||
Class 1 | 510,620 | 643,248 | 734,837 | 541,176 | |||||||||||||||
Class 2 | 1,219,957 | 727,052 | 1,806,569 | 1,375,241 | |||||||||||||||
Issued on reinvestment of distributions | |||||||||||||||||||
Class 2 | – | – | – | – | |||||||||||||||
Payments for redemption of shares | |||||||||||||||||||
Class 1 | (67,702 | ) | (186,078 | ) | (49,423 | ) | (138,791 | ) | |||||||||||
Class 2 | (9,253,499 | ) | (3,556,684 | ) | (12,265,757 | ) | (5,780,461 | ) | |||||||||||
Net change from capital transactions | (7,590,624 | ) | (2,372,462 | ) | (9,773,774 | ) | (4,002,835 | ) | |||||||||||
99
Securian Funds Trust
Statements of Changes in Net Assets – continued
Year ended December 31, 2019 and year ended December 31, 2018
| SFT International Bond Fund | SFT IvySM Growth Fund | SFT IvySM Small Cap Growth Fund | |||||||||||||||||||||||||
2019 | 2018 | 2019 | 2018 | 2019 | 2018 | ||||||||||||||||||||||
Operations: | |||||||||||||||||||||||||||
Net investment income | $ | 4,373,883 | $ | 3,555,562 | $ | (142,468 | ) | $ | 227,511 | $ | (1,505,495 | ) | $ | (1,142,302 | ) | ||||||||||||
Net realized gains (losses) on investments | 2,735,266 | 786,293 | 72,857,334 | 80,503,806 | 11,870,330 | 26,702,135 | |||||||||||||||||||||
| Net change in unrealized appreciation or depreciation of investments | (5,356,463 | ) | (2,954,774 | ) | 84,915,152 | (65,040,936 | ) | 26,987,819 | (30,792,811 | ) | |||||||||||||||||
| Net increase (decrease) in net assets resulting from operations | 1,752,686 | 1,387,081 | 157,630,018 | 15,690,381 | 37,352,654 | (5,232,978 | ) | ||||||||||||||||||||
Distributions to shareholders: | |||||||||||||||||||||||||||
From distributable earnings | |||||||||||||||||||||||||||
Class 2 | – | – | – | – | – | – | |||||||||||||||||||||
Decrease in net assets from distributions | – | – | – | – | – | – | |||||||||||||||||||||
Capital stock transactions: | |||||||||||||||||||||||||||
| Proceeds from shares issued in Reorganization1 | |||||||||||||||||||||||||||
Class 1 | – | – | – | – | – | – | |||||||||||||||||||||
Class 2 | – | – | – | – | – | – | |||||||||||||||||||||
Proceeds from sales | |||||||||||||||||||||||||||
Class 1 | 293,301 | 186,296 | – | – | – | – | |||||||||||||||||||||
Class 2 | 3,454,630 | 5,663,781 | 802,099 | 3,443,363 | 5,859,469 | 4,211,659 | |||||||||||||||||||||
Value of distributions reinvested | |||||||||||||||||||||||||||
Class 2 | – | – | – | – | – | – | |||||||||||||||||||||
Payments for redemption of shares | |||||||||||||||||||||||||||
Class 1 | (158,050 | ) | (100,702 | ) | – | – | – | – | |||||||||||||||||||
Class 2 | (9,594,759 | ) | (10,472,063 | ) | (67,472,882 | ) | (69,687,546 | ) | (29,858,350 | ) | (19,844,142 | ) | |||||||||||||||
| Increase (decrease) in net assets from capital stock transactions | (6,004,878 | ) | (4,722,688 | ) | (66,670,783 | ) | (66,244,183 | ) | (23,998,881 | ) | (15,632,483 | ) | |||||||||||||||
Total increase (decrease) in net assets | (4,252,192 | ) | (3,335,607 | ) | 90,959,235 | (50,553,802 | ) | 13,353,773 | (20,865,461 | ) | |||||||||||||||||
Net assets at beginning of period | 104,667,321 | 108,002,928 | 453,883,459 | 504,437,261 | 163,367,403 | 184,232,864 | |||||||||||||||||||||
Net assets at end of period | $ | 100,415,129 | $ | 104,667,321 | $ | 544,842,694 | $ | 453,883,459 | $ | 176,721,176 | $ | 163,367,403 | |||||||||||||||
Capital share transactions: | |||||||||||||||||||||||||||
| Shares issued in Reorganization1 | |||||||||||||||||||||||||||
Class 1 | – | – | – | – | – | – | |||||||||||||||||||||
Class 2 | – | – | – | – | – | – | |||||||||||||||||||||
Proceeds from sales | |||||||||||||||||||||||||||
Class 1 | 111,392 | 73,361 | – | – | – | – | |||||||||||||||||||||
Class 2 | 1,348,942 | 2,315,453 | 41,386 | 202,617 | 332,095 | 240,939 | |||||||||||||||||||||
Issued on reinvestment of distributions | |||||||||||||||||||||||||||
Class 2 | – | – | – | – | – | – | |||||||||||||||||||||
Payments for redemption of shares | |||||||||||||||||||||||||||
Class 1 | (60,030 | ) | (39,634 | ) | – | – | – | – | |||||||||||||||||||
Class 2 | (3,760,062 | ) | (4,203,051 | ) | (3,458,081 | ) | (4,056,700 | ) | (1,679,618 | ) | (1,138,320 | ) | |||||||||||||||
Net change from capital transactions | (2,359,758 | ) | (1,853,871 | ) | (3,416,695 | ) | (3,854,083 | ) | (1,347,523 | ) | (897,381 | ) | |||||||||||||||
1 Refer to Note 1 – Fund Reorganization for further details.
See accompanying notes to financial statements.
100
| SFT Managed Volatility Equity Fund | SFT Real Estate Securities Fund | ||||||||||||||||||
2019 | 2018 | 2019 | 2018 | ||||||||||||||||
Operations: | |||||||||||||||||||
Net investment income | $ | 7,534,805 | $ | 5,228,033 | $ | 2,117,814 | $ | 2,092,427 | |||||||||||
Net realized gains (losses) on investments | (5,380,256 | ) | (2,040,715 | ) | 8,466,622 | 775,002 | |||||||||||||
| Net change in unrealized appreciation or depreciation of investments | 50,433,581 | (18,432,256 | ) | 17,952,628 | (9,604,765 | ) | |||||||||||||
| Net increase (decrease) in net assets resulting from operations | 52,588,130 | (15,244,938 | ) | 28,537,064 | (6,737,336 | ) | |||||||||||||
Distributions to shareholders: | |||||||||||||||||||
From distributable earnings | |||||||||||||||||||
Class 2 | – | – | – | – | |||||||||||||||
Decrease in net assets from distributions | – | – | – | – | |||||||||||||||
Capital stock transactions: | |||||||||||||||||||
| Proceeds from shares issued in Reorganization1 | |||||||||||||||||||
Class 1 | – | – | – | – | |||||||||||||||
Class 2 | – | – | – | – | |||||||||||||||
Proceeds from sales | |||||||||||||||||||
Class 1 | – | – | 1,057,638 | 923,820 | |||||||||||||||
Class 2 | 47,244,395 | 57,595,894 | 1,584,153 | 4,546,670 | |||||||||||||||
Value of distributions reinvested | |||||||||||||||||||
Class 2 | – | – | – | – | |||||||||||||||
Payments for redemption of shares | |||||||||||||||||||
Class 1 | – | – | (372,857 | ) | (190,395 | ) | |||||||||||||
Class 2 | (7,839,141 | ) | (5,346,993 | ) | (16,787,194 | ) | (14,308,667 | ) | |||||||||||
| Increase (decrease) in net assets from capital stock transactions | 39,405,254 | 52,248,901 | (14,518,260 | ) | (9,028,572 | ) | |||||||||||||
Total increase (decrease) in net assets | 91,993,384 | 37,003,963 | 14,018,804 | (15,765,908 | ) | ||||||||||||||
Net assets at beginning of period | 298,484,602 | 261,480,639 | 120,189,257 | 135,955,165 | |||||||||||||||
Net assets at end of period | $ | 390,477,986 | $ | 298,484,602 | $ | 134,208,061 | $ | 120,189,257 | |||||||||||
Capital share transactions: | |||||||||||||||||||
| Shares issued in Reorganization1 | |||||||||||||||||||
Class 1 | – | – | – | – | |||||||||||||||
Class 2 | – | – | – | – | |||||||||||||||
Proceeds from sales | |||||||||||||||||||
Class 1 | – | – | 195,847 | 200,295 | |||||||||||||||
Class 2 | 3,734,839 | 4,744,414 | 304,892 | 1,034,951 | |||||||||||||||
Issued on reinvestment of distributions | |||||||||||||||||||
Class 2 | – | – | – | – | |||||||||||||||
Payments for redemption of shares | |||||||||||||||||||
Class 1 | – | – | (70,129 | ) | (40,649 | ) | |||||||||||||
Class 2 | (613,619 | ) | (441,450 | ) | (3,250,483 | ) | (3,105,495 | ) | |||||||||||
Net change from capital transactions | 3,121,220 | 4,302,964 | (2,819,873 | ) | (1,910,898 | ) | |||||||||||||
101
Securian Funds Trust
Statements of Changes in Net Assets – continued
Year ended December 31, 2019 and year ended December 31, 2018
| SFT T. Rowe Price Value Fund | SFT Wellington Core Equity Fund | ||||||||||||||||||
2019 | 2018 | 2019 | 2018 | ||||||||||||||||
Operations: | |||||||||||||||||||
Net investment income | $ | 2,527,269 | $ | 2,665,725 | $ | 551,953 | $ | 479,981 | |||||||||||
Net realized gains (losses) on investments | 10,493,939 | 16,283,415 | 5,212,510 | 3,883,613 | |||||||||||||||
| Net change in unrealized appreciation or depreciation of investments | 31,861,701 | (38,728,184 | ) | 27,656,503 | (6,048,077 | ) | |||||||||||||
| Net increase (decrease) in net assets resulting from operations | 44,882,909 | (19,779,044 | ) | 33,420,966 | (1,684,483 | ) | |||||||||||||
Distributions to shareholders: | |||||||||||||||||||
From distributable earnings | |||||||||||||||||||
Class 2 | – | – | – | – | |||||||||||||||
Decrease in net assets from distributions | – | – | – | – | |||||||||||||||
Capital stock transactions: | |||||||||||||||||||
| Proceeds from shares issued in Reorganization1 | |||||||||||||||||||
Class 1 | – | – | – | – | |||||||||||||||
Class 2 | – | – | – | – | |||||||||||||||
Proceeds from sales | |||||||||||||||||||
Class 1 | – | – | 388,020 | 196,628 | |||||||||||||||
Class 2 | 890,940 | 1,416,323 | 826,629 | 814,581 | |||||||||||||||
Value of distributions reinvested | |||||||||||||||||||
Class 2 | – | – | – | – | |||||||||||||||
Payments for redemption of shares | |||||||||||||||||||
Class 1 | – | – | (184,716 | ) | (127,077 | ) | |||||||||||||
Class 2 | (26,185,195 | ) | (26,263,040 | ) | (13,095,888 | ) | (16,564,651 | ) | |||||||||||
| Increase (decrease) in net assets from capital stock transactions | (25,294,255 | ) | (24,846,717 | ) | (12,065,955 | ) | (15,680,519 | ) | |||||||||||
Total increase (decrease) in net assets | 19,588,654 | (44,625,761 | ) | 21,355,011 | (17,365,002 | ) | |||||||||||||
Net assets at beginning of period | 181,589,094 | 226,214,855 | 103,526,261 | 120,891,263 | |||||||||||||||
Net assets at end of period | $ | 201,177,748 | $ | 181,589,094 | $ | 124,881,272 | $ | 103,526,261 | |||||||||||
Capital share transactions: | |||||||||||||||||||
| Shares issued in Reorganization1 | |||||||||||||||||||
Class 1 | – | – | – | – | |||||||||||||||
Class 2 | – | – | – | – | |||||||||||||||
Proceeds from sales | |||||||||||||||||||
Class 1 | – | – | 23,139 | 13,132 | |||||||||||||||
Class 2 | 63,184 | 105,128 | 49,861 | 55,340 | |||||||||||||||
Issued on reinvestment of distributions | |||||||||||||||||||
Class 2 | – | – | – | – | |||||||||||||||
Payments for redemption of shares | |||||||||||||||||||
Class 1 | – | – | (10,670 | ) | (8,446 | ) | |||||||||||||
Class 2 | (1,793,344 | ) | (1,892,242 | ) | (791,884 | ) | (1,106,343 | ) | |||||||||||
Net change from capital transactions | (1,730,160 | ) | (1,787,114 | ) | (729,554 | ) | (1,046,317 | ) | |||||||||||
1 Refer to Note 1 – Fund Reorganization for further details.
See accompanying notes to financial statements.
102
Securian Funds Trust
Financial Highlights
SFT Core Bond Fund
Class 1 Shares | |||||||||||||||||||||||
Year ended December 31, | |||||||||||||||||||||||
2019 | 2018 | 2017 | 2016 | 2015 | |||||||||||||||||||
Net asset value, beginning of period | $ | 2.355 | $ | 2.368 | $ | 2.257 | $ | 2.157 | $ | 2.148 | |||||||||||||
Income from investment operations: | |||||||||||||||||||||||
Net investment income (a) | .078 | .077 | .069 | .066 | .066 | ||||||||||||||||||
Net realized and unrealized gain(loss) on investments | .138 | (.090 | ) | .042 | .034 | (.057 | ) | ||||||||||||||||
Total from investment operations | .216 | (.013 | ) | .111 | .100 | .009 | |||||||||||||||||
Net asset value, end of period | $ | 2.571 | $ | 2.355 | $ | 2.368 | $ | 2.257 | $ | 2.157 | |||||||||||||
Total return (b) | 9.18 | % | (0.59 | )% | 4.95 | % | 4.63 | % | 0.41 | % | |||||||||||||
Net assets, end of period (in thousands) | $ | 5,060 | $ | 3,640 | $ | 2,608 | $ | 2,113 | $ | 6,243 | |||||||||||||
Ratios to average net assets: | |||||||||||||||||||||||
Expenses (c) | .49 | % | .50 | % | .49 | % | .49 | % | .49 | % | |||||||||||||
Net investment income | 3.11 | % | 3.29 | % | 2.96 | % | 2.97 | % | 3.03 | % | |||||||||||||
Portfolio turnover rate (excluding short-term securities) | 130.4 | % | 151.1 | % | 159.8 | % | 249.6 | % | 179.3 | % | |||||||||||||
Class 2 Shares | |||||||||||||||||||||||
Year ended December 31, | |||||||||||||||||||||||
2019 | 2018 | 2017 | 2016 | 2015 | |||||||||||||||||||
Net asset value, beginning of period | $ | 2.297 | $ | 2.316 | $ | 2.212 | $ | 2.120 | $ | 2.117 | |||||||||||||
Income from investment operations: | |||||||||||||||||||||||
Net investment income (a) | .070 | .069 | .062 | .059 | .059 | ||||||||||||||||||
Net realized and unrealized gain(loss) on investments | .134 | (.088 | ) | .042 | .033 | (.056 | ) | ||||||||||||||||
Total from investment operations | .204 | (.019 | ) | .104 | .092 | .003 | |||||||||||||||||
Net asset value, end of period | $ | 2.501 | $ | 2.297 | $ | 2.316 | $ | 2.212 | $ | 2.120 | |||||||||||||
Total return (b) | 8.90 | % | (0.84 | )% | 4.69 | % | 4.37 | % | 0.16 | % | |||||||||||||
Net assets, end of period (in thousands) | $ | 482,818 | $ | 434,229 | $ | 382,697 | $ | 368,156 | $ | 382,934 | |||||||||||||
Ratios to average net assets: | |||||||||||||||||||||||
| Expenses (c) . | .74 | % | .75 | % | .74 | % | .74 | % | .74 | % | |||||||||||||
Net investment income | 2.87 | % | 3.04 | % | 2.71 | % | 2.68 | % | 2.78 | % | |||||||||||||
Portfolio turnover rate (excluding short-term securities) | 130.4 | % | 151.1 | % | 159.8 | % | 249.6 | % | 179.3 | % | |||||||||||||
(a) Based on average shares outstanding during the year.
(b) Total return figures are based on a share outstanding throughout the period and assume reinvestment of distributions at net asset value. Total return figures do not reflect charges pursuant to the terms of the variable life insurance policies and variable annuity contracts funded by separate accounts that invest in the Fund's shares. For periods less than one year, total return presented has not been annualized.
(c) In addition to fees and expenses which the Fund bears directly, the Fund indirectly bears a pro rata share of the fees and expenses of the acquired funds in which it invests. Such indirect expenses are not included in the above reported expense ratios.
103
Securian Funds Trust
Financial Highlights – continued
SFT Dynamic Managed Volatility Fund
Class 2 Shares | |||||||||||||||||||||||
Year ended December 31, | |||||||||||||||||||||||
2019 | 2018 | 2017 | 2016 | 2015 | |||||||||||||||||||
Net asset value, beginning of period | $ | 13.983 | $ | 14.401 | $ | 12.210 | $ | 11.226 | $ | 11.603 | |||||||||||||
Income from investment operations: | |||||||||||||||||||||||
Net investment income (a) | .185 | .162 | .116 | .091 | .082 | ||||||||||||||||||
Net realized and unrealized gain(loss) on investments | 2.724 | (.580 | ) | 2.075 | .893 | (.459 | ) | ||||||||||||||||
Total from investment operations | 2.909 | (.418 | ) | 2.191 | .984 | (.377 | ) | ||||||||||||||||
Net asset value, end of period | $ | 16.892 | $ | 13.983 | $ | 14.401 | $ | 12.210 | $ | 11.226 | |||||||||||||
Total return (b) | 20.81 | % | (2.90 | )% | 17.94 | % | 8.77 | % | (3.25 | )% | |||||||||||||
Net assets, end of period (in thousands) | $ | 577,805 | $ | 415,233 | $ | 373,124 | $ | 281,000 | $ | 203,987 | |||||||||||||
Ratios to average net assets: | |||||||||||||||||||||||
Expenses before waiver (c) | .90 | % | .98 | % | .98 | % | 1.00 | % | 1.02 | % | |||||||||||||
Expenses net of waiver (c)(d) | .80 | % | .80 | % | .80 | % | .80 | % | .80 | % | |||||||||||||
Net investment income | 1.18 | % | 1.12 | % | .87 | % | .79 | % | .71 | % | |||||||||||||
Portfolio turnover rate (excluding short-term securities) | 1.2 | % | 2.2 | % | 1.7 | % | 1.4 | % | 5.1 | % | |||||||||||||
(a) Based on average shares outstanding during the year.
(b) Total return figures are based on a share outstanding throughout the period and assume reinvestment of distributions at net asset value. Total return figures do not reflect charges pursuant to the terms of the variable life insurance policies and variable annuity contracts funded by separate accounts that invest in the Fund's shares. For periods less than one year, total return presented has not been annualized.
(c) In addition to fees and expenses which the Fund bears directly, the Fund indirectly bears a pro rata share of the fees and expenses of the acquired funds in which it invests. Such indirect expenses are not included in the above reported expense ratios.
(d) Ratio is net of fees waived by the advisor and distributor (see note 4).
104
Securian Funds Trust
Financial Highlights – continued
SFT Government Money Market Fund
Class 2 Shares | |||||||||||||||||||||||
Year ended December 31, | |||||||||||||||||||||||
2019 | 2018 | 2017 | 2016 | 2015 | |||||||||||||||||||
Net asset value, beginning of period | $ | 1.000 | $ | 1.000 | $ | 1.000 | $ | 1.000 | $ | 1.000 | |||||||||||||
Income from investment operations: | |||||||||||||||||||||||
Net investment income (a) | .015 | .012 | .001 | – | – | ||||||||||||||||||
Net realized and unrealized gain (loss) on investments | – | – | – | – | – | ||||||||||||||||||
Total from investment operations | .015 | .012 | .001 | – | – | ||||||||||||||||||
Less distributions: | |||||||||||||||||||||||
Distributions from net investment income | (.015 | ) | (.012 | ) | (.001 | ) | – | – | |||||||||||||||
Net asset value, end of period | $ | 1.000 | $ | 1.000 | $ | 1.000 | $ | 1.000 | $ | 1.000 | |||||||||||||
Total return (b) | 1.50 | % | 1.18 | % | 0.13 | % | – | % | – | % | |||||||||||||
Net assets, end of period (in thousands) | $ | 188,351 | $ | 72,761 | $ | 66,980 | $ | 77,795 | $ | 88,829 | |||||||||||||
Ratios to average net assets: | |||||||||||||||||||||||
Expenses before waiver | .83 | % | .90 | % | .92 | % | .91 | % | .85 | % | |||||||||||||
Expenses net of waiver (c)(d) | .70 | % | .70 | % | .78 | % | .36 | % | .12 | % | |||||||||||||
Net investment income | 1.35 | % | 1.18 | % | .13 | % | – | % | – | % | |||||||||||||
(a) Based on average shares outstanding during the year.
(b) Total return figures are based on a share outstanding throughout the period and assume reinvestment of distributions at net asset value. Total return figures do not reflect charges pursuant to the terms of the variable life insurance policies and variable annuity contracts funded by separate accounts that invest in the Fund's shares. For periods less than one year, total return presented has not been annualized.
(c) In addition to fees and expenses which the Fund bears directly, the Fund indirectly bears a pro rata share of the fees and expenses of the acquired funds in which it invests. Such indirect expenses are not included in the above reported expense ratios.
(d) Ratio is net of fees waived by the advisor and distributor (see note 4).
105
Securian Funds Trust
Financial Highlights – continued
SFT Index 400 Mid-Cap Fund
Class 1 Shares | |||||||||||||||||||||||
Year ended December 31, | |||||||||||||||||||||||
2019 | 2018 | 2017 | 2016 | 2015 | |||||||||||||||||||
Net asset value, beginning of period | $ | 4.392 | $ | 4.955 | $ | 4.275 | $ | 3.553 | $ | 3.640 | |||||||||||||
Income from investment operations: | |||||||||||||||||||||||
| Net investment income (a) | .067 | .065 | .055 | .045 | .046 | ||||||||||||||||||
| Net realized and unrealized gain(loss) on investments | 1.068 | (.628 | ) | .625 | .677 | (.133 | ) | ||||||||||||||||
Total from investment operations | 1.135 | (.563 | ) | .680 | .722 | (.087 | ) | ||||||||||||||||
Net asset value, end of period | $ | 5.527 | $ | 4.392 | $ | 4.955 | $ | 4.275 | $ | 3.553 | |||||||||||||
Total return (b) | 25.82 | % | (11.36 | )% | 15.90 | % | 20.34 | % | (2.39 | )% | |||||||||||||
Net assets, end of period (in thousands) | $ | 12,088 | $ | 7,662 | $ | 6,378 | $ | 4,290 | $ | 16,847 | |||||||||||||
Ratios to average net assets: | |||||||||||||||||||||||
Expenses (c) | .29 | % | .27 | % | .26 | % | .26 | % | .26 | % | |||||||||||||
| Net investment income | 1.31 | % | 1.29 | % | 1.21 | % | 1.24 | % | 1.24 | % | |||||||||||||
Portfolio turnover rate (excluding short-term securities) | 15.1 | % | 14.6 | % | 16.6 | % | 18.5 | % | 16.1 | % | |||||||||||||
Class 2 Shares | |||||||||||||||||||||||
Year ended December 31, | |||||||||||||||||||||||
2019 | 2018 | 2017 | 2016 | 2015 | |||||||||||||||||||
Net asset value, beginning of period | $ | 4.284 | $ | 4.845 | $ | 4.191 | $ | 3.491 | $ | 3.586 | |||||||||||||
Income from investment operations: | |||||||||||||||||||||||
| Net investment income (a) | .054 | .050 | .042 | .039 | .036 | ||||||||||||||||||
| Net realized and unrealized gain(loss) on investments | 1.039 | (.611 | ) | .612 | .661 | (.131 | ) | ||||||||||||||||
Total from investment operations | 1.093 | (.561 | ) | .654 | .700 | (.095 | ) | ||||||||||||||||
Net asset value, end of period | $ | 5.377 | $ | 4.284 | $ | 4.845 | $ | 4.191 | $ | 3.491 | |||||||||||||
Total return (b) | 25.51 | % | (11.58 | )% | 15.61 | % | 20.04 | % | (2.63 | )% | |||||||||||||
Net assets, end of period (in thousands) | $ | 186,108 | $ | 182,703 | $ | 220,335 | $ | 214,408 | $ | 185,717 | |||||||||||||
Ratios to average net assets: | |||||||||||||||||||||||
Expenses (c) | .54 | % | .52 | % | .51 | % | .51 | % | .51 | % | |||||||||||||
| Net investment income | 1.09 | % | 1.03 | % | .95 | % | 1.06 | % | .98 | % | |||||||||||||
Portfolio turnover rate (excluding short-term securities) | 15.1 | % | 14.6 | % | 16.6 | % | 18.5 | % | 16.1 | % | |||||||||||||
(a) Based on average shares outstanding during the year.
(b) Total return figures are based on a share outstanding throughout the period and assume reinvestment of distributions at net asset value. Total return figures do not reflect charges pursuant to the terms of the variable life insurance policies and variable annuity contracts funded by separate accounts that invest in the Fund's shares. For periods less than one year, total return presented has not been annualized.
(c) In addition to fees and expenses which the Fund bears directly, the Fund indirectly bears a pro rata share of the fees and expenses of the acquired funds in which it invests. Such indirect expenses are not included in the above reported expense ratios.
106
Securian Funds Trust
Financial Highlights – continued
SFT Index 500 Fund
Class 1 Shares | |||||||||||||||||||||||
Year ended December 31, | |||||||||||||||||||||||
2019 | 2018 | 2017 | 2016 | 2015 | |||||||||||||||||||
Net asset value, beginning of period | $ | 10.144 | $ | 10.629 | $ | 8.745 | $ | 7.829 | $ | 7.737 | |||||||||||||
Income from investment operations: | |||||||||||||||||||||||
| Net investment income (a) | .215 | .192 | .175 | .160 | .147 | ||||||||||||||||||
| Net realized and unrealized gain(loss) on investments | 2.950 | (.677 | ) | 1.709 | .756 | (.055 | ) | ||||||||||||||||
Total from investment operations | 3.165 | (.485 | ) | 1.884 | .916 | .092 | |||||||||||||||||
Net asset value, end of period | $ | 13.309 | $ | 10.144 | $ | 10.629 | $ | 8.745 | $ | 7.829 | |||||||||||||
Total return (b) | 31.20 | % | (4.56 | )% | 21.54 | % | 11.72 | % | 1.18 | % | |||||||||||||
Net assets, end of period (in thousands) | $ | 224,410 | $ | 164,095 | $ | 167,661 | $ | 133,014 | $ | 110,210 | |||||||||||||
Ratios to average net assets: | |||||||||||||||||||||||
Expenses (c) | .20 | % | .20 | % | .20 | % | .20 | % | .21 | % | |||||||||||||
| Net investment income | 1.81 | % | 1.74 | % | 1.82 | % | 1.97 | % | 1.88 | % | |||||||||||||
Portfolio turnover rate (excluding short-term securities) | 2.6 | % | 2.4 | % | 2.7 | % | 3.5 | % | 6.1 | % | |||||||||||||
Class 2 Shares | |||||||||||||||||||||||
Year ended December 31, | |||||||||||||||||||||||
2019 | 2018 | 2017 | 2016 | 2015 | |||||||||||||||||||
Net asset value, beginning of period | $ | 9.894 | $ | 10.393 | $ | 8.573 | $ | 7.693 | $ | 7.622 | |||||||||||||
Income from investment operations: | |||||||||||||||||||||||
| Net investment income (a) | .181 | .160 | .148 | .136 | .124 | ||||||||||||||||||
| Net realized and unrealized gain(loss) on investments | 2.874 | (.659 | ) | 1.672 | .744 | (.053 | ) | ||||||||||||||||
Total from investment operations | 3.055 | (.499 | ) | 1.820 | .880 | .071 | |||||||||||||||||
Net asset value, end of period | $ | 12.949 | $ | 9.894 | $ | 10.393 | $ | 8.573 | $ | 7.693 | |||||||||||||
Total return (b) | 30.88 | % | (4.80 | )% | 21.23 | % | 11.44 | % | 0.93 | % | |||||||||||||
Net assets, end of period (in thousands) | $ | 689,994 | $ | 630,692 | $ | 708,275 | $ | 609,796 | $ | 577,069 | |||||||||||||
Ratios to average net assets: | |||||||||||||||||||||||
Expenses (c) | .45 | % | .45 | % | .45 | % | .45 | % | .46 | % | |||||||||||||
| Net investment income | 1.56 | % | 1.49 | % | 1.57 | % | 1.72 | % | 1.61 | % | |||||||||||||
Portfolio turnover rate (excluding short-term securities) | 2.6 | % | 2.4 | % | 2.7 | % | 3.5 | % | 6.1 | % | |||||||||||||
(a) Based on average shares outstanding during the year.
(b) Total return figures are based on a share outstanding throughout the period and assume reinvestment of distributions at net asset value. Total return figures do not reflect charges pursuant to the terms of the variable life insurance policies and variable annuity contracts funded by separate accounts that invest in the Fund's shares. For periods less than one year, total return presented has not been annualized.
(c) In addition to fees and expenses which the Fund bears directly, the Fund indirectly bears a pro rata share of the fees and expenses of the acquired funds in which it invests. Such indirect expenses are not included in the above reported expense ratios.
107
Securian Funds Trust
Financial Highlights – continued
SFT International Bond Fund
Class 1 Shares | |||||||||||||||||||||||
Year ended December 31, | |||||||||||||||||||||||
2019 | 2018 | 2017 | 2016 | 2015 | |||||||||||||||||||
Net asset value, beginning of period | $ | 2.570 | $ | 2.533 | $ | 2.499 | $ | 2.418 | $ | 2.517 | |||||||||||||
Income from investment operations: | |||||||||||||||||||||||
Net investment income (a) | .116 | .091 | .102 | .064 | .063 | ||||||||||||||||||
Net realized and unrealized gain(loss) on investments | (.066 | ) | (.054 | ) | (.068 | ) | .017 | (.162 | ) | ||||||||||||||
Total from investment operations | .050 | .037 | .034 | .081 | (.099 | ) | |||||||||||||||||
Net asset value, end of period | $ | 2.620 | $ | 2.570 | $ | 2.533 | $ | 2.499 | $ | 2.418 | |||||||||||||
Total return (b) | 1.93 | % | 1.46 | % | 1.38 | % | 3.35 | % | (3.92 | )% | |||||||||||||
Net assets, end of period (in thousands) | $ | 1,396 | $ | 1,237 | $ | 1,134 | $ | 1,097 | $ | 984 | |||||||||||||
Ratios to average net assets: | |||||||||||||||||||||||
Expenses (c) | 1.01 | % | .95 | % | .98 | % | 1.00 | % | .89 | % | |||||||||||||
Net investment income | 4.43 | % | 3.57 | % | 3.97 | % | 2.67 | % | 2.55 | % | |||||||||||||
Portfolio turnover rate (excluding short-term securities) | 23.4 | % | 20.4 | % | 58.7 | % | 54.0 | % | 42.4 | % | |||||||||||||
Class 2 Shares | |||||||||||||||||||||||
Year ended December 31, | |||||||||||||||||||||||
2019 | 2018 | 2017 | 2016 | 2015 | |||||||||||||||||||
Net asset value, beginning of period | $ | 2.507 | $ | 2.477 | $ | 2.450 | $ | 2.376 | $ | 2.479 | |||||||||||||
Income from investment operations: | |||||||||||||||||||||||
Net investment income (a) | .108 | .082 | .093 | .057 | .056 | ||||||||||||||||||
Net realized and unrealized gain(loss) on investments | (.066 | ) | (.052 | ) | (.066 | ) | .017 | (.159 | ) | ||||||||||||||
Total from investment operations | .042 | .030 | .027 | .074 | (.103 | ) | |||||||||||||||||
Net asset value, end of period | $ | 2.549 | $ | 2.507 | $ | 2.477 | $ | 2.450 | $ | 2.376 | |||||||||||||
Total return (b) | 1.68 | % | 1.21 | % | 1.12 | % | 3.09 | % | (4.16 | )% | |||||||||||||
Net assets, end of period (in thousands) | $ | 99,019 | $ | 103,430 | $ | 106,869 | $ | 109,908 | $ | 112,548 | |||||||||||||
Ratios to average net assets: | |||||||||||||||||||||||
Expenses (c) | 1.26 | % | 1.20 | % | 1.23 | % | 1.24 | % | 1.14 | % | |||||||||||||
Net investment income | 4.20 | % | 3.32 | % | 3.72 | % | 2.42 | % | 2.29 | % | |||||||||||||
Portfolio turnover rate (excluding short-term securities) | 23.4 | % | 20.4 | % | 58.7 | % | 54.0 | % | 42.4 | % | |||||||||||||
(a) Based on average shares outstanding during the year.
(b) Total return figures are based on a share outstanding throughout the period and assume reinvestment of distributions at net asset value. Total return figures do not reflect charges pursuant to the terms of the variable life insurance policies and variable annuity contracts funded by separate accounts that invest in the Fund's shares. For periods less than one year, total return presented has not been annualized.
(c) In addition to fees and expenses which the Fund bears directly, the Fund indirectly bears a pro rata share of the fees and expenses of the acquired funds in which it invests. Such indirect expenses are not included in the above reported expense ratios.
108
Securian Funds Trust
Financial Highlights – continued
SFT IvySM Growth Fund
Class 2 Shares | |||||||||||||||||||||||
Year ended December 31, | |||||||||||||||||||||||
2019 | 2018 | 2017 | 2016 | 2015 | |||||||||||||||||||
Net asset value, beginning of period | $ | 16.007 | $ | 15.662 | $ | 12.120 | $ | 12.012 | $ | 11.253 | |||||||||||||
Income from investment operations: | |||||||||||||||||||||||
Net investment income (a) | (.005 | ) | .008 | .022 | .034 | .001 | |||||||||||||||||
Net realized and unrealized gain on investments | 5.846 | .337 | 3.520 | .074 | .758 | ||||||||||||||||||
Total from investment operations | 5.841 | .345 | 3.542 | .108 | .759 | ||||||||||||||||||
Net asset value, end of period | $ | 21.848 | $ | 16.007 | $ | 15.662 | $ | 12.120 | $ | 12.012 | |||||||||||||
Total return (b) | 36.49 | % | 2.21 | % | 29.22 | % | 0.91 | % | 6.74 | % | |||||||||||||
Net assets, end of period (in thousands) | $ | 544,843 | $ | 453,883 | $ | 504,437 | $ | 438,985 | $ | 479,081 | |||||||||||||
Ratios to average net assets: | |||||||||||||||||||||||
Expenses (c) | .98 | % | .97 | % | .97 | % | .98 | % | .97 | % | |||||||||||||
Net investment income | (.03 | )% | .04 | % | .16 | % | .29 | % | .01 | % | |||||||||||||
Portfolio turnover rate (excluding short-term securities) | 29.9 | % | 42.3 | % | 40.5 | % | 52.5 | % | 31.6 | % | |||||||||||||
(a) Based on average shares outstanding during the year.
(b) Total return figures are based on a share outstanding throughout the period and assume reinvestment of distributions at net asset value. Total return figures do not reflect charges pursuant to the terms of the variable life insurance policies and variable annuity contracts funded by separate accounts that invest in the Fund's shares. For periods less than one year, total return presented has not been annualized.
(c) In addition to fees and expenses which the Fund bears directly, the Fund indirectly bears a pro rata share of the fees and expenses of the acquired funds in which it invests. Such indirect expenses are not included in the above reported expense ratios.
109
Securian Funds Trust
Financial Highlights – continued
SFT IvySM Small Cap Growth Fund
Class 2 Shares | |||||||||||||||||||||||
Year ended December 31, | |||||||||||||||||||||||
2019 | 2018 | 2017 | 2016 | 2015 | |||||||||||||||||||
Net asset value, beginning of period | $ | 15.181 | $ | 15.802 | $ | 12.611 | $ | 10.414 | $ | 10.810 | |||||||||||||
Income from investment operations: | |||||||||||||||||||||||
Net investment income (a) | (.146 | ) | (.102 | ) | (.111 | ) | (.076 | ) | (.090 | ) | |||||||||||||
Net realized and unrealized gain(loss) on investments | 3.737 | (.519 | ) | 3.302 | 2.273 | (.306 | ) | ||||||||||||||||
Total from investment operations | 3.591 | (.621 | ) | 3.191 | 2.197 | (.396 | ) | ||||||||||||||||
Net asset value, end of period | $ | 18.772 | $ | 15.181 | $ | 15.802 | $ | 12.611 | $ | 10.414 | |||||||||||||
Total return (b) | 23.66 | % | (3.93 | )% | 25.30 | % | 21.10 | % | (3.66 | )% | |||||||||||||
Net assets, end of period (in thousands) | $ | 176,721 | $ | 163,367 | $ | 184,233 | $ | 163,294 | $ | 145,465 | |||||||||||||
Ratios to average net assets: | |||||||||||||||||||||||
Expenses (c) | 1.23 | % | 1.21 | % | 1.22 | % | 1.24 | % | 1.19 | % | |||||||||||||
Net investment income | (.81 | )% | (.59 | )% | (.78 | )% | (.68 | )% | (.80 | )% | |||||||||||||
Portfolio turnover rate (excluding short-term securities) | 43.3 | % | 53.1 | % | 54.4 | % | 99.2 | % | 65.4 | % | |||||||||||||
(a) Based on average shares outstanding during the year.
(b) Total return figures are based on a share outstanding throughout the period and assume reinvestment of distributions at net asset value. Total return figures do not reflect charges pursuant to the terms of the variable life insurance policies and variable annuity contracts funded by separate accounts that invest in the Fund's shares. For periods less than one year, total return presented has not been annualized.
(c) In addition to fees and expenses which the Fund bears directly, the Fund indirectly bears a pro rata share of the fees and expenses of the acquired funds in which it invests. Such indirect expenses are not included in the above reported expense ratios.
110
Securian Funds Trust
Financial Highlights – continued
SFT Managed Volatility Equity Fund
Class 2 Shares | |||||||||||||||||||||||
Year ended December 31, | |||||||||||||||||||||||
2019 | 2018 | 2017 | 2016 | 2015 (a) | |||||||||||||||||||
Net asset value, beginning of period | $ | 11.594 | $ | 12.195 | $ | 10.483 | $ | 10.064 | $ | 10.000 | |||||||||||||
Income from investment operations: | |||||||||||||||||||||||
Net investment income (b) | .275 | .220 | .169 | .253 | .066 | ||||||||||||||||||
Net realized and unrealized gain(loss) on investments | 1.658 | (.821 | ) | 1.543 | .166 | (.002 | ) | ||||||||||||||||
Total from investment operations | 1.933 | (.601 | ) | 1.712 | .419 | .064 | |||||||||||||||||
Net asset value, end of period | $ | 13.527 | $ | 11.594 | $ | 12.195 | $ | 10.483 | $ | 10.064 | |||||||||||||
Total return (c) | 16.67 | % | (4.93 | )% | 16.33 | % | 4.16 | % | 0.64 | % | |||||||||||||
Net assets, end of period (in thousands) | $ | 390,478 | $ | 298,485 | $ | 261,481 | $ | 200,138 | $ | 25,514 | |||||||||||||
Ratios to average net assets: | |||||||||||||||||||||||
Expenses before waiver (d) | .90 | % | .97 | % | .99 | % | 1.09 | % | 2.28 | %(e) | |||||||||||||
Expenses net of waiver (f) | .80 | % | .80 | % | .80 | % | .80 | % | .80 | %(e) | |||||||||||||
Net investment income | 2.17 | % | 1.82 | % | 1.48 | % | 2.43 | % | 5.53 | %(e) | |||||||||||||
Portfolio turnover rate (excluding short-term securities) | – | % | – | % | 9.2 | % | 8.5 | % | – | %(g) | |||||||||||||
(a) The Fund commenced operations on November 18, 2015.
(b) Based on average shares outstanding during the year.
(c) Total return figures are based on a share outstanding throughout the period and assume reinvestment of distributions at net asset value. Total return figures do not reflect charges pursuant to the terms of the variable life insurance policies and variable annuity contracts funded by separate accounts that invest in the Fund's shares. For periods less than one year, total return presented has not been annualized.
(d) In addition to fees and expenses which the Fund bears directly, the Fund indirectly bears a pro rata share of the fees and expenses of the acquired funds in which it invests. Such indirect expenses are not included in the above reported expense ratios.
(e) Adjusted to an annual basis.
(f) Ratio is net of fees waived by the advisor and distributor (see note 4).
(g) Not Annualized.
111
Securian Funds Trust
Financial Highlights – continued
SFT Real Estate Securities Fund
Class 1 Shares | |||||||||||||||||||||||
Year ended December 31, | |||||||||||||||||||||||
2019 | 2018 | 2017 | 2016 | 2015 | |||||||||||||||||||
Net asset value, beginning of period | $ | 4.534 | $ | 4.781 | $ | 4.526 | $ | 4.324 | $ | 4.108 | |||||||||||||
Income from investment operations: | |||||||||||||||||||||||
| Net investment income (a) | .096 | .085 | .081 | .074 | .066 | ||||||||||||||||||
| Net realized and unrealized gain(loss) on investments | 1.031 | (.332 | ) | .174 | .128 | .150 | |||||||||||||||||
Total from investment operations | 1.127 | (.247 | ) | .255 | .202 | .216 | |||||||||||||||||
Net asset value, end of period | $ | 5.661 | $ | 4.534 | $ | 4.781 | $ | 4.526 | $ | 4.324 | |||||||||||||
Total return (b) | 24.87 | % | (5.16 | )% | 5.63 | % | 4.66 | % | 5.25 | % | |||||||||||||
Net assets, end of period (in thousands) | $ | 5,858 | $ | 4,122 | $ | 3,583 | $ | 3,085 | $ | 6,750 | |||||||||||||
Ratios to average net assets: | |||||||||||||||||||||||
Expenses (c) | .88 | % | .87 | % | .85 | % | .82 | % | .84 | % | |||||||||||||
| Net investment income | 1.79 | % | 1.83 | % | 1.75 | % | 1.68 | % | 1.59 | % | |||||||||||||
Portfolio turnover rate (excluding short-term securities) | 55.5 | % | 70.0 | % | 75.4 | % | 78.0 | % | 65.8 | % | |||||||||||||
Class 2 Shares | |||||||||||||||||||||||
Year ended December 31, | |||||||||||||||||||||||
2019 | 2018 | 2017 | 2016 | 2015 | |||||||||||||||||||
Net asset value, beginning of period | $ | 4.422 | $ | 4.674 | $ | 4.436 | $ | 4.249 | $ | 4.047 | |||||||||||||
Income from investment operations: | |||||||||||||||||||||||
| Net investment income (a) | .082 | .072 | .070 | .063 | .053 | ||||||||||||||||||
| Net realized and unrealized gain(loss) on investments | 1.004 | (.324 | ) | .168 | .124 | .149 | |||||||||||||||||
Total from investment operations | 1.086 | (.252 | ) | .238 | .187 | .202 | |||||||||||||||||
Net asset value, end of period | $ | 5.508 | $ | 4.422 | $ | 4.674 | $ | 4.436 | $ | 4.249 | |||||||||||||
Total return (b) | 24.56 | % | (5.40 | )% | 5.37 | % | 4.40 | % | 4.99 | % | |||||||||||||
Net assets, end of period (in thousands) | $ | 128,350 | $ | 116,067 | $ | 132,372 | $ | 143,139 | $ | 145,156 | |||||||||||||
Ratios to average net assets: | |||||||||||||||||||||||
Expenses (c) | 1.13 | % | 1.12 | % | 1.10 | % | 1.08 | % | 1.09 | % | |||||||||||||
| Net investment income | 1.59 | % | 1.60 | % | 1.55 | % | 1.43 | % | 1.30 | % | |||||||||||||
Portfolio turnover rate (excluding short-term securities) | 55.5 | % | 70.0 | % | 75.4 | % | 78.0 | % | 65.8 | % | |||||||||||||
(a) Based on average shares outstanding during the year.
(b) Total return figures are based on a share outstanding throughout the period and assume reinvestment of distributions at net asset value. Total return figures do not reflect charges pursuant to the terms of the variable life insurance policies and variable annuity contracts funded by separate accounts that invest in the Fund's shares. For periods less than one year, total return presented has not been annualized.
(c) In addition to fees and expenses which the Fund bears directly, the Fund indirectly bears a pro rata share of the fees and expenses of the acquired funds in which it invests. Such indirect expenses are not included in the above reported expense ratios.
112
Securian Funds Trust
Financial Highlights – continued
SFT T. Rowe Price Value Fund
Class 2 Shares | |||||||||||||||||||||||
Year ended December 31, | |||||||||||||||||||||||
2019 | 2018 | 2017 | 2016 | 2015 | |||||||||||||||||||
Net asset value, beginning of period | $ | 12.568 | $ | 13.933 | $ | 11.747 | $ | 10.617 | $ | 10.836 | |||||||||||||
Income from investment operations: | |||||||||||||||||||||||
Net investment income (a) | .186 | .174 | .153 | .173 | .119 | ||||||||||||||||||
Net realized and unrealized gain(loss) on investments | 3.064 | (1.539 | ) | 2.033 | .957 | (.338 | ) | ||||||||||||||||
Total from investment operations | 3.250 | (1.365 | ) | 2.186 | 1.130 | (.219 | ) | ||||||||||||||||
Net asset value, end of period | $ | 15.818 | $ | 12.568 | $ | 13.933 | $ | 11.747 | $ | 10.617 | |||||||||||||
Total return (b) | 25.86 | % | (9.80 | )% | 18.61 | % | 10.65 | % | (2.02 | )% | |||||||||||||
Net assets, end of period (in thousands) | $ | 201,178 | $ | 181,589 | $ | 226,215 | $ | 208,513 | $ | 207,698 | |||||||||||||
Ratios to average net assets: | |||||||||||||||||||||||
Expenses (c) | 1.06 | % | 1.04 | % | 1.03 | % | 1.03 | % | 1.01 | % | |||||||||||||
Net investment income | 1.28 | % | 1.26 | % | 1.20 | % | 1.59 | % | 1.10 | % | |||||||||||||
Portfolio turnover rate (excluding short-term securities) | 131.1 | % | 140.0 | % | 90.4 | % | 102.9 | % | 65.0 | % | |||||||||||||
(a) Based on average shares outstanding during the year.
(b) Total return figures are based on a share outstanding throughout the period and assume reinvestment of distributions at net asset value. Total return figures do not reflect charges pursuant to the terms of the variable life insurance policies and variable annuity contracts funded by separate accounts that invest in the Fund's shares. For periods less than one year, total return presented has not been annualized.
(c) In addition to fees and expenses which the Fund bears directly, the Fund indirectly bears a pro rata share of the fees and expenses of the acquired funds in which it invests. Such indirect expenses are not included in the above reported expense ratios.
113
Securian Funds Trust
Financial Highlights – continued
SFT Wellington Core Equity Fund
Class 1 Shares | |||||||||||||||||||||||
Year ended December 31, | |||||||||||||||||||||||
2019 | 2018 | 2017 | 2016 | 2015 | |||||||||||||||||||
Net asset value, beginning of period | $ | 14.069 | $ | 14.369 | $ | 11.834 | $ | 11.261 | $ | 11.148 | |||||||||||||
Income from investment operations: | |||||||||||||||||||||||
Net investment income (a) | .120 | .099 | .084 | .089 | .075 | ||||||||||||||||||
Net realized and unrealized gain(loss) on investments | 4.672 | (.399 | ) | 2.451 | .484 | .038 | |||||||||||||||||
Total from investment operations | 4.792 | (.300 | ) | 2.535 | .573 | .113 | |||||||||||||||||
Net asset value, end of period | $ | 18.861 | $ | 14.069 | $ | 14.369 | $ | 11.834 | $ | 11.261 | |||||||||||||
Total return (b) | 34.06 | % | (2.09 | )% | 21.42 | % | 5.09 | % | 1.01 | % | |||||||||||||
Net assets, end of period (in thousands) | $ | 1,251 | $ | 757 | $ | 706 | $ | 696 | $ | 587 | |||||||||||||
Ratios to average net assets: | |||||||||||||||||||||||
Expenses (c) | .86 | % | .84 | % | .85 | % | .80 | % | .78 | % | |||||||||||||
Net investment income | .71 | % | .66 | % | .64 | % | .80 | % | .66 | % | |||||||||||||
Portfolio turnover rate (excluding short-term securities) | 14.9 | % | 21.6 | % | 138.0 | % | 88.8 | % | 84.6 | % | |||||||||||||
Class 2 Shares | |||||||||||||||||||||||
Year ended December 31, | |||||||||||||||||||||||
2019 | 2018 | 2017 | 2016 | 2015 | |||||||||||||||||||
Net asset value, beginning of period | $ | 13.906 | $ | 14.238 | $ | 11.755 | $ | 11.214 | $ | 11.129 | |||||||||||||
Income from investment operations: | |||||||||||||||||||||||
Net investment income (a) | .077 | .060 | .051 | .060 | .046 | ||||||||||||||||||
Net realized and unrealized gain(loss) on investments | 4.613 | (.392 | ) | 2.432 | .481 | .039 | |||||||||||||||||
Total from investment operations | 4.690 | (.332 | ) | 2.483 | .541 | .085 | |||||||||||||||||
Net asset value, end of period | $ | 18.596 | $ | 13.906 | $ | 14.238 | $ | 11.755 | $ | 11.214 | |||||||||||||
Total return (b) | 33.73 | % | (2.33 | )% | 21.12 | % | 4.83 | % | 0.76 | % | |||||||||||||
Net assets, end of period (in thousands) | $ | 123,630 | $ | 102,769 | $ | 120,185 | $ | 113,799 | $ | 128,297 | |||||||||||||
Ratios to average net assets: | |||||||||||||||||||||||
Expenses (c) | 1.11 | % | 1.09 | % | 1.10 | % | 1.05 | % | 1.03 | % | |||||||||||||
Net investment income | .47 | % | .40 | % | .40 | % | .54 | % | .41 | % | |||||||||||||
Portfolio turnover rate (excluding short-term securities) | 14.9 | % | 21.6 | % | 138.0 | % | 88.8 | % | 84.6 | % | |||||||||||||
(a) Based on average shares outstanding during the year.
(b) Total return figures are based on a share outstanding throughout the period and assume reinvestment of distributions at net asset value. Total return figures do not reflect charges pursuant to the terms of the variable life insurance policies and variable annuity contracts funded by separate accounts that invest in the Fund's shares. For periods less than one year, total return presented has not been annualized.
(c) In addition to fees and expenses which the Fund bears directly, the Fund indirectly bears a pro rata share of the fees and expenses of the acquired funds in which it invests. Such indirect expenses are not included in the above reported expense ratios.
114
Securian Funds Trust
Notes to Financial Statements
December 31, 2019
(1) Organization
Securian Funds Trust (the "Trust") is a Delaware statutory trust registered under the Investment Company Act of 1940, as amended (the "1940 Act") as a no-load, diversified open-end management investment company, except that SFT International Bond Fund operates as a non-diversified, open-end management investment company. The Trust is a series trust that includes the Funds and share classes listed below:
Fund Name | Share Class 1 | Share Class 2 | |||||||||
| SFT Core Bond Fund | P | P | |||||||||
SFT Dynamic Managed Volatility Fund | NA | P | |||||||||
SFT Government Money Market Fund | NA | P | |||||||||
SFT Index 400 Mid-Cap Fund | P | P | |||||||||
| SFT Index 500 Fund | P | P | |||||||||
SFT International Bond Fund | P | P | |||||||||
SFT IvySM Growth Fund | NA | P | |||||||||
SFT IvySM Small Cap Growth Fund | NA | P | |||||||||
SFT Managed Volatility Equity Fund | NA | P | |||||||||
SFT Real Estate Securities Fund | P | P | |||||||||
SFT T. Rowe Price Value Fund | NA | P | |||||||||
SFT Wellington Core Equity Fund | P | P | |||||||||
Securian Asset Management, Inc. ("Securian AM"), a wholly-owned subsidiary of Securian Financial Group, Inc. ("Securian Financial Group"), serves as the investment adviser to each of the Funds in the Trust pursuant to an investment advisory agreement between Securian AM and the Trust. The Trust's prospectus provides a detailed description of each Fund's investment objective, policies and strategies.
Class 2 shares are subject to a 12b-1 distribution fee. Both classes of shares have identical voting, dividend, liquidation and other rights, and the same terms and conditions, except that Class 1 shares are not subject to a 12b-1 distribution fee. Income, expenses (other than Rule 12b-1 fees) and realized and unrealized gains or losses are allocated to each class of shares based upon their relative net assets.
The Trust accounts for the assets, liabilities and operations of each Fund separately. Shares of the Trust are not offered directly to the public, but sold only to Minnesota Life Insurance Company ("Minnesota Life") and Securian Life Insurance Company ("Securian Life") in connection with Minnesota Life and Securian Life variable life insurance policies and variable annuity contracts, and to certain other separate accounts of life insurance affiliates of Minnesota Life and Securian Life, and may also be offered to certain qualified plans.
Fund Reorganization
The Trust's Board of Trustees (the "Board") and shareholders approved the Fund Reorganization of the SFT Mortgage Securities Fund (the "Target Fund") into the SFT Core Bond Fund (the "Acquiring Fund") effective at the close of business on November 30, 2018. The reorganization was recommended primarily because of a decrease in asset levels over recent years and the concern that expenses as a percentage of assets would increase. Upon the closing of the reorganization, the SFT Mortgage Securities Fund transferred all of its assets and liabilities to the SFT Core Bond Fund in exchange for Acquiring Fund Shares of equal value. Shares of the Acquiring Fund were then distributed to shareholders of the Target Fund and the Target Fund was terminated. As a result of the reorganization, shareholders of the Target Fund became shareholders of the Acquiring Fund. The shareholders of the Target Fund received Acquiring Fund shares with a total value equal to the total value of their Target Fund shares immediately prior to the closing of the reorganization. For accounting and performance reporting purposes, the Acquiring Fund is the survivor.
115
Securian Funds Trust
Notes to Financial Statements – continued
(2) Summary of Significant Accounting Policies
The Funds are investment companies and follow accounting and reporting guidance under Financial Accounting Standards Board (FASB) Accounting Standards Codification (ASC) Topic 946, "Financial Services—Investment Companies." The significant accounting policies followed consistently by the Trust are as follows:
Use of Estimates
The preparation of financial statements in conformity with U.S. generally accepted accounting principles (GAAP) requires management to make estimates and assumptions that affect the reported amounts of assets and liabilities, including disclosure of contingent assets and liabilities, as of the balance sheet date and the reported amounts of revenue and expenses during the reporting period. Actual results could differ from those estimates.
Investments in Securities
Each Fund's net asset value is generally calculated as of the close of normal trading on the New York Stock Exchange (typically 3:00 p.m. Central Time). Investments in securities traded on a U.S. or foreign securities exchange are valued at the last sale price on that exchange prior to the time when assets are valued; securities traded in the over-the-counter market and listed securities for which no sale was reported on that date are valued on the basis of the last current bid price by an independent pricing service or at a price deemed best to reflect fair value quoted by dealers who make markets in these securities. The pricing service may use models that price securities based on current yields and relative security characteristics, such as coupon rate, maturity date, issuer credit quality and prepayment speeds, as applicable. When market quotations are not readily available, securities are valued at fair value as determined in good faith by the Securian AM Valuation Committee ("the Valuation Committee") under the supervision of the Board and in accordance with Board-approved valuation policies and procedures. The Board has delegated the daily oversight of the securities valuation function to the Valuation Committee whose members ensure the valuations comply with the valuation policies and affirms the reasonableness of the fair valuation determinations. The fair valued securities are reviewed by the Board at their quarterly meetings.
A Fund's investments will also be valued at fair value by the Valuation Committee if Securian AM determines that an event impacting the value of an investment occurred after the close of the security's primary exchange or market (for example, a foreign exchange or market) and before the time the Fund's net asset value is calculated. If a significant event impacting the value of a security or group of securities occurs, the Valuation Committee is immediately notified and the members meet promptly to determine whether fair value pricing is needed in accordance with the Fund's valuation procedures and, if so, to approve the pricing methodology to be used.
Short-term securities, with the exception of those held in the SFT Government Money Market Fund, are valued at market value. Pursuant to Rule 2a-7 of the 1940 Act, all securities in the SFT Government Money Market Fund are valued at amortized cost, which approximates market value, in order to attempt to maintain a constant net asset value of $1.00 per share. However, there is no assurance the SFT Government Money Market Fund will maintain the $1.00 net asset value.
Security transactions are accounted for on the date the securities are purchased or sold. Realized gains and losses are calculated using the first in, first out basis. Paydowns of securities are recorded as receivables as of the due date, which varies by the issuer. Dividend income is recognized on the ex-dividend date or upon dividend notification for certain foreign securities, and interest income, including amortization of bond premium and accretion of bond discount computed on an effective yield basis, is accrued daily.
116
Securian Funds Trust
Notes to Financial Statements – continued
(2) Summary of Significant Accounting Policies – (continued)
Foreign Currency Translations and Forward Foreign Currency Contracts
Securities and other assets and liabilities denominated in foreign currencies are translated daily into U.S. dollars at the closing rate of exchange. Foreign currency amounts related to the purchase or sale of securities, income and expenses are translated at the exchange rate on the transaction date.
The Fund isolates the portion of the results of operations resulting from changes in foreign exchange rates on investments from the fluctuations arising from changes in market prices of securities.
Net realized foreign exchange gains or losses arise from sales and maturities of short-term securities, sales of foreign currencies, currency gains or losses realized between trade and settlement dates on security transactions, the difference between the amounts of dividends, interest and foreign withholding taxes recorded on the Fund's books and the U.S. dollar equivalent of the amounts actually received or paid. Net unrealized foreign exchange gains and losses arise from changes in the value of assets and liabilities, other than investments in securities, resulting from changes in the exchange rates.
SFT International Bond Fund may enter into forward foreign currency exchange contracts for operational purposes and to protect against adverse exchange rate fluctuations. A forward foreign currency contract is an agreement between the Fund and a counterparty to buy or sell a foreign currency at a specific exchange rate on a future date. SFT International Bond Fund may also enter into these contracts for purposes of increasing exposure to a foreign currency or to shift exposure to foreign currency fluctuations from one country to another. The net U.S. dollar value of foreign currency underlying all contractual commitments held by SFT International Bond Fund and the resulting unrealized appreciation or depreciation are determined using foreign currency exchange rates from an independent pricing service. SFT International Bond Fund is subject to the credit risk that the other party will not complete the obligations of the contract. The fair values of the forward foreign currency exchange contracts are obtained from an independent pricing source.
Futures Transactions
To gain exposure to, or for protection from market changes, the Funds (excluding the SFT Government Money Market Fund) may buy and sell financial futures contracts traded on any U.S. or foreign exchange. The Funds may also buy and write put and call options on these futures contracts. Risks of entering into futures contracts and related options include the possibility of an illiquid market and that a change in the value of the contract or option may not correlate with changes in the value of the underlying securities.
Upon entering into a futures contract, a Fund is required to deposit either cash or securities in an amount (initial margin) equal to a certain percentage of the contract value as determined by each relevant clearing agency and is aggregated at a Futures Commission Merchant ("FCM") which is registered with the Commodity Futures Trading Commission or the applicable regulator. Subsequent payments (variation margin) are made or received by a Fund each day. The variation margin payments are equal to the daily changes in the contract value and are recorded as unrealized gains and losses. A Fund recognizes a realized gain or loss when the contract is closed or expired. In the event of default, counterparty risk is significantly reduced as creditors to the FCM do not have claim to a Fund's assets in the segregated account. For a listing of open futures contracts see the Investments in Securities for each Fund.
Interest Rate Swaps
The SFT International Bond Fund may enter into interest rate swap contracts primarily to manage interest rate risk. An interest rate swap is an agreement between the Fund and a counterparty to exchange interest rate cash flows during the life of the agreement. Each party's payment obligation is computed based on different interest rates, applied to a notional amount. Interest rate swaps often exchange payments based on a fixed rate for payments linked to a floating rate (i.e. LIBOR).
117
Securian Funds Trust
Notes to Financial Statements – continued
(2) Summary of Significant Accounting Policies – (continued)
These agreements are executed on a registered exchange ("centrally cleared interest rate swaps"), significantly reducing risk from counterparty default. Upon entering into an interest rate swap contract, a Fund is required to pledge an initial margin, and the daily change in fair value is accounted for as a variation margin payable or receivable on the Statement of Assets and Liabilities. Over the term of the contract, contractually required payments to be paid and to be received are accrued daily and recorded as unrealized appreciation and depreciation until the payments are made.
Options Transactions
Each Fund (excluding the SFT Government Money Market Fund) may write (i.e., sell) covered call and secured put options and purchase and sell put and call options written by others. An option is a type of derivative financial instrument. The Funds may invest in derivative financial instruments, including options, in order to manage risk or gain exposure to various other investments or markets. The risk in writing a call option is that the Fund gives up the opportunity for profit if the market price of the security increases. The risk in writing a put option is that a Fund may incur a loss if the market price of the security decreases and the option is exercised.
The risk in buying an option is that the Fund pays a premium whether or not the option is exercised. The Fund also has the additional risk of not being able to enter into a closing transaction if a liquid secondary market does not exist. Option contracts are valued daily and unrealized appreciation or depreciation is recorded. The Fund will realize a gain or loss upon expiration or closing of the option transaction. When an option is exercised, the proceeds on sales for a written call option, the purchase cost for a written put option, or the cost of a security for a purchased put or call option is adjusted by the amount of premium received or paid. The Funds designate collateral consisting of cash, U.S. government securities or other liquid assets sufficient to collateralize the market value of written options.
Repurchase Agreements
Each Fund may enter into repurchase agreements with respect to securities. A repurchase agreement is a transaction in which a Fund acquires a security and simultaneously commits to resell that security to the seller (a bank or securities dealer) at an agreed-upon price on an agreed-upon date. Each Fund requires at all times that the repurchase agreement be collateralized by cash, U.S. Government securities, U.S. Government agencies securities or corporate securities having a value equal to, or in excess of, the value of the repurchase agreement. If the seller of the agreement defaults on its obligation to repurchase the underlying securities at a time when the value of those securities has declined, a Fund may incur a loss upon disposition of the securities. Repurchase agreements are carried at amortized cost. At December 31, 2019, no Funds were invested in repurchase agreements.
Federal Taxes
Each Fund, other than SFT Dynamic Managed Volatility Fund, SFT International Bond Fund, SFT Managed Volatility Equity Fund, and SFT T. Rowe Price Value Fund, qualifies for federal income tax purposes as a partnership under the Internal Revenue Code of 1986, as amended (the "Code"). A Fund is treated, for federal income tax purposes, as a partnership if it has more than one shareholder. A Fund's election to be treated as a partnership is not expected to result in any material adverse federal income tax consequences to any owner of a variable annuity contract or variable life insurance policy, or in the tax treatment of any such contract or policy.
118
Securian Funds Trust
Notes to Financial Statements – continued
(2) Summary of Significant Accounting Policies – (continued)
As a partnership, a Fund is not subject to income tax, and any income, gains, deductions or losses of the Fund will instead pass through and be taken into account for federal income tax purposes by its partners, which will be Minnesota Life and Securian Life through their respective separate accounts. SFT Dynamic Managed Volatility Fund, SFT Managed Volatility Equity Fund and SFT T. Rowe Price Value Fund are treated as disregarded entities for federal income tax purposes. While the Trust anticipates that each Fund other than SFT Dynamic Managed Volatility Fund, SFT Managed Volatility Equity Fund, and SFT T. Rowe Price Value Fund will always have two shareholders, Minnesota Life and Securian Life, a wholly owned subsidiary of Minnesota Life, such ownership could change and accordingly a Fund may at some time have only one shareholder and would be treated as a disregarded entity for federal income tax purposes. A disregarded entity is disregarded for federal income tax purposes as an entity separate from its owner, and the owner is treated as directly owning the assets of the disregarded entity and takes into account for federal income tax purposes the income, gains, deductions and losses relating to those assets.
SFT International Bond Fund qualifies as a regulated investment company for federal income tax purposes. The Fund's policy is to comply with the requirements of subchapter M of the Internal Revenue Code that are applicable to regulated investment companies and to distribute all (or a sufficient amount) of its taxable income and net capital gain to its shareholders. Therefore, no income tax provision is required.
The FASB ASC Topic 740, "Income Taxes" (ASC 740), provides guidance for how uncertain tax positions should be recognized, measured, presented, and disclosed in the financial statements. The Funds have evaluated the implications of ASC 740 for all open tax years, and have determined there is no impact to the Funds' financial statements as of the year ended December 31, 2019. The Funds' federal and state income tax returns for which the applicable statutes of limitations have not expired (2016, 2017, 2018 and 2019) remain subject to examination by the Internal Revenue Service and states department of revenue.
Net investment income (loss) and net realized gains (losses) may differ for financial statement and tax purposes primarily because of temporary book-to-tax differences.
Distributions to Shareholders
Distributions to shareholders from net investment income and realized gains (if any) for the SFT Government Money Market Fund are declared daily and reinvested at month-end in additional shares of capital stock. Distributions to shareholders from net investment income and realized gains (if any) for the SFT International Bond Fund are generally declared and reinvested in additional shares of capital stock on an annual basis. The SFT International Bond Fund uses consent dividends in place of regular distributions. The Funds within the partnership are not required to distribute taxable income, and Funds other than SFT Government Money Market Fund and SFT International Bond Fund will not distribute taxable income.
The federal income tax character of distributions paid to shareholders during the fiscal years ended December 31, 2019 and December 31, 2018 was as follows:
December 31, 2019 | December 31, 2018 | ||||||||||||||||||
| Fund | Ordinary Income | Long-Term Capital Gain | Ordinary Income | Long-Term Capital Gain | |||||||||||||||
SFT International Bond Fund | $ | – | $ | – | $ | – | $ | – | |||||||||||
119
Securian Funds Trust
Notes to Financial Statements – continued
(2) Summary of Significant Accounting Policies – (continued)
At December 31, 2019, as a result of permanent book-to-tax difference, the following reclassification adjustments were made on the Statements of Assets and Liabilities:
Fund | Paid-In Capital | Total Distributable Earnings (Loss) | |||||||||
| SFT International Bond Fund | $ | 6,691,361 | $ | (6,691,361 | ) | ||||||
Distributable Earnings
As of December 31, 2019, the components of distributable earnings on a federal income tax basis were:
Fund | Undistributed Ordinary Income | Undistributed Long-Term Capital Gains | Unrealized Appreciation/ (Depreciation) | Post October Capital/ Late Year Ordinary Loss | Capital Loss Carryforward | ||||||||||||||||||
| SFT International Bond Fund | $ | 5,562,913 | $ | – | $ | (7,729,261 | ) | $ | – | $ | (1,029,920 | ) | |||||||||||
For the year ended December 31, 2019, the SFT International Bond Fund had a foreign tax credit of $122,504 and foreign sourced income of $5,010,758.
Securities Purchased on a When-Issued or Forward Commitment Basis
Delivery and payment for securities which have been purchased or sold by a Fund on a when-issued or forward commitment basis can take place a month or more after the transaction date. During this period, such securities are subject to market fluctuations. As of December 31, 2019, the SFT Core Bond Fund had entered into outstanding, when-issued or forward commitments of $8,457,725. The Fund has segregated assets to cover such when-issued and forward commitments.
Cross-Trades
The Funds are permitted to purchase and sell securities ("cross-trade") from and to other Funds within the Trust as well as outside of the Trust, where both accounts are managed by the same sub-adviser pursuant to "Cross-Trading" procedures adopted by the Board. These procedures have been designed to ensure that any cross-trade of securities by a respective Fund from and to another Fund that is or could be considered an affiliate of the Funds under certain limited circumstances by virtue of having a common investment adviser, common officer, or common trustee complies with Rule 17a-7 of the 1940 Act. Further, as defined under these procedures, each cross-trade is effected at the current market price to save costs where allowed. Pursuant to these procedures, for the year ended December 31, 2019, the Funds engaged in the following cross-trades, which resulted in the following net realized gains (losses):
Purchases | Sales | Net Realized Gains (Losses) | |||||||||||||
SFT T. Rowe Price Value Fund | $ | 566,346 | $ | 44,946 | $ | (25,594 | ) | ||||||||
(3) Investment Security Transactions
The cost of purchases and proceeds from sales of investment securities, other than temporary investments in short-term securities, for the year ended December 31, 2019 were as follows:
Non-U.S. Government | U.S. Government* | ||||||||||||||||||
Fund | Purchases | Sales | Purchases | Sales | |||||||||||||||
| SFT Core Bond Fund | $ | 141,113,997 | $ | 104,692,535 | $ | 485,024,632 | $ | 498,802,837 | |||||||||||
SFT Dynamic Managed Volatility Fund | 10,075,212 | 4,177,817 | – | 230,412 | |||||||||||||||
SFT Index 400 Mid-Cap Fund | 29,536,387 | 63,716,020 | – | – | |||||||||||||||
| SFT Index 500 Fund | 23,042,367 | 118,355,781 | – | – | |||||||||||||||
120
Securian Funds Trust
Notes to Financial Statements – continued
(3) Investment Security Transactions – (continued)
Non-U.S. Government | U.S. Government* | ||||||||||||||||||
Fund | Purchases | Sales | Purchases | Sales | |||||||||||||||
SFT International Bond Fund | $ | 14,826,109 | $ | 12,562,992 | $ | 33,998,152 | $ | – | |||||||||||
SFT IvySM Growth Fund | 152,929,661 | 220,905,543 | – | – | |||||||||||||||
SFT IvySM Small Cap Growth Fund | 77,618,977 | 106,067,602 | – | – | |||||||||||||||
SFT Managed Volatility Equity Fund | 33,692,873 | – | – | – | |||||||||||||||
SFT Real Estate Securities Fund | 72,245,600 | 80,420,255 | – | – | |||||||||||||||
SFT T. Rowe Price Value Fund | 256,615,186 | 277,722,514 | – | – | |||||||||||||||
SFT Wellington Core Equity Fund | 17,233,068 | 27,618,892 | – | – | |||||||||||||||
* Includes U.S. government-sponsored enterprise securities.
(4) Expenses and Related Party Transactions
The Funds have an investment advisory agreement with Securian AM, a wholly-owned subsidiary of Securian Financial Group. Under the advisory agreement, Securian AM manages the Funds' investments and provides research, statistical and advisory services and pays related office rental and executive expenses and salaries.
Each Fund of the Trust pays Securian AM an annual fee, based on average daily net assets, in the following amounts:
Fund | Annual Fee on Net Assets | ||||||
| SFT Core Bond Fund | 0.40% of net assets to $1 billion; and 0.35% of net assets exceeding $1 billion | ||||||
SFT Dynamic Managed Volatility Fund (a) | 0.55% of all assets | ||||||
SFT Government Money Market Fund | 0.30% of net assets to $1 billion; and 0.25% of net assets exceeding $1 billion | ||||||
SFT Index 400 Mid-Cap Fund | 0.15% of net assets to $1 billion; and 0.10% of net assets exceeding $1 billion | ||||||
| SFT Index 500 Fund | 0.15% of net assets to $1 billion; and 0.10% of net assets exceeding $1 billion | ||||||
SFT International Bond Fund | 0.60% of net assets to $1 billion; and 0.55% of net assets exceeding $1 billion | ||||||
SFT IvySM Growth Fund | 0.67% of net assets to $500 million; and 0.625% of next $300 million of net assets; and 0.60% of next $200 million of net assets; and 0.50% of net assets exceeding $1 billion | ||||||
SFT IvySM Small Cap Growth Fund | 0.85% of net assets to $1 billion; and 0.80% of next $2 billion of net assets; and 0.76% of net assets exceeding $3 billion | ||||||
SFT Managed Volatility Equity Fund (a) | 0.55% of all assets | ||||||
SFT Real Estate Securities Fund | 0.70% of net assets to $1 billion; and 0.65% of net assets exceeding $1 billion | ||||||
SFT T. Rowe Price Value Fund | 0.67% of net assets to $1 billion; and 0.65% of next $1.5 billion of net assets; and 0.60% of net assets exceeding $2.5 billion | ||||||
SFT Wellington Core Equity Fund | 0.65% of all assets | ||||||
(a) Effective May 1, 2019, the Fund's investment advisory fee is 0.55% of all assets. Prior to May 1, 2019, the Fund's investment advisory fee was 0.65% of all assets.
Securian AM has a sub-advisory agreement with Franklin Advisers, Inc. ("Franklin"), a Registered Investment Advisor for the SFT International Bond Fund, under which Securian AM pays Franklin an annual fee of 0.37% based on average daily net assets.
Securian AM has a sub-advisory agreement with Ivy Investment Management Company ("IICO"), a Registered Investment Advisor for the SFT IvySM Growth Fund and the SFT IvySM Small Cap Growth Fund, under which Securian AM pays IICO an annual fee ranging from 0.33% to 0.55% and 0.40% to 0.82% respectively, based on average daily net assets.
121
Securian Funds Trust
Notes to Financial Statements – continued
(4) Expenses and Related Party Transactions – (continued)
Securian AM has a sub-advisory agreement with T. Rowe Price Associates, Inc. ("T. Rowe Price"), a Registered Investment Advisor for the SFT T. Rowe Price Value Fund, under which Securian AM pays T. Rowe Price an annual fee ranging from 0.25% to 0.48% based on average daily net assets.
Securian AM has a sub-advisory agreement with Wellington Management Company LLP ("Wellington Management"), a Registered Investment Advisor for the SFT Wellington Core Equity Fund, under which Securian AM pays Wellington Management an annual fee ranging from 0.28% to 0.31% based on average daily net assets.
The Trust bears certain other operating expenses including independent trustees' fees, federal registration fees, printing and shareholder report expenses, legal fees, audit fees, custodian fees, compensation paid to the Trust's Chief Compliance Officer, and other miscellaneous expenses. Each Fund will pay all expenses directly related to its individual operations.
Operating expenses not attributable to a specific Fund are generally allocated based upon the proportionate daily net assets of each Fund.
Administrative Services Fee
The Trust has an agreement with Securian Financial Group under which Securian Financial Group provides accounting, legal, security valuations and other administrative services. Each Fund reimburses Securian Financial Group quarterly for the actual costs incurred in performing such services, as determined in accordance with Securian Financial Group's customary cost accounting procedures consistently applied. Total quarterly administrative fees by Fund range from $6,600 to $25,300.
Accounting Services
The Trust has an agreement with State Street Bank and Trust Company ("State Street") in which State Street provides daily fund accounting and investment administration services. In 2019, these fees ranged from 0.01% to 0.05% of net assets depending on the size and makeup of the respective Fund. The fees are based upon a calculation of multiple factors including base fees, size of assets, and certain other fees.
Distribution Fees
The Trust has adopted a Rule 12b-1 Distribution Plan which covers all of its Class 2 shares ("Covered Funds"). Each Covered Fund pays distribution fees at the annual rate of 0.25% of the average daily net assets of the Covered Fund. These fees are paid out of the Covered Fund's assets, which reduces a Covered Fund's net assets as do other Covered Fund expenses. The fees are paid to Securian Financial Services, Inc. ("Securian Financial"), the Trust's underwriter, to pay for distribution-related expenses and activities in connection with the distribution of the Covered Fund's shares. Securian Financial may also use the fees to pay insurance companies, dealers or others for certain non-distribution services as provided for in the distribution plan.
Net Investment Income Maintenance Agreement for the SFT Government Money Market Fund
Effective May 1, 2012, the Board approved a Restated Net Investment Income Maintenance Agreement among Securian Funds Trust (on behalf of SFT Government Money Market Fund), Securian AM and Securian Financial. Under such Agreement, Securian AM agrees to waive, reimburse or pay SFT Government Money Market Fund expenses so that the Fund's daily net investment income does not fall below zero. Securian Financial may also waive its Rule 12b-1 fees. Securian AM and Securian Financial each has the option under the Agreement to recover the full amount waived, reimbursed or paid (the "Expense Waiver") on any day on which the Fund's net investment income exceeds zero. On any day, however, the Expense Waiver does not constitute an obligation of the Fund unless Securian AM or Securian Financial has expressly exercised its right to recover a
122
Securian Funds Trust
Notes to Financial Statements – continued
(4) Expenses and Related Party Transactions – (continued)
specified portion of the Expense Waiver on that day, in which case such specified portion is then due and payable by the Fund. In addition, the right of Securian AM and/or Securian Financial to recover the Expense Waiver is subject to the following limitations: (1) if a repayment of the Expense Waiver by the Fund would cause the Fund's net investment income to fall below zero, such repayment is deferred until a date when repayment would not cause the Fund's net investment income to fall below zero; (2) the right to recover any portion of the Expense Waiver expires three years after the effective date of that portion of the Expense Waiver; and (3) any repayment of the Expense Waiver by the Fund cannot cause the Fund's expense ratio to exceed 1.25%. For the year ended December 31, 2019, no waivers were made pursuant to the Agreement. As of December 31, 2019, Securian AM and Securian Financial have collectively waived a cumulative total of $4,631,950 pursuant to the Agreement, including expenses waived under the prior agreement with Advantus Series Fund, Inc., of which $77,228 was eligible for recovery by Securian AM and Securian Financial as of such date. Amounts subject to potential recovery for the years ended December 31, 2020 and 2021 are $0. If Securian AM and Securian Financial exercise their rights to be paid such waived amounts, the Fund's future yield will be negatively affected. The Agreement shall continue in effect following April 30, 2021, provided such continuance is specifically approved by a majority of the Trust's independent Trustees.
SFT Dynamic Managed Volatility Fund, SFT Government Money Market Fund, and SFT Managed Volatility Fund Expense Waivers
Securian AM and the Trust, on behalf of the SFT Dynamic Managed Volatility Fund, SFT Government Money Market Fund, and SFT Managed Volatility Equity Fund, have entered into Expense Limitation Agreements which limit the operating expenses of these Funds, excluding certain expenses (such as interest expense, acquired fund fees, cash overdraft fees, taxes, brokerage commissions, other expenditures which are capitalized in accordance with GAAP, and other extraordinary expenses not incurred in the ordinary course of the Fund's business), through April 30, 2021.
The Agreements renew annually for a full year each year thereafter unless terminated by Securian AM upon at least 30 days' notice prior to the end of a contract term. The Funds are authorized to reimburse Securian AM for management fees previously waived and/or for the cost of expenses previously paid by Securian AM pursuant to this agreement, provided that such reimbursement will not cause any Fund to exceed any limits in effect at the time of such reimbursement. The Fund's ability to reimburse Securian AM in this manner only applies to fees waived or reimbursements made by Securian AM within the three fiscal years prior to the date of such reimbursement. To the extent that the Fund makes such reimbursements to Securian AM, the amount of the reimbursements will be reflected in the financial statements in the Funds' shareholder reports and in Other Expenses under Fees and Expenses of the Fund in the prospectus.
As of December 31, 2019, the amounts waived and eligible for recovery are as follows:
Agreement | Expense | Advisory Fees Waived for the Year Ended | Recoverable through December 31, | ||||||||||||||||||||
Fund | Date | Limit | December 31, 2019* | 2020 | 2021 | ||||||||||||||||||
SFT Dynamic Managed Volatility Fund | May 1, 2013 | 0.80 | % | $ | 471,221 | $ | 1,192,541 | $ | 471,221 | ||||||||||||||
SFT Government Money Market Fund | November 1, 2017 | 0.70 | % | $ | 128,729 | $ | 269,089 | $ | 128,729 | ||||||||||||||
SFT Managed Volatility Equity Fund | November 18, 2015 | 0.80 | % | $ | 344,250 | $ | 848,729 | $ | 344,250 | ||||||||||||||
* This amount is reflected in fees waived in the accompanying Statements of Operations.
123
Securian Funds Trust
Notes to Financial Statements – continued
(5) Illiquid Investments
Non-Money Market Funds – Pursuant to Rule 22e-4 under the Investment Company Act of 1940, no Fund may acquire an "illiquid investment" if, immediately after the acquisition, the Fund would have invested more than 15% of its net assets in illiquid investments. Rule 22e-4 generally defines an illiquid investment as any investment that the Fund reasonably expects cannot be sold or disposed of in current market conditions in seven calendar days or less without the sale or disposition significantly changing the market value of the investment. At December 31, 2019, the Funds' did not hold illiquid investments.
Government Money Market Funds – Money market funds are governed by Rule 2a-7 under the Investment Company Act of 1940. By definition, a government money market fund is a fund that invests 99.5% or more of its total assets in cash, government securities, and/or repurchase agreements that are collateralized fully. Consequently, the SFT Government Money Market Fund currently limits investments in "illiquid securities" to 0.5% of net assets at the time of purchase. Rule 2a-7 defines an illiquid security as a security that cannot be sold or disposed of in the ordinary course of business within seven calendar days at approximately the value ascribed to it by the Fund. At December 31, 2019, the Fund did not hold illiquid securities.
(6) Fair Value Measurement
The Trust has established a three-tier hierarchy to maximize the use of observable market data and minimize the use of unobservable inputs when determining fair value. The hierarchy also establishes a classification of fair value measurements for disclosure purposes. Inputs refer broadly to the assumptions that market participants would use in pricing the asset or liability. Inputs may be observable or unobservable. Observable inputs include information market participants would use in pricing the asset or liability based on market data obtained from sources independent of the reporting entity. Unobservable inputs reflect the Trust's estimates about the assumptions market participants would use in valuing the financial asset and liability based on the best information available in the circumstances. Level 1 includes unadjusted quoted prices in active markets for identical assets and liabilities. Level 2 includes other significant observable market-based inputs (including quoted prices for similar securities, interest rates, credit risk and prepayment speed). Level 3 includes unobservable inputs, which may include the advisor's own assumptions in determining the fair value of an investment or are based on independent non-binding broker quotes. Other financial instruments are derivative instruments not reflected in total investments, such as futures, forwards, swaps, and written options.
The following is a summary of the levels used for the year ended December 31, 2019, in valuing the Fund's assets and liabilities (please see the Investments in Securities for each Fund for a listing of all securities within each category):
| Fair Value Measurement at December 31, 2019 using | |||||||||||||||||||
Fund | Level 1 | Level 2 | Level 3 | Total | |||||||||||||||
SFT Core Bond Fund | |||||||||||||||||||
Assets | |||||||||||||||||||
Government Obligations | $ | – | $ | 149,339,113 | $ | – | $ | 149,339,113 | |||||||||||
Asset-Backed Securities | – | 65,325,183 | – | 65,325,183 | |||||||||||||||
Other Mortgage-Backed Securities | – | 65,569,002 | – | 65,569,002 | |||||||||||||||
Corporate Obligations | – | 203,967,076 | – | 203,967,076 | |||||||||||||||
Investment Companies | 9,991,288 | – | – | 9,991,288 | |||||||||||||||
Total Investments | 9,991,288 | 484,200,374 | – | 494,191,662 | |||||||||||||||
Other Financial Instruments* | |||||||||||||||||||
Futures Contracts | 634,771 | – | – | 634,771 | |||||||||||||||
Liabilities | |||||||||||||||||||
Other Financial Instruments* | |||||||||||||||||||
Futures Contracts | (1,002,347 | ) | – | – | (1,002,347 | ) | |||||||||||||
124
Securian Funds Trust
Notes to Financial Statements – continued
(6) Fair Value Measurement – (continued)
| Fair Value Measurement at December 31, 2019 using | |||||||||||||||||||
Fund | Level 1 | Level 2 | Level 3 | Total | |||||||||||||||
SFT Dynamic Managed Volatility Fund | |||||||||||||||||||
Assets | |||||||||||||||||||
Government Obligations | $ | – | $ | 19,327,470 | $ | – | $ | 19,327,470 | |||||||||||
Other Mortgage-Backed Securities | – | 1,614,151 | – | 1,614,151 | |||||||||||||||
Corporate Obligations | – | 166,075,872 | – | 166,075,872 | |||||||||||||||
Purchased Options | 1,004,400 | – | – | 1,004,400 | |||||||||||||||
Investment Companies | 382,779,880 | – | – | 382,779,880 | |||||||||||||||
Total Investments | �� | 383,784,280 | 187,017,493 | – | 570,801,773 | ||||||||||||||
Other Financial Instruments* | |||||||||||||||||||
Futures Contracts | 5,343,026 | – | – | 5,343,026 | |||||||||||||||
Liabilities | |||||||||||||||||||
Other Financial Instruments* | |||||||||||||||||||
Futures Contracts | (21,673 | ) | – | – | (21,673 | ) | |||||||||||||
SFT Government Money Market Fund | |||||||||||||||||||
Assets | |||||||||||||||||||
U.S. Government Obligations | – | 160,850,653 | – | 160,850,653 | |||||||||||||||
Investment Companies | 28,312,054 | – | – | 28,312,054 | |||||||||||||||
Total Investments | 28,312,054 | 160,850,653 | – | 189,162,707 | |||||||||||||||
SFT Index 400 Mid-Cap Fund | |||||||||||||||||||
Assets | |||||||||||||||||||
Common Stocks | 187,416,922 | – | – | 187,416,922 | |||||||||||||||
Investment Companies | 10,486,442 | – | – | 10,486,442 | |||||||||||||||
Total Investments | 197,903,364 | – | – | 197,903,364 | |||||||||||||||
Other Financial Instruments* | |||||||||||||||||||
Futures Contracts | 162,963 | – | – | 162,963 | |||||||||||||||
SFT Index 500 Fund | |||||||||||||||||||
Assets | |||||||||||||||||||
Common Stocks | 897,817,769 | – | – | 897,817,769 | |||||||||||||||
Investment Companies | 16,354,388 | – | – | 16,354,388 | |||||||||||||||
Total Investments | 914,172,157 | – | – | 914,172,157 | |||||||||||||||
Other Financial Instruments* | |||||||||||||||||||
Futures Contracts | 337,133 | – | – | 337,133 | |||||||||||||||
SFT International Bond Fund | |||||||||||||||||||
Assets | |||||||||||||||||||
Long-Term Debt Securities | – | 80,921,148 | – | 80,921,148 | |||||||||||||||
Short-Term Debt Securities | – | 6,857,532 | – | 6,857,532 | |||||||||||||||
Investment Companies | 10,067,135 | – | – | 10,067,135 | |||||||||||||||
Total Investments | 10,067,135 | 87,778,680 | – | 97,845,815 | |||||||||||||||
Other Financial Instruments* | |||||||||||||||||||
Forward Foreign Currency Contracts | – | 967,507 | – | 967,507 | |||||||||||||||
Liabilities | |||||||||||||||||||
Other Financial Instruments* | |||||||||||||||||||
Forward Foreign Currency Contracts | – | (2,846,999 | ) | – | (2,846,999 | ) | |||||||||||||
Interest Rate Swap Contracts | – | (1,623,904 | ) | – | (1,623,904 | ) | |||||||||||||
SFT IvySM Growth Fund | |||||||||||||||||||
Assets | |||||||||||||||||||
Common Stocks | 540,039,158 | – | – | 540,039,158 | |||||||||||||||
Investment Companies | 5,205,439 | – | – | 5,205,439 | |||||||||||||||
Total Investments | 545,244,597 | – | – | 545,244,597 | |||||||||||||||
125
Securian Funds Trust
Notes to Financial Statements – continued
(6) Fair Value Measurement – (continued)
| Fair Value Measurement at December 31, 2019 using | |||||||||||||||||||
Fund | Level 1 | Level 2 | Level 3 | Total | |||||||||||||||
SFT IvySM Small Cap Growth Fund | |||||||||||||||||||
Assets | |||||||||||||||||||
Common Stocks | $ | 171,674,315 | $ | – | $ | – | $ | 171,674,315 | |||||||||||
Investment Companies | 5,175,411 | – | – | 5,175,411 | |||||||||||||||
Total Investments | 176,849,726 | – | – | 176,849,726 | |||||||||||||||
SFT Managed Volatility Equity Fund | |||||||||||||||||||
Assets | |||||||||||||||||||
Investment Companies | 385,767,822 | – | – | 385,767,822 | |||||||||||||||
U.S. Government Obligations | – | 3,500,926 | – | 3,500,926 | |||||||||||||||
Purchased Options | 340,380 | – | – | 340,380 | |||||||||||||||
Total Investments | 386,108,202 | 3,500,926 | – | 389,609,128 | |||||||||||||||
Other Financial Instruments* | |||||||||||||||||||
Futures Contracts | 1,435,340 | – | – | 1,435,340 | |||||||||||||||
SFT Real Estate Securities Fund | |||||||||||||||||||
Assets | |||||||||||||||||||
Common Stocks | 132,787,377 | – | – | 132,787,377 | |||||||||||||||
Investment Companies | 1,013,055 | – | – | 1,013,055 | |||||||||||||||
Total Investments | 133,800,432 | – | – | 133,800,432 | |||||||||||||||
SFT T. Rowe Price Value Fund | |||||||||||||||||||
Assets | |||||||||||||||||||
Common Stocks | 197,227,357 | – | – | 197,227,357 | |||||||||||||||
Preferred Stocks | 2,978,992 | – | – | 2,978,992 | |||||||||||||||
Investment Companies | 980,272 | – | – | 980,272 | |||||||||||||||
Total Investments | 201,186,621 | – | – | 201,186,621 | |||||||||||||||
SFT Wellington Core Equity Fund | |||||||||||||||||||
Assets | |||||||||||||||||||
Common Stocks | 124,374,050 | – | – | 124,374,050 | |||||||||||||||
Investment Companies | 561,232 | – | – | 561,232 | |||||||||||||||
Total Investments | 124,935,282 | – | – | 124,935,282 | |||||||||||||||
* Investments in Other Financial Instruments are derivative instruments reflected in the Investment in Securities. All derivatives currently held are reflected at the gross unrealized appreciation (depreciation) on the investments.
Level 2 Measurements:
Government obligations comprised of U.S. Treasury, agency and government guaranteed fixed maturity securities – These securities are principally valued using the market approach. Valuation is based primarily on quoted prices in markets that are not active or using matrix pricing or other similar techniques using standard market observable inputs such as the benchmark U.S. Treasury yield curve, the spread of the U.S. Treasury curve for the identical security and comparable securities that are actively traded.
Asset-backed and other mortgage-backed securities comprised of RMBS, CMBS and ABS fixed maturity securities – These securities are principally valued using the market approach. Valuation is based primarily on matrix pricing or other similar techniques using standard market inputs including spreads for actively traded securities, spreads off benchmark yields, expected prepayment speeds and volumes, current and forecasted loss severity, rating, weighted average coupon, weighted average maturity, average delinquency rates, geographic region, debt-service coverage ratios and issuance-specific information including: collateral type, payment terms of the underlying assets, payment priority within the tranche, structure of the security, deal performance and vintage of loans, etc.
126
Securian Funds Trust
Notes to Financial Statements – continued
(6) Fair Value Measurement – (continued)
Corporate obligations comprised of U.S. corporate and foreign corporate fixed maturity securities – These securities are principally valued using the market and income approaches. Valuation is based primarily on quoted prices in markets that are not active, or using matrix pricing or other similar techniques that use standard market observable inputs such as benchmark yields, spreads off benchmark yields, new issuances, issuer rating, duration, and trades of identical or comparable securities. Investment grade privately placed securities are valued using discounted cash flow methodologies using standard market observable inputs, and inputs derived from, or corroborated by, market observable data including market yield curve, duration, call provisions, observable prices and spreads for similar publicly traded or privately traded issues that incorporate the credit quality and industry sector of the issuer.
Long-term and short-term debt securities comprised of foreign government and state and political subdivision fixed maturity securities – These securities are principally valued using the market approach. Valuation is based primarily on matrix pricing or other similar techniques using standard market observable inputs including benchmark U.S. Treasury or other yields, issuer ratings, broker-dealer quotes, issuer spreads and reported trades of similar securities, including those within the same sub-sector or with a similar maturity or credit rating.
Forward Foreign Currency and Interest Rate Swap Contracts – These derivatives are traded in the over-the-counter derivative market and are principally valued using market price quotations or industry recognized modeling techniques. The significant inputs to the models are observable in the market or can be derived from or corroborated by observable market data. These significant inputs may include interest rates, foreign currency exchange rates, interest rate curves, contractual terms, market prices, and measures of volatility.
The Funds' policy is to recognize transfers between the levels as of the end of the period. There were no transfers of financial assets between Levels during the period.
(7) Derivative Instruments Reporting
The Trust provides, when applicable, disclosures of the location, by line item, of fair value amounts in the Statement of Assets and Liabilities and the location, by line item, of amounts of gains and losses reported in the Statement of Operations. The derivative instruments outstanding as of period end are disclosed in the Investments in Securities. The following tables represent the average monthly volume of the Fund's derivative transactions during the year ended December 31, 2019:
| Average Notional Amount | |||||||
SFT Core Bond Fund | |||||||
Futures Contracts | $ | 99,261,800 | |||||
SFT Dynamic Managed Volatility Fund | |||||||
Futures Contracts | $ | 148,063,061 | |||||
Written options contracts | $ | 91,784 | (a) | ||||
SFT Index 400 Mid-Cap Fund | |||||||
Futures Contracts | $ | 9,298,225 | |||||
SFT Index 500 Fund | |||||||
Futures Contracts | $ | 14,148,167 | |||||
SFT International Bond Fund | |||||||
Swap contracts | $ | 17,539,333 | |||||
Forward foreign currency contracts | $ | 115,801,376 | |||||
SFT Managed Volatility Fund | |||||||
Futures Contracts | $ | 42,003,189 | |||||
Written options contracts | $ | 155,797 | (b) | ||||
(a) Positions were open for seven months during the period.
(b) Positions were open for nine months during the period.
127
Securian Funds Trust
Notes to Financial Statements – continued
(7) Derivative Instruments Reporting – (continued)
Equity derivatives were purchased or sold to manage the SFT Index 400 Mid-Cap and SFT Index 500 Funds' shareholder liquidity and to attempt to replicate intended stock investments to maintain fully invested Funds. Equity index options are utilized by the SFT Dynamic Managed Volatility Fund and the SFT Managed Volatility Equity Fund to manage the equity exposure while attempting to reduce the volatility and risk of the Funds.
Interest rate derivatives were purchased or sold in the SFT Core Bond Fund, SFT Dynamic Volatility Fund and the SFT International Bond Fund to both manage the average duration of the fixed income portfolio and to hedge against the effects of interest rate changes on a portfolio's current or intended investments.
Foreign exchange derivatives were used to attempt to hedge against the effects of exchange rate changes within the SFT International Bond Fund's current or intended investments in foreign securities, as well as, to more efficiently obtain exposure to foreign currencies or to take advantage of cross currency markets in order to benefit from valuation differentials and shifts in pricing within the currency markets.
The tables below detail the risk exposure of each of the Funds from derivative instruments:
Risk Exposure | |||||||||||||||
| Equity Contracts | Interest Rate Contracts | Foreign Exchange Contracts | |||||||||||||
SFT Core Bond Fund | |||||||||||||||
| Fair Value of Derivative Instruments on the Statement of Assets and Liabilities as of December 31, 2019 | |||||||||||||||
Assets: | |||||||||||||||
Variation margin on futures contracts* | $ | – | $ | 634,771 | $ | – | |||||||||
Liabilities: | |||||||||||||||
Variation margin on futures contracts* | $ | – | $ | (1,002,347 | ) | $ | – | ||||||||
| The Effect of Derivative Instruments on the Statement of Operations for the period ended December 31, 2019 | |||||||||||||||
Net Realized Gain (Loss) on Derivatives: | |||||||||||||||
Futures contracts | $ | – | $ | 2,563,258 | $ | – | |||||||||
Net Change in Unrealized Appreciation (Depreciation) on Derivatives: | |||||||||||||||
Futures contracts | $ | – | $ | (1,257,646 | ) | $ | – | ||||||||
SFT Dynamic Managed Volatility Fund | |||||||||||||||
| Fair Value of Derivative Instruments on the Statement of Assets and Liabilities as of December 31, 2019 | |||||||||||||||
Assets: | |||||||||||||||
Variation margin on futures contracts* | $ | 5,019,466 | $ | 323,560 | $ | – | |||||||||
Investments in securities, at market value (purchased options) | 1,004,400 | – | – | ||||||||||||
Total | $ | 6,023,866 | $ | 323,560 | $ | – | |||||||||
Liabilities: | |||||||||||||||
Variation margin on futures contracts* | $ | – | $ | (21,673 | ) | $ | – | ||||||||
| The Effect of Derivative Instruments on the Statement of Operations for the period ended December 31, 2019 | |||||||||||||||
Net Realized Gain (Loss) on Derivatives: | |||||||||||||||
Futures contracts | $ | 10,319,095 | $ | (2,231,233 | ) | $ | – | ||||||||
Purchased options contracts | 7,595,848 | – | – | ||||||||||||
Written options contracts | (433,395 | ) | – | – | |||||||||||
Total | $ | 17,481,548 | $ | (2,231,233 | ) | $ | – | ||||||||
128
Securian Funds Trust
Notes to Financial Statements – continued
(7) Derivative Instruments Reporting – (continued)
Risk Exposure | |||||||||||||||
| Equity Contracts | Interest Rate Contracts | Foreign Exchange Contracts | |||||||||||||
Net Change in Unrealized Appreciation (Depreciation) on Derivatives: | |||||||||||||||
Futures contracts | $ | 4,084,912 | $ | 782,079 | $ | – | |||||||||
Purchased options contracts | (753,071 | ) | – | – | |||||||||||
Total | $ | 3,331,841 | $ | 782,079 | $ | – | |||||||||
SFT Index 400 Mid-Cap Fund | |||||||||||||||
| Fair Value of Derivative Instruments on the Statement of Assets and Liabilities as of December 31, 2019 | |||||||||||||||
Assets: | |||||||||||||||
Variation margin on futures contracts* | $ | 162,963 | $ | – | $ | – | |||||||||
| The Effect of Derivative Instruments on the Statement of Operations for the period ended December 31, 2019 | |||||||||||||||
Net Realized Gain (Loss) on Derivatives: | |||||||||||||||
Futures contracts | $ | 1,333,848 | $ | – | $ | – | |||||||||
Net Change in Unrealized Appreciation (Depreciation) on Derivatives: | |||||||||||||||
Futures contracts | $ | 707,757 | $ | – | $ | – | |||||||||
SFT Index 500 Fund | |||||||||||||||
| Fair Value of Derivative Instruments on the Statement of Assets and Liabilities as of December 31, 2019 | |||||||||||||||
Assets: | |||||||||||||||
Variation margin on futures contracts* | $ | 337,133 | $ | – | $ | – | |||||||||
| The Effect of Derivative Instruments on the Statement of Operations for the period ended December 31, 2019 | |||||||||||||||
Net Realized Gain (Loss) on Derivatives: | |||||||||||||||
Futures contracts | $ | 2,210,006 | $ | – | $ | – | |||||||||
Net Change in Unrealized Appreciation (Depreciation) on Derivatives: | |||||||||||||||
Futures contracts | $ | 772,601 | $ | – | $ | – | |||||||||
SFT International Bond Fund | |||||||||||||||
| Fair Value of Derivative Instruments on the Statement of Assets and Liabilities as of December 31, 2019 | |||||||||||||||
Assets: | |||||||||||||||
Unrealized appreciation on forward foreign currency contracts | $ | – | $ | – | $ | 967,507 | |||||||||
Liabilities: | |||||||||||||||
Unrealized depreciation on forward foreign currency contracts | $ | – | $ | – | $ | (2,846,999 | ) | ||||||||
Variation margin on swap contracts* | – | (1,623,904 | ) | – | |||||||||||
Total | $ | – | $ | (1,623,904 | ) | $ | (2,846,999 | ) | |||||||
| The Effect of Derivative Instruments on the Statement of Operations for the period ended December 31, 2019 | |||||||||||||||
Net Realized Gain (Loss) on Derivatives: | |||||||||||||||
Swap contracts | $ | – | $ | (1,056,250 | ) | $ | – | ||||||||
Foreign currency contracts | – | – | 4,095,973 | ||||||||||||
Total | $ | – | $ | (1,056,250 | ) | $ | 4,095,973 | ||||||||
129
Securian Funds Trust
Notes to Financial Statements – continued
(7) Derivative Instruments Reporting – (continued)
Risk Exposure | |||||||||||||||
| Equity Contracts | Interest Rate Contracts | Foreign Exchange Contracts | |||||||||||||
Net Change in Unrealized Appreciation (Depreciation) on Derivatives: | |||||||||||||||
Swap contracts | $ | – | $ | (1,809,465 | ) | $ | – | ||||||||
Foreign currency contracts | – | – | (2,584,109 | ) | |||||||||||
Total | $ | – | $ | (1,809,465 | ) | $ | (2,584,109 | ) | |||||||
SFT Managed Volatility Equity Fund | |||||||||||||||
| Fair Value of Derivative Instruments on the Statement of Assets and Liabilities as of December 31, 2019 | |||||||||||||||
Assets: | |||||||||||||||
Variation margin on futures contracts* | $ | 1,435,340 | $ | – | $ | – | |||||||||
Investments in securities, at market value (purchased options) | 340,380 | – | – | ||||||||||||
Total | $ | 1,775,720 | $ | – | $ | – | |||||||||
| The Effect of Derivative Instruments on the Statement of Operations for the period ended December 31, 2019 | |||||||||||||||
Net Realized Gain (Loss) on Derivatives: | |||||||||||||||
Futures contracts | $ | (6,524,124 | ) | $ | – | $ | – | ||||||||
Investments (purchased options contracts) | 2,104,388 | – | – | ||||||||||||
Written options contracts | (960,520 | ) | – | – | |||||||||||
Total | $ | (5,380,256 | ) | $ | – | $ | – | ||||||||
Net Change in Unrealized Appreciation (Depreciation) on Derivatives: | |||||||||||||||
Futures contracts | $ | 4,140,160 | $ | – | $ | – | |||||||||
Purchased options contracts | 547,027 | – | – | ||||||||||||
Written options contracts | (179,854 | ) | – | – | |||||||||||
Total | $ | 4,507,333 | $ | – | $ | – | |||||||||
* Includes cumulative appreciation/depreciation of futures and swap contracts as reported in the notes to the Schedules of Investments in Securities. Only the current day's variation margin is reported within the Statement of Assets and Liabilities.
The Funds may be exposed to credit-related losses in the event of nonperformance by counterparties to derivative financial instruments. The Funds manage credit risk related to derivatives by entering into transactions with highly rated counterparties. Generally, the current credit exposure of the derivative contracts is limited to the positive estimated fair value of derivative contracts at the reporting date after taking into consideration the existence of netting arrangements and any collateral received pursuant to credit support annexes. Because exchange traded derivatives are purchased through regulated exchanges and positions are settled regularly, the Funds have minimal exposure to credit-related losses in the event of nonperformance by counterparties to such derivative instruments. For the year ended December 31, 2019 none of the Funds' derivatives were subject to master netting arrangements.
130
Securian Funds Trust
Notes to Financial Statements – continued
(8) Affiliated Ownership
The SFT Dynamic Managed Volatility Fund invests in underlying securities and other investment companies, of which certain underlying funds (the "affiliated underlying funds") may be deemed to be under common control with the SFT Dynamic Managed Volatility Fund because they share the same investment advisor, Securian AM, and because they are overseen by the same Board of Trustees. The SFT Dynamic Managed Volatility Fund will achieve its equity exposure by investing primarily in Class 1 Shares of the SFT Index 500 Fund, an affiliated fund in the Trust that seeks investment results that correspond generally to the price and yield performance of the common stocks included in the Standard & Poor's 500® Index. A summary of all transactions with the affiliated SFT Index 500 Fund as of December 31, 2019 are as follows:
Fund/Underlying Fund | Balance of Shares Held at December 31, 2019 | Net Realized Gain/(Loss) | Net Change in Unrealized Appreciation/ Depreciation | Distributions Received | Value at December 31, 2019 | ||||||||||||||||||
SFT Dynamic Managed Volatility Fund | |||||||||||||||||||||||
| SFT Index 500 Fund | 14,224,618 | $ | — | $ | 45,016,748 | $ | — | $ | 189,313,819 | ||||||||||||||
(9) Recent Accounting Pronouncements
In March 2017, the FASB issued Accounting Standards Update ("ASU") No. 2017-08 Premium Amortization on Purchased Callable Debt Securities, which amends the accounting standards to shorten the amortization period of certain purchased callable debt securities to the earliest call date. The ASU is effective for annual and interim periods beginning after December 15, 2019. The adoption of ASU 2017-08 had no impact on the financial statements.
In August 2018, the FASB issued ASU No. 2018-13 Disclosure Framework—Changes to the Disclosure Requirements for Fair Value Measurement, which amends and eliminates certain disclosure requirements for fair value as part of its framework project. The ASU is effective for annual periods beginning after December 15, 2019. The Funds' have adopted ASU No. 2018-13.
(10) Subsequent Events
Management has evaluated subsequent events for the Trust through the date of the filing, and has concluded there are no events that require disclosure.
131
Securian Funds Trust
Other Information
(unaudited)
Fund Expenses Paid by Shareholders
Shareholders of the Trust incur two types of costs: (1) transaction costs, including sales charges (loads) on purchase payments, reinvested dividends, or other distributions; redemption fees; (the Trust does not impose transaction costs, but you will incur such costs in connection with the variable life insurance policies and variable annuity contracts that invest in the Funds) and exchange fees; and (2) ongoing costs, including management fees; distribution and/or service (12b-1) fees; and other Trust expenses. The examples below are intended to help you understand your ongoing costs (in dollars) of investing in the Funds and to compare these costs with the ongoing costs of investing in other mutual funds.
The examples below are based on an investment of $1,000 invested at the beginning of the period and held for the entire period, July 1, 2019 through December 31, 2019. Expenses paid during the period in the tables below are equal to the Fund's annualized expense ratio, multiplied by the average account value over the period, multiplied by number of days in most recent fiscal half-year divided by 365 to reflect the entire year.
Actual Expenses
The table below provides information about actual account values and actual expenses for the Funds. You may use the information in this table, together with the amount you invested, to estimate the expenses that you paid over the period. Simply divide your account value by $1,000 (for example, an $8,600 account value divided by $1,000 = 8.6), then multiply the result by the number in the table for the fund you own under the heading entitled "Expenses Paid During Period" to estimate the expenses you paid on your account during this period.
Actual Expenses | |||||||||||||||||||||||||||||||
CLASS 1 | CLASS 2 | ||||||||||||||||||||||||||||||
| Beginning Account Value | Ending Account Value | Annual Expense Ratio | Expenses Paid During Period | Ending Account Value | Annual Expense Ratio | Expenses Paid During Period | |||||||||||||||||||||||||
| SFT Core Bond Fund | $ | 1,000 | $ | 1,023.50 | 0.48 | % | $ | 2.45 | $ | 1,022.20 | 0.73 | % | $ | 3.72 | |||||||||||||||||
| SFT Dynamic Managed Volatility Fund | 1,000 | NA | NA | NA | 1,062.50 | 0.80 | % | 4.16 | |||||||||||||||||||||||
| SFT Government Money Market Fund | 1,000 | NA | NA | NA | 1,006.40 | 0.70 | % | 3.54 | |||||||||||||||||||||||
SFT Index 400 Mid-Cap Fund | 1,000 | 1,068.40 | 0.29 | % | 1.51 | 1,067.00 | 0.54 | % | 2.81 | ||||||||||||||||||||||
| SFT Index 500 Fund | 1,000 | 1,108.20 | 0.20 | % | 1.06 | 1,106.90 | 0.45 | % | 2.39 | ||||||||||||||||||||||
SFT International Bond Fund | 1,000 | 986.20 | 1.01 | % | 5.06 | 985.00 | 1.26 | % | 6.30 | ||||||||||||||||||||||
SFT IvySM Growth Fund | 1,000 | NA | NA | NA | 1,101.80 | 0.97 | % | 5.14 | |||||||||||||||||||||||
| SFT IvySM Small Cap Growth Fund | 1,000 | NA | NA | NA | 995.30 | 1.23 | % | 6.19 | |||||||||||||||||||||||
| SFT Managed Volatility Equity Fund | 1,000 | NA | NA | NA | 1,053.30 | 0.80 | % | 4.14 | |||||||||||||||||||||||
| SFT Real Estate Securities Fund | 1,000 | 1,076.90 | 0.88 | % | 4.61 | 1,075.50 | 1.13 | % | 5.91 | ||||||||||||||||||||||
| SFT T. Rowe Price Value Fund | 1,000 | NA | NA | NA | 1,070.90 | 1.05 | % | 5.48 | |||||||||||||||||||||||
| SFT Wellington Core Equity Fund | 1,000 | 1,118.40 | 0.86 | % | 4.59 | 1,117.00 | 1.11 | % | 5.92 | ||||||||||||||||||||||
132
Securian Funds Trust
Other Information – continued
(unaudited)
Hypothetical Example for Comparison Purposes
The table below also provides information about hypothetical account values and hypothetical expenses based on the Funds' actual expense ratios and an assumed rate of return of 5% per year before expenses, which are not the Funds' actual returns. The hypothetical account values and expenses may not be used to estimate the actual ending account balance or expenses you paid for the year. You may use this information to compare the ongoing costs of investing in the Funds' and other funds. To do so, compare the 5% hypothetical example of the funds you own with the 5% hypothetical examples that appear in the shareholder reports of other similar funds.
Hypothetical Expenses | |||||||||||||||||||||||||||||||
CLASS 1 | CLASS 2 | ||||||||||||||||||||||||||||||
| Beginning Account Value | Ending Account Value | Annual Expense Ratio | Expenses Paid During Period | Ending Account Value | Annual Expense Ratio | Expenses Paid During Period | |||||||||||||||||||||||||
| SFT Core Bond Fund | $ | 1,000 | $ | 1,022.79 | 0.48 | % | $ | 2.45 | $ | 1,021.53 | 0.73 | % | $ | 3.72 | |||||||||||||||||
| SFT Dynamic Managed Volatility Fund | 1,000 | NA | NA | NA | 1,021.17 | 0.80 | % | 4.08 | |||||||||||||||||||||||
| SFT Government Money Market Fund | 1,000 | NA | NA | NA | 1,021.68 | 0.70 | % | 3.57 | |||||||||||||||||||||||
SFT Index 400 Mid-Cap Fund | 1,000 | 1,023.74 | 0.29 | % | 1.48 | 1,022.48 | 0.54 | % | 2.75 | ||||||||||||||||||||||
| SFT Index 500 Fund | 1,000 | 1,024.20 | 0.20 | % | 1.02 | 1,022.94 | 0.45 | % | 2.29 | ||||||||||||||||||||||
SFT International Bond Fund | 1,000 | 1,020.11 | 1.01 | % | 5.14 | 1,018.85 | 1.26 | % | 6.41 | ||||||||||||||||||||||
SFT IvySM Growth Fund | 1,000 | NA | NA | NA | 1,020.32 | 0.97 | % | 4.94 | |||||||||||||||||||||||
| SFT IvySM Small Cap Growth Fund | 1,000 | NA | NA | NA | 1,019.00 | 1.23 | % | 6.26 | |||||||||||||||||||||||
| SFT Managed Volatility Equity Fund | 1,000 | NA | NA | NA | 1,021.17 | 0.80 | % | 4.08 | |||||||||||||||||||||||
| SFT Real Estate Securities Fund | 1,000 | 1,020.77 | 0.88 | % | 4.48 | 1,019.51 | 1.13 | % | 5.75 | ||||||||||||||||||||||
| SFT T. Rowe Price Value Fund | 1,000 | NA | NA | NA | 1,019.91 | 1.05 | % | 5.35 | |||||||||||||||||||||||
| SFT Wellington Core Equity Fund | 1,000 | 1,020.87 | 0.86 | % | 4.38 | 1,019.61 | 1.11 | % | 5.65 | ||||||||||||||||||||||
Please note that the expenses shown in both tables are meant to highlight your ongoing costs only and do not reflect any transactional costs, such as sales charges (loads), redemption fees, or exchange fees. Therefore, the information provided in the hypothetical example table is useful in comparing ongoing costs only, and will not help you determine the relative total costs of owning different funds. In addition, if these transactional costs were included, your costs would have been higher.
Proxy Voting Policies and Procedures
A description of the policies and procedures that Securian AM uses to vote proxies related to each Fund's portfolio securities is set forth in the Trust's Statement of Additional Information which is available without charge, upon request, by calling, toll-free, 800-995-3850 or on the Securities and Exchange Commission's website at www.sec.gov. The Trust will provide this document within three business days of receipt of a request, by first-class mail or other means designed to ensure equally prompt delivery.
133
Securian Funds Trust
Other Information – continued
(unaudited)
Proxy Voting Record
The Trust's proxy voting record for the 12 month period ended December 31 is available by calling, toll-free, 866-330-7355 or on the Securities and Exchange Commission's website at www.sec.gov no later than August 31 each year. The Trust will also provide this information, within three business days of receipt of a request, by first-class mail or other means designed to ensure equally prompt delivery.
Availability of Quarterly Schedule of Investments
The Trust files its complete schedule of investment holdings with the SEC for the first and third quarters of each fiscal year on Form N-PORT. Previously, the Trust filed a complete schedule of portfolio holdings with the SEC for the first and third quarters of each fiscal year on Form N-Q. The Trust's Forms N-PORT and N-Q are available on the SEC's website at www.sec.gov.
134
Securian Funds Trust
Trustees and Executive Officers
(unaudited)
Under Delaware law, the Board of Trustees of the Trust has overall responsibility for managing the Trust in good faith and in a manner reasonably believed to be in the best interests of the Trust. The Trustees meet periodically throughout the year to oversee the Trust's activities, review contractual arrangements with companies that provide services to the Trust, and review the performance of the Trust and its Funds. One of the four current Trustees is considered an "interested person" (as defined in the Investment Company Act of 1940) of the Trust. The other three Trustees, because they are not interested persons of the Trust, are considered independent ("Independent Trustees") and are not employees or officers of, and have no financial interest in, the Trust's investment adviser, Securian Asset Management, Inc. (Securian AM) or its affiliated companies, including Minnesota Life Insurance Company. 75% of the Board of Trustees is required to be comprised of Independent Trustees.
Only executive officers and other officers who perform policy-making functions with the Trust are listed. None of the Trustees is a director of any public company (a company required to file reports under the Securities Exchange Act of 1934) or of any registered investment companies other than the Trust. Each Trustee serves for an indefinite term, until his or her resignation, death or removal.
Position with Trust
Name, Address(1) and Length of Principal Occupation(s)
and Year of Birth, Time Served(2) During Past 5 Years
Independent Trustees
Julie K. Getchell 1954 Trustee since 2011
Retired; Senior Financial Consultant Cargill, 2009-2012; Chief Financial Officer, La Grosse Global Fund Services, 2007-2009; Senior Managing Director, Black River Asset Management, 2005-2007; Consultant, Black River Asset Management, 2004-2005; Chief Financial Officer, Prestige Resorts & Destinations, 2001-2003; Chief Operating Officer, Insight Investment Management, Inc., 1991-1996; Chartered Financial Analyst; CPA—inactive
Linda L. Henderson 1949 Trustee since 2007
Retired: Professional Adviser, Carlson School of Management, working with faculty and MBA students managing Carlson Growth Fund. Semi-retirement, 2004-2007. RBC Wealth Management (formerly Dain Bosworth and Dain Rauscher) 1985-2004. Senior Vice President and Director of Fixed Income Research and Strategies, 2000-2004. Director of Retail Fixed Income. 1996-2000. Director of Financial Services, 1994-1996. Manager of the Investment Management Group, 1992-1994. Consultant, Investment Management Group, 1991-1992. Investment Executive, 1985-1991. Assistant Professor of Business Administration/Finance, University of Wisconsin-River Falls, 1980-1985. Chartered Financial Analyst
William C. Melton 1947 Trustee since 2002
Retired; member, State of Minnesota Council of Economic Advisors from 1988 to 1994, and again from 2010 to the present; various senior positions at American Express Financial Advisors (formerly Investors Diversified Services and, thereafter, IDS/American Express) from 1982 through 1997, including Chief Economist and, thereafter, Chief International Economist
Interested Trustee and Principal Executive Officer
David M. Kuplic 1957 Trustee since 2016 and President since 2011
Senior Vice President, Minnesota Life Insurance Company since June 2007; President, Securian AM since 2017; Executive Vice President and Director, Securian AM since July 2007; Senior Vice President and Director, Advantus Capital Management, Inc., February 2006 to July 2007; Senior Vice President, Securian Financial Group, Inc. since June 2007; President and Director, MIMLIC Funding, Inc. (entity holding legal title to bonds beneficially owned by certain clients of Securian AM) since July 2007; Senior Vice President, Securian Life Insurance Company since June 2007; President and Director, Marketview Properties, LLC (entity holding real
135
Securian Funds Trust
Trustees and Executive Officers – continued
(unaudited)
estate assets) since January 2010; President and Director, Marketview Properties II, LLC (entity holding real estate assets) since March 2010; President and Director, Marketview Properties III, LLC since January 2012; President, Marketview Properties IV, LLC since January 2012
Other Executive Officers(3)
Gary M. Kleist 1959 Vice President and Treasurer since 2003
Financial Vice President, Chief of Operations and Director, Securian AM since December 1997; Second Vice President, Minnesota Life Insurance Company since February 2000; Second Vice President, Securian Financial Group, Inc. since February 2000; Second Vice President, Securian Life Insurance Company since June 2007; Financial Vice President, Marketview Properties, LLC since January 2010; Financial Vice President, Marketview Properties II, LLC (entities holding certain real estate assets) since March 2010; Financial Vice President, Marketview Properties III, LLC since January 2012; Financial Vice President, Marketview Properties IV, LLC since January 2012
Daniel H. Kruse 1963 Vice President since 2017
Vice President, Minnesota Life Insurance Company since February 2015; Vice President, Securian Life Insurance Company since February 2015; Vice President, Securian Financial Group since 2015; Second Vice President, Minnesota Life Insurance Company, February 2008 to January 2015; Second Vice President, Securian Life Insurance Company, February 2008 to January 2015; Second Vice President, Securian Financial Group, February 2008 to January 2015
Michael J. Radmer 1945 Secretary since 1998
Senior Counsel with the law firm of Dorsey & Whitney LLP since January 2016; Partner from 1976 to December 2015
Dorsey & Whitney LLP
50 South Sixth Street
Minneapolis, Minnesota 55402
(1) Unless otherwise noted, the address of each Trustee and officer is the address of the Trust: 400 Robert Street North, St. Paul, Minnesota 55101.
(2) The years reflect when a person became a director or officer of Advantus Series Fund, the predecessor to the Trust.
(3) Although not a 'corporate' officer of the Trust, Michael Steinert, 1975, serves as the Trust's Chief Compliance Officer. Mr. Steinert also serves as Vice President and Chief Compliance Officer of Securian AM.
136
This offering is available through Securian Financial Services, Inc., a registered broker/dealer. Securian Financial Services, Inc. is the distributor of Minnesota Life and Securian Life variable insurance products.
This report may be used as sales literature in connection with the offer or sale of variable annuity or variable life insurance contracts funded by Securian Funds Trust ("Trust") if preceded or accompanied by (a) the current prospectus for the Trust and such contracts and (b) the current applicable variable annuity or variable life performance report.

Securian Financial Services, Inc.
www.securian.com
Securities Dealer, Member FINRA/SIPC.
Registered Investment Advisor
400 Robert Street North, St. Paul, MN 55101-2098
1.888.237.1838
F38897 Rev 2-2020
Minnesota Life Insurance Company
A Securian Company
Securian Life Insurance Company
A New York admitted insurer
400 Robert Street North
St. Paul, MN 55101-2098
PRESORTED STANDARD
U.S. POSTAGE PAID
CAROL STREAM, IL
PERMIT NO. 1480

©2019 Securian Funds Trust All rights reserved.
F38897 Rev 2-2020
Call 1-800-995-3850 to receive your financial documents electronically. It's fast and convenient.
ITEM 2. CODE OF ETHICS.
Filed herewith as Exhibit 12(a)(1). During the period covered by this report, there has been no amendment to the code of ethics that relates to any element of the code of ethics definition set forth in paragraph (b) of Item 2 of Form N-CSR, nor has the registrant granted a waiver, including an implicit waiver, from a provision of the code of ethics to the registrant’s principal executive officer, principal financial officer, principal accounting officer or controller, or persons performing similar functions that relates to one or more of the items set forth in paragraph (b) of Item 2 of form N-CSR.
ITEM 3. AUDIT COMMITTEE FINANCIAL EXPERT.
The Board of Trustees of the Trust has determined that Julie K. Getchell, a member of the Board’s Audit Committee, possesses the technical attributes identified in Instruction 2(b) of Item 3 to Form N-CSR to qualify as an “audit committee financial expert,” and has designated Ms.
Getchell as the Audit Committee’s financial expert. Ms. Getchell is an “independent” Trustee pursuant to paragraph (a)(2) of Item 3 to Form N-CSR.
ITEM 4. PRINCIPAL ACCOUNTANT FEES AND SERVICES.
(a) Audit Fees
The aggregate fees billed for each of the last two fiscal years for professional services rendered by the principal accountant to the registrant for the audit of the registrant’s annual financial statements or services that are normally provided by the accountant in connection with statutory and regulatory filings or engagements for those fiscal years were as follows:
2019 |
| 2018 |
| ||
$ | 322,606 |
| $ | 317,838 |
|
(b) Audit-Related Fees
The aggregate fees billed in each of the last two fiscal years for assurance and related services rendered by the principal accountant to the registrant that are reasonably related to the performance of the audit of the registrant’s financial statements and are not reported under paragraph (a) of this Item 4 were as follows:
2019 |
| 2018 |
| ||
$ | — |
| $ |
|
|
There were no fees billed in each of the last two fiscal years for assurance and related services rendered by the principal accountant to the registrant’s investment adviser or to any entity controlling, controlled by or under common control with the investment adviser that provides ongoing services to the registrant that were required to be pre-approved by the audit committee pursuant to paragraph (c)(7)(ii) of Rule 2-01 of Regulation S-X.
(c) Tax Fees
The aggregate fees billed in each of the last two fiscal years for professional services rendered by the principal accountant to the registrant for tax compliance, tax advice, tax planning and tax return preparation were as follows:
2019 |
| 2018 |
| ||
$ | — |
| $ | 7,300 |
|
There were no fees billed in each of the last two fiscal years for professional services rendered by the principal accountant to the investment adviser or to any entity controlling, controlled by or under common control with the investment adviser that provides ongoing services to the registrant for tax compliance, tax advice and tax planning that were required to be pre-approved by the audit committee pursuant to paragraph (c)(7)(ii) of Rule 2-01 of Regulation S-X.
(d) All Other Fees
The aggregate fees billed in each of the last two fiscal years for products and services provided by the principal accountant to the registrant, other than the services reported in paragraphs (a) — (c) of this Item 4 were as follows:
2019 |
| 2018 |
| ||
$ | — |
| $ | 24,874 |
|
There were no fees billed in each of the last two fiscal years for products and services provided by the principal accountant to the investment adviser or to any entity controlling, controlled by or under common control with the investment adviser that provides ongoing services to the registrant, other than the services reported in paragraphs (a) — (c) of this Item 4, that were required to be pre-approved by the audit committee pursuant to paragraph (c)(7)(ii) of Rule 2-01 of Regulation S-X.
(e)(1) Registrant’s audit committee has adopted the following pre-approval policies and procedures in accordance with paragraph (c)(7) of Rule 2-01 of Regulation S-X:
SECURIAN FUNDS TRUST
AUDIT COMMITTEE POLICY
Regarding Pre-Approval of Services Provided by the Independent Auditor
The Audit Committee (the “Committee”) of the Securian Funds Trust (the “Trust”) has responsibility for ensuring that all services performed by the independent audit firm (the “Auditor”) for the Trust do not impair the Auditor’s independence. This review is intended to provide reasonable oversight without removing management from its responsibility for day-to-day operations. In this regard, the Committee should:
· Understand the nature of the professional services expected to be provided and their impact on the Auditor’s independence and audit quality
· Examine and evaluate the safeguards put into place by the Trust and the Auditor to safeguard independence
· Meet semi-annually with the engagement partner of the Auditor
· Consider approving categories of service that are not deemed to impair independence for a one-year period
It is important that a qualitative rather than a mere quantitative evaluation be performed by the Committee in discharging its responsibilities.
Policy for Audit and Non-Audit Services Provided to the Trust
On an annual basis, the Committee will review and consider whether to pre-approve the financial plan for audit fees as well as categories of audit-related and non-audit services that may be performed by the Auditor directly for the Trust. At least annually the Committee will receive a report from the Auditor of all audit and non-audit services, which were approved during the year.
The engagement of the Auditor for any non-audit service requires the written pre-approval of the Trust’s Treasurer, and all non-audit services performed by the Auditor will be disclosed in the required SEC periodic filings.
In connection with the Committee review and pre-approval responsibilities, the review by the Committee will consist of the following:
Audit Services
The categories of audit services and related fees to be reviewed and considered for pre-approval annually by the Committee or its delegate include the following:
· Annual Trust financial statement audits
· SEC and regulatory filings and consents
Audit-related Services
In addition, the following categories of audit-related services are deemed to be consistent with the role of the Auditor and, as such, will be considered for pre-approval by the Committee or its delegate, on an annual basis.
· Accounting consultations
· Trust merger support services
· Other accounting related matters
· Agreed Upon Procedure Reports
· Attestation Reports
· Other Internal Control Reports
Notwithstanding any annual pre-approval of these categories of services, individual projects with an estimated fee of $20,000 or more are subject to pre-approval by the Committee on a case-by-case basis. Individual projects with an estimated fee of less than $20,000 are subject to pre-approval by the then-serving Chair of the Committee on a case-by-case basis. The Chair shall thereafter report to the full Committee on any such matters at the Committee’s next regularly scheduled meeting.
Tax Services
The following categories of tax services are deemed to be consistent with the role of the Auditor and, as such, will be considered for pre-approval by the Committee or its delegate, on an annual basis.
· Tax compliance services related to the filing or amendment of the following:
· Federal, state and local income tax compliance; and,
· Sales and use tax compliance
· Timely RIC qualification reviews
· Tax distribution analysis and planning
· Tax authority examination services
· Tax appeals support services
· Accounting methods studies
· Trust merger support services
· Tax consulting services and related projects
Notwithstanding any annual pre-approval of these categories of services, individual projects with an estimated fee of $20,000 or more are subject to pre-approval by the Committee on a case-by-case basis. Individual projects with an estimated fee of less than $20,000 are subject to pre-approval by the then-serving Chair of the Committee on a case-by-case basis. The Chair shall thereafter report to the full Committee on any such matters at the Committee’s next regularly scheduled meeting.
Other Non-audit Services
The SEC auditor independence rules adopted in response to the Sarbanes-Oxley Act specifically allow certain non-audit services. Because of the nature of these services, none of these services may be commenced by the Auditor without the prior approval of the Committee. The Committee may delegate this responsibility to one or more of the Committee members, with the decisions presented to the full Committee at the next scheduled meeting.
Proscribed Services
In accordance with SEC rules on independence, the Auditor is prohibited from performing services in the following categories of non-audit services:
· Management functions
· Accounting and bookkeeping services
· Internal audit services
· Financial information systems design and implementation
· Valuation services supporting the financial statements
· Actuarial services supporting the financial statements
· Executive recruitment
· Expert services (e.g., litigation support)
· Investment banking
Policy for Pre approval of Non-Audit Services Provided to Other Affiliated Entities
The Committee is also responsible for pre-approving certain non-audit services provided to Securian Asset Management Inc. (“Securian AM”) and any other entity under common control with Securian AM that provides ongoing services to the Trust. The only non-audit services provided to these entities which require pre-approval are those services that relate directly to the operations and financial reporting of the Trust.
Although the Committee is not required to pre-approve all services provided to Securian AM and affiliated service providers, the Committee will annually receive a report from the Auditor on the aggregate fees for all services provided to Securian AM and its affiliates.
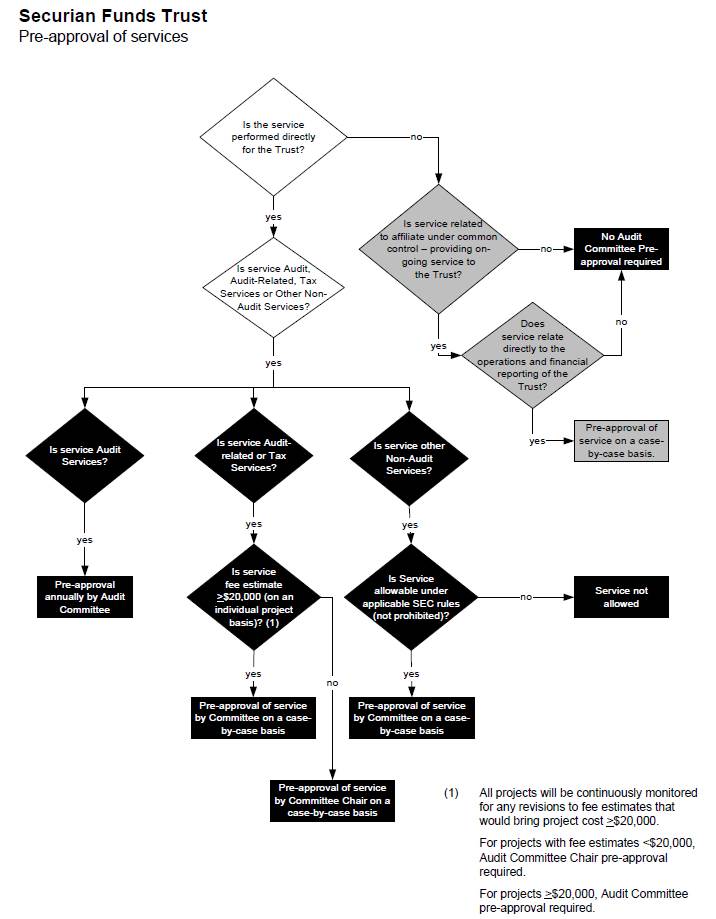
(e)(2) None of the services provided to the registrant described in paragraphs (b) — (d) of this Item 4 were pre-approved by the audit committee pursuant to paragraph (c)(7)(i)(C) of Rule 2-01 of Regulation S-X.
(f) No disclosures are required by this Item 4(f).
(g) The aggregate non-audit fees billed for each of the last two fiscal years by the registrant’s accountant for services rendered to the registrant and to the registrant’s investment adviser (not including any sub-adviser whose role is primarily portfolio management and is subcontracted with or overseen by another investment adviser) and any entity controlling, controlled by or under common control with the adviser that provides ongoing services to the registrant were as follows:
2019 |
| 2018 |
| ||
$ | — |
| $ | — |
|
(h) The registrant’s audit committee has considered that the provision of the non-audit services rendered to the registrant’s investment adviser (not including any sub-adviser whose role is primarily portfolio management and is subcontracted with or overseen by another investment adviser) and any entity controlling, controlled by or under common control with the adviser that provides ongoing services to the registrant that were not pre-approved pursuant to paragraph (c)(7)(ii) of Rule 2-01 of Regulation S-X is compatible with maintaining the principal accountant’s independence.
ITEM 5. AUDIT COMMITTEE OF LISTED REGISTRANTS.
Not applicable.
ITEM 6. SCHEDULE OF INVESTMENTS.
Not applicable. Schedule I — Investments in Securities of Unaffiliated Issuers is included as part of the report to shareholders filed under Item 1 of this Form N-CSR.
ITEM 7. DISCLOSURE OF PROXY VOTING POLICIES AND PROCEDURES FOR CLOSED-END MANAGEMENT INVESTMENT COMPANIES.
Not applicable.
ITEM 8. PORTFOLIO MANAGERS OF CLOSED-END MANAGEMENT INVESTMENT COMPANIES.
Not applicable.
ITEM 9. PURCHASES OF EQUITY SECURITIES BY CLOSED-END MANAGEMENT INVESTMENT COMPANY AND AFFILIATED PURCHASERS
Not applicable.
ITEM 10. SUBMISSION OF MATTERS TO A VOTE OF SECURITY HOLDERS
The registrant has a governance committee of its board of trustees, the members of which are all trustees who are not “interested persons” of the registrant, as defined in Section 2(a)(19) of the Investment Company Act of 1940 (“independent trustees”). The governance committee, which operates in accordance with a separate governance committee charter approved by the board of trustees, selects and recommends to the board of trustees individuals for nomination as independent trustees. The names of potential independent trustee candidates are drawn from a number of sources, including recommendations from management of Securian Asset Management, Inc., the registrant’s investment adviser. Each candidate is evaluated by the governance committee with respect to the relevant business and industry experience that would enable the candidate to serve effectively as an independent trustee, as well as his or her compatibility with respect to business philosophy and style. The members of the governance committee may conduct an in-person interview of each viable candidate using a standardized questionnaire. When all of the viable candidates have been evaluated and interviewed, the governance committee determines which of the viable candidates should be presented to the board of trustees for selection to become a member of the board of trustees.
Inasmuch as the registrant does not hold annual meetings of shareholders and meetings of shareholders occur only intermittently, the governance committee does not at present consider nominees recommended by shareholders.
ITEM 11. CONTROLS AND PROCEDURES.
(a) Based upon their evaluation of the registrant’s disclosure controls and procedures as conducted within 90 days of the filing date of this Form N-CSR, the registrant’s principal financial officer and principal executive officer have concluded that those disclosure controls and procedures provide reasonable assurance that the material information required to be disclosed by the registrant on this report is recorded, processed, summarized and reported within the time periods specified in the Securities and Exchange Commission’s rules and forms.
(b) There were no changes in the registrant’s internal controls over financial reporting (as defined in Rule 30a-3(d) under the Investment Company Act of 1940) that occurred during the second fiscal quarter of the period covered by this report that has materially affected, or is reasonably likely to materially affect, the registrant’s internal control over financial reporting.
ITEM 12. DISCLOSURE OF SECURITIES LENDING ACTIVITIES FOR CLOSED-END MANAGEMENT INVESTMENT COMPANIES.
(a)(1) | Not applicable. |
(a)(2) | Not applicable. |
(a)(3) | Not applicable. |
(a)(4) | Not applicable. |
(b) | Not applicable. |
ITEM 13. EXHIBITS.
(a) File the exhibits listed below as part of this Form. Letter or number the exhibits in the sequence indicated.
(1) Any code of ethics, or amendment thereto, that is the subject of the disclosure required by Item 2, to the extent that the registrant intends to satisfy the Item 2 requirements through filing of an exhibit:
Exhibit 99.CODE ETH attached hereto.
(2) A separate certification for each principal executive officer and principal financial officer of the registrant as required by Rule 30a-2 under the Investment Company Act of 1940 (17 CFR 270.30a-2):
Exhibit 99.CERT attached hereto.
(3) Any written solicitation to purchase securities under Rule 23c-1 under the Investment Company Act of 1940 sent or given during the period covered by this report by or on behalf of the registrant to 10 or more persons:
Not applicable.
(b) If the report is filed under Section 13(a) or 15(d) of the Securities Exchange Act of 1934, provide the certifications required by Rule 30a-2(b) under the Investment Company Act of 1940 (17 CFR 270.30a-2(b)), Rule 13a-14(b) or Rule 15d-14 under the Securities Exchange Act of 1934 (17 CFR 240.13a-14(b) or 240.15d-14(b)) and Section 1350 of Chapter 63 of Title 18 of the United States Code (18 U.S.C. 1350) as an exhibit. A certification furnished pursuant to this paragraph will not be deemed “filed” for the purposes of Section 18 of the Securities Exchange Act of 1934 (15 U.S.C. 78r), or otherwise subject to the liability of that section. Such certification will not be deemed to be incorporated by reference into any filing under the Securities Act of 1933 or the
Securities Exchange Act of 1934, except to the extent that the registrant specifically incorporates it by reference:
Exhibit 99.906 CERT attached hereto
SIGNATURES
Pursuant to the requirements of the Securities Exchange Act of 1934 and the Investment Company Act of 1940, the registrant has duly caused this report to be signed on its behalf by the undersigned, thereunto duly authorized.
(Registrant) Securian Funds Trust | ||
| ||
By (Signature and Title) | /s/ David M. Kuplic |
|
| David M. Kuplic, President | |
|
| |
Date: February 17, 2020 |
| |
Pursuant to the requirements of the Securities Exchange Act of 1934 and the Investment Company Act of 1940, this report has been signed below by the following persons on behalf of the registrant and in the capacities and on the dates indicated.
By (Signature and Title) | /s/ David M. Kuplic |
|
| David M. Kuplic, President (Principal Executive Officer) | |
By (Signature and Title) | /s/ Gary M. Kleist |
|
| Gary M. Kleist, Treasurer (Principal Financial Officer) | |
Date: February 17, 2020 |
| |