UNITED STATES
SECURITIES AND EXCHANGE COMMISSION
Washington, D.C. 20549
FORM N-CSR
CERTIFIED SHAREHOLDER REPORT OF REGISTERED MANAGEMENT INVESTMENT COMPANIES
Investment Company Act file number 811-4279
Securian Funds Trust
(Exact name of registrant as specified in charter)
400 Robert Street North
St. Paul, Minnesota 55101-2098
(Address of principal executive offices) (Zip code)
Paul J. Thibodeaux, Esq.
400 Robert Street North
St. Paul, Minnesota 55101-2098
(Name and address of agent for service)
Registrant's telephone number, including area code:
(651) 665-3500
Date of fiscal year end: December 31, 2022
Date of reporting period: December 31, 2022
ITEM 1. REPORT TO STOCKHOLDERS.
Filed herewith.
Offered in Minnesota Life
Insurance Company and
Securian Life Insurance
Company variable products
Annual report
December 31, 2022
SFT Balanced Stabilization Fund
SFT Core Bond Fund
SFT Delaware IvySM Growth Fund
SFT Delaware IvySM Small Cap Growth Fund
SFT Equity Stabilization Fund
SFT Government Money Market Fund
SFT Index 400 Mid-Cap Fund
SFT Index 500 Fund
SFT International Bond Fund
SFT Real Estate Securities Fund
SFT T. Rowe Price Value Fund
SFT Wellington Core Equity Fund
TABLE OF CONTENTS
| | | Page No. | |
Letter from the President | | | 1 | | |
Portfolio Manager Reviews | |
SFT Balanced Stabilization Fund | | | 2 | | |
| SFT Core Bond Fund | | | 7 | | |
SFT Delaware IvySM Growth Fund | | | 12 | | |
SFT Delaware IvySM Small Cap Growth Fund | | | 17 | | |
SFT Equity Stabilization Fund | | | 21 | | |
SFT Government Money Market Fund | | | 26 | | |
SFT Index 400 Mid-Cap Fund | | | 28 | | |
| SFT Index 500 Fund | | | 32 | | |
SFT International Bond Fund | | | 36 | | |
SFT Real Estate Securities Fund | | | 41 | | |
SFT T. Rowe Price Value Fund | | | 45 | | |
SFT Wellington Core Equity Fund | | | 49 | | |
Report of Independent Registered Public Accounting Firm | | | 53 | | |
Investments In Securities | |
SFT Balanced Stabilization Fund | | | 54 | | |
| SFT Core Bond Fund | | | 61 | | |
SFT Delaware IvySM Growth Fund | | | 73 | | |
SFT Delaware IvySM Small Cap Growth Fund | | | 75 | | |
SFT Equity Stabilization Fund | | | 77 | | |
SFT Government Money Market Fund | | | 79 | | |
SFT Index 400 Mid-Cap Fund | | | 80 | | |
| SFT Index 500 Fund | | | 87 | | |
SFT International Bond Fund | | | 95 | | |
SFT Real Estate Securities Fund | | | 98 | | |
SFT T. Rowe Price Value Fund | | | 99 | | |
SFT Wellington Core Equity Fund | | | 102 | | |
Financial Statements | |
Statements of Assets and Liabilities | | | 104 | | |
Statements of Operations | | | 106 | | |
Statements of Changes in Net Assets | | | 108 | | |
Financial Highlights | | | 113 | | |
Notes to Financial Statements | | | 125 | | |
Fund Expense Examples | | | 143 | | |
Proxy Voting and Quarterly Holdings Information | | | 144 | | |
Statement Regarding Liquidity Risk Management Program | | | 145 | | |
Trustees and Executive Officers | | | 146 | | |
Letter from the President

Last year's market performance was one for the record books, but not in a positive way. While fourth quarter returns were generally upbeat, they were not enough to offset the significant losses occurring earlier in the year. Indeed, both equity and fixed income markets recorded sizable losses for the year, a most uncommon outcome.
A driving force in this market weakness was the Federal Reserve's attempt to slow inflation by raising short term interest rates, moving up the target Federal Funds rate to over 4 percent from near zero the year before. The last time rates had risen that aggressively was over forty years ago. Inflation appears to have peaked at 9.1 percent in June, but it still remains at unacceptable levels, so further Federal Reserve tightening is likely.
In 2023, optimistic corporate earnings expectations, continued geopolitical tensions and an inflation-fighting Federal Reserve will likely fuel continued volatility. For now however, the employment picture is strong, and services spending has been enough to offset weakness in manufacturing. But with so much ambiguity in the market, a recession—and higher unemployment—seem to be the base case for many market forecasters. Bond investors appear to be pricing Treasuries to reflect recession concerns, but corporate earnings estimates, and corporate bond spreads don't reflect a downturn. It appears that many risk assets still are not incorporating a generous margin of safety, therefore a level of caution is warranted.
As always, we believe the best investment tactic is to position for the long-term and use diversification to reduce risk of a downside surprise.
Sincerely,

David Kuplic
President, Securian Funds Trust
1
SFT Balanced Stabilization Fund


Jeremy Gogos, Ph.D., CFA, Merlin Erickson Portfolio Managers
Securian Asset Management
Fund Objective
The SFT Balanced Stabilization Fund seeks to maximize risk-adjusted total return relative to its blended benchmark index comprised of 60 percent S&P 500® Index and 40 percent Bloomberg U.S. Aggregate Bond Index (collectively, the "Blended Benchmark Index"). The SFT Balanced Stabilization Fund invests primarily in Class 1 shares of the SFT Index 500 Fund for equity exposure, in a basket of fixed income securities for fixed income exposure and certain derivative instruments. The Fund is subject to risks associated with such investments as described in detail in the Fund's prospectus. The net asset value of the Fund will fluctuate and is not guaranteed. It is possible to lose money by investing in the Fund. There is no assurance that efforts to manage Fund volatility will achieve the desired results.
Performance Update
The Fund generated a total net return of -12.62 percent over the 12 months ending December 31, 2022, outperforming the Blended Benchmark Index which returned -15.79 percent over the same period.
What influenced the Fund's return during the past 12 months?
Equity volatility is what guides the asset allocation of the Fund's strategy. When equity volatility is low, the equity exposure of this strategy will be high. Conversely, when equity volatility is high, the equity exposure of this strategy will be low.
In 2022, markets saw some of the worst risk asset performance in recent memory; essentially every major asset class delivered deeply negative performance. For example, for 2022, the S&P 500® returned -18.11 percent for 2022, and the Bloomberg US Credit Index returned -15.76 percent. Commodities were a lone bright spot in an otherwise challenging year, as the Bloomberg Commodity Index closed out 2022 up 13.75 percent.
In our view, the primary driver of 2022's awful risk asset performance was the monetary policy tightening happening in concert around the globe. We will further discuss this topic shortly. For now, suffice to say that we view the 2022 S&P 500® return of -18.11 percent, and realized volatility of 24.17 percent—an 85th percentile value—as direct consequences of the aggressive monetary tightening the Federal Reserve (the "Fed") pursued in response to the severe inflation backdrop of late 2021 and early 2022.
Elevated volatility wasn't confined to equity. Rates and spreads also saw outsized moves through all of 2022. The 10-year U.S. Treasury yield, investment grade spreads, and high yield spreads all saw volatility in 2022 that ranked in the 82nd to 83rd percentile historically.
Realized 20-day S&P 500® volatility saw a minimum of 13.29 percent, and a maximum of 34.87 percent, over the course of the year. Given this rather elevated volatility, the Fund equity exposure ranged from a minimum of 27.01 percent to a maximum of 50.25 percent, and averaged 36.10 percent for the year. This equity underweight was the primary reason the Fund outperformed its benchmark in 2022.
In absolute terms, the Fund's fixed income holdings modestly outperformed the benchmark's fixed income portion; they saw absolute returns of -12.69 percent and -13.07 percent, respectively. We continued to maintain an overall fixed income underweight relative to the benchmark for essentially all of 2022, and so the overall contributions to return for the Fund and benchmark fixed income were -4.10 percent and -5.19 percent, respectively.
2
What other market conditions or events influenced the Fund's performance during the past 12 months?
In 2022, markets saw the correlation between the S&P 500® and the 10-Year U.S. Treasury go deeply negative again. As we have highlighted previously, the idea of fixed income being a portfolio bulwark against equity losses relies on this correlation being positive. That is, as equity prices decrease, bond yields also decrease and, by extension, bond prices rise, offsetting the equity decline. The prevailing inflation backdrop through all of 2022, and the market expectations for central bank action that that backdrop created, caused equity and fixed income assets to move in tandem for most of 2022. As a result, the canonical 60/40 portfolio saw its second-worst year ever in the available daily history of the S&P 500® Total Return and Bloomberg U.S. Aggregate Bond indexes (1989-present), sorted by worst percent return. For reference, 2008 saw a -20.91 percent return on the same portfolio.
The "growth over value" trade also largely unwound over the course of 2022. The high-flying tech-focused names that powered the absurd COVID-19 equity rally of 2020-2021, and which ended up accounting for a wildly outsized portion of the S&P 500® market capitalization, saw extreme pullbacks in 2022. For example, Meta lost -64.22 percent, Tesla lost -65.03 percent, and Amazon lost -49.62 percent.
In short, 2022 exemplified the type of market regime we have repeatedly cautioned against, namely one in which investors need portfolio protection approaches beyond a fixed income allocation to mitigate losses.
What strategies and techniques did you employ that specifically affected Fund performance?
Throughout the year, the Fund held a core long position in cash equity that tracks the S&P 500®. In addition, the Fund had short positions in S&P 500® futures, long and short S&P 500® put options, long and short Chicago Board Options Exchange (CBOE) Volatility Index (VIX) call options, and long and short VIX put options. These derivative positions were held either as expressions of the target equity allocation of the Fund given prevailing volatility, or as supplemental hedges for managing the Fund's risk.
What will affect the Fund going forward?
By multiple measures, inflation continued to be a serious economic and political problem through all of 2022. Consumer Price Index (CPI) peaked at 9.1 percent year-over-year on June 30, 2022, and Personal Consumption Expenditures (PCE) printed a 5.20 percent year-over-year change on September 30, 2022. While these inflation metrics, along with market inflation expectations, have been on a downward trajectory to close out the year, every inflation metric is still well above the Fed's stated 2.0 percent target. As a result, 2022 saw the Fed embark on a very aggressive monetary tightening campaign. Its policy rate was at zero to begin 2022; it ended 2022 at 4.25 percent. The Fed Funds rate hasn't increased by more than 4 percent in a one-year period since 1981, when the Fed was contending with inflation of nearly 15 percent year-over-year, and its policy rate was north of 10 percent.
For numerous years, we have been bearish on equities. We viewed easy monetary policy as having distorted valuations across multiple asset classes, and we felt that investors were often foolheartedly latching onto growth narratives to rationalize buying indefensibly overpriced stock. Perhaps ironically, in a year where we view a recession as likely, we are more bullish on equity than we have been for quite some time.
First, let us address the notion of a potential recession. The 10-year to 3-month yield curve was inverted from November 8, 2022 through year-end, and hit a minimum of -85 basis points on December 7, 2022. As many market commentators note, this yield curve anomaly highlights overly aggressive monetary policy moves, and it has happened leading up to every recession in modern history. Based on this data point alone, we would expect a recession within the next 12-24 months. Further, it is worth reiterating that gross domestic product (GDP) printed negative growth in Q1 and Q2 of 2022.
We think signals from the consumer sector also suggest a slowing economy. Consumers have been saving a smaller fraction of their disposable income than ever, and credit card utilization has now reached pre-pandemic levels. Both trajectories are unsustainable. We interpret both of these data points as suggesting a material decrease in consumer demand as 2023 unfolds. When you combine these consumer metrics with rates market data that suggests the Fed has hiked its policy rate to an unsustainable level, we see a 2023 recession as a strong possibility.
3
Perhaps ironically, we view the somewhat grim macroeconomic picture as a potential tailwind for equities. Recent equity market responses to "easier" monetary policy suggest that any pivot in Fed policy will be enthusiastically received by risk markets. Further, in the asset rout of 2022, fundamental equity valuation metrics have reverted to more reasonable levels.
We also view recent geopolitical developments as supportive of a bullish equity view. First, while the response of Western nations has not been perfectly harmonious, our European allies have largely found ways to survive without Russian natural gas, and the Ukrainian resistance has proved a very formidable adversary for Russia's bumbling invasion force. As such, the potential impacts of Russian natural gas and oil supply shortages likely have fewer global economic knock-on effects than originally anticipated. Another key geopolitical development in late 2022 is that China abandoned its zero-COVID policy. The implementation of this policy change is taking an enormous human toll on the Chinese population, and we do not want to marginalize that tragedy. But, if we endeavor to keep our focus on economic issues, we anticipate that supply chain disruption will decrease materially once China's working population weathers this current COVID-19 wave that their government left them woefully unprepared for.
To summarize, we anticipate that the Fed is very close to the end of its tightening campaign. By extension, we think volatility will come down modestly from 2022 levels as 2023 unfolds. And, perhaps most importantly, we anticipate that a 2023 recession will give the Fed the justification it needs to pivot to monetary easing. Should this pivot come to pass, we think a broad risk asset rally is likely.
In a tactical sense, we will continue to use our volatility metrics to inform the equity allocation of the Fund. We will increase equity exposure if we believe volatility will decrease, and decrease equity exposure if we believe volatility will increase. Given our more bullish view of equity returns for the near future, we will maintain the Fund's equity exposure toward the upper end of its allowed range while keeping downside hedge positions in place.
4
Ten Largest Holdings^
| Security description | | Market
value | | % of net
assets | |
iShares Core S&P 500 ETF | | $ | 40,511,102 | | | | 6.5 | % | |
U.S. Treasury Note 1.000%, 12/15/24 | | | 14,509,453 | | | | 2.3 | % | |
SPDR S&P 500 ETF Trust | | | 13,832,493 | | | | 2.2 | % | |
U.S. Treasury Note 3.875%, 12/31/27 | | | 9,312,015 | | | | 1.5 | % | |
Vanguard S&P 500 ETF | | | 7,088,284 | | | | 1.1 | % | |
U.S. Treasury Bond 4.000%, 11/15/42 | | | 5,452,234 | | | | 0.9 | % | |
CenterPoint Energy Houston Electric LLC, Series AJ 4.850%, 10/01/52 | | | 2,979,109 | | | | 0.5 | % | |
Intercontinental Exchange, Inc. 4.350%, 06/15/29 | | | 2,907,195 | | | | 0.5 | % | |
M&T Bank Corp. 4.553%, 08/16/28 | | | 2,903,016 | | | | 0.5 | % | |
KeyBank NA 4.390%, 12/14/27 | | | 2,890,011 | | | | 0.4 | % | |
| | $ | 102,384,912 | | | | 16.4 | % | |
^Does not include short-term investments or investments in Class 1 shares of the SFT Index 500 Fund, an affiliated Fund in Securian Funds Trust, which provides the SFT Balanced Stabilization Fund with its primary equity exposure.
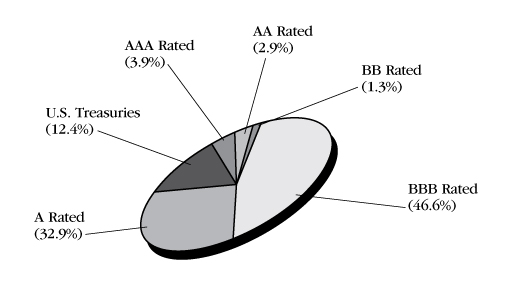
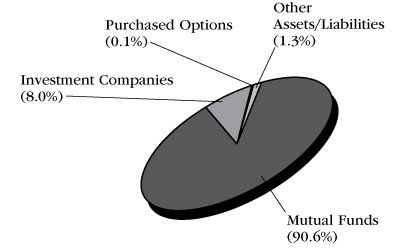
Sector Diversification (shown as a percentage of net assets)

Asset Quality (shown as a percentage of fixed income investments)
5
Comparison of Change in Investment Value*
A Hypothetical $10,000 Investment in SFT Balanced Stabilization Fund,
the Blended Benchmark Index and Consumer Price Index (CPI)

On the chart above you can see how the SFT Balanced Stabilization Fund's shares total return compared to its Blended Benchmark Index, comprised of 60 percent of the S&P 500® Index and 40 percent of the Bloomberg U.S. Aggregate Bond Index, and the Consumer Price Index. The three lines represent the total return of a hypothetical $10,000 investment made on May 1, 2013 through December 31, 2022, assuming reinvestment of distributions, if any.
* The results shown are past performance and are not an indication of future performance. Current performance may be lower or higher. The investment returns and principal value of an investment will fluctuate so that shares upon redemption may be worth more or less than their original cost. Performance figures of the Fund do not reflect charges pursuant to the terms of the variable life insurance policies and variable annuity contracts funded by separate accounts that invest in the Fund's shares. When such charges are deducted, actual investment performance in a variable policy or contract will be lower.
Securian Asset Management, Inc. ("Securian AM") and Securian Funds Trust, on behalf of the SFT Balanced Stabilization Fund (the "Fund"), have entered into an Expense Limitation Agreement, dated May 1, 2013, which limits the operating expenses of the Fund, excluding certain expenses (such as interest expense, acquired fund fees, cash overdraft fees, taxes, brokerage commissions, other expenditures which are capitalized in accordance with the generally accepted accounting principles, and other extraordinary expenses not incurred in the ordinary course of the Fund's business), to 0.80% of the Fund's average daily net assets through April 30, 2021. The Expense Limitation Agreement was terminated on May 1, 2021. The Fund is authorized to reimburse Securian AM for management fees previously waived and/or for the cost of expenses previously paid by Securian AM pursuant to this agreement, provided that such reimbursement will not cause the Fund to exceed any limits in effect at the time of such reimbursement. The Fund's ability to reimburse Securian AM in this manner only applies to fees waived or reimbursements made by Securian AM within the three fiscal years prior to the date of such reimbursement. To the extent that the Fund makes such reimbursements to Securian AM, the amount of the reimbursements will be reflected in the financial statements in the Fund's shareholder reports and in Other Expenses under Fees and Expenses of the Fund.
The Blended Benchmark Index is comprised of 60 percent of the S&P 500® Index and 40 percent of the Bloomberg U.S. Aggregate Bond Index.
The S&P 500® Index is a broad, unmanaged index of 500 common stocks which are representative of the U.S. stock market overall. The Bloomberg U.S. Aggregate Bond Index is an unmanaged benchmark composite representing the average market-weighted performance of U.S. Treasury and agency securities, investment grade corporate bonds and mortgage-backed securities with maturities greater than one year.
6


Stephen M. Kane, CFA, Laird R. Landmann, Bryan T. Whalen, CFA
Portfolio Managers
TCW
Fund Objective
The SFT Core Bond Fund seeks as high a level of long-term total return as is consistent with prudent investment risk. Preservation of capital is a secondary objective. The SFT Core Bond Fund invests in long-term, fixed income, high quality debt instruments. The investment adviser for the Fund is Securian Asset Management, Inc. Metropolitan West Asset Management, LLC ("Met West") serves as the investment sub-adviser to the Fund and provides investment advice under a sub-advisory agreement. The risks incurred by investing in debt instruments include, but are not limited to, reinvestment of prepaid debt obligations at lower rates of return, and the inability to reinvest at higher interest rates when debt obligations are prepaid more slowly than expected. In addition, the net asset value of the SFT Core Bond Fund may fluctuate in response to changes in interest rates and is not guaranteed.
Performance Update
The Fund's Class 2 shares generated a total net return of -14.17 percent over the 12 months ending December 31, 2022, underperforming the Bloomberg U.S. Aggregate Bond Index which returned -13.01 percent over the same period.
What influenced the Fund's return during the past 12 months?
While the challenging effects from the Federal Open Market Committee's shift in policy—from near-zero interest rates to one of the most aggressive hiking cycles in decades—was felt throughout nearly all segments of the market, perhaps no sector bore the brunt of this regime change more than residential Mortgage-Backed Securities ("MBS"). The mortgage market, spurred by pandemic-era stimulus and the Federal Reserve's (the "Fed") sizeable footprint in the agency MBS space, saw record low mortgage rates throughout 2020 and 2021, setting the stage for the downward repricing of the sector in 2022 as the surge in U.S. Treasury rates quickly moved a large segment of the mortgage universe "out of the money" (i.e., no incentive to refinance). As a result, durations extended across the coupon stack as prepayment expectations essentially fell to zero, and, when coupled with elevated volatility, increased hedging costs and heightened selling in the sector to meet outflows, the agency MBS sector posted the worst year of total returns on record, negatively impacting the Fund's sizeable allocation to the space. Similarly, spreads widened across non-agency backed issues amid broader macro uncertainty and elevated rate environment, resulting in falling prices across the sector and a headwind for performance.
What other market conditions or events influenced the Fund's performance during the past 12 months?
Much as any year brings its share of the unexpected, possibly the biggest surprise of 2022 was the Fed finding a long-lost resolve in the face of a capital markets-wide selloff precipitated by a rooted and flowered inflation, germinated in the pandemic (and seeded decades prior). As for the markets, the tumult of the year would be hard to overstate. Pricing weakness was felt across asset classes with broad stock and bond measures dropping more than 15 percent, a first for the record books and a nemesis to diversification. Compounding the deleterious effect of one of the most hawkish and synchronized central bank tightening campaigns in history, low bond yields and relatively lofty stock valuations to start the year set the stage for such disappointing results. What periodic relief there was in 2022 manifested itself as a pattern of sporadic bear market rallies and a near obsession with the word "pivot", though optimism proved unsustainable. "Pivot" now follows "transitory" in the Fed lexicon...will it too be forgotten as Chair Powell stays a steady course?
7
Although late to take action to combat inflation, the Fed initiated its aggressive tightening measures in March to eventually get through four consecutive 75 basis point (bps) increases to the Fed Funds rate, followed by an additional 50 bps bump in December, bringing the target range to 4.25 percent to 4.50 percent by the end of the year. Resilient labor markets—sub 4 percent unemployment—provide continuing cover for an expected 50 bps of further tightening early in 2023 and peak short rates near 5 percent. Fed action has historically worked with a lag, though the first effects of slowing economic activity thus far have already shown up in the interest-rate sensitive housing market. Existing home sales fell for ten consecutive months in 2022, and are now down over 35 percent on a year-over-year basis as mortgage rates rose off historically low levels and affordability sharply deteriorated for new homebuyers on the higher financing costs and still high prices, at least for now.
Finding 4 percent for the first time since 2010 in early October and reaching a high of 4.24 percent later in the month, the 10-Year yield stabilized somewhat lower to close 2022 at 3.89 percent, though still nearly 240 bps above where it started the year. Fixed income remediated into the fourth quarter on reduced rate volatility, with the Bloomberg U.S. Aggregate Index actually gaining 1.9 percent, but year-to-date losses were too steep to overcome, falling a crushing 13 percent. Credit markets lagged in 2022 as spreads widened in both the investment grade and high yield markets. Despite widening, investment grade spreads around 130 bps are still moderately tighter than their long-term averages and substantially narrower than they have been in recessions, suggesting there is room for them to widen further in 2023 if the economy endures a more significant downturn. For leveraged finance, despite a 4Q rally of 4.2 percent, high yield bonds were down 11.2 percent for the year and the amount of distressed debt in the U.S. alone jumped more than 300 percent in 12 months.
Even more affected than the corporate market, agency MBS spreads reached levels similar to where they were in 2008, and delivered an 11.8 percent loss for 2022 despite clawing back 2.1 percent in the fourth quarter. Similarly, non-agency MBS spreads reflected weaker economic expectations than those priced by credit markets, resulting in deeply negative year-to-date returns (though better than the agency MBS market). Meanwhile, commercial real estate remains vulnerable as the work from home dynamic has weighed on office properties, adding to stress in brick-and-mortar retailers and translating to lagging results and an increasing percentage of Commercial Mortgage-Backed Securities ("CMBS") collateral loans going to special servicing. Both agency and non-agency CMBS tumbled approximately 11 percent on the year, with the agency market dragged down mostly on duration while non-agency CMBS experienced more pronounced spread widening. On the Asset-Backed Securities ("ABS") front, early signs of stress are emerging despite a modest current annual loss of 4.3 percent, with delinquencies and writeoffs picking up, especially among the highest risk borrowers.
What strategies and techniques did you employ that specifically affected Fund performance?
Though repositioning into weakness generally produces challenges to immediate performance, improved valuations resulting from spread widening and increased volatility provided attractive opportunities to add exposure to high-quality corporate sectors and issuers, especially more defensive sectors that traditionally withstand prolonged bouts of volatility. As such, positions were added among consumer non-cyclicals, communications, and banking within financials. The resultant overweight to non-cyclicals contributed positively to relative performance as the sector outpaced the broader Index, though communications and financials lagged. Banking was among the largest additions to the corporate basis during the year given strong balance sheets and well-regulated emphasis of liquidity and capital across the sector, though the liquidity needs for many banks led to programmatic issuance and a concomitant widening of spreads past the rest of the investment grade corporate universe. Consistent with the team's relative value discipline, exposure was added to the sector in a disciplined, dollar-cost averaging manner on these increased spread levels.
Similarly, wide spreads and discount dollar pricing provided opportunity to increase the Fund's allocation to residential MBS, which weighed on returns given the significant underperformance of both agency and non-agency backed issues. The immediate performance drag notwithstanding, the team remains constructive on both the relative value and outlook for the sector. Agency MBS, largely "priced to worst" amid fully extended durations, presents upside optionality should rate volatility level off or drop in the coming year, while the relatively high liquidity and government guarantee further underpin constructive sentiment. Among non-agency deals, despite current low prices, collateral backing the deals benefits from record levels of home price appreciation, decreasing
8
loan to value ratios, improved lending standards, and structural supply and demand imbalances, all of which should help to cushion the sector, even in a recessionary environment.
What will affect the Fund going forward?
The path towards economic stability will be challenging as uncertainty over the trajectory of monetary policy, inflation, and geopolitical tensions renders the market susceptible to continued volatility. Without question, the effects of higher rates and tighter financial conditions will continue to be felt into 2023, with a recession the most likely outcome. However, unlike the last two recessions, we believe this one is not likely to be crisis-driven (i.e., subprime meltdown or pandemic), but rather by the Fed, suggesting a different look than recent versions. As such, the team's approach is to remain disciplined and opportunistic. Specific to the inflation picture in the U.S., prices appear to have peaked, with expectations for further deceleration as economic activity slows. As a corollary to that, it is anticipated that the yield curve will steepen significantly, with the two-year rate dropping quickly to reflect an easing Fed (by year-end 2022, the curve has steepened more than 30 bps from the cycle low). Positioning reflects this, under a belief that disciplined active managers will be well-situated to take advantage of market volatility and thus set the stage for strong prospective returns.
With the bellwether Treasury yield above the team's estimate of sustainable levels, the duration of the strategy was extended throughout 2022 to approximately 0.5 years long versus the Index. On sector positioning, allocations dictate caution given that corporate spread levels remain insufficient. As such, the strategy emphasizes more resilient sectors and issues subject to less would-be volatility, with the expectation that as recession unfolds, the non-linear move in spreads will allow for de-risking as valuations improve, while maintaining room to increase exposure during larger corrections. Unlike credit markets, both agency and non-agency MBS prices reflect economic pressure, and represent what we view as attractive value at this point. Expectations are that agency MBS could be used as buy liquidity for other opportunities in market volatility. As for non-agency holdings, especially long-seasoned legacy issues, these continue to exhibit good collateral performance, i.e., low delinquencies and improving loan-to-value ratios, though some volatility is possible, particularly if unemployment rises. The team remains selective in these sectors and, similar to credit, will look to reduce higher quality holdings, using proceeds to migrate down the quality spectrum as valuations cheapen to improve the return outlook. Finally, exposure to other securitized issues is higher quality, particularly in the CMBS market, which faces stress in 2023 as rising delinquencies ultimately filter through to defaults and losses. ABS at the top of the capital structure provides what we believe to be fair compensation given robust structures, with an ongoing focus on off-the-run sectors that offer more attractive yields than more traditional credit cards and auto receivables.
9
Ten Largest Holdings^
| Security description | | Market
value | | % of net
assets | |
U.S. Treasury Bond 2.000%, 11/15/41 | | $ | 34,735,371 | | | | 7.9 | % | |
Federal National Mortgage Association 2.500%, 12/25/51, TBA | | | 25,285,488 | | | | 5.8 | % | |
Federal National Mortgage Association 5.000%, 01/12/53, TBA | | | 21,151,711 | | | | 4.8 | % | |
Federal National Mortgage Association 2.000%, 01/12/53, TBA | | | 16,481,938 | | | | 3.8 | % | |
Federal National Mortgage Association 3.000%, 02/25/52, TBA | | | 15,498,984 | | | | 3.5 | % | |
U.S. Treasury Bond 4.000%, 11/15/52 | | | 15,343,659 | | | | 3.5 | % | |
U.S. Treasury Note 3.750%, 12/31/27 | | | 9,122,788 | | | | 2.1 | % | |
Federal National Mortgage Association 2.000%, 11/01/51 | | | 8,401,492 | | | | 1.9 | % | |
Federal National Mortgage Association 4.500%, 01/12/53, TBA | | | 6,296,625 | | | | 1.4 | % | |
U.S. Treasury Note 3.875%, 11/30/27 | | | 5,920,849 | | | | 1.3 | % | |
| | $ | 158,238,905 | | | | 36.0 | % | |
^Excludes short-term investments.
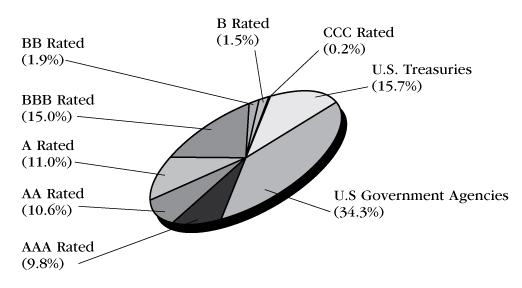
Sector Diversification (shown as a percentage of net assets)

Asset Quality (shown as a percentage of investments)
10
Comparison of Change in Investment Value*
A Hypothetical $10,000 Investment in SFT Core Bond Fund,
Bloomberg U.S. Aggregate Bond Index and Consumer Price Index (CPI)
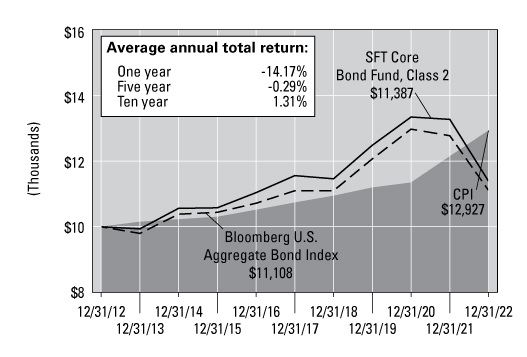
On the chart above you can see how the SFT Core Bond Fund's Class 2 shares total return compared to the Bloomberg U.S. Aggregate Bond Index and the Consumer Price Index. The three lines represent the total return of a hypothetical $10,000 investment made on December 31, 2012 through December 31, 2022, assuming reinvestment of distributions, if any.
* The results shown are past performance and are not an indication of future performance. Current performance may be lower or higher. The investment returns and principal value of an investment will fluctuate so that shares upon redemption may be worth more or less than their original cost. Performance figures of the Fund do not reflect charges pursuant to the terms of the variable life insurance policies and variable annuity contracts funded by separate accounts that invest in the Fund's shares. When such charges are deducted, actual investment performance in a variable policy or contract will be lower.
The Bloomberg U.S. Aggregate Bond Index is an unmanaged benchmark composite representing average market-weighted performance of U.S. Treasury and agency securities, investment-grade corporate bonds and mortgage-backed securities with maturities greater than one year.
11
SFT Delaware IvySM Growth Fund


Bradley M. Klapmeyer, CFA, Brad Angermeier, CFA Portfolio Managers
Delaware Investments Fund Advisers
Fund Objective
The SFT Delaware IvySM Growth Fund seeks to provide growth of capital. The Fund pursues its objective by investing primarily in a diversified portfolio of common stocks issued by large capitalization companies. The investment adviser for the Fund is Securian Asset Management, Inc. Delaware Investments Fund Advisers serves as investment sub-adviser to the Fund and provides investment advice under a sub-advisory agreement. The risks incurred by investing in the Fund include, but are not limited to, the risk of declines in the market for large cap stocks or in the equity markets generally.
Performance Update
The Fund generated a total net return of -27.15 percent over the 12 months ending December 31, 2022, outperforming the Russell 1000 Growth® Index which returned -29.14 percent over the same period.
What influenced the Fund's return during the past 12 months?
After solid gains of 38.5 percent and 27.6 percent respectively for 2020 and 2021, the Russell 1000 Growth® Index posted a sizeable drawdown of 29.1 percent for calendar year 2022. Despite this decline, it is important to keep things in perspective. Excluding a slight drop of 1.5 percent in 2018, this marks the first year of a significant negative return for the Fund's benchmark since the recession of 2008-2009.
While value styles shined during 2022, there were also moments of clarity wherein investors were drawn back to business quality—profitability, cash flow, and competitive advantage—as a necessary consideration. The market's hunt for the next "thematic" trade, whether that be a peak interest rates, lower inflation, or a Federal Reserve (the "Fed") policy pivot, was not a sustainable and repeatable investment strategy. It is not surprising that in a period when the relative growth of many "hyper-growth" companies disappointed, investors returned to a theme with lasting power—business quality.
What other market conditions or events influenced the Fund's performance during the past 12 months?
There were some key events that occurred in 2022 that will shape the outlook for the coming year. Particularly notable was the aggressive increase of interest rates by the Fed. The Fed raised rates 4.25 percent, starting at near zero in March 2022 and ending the year at 4.375 percent. Additionally, starting in June 2022 the Fed initiated quantitative tightening by reducing its balance sheet by $80 to $90 billion per month. The inversion of the yield curve provided support for those arguing a recession is on the horizon.
This aggressive policy response was necessary as inflation hit a four-decade high. While a portion of the sharp move higher in inflation was attributable to unique circumstances associated with the pandemic, such as supply disruptions and continued China COVID-19 lockdowns, the services component continued to remain elevated. Exiting the year, the Fed made it clear that it wants to address the "stable prices" portion of its dual mandate and that it, too, believes some amount of economic pain is required to get there.
Labor markets remained strong throughout the year. The unemployment rate remained at a 50-year low despite the Fed's tightening and clear signals of economic slowing. One clear signal of slowing was the move lower in manufacturing data with headline data hovering around contraction territory. Housing data weakened as activity was directly affected by the higher rates, which more than doubled from their lows, cratering affordability. The ripple effects from a slowdown in housing can easily turn into waves given its importance to the overall economy.
12
What strategies and techniques did you employ that specifically affected Fund performance?
From a sector perspective, strong stock selection in the consumer discretionary, information technology (IT) and communication services sectors were the largest contributors to the Fund's outperformance. Stock selection in the industrials and financials sectors, along with underweight positions in the energy and healthcare sectors, were the largest detractors to the Fund's performance.
The consumer discretionary sector was the largest contributor to the Fund's outperformance. Lack of exposure to Tesla Inc., accounted for most of the Fund's consumer discretionary contribution. We remain convicted in our view that economics in the auto industry will be competed away over time and Tesla is overpriced relative to its realizable future earnings. Additional positive contributors, but of lesser magnitude, included LVMH Moet Hennessy Louis Vuitton SE Unsponsored ADR and Ferrari NV.
Positive relative performance in the IT sector was helped by outperformance from the Funds overweight positions in Motorola Solutions Inc., Visa Inc., and VeriSign Inc. Each of these names provide critical components or services to their customers such that their businesses should be able to outperform in periods of economic weakness. These positive contributions were able to overwhelm negative stock contributions from PayPal Holdings Inc., Salesforce Inc., and NVIDIA Corp.
Within communications services sector, relative outperformance was driven by Electronic Arts Inc. Despite benefiting from the pandemic, Electronic Arts has been able to sustain growth due to subscription-like video game franchises. Lack of exposure to Netflix, Inc. and an underweight exposure to Meta Platforms, Inc. also drove the Fund's outperformance.
The relative underperformance within the industrials sector was driven by weakness in TransUnion and Stanley, Black & Decker Inc., along with a lack of exposure to a machinery stocks. TransUnion's weakness was related to the company's exposure to both mortgage activity and to fintech health. Stanley, Black & Decker struggled to forecast end-market demand and was also hit with input prices. Machinery stocks, such a Caterpillar Inc. (not owned), saw strong relative performance as investors favored relative value. Notable positive offsets to this industrials' headwind were relative strength from the Fund's overweight positions in CoStar Group Inc. and J.B. Hunt Transport Services Inc.
The energy sector was a negative contributor during the year as the Fund lacked exposure. Energy was driven by rising commodity prices related to unfortunate geopolitical events. We remain comfortable with our lack of exposure to these transitory trends.
What will affect the Fund going forward?
We are full of optimism that the current environment, while volatile, is extremely ripe for active stock picking to generate significant value. It is unlikely that we will return to a zero-rate environment and with that regime change comes a different set of standards. Higher valuation levels and access to capital will have to be earned through consistent growth, strong cash generation, strong profitability, and disciplined capital management. The days of free money and an "everyone wins" mentality is likely behind us.
We believe this regime change will highlight the importance of high-quality stock selection and the minimization, through a disciplined process, of behavioral mistakes. The likelihood of false positives, or mistakes, has already dramatically increased in the post-pandemic reopening euphoria and we believe this will likely continue to increase over the coming years. The tendency to favor growth as a way to validate quality will be exposed as a poor investment strategy resulting in a high degree of what we call "growth flame-outs" that can be associated with material disappointment.
Inflationary pressures are cooling, but they may prove to be more resilient. This is important because the persistence of inflation could keep the Fed involved longer, which we believe has negative ramifications on economic activity both for 2023 and likely for 2024. Risk assets (cyclicals and high growth) will periodically react
13
positively to the concept of a "Fed Pivot" wherein the central bank would slow or pause its rate hikes, thereby creating a bullish narrative. We believe these "risk-on" events will be difficult to sustain until expectations are reset materially lower and overly optimistic outlooks are extinguished.
Investors should favor these high-quality stocks through cycles, and especially in periods of downside volatility, as we believe quality-first investing is a superior long-term strategy for durable compounding. If downside volatility does not surface, we believe our portfolio of high-quality growth stocks will likewise shine as their "growthy" attributes will prove to be more sustainable, remain underappreciated and allow for strong upside participation.
Our conviction is high as we believe business quality is more persistent than growth, and through-the-cycle outperformance can be achieved through a disciplined stock selection process that prioritizes high-quality business models first and growth second.
14
Ten Largest Holdings^
| Security description | | Market
value | | % of net
assets | |
Microsoft Corp. | | $ | 59,118,508 | | | | 12.4 | % | |
Apple, Inc. | | | 37,856,924 | | | | 7.9 | % | |
Visa, Inc. Class A | | | 28,353,423 | | | | 5.9 | % | |
Alphabet, Inc. Class A | | | 24,128,611 | | | | 5.0 | % | |
Motorola Solutions, Inc. | | | 23,366,050 | | | | 4.9 | % | |
VeriSign, Inc. | | | 22,922,584 | | | | 4.8 | % | |
Amazon.com, Inc. | | | 22,425,060 | | | | 4.7 | % | |
UnitedHealth Group, Inc. | | | 20,417,232 | | | | 4.3 | % | |
CoStar Group, Inc. | | | 20,280,745 | | | | 4.2 | % | |
Coca-Cola Co. | | | 16,081,499 | | | | 3.4 | % | |
| | $ | 274,950,636 | | | | 57.5 | % | |
^Excludes short-term investments.
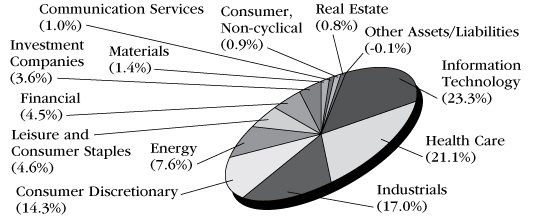
Sector Diversification (shown as a percentage of net assets)

15
Comparison of Change in Investment Value*
A Hypothetical $10,000 Investment in SFT Delaware IvySM Growth Fund,
the Russell 1000 Growth® Index and Consumer Price Index (CPI)

On the chart above you can see how the SFT Delaware IvySM Growth Fund's shares total return compared to the Russell 1000 Growth® Index and the Consumer Price Index. The three lines represent the total return of a hypothetical $10,000 investment made on May 1, 2014 through December 31, 2022, assuming reinvestment of distributions, if any.
* The results shown are past performance and are not an indication of future performance. Current performance may be lower or higher. The investment returns and principal value of an investment will fluctuate so that shares upon redemption may be worth more or less than their original cost. Performance figures of the Fund do not reflect charges pursuant to the terms of the variable life insurance policies and variable annuity contracts funded by separate accounts that invest in the Fund's shares. When such charges are deducted, actual investment performance in a variable policy or contract will be lower.
The Russell 1000 Growth® Index is an unmanaged index that measures the performance of those Russell 1000 Index companies with higher price-to-book ratios and higher forecasted growth values. The index measures the performance of the 1,000 largest companies in the Russell 3000 Index, which measures the performance of the 3,000 largest U.S. companies based on total market capitalization.
'Ivy' is the registered service mark of Ivy Distributors, Inc., an affiliate of the Delaware Investments Fund Advisers, the Fund's sub-adviser.
16
SFT Delaware IvySM Small Cap Growth Fund


Timothy J. Miller, CFA, Kenneth G. McQuade, CFA Portfolio Managers
Delaware Investments Fund Advisers
Fund Objective
The SFT Delaware IvySM Small Cap Growth Fund seeks to provide growth of capital. The Fund pursues its objective by investing primarily in a diversified portfolio of common stocks issued by small capitalization companies. The investment adviser for the Fund is Securian Asset Management, Inc. Delaware Investments Fund Advisers serves as investment sub-adviser to the Fund and provides investment advice under a sub-advisory agreement. The risks incurred by investing in the Fund include, but are not limited to, the risk of declines in the market for small cap stocks or in the equity markets generally.
Performance Update
The Fund generated a total net return of -26.87 percent over the 12 months ending December 31, 2022, underperforming the Russell 2000 Growth® Index which returned -26.36 percent over the same period.
What influenced the Fund's return during the past 12 months?
For small-cap growth stocks, 2022 was the third-worst year of the past 25, eclipsed only by the global financial crisis of 2008-2009 and the 2002 "tech bubble." The double-whammy of rising interest rates, which hurt valuations, and the lingering pandemic-induced economic disruption, which dampened earnings estimates, was largely responsible. The 10-year Treasury yield, which had been in a downtrend since 2008, bottomed near zero and remained there for almost a year following the onset of the pandemic. In 2021, growth stocks thrived as the economy responded to significant fiscal and monetary stimulus. Earnings growth surged for most major sectors of the market. But that surprisingly strong growth led to significant shortages and supply-chain disruptions that fueled inflation and led to the conditions that stifled equity markets in 2022.
What other market conditions or events influenced the Fund's performance during the past 12 months?
Small-cap growth stocks had been a major beneficiary of the low interest rate, healthy economic environment and were thus vulnerable to rising rates. During 2022, the 10-year Treasury yield rose from 1.5 percent to 3.9 percent and the yield curve inverted midway through the year. High yield spreads rose more than 250 basis points by midyear signaling increased concern about a potential recession (a basis point equals one-hundredth of a percentage point). The combination crushed small-cap growth stocks by the end of the second quarter. A brief attempt at a late summer rally was thwarted over the balance of the year. The Russell 2000® Growth Index declined more than 26 percent for the year and lagged the Russell 2000® Value Index, which declined 16 percent. High-valuation, non-earning growth stocks were punished the most during the year. Energy was the only sector to generate a positive return. The worst-performing sectors were communication services, consumer discretionary, real estate, and information technology (IT).
What strategies and techniques did you employ that specifically affected Fund performance?
Throughout the fiscal year, the Fund consistently maintained its strategy of diversifying across sectors while emphasizing quality growth companies. The Fund performed ahead of the benchmark for most of the year before it succumbed to the relentless pressure on growth stocks. Those stocks that had outperformed most during the year were the last targets of the selloff. Energy stocks were a prime example. Although energy companies dramatically outperformed for the first 10 months of the year, beginning in mid-November, energy stocks sold off significantly in spite of a fundamental outlook that remains healthy. BJ's Wholesale Club Holdings Inc. was another example. A large position in the Fund, BJ's had been a strong performer throughout the year but fell under the pressure of the
17
market selloff—again, despite consistently good sales and earnings results. The Fund's attribution for the year shows that stock selection contributed positively in all sectors of the Fund except healthcare.
Sector allocation, or weighting, detracted in the IT sector, which was consistently overweight the benchmark during the fiscal period. The Fund's small underweight in the energy sector also detracted. The benchmark energy sector was up 41.9 percent for the year while the Fund gained 39.4 percent. A weighting of one percentage point below the benchmark was to blame.
The Fund's allocation to the healthcare sector detracted, primarily the result of poor stock selection. Several holdings that previously were strong performers drastically reversed course due to high valuations, underwhelming profitability, weakness in procedure volumes, and disappointing sales as potential customers were constrained by rising prices. The overall healthcare sector underperformed the broader index, a departure from typical down years. More specifically, small-cap healthcare did not perform like a defensive sector. The repercussions of COVID-19 on the healthcare system lasted well beyond expectations. Many companies with new products or services faced challenges getting in front of decision-makers, obtaining budget sign offs, or hiring personnel to accept, install, and implement new product platforms.
In many cases we felt the new product or service was superior and would gain traction in the marketplace, but that scenario was rarely realized. For example, Omnicell Inc. has a best-in-class solution for medication management that has successfully gained share in past years but hit a significant wall this period due to budget constraints and facilities' inability to implement new platforms while labor is scarce. As a result, previously consistent revenues and bookings dried up for several quarters and visibility was lost.
For the healthcare sector as a whole, we decided to maintain our positions in some companies where we felt sufficiently confident that competitive advantages remained compelling. In other instances, we exited our positions and moved on. We may renew those positions if and when sales visibility better matches our investment horizon. Through this environment, we maintained our long-term philosophy of owning names with novel offerings that make healthcare more efficient and value based.
The industrials sector contributed on both an absolute and relative basis during the period, benefiting from advantageous stock selection. Our neutral allocation also contributed slightly as the industrial sector outperformed the market as a whole. We had exposure to alternative energy, resource management, and electrification, which we think have plenty of demand and visibility going forward. Lesser exposure to housing-related names, such as building supplies, and areas only growing via cyclical inflation also aided performance. We maintained our process of searching for areas of the economy that have long-term growth potential rather than attempting to time cyclical stocks.
The consumer discretionary sector was the largest positive contributor for the year while the IT sector was a modest drag. Stock selection led the way in the consumer discretionary sector. Monarch Casino & Resort Inc., Texas Roadhouse Inc., and Visteon Corp. were all significant contributors. Other relative contributors (declining less than the Russell 2000 Growth® Index) included Churchill Downs Inc. and Marriott Vacations Worldwide Corp. Pent-up demand for experiences, both travel and dining, helped drive success for these companies.
The IT sector has historically been a large driver of outperformance for the Fund and we expect it will continue to be the most-favored sector from a fundamental growth perspective. That said, the sector corrected last year, reflecting the macro factors mentioned above. We reduced our large overweight versus the index throughout the year as we exited less-seasoned companies in favor of a higher quality, profitable group of stocks. The result was performance for the year that essentially matched the benchmark, with the drag from an overweight offset by modestly positive stock selection. The Fund also benefited from several take-outs as private equity firms took advantage of lower stock prices to make strategic acquisitions. Sailpoint Technologies Holdings Inc., ForgeRock Inc., and Switch Inc. were among the companies acquired.
What will affect the Fund going forward?
At the end of the Fund's fiscal year, we see no need to change its strategic positioning as we navigate through the headwind of interest rate hikes and their impact on the economy. Clearly a lot of damage has been done to small-cap stock valuations, obviating the need to be overly defensive. The Fund's emphasis on high-quality, sustainable-growth businesses across all major sectors of the market has worked well in the small-cap growth asset class and remains the focus of the Fund.
18
Ten Largest Holdings^
| Security description | | Market
value | | % of stock
portfolio | |
BJ's Wholesale Club Holdings, Inc. | | $ | 3,992,756 | | | | 2.8 | % | |
Allegro MicroSystems, Inc. | | | 3,852,917 | | | | 2.7 | % | |
Visteon Corp. | | | 3,284,618 | | | | 2.3 | % | |
Red Rock Resorts, Inc. Class A | | | 3,243,291 | | | | 2.3 | % | |
Marriott Vacations Worldwide Corp. | | | 3,145,637 | | | | 2.2 | % | |
Kinsale Capital Group, Inc. | | | 2,988,912 | | | | 2.1 | % | |
Cactus, Inc. Class A | | | 2,977,503 | | | | 2.1 | % | |
Paycor HCM, Inc. | | | 2,829,270 | | | | 2.0 | % | |
Inmode Ltd. | | | 2,754,077 | | | | 2.0 | % | |
Texas Roadhouse, Inc. | | | 2,748,509 | | | | 2.0 | % | |
| | $ | 31,817,490 | | | | 22.5 | % | |
^Excludes short-term investments.
Sector Diversification (shown as a percentage of net assets)
19
Comparison of Change in Investment Value*
A Hypothetical $10,000 Investment in SFT Delaware IvySM Small Cap Growth Fund,
the Russell 2000 Growth® Index and Consumer Price Index (CPI)

On the chart above you can see how the SFT Delaware IvySM Small Cap Growth Fund's shares total return compared to the Russell 2000 Growth® Index and the Consumer Price Index. The three lines represent the total return of a hypothetical $10,000 investment made on May 1, 2014 through December 31, 2022, assuming reinvestment of distributions, if any.
* The results shown are past performance and are not an indication of future performance. Current performance may be lower or higher. The investment returns and principal value of an investment will fluctuate so that shares upon redemption may be worth more or less than their original cost. Performance figures of the Fund do not reflect charges pursuant to the terms of the variable life insurance policies and variable annuity contracts funded by separate accounts that invest in the Fund's shares. When such charges are deducted, actual investment performance in a variable policy or contract will be lower.
The Russell 2000 Growth® Index is an unmanaged index of those Russell 2000 Index growth companies with higher price-to-book ratios and higher forecasted growth values. The index is broad-based, comprised of 2,000 of the smallest U.S.-domiciled company common stocks based on total market capitalization.
'Ivy' is the registered service mark of Ivy Distributors, Inc., an affiliate of the Delaware Investments Fund Advisers, the Fund's sub-adviser.
20
SFT Equity Stabilization Fund


Jeremy Gogos, Ph.D., CFA, Merlin Erickson
Portfolio Managers
Securian Asset Management
Fund Objective
The SFT Equity Stabilization Fund seeks to maximize risk-adjusted total return relative to its blended benchmark index comprised of 60 percent S&P 500® Low Volatility Index, 20 percent S&P 500® BMI International Developed Low Volatility Index and 20 percent Bloomberg U.S. 3-Month Treasury Bellwether Index (collectively, the "Blended Benchmark Index"). The SFT Equity Stabilization Fund invests at least 80 percent of its assets in equity securities. Equity securities include those that are equity based, such as ETFs that invest primarily in U.S. and foreign equity securities. The Fund is subject to risks associated with such investments as described in detail in the Fund's prospectus. The net asset value of the Fund will fluctuate and is not guaranteed. It is possible to lose money by investing in the Fund. There is no assurance that efforts to manage Fund volatility will achieve the desired results.
Performance Update
The Fund generated a total net return of -9.71 percent over the 12 months ending December 31, 2022, underperforming the Blended Benchmark Index which returned -4.59 percent over the same period.
What influenced the Fund's return during the past 12 months?
Equity volatility is what guides the asset allocation of the Fund's strategy. When equity volatility is low, the equity exposure of the Fund's strategy will be high. Conversely, when equity volatility is high, the equity exposure of the Fund's strategy will be low.
In 2022, the markets saw some of the worst risk asset performance in recent memory, and the losses were not concentrated in a single asset class; essentially every major asset class delivered deeply negative performance in 2022. For example, the S&P 500® returned -18.11 percent for 2022, and the Bloomberg US Credit Index returned -15.76 percent. Commodities were a lone bright spot in an otherwise challenging year, as the Bloomberg Commodity Index closed out 2022 up 13.75 percent.
In our view, the primary driver of 2022's awful risk asset performance was the monetary policy tightening happening in concert around the globe. We will further discuss this topic shortly. For now, suffice to say that we view the 2022 S&P 500® return of -18.11 percent, and realized volatility of 24.17 percent—an 85th percentile value—as direct consequences of the aggressive monetary tightening the Federal Reserve (the "Fed") pursued in response to the severe inflation backdrop of late 2021 and early 2022.
Elevated volatility wasn't confined to equity. Rates and spreads also saw outsized moves through all of 2022. The 10-year U.S. Treasury yield, investment grade spreads, and high yield spreads all saw volatility in 2022 that ranked in the 82nd to 83rd percentile historically.
Realized 20-day S&P 500® volatility saw a minimum of 13.29 percent, and a maximum of 34.87 percent, over the course of the year. Similarly, the Chicago Board Options Exchange (CBOE) Volatility Index (VIX) varied from a minimum of 16.60, to a maximum of 36.45, over the course of 2022. Its average value for the year was 25.62. Given this rather elevated volatility, the Fund equity exposure ranged from a minimum of 51.01 percent to a maximum of 92.92 percent, and averaged 70.78 percent for the year. This equity underweight was a key driver of performance for the Fund this past year. Style allocation within equity also drove performance through the Fund's low volatility and dividend-focused equity.
21
What other market conditions or events influenced the Fund's performance during the past 12 months?
In 2022, the markets saw the correlation between the S&P 500® and the 10-year U.S. Treasury go deeply negative again. This correlation closed out 2022 at -0.45. As we have highlighted previously, the idea of fixed income being a portfolio bulwark against equity losses relies on this correlation being positive. That is, as equity prices decrease, bond prices rise, offsetting the equity decline. The prevailing inflation backdrop through all of 2022, and the market expectations for central bank action that that backdrop created, caused equity and fixed income assts to move in tandem for most of 2022. Thus, the canonical 60/40 portfolio saw its second-worst year ever (-15.56 percent) in the available daily history of the S&P Total Return and Bloomberg Aggregate indexes. For reference, 2008 saw a -20.91 percent return on the same portfolio.
The "growth over value" trade largely unwound over the course of 2022. The high-flying tech-focused names that powered the absurd COVID-19 equity rally of 2020-2021, and which ended up accounting for a wildly outsized portion of the S&P 500® market capitalization, saw extreme pullbacks in 2022. For example, Meta lost -64.22 percent, Tesla lost -65.03 percent, and Amazon lost -49.62 percent.
In short, 2022 exemplified the type of market regime we have repeatedly cautioned against, namely one in which investors need portfolio protection approaches beyond a fixed income allocation to mitigate losses.
What strategies and techniques did you employ that specifically affected Fund performance?
Throughout the year, the Fund held a core long position in domestic and international minimum volatility and dividend-focused cash equity. In addition, the Fund had long and short positions in S&P 500® futures, long and short S&P 500® put options, long and short S&P 500® call options, long and short Chicago Board Options Exchange (CBOE) Volatility Index (VIX) call options, and long and short VIX put options. These derivative positions were held either as expressions of the target equity allocation of the Fund given prevailing volatility, or as supplemental hedges for managing the Fund's risk.
What will affect the Fund going forward?
By multiple measures, inflation continued to be a serious economic and political problem through all of 2022. Consumer Price Index (CPI) peaked at 9.1 percent year-over-year on June 30, 2022, and Personal Consumption Expenditures (PCE) printed a 5.20 percent year-over-year change on September 30, 2022. While these inflation metrics, along with market inflation expectations, have been on a downward trajectory to close out the year, every inflation metric is still well above the Fed's stated 2.0 percent target. As a result, the Fed hiked its policy rate from zero to begin 2022, to 4.25 percent at the end of the year. The Fed Funds rate hasn't increased by more than 4 percent in a one-year period since 1981, when the Fed was contending with inflation of nearly 15 percent year-over-year, and its policy rate was north of 10 percent.
For numerous years, we have been bearish on equities. We viewed easy monetary policy as having distorted valuations across multiple asset classes, and we felt that investors were often foolheartedly latching onto growth narratives to rationalize buying indefensibly overpriced stock. Perhaps ironically, in a year where we view a recession as likely, we are more bullish on equity than we have been for quite some time.
First, let us address the notion of a potential recession. The 10-year to 3-month yield curve was inverted from November 8, 2022 through year-end, and hit a minimum of -85 basis points on December 7, 2022. As many market commentators note, this yield curve anomaly highlights overly aggressive monetary policy moves, and it has happened leading up to every recession in modern history. Based on this data point alone, we would expect a recession within the next 12-24 months. Further, it is worth reiterating that gross domestic product (GDP) printed negative growth in Q1 and Q2 of 2022.
We think signals from the consumer sector also suggest a slowing economy. Consumers have been saving a smaller fraction of their disposable income than ever, and credit card utilization has now reached pre-pandemic levels. Both trajectories are unsustainable. We interpret both of these data points as suggesting a material decrease in consumer demand as 2023 unfolds. When you combine these consumer metrics with rates market data that suggests the Fed has hiked its policy rate to an unsustainable level, we see a 2023 recession as a strong possibility.
22
Perhaps ironically, we view the somewhat grim macroeconomic picture as a potential tailwind for equities. Recent equity market responses to "easier" monetary policy suggest that any pivot in Fed policy will be enthusiastically received by risk markets. Further, in the asset rout of 2022, fundamental equity valuation metrics have reverted to more reasonable levels.
We also view recent geopolitical developments as supportive of a bullish equity view. First, while the response of Western nations has not been perfectly harmonious, our European allies have largely found ways to survive without Russian natural gas, and the Ukrainian resistance has proved a very formidable adversary for Russia's bumbling invasion force. As such, the potential impacts of Russian natural gas and oil supply shortages likely have fewer global economic knock-on effects than originally anticipated. Another key geopolitical development in late 2022 is that China abandoned its zero-COVID policy. The implementation of this policy change is taking an enormous human toll on the Chinese population, and we do not want to marginalize that tragedy. But, if we endeavor to keep our focus on economic issues, we anticipate that supply chain disruption will decrease materially once China's working population weathers this current COVID-19 wave that their government left them woefully unprepared for.
To summarize, we anticipate that the Fed is very close to the end of its tightening campaign. By extension, we think volatility will come down modestly from 2022 levels as 2023 unfolds. And, perhaps most importantly, we anticipate that a 2023 recession will give the Fed the justification it needs to pivot to monetary easing. Should this pivot come to pass, we think a broad risk asset rally is likely.
In a tactical sense, we will continue to use our volatility metrics to inform the equity allocation of the Fund. We will increase equity exposure if we believe volatility will decrease, and decrease equity exposure if we believe volatility will increase. Given our more bullish view of equity returns for the near future, we will maintain the Fund's equity exposure toward the upper end of its allowed range while keeping downside hedge positions in place.
23
Ten Largest Holdings^
| Security description | | Market
value | | % of market
value | |
iShares Edge MSCI Minimum Volatility USA ETF | | $ | 105,101,035 | | | | 32.0 | % | |
iShares Edge MSCI Minimum Volatility EAFE ETF | | | 79,735,463 | | | | 24.3 | % | |
iShares Core High Dividend ETF | | | 59,510,825 | | | | 18.1 | % | |
iShares Edge MSCI Minimum Volatility Emerging Markets ETF | | | 21,385,516 | | | | 6.5 | % | |
iShares MSCI Germany ETF | | | 16,326,301 | | | | 5.0 | % | |
BlackRock Short Maturity Bond ETF | | | 15,698,407 | | | | 4.7 | % | |
| | $ | 297,757,547 | | | | 90.6 | % | |
^Excludes short-term investments.
Sector Diversification (shown as a percentage of net assets)
24
Comparison of Change in Investment Value*
A Hypothetical $10,000 Investment in SFT Equity Stabilization Fund,
the Blended Benchmark Index and Consumer Price Index (CPI)

On the chart above you can see how the SFT Equity Stabilization Fund's shares total return compared to its Blended Benchmark Index, comprised of 60 percent of the S&P 500® Low Volatility Index, 20% S&P 500® BMI International Developed Low Volatility Index and 20% Bloomberg U.S. 3-Month Treasury Bellwether Index and the Consumer Price Index. The three lines represent the total return of a hypothetical $10,000 investment made on November 18, 2015 through December 31, 2022, assuming reinvestment of distributions, if any.
* The results shown are past performance and are not an indication of future performance. Current performance may be lower or higher. The investment returns and principal value of an investment will fluctuate so that shares upon redemption may be worth more or less than their original cost. Performance figures of the Fund do not reflect charges pursuant to the terms of the variable life insurance policies and variable annuity contracts funded by separate accounts that invest in the Fund's shares. When such charges are deducted, actual investment performance in a variable policy or contract will be lower.
Securian Asset Management, Inc. ("Securian AM") and Securian Funds Trust, on behalf of the SFT Equity Stabilization Fund (the "Fund"), have entered into an Expense Limitation Agreement, dated November 18, 2015, which limits the operating expenses of the Fund, excluding certain expenses (such as interest expense, acquired fund fees, cash overdraft fees, taxes, brokerage commissions, other expenditures which are capitalized in accordance with the generally accepted accounting principles, and other extraordinary expenses not incurred in the ordinary course of the Fund's business), to 0.80% of the Fund's average daily net assets through April 30, 2021. The Expense Limitation Agreement was terminated on May 1, 2021. The Fund is authorized to reimburse Securian AM for management fees previously waived and/or for the cost of expenses previously paid by Securian AM pursuant to this agreement, provided that such reimbursement will not cause the Fund to exceed any limits in effect at the time of such reimbursement. The Fund's ability to reimburse Securian AM in this manner only applies to fees waived or reimbursements made by Securian AM within the three fiscal years prior to the date of such reimbursement. To the extent that the Fund makes such reimbursements to Securian AM, the amount of the reimbursements will be reflected in the financial statements in the Fund's shareholder reports and in Other Expenses under Fees and Expenses of the Fund.
The Blended Benchmark Index is comprised of 60 percent of the S&P 500® Low Volatility Index, 20% S&P 500® BMI International Developed Low Volatility Index and 20% Bloomberg U.S. 3-Month Treasury Bellwether Index.
The S&P 500® Low Volatility Index measures performance of the 100 least volatile stocks in the S&P 500®. The S&P 500® BMI International Developed Low Volatility Index measures the performance of the 200 least volatile stocks in the S&P Developed Market large/midcap universe. Constituents are weighted relative to the inverse of their corresponding volatility, with the least volatile stocks receiving the highest weights. The Bloomberg U.S. 3-Month Treasury Bellwether Index tracks the market for the on-the-run 3-month Treasury bill issued by the U.S. government.
25
SFT Government Money Market Fund


Lena Harhaj, CFA, Katie Brisson
Portfolio Managers
Securian Asset Management
Fund Objective
The SFT Government Money Market Fund seeks maximum current income to the extent consistent with liquidity and the preservation of capital. The Fund invests at least 99.5 percent of its total assets in cash, government securities, and/or repurchase agreements that are collateralized fully (i.e., collateralized by cash or government securities). Investment in the SFT Government Money Market Fund is neither insured nor guaranteed by the U.S. Government, and there can be no assurance that the Fund will be able to maintain a stable net asset value of $1.00 per share. It is possible to lose money by investing in the Fund.
Performance Update
The Fund generated a total net return of 1.12 percent over the 12 months ending December 31, 2022; the 3-month U.S. Treasury Bill returned 1.51 percent over the same period.
What influenced the Fund's return during the past 12 months?
Money market funds in general outperformed stock and bond investments during the last year. Rates increased across the entire U.S. Treasury curve during an active Federal Reserve (the "Fed") hiking cycle. The Federal Open Market Committee voted to increase rates in 7 of the 8 meetings for a total of 425 basis points.
What other market conditions or events influenced the Fund's performance during the past 12 months?
Rates on the short end of the U.S. Treasury curve increased approximately 400-450 basis points, while the longer dated tenors ranged 200-325 basis points.
What strategies and techniques did you employ that specifically affected Fund performance?
The Fund continues to pick up incremental yield versus U.S. Treasury Bills by purchasing short-dated Agency Discount Notes.
What will affect the Fund going forward?
As the Fed finishes it's hiking cycle, short term rates will have settled to levels not seen since 2007. The yield curve remains inverted from 6-months to 10-year tenors and is therefore not incentivizing any duration extension in the broad fixed income market. The supply and demand of money market instruments, and in particular the gap, will impact yields in short-dated U.S. Treasury bills to the extent that they trade through reverse repo rates.
26
The results shown are past performance and are not an indication of future performance. Current performance may be lower or higher. The investment returns and principal value of an investment will fluctuate so that shares upon redemption may be worth more or less than their original cost. Investment in the SFT Government Money Market Fund is neither insured nor guaranteed by the U.S. Government or any other agency, and there can be no assurance that the Fund will be able to maintain a stable net asset value of $1.00 per share. Shares upon redemption may be worth more or less than their original cost.
Performance figures of the Fund do not reflect charges pursuant to the terms of the variable life insurance policies and variable annuity contracts funded by separate accounts that invest in the Fund's shares. When such charges are deducted, actual investment performance in a variable policy or contract will be lower.
The Bloomberg U.S. Treasury Bill 1-3 Month Index is a market value-weighted index of investment-grade fixed-rate public obligations of the U.S. Treasury with maturities of three months, excluding zero coupons.
Effective May 1, 2012, the Board of Trustees of Securian Funds Trust (the "Trust") approved a Restated Net Investment Income Maintenance Agreement among the Trust (on behalf of the Fund), Securian Asset Management, Inc. ("Securian AM") and Securian Financial Services, Inc. ("Securian Financial"). A similar agreement was previously approved by the Board of Directors of Advantus Series Fund, Inc., the Trust's predecessor, effective October 29, 2009. Under such Agreement, Securian AM agrees to waive, reimburse or pay the Fund's expenses so that the Fund's daily net investment income does not fall below zero. Securian Financial may also waive its Rule 12b-1 fees. Securian AM and Securian Financial each has the option under the Agreement to recover the full amount waived, reimbursed or paid (the "Expense Waiver") on any day on which the Fund's net investment income exceeds zero. On any day, however, the Expense Waiver does not constitute an obligation of the Fund unless Securian AM or Securian Financial has expressly exercised its right to recover a specified portion of the Expense Waiver on that day, in which case such specified portion is then due and payable by the Fund. In addition, the right of Securian AM and/or Securian Financial to recover the Expense Waiver is subject to the following limitations: (1) if a repayment of the Expense Waiver by the Fund would cause the Fund's net investment income to fall below zero, such repayment is deferred until a date when repayment would not cause the Fund's net investment income to fall below zero; (2) the right to recover any portion of the Expense Waiver expires three years after the effective date of that portion of the Expense Waiver; and (3) any repayment of the Expense Waiver by the Fund cannot cause the Fund's expense ratio to exceed 1.25%. If Securian AM and Securian Financial exercise their rights to be paid such waived amounts, the Fund's future yield will be negatively affected for an indefinite period. The Agreement is effective through April 30, 2023, and shall continue in effect thereafter, provided such continuance is specifically approved by Securian AM, Securian Financial, and a majority of the Trust's independent Trustees.
Effective November 1, 2017, Securian AM and the Trust, on behalf of the Fund, entered into an Expense Limitation Agreement which limits the operating expenses of the Fund, excluding certain expenses, (such as interest expense, acquired fund fees, cash overdraft fees, taxes, brokerage commissions, other expenditures which are capitalized in accordance with GAAP, and other extraordinary expenses not incurred in the ordinary course of the Fund's business), to 0.70% of the Fund's average daily net assets through April 30, 2023.
The Expense Limitation Agreement renews annually for a full year each year thereafter unless terminated by Securian AM upon at least 30 day's notice prior to the end of the contract term. The Fund is authorized to reimburse Securian AM for management fees previously waived and/or for the cost of expenses previously paid by Securian AM pursuant to this agreement, provided that such reimbursement will not cause the Fund to exceed any limits in effect at the time of such reimbursement.
The Fund's ability to reimburse Securian AM in this manner only applies to fees waived or reimbursements made by Securian AM within the three fiscal years prior to the date of such reimbursement. To the extent that the Fund makes such reimbursements to Securian AM, the amount of the reimbursements will be reflected in the financial statements in the Fund's shareholder reports and in Other Expenses under Fees and Expenses of the Fund in the Fund's prospectus.
27
SFT Index 400 Mid-Cap Fund

James Seifert
Portfolio Manager
Securian Asset Management
Fund Objective
The SFT Index 400 Mid-Cap Fund seeks to provide investment results generally corresponding to the aggregate price and dividend performance of publicly traded common stocks that comprise the Standard & Poor's MidCap 400® Index (the "S&P MidCap 400®"). It is designed to provide an economical and convenient means of maintaining a diversified portfolio in this equity security area as part of an overall investment strategy. The risks incurred by investing in the SFT Index 400 Mid-Cap Fund include, but are not limited to, the risk that the Fund may not be able to replicate the performance of the S&P MidCap 400®, and the risk of declines in the market for mid-cap stocks or in the equity markets generally.
Performance Update
The Fund's Class 2 shares generated a total net return of -13.60 percent over the 12 months ending December 31, 2022; the S&P MidCap 400® returned -13.06 percent over the same period.
What influenced the Fund's return during the past 12 months?
The SFT Index 400 Fund is passively managed. The Fund is fully invested and holds all names at published free float adjusted index weights. The Fund seeks investment results that correspond generally to the price and yield performance, before fees and expenses, of the S&P MidCap 400® Index.
Only two of the nine sectors posted positive annual returns. Energy names, representing a 1.85 percent weight in the index, ended the year up 26.8 percent followed by the utility sector which ended the year up 6.4 percent. The materials and services sector, the largest sector—representing a 29.8 percent weight in the index, ended the year down 14.29 percent. However, the consumer durables sector, representing a 7.52 percent weight in the index, turned in the worst return down 21.98 percent. In terms of size, decile 2, (decile segments consist of 40 names sorted by market capitalization) consisting of names with market capitalizations between $8.9 billion and $11.1 billion and representing 15.2 percent of the index, ended the period with the worst return down 21.5 percent. All other decile groups ended the year with negative returns.
What other market conditions or events influenced the Fund's performance during the past 12 months?
The S&P MidCap 400® enjoyed a nice Q4 return of 10.78 percent. But the good performance in the fourth quarter wasn't enough to prevent a bloodbath for the year. With short-term treasuries closing December at over 4 percent, investors pummeled valuations on stocks and bonds that began the year with low yields. The Federal Reserve (the "Fed") hiked rates by over 4 percent during the year. When the dust cleared, long bonds produced equity-like losses with the Bloomberg Long Treasury Index returning a negative 29 percent for the year and the Bloomberg Corporate Bond Index losing over 15 percent. Commodities were the best performers against the inflationary backdrop though most of the performance came in the first half.
Most active market participants have never experienced a hiking cycle like this. At the beginning of the year, policymakers expected inflation to fall on its own as pandemic effects burned off. Instead, inflation broadened, and wage growth picked up. In response, the Fed raised rates seven times to increase the Federal Funds rate target by over 4 percent while signaling more to come. The last time policymakers increased rates this quickly was 1979-1980. Investors will also get a better feel for the impact of quantitative tightening in coming months. The Fed's asset reduction program reached its run rate in the fourth quarter and will add to tightening conditions.
28
Inflation rolled over but is still at an unacceptable level as the Consumer Price Index (CPI) fell from its June peak of 9.1 percent to just over 7 percent in November. Supply chain bottlenecks are receding, and interest rates are taking a bite out of the housing market and related spending. Unfortunately, inflation remains a problem as consumers pivot to spending their savings on experiences, eating out and higher rents. Companies are still having to pay higher wages to attract workers.
The bottom line is that while the peak is almost certainly behind us, we don't have clarity about where inflation will normalize. Until the Fed sees a clear path to core inflation below 3 percent, policymakers are likely to seek tighter financial conditions.
What will affect the Fund going forward?
Inflation isn't the only thing slowing. Real gross domestic product ("GDP") growth for 2022 is likely to be much lower than anticipated at the beginning of last year, but solid, if unspectacular, all the same. However, estimates for 2023 are coming down quickly as the Fed turns the screws. According to Bloomberg, the median estimate for real GDP growth among economists polled is only 0.3 percent for the year, dangerously close to a recession. Investors are betting on a downturn, accepting lower yields on longer bonds compared to short paper. This inversion means that investors expect the Fed to have to start lowering rates in the second half of next year as the economy falls into a recession. The New York Fed's probability of recession index is at a level that preceded previous downturns. Saying that, these indicators have variable lags. For now, the employment picture is strong, and services spending has been enough to offset weakness in manufacturing.
Expectations for calendar year 2023 are surprisingly resilient with 5.3 percent expected earning per share ("EPS") growth on 3.3 percent revenue growth, implying margin expansion at a time when the economy is teetering near a recession. Overly optimistic earnings expectations continued geopolitical tensions and an inflation-fighting Fed will likely underpin continued volatility. Policymakers are faced with contradictory signals—manufacturing weakness vs services strength, weaker leading indicators measured against relatively strong concurrent data, and strong wage growth vs waning pandemic savings. The net result is a noisy economy that's drifting downward while the Fed tries to fine-tune its policies with imperfect information. While the timing is uncertain, this makes a recession our base case.
A recession—and higher unemployment—seem to be the base case for many market participants, yet volatility and spreads declined during the last quarter. Bond investors are pricing treasuries to reflect recession concerns, but earnings estimates and spreads don't reflect a downturn. Risk assets still are not incorporating a generous margin of safety as the Fed tightens into a slowdown. These conditions may set the stage for a capitulation if the data disappoint.
29
Ten Largest Holdings^
| Security description | | Market
value | | % of net
assets | |
Fair Isaac Corp. | | $ | 1,380,326 | | | | 0.7 | % | |
First Horizon Corp. | | | 1,208,119 | | | | 0.6 | % | |
United Therapeutics Corp. | | | 1,176,321 | | | | 0.6 | % | |
Hubbell, Inc. | | | 1,168,002 | | | | 0.6 | % | |
RPM International, Inc. | | | 1,160,142 | | | | 0.6 | % | |
Carlisle Cos., Inc. | | | 1,125,229 | | | | 0.6 | % | |
Reliance Steel & Aluminum Co. | | | 1,091,961 | | | | 0.6 | % | |
AECOM | | | 1,091,520 | | | | 0.5 | % | |
Toro Co. | | | 1,090,116 | | | | 0.5 | % | |
Neurocrine Biosciences, Inc. | | | 1,055,133 | | | | 0.5 | % | |
| | $ | 11,546,869 | | | | 5.8 | % | |
^Excludes short-term investments.
Sector Diversification (shown as a percentage of net assets)
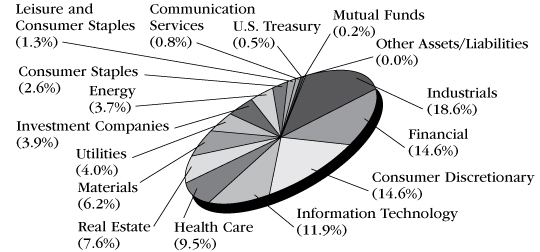
30
Comparison of Change in Investment Value*
A Hypothetical $10,000 Investment in SFT Index 400 Mid-Cap Fund,
S&P MidCap 400® Index and Consumer Price Index (CPI)

On the chart above you can see how the SFT Index 400 Mid-Cap Fund's Class 2 shares total return compared to the S&P MidCap 400® Index and the Consumer Price Index. The three lines represent the total return of a hypothetical $10,000 investment made on December 31, 2012 through December 31, 2022, assuming reinvestment of distributions, if any.
* The results shown are past performance and are not an indication of future performance. Current performance may be lower or higher. The investment returns and principal value of an investment will fluctuate so that shares upon redemption may be worth more or less than their original cost. Performance figures of the Fund do not reflect charges pursuant to the terms of the variable life insurance policies and variable annuity contracts funded by separate accounts that invest in the Fund's shares. When such charges are deducted, actual investment performance in a variable policy or contract will be lower.
The S&P MidCap 400® Index provides investors with a benchmark for mid-sized companies. The index, which is distinct from the large-cap S&P 500®, is designed to measure the performance of 400 mid-sized companies, reflecting the distinctive risk and return characteristics of this market segment.
"Standard & Poor's®", "S&P®", "Standard & Poor's MidCap 400®" and "S&P MidCap 400®" are trademarks of the S&P Global, Inc. and have been licensed for use by the Securian Funds Trust—SFT Index 400 Mid-Cap Fund. The Fund is not sponsored, endorsed, sold or promoted by Standard & Poor's and Standard & Poor's makes no representation regarding the advisability of investing in the Fund.
31

James Seifert
Portfolio Manager
Securian Asset Management
Fund Objective
The SFT Index 500 Fund seeks investment results that correspond generally to the price and yield performance of the common stocks included in the Standard and Poor's 500® Index (the "S&P 500®"). It is designed to provide an economical and convenient means of maintaining a broad position in the equity market as part of an overall investment strategy. The risks incurred by investing in the SFT Index 500 Fund include, but are not limited to, the risk that the Fund may not be able to replicate the performance of the S&P 500®, and the risk of declines in the equity markets generally.
Performance Update
The Fund's Class 2 shares generated a total net return of -18.47 percent over the 12 months ending December 31, 2022; the S&P 500® returned -18.11 percent over the same period.
What influenced the Fund's return during the past 12 months?
The SFT Index 500 Fund is passively managed. The Fund is fully invested and holds all names at published float adjusted index weights. The Fund seeks investment results that correspond generally to the price and yield performance, before fees and expenses, of the S&P 500®.
Only one of the nine sectors posted positive annual returns. Energy names, representing a 2.58 percent weight in the S&P 500® index, ended the year up 68 percent. The technology sector, the largest sector—representing 31.1 percent weight in the S&P 500® index, ended the year down 26.9 percent. However, consumer durable names, representing a 3.9 percent weight in the S&P 500® index, turned in the worst return down 46.7 percent. In terms of size, decile 1, (decile segments consist of 50 names sorted by market capitalization) consisting of the mega-cap names and representing 55.1 percent of the S&P 500® index, ended the period with the worst return down 25.03 percent. All other decile groups ended the year with negative returns.
What other market conditions or events influenced the Fund's performance during the past 12 months?
The S&P 500® enjoyed a nice Q4 return of 7.56 percent. But the good performance in the fourth quarter wasn't enough to prevent a bloodbath for the year. With short-term treasuries closing December at over 4 percent, investors pummeled valuations on stocks and bonds that began the year with low yields. The Federal Reserve (the "Fed") hiked rates by over 4 percent during the year. When the dust cleared, long bonds produced equity-like losses with the Bloomberg Long Treasury Index returning a negative 29 percent for the year and the Bloomberg Corporate Bond Index losing over 15 percent. Commodities were the best performers against the inflationary backdrop though most of the performance came in the first half.
Most active market participants have never experienced a hiking cycle like this. At the beginning of the year, policymakers expected inflation to fall on its own as pandemic effects burned off. Instead, inflation broadened, and wage growth picked up. In response, the Fed raised rates seven times to increase the Federal Funds rate target by over 4 percent while signaling more to come. The last time policymakers increased rates this quickly was in 1979-1980. Investors will also get a better feel for the impact of quantitative tightening in coming months. The Fed's asset reduction program reached its run rate in the fourth quarter and will add to tightening conditions. Inflation rolled over but is still at an unacceptable level as the Consumer Price Index (CPI) fell from its June peak
32
of 9.1 percent to just over 7 percent in November. Supply chain bottlenecks are receding, and interest rates are taking a bite out of the housing market and related spending. Unfortunately, inflation remains a problem as consumers pivot to spending their savings on experiences, eating out and higher rents. Companies are still having to pay higher wages to attract workers.
The bottom line is that while the peak is almost certainly behind us, we don't have clarity about where inflation will normalize. Until the Fed sees a clear path to core inflation below 3 percent, policymakers are likely to seek tighter financial conditions.
What will affect the Fund going forward?
Inflation isn't the only thing slowing. Real gross domestic product ("GDP") growth for 2022 is likely to be much lower than anticipated at the beginning of last year, but solid, if unspectacular, all the same. However, estimates for 2023 are coming down quickly as the Fed turns the screws. According to Bloomberg, the median estimate for real GDP growth among economists polled is only 0.3 percent for the year, dangerously close to a recession. Investors are betting on a downturn, accepting lower yields on longer bonds compared to short paper. This inversion means that investors expect the Fed to have to start lowering rates in the second half of next year as the economy falls into a recession. The New York Fed's probability of recession index is at a level that preceded previous downturns. Saying that, these indicators have variable lags. For now, the employment picture is strong, and services spending has been enough to offset weakness in manufacturing.
Expectations for calendar year 2023 are surprisingly resilient with 5.3 percent expected earnings per share ("EPS") growth on 3.3 percent revenue growth, implying margin expansion at a time when the economy is teetering near a recession. Overly optimistic earnings expectations continued geopolitical tensions and an inflation-fighting Fed will likely underpin continued volatility. Policymakers are faced with contradictory signals—manufacturing weakness vs services strength, weaker leading indicators measured against relatively strong concurrent data, and strong wage growth vs waning pandemic savings. The net result is a noisy economy that's drifting downward while the Fed tries to fine-tune its policies with imperfect information. While the timing is uncertain, this makes a recession our base case.
A recession—and higher unemployment—seem to be the base case for many market participants, yet volatility and spreads declined during the last quarter. Bond investors are pricing treasuries to reflect recession concerns, but earnings estimates and spreads don't reflect a downturn. Risk assets still are not incorporating a generous margin of safety as the Fed tightens into a slowdown. These conditions may set the stage for a capitulation if the data disappoint.
33
Ten Largest Holdings^
| Security description | | Market
value | | % of total
net assets | |
Apple, Inc. | | $ | 58,707,831 | | | | 6.0 | % | |
Microsoft Corp. | | | 54,018,496 | | | | 5.5 | % | |
Amazon.com, Inc. | | | 22,527,288 | | | | 2.3 | % | |
Berkshire Hathaway, Inc. Class B | | | 16,816,825 | | | | 1.7 | % | |
Alphabet, Inc. Class A | | | 15,923,838 | | | | 1.6 | % | |
UnitedHealth Group, Inc. | | | 14,968,572 | | | | 1.5 | % | |
Alphabet, Inc. Class C | | | 14,195,824 | | | | 1.4 | % | |
Johnson & Johnson | | | 13,955,350 | | | | 1.4 | % | |
Exxon Mobil Corp. | | | 13,725,622 | | | | 1.4 | % | |
JPMorgan Chase & Co. | | | 11,885,283 | | | | 1.2 | % | |
| | $ | 236,724,929 | | | | 24.0 | % | |
^Excludes short-term investments.
Sector Diversification (shown as a percentage of net assets)
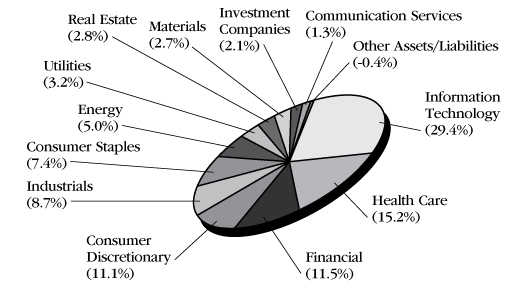
34
Comparison of Change in Investment Value*
A Hypothetical $10,000 Investment in SFT Index 500 Fund,
S&P 500® Index and Consumer Price Index (CPI)

On the chart above you can see how the SFT Index 500 Fund's Class 2 shares total return compared to the S&P 500® Index (as adjusted for dividend reinvestment) and the Consumer Price Index. The three lines represent the total return of a hypothetical $10,000 investment made on December 31, 2012 through December 31, 2022, assuming reinvestment of distributions, if any.
* The results shown are past performance and are not an indication of future performance. Current performance may be lower or higher. The investment returns and principal value of an investment will fluctuate so that shares upon redemption may be worth more or less than their original cost. Performance figures of the Fund do not reflect charges pursuant to the terms of the variable life insurance policies and variable annuity contracts funded by separate accounts that invest in the Fund's shares. When such charges are deducted, actual investment performance in a variable policy or contract will be lower. The S&P 500® Index is a broad, unmanaged index of 500 common stocks which are representative of the U.S. stock market overall.
"Standard & Poor's®", "S&P®", "Standard & Poor's 500" and "S&P 500" are trademarks of the S&P Global, Inc. and have been licensed for use by Securian Funds Trust—SFT Index 500 Fund. The Fund is not sponsored, endorsed, sold or promoted by Standard & Poor's and Standard & Poor's makes no representation regarding the advisability of investing in the Fund.
35
SFT International Bond Fund


David Hoffman, CFA, Managing Director Jack P. McIntyre, CFA, Anujeet Sareen, CFA,
Brian Kloss, JD, CPA, Tracy Chen, CFA, CAIA
Portfolio Managers
Brandywine Global Investment Management
Fund Objective
The SFT International Bond Fund seeks to maximize current income consistent with protection of principal. The Fund pursues its objective by investing primarily in debt securities issued by issuers located anywhere in the world. The investment adviser for the Fund is Securian Asset Management, Inc. Brandywine Global Investment Management, LLC serves as investment sub-adviser to the Fund and provides investment advice under a sub-advisory agreement. Investment risks associated with international investing in addition to other risks include currency fluctuations, political and economic instability, and differences in accounting standards when investing in foreign markets.
Performance Update
The Fund's Class 2 shares generated a total net return of -10.49 percent over the 12 months ending December 31, 2022, outperforming the FTSE World Government Bond Index which returned -18.26 percent over the same period.
What influenced the Fund's return during the past 12 months?
While global interest rates rose in most markets during the year, security selection and our underweight duration positioning during the first half of the year were among the largest contributors to relative results.
Developed market interest rates generally moved higher for the full calendar year in 2022 as many central banks around the world increased rates to battle high inflation. This was most notable in the U.S. and Europe. In the U.S., the Federal Reserve (the "Fed") raised interest rates 425 basis points (bps) during the calendar year, creating a headwind for bond investors.
The Fund's bond positions in Emerging Markets (EM) were also a headwind in 2022. Yields moved higher in most EM markets in calendar year 2022, but typically not as much as many Developed Markets. Emerging markets experienced high inflation, mixed growth prospects and knock-on effects from a persistently strong U.S. Dollar (USD). The largest detractor on the EM bond side was our position in long-dated Mexican sovereign bonds.
While the Fund is predominately hedged from a currency perspective, the USD remained strong for much of the calendar year and our small exposure to foreign currency positions were a minor detractor to relative results.
What other market conditions or events influenced the Fund's performance during the past 12 months?
While the Fed initially characterized surging inflation as being transitory, this proved to be widely inaccurate, as supply chain issues persisted and the war in Ukraine added fuel to the inflation fire. This left central banks little choice but to abruptly reverse course and aggressively raise rates in an attempt to rein in a four-decade high in inflation, even with the risk that this move could trigger a global recession. In the U.S., the Fed raised rates seven times and a total of 4.25 percent in 2022, the most since 1980. Europe was faced with an energy crisis and slowing
36
growth largely due to the Russian war with Ukraine. Both the European Central Bank (ECB) and the Bank of England (BoE) also aggressively raised rates, by 250 bps and 325 bps, respectively, in 2022. At the end of the year, rates in both regions were the highest since 2008, with potentially more hikes on tap for 2023.
China continued its zero-COVID policy for much of 2022. This caused wide-spread lock-downs and negatively impacted the economy. The Chinese economy grew at the slowest rate in three decades during 2022 with knock-on effects to global markets around the world. Protests flared across the country late in the year and Chinese officials finally rolled back many of the zero-COVID policies.
What strategies and techniques did you employ that specifically affected Fund performance?
We maintained an underweight duration position versus the benchmark for the first half of the calendar year. We favored this posturing due to the potential for rising rates as inflation proved stickier and less transitory than originally expected. However, as the Fed began aggressively raising interest rates in the first half of 2022, we felt it was prudent to begin increasing duration to take advantage of value opportunities and in anticipation of the potential for slowing growth and inflation. By the end of the year, we moved from an underweight duration position versus the benchmark to an overweight position. We elected to increase duration for a couple of key reasons. First, we recognize that rate hikes tend to impact the economy on a lagged basis and we felt the aggressive hikes had the potential to materially slow growth and inflation to a point that the Fed may have to reverse course in 2023. Secondly, virtually all major economic indicators began to turn lower (some sharply) by late summer. It is rare that the Fed will continue to aggressively raise rates into slowing growth. By the end of the year, inflation and growth showed continued signs of slowing and we felt recession risk was elevated for 2023.
The increase in duration occurred primarily in longer-dated U.S. Treasuries. However, we added duration in European markets as well. Within Europe, we added exposure to France and Germany and increased our duration exposure to Poland. We anticipate rates to fall in 2023 in all these markets as growth and inflation slows in light of a hawkish central bank backdrop.
On the currency front, our USD exposure remained relatively stable during the calendar year 2022. Our dollar exposure was approximately 97 percent of the portfolio for most of the year. We had minor changes in our minimal foreign currency positions during the year. The most notable change being an increase in the Japanese Yen. As this portfolio is predominately hedged back to the USD, currency is not expected to be a significant driver of returns or volatility.
What will affect the Fund going forward?
The outlook for the global bond market remains complicated. Several factors add to the uncertainty for the global economy. For instance, the bond market is signaling that inflation is set to moderate, which can be seen by the inverted yield curve, while the Fed appears committed to reducing inflation and continuing their hawkish rhetoric. The U.S. Treasury yield curve indicates monetary policy is restrictive enough with rates where they are. This signal, plus more supply-side normalization, should lead to significantly slower inflation and a softer labor market.
Adding to the uncertainty is China's policymakers attempt to stimulate their economy as they try and improve growth and avoid deflation. Meanwhile, European policymakers are caught between fighting the worst inflation in decades, while subsidizing households from soaring energy costs. We believe the most intense period of global economic softness is likely to be in the first half of 2023. However, there are a range of factors that could limit downside recessionary forces, including the recent drop in energy prices, the rebound in the U.S. auto sector, and what could turn out to be a rapid decline in inflation.
The conditions for a credit crunch, commonly seen ahead of previous U.S. recessions, does not exist currently. There has been no extreme period of lending and household and corporate balance sheets are in relatively good shape. That said, recession odds increase significantly if Fed Chair Powell remains dogmatic about creating labor market slack through monetary policy. A pause in rate hikes seems probable, especially if the data show a steep decline in inflation.
37
Outside of the U.S., the global economy is likely already in a recession because of the strong USD and a very weak Chinese economy, albeit China's recent re-opening is a positive development for the country's growth narrative. If the greenback weakens as the U.S. economy decelerates and inflation retreats, all while the U.S. avoids a deep recession, then we believe the global economy could stabilize by this time next year. All told, we are increasingly confident about bond markets in 2023; however, the path and timing of returns remains uncertain as macro uncertainty persists. We do not foresee a repeat of 2022, where the only asset class that performed well was cash. Instead, we believe 2023 will provide a better outcome for bond markets because of the starting point of yields, we just expect some volatility throughout the year.
38
Ten Largest Holdings^
| Security description | | Market
value | | % of bond
portfolio | |
U.S. Treasury Bond 2.250%, 02/15/52 | | $ | 4,586,305 | | | | 5.8 | % | |
Korea Treasury Bond 2.000%, 06/10/31 | | | 4,427,064 | | | | 5.6 | % | |
Bundesrepublik Deutschland Bundesanleihe 1.700%, 08/15/32 | | | 4,381,879 | | | | 5.6 | % | |
U.S. Treasury Bond 3.000%, 08/15/52 | | | 3,914,219 | | | | 5.0 | % | |
French Republic Government Bond OAT 0.010%, 05/25/32 | | | 3,876,936 | | | | 4.9 | % | |
Republic of Poland Government Bond 1.750%, 04/25/32 | | | 3,410,512 | | | | 4.4 | % | |
Province of Ontario Canada 2.600%, 06/02/25 | | | 3,208,834 | | | | 4.1 | % | |
Mexican Bonos 8.500%, 11/18/38 | | | 2,414,018 | | | | 3.1 | % | |
Mexican Bonos 8.500%, 05/31/29 | | | 2,286,854 | | | | 2.9 | % | |
Federal Home Loan Mortgage Corp. 5.500%, 12/01/52 | | | 2,255,095 | | | | 2.9 | % | |
| | $ | 34,761,716 | | | | 44.3 | % | |
^Excludes short-term investments.
Country Diversification (shown as a percentage of net assets)

Currency Diversification (shown as a percentage of net assets)
African | | | 0.20 | % | |
South African Rand | | | 0.20 | % | |
Americas | | | 98.75 | % | |
U.S. Dollar | | | 96.61 | % | |
Chilean Peso | | | 0.93 | % | |
Brazilian Real | | | 0.87 | % | |
Mexican Peso | | | 0.47 | % | |
Colombian Peso | | | 0.17 | % | |
Canadian Dollar* | | | -0.30 | % | |
Asia Pacific | | | 1.06 | % | |
Japanese Yen | | | 1.16 | % | |
South Korean Won | | | 0.48 | % | |
Thailand Baht | | | 0.16 | % | |
Malaysian Ringgit* | | | -0.07 | % | |
Australian Dollar* | | | -0.21 | % | |
Chinese Yuan Renminbi* | | | -0.46 | % | |
Europe | | | -0.01 | % | |
Norwegian Krone | | | 0.74 | % | |
Swedish Krona | | | 0.70 | % | |
Polish Zloty | | | 0.57 | % | |
Russian Ruble | | | 0.20 | % | |
British Pound* | | | -0.63 | % | |
Euro* | | | -1.59 | % | |
*A negative figure reflects net "short" exposure, designed to benefit if the value of the associated currency decreases. Conversely, the Fund's value would potentially decline if the value of the associated currency increases.
39
Comparison of Change in Investment Value*
A Hypothetical $10,000 Investment in SFT International Bond Fund,
FTSE World Government Bond Index and Consumer Price Index (CPI)

On the chart above you can see how the SFT International Bond Fund's Class 2 shares total return compared to the FTSE World Government Bond Index, and the Consumer Price Index. The three lines represent the total return of a hypothetical $10,000 investment made on December 31, 2012 through December 31, 2022, assuming reinvestment of distributions, if any.
* The results shown are past performance and are not an indication of future performance. Current performance may be lower or higher. The investment returns and principal value of an investment will fluctuate so that shares upon redemption may be worth more or less than their original cost. Performance figures of the Fund do not reflect charges pursuant to the terms of the variable life insurance policies and variable annuity contracts funded by separate accounts that invest in the Fund's shares. When such charges are deducted, actual investment performance in a variable policy or contract will be lower.
The FTSE World Government Bond Index is a market capitalization weighted index consisting of the government bond markets from over twenty countries. Country eligibility is determined based upon market capitalization and investability criteria. The index includes all fixed-rate bonds with a remaining maturity of one year or longer and with amounts outstanding of at least the equivalent of U.S. $25 million. Government securities typically exclude floating or variable rate bonds, U.S./Canadian savings bonds and private placements. Each bond must have a minimum rating of BBB-/Baa3 by S&P or Moody's.
40
SFT Real Estate Securities Fund


Jon Cheigh CIO, Mathew Kirschner, CFA,
Jason A. Yablon
Portfolio Managers
Cohen & Steers Capital Management
Fund Objective
The SFT Real Estate Securities Fund seeks above-average income and long-term growth of capital. The Fund intends to pursue its objective by investing primarily in equity securities of companies in the real estate industry. The investment adviser for the Fund is Securian Asset Management, Inc. Cohen & Steers Capital Management, Inc. serves as the investment sub-adviser to the Fund and provides investment advice under a sub-advisory agreement. Investment risks associated with investing in the Fund, in addition to other risks, include rental income fluctuations, depreciation, property tax value changes, and differences in real estate market value.
Performance Update
The Fund's Class 2 shares generated a total net return of -26.29 percent over the 12 months ending December 31, 2022, underperforming the FTSE NAREIT All Equity REITs Index which returned -24.95 percent, as well as the previous benchmark FTSE NAREIT Equity REIT Index, which returned -24.37 percent over the same period.
What influenced the Fund's return during the past 12 months?
2022 was marked by concerns of recession and persistently high inflation. Bond yields rose meaningfully and the Federal Reserve continued to aggressively raise interest rates to slow demand, which resulted in a broad decline in risk assets.
Within listed real estate, favorable supply/demand dynamics supported rising rents and healthy earnings growth in many sectors, with new supply checked by higher financing and building costs. Although real estate conditions generally remained sound, slowing economic growth and high inflation clouded the outlook for REITs.
What other market conditions or events influenced the Fund's performance during the past 12 months?
Retail REITs outperformed, bolstered by a resilient consumer. Regional malls (14.4 percent) total return and shopping centers (-0.1 percent) performed well despite inflationary headwinds, as the decline in oil prices and a strong job market aided discretionary spending. Free standing REITs (-6.1 percent) benefited partly from consumer spending trends, as well from the potential for attractive asset acquisitions from private real estate investors.
Demand for warehouse space remained exceedingly high, but growth expectations for industrial REITs (-11.2 percent) came down. Self storage (-14.9 percent) also declined as rental growth, while still well above the long-term trend, decelerated. Data centers (-10.2 percent) were caught up in the broader technology sector selloff, despite expectations for increased occupancy and margin expansion in 2023.
Residential property companies trailed on concerns around rental and leasing rates. Apartments (-18.0 percent) declined on softer rents in coastal markets and expectations for technology-related job losses. Single family homes (-20.0 percent) fell on concerns about asset values and as companies were hit with rising property taxes in some states. Nevertheless, asking rents rose amid affordability issues in the for-sale home market, which should support leasing strength in the sector. Hotels (-9.8 percent) declined on an uncertain outlook, even as business and leisure travel continued to rebound.
Office REITs (-17.3 percent) underperformed, with earnings results underscoring a difficult leasing environment as tenants reassessed their space needs. Infrastructure (-20.1 percent), the largest listed real estate sector, was pulled lower by rising interest rates and somewhat disappointing earnings results.
41
What strategies and techniques did you employ that specifically affected Fund performance?
The portfolio's overweight allocation to regional malls, expressed as an overweight position in Simon Property Group, contributed to relative performance, as the company delivered strong results owing to a steady core business and a resilient balance sheet, and good visibility into 2023. Underweight allocations in the infrastructure and office sectors also aided relative performance.
The portfolio had no allocation in the specialty sector, which detracted from relative performance. This included a pair of gaming net lease companies that outperformed the benchmark. An overweight allocation in single family homes also hindered relative performance, as did an underweight in shopping centers.
What will affect the Fund going forward?
We believe listed real estate, which has seen improved valuations with the correction in share prices during the year, offers attractive return potential relative to broad equities. Slowing economic growth and high inflation temper the near-term outlook for real estate, particularly for sectors lacking pricing power. However, cash flows generally remain sound, and we anticipate healthy earnings growth in 2023. Moreover, real estate companies typically have high operating margins, low sensitivity to commodity and labor prices, and (in many cases) inflation-linked rents, making them better suited than traditional asset categories to defend against a prolonged environment of high inflation.
The portfolio may benefit from demand for shorter-lease-duration property types. We are overweight residential sectors and favor single family homes and Sunbelt apartments based on our positive view of rental housing demand (supported by the lack of affordability in the purchase market) and demographic tailwinds. The portfolio is also overweight self storage given healthy demand due to increased relocation activity. Though we have trimmed the weighting on decelerating fundamentals, we anticipate demand will outpace supply in 2023, suggesting companies will continue to have pricing power. In health care, we see value in senior housing, where occupancies fell dramatically in early 2020 but are now steadily recovering.
Data center REITs are well situated, in our view. We believe companies that provide information and logistics infrastructure, especially data centers and industrial warehouses, may continue to benefit from strong secular demand in the shift toward an e-everything economy.
Within retail, our holdings are concentrated in companies with high-quality assets that we believe may be long-term winners. Though we remain cautious toward offices as businesses reassess their future needs, we have allocated within the Sunbelt, which we favor over coastal locations.
42
Ten Largest Holdings^
| Security description | | Market
value | | % of net
assets | |
Prologis, Inc. | | $ | 10,438,798 | | | | 9.0 | % | |
American Tower Corp. | | | 7,950,682 | | | | 6.9 | % | |
Simon Property Group, Inc. | | | 7,250,748 | | | | 6.3 | % | |
Welltower, Inc. | | | 6,436,420 | | | | 5.5 | % | |
Realty Income Corp. | | | 6,039,487 | | | | 5.2 | % | |
Equinix, Inc. | | | 5,775,400 | | | | 5.0 | % | |
Digital Realty Trust, Inc. | | | 5,657,334 | | | | 4.9 | % | |
Invitation Homes, Inc. | | | 5,550,446 | | | | 4.8 | % | |
Public Storage | | | 5,437,647 | | | | 4.7 | % | |
Crown Castle, Inc. | | | 4,805,047 | | | | 4.1 | % | |
| | $ | 65,342,009 | | | | 56.4 | % | |
^Excludes short-term investments.
Sector Diversification (shown as a percentage of net assets)
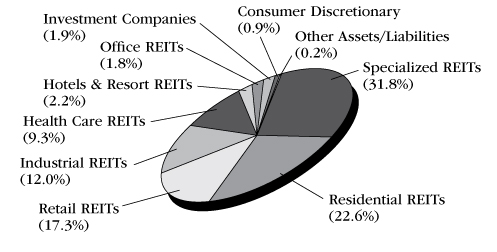
43
Comparison of Change in Investment Value*
A Hypothetical $10,000 Investment in SFT Real Estate Securities Fund, FTSE NARIET All REITs Index,
FTSE NAREIT Equity REITS Index, and Consumer Price Index (CPI)

On the chart above you can see how the SFT Real Estate Securities Fund's Class 2 shares total return compared to the FTSE NARIET All REITs Index, FTSE NAREIT Equity REITs Index and the Consumer Price Index. The three lines represent the total return of a hypothetical $10,000 investment made on December 31, 2012 through December 31, 2022, assuming reinvestment of distributions, if any.
* The results shown are past performance and are not an indication of future performance. Current performance may be lower or higher. The investment returns and principal value of an investment will fluctuate so that shares upon redemption may be worth more or less than their original cost. Performance figures of the Fund do not reflect charges pursuant to the terms of the variable life insurance policies and variable annuity contracts funded by separate accounts that invest in the Fund's shares. When such charges are deducted, actual investment performance in a variable policy or contract will be lower.
FTSE NARIET All Equity REITs Index is the benchmark beginning 8/1/2022 and thereafter. The FTSE NARIET All Equity REITs Index contains all tax-qualified REITs with more than 50 percent of total assets in qualifying real estate assets other than mortgages secured by real property that also meet minimum size and liquidity criteria.
The FTSE NARIET Equity REITs Index is the benchmark through 7/31/2022. The FTSE NAREIT Equity Index contains all tax-qualified REITs except timber and infrastructure REITs with more than 50 percent of total net assets in qualifying real estate assets other than mortgages secured by real property that also meet minimum size and liquidity criteria.
44
SFT T. Rowe Price Value Fund

Mark Finn, CFA, CPA
Portfolio Manager
T. Rowe Price
Fund Objective
The SFT T. Rowe Price Value Fund seeks to provide long-term capital appreciation by investing in common stocks believed to be undervalued. Income is a secondary objective. The Fund pursues its objective by taking a value approach to investment selection. Holdings consist primarily of large cap stocks but may also include stocks of mid-cap and small-cap companies. The investment adviser for the Fund is Securian Asset Management, Inc. T. Rowe Price Associates, Inc. serves as the investment sub-adviser to the Fund and provides investment advice under a sub-advisory agreement. The Fund's value approach to investing carries the risk that the market will not recognize a security's intrinsic value for a long time or that a stock judged to be undervalued may actually be appropriately priced at a low level.
Performance Update
The Fund generated a total net return of -11.67 percent over the 12 months ending December 31, 2022, underperforming the Russell 1000 Value Index which returned -7.58 percent over the same period.
What influenced the Fund's return during the past 12 months?
Broadly speaking, sector allocation contributed to relative results.
What other market conditions or events influenced the Fund's performance during the past 12 months?
Major U.S. stock indexes fell sharply in 2022, the worst year for equities since the 2008 global financial crisis. Investors shunned riskier assets in response to Russia's invasion of Ukraine, elevated inflation exacerbated by rising commodity prices and global supply chain disruptions, surging U.S. Treasury yields, tightening financial conditions, and slowing economic and corporate earnings growth. The Federal Reserve's (the "Fed") aggressive short-term interest rate hikes that began in March, as well as comments that it would be willing to risk causing a recession by raising rates and keeping them at a higher level in order to bring inflation down, also weighed on the market. Although many indexes finished the year above their lowest levels of 2022, the year ended with many investors concerned that ongoing Fed rate hikes would hurt corporate earnings and push the economy into a recession in 2023.
What strategies and techniques did you employ that specifically affected Fund performance?
The largest contributor during the period was the consumer discretionary sector, where favorable security selection and an underweight allocation aided relative results. Shares of Dollar General contributed to relative performance over the period. Early in the year, the company reported financials that showed strong topline growth but margins being impacted by a one-time employee appreciation bonus. Midway in the year, the company reported revenue and earnings ahead of consensus and same-store sales that exceeded expectations, to which the market reacted favorably.
An underweight allocation in the information technology sector also contributed to relative performance. Many companies within the information technology sector operate at different stages of the economic cycle, and rising interest rates and recession fears continued to negatively impact tech stock.
Favorable stock selection and an overweight position in the financials sector contributed to relative results, as well. Chubb contributed to relative performance over the year as the company benefited from the continued upcycle in
45
property and casualty ("P&C") and strong execution. During the fourth quarter, the company reported attractive underwriting results, driven by the rising P&C upcycle, and elevated investment income, due to higher yields.
On the other end of the spectrum, an underweight allocation in the energy sector, coupled with poor stock selection, detracted from relative results during the period. Our focus is on energy companies with strong balance sheets and the capital discipline to navigate the current rapidly changing environment and those that are making strides to invest in the transition to renewable energy.
The materials sector also hindered relative results, owing to unfavorable stock choices.
What will affect the Fund going forward?
We remain cautious on the direction of the economy and believe there is a considerable likelihood of the Fed causing an economic slowdown or recession. While goods inflation seems to be peaking, services inflation remains high and will be challenging to tame due to structural imbalances in the labor market. While the market multiple has contracted during 2022, we see elevated risk in earnings estimates, which have yet to reflect a likely recession in 2023.
As a result, we believe equity markets will remain choppy throughout the year, as expectations adjust to a slowing economy with tighter financial conditions. We believe a cautious stance remains appropriate, so we are looking to further emphasize company-level fundamentals and quality while being positioned for a variety of market environments. We believe we will have ample opportunities to increase the risk we are taking on in the portfolio as valuations become more favorable. Overall, our focus continues to be on finding high-quality companies that have attractive fundamentals and valuations. We believe this balanced approach should lead to a portfolio that has the potential to serve our clients well.
46
Ten Largest Holdings^
| Security description | | Market
value | | % of net
assets | |
Elevance Health, Inc. | | $ | 7,026,150 | | | | 3.8 | % | |
Johnson & Johnson | | | 6,302,342 | | | | 3.4 | % | |
Southern Co. | | | 5,873,044 | | | | 3.2 | % | |
Bank of America Corp. | | | 5,746,651 | | | | 3.1 | % | |
Exxon Mobil Corp. | | | 5,616,586 | | | | 3.0 | % | |
Becton Dickinson & Co. | | | 5,237,817 | | | | 2.8 | % | |
JPMorgan Chase & Co. | | | 4,844,497 | | | | 2.6 | % | |
Philip Morris International, Inc. | | | 4,669,931 | | | | 2.5 | % | |
Travelers Cos., Inc. | | | 4,141,467 | | | | 2.3 | % | |
Alphabet, Inc. Class C | | | 4,112,636 | | | | 2.2 | % | |
| | $ | 53,571,121 | | | | 28.9 | % | |
^Excludes short-term investments.
Sector Diversification (shown as a percentage of net assets)
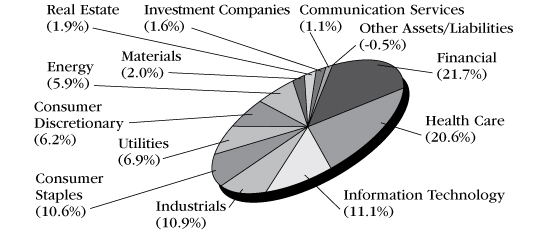
47
Comparison of Change in Investment Value*
A Hypothetical $10,000 Investment in SFT T. Rowe Price Value Fund,
the Russell 1000 Value Index and Consumer Price Index (CPI)

On the chart above you can see how the SFT T. Rowe Price Value Fund's shares total return compared to the Russell 1000 Value Index and the Consumer Price Index. The three lines represent the total return of a hypothetical $10,000 investment made on May 1, 2014 through December 31, 2022, assuming reinvestment of distributions, if any.
* The results shown are past performance and are not an indication of future performance. Current performance may be lower or higher. The investment returns and principal value of an investment will fluctuate so that shares upon redemption may be worth more or less than their original cost. Performance figures of the Fund do not reflect charges pursuant to the terms of the variable life insurance policies and variable annuity contracts funded by separate accounts that invest in the Fund's shares. When such charges are deducted, actual investment performance in a variable policy or contract will be lower.
Russell 1000 Value Index measures the performance of those Russell 1000 companies with lower price-to-book ratios and lower forecasted growth values.
48
SFT Wellington Core Equity Fund


Mammen Chally, CFA, David A. Siegle, CFA,
Douglas W. McLane, CFA
Portfolio Managers
Wellington Management Company
Fund Objective
The SFT Wellington Core Equity Fund seeks long-term capital appreciation. The Fund pursues its objective by investing primarily in a diversified portfolio of common stocks. The investment adviser for the Fund is Securian Asset Management, Inc. Wellington Management Company LLC serves as the investment sub-adviser to the Fund and provides investment advice under a sub-advisory agreement. Risks associated with investing in the Fund include, but are not limited to, issuer-specific market volatility and risk of declines in the equity markets generally.
Performance Update
The Fund's Class 2 shares generated a total net return of -19.46 percent over the period ending December 31, 2022, underperforming the S&P 500® Index, which returned -18.11 percent over the same period.
What influenced the Fund's return during the past 12 months?
During the period, security selection was the primary driver of relative underperformance, and sector allocation, a fall-out of our bottom-up stock selection process, contributed to relative performance. Weak selection in communication services (underweight to Netflix, overweight to Alphabet), real estate (overweight to AvalonBay Communities, underweight to American Tower), and materials (overweight to PPG Industries and not owning Linde) was partially offset by stronger selection in consumer discretionary (underweight to Tesla, overweight to TJX Companies), information technology (underweights to NVIDIA and not owning PayPal), and industrials (overweights to Deere and Raytheon Technologies). From a sector allocation perspective, the Fund's overweight position in health care and underweight to consumer discretionary contributed to relative performance while underweight positions to energy and materials detracted, partially offsetting results.
What other market conditions or events influenced the Fund's performance during the past 12 months?
U.S. equities, as measured by the S&P 500® Index, fell over the trailing 12-month period ending December 31, 2022, amid rampant inflation, surging borrowing costs, uncertainty about corporate earnings, and an increased probability of recession. U.S. equities opened the year lower as they registered their first quarterly loss since March 2020. Fears about the economic implications of Russia's large-scale military attack on Ukraine and the prospect of aggressive monetary policy tightening by the Federal Reserve (the "Fed") drove the S&P 500® Index into correction territory in February. President Joe Biden signed into law a massive U.S. $1.5 trillion spending bill, which included substantial increases in domestic and national security programs and U.S. $13.6 billion of aid to Ukraine. U.S. equities continued to fall during a volatile second quarter. Growth stocks significantly underperformed their value counterparts as surging Treasury yields and disappointing earnings results from some of the largest technology companies drove the Nasdaq Composite Index to its largest quarterly loss since September 2001. The housing market was pressured by soaring mortgage rates, slowing demand, and elevated home prices. U.S. equities fell in the third quarter as risk sentiment deteriorated on fears that aggressive interest-rate hikes and tighter financial conditions would constrict economic growth and drive the U.S. to recession. U.S. equities rallied in the fourth quarter following three straight quarterly declines. Greater optimism that the Fed would begin to scale back its aggressive pace of interest-rate hikes, along with outsized short covering and hedging, helped to fuel a sharp rebound in stocks in October and November before risk sentiment waned in December amid recession fears, macroeconomic headwinds, and downside earnings risks in the coming quarters. In December, the Fed raised interest rates by 50 basis points (bps), snapping a streak of four consecutive hikes of 75 bps.
49
What strategies and techniques did you employ that specifically affected Fund performance?
Over the period, the Fund increased exposure to health care and energy while we decreased exposure to communication services and information technology. Our largest new position was Pfizer, an American pharmaceutical company. We initiated a position in the company as it has many revenue drivers with a broad portfolio of medicines across therapeutic areas such as oncology, cardiovascular/diabetes, neurology, and autoimmune. In addition, Pfizer has had a strategic shift towards science and technology and away from generics after the sale of its Upjohn business to Mylan, a global healthcare company, which we believe should unlock value over the long term.
On the flipside, our largest elimination was Meta Platforms, a social media platform company. We eliminated our position in Meta following a 3Q22 earnings call where Chairman and Chief Executive Officer Mark Zuckerberg's continued aggressive spending led us to believe that he is not committed to increasing shareholder value. The company's governance challenges coupled with the unknown spending plans for the Metaverse led to our decision to eliminate the stock.
What will affect the Fund going forward?
As we look ahead, there are increasing indications that inflationary pressures are abating in the goods components of both the consumer price index (CPI) and the personal consumption expenditures price index (PCE) and that there is a clearer path to a gradual disinflation in housing-related expenses by the second half of 2023. However, the services component of both indicators remains stubbornly high, driven by a still-resilient U.S. labor market driving continued upward wage pressure. Accordingly, the Federal Open Market Committee (FOMC) remains steadfast in its determination to continue to slow the U.S. economy and has indicated that incremental rate hikes should be expected in early 2023, with the FOMC's "dot plot" median rate projection now having increased from 4.6 percent to 5.1 percent for the end of 2023. It is increasingly clear that a mild recession is the likely scenario as the Fed seeks to cool wage inflation and bring down both realized inflation and future inflationary expectations.
With the Fed undertaking efforts to slow growth, companies may feel the impacts of decelerating revenue without relief from wage pressure in early 2023. Thus, a key challenge for and differentiator amongst companies will be the degree to which they can avoid the resultant margin compression through productivity offsets, innovation, or market share gains.
As we enter 2023, the conflict in Europe is approaching its one-year anniversary without any apparent cessation in sight. Both the preparation ahead of the winter season and milder than expected temperatures across the region have spared the continent from the worst-case scenario in terms of heating and energy supply, but much uncertainty remains in the conflict even after this winter has passed.
On the positive side, supply chain issues which plagued most industries in the preceding two years continue to ease, providing cost relief and improving visibility. Further, China appears to be relaxing its restrictive COVID-19-related policies in an effort to revitalize growth and placate an increasingly frustrated populace. This incremental source of demand could help offset the expected frictions from slower growth elsewhere in the world.
50
Ten Largest Holdings^
| Security description | | Market
value | | % of stock
portfolio | |
Microsoft Corp. | | $ | 5,601,236 | | | | 5.1 | % | |
Apple, Inc. | | | 4,854,835 | | | | 4.5 | % | |
Alphabet, Inc. Class A | | | 4,662,426 | | | | 4.3 | % | |
UnitedHealth Group, Inc. | | | 3,707,018 | | | | 3.4 | % | |
Amazon.com, Inc. | | | 3,208,632 | | | | 2.9 | % | |
JPMorgan Chase & Co. | | | 2,732,019 | | | | 2.5 | % | |
Procter & Gamble Co. | | | 2,683,673 | | | | 2.5 | % | |
EOG Resources, Inc. | | | 2,676,013 | | | | 2.5 | % | |
Pfizer, Inc. | | | 2,377,639 | | | | 2.2 | % | |
Eli Lilly & Co. | | | 2,302,597 | | | | 2.1 | % | |
| | $ | 34,806,088 | | | | 32.0 | % | |
^Excludes short-term investments.
Sector Diversification (shown as a percentage of net assets)

51
Comparison of Change in Investment Value*
A Hypothetical $10,000 Investment in SFT Wellington Core Equity Fund,
the S&P 500® Index and Consumer Price Index (CPI)
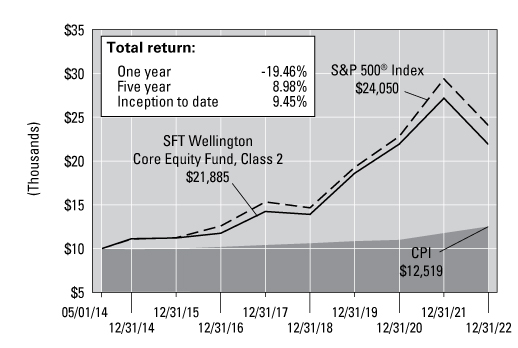
On the chart above you can see how the SFT Wellington Core Equity Fund's Class 2 shares total return compared to the S&P 500® Index and the Consumer Price Index. The three lines represent the total return of a hypothetical $10,000 investment made on May 1, 2014 through December 31, 2022, assuming reinvestment of distributions, if any.
* The results shown are past performance and are not an indication of future performance. Current performance may be lower or higher. The investment returns and principal value of an investment will fluctuate so that shares upon redemption may be worth more or less than their original cost. Performance figures of the Fund do not reflect charges pursuant to the terms of the variable life insurance policies and variable annuity contracts funded by separate accounts that invest in the Fund's shares. When such charges are deducted, actual investment performance in a variable policy or contract will be lower.
The S&P 500® Index is a broad, unmanaged index of 500 common stocks which are representative of the U.S. stock market overall.
52

Report of Independent Registered Public Accounting Firm
To the Shareholders and Board of Trustees
Securian Funds Trust:
Opinion on the Financial Statements
We have audited the accompanying statements of assets and liabilities of SFT Balanced Stabilization Fund, SFT Core Bond Fund, SFT Delaware IvySM Growth Fund, SFT Delaware IvySM Small Cap Growth Fund, SFT Equity Stabilization Fund, SFT Government Money Market Fund, SFT Index 400 Mid-Cap Fund, SFT Index 500 Fund, SFT International Bond Fund, SFT Real Estate Securities Fund, SFT T. Rowe Price Value Fund, and SFT Wellington Core Equity Fund (collectively, the Funds), including the schedules of investments, as of December 31, 2022, the related statements of operations for the year then ended, the statements of changes in net assets for each of the years in the two-year period then ended, and the related notes (collectively, the financial statements) and the financial highlights for each of the years in the five-year period then ended. In our opinion, the financial statements and financial highlights present fairly, in all material respects, the financial position of the Funds as of December 31, 2022, the results of their operations for the year then ended, the changes in their net assets for each of the years in the two-year period then ended, and the financial highlights for each of the years in the five-year period then ended, in conformity with U.S. generally accepted accounting principles.
Basis for Opinion
These financial statements and financial highlights are the responsibility of the Funds' management. Our responsibility is to express an opinion on these financial statements and financial highlights based on our audits. We are a public accounting firm registered with the Public Company Accounting Oversight Board (United States) (PCAOB) and are required to be independent with respect to the Funds in accordance with the U.S. federal securities laws and the applicable rules and regulations of the Securities and Exchange Commission and the PCAOB.
We conducted our audits in accordance with the standards of the PCAOB. Those standards require that we plan and perform the audit to obtain reasonable assurance about whether the financial statements and financial highlights are free of material misstatement, whether due to error or fraud. Our audits included performing procedures to assess the risks of material misstatement of the financial statements and financial highlights, whether due to error or fraud, and performing procedures that respond to those risks. Such procedures included examining, on a test basis, evidence regarding the amounts and disclosures in the financial statements and financial highlights. Such procedures also included confirmation of securities owned as of December 31, 2022, by correspondence with the custodian and brokers; when replies were not received from brokers, we performed other auditing procedures. Our audits also included evaluating the accounting principles used and significant estimates made by management, as well as evaluating the overall presentation of the financial statements and financial highlights. We believe that our audits provide a reasonable basis for our opinion.

We have served as the auditor of one or more Securian Funds Trust investment companies since 1985.
Minneapolis, Minnesota
February 23, 2023
KPMG LLP, a Delaware limited liability partnership and a member firm of
the KPMG global organization of independent member firms affiliated with
KPMG International Limited, a private English company limited by guarantee.
53
SFT Balanced Stabilization Fund
Investments in Securities
(Percentages of each investment category relate to total net assets)
| | | Principal | | Value(a) | |
Long-Term Debt Securities (39.5%) | |
Government Obligations (5.0%) | |
U.S. Government Agencies and Obligations (3.5%) | |
Federal Home Loan Mortgage Corporation (0.0%) | |
3.000%, 09/01/43 | | $ | 52,009 | | | $ | 46,845 | | |
3.500%, 10/01/44 | | | 54,450 | | | | 50,889 | | |
3.500%, 11/01/44 | | | 53,038 | | | | 49,570 | | |
3.500%, 12/01/44 | | | 58,106 | | | | 54,306 | | |
| | | | | | 201,610 | | |
Federal National Mortgage Association (0.1%) | |
3.000%, 04/01/43 | | | 80,482 | | | | 72,753 | | |
3.000%, 05/01/43 | | | 26,921 | | | | 24,344 | | |
3.000%, 06/01/43 | | | 118,892 | | | | 107,491 | | |
3.500%, 08/01/42 | | | 53,768 | | | | 50,962 | | |
3.500%, 02/01/43 | | | 71,449 | | | | 66,864 | | |
| | | | | | 322,414 | | |
U.S. Treasury (4.9%) | |
U.S. Treasury Bond | |
4.000%, 11/15/42 | | | 5,530,000 | | | | 5,452,234 | | |
4.000%, 11/15/52 | | | 1,200,000 | | | | 1,212,938 | | |
U.S. Treasury Note,
1.000%, 12/15/24 | | | 15,500,000 | | | | 14,509,453 | | |
3.875%, 12/31/27 | | | 9,350,000 | | | | 9,312,015 | | |
| | | | | | 30,486,640 | | |
Total government obligations
(cost: $32,016,161) | | | | | 31,010,664 | | |
Other Mortgage-Backed Securities (0.2%) | |
Commercial Mortgage-Backed Securities (0.2%) | |
Bank, Series 2019-BNK18,
Class A4, 3.584%, 05/15/62 | | | 1,500,000 | | | | 1,358,382 | | |
Total other mortgage-backed securities
(cost: $1,543,242) | | | | | 1,358,382 | | |
Corporate Obligations (34.3%) | |
Basic Materials (0.8%) | |
Chemicals (0.4%) | |
Celanese U.S. Holdings LLC,
6.330%, 07/15/29 | | | 1,500,000 | | | | 1,460,701 | | |
Nutrien Ltd.,
3.000%, 04/01/25 (b) | | | 1,000,000 | | | | 958,217 | | |
| | | | | | 2,418,918 | | |
Mining (0.4%) | |
Anglo American Capital PLC,
2.625%, 09/10/30 (b) (c) | | | 2,000,000 | | | | 1,634,594 | | |
FMG Resources August Pty.
Ltd., 6.125%, 04/15/32 (b) (c) | | | 1,000,000 | | | | 926,250 | | |
| | | | | | 2,560,844 | | |
Communications (1.5%) | |
Cable/Satellite TV (0.3%) | |
Comcast Corp. | |
2.887%, 11/01/51 | | | 1,319,000 | | | | 854,911 | | |
2.937%, 11/01/56 | | | 327,000 | | | | 206,113 | | |
4.200%, 08/15/34 (d) | | | 500,000 | | | | 460,949 | | |
| | | | | | 1,521,973 | | |
| | | Principal | | Value(a) | |
Diversified Telecommunication Services (0.5%) | |
AT&T, Inc. | |
2.550%, 12/01/33 | | $ | 943,000 | | | $ | 727,585 | | |
3.550%, 09/15/55 | | | 1,405,000 | | | | 950,333 | | |
3.800%, 12/01/57 | | | 75,000 | | | | 52,243 | | |
4.500%, 05/15/35 | | | 1,000,000 | | | | 913,070 | | |
Verizon Communications,
Inc., 2.987%, 10/30/56 | | | 1,194,000 | | | | 738,273 | | |
| | | | | | 3,381,504 | | |
Internet & Catalog Retail (0.3%) | |
Amazon.com, Inc. | |
3.875%, 08/22/37 | | | 1,000,000 | | | | 890,758 | | |
4.050%, 08/22/47 | | | 1,000,000 | | | | 865,619 | | |
| | | | | | 1,756,377 | | |
Media (0.2%) | |
Paramount Global,
4.000%, 01/15/26 | | | 250,000 | | | | 239,567 | | |
Walt Disney Co.,
4.950%, 10/15/45 | | | 1,000,000 | | | | 946,909 | | |
| | | | | | 1,186,476 | | |
Telecommunication (0.2%) | |
Crown Castle Towers LLC,
3.663%, 05/15/45 (c) | | | 1,000,000 | | | | 965,463 | | |
Vodafone Group PLC,
4.125%, 05/30/25 (b) | | | 500,000 | | | | 492,129 | | |
| | | | | | 1,457,592 | | |
Wireless Telecommunication Services (0.0%) | |
Rogers Communications, Inc.,
4.100%, 10/01/23 (b) | | | 250,000 | | | | 247,424 | | |
Consumer Cyclical (1.2%) | |
Entertainment (0.2%) | |
Warnermedia Holdings, Inc.,
5.141%, 03/15/52 (c) | | | 1,400,000 | | | | 1,030,336 | | |
Food & Staples Retailing (0.3%) | |
Kroger Co. | |
4.450%, 02/01/47 | | | 1,000,000 | | | | 854,328 | | |
5.150%, 08/01/43 | | | 1,100,000 | | | | 1,014,426 | | |
| | | | | | 1,868,754 | | |
Home Furnishings (0.1%) | |
Harman International
Industries, Inc.,
4.150%, 05/15/25 | | | 1,000,000 | | | | 974,197 | | |
Retail (0.6%) | |
AutoZone, Inc.,
3.250%, 04/15/25 | | | 1,000,000 | | | | 960,086 | | |
Lowe's Cos., Inc.,
5.625%, 04/15/53 | | | 2,250,000 | | | | 2,163,312 | | |
Target Corp.,
3.500%, 07/01/24 (d) | | | 750,000 | | | | 734,662 | | |
| | | | | | 3,858,060 | | |
See accompanying notes to financial statements.
54
SFT Balanced Stabilization Fund
Investments in Securities – continued
| | | Principal | | Value(a) | |
Consumer Staples (0.7%) | |
Consumer Products — Miscellaneous (0.1%) | |
SC Johnson & Son, Inc.,
3.350%, 09/30/24 (c) | | $ | 750,000 | | | $ | 725,499 | | |
Household Products (0.4%) | |
Avery Dennison Corp.,
2.650%, 04/30/30 | | | 2,000,000 | | | | 1,650,398 | | |
Kimberly-Clark Corp.,
3.900%, 05/04/47 | | | 1,000,000 | | | | 822,619 | | |
| | | | | | 2,473,017 | | |
Personal Care (0.2%) | |
Estee Lauder Cos., Inc.,
4.150%, 03/15/47 | | | 1,000,000 | | | | 857,290 | | |
Consumer, Non-cyclical (3.7%) | |
Agricultural Operations (0.4%) | |
Cargill, Inc.
3.125%, 05/25/51 (c) | | | 1,000,000 | | | | 693,544 | | |
4.375%, 04/22/52 (c) | | | 2,150,000 | | | | 1,873,652 | | |
| | | | | | 2,567,196 | | |
Beverages (0.5%) | |
Anheuser-Busch InBev
Worldwide, Inc.,
4.375%, 04/15/38 | | | 1,000,000 | | | | 904,281 | | |
Constellation Brands, Inc.,
5.250%, 11/15/48 | | | 2,050,000 | | | | 1,935,241 | | |
| | | | | | 2,839,522 | | |
Biotechnology (0.6%) | |
Amgen, Inc., 4.050%, 08/18/29 | | | 2,000,000 | | | | 1,877,166 | | |
Bio-Rad Laboratories, Inc.,
3.700%, 03/15/32 | | | 2,000,000 | | | | 1,721,446 | | |
| | | | | | 3,598,612 | | |
Commercial Service — Finance (0.0%) | |
Moody's Corp.,
4.875%, 02/15/24 | | | 250,000 | | | | 249,036 | �� | |
Commercial Services (0.3%) | |
Ashtead Capital, Inc.,
5.500%, 08/11/32 (c) | | | 2,000,000 | | | | 1,922,080 | | |
Diagnostic Equipment (0.3%) | |
Abbott Laboratories | |
3.875%, 09/15/25 | | | 750,000 | | | | 736,707 | | |
4.750%, 11/30/36 | | | 1,000,000 | | | | 994,783 | | |
4.750%, 04/15/43 | | | 250,000 | | | | 240,620 | | |
| | | | | | 1,972,110 | | |
Drugstore Chains (0.0%) | |
CVS Pass-Through Trust,
6.943%, 01/10/30 | | | 123,851 | | | | 126,929 | | |
Food (0.3%) | |
Mars, Inc.,
3.950%, 04/01/49 (c) | | | 1,000,000 | | | | 827,261 | | |
Tyson Foods, Inc.,
5.150%, 08/15/44 | | | 1,000,000 | | | | 930,676 | | |
| | | | | | 1,757,937 | | |
| | | Principal | | Value(a) | |
Food Products (0.1%) | |
General Mills, Inc.,
3.000%, 02/01/51 | | $ | 1,002,000 | | | $ | 678,730 | | |
Pharmaceuticals (1.2%) | |
AbbVie, Inc. | |
3.600%, 05/14/25 | | | 1,000,000 | | | | 970,104 | | |
3.800%, 03/15/25 | | | 670,000 | | | | 653,897 | | |
4.400%, 11/06/42 | | | 1,000,000 | | | | 873,788 | | |
4.450%, 05/14/46 | | | 1,000,000 | | | | 868,346 | | |
Becton Dickinson & Co.,
4.298%, 08/22/32 | | | 2,000,000 | | | | 1,879,118 | | |
Bristol-Myers Squibb Co. | |
3.250%, 11/01/23 | | | 500,000 | | | | 492,944 | | |
3.875%, 08/15/25 | | | 229,000 | | | | 223,000 | | |
Novartis Capital Corp.,
3.400%, 05/06/24 (d) | | | 500,000 | | | | 489,878 | | |
Takeda Pharmaceutical Co.
Ltd., 5.000%, 11/26/28 (b) | | | 1,000,000 | | | | 990,842 | | |
| | | | | | 7,441,917 | | |
Energy (2.3%) | |
Oil & Gas (1.2%) | |
Baker Hughes Holdings LLC/
Baker Hughes Co-Obligor,
Inc., 3.337%, 12/15/27 | | | 1,000,000 | | | | 925,052 | | |
BP Capital Markets America,
Inc., 4.234%, 11/06/28 | | | 1,000,000 | | | | 968,064 | | |
Chevron USA, Inc.,
3.900%, 11/15/24 | | | 1,000,000 | | | | 983,017 | | |
Coterra Energy, Inc.,
3.900%, 05/15/27 | | | 1,000,000 | | | | 935,087 | | |
EOG Resources, Inc.,
2.625%, 03/15/23 | | | 250,000 | | | | 248,851 | | |
Marathon Petroleum Corp.,
3.625%, 09/15/24 | | | 750,000 | | | | 729,709 | | |
Phillips 66,
4.650%, 11/15/34 | | | 1,000,000 | | | | 941,072 | | |
TotalEnergies Capital
International SA,
3.750%, 04/10/24 (b) | | | 750,000 | | | | 740,056 | | |
Valero Energy Corp.,
4.350%, 06/01/28 | | | 1,000,000 | | | | 965,044 | | |
| | | | | | 7,435,952 | | |
Pipelines (1.1%) | |
Energy Transfer LP | |
4.250%, 04/01/24 | | | 1,000,000 | | | | 983,486 | | |
4.900%, 03/15/35 | | | 1,000,000 | | | | 893,051 | | |
Enterprise Products
Operating LLC,
Series J, 5.750%, 03/01/35 | | | 250,000 | | | | 240,185 | | |
Kinder Morgan, Inc.,
5.300%, 12/01/34 | | | 750,000 | | | | 703,838 | | |
Magellan Midstream
Partners LP,
4.200%, 10/03/47 | | | 1,000,000 | | | | 754,804 | | |
MPLX LP,
4.950%, 09/01/32 | | | 2,000,000 | | | | 1,884,760 | | |
See accompanying notes to financial statements.
55
SFT Balanced Stabilization Fund
Investments in Securities – continued
| | | Principal | | Value(a) | |
Southern Natural Gas Co.
LLC, 4.800%, 03/15/47 (c) | | $ | 1,500,000 | | | $ | 1,226,805 | | |
Williams Cos., Inc.,
3.750%, 06/15/27 | | | 500,000 | | | | 471,238 | | |
| | | | | | 7,158,167 | | |
Financial (11.4%) | |
Banks (6.4%) | |
Associated Banc-Corp.,
4.250%, 01/15/25 | | | 750,000 | | | | 715,248 | | |
Bank of America Corp. | |
Series L, 3.950%, 04/21/25 | | | 1,000,000 | | | | 972,806 | | |
Series L, 4.183%, 11/25/27 | | | 1,000,000 | | | | 949,221 | | |
4.244%, 04/24/38
(3-Month USD LIBOR +
1.814%) (e) | | | 1,000,000 | | | | 858,189 | | |
Bank of New York Mellon Corp. | |
3.442%, 02/07/28
(3-Month USD LIBOR +
1.069%) (e) | | | 1,000,000 | | | | 940,298 | | |
5.834%, 10/25/33 | | | 1,000,000 | | | | 1,043,178 | | |
Capital One Financial Corp.,
4.250%, 04/30/25 | | | 1,500,000 | | | | 1,473,118 | | |
Citigroup, Inc. | |
3.300%, 04/27/25 | | | 750,000 | | | | 724,740 | | |
3.980%, 03/20/30
(3-Month USD LIBOR +
1.338%) (e) | | | 1,000,000 | | | | 901,475 | | |
4.650%, 07/23/48 | | | 1,250,000 | | | | 1,091,204 | | |
4.750%, 05/18/46 (f) | | | 1,200,000 | | | | 1,007,968 | | |
Comerica Bank,
5.332%, 08/25/33
(SOFRRATE + 2.610%) (e) | | | 2,000,000 | | | | 1,920,018 | | |
Discover Bank,
4.250%, 03/13/26 | | | 500,000 | | | | 475,643 | | |
Fifth Third Bank NA,
3.950%, 07/28/25 | | | 1,000,000 | | | | 979,669 | | |
First Republic Bank | |
4.375%, 08/01/46 | | | 575,000 | | | | 438,691 | | |
4.625%, 02/13/47 | | | 1,379,000 | | | | 1,099,721 | | |
Goldman Sachs Group, Inc. | |
3.850%, 01/26/27 | | | 1,000,000 | | | | 953,972 | | |
4.482%, 08/23/28
(SOFRRATE + 1.725%) (e) | | | 2,000,000 | | | | 1,918,994 | | |
5.150%, 05/22/45 (f) | | | 1,000,000 | | | | 909,112 | | |
JPMorgan Chase & Co. | |
3.125%, 01/23/25 | | | 1,000,000 | | | | 965,839 | | |
3.328%, 04/22/52
(SOFRRATE + 1.580%) (e) | | | 2,000,000 | | | | 1,374,732 | | |
KeyBank NA,
4.390%, 12/14/27 | | | 3,000,000 | | | | 2,890,011 | | |
M&T Bank Corp.,
4.553%, 08/16/28
(SOFRINDX + 1.780%) (e) | | | 3,000,000 | | | | 2,903,016 | | |
Morgan Stanley | |
2.802%, 01/25/52
(SOFRRATE + 1.430%) (e) | | | 2,000,000 | | | | 1,252,700 | | |
6.342%, 10/18/33 | | | 1,000,000 | | | | 1,050,736 | | |
| PNC Bank NA | |
3.800%, 07/25/23 | | | 250,000 | | | | 248,117 | | |
4.050%, 07/26/28 | | | 1,000,000 | | | | 946,269 | | |
SVB Financial Group,
2.100%, 05/15/28 | | | 2,000,000 | | | | 1,667,258 | | |
Synchrony Bank,
5.400%, 08/22/25 | | | 1,000,000 | | | | 992,463 | | |
| | | Principal | | Value(a) | |
Truist Bank,
2.750%, 05/01/23 | | $ | 250,000 | | | $ | 248,249 | | |
Truist Financial Corp.,
6.123%, 10/28/33 | | | 2,000,000 | | | | 2,109,078 | | |
U.S. Bancorp,
5.850%, 10/21/33 | | | 1,000,000 | | | | 1,046,147 | | |
Wells Fargo & Co. | |
3.068%, 04/30/41
(SOFRRATE +
2.530%) (e) (f) | | | 1,600,000 | | | | 1,148,654 | | |
4.750%, 12/07/46 | | | 2,300,000 | | | | 1,945,800 | | |
| | | | | | 40,162,334 | | |
Diversified Financial Services (1.1%) | |
American Express Co. | |
3.300%, 05/03/27 | | | 1,000,000 | | | | 936,381 | | |
4.050%, 12/03/42 (f) | | | 2,000,000 | | | | 1,731,710 | | |
CME Group, Inc.,
3.000%, 03/15/25 | | | 1,000,000 | | | | 966,279 | | |
Discover Financial Services,
3.750%, 03/04/25 | | | 1,000,000 | | | | 960,368 | | |
Eaton Vance Corp.,
3.500%, 04/06/27 | | | 1,000,000 | | | | 933,708 | | |
Pine Street Trust I,
4.572%, 02/15/29 (c) | | | 1,500,000 | | | | 1,388,424 | | |
| | | | | | 6,916,870 | | |
Finance (0.9%) | |
Allied World Assurance Co.
Holdings Ltd.,
4.350%, 10/29/25 (b) | | | 1,290,000 | | | | 1,227,576 | | |
Intercontinental Exchange,
Inc., 4.350%, 06/15/29 | | | 3,000,000 | | | | 2,907,195 | | |
Jefferies Group LLC/
Jefferies Group Capital
Finance, Inc.,
2.625%, 10/15/31 | | | 2,000,000 | | | | 1,537,840 | | |
| | | | | | 5,672,611 | | |
Insurance (1.3%) | |
American Financial Group,
Inc., 4.500%, 06/15/47 | | | 1,000,000 | | | | 796,126 | | |
Assured Guaranty
U.S. Holdings, Inc.,
5.000%, 07/01/24 | | | 330,000 | | | | 329,297 | | |
Liberty Mutual Group, Inc.,
4.250%, 06/15/23 (c) | | | 750,000 | | | | 744,438 | | |
Marsh & McLennan Cos., Inc.,
4.350%, 01/30/47 | | | 1,000,000 | | | | 858,694 | | |
Metropolitan Life Global
Funding I,
1.550%, 01/07/31 (c) | | | 3,000,000 | | | | 2,334,009 | | |
Pacific Life Insurance Co.,
4.300%, 10/24/67
(3-Month USD LIBOR +
2.796%) (c) (e) | | | 1,000,000 | | | | 780,000 | | |
Principal Life Global Funding II,
1.500%, 08/27/30 (c) | | | 3,000,000 | | | | 2,276,127 | | |
| | | | | | 8,118,691 | | |
Property / Casualty Insurance (0.2%) | |
Arch Capital Finance LLC,
4.011%, 12/15/26 (d) | | | 1,000,000 | | | | 955,919 | | |
See accompanying notes to financial statements.
56
SFT Balanced Stabilization Fund
Investments in Securities – continued
| | | Principal | | Value(a) | |
Real Estate Investment Trust — Diversified (0.1%) | |
Kite Realty Group Trust,
4.000%, 03/15/25 (d) | | $ | 1,000,000 | | | $ | 952,180 | | |
Real Estate Investment Trust — Health Care (0.7%) | |
Healthcare Realty Holdings LP | |
3.750%, 07/01/27 | | | 1,000,000 | | | | 928,128 | | |
3.875%, 05/01/25 | | | 1,000,000 | | | | 958,992 | | |
Physicians Realty LP,
4.300%, 03/15/27 | | | 1,000,000 | | | | 939,944 | | |
Welltower, Inc.,
4.125%, 03/15/29 | | | 1,500,000 | | | | 1,369,158 | | |
| | | | | | 4,196,222 | | |
Real Estate Investment Trust — Office Property (0.1%) | |
Alexandria Real Estate
Equities, Inc.,
4.500%, 07/30/29 | | | 500,000 | | | | 472,117 | | |
Real Estate Investment Trust — Shopping Centers (0.0%) | |
Retail Opportunity
Investments Partnership LP,
5.000%, 12/15/23 | | | 250,000 | | | | 247,148 | | |
Real Estate Investment Trust — Single Tenant (0.1%) | |
Office Properties Income
Trust, 4.500%, 02/01/25 | | | 750,000 | | | | 679,655 | | |
Specialized REITs (0.5%) | |
American Tower Corp.,
3.375%, 10/15/26 | | | 1,000,000 | | | | 936,953 | | |
Crown Castle, Inc.,
4.750%, 05/15/47 | | | 1,000,000 | | | | 847,797 | | |
Essex Portfolio LP,
3.500%, 04/01/25 | | | 1,000,000 | | | | 961,011 | | |
Goodman U.S. Finance Four
LLC, 4.500%, 10/15/37 (c) | | | 500,000 | | | | 416,960 | | |
| | | | | | 3,162,721 | | |
Health Care (0.9%) | |
Health Care Providers & Services (0.5%) | |
Aetna, Inc.,
3.875%, 08/15/47 | | | 1,000,000 | | | | 779,372 | | |
Elevance Health, Inc.,
4.375%, 12/01/47 | | | 1,000,000 | | | | 867,843 | | |
Laboratory Corp. of America
Holdings, 4.000%, 11/01/23 | | | 250,000 | | | | 247,540 | | |
UnitedHealth Group, Inc. | |
2.750%, 02/15/23 (d) | | | 250,000 | | | | 249,361 | | |
3.750%, 07/15/25 (d) | | | 1,000,000 | | | | 976,259 | | |
| | | | | | 3,120,375 | | |
Pharmaceuticals (0.4%) | |
Cardinal Health, Inc.,
3.750%, 09/15/25 | | | 1,000,000 | | | | 966,715 | | |
Mead Johnson Nutrition Co.,
5.900%, 11/01/39 | | | 1,000,000 | | | | 1,044,463 | | |
Mylan, Inc.,
4.200%, 11/29/23 | | | 500,000 | | | | 495,199 | | |
| | | | | | 2,506,377 | | |
| | | Principal | | Value(a) | |
Industrials (4.0%) | |
Aerospace & Defense (0.8%) | |
General Dynamics Corp.,
3.500%, 05/15/25 | | $ | 1,000,000 | | | $ | 973,544 | | |
L3Harris Technologies, Inc.,
3.832%, 04/27/25 | | | 1,000,000 | | | | 972,314 | | |
Raytheon Technologies Corp. | |
3.700%, 12/15/23 | | | 500,000 | | | | 494,568 | | |
4.050%, 05/04/47 | | | 1,000,000 | | | | 825,286 | | |
4.125%, 11/16/28 | | | 1,500,000 | | | | 1,440,733 | | |
| | | | | | 4,706,445 | | |
Air Freight & Logistics (0.1%) | |
FedEx Corp.,
4.400%, 01/15/47 | | | 1,000,000 | | | | 802,940 | | |
Building Products (0.4%) | |
CRH America Finance, Inc.,
4.400%, 05/09/47 (c) | | | 1,000,000 | | | | 829,956 | | |
Mohawk Industries, Inc.,
3.625%, 05/15/30 | | | 2,000,000 | | | | 1,725,664 | | |
| | | | | | 2,555,620 | | |
Containers & Packaging (0.3%) | |
Amcor Finance USA, Inc.,
4.500%, 05/15/28 | | | 1,000,000 | | | | 944,362 | | |
Sealed Air Corp.,
6.875%, 07/15/33 (c) | | | 1,000,000 | | | | 992,500 | | |
| | | | | | 1,936,862 | | |
Electrical Equipment (0.9%) | |
Flex Ltd. | |
4.750%, 06/15/25 (b) | | | 1,000,000 | | | | 977,379 | | |
4.875%, 06/15/29 (b) | | | 1,000,000 | | | | 942,011 | | |
General Motors Financial Co.,
Inc., 5.000%, 04/09/27 | | | 2,000,000 | | | | 1,944,074 | | |
Jabil, Inc., 3.600%, 01/15/30 | | | 2,000,000 | | | | 1,764,496 | | |
| | | | | | 5,627,960 | | |
Environmental Control (0.2%) | |
Republic Services, Inc.,
3.950%, 05/15/28 | | | 1,000,000 | | | | 951,547 | | |
Industrial Conglomerates (0.1%) | |
3M Co., 3.625%, 10/15/47 | | | 1,000,000 | | | | 748,726 | | |
Machinery (0.3%) | |
Caterpillar, Inc.,
3.250%, 04/09/50 | | | 2,300,000 | | | | 1,763,543 | | |
Miscellaneous Manufacturing (0.4%) | |
Carlisle Cos., Inc.,
3.750%, 12/01/27 | | | 1,000,000 | | | | 932,726 | | |
Textron, Inc. | |
3.875%, 03/01/25 | | | 750,000 | | | | 730,742 | | |
4.300%, 03/01/24 | | | 500,000 | | | | 494,443 | | |
| | | | | | 2,157,911 | | |
Road & Rail (0.0%) | |
Kansas City Southern,
4.300%, 05/15/43 | | | 250,000 | | | | 207,190 | | |
See accompanying notes to financial statements.
57
SFT Balanced Stabilization Fund
Investments in Securities – continued
| | | Principal | | Value(a) | |
Transportation (0.2%) | |
Burlington Northern Santa
Fe LLC, 3.750%, 04/01/24 | | $ | 350,000 | | | $ | 344,819 | | |
Penske Truck Leasing Co.
LP/PTL Finance Corp.,
3.900%, 02/01/24 (c) | | | 1,000,000 | | | | 980,098 | | |
| | | | | | 1,324,917 | | |
Trucking & Leasing (0.3%) | |
GATX Corp. | |
3.250%, 03/30/25 | | | 1,000,000 | | | | 952,482 | | |
4.550%, 11/07/28 | | | 1,000,000 | | | | 945,425 | | |
| | | | | | 1,897,907 | | |
Information Technology (1.7%) | |
Communications Equipment (0.2%) | |
QUALCOMM, Inc.,
4.650%, 05/20/35 | | | 1,000,000 | | | | 969,747 | | |
Computers (0.8%) | |
Apple, Inc.,
4.375%, 05/13/45 (d) | | | 1,000,000 | | | | 930,063 | | |
Dell International LLC/EMC
Corp., 6.200%, 07/15/30 | | | 2,000,000 | | | | 2,039,594 | | |
Leidos, Inc., 4.375%, 05/15/30 | | | 2,000,000 | | | | 1,807,500 | | |
| | | | | | 4,777,157 | | |
Interactive Media & Services (0.1%) | |
eBay, Inc.,
3.450%, 08/01/24 | | | 750,000 | | | | 731,015 | | |
IT Services (0.3%) | |
Global Payments, Inc. | |
4.800%, 04/01/26 | | | 750,000 | | | | 726,554 | | |
5.300%, 08/15/29 | | | 1,500,000 | | | | 1,458,252 | | |
| | | | | | 2,184,806 | | |
Software (0.3%) | |
Fiserv, Inc., 3.850%, 06/01/25 | | | 1,000,000 | | | | 970,867 | | |
Oracle Corp., 3.800%, 11/15/37 | | | 1,000,000 | | | | 795,299 | | |
| | | | | | 1,766,166 | | |
Materials (0.6%) | |
Chemicals (0.5%) | |
Mosaic Co.,
5.450%, 11/15/33 | | | 200,000 | | | | 197,529 | | |
Sherwin-Williams Co.,
3.950%, 01/15/26 | | | 1,000,000 | | | | 973,708 | | |
Yara International ASA | |
3.148%, 06/04/30 (b) (c) | | | 1,000,000 | | | | 789,408 | | |
4.750%, 06/01/28 (b) (c) | | | 1,000,000 | | | | 921,583 | | |
| | | | | | 2,882,228 | | |
Construction Materials (0.1%) | |
Vulcan Materials Co.,
4.500%, 06/15/47 | | | 1,000,000 | | | | 835,700 | | |
| | | Principal | | Value(a) | |
Technology (0.5%) | |
Semiconductor Equipment (0.5%) | |
Broadcom, Inc.,
3.419%, 04/15/33 (c) | | $ | 2,000,000 | | | $ | 1,612,620 | | |
Micron Technology, Inc.,
2.703%, 04/15/32 | | | 2,000,000 | | | | 1,507,182 | | |
| | | | | | 3,119,802 | | |
Transportation (1.3%) | |
Airlines (0.7%) | |
Air Canada Pass Through Trust,
Series 2015-2A,
4.125%, 06/15/29 (b) (c) | | | 760,708 | | | | 616,173 | | |
American Airlines Pass
Through Trust,
Series 2015-2, Class A,
4.000%, 03/22/29 | | | 692,098 | | | | 546,758 | | |
British Airways Pass
Through Trust,
Series 2013-1, Class A,
4.625%, 12/20/25 (c) | | | 371,432 | | | | 364,003 | | |
Delta Air Lines, Inc./
SkyMiles IP Ltd.,
4.750%, 10/20/28 (c) | | | 2,000,000 | | | | 1,880,312 | | |
United Airlines Pass
Through Trust,
Series AA, 3.500%, 09/01/31 | | | 983,882 | | | | 835,681 | | |
United Airlines Pass
Through Trust,
Series 2013-1, Class A,
4.300%, 02/15/27 | | | 150,777 | | | | 140,304 | | |
| | | | | | 4,383,231 | | |
Transport — Rail (0.6%) | |
Norfolk Southern Corp.,
3.850%, 01/15/24 | | | 500,000 | | | | 494,952 | | |
Union Pacific Corp. | |
3.750%, 03/15/24 | | | 500,000 | | | | 492,962 | | |
5.375%, 06/01/33 | | | 2,500,000 | | | | 2,516,420 | | |
| | | | | | 3,504,334 | | |
Utilities (3.7%) | |
Electric Utilities (2.6%) | |
Alabama Power Co.,
3.125%, 07/15/51 | | | 2,000,000 | | | | 1,384,540 | | |
Ameren Illinois Co.,
3.700%, 12/01/47 | | | 1,000,000 | | | | 788,503 | | |
Arizona Public Service Co.,
4.350%, 11/15/45 | | | 1,000,000 | | | | 787,302 | | |
CenterPoint Energy
Houston Electric LLC,
Series AJ,
4.850%, 10/01/52 | | | 3,150,000 | | | | 2,979,109 | | |
Duke Energy Corp.,
4.500%, 08/15/32 | | | 1,000,000 | | | | 941,639 | | |
Duke Energy Florida
LLC, 5.950%, 11/15/52 | | | 1,000,000 | | | | 1,071,983 | | |
Duke Energy Progress
LLC, 3.600%, 09/15/47 | | | 1,000,000 | | | | 765,745 | | |
Entergy Texas, Inc.,
3.450%, 12/01/27 | | | 3,000,000 | | | | 2,763,333 | | |
See accompanying notes to financial statements.
58
SFT Balanced Stabilization Fund
Investments in Securities – continued
| | | Principal | | Value(a) | |
Northern States Power Co.,
3.750%, 12/01/47 | | $ | 1,000,000 | | | $ | 740,052 | | |
Oglethorpe Power Corp.,
4.250%, 04/01/46 | | | 800,000 | | | | 582,731 | | |
Oklahoma Gas & Electric Co.,
4.150%, 04/01/47 | | | 1,000,000 | | | | 795,243 | | |
Wisconsin Power & Light Co.,
3.950%, 09/01/32 | | | 3,000,000 | | | | 2,758,383 | | |
| | | | | | 16,358,563 | | |
Electric — Integrated (0.1%) | |
Berkshire Hathaway Energy Co.,
3.750%, 11/15/23 | | | 250,000 | | | | 247,156 | | |
Gas Utilities (0.7%) | |
National Fuel Gas Co. | |
4.750%, 09/01/28 | | | 1,000,000 | | | | 943,650 | | |
5.200%, 07/15/25 | | | 1,000,000 | | | | 991,989 | | |
ONEOK, Inc. | |
4.000%, 07/13/27 | | | 500,000 | | | | 469,214 | | |
4.350%, 03/15/29 | | | 1,500,000 | | | | 1,389,451 | | |
Washington Gas Light Co.,
Series K, 3.796%, 09/15/46 | | | 1,000,000 | | | | 749,813 | | |
| | | | | | 4,544,117 | | |
Multi-Utilities (0.1%) | |
Atmos Energy Corp.,
4.125%, 03/15/49 | | | 750,000 | | | | 614,091 | | |
Eastern Energy Gas
Holdings LLC,
3.550%, 11/01/23 | | | 250,000 | | | | 246,743 | | |
| | | | | | 860,834 | | |
Water Utilities (0.2%) | |
American Water Capital Corp.,
3.750%, 09/01/47 | | | 1,000,000 | | | | 782,880 | | |
Aquarion Co.,
4.000%, 08/15/24 (c) | | | 500,000 | | | | 493,099 | | |
| | | | | | 1,275,979 | | |
Total corporate obligations
(cost: $228,781,821) | | | | | 214,352,072 | | |
Total long-term debt securities
(cost: $262,341,224) | | | | | 246,721,118 | | |
| | | Shares | | Value(a) | |
Mutual Funds (47.3%) | |
Investment Companies (47.3%) | |
iShares Core S&P 500 ETF | | | 105,440 | | | $ | 40,511,102 | | |
SFT Index 500 Fund (g) | | | 14,224,618 | | | | 234,734,959 | | |
SPDR S&P 500 ETF Trust (d) | | | 36,170 | | | | 13,832,493 | | |
Vanguard S&P 500 ETF | | | 20,175 | | | | 7,088,284 | | |
Total mutual funds
(cost: $168,921,296) | | | | | 296,166,838 | | |
Short-Term Securities (12.3%) | |
Investment Companies (12.3%) | |
State Street Institutional
U.S. Government Money
Market Fund, current rate
4.120% | | | 77,124,275 | | | | 77,124,275 | | |
Total short-term securities
(cost: $77,124,275) | | | | | 77,124,275 | | |
Total investments excluding
purchased options (99.1%)
(cost: $508,386,795) | | | | | 620,012,231 | | |
Total purchased options
outstanding (0.1%)
(cost: $993,552) | | | | | 553,957 | | |
Total investments in securities
(cost: $509,380,347) (h) | | | | | 620,566,188 | | |
Cash and other assets in excess
of liabilities (0.8%) | | | | | 4,845,852 | | |
Total net assets (100.0%) | | | | $ | 625,412,040 | | |
Investments in Securities Legend
(a) Securities are valued by procedures described in Note 2 of the notes to financial statements.
(b) Foreign security: The Fund held 1.8% of net assets in foreign securities at December 31, 2022.
(c) Security sold within terms of a private placement memorandum exempt from registration pursuant to Rule 144A under the Securities Act of 1933, as amended, and may be sold only to dealers in that program.
(d) Fully or partially pledged as initial margin deposits on open futures contracts.
(e) Variable rate security.
(f) Pursuant to the Fund's Liquidity Risk Management Program, this security has been determined to be illiquid by the Fund's Liquidity Risk Management Program Administrator.
(g) Affiliated security.
(h) At December 31, 2022, the cost of investments for federal income tax purposes was $510,224,207. The aggregate unrealized appreciation and depreciation of investments based on this cost were:
Gross unrealized appreciation | | $ | 137,908,686 | | |
Gross unrealized depreciation | | | (26,308,858 | ) | |
Net unrealized appreciation | | $ | 111,599,828 | | |
See accompanying notes to financial statements.
59
SFT Balanced Stabilization Fund
Investments in Securities – continued
Holdings of Open Futures Contracts
On December 31, 2022, securities with an aggregate market value of $17,738,529 have been pledged to cover margin requirements for the following open futures contracts:
Description | |
Expiration
Date | |
Number of
Contracts | |
Position
Type | |
Notional
Amount | |
Market
Value | | Unrealized
Appreciation/
(Depreciation)(a) | |
S&P 500 E-Mini Index Future | | March 2023 | | | 198 | | | Short | | $ | (39,573,236 | ) | | $ | (38,223,900 | ) | | $ | 1,349,336 | | |
Call Options Purchased:
The Fund had the following call options purchased open at December 31, 2022:
Description | | Exercise
Price | | Expiration
Date | | Number of
Contracts | | Notional
Amount | | Value(a) | |
CBOE Volatility Index | | $ | 25 | | | January 2023 | | | 3,203 | | | $ | 320,300 | | | $ | 294,676 | | |
Put Options Purchased:
The Fund had the following put options purchased open at December 31, 2022:
Description | | Exercise
Price | | Expiration
Date | | Number of
Contracts | | Notional
Amount | | Value(a) | |
S&P 500 Index | | $ | 3,720 | | | January 2023 | | | 81 | | | $ | 8,100 | | | $ | 259,281 | | |
Call Options Written:
The Fund had the following call options written open at December 31, 2022
Description | | Exercise
Price | | Expiration
Date | | Number of
Contracts | | Notional
Amount | | Value(a) | |
CBOE Volatility Index | | $ | 35 | | | January 2023 | | | 3.203 | | | $ | 320,300 | | | $ | (73,669 | ) | |
Put Options Written:
The Fund had the following put options written open at December 31, 2022:
Description | | Exercise
Price | | Expiration
Date | | Number of
Contracts | | Notional
Amount | | Value(a) | |
S&P 500 Index | | $ | 3,330 | | | January 2023 | | | 81 | | | $ | 8,100 | | | $ | (17,820 | ) | |
See accompanying notes to financial statements.
60
SFT Core Bond Fund
Investments in Securities
(Percentages of each investment category relate to total net assets)
| | | Principal | | Value(a) | |
Long-Term Debt Securities (105.5%) | |
Government Obligations (53.6%) | |
Other Government Obligations (0.8%) | |
Provincial or Local Government Obligations (0.8%) | |
Douglas County Public
Utility District No. 1
Wells Hydroelectric
Project Revenue, Series A,
5.450%, 09/01/40 | | $ | 1,185,000 | | | $ | 1,156,311 | | |
Municipal Electric Authority
of Georgia, 6.655%, 04/01/57 | | | 693,000 | | | | 735,938 | | |
Ohio Water Development
Authority, Series A2,
4.817%, 12/01/30 | | | 250,000 | | | | 248,028 | | |
Port Authority of New York &
New Jersey,
4.458%, 10/01/62 | | | 1,150,000 | | | | 1,014,300 | | |
Texas A&M University,
Series D, 4.000%, 05/15/31 | | | 325,000 | | | | 305,386 | | |
| | | | | | 3,459,963 | | |
U.S. Government Agencies and
Obligations (52.8%) | |
Federal Home Loan Mortgage
Corporation (6.2%) | |
2.000%, 11/01/51 | | | 5,232,957 | | | | 4,282,679 | | |
2.500%, 04/01/28 | | | 59,501 | | | | 56,143 | | |
2.500%, 01/01/52 | | | 1,921,242 | | | | 1,637,217 | | |
2.500%, 03/01/52 | | | 7,969,828 | | | | 6,778,676 | | |
3.000%, 08/01/42 | | | 271,468 | | | | 249,267 | | |
3.000%, 12/01/42 | | | 107,671 | | | | 98,888 | | |
3.000%, 01/01/43 | | | 152,489 | | | | 133,823 | | |
3.000%, 02/01/43 | | | 369,543 | | | | 340,581 | | |
3.000%, 04/01/43 | | | 524,826 | | | | 475,954 | | |
3.000%, 10/25/46 | | | 45,710 | | | | 41,223 | | |
3.000%, 02/01/52 | | | 3,646,540 | | | | 3,210,042 | | |
3.500%, 10/01/25 | | | 41,946 | | | | 40,058 | | |
3.500%, 05/01/32 | | | 81,696 | | | | 78,342 | | |
3.500%, 03/01/42 | | | 380,987 | | | | 356,641 | | |
3.500%, 08/01/42 | | | 322,596 | | | | 301,952 | | |
3.500%, 05/25/45 | | | 182,485 | | | | 162,392 | | |
4.000%, 09/01/40 | | | 340,723 | | | | 330,899 | | |
4.000%, 11/01/40 | | | 613,971 | | | | 598,742 | | |
4.000%, 02/01/41 | | | 136,682 | | | | 133,794 | | |
4.000%, 03/01/41 | | | 151,130 | | | | 146,896 | | |
4.000%, 08/01/52 | | | 5,384,103 | | | | 5,060,413 | | |
4.500%, 04/01/23 | | | 701 | | | | 643 | | |
4.500%, 09/01/40 | | | 43,213 | | | | 42,757 | | |
4.500%, 01/01/41 | | | 216,151 | | | | 214,083 | | |
4.500%, 02/01/41 | | | 126,666 | | | | 125,448 | | |
4.500%, 03/01/41 | | | 278,989 | | | | 276,138 | | |
4.500%, 04/01/41 | | | 232,003 | | | | 237,229 | | |
5.000%, 03/01/23 | | | 209 | | | | 199 | | |
5.000%, 05/01/29 | | | 10,504 | | | | 10,399 | | |
5.000%, 04/01/35 | | | 39,164 | | | | 39,695 | | |
5.000%, 08/01/35 | | | 23,993 | | | | 24,078 | | |
5.000%, 11/01/35 | | | 39,817 | | | | 40,514 | | |
5.000%, 11/01/39 | | | 239,568 | | | | 244,588 | | |
5.000%, 04/01/40 | | | 76,032 | | | | 77,580 | | |
5.000%, 08/01/40 | | | 49,010 | | | | 50,442 | | |
| | | Principal | | Value(a) | |
5.339%, 10/25/29
(1-Month USD LIBOR +
0.950%) (b) | | $ | 340,525 | | | $ | 323,440 | | |
5.500%, 11/01/23 | | | 10,395 | | | | 9,744 | | |
5.500%, 05/01/34 | | | 329,795 | | | | 341,486 | | |
5.500%, 10/01/34 | | | 96,356 | | | | 96,581 | | |
5.500%, 07/01/35 | | | 135,361 | | | | 141,382 | | |
5.500%, 10/01/35 | | | 142,480 | | | | 143,771 | | |
5.500%, 12/01/38 | | | 70,172 | | | | 71,539 | | |
6.000%, 11/01/33 | | | 143,458 | | | | 151,078 | | |
6.250%, 12/15/23 | | | 3,044 | | | | 3,042 | | |
6.500%, 09/01/32 | | | 18,479 | | | | 19,472 | | |
6.500%, 11/01/32 | | | 14,639 | | | | 16,059 | | |
6.500%, 06/01/36 | | | 92,374 | | | | 93,353 | | |
7.000%, 12/01/37 | | | 23,857 | | | | 25,010 | | |
| | | | | | 27,334,372 | | |
Federal National Mortgage
Association (28.7%) | |
2.000%, 11/01/51 | | | 10,265,677 | | | | 8,401,492 | | |
2.000%, 01/12/53, TBA (d) | | | 20,200,000 | | | | 16,481,938 | | |
2.500%, 03/01/27 | | | 88,442 | | | | 82,096 | | |
2.500%, 11/01/27 | | | 135,525 | | | | 127,861 | | |
2.500%, 03/01/28 | | | 108,770 | | | | 102,025 | | |
2.500%, 07/01/28 | | | 146,475 | | | | 137,062 | | |
2.500%, 03/01/52 | | | 2,758,461 | | | | 2,342,745 | | |
2.500%, 04/01/52 | | | 2,484,965 | | | | 2,112,302 | | |
2.500%, 12/25/51, TBA (d) | | | 29,775,000 | | | | 25,285,488 | | |
3.000%, 11/01/27 | | | 63,649 | | | | 60,679 | | |
3.000%, 09/01/42 | | | 73,075 | | | | 65,782 | | |
3.000%, 01/01/46 | | | 75,765 | | | | 68,179 | | |
3.000%, 04/01/52 | | | 6,016,812 | | | | 5,291,259 | | |
3.000%, 02/25/52, TBA (d) | | | 17,625,000 | | | | 15,498,984 | | |
3.500%, 11/01/25 | | | 51,859 | | | | 51,302 | | |
3.500%, 01/01/26 | | | 59,332 | | | | 58,695 | | |
3.500%, 12/01/32 | | | 78,889 | | | | 76,501 | | |
3.500%, 11/01/40 | | | 254,419 | | | | 234,192 | | |
3.500%, 01/01/41 | | | 283,450 | | | | 263,313 | | |
3.500%, 02/01/41 | | | 344,709 | | | | 324,472 | | |
3.500%, 04/01/41 | | | 181,772 | | | | 167,563 | | |
3.500%, 11/01/41 | | | 980,046 | | | | 905,813 | | |
3.500%, 12/01/41 | | | 199,094 | | | | 186,328 | | |
3.500%, 05/01/42 | | | 104,487 | | | | 96,350 | | |
3.500%, 01/01/43 | | | 234,041 | | | | 217,684 | | |
3.500%, 02/01/43 | | | 285,795 | | | | 267,458 | | |
3.500%, 05/01/43 | | | 925,892 | | | | 868,347 | | |
3.500%, 02/25/49, TBA (d) | | | 3,600,000 | | | | 3,276,563 | | |
4.000%, 12/01/40 | | | 38,977 | | | | 37,806 | | |
4.000%, 04/01/41 | | | 568,535 | | | | 544,059 | | |
4.000%, 09/01/41 | | | 155,425 | | | | 151,317 | | |
4.000%, 11/01/41 | | | 92,100 | | | | 89,380 | | |
4.000%, 06/01/42 | | | 268,308 | | | | 260,056 | | |
4.000%, 09/01/43 | | | 163,753 | | | | 158,310 | | |
4.500%, 04/01/25 | | | 6,756 | | | | 6,710 | | |
4.500%, 05/25/34 | | | 537,000 | | | | 526,154 | | |
4.500%, 05/01/35 | | | 86,325 | | | | 91,499 | | |
4.500%, 07/01/35 | | | 226,907 | | | | 222,187 | | |
4.500%, 09/01/37 | | | 79,909 | | | | 78,250 | | |
4.500%, 06/01/39 | | | 81,466 | | | | 80,945 | | |
4.500%, 04/01/41 | | | 703,449 | | | | 699,617 | | |
4.500%, 07/01/41 | | | 480,421 | | | | 473,809 | | |
4.500%, 07/01/47 | | | 200,986 | | | | 199,912 | | |
4.500%, 08/01/52 | | | 6,106,672 | | | | 5,896,606 | | |
See accompanying notes to financial statements.
61
SFT Core Bond Fund
Investments in Securities – continued
| | | Principal | | Value(a) | |
4.500%, 01/12/53, TBA (d) | | $ | 6,525,000 | | | $ | 6,296,625 | | |
5.000%, 06/25/23 | | | 2,550 | | | | 2,537 | | |
5.000%, 07/01/23 | | | 2,380 | | | | 2,399 | | |
5.000%, 11/01/33 | | | 96,534 | | | | 98,245 | | |
5.000%, 03/01/34 | | | 75,061 | | | | 76,487 | | |
5.000%, 05/01/34 | | | 15,866 | | | | 15,886 | | |
5.000%, 12/01/34 | | | 91,535 | | | | 93,148 | | |
5.000%, 07/01/35 | | | 83,077 | | | | 85,298 | | |
5.000%, 08/01/35 | | | 34,051 | | | | 34,797 | | |
5.000%, 03/01/38 | | | 38,075 | | | | 38,846 | | |
5.000%, 04/01/38 | | | 67,054 | | | | 68,282 | | |
5.000%, 06/01/39 | | | 58,124 | | | | 59,684 | | |
5.000%, 12/01/39 | | | 215,358 | | | | 221,181 | | |
5.000%, 06/01/40 | | | 27,490 | | | | 27,781 | | |
5.000%, 04/01/41 | | | 222,978 | | | | 227,713 | | |
5.000%, 01/12/53, TBA (d) | | | 21,450,000 | | | | 21,151,711 | | |
5.500%, 08/01/23 | | | 1,553 | | | | 1,521 | | |
5.500%, 02/01/24 | | | 4,395 | | | | 4,423 | | |
5.500%, 04/01/33 | | | 330,764 | | | | 337,808 | | |
5.500%, 05/01/33 | | | 4,399 | | | | 4,493 | | |
5.500%, 12/01/33 | | | 34,789 | | | | 35,532 | | |
5.500%, 01/01/34 | | | 64,973 | | | | 66,362 | | |
5.500%, 02/01/34 | | | 74,359 | | | | 76,177 | | |
5.500%, 03/01/34 | | | 116,302 | | | | 117,743 | | |
5.500%, 04/01/34 | | | 55,822 | | | | 57,381 | | |
5.500%, 05/01/34 | | | 1,936 | | | | 1,959 | | |
5.500%, 09/01/34 | | | 79,676 | | | | 81,657 | | |
5.500%, 10/01/34 | | | 24,858 | | | | 24,946 | | |
5.500%, 01/01/35 | | | 41,345 | | | | 42,228 | | |
5.500%, 02/01/35 | | | 131,505 | | | | 132,708 | | |
5.500%, 04/01/35 | | | 102,074 | | | | 102,450 | | |
5.500%, 06/01/35 | | | 6,824 | | | | 6,860 | | |
5.500%, 08/01/35 | | | 69,744 | | | | 71,234 | | |
5.500%, 10/01/35 | | | 134,221 | | | | 135,152 | | |
5.500%, 11/01/35 | | | 30,406 | | | | 31,631 | | |
5.500%, 09/01/36 | | | 61,264 | | | | 62,670 | | |
5.500%, 12/01/39 | | | 37,317 | | | | 38,079 | | |
6.000%, 08/01/23 | | | 3,047 | | | | 3,043 | | |
6.000%, 09/01/32 | | | 7,376 | | | | 7,749 | | |
6.000%, 10/01/32 | | | 223,447 | | | | 232,177 | | |
6.000%, 11/01/32 | | | 264,026 | | | | 277,303 | | |
6.000%, 03/01/33 | | | 173,421 | | | | 181,216 | | |
6.000%, 12/01/33 | | | 69,331 | | | | 74,651 | | |
6.000%, 08/01/34 | | | 10,863 | | | | 10,849 | | |
6.000%, 09/01/34 | | | 13,010 | | | | 13,623 | | |
6.000%, 11/01/34 | | | 7,544 | | | | 7,891 | | |
6.000%, 12/01/34 | | | 54,552 | | | | 57,546 | | |
6.000%, 11/01/36 | | | 6,546 | | | | 6,907 | | |
6.000%, 01/01/37 | | | 76,461 | | | | 80,982 | | |
6.000%, 08/01/37 | | | 37,349 | | | | 39,419 | | |
6.000%, 10/01/38 | | | 69,986 | | | | 73,689 | | |
6.500%, 11/01/23 | | | 1,666 | | | | 1,667 | | |
6.500%, 12/01/31 | | | 26,957 | | | | 27,998 | | |
6.500%, 02/01/32 | | | 118,108 | | | | 123,278 | | |
6.500%, 04/01/32 | | | 68,076 | | | | 72,593 | | |
6.500%, 05/01/32 | | | 16,975 | | | | 17,132 | | |
6.500%, 07/01/32 | | | 114,134 | | | | 120,884 | | |
6.500%, 08/01/32 | | | 61,730 | | | | 65,844 | | |
6.500%, 09/01/32 | | | 37,594 | | | | 40,099 | | |
6.500%, 10/01/32 | | | 47,508 | | | | 48,036 | | |
6.500%, 09/01/34 | | | 2,747 | | | | 2,764 | | |
6.500%, 11/01/34 | | | 2,835 | | | | 3,118 | | |
6.500%, 03/01/35 | | | 38,871 | | | | 40,991 | | |
6.500%, 09/01/37 | | | 58,081 | | | | 58,990 | | |
6.500%, 11/01/37 | | | 19,731 | | | | 20,932 | | |
| | | Principal | | Value(a) | |
7.000%, 07/01/31 | | $ | 29,955 | | | $ | 31,512 | | |
7.000%, 09/01/31 | | | 93,079 | | | | 97,946 | | |
7.000%, 11/01/31 | | | 82,523 | | | | 86,821 | | |
7.000%, 02/01/32 | | | 36,774 | | | | 36,948 | | |
7.000%, 03/01/32 | | | 8,891 | | | | 9,563 | | |
7.000%, 07/01/32 | | | 37,328 | | | | 40,134 | | |
7.500%, 04/01/31 | | | 33,007 | | | | 33,772 | | |
7.500%, 05/01/31 | | | 7,833 | | | | 8,252 | | |
8.689%, 02/25/25
(1-Month USD LIBOR +
4.300%) (b) | | | 333,624 | | | | 338,890 | | |
8.789%, 01/25/24
(1-Month USD LIBOR +
4.400%) (b) | | | 31,097 | | | | 31,880 | | |
8.839%, 01/25/29
(1-Month USD LIBOR +
4.450%) (b) | | | 762,420 | | | | 780,189 | | |
| | | | | | 125,710,002 | | |
Government National Mortgage
Association (1.3%) | |
0.000%,
06/17/45 (b) (c) | | | 117,445 | | | | 1 | | |
1.000%, 12/20/42 | | | 39,231 | | | | 32,842 | | |
3.000%, 03/15/45 | | | 479,663 | | | | 431,699 | | |
3.000%, 04/15/45 | | | 872,600 | | | | 775,678 | | |
3.000%, 05/15/45 | | | 39,513 | | | | 35,132 | | |
3.250%, 04/20/33 | | | 84,301 | | | | 76,404 | | |
3.250%, 03/20/35 | | | 693,623 | | | | 663,129 | | |
3.250%, 11/20/35 | | | 393,402 | | | | 376,073 | | |
3.250%, 01/20/36 | | | 661,193 | | | | 631,931 | | |
3.500%, 11/15/40 | | | 58,589 | | | | 54,804 | | |
3.500%, 04/20/46 | | | 238,610 | | | | 223,026 | | |
3.750%, 03/20/46 | | | 588,881 | | | | 562,570 | | |
4.000%, 07/20/31 | | | 209,556 | | | | 207,411 | | |
4.000%, 04/20/39 | | | 147,367 | | | | 142,256 | | |
4.000%, 12/20/40 | | | 394,630 | | | | 377,254 | | |
4.000%, 01/15/41 | | | 19,771 | | | | 19,421 | | |
4.000%, 02/15/41 | | | 166,007 | | | | 161,694 | | |
4.000%, 10/15/41 | | | 103,679 | | | | 99,242 | | |
4.000%, 12/20/44 | | | 46,535 | | | | 45,263 | | |
4.500%, 06/15/40 | | | 119,478 | | | | 118,542 | | |
5.000%, 05/15/33 | | | 29,877 | | | | 30,718 | | |
5.000%, 12/15/39 | | | 44,640 | | | | 46,188 | | |
5.000%, 01/15/40 | | | 386,360 | | | | 396,410 | | |
5.000%, 07/15/40 | | | 80,502 | | | | 81,700 | | |
5.500%, 07/15/38 | | | 95,241 | | | | 100,046 | | |
5.500%, 10/15/38 | | | 155,075 | | | | 160,135 | | |
| | | | | | 5,849,569 | | |
U.S. Treasury (16.6%) | |
U.S. Treasury Bond | |
2.000%, 11/15/41 | | | 48,275,000 | | | | 34,735,371 | | |
4.000%, 11/15/52 | | | 15,180,000 | | | | 15,343,659 | | |
U.S. Treasury Inflation-Indexed
Notes, 0.625%, 07/15/32 | | | 594,819 | | | | 546,490 | | |
U.S. Treasury Note | |
3.750%, 12/31/27 | | | 9,160,000 | | | | 9,122,788 | | |
3.875%, 11/30/27 | | | 5,945,000 | | | | 5,920,849 | | |
4.125%, 10/31/27 | | | 255,000 | | | | 256,275 | | |
4.125%, 11/15/32 | | | 5,490,000 | | | | 5,621,245 | | |
4.250%, 12/31/24 | | | 95,000 | | | | 94,718 | | |
4.500%, 11/30/24 | | | 1,235,000 | | | | 1,235,772 | | |
| | | | | | 72,877,167 | | |
See accompanying notes to financial statements.
62
SFT Core Bond Fund
Investments in Securities – continued
| | | Principal | | Value(a) | |
Vendee Mortgage Trust (0.0%) | |
Vendee Mortgage Trust,
Series 1995-1, Class 2,
7.793%, 02/15/25 | | $ | 4,030 | | | $ | 4,027 | | |
Total government obligations
(cost: $246,553,698) | | | | | 235,235,100 | | |
Asset-Backed Securities (10.2%) | |
AGL CLO 12 Ltd.,
Series 2021-12A, Class B,
5.843%, 07/20/34
(3-Month USD LIBOR +
1.600%) (b) (e) | | | 875,000 | | | | 822,611 | | |
AMSR Trust | |
Series 2021-SFR2, Class D,
2.278%, 08/17/38 (e) | | | 1,150,000 | | | | 976,183 | | |
Series 2021-SFR4, Class B,
2.417%, 12/17/38 (e) | | | 4,950,000 | | | | 4,310,732 | | |
Bear Stearns Asset-Backed
Securities Trust,
Series 2004-HE1, Class M1,
5.363%, 02/25/34
(1-Month USD LIBOR +
0.975%) (b) | | | 361,951 | | | | 406,147 | | |
CarMax Auto Owner Trust,
Series 2019-4, Class D,
2.800%, 04/15/26 | | | 1,400,000 | | | | 1,345,586 | | |
Chase Funding Trust | |
Series 2002-3, Class 2A1,
5.029%, 08/25/32
(1-Month USD LIBOR +
0.640%) (b) | | | 94,443 | | | | 105,464 | | |
Series 2003-2, Class 2A2,
4.576%, 02/25/33
(1-Month USD LIBOR +
0.560%) (b) | | | 123,519 | | | | 126,468 | | |
CIFC Funding Ltd.,
Series 2022-3A, Class A,
5.398%, 04/21/35
(SOFRRATE + 1.410%) (b) (e) | | | 1,250,000 | | | | 1,216,180 | | |
Commonbond Student
Loan Trust | |
Series 2017-AGS, Class C,
5.280%, 05/25/41 (e) | | | 18,377 | | | | 17,137 | | |
Series 2018-AGS, Class A1,
3.210%, 02/25/44 (e) | | | 632,514 | | | | 599,768 | | |
Series 2018-AGS, Class A2,
4.889%, 02/25/44
(1-Month USD LIBOR +
0.500%) (b) (e) | | | 222,633 | | | | 220,050 | | |
Series 2019-AGS, Class A1,
2.540%, 01/25/47 (e) | | | 1,329,525 | | | | 1,182,152 | | |
Series 2021-AGS, Class A,
1.200%, 03/25/52 (e) | | | 550,277 | | | | 464,555 | | |
Eaton Vance CLO Ltd.,
Series 2019-1A, Class AR,
5.179%, 04/15/31
(3-Month USD LIBOR +
1.100%) (b) (e) | | | 1,000,000 | | | | 981,056 | | |
Exeter Automobile
Receivables Trust,
Series 2020-3A, Class D,
1.730%, 07/15/26 | | | 1,850,000 | | | | 1,774,071 | | |
| | | Principal | | Value(a) | |
FirstKey Homes Trust | |
Series 2021-SFR1, Class B,
1.788%, 08/17/38 (e) | | $ | 2,075,000 | | | $ | 1,766,804 | | |
Series 2021-SFR2, Class D,
2.058%, 09/17/38 (e) | | | 1,950,000 | | | | 1,653,766 | | |
Home Partners of America
Trust | |
Series 2021-1, Class A,
1.698%, 09/17/41 (e) | | | 1,655,650 | | | | 1,368,422 | | |
Series 2021-3, Class B,
2.649%, 01/17/41 (e) | | | 3,738,556 | | | | 3,114,813 | | |
HPS Loan Management Ltd.,
Series 2021-16A, Class A1,
5.465%, 01/23/35
(3-Month USD LIBOR +
1.140%) (b) (e) | | | 1,150,000 | | | | 1,111,759 | | |
Invitation Homes Trust,
Series 2018-SFR4, Class C,
5.739%, 01/17/38
(1-Month USD LIBOR +
1.400%) (b) (e) | | | 5,049,767 | | | | 5,014,336 | | |
Morgan Stanley Dean
Witter Capital I, Inc.,
Series 2002-NC3, Class A2,
4.949%, 08/25/32
(1-Month USD LIBOR +
0.560%) (b) | | | 162,375 | | | | 169,331 | | |
Navient Private Education
Refi Loan Trust | |
Series 2020-HA, Class A,
1.310%, 01/15/69 (e) | | | 859,775 | | | | 762,515 | | |
Series 2021-BA, Class A,
0.940%, 07/15/69 (e) | | | 1,651,329 | | | | 1,388,790 | | |
Series 2021-CA, Class A,
1.060%, 10/15/69 (e) | | | 824,990 | | | | 698,126 | | |
Series 2021-FA, Class A,
1.110%, 02/18/70 (e) | | | 1,500,766 | | | | 1,265,593 | | |
Series 2022-A, Class A,
2.230%, 07/15/70 (e) | | | 1,554,427 | | | | 1,364,142 | | |
Octagon Investment
Partners 46 Ltd.,
Series 2020-2A, Class BR,
5.729%, 07/15/36
(3-Month USD LIBOR +
1.650%) (b) (e) | | | 1,125,000 | | | | 1,076,640 | | |
Park Avenue Institutional
Advisers CLO Ltd.,
Series 2021-1A, Class A1A,
5.633%, 01/20/34
(3-Month USD LIBOR +
1.390%) (b) (e) | | | 675,000 | | | | 661,513 | | |
Progress Residential Trust,
Series 2021-SFR7, Class D,
2.341%, 08/17/40 (e) | | | 1,525,000 | | | | 1,187,120 | | |
Santander Bank Auto
Credit-Linked Notes,
Series 2021-1A, Class B,
1.833%, 12/15/31 (e) | | | 801,839 | | | | 770,975 | | |
Santander Consumer Auto
Receivables Trust,
Series 2021-AA, Class D,
1.570%, 01/15/27 (e) | | | 1,500,000 | | | | 1,309,185 | | |
See accompanying notes to financial statements.
63
SFT Core Bond Fund
Investments in Securities – continued
| | | Principal | | Value(a) | |
Santander Drive Auto
Receivables Trust,
Series 2020-3, Class C,
1.120%, 01/15/26 | | $ | 984,988 | | | $ | 977,300 | | |
Saxon Asset Securities
Trust, Series 2004-1,
Class A, 2.047%, 03/25/35
(1-Month USD LIBOR +
0.540%) (b) | | | 222,524 | | | | 223,579 | | |
SoFi Professional Loan
Program LLC, Series 2021-B,
Class AFX, 1.140%,
02/15/47 (e) | | | 2,089,868 | | | | 1,627,072 | | |
Tricon American Homes
Trust, Series 2020-SFR2,
Class B, 1.832%, 11/17/39 (e) | | | 975,000 | | | | 808,293 | | |
Tricon Residential Trust,
Series 2021-SFR1, Class B,
2.244%, 07/17/38 (e) | | | 2,300,000 | | | | 1,979,190 | | |
Total asset-backed securities
(cost: $49,982,591) | | | | | 44,847,424 | | |
Other Mortgage-Backed Securities (12.4%) | |
Collateralized Mortgage Obligations/Mortgage
Revenue Bonds (8.3%) | |
Agate Bay Mortgage Trust,
Series 2015-1, Class B2,
3.666%, 01/25/4 (b) (e) | | | 85,929 | | | | 82,936 | | |
Bear Stearns Mortgage
Securities, Inc.,
Series 1996-6, Class B2,
8.000%, 11/25/29 | | | 23,746 | | | | 22,635 | | |
Bellemeade RE Ltd.,
Series 2018-3A, Class M1B,
6.239%, 10/25/28
(1-Month USD LIBOR +
1.850%) (b) (e) (f) | | | 317,107 | | | | 316,854 | | |
Citigroup Mortgage Loan
Trust, Inc. | |
Series 2018-RP1, Class A1,
3.000%, 09/25/64 (b) (e) | | | 143,843 | | | | 137,134 | | |
Series 2021-INV1,
Class A7A, 2.500%,
05/25/51 (b) (e) | | | 1,948,221 | | | | 1,667,632 | | |
CSMC Trust | |
Series 2013-6,
Class B4,3.330%,
08/25/43 (b) (e) | | | 1,039,606 | | | | 877,732 | | |
Series 2017-HL1,
Class A12,3.500%,
06/25/47 (b) (e) | | | 953,266 | | | | 873,034 | | |
Eagle RE Ltd., Series 2020-1,
Class M1B, 5.839%, 01/25/30
(1-Month LIBOR +
1.450%) (b) (e) (f) | | | 3,691,265 | | | | 3,671,197 | | |
FARM Mortgage Trust,
Series 2021-1, Class A,
2.180%, 01/25/51 (b) (e) | | | 1,585,331 | | | | 1,348,405 | | |
Flagstar Mortgage Trust | |
Series 2021-5INV, Class A5,
2.500%, 07/25/51 (b) (e) | | | 2,109,078 | | | | 1,805,322 | | |
Series 2021-6INV, Class A6,
2.500%, 08/25/51 (b) (e) | | | 2,216,681 | | | | 1,916,620 | | |
| | | Principal | | Value(a) | |
GS Mortgage-Backed
Securities Trust,
Series 2014-EB1A,
Class B4, 3.148%,
07/25/44 (b) (e) | | $ | 2,110,021 | | | $ | 1,912,762 | | |
JP Morgan Mortgage Trust | |
Series 2014-2, Class B1,
3.412%, 06/25/29 (b) (e) | | | 85,169 | | | | 73,151 | | |
Series 2016-3, Class B3,
3.282%, 10/25/46 (b) (e) | | | 209,681 | | | | 193,601 | | |
Series 2017-2, Class B4,
3.654%, 05/25/47 (b) (e) | | | 2,840,176 | | | | 2,152,142 | | |
Series 2021-13, Class A4,
2.500%, 04/25/52 (b) (e) | | | 3,941,441 | | | | 3,390,871 | | |
Series 2021-4, Class A5,
2.500%, 08/25/51 (b) (e) | | | 2,400,000 | | | | 1,637,377 | | |
JP Morgan Trust,
Series 2015-6, Class B4,
3.535%, 10/25/45 (b) (e) | | | 1,375,000 | | | | 861,244 | | |
MRFC Mortgage Pass-Through
Trust, Series 1998-2,
Class B1, 6.750%, 06/25/28 | | | 3,046 | | | | 3,075 | | |
Prudential Home Mortgage
Securities Co., Inc.,
Series 1994-E, Class 5B,
7.479%, 09/28/24 (b) (e) | | | 35 | | | | 35 | | |
Radnor RE Ltd., Series 2019-1,
Class M1B, 6.339%, 02/25/29
(1-Month USD LIBOR +
1.950%) (b) (e) (f) | | | 726,645 | | | | 718,304 | | |
Seasoned Credit Risk
Transfer Trust | |
Series 2017-2, Class M1,
4.000%, 08/25/56 (b) (e) | | | 1,053,117 | | | | 1,019,182 | | |
Series 2017-3, Class M1,
4.000%, 07/25/56 (b) | | | 1,434,320 | | | | 1,402,058 | | |
Sequoia Mortgage Trust | |
Series 2013-8, Class B4,
3.488%, 06/25/43 (b) | | | 473,469 | | | | 348,437 | | |
Series 2015-1, Class B2,
3.913%, 01/25/45 (b) (e) | | | 132,359 | | | | 124,739 | | |
Series 2015-3, Class B1,
3.723%, 07/25/45 (b) (e) | | | 209,247 | | | | 197,153 | | |
Series 2015-4, Class B2,
3.136%, 11/25/30 (b) (e) | | | 180,951 | | | | 172,922 | | |
Series 2017-1, Class B3,
3.607%, 02/25/47 (b) (e) | | | 1,012,345 | | | | 771,641 | | |
Shellpoint Co-Originator Trust,
Series 2017-1, Class B4,
3.603%, 04/25/47 (b) (e) | | | 1,362,521 | | | | 961,550 | | |
Structured Asset Mortgage
Investments, Inc. | |
Series 1998-2, Class B,
6.750%, 05/02/30 (b) | | | 5,650 | | | | 125 | | |
Series 1998-2, Class C,
6.750%, 05/02/30 (b) | | | 3,657 | | | | 81 | | |
Towd Point Mortgage Trust | |
Series 2015-2, Class 2M2,
4.166%, 11/25/57 (b) (e) | | | 2,702,710 | | | | 2,672,231 | | |
Series 2015-4, Class M2,
3.750%, 04/25/55 (b) (e) | | | 2,505,000 | | | | 2,447,852 | | |
Series 2018-4, Class A1,
3.000%, 06/25/58 (b) (e) | | | 1,814,834 | | | | 1,626,928 | | |
See accompanying notes to financial statements.
64
SFT Core Bond Fund
Investments in Securities – continued
| | | Principal | | Value(a) | |
WinWater Mortgage Loan
Trust, Series 2015-4,
Class B3, 3.677%,
06/20/45 (b) (e) | | $ | 1,599,161 | | | $ | 1,370,090 | | |
| | | | | | 36,777,052 | | |
Commercial Mortgage-Backed Securities (4.1%) | |
BAMLL Commercial
Mortgage Securities Trust,
Series 2014-520M, Class A,
4.185%, 08/15/46 (b) (e) | | | 1,350,000 | | | | 1,050,386 | | |
BB-UBS Trust | |
Series 2012-SHOW, Class C,
4.026%, 11/05/36 (b) (e) | | | 500,000 | | | | 479,875 | | |
Series 2012-SHOW, Class D,
4.026%, 11/05/36 (b) (e) | | | 500,000 | | | | 470,048 | | |
BX Trust, Series 2022-PSB,
Class D,
9.029%, 08/15/39 (b) (e) | | | 820,507 | | | | 812,155 | | |
CFCRE Commercial Mortgage
Trust, Series 2016-C7,
Class A3, 3.839%, 12/10/54 | | | 500,000 | | | | 472,798 | | |
Citigroup Commercial
Mortgage Trust,
Series 2018-TBR, Class A,
5.273%, 12/15/36
(1-Month USD LIBOR +
0.830%) (b) (e) | | | 4,000,000 | | | | 3,910,245 | | |
Irvine Core Office Trust,
Series 2013-IRV, Class A1,
2.068%, 05/15/48 (e) | | | 20,109 | | | | 20,010 | | |
JPMCC Commercial
Mortgage Securities Trust,
Series 2017-JP5, Class A5,
3.723%, 03/15/50 | | | 1,000,000 | | | | 933,830 | | |
One Market Plaza Trust,
Series 2017-1MKT, Class A,
3.614%, 02/10/32 (e) | | | 992,000 | | | | 960,495 | | |
UBS Commercial Mortgage Trust | |
Series 2017-C1, Class AS,
3.724%, 06/15/50 | | | 2,750,000 | | | | 2,433,444 | | |
Series 2017-C6, Class A5,
3.580%, 12/15/50 | | | 3,500,000 | | | | 3,206,865 | | |
Series 2017-C7, Class AS,
4.061%, 12/15/50 (b) | | | 1,505,000 | | | | 1,360,092 | | |
Wells Fargo Commercial
Mortgage Trust,
Series 2015-C29, Class A4,
3.637%, 06/15/48 | | | 1,905,000 | | | | 1,810,046 | | |
| | | | | | 17,920,289 | | |
Total other mortgage-backed
securities (cost: $62,602,573) | | | | | 54,697,341 | | |
Corporate Obligations (26.3%) | |
Basic Materials (0.1%) | |
Chemicals (0.1%) | |
International Flavors &
Fragrances, Inc.,
2.300%, 11/01/30 (e) | | | 500,000 | | | | 395,576 | | |
SK Invictus Intermediate II
Sarl, 5.000%, 10/30/29 (e) (f) | | | 50,000 | | | | 40,063 | | |
| | | | | | 435,639 | | |
| | | Principal | | Value(a) | |
Communication Services (0.3%) | |
Wireless Telecommunication Services (0.3%) | |
T-Mobile USA, Inc.,
2.550%, 02/15/31 | | $ | 1,500,000 | | | $ | 1,229,249 | | |
Communications (1.6%) | |
Cable/Satellite TV (0.4%) | |
Charter Communications
Operating LLC/Charter
Communications Operating
Capital | |
2.800%, 04/01/31 | | | 1,130,000 | | | | 883,683 | | |
4.800%, 03/01/50 | | | 1,000,000 | | | | 733,849 | | |
| | | | | | 1,617,532 | | |
Media (0.3%) | |
Cable One, Inc.,
4.000%, 11/15/30 (e) | | | 162,000 | | | | 127,575 | | |
CSC Holdings LLC | |
5.375%, 02/01/28 (e) | | | 200,000 | | | | 161,250 | | |
6.500%, 02/01/29 (e) | | | 554,000 | | | | 454,280 | | |
7.500%, 04/01/28 (e) | | | 50,000 | | | | 33,750 | | |
Paramount Global,
4.200%, 05/19/32 | | | 250,000 | | | | 205,052 | | |
Time Warner Cable LLC,
5.500%, 09/01/41 | | | 535,000 | | | | 446,163 | | |
| | | | | | 1,428,070 | | |
Telecommunication (0.6%) | |
AT&T, Inc., 3.550%, 09/15/55 | | | 1,787,000 | | | | 1,208,716 | | |
CommScope, Inc.,
4.750%, 09/01/29 (e) | | | 264,000 | | | | 212,850 | | |
Crown Castle Towers LLC,
4.241%, 07/15/48 (e) | | | 625,000 | | | | 570,277 | | |
Intelsat Jackson Holdings SA,
6.500%, 03/15/30 (e) (f) | | | 151,000 | | | | 132,314 | | |
Level 3 Financing, Inc.,
4.250%, 07/01/28 (e) | | | 536,000 | | | | 422,100 | | |
Zayo Group Holdings, Inc.,
4.000%, 03/01/27 (e) | | | 161,000 | | | | 118,536 | | |
| | | | | | 2,664,793 | | |
Wireless Telecommunication Services (0.3%) | |
Sprint Spectrum Co. LLC/
Sprint Spectrum Co. II LLC/
Sprint Spectrum Co. III LLC,
5.152%, 09/20/29 (e) | | | 500,000 | | | | 493,433 | | |
T-Mobile USA, Inc.,
2.625%, 04/15/26 | | | 1,000,000 | | | | 915,978 | | |
| | | | | | 1,409,411 | | |
Consumer Cyclical (0.7%) | |
Entertainment (0.5%) | |
Caesars Entertainment, Inc. | |
4.625%, 10/15/29 (e) | | | 169,000 | | | | 137,524 | | |
8.125%, 07/01/27 (e) | | | 92,000 | | | | 90,275 | | |
Warnermedia Holdings, Inc. | |
5.050%, 03/15/42 (e) | | | 1,000,000 | | | | 770,881 | | |
5.141%, 03/15/52 (e) | | | 1,500,000 | | | | 1,103,931 | | |
| | | | | | 2,102,611 | | |
See accompanying notes to financial statements.
65
SFT Core Bond Fund
Investments in Securities – continued
| | | Principal | | Value(a) | |
Retail (0.2%) | |
Alimentation Couche-Tard,
Inc., 3.800%, 01/25/50 (e) (f) | | $ | 500,000 | | | $ | 353,262 | | |
Fertitta Entertainment LLC/
Fertitta Entertainment
Finance Co., Inc.,
6.750%, 01/15/30 (e) | | | 55,000 | | | | 44,275 | | |
FirstCash, Inc.,
5.625%, 01/01/30 (e) | | | 254,000 | | | | 226,060 | | |
Michaels Cos., Inc.,
7.875%, 05/01/29 (e) | | | 341,000 | | | | 226,765 | | |
| | | | | | 850,362 | | |
Consumer, Non-cyclical (2.3%) | |
Agricultural Products (0.3%) | |
Imperial Brands Finance PLC | |
3.875%, 07/26/29 (e) (f) | | | 30,000 | | | | 25,671 | | |
6.125%, 07/27/27 (e) (f) | | | 470,000 | | | | 464,713 | | |
Reynolds American, Inc.,
5.850%, 08/15/45 | | | 1,000,000 | | | | 858,961 | | |
| | | | | | 1,349,345 | | |
Beverages (0.1%) | |
Anheuser-Busch InBev
Worldwide, Inc.,
4.600%, 04/15/48 | | | 371,000 | | | | 327,547 | | |
Biotechnology (0.1%) | |
Grifols Escrow Issuer SA,
4.750%, 10/15/28 (e) (f) | | | 271,000 | | | | 234,754 | | |
Commercial Services (0.1%) | |
Rent-A-Center, Inc.,
6.375%, 02/15/29 (e) | | | 54,000 | | | | 43,267 | | |
WASH Multifamily
Acquisition, Inc.,
5.750%, 04/15/26 (e) | | | 236,000 | | | | 221,250 | | |
| | | | | | 264,517 | | |
Food (0.3%) | |
JBS USA LUX SA/JBS USA
Food Co./JBS USA Finance,
Inc., 5.750%, 04/01/33 (e) (f) | | | 1,500,000 | | | | 1,425,000 | | |
Food Products (0.2%) | |
Kraft Heinz Foods Co.,
5.200%, 07/15/45 | | | 750,000 | | | | 694,888 | | |
Pilgrim's Pride Corp.,
3.500%, 03/01/32 (e) | | | 560,000 | | | | 438,200 | | |
| | | | | | 1,133,088 | | |
Household Products (0.0%) | |
Spectrum Brands, Inc.,
5.500%, 07/15/30 (e) | | | 132,000 | | | | 116,655 | | |
Pharmaceuticals (1.2%) | |
BAT Capital Corp. | |
2.726%, 03/25/31 | | | 750,000 | | | | 586,775 | | |
4.540%, 08/15/47 | | | 1,000,000 | | | | 715,383 | | |
Bayer U.S. Finance II LLC | |
4.375%, 12/15/28 (e) | | | 1,500,000 | | | | 1,413,480 | | |
4.400%, 07/15/44 (e) | | | 1,000,000 | | | | 791,207 | | |
| | | Principal | | Value(a) | |
Becton Dickinson & Co.,
4.298%, 08/22/32 | | $ | 1,000,000 | | | $ | 939,559 | | |
CVS Health Corp.,
5.050%, 03/25/48 | | | 1,000,000 | | | | 900,796 | | |
| | | | | | 5,347,200 | | |
Energy (1.6%) | |
Oil & Gas (0.5%) | |
KazMunayGas National Co.
JSC, 5.375%, 04/24/30 (f) | | | 500,000 | | | | 453,125 | | |
NGPL PipeCo LLC,
3.250%, 07/15/31 (e) | | | 1,000,000 | | | | 814,532 | | |
Qatar Energy,
2.250%, 07/12/31 (f) | | | 500,000 | | | | 414,033 | | |
Transocean Phoenix 2 Ltd.,
7.750%, 10/15/24 (e) (f) | | | 92,800 | | | | 91,872 | | |
Transocean Proteus Ltd.,
6.250%, 12/01/24 (e) (f) | | | 93,600 | | | | 92,664 | | |
USA Compression Partners
LP/USA Compression
Finance Corp.,
6.875%, 09/01/27 | | | 246,000 | | | | 231,240 | | |
| | | | | | 2,097,466 | | |
Pipelines (1.1%) | |
Energy Transfer LP | |
6.250%, 04/15/49 | | | 190,000 | | | | 178,260 | | |
6.850%, 02/15/40 | | | 1,850,000 | | | | 1,776,364 | | |
Galaxy Pipeline Assets
Bidco Ltd.,
2.160%, 03/31/34 (e) (f) | | | 462,330 | | | | 392,745 | | |
Plains All American Pipeline
LP/PAA Finance Corp.,
3.550%, 12/15/29 | | | 500,000 | | | | 434,032 | | |
Rockies Express Pipeline LLC,
4.950%, 07/15/29 (e) | | | 256,000 | | | | 231,680 | | |
Tennessee Gas Pipeline Co.
LLC, 8.375%, 06/15/32 | | | 1,500,000 | | | | 1,711,561 | | |
TransMontaigne Partners
LP/TLP Finance Corp.,
6.125%, 02/15/26 | | | 156,000 | | | | 134,160 | | |
Venture Global Calcasieu
Pass LLC,
4.125%, 08/15/31 (e) | | | 260,000 | | | | 220,350 | | |
| | | | | | 5,079,152 | | |
Financial (13.7%) | |
Banks (10.3%) | |
ABN AMRO Bank NV,
2.470%, 12/13/29
(1-Year CMT +
1.100%) (b) (e) (f) | | | 500,000 | | | | 405,513 | | |
Bank of America Corp. | |
2.496%, 02/13/31
(3-Month USD LIBOR +
0.990%) (b) | | | 1,000,000 | | | | 814,438 | | |
2.572%, 10/20/32
(SOFRRATE + 1.210%) (b) | | | 1,000,000 | | | | 785,084 | | |
3.974%, 02/07/30
(3-Month USD LIBOR +
1.210%) (b) | | | 4,040,000 | | | | 3,667,201 | | |
See accompanying notes to financial statements.
66
SFT Core Bond Fund
Investments in Securities – continued
| | | Principal | | Value(a) | |
Citigroup, Inc. | |
1.281%, 11/03/25
(SOFRRATE + 0.528%) (b) | | $ | 2,625,000 | | | $ | 2,419,179 | | |
2.520%, 11/03/32
(SOFRRATE + 1.177%) (b) | | | 750,000 | | | | 584,637 | | |
2.666%, 01/29/31
(SOFRRATE + 1.146%) (b) | | | 1,000,000 | | | | 821,588 | | |
3.057%, 01/25/33 (b) | | | 330,000 | | | | 266,823 | | |
Credit Suisse Group AG | |
3.091%, 05/14/32
(SOFRRATE +
1.730%) (b) (e) (f) | | | 3,935,000 | | | | 2,725,531 | | |
6.537%, 08/12/33 (b) (e) (f) | | | 320,000 | | | | 282,491 | | |
9.016%, 11/15/33 (b) (e) (f) | | | 1,690,000 | | | | 1,741,312 | | |
Goldman Sachs Group, Inc. | |
1.431%, 03/09/27
(SOFRRATE + 0.798%) (b) | | | 300,000 | | | | 263,152 | | |
2.383%, 07/21/32
(SOFRRATE + 1.248%) (b) | | | 3,785,000 | | | | 2,947,220 | | |
HSBC Holdings PLC | |
2.013%, 09/22/28
(SOFRRATE +
1.732%) (b) (f) | | | 1,000,000 | | | | 836,968 | | |
2.357%, 08/18/31 (b) (f) | | | 1,770,000 | | | | 1,355,200 | | |
2.804%, 05/24/32
(SOFRRATE +
1.187%) (b) (f) | | | 1,500,000 | | | | 1,159,663 | | |
JPMorgan Chase & Co. | |
0.969%, 06/23/25
(3-Month USD TERM
SOFR + 0.580%) (b) | | | 1,000,000 | | | | 932,662 | | |
1.470%, 09/22/27
(SOFRRATE + 0.765%) (b) | | | 1,500,000 | | | | 1,297,863 | | |
2.580%, 04/22/32
(SOFRRATE + 1.250%) (b) | | | 1,000,000 | | | | 804,978 | | |
3.540%, 05/01/28
(3-Month USD LIBOR +
1.380%) (b) | | | 2,500,000 | | | | 2,315,775 | | |
Lloyds Banking Group PLC,
4.976%, 08/11/33 (b) (f) | | | 495,000 | | | | 455,955 | | |
Lloyds Banking Group PLC | |
1.627%, 05/11/27
(1-Year CMT +
0.850%) (b) (f) | | | 1,000,000 | | | | 866,302 | | |
3.574%, 11/07/28
(3-Month USD LIBOR +
1.205%) (b) (f) | | | 1,000,000 | | | | 901,041 | | |
Morgan Stanley | |
0.529%, 01/25/24
(SOFRRATE + 0.455%) (b) | | | 3,700,000 | | | | 3,665,153 | | |
1.164%, 10/21/25 (b) | | | 800,000 | | | | 736,790 | | |
1.928%, 04/28/32
(SOFRRATE + 1.020%) (b) | | | 1,894,000 | | | | 1,436,732 | | |
NatWest Group PLC,
4.269%, 03/22/25
(3-Month USD LIBOR +
1.762%) (b) (f) | | | 1,000,000 | | | | 975,151 | | |
PNC Financial Services
Group, Inc.,
6.037%, 10/28/33 | | | 425,000 | | | | 446,040 | | |
Santander UK Group
Holdings PLC,
2.469%, 01/11/28
(SOFRRATE + 1.220%) (b) (f) | | | 2,000,000 | | | | 1,711,150 | | |
| | | Principal | | Value(a) | |
U.S. Bancorp | |
3.000%, 07/30/29 | | $ | 765,000 | | | $ | 673,800 | | |
Series J,5.300%, 04/15/27
(3-Month USD LIBOR +
2.914%) (b) | | | 800,000 | | | | 698,000 | | |
5.850%, 10/21/33 | | | 430,000 | | | | 449,843 | | |
Wells Fargo & Co. | |
2.393%, 06/02/28
(SOFRRATE + 2.100%) (b) | | | 4,125,000 | | | | 3,649,235 | | |
2.879%, 10/30/30
(3-Month USD TERM
SOFR + 1.431%) (b) | | | 1,000,000 | | | | 852,960 | | |
3.000%, 10/23/26 | | | 1,100,000 | | | | 1,018,038 | | |
| | | | | | 44,963,468 | | |
Diversified Financial Services (0.4%) | |
DY7 Leasing LLC,
2.578%, 12/10/25 | | | 31,426 | | | | 30,297 | | |
Helios Leasing I LLC,
1.825%, 05/16/25 | | | 34,056 | | | | 32,735 | | |
Macquarie Group Ltd.,
2.691%, 06/23/32 (SOFRRATE +
1.440%) (b) (e) (f) | | | 2,075,000 | | | | 1,592,544 | | |
| | | | | | 1,655,576 | | |
Finance (1.1%) | |
AerCap Ireland Capital DAC/
AerCap Global Aviation
Trust, 3.300%, 01/30/32 (f) | | | 1,500,000 | | | | 1,169,412 | | |
Air Lease Corp.,
3.250%, 10/01/29 | | | 1,500,000 | | | | 1,277,508 | | |
Avolon Holdings Funding
Ltd., 2.528%, 11/18/27 (e) (f) | | | 1,500,000 | | | | 1,209,375 | | |
Seasoned Credit Risk
Transfer Trust,
Series 2021-3, Class TT,
2.000%, 03/25/61 | | | 1,292,498 | | | | 1,158,829 | | |
| | | | | | 4,815,124 | | |
Insurance (0.7%) | |
Acrisure LLC/Acrisure
Finance, Inc.,
7.000%, 11/15/25 (e) | | | 48,000 | | | | 44,040 | | |
Alliant Holdings Intermediate
LLC/Alliant Holdings
Co-Issuer,
6.750%, 10/15/27 (e) | | | 50,000 | | | | 44,938 | | |
AssuredPartners, Inc.,
5.625%, 01/15/29 (e) | | | 48,000 | | | | 39,120 | | |
Athene Global Funding,
1.985%, 08/19/28 (e) | | | 1,000,000 | | | | 806,408 | | |
Farmers Insurance Exchange,
4.747%, 11/01/57
(3-Month USD LIBOR +
3.231%) (b) (e) | | | 500,000 | | | | 397,155 | | |
Teachers Insurance &
Annuity Association of
America, 4.270%, 05/15/47 (e) | | | 2,125,000 | | | | 1,759,137 | | |
| | | | | | 3,090,798 | | |
Real Estate Investment Trust — Health Care (0.2%) | |
Healthcare Realty Holdings
LP, 3.100%, 02/15/30 | | | 1,000,000 | | | | 840,749 | | |
See accompanying notes to financial statements.
67
SFT Core Bond Fund
Investments in Securities – continued
| | | Principal | | Value(a) | |
Real Estate Investment Trust — Office Property (0.1%) | |
Hudson Pacific Properties LP | |
3.250%, 01/15/30 | | $ | 590,000 | | | $ | 452,645 | | |
5.950%, 02/15/28 | | | 35,000 | | | | 32,866 | | |
| | | | | | 485,511 | | |
Residential REITs (0.0%) | |
Invitation Homes Operating
Partnership LP,
2.700%, 01/15/34 | | | 180,000 | | | | 131,710 | | |
Savings and Loans (0.1%) | |
Nationwide Building Society,
2.972%, 02/16/28
(SOFRRATE +
1.290%) (b) (e) (f) | | | 500,000 | | | | 441,198 | | |
Specialized REITs (0.8%) | |
Extra Space Storage LP,
2.550%, 06/01/31 | | | 575,000 | | | | 451,639 | | |
GLP Capital LP/GLP
Financing II, Inc. | |
4.000%, 01/15/30 | | | 472,000 | | | | 413,963 | | |
5.300%, 01/15/29 | | | 1,000,000 | | | | 947,668 | | |
5.375%, 04/15/26 | | | 500,000 | | | | 491,850 | | |
VICI Properties LP/VICI
Note Co., Inc. | |
3.750%, 02/15/27 (e) | | | 40,000 | | | | 36,200 | | |
3.875%, 02/15/29 (e) | | | 1,500,000 | | | | 1,314,375 | | |
| | | | | | 3,655,695 | | |
Health Care (2.1%) | |
Health Care Providers & Services (2.1%) | |
Centene Corp. | |
3.000%, 10/15/30 | | | 1,087,000 | | | | 891,340 | | |
4.250%, 12/15/27 | | | 715,000 | | | | 672,100 | | |
CommonSpirit Health,
4.350%, 11/01/42 | | | 460,000 | | | | 389,188 | | |
HCA, Inc. | |
3.500%, 09/01/30 | | | 650,000 | | | | 559,813 | | |
3.625%, 03/15/32 (e) | | | 1,000,000 | | | | 848,966 | | |
4.625%, 03/15/52 (e) | | | 680,000 | | | | 534,870 | | |
5.250%, 04/15/25 | | | 455,000 | | | | 453,863 | | |
5.375%, 02/01/25 | | | 545,000 | | | | 545,000 | | |
ModivCare Escrow Issuer,
Inc., 5.000%, 10/01/29 (e) | | | 157,000 | | | | 131,095 | | |
ModivCare, Inc.,
5.875%, 11/15/25 (e) | | | 96,000 | | | | 90,720 | | |
Molina Healthcare, Inc.,
3.875%, 05/15/32 (e) | | | 789,000 | | | | 668,677 | | |
New York & Presbyterian
Hospital,
2.256%, 08/01/40 | | | 1,175,000 | | | | 780,514 | | |
NYU Langone Hospitals,
Series 2020,
3.380%, 07/01/55 | | | 2,354,000 | | | | 1,613,549 | | |
Sinai Health System,
3.034%, 01/20/36 | | | 1,150,000 | | | | 1,021,037 | | |
| | | | | | 9,200,732 | | |
| | | Principal | | Value(a) | |
Industrials (0.2%) | |
Construction & Engineering (0.0%) | |
Artera Services LLC,
9.033%, 12/04/25 (e) | | $ | 162,000 | | | $ | 134,460 | | |
Containers & Packaging (0.1%) | |
Ardagh Packaging Finance
PLC/Ardagh Holdings USA,
Inc., 5.250%, 08/15/27 (e) (f) | | | 446,000 | | | | 336,730 | | |
Trivium Packaging Finance BV | |
5.500%, 08/15/26 (e) (f) | | | 191,000 | | | | 177,869 | | |
8.500%, 08/15/27 (e) (f) | | | 48,000 | | | | 44,220 | | |
| | | | | | 558,819 | | |
Environmental Control (0.1%) | |
Waste Pro USA, Inc.,
5.500%, 02/15/26 (e) | | | 354,000 | | | | 311,962 | | |
Machinery (0.0%) | |
OT Merger Corp.,
7.875%, 10/15/29 (e) | | | 63,000 | | | | 33,390 | | |
Information Technology (0.6%) | |
Computers (0.1%) | |
NCR Corp., 5.125%, 04/15/29 (e) | | | 489,000 | | | | 405,870 | | |
IT Services (0.1%) | |
Global Payments, Inc. | |
5.400%, 08/15/32 | | | 225,000 | | | | 215,433 | | |
5.950%, 08/15/52 | | | 293,000 | | | | 267,908 | | |
| | | | | | 483,341 | | |
Software (0.4%) | |
Gen Digital, Inc.,
6.750%, 09/30/27 (e) | | | 225,000 | | | | 220,500 | | |
Open Text Corp.,
6.900%, 12/01/27 (e) | | | 85,000 | | | | 85,106 | | |
Oracle Corp. | |
3.600%, 04/01/50 | | | 1,000,000 | | | | 682,023 | | |
3.850%, 07/15/36 | | | 500,000 | | | | 404,187 | | |
6.900%, 11/09/52 | | | 215,000 | | | | 233,677 | | |
| | | | | | 1,625,493 | | |
Real Estate (0.0%) | |
Residential REITs (0.0%) | |
Invitation Homes Operating
Partnership LP,
2.000%, 08/15/31 | | | 60,000 | | | | 44,367 | | |
Technology (0.1%) | |
Semiconductor Equipment (0.1%) | |
Broadcom, Inc.,
3.419%, 04/15/33 (e) | | | 500,000 | | | | 403,155 | | |
Transport-Services (0.2%) | |
Airlines (0.2%) | |
JetBlue Pass Through Trust,
Series 2020-1, Class A,
4.000%, 05/15/34 | | | 747,448 | | | | 656,821 | | |
See accompanying notes to financial statements.
68
SFT Core Bond Fund
Investments in Securities – continued
| | | Principal | | Value(a) | |
Utilities (2.8%) | |
Electric Utilities (1.7%) | |
American Transmission
System, Inc.,
2.650%, 01/15/32 (e) | | $ | 975,000 | | | $ | 800,836 | | |
Duke Energy Carolinas LLC,
4.250%, 12/15/41 | | | 2,030,000 | | | | 1,769,582 | | |
Entergy Mississippi LLC,
3.250%, 12/01/27 | | | 500,000 | | | | 457,298 | | |
Eversource Energy, Series N,
3.800%, 12/01/23 | | | 950,000 | | | | 938,749 | | |
FirstEnergy Corp.,
2.650%, 03/01/30 | | | 266,000 | | | | 217,725 | | |
FirstEnergy Transmission LLC,
5.450%, 07/15/44 (e) | | | 2,000,000 | | | | 1,877,500 | | |
MidAmerican Energy Co.,
4.250%, 07/15/49 | | | 1,750,000 | | | | 1,486,861 | | |
| | | | | | 7,548,551 | | |
Electric — Integrated (0.2%) | |
Exelon Corp.,
4.050%, 04/15/30 | | | 1,000,000 | | | | 931,474 | | |
Gas Utilities (0.9%) | |
East Ohio Gas Co.,
1.300%, 06/15/25 (e) | | | 1,380,000 | | | | 1,250,048 | | |
Piedmont Natural Gas Co.,
Inc., 3.350%, 06/01/50 | | | 1,410,000 | | | | 954,966 | | |
Southern Co. Gas Capital Corp. | |
3.875%, 11/15/25 | | | 1,105,000 | | | | 1,060,136 | | |
4.400%, 05/30/47 | | | 775,000 | | | | 623,202 | | |
| | | | | | 3,888,352 | | |
Total corporate obligations
(cost: $127,675,495) | | | | | 115,419,007 | | |
Bank Loans (2.1%) | |
Acrisure LLC, 2020 Term
Loan B, 7.884%, 02/15/27
(1-Month USD LIBOR +
3.500%) (b) (e) | | | 248,721 | | | | 232,865 | | |
AI Aqua Merger Sub, Inc.,
2021 1st Lien Term Loan B,
7.967%, 07/31/28
(1-Month USD SOFRRATE+
3.750%) (b) (e) | | | 248,750 | | | | 233,203 | | |
Amentum Government
Services Holdings LLC,
Term Loan B,
8.170%, 01/29/27
(3-Month USD LIBOR +
4.000%) (b) (e) | | | 248,725 | | | | 242,506 | | |
American Airlines, Inc.,
2021 Term Loan,
8.993%, 04/20/28
(3-Month USD LIBOR +
4.750%) (b) (e) | | | 29,399 | | | | 29,227 | | |
Arches Buyer, Inc.,
2021 Term Loan B,
7.634%, 12/06/27
(1-Month USD LIBOR +
3.250%) (b) (d) (e) | | | 38,046 | | | | 35,106 | | |
| | | Principal | | Value(a) | |
Asurion LLC | |
2021 Second Lien Term
Loan B4, 9.634%, 01/20/29
(1-Month USD LIBOR +
5.250%) (b) (e) | | $ | 22,509 | | | $ | 17,370 | | |
2022 Term Loan B10,
8.680%, 08/19/28
(3-Month USD TERM
SOFR + 4.000%) (b) (e) | | | 249,375 | | | | 222,567 | | |
Bausch & Lomb, Inc.,
Term Loan, 7.842%, 05/10/27,
(3-Month USD SOFR +
3.250%) (b) (d) (e) | | | 27,196 | | | | 25,757 | | |
Caesars Resort Collection LLC,
2020 Term Loan B1,
7.884%, 07/21/25
(1-Month USD LIBOR +
3.500%) (b) (e) | | | 347,294 | | | | 346,100 | | |
CDK Global, Inc., 2022
USD Term Loan B,
9.080%, 07/06/29
(3-Month USD SOFR +
4.500%) (b) (e) | | | 250,000 | | | | 247,617 | | |
CommScope, Inc., 2019
Term Loan B,
7.634%, 04/06/26
(1-Month USD LIBOR +
3.250%) (b) (e) | | | 248,715 | | | | 233,869 | | |
Corporation Service Co.,
Term Loan B,
7.673%, 11/02/29
(1-Month USD SOFR +
3.250%) (b) (d) (e) | | | 250,000 | | | | 247,500 | | |
Crown Finance U.S., Inc,
2022 DIP Term Loan,
14.417%, 09/07/23
(1-Month USD SOFR +
10.000%) (b) (d) (e) | | | 106,909 | | | | 104,851 | | |
Deerfield Dakota Holding LLC,
2020 USD Term Loan B,
8.073%, 04/09/27
(1-Month USD SOFR +
3.750%) (b) | | | 21,390 | | | | 19,920 | | |
DirecTV Financing LLC,
Term Loan,
9.384%, 08/02/27
(1-Month USD LIBOR +
5.000%) (b) (e) | | | 237,936 | | | | 230,760 | | |
Fertitta Entertainment LLC,
2022 Term Loan B,
8.323%, 01/27/29
(1-Month USD SOFRRATE +
4.000%) (b) (e) | | | 248,747 | | | | 235,860 | | |
Formula One Holdings Ltd.,
Term Loan B,
7.573%, 01/15/30
(3-Month USD SOFR +
3.250%) (b) (d) (e) | | | 8,453 | | | | 8,444 | | |
Gainwell Acquisition Corp.,
Term Loan B,
8.730%, 10/01/27
(3-Month USD LIBOR +
4.000%) (b) (e) | | | 248,731 | | | | 234,740 | | |
See accompanying notes to financial statements.
69
SFT Core Bond Fund
Investments in Securities – continued
| | | Principal | | Value(a) | |
Grifols Worldwide Operations
USA, Inc., USD 2019
Term Loan B,
6.384%, 11/15/27
(1-Month USD LIBOR +
2.000%) (b) (e) | | $ | 250,000 | | | $ | 240,972 | | |
Hostess Brands LLC, 2019
Term Loan,
6.665%, 08/03/25
(3-Month USD LIBOR +
2.250%) (b) (e) | | | 226,337 | | | | 225,291 | | |
Hub International Ltd., 2021
Term Loan B,
7.528%, 04/25/25
(3-Month USD LIBOR +
3.250%) (b) (e) | | | 248,731 | | | | 246,244 | | |
II-VI, Inc., 2022 Term Loan B,
7.134%, 07/02/29
(3-Month USD LIBOR +
2.750%) (b) (e) | | | 262,031 | | | | 259,083 | | |
Ingram Micro, Inc., 2021
Term Loan B,
8.230%, 06/30/28
(3-Month USD LIBOR +
3.500%) (b) (e) | | | 248,737 | | | | 244,540 | | |
Intelsat Jackson Holdings SA,
2021 Exit Term Loan B,
7.445%, 02/01/29
(6-Month USD SOFRRATE +
4.500%) (b) (e) | | | 237,696 | | | | 229,139 | | |
J&J Ventures Gaming LLC,
Term Loan,
8.730%, 04/26/28
(3-Month USD LIBOR +
4.000%) (b) (e) | | | 248,741 | | | | 237,547 | | |
Jazz Financing Lux SARL,
USD Term Loan,
7.884%, 05/05/28
(1-Month USD LIBOR +
3.500%) (b) (e) | | | 224,299 | | | | 222,088 | | |
Medline Borrower LP,
USD Term Loan B,
7.634%, 10/23/28
(1-Month USD LIBOR +
3.250%) (b) (e) | | | 248,747 | | | | 235,936 | | |
Mitnick Corporate Purchaser,
Inc., Term Loan,
8.944%, 05/02/29
(3-Month USD SOFR +
4.750%) (b) (e) | | | 21,945 | | | | 20,505 | | |
Naked Juice LLC, Term Loan,
7.930%, 01/24/29
(3-Month USD TERM
SOFRRATE + 3.250%) (b) (e) | | | 249,373 | | | | 222,165 | | |
NortonLifeLock, Inc., 2022
Term Loan B,
6.423%, 09/12/29
(1-Month USD SOFR +
2.000%) (b) (e) | | | 250,000 | | | | 245,312 | | |
Open Text Corp.,
Term Loan B,
6.134%, 05/30/25
(1-Month USD LIBOR +
1.750%) (b) (d) (e) | | | 29,202 | | | | 28,454 | | |
| | | Principal | | Value(a) | |
Organon & Co.,
USD Term Loan,
7.750%, 06/02/28
(3-Month USD LIBOR +
3.000%) (b) (e) | | $ | 500,427 | | | $ | 494,589 | | |
Peraton Corp., Term Loan B,
8.139%, 02/01/28
(1-Month USD LIBOR +
3.750%) (b) (e) | | | 248,711 | | | | 242,538 | | |
Playtika Holding Corp.,
2021 Term Loan,
7.134%, 03/13/28
(1-Month USD LIBOR +
2.750%) (b) (e) | | | 249,367 | | | | 237,522 | | |
Pre-Paid Legal Services, Inc.,
2021 Term Loan,
8.134%, 12/15/28
(1-Month USD LIBOR +
3.750%) (b) (e) | | | 248,747 | | | | 239,046 | | |
Proofpoint, Inc.,
1st Lien Term Loan,
7.985%, 08/31/28
(3-Month USD LIBOR +
3.250%) (b) (e) | | | 248,744 | | | | 238,561 | | |
RealPage, Inc.,
1st Lien Term Loan,
7.384%, 04/24/28
(1-Month USD LIBOR +
3.000%) (b) (e) | | | 21,889 | | | | 20,786 | | |
SBA Senior Finance II LLC,
2018 Term Loan B,
6.140%, 04/11/25
(1-Month USD LIBOR +
1.750%) (b) (e) | | | 249,347 | | | | 248,323 | | |
Scientific Games International,
Inc., 2022 USD Term Loan,
7.417%, 04/14/29
(1-Month USD SOFR +
3.000%) (b) (e) | | | 248,750 | | | | 244,915 | | |
Spin Holdco, Inc., 2021
Term Loan,
7.144%, 03/04/28
(3-Month USD LIBOR +
4.000%) (b) (e) | | | 248,734 | | | | 210,180 | | |
Sunshine Luxembourg VII
SARL, 2021 Term Loan B3,
8.480%, 10/01/26
(3-Month USD LIBOR +
3.750%) (b) (e) | | | 248,734 | | | | 237,817 | | |
Trans Union LLC, 2019
Term Loan B5,
6.134%, 11/16/26
(1-Month USD LIBOR +
1.750%) (b) (e) | | | 100,860 | | | | 99,373 | | |
TruGreen LP, 2020
Term Loan,
8.384%, 11/02/27
(1-Month USD LIBOR +
4.000%) (b) (e) | | | 248,731 | | | | 218,883 | | |
United Airlines, Inc., 2021
Term Loan B,
8.108%, 04/21/28
(3-Month USD LIBOR +
3.750%) (b) (e) | | | 248,734 | | | | 244,796 | | |
See accompanying notes to financial statements.
70
SFT Core Bond Fund
Investments in Securities – continued
| | | Principal | | Value(a) | |
Whatabrands LLC, 2021
Term Loan B,
7.637%, 08/03/28
(1-Month USD LIBOR +
3.250%) (b) (e) | | $ | 248,744 | | | $ | 240,193 | | |
Yum Brands, 2021
Term Loan B,
6.089%, 03/15/28
(1-Month USD LIBOR +
1.750%) (b) (e) | | | 59,572 | | | | 58,567 | | |
Zayo Group Holdings, Inc.,
USD Term Loan,
7.384%, 03/09/27
(1-Month USD LIBOR +
3.000%) (b) (e) | | | 300,000 | | | | 241,792 | | |
Total Bank Loans
(cost: $9,203,909) | | | | | 9,123,419 | | |
Foreign Bonds (0.9%) | |
Brazilian Government
International Bond,
3.875%, 06/12/30 (f) | | | 400,000 | | | | 347,371 | | |
Colombia Government
International Bond,
3.000%, 01/30/30 (f) | | | 300,000 | | | | 230,534 | | |
Dominican Republic
International Bond,
4.875%, 09/23/32 (f) | | | 150,000 | | | | 125,063 | | |
Guatemala Government
Bond, 4.900%, 06/01/30 (f) | | | 200,000 | | | | 189,000 | | |
Hungary Government
International Bond,
2.125%, 09/22/31 (f) | | | 250,000 | | | | 185,002 | | |
Mexico Government
International Bond,
2.659%, 05/24/31 (f) | | | 600,000 | | | | 486,000 | | |
Panama Government
International Bond,
2.252%, 09/29/32 (f) | | | 500,000 | | | | 370,625 | | |
Paraguay Government
International Bond,
4.950%, 04/28/31 (e) (f) | | | 300,000 | | | | 291,375 | | |
Perusahaan Penerbit SBSN
Indonesia III,
2.800%, 06/23/30 (e) (f) | | | 500,000 | | | | 437,500 | | |
Peruvian Government
International Bond,
2.844%, 06/20/30 (f) | | | 400,000 | | | | 339,406 | | |
Philippine Government
International Bond,
1.950%, 01/06/32 (f) | | | 250,000 | | | | 204,184 | | |
Republic of Poland
Government International
Bond, 5.750%, 11/16/32 (f) | | | 22,000 | | | | 23,392 | | |
Republic of South Africa
Government International
Bond, 4.850%, 09/30/29 (f) | | | 400,000 | | | | 356,494 | | |
Romanian Government
International Bond,
3.000%, 02/14/31 (f) | | | 300,000 | | | | 235,734 | | |
Total Foreign Bonds
(cost: $3,844,129) | | | | | 3,821,680 | | |
Total long-term debt securities
(cost: $499,862,395) | | | | | 463,143,971 | | |
| | | Shares/
Principal | | Value(a) | |
Short-Term Securities (16.5%) | |
Investment Companies (4.4%) | |
State Street Institutional
U.S. Government Money
Market Fund, current rate
4.120% | | | 19,232,086 | | | $ | 19,232,086 | | |
U.S. Government Obligations (12.1%) | |
Federal Home Loan Bank,
4.290%, 02/28/23 | | $ | 15,000,000 | | | | 14,898,585 | | |
U.S. Treasury Bill | |
3.300%, 01/19/23 | | | 36,575,000 | | | | 36,513,148 | | |
4.640%, 05/25/23 | | | 1,785,000 | | | | 1,753,105 | | |
Total U.S. government
obligations
(cost: $53,202,181) | | | | | 53,164,838 | | |
Total short-term securities
(cost: $72,434,267) | | | | | 72,396,924 | | |
Total investments in securities
(cost: $572,296,662) (g) | | | | | 535,540,895 | | |
Liabilities in excess of cash
and other assets (-22.0%) | | | | | (96,583,197 | ) | |
Total net assets (100.0%) | | | | $ | 438,957,698 | | |
See accompanying notes to financial statements.
71
SFT Core Bond Fund
Investments in Securities – continued
Investments in Securities Legend
(a) Securities are valued by procedures described in Note 2 of the notes to financial statements.
(b) Variable rate security.
(c) Interest-only security that entitles holders to receive only interest on the underlying mortgages. The principal amount of the underlying pool represents the notional amount on which current interest is calculated. The yield to maturity of an interest-only security is sensitive to the rate of principal payments on the underlying mortgage assets. The rate disclosed represents the market yield based upon the current cost basis and estimated timing and amount of future cash flows.
(d) Security is issued on a when-issued or forward commitment basis. As of December 31, 2022, the total cost of investments issued on a when-issued or forward commitment basis was $89,082,094.
(e) Security sold within terms of a private placement memorandum exempt from registration pursuant to Rule 144A under the Securities Act of 1933, as amended, and may be sold only to dealers in that program.
(f) Foreign security: The Fund held 7.1% of net assets in foreign securities at December 31, 2022.
(g) At December 31, 2022, the cost of investments for federal income tax purposes was $572,787,759. The aggregate unrealized appreciation and depreciation of investments based on this cost were:
Gross unrealized appreciation | | $ | 863,466 | | |
Gross unrealized depreciation | | | (38,006,526 | ) | |
Net unrealized depreciation | | $ | (37,143,060 | ) | |
Holdings of Open Futures Contracts
On December 31, 2022, $1,315,000 in cash has been pledged to cover margin requirements for the following open futures contracts:
Description | | Expiration
Date | | Number of
Contracts | | Position
Type | | Notional
Amount | | Market
Value | | Unrealized
Appreciation/
(Depreciation)(a) | |
2 Year U.S. Treasury Note | | March 2023 | | | 542 | | | Long | | $ | 111,026,155 | | | $ | 111,152,344 | | | $ | 126,189 | | |
5 Year U.S. Treasury Note | | March 2023 | | | 90 | | | Long | | | 9,720,054 | | | | 9,713,672 | | | | (6,382 | ) | |
10 Year U.S. Ultra | | March 2023 | | | 40 | | | Short | | | (4,744,168 | ) | | | (4,731,250 | ) | | | 12,918 | | |
U.S. Ultra Bond | | March 2023 | | | 103 | | | Short | | | (13,805,267 | ) | | | (13,834,187 | ) | | | (28,921 | ) | |
| | | | | | | | | | | $ | 102,300,579 | | | $ | 103,804 | | |
See accompanying notes to financial statements.
72
SFT Delaware IvySM Growth Fund
Investments in Securities
(Percentages of each investment category relate to total net assets)
| | | Shares | | Value(a) | |
Common Stocks (99.2%) | |
Consumer Discretionary (12.8%) | |
Automobiles (2.1%) | |
Ferrari NV (b) | | | 47,655 | | | $ | 10,208,654 | | |
Hotels, Restaurants & Leisure (1.2%) | |
Booking Holdings, Inc. (c) | | | 2,926 | | | | 5,896,709 | | |
Internet & Catalog Retail (4.7%) | |
Amazon.com, Inc. (c) | | | 266,965 | | | | 22,425,060 | | |
Specialty Retail (1.3%) | |
Home Depot, Inc. | | | 19,896 | | | | 6,284,351 | | |
Textiles, Apparel & Luxury Goods (3.5%) | |
LVMH Moet Hennessy Louis
Vuitton SE ADR (b) | | | 52,431 | | | | 7,595,679 | | |
NIKE, Inc. Class B | | | 76,392 | | | | 8,938,628 | | |
| | | | | | 16,534,307 | | |
Consumer Staples (3.6%) | |
Beverages (3.4%) | |
Coca-Cola Co. | | | 252,814 | | | | 16,081,499 | | |
Personal Care (0.2%) | |
Estee Lauder Cos., Inc.
Class A | | | 4,429 | | | | 1,098,879 | | |
Financial (4.9%) | |
Capital Markets (4.9%) | |
Intercontinental Exchange, Inc. | | | 110,992 | | | | 11,386,669 | | |
S&P Global, Inc. | | | 35,929 | | | | 12,034,059 | | |
| | | | | | 23,420,728 | | |
Health Care (10.3%) | |
Health Care Equipment & Supplies (5.0%) | |
Cooper Cos., Inc. | | | 29,217 | | | | 9,661,185 | | |
Danaher Corp. | | | 27,672 | | | | 7,344,702 | | |
Intuitive Surgical, Inc. (c) | | | 26,882 | | | | 7,133,139 | | |
| | | | | | 24,139,026 | | |
Health Care Providers & Services (4.3%) | |
UnitedHealth Group, Inc. | | | 38,510 | | | | 20,417,232 | | |
Pharmaceuticals (1.0%) | |
Zoetis, Inc. | | | 32,679 | | | | 4,789,108 | | |
Industrials (10.2%) | |
Professional Services (7.5%) | |
CoStar Group, Inc. (c) | | | 262,432 | | | | 20,280,745 | | |
Equifax, Inc. | | | 13,996 | | | | 2,720,262 | | |
TransUnion | | | 157,593 | | | | 8,943,403 | | |
Verisk Analytics, Inc. | | | 23,272 | | | | 4,105,646 | | |
| | | | | | 36,050,056 | | |
Road & Rail (2.7%) | |
JB Hunt Transport Services, Inc. | | | 51,657 | | | | 9,006,915 | | |
Union Pacific Corp. | | | 18,916 | | | | 3,916,936 | | |
| | | | | | 12,923,851 | | |
| | | Shares | | Value(a) | |
Information Technology (57.4%) | |
Communications Equipment (4.9%) | |
Motorola Solutions, Inc. | | | 90,668 | | | $ | 23,366,050 | | |
Computers & Peripherals (7.9%) | |
Apple, Inc. | | | 291,364 | | | | 37,856,924 | | |
Interactive Media & Services (5.8%) | |
Alphabet, Inc. Class A (c) | | | 273,474 | | | | 24,128,611 | | |
Alphabet, Inc. Class C (c) | | | 42,161 | | | | 3,740,946 | | |
| | | | | | 27,869,557 | | |
IT Services (13.5%) | |
Broadridge Financial
Solutions, Inc. | | | 65,715 | | | | 8,814,353 | | |
PayPal Holdings, Inc. (c) | | | 61,431 | | | | 4,375,116 | | |
VeriSign, Inc. (c) | | | 111,578 | | | | 22,922,584 | | |
Visa, Inc. Class A | | | 136,472 | | | | 28,353,423 | | |
| | | | | | 64,465,476 | | |
Semiconductors & Semiconductor Equipment (2.7%) | |
NVIDIA Corp. | | | 87,548 | | | | 12,794,265 | | |
Software (22.6%) | |
Adobe, Inc. (c) | | | 27,317 | | | | 9,192,990 | | |
Autodesk, Inc. (c) | | | 31,562 | | | | 5,897,991 | | |
Electronic Arts, Inc. | | | 121,496 | | | | 14,844,381 | | |
Intuit, Inc. | | | 28,321 | | | | 11,023,099 | | |
Microsoft Corp. | | | 246,512 | | | | 59,118,508 | | |
Salesforce, Inc. (c) | | | 45,991 | | | | 6,097,947 | | |
Veeva Systems, Inc.
Class A (c) | | | 11,413 | | | | 1,841,830 | | |
| | | | | | 108,016,746 | | |
Total common stocks
(cost: $331,576,005) | | | | | 474,638,478 | | |
Short-Term Securities (0.8%) | |
Investment Companies (0.8%) | |
State Street Institutional
U.S. Government Money
Market Fund, current rate
4.120% | | | 3,803,470 | | | | 3,803,470 | | |
Total short-term securities
(cost: $3,803,470) | | | | | 3,803,470 | | |
Total investments in securities
(cost: $335,379,475) (d) | | | | | 478,441,948 | | |
Cash and other assets in excess
of liabilities (0.0%) | | | | | 17,221 | | |
Total net assets (100.0%) | | | | $ | 478,459,169 | | |
See accompanying notes to financial statements.
73
SFT Delaware IvySM Growth Fund
Investments in Securities – continued
Investments in Securities Legend
(a) Securities are valued by procedures described in Note 2 of the notes to financial statements.
(b) Foreign security: The Fund held 3.7% of net assets in foreign securities at December 31, 2022.
(c) Non-income producing security.
(d) At December 31, 2022, the cost of investments for federal income tax purposes was $335,979,714. The aggregate unrealized appreciation and depreciation of investments based on this cost were:
Gross unrealized appreciation | | $ | 156,856,407 | | |
Gross unrealized depreciation | | | (14,394,173 | ) | |
Net unrealized appreciation | | $ | 142,462,234 | | |
See accompanying notes to financial statements.
74
SFT Delaware IvySM Small Cap Growth Fund
Investments in Securities
(Percentages of each investment category relate to total net assets)
| | | Shares | | Value(a) | |
Common Stocks (96.5%) | |
Communication Services (1.0%) | |
Diversified Telecommunication Services (1.0%) | |
Iridium Communications,
Inc. (b) | | | 28,885 | | | $ | 1,484,689 | | |
Consumer Discretionary (14.3%) | |
Auto Components (4.1%) | |
Fox Factory Holding Corp. (b) | | | 28,464 | | | | 2,596,771 | | |
Visteon Corp. (b) | | | 25,106 | | | | 3,284,618 | | |
| | | | | | 5,881,389 | | |
Entertainment (1.9%) | |
Monarch Casino &
Resort, Inc. (b) | | | 34,386 | | | | 2,643,939 | | |
Hotels, Restaurants & Leisure (6.5%) | |
Marriott Vacations
Worldwide Corp. | | | 23,372 | | | | 3,145,637 | | |
Red Rock Resorts, Inc. Class A | | | 81,062 | | | | 3,243,291 | | |
Texas Roadhouse, Inc. | | | 30,220 | | | | 2,748,509 | | |
| | | | | | 9,137,437 | | |
Internet & Catalog Retail (0.3%) | |
Xometry, Inc. Class A (b) | | | 11,997 | | | | 386,663 | | |
Media (0.5%) | |
Nexstar Media Group, Inc.
Class A | | | 3,964 | | | | 693,819 | | |
Specialty Retail (1.0%) | |
Boot Barn Holdings, Inc. (b) | | | 23,255 | | | | 1,453,903 | | |
Consumer, Non-cyclical (0.9%) | |
Beverages (0.9%) | |
Duckhorn Portfolio, Inc. (b) | | | 75,216 | | | | 1,246,329 | | |
Energy (7.6%) | |
Electrical Equipment (1.7%) | |
Shoals Technologies
Group, Inc. Class A (b) | | | 96,577 | | | | 2,382,555 | | |
Energy Equipment & Services (4.1%) | |
Cactus, Inc. Class A | | | 59,242 | | | | 2,977,503 | | |
Liberty Energy, Inc. Class A | | | 80,907 | | | | 1,295,321 | | |
Weatherford
International PLC (b) (c) | | | 30,454 | | | | 1,550,718 | | |
| | | | | | 5,823,542 | | |
Oil, Gas & Consumable Fuels (1.8%) | |
Northern Oil & Gas, Inc. | | | 32,131 | | | | 990,277 | | |
SM Energy Co. | | | 43,129 | | | | 1,502,183 | | |
| | | | | | 2,492,460 | | |
Financial (4.5%) | |
Capital Markets (1.5%) | |
Focus Financial Partners, Inc.
Class A (b) | | | 29,186 | | | | 1,087,762 | | |
Houlihan Lokey, Inc. | | | 11,854 | | | | 1,033,195 | | |
| | | | | | 2,120,957 | | |
| | | Shares | | Value(a) | |
Commercial Banks (0.9%) | |
Seacoast Banking
Corp. of Florida | | | 38,302 | | | $ | 1,194,639 | | |
Insurance (2.1%) | |
Kinsale Capital Group, Inc. | | | 11,429 | | | | 2,988,912 | | |
Health Care (21.1%) | |
Biotechnology (3.7%) | |
CareDx, Inc. (b) | | | 58,394 | | | | 666,276 | | |
Insmed, Inc. (b) | | | 39,910 | | | | 797,402 | | |
PTC Therapeutics, Inc. (b) | | | 14,763 | | | | 563,504 | | |
TransMedics Group, Inc. (b) | | | 22,164 | | | | 1,367,962 | | |
Vericel Corp. (b) | | | 70,489 | | | | 1,856,680 | | |
| | | | | | 5,251,824 | | |
Health Care Equipment & Supplies (6.7%) | |
Axonics, Inc. (b) | | | 23,482 | | | | 1,468,329 | | |
CryoPort, Inc. (b) | | | 95,979 | | | | 1,665,236 | | |
Inmode Ltd. (b) (c) | | | 77,145 | | | | 2,754,077 | | |
Penumbra, Inc. (b) | | | 11,916 | | | | 2,650,833 | | |
Tandem Diabetes Care, Inc. (b) | | | 19,374 | | | | 870,861 | | |
| | | | | | 9,409,336 | | |
Health Care Providers & Services (5.4%) | |
AMN Healthcare Services,
Inc. (b) | | | 12,409 | | | | 1,275,893 | | |
Option Care Health, Inc. (b) | | | 57,621 | | | | 1,733,816 | | |
Privia Health Group, Inc. (b) | | | 84,409 | | | | 1,916,929 | | |
Progyny, Inc. (b) | | | 88,221 | | | | 2,748,084 | | |
| | | | | | 7,674,722 | | |
Health Care Technology (1.4%) | |
Evolent Health, Inc.
Class A (b) | | | 70,363 | | | | 1,975,793 | | |
Life Sciences Tools & Services (0.5%) | |
Cytek Biosciences, Inc. (b) | | | 69,644 | | | | 711,065 | | |
Pharmaceuticals (3.4%) | |
Harmony Biosciences
Holdings, Inc. (b) | | | 46,214 | | | | 2,546,391 | | |
Pacira BioSciences, Inc. (b) | | | 57,908 | | | | 2,235,828 | | |
| | | | | | 4,782,219 | | |
Industrials (17.0%) | |
Aerospace & Defense (0.5%) | |
Parsons Corp. (b) | | | 16,137 | | | | 746,336 | | |
Air Freight & Logistics (1.3%) | |
Air Transport Services Group,
Inc. (b) | | | 72,515 | | | | 1,883,940 | | |
Building Products (0.8%) | |
AAON, Inc. | | | 14,524 | | | | 1,093,948 | | |
Commercial Services & Supplies (3.7%) | |
Casella Waste Systems, Inc.
Class A (b) | | | 33,205 | | | | 2,633,489 | | |
Clean Harbors, Inc. (b) | | | 22,321 | | | | 2,547,272 | | |
| | | | | | 5,180,761 | | |
See accompanying notes to financial statements.
75
SFT Delaware IvySM Small Cap Growth Fund
Investments in Securities – continued
| | | Shares | | Value(a) | |
Construction & Engineering (1.6%) | |
Valmont Industries, Inc. | | | 6,827 | | | $ | 2,257,484 | | |
Electrical Equipment (1.8%) | |
EnerSys | | | 33,819 | | | | 2,497,195 | | |
Machinery (3.9%) | |
Chart Industries, Inc. (b) | | | 8,185 | | | | 943,158 | | |
Evoqua Water
Technologies Corp. (b) | | | 46,767 | | | | 1,851,973 | | |
Kornit Digital Ltd. (b) (c) | | | 24,793 | | | | 569,495 | | |
RBC Bearings, Inc. (b) | | | 9,866 | | | | 2,065,447 | | |
| | | | | | 5,430,073 | | |
Marine (1.5%) | |
Kirby Corp. (b) | | | 33,563 | | | | 2,159,779 | | |
Professional Services (0.5%) | |
CBIZ, Inc. (b) | | | 14,902 | | | | 698,159 | | |
Road & Rail (1.4%) | |
Saia, Inc. (b) | | | 9,525 | | | | 1,997,202 | | |
Information Technology (23.3%) | |
Communications Equipment (1.8%) | |
Calix, Inc. (b) | | | 17,373 | | | | 1,188,834 | | |
Viavi Solutions, Inc. (b) | | | 136,542 | | | | 1,435,057 | | |
| | | | | | 2,623,891 | | |
Electronic Equipment, Instruments & Components (0.7%) | |
Belden, Inc. | | | 13,551 | | | | 974,317 | | |
IT Services (1.5%) | |
Shift4 Payments, Inc.
Class A (b) | | | 37,696 | | | | 2,108,337 | | |
Semiconductors & Semiconductor Equipment (4.2%) | |
Allegro MicroSystems, Inc. (b) | | | 128,345 | | | | 3,852,917 | | |
Onto Innovation, Inc. (b) | | | 13,269 | | | | 903,486 | | |
Power Integrations, Inc. | | | 16,955 | | | | 1,216,013 | | |
| | | | | | 5,972,416 | | |
Software (15.1%) | |
Box, Inc. Class A (b) | | | 70,672 | | | | 2,200,019 | | |
CyberArk Software Ltd. (b) (c) | | | 20,876 | | | | 2,706,573 | | |
DoubleVerify Holdings, Inc. (b) | | | 68,302 | | | | 1,499,912 | | |
Five9, Inc. (b) | | | 19,346 | | | | 1,312,820 | | |
| | | Shares | | Value(a) | |
Globant SA (b) (c) | | | 13,605 | | | $ | 2,287,817 | | |
Instructure Holdings, Inc. (b) | | | 58,914 | | | | 1,380,944 | | |
Jamf Holding Corp. (b) | | | 45,053 | | | | 959,629 | | |
Paycor HCM, Inc. (b) | | | 115,622 | | | | 2,829,270 | | |
Smartsheet, Inc. Class A (b) | | | 53,613 | | | | 2,110,208 | | |
Sprout Social, Inc. Class A (b) | | | 35,911 | | | | 2,027,535 | | |
Tenable Holdings, Inc. (b) | | | 51,634 | | | | 1,969,837 | | |
| | | | | | 21,284,564 | | |
Leisure and Consumer Staples (4.6%) | |
Beverages (1.2%) | |
MGP Ingredients, Inc. | | | 16,097 | | | | 1,712,399 | | |
Food & Staples Retailing (2.9%) | |
BJ's Wholesale Club
Holdings, Inc. (b) | | | 60,350 | | | | 3,992,756 | | |
Food Products (0.5%) | |
Sovos Brands, Inc. (b) | | | 51,791 | | | | 744,236 | | |
Materials (1.4%) | |
Metals & Mining (1.4%) | |
ATI, Inc. (b) | | | 68,879 | | | | 2,056,727 | | |
Real Estate (0.8%) | |
Hotels & Resort REITs (0.8%) | |
Ryman Hospitality
Properties, Inc. | | | 13,624 | | | | 1,114,171 | | |
Total common stocks
(cost: $138,695,488) | | | | | 136,264,883 | | |
Short-Term Securities (3.6%) | |
Investment Companies (3.6%) | |
State Street Institutional
U.S. Government Money
Market Fund, current
rate 4.120% | | | 5,052,123 | | | | 5,052,123 | | |
Total short-term securities
(cost: $5,052,123) | | | | | 5,052,123 | | |
Total investments in securities
(cost: $143,747,611) (d) | | | | | 141,317,006 | | |
Liabilities in excess of cash
and other assets (-0.1%) | | | | | (179,214 | ) | |
Total net assets (100.0%) | | | | $ | 141,137,792 | | |
Investments in Securities Legend
(a) Securities are valued by procedures described in Note 2 of the notes to financial statements.
(b) Non-income producing security.
(c) Foreign security: The Fund held 7.0% of net assets in foreign securities at December 31, 2022.
(d) At December 31, 2022, the cost of investments for federal income tax purposes was $144,049,566. The aggregate unrealized appreciation and depreciation of investments based on this cost were:
Gross unrealized appreciation | | $ | 14,363,071 | | |
Gross unrealized depreciation | | | (17,095,631 | ) | |
Net unrealized depreciation | | $ | (2,732,560 | ) | |
See accompanying notes to financial statements.
76
SFT Equity Stabilization Fund
Investments in Securities
(Percentages of each investment category relate to total net assets)
| | | Shares | | Value(a) | |
Mutual Funds (90.6%) | |
Investment Companies (90.6%) | |
BlackRock Short Maturity
Bond ETF | | | 318,620 | | | $ | 15,698,407 | | |
iShares Core High
Dividend ETF | | | 570,902 | | | | 59,510,825 | | |
iShares Edge MSCI
Minimum Volatility
EAFE ETF | | | 1,253,998 | | | | 79,735,463 | | |
iShares Edge MSCI
Minimum Volatility
Emerging Markets ETF | | | 403,120 | | | | 21,385,516 | | |
iShares Edge MSCI
Minimum Volatility
USA ETF (b) | | | 1,457,712 | | | | 105,101,035 | | |
iShares MSCI
Germany ETF | | | 660,182 | | | | 16,326,301 | | |
Total mutual funds
(cost: $261,455,687) | | | | | 297,757,547 | | |
| | | Shares | | Value(a) | |
Short-Term Securities (8.0%) | |
Investment Companies (8.0%) | |
State Street Institutional
U.S. Government Money
Market Fund, current rate
4.120% | | | 26,175,390 | | | $ | 26,175,390 | | |
Total investments excluding
purchased options
(cost: $287,631,077) | | | | | 323,932,937 | | |
Total purchased options
outstanding (0.1%)
(cost: $527,430) | | | | | 294,043 | | |
Total investments in securities
(cost: $288,158,507) (c) | | | | | 324,226,980 | | |
Cash and other assets in excess
of liabilities (1.3%) | | | | | 4,118,022 | | |
Total net assets (100.0%) | | | | $ | 328,345,002 | | |
Investments in Securities Legend
(a) Securities are valued by procedures described in Note 2 of the notes to financial statements.
(b) Fully or partially pledged as initial margin deposits on open futures contracts.
(c) At December 31, 2022, the cost of investments for federal income tax purposes was $290,319,241. The aggregate unrealized appreciation and depreciation of investments based on this cost were:
Gross unrealized appreciation | | $ | 36,636,418 | | |
Gross unrealized depreciation | | | (2,585,834 | ) | |
Net unrealized appreciation | | $ | 34,050,584 | | |
Holdings of Open Futures Contracts
On December 31, 2022, securities with an aggregate market value of $12,689,600 have been pledged to cover margin requirements for the following open futures contracts:
Description | |
Expiration
Date | |
Number of
Contracts | |
Position
Type | |
Notional
Amount | |
Market
Value | | Unrealized
Appreciation/
(Depreciation)(a) | |
S&P 500 E-Mini Index Future | | March 2023 | | | 43 | | | Short | | $ | (8,492,555 | ) | | $ | (8,301,150 | ) | | $ | 191,405 | | |
Call Options Purchased:
The Fund had the following call options purchased open at December 31, 2022: | |
Description | | Exercise
Price | | Expiration
Date | | Number of
Contracts | | Notional
Amount | | Value(a) | |
CBOE Volatility Index | | $ | 25 | | | January 2023 | | | 1,700 | | | $ | 170,000 | | | $ | 156,400 | | |
Put Options Purchased:
The Fund had the following put options purchased open at December 31, 2022: | |
Description | | Exercise
Price | | Expiration
Date | | Number of
Contracts | | Notional
Amount | | Value(a) | |
S&P 500 Index | | $ | 3,720 | | | January 2023 | | | 43 | | | $ | 4,300 | | | $ | 137,643 | | |
See accompanying notes to financial statements.
77
SFT Equity Stabilization Fund
Investments in Securities – continued
Call Options Written:
The Fund had the following call options written open at December 31, 2022:
Exercise
Description | | Expiration
Price | | Number of
Date | | Notional
Contracts | | Amount | | Value(a) | |
CBOE Volatility Index | | $ | 35 | | | January 2023 | | | 1,700 | | | $ | 170,000 | | | $ | (39,100 | ) | |
Put Options Written:
The Fund had the following put options written open at December 31, 2022:
Description | | Exercise
Price | | Expiration
Date | | Number of
Contracts | | Notional
Amount | | Value(a) | |
S&P 500 Index | | $ | 3,330 | | | January 2023 | | | 43 | | | $ | 4,300 | | | $ | (9,460 | ) | |
See accompanying notes to financial statements.
78
SFT Government Money Market Fund
Investments in Securities
(Percentages of each investment category relate to total net assets)
| | | Principal | | Value(a) | |
Short-Term Securities (100.3%) | |
U.S. Government Obligations (91.6%) | |
Discount Notes (91.6%) | |
Federal Home Loan Bank
3.860%, 01/25/23 (b) | | $ | 8,000,000 | | | $ | 7,979,251 | | |
4.140%, 01/27/23 (b) | | | 20,000,000 | | | | 19,940,056 | | |
4.270%, 02/08/23 (b) | | | 30,000,000 | | | | 29,866,367 | | |
4.270%, 02/15/23 (b) | | | 15,580,000 | | | | 15,498,205 | | |
4.340%, 02/15/23 (b) | | | 10,000,000 | | | | 9,946,562 | | |
4.450%, 02/27/23 (b) | | | 2,000,000 | | | | 1,986,225 | | |
4.450%, 03/01/23 (b) | | | 6,500,000 | | | | 6,453,607 | | |
4.520%, 03/15/23 (b) | | | 25,000,000 | | | | 24,776,944 | | |
4.530%, 03/23/23 (b) | | | 9,300,000 | | | | 9,207,930 | | |
4.560%, 03/23/23 (b) | | | 3,700,000 | | | | 3,663,120 | | |
4.570%, 03/23/23 (b) | | | 20,000,000 | | | | 19,800,200 | | |
U.S. Treasury Bill
3.750%, 03/16/23 | | | 20,000,000 | | | | 19,849,122 | | |
3.910%, 01/17/23 | | | 15,000,000 | | | | 14,973,217 | | |
4.020%, 02/14/23 | | | 10,000,000 | | | | 9,951,582 | | |
4.710%, 05/25/23 | | | 10,000,000 | | | | 9,818,700 | | |
Total U.S. government obligations
(cost: $203,711,088) | | | | | 203,711,088 | | |
| | | Shares | | Value(a) | |
Investment Companies (8.7%) | |
State Street Institutional
U.S. Government Money
Market Fund, current rate
4.120% | | | 19,354,925 | | | $ | 19,354,925 | | |
Total short-term securities
(cost: $223,066,013) | | | | | 223,066,013 | | |
Total investments in securities
(cost: $223,066,013) (c) | | | | | 223,066,013 | | |
Liabilities in excess of cash
and other assets (-0.3%) | | | | | (584,215 | ) | |
Total net assets (100.0%) | | | | $ | 222,481,798 | | |
Investments in Securities Legend
(a) Securities are valued by procedures described in Note 2 of the notes to financial statements.
(b) Rate represents annualized yield at date of purchase.
(c) Also represents the cost of securities for federal income tax purposes at December 31, 2022.
See accompanying notes to financial statements.
79
SFT Index 400 Mid-Cap Fund
Investments in Securities
(Percentages of each investment category relate to total net assets)
| | | Shares | | Value(a) | |
Common Stocks (95.4%) | |
Communication Services (0.8%) | |
Diversified Telecommunication Services (0.6%) | |
Frontier Communications
Parent, Inc. (b) | | | 20,403 | | | $ | 519,869 | | |
Iridium Communications,
Inc. (b) | | | 11,468 | | | | 589,455 | | |
| | | | | | 1,109,324 | | |
Electric Utilities (0.2%) | |
Portland General Electric Co. | | | 8,140 | | | | 398,860 | | |
Consumer Discretionary (14.6%) | |
Auto Components (1.4%) | |
Adient PLC (b) (c) | | | 8,643 | | | | 299,826 | | |
Dana, Inc. | | | 11,650 | | | | 176,264 | | |
Fox Factory Holding
Corp. (b) | | | 3,842 | | | | 350,506 | | |
Gentex Corp. | | | 21,557 | | | | 587,859 | | |
Goodyear Tire &
Rubber Co. (b) | | | 25,993 | | | | 263,829 | | |
Lear Corp. | | | 5,458 | | | | 676,901 | | |
Visteon Corp. (b) | | | 2,600 | | | | 340,158 | | |
| | | | | | 2,695,343 | | |
Automobiles (0.4%) | |
Harley-Davidson, Inc. | | | 12,145 | | | | 505,232 | | |
Thor Industries, Inc. | | | 4,965 | | | | 374,808 | | |
| | | | | | 880,040 | | |
Casino Gaming (0.2%) | |
Boyd Gaming Corp. | | | 7,289 | | | | 397,469 | | |
Diversified Consumer Services (1.0%) | |
Graham Holdings Co.
Class B | | | 358 | | | | 216,307 | | |
Grand Canyon
Education, Inc. (b) | | | 2,819 | | | | 297,855 | | |
H&R Block, Inc. | | | 14,286 | | | | 521,582 | | |
Service Corp. International | | | 14,134 | | | | 977,225 | | |
| | | | | | 2,012,969 | | |
Entertainment (0.1%) | |
World Wrestling
Entertainment, Inc. Class A | | | 3,948 | | | | 270,517 | | |
Hotels, Restaurants & Leisure (2.5%) | |
Choice Hotels
International, Inc. | | | 2,547 | | | | 286,894 | | |
Churchill Downs, Inc. | | | 3,030 | | | | 640,633 | | |
Cracker Barrel Old
Country Store, Inc. | | | 2,080 | | | | 197,059 | | |
Light & Wonder, Inc.
Class A (b) | | | 8,542 | | | | 500,561 | | |
Marriott Vacations
Worldwide Corp. | | | 3,488 | | | | 469,450 | | |
Papa John's
International, Inc. | | | 2,986 | | | | 245,778 | | |
Penn Entertainment, Inc. (b) | | | 14,254 | | | | 423,344 | | |
Texas Roadhouse, Inc. | | | 6,162 | | | | 560,434 | | |
Travel & Leisure Co. | | | 7,469 | | | | 271,871 | | |
| | | Shares | | Value(a) | |
Wendy's Co. | | | 15,660 | | | $ | 354,386 | | |
Wingstop, Inc. | | | 2,768 | | | | 380,932 | | |
Wyndham Hotels &
Resorts, Inc. | | | 8,116 | | | | 578,752 | | |
| | | | | | 4,910,094 | | |
Household Durables (1.3%) | |
Helen of Troy Ltd. (b) (c) | | | 2,247 | | | | 249,215 | | |
KB Home | | | 7,614 | | | | 242,506 | | |
Leggett & Platt, Inc. | | | 12,183 | | | | 392,658 | | |
Taylor Morrison
Home Corp. (b) | | | 9,956 | | | | 302,165 | | |
Tempur Sealy
International, Inc. | | | 15,623 | | | | 536,337 | | |
Toll Brothers, Inc. | | | 9,664 | | | | 482,427 | | |
TopBuild Corp. (b) | | | 2,913 | | | | 455,855 | | |
| | | | | | 2,661,163 | | |
Interactive Media & Services (0.1%) | |
TripAdvisor, Inc. (b) | | | 9,629 | | | | 173,130 | | |
Leisure Equipment & Products (1.1%) | |
Brunswick Corp. | | | 6,650 | | | | 479,332 | | |
Mattel, Inc. (b) | | | 32,567 | | | | 580,995 | | |
Polaris, Inc. | | | 5,007 | | | | 505,707 | | |
Topgolf Callaway Brands
Corp. (b) | | | 12,654 | | | | 249,917 | | |
YETI Holdings, Inc. (b) | | | 7,841 | | | | 323,912 | | |
| | | | | | 2,139,863 | | |
Media (1.0%) | |
Cable One, Inc. | | | 448 | | | | 318,913 | | |
John Wiley & Sons, Inc.
Class A | | | 3,856 | | | | 154,471 | | |
New York Times Co. Class A | | | 15,097 | | | | 490,049 | | |
Nexstar Media Group, Inc.
Class A | | | 3,450 | | | | 603,854 | | |
TEGNA, Inc. | | | 20,502 | | | | 434,437 | | |
| | | | | | 2,001,724 | | |
Multiline Retail (0.6%) | |
Kohl's Corp. | | | 10,718 | | | | 270,630 | | |
Macy's, Inc. | | | 24,902 | | | | 514,226 | | |
Nordstrom, Inc. | | | 10,172 | | | | 164,176 | | |
Ollie's Bargain Outlet
Holdings, Inc. (b) | | | 5,349 | | | | 250,547 | | |
| | | | | | 1,199,579 | | |
Specialty Retail (2.7%) | |
AutoNation, Inc. (b) | | | 3,143 | | | | 337,244 | | |
Dick's Sporting Goods, Inc. | | | 5,092 | | | | 612,517 | | |
Five Below, Inc. (b) | | | 5,122 | | | | 905,928 | | |
Foot Locker, Inc. | | | 7,235 | | | | 273,411 | | |
GameStop Corp. Class A (b) | | | 23,227 | | | | 428,770 | | |
Gap, Inc. | | | 19,384 | | | | 218,652 | | |
Lithia Motors, Inc. | | | 2,514 | | | | 514,716 | | |
Murphy USA, Inc. | | | 1,911 | | | | 534,201 | | |
RH (b) | | | 1,826 | | | | 487,889 | | |
Victoria's Secret & Co. (b) | | | 7,466 | | | | 267,133 | | |
Williams-Sonoma, Inc. | | | 6,131 | | | | 704,575 | | |
| | | | | | 5,285,036 | | |
See accompanying notes to financial statements.
80
SFT Index 400 Mid-Cap Fund
Investments in Securities – continued
| | | Shares | | Value(a) | |
Textiles, Apparel & Luxury Goods (2.2%) | |
Capri Holdings Ltd. (b) (c) | | | 11,835 | | | $ | 678,382 | | |
Carter's, Inc. | | | 3,461 | | | | 258,225 | | |
Columbia Sportswear Co. | | | 3,232 | | | | 283,058 | | |
Crocs, Inc. (b) | | | 5,713 | | | | 619,461 | | |
Deckers Outdoor Corp. (b) | | | 2,423 | | | | 967,165 | | |
Hanesbrands, Inc. | | | 32,066 | | | | 203,940 | | |
PVH Corp. | | | 5,993 | | | | 423,046 | | |
Skechers U.S.A., Inc.
Class A (b) | | | 12,296 | | | | 515,817 | | |
Under Armour, Inc.
Class A (b) | | | 17,339 | | | | 176,164 | | |
Under Armour, Inc.
Class C (b) | | | 18,105 | | | | 161,497 | | |
| | | | | | 4,286,755 | | |
Consumer Staples (2.6%) | |
Beverages (0.3%) | |
Boston Beer Co., Inc.
Class A (b) | | | 885 | | | | 291,626 | | |
Coca-Cola Consolidated, Inc. | | | 420 | | | | 215,191 | | |
| | | | | | 506,817 | | |
Food & Staples Retailing (0.7%) | |
Casey's General Stores, Inc. | | | 3,484 | | | | 781,635 | | |
Grocery Outlet Holding
Corp. (b) | | | 8,134 | | | | 237,432 | | |
Sprouts Farmers Market,
Inc. (b) | | | 9,712 | | | | 314,377 | | |
| | | | | | 1,333,444 | | |
Food Products (1.4%) | |
Darling Ingredients, Inc. (b) | | | 14,728 | | | | 921,826 | | |
Flowers Foods, Inc. | | | 17,619 | | | | 506,370 | | |
Ingredion, Inc. | | | 6,037 | | | | 591,203 | | |
Lancaster Colony Corp. | | | 1,897 | | | | 374,278 | | |
Post Holdings, Inc. (b) | | | 4,966 | | | | 448,231 | | |
| | | | | | 2,841,908 | | |
Household Products (0.1%) | |
Energizer Holdings, Inc. | | | 6,051 | | | | 203,011 | | |
Personal Products (0.1%) | |
Coty, Inc. Class A (b) | | | 33,592 | | | | 287,548 | | |
Energy (3.7%) | |
Energy Equipment & Services (0.6%) | |
ChampionX Corp. | | | 18,320 | | | | 531,097 | | |
NOV, Inc. | | | 36,096 | | | | 754,045 | | |
| | | | | | 1,285,142 | | |
Oil, Gas & Consumable Fuels (3.1%) | |
Antero Midstream Corp. | | | 30,779 | | | | 332,106 | | |
Antero Resources Corp. (b) | | | 25,300 | | | | 784,047 | | |
CNX Resources Corp. (b) | | | 16,585 | | | | 279,291 | | |
DT Midstream, Inc. (b) | | | 8,818 | | | | 487,283 | | |
Equitrans Midstream Corp. | | | 39,770 | | | | 266,459 | | |
HF Sinclair Corp. | | | 12,359 | | | | 641,309 | | |
Matador Resources Co. | | | 10,246 | | | | 586,481 | | |
Murphy Oil Corp. | | | 13,428 | | | | 577,538 | | |
PBF Energy, Inc. Class A | | | 10,503 | | | | 428,312 | | |
PDC Energy, Inc. | | | 8,467 | | | | 537,485 | | |
| | | Shares | | Value(a) | |
Range Resources Corp. | | | 22,205 | | | $ | 555,569 | | |
Southwestern Energy Co. (b) | | | 101,413 | | | | 593,266 | | |
| | | | | | 6,069,146 | | |
Financial (14.6%) | |
Capital Markets (2.0%) | |
Affiliated Managers
Group, Inc. | | | 3,526 | | | | 558,624 | | |
Evercore, Inc. Class A | | | 3,288 | | | | 358,655 | | |
Federated Hermes, Inc. | | | 7,732 | | | | 280,749 | | |
Interactive Brokers Group,
Inc. Class A | | | 9,391 | | | | 679,439 | | |
Janus Henderson Group
PLC (c) | | | 12,101 | | | | 284,616 | | |
Jefferies Financial Group, Inc. | | | 16,834 | | | | 577,069 | | |
SEI Investments Co. | | | 9,402 | | | | 548,137 | | |
Stifel Financial Corp. | | | 9,766 | | | | 570,041 | | |
| | | | | | 3,857,330 | | |
Commercial Banks (6.7%) | |
Associated Banc-Corp. | | | 13,817 | | | | 319,035 | | |
Bank of Hawaii Corp. | | | 3,689 | | | | 286,119 | | |
Bank OZK | | | 10,155 | | | | 406,809 | | |
Cadence Bank | | | 16,765 | | | | 413,425 | | |
Cathay General Bancorp | | | 6,751 | | | | 275,373 | | |
Commerce Bancshares, Inc. | | | 10,411 | | | | 708,677 | | |
Cullen/Frost Bankers, Inc. | | | 5,956 | | | | 796,317 | | |
East West Bancorp, Inc. | | | 12,952 | | | | 853,537 | | |
First Financial
Bankshares, Inc. | | | 11,844 | | | | 407,434 | | |
First Horizon Corp. | | | 49,311 | | | | 1,208,119 | | |
FNB Corp. | | | 32,235 | | | | 420,667 | | |
Fulton Financial Corp. | | | 15,391 | | | | 259,031 | | |
Glacier Bancorp, Inc. | | | 10,114 | | | | 499,834 | | |
Hancock Whitney Corp. | | | 7,790 | | | | 376,958 | | |
Home BancShares, Inc. | | | 17,414 | | | | 396,865 | | |
International
Bancshares Corp. | | | 4,776 | | | | 218,550 | | |
Old National Bancorp | | | 26,915 | | | | 483,932 | | |
PacWest Bancorp | | | 10,754 | | | | 246,804 | | |
Pinnacle Financial
Partners, Inc. | | | 6,963 | | | | 511,084 | | |
Prosperity Bancshares, Inc. | | | 8,403 | | | | 610,730 | | |
Synovus Financial Corp. | | | 13,366 | | | | 501,893 | | |
Texas Capital
Bancshares, Inc. (b) | | | 4,537 | | | | 273,626 | | |
UMB Financial Corp. | | | 3,970 | | | | 331,574 | | |
Umpqua Holdings Corp. | | | 19,946 | | | | 356,036 | | |
United Bankshares, Inc. | | | 12,374 | | | | 501,023 | | |
Valley National Bancorp | | | 38,621 | | | | 436,803 | | |
Webster Financial Corp. | | | 15,956 | | | | 755,357 | | |
Wintrust Financial Corp. | | | 5,601 | | | | 473,397 | | |
| | | | | | 13,329,009 | | |
Consumer Finance (0.4%) | |
FirstCash Holdings, Inc. | | | 3,424 | | | | 297,580 | | |
Navient Corp. | | | 9,720 | | | | 159,894 | | |
SLM Corp. | | | 22,955 | | | | 381,053 | | |
| | | | | | 838,527 | | |
See accompanying notes to financial statements.
81
SFT Index 400 Mid-Cap Fund
Investments in Securities – continued
| | | Shares | | Value(a) | |
Diversified Financial Services (0.3%) | |
Voya Financial, Inc. | | | 8,941 | | | $ | 549,782 | | |
Insurance (3.9%) | |
American Financial
Group, Inc. | | | 6,477 | | | | 889,163 | | |
Brighthouse Financial,
Inc. (b) | | | 6,352 | | | | 325,667 | | |
CNO Financial Group, Inc. | | | 10,446 | | | | 238,691 | | |
First American Financial
Corp. | | | 9,511 | | | | 497,806 | | |
Hanover Insurance
Group, Inc. | | | 3,299 | | | | 445,794 | | |
Kemper Corp. | | | 5,830 | | | | 286,836 | | |
Kinsale Capital Group, Inc. | | | 2,020 | | | | 528,270 | | |
Old Republic International
Corp. | | | 26,006 | | | | 628,045 | | |
Primerica, Inc. | | | 3,420 | | | | 485,024 | | |
Reinsurance Group of
America, Inc. | | | 6,107 | | | | 867,744 | | |
RenaissanceRe Holdings
Ltd. (c) | | | 4,047 | | | | 745,579 | | |
RLI Corp. | | | 3,741 | | | | 491,081 | | |
Selective Insurance
Group, Inc. | | | 5,502 | | | | 487,532 | | |
Unum Group | | | 17,167 | | | | 704,362 | | |
| | | | | | 7,621,594 | | |
Residential REITs (0.6%) | |
Annaly Capital
Management, Inc. | | | 42,994 | | | | 906,314 | | |
Independence
Realty Trust, Inc. | | | 20,569 | | | | 346,793 | | |
| | | | | | 1,253,107 | | |
Thrifts & Mortgage Finance (0.7%) | |
Essent Group Ltd. (c) | | | 9,808 | | | | 381,335 | | |
MGIC Investment Corp. | | | 27,295 | | | | 354,835 | | |
New York Community
Bancorp, Inc. | | | 62,515 | | | | 537,629 | | |
Washington Federal, Inc. | | | 5,953 | | | | 199,723 | | |
| | | | | | 1,473,522 | | |
Health Care (9.5%) | |
Biotechnology (1.9%) | |
Arrowhead
Pharmaceuticals, Inc. (b) | | | 9,639 | | | | 390,958 | | |
Exelixis, Inc. (b) | | | 29,641 | | | | 475,442 | | |
Halozyme Therapeutics,
Inc. (b) | | | 12,425 | | | | 706,982 | | |
Neurocrine Biosciences,
Inc. (b) | | | 8,834 | | | | 1,055,133 | | |
United Therapeutics
Corp. (b) | | | 4,230 | | | | 1,176,321 | | |
| | | | | | 3,804,836 | | |
Health Care Equipment & Supplies (3.4%) | |
Enovis Corp. (b) | | | 4,385 | | | | 234,685 | | |
Envista Holdings Corp. (b) | | | 14,983 | | | | 504,478 | | |
Globus Medical, Inc.
Class A (b) | | | 7,134 | | | | 529,842 | | |
Haemonetics Corp. (b) | | | 4,686 | | | | 368,554 | | |
ICU Medical, Inc. (b) | | | 1,891 | | | | 297,795 | | |
| | | Shares | | Value(a) | |
Inari Medical, Inc. (b) | | | 4,388 | | | $ | 278,901 | | |
Integra LifeSciences
Holdings Corp. (b) | | | 6,633 | | | | 371,912 | | |
Lantheus Holdings, Inc. (b) | | | 6,325 | | | | 322,322 | | |
LivaNova PLC (b) (c) | | | 4,871 | | | | 270,535 | | |
Masimo Corp. (b) | | | 4,413 | | | | 652,903 | | |
Neogen Corp. (b) | | | 19,859 | | | | 302,453 | | |
Omnicell, Inc. (b) | | | 4,030 | | | | 203,193 | | |
Penumbra, Inc. (b) | | | 3,560 | | | | 791,958 | | |
QuidelOrtho Corp. (b) | | | 4,952 | | | | 424,238 | | |
Shockwave Medical, Inc. (b) | | | 3,363 | | | | 691,466 | | |
STAAR Surgical Co. (b) | | | 4,358 | | | | 211,537 | | |
Tandem Diabetes Care,
Inc. (b) | | | 5,831 | | | | 262,104 | | |
| | | | | | 6,718,876 | | |
Health Care Providers & Services (2.3%) | |
Acadia Healthcare Co.,
Inc. (b) | | | 8,360 | | | | 688,195 | | |
Amedisys, Inc. (b) | | | 2,994 | | | | 250,119 | | |
Chemed Corp. | | | 1,411 | | | | 720,217 | | |
Encompass Health Corp. | | | 9,098 | | | | 544,151 | | |
HealthEquity, Inc. (b) | | | 7,691 | | | | 474,073 | | |
LHC Group, Inc. (b) | | | 2,895 | | | | 468,093 | | |
Option Care Health, Inc. (b) | | | 14,115 | | | | 424,720 | | |
Patterson Cos., Inc. | | | 7,960 | | | | 223,119 | | |
Progyny, Inc. (b) | | | 6,913 | | | | 215,340 | | |
R1 RCM, Inc. (b) | | | 12,537 | | | | 137,280 | | |
Tenet Healthcare Corp. (b) | | | 9,936 | | | | 484,777 | | |
| | | | | | 4,630,084 | | |
Life Sciences Tools & Services (1.2%) | |
Bruker Corp. | | | 9,198 | | | | 628,683 | | |
Medpace Holdings, Inc. (b) | | | 2,293 | | | | 487,056 | | |
Repligen Corp. (b) | | | 4,800 | | | | 812,688 | | |
Sotera Health Co. (b) | | | 9,024 | | | | 75,170 | | |
Syneos Health, Inc. (b) | | | 9,456 | | | | 346,846 | | |
| | | | | | 2,350,443 | | |
Pharmaceuticals (0.7%) | |
Jazz Pharmaceuticals
PLC (b) (c) | | | 5,781 | | | | 920,971 | | |
Perrigo Co. PLC (c) | | | 12,372 | | | | 421,762 | | |
| | | | | | 1,342,733 | | |
Industrials (18.6%) | |
Aerospace & Defense (1.4%) | |
Axon Enterprise, Inc. (b) | | | 6,266 | | | | 1,039,717 | | |
Curtiss-Wright Corp. | | | 3,515 | | | | 586,970 | | |
Hexcel Corp. | | | 7,662 | | | | 450,909 | | |
Mercury Systems, Inc. (b) | | | 5,257 | | | | 235,198 | | |
Woodward, Inc. | | | 5,529 | | | | 534,157 | | |
| | | | | | 2,846,951 | | |
Air Freight & Logistics (0.2%) | |
GXO Logistics, Inc. (b) | | | 10,831 | | | | 462,375 | | |
Airlines (0.1%) | |
JetBlue Airways Corp. (b) | | | 29,762 | | | | 192,858 | | |
Building Products (2.5%) | |
Builders FirstSource, Inc. (b) | | | 13,525 | | | | 877,502 | | |
Carlisle Cos., Inc. | | | 4,775 | | | | 1,125,229 | | |
See accompanying notes to financial statements.
82
SFT Index 400 Mid-Cap Fund
Investments in Securities – continued
| | | Shares | | Value(a) | |
Fortune Brands Innovations,
Inc. | | | 11,785 | | | $ | 673,041 | | |
Lennox International, Inc. | | | 2,945 | | | | 704,532 | | |
Owens Corning | | | 8,588 | | | | 732,556 | | |
Simpson Manufacturing
Co., Inc. | | | 3,891 | | | | 344,976 | | |
Trex Co., Inc. (b) | | | 10,068 | | | | 426,179 | | |
| | | | | | 4,884,015 | | |
Commercial Services & Supplies (1.5%) | |
Brink's Co. | | | 4,265 | | | | 229,073 | | |
Clean Harbors, Inc. (b) | | | 4,588 | | | | 523,583 | | |
IAA, Inc. (b) | | | 12,292 | | | | 491,680 | | |
MSA Safety, Inc. | | | 3,368 | | | | 485,632 | | |
Stericycle, Inc. (b) | | | 8,395 | | | | 418,827 | | |
Tetra Tech, Inc. | | | 4,849 | | | | 704,026 | | |
| | | | | | 2,852,821 | | |
Construction & Engineering (1.8%) | |
AECOM | | | 12,852 | | | | 1,091,520 | | |
Dycom Industries, Inc. (b) | | | 2,667 | | | | 249,631 | | |
EMCOR Group, Inc. | | | 4,379 | | | | 648,574 | | |
Fluor Corp. (b) | | | 13,057 | | | | 452,556 | | |
MasTec, Inc. (b) | | | 5,400 | | | | 460,782 | | |
Valmont Industries, Inc. | | | 2,044 | | | | 675,889 | | |
| | | | | | 3,578,952 | | |
Electrical Equipment (1.9%) | |
Acuity Brands, Inc. | | | 2,987 | | | | 494,677 | | |
EnerSys | | | 3,707 | | | | 273,725 | | |
Hubbell, Inc. | | | 4,977 | | | | 1,168,002 | | |
nVent Electric PLC (c) | | | 15,308 | | | | 588,899 | | |
Regal Rexnord Corp. | | | 6,084 | | | | 729,958 | | |
Sunrun, Inc. (b) | | | 19,583 | | | | 470,384 | | |
Vicor Corp. (b) | | | 2,030 | | | | 109,113 | | |
| | | | | | 3,834,758 | | |
Machinery (4.5%) | |
AGCO Corp. | | | 5,654 | | | | 784,153 | | |
Chart Industries, Inc. (b) | | | 3,850 | | | | 443,636 | | |
Crane Holdings Co. | | | 4,343 | | | | 436,254 | | |
Donaldson Co., Inc. | | | 11,264 | | | | 663,112 | | |
Esab Corp. | | | 4,727 | | | | 221,791 | | |
Flowserve Corp. | | | 12,010 | | | | 368,467 | | |
Graco, Inc. | | | 15,427 | | | | 1,037,620 | | |
ITT, Inc. | | | 7,621 | | | | 618,063 | | |
Kennametal, Inc. | | | 7,327 | | | | 176,288 | | |
Lincoln Electric
Holdings, Inc. | | | 5,326 | | | | 769,554 | | |
Middleby Corp. (b) | | | 4,989 | | | | 668,027 | | |
Oshkosh Corp. | | | 5,976 | | | | 527,023 | | |
Terex Corp. | | | 6,163 | | | | 263,283 | | |
Timken Co. | | | 6,084 | | | | 429,956 | | |
Toro Co. | | | 9,630 | | | | 1,090,116 | | |
Watts Water Technologies,
Inc. Class A | | | 2,564 | | | | 374,934 | | |
| | | | | | 8,872,277 | | |
Marine (0.2%) | |
Kirby Corp. (b) | | | 5,504 | | | | 354,182 | | |
| | | Shares | | Value(a) | |
Professional Services (1.8%) | |
ASGN, Inc. (b) | | | 4,544 | | | $ | 370,245 | | |
CACI International, Inc.
Class A (b) | | | 2,165 | | | | 650,777 | | |
FTI Consulting, Inc. (b) | | | 3,231 | | | | 513,083 | | |
Insperity, Inc. | | | 3,281 | | | | 372,722 | | |
KBR, Inc. | | | 12,523 | | | | 661,215 | | |
ManpowerGroup, Inc. | | | 4,663 | | | | 388,008 | | |
Science Applications
International Corp. | | | 5,097 | | | | 565,410 | | |
| | | | | | 3,521,460 | | |
Road & Rail (1.7%) | |
Avis Budget Group, Inc. (b) | | | 2,287 | | | | 374,908 | | |
Knight-Swift Transportation
Holdings, Inc. | | | 14,771 | | | | 774,148 | | |
Landstar System, Inc. | | | 3,326 | | | | 541,805 | | |
RXO, Inc. (b) | | | 10,504 | | | | 180,669 | | |
Ryder System, Inc. | | | 4,562 | | | | 381,246 | | |
Saia, Inc. (b) | | | 2,462 | | | | 516,232 | | |
Werner Enterprises, Inc. | | | 5,344 | | | | 215,150 | | |
XPO, Inc. (b) | | | 10,504 | | | | 349,678 | | |
| | | | | | 3,333,836 | | |
Trading Companies & Distributors (1.0%) | |
GATX Corp. | | | 3,199 | | | | 340,181 | | |
MSC Industrial Direct
Co., Inc. Class A | | | 4,314 | | | | 352,454 | | |
Univar Solutions, Inc. (b) | | | 14,994 | | | | 476,809 | | |
Watsco, Inc. | | | 3,057 | | | | 762,416 | | |
| | | | | | 1,931,860 | | |
Information Technology (11.9%) | |
Communications Equipment (0.8%) | |
Calix, Inc. (b) | | | 5,183 | | | | 354,673 | | |
Ciena Corp. (b) | | | 13,570 | | | | 691,799 | | |
Lumentum Holdings, Inc. (b) | | | 6,190 | | | | 322,932 | | |
Viasat, Inc. (b) | | | 6,899 | | | | 218,353 | | |
| | | | | | 1,587,757 | | |
Computers & Peripherals (0.1%) | |
Xerox Holdings Corp. | | | 10,228 | | | | 149,329 | | |
Electronic Equipment, Instruments &
Components (2.9%) | |
Arrow Electronics, Inc. (b) | | | 5,652 | | | | 591,030 | | |
Avnet, Inc. | | | 8,409 | | | | 349,646 | | |
Belden, Inc. | | | 3,923 | | | | 282,064 | | |
Cognex Corp. | | | 15,891 | | | | 748,625 | | |
Coherent Corp. (b) | | | 12,744 | | | | 447,314 | | |
IPG Photonics Corp. (b) | | | 2,926 | | | | 277,005 | | |
Jabil, Inc. | | | 12,372 | | | | 843,770 | | |
Littelfuse, Inc. | | | 2,350 | | | | 517,470 | | |
National Instruments Corp. | | | 11,982 | | | | 442,136 | | |
Novanta, Inc. (b) (c) | | | 3,250 | | | | 441,578 | | |
TD SYNNEX Corp. | | | 3,851 | | | | 364,728 | | |
Vishay Intertechnology, Inc. | | | 11,827 | | | | 255,108 | | |
Vontier Corp. | | | 14,422 | | | | 278,777 | | |
| | | | | | 5,839,251 | | |
See accompanying notes to financial statements.
83
SFT Index 400 Mid-Cap Fund
Investments in Securities – continued
| | | Shares | | Value(a) | |
Interactive Media & Services (0.2%) | |
Ziff Davis, Inc. (b) | | | 4,323 | | | $ | 341,949 | | |
IT Services (2.0%) | |
Concentrix Corp. | | | 3,901 | | | | 519,457 | | |
Euronet Worldwide, Inc. (b) | | | 4,301 | | | | 405,928 | | |
ExlService Holdings, Inc. (b) | | | 3,026 | | | | 512,695 | | |
Genpact Ltd. (c) | | | 15,414 | | | | 713,977 | | |
Kyndryl Holdings, Inc. (b) | | | 18,756 | | | | 208,567 | | |
Maximus, Inc. | | | 5,512 | | | | 404,195 | | |
Western Union Co. | | | 35,487 | | | | 488,656 | | |
WEX, Inc. (b) | | | 3,982 | | | | 651,654 | | |
| | | | | | 3,905,129 | | |
Life Sciences Tools & Services (0.2%) | |
Azenta, Inc. (b) | | | 6,836 | | | | 397,992 | | |
Semiconductors & Semiconductor Equipment (2.5%) | |
Allegro MicroSystems, Inc. (b) | | | 5,977 | | | | 179,429 | | |
Amkor Technology, Inc. | | | 9,149 | | | | 219,393 | | |
Cirrus Logic, Inc. (b) | | | 5,008 | | | | 372,996 | | |
Lattice Semiconductor
Corp. (b) | | | 12,595 | | | | 817,164 | | |
MACOM Technology
Solutions Holdings, Inc. (b) | | | 4,666 | | | | 293,865 | | |
MKS Instruments, Inc. | | | 5,214 | | | | 441,782 | | |
Power Integrations, Inc. | | | 5,204 | | | | 373,231 | | |
Silicon Laboratories, Inc. (b) | | | 3,025 | | | | 410,402 | | |
SiTime Corp. (b) | | | 1,510 | | | | 153,446 | | |
SunPower Corp. (b) | | | 7,789 | | | | 140,436 | | |
Synaptics, Inc. (b) | | | 3,618 | | | | 344,289 | | |
Universal Display Corp. | | | 4,043 | | | | 436,806 | | |
Wolfspeed, Inc. (b) | | | 11,414 | | | | 788,022 | | |
| | | | | | 4,971,261 | | |
Software (3.2%) | |
ACI Worldwide, Inc. (b) | | | 10,248 | | | | 235,704 | | |
Aspen Technology, Inc. (b) | | | 2,715 | | | | 557,661 | | |
Blackbaud, Inc. (b) | | | 4,050 | | | | 238,383 | | |
CommVault Systems, Inc. (b) | | | 4,066 | | | | 255,507 | | |
Dynatrace, Inc. (b) | | | 18,516 | | | | 709,163 | | |
Envestnet, Inc. (b) | | | 5,031 | | | | 310,413 | | |
Fair Isaac Corp. (b) | | | 2,306 | | | | 1,380,326 | | |
Manhattan Associates, Inc. (b) | | | 5,786 | | | | 702,420 | | |
NCR Corp. (b) | | | 12,626 | | | | 295,575 | | |
Paylocity Holding Corp. (b) | | | 3,855 | | | | 748,872 | | |
Qualys, Inc. (b) | | | 3,188 | | | | 357,789 | | |
Super Micro Computer, Inc. (b) | | | 4,241 | | | | 348,186 | | |
Teradata Corp. (b) | | | 9,287 | | | | 312,600 | | |
| | | | | | 6,452,599 | | |
Leisure and Consumer Staples (1.3%) | |
Beverages (0.2%) | |
Celsius Holdings, Inc. (b) | | | 3,761 | | | | 391,294 | | |
Food & Staples Retailing (0.8%) | |
BJ's Wholesale Club
Holdings, Inc. (b) | | | 12,412 | | | | 821,178 | | |
Performance Food
Group Co. (b) | | | 14,305 | | | | 835,269 | | |
| | | | | | 1,656,447 | | |
| | | Shares | | Value(a) | |
Food Products (0.1%) | |
Pilgrim's Pride Corp. (b) | | | 4,047 | | | $ | 96,035 | | |
Personal Products (0.2%) | |
BellRing Brands, Inc. (b) | | | 12,368 | | | | 317,116 | | |
Materials (6.2%) | |
Chemicals (2.5%) | |
Ashland, Inc. | | | 4,623 | | | | 497,111 | | |
Avient Corp. | | | 7,805 | | | | 263,497 | | |
Cabot Corp. | | | 5,165 | | | | 345,229 | | |
Chemours Co. | | | 13,868 | | | | 424,638 | | |
Ingevity Corp. (b) | | | 3,166 | | | | 223,013 | | |
NewMarket Corp. | | | 628 | | | | 195,377 | | |
Olin Corp. | | | 11,705 | | | | 619,663 | | |
RPM International, Inc. | | | 11,905 | | | | 1,160,142 | | |
Scotts Miracle-Gro Co. | | | 3,637 | | | | 176,722 | | |
Sensient Technologies Corp. | | | 3,880 | | | | 282,930 | | |
Valvoline, Inc. | | | 16,267 | | | | 531,117 | | |
Westlake Corp. | | | 3,158 | | | | 323,821 | | |
| | | | | | 5,043,260 | | |
Construction Materials (0.2%) | |
Eagle Materials, Inc. | | | 3,441 | | | | 457,137 | | |
Containers & Packaging (0.9%) | |
AptarGroup, Inc. | | | 6,015 | | | | 661,530 | | |
Greif, Inc. Class A | | | 2,325 | | | | 155,914 | | |
Silgan Holdings, Inc. | | | 7,688 | | | | 398,546 | | |
Sonoco Products Co. | | | 8,922 | | | | 541,655 | | |
| | | | | | 1,757,645 | | |
Metals & Mining (2.4%) | |
Alcoa Corp. | | | 16,259 | | | | 739,297 | | |
Cleveland-Cliffs, Inc. (b) | | | 47,353 | | | | 762,857 | | |
Commercial Metals Co. | | | 10,783 | | | | 520,819 | | |
MP Materials Corp. (b) | | | 8,429 | | | | 204,656 | | |
Reliance Steel &
Aluminum Co. | | | 5,394 | | | | 1,091,961 | | |
Royal Gold, Inc. | | | 6,084 | | | | 685,789 | | |
U.S. Steel Corp. | | | 21,528 | | | | 539,276 | | |
Worthington Industries, Inc. | | | 2,758 | | | | 137,100 | | |
| | | | | | 4,681,755 | | |
Paper & Forest Products (0.2%) | |
Louisiana-Pacific Corp. | | | 6,588 | | | | 390,009 | | |
Real Estate (7.6%) | |
Diversified REITs (0.4%) | |
STORE Capital Corp. | | | 24,418 | | | | 782,841 | | |
Health Care REITs (0.8%) | |
Healthcare Realty
Trust, Inc. Class A | | | 34,972 | | | | 673,911 | | |
Medical Properties
Trust, Inc. | | | 54,953 | | | | 612,176 | | |
Physicians Realty Trust | | | 20,976 | | | | 303,523 | | |
| | | | | | 1,589,610 | | |
Hotels & Resort REITs (0.1%) | |
Park Hotels & Resorts, Inc. | | | 20,662 | | | | 243,605 | | |
See accompanying notes to financial statements.
84
SFT Index 400 Mid-Cap Fund
Investments in Securities – continued
| | | Shares | | Value(a) | |
Industrial REITs (1.1%) | |
EastGroup Properties, Inc. | | | 3,978 | | | $ | 588,983 | | |
First Industrial Realty
Trust, Inc. | | | 12,142 | | | | 585,973 | | |
Rexford Industrial
Realty, Inc. | | | 16,862 | | | | 921,339 | | |
| | | | | | 2,096,295 | | |
Office REITs (0.9%) | |
Corporate Office
Properties Trust | | | 10,248 | | | | 265,833 | | |
Cousins Properties, Inc. | | | 13,828 | | | | 349,710 | | |
Douglas Emmett, Inc. | | | 16,154 | | | | 253,295 | | |
Highwoods Properties, Inc. | | | 9,586 | | | | 268,217 | | |
JBG SMITH Properties | | | 9,087 | | | | 172,471 | | |
Kilroy Realty Corp. | | | 9,576 | | | | 370,304 | | |
SL Green Realty Corp. | | | 5,871 | | | | 197,970 | | |
| | | | | | 1,877,800 | | |
Real Estate Management & Development (0.4%) | |
Jones Lang LaSalle, Inc. (b) | | | 4,347 | | | | 692,781 | | |
Residential REITs (0.2%) | |
Apartment Income
REIT Corp. | | | 13,777 | | | | 472,689 | | |
Retail REITs (1.3%) | |
Brixmor Property
Group, Inc. | | | 27,560 | | | | 624,785 | | |
Kite Realty Group Trust | | | 20,134 | | | | 423,821 | | |
Macerich Co. | | | 19,737 | | | | 222,239 | | |
National Retail
Properties, Inc. | | | 16,424 | | | | 751,562 | | |
Spirit Realty Capital, Inc. | | | 12,834 | | | | 512,461 | | |
| | | | | | 2,534,868 | | |
Specialized REITs (2.4%) | |
CubeSmart | | | 20,637 | | | | 830,639 | | |
EPR Properties | | | 6,834 | | | | 257,778 | | |
Lamar Advertising Co.
Class A | | | 8,037 | | | | 758,693 | | |
Life Storage, Inc. | | | 7,811 | | | | 769,383 | | |
National Storage
Affiliates Trust | | | 7,692 | | | | 277,835 | | |
Omega Healthcare
Investors, Inc. | | | 21,520 | | | | 601,484 | | |
Pebblebrook Hotel Trust | | | 12,081 | | | | 161,765 | | |
PotlatchDeltic Corp. | | | 7,344 | | | | 323,063 | | |
Rayonier, Inc. | | | 13,455 | | | | 443,477 | | |
Sabra Health Care REIT, Inc. | | | 21,225 | | | | 263,827 | | |
| | | | | | 4,687,944 | | |
Utilities (4.0%) | |
Construction & Engineering (0.3%) | |
MDU Resources Group, Inc. | | | 18,687 | | | | 566,964 | | |
Electric Utilities (1.4%) | |
ALLETE, Inc. | | | 5,195 | | | | 335,129 | | |
Hawaiian Electric
Industries, Inc. | | | 9,976 | | | | 417,496 | | |
IDACORP, Inc. | | | 4,630 | | | | 499,346 | | |
| | | Shares/
Principal | | Value(a) | |
OGE Energy Corp. | | | 18,397 | | | $ | 727,601 | | |
Ormat Technologies, Inc. | | | 4,451 | | | | 384,922 | | |
PNM Resources, Inc. | | | 7,825 | | | | 381,782 | | |
| | | | | | 2,746,276 | | |
Gas Utilities (1.4%) | |
National Fuel Gas Co. | | | 8,337 | | | | 527,732 | | |
New Jersey Resources Corp. | | | 8,765 | | | | 434,919 | | |
ONE Gas, Inc. | | | 4,931 | | | | 373,375 | | |
Southwest Gas
Holdings, Inc. | | | 5,629 | | | | 348,323 | | |
Spire, Inc. | | | 4,851 | | | | 334,040 | | |
UGI Corp. | | | 19,241 | | | | 713,264 | | |
| | | | | | 2,731,653 | | |
Multi-Utilities (0.4%) | |
Black Hills Corp. | | | 5,910 | | | | 415,709 | | |
NorthWestern Corp. | | | 5,309 | | | | 315,036 | | |
| | | | | | 730,745 | | |
Water Utilities (0.5%) | |
Essential Utilities, Inc. | | | 21,934 | | | | 1,046,910 | | |
Total common stocks
(cost: $146,773,785) | | | | | 188,622,016 | | |
Long-Term Debt Securities (0.5%) | |
Government Obligation (0.5%) | |
U.S. Treasury (0.5%) | |
U.S. Treasury Note,
1.750%, 05/15/23 (d) | | $ | 1,000,000 | | | | 989,219 | | |
Total long-term debt securities
(cost: $998,909) | | | | | 989,219 | | |
Mutual Funds (0.2%) | |
Investment Companies (0.2%) | |
SPDR S&P MidCap 400
ETF Trust | | | 700 | | | | 309,953 | | |
Total mutual funds
(cost: $318,031) | | | | | 309,953 | | |
Short-Term Securities (3.9%) | |
Investment Companies (3.9%) | |
State Street Institutional
U.S. Government Money
Market Fund, current
rate 4.120% | | | 7,709,769 | | | | 7,709,769 | | |
Total short-term securities
(cost: $7,709,769) | | | | | 7,709,769 | | |
Total investments in securities
(cost: $155,800,494) (e) | | | | | 197,630,957 | | |
Cash and other assets in excess
of liabilities (0.0%) | | | | | 37,069 | | |
Total net assets (100.0%) | | | | $ | 197,668,026 | | |
See accompanying notes to financial statements.
85
SFT Index 400 Mid-Cap Fund
Investments in Securities – continued
Investments in Securities Legend
(a) Securities are valued by procedures described in Note 2 of the notes to financial statements.
(b) Non-income producing security.
(c) Foreign security: The Fund held 3.0% of net assets in foreign securities at December 31, 2022.
(d) Fully or partially pledged as initial margin deposits on open futures contracts.
(e) At December 31, 2022, the cost of investments for federal income tax purposes was $155,781,997. The aggregate unrealized appreciation and depreciation of investments based on this cost were:
Gross unrealized appreciation | | $ | 56,978,513 | | |
Gross unrealized depreciation | | | (15,359,438 | ) | |
Net unrealized appreciation | | $ | 41,619,075 | | |
Holdings of Open Futures Contracts
On December 31, 2022, securities with an aggregate market value of $989,219 have been pledged to cover margin requirements for the following open futures contracts:
Description | | Expiration
Date | | Number of
Contracts | | Position
Type | | Notional
Amount | | Market
Value | | Unrealized
Appreciation/
(Depreciation)(a) | |
S&P Mid 400® E-Mini Index Future | | March 2023 | | | 35 | | | Long | | $ | 8,778,985 | | | $ | 8,549,100 | | | $ | (229,885 | ) | |
See accompanying notes to financial statements.
86
SFT Index 500 Fund
Investments in Securities
(Percentages of each investment category relate to total net assets)
| | | Shares | | Value(a) | |
Common Stocks (98.3%) | |
Communication Services (1.3%) | |
Diversified Telecommunication Services (0.9%) | |
AT&T, Inc. | | | 215,351 | | | $ | 3,964,612 | | |
Lumen Technologies, Inc. | | | 28,760 | | | | 150,127 | | |
Verizon Communications, Inc. | | | 126,902 | | | | 4,999,939 | | |
| | | | | | 9,114,678 | | |
Entertainment (0.1%) | |
Warner Bros Discovery, Inc. (b) | | | 66,773 | | | | 633,008 | | |
Interactive Media & Services (0.0%) | |
Match Group, Inc. (b) | | | 8,407 | | | | 348,806 | | |
Media (0.1%) | |
Fox Corp. Class A | | | 9,081 | | | | 275,790 | | |
Fox Corp. Class B | | | 4,151 | | | | 118,096 | | |
Paramount Global Class B | | | 15,260 | | | | 257,589 | | |
| | | | | | 651,475 | | |
Wireless Telecommunication Services (0.2%) | |
T-Mobile U.S., Inc. (b) | | | 18,063 | | | | 2,528,820 | | |
Consumer Discretionary (11.1%) | |
Auto Components (0.1%) | |
Aptiv PLC (b) (c) | | | 8,187 | | | | 762,455 | | |
BorgWarner, Inc. | | | 6,988 | | | | 281,267 | | |
| | | | | | 1,043,722 | | |
Automobiles (1.3%) | |
Ford Motor Co. | | | 119,343 | | | | 1,387,959 | | |
General Motors Co. | | | 42,928 | | | | 1,444,098 | | |
Tesla, Inc. (b) | | | 81,103 | | | | 9,990,268 | | |
| | | | | | 12,822,325 | | |
Distributors (0.2%) | |
Genuine Parts Co. | | | 4,210 | | | | 730,477 | | |
LKQ Corp. | | | 7,651 | | | | 408,640 | | |
Pool Corp. | | | 1,170 | | | | 353,726 | | |
| | | | | | 1,492,843 | | |
Entertainment (0.5%) | |
Walt Disney Co. (b) | | | 55,085 | | | | 4,785,785 | | |
Hotels, Restaurants & Leisure (1.8%) | |
Booking Holdings, Inc. (b) | | | 1,194 | | | | 2,406,244 | | |
Caesars Entertainment,
Inc. (b) | | | 6,434 | | | | 267,654 | | |
Carnival Corp. (b) (c) | | | 30,259 | | | | 243,888 | | |
Chipotle Mexican Grill,
Inc. (b) | | | 849 | | | | 1,177,979 | | |
Darden Restaurants, Inc. | | | 3,638 | | | | 503,244 | | |
Domino's Pizza, Inc. | | | 1,070 | | | | 370,648 | | |
Las Vegas Sands Corp. (b) | | | 9,860 | | | | 473,970 | | |
Marriott International, Inc.
Class A | | | 8,130 | | | | 1,210,476 | | |
McDonald's Corp. | | | 22,132 | | | | 5,832,446 | | |
MGM Resorts International | | | 9,631 | | | | 322,927 | | |
Norwegian Cruise Line
Holdings Ltd. (b) (c) | | | 12,644 | | | | 154,763 | | |
| | | Shares | | Value(a) | |
Royal Caribbean Cruises
Ltd. (b) (c) | | | 6,631 | | | $ | 327,770 | | |
Starbucks Corp. | | | 34,685 | | | | 3,440,752 | | |
Wynn Resorts Ltd. (b) | | | 3,025 | | | | 249,472 | | |
Yum! Brands, Inc. | | | 8,474 | | | | 1,085,350 | | |
| | | | | | 18,067,583 | | |
Household Durables (0.3%) | |
DR Horton, Inc. | | | 9,379 | | | | 836,044 | | |
Garmin Ltd. (c) | | | 4,629 | | | | 427,210 | | |
Lennar Corp. Class A | | | 7,698 | | | | 696,669 | | |
Mohawk Industries, Inc. (b) | | | 1,513 | | | | 154,659 | | |
Newell Brands, Inc. | | | 11,294 | | | | 147,726 | | |
NVR, Inc. (b) | | | 94 | | | | 433,583 | | |
PulteGroup, Inc. | | | 6,846 | | | | 311,698 | | |
Whirlpool Corp. | | | 1,635 | | | | 231,287 | | |
| | | | | | 3,238,876 | | |
Internet & Catalog Retail (2.8%) | |
Amazon.com, Inc. (b) | | | 268,182 | | | | 22,527,288 | | |
Etsy, Inc. (b) | | | 3,721 | | | | 445,702 | | |
Expedia Group, Inc. (b) | | | 4,463 | | | | 390,959 | | |
Netflix, Inc. (b) | | | 13,447 | | | | 3,965,251 | | |
| | | | | | 27,329,200 | | |
Leisure Equipment & Products (0.0%) | |
Hasbro, Inc. | | | 3,835 | | | | 233,973 | | |
Media (0.7%) | |
Charter Communications,
Inc. Class A (b) | | | 3,227 | | | | 1,094,276 | | |
Comcast Corp. Class A | | | 130,351 | | | | 4,558,374 | | |
DISH Network Corp.
Class A (b) | | | 7,594 | | | | 106,620 | | |
Interpublic Group of Cos., Inc. | | | 11,691 | | | | 389,427 | | |
Live Nation Entertainment,
Inc. (b) | | | 4,263 | | | | 297,301 | | |
News Corp. Class A | | | 11,519 | | | | 209,646 | | |
News Corp. Class B | | | 3,493 | | | | 64,411 | | |
Omnicom Group, Inc. | | | 6,161 | | | | 502,553 | | |
| | | | | | 7,222,608 | | |
Multiline Retail (0.5%) | |
Dollar General Corp. | | | 6,869 | | | | 1,691,491 | | |
Dollar Tree, Inc. (b) | | | 6,334 | | | | 895,881 | | |
Target Corp. | | | 13,914 | | | | 2,073,743 | | |
| | | | | | 4,661,115 | | |
Specialty Retail (2.4%) | |
Advance Auto Parts, Inc. | | | 1,798 | | | | 264,360 | | |
AutoZone, Inc. (b) | | | 586 | | | | 1,445,182 | | |
Bath & Body Works, Inc. | | | 6,850 | | | | 288,659 | | |
Best Buy Co., Inc. | | | 6,054 | | | | 485,591 | | |
CarMax, Inc. (b) | | | 4,756 | | | | 289,593 | | |
Home Depot, Inc. | | | 30,985 | | | | 9,786,922 | | |
Lowe's Cos., Inc. | | | 18,755 | | | | 3,736,746 | | |
O'Reilly Automotive, Inc. (b) | | | 1,941 | | | | 1,638,262 | | |
Ross Stores, Inc. | | | 10,455 | | | | 1,213,512 | | |
TJX Cos., Inc. | | | 35,058 | | | | 2,790,617 | | |
See accompanying notes to financial statements.
87
SFT Index 500 Fund
Investments in Securities – continued
| | | Shares | | Value(a) | |
Tractor Supply Co. | | | 3,309 | | | $ | 744,426 | | |
Ulta Beauty, Inc. (b) | | | 1,578 | | | | 740,192 | | |
| | | | | | 23,424,062 | | |
Textiles, Apparel & Luxury Goods (0.5%) | |
NIKE, Inc. Class B | | | 38,063 | | | | 4,453,752 | | |
Ralph Lauren Corp. | | | 1,233 | | | | 130,291 | | |
Tapestry, Inc. | | | 7,280 | | | | 277,222 | | |
VF Corp. | | | 9,909 | | | | 273,588 | | |
| | | | | | 5,134,853 | | |
Consumer Staples (7.4%) | |
Beverages (1.9%) | |
Brown-Forman Corp.
Class B | | | 5,525 | | | | 362,882 | | |
Coca-Cola Co. | | | 117,603 | | | | 7,480,727 | | |
Constellation Brands, Inc.
Class A | | | 4,905 | | | | 1,136,734 | | |
Keurig Dr Pepper, Inc. | | | 25,676 | | | | 915,606 | | |
Molson Coors Beverage Co.
Class B | | | 5,647 | | | | 290,933 | | |
Monster Beverage Corp. (b) | | | 11,441 | | | | 1,161,605 | | |
PepsiCo, Inc. | | | 41,629 | | | | 7,520,695 | | |
| | | | | | 18,869,182 | | |
Food & Staples Retailing (1.9%) | |
Costco Wholesale Corp. | | | 13,431 | | | | 6,131,251 | | |
CVS Health Corp. | | | 39,703 | | | | 3,699,923 | | |
Kroger Co. | | | 19,682 | | | | 877,423 | | |
Sysco Corp. | | | 15,288 | | | | 1,168,768 | | |
Walgreens Boots
Alliance, Inc. | | | 21,689 | | | | 810,301 | | |
Walmart, Inc. | | | 42,647 | | | | 6,046,918 | | |
| | | | | | 18,734,584 | | |
Food Products (1.2%) | |
Archer-Daniels-Midland Co. | | | 16,598 | | | | 1,541,124 | | |
Campbell Soup Co. | | | 5,989 | | | | 339,876 | | |
Conagra Brands, Inc. | | | 14,406 | | | | 557,512 | | |
General Mills, Inc. | | | 17,934 | | | | 1,503,766 | | |
Hershey Co. | | | 4,465 | | | | 1,033,960 | | |
Hormel Foods Corp. | | | 8,684 | | | | 395,556 | | |
J M Smucker Co. | | | 3,241 | | | | 513,569 | | |
Kellogg Co. | | | 7,654 | | | | 545,271 | | |
Kraft Heinz Co. | | | 24,058 | | | | 979,401 | | |
Lamb Weston Holdings, Inc. | | | 4,297 | | | | 383,980 | | |
McCormick & Co., Inc. | | | 7,516 | | | | 623,001 | | |
Mondelez International, Inc.
Class A | | | 41,263 | | | | 2,750,179 | | |
Tyson Foods, Inc. Class A | | | 8,690 | | | | 540,953 | | |
| | | | | | 11,708,148 | | |
Household Products (1.5%) | |
Church & Dwight Co., Inc. | | | 7,289 | | | | 587,566 | | |
Clorox Co. | | | 3,720 | | | | 522,028 | | |
Colgate-Palmolive Co. | | | 25,237 | | | | 1,988,423 | | |
Kimberly-Clark Corp. | | | 10,131 | | | | 1,375,283 | | |
Procter & Gamble Co. | | | 71,603 | | | | 10,852,151 | | |
| | | | | | 15,325,451 | | |
| | | Shares | | Value(a) | |
Personal Care (0.2%) | |
Estee Lauder Cos., Inc.
Class A | | | 7,031 | | | $ | 1,744,461 | | |
Tobacco (0.7%) | |
Altria Group, Inc. | | | 54,152 | | | | 2,475,288 | | |
Philip Morris
International, Inc. | | | 46,841 | | | | 4,740,778 | | |
| | | | | | 7,216,066 | | |
Energy (5.0%) | |
Energy Equipment & Services (0.4%) | |
Baker Hughes Co. | | | 30,260 | | | | 893,578 | | |
Halliburton Co. | | | 27,437 | | | | 1,079,646 | | |
Schlumberger Ltd. (c) | | | 42,846 | | | | 2,290,547 | | |
| | | | | | 4,263,771 | | |
Oil, Gas & Consumable Fuels (4.6%) | |
APA Corp. | | | 9,698 | | | | 452,703 | | |
Chevron Corp. | | | 53,753 | | | | 9,648,126 | | |
ConocoPhillips | | | 37,651 | | | | 4,442,818 | | |
Coterra Energy, Inc. | | | 23,773 | | | | 584,103 | | |
Devon Energy Corp. | | | 19,752 | | | | 1,214,946 | | |
Diamondback Energy, Inc. | | | 5,334 | | | | 729,585 | | |
EOG Resources, Inc. | | | 17,748 | | | | 2,298,721 | | |
EQT Corp. | | | 11,015 | | | | 372,637 | | |
Exxon Mobil Corp. | | | 124,439 | | | | 13,725,622 | | |
Hess Corp. | | | 8,361 | | | | 1,185,757 | | |
Kinder Morgan, Inc. | | | 59,768 | | | | 1,080,605 | | |
Marathon Oil Corp. | | | 19,189 | | | | 519,446 | | |
Marathon Petroleum Corp. | | | 14,161 | | | | 1,648,199 | | |
Occidental Petroleum Corp. | | | 21,971 | | | | 1,383,953 | | |
Phillips 66 | | | 14,281 | | | | 1,486,366 | | |
Pioneer Natural
Resources Co. | | | 7,162 | | | | 1,635,729 | | |
Targa Resources Corp. | | | 6,820 | | | | 501,270 | | |
Valero Energy Corp. | | | 11,649 | | | | 1,477,792 | | |
Williams Cos., Inc. | | | 36,803 | | | | 1,210,819 | | |
| | | | | | 45,599,197 | | |
Financial (11.5%) | |
Capital Markets (3.1%) | |
Ameriprise Financial, Inc. | | | 3,214 | | | | 1,000,743 | | |
Bank of New York
Mellon Corp. | | | 22,225 | | | | 1,011,682 | | |
BlackRock, Inc. | | | 4,525 | | | | 3,206,551 | | |
Cboe Global Markets, Inc. | | | 3,154 | | | | 395,732 | | |
Charles Schwab Corp. | | | 46,089 | | | | 3,837,370 | | |
CME Group, Inc. | | | 10,869 | | | | 1,827,731 | | |
FactSet Research
Systems, Inc. | | | 1,221 | | | | 489,877 | | |
Franklin Resources, Inc. | | | 8,524 | | | | 224,863 | | |
Goldman Sachs Group, Inc. | | | 10,232 | | | | 3,513,464 | | |
Intercontinental
Exchange, Inc. | | | 16,877 | | | | 1,731,411 | | |
Invesco Ltd. (c) | | | 13,650 | | | | 245,564 | | |
MarketAxess Holdings, Inc. | | | 1,169 | | | | 326,022 | | |
Moody's Corp. | | | 4,807 | | | | 1,339,326 | | |
Morgan Stanley | | | 39,833 | | | | 3,386,602 | | |
MSCI, Inc. | | | 2,447 | | | | 1,138,271 | | |
Nasdaq, Inc. | | | 10,242 | | | | 628,347 | | |
Northern Trust Corp. | | | 6,253 | | | | 553,328 | | |
See accompanying notes to financial statements.
88
SFT Index 500 Fund
Investments in Securities – continued
| | | Shares | | Value(a) | |
Raymond James
Financial, Inc. | | | 5,781 | | | $ | 617,700 | | |
S&P Global, Inc. | | | 10,062 | | | | 3,370,166 | | |
State Street Corp. | | | 11,031 | | | | 855,675 | | |
T Rowe Price Group, Inc. | | | 6,708 | | | | 731,575 | | |
| | | | | | 30,432,000 | | |
Commercial Banks (3.8%) | |
Bank of America Corp. | | | 210,894 | | | | 6,984,809 | | |
Citigroup, Inc. | | | 58,524 | | | | 2,647,040 | | |
Citizens Financial
Group, Inc. | | | 14,873 | | | | 585,550 | | |
Comerica, Inc. | | | 3,925 | | | | 262,386 | | |
Fifth Third Bancorp | | | 20,740 | | | | 680,479 | | |
First Republic Bank | | | 5,483 | | | | 668,323 | | |
Huntington Bancshares, Inc. | | | 43,593 | | | | 614,661 | | |
JPMorgan Chase & Co. | | | 88,630 | | | | 11,885,283 | | |
KeyCorp | | | 28,190 | | | | 491,070 | | |
M&T Bank Corp. | | | 5,147 | | | | 746,624 | | |
PNC Financial Services
Group, Inc. | | | 12,187 | | | | 1,924,815 | | |
Regions Financial Corp. | | | 28,235 | | | | 608,747 | | |
Signature Bank | | | 1,806 | | | | 208,087 | | |
SVB Financial Group (b) | | | 1,777 | | | | 408,959 | | |
Truist Financial Corp. | | | 40,089 | | | | 1,725,030 | | |
U.S. Bancorp | | | 40,855 | | | | 1,781,687 | | |
Wells Fargo & Co. | | | 115,138 | | | | 4,754,048 | | |
Zions Bancorp NA | | | 4,504 | | | | 221,417 | | |
| | | | | | 37,199,015 | | |
Consumer Finance (0.5%) | |
American Express Co. | | | 17,998 | | | | 2,659,205 | | |
Capital One Financial Corp. | | | 11,517 | | | | 1,070,620 | | |
Discover Financial Services | | | 8,197 | | | | 801,913 | | |
Synchrony Financial | | | 13,613 | | | | 447,323 | | |
| | | | | | 4,979,061 | | |
Insurance (4.1%) | |
Aflac, Inc. | | | 17,097 | | | | 1,229,958 | | |
Allstate Corp. | | | 7,992 | | | | 1,083,715 | | |
American International
Group, Inc. | | | 22,450 | | | | 1,419,738 | | |
Aon PLC Class A (c) | | | 6,250 | | | | 1,875,875 | | |
Arch Capital
Group Ltd. (b) (c) | | | 11,089 | | | | 696,167 | | |
Arthur J Gallagher & Co. | | | 6,371 | | | | 1,201,188 | | |
Assurant, Inc. | | | 1,555 | | | | 194,468 | | |
Berkshire Hathaway, Inc.
Class B (b) | | | 54,441 | | | | 16,816,825 | | |
Brown & Brown, Inc. | | | 7,034 | | | | 400,727 | | |
Chubb Ltd. (c) | | | 12,523 | | | | 2,762,574 | | |
Cincinnati Financial Corp. | | | 4,677 | | | | 478,878 | | |
Everest Re Group Ltd. (c) | | | 1,152 | | | | 381,623 | | |
Globe Life, Inc. | | | 2,674 | | | | 322,351 | | |
Hartford Financial Services
Group, Inc. | | | 9,596 | | | | 727,665 | | |
Lincoln National Corp. | | | 4,648 | | | | 142,787 | | |
Loews Corp. | | | 5,901 | | | | 344,205 | | |
Marsh & McLennan
Cos., Inc. | | | 14,947 | | | | 2,473,430 | | |
MetLife, Inc. | | | 19,914 | | | | 1,441,176 | | |
Principal Financial
Group, Inc. | | | 6,800 | | | | 570,656 | | |
| | | Shares | | Value(a) | |
Progressive Corp. | | | 17,678 | | | $ | 2,293,013 | | |
Prudential Financial, Inc. | | | 11,056 | | | | 1,099,630 | | |
Travelers Cos., Inc. | | | 7,065 | | | | 1,324,617 | | |
Willis Towers Watson
PLC (c) | | | 3,321 | | | | 812,250 | | |
WR Berkley Corp. | | | 6,129 | | | | 444,782 | | |
| | | | | | 40,538,298 | | |
Health Care (15.2%) | |
Biotechnology (2.4%) | |
AbbVie, Inc. | | | 53,437 | | | | 8,635,954 | | |
Amgen, Inc. | | | 16,152 | | | | 4,242,161 | | |
Biogen, Inc. (b) | | | 4,345 | | | | 1,203,217 | | |
Gilead Sciences, Inc. | | | 37,898 | | | | 3,253,543 | | |
Incyte Corp. (b) | | | 5,508 | | | | 442,403 | | |
Moderna, Inc. (b) | | | 9,983 | | | | 1,793,146 | | |
Regeneron
Pharmaceuticals, Inc. (b) | | | 3,236 | | | | 2,334,742 | | |
Vertex Pharmaceuticals,
Inc. (b) | | | 7,727 | | | | 2,231,403 | | |
| | | | | | 24,136,569 | | |
Health Care Equipment & Supplies (3.4%) | |
Abbott Laboratories | | | 52,684 | | | | 5,784,176 | | |
Align Technology, Inc. (b) | | | 2,232 | | | | 470,729 | | |
Baxter International, Inc. | | | 15,232 | | | | 776,375 | | |
Becton Dickinson & Co. | | | 8,620 | | | | 2,192,066 | | |
Boston Scientific Corp. (b) | | | 43,279 | | | | 2,002,519 | | |
Cooper Cos., Inc. | | | 1,466 | | | | 484,762 | | |
Danaher Corp. | | | 19,797 | | | | 5,254,520 | | |
Dentsply Sirona, Inc. | | | 6,493 | | | | 206,737 | | |
Dexcom, Inc. (b) | | | 11,592 | | | | 1,312,678 | | |
Edwards Lifesciences
Corp. (b) | | | 18,681 | | | | 1,393,789 | | |
Hologic, Inc. (b) | | | 7,543 | | | | 564,292 | | |
IDEXX Laboratories, Inc. (b) | | | 2,488 | | | | 1,015,004 | | |
Intuitive Surgical, Inc. (b) | | | 10,668 | | | | 2,830,754 | | |
Medtronic PLC (c) | | | 40,162 | | | | 3,121,391 | | |
ResMed, Inc. | | | 4,406 | | | | 917,021 | | |
STERIS PLC (c) | | | 2,975 | | | | 549,453 | | |
Stryker Corp. | | | 10,177 | | | | 2,488,175 | | |
Teleflex, Inc. | | | 1,454 | | | | 362,962 | | |
West Pharmaceutical
Services, Inc. | | | 2,230 | | | | 524,831 | | |
Zimmer Biomet
Holdings, Inc. | | | 6,343 | | | | 808,732 | | |
| | | | | | 33,060,966 | | |
Health Care Providers & Services (3.3%) | |
AmerisourceBergen Corp. | | | 4,901 | | | | 812,145 | | |
Cardinal Health, Inc. | | | 7,920 | | | | 608,810 | | |
Centene Corp. (b) | | | 17,051 | | | | 1,398,352 | | |
Cigna Corp. | | | 9,256 | | | | 3,066,883 | | |
DaVita, Inc. (b) | | | 1,571 | | | | 117,307 | | |
Elevance Health, Inc. | | | 7,218 | | | | 3,702,617 | | |
HCA Healthcare, Inc. | | | 6,460 | | | | 1,550,142 | | |
Henry Schein, Inc. (b) | | | 4,083 | | | | 326,109 | | |
Humana, Inc. | | | 3,830 | | | | 1,961,688 | | |
Laboratory Corp. of
America Holdings | | | 2,666 | | | | 627,790 | | |
McKesson Corp. | | | 4,331 | | | | 1,624,645 | | |
Molina Healthcare, Inc. (b) | | | 1,740 | | | | 574,583 | | |
See accompanying notes to financial statements.
89
SFT Index 500 Fund
Investments in Securities – continued
| | | Shares | | Value(a) | |
Quest Diagnostics, Inc. | | | 3,467 | | | $ | 542,377 | | |
UnitedHealth Group, Inc. | | | 28,233 | | | | 14,968,572 | | |
Universal Health Services,
Inc. Class B | | | 1,899 | | | | 267,550 | | |
| | | | | | 32,149,570 | | |
Life Sciences Tools & Services (1.3%) | |
Agilent Technologies, Inc. | | | 8,891 | | | | 1,330,538 | | |
Bio-Rad Laboratories, Inc.
Class A (b) | | | 692 | | | | 290,979 | | |
Bio-Techne Corp. | | | 4,680 | | | | 387,879 | | |
Charles River Laboratories
International, Inc. (b) | | | 1,510 | | | | 329,029 | | |
Illumina, Inc. (b) | | | 4,755 | | | | 961,461 | | |
IQVIA Holdings, Inc. (b) | | | 5,633 | | | | 1,154,145 | | |
Mettler-Toledo
International, Inc. (b) | | | 707 | | | | 1,021,933 | | |
PerkinElmer, Inc. | | | 3,758 | | | | 526,947 | | |
Thermo Fisher
Scientific, Inc. | | | 11,886 | | | | 6,545,501 | | |
Waters Corp. (b) | | | 1,844 | | | | 631,718 | | |
| | | | | | 13,180,130 | | |
Pharmaceuticals (4.8%) | |
Bristol-Myers Squibb Co. | | | 64,244 | | | | 4,622,356 | | |
Catalent, Inc. (b) | | | 5,437 | | | | 244,719 | | |
Eli Lilly & Co. | | | 23,830 | | | | 8,717,967 | | |
Johnson & Johnson | | | 79,000 | | | | 13,955,350 | | |
Merck & Co., Inc. | | | 76,610 | | | | 8,499,880 | | |
Organon & Co. | | | 7,631 | | | | 213,134 | | |
Pfizer, Inc. | | | 169,613 | | | | 8,690,970 | | |
Viatris, Inc. | | | 36,642 | | | | 407,826 | | |
Zoetis, Inc. | | | 14,077 | | | | 2,062,984 | | |
| | | | | | 47,415,186 | | |
Industrials (8.7%) | |
Aerospace & Defense (1.9%) | |
Boeing Co. (b) | | | 16,928 | | | | 3,224,615 | | |
General Dynamics Corp. | | | 6,847 | | | | 1,698,809 | | |
Howmet Aerospace, Inc. | | | 11,065 | | | | 436,072 | | |
Huntington Ingalls
Industries, Inc. | | | 1,189 | | | | 274,279 | | |
L3Harris Technologies, Inc. | | | 5,731 | | | | 1,193,251 | | |
Lockheed Martin Corp. | | | 7,056 | | | | 3,432,673 | | |
Northrop Grumman Corp. | | | 4,443 | | | | 2,424,145 | | |
Raytheon Technologies
Corp. | | | 44,419 | | | | 4,482,765 | | |
Teledyne Technologies,
Inc. (b) | | | 1,468 | | | | 587,068 | | |
TransDigm Group, Inc. | | | 1,569 | | | | 987,921 | | |
| | | | | | 18,741,598 | | |
Air Freight & Logistics (0.6%) | |
CH Robinson Worldwide,
Inc. | | | 3,550 | | | | 325,038 | | |
Expeditors International of
Washington, Inc. | | | 4,739 | | | | 492,477 | | |
FedEx Corp. | | | 7,203 | | | | 1,247,560 | | |
United Parcel Service, Inc.
Class B | | | 22,079 | | | | 3,838,213 | | |
| | | | | | 5,903,288 | | |
| | | Shares | | Value(a) | |
Airlines (0.2%) | |
Alaska Air Group, Inc. (b) | | | 3,756 | | | $ | 161,283 | | |
American Airlines
Group, Inc. (b) | | | 19,637 | | | | 249,783 | | |
Delta Air Lines, Inc. (b) | | | 19,374 | | | | 636,629 | | |
Southwest Airlines Co. (b) | | | 17,940 | | | | 604,040 | | |
United Airlines
Holdings, Inc. (b) | | | 9,878 | | | | 372,400 | | |
| | | | | | 2,024,135 | | |
Building Products (0.4%) | |
Allegion PLC (c) | | | 2,654 | | | | 279,360 | | |
AO Smith Corp. | | | 3,750 | | | | 214,650 | | |
Carrier Global Corp. | | | 25,169 | | | | 1,038,221 | | |
Johnson Controls
International PLC (c) | | | 20,809 | | | | 1,331,776 | | |
Masco Corp. | | | 6,767 | | | | 315,816 | | |
Trane Technologies PLC (c) | | | 6,932 | | | | 1,165,200 | | |
| | | | | | 4,345,023 | | |
Commercial Services & Supplies (0.5%) | |
Cintas Corp. | | | 2,590 | | | | 1,169,696 | | |
Copart, Inc. (b) | | | 12,948 | | | | 788,404 | | |
Republic Services, Inc. | | | 6,216 | | | | 801,802 | | |
Rollins, Inc. | | | 6,944 | | | | 253,734 | | |
Waste Management, Inc. | | | 11,287 | | | | 1,770,704 | | |
| | | | | | 4,784,340 | | |
Construction & Engineering (0.1%) | |
Jacobs Solutions, Inc. | | | 3,807 | | | | 457,106 | | |
Quanta Services, Inc. | | | 4,281 | | | | 610,043 | | |
| | | | | | 1,067,149 | | |
Electrical Equipment (0.6%) | |
AMETEK, Inc. | | | 6,939 | | | | 969,517 | | |
Eaton Corp. PLC (c) | | | 11,952 | | | | 1,875,866 | | |
Emerson Electric Co. | | | 17,866 | | | | 1,716,208 | | |
Generac Holdings, Inc. (b) | | | 1,817 | | | | 182,899 | | |
Rockwell Automation, Inc. | | | 3,513 | | | | 904,844 | | |
| | | | | | 5,649,334 | | |
Industrial Conglomerates (1.1%) | |
3M Co. | | | 16,701 | | | | 2,002,784 | | |
General Electric Co. | | | 33,016 | | | | 2,766,411 | | |
Honeywell International, Inc. | | | 20,315 | | | | 4,353,504 | | |
Roper Technologies, Inc. | | | 3,262 | | | | 1,409,477 | | |
Textron, Inc. | | | 6,307 | | | | 446,536 | | |
| | | | | | 10,978,712 | | |
Machinery (1.8%) | |
Caterpillar, Inc. | | | 15,689 | | | | 3,758,457 | | |
Cummins, Inc. | | | 4,310 | | | | 1,044,270 | | |
Deere & Co. | | | 8,320 | | | | 3,567,283 | | |
Dover Corp. | | | 4,180 | | | | 566,014 | | |
Fortive Corp. | | | 10,644 | | | | 683,877 | | |
IDEX Corp. | | | 2,249 | | | | 513,514 | | |
Illinois Tool Works, Inc. | | | 8,487 | | | | 1,869,686 | | |
Ingersoll Rand, Inc. | | | 12,235 | | | | 639,279 | | |
Nordson Corp. | | | 1,610 | | | | 382,729 | | |
Otis Worldwide Corp. | | | 12,576 | | | | 984,826 | | |
PACCAR, Inc. | | | 10,434 | | | | 1,032,653 | | |
See accompanying notes to financial statements.
90
SFT Index 500 Fund
Investments in Securities – continued
| | | Shares | | Value(a) | |
Parker-Hannifin Corp. | | | 3,905 | | | $ | 1,136,355 | | |
Pentair PLC (c) | | | 4,970 | | | | 223,551 | | |
Snap-On, Inc. | | | 1,655 | | | | 378,151 | | |
Stanley Black & Decker, Inc. | | | 4,397 | | | | 330,303 | | |
Westinghouse Air Brake
Technologies Corp. | | | 5,495 | | | | 548,456 | | |
Xylem, Inc. | | | 5,351 | | | | 591,660 | | |
| | | | | | 18,251,064 | | |
Professional Services (0.4%) | |
CoStar Group, Inc. (b) | | | 12,288 | | | | 949,617 | | |
Equifax, Inc. | | | 3,663 | | | | 711,941 | | |
Robert Half
International, Inc. | | | 3,252 | | | | 240,095 | | |
United Rentals, Inc. (b) | | | 2,093 | | | | 743,894 | | |
Verisk Analytics, Inc. | | | 4,756 | | | | 839,053 | | |
| | | | | | 3,484,600 | | |
Road & Rail (0.9%) | |
CSX Corp. | | | 63,526 | | | | 1,968,036 | | |
JB Hunt Transport
Services, Inc. | | | 2,471 | | | | 430,844 | | |
Norfolk Southern Corp. | | | 7,013 | | | | 1,728,143 | | |
Old Dominion Freight
Line, Inc. | | | 2,750 | | | | 780,395 | | |
Union Pacific Corp. | | | 18,577 | | | | 3,846,739 | | |
| | | | | | 8,754,157 | | |
Trading Companies & Distributors (0.2%) | |
Fastenal Co. | | | 17,244 | | | | 815,986 | | |
WW Grainger, Inc. | | | 1,386 | | | | 770,963 | | |
| | | | | | 1,586,949 | | |
Information Technology (29.4%) | |
Communications Equipment (0.9%) | |
Arista Networks, Inc. (b) | | | 7,395 | | | | 897,383 | | |
Cisco Systems, Inc. | | | 124,066 | | | | 5,910,504 | | |
F5, Inc. (b) | | | 1,821 | | | | 261,332 | | |
Juniper Networks, Inc. | | | 9,806 | | | | 313,400 | | |
Motorola Solutions, Inc. | | | 5,045 | | | | 1,300,147 | | |
| | | | | | 8,682,766 | | |
Computers & Peripherals (6.1%) | |
Apple, Inc. (d) | | | 451,842 | | | | 58,707,831 | | |
NetApp, Inc. | | | 6,487 | | | | 389,609 | | |
Seagate Technology
Holdings PLC (c) | | | 5,782 | | | | 304,191 | | |
Western Digital Corp. (b) | | | 9,598 | | | | 302,817 | | |
| | | | | | 59,704,448 | | |
Electronic Equipment, Instruments &
Components (0.5%) | |
Amphenol Corp. Class A | | | 17,981 | | | | 1,369,073 | | |
CDW Corp. | | | 4,127 | | | | 737,000 | | |
Corning, Inc. | | | 23,001 | | | | 734,652 | | |
Keysight Technologies,
Inc. (b) | | | 5,362 | | | | 917,277 | | |
TE Connectivity Ltd. (c) | | | 9,542 | | | | 1,095,422 | | |
Trimble, Inc. (b) | | | 7,353 | | | | 371,768 | | |
| | | | | | 5,225,192 | | |
| | | Shares | | Value(a) | |
Interactive Media & Services (4.0%) | |
Akamai Technologies,
Inc. (b) | | | 4,723 | | | $ | 398,149 | | |
Alphabet, Inc. Class A (b) | | | 180,481 | | | | 15,923,838 | | |
Alphabet, Inc. Class C (b) | | | 159,989 | | | | 14,195,824 | | |
eBay, Inc. | | | 16,385 | | | | 679,486 | | |
Meta Platforms, Inc.
Class A (b) | | | 67,946 | | | | 8,176,622 | | |
| | | | | | 39,373,919 | | |
IT Services (4.4%) | |
Accenture PLC Class A (c) | | | 19,081 | | | | 5,091,574 | | |
Automatic Data
Processing, Inc. | | | 12,566 | | | | 3,001,515 | | |
Broadridge Financial
Solutions, Inc. | | | 3,541 | | | | 474,954 | | |
Cognizant Technology
Solutions Corp. Class A | | | 15,511 | | | | 887,074 | | |
DXC Technology Co. (b) | | | 6,898 | | | | 182,797 | | |
EPAM Systems, Inc. (b) | | | 1,789 | | | | 586,327 | | |
Fidelity National Information
Services, Inc. | | | 17,929 | | | | 1,216,483 | | |
Fiserv, Inc. (b) | | | 19,092 | | | | 1,929,628 | | |
FleetCor Technologies,
Inc. (b) | | | 2,194 | | | | 402,994 | | |
Gartner, Inc. (b) | | | 2,411 | | | | 810,433 | | |
Global Payments, Inc. | | | 8,158 | | | | 810,253 | | |
International Business
Machines Corp. | | | 27,319 | | | | 3,848,974 | | |
Jack Henry &
Associates, Inc. | | | 2,188 | | | | 384,125 | | |
Leidos Holdings, Inc. | | | 4,049 | | | | 425,914 | | |
Mastercard, Inc. Class A | | | 25,638 | | | | 8,915,102 | | |
Paychex, Inc. | | | 9,612 | | | | 1,110,763 | | |
PayPal Holdings, Inc. (b) | | | 34,447 | | | | 2,453,315 | | |
VeriSign, Inc. (b) | | | 2,788 | | | | 572,767 | | |
Visa, Inc. Class A | | | 49,404 | | | | 10,264,175 | | |
| | | | | | 43,369,167 | | |
Office Electronics (0.0%) | |
Zebra Technologies
Corp. Class A (b) | | | 1,610 | | | | 412,820 | | |
Semiconductors & Semiconductor Equipment (5.0%) | |
Advanced Micro
Devices, Inc. (b) | | | 48,719 | | | | 3,155,530 | | |
Analog Devices, Inc. | | | 15,505 | | | | 2,543,285 | | |
Applied Materials, Inc. | | | 25,995 | | | | 2,531,393 | | |
Broadcom, Inc. | | | 12,263 | | | | 6,856,611 | | |
Enphase Energy, Inc. (b) | | | 4,122 | | | | 1,092,165 | | |
First Solar, Inc. (b) | | | 2,996 | | | | 448,771 | | |
Intel Corp. | | | 124,702 | | | | 3,295,874 | | |
KLA Corp. | | | 4,255 | | | | 1,604,263 | | |
Lam Research Corp. | | | 4,144 | | | | 1,741,723 | | |
Microchip Technology, Inc. | | | 16,563 | | | | 1,163,551 | | |
Micron Technology, Inc. | | | 32,850 | | | | 1,641,843 | | |
Monolithic Power
Systems, Inc. | | | 1,410 | | | | 498,590 | | |
NVIDIA Corp. | | | 75,239 | | | | 10,995,428 | | |
NXP Semiconductors NV (c) | | | 7,780 | | | | 1,229,473 | | |
ON Semiconductor Corp. (b) | | | 13,066 | | | | 814,926 | | |
Qorvo, Inc. (b) | | | 3,059 | | | | 277,268 | | |
See accompanying notes to financial statements.
91
SFT Index 500 Fund
Investments in Securities – continued
| | | Shares | | Value(a) | |
QUALCOMM, Inc. | | | 33,872 | | | $ | 3,723,888 | | |
Skyworks Solutions, Inc. | | | 4,848 | | | | 441,798 | | |
SolarEdge Technologies,
Inc. (b) (c) | | | 1,664 | | | | 471,361 | | |
Teradyne, Inc. | | | 4,664 | | | | 407,400 | | |
Texas Instruments, Inc. | | | 27,421 | | | | 4,530,498 | | |
| | | | | | 49,465,639 | | |
Software (8.4%) | |
Activision Blizzard, Inc. | | | 21,519 | | | | 1,647,279 | | |
Adobe, Inc. (b) | | | 14,113 | | | | 4,749,448 | | |
ANSYS, Inc. (b) | | | 2,627 | | | | 634,657 | | |
Autodesk, Inc. (b) | | | 6,504 | | | | 1,215,402 | | |
Cadence Design
Systems, Inc. (b) | | | 8,306 | | | | 1,334,276 | | |
Ceridian HCM
Holding, Inc. (b) | | | 4,592 | | | | 294,577 | | |
Contra Abiomed, Inc.,
Contingent Value
Rights (b) (e) | | | 1,425 | | | | 1,453 | | |
Electronic Arts, Inc. | | | 7,926 | | | | 968,399 | | |
Fortinet, Inc. (b) | | | 19,539 | | | | 955,262 | | |
Gen Digital, Inc. | | | 17,516 | | | | 375,368 | | |
Intuit, Inc. | | | 8,502 | | | | 3,309,148 | | |
Microsoft Corp. | | | 225,246 | | | | 54,018,496 | | |
Oracle Corp. | | | 46,436 | | | | 3,795,679 | | |
Paycom Software, Inc. (b) | | | 1,440 | | | | 446,846 | | |
PTC, Inc. (b) | | | 3,200 | | | | 384,128 | | |
Salesforce, Inc. (b) | | | 30,216 | | | | 4,006,339 | | |
ServiceNow, Inc. (b) | | | 6,080 | | | | 2,360,682 | | |
Synopsys, Inc. (b) | | | 4,646 | | | | 1,483,421 | | |
Take-Two Interactive
Software, Inc. (b) | | | 4,704 | | | | 489,828 | | |
Tyler Technologies, Inc. (b) | | | 1,286 | | | | 414,619 | | |
| | | | | | 82,885,307 | | |
Technology Hardware Storage & Peripherals (0.1%) | |
Hewlett Packard
Enterprise Co. | | | 38,879 | | | | 620,509 | | |
HP, Inc. | | | 26,748 | | | | 718,719 | | |
| | | | | | 1,339,228 | | |
Materials (2.7%) | |
Chemicals (1.9%) | |
Air Products &
Chemicals, Inc. | | | 6,744 | | | | 2,078,905 | | |
Albemarle Corp. | | | 3,592 | | | | 778,961 | | |
Celanese Corp. | | | 2,991 | | | | 305,800 | | |
CF Industries Holdings, Inc. | | | 5,879 | | | | 500,891 | | |
Corteva, Inc. | | | 21,497 | | | | 1,263,594 | | |
Dow, Inc. | | | 21,264 | | | | 1,071,493 | | |
DuPont de Nemours, Inc. | | | 14,930 | | | | 1,024,646 | | |
Eastman Chemical Co. | | | 3,585 | | | | 291,962 | | |
Ecolab, Inc. | | | 7,470 | | | | 1,087,333 | | |
FMC Corp. | | | 3,806 | | | | 474,989 | | |
International Flavors &
Fragrances, Inc. | | | 7,703 | | | | 807,583 | | |
Linde PLC (c) | | | 14,993 | | | | 4,890,417 | | |
LyondellBasell Industries
NV Class A (c) | | | 7,632 | | | | 633,685 | | |
Mosaic Co. | | | 10,260 | | | | 450,106 | | |
| | | Shares | | Value(a) | |
PPG Industries, Inc. | | | 7,025 | | | $ | 883,323 | | |
Sherwin-Williams Co. | | | 7,126 | | | | 1,691,214 | | |
| | | | | | 18,234,902 | | |
Commercial Services & Supplies (0.1%) | |
Avery Dennison Corp. | | | 2,430 | | | | 439,830 | | |
Construction Materials (0.1%) | |
Martin Marietta
Materials, Inc. | | | 1,899 | | | | 641,805 | | |
Vulcan Materials Co. | | | 4,047 | | | | 708,670 | | |
| | | | | | 1,350,475 | | |
Containers & Packaging (0.2%) | |
Amcor PLC (c) | | | 44,992 | | | | 535,855 | | |
Ball Corp. | | | 9,399 | | | | 480,665 | | |
International Paper Co. | | | 10,747 | | | | 372,168 | | |
Packaging Corp. of America | | | 2,782 | | | | 355,845 | | |
Sealed Air Corp. | | | 4,294 | | | | 214,185 | | |
WestRock Co. | | | 7,592 | | | | 266,935 | | |
| | | | | | 2,225,653 | | |
Metals & Mining (0.4%) | |
Freeport-McMoRan, Inc. | | | 43,188 | | | | 1,641,144 | | |
Newmont Corp. | | | 23,983 | | | | 1,131,998 | | |
Nucor Corp. | | | 7,726 | | | | 1,018,364 | | |
Steel Dynamics, Inc. | | | 5,049 | | | | 493,287 | | |
| | | | | | 4,284,793 | | |
Real Estate (2.8%) | |
Health Care REITs (0.2%) | |
Healthpeak Properties, Inc. | | | 16,191 | | | | 405,909 | | |
Ventas, Inc. | | | 12,077 | | | | 544,069 | | |
Welltower, Inc. | | | 14,277 | | | | 935,857 | | |
| | | | | | 1,885,835 | | |
Hotels & Resort REITs (0.1%) | |
Hilton Worldwide
Holdings, Inc. | | | 8,165 | | | | 1,031,730 | | |
Host Hotels & Resorts, Inc. | | | 21,605 | | | | 346,760 | | |
| | | | | | 1,378,490 | | |
Industrial REITs (0.3%) | |
Prologis, Inc. | | | 27,891 | | | | 3,144,152 | | |
Office REITs (0.1%) | |
Alexandria Real Estate
Equities, Inc. | | | 4,524 | | | | 659,011 | | |
Boston Properties, Inc. | | | 4,310 | | | | 291,270 | | |
Vornado Realty Trust | | | 4,833 | | | | 100,575 | | |
| | | | | | 1,050,856 | | |
Real Estate Investment Trust (0.0%) | |
Federal Realty
Investment Trust | | | 2,185 | | | | 220,772 | | |
Real Estate Services (0.1%) | |
CBRE Group, Inc.
Class A (b) | | | 9,537 | | | | 733,967 | | |
See accompanying notes to financial statements.
92
SFT Index 500 Fund
Investments in Securities – continued
| | | Shares | | Value(a) | |
Residential REITs (0.4%) | |
AvalonBay
Communities, Inc. | | | 4,241 | | | $ | 685,006 | | |
Camden Property Trust | | | 3,180 | | | | 355,778 | | |
Equity Residential | | | 10,277 | | | | 606,343 | | |
Essex Property Trust, Inc. | | | 1,910 | | | | 404,767 | | |
Invitation Homes, Inc. | | | 17,550 | | | | 520,182 | | |
Mid-America Apartment
Communities, Inc. | | | 3,433 | | | | 538,947 | | |
UDR, Inc. | | | 9,165 | | | | 354,961 | | |
| | | | | | 3,465,984 | | |
Retail REITs (0.3%) | |
Kimco Realty Corp. | | | 18,687 | | | | 395,791 | | |
Realty Income Corp. | | | 18,950 | | | | 1,201,998 | | |
Regency Centers Corp. | | | 4,621 | | | | 288,813 | | |
Simon Property Group, Inc. | | | 9,823 | | | | 1,154,006 | | |
| | | | | | 3,040,608 | | |
Specialized REITs (1.3%) | |
American Tower Corp. | | | 14,071 | | | | 2,981,082 | | |
Crown Castle, Inc. | | | 13,094 | | | | 1,776,070 | | |
Digital Realty Trust, Inc. | | | 8,624 | | | | 864,728 | | |
Equinix, Inc. | | | 2,852 | | | | 1,868,146 | | |
Extra Space Storage, Inc. | | | 4,026 | | | | 592,547 | | |
Iron Mountain, Inc. | | | 8,722 | | | | 434,792 | | |
Public Storage | | | 4,741 | | | | 1,328,381 | | |
SBA Communications Corp. | | | 3,234 | | | | 906,522 | | |
VICI Properties, Inc. | | | 29,101 | | | | 942,872 | | |
Weyerhaeuser Co. | | | 22,170 | | | | 687,270 | | |
| | | | | | 12,382,410 | | |
Utilities (3.2%) | |
Electric Utilities (2.0%) | |
Alliant Energy Corp. | | | 7,529 | | | | 415,676 | | |
American Electric
Power Co., Inc. | | | 15,527 | | | | 1,474,289 | | |
Constellation Energy Corp. | | | 9,807 | | | | 845,461 | | |
Duke Energy Corp. | | | 23,268 | | | | 2,396,371 | | |
Edison International | | | 11,445 | | | | 728,131 | | |
Entergy Corp. | | | 6,058 | | | | 681,525 | | |
Evergy, Inc. | | | 6,836 | | | | 430,190 | | |
Eversource Energy | | | 10,524 | | | | 882,332 | | |
Exelon Corp. | | | 30,027 | | | | 1,298,067 | | |
FirstEnergy Corp. | | | 16,412 | | | | 688,319 | | |
NextEra Energy, Inc. | | | 60,044 | | | | 5,019,678 | | |
PG&E Corp. (b) | | | 48,649 | | | | 791,033 | | |
Pinnacle West Capital Corp. | | | 3,392 | | | | 257,928 | | |
PPL Corp. | | | 22,248 | | | | 650,087 | | |
Southern Co. | | | 32,895 | | | | 2,349,032 | | |
Xcel Energy, Inc. | | | 16,535 | | | | 1,159,269 | | |
| | | | | | 20,067,388 | | |
Gas Utilities (0.1%) | |
Atmos Energy Corp. | | | 4,141 | | | | 464,082 | | |
ONEOK, Inc. | | | 13,409 | | | | 880,971 | | |
| | | | | | 1,345,053 | | |
Independent Power Producers & Energy Traders (0.1%) | |
AES Corp. | | | 20,182 | | | | 580,434 | | |
NRG Energy, Inc. | | | 6,868 | | | | 218,540 | | |
| | | | | | 798,974 | | |
| | | Shares | | Value(a) | |
Multi-Utilities (0.9%) | |
Ameren Corp. | | | 7,811 | | | $ | 694,554 | | |
CenterPoint Energy, Inc. | | | 19,022 | | | | 570,470 | | |
CMS Energy Corp. | | | 8,770 | | | | 555,404 | | |
Consolidated Edison, Inc. | | | 10,640 | | | | 1,014,098 | | |
Dominion Energy, Inc. | | | 25,178 | | | | 1,543,915 | | |
DTE Energy Co. | | | 5,854 | | | | 688,021 | | |
NiSource, Inc. | | | 12,271 | | | | 336,471 | | |
Public Service Enterprise
Group, Inc. | | | 15,076 | | | | 923,707 | | |
Sempra Energy | | | 9,432 | | | | 1,457,621 | | |
WEC Energy Group, Inc. | | | 9,465 | | | | 887,438 | | |
| | | | | | 8,671,699 | | |
Water Utilities (0.1%) | |
American Water Works
Co., Inc. | | | 5,432 | | | | 827,945 | | |
Total common stocks
(cost: $355,130,532) | | | | | 970,864,008 | | |
Short-Term Securities (2.1%) | |
Investment Companies (2.1%) | |
State Street Institutional
U.S. Government Money
Market Fund, current
rate 4.120% | | | 20,839,604 | | | | 20,839,604 | | |
Total short-term securities
(cost: $20,839,604) | | | | | 20,839,604 | | |
Total investments in securities
(cost: $375,970,136) (f) | | | | | 991,703,612 | | |
Liabilities in excess of cash
and other assets (-0.4%) | | | | | (4,119,813 | ) | |
Total net assets (100.0%) | | | | $ | 987,583,799 | | |
See accompanying notes to financial statements.
93
SFT Index 500 Fund
Investments in Securities – continued
Investments in Securities Legend
(a) Securities are valued by procedures described in Note 2 of the notes to financial statements.
(b) Non-income producing security.
(c) Foreign security: The Fund held 3.4% of net assets in foreign securities at December 31, 2022.
(d) Fully or partially pledged as initial margin deposits on open futures contracts.
(e) This security is fair valued by Securian AM, as the Valuation Designee, in accordance with procedures approved by the Board of Trustees of Securian Funds Trust and in accordance with provisions of the Investment Company Act of 1940, as amended.
(f) At December 31, 2022, the cost of investments for federal income tax purposes was $377,771,146. The aggregate unrealized appreciation and depreciation of investments based on this cost were:
Gross unrealized appreciation | | $ | 638,954,919 | | |
Gross unrealized depreciation | | | (25,563,235 | ) | |
Net unrealized appreciation | | $ | 613,391,684 | | |
Holdings of Open Futures Contracts
On December 31, 2022, securities with an aggregate market value of $18,190,200 have been pledged to cover margin requirements for the following open futures contracts:
Description | | Expiration
Date | | Number of
Contracts | | Position
Type | | Notional
Amount | | Market
Value | | Unrealized
Appreciation/
(Depreciation)(a) | |
S&P 500 E-Mini Index Future | | March 2023 | | | 80 | | | Long | | $ | 15,984,782 | | | $ | 15,444,000 | | | $ | (540,782 | ) | |
See accompanying notes to financial statements.
94
SFT International Bond Fund
Investments in Securities
(Percentages of each investment category relate to total net assets)
| | | Principal(b) | | Value(a) | |
Long-Term Debt Securities (99.2%) | |
Australia (7.0%) | |
Financial (4.4%) | |
Commonwealth Bank of
Australia (USD)
5.046%, 03/14/25
(SOFRRATE +
0.740%) (c) (d) | | | 1,770,000 | | | $ | 1,759,966 | | |
Macquarie
Group Ltd. (USD)
6.207%, 11/22/24 (c) | | | 1,660,000 | | | | 1,670,674 | | |
| | | | | | 3,430,640 | | |
Government (2.6%) | |
New South Wales
Treasury Corp. (AUD)
4.000%, 04/20/23 | | | 530,000 | | | | 360,200 | | |
Queensland Treasury
Corp. (AUD)
4.250%, 07/21/23 (c) | | | 1,210,000 | | | | 824,155 | | |
Western Australian
Treasury Corp. (AUD)
6.000%, 10/16/23 | | | 1,280,000 | | | | 883,995 | | |
| | | | | | 2,068,350 | | |
Brazil (5.6%) | |
Government (5.6%) | |
Brazil Notas do Tesouro
Nacional Serie F (BRL)
10.000%, 01/01/27 | | | 11,950,000 | | | | 2,085,058 | | |
10.000%, 01/01/29 | | | 3,440,000 | | | | 583,059 | | |
10.000%, 01/01/31 | | | 3,320,000 | | | | 548,923 | | |
10.000%, 01/01/33 | | | 7,260,000 | | | | 1,179,911 | | |
| | | | | | 4,396,951 | | |
Canada (4.1%) | |
Government (4.1%) | |
Province of Ontario
Canada (CAD)
2.600%, 06/02/25 | | | 4,500,000 | | | | 3,208,834 | | |
Colombia (4.4%) | |
Government (4.4%) | |
Colombian TES (COP)
6.000%, 04/28/28 | | | 8,700,000,000 | | | | 1,339,265 | | |
6.250%, 11/26/25 | | | 5,300,000,000 | | | | 936,982 | | |
7.000%, 03/26/31 | | | 6,010,000,000 | | | | 877,426 | | |
7.250%, 10/26/50 | | | 2,720,000,000 | | | | 320,254 | | |
| | | | | | 3,473,927 | | |
France (6.5%) | |
Government (6.5%) | |
French Republic
Government Bond
OAT (EUR)
0.010%, 05/25/32 | | | 4,830,000 | | | | 3,876,936 | | |
0.750%, 05/25/52 | | | 2,110,000 | | | | 1,186,975 | | |
| | | | | | 5,063,911 | | |
| | | Principal(b) | | Value(a) | |
Germany (5.6%) | |
Government (5.6%) | |
Bundesrepublik
Deutschland
Bundesanleihe (EUR)
1.700%, 08/15/32 | | | 4,430,000 | | | $ | 4,381,879 | | |
Malaysia (2.9%) | |
Government (2.9%) | |
Malaysia Government
Bond (MYR)
3.480%, 03/15/23 | | | 4,950,000 | | | | 1,124,701 | | |
3.899%, 11/16/27 | | | 3,350,000 | | | | 761,549 | | |
3.955%, 09/15/25 | | | 1,700,000 | | | | 387,951 | | |
| | | | | | 2,274,201 | | |
Mexico (12.7%) | |
Government (12.7%) | |
Mexican Bonos (MXN)
7.750%, 11/13/42 | | | 47,700,000 | | | | 2,164,619 | | |
8.000%, 11/07/47 | | | 32,700,000 | | | | 1,498,784 | | |
8.000%, 07/31/53 | | | 36,100,000 | | | | 1,692,239 | | |
8.500%, 05/31/29 | | | 45,500,000 | | | | 2,286,854 | | |
8.500%, 11/18/38 | | | 49,300,000 | | | | 2,414,018 | | |
| | | | | | 10,056,514 | | |
Poland (4.3%) | |
Government (4.3%) | |
Republic of Poland
Government Bond (PLN)
1.750%, 04/25/32 | | | 22,790,000 | | | | 3,410,512 | | |
Russia (0.2%) | |
Government (0.2%) | |
Russian Federal
Bond—OFZ (RUB)
7.650%, 04/10/30 (e) | | | 29,000,000 | | | | 119,178 | | |
South Africa (4.3%) | |
Government (4.3%) | |
Republic of South Africa
Government
Bond (ZAR)
6.500%, 02/28/41 | | | 44,700,000 | | | | 1,644,682 | | |
8.750%, 02/28/48 | | | 37,000,000 | | | | 1,701,610 | | |
| | | | | | 3,346,292 | | |
South Korea (7.4%) | |
Government (7.4%) | |
Korea Treasury
Bond (KRW)
1.875%, 03/10/51 | | | 2,600,000,000 | | | | 1,417,005 | | |
2.000%, 06/10/31 | | | 6,430,000,000 | | | | 4,427,064 | | |
| | | | | | 5,844,069 | | |
United States (34.2%) | |
Financial (4.1%) | |
Goldman Sachs Group,
Inc. (USD)
5.700%, 11/01/24 | | | 1,660,000 | | | | 1,679,869 | | |
See accompanying notes to financial statements.
95
SFT International Bond Fund
Investments in Securities – continued
| | | Principal(b) | | Value(a) | |
Jackson National Life
Global Funding (USD)
5.473%, 06/28/24 (c) (d) | | | 1,530,000 | | | $ | 1,530,304 | | |
| | | | | | 3,210,173 | | |
Government (15.6%) | |
U.S. Treasury Bond (USD)
1.875%, 11/15/51 | | | 2,020,000 | | | | 1,291,537 | | |
U.S. Treasury Bond (USD)
2.250%, 02/15/52 | | | 6,530,000 | | | | 4,586,305 | | |
U.S. Treasury Bond (USD)
3.000%, 08/15/52 | | | 4,700,000 | | | | 3,914,219 | | |
U.S. Treasury Note (USD)
1.875%, 02/15/32 | | | 2,260,000 | | | | 1,922,765 | | |
U.S. Treasury Note (USD)
4.435%, 07/31/24
(3-Month U.S. Treasury
Money Market Yield +
0.037%) (d) | | | 540,000 | | | | 539,593 | | |
| | | | | | 12,254,419 | | |
Mortgage Securities (14.5%) | |
Federal Home Loan
Mortgage Corp. (USD)
4.500%, 09/01/52 | | | 1,289,270 | | | | 1,244,285 | | |
4.500%, 10/01/52 | | | 912,734 | | | | 881,212 | | |
5.000%, 08/01/52 | | | 648,802 | | | | 639,882 | | |
5.000%, 11/01/52 | | | 801,710 | | | | 790,842 | | |
5.500%, 12/01/52 | | | 2,247,173 | | | | 2,255,095 | | |
| | | Principal(b)/
Shares | | Value(a) | |
Federal National
Mortgage
Association (USD)
4.500%, 09/01/52 | | | 1,864,479 | | | $ | 1,800,084 | | |
5.000%, 12/01/52 | | | 1,443,373 | | | | 1,423,807 | | |
5.000%, 10/01/52 | | | 667,894 | | | | 658,713 | | |
5.500%, 12/01/52 | | | 1,641,879 | | | | 1,648,094 | | |
| | | | | | 11,342,014 | | |
Total long-term debt securities
(cost: $87,035,003) | | | | | 77,881,864 | | |
Short-Term Securities (1.2%) | |
Investment Companies (1.2%) | |
United States (1.2%) | |
State Street Institutional
U.S. Government
Money Market Fund,
current rate 4.120% | | | 944,622 | | | | 944,622 | | |
Total short-term securities
(cost: $944,622) | | | | | 944,622 | | |
Total investments in securities
(cost: $87,979,625) (f) | | | | | 78,826,486 | | |
Liabilities in excess of cash
and other assets (-0.4%) | | | | | (344,243 | ) | |
Total net assets (100.0%) | | | | $ | 78,482,243 | | |
Investments in Securities Legend
(a) Securities are valued by procedures described in Note 2 of the notes to financial statements.
(b) Principal amounts for foreign debt securities are denominated in the currencies indicated. United States debt securities are denominated in U.S. Dollars.
(c) Security sold within terms of a private placement memorandum exempt from registration pursuant to Rule 144A under the Securities Act of 1933, as amended, and may be sold only to dealers in that program.
(d) Variable rate security.
(e) Pursuant to the Fund's Liquidity Risk Management Program, this security has been determined to be illiquid by the Fund's Liquidity Risk Management Program Administrator.
(f) At December 31, 2022, the cost of investments for federal income tax purposes was $86,153,565 . The aggregate unrealized appreciation and depreciation of investments based on this cost were:
Gross unrealized appreciation | | $ | 625,214 | | |
Gross unrealized depreciation | | | (9,852,650 | ) | |
Net unrealized depreciation | | $ | (9,227,436 | ) | |
See accompanying notes to financial statements.
96
SFT International Bond Fund
Investments in Securities – continued
Foreign Forward Currency Contracts
On December 31, 2022, SFT International Bond Fund had entered into forward foreign currency contracts that obligate the Fund to deliver currencies at specified future dates. Unrealized appreciation and depreciation on these contracts is included in the accompanying financial statements. The terms of the open contracts were as follows:
Settlement
Date | | Currency to be
delivered – SELL | | Currency to be
received – BUY | | Unrealized
Appreciation(a) | | Unrealized
Depreciation(a) | | Counterparty | |
01/13/23 | | | 516,225 | | | USD | | | | | 5,700,000 | | | SEK | | | | $ | 31,151 | | | $ | – | | | HSB | |
01/19/23 | | | 19,099 | | | USD | | | | | 100,000 | | | BRL | | | | | – | | | | (212 | ) | | JPM | |
01/19/23 | | | 127,937 | | | USD | | | | | 680,000 | | | BRL | | | | | 493 | | | | – | | | JPM | |
01/19/23 | | | 22,980,000 | | | BRL | | | | | 4,295,327 | | | USD | | | | | – | | | | (44,865 | ) | | JPM | |
01/20/23 | | | 13,670,000 | | | PLN | | | | | 2,717,054 | | | USD | | | | | – | | | | (396,885 | ) | | GSC | |
01/20/23 | | | 395,889 | | | USD | | | | | 1,810,000 | | | PLN | | | | | 16,417 | | | | – | | | MSC | |
01/20/23 | | | 1,430,000 | | | PLN | | | | | 315,788 | | | USD | | | | | – | | | | (9,957 | ) | | UBS | |
01/25/23 | | | 4,680,000 | | | CAD | | | | | 3,399,433 | | | USD | | | | | – | | | | (55,037 | ) | | GSC | |
01/27/23 | | | 15,890,000,000 | | | COP | | | | | 3,176,031 | | | USD | | | | | – | | | | (87,768 | ) | | JPM | |
01/27/23 | | | 1,100,000,000 | | | COP | | | | | 225,549 | | | USD | | | | | – | | | | (390 | ) | | JPM | |
01/31/23 | | | 104,763 | | | USD | | | | | 2,100,000 | | | MXN | | | | | 2,488 | | | | – | | | GSC | |
01/31/23 | | | 364,429 | | | USD | | | | | 7,100,000 | | | MXN | | | | | – | | | | (1,817 | ) | | JPM | |
01/31/23 | | | 187,600,000 | | | MXN | | | | | 9,240,108 | | | USD | | | | | – | | | | (341,011 | ) | | MSC | |
01/31/23 | | | 13,300,000 | | | MXN | | | | | 665,957 | | | USD | | | | | – | | | | (13,301 | ) | | MSC | |
02/03/23 | | | 9,680,000 | | | EUR | | | | | 9,719,253 | | | USD | | | | | – | | | | (631,865 | ) | | BLC | |
02/03/23 | | | 653,470 | | | USD | | | | | 610,000 | | | EUR | | | | | – | | | | (1,179 | ) | | HSB | |
02/03/23 | | | 480,000 | | | EUR | | | | | 504,735 | | | USD | | | | | – | | | | (8,543 | ) | | MSC | |
02/03/23 | | | 490,000 | | | EUR | | | | | 525,216 | | | USD | | | | | 1,244 | | | | – | | | MSC | |
02/15/23 | | | 56,500,000 | | | ZAR | | | | | 3,243,938 | | | USD | | | | | – | | | | (64,960 | ) | | HSB | |
02/16/23 | | | 2,500,000 | | | CNH | | | | | 359,619 | | | USD | | | | | – | | | | (2,936 | ) | | MSC | |
03/03/23 | | | 410,000 | | | GBP | | | | | 498,871 | | | USD | | | | | 4,970 | | | | – | | | JPM | |
03/07/23 | | | 3,330,000 | | | AUD | | | | | 2,265,442 | | | USD | | | | | 1,506 | | | | – | | | JPM | |
03/08/23 | | | 103,076 | | | USD | | | | | 130,000,000 | | | KRW | | | | | 23 | | | | – | | | HSB | |
03/08/23 | | | 7,050,000,000 | | | KRW | | | | | 5,419,950 | | | USD | | | | | – | | | | (171,233 | ) | | HSB | |
03/10/23 | | | 121,739 | | | USD | | | | | 4,200,000 | | | THB | | | | | 319 | | | | – | | | HSB | |
03/14/23 | | | 881,887 | | | USD | | | | | 119,000,000 | | | JPY | | | | | 28,372 | | | | – | | | JPM | |
03/20/23 | | | 721,608 | | | USD | | | | | 630,000,000 | | | CLP | | | | | 10,439 | | | | – | | | JPM | |
03/20/23 | | | 587,487 | | | USD | | | | | 5,700,000 | | | NOK | | | | | – | | | | (6,841 | ) | | MSC | |
03/21/23 | | | 10,300,000 | | | MYR | | | | | 2,347,846 | | | USD | | | | | 1,765 | | | | – | | | BLC | |
| | | | | | | | | | | | | | | | | | | $ | 99,187 | | | $ | (1,838,800 | ) | | | | | |
Currency Legend
AUD Australian Dollar
BRL Brazilian Real
CAD Canadian Dollar
CLP Chilean Peso
CNH Chinese Yuan Renminbi Offshore
COP Colombian Peso
EUR Euro
GBP British Pound
JPY Japanese Yen
KRW South Korean Won
MXN Mexican Peso
MYR Malaysian Ringgit
NOK Norwegian Krone
PLN Polish Zloty
Currency Legend
RUB Russian Ruble
SEK Swedish Krona
THB Thai Baht
USD United States Dollar
ZAR South African Rand
Counterparty Legend
BLC Barclays Bank PLC
GSC Goldman Sachs
HSB HSBC Bank PLC
JPM JPMorgan Chase Bank NA
MSC Morgan Stanley and Co., Inc.
UBS UBS AG
Holdings of Open Futures Contracts
On December 31, 2022, $307,450 in cash has been pledged to cover margin requirements for the following open futures contracts:
Description | | Expiration
Date | | Number of
Contracts | | Position
Type | | Notional
Amount | | Market
Value | | Unrealized
Appreciation/
(Depreciation)(a) | |
U.S. Ultra Bond | | March 2023 | | | 43 | | | Long | | $ | 5,936,182 | | | $ | 5,775,438 | | | $ | (160,744 | ) | |
See accompanying notes to financial statements.
97
SFT Real Estate Securities Fund
Investments in Securities
(Percentages of each investment category relate to total net assets)
| | | Shares | | Value(a) | |
Common Stocks (97.9%) | |
Consumer Discretionary (0.9%) | |
Boyd Gaming Corp. | | | 19,383 | | | $ | 1,056,955 | | |
Real Estate (97.0%) | |
Health Care REITs (9.3%) | |
Healthcare Realty Trust, Inc.
Class A | | | 144,644 | | | | 2,787,290 | | |
Healthpeak Properties, Inc. | | | 60,617 | | | | 1,519,668 | | |
Welltower, Inc. | | | 98,191 | | | | 6,436,420 | | |
| | | | | | 10,743,378 | | |
Hotels & Resort REITs (2.2%) | |
Host Hotels & Resorts, Inc. | | | 156,046 | | | | 2,504,538 | | |
Industrial REITs (12.0%) | |
Americold Realty Trust, Inc. | | | 122,040 | | | | 3,454,953 | | |
Prologis, Inc. | | | 92,600 | | | | 10,438,798 | | |
| | | | | | 13,893,751 | | |
Office REITs (1.8%) | |
Highwoods Properties, Inc. | | | 76,500 | | | | 2,140,470 | | |
Residential REITs (22.6%) | |
American Homes 4 Rent
Class A | | | 76,800 | | | | 2,314,752 | | |
Apartment Income
REIT Corp. (a) | | | 51,977 | | | | 1,783,331 | | |
Camden Property Trust | | | 39,597 | | | | 4,430,112 | | |
Essex Property Trust, Inc. | | | 2,698 | | | | 571,760 | | |
Invitation Homes, Inc. | | | 187,262 | | | | 5,550,446 | | |
Mid-America Apartment
Communities, Inc. | | | 23,711 | | | | 3,722,390 | | |
Sun Communities, Inc. | | | 30,422 | | | | 4,350,346 | | |
UDR, Inc. | | | 88,088 | | | | 3,411,648 | | |
| | | | | | 26,134,785 | | |
| | | Shares | | Value(a) | |
Retail REITs (17.3%) | |
Kimco Realty Corp. | | | 107,600 | | | $ | 2,278,968 | | |
Realty Income Corp. | | | 95,215 | | | | 6,039,487 | | |
Simon Property Group, Inc. | | | 61,719 | | | | 7,250,748 | | |
SITE Centers Corp. | | | 80,257 | | | | 1,096,311 | | |
Spirit Realty Capital, Inc. | | | 82,856 | | | | 3,308,440 | | |
| | | | | | 19,973,954 | | |
Specialized REITs (31.8%) | |
American Tower Corp. | | | 37,528 | | | | 7,950,682 | | |
Crown Castle, Inc. | | | 35,425 | | | | 4,805,047 | | |
Digital Realty Trust, Inc. | | | 56,421 | | | | 5,657,334 | | |
Equinix, Inc. | | | 8,817 | | | | 5,775,400 | | |
Extra Space Storage, Inc. | | | 9,962 | | | | 1,466,207 | | |
Life Storage, Inc. | | | 31,907 | | | | 3,142,839 | | |
Public Storage | | | 19,407 | | | | 5,437,647 | | |
SBA Communications Corp. | | | 6,903 | | | | 1,934,980 | | |
Weyerhaeuser Co. | | | 21,600 | | | | 669,600 | | |
| | | | | | 36,839,736 | | |
Total common stocks
(cost: $123,155,583) | | | | | 113,287,567 | | |
Short-Term Securities (1.9%) | |
Investment Companies (1.9%) | |
State Street Institutional
U.S. Government Money
Market Fund, current
rate 4.120% | | | 2,207,429 | | | | 2,207,429 | | |
Total short-term securities
(cost: $2,207,429) | | | | | 2,207,429 | | |
Total investments in securities
(cost: $125,363,012) (b) | | | | | 115,494,996 | | |
Cash and other assets in excess
of liabilities (0.2%) | | | | | 263,323 | | |
Total net assets (100.0%) | | | | $ | 115,758,319 | | |
Investments in Securities Legend
(a) Securities are valued by procedures described in Note 2 of the notes to financial statements.
(b) At December 31, 2022, the cost of investments for federal income tax purposes was $126,556,516. The aggregate unrealized appreciation and depreciation of investments based on this cost were:
Gross unrealized appreciation | | $ | 1,627,027 | | |
Gross unrealized depreciation | | | (12,688,547 | ) | |
Net unrealized depreciation | | $ | (11,061,520 | ) | |
See accompanying notes to financial statements.
98
SFT T. Rowe Price Value Fund
Investments in Securities
(Percentages of each investment category relate to total net assets)
| | | Shares | | Value(a) | |
Common Stocks (98.9%) | |
Communication Services (1.1%) | |
Diversified Telecommunication Services (1.1%) | |
Verizon Communications, Inc. | | | 48,700 | | | $ | 1,918,780 | | |
Consumer Discretionary (6.2%) | |
Entertainment (0.7%) | |
Walt Disney Co. (b) | | | 14,281 | | | | 1,240,733 | | |
Hotels, Restaurants & Leisure (2.3%) | |
Booking Holdings, Inc. (b) | | | 10 | | | | 20,153 | | |
McDonald's Corp. | | | 12,364 | | | | 3,258,285 | | |
Yum! Brands, Inc. | | | 7,072 | | | | 905,782 | | |
| | | | | | 4,184,220 | | |
Multiline Retail (0.8%) | |
Dollar General Corp. | | | 6,096 | | | | 1,501,140 | | |
Specialty Retail (2.4%) | |
Home Depot, Inc. | | | 5,600 | | | | 1,768,816 | | |
Ross Stores, Inc. | | | 5,792 | | | | 672,277 | | |
TJX Cos., Inc. | | | 12,180 | | | | 969,528 | | |
Ulta Beauty, Inc. (b) | | | 2,400 | | | | 1,125,768 | | |
| | | | | | 4,536,389 | | |
Consumer Staples (10.6%) | |
Beverages (1.2%) | |
Coca-Cola Co. | | | 13,112 | | | | 834,055 | | |
Constellation Brands, Inc.
Class A | | | 1,255 | | | | 290,846 | | |
Keurig Dr Pepper, Inc. | | | 32,129 | | | | 1,145,720 | | |
| | | | | | 2,270,621 | | |
Food & Staples Retailing (1.8%) | |
Walmart, Inc. | | | 22,647 | | | | 3,211,118 | | |
Food Products (2.9%) | |
Kraft Heinz Co. | | | 51,179 | | | | 2,083,497 | | |
Mondelez International, Inc.
Class A | | | 49,895 | | | | 3,325,502 | | |
| | | | | | 5,408,999 | | |
Household Products (2.2%) | |
Kimberly-Clark Corp. | | | 5,400 | | | | 733,050 | | |
Procter & Gamble Co. | | | 22,086 | | | | 3,347,354 | | |
| | | | | | 4,080,404 | | |
Tobacco (2.5%) | |
Philip Morris
International, Inc. | | | 46,141 | | | | 4,669,931 | | |
Energy (5.9%) | |
Oil, Gas & Consumable Fuels (5.9%) | |
Chevron Corp. | | | 17,100 | | | | 3,069,279 | | |
ConocoPhillips | | | 3,300 | | | | 389,400 | | |
Exxon Mobil Corp. | | | 50,921 | | | | 5,616,586 | | |
Kinder Morgan, Inc. | | | 102,900 | | | | 1,860,432 | | |
| | | | | | 10,935,697 | | |
| | | Shares | | Value(a) | |
Financial (21.7%) | |
Capital Markets (0.7%) | |
Goldman Sachs Group, Inc. | | | 3,700 | | | $ | 1,270,506 | | |
Commercial Banks (8.9%) | |
Bank of America Corp. | | | 173,510 | | | | 5,746,651 | | |
Citigroup, Inc. | | | 18,900 | | | | 854,847 | | |
JPMorgan Chase & Co. | | | 36,126 | | | | 4,844,497 | | |
U.S. Bancorp | | | 42,200 | | | | 1,840,342 | | |
Wells Fargo & Co. | | | 76,814 | | | | 3,171,650 | | |
| | | | | | 16,457,987 | | |
Diversified Financial Services (0.3%) | |
Corebridge Financial, Inc. | | | 25,109 | | | | 503,687 | | |
Insurance (11.8%) | |
Allstate Corp. | | | 11,361 | | | | 1,540,552 | | |
American International
Group, Inc. | | | 18,951 | | | | 1,198,461 | | |
Berkshire Hathaway, Inc.
Class B (b) | | | 11,700 | | | | 3,614,130 | | |
Chubb Ltd. (c) | | | 17,006 | | | | 3,751,523 | | |
Hartford Financial Services
Group, Inc. | | | 16,455 | | | | 1,247,783 | | |
MetLife, Inc. | | | 42,233 | | | | 3,056,402 | | |
Progressive Corp. | | | 26,102 | | | | 3,385,690 | | |
Travelers Cos., Inc. | | | 22,089 | | | | 4,141,467 | | |
| | | | | | 21,936,008 | | |
Health Care (20.6%) | |
Biotechnology (1.8%) | |
AbbVie, Inc. | | | 14,357 | | | | 2,320,235 | | |
Amgen, Inc. | | | 4,000 | | | | 1,050,560 | | |
| | | | | | 3,370,795 | | |
Health Care Equipment & Supplies (3.5%) | |
Becton Dickinson & Co. | | | 20,597 | | | | 5,237,817 | | |
Danaher Corp. | | | 4,131 | | | | 1,096,450 | | |
GE HealthCare
Technologies, Inc. (b) | | | 3,530 | | | | 206,082 | | |
| | | | | | 6,540,349 | | |
Health Care Providers & Services (8.0%) | |
AmerisourceBergen Corp. | | | 6,472 | | | | 1,072,475 | | |
Centene Corp. (b) | | | 24,973 | | | | 2,048,036 | | |
Cigna Corp. | | | 2,470 | | | | 818,410 | | |
Elevance Health, Inc. | | | 13,697 | | | | 7,026,150 | | |
HCA Healthcare, Inc. | | | 9,047 | | | | 2,170,918 | | |
Humana, Inc. | | | 2,050 | | | | 1,049,989 | | |
UnitedHealth Group, Inc. | | | 1,167 | | | | 618,720 | | |
| | | | | | 14,804,698 | | |
Life Sciences Tools & Services (1.6%) | |
PerkinElmer, Inc. | | | 6,119 | | | | 858,006 | | |
Thermo Fisher
Scientific, Inc. | | | 3,694 | | | | 2,034,249 | | |
| | | | | | 2,892,255 | | |
See accompanying notes to financial statements.
99
SFT T. Rowe Price Value Fund
Investments in Securities – continued
| | | Shares | | Value(a) | |
Pharmaceuticals (5.7%) | |
AstraZeneca PLC ADR (c) | | | 38,955 | | | $ | 2,641,149 | | |
Johnson & Johnson | | | 35,677 | | | | 6,302,342 | | |
Merck & Co., Inc. | | | 13,800 | | | | 1,531,110 | | |
| | | | | | 10,474,601 | | |
Industrials (10.9%) | |
Aerospace & Defense (2.1%) | |
L3Harris Technologies, Inc. | | | 14,316 | | | | 2,980,734 | | |
Northrop Grumman Corp. | | | 1,620 | | | | 883,888 | | |
| | | | | | 3,864,622 | | |
Commercial Services & Supplies (0.4%) | |
Republic Services, Inc. | | | 5,792 | | | | 747,110 | | |
Electrical Equipment (2.4%) | |
AMETEK, Inc. | | | 3,613 | | | | 504,808 | | |
Eaton Corp. PLC (c) | | | 19,024 | | | | 2,985,817 | | |
Hubbell, Inc. | | | 3,708 | | | | 870,194 | | |
| | | | | | 4,360,819 | | |
Industrial Conglomerates (3.2%) | |
General Electric Co. | | | 37,697 | | | | 3,158,632 | | |
Honeywell International, Inc. | | | 8,737 | | | | 1,872,339 | | |
Siemens AG (c) | | | 6,880 | | | | 951,904 | | |
| | | | | | 5,982,875 | | |
Machinery (0.3%) | |
Cummins, Inc. | | | 800 | | | | 193,832 | | |
Dover Corp. | | | 2,600 | | | | 352,066 | | |
| | | | | | 545,898 | | |
Road & Rail (2.5%) | |
CSX Corp. | | | 71,291 | | | | 2,208,595 | | |
Norfolk Southern Corp. | | | 6,056 | | | | 1,492,320 | | |
Union Pacific Corp. | | | 4,900 | | | | 1,014,643 | | |
| | | | | | 4,715,558 | | |
Information Technology (11.1%) | |
Electronic Equipment, Instruments & Components (0.3%) | |
TE Connectivity Ltd. (c) | | | 4,600 | | | | 528,080 | | |
Interactive Media & Services (2.2%) | |
Alphabet, Inc. Class C (b) | | | 46,350 | | | | 4,112,636 | | |
IT Services (2.2%) | |
Accenture PLC Class A (c) | | | 2,400 | | | | 640,416 | | |
Booz Allen Hamilton
Holding Corp. | | | 900 | | | | 94,068 | | |
Fidelity National
Information Services, Inc. | | | 8,600 | | | | 583,510 | | |
Fiserv, Inc. (b) | | | 27,563 | | | | 2,785,792 | | |
| | | | | | 4,103,786 | | |
Semiconductors & Semiconductor Equipment (5.5%) | |
Applied Materials, Inc. | | | 10,200 | | | | 993,276 | | |
Broadcom, Inc. | | | 4,761 | | | | 2,662,018 | | |
KLA Corp. | | | 7,731 | | | | 2,914,819 | | |
Lam Research Corp. | | | 2,600 | | | | 1,092,780 | | |
Micron Technology, Inc. | | | 21,000 | | | | 1,049,580 | | |
Texas Instruments, Inc. | | | 9,400 | | | | 1,553,068 | | |
| | | | | | 10,265,541 | | |
| | | Shares | | Value(a) | |
Software (0.9%) | |
Activision Blizzard, Inc. | | | 10,400 | | | $ | 796,120 | | |
Microsoft Corp. | | | 3,365 | | | | 806,994 | | |
| | | | | | 1,603,114 | | |
Materials (2.0%) | |
Chemicals (2.0%) | |
International Flavors &
Fragrances, Inc. | | | 8,700 | | | | 912,108 | | |
Nutrien Ltd. (c) | | | 25,957 | | | | 1,895,640 | | |
Sherwin-Williams Co. | | | 3,600 | | | | 854,388 | | |
| | | | | | 3,662,136 | | |
Real Estate (1.9%) | |
Industrial REITs (1.1%) | |
Prologis, Inc. | | | 17,131 | | | | 1,931,177 | | |
Office REITs (0.1%) | |
Boston Properties, Inc. | | | 2,900 | | | | 195,982 | | |
Residential REITs (0.2%) | |
Equity LifeStyle
Properties, Inc. | | | 6,263 | | | | 404,590 | | |
Specialized REITs (0.5%) | |
Weyerhaeuser Co. | | | 29,797 | | | | 923,707 | | |
Utilities (6.9%) | |
Electric Utilities (4.7%) | |
American Electric
Power Co., Inc. | | | 12,813 | | | | 1,216,594 | | |
FirstEnergy Corp. | | | 25,200 | | | | 1,056,888 | | |
Southern Co. | | | 82,244 | | | | 5,873,044 | | |
Xcel Energy, Inc. | | | 7,399 | | | | 518,744 | | |
| | | | | | 8,665,270 | | |
Multi-Utilities (2.2%) | |
Ameren Corp. | | | 8,160 | | | | 725,587 | | |
Dominion Energy, Inc. | | | 10,011 | | | | 613,875 | | |
DTE Energy Co. | | | 6,178 | | | | 726,100 | | |
Sempra Energy | | | 11,944 | | | | 1,845,826 | | |
WEC Energy Group, Inc. | | | 2,800 | | | | 262,528 | | |
| | | | | | 4,173,916 | | |
Total common stocks
(cost: $177,181,026) | | | | | 182,995,735 | | |
Short-Term Securities (1.6%) | |
Investment Companies (1.6%) | |
State Street Institutional
U.S. Government Money
Market Fund, current
rate 4.120% | | | 505,739 | | | | 505,739 | | |
T. Rowe Price Government
Reserve Fund, current
rate 4.300% | | | 2,441,999 | | | | 2,441,999 | | |
Total short-term securities
(cost: $2,947,738) | | | | | 2,947,738 | | |
Total investments in securities
(cost: $180,128,764) (d) | | | | | 185,943,473 | | |
Liabilities in excess of cash
and other assets (-0.5%) | | | | | (834,236 | ) | |
Total net assets (100.0%) | | | | $ | 185,109,237 | | |
See accompanying notes to financial statements.
100
SFT T. Rowe Price Value Fund
Investments in Securities – continued
Investments in Securities Legend
(a) Securities are valued by procedures described in Note 2 of the notes to financial statements.
(b) Non-income producing security.
(c) Foreign security: The Fund held 7.2% of net assets in foreign securities at December 31, 2022.
(d) At December 31, 2022, the cost of investments for federal income tax purposes was $183,976,527. The aggregate unrealized appreciation and depreciation of investments based on this cost were:
Gross unrealized appreciation | | $ | 5,952,055 | | |
Gross unrealized depreciation | | | (3,985,109 | ) | |
Net unrealized appreciation | | $ | 1,966,946 | | |
See accompanying notes to financial statements.
101
SFT Wellington Core Equity Fund
Investments in Securities
(Percentages of each investment category relate to total net assets)
| | | Shares | | Value(a) | |
Common Stocks (98.9%) | |
Consumer Discretionary (10.4%) | |
Automobiles (0.9%) | |
Ford Motor Co. | | | 63,854 | | | $ | 742,622 | | |
Tesla, Inc. (b) | | | 1,809 | | | | 222,833 | | |
| | | | | | 965,455 | | |
Entertainment (1.2%) | |
Walt Disney Co. (b) | | | 14,532 | | | | 1,262,540 | | |
Hotels, Restaurants & Leisure (2.0%) | |
Airbnb, Inc. Class A (b) | | | 5,162 | | | | 441,351 | | |
McDonald's Corp. | | | 6,698 | | | | 1,765,124 | | |
| | | | | | 2,206,475 | | |
Internet & Catalog Retail (2.9%) | |
Amazon.com, Inc. (b) | | | 38,198 | | | | 3,208,632 | | |
Specialty Retail (1.9%) | |
TJX Cos., Inc. | | | 26,502 | | | | 2,109,559 | | |
Textiles, Apparel & Luxury Goods (1.5%) | |
NIKE, Inc. Class B | | | 13,753 | | | | 1,609,238 | | |
Consumer Staples (7.6%) | |
Beverages (2.9%) | |
Constellation Brands, Inc.
Class A | | | 6,837 | | | | 1,584,475 | | |
Monster Beverage Corp. (b) | | | 15,570 | | | | 1,580,822 | | |
| | | | | | 3,165,297 | | |
Food & Staples Retailing (1.2%) | |
Sysco Corp. | | | 16,091 | | | | 1,230,157 | | |
Household Products (3.5%) | |
Colgate-Palmolive Co. | | | 14,630 | | | | 1,152,697 | | |
Procter & Gamble Co. | | | 17,707 | | | | 2,683,673 | | |
| | | | | | 3,836,370 | | |
Energy (3.9%) | |
Oil, Gas & Consumable Fuels (3.9%) | |
ConocoPhillips | | | 12,788 | | | | 1,508,984 | | |
EOG Resources, Inc. | | | 20,661 | | | | 2,676,013 | | |
| | | | | | 4,184,997 | | |
Financial (12.1%) | |
Capital Markets (2.9%) | |
Charles Schwab Corp. | | | 14,299 | | | | 1,190,535 | | |
Morgan Stanley | | | 23,002 | | | | 1,955,630 | | |
| | | | | | 3,146,165 | | |
Commercial Banks (5.2%) | |
Bank of America Corp. | | | 56,907 | | | | 1,884,760 | | |
JPMorgan Chase & Co. | | | 20,373 | | | | 2,732,019 | | |
PNC Financial Services
Group, Inc. | | | 6,296 | | | | 994,390 | | |
| | | | | | 5,611,169 | | |
Consumer Finance (1.5%) | |
American Express Co. | | | 11,323 | | | | 1,672,973 | | |
| | | Shares | | Value(a) | |
Insurance (2.5%) | |
Chubb Ltd. (c) | | | 6,934 | | | $ | 1,529,640 | | |
Progressive Corp. | | | 9,326 | | | | 1,209,676 | | |
| | | | | | 2,739,316 | | |
Health Care (18.5%) | |
Biotechnology (2.9%) | |
Regeneron Pharmaceuticals,
Inc. (b) | | | 2,375 | | | | 1,713,539 | | |
Vertex Pharmaceuticals,
Inc. (b) | | | 4,953 | | | | 1,430,327 | | |
| | | | | | 3,143,866 | | |
Health Care Equipment & Supplies (5.2%) | |
Abbott Laboratories | | | 12,956 | | | | 1,422,439 | | |
Becton Dickinson & Co. | | | 6,020 | | | | 1,530,886 | | |
Danaher Corp. | | | 5,685 | | | | 1,508,913 | | |
Hologic, Inc. (b) | | | 16,456 | | | | 1,231,073 | | |
| | | | | | 5,693,311 | | |
Health Care Providers & Services (4.3%) | |
Laboratory Corp. of America
Holdings | | | 4,158 | | | | 979,126 | | |
UnitedHealth Group, Inc. | | | 6,992 | | | | 3,707,018 | | |
| | | | | | 4,686,144 | | |
Life Sciences Tools & Services (1.8%) | |
Thermo Fisher Scientific,
Inc. | | | 3,563 | | | | 1,962,109 | | |
Pharmaceuticals (4.3%) | |
Eli Lilly & Co. | | | 6,294 | | | | 2,302,597 | | |
Pfizer, Inc. | | | 46,402 | | | | 2,377,639 | | |
| | | | | | 4,680,236 | | |
Industrials (9.5%) | |
Aerospace & Defense (1.6%) | |
Raytheon Technologies Corp. | | | 17,525 | | | | 1,768,623 | | |
Building Products (2.0%) | |
Fortune Brands Innovations,
Inc. | | | 12,310 | | | | 703,024 | | |
Johnson Controls
International PLC (c) | | | 22,672 | | | | 1,451,008 | | |
| | | | | | 2,154,032 | | |
Commercial Services & Supplies (0.7%) | |
Republic Services, Inc. | | | 5,768 | | | | 744,014 | | |
Electrical Equipment (1.3%) | |
AMETEK, Inc. | | | 10,290 | | | | 1,437,719 | | |
Machinery (3.9%) | |
Deere & Co. | | | 4,020 | | | | 1,723,615 | | |
IDEX Corp. | | | 5,371 | | | | 1,226,360 | | |
Illinois Tool Works, Inc. | | | 5,919 | | | | 1,303,956 | | |
| | | | | | 4,253,931 | | |
See accompanying notes to financial statements.
102
SFT Wellington Core Equity Fund
Investments in Securities – continued
| | | Shares | | Value(a) | |
Information Technology (30.4%) | |
Communications Equipment (2.5%) | |
F5, Inc. (b) | | | 5,859 | | | $ | 840,825 | | |
Motorola Solutions, Inc. | | | 7,218 | | | | 1,860,151 | | |
| | | | | | 2,700,976 | | |
Computers & Peripherals (5.2%) | |
Apple, Inc. | | | 37,365 | | | | 4,854,835 | | |
NetApp, Inc. | | | 14,273 | | | | 857,236 | | |
| | | | | | 5,712,071 | | |
Electronic Equipment, Instruments & Components (2.0%) | |
CDW Corp. | | | 6,879 | | | | 1,228,452 | | |
Corning, Inc. | | | 30,165 | | | | 963,470 | | |
| | | | | | 2,191,922 | | |
Interactive Media & Services (5.1%) | |
Alphabet, Inc. Class A (b) | | | 52,844 | | | | 4,662,426 | | |
GoDaddy, Inc. Class A (b) | | | 11,600 | | | | 867,912 | | |
| | | | | | 5,530,338 | | |
IT Services (3.4%) | |
Global Payments, Inc. | | | 6,465 | | | | 642,104 | | |
Leidos Holdings, Inc. | | | 10,185 | | | | 1,071,360 | | |
Mastercard, Inc. Class A | | | 5,731 | | | | 1,992,840 | | |
| | | | | | 3,706,304 | | |
Semiconductors & Semiconductor Equipment (4.8%) | |
Advanced Micro Devices,
Inc. (b) | | | 11,308 | | | | 732,419 | | |
KLA Corp. | | | 3,443 | | | | 1,298,114 | | |
NVIDIA Corp. | | | 2,777 | | | | 405,831 | | |
QUALCOMM, Inc. | | | 9,240 | | | | 1,015,846 | | |
Texas Instruments, Inc. | | | 10,713 | | | | 1,770,002 | | |
| | | | | | 5,222,212 | | |
Software (7.4%) | |
Microsoft Corp. | | | 23,356 | | | | 5,601,236 | | |
Palo Alto Networks, Inc. (b) | | | 5,608 | | | | 782,540 | | |
Salesforce, Inc. (b) | | | 7,296 | | | | 967,377 | | |
Workday, Inc. Class A (b) | | | 4,172 | | | | 698,101 | | |
| | | | | | 8,049,254 | | |
| | | Shares | | Value(a) | |
Materials (1.1%) | |
Chemicals (1.1%) | |
PPG Industries, Inc. | | | 9,646 | | | $ | 1,212,888 | | |
Real Estate (1.7%) | |
Industrial REITs (1.0%) | |
Prologis, Inc. | | | 9,274 | | | | 1,045,458 | | |
Residential REITs (0.7%) | |
AvalonBay Communities, Inc. | | | 4,644 | | | | 750,099 | | |
Utilities (3.7%) | |
Electric Utilities (3.7%) | |
American Electric
Power Co., Inc. | | | 17,730 | | | | 1,683,463 | | |
Duke Energy Corp. | | | 13,538 | | | | 1,394,279 | | |
Eversource Energy | | | 10,628 | | | | 891,052 | | |
| | | | | | 3,968,794 | | |
Total common stocks
(cost: $78,145,459) | | | | | 107,562,644 | | |
Short-Term Securities (1.7%) | |
Investment Companies (1.7%) | |
State Street Institutional
U.S. Government Money
Market Fund, current
rate 4.120% | | | 1,856,525 | | | | 1,856,525 | | |
Total short-term securities
(cost: $1,856,525) | | | | | 1,856,525 | | |
Total investments in securities
(cost: $80,001,984) (d) | | | | | 109,419,169 | | |
Liabilities in excess of cash
and other assets (-0.6%) | | | | | (655,187 | ) | |
Total net assets (100.0%) | | | | $ | 108,763,982 | | |
Investments in Securities Legend
(a) Securities are valued by procedures described in Note 2 of the notes to financial statements.
(b) Non-income producing security.
(c) Foreign security: The Fund held 2.7% of net assets in foreign securities at December 31, 2022.
(d) At December 31, 2022, the cost of investments for federal income tax purposes was $80,077,146. The aggregate unrealized appreciation and depreciation of investments based on this cost were:
Gross unrealized appreciation | | $ | 34,225,281 | | |
Gross unrealized depreciation | | | (4,883,258 | ) | |
Net unrealized appreciation | | $ | 29,342,023 | | |
See accompanying notes to financial statements.
103
Securian Funds Trust
Statements of Assets and Liabilities
December 31, 2022
| | | SFT
Balanced
Stabilization
Fund | | SFT
Core Bond
Fund | | SFT
Delaware
IvySM Growth
Fund | | SFT
Delaware
IvySM Small
Cap Growth
Fund | | SFT
Equity
Stabilization
Fund(a) | | SFT
Government
Money
Market
Fund | |
Assets | | | | | | | | | | | | | | | | | | | | | | | | | |
Investments in securities, at market value – see
accompanying schedule for detailed listing* | |
Unaffiliated issuers | | $ | 385,831,229 | | | $ | 535,540,895 | | | $ | 478,441,948 | | | $ | 141,317,006 | | | $ | 324,226,980 | | | $ | 223,066,013 | | |
Affiliated issuers (Note 8) | | | 234,734,959 | | | | – | | | | – | | | | – | | | | – | | | | – | | |
Cash on demand deposit | | | 9,000,000 | | | | 59,214 | | | | – | | | | – | | | | 7,225,000 | | | | – | | |
Due from broker1,3 | | | – | | | | 1,315,000 | | | | – | | | | – | | | | 500,000 | | | | – | | |
Foreign currency on deposit2 | | | – | | | | 6 | | | | – | | | | – | | | | – | | | | – | | |
Receivable: | |
Fund shares sold | | | – | | | | 319 | | | | – | | | | – | | | | – | | | | – | | |
Investment securities sold | | | 12,745,189 | | | | 1,317,625 | | | | 423,466 | | | | 151,433 | | | | – | | | | – | | |
Investment securities sold on a when-issued or forward – commitment
basis (Note 2) | | | – | | | | 15,147 | | | | – | | | | – | | | | – | | | | – | | |
Investment securities sold on a TBA basis (Note 2) | | | – | | | | 5,799,770 | | | | – | | | | – | | | | – | | | | – | | |
| Dividends and accrued interest | | | 2,766,172 | | | | 2,230,671 | | | | 192,592 | | | | 53,935 | | | | 84,924 | | | | 77,989 | | |
Refundable foreign income taxes withheld | | | – | | | | – | | | | – | | | | – | | | | – | | | | – | | |
Variation margin on futures contracts | | | 106,425 | | | | – | | | | – | | | | – | | | | 3,085 | | | | – | | |
Unrealized appreciation on forward foreign currency contracts | | | – | | | | – | | | | – | | | | – | | | | – | | | | – | | |
Prepaid expenses | | | 11,611 | | | | 11,610 | | | | 11,440 | | | | 11,440 | | | | 11,440 | | | | 13,767 | | |
| Total assets | | | 645,195,585 | | | | 546,290,257 | | | | 479,069,446 | | | | 141,533,814 | | | | 332,051,429 | | | | 223,157,769 | | |
Liabilities | | | | | | | | | | | | | | | | | | | | | | | | | |
Payable: | |
Fund shares repurchased | | | 98,761 | | | | 540,591 | | | | 162,208 | | | | 20,880 | | | | 486,822 | | | | 516,570 | | |
| Investment securities purchased | | | 19,077,411 | | | | 11,645,973 | | | | – | | | | 183,722 | | | | 2,888,042 | | | | – | | |
Investment securities purchased on a when-issued or forward –
commitment basis (Note 2) | | | – | | | | 413,515 | | | | – | | | | – | | | | – | | | | – | | |
Investment securities purchased on a TBA basis (Note 2) | | | – | | | | 94,324,118 | | | | – | | | | – | | | | – | | | | – | | |
Adviser | | | 438,261 | | | | 252,853 | | | | 382,890 | | | | 142,244 | | | | 234,170 | | | | 106,665 | | |
Variation margin on futures contracts | | | – | | | | 38,414 | | | | – | | | | – | | | | – | | | | – | | |
Accrued expenses | | | 77,623 | | | | 117,095 | | | | 65,179 | | | | 49,176 | | | | 48,833 | | | | 52,736 | | |
Unrealized depreciation on forward foreign currency contracts | | | – | | | | – | | | | – | | | | – | | | | – | | | | – | | |
Options written at value4 | | | 91,489 | | | | – | | | | – | | | | – | | | | 48,560 | | | | – | | |
| Total liabilities | | | 19,783,545 | | | | 107,332,559 | | | | 610,277 | | | | 396,022 | | | | 3,706,427 | | | | 675,971 | | |
Net assets applicable to outstanding capital stock | | $ | 625,412,040 | | | $ | 438,957,698 | | | $ | 478,459,169 | | | $ | 141,137,792 | | | $ | 328,345,002 | | | $ | 222,481,798 | | |
Net Assets Consist of: | |
Paid in capital** | | $ | 407,036,216 | | | $ | 390,993,488 | | | $ | (48,329,136 | ) | | $ | 19,048,767 | | | $ | 271,328,377 | | | $ | 222,479,733 | | |
| Total distributable earnings | | | 218,375,824 | | | | 47,964,210 | | | | 526,788,305 | | | | 122,089,025 | | | | 57,016,625 | | | | 2,065 | | |
Net assets | | $ | 625,412,040 | | | $ | 438,957,698 | | | $ | 478,459,169 | | | $ | 141,137,792 | | | $ | 328,345,002 | | | $ | 222,481,798 | | |
Net assets by class: | |
Class 1 | | $ | N/A | | | $ | 7,302,723 | | | $ | N/A | | | $ | N/A | | | $ | N/A | | | $ | N/A | | |
| Class 2 | | | 625,412,040 | | | | 431,654,975 | | | | 478,459,169 | | | | 141,137,792 | | | | 328,345,002 | | | | 222,481,798 | | |
Net asset value per share of outstanding capital stock by class: | |
Class 1 | | | N/A | | | | 2.364 | | | | N/A | | | | N/A | | | | N/A | | | | N/A | | |
Class 2 | | | 18.534 | | | | 2.282 | | | | 27.100 | | | | 19.561 | | | | 12.969 | | | | 1.000 | | |
* Identified cost | |
Unaffiliated issuers | | $ | 402,380,347 | | | $ | 572,296,662 | | | $ | 335,379,475 | | | $ | 143,747,611 | | | $ | 288,158,507 | | | $ | 223,066,013 | | |
Affiliated issuers | | | 107,000,000 | | | | – | | | | – | | | | – | | | | – | | | | – | | |
** Shares outstanding by class: | |
Class 1 | | | N/A | | | | 3,089,179 | | | | N/A | | | | N/A | | | | N/A | | | | N/A | | |
Class 2 | | | 33,744,926 | | | | 189,124,958 | | | | 17,655,472 | | | | 7,215,281 | | | | 25,318,090 | | | | 222,481,798 | | |
| 1 Cash collateral for open futures contracts | | $ | – | | | $ | 1,315,000 | | | $ | – | | | $ | – | | | $ | 500,000 | | | $ | – | | |
| 2 Foreign currency on deposit (cost) | | $ | – | | | $ | 5 | | | $ | – | | | $ | – | | | $ | – | | | $ | – | | |
| 3 Collateral for open foreign currency contracts | | $ | – | | | $ | – | | | $ | – | | | $ | – | | | $ | – | | | $ | – | | |
| 4 Premiums received | | $ | 279,314 | | | $ | – | | | $ | – | | | $ | – | | | $ | 148,314 | | | $ | – | | |
See accompanying notes to financial statements.
104
| | | SFT
Index 400
Mid-Cap
Fund | | SFT
Index 500
Fund | | SFT
International
Bond
Fund | | SFT
Real Estate
Securities
Fund | | SFT
T. Rowe Price
Value
Fund | | SFT
Wellington
Core Equity
Fund | |
Assets | | | | | | | | | | | | | | | | | | | | | | | | | |
Investments in securities, at market value – see
accompanying schedule for detailed listing* | |
Unaffiliated issuers | | $ | 197,630,957 | | | $ | 991,703,612 | | | $ | 78,826,486 | | | $ | 115,494,996 | | | $ | 185,943,473 | | | $ | 109,419,169 | | |
Affiliated issuers (Note 8) | | | – | | | | – | | | | – | | | | – | | | | – | | | | – | | |
Cash on demand deposit | | | – | | | | 5,685 | | | | – | | | | – | | | | 22,442 | | | | – | | |
Due from broker1,3 | | | – | | | | – | | | | 497,450 | | | | – | | | | – | | | | – | | |
Foreign currency on deposit2 | | | – | | | | – | | | | 30,600 | | | | – | | | | 261 | | | | – | | |
Receivable: | |
Fund shares sold | | | 21,741 | | | | 88,148 | | | | 382 | | | | 2,751 | | | | – | | | | – | | |
Investment securities sold | | | – | | | | – | | | | – | | | | 155,083 | | | | 290,045 | | | | – | | |
Investment securities sold on a when-issued or forward – commitment
basis (Note 2) | | | – | | | | – | | | | – | | | | – | | | | – | | | | – | | |
Investment securities sold on a TBA basis (Note 2) | | | – | | | | – | | | | – | | | | – | | | | – | | | | – | | |
| Dividends and accrued interest | | | 274,905 | | | | 918,321 | | | | 1,017,870 | | | | 376,314 | | | | 240,585 | | | | 60,563 | | |
Refundable foreign income taxes withheld | | | – | | | | – | | | | 3,374 | | | | – | | | | 10,513 | | | | – | | |
Variation margin on futures contracts | | | – | | | | – | | | | 9,528 | | | | – | | | | – | | | | – | | |
Unrealized appreciation on forward foreign currency contracts | | | – | | | | – | | | | 99,187 | | | | – | | | | – | | | | – | | |
Prepaid expenses | | | 11,440 | | | | 11,440 | | | | 11,440 | | | | 11,440 | | | | 30,930 | | | | 11,440 | | |
| Total assets | | | 197,939,043 | | | | 992,727,206 | | | | 80,496,317 | | | | 116,040,584 | | | | 186,538,249 | | | | 109,491,172 | | |
Liabilities | | | | | | | | | | | | | | | | | | | | | | | | | |
Payable: | |
Fund shares repurchased | | | 93,570 | | | | 4,691,154 | | | | 15,313 | | | | 51,194 | | | | 42,247 | | | | 15,397 | | |
| Investment securities purchased | | | – | | | | – | | | | – | | | | 79,054 | | | | 1,180,443 | | | | 573,211 | | |
Investment securities purchased on a when-issued or forward –
commitment basis (Note 2) | | | – | | | | – | | | | – | | | | – | | | | – | | | | – | | |
Investment securities purchased on a TBA basis (Note 2) | | | – | | | | – | | | | – | | | | – | | | | – | | | | – | | |
Adviser | | | 69,068 | | | | 280,670 | | | | 66,554 | | | | 99,483 | | | | 152,842 | | | | 90,799 | | |
Variation margin on futures contracts | | | 46,910 | | | | 62,398 | | | | – | | | | – | | | | – | | | | – | | |
Accrued expenses | | | 61,469 | | | | 109,185 | | | | 93,407 | | | | 52,534 | | | | 53,480 | | | | 47,783 | | |
Unrealized depreciation on forward foreign currency contracts | | | – | | | | – | | | | 1,838,800 | | | | – | | | | – | | | | – | | |
Options written at value4 | | | – | | | | – | | | | – | | | | – | | | | – | | | | – | | |
| Total liabilities | | | 271,017 | | | | 5,143,407 | | | | 2,014,074 | | | | 282,265 | | | | 1,429,012 | | | | 727,190 | | |
Net assets applicable to outstanding capital stock | | $ | 197,668,026 | | | $ | 987,583,799 | | | $ | 78,482,243 | | | $ | 115,758,319 | | | $ | 185,109,237 | | | $ | 108,763,982 | | |
Net Assets Consist of: | |
Paid in capital** | | $ | (51,322,689 | ) | | $ | (131,066,274 | ) | | $ | 96,703,833 | | | $ | (7,500,451 | ) | | $ | 37,964,769 | | | $ | 10,521,871 | | |
| Total distributable earnings | | | 248,990,715 | | | | 1,118,650,073 | | | | (18,221,590 | ) | | | 123,258,770 | | | | 147,144,468 | | | | 98,242,111 | | |
Net assets | | $ | 197,668,026 | | | $ | 987,583,799 | | | $ | 78,482,243 | | | $ | 115,758,319 | | | $ | 185,109,237 | | | $ | 108,763,982 | | |
Net assets by class: | |
Class 1 | | $ | 28,379,168 | | | $ | 322,374,733 | | | $ | 1,721,136 | | | $ | 11,211,677 | | | $ | N/A | | | $ | 3,843,062 | | |
| Class 2 | | | 169,288,858 | | | | 665,209,066 | | | | 76,761,107 | | | | 104,546,642 | | | | 185,109,237 | | | | 104,920,920 | | |
Net asset value per share of outstanding capital stock by class: | |
Class 1 | | | 6.745 | | | | 16.502 | | | | 2.116 | | | | 5.885 | | | | N/A | | | | 22.365 | | |
Class 2 | | | 6.513 | | | | 15.936 | | | | 2.045 | | | | 5.683 | | | | 19.905 | | | | 21.885 | | |
* Identified cost | |
Unaffiliated issuers | | $ | 155,800,494 | | | $ | 375,970,136 | | | $ | 87,979,625 | | | $ | 125,363,012 | | | $ | 180,128,764 | | | $ | 80,001,984 | | |
Affiliated issuers | | | – | | | | – | | | | – | | | | – | | | | – | | | | – | | |
** Shares outstanding by class: | |
Class 1 | | | 4,207,696 | | | | 19,535,630 | | | | 813,306 | | | | 1,904,998 | | | | N/A | | | | 171,833 | | |
Class 2 | | | 25,992,692 | | | | 41,742,853 | | | | 37,544,471 | | | | 18,397,530 | | | | 9,299,498 | | | | 4,794,138 | | |
| 1 Cash collateral for open futures contracts | | $ | – | | | $ | – | | | $ | 307,450 | | | $ | – | | | $ | – | | | $ | – | | |
| 2 Foreign currency on deposit (cost) | | $ | – | | | $ | – | | | $ | 31,735 | | | $ | – | | | $ | 261 | | | $ | – | | |
| 3 Collateral for open foreign currency contracts | | $ | – | | | $ | – | | | $ | 190,000 | | | $ | – | | | $ | – | | | $ | – | | |
| 4 Premiums received | | $ | – | | | $ | – | | | $ | – | | | $ | – | | | $ | – | | | $ | – | | |
105
Securian Funds Trust
Statements of Operations
Year ended December 31, 2022
| | | SFT
Balanced
Stabilization
Fund | | SFT
Core Bond
Fund | | SFT
Delaware
IvySM Growth
Fund | | SFT
Delaware
IvySM Small
Cap Growth
Fund | | SFT
Equity
Stabilization
Fund(a) | | SFT
Government
Money
Market
Fund | |
Income: | |
Interest1 | | $ | 7,095,302 | | | $ | 14,668,014 | | | $ | – | | | $ | – | | | $ | – | | | $ | 3,069,896 | | |
Dividends1 | | | 3,159,677 | | | | 160,249 | | | | 3,779,682 | | | | 729,500 | | | | 7,349,301 | | | | 517,395 | | |
Foreign tax withholding | | | – | | | | – | | | | (43,160 | ) | | | – | | | | – | | | | – | | |
Total investment income | | | 10,254,979 | | | | 14,828,263 | | | | 3,736,522 | | | | 729,500 | | | | 7,349,301 | | | | 3,587,291 | | |
Expenses (Note 4): | |
Investment advisory fee | | | 3,594,312 | | | | 1,899,176 | | | | 3,522,880 | | | | 1,377,838 | | | | 1,865,667 | | | | 546,785 | | |
Rule 12b-1 fees | | | 1,633,778 | | | | 1,169,037 | | | | 1,360,089 | | | | 405,247 | | | | 848,031 | | | | 546,785 | | |
Audit and accounting services | | | 237,433 | | | | 277,725 | | | | 160,683 | | | | 109,540 | | | | 127,007 | | | | 138,503 | | |
Administrative services fee | | | 39,099 | | | | 45,099 | | | | 35,098 | | | | 35,098 | | | | 39,099 | | | | 58,101 | | |
Legal fees | | | 29,101 | | | | 29,101 | | | | 29,101 | | | | 29,101 | | | | 29,101 | | | | 29,101 | | |
Custodian fees | | | 15,100 | | | | 33,756 | | | | 12,301 | | | | 16,801 | | | | 14,899 | | | | 9,702 | | |
Printing and shareholder reports | | | 8,599 | | | | 8,599 | | | | 8,599 | | | | 8,599 | | | | 8,599 | | | | 8,399 | | |
Trustee's fees | | | 38,458 | | | | 38,458 | | | | 38,458 | | | | 38,458 | | | | 38,458 | | | | 38,458 | | |
S&P licensing fee | | | – | | | | – | | | | – | | | | – | | | | – | | | | – | | |
Insurance | | | 12,665 | | | | 12,665 | | | | 12,665 | | | | 12,665 | | | | 12,665 | | | | 12,665 | | |
Other | | | 7,353 | | | | 20,445 | | | | 42,956 | | | | 31,758 | | | | 16,446 | | | | 12,243 | | |
Total expenses before fees waived | | | 5,615,898 | | | | 3,534,061 | | | | 5,222,830 | | | | 2,065,105 | | | | 2,999,972 | | | | 1,400,742 | | |
Less fees waived (Note 4) | | | – | | | | – | | | | – | | | | – | | | | – | | | | (348,440 | ) | |
Total expenses net of fees waived | | | 5,615,898 | | | | 3,534,061 | | | | 5,222,830 | | | | 2,065,105 | | | | 2,999,972 | | | | 1,052,302 | | |
Net investment income (loss) | | | 4,639,081 | | | | 11,294,202 | | | | (1,486,308 | ) | | | (1,335,605 | ) | | | 4,349,329 | | | | 2,534,989 | | |
Realized gains (losses) on investments and foreign
currencies: | |
Investments (Note 3) | |
Unaffiliated issuers | | | (5,869,240 | ) | | | (35,171,287 | ) | | | 22,834,638 | | | | 1,195,339 | | | | 10,476,268 | | | | – | | |
Written options contracts | | | 424,854 | | | | – | | | | – | | | | – | | | | 568,144 | | | | – | | |
Foreign currency transactions | | | – | | | | – | | | | – | | | | – | | | | – | | | | – | | |
Foreign forward currency contracts | | | – | | | | – | | | | – | | | | – | | | | – | | | | – | | |
Net increase from litigation payments | | | – | | | | 41,752 | | | | – | | | | 25,755 | | | | – | | | | – | | |
Futures contracts | | | 5,062,663 | | | | (2,784,352 | ) | | | – | | | | – | | | | (10,514,880 | ) | | | – | | |
Net change in unrealized appreciation or depreciation on: | |
Investments | |
| Unaffiliated issuers, net of foreign capital gains tax | | | (44,832,276 | ) | | | (48,291,558 | ) | | | (208,274,945 | ) | | | (53,902,189 | ) | | | (41,184,950 | ) | | | – | | |
Affiliated issuers (Note 8) | | | (52,479,679 | ) | | | – | | | | – | | | | – | | | | – | | | | – | | |
Written options contracts | | | 187,588 | | | | – | | | | – | | | | – | | | | 99,660 | | | | – | | |
Translation of assets and liabilities in foreign currency | | | – | | | | 1 | | | | – | | | | – | | | | – | | | | – | | |
Foreign forward currency contracts | | | – | | | | – | | | | – | | | | – | | | | – | | | | – | | |
Futures contracts | | | 1,349,336 | | | | 44,662 | | | | – | | | | – | | | | 266,391 | | | | – | | |
| Net gains (losses) on investments | | | (96,156,754 | ) | | | (86,160,782 | ) | | | (185,440,307 | ) | | | (52,681,095 | ) | | | (40,289,367 | ) | | | – | | |
Net increase (decrease) in net assets resulting from
operations | | $ | (91,517,673 | ) | | $ | (74,866,580 | ) | | $ | (186,926,615 | ) | | $ | (54,016,700 | ) | | $ | (35,940,038 | ) | | $ | 2,534,989 | | |
1 All income is from unaffiliated issuers.
See accompanying notes to financial statements.
106
| | | SFT
Index 400
Mid-Cap
Fund | | SFT
Index 500
Fund | | SFT
International
Bond
Fund | | SFT
Real Estate
Securities
Fund | | SFT
T. Rowe Price
Value
Fund | | SFT
Wellington
Core Equity
Fund | |
Income: | |
Interest1 | | $ | 13,351 | | | $ | 6,683 | | | $ | 3,082,332 | | | $ | – | | | $ | 85,723 | | | $ | 56 | | |
Dividends1 | | | 3,052,276 | | | | 17,152,410 | | | | 39,097 | | | | 3,438,507 | | | | 3,902,127 | | | | 1,796,141 | | |
Foreign tax withholding | | | (3,148 | ) | | | (3,974 | ) | | | (24,946 | ) | | | – | | | | (60,552 | ) | | | (7,169 | ) | |
Total investment income | | | 3,062,479 | | | | 17,155,119 | | | | 3,096,483 | | | | 3,438,507 | | | | 3,927,298 | | | | 1,789,028 | | |
Expenses (Note 4): | |
Investment advisory fee | | | 307,452 | | | | 1,552,501 | | | | 507,470 | | | | 940,102 | | | | 1,343,326 | | | | 775,985 | | |
Rule 12b-1 fees | | | 446,758 | | | | 1,817,289 | | | | 207,096 | | | | 307,258 | | | | 501,241 | | | | 290,483 | | |
Audit and accounting services | | | 130,956 | | | | 234,675 | | | | 153,014 | | | | 126,175 | | | | 110,211 | | | | 114,368 | | |
Administrative services fee | | | 35,098 | | | | 35,098 | | | | 49,100 | | | | 35,098 | | | | 35,098 | | | | 35,098 | | |
Legal fees | | | 29,101 | | | | 41,300 | | | | 29,101 | | | | 29,101 | | | | 29,101 | | | | 29,101 | | |
Custodian fees | | | 17,400 | | | | 18,998 | | | | 49,889 | | | | 13,001 | | | | 44,800 | | | | 15,100 | | |
Printing and shareholder reports | | | 8,599 | | | | 8,599 | | | | 8,599 | | | | 8,599 | | | | 8,599 | | | | 8,599 | | |
Trustee's fees | | | 38,458 | | | | 38,458 | | | | 38,458 | | | | 38,458 | | | | 38,458 | | | | 38,458 | | |
S&P licensing fee | | | 20,355 | | | | 62,591 | | | | – | | | | – | | | | – | | | | – | | |
Insurance | | | 12,665 | | | | 12,665 | | | | 12,665 | | | | 12,665 | | | | 12,665 | | | | 12,665 | | |
Other | | | 10,569 | | | | 32,770 | | | | 21,478 | | | | 8,668 | | | | 31,773 | | | | 8,578 | | |
Total expenses before fees waived | | | 1,057,411 | | | | 3,854,944 | | | | 1,076,870 | | | | 1,519,125 | | | | 2,155,272 | | | | 1,328,435 | | |
Less fees waived (Note 4) | | | – | | | | – | | | | – | | | | – | | | | – | | | | – | | |
Total expenses net of fees waived | | | 1,057,411 | | | | 3,854,944 | | | | 1,076,870 | | | | 1,519,125 | | | | 2,155,272 | | | | 1,328,435 | | |
Net investment income (loss) | | | 2,005,068 | | | | 13,300,175 | | | | 2,019,613 | | | | 1,919,382 | | | | 1,772,026 | | | | 460,593 | | |
Realized gains (losses) on investments and foreign
currencies: | |
Investments (Note 3) | |
Unaffiliated issuers | | | 8,500,797 | | | | 13,540,964 | | | | (1,683,074 | ) | | | 11,797,899 | | | | 8,292,243 | | | | 3,350,908 | | |
Written options contracts | | | – | | | | – | | | | – | | | | – | | | | – | | | | – | | |
Foreign currency transactions | | | – | | | | – | | | | (86,827 | ) | | | – | | | | (7,553 | ) | | | – | | |
Foreign forward currency contracts | | | 22,111 | | | | 15,172 | | | | 2,059,228 | | | | – | | | | 15,537 | | | | 23,214 | | |
Net increase from litigation payments | | | – | | | | – | | | | 19,201 | | | | – | | | | – | | | | – | | |
Futures contracts | | | (1,780,923 | ) | | | (4,074,989 | ) | | | (2,999,704 | ) | | | – | | | | – | | | | – | | |
Net change in unrealized appreciation or depreciation on: | |
Investments | |
| Unaffiliated issuers, net of foreign capital gains tax | | | (40,073,756 | ) | | | (246,609,124 | ) | | | (7,097,260 | ) | | | (55,799,207 | ) | | | (37,095,919 | ) | | | (31,436,967 | ) | |
Affiliated issuers (Note 8) | | | – | | | | – | | | | – | | | | – | | | | – | | | | – | | |
Written options contracts | | | – | | | | – | | | | – | | | | – | | | | – | | | | – | | |
Translation of assets and liabilities in foreign currency | | | – | | | | – | | | | 12,518 | | | | – | | | | 230 | | | | – | | |
Foreign forward currency contracts | | | – | | | | – | | | | (1,987,630 | ) | | | – | | | | – | | | | – | | |
Futures contracts | | | (432,355 | ) | | | (1,244,501 | ) | | | (44,386 | ) | | | – | | | | – | | | | – | | |
| Net gains (losses) on investments | | | (33,764,126 | ) | | | (238,372,478 | ) | | | (11,807,934 | ) | | | (44,001,308 | ) | | | (28,795,462 | ) | | | (28,062,845 | ) | |
Net increase (decrease) in net assets resulting from
operations | | $ | (31,759,058 | ) | | $ | (225,072,303 | ) | | $ | (9,788,321 | ) | | $ | (42,081,926 | ) | | $ | (27,023,436 | ) | | $ | (27,602,252 | ) | |
107
Securian Funds Trust
Statements of Changes in Net Assets
Year ended December 31, 2022 and year ended December 31, 2021
| | | SFT
Balanced
Stabilization
Fund | | SFT
Core Bond
Fund | | SFT
Delaware
IvySM Growth
Fund | |
| | | 2022 | | 2021 | | 2022 | | 2021 | | 2022 | | 2021 | |
Operations: | |
Net investment income (loss) | | $ | 4,639,081 | | | $ | 680,135 | | | $ | 11,294,202 | | | $ | 9,127,135 | | | $ | (1,486,308 | ) | | $ | (2,511,586 | ) | |
Net realized gains (losses) on investments | | | (381,723 | ) | | | 30,773,557 | | | | (37,913,887 | ) | | | (467,086 | ) | | | 22,834,638 | | | | 80,994,825 | | |
Net change in unrealized appreciation or
depreciation of investments | | | (95,775,031 | ) | | | 57,575,189 | | | | (48,246,895 | ) | | | (11,323,520 | ) | | | (208,274,945 | ) | | | 95,694,143 | | |
Net increase (decrease) in net assets
resulting from operations | | | (91,517,673 | ) | | | 89,028,881 | | | | (74,866,580 | ) | | | (2,663,471 | ) | | | (186,926,615 | ) | | | 174,177,382 | | |
Distributions to shareholders: | |
From distributable earnings | |
Class 2 | | | – | | | | – | | | | – | | | | – | | | | – | | | | – | | |
Decrease in net assets from distributions | | | – | | | | – | | | | – | | | | – | | | | – | | | | – | | |
Capital stock transactions: | |
Proceeds from sales | |
Class 1 | | | – | | | | – | | | | 3,230,634 | | | | 2,557,649 | | | | – | | | | – | | |
Class 2 | | | 29,621,512 | | | | 20,502,040 | | | | 16,187,058 | | | | 57,112,903 | | | | 3,132,710 | | | | 533,469 | | |
Value of distributions reinvested | |
Class 2 | | | – | | | | – | | | | – | | | | – | | | | – | | | | – | | |
Payments for redemption of shares | |
Class 1 | | | – | | | | – | | | | (2,572,439 | ) | | | (321,527 | ) | | | – | | | | – | | |
Class 2 | | | (42,234,628 | ) | | | (58,176,028 | ) | | | (33,351,620 | ) | | | (23,367,538 | ) | | | (43,183,443 | ) | | | (75,521,572 | ) | |
Increase (decrease) in net assets from
capital stock transactions | | | (12,613,116 | ) | | | (37,673,988 | ) | | | (16,506,367 | ) | | | 35,981,487 | | | | (40,050,733 | ) | | | (74,988,103 | ) | |
| Total increase (decrease) in net assets | | | (104,130,789 | ) | | | 51,354,893 | | | | (91,372,947 | ) | | | 33,318,016 | | | | (226,977,348 | ) | | | 99,189,279 | | |
Net assets at beginning of period | | | 729,542,829 | | | | 678,187,936 | | | | 530,330,645 | | | | 497,012,629 | | | | 705,436,517 | | | | 606,247,238 | | |
Net assets at end of period | | $ | 625,412,040 | | | $ | 729,542,829 | | | $ | 438,957,698 | | | $ | 530,330,645 | | | $ | 478,459,169 | | | $ | 705,436,517 | | |
Capital share transactions: | |
Proceeds from sales | |
Class 1 | | | – | | | | – | | | | 1,322,960 | | | | 931,524 | | | | – | | | | – | | |
Class 2 | | | 1,556,915 | | | | 1,040,728 | | | | 6,535,013 | | | | 21,495,901 | | | | 111,963 | | | | 18,676 | | |
Issued on reinvestment of distributions | |
Class 2 | | | – | | | | – | | | | – | | | | – | | | | – | | | | – | | |
Payments for redemption of shares | |
Class 1 | | | – | | | | – | | | | (1,055,792 | ) | | | (117,009 | ) | | | – | | | | – | | |
Class 2 | | | (2,209,032 | ) | | | (2,916,842 | ) | | | (13,939,714 | ) | | | (8,812,950 | ) | | | (1,418,840 | ) | | | (2,287,884 | ) | |
Net change from capital transactions | | | (652,117 | ) | | | (1,876,114 | ) | | | (7,137,533 | ) | | | 13,497,466 | | | | (1,306,877 | ) | | | (2,269,208 | ) | |
See accompanying notes to financial statements.
108
| | | SFT
Delaware
IvySM Small
Cap Growth
Fund | | SFT
Equity
Stabilization
Fund | |
| | | 2022 | | 2021 | | 2022 | | 2021 | |
Operations: | |
Net investment income (loss) | | $ | (1,335,605 | ) | | $ | (1,843,532 | ) | | $ | 4,349,329 | | | $ | 4,062,284 | | |
Net realized gains (losses) on investments | | | 1,221,094 | | | | 35,934,114 | | | | 529,532 | | | | 13,648,891 | | |
Net change in unrealized appreciation or
depreciation of investments | | | (53,902,189 | ) | | | (23,831,963 | ) | | | (40,818,899 | ) | | | 23,514,377 | | |
Net increase (decrease) in net assets
resulting from operations | | | (54,016,700 | ) | | | 10,258,619 | | | | (35,940,038 | ) | | | 41,225,552 | | |
Distributions to shareholders: | |
From distributable earnings | |
Class 2 | | | – | | | | – | | | | – | | | | – | | |
Decrease in net assets from distributions | | | – | | | | – | | | | – | | | | – | | |
Capital stock transactions: | |
Proceeds from sales | |
Class 1 | | | – | | | | – | | | | – | | | | – | | |
Class 2 | | | 2,356,271 | | | | 1,835,165 | | | | 14,861,373 | | | | 11,333,212 | | |
Value of distributions reinvested | |
Class 2 | | | – | | | | – | | | | – | | | | – | | |
Payments for redemption of shares | |
Class 1 | | | – | | | | – | | | | – | | | | – | | |
Class 2 | | | (11,868,005 | ) | | | (19,261,342 | ) | | | (22,909,068 | ) | | | (35,808,323 | ) | |
Increase (decrease) in net assets from
capital stock transactions | | | (9,511,734 | ) | | | (17,426,177 | ) | | | (8,047,695 | ) | | | (24,475,111 | ) | |
| Total increase (decrease) in net assets | | | (63,528,434 | ) | | | (7,167,558 | ) | | | (43,987,733 | ) | | | 16,750,441 | | |
Net assets at beginning of period | | | 204,666,226 | | | | 211,833,784 | | | | 372,332,735 | | | | 355,582,294 | | |
Net assets at end of period | | $ | 141,137,792 | | | $ | 204,666,226 | | | $ | 328,345,002 | | | $ | 372,332,735 | | |
Capital share transactions: | |
Proceeds from sales | |
Class 1 | | | – | | | | – | | | | – | | | | – | | |
Class 2 | | | 109,498 | | | | 67,382 | | | | 1,134,473 | | | | 820,033 | | |
Issued on reinvestment of distributions | |
Class 2 | | | – | | | | – | | | | – | | | | – | | |
Payments for redemption of shares | |
Class 1 | | | – | | | | – | | | | – | | | | – | | |
Class 2 | | | (545,360 | ) | | | (697,889 | ) | | | (1,739,173 | ) | | | (2,668,223 | ) | |
Net change from capital transactions | | | (435,862 | ) | | | (630,507 | ) | | | (604,700 | ) | | | (1,848,190 | ) | |
109
Securian Funds Trust
Statements of Changes in Net Assets – continued
Year ended December 31, 2022 and year ended December 31, 2021
| | | SFT
Government
Money Market
Fund | | SFT
Index 400
Mid-Cap
Fund | | SFT
Index 500
Fund | |
| | | 2022 | | 2021 | | 2022 | | 2021 | | 2022 | | 2021 | |
Operations: | |
Net investment income (loss) | | $ | 2,534,989 | | | $ | – | | | $ | 2,005,068 | | | $ | 1,652,494 | | | $ | 13,300,175 | | | $ | 11,323,005 | | |
Net realized gains (losses) on investments | | | – | | | | – | | | | 6,741,985 | | | | 25,848,251 | | | | 9,481,147 | | | | 54,598,627 | | |
Net change in unrealized appreciation or
depreciation of investments | | | – | | | | – | | | | (40,506,111 | ) | | | 19,807,664 | | | | (247,853,625 | ) | | | 208,627,322 | | |
Net increase (decrease) in net assets
resulting from operations | | | 2,534,989 | | | | – | | | | (31,759,058 | ) | | | 47,308,409 | | | | (225,072,303 | ) | | | 274,548,954 | | |
Distributions to shareholders: | |
From distributable earnings | |
Class 2 | | | (2,534,989 | ) | | | – | | | | – | | | | – | | | | – | | | | – | | |
Decrease in net assets from distributions | | | (2,534,989 | ) | | | – | | | | – | | | | – | | | | – | | | | – | | |
Capital stock transactions: | |
Proceeds from sales | |
Class 1 | | | – | | | | – | | | | 7,357,506 | | | | 5,959,281 | | | | 30,015,096 | | | | 29,049,479 | | |
Class 2 | | | 84,358,046 | | | | 38,077,001 | | | | 2,800,098 | | | | 2,325,362 | | | | 18,902,724 | | | | 19,582,173 | | |
Value of distributions reinvested | |
Class 2 | | | 2,534,989 | | | | – | | | | – | | | | – | | | | – | | | | – | | |
Payments for redemption of shares | |
Class 1 | | | – | | | | – | | | | (747,878 | ) | | | (573,325 | ) | | | (4,441,720 | ) | | | (14,455,661 | ) | |
Class 2 | | | (61,489,586 | ) | | | (37,875,640 | ) | | | (13,137,316 | ) | | | (26,036,416 | ) | | | (59,775,837 | ) | | | (84,212,900 | ) | |
Increase (decrease) in net assets from
capital stock transactions | | | 25,403,449 | | | | 201,361 | | | | (3,727,590 | ) | | | (18,325,098 | ) | | | (15,299,737 | ) | | | (50,036,909 | ) | |
Total increase (decrease) in net assets | | | 25,403,449 | | | | 201,361 | | | | (35,486,648 | ) | | | 28,983,311 | | | | (240,372,040 | ) | | | 224,512,045 | | |
Net assets at beginning of period | | | 197,078,349 | | | | 196,876,988 | | | | 233,154,674 | | | | 204,171,363 | | | | 1,227,955,839 | | | | 1,003,443,794 | | |
Net assets at end of period | | $ | 222,481,798 | | | $ | 197,078,349 | | | $ | 197,668,026 | | | $ | 233,154,674 | | | $ | 987,583,799 | | | $ | 1,227,955,839 | | |
Capital share transactions: | |
Proceeds from sales | |
Class 1 | | | – | | | | – | | | | 1,065,896 | | | | 803,253 | | | | 1,712,141 | | | | 1,537,397 | | |
Class 2 | | | 84,358,046 | | | | 38,077,001 | | | | 422,867 | | | | 326,818 | | | | 1,128,392 | | | | 1,090,964 | | |
Issued on reinvestment of distributions | |
Class 2 | | | 2,534,989 | | | | – | | | | – | | | | – | | | | – | | | | – | | |
Payments for redemption of shares | |
Class 1 | | | – | | | | – | | | | (110,879 | ) | | | (78,858 | ) | | | (263,959 | ) | | | (745,439 | ) | |
Class 2 | | | (61,489,586 | ) | | | (37,875,640 | ) | | | (2,001,142 | ) | | | (3,734,848 | ) | | | (3,521,706 | ) | | | (4,855,719 | ) | |
Net change from capital transactions | | | 25,403,449 | | | | 201,361 | | | | (623,258 | ) | | | (2,683,635 | ) | | | (945,132 | ) | | | (2,972,797 | ) | |
See accompanying notes to financial statements.
110
| | | SFT
International Bond
Fund | | SFT
Real Estate
Securities
Fund | |
| | | 2022 | | 2021 | | 2022 | | 2021 | |
Operations: | |
Net investment income (loss) | | $ | 2,019,613 | | | $ | 831,779 | | | $ | 1,919,382 | | | $ | 1,254,508 | | |
Net realized gains (losses) on investments | | | (2,691,176 | ) | | | (9,883,969 | ) | | | 11,797,899 | | | | 18,190,448 | | |
Net change in unrealized appreciation or
depreciation of investments | | | (9,116,758 | ) | | | 5,392,471 | | | | (55,799,207 | ) | | | 34,305,944 | | |
Net increase (decrease) in net assets
resulting from operations | | | (9,788,321 | ) | | | (3,659,719 | ) | | | (42,081,926 | ) | | | 53,750,900 | | |
Distributions to shareholders: | |
From distributable earnings | |
Class 2 | | | – | | | | – | | | | – | | | | – | | |
Decrease in net assets from distributions | | | – | | | | – | | | | – | | | | – | | |
Capital stock transactions: | |
Proceeds from sales | |
Class 1 | | | 354,918 | | | | 685,192 | | | | 2,477,049 | | | | 3,897,473 | | |
Class 2 | | | 6,220,821 | | | | 7,322,451 | | | | 2,620,143 | | | | 10,951,153 | | |
Value of distributions reinvested | |
Class 2 | | | – | | | | – | | | | – | | | | – | | |
Payments for redemption of shares | |
Class 1 | | | (215,972 | ) | | | (376,322 | ) | | | (983,199 | ) | | | (375,521 | ) | |
Class 2 | | | (8,842,598 | ) | | | (4,372,840 | ) | | | (20,081,328 | ) | | | (20,337,710 | ) | |
Increase (decrease) in net assets from
capital stock transactions | | | (2,482,831 | ) | | | 3,258,481 | | | | (15,967,335 | ) | | | (5,864,605 | ) | |
Total increase (decrease) in net assets | | | (12,271,152 | ) | | | (401,238 | ) | | | (58,049,261 | ) | | | 47,886,295 | | |
Net assets at beginning of period | | | 90,753,395 | | | | 91,154,633 | | | | 173,807,580 | | | | 125,921,285 | | |
Net assets at end of period | | $ | 78,482,243 | | | $ | 90,753,395 | | | $ | 115,758,319 | | | $ | 173,807,580 | | |
Capital share transactions: | |
Proceeds from sales | |
Class 1 | | | 160,173 | | | | 287,069 | | | | 391,287 | | | | 542,889 | | |
Class 2 | | | 2,857,112 | | | | 3,148,037 | | | | 450,796 | | | | 1,590,621 | | |
Issued on reinvestment of distributions | |
Class 2 | | | – | | | | – | | | | – | | | | – | | |
Payments for redemption of shares | |
Class 1 | | | (98,419 | ) | | | (158,139 | ) | | | (144,006 | ) | | | (56,722 | ) | |
Class 2 | | | (4,146,064 | ) | | | (1,885,931 | ) | | | (2,886,927 | ) | | | (3,079,110 | ) | |
Net change from capital transactions | | | (1,227,198 | ) | | | 1,391,036 | | | | (2,188,850 | ) | | | (1,002,322 | ) | |
111
Securian Funds Trust
Statements of Changes in Net Assets – continued
Year ended December 31, 2022 and year ended December 31, 2021
| | | SFT
T. Rowe Price
Value
Fund | | SFT
Wellington
Core Equity
Fund | |
| | | 2022 | | 2021 | | 2022 | | 2021 | |
Operations: | |
Net investment income (loss) | | $ | 1,772,026 | | | $ | 897,403 | | | $ | 460,593 | | | $ | 238,717 | | |
Net realized gains (losses) on investments | | | 8,300,227 | | | | 55,592,342 | | | | 3,374,122 | | | | 14,602,167 | | |
Net change in unrealized appreciation or
depreciation of investments | | | (37,095,689 | ) | | | 696,317 | | | | (31,436,967 | ) | | | 14,573,796 | | |
Net increase (decrease) in net assets
resulting from operations | | | (27,023,436 | ) | | | 57,186,062 | | | | (27,602,252 | ) | | | 29,414,680 | | |
Distributions to shareholders: | |
From distributable earnings | |
Class 2 | | | – | | | | – | | | | – | | | | – | | |
Decrease in net assets from distributions | | | – | | | | – | | | | – | | | | – | | |
Capital stock transactions: | |
Proceeds from sales | |
Class 1 | | | – | | | | – | | | | 2,003,044 | | | | 1,136,597 | | |
Class 2 | | | 3,145,151 | | | | 10,386,456 | | | | 644,745 | | | | 885,222 | | |
Value of distributions reinvested | |
Class 2 | | | – | | | | – | | | | – | | | | – | | |
Payments for redemption of shares | |
Class 1 | | | – | | | | – | | | | (549,192 | ) | | | (304,280 | ) | |
Class 2 | | | (30,345,304 | ) | | | (34,589,303 | ) | | | (10,492,245 | ) | | | (16,668,396 | ) | |
Increase (decrease) in net assets from
capital stock transactions | | | (27,200,153 | ) | | | (24,202,847 | ) | | | (8,393,648 | ) | | | (14,950,857 | ) | |
Total increase (decrease) in net assets | | | (54,223,589 | ) | | | 32,983,215 | | | | (35,995,900 | ) | | | 14,463,823 | | |
Net assets at beginning of period | | | 239,332,826 | | | | 206,349,611 | | | | 144,759,882 | | | | 130,296,059 | | |
Net assets at end of period | | $ | 185,109,237 | | | $ | 239,332,826 | | | $ | 108,763,982 | | | $ | 144,759,882 | | |
Capital share transactions: | |
Proceeds from sales | |
Class 1 | | | – | | | | – | | | | 86,449 | | | | 43,942 | | |
Class 2 | | | 156,376 | | | | 480,185 | | | | 28,079 | | | | 37,894 | | |
Issued on reinvestment of distributions | |
Class 2 | | | – | | | | – | | | | – | | | | – | | |
Payments for redemption of shares | |
Class 1 | | | – | | | | – | | | | (23,633 | ) | | | (12,427 | ) | |
Class 2 | | | (1,478,169 | ) | | | (1,710,343 | ) | | | (450,239 | ) | | | (682,712 | ) | |
Net change from capital transactions | | | (1,321,793 | ) | | | (1,230,158 | ) | | | (359,344 | ) | | | (613,303 | ) | |
See accompanying notes to financial statements.
112
Securian Funds Trust
Financial Highlights
SFT Balanced Stabilization Fund
| | | Class 2 Shares | |
| | | Year ended December 31, | |
| | | 2022 | | 2021 | | 2020 | | 2019 | | 2018 | |
Net asset value, beginning of period | | $ | 21.210 | | | $ | 18.697 | | | $ | 16.892 | | | $ | 13.983 | | | $ | 14.401 | | |
Income from investment operations: | |
Net investment income (a) | | | .136 | | | | .019 | | | | .082 | | | | .185 | | | | .162 | | |
Net realized and unrealized gain(loss)
on investments | | | (2.812 | ) | | | 2.494 | | | | 1.723 | | | | 2.724 | | | | (.580 | ) | |
| Total from investment operations | | | (2.676 | ) | | | 2.513 | | | | 1.805 | | | | 2.909 | | | | (.418 | ) | |
Net asset value, end of period | | $ | 18.534 | | | $ | 21.210 | | | $ | 18.697 | | | $ | 16.892 | | | $ | 13.983 | | |
Total return (b) | | | (12.62 | )% | | | 13.46 | % | | | 10.67 | % | | | 20.81 | % | | | (2.90 | )% | |
Net assets, end of period (in thousands) | | $ | 625,412 | | | $ | 729,543 | | | $ | 678,188 | | | $ | 577,805 | | | $ | 415,233 | | |
Ratios to average net assets: | |
Expenses before waiver (c) | | | .86 | % | | | .85 | % | | | .86 | % | | | .90 | % | | | .98 | % | |
Expenses (c) | | | .86 | % | | | .84 | %(d) | | | .80 | %(d) | | | .80 | %(d) | | | .80 | %(d) | |
Net investment income | | | .71 | % | | | .10 | % | | | .48 | % | | | 1.18 | % | | | 1.12 | % | |
Portfolio turnover rate (excluding
short-term securities) | | | 12.0 | % | | | 5.8 | % | | | – | % | | | 1.2 | % | | | 2.2 | % | |
(a) Based on average shares outstanding during the year.
(b) Total return figures are based on a share outstanding throughout the period and assume reinvestment of distributions at net asset value. Total return figures do not reflect charges pursuant to the terms of the variable life insurance policies and variable annuity contracts funded by separate accounts that invest in the Fund's shares.
(c) In addition to fees and expenses which the Fund bears directly, the Fund indirectly bears a pro rata share of the fees and expenses of the acquired funds in which it invests. Such indirect expenses are not included in the above reported expense ratios.
(d) Ratio is net of fees waived by the advisor and distributor (see Note 4).
113
Securian Funds Trust
Financial Highlights – continued
SFT Core Bond Fund
| | | Class 1 Shares | |
| | | Year ended December 31, | |
| | | 2022 | | 2021 | | 2020 | | 2019 | | 2018 | |
Net asset value, beginning of period | | $ | 2.747 | | | $ | 2.755 | | | $ | 2.571 | | | $ | 2.355 | | | $ | 2.368 | | |
Income from investment operations: | |
Net investment income (a) | | | .065 | | | | .056 | | | | .067 | | | | .078 | | | | .077 | | |
Net realized and unrealized gain(loss)
on investments | | | (.448 | ) | | | (.064 | ) | | | .117 | | | | .138 | | | | (.090 | ) | |
Total from investment operations | | | (.383 | ) | | | (.008 | ) | | | .184 | | | | .216 | | | | (.013 | ) | |
Net asset value, end of period | | $ | 2.364 | | | $ | 2.747 | | | $ | 2.755 | | | $ | 2.571 | | | $ | 2.355 | | |
Total return (b) | | | (13.93 | )% | | | (0.29 | )% | | | 7.15 | % | | | 9.18 | % | | | (0.59 | )% | |
Net assets, end of period (in thousands) | | $ | 7,303 | | | $ | 7,751 | | | $ | 5,530 | | | $ | 5,060 | | | $ | 3,640 | | |
Ratios to average net assets: | |
Expenses (c) | | | .50 | % | | | .49 | % | | | .48 | % | | | .49 | % | | | .50 | % | |
Net investment income | | | 2.62 | % | | | 2.03 | % | | | 2.52 | % | | | 3.11 | % | | | 3.29 | % | |
Portfolio turnover rate (excluding
short-term securities) | | | 139.2 | % | | | 67.3 | % | | | 93.0 | % | | | 130.4 | % | | | 151.1 | % | |
| | | Class 2 Shares | |
| | | Year ended December 31, | |
| | | 2022 | | 2021 | | 2020 | | 2019 | | 2018 | |
Net asset value, beginning of period | | $ | 2.659 | | | $ | 2.673 | | | $ | 2.501 | | | $ | 2.297 | | | $ | 2.316 | | |
Income from investment operations: | |
Net investment income (a) | | | .057 | | | | .047 | | | | .059 | | | | .070 | | | | .069 | | |
Net realized and unrealized gain(loss)
on investments | | | (.434 | ) | | | (.061 | ) | | | .113 | | | | .134 | | | | (.088 | ) | |
Total from investment operations | | | (.377 | ) | | | (.014 | ) | | | .172 | | | | .204 | | | | (.019 | ) | |
Net asset value, end of period | | $ | 2.282 | | | $ | 2.659 | | | $ | 2.673 | | | $ | 2.501 | | | $ | 2.297 | | |
Total return (b) | | | (14.17 | )% | | | (0.54 | )% | | | 6.88 | % | | | 8.90 | % | | | (0.84 | )% | |
Net assets, end of period (in thousands) | | $ | 431,655 | | | $ | 522,580 | | | $ | 491,483 | | | $ | 482,818 | | | $ | 434,229 | | |
Ratios to average net assets: | |
Expenses (c) | | | .75 | % | | | .74 | % | | | .73 | % | | | .74 | % | | | .75 | % | |
Net investment income | | | 2.38 | % | | | 1.78 | % | | | 2.28 | % | | | 2.87 | % | | | 3.04 | % | |
Portfolio turnover rate (excluding
short-term securities) | | | 139.2 | % | | | 67.3 | % | | | 93.0 | % | | | 130.4 | % | | | 151.1 | % | |
(a) Based on average shares outstanding during the year.
(b) Total return figures are based on a share outstanding throughout the period and assume reinvestment of distributions at net asset value. Total return figures do not reflect charges pursuant to the terms of the variable life insurance policies and variable annuity contracts funded by separate accounts that invest in the Fund's shares.
(c) In addition to fees and expenses which the Fund bears directly, the Fund indirectly bears a pro rata share of the fees and expenses of the acquired funds in which it invests. Such indirect expenses are not included in the above reported expense ratios.
114
Securian Funds Trust
Financial Highlights – continued
SFT Delaware IvySM Growth Fund
| | | Class 2 Shares | |
| | | Year ended December 31, | |
| | | 2022 | | 2021 | | 2020 | | 2019 | | 2018 | |
Net asset value, beginning of period | | $ | 37.202 | | | $ | 28.554 | | | $ | 21.848 | | | $ | 16.007 | | | $ | 15.662 | | |
Income from investment operations: | |
Net investment income (loss) (a) | | | (.082 | ) | | | (.124 | ) | | | (.038 | ) | | | (.005 | ) | | | .008 | | |
Net realized and unrealized gain(loss)
on investments | | | (10.020 | ) | | | 8.772 | | | | 6.744 | | | | 5.846 | | | | .337 | | |
Total from investment operations | | | (10.102 | ) | | | 8.648 | | | | 6.706 | | | | 5.841 | | | | .345 | | |
Net asset value, end of period | | $ | 27.100 | | | $ | 37.202 | | | $ | 28.554 | | | $ | 21.848 | | | $ | 16.007 | | |
Total return (b) | | | (27.15 | )% | | | 30.29 | % | | | 30.69 | % | | | 36.49 | % | | | 2.21 | % | |
Net assets, end of period (in thousands) | | $ | 478,459 | | | $ | 705,437 | | | $ | 606,247 | | | $ | 544,843 | | | $ | 453,883 | | |
Ratios to average net assets: | |
Expenses (c) | | | .96 | % | | | .96 | % | | | .97 | % | | | .98 | % | | | .97 | % | |
Net investment income (loss) | | | (.27 | )% | | | (.38 | )% | | | (.16 | )% | | | (.03 | )% | | | .04 | % | |
Portfolio turnover rate (excluding
short-term securities) | | | 8.5 | % | | | 14.4 | % | | | 28.9 | % | | | 29.9 | % | | | 42.3 | % | |
(a) Based on average shares outstanding during the year.
(b) Total return figures are based on a share outstanding throughout the period and assume reinvestment of distributions at net asset value. Total return figures do not reflect charges pursuant to the terms of the variable life insurance policies and variable annuity contracts funded by separate accounts that invest in the Fund's shares.
(c) In addition to fees and expenses which the Fund bears directly, the Fund indirectly bears a pro rata share of the fees and expenses of the acquired funds in which it invests. Such indirect expenses are not included in the above reported expense ratios.
115
Securian Funds Trust
Financial Highlights – continued
SFT Delaware IvySM Small Cap Growth Fund
| | | Class 2 Shares | |
| | | Year ended December 31, | |
| | | 2022 | | 2021 | | 2020 | | 2019 | | 2018 | |
Net asset value, beginning of period | | $ | 26.750 | | | $ | 25.579 | | | $ | 18.772 | | | $ | 15.181 | | | $ | 15.802 | | |
Income from investment operations: | |
Net investment loss (a) | | | (.179 | ) | | | (.233 | ) | | | (.161 | ) | | | (.146 | ) | | | (.102 | ) | |
Net realized and unrealized gain(loss)
on investments | | | (7.010 | ) | | | 1.404 | | | | 6.968 | | | | 3.737 | | | | (.519 | ) | |
Total from investment operations | | | (7.189 | ) | | | 1.171 | | | | 6.807 | | | | 3.591 | | | | (.621 | ) | |
Net asset value, end of period | | $ | 19.561 | | | $ | 26.750 | | | $ | 25.579 | | | $ | 18.772 | | | $ | 15.181 | | |
Total return (b) | | | (26.87 | )% | | | 4.58 | % | | | 36.26 | % | | | 23.66 | % | | | (3.93 | )% | |
Net assets, end of period (in thousands) | | $ | 141,138 | | | $ | 204,666 | | | $ | 211,834 | | | $ | 176,721 | | | $ | 163,367 | | |
Ratios to average net assets: | |
Expenses (c) | | | 1.27 | % | | | 1.23 | % | | | 1.24 | % | | | 1.23 | % | | | 1.21 | % | |
Net investment loss | | | (.82 | )% | | | (.84 | )% | | | (.83 | )% | | | (.81 | )% | | | (.59 | )% | |
Portfolio turnover rate (excluding
short-term securities) | | | 61.8 | % | | | 47.1 | % | | | 53.6 | % | | | 43.3 | % | | | 53.1 | % | |
(a) Based on average shares outstanding during the year.
(b) Total return figures are based on a share outstanding throughout the period and assume reinvestment of distributions at net asset value. Total return figures do not reflect charges pursuant to the terms of the variable life insurance policies and variable annuity contracts funded by separate accounts that invest in the Fund's shares.
(c) In addition to fees and expenses which the Fund bears directly, the Fund indirectly bears a pro rata share of the fees and expenses of the acquired funds in which it invests. Such indirect expenses are not included in the above reported expense ratios.
116
Securian Funds Trust
Financial Highlights – continued
SFT Equity Stabilization Fund
| | | Class 2 Shares | |
| | | Year ended December 31, | |
| | | 2022 | | 2021 | | 2020 | | 2019 | | 2018 | |
Net asset value, beginning of period | | $ | 14.363 | | | $ | 12.804 | | | $ | 13.527 | | | $ | 11.594 | | | $ | 12.195 | | |
Income from investment operations: | |
Net investment income (a) | | | .169 | | | | .154 | | | | .173 | | | | .275 | | | | .220 | | |
Net realized and unrealized gain(loss)
on investments | | | (1.563 | ) | | | 1.405 | | | | (.896 | ) | | | 1.658 | | | | (.821 | ) | |
Total from investment operations | | | (1.394 | ) | | | 1.559 | | | | (.723 | ) | | | 1.933 | | | | (.601 | ) | |
Net asset value, end of period | | $ | 12.969 | | | $ | 14.363 | | | $ | 12.804 | | | $ | 13.527 | | | $ | 11.594 | | |
Total return (b) | | | (9.71 | )% | | | 12.18 | % | | | (5.35 | )% | | | 16.67 | % | | | (4.93 | )% | |
Net assets, end of period (in thousands) | | $ | 328,345 | | | $ | 372,333 | | | $ | 355,582 | | | $ | 390,478 | | | $ | 298,485 | | |
Ratios to average net assets: | |
Expenses before waiver (c) | | | .88 | % | | | .87 | % | | | .88 | % | | | .90 | % | | | .97 | % | |
Expenses (c) | | | .88 | % | | | .85 | %(d) | | | .80 | %(d) | | | .80 | %(d) | | | .80 | %(d) | |
Net investment income | | | 1.28 | % | | | 1.13 | % | | | 1.38 | % | | | 2.17 | % | | | 1.82 | % | |
Portfolio turnover rate (excluding
short-term securities) | | | 12.3 | % | | | 3.4 | % | | | 20.1 | % | | | – | % | | | – | % | |
(a) Based on average shares outstanding during the year.
(b) Total return figures are based on a share outstanding throughout the period and assume reinvestment of distributions at net asset value. Total return figures do not reflect charges pursuant to the terms of the variable life insurance policies and variable annuity contracts funded by separate accounts that invest in the Fund's shares.
(c) In addition to fees and expenses which the Fund bears directly, the Fund indirectly bears a pro rata share of the fees and expenses of the acquired funds in which it invests. Such indirect expenses are not included in the above reported expense ratios.
(d) Ratio is net of fees waived by the advisor and distributor (see Note 4).
117
Securian Funds Trust
Financial Highlights – continued
SFT Government Money Market Fund
| | | Class 2 Shares | |
| | | Year ended December 31, | |
| | | 2022 | | 2021 | | 2020 | | 2019 | | 2018 | |
Net asset value, beginning of period | | $ | 1.000 | | | $ | 1.000 | | | $ | 1.000 | | | $ | 1.000 | | | $ | 1.000 | | |
Income from investment operations: | |
| Net investment income (a) | | | .011 | | | | – | | | | .002 | | | | .015 | | | | .012 | | |
Net realized and unrealized gain
on investments | | | – | | | | – | | | | – | | | | – | | | | – | | |
| Total from investment operations | | | .011 | | | | – | | | | .002 | | | | .015 | | | | .012 | | |
Less distributions: | |
| Distributions from net investment income | | | (.011 | ) | | | – | | | | (.002 | ) | | | (.015 | ) | | | (.012 | ) | |
Net asset value, end of period | | $ | 1.000 | | | $ | 1.000 | | | $ | 1.000 | | | $ | 1.000 | | | $ | 1.000 | | |
Total return (b) | | | 1.12 | % | | | – | % | | | 0.21 | % | | | 1.50 | % | | | 1.18 | % | |
Net assets, end of period (in thousands) | | $ | 222,482 | | | $ | 197,078 | | | $ | 196,877 | | | $ | 188,351 | | | $ | 72,761 | | |
Ratios to average net assets: | |
Expenses before waiver | | | .64 | % | | | .66 | % | | | .68 | % | | | .83 | % | | | .90 | % | |
Expenses net of waiver (c)(d) | | | .48 | % | | | .04 | % | | | .29 | % | | | .70 | % | | | .70 | % | |
Net investment income | | | 1.16 | % | | | – | % | | | .20 | % | | | 1.35 | % | | | 1.18 | % | |
(a) Based on average shares outstanding during the year.
(b) Total return figures are based on a share outstanding throughout the period and assume reinvestment of distributions at net asset value. Total return figures do not reflect charges pursuant to the terms of the variable life insurance policies and variable annuity contracts funded by separate accounts that invest in the Fund's shares.
(c) In addition to fees and expenses which the Fund bears directly, the Fund indirectly bears a pro rata share of the fees and expenses of the acquired funds in which it invests. Such indirect expenses are not included in the above reported expense ratios.
(d) Ratio is net of fees waived by the advisor and distributor (see Note 4).
118
Securian Funds Trust
Financial Highlights – continued
SFT Index 400 Mid-Cap Fund
| | | Class 1 Shares | |
| | | Year ended December 31, | |
| | | 2022 | | 2021 | | 2020 | | 2019 | | 2018 | |
Net asset value, beginning of period | | $ | 7.786 | | | $ | 6.264 | | | $ | 5.527 | | | $ | 4.392 | | | $ | 4.955 | | |
Income from investment operations: | |
| Net investment income (a) | | | .084 | | | | .068 | | | | .065 | | | | .067 | | | | .065 | | |
Net realized and unrealized gain(loss)
on investments | | | (1.125 | ) | | | 1.454 | | | | .672 | | | | 1.068 | | | | (.628 | ) | |
Total from investment operations | | | (1.041 | ) | | | 1.522 | | | | .737 | | | | 1.135 | | | | (.563 | ) | |
Net asset value, end of period | | $ | 6.745 | | | $ | 7.786 | | | $ | 6.264 | | | $ | 5.527 | | | $ | 4.392 | | |
Total return (b) | | | (13.38 | )% | | | 24.30 | % | | | 13.34 | % | | | 25.82 | % | | | (11.36 | )% | |
Net assets, end of period (in thousands) | | $ | 28,379 | | | $ | 25,327 | | | $ | 15,838 | | | $ | 12,088 | | | $ | 7,662 | | |
Ratios to average net assets: | |
Expenses (c) | | | .30 | % | | | .28 | % | | | .31 | % | | | .29 | % | | | .27 | % | |
| Net investment income | | | 1.22 | % | | | .93 | % | | | 1.27 | % | | | 1.31 | % | | | 1.29 | % | |
Portfolio turnover rate (excluding
short-term securities) | | | 15.0 | % | | | 15.3 | % | | | 14.4 | % | | | 15.1 | % | | | 14.6 | % | |
| | | Class 2 Shares | |
| | | Year ended December 31, | |
| | | 2022 | | 2021 | | 2020 | | 2019 | | 2018 | |
Net asset value, beginning of period | | $ | 7.538 | | | $ | 6.079 | | | $ | 5.377 | | | $ | 4.284 | | | $ | 4.845 | | |
Income from investment operations: | |
| Net investment income (loss) (a) | | | .063 | | | | .050 | | | | .050 | | | | .054 | | | | .050 | | |
Net realized and unrealized gain(loss)
on investments | | | (1.088 | ) | | | 1.409 | | | | .652 | | | | 1.039 | | | | (.611 | ) | |
Total from investment operations | | | (1.025 | ) | | | 1.459 | | | | .702 | | | | 1.093 | | | | (.561 | ) | |
Net asset value, end of period | | $ | 6.513 | | | $ | 7.538 | | | $ | 6.079 | | | $ | 5.377 | | | $ | 4.284 | | |
Total return (b) | | | (13.60 | )% | | | 23.99 | % | | | 13.06 | % | | | 25.51 | % | | | (11.58 | )% | |
Net assets, end of period (in thousands) | | $ | 169,289 | | | $ | 207,828 | | | $ | 188,333 | | | $ | 186,108 | | | $ | 182,703 | | |
Ratios to average net assets: | |
Expenses (c) | | | .55 | % | | | .53 | % | | | .56 | % | | | .54 | % | | | .52 | % | |
| Net investment income | | | 0.94 | % | | | .71 | % | | | 1.02 | % | | | 1.09 | % | | | 1.03 | % | |
Portfolio turnover rate (excluding
short-term securities) | | | 15.0 | % | | | 15.3 | % | | | 14.4 | % | | | 15.1 | % | | | 14.6 | % | |
(a) Based on average shares outstanding during the year.
(b) Total return figures are based on a share outstanding throughout the period and assume reinvestment of distributions at net asset value. Total return figures do not reflect charges pursuant to the terms of the variable life insurance policies and variable annuity contracts funded by separate accounts that invest in the Fund's shares.
(c) In addition to fees and expenses which the Fund bears directly, the Fund indirectly bears a pro rata share of the fees and expenses of the acquired funds in which it invests. Such indirect expenses are not included in the above reported expense ratios.
119
Securian Funds Trust
Financial Highlights – continued
SFT Index 500 Fund
| | | Class 1 Shares | |
| | | Year ended December 31, | |
| | | 2022 | | 2021 | | 2020 | | 2019 | | 2018 | |
Net asset value, beginning of period | | $ | 20.191 | | | $ | 15.732 | | | $ | 13.309 | | | $ | 10.144 | | | $ | 10.629 | | |
Income from investment operations: | |
| Net investment income (a) | | | .251 | | | | .215 | | | | .217 | | | | .215 | | | | .192 | | |
Net realized and unrealized gain(loss)
on investments | | | (3.940 | ) | | | 4.244 | | | | 2.206 | | | | 2.950 | | | | (.677 | ) | |
Total from investment operations | | | (3.689 | ) | | | 4.459 | | | | 2.423 | | | | 3.165 | | | | (.485 | ) | |
Net asset value, end of period | | $ | 16.502 | | | $ | 20.191 | | | $ | 15.732 | | | $ | 13.309 | | | $ | 10.144 | | |
Total return (b) | | | (18.27 | )% | | | 28.35 | % | | | 18.20 | % | | | 31.20 | % | | | (4.56 | )% | |
Net assets, end of period (in thousands) | | $ | 322,375 | | | $ | 365,210 | | | $ | 272,088 | | | $ | 224,410 | | | $ | 164,095 | | |
Ratios to average net assets: | |
Expenses (c) | | | .19 | % | | | .19 | % | | | .20 | % | | | .20 | % | | | .20 | % | |
| Net investment income | | | 1.44 | % | | | 1.19 | % | | | 1.62 | % | | | 1.81 | % | | | 1.74 | % | |
Portfolio turnover rate (excluding
short-term securities) | | | 2.1 | % | | | 2.3 | % | | | 3.3 | % | | | 2.6 | % | | | 2.4 | % | |
| | | Class 2 Shares | |
| | | Year ended December 31, | |
| | | 2022 | | 2021 | | 2020 | | 2019 | | 2018 | |
Net asset value, beginning of period | | $ | 19.547 | | | $ | 15.268 | | | $ | 12.949 | | | $ | 9.894 | | | $ | 10.393 | | |
Income from investment operations: | |
| Net investment income (a) | | | .200 | | | | .164 | | | | .179 | | | | .181 | | | | .160 | | |
Net realized and unrealized gain(loss)
on investments | | | (3.811 | ) | | | 4.115 | | | | 2.140 | | | | 2.874 | | | | (.659 | ) | |
Total from investment operations | | | (3.611 | ) | | | 4.279 | | | | 2.319 | | | | 3.055 | | | | (.499 | ) | |
Net asset value, end of period | | $ | 15.936 | | | $ | 19.547 | | | $ | 15.268 | | | $ | 12.949 | | | $ | 9.894 | | |
Total return (b) | | | (18.47 | )% | | | 28.03 | % | | | 17.91 | % | | | 30.88 | % | | | (4.80 | )% | |
Net assets, end of period (in thousands) | | $ | 665,209 | | | $ | 862,746 | | | $ | 731,356 | | | $ | 689,994 | | | $ | 630,692 | | |
Ratios to average net assets: | |
Expenses (c) | | | .44 | % | | | .44 | % | | | .45 | % | | | .45 | % | | | .45 | % | |
| Net investment income | | | 1.18 | % | | | .94 | % | | | 1.38 | % | | | 1.56 | % | | | 1.49 | % | |
Portfolio turnover rate (excluding
short-term securities) | | | 2.1 | % | | | 2.3 | % | | | 3.3 | % | | | 2.6 | % | | | 2.4 | % | |
(a) Based on average shares outstanding during the year.
(b) Total return figures are based on a share outstanding throughout the period and assume reinvestment of distributions at net asset value. Total return figures do not reflect charges pursuant to the terms of the variable life insurance policies and variable annuity contracts funded by separate accounts that invest in the Fund's shares.
(c) In addition to fees and expenses which the Fund bears directly, the Fund indirectly bears a pro rata share of the fees and expenses of the acquired funds in which it invests. Such indirect expenses are not included in the above reported expense ratios.
120
Securian Funds Trust
Financial Highlights – continued
SFT International Bond Fund
| | | Class 1 Shares | |
| | | Year ended December 31, | |
| | | 2022 | | 2021 | | 2020 | | 2019 | | 2018 | |
Net asset value, beginning of period | | $ | 2.367 | | | $ | 2.458 | | | $ | 2.620 | | | $ | 2.570 | | | $ | 2.533 | | |
Income from investment operations: | |
Net investment income (a) | | | .059 | | | | .028 | | | | .035 | | | | .116 | | | | .091 | | |
Net realized and unrealized loss
on investments | | | (.310 | ) | | | (.119 | ) | | | (.197 | ) | | | (.066 | ) | | | (.054 | ) | |
Total from investment operations | | | (.251 | ) | | | (.091 | ) | | | (.162 | ) | | | .050 | | | | .037 | | |
Net asset value, end of period | | $ | 2.116 | | | $ | 2.367 | | | $ | 2.458 | | | $ | 2.620 | | | $ | 2.570 | | |
| Total return (b) | | | (10.59 | )%(c) | | | (3.70 | )%(c) | | | (6.18 | )%(c) | | | 1.93 | % | | | 1.46 | % | |
Net assets, end of period (in thousands) | | $ | 1,721 | | | $ | 1,779 | | | $ | 1,531 | | | $ | 1,396 | | | $ | 1,237 | | |
Ratios to average net assets: | |
Expenses (d) | | | 1.03 | % | | | 1.04 | % | | | .98 | % | | | 1.01 | % | | | .95 | % | |
Net investment income | | | 2.66 | % | | | 1.16 | % | | | 1.40 | % | | | 4.43 | % | | | 3.57 | % | |
Portfolio turnover rate (excluding
short-term securities) | | | 108.7 | % | | | 124.2 | % | | | 62.1 | % | | | 23.4 | % | | | 20.4 | % | |
| | | Class 2 Shares | |
| | | Year ended December 31, | |
| | | 2022 | | 2021 | | 2020 | | 2019 | | 2018 | |
Net asset value, beginning of period | | $ | 2.291 | | | $ | 2.385 | | | $ | 2.549 | | | $ | 2.507 | | | $ | 2.477 | | |
Income from investment operations: | |
Net investment income (a) | | | .051 | | | | .021 | | | | .028 | | | | .108 | | | | .082 | | |
Net realized and unrealized loss
on investments | | | (.297 | ) | | | (.115 | ) | | | (.192 | ) | | | (.066 | ) | | | (.052 | ) | |
Total from investment operations | | | (.246 | ) | | | (.094 | ) | | | (.164 | ) | | | .042 | | | | .030 | | |
Net asset value, end of period | | $ | 2.045 | | | $ | 2.291 | | | $ | 2.385 | | | $ | 2.549 | | | $ | 2.507 | | |
| Total return (b) | | | (10.76 | )%(c) | | | (3.94 | )%(c) | | | (6.43 | )%(c) | | | 1.68 | % | | | 1.21 | % | |
Net assets, end of period (in thousands) | | $ | 76,761 | | | $ | 88,974 | | | $ | 89,624 | | | $ | 99,019 | | | $ | 103,430 | | |
Ratios to average net assets: | |
Expenses (d) | | | 1.28 | % | | | 1.29 | % | | | 1.23 | % | | | 1.26 | % | | | 1.20 | % | |
Net investment income | | | 2.38 | % | | | .91 | % | | | 1.15 | % | | | 4.20 | % | | | 3.32 | % | |
Portfolio turnover rate (excluding
short-term securities) | | | 108.7 | % | | | 124.2 | % | | | 62.1 | % | | | 23.4 | % | | | 20.4 | % | |
(a) Based on average shares outstanding during the year.
(b) Total return figures are based on a share outstanding throughout the period and assume reinvestment of distributions at net asset value. Total return figures do not reflect charges pursuant to the terms of the variable life insurance policies and variable annuity contracts funded by separate accounts that invest in the Fund's shares.
(c) The return includes adjustments in accordance with generally accepted accounting principles required at period end date.
(d) In addition to fees and expenses which the Fund bears directly, the Fund indirectly bears a pro rata share of the fees and expenses of the acquired funds in which it invests. Such indirect expenses are not included in the above reported expense ratios.
121
Securian Funds Trust
Financial Highlights – continued
SFT Real Estate Securities Fund
| | | Class 1 Shares | |
| | | Year ended December 31, | |
| | | 2022 | | 2021 | | 2020 | | 2019 | | 2018 | |
Net asset value, beginning of period | | $ | 7.964 | | | $ | 5.515 | | | $ | 5.661 | | | $ | 4.534 | | | $ | 4.781 | | |
Income from investment operations: | |
| Net investment income (a) | | | .114 | | | | .061 | | | | .087 | | | | .096 | | | | .085 | | |
Net realized and unrealized gain(loss)
on investments | | | (2.193 | ) | | | 2.388 | | | | (.233 | ) | | | 1.031 | | | | (.332 | ) | |
Total from investment operations | | | (2.079 | ) | | | 2.449 | | | | (.146 | ) | | | 1.127 | | | | (.247 | ) | |
Net asset value, end of period | | $ | 5.885 | | | $ | 7.964 | | | $ | 5.515 | | | $ | 5.661 | | | $ | 4.534 | | |
Total return (b) | | | (26.10 | )% | | | 44.41 | % | | | (2.59 | )% | | | 24.87 | % | | | (5.16 | )% | |
Net assets, end of period (in thousands) | | $ | 11,211 | | | $ | 13,201 | | | $ | 6,461 | | | $ | 5,858 | | | $ | 4,122 | | |
Ratios to average net assets: | |
Expenses (c) | | | .90 | % | | | .87 | % | | | .91 | % | | | .88 | % | | | .87 | % | |
| Net investment income | | | 1.71 | % | | | .91 | % | | | 1.69 | % | | | 1.79 | % | | | 1.83 | % | |
Portfolio turnover rate (excluding
short-term securities) | | | 78.7 | % | | | 59.7 | % | | | 74.9 | % | | | 55.5 | % | | | 70.0 | % | |
| | | Class 2 Shares | |
| | | Year ended December 31, | |
| | | 2022 | | 2021 | | 2020 | | 2019 | | 2018 | |
Net asset value, beginning of period | | $ | 7.709 | | | $ | 5.352 | | | $ | 5.508 | | | $ | 4.422 | | | $ | 4.674 | | |
Income from investment operations: | |
| Net investment income (a) | | | .091 | | | | .055 | | | | .073 | | | | .082 | | | | .072 | | |
Net realized and unrealized gain(loss)
on investments | | | (2.117 | ) | | | 2.302 | | | | (.229 | ) | | | 1.004 | | | | (.324 | ) | |
Total from investment operations | | | (2.026 | ) | | | 2.357 | | | | (.156 | ) | | | 1.086 | | | | (.252 | ) | |
Net asset value, end of period | | $ | 5.683 | | | $ | 7.709 | | | $ | 5.352 | | | $ | 5.508 | | | $ | 4.422 | | |
Total return (b) | | | (26.29 | )% | | | 44.05 | % | | | (2.83 | )% | | | 24.56 | % | | | (5.40 | )% | |
Net assets, end of period (in thousands) | | $ | 104,547 | | | $ | 160,607 | | | $ | 119,460 | | | $ | 128,350 | | | $ | 116,067 | | |
Ratios to average net assets: | |
Expenses (c) | | | 1.15 | % | | | 1.12 | % | | | 1.16 | % | | | 1.13 | % | | | 1.12 | % | |
| Net investment income | | | 1.40 | % | | | .85 | % | | | 1.46 | % | | | 1.59 | % | | | 1.60 | % | |
Portfolio turnover rate (excluding
short-term securities) | | | 78.7 | % | | | 59.7 | % | | | 74.9 | % | | | 55.5 | % | | | 70.0 | % | |
(a) Based on average shares outstanding during the year.
(b) Total return figures are based on a share outstanding throughout the period and assume reinvestment of distributions at net asset value. Total return figures do not reflect charges pursuant to the terms of the variable life insurance policies and variable annuity contracts funded by separate accounts that invest in the Fund's shares.
(c) In addition to fees and expenses which the Fund bears directly, the Fund indirectly bears a pro rata share of the fees and expenses of the acquired funds in which it invests. Such indirect expenses are not included in the above reported expense ratios.
122
Securian Funds Trust
Financial Highlights – continued
SFT T. Rowe Price Value Fund
| | | Class 2 Shares | |
| | | Year ended December 31, | |
| | | 2022 | | 2021 | | 2020 | | 2019 | | 2018 | |
Net asset value, beginning of period | | $ | 22.533 | | | $ | 17.411 | | | $ | 15.818 | | | $ | 12.568 | | | $ | 13.933 | | |
Income from investment operations: | |
Net investment income (a) | | | .180 | | | | .082 | | | | .147 | | | | .186 | | | | .174 | | |
Net realized and unrealized gain(loss)
on investments | | | (2.808 | ) | | | 5.040 | | | | 1.446 | | | | 3.064 | | | | (1.539 | ) | |
Total from investment operations | | | (2.628 | ) | | | 5.122 | | | | 1.593 | | | | 3.250 | | | | (1.365 | ) | |
Net asset value, end of period | | $ | 19.905 | | | $ | 22.533 | | | $ | 17.411 | | | $ | 15.818 | | | $ | 12.568 | | |
Total return (b) | | | (11.67 | )% | | | 29.43 | % | | | 10.06 | % | | | 25.86 | % | | | (9.80 | )% | |
Net assets, end of period (in thousands) | | $ | 185,109 | | | $ | 239,333 | | | $ | 206,350 | | | $ | 201,178 | | | $ | 181,589 | | |
Ratios to average net assets: | |
Expenses (c) | | | 1.07 | % | | | 1.05 | % | | | 1.06 | % | | | 1.06 | % | | | 1.04 | % | |
Net investment income | | | .88 | % | | | .40 | % | | | 1.01 | % | | | 1.28 | % | | | 1.26 | % | |
Portfolio turnover rate (excluding
short-term securities) | | | 186.4 | % | | | 100.1 | % | | | 113.2 | % | | | 131.1 | % | | | 140.0 | % | |
(a) Based on average shares outstanding during the year.
(b) Total return figures are based on a share outstanding throughout the period and assume reinvestment of distributions at net asset value. Total return figures do not reflect charges pursuant to the terms of the variable life insurance policies and variable annuity contracts funded by separate accounts that invest in the Fund's shares.
(c) In addition to fees and expenses which the Fund bears directly, the Fund indirectly bears a pro rata share of the fees and expenses of the acquired funds in which it invests. Such indirect expenses are not included in the above reported expense ratios.
123
Securian Funds Trust
Financial Highlights – continued
SFT Wellington Core Equity Fund
| | Class 1 Shares | |
| | | Year ended December 31, | |
| | | 2022 | | 2021 | | 2020 | | 2019 | | 2018 | |
Net asset value, beginning of period | | $ | 27.698 | | | $ | 22.304 | | | $ | 18.861 | | | $ | 14.069 | | | $ | 14.369 | | |
Income from investment operations: | |
Net investment income (a) | | | .152 | | | | .105 | | | | .116 | | | | .120 | | | | .099 | | |
Net realized and unrealized gain(loss)
on investments | | | (5.485 | ) | | | 5.289 | | | | 3.327 | | | | 4.672 | | | | (.399 | ) | |
Total from investment operations | | | (5.333 | ) | | | 5.394 | | | | 3.443 | | | | 4.792 | | | | (.300 | ) | |
Net asset value, end of period | | $ | 22.365 | | | $ | 27.698 | | | $ | 22.304 | | | $ | 18.861 | | | $ | 14.069 | | |
Total return (b) | | | (19.26 | )% | | | 24.18 | % | | | 18.25 | % | | | 34.06 | % | | | (2.09 | )% | |
Net assets, end of period (in thousands) | | $ | 3,843 | | | $ | 3,020 | | | $ | 1,729 | | | $ | 1,251 | | | $ | 757 | | |
Ratios to average net assets: | |
Expenses (c) | | | .87 | % | | | .84 | % | | | .86 | % | | | .86 | % | | | .84 | % | |
Net investment income | | | .65 | % | | | .42 | % | | | .61 | % | | | .71 | % | | | .66 | % | |
Portfolio turnover rate (excluding
short-term securities) | | | 14.0 | % | | | 14.4 | % | | | 23.0 | % | | | 14.9 | % | | | 21.6 | % | |
| | | Class 2 Shares | |
| | | Year ended December 31, | |
| | | 2022 | | 2021 | | 2020 | | 2019 | | 2018 | |
Net asset value, beginning of period | | $ | 27.173 | | | $ | 21.936 | | | $ | 18.596 | | | $ | 13.906 | | | $ | 14.238 | | |
Income from investment operations: | |
Net investment income (a) | | | .088 | | | | .042 | | | | .068 | | | | .077 | | | | .060 | | |
Net realized and unrealized gain(loss)
on investments | | | (5.376 | ) | | | 5.195 | | | | 3.272 | | | | 4.613 | | | | (.392 | ) | |
Total from investment operations | | | (5.288 | ) | | | 5.237 | | | | 3.340 | | | | 4.690 | | | | (.332 | ) | |
Net asset value, end of period | | $ | 21.885 | | | $ | 27.173 | | | $ | 21.936 | | | $ | 18.596 | | | $ | 13.906 | | |
Total return (b) | | | (19.46 | )% | | | 23.87 | % | | | 17.96 | % | | | 33.73 | % | | | (2.33 | )% | |
Net assets, end of period (in thousands) | | $ | 104,921 | | | $ | 141,740 | | | $ | 128,567 | | | $ | 123,630 | | | $ | 102,769 | | |
Ratios to average net assets: | |
Expenses (c) | | | 1.12 | % | | | 1.08 | % | | | 1.11 | % | | | 1.11 | % | | | 1.09 | % | |
Net investment income | | | .38 | % | | | .17 | % | | | .37 | % | | | .47 | % | | | .40 | % | |
Portfolio turnover rate (excluding
short-term securities) | | | 14.0 | % | | | 14.4 | % | | | 23.0 | % | | | 14.9 | % | | | 21.6 | % | |
(a) Based on average shares outstanding during the year.
(b) Total return figures are based on a share outstanding throughout the period and assume reinvestment of distributions at net asset value. Total return figures do not reflect charges pursuant to the terms of the variable life insurance policies and variable annuity contracts funded by separate accounts that invest in the Fund's shares.
(c) In addition to fees and expenses which the Fund bears directly, the Fund indirectly bears a pro rata share of the fees and expenses of the acquired funds in which it invests. Such indirect expenses are not included in the above reported expense ratios.
124
Securian Funds Trust
Notes to Financial Statements
(1) Organization
Securian Funds Trust (the "Trust") is a Delaware statutory trust registered under the Investment Company Act of 1940, as amended (the 1940 Act), each of whose Funds operate as a no-load, diversified open-end management investment company, except that the SFT Delaware IvySM Growth Fund and the SFT International Bond Fund operate as non-diversified, open-end management investment companies. The Trust is a series trust that includes the Funds and share classes listed below:
Fund Name | | Share Class 1 | | Share Class 2 | |
SFT Balanced Stabilization Fund | | | NA | | | | 🗸 | | |
| SFT Core Bond Fund | | | 🗸 | | | | 🗸 | | |
SFT Delaware IvySM Growth Fund | | | NA | | | | 🗸 | | |
SFT Delaware IvySM Small Cap Growth Fund | | | NA | | | | 🗸 | | |
SFT Equity Stabilization Fund | | | NA | | | | 🗸 | | |
SFT Government Money Market Fund | | | NA | | | | 🗸 | | |
SFT Index 400 Mid-Cap Fund | | | 🗸 | | | | 🗸 | | |
| SFT Index 500 Fund | | | 🗸 | | | | 🗸 | | |
SFT International Bond Fund | | | 🗸 | | | | 🗸 | | |
SFT Real Estate Securities Fund | | | 🗸 | | | | 🗸 | | |
SFT T. Rowe Price Value Fund | | | NA | | | | 🗸 | | |
SFT Wellington Core Equity Fund | | | 🗸 | | | | 🗸 | | |
Securian Asset Management, Inc. ("Securian AM"), a wholly-owned subsidiary of Securian Financial Group, Inc. ("Securian Financial Group"), serves as the investment adviser to each of the Funds in the Trust pursuant to an investment advisory agreement between Securian AM and the Trust. The Funds' prospectus provides a detailed description of each Fund's investment objective, policies and strategies.
Class 2 shares are subject to a Rule 12b-1 distribution fee. Both classes of shares have identical voting, dividend, liquidation and other rights, and the same terms and conditions, except that Class 1 shares are not subject to a Rule 12b-1 distribution fee. Income, expenses (other than Rule 12b-1 fees) and realized and unrealized gains or losses are allocated to each class of shares based upon their relative net assets.
The Trust accounts for the assets, liabilities and operations of each Fund separately. Shares of the Funds are not offered directly to the public, but sold only to Minnesota Life Insurance Company ("Minnesota Life") and Securian Life Insurance Company ("Securian Life") in connection with Minnesota Life and Securian Life variable life insurance policies and variable annuity contracts, and to certain other separate accounts of life insurance affiliates of Minnesota Life and Securian Life, and may also be offered to certain qualified plans.
The Funds are investment companies and follow accounting and reporting guidance under Financial Accounting Standards Board (FASB) Accounting Standards Codification (ASC) Topic 946, "Financial Services—Investment Companies." The significant accounting policies followed consistently by the Trust are as follows:
Use of Estimates
The preparation of financial statements in conformity with U.S. generally accepted accounting principles (GAAP) requires management to make estimates and assumptions that affect the reported amounts of assets and liabilities, including disclosure of contingent assets and liabilities, as of the statement of assets and liabilities date and the reported amounts of revenue and expenses during the reporting period. Actual results could differ from those estimates.
125
Securian Funds Trust
Notes to Financial Statements – continued
(2) Summary of Significant Accounting Policies
Investments in Securities
Each Fund's net asset value is generally calculated as of the close of normal trading on the New York Stock Exchange (typically 3:00 p.m. Central Time). Investments in securities traded on a U.S. or foreign securities exchange are valued at the last sale price on that exchange prior to the time when assets are valued; securities traded in the over-the-counter market and listed securities for which no sale was reported on that date are valued on the basis of the last current bid price by an independent pricing service or at a price deemed best to reflect fair value quoted by dealers who make markets in these securities. The pricing service may use models that price securities based on current yields and relative security characteristics, such as coupon rate, maturity date, issuer credit quality and prepayment speeds, as applicable. When market quotations are not readily available, securities are valued at fair value as determined in good faith by Securian AM, as the Valuation Designee, in accordance with procedures approved by the Board of Trustees (the "Board") of Securian Funds Trust and in accordance with provisions of the 1940 act. The Board has delegated the daily oversight of the securities valuation function to Securian AM who ensures the valuations comply with the valuation policies and affirms the reasonableness of the fair valuation determinations. The fair valued securities are reviewed by the Board at their quarterly meetings.
A Fund's investments will also be valued at fair value by Securian AM if it determines that an event impacting the value of an investment occurred after the close of the security's primary exchange or market (for example, a foreign exchange or market) and before the time the Fund's net asset value is calculated. If a significant event impacting the value of a security or group of securities occurs, Securian AM is immediately notified and promptly determines whether fair value pricing is needed in accordance with the Fund's valuation procedures and, if so, approves the pricing methodology to be used.
Short-term securities, with the exception of those held in the SFT Government Money Market Fund, are valued at market value. Pursuant to Rule 2a-7 of the 1940 Act, all securities in the SFT Government Money Market Fund are valued at amortized cost, which approximates market value, in order to attempt to maintain a stable net asset value of $1.00 per share. However, there is no assurance the SFT Government Money Market Fund will maintain the $1.00 net asset value.
Security transactions are accounted for on the date the securities are purchased or sold. Realized gains and losses are calculated using the first in, first out basis. Paydowns of securities are recorded as receivables as of the due date, which varies by the issuer. Dividend income is recognized on the ex-dividend date or upon dividend notification for certain foreign securities, and interest income, including amortization of bond premium and accretion of bond discount computed on an effective yield basis, is accrued daily.
Foreign Currency Translations and Forward Foreign Currency Contracts
Securities and other assets and liabilities denominated in foreign currencies are translated daily into U.S. dollars at the closing rate of exchange. Foreign currency amounts related to the purchase or sale of securities, income and expenses are translated at the exchange rate on the transaction date.
Net realized foreign exchange gains or losses arise from sales and maturities of short-term securities, sales of foreign currencies, currency gains or losses realized between trade and settlement dates on security transactions, the difference between the amounts of dividends, interest and foreign withholding taxes recorded on the Fund's books and the U.S. dollar equivalent of the amounts actually received or paid. Net unrealized foreign exchange gains and losses arise from changes in the value of assets and liabilities, other than investments in securities, resulting from changes in the exchange rates.
126
Securian Funds Trust
Notes to Financial Statements – continued
(2) Summary of Significant Accounting Policies – (continued)
The Funds do not separately report changes in foreign exchange rates on investments from the fluctuations arising from changes in market prices of securities.
SFT International Bond Fund may enter into forward foreign currency exchange contracts for operational purposes and to protect against adverse exchange rate fluctuations. A forward foreign currency contract is an agreement between the Fund and a counterparty to buy or sell a foreign currency at a specific exchange rate on a future date. SFT International Bond Fund may also enter into these contracts for purposes of increasing exposure to a foreign currency or to shift exposure to foreign currency fluctuations from one country to another. The net U.S. dollar value of foreign currency underlying all contractual commitments held by SFT International Bond Fund and the resulting unrealized appreciation or depreciation are determined using foreign currency exchange rates from an independent pricing service. SFT International Bond Fund is subject to the credit risk that the other party will not complete the obligations of the contract. The fair values of the forward foreign currency exchange contracts are obtained from an independent pricing source.
Futures Transactions
To gain exposure to, or for protection from market changes, the Funds (excluding the SFT Government Money Market Fund) may buy and sell financial futures contracts traded on any U.S. or foreign exchange. The Funds may also buy and write put and call options on these futures contracts. Risks of entering into futures contracts and related options include the possibility of an illiquid market and that a change in the value of the contract or option may not correlate with changes in the value of the underlying securities.
Upon entering into a futures contract, a Fund is required to deposit either cash or securities in an amount (initial margin) equal to a certain percentage of the contract value as determined by each relevant clearing agency and is aggregated at a Futures Commission Merchant ("FCM") which is registered with the Commodity Futures Trading Commission or the applicable regulator. Subsequent payments (variation margin) are made or received by a Fund each day. The variation margin payments are equal to the daily changes in the contract value and are recorded as unrealized gains and losses. A Fund recognizes a realized gain or loss when the contract is closed or expired. In the event of default, counterparty risk is significantly reduced as creditors to the FCM do not have claim to a Fund's assets in the segregated account. For a listing of open futures contracts see the Investments in Securities for each Fund.
Options Transactions
Each Fund (excluding the SFT Government Money Market Fund) may write (i.e., sell) covered call and secured put options and purchase and sell put and call options written by others. An option is a type of derivative financial instrument. The Funds may invest in derivative financial instruments, including options, in order to manage risk or gain exposure to various other investments or markets. The risk in writing a call option is that the Fund gives up the opportunity for profit if the market price of the security increases. The risk in writing a put option is that a Fund may incur a loss if the market price of the security decreases and the option is exercised.
The risk in buying an option is that the Fund pays a premium whether or not the option is exercised. The Fund also has the additional risk of not being able to enter into a closing transaction if a liquid secondary market does not exist. Option contracts are valued daily and unrealized appreciation or depreciation is recorded. The Fund will realize a gain or loss upon expiration or closing of the option transaction. When an option is exercised, the proceeds on sales for a written call option, the purchase cost for a written put option, or the cost of a security for a purchased put or call option is adjusted by the amount of premium received or paid. The Funds designate
127
Securian Funds Trust
Notes to Financial Statements – continued
(2) Summary of Significant Accounting Policies – (continued)
collateral consisting of cash, U.S. government securities or other liquid assets sufficient to collateralize the market value of written options.
Bank Loans
The SFT Core Bond Fund may enter into bank loans. Bank loans are interests in amounts owed by corporate or other borrowers and may be in the form of loans, trade claims or other receivables and may include standby financing commitments such as revolving credit facilities that obligate the Fund to supply additional cash to the borrower on demand. Bank loans may be made directly with a borrower or acquired through assignment or participation. The Fund's right to enforce a borrower's compliance with the terms of the loan agreement, or benefit directly from the collateral supporting the loan, varies when the loan is a direct borrowing, an assignment, or a participation. Investments in bank loans may involve special risks including risk of loss in case of default, insolvency, or the bankruptcy of the borrower and are generally subject to restrictions on transfer with limited opportunities to sell them in secondary markets. The Fund may also invest in loan commitments, which are contractual obligations for a future funding. The Fund may earn a commitment fee on any unfunded portion of these commitments which is amortized to interest income over the commitment period. Both the funded portion of a loan interest as well as its unfunded commitment, if any, is reflected on the Schedule of Investments. Although typically secured, bank loans may not be backed by sufficient collateral to satisfy their issuers' obligations in the event of bankruptcy, insolvency or similar distressed scenarios. Bank loans may also be illiquid, not readily marketable, or subject to restrictions on resale.
Repurchase Agreements
Each Fund may enter into repurchase agreements with respect to securities. A repurchase agreement is a transaction in which a Fund acquires a security and simultaneously commits to resell that security to the seller (a bank or securities dealer) at an agreed-upon price on an agreed-upon date. Each Fund requires at all times that the repurchase agreement be collateralized by cash, U.S. Government securities, U.S. Government agencies securities or corporate securities having a value equal to, or in excess of, the value of the repurchase agreement. If the seller of the agreement defaults on its obligation to repurchase the underlying securities at a time when the value of those securities has declined, a Fund may incur a loss upon disposition of the securities. Repurchase agreements are carried at amortized cost. At December 31, 2022, no Funds were invested in repurchase agreements.
Federal Taxes
Each Fund, other than SFT Balanced Stabilization Fund, SFT Equity Stabilization Fund, SFT International Bond Fund, and SFT T. Rowe Price Value Fund, qualifies as a partnership for federal income tax purposes under the Internal Revenue Code of 1986, as amended (the "Code"). A Fund is treated, for federal income tax purposes, as a partnership if it has more than one shareholder. A Fund's election to be treated as a partnership is not expected to result in any material adverse federal income tax consequences to any owner of a variable annuity contract or variable life insurance policy, or in the tax treatment of any such contract or policy. As a partnership, a Fund is not subject to income tax, and any income, gains, deductions, or losses of the Fund will instead pass through and be considered for federal income tax purposes by its partners, which will be Minnesota Life and Securian Life through their respective separate accounts. SFT Balanced Stabilization Fund, SFT Equity Stabilization Fund and SFT T. Rowe Price Value Fund are treated as disregarded entities for federal income tax purposes. While the Trust anticipates that each Fund other than SFT Balanced Stabilization Fund, SFT Equity Stabilization Fund, and SFT T. Rowe Price Value Fund will always have two shareholders, Minnesota Life and Securian Life, a wholly owned subsidiary of Minnesota Life, such ownership could change and accordingly a Fund may at some time have only one shareholder and would be treated as a disregarded entity for federal income tax purposes. A disregarded entity is disregarded for federal income tax purposes as an entity separate
128
Securian Funds Trust
Notes to Financial Statements – continued
(2) Summary of Significant Accounting Policies – (continued)
from its owner, and the owner is treated as directly owning the assets of the disregarded entity and considers for federal income tax purposes the income, gains, deductions, and losses relating to those assets.
SFT International Bond Fund qualifies as a regulated investment company for federal income tax purposes. The Fund's policy is to comply with the requirements of subchapter M of the Code that are applicable to regulated investment companies and to distribute all (or a sufficient amount) of its taxable income and net capital gain to its shareholders. Therefore, no income tax provision is required.
The FASB ASC 740, "Income Taxes" (ASC 740), provides guidance for how uncertain tax positions should be recognized, measured, presented, and disclosed in the financial statements. The Funds have evaluated the implications of ASC 740 for all open tax years, and have determined there is no impact to the Funds' financial statements as of December 31, 2022. The Funds' federal and state income returns for which the applicable statutes of limitations have not expired (2019, 2020, 2021 and 2022) remain subject to examination by the Internal Revenue Service and states' department of revenue.
Net investment income (loss) and net realized gains (losses) may differ for financial statement and tax purposes primarily because of temporary book-to-tax differences.
Distributions to Shareholders
Distributions to shareholders from net investment income and realized gains (if any) for the SFT Government Money Market Fund are declared daily and reinvested at month-end in additional shares of capital stock.
Distributions to shareholders from net investment income and realized gains (if any) for the SFT International Bond Fund are generally declared and reinvested in additional shares of capital stock on an annual basis. The SFT International Bond Fund uses consent dividends in place of regular distributions. The Funds that are partnerships and disregarded entities (those funds other than SFT Government Money Market Fund and SFT International Bond Fund) are not required to and will not distribute taxable income.
The federal income tax character of distributions paid to shareholders during the fiscal year ended December 31, 2022 was as follows:
| | | December 31, 2022 | | December 31, 2021 | |
Fund | | Ordinary
Income | | Long-Term
Capital Gain | | Ordinary
Income | | Long-Term
Capital Gain | |
| SFT International Bond Fund | | $ | – | | | $ | – | | | $ | – | | | $ | – | | |
At December 31, 2022, as a result of permanent book-to-tax difference, the following reclassification adjustments were made on the Statements of Assets and Liabilities primarily relate to net operating losses:
Fund | | Paid-In Capital | | Total
Distributable
Earnings (Loss) | |
| SFT International Bond Fund | | $ | 1,226,385 | | | $ | (1,226,385 | ) | |
129
Securian Funds Trust
Notes to Financial Statements – continued
(2) Summary of Significant Accounting Policies – (continued)
Distributable Earnings
As of December 31, 2022, the components of distributable earnings on a federal income tax basis were:
Fund | | Undistributed
Ordinary Income | | Undistributed
Long-Term
Capital Gains | | Unrealized
Appreciation/
(Depreciation) | | Post October
Capital/
Late Year
Ordinary Loss | | Capital Loss
Carryforward | |
| SFT International Bond Fund | | $ | – | | | $ | – | | | $ | (9,230,747 | ) | | $ | – | | | $ | (8,990,843 | ) | |
For the year ending December 31, 2022, the SFT International Bond Fund had a foreign tax credit of $10,495 and foreign sourced income of $2,243,808.
Securities Purchased on a When-Issued or Forward Commitment Basis
Delivery and payment for securities which have been purchased or sold by a Fund on a when-issued or forward commitment basis, including To Be Announced ("TBA") securities, can take place a month or more after the transaction date. During this period, such securities are subject to market fluctuations. As of December 31, 2022, the SFT Core Bond Fund had entered into outstanding, when-issued or forward commitments, including TBA securities, at a fair value of $88,441,421.
Cross-Trades
The Funds are permitted to purchase and sell securities (i.e., "cross-trade") from and to other Funds within the Trust as well as outside of the Trust, where both accounts are managed by the same adviser or sub-adviser pursuant to "Cross-Trading" procedures adopted by the Board. These procedures have been designed to ensure that any cross-trade of securities by a respective Fund from and to another Fund that is or could be considered an affiliate of the Funds under certain limited circumstances by virtue of having a common investment adviser, common officer, or common trustee complies with Rule 17a-7 under the 1940 Act. Further, as defined under these procedures, each cross-trade is effected at the current market price to save costs where allowed. For the year ended December 31, 2022, the Funds engaged in the following cross-trades, which resulted in the following net realized gains (losses):
| | | Purchases | | Sales | | Net Realized
Gains (Losses) | |
SFT T. Rowe Price Value Fund | | $ | – | | | $ | 1,513,526 | | | $ | 615,870 | | |
(3) Investment Security Transactions
The cost of purchases and proceeds from sales of investment securities, other than temporary investments in short-term securities, for the year ended December 31, 2022 were as follows:
| | | Non-U.S. Government | | U.S. Government* | |
| | | Purchases | | Sales | | Purchases | | Sales | |
SFT Balanced Stabilization Fund | | $ | 110,556,003 | | | $ | 42,654,717 | | | $ | 52,751,922 | | | $ | 20,384,599 | | |
| SFT Core Bond Fund | | | 117,721,921 | | | | 197,685,265 | | | | 503,019,830 | | | | 465,317,493 | | |
SFT Delaware IvySM Growth Fund | | | 46,703,337 | | | | 89,647,687 | | | | – | | | | – | | |
SFT Delaware IvySM Small Cap Growth Fund | | | 98,668,777 | | | | 110,351,487 | | | | – | | | | – | | |
SFT Equity Stabilization Fund | | | 40,123,706 | | | | 37,207,763 | | | | – | | | | – | | |
SFT Index 400 Mid-Cap Fund | | | 29,640,272 | | | | 28,553,062 | | | | 997,035 | | | | 1,000,000 | | |
| SFT Index 500 Fund | | | 24,299,647 | | | | 21,373,491 | | | | – | | | | – | | |
SFT International Bond Fund | | | 32,906,754 | | | | 23,666,421 | | | | 55,679,860 | | | | 65,659,899 | | |
SFT Real Estate Securities Fund | | | 105,281,980 | | | | 117,848,870 | | | | – | | | | – | | |
SFT T. Rowe Price Value Fund | | | 367,306,195 | | | | 392,993,736 | | | | – | | | | – | | |
SFT Wellington Core Equity Fund | | | 16,716,781 | | | | 24,892,969 | | | | – | | | | – | | |
* Includes U.S. government-sponsored enterprise securities.
130
Securian Funds Trust
Notes to Financial Statements – continued
(4) Expenses and Related Party Transactions
The Trust has entered into an investment advisory agreement with Securian AM, a wholly-owned subsidiary of Securian Financial Group. Under the advisory agreement, Securian AM manages the Funds' investments and provides research, statistical and advisory services and pays related office rental and executive expenses and salaries.
Each Fund pays Securian AM an annual fee, based on average daily net assets, in the following amounts:
Fund | | Annual Fee on Net Assets | |
SFT Balanced Stabilization Fund | | 0.55% of assets to $750 million; and 0.50% of assets exceeding $750 million | |
| SFT Core Bond Fund | | 0.40% of assets to $750 million; and 0.35% of assets exceeding $750 million | |
SFT Delaware IvySM Growth Fund | | 0.67% of assets to $300 million; and 0.625% of next $200 million of assets; and 0.60% of next $500 million of assets; and 0.50% of assets exceeding $1 billion | |
SFT Delaware IvySM Small Cap Growth Fund | | 0.85% of assets to $300 million; and 0.80% of next $200 million of assets; and 0.75% of next $500 million of assets; and 0.70% of assets exceeding $1 billion | |
SFT Equity Stabilization Fund | | 0.55% of assets to $750 million; and 0.50% of assets exceeding $750 million | |
SFT Government Money Market Fund | | 0.25% of assets to $750 million; and 0.20% of assets exceeding $750 million | |
SFT Index 400 Mid-Cap Fund | | 0.15% of net assets to $1 billion; and 0.10% of net assets exceeding $1 billion | |
| SFT Index 500 Fund | | 0.15% of net assets to $1 billion; and 0.10% of net assets exceeding $1 billion | |
SFT International Bond Fund | | 0.60% of assets to $300 million; and 0.575% of next $200 million of assets; and 0.55% of next $500 million of assets; and 0.50% of assets exceeding $1 billion | |
SFT Real Estate Securities Fund | | 0.70% of assets to $300 million; and 0.675% of next $200 million of assets; and 0.65% of next $500 million of assets; and 0.60% of assets exceeding $1 billion | |
SFT T. Rowe Price Value Fund | | 0.67% of assets to $300 million; and 0.65% of next $200 million of assets; and 0.625% of next $500 million of assets; and 0.60% of assets exceeding $1 billion | |
SFT Wellington Core Equity Fund | | 0.65% of assets to $300 million; and 0.625% of next $200 million of assets; and 0.60% of next $500 million of assets; and 0.55% of assets exceeding $1 billion | |
Securian AM has entered into a sub-advisory agreement with Brandywine Global Investment Management, LLC ("Brandywine"), a wholly owned subsidiary of Franklin Resources, Inc., as sub-adviser to the SFT International Bond Fund, under which Securian AM pays Brandywine an annual fee of 0.30% based on average daily net assets.
Securian AM has entered into a sub-advisory agreement with Cohen & Steers Capital Management, Inc. ("Cohen & Steers"), as sub-adviser to the SFT Real Estate Securities Fund, under which Securian AM pays Cohen & Steers an annual fee ranging from 0.25% to 0.38% based on average daily net assets.
Securian AM has entered into a sub-advisory agreement with and Delaware Investments Fund Advisers ("DIFA"), a series of Macquarie Investment Management Business Trust, as sub-adviser to SFT Delaware IvySM Growth Fund and the SFT Delaware IvySM Call Cap Growth Fund, under which Securian AM pays DIFA an annual fee for SFT Delaware IvySM Growth Fund and the SFT Delaware IvySM Small Cap Growth Fund ranging from 0.33% to 0.55% and 0.40% to 0.82%, respectively, based on average daily net assets.
131
Securian Funds Trust
Notes to Financial Statements – continued
(4) Expenses and Related Party Transactions – (continued)
Securian AM has entered into a sub-advisory agreement with Metropolitan West Asset Management, LLC ("MetWest"), a wholly-owned subsidiary of TCW Group, Inc., as sub-adviser to SFT Core Bond Fund, under which Securian pays MetWest an annual fee ranging from 0.10% to 0.18% based on average daily net assets.
Securian AM has entered into a sub-advisory agreement with T. Rowe Price Associates, Inc. ("T. Rowe Price"), as sub-adviser to for the SFT T. Rowe Price Value Fund, under which Securian AM pays T. Rowe Price an annual fee ranging from 0.25% to 0.48% based on average daily net assets.
Securian AM has entered into a sub-advisory agreement with Wellington Management Company LLP ("Wellington Management"), as sub-adviser to for the SFT Wellington Core Equity Fund, under which Securian AM pays Wellington Management an annual fee ranging from 0.28% to 0.31% based on average daily net assets.
The Trust bears certain other operating expenses including independent trustees' fees, federal registration fees, printing and shareholder report expenses, legal fees, audit fees, custodian fees, a percentage of the compensation paid to the Trust's Chief Compliance Officer, and other miscellaneous expenses. Each Fund will pay all expenses directly related to its individual operations.
Operating expenses not attributable to a specific Fund are generally allocated based upon the proportionate daily net assets of each Fund.
Administrative Services Fee
The Trust has entered into an agreement with Securian Financial Group under which Securian Financial Group provides accounting, legal, security valuations and other administrative services. Each Fund reimburses Securian Financial Group quarterly for the actual costs incurred in performing such services, as determined in accordance with Securian Financial Group's customary cost accounting procedures consistently applied. Total quarterly administrative fees by Fund range from $4,500 to $19,000.
Accounting Services
The Trust has entered into an agreement with State Street Bank and Trust Company ("State Street") in which State Street provides daily fund accounting and investment administration services. In 2022, these fees ranged from 0.01% to 0.05% of net assets depending on the size and makeup of the respective Fund. The fees are based upon a calculation of multiple factors including base fees, size of assets, and certain other fees.
Distribution Fees
The Trust has adopted a Rule 12b-1 Distribution Plan which covers all of its Class 2 shares (each, a "Covered Fund"). Each Covered Fund pays distribution fees at the annual rate of 0.25% of the average daily net assets of the Covered Fund. These fees are paid out of the Covered Fund's assets, which reduces a Covered Fund's net assets as do other Covered Fund expenses. The fees are paid to Securian Financial Services, Inc. ("Securian Financial"), the Trust's underwriter, to pay for distribution-related expenses and activities in connection with the distribution of the Covered Fund's shares. Securian Financial may also use the fees to pay insurance companies, dealers or others for certain non-distribution services as provided for in the distribution plan.
Net Investment Income Maintenance Agreement for the SFT Government Money Market Fund
Effective May 1, 2012, the Board approved a Restated Net Investment Income Maintenance Agreement among the Trust (on behalf of SFT Government Money Market Fund), Securian AM and Securian Financial. Under such Agreement, Securian AM agrees to waive, reimburse, or pay SFT Government Money Market Fund expenses so that the Fund's daily net investment income does not fall below zero. Securian Financial may also waive its Rule 12b-1 fees. Securian AM and Securian Financial each has the option under the Agreement to recover the full amount waived, reimbursed, or paid (the "Expense Waiver") on any day on which the Fund's net
132
Securian Funds Trust
Notes to Financial Statements – continued
(4) Expenses and Related Party Transactions – (continued)
investment income exceeds zero. On any day, however, the Expense Waiver does not constitute an obligation of the Fund unless Securian AM or Securian Financial has expressly exercised its right to recover a specified portion of the Expense Waiver on that day, in which case such specified portion is then due and payable by the Fund. In addition, the right of Securian AM and/or Securian Financial to recover the Expense Waiver is subject to the following limitations: (1) if a repayment of the Expense Waiver by the Fund would cause the Fund's net investment income to fall below zero, such repayment is deferred until a date when repayment would not cause the Fund's net investment income to fall below zero; (2) the right to recover any portion of the Expense Waiver expires three years after the effective date of that portion of the Expense Waiver; and (3) any repayment of the Expense Waiver by the Fund cannot cause the Fund's expense ratio to exceed 1.25%. If Securian AM and Securian Financial exercise their rights to be paid such waived amounts, the Fund's future yield will be negatively affected for an indefinite period. The agreement runs through April 30, 2023.
As of December 31, 2022, the amounts waived and eligible for recovery are as follows:
| | | Agreement | | Advisory
Fees Waived
for the
year ended
December 31, | | 12b-1 Fees
Waived
for the
year ended
December 31, | | Excess Expense
Waived
for the
year ended
December 31, | | Total
eligible for
recovery
as of
December 31, | | Expiring December 31, | |
Fund | | Date | | 2022* | | 2022* | | 2022* | | 2022 | | 2023 | | 2024 | | 2025 | |
SFT Government
Money Market
Fund | | May 1, 2012 | | $ | 159,432 | | | $ | 159,432 | | | $ | 29,576 | | | $ | 2,327,804 | | | $ | 776,001 | | | $ | 1,203,364 | | | $ | 348,440 | | |
* This amount is reflected in fees waived in the accompanying Statements of Operations.
SFT Balanced Stabilization Fund, SFT Equity Stabilization Fund, and SFT Government Money Market Fund Expense Waivers
Securian AM and the Trust, on behalf of the SFT Balanced Stabilization Fund, SFT Equity Stabilization Fund and SFT Government Money Market Fund, have entered into seperate Expense Limitation Agreements which limit the operating expenses of these Funds, excluding certain expenses (such as interest expense, acquired fund fees, cash overdraft fees, taxes, brokerage commissions, other expenditures which are capitalized in accordance with GAAP, and other extraordinary expenses not incurred in the ordinary course of the Fund's business). The Expense Limitation Agreements for SFT Balanced Stabilization Fund and SFT Equity Stabilization Fund were terminated effective May 1, 2021. The SFT Government Money Market Fund Expense Limitation Agreement runs through April 30, 2023.
The SFT Government Money Market Expense Limitation Agreement renews annually for a full year each year thereafter unless terminated by Securian AM upon at least 30 days' notice prior to the end of a contract term. The Funds are authorized to reimburse Securian AM for management fees previously waived and/or for the cost of expenses previously paid by Securian AM pursuant to their respective Expense Limitation Agreement, provided that such reimbursement will not cause any Fund to exceed any limits in effect at the time of such reimbursement. A Fund's ability to reimburse Securian AM in this manner only applies to fees waived or reimbursements made by Securian AM within the three fiscal years prior to the date of such reimbursement. To the extent that the Fund makes such reimbursements to Securian AM, the amount of the reimbursements will be reflected in the financial statements in the Funds' shareholder reports and in Other Expenses under Fees and Expenses of the Fund in the Funds' prospectus.
133
Securian Funds Trust
Notes to Financial Statements – continued
(4) Expenses and Related Party Transactions – (continued)
As of December 31, 2022, the amounts waived and eligible for recovery are as follows:
| | | Agreement | | Expense | | Advisory Fees
Waived for the
year ended
December 31, | | Total eligible
for recovery
as of
December 31, | | Expiring December 31, | |
Fund | | Date | | Limit | | 2022* | | 2022 | | 2023 | | 2024 | | 2025 | |
SFT Balanced
Stabilization Fund | | Terminated May 1, 2021 | | | N/A | | | $ | – | | | $ | 494,720 | | | $ | 373,980 | | | $ | 120,740 | | | $ | – | | |
SFT Equity
Stabilization Fund | | Terminated May 1, 2021 | | | N/A | | | $ | – | | | $ | 361,396 | | | $ | 274,362 | | | $ | 87,034 | | | $ | – | | |
SFT Government
Money Market Fund | | November 1, 2017 | | | 0.70 | % | | $ | – | | | $ | – | | | $ | – | | | $ | – | | | $ | – | | |
* This amount is reflected in fees waived in the accompanying Statements of Operations.
(5) Illiquid Investments
Non-Money Market Funds—Pursuant to Rule 22e-4 under the 1940 Act, no Fund may acquire an "illiquid investment" if, immediately after the acquisition, the Fund would have invested more than 15% of its net assets in illiquid investments. Rule 22e-4 generally defines an illiquid investment as any investment that the Fund reasonably expects cannot be sold or disposed of in current market conditions in seven calendar days or less without the sale or disposition significantly changing the market value of the investment. At December 31, 2022, the SFT Balanced Stabilization Fund held four illiquid securities with a market value of $4,797,444, which represents 0.8% of net assets.
Government Money Market Funds—Money market funds are governed by Rule 2a-7 under the 1940 Act. By definition, a government money market fund is a fund that invests 99.5% or more of its total assets in cash, government securities, and/or repurchase agreements that are collateralized fully. Consequently, the SFT Government Money Market Fund currently limits investments in "illiquid securities" to 0.5% of net assets at the time of purchase. Rule 2a-7 defines an illiquid security as a security that cannot be sold or disposed of in the ordinary course of business within seven calendar days at approximately the value ascribed to it by the Fund. At December 31, 2022, the Fund did not hold illiquid securities.
(6) Fair Value Measurement
The Trust utilizes a three-tier hierarchy to maximize the use of observable market data and minimize the use of unobservable inputs when determining fair value. The hierarchy also establishes a classification of fair value measurements for disclosure purposes. Inputs refer broadly to the assumptions that market participants would use in pricing the asset or liability. Inputs may be observable or unobservable. Observable inputs include information market participants would use in pricing the asset or liability based on market data obtained from sources independent of the reporting entity. Unobservable inputs reflect the Trust's estimates about the assumptions market participants would use in valuing the financial asset or liability based on the best information available in the circumstances. Level 1 includes unadjusted quoted prices in active markets for identical assets and liabilities. Level 2 includes other significant observable market-based inputs (including quoted prices for similar securities, interest rates, credit risk and prepayment speed). Level 3 includes unobservable inputs, which may include the advisor's own assumptions in determining the fair value of an investment or are based on independent non-binding broker quotes. Other financial instruments are derivative instruments not reflected in total investments, such as futures, forwards, swaps, and written options.
134
Securian Funds Trust
Notes to Financial Statements – continued
(6) Fair Value Measurement – (continued)
The following is a summary of the levels used as of December 31, 2022, in valuing the Fund's assets and liabilities (please see the Investments in Securities for each Fund for a listing of all securities within each category):
| | | Fair Value Measurement at
December 31, 2022 using | | | |
Fund | | Level 1 | | Level 2 | | Level 3 | | Total | |
SFT Balanced Stabilization Fund | |
Assets | |
Government Obligations | | $ | – | | | $ | 31,010,664 | | | $ | – | | | $ | 31,010,664 | | |
Other Mortgage-Backed Securities | | | – | | | | 1,358,382 | | | | – | | | | 1,358,382 | | |
Corporate Obligations | | | – | | | | 214,352,072 | | | | – | | | | 214,352,072 | | |
Purchased Options | | | 553,957 | | | | – | | | | – | | | | 553,957 | | |
Investment Companies | | | 373,291,113 | | | | – | | | | – | | | | 373,291,113 | | |
Total Investments | | | 373,845,070 | | | | 246,721,118 | | | | – | | | | 620,566,188 | | |
Other Financial Instruments* | |
Futures Contracts | | | 1,349,336 | | | | – | | | | – | | | | 1,349,336 | | |
Liabilities | |
Other Financial Instruments* | |
Written Options | | | (91,489 | ) | | | – | | | | – | | | | (91,489 | ) | |
SFT Core Bond Fund | |
Assets | |
Government Obligations | | | – | | | | 235,235,100 | | | | – | | | | 235,235,100 | | |
Asset-Backed Securities | | | – | | | | 44,847,424 | | | | – | | | | 44,847,424 | | |
Other Mortgage-Backed Securities | | | – | | | | 54,697,341 | | | | – | | | | 54,697,341 | | |
Corporate Obligations | | | – | | | | 115,419,007 | | | | – | | | | 115,419,007 | | |
Bank Loans | | | – | | | | 9,123,419 | | | | – | | | | 9,123,419 | | |
Foreign Bonds | | | – | | | | 3,821,680 | | | | – | | | | 3,821,680 | | |
U.S. Government Obligations | | | – | | | | 53,164,838 | | | | – | | | | 53,164,838 | | |
Investment Companies | | | 19,232,086 | | | | – | | | | – | | | | 19,232,086 | | |
Total Investments | | | 19,232,086 | | | | 516,308,809 | | | | – | | | | 535,540,895 | | |
Other Financial Instruments* | |
Futures Contracts | | | 139,107 | | | | – | | | | – | | | | 139,107 | | |
Liabilities | |
Other Financial Instruments* | |
Futures Contracts | | | (35,303 | ) | | | – | | | | – | | | | (35,303 | ) | |
SFT Delaware IvySM Growth Fund | |
Assets | |
Common Stocks | | | 474,638,478 | | | | – | | | | – | | | | 474,638,478 | | |
Investment Companies | | | 3,803,470 | | | | – | | | | – | | | | 3,803,470 | | |
Total Investments | | | 478,441,948 | | | | – | | | | – | | | | 478,441,948 | | |
SFT Delaware IvySM Small Cap Growth Fund | |
Assets | |
Common Stocks | | | 136,264,883 | | | | – | | | | – | | | | 136,264,883 | | |
Investment Companies | | | 5,052,123 | | | | – | | | | – | | | | 5,052,123 | | |
Total Investments | | | 141,317,006 | | | | – | | | | – | | | | 141,317,006 | | |
135
Securian Funds Trust
Notes to Financial Statements – continued
(6) Fair Value Measurement – (continued)
| | | Fair Value Measurement at
December 31, 2022 using | | | |
Fund | | Level 1 | | Level 2 | | Level 3 | | Total | |
SFT Equity Stabilization Fund | |
Assets | |
Investment Companies | | $ | 323,932,937 | | | $ | – | | | $ | – | | | $ | 323,932,937 | | |
Purchased Options | | | 294,043 | | | | – | | | | – | | | | 294,043 | | |
Total Investments | | | 324,226,980 | | | | – | | | | – | | | | 324,226,980 | | |
Other Financial Instruments* | |
Futures Contracts | | | 191,405 | | | | – | | | | – | | | | 191,405 | | |
Liabilities | |
Other Financial Instruments* | |
Written Options | | | (48,560 | ) | | | – | | | | – | | | | (48,560 | ) | |
SFT Government Money Market Fund | |
Assets | |
U.S. Government Obligations | | | – | | | | 203,711,088 | | | | – | | | | 203,711,088 | | |
Investment Companies | | | 19,354,925 | | | | – | | | | – | | | | 19,354,925 | | |
Total Investments | | | 19,354,925 | | | | 203,711,088 | | | | – | | | | 223,066,013 | | |
SFT Index 400 Mid-Cap Fund | |
Assets | |
Common Stocks | | | 188,622,016 | | | | – | | | | – | | | | 188,622,016 | | |
Long-Term Debt Securities | | | – | | | | 989,219 | | | | – | | | | 989,219 | | |
Investment Companies | | | 8,019,722 | | | | – | | | | – | | | | 8,019,722 | | |
Total Investments | | | 196,641,738 | | | | 989,219 | | | | – | | | | 197,630,957 | | |
Liabilities | |
Other Financial Instruments* | |
Futures Contracts | | | (229,885 | ) | | | – | | | | – | | | | (229,885 | ) | |
SFT Index 500 Fund | |
Assets | |
Common Stocks | | | 970,864,008 | | | | – | | | | – | | | | 970,864,008 | | |
Investment Companies | | | 20,839,604 | | | | – | | | | – | | | | 20,839,604 | | |
Total Investments | | | 991,703,612 | | | | – | | | | – | | | | 991,703,612 | | |
Liabilities | |
Other Financial Instruments* | |
Futures Contracts | | | (540,782 | ) | | | – | | | | – | | | | (540,782 | ) | |
SFT International Bond Fund | |
Assets | |
Long-Term Debt Securities | | | – | | | | 77,881,864 | | | | – | | | | 77,881,864 | | |
Investment Companies | | | 944,622 | | | | – | | | | – | | | | 944,622 | | |
Total Investments | | | 944,622 | | | | 77,881,864 | | | | – | | | | 78,826,486 | | |
Other Financial Instruments* | |
Forward Foreign Currency Contracts | | | – | | | | 99,187 | | | | – | | | | 99,187 | | |
Liabilities | |
Other Financial Instruments* | |
Forward Foreign Currency Contracts | | | – | | | | (1,838,800 | ) | | | – | | | | (1,838,800 | ) | |
Futures Contracts | | | (160,744 | ) | | | – | | | | – | | | | (160,744 | ) | |
SFT Real Estate Securities Fund | |
Assets | |
Common Stocks | | | 113,287,567 | | | | – | | | | – | | | | 113,287,567 | | |
Investment Companies | | | 2,207,429 | | | | – | | | | – | | | | 2,207,429 | | |
Total Investments | | | 115,494,996 | | | | – | | | | – | | | | 115,494,996 | | |
136
Securian Funds Trust
Notes to Financial Statements – continued
(6) Fair Value Measurement – (continued)
| | | Fair Value Measurement at
December 31, 2022 using | | | |
Fund | | Level 1 | | Level 2 | | Level 3 | | Total | |
SFT T. Rowe Price Value Fund | |
Assets | |
Common Stocks | | $ | 182,995,735 | | | $ | – | | | $ | – | | | $ | 182,995,735 | | |
Investment Companies | | | 2,947,738 | | | | – | | | | – | | | | 2,947,738 | | |
Total Investments | | | 185,943,473 | | | | – | | | | – | | | | 185,943,473 | | |
SFT Wellington Core Equity Fund | |
Assets | |
Common Stocks | | | 107,562,644 | | | | – | | | | – | | | | 107,562,644 | | |
Investment Companies | | | 1,856,525 | | | | – | | | | – | | | | 1,856,525 | | |
Total Investments | | | 109,419,169 | | | | – | | | | – | | | | 109,419,169 | | |
* Investments in Other Financial Instruments are derivative instruments reflected in the Investment in Securities. All derivatives currently held are reflected at the gross unrealized appreciation (depreciation) on the investments.
Level 2 Measurements:
Government obligations comprised of U.S. Treasury, agency and government guaranteed fixed maturity securities – These securities are principally valued using the market approach. Valuation is based primarily on quoted prices in markets that are not active or using matrix pricing or other similar techniques using standard market observable inputs such as the benchmark U.S. Treasury yield curve, the spread of the U.S. Treasury curve for the identical security and comparable securities that are actively traded.
Asset-backed and other mortgage-backed securities comprised of RMBS, CMBS and ABS fixed maturity securities – These securities are principally valued using the market approach. Valuation is based primarily on matrix pricing or other similar techniques using standard market inputs including spreads for actively traded securities, spreads off benchmark yields, expected prepayment speeds and volumes, current and forecasted loss severity, rating, weighted average coupon, weighted average maturity, average delinquency rates, geographic region, debt-service coverage ratios and issuance-specific information including: collateral type, payment terms of the underlying assets, payment priority within the tranche, structure of the security, deal performance and vintage of loans, etc.
Corporate obligations comprised of U.S. corporate and foreign corporate fixed maturity securities – These securities are principally valued using the market and income approaches. Valuation is based primarily on quoted prices in markets that are not active, or using matrix pricing or other similar techniques that use standard market observable inputs such as benchmark yields, spreads off benchmark yields, new issuances, issuer rating, duration, and trades of identical or comparable securities. Investment grade privately placed securities are valued using discounted cash flow methodologies using standard market observable inputs, and inputs derived from, or corroborated by, market observable data including market yield curve, duration, call provisions, observable prices and spreads for similar publicly traded or privately traded issues that incorporate the credit quality and industry sector of the issuer.
Long-term and short-term debt securities comprised of foreign government and state and political subdivision fixed maturity securities – These securities are principally valued using the market approach. Valuation is based primarily on matrix pricing or other similar techniques using standard market observable inputs including benchmark U.S. Treasury or other yields, issuer ratings, broker-dealer quotes, issuer spreads and reported trades of similar securities, including those within the same sub-sector or with a similar maturity or credit rating.
137
Securian Funds Trust
Notes to Financial Statements – continued
(6) Fair Value Measurement – (continued)
Bank Loans – These securities are generally valued by independent pricing services based on the average of quoted prices received from multiple dealers or valued relative to other benchmark securities when broker-dealer quotes are unavailable. These quoted prices are based on interest rates, yield curves, option adjusted spreads, credit spreads and/or other criteria. To the extent that these inputs are observable, the values of Bank Loans are categorized as Level 2. To the extent that these inputs are unobservable, the values are categorized as Level 3.
Forward Foreign Currency – These derivatives are traded in the over-the-counter derivative market and are principally valued using market price quotations or industry recognized modeling techniques. The significant inputs to the models are observable in the market or can be derived from or corroborated by observable market data. These significant inputs may include interest rates, foreign currency exchange rates, interest rate curves, contractual terms, market prices, and measures of volatility.
The Funds' policy is to recognize transfers between the levels as of the end of the period. There were no transfers of financial assets between Levels 1, 2 and 3 during the period.
(7) Derivative Instruments Reporting
The Trust provides, when applicable, disclosures of the location, by line item, of fair value amounts in the Statement of Assets and Liabilities and the location, by line item, of amounts of gains and losses reported in the Statement of Operations. The derivative instruments outstanding as of period end are disclosed in the Investments in Securities. The following tables represent the average monthly volume of the Fund's derivative transactions during the year ended December 31, 2022:
| | | Average
Notional Amount | |
SFT Balanced Stabilization Fund | |
Futures contracts | | $ | 86,871,755 | (a) | |
Purchased options contracts | | | 1,145,765 | | |
Written options contracts | | | (159,218 | )(a) | |
SFT Core Bond Fund | |
Futures contracts | | $ | 123,895,092 | (a) | |
SFT Equity Stabilization Fund | |
Futures contracts | | $ | 47,909,095 | | |
Purchased options contracts | | | 782,368 | | |
Written options contracts | | | (98,883 | ) | |
SFT Index 400 Mid-Cap Fund | |
Futures contracts | | $ | 10,677,079 | | |
SFT Index 500 Fund | |
Futures contracts | | $ | 23,195,450 | | |
SFT International Bond Fund | |
Futures contracts | | $ | 11,246,030 | | |
Forward foreign currency contracts | | | 56,177,789 | | |
(a) Positions were open for eleven months during the period.
Equity derivatives were purchased or sold to manage the SFT Index 400 Mid-Cap and SFT Index 500 Funds' shareholder liquidity and to attempt to replicate intended stock investments to maintain fully invested Funds. Equity index options are utilized by the SFT Balanced Stabilization Fund and the SFT Equity Stabilization Fund to manage the equity exposure while attempting to reduce the volatility and risk of the Funds.
138
Securian Funds Trust
Notes to Financial Statements – continued
(7) Derivative Instruments Reporting – (continued)
Interest rate derivatives were purchased or sold in the SFT Core Bond Fund and SFT International Bond Fund to both manage the average duration of the fixed income portfolio and to hedge against the effects of interest rate changes on a portfolio's current or intended investments.
Foreign exchange derivatives were used to attempt to hedge against the effects of exchange rate changes within the SFT International Bond Fund's current or intended investments in foreign securities, as well as to more efficiently obtain exposure to foreign currencies or to take advantage of cross currency markets in order to benefit from valuation differentials and shifts in pricing within the currency markets.
The tables below detail the risk exposure of each Fund from derivative instruments:
| | | Risk Exposure | |
| | | Equity
Contracts | | Interest
Rate
Contracts | | Foreign
Exchange
Contracts | |
SFT Balanced Stabilization Fund | |
Fair Value of Derivative Instruments on the Statement of Assets and Liabilities
as of December 31, 2022 | |
Assets: | |
Investments in securities, at market value (purchased options) | | $ | 553,957 | | | $ | – | | | $ | – | | |
Variation margin on futures contracts* | | | 1,349,336 | | | | – | | | | – | | |
Total | | $ | 1,903,293 | | | $ | – | | | $ | – | | |
Liabilities: | |
Written options contracts | | $ | (91,489 | ) | | $ | – | | | $ | – | | |
The Effect of Derivative Instruments on the Statement of Operations
for the year ended December 31, 2022 | |
Net Realized Gain (Loss) on Derivatives: | |
Futures contracts | | $ | 5,062,663 | | | $ | – | | | $ | – | | |
Purchased options contracts | | | 1,301,206 | | | | – | | | | – | | |
Written options contracts | | | 424,854 | | | | – | | | | – | | |
Total | | $ | 6,788,723 | | | $ | – | | | $ | – | | |
Net Change in Unrealized Appreciation (Depreciation) on Derivatives: | |
Futures contracts | | $ | 1,349,336 | | | $ | – | | | $ | – | | |
Purchased options contracts | | | (239,605 | ) | | | – | | | | – | | |
Written options contracts | | | 187,588 | | | | – | | | | – | | |
Total | | $ | 1,297,319 | | | $ | – | | | $ | – | | |
139
Securian Funds Trust
Notes to Financial Statements – continued
(7) Derivative Instruments Reporting – (continued)
| | | Risk Exposure | |
| | | Equity
Contracts | | Interest
Rate
Contracts | | Foreign
Exchange
Contracts | |
SFT Core Bond Fund | |
Fair Value of Derivative Instruments on the Statement of Assets and Liabilities
as of December 31, 2022 | |
Assets: | |
Variation margin on futures contracts* | | $ | – | | | $ | 139,107 | | | $ | – | | |
Liabilities: | |
Variation margin on futures contracts* | | $ | – | | | $ | (35,303 | ) | | $ | – | | |
The Effect of Derivative Instruments on the Statement of Operations
for the year ended December 31, 2022 | |
Net Realized Gain (Loss) on Derivatives: | |
Futures contracts | | $ | – | | | $ | (2,784,352 | ) | | $ | – | | |
Net Change in Unrealized Appreciation (Depreciation) on Derivatives: | |
Futures contracts | | $ | – | | | $ | 44,662 | | | $ | – | | |
SFT Equity Stabilization Fund | |
Fair Value of Derivative Instruments on the Statement of Assets and Liabilities
as of December 31, 2022 | |
Assets: | |
Investments in securities, at market value (purchased options) | | $ | 294,043 | | | $ | – | | | $ | – | | |
Variation margin on futures contracts* | | | 191,405 | | | | – | | | | – | | |
Total | | $ | 485,448 | | | $ | – | | | $ | – | | |
Liabilities: | |
Written options contracts | | $ | (48,560 | ) | | $ | – | | | $ | – | | |
The Effect of Derivative Instruments on the Statement of Operations
for the year ended December 31, 2022 | |
Net Realized Gain (Loss) on Derivatives: | |
Futures contracts | | $ | (10,514,880 | ) | | $ | – | | | $ | – | | |
Purchased options contracts | | | 1,371,581 | | | | – | | | | – | | |
Written options contracts | | | 568,144 | | | | – | | | | – | | |
Total | | $ | (8,575,155 | ) | | $ | – | | | $ | – | | |
Net Change in Unrealized Appreciation (Depreciation) on Derivatives: | |
Futures contracts | | $ | 266,391 | | | $ | – | | | $ | – | | |
Purchased options contracts | | | (128,584 | ) | | | – | | | | – | | |
Written options contracts | | | 99,660 | | | | – | | | | – | | |
Total | | $ | 237,467 | | | $ | – | | | $ | – | | |
140
Securian Funds Trust
Notes to Financial Statements – continued
(7) Derivative Instruments Reporting – (continued)
| | | Risk Exposure | |
| | | Equity
Contracts | | Interest
Rate
Contracts | | Foreign
Exchange
Contracts | |
SFT Index 400 Mid-Cap Fund | |
Fair Value of Derivative Instruments on the Statement of Assets and Liabilities
as of December 31, 2022 | |
Liabilities: | |
Variation margin on futures contracts* | | $ | (229,885 | ) | | $ | – | | | $ | – | | |
The Effect of Derivative Instruments on the Statement of Operations
for the year ended December 31, 2022 | |
Net Realized Gain (Loss) on Derivatives: | |
Futures contracts | | $ | (1,780,923 | ) | | $ | – | | | $ | – | | |
Net Change in Unrealized Appreciation (Depreciation) on Derivatives: | |
Futures contracts | | $ | (432,355 | ) | | $ | – | | | $ | – | | |
SFT Index 500 Fund | |
Fair Value of Derivative Instruments on the Statement of Assets and Liabilities
as of December 31, 2022 | |
Liabilities: | |
Variation margin on futures contracts* | | $ | (540,782 | ) | | $ | – | | | $ | – | | |
The Effect of Derivative Instruments on the Statement of Operations
for the year ended December 31, 2022 | |
Net Realized Gain (Loss) on Derivatives: | |
Futures contracts | | $ | (4,074,989 | ) | | $ | – | | | $ | – | | |
Net Change in Unrealized Appreciation (Depreciation) on Derivatives: | |
Futures contracts | | $ | (1,244,501 | ) | | $ | – | | | $ | – | | |
SFT International Bond Fund | |
Fair Value of Derivative Instruments on the Statement of Assets and Liabilities
as of December 31, 2022 | |
Assets: | |
Unrealized appreciation on forward foreign currency contracts | | $ | – | | | $ | – | | | $ | 99,187 | | |
Liabilities: | |
Unrealized depreciation on forward foreign currency contracts | | $ | – | | | $ | – | | | $ | (1,838,800 | ) | |
Variation margin on futures contracts* | | | – | | | | (160,744 | ) | | | – | | |
Total | | $ | – | | | $ | (160,744 | ) | | $ | (1,838,800 | ) | |
The Effect of Derivative Instruments on the Statement of Operations
for the year ended December 31, 2022 | |
Net Realized Gain (Loss) on Derivatives: | |
Foreign currency contracts | | $ | – | | | $ | – | | | $ | 2,059,228 | | |
Futures contracts | | | – | | | | (2,999,704 | ) | | | – | | |
Total | | $ | – | | | $ | (2,999,704 | ) | | $ | 2,059,228 | | |
Net Change in Unrealized Appreciation (Depreciation) on Derivatives: | |
Foreign currency contracts | | $ | – | | | $ | – | | | $ | (1,987,630 | ) | |
Futures contracts | | | – | | | | (44,386 | ) | | | – | | |
Total | | $ | – | | | $ | (44,386 | ) | | $ | (1,987,630 | ) | |
* Includes cumulative appreciation/depreciation of futures contracts as reported in the notes to the Schedules of Investments in Securities. Only the current day's variation margin is reported within the Statement of Assets and Liabilities.
141
Securian Funds Trust
Notes to Financial Statements – continued
(7) Derivative Instruments Reporting – (continued)
The Funds may be exposed to credit-related losses in the event of nonperformance by counterparties to derivative financial instruments. The Funds manage credit risk related to derivatives by entering into transactions with highly rated counterparties. Generally, the current credit exposure of the derivative contracts is limited to the positive estimated fair value of derivative contracts at the reporting date after taking into consideration the existence of netting arrangements and any collateral received pursuant to credit support annexes. Because exchange traded derivatives are purchased through regulated exchanges and positions are settled regularly, the Funds have minimal exposure to credit-related losses in the event of nonperformance by counterparties to such derivative instruments. For the year ended December 31, 2022, none of the Funds' derivatives were subject to master netting arrangements.
(8) Affiliated Ownership
The SFT Balanced Stabilization Fund invests in underlying securities and other investment companies, of which certain underlying funds (affiliated underlying funds) may be deemed to be under common control with the SFT Balanced Stabilization Fund because they share the same investment advisor, Securian AM, and because they are overseen by the same Board. The SFT Balanced Stabilization Fund achieves its equity exposure by investing primarily in Class 1 Shares of the SFT Index 500 Fund, an affiliated fund in the Trust that seeks investment results that correspond generally to the price and yield performance of the common stocks included in the Standard & Poor's 500® Index. A summary of all transactions with the affiliated SFT Index 500 Fund as of December 31, 2022 are as follows:
| | | | | | | As of December 31, 2022 | |
Fund/Underlying Fund | | Beginning Value
as of
January 1, 2022 | | Change in
Unrealized
Appreciation/
Depreciation | | Ending
Value | | Share
Balance | |
SFT Balanced Stabilization Fund | |
| SFT Index 500 Fund | | $ | 287,214,638 | | | $ | (52,479,679 | ) | | $ | 234,734,959 | | | | 14,224,618 | | |
(9) Other Risks
The Funds can invest in securities of foreign issuers, which may subject them to investment risks not normally associated with investing in U.S. securities. Significant market disruptions, such as those caused by pandemics (e.g., COVID-19 pandemic), natural or environmental disasters, war (e.g., Russia's invasion of Ukraine), acts of terrorism, or other events, can adversely affect local and global markets and normal market operations.
(10) Subsequent Events
Management has evaluated subsequent events for the Trust through the date of the filing, and has concluded there were no material events that would require disclosure.
142
Securian Funds Trust
Other Information
(unaudited)
Fund Expenses Paid by Shareholders
Shareholders of the Trust incur two types of costs: (1) transaction costs, including sales charges (loads) on purchase payments, reinvested dividends, or other distributions; redemption fees; (the Trust does not impose transaction costs, but you will incur such costs in connection with the variable life insurance policies and variable annuity contracts that invest in the Funds) and exchange fees; and (2) ongoing costs, including management fees; distribution and/or service (12b-1) fees; and other Trust expenses. The examples below are intended to help you understand your ongoing costs (in dollars) of investing in the Funds and to compare these costs with the ongoing costs of investing in other mutual funds.
The examples below are based on an investment of $1,000 invested at the beginning of the period and held for the entire period, July 1, 2022 through December 31, 2022. Expenses paid during the period in the tables below are equal to the Fund's annualized expense ratio, multiplied by the average account value over the period, multiplied by number of days in most recent fiscal half-year divided by 365 to reflect the entire year.
Actual Expenses
The table below provides information about actual account values and actual expenses for the Funds. You may use the information in this table, together with the amount you invested, to estimate the expenses that you paid over the period. Simply divide your account value by $1,000 (for example, an $8,600 account value divided by $1,000 = 8.6), then multiply the result by the number in the table for the fund you own under the heading entitled "Expenses Paid During Period" to estimate the expenses you paid on your account during this period.
| | | Actual Expenses | |
| | | CLASS 1 | | CLASS 2 | |
| | | Beginning
Account
Value | | Ending
Account
Value | | Annual
Expense
Ratio | | Expenses
Paid During
Period | | Ending
Account
Value | | Annual
Expense
Ratio | | Expenses
Paid During
Period | |
SFT Balanced Stabilization Fund | | $ | 1,000 | | | | NA | | | | NA | | | | NA | | | $ | 997.90 | | | | 0.86 | % | | $ | 4.33 | | |
| SFT Core Bond Fund | | | 1,000 | | | $ | 955.90 | | | | 0.51 | % | | $ | 2.51 | | | | 954.50 | | | | 0.76 | % | | | 3.74 | | |
SFT Delaware IvySM Growth Fund | | | 1,000 | | | | NA | | | | NA | | | | NA | | | | 998.20 | | | | 0.97 | % | | | 4.89 | | |
SFT Delaware IvySM Small Cap
Growth Fund | | | 1,000 | | | | NA | | | | NA | | | | NA | | | | 1,001.90 | | | | 1.29 | % | | | 6.51 | | |
SFT Equity Stabilization Fund | | | 1,000 | | | | NA | | | | NA | | | | NA | | | | 1,003.70 | | | | 0.89 | % | | | 4.49 | | |
SFT Government Money Market
Fund | | | 1,000 | | | | NA | | | | NA | | | | NA | | | | 1,010.90 | | | | 0.64 | % | | | 3.24 | | |
SFT Index 400 Mid-Cap Fund | | | 1,000 | | | | 1,078.50 | | | | 0.30 | % | | | 1.57 | | | | 1,077.10 | | | | 0.55 | % | | | 2.88 | | |
| SFT Index 500 Fund | | | 1,000 | | | | 1,022.00 | | | | 0.20 | % | | | 1.02 | | | | 1,020.80 | | | | 0.45 | % | | | 2.29 | | |
SFT International Bond Fund | | | 1,000 | | | | 973.40 | | | | 1.04 | % | | | 5.17 | | | | 972.10 | | | | 1.29 | % | | | 6.41 | | |
SFT Real Estate Securities Fund | | | 1,000 | | | | 926.00 | | | | 0.92 | % | | | 4.47 | | | | 924.80 | | | | 1.17 | % | | | 5.68 | | |
SFT T. Rowe Price Value Fund | | | 1,000 | | | | NA | | | | NA | | | | NA | | | | 1,036.80 | | | | 1.09 | % | | | 5.60 | | |
SFT Wellington Core Equity Fund | | | 1,000 | | | | 1,022.40 | | | | 0.88 | % | | | 4.49 | | | | 1,021.10 | | | | 1.13 | % | | | 5.76 | | |
143
Securian Funds Trust
Other Information – continued
(unaudited)
Hypothetical Example for Comparison Purposes
The table below also provides information about hypothetical account values and hypothetical expenses based on the Funds' actual expense ratios and an assumed rate of return of 5% per year before expenses, which are not the Funds' actual returns. The hypothetical account values and expenses may not be used to estimate the actual ending account balance or expenses you paid for the year. You may use this information to compare the ongoing costs of investing in the Funds' and other funds. To do so, compare the 5% hypothetical example of the funds you own with the 5% hypothetical examples that appear in the shareholder reports of other similar funds.
| | | Hypothetical Expenses | |
| | | CLASS 1 | | CLASS 2 | |
| | | Beginning
Account
Value | | Ending
Account
Value | | Annual
Expense
Ratio | | Expenses
Paid During
Period | | Ending
Account
Value | | Annual
Expense
Ratio | | Expenses
Paid During
Period | |
SFT Balanced Stabilization Fund | | $ | 1,000 | | | | NA | | | | NA | | | | NA | | | $ | 1,020.87 | | | | 0.86 | % | | $ | 4.38 | | |
| SFT Core Bond Fund | | | 1,000 | | | $ | 1,022.63 | | | | 0.51 | % | | $ | 2.60 | | | | 1,021.37 | | | | 0.76 | % | | | 3.87 | | |
SFT Delaware IvySM Growth Fund | | | 1,000 | | | | NA | | | | NA | | | | NA | | | | 1,020.32 | | | | 0.97 | % | | | 4.94 | | |
SFT Delaware IvySM Small Cap
Growth Fund | | | 1,000 | | | | NA | | | | NA | | | | NA | | | | 1,018.70 | | | | 1.29 | % | | | 6.56 | | |
SFT Equity Stabilization Fund | | | 1,000 | | | | NA | | | | NA | | | | NA | | | | 1,020.72 | | | | 0.89 | % | | | 4.53 | | |
SFT Government Money Market
Fund | | | 1,000 | | | | NA | | | | NA | | | | NA | | | | 1,021.98 | | | | 0.64 | % | | | 3.26 | | |
SFT Index 400 Mid-Cap Fund | | | 1,000 | | | | 1,023.69 | | | | 0.30 | % | | | 1.53 | | | | 1,022.43 | | | | 0.55 | % | | | 2.80 | | |
| SFT Index 500 Fund | | | 1,000 | | | | 1,024.20 | | | | 0.20 | % | | | 1.02 | | | | 1,022.94 | | | | 0.45 | % | | | 2.29 | | |
SFT International Bond Fund | | | 1,000 | | | | 1,019.96 | | | | 1.04 | % | | | 5.30 | | | | 1,018.70 | | | | 1.29 | % | | | 6.56 | | |
SFT Real Estate Securities Fund | | | 1,000 | | | | 1,020.56 | | | | 0.92 | % | | | 4.69 | | | | 1,019.31 | | | | 1.17 | % | | | 5.96 | | |
SFT T. Rowe Price Value Fund | | | 1,000 | | | | NA | | | | NA | | | | NA | | | | 1,019.71 | | | | 1.09 | % | | | 5.55 | | |
SFT Wellington Core Equity Fund | | | 1,000 | | | | 1,020.77 | | | | 0.88 | % | | | 4.48 | | | | 1,019.51 | | | | 1.13 | % | | | 5.75 | | |
Please note that the expenses shown in both tables are meant to highlight your ongoing costs only and do not reflect any transactional costs, such as sales charges (loads), redemption fees, or exchange fees. Therefore, the information provided in the hypothetical example table is useful in comparing ongoing costs only and will not help you determine the relative total costs of owning different funds. In addition, if these transactional costs were included, your costs would have been higher.
Proxy Voting Policies and Procedures
A description of the policies and procedures that Securian AM uses to vote proxies related to each Fund's portfolio securities is set forth in the Trust's Statement of Additional Information which is available without charge, upon request, by calling, toll-free, 800-995-3850 or on the Securities and Exchange Commission's ("SEC") website at www.sec.gov. The Trust will provide this document within three business days of receipt of a request, by first-class mail or other means designed to ensure equally prompt delivery.
Proxy Voting Record
The Trust's proxy voting record for the 12 month period ended June 30 is available by calling, toll-free, 866-330-7355 or on the SEC's website at www.sec.gov no later than August 31 each year. The Trust will also provide this information, within three business days of receipt of a request, by first-class mail or other means designed to ensure equally prompt delivery.
Availability of Quarterly Schedule of Investments
The Trust files its complete schedule of investment holdings with the SEC for the first and third quarters of each fiscal year on Form N-PORT. The Trust's Form N-PORT are available on the SEC's website at www.sec.gov.
144
Securian Funds Trust
Statement Regarding Liquidity Risk Management Program
(unaudited)
The following statement discusses the operation and effectiveness of the Funds' liquidity risk management program for the period from January 1, 2022 through December 31, 2022 and describes the Board's review of the Funds' liquidity risk management program that took place during the six-month period ended June 30, 2022.
The Funds have adopted a Liquidity Risk Management Program (the "LRM Program"). The Funds' Board has appointed the Securian AM Liquidity Risk Oversight Committee (the "Committee") as the administrator of the LRM Program. In its capacity as program administrator, the Committee oversees and monitors the LRM Program for the Funds. In addition, the Committee assesses and manages the Funds' liquidity risk, which is the risk that a Fund could not meet requests to redeem shares issued by the Fund without significant dilution of remaining investors' interests in the Fund. The Committee assesses and manages liquidity risk by classifying and reviewing periodically the classification of Fund investments for liquidity risk management purposes; reporting periodically to the Board on Fund liquidity risk and the status of the LRM Program; and determining the policies, procedures and controls necessary to create and maintain the LRM Program, among other means. The Committee's process of determining the degree of liquidity of the Funds' investments is supported by one or more third-party liquidity assessment vendors.
The Funds' Board reviewed a report prepared by the Committee to address the operation of the LRM Program, assess its adequacy and effectiveness of implementation, including (if applicable), the operation of the highly liquid investment minimum and any material changes to the LRM Program for the period from January 1, 2022 through December 31, 2022 (the "Covered Period"). To prepare this report, the Committee discussed the operation and effectiveness of the Funds' third-party liquidity assessment services in light of the liquidity risks posed by each Fund. Additionally, the Committee reviewed portfolio managers' responses to the LRM Program's Annual Liquidity Risk Assessment Review Checklist for each Fund. As a result of its review, the Committee reported the following to the Board:
— The Funds' LRM Program operated effectively during the Covered Period, was adequately designed and was effectively implemented.
— Because each Fund primarily holds assets that are highly liquid investments, the Funds do not have highly liquid investments minimums. It is expected each Fund will continue to primarily hold assets that are highly liquid investments for the foreseeable future.
— There were no material changes to the LRM Program during the Covered Period.
— There were no breaches of any Fund's restriction on holding greater than 15% illiquid assets.
145
Securian Funds Trust
Trustees and Executive Officers
(unaudited)
Under Delaware law, the Board of Trustees of the Trust has overall responsibility for managing the Trust in good faith and in a manner reasonably believed to be in the best interests of the Trust. The Trustees meet periodically throughout the year to oversee the Trust's activities, review contractual arrangements with companies that provide services to the Trust, and review the performance of the Trust and its Funds. One of the six current Trustees is considered an "interested person" (as defined in the Investment Company Act of 1940) of the Trust. The other five Trustees, because they are not interested persons of the Trust, are considered independent ("Independent Trustees") and are not employees or officers of, and have no financial interest in, the Trust's investment adviser, Securian Asset Management, Inc. ("Securian AM") or its affiliated companies, including Minnesota Life Insurance Company.
Only executive officers and other officers who perform policy-making functions with the Trust are listed. Each Trustee serves for an indefinite term, until his or her resignation, death or removal.
The Funds' Statement of Additional Information contains additional information about the Funds' Trustees and is available without charge upon request, by calling, toll free, 800-995-3850.
Name, Address(1)
and Age | | Position(s)
Held Within
the Trust | | Term of Office and
Length of Time
Served(2) | |
Principal Occupation(s)
During the Last 5 Years | | Other Directorships
Held During Past
5 Years by Trustee | |
Independent Trustees | | | | | | | | | |
Julie K. Gethell
Year of birth: 1954 | | Trustee | | Since 2011 | | Retired; Senior Financial Consultant Cargill, 2009-2012; Chief Financial Officer, La Grosse Global Fund Services, 2007-2009; Senior Managing Director, Black River Asset Management, 2005-2007; Consultant, Black River Asset Management, 2004-2005; Chief Financial Officer, Prestige Resorts & Destinations, 2001-2003; Chief Operating Officer, Insight Investment Management, Inc., 1991-1996; Chartered Financial Analyst; CPA—inactive | | None | |
Brian E. Gustafson
Year of birth: 1967 | | Trustee | | Since 2022 | | Managing Director, Investments, Tonkawa, from 2001 to present; Chartered Financial Analyst | | None | |
146
Securian Funds Trust
Trustees and Executive Officers – continued
(unaudited)
Name, Address(1)
and Age | | Position(s)
Held Within
the Trust | | Term of Office and
Length of Time
Served(2) | |
Principal Occupation(s)
During the Last 5 Years | | Other Directorships
Held During Past
5 Years by Trustee | |
Independent Trustees — continued | | | | | | | | | |
Linda L. Henderson
Year of birth: 1949 | | Trustee | | Since 2007 | | Retired: Professional Adviser, Carlson School of Management, working with faculty and MBA students managing Carlson Growth Fund. Semi-retirement, 2004-2007. RBC Wealth Management (formerly Dain Bosworth and Dain Rauscher) 1985-2004. Senior Vice President and Director of Fixed Income Research and Strategies, 2000-2004. Director of Retail Fixed Income. 1996-2000. Director of Financial Services, 1994-1996. Manager of the Investment Management Group, 1992-1994. Consultant, Investment Management Group, 1991-1992. Investment Executive, 1985-1991. Assistant Professor of Business Administration/Finance, University of Wisconsin-River Falls, 1980-1985. Chartered Financial Analyst | | None | |
Wan-Chong Kung
Year of birth: 1960 | | Trustee | | Since 2022 | | Retired; Portfolio Manager, Nuveen Asset Management, LLC, from 2011-2019 | | Federal Home Loan Bank of Des Moines, 2022-present; Trust for Advised Portfolios, 2020-present | |
William C. Melton
Year of birth: 1947 | | Trustee | | Since 2002 | | Retired; member, State of Minnesota Council of Economic Advisors from 1988 to 1994, and again from 2010 to the present; various senior positions at American Express Financial Advisors (formerly Investors Diversified Services and, thereafter, IDS/American Express) from 1982 through 1997, including Chief Economist and, thereafter, Chief International Economist | | None | |
147
Securian Funds Trust
Trustees and Executive Officers – continued
(unaudited)
Name, Address(1)
and Age | | Position(s)
Held Within
the Trust | | Term of Office and
Length of Time
Served(2) | |
Principal Occupation(s)
During the Last 5 Years | | Other Directorships
Held During Past
5 Years by Trustee | |
Interested Trustee | | | | | | | | | |
David M. Kuplic
Year of birth: 1957 | | Trustee, President and Principal Executive Officer | | Trustee since 2016, President and Principal Excutive Officer since since 2011 | | Retired; Senior Vice President, Minnesota Life Insurance Company from June 2007 to June 2021; President and CEO, Securian AM from November 2017 to June 2021; Senior Vice President and Director, Advantus Capital Management, Inc., February 2006 to November 2017; Senior Vice President, Securian Financial Group, Inc. from June 2007 to June 2021; Senior Vice President, Securian Life Insurance Company from June 2007 to June 2021; President and Director, Marketview Properties, LLC (entity holding real estate assets) from January 2010 to June 2021; President and Director, Marketview Properties II, LLC (entity holding real estate assets) from March 2010 to June 2021; President and Director, Marketview Properties III, LLC (entity holding real estate assets) from January 2012 to June 2021; President and Director, Marketview Properties IV, LLC (entity holding real estate assets) from January 2012 to June 2021 | | None | |
148
Securian Funds Trust
Trustees and Executive Officers – continued
(unaudited)
Name, Address(1)
and Age | | Position(s)
Held Within
the Trust | | Term of Office and
Length of Time
Served(2) | |
Principal Occupation(s)
During the Last 5 Years | |
Other Executive Officers(3) | | | | | | | |
Kevin L. Ligtenberg
Year of birth: 1973 | | Vice President and Treasurer | | Since 2021 | | Vice President, Director of Investment Operations, Securian AM since August 2021; Director of Investment Operations, Securian AM from May 2021 to July 2021; Manager of Investment Operations, Securian AM from March 2013 to May 2021 | |
Christopher B. Owens
Year of birth: 1977 | | Vice President | | Since 2020 | | Second Vice President—Retail Life and Annuity Sales, Securian Financial Group, Inc. since June 2018; National Sales Vice President—Retail Life and Annuity Sales, Securian Financial Group, Inc., October 2011 to June 2018 | |
Paul Jason Thibodeaux
Year of birth: 1979 | | Secretary | | Since 2021 | | Vice President, Assistant General Counsel, Securian AM since June, 2022; Senior Investment Counsel, Securian AM from January, 2018 to May 2022; Attorney, Gray Plant Mooty (now known as Lathrop GPM, LLP) from 2014 to 2018 | |
(1) Unless otherwise noted, the address of each Trustee and officer is the address of the Trust: 400 Robert Street North, St. Paul, Minnesota 55101.
(2) The years reflect when a person became a director or officer of Advantus Series Fund, the predecessor to the Trust.
(3) Although not a corporate officer of the Trust, Michael T. Steinert, born in 1975, has served as the Trust's Chief Compliance Officer since August 2017. Mr. Steinert is also Senior Vice President, Chief Operating Officer, Treasurer and Chief Compliance Officer of Securian AM.
149
(This page has been left blank intentionally.)
(This page has been left blank intentionally.)
(This page has been left blank intentionally.)
This offering is available through Securian Financial Services, Inc., a registered broker/dealer. Securian Financial Services, Inc. is the distributor of Minnesota Life and Securian Life variable insurance products.
This report may be used as sales literature in connection with the offer or sale of variable annuity or variable life insurance contracts funded by Securian Funds Trust ("Trust") if preceded or accompanied by (a) the current prospectus for the Trust and such contracts and (b) the current applicable variable annuity or variable life performance report.

Securian Financial Services, Inc.
www.securian.com
Securities Dealer, Member FINRA/SIPC.
Registered Investment Advisor
400 Robert Street North, St. Paul, MN 55101-2098
1.888.237.1838
F38897 Rev 2-2023
Minnesota Life Insurance Company
A Securian Company
Securian Life Insurance Company
A New York admitted insurer
400 Robert Street North
St. Paul, MN 55101-2098
PRESORTED STANDARD
U.S. POSTAGE PAID
CAROL STREAM, IL
PERMIT NO. 1480

©2022 Securian Funds Trust All rights reserved.
F38897 Rev 2-2023
Call 1-800-995-3850 to receive your financial documents electronically. It's fast and convenient.
ITEM 2. CODE OF ETHICS.
Filed herewith as Exhibit 12(a)(1). During the period covered by this report, there has been no amendment to the code of ethics that relates to any element of the code of ethics definition set forth in paragraph (b) of Item 2 of Form N-CSR, nor has the registrant granted a waiver, including an implicit waiver, from a provision of the code of ethics to the registrant’s principal executive officer, principal financial officer, principal accounting officer or controller, or persons performing similar functions that relates to one or more of the items set forth in paragraph (b) of Item 2 of form N-CSR.
ITEM 3. AUDIT COMMITTEE FINANCIAL EXPERT.
The Board of Trustees of the Trust has determined that Julie K. Getchell, a member of the Board's Audit Committee, possesses the technical attributes identified in Instruction 2(b) of Item 3 to Form N-CSR to qualify as an "audit committee financial expert," and has designated Ms. Getchell as the Audit Committee's financial expert. Ms. Getchell is an "independent" Trustee pursuant to paragraph (a)(2) of Item 3 to Form N-CSR.
ITEM 4. PRINCIPAL ACCOUNTANT FEES AND SERVICES.
(a) Audit Fees
The aggregate fees billed for each of the last two fiscal years for professional services rendered by the principal accountant to the registrant for the audit of the registrant's annual financial statements or services that are normally provided by the accountant in connection with statutory and regulatory filings or engagements for those fiscal years were as follows:
| | 2022 | | | | 2021 | |
| $ | 362,000 | | | $ | 333,668 | |
(b) Audit-Related Fees
The aggregate fees billed in each of the last two fiscal years for assurance and related services rendered by the principal accountant to the registrant that are reasonably related to the performance of the audit of the registrant's financial statements and are not reported under paragraph (a) of this Item 4 were as follows:
There were no fees billed in each of the last two fiscal years for assurance and related services rendered by the principal accountant to the registrant's investment adviser or to any entity controlling, controlled by or under common control with the investment adviser that provides ongoing services to the registrant that were required to be pre-approved by the audit committee pursuant to paragraph (c)(7)(ii) of Rule 2-01 of Regulation S-X.
(c) Tax Fees
The aggregate fees billed in each of the last two fiscal years for professional services rendered by the principal accountant to the registrant for tax compliance, tax advice, tax planning and tax return preparation were as follows:
There were no fees billed in each of the last two fiscal years for professional services rendered by the principal accountant to the investment adviser or to any entity controlling, controlled by or under common control with the investment adviser that provides ongoing services to the registrant for tax compliance, tax advice and tax planning that were required to be pre-approved by the audit committee pursuant to paragraph (c)(7)(ii) of Rule 2-01 of Regulation S-X.
(d) All Other Fees
The aggregate fees billed in each of the last two fiscal years for products and services provided by the principal accountant to the registrant, other than the services reported in paragraphs (a) – (c) of this Item 4 were as follows:
There were no fees billed in each of the last two fiscal years for products and services provided by the principal accountant to the investment adviser or to any entity controlling, controlled by or under common control with the investment adviser that provides ongoing services to the registrant, other than the services reported in paragraphs (a) – (c) of this Item 4, that were required to be pre-approved by the audit committee pursuant to paragraph (c)(7)(ii) of Rule 2-01 of Regulation S-X.
(e)(1) Registrant's audit committee has adopted the following pre-approval policies and procedures in accordance with paragraph (c)(7) of Rule 2-01 of Regulation S-X:
SECURIAN FUNDS TRUST
AUDIT COMMITTEE POLICY
Regarding Pre-Approval of Services Provided by the Independent Auditor
The Audit Committee (the “Committee”) of the Securian Funds Trust (the “Trust”) has responsibility for ensuring that all services performed by the independent audit firm (the “Auditor”) for the Trust do not impair the Auditor’s independence. This review is intended to provide reasonable oversight without removing management from its responsibility for day-to-day operations. In this regard, the Committee should:
| ● | Understand the nature of the professional services expected to be provided and their impact on the Auditor’s independence and audit quality |
| ● | Examine and evaluate the safeguards put into place by the Trust and the Auditor to safeguard independence |
| ● | Meet semi-annually with the engagement partner of the Auditor |
| ● | Consider approving categories of service that are not deemed to impair independence for a one-year period |
It is important that a qualitative rather than a mere quantitative evaluation be performed by the Committee in discharging its responsibilities.
Policy for Audit and Non-Audit Services Provided to the Trust
On an annual basis, the Committee will review and consider whether to pre-approve the financial plan for audit fees as well as categories of audit-related and non-audit services that may be performed by the Auditor directly for the Trust. At least annually the Committee will receive a report from the Auditor of all audit and non-audit services, which were approved during the year.
The engagement of the Auditor for any non-audit service requires the written pre-approval of the Trust’s Treasurer, and all non-audit services performed by the Auditor will be disclosed in the required SEC periodic filings.
In connection with the Committee review and pre-approval responsibilities, the review by the Committee will consist of the following:
Audit Services
The categories of audit services and related fees to be reviewed and considered for pre-approval annually by the Committee or its delegate include the following:
| ● | Annual Trust financial statement audits |
| ● | SEC and regulatory filings and consents |
Audit-related Services
In addition, the following categories of audit-related services are deemed to be consistent with the role of the Auditor and, as such, will be considered for pre-approval by the Committee or its delegate, on an annual basis.
| ● | Accounting consultations |
| ● | Trust merger support services |
| ● | Other accounting related matters |
| ● | Agreed Upon Procedure Reports |
| ● | Other Internal Control Reports |
Notwithstanding any annual pre-approval of these categories of services, individual projects with an estimated fee of $20,000 or more are subject to pre-approval by the Committee on a case-by-case basis. Individual projects with an estimated fee of less than $20,000 are subject to pre-approval by the then-serving Chair of the Committee on a case-by-case basis. The Chair shall thereafter report to the full Committee on any such matters at the Committee’s next regularly scheduled meeting.
Tax Services
The following categories of tax services are deemed to be consistent with the role of the Auditor and, as such, will be considered for pre-approval by the Committee or its delegate, on an annual basis.
| ● | Tax compliance services related to the filing or amendment of the following: |
| o | Federal, state and local income tax compliance; and, |
| o | Sales and use tax compliance |
| ● | Timely RIC qualification reviews |
| ● | Tax distribution analysis and planning |
| ● | Tax authority examination services |
| ● | Tax appeals support services |
| ● | Accounting methods studies |
| ● | Trust merger support services |
| ● | Tax consulting services and related projects |
Notwithstanding any annual pre-approval of these categories of services, individual projects with an estimated fee of $20,000 or more are subject to pre-approval by the Committee on a case-by-case basis. Individual projects with an estimated fee of less than $20,000 are subject to pre-approval by the then-serving Chair of the Committee on a case-by-case basis. The Chair shall thereafter report to the full Committee on any such matters at the Committee’s next regularly scheduled meeting.
Other Non-audit Services
The SEC auditor independence rules adopted in response to the Sarbanes-Oxley Act specifically allow certain non-audit services. Because of the nature of these services, none of these services may be commenced by the Auditor without the prior approval of the Committee. The Committee may delegate this responsibility to one or more of the Committee members, with the decisions presented to the full Committee at the next scheduled meeting.
Proscribed Services
In accordance with SEC rules on independence, the Auditor is prohibited from performing services in the following categories of non-audit services:
| ● | Accounting and bookkeeping services |
| ● | Financial information systems design and implementation |
| ● | Valuation services supporting the financial statements |
| ● | Actuarial services supporting the financial statements |
| ● | Expert services (e.g., litigation support) |
Policy for Pre approval of Non-Audit Services Provided to Other Affiliated Entities
The Committee is also responsible for pre-approving certain non-audit services provided to Securian Asset Management, Inc. (“Securian AM”) and any other entity under common control with Securian AM that provides ongoing services to the Trust. The only non-audit services provided to these entities which require pre-approval are those services that relate directly to the operations and financial reporting of the Trust.
Although the Committee is not required to pre-approve all services provided to Securian AM and affiliated service providers, the Committee will annually receive a report from the Auditor on the aggregate fees for all services provided to Securian AM and its affiliates.

(e)(2) None of the services provided to the registrant described in paragraphs (b) – (d) of this Item 4 were pre-approved by the audit committee pursuant to paragraph (c)(7)(i)(C) of Rule 2-01 of Regulation S-X.
(f) No disclosures are required by this Item 4(f).
(g) The aggregate non-audit fees billed for each of the last two fiscal years by the registrant's accountant for services rendered to the registrant and to the registrant's investment adviser (not including any sub-adviser whose role is primarily portfolio management and is subcontracted with or overseen by another investment adviser) and any entity controlling, controlled by or under common control with the adviser that provides ongoing services to the registrant were as follows:
(h) The registrant's audit committee has considered that the provision of the non-audit services rendered to the registrant's investment adviser (not including any sub-adviser whose role is primarily portfolio management and is subcontracted with or overseen by another investment adviser) and any entity controlling, controlled by or under common control with the adviser that provides ongoing services to the registrant that were not pre-approved pursuant to paragraph (c)(7)(ii) of Rule 2-01 of Regulation S-X is compatible with maintaining the principal accountant's independence.
ITEM 5. AUDIT COMMITTEE OF LISTED REGISTRANTS.
Not applicable.
ITEM 6. SCHEDULE OF INVESTMENTS.
Not applicable. Schedule I – Investments in Securities of Unaffiliated Issuers is included as part of the report to shareholders filed under Item 1 of this Form N-CSR.
ITEM 7. DISCLOSURE OF PROXY VOTING POLICIES AND PROCEDURES FOR CLOSED-END MANAGEMENT INVESTMENT COMPANIES.
Not applicable.
ITEM 8. PORTFOLIO MANAGERS OF CLOSED-END MANAGEMENT INVESTMENT COMPANIES.
Not applicable.
ITEM 9. PURCHASES OF EQUITY SECURITIES BY CLOSED-END MANAGEMENT INVESTMENT COMPANY AND AFFILIATED PURCHASERS
Not applicable.
ITEM 10. SUBMISSION OF MATTERS TO A VOTE OF SECURITY HOLDERS
The registrant has a governance committee of its board of trustees, the members of which are all trustees who are not “interested persons” of the registrant, as defined in Section 2(a)(19) of the Investment Company Act of 1940 (“independent trustees”). The governance committee, which operates in accordance with a separate governance committee charter approved by the board of trustees, selects and recommends to the board of trustees individuals for nomination as independent trustees. The names of potential independent trustee candidates are drawn from a number of sources, including recommendations from management of Securian Asset Management, Inc., the registrant’s investment adviser. Each candidate is evaluated by the governance committee with respect to the relevant business and industry experience that would enable the candidate to serve effectively as an independent trustee, as well as his or her compatibility with respect to business philosophy and style. The members of the governance committee may conduct an in-person interview of each viable candidate using a standardized questionnaire. When all of the viable candidates have been evaluated and interviewed, the governance committee determines which of the viable candidates should be presented to the board of trustees for selection to become a member of the board of trustees.
Inasmuch as the registrant does not hold annual meetings of shareholders and meetings of shareholders occur only intermittently, the governance committee does not at present consider nominees recommended by shareholders.
ITEM 11. CONTROLS AND PROCEDURES.
(a) Based upon their evaluation of the registrant's disclosure controls and procedures as conducted within 90 days of the filing date of this Form N-CSR, the registrant's principal financial officer and principal executive officer have concluded that those disclosure controls and procedures provide reasonable assurance that the material information required to be disclosed by the registrant on this report is recorded, processed, summarized and reported within the time periods specified in the Securities and Exchange Commission's rules and forms.
(b) There were no changes in the registrant's internal controls over financial reporting (as defined in Rule 30a-3(d) under the Investment Company Act of 1940) that occurred during the second fiscal quarter of the period covered by this report that has materially affected, or is reasonably likely to materially affect, the registrant's internal control over financial reporting.
ITEM 12. Disclosure of Securities Lending Activities for Closed-End Management Investment Companies.
(a)(1) Not applicable.
(a)(2) Not applicable.
(a)(3) Not applicable.
(a)(4) Not applicable.
(b) Not applicable.
ITEM 13. EXHIBITS.
(a) File the exhibits listed below as part of this Form. Letter or number the exhibits in the sequence indicated.
(1) Any code of ethics, or amendment thereto, that is the subject of the disclosure required by Item 2, to the extent that the registrant intends to satisfy the Item 2 requirements through filing of an exhibit:
Exhibit 99.CODE ETH attached hereto.
(2) A separate certification for each principal executive officer and principal financial officer of the registrant as required by Rule 30a-2 under the Investment Company Act of 1940 (17 CFR 270.30a-2):
Exhibit 99.CERT attached hereto.
(b) If the report is filed under Section 13(a) or 15(d) of the Securities Exchange Act of 1934, provide the certifications required by Rule 30a-2(b) under the Investment Company Act of 1940 (17 CFR 270.30a-2(b)), Rule 13a-14(b) or Rule 15d-14 under the Securities Exchange Act of 1934 (17 CFR 240.13a-14(b) or 240.15d-14(b)) and Section 1350 of Chapter 63 of Title 18 of the United States Code (18 U.S.C. 1350) as an exhibit. A certification furnished pursuant to this paragraph will not be deemed "filed" for the purposes of Section 18 of the Securities Exchange Act of 1934 (15 U.S.C. 78r), or otherwise subject to the liability of that section. Such certification will not be deemed to be incorporated by reference into any filing under the Securities Act of 1933 or the Securities Exchange Act of 1934, except to the extent that the registrant specifically incorporates it by reference:
Exhibit 99.906 CERT attached hereto
SIGNATURES
Pursuant to the requirements of the Securities Exchange Act of 1934 and the Investment Company Act of 1940, the registrant has duly caused this report to be signed on its behalf by the undersigned, thereunto duly authorized.
(Registrant) Securian Funds Trust
| By (Signature and Title) | /s/ David M. Kuplic | |
| David M. Kuplic, President | |
Date: February 27, 2023
Pursuant to the requirements of the Securities Exchange Act of 1934 and the Investment Company Act of 1940, this report has been signed below by the following persons on behalf of the registrant and in the capacities and on the dates indicated.
| By (Signature and Title) | /s/ David M. Kuplic | |
| David M. Kuplic, President (Principal Executive Officer) | |
| By (Signature and Title) | /s/ Kevin L. Ligtenberg | |
| Kevin L.Ligtenberg, Treasurer (Principal Financial Officer) | |
Date: February 27, 2023