UNITED STATES
SECURITIES AND EXCHANGE COMMISSION
Washington, D.C. 20549
FORM N-CSR
CERTIFIED SHAREHOLDER REPORT OF REGISTERED MANAGEMENT INVESTMENT COMPANIES
Investment Company Act file number 811-4279
Securian Funds Trust
(Exact name of registrant as specified in charter)
400 Robert Street North
St. Paul, Minnesota 55101-2098
(Address of principal executive offices) (Zip code)
Michael P. Boyle, Esq.
400 Robert Street North
St. Paul, Minnesota 55101-2098
(Name and address of agent for service)
Registrant's telephone number, including area code:
(651) 665-3500
Date of fiscal year end: December 31
Date of reporting period: December 31, 2020
ITEM 1. REPORT TO STOCKHOLDERS.
Filed herewith.
Offered in Minnesota Life
Insurance Company and
Securian Life Insurance
Company variable products
Annual report
December 31, 2020
SFT Core Bond Fund
SFT Dynamic Managed Volatility Fund
SFT Government Money Market Fund
SFT Index 400 Mid-Cap Fund
SFT Index 500 Fund
SFT International Bond Fund
SFT IvySM Growth Fund
SFT IvySM Small Cap Growth Fund
SFT Managed Volatility Equity Fund
SFT Real Estate Securities Fund
SFT T. Rowe Price Value Fund
SFT Wellington Core Equity Fund
(This page has been left blank intentionally.)
TABLE OF CONTENTS
| | | Page No. | |
Letter from the President | | | 1 | | |
Portfolio Manager Reviews | |
| SFT Core Bond Fund | | | 2 | | |
SFT Dynamic Managed Volatility Fund | | | 6 | | |
SFT Government Money Market Fund | | | 11 | | |
SFT lndex 400 Mid-Cap Fund | | | 13 | | |
| SFT lndex 500 Fund | | | 17 | | |
SFT lnternational Bond Fund | | | 21 | | |
SFT IvySM Growth Fund | | | 26 | | |
SFT IvySM Small Cap Growth Fund | | | 30 | | |
SFT Managed Volatility Equity Fund | | | 34 | | |
SFT Real Estate Securities Fund | | | 39 | | |
SFT T. Rowe Price Value Fund | | | 43 | | |
SFT Wellington Core Equity Fund | | | 47 | | |
Report of Independent Registered Public Accounting Firm | | | 51 | | |
Investments In Securities | |
| SFT Core Bond Fund | | | 52 | | |
SFT Dynamic Managed Volatility Fund | | | 61 | | |
SFT Government Money Market Fund | | | 68 | | |
SFT lndex 400 Mid-Cap Fund | | | 69 | | |
| SFT lndex 500 Fund | | | 76 | | |
SFT lnternational Bond Fund | | | 84 | | |
SFT IvySM Growth Fund | | | 90 | | |
SFT IvySM Small Cap Growth Fund | | | 92 | | |
SFT Managed Volatility Equity Fund | | | 94 | | |
SFT Real Estate Securities Fund | | | 95 | | |
SFT T. Rowe Price Value Fund | | | 97 | | |
SFT Wellington Core Equity Fund | | | 100 | | |
Financial Statements | |
Statements of Assets and Liabilities | | | 102 | | |
Statements of Operations | | | 104 | | |
Statements of Changes in Net Assets | | | 106 | | |
Financial Highlights | | | 111 | | |
Notes to Financial Statements | | | 123 | | |
Fund Expense Examples | | | 141 | | |
Proxy Voting and Quarterly Holdings Information | | | 143 | | |
Statement Regarding Liquidity Risk Management Program | | | 144 | | |
Trustees and Executive Officers | | | 145 | | |
Letter from the President

2020 was a year most of us will not soon forget. While starting the year off on solid footing, the pandemic soon changed many aspects of our lives and led to a pronounced drop-off in employment, economic growth, and the markets overall. As the pandemic spread, many industries were forced to close or to make significant changes to their business models. This led to broad layoffs in the service sector, in particular in industries such as travel, hospitality, and leisure. The markets reacted as expected and we experienced a broad correction in the equity markets as well as in the credit sensitive fixed income markets during the first half of the year.
This market correction, however, remained short lived. As we progressed through the year, people and businesses learned to cope with the pandemic. Many changes that might have taken a decade to evolve, occurred seemingly overnight. The broad movement and acceptance of working from home, of remote education, and the use of telemedicine are just a few of the ways we adapted. This ingenuity restored many of our jobs, strengthened our economic growth, and led to a strong market recovery. Bold Federal Reserve actions to provide ample liquidity and credit support to the markets, the multi trillion-dollar stimulus packages passed by Congress, and the encouragement provided by enhanced COVID-19 testing and news of a vaccine all contributed to the recovery.
These actions culminated with exceptional market returns across most major asset classes. The S&P 500® ended the year up 18.40 percent, with the Russell 2000 up an even stronger 19.96 percent. Technology stocks were in a league of their own with the Nasdaq up over 45 percent. Fixed income returns were solid with the Bloomberg Barclays U.S. Aggregate Bond Index up 7.51 percent.
As we look forward to 2021, we are encouraged by the prospects of the roll out of vaccinations, putting much of our economic shutdown behind. We expect, however, this could be a bumpy path as many complications need to be worked through. We also anticipate that many of the recent lessons learned will lead to lasting improvements in the way many organizations work and provide services as new business models emerge. This optimism leads us to believe that our economic future remains bright and that market returns will continue to remain positive. As always, we believe the best investment tactic is to position for the long-term and seek diversification to help reduce risk of a downside surprise.
Sincerely,

David Kuplic
President, Securian Funds Trust
1


Thomas Houghton, CFA, Daniel Henken, CFA and Lena Harhaj, CFA Portfolio Managers
Fund Objective
The SFT Core Bond Fund seeks as high a level of long-term total return as is consistent with prudent investment risk. Preservation of capital is a secondary objective. The SFT Core Bond Fund invests in long-term, fixed income, high quality debt instruments. The risks incurred by investing in debt instruments include, but are not limited to, reinvestment of prepaid debt obligations at lower rates of return, and the inability to reinvest at higher interest rates when debt obligations are prepaid more slowly than expected. In addition, the net asset value of the SFT Core Bond Fund may fluctuate in response to changes in interest rates and is not guaranteed.
Performance Update
The Fund's Class 2 shares generated a total net return of 6.88 percent over the 12 months ending December 31, 2020, underperforming the Bloomberg Barclays U.S. Aggregate Bond Index which returned 7.51 percent over the same period.
What influenced the Fund's return during the past 12 months?
Investors looked through near term weakness to bid up lagging asset classes during the fourth quarter of 2020, resulting in winners all around. The final quarter provided clarity in the U.S. election, another COVID-19 relief package, and news of several effective vaccines, and all boosted confidence that 2021 would see a return to normal. For the past 12 months, almost all major asset classes ended in strongly positive territory.
Credit markets finished the year on a high note. In the fourth quarter, investment grade and high yield corporates tightened 40 basis points (bps) and 161 bps, respectively, producing excess returns of 4.11 percent and 6.69 percent, respectively. Fixed income returns were solid on the year with the Bloomberg Barclays U.S. Aggregate Bond Index up 7.51 percent.
Despite the strong positive momentum, equity markets continue to price in stubbornly high volatility. While inflation expectations have perked up, interest rates remain at historically low levels. The Federal Reserve's (Fed) intentions are clear—rates are to remain anchored near zero until inflation takes hold. The Fed remains committed to maintaining an aggressive pace of asset purchases, even as its balance sheet has grown by over $3.2 trillion since the end of February 2020.
What other market conditions or events influenced the Fund's performance during the past 12 months?
Credit's fourth quarter rally propelled high yield and investment grade corporates to record low yields, resulting in positive excess returns over comparable U.S. Treasury securities for the full year, despite starting the year with the worst quarter ever recorded for corporate bond performance.
What strategies and techniques did you employ that specifically affected Fund performance?
The decision to overweight corporates, particularly industrials and utilities, as well as agency credit risk-transfer securities resulted in a strong positive excess return in 2020. Security selection was a detractor in 2020 as we have been very cautious on adding high yield, crossover credit, or higher beta investment grade holdings to the portfolio. We have favored holdings that we feel are durable in a choppy economic recovery and exhibit more stable credit fundamentals. Recent security selection results have been encouraging as the market normalizes and liquidity has returned to off the run sectors. Consistent with our philosophy, overall duration did not exhibit
2
material differences from the Fund's benchmark in 2020 and interest rate positioning contributed very little to performance relative to the benchmark.
What will affect the Fund going forward?
While COVID-19 continues to take a real toll, the return to normal is likely to be far more robust than in previous recoveries. Unlike most recessions, the pandemic was an exogenous event. Quick regulatory approvals and an imminent vaccine rollout were game changers, lifting a cloud of uncertainty and unleashing animal spirits.
While a strong rebound is likely, in our view we're not going to return to the old normal. The pandemic accelerated trends that were already in place and focused an unflinching spotlight on imbalances and sectors with weak value propositions. Work from home appears to be here to stay, and demand for office space and business travel may take years to recover. Brick-and-mortar retail may never be the same with the ramped up online environment and delivery services. We expect that new business models will emerge, and some sectors could experience a painful transition as investment and infrastructure align in new ways, while other businesses benefit as supply chains realign.
Although markets seem fully priced and even overvalued by normal standards, we believe the stage is set for good economic growth in the coming year. We expect the current slowdown to be short-lived, and ample liquidity remains a strong support. Despite the recent rise in rates and inflation expectations, we do not believe interest rates are set to rise dramatically from current levels. The world's developed economies are awash in savings and have plenty of labor slack, and their respective central banks are determined to keep rising rates from choking off nascent economic growth.
3
Ten Largest Holdings^
| Security description | | Market
value | | % of net
assets | |
U.S. Treasury Bond 1.250%, 05/15/50 | | $ | 10,119,676 | | | | 2.0 | % | |
U.S. Treasury Note 0.250%, 05/31/25 | | | 7,667,296 | | | | 1.5 | % | |
U.S. Treasury Bond 5.375%, 02/15/31 | | | 7,353,212 | | | | 1.5 | % | |
Invitation Homes 2018-SFR4 Trust, 1.553%, 01/17/38 | | | 5,049,998 | | | | 1.0 | % | |
U.S. Treasury Note 0.625%, 11/30/27 | | | 5,049,211 | | | | 1.0 | % | |
U.S. Treasury Note 0.500%, 05/31/27 | | | 5,002,352 | | | | 1.0 | % | |
Bank of America Corp., 3.974%, 02/07/30 | | | 4,758,442 | | | | 1.0 | % | |
Eagle RE 2020-1 Ltd., 1.598%, 01/25/30 | | | 4,664,641 | | | | 0.9 | % | |
Wells Fargo & Co 2.393%, 06/02/28 | | | 4,391,566 | | | | 0.9 | % | |
Federal Home Loan Mortgage Corporation 3.598%, 10/25/29 | | | 4,131,146 | | | | 0.8 | % | |
| | | $ | 58,187,540 | | | | 11.6 | % | |
^Excludes short-term investments.
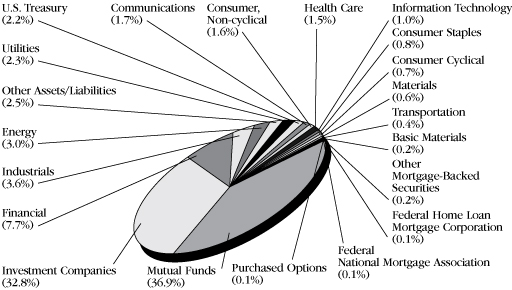
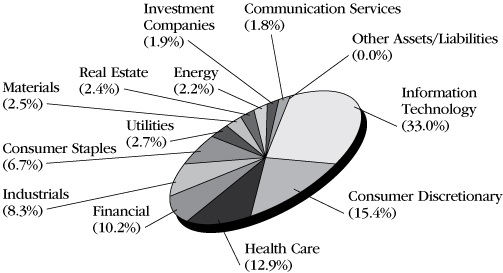
Sector Diversification (shown as a percentage of net assets)

Asset Quality (shown as a percentage of investments) (Unaudited)

Ratings are obtained from Standard & Poor's, Moody's and Fitch. If only one rating is available for a security, that rating is used. A weighted average is used for holdings where more than one of the agencies have assigned a rating. Securian Asset Management provides ratings for securities that are not assigned a rating by the agencies.
4
Comparison of Change in Investment Value*
A Hypothetical $10,000 Investment in SFT Core Bond Fund,
Bloomberg Barclays U.S. Aggregate Bond Index and Consumer Price Index (CPI)
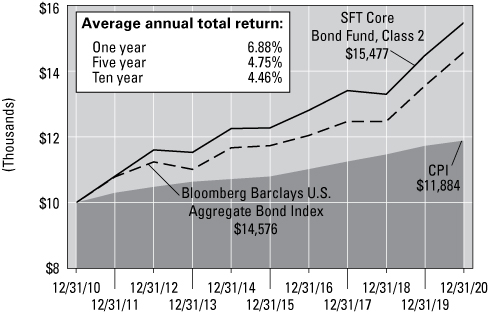
On the chart above you can see how the SFT Core Bond Fund's Class 2 shares total return compared to the Bloomberg Barclays U.S. Aggregate Bond Index and the Consumer Price Index. The three lines represent the total return of a hypothetical $10,000 investment made on December 31, 2010 through December 31, 2020, assuming reinvestment of distributions, if any.
* The results shown are past performance and are not an indication of future performance. Current performance may be lower or higher. The investment returns and principal value of an investment will fluctuate so that shares upon redemption may be worth more or less than their original cost. Performance figures of the Fund do not reflect charges pursuant to the terms of the variable life insurance policies and variable annuity contracts funded by separate accounts that invest in the Fund's shares. When such charges are deducted, actual investment performance in a variable policy or contract will be lower.
The Bloomberg Barclays U.S. Aggregate Bond Index is an unmanaged benchmark composite representing average market-weighted performance of U.S. Treasury and agency securities, investment-grade corporate bonds and mortgage-backed securities with maturities greater than one year.
5
SFT Dynamic Managed Volatility Fund


Craig M. Stapleton, CFA, FRM, Jeremy Gogos, Ph.D., CFA and Merlin Erickson Portfolio Managers
Fund Objective
The SFT Dynamic Managed Volatility Fund seeks to maximize risk-adjusted total return relative to its blended benchmark index comprised of 60 percent S&P 500® Index and 40 percent Barclays U.S. Aggregate Bond Index (collectively, the Blended Benchmark Index). The SFT Dynamic Managed Volatility Fund invests primarily in Class 1 shares of the SFT Index 500 Fund for equity exposure, in a basket of fixed income securities for fixed income exposure and certain derivative instruments. The Fund is subject to risks associated with such investments as described in detail in the Fund's prospectus. The net asset value of the Fund will fluctuate and is not guaranteed. It is possible to lose money by investing in the Fund. There is no assurance that efforts to manage Fund volatility will achieve the desired results.
Performance Update
The Fund generated a total net return of 10.67 percent, with a volatility of 12.11 percent, over the 12 months ending December 31, 2020. The Blended Benchmark Index, which is comprised of the S&P 500® Index, weighted 60 percent, and the Bloomberg Barclays U.S. Aggregate Index, weighted 40 percent, returned 14.73 percent with a volatility of 20.21 percent, over the same period.
What influenced the Fund's return during the past 12 months?
Equity volatility is what guides the asset allocation of this strategy. When equity volatility is low, the equity exposure of this strategy will be high. Conversely, when equity volatility is high, the equity exposure of this strategy will be low. Clearly, in 2020, the COVID-19 virus was the predominant driver of market volatility.
The S&P 500® realized 34.43 percent volatility for 2020, the sixth highest calendar-year volatility in the index's 93-year history. 2008 is the only year in the modern era more volatile (40.97 percent realized volatility). All other higher years occurred in the 1920s and 1930s. Realized one-month volatility began 2020 quite low, entering the year at 6.90 percent. As such, the Fund's equity exposure was at 80.28 percent. In early February, as the market began to appreciate how truly disruptive COVID-19 could be, volatility began to escalate. From 02/03/2020 through 03/16/2020, the Fund was steadily de-risked from 80.04 percent to 19.38 percent equity exposure. This reduction in equity exposure was concurrent with one-month volatility increasing from 11.80 percent to 79.66 percent over the same time period. This volatility peaked on 03/27/2020, at 97.12 percent, but stayed above 40 percent through the end of April. Indeed, the Fund did not begin adding back equity exposure in earnest until mid-May, and volatility did not drop enough for the Fund to get to "neutral" weight—i.e. 60 percent exposure—until early August. September and October also saw brief periods of volatility rising to the mid 20 percent range, and as a result the Fund was underweight equity for most of Q3 and Q4. One-month volatility closed out 2020 at 8.3 percent, and the Fund finished 2020 with 56.62 percent linear S&P exposure, approximately 15.00 percent exposure in long S&P 500® call options, and approximately 1.30 percent exposure in long Chicago Board of Options Exchange (CBOE) Volatility Index (VIX) puts.
All told, the Fund's average equity exposure for 2020 was 46.32 percent, which contributed 8.10 percent to the overall Fund return on a net basis. The benchmark equity component contributed 11.56 percent to the Blended Benchmark Index return. The Fund's fixed income and cash assets averaged 53.68 percent weight for the year, and contributed 2.57 percent to the overall Fund return on a net basis. The benchmark fixed income component delivered 3.17 percent to the Blended Benchmark Index return.
6
What other market conditions or events influenced the Fund's performance during the past 12 months?
Following are just some of the financial extremes witnessed in 2020:
• March 2020 saw a realized volatility of 93.42 percent, the most volatile month ever in the S&P 500® history.
• The CBOE VIX set a new closing record of 82.7 on 03/16/2020.
• The 33.92 percent drawdown from 02/20/2020 through 03/23/2020 was the ninth-largest S&P loss ever in 23 business days, and all other such periods that surpassed it were in 1929 and 1931.
• Similarly, over the next 103 days, the S&P 500® rallied 51.50 percent, surpassing its pre-COVID-19 high. The speed of this rally is also unmatched in the last 87 years; only periods from 1932 and 1933 saw a larger S&P 500® price appreciation in the same number of business days.
• The highest single-week Initial Jobless Claims (IJC) number during the Great Financial Crisis (GFC) was 665,000; during the week of 03/20/2020, the IJC number jumped from 282,000 to 3,307,000, and experienced forty-one continuous weeks of prints above the GFC peak.
• The US 10-year Treasury rate set a new record low of 0.51 percent on 08/04/2020.
• Second quarter of 2020 saw the largest quarter-over-quarter US Gross Domestic Product (GDP) contraction in history -31.40 percent.
In addition to these "top-level" anomalies, there were other very troubling developments underneath:
• The well-known concentration of S&P 500® market cap in tech names was not helped by Tesla joining the index. As of year end, 24.86 percent of the S&P 500® market cap was concentrated in Apple, Amazon, Facebook, Alphabet (Google), Microsoft, Tesla, and Netflix. Also of note, Tesla saw a 743 percent return for 2020.
• The best-performing S&P 500® sector in 2020 was Information Technology. The worst-performing sector was Energy. The performance gap between the two was the largest on record, going back to 2002. COVID-19 created an environment where industries that benefit from "work from home" (delivery retail, tech, etc.) were handed outlandish returns, and most other real-economy sectors were punished.
• The Growth and Value sub-indexes of the S&P 500® tell a similar story. The outperformance of Growth over Value in 2020 is the largest on record back to 1994. The next largest Growth-Value gap was in 1998, leading up to the DotCom bubble.
• The current projection for S&P 500® earnings growth year-over-year for the fourth quarter 2020 is 8.8 percent; yet the S&P 500® closed 2020 at a new all-time high.
We continue to view the equity markets as generally overvalued, and the absurd performance of the top equity sectors and names as liquidity fueled mania. To that end, consider the peak-to-trough performance of both the Fund and the Fund's benchmark through the COVID-19 panic. The Fund achieved its goal of mitigating severe drawdowns. However, with the Federal Reserve unexpectedly cutting its target policy rate to 0.0 percent (03/13/2020) and pledging to inject trillions of short-term liquidity into the financial system, and the roughly $2 trillion CARES Act passing on 03/27/2020, any asset allocation that involved being underweight equity was a losing proposition. This underweight was the driver of the Fund's underperformance in 2020.
What strategies and techniques did you employ that specifically affected Fund performance?
Throughout the year, the Fund held a core long position in cash equity that tracks the S&P 500®. In addition, the Fund had long and short positions in S&P 500® futures, long and short S&P 500® call options, long and short S&P 500® put options, long and short CBOE VIX call options, and long and short VIX put options. These derivative positions were held either as expressions of the target equity allocation of the Fund given prevailing volatility, or as supplemental hedges for managing the Fund's risk.
7
What will affect the Fund going forward?
We expect worse-than-average returns, and higher volatility, for domestic risk markets on a go-forward basis. Equity indexes continue to make new highs, while most fundamental valuation metrics suggest the equity market is quite overvalued, and S&P 500® earnings have declined year-over-year for 7 of the last 8 quarters. Both investment grade and high yield corporate credit yields are near their historic lows, while domestic corporate debt outstanding hit another new record in 2020. Multiple indications of inflation expectations have steadily risen since early 2020.
In short, up to this point, the monetary and fiscal tsunami unleashed upon the markets has been the primary driver of the returns seen since the COVID-19 market nadir. In our view, it seems plausible that the market has finally reached the point where central bank liquidity can no longer be injected without stoking fears of inflation. Further, every major central bank is now at their logical policy limit: short-term rates pinned at zero, and aggressive asset purchases to support markets.
Some market observers find justification for bullish sentiment in the COVID-19 vaccine release, and the promise of societal dynamics returning to normal. But in response, we pose the following simple logical question: if the market was impervious to the sectors worst affected by COVID-19 struggling mightily for the better part of a year, should the market see material gains as a result of those sectors returning to normal operation?
Given the present situation of extremely accommodative monetary policy, and probable further fiscal stimulus from the newly-elected Democratic federal government, we view the risk of a major equity selloff as reduced. But again, we are hard-pressed to see the case for material risk asset gains in 2021. And, perhaps more importantly, given the current central bank positioning, the—in our view—absolutely irresponsible federal debt and deficit, and the already staggering level of federal stimulus, we see the entire market as extremely vulnerable to an exogenous shock.
In a tactical sense, we will continue to use our volatility metrics to inform the equity allocations of the Fund. We will increase equity exposure if we believe volatility will decrease, decrease equity exposure if we believe volatility will increase, and in the event that we are overweight equity, we will carry some form of tail risk hedge for the foreseeable future.
8
Ten Largest Holdings^
| Security description | | Market
value | | % of net
assets | |
U.S. Treasury Note, 2.625%, 12/15/21 | | $ | 15,356,836 | | | | 2.3 | % | |
SPDR S&P 500 ETF Trust | | | 13,523,240 | | | | 2.0 | % | |
Vanguard S&P 500 ETF | | | 6,933,946 | | | | 1.0 | % | |
iShares iBoxx $ Investment Grade Corporate Bond ETF | | | 6,146,785 | | | | 0.9 | % | |
Regions Financial Corp., 3.800%, 08/14/23 | | | 2,169,609 | | | | 0.3 | % | |
Raytheon Technologies Corp. 4.125%, 11/16/28 | | | 1,788,245 | | | | 0.3 | % | |
Pine Street Trust I, 4.572%, 02/15/29 | | | 1,778,290 | | | | 0.3 | % | |
Welltower, Inc., 4.125%, 03/15/29 | | | 1,749,862 | | | | 0.3 | % | |
Southern Natural Gas Co. LLC, 4.800%, 03/15/47 | | | 1,744,424 | | | | 0.3 | % | |
Bank 2019-BNK18, 3.584%, 05/15/62 | | | 1,736,682 | | | | 0.3 | % | |
| | | $ | 52,927,919 | | | | 8.0 | % | |
^Does not include short-term investments or investments in Class 1 shares of the SFT Index 500 Fund, an affiliated Fund in Securian Funds Trust, which provides the SFT Dynamic Managed Volatility Fund with its primary equity exposure.
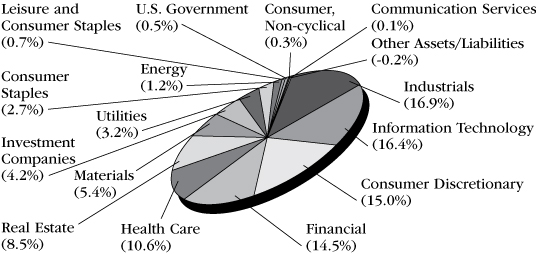
Sector Diversification (shown as a percentage of net assets)
Asset Quality (shown as a percentage of fixed income investments) (Unaudited)

Ratings are obtained from Standard & Poor's, Moody's and Fitch. If only one rating is available for a security, that rating is used. A weighted average is used for holdings where more than one of the agencies have assigned a rating. Securian Asset Management provides ratings for securities that are not assigned a rating by the agencies.
9
Comparison of Change in Investment Value*
A Hypothetical $10,000 Investment in SFT Dynamic Managed Volatility Fund,
the Blended Benchmark Index and Consumer Price Index (CPI)
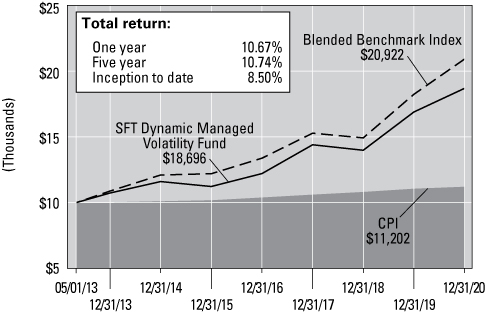
On the chart above you can see how the SFT Dynamic Managed Volatility Fund's shares total return compared to its Blended Benchmark Index, comprised of 60 percent of the S&P 500 Index and 40 percent of the Bloomberg Barclays U.S. Aggregate Bond Index, and the Consumer Price Index. The three lines represent the total return of a hypothetical $10,000 investment made on May 1, 2013 through December 31, 2020, assuming reinvestment of distributions, if any.
* The results shown are past performance and are not an indication of future performance. Current performance may be lower or higher. The investment returns and principal value of an investment will fluctuate so that shares upon redemption may be worth more or less than their original cost. Performance figures of the Fund do not reflect charges pursuant to the terms of the variable life insurance policies and variable annuity contracts funded by separate accounts that invest in the Fund's shares. When such charges are deducted, actual investment performance in a variable policy or contract will be lower.
Securian Asset Management, Inc. (Securian AM) and the Securian Funds Trust, on behalf of the SFT Dynamic Managed Volatility Fund (the "Fund"), have entered into an Expense Limitation Agreement, dated May 1, 2013, which limits the operating expenses of the Fund, excluding certain expenses (such as interest expense, acquired fund fees, cash overdraft fees, taxes, brokerage commissions, other expenditures which are capitalized in accordance with the generally accepted accounting principles, and other extraordinary expenses not incurred in the ordinary course of the Fund's business), to 0.80% of the Fund's average daily net assets through April 30, 2021. The Agreement renews annually for a full year each year thereafter unless terminated by Securian AM upon at least 30 days' notice prior to the end of a contract term. The Fund is authorized to reimburse Securian AM for management fees previously waived and/or for the cost of expenses previously paid by Securian AM pursuant to this agreement, provided that such reimbursement will not cause the Fund to exceed any limits in effect at the time of such reimbursement. The Fund's ability to reimburse Securian AM in this manner only applies to fees waived or reimbursements made by Securian AM within the three fiscal years prior to the date of such reimbursement. To the extent that the Fund makes such reimbursements to Securian AM, the amount of the reimbursements will be reflected in the financial statements in the Fund's shareholder reports and in Other Expenses under Fees and Expenses of the Fund.
The Blended Benchmark Index is comprised of 60 percent of the S&P 500® Index and 40 percent of the Bloomberg Barclays U.S. Aggregate Bond Index.
The S&P 500® Index is a broad, unmanaged index of 500 common stocks which are representative of the U.S. stock market overall. The Bloomberg Barclays U.S. Aggregate Bond Index is an unmanaged benchmark composite representing the average market-weighted performance of U.S. Treasury and agency securities, investment grade corporate bonds and mortgage-backed securities with maturities greater than one year.
10
SFT Government Money Market Fund


Thomas Houghton, CFA and Lena Harhaj, CFA Portfolio Managers
Fund Objective
The SFT Government Money Market Fund seeks maximum current income to the extent consistent with liquidity and the preservation of capital. The Fund invests at least 99.5 percent of its total assets in cash, government securities, and/or repurchase agreements that are collateralized fully (i.e., collateralized by cash or government securities). Investment in the SFT Government Money Market Fund is neither insured nor guaranteed by the U.S. Government, and there can be no assurance that the Fund will be able to maintain a stable net asset value of $1.00 per share. It is possible to lose money by investing in the Fund.
Performance Update
The Fund generated a total net return of 0.21 percent over the 12 months ending December 31, 2020, underperforming the three-month Treasury Bill which returned 0.67 percent over the same period.
What influenced the Fund's return during the past 12 months?
The U.S. Treasury yield curve followed the decline in the Federal Funds Rate at the beginning of the year. Rates in the front end of the curve finished the year down 140-150 basis points.
What strategies and techniques did you employ that specifically affected Fund performance?
The Fund continues to pick up incremental yield versus U.S. Treasury Bills by purchasing short dated Agency Discount Notes.
What will affect the Fund going forward?
While COVID-19 continues to take a real toll, the return to normal is likely to be far more robust than in previous recoveries. Unlike most recessions, the pandemic was an exogenous event. Quick regulatory approvals and an imminent vaccine rollout were game changers, lifting a cloud of uncertainty and unleashing animal spirits.
Although markets seem fully priced and even overvalued by normal standards, we believe the stage is set for good economic growth in the coming year. We expect the current slowdown to be short-lived, and ample liquidity remains a strong support. Despite the recent rise in rates and inflation expectations, we do not believe interest rates are set to rise dramatically from current levels. The world's developed economies are awash in savings and have plenty of labor slack, and their respective central banks are determined to keep rising rates from choking off nascent economic growth.
11
The results shown are past performance and are not an indication of future performance. Current performance may be lower or higher. The investment returns and principal value of an investment will fluctuate so that shares upon redemption may be worth more or less than their original cost. Investment in the SFT Government Money Market Fund is neither insured nor guaranteed by the U.S. Government or any other agency, and there can be no assurance that the Fund will be able to maintain a stable net asset value of $1.00 per share. Shares upon redemption may be worth more or less than their original cost. Performance figures of the Fund do not reflect charges pursuant to the terms of the variable life insurance policies and variable annuity contracts funded by separate accounts that invest in the Fund's shares. When such charges are deducted, actual investment performance in a variable policy or contract will be lower.
The Bloomberg Barclays U.S. Treasury Bill 1-3 Month Index is a market value-weighted index of investment-grade fixed-rate public obligations of the U.S. Treasury with maturities of three months, excluding zero coupons.
Effective May 1, 2012, the Board of Trustees of Securian Funds Trust approved a Restated Net Investment Income Maintenance Agreement among Securian Funds Trust (on behalf of SFT Government Money Market Fund), Securian Asset Management, Inc. (Securian AM) and Securian Financial Services, Inc. (Securian Financial). A similar agreement was previously approved by the Board of Directors of Advantus Series Fund, Inc., the Trust's predecessor, effective October 29, 2009. Under such Agreement, Securian AM agrees to waive, reimburse or pay SFT Government Money Market Fund expenses so that the Fund's daily net investment income does not fall below zero. Securian Financial may also waive its Rule 12b-1 fees. Securian AM and Securian Financial each has the option under the Agreement to recover the full amount waived, reimbursed or paid (the "Expense Waiver") on any day on which the Fund's net investment income exceeds zero. On any day, however, the Expense Waiver does not constitute an obligation of the Fund unless Securian AM or Securian Financial has expressly exercised its right to recover a specified portion of the Expense Waiver on that day, in which case such specified portion is then due and payable by the Fund. In addition, the right of Securian AM and/or Securian Financial to recover the Expense Waiver is subject to the following limitations: (1) if a repayment of the Expense Waiver by the Fund would cause the Fund's net investment income to fall below zero, such repayment is deferred until a date when repayment would not cause the Fund's net investment income to fall below zero; (2) the right to recover any portion of the Expense Waiver expires three years after the effective date of that portion of the Expense Waiver; and (3) any repayment of the Expense Waiver by the Fund cannot cause the Fund's expense ratio to exceed 1.25%. If Securian AM and Securian Financial exercise their rights to be paid such waived amounts, the Fund's future yield will be negatively affected for an indefinite period. The Agreement is effective through April 30, 2021, and shall continue in effect thereafter, provided such continuance is specifically approved by Securian AM, Securian Financial, and a majority of the Trust's independent Trustees.
Effective November 1, 2017, Securian AM and Securian Funds Trust, on behalf of the SFT Government Money Market Fund, entered into an Expense Limitation Agreement which limits the operating expenses of the Fund, excluding certain expenses, (such as interest expense, acquired fund fees, cash overdraft fees, taxes, brokerage commissions, other expenditures which are capitalized in accordance with GAAP, and other extraordinary expenses not incurred in the ordinary course of the Funds' business), to 0.70% of the Fund's Average daily net assets through April 30, 2021.
The Agreement renews annually for a full year each year thereafter unless terminated by Securian AM upon at least 30 days' notice prior to the end of the contract term. The Fund is authorized to reimburse Securian AM for management fees previously waived and/or for the cost of expenses previously paid by Securian AM pursuant to this agreement, provided that such reimbursement will not cause any Fund to exceed any limits in effect at the time of such reimbursement.
The Fund's ability to reimburse Securian AM in this manner only applies to fees waived or reimbursements made by Securian AM within the three fiscal years prior to the date of such reimbursement. To the extent that the Fund makes such reimbursements to Securian AM, the amount of the reimbursements will be reflected in the financial statements in the Funds' shareholder reports and in Other Expenses under Fees and Expenses of the Fund in the prospectus.
12
SFT Index 400 Mid-Cap Fund

James Seifert
Portfolio Manager
Fund Objective
The SFT Index 400 Mid-Cap Fund seeks to provide investment results generally corresponding to the aggregate price and dividend performance of publicly traded common stocks that comprise the Standard & Poor's MidCap 400® Index (S&P MidCap 400®). It is designed to provide an economical and convenient means of maintaining a diversified portfolio in this equity security area as part of an overall investment strategy. The risks incurred by investing in the SFT Index 400 Mid-Cap Fund include, but are not limited to, the risk that the Fund may not be able to replicate the performance of the S&P MidCap 400®, and the risk of declines in the market for mid-cap stocks or in the equity markets generally.
Performance Update
The Fund's Class 2 shares generated a total net return of 13.06 percent over the 12 months ending December 31, 2020; the S&P MidCap 400® Index returned 13.66 percent over the same period.
What influenced the Fund's return during the past 12 months?
The SFT Index 400 Mid-Cap Fund is passively managed. The Fund is fully invested and holds all names at published free float adjusted index weights. The Fund seeks investment results that correspond generally to the price and yield performance, before fees and expenses, of the S&P MidCap 400®.
Six of the nine sectors posted positive annual returns. The consumer non-durables sector led all sectors with a 12 month return of 36.3 percent. Technology names followed with an annual return of 32.6 percent. Energy, utility and finance sectors detracted from performance with returns of -37.1 percent, -9.7 percent and -5.9 percent, respectively. In terms of size, decile 1, (decile segments consist of 40 names) consisting of the largest of the mid-cap index and representing 20.6 percent of the weight in the index, ended the period with a return of 18.7 percent. Decile ten, representing the 40 smallest market cap names, ended the year with a return of 48.1 percent.
What other market conditions or events influenced the Fund's performance during the past 12 months?
Lower political uncertainty, another COVID-19 relief package, and news of a number of effective vaccines boosted confidence that 2021 would see a return to normal. Investors looked through near term weakness to bid up lagging asset classes, resulting in winners all around in the fourth quarter. For the full year, almost all major asset classes ended the year strongly. COVID-19 continues to weigh on real estate performance, and commodities also lagged, posting negative returns for the year. Despite the strong positive momentum, equity markets continue to price in stubbornly high volatility. While inflation expectations have perked up, rates remain at historically low levels with even the 30-year bond yielding only 1.65 percent at the end of the year.
Despite what is still the worst economic contraction in decades with consensus growth in real GDP of -3.5 percent for the year, it could have been far worse. When signs that the economy was stalling emerged in fourth quarter, Congress stepped up once again. While it remains the worst of times for more than 10 million workers who are still unemployed, aggregate personal income is higher than a year ago, a far different result than in previous shocks.
Fiscal transfers and a lack of spending opportunities not only provided needed aid but increased the savings rate. Substantial pent up demand is the backdrop for a vaccine-driven return to normal next year. Investors are not the only people looking through to a normalizing economy. Manufacturing, both in the U.S. and globally, returned to expansion territory at the end of the second quarter in 2020.
13
What will affect the Fund going forward?
While a strong rebound is likely, in our view we're not going to return to the old normal. The pandemic accelerated trends that were already in place and focused an unflinching spotlight on imbalances and sectors with weak value propositions. Work from home appears to be here to stay, and demand for office space and business travel may take years to recover. Bricks and mortar retail will never be the same. Financial services companies need to compete in a low return world, at least for now. Higher education will have to demonstrate a better value proposition for on-campus learning. The cat's out of the bag as more patients opt for telemedicine over in-person visits.
We believe new business models will emerge, and some sectors could experience a painful transition as investment and infrastructure align in new ways, while other businesses benefit as supply chains realign. Even well-performing companies will feel pressure to leverage technology to increase efficiency and scale. These changes are likely to continue to provide investment opportunities.
The pandemic bared the reality of unequal impacts with low wage, service workers suffering the most. At the same time, the "haves" have more flexibility than ever before. Low tax states with a strong quality of life are drawing attractive businesses, which sets the stage for tension between needed rebalancing and tax policy. Populism and political division are most likely here to stay.
On the bright side, the economy has been surprisingly resilient, and strong growth will likely ease the transition. While markets seem fully priced and even overvalued by normal standards, the stage is set for good economic growth in the coming year. We expect the current slowdown to be short-lived, and ample liquidity remains a strong support. However, with markets fully valued and rates at rock bottom, we believe now is a good time maintain investment discipline.
14
Ten Largest Holdings^
| Security description | | Market
value | | % of net
Assets | |
Enphase Energy, Inc. | | $ | 2,101,253 | | | | 1.0 | % | |
Trimble, Inc. | | | 1,583,451 | | | | 0.8 | % | |
SolarEdge Technologies, Inc. | | | 1,553,157 | | | | 0.8 | % | |
Caesars Entertainment, Inc. | | | 1,466,313 | | | | 0.7 | % | |
Monolithic Power Systems, Inc. | | | 1,464,920 | | | | 0.7 | % | |
Fair Isaac Corp. | | | 1,439,600 | | | | 0.7 | % | |
Generac Holdings, Inc. | | | 1,354,681 | | | | 0.7 | % | |
Cognex Corp. | | | 1,329,038 | | | | 0.7 | % | |
Ceridian HCM Holding, Inc. | | | 1,313,778 | | | | 0.6 | % | |
Masimo Corp. | | | 1,288,492 | | | | 0.6 | % | |
| | | $ | 14,894,683 | | | | 7.3 | % | |
^Excludes short-term investments.
Sector Diversification (shown as a percentage of net assets)
15
Comparison of Change in Investment Value*
A Hypothetical $10,000 Investment in SFT Index 400 Mid-Cap Fund,
S&P MidCap 400® Index and Consumer Price Index (CPI)

On the chart above you can see how the SFT Index 400 Mid-Cap Fund's Class 2 shares total return compared to the S&P MidCap 400® Index and the Consumer Price Index. The three lines represent the total return of a hypothetical $10,000 investment made on December 31, 2010 through December 31, 2020, assuming reinvestment of distributions, if any.
* The results shown are past performance and are not an indication of future performance. Current performance may be lower or higher. The investment returns and principal value of an investment will fluctuate so that shares upon redemption may be worth more or less than their original cost. Performance figures of the Fund do not reflect charges pursuant to the terms of the variable life insurance policies and variable annuity contracts funded by separate accounts that invest in the Fund's shares. When such charges are deducted, actual investment performance in a variable policy or contract will be lower.
The S&P MidCap 400® provides investors with a benchmark for mid-sized companies. The index, which is distinct from the large-cap S&P 500®, is designed to measure the performance of 400 mid-sized companies, reflecting the distinctive risk and return characteristics of this market segment.
"Standard & Poor's®", "S&P®", "Standard & Poor's MidCap 400®" and "S&P MidCap 400®" are trademarks of the S&P Global, Inc. and have been licensed for use by the Securian Funds Trust—SFT Index 400 Mid-Cap Fund. The Fund is not sponsored, endorsed, sold or promoted by Standard & Poor's and Standard & Poor's makes no representation regarding the advisability of investing in the Fund.
16

James Seifert
Portfolio Manager
Fund Objective
The SFT Index 500 Fund seeks investment results that correspond generally to the price and yield performance of the common stocks included in the Standard and Poor's 500® Index (S&P 500). It is designed to provide an economical and convenient means of maintaining a broad position in the equity market as part of an overall investment strategy. The risks incurred by investing in the SFT Index 500 Fund include, but are not limited to, the risk that the Fund may not be able to replicate the performance of the S&P 500®, and the risk of declines in the equity markets generally.
Performance Update
The Fund's Class 2 shares generated a total net return of 17.91 percent over the 12 months ending December 31, 2020; the S&P 500® Index returned 18.40 percent over the same period.
What influenced the Fund's return during the past 12 months?
The SFT Index 500 Fund is passively managed. The Fund is fully invested and holds all names at published float adjusted index weights. The Fund seeks investment results that correspond generally to the price and yield performance, before fees and expenses, of the S&P 500®.
Seven of the nine sectors posted positive annual returns. The technology sector led all sectors with a 12 month return of 38 percent. Materials and services names followed with an annual return of 26.8 percent. Energy and Utilities sectors detracted from performance with returns of -33.4 percent and -1.9 percent, respectively. In terms of size, decile 1, (decile segments consist of 50 names) consisting of the mega-cap names and representing 51.4 percent of the weight in the index, ended the period with a return of 23.7 percent. All other decile groups ended the year with positive returns.
What other market conditions or events influenced the Fund's performance during the past 12 months?
Lower political uncertainty, another COVID-19 relief package, and news of a number of effective vaccines boosted confidence that 2021 would see a return to normal. Investors looked through near term weakness to bid up lagging asset classes, resulting in winners all around in the fourth quarter. For the full year, almost all major asset classes ended the year strongly. COVID-19 continues to weigh on real estate performance, and commodities also lagged, posting negative returns for the year. Despite the strong positive momentum, equity markets continue to price in stubbornly high volatility. While inflation expectations have perked up, rates remain at historically low levels with even the 30-year bond yielding only 1.65 percent at the end of the year.
Despite what is still the worst economic contraction in decades with consensus growth in real GDP of -3.5 percent for the year, it could have been far worse. When signs that the economy was stalling emerged in fourth quarter, Congress stepped up once again. While it remains the worst of times for more than 10 million workers who are still unemployed, aggregate personal income is higher than a year ago, a far different result than in previous shocks.
Fiscal transfers and a lack of spending opportunities not only provided needed aid but increased the savings rate. Substantial pent up demand is the backdrop for a vaccine-driven return to normal next year. Investors are not the only people looking through to a normalizing economy. Manufacturing, both in the U.S. and globally, returned to expansion territory at the end of the second quarter in 2020.
17
What will affect the Fund going forward?
While a strong rebound is likely, in our view we're not going to return to the old normal. The pandemic accelerated trends that were already in place and focused an unflinching spotlight on imbalances and sectors with weak value propositions. Work from home appears to be here to stay, and demand for office space and business travel may take years to recover. Bricks and mortar retail will never be the same. Financial services companies need to compete in a low return world, at least for now. Higher education will have to demonstrate a better value proposition for on-campus learning. The cat's out of the bag as more patients opt for telemedicine over in-person visits.
We believe new business models will emerge, and some sectors could experience a painful transition as investment and infrastructure align in new ways, while other businesses benefit as supply chains realign. Even well-performing companies will feel pressure to leverage technology to increase efficiency and scale. These changes are likely to continue to provide investment opportunities.
The pandemic bared the reality of unequal impacts with low wage, service workers suffering the most. At the same time, the "haves" have more flexibility than ever before. Low tax states with a strong quality of life are drawing attractive businesses, which sets the stage for tension between needed rebalancing and tax policy. Populism and political division are most likely here to stay.
On the bright side, the economy has been surprisingly resilient, and strong growth will likely ease the transition. While markets seem fully priced and even overvalued by normal standards, the stage is set for good economic growth in the coming year. We expect the current slowdown to be short-lived, and ample liquidity remains a strong support. However, with markets fully valued and rates at rock bottom, we believe now is a good time maintain investment discipline.
18
Ten Largest Holdings^
| Security description | | Market
value | | % of total
net assets | |
Apple, Inc. | | $ | 65,947,461 | | | | 6.6 | % | |
Microsoft Corp. | | | 52,295,168 | | | | 5.2 | % | |
Amazon.com, Inc. | | | 43,199,920 | | | | 4.3 | % | |
Facebook, Inc.—Class A | | | 20,421,168 | | | | 2.0 | % | |
Tesla, Inc. | | | 16,641,816 | | | | 1.7 | % | |
Alphabet, Inc.—Class A | | | 16,387,184 | | | | 1.6 | % | |
Alphabet, Inc.—Class C | | | 15,815,973 | | | | 1.6 | % | |
Berkshire Hathaway, Inc.—Class B | | | 14,033,004 | | | | 1.4 | % | |
Johnson & Johnson | | | 12,884,229 | | | | 1.3 | % | |
JPMorgan Chase & Co. | | | 12,045,474 | | | | 1.2 | % | |
| | | $ | 269,671,397 | | | | 26.9 | % | |
^Excludes short-term investments.
Sector Diversification (shown as a percentage of net assets)
19
Comparison of Change in Investment Value*
A Hypothetical $10,000 Investment in SFT Index 500 Fund,
S&P 500® Index and Consumer Price Index (CPI)

On the chart above you can see how the SFT Index 500 Fund's Class 2 shares total return compared to the S&P 500® Index (as adjusted for dividend reinvestment) and the Consumer Price Index. The three lines represent the total return of a hypothetical $10,000 investment made on December 31, 2010 through December 31, 2020, assuming reinvestment of distributions, if any.
* The results shown are past performance and are not an indication of future performance. Current performance may be lower or higher. The investment returns and principal value of an investment will fluctuate so that shares upon redemption may be worth more or less than their original cost. Performance figures of the Fund do not reflect charges pursuant to the terms of the variable life insurance policies and variable annuity contracts funded by separate accounts that invest in the Fund's shares. When such charges are deducted, actual investment performance in a variable policy or contract will be lower. The S&P 500® Index is a broad, unmanaged index of 500 common stocks which are representative of the U.S. stock market overall.
"Standard & Poor's®", "S&P®", "Standard & Poor's 500" and "S&P 500" are trademarks of the S&P Global, Inc. and have been licensed for use by Securian Funds Trust—SFT Index 500 Fund. The Fund is not sponsored, endorsed, sold or promoted by Standard & Poor's and Standard & Poor's makes no representation regarding the advisability of investing in the Fund.
20
SFT International Bond Fund


Michael Hasenstab, Ph.D. and Christine Zhu
Portfolio Managers Franklin Advisers, Inc.
Fund Objective
The SFT International Bond Fund seeks to maximize current income consistent with protection of principal. The Fund pursues its objective by investing primarily in debt securities issued by issuers located anywhere in the world. While Securian Asset Management, Inc. acts as the investment adviser for the Fund, Franklin Advisers, Inc. provides investment advice to the SFT International Bond Fund under a sub-advisory agreement. Investment risks associated with international investing in addition to other risks include currency fluctuations, political and economic instability, and differences in accounting standards when investing in foreign markets.
Performance Update
The Fund generated a total net return of -6.36 percent over the 12 months ended December 31, 2020, underperforming the FTSE World Government Bond Index, which returned 10.11 percent over the same period.
What influenced the Fund's return during the past 12 months?
In calendar year 2020, the Fund's relative underperformance was primarily due to currency positions, followed by interest-rate strategies. Sovereign credit exposures had a largely neutral effect on relative results.
In currency markets, the US dollar (USD) initially strengthened in March on tremendous demand for US dollars during the financial market shocks, but then entered a broad-based weakening pattern in mid-May that largely persisted through the end December. The Fund's underweighted positions in the euro, the Australian dollar and the Mexican peso detracted from relative performance. We continued to hold long exposure in the USD against a net-negative position in the euro, as we expect the euro to weaken against the USD on negative rates in the eurozone and comparatively greater headwinds to growth and reflation efforts across Europe. We also held a net-negative position in the Australian dollar to hedge emerging market beta risks during much of the period, but reduced the position in December, as part of our tactical rotation into areas of risk and value in Asia.
Overweighted currency positions in Latin America (the Brazilian real and Argentine peso) and Asia ex Japan (the Indonesian rupiah) also detracted from relative results. However, overweighted positions in northern European currencies (the Swedish krona and Norwegian krone) contributed to relative performance, as did the Fund's overweighted positions in the Japanese yen.
Developed market sovereign bond yields fluctuated during the summer months, rising on reflation expectations but dropping in September as broad risk aversion returned to global financial markets. Sovereign bond yields also declined in several countries on ongoing monetary accommodation during the year, notably including much of Latin America and Asia, particularly Brazil, Mexico, Indonesia and India. The Fund maintained a defensive approach regarding interest rates in developed markets, while holding duration exposures in select emerging markets. Underweighted duration exposure in the U.S. detracted from relative results, as did select underweighted duration exposures in Europe. However, select overweighted duration exposures in Latin America (Argentina and Mexico) contributed to relative performance. We continue to emphasize select local-currency bonds outside of the major developed markets, in countries that we view as having resilient fundamentals and attractive risk-adjusted yields.
What other market conditions or events influenced the Fund's performance during the past 12 months?
The 2020 calendar year started optimistically, as a phase one trade deal between the U.S. and China appeared to bolster market sentiment, driving risk asset valuations higher in several markets across the globe.
21
In Europe, the European Central Bank (ECB) kept monetary policy unchanged through the end of the year, with the main refinancing operations rate remaining at 0.0 percent, and the main deposit facility rate remaining at -0.5 percent.
In Japan, Yoshihide Suga was confirmed as the new prime minister on September 16, following Shinzo Abe's resignation on August 28. Abe had been prime minister since December 2012. The Bank of Japan (BOJ) made no changes to its rates policy in 2020. Overnight interest rates remained at -0.1 percent and the yield target on the 10-year Japanese government bond remained at 0.0 percent throughout the period. Despite the BOJ's efforts to drive inflation higher during the Abenomics era, deflationary pressures returned, with core inflation (National Consumer Price Index (CPI) ex fresh food) dropping to -0.4 percent year-over-year in August and falling further to -0.9 percent in November. The BOJ announced in December that it had launched a comprehensive review of its monetary framework, scheduled to arrive in March 2021.
Nearly every country in the world declared some form of fiscal response to the economic crisis in 2020, with most countries pursuing programs that went beyond the measures they deployed during the global financial crisis. During the 12-month period Brazil cut rates by 250 basis points (bps) to 2.00 percent, Colombia cut rates by 250 bps to 1.75 percent, Mexico cut rates by 300 bps to 4.25 percent, Indonesia cut rates by 125 bps to 3.75 percent and India cut rates by 115 bps to 4.00 percent.
In markets, the yield on the 10-year US Treasury (UST) note finished the period 100 bps lower, at 0.92 percent, ranging from a pre-pandemic high of 1.92 percent on January 1 to an all-time low of 0.51 percent on August 4. The UST yield curve notably steepened from early August through the end of December, with the spread between the three-month UST bill and the 10-year UST note rising from 40 bps to 83 bps on mounting debt issuance and rising reflation expectations.
In Europe, the yield on the 10-year German Bund finished the year 38 bps lower at -0.57 percent, ranging from a pre-pandemic high of -0.19 percent on January 13 to an all-time low of -0.86 percent on March 9, during peak financial market shocks. Expanding monetary accommodation, political challenges to disbursing fiscal stimulus measures and persistent deflationary pressures kept yields suppressed across much of core Europe through the end of the year. Sovereign bond yields also declined in several countries on ongoing monetary accommodation during the year, notably including much of Latin America and Asia, particularly Brazil, Mexico, Indonesia and India.
In currency markets, the USD initially strengthened in March on tremendous demand for US dollars during the financial market shocks, but then entered a broad-based weakening pattern in mid-May that largely persisted through the end December. Many developed market and emerging market currencies alike strengthened against the USD over the final seven months of the year. In credit markets, spreads widened substantially during peak financial market volatility in February and March, but progressively tightened from April through December, with several sovereign and corporate sectors finishing the year at pre-pandemic levels.
What strategies and techniques did you employ that specifically affected Fund performance?
We continued to maintain low portfolio duration. We are significantly underweight developed market duration, preferring to hold short- to intermediate-term USTs, while holding no exposure to the long end of the curve. We hold no duration exposure in the eurozone. Instead, we continue to emphasize select local-currency bonds outside of the major developed markets, in countries that we view as having resilient fundamentals and attractive risk-adjusted yields.
In December, we shifted the emphasis of our currency allocations from a safe-haven stance toward medium-term valuation opportunities against the euro and USD. We see fundamental value in specific currencies of economies with current account surpluses, notably in northern Europe, Japan and other areas of Asia. We are also holding various unhedged local-currency positions, notably in South Korea, Indonesia, India and Ghana. We have notable long exposures in the Norwegian krone and Swedish krona against the euro, and in the Japanese yen and Chinese yuan against the USD. We continued to hold long exposure in the USD against a net-negative position in the euro, as we expect the euro to weaken against the USD on negative rates in the eurozone and comparatively greater headwinds to growth and reflation efforts across Europe. We reduced our net-negative position in the Australian dollar in December, as part of our tactical rotation into areas of risk and value in Asia.
22
We continued to broadly avoid credit sectors, which remain overvalued and vulnerable to ongoing economic damage, in our view. Nonetheless, we continue to monitor credit conditions and have become increasingly constructive in various areas of the global fixed income markets, notably in areas of Asia, as we expect vaccine distributions to improve economic activity in the second half of 2021.
What will affect the Fund going forward?
We are optimistic for the potential effectiveness of vaccine distributions in 2021, which we expect to incrementally support a rebound in economic activity midway through the year. We anticipate being constructive in a number of regions as the world transitions towards a post-COVID-19 era, with a particular focus on areas of Asia that have addressed the health crisis and economic crisis more effectively. However, it remains crucial to be highly selective as there is wide variance in how countries have contained COVID-19, handled fiscal and monetary policy, and supported their economies.
Additionally, optimism for a potential curtailment of the pandemic in the second half of the year should be counterbalanced with caution over acute near-term risks, in our view. The pandemic continues to destroy areas of economic activity as cases surge to record levels in areas of Europe, the US and Latin America, resulting in substantial risks for a number of financial assets. COVID-19 cases appear likely to reach a zenith during the winter months before vaccine distributions may cause the pandemic to ebb in the late spring and summer of 2021. Broad disinflationary effects are likely to persist until economies can return to full mobility. There will also be wide variation in distribution efficiency in countries, with several emerging markets lagging the deployments of vaccines in advanced economies, creating staggered timelines for economic recoveries and specific investment opportunities.
From a macro standpoint, fiscal and monetary policies continue to have a substantial impact on financial market valuations. Central banks are now seen as the policymaker of first and last resort during a crisis, with extreme monetary policy becoming the norm in developed economies. Emerging markets typically have less ability to pursue ultra-accommodative policies given the amplified risks to price stability and their exchange rates. Stronger institutions in developed countries allow for more extreme measures, though not without consequence; massive fiscal deficits and persistently low rates to minimize debt financing should lead to currency depreciation, notably in the euro area and the US.
We believe environmental, social and governance (ESG) factors will play a major role in rebuilding the post-COVID-19 world. Social cohesion and good governance have the power to accelerate a country's post-crisis recovery, or the lack thereof can stymie it. Tragically we have seen the consequences of weak ESG factors in specific emerging markets during the pandemic. Countries that were less prepared for a health crisis due to weaker health care systems and less developed infrastructure, and/or less prepared for an economic crisis due to fiscal imbalances, high levels of debt and external dependencies, have suffered greater damage. By contrast, countries that were in stronger fundamental shape before the crisis, with stronger institutions, lower levels of debt and more diversified economies, have generally fared better.
Widening income inequality in many countries also remains a critical issue that threatens to undermine economic stability and intensify social discord. Damaged economies and elevated unemployment from the pandemic have only worsened several pre-existing structural problems. Countries that effectively address these challenges in the years ahead can strengthen the underpinnings of their economies, while those that neglect these factors risk further instability. We expect ESG to be a defining characteristic for global fixed income markets in years ahead. Countries that are projected to improve on ESG factors often present the strongest investment opportunities.
23
Ten Largest Holdings^
| Security description | | Market
value | | % of bond
portfolio | |
U.S. Treasury Note 2.125%, 05/15/25 | | $ | 5,342,520 | | | | 5.9 | % | |
U.S. Treasury Note 1.500%, 11/30/24 | | | 4,456,690 | | | | 4.9 | % | |
U.S. Treasury Note 2.000%, 02/15/25 | | | 4,432,549 | | | | 4.9 | % | |
Korea Treasury Bond 4.250%, 06/10/21 | | | 4,279,686 | | | | 4.7 | % | |
Korea Treasury Bond 1.375%, 12/10/29 | | | 4,207,892 | | | | 4.6 | % | |
U.S. Treasury Note 1.750%, 12/31/24 | | | 3,696,023 | | | | 4.1 | % | |
Korea Treasury Bond 3.375%, 09/10/23 | | | 2,668,196 | | | | 2.9 | % | |
U.S. Treasury Note 2.875%, 05/31/25 | | | 2,659,249 | | | | 2.9 | % | |
Mexican Bonos 6.500%, 06/09/22 | | | 2,559,553 | | | | 2.8 | % | |
Korea Treasury Bond 3.000%, 09/10/24 | | | 2,371,397 | | | | 2.6 | % | |
| | | $ | 36,673,755 | | | | 40.3 | % | |
^Excludes short-term investments.
Country Diversification (shown as a percentage of net assets)

Currency Diversification (shown as a percentage of net assets)
African | | | 1.57 | % | |
Ghana Cedi | | | 1.57 | % | |
Americas | | | 37.65 | % | |
United States Dollar | | | 34.97 | % | |
Argentine Peso | | | 1.85 | % | |
Mexican Peso | | | 0.79 | % | |
Brazilian Real | | | 0.04 | % | |
Asia Pacific | | | 71.87 | % | |
Japanese Yen | | | 49.98 | % | |
Republic of Korea Won | | | 17.95 | % | |
Indian Rupee | | | 5.02 | % | |
Indonesian Rupiah | | | 4.74 | % | |
Chinese Yuan Renminbi | | | 4.47 | % | |
Australian Dollar (AUD)* | | | -10.29 | % | |
Europe | | | -11.09 | % | |
Norwegian Krone | | | 11.44 | % | |
Swedish krona | | | 7.81 | % | |
Euro* | | | -30.34 | % | |
*A negative figure reflects net "short" exposure, designed to benefit if the value of the associated currency decreases. Conversely, the Fund's value would potentially decline if the value of the associated currency increases.
24
Comparison of Change in Investment Value*
A Hypothetical $10,000 Investment in SFT International Bond Fund,
FTSE World Government Bond Index and Consumer Price Index (CPI)
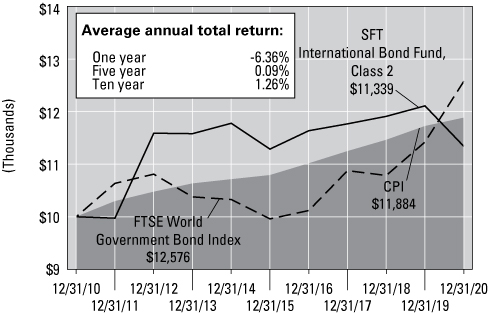
On the chart above you can see how the SFT International Bond Fund's Class 2 shares total return compared to the FTSE World Government Bond Index, and the Consumer Price Index. The three lines represent the total return of a hypothetical $10,000 investment made on December 31, 2010 through December 31, 2020, assuming reinvestment of distributions, if any.
* The results shown are past performance and are not an indication of future performance. Current performance may be lower or higher. The investment returns and principal value of an investment will fluctuate so that shares upon redemption may be worth more or less than their original cost. Performance figures of the Fund do not reflect charges pursuant to the terms of the variable life insurance policies and variable annuity contracts funded by separate accounts that invest in the Fund's shares. When such charges are deducted, actual investment performance in a variable policy or contract will be lower.
The FTSE World Government Bond Index is a market capitalization weighted index consisting of the government bond markets from over twenty countries. Country eligibility is determined based upon market capitalization and investability criteria. The index includes all fixed-rate bonds with a remaining maturity of one year or longer and with amounts outstanding of at least the equivalent of U.S. $25 million. Government securities typically exclude floating or variable rate bonds, U.S./Canadian savings bonds and private placements. Each bond must have a minimum rating of BBB-/Baa3 by S&P or Moody's.
25

Bradley M. Klapmeyer, CFA Portfolio Manager Ivy
Investment Management Company
Fund Objective
The SFT IvySM Growth Fund seeks to provide growth of capital. The Fund pursues its objective by investing primarily in a diversified portfolio of common stocks issued by large capitalization companies. While Securian Asset Management, Inc. acts as the investment adviser for the Fund, Ivy Investment Management Company (IICO) provides investment advice to the Fund under a sub-advisory agreement. The risks incurred by investing in the Fund include, but are not limited to, the risk of declines in the market for large cap stocks or in the equity markets generally.
Performance Update
The Fund generated a total net return of 30.69 percent over the 12 months ending December 31, 2020, underperforming the Russell 1000 Growth Index which returned 38.49 percent for the same period.
What influenced the Fund's return during the past 12 months?
During the measurement period, the Fund posted a strong absolute gain, but underperformed relative to its benchmark. Stock selection within the consumer discretionary, information technology and communication services sectors was the main reason for relative underperformance.
Market returns were strongly influenced by the "tails"—on one end were hyper growers that lack proven business models throughout cycles and on the other end were cyclical value stocks that are highly dependent on accelerating economic growth prospects. This created a unique challenge for the Fund's desire to maintain a strong quality bias as many of the outperforming areas lacked the strong business model characteristics we typically require. Given that we believe quality is more durable than growth, we were forced to sacrifice on some relative growth attributes in favor of quality, and although that resulted in underperformance in 2020, we think maintaining a focus on quality growth will be rewarded through the cycle.
What other market conditions or events influenced the Fund's performance during the past 12 months?
2020 initially started, pre-pandemic, with hopes that easing credit conditions and monetary policy would ultimately lead to accelerating growth later in 2020. Oddly enough, 2020 ended with that same narrative but for 2021 with hope that another round of, again unprecedented, monetary and fiscal policy will kick-start a new, but stronger post pandemic economic cycle.
Maintaining exposure to the large-cap growth style over the past decade has been a rewarding proposition with an annual total return for the Russell 1000 Growth Index since 2010 slightly more than 17 percent. While those average annual gains are remarkable, it hasn't been a smooth ride as the past decade has been marked by its fair share of turbulence as global economies emerged from the depths of the global financial crisis. While this decade long run for growth style investing was capped with another year of strong gains, 2020 made sure it was a hard-earned return.
What strategies and techniques did you employ that specifically affected Fund performance?
Performance in consumer discretionary was the leading source of negative sector attribution. The Fund was overweight the sector but challenging stock selection more than offset this positive allocation. The most significant detractor was underweight exposure to Tesla, which posted a significant gain for the period. We maintained no exposure as we believe Telsa's valuation is embedding unrealistic long-term business economics and earnings. An
26
overweight position in two other stocks, V.F. Corp. and Booking Holdings Inc., also detracted from performance. Finally, a notable overweight position in Tractor Supply Co. was a source of positive attribution. Strength in Tractor Supply, a position initially introduced in the portfolio in January 2020, outperformed as it remained operational during COVID-19 because its products were deemed essential to consumers.
Information technology was another detractor, driven by an overweight position in Motorola Solutions, which underperformed as a result of concerns related to demand within its first responder communications business unit. Apple, Inc. was another detractor as the Fund's underweight position proved incorrect given the company's impressive returns during the period. Positive attribution wasn't absent during the period as several overweight positions, including NVIDIA Corp., PayPal Holdings, Adobe and Microsoft, provided a partial offset to challenged performance within the sector.
Within the communication services sector, the Fund continued to experience a headwind from the pervasive theme of rewarding relatively unproven business models, which stands in contrast to the Fund's well-tenured process and philosophy. Underweight positions in Netflix, Pinterest and Roku were sources of detraction, while an overweight in Electronic Arts, despite gaining double digits in the period, added to the relative underperformance within the sector. Positive attribution was present as the Fund continued to avoid traditional media companies that significantly underperformed the sector.
Industrials was a source of positive attribution driven by the Fund's stock selection within the sector. Underweight positions in aerospace and defense stalwarts such as Boeing and Lockheed Martin were bright spots. A continued overweight in CoStar Group, as in recent years, again proved to be a source of positive attribution. The Fund experienced a headwind to performance with overweight positions in several long-term holdings such as Stanley Black & Decker, Caterpillar, Northrop Grumman and J.B. Hunt Transport Services.
Lastly, Fund exposure to the real estate and materials sectors, while relatively small, provided positive sources of attribution through both positive allocation and stock selection.
What will affect the Fund going forward?
Supported by low interest rates, flowing fiscal stimulus and improving global growth prospects, the markets will likely enter 2021 with a sustained desire to swing for the fences. As such, it is possible to see continued strength in the near-term from hyper-growth dream stocks and lower quality, deeply cyclical value names.
We see these tail trades, or "barbell strategies," as temporary. Neither has deep roots attached to quality businesses. We believe as the year progresses the persistence and intensity of outperformance from these tails will cede momentum to more durable investment strategies. We are hopeful that macro and stylist influences on the market will diminish leaving a market better tuned for stock picking, not macro or factor guessing.
The catalyst driving our view of a more rational market environment is simply related to the "rubber meeting the road." Market valuation expansion has been a significant portion of growth style returns over the past two years, which embeds a high level of expectations around accelerating growth or sustaining high levels of rapid growth. We believe that parts of the market—work from home, pandemic beneficiaries and hyper-growth stocks—have built in expectations of years of forward good news based on current low interest rates, contained inflation, upsized fiscal stimulus and stronger near-term economic prospects. We think these high expectations of sustained growth along with a broadening economic recovery and upward movement in rates, poses a real risk to the growth tail of the market.
Our empirically proven investment philosophy is based on the fleeting nature of growth sustainability and that growth, if ultimately durable, needs to be attached to a quality business. As such, we have always started our stock selection process with good business model selection and believe quality is paramount to controlling downside risk and driving strong multi-year returns. Although the current environment may be recklessly rewarding only those companies with the highest near-term growth or strongest pandemic revisions, we stand firm in our assessment that quality is more durable than growth. We believe starting with quality while avoiding the temptation to chase growth for growth's sake (at any cost) will reap significant and more predictable benefits over a multi-year horizon.
27
Ten Largest Holdings^
| Security description | | Market
value | | % of net
assets | |
Microsoft Corp. | | $ | 60,341,656 | | | | 10.0 | % | |
Apple, Inc. | | | 53,483,093 | | | | 8.8 | % | |
Amazon.com, Inc. | | | 41,265,303 | | | | 6.8 | % | |
Alphabet, Inc.—Class A | | | 27,197,468 | | | | 4.5 | % | |
Visa, Inc.—Class A | | | 26,988,439 | | | | 4.5 | % | |
Facebook, Inc.—Class A | | | 22,041,280 | | | | 3.6 | % | |
PayPal Holdings, Inc. | | | 19,013,995 | | | | 3.1 | % | |
Adobe, Inc. | | | 18,808,513 | | | | 3.1 | % | |
Motorola Solutions, Inc. | | | 18,400,492 | | | | 3.0 | % | |
Intuit, Inc. | | | 17,718,863 | | | | 2.9 | % | |
| | | $ | 305,259,102 | | | | 50.3 | % | |
^Excludes short-term investments.
Sector Diversification (shown as a percentage of net assets)

28
Comparison of Change in Investment Value*
A Hypothetical $10,000 Investment in SFT IvySM Growth Fund,
the Russell 1000 Growth Index and Consumer Price Index (CPI)
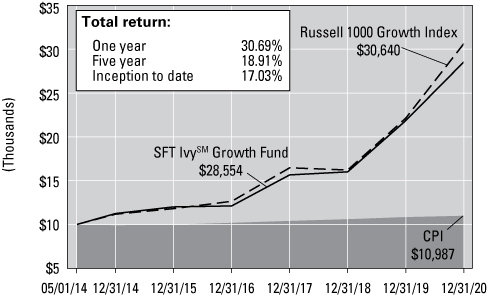
On the chart above you can see how the SFT IvySM Growth Fund's shares total return compared to the Russell 1000 Growth Index and the Consumer Price Index. The three lines represent the total return of a hypothetical $10,000 investment made on May 1, 2014 through December 31, 2020, assuming reinvestment of distributions, if any.
* The results shown are past performance and are not an indication of future performance. Current performance may be lower or higher. The investment returns and principal value of an investment will fluctuate so that shares upon redemption may be worth more or less than their original cost. Performance figures of the Fund do not reflect charges pursuant to the terms of the variable life insurance policies and variable annuity contracts funded by separate accounts that invest in the Fund's shares. When such charges are deducted, actual investment performance in a variable policy or contract will be lower.
The Russell 1000 Growth Index is an unmanaged index that measures the performance of those Russell 1000 Index companies with higher price-to-book ratios and higher forecasted growth values. The index measures the performance of the 1,000 largest companies in the Russell 3000 Index, which measures the performance of the 3,000 largest U.S. companies based on total market capitalization.
'Ivy' is the registered service mark of Ivy Distributors, Inc., an affiliate of IICO.
29
SFT IvySM Small Cap Growth Fund


Timothy J. Miller, CFA, Kenneth G. McQuade, CFA, Bradley P. Halverson, CFA Portfolio Managers Ivy Investment Management Company
Fund Objective
The SFT IvySM Small Cap Growth Fund seeks to provide growth of capital. The Fund pursues its objective by investing primarily in a diversified portfolio of common stocks issued by small capitalization companies. While Securian Asset Management, Inc. acts as the investment adviser for the Fund, Ivy Investment Management Company (IICO) provides investment advice to the Fund under a sub-advisory agreement. The risks incurred by investing in the Fund include, but are not limited to, the risk of declines in the market for small cap stocks or in the equity markets generally.
Performance Update
The Fund generated a total net return of 36.26 percent over the 12 months ending December 31, 2020, outperforming the Russell 2000 Growth Index which returned 34.63 percent over the same period.
What influenced the Fund's return during the past 12 months?
The Fund outperformed its benchmark for the measurement period. The Fund's steady focus on sustainable, quality growth companies provided a consistent lead over the benchmark during a period of tremendous volatility and mood swings in the market. After a strong start to the year, COVID-19 focused investor expectations on industries and companies that could weather the turmoil or indeed prosper.
What other market conditions or events influenced the Fund's performance during the past 12 months?
One needed more than "2020" vision to foresee the events that would transpire last year and how the market could rise so much in the midst of all of the chaos. The broad market gains in the U.S. were good last year and the small-cap market gains were great.
Growth stocks were the leaders across the entire market cap spectrum, as investors gravitated to the durability and predictability of companies in the technology, healthcare, and emerging growth industries. COVID-19 caused a sharp correction in the spring, but the rapid and forceful response of fiscal and monetary policy provided the catalyst for the stock market to foresee better days ahead. Confidence in that foresight was further enhanced by the rapid development and success of a vaccine late in the year, sparking a broader year-end rally.
What strategies and techniques did you employ that specifically affected Fund performance?
There were clear winners that thrived during the economic contraction, including health care service companies such as Teledoc, or critical software vendors whose subscription model proved resilient, or consumer companies exposed to outdoor recreation. The Fund made a few adjustments to increase exposure in these stocks while reducing exposure in the most vulnerable industries such as travel and entertainment and energy. The correction lasted about a month, and then the impact of aggressive fiscal stimulus and monetary accommodation turned sentiment around quickly. The rally was led by the stocks hit the hardest during the correction, and then a tug of war ensued over the balance of the year between defensive COVID-19 beneficiaries versus a reopening recovery trade. The challenge for the Fund was to maintain the significant outperformance generated prior to the bottom. By year-end only a small portion of that gain had been forfeited. The two leading sectors for the Fund were the two largest weights, information technology and health care.
Information technology was a significant contributor to Fund performance during the year as the sector handily beat the index and stock selection nicely outpaced sector returns. As the world lurched into lockdown in March,
30
the digital transformation theme of the past decade suddenly accelerated as the necessity to work remotely impacted all types of organizations worldwide. Many technology companies became immediate beneficiaries as reliance on software, communications, technology and digital tools became mission critical. The Fund has historically been overweight information technology because the market, over a full market cycle, has rewarded strong, enduring business models operating in large, exploitable markets. This year was turbocharged as software, semiconductors and information technology services were key contributing industries, bolstered by strong stock selection leading to significant returns in excess of the Fund's benchmark. Notable performance came from Five9, a company providing crucial cloud call-center software; Enphase Energy, a company delivering solar inverters and batteries to the U.S. residential market; and Monolithic Power, a leading analog semiconductor company. In the year ahead, we believe demand for these technologies will remain robust and we expect to retain an overweight sector stance devoted to strong growth companies. Still, we are conscientious of elevated valuations and continue to evaluate position sizes and seek for new opportunities of innovative companies we believe are well positioned for sustained growth and profitability.
Health care produced the strongest return of any sector and, as the largest weighted sector in the Fund's benchmark, created a significant performance hurdle to keep up with. COVID-19 was the obvious key focal point that created many direct impacts such as minimal capacity for non-emergency procedures, lower private pay from rising unemployment, massive vaccine and treatment funding and significant stress on staffing. Another incremental aspect of the pandemic was the rapid development and acceptance of novel technologies that could make health care delivery more efficient, more effective and more customized, such as genetic testing, vaccine technologies and gene editing. Biotech was the largest contributing segment. Biotechnology produced a strong double-digit annual return in the Fund's benchmark on the back of accelerated adoption of technologies along with low interest rates, easy credit and an accommodating Food and Drug Administration. Despite the tough performance hurdle, we outperformed within health care due to strong stock selection including multiple names that more than doubled their returns in the year. Although we remained underweight the sector to avoid much of biotech's more binary risk profiles, stock selection more than offset the weighting headwind. Looking forward, we think demand for more efficiency and individualized treatments along with available funding for development keeps the fundamental outlook bright for the more novel niches in health care, likely at the expense of outdated facilities and invasive therapies. As a result, we continue to gravitate toward innovation and services that facilitate value-based health care in more cost-effective settings.
The balance of the portfolio was a net drag on performance for the year. As the market migrated to a recovery-oriented environment in the latter half of the year, the cyclical, value-oriented portion of the Fund's benchmark led the way. Stocks in the energy, machinery and materials sectors were the outperformers and these areas were underweight positions in the Fund.
Consumer discretionary was a strong absolute performer and the Fund performed in line with the Fund's benchmark. The shortfall in industrials was primarily due to the cyclical phenomena mentioned above, and a bit of a speculative flurry of performance in solar stocks. Finally, financials was a drag on returns due to disappointing stock performance from a few names such as eHealth and Houlihan Lokey. The former has been sold.
What will affect the Fund going forward?
As unpredictable as 2020 was, the lesson learned was to maintain the Fund's core stock selection discipline, which has proven over the years to be a successful strategy. We believe the market ultimately rewards the small-cap growth companies that deliver sales and earnings growth and returns on capital that merit the high valuations often achieved.
The pandemic in some cases validated and accelerated the adoption of the innovative growth models that the Fund is always pursuing. The outlook for 2021 seems brighter with the rollout of the vaccine but there will undoubtedly be the unexpected turn of events that lead to market volatility. Innovation is in full stride however, which we think is an ideal environment to invest in small-cap growth companies.
31
Ten Largest Holdings^
| Security description | | Market
value | | % of stock
portfolio | |
Five9, Inc. | | $ | 7,542,277 | | | | 3.6 | % | |
CareDx, Inc. | | | 6,452,107 | | | | 3.0 | % | |
Varonis Systems, Inc. | | | 6,092,836 | | | | 2.9 | % | |
Globant SA | | | 5,309,249 | | | | 2.5 | % | |
Monolithic Power Systems, Inc. | | | 5,255,034 | | | | 2.5 | % | |
PetIQ, Inc. | | | 4,842,701 | | | | 2.3 | % | |
The Brink's Co. | | | 4,627,728 | | | | 2.2 | % | |
Mercury Systems, Inc. | | | 4,457,421 | | | | 2.1 | % | |
Vericel Corp. | | | 4,370,940 | | | | 2.1 | % | |
Q2 Holdings, Inc. | | | 4,136,139 | | | | 2.0 | % | |
| | | $ | 53,086,432 | | | | 25.2 | % | |
^Excludes short-term investments.
Sector Diversification (shown as a percentage of net assets)
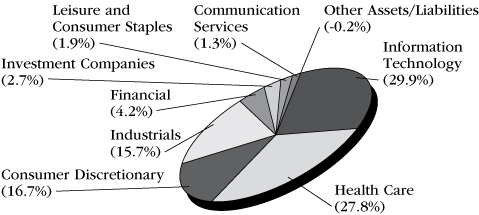
32
Comparison of Change in Investment Value*
A Hypothetical $10,000 Investment in SFT IvySM Small Cap Growth Fund,
the Russell 2000 Growth Index and Consumer Price Index (CPI)
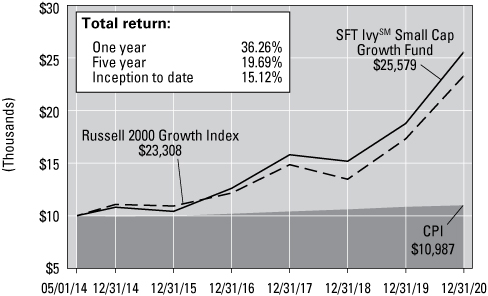
On the chart above you can see how the SFT IvySM Small Cap Growth Fund's shares total return compared to the Russell 2000 Growth Index and the Consumer Price Index. The three lines represent the total return of a hypothetical $10,000 investment made on May 1, 2014 through December 31, 2020, assuming reinvestment of distributions, if any.
* The results shown are past performance and are not an indication of future performance. Current performance may be lower or higher. The investment returns and principal value of an investment will fluctuate so that shares upon redemption may be worth more or less than their original cost. Performance figures of the Fund do not reflect charges pursuant to the terms of the variable life insurance policies and variable annuity contracts funded by separate accounts that invest in the Fund's shares. When such charges are deducted, actual investment performance in a variable policy or contract will be lower.
The Russell 2000 Growth Index is an unmanaged index of those Russell 2000 Index growth companies with higher price-to-book ratios and higher forecasted growth values. The index is broad-based, comprised of 2,000 of the smallest U.S.-domiciled company common stocks based on total market capitalization.
'Ivy' is the registered service mark of Ivy Distributors, Inc., an affiliate of IICO.
33
SFT Managed Volatility Equity Fund


Craig M. Stapleton, CFA, FRM, Jeremy Gogos, Ph.D., CFA and Merlin Erickson Portfolio Managers
Fund Objective
The SFT Managed Volatility Equity Fund seeks to maximize risk-adjusted total return relative to its blended benchmark index comprised of 60 percent S&P 500® Low Volatility Index, 20 percent S&P 500® BMI International Developed Low Volatility Index and 20 percent Bloomberg Barclays U.S. 3-Month Treasury Bellwether Index (collectively, the Blended Benchmark Index). The SFT Managed Volatility Equity Fund invests at least 80% of its assets in equity securities. Equity securities include those that are equity based, such as ETFs that invest primarily in U.S. and foreign equity securities. The Fund is subject to risks associated with such investments as described in detail in the Fund's prospectus. The net asset value of the Fund will fluctuate and is not guaranteed. It is possible to lose money by investing in the Fund. There is no assurance that efforts to manage Fund volatility will achieve the desired results.
Performance Update
The Fund generated a total net return of -5.35 percent, with a volatility of 11.87 percent, over the 12 months ending December 31, 2020. The Blended Benchmark Index, which is comprised of the S&P 500® Low Volatility Index, weighted 60 percent, the S&P 500 BMI International Developed Low Volatility Index, weighted 20 percent, and the Bloomberg Barclays U.S. 3-Month Treasury Bellwether Index, weighted 20 percent, returned -1.96 percent, with a volatility of 23.35 percent, over the same period.
What influenced the Fund's return during the past 12 months?
Equity volatility is what guides the asset allocation of this strategy. When equity volatility is low, the equity exposure of this strategy will be high. Conversely, when equity volatility is high, the equity exposure of this strategy will be low. Clearly, in 2020, COVID-19 was the predominant driver of market volatility.
The S&P 500 realized 34.43 percent volatility for 2020, the sixth highest calendar-year volatility in the index's 93-year history. 2008 is the only year in the modern era more volatile (40.97 percent realized volatility). All other higher years occurred in the 1920s and 1930s. Realized one-month volatility began 2020 quite low, entering the year at 6.90 percent. As such, the Fund's equity exposure was at 98.95 percent. In early February, as the market began to appreciate how truly disruptive COVID-19 could be, volatility began to escalate. From 02/21/2020 through 03/27/2020, the Fund was steadily de-risked from 99.52 percent to 13.61 percent equity exposure. This reduction in equity exposure was concurrent with one-month volatility increasing from 13.90 percent to 97.12 percent over the same time period. 03/27/2020 turned out to be the peak of one-month realized volatility in the COVID-19 market panic, but it stayed above 40 percent through the end of April. Indeed, the Fund did not begin adding back equity exposure in earnest until mid-May, and volatility did not drop enough for the Fund to get to "neutral" weight—i.e. 80 percent exposure—until late July. September and October also saw brief periods of volatility rising to the mid 20 percent range, and so the Fund was underweight equity for most of Q3 and Q4. One-month volatility closed out 2020 at 8.3 percent, and the Fund finished 2020 with 87.54 percent linear S&P exposure, approximately 11.59 percent exposure in long S&P 500 call options, and approximately 1.30 percent exposure in long Chicago Board of Options Exchange (CBOE) Volatility Index (VIX) puts.
All told, the Fund's average equity exposure for 2020 was 64.52 percent, which contributed -5.43 percent to the overall Fund return on a net basis. The benchmark equity component contributed -2.09 percent to the Blended Benchmark Index return. The Fund's fixed income and cash assets averaged 35.48 percent weight for the year, and contributed 0.08 percent to the overall Fund return on a net basis. The benchmark fixed income component delivered 0.13 percent to the Blended Benchmark Index return.
34
What other market conditions or events influenced the Fund's performance during the past 12 months?
Following are just some of the financial extremes witnessed in 2020:
• March 2020 saw a realized volatility of 93.42 percent, the most volatile month ever in the S&P 500 history.
• The CBOE VIX set a new closing record of 82.7 on 03/16/2020.
• The 33.92 percent drawdown from 02/20/2020 through 03/23/2020 was the ninth-largest S&P loss ever in 23 business days, and all other such periods that surpassed it were in 1929 and 1931.
• Similarly, over the next 103 days, the S&P 500 rallied 51.50 percent, surpassing its pre-COVID-19 high. The speed of this rally is also unmatched in the last 87 years; only periods from 1932 and 1933 saw a larger S&P 500 price appreciation in the same number of business days.
• International indexes (Nikkei 225, Hang Seng, FTSE 100, EuroStoxx 50) also saw rapid drawdowns in the 25-35 percent range in response to COVID-19.
• The highest single-week Initial Jobless Claims (IJC) number during the Great Financial Crisis (GFC) was 665,000; during the week of 03/20/2020, the IJC number jumped from 282,000 to 3,307,000, and experienced forty-one continuous weeks of prints above the GFC peak.
• The US 10-year Treasury rate set a new record low of 0.51 percent on 08/04/2020.
• Second quarter of 2020 saw the largest quarter-over-quarter US Gross Domestic Product (GDP) contraction in history -31.40 percent.
In addition to these "top-level" anomalies, there were other very troubling developments underneath:
• The well-known concentration of S&P 500 market cap in tech names was not helped by Tesla joining the index. As of year end, 24.86 percent of the S&P 500 market cap was concentrated in Apple, Amazon, Facebook, Alphabet (Google), Microsoft, Tesla, and Netflix. Also of note, Tesla saw a 743 percent return for 2020.
• The best-performing S&P 500 sector in 2020 was Information Technology. The worst-performing sector was Energy. The performance gap between the two was the largest on record, going back to 2002. COVID-19 created an environment where industries that benefit from "work from home" (delivery retail, tech, etc.) were handed outlandish returns, and most other real-economy sectors were punished.
• The Growth and Value sub-indexes of the S&P 500 tell a similar story. The outperformance of Growth over Value in 2020 is the largest on record back to 1994. The next largest Growth-Value gap was in 1998, leading up to the DotCom bubble.
• The current projection for S&P 500 earnings growth year-over-year for the fourth quarter 2020 is -8.8 percent; yet the S&P 500 closed 2020 at a new all-time high.
We continue to view the equity markets as generally overvalued, and the absurd performance of the top equity sectors and names as liquidity fueled mania. To that end, consider the peak-to-trough performance of both the Fund and the Fund's benchmark through the COVID-19 panic. The Fund achieved its goal of mitigating severe drawdowns. However, with the Federal Reserve (Fed) unexpectedly cutting its target policy rate to 0.0 percent (03/13/2020) and pledging to inject trillions of short-term liquidity into the financial system, and the roughly $2 trillion CARES act passing on 03/27/2020, any asset allocation that involved being underweight equity was a losing proposition. This underweight was one primary driver of the Fund's underperformance in 2020. The other driver was the Fund's tilt toward value and low volatility stocks in its cash equity holdings. As alluded to above, these equity factors were extremely challenged in 2020.
35
What strategies and techniques did you employ that specifically affected Fund performance?
Throughout the year, the Fund held a core long position in cash equity that represents low volatility domestic and international equity. In addition, the Fund had long and short positions in S&P 500 futures, long and short S&P 500 call options, long and short S&P 500 put options, long and short VIX call options, and long and short VIX put options. These derivative positions were held either as expressions of the target equity allocation of the Fund given prevailing volatility, or as supplemental hedges for managing the Fund's risk.
What will affect the Fund going forward?
We expect worse-than-average returns, and higher volatility, for domestic risk markets on a go-forward basis. Equity indexes continue to make new highs, while most fundamental valuation metrics suggest the equity market is quite overvalued, and S&P 500 earnings have declined year-over-year for 7 of the last 8 quarters. Both investment grade and high yield corporate credit yields are near their historic lows, while domestic corporate debt outstanding hit another new record in 2020. Multiple indications of inflation expectations have steadily risen since early 2020.
In short, up to this point, the monetary and fiscal tsunami unleashed upon the markets has been the primary driver of the returns seen since the COVID-19 market nadir. In our view, it seems plausible that the market has finally reached the point where central bank liquidity can no longer be injected without stoking fears of inflation. And further, every major central bank is now at their logical policy limit: short-term rates pinned at zero, and aggressive asset purchases to support markets.
Some market observers find justification for bullish sentiment in the COVID-19 vaccine release, and the promise of societal dynamics returning to normal. But in response, we pose the following simple logical question: if the market was impervious to the sectors worst affected by COVID-19 struggling mightily for the better part of a year, should the market see material gains as a result of those sectors returning to normal operation?
Given the present situation of extremely accommodative monetary policy, and probable further fiscal stimulus from the newly-elected Democratic federal government, we view the risk of a major equity selloff as reduced. But again, we are hard-pressed to see the case for material risk asset gains in 2021. And, perhaps more importantly, given the current central bank positioning, the—in our view—absolutely irresponsible federal debt and deficit, and the already staggering level of federal stimulus, we see the entire market as extremely vulnerable to an exogenous shock.
In a tactical sense, we will continue to use our volatility metrics to inform the equity allocations of the Funds. We will increase equity exposure if we believe volatility will decrease, decrease equity exposure if we believe volatility will increase, and in the event that we are overweight equity, we will carry some form of tail risk hedge for the foreseeable future.
36
Ten Largest Holdings^
| Security description | | Market
value | | % of market
value | |
iShares Edge MSCI Minimum Volatility USA ETF | | $ | 114,923,012 | | | | 32.3 | % | |
iShares Edge MSCI Minimum Volatility EAFE ETF | | | 91,455,132 | | | | 25.7 | % | |
iShares Core High Dividend ETF | | | 66,318,585 | | | | 18.7 | % | |
iShares Edge MSCI Minimum Volatility Emerging Markets ETF | | | 21,871,832 | | | | 6.2 | % | |
iShares MSCI Germany ETF | | | 16,877,240 | | | | 4.7 | % | |
BlackRock Short Maturity Bond ETF | | | 13,809,042 | | | | 3.9 | % | |
| | | $ | 325,254,843 | | | | 91.5 | % | |
^Excludes short-term investments.
Sector Diversification (shown as a percentage of net assets)
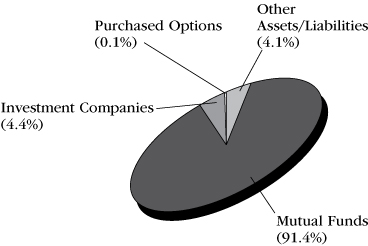
37
Comparison of Change in Investment Value*
A Hypothetical $10,000 Investment in SFT Managed Volatility Equity Fund,
the Blended Benchmark Index and Consumer Price Index (CPI)

On the chart above you can see how the SFT Managed Volatility Equity Fund's shares total return compared to its Blended Benchmark Index, comprised of 60 percent of the S&P 500® Low Volatility Index, 20% S&P 500® BMI International Developed Low Volatility Index and 20% Bloomberg Barclays U.S. 3 Month Treasury Bellwether Index and the Consumer Price Index. The three lines represent the total return of a hypothetical $10,000 investment made on November 18, 2015 through December 31, 2020, assuming reinvestment of distributions, if any.
* The results shown are past performance and are not an indication of future performance. Current performance may be lower or higher. The investment returns and principal value of an investment will fluctuate so that shares upon redemption may be worth more or less than their original cost. Performance figures of the Fund do not reflect charges pursuant to the terms of the variable life insurance policies and variable annuity contracts funded by separate accounts that invest in the Fund's shares. When such charges are deducted, actual investment performance in a variable policy or contract will be lower.
Securian Asset Management, Inc. (Securian AM) and the Securian Funds Trust, on behalf of the SFT Managed Volatility Equity Fund (the "Fund"), have entered into an Expense Limitation Agreement, dated November 18, 2015, which limits the operating expenses of the Fund, excluding certain expenses (such as interest expense, acquired fund fees, cash overdraft fees, taxes, brokerage commissions, other expenditures which are capitalized in accordance with the generally accepted accounting principles, and other extraordinary expenses not incurred in the ordinary course of the Fund's business), to 0.80% of the Fund's average daily net assets through April 30, 2021. The Agreement renews annually for a full year each year thereafter unless terminated by Securian AM upon at least 30 days' notice prior to the end of a contract term. The Fund is authorized to reimburse Securian AM for management fees previously waived and/or for the cost of expenses previously paid by Securian AM pursuant to this agreement, provided that such reimbursement will not cause the Fund to exceed any limits in effect at the time of such reimbursement. The Fund's ability to reimburse Securian AM in this manner only applies to fees waived or reimbursements made by Securian AM within the three fiscal years prior to the date of such reimbursement. To the extent that the Fund makes such reimbursements to Securian AM, the amount of the reimbursements will be reflected in the financial statements in the Fund's shareholder reports and in Other Expenses under Fees and Expenses of the Fund.
The Blended Benchmark Index is comprised of 60 percent of the S&P 500® Low Volatility Index, 20% S&P 500® BMI International Developed Low Volatility Index and 20% Bloomberg Barclays U.S. 3-Month Treasury Bellwether Index.
The S&P 500® Low Volatility Index measures performance of the 100 least volatile stocks in the S&P 500®. The S&P 500® BMI International Developed Low Volatility Index measures the performance of the 200 least volatile stocks in the S&P Developed Market large/midcap universe. Constituents are weighted relative to the inverse of their corresponding volatility, with the least volatile stocks receiving the highest weights. The Bloomberg Barclays U.S. 3-Month Treasury Bellwether Index tracks the market for the on-the-run 3-month Treasury bill issued by the U.S. government.
38
SFT Real Estate Securities Fund


Matthew Richmond, Lowell Bolken, CFA and Joshua Klaetsch, CFA Portfolio Managers
Fund Objective
The SFT Real Estate Securities Fund seeks above-average income and long-term growth of capital. The Fund intends to pursue its objective by investing primarily in equity securities of companies in the real estate industry. Investment risks associated with investing in the SFT Real Estate Securities Fund, in addition to other risks, include rental income fluctuations, depreciation, property tax value changes, and differences in real estate market value.
Performance Update
The Fund's Class 2 shares generated a total net return of -2.83 percent over the 12 months ending December 31, 2020, outperforming the FTSE NAREIT Equity REITs Index which returned -8.00 percent over the same period.
What influenced the Fund's return during the past 12 months?
Real estate stocks delivered negative returns for the year ending December 31, 2020, widely underperforming the S&P 500® for the second consecutive year. The COVID-19 pandemic ushered in unprecedented economic strife on main-street America, leading to significant occupancy losses and operating uncertainty across the commercial real estate landscape. The majority of damage was inflicted throughout the first half of the year, with steady improvement in operating conditions being achieved in the second half. With the economy effectively shuttered in the second quarter and job losses exceeding 20 million (as opposed to 8 million in the Global Financial Crisis of 2008) it comes as little surprise that real estate demand suffered wide-reaching effects.
COVID-19 continues to weigh on real estate demand across most property types, but the welcome news of effective vaccines has shifted the outlook for the sector. Relative to earlier in the year, rental collections have improved dramatically and the sector appears to have stabilized. Significant laggards, including retail and hotels can now see a light at the end of what has been a very long tunnel. While it will likely take years for demand to return to pre-COVID-19 levels, the specter of widespread tenant bankruptcies has faded. Optimism surrounding a return to normal activity levels across the economy and space demand resumption is driving expectations of 5% cash flow growth for REITs in 2021.
What other market conditions or events influenced the Fund's performance during the past 12 months?
Data Centers and Cell Tower owners were the standouts among the property types, while retail and hotel owners suffered near catastrophic business interruption. Demand for space remains strong, with enterprise migrations in datacenters and 5G buildouts in towers expected to accelerate. At the same time, edge and cloud computing, mobile data usage growth, and artificial intelligence are all expected to provide tailwinds to demand for the foreseeable future. We continue to see the communications infrastructure names as attractively valued when considering their growth prospects and defensive lease structures, and the portfolio remains overweight to this sector.
Industrial REITs were another clear winner throughout the pandemic as on-line shopping exploded and consumers continued to execute a secular shift from 'bricks and mortar' shopping to E-Commerce with same day delivery.
Single family rental REITs also delivered solid performance. A limited supply of affordable and available inventory, coupled with surging demand from renters fleeing large, urban areas drove near sector leading returns for single family rental REITs.
As if "bricks & mortar" retailers needed another problem in the fight for consumer dollars, the pandemic all but destroyed the demand for in-person shopping. Another year of significant store closures and bankruptcy filings resulted in dismal performance for mall REITs, whose returns lagged the index by nearly 30%.
39
Office REITs were another casualty of COVID-19, as the world reverted to a work-from-home model. We believe this phenomenon has staying power that will impinge office demand for the foreseeable future. Demand and rental rates will likely take years to recover (if ever) to pre-COVID-19 levels in certain urban markets.
What strategies and techniques did you employ that specifically affected Fund performance?
The Portfolio delivered negative returns, but widely outperformed its benchmark and finished in the top quartile of peers. We properly anticipated the wide-ranging influence of the pandemic and quickly shifted the portfolio to a "defensive" posture in the late first quarter. Our investment philosophy consistently favors companies we believe own well-located, high-quality properties that feature stable balance sheets, exhibit improving property fundamentals and have above-average cash flow growth prospects. Those characteristics have proven over time to result in favorable performance.
Office stocks underperformed the index, but selection decisions within the sector aided the portfolio's relative performance. A long-held overweight position in a biotech/life science owner was a sizable outperformer. This company benefited from owning a high quality portfolio of buildings with a highly attractive tenant roster. Near complete avoidance of New York City (NYC) office owners also benefitted the portfolio. Owners of NYC office faced significant challenges now and into the forseeable future with the COVID-19 fallout expected to impact demand for years, as dense urban office leasing will become taboo in the post-COVID-19 world. We also reduced our holdings in West Coast centric office owners as conditions in that region have deteriorated.
Data Center and Cell Tower REITs were among the top performers in 2020, and the portfolio's overweight position was a significant contributor to benchmark-relative performance. We continue to see the communications infrastructure names as attractively valued when considering their growth prospects and defensive lease structures, and the portfolio remains overweight to this sector.
Retail REITs dramatically lagged the Fund's benchmark as COVID-19-related business disruption drove record bankruptcies and tenant disruption. Later in the year, particularly following "Pfizer Monday", Retail REITs became a prime beneficiary within the reopening rally. We continue to have concerns over tenant health in the space, but also recognize the steep discounted valuations available at today's pricing. We shifted the portfolio to an overweight position as we became increasingly optimistic that retail fundamentals will improve in a post-vaccine environment.
Hotel REITs and operating companies continued to feel the impacts of restricted travel throughout the year and their stock performance relative to the REIT benchmark reflected that reality. While business and air travel remain largely shut down, hotel REIT management teams have noted a surprising uptick in leisure demand at drive-to resort properties. Similarly to Retail, we have taken advantage of depressed pricing to initiate an overweight position predicated on improving lodging trends in 2021.
What will affect the Fund going forward?
The Federal Reserve's (Fed) intentions are clear—rates are to remain anchored near zero until inflation takes hold. The Fed remains committed to maintaining an aggressive pace of asset purchases, even as its balance sheet has grown by over $3.2 trillion since the end of February. Congress seems to understand that fiscal policy needs to play a leading role. The late passage of a new COVID-19 relief bill provides for ongoing enhanced unemployment benefits, $600 stimulus checks, and continued aid for small businesses and transportation. At a value of $900 billion, while smaller than the $2.5 trillion CARES Act, the package still weighs in at over 4 percent of GDP. Under a Biden administration, we believe policymakers are likely to support actions that seek to drive growth until the tide lifts all boats.
While a strong rebound is likely, in our view we're not going to return to the old normal. The pandemic accelerated trends that were already in place and focused an unflinching spotlight on imbalances and sectors with weak value propositions. Work from home appears to be here to stay, and demand for office space and business travel will likely face a long recovery; as will bricks and mortar retail. Indeed, many office, hotel, and retail properties will never recover pre-COVID-19 occupancy levels. We have been careful to avoid companies that we believe are more exposed to these trends, and have focused the portfolio's positioning to take advantage of those we believe will recover and thrive in a post-COVID-19 world.
On the bright side, the economy has been surprisingly resilient, and strong growth will ease the transition back to normality. REIT stocks remain attractively valued, particularly against the backdrop of Fed actions, improving economic growth, and forever low interest rates. Slow vaccine rollout, new vaccine-resistant strains, and higher 10-year Treasury rates are all risks that could cause the group to deliver uninspiring returns again in 2021.
40
Ten Largest Holdings^
| Security description | | Market
value | | % of net
assets | |
ProLogis, Inc. | | $ | 9,695,024 | | | | 7.7 | % | |
Equinix, Inc. | | | 7,737,426 | | | | 6.1 | % | |
Welltower, Inc. | | | 4,775,418 | | | | 3.8 | % | |
Simon Property Group, Inc. | | | 4,560,689 | | | | 3.6 | % | |
Digital Realty Trust, Inc. | | | 4,324,810 | | | | 3.4 | % | |
Public Storage | | | 4,318,391 | | | | 3.4 | % | |
AvalonBay Communities, Inc. | | | 3,806,362 | | | | 3.0 | % | |
Ventas, Inc. | | | 3,408,084 | | | | 2.7 | % | |
Duke Realty Corp. | | | 3,341,492 | | | | 2.7 | % | |
Invitation Homes, Inc. | | | 3,329,370 | | | | 2.6 | % | |
| | | $ | 49,297,066 | | | | 39.0 | % | |
^Excludes short-term investments.
Sector Diversification (shown as a percentage of net assets)

41
Comparison of Change in Investment Value*
A Hypothetical $10,000 Investment in SFT Real Estate Securities Fund,
FTSE NAREIT Equity REITs Index, and Consumer Price Index (CPI)

On the chart above you can see how the SFT Real Estate Securities Fund's Class 2 shares total return compared to the FTSE NAREIT Equity REITs Index and the Consumer Price Index. The three lines represent the total return of a hypothetical $10,000 investment made on December 31, 2010 through December 31, 2020, assuming reinvestment of distributions, if any.
* The results shown are past performance and are not an indication of future performance. Current performance may be lower or higher. The investment returns and principal value of an investment will fluctuate so that shares upon redemption may be worth more or less than their original cost. Performance figures of the Fund do not reflect charges pursuant to the terms of the variable life insurance policies and variable annuity contracts funded by separate accounts that invest in the Fund's shares. When such charges are deducted, actual investment performance in a variable policy or contract will be lower.
FTSE NAREIT Equity REITs Index is a broad-based index consisting of real estate investment trusts.
42
SFT T. Rowe Price Value Fund

Mark Finn, CFA, CPA
Portfolio Manager T. Rowe Price
Fund Objective
The SFT T. Rowe Price Value Fund seeks to provide long-term capital appreciation by investing in common stocks believed to be undervalued. Income is a secondary objective. The Fund pursues its objective by taking a value approach to investment selection. Holdings consist primarily of large cap stocks, but may also include stocks of mid-cap and small-cap companies. While Securian Asset Management, Inc. acts as the investment adviser for the Fund, T. Rowe Price Associates, Inc. (T. Rowe Price) provides investment advice to the Fund under a sub-advisory agreement. The Fund's value approach to investing carries the risk that the market will not recognize a security's intrinsic value for a long time or that a stock judged to be undervalued may actually be appropriately priced at a low level.
Performance Update
The Fund generated a total net return of 10.06 percent over the 12 months ending December 31, 2020, outperforming the Russell 1000 Value Index which returned 2.80 percent over the same period.
What influenced the Fund's return during the past 12 months?
Overall, outperformance was driven by stock selection and, to a lesser extent, sector allocation.
The information technology sector was the leading contributor to relative results due to stock selection, particularly Microsoft. During the year, shares of Microsoft rose as the company reported robust growth within its Intelligent Cloud segment. Additionally, investors appeared to prioritize Microsoft's solid fundamentals, defensible business model, and attractive growth potential. Health care also contributed to relative returns due to beneficial security choices. An underweight allocation and stock selection in the energy sector boosted relative performance.
Conversely, the consumer staples sector was the main detractor from relative returns due to security selection, notably Tyson Foods. Shares of Tyson Foods plummeted in the first quarter and struggled to recover during the remainder of the year as the company grappled with a shift from commercial to residential consumption. Shares were also pressured due to reports of COVID-19 outbreaks at numerous plants. Stock selection in the consumer discretionary sector also weighed on relative results, although an underweight allocation moderated losses.
What other market conditions or events influenced the Fund's return during the last 12 months?
U.S. stocks rose for the one-year period, despite the COVID-19 pandemic and related economic dislocations. Equities declined sharply at the beginning of the year as COVID-19 spreads quickly in the U.S., prompting government officials to close schools, non-essential businesses, and public facilities. Stocks rebounded during the second quarter, driven by the Federal Reserve's and federal government's massive stimulus efforts, as well as slowing global COVID-19 infection rates. The rebound continued during much of the third quarter, as a faster-than-expected rebound in the economy coupled with reports of progress in developing several possible COVID-19 vaccines and treatments boosted stocks. During the final months of the year, stocks benefited from reduced political uncertainty as former Vice President Joe Biden defeated incumbent President Donald Trump in the November 3 presidential election. Stocks also received a major boost following positive announcements in the development and eventual distribution of approved COVID-19 vaccines.
43
What strategies and techniques did you employ that affected Fund performance?
The portfolio buys and holds fundamentally strong, attractively valued companies that have potential for better performance. Our holdings are typically higher-quality companies that generate strong free cash flow and trade for less than our estimated sum-of-the-parts valuation. Leaning into cyclicality during the early parts of 2020 ultimately benefited our relative performance.
What will affect the Fund going forward?
We expect the cyclical rally to continue into 2021 as the vaccines are rolled out. Throughout the year, we have kept our focus on keeping the quality of the portfolio high while increasing cyclical exposure during the second half of 2020. Leaning into cyclicality ultimately benefited our clients, as the portfolio has continued to outperform the Fund's benchmark since September, when value stocks began to lead growth stocks.
In a scenario where the economy continues to normalize, value is likely to outperform given a higher concentration of cyclically sensitive companies. The potential for rate stabilization combined with consumer strength provides the prospect for financials to rebound. Given where the market stands, and the large valuation disparities between value and growth names, we are confident our portfolio is positioned well to withstand a variety of market environments, including a potential cyclical rally. Long term, our focus remains on avoiding secular risk and keeping the quality of the portfolio high.
44
Ten Largest Holdings^
Security description | | Market
value | | % of net
assets | |
Morgan Stanley | | $ | 9,371,615 | | | | 4.5 | % | |
Alphabet, Inc.—Class C | | | 9,036,197 | | | | 4.4 | % | |
Microsoft Corp. | | | 6,244,442 | | | | 3.0 | % | |
NextEra Energy, Inc. | | | 5,958,063 | | | | 2.9 | % | |
QUALCOMM, Inc. | | | 5,712,902 | | | | 2.8 | % | |
ProLogis, Inc. | | | 5,290,850 | | | | 2.6 | % | |
Danaher Corp. | | | 5,009,479 | | | | 2.4 | % | |
General Electric Co. | | | 4,433,616 | | | | 2.1 | % | |
Thermo Fisher Scientific, Inc. | | | 4,387,182 | | | | 2.1 | % | |
Applied Materials, Inc. | | | 4,170,447 | | | | 2.0 | % | |
| | | $ | 59,614,793 | | | | 28.8 | % | |
^Excludes short-term investments.
Sector Diversification (shown as a percentage of net assets)
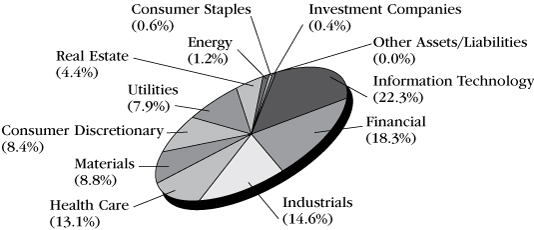
45
Comparison of Change in Investment Value*
A Hypothetical $10,000 Investment in SFT T. Rowe Price Value Fund,
the Russell 1000 Value Index and Consumer Price Index (CPI)

On the chart above you can see how the SFT T. Rowe Price Value Fund's shares total return compared to the Russell 1000 Value Index and the Consumer Price Index. The three lines represent the total return of a hypothetical $10,000 investment made on May 1, 2014 through December 31, 2020, assuming reinvestment of distributions, if any.
* The results shown are past performance and are not an indication of future performance. Current performance may be lower or higher. The investment returns and principal value of an investment will fluctuate so that shares upon redemption may be worth more or less than their original cost. Performance figures of the Fund do not reflect charges pursuant to the terms of the variable life insurance policies and variable annuity contracts funded by separate accounts that invest in the Fund's shares. When such charges are deducted, actual investment performance in a variable policy or contract will be lower.
Russell 1000 Value Index measures the performance of those Russell 1000 companies with lower price-to-book ratios and lower forecasted growth values.
46
SFT Wellington Core Equity Fund


Mammen Chally, CFA, David A. Siegle, CFA and Douglas W. McLane, CFA Portfolio Managers Wellington Management Company LLC
Fund Objective
The SFT Wellington Core Equity Fund seeks long-term capital appreciation. The Fund pursues its objective by investing primarily in a diversified portfolio of common stocks. Securian Asset Management, Inc. acts as the investment adviser for the Fund, Wellington Management Company LLP provides investment advice to the Fund under a sub-advisory agreement. Risks associated with investing in the Fund include, but are not limited to, issuer-specific market volatility and risk of declines in the equity markets generally.
Performance Update
The Fund's Class 2 shares generated a total net return of 17.96 percent over the period ending December 31, 2020, underperforming the S&P 500® Index, which returned 18.40 percent over the same period.
What influenced the Fund's return during the past 12 months?
During the period, sector allocation, a fall-out of our bottom-up stock selection process, was the primary driver of positive performance, while security selection slightly detracted. The Fund's underweight position to energy and overweight to health care contributed to relative performance while an underweight to information technology and overweight to consumer staples detracted, partially offsetting results. Weak selection in information technology (not owning Nvidia, underweight to Apple), consumer discretionary (overweights to PVH and VF), and real estate (overweights to Boston Properties and American Tower) was partially offset by stronger selection in consumer staples (overweight to Monster Beverage, not owning Coca-Cola), industrials (not owning Boeing, overweight to FedEx), and utilities (overweight to NextEra Energy, not owning Dominion Energy).
What other market conditions or events influenced the Fund's performance during the past 12 months?
United States (U.S.) equities, as measured by the S&P 500® Index posted positive results over the trailing 12-month period ending December 31, 2020. U.S. equities ended the first quarter sharply lower after achieving record highs in February, as COVID-19 spreads rapidly throughout the country, causing unprecedented market disruptions and financial damage, and heightening fears of a severe economic downturn. Many states adopted extraordinary measures to fight the contagion, while companies shuttered stores and production, withdrew earnings guidance, and drew down credit lines at a record pace as borrowing costs soared. Volatility surged to extreme levels, and the S&P 500® Index suffered its fastest-ever decline into a bear market. U.S. equities ended the second-quarter higher after an extraordinary rally drove U.S. stocks to their largest quarterly gain since the fourth quarter of 1998. The unprecedented scale of the fiscal and monetary stimulus implemented by Congress and the U.S. Federal Reserve (Fed) in response to the pandemic was the most influential driver of the market's rebound in the second quarter. Risk sentiment eased at the end of the quarter on concerns about a sharp rise in infections in some southern and western states, the rapid speed of the market's rebound, and cautious economic-outlook comments from the Fed.
In the third-quarter, U.S. equities extended their strong rally, with markets bolstered by substantial monetary support from the Fed, a broadening U.S. economic recovery, better-than-expected corporate earnings, and promising trials for COVID-19 vaccines. The U.S. economy gradually recovered during the quarter; however, the path to a sustainable economic recovery was clouded by concerns about a resurgence in COVID-19 infections in many areas of the country, an undetermined timeline for vaccines, high unemployment, elevated debt burdens, and uncertainty about additional fiscal stimulus. In September, the S&P 500® Index declined for the first time in five months. The Fed signaled that it expects to hold interest rates near zero until inflation is on track to moderately
47
exceed 2 percent. During the fourth-quarter U.S. equities rallied, bolstered by better-than-expected third-quarter earnings, economic resilience, substantial monetary support from the U.S. Federal Reserve (Fed), and optimism that vaccines will support a broad reopening of the U.S. economy in 2021. A sharp escalation in COVID-19 infections across the country and renewed restrictions to curb the spread of the virus were overshadowed by highly encouraging vaccine developments. In December, the government unveiled a long-awaited fifth stimulus package, worth approximately $900 billion. The Fed committed to purchasing at least $120 billion of U.S. government debt per month. Joe Biden was elected president after a closely contested election, removing a key element of uncertainty for the market. Third-quarter earnings results for companies in the S&P 500® Index were significantly better than expected.
What strategies and techniques did you employ that affected Fund performance?
Over the period, the Fund increased exposure to health care and financials while we decreased exposure to information technology and communication services. We established a new position in Texas Instruments, a U.S.-based semiconductor design and manufacturing company. Overall, we are positive on semiconductors as they could serve as leaders during the recovery due to broad geographical exposure, continued investment in infrastructure spending (5G), and the true technology edges. Texas Instruments is also a high quality company with a clean balance sheet and strong competitive position.
We eliminated our position in U.S. REIT, Boston Properties. Due to the stay-at-home policies during the period, physical occupancy within the company's properties has been low. The company has formed a Heath and Security Task Force to prepare buildings for re-occupancy. Earnings per share for the third quarter of 2020 were lower year-over-year. The company has had to write-off accrued rent and accounts receivable of tenants primarily in the retail, fitness, and entertainment sectors.
What will affect the Fund going forward?
As of this writing, the Georgia runoff election for the U.S. Senate is now complete, and it appears the control of the U.S. Senate will flip to the democrats. As time passes, we will consider the various policy implications from this event given the alignment of majorities for both legislative houses and the presidency. As far as we can tell, the administration's initial focus will be on COVID-19 containment, stimulus, and economic reopening. There is also a lot of talk around infrastructure. We are assuming most of these initiatives are largely financed with borrowings by the government. Depending on how this plays out relative to the rest of the world, it seems to suggest U.S. Dollar weakness, higher rates, or some combination of the two.
It is encouraging that we have started vaccinating the population even if the pace of the initial roll out has been disappointing relative to earlier expectations. Despite worries about different strains, at least so far, we remain optimistic of putting the pandemic behind us this year. Given the efficacy of the various vaccines there still may be some lasting lifestyle changes and we are mindful of that. Despite that, we expect unemployment rates to come down in 2021 as a recovery takes hold, especially in some of the hardest-hit industries.
On the cautious side, we are very mindful of pockets of extreme speculation and valuations that are hard to justify. In some of these cases, access to this very cheap capital can accelerate the business model from the original plan. On the positive side, the combination of a high savings rate, stimulus payments, and rehiring more recently implies a very healthy consumer when the economic recovery takes shape.
As always, we continue to focus on the long term. While we did make some changes, we continue to be incremental and mindful of the impact of volatility.
48
Ten Largest Holdings^
| Security description | | Market
value | | % of stock
portfolio | |
Apple, Inc. | | $ | 7,279,241 | | | | 5.6 | % | |
Amazon.com, Inc. | | | 5,761,509 | | | | 4.4 | % | |
Alphabet, Inc.—Class A | | | 5,561,127 | | | | 4.3 | % | |
Microsoft Corp. | | | 4,963,525 | | | | 3.8 | % | |
The Walt Disney Co. | | | 3,471,228 | | | | 2.7 | % | |
Facebook, Inc.—Class A | | | 3,371,614 | | | | 2.6 | % | |
JPMorgan Chase & Co. | | | 3,003,681 | | | | 2.3 | % | |
The Procter & Gamble Co. | | | 2,995,406 | | | | 2.3 | % | |
UnitedHealth Group, Inc. | | | 2,772,827 | | | | 2.1 | % | |
Bank of America Corp. | | | 2,523,125 | | | | 1.9 | % | |
| | | $ | 41,703,283 | | | | 32.0 | % | |
^Excludes short-term investments.
Sector Diversification (shown as a percentage of net assets)

49
Comparison of Change in Investment Value*
A Hypothetical $10,000 Investment in SFT Wellington Core Equity Fund,
the S&P 500® Index and Consumer Price Index (CPI)
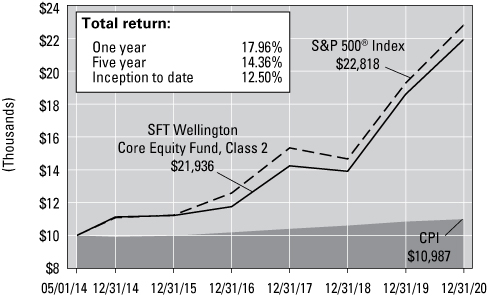
On the chart above you can see how the SFT Wellington Core Equity Fund's Class 2 shares total return compared to the S&P 500® Index and the Consumer Price Index. The three lines represent the total return of a hypothetical $10,000 investment made on May 1, 2014 through December 31, 2020, assuming reinvestment of distributions, if any.
* The results shown are past performance and are not an indication of future performance. Current performance may be lower or higher. The investment returns and principal value of an investment will fluctuate so that shares upon redemption may be worth more or less than their original cost. Performance figures of the Fund do not reflect charges pursuant to the terms of the variable life insurance policies and variable annuity contracts funded by separate accounts that invest in the Fund's shares. When such charges are deducted, actual investment performance in a variable policy or contract will be lower.
The S&P 500® Index is a broad, unmanaged index of 500 common stocks which are representative of the U.S. stock market overall.
50
Report of Independent Registered Public Accounting Firm
To the Shareholders and Board of Trustees
Securian Funds Trust:
Opinion on the Financial Statements
We have audited the accompanying statements of assets and liabilities of SFT Core Bond Fund, SFT Dynamic Managed Volatility Fund, SFT Government Money Market Fund, SFT Index 400 Mid-Cap Fund, SFT Index 500 Fund, SFT International Bond Fund, SFT IvySM Growth Fund, SFT IvySM Small Cap Growth Fund, SFT Managed Volatility Equity Fund, SFT Real Estate Securities Fund, SFT T. Rowe Price Value Fund, and SFT Wellington Core Equity Fund (collectively, the Funds), including the schedules of investments in securities, as of December 31, 2020, the related statements of operations for the year then ended, the statements of changes in net assets for each of the years in the two-year period then ended, and the related notes (collectively, the financial statements) and the financial highlights for each of the years in the five-year period then ended. In our opinion, the financial statements and financial highlights present fairly, in all material respects, the financial position of each Fund as of December 31, 2020, the results of its operations for the year then ended, the changes in its net assets for each of the years in the two-year period then ended, and the financial highlights for each of the years in the five-year period then ended, in conformity with U.S. generally accepted accounting principles.
Basis for Opinion
These financial statements and financial highlights are the responsibility of the Funds' management. Our responsibility is to express an opinion on these financial statements and financial highlights based on our audits. We are a public accounting firm registered with the Public Company Accounting Oversight Board (United States) (PCAOB) and are required to be independent with respect to the Funds in accordance with the U.S. federal securities laws and the applicable rules and regulations of the Securities and Exchange Commission and the PCAOB.
We conducted our audits in accordance with the standards of the PCAOB. Those standards require that we plan and perform the audit to obtain reasonable assurance about whether the financial statements and financial highlights are free of material misstatement, whether due to error or fraud. Our audits included performing procedures to assess the risks of material misstatement of the financial statements and financial highlights, whether due to error or fraud, and performing procedures that respond to those risks. Such procedures included examining, on a test basis, evidence regarding the amounts and disclosures in the financial statements and financial highlights. Such procedures also included confirmation of securities owned as of December 31, 2020, by correspondence with custodians and brokers, or other appropriate auditing procedures. Our audits also included evaluating the accounting principles used and significant estimates made by management, as well as evaluating the overall presentation of the financial statements and financial highlights. We believe that our audits provide a reasonable basis for our opinion.

We have served as the auditor of one or more Securian Funds Trust investment companies since 1985.
Minneapolis, Minnesota
February 18, 2021
51
SFT Core Bond Fund
Investments in Securities
(Percentages of each investment category relate to total net assets)
| | | Principal | | Value(a) | |
Long-Term Debt Securities (99.3%) | |
Government Obligations (23.5%) | |
Other Government Obligations (1.7%) | |
Provincial or Local Government
Obligations (1.7%) | |
Douglas County Public
Utility District No. 1,
5.450%, 09/01/40 | | $ | 1,185,000 | | | $ | 1,645,846 | | |
Municipal Electric
Authority of Georgia,
6.655%, 04/01/57 | | | 1,176,000 | | | | 1,817,673 | | |
Ohio State Water
Development Authority,
4.817%, 12/01/30 | | | 250,000 | | | | 308,572 | | |
Port Authority of
New York & New Jersey | |
4.458%, 10/01/62 | | | 1,150,000 | | | | 1,529,891 | | |
4.926%, 10/01/51 | | | 2,055,000 | | | | 2,861,629 | | |
Texas A&M University,
4.000%, 05/15/31 | | | 325,000 | | | | 367,770 | | |
| | | | | | 8,531,381 | | |
U.S. Government Agencies and
Obligations (21.8%) | |
Federal Home Loan Mortgage Corporation
(FHLMC) (4.4%) | |
0.803%, 01/25/23
(1-Month USD LIBOR +
0.650%) (b) | | | 39,137 | | | | 39,189 | | |
1.098%, 10/25/29
(1-Month USD LIBOR +
0.950%) (b) | | | 450,000 | | | | 419,792 | | |
2.500%, 03/01/28 | | | 321,288 | | | | 339,850 | | |
2.500%, 04/01/28 | | | 117,045 | | | | 123,724 | | |
3.000%, 08/01/42 | | | 396,756 | | | | 430,620 | | |
3.000%, 12/01/42 | | | 161,602 | | | | 175,368 | | |
3.000%, 01/01/43 | | | 216,594 | | | | 235,683 | | |
3.000%, 02/01/43 | | | 521,140 | | | | 569,936 | | |
3.000%, 04/01/43 | | | 807,356 | | | | 876,292 | | |
3.000%, 10/25/46 | | | 132,782 | | | | 132,484 | | |
3.448%, 10/25/27
(1-Month USD LIBOR +
3.300%) (b) | | | 895,441 | | | | 918,293 | | |
3.500%, 10/01/25 | | | 122,569 | | | | 130,093 | | |
3.500%, 05/01/32 | | | 163,959 | | | | 177,265 | | |
3.500%, 03/01/42 | | | 666,336 | | | | 726,975 | | |
3.500%, 08/01/42 | | | 511,514 | | | | 559,364 | | |
3.500%, 05/25/45 | | | 565,387 | | | | 570,083 | | |
3.598%, 10/25/29
(1-Month USD LIBOR +
3.450%) (b) | | | 4,000,000 | | | | 4,131,146 | | |
4.000%, 09/01/40 | | | 541,716 | | | | 602,100 | | |
4.000%, 11/01/40 | | | 1,080,096 | | | | 1,211,056 | | |
4.000%, 02/01/41 | | | 233,576 | | | | 258,130 | | |
4.000%, 03/01/41 | | | 244,360 | | | | 274,355 | | |
4.500%, 04/01/23 | | | 11,269 | | | | 12,180 | | |
4.500%, 09/01/40 | | | 86,188 | | | | 95,423 | | |
4.500%, 01/01/41 | | | 460,196 | | | | 516,738 | | |
4.500%, 02/01/41 | | | 223,185 | | | | 249,736 | | |
4.500%, 03/01/41 | | | 485,527 | | | | 545,188 | | |
4.500%, 04/01/41 | | | 421,631 | | | | 473,433 | | |
| | | Principal | | Value(a) | |
4.698%, 10/25/24
(1-Month USD LIBOR +
4.550%) (b) | | $ | 85,571 | | | $ | 87,761 | | |
4.948%, 05/25/28
(1-Month USD LIBOR +
4.800%) (b) | | | 1,335,409 | | | | 1,388,657 | | |
5.000%, 03/01/23 | | | 6,708 | | | | 7,406 | | |
5.000%, 05/01/29 | | | 19,311 | | | | 21,543 | | |
5.000%, 04/01/35 | | | 86,421 | | | | 95,947 | | |
5.000%, 08/01/35 | | | 42,909 | | | | 49,865 | | |
5.000%, 11/01/35 | | | 78,520 | | | | 91,326 | | |
5.000%, 11/01/39 | | | 443,368 | | | | 515,578 | | |
5.000%, 04/01/40 | | | 123,342 | | | | 140,987 | | |
5.000%, 08/01/40 | | | 95,686 | | | | 109,916 | | |
5.500%, 11/01/23 | | | 60,154 | | | | 67,116 | | |
5.500%, 05/01/34 | | | 486,200 | | | | 569,879 | | |
5.500%, 10/01/34 | | | 176,466 | | | | 206,668 | | |
5.500%, 07/01/35 | | | 173,130 | | | | 201,362 | | |
5.500%, 10/01/35 | | | 208,583 | | | | 245,013 | | |
5.500%, 12/01/38 | | | 120,100 | | | | 140,095 | | |
5.700%, 07/25/28
(1-Month USD LIBOR +
5.550%) (b) | | | 2,385,871 | | | | 2,489,670 | | |
6.000%, 09/01/22 | | | 9,311 | | | | 9,568 | | |
6.000%, 11/01/33 | | | 248,718 | | | | 298,922 | | |
6.250%, 12/15/23 | | | 19,043 | | | | 20,146 | | |
6.500%, 09/01/32 | | | 23,961 | | | | 28,472 | | |
6.500%, 11/01/32 | | | 23,251 | | | | 27,192 | | |
6.500%, 06/01/36 | | | 148,208 | | | | 178,552 | | |
7.000%, 12/01/37 | | | 38,148 | | | | 45,231 | | |
| | | | | | 21,831,368 | | |
Federal National Mortgage Association
(FNMA) (5.4%) | |
2.500%, 03/01/27 | | | 183,207 | | | | 193,505 | | |
2.500%, 11/01/27 | | | 310,986 | | | | 324,407 | | |
2.500%, 03/01/28 | | | 205,860 | | | | 217,358 | | |
2.500%, 07/01/28 | | | 289,293 | | | | 305,990 | | |
3.000%, 06/01/22 | | | 29,193 | | | | 30,588 | | |
3.000%, 09/01/22 | | | 22,267 | | | | 23,331 | | |
3.000%, 11/01/27 | | | 130,877 | | | | 137,489 | | |
3.000%, 06/01/28 | | | 115,221 | | | | 122,739 | | |
3.000%, 09/01/42 | | | 111,488 | | | | 121,003 | | |
3.000%, 01/01/46 | | | 293,180 | | | | 308,739 | | |
3.500%, 11/01/25 | | | 142,533 | | | | 151,308 | | |
3.500%, 01/01/26 | | | 173,730 | | | | 184,427 | | |
3.500%, 12/01/32 | | | 140,831 | | | | 152,247 | | |
3.500%, 11/01/40 | | | 370,516 | | | | 409,404 | | |
3.500%, 01/01/41 | | | 460,850 | | | | 502,986 | | |
3.500%, 02/01/41 | | | 606,868 | | | | 660,571 | | |
3.500%, 04/01/41 | | | 251,488 | | | | 275,004 | | |
3.500%, 11/01/41 | | | 1,650,024 | | | | 1,812,020 | | |
3.500%, 12/01/41 | | | 377,266 | | | | 406,914 | | |
3.500%, 05/01/42 | | | 165,743 | | | | 181,154 | | |
3.500%, 01/01/43 | | | 399,558 | | | | 434,076 | | |
3.500%, 02/01/43 | | | 398,538 | | | | 442,318 | | |
3.500%, 05/01/43 | | | 1,462,374 | | | | 1,609,643 | | |
3.798%, 09/25/29
(1-Month USD LIBOR +
3.650%) (b) | | | 187,705 | | | | 192,091 | | |
4.000%, 06/25/23 | | | 33,108 | | | | 33,680 | | |
4.000%, 12/01/40 | | | 75,822 | | | | 82,919 | | |
See accompanying notes to financial statements.
52
SFT Core Bond Fund
Investments in Securities – continued
| | | Principal | | Value(a) | |
4.000%, 04/01/41 | | $ | 917,717 | | | $ | 1,020,034 | | |
4.000%, 09/01/41 | | | 337,922 | | | | 373,375 | | |
4.000%, 11/01/41 | | | 164,938 | | | | 180,950 | | |
4.000%, 06/01/42 | | | 474,197 | | | | 522,327 | | |
4.000%, 09/01/43 | | | 297,602 | | | | 326,492 | | |
4.448%, 02/25/25
(1-Month USD LIBOR +
4.300%) (b) | | | 1,068,721 | | | | 1,089,302 | | |
4.500%, 04/01/21 | | | 150 | | | | 158 | | |
4.500%, 04/01/25 | | | 22,769 | | | | 24,206 | | |
4.500%, 05/25/34 | | | 537,000 | | | | 625,997 | | |
4.500%, 05/01/35 | | | 169,868 | | | | 187,774 | | |
4.500%, 07/01/35 | | | 322,949 | | | | 356,201 | | |
4.500%, 09/01/37 | | | 127,279 | | | | 140,693 | | |
4.500%, 06/01/39 | | | 133,178 | | | | 149,539 | | |
4.500%, 04/01/41 | | | 1,142,057 | | | | 1,303,104 | | |
4.500%, 07/01/41 | | | 871,151 | | | | 970,659 | | |
4.500%, 07/01/47 | | | 335,113 | | | | 371,760 | | |
4.548%, 01/25/24
(1-Month USD LIBOR +
4.400%) (b) | | | 69,710 | | | | 70,267 | | |
4.598%, 01/25/29
(1-Month USD LIBOR +
4.450%) (b) | | | 1,234,508 | | | | 1,285,467 | | |
5.000%, 06/25/23 | | | 32,491 | | | | 33,700 | | |
5.000%, 07/01/23 | | | 24,552 | | | | 27,108 | | |
5.000%, 11/01/33 | | | 148,865 | | | | 171,978 | | |
5.000%, 03/01/34 | | | 104,441 | | | | 118,273 | | |
5.000%, 05/01/34 | | | 31,031 | | | | 35,971 | | |
5.000%, 12/01/34 | | | 153,850 | | | | 177,990 | | |
5.000%, 07/01/35 | | | 137,290 | | | | 159,354 | | |
5.000%, 08/01/35 | | | 46,876 | | | | 54,503 | | |
5.000%, 03/01/38 | | | 73,589 | | | | 85,562 | | |
5.000%, 04/01/38 | | | 103,581 | | | | 120,564 | | |
5.000%, 06/01/39 | | | 84,252 | | | | 97,747 | | |
5.000%, 12/01/39 | | | 338,678 | | | | 394,424 | | |
5.000%, 06/01/40 | | | 48,139 | | | | 55,922 | | |
5.000%, 04/01/41 | | | 310,586 | | | | 361,117 | | |
5.500%, 08/01/23 | | | 15,058 | | | | 16,801 | | |
5.500%, 02/01/24 | | | 24,039 | | | | 26,821 | | |
5.500%, 04/01/33 | | | 453,830 | | | | 528,153 | | |
5.500%, 05/01/33 | | | 6,837 | | | | 7,857 | | |
5.500%, 12/01/33 | | | 54,272 | | | | 63,307 | | |
5.500%, 01/01/34 | | | 107,737 | | | | 125,706 | | |
5.500%, 02/01/34 | | | 116,223 | | | | 134,083 | | |
5.500%, 03/01/34 | | | 191,541 | | | | 223,471 | | |
5.500%, 04/01/34 | | | 98,725 | | | | 114,617 | | |
5.500%, 05/01/34 | | | 4,368 | | | | 4,892 | | |
5.500%, 09/01/34 | | | 140,455 | | | | 159,453 | | |
5.500%, 10/01/34 | | | 42,500 | | | | 49,691 | | |
5.500%, 01/01/35 | | | 72,059 | | | | 84,760 | | |
5.500%, 02/01/35 | | | 206,475 | | | | 238,708 | | |
5.500%, 04/01/35 | | | 194,602 | | | | 228,265 | | |
5.500%, 06/01/35 | | | 35,501 | | | | 40,151 | | |
5.500%, 08/01/35 | | | 107,623 | | | | 125,347 | | |
5.500%, 10/01/35 | | | 284,690 | | | | 334,721 | | |
5.500%, 11/01/35 | | | 53,933 | | | | 63,589 | | |
5.500%, 09/01/36 | | | 91,223 | | | | 106,814 | | |
5.500%, 12/01/39 | | | 63,519 | | | | 74,159 | | |
6.000%, 08/01/23 | | | 22,337 | | | | 23,289 | | |
6.000%, 09/01/32 | | | 10,123 | | | | 11,972 | | |
6.000%, 10/01/32 | | | 367,394 | | | | 438,216 | | |
6.000%, 11/01/32 | | | 344,673 | | | | 409,432 | | |
6.000%, 03/01/33 | | | 300,584 | | | | 358,726 | | |
| | | Principal | | Value(a) | |
6.000%, 04/01/33 | | $ | 11,637 | | | $ | 13,072 | | |
6.000%, 12/01/33 | | | 98,688 | | | | 118,350 | | |
6.000%, 08/01/34 | | | 36,364 | | | | 42,850 | | |
6.000%, 09/01/34 | | | 16,041 | | | | 19,280 | | |
6.000%, 11/01/34 | | | 12,136 | | | | 13,881 | | |
6.000%, 12/01/34 | | | 82,696 | | | | 99,305 | | |
6.000%, 11/01/36 | | | 11,012 | | | | 13,139 | | |
6.000%, 01/01/37 | | | 105,370 | | | | 125,708 | | |
6.000%, 08/01/37 | | | 68,118 | | | | 80,495 | | |
6.000%, 12/01/37 | | | 2,062 | | | | 2,315 | | |
6.000%, 10/01/38 | | | 111,630 | | | | 131,743 | | |
6.500%, 11/01/23 | | | 14,686 | | | | 15,404 | | |
6.500%, 12/01/31 | | | 50,135 | | | | 59,384 | | |
6.500%, 02/01/32 | | | 162,392 | | | | 193,500 | | |
6.500%, 04/01/32 | | | 109,762 | | | | 128,705 | | |
6.500%, 05/01/32 | | | 25,906 | | | | 29,534 | | |
6.500%, 07/01/32 | | | 218,507 | | | | 256,650 | | |
6.500%, 08/01/32 | | | 87,760 | | | | 102,701 | | |
6.500%, 09/01/32 | | | 55,197 | | | | 64,726 | | |
6.500%, 10/01/32 | | | 75,611 | | | | 89,100 | | |
6.500%, 09/01/34 | | | 9,486 | | | | 10,979 | | |
6.500%, 11/01/34 | | | 3,303 | | | | 3,891 | | |
6.500%, 03/01/35 | | | 61,645 | | | | 72,941 | | |
6.500%, 02/01/36 | | | 6,708 | | | | 7,516 | | |
6.500%, 09/01/37 | | | 62,578 | | | | 73,203 | | |
6.500%, 11/01/37 | | | 39,406 | | | | 47,491 | | |
7.000%, 07/01/31 | | | 47,524 | | | | 57,699 | | |
7.000%, 09/01/31 | | | 144,431 | | | | 170,327 | | |
7.000%, 11/01/31 | | | 145,153 | | | | 168,365 | | |
7.000%, 02/01/32 | | | 68,963 | | | | 81,853 | | |
7.000%, 03/01/32 | | | 14,495 | | | | 17,374 | | |
7.000%, 07/01/32 | | | 53,120 | | | | 61,817 | | |
7.000%, 10/01/37 | | | 15,037 | | | | 16,155 | | |
7.500%, 07/25/22 | | | 2,857 | | | | 2,900 | | |
7.500%, 04/01/31 | | | 51,651 | | | | 57,906 | | |
7.500%, 05/01/31 | | | 19,078 | | | | 21,938 | | |
| | | | | | 26,673,627 | | |
Government National Mortgage Association
(GNMA) (2.0%) | |
0.004%, 06/17/45 (b) (c) | | | 337,198 | | | | 34 | | |
0.643%, 07/16/40 (b) (c) | | | 18,864 | | | | — | | |
1.000%, 12/20/42 | | | 67,808 | | | | 66,283 | | |
3.000%, 03/15/45 | | | 850,809 | | | | 891,987 | | |
3.000%, 04/15/45 | | | 1,363,720 | | | | 1,429,533 | | |
3.000%, 05/15/45 | | | 109,646 | | | | 115,622 | | |
3.250%, 04/20/33 | | | 126,238 | | | | 133,871 | | |
3.250%, 03/20/35 | | | 996,366 | | | | 1,056,657 | | |
3.250%, 11/20/35 | | | 503,487 | | | | 533,288 | | |
3.250%, 01/20/36 | | | 858,769 | | | | 909,602 | | |
3.500%, 11/15/40 | | | 63,878 | | | | 68,487 | | |
3.500%, 04/20/46 | | | 585,512 | | | | 627,956 | | |
3.750%, 03/20/46 | | | 730,337 | | | | 813,140 | | |
4.000%, 07/20/31 | | | 295,925 | | | | 319,650 | | |
4.000%, 04/20/39 | | | 202,896 | | | | 219,091 | | |
4.000%, 12/20/40 | | | 587,513 | | | | 666,694 | | |
4.000%, 01/15/41 | | | 34,324 | | | | 37,464 | | |
4.000%, 02/15/41 | | | 249,712 | | | | 281,237 | | |
4.000%, 10/15/41 | | | 176,395 | | | | 194,481 | | |
4.000%, 12/20/44 | | | 87,529 | | | | 96,563 | | |
4.500%, 06/15/40 | | | 167,676 | | | | 189,202 | | |
5.000%, 05/15/33 | | | 51,388 | | | | 57,738 | | |
5.000%, 12/15/39 | | | 65,825 | | | | 76,517 | | |
See accompanying notes to financial statements.
53
SFT Core Bond Fund
Investments in Securities – continued
| | | Principal | | Value(a) | |
5.000%, 01/15/40 | | $ | 639,139 | | | $ | 725,093 | | |
5.000%, 07/15/40 | | | 175,445 | | | | 199,884 | | |
5.500%, 07/15/38 | | | 174,011 | | | | 203,335 | | |
5.500%, 10/15/38 | | | 258,143 | | | | 304,126 | | |
8.500%, 10/15/22 | | | 4,217 | | | | 4,234 | | |
| | | | | | 10,221,769 | | |
U.S. Treasury (10.0%) | |
U.S. Treasury Bond | |
1.125%, 08/15/40 | | | 2,988,000 | | | | 2,828,796 | | |
1.250%, 05/15/50 | | | 11,155,000 | | | | 10,119,676 | | |
5.375%, 02/15/31 (d) | | | 5,115,000 | | | | 7,353,212 | | |
U.S. Treasury Note | |
0.250%, 05/31/25 | | | 7,682,000 | | | | 7,667,296 | | |
0.250%, 07/31/25 | | | 1,550,000 | | | | 1,545,459 | | |
0.250%, 10/31/25 | | | 615,000 | | | | 612,357 | | |
0.375%, 03/31/22 | | | 600,000 | | | | 601,898 | | |
0.500%, 05/31/27 | | | 5,020,000 | | | | 5,002,352 | | |
0.500%, 08/31/27 | | | 1,975,000 | | | | 1,962,965 | | |
0.625%, 11/30/27 | | | 5,050,000 | | | | 5,049,211 | | |
0.625%, 08/15/30 | | | 3,500,000 | | | | 3,412,500 | | |
0.875%, 11/15/30 | | | 1,500,000 | | | | 1,495,078 | | |
1.500%, 01/31/27 | | | 1,500,000 | | | | 1,589,883 | | |
2.250%, 02/15/27 (d) | | | 150,000 | | | | 165,803 | | |
2.750%, 02/15/28 | | | 200,000 | | | | 229,352 | | |
| | | | | | 49,635,838 | | |
Vendee Mortgage Trust (0.0%) | |
Vendee Mortgage Trust,
7.793%, 02/15/25 | | | 17,951 | | | | 19,447 | | |
Total government obligations
(cost: $111,033,067) | | | | | 116,913,430 | | |
Asset-Backed Securities (14.9%) | |
AmeriCredit Automobile
Receivables Trust
2.740%, 12/08/22 | | | 1,250,000 | | | | 1,261,964 | | |
3.180%, 07/18/23 | | | 3,250,000 | | | | 3,348,680 | | |
Bank of The West
Auto Trust,
3.210%, 04/15/25 (e) | | | 2,293,000 | | | | 2,343,115 | | |
Bear Stearns Asset
Backed Securities Trust,
1.123%, 02/25/34
(1-Month USD LIBOR +
0.975%) (b) | | | 361,951 | | | | 354,344 | | |
CarMax Auto Owner Trust,
2.950%, 11/15/23 | | | 1,950,000 | | | | 2,013,257 | | |
Chase Funding Trust
0.708%, 02/25/33
(1-Month USD LIBOR +
0.560%) (b) | | | 150,059 | | | | 141,723 | | |
0.788%, 08/25/32
(1-Month USD LIBOR +
0.640%) (b) | | | 94,443 | | | | 90,773 | | |
Chesapeake Funding II LLC | |
3.260%, 11/15/29 (e) | | | 375,000 | | | | 380,198 | | |
3.380%, 08/15/29 (e) | | | 275,000 | | | | 277,102 | | |
3.570%, 04/15/30 (e) | | | 1,200,000 | | | | 1,224,921 | | |
3.710%, 05/15/29 (e) | | | 1,925,000 | | | | 1,934,557 | | |
Commonbond Student
Loan Trust | |
2.550%, 05/25/41 (e) | | | 250,952 | | | | 257,727 | | |
5.280%, 05/25/41 (e) | | | 36,048 | | | | 39,359 | | |
| | | Principal | | Value(a) | |
Commonbond Student
Loan Trust 2018-A-GS
0.648%, 02/25/44
(1-Month USD LIBOR +
0.500%) (b) (e) | | $ | 500,376 | | | $ | 495,376 | | |
3.210%, 02/25/44 (e) | | | 1,296,927 | | | | 1,346,087 | | |
Commonbond Student
Loan Trust 2019-A-GS,
2.540%, 01/25/47 (e) | | | 2,927,083 | | | | 3,000,865 | | |
Drive Auto Receivables
Trust | |
3.530%, 12/15/23 (e) | | | 294,589 | | | | 299,018 | | |
3.990%, 01/15/25 | | | 3,325,000 | | | | 3,402,053 | | |
5.300%, 07/15/24 (e) | | | 1,045,000 | | | | 1,060,448 | | |
Earnest Student Loan
Program LLC | |
2.650%, 01/25/41 (e) | | | 1,896,006 | | | | 1,922,389 | | |
2.720%, 01/25/41 (e) | | | 166,296 | | | | 167,775 | | |
3.020%, 05/25/34 (e) | | | 207,628 | | | | 208,685 | | |
Exeter Automobile
Receivables Trust
2016-2, 8.250%,
04/17/23 (e) | | | 1,203,983 | | | | 1,207,627 | | |
Foursight Capital
Automobile Receivables
Trust, 5.280%,
08/15/24 (e) | | | 3,850,000 | | | | 3,868,280 | | |
GM Financial Consumer
Automobile Receivables
Trust, 2.770%, 07/17/23 | | | 800,000 | | | | 813,690 | | |
Home Partners of America
2018-1 Trust, 1.053%,
07/17/37 (1-Month USD
LIBOR + 0.900%) (b) (e) | | | 1,215,398 | | | | 1,212,680 | | |
Invitation Homes
2018-SFR1 Trust
1.403%, 03/17/37
(1-Month USD LIBOR +
1.250%) (b) (e) | | | 3,500,000 | | | | 3,497,109 | | |
1.603%, 03/17/37
(1-Month USD LIBOR +
1.450%) (b) (e) | | | 999,636 | | | | 999,636 | | |
Invitation Homes
2018-SFR3 Trust
1.153%, 07/17/37
(1-Month USD LIBOR +
1.000%) (b) (e) | | | 1,966,191 | | | | 1,966,191 | | |
1.803%, 07/17/37
(1-Month USD LIBOR +
1.650%) (b) (e) | | | 1,500,000 | | | | 1,501,865 | | |
Invitation Homes
2018-SFR4 Trust,
1.553%, 01/17/38
(1-Month USD LIBOR +
1.400%) (b) (e) | | | 5,050,000 | | | | 5,049,998 | | |
Invitation Homes Trust,
1.439%, 06/17/37
(1-Month USD LIBOR +
1.280%) (b) (e) | | | 1,500,000 | | | | 1,495,425 | | |
Kubota Credit Owner
Trust 2020-2, 0.410%,
06/15/23 (e) | | | 2,150,000 | | | | 2,152,379 | | |
See accompanying notes to financial statements.
54
SFT Core Bond Fund
Investments in Securities – continued
| | | Principal | | Value(a) | |
Morgan Stanley Dean
Witter Capital I, Inc.,
0.708%, 08/25/32
(1-Month USD LIBOR +
0.560%) (b) | | $ | 178,343 | | | $ | 172,873 | | |
Navient Private Education
Loan Trust, 1.310%,
01/15/69 (e) | | | 2,250,000 | | | | 2,272,881 | | |
Progress Residential
2018-SFR1 Trust,
3.684%, 03/17/35 (e) | | | 500,000 | | | | 500,774 | | |
Progress Residential
2019-SFR2 Trust,
3.446%, 05/17/36 (e) | | | 2,500,000 | | | | 2,575,858 | | |
Progress Residential Trust,
3.565%, 08/17/34 (e) | | | 1,525,000 | | | | 1,542,828 | | |
Saxon Asset Securities
Trust, 0.688%, 03/25/35
(1-Month USD LIBOR +
0.540%) (b) | | | 270,238 | | | | 255,144 | | |
Sofi Professional Loan
Program 2017-F LLC,
2.840%, 01/25/41 (e) | | | 1,068,028 | | | | 1,091,672 | | |
Sofi Professional Loan
Program 2018-A LLC,
2.950%, 02/25/42 (e) | | | 1,054,781 | | | | 1,076,845 | | |
SoFi Professional Loan
Program LLC, 2.650%,
09/25/40 (e) | | | 798,500 | | | | 822,677 | | |
Towd Point
Mortgage Trust | |
3.000%, 06/25/58 (b) (e) | | | 3,118,328 | | | | 3,309,332 | | |
3.750%, 04/25/55 (b) (e) | | | 2,505,000 | | | | 2,698,436 | | |
4.188%, 11/25/57 (b) (e) | | | 3,154,000 | | | | 3,438,445 | | |
Tricon American Homes
Trust, 1.832%,
11/17/39 (e) | | | 975,000 | | | | 968,014 | | |
Volvo Financial
Equipment LLC
Series 2018-1, 3.060%,
12/15/25 (e) | | | 1,300,000 | | | | 1,317,684 | | |
Westlake Automobile
Receivables Trust
2017-2, 4.630%,
07/15/24 (e) | | | 2,550,000 | | | | 2,561,516 | | |
Total asset-backed securities
(cost: $73,057,099) | | | | | 73,940,275 | | |
Other Mortgage-Backed Securities (10.9%) | |
Collateralized Mortgage Obligations/Mortgage
Revenue Bonds (5.9%) | |
Agate Bay Mortgage Trust,
3.793%, 01/25/45 (b) (e) | | | 199,779 | | | | 205,394 | | |
Bear Stearns Mortgage
Securities, Inc.,
8.000%, 11/25/29 | | | 36,232 | | | | 18,806 | | |
Bellemeade Re 2018-1,
Ltd., 1.748%, 04/25/28
(1-Month USD LIBOR +
1.600%) (b) (e) (f) | | | 961,413 | | | | 959,922 | | |
Bellemeade Re 2018-3,
Ltd., 1.998%, 10/25/28
(1-Month USD LIBOR +
1.850%) (b) (e) (f) | | | 2,073,741 | | | | 2,069,730 | | |
| | | Principal | | Value(a) | |
Citigroup Mortgage Loan
Trust, Inc., 3.000%,
09/25/64 (b) (e) | | $ | 327,208 | | | $ | 346,062 | | |
COLT 2019-2 Mortgage
Loan Trust, 3.337%,
05/25/49 (b) (e) | | | 1,414,400 | | | | 1,422,851 | | |
CSMC Trust | |
3.313%, 08/25/43 (b) (e) | | | 2,666,825 | | | | 2,695,826 | | |
3.500%, 06/25/47 (b) (e) | | | 2,550,000 | | | | 2,627,714 | | |
Eagle RE 2020-1 Ltd.,
1.598%, 01/25/30 (b) (e) | | | 4,725,000 | | | | 4,664,641 | | |
GS Mortgage-Backed
Securities Trust,
2.993%, 07/25/44 (b) (e) | | | 2,110,021 | | | | 1,932,818 | | |
JP Morgan Mortgage Trust | |
2.530%, 11/25/33 (b) | | | 81,760 | | | | 80,802 | | |
3.347%, 10/25/46 (b) (e) | | | 285,649 | | | | 290,507 | | |
3.398%, 06/25/29 (b) (e) | | | 171,549 | | | | 175,920 | | |
3.560%, 10/25/45 (b) (e) | | | 1,375,000 | | | | 1,369,479 | | |
3.611%, 05/25/43 (b) (e) | | | 226,553 | | | | 226,447 | | |
MRFC Mortgage
Pass-Through Trust
Series 1998-2,
6.750%, 06/25/28 | | | 4,609 | | | | 4,690 | | |
Prudential Home
Mortgage Securities,
7.639%, 09/28/24 (b) (e) | | | 310 | | | | 299 | | |
PSMC Trust, 3.500%,
02/25/48 (b) (e) | | | 677,853 | | | | 680,738 | | |
Radnor RE 2019-1, Ltd.,
2.098%, 02/25/29
(1-Month USD LIBOR +
1.950%) (b) (e) (f) | | | 726,645 | | | | 726,769 | | |
Seasoned Credit Risk
Transfer Trust
4.000%, 07/25/56 (b) | | | 2,602,000 | | | | 2,617,904 | | |
4.000%, 08/25/56 (b) (e) | | | 1,200,000 | | | | 1,216,356 | | |
Sequoia Mortgage Trust
3.163%, 11/25/30 (b) (e) | | | 494,056 | | | | 500,750 | | |
3.512%, 06/25/43 (b) | | | 1,233,388 | | | | 1,254,040 | | |
3.711%, 07/25/45 (b) (e) | | | 376,743 | | | | 389,613 | | |
3.868%, 01/25/45 (b) (e) | | | 279,821 | | | | 286,624 | | |
Structured Asset Mortgage
Investments, Inc.,
6.750%, 05/02/30 (b) | | | 9,498 | | | | 398 | | |
WinWater Mortgage Loan
Trust 2015-4, 3.703%,
06/20/45 (b) (e) | | | 2,429,007 | | | | 2,479,063 | | |
| | | | | | 29,244,163 | | |
Commercial Mortgage-Backed
Securities (5.0%) | |
BAMLL Commercial
Mortgage Securities
Trust 2014-520M,
4.185%, 08/15/46 (b) (e) | | | 1,350,000 | | | | 1,583,799 | | |
BB-UBS Trust, 4.026%,
11/05/36 (b) (e) | | | 1,000,000 | | | | 950,100 | | |
CFCRE Commercial
Mortgage Trust,
3.839%, 12/10/54 | | | 500,000 | | | | 567,050 | | |
See accompanying notes to financial statements.
55
SFT Core Bond Fund
Investments in Securities – continued
| | | Principal | | Value(a) | |
Citigroup Commercial
Mortgage Trust
2018-TBR, 0.989%,
12/15/36 (1-Month USD
LIBOR + 0.830%) (b) (e) | | $ | 4,000,000 | | | $ | 3,924,953 | | |
CSMC Trust, 3.304%,
09/15/37 (e) | | | 357,244 | | | | 357,398 | | |
Hometown Commercial
Mortgage, 6.057%,
06/11/39 (e) | | | 28,292 | | | | 13,111 | | |
Irvine Core Office Trust,
2.068%, 05/15/48 (e) | | | 132,974 | | | | 134,870 | | |
JPMCC Commercial
Mortgage Securities
Trust, 3.723%, 03/15/50 | | | 1,000,000 | | | | 1,142,312 | | |
Morgan Stanley Bank of
America Merrill Lynch
Trust, 3.720%, 12/15/49 | | | 225,000 | | | | 257,582 | | |
Morgan Stanley Capital I
Trust, 3.451%,
08/05/34 (e) | | | 700,000 | | | | 695,877 | | |
One Market Plaza Trust,
3.614%, 02/10/32 (e) | | | 2,500,000 | | | | 2,590,814 | | |
UBS Commercial
Mortgage Trust | |
3.580%, 12/15/50 | | | 3,500,000 | | | | 3,971,075 | | |
3.724%, 06/15/50 | | | 2,750,000 | | | | 3,044,133 | | |
4.061%, 12/15/50 (b) | | | 1,505,000 | | | | 1,731,240 | | |
Wells Fargo Commercial
Mortgage Trust
3.184%, 04/15/50 | | | 1,544,000 | | | | 1,688,836 | | |
3.637%, 06/15/48 | | | 1,905,000 | | | | 2,127,102 | | |
| | | | | | 24,780,252 | | |
Total other mortgage-backed securities
(cost: $52,847,238) | | | | | 54,024,415 | | |
Corporate Obligations (50.0%) | |
Basic Materials (0.3%) | |
Chemicals (0.3%) | |
Albemarle Corp., 1.271%,
11/15/22 (3-Month USD
LIBOR + 1.050%) (b) | | | 1,530,000 | | | | 1,526,376 | | |
Communications (3.0%) | |
Media (1.1%) | |
Comcast Corp., 3.300%,
04/01/27 | | | 2,120,000 | | | | 2,410,641 | | |
The Walt Disney Co.,
3.600%, 01/13/51 | | | 2,750,000 | | | | 3,328,872 | | |
| | | | | | 5,739,513 | | |
Telecommunication (1.9%) | |
AT&T, Inc. | |
2.300%, 06/01/27 | | | 650,000 | | | | 693,250 | | |
3.550%, 09/15/55 (e) | | | 4,012,000 | | | | 3,998,380 | | |
3.650%, 06/01/51 | | | 650,000 | | | | 680,610 | | |
Crown Castle Towers LLC,
3.222%, 05/15/42 (e) | | | 2,375,000 | | | | 2,400,267 | | |
Verizon Communications,
Inc., 1.321%, 05/15/25
(3-Month USD LIBOR +
1.100%) (b) | | | 1,500,000 | | | | 1,540,276 | | |
| | | | | | 9,312,783 | | |
| | | Principal | | Value(a) | |
Consumer Cyclical (1.8%) | |
Auto/Truck Parts & Equipment — Original (1.5%) | |
Ford Motor Credit Co. LLC,
5.750%, 02/01/21 | | $ | 2,190,000 | | | $ | 2,195,475 | | |
General Motors Financial
Co., Inc., 1.080%,
04/09/21 (3-Month USD
LIBOR + 0.850%) (b) | | | 1,650,000 | | | | 1,651,004 | | |
Hyundai Capital America
2.850%, 11/01/22 (e) | | | 3,000,000 | | | | 3,108,895 | | |
3.250%, 09/20/22 (e) | | | 625,000 | | | | 650,700 | | |
| | | | | | 7,606,074 | | |
Retail (0.3%) | |
AutoZone, Inc.,
3.625%, 04/15/25 | | | 1,375,000 | | | | 1,540,225 | | |
Consumer, Non-cyclical (3.2%) | |
Agricultural Operations (0.2%) | |
Bunge, Ltd. Finance Corp.,
1.630%, 08/17/25 | | | 1,000,000 | | | | 1,033,514 | | |
Agricultural Products (0.3%) | |
Altria Group, Inc.,
5.800%, 02/14/39 | | | 955,000 | | | | 1,258,283 | | |
Drugstore Chains (0.8%) | |
CVS Pass-Through Trust
5.298%, 01/11/27 (e) | | | 856,987 | | | | 916,505 | | |
5.880%, 01/10/28 | | | 308,589 | | | | 349,740 | | |
6.036%, 12/10/28 | | | 1,886,347 | | | | 2,191,517 | | |
6.943%, 01/10/30 | | | 489,379 | | | | 585,146 | | |
| | | | | | 4,042,908 | | |
Food (0.3%) | |
Ingredion, Inc., 3.900%,
06/01/50 | | | 1,160,000 | | | | 1,386,834 | | |
Health Care Products (0.5%) | |
Dentsply Sirona, Inc.,
3.250%, 06/01/30 | | | 2,465,000 | | | | 2,745,347 | | |
Pharmaceuticals (0.9%) | |
Johnson & Johnson,
2.250%, 09/01/50 | | | 1,750,000 | | | | 1,757,825 | | |
Viatris, Inc.
2.300%, 06/22/27 (e) | | | 1,400,000 | | | | 1,490,469 | | |
3.850%, 06/22/40 (e) | | | 1,000,000 | | | | 1,128,672 | | |
| | | | | | 4,376,966 | | |
Public Thoroughfares (0.2%) | |
Transurban Finance Co.
Pty, Ltd., 2.450%,
03/16/31 (e) (f) | | | 1,100,000 | | | | 1,153,938 | | |
Energy (8.4%) | |
Oil & Gas (0.6%) | |
Equinor ASA, 3.000%,
04/06/27 (f) | | | 2,800,000 | | | | 3,117,382 | | |
Oil, Gas & Consumable Fuels (2.0%) | |
HollyFrontier Corp.,
2.625%, 10/01/23 | | | 1,700,000 | | | | 1,737,410 | | |
See accompanying notes to financial statements.
56
SFT Core Bond Fund
Investments in Securities – continued
| | | Principal | | Value(a) | |
Marathon Petroleum
Corp., 5.850%, 12/15/45 | | $ | 2,270,000 | | | $ | 2,805,090 | | |
Noble Energy, Inc.,
3.900%, 11/15/24 | | | 2,035,000 | | | | 2,270,909 | | |
The Williams Cos., Inc.,
3.350%, 08/15/22 | | | 628,000 | | | | 653,141 | | |
Valero Energy Corp.,
1.367%, 09/15/23
(3-Month USD LIBOR +
1.150%) (b) | | | 2,500,000 | | | | 2,506,372 | | |
| | | | | | 9,972,922 | | |
Pipelines (5.8%) | |
Boardwalk Pipelines L.P. | |
3.400%, 02/15/31 | | | 450,000 | | | | 469,544 | | |
4.450%, 07/15/27 | | | 538,000 | | | | 602,203 | | |
4.800%, 05/03/29 | | | 1,095,000 | | | | 1,254,749 | | |
4.950%, 12/15/24 | | | 1,000,000 | | | | 1,116,080 | | |
El Paso Natural Gas Co.
LLC, 8.375%, 06/15/32 | | | 675,000 | | | | 950,562 | | |
Enterprise Products
Operating LLC, 3.003%,
06/01/67 (3-Month USD
LIBOR + 2.778%) (b) | | | 2,180,000 | | | | 1,870,440 | | |
EQM Midstream Partners
L.P., 6.500%, 07/15/48 | | | 975,000 | | | | 1,014,000 | | |
Gray Oak Pipeline LLC
2.600%, 10/15/25 (e) | | | 1,400,000 | | | | 1,442,934 | | |
3.450%, 10/15/27 (e) | | | 1,525,000 | | | | 1,592,888 | | |
Kinder Morgan Energy
Partners L.P., 5.800%,
03/01/21 | | | 1,000,000 | | | | 1,008,141 | | |
MPLX L.P.
1.330%, 09/09/22
(3-Month USD LIBOR +
1.100%) (b) | | | 2,230,000 | | | | 2,230,378 | | |
5.250%, 01/15/25 | | | 2,450,000 | | | | 2,514,312 | | |
5.500%, 02/15/49 | | | 1,700,000 | | | | 2,238,582 | | |
Sabine Pass Liquefaction
LLC, 4.500%, 05/15/30 (e) | | | 825,000 | | | | 977,854 | | |
Sunoco Logistics Partners
Operations L.P., 6.850%,
02/15/40 | | | 2,150,000 | | | | 2,531,020 | | |
Tennessee Gas Pipeline
Co. LLC, 8.375%,
06/15/32 | | | 1,850,000 | | | | 2,659,414 | | |
Western Midstream
Operating L.P.
3.950%, 06/01/25 | | | 2,250,000 | | | | 2,295,000 | | |
6.250%, 02/01/50 | | | 1,665,000 | | | | 1,831,500 | | |
| | | | | | 28,599,601 | | |
Financial (14.4%) | |
Banks (9.6%) | |
Athene Global Funding,
3.000%, 07/01/22 (e) | | | 1,275,000 | | | | 1,318,462 | | |
Bank of America Corp.,
3.974%, 02/07/30
(3-Month USD LIBOR +
1.210%) (b) | | | 4,040,000 | | | | 4,758,442 | | |
BBVA USA | |
3.500%, 06/11/21 | | | 850,000 | | | | 859,603 | | |
3.875%, 04/10/25 | | | 2,500,000 | | | | 2,803,475 | | |
| | | Principal | | Value(a) | |
Citibank NA, 0.824%,
05/20/22 (3-Month USD
LIBOR + 0.600%) (b) | | $ | 3,650,000 | | | $ | 3,656,389 | | |
Citizens Bank NA/
Providence, 1.201%,
03/29/23 (3-Month USD
LIBOR + 0.950%) (b) | | | 3,150,000 | | | | 3,190,887 | | |
Discover Bank, 3.450%,
07/27/26 | | | 1,900,000 | | | | 2,124,947 | | |
HSBC Holdings PLC,
3.262%, 03/13/23
(3-Month USD LIBOR +
1.055%) (b) (f) | | | 1,875,000 | | | | 1,936,774 | | |
JPMorgan Chase & Co. | |
3.540%, 05/01/28
(3-Month USD LIBOR +
1.380%) (b) | | | 1,500,000 | | | | 1,711,624 | | |
3.558%, 04/01/21
(3-Month USD LIBOR +
3.320%) (b) | | | 1,700,000 | | | | 1,670,148 | | |
3.684%, 04/30/21
(3-Month USD LIBOR +
3.470%) (b) | | | 734,000 | | | | 732,499 | | |
4.600%, 02/01/25 (b) | | | 1,175,000 | | | | 1,213,188 | | |
Midwest Connector
Capital Co. LLC, 3.625%,
04/01/22 (e) | | | 2,300,000 | | | | 2,340,291 | | |
Morgan Stanley | |
3.125%, 07/27/26 | | | 800,000 | | | | 894,213 | | |
5.500%, 07/28/21 | | | 740,000 | | | | 761,759 | | |
Regions Financial Corp.,
3.800%, 08/14/23 | | | 1,675,000 | | | | 1,817,048 | | |
Synovus Financial Corp.,
3.125%, 11/01/22 | | | 2,580,000 | | | | 2,678,868 | | |
The Goldman Sachs
Group, Inc., 0.994%,
10/31/22 (3-Month USD
LIBOR + 0.780%) (b) | | | 1,050,000 | | | | 1,054,278 | | |
Truist Bank, 0.812%,
05/17/22 (3-Month USD
LIBOR + 0.590%) (b) | | | 2,850,000 | | | | 2,867,324 | | |
Truist Financial Corp.,
5.050%, 12/15/24
(3-Month USD LIBOR +
3.102%) (b) | | | 1,770,000 | | | | 1,796,550 | | |
US Bancorp
3.000%, 07/30/29 | | | 765,000 | | | | 854,431 | | |
5.300%, 04/15/27
(3-Month USD LIBOR +
2.914%) (b) | | | 800,000 | | | | 899,800 | | |
Wells Fargo & Co. | |
2.393%, 06/02/28 (b) | | | 4,125,000 | | | | 4,391,566 | | |
3.000%, 10/23/26 | | | 1,100,000 | | | | 1,218,766 | | |
| | | | | | 47,551,332 | | |
Capital Markets (0.4%) | |
Stifel Financial Corp.,
4.000%, 05/15/30 | | | 1,850,000 | | | | 2,114,065 | | |
Diversified Financial Services (1.1%) | |
DY7 Leasing LLC,
2.578%, 12/10/25 | | | 52,377 | | | | 54,784 | | |
Helios Leasing I LLC,
1.825%, 05/16/25 | | | 60,188 | | | | 61,681 | | |
See accompanying notes to financial statements.
57
SFT Core Bond Fund
Investments in Securities – continued
| | | Principal | | Value(a) | |
Pine Street Trust I,
4.572%, 02/15/29 (e) | | $ | 1,450,000 | | | $ | 1,719,013 | | |
The Charles Schwab
Corp., 4.625%, 03/01/22
(3-Month USD LIBOR +
3.315%) (b) | | | 2,200,000 | | | | 2,238,500 | | |
USAA Capital Corp.,
1.500%, 05/01/23 (e) | | | 1,250,000 | | | | 1,282,192 | | |
| | | | | | 5,356,170 | | |
Insurance (2.8%) | |
AIG Global Funding,
0.800%, 07/07/23 (e) | | | 1,390,000 | | | | 1,403,700 | | |
Brown & Brown, Inc.,
2.375%, 03/15/31 | | | 1,100,000 | | | | 1,151,275 | | |
Equitable Financial Life
Global Funding, 1.400%,
07/07/25 (e) | | | 2,450,000 | | | | 2,516,370 | | |
Kemper Corp., 2.400%,
09/30/30 | | | 2,785,000 | | | | 2,835,294 | | |
Teachers Insurance &
Annuity Association of
America, 4.270%,
05/15/47 (e) | | | 2,500,000 | | | | 3,126,157 | | |
Unum Group, 5.750%,
08/15/42 | | | 2,310,000 | | | | 2,805,310 | | |
| | | | | | 13,838,106 | | |
Real Estate Investment Trust — Office Property (0.4%) | |
SL Green Operating
Partnership L.P., 1.201%,
08/16/21 (3-Month USD
LIBOR + 0.980%) (b) | | | 2,000,000 | | | | 1,995,354 | | |
Real Estate Investment Trust — Residential (0.1%) | |
UDR, Inc., 4.000%, 10/01/25 | | | 400,000 | | | | 453,941 | | |
Health Care (1.4%) | |
Health Care Providers & Services (1.4%) | |
NYU Langone Hospitals,
4.428%, 07/01/42 | | | 1,480,000 | | | | 1,663,603 | | |
Sinai Health System,
3.034%, 01/20/36 | | | 1,285,000 | | | | 1,332,321 | | |
The New York and
Presbyterian Hospital | |
2.256%, 08/01/40 | | | 3,175,000 | | | | 3,105,609 | | |
2.606%, 08/01/60 | | | 650,000 | | | | 641,598 | | |
| | | | | | 6,743,131 | | |
Industrials (1.0%) | |
Aerospace & Defense (0.2%) | |
General Dynamics Corp.,
3.000%, 05/11/21 | | | 1,150,000 | | | | 1,161,078 | | |
Machinery (0.3%) | |
Westinghouse Air Brake
Technologies Corp.,
3.200%, 06/15/25 | | | 1,350,000 | | | | 1,456,460 | | |
Transportation (0.5%) | |
CSX Corp. | |
4.250%, 11/01/66 | | | 1,085,000 | | | | 1,452,285 | | |
4.750%, 11/15/48 | | | 625,000 | | | | 857,301 | | |
| | | | | | 2,309,586 | | |
| | | Principal | | Value(a) | |
Technology (1.7%) | |
Computers (1.7%) | |
Apple, Inc. | |
0.750%, 05/11/23 | | $ | 965,000 | | | $ | 976,512 | | |
1.125%, 05/11/25 | | | 2,435,000 | | | | 2,504,068 | | |
Dell International LLC /
EMC Corp., 5.300%,
10/01/29 (e) | | | 1,475,000 | | | | 1,808,276 | | |
Leidos, Inc. | |
2.950%, 05/15/23 (e) | | | 1,950,000 | | | | 2,051,609 | | |
3.625%, 05/15/25 (e) | | | 975,000 | | | | 1,090,138 | | |
| | | | | | 8,430,603 | | |
Transportation (4.2%) | |
Airlines (4.2%) | |
Air Canada 2013-1 Class B
Pass Through Trust,
5.375%, 11/15/22 (e) (f) | | | 634,631 | | | | 636,104 | | |
Air Canada 2017-1 Class A
Pass Through Trust,
3.550%, 07/15/31 (e) (f) | | | 1,952,280 | | | | 1,709,265 | | |
American Airlines 2013-1
Class B Pass Through
Trust, 5.625%,
07/15/22 (e) | | | 641,452 | | | | 640,119 | | |
American Airlines 2016-1
Class B Pass Through
Trust, 5.250%, 07/15/25 | | | 843,291 | | | | 716,134 | | |
American Airlines 2017-1
Class B Pass Through
Trust, 4.950%, 08/15/26 | | | 696,500 | | | | 588,898 | | |
British Airways 2019-1
Class A Pass Through
Trust, 3.350%,
12/15/30 (e) | | | 1,389,373 | | | | 1,316,692 | | |
British Airways 2020-1
Class A Pass Through
Trust, 4.250%,
05/15/34 (e) | | | 925,000 | | | | 988,594 | | |
Delta Air Lines 2015-1
Class B Pass Through
Trust, 4.250%, 01/30/25 | | | 1,225,728 | | | | 1,253,179 | | |
Delta Air Lines 2020-1
Class A Pass Through
Trust, 2.500%, 12/10/29 | | | 1,814,159 | | | | 1,723,208 | | |
Hawaiian Airlines 2013-1
Class B Pass Through
Certificates, 4.950%,
07/15/23 | | | 1,754,603 | | | | 1,599,514 | | |
JetBlue 2020-1 Class A
Pass Through Trust,
4.000%, 05/15/34 | | | 860,000 | | | | 928,243 | | |
United Airlines 2014-1
Class B Pass Through
Trust, 4.750%, 10/11/23 | | | 350,300 | | | | 351,668 | | |
United Airlines 2014-2
Class B Pass Through
Trust, 4.625%, 03/03/24 | | | 1,472,063 | | | | 1,481,310 | | |
United Airlines 2016-1
Class B Pass Through
Trust, 3.650%, 07/07/27 | | | 919,479 | | | | 901,710 | | |
See accompanying notes to financial statements.
58
SFT Core Bond Fund
Investments in Securities – continued
| | | Principal | | Value(a) | |
United Airlines 2019-2
Class B Pass Through
Trust, 3.500%, 11/01/29 | | $ | 1,448,319 | | | $ | 1,352,754 | | |
United Airlines 2020-1
Class A Pass Through
Trust, 5.875%, 04/15/29 | | | 2,000,000 | | | | 2,160,425 | | |
US Airways 2012-2 Class B
Pass Through Trust,
6.750%, 12/03/22 | | | 1,564,028 | | | | 1,520,547 | | |
US Airways 2013-1 Class B
Pass Through Trust,
5.375%, 05/15/23 | | | 997,442 | | | | 949,928 | | |
| | | | | | 20,818,292 | | |
Utilities (10.6%) | |
Electric Companies (0.5%) | |
Indianapolis Power &
Light Co., 4.700%,
09/01/45 (e) | | | 1,900,000 | | | | 2,396,862 | | |
Electric Utilities (6.2%) | |
Cleco Corporate Holdings
LLC, 3.743%, 05/01/26 | | | 1,125,000 | | | | 1,245,033 | | |
Entergy Mississippi LLC,
3.250%, 12/01/27 | | | 1,100,000 | | | | 1,205,687 | | |
Entergy Texas, Inc.,
3.450%, 12/01/27 | | | 1,885,000 | | | | 2,060,767 | | |
Eversource Energy,
3.800%, 12/01/23 | | | 2,400,000 | | | | 2,627,436 | | |
Exelon Generation Co.
LLC, 3.250%, 06/01/25 | | | 1,430,000 | | | | 1,559,289 | | |
FirstEnergy Transmission
LLC, 5.450%, 07/15/44 (e) | | | 2,000,000 | | | | 2,537,727 | | |
IPALCO Enterprises, Inc.,
3.700%, 09/01/24 | | | 1,175,000 | | | | 1,280,718 | | |
MidAmerican Energy Co.,
4.250%, 07/15/49 | | | 1,750,000 | | | | 2,349,602 | | |
Pacific Gas and Electric Co.
1.750%, 06/16/22 | | | 2,000,000 | | | | 2,005,644 | | |
4.500%, 07/01/40 | | | 1,500,000 | | | | 1,676,611 | | |
PacifiCorp, 3.300%,
03/15/51 | | | 1,410,000 | | | | 1,617,442 | | |
PPL Capital Funding, Inc.,
2.905%, 03/30/67
(3-Month USD LIBOR +
2.665%) (b) | | | 2,175,000 | | | | 1,875,896 | | |
The AES Corp. | |
1.375%, 01/15/26 (e) | | | 620,000 | | | | 625,321 | | |
3.300%, 07/15/25 (e) | | | 1,825,000 | | | | 1,989,250 | | |
Vistra Operations Co. LLC,
3.700%, 01/30/27 (e) | | | 2,550,000 | | | | 2,811,850 | | |
Xcel Energy, Inc., 3.500%,
12/01/49 | | | 3,040,000 | | | | 3,553,833 | | |
| | | | | | 31,022,106 | | |
| | | Principal | | Value(a) | |
Electric — Integrated (2.1%) | |
Ameren Corp.,
3.500%, 01/15/31 | | $ | 2,150,000 | | | $ | 2,480,571 | | |
Exelon Corp.
4.050%, 04/15/30 | | | 1,000,000 | | | | 1,183,284 | | |
4.700%, 04/15/50 | | | 1,410,000 | | | | 1,874,922 | | |
Florida Power & Light Co.
0.602%, 07/28/23
(3-Month USD LIBOR +
0.380%) (b) | | | 3,200,000 | | | | 3,200,651 | | |
2.850%, 04/01/25 | | | 1,450,000 | | | | 1,577,966 | | |
| | | | | | 10,317,394 | | |
Gas Utilities (1.8%) | |
Piedmont Natural Gas
Co., Inc., 3.350%,
06/01/50 | | | 1,800,000 | | | | 2,009,331 | | |
Southern Co. Gas
Capital Corp.
3.875%, 11/15/25 | | | 2,605,000 | | | | 2,923,568 | | |
4.400%, 05/30/47 | | | 775,000 | | | | 973,203 | | |
The East Ohio Gas Co.
1.300%, 06/15/25 (e) | | | 1,380,000 | | | | 1,406,120 | | |
3.000%, 06/15/50 (e) | | | 1,685,000 | | | | 1,836,734 | | |
| | | | | | 9,148,956 | | |
Total corporate obligations
(cost: $233,383,987) | | | | | 248,526,102 | | |
Total long-term debt securities
(cost: $470,321,391) | | | | | 493,404,222 | | |
Short-Term Securities (0.3%) | |
Investment Companies (0.3%) | |
State Street Institutional
U.S. Government Money
Market Fund, current
rate 0.030% | | | 1,570,800 | | | | 1,570,800 | | |
Total short-term securities
(cost: $1,570,800) | | | | | 1,570,800 | | |
Total investments in securities
(cost: $471,892,191) (g) | | | | | 494,975,022 | | |
Cash and other assets in
excess of liabilities (0.4%) | | | | | 2,037,607 | | |
Total net assets (100.0%) | | | | $ | 497,012,629 | | |
See accompanying notes to financial statements.
59
SFT Core Bond Fund
Investments in Securities – continued
Investments in Securities Legend
(a) Securities are valued by procedures described in Note 2 of the Notes to Financial Statements.
(b) Variable rate security.
(c) Interest-only security that entitles holders to receive only interest on the underlying mortgages. The principal amount of the underlying pool represents the notional amount on which current interest is calculated. The yield to maturity of an interest-only security is sensitive to the rate of principal payments on the underlying mortgage assets. The rate disclosed represents the market yield based upon the current cost basis and estimated timing and amount of future cash flows.
(d) Fully or partially pledged as initial margin deposits on open futures contracts.
Holdings of Open Futures Contracts
On December 31, 2020, securities with an aggregate market value of $1,548,113 have been pledged to cover margin requirements for the following open futures contracts:
Description | | Expiration
Date | | Number of
Contracts | | Position
Type | | Notional
Amount | | Market
Value | | Unrealized
Appreciation/
(Depreciation)(a) | |
5 Year U.S. Treasury Note | | March 2021 | | | 167 | | | Long | | $ | 21,029,358 | | | $ | 21,069,399 | | | $ | 40,041 | | |
10 Year U.S. Ultra | | March 2021 | | | 125 | | | Short | | | (19,661,787 | ) | | | (19,544,922 | ) | | | 116,865 | | |
U.S. Long Bond | | March 2021 | | | 252 | | | Long | | | 44,204,991 | | | | 43,643,250 | | | | (561,741 | ) | |
U.S. Ultra Bond | | March 2021 | | | 58 | | | Short | | | (12,627,082 | ) | | | (12,386,625 | ) | | | 240,457 | | |
| | | | | | | | | | | $ | 32,781,102 | | | $ | (164,378 | ) | |
(e) Security sold within terms of a private placement memorandum exempt from registration pursuant to Rule 144A under the Securities Act of 1933, as amended, and may be sold only to dealers in that program. This security has been determined to be liquid unless otherwise indicated.
(f) Foreign security: The Fund held 2.5% of net assets in foreign securities at December 31, 2020.
(g) At December 31, 2020 the cost of investments for federal income tax purposes was $471,868,524. The aggregate unrealized appreciation and depreciation of investments based on this cost were:
Gross unrealized appreciation | | $ | 27,481,617 | | |
Gross unrealized depreciation | | | (4,539,497 | ) | |
Net unrealized appreciation | | $ | 22,942,120 | | |
See accompanying notes to financial statements.
60
SFT Dynamic Managed Volatility Fund
Investments in Securities
(Percentages of each investment category relate to total net assets)
| | | Principal | | Value(a) | |
Long-Term Debt Securities (27.7%) | |
Government Obligations (2.4%) | |
U.S. Government Agencies and
Obligations (2.4%) | |
Federal Home Loan Mortgage
Corporation (FHLMC) (0.1%) | |
3.000%, 09/01/43 | | $ | 90,311 | | | $ | 96,063 | | |
3.500%, 10/01/44 | | | 121,397 | | | | 130,150 | | |
3.500%, 11/01/44 | | | 116,928 | | | | 125,339 | | |
3.500%, 12/01/44 | | | 125,598 | | | | 134,603 | | |
| | | | | | 486,155 | | |
Federal National Mortgage Association
(FNMA) (0.1%) | |
3.000%, 04/01/43 | | | 148,124 | | | | 157,857 | | |
3.000%, 05/01/43 | | | 54,687 | | | | 57,932 | | |
3.000%, 06/01/43 | | | 199,351 | | | | 212,517 | | |
3.500%, 08/01/42 | | | 83,181 | | | | 90,963 | | |
3.500%, 02/01/43 | | | 99,634 | | | | 110,580 | | |
| | | | | | 629,849 | | |
U.S. Treasury (2.2%) | |
U.S. Treasury Note,
2.625%, 12/15/21 (b) | | | 15,000,000 | | | | 15,356,836 | | |
Total government obligations
(cost: $16,018,860) | | | | | 16,472,840 | | |
Other Mortgage-Backed Securities (0.2%) | |
Commercial Mortgage-Backed Securities (0.2%) | |
Bank 2019-BNK18,
3.584%, 05/15/62 | | | 1,500,000 | | | | 1,736,682 | | |
Total other mortgage-backed securities
(cost: $1,544,239) | | | | | 1,736,682 | | |
Corporate Obligations (25.1%) | |
Basic Materials (0.2%) | |
Chemicals (0.2%) | |
Nutrien, Ltd.,
3.000%, 04/01/25 (c) | | | 1,000,000 | | | | 1,080,153 | | |
Mining (0.0%) | |
BHP Billiton Finance USA,
Ltd., 2.875%, 02/24/22 (c) | | | 122,000 | | | | 125,480 | | |
Communications (1.7%) | |
Cable/Satellite TV (0.4%) | |
Comcast Corp. | |
4.200%, 08/15/34 (b) | | | 500,000 | | | | 626,645 | | |
4.650%, 07/15/42 (b) | | | 250,000 | | | | 338,734 | | |
6.400%, 05/15/38 | | | 1,000,000 | | | | 1,557,942 | | |
| | | | | | 2,523,321 | | |
Diversified Telecommunication Services (0.7%) | |
AT&T, Inc. | |
2.550%, 12/01/33 (d) | | | 943,000 | | | | 966,705 | | |
3.550%, 09/15/55 (d) | | | 1,405,000 | | | | 1,400,230 | | |
3.800%, 12/01/57 (d) | | | 75,000 | | | | 78,370 | | |
4.500%, 05/15/35 | | | 1,000,000 | | | | 1,213,436 | | |
Verizon Communications,
Inc., 2.987%, 10/30/56 (d) | | | 1,194,000 | | | | 1,201,896 | | |
| | | | | | 4,860,637 | | |
| | | Principal | | Value(a) | |
Internet & Catalog Retail (0.2%) | |
Amazon.com, Inc.,
3.875%, 08/22/37 | | $ | 1,000,000 | | | $ | 1,247,469 | | |
Media (0.2%) | |
ViacomCBS, Inc. | |
3.500%, 01/15/25 | | | 750,000 | | | | 822,771 | | |
4.000%, 01/15/26 | | | 250,000 | | | | 286,126 | | |
| | | | | | 1,108,897 | | |
Telecommunication (0.2%) | |
Crown Castle Towers LLC,
3.663%, 05/15/45 (d) | | | 1,000,000 | | | | 1,077,093 | | |
Vodafone Group PLC,
4.125%, 05/30/25 (c) | | | 500,000 | | | | 571,748 | | |
| | | | | | 1,648,841 | | |
Wireless Telecommunication Services (0.0%) | |
Rogers Communications,
Inc., 4.100%, 10/01/23 (c) | | | 250,000 | | | | 273,372 | | |
Consumer Cyclical (0.7%) | |
Auto/Truck Parts & Equipment — Original (0.1%) | |
Harley-Davidson Financial
Services, Inc.,
3.550%, 05/21/21 (d) | | | 575,000 | | | | 581,306 | | |
Food & Staples Retailing (0.2%) | |
The Kroger Co.,
4.450%, 02/01/47 | | | 1,000,000 | | | | 1,258,469 | | |
Home Furnishings (0.1%) | |
Harman International
Industries, Inc.,
4.150%, 05/15/25 | | | 1,000,000 | | | | 1,113,477 | | |
Retail (0.3%) | |
AutoZone, Inc.,
3.250%, 04/15/25 | | | 1,000,000 | | | | 1,095,678 | | |
Target Corp.,
3.500%, 07/01/24 (b) | | | 750,000 | | | | 830,271 | | |
| | | | | | 1,925,949 | | |
Consumer Staples (0.8%) | |
Beverages (0.1%) | |
The Coca-Cola Co.,
3.200%, 11/01/23 (b) | | | 500,000 | | | | 542,113 | | |
Consumer Products — Miscellaneous (0.1%) | |
Johnson (S.C.) & Son, Inc.,
3.350%, 09/30/24 (d) | | | 750,000 | | | | 806,330 | | |
Food Products (0.2%) | |
General Mills, Inc.,
4.150%, 02/15/43 | | | 1,000,000 | | | | 1,250,015 | | |
Household Products (0.2%) | |
Kimberly-Clark Corp.,
3.900%, 05/04/47 | | | 1,000,000 | | | | 1,295,724 | | |
Personal Care (0.2%) | |
The Estee Lauder Cos.,
Inc., 4.150%, 03/15/47 | | | 1,000,000 | | | | 1,312,177 | | |
See accompanying notes to financial statements.
61
SFT Dynamic Managed Volatility Fund
Investments in Securities – continued
| | | Principal | | Value(a) | |
Consumer, Non-cyclical (1.6%) | |
Beverages (0.2%) | |
Anheuser-Busch InBev
Worldwide, Inc.,
4.375%, 04/15/38 | | $ | 1,000,000 | | | $ | 1,238,198 | | |
Commercial Service — Finance (0.0%) | |
Moody's Corp.,
4.875%, 02/15/24 | | | 250,000 | | | | 281,507 | | |
Diagnostic Equipment (0.4%) | |
Abbott Laboratories | |
3.875%, 09/15/25 | | | 750,000 | | | | 858,984 | | |
4.750%, 11/30/36 | | | 1,000,000 | | | | 1,375,519 | | |
4.750%, 04/15/43 | | | 250,000 | | | | 351,060 | | |
| | | | | | 2,585,563 | | |
Drugstore Chains (0.0%) | |
CVS Pass-Through Trust,
6.943%, 01/10/30 | | | 149,201 | | | | 178,398 | | |
Food (0.4%) | |
Mars, Inc.,
3.950%, 04/01/49 (d) | | | 1,000,000 | | | | 1,274,264 | | |
Tyson Foods, Inc.,
5.150%, 08/15/44 | | | 1,000,000 | | | | 1,379,989 | | |
| | | | | | 2,654,253 | | |
Pharmaceuticals (0.6%) | |
AbbVie, Inc.,
3.800%, 03/15/25 | | | 670,000 | | | | 747,169 | | |
Bristol-Myers Squibb Co.,
3.875%, 08/15/25 | | | 1,000,000 | | | | 1,140,791 | | |
Novartis Capital Corp.,
3.400%, 05/06/24 (b) | | | 500,000 | | | | 548,503 | | |
Takeda Pharmaceutical
Co., Ltd., 5.000%,
11/26/28 (c) | | | 1,000,000 | | | | 1,242,500 | | |
| | | | | | 3,678,963 | | |
Energy (3.0%) | |
Oil & Gas (0.7%) | |
Baker Hughes a GE Co.
LLC / Baker Hughes
Co-Obligor, Inc.,
3.337%, 12/15/27 | | | 1,000,000 | | | | 1,120,292 | | |
BP Capital Markets
America, Inc., 4.234%,
11/06/28 | | | 1,000,000 | | | | 1,195,078 | | |
Cimarex Energy Co.,
3.900%, 05/15/27 | | | 1,000,000 | | | | 1,102,138 | | |
Valero Energy Corp.,
4.350%, 06/01/28 | | | 1,000,000 | | | | 1,138,205 | | |
| | | | | | 4,555,713 | | |
Oil, Gas & Consumable Fuels (0.8%) | |
Chevron Corp.,
3.191%, 06/24/23 (b) | | | 250,000 | | | | 265,891 | | |
EOG Resources, Inc.,
2.625%, 03/15/23 | | | 250,000 | | | | 260,891 | | |
Marathon Petroleum Corp.,
3.625%, 09/15/24 | | | 750,000 | | | | 818,467 | | |
| | | Principal | | Value(a) | |
Noble Energy, Inc.,
3.900%, 11/15/24 | | $ | 1,000,000 | | | $ | 1,115,926 | | |
Phillips 66,
4.650%, 11/15/34 | | | 1,000,000 | | | | 1,211,536 | | |
Total Capital International
SA, 3.750%, 04/10/24 (c) | | | 750,000 | | | | 829,220 | | |
Valero Energy Corp.,
3.650%, 03/15/25 | | | 1,000,000 | | | | 1,094,068 | | |
| | | | | | 5,595,999 | | |
Pipelines (1.5%) | |
Columbia Pipeline Group,
Inc., 4.500%, 06/01/25 | | | 1,000,000 | | | | 1,150,036 | | |
Energy Transfer Operating
L.P., 4.900%, 03/15/35 | | | 1,000,000 | | | | 1,100,962 | | |
Enterprise Products
Operating LLC,
5.750%, 03/01/35 | | | 250,000 | | | | 315,243 | | |
Florida Gas Transmission
Co. LLC, 4.350%,
07/15/25 (d) | | | 1,000,000 | | | | 1,135,632 | | |
Kinder Morgan, Inc.,
5.300%, 12/01/34 | | | 750,000 | | | | 924,282 | | |
Magellan Midstream
Partners L.P., 4.200%,
10/03/47 | | | 1,000,000 | | | | 1,138,993 | | |
MPLX L.P., 5.250%,
01/15/25 | | | 500,000 | | | | 513,125 | | |
Plains All American
Pipeline L.P./PAA
Finance Corp., 3.850%,
10/15/23 | | | 250,000 | | | | 267,305 | | |
Southern Natural Gas Co.
LLC, 4.800%, 03/15/47 (d) | | | 1,500,000 | | | | 1,744,424 | | |
Sunoco Logistics Partners
Operations L.P., 4.250%,
04/01/24 | | | 1,000,000 | | | | 1,082,779 | | |
The Williams Cos., Inc. | |
3.750%, 06/15/27 | | | 500,000 | | | | 570,518 | | |
4.300%, 03/04/24 | | | 500,000 | | | | 550,950 | | |
| | | | | | 10,494,249 | | |
Financial (7.7%) | |
Banks (2.9%) | |
Associated Banc-Corp.,
4.250%, 01/15/25 | | | 750,000 | | | | 812,657 | | |
Bank of America Corp. | |
3.950%, 04/21/25 | | | 1,000,000 | | | | 1,127,289 | | |
4.183%, 11/25/27 | | | 1,000,000 | | | | 1,160,086 | | |
4.244%, 04/24/38
(3-Month USD LIBOR +
1.814%) (e) | | | 1,000,000 | | | | 1,231,916 | | |
5.700%, 01/24/22 | | | 250,000 | | | | 264,214 | | |
Capital One Financial
Corp. | |
4.250%, 04/30/25 | | | 1,500,000 | | | | 1,712,121 | | |
4.750%, 07/15/21 | | | 250,000 | | | | 255,833 | | |
Citigroup, Inc. | |
3.300%, 04/27/25 | | | 750,000 | | | | 831,722 | | |
3.980%, 03/20/30
(3-Month USD LIBOR +
1.338%) (e) | | | 1,000,000 | | | | 1,176,008 | | |
See accompanying notes to financial statements.
62
SFT Dynamic Managed Volatility Fund
Investments in Securities – continued
| | | Principal | | Value(a) | |
Discover Bank, 4.250%,
03/13/26 | | $ | 500,000 | | | $ | 575,235 | | |
Fifth Third Bank, 3.950%,
07/28/25 | | | 1,000,000 | | | | 1,142,349 | | |
JPMorgan Chase & Co.,
3.125%, 01/23/25 | | | 1,000,000 | | | | 1,095,259 | | |
KeyBank NA, 3.180%,
10/15/27 | | | 1,000,000 | | | | 1,036,838 | | |
| PNC Bank NA | |
2.450%, 07/28/22 | | | 1,000,000 | | | | 1,032,753 | | |
3.800%, 07/25/23 | | | 250,000 | | | | 271,013 | | |
4.050%, 07/26/28 | | | 1,000,000 | | | | 1,184,945 | | |
Regions Financial Corp.,
3.800%, 08/14/23 | | | 2,000,000 | | | | 2,169,609 | | |
Synchrony Bank, 3.000%,
06/15/22 | | | 1,000,000 | | | | 1,032,630 | | |
The Goldman Sachs
Group, Inc., 3.850%,
01/26/27 | | | 1,000,000 | | | | 1,141,195 | | |
Truist Bank, 2.750%,
05/01/23 | | | 250,000 | | | | 263,287 | | |
| | | | | | 19,516,959 | | |
Capital Markets (0.3%) | |
E*TRADE Financial Corp.,
2.950%, 08/24/22 | | | 1,000,000 | | | | 1,038,834 | | |
The Bank of New York
Mellon Corp., 3.442%,
02/07/28 (3-Month USD
LIBOR + 1.069%) (e) | | | 1,000,000 | | | | 1,141,859 | | |
| | | | | | 2,180,693 | | |
Diversified Financial Services (1.0%) | |
American Express Credit
Corp., 3.300%, 05/03/27 | | | 1,000,000 | | | | 1,140,944 | | |
CME Group, Inc., 3.000%,
03/15/25 | | | 1,000,000 | | | | 1,096,343 | | |
Discover Financial
Services, 3.750%,
03/04/25 | | | 1,000,000 | | | | 1,100,597 | | |
Eaton Vance Corp.,
3.500%, 04/06/27 | | | 1,000,000 | | | | 1,122,887 | | |
Pine Street Trust I,
4.572%, 02/15/29 (d) | | | 1,500,000 | | | | 1,778,290 | | |
TD Ameritrade Holding
Corp., 2.950%, 04/01/22 | | | 700,000 | | | | 720,294 | | |
| | | | | | 6,959,355 | | |
Insurance (1.5%) | |
American Financial Group,
Inc., 4.500%, 06/15/47 | | | 1,000,000 | | | | 1,208,752 | | |
Assured Guaranty US
Holdings, Inc., 5.000%,
07/01/24 | | | 500,000 | | | | 571,772 | | |
First American Financial
Corp., 4.600%, 11/15/24 | | | 750,000 | | | | 831,276 | | |
Liberty Mutual Group,
Inc., 4.250%, 06/15/23 (d) | | | 750,000 | | | | 816,040 | | |
Manulife Financial Corp.,
4.150%, 03/04/26 (c) | | | 750,000 | | | | 872,371 | | |
Marsh & McLennan Cos.,
Inc., 4.350%, 01/30/47 | | | 1,000,000 | | | | 1,324,918 | | |
| | | Principal | | Value(a) | |
Metropolitan Life Global
Funding I, 3.875%,
04/11/22 (d) | | $ | 250,000 | | | $ | 261,288 | | |
Old Republic International
Corp., 4.875%, 10/01/24 | | | 750,000 | | | | 855,092 | | |
Pacific Life Insurance Co.,
4.300%, 10/24/67
(3-Month USD LIBOR +
2.796%) (d) (e) | | | 1,000,000 | | | | 1,135,000 | | |
StanCorp Financial Group,
Inc., 5.000%, 08/15/22 | | | 750,000 | | | | 797,940 | | |
The Hanover Insurance
Group, Inc., 4.500%,
04/15/26 | | | 1,000,000 | | | | 1,167,477 | | |
| | | | | | 9,841,926 | | |
Property / Casualty Insurance (0.2%) | |
Arch Capital Finance LLC,
4.011%, 12/15/26 (b) | | | 1,000,000 | | | | 1,162,789 | | |
Real Estate Investment Trust — Diversified (0.1%) | |
Retail Properties of
America, Inc., 4.000%,
03/15/25 (b) | | | 1,000,000 | | | | 1,023,975 | | |
Real Estate Investment Trust — Health Care (0.8%) | |
Healthcare Realty Trust,
Inc., 3.875%, 05/01/25 | | | 1,000,000 | | | | 1,107,852 | | |
Healthcare Trust of
America Holdings L.P.,
3.750%, 07/01/27 | | | 1,000,000 | | | | 1,133,554 | | |
Physicians Realty L.P.,
4.300%, 03/15/27 | | | 1,000,000 | | | | 1,108,270 | | |
Welltower, Inc., 4.125%,
03/15/29 | | | 1,500,000 | | | | 1,749,862 | | |
| | | | | | 5,099,538 | | |
Real Estate Investment Trust — Office Property (0.1%) | |
Alexandria Real Estate
Equities, Inc., 4.500%,
07/30/29 | | | 500,000 | | | | 610,352 | | |
Real Estate Investment Trust — Residential (0.1%) | |
UDR, Inc., 4.000%,
10/01/25 | | | 750,000 | | | | 851,139 | | |
Real Estate Investment Trust — Shopping Centers (0.0%) | |
Retail Opportunity
Investments Partnership
L.P., 5.000%, 12/15/23 | | | 250,000 | | | | 268,119 | | |
Real Estate Investment Trust — Single Tenant (0.2%) | |
Office Properties Income
Trust, 4.500%, 02/01/25 | | | 750,000 | | | | 794,638 | | |
Tanger Properties L.P.,
3.875%, 12/01/23 | | | 500,000 | | | | 519,328 | | |
| | | | | | 1,313,966 | | |
Real Estate Investment Trust — Storage (0.1%) | |
CubeSmart L.P., 4.375%,
12/15/23 | | | 500,000 | | | | 547,198 | | |
See accompanying notes to financial statements.
63
SFT Dynamic Managed Volatility Fund
Investments in Securities – continued
| | | Principal | | Value(a) | |
Specialized REITs (0.4%) | |
American Tower Corp.,
3.375%, 10/15/26 | | $ | 1,000,000 | | | $ | 1,123,352 | | |
Essex Portfolio L.P.,
3.500%, 04/01/25 | | | 1,000,000 | | | | 1,108,033 | | |
Goodman US Finance
Four LLC, 4.500%,
10/15/37 (d) | | | 500,000 | | | | 582,348 | | |
Healthpeak Properties,
Inc., 4.250%, 11/15/23 | | | 13,000 | | | | 14,229 | | |
| | | | | | 2,827,962 | | |
Health Care (1.5%) | |
Health Care Providers & Services (0.6%) | |
Aetna, Inc., 3.875%,
08/15/47 | | | 1,000,000 | | | | 1,192,674 | | |
Anthem, Inc., 4.375%,
12/01/47 | | | 1,000,000 | | | | 1,288,922 | | |
Laboratory Corp. of
America Holdings,
4.000%, 11/01/23 | | | 250,000 | | | | 272,247 | | |
UnitedHealth Group, Inc. | |
2.750%, 02/15/23 (b) | | | 250,000 | | | | 261,629 | | |
3.750%, 07/15/25 (b) | | | 1,000,000 | | | | 1,139,336 | | |
| | | | | | 4,154,808 | | |
Pharmaceuticals (0.9%) | |
AbbVie, Inc., 3.600%,
05/14/25 | | | 1,000,000 | | | | 1,114,088 | | |
Bristol-Myers Squibb Co.,
3.250%, 11/01/23 | | | 500,000 | | | | 542,139 | | |
Cardinal Health, Inc.,
3.750%, 09/15/25 | | | 1,000,000 | | | | 1,128,985 | | |
Eli Lilly & Co., 3.950%,
05/15/47 | | | 1,000,000 | | | | 1,278,068 | | |
Mead Johnson Nutrition
Co., 5.900%, 11/01/39 | | | 1,000,000 | | | | 1,483,385 | | |
Mylan, Inc., 4.200%,
11/29/23 | | | 500,000 | | | | 546,739 | | |
| | | | | | 6,093,404 | | |
Industrials (3.6%) | |
Aerospace & Defense (0.9%) | |
General Dynamics Corp.,
3.500%, 05/15/25 | | | 1,000,000 | | | | 1,117,802 | | |
L3Harris Technologies,
Inc., 3.832%, 04/27/25 | | | 1,000,000 | | | | 1,122,404 | | |
Raytheon Technologies
Corp. | |
3.700%, 12/15/23 | | | 500,000 | | | | 543,690 | | |
4.050%, 05/04/47 | | | 1,000,000 | | | | 1,245,736 | | |
4.125%, 11/16/28 | | | 1,500,000 | | | | 1,788,245 | | |
| | | | | | 5,817,877 | | |
Air Freight & Logistics (0.2%) | |
FedEx Corp., 4.400%,
01/15/47 | | | 1,000,000 | | | | 1,263,522 | | |
Building Products (0.2%) | |
CRH America Finance, Inc.,
4.400%, 05/09/47 (d) | | | 1,000,000 | | | | 1,228,399 | | |
| | | Principal | | Value(a) | |
Containers & Packaging (0.2%) | |
Amcor Finance USA, Inc.,
4.500%, 05/15/28 | | $ | 1,000,000 | | | $ | 1,194,680 | | |
Electrical Equipment (0.2%) | |
Flex. Ltd., 4.750%,
06/15/25 (c) | | | 1,000,000 | | | | 1,135,028 | | |
Electronic Parts Distributions (0.2%) | |
Avnet, Inc., 3.750%,
12/01/21 | | | 1,500,000 | | | | 1,536,276 | | |
Environmental Control (0.3%) | |
Republic Services, Inc.,
3.950%, 05/15/28 | | | 1,000,000 | | | | 1,172,660 | | |
Waste Management, Inc.,
3.900%, 03/01/35 | | | 1,000,000 | | | | 1,224,459 | | |
| | | | | | 2,397,119 | | |
Industrial Conglomerates (0.2%) | |
3M Co., 3.625%, 10/15/47 | | | 1,000,000 | | | | 1,192,372 | | |
Machinery (0.3%) | |
Caterpillar Financial
Services Corp.
2.850%, 05/17/24 | | | 1,000,000 | | | | 1,076,496 | | |
3.750%, 11/24/23 (b) | | | 750,000 | | | | 822,877 | | |
| | | | | | 1,899,373 | | |
Miscellaneous Manufacturing (0.4%) | |
Carlisle Cos., Inc.,
3.750%, 12/01/27 | | | 1,000,000 | | | | 1,131,467 | | |
Textron, Inc.
3.875%, 03/01/25 | | | 750,000 | | | | 824,033 | | |
4.300%, 03/01/24 | | | 500,000 | | | | 549,133 | | |
| | | | | | 2,504,633 | | |
Road & Rail (0.0%) | |
Kansas City Southern,
4.300%, 05/15/43 | | | 250,000 | | | | 293,989 | | |
Transportation (0.2%) | |
Burlington Northern
Santa Fe LLC, 3.750%,
04/01/24 | | | 350,000 | | | | 383,666 | | |
Penske Truck Leasing Co.
L.P. / PTL Finance Corp.,
3.900%, 02/01/24 (d) | | | 1,000,000 | | | | 1,091,972 | | |
| | | | | | 1,475,638 | | |
Trucking & Leasing (0.3%) | |
GATX Corp. | |
3.250%, 03/30/25 | | | 1,000,000 | | | | 1,097,422 | | |
4.550%, 11/07/28 | | | 1,000,000 | | | | 1,207,182 | | |
| | | | | | 2,304,604 | | |
Information Technology (1.0%) | |
Communications Equipment (0.2%) | |
QUALCOMM, Inc.,
4.650%, 05/20/35 | | | 1,000,000 | | | | 1,337,703 | | |
See accompanying notes to financial statements.
64
SFT Dynamic Managed Volatility Fund
Investments in Securities – continued
| | | Principal | | Value(a) | |
Computers (0.2%) | |
Apple, Inc., 4.375%,
05/13/45 (b) | | $ | 1,000,000 | | | $ | 1,370,466 | | |
Interactive Media & Services (0.1%) | |
eBay, Inc., 3.450%,
08/01/24 | | | 750,000 | | | | 819,275 | | |
IT Services (0.1%) | |
Global Payments, Inc.,
4.800%, 04/01/26 | | | 750,000 | | | | 890,041 | | |
Software (0.4%) | |
Fiserv, Inc., 3.850%,
06/01/25 | | | 1,000,000 | | | | 1,127,207 | | |
Oracle Corp., 3.800%,
11/15/37 | | | 1,000,000 | | | | 1,207,847 | | |
| | | | | | 2,335,054 | | |
Materials (0.6%) | |
Chemicals (0.4%) | |
The Dow Chemical Co.,
3.500%, 10/01/24 | | | 496,000 | | | | 543,315 | | |
The Mosaic Co., 5.450%,
11/15/33 | | | 200,000 | | | | 248,651 | | |
The Sherwin-Williams Co.,
3.950%, 01/15/26 | | | 1,000,000 | | | | 1,143,756 | | |
Yara International ASA,
4.750%, 06/01/28 (c) (d) | | | 1,000,000 | | | | 1,185,807 | | |
| | | | | | 3,121,529 | | |
Construction Materials (0.2%) | |
Vulcan Materials Co.,
4.500%, 06/15/47 | | | 1,000,000 | | | | 1,238,779 | | |
Transportation (0.4%) | |
Airlines (0.2%) | |
American Airlines 2015-2
Class A Pass Through
Trust, 4.000%, 03/22/29 | | | 786,862 | | | | 730,997 | | |
British Airways 2013-1
Class A Pass Through
Trust, 4.625%,
12/20/25 (d) | | | 624,848 | | | | 621,358 | | |
United Airlines 2013-1
Class A Pass Through
Trust, 4.300%, 02/15/27 | | | 175,701 | | | | 177,454 | | |
| | | | | | 1,529,809 | | |
Transport — Rail (0.2%) | |
Norfolk Southern Corp.,
3.850%, 01/15/24 | | | 500,000 | | | | 545,624 | | |
Union Pacific Corp.,
3.750%, 03/15/24 | | | 500,000 | | | | 546,435 | | |
| | | | | | 1,092,059 | | |
Utilities (2.3%) | |
Electric Utilities (1.1%) | |
Ameren Illinois Co.,
3.700%, 12/01/47 | | | 1,000,000 | | | | 1,226,068 | | |
Arizona Public Service Co.,
4.350%, 11/15/45 | | | 1,000,000 | | | | 1,288,859 | | |
| | | Principal | | Value(a) | |
Duke Energy Progress LLC,
3.600%, 09/15/47 | | $ | 1,000,000 | | | $ | 1,211,649 | | |
Entergy Louisiana LLC,
3.300%, 12/01/22 | | | 250,000 | | | | 262,075 | | |
Northern States Power
Co., 3.750%, 12/01/47 | | | 1,000,000 | | | | 1,212,974 | | |
Oglethorpe Power Corp.,
4.250%, 04/01/46 | | | 800,000 | | | | 849,859 | | |
Oklahoma Gas & Electric
Co., 4.150%, 04/01/47 | | | 1,000,000 | | | | 1,232,584 | | |
PPL Capital Funding, Inc.,
3.400%, 06/01/23 | | | 250,000 | | | | 265,498 | | |
| | | | | | 7,549,566 | | |
Electric — Integrated (0.0%) | |
Berkshire Hathaway
Energy Co., 3.750%,
11/15/23 | | | 250,000 | | | | 272,224 | | |
Gas Utilities (0.7%) | |
National Fuel Gas Co.,
4.750%, 09/01/28 | | | 1,000,000 | | | | 1,073,509 | | |
ONEOK, Inc. | |
4.000%, 07/13/27 | | | 500,000 | | | | 557,522 | | |
4.350%, 03/15/29 | | | 1,500,000 | | | | 1,701,148 | | |
Washington Gas Light Co.,
3.796%, 09/15/46 | | | 1,000,000 | | | | 1,192,578 | | |
| | | | | | 4,524,757 | | |
Multi-Utilities (0.2%) | |
Dominion Energy Gas
Holdings LLC, 3.550%,
11/01/23 | | | 250,000 | | | | 269,370 | | |
National Fuel Gas Co.,
5.200%, 07/15/25 | | | 1,000,000 | | | | 1,122,038 | | |
| | | | | | 1,391,408 | | |
Water Utilities (0.3%) | |
American Water Capital
Corp., 3.750%, 09/01/47 | | | 1,000,000 | | | | 1,224,800 | | |
Aquarion Co., 4.000%,
08/15/24 (d) | | | 500,000 | | | | 546,581 | | |
| | | | | | 1,771,381 | | |
Total corporate obligations
(cost: $148,358,495) | | | | | 170,156,317 | | |
Total long-term debt securities
(cost: $165,921,594) | | | | | 188,365,839 | | |
Mutual Funds (36.9%) | |
Investment Companies (36.9%) | |
iShares iBoxx $
Investment Grade
Corporate Bond ETF | | | 44,500 | | | | 6,146,785 | | |
SFT Index 500 Fund (f) | | | 14,224,618 | | | | 223,777,991 | | |
SPDR S&P 500 ETF
Trust (b) | | | 36,170 | | | | 13,523,240 | | |
Vanguard S&P 500 ETF | | | 20,175 | | | | 6,933,946 | | |
Total mutual funds
(cost: $123,653,387) | | | | | 250,381,962 | | |
See accompanying notes to financial statements.
65
SFT Dynamic Managed Volatility Fund
Investments in Securities – continued
| | | Principal | | Value(a) | |
Short-Term Securities (32.8%) | |
Investment Companies (32.8%) | |
State Street Institutional
U.S. Government Money
Market Fund, current
rate 0.030% | | $ | 222,112,587 | | | $ | 222,112,587 | | |
Total short-term securities
(cost: $222,112,587) | | | | | 222,112,587 | | |
Total investments excluding
purchased options (97.4%)
(cost: $511,687,568) | | | | | 660,860,388 | | |
Total purchased options
outstanding (0.1%)
(cost: $379,942) | | | | | 338,818 | | |
Total investments in securities
(cost: $512,067,510) (g) | | | | | 661,199,206 | | |
Cash and other assets in
excess of liabilities (2.5%) | | | | | 16,988,730 | | |
Total net assets (100.0%) | | | | $ | 678,187,936 | | |
Investments in Securities Legend
(a) Securities are valued by procedures described in Note 2 of the Notes to Financial Statements.
(b) Fully or partially pledged as initial margin deposits on open futures contracts.
Holdings of Open Futures Contracts
On December 31, 2020, securities with an aggregate market value of $30,778,213 have been pledged to cover margin requirements for the following open futures contracts:
Description | | Expiration
Date | | Number of
Contracts | | Position
Type | | Notional
Amount | | Market
Value | | Unrealized
Appreciation/
(Depreciation)(a) | |
S&P 500 E-Mini Index Future | | March 2021 | | | 746 | | | Long | | $ | 138,032,875 | | | $ | 139,830,240 | | | $ | 1,797,365 | | |
(c) Foreign security: The Fund held 1.1% of net assets in foreign securities at December 31, 2020.
(d) Security sold within terms of a private placement memorandum exempt from registration pursuant to Rule 144A under the Securities Act of 1933, as amended, and may be sold only to dealers in that program. This security has been determined to be liquid unless otherwise indicated.
(e) Variable rate security.
(f) Affiliated security.
(g) At December 31, 2020 the cost of investments for federal income tax purposes was $513,839,554. The aggregate unrealized appreciation and depreciation of investments based on this cost were:
Gross unrealized appreciation | | $ | 149,225,120 | | |
Gross unrealized depreciation | | | (77,908 | ) | |
Net unrealized appreciation | | $ | 149,147,212 | | |
See accompanying notes to financial statements.
66
SFT Dynamic Managed Volatility Fund
Investments in Securities – continued
Put Options Purchased:
The Fund had the following put options purchased open at December 31, 2020:
Description | | Exercise Price | | Expiration Date | | Number of Contracts | | Notional Amount | | Value(a) | |
CBOE Volatility Index | | $ | 21 | | | January 2021 | | | 2,018 | | | $ | 201,800 | | | $ | 203,818 | | |
CBOE Volatility Index | | | 20 | | | January 2021 | | | 2,250 | | | | 225,000 | | | | 135,000 | | |
| | | | | | | | | | | $ | 338,818 | | |
Put Options Written:
The Fund had the following put options written open at December 31, 2020:
Description | | Exercise Price | | Expiration Date | | Number of Contracts | | Notional Amount | | Value(a) | |
CBOE Volatility Index | | $ | 11 | | | January 2021 | | | 1,961 | | | $ | 196,100 | | | $ | (9,805 | ) | |
See accompanying notes to financial statements.
67
SFT Government Money Market Fund
Investments in Securities
(Percentages of each investment category relate to total net assets)
| | | Principal | | Value(a) | |
Short-Term Securities (100.3%) | |
U.S. Government Obligations (91.9%) | |
Discount Notes (91.9%) | |
Federal Home Loan Bank (91.9%)
0.060%, 01/11/21 (b) | | $ | 15,000,000 | | | $ | 14,999,729 | | |
0.061%, 01/14/21 (b) | | | 20,000,000 | | | | 19,999,531 | | |
0.073%, 01/27/21 (b) | | | 25,000,000 | | | | 24,998,646 | | |
0.079%, 02/11/21 (b) | | | 15,000,000 | | | | 14,998,633 | | |
0.079%, 02/17/21 (b) | | | 15,000,000 | | | | 14,998,433 | | |
0.080%, 03/10/21 (b) | | | 1,400,000 | | | | 1,399,788 | | |
0.085%, 02/24/21 (b) | | | 15,000,000 | | | | 14,998,088 | | |
0.088%, 01/27/21 (b) | | | 5,000,000 | | | | 4,999,675 | | |
0.090%, 04/23/21 (b) | | | 3,000,000 | | | | 2,999,160 | | |
0.091%, 01/15/21 (b) | | | 6,500,000 | | | | 6,499,757 | | |
0.091%, 05/19/21 (b) | | | 10,000,000 | | | | 9,996,550 | | |
U.S. Treasury Bill | |
0.063%, 02/25/21 | | | 30,000,000 | | | | 29,997,113 | | |
0.079%, 02/04/21 | | | 10,000,000 | | | | 9,999,244 | | |
0.094%, 01/14/21 | | | 10,000,000 | | | | 9,999,640 | | |
Total U.S. government obligations | | | | | 180,883,987 | | |
| | | Shares | | Value(a) | |
Investment Companies (8.4%) | |
State Street Institutional
U.S. Government Money
Market Fund, current
rate 0.030% | | | 16,559,064 | | | $ | 16,559,064 | | |
Total short-term securities
(cost: $197,443,051) | | | | | 197,443,051 | | |
Total investments in securities
(cost: $197,443,051) (c) | | | | | 197,443,051 | | |
Liabilities in excess of cash
and other assets (-0.3%) | | | | | (566,063 | ) | |
Total net assets (100.0%) | | | | $ | 196,876,988 | | |
Investments in Securities Legend
(a) Securities are valued by procedures described in Note 2 of the Notes to Financial Statements.
(b) Rate represents annualized yield at date of purchase.
(c) Also represents the cost of securities for federal income tax purposes at December 31, 2020.
See accompanying notes to financial statements.
68
SFT Index 400 Mid-Cap Fund
Investments in Securities
(Percentages of each investment category relate to total net assets)
| | | Shares | | Value(a) | |
Common Stocks (95.5%) | |
Communication Services (0.1%) | |
Wireless Telecommunication Services (0.1%) | |
Telephone & Data
Systems, Inc. | | | 9,437 | | | $ | 175,245 | | |
Consumer Discretionary (15.0%) | |
Auto Components (1.6%) | |
Adient PLC (b) (c) | | | 8,900 | | | | 309,453 | | |
Dana, Inc. | | | 13,696 | | | | 267,346 | | |
Fox Factory Holding
Corp. (b) | | | 3,924 | | | | 414,806 | | |
Gentex Corp. | | | 23,230 | | | | 788,194 | | |
Lear Corp. | | | 5,179 | | | | 823,616 | | |
The Goodyear Tire &
Rubber Co. | | | 22,099 | | | | 241,100 | | |
Visteon Corp. (b) | | | 2,600 | | | | 326,352 | | |
| | | | | | 3,170,867 | | |
Automobiles (0.5%) | |
Harley-Davidson, Inc. | | | 14,530 | | | | 533,251 | | |
Thor Industries, Inc. | | | 5,248 | | | | 488,011 | | |
| | | | | | 1,021,262 | | |
Diversified Consumer Services (1.1%) | |
Adtalem Global
Education, Inc. (b) | | | 4,937 | | | | 167,611 | | |
Graham Holdings Co. –
Class B | | | 358 | | | | 190,950 | | |
Grand Canyon
Education, Inc. (b) | | | 4,441 | | | | 413,502 | | |
H&R Block, Inc. | | | 17,387 | | | | 275,758 | | |
Service Corp.
International/US | | | 16,375 | | | | 804,012 | | |
Strategic Education, Inc. | | | 2,270 | | | | 216,399 | | |
WW International, Inc. (b) | | | 4,453 | | | | 108,653 | | |
| | | | | | 2,176,885 | | |
Hotels, Restaurants & Leisure (3.8%) | |
Boyd Gaming Corp. | | | 7,612 | | | | 326,707 | | |
Caesars Entertainment,
Inc. (b) | | | 19,743 | | | | 1,466,313 | | |
Choice Hotels
International, Inc. | | | 2,695 | | | | 287,637 | | |
Churchill Downs, Inc. | | | 3,347 | | | | 651,962 | | |
Cracker Barrel Old
Country Store, Inc. | | | 2,194 | | | | 289,432 | | |
Jack in the Box, Inc. | | | 2,096 | | | | 194,509 | | |
Marriott Vacations
Worldwide Corp. | | | 3,887 | | | | 533,374 | | |
Papa John's
International, Inc. | | | 3,086 | | | | 261,847 | | |
Penn National Gaming,
Inc. (b) | | | 13,977 | | | | 1,207,193 | | |
Scientific Games Corp. –
Class A (b) | | | 5,304 | | | | 220,063 | | |
Six Flags Entertainment
Corp. | | | 7,169 | | | | 244,463 | | |
Texas Roadhouse, Inc. | | | 6,191 | | | | 483,889 | | |
The Wendy's Co. | | | 16,993 | | | | 372,487 | | |
Wingstop, Inc. | | | 2,774 | | | | 367,694 | | |
| | | Shares | | Value(a) | |
Wyndham
Destinations, Inc. | | | 8,139 | | | $ | 365,115 | | |
Wyndham Hotels &
Resorts, Inc. | | | 8,831 | | | | 524,915 | | |
| | | | | | 7,797,600 | | |
Household Durables (1.4%) | |
Helen of Troy, Ltd. (b) (c) | | | 2,359 | | | | 524,146 | | |
KB Home | | | 8,349 | | | | 279,858 | | |
Taylor Morrison Home Corp. (b) | | | 12,317 | | | | 315,931 | | |
Tempur Sealy
International, Inc. (b) | | | 18,191 | | | | 491,157 | | |
Toll Brothers, Inc. | | | 10,884 | | | | 473,128 | | |
TopBuild Corp. (b) | | | 3,113 | | | | 573,041 | | |
TRI Pointe Group, Inc. (b) | | | 12,022 | | | | 207,380 | | |
| | | | | | 2,864,641 | | |
Internet & Catalog Retail (0.5%) | |
GrubHub, Inc. (b) | | | 8,792 | | | | 652,982 | | |
TripAdvisor, Inc. (b) | | | 9,115 | | | | 262,330 | | |
| | | | | | 915,312 | | |
Leisure Equipment & Products (0.8%) | |
Brunswick Corp. | | | 7,426 | | | | 566,158 | | |
Mattel, Inc. (b) | | | 32,992 | | | | 575,711 | | |
Polaris, Inc. | | | 5,497 | | | | 523,754 | | |
| | | | | | 1,665,623 | | |
Media (1.3%) | |
Cable One, Inc. | | | 518 | | | | 1,153,959 | | |
Cinemark Holdings, Inc. | | | 10,192 | | | | 177,443 | | |
John Wiley & Sons, Inc. –
Class A | | | 4,136 | | | | 188,850 | | |
TEGNA, Inc. | | | 20,782 | | | | 289,909 | | |
The New York Times Co. –
Class A | | | 13,726 | | | | 710,595 | | |
World Wrestling
Entertainment, Inc. –
Class A | | | 4,426 | | | | 212,669 | | |
| | | | | | 2,733,425 | | |
Multiline Retail (0.7%) | |
Kohl's Corp. | | | 14,944 | | | | 608,071 | | |
Nordstrom, Inc. | | | 10,313 | | | | 321,869 | | |
Ollie's Bargain Outlet
Holdings, Inc. (b) | | | 5,391 | | | | 440,822 | | |
| | | | | | 1,370,762 | | |
Specialty Retail (2.4%) | |
American Eagle
Outfitters, Inc. | | | 14,178 | | | | 284,552 | | |
AutoNation, Inc. (b) | | | 5,574 | | | | 389,010 | | |
Dick's Sporting Goods, Inc. | | | 6,226 | | | | 349,963 | | |
Five Below, Inc. (b) | | | 5,296 | | | | 926,694 | | |
Foot Locker, Inc. | | | 9,895 | | | | 400,154 | | |
Lithia Motors, Inc. Class A | | | 2,490 | | | | 728,748 | | |
Murphy USA, Inc. | | | 2,518 | | | | 329,531 | | |
RH (b) | | | 1,499 | | | | 670,833 | | |
Urban Outfitters, Inc. (b) | | | 6,488 | | | | 166,093 | | |
Williams-Sonoma, Inc. | | | 7,260 | | | | 739,358 | | |
| | | | | | 4,984,936 | | |
See accompanying notes to financial statements.
69
SFT Index 400 Mid-Cap Fund
Investments in Securities – continued
| | | Shares | | Value(a) | |
Textiles, Apparel & Luxury Goods (0.9%) | |
Carter's, Inc. | | | 4,137 | | | $ | 389,168 | | |
Columbia Sportswear Co. | | | 2,879 | | | | 251,567 | | |
Deckers Outdoor Corp. (b) | | | 2,721 | | | | 780,328 | | |
Skechers U.S.A., Inc. –
Class A (b) | | | 12,852 | | | | 461,901 | | |
| | | | | | 1,882,964 | | |
Consumer Staples (2.7%) | |
Beverages (0.4%) | |
The Boston Beer Co.,
Inc. – Class A (b) | | | 885 | | | | 879,947 | | |
Food & Staples Retailing (0.6%) | |
Casey's General Stores, Inc. | | | 3,484 | | | | 622,312 | | |
Grocery Outlet Holding
Corp. (b) | | | 8,095 | | | | 317,729 | | |
Sprouts Farmers Market,
Inc. (b) | | | 11,181 | | | | 224,738 | | |
| | | | | | 1,164,779 | | |
Food Products (1.3%) | |
Flowers Foods, Inc. | | | 18,654 | | | | 422,140 | | |
Ingredion, Inc. | | | 6,350 | | | | 499,555 | | |
Lancaster Colony Corp. | | | 1,798 | | | | 330,347 | | |
Post Holdings, Inc. (b) | | | 5,807 | | | | 586,565 | | |
Sanderson Farms, Inc. | | | 1,818 | | | | 240,340 | | |
The Hain Celestial Group,
Inc. (b) | | | 7,822 | | | | 314,053 | | |
Tootsie Roll Industries, Inc. | | | 1,599 | | | | 47,490 | | |
TreeHouse Foods, Inc. (b) | | | 5,356 | | | | 227,576 | | |
| | | | | | 2,668,066 | | |
Household Products (0.1%) | |
Energizer Holdings, Inc. | | | 5,520 | | | | 232,833 | | |
Personal Products (0.3%) | |
Coty, Inc. – Class A | | | 26,863 | | | | 188,578 | | |
Edgewell Personal Care Co. | | | 5,152 | | | | 178,156 | | |
Nu Skin Enterprises, Inc. –
Class A | | | 4,837 | | | | 264,246 | | |
| | | | | | 630,980 | | |
Consumer, Non-cyclical (0.3%) | |
IT Services (0.3%) | |
CoreLogic, Inc. | | | 7,373 | | | | 570,080 | | |
Energy (1.2%) | |
Energy Equipment & Services (0.1%) | |
ChampionX Corp. (b) | | | 17,617 | | | | 269,540 | | |
Oil, Gas & Consumable Fuels (1.1%) | |
Antero Midstream Corp. | | | 27,109 | | | | 209,010 | | |
Cimarex Energy Co. | | | 9,665 | | | | 362,534 | | |
CNX Resources Corp. (b) | | | 21,284 | | | | 229,867 | | |
EQT Corp. | | | 26,125 | | | | 332,049 | | |
Equitrans Midstream Corp. | | | 38,536 | | | | 309,829 | | |
Murphy Oil Corp. | | | 13,686 | | | | 165,601 | | |
World Fuel Services Corp. | | | 6,019 | | | | 187,552 | | |
WPX Energy, Inc. (b) | | | 38,292 | | | | 312,080 | | |
| | | | | | 2,108,522 | | |
| | | Shares | | Value(a) | |
Financial (14.5%) | |
Capital Markets (2.5%) | |
Affiliated Managers
Group, Inc. | | | 4,299 | | | $ | 437,208 | | |
Eaton Vance Corp. | | | 10,825 | | | | 735,342 | | |
Evercore, Inc. – Class A | | | 3,812 | | | | 417,948 | | |
Factset Research
Systems, Inc. | | | 3,590 | | | | 1,193,675 | | |
Federated Hermes,
Inc. – Class B | | | 8,947 | | | | 258,479 | | |
Interactive Brokers Group,
Inc. – Class A | | | 7,562 | | | | 460,677 | | |
Janus Henderson Group
PLC (c) | | | 14,101 | | | | 458,424 | | |
SEI Investments Co. | | | 11,374 | | | | 653,664 | | |
Stifel Financial Corp. | | | 9,764 | | | | 492,691 | | |
| | | | | | 5,108,108 | | |
Commercial Banks (6.0%) | |
Associated Banc-Corp. | | | 14,559 | | | | 248,231 | | |
BancorpSouth Bank | | | 9,140 | | | | 250,802 | | |
Bank of Hawaii Corp. | | | 3,789 | | | | 290,313 | | |
Bank OZK | | | 11,459 | | | | 358,323 | | |
Cathay General Bancorp | | | 7,098 | | | | 228,485 | | |
CIT Group, Inc. | | | 9,339 | | | | 335,270 | | |
Commerce
Bancshares, Inc. | | | 9,992 | | | | 656,474 | | |
Cullen/Frost Bankers, Inc. | | | 5,302 | | | | 462,493 | | |
East West Bancorp, Inc. | | | 13,419 | | | | 680,477 | | |
First Financial
Bankshares, Inc. | | | 13,471 | | | | 487,313 | | |
First Horizon Corp. | | | 52,591 | | | | 671,061 | | |
FNB Corp. | | | 30,584 | | | | 290,548 | | |
Fulton Financial Corp. | | | 15,380 | | | | 195,634 | | |
Glacier Bancorp, Inc. | | | 9,044 | | | | 416,114 | | |
Hancock Whitney Corp. | | | 8,191 | | | | 278,658 | | |
Home BancShares, Inc. | | | 14,404 | | | | 280,590 | | |
International
Bancshares Corp. | | | 5,278 | | | | 197,608 | | |
PacWest Bancorp | | | 11,070 | | | | 281,178 | | |
Pinnacle Financial
Partners, Inc. | | | 7,190 | | | | 463,036 | | |
Prosperity Bancshares, Inc. | | | 8,774 | | | | 608,565 | | |
Signature Bank | | | 5,078 | | | | 687,003 | | |
Sterling Bancorp | | | 18,424 | | | | 331,264 | | |
Synovus Financial Corp. | | | 14,011 | | | | 453,536 | | |
TCF Financial Corp. | | | 14,454 | | | | 535,087 | | |
Texas Capital
Bancshares, Inc. (b) | | | 4,783 | | | | 284,588 | | |
Trustmark Corp. | | | 6,012 | | | | 164,188 | | |
UMB Financial Corp. | | | 4,079 | | | | 281,410 | | |
Umpqua Holdings Corp. | | | 20,876 | | | | 316,063 | | |
United Bankshares, Inc. | | | 12,300 | | | | 398,520 | | |
Valley National Bancorp | | | 38,285 | | | | 373,279 | | |
Webster Financial Corp. | | | 8,550 | | | | 360,382 | | |
Wintrust Financial Corp. | | | 5,463 | | | | 333,735 | | |
| | | | | | 12,200,228 | | |
Consumer Finance (0.6%) | |
FirstCash, Inc. | | | 3,924 | | | | 274,837 | | |
Navient Corp. | | | 17,658 | | | | 173,402 | | |
PROG Holdings, Inc. | | | 6,404 | | | | 344,983 | | |
SLM Corp. | | | 35,570 | | | | 440,712 | | |
| | | | | | 1,233,934 | | |
See accompanying notes to financial statements.
70
SFT Index 400 Mid-Cap Fund
Investments in Securities – continued
| | | Shares | | Value(a) | |
Diversified Financial Services (0.2%) | |
Jefferies Financial
Group, Inc. | | | 19,613 | | | $ | 482,480 | | |
Diversified REITs (0.1%) | |
PS Business Parks, Inc. | | | 1,877 | | | | 249,397 | | |
Insurance (4.2%) | |
Alleghany Corp. | | | 1,382 | | | | 834,300 | | |
American Financial
Group, Inc. | | | 6,668 | | | | 584,250 | | |
Brighthouse Financial,
Inc. (b) | | | 8,484 | | | | 307,163 | | |
Brown & Brown, Inc. | | | 22,349 | | | | 1,059,566 | | |
CNO Financial Group, Inc. | | | 13,175 | | | | 292,880 | | |
First American Financial
Corp. | | | 10,583 | | | | 546,400 | | |
Genworth Financial, Inc. –
Class A (b) | | | 47,967 | | | | 181,315 | | |
Kemper Corp. | | | 5,828 | | | | 447,765 | | |
Kinsale Capital Group, Inc. | | | 2,020 | | | | 404,263 | | |
Mercury General Corp. | | | 2,480 | | | | 129,481 | | |
Old Republic International
Corp. | | | 26,805 | | | | 528,327 | | |
Primerica, Inc. | | | 3,725 | | | | 498,889 | | |
Reinsurance Group of
America, Inc. | | | 6,440 | | | | 746,396 | | |
RenaissanceRe Holdings,
Ltd. (c) | | | 4,816 | | | | 798,589 | | |
RLI Corp. | | | 3,741 | | | | 389,625 | | |
Selective Insurance
Group, Inc. | | | 5,672 | | | | 379,911 | | |
The Hanover Insurance
Group, Inc. | | | 3,531 | | | | 412,845 | | |
| | | | | | 8,541,965 | | |
Thrifts & Mortgage Finance (0.9%) | |
Essent Group, Ltd. (c) | | | 10,657 | | | | 460,382 | | |
LendingTree, Inc. (b) | | | 1,050 | | | | 287,480 | | |
MGIC Investment Corp. | | | 32,095 | | | | 402,792 | | |
New York Community
Bancorp, Inc. | | | 43,975 | | | | 463,936 | | |
Washington Federal, Inc. | | | 7,186 | | | | 184,968 | | |
| | | | | | 1,799,558 | | |
Health Care (10.6%) | |
Biotechnology (1.9%) | |
Arrowhead
Pharmaceuticals, Inc. (b) | | | 9,740 | | | | 747,350 | | |
Emergent BioSolutions,
Inc. (b) | | | 4,268 | | | | 382,413 | | |
Exelixis, Inc. (b) | | | 29,409 | | | | 590,239 | | |
Halozyme Therapeutics,
Inc. (b) | | | 12,045 | | | | 514,442 | | |
Ligand Pharmaceuticals,
Inc. (b) | | | 1,503 | | | | 149,473 | | |
Repligen Corp. (b) | | | 4,711 | | | | 902,769 | | |
United Therapeutics
Corp. (b) | | | 4,212 | | | | 639,339 | | |
| | | | | | 3,926,025 | | |
Health Care Equipment & Supplies (3.2%) | |
Avanos Medical, Inc. (b) | | | 4,534 | | | | 208,020 | | |
Cantel Medical Corp. | | | 3,513 | | | | 277,035 | | |
| | | Shares | | Value(a) | |
Globus Medical, Inc. –
Class A (b) | | | 7,215 | | | $ | 470,562 | | |
Haemonetics Corp. (b) | | | 4,813 | | | | 571,544 | | |
Hill-Rom Holdings, Inc. | | | 6,333 | | | | 620,444 | | |
ICU Medical, Inc. (b) | | | 1,891 | | | | 405,601 | | |
Integra LifeSciences
Holdings Corp. (b) | | | 6,710 | | | | 435,613 | | |
LivaNova PLC (b) (c) | | | 4,606 | | | | 304,963 | | |
Masimo Corp. (b) | | | 4,801 | | | | 1,288,492 | | |
Neogen Corp. (b) | | | 5,028 | | | | 398,721 | | |
NuVasive, Inc. (b) | | | 4,861 | | | | 273,820 | | |
Penumbra, Inc. (b) | | | 3,220 | | | | 563,500 | | |
Quidel Corp. (b) | | | 3,607 | | | | 647,998 | | |
| | | | | | 6,466,313 | | |
Health Care Providers & Services (2.9%) | |
Acadia Healthcare Co.,
Inc. (b) | | | 8,435 | | | | 423,943 | | |
Amedisys, Inc. (b) | | | 3,138 | | | | 920,470 | | |
Chemed Corp. | | | 1,546 | | | | 823,415 | | |
Encompass Health Corp. | | | 9,425 | | | | 779,353 | | |
HealthEquity, Inc. (b) | | | 7,286 | | | | 507,907 | | |
LHC Group, Inc. (b) | | | 2,995 | | | | 638,893 | | |
Molina Healthcare, Inc. (b) | | | 5,621 | | | | 1,195,474 | | |
Patterson Cos., Inc. | | | 8,233 | | | | 243,944 | | |
Tenet Healthcare Corp. (b) | | | 10,002 | | | | 399,380 | | |
| | | | | | 5,932,779 | | |
Life Sciences Tools & Services (1.9%) | |
Bio-Techne Corp. | | | 3,644 | | | | 1,157,152 | | |
Charles River Laboratories
International, Inc. (b) | | | 4,715 | | | | 1,178,090 | | |
Medpace Holdings, Inc. (b) | | | 2,547 | | | | 354,542 | | |
PRA Health Sciences,
Inc. (b) | | | 6,081 | | | | 762,801 | | |
Syneos Health, Inc. (b) | | | 7,196 | | | | 490,264 | | |
| | | | | | 3,942,849 | | |
Pharmaceuticals (0.7%) | |
Jazz Pharmaceuticals
PLC (b) (c) | | | 5,281 | | | | 871,629 | | |
Nektar Therapeutics (b) | | | 17,006 | | | | 289,102 | | |
Prestige Consumer
Healthcare, Inc. (b) | | | 4,749 | | | | 165,598 | | |
| | | | | | 1,326,329 | | |
Industrials (16.9%) | |
Aerospace & Defense (1.0%) | |
Axon Enterprise, Inc. (b) | | | 6,024 | | | | 738,121 | | |
Curtiss-Wright Corp. | | | 3,934 | | | | 457,721 | | |
Hexcel Corp. | | | 7,918 | | | | 383,944 | | |
Mercury Systems, Inc. (b) | | | 5,308 | | | | 467,422 | | |
| | | | | | 2,047,208 | | |
Air Freight & Logistics (0.5%) | |
XPO Logistics, Inc. (b) | | | 8,665 | | | | 1,032,868 | | |
Airlines (0.2%) | |
JetBlue Airways Corp. (b) | | | 29,809 | | | | 433,423 | | |
Building Products (1.8%) | |
Builders FirstSource,
Inc. (b) | | | 19,446 | | | | 793,591 | | |
See accompanying notes to financial statements.
71
SFT Index 400 Mid-Cap Fund
Investments in Securities – continued
| | | Shares | | Value(a) | |
Lennox International, Inc. | | | 3,281 | | | $ | 898,896 | | |
Owens Corning | | | 10,259 | | | | 777,222 | | |
Simpson Manufacturing
Co., Inc. | | | 4,110 | | | | 384,079 | | |
Trex Co., Inc. (b) | | | 10,976 | | | | 918,911 | | |
| | | | | | 3,772,699 | | |
Commercial Services & Supplies (2.0%) | |
Clean Harbors, Inc. (b) | | | 4,818 | | | | 366,650 | | |
Healthcare Services
Group, Inc. | | | 7,055 | | | | 198,245 | | |
Herman Miller, Inc. | | | 5,583 | | | | 188,705 | | |
HNI Corp. | | | 4,044 | | | | 139,356 | | |
IAA, Inc. (b) | | | 12,746 | | | | 828,235 | | |
KAR Auction Services, Inc. | | | 12,252 | | | | 228,010 | | |
MSA Safety, Inc. | | | 3,395 | | | | 507,179 | | |
Stericycle, Inc. (b) | | | 8,678 | | | | 601,646 | | |
Tetra Tech, Inc. | | | 5,097 | | | | 590,131 | | |
The Brink's Co. | | | 4,685 | | | | 337,320 | | |
| | | | | | 3,985,477 | | |
Construction & Engineering (1.3%) | |
AECOM (b) | | | 14,291 | | | | 711,406 | | |
Dycom Industries, Inc. (b) | | | 2,967 | | | | 224,068 | | |
EMCOR Group, Inc. | | | 5,207 | | | | 476,232 | | |
Fluor Corp. | | | 11,863 | | | | 189,452 | | |
KBR, Inc. | | | 13,510 | | | | 417,864 | | |
MasTec, Inc. (b) | | | 5,321 | | | | 362,786 | | |
Valmont Industries, Inc. | | | 2,044 | | | | 357,557 | | |
| | | | | | 2,739,365 | | |
Electrical Equipment (2.8%) | |
Acuity Brands, Inc. | | | 3,491 | | | | 422,725 | | |
Belden, Inc. | | | 4,223 | | | | 176,944 | | |
EnerSys | | | 4,007 | | | | 332,822 | | |
Generac Holdings, Inc. (b) | | | 5,957 | | | | 1,354,681 | | |
Hubbell, Inc. | | | 5,141 | | | | 806,057 | | |
nVent Electric PLC (c) | | | 16,126 | | | | 375,575 | | |
Regal Beloit Corp. | | | 3,840 | | | | 471,590 | | |
Sunrun, Inc. (b) | | | 14,792 | | | | 1,026,269 | | |
Woodward, Inc. | | | 5,534 | | | | 672,547 | | |
| | | | | | 5,639,210 | | |
Industrial Conglomerates (0.4%) | |
Carlisle Cos., Inc. | | | 5,060 | | | | 790,271 | | |
Machinery (4.4%) | |
AGCO Corp. | | | 5,822 | | | | 600,190 | | |
Colfax Corp. (b) | | | 9,544 | | | | 364,963 | | |
Crane Co. | | | 4,682 | | | | 363,604 | | |
Donaldson Co., Inc. | | | 11,966 | | | | 668,660 | | |
Graco, Inc. | | | 15,882 | | | | 1,149,063 | | |
ITT, Inc. | | | 8,190 | | | | 630,794 | | |
Kennametal, Inc. | | | 7,894 | | | | 286,079 | | |
Lincoln Electric
Holdings, Inc. | | | 5,637 | | | | 655,301 | | |
Nordson Corp. | | | 5,099 | | | | 1,024,644 | | |
Oshkosh Corp. | | | 6,464 | | | | 556,356 | | |
Terex Corp. | | | 6,569 | | | | 229,192 | | |
The Middleby Corp. (b) | | | 5,271 | | | | 679,537 | | |
The Timken Co. | | | 6,429 | | | | 497,347 | | |
The Toro Co. | | | 10,171 | | | | 964,618 | | |
Trinity Industries, Inc. | | | 8,008 | | | | 211,331 | | |
| | | | | | 8,881,679 | | |
| | | Shares | | Value(a) | |
Marine (0.1%) | |
Kirby Corp. (b) | | | 5,691 | | | $ | 294,965 | | |
Professional Services (0.8%) | |
ASGN, Inc. (b) | | | 4,998 | | | | 417,483 | | |
FTI Consulting, Inc. (b) | | | 3,380 | | | | 377,614 | | |
Insperity, Inc. | | | 3,381 | | | | 275,281 | | |
Manpowergroup, Inc. | | | 5,453 | | | | 491,751 | | |
| | | | | | 1,562,129 | | |
Road & Rail (0.8%) | |
Avis Budget Group,
Inc. (b) | | | 4,888 | | | | 182,322 | | |
Knight-Swift
Transportation
Holdings, Inc. | | | 11,913 | | | | 498,202 | | |
Landstar System, Inc. | | | 3,627 | | | | 488,412 | | |
Ryder System, Inc. | | | 5,108 | | | | 315,470 | | |
Werner Enterprises, Inc. | | | 5,502 | | | | 215,788 | | |
| | | | | | 1,700,194 | | |
Trading Companies & Distributors (0.8%) | |
GATX Corp. | | | 3,299 | | | | 274,411 | | |
MSC Industrial Direct Co.,
Inc. – Class A | | | 4,321 | | | | 364,649 | | |
Univar Solutions, Inc. (b) | | | 16,029 | | | | 304,711 | | |
Watsco, Inc. | | | 3,083 | | | | 698,454 | | |
| | | | | | 1,642,225 | | |
Information Technology (16.4%) | |
Communications Equipment (1.0%) | |
Ciena Corp. (b) | | | 14,628 | | | | 773,090 | | |
InterDigital, Inc. | | | 2,829 | | | | 171,664 | | |
Lumentum Holdings,
Inc. (b) | | | 7,157 | | | | 678,483 | | |
NetScout Systems, Inc. (b) | | | 6,936 | | | | 190,185 | | |
ViaSat, Inc. (b) | | | 6,081 | | | | 198,545 | | |
| | | | | | 2,011,967 | | |
Computers & Peripherals (0.2%) | |
NCR Corp. (b) | | | 12,219 | | | | 459,068 | | |
Electronic Equipment, Instruments &
Components (3.6%) | |
Arrow Electronics, Inc. (b) | | | 7,161 | | | | 696,765 | | |
Avnet, Inc. | | | 9,368 | | | | 328,910 | | |
Cognex Corp. | | | 16,554 | | | | 1,329,038 | | |
Coherent, Inc. (b) | | | 2,255 | | | | 338,295 | | |
II-VI, Inc. (b) | | | 9,832 | | | | 746,839 | | |
Jabil, Inc. | | | 12,758 | | | | 542,598 | | |
Littelfuse, Inc. | | | 2,350 | | | | 598,451 | | |
National Instruments Corp. | | | 12,441 | | | | 546,658 | | |
SYNNEX Corp. | | | 3,901 | | | | 317,697 | | |
Trimble, Inc. (b) | | | 23,715 | | | | 1,583,451 | | |
Vishay Intertechnology,
Inc. | | | 12,566 | | | | 260,242 | | |
| | | | | | 7,288,944 | | |
Interactive Media & Services (0.3%) | |
j2 Global, Inc. (b) | | | 4,062 | | | | 396,817 | | |
Yelp, Inc. (b) | | | 6,576 | | | | 214,838 | | |
| | | | | | 611,655 | | |
See accompanying notes to financial statements.
72
SFT Index 400 Mid-Cap Fund
Investments in Securities – continued
| | | Shares | | Value(a) | |
IT Services (2.2%) | |
Alliance Data Systems
Corp. | | | 4,523 | | | $ | 335,154 | | |
CACI International, Inc. –
Class A (b) | | | 2,437 | | | | 607,617 | | |
Concentrix Corp. (b) | | | 3,901 | | | | 385,029 | | |
LiveRamp Holdings,
Inc. (b) | | | 6,286 | | | | 460,072 | | |
MAXIMUS, Inc. | | | 5,825 | | | | 426,332 | | |
Perspecta, Inc. | | | 12,969 | | | | 312,294 | | |
Sabre Corp. | | | 30,075 | | | | 361,501 | | |
Science Applications
International Corp. | | | 5,519 | | | | 522,318 | | |
Teradata Corp. (b) | | | 10,361 | | | | 232,812 | | |
WEX, Inc. (b) | | | 4,182 | | | | 851,162 | | |
| | | | | | 4,494,291 | | |
Semiconductors & Semiconductor Equipment (5.3%) | |
Cirrus Logic, Inc. (b) | | | 5,494 | | | | 451,607 | | |
CMC Materials, Inc. | | | 2,688 | | | | 406,694 | | |
Cree, Inc. (b) | | | 10,459 | | | | 1,107,608 | | |
Enphase Energy, Inc. (b) | | | 11,975 | | | | 2,101,253 | | |
First Solar, Inc. (b) | | | 8,036 | | | | 794,921 | | |
MKS Instruments, Inc. | | | 5,226 | | | | 786,252 | | |
Monolithic Power
Systems, Inc. | | | 4,000 | | | | 1,464,920 | | |
Semtech Corp. (b) | | | 6,161 | | | | 444,146 | | |
Silicon Laboratories,
Inc. (b) | | | 4,153 | | | | 528,843 | | |
SolarEdge Technologies,
Inc. (b) | | | 4,867 | | | | 1,553,157 | | |
Synaptics, Inc. (b) | | | 3,214 | | | | 309,830 | | |
Universal Display Corp. | | | 4,062 | | | | 933,448 | | |
| | | | | | 10,882,679 | | |
Software (3.8%) | |
ACI Worldwide, Inc. (b) | | | 11,068 | | | | 425,343 | | |
Blackbaud, Inc. | | | 4,698 | | | | 270,417 | | |
CDK Global, Inc. | | | 11,535 | | | | 597,859 | | |
Ceridian HCM Holding,
Inc. (b) | | | 12,329 | | | | 1,313,778 | | |
CommVault Systems,
Inc. (b) | | | 4,405 | | | | 243,905 | | |
Fair Isaac Corp. (b) | | | 2,817 | | | | 1,439,600 | | |
Manhattan Associates,
Inc. (b) | | | 6,021 | | | | 633,289 | | |
Paylocity Holding Corp. (b) | | | 3,580 | | | | 737,158 | | |
PTC, Inc. (b) | | | 9,953 | | | | 1,190,478 | | |
Qualys, Inc. (b) | | | 3,177 | | | | 387,181 | | |
Sailpoint Technologies
Holdings, Inc. (b) | | | 8,617 | | | | 458,769 | | |
| | | | | | 7,697,777 | | |
Leisure and Consumer Staples (0.7%) | |
Food & Staples Retailing (0.2%) | |
BJ's Wholesale Club
Holdings, Inc. (b) | | | 13,013 | | | | 485,125 | | |
Food Products (0.5%) | |
Darling Ingredients, Inc. (b) | | | 15,363 | | | | 886,138 | | |
Pilgrim's Pride Corp. (b) | | | 4,617 | | | | 90,539 | | |
| | | | | | 976,677 | | |
| | | Shares | | Value(a) | |
Materials (5.4%) | |
Chemicals (2.5%) | |
Ashland Global
Holdings, Inc. | | | 5,168 | | | $ | 409,306 | | |
Avient Corp. | | | 8,671 | | | | 349,268 | | |
Cabot Corp. | | | 5,365 | | | | 240,781 | | |
Ingevity Corp. (b) | | | 3,908 | | | | 295,953 | | |
Minerals
Technologies, Inc. | | | 3,213 | | | | 199,592 | | |
NewMarket Corp. | | | 728 | | | | 289,955 | | |
Olin Corp. | | | 13,468 | | | | 330,774 | | |
RPM International, Inc. | | | 12,317 | | | | 1,118,137 | | |
Sensient Technologies
Corp. | | | 3,990 | | | | 294,342 | | |
The Chemours Co. | | | 15,593 | | | | 386,550 | | |
The Scotts Miracle-Gro Co. | | | 3,857 | | | | 768,083 | | |
Valvoline, Inc. | | | 17,562 | | | | 406,385 | | |
| | | | | | 5,089,126 | | |
Construction Materials (0.2%) | |
Eagle Materials, Inc. | | | 3,955 | | | | 400,839 | | |
Containers & Packaging (0.9%) | |
Aptargroup, Inc. | | | 6,135 | | | | 839,820 | | |
Greif, Inc. – Class A | | | 2,424 | | | | 113,637 | | |
O-I Glass, Inc. | | | 14,898 | | | | 177,286 | | |
Silgan Holdings, Inc. | | | 7,442 | | | | 275,950 | | |
Sonoco Products Co. | | | 9,519 | | | | 564,001 | | |
| | | | | | 1,970,694 | | |
Metals & Mining (1.5%) | |
Commercial Metals Co. | | | 11,381 | | | | 233,766 | | |
Compass Minerals
International, Inc. | | | 3,196 | | | | 197,257 | | |
Reliance Steel &
Aluminum Co. | | | 6,043 | | | | 723,649 | | |
Royal Gold, Inc. | | | 6,219 | | | | 661,453 | | |
Steel Dynamics, Inc. | | | 18,944 | | | | 698,465 | | |
United States Steel Corp. | | | 20,893 | | | | 350,376 | | |
Worthington
Industries, Inc. | | | 3,402 | | | | 174,659 | | |
| | | | | | 3,039,625 | | |
Paper & Forest Products (0.3%) | |
Domtar Corp. | | | 5,232 | | | | 165,593 | | |
Louisiana-Pacific Corp. | | | 10,363 | | | | 385,192 | | |
| | | | | | 550,785 | | |
Real Estate (8.5%) | |
Health Care REITs (1.3%) | |
Healthcare Realty
Trust, Inc. | | | 12,897 | | | | 381,751 | | |
Medical Properties
Trust, Inc. | | | 50,809 | | | | 1,107,128 | | |
Omega Healthcare
Investors, Inc. | | | 21,518 | | | | 781,534 | | |
Physicians Realty Trust | | | 19,739 | | | | 351,354 | | |
| | | | | | 2,621,767 | | |
See accompanying notes to financial statements.
73
SFT Index 400 Mid-Cap Fund
Investments in Securities – continued
| | | Shares | | Value(a) | |
Hotels & Resort REITs (0.4%) | |
Park Hotels & Resorts, Inc. | | | 22,334 | | | $ | 383,028 | | |
Pebblebrook Hotel Trust | | | 12,410 | | | | 233,308 | | |
Service Properties Trust | | | 15,624 | | | | 179,520 | | |
| | | | | | 795,856 | | |
Industrial REITs (0.8%) | |
EastGroup Properties, Inc. | | | 3,696 | | | | 510,270 | | |
First Industrial Realty
Trust, Inc. | | | 12,233 | | | | 515,376 | | |
Rexford Industrial
Realty, Inc. | | | 12,373 | | | | 607,638 | | |
| | | | | | 1,633,284 | | |
Office REITs (1.4%) | |
Corporate Office
Properties Trust | | | 10,633 | | | | 277,309 | | |
Cousins Properties, Inc. | | | 14,083 | | | | 471,780 | | |
Douglas Emmett, Inc. | | | 15,627 | | | | 455,996 | | |
Highwoods Properties, Inc. | | | 9,849 | | | | 390,316 | | |
Hudson Pacific
Properties, Inc. | | | 14,422 | | | | 346,416 | | |
JBG SMITH Properties | | | 10,547 | | | | 329,805 | | |
Kilroy Realty Corp. | | | 9,941 | | | | 570,613 | | |
| | | | | | 2,842,235 | | |
Real Estate Investment Trust (0.3%) | |
Apartment Income REIT
Corp. (b) | | | 14,111 | | | | 542,004 | | |
Real Estate Management & Development (0.4%) | |
Jones Lang LaSalle, Inc. | | | 4,863 | | | | 721,523 | | |
Residential REITs (0.7%) | |
American Campus
Communities, Inc. | | | 13,046 | | | | 557,977 | | |
Camden Property Trust | | | 9,232 | | | | 922,462 | | |
| | | | | | 1,480,439 | | |
Retail REITs (1.0%) | |
Brixmor Property
Group, Inc. | | | 28,104 | | | | 465,121 | | |
National Retail
Properties, Inc. | | | 16,468 | | | | 673,871 | | |
Spirit Realty Capital, Inc. | | | 10,830 | | | | 435,041 | | |
The Macerich Co. | | | 10,626 | | | | 113,380 | | |
Urban Edge Properties | | | 10,398 | | | | 134,550 | | |
Weingarten Realty Investors | | | 11,418 | | | | 247,428 | | |
| | | | | | 2,069,391 | | |
Specialized REITs (2.2%) | |
CoreSite Realty Corp. | | | 4,047 | | | | 507,008 | | |
CyrusOne, Inc. | | | 11,350 | | | | 830,252 | | |
EPR Properties | | | 7,073 | | | | 229,872 | | |
Lamar Advertising Co. –
Class A | | | 8,192 | | | | 681,738 | | |
Life Storage, Inc. | | | 4,556 | | | | 543,941 | | |
PotlatchDeltic Corp. | | | 6,339 | | | | 317,077 | | |
Rayonier, Inc. | | | 12,941 | | | | 380,207 | | |
Sabra Health Care
REIT, Inc. | | | 19,615 | | | | 340,713 | | |
STORE Capital Corp. | | | 22,403 | | | | 761,254 | | |
| | | | | | 4,592,062 | | |
| | | Shares/
Principal | | Value(a) | |
Utilities (3.2%) | |
Electric Utilities (0.7%) | |
ALLETE, Inc. | | | 4,926 | | | $ | 305,116 | | |
Hawaiian Electric
Industries, Inc. | | | 10,349 | | | | 366,251 | | |
IDACORP, Inc. | | | 4,783 | | | | 459,312 | | |
PNM Resources, Inc. | | | 7,550 | | | | 366,402 | | |
| | | | | | 1,497,081 | | |
Gas Utilities (1.2%) | |
National Fuel Gas Co. | | | 8,623 | | | | 354,664 | | |
New Jersey
Resources Corp. | | | 9,112 | | | | 323,932 | | |
ONE Gas, Inc. | | | 5,033 | | | | 386,383 | | |
Southwest Gas
Holdings, Inc. | | | 5,330 | | | | 323,797 | | |
Spire, Inc. | | | 4,893 | | | | 313,348 | | |
UGI Corp. | | | 19,757 | | | | 690,705 | | |
| | | | | | 2,392,829 | | |
Multi-Utilities (0.8%) | |
Black Hills Corp. | | | 5,948 | | | | 365,505 | | |
MDU Resources
Group, Inc. | | | 19,008 | | | | 500,671 | | |
NorthWestern Corp. | | | 4,794 | | | | 279,538 | | |
OGE Energy Corp. | | | 18,960 | | | | 604,065 | | |
| | | | | | 1,749,779 | | |
Water Utilities (0.5%) | |
Essential Utilities, Inc. | | | 21,157 | | | | 1,000,514 | | |
Total common stocks
(cost: $132,795,177) | | | | | 194,913,963 | | |
Short-Term Securities (4.7%) | |
Investment Companies (4.2%) | |
State Street Institutional
U.S. Government Money
Market Fund, current
rate 0.030% | | | 8,665,399 | | | | 8,665,399 | | |
U.S. Government Obligations (0.5%) | |
U.S. Treasury Bill, current
rate 0.093%, 05/20/21 (d) | | $ | 1,000,000 | | | | 999,693 | | |
Total short-term securities
(cost: $9,664,775) | | | | | 9,665,092 | | |
Total investments in securities
(cost: $142,459,952) (e) | | | | | 204,579,055 | | |
Liabilities in excess of cash
and other assets (-0.2%) | | | | | (407,692 | ) | |
Total net assets (100.0%) | | | | $ | 204,171,363 | | |
See accompanying notes to financial statements.
74
SFT Index 400 Mid-Cap Fund
Investments in Securities – continued
Investments in Securities Legend
(a) Securities are valued by procedures described in Note 2 of the Notes to Financial Statements.
(b) Non-income producing security.
(c) Foreign security: The Fund held 2.0% of net assets in foreign securities at December 31, 2020.
(d) Fully or partially pledged as initial margin deposits on open futures contracts.
Holdings of Open Futures Contracts
On December 31, 2020, securities with an aggregate market value of $999,693 have been pledged to cover margin requirements for the following open futures contracts:
Description | | Expiration
Date | | Number of
Contracts | | Position
Type | | Notional
Amount | | Market
Value | | Unrealized
Appreciation/
(Depreciation)(a) | |
S&P Mid 400@ E-Mini Index Future | | March 2021 | | | 40 | | | Long | | $ | 9,034,078 | | | $ | 9,214,000 | | | $ | 179,922 | | |
(e) At December 31, 2020 the cost of investments for federal income tax purposes was $143,006,852. The aggregate unrealized appreciation and depreciation of investments based on this cost were:
Gross unrealized appreciation | | $ | 70,731,150 | | |
Gross unrealized depreciation | | | (8,979,025 | ) | |
Net unrealized appreciation | | $ | 61,752,125 | | |
See accompanying notes to financial statements.
75
SFT Index 500 Fund
Investments in Securities
(Percentages of each investment category relate to total net assets)
| | | Shares | | Value(a) | |
Common Stocks (98.1%) | |
Communication Services (1.8%) | |
Diversified Telecommunication Services (1.4%) | |
AT&T, Inc. | | | 221,606 | | | $ | 6,373,389 | | |
CenturyLink, Inc. | | | 30,707 | | | | 299,393 | | |
Verizon
Communications, Inc. | | | 128,687 | | | | 7,560,361 | | |
| | | | | | 14,233,143 | | |
Media (0.1%) | |
Fox Corp. – Class A | | | 10,497 | | | | 305,672 | | |
Fox Corp. – Class B | | | 4,810 | | | | 138,913 | | |
ViacomCBS, Inc. – Class B | | | 17,569 | | | | 654,621 | | |
| | | | | | 1,099,206 | | |
Wireless Telecommunication Services (0.3%) | |
T-Mobile US, Inc. –
Class A (b) | | | 18,141 | | | | 2,446,314 | | |
Consumer Discretionary (15.4%) | |
Auto Components (0.2%) | |
Aptiv PLC (c) | | | 8,397 | | | | 1,094,045 | | |
BorgWarner, Inc. | | | 7,604 | | | | 293,819 | | |
| | | | | | 1,387,864 | | |
Automobiles (1.9%) | |
Ford Motor Co. | | | 121,519 | | | | 1,068,152 | | |
General Motors Co. | | | 39,169 | | | | 1,630,997 | | |
Tesla, Inc. (b) | | | 23,583 | | | | 16,641,816 | | |
| | | | | | 19,340,965 | | |
Distributors (0.1%) | |
Genuine Parts Co. | | | 4,410 | | | | 442,896 | | |
LKQ Corp. (b) | | | 8,707 | | | | 306,835 | | |
Pool Corp. | | | 1,270 | | | | 473,075 | | |
| | | | | | 1,222,806 | | |
Entertainment (1.0%) | |
The Walt Disney Co. (b) | | | 56,303 | | | | 10,200,977 | | |
Hotels & Resort REITs (0.1%) | |
Hilton Worldwide
Holdings, Inc. | | | 8,628 | | | | 959,951 | | |
Hotels, Restaurants & Leisure (1.6%) | |
Carnival Corp. (c) | | | 23,128 | | | | 500,953 | | |
Chipotle Mexican
Grill, Inc. (b) | | | 899 | | | | 1,246,652 | | |
Darden Restaurants, Inc. | | | 4,038 | | | | 481,007 | | |
Domino's Pizza, Inc. | | | 1,270 | | | | 486,994 | | |
Las Vegas Sands Corp. | | | 10,214 | | | | 608,754 | | |
Marriott International,
Inc. – Class A | | | 8,270 | | | | 1,090,978 | | |
McDonald's Corp. | | | 23,172 | | | | 4,972,248 | | |
MGM Resorts
International | | | 12,749 | | | | 401,721 | | |
Norwegian Cruise Line
Holdings, Ltd. (b) (c) | | | 9,815 | | | | 249,596 | | |
Royal Caribbean
Cruises, Ltd. (c) | | | 5,790 | | | | 432,455 | | |
Starbucks Corp. | | | 36,500 | | | | 3,904,770 | | |
| | | Shares | | Value(a) | |
Wynn Resorts, Ltd. | | | 2,955 | | | $ | 333,413 | | |
Yum! Brands, Inc. | | | 9,381 | | | | 1,018,401 | | |
| | | | | | 15,727,942 | | |
Household Durables (0.4%) | |
DR Horton, Inc. | | | 10,312 | | | | 710,703 | | |
Garmin, Ltd. (c) | | | 4,556 | | | | 545,171 | | |
Leggett & Platt, Inc. | | | 4,119 | | | | 182,472 | | |
Lennar Corp. – Class A | | | 8,555 | | | | 652,148 | | |
Mohawk Industries, Inc. (b) | | | 1,813 | | | | 255,542 | | |
Newell Brands, Inc. | | | 11,743 | | | | 249,304 | | |
NVR, Inc. (b) | | | 109 | | | | 444,705 | | |
PulteGroup, Inc. | | | 8,337 | | | | 359,491 | | |
Whirlpool Corp. | | | 1,935 | | | | 349,248 | | |
| | | | | | 3,748,784 | | |
Internet & Catalog Retail (5.5%) | |
Amazon.com, Inc. (b) | | | 13,264 | | | | 43,199,920 | | |
Booking Holdings, Inc. (b) | | | 1,274 | | | | 2,837,542 | | |
Etsy, Inc. (b) | | | 3,921 | | | | 697,585 | | |
Expedia Group, Inc. | | | 4,181 | | | | 553,564 | | |
Netflix, Inc. (b) | | | 13,739 | | | | 7,429,089 | | |
| | | | | | 54,717,700 | | |
Leisure Equipment & Products (0.0%) | |
Hasbro, Inc. | | | 3,935 | | | | 368,080 | | |
Media (1.2%) | |
Charter Communications,
Inc. – Class A (b) | | | 4,538 | | | | 3,002,114 | | |
Comcast Corp. – Class A | | | 141,991 | | | | 7,440,328 | | |
Discovery, Inc. –
Class A (b) | | | 4,912 | | | | 147,802 | | |
Discovery, Inc. –
Class C (b) | | | 9,173 | | | | 240,241 | | |
DISH Network Corp. –
Class A (b) | | | 7,689 | | | | 248,662 | | |
Live Nation
Entertainment, Inc. (b) | | | 4,429 | | | | 325,443 | | |
News Corp. – Class A | | | 12,158 | | | | 218,479 | | |
News Corp. – Class B | | | 3,693 | | | | 65,625 | | |
Omnicom Group, Inc. | | | 6,685 | | | | 416,944 | | |
The Interpublic Group of
Cos., Inc. | | | 12,129 | | | | 285,274 | | |
| | | | | | 12,390,912 | | |
Multiline Retail (0.5%) | |
Dollar General Corp. | | | 7,619 | | | | 1,602,276 | | |
Dollar Tree, Inc. (b) | | | 7,314 | | | | 790,204 | | |
Target Corp. | | | 15,573 | | | | 2,749,102 | | |
| | | | | | 5,141,582 | | |
Specialty Retail (2.2%) | |
Advance Auto Parts, Inc. | | | 2,099 | | | | 330,614 | | |
AutoZone, Inc. (b) | | | 755 | | | | 895,007 | | |
Best Buy Co., Inc. | | | 7,142 | | | | 712,700 | | |
CarMax, Inc. (b) | | | 5,066 | | | | 478,534 | | |
Home Depot, Inc. (The) | | | 33,480 | | | | 8,892,958 | | |
L Brands, Inc. | | | 7,264 | | | | 270,148 | | |
Lowe's Cos., Inc. | | | 22,786 | | | | 3,657,381 | | |
See accompanying notes to financial statements.
76
SFT Index 500 Fund
Investments in Securities – continued
| | | Shares | | Value(a) | |
O'Reilly
Automotive, Inc. (b) | | | 2,253 | | | $ | 1,019,640 | | |
Ross Stores, Inc. | | | 11,071 | | | | 1,359,630 | | |
The Gap, Inc. | | | 6,397 | | | | 129,155 | | |
The TJX Cos., Inc. | | | 37,337 | | | | 2,549,744 | | |
Tiffany & Co. | | | 3,354 | | | | 440,883 | | |
Tractor Supply Co. | | | 3,609 | | | | 507,353 | | |
Ulta Salon Cosmetics &
Fragrance, Inc. (b) | | | 1,778 | | | | 510,571 | | |
| | | | | | 21,754,318 | | |
Textiles, Apparel & Luxury Goods (0.7%) | |
Hanesbrands, Inc. | | | 10,832 | | | | 157,931 | | |
NIKE, Inc. – Class B | | | 39,022 | | | | 5,520,442 | | |
PVH Corp. | | | 2,192 | | | | 205,807 | | |
Ralph Lauren Corp. | | | 1,433 | | | | 148,659 | | |
Tapestry, Inc. | | | 8,626 | | | | 268,096 | | |
Under Armour, Inc. –
Class A (b) | | | 5,824 | | | | 99,998 | | |
Under Armour, Inc. –
Class C (b) | | | 6,052 | | | | 90,054 | | |
VF Corp. | | | 9,945 | | | | 849,402 | | |
| | | | | | 7,340,389 | | |
Consumer Staples (6.7%) | |
Beverages (1.6%) | |
Brown-Forman Corp. –
Class B | | | 5,618 | | | | 446,238 | | |
Constellation Brands,
Inc. – Class A | | | 5,219 | | | | 1,143,222 | | |
Molson Coors Beverage
Co. – Class B | | | 5,814 | | | | 262,735 | | |
Monster Beverage
Corp. (b) | | | 11,492 | | | | 1,062,780 | | |
PepsiCo, Inc. | | | 42,976 | | | | 6,373,341 | | |
The Coca-Cola Co. | | | 120,278 | | | | 6,596,045 | | |
| | | | | | 15,884,361 | | |
Food & Staples Retailing (1.7%) | |
Costco Wholesale Corp. | | | 13,722 | | | | 5,170,175 | | |
CVS Health Corp. | | | 40,705 | | | | 2,780,152 | | |
Sysco Corp. | | | 15,840 | | | | 1,176,278 | | |
The Kroger Co. | | | 24,080 | | | | 764,781 | | |
Walgreens Boots
Alliance, Inc. | | | 22,350 | | | | 891,318 | | |
Walmart, Inc. | | | 43,113 | | | | 6,214,739 | | |
| | | | | | 16,997,443 | | |
Food Products (1.0%) | |
Archer-Daniels-Midland Co. | | | 17,302 | | | | 872,194 | | |
Campbell Soup Co. | | | 6,298 | | | | 304,508 | | |
Conagra Brands, Inc. | | | 15,192 | | | | 550,862 | | |
General Mills, Inc. | | | 19,010 | | | | 1,117,788 | | |
Hormel Foods Corp. | | | 8,731 | | | | 406,952 | | |
Kellogg Co. | | | 7,909 | | | | 492,177 | | |
Lamb Weston
Holdings, Inc. | | | 4,497 | | | | 354,094 | | |
McCormick & Co., Inc. | | | 7,734 | | | | 739,370 | | |
Mondelez International,
Inc. – Class A | | | 44,475 | | | | 2,600,453 | | |
The Hershey Co. | | | 4,587 | | | | 698,738 | | |
The JM Smucker Co. | | | 3,533 | | | | 408,415 | | |
| | | Shares | | Value(a) | |
The Kraft Heinz Co. | | | 20,151 | | | $ | 698,434 | | |
Tyson Foods, Inc. –
Class A | | | 9,146 | | | | 589,368 | | |
| | | | | | 9,833,353 | | |
Household Products (1.6%) | |
Church & Dwight Co., Inc. | | | 7,706 | | | | 672,194 | | |
Colgate-Palmolive Co. | | | 26,656 | | | | 2,279,355 | | |
Kimberly-Clark Corp. | | | 10,577 | | | | 1,426,097 | | |
The Clorox Co. | | | 3,920 | | | | 791,526 | | |
The Procter & Gamble Co. | | | 77,111 | | | | 10,729,224 | | |
| | | | | | 15,898,396 | | |
Personal Care (0.2%) | |
The Estee Lauder Cos.,
Inc. – Class A | | | 7,031 | | | | 1,871,582 | | |
Tobacco (0.6%) | |
Altria Group, Inc. | | | 57,793 | | | | 2,369,513 | | |
Philip Morris
International, Inc. | | | 48,429 | | | | 4,009,437 | | |
| | | | | | 6,378,950 | | |
Energy (2.2%) | |
Energy Equipment & Services (0.2%) | |
Baker Hughes Co. | | | 21,327 | | | | 444,668 | | |
Halliburton Co. | | | 27,491 | | | | 519,580 | | |
Nov, Inc. | | | 12,074 | | | | 165,776 | | |
Schlumberger, Ltd. (c) | | | 43,289 | | | | 944,999 | | |
TechnipFMC PLC (c) | | | 13,137 | | | | 123,487 | | |
| | | | | | 2,198,510 | | |
Oil, Gas & Consumable Fuels (2.0%) | |
Apache Corp. | | | 11,738 | | | | 166,562 | | |
Cabot Oil & Gas Corp. | | | 12,395 | | | | 201,791 | | |
Chevron Corp. | | | 59,865 | | | | 5,055,599 | | |
Concho Resources, Inc. | | | 6,104 | | | | 356,168 | | |
ConocoPhillips | | | 33,211 | | | | 1,328,108 | | |
Devon Energy Corp. | | | 11,895 | | | | 188,060 | | |
Diamondback Energy, Inc. | | | 4,880 | | | | 236,192 | | |
EOG Resources, Inc. | | | 18,142 | | | | 904,742 | | |
Exxon Mobil Corp. | | | 131,490 | | | | 5,420,018 | | |
Hess Corp. | | | 8,499 | | | | 448,662 | | |
HollyFrontier Corp. | | | 4,582 | | | | 118,445 | | |
Kinder Morgan, Inc. | | | 60,544 | | | | 827,636 | | |
Marathon Oil Corp. | | | 24,548 | | | | 163,735 | | |
Marathon Petroleum Corp. | | | 20,234 | | | | 836,878 | | |
Occidental Petroleum Corp. | | | 26,063 | | | | 451,151 | | |
Phillips 66 | | | 13,583 | | | | 949,995 | | |
Pioneer Natural
Resources Co. | | | 5,113 | | | | 582,320 | | |
The Williams Cos., Inc. | | | 37,740 | | | | 756,687 | | |
Valero Energy Corp. | | | 12,681 | | | | 717,364 | | |
| | | | | | 19,710,113 | | |
Financial (10.2%) | |
Capital Markets (2.7%) | |
Ameriprise Financial, Inc. | | | 3,669 | | | | 712,997 | | |
BlackRock, Inc. | | | 4,411 | | | | 3,182,713 | | |
CBOE Global Markets, Inc. | | | 3,354 | | | | 312,324 | | |
CME Group, Inc. | | | 11,164 | | | | 2,032,406 | | |
Franklin Resources, Inc. | | | 8,415 | | | | 210,291 | | |
Intercontinental Exchange, Inc. | | | 17,454 | | | | 2,012,272 | | |
See accompanying notes to financial statements.
77
SFT Index 500 Fund
Investments in Securities – continued
| | | Shares | | Value(a) | |
Invesco, Ltd. (c) | | | 11,713 | | | $ | 204,158 | | |
MarketAxess
Holdings, Inc. | | | 1,169 | | | | 666,985 | | |
Moody's Corp. | | | 5,023 | | | | 1,457,876 | | |
Morgan Stanley | | | 44,447 | | | | 3,045,953 | | |
MSCI, Inc. | | | 2,547 | | | | 1,137,312 | | |
Nasdaq, Inc. | | | 3,475 | | | | 461,271 | | |
Northern Trust Corp. | | | 6,472 | | | | 602,802 | | |
Raymond James
Financial, Inc. | | | 3,754 | | | | 359,145 | | |
S&P Global, Inc. | | | 7,482 | | | | 2,459,558 | | |
State Street Corp. | | | 10,971 | | | | 798,469 | | |
T Rowe Price Group, Inc. | | | 7,041 | | | | 1,065,937 | | |
The Bank of New York
Mellon Corp. | | | 25,352 | | | | 1,075,939 | | |
The Charles Schwab Corp. | | | 46,388 | | | | 2,460,419 | | |
The Goldman Sachs
Group, Inc. | | | 10,700 | | | | 2,821,697 | | |
| | | | | | 27,080,524 | | |
Commercial Banks (3.8%) | |
Bank of America Corp. | | | 236,742 | | | | 7,175,650 | | |
Citigroup, Inc. | | | 64,745 | | | | 3,992,177 | | |
Citizens Financial
Group, Inc. | | | 13,281 | | | | 474,929 | | |
Comerica, Inc. | | | 4,296 | | | | 239,975 | | |
Fifth Third Bancorp | | | 22,155 | | | | 610,813 | | |
First Republic Bank | | | 5,355 | | | | 786,810 | | |
Huntington
Bancshares, Inc. | | | 31,636 | | | | 399,563 | | |
JPMorgan Chase & Co. | | | 94,794 | | | | 12,045,474 | | |
KeyCorp | | | 30,366 | | | | 498,306 | | |
M&T Bank Corp. | | | 3,948 | | | | 502,580 | | |
People's United
Financial, Inc. | | | 13,212 | | | | 170,831 | | |
Regions Financial Corp. | | | 29,868 | | | | 481,472 | | |
SVB Financial Group (b) | | | 1,632 | | | | 632,939 | | |
The PNC Financial
Services Group, Inc. | | | 13,176 | | | | 1,963,224 | | |
Truist Financial Corp. | | | 41,924 | | | | 2,009,417 | | |
US Bancorp | | | 42,631 | | | | 1,986,178 | | |
Wells Fargo & Co. | | | 128,575 | | | | 3,880,393 | | |
Zions Bancorp NA | | | 5,099 | | | | 221,501 | | |
| | | | | | 38,072,232 | | |
Consumer Finance (0.5%) | |
American Express Co. | | | 20,282 | | | | 2,452,297 | | |
Capital One Financial Corp. | | | 14,224 | | | | 1,406,042 | | |
Discover Financial
Services | | | 9,531 | | | | 862,841 | | |
Synchrony Financial | | | 16,884 | | | | 586,044 | | |
| | | | | | 5,307,224 | | |
Insurance (3.2%) | |
Aflac, Inc. | | | 20,315 | | | | 903,408 | | |
American International
Group, Inc. | | | 26,792 | | | | 1,014,345 | | |
Aon PLC (c) | | | 7,109 | | | | 1,501,918 | | |
Arthur J Gallagher & Co. | | | 5,955 | | | | 736,693 | | |
Assurant, Inc. | | | 1,755 | | | | 239,066 | | |
Berkshire Hathaway,
Inc. – Class B (b) | | | 60,521 | | | | 14,033,004 | | |
Chubb, Ltd. (c) | | | 14,036 | | | | 2,160,421 | | |
| | | Shares | | Value(a) | |
Cincinnati Financial Corp. | | | 4,606 | | | $ | 402,426 | | |
Everest Re Group, Ltd. (c) | | | 1,252 | | | | 293,081 | | |
Globe Life, Inc. | | | 2,974 | | | | 282,411 | | |
Hartford Financial
Services Group, Inc. | | | 11,143 | | | | 545,784 | | |
Lincoln National Corp. | | | 5,649 | | | | 284,201 | | |
Loews Corp. | | | 7,265 | | | | 327,070 | | |
Marsh & McLennan
Cos., Inc. | | | 15,772 | | | | 1,845,324 | | |
MetLife, Inc. | | | 23,788 | | | | 1,116,847 | | |
Principal Financial
Group, Inc. | | | 7,945 | | | | 394,152 | | |
Prudential Financial, Inc. | | | 12,314 | | | | 961,354 | | |
The Allstate Corp. | | | 9,456 | | | | 1,039,498 | | |
The Progressive Corp. | | | 18,211 | | | | 1,800,704 | | |
The Travelers Cos., Inc. | | | 7,877 | | | | 1,105,695 | | |
Unum Group | | | 6,313 | | | | 144,820 | | |
Willis Towers
Watson PLC (c) | | | 4,009 | | | | 844,616 | | |
WR Berkley Corp. | | | 4,366 | | | | 289,990 | | |
| | | | | | 32,266,828 | | |
Health Care (12.9%) | |
Biotechnology (1.8%) | |
AbbVie, Inc. | | | 54,903 | | | | 5,882,857 | | |
Alexion
Pharmaceuticals, Inc. (b) | | | 6,805 | | | | 1,063,213 | | |
Amgen, Inc. | | | 18,104 | | | | 4,162,472 | | |
Biogen, Inc. (b) | | | 4,785 | | | | 1,171,655 | | |
Gilead Sciences, Inc. | | | 38,982 | | | | 2,271,091 | | |
Incyte Corp. (b) | | | 5,788 | | | | 503,440 | | |
Regeneron
Pharmaceuticals, Inc. (b) | | | 3,326 | | | | 1,606,824 | | |
Vertex
Pharmaceuticals, Inc. (b) | | | 8,087 | | | | 1,911,282 | | |
| | | | | | 18,572,834 | | |
Health Care Equipment & Supplies (3.7%) | |
Abbott Laboratories | | | 55,117 | | | | 6,034,760 | | |
ABIOMED, Inc. (b) | | | 1,425 | | | | 461,985 | | |
Align Technology, Inc. (b) | | | 2,232 | | | | 1,192,736 | | |
Baxter International, Inc. | | | 15,885 | | | | 1,274,612 | | |
Becton Dickinson and Co. | | | 9,019 | | | | 2,256,734 | | |
Boston Scientific Corp. (b) | | | 44,530 | | | | 1,600,853 | | |
Danaher Corp. | | | 19,661 | | | | 4,367,495 | | |
Dentsply Sirona, Inc. | | | 6,796 | | | | 355,839 | | |
DexCom, Inc. (b) | | | 2,986 | | | | 1,103,984 | | |
Edwards Lifesciences
Corp. (b) | | | 19,381 | | | | 1,768,129 | | |
Hologic, Inc. (b) | | | 7,992 | | | | 582,057 | | |
IDEXX
Laboratories, Inc. (b) | | | 2,688 | | | | 1,343,651 | | |
Intuitive Surgical, Inc. (b) | | | 3,656 | | | | 2,990,974 | | |
Medtronic PLC (c) | | | 41,858 | | | | 4,903,246 | | |
ResMed, Inc. | | | 4,506 | | | | 957,795 | | |
STERIS PLC (c) | | | 2,645 | | | | 501,333 | | |
Stryker Corp. | | | 10,167 | | | | 2,491,322 | | |
Teleflex, Inc. | | | 1,454 | | | | 598,423 | | |
The Cooper Cos., Inc. | | | 1,566 | | | | 568,959 | | |
Varian Medical
Systems, Inc. (b) | | | 2,761 | | | | 483,203 | | |
See accompanying notes to financial statements.
78
SFT Index 500 Fund
Investments in Securities – continued
| | | Shares | | Value(a) | |
West Pharmaceutical
Services, Inc. | | | 2,330 | | | $ | 660,112 | | |
Zimmer Biomet
Holdings, Inc. | | | 6,446 | | | | 993,264 | | |
| | | | | | 37,491,466 | | |
Health Care Providers & Services (2.3%) | |
AmerisourceBergen Corp. | | | 4,512 | | | | 441,093 | | |
Anthem, Inc. | | | 7,734 | | | | 2,483,310 | | |
Cardinal Health, Inc. | | | 9,124 | | | | 488,682 | | |
Centene Corp. (b) | | | 18,030 | | | | 1,082,341 | | |
Cigna Corp. | | | 11,235 | | | | 2,338,902 | | |
DaVita, Inc. (b) | | | 2,298 | | | | 269,785 | | |
HCA Healthcare, Inc. | | | 8,207 | | | | 1,349,723 | | |
Henry Schein, Inc. (b) | | | 4,383 | | | | 293,047 | | |
Humana, Inc. | | | 4,112 | | | | 1,687,030 | | |
Laboratory Corp. of
America Holdings (b) | | | 2,984 | | | | 607,393 | | |
McKesson Corp. | | | 4,993 | | | | 868,383 | | |
Quest Diagnostics, Inc. | | | 4,127 | | | | 491,815 | | |
UnitedHealth Group, Inc. | | | 29,507 | | | | 10,347,515 | | |
Universal Health Services,
Inc. – Class B | | | 2,330 | | | | 320,375 | | |
| | | | | | 23,069,394 | | |
Health Care Technology (0.1%) | |
Cerner Corp. | | | 9,534 | | | | 748,228 | | |
Life Sciences Tools & Services (1.2%) | |
Agilent Technologies, Inc. | | | 9,516 | | | | 1,127,551 | | |
Bio-Rad Laboratories,
Inc. – Class A (b) | | | 692 | | | | 403,394 | | |
Illumina, Inc. (b) | | | 4,540 | | | | 1,679,800 | | |
IQVIA Holdings, Inc. (b) | | | 5,962 | | | | 1,068,212 | | |
Mettler-Toledo
International, Inc. (b) | | | 767 | | | | 874,135 | | |
PerkinElmer, Inc. | | | 3,434 | | | | 492,779 | | |
Thermo Fisher
Scientific, Inc. | | | 12,326 | | | | 5,741,204 | | |
Waters Corp. (b) | | | 1,944 | | | | 480,984 | | |
| | | | | | 11,868,059 | | |
Pharmaceuticals (3.8%) | |
Bristol-Myers Squibb Co. | | | 70,274 | | | | 4,359,096 | | |
Catalent, Inc. (b) | | | 5,121 | | | | 532,943 | | |
Eli Lilly & Co. | | | 24,691 | | | | 4,168,828 | | |
Johnson & Johnson | | | 81,867 | | | | 12,884,229 | | |
Merck & Co., Inc. | | | 78,679 | | | | 6,435,942 | | |
Perrigo Co. PLC (c) | | | 4,173 | | | | 186,617 | | |
Pfizer, Inc. | | | 172,856 | | | | 6,362,829 | | |
Viatris, Inc. (b) | | | 37,518 | | | | 703,087 | | |
Zoetis, Inc. | | | 14,780 | | | | 2,446,090 | | |
| | | | | | 38,079,661 | | |
Industrials (8.3%) | |
Aerospace & Defense (1.5%) | |
General Dynamics Corp. | | | 7,228 | | | | 1,075,671 | | |
Howmet Aerospace, Inc. | | | 12,135 | | | | 346,333 | | |
Huntington Ingalls
Industries, Inc. | | | 1,189 | | | | 202,701 | | |
L3Harris Technologies, Inc. | | | 6,534 | | | | 1,235,057 | | |
Lockheed Martin Corp. | | | 7,657 | | | | 2,718,082 | | |
Northrop Grumman Corp. | | | 4,822 | | | | 1,469,360 | | |
| | | Shares | | Value(a) | |
Raytheon
Technologies Corp. | | | 47,229 | | | $ | 3,377,346 | | |
Teledyne
Technologies, Inc. (b) | | | 1,186 | | | | 464,888 | | |
The Boeing Co. | | | 16,502 | | | | 3,532,418 | | |
TransDigm Group, Inc. (b) | | | 1,669 | | | | 1,032,860 | | |
| | | | | | 15,454,716 | | |
Air Freight & Logistics (0.7%) | |
CH Robinson
Worldwide, Inc. | | | 4,150 | | | | 389,561 | | |
Expeditors International
of Washington, Inc. | | | 5,239 | | | | 498,281 | | |
FedEx Corp. | | | 7,513 | | | | 1,950,525 | | |
United Parcel Service,
Inc. – Class B | | | 22,242 | | | | 3,745,553 | | |
| | | | | | 6,583,920 | | |
Airlines (0.3%) | |
Alaska Air Group, Inc. | | | 3,843 | | | | 199,836 | | |
American Airlines
Group, Inc. | | | 18,994 | | | | 299,535 | | |
Delta Air Lines, Inc. | | | 19,832 | | | | 797,445 | | |
Southwest Airlines Co. | | | 18,356 | | | | 855,573 | | |
United Airlines
Holdings, Inc. (b) | | | 9,101 | | | | 393,618 | | |
| | | | | | 2,546,007 | | |
Building Products (0.4%) | |
Allegion PLC (c) | | | 2,838 | | | | 330,287 | | |
AO Smith Corp. | | | 4,150 | | | | 227,503 | | |
Carrier Global Corp. | | | 25,335 | | | | 955,636 | | |
Fortune Brands Home &
Security, Inc. | | | 4,297 | | | | 368,339 | | |
Johnson Controls
International PLC (c) | | | 22,512 | | | | 1,048,834 | | |
Masco Corp. | | | 8,137 | | | | 446,965 | | |
Trane Technologies PLC (c) | | | 7,467 | | | | 1,083,910 | | |
| | | | | | 4,461,474 | | |
Commercial Services & Supplies (0.5%) | |
Avery Dennison Corp. | | | 2,530 | | | | 392,428 | | |
Cintas Corp. | | | 2,791 | | | | 986,507 | | |
Copart, Inc. (b) | | | 6,462 | | | | 822,289 | | |
Republic Services, Inc. | | | 6,516 | | | | 627,491 | | |
Rollins, Inc. | | | 6,878 | | | | 268,723 | | |
Waste Management, Inc. | | | 12,090 | | | | 1,425,774 | | |
| | | | | | 4,523,212 | | |
Construction & Engineering (0.1%) | |
Jacobs Engineering
Group, Inc. | | | 4,007 | | | | 436,603 | | |
Quanta Services, Inc. | | | 4,251 | | | | 306,157 | | |
| | | | | | 742,760 | | |
Electrical Equipment (0.5%) | |
AMETEK, Inc. | | | 7,154 | | | | 865,205 | | |
Eaton Corp. PLC (c) | | | 12,395 | | | | 1,489,135 | | |
Emerson Electric Co. | | | 18,598 | | | | 1,494,721 | | |
Rockwell Automation, Inc. | | | 3,613 | | | | 906,177 | | |
| | | | | | 4,755,238 | | |
See accompanying notes to financial statements.
79
SFT Index 500 Fund
Investments in Securities – continued
| | | Shares | | Value(a) | |
Industrial Conglomerates (1.2%) | |
3M Co. | | | 17,938 | | | $ | 3,135,383 | | |
General Electric Co. | | | 272,417 | | | | 2,942,103 | | |
Honeywell
International, Inc. | | | 21,821 | | | | 4,641,327 | | |
Roper Technologies, Inc. | | | 3,262 | | | | 1,406,215 | | |
Textron, Inc. | | | 7,117 | | | | 343,965 | | |
| | | | | | 12,468,993 | | |
Machinery (1.6%) | |
Caterpillar, Inc. | | | 16,894 | | | | 3,075,046 | | |
Cummins, Inc. | | | 4,571 | | | | 1,038,074 | | |
Deere & Co. | | | 9,745 | | | | 2,621,892 | | |
Dover Corp. | | | 4,481 | | | | 565,726 | | |
Flowserve Corp. | | | 4,009 | | | | 147,732 | | |
Fortive Corp. | | | 10,486 | | | | 742,619 | | |
IDEX Corp. | | | 2,349 | | | | 467,921 | | |
Illinois Tool Works, Inc. | | | 8,957 | | | | 1,826,153 | | |
Ingersoll Rand, Inc. (b) | | | 11,559 | | | | 526,628 | | |
Otis Worldwide Corp. | | | 12,663 | | | | 855,386 | | |
PACCAR, Inc. | | | 10,773 | | | | 929,494 | | |
Parker Hannifin Corp. | | | 4,005 | | | | 1,091,002 | | |
Pentair PLC (c) | | | 5,149 | | | | 273,360 | | |
Snap-On, Inc. | | | 1,655 | | | | 283,237 | | |
Stanley Black &
Decker, Inc. | | | 4,982 | | | | 889,586 | | |
Westinghouse Air Brake
Technologies Corp. | | | 5,563 | | | | 407,212 | | |
Xylem, Inc. | | | 5,551 | | | | 565,036 | | |
| | | | | | 16,306,104 | | |
Professional Services (0.4%) | |
Equifax, Inc. | | | 3,763 | | | | 725,657 | | |
IHS Markit, Ltd. (c) | | | 11,590 | | | | 1,041,130 | | |
Nielsen Holdings PLC (c) | | | 11,102 | | | | 231,699 | | |
Robert Half
International, Inc. | | | 3,452 | | | | 215,681 | | |
United Rentals, Inc. (b) | | | 2,193 | | | | 508,578 | | |
Verisk Analytics, Inc. | | | 5,056 | | | | 1,049,575 | | |
| | | | | | 3,772,320 | | |
Road & Rail (1.0%) | |
CSX Corp. | | | 23,783 | | | | 2,158,307 | | |
JB Hunt Transport
Services, Inc. | | | 2,571 | | | | 351,327 | | |
Kansas City Southern | | | 2,873 | | | | 586,466 | | |
Norfolk Southern Corp. | | | 7,898 | | | | 1,876,644 | | |
Old Dominion Freight
Line, Inc. | | | 2,950 | | | | 575,781 | | |
Union Pacific Corp. | | | 20,956 | | | | 4,363,458 | | |
| | | | | | 9,911,983 | | |
Trading Companies & Distributors (0.1%) | |
Fastenal Co. | | | 17,853 | | | | 871,762 | | |
WW Grainger, Inc. | | | 1,386 | | | | 565,959 | | |
| | | | | | 1,437,721 | | |
Information Technology (33.0%) | |
Communications Equipment (0.8%) | |
Arista Networks, Inc. (b) | | | 1,729 | | | | 502,395 | | |
Cisco Systems, Inc. | | | 131,406 | | | | 5,880,418 | | |
F5 Networks, Inc. (b) | | | 1,921 | | | | 337,981 | | |
| | | Shares | | Value(a) | |
Juniper Networks, Inc. | | | 10,254 | | | $ | 230,818 | | |
Motorola Solutions, Inc. | | | 5,245 | | | | 891,965 | | |
| | | | | | 7,843,577 | | |
Computers & Peripherals (6.7%) | |
Apple, Inc. (d) | | | 497,004 | | | | 65,947,461 | | |
NetApp, Inc. | | | 6,946 | | | | 460,103 | | |
Western Digital Corp. | | | 9,450 | | | | 523,435 | | |
| | | | | | 66,930,999 | | |
Electronic Equipment,
Instruments & Components (0.6%) | |
Amphenol Corp. – Class A | | | 9,303 | | | | 1,216,553 | | |
CDW Corp. | | | 4,364 | | | | 575,132 | | |
Corning, Inc. | | | 23,759 | | | | 855,324 | | |
FLIR Systems, Inc. | | | 4,031 | | | | 176,679 | | |
IPG Photonics Corp. (b) | | | 1,098 | | | | 245,721 | | |
Keysight
Technologies, Inc. (b) | | | 5,762 | | | | 761,103 | | |
Seagate
Technology PLC (c) | | | 6,951 | | | | 432,074 | | |
TE Connectivity, Ltd. (c) | | | 10,285 | | | | 1,245,205 | | |
Vontier Corp. (b) | | | 4,189 | | | | 139,913 | | |
| | | | | | 5,647,704 | | |
Interactive Media & Services (5.5%) | |
Akamai
Technologies, Inc. (b) | | | 5,023 | | | | 527,365 | | |
Alphabet, Inc. – Class A (b) | | | 9,350 | | | | 16,387,184 | | |
Alphabet, Inc. – Class C (b) | | | 9,028 | | | | 15,815,973 | | |
eBay, Inc. | | | 20,365 | | | | 1,023,341 | | |
Facebook, Inc. – Class A (b) | | | 74,759 | | | | 20,421,168 | | |
Twitter, Inc. (b) | | | 24,734 | | | | 1,339,346 | | |
| | | | | | 55,514,377 | | |
IT Services (5.3%) | |
Accenture PLC – Class A (c) | | | 19,703 | | | | 5,146,621 | | |
Automatic Data
Processing, Inc. | | | 13,335 | | | | 2,349,627 | | |
Broadridge Financial
Solutions, Inc. | | | 3,541 | | | | 542,481 | | |
Cognizant Technology
Solutions Corp. – Class A | | | 16,626 | | | | 1,362,501 | | |
DXC Technology Co. | | | 7,911 | | | | 203,708 | | |
Fidelity National
Information Services, Inc. | | | 19,296 | | | | 2,729,612 | | |
Fiserv, Inc. (b) | | | 17,887 | | | | 2,036,614 | | |
FleetCor
Technologies, Inc. (b) | | | 2,594 | | | | 707,721 | | |
Gartner, Inc. (b) | | | 2,730 | | | | 437,319 | | |
Global Payments, Inc. | | | 9,309 | | | | 2,005,345 | | |
International Business
Machines Corp. | | | 27,710 | | | | 3,488,135 | | |
Jack Henry &
Associates, Inc. | | | 2,288 | | | | 370,633 | | |
Leidos Holdings, Inc. | | | 4,144 | | | | 435,617 | | |
Mastercard, Inc. – Class A | | | 27,358 | | | | 9,765,164 | | |
Paychex, Inc. | | | 9,950 | | | | 927,141 | | |
PayPal Holdings, Inc. (b) | | | 36,438 | | | | 8,533,780 | | |
The Western Union Co. | | | 12,785 | | | | 280,503 | | |
VeriSign, Inc. (b) | | | 3,088 | | | | 668,243 | | |
Visa, Inc. – Class A | | | 52,733 | | | | 11,534,289 | | |
| | | | | | 53,525,054 | | |
See accompanying notes to financial statements.
80
SFT Index 500 Fund
Investments in Securities – continued
| | | Shares | | Value(a) | |
Office Electronics (0.1%) | |
Zebra Technologies
Corp. – Class A (b) | | | 1,710 | | | $ | 657,204 | | |
Semiconductors & Semiconductor Equipment (5.0%) | |
Advanced Micro
Devices, Inc. (b) | | | 37,373 | | | | 3,427,478 | | |
Analog Devices, Inc. | | | 11,490 | | | | 1,697,418 | | |
Applied Materials, Inc. | | | 28,401 | | | | 2,451,006 | | |
Broadcom, Inc. | | | 12,579 | | | | 5,507,715 | | |
Intel Corp. | | | 127,440 | | | | 6,349,061 | | |
KLA Corp. | | | 4,803 | | | | 1,243,545 | | |
Lam Research Corp. | | | 4,479 | | | | 2,115,297 | | |
Maxim Integrated
Products, Inc. | | | 8,312 | | | | 736,859 | | |
Microchip Technology, Inc. | | | 8,036 | | | | 1,109,852 | | |
Micron
Technology, Inc. (b) | | | 34,619 | | | | 2,602,656 | | |
NVIDIA Corp. | | | 19,250 | | | | 10,052,350 | | |
Qorvo, Inc. (b) | | | 3,459 | | | | 575,128 | | |
QUALCOMM, Inc. | | | 35,172 | | | | 5,358,103 | | |
Skyworks Solutions, Inc. | | | 5,164 | | | | 789,472 | | |
Teradyne, Inc. | | | 5,164 | | | | 619,112 | | |
Texas Instruments, Inc. | | | 28,546 | | | | 4,685,255 | | |
Xilinx, Inc. | | | 7,622 | | | | 1,080,571 | | |
| | | | | | 50,400,878 | | |
Software (8.8%) | |
Activision Blizzard, Inc. | | | 24,034 | | | | 2,231,557 | | |
Adobe, Inc. (b) | | | 14,919 | | | | 7,461,290 | | |
ANSYS, Inc. (b) | | | 2,727 | | | | 992,083 | | |
Autodesk, Inc. (b) | | | 6,838 | | | | 2,087,915 | | |
Cadence Design
Systems, Inc. (b) | | | 8,674 | | | | 1,183,394 | | |
Citrix Systems, Inc. | | | 3,828 | | | | 498,023 | | |
Electronic Arts, Inc. | | | 9,020 | | | | 1,295,272 | | |
Fortinet, Inc. (b) | | | 4,139 | | | | 614,766 | | |
Intuit, Inc. | | | 8,171 | | | | 3,103,754 | | |
Microsoft Corp. | | | 235,119 | | | | 52,295,168 | | |
NortonLifeLock, Inc. | | | 18,406 | | | | 382,477 | | |
Oracle Corp. | | | 58,989 | | | | 3,815,998 | | |
Paycom Software, Inc. (b) | | | 1,540 | | | | 696,465 | | |
Salesforce.com, Inc. (b) | | | 28,455 | | | | 6,332,091 | | |
ServiceNow, Inc. (b) | | | 6,106 | | | | 3,360,925 | | |
Synopsys, Inc. (b) | | | 4,746 | | | | 1,230,353 | | |
Take-Two Interactive
Software, Inc. (b) | | | 3,604 | | | | 748,875 | | |
Tyler Technologies, Inc. (b) | | | 1,286 | | | | 561,365 | | |
| | | | | | 88,891,771 | | |
Technology Hardware Storage & Peripherals (0.2%) | |
Hewlett Packard
Enterprise Co. | | | 40,023 | | | | 474,272 | | |
HP, Inc. | | | 42,713 | | | | 1,050,313 | | |
Xerox Holdings Corp. | | | 5,182 | | | | 120,171 | | |
| | | | | | 1,644,756 | | |
Materials (2.5%) | |
Chemicals (1.8%) | |
Air Products &
Chemicals, Inc. | | | 6,874 | | | | 1,878,114 | | |
Albemarle Corp. | | | 3,262 | | | | 481,210 | | |
Celanese Corp. | | | 3,635 | | | | 472,332 | | |
| | | Shares | | Value(a) | |
CF Industries
Holdings, Inc. | | | 6,652 | | | $ | 257,499 | | |
Corteva, Inc. | | | 23,168 | | | | 897,065 | | |
Dow, Inc. | | | 23,067 | | | | 1,280,219 | | |
DuPont de Nemours, Inc. | | | 22,821 | | | | 1,622,801 | | |
Eastman Chemical Co. | | | 4,205 | | | | 421,678 | | |
Ecolab, Inc. | | | 7,723 | | | | 1,670,948 | | |
FMC Corp. | | | 3,984 | | | | 457,881 | | |
International Flavors &
Fragrances, Inc. | | | 3,289 | | | | 357,975 | | |
Linde PLC (c) | | | 16,322 | | | | 4,301,010 | | |
LyondellBasell Industries
NV – Class A (c) | | | 7,995 | | | | 732,822 | | |
PPG Industries, Inc. | | | 7,343 | | | | 1,059,008 | | |
The Mosaic Co. | | | 10,728 | | | | 246,851 | | |
The Sherwin-Williams Co. | | | 2,542 | | | | 1,868,141 | | |
| | | | | | 18,005,554 | | |
Construction Materials (0.1%) | |
Martin Marietta Materials, Inc. | | | 1,899 | | | | 539,259 | | |
Vulcan Materials Co. | | | 4,047 | | | | 600,211 | | |
| | | | | | 1,139,470 | | |
Containers & Packaging (0.3%) | |
Amcor PLC (c) | | | 48,777 | | | | 574,105 | | |
Ball Corp. | | | 10,172 | | | | 947,827 | | |
International Paper Co. | | | 12,224 | | | | 607,777 | | |
Packaging Corp. of
America | | | 2,882 | | | | 397,457 | | |
Sealed Air Corp. | | | 4,794 | | | | 219,517 | | |
WestRock Co. | | | 8,150 | | | | 354,770 | | |
| | | | | | 3,101,453 | | |
Metals & Mining (0.3%) | |
Freeport-McMoRan, Inc. | | | 45,181 | | | | 1,175,609 | | |
Newmont Corp. | | | 24,983 | | | | 1,496,232 | | |
Nucor Corp. | | | 9,389 | | | | 499,401 | | |
| | | | | | 3,171,242 | | |
Real Estate (2.4%) | |
Health Care REITs (0.2%) | |
Healthpeak Properties, Inc. | | | 16,742 | | | | 506,110 | | |
Ventas, Inc. | | | 11,648 | | | | 571,218 | | |
Welltower, Inc. | | | 12,977 | | | | 838,574 | | |
| | | | | | 1,915,902 | | |
Hotels & Resort REITs (0.0%) | |
Host Hotels & Resorts, Inc. | | | 21,934 | | | | 320,895 | | |
Industrial REITs (0.3%) | |
Duke Realty Corp. | | | 11,567 | | | | 462,333 | | |
ProLogis, Inc. | | | 22,988 | | | | 2,290,984 | | |
| | | | | | 2,753,317 | | |
Office REITs (0.1%) | |
Alexandria Real Estate
Equities, Inc. | | | 3,850 | | | | 686,147 | | |
Boston Properties, Inc. | | | 4,405 | | | | 416,405 | | |
SL Green Realty Corp. | | | 2,231 | | | | 132,923 | | |
Vornado Realty Trust | | | 4,877 | | | | 182,107 | | |
| | | | | | 1,417,582 | | |
See accompanying notes to financial statements.
81
SFT Index 500 Fund
Investments in Securities – continued
| | | Shares | | Value(a) | |
Real Estate Services (0.1%) | |
CBRE Group, Inc. –
Class A (b) | | | 10,432 | | | $ | 654,295 | | |
Residential REITs (0.3%) | |
AvalonBay
Communities, Inc. | | | 4,341 | | | | 696,427 | | |
Equity Residential | | | 10,650 | | | | 631,332 | | |
Essex Property Trust, Inc. | | | 2,010 | | | | 477,214 | | |
Mid-America Apartment
Communities, Inc. | | | 3,533 | | | | 447,596 | | |
UDR, Inc. | | | 9,157 | | | | 351,903 | | |
| | | | | | 2,604,472 | | |
Retail REITs (0.2%) | |
Federal Realty Investment
Trust | | | 2,043 | | | | 173,900 | | |
Kimco Realty Corp. | | | 13,449 | | | | 201,870 | | |
Realty Income Corp. | | | 10,835 | | | | 673,612 | | |
Regency Centers Corp. | | | 4,907 | | | | 223,710 | | |
Simon Property
Group, Inc. | | | 10,196 | | | | 869,515 | | |
| | | | | | 2,142,607 | | |
Specialized REITs (1.2%) | |
American Tower Corp. | | | 13,814 | | | | 3,100,691 | | |
Crown Castle
International Corp. | | | 13,359 | | | | 2,126,619 | | |
Digital Realty Trust, Inc. | | | 8,712 | | | | 1,215,411 | | |
Equinix, Inc. | | | 2,752 | | | | 1,965,424 | | |
Extra Space Storage, Inc. | | | 3,920 | | | | 454,171 | | |
Iron Mountain, Inc. | | | 8,961 | | | | 264,170 | | |
Public Storage | | | 4,730 | | | | 1,092,299 | | |
SBA
Communications Corp. | | | 3,455 | | | | 974,759 | | |
Weyerhaeuser Co. | | | 23,212 | | | | 778,298 | | |
| | | | | | 11,971,842 | | |
Utilities (2.7%) | |
Electric Utilities (1.6%) | |
Alliant Energy Corp. | | | 7,767 | | | | 400,234 | | |
American Electric Power
Co., Inc. | | | 15,436 | | | | 1,285,356 | | |
Duke Energy Corp. | | | 22,887 | | | | 2,095,534 | | |
Edison International | | | 11,771 | | | | 739,454 | | |
Entergy Corp. | | | 6,183 | | | | 617,311 | | |
Evergy, Inc. | | | 7,048 | | | | 391,234 | | |
Eversource Energy | | | 10,661 | | | | 922,283 | | |
Exelon Corp. | | | 30,338 | | | | 1,280,870 | | |
FirstEnergy Corp. | | | 16,873 | | | | 516,483 | | |
NextEra Energy, Inc. | | | 60,923 | | | | 4,700,209 | | |
| | | Shares | | Value(a) | |
Pinnacle West
Capital Corp. | | | 3,475 | | | $ | 277,826 | | |
PPL Corp. | | | 23,909 | | | | 674,234 | | |
The Southern Co. | | | 32,847 | | | | 2,017,791 | | |
Xcel Energy, Inc. | | | 16,340 | | | | 1,089,388 | | |
| | | | | | 17,008,207 | | |
Gas Utilities (0.1%) | |
Atmos Energy Corp. | | | 3,873 | | | | 369,600 | | |
ONEOK, Inc. | | | 13,820 | | | | 530,412 | | |
| | | | | | 900,012 | | |
Independent Power Producers &
Energy Traders (0.1%) | |
AES Corp. | | | 20,684 | | | | 486,074 | | |
NRG Energy, Inc. | | | 7,594 | | | | 285,155 | | |
| | | | | | 771,229 | | |
Multi-Utilities (0.8%) | |
Ameren Corp. | | | 7,687 | | | | 600,047 | | |
CenterPoint Energy, Inc. | | | 16,943 | | | | 366,647 | | |
CMS Energy Corp. | | | 8,904 | | | | 543,233 | | |
Consolidated Edison, Inc. | | | 10,548 | | | | 762,304 | | |
Dominion Energy, Inc. | | | 25,370 | | | | 1,907,824 | | |
DTE Energy Co. | | | 5,947 | | | | 722,025 | | |
NiSource, Inc. | | | 11,917 | | | | 273,376 | | |
Public Service Enterprise
Group, Inc. | | | 15,731 | | | | 917,117 | | |
Sempra Energy | | | 8,970 | | | | 1,142,868 | | |
WEC Energy Group, Inc. | | | 9,809 | | | | 902,722 | | |
| | | | | | 8,138,163 | | |
Water Utilities (0.1%) | |
American Water Works
Co., Inc. | | | 5,637 | | | | 865,110 | | |
Total common stocks
(cost: $330,167,228) | | | | | 984,312,211 | | |
Short-Term Securities (1.9%) | |
Investment Companies (1.9%) | |
State Street Institutional
U.S. Government Money
Market Fund, current
rate 0.030% | | | 18,816,906 | | | | 18,816,906 | | |
Total short-term securities
(cost: $18,816,906) | | | | | 18,816,906 | | |
Total investments in securities
(cost: $348,984,134) (e) | | | | | 1,003,129,117 | | |
Cash and other assets in
excess of liabilities (0.0%) | | | | | 314,677 | | |
Total net assets (100.0%) | | | | $ | 1,003,443,794 | | |
Investments in Securities Legend
(a) Securities are valued by procedures described in Note 2 of the Notes to Financial Statements.
(b) Non-income producing security.
(c) Foreign security: The Fund held 3.2% of net assets in foreign securities at December 31, 2020.
(d) Fully or partially pledged as initial margin deposits on open futures contracts.
See accompanying notes to financial statements.
82
SFT Index 500 Fund
Investments in Securities – continued
Holdings of Open Futures Contracts
On December 31, 2020, securities with an aggregate market value of $18,576,600 have been pledged to cover margin requirements for the following open futures contracts:
Description | | Expiration
Date | | Number of
Contracts | | Position
Type | | Notional
Amount | | Market
Value | | Unrealized
Appreciation/
(Depreciation)(a) | |
S&P 500 E-Mini Index Future | | March 2021 | | | 96 | | | Long | | $ | 17,720,226 | | | $ | 17,994,240 | | | $ | 274,014 | | |
(e) At December 31, 2020 the cost of investments for federal income tax purposes was $351,710,908. The aggregate unrealized appreciation and depreciation of investments based on this cost were:
Gross unrealized appreciation | | $ | 663,062,029 | | |
Gross unrealized depreciation | | | (11,369,806 | ) | |
Net unrealized appreciation | | $ | 651,692,223 | | |
See accompanying notes to financial statements.
83
SFT International Bond Fund
Investments in Securities
(Percentages of each investment category relate to total net assets)
| | | Principal(b) | | Value(a) | |
Long-Term Debt Securities (69.1%) | |
Argentina (1.7%) | |
Government (1.7%) | |
Argentina Treasury Bond
BONCER (ARS) | |
1.000%, 08/05/21 | | | 5,255,800 | | | $ | 48,385 | | |
1.100%, 04/17/21 | | | 9,861,335 | | | | 84,740 | | |
1.200%, 03/18/22 | | | 58,485,718 | | | | 510,389 | | |
1.300%, 09/20/22 | | | 492,100 | | | | 3,885 | | |
1.400%, 03/25/23 | | | 32,768,158 | | | | 269,254 | | |
1.500%, 03/25/24 | | | 32,768,162 | | | | 246,655 | | |
Argentine Bonos del
Tesoro (ARS) | |
15.500%, 10/17/26 | | | 59,411,000 | | | | 128,727 | | |
16.000%, 10/17/23 | | | 29,346,000 | | | | 88,346 | | |
18.200%, 10/03/21 | | | 28,501,000 | | | | 161,338 | | |
Letras de la Nacion
Argentina con Ajuste
por CER (ARS) | |
0.017%, 02/26/21 (c) | | | 1,955,900 | | | | 15,202 | | |
| | | | | | 1,556,921 | | |
Brazil (1.9%) | |
Government (1.9%) | |
Brazil Letras do Tesouro
Nacional (BRL) | |
0.019%, 10/01/21 (c) | | | 5,200,000 | | | | 982,335 | | |
0.163%, 01/01/22 (c) | | | 3,100,000 | | | | 580,159 | | |
0.243%, 04/01/21 (c) | | | 340,000 | | | | 65,138 | | |
Brazil Notas do Tesouro
Nacional Serie F (BRL) | |
10.000%, 01/01/21 | | | 784,000 | | | | 143,571 | | |
| | | | | | 1,771,203 | | |
Ghana (1.5%) | |
Government (1.5%) | |
Ghana Government
Bond (GHS) | |
18.750%, 01/24/22 | | | 960,000 | | | | 163,693 | | |
19.000%, 11/02/26 | | | 2,890,000 | | | | 464,674 | | |
19.750%, 03/25/24 | | | 960,000 | | | | 163,388 | | |
19.750%, 03/15/32 | | | 2,890,000 | | | | 450,714 | | |
24.500%, 06/21/21 | | | 50,000 | | | | 8,779 | | |
24.750%, 03/01/21 | | | 100,000 | | | | 17,232 | | |
24.750%, 07/19/21 | | | 160,000 | | | | 28,229 | | |
Republic of Ghana
Government
Bonds (GHS) | |
16.250%, 05/17/21 | | | 130,000 | | | | 22,090 | | |
16.500%, 03/22/21 | | | 100,000 | | | | 17,033 | | |
17.600%, 11/28/22 | | | 100,000 | | | | 16,715 | | |
| | | | | | 1,352,547 | | |
Indonesia (4.6%) | |
Government (4.6%) | |
Indonesia Treasury
Bond (IDR) | |
6.500%, 06/15/25 | | | 23,654,000,000 | | | | 1,773,461 | | |
8.375%, 03/15/24 | | | 7,865,000,000 | | | | 615,602 | | |
9.500%, 07/15/23 | | | 18,680,000,000 | | | | 1,486,745 | | |
| | | Principal(b) | | Value(a) | |
10.000%, 09/15/24 | | | 1,959,000,000 | | | $ | 161,672 | | |
10.250%, 07/15/22 | | | 2,658,000,000 | | | | 207,069 | | |
| | | | | | 4,244,549 | | |
Mexico (10.0%) | |
Government (10.0%) | |
Mexican Bonos (MXN) | |
6.500%, 06/10/21 | | | 20,100,000 | | | | 1,017,231 | | |
6.500%, 06/09/22 | | | 49,538,000 | | | | 2,559,553 | | |
6.750%, 03/09/23 | | | 26,998,000 | | | | 1,421,204 | | |
7.250%, 12/09/21 | | | 44,130,000 | | | | 2,273,109 | | |
8.000%, 12/07/23 | | | 22,829,000 | | | | 1,257,173 | | |
10.000%, 12/05/24 | | | 9,340,000 | | | | 560,658 | | |
| | | | | | 9,088,928 | | |
Norway (4.3%) | |
Government (4.3%) | |
Norway Government
Bond (NOK) | |
1.500%, 02/19/26 (d) | | | 1,910,000 | | | | 232,263 | | |
1.750%, 03/13/25 (d) | | | 3,215,000 | | | | 393,522 | | |
2.000%, 05/24/23 (d) | | | 8,483,000 | | | | 1,029,231 | | |
3.000%, 03/14/24 (d) | | | 9,548,000 | | | | 1,205,116 | | |
3.750%, 05/25/21 (d) | | | 8,735,000 | | | | 1,034,276 | | |
| | | | | | 3,894,408 | | |
South Korea (17.8%) | |
Government (17.8%) | |
Korea Treasury
Bond (KRW) | |
1.375%, 12/10/29 | | | 4,709,000,000 | | | | 4,207,892 | | |
3.000%, 03/10/23 | | | 967,000,000 | | | | 928,773 | | |
3.000%, 09/10/24 | | | 2,419,000,000 | | | | 2,371,397 | | |
3.375%, 09/10/23 | | | 2,729,000,000 | | | | 2,668,196 | | |
3.500%, 03/10/24 | | | 1,785,000,000 | | | | 1,766,203 | | |
4.250%, 06/10/21 | | | 4,577,300,000 | | | | 4,279,686 | | |
| | | | | | 16,222,147 | | |
United States (27.3%) | |
Government (27.3%) | |
U.S. Treasury Note (USD) | |
1.500%, 10/31/24 | | | 170,000 | | | | 178,175 | | |
1.500%, 11/30/24 | | | 4,250,000 | | | | 4,456,690 | | |
1.625%, 02/15/26 | | | 890,000 | | | | 946,598 | | |
1.625%, 10/31/26 | | | 890,000 | | | | 949,171 | | |
1.750%, 12/31/24 | | | 3,489,000 | | | | 3,696,023 | | |
2.000%, 02/15/25 | | | 4,140,000 | | | | 4,432,549 | | |
2.125%, 05/15/25 | | | 4,950,000 | | | | 5,342,520 | | |
2.125%, 05/31/26 | | | 405,000 | | | | 442,130 | | |
2.625%, 12/31/25 | | | 1,641,000 | | | | 1,824,907 | | |
2.875%, 05/31/25 | | | 2,390,000 | | | | 2,659,249 | | |
| | | | | | 24,928,012 | | |
Total long-term debt securities
(cost: $68,159,586) | | | | | 63,058,715 | | |
See accompanying notes to financial statements.
84
SFT International Bond Fund
Investments in Securities – continued
| | | Principal(b) | | Value(a) | |
Short-Term Securities (30.3%) | |
Argentina (0.1%) | |
Letras de la Nacion
Argentina con Ajuste
por CER (ARS) | |
0.000%, 05/21/21 (c) | | | 4,490,300 | | | $ | 48,479 | | |
0.000%, 05/21/21 (c) | | | 2,206,577 | | | | 16,217 | | |
0.002%, 09/13/21 (c) | | | 3,720,289 | | | | 26,585 | | |
Letras Del Tesoro En
Pesos A Descuento (ARS) | |
0.003%, 03/31/21 (c) | | | 1,670,389 | | | | 10,612 | | |
| | | | | | 101,893 | | |
Japan (14.0%) | |
Japan Treasury Discount
Bill (JPY) | |
0.004%, 03/22/21 (c) | | | 48,900,000 | | | | 473,734 | | |
0.004%, 06/16/21 (c) | | | 49,450,000 | | | | 479,210 | | |
0.009%, 05/25/21 (c) | | | 460,700,000 | | | | 4,464,150 | | |
0.017%, 03/25/21 (c) | | | 91,100,000 | | | | 866,347 | | |
0.022%, 01/12/21 (c) | | | 172,400,000 | | | | 1,669,852 | | |
0.023%, 02/25/21 (c) | | | 492,000,000 | | | | 4,766,104 | | |
| | | | | | 12,719,397 | | |
Mexico (1.4%) | |
Mexico Cetes (MXN) | |
0.001%, 06/17/21 (c) | | | 7,323,000 | | | | 360,347 | | |
0.002%, 10/21/21 (c) | | | 163,800 | | | | 7,942 | | |
0.006%, 05/06/21 (c) | | | 365,700 | | | | 18,081 | | |
| | | Principal(b) | | Value(a) | |
0.024%, 04/08/21 (c) | | | 6,406,100 | | | $ | 317,788 | | |
0.039%, 03/25/21 (c) | | | 265,700 | | | | 13,203 | | |
0.043%, 03/25/21 (c) | | | 1,590,900 | | | | 79,052 | | |
0.067%, 01/28/21 (c) | | | 365,700 | | | | 18,293 | | |
0.079%, 03/25/21 (c) | | | 117,000 | | | | 5,814 | | |
0.082%, 02/25/21 (c) | | | 144,000 | | | | 7,179 | | |
0.094%, 03/25/21 (c) | | | 475,800 | | | | 23,642 | | |
0.099%, 02/25/21 (c) | | | 2,947,300 | | | | 146,942 | | |
0.103%, 02/25/21 (c) | | | 5,906,000 | | | | 294,451 | | |
| | | | | | 1,292,734 | | |
United States (2.4%) | |
U.S. Treasury Bill (USD) | |
0.000%, 01/12/21 (c) | | | 2,210,000 | | | | 2,209,980 | | |
Investment Companies (12.4%) | |
United States (12.4%) | |
State Street Institutional
U.S. Government Money
Market Fund, current
rate 0.030% | | | 11,263,853 | | | | 11,263,853 | | |
Total short-term securities
(cost: $27,331,149) | | | | | 27,587,857 | | |
Total investments in securities
(cost: $95,490,735) (e) | | | | | 90,646,572 | | |
Cash and other assets in
excess of liabilities (0.6%) | | | | | 508,061 | | |
Total net assets (100.0%) | | | | $ | 91,154,633 | | |
See accompanying notes to financial statements.
85
SFT International Bond Fund
Investments in Securities – continued
Foreign Forward Currency Contracts
On December 31, 2020, SFT International Bond Fund had entered into forward foreign currency contracts that obligate the Fund to deliver currencies at specified future dates. Unrealized appreciation and depreciation on these contracts is included in the accompanying financial statements. The terms of the open contracts were as follows:
Settlement
Date | | Currency to be
delivered – SELL | | Currency to be
received – BUY | | Unrealized
Appreciation(a) | | Unrealized
Depreciation(a) | | Counterparty | |
01/07/21 | | | 43,020,000 | | | MXN | | | | | 1,980,572 | | | USD | | | | $ | – | | | $ | (178,031 | ) | | HSB | |
01/07/21 | | | 464,096 | | | USD | | | | | 9,220,000 | | | MXN | | | | | – | | | | (1,466 | ) | | HSB | |
01/07/21 | | | 1,687,890 | | | USD | | | | | 33,800,000 | | | MXN | | | | | 8,083 | | | | – | | | HSB | |
01/11/21 | | | 296,876 | | | EUR | | | | | 318,081 | | | CHF | | | | | – | | | | (12,290 | ) | | UBS | |
01/11/21 | | | 296,876 | | | EUR | | | | | 318,081 | | | CHF | | | | | 8,915 | | | | – | | | UBS | |
01/11/21 | | | 318,081 | | | CHF | | | | | 295,111 | | | EUR | | | | | 3,181 | | | | – | | | UBS | |
01/11/21 | | | 318,081 | | | CHF | | | | | 295,111 | | | EUR | | | | | – | | | | (1,966 | ) | | UBS | |
01/13/21 | | | 10,824,000 | | | MXN | | | | | 500,810 | | | USD | | | | | – | | | | (41,964 | ) | | CIT | |
01/13/21 | | | 607,000,000 | | | KRW | | | | | 506,297 | | | USD | | | | | – | | | | (52,637 | ) | | DBK | |
01/13/21 | | | 561,076 | | | USD | | | | | 607,000,000 | | | KRW | | | | | – | | | | (2,142 | ) | | DBK | |
01/13/21 | | | 560,000 | | | AUD | | | | | 42,704,467 | | | JPY | | | | | – | | | | (27,974 | ) | | JPM | |
01/13/21 | | | 560,000 | | | AUD | | | | | 42,704,467 | | | JPY | | | | | 9,496 | | | | – | | | JPM | |
01/13/21 | | | 43,990,132 | | | JPY | | | | | 560,000 | | | AUD | | | | | 10,202 | | | | – | | | JPM | |
01/13/21 | | | 43,990,132 | | | JPY | | | | | 560,000 | | | AUD | | | | | – | | | | (4,178 | ) | | JPM | |
01/13/21 | | | 198,798 | | | CHF | | | | | 184,451 | | | EUR | | | | | – | | | | (1,640 | ) | | UBS | |
01/13/21 | | | 198,798 | | | CHF | | | | | 184,451 | | | EUR | | | | | 2,405 | | | | – | | | UBS | |
01/13/21 | | | 184,482 | | | EUR | | | | | 198,798 | | | CHF | | | | | – | | | | (9,152 | ) | | UBS | |
01/13/21 | | | 184,482 | | | EUR | | | | | 198,798 | | | CHF | | | | | 8,349 | | | | – | | | UBS | |
01/14/21 | | | 312,166 | | | CHF | | | | | 289,504 | | | EUR | | | | | – | | | | (2,749 | ) | | GSC | |
01/14/21 | | | 312,166 | | | CHF | | | | | 289,504 | | | EUR | | | | | 3,783 | | | | – | | | GSC | |
01/14/21 | | | 290,704 | | | EUR | | | | | 312,166 | | | CHF | | | | | – | | | | (12,898 | ) | | GSC | |
01/14/21 | | | 290,704 | | | EUR | | | | | 312,166 | | | CHF | | | | | 10,396 | | | | – | | | GSC | |
01/15/21 | | | 15,933,000 | | | MXN | | | | | 735,867 | | | USD | | | | | – | | | | (62,913 | ) | | CIT | |
01/15/21 | | | 8,158,000 | | | EUR | | | | | 994,460,200 | | | JPY | | | | | – | | | | (713,931 | ) | | DBK | |
01/15/21 | | | 8,158,000 | | | EUR | | | | | 994,460,200 | | | JPY | | | | | 363,507 | | | | – | | | DBK | |
01/15/21 | | | 538,289,919 | | | JPY | | | | | 6,870,000 | | | AUD | | | | | – | | | | (38,068 | ) | | DBK | |
01/15/21 | | | 538,289,919 | | | JPY | | | | | 6,870,000 | | | AUD | | | | | 125,267 | | | | – | | | DBK | |
01/15/21 | | | 147,550 | | | EUR | | | | | 174,242 | | | USD | | | | | – | | | | (6,337 | ) | | DBK | |
01/15/21 | | | 8,470,000 | | | AUD | | | | | 641,517,800 | | | JPY | | | | | – | | | | (442,853 | ) | | DBK | |
01/15/21 | | | 8,470,000 | | | AUD | | | | | 641,517,800 | | | JPY | | | | | 120,885 | | | | – | | | DBK | |
01/15/21 | | | 180,870 | | | USD | | | | | 147,550 | | | EUR | | | | | – | | | | (292 | ) | | DBK | |
01/19/21 | | | 747,830 | | | USD | | | | | 4,887,990 | | | CNH | | | | | 3,893 | | | | – | | | CIT | |
01/19/21 | | | 362,454 | | | EUR | | | | | 3,756,850 | | | SEK | | | | | – | | | | (17,522 | ) | | DBK | |
01/19/21 | | | 362,454 | | | EUR | | | | | 3,756,850 | | | SEK | | | | | 31,478 | | | | – | | | DBK | |
01/19/21 | | | 809,543 | | | USD | | | | | 5,292,550 | | | CNH | | | | | 4,397 | | | | – | | | HSB | |
01/25/21 | | | 517,375 | | | EUR | | | | | 63,761,841 | | | JPY | | | | | – | | | | (19,146 | ) | | HSB | |
01/25/21 | | | 517,375 | | | EUR | | | | | 63,761,841 | | | JPY | | | | | 3,575 | | | | – | | | HSB | |
01/27/21 | | | 13,005,000 | | | MXN | | | | | 616,330 | | | USD | | | | | – | | | | (34,749 | ) | | CIT | |
01/28/21 | | | 21,750,000 | | | MXN | | | | | 1,027,625 | | | USD | | | | | – | | | | (61,136 | ) | | CIT | |
01/29/21 | | | 514,234,382 | | | KRW | | | | | 427,282 | | | USD | | | | | – | | | | (46,261 | ) | | CIT | |
01/29/21 | | | 465,741 | | | USD | | | | | 514,234,382 | | | KRW | | | | | 7,802 | | | | – | | | CIT | |
02/02/21 | | | 9,070,054 | | | BRL | | | | | 1,680,137 | | | USD | | | | | – | | | | (65,535 | ) | | CIT | |
02/04/21 | | | 610,000,000 | | | KRW | | | | | 509,310 | | | USD | | | | | – | | | | (52,434 | ) | | DBK | |
02/04/21 | | | 419,941 | | | USD | | | | | 454,270,800 | | | KRW | | | | | – | | | | (1,607 | ) | | DBK | |
02/04/21 | | | 143,508 | | | USD | | | | | 155,729,200 | | | KRW | | | | | – | | | | (98 | ) | | DBK | |
02/08/21 | | | 306,464 | | | USD | | | | | 22,722,800 | | | INR | | | | | 3,386 | | | | – | | | CIT | |
02/08/21 | | | 420,460 | | | USD | | | | | 31,175,800 | | | INR | | | | | 4,656 | | | | – | | | JPM | |
02/09/21 | | | 494,137 | | | USD | | | | | 36,649,400 | | | INR | | | | | 5,568 | | | | – | | | HSB | |
02/09/21 | | | 318,085 | | | CHF | | | | | 295,150 | | | EUR | | | | | 1,735 | | | | – | | | UBS | |
02/09/21 | | | 318,085 | | | CHF | | | | | 295,150 | | | EUR | | | | | – | | | | (597 | ) | | UBS | |
02/09/21 | | | 296,941 | | | EUR | | | | | 318,085 | | | CHF | | | | | – | | | | (12,603 | ) | | UBS | |
02/09/21 | | | 296,941 | | | EUR | | | | | 318,085 | | | CHF | | | | | 9,272 | | | | – | | | UBS | |
02/10/21 | | | 1,944,607 | | | USD | | | | | 2,133,000,000 | | | KRW | | | | | 19,840 | | | | – | | | HSB | |
02/10/21 | | | 57,690,000 | | | MXN | | | | | 2,759,389 | | | USD | | | | | – | | | | (124,149 | ) | | HSB | |
02/10/21 | | | 2,133,000,000 | | | KRW | | | | | 1,888,814 | | | USD | | | | | – | | | | (75,633 | ) | | HSB | |
02/10/21 | | | 739,860 | | | EUR | | | | | 795,220 | | | CHF | | | | | – | | | | (28,802 | ) | | UBS | |
02/10/21 | | | 739,860 | | | EUR | | | | | 795,220 | | | CHF | | | | | 23,542 | | | | – | | | UBS | |
02/10/21 | | | 795,220 | | | CHF | | | | | 738,086 | | | EUR | | | | | 8,894 | | | | – | | | UBS | |
02/10/21 | | | 795,220 | | | CHF | | | | | 738,086 | | | EUR | | | | | – | | | | (5,806 | ) | | UBS | |
02/12/21 | | | 416,225 | | | CHF | | | | | 385,847 | | | EUR | | | | | 2,294 | | | | – | | | GSC | |
02/12/21 | | | 416,225 | | | CHF | | | | | 385,847 | | | EUR | | | | | – | | | | (1,265 | ) | | GSC | |
02/12/21 | | | 386,532 | | | EUR | | | | | 416,225 | | | CHF | | | | | – | | | | (18,205 | ) | | GSC | |
See accompanying notes to financial statements.
86
SFT International Bond Fund
Investments in Securities – continued
Settlement
Date | | Currency to be
delivered – SELL | | Currency to be
received – BUY | | Unrealized
Appreciation(a) | | Unrealized
Depreciation(a) | | Counterparty | |
02/12/21 | | | 386,532 | | | EUR | | | | | 416,225 | | | CHF | | | | $ | 16,338 | | | $ | – | | | GSC | |
02/16/21 | | | 491,577 | | | EUR | | | | | 5,009,117 | | | SEK | | | | | – | | | | (20,645 | ) | | DBK | |
02/16/21 | | | 491,577 | | | EUR | | | | | 5,009,117 | | | SEK | | | | | 28,903 | | | | – | | | DBK | |
02/16/21 | | | 491,575 | | | EUR | | | | | 5,009,100 | | | SEK | | | | | – | | | | (20,645 | ) | | DBK | |
02/16/21 | | | 491,575 | | | EUR | | | | | 5,009,100 | | | SEK | | | | | 28,903 | | | | – | | | DBK | |
02/16/21 | | | 230,526 | | | USD | | | | | 17,063,067 | | | INR | | | | | 1,960 | | | | – | | | HSB | |
02/18/21 | | | 561,418 | | | USD | | | | | 3,677,220 | | | CNH | | | | | 2,993 | | | | – | | | JPM | |
02/22/21 | | | 3,106,031 | | | AUD | | | | | 236,624,609 | | | JPY | | | | | – | | | | (153,841 | ) | | JPM | |
02/22/21 | | | 3,106,031 | | | AUD | | | | | 236,624,609 | | | JPY | | | | | 49,292 | | | | – | | | JPM | |
02/23/21 | | | 970,456 | | | USD | | | | | 1,071,500,000 | | | KRW | | | | | 16,605 | | | | – | | | CIT | |
02/23/21 | | | 1,071,500,000 | | | KRW | | | | | 967,276 | | | USD | | | | | – | | | | (19,784 | ) | | CIT | |
02/24/21 | | | 650,710 | | | EUR | | | | | 81,689,118 | | | JPY | | | | | – | | | | (25,977 | ) | | HSB | |
02/24/21 | | | 650,710 | | | EUR | | | | | 81,689,118 | | | JPY | | | | | 20,651 | | | | – | | | HSB | |
02/25/21 | | | 1,296,969 | | | AUD | | | | | 98,293,364 | | | JPY | | | | | – | | | | (54,438 | ) | | CIT | |
02/25/21 | | | 1,296,969 | | | AUD | | | | | 98,293,364 | | | JPY | | | | | 5,822 | | | | – | | | CIT | |
02/25/21 | | | 917,461 | | | EUR | | | | | 114,418,424 | | | JPY | | | | | – | | | | (43,905 | ) | | HSB | |
02/25/21 | | | 917,461 | | | EUR | | | | | 114,418,424 | | | JPY | | | | | 29,038 | | | | – | | | HSB | |
02/25/21 | | | 517,376 | | | EUR | | | | | 63,780,339 | | | JPY | | | | | – | | | | (19,360 | ) | | HSB | |
02/25/21 | | | 517,376 | | | EUR | | | | | 63,780,339 | | | JPY | | | | | 3,778 | | | | – | | | HSB | |
02/25/21 | | | 112,344 | | | AUD | | | | | 8,514,975 | | | JPY | | | | | – | | | | (4,708 | ) | | JPM | |
02/25/21 | | | 112,344 | | | AUD | | | | | 8,514,975 | | | JPY | | | | | 504 | | | | – | | | JPM | |
02/26/21 | | | 514,234,381 | | | KRW | | | | | 433,935 | | | USD | | | | | – | | | | (39,801 | ) | | CIT | |
02/26/21 | | | 669,184 | | | EUR | | | | | 84,171,170 | | | JPY | | | | | – | | | | (28,939 | ) | | CIT | |
02/26/21 | | | 669,184 | | | EUR | | | | | 84,171,170 | | | JPY | | | | | 25,026 | | | | – | | | CIT | |
02/26/21 | | | 2,213,415 | | | USD | | | | | 2,443,765,618 | | | KRW | | | | | 37,892 | | | | – | | | CIT | |
02/26/21 | | | 1,494,000,000 | | | KRW | | | | | 1,348,862 | | | USD | | | | | – | | | | (27,478 | ) | | CIT | |
02/26/21 | | | 435,531,237 | | | KRW | | | | | 391,225 | | | USD | | | | | – | | | | (10,006 | ) | | CIT | |
02/26/21 | | | 1,324,199 | | | USD | | | | | 1,770,000 | | | AUD | | | | | 42,237 | | | | – | | | JPM | |
02/26/21 | | | 1,770,000 | | | AUD | | | | | 1,291,868 | | | USD | | | | | – | | | | (74,568 | ) | | JPM | |
03/08/21 | | | 11,783,000 | | | MXN | | | | | 538,787 | | | USD | | | | | – | | | | (48,444 | ) | | CIT | |
03/08/21 | | | 408,619 | | | USD | | | | | 30,375,500 | | | INR | | | | | 4,387 | | | | – | | | CIT | |
03/08/21 | | | 9,800,000,000 | | | KRW | | | | | 8,264,463 | | | USD | | | | | – | | | | (764,923 | ) | | HSB | |
03/08/21 | | | 8,933,618 | | | USD | | | | | 9,800,000,000 | | | KRW | | | | | 95,769 | | | | – | | | HSB | |
03/08/21 | | | 420,461 | | | USD | | | | | 31,264,100 | | | INR | | | | | 4,628 | | | | – | | | JPM | |
03/09/21 | | | 494,136 | | | USD | | | | | 36,751,860 | | | INR | | | | | 5,506 | | | | – | | | HSB | |
03/09/21 | | | 543,953 | | | USD | | | | | 40,440,200 | | | INR | | | | | 5,831 | | | | – | | | JPM | |
03/10/21 | | | 880,250 | | | AUD | | | | | 67,334,459 | | | JPY | | | | | – | | | | (44,042 | ) | | CIT | |
03/10/21 | | | 880,250 | | | AUD | | | | | 67,334,459 | | | JPY | | | | | 17,119 | | | | – | | | CIT | |
03/10/21 | | | 368,585 | | | EUR | | | | | 397,596 | | | CHF | | | | | – | | | | (18,030 | ) | | UBS | |
03/10/21 | | | 368,585 | | | EUR | | | | | 397,596 | | | CHF | | | | | 17,129 | | | | – | | | UBS | |
03/10/21 | | | 397,596 | | | CHF | | | | | 367,915 | | | EUR | | | | | 258 | | | | – | | | UBS | |
03/10/21 | | | 397,596 | | | CHF | | | | | 367,915 | | | EUR | | | | | – | | | | (178 | ) | | UBS | |
03/11/21 | | | 14,445,000 | | | MXN | | | | | 641,436 | | | USD | | | | | – | | | | (78,216 | ) | | CIT | |
03/11/21 | | | 483,617 | | | EUR | | | | | 520,280 | | | CHF | | | | | – | | | | (7,135 | ) | | GSC | |
03/11/21 | | | 483,617 | | | EUR | | | | | 520,280 | | | CHF | | | | | 4,367 | | | | – | | | GSC | |
03/11/21 | | | 520,280 | | | CHF | | | | | 482,406 | | | EUR | | | | | 3,173 | | | | – | | | GSC | |
03/11/21 | | | 520,280 | | | CHF | | | | | 482,406 | | | EUR | | | | | – | | | | (1,889 | ) | | GSC | |
03/11/21 | | | 972,503 | | | AUD | | | | | 74,910,933 | | | JPY | | | | | – | | | | (45,689 | ) | | HSB | |
03/11/21 | | | 972,503 | | | AUD | | | | | 74,910,933 | | | JPY | | | | | 20,985 | | | | – | | | HSB | |
03/15/21 | | | 184,996 | | | USD | | | | | 13,728,522 | | | INR | | | | | 1,505 | | | | – | | | CIT | |
03/15/21 | | | 722,598 | | | EUR | | | | | 7,513,650 | | | SEK | | | | | – | | | | (29,685 | ) | | DBK | |
03/15/21 | | | 722,598 | | | EUR | | | | | 7,513,650 | | | SEK | | | | | 59,923 | | | | – | | | DBK | |
03/15/21 | | | 490,246 | | | EUR | | | | | 5,009,117 | | | SEK | | | | | 19,306 | | | | – | | | DBK | |
03/15/21 | | | 490,246 | | | EUR | | | | | 5,009,117 | | | SEK | | | | | – | | | | (9,579 | ) | | DBK | |
03/15/21 | | | 416,222 | | | CHF | | | | | 384,167 | | | EUR | | | | | 727 | | | | – | | | GSC | |
03/15/21 | | | 416,222 | | | CHF | | | | | 384,167 | | | EUR | | | | | – | | | | (1,865 | ) | | GSC | |
03/15/21 | | | 386,500 | | | EUR | | | | | 416,222 | | | CHF | | | | | – | | | | (15,023 | ) | | GSC | |
03/15/21 | | | 386,500 | | | EUR | | | | | 416,222 | | | CHF | | | | | 13,303 | | | | – | | | GSC | |
03/15/21 | | | 229,889 | | | USD | | | | | 17,063,067 | | | INR | | | | | 1,911 | | | | – | | | HSB | |
03/15/21 | | | 1,122,700 | | | USD | | | | | 7,365,050 | | | CNH | | | | | 5,858 | | | | – | | | JPM | |
03/16/21 | | | 14,589,000 | | | MXN | | | | | 671,320 | | | USD | | | | | – | | | | (55,091 | ) | | CIT | |
03/16/21 | | | 404,770 | | | USD | | | | | 2,655,860 | | | CNH | | | | | 2,166 | | | | – | | | HSB | |
03/16/21 | | | 1,462,752 | | | USD | | | | | 12,777,100 | | | NOK | | | | | 29,351 | | | | – | | | JPM | |
03/17/21 | | | 650,000 | | | AUD | | | | | 49,914,150 | | | JPY | | | | | – | | | | (28,651 | ) | | HSB | |
03/17/21 | | | 650,000 | | | AUD | | | | | 49,914,150 | | | JPY | | | | | 10,656 | | | | – | | | HSB | |
03/22/21 | | | 508,500,000 | | | KRW | | | | | 430,750 | | | USD | | | | | – | | | | (37,775 | ) | | CIT | |
03/22/21 | | | 463,406 | | | USD | | | | | 508,500,000 | | | KRW | | | | | 5,118 | | | | – | | | CIT | |
03/22/21 | | | 334,383 | | | EUR | | | | | 3,525,000 | | | NOK | | | | | 747 | | | | – | | | JPM | |
See accompanying notes to financial statements.
87
SFT International Bond Fund
Investments in Securities – continued
Settlement
Date | | Currency to be
delivered – SELL | | Currency to be
received – BUY | | Unrealized
Appreciation(a) | | Unrealized
Depreciation(a) | | Counterparty | |
03/22/21 | | | 334,383 | | | EUR | | | | | 3,525,000 | | | NOK | | | | $ | 1,088 | | | $ | – | | | JPM | |
03/23/21 | | | 33,800,000 | | | MXN | | | | | 1,673,682 | | | USD | | | | | – | | | | (7,938 | ) | | HSB | |
03/25/21 | | | 917,485 | | | EUR | | | | | 112,854,334 | | | JPY | | | | | – | | | | (52,596 | ) | | HSB | |
03/25/21 | �� | | 917,485 | | | EUR | | | | | 112,854,334 | | | JPY | | | | | 22,222 | | | | – | | | HSB | |
03/29/21 | | | 728,510 | | | EUR | | | | | 91,873,080 | | | JPY | | | | | 3,944 | | | | – | | | CIT | |
03/29/21 | | | 728,510 | | | EUR | | | | | 91,873,080 | | | JPY | | | | | – | | | | (6,154 | ) | | CIT | |
03/31/21 | | | 728,510 | | | EUR | | | | | 89,767,687 | | | JPY | | | | | – | | | | (43,129 | ) | | CIT | |
03/31/21 | | | 728,510 | | | EUR | | | | | 89,767,687 | | | JPY | | | | | 20,487 | | | | – | | | CIT | |
03/31/21 | | | 939,420 | | | USD | | | | | 8,890,338 | | | NOK | | | | | 98,706 | | | | – | | | JPM | |
04/13/21 | | | 290,258 | | | EUR | | | | | 312,168 | | | CHF | | | | | – | | | | (13,496 | ) | | GSC | |
04/13/21 | | | 290,258 | | | EUR | | | | | 312,168 | | | CHF | | | | | 11,817 | | | | – | | | GSC | |
04/13/21 | | | 312,168 | | | CHF | | | | | 288,062 | | | EUR | | | | | 474 | | | | – | | | GSC | |
04/13/21 | | | 312,168 | | | CHF | | | | | 288,062 | | | EUR | | | | | – | | | | (1,488 | ) | | GSC | |
04/13/21 | | | 972,497 | | | AUD | | | | | 73,625,316 | | | JPY | | | | | – | | | | (56,575 | ) | | HSB | |
04/13/21 | | | 972,497 | | | AUD | | | | | 73,625,316 | | | JPY | | | | | 19,552 | | | | – | | | HSB | |
04/13/21 | | | 560,000 | | | AUD | | | | | 42,659,891 | | | JPY | | | | | – | | | | (28,682 | ) | | JPM | |
04/13/21 | | | 560,000 | | | AUD | | | | | 42,659,891 | | | JPY | | | | | 9,920 | | | | – | | | JPM | |
04/13/21 | | | 1,490,050 | | | AUD | | | | | 112,847,449 | | | JPY | | | | | – | | | | (86,312 | ) | | JPM | |
04/13/21 | | | 1,490,050 | | | AUD | | | | | 112,847,449 | | | JPY | | | | | 29,968 | | | | – | | | JPM | |
04/13/21 | | | 184,613 | | | EUR | | | | | 198,798 | | | CHF | | | | | – | | | | (9,748 | ) | | UBS | |
04/13/21 | | | 184,613 | | | EUR | | | | | 198,798 | | | CHF | | | | | 8,963 | | | | – | | | UBS | |
04/13/21 | | | 198,798 | | | CHF | | | | | 183,848 | | | EUR | | | | | 302 | | | | – | | | UBS | |
04/13/21 | | | 198,798 | | | CHF | | | | | 183,848 | | | EUR | | | | | – | | | | (456 | ) | | UBS | |
04/15/21 | | | 483,874 | | | EUR | | | | | 5,009,117 | | | SEK | | | | | – | | | | (24,356 | ) | | DBK | |
04/15/21 | | | 483,874 | | | EUR | | | | | 5,009,117 | | | SEK | | | | | 41,712 | | | | – | | | DBK | |
04/16/21 | | | 194,825 | | | EUR | | | | | 230,188 | | | USD | | | | | – | | | | (8,711 | ) | | BOA | |
04/16/21 | | | 239,298 | | | USD | | | | | 194,825 | | | EUR | | | | | – | | | | (399 | ) | | BOA | |
04/16/21 | | | 362,092 | | | EUR | | | | | 3,756,850 | | | SEK | | | | | – | | | | (17,900 | ) | | DBK | |
04/16/21 | | | 362,092 | | | EUR | | | | | 3,756,850 | | | SEK | | | | | 31,911 | | | | – | | | DBK | |
04/30/21 | | | 669,187 | | | EUR | | | | | 82,129,957 | | | JPY | | | | | – | | | | (33,644 | ) | | CIT | |
04/30/21 | | | 669,187 | | | EUR | | | | | 82,129,957 | | | JPY | | | | | 9,439 | | | | – | | | CIT | |
05/03/21 | | | 153,900 | | | USD | | | | | 205,000 | | | AUD | | | | | 4,424 | | | | – | | | MSC | |
05/03/21 | | | 205,000 | | | AUD | | | | | 144,944 | | | USD | | | | | – | | | | (13,379 | ) | | MSC | |
05/17/21 | | | 227,819 | | | USD | | | | | 250,000,000 | | | KRW | | | | | 2,609 | | | | – | | | CIT | |
05/17/21 | | | 250,000,000 | | | KRW | | | | | 224,125 | | | USD | | | | | – | | | | (6,304 | ) | | CIT | |
06/08/21 | | | 306,465 | | | USD | | | | | 23,044,600 | | | INR | | | | | 3,033 | | | | – | | | CIT | |
06/09/21 | | | 180,360 | | | USD | | | | | 13,570,300 | | | INR | | | | | 1,869 | | | | – | | | CIT | |
06/09/21 | | | 295,190 | | | EUR | | | | | 318,081 | | | CHF | | | | | – | | | | (4,551 | ) | | UBS | |
06/09/21 | | | 295,190 | | | EUR | | | | | 318,081 | | | CHF | | | | | 3,711 | | | | – | | | UBS | |
06/09/21 | | | 318,081 | | | CHF | | | | | 294,011 | | | EUR | | | | | 925 | | | | – | | | UBS | |
06/09/21 | | | 318,081 | | | CHF | | | | | 294,011 | | | EUR | | | | | – | | | | (1,532 | ) | | UBS | |
06/11/21 | | | 973,796 | | | EUR | | | | | 10,018,200 | | | SEK | | | | | – | | | | (13,503 | ) | | DBK | |
06/11/21 | | | 973,796 | | | EUR | | | | | 10,018,200 | | | SEK | | | | | 40,029 | | | | – | | | DBK | |
06/15/21 | | | 288,341 | | | EUR | | | | | 3,097,500 | | | NOK | | | | | 10,606 | | | | – | | | DBK | |
06/15/21 | | | 5,187,181 | | | USD | | | | | 538,509,244 | | | JPY | | | | | 39,181 | | | | – | | | DBK | |
06/15/21 | | | 255,346 | | | EUR | | | | | 2,624,700 | | | SEK | | | | | 10,434 | | | | – | | | DBK | |
06/15/21 | | | 255,346 | | | EUR | | | | | 2,624,700 | | | SEK | | | | | – | | | | (3,767 | ) | | DBK | |
06/15/21 | | | 288,341 | | | EUR | | | | | 3,097,500 | | | NOK | | | | | – | | | | (3,005 | ) | | DBK | |
06/15/21 | | | 396,788 | | | USD | | | | | 41,194,514 | | | JPY | | | | | 3,015 | | | | – | | | HSB | |
06/15/21 | | | 423,981 | | | USD | | | | | 43,990,132 | | | JPY | | | | | 2,954 | | | | – | | | JPM | |
06/16/21 | | | 123,286 | | | USD | | | | | 9,249,779 | | | INR | | | | | 805 | | | | – | | | CIT | |
06/16/21 | | | 445,183 | | | EUR | | | | | 4,735,500 | | | NOK | | | | | 11,195 | | | | – | | | DBK | |
06/16/21 | | | 445,183 | | | EUR | | | | | 4,735,500 | | | NOK | | | | | – | | | | (4,945 | ) | | DBK | |
06/16/21 | | | 654,397 | | | EUR | | | | | 6,686,100 | | | SEK | | | | | 21,165 | | | | – | | | DBK | |
06/16/21 | | | 654,397 | | | EUR | | | | | 6,686,100 | | | SEK | | | | | – | | | | (9,019 | ) | | DBK | |
06/16/21 | | | 160,308 | | | USD | | | | | 12,024,712 | | | INR | | | | | 1,011 | | | | – | | | HSB | |
06/16/21 | | | 404,772 | | | USD | | | | | 2,671,330 | | | CNH | | | | | 2,226 | | | | – | | | HSB | |
06/18/21 | | | 492,483 | | | EUR | | | | | 5,230,000 | | | NOK | | | | | 8,900 | | | | – | | | DBK | |
06/18/21 | | | 492,483 | | | EUR | | | | | 5,230,000 | | | NOK | | | | | – | | | | (3,024 | ) | | DBK | |
06/18/21 | | | 164,727 | | | EUR | | | | | 1,680,000 | | | SEK | | | | | 4,119 | | | | – | | | JPM | |
06/18/21 | | | 164,727 | | | EUR | | | | | 1,680,000 | | | SEK | | | | | – | | | | (1,439 | ) | | JPM | |
06/30/21 | | | 728,510 | | | EUR | | | | | 89,825,275 | | | JPY | | | | | – | | | | (44,340 | ) | | CIT | |
06/30/21 | | | 728,510 | | | EUR | | | | | 89,825,275 | | | JPY | | | | | 21,529 | | | | – | | | CIT | |
07/13/21 | | | 560,000 | | | AUD | | | | | 42,608,184 | | | JPY | | | | | – | | | | (29,375 | ) | | JPM | |
07/13/21 | | | 560,000 | | | AUD | | | | | 42,608,184 | | | JPY | | | | | 10,398 | | | | – | | | JPM | |
09/15/21 | | | 255,349 | | | EUR | | | | | 2,627,800 | | | SEK | | | | | 10,709 | | | | – | | | DBK | |
09/15/21 | | | 255,349 | | | EUR | | | | | 2,627,800 | | | SEK | | | | | – | | | | (4,048 | ) | | DBK | |
09/15/21 | | | 288,338 | | | EUR | | | | | 3,104,300 | | | NOK | | | | | – | | | | (2,957 | ) | | DBK | |
See accompanying notes to financial statements.
88
SFT International Bond Fund
Investments in Securities – continued
Settlement
Date | | Currency to be
delivered – SELL | | Currency to be
received – BUY | | Unrealized
Appreciation(a) | | Unrealized
Depreciation(a) | | Counterparty | |
09/15/21 | | | 288,338 | | | EUR | | | | | 3,104,300 | | | NOK | | | | $ | 10,496 | | | $ | – | | | DBK | |
09/20/21 | | | 1,641,695 | | | USD | | | | | 14,272,900 | | | NOK | | | | | 23,991 | | | | – | | | JPM | |
| | | | | | | | | | | $ | 2,004,305 | | | $ | (4,446,111 | ) | | | |
Investments in Securities Legend
(a) Securities are valued by procedures described in Note 2 of the Notes to Investments in Securities.
(b) Principal amounts for foreign debt securities are denominated in the currencies indicated. United States debt securities are denominated in U.S. Dollars.
(c) Rate represents annualized yield at date of purchase.
(d) Security sold within terms of a private placement memorandum exempt from registration pursuant to Rule 144A under the Securities Act of 1933, as amended, and may be sold only to dealers in that program. This security has been determined to be liquid unless otherwise indicated.
(e) At December 31, 2020 the cost of investments for federal income tax purposes was $93,058,702. The aggregate unrealized appreciation and depreciation of investments based on this cost were:
Gross unrealized appreciation | | $ | 3,508,967 | | |
Gross unrealized depreciation | | | (8,362,903 | ) | |
Net unrealized depreciation | | $ | (4,853,936 | ) | |
Currency Legend
ARS Argentine Peso
AUD Australian Dollar
BRL Brazilian Real
CHF Swiss Franc
CNH Chinese Yuan Renminbi Offshore
EUR Euro
GHS Ghanaian Cedi
IDR Indonesian Rupiah
INR Indian Rupee
JPY Japanese Yen
KRW South Korean Won
MXN Mexican Peso
NOK Norwegian Krone
SEK Swedish Krona
USD United States Dollar
Counterparty Legend
BOA Bank of America Merrill Lynch
CIT Citibank NA
DBK Deutsche Bank AG
GSC Goldman Sachs
HSB HSBC Bank PLC
JPM JPMorgan Chase Bank NA
MSC Morgan Stanley and Co., Inc.
UBS UBS AG
See accompanying notes to financial statements.
89
SFT IvySM Growth Fund
Investments in Securities
(Percentages of each investment category relate to total net assets)
| | | Shares | | Value(a) | |
Common Stocks (99.6%) | |
Communication Services (0.6%) | |
Interactive Media & Services (0.6%) | |
Pinterest, Inc. Class A (b) | | | 50,546 | | | $ | 3,330,981 | | |
Consumer Discretionary (16.2%) | |
Automobiles (2.2%) | |
Ferrari NV (c) | | | 58,658 | | | | 13,463,184 | | |
Internet & Catalog Retail (9.3%) | |
Amazon.com, Inc. (b) | | | 12,670 | | | | 41,265,303 | | |
Booking Holdings, Inc. (b) | | | 6,827 | | | | 15,205,572 | | |
| | | | | | 56,470,875 | | |
Specialty Retail (3.4%) | |
O'Reilly
Automotive, Inc. (b) | | | 11,386 | | | | 5,152,962 | | |
Home Depot, Inc. (The) | | | 39,361 | | | | 10,455,069 | | |
Tractor Supply Co. | | | 33,125 | | | | 4,656,712 | | |
| | | | | | 20,264,743 | | |
Textiles, Apparel & Luxury Goods (1.3%) | |
NIKE, Inc. – Class B | | | 56,050 | | | | 7,929,394 | | |
Consumer Staples (3.3%) | |
Beverages (2.7%) | |
The Coca-Cola Co. | | | 296,948 | | | | 16,284,628 | | |
Personal Care (0.6%) | |
The Estee Lauder Cos.,
Inc. – Class A | | | 13,387 | | | | 3,563,486 | | |
Financial (2.8%) | |
Capital Markets (2.8%) | |
Intercontinental
Exchange, Inc. | | | 76,289 | | | | 8,795,359 | | |
S&P Global, Inc. | | | 25,074 | | | | 8,242,576 | | |
| | | | | | 17,037,935 | | |
Health Care (12.7%) | |
Health Care Equipment & Supplies (5.2%) | |
Danaher Corp. | | | 36,502 | | | | 8,108,554 | | |
DexCom, Inc. (b) | | | 5,138 | | | | 1,899,621 | | |
Intuitive Surgical, Inc. (b) | | | 10,154 | | | | 8,306,988 | | |
The Cooper Cos., Inc. | | | 36,760 | | | | 13,355,643 | | |
| | | | | | 31,670,806 | | |
Health Care Providers & Services (2.8%) | |
UnitedHealth Group, Inc. | | | 48,154 | | | | 16,886,645 | | |
Health Care Technology (2.7%) | |
Cerner Corp. | | | 211,494 | | | | 16,598,049 | | |
Life Sciences Tools & Services (0.6%) | |
Mettler-Toledo
International, Inc. (b) | | | 3,077 | | | | 3,506,795 | | |
Pharmaceuticals (1.4%) | |
Zoetis, Inc. | | | 51,482 | | | | 8,520,271 | | |
| | | Shares | | Value(a) | |
Industrials (6.6%) | |
Aerospace & Defense (0.5%) | |
Northrop Grumman Corp. | | | 9,853 | | | $ | 3,002,406 | | |
Machinery (2.1%) | |
Stanley Black &
Decker, Inc. | | | 70,380 | | | | 12,567,053 | | |
Professional Services (1.4%) | |
Verisk Analytics, Inc. | | | 41,400 | | | | 8,594,226 | | |
Road & Rail (2.6%) | |
JB Hunt Transport
Services, Inc. | | | 63,962 | | | | 8,740,407 | | |
Union Pacific Corp. | | | 35,527 | | | | 7,397,432 | | |
| | | | | | 16,137,839 | | |
Information Technology (57.1%) | |
Communications Equipment (3.0%) | |
Motorola Solutions, Inc. | | | 108,200 | | | | 18,400,492 | | |
Computers & Peripherals (8.8%) | |
Apple, Inc. | | | 403,068 | | | | 53,483,093 | | |
Interactive Media & Services (8.9%) | |
Alphabet, Inc. – Class A (b) | | | 15,518 | | | | 27,197,468 | | |
Alphabet, Inc. – Class C (b) | | | 2,634 | | | | 4,614,452 | | |
Facebook, Inc. – Class A (b) | | | 80,690 | | | | 22,041,280 | | |
| | | | | | 53,853,200 | | |
IT Services (11.8%) | |
Broadridge Financial
Solutions, Inc. | | | 72,256 | | | | 11,069,619 | | |
PayPal Holdings, Inc. (b) | | | 81,187 | | | | 19,013,995 | | |
VeriSign, Inc. (b) | | | 66,372 | | | | 14,362,901 | | |
Visa, Inc. – Class A | | | 123,387 | | | | 26,988,439 | | |
| | | | | | 71,434,954 | | |
Office Electronics (1.2%) | |
Zebra Technologies
Corp. – Class A (b) | | | 19,165 | | | | 7,365,684 | | |
Semiconductors & Semiconductor
Equipment (2.4%) | |
NVIDIA Corp. | | | 27,403 | | | | 14,309,847 | | |
Software (21.0%) | |
Adobe, Inc. (b) | | | 37,608 | | | | 18,808,513 | | |
Electronic Arts, Inc. | | | 115,004 | | | | 16,514,574 | | |
Intuit, Inc. | | | 46,647 | | | | 17,718,863 | | |
Microsoft Corp. | | | 271,296 | | | | 60,341,656 | | |
Salesforce.com, Inc. (b) | | | 61,514 | | | | 13,688,711 | | |
| | | | | | 127,072,317 | | |
Real Estate (0.3%) | |
Specialized REITs (0.3%) | |
Equinix, Inc. | | | 2,809 | | | | 2,006,132 | | |
Total common stocks
(cost: $348,111,760) | | | | | 603,755,035 | | |
See accompanying notes to financial statements.
90
SFT IvySM Growth Fund
Investments in Securities – continued
| | | Shares | | Value(a) | |
Short-Term Securities (0.5%) | |
Investment Companies (0.5%) | |
State Street Institutional
U.S. Government Money
Market Fund, current
rate 0.030% | | | 3,163,198 | | | $ | 3,163,198 | | |
Total short-term securities
(cost: $3,163,198) | | | | | 3,163,198 | | |
Total investments in securities
(cost: $351,274,958) (d) | | | | | 606,918,233 | | |
Liabilities in excess of cash
and other assets (-0.1%) | | | | | (670,995 | ) | |
Total net assets (100.0%) | | | | $ | 606,247,238 | | |
Investments in Securities Legend
(a) Securities are valued by procedures described in Note 2 of the Notes to Financial Statements.
(b) Non-income producing security.
(c) Foreign security: The Fund held 2.2% of net assets in foreign securities at December 31, 2020.
(d) At December 31, 2020 the cost of investments for federal income tax purposes was $352,112,436. The aggregate unrealized appreciation and depreciation of investments based on this cost were:
Gross unrealized appreciation | | $ | 255,017,443 | | |
Gross unrealized depreciation | | | (211,646 | ) | |
Net unrealized appreciation | | $ | 254,805,797 | | |
See accompanying notes to financial statements.
91
SFT IvySM Small Cap Growth Fund
Investments in Securities
(Percentages of each investment category relate to total net assets)
| | | Shares | | Value(a) | |
Common Stocks (97.5%) | |
Communication Services (1.3%) | |
Diversified Telecommunication Services (0.8%) | |
Bandwidth, Inc.
Class A (b) | | | 11,259 | | | $ | 1,730,171 | | |
Media (0.5%) | |
Gray Television, Inc. (b) | | | 59,634 | | | | 1,066,852 | | |
Consumer Discretionary (16.7%) | |
Auto Components (3.1%) | |
Fox Factory Holding
Corp. (b) | | | 31,196 | | | | 3,297,729 | | |
Visteon Corp. (b) | | | 25,624 | | | | 3,216,325 | | |
| | | | | | 6,514,054 | | |
Entertainment (0.9%) | |
Monarch Casino &
Resort, Inc. (b) | | | 30,447 | | | | 1,863,965 | | |
Hotels, Restaurants & Leisure (4.2%) | |
Churchill Downs, Inc. | | | 17,775 | | | | 3,462,392 | | |
Texas Roadhouse, Inc. | | | 30,023 | | | | 2,346,598 | | |
Wingstop, Inc. | | | 10,921 | | | | 1,447,579 | | |
Wyndham Hotels &
Resorts, Inc. | | | 28,819 | | | | 1,713,001 | | |
| | | | | | 8,969,570 | | |
Household Durables (2.7%) | |
Installed Building
Products, Inc. (b) | | | 28,616 | | | | 2,916,829 | | |
TopBuild Corp. (b) | | | 15,545 | | | | 2,861,524 | | |
| | | | | | 5,778,353 | | |
Leisure Equipment & Products (1.4%) | |
Malibu Boats, Inc. –
Class A (b) | | | 46,939 | | | | 2,930,871 | | |
Media (1.9%) | |
Nexstar Media Group,
Inc. – Class A | | | 36,455 | | | | 3,980,522 | | |
Specialty Retail (1.4%) | |
Lithia Motors, Inc. Class A | | | 9,896 | | | | 2,896,262 | | |
Textiles, Apparel & Luxury Goods (1.1%) | |
Deckers Outdoor Corp. (b) | | | 8,598 | | | | 2,465,734 | | |
Financial (4.2%) | |
Capital Markets (3.2%) | |
Focus Financial Partners,
Inc. Class A (b) | | | 18,033 | | | | 784,435 | | |
Hamilton Lane, Inc. –
Class A | | | 21,400 | | | | 1,670,270 | | |
Houlihan Lokey, Inc. | | | 38,525 | | | | 2,590,036 | | |
LPL Financial
Holdings, Inc. | | | 17,416 | | | | 1,815,096 | | |
| | | | | | 6,859,837 | | |
| | | Shares | | Value(a) | |
Commercial Banks (0.8%) | |
Pinnacle Financial
Partners, Inc. | | | 8,144 | | | $ | 524,473 | | |
Seacoast Banking Corp.
of Florida (b) | | | 40,262 | | | | 1,185,716 | | |
| | | | | | 1,710,189 | | |
Insurance (0.2%) | |
Selectquote, Inc. (b) | | | 15,221 | | | | 315,836 | | |
Health Care (27.8%) | |
Biotechnology (8.2%) | |
Amicus
Therapeutics, Inc. (b) | | | 48,099 | | | | 1,110,606 | | |
CareDx, Inc. (b) | | | 89,056 | | | | 6,452,107 | | |
Halozyme
Therapeutics, Inc. (b) | | | 29,746 | | | | 1,270,452 | | |
Insmed, Inc. (b) | | | 33,766 | | | | 1,124,070 | | |
Novavax, Inc. (b) | | | 4,400 | | | | 490,644 | | |
Veracyte, Inc. (b) | | | 53,469 | | | | 2,616,773 | | |
Vericel Corp. (b) | | | 141,546 | | | | 4,370,940 | | |
| | | | | | 17,435,592 | | |
Health Care Equipment & Supplies (9.7%) | |
Acutus Medical, Inc. (b) | | | 28,791 | | | | 829,469 | | |
Axonics Modulation
Technologies, Inc. (b) | | | 61,847 | | | | 3,087,402 | | |
Haemonetics Corp. (b) | | | 30,498 | | | | 3,621,637 | | |
iRhythm
Technologies, Inc. (b) | | | 14,554 | | | | 3,452,354 | | |
OraSure
Technologies, Inc. (b) | | | 161,215 | | | | 1,706,461 | | |
Penumbra, Inc. (b) | | | 10,741 | | | | 1,879,675 | | |
Tactile Systems
Technology, Inc. (b) | | | 62,125 | | | | 2,791,897 | | |
Tandem Diabetes
Care, Inc. (b) | | | 33,092 | | | | 3,166,243 | | |
| | | | | | 20,535,138 | | |
Health Care Providers & Services (6.4%) | |
1Life Healthcare, Inc. (b) | | | 66,409 | | | | 2,898,753 | | |
AMN Healthcare
Services, Inc. (b) | | | 40,904 | | | | 2,791,698 | | |
LHC Group, Inc. (b) | | | 13,948 | | | | 2,975,387 | | |
PetIQ, Inc. (b) | | | 125,948 | | | | 4,842,701 | | |
| | | | | | 13,508,539 | | |
Health Care Technology (2.1%) | |
Omnicell, Inc. (b) | | | 30,730 | | | | 3,688,215 | | |
Simulations Plus, Inc. | | | 9,771 | | | | 702,730 | | |
| | | | | | 4,390,945 | | |
Life Sciences Tools & Services (1.4%) | |
NeoGenomics, Inc. (b) | | | 53,845 | | | | 2,899,015 | | |
Industrials (15.7%) | |
Aerospace & Defense (2.1%) | |
Mercury Systems, Inc. (b) | | | 50,618 | | | | 4,457,421 | | |
See accompanying notes to financial statements.
92
SFT IvySM Small Cap Growth Fund
Investments in Securities – continued
| | | Shares | | Value(a) | |
Air Freight & Logistics (1.3%) | |
Air Transport Services
Group, Inc. (b) | | | 89,165 | | | $ | 2,794,431 | | |
Building Products (0.9%) | |
Simpson Manufacturing
Co., Inc. | | | 19,641 | | | | 1,835,451 | | |
Commercial Services & Supplies (3.4%) | |
Clean Harbors, Inc. (b) | | | 32,125 | | | | 2,444,713 | | |
The Brink's Co. | | | 64,274 | | | | 4,627,728 | | |
| | | | | | 7,072,441 | | |
Electrical Equipment (2.9%) | |
EnerSys | | | 29,925 | | | | 2,485,571 | | |
Plug Power, Inc. (b) | | | 109,376 | | | | 3,708,940 | | |
| | | | | | 6,194,511 | | |
Machinery (2.9%) | |
John Bean
Technologies Corp. | | | 15,020 | | | | 1,710,327 | | |
Kennametal, Inc. | | | 65,442 | | | | 2,371,618 | | |
RBC Bearings, Inc. (b) | | | 11,863 | | | | 2,123,952 | | |
| | | | | | 6,205,897 | | |
Machinery — Farm (0.3%) | |
Hydrofarm Holdings
Group, Inc. (b) | | | 12,814 | | | | 673,760 | | |
Road & Rail (1.9%) | |
Knight-Swift
Transportation
Holdings, Inc. | | | 96,486 | | | | 4,035,045 | | |
Information Technology (29.9%) | |
Communications Equipment (1.3%) | |
Viavi Solutions, Inc. (b) | | | 185,206 | | | | 2,773,460 | | |
Electronic Equipment, Instruments & Components (1.2%) | |
Coherent, Inc. (b) | | | 16,532 | | | | 2,480,131 | | |
Interactive Media & Services (7.9%) | |
Envestnet, Inc. (b) | | | 27,568 | | | | 2,268,571 | | |
Five9, Inc. (b) | | | 43,247 | | | | 7,542,277 | | |
Mimecast, Ltd. (b) (c) | | | 49,190 | | | | 2,795,959 | | |
Q2 Holdings, Inc. (b) | | | 32,689 | | | | 4,136,139 | | |
| | | | | | 16,742,946 | | |
IT Services (4.6%) | |
Booz Allen Hamilton
Holding Corp. | | | 20,419 | | | | 1,780,128 | | |
Evo Payments, Inc. –
Class A (b) | | | 69,742 | | | | 1,883,732 | | |
Shift4 Payments, Inc.
Class A (b) | | | 52,400 | | | | 3,950,960 | | |
Switch, Inc. Class A | | | 127,674 | | | | 2,090,023 | | |
| | | | | | 9,704,843 | | |
| | | Shares | | Value(a) | |
Semiconductors & Semiconductor
Equipment (5.1%) | |
Enphase Energy, Inc. (b) | | | 22,893 | | | $ | 4,017,035 | | |
Monolithic Power
Systems, Inc. | | | 14,349 | | | | 5,255,034 | | |
SiTime Corp. (b) | | | 12,902 | | | | 1,444,121 | | |
| | | | | | 10,716,190 | | |
Software (9.8%) | |
Globant SA (b) (c) | | | 24,398 | | | | 5,309,249 | | |
LivePerson, Inc. (b) | | | 45,438 | | | | 2,827,607 | | |
Proofpoint, Inc. (b) | | | 20,691 | | | | 2,822,459 | | |
Sailpoint Technologies
Holdings, Inc. (b) | | | 34,518 | | | | 1,837,738 | | |
Smartsheet, Inc. –
Class A (b) | | | 28,174 | | | | 1,952,177 | | |
Varonis Systems, Inc. (b) | | | 37,240 | | | | 6,092,836 | | |
| | | | | | 20,842,066 | | |
Leisure and Consumer Staples (1.9%) | |
Food & Staples Retailing (0.8%) | |
BJ's Wholesale Club
Holdings, Inc. (b) | | | 43,688 | | | | 1,628,689 | | |
Food Products (1.1%) | |
Nomad Foods, Ltd. (b) (c) | | | 95,108 | | | | 2,417,645 | | |
| | | | | | 4,046,334 | | |
Total common stocks
(cost: $131,122,825) | | | | | 206,426,372 | | |
Short-Term Securities (2.7%) | |
Investment Companies (2.7%) | |
State Street Institutional
U.S. Government Money
Market Fund, current
rate 0.030% | | | 5,817,250 | | | | 5,817,250 | | |
Total short-term securities
(cost: $5,817,250) | | | | | 5,817,250 | | |
Total investments in securities
(cost: $136,940,075) (d) | | | | | 212,243,622 | | |
Liabilities in excess of cash
and other assets (-0.2%) | | | | | (409,838 | ) | |
Total net assets (100.0%) | | | | $ | 211,833,784 | | |
Investments in Securities Legend
(a) Securities are valued by procedures described in Note 2 of the Notes to Financial Statements.
(b) Non-income producing security.
(c) Foreign security: The Fund held 5.0% of net assets in foreign securities at December 31, 2020.
(d) At December 31, 2020 the cost of investments for federal income tax purposes was $137,530,543. The aggregate unrealized appreciation and depreciation of investments based on this cost were:
Gross unrealized appreciation | | $ | 75,664,558 | | |
| Gross unrealized depreciation | | | (951,479 | ) | |
Net unrealized appreciation | | $ | 74,713,079 | | |
See accompanying notes to financial statements.
93
SFT Managed Volatility Equity Fund
Investments in Securities
(Percentages of each investment category relate to total net assets)
| | | Shares | | Value(a) | |
Mutual Funds (91.4%) | |
Investment Companies (91.4%) | |
iShares Core High
Dividend ETF | | | 756,457 | | | $ | 66,318,585 | | |
iShares Edge MSCI
Minimum Volatility
EAFE ETF | | | 1,245,813 | | | | 91,455,132 | | |
iShares Edge MSCI
Minimum Volatility
Emerging Markets ETF | | | 358,085 | | | | 21,871,832 | | |
iShares Edge MSCI
Minimum Volatility
USA ETF | | | 1,693,032 | | | | 114,923,012 | | |
iShares MSCI
Germany ETF | | | 531,232 | | | | 16,877,240 | | |
iShares Short
Maturity Bond ETF | | | 275,245 | | | | 13,809,042 | | |
Total mutual funds
(cost: $271,566,620) | | | | | 325,254,843 | | |
| | | Shares | | Value(a) | |
Short-Term Securities (4.4%) | |
Investment Companies (4.4%) | |
State Street Institutional
U.S. Government Money
Market Fund, current
rate 0.030% | | | 15,484,025 | | | $ | 15,484,025 | | |
Total investments excluding
purchased options
(cost: $287,050,645) | | | | | 340,738,868 | | |
Total purchased options
outstanding (0.1%)
(cost: $201,455) | | | | | 179,650 | | |
Total investments in securities
(cost: $287,252,100) (b) | | | | | 340,918,518 | | |
Cash and other assets in
excess of liabilities (4.1%) | | | | | 14,663,776 | | |
Total net assets (100.0%) | | | | $ | 355,582,294 | | |
Investments in Securities Legend
(a) Securities are valued by procedures described in Note 2 of the Notes to Financial Statements.
(b) At December 31, 2020 the cost of investments for federal income tax purposes was $289,358,934. The aggregate unrealized appreciation and depreciation of investments based on this cost were:
Gross unrealized appreciation | | $ | 51,572,133 | | |
Gross unrealized depreciation | | | (16,119 | ) | |
Net unrealized appreciation | | $ | 51,556,014 | | |
Call Options Purchased:
The Fund had the following call options purchased open at December 31, 2020:
Description | | Exercise Price | | Expiration Date | | Number of
Contracts | | Notional Amount | | Value(a) | |
CBOE Volatility Index | | $ | 21 | | | January 2021 | | | 1,070 | | | $ | 107,000 | | | $ | 108,070 | | |
CBOE Volatility Index | | | 20 | | | January 2021 | | | 1,193 | | | | 119,300 | | | | 71,580 | | |
| | | | | | | | | | | $ | 179,650 | | |
Put Options Written:
The Fund had the following put options written open at December 31, 2020:
Description | | Exercise Price | | Expiration Date | | Number of
Contracts | | Notional Amount | | Value(a) | |
CBOE Volatility Index | | $ | 11 | | | January 2021 | | | 714 | | | $ | 71,400 | | | $ | (3,570 | ) | |
See accompanying notes to financial statements.
94
SFT Real Estate Securities Fund
Investments in Securities
(Percentages of each investment category relate to total net assets)
| | | Shares | | Value(a) | |
Common Stocks (97.2%) | |
Real Estate (97.2%) | |
Diversified REITs (2.7%) | |
Essential Properties Realty
Trust, Inc. | | | 42,300 | | | $ | 896,760 | | |
VEREIT, Inc. | | | 56,500 | | | | 2,135,135 | | |
WP Carey, Inc. | | | 5,100 | | | | 359,958 | | |
| | | | | | 3,391,853 | | |
Health Care REITs (11.3%) | |
CareTrust REIT, Inc. | | | 46,900 | | | | 1,040,242 | | |
Healthcare Trust of
America, Inc. – Class A | | | 31,000 | | | | 853,740 | | |
Healthpeak Properties, Inc. | | | 89,600 | | | | 2,708,608 | | |
Omega Healthcare
Investors, Inc. | | | 39,400 | | | | 1,431,008 | | |
Ventas, Inc. | | | 69,496 | | | | 3,408,084 | | |
Welltower, Inc. | | | 73,900 | | | | 4,775,418 | | |
| | | | | | 14,217,100 | | |
Hotels & Resort REITs (4.9%) | |
Host Hotels & Resorts, Inc. | | | 148,646 | | | | 2,174,691 | | |
MGM Growth
Properties LLC | | | 26,400 | | | | 826,320 | | |
Park Hotels & Resorts, Inc. | | | 64,700 | | | | 1,109,605 | | |
Pebblebrook Hotel Trust | | | 50,700 | | | | 953,160 | | |
RLJ Lodging Trust | | | 76,000 | | | | 1,075,400 | | |
| | | | | | 6,139,176 | | |
Industrial REITs (12.2%) | |
Duke Realty Corp. | | | 83,600 | | | | 3,341,492 | | |
First Industrial Realty
Trust, Inc. | | | 19,700 | | | | 829,961 | | |
ProLogis, Inc. | | | 97,281 | | | | 9,695,024 | | |
Terreno Realty Corp. | | | 27,000 | | | | 1,579,770 | | |
| | | | | | 15,446,247 | | |
Office REITs (8.4%) | |
Alexandria Real Estate
Equities, Inc. | | | 16,822 | | | | 2,998,017 | | |
Boston Properties, Inc. | | | 19,883 | | | | 1,879,540 | | |
Cousins Properties, Inc. | | | 43,750 | | | | 1,465,625 | | |
Douglas Emmett, Inc. | | | 25,600 | | | | 747,008 | | |
Highwoods Properties, Inc. | | | 25,900 | | | | 1,026,417 | | |
Kilroy Realty Corp. | | | 22,936 | | | | 1,316,526 | | |
Vornado Realty Trust | | | 30,800 | | | | 1,150,072 | | |
| | | | | | 10,583,205 | | |
Residential REITs (19.0%) | |
American Homes 4
Rent – Class A | | | 79,400 | | | | 2,382,000 | | |
AvalonBay
Communities, Inc. | | | 23,726 | | | | 3,806,362 | | |
Camden Property Trust | | | 21,100 | | | | 2,108,312 | | |
Equity Lifestyle
Properties, Inc. | | | 25,000 | | | | 1,584,000 | | |
Equity Residential | | | 43,600 | | | | 2,584,608 | | |
Essex Property Trust, Inc. | | | 2,016 | | | | 478,639 | | |
| | | Shares | | Value(a) | |
Invitation Homes, Inc. | | | 112,100 | | | $ | 3,329,370 | | |
Mid-America Apartment
Communities, Inc. | | | 18,100 | | | | 2,293,089 | | |
Sun Communities, Inc. | | | 14,100 | | | | 2,142,495 | | |
UDR, Inc. | | | 84,500 | | | | 3,247,335 | | |
| | | | | | 23,956,210 | | |
Retail REITs (13.9%) | |
Agree Realty Corp. | | | 21,200 | | | | 1,411,496 | | |
Brixmor Property
Group, Inc. | | | 134,600 | | | | 2,227,630 | | |
Federal Realty
Investment Trust | | | 10,900 | | | | 927,808 | | |
Kimco Realty Corp. | | | 91,900 | | | | 1,379,419 | | |
National Retail
Properties, Inc. | | | 32,500 | | | | 1,329,900 | | |
Realty Income Corp. | | | 52,700 | | | | 3,276,359 | | |
Regency Centers Corp. | | | 24,514 | | | | 1,117,593 | | |
Simon Property
Group, Inc. | | | 53,479 | | | | 4,560,689 | | |
Weingarten Realty
Investors | | | 59,900 | | | | 1,298,033 | | |
| | | | | | 17,528,927 | | |
Specialized REITs (24.8%) | |
American Tower Corp. | | | 3,900 | | | | 875,394 | | |
CubeSmart | | | 28,100 | | | | 944,441 | | |
CyrusOne, Inc. | | | 42,200 | | | | 3,086,930 | | |
Digital Realty Trust, Inc. | | | 31,000 | | | | 4,324,810 | | |
Equinix, Inc. | | | 10,834 | | | | 7,737,426 | | |
Extra Space Storage, Inc. | | | 22,100 | | | | 2,560,506 | | |
Gaming and Leisure
Properties, Inc. | | | 105 | | | | 4,452 | | |
Life Storage, Inc. | | | 11,700 | | | | 1,396,863 | | |
Public Storage | | | 18,700 | | | | 4,318,391 | | |
QTS Realty Trust, Inc. –
Class A | | | 18,200 | | | | 1,126,216 | | |
STORE Capital Corp. | | | 64,500 | | | | 2,191,710 | | |
VICI Properties, Inc. | | | 105,141 | | | | 2,681,096 | | |
| | | | | | 31,248,235 | | |
Total common stocks
(cost: $110,885,706) | | | | | 122,510,953 | | |
Short-Term Securities (2.5%) | |
Investment Companies (2.5%) | |
State Street Institutional
U.S. Government Money
Market Fund, current
rate 0.030% | | | 3,087,714 | | | | 3,087,714 | | |
Total short-term securities
(cost: $3,087,714) | | | | | 3,087,714 | | |
Total investments in securities
(cost: $113,973,420) (b) | | | | | 125,598,667 | | |
Cash and other assets in
excess of liabilities (0.3%) | | | | | 322,618 | | |
Total net assets (100.0%) | | | | $ | 125,921,285 | | |
See accompanying notes to financial statements.
95
SFT Real Estate Securities Fund
Investments in Securities – continued
Investments in Securities Legend
(a) Securities are valued by procedures described in Note 2 of the Notes to Financial Statements.
(b) At December 31, 2020 the cost of investments for federal income tax purposes was $117,090,163. The aggregate unrealized appreciation and depreciation of investments based on this cost were:
Gross unrealized appreciation | | $ | 10,510,823 | | |
Gross unrealized depreciation | | | (2,002,319 | ) | |
Net unrealized appreciation | | $ | 8,508,504 | | |
See accompanying notes to financial statements.
96
SFT T. Rowe Price Value Fund
Investments in Securities
(Percentages of each investment category relate to total net assets)
| | | Shares | | Value(a) | |
Common Stocks (99.5%) | |
Consumer Discretionary (8.4%) | |
Automobiles (1.5%) | |
General Motors Co. | | | 73,734 | | | $ | 3,070,284 | | |
Entertainment (1.4%) | |
The Walt Disney Co. (b) | | | 16,290 | | | | 2,951,422 | | |
Hotels & Resort REITs (0.8%) | |
Hilton Worldwide
Holdings, Inc. | | | 14,077 | | | | 1,566,207 | | |
Hotels, Restaurants & Leisure (2.6%) | |
Marriott International, Inc. –
Class A | | | 6,499 | | | | 857,348 | | |
McDonald's Corp. | | | 7,574 | | | | 1,625,229 | | |
MGM Resorts International | | | 6,853 | | | | 215,938 | | |
Yum! Brands, Inc. | | | 25,657 | | | | 2,785,324 | | |
| | | | | | 5,483,839 | | |
Household Durables (0.4%) | |
Lennar Corp. – Class A | | | 9,773 | | | | 744,996 | | |
Media (0.2%) | |
Live Nation
Entertainment, Inc. (b) | | | 6,500 | | | | 477,620 | | |
Specialty Retail (1.5%) | |
O'Reilly Automotive, Inc. (b) | | | 290 | | | | 131,245 | | |
Ross Stores, Inc. | | | 2,673 | | | | 328,271 | | |
The Home Depot, Inc. | | | 3,929 | | | | 1,043,621 | | |
The TJX Cos., Inc. | | | 23,138 | | | | 1,580,094 | | |
| | | | | | 3,083,231 | | |
Consumer Staples (0.6%) | |
Beverages (0.4%) | |
The Coca-Cola Co. | | | 15,094 | | | | 827,755 | | |
Food Products (0.1%) | |
The Kraft Heinz Co. | | | 8,900 | | | | 308,474 | | |
Tobacco (0.1%) | |
Philip Morris International, Inc. | | | 2,216 | | | | 183,463 | | |
Energy (1.2%) | |
Oil, Gas & Consumable Fuels (1.2%) | |
EOG Resources, Inc. | | | 10,100 | | | | 503,687 | | |
The Williams Cos., Inc. | | | 78,613 | | | | 1,576,191 | | |
TOTAL SE (c) | | | 9,971 | | | | 430,660 | | |
| | | | | | 2,510,538 | | |
Financial (18.3%) | |
Capital Markets (6.4%) | |
Morgan Stanley | | | 136,752 | | | | 9,371,615 | | |
The Charles Schwab Corp. | | | 38,013 | | | | 2,016,209 | | |
The Goldman Sachs
Group, Inc. | | | 6,714 | | | | 1,770,549 | | |
| | | | | | 13,158,373 | | |
Commercial Banks (5.0%) | |
Bank of America Corp. | | | 110,509 | | | | 3,349,528 | | |
JPMorgan Chase & Co. | | | 26,697 | | | | 3,392,388 | | |
| | | Shares | | Value(a) | |
The PNC Financial
Services Group, Inc. | | | 13,581 | | | $ | 2,023,569 | | |
Wells Fargo & Co. | | | 51,337 | | | | 1,549,350 | | |
| | | | | | 10,314,835 | | |
Consumer Finance (0.6%) | |
Capital One Financial Corp. | | | 12,677 | | | | 1,253,122 | | |
Diversified Financial Services (1.2%) | |
Equitable Holdings, Inc. | | | 98,411 | | | | 2,518,338 | | |
Insurance (5.1%) | |
American International
Group, Inc. | | | 91,178 | | | | 3,451,999 | | |
Chubb, Ltd. (c) | | | 11,346 | | | | 1,746,376 | | |
Hartford Financial Services
Group, Inc. | | | 13,852 | | | | 678,471 | | |
Marsh & McLennan Cos., Inc. | | | 10,522 | | | | 1,231,074 | | |
MetLife, Inc. | | | 40,983 | | | | 1,924,152 | | |
Principal Financial Group, Inc. | | | 5,961 | | | | 295,725 | | |
The Travelers Cos., Inc. | | | 7,900 | | | | 1,108,923 | | |
| | | | | | 10,436,720 | | |
Health Care (13.1%) | |
Biotechnology (1.0%) | |
AbbVie, Inc. | | | 20,132 | | | | 2,157,144 | | |
Health Care Equipment & Supplies (4.8%) | |
Becton Dickinson and Co. | | | 1,072 | | | | 268,236 | | |
Boston Scientific Corp. (b) | | | 4,479 | | | | 161,020 | | |
Danaher Corp. | | | 22,551 | | | | 5,009,479 | | |
Medtronic PLC (c) | | | 19,809 | | | | 2,320,426 | | |
Stryker Corp. | | | 7,413 | | | | 1,816,482 | | |
Zimmer Biomet Holdings, Inc. | | | 1,618 | | | | 249,318 | | |
| | | | | | 9,824,961 | | |
Health Care Providers & Services (3.0%) | |
Anthem, Inc. | | | 5,430 | | | | 1,743,519 | | |
Centene Corp. (b) | | | 2,446 | | | | 146,833 | | |
HCA Healthcare, Inc. | | | 17,474 | | | | 2,873,774 | | |
UnitedHealth Group, Inc. | | | 4,013 | | | | 1,407,279 | | |
| | | | | | 6,171,405 | | |
Life Sciences Tools & Services (2.9%) | |
Agilent Technologies, Inc. | | | 14,068 | | | | 1,666,917 | | |
Thermo Fisher Scientific, Inc. | | | 9,419 | | | | 4,387,182 | | |
| | | | | | 6,054,099 | | |
Pharmaceuticals (1.4%) | |
Bausch Health Cos., Inc. (b) (c) | | | 19,704 | | | | 409,843 | | |
Elanco Animal Health, Inc. (b) | | | 35,185 | | | | 1,079,124 | | |
Eli Lilly & Co. | | | 4,900 | | | | 827,316 | | |
Johnson & Johnson | | | 3,800 | | | | 598,044 | | |
| | | | | | 2,914,327 | | |
Industrials (14.6%) | |
Air Freight & Logistics (1.6%) | |
FedEx Corp. | | | 6,384 | | | | 1,657,414 | | |
United Parcel
Service, Inc. – Class B | | | 9,671 | | | | 1,628,596 | | |
| | | | | | 3,286,010 | | |
See accompanying notes to financial statements.
97
SFT T. Rowe Price Value Fund
Investments in Securities – continued
| | | Shares | | Value(a) | |
Building Products (0.6%) | |
Johnson Controls
International PLC (c) | | | 28,411 | | | $ | 1,323,669 | | |
Commercial Services & Supplies (0.2%) | |
Avery Dennison Corp. | | | 2,700 | | | | 418,797 | | |
Construction & Engineering (0.8%) | |
Jacobs Engineering
Group, Inc. | | | 15,281 | | | | 1,665,018 | | |
Electrical Equipment (0.8%) | |
Hubbell, Inc. | | | 400 | | | | 62,716 | | |
Rockwell Automation, Inc. | | | 4,650 | | | | 1,166,266 | | |
Schneider Electric SE (c) | | | 3,465 | | | | 501,545 | | |
| | | | | | 1,730,527 | | |
Industrial Conglomerates (4.2%) | |
General Electric Co. | | | 410,520 | | | | 4,433,616 | | |
Honeywell International, Inc. | | | 16,362 | | | | 3,480,197 | | |
Roper Technologies, Inc. | | | 1,641 | | | | 707,419 | | |
| | | | | | 8,621,232 | | |
Machinery (3.4%) | |
Caterpillar, Inc. | | | 15,911 | | | | 2,896,120 | | |
Deere & Co. | | | 12,800 | | | | 3,443,840 | | |
Stanley Black & Decker, Inc. | | | 3,222 | | | | 575,321 | | |
| | | | | | 6,915,281 | | |
Professional Services (0.8%) | |
United Rentals, Inc. (b) | | | 7,000 | | | | 1,623,370 | | |
Road & Rail (2.2%) | |
Norfolk Southern Corp. | | | 11,819 | | | | 2,808,312 | | |
Union Pacific Corp. | | | 8,322 | | | | 1,732,807 | | |
| | | | | | 4,541,119 | | |
Information Technology (22.3%) | |
Computers & Peripherals (0.3%) | |
Apple, Inc. | | | 5,578 | | | | 740,145 | | |
Electronic Equipment, Instruments &
Components (0.3%) | |
Keysight Technologies, Inc. (b) | | | 5,144 | | | | 679,471 | | |
Interactive Media & Services (4.4%) | |
Alphabet, Inc. – Class C (b) | | | 5,158 | | | | 9,036,197 | | |
IT Services (0.9%) | |
Fidelity National
Information Services, Inc. | | | 1,100 | | | | 155,606 | | |
Fiserv, Inc. (b) | | | 8,365 | | | | 952,439 | | |
Visa, Inc. – Class A | | | 3,500 | | | | 765,555 | | |
| | | | | | 1,873,600 | | |
Semiconductors & Semiconductor Equipment (12.4%) | |
Analog Devices, Inc. | | | 11,455 | | | | 1,692,247 | | |
Applied Materials, Inc. | | | 48,325 | | | | 4,170,447 | | |
| ASML Holding NV (c) | | | 2,554 | | | | 1,245,637 | | |
Broadcom, Inc. | | | 7,621 | | | | 3,336,855 | | |
Lam Research Corp. | | | 2,516 | | | | 1,188,231 | | |
Micron Technology, Inc. (b) | | | 27,782 | | | | 2,088,651 | | |
NVIDIA Corp. | | | 2,691 | | | | 1,405,240 | | |
NXP Semiconductors NV (c) | | | 20,820 | | | | 3,310,588 | | |
| | | Shares | | Value(a) | |
QUALCOMM, Inc. | | | 37,501 | | | $ | 5,712,902 | | |
Texas Instruments, Inc. | | | 8,412 | | | | 1,380,662 | | |
| | | | | | 25,531,460 | | |
Software (4.0%) | |
Citrix Systems, Inc. | | | 4,100 | | | | 533,410 | | |
Microsoft Corp. | | | 28,075 | | | | 6,244,442 | | |
Salesforce.com, Inc. (b) | | | 900 | | | | 200,277 | | |
Synopsys, Inc. (b) | | | 4,668 | | | | 1,210,132 | | |
| | | | | | 8,188,261 | | |
Materials (8.8%) | |
Chemicals (3.4%) | |
Air Liquide SA (c) | | | 2,210 | | | | 363,018 | | |
Covestro AG (c) | | | 8,166 | | | | 504,372 | | |
DuPont de Nemours, Inc. | | | 18,194 | | | | 1,293,775 | | |
Linde PLC (c) | | | 12,332 | | | | 3,249,605 | | |
PPG Industries, Inc. | | | 11,264 | | | | 1,624,494 | | |
| | | | | | 7,035,264 | | |
Containers & Packaging (4.2%) | |
International Paper Co. | | | 53,609 | | | | 2,665,439 | | |
Packaging Corp. of America | | | 25,175 | | | | 3,471,884 | | |
WestRock Co. | | | 55,620 | | | | 2,421,139 | | |
| | | | | | 8,558,462 | | |
Metals & Mining (1.2%) | |
BHP Group, Ltd. (c) | | | 20,489 | | | | 670,833 | | |
Freeport-McMoRan, Inc. | | | 44,600 | | | | 1,160,492 | | |
Southern Copper Corp. | | | 9,849 | | | | 641,367 | | |
| | | | | | 2,472,692 | | |
Real Estate (4.4%) | |
Health Care REITs (0.6%) | |
Welltower, Inc. | | | 17,843 | | | | 1,153,015 | | |
Industrial REITs (2.6%) | |
ProLogis, Inc. | | | 53,089 | | | | 5,290,850 | | |
Residential REITs (0.2%) | |
Sun Communities, Inc. | | | 2,449 | | | | 372,125 | | |
Specialized REITs (1.0%) | |
Digital Realty Trust, Inc. | | | 2,086 | | | | 291,018 | | |
Weyerhaeuser Co. | | | 55,908 | | | | 1,874,595 | | |
| | | | | | 2,165,613 | | |
Utilities (7.8%) | |
Electric Utilities (4.2%) | |
Entergy Corp. | | | 5,156 | | | | 514,775 | | |
FirstEnergy Corp. | | | 7,500 | | | | 229,575 | | |
NextEra Energy, Inc. | | | 77,227 | | | | 5,958,063 | | |
The Southern Co. | | | 30,064 | | | | 1,846,832 | | |
| | | | | | 8,549,245 | | |
Independent Power
Producers & Energy Traders (0.4%) | |
AES Corp. | | | 32,519 | | | | 764,196 | | |
Multi-Utilities (3.2%) | |
Ameren Corp. | | | 18,842 | | | | 1,470,807 | | |
Dominion Energy, Inc. | | | 3,300 | | | | 248,160 | | |
See accompanying notes to financial statements.
98
SFT T. Rowe Price Value Fund
Investments in Securities – continued
| | | Shares | | Value(a) | |
Public Service Enterprise
Group, Inc. | | | 25,988 | | | $ | 1,515,100 | | |
Sempra Energy | | | 26,959 | | | | 3,434,846 | | |
| | | | | | 6,668,913 | | |
Total common stocks
(cost: $163,011,231) | | | | | 205,215,685 | | |
Preferred Stocks (0.1%) | |
Utilities (0.1%) | |
The Southern Co.
Series 2019, 6.750% | | | 5,830 | | | | 302,577 | | |
Total preferred stocks
(cost: $292,622) | | | | | 302,577 | | |
Short-Term Securities (0.4%) | |
Investment Companies (0.4%) | |
State Street Institutional
U.S. Government Money
Market Fund, current
rate 0.030% | | | 500,000 | | | | 500,000 | | |
T. Rowe Price Reserve
Investment Fund, current
rate 0.000% | | | 342,783 | | | | 342,783 | | |
Total short-term securities
(cost: $842,783) | | | | | 842,783 | | |
Total investments in securities
(cost: $164,146,636) (d) | | | | | 206,361,045 | | |
Liabilities in excess of cash and
other assets (0.0%) | | | | | (11,434 | ) | |
Total net assets (100.0%) | | | | $ | 206,349,611 | | |
Investments in Securities Legend
(a) Securities are valued by procedures described in Note 2 of the Notes to Financial Statements.
(b) Non-income producing security.
(c) Foreign security: The Fund held 7.8% of net assets in foreign securities at December 31, 2020.
(d) At December 31, 2020 the cost of investments for federal income tax purposes was $165,900,683. The aggregate unrealized appreciation and depreciation of investments based on this cost were:
Gross unrealized appreciation | | $ | 41,327,386 | | |
Gross unrealized depreciation | | | (867,024 | ) | |
Net unrealized appreciation | | $ | 40,460,362 | | |
See accompanying notes to financial statements.
99
SFT Wellington Core Equity Fund
Investments in Securities
(Percentages of each investment category relate to total net assets)
| | | Shares | | Value(a) | |
Common Stocks (99.8%) | |
Communications (1.4%) | |
Diversified Telecommunication Services (1.4%) | |
Verizon Communications,
Inc. | | | 30,319 | | | $ | 1,781,241 | | |
Consumer Discretionary (14.0%) | |
Automobiles (0.7%) | |
Tesla, Inc. (b) | | | 1,352 | | | | 954,066 | | |
Hotels, Restaurants & Leisure (1.8%) | |
Airbnb, Inc. Class A (b) | | | 3,000 | | | | 440,400 | | |
McDonald's Corp. | | | 8,689 | | | | 1,864,486 | | |
| | | | | | 2,304,886 | | |
Internet & Catalog Retail (4.4%) | |
Amazon.com, Inc. (b) | | | 1,769 | | | | 5,761,509 | | |
Media (2.6%) | |
The Walt Disney Co. (b) | | | 19,159 | | | | 3,471,228 | | |
Specialty Retail (1.8%) | |
The TJX Cos., Inc. | | | 33,602 | | | | 2,294,680 | | |
Textiles, Apparel & Luxury Goods (2.6%) | |
NIKE, Inc. – Class B | | | 12,212 | | | | 1,727,632 | | |
VF Corp. | | | 19,779 | | | | 1,689,324 | | |
| | | | | | 3,416,956 | | |
Consumer Staples (8.8%) | |
Beverages (2.7%) | |
Constellation Brands,
Inc. – Class A | | | 9,278 | | | | 2,032,346 | | |
Monster Beverage Corp. (b) | | | 15,814 | | | | 1,462,479 | | |
| | | | | | 3,494,825 | | |
Food & Staples Retailing (2.6%) | |
Costco Wholesale Corp. | | | 3,888 | | | | 1,464,920 | | |
Walmart, Inc. | | | 13,931 | | | | 2,008,154 | | |
| | | | | | 3,473,074 | | |
Household Products (3.5%) | |
Colgate-Palmolive Co. | | | 17,826 | | | | 1,524,301 | | |
The Procter & Gamble Co. | | | 21,528 | | | | 2,995,406 | | |
| | | | | | 4,519,707 | | |
Energy (0.9%) | |
Oil, Gas & Consumable Fuels (0.9%) | |
EOG Resources, Inc. | | | 23,125 | | | | 1,153,244 | | |
Financial (11.2%) | |
Capital Markets (2.7%) | |
BlackRock, Inc. | | | 2,062 | | | | 1,487,816 | | |
Morgan Stanley | | | 29,600 | | | | 2,028,488 | | |
| | | | | | 3,516,304 | | |
Commercial Banks (5.6%) | |
Bank of America Corp. | | | 83,244 | | | | 2,523,125 | | |
JPMorgan Chase & Co. | | | 23,638 | | | | 3,003,681 | | |
The PNC Financial
Services Group, Inc. | | | 12,298 | | | | 1,832,402 | | |
| | | | | | 7,359,208 | | |
| | | Shares | | Value(a) | |
Consumer Finance (1.1%) | |
American Express Co. | | | 12,300 | | | $ | 1,487,193 | | |
Insurance (1.7%) | |
Athene Holding, Ltd. –
Class A (b) (c) | | | 23,394 | | | | 1,009,217 | | |
Chubb, Ltd. (c) | | | 7,984 | | | | 1,228,897 | | |
| | | | | | 2,238,114 | | |
Health Care (14.2%) | |
Biotechnology (0.6%) | |
Regeneron
Pharmaceuticals, Inc. (b) | | | 1,757 | | | | 848,824 | | |
Health Care Equipment & Supplies (5.4%) | |
Abbott Laboratories | | | 10,506 | | | | 1,150,302 | | |
Baxter International, Inc. | | | 18,394 | | | | 1,475,934 | | |
Becton Dickinson and Co. | | | 4,898 | | | | 1,225,578 | | |
Danaher Corp. | | | 6,998 | | | | 1,554,536 | | |
Hologic, Inc. (b) | | | 21,587 | | | | 1,572,181 | | |
| | | | | | 6,978,531 | | |
Health Care Providers & Services (2.9%) | |
Laboratory Corp. of America
Holdings (b) | | | 4,948 | | | | 1,007,165 | | |
UnitedHealth Group, Inc. | | | 7,907 | | | | 2,772,827 | | |
| | | | | | 3,779,992 | | |
Life Sciences Tools & Services (1.6%) | |
Thermo Fisher Scientific, Inc. | | | 4,467 | | | | 2,080,639 | | |
Pharmaceuticals (3.7%) | |
Eli Lilly & Co. | | | 14,260 | | | | 2,407,659 | | |
Merck & Co., Inc. | | | 29,108 | | | | 2,381,034 | | |
| | | | | | 4,788,693 | | |
Industrials (8.5%) | |
Aerospace & Defense (1.1%) | |
Raytheon Technologies Corp. | | | 19,426 | | | | 1,389,153 | | |
Air Freight & Logistics (1.4%) | |
FedEx Corp. | | | 7,171 | | | | 1,861,735 | | |
Building Products (1.2%) | |
Fortune Brands Home &
Security, Inc. | | | 18,517 | | | | 1,587,277 | | |
Commercial Services & Supplies (0.5%) | |
Republic Services, Inc. | | | 6,994 | | | | 673,522 | | |
Electrical Equipment (1.2%) | |
AMETEK, Inc. | | | 12,654 | | | | 1,530,375 | | |
Machinery (2.2%) | |
IDEX Corp. | | | 6,121 | | | | 1,219,303 | | |
Illinois Tool Works, Inc. | | | 7,912 | | | | 1,613,099 | | |
| | | | | | 2,832,402 | | |
Professional Services (0.9%) | |
Equifax, Inc. | | | 6,434 | | | | 1,240,733 | | |
Information Technology (34.6%) | |
Communications Equipment (1.2%) | |
Motorola Solutions, Inc. | | | 9,094 | | | | 1,546,526 | | |
See accompanying notes to financial statements.
100
SFT Wellington Core Equity Fund
Investments in Securities – continued
| | | Shares | | Value(a) | |
Computers & Peripherals (5.6%) | |
Apple, Inc. | | | 54,859 | | | $ | 7,279,241 | | |
Electronic Equipment, Instruments &
Components (1.9%) | |
CDW Corp. | | | 7,195 | | | | 948,229 | | |
Corning, Inc. | | | 42,901 | | | | 1,544,436 | | |
| | | | | | 2,492,665 | | |
Interactive Media & Services (7.6%) | |
Alphabet, Inc. – Class A (b) | | | 3,173 | | | | 5,561,127 | | |
Facebook, Inc. – Class A (b) | | | 12,343 | | | | 3,371,614 | | |
GoDaddy, Inc. – Class A (b) | | | 11,695 | | | | 970,100 | | |
| | | | | | 9,902,841 | | |
IT Services (5.3%) | |
Fidelity National
Information Services, Inc. | | | 9,748 | | | | 1,378,952 | | |
Global Payments, Inc. | | | 7,270 | | | | 1,566,103 | | |
Leidos Holdings, Inc. | | | 15,332 | | | | 1,611,700 | | |
Mastercard, Inc. – Class A | | | 6,617 | | | | 2,361,872 | | |
| | | | | | 6,918,627 | | |
Semiconductors & Semiconductor
Equipment (6.1%) | |
Advanced Micro Devices, Inc. (b) | | | 11,549 | | | | 1,059,159 | | |
KLA Corp. | | | 3,930 | | | | 1,017,516 | | |
Micron Technology, Inc. (b) | | | 13,652 | | | | 1,026,358 | | |
QUALCOMM, Inc. | | | 10,306 | | | | 1,570,016 | | |
Teradyne, Inc. | | | 9,770 | | | | 1,171,325 | | |
Texas Instruments, Inc. | | | 12,598 | | | | 2,067,710 | | |
| | | | | | 7,912,084 | | |
Software (6.9%) | |
Microsoft Corp. | | | 22,316 | | | | 4,963,525 | | |
Salesforce.com, Inc. (b) | | | 9,071 | | | | 2,018,570 | | |
SS&C Technologies Holdings, Inc. | | | 11,906 | | | | 866,161 | | |
Workday, Inc. – Class A (b) | | | 4,996 | | | | 1,197,091 | | |
| | | | | | 9,045,347 | | |
Materials (2.1%) | |
Chemicals (1.3%) | |
PPG Industries, Inc. | | | 11,857 | | | | 1,710,017 | | |
Construction Materials (0.8%) | |
Vulcan Materials Co. | | | 6,646 | | | | 985,668 | | |
Real Estate (1.5%) | |
Specialized REITs (1.5%) | |
American Tower Corp. | | | 5,875 | | | | 1,318,702 | | |
Gaming and Leisure
Properties, Inc. | | | 15,362 | | | | 651,349 | | |
| | | | | | 1,970,051 | | |
Utilities (2.6%) | |
Electric Utilities (2.6%) | |
American Electric
Power Co., Inc. | | | 19,543 | | | | 1,627,345 | | |
NextEra Energy, Inc. | | | 23,732 | | | | 1,830,924 | | |
| | | | | | 3,458,269 | | |
Total common stocks
(cost: $83,759,091) | | | | | 130,039,447 | | |
| | | Shares | | Value(a) | |
Short-Term Securities (0.3%) | |
Investment Companies (0.3%) | |
State Street Institutional
U.S. Government Money
Market Fund, current
rate 0.030% | | | 336,895 | | | $ | 336,895 | | |
Total short-term securities
(cost: $336,895) | | | | | 336,895 | | |
Total investments in securities
(cost: $84,095,986) (d) | | | | | 130,376,342 | | |
Liabilities in excess of cash and
other assets (-0.1%) | | | | | (80,283 | ) | |
Total net assets (100.0%) | | | | $ | 130,296,059 | | |
Investments in Securities Legend
(a) Securities are valued by procedures described in Note 2 of the Notes to Financial Statements.
(b) Non-income producing security.
(c) Foreign security: The Fund held 1.7% of net assets in foreign securities at December 31, 2020.
(d) At December 31, 2020 the cost of investments for federal income tax purposes was $84,172,877. The aggregate unrealized appreciation and depreciation of investments based on this cost were:
Gross unrealized appreciation | | $ | 47,159,187 | | |
| Gross unrealized depreciation | | | (955,722 | ) | |
Net unrealized appreciation | | $ | 46,203,465 | | |
See accompanying notes to financial statements.
101
Securian Funds Trust
Statements of Assets and Liabilities
December 31, 2020
| | | SFT
Core Bond
Fund | | SFT
Dynamic
Managed
Volatility
Fund | | SFT
Government
Money
Market
Fund | | SFT
Index 400
Mid-Cap
Fund | | SFT
Index 500
Fund | | SFT
International
Bond
Fund | |
Assets | | | | | | | | | | | | | | | | | | | | | | | | | |
Investments in securities, at market value – see
accompanying schedule for detailed listing* | |
Unaffiliated issuers | | $ | 494,975,022 | | | $ | 437,421,215 | | | $ | 197,443,051 | | | $ | 204,579,055 | | | $ | 1,003,129,117 | | | $ | 90,646,572 | | |
Affiliated issuers (note 8) | | | – | | | | 223,777,991 | | | | – | | | | – | | | | – | | | | – | | |
Cash on demand deposit | | | 401 | | | | 3,000,000 | | | | – | | | | – | | | | – | | | | – | | |
Due from broker1 | | | 200,000 | | | | 9,000,000 | | | | – | | | | – | | | | – | | | | 2,410,000 | | |
Foreign currency on deposit2 | | | – | | | | – | | | | – | | | | – | | | | – | | | | 220,252 | | |
Receivable: | |
Fund shares sold | | | 29 | | | | 153,529 | | | | – | | | | 10,164 | | | | 43,947 | | | | 25 | | |
Investment securities sold (including paydowns) | | | 7,292 | | | | 2,922,756 | | | | – | | | | – | | | | – | | | | – | | |
Dividends and accrued interest | | | 2,602,059 | | | | 1,495,559 | | | | 330 | | | | 187,254 | | | | 728,773 | | | | 483,959 | | |
Refundable foreign income taxes withheld | | | – | | | | – | | | | – | | | | – | | | | – | | | | 41,051 | | |
Adviser (note 4) | | | – | | | | 39,153 | | | | 60,432 | | | | – | | | | – | | | | – | | |
Variation margin on futures contracts | | | 23,612 | | | | 917,582 | | | | – | | | | 16,647 | | | | 118,091 | | | | – | | |
Unrealized appreciation on forward foreign currency contracts | | | – | | | | – | | | | – | | | | – | | | | – | | | | 2,004,305 | | |
Prepaid expenses | | | 20,126 | | | | 8,793 | | | | 13,019 | | | | 12,218 | | | | 26,894 | | | | 10,784 | | |
Total assets | | | 497,828,541 | | | | 678,736,578 | | | | 197,516,832 | | | | 204,805,338 | | | | 1,004,046,822 | | | | 95,816,948 | | |
Liabilities | | | | | | | | | | | | | | | | | | | | | | | | | |
Due to custodian | | | – | | | | – | | | | – | | | | 300 | | | | – | | | | – | | |
Payable: | |
Fund shares repurchased | | | 448,806 | | | | – | | | | 531,703 | | | | 161,777 | | | | 232,221 | | | | 8,395 | | |
Investment securities purchased | | | – | | | | – | | | | – | | | | 341,745 | | | | – | | | | – | | |
Adviser | | | 285,307 | | | �� | 464,982 | | | | 61,620 | | | | 71,773 | | | | 284,324 | | | | 81,484 | | |
Accrued expenses | | | 81,799 | | | | 73,855 | | | | 46,521 | | | | 58,380 | | | | 86,483 | | | | 126,325 | | |
Unrealized depreciation on forward foreign currency contracts | | | – | | | | – | | | | – | | | | – | | | | – | | | | 4,446,111 | | |
Options written at value3 | | | – | | | | 9,805 | | | | – | | | | – | | | | – | | | | – | | |
Total liabilities | | | 815,912 | | | | 548,642 | | | | 639,844 | | | | 633,975 | | | | 603,028 | | | | 4,662,315 | | |
Net assets applicable to outstanding capital stock | | $ | 497,012,629 | | | $ | 678,187,936 | | | $ | 196,876,988 | | | $ | 204,171,363 | | | $ | 1,003,443,794 | | | $ | 91,154,633 | | |
Net Assets Consist of: | |
Paid in capital** | | $ | 371,518,368 | | | $ | 457,323,320 | | | $ | 196,874,922 | | | $ | (29,270,001 | ) | | $ | (65,729,628 | ) | | $ | 102,073,180 | | |
Total distributable earnings | | | 125,494,261 | | | | 220,864,616 | | | | 2,066 | | | | 233,441,364 | | | | 1,069,173,422 | | | | (10,918,547 | ) | |
Net assets | | $ | 497,012,629 | | | $ | 678,187,936 | | | $ | 196,876,988 | | | $ | 204,171,363 | | | $ | 1,003,443,794 | | | $ | 91,154,633 | | |
Net assets by class: | |
Class 1 | | $ | 5,529,725 | | | $ | N/A | | | $ | N/A | | | $ | 15,837,647 | | | $ | 272,088,140 | | | $ | 1,530,393 | | |
Class 2 | | | 491,482,904 | | | | 678,187,936 | | | | 196,876,988 | | | | 188,333,716 | | | | 731,355,654 | | | | 89,624,240 | | |
Net asset value per share of outstanding capital stock by class: | |
Class 1 | | | 2.755 | | | | N/A | | | | N/A | | | | 6.264 | | | | 15.732 | | | | 2.458 | | |
Class 2 | | | 2.673 | | | | 18.697 | | | | 1.000 | | | | 6.079 | | | | 15.268 | | | | 2.385 | | |
* Identified cost: | |
Unaffiliated issuers | | $ | 471,892,191 | | | $ | 405,067,510 | | | $ | 197,443,051 | | | $ | 142,459,952 | | | $ | 348,984,134 | | | $ | 95,490,735 | | |
Affiliated issuers | | | – | | | | 107,000,000 | | | | – | | | | – | | | | – | | | | – | | |
** Shares outstanding by class: | |
Class 1 | | | 2,007,496 | | | | N/A | | | | N/A | | | | 2,528,285 | | | | 17,295,490 | | | | 622,622 | | |
Class 2 | | | 183,846,708 | | | | 36,273,157 | | | | 196,876,988 | | | | 30,978,996 | | | | 47,900,922 | | | | 37,571,317 | | |
| 1 Collateral for open foreign currency contracts | | $ | – | | | $ | – | | | $ | – | | | $ | – | | | $ | – | | | $ | 2,410,000 | | |
| 2 Foreign currency on deposit (cost) | | $ | – | | | $ | – | | | $ | – | | | $ | – | | | $ | – | | | $ | 220,954 | | |
| 3 Premiums received | | $ | – | | | $ | 3,588 | | | $ | – | | | $ | – | | | $ | – | | | $ | – | | |
See accompanying notes to financial statements.
102
| | | SFT
IvySM Growth
Fund | | SFT
IvySM Small
Cap Growth
Fund | | SFT
Managed
Volatility
Equity
Fund | | SFT
Real Estate
Securities
Fund | | SFT
T. Rowe Price
Value
Fund | | SFT
Wellington
Core Equity
Fund | |
Assets | | | | | | | | | | | | | | | | | | | | | | | | | |
Investments in securities, at market value – see
accompanying schedule for detailed listing* | |
Unaffiliated issuers | | $ | 606,918,233 | | | $ | 212,243,622 | | | $ | 340,918,518 | | | $ | 125,598,667 | | | $ | 206,361,045 | | | $ | 130,376,342 | | |
Affiliated issuers (note 8) | | | – | | | | – | | | | – | | | | – | | | | – | | | | – | | |
Cash on demand deposit | | | – | | | | – | | | | – | | | | – | | | | – | | | | – | | |
Due from broker1 | | | – | | | | – | | | | 16,725,000 | | | | – | | | | – | | | | – | | |
Foreign currency on deposit2 | | | – | | | | – | | | | – | | | | – | | | | – | | | | – | | |
Receivable: | |
Fund shares sold | | | – | | | | – | | | | – | | | | – | | | | – | | | | 2,303 | | |
Investment securities sold (including paydowns) | | | – | | | | 99,320 | | | | 1,208,766 | | | | – | | | | 619,696 | | | | – | | |
Dividends and accrued interest | | | 171,584 | | | | 24,869 | | | | 372 | | | | 542,115 | | | | 125,273 | | | | 65,642 | | |
Refundable foreign income taxes withheld | | | – | | | | – | | | | – | | | | – | | | | – | | | | – | | |
Adviser (note 4) | | | – | | | | – | | | | 24,803 | | | | – | | | | – | | | | – | | |
Variation margin on futures contracts | | | – | | | | – | | | | – | | | | – | | | | – | | | | – | | |
Unrealized appreciation on forward foreign currency contracts | | | – | | | | – | | | | – | | | | – | | | | – | | | | – | | |
Prepaid expenses | | | 19,972 | | | | 12,047 | | | | 17,317 | | | | 11,297 | | | | 31,864 | | | | 11,057 | | |
Total assets | | | 607,109,789 | | | | 212,379,858 | | | | 358,894,776 | | | | 126,152,079 | | | | 207,137,878 | | | | 130,455,344 | | |
Liabilities | | | | | | | | | | | | | | | | | | | | | | | | | |
Due to custodian | | | – | | | | – | | | | 3,000,000 | | | | – | | | | – | | | | – | | |
Payable: | |
Fund shares repurchased | | | 340,713 | | | | 167,341 | | | | 13,370 | | | | 79,984 | | | | 15,765 | | | | 11,346 | | |
Investment securities purchased | | | – | | | | 140,031 | | | | – | | | | – | | | | 556,893 | | | | – | | |
Adviser | | | 467,963 | | | | 197,194 | | | | 246,364 | | | | 105,532 | | | | 165,998 | | | | 104,628 | | |
Accrued expenses | | | 53,875 | | | | 41,508 | | | | 49,178 | | | | 45,278 | | | | 49,611 | | | | 43,311 | | |
Unrealized depreciation on forward foreign currency contracts | | | – | | | | – | | | | – | | | | – | | | | – | | | | – | | |
Options written at value3 | | | – | | | | – | | | | 3,570 | | | | – | | | | – | | | | – | | |
Total liabilities | | | 862,551 | | | | 546,074 | | | | 3,312,482 | | | | 230,794 | | | | 788,267 | | | | 159,285 | | |
Net assets applicable to outstanding capital stock | | $ | 606,247,238 | | | $ | 211,833,784 | | | $ | 355,582,294 | | | $ | 125,921,285 | | | $ | 206,349,611 | | | $ | 130,296,059 | | |
Net Assets Consist of: | |
Paid in capital** | | $ | 66,709,700 | | | $ | 45,986,678 | | | $ | 303,851,183 | | | $ | 14,331,489 | | | $ | 89,367,769 | | | $ | 33,866,376 | | |
Total distributable earnings | | | 539,537,538 | | | | 165,847,106 | | | | 51,731,111 | | | | 111,589,796 | | | | 116,981,842 | | | | 96,429,683 | | |
Net assets | | $ | 606,247,238 | | | $ | 211,833,784 | | | $ | 355,582,294 | | | $ | 125,921,285 | | | $ | 206,349,611 | | | $ | 130,296,059 | | |
Net assets by class: | |
Class 1 | | $ | N/A | | | $ | N/A | | | $ | N/A | | | $ | 6,460,679 | | | $ | N/A | | | $ | 1,728,658 | | |
Class 2 | | | 606,247,238 | | | | 211,833,784 | | | | 355,582,294 | | | | 119,460,606 | | | | 206,349,611 | | | | 128,567,401 | | |
Net asset value per share of outstanding capital stock by class: | |
Class 1 | | | N/A | | | | N/A | | | | N/A | | | | 5.515 | | | | N/A | | | | 22.304 | | |
Class 2 | | | 28.554 | | | | 25.579 | | | | 12.804 | | | | 5.352 | | | | 17.411 | | | | 21.936 | | |
* Identified cost: | |
Unaffiliated issuers | | $ | 351,274,958 | | | $ | 136,940,075 | | | $ | 287,252,100 | | | $ | 113,973,420 | | | $ | 164,146,636 | | | $ | 84,095,986 | | |
Affiliated issuers | | | – | | | | – | | | | – | | | | – | | | | – | | | | – | | |
** Shares outstanding by class: | |
Class 1 | | | N/A | | | | N/A | | | | N/A | | | | 1,171,550 | | | | N/A | | | | 77,503 | | |
Class 2 | | | 21,231,557 | | | | 8,281,650 | | | | 27,770,980 | | | | 22,322,149 | | | | 11,851,449 | | | | 5,861,115 | | |
| 1 Collateral for open foreign currency contracts | | $ | – | | | $ | – | | | $ | – | | | $ | – | | | $ | – | | | $ | – | | |
| 2 Foreign currency on deposit (cost) | | $ | – | | | $ | – | | | $ | – | | | $ | – | | | $ | – | | | $ | – | | |
| 3 Premiums received | | $ | – | | | $ | – | | | $ | 1,306 | | | $ | – | | | $ | – | | | $ | – | | |
103
Securian Funds Trust
Statements of Operations
Year ended December 31, 2020
| | | SFT
Core Bond
Fund | | SFT
Dynamic
Managed
Volatility
Fund | | SFT
Government
Money
Market
Fund | | SFT
Index 400
Mid-Cap
Fund | | SFT
Index 500
Fund | | SFT
International
Bond
Fund | |
Income: | |
Interest1 | | $ | 14,617,182 | | | $ | 6,561,947 | | | $ | 840,870 | | | $ | 956 | | | $ | – | | | $ | 2,293,992 | | |
Dividends1 | | | 36,839 | | | | 1,150,761 | | | | 132,182 | | | | 2,747,903 | | | | 16,083,351 | | | | 11,197 | | |
Foreign tax withholding | | | – | | | | – | | | | – | | | | (169 | ) | | | – | | | | (117,312 | ) | |
Total investment income | | | 14,654,021 | | | | 7,712,708 | | | | 973,052 | | | | 2,748,690 | | | | 16,083,351 | | | | 2,187,877 | | |
Expenses (note 4): | |
Investment advisory fee | | | 1,945,071 | | | | 3,318,828 | | | | 597,916 | | | | 260,912 | | | | 1,319,417 | | | | 552,160 | | |
Rule 12b-1 fees | | | 1,202,617 | | | | 1,508,558 | | | | 498,263 | | | | 404,749 | | | | 1,629,007 | | | | 226,596 | | |
Audit and accounting services | | | 255,433 | | | | 241,112 | | | | 132,083 | | | | 136,715 | | | | 229,165 | | | | 152,843 | | |
Administrative services fee | | | 67,201 | | | | 45,399 | | | | 53,800 | | | | 32,600 | | | | 32,600 | | | | 77,900 | | |
Legal fees | | | 18,291 | | | | 18,291 | | | | 16,356 | | | | 15,854 | | | | 31,525 | | | | 20,371 | | |
Custodian fees | | | 12,156 | | | | 21,777 | | | | 9,680 | | | | 18,817 | | | | 24,439 | | | | 39,246 | | |
Printing and shareholder reports | | | 10,698 | | | | 10,698 | | | | 10,698 | | | | 10,698 | | | | 10,698 | | | | 10,698 | | |
Trustee's fees | | | 22,627 | | | | 23,359 | | | | 23,359 | | | | 23,359 | | | | 23,359 | | | | 23,359 | | |
S&P licensing fee | | | – | | | | – | | | | – | | | | 21,001 | | | | 60,899 | | | | – | | |
Insurance | | | 9,161 | | | | 9,161 | | | | 9,161 | | | | 9,161 | | | | 9,161 | | | | 9,161 | | |
Other | | | 16,688 | | | | 4,188 | | | | 6,188 | | | | 10,390 | | | | 30,590 | | | | 17,290 | | |
Total expenses before fees waived | | | 3,559,943 | | | | 5,201,371 | | | | 1,357,504 | | | | 944,256 | | | | 3,400,860 | | | | 1,129,624 | | |
Less fees waived (note 4) | | | – | | | | (373,980 | ) | | | (776,001 | ) | | | – | | | | – | | | | – | | |
Total expenses net of fees waived | | | 3,559,943 | | | | 4,827,391 | | | | 581,503 | | | | 944,256 | | | | 3,400,860 | | | | 1,129,624 | | |
Net investment income | | | 11,094,078 | | | | 2,885,317 | | | | 391,549 | | | | 1,804,434 | | | | 12,682,491 | | | | 1,058,253 | | |
Realized gains (losses) on investments and foreign
currencies: | |
Investments (note 3) | |
Unaffiliated issuers | | | 8,620,781 | | | | 20,491,707 | | | | – | | | | 8,440,423 | | | | 55,790,266 | | | | (3,130,249 | ) | |
Written options contracts | | | – | | | | (8,340,299 | ) | | | – | | | | – | | | | – | | | | – | | |
Swap contracts | | | – | | | | – | | | | – | | | | – | | | | – | | | | (5,621,871 | ) | |
Foreign forward currency contracts | | | – | | | | – | | | | – | | | | – | | | | – | | | | (1,003,814 | ) | |
Foreign currency transactions | | | – | | | | – | | | | – | | | | – | | | | – | | | | 111,769 | | |
Net increase from litigation payments | | | 2,525 | | | | – | | | | – | | | | 7,229 | | | | 24,874 | | | | – | | |
Futures contracts | | | 2,564,931 | | | | 5,933,967 | | | | – | | | | 1,449,174 | | | | 1,866,561 | | | | – | | |
Net change in unrealized appreciation or depreciation on: | |
Investments | |
Unaffiliated issuers, net of foreign capital gains tax2 | | | 9,426,813 | | | | 13,311,603 | | | | – | | | | 11,339,808 | | | | 81,079,269 | | | | 1,086,406 | | |
Affiliated issuers (note 8) | | | – | | | | 34,464,172 | | | | – | | | | – | | | | – | | | | – | | |
Written options contracts | | | – | | | | (6,217 | ) | | | – | | | | – | | | | – | | | | – | | |
Swap contracts | | | – | | | | – | | | | – | | | | – | | | | – | | | | 1,623,904 | | |
Translation of assets and liabilities in foreign currency | | | – | | | | – | | | | – | | | | – | | | | – | | | | 120,286 | | |
Foreign forward currency contracts | | | – | | | | – | | | | – | | | | – | | | | – | | | | (562,315 | ) | |
Futures contracts | | | 203,198 | | | | (3,523,988 | ) | | | – | | | | 16,959 | | | | (63,119 | ) | | | – | | |
Net gains (losses) on investments | | | 20,818,248 | | | | 62,330,945 | | | | – | | | | 21,253,593 | | | | 138,697,851 | | | | (7,375,884 | ) | |
Net increase (decrease) in net assets resulting from
operations | | $ | 31,912,326 | | | $ | 65,216,262 | | | $ | 391,549 | | | $ | 23,058,027 | | | $ | 151,380,342 | | | $ | (6,317,631 | ) | |
1 All income is from unaffiliated issuers. | | | | | | | | | | | | | |
2 Change in unrealized appreciation or depreciation on
deferred foreign capital gains tax | | $ | – | | | $ | – | | | $ | – | | | $ | – | | | $ | – | | | $ | 21,850 | | |
See accompanying notes to financial statements.
104
| | | SFT
IvySM Growth
Fund | | SFT
IvySM Small
Cap Growth
Fund | | SFT
Managed
Volatility
Equity
Fund | | SFT
Real Estate
Securities
Fund | | SFT
T. Rowe Price
Value
Fund | | SFT
Wellington
Core Equity
Fund | |
Income: | |
Interest1 | | $ | 23,258 | | | $ | 46,132 | | | $ | 7,171 | | | $ | – | | | $ | 10,299 | | | $ | 341 | | |
Dividends1 | | | 4,457,423 | | | | 664,132 | | | | 7,824,174 | | | | 3,141,247 | | | | 3,805,611 | | | | 1,736,551 | | |
Foreign tax withholding | | | (16,656 | ) | | | – | | | | – | | | | – | | | | (57,912 | ) | | | (7,282 | ) | |
Total investment income | | | 4,464,025 | | | | 710,264 | | | | 7,831,345 | | | | 3,141,247 | | | | 3,757,998 | | | | 1,729,610 | | |
Expenses (note 4): | |
Investment advisory fee | | | 3,664,805 | | | | 1,460,840 | | | | 1,972,040 | | | | 840,252 | | | | 1,217,997 | | | | 762,203 | | |
Rule 12b-1 fees | | | 1,376,830 | | | | 429,659 | | | | 896,382 | | | | 286,026 | | | | 454,476 | | | | 289,704 | | |
Audit and accounting services | | | 166,889 | | | | 121,961 | | | | 148,002 | | | | 134,068 | | | | 120,549 | | | | 128,922 | | |
Administrative services fee | | | 32,600 | | | | 32,600 | | | | 32,700 | | | | 32,600 | | | | 32,600 | | | | 32,600 | | |
Legal fees | | | 20,990 | | | | 17,885 | | | | 15,854 | | | | 15,854 | | | | 18,259 | | | | 15,854 | | |
Custodian fees | | | 14,229 | | | | 17,834 | | | | 20,988 | | | | 12,499 | | | | 29,673 | | | | 14,999 | | |
Printing and shareholder reports | | | 10,698 | | | | 10,698 | | | | 10,698 | | | | 10,698 | | | | 10,698 | | | | 10,698 | | |
Trustee's fees | | | 23,359 | | | | 23,359 | | | | 23,359 | | | | 23,359 | | | | 23,359 | | | | 23,359 | | |
S&P licensing fee | | | – | | | | – | | | | – | | | | – | | | | – | | | | – | | |
Insurance | | | 9,161 | | | | 9,161 | | | | 9,161 | | | | 9,161 | | | | 9,161 | | | | 9,161 | | |
Other | | | 19,291 | | | | 9,790 | | | | 13,589 | | | | 7,989 | | | | 9,992 | | | | 7,590 | | |
Total expenses before fees waived | | | 5,338,852 | | | | 2,133,787 | | | | 3,142,773 | | | | 1,372,506 | | | | 1,926,764 | | | | 1,295,090 | | |
Less fees waived (note 4) | | | – | | | | – | | | | (274,362 | ) | | | – | | | | – | | | | – | | |
Total expenses net of fees waived | | | 5,338,852 | | | | 2,133,787 | | | | 2,868,411 | | | | 1,372,506 | | | | 1,926,764 | | | | 1,295,090 | | |
Net investment income | | | (874,827 | ) | | | (1,423,523 | ) | | | 4,962,934 | | | | 1,768,741 | | | | 1,831,234 | | | | 434,520 | | |
Realized gains (losses) on investments and foreign
currencies: | |
Investments (note 3) | |
Unaffiliated issuers | | | 63,715,946 | | | | 24,114,747 | | | | 21,984,097 | | | | (1,575,537 | ) | | | (1,294,529 | ) | | | 4,835,957 | | |
Written options contracts | | | – | | | | – | | | | (6,411,224 | ) | | | – | | | | – | | | | – | | |
Swap contracts | | | – | | | | – | | | | – | | | | – | | | | – | | | | – | | |
Foreign forward currency contracts | | | – | | | | – | | | | – | | | | – | | | | – | | | | – | | |
Foreign currency transactions | | | – | | | | – | | | | – | | | | – | | | | 1,334 | | | | – | | |
Net increase from litigation payments | | | – | | | | – | | | | – | | | | – | | | | 19,489 | | | | 342 | | |
Futures contracts | | | – | | | | – | | | | (36,572,698 | ) | | | – | | | | – | | | | – | | |
Net change in unrealized appreciation or depreciation on: | |
Investments | |
Unaffiliated issuers, net of foreign capital gains tax2 | | | 86,666,599 | | | | 34,510,775 | | | | (4,135,685 | ) | | | (4,155,015 | ) | | | 19,023,878 | | | | 14,746,053 | | |
Affiliated issuers (note 8) | | | – | | | | – | | | | – | | | | – | | | | – | | | | – | | |
Written options contracts | | | – | | | | – | | | | (2,264 | ) | | | – | | | | – | | | | – | | |
Swap contracts | | | – | | | | – | | | | – | | | | – | | | | – | | | | – | | |
Translation of assets and liabilities in foreign currency | | | – | | | | – | | | | – | | | | – | | | | (58 | ) | | | – | | |
Foreign forward currency contracts | | | – | | | | – | | | | – | | | | – | | | | – | | | | – | | |
Futures contracts | | | – | | | | – | | | | (1,435,340 | ) | | | – | | | | – | | | | – | | |
Net gains (losses) on investments | | | 150,382,545 | | | | 58,625,522 | | | | (26,573,114 | ) | | | (5,730,552 | ) | | | 17,750,114 | | | | 19,582,352 | | |
Net increase (decrease) in net assets resulting from
operations | | $ | 149,507,718 | | | $ | 57,201,999 | | | $ | (21,610,180 | ) | | $ | (3,961,811 | ) | | $ | 19,581,348 | | | $ | 20,016,872 | | |
1 All income is from unaffiliated issuers. | | | | | | | | | | | | | |
2 Change in unrealized appreciation or depreciation on
deferred foreign capital gains tax | | $ | – | | | $ | – | | | $ | – | | | $ | – | | | $ | – | | | $ | – | | |
105
Securian Funds Trust
Statements of Changes in Net Assets
Year ended December 31, 2020 and year ended December 31, 2019
| | | SFT
Core Bond
Fund | | SFT
Dynamic
Managed
Volatility
Fund | | SFT
Government
Money
Market
Fund | |
| | | 2020 | | 2019 | | 2020 | | 2019 | | 2020 | | 2019 | |
Operations: | |
Net investment income | | $ | 11,094,078 | | | $ | 13,478,143 | | | $ | 2,885,317 | | | $ | 5,867,064 | | | $ | 391,549 | | | $ | 1,284,447 | | |
Net realized gains (losses) on investments | | | 11,188,237 | | | | 9,488,921 | | | | 18,085,375 | | | | 15,312,921 | | | | – | | | | – | | |
Net change in unrealized appreciation or
depreciation of investments | | | 9,630,011 | | | | 16,218,224 | | | | 44,245,570 | | | | 70,624,152 | | | | – | | | | – | | |
Net increase (decrease) in net assets
resulting from operations | | | 31,912,326 | | | | 39,185,288 | | | | 65,216,262 | | | | 91,804,137 | | | | 391,549 | | | | 1,284,447 | | |
Distributions to shareholders: | |
From distributable earnings | |
Class 2 | | | – | | | | – | | | | – | | | | – | | | | (391,549 | ) | | | (1,284,447 | ) | |
Decrease in net assets from distributions | | | – | | | | – | | | | – | | | | – | | | | (391,549 | ) | | | (1,284,447 | ) | |
Capital stock transactions: | |
Proceeds from sales | |
Class 1 | | | 888,112 | | | | 1,334,322 | | | | – | | | | – | | | | – | | | | – | | |
Class 2 | | | 17,474,501 | | | | 49,742,319 | | | | 66,737,165 | | | | 79,500,104 | | | | 58,941,198 | | | | 139,146,640 | | |
Value of distributions reinvested | |
Class 2 | | | – | | | | – | | | | – | | | | – | | | | 391,549 | | | | 1,284,447 | | |
Payments for redemption of shares | |
Class 1 | | | (766,595 | ) | | | (270,848 | ) | | | – | �� | | | – | | | | – | | | | – | | |
Class 2 | | | (40,373,412 | ) | | | (39,982,740 | ) | | | (31,570,215 | ) | | | (8,732,213 | ) | | | (50,806,705 | ) | | | (24,840,919 | ) | |
Increase (decrease) in net assets from
capital stock transactions | | | (22,777,394 | ) | | | 10,823,053 | | | | 35,166,950 | | | | 70,767,891 | | | | 8,526,042 | | | | 115,590,168 | | |
Total increase (decrease) in net assets | | | 9,134,932 | | | | 50,008,341 | | | | 100,383,212 | | | | 162,572,028 | | | | 8,526,042 | | | | 115,590,168 | | |
Net assets at beginning of period | | | 487,877,697 | | | | 437,869,356 | | | | 577,804,724 | | | | 415,232,696 | | | | 188,350,946 | | | | 72,760,778 | | |
Net assets at end of period | | $ | 497,012,629 | | | $ | 487,877,697 | | | $ | 678,187,936 | | | $ | 577,804,724 | | | $ | 196,876,988 | | | $ | 188,350,946 | | |
Capital share transactions: | |
Proceeds from sales | |
Class 1 | | | 332,559 | | | | 530,425 | | | | – | | | | – | | | | – | | | | – | | |
Class 2 | | | 6,723,644 | | | | 20,409,568 | | | | 3,896,625 | | | | 5,065,468 | | | | 58,941,198 | | | | 139,146,640 | | |
Issued on reinvestment of distributions | |
Class 2 | | | – | | | | – | | | | – | | | | – | | | | 391,549 | | | | 1,284,447 | | |
Payments for redemption of shares | |
Class 1 | | | (293,488 | ) | | | (107,768 | ) | | | – | | | | – | | | | – | | | | – | | |
Class 2 | | | (15,912,214 | ) | | | (16,439,579 | ) | | | (1,828,550 | ) | | | (555,947 | ) | | | (50,806,705 | ) | | | (24,840,919 | ) | |
Net change from capital transactions | | | (9,149,499 | ) | | | 4,392,646 | | | | 2,068,075 | | | | 4,509,521 | | | | 8,526,042 | | | | 115,590,168 | | |
See accompanying notes to financial statements.
106
| | | SFT
Index 400
Mid-Cap
Fund | | SFT
Index 500
Fund | |
| | | 2020 | | 2019 | | 2020 | | 2019 | |
Operations: | |
Net investment income | | $ | 1,804,434 | | | $ | 2,271,732 | | | $ | 12,682,491 | | | $ | 14,404,923 | | |
Net realized gains (losses) on investments | | | 9,896,826 | | | | 19,744,824 | | | | 57,681,701 | | | | 90,285,793 | | |
Net change in unrealized appreciation or
depreciation of investments | | | 11,356,767 | | | | 23,403,635 | | | | 81,016,150 | | | | 128,561,149 | | |
Net increase (decrease) in net assets
resulting from operations | | | 23,058,027 | | | | 45,420,191 | | | | 151,380,342 | | | | 233,251,865 | | |
Distributions to shareholders: | |
From distributable earnings | |
Class 2 | | | – | | | | – | | | | – | | | | – | | |
Decrease in net assets from distributions | | | – | | | | – | | | | – | | | | – | | |
Capital stock transactions: | |
Proceeds from sales | |
Class 1 | | | 1,964,813 | | | | 2,617,325 | | | | 7,352,443 | | | | 8,781,974 | | |
Class 2 | | | 4,604,250 | | | | 5,969,796 | | | | 12,379,911 | | | | 21,035,749 | | |
Value of distributions reinvested | |
Class 2 | | | – | | | | – | | | | – | | | | – | | |
Payments for redemption of shares | |
Class 1 | | | (332,878 | ) | | | (344,997 | ) | | | (1,431,736 | ) | | | (576,895 | ) | |
Class 2 | | | (23,318,726 | ) | | | (45,831,458 | ) | | | (80,640,952 | ) | | | (142,875,851 | ) | |
Increase (decrease) in net assets from
capital stock transactions | | | (17,082,541 | ) | | | (37,589,334 | ) | | | (62,340,334 | ) | | | (113,635,023 | ) | |
Total increase (decrease) in net assets | | | 5,975,486 | | | | 7,830,857 | | | | 89,040,008 | | | | 119,616,842 | | |
Net assets at beginning of period | | | 198,195,877 | | | | 190,365,020 | | | | 914,403,786 | | | | 794,786,944 | | |
Net assets at end of period | | $ | 204,171,363 | | | $ | 198,195,877 | | | $ | 1,003,443,794 | | | $ | 914,403,786 | | |
Capital share transactions: | |
Proceeds from sales | |
Class 1 | | | 404,539 | | | | 510,620 | | | | 543,123 | | | | 734,837 | | |
Class 2 | | | 1,091,233 | | | | 1,219,957 | | | | 923,044 | | | | 1,806,569 | | |
Issued on reinvestment of distributions | |
Class 2 | | | – | | | | – | | | | – | | | | – | | |
Payments for redemption of shares | |
Class 1 | | | (63,527 | ) | | | (67,702 | ) | | | (109,305 | ) | | | (49,423 | ) | |
Class 2 | | | (4,722,525 | ) | | | (9,253,499 | ) | | | (6,307,407 | ) | | | (12,265,757 | ) | |
Net change from capital transactions | | | (3,290,280 | ) | | | (7,590,624 | ) | | | (4,950,545 | ) | | | (9,773,774 | ) | |
107
Securian Funds Trust
Statements of Changes in Net Assets – continued
Year ended December 31, 2020 and year ended December 31, 2019
| | SFT
International
Bond
Fund | | SFT IvySM
Growth
Fund | | SFT IvySM
Small Cap
Growth
Fund | |
| | | 2020 | | 2019 | | 2020 | | 2019 | | 2020 | | 2019 | |
Operations: | |
Net investment income | | $ | 1,058,253 | | | $ | 4,373,883 | | | $ | (874,827 | ) | | $ | (142,468 | ) | | $ | (1,423,523 | ) | | $ | (1,505,495 | ) | |
Net realized gains (losses) on investments | | | (9,644,165 | ) | | | 2,735,266 | | | | 63,715,946 | | | | 72,857,334 | | | | 24,114,747 | | | | 11,870,330 | | |
Net change in unrealized appreciation or
depreciation of investments | | | 2,268,281 | | | | (5,356,463 | ) | | | 86,666,599 | | | | 84,915,152 | | | | 34,510,775 | | | | 26,987,819 | | |
Net increase (decrease) in net assets
resulting from operations | | | (6,317,631 | ) | | | 1,752,686 | | | | 149,507,718 | | | | 157,630,018 | | | | 57,201,999 | | | | 37,352,654 | | |
Distributions to shareholders: | |
From distributable earnings | |
Class 2 | | | – | | | | – | | | | – | | | | – | | | | – | | | | – | | |
Decrease in net assets from distributions | | | – | | | | – | | | | – | | | | – | | | | – | | | | – | | |
Capital stock transactions: | |
Proceeds from sales | |
Class 1 | | | 323,164 | | | | 293,301 | | | | – | | | | – | | | | – | | | | – | | |
Class 2 | | | 6,978,780 | | | | 3,454,630 | | | | 1,136,939 | | | | 802,099 | | | | 1,129,856 | | | | 5,859,469 | | |
Value of distributions reinvested | |
Class 2 | | | – | | | | – | | | | – | | | | – | | | | – | | | | – | | |
Payments for redemption of shares | |
Class 1 | | | (101,613 | ) | | | (158,050 | ) | | | – | | | | – | | | | – | | | | – | | |
Class 2 | | | (10,143,196 | ) | | | (9,594,759 | ) | | | (89,240,113 | ) | | | (67,472,882 | ) | | | (23,219,247 | ) | | | (29,858,350 | ) | |
Increase (decrease) in net assets from
capital stock transactions | | | (2,942,865 | ) | | | (6,004,878 | ) | | | (88,103,174 | ) | | | (66,670,783 | ) | | | (22,089,391 | ) | | | (23,998,881 | ) | |
Total increase (decrease) in net assets | | | (9,260,496 | ) | | | (4,252,192 | ) | | | 61,404,544 | | | | 90,959,235 | | | | 35,112,608 | | | | 13,353,773 | | |
Net assets at beginning of period | | | 100,415,129 | | | | 104,667,321 | | | | 544,842,694 | | | | 453,883,459 | | | | 176,721,176 | | | | 163,367,403 | | |
Net assets at end of period | | $ | 91,154,633 | | | $ | 100,415,129 | | | $ | 606,247,238 | | | $ | 544,842,694 | | | $ | 211,833,784 | | | $ | 176,721,176 | | |
Capital share transactions: | |
Proceeds from sales | |
Class 1 | | | 130,501 | | | | 111,392 | | | | – | | | | – | | | | – | | | | – | | |
Class 2 | | | 2,895,845 | | | | 1,348,942 | | | | 51,028 | | | | 41,386 | | | | 52,292 | | | | 332,095 | | |
Issued on reinvestment of distributions | |
Class 2 | | | – | | | | – | | | | – | | | | – | | | | – | | | | – | | |
Payments for redemption of shares | |
Class 1 | | | (40,555 | ) | | | (60,030 | ) | | | – | | | | – | | | | – | | | | – | | |
Class 2 | | | (4,168,472 | ) | | | (3,760,062 | ) | | | (3,757,367 | ) | | | (3,458,081 | ) | | | (1,184,615 | ) | | | (1,679,618 | ) | |
Net change from capital transactions | | | (1,182,681 | ) | | | (2,359,758 | ) | | | (3,706,339 | ) | | | (3,416,695 | ) | | | (1,132,323 | ) | | | (1,347,523 | ) | |
See accompanying notes to financial statements.
108
| | | SFT
Managed
Volatility
Equity
Fund | | SFT
Real Estate
Securities
Fund | |
| | | 2020 | | 2019 | | 2020 | | 2019 | |
Operations: | |
Net investment income | | $ | 4,962,934 | | | $ | 7,534,805 | | | $ | 1,768,741 | | | $ | 2,117,814 | | |
Net realized gains (losses) on investments | | | (20,999,825 | ) | | | (5,380,256 | ) | | | (1,575,537 | ) | | | 8,466,622 | | |
Net change in unrealized appreciation or
depreciation of investments | | | (5,573,289 | ) | | | 50,433,581 | | | | (4,155,015 | ) | | | 17,952,628 | | |
Net increase (decrease) in net assets
resulting from operations | | | (21,610,180 | ) | | | 52,588,130 | | | | (3,961,811 | ) | | | 28,537,064 | | |
Distributions to shareholders: | |
From distributable earnings | |
Class 2 | | | – | | | | – | | | | – | | | | – | | |
Decrease in net assets from distributions | | | – | | | | – | | | | – | | | | – | | |
Capital stock transactions: | |
Proceeds from sales | |
Class 1 | | | – | | | | – | | | | 955,799 | | | | 1,057,638 | | |
Class 2 | | | 10,751,053 | | | | 47,244,395 | | | | 5,095,931 | | | | 1,584,153 | | |
Value of distributions reinvested | |
Class 2 | | | – | | | | – | | | | – | | | | – | | |
Payments for redemption of shares | |
Class 1 | | | – | | | | – | | | | (234,691 | ) | | | (372,857 | ) | |
Class 2 | | | (24,036,565 | ) | | | (7,839,141 | ) | | | (10,142,004 | ) | | | (16,787,194 | ) | |
Increase (decrease) in net assets from
capital stock transactions | | | (13,285,512 | ) | | | 39,405,254 | | | | (4,324,965 | ) | | | (14,518,260 | ) | |
Total increase (decrease) in net assets | | | (34,895,692 | ) | | | 91,993,384 | | | | (8,286,776 | ) | | | 14,018,804 | | |
Net assets at beginning of period | | | 390,477,986 | | | | 298,484,602 | | | | 134,208,061 | | | | 120,189,257 | | |
Net assets at end of period | | $ | 355,582,294 | | | $ | 390,477,986 | | | $ | 125,921,285 | | | $ | 134,208,061 | | |
Capital share transactions: | |
Proceeds from sales | |
Class 1 | | | – | | | | – | | | | 183,812 | | | | 195,847 | | |
Class 2 | | | 852,322 | | | | 3,734,839 | | | | 1,052,070 | | | | 304,892 | | |
Issued on reinvestment of distributions | |
Class 2 | | | – | | | | – | | | | – | | | | – | | |
Payments for redemption of shares | |
Class 1 | | | – | | | | – | | | | (47,116 | ) | | | (70,129 | ) | |
Class 2 | | | (1,947,315 | ) | | | (613,619 | ) | | | (2,034,097 | ) | | | (3,250,483 | ) | |
Net change from capital transactions | | | (1,094,993 | ) | | | 3,121,220 | | | | (845,331 | ) | | | (2,819,873 | ) | |
109
Securian Funds Trust
Statements of Changes in Net Assets – continued
Year ended December 31, 2020 and year ended December 31, 2019
| | | SFT
T. Rowe Price
Value
Fund | | SFT
Wellington
Core Equity
Fund | |
| | | 2020 | | 2019 | | 2020 | | 2019 | |
Operations: | |
Net investment income | | $ | 1,831,234 | | | $ | 2,527,269 | | | $ | 434,520 | | | $ | 551,953 | | |
Net realized gains (losses) on investments | | | (1,273,706 | ) | | | 10,493,939 | | | | 4,836,299 | | | | 5,212,510 | | |
Net change in unrealized appreciation or
depreciation of investments | | | 19,023,820 | | | | 31,861,701 | | | | 14,746,053 | | | | 27,656,503 | | |
Net increase (decrease) in net assets
resulting from operations | | | 19,581,348 | | | | 44,882,909 | | | | 20,016,872 | | | | 33,420,966 | | |
Distributions to shareholders: | |
From distributable earnings | |
Class 2 | | | – | | | | – | | | | – | | | | – | | |
Decrease in net assets from distributions | | | – | | | | – | | | | – | | | | – | | |
Capital stock transactions: | |
Proceeds from sales | |
Class 1 | | | – | | | | – | | | | 436,384 | | | | 388,020 | | |
Class 2 | | | 5,813,976 | | | | 890,940 | | | | 606,908 | | | | 826,629 | | |
Value of distributions reinvested | |
Class 2 | | | – | | | | – | | | | – | | | | – | | |
Payments for redemption of shares | |
Class 1 | | | – | | | | – | | | | (235,014 | ) | | | (184,716 | ) | |
Class 2 | | | (20,223,461 | ) | | | (26,185,195 | ) | | | (15,410,363 | ) | | | (13,095,888 | ) | |
Increase (decrease) in net assets from
capital stock transactions | | | (14,409,485 | ) | | | (25,294,255 | ) | | | (14,602,085 | ) | | | (12,065,955 | ) | |
Total increase (decrease) in net assets | | | 5,171,863 | | | | 19,588,654 | | | | 5,414,787 | | | | 21,355,011 | | |
Net assets at beginning of period | | | 201,177,748 | | | | 181,589,094 | | | | 124,881,272 | | | | 103,526,261 | | |
Net assets at end of period | | $ | 206,349,611 | | | $ | 201,177,748 | | | $ | 130,296,059 | | | $ | 124,881,272 | | |
Capital share transactions: | |
Proceeds from sales | |
Class 1 | | | – | | | | – | | | | 23,395 | | | | 23,139 | | |
Class 2 | | | 469,196 | | | | 63,184 | | | | 37,494 | | | | 49,861 | | |
Issued on reinvestment of distributions | |
Class 2 | | | – | | | | – | | | | – | | | | – | | |
Payments for redemption of shares | |
Class 1 | | | – | | | | – | | | | (12,208 | ) | | | (10,670 | ) | |
Class 2 | | | (1,335,815 | ) | | | (1,793,344 | ) | | | (824,599 | ) | | | (791,884 | ) | |
Net change from capital transactions | | | (866,619 | ) | | | (1,730,160 | ) | | | (775,918 | ) | | | (729,554 | ) | |
See accompanying notes to financial statements.
110
Securian Funds Trust
Financial Highlights
SFT Core Bond Fund
| | | Class 1 Shares | |
| | | Year ended December 31, | |
| | | 2020 | | 2019 | | 2018 | | 2017 | | 2016 | |
Net asset value, beginning of period | | $ | 2.571 | | | $ | 2.355 | | | $ | 2.368 | | | $ | 2.257 | | | $ | 2.157 | | |
Income from investment operations: | |
Net investment income (a) | | | .067 | | | | .078 | | | | .077 | | | | .069 | | | | .066 | | |
Net realized and unrealized gain(loss) on investments | | | .117 | | | | .138 | | | | (.090 | ) | | | .042 | | | | .034 | | |
Total from investment operations | | | .184 | | | | .216 | | | | (.013 | ) | | | .111 | | | | .100 | | |
Net asset value, end of period | | $ | 2.755 | | | $ | 2.571 | | | $ | 2.355 | | | $ | 2.368 | | | $ | 2.257 | | |
Total return (b) | | | 7.15 | % | | | 9.18 | % | | | (0.59 | )% | | | 4.95 | % | | | 4.63 | % | |
Net assets, end of period (in thousands) | | $ | 5,530 | | | $ | 5,060 | | | $ | 3,640 | | | $ | 2,608 | | | $ | 2,113 | | |
Ratios to average net assets: | |
Expenses (c) | | | .48 | % | | | .49 | % | | | .50 | % | | | .49 | % | | | .49 | % | |
Net investment income | | | 2.52 | % | | | 3.11 | % | | | 3.29 | % | | | 2.96 | % | | | 2.97 | % | |
| Portfolio turnover rate (excluding short-term securities) | | | 93.02 | % | | | 130.4 | % | | | 151.1 | % | | | 159.8 | % | | | 249.6 | % | |
| | | Class 2 Shares | |
| | | Year ended December 31, | |
| | | 2020 | | 2019 | | 2018 | | 2017 | | 2016 | |
Net asset value, beginning of period | | $ | 2.501 | | | $ | 2.297 | | | $ | 2.316 | | | $ | 2.212 | | | $ | 2.120 | | |
Income from investment operations: | |
Net investment income (a) | | | .059 | | | | .070 | | | | .069 | | | | .062 | | | | .059 | | |
Net realized and unrealized gain(loss) on investments | | | .113 | | | | .134 | | | | (.088 | ) | | | .042 | | | | .033 | | |
Total from investment operations | | | .172 | | | | .204 | | | | (.019 | ) | | | .104 | | | | .092 | | |
Net asset value, end of period | | $ | 2.673 | | | $ | 2.501 | | | $ | 2.297 | | | $ | 2.316 | | | $ | 2.212 | | |
Total return (b) | | | 6.88 | % | | | 8.90 | % | | | (0.84 | )% | | | 4.69 | % | | | 4.37 | % | |
Net assets, end of period (in thousands) | | $ | 491,483 | | | $ | 482,818 | | | $ | 434,229 | | | $ | 382,697 | | | $ | 368,156 | | |
Ratios to average net assets: | |
Expenses (c) | | | .73 | % | | | .74 | % | | | .75 | % | | | .74 | % | | | .74 | % | |
Net investment income | | | 2.28 | % | | | 2.87 | % | | | 3.04 | % | | | 2.71 | % | | | 2.68 | % | |
| Portfolio turnover rate (excluding short-term securities) | | | 93.02 | % | | | 130.4 | % | | | 151.1 | % | | | 159.8 | % | | | 249.6 | % | |
(a) Based on average shares outstanding during the year.
(b) Total return figures are based on a share outstanding throughout the period and assume reinvestment of distributions at net asset value. Total return figures do not reflect charges pursuant to the terms of the variable life insurance policies and variable annuity contracts funded by separate accounts that invest in the Fund's shares. For periods less than one year, total return presented has not been annualized.
(c) In addition to fees and expenses which the Fund bears directly, the Fund indirectly bears a pro rata share of the fees and expenses of the acquired funds in which it invests. Such indirect expenses are not included in the above reported expense ratios.
111
Securian Funds Trust
Financial Highlights – continued
SFT Dynamic Managed Volatility Fund
| | | Class 2 Shares | |
| | | Year ended December 31, | |
| | | 2020 | | 2019 | | 2018 | | 2017 | | 2016 | |
Net asset value, beginning of period | | $ | 16.892 | | | $ | 13.983 | | | $ | 14.401 | | | $ | 12.210 | | | $ | 11.226 | | |
Income from investment operations: | |
Net investment income (a) | | | .082 | | | | .185 | | | | .162 | | | | .116 | | | | .091 | | |
Net realized and unrealized gain(loss) on investments | | | 1.723 | | | | 2.724 | | | | (.580 | ) | | | 2.075 | | | | .893 | | |
Total from investment operations | | | 1.805 | | | | 2.909 | | | | (.418 | ) | | | 2.191 | | | | .984 | | |
Net asset value, end of period | | $ | 18.697 | | | $ | 16.892 | | | $ | 13.983 | | | $ | 14.401 | | | $ | 12.210 | | |
Total return (b) | | | 10.67 | % | | | 20.81 | % | | | (2.90 | )% | | | 17.94 | % | | | 8.77 | % | |
Net assets, end of period (in thousands) | | $ | 678,188 | | | $ | 577,805 | | | $ | 415,233 | | | $ | 373,124 | | | $ | 281,000 | | |
Ratios to average net assets: | |
Expenses before waiver (c) | | | .86 | % | | | .90 | % | | | .98 | % | | | .98 | % | | | 1.00 | % | |
Expenses net of waiver (c)(d) | | | .80 | % | | | .80 | % | | | .80 | % | | | .80 | % | | | .80 | % | |
Net investment income | | | .48 | % | | | 1.18 | % | | | 1.12 | % | | | .87 | % | | | .79 | % | |
Portfolio turnover rate (excluding short-term securities) | | | – | % | | | 1.2 | % | | | 2.2 | % | | | 1.7 | % | | | 1.4 | % | |
(a) Based on average shares outstanding during the year.
(b) Total return figures are based on a share outstanding throughout the period and assume reinvestment of distributions at net asset value. Total return figures do not reflect charges pursuant to the terms of the variable life insurance policies and variable annuity contracts funded by separate accounts that invest in the Fund's shares. For periods less than one year, total return presented has not been annualized.
(c) In addition to fees and expenses which the Fund bears directly, the Fund indirectly bears a pro rata share of the fees and expenses of the acquired funds in which it invests. Such indirect expenses are not included in the above reported expense ratios.
(d) Ratio is net of fees waived by the advisor and distributor (see note 4).
112
Securian Funds Trust
Financial Highlights – continued
SFT Government Money Market Fund
| | | Class 2 Shares | |
| | | Year ended December 31, | |
| | | 2020 | | 2019 | | 2018 | | 2017 | | 2016 | |
Net asset value, beginning of period | | $ | 1.000 | | | $ | 1.000 | | | $ | 1.000 | | | $ | 1.000 | | | $ | 1.000 | | |
Income from investment operations: | |
Net investment income (a) | | | .002 | | | | .015 | | | | .012 | | | | .001 | | | | – | | |
Net realized and unrealized gain on investments | | | – | | | | – | | | | – | | | | – | | | | – | | |
Total from investment operations | | | .002 | | | | .015 | | | | .012 | | | | .001 | | | | – | | |
Less distributions: | |
Distributions from net investment income | | | (.002 | ) | | | (.015 | ) | | | (.012 | ) | | | (.001 | ) | | | – | | |
Net asset value, end of period | | $ | 1.000 | | | $ | 1.000 | | | $ | 1.000 | | | $ | 1.000 | | | $ | 1.000 | | |
Total return (b) | | | 0.21 | % | | | 1.50 | % | | | 1.18 | % | | | 0.13 | % | | | – | % | |
Net assets, end of period (in thousands) | | $ | 196,877 | | | $ | 188,351 | | | $ | 72,761 | | | $ | 66,980 | | | $ | 77,795 | | |
Ratios to average net assets: | |
Expenses before waiver | | | .68 | % | | | .83 | % | | | .90 | % | | | .92 | % | | | .91 | % | |
Expenses net of waiver (c)(d) | | | .29 | % | | | .70 | % | | | .70 | % | | | .78 | % | | | .36 | % | |
Net investment income | | | .20 | % | | | 1.35 | % | | | 1.18 | % | | | .13 | % | | | – | % | |
(a) Based on average shares outstanding during the year.
(b) Total return figures are based on a share outstanding throughout the period and assume reinvestment of distributions at net asset value. Total return figures do not reflect charges pursuant to the terms of the variable life insurance policies and variable annuity contracts funded by separate accounts that invest in the Fund's shares. For periods less than one year, total return presented has not been annualized.
(c) In addition to fees and expenses which the Fund bears directly, the Fund indirectly bears a pro rata share of the fees and expenses of the acquired funds in which it invests. Such indirect expenses are not included in the above reported expense ratios.
(d) Ratio is net of fees waived by the advisor and distributor (see note 4).
113
Securian Funds Trust
Financial Highlights – continued
SFT Index 400 Mid-Cap Fund
| | | Class 1 Shares | |
| | | Year ended December 31, | |
| | | 2020 | | 2019 | | 2018 | | 2017 | | 2016 | |
Net asset value, beginning of period | | $ | 5.527 | | | $ | 4.392 | | | $ | 4.955 | | | $ | 4.275 | | | $ | 3.553 | | |
Income from investment operations: | |
| Net investment income (a) | | | .065 | | | | .067 | | | | .065 | | | | .055 | | | | .045 | | |
| Net realized and unrealized gain(loss) on investments | | | .672 | | | | 1.068 | | | | (.628 | ) | | | .625 | | | | .677 | | |
Total from investment operations | | | .737 | | | | 1.135 | | | | (.563 | ) | | | .680 | | | | .722 | | |
Net asset value, end of period | | $ | 6.264 | | | $ | 5.527 | | | $ | 4.392 | | | $ | 4.955 | | | $ | 4.275 | | |
Total return (b) | | | 13.34 | % | | | 25.82 | % | | | (11.36 | )% | | | 15.90 | % | | | 20.34 | % | |
Net assets, end of period (in thousands) | | $ | 15,838 | | | $ | 12,088 | | | $ | 7,662 | | | $ | 6,378 | | | $ | 4,290 | | |
Ratios to average net assets: | |
Expenses (c) | | | .31 | % | | | .29 | % | | | .27 | % | | | .26 | % | | | .26 | % | |
| Net investment income | | | 1.27 | % | | | 1.31 | % | | | 1.29 | % | | | 1.21 | % | | | 1.24 | % | |
Portfolio turnover rate (excluding short-term securities) | | | 14.4 | % | | | 15.1 | % | | | 14.6 | % | | | 16.6 | % | | | 18.5 | % | |
| | | Class 2 Shares | |
| | | Year ended December 31, | |
| | | 2020 | | 2019 | | 2018 | | 2017 | | 2016 | |
Net asset value, beginning of period | | $ | 5.377 | | | $ | 4.284 | | | $ | 4.845 | | | $ | 4.191 | | | $ | 3.491 | | |
Income from investment operations: | |
| Net investment income (a) | | | .050 | | | | .054 | | | | .050 | | | | .042 | | | | .039 | | |
| Net realized and unrealized gain(loss) on investments | | | .652 | | | | 1.039 | | | | (.611 | ) | | | .612 | | | | .661 | | |
Total from investment operations | | | .702 | | | | 1.093 | | | | (.561 | ) | | | .654 | | | | .700 | | |
Net asset value, end of period | | $ | 6.079 | | | $ | 5.377 | | | $ | 4.284 | | | $ | 4.845 | | | $ | 4.191 | | |
Total return (b) | | | 13.06 | % | | | 25.51 | % | | | (11.58 | )% | | | 15.61 | % | | | 20.04 | % | |
Net assets, end of period (in thousands) | | $ | 188,333 | | | $ | 186,108 | | | $ | 182,703 | | | $ | 220,335 | | | $ | 214,408 | | |
Ratios to average net assets: | |
Expenses (c) | | | .56 | % | | | .54 | % | | | .52 | % | | | .51 | % | | | .51 | % | |
| Net investment income | | | 1.02 | % | | | 1.09 | % | | | 1.03 | % | | | .95 | % | | | 1.06 | % | |
Portfolio turnover rate (excluding short-term securities) | | | 14.4 | % | | | 15.1 | % | | | 14.6 | % | | | 16.6 | % | | | 18.5 | % | |
(a) Based on average shares outstanding during the year.
(b) Total return figures are based on a share outstanding throughout the period and assume reinvestment of distributions at net asset value. Total return figures do not reflect charges pursuant to the terms of the variable life insurance policies and variable annuity contracts funded by separate accounts that invest in the Fund's shares. For periods less than one year, total return presented has not been annualized.
(c) In addition to fees and expenses which the Fund bears directly, the Fund indirectly bears a pro rata share of the fees and expenses of the acquired funds in which it invests. Such indirect expenses are not included in the above reported expense ratios.
114
Securian Funds Trust
Financial Highlights – continued
SFT Index 500 Fund
| | | Class 1 Shares | |
| | | Year ended December 31, | |
| | | 2020 | | 2019 | | 2018 | | 2017 | | 2016 | |
Net asset value, beginning of period | | $ | 13.309 | | | $ | 10.144 | | | $ | 10.629 | | | $ | 8.745 | | | $ | 7.829 | | |
Income from investment operations: | |
| Net investment income (a) | | | .217 | | | | .215 | | | | .192 | | | | .175 | | | | .160 | | |
| Net realized and unrealized gain(loss) on investments | | | 2.206 | | | | 2.950 | | | | (.677 | ) | | | 1.709 | | | | .756 | | |
Total from investment operations | | | 2.423 | | | | 3.165 | | | | (.485 | ) | | | 1.884 | | | | .916 | | |
Net asset value, end of period | | $ | 15.732 | | | $ | 13.309 | | | $ | 10.144 | | | $ | 10.629 | | | $ | 8.745 | | |
Total return (b) | | | 18.20 | % | | | 31.20 | % | | | (4.56 | )% | | | 21.54 | % | | | 11.72 | % | |
Net assets, end of period (in thousands) | | $ | 272,088 | | | $ | 224,410 | | | $ | 164,095 | | | $ | 167,661 | | | $ | 133,014 | | |
Ratios to average net assets: | |
Expenses (c) | | | .20 | % | | | .20 | % | | | .20 | % | | | .20 | % | | | .20 | % | |
| Net investment income | | | 1.62 | % | | | 1.81 | % | | | 1.74 | % | | | 1.82 | % | | | 1.97 | % | |
Portfolio turnover rate (excluding short-term securities) | | | 3.3 | % | | | 2.6 | % | | | 2.4 | % | | | 2.7 | % | | | 3.5 | % | |
| | | Class 2 Shares | |
| | | Year ended December 31, | |
| | | 2020 | | 2019 | | 2018 | | 2017 | | 2016 | |
Net asset value, beginning of period | | $ | 12.949 | | | $ | 9.894 | | | $ | 10.393 | | | $ | 8.573 | | | $ | 7.693 | | |
Income from investment operations: | |
| Net investment income (a) | | | 0.179 | | | | .181 | | | | .160 | | | | .148 | | | | .136 | | |
| Net realized and unrealized gain(loss) on investments | | | 2.140 | | | | 2.874 | | | | (.659 | ) | | | 1.672 | | | | .744 | | |
Total from investment operations | | | 2.319 | | | | 3.055 | | | | (.499 | ) | | | 1.820 | | | | .880 | | |
Net asset value, end of period | | $ | 15.268 | | | $ | 12.949 | | | $ | 9.894 | | | $ | 10.393 | | | $ | 8.573 | | |
Total return (b) | | | 17.91 | % | | | 30.88 | % | | | (4.80 | )% | | | 21.23 | % | | | 11.44 | % | |
Net assets, end of period (in thousands) | | $ | 731,356 | | | $ | 689,994 | | | $ | 630,692 | | | $ | 708,275 | | | $ | 609,796 | | |
Ratios to average net assets: | |
Expenses (c) | | | .45 | % | | | .45 | % | | | .45 | % | | | .45 | % | | | .45 | % | |
| Net investment income | | | 1.38 | % | | | 1.56 | % | | | 1.49 | % | | | 1.57 | % | | | 1.72 | % | |
Portfolio turnover rate (excluding short-term securities) | | | 3.3 | % | | | 2.6 | % | | | 2.4 | % | | | 2.7 | % | | | 3.5 | % | |
(a) Based on average shares outstanding during the year.
(b) Total return figures are based on a share outstanding throughout the period and assume reinvestment of distributions at net asset value. Total return figures do not reflect charges pursuant to the terms of the variable life insurance policies and variable annuity contracts funded by separate accounts that invest in the Fund's shares. For periods less than one year, total return presented has not been annualized.
(c) In addition to fees and expenses which the Fund bears directly, the Fund indirectly bears a pro rata share of the fees and expenses of the acquired funds in which it invests. Such indirect expenses are not included in the above reported expense ratios.
115
Securian Funds Trust
Financial Highlights – continued
SFT International Bond Fund
| | | Class 1 Shares | |
| | | Year ended December 31, | |
| | | 2020 | | 2019 | | 2018 | | 2017 | | 2016 | |
Net asset value, beginning of period | | $ | 2.620 | | | $ | 2.570 | | | $ | 2.533 | | | $ | 2.499 | | | $ | 2.418 | | |
Income from investment operations: | |
Net investment income (a) | | | .035 | | | | .116 | | | | .091 | | | | .102 | | | | .064 | | |
Net realized and unrealized gain(loss)
on investments | | | (.197 | ) | | | (.066 | ) | | | (.054 | ) | | | (.068 | ) | | | .017 | | |
Total from investment operations | | | (.162 | ) | | | .050 | | | | .037 | | | | .034 | | | | .081 | | |
Net asset value, end of period | | $ | 2.458 | | | $ | 2.620 | | | $ | 2.570 | | | $ | 2.533 | | | $ | 2.499 | | |
| Total return (b) | | | (6.18 | )%(c) | | | 1.93 | % | | | 1.46 | % | | | 1.38 | % | | | 3.35 | % | |
Net assets, end of period (in thousands) | | $ | 1,531 | | | $ | 1,396 | | | $ | 1,237 | | | $ | 1,134 | | | $ | 1,097 | | |
Ratios to average net assets: | |
Expenses (d) | | | .98 | % | | | 1.01 | % | | | .95 | % | | | .98 | % | | | 1.00 | % | |
Net investment income | | | 1.40 | % | | | 4.43 | % | | | 3.57 | % | | | 3.97 | % | | | 2.67 | % | |
Portfolio turnover rate (excluding short-term
securities) | | | 62.1 | % | | | 23.4 | % | | | 20.4 | % | | | 58.7 | % | | | 54.0 | % | |
| | | Class 2 Shares | |
| | | Year ended December 31, | |
| | | 2020 | | 2019 | | 2018 | | 2017 | | 2016 | |
Net asset value, beginning of period | | $ | 2.549 | | | $ | 2.507 | | | $ | 2.477 | | | $ | 2.450 | | | $ | 2.376 | | |
Income from investment operations: | |
Net investment income (a) | | | .028 | | | | .108 | | | | .082 | | | | .093 | | | | .057 | | |
Net realized and unrealized gain(loss)
on investments | | | (.192 | ) | | | (.066 | ) | | | (.052 | ) | | | (.066 | ) | | | .017 | | |
Total from investment operations | | | (.164 | ) | | | .042 | | | | .030 | | | | .027 | | | | .074 | | |
Net asset value, end of period | | $ | 2.385 | | | $ | 2.549 | | | $ | 2.507 | | | $ | 2.477 | | | $ | 2.450 | | |
| Total return (b) | | | (6.43 | )%(c) | | | 1.68 | % | | | 1.21 | % | | | 1.12 | % | | | 3.09 | % | |
Net assets, end of period (in thousands) | | $ | 89,624 | | | $ | 99,019 | | | $ | 103,430 | | | $ | 106,869 | | | $ | 109,908 | | |
Ratios to average net assets: | |
Expenses (d) | | | 1.23 | % | | | 1.26 | % | | | 1.20 | % | | | 1.23 | % | | | 1.24 | % | |
Net investment income | | | 1.15 | % | | | 4.20 | % | | | 3.32 | % | | | 3.72 | % | | | 2.42 | % | |
Portfolio turnover rate (excluding short-term
securities) | | | 62.1 | % | | | 23.4 | % | | | 20.4 | % | | | 58.7 | % | | | 54.0 | % | |
(a) Based on average shares outstanding during the year.
(b) Total return figures are based on a share outstanding throughout the period and assume reinvestment of distributions at net asset value. Total return figures do not reflect charges pursuant to the terms of the variable life insurance policies and variable annuity contracts funded by separate accounts that invest in the Fund's shares. For periods less than one year, total return presented has not been annualized.
(c) The return includes adjustments in accordance with generally accepted accounting principles required at period end date.
(d) In addition to fees and expenses which the Fund bears directly, the Fund indirectly bears a pro rata share of the fees and expenses of the acquired funds in which it invests. Such indirect expenses are not included in the above reported expense ratios.
116
Securian Funds Trust
Financial Highlights – continued
SFT IvySM Growth Fund
| | | Class 2 Shares | |
| | | Year ended December 31, | |
| | | 2020 | | 2019 | | 2018 | | 2017 | | 2016 | |
Net asset value, beginning of period | | $ | 21.848 | | | $ | 16.007 | | | $ | 15.662 | | | $ | 12.120 | | | $ | 12.012 | | |
Income from investment operations: | |
Net investment income (loss) (a) | | | (.038 | ) | | | (.005 | ) | | | .008 | | | | .022 | | | | .034 | | |
Net realized and unrealized gain on investments | | | 6.744 | | | | 5.846 | | | | .337 | | | | 3.520 | | | | .074 | | |
Total from investment operations | | | 6.706 | | | | 5.841 | | | | .345 | | | | 3.542 | | | | .108 | | |
Net asset value, end of period | | $ | 28.554 | | | $ | 21.848 | | | $ | 16.007 | | | $ | 15.662 | | | $ | 12.120 | | |
Total return (b) | | | 30.69 | % | | | 36.49 | % | | | 2.21 | % | | | 29.22 | % | | | 0.91 | % | |
Net assets, end of period (in thousands) | | $ | 606,247 | | | $ | 544,843 | | | $ | 453,883 | | | $ | 504,437 | | | $ | 438,985 | | |
Ratios to average net assets: | |
Expenses (c) | | | .97 | % | | | .98 | % | | | .97 | % | | | .97 | % | | | .98 | % | |
Net investment income (loss) | | | (.16 | )% | | | (.03 | )% | | | .04 | % | | | .16 | % | | | .29 | % | |
Portfolio turnover rate (excluding short-term securities) | | | 28.9 | % | | | 29.9 | % | | | 42.3 | % | | | 40.5 | % | | | 52.5 | % | |
(a) Based on average shares outstanding during the year.
(b) Total return figures are based on a share outstanding throughout the period and assume reinvestment of distributions at net asset value. Total return figures do not reflect charges pursuant to the terms of the variable life insurance policies and variable annuity contracts funded by separate accounts that invest in the Fund's shares. For periods less than one year, total return presented has not been annualized.
(c) In addition to fees and expenses which the Fund bears directly, the Fund indirectly bears a pro rata share of the fees and expenses of the acquired funds in which it invests. Such indirect expenses are not included in the above reported expense ratios.
117
Securian Funds Trust
Financial Highlights – continued
SFT IvySM Small Cap Growth Fund
| | | Class 2 Shares | |
| | | Year ended December 31, | |
| | | 2020 | | 2019 | | 2018 | | 2017 | | 2016 | |
Net asset value, beginning of period | | $ | 18.772 | | | $ | 15.181 | | | $ | 15.802 | | | $ | 12.611 | | | $ | 10.414 | | |
Income from investment operations: | |
Net investment loss (a) | | | (.161 | ) | | | (.146 | ) | | | (.102 | ) | | | (.111 | ) | | | (.076 | ) | |
Net realized and unrealized gain(loss) on investments | | | 6.968 | | | | 3.737 | | | | (.519 | ) | | | 3.302 | | | | 2.273 | | |
Total from investment operations | | | 6.807 | | | | 3.591 | | | | (.621 | ) | | | 3.191 | | | | 2.197 | | |
Net asset value, end of period | | $ | 25.579 | | | $ | 18.772 | | | $ | 15.181 | | | $ | 15.802 | | | $ | 12.611 | | |
Total return (b) | | | 36.26 | % | | | 23.66 | % | | | (3.93 | )% | | | 25.30 | % | | | 21.10 | % | |
Net assets, end of period (in thousands) | | $ | 211,834 | | | $ | 176,721 | | | $ | 163,367 | | | $ | 184,233 | | | $ | 163,294 | | |
Ratios to average net assets: | |
Expenses (c) | | | 1.24 | % | | | 1.23 | % | | | 1.21 | % | | | 1.22 | % | | | 1.24 | % | |
Net investment loss | | | (.83 | )% | | | (.81 | )% | | | (.59 | )% | | | (.78 | )% | | | (.68 | )% | |
Portfolio turnover rate (excluding short-term securities) | | | 53.6 | % | | | 43.3 | % | | | 53.1 | % | | | 54.4 | % | | | 99.2 | % | |
(a) Based on average shares outstanding during the year.
(b) Total return figures are based on a share outstanding throughout the period and assume reinvestment of distributions at net asset value. Total return figures do not reflect charges pursuant to the terms of the variable life insurance policies and variable annuity contracts funded by separate accounts that invest in the Fund's shares. For periods less than one year, total return presented has not been annualized.
(c) In addition to fees and expenses which the Fund bears directly, the Fund indirectly bears a pro rata share of the fees and expenses of the acquired funds in which it invests. Such indirect expenses are not included in the above reported expense ratios.
118
Securian Funds Trust
Financial Highlights – continued
SFT Managed Volatility Equity Fund
| | | Class 2 Shares | |
| | | Year ended December 31, | |
| | | 2020 | | 2019 | | 2018 | | 2017 | | 2016 | |
Net asset value, beginning of period | | $ | 13.527 | | | $ | 11.594 | | | $ | 12.195 | | | $ | 10.483 | | | $ | 10.064 | | |
Income from investment operations: | |
Net investment income (a) | | | .173 | | | | .275 | | | | .220 | | | | .169 | | | | .253 | | |
Net realized and unrealized gain(loss) on investments | | | (.896 | ) | | | 1.658 | | | | (.821 | ) | | | 1.543 | | | | .166 | | |
Total from investment operations | | | (.723 | ) | | | 1.933 | | | | (.601 | ) | | | 1.712 | | | | .419 | | |
Net asset value, end of period | | $ | 12.804 | | | $ | 13.527 | | | $ | 11.594 | | | $ | 12.195 | | | $ | 10.483 | | |
Total return (b) | | | (5.35 | )% | | | 16.67 | % | | | (4.93 | )% | | | 16.33 | % | | | 4.16 | % | |
Net assets, end of period (in thousands) | | $ | 355,582 | | | $ | 390,478 | | | $ | 298,485 | | | $ | 261,481 | | | $ | 200,138 | | |
Ratios to average net assets: | |
Expenses before waiver (c) | | | .88 | % | | | .90 | % | | | .97 | % | | | .99 | % | | | 1.09 | % | |
Expenses net of waiver (d) | | | .80 | % | | | .80 | % | | | .80 | % | | | .80 | % | | | .80 | % | |
Net investment income | | | 1.38 | % | | | 2.17 | % | | | 1.82 | % | | | 1.48 | % | | | 2.43 | % | |
Portfolio turnover rate (excluding short-term securities) | | | 20.1 | % | | | – | % | | | – | % | | | 9.2 | % | | | 8.5 | % | |
(a) Based on average shares outstanding during the year.
(b) Total return figures are based on a share outstanding throughout the period and assume reinvestment of distributions at net asset value. Total return figures do not reflect charges pursuant to the terms of the variable life insurance policies and variable annuity contracts funded by separate accounts that invest in the Fund's shares. For periods less than one year, total return presented has not been annualized.
(c) In addition to fees and expenses which the Fund bears directly, the Fund indirectly bears a pro rata share of the fees and expenses of the acquired funds in which it invests. Such indirect expenses are not included in the above reported expense ratios.
(d) Ratio is net of fees waived by the advisor and distributor (see note 4).
119
Securian Funds Trust
Financial Highlights – continued
SFT Real Estate Securities Fund
| | | Class 1 Shares | |
| | | Year ended December 31, | |
| | | 2020 | | 2019 | | 2018 | | 2017 | | 2016 | |
Net asset value, beginning of period | | $ | 5.661 | | | $ | 4.534 | | | $ | 4.781 | | | $ | 4.526 | | | $ | 4.324 | | |
Income from investment operations: | |
| Net investment income (a) | | | .087 | | | | .096 | | | | .085 | | | | .081 | | | | .074 | | |
| Net realized and unrealized gain(loss) on investments | | | (.233 | ) | | | 1.031 | | | | (.332 | ) | | | .174 | | | | .128 | | |
Total from investment operations | | | (.146 | ) | | | 1.127 | | | | (.247 | ) | | | .255 | | | | .202 | | |
Net asset value, end of period | | $ | 5.515 | | | $ | 5.661 | | | $ | 4.534 | | | $ | 4.781 | | | $ | 4.526 | | |
Total return (b) | | | (2.59 | )% | | | 24.87 | % | | | (5.16 | )% | | | 5.63 | % | | | 4.66 | % | |
Net assets, end of period (in thousands) | | $ | 6,461 | | | $ | 5,858 | | | $ | 4,122 | | | $ | 3,583 | | | $ | 3,085 | | |
Ratios to average net assets: | |
Expenses (c) | | | .91 | % | | | .88 | % | | | .87 | % | | | .85 | % | | | .82 | % | |
| Net investment income | | | 1.69 | % | | | 1.79 | % | | | 1.83 | % | | | 1.75 | % | | | 1.68 | % | |
Portfolio turnover rate (excluding short-term securities) | | | 74.9 | % | | | 55.5 | % | | | 70.0 | % | | | 75.4 | % | | | 78.0 | % | |
| | | Class 2 Shares | |
| | | Year ended December 31, | |
| | | 2020 | | 2019 | | 2018 | | 2017 | | 2016 | |
Net asset value, beginning of period | | $ | 5.508 | | | $ | 4.422 | | | $ | 4.674 | | | $ | 4.436 | | | $ | 4.249 | | |
Income from investment operations: | |
| Net investment income (a) | | | .073 | | | | .082 | | | | .072 | | | | .070 | | | | .063 | | |
| Net realized and unrealized gain(loss) on investments | | | (.229 | ) | | | 1.004 | | | | (.324 | ) | | | .168 | | | | .124 | | |
Total from investment operations | | | (.156 | ) | | | 1.086 | | | | (.252 | ) | | | .238 | | | | .187 | | |
Net asset value, end of period | | $ | 5.352 | | | $ | 5.508 | | | $ | 4.422 | | | $ | 4.674 | | | $ | 4.436 | | |
Total return (b) | | | (2.83 | )% | | | 24.56 | % | | | (5.40 | )% | | | 5.37 | % | | | 4.40 | % | |
Net assets, end of period (in thousands) | | $ | 119,460 | | | $ | 128,350 | | | $ | 116,067 | | | $ | 132,372 | | | $ | 143,139 | | |
Ratios to average net assets: | |
Expenses (c) | | | 1.16 | % | | | 1.13 | % | | | 1.12 | % | | | 1.10 | % | | | 1.08 | % | |
| Net investment income | | | 1.46 | % | | | 1.59 | % | | | 1.60 | % | | | 1.55 | % | | | 1.43 | % | |
Portfolio turnover rate (excluding short-term securities) | | | 74.9 | % | | | 55.5 | % | | | 70.0 | % | | | 75.4 | % | | | 78.0 | % | |
(a) Based on average shares outstanding during the year.
(b) Total return figures are based on a share outstanding throughout the period and assume reinvestment of distributions at net asset value. Total return figures do not reflect charges pursuant to the terms of the variable life insurance policies and variable annuity contracts funded by separate accounts that invest in the Fund's shares. For periods less than one year, total return presented has not been annualized.
(c) In addition to fees and expenses which the Fund bears directly, the Fund indirectly bears a pro rata share of the fees and expenses of the acquired funds in which it invests. Such indirect expenses are not included in the above reported expense ratios.
120
Securian Funds Trust
Financial Highlights – continued
SFT T. Rowe Price Value Fund
| | | Class 2 Shares | |
| | | Year ended December 31, | |
| | | 2020 | | 2019 | | 2018 | | 2017 | | 2016 | |
Net asset value, beginning of period | | $ | 15.818 | | | $ | 12.568 | | | $ | 13.933 | | | $ | 11.747 | | | $ | 10.617 | | |
Income from investment operations: | |
Net investment income (a) | | | .147 | | | | .186 | | | | .174 | | | | .153 | | | | .173 | | |
Net realized and unrealized gain(loss) on investments | | | 1.446 | | | | 3.064 | | | | (1.539 | ) | | | 2.033 | | | | .957 | | |
Total from investment operations | | | 1.593 | | | | 3.250 | | | | (1.365 | ) | | | 2.186 | | | | 1.130 | | |
Net asset value, end of period | | $ | 17.411 | | | $ | 15.818 | | | $ | 12.568 | | | $ | 13.933 | | | $ | 11.747 | | |
Total return (b) | | | 10.06 | % | | | 25.86 | % | | | (9.80 | )% | | | 18.61 | % | | | 10.65 | % | |
Net assets, end of period (in thousands) | | $ | 206,350 | | | $ | 201,178 | | | $ | 181,589 | | | $ | 226,215 | | | $ | 208,513 | | |
Ratios to average net assets: | |
Expenses (c) | | | 1.06 | % | | | 1.06 | % | | | 1.04 | % | | | 1.03 | % | | | 1.03 | % | |
Net investment income | | | 1.01 | % | | | 1.28 | % | | | 1.26 | % | | | 1.20 | % | | | 1.59 | % | |
Portfolio turnover rate (excluding short-term securities) | | | 113.2 | % | | | 131.1 | % | | | 140.0 | % | | | 90.4 | % | | | 102.9 | % | |
(a) Based on average shares outstanding during the year.
(b) Total return figures are based on a share outstanding throughout the period and assume reinvestment of distributions at net asset value. Total return figures do not reflect charges pursuant to the terms of the variable life insurance policies and variable annuity contracts funded by separate accounts that invest in the Fund's shares. For periods less than one year, total return presented has not been annualized.
(c) In addition to fees and expenses which the Fund bears directly, the Fund indirectly bears a pro rata share of the fees and expenses of the acquired funds in which it invests. Such indirect expenses are not included in the above reported expense ratios.
121
Securian Funds Trust
Financial Highlights – continued
SFT Wellington Core Equity Fund
| | | Class 1 Shares | |
| | | Year ended December 31, | |
| | | 2020 | | 2019 | | 2018 | | 2017 | | 2016 | |
Net asset value, beginning of period | | $ | 18.861 | | | $ | 14.069 | | | $ | 14.369 | | | $ | 11.834 | | | $ | 11.261 | | |
Income from investment operations: | |
Net investment income (a) | | | .116 | | | | .120 | | | | .099 | | | | .084 | | | | .089 | | |
Net realized and unrealized gain(loss) on investments | | | 3.327 | | | | 4.672 | | | | (.399 | ) | | | 2.451 | | | | .484 | | |
Total from investment operations | | | 3.443 | | | | 4.792 | | | | (.300 | ) | | | 2.535 | | | | .573 | | |
Net asset value, end of period | | $ | 22.304 | | | $ | 18.861 | | | $ | 14.069 | | | $ | 14.369 | | | $ | 11.834 | | |
Total return (b) | | | 18.25 | % | | | 34.06 | % | | | (2.09 | )% | | | 21.42 | % | | | 5.09 | % | |
Net assets, end of period (in thousands) | | $ | 1,729 | | | $ | 1,251 | | | $ | 757 | | | $ | 706 | | | $ | 696 | | |
Ratios to average net assets: | |
Expenses (c) | | | .86 | % | | | .86 | % | | | .84 | % | | | .85 | % | | | .80 | % | |
Net investment income | | | .61 | % | | | .71 | % | | | .66 | % | | | .64 | % | | | .80 | % | |
Portfolio turnover rate (excluding short-term securities) | | | 23.0 | % | | | 14.9 | % | | | 21.6 | % | | | 138.0 | % | | | 88.8 | % | |
| | | Class 2 Shares | |
| | | 2020 | | 2019 | | 2018 | | 2017 | | 2016 | |
Net asset value, beginning of period | | $ | 18.596 | | | $ | 13.906 | | | $ | 14.238 | | | $ | 11.755 | | | $ | 11.214 | | |
Income from investment operations: | |
Net investment income (a) | | | .068 | | | | .077 | | | | .060 | | | | .051 | | | | .060 | | |
Net realized and unrealized gain(loss) on investments | | | 3.272 | | | | 4.613 | | | | (.392 | ) | | | 2.432 | | | | .481 | | |
Total from investment operations | | | 3.340 | | | | 4.690 | | | | (.332 | ) | | | 2.483 | | | | .541 | | |
Net asset value, end of period | | $ | 21.936 | | | $ | 18.596 | | | $ | 13.906 | | | $ | 14.238 | | | $ | 11.755 | | |
Total return (b) | | | 17.96 | % | | | 33.73 | % | | | (2.33 | )% | | | 21.12 | % | | | 4.83 | % | |
Net assets, end of period (in thousands) | | $ | 128,567 | | | $ | 123,630 | | | $ | 102,769 | | | $ | 120,185 | | | $ | 113,799 | | |
Ratios to average net assets: | |
Expenses (c) | | | 1.11 | % | | | 1.11 | % | | | 1.09 | % | | | 1.10 | % | | | 1.05 | % | |
Net investment income | | | .37 | % | | | .47 | % | | | .40 | % | | | .40 | % | | | .54 | % | |
Portfolio turnover rate (excluding short-term securities) | | | 23.0 | % | | | 14.9 | % | | | 21.6 | % | | | 138.0 | % | | | 88.8 | % | |
(a) Based on average shares outstanding during the year.
(b) Total return figures are based on a share outstanding throughout the period and assume reinvestment of distributions at net asset value. Total return figures do not reflect charges pursuant to the terms of the variable life insurance policies and variable annuity contracts funded by separate accounts that invest in the Fund's shares. For periods less than one year, total return presented has not been annualized.
(c) In addition to fees and expenses which the Fund bears directly, the Fund indirectly bears a pro rata share of the fees and expenses of the acquired funds in which it invests. Such indirect expenses are not included in the above reported expense ratios.
122
Securian Funds Trust
Notes to Financial Statements
(1) Organization
Securian Funds Trust (the "Trust") is a Delaware statutory trust registered under the Investment Company Act of 1940, as amended (the "1940 Act") as a no-load, diversified open-end management investment company, except that SFT International Bond Fund operates as a non-diversified, open-end management investment company. The Trust is a series trust that includes the Funds and share classes listed below:
Fund Name | | Share Class 1 | | Share Class 2 | |
| SFT Core Bond Fund | | | P | | | | P | | |
SFT Dynamic Managed Volatility Fund | | | NA | | | | P | | |
SFT Government Money Market Fund | | | NA | | | | P | | |
SFT Index 400 Mid-Cap Fund | | | P | | | | P | | |
| SFT Index 500 Fund | | | P | | | | P | | |
SFT International Bond Fund | | | P | | | | P | | |
SFT IvySM Growth Fund | | | NA | | | | P | | |
SFT IvySM Small Cap Growth Fund | | | NA | | | | P | | |
SFT Managed Volatility Equity Fund | | | NA | | | | P | | |
SFT Real Estate Securities Fund | | | P | | | | P | | |
SFT T. Rowe Price Value Fund | | | NA | | | | P | | |
SFT Wellington Core Equity Fund | | | P | | | | P | | |
Securian Asset Management, Inc. ("Securian AM"), a wholly-owned subsidiary of Securian Financial Group, Inc. ("Securian Financial Group"), serves as the investment adviser to each of the Funds in the Trust pursuant to an investment advisory agreement between Securian AM and the Trust. The Trust's prospectus provides a detailed description of each Fund's investment objective, policies and strategies.
Class 2 shares are subject to a 12b-1 distribution fee. Both classes of shares have identical voting, dividend, liquidation and other rights, and the same terms and conditions, except that Class 1 shares are not subject to a 12b-1 distribution fee. Income, expenses (other than Rule 12b-1 fees) and realized and unrealized gains or losses are allocated to each class of shares based upon their relative net assets.
The Trust accounts for the assets, liabilities and operations of each Fund separately. Shares of the Trust are not offered directly to the public, but sold only to Minnesota Life Insurance Company ("Minnesota Life") and Securian Life Insurance Company ("Securian Life") in connection with Minnesota Life and Securian Life variable life insurance policies and variable annuity contracts, and to certain other separate accounts of life insurance affiliates of Minnesota Life and Securian Life, and may also be offered to certain qualified plans.
The Funds are investment companies and follow accounting and reporting guidance under Financial Accounting Standards Board (FASB) Accounting Standards Codification (ASC) Topic 946, "Financial Services—Investment Companies." The significant accounting policies followed consistently by the Trust are as follows:
Use of Estimates
The preparation of financial statements in conformity with U.S. generally accepted accounting principles (GAAP) requires management to make estimates and assumptions that affect the reported amounts of assets and liabilities, including disclosure of contingent assets and liabilities, as of the balance sheet date and the reported amounts of revenue and expenses during the reporting period. Actual results could differ from those estimates.
(2) Summary of Significant Accounting Policies
Investments in Securities
Each Fund's net asset value is generally calculated as of the close of normal trading on the New York Stock Exchange (typically 3:00 p.m. Central Time). Investments in securities traded on a U.S. or foreign securities
123
Securian Funds Trust
Notes to Financial Statements – continued
(2) Summary of Significant Accounting Policies – (continued)
exchange are valued at the last sale price on that exchange prior to the time when assets are valued; securities traded in the over-the-counter market and listed securities for which no sale was reported on that date are valued on the basis of the last current bid price by an independent pricing service or at a price deemed best to reflect fair value quoted by dealers who make markets in these securities. The pricing service may use models that price securities based on current yields and relative security characteristics, such as coupon rate, maturity date, issuer credit quality and prepayment speeds, as applicable. When market quotations are not readily available, securities are valued at fair value as determined in good faith by the Securian AM Valuation Committee ("the Valuation Committee") under the supervision of the Trust's Board of Trustees (the "Board") and in accordance with Board-approved valuation policies and procedures. The Board has delegated the daily oversight of the securities valuation function to the Valuation Committee whose members ensure the valuations comply with the valuation policies and affirms the reasonableness of the fair valuation determinations. The fair valued securities are reviewed by the Board at their quarterly meetings.
A Fund's investments will also be valued at fair value by the Valuation Committee if Securian AM determines that an event impacting the value of an investment occurred after the close of the security's primary exchange or market (for example, a foreign exchange or market) and before the time the Fund's net asset value is calculated. If a significant event impacting the value of a security or group of securities occurs, the Valuation Committee is immediately notified and the members meet promptly to determine whether fair value pricing is needed in accordance with the Fund's valuation procedures and, if so, to approve the pricing methodology to be used.
Short-term securities, with the exception of those held in the SFT Government Money Market Fund, are valued at market value. Pursuant to Rule 2a-7 of the 1940 Act, all securities in the SFT Government Money Market Fund are valued at amortized cost, which approximates market value, in order to attempt to maintain a constant net asset value of $1.00 per share. However, there is no assurance the SFT Government Money Market Fund will maintain the $1.00 net asset value.
Security transactions are accounted for on the date the securities are purchased or sold. Realized gains and losses are calculated using the first in, first out basis. Paydowns of securities are recorded as receivables as of the due date, which varies by the issuer. Dividend income is recognized on the ex-dividend date or upon dividend notification for certain foreign securities, and interest income, including amortization of bond premium and accretion of bond discount computed on an effective yield basis, is accrued daily.
Foreign Currency Translations and Forward Foreign Currency Contracts
Securities and other assets and liabilities denominated in foreign currencies are translated daily into U.S. dollars at the closing rate of exchange. Foreign currency amounts related to the purchase or sale of securities, income and expenses are translated at the exchange rate on the transaction date.
Net realized foreign exchange gains or losses arise from sales and maturities of short-term securities, sales of foreign currencies, currency gains or losses realized between trade and settlement dates on security transactions, the difference between the amounts of dividends, interest and foreign withholding taxes recorded on the Fund's books and the U.S. dollar equivalent of the amounts actually received or paid. Net unrealized foreign exchange gains and losses arise from changes in the value of assets and liabilities, other than investments in securities, resulting from changes in the exchange rates.
The Funds do not separately report changes in foreign exchange rates on investments from the fluctuations arising from changes in market prices of securities.
SFT International Bond Fund may enter into forward foreign currency exchange contracts for operational purposes and to protect against adverse exchange rate fluctuations. A forward foreign currency contract is an agreement between the Fund and a counterparty to buy or sell a foreign currency at a specific exchange rate on
124
Securian Funds Trust
Notes to Financial Statements – continued
(2) Summary of Significant Accounting Policies – (continued)
a future date. SFT International Bond Fund may also enter into these contracts for purposes of increasing exposure to a foreign currency or to shift exposure to foreign currency fluctuations from one country to another. The net U.S. dollar value of foreign currency underlying all contractual commitments held by SFT International Bond Fund and the resulting unrealized appreciation or depreciation are determined using foreign currency exchange rates from an independent pricing service. SFT International Bond Fund is subject to the credit risk that the other party will not complete the obligations of the contract. The fair values of the forward foreign currency exchange contracts are obtained from an independent pricing source.
Futures Transactions
To gain exposure to, or for protection from market changes, the Funds (excluding the SFT Government Money Market Fund) may buy and sell financial futures contracts traded on any U.S. or foreign exchange. The Funds may also buy and write put and call options on these futures contracts. Risks of entering into futures contracts and related options include the possibility of an illiquid market and that a change in the value of the contract or option may not correlate with changes in the value of the underlying securities.
Upon entering into a futures contract, a Fund is required to deposit either cash or securities in an amount (initial margin) equal to a certain percentage of the contract value as determined by each relevant clearing agency and is aggregated at a Futures Commission Merchant ("FCM") which is registered with the Commodity Futures Trading Commission or the applicable regulator. Subsequent payments (variation margin) are made or received by a Fund each day. The variation margin payments are equal to the daily changes in the contract value and are recorded as unrealized gains and losses. A Fund recognizes a realized gain or loss when the contract is closed or expired. In the event of default, counterparty risk is significantly reduced as creditors to the FCM do not have claim to a Fund's assets in the segregated account. For a listing of open futures contracts see the Investments in Securities for each Fund.
Interest Rate Swaps
The SFT International Bond Fund may enter into interest rate swap contracts primarily to manage interest rate risk. An interest rate swap is an agreement between the Fund and a counterparty to exchange interest rate cash flows during the life of the agreement. Each party's payment obligation is computed based on different interest rates, applied to a notional amount. Interest rate swaps often exchange payments based on a fixed rate for payments linked to a floating rate.
These agreements are executed on a registered exchange ("centrally cleared interest rate swaps"), significantly reducing risk from counterparty default. Upon entering into an interest rate swap contract, a Fund is required to pledge an initial margin, and the daily change in fair value is accounted for as a variation margin payable or receivable on the Statement of Assets and Liabilities. Over the term of the contract, contractually required payments to be paid and to be received are accrued daily and recorded as unrealized appreciation and depreciation until the payments are made.
Options Transactions
Each Fund (excluding the SFT Government Money Market Fund) may write (i.e., sell) covered call and secured put options and purchase and sell put and call options written by others. An option is a type of derivative financial instrument. The Funds may invest in derivative financial instruments, including options, in order to manage risk or gain exposure to various other investments or markets. The risk in writing a call option is that the Fund gives up the opportunity for profit if the market price of the security increases. The risk in writing a put option is that a Fund may incur a loss if the market price of the security decreases and the option is exercised.
125
Securian Funds Trust
Notes to Financial Statements – continued
(2) Summary of Significant Accounting Policies – (continued)
The risk in buying an option is that the Fund pays a premium whether or not the option is exercised. The Fund also has the additional risk of not being able to enter into a closing transaction if a liquid secondary market does not exist. Option contracts are valued daily and unrealized appreciation or depreciation is recorded. The Fund will realize a gain or loss upon expiration or closing of the option transaction. When an option is exercised, the proceeds on sales for a written call option, the purchase cost for a written put option, or the cost of a security for a purchased put or call option is adjusted by the amount of premium received or paid. The Funds designate collateral consisting of cash, U.S. government securities or other liquid assets sufficient to collateralize the market value of written options.
Repurchase Agreements
Each Fund may enter into repurchase agreements with respect to securities. A repurchase agreement is a transaction in which a Fund acquires a security and simultaneously commits to resell that security to the seller (a bank or securities dealer) at an agreed-upon price on an agreed-upon date. Each Fund requires at all times that the repurchase agreement be collateralized by cash, U.S. Government securities, U.S. Government agencies securities or corporate securities having a value equal to, or in excess of, the value of the repurchase agreement. If the seller of the agreement defaults on its obligation to repurchase the underlying securities at a time when the value of those securities has declined, a Fund may incur a loss upon disposition of the securities. Repurchase agreements are carried at amortized cost. At December 31, 2020, no Funds were invested in repurchase agreements.
Federal Taxes
Each Fund, other than SFT Dynamic Managed Volatility Fund, SFT International Bond Fund, SFT Managed Volatility Equity Fund, and SFT T. Rowe Price Value Fund, qualifies for federal income tax purposes as a partnership under the Internal Revenue Code of 1986, as amended (the "Code"). A Fund is treated, for federal income tax purposes, as a partnership if it has more than one shareholder. A Fund's election to be treated as a partnership is not expected to result in any material adverse federal income tax consequences to any owner of a variable annuity contract or variable life insurance policy, or in the tax treatment of any such contract or policy. As a partnership, a Fund is not subject to income tax, and any income, gains, deductions or losses of the Fund will instead pass through and be taken into account for federal income tax purposes by its partners, which will be Minnesota Life and Securian Life through their respective separate accounts. SFT Dynamic Managed Volatility Fund, SFT Managed Volatility Equity Fund and SFT T. Rowe Price Value Fund are treated as disregarded entities for federal income tax purposes. While the Trust anticipates that each Fund other than SFT Dynamic Managed Volatility Fund, SFT Managed Volatility Equity Fund, and SFT T. Rowe Price Value Fund will always have two shareholders, Minnesota Life and Securian Life, a wholly owned subsidiary of Minnesota Life, such ownership could change and accordingly a Fund may at some time have only one shareholder and would be treated as a disregarded entity for federal income tax purposes. A disregarded entity is disregarded for federal income tax purposes as an entity separate from its owner, and the owner is treated as directly owning the assets of the disregarded entity and takes into account for federal income tax purposes the income, gains, deductions and losses relating to those assets.
SFT International Bond Fund qualifies as a regulated investment company for federal income tax purposes. The Fund's policy is to comply with the requirements of subchapter M of the Internal Revenue Code that are applicable to regulated investment companies and to distribute all (or a sufficient amount) of its taxable income and net capital gain to its shareholders. Therefore, no income tax provision is required.
The FASB ASC Topic 740, "Income Taxes" (ASC 740), provides guidance for how uncertain tax positions should be recognized, measured, presented, and disclosed in the financial statements. The Funds have evaluated the implications of ASC 740 for all open tax years, and have determined there is no impact to the Funds' financial
126
Securian Funds Trust
Notes to Financial Statements – continued
(2) Summary of Significant Accounting Policies – (continued)
statements as of the year ended December 31, 2020. The Funds' federal and state income returns for which the applicable statutes of limitations have not expired (2017, 2018, 2019 and 2020) remain subject to examination by the Internal Revenue Service and states department of revenue.
Net investment income (loss) and net realized gains (losses) may differ for financial statement and tax purposes primarily because of temporary book-to-tax differences.
Distributions to Shareholders
Distributions to shareholders from net investment income and realized gains (if any) for the SFT Government Money Market Fund are declared daily and reinvested at month-end in additional shares of capital stock.
Distributions to shareholders from net investment income and realized gains (if any) for the SFT International Bond Fund are generally declared and reinvested in additional shares of capital stock on an annual basis. There were no cash distributions paid to shareholders for the years ended December 31, 2020 and December 31, 2019, as any tax distribution liability for those years are intended to be passed on to shareholders through consent dividends. Consent dividends paid for 2019 were $5,562,914. Consent dividends to be paid for 2020 upon tax return finalization are estimated to be $0.
The Funds that are partnerships and disregarded entities (those funds other than SFT Government Money Market Fund and SFT International Bond Fund) are not required to and will not distribute taxable income.
The federal income tax character of distributions paid to shareholders during the fiscal year ended December 31, 2020 and December 31, 2019 was as follows:
| | | December 31, 2020 | | December 31, 2019 | |
Fund | | Ordinary
Income | | Long-Term
Capital Gain | | Ordinary
Income | | Long-Term
Capital Gain | |
SFT International Bond Fund | | $ | — | | | $ | — | | | $ | — | | | $ | — | | |
At December 31, 2020, as a result of permanent book-to-tax differences, the following reclassification adjustments were made on the Statements of Assets and Liabilities and primarily relate to net operating losses and 2019 consent dividends paid:
Fund | | Paid-In Capital | | Total
Distributable
Earnings (Loss) | |
SFT International Bond Fund | | $ | 1,404,648 | | | $ | (1,404,648 | ) | |
Distributable Earnings
As of December 31, 2020, the components of distributable earnings on a federal income tax basis were:
| Fund | | Undistributed
Ordinary Income | | Undistributed
Long-Term
Capital Gains | | Unrealized
Appreciation/
(Depreciation) | | Post October
Capital/
Late Year
Ordinary Loss | | Capital Loss
Carryforward | |
SFT International Bond Fund | | $ | — | | | $ | — | | | $ | (4,900,487 | ) | | $ | — | | | $ | (6,018,060 | ) | |
For the year ending December 31, 2020, the SFT International Bond Fund had a foreign tax credit of $121,348 and foreign sourced income of $1,754,994.
Securities Purchased on a When-Issued or Forward Commitment Basis
Delivery and payment for securities which have been purchased or sold by a Fund on a when-issued or forward commitment basis can take place a month or more after the transaction date. During this period, such securities are subject to market fluctuations. As of December 31, 2020, the Funds' did not hold when issued or forward commitments.
127
Securian Funds Trust
Notes to Financial Statements – continued
(2) Summary of Significant Accounting Policies – (continued)
Cross-Trades
The Funds are permitted to purchase and sell securities ("cross-trade") from and to other Funds within the Trust as well as outside of the Trust, where both accounts are managed by the same sub-adviser pursuant to "Cross-Trading" procedures adopted by the Board. These procedures have been designed to ensure that any cross-trade of securities by a respective Fund from and to another Fund that is or could be considered an affiliate of the Funds under certain limited circumstances by virtue of having a common investment adviser, common officer, or common trustee complies with Rule 17a-7 of the 1940 Act. Further, as defined under these procedures, each cross-trade is effected at the current market price to save costs where allowed. Pursuant to these procedures, for the year ended December 31, 2020, the Funds engaged in the following cross-trades, which resulted in the following net realized gains (losses):
| | | Purchases | | Sales | | Net Realized
Gains (Losses) | |
SFT T. Rowe Price Value Fund | | $ | 304,541 | | | $ | 121,254 | | | $ | (116,304 | ) | |
SFT Wellington Core Equity Fund | | | – | | | | 319,450 | | | | 153,885 | | |
(3) Investment Security Transactions
The cost of purchases and proceeds from sales of investment securities, other than temporary investments in short-term securities, for the year ended December 31, 2020 were as follows:
| | | Non-U.S. Government | | U.S. Government* | |
Fund | | Purchases | | Sales | | Purchases | | Sales | |
| SFT Core Bond Fund | | $ | 172,658,522 | | | $ | 139,334,926 | | | $ | 273,385,961 | | | $ | 312,183,748 | | |
SFT Dynamic Managed Volatility Fund | | | – | | | | 6,765,198 | | | | – | | | | 428,108 | | |
SFT Index 400 Mid-Cap Fund | | | 24,102,639 | | | | 35,479,258 | | | | – | | | | – | | |
| SFT Index 500 Fund | | | 28,593,157 | | | | 77,141,225 | | | | – | | | | – | | |
SFT International Bond Fund | | | 9,429,580 | | | | 15,440,551 | | | | 32,593,782 | | | | 43,058,088 | | |
SFT IvySM Growth Fund | | | 157,591,262 | | | | 244,257,930 | | | | – | | | | – | | |
SFT IvySM Small Cap Growth Fund | | | 89,788,178 | | | | 113,533,468 | | | | – | | | | – | | |
SFT Managed Volatility Equity Fund | | | 64,991,449 | | | | 95,737,441 | | | | – | | | | – | | |
SFT Real Estate Securities Fund | | | 88,382,974 | | | | 92,039,716 | | | | – | | | | – | | |
SFT T. Rowe Price Value Fund | | | 205,229,071 | | | | 217,652,559 | | | | – | | | | – | | |
SFT Wellington Core Equity Fund | | | 26,772,445 | | | | 40,689,057 | | | | – | | | | – | | |
* Includes U.S. government-sponsored enterprise securities.
(4) Expenses and Related Party Transactions
The Funds have an investment advisory agreement with Securian AM, a wholly-owned subsidiary of Securian Financial Group. Under the advisory agreement, Securian AM manages the Funds' investments and provides research, statistical and advisory services and pays related office rental and executive expenses and salaries.
Each Fund of the Trust pays Securian AM an annual fee, based on average daily net assets, in the following amounts:
Fund | | Annual Fee on Net Assets | |
| SFT Core Bond Fund | | 0.40% of net assets to $1 billion; and 0.35% of net assets exceeding $1 billion | |
SFT Dynamic Managed Volatility Fund | | 0.55% of all assets | |
SFT Government Money Market Fund | | 0.30% of net assets to $1 billion; and 0.25% of net assets exceeding $1 billion | |
SFT Index 400 Mid-Cap Fund | | 0.15% of net assets to $1 billion; and 0.10% of net assets exceeding $1 billion | |
| SFT Index 500 Fund | | 0.15% of net assets to $1 billion; and 0.10% of net assets exceeding $1 billion | |
SFT International Bond Fund | | 0.60% of net assets to $1 billion; and 0.55% of net assets exceeding $1 billion | |
128
Securian Funds Trust
Notes to Financial Statements – continued
(4) Expenses and Related Party Transactions – (continued)
Fund | | Annual Fee on Net Assets | |
SFT IvySM Growth Fund | | 0.67% of net assets to $500 million; and 0.625% of next $300 million of net assets; and 0.60% of next $200 million of net assets; and 0.50% of net assets exceeding $1 billion | |
SFT IvySM Small Cap Growth Fund | | 0.85% of net assets to $1 billion; and 0.80% of next $2 billion of net assets; and 0.76% of net assets exceeding $3 billion | |
SFT Managed Volatility Equity Fund | | 0.55% of all assets | |
SFT Real Estate Securities Fund | | 0.70% of net assets to $1 billion; and 0.65% of net assets exceeding $1 billion | |
SFT T. Rowe Price Value Fund | | 0.67% of net assets to $1 billion; and 0.65% of next $1.5 billion of net assets; and 0.60% of net assets exceeding $2.5 billion | |
SFT Wellington Core Equity Fund | | 0.65% of all assets | |
Securian AM has a sub-advisory agreement with Franklin Advisers, Inc. ("Franklin"), a registered investment adviser for the SFT International Bond Fund, under which Securian AM pays Franklin an annual fee of 0.37% based on average daily net assets.
Securian AM has a sub-advisory agreement with Ivy Investment Management Company ("IICO"), a registered investment adviser for the SFT IvySM Growth Fund and the SFT IvySM Small Cap Growth Fund, under which Securian AM pays IICO an annual fee ranging from 0.33% to 0.55% and 0.40% to 0.82% respectively, based on average daily net assets.
Securian AM has a sub-advisory agreement with T. Rowe Price Associates, Inc. ("T. Rowe Price"), a registered investment adviser for the SFT T. Rowe Price Value Fund, under which Securian AM pays T. Rowe Price an annual fee ranging from 0.25% to 0.48% based on average daily net assets.
Securian AM has a sub-advisory agreement with Wellington Management Company LLP ("Wellington Management"), a registered investment adviser for the SFT Wellington Core Equity Fund, under which Securian AM pays Wellington Management an annual fee ranging from 0.28% to 0.31% based on average daily net assets.
The Trust bears certain other operating expenses including independent trustees' fees, federal registration fees, printing and shareholder report expenses, legal fees, audit fees, custodian fees, compensation paid to the Trust's Chief Compliance Officer, and other miscellaneous expenses. Each Fund will pay all expenses directly related to its individual operations.
Operating expenses not attributable to a specific Fund are generally allocated based upon the proportionate daily net assets of each Fund.
Administrative Services Fee
The Trust has an agreement with Securian Financial Group under which Securian Financial Group provides accounting, legal, security valuations and other administrative services. Each Fund reimburses Securian Financial Group quarterly for the actual costs incurred in performing such services, as determined in accordance with Securian Financial Group's customary cost accounting procedures consistently applied. Total quarterly administrative fees by Fund range from $6,800 to $24,000.
Accounting Services
The Trust has an agreement with State Street Bank and Trust Company ("State Street") in which State Street provides daily fund accounting and investment administration services. In 2020, these fees ranged from 0.01% to 0.05% of net assets depending on the size and makeup of the respective Fund. The fees are based upon a calculation of multiple factors including base fees, size of assets, and certain other fees.
129
Securian Funds Trust
Notes to Financial Statements – continued
(4) Expenses and Related Party Transactions – (continued)
Distribution Fees
The Trust has adopted a Rule 12b-1 Distribution Plan which covers all of its Class 2 shares ("Covered Funds"). Each Covered Fund pays distribution fees at the annual rate of 0.25% of the average daily net assets of the Covered Fund. These fees are paid out of the Covered Fund's assets, which reduces a Covered Fund's net assets as do other Covered Fund expenses. The fees are paid to Securian Financial Services, Inc. ("Securian Financial"), the Trust's underwriter, to pay for distribution-related expenses and activities in connection with the distribution of the Covered Fund's shares. Securian Financial may also use the fees to pay insurance companies, dealers or others for certain non-distribution services as provided for in the distribution plan.
Net Investment Income Maintenance Agreement for the SFT Government Money Market Fund
Effective May 1, 2012, the Board approved a Restated Net Investment Income Maintenance Agreement among Securian Funds Trust (on behalf of SFT Government Money Market Fund), Securian AM and Securian Financial. Under such Agreement, Securian AM agrees to waive, reimburse or pay SFT Government Money Market Fund expenses so that the Fund's daily net investment income does not fall below zero. Securian Financial may also waive its Rule 12b-1 fees. Securian AM and Securian Financial each has the option under the Agreement to recover the full amount waived, reimbursed or paid (the "Expense Waiver") on any day on which the Fund's net investment income exceeds zero. On any day, however, the Expense Waiver does not constitute an obligation of the Fund unless Securian AM or Securian Financial has expressly exercised its right to recover a specified portion of the Expense Waiver on that day, in which case such specified portion is then due and payable by the Fund. In addition, the right of Securian AM and/or Securian Financial to recover the Expense Waiver is subject to the following limitations: (1) if a repayment of the Expense Waiver by the Fund would cause the Fund's net investment income to fall below zero, such repayment is deferred until a date when repayment would not cause the Fund's net investment income to fall below zero; (2) the right to recover any portion of the Expense Waiver expires three years after the effective date of that portion of the Expense Waiver; and (3) any repayment of the Expense Waiver by the Fund cannot cause the Fund's expense ratio to exceed 1.25%.
As of December 31, 2020, the amounts waived and eligible for recovery are as follows:
| | | Agreement | | Advisory Fees
Waived for the
Year Ended | | 12b-1 Fees
Waived for the
Year Ended | | Excess Expense
Waived for the
Year Ended | | Recoverable through
December 31, | |
Fund | | Date | | December 31, 2020* | | December 31, 2020* | | December 31, 2020* | | 2021 | | 2022 | |
SFT Government Money
Market Fund | | May 1, 2012 | | $ | 401,519 | | | $ | 344,062 | | | $ | 30,420 | | | $ | 776,001 | | | $ | 766,001 | | |
* This amount is reflected in fees waived in the accompanying Statements of Operations.
If Securian AM and Securian Financial exercise their rights to be paid such waived amounts, the Fund's future yield will be negatively affected for an indefinite period. The Agreement shall continue in effect following April 30, 2021, provided such continuance is specifically approved by a majority of the Trust's independent Trustees.
SFT Dynamic Managed Volatility Fund, SFT Government Money Market Fund, and SFT Managed Volatility Fund Expense Waivers
Securian AM and the Trust, on behalf of the SFT Dynamic Managed Volatility Fund, SFT Government Money Market Fund, and SFT Managed Volatility Equity Fund, have entered into Expense Limitation Agreements which limit the operating expenses of these Funds, excluding certain expenses (such as interest expense, acquired fund fees, cash overdraft fees, taxes, brokerage commissions, other expenditures which are capitalized in accordance with GAAP, and other extraordinary expenses not incurred in the ordinary course of the Fund's business), through April 30, 2021.
130
Securian Funds Trust
Notes to Financial Statements – continued
(4) Expenses and Related Party Transactions – (continued)
The Agreements renew annually for a full year each year thereafter unless terminated by Securian AM upon at least 30 days' notice prior to the end of a contract term. The Funds are authorized to reimburse Securian AM for management fees previously waived and/or for the cost of expenses previously paid by Securian AM pursuant to this agreement, provided that such reimbursement will not cause any Fund to exceed any limits in effect at the time of such reimbursement. The Fund's ability to reimburse Securian AM in this manner only applies to fees waived or reimbursements made by Securian AM within the three fiscal years prior to the date of such reimbursement. To the extent that the Fund makes such reimbursements to Securian AM, the amount of the reimbursements will be reflected in the financial statements in the Funds' shareholder reports and in Other Expenses under Fees and Expenses of the Fund in the prospectus.
As of December 31, 2020, the amounts waived and eligible for recovery are as follows:
| | | Agreement | | Expense | | Advisory Fees
Waived for the
Year Ended | | Recoverable through
December 31, | |
Fund | | Date | | Limit | | December 31, 2020* | | 2021 | | 2022 | |
SFT Dynamic Managed Volatility Fund | | May 1, 2013 | | | 0.80 | % | | $ | 373,980 | | | $ | 845,201 | | | $ | 373,980 | | |
SFT Government Money Market Fund | | November 1, 2017 | | | 0.70 | % | | | – | | | | 128,729 | | | | – | | |
SFT Managed Volatility Equity Fund | | November 18, 2015 | | | 0.80 | % | | | 274,362 | | | | 618,612 | | | | 274,362 | | |
* This amount is reflected in fees waived in the accompanying Statements of Operations.
(5) Illiquid Investments
Non-Money Market Funds – Pursuant to Rule 22e-4 under the Investment Company Act of 1940, no Fund may acquire an "illiquid investment" if, immediately after the acquisition, the Fund would have invested more than 15% of its net assets in illiquid investments. Rule 22e-4 generally defines an illiquid investment as any investment that the Fund reasonably expects cannot be sold or disposed of in current market conditions in seven calendar days or less without the sale or disposition significantly changing the market value of the investment. At December 31, 2020, the Funds' did not hold illiquid securities.
Government Money Market Funds – Money market funds are governed by Rule 2a-7 under the Investment Company Act of 1940. By definition, a government money market fund is a fund that invests 99.5% or more of its total assets in cash, government securities, and/or repurchase agreements that are collateralized fully. Consequently, the SFT Government Money Market Fund currently limits investments in "illiquid securities" to 0.5% of net assets at the time of purchase. Rule 2a-7 defines an illiquid security as a security that cannot be sold or disposed of in the ordinary course of business within seven calendar days at approximately the value ascribed to it by the Fund. At December 31, 2020, the Fund did not hold illiquid securities.
(6) Fair Value Measurement
The Trust has established a three-tier hierarchy to maximize the use of observable market data and minimize the use of unobservable inputs when determining fair value. The hierarchy also establishes a classification of fair value measurements for disclosure purposes. Inputs refer broadly to the assumptions that market participants would use in pricing the asset or liability. Inputs may be observable or unobservable. Observable inputs include information market participants would use in pricing the asset or liability based on market data obtained from sources independent of the reporting entity. Unobservable inputs reflect the Trust's estimates about the assumptions market participants would use in valuing the financial asset and liability based on the best information available in the circumstances. Level 1 includes unadjusted quoted prices in active markets for identical assets and liabilities. Level 2 includes other significant observable market-based inputs (including quoted prices for similar securities, interest rates, credit risk and prepayment speed). Level 3 includes
131
Securian Funds Trust
Notes to Financial Statements – continued
(6) Fair Value Measurement – (continued)
unobservable inputs, which may include the advisor's own assumptions in determining the fair value of an investment or are based on independent non-binding broker quotes. Other financial instruments are derivative instruments not reflected in total investments, such as futures, forwards, swaps, and written options.
The following is a summary of the levels used for the year ended December 31, 2020, in valuing the Fund's assets and liabilities (please see the Investments in Securities for each Fund for a listing of all securities within each category):
| | | Fair Value Measurement at
December 31, 2020 using | | | |
Fund | | Level 1 | | Level 2 | | Level 3 | | Total | |
SFT Core Bond Fund | |
Assets | |
Government Obligations | | $ | – | | | $ | 116,913,430 | | | $ | – | | | $ | 116,913,430 | | |
Asset-Backed Securities | | | – | | | | 73,940,275 | | | | – | | | | 73,940,275 | | |
Other Mortgage-Backed Securities | | | – | | | | 54,024,415 | | | | – | | | | 54,024,415 | | |
Corporate Obligations | | | – | | | | 248,526,102 | | | | – | | | | 248,526,102 | | |
Investment Companies | | | 1,570,800 | | | | – | | | | – | | | | 1,570,800 | | |
Total Investments | | | 1,570,800 | | | | 493,404,222 | | | | – | | | | 494,975,022 | | |
Other Financial Instruments* | |
Futures Contracts | | | 397,363 | | | | – | | | | – | | | | 397,363 | | |
Liabilities | |
Other Financial Instruments* | |
Futures Contracts | | | (561,741 | ) | | | – | | | | – | | | | (561,741 | ) | |
SFT Dynamic Managed Volatility Fund | |
Assets | |
Government Obligations | | | – | | | | 16,472,840 | | | | – | | | | 16,472,840 | | |
Other Mortgage-Backed Securities | | | – | | | | 1,736,682 | | | | – | | | | 1,736,682 | | |
Corporate Obligations | | | – | | | | 170,156,317 | | | | – | | | | 170,156,317 | | |
Purchased Options | | | 338,818 | | | | – | | | | – | | | | 338,818 | | |
Investment Companies | | | 472,494,549 | | | | – | | | | – | | | | 472,494,549 | | |
Total Investments | | | 472,833,367 | | | | 188,365,839 | | | | – | | | | 661,199,206 | | |
Other Financial Instruments* | |
Futures Contracts | | | 1,797,365 | | | | – | | | | – | | | | 1,797,365 | | |
Liabilities | |
Other Financial Instruments* | |
Written Options | | | (9,805 | ) | | | – | | | | – | | | | (9,805 | ) | |
SFT Government Money Market Fund | |
Assets | |
U.S. Government Obligations | | | – | | | | 180,883,987 | | | | – | | | | 180,883,987 | | |
Investment Companies | | | 16,559,064 | | | | – | | | | – | | | | 16,559,064 | | |
Total Investments | | | 16,559,064 | | | | 180,883,987 | | | | – | | | | 197,443,051 | | |
SFT Index 400 Mid-Cap Fund | |
Assets | |
Common Stocks | | | 194,913,963 | | | | – | | | | – | | | | 194,913,963 | | |
U.S. Government Obligations | | | – | | | | 999,693 | | | | – | | | | 999,693 | | |
Investment Companies | | | 8,665,399 | | | | – | | | | – | | | | 8,665,399 | | |
Total Investments | | | 203,579,362 | | | | 999,693 | | | | – | | | | 204,579,055 | | |
Assets | |
Other Financial Instruments* | |
Futures Contracts | | | 179,922 | | | | – | | | | – | | | | 179,922 | | |
132
Securian Funds Trust
Notes to Financial Statements – continued
(6) Fair Value Measurement – (continued)
| | | Fair Value Measurement at
December 31, 2020 using | | | |
Fund | | Level 1 | | Level 2 | | Level 3 | | Total | |
SFT Index 500 Fund | |
Assets | |
Common Stocks | | $ | 984,312,211 | | | $ | – | | | $ | – | | | $ | 984,312,211 | | |
Investment Companies | | | 18,816,906 | | | | – | | | | – | | | | 18,816,906 | | |
Total Investments | | | 1,003,129,117 | | | | – | | | | – | | | | 1,003,129,117 | | |
Other Financial Instruments* | |
Futures Contracts | | | 274,014 | | | | – | | | | – | | | | 274,014 | | |
SFT International Bond Fund | |
Assets | |
Long-Term Debt Securities | | | – | | | | 63,058,715 | | | | – | | | | 63,058,715 | | |
Short-Term Debt Securities | | | – | | | | 16,324,004 | | | | – | | | | 16,324,004 | | |
Investment Companies | | | 11,263,853 | | | | – | | | | – | | | | 11,263,853 | | |
Total Investments | | | 11,263,853 | | | | 79,382,719 | | | | – | | | | 90,646,572 | | |
Other Financial Instruments* | |
Forward Foreign Currency Contracts | | | – | | | | 2,004,305 | | | | – | | | | 2,004,305 | | |
Liabilities | |
Other Financial Instruments* | |
Forward Foreign Currency Contracts | | | – | | | | (4,446,111 | ) | | | – | | | | (4,446,111 | ) | |
SFT IvySM Growth Fund | |
Assets | |
Common Stocks | | | 603,755,035 | | | | – | | | | – | | | | 603,755,035 | | |
Investment Companies | | | 3,163,198 | | | | – | | | | – | | | | 3,163,198 | | |
Total Investments | | | 606,918,233 | | | | – | | | | – | | | | 606,918,233 | | |
SFT IvySM Small Cap Growth Fund | |
Assets | |
Common Stocks | | | 206,426,372 | | | | – | | | | – | | | | 206,426,372 | | |
Investment Companies | | | 5,817,250 | | | | – | | | | – | | | | 5,817,250 | | |
Total Investments | | | 212,243,622 | | | | – | | | | – | | | | 212,243,622 | | |
SFT Managed Volatility Equity Fund | |
Assets | |
Investment Companies | | | 340,738,868 | | | | – | | | | – | | | | 340,738,868 | | |
Purchased Options | | | 179,650 | | | | – | | | | – | | | | 179,650 | | |
Total Investments | | | 340,918,518 | | | | – | | | | – | | | | 340,918,518 | | |
Liabilities | |
Other Financial Instruments* | |
| Written Options | | | (3,570 | ) | | | – | | | | – | | | | (3,570 | ) | |
SFT Real Estate Securities Fund | |
Assets | |
Common Stocks | | | 122,510,953 | | | | – | | | | – | | | | 122,510,953 | | |
Investment Companies | | | 3,087,714 | | | | – | | | | – | | | | 3,087,714 | | |
Total Investments | | | 125,598,667 | | | | – | | | | – | | | | 125,598,667 | | |
SFT T. Rowe Price Value Fund | |
Assets | |
Common Stocks | | | 205,215,685 | | | | – | | | | – | | | | 205,215,685 | | |
Preferred Stocks | | | 302,577 | | | | – | | | | – | | | | 302,577 | | |
Investment Companies | | | 842,783 | | | | – | | | | – | | | | 842,783 | | |
Total Investments | | | 206,361,045 | | | | – | | | | – | | | | 206,361,045 | | |
133
Securian Funds Trust
Notes to Financial Statements – continued
(6) Fair Value Measurement – (continued)
| | | Fair Value Measurement at
December 31, 2020 using | | | |
Fund | | Level 1 | | Level 2 | | Level 3 | | Total | |
SFT Wellington Core Equity Fund | |
Assets | |
Common Stocks | | $ | 130,039,447 | | | $ | – | | | $ | – | | | $ | 130,039,447 | | |
Investment Companies | | | 336,895 | | | | – | | | | – | | | | 336,895 | | |
Total Investments | | | 130,376,342 | | | | – | | | | – | | | | 130,376,342 | | |
* Investments in Other Financial Instruments are derivative instruments reflected in the Investment in Securities. All derivatives currently held are reflected at the gross unrealized appreciation (depreciation) on the investments.
Level 2 Measurements:
Government obligations comprised of U.S. Treasury, agency and government guaranteed fixed maturity securities – These securities are principally valued using the market approach. Valuation is based primarily on quoted prices in markets that are not active or using matrix pricing or other similar techniques using standard market observable inputs such as the benchmark U.S. Treasury yield curve, the spread of the U.S. Treasury curve for the identical security and comparable securities that are actively traded.
Asset-backed and other mortgage-backed securities comprised of RMBS, CMBS and ABS fixed maturity securities – These securities are principally valued using the market approach. Valuation is based primarily on matrix pricing or other similar techniques using standard market inputs including spreads for actively traded securities, spreads off benchmark yields, expected prepayment speeds and volumes, current and forecasted loss severity, rating, weighted average coupon, weighted average maturity, average delinquency rates, geographic region, debt-service coverage ratios and issuance-specific information including: collateral type, payment terms of the underlying assets, payment priority within the tranche, structure of the security, deal performance and vintage of loans, etc.
Corporate obligations comprised of U.S. corporate and foreign corporate fixed maturity securities – These securities are principally valued using the market and income approaches. Valuation is based primarily on quoted prices in markets that are not active, or using matrix pricing or other similar techniques that use standard market observable inputs such as benchmark yields, spreads off benchmark yields, new issuances, issuer rating, duration, and trades of identical or comparable securities. Investment grade privately placed securities are valued using discounted cash flow methodologies using standard market observable inputs, and inputs derived from, or corroborated by, market observable data including market yield curve, duration, call provisions, observable prices and spreads for similar publicly traded or privately traded issues that incorporate the credit quality and industry sector of the issuer.
Long-term and short-term debt securities comprised of foreign government and state and political subdivision fixed maturity securities – These securities are principally valued using the market approach. Valuation is based primarily on matrix pricing or other similar techniques using standard market observable inputs including benchmark U.S. Treasury or other yields, issuer ratings, broker-dealer quotes, issuer spreads and reported trades of similar securities, including those within the same sub-sector or with a similar maturity or credit rating.
Forward Foreign Currency and Interest Rate Swap Contracts – Forward foreign currency contracts are traded in the over-the-counter derivative market, and interest rate swaps are generally centrally cleared. These contracts are principally valued using market price quotations or industry recognized modeling techniques. The significant inputs to the models are observable in the market or can be derived from or corroborated by observable market data. These significant inputs may include interest rates, foreign currency exchange rates, interest rate curves, contractual terms, market prices, and measures of volatility.
134
Securian Funds Trust
Notes to Financial Statements – continued
(6) Fair Value Measurement – (continued)
The Funds' policy is to recognize transfers between the levels as of the end of the period. There were no transfers of financial assets between Levels 1, 2 and 3 during the period.
(7) Derivative Instruments Reporting
The Trust provides, when applicable, disclosures of the location, by line item, of fair value amounts in the Statement of Assets and Liabilities and the location, by line item, of amounts of gains and losses reported in the Statement of Operations. The derivative instruments outstanding as of period end are disclosed in the Investments in Securities. The following tables represent the average monthly volume of the Fund's derivative transactions during the year ended December 31, 2020:
| | | Average
Notional Amount | |
SFT Core Bond Fund | |
Futures Contracts | | $ | 102,592,177 | | |
SFT Dynamic Managed Volatility Fund | |
Futures Contracts | | $ | 116,009,781 | | |
Written options contracts | | $ | 1,643,662 | | |
SFT Index 400 Mid-Cap Fund | |
Futures Contracts | | $ | 6,257,870 | | |
SFT Index 500 Fund | |
Futures Contracts | | $ | 10,189,022 | | |
SFT International Bond Fund | |
Swap | | $ | 11,227,000 | (a) | |
Forward foreign currency contracts | | $ | 113,900,683 | | |
SFT Managed Volatility Equity Fund | |
Futures Contracts | | $ | 94,663,365 | (b) | |
Written options contracts | | $ | 1,108,096 | | |
(a) Positions were open for two months during the period.
(b) Positions were open for eleven months during the period.
Equity derivatives were purchased or sold to manage the SFT Index 400 Mid-Cap and SFT Index 500 Funds' shareholder liquidity and to attempt to replicate intended stock investments to maintain fully invested Funds. Equity index options are utilized by the SFT Dynamic Managed Volatility Fund and the SFT Managed Volatility Equity Fund to manage the equity exposure while attempting to reduce the volatility and risk of the Funds.
Interest rate derivatives were purchased or sold in the SFT Core Bond Fund, SFT Dynamic Volatility Fund and the SFT International Bond Fund to both manage the average duration of the fixed income portfolio and to hedge against the effects of interest rate changes on a portfolio's current or intended investments.
Foreign exchange derivatives were used to attempt to hedge against the effects of exchange rate changes within the SFT International Bond Fund's current or intended investments in foreign securities, as well as, to more efficiently obtain exposure to foreign currencies or to take advantage of cross currency markets in order to benefit from valuation differentials and shifts in pricing within the currency markets.
135
Securian Funds Trust
Notes to Financial Statements – continued
(7) Derivative Instruments Reporting – (continued)
The tables below detail the risk exposure of each of the Funds from derivative instruments:
| | | Risk Exposure | |
| | | Equity
Contracts | | Interest
Rate
Contracts | | Foreign
Exchange
Contracts | |
SFT Core Bond Fund | |
Fair Value of Derivative Instruments on the Statement of Assets and Liabilities
as of December 31, 2020 | |
Assets: | |
Variation margin on futures contracts* | | $ | – | | | $ | 397,363 | | | $ | – | | |
Liabilities: | |
Variation margin on futures contracts* | | $ | – | | | $ | (561,741 | ) | | $ | – | | |
The Effect of Derivative Instruments on the Statement of Operations
for the period ended December 31, 2020 | |
Net Realized Gain (Loss) on Derivatives: | |
Futures contracts | | $ | – | | | $ | 2,564,931 | | | $ | – | | |
Net Change in Unrealized Appreciation (Depreciation) on Derivatives: | |
Futures contracts | | $ | – | | | $ | 203,198 | | | $ | – | | |
SFT Dynamic Managed Volatility Fund | |
Fair Value of Derivative Instruments on the Statement of Assets and Liabilities
as of December 31, 2020 | |
Assets: | |
Investments in securities, at market value (purchased options) | | $ | 338,818 | | | $ | – | | | $ | – | | |
Variation margin on futures contracts* | | | 1,797,365 | | | | – | | | | – | | |
Total | | $ | 2,136,183 | | | $ | – | | | $ | – | | |
Liabilities: | |
Written options contracts | | $ | (9,805 | ) | | $ | – | | | $ | – | | |
The Effect of Derivative Instruments on the Statement of Operations
for the period ended December 31, 2020 | |
Net Realized Gain (Loss) on Derivatives: | |
Futures contracts | | $ | 5,933,967 | | | $ | – | | | $ | – | | |
Purchased options contracts | | | 19,147,919 | | | | – | | | | – | | |
Written options contracts | | | (8,340,299 | ) | | | – | | | | – | | |
Total | | $ | 16,741,587 | | | $ | – | | | $ | – | | |
Net Change in Unrealized Appreciation (Depreciation) on Derivatives: | |
Futures contracts | | $ | (3,222,101 | ) | | $ | (301,887 | ) | | $ | – | | |
Purchased options contracts | | | 8,901 | | | | – | | | | – | | |
Written options contracts | | | | | (6,217 | ) | | | – | | |
Total | | $ | (3,219,417 | ) | | $ | (301,887 | ) | | $ | – | | |
136
Securian Funds Trust
Notes to Financial Statements – continued
(7) Derivative Instruments Reporting – (continued)
| | | Risk Exposure | |
| | | Equity
Contracts | | Interest
Rate
Contracts | | Foreign
Exchange
Contracts | |
SFT Index 400 Mid-Cap Fund | |
Fair Value of Derivative Instruments on the Statement of Assets and Liabilities
as of December 31, 2020 | |
Assets: | |
Variation margin on futures contracts* | | $ | 179,922 | | | $ | – | | | $ | – | | |
The Effect of Derivative Instruments on the Statement of Operations
for the period ended December 31, 2020 | |
Net Realized Gain (Loss) on Derivatives: | |
Futures contracts | | $ | 1,449,174 | | | $ | – | | | $ | – | | |
Net Change in Unrealized Appreciation (Depreciation) on Derivatives: | |
Futures contracts | | $ | 16,959 | | | $ | – | | | $ | – | | |
SFT Index 500 Fund | |
Fair Value of Derivative Instruments on the Statement of Assets and Liabilities
as of December 31, 2020 | |
Assets: | |
Variation margin on futures contracts* | | $ | 274,014 | | | $ | – | | | $ | – | | |
The Effect of Derivative Instruments on the Statement of Operations
for the period ended December 31, 2020 | |
Net Realized Gain (Loss) on Derivatives: | |
Futures contracts | | $ | 1,866,561 | | | $ | – | | | $ | – | | |
Net Change in Unrealized Appreciation (Depreciation) on Derivatives: | |
Futures contracts | | $ | (63,119 | ) | | $ | – | | | $ | – | | |
SFT International Bond Fund | |
Fair Value of Derivative Instruments on the Statement of Assets and Liabilities
as of December 31, 2020 | |
Assets: | |
Unrealized appreciation on forward foreign currency contracts | | $ | – | | | $ | – | | | $ | 2,004,305 | | |
Liabilities: | |
Unrealized depreciation on forward foreign currency contracts | | $ | – | | | $ | – | | | $ | (4,446,111 | ) | |
The Effect of Derivative Instruments on the Statement of Operations
for the period ended December 31, 2020 | |
Net Realized Gain (Loss) on Derivatives: | |
Swap contracts | | $ | – | | | $ | (5,621,871 | ) | | $ | – | | |
Foreign currency contracts | | | – | | | | – | | | | (1,003,814 | ) | |
Total | | $ | – | | | $ | (5,621,871 | ) | | $ | (1,003,814 | ) | |
Net Change in Unrealized Appreciation (Depreciation) on Derivatives: | |
Swap contracts | | $ | – | | | $ | 1,623,904 | | | $ | – | | |
Foreign currency contracts | | | – | | | | – | | | | (562,315 | ) | |
Total | | $ | – | | | $ | 1,623,904 | | | $ | (562,315 | ) | |
137
Securian Funds Trust
Notes to Financial Statements – continued
(7) Derivative Instruments Reporting – (continued)
| | | Risk Exposure | |
| | | Equity
Contracts | | Interest
Rate
Contracts | | Foreign
Exchange
Contracts | |
SFT Managed Volatility Equity Fund | |
Fair Value of Derivative Instruments on the Statement of Assets and Liabilities
as of December 31, 2020 | |
Assets: | |
Investments in securities, at market value (purchased options) | | $ | 179,650 | | | $ | – | | | $ | – | | |
Liabilities: | |
Written options contracts | | $ | (3,570 | ) | | $ | – | | | $ | – | | |
The Effect of Derivative Instruments on the Statement of Operations
for the period ended December 31, 2020 | |
Net Realized Gain (Loss) on Derivatives: | |
Futures contracts | | $ | (36,572,698 | ) | | $ | – | | | $ | – | | |
Purchased options contracts | | | 13,514,268 | | | | – | | | | – | | |
Written options contracts | | | (6,411,224 | ) | | | – | | | | – | | |
Total | | $ | (29,469,654 | ) | | $ | – | | | $ | – | | |
Net Change in Unrealized Appreciation (Depreciation) on Derivatives: | |
Futures contracts | | $ | (1,435,340 | ) | | $ | – | | | $ | – | | |
Purchased options contracts | | | (655 | ) | | | – | | | | – | | |
Written options contracts | | | (2,264 | ) | | | – | | | | – | | |
Total | | $ | (1,438,259 | ) | | $ | – | | | $ | – | | |
* Includes cumulative appreciation/depreciation of futures and swap contracts as reported in the notes to the Schedules of Investments in Securities. Only the current day's variation margin is reported within the Statement of Assets and Liabilities.
The Funds may be exposed to credit-related losses in the event of nonperformance by counterparties to derivative financial instruments. The Funds manage credit risk related to derivatives by entering into transactions with highly rated counterparties. Generally, the current credit exposure of the derivative contracts is limited to the positive estimated fair value of derivative contracts at the reporting date after taking into consideration the existence of netting arrangements and any collateral received pursuant to credit support annexes. Because exchange traded derivatives are purchased through regulated exchanges and positions are settled regularly, the Funds have minimal exposure to credit-related losses in the event of nonperformance by counterparties to such derivative instruments. For the year ended December 31, 2020 none of the Funds' derivatives were subject to master netting arrangements.
(8) Affiliated Ownership
The SFT Dynamic Managed Volatility Fund invests in underlying securities and other investment companies, of which certain underlying funds (the "affiliated underlying funds") may be deemed to be under common control with the SFT Dynamic Managed Volatility Fund because they share the same investment advisor, Securian AM, and because they are overseen by the same Board of Trustees. The SFT Dynamic Managed Volatility Fund will achieve its equity exposure by investing primarily in Class 1 Shares of the SFT Index 500 Fund, an affiliated fund in the Trust that seeks investment results that correspond generally to the price and
138
Securian Funds Trust
Notes to Financial Statements – continued
(8) Affiliated Ownership – (continued)
yield performance of the common stocks included in the Standard & Poor's 500® Index. A summary of all transactions with the affiliated SFT Index 500 Fund as of December 31, 2020 are as follows:
| | | Beginning | | Change in
Unrealized | | As of December 31, 2020 | |
Fund/Underlying Fund | | Value as of
January 1, 2020 | | Appreciation/
Depreciation | | Ending
Value | | Share
Balance | |
SFT Dynamic Managed Volatility Fund | |
| SFT Index 500 Fund | | $ | 189,313,819 | | | $ | 34,464,172 | | | $ | 223,777,991 | | | | 14,224,618 | | |
(9) Other Risks
An outbreak of infectious respiratory illness caused by a novel coronavirus known as COVID-19 was first detected in China in December 2019 and was declared a pandemic by the World Health Organization. The impact of COVID-19 could be highly disruptive to economies and markets, adversely impacting individual companies, sectors, industries, markets, currencies, interest and inflation rates, credit ratings, investor sentiment, and other factors affecting the value of a Fund's investments. This may impact liquidity in the marketplace, which in turn may affect the Fund's ability to meet redemption requests. Public health crises caused by the COVID-19 pandemic may exacerbate other pre-existing political, social and economic risks in certain countries or globally. The duration of the COVID-19 pandemic and its effects cannot be determined.
(10) Subsequent Events
Management has evaluated subsequent events for the Trust through the date of the filing, and has concluded there were no material events that would require disclosure except the following:
Management Fees
At an in-person meeting on January 28, 2021 the Board approved the following changes to the investment advisory fees effective May 1, 2021:
Fund | | New Management Fee Rate
(As a Percentage of Daily Net Assets) | |
| SFT Core Bond Fund | | 0.40% of assets to $750 million; and 0.35% of assets exceeding $750 million | |
SFT Dynamic Managed Volatility Fund | | 0.55% of assets to $750 million; and 0.50% of assets exceeding $750 million | |
SFT Government Money Market Fund | | 0.25% of assets to $750 million; and 0.20% of assets exceeding $750 million | |
SFT Index 400 Mid-Cap Fund | | No Change | |
| SFT Index 500 Fund | | No Change | |
SFT International Bond Fund | | 0.60% of assets to $300 million; and 0.575% of next $200 million of assets; and 0.55% of next $500 million of assets; and 0.50% of assets exceeding $1 billion | |
SFT IvySM Growth Fund | | 0.67% of assets to $300 million; and 0.625% of next $200 million of assets; and 0.60% of next $500 million of assets; and 0.50% of assets exceeding $1 billion | |
SFT IvySM Small Cap Growth Fund | | 0.85% of assets to $300 million; and 0.80% of next $200 million of assets; and 0.75% of next $500 million of assets; and 0.70% of assets exceeding $1 billion | |
SFT Managed Volatility Equity Fund | | 0.55% of assets to $750 million; and 0.50% of assets exceeding $750 million | |
139
Securian Funds Trust
Notes to Financial Statements – continued
(10) Subsequent Events – (continued)
Fund | | New Management Fee Rate
(As a Percentage of Daily Net Assets) | |
SFT Real Estate Securities Fund | | 0.70% of assets to $300 million; and 0.675% of next $200 million of assets; and 0.65% of next $500 million of assets; and 0.60% of assets exceeding $1 billion | |
SFT T. Rowe Price Value Fund | | 0.67% of assets to $300 million; and 0.65% of next $200 million of assets; and 0.625% of next $500 million of assets; and 0.60% of assets exceeding $1 billion | |
SFT Wellington Core Equity Fund | | 0.65% of assets to $300 million; and 0.625% of next $200 million of assets; and 0.60% of next $500 million of assets; and 0.55% of assets exceeding $1 billion | |
Expense Limitation Agreements
Securian AM has notified the Board of its intent to not renew the SFT Dynamic Manage Volatility Fund and SFT Managed Volatility Equity Fund Expense Limitation Agreements for another contract term. The SFT Government Money Market Fund Expense Limitation Agreement will be renewed.
SFT IvySM Growth Fund Classification Change
On October 29, 2020, the Board approved a change to the SFT IvySM Growth Fund's classification from a diversified fund to a non-diversified fund, subject to shareholder approval. Shareholders of SFT IvySM Growth are expected to be asked to approve this change to be effective when the Fund's registration statement is revised or supplemented to reflect the change.
Waddell & Reed Financial, Inc. Acquisition
On December 3, 2020, Macquarie Asset Management, the asset management division of Macquarie Group, announced that it had entered into an agreement to acquire Waddell & Reed Financial, Inc., the parent company of Ivy Investment Management Company (IICO), the investment sub-adviser of SFT IvySM Growth Fund and the SFT IvySM Small Cap Growth Fund. This transaction is expected to close by mid-2021, subject to regulatory approvals, Waddell & Reed Financial, Inc. stockholder approval and other customary closing conditions. The Board is expected to be asked to approve a new investment sub-advisory agreement with IICO due to the change of control resulting from the transaction.
140
Securian Funds Trust
Other Information
(unaudited)
Fund Expenses Paid by Shareholders
Shareholders of the Trust incur two types of costs: (1) transaction costs, including sales charges (loads) on purchase payments, reinvested dividends, or other distributions; redemption fees; (the Trust does not impose transaction costs, but you will incur such costs in connection with the variable life insurance policies and variable annuity contracts that invest in the Funds) and exchange fees; and (2) ongoing costs, including management fees; distribution and/or service (12b-1) fees; and other Trust expenses. The examples below are intended to help you understand your ongoing costs (in dollars) of investing in the Funds and to compare these costs with the ongoing costs of investing in other mutual funds.
The examples below are based on an investment of $1,000 invested at the beginning of the period and held for the entire period, July 1, 2020 through December 31, 2020. Expenses paid during the period in the tables below are equal to the Fund's annualized expense ratio, multiplied by the average account value over the period, multiplied by number of days in most recent fiscal half-year divided by 366 to reflect the entire year.
Actual Expenses
The table below provides information about actual account values and actual expenses for the Funds. You may use the information in this table, together with the amount you invested, to estimate the expenses that you paid over the period. Simply divide your account value by $1,000 (for example, an $8,600 account value divided by $1,000 = 8.6), then multiply the result by the number in the table for the fund you own under the heading entitled "Expenses Paid During Period" to estimate the expenses you paid on your account during this period.
| | | Actual Expenses | |
| | | CLASS 1 | | CLASS 2 | |
| | | Beginning
Account
Value | | Ending
Account
Value | | Annual
Expense
Ratio | | Expenses
Paid During
Period | | Ending
Account
Value | | Annual
Expense
Ratio | | Expenses
Paid During
Period | |
| SFT Core Bond Fund | | $ | 1,000 | | | $ | 1,034.80 | | | | 0.48 | % | | $ | 2.46 | | | $ | 1,033.50 | | | | 0.73 | % | | $ | 3.73 | | |
SFT Dynamic Managed
Volatility Fund | | | 1,000 | | | | NA | | | | NA | | | | NA | | | | 1,112.10 | | | | 0.80 | % | | | 4.25 | | |
SFT Government Money
Market Fund | | | 1,000 | | | | NA | | | | NA | | | | NA | | | | 1,000.00 | | | | 0.10 | % | | | 0.50 | | |
SFT Index 400 Mid-Cap Fund | | | 1,000 | | | | 1,301.30 | | | | 0.30 | % | | | 1.74 | | | | 1,299.70 | | | | 0.55 | % | | | 3.18 | | |
| SFT Index 500 Fund | | | 1,000 | | | | 1,220.10 | | | | 0.20 | % | | | 1.12 | | | | 1,218.60 | | | | 0.45 | % | | | 2.51 | | |
SFT International Bond Fund | | | 1,000 | | | | 1,001.30 | | | | 0.89 | % | | | 4.48 | | | | 1,000.00 | | | | 1.14 | % | | | 5.73 | | |
SFT IvySM Growth Fund | | | 1,000 | | | | NA | | | | NA | | | | NA | | | | 1,199.90 | | | | 0.96 | % | | | 5.31 | | |
SFT IvySM Small Cap Growth
Fund | | | 1,000 | | | | NA | | | | NA | | | | NA | | | | 1,369.30 | | | | 1.23 | % | | | 7.33 | | |
SFT Managed Volatility Equity
Fund | | | 1,000 | | | | NA | | | | NA | | | | NA | | | | 1,067.30 | | | | 0.80 | % | | | 4.16 | | |
SFT Real Estate Securities
Fund | | | 1,000 | | | | 1,119.20 | | | | 0.90 | % | | | 4.79 | | | | 1,117.80 | | | | 1.15 | % | | | 6.12 | | |
SFT T. Rowe Price Value
Fund | | | 1,000 | | | | NA | | | | NA | | | | NA | | | | 1,278.00 | | | | 1.04 | % | | | 5.96 | | |
SFT Wellington Core Equity
Fund | | | 1,000 | | | | 1,235.80 | | | | 0.84 | % | | | 4.72 | | | | 1,234.20 | | | | 1.09 | % | | | 6.12 | | |
141
Securian Funds Trust
Other Information – continued
(unaudited)
Hypothetical Example for Comparison Purposes
The table below also provides information about hypothetical account values and hypothetical expenses based on the Funds' actual expense ratios and an assumed rate of return of 5% per year before expenses, which are not the Funds' actual returns. The hypothetical account values and expenses may not be used to estimate the actual ending account balance or expenses you paid for the year. You may use this information to compare the ongoing costs of investing in the Funds' and other funds. To do so, compare the 5% hypothetical example of the funds you own with the 5% hypothetical examples that appear in the shareholder reports of other similar funds.
| | | Hypothetical Expenses | |
| | | CLASS 1 | | CLASS 2 | |
| | | Beginning
Account
Value | | Ending
Account
Value | | Annual
Expense
Ratio | | Expenses
Paid During
Period | | Ending
Account
Value | | Annual
Expense
Ratio | | Expenses
Paid During
Period | |
| SFT Core Bond Fund | | $ | 1,000 | | | $ | 1,022.72 | | | | 0.48 | % | | $ | 2.44 | | | $ | 1,021.47 | | | | 0.73 | % | | $ | 3.71 | | |
SFT Dynamic Managed
Volatility Fund | | | 1,000 | | | | NA | | | | NA | | | | NA | | | | 1,021.11 | | | | 0.80 | % | | | 4.06 | | |
SFT Government Money
Market Fund | | | 1,000 | | | | NA | | | | NA | | | | NA | | | | 1,024.63 | | | | 0.10 | % | | | 0.51 | | |
SFT Index 400 Mid-Cap Fund | | | 1,000 | | | | 1,023.63 | | | | 0.30 | % | | | 1.53 | | | | 1,022.37 | | | | 0.55 | % | | | 2.80 | | |
| SFT Index 500 Fund | | | 1,000 | | | | 1,024.13 | | | | 0.20 | % | | | 1.02 | | | | 1,022.87 | | | | 0.45 | % | | | 2.29 | | |
SFT International Bond Fund | | | 1,000 | | | | 1,020.66 | | | | 0.89 | % | | | 4.52 | | | | 1,019.41 | | | | 1.14 | % | | | 5.79 | | |
SFT IvySM Growth Fund | | | 1,000 | | | | NA | | | | NA | | | | NA | | | | 1,020.31 | | | | 0.96 | % | | | 4.88 | | |
SFT IvySM Small Cap Growth
Fund | | | 1,000 | | | | NA | | | | NA | | | | NA | | | | 1,018.95 | | | | 1.23 | % | | | 6.24 | | |
SFT Managed Volatility Equity
Fund | | | 1,000 | | | | NA | | | | NA | | | | NA | | | | 1,021.11 | | | | 0.80 | % | | | 4.06 | | |
SFT Real Estate Securities
Fund | | | 1,000 | | | | 1,020.61 | | | | 0.90 | % | | | 4.57 | | | | 1,019.36 | | | | 1.15 | % | | | 5.84 | | |
SFT T. Rowe Price Value
Fund | | | 1,000 | | | | NA | | | | NA | | | | NA | | | | 1,019.91 | | | | 1.04 | % | | | 5.28 | | |
SFT Wellington Core Equity
Fund | | | 1,000 | | | | 1,020.91 | | | | 0.84 | % | | | 4.27 | | | | 1,019.66 | | | | 1.09 | % | | | 5.53 | | |
Please note that the expenses shown in both tables are meant to highlight your ongoing costs only and do not reflect any transactional costs, such as sales charges (loads), redemption fees, or exchange fees. Therefore, the information provided in the hypothetical example table is useful in comparing ongoing costs only, and will not help you determine the relative total costs of owning different funds. In addition, if these transactional costs were included, your costs would have been higher.
Proxy Voting Policies and Procedures
A description of the policies and procedures that Securian AM uses to vote proxies related to each Fund's portfolio securities is set forth in the Trust's Statement of Additional Information, which is available without charge, upon request, by calling, toll-free, 800-995-3850 or on the Securities and Exchange Commission's website at www.sec.gov. The Trust will provide this document within three business days of receipt of a request, by first-class mail or other means designed to ensure equally prompt delivery.
142
Securian Funds Trust
Other Information – continued
(unaudited)
Proxy Voting Record
The Trust's proxy voting record for the 12 month period ended June 30 is available by calling, toll-free, 866-330-7355 or on the Securities and Exchange Commission's website at www.sec.gov no later than August 31 each year. The Trust will also provide this information, within three business days of receipt of a request, by first-class mail or other means designed to ensure equally prompt delivery.
Availability of Quarterly Schedule of Investments
The Trust files its complete schedule of investment holdings with the SEC for the first and third quarters of each fiscal year on Form N-PORT. Previously, the Trust filed a complete schedule of portfolio holdings with the SEC for the first and third quarters of each fiscal year on Form N-Q. The Trust's Forms N-PORT and N-Q are available on the SEC's website at www.sec.gov.
143
Securian Funds Trust
Statement Regarding Liquidity Risk Management Program
(unaudited)
The following statement discusses the operation and effectiveness of the Funds' liquidity risk management program for the period from January 1, 2019 through December 31, 2019 and describes the Board's review of the Funds' liquidity risk management program that took place during the six-month period ended June 30, 2020.
The Funds have adopted a Liquidity Risk Management Program (the "LRM Program"). The Funds' Board has appointed the Securian AM Liquidity Risk Oversight Committee (the "Committee") as the administrator of the LRM Program. In its capacity as program administrator, the Committee oversees and monitors the LRM Program for the Funds. In addition, the Committee assesses and manages the Funds' liquidity risk, which is the risk that a Fund could not meet requests to redeem shares issued by the Fund without significant dilution of remaining investors' interests in the Fund. The Committee assesses and manages liquidity risk by classifying and reviewing periodically the classification of Fund investments for liquidity risk management purposes; reporting periodically to the Board on Fund liquidity risk and the status of the LRM Program; and determining the policies, procedures and controls necessary to create and maintain the LRM Program, among other means. The Committee's process of determining the degree of liquidity of the Funds' investments is supported by one or more third-party liquidity assessment vendors.
The Funds' Board reviewed a report prepared by the Committee to address the operation of the LRM Program, assess its adequacy and effectiveness of implementation, including (if applicable), the operation of the highly liquid investment minimum and any material changes to the LRM Program for the period from January 1, 2019 through December 31, 2019 (the "Covered Period"). To prepare this report, the Committee discussed the operation and effectiveness of the Funds' third-party liquidity assessment services in light of the liquidity risks posed by each Fund. Additionally, the Committee reviewed portfolio managers' responses to the LRM Program's Annual Liquidity Risk Assessment Review Checklist for each Fund. As a result of its review, the Committee reported the following to the Board:
— The Funds' LRM Program operated effectively during the Covered Period, was adequately designed and was effectively implemented.
— Because each Fund primarily holds assets that are highly liquid investments, the Funds do not have highly liquid investments minimums. It is expected each Fund will continue to primarily hold assets that are highly liquid investments for the foreseeable future.
— There were no material changes to the LRM Program during the Covered Period. However, Securian AM's liquidity risk management policies and procedures were revised to eliminate one stress test review of the SFT Government Money Market Fund.
— There were no breaches of any Fund's restriction on holding greater than 15% illiquid assets.
144
Securian Funds Trust
Trustees and Executive Officers
(unaudited)
Under Delaware law, the Board of Trustees of the Trust has overall responsibility for managing the Trust in good faith and in a manner reasonably believed to be in the best interests of the Trust. The Trustees meet periodically throughout the year to oversee the Trust's activities, review contractual arrangements with companies that provide services to the Trust, and review the performance of the Trust and its Funds. One of the four current Trustees is considered an "interested person" (as defined in the Investment Company Act of 1940) of the Trust. The other three Trustees, because they are not interested persons of the Trust, are considered independent ("Independent Trustees") and are not employees or officers of, and have no financial interest in, the Trust's investment adviser, Securian Asset Management, Inc. (Securian AM) or its affiliated companies, including Minnesota Life Insurance Company. 75% of the Board of Trustees is required to be comprised of Independent Trustees.
Only executive officers and other officers who perform policy-making functions with the Trust are listed. None of the Trustees is a director of any public company (a company required to file reports under the Securities Exchange Act of 1934) or of any registered investment companies other than the Trust. Each Trustee serves for an indefinite term, until his or her resignation, death or removal.
The Funds' Statement of Additional Information contains additional information about the Funds' Trustees and is available without charge upon request, by calling, toll free, 800-995-3850.
Position with Trust
Name, Address(1) and Length of Principal Occupation(s)
and Year of Birth, Time Served(2) During Past 5 Years
Independent Trustees
Julie K. Getchell 1954 Trustee since 2011
Retired; Senior Financial Consultant Cargill, 2009-2012; Chief Financial Officer, La Grosse Global Fund Services, 2007-2009; Senior Managing Director, Black River Asset Management, 2005-2007; Consultant, Black River Asset Management, 2004-2005; Chief Financial Officer, Prestige Resorts & Destinations, 2001-2003; Chief Operating Officer, Insight Investment Management, Inc., 1991-1996; Chartered Financial Analyst; CPA—inactive
Linda L. Henderson 1949 Trustee since 2007
Retired: Professional Adviser, Carlson School of Management, working with faculty and MBA students managing Carlson Growth Fund. Semi-retirement, 2004-2007. RBC Wealth Management (formerly Dain Bosworth and Dain Rauscher) 1985-2004. Senior Vice President and Director of Fixed Income Research and Strategies, 2000-2004. Director of Retail Fixed Income. 1996-2000. Director of Financial Services, 1994-1996. Manager of the Investment Management Group, 1992-1994. Consultant, Investment Management Group, 1991-1992. Investment Executive, 1985-1991. Assistant Professor of Business Administration/Finance, University of Wisconsin-River Falls, 1980-1985. Chartered Financial Analyst
William C. Melton 1947 Trustee since 2002
Retired; member, State of Minnesota Council of Economic Advisors from 1988 to 1994, and again from 2010 to the present; various senior positions at American Express Financial Advisors (formerly Investors Diversified Services and, thereafter, IDS/American Express) from 1982 through 1997, including Chief Economist and, thereafter, Chief International Economist
Interested Trustee and Principal Executive Officer
David M. Kuplic 1957 Trustee since 2016 and President since 2011
Senior Vice President, Minnesota Life Insurance Company since June 2007; President, Securian AM since 2017; Executive Vice President and Director, Securian AM since July 2007; Senior Vice President and Director, Advantus Capital Management, Inc., February 2006 to July 2007; Senior Vice President, Securian Financial
145
Securian Funds Trust
Trustees and Executive Officers – continued
(unaudited)
Group, Inc. since June 2007; President and Director, MIMLIC Funding, Inc. (entity holding legal title to bonds beneficially owned by certain clients of Securian AM) since July 2007; Senior Vice President, Securian Life Insurance Company since June 2007; President and Director, Marketview Properties, LLC (entity holding real estate assets) since January 2010; President and Director, Marketview Properties II, LLC (entity holding real estate assets) since March 2010; President and Director, Marketview Properties III, LLC since January 2012; President, Marketview Properties IV, LLC since January 2012
Other Executive Officers(3)
Gary M. Kleist 1959 Vice President and Treasurer since 2003
Financial Vice President, Chief of Operations and Director, Securian AM since December 1997; Second Vice President, Minnesota Life Insurance Company since February 2000; Second Vice President, Securian Financial Group, Inc. since February 2000; Second Vice President, Securian Life Insurance Company since June 2007; Financial Vice President, Marketview Properties, LLC since January 2010; Financial Vice President, Marketview Properties II, LLC (entities holding certain real estate assets) since March 2010; Financial Vice President, Marketview Properties III, LLC since January 2012; Financial Vice President, Marketview Properties IV, LLC since January 2012
Christopher B. Owens 1977 Vice President since 2020
Second Vice President—Retail Life and Annuity Sales, Securian Financial Group, Inc. since June 2018; National Sales Vice President—Retail Life and Annuity Sales, Securian Financial Group, Inc., October 2011 to June 2018
Michael J. Radmer 1945 Secretary since 1998(4)
Senior Counsel with the law firm of Dorsey & Whitney LLP since January 2016; Partner from 1976 to December 2015
Dorsey & Whitney LLP
50 South Sixth Street
Minneapolis, Minnesota 55402
(1) Unless otherwise noted, the address of each Trustee and officer is the address of the Trust: 400 Robert Street North, St. Paul, Minnesota 55101.
(2) The years reflect when a person became a director or officer of Advantus Series Fund, the predecessor to the Trust.
(3) Although not a 'corporate' officer of the Trust, Michael Steinert, 1975, serves as the Trust's Chief Compliance Officer. Mr. Steinert also serves as Vice President and Chief Compliance Officer of Securian AM.
(4) Michael J. Radmer resigned as Secretary on December 31, 2020. The trustees will appoint a replacement Secretary at a future meeting.
146
This offering is available through Securian Financial Services, Inc., a registered broker/dealer. Securian Financial Services, Inc. is the distributor of Minnesota Life and Securian Life variable insurance products.
This report may be used as sales literature in connection with the offer or sale of variable annuity or variable life insurance contracts funded by Securian Funds Trust ("Trust") if preceded or accompanied by (a) the current prospectus for the Trust and such contracts and (b) the current applicable variable annuity or variable life performance report.

Securian Financial Services, Inc.
www.securian.com
Securities Dealer, Member FINRA/SIPC.
Registered Investment Advisor
400 Robert Street North, St. Paul, MN 55101-2098
1.888.237.1838
F38897 Rev 2-2021
Minnesota Life Insurance Company
A Securian Company
Securian Life Insurance Company
A New York admitted insurer
400 Robert Street North
St. Paul, MN 55101-2098
PRESORTED STANDARD
U.S. POSTAGE PAID
CAROL STREAM, IL
PERMIT NO. 1480

©2020 Securian Funds Trust All rights reserved.
F38897 Rev 2-2021
Call 1-800-995-3850 to receive your financial documents electronically. It's fast and convenient.
ITEM 2. CODE OF ETHICS.
Filed herewith as Exhibit 12(a)(1). During the period covered by this report, there has been no amendment to the code of ethics that relates to any element of the code of ethics definition set forth in paragraph (b) of Item 2 of Form N-CSR, nor has the registrant granted a waiver, including an implicit waiver, from a provision of the code of ethics to the registrant’s principal executive officer, principal financial officer, principal accounting officer or controller, or persons performing similar functions that relates to one or more of the items set forth in paragraph (b) of Item 2 of form N-CSR.
ITEM 3. AUDIT COMMITTEE FINANCIAL EXPERT.
The Board of Trustees of the Trust has determined that Julie K. Getchell, a member of the Board's Audit Committee, possesses the technical attributes identified in Instruction 2(b) of Item 3 to Form N-CSR to qualify as an "audit committee financial expert," and has designated Ms. Getchell as the Audit Committee's financial expert. Ms. Getchell is an "independent" Trustee pursuant to paragraph (a)(2) of Item 3 to Form N-CSR.
ITEM 4. PRINCIPAL ACCOUNTANT FEES AND SERVICES.
(a) Audit Fees
The aggregate fees billed for each of the last two fiscal years for professional services rendered by the principal accountant to the registrant for the audit of the registrant's annual financial statements or services that are normally provided by the accountant in connection with statutory and regulatory filings or engagements for those fiscal years were as follows:
| 2020 | | | 2019 | |
| $ | 328,090 | | | $ | 322,606 | |
(b) Audit-Related Fees
The aggregate fees billed in each of the last two fiscal years for assurance and related services rendered by the principal accountant to the registrant that are reasonably related to the performance of the audit of the registrant's financial statements and are not reported under paragraph (a) of this Item 4 were as follows:
There were no fees billed in each of the last two fiscal years for assurance and related services rendered by the principal accountant to the registrant's investment adviser or to any entity controlling, controlled by or under common control with the investment adviser that provides ongoing services to the registrant that were required to be pre-approved by the audit committee pursuant to paragraph (c)(7)(ii) of Rule 2-01 of Regulation S-X.
(c) Tax Fees
The aggregate fees billed in each of the last two fiscal years for professional services rendered by the principal accountant to the registrant for tax compliance, tax advice, tax planning and tax return preparation were as follows:
There were no fees billed in each of the last two fiscal years for professional services rendered by the principal accountant to the investment adviser or to any entity controlling, controlled by or under common control with the investment adviser that provides ongoing services to the registrant for tax compliance, tax advice and tax planning that were required to be pre-approved by the audit committee pursuant to paragraph (c)(7)(ii) of Rule 2-01 of Regulation S-X.
(d) All Other Fees
The aggregate fees billed in each of the last two fiscal years for products and services provided by the principal accountant to the registrant, other than the services reported in paragraphs (a) – (c) of this Item 4 were as follows:
There were no fees billed in each of the last two fiscal years for products and services provided by the principal accountant to the investment adviser or to any entity controlling, controlled by or under common control with the investment adviser that provides ongoing services to the registrant, other than the services reported in paragraphs (a) – (c) of this Item 4, that were required to be pre-approved by the audit committee pursuant to paragraph (c)(7)(ii) of Rule 2-01 of Regulation S-X.
(e)(1) Registrant's audit committee has adopted the following pre-approval policies and procedures in accordance with paragraph (c)(7) of Rule 2-01 of Regulation S-X:
SECURIAN FUNDS TRUST
AUDIT COMMITTEE POLICY
Regarding Pre-Approval of Services Provided by the Independent Auditor
The Audit Committee (the “Committee”) of the Securian Funds Trust (the “Trust”) has responsibility for ensuring that all services performed by the independent audit firm (the “Auditor”) for the Trust do not impair the Auditor’s independence. This review is intended to provide reasonable oversight without removing management from its responsibility for day-to-day operations. In this regard, the Committee should:
| • | Understand the nature of the professional services expected to be provided and their impact on the Auditor’s independence and audit quality |
| • | Examine and evaluate the safeguards put into place by the Trust and the Auditor to safeguard independence |
| • | Meet semi-annually with the engagement partner of the Auditor |
| • | Consider approving categories of service that are not deemed to impair independence for a one-year period |
It is important that a qualitative rather than a mere quantitative evaluation be performed by the Committee in discharging its responsibilities.
Policy for Audit and Non-Audit Services Provided to the Trust
On an annual basis, the Committee will review and consider whether to pre-approve the financial plan for audit fees as well as categories of audit-related and non-audit services that may be performed by the Auditor directly for the Trust. At least annually the Committee will receive a report from the Auditor of all audit and non-audit services, which were approved during the year.
The engagement of the Auditor for any non-audit service requires the written pre-approval of the Trust’s Treasurer, and all non-audit services performed by the Auditor will be disclosed in the required SEC periodic filings.
In connection with the Committee review and pre-approval responsibilities, the review by the Committee will consist of the following:
Audit Services
The categories of audit services and related fees to be reviewed and considered for pre-approval annually by the Committee or its delegate include the following:
| • | Annual Trust financial statement audits |
| • | SEC and regulatory filings and consents |
Audit-related Services
In addition, the following categories of audit-related services are deemed to be consistent with the role of the Auditor and, as such, will be considered for pre-approval by the Committee or its delegate, on an annual basis.
| • | Accounting consultations |
| • | Trust merger support services |
| • | Other accounting related matters |
| • | Agreed Upon Procedure Reports |
| • | Other Internal Control Reports |
Notwithstanding any annual pre-approval of these categories of services, individual projects with an estimated fee of $20,000 or more are subject to pre-approval by the Committee on a case-by-case basis. Individual projects with an estimated fee of less than $20,000 are subject to pre-approval by the then-serving Chair of the Committee on a case-by-case basis. The Chair shall thereafter report to the full Committee on any such matters at the Committee’s next regularly scheduled meeting.
Tax Services
The following categories of tax services are deemed to be consistent with the role of the Auditor and, as such, will be considered for pre-approval by the Committee or its delegate, on an annual basis.
| • | Tax compliance services related to the filing or amendment of the following: |
| o | Federal, state and local income tax compliance; and, |
| o | Sales and use tax compliance |
| • | Timely RIC qualification reviews |
| • | Tax distribution analysis and planning |
| • | Tax authority examination services |
| • | Tax appeals support services |
| • | Accounting methods studies |
| • | Trust merger support services |
| • | Tax consulting services and related projects |
Notwithstanding any annual pre-approval of these categories of services, individual projects with an estimated fee of $20,000 or more are subject to pre-approval by the Committee on a case-by-case basis. Individual projects with an estimated fee of less than $20,000 are subject to pre-approval by the then-serving Chair of the Committee on a case-by-case basis. The Chair shall thereafter report to the full Committee on any such matters at the Committee’s next regularly scheduled meeting.
Other Non-audit Services
The SEC auditor independence rules adopted in response to the Sarbanes-Oxley Act specifically allow certain non-audit services. Because of the nature of these services, none of these services may be commenced by the Auditor without the prior approval of the Committee. The Committee may delegate this responsibility to one or more of the Committee members, with the decisions presented to the full Committee at the next scheduled meeting.
Proscribed Services
In accordance with SEC rules on independence, the Auditor is prohibited from performing services in the following categories of non-audit services:
| • | Accounting and bookkeeping services |
| • | Financial information systems design and implementation |
| • | Valuation services supporting the financial statements |
| • | Actuarial services supporting the financial statements |
| • | Expert services (e.g., litigation support) |
Policy for Pre approval of Non-Audit Services Provided to Other Affiliated Entities
The Committee is also responsible for pre-approving certain non-audit services provided to Securian Asset Management Inc. (“Securian AM”) and any other entity under common control with Securian AM that provides ongoing services to the Trust. The only non-audit services provided to these entities which require pre-approval are those services that relate directly to the operations and financial reporting of the Trust.
Although the Committee is not required to pre-approve all services provided to Securian AM and affiliated service providers, the Committee will annually receive a report from the Auditor on the aggregate fees for all services provided to Securian AM and its affiliates.

(e)(2) None of the services provided to the registrant described in paragraphs (b) – (d) of this Item 4 were pre-approved by the audit committee pursuant to paragraph (c)(7)(i)(C) of Rule 2-01 of Regulation S-X.
(f) No disclosures are required by this Item 4(f).
(g) The aggregate non-audit fees billed for each of the last two fiscal years by the registrant's accountant for services rendered to the registrant and to the registrant's investment adviser (not including any sub-adviser whose role is primarily portfolio management and is subcontracted with or overseen by another investment adviser) and any entity controlling, controlled by or under common control with the adviser that provides ongoing services to the registrant were as follows:
(h) The registrant's audit committee has considered that the provision of the non-audit services rendered to the registrant's investment adviser (not including any sub-adviser whose role is primarily portfolio management and is subcontracted with or overseen by another investment adviser) and any entity controlling, controlled by or under common control with the adviser that provides ongoing services to the registrant that were not pre-approved pursuant to paragraph (c)(7)(ii) of Rule 2-01 of Regulation S-X is compatible with maintaining the principal accountant's independence.
ITEM 5. AUDIT COMMITTEE OF LISTED REGISTRANTS.
Not applicable.
ITEM 6. SCHEDULE OF INVESTMENTS.
Not applicable. Schedule I – Investments in Securities of Unaffiliated Issuers is included as part of the report to shareholders filed under Item 1 of this Form N-CSR.
ITEM 7. DISCLOSURE OF PROXY VOTING POLICIES AND PROCEDURES FOR CLOSED-END MANAGEMENT INVESTMENT COMPANIES.
Not applicable.
ITEM 8. PORTFOLIO MANAGERS OF CLOSED-END MANAGEMENT INVESTMENT COMPANIES.
Not applicable.
ITEM 9. PURCHASES OF EQUITY SECURITIES BY CLOSED-END MANAGEMENT INVESTMENT COMPANY AND AFFILIATED PURCHASERS
Not applicable.
ITEM 10. SUBMISSION OF MATTERS TO A VOTE OF SECURITY HOLDERS
The registrant has a governance committee of its board of trustees, the members of which are all trustees who are not “interested persons” of the registrant, as defined in Section 2(a)(19) of the Investment Company Act of 1940 (“independent trustees”). The governance committee, which operates in accordance with a separate governance committee charter approved by the board of trustees, selects and recommends to the board of trustees individuals for nomination as independent trustees. The names of potential independent trustee candidates are drawn from a number of sources, including recommendations from management of Securian Asset Management, Inc., the registrant’s investment adviser. Each candidate is evaluated by the governance committee with respect to the relevant business and industry experience that would enable the candidate to serve effectively as an independent trustee, as well as his or her compatibility with respect to business philosophy and style. The members of the governance committee may conduct an in-person interview of each viable candidate using a standardized questionnaire. When all of the viable candidates have been evaluated and interviewed, the governance committee determines which of the viable candidates should be presented to the board of trustees for selection to become a member of the board of trustees.
Inasmuch as the registrant does not hold annual meetings of shareholders and meetings of shareholders occur only intermittently, the governance committee does not at present consider nominees recommended by shareholders.
ITEM 11. CONTROLS AND PROCEDURES.
(a) Based upon their evaluation of the registrant's disclosure controls and procedures as conducted within 90 days of the filing date of this Form N-CSR, the registrant's principal financial officer and principal executive officer have concluded that those disclosure controls and procedures provide reasonable assurance that the material information required to be disclosed by the registrant on this report is recorded, processed, summarized and reported within the time periods specified in the Securities and Exchange Commission's rules and forms.
(b) There were no changes in the registrant's internal controls over financial reporting (as defined in Rule 30a-3(d) under the Investment Company Act of 1940) that occurred during the second fiscal quarter of the period covered by this report that has materially affected, or is reasonably likely to materially affect, the registrant's internal control over financial reporting.
ITEM 12. Disclosure of Securities Lending Activities for Closed-End Management Investment Companies.
(a)(1) Not applicable.
(a)(2) Not applicable.
(a)(3) Not applicable.
(a)(4) Not applicable.
(b) Not applicable.
ITEM 13. EXHIBITS.
(a) File the exhibits listed below as part of this Form. Letter or number the exhibits in the sequence indicated.
| (1) | Any code of ethics, or amendment thereto, that is the subject of the disclosure required by Item 2, to the extent that the registrant intends to satisfy the Item 2 requirements through filing of an exhibit: |
Exhibit 99.CODE ETH attached hereto.
| (2) | A separate certification for each principal executive officer and principal financial officer of the registrant as required by Rule 30a-2 under the Investment Company Act of 1940 (17 CFR 270.30a-2): |
Exhibit 99.CERT attached hereto.
| (b) | If the report is filed under Section 13(a) or 15(d) of the Securities Exchange Act of 1934, provide the certifications required by Rule 30a-2(b) under the Investment Company Act of 1940 (17 CFR 270.30a-2(b)), Rule 13a-14(b) or Rule 15d-14 under the Securities Exchange Act of 1934 (17 CFR 240.13a-14(b) or 240.15d-14(b)) and Section 1350 of Chapter 63 of Title 18 of the United States Code (18 U.S.C. 1350) as an exhibit. A certification furnished pursuant to this paragraph will not be deemed "filed" for the purposes of Section 18 of the Securities Exchange Act of 1934 (15 U.S.C. 78r), or otherwise subject to the liability of that section. Such certification will not be deemed to be incorporated by reference into any filing under the Securities Act of 1933 or the Securities Exchange Act of 1934, except to the extent that the registrant specifically incorporates it by reference: |
Exhibit 99.906 CERT attached hereto
SIGNATURES
Pursuant to the requirements of the Securities Exchange Act of 1934 and the Investment Company Act of 1940, the registrant has duly caused this report to be signed on its behalf by the undersigned, thereunto duly authorized.
(Registrant) Securian Funds Trust
| By (Signature and Title) | /s/ David M. Kuplic | |
| | David M. Kuplic, President | |
Date: February 16, 2021
Pursuant to the requirements of the Securities Exchange Act of 1934 and the Investment Company Act of 1940, this report has been signed below by the following persons on behalf of the registrant and in the capacities and on the dates indicated.
| By (Signature and Title) | /s/ David M. Kuplic | |
| | David M. Kuplic, President (Principal Executive Officer) | |
| By (Signature and Title) | /s/ Gary M. Kleist | |
| | Gary M. Kleist, Treasurer (Principal Financial Officer) | |
Date: February 16, 2021