UNITED STATES
SECURITIES AND EXCHANGE COMMISSION
Washington, D.C. 20549
FORM N-CSR
CERTIFIED SHAREHOLDER REPORT OF REGISTERED
MANAGEMENT INVESTMENT COMPANIES
| Investment Company Act file number | 811-02064 |
| PAX WORLD FUNDS SERIES TRUST I |
| (Exact name of Registrant as specified in charter) |
| 30 Penhallow Street, Suite 400, Portsmouth, NH | | 03801 |
| (Address of principal executive offices) | | (Zip code) |
Pax World Management LLC
30 Penhallow Street, Suite 400, Portsmouth, NH 03801
Attn.: Joseph Keefe |
| (Name and address of agent for service) |
| Registrant’s telephone number, including area code: | 800-767-1729 | |
| Date of fiscal year end: | December 31 | |
| | |
| Date of reporting period: | December 31, 2019 | |
Form N-CSR is to be used by management investment companies to file reports with the Commission not later than 10 days after the transmission to stockholders of any report that is required to be transmitted to stockholders under Rule 30e-1 under the Investment Company Act of 1940 (17 CFR 270.30e-1). The Commission may use the information provided on Form N-CSR in its regulatory, disclosure review, inspection, and policymaking roles.
A registrant is required to disclose the information specified by Form N-CSR, and the Commission will make this information public. A registrant is not required to respond to the collection of information contained in Form N-CSR unless the Form displays a currently valid Office of Management and Budget (“OMB”) control number. Please direct comments concerning the accuracy of the information collection burden estimate and any suggestions for reducing the burden to Secretary, Securities and Exchange Commission, 450 Fifth Street, NW, Washington, DC 20549-0609. The OMB has reviewed this collection of information under the clearance requirements of 44 U.S.C. §3507.
| Item 1. | Reports to Stockholders |

Beginning on January 1, 2021, as permitted by regulations adopted by the Securities and Exchange Commission, paper copies of the Funds’ Annual and Semi-Annual Reports will no longer be sent by mail, unless you specifically request paper copies of the reports from the Funds or from your financial intermediary, such as a broker-dealer or bank. Instead, the reports will be made available on a website, and you will be notified by mail each time a report is posted and provided with a website link to access the report.
If you already elected to receive shareholder reports electronically, you will not be affected by this change and you need not take any action. You may elect to receive shareholder reports and other communications electronically by logging in to your account at www.impaxam.com/account. If you own Fund shares through a financial intermediary, please contact your financial intermediary or follow instructions included with this report.
You may elect to receive all future Annual and Semi-Annual Reports in paper free of charge. You can inform us that you wish to continue receiving paper copies by calling 1(800) 372-7827. If you own Fund shares through a financial intermediary, please contact your financial intermediary or follow instructions included with this report to elect to continue receiving paper copies of your shareholder reports. Your election to receive reports in paper will apply to all funds held with Pax World or your financial intermediary.
| | |
Glossary of Terms | 2 |
Letter to Shareholders | 5 |
Portfolio Manager Comments and Highlights | 12 |
Pax Large Cap Fund | 12 |
Pax Small Cap Fund | 16 |
Pax ESG Beta Quality Fund | 20 |
Pax ESG Beta Dividend Fund | 24 |
Pax Global Opportunities Fund | 28 |
Pax Global Environmental Markets Fund | 33 |
Pax Ellevate Global Women’s Leadership Fund | 40 |
Pax MSCI EAFE ESG Leaders Index Fund | 46 |
Pax Core Bond Fund | 51 |
Pax High Yield Bond Fund | 55 |
Pax Sustainable Allocation Fund (formerly known as the “Pax Balanced Fund”) | 60 |
Sustainable Investing Update | 64 |
Shareholder Expense Examples | 66 |
Schedules of Investments | 69 |
Statements of Assets and Liabilities | 116 |
Statements of Operations | 120 |
Statements of Changes in Net Assets | 122 |
Financial Highlights | 128 |
Notes to Financial Statements | 140 |
Report of Independent Registered Public Accounting Firm | 162 |
Board Approval of Sub-Advisory Agreement | 165 |
Trustees and Officers | 167 |
Account Options and Services | 172 |
For More Information |
General Fund Information 800.767.1729 Shareholder Account Information 800.372.7827 Account Inquiries Pax World
P.O. Box 9824
Providence, RI 02940-8024 Investment Advisers Impax Asset Management LLC
Pax Ellevate Management LLC
30 Penhallow Street, Suite 400
Portsmouth, NH 03801 | Transfer and Dividend Disbursing Agent BNY Mellon Investment
Servicing (U.S.) Inc.
P.O. Box 9824
Providence, RI 02940-8024 Custodian State Street Bank and Trust Company
1 Lincoln Street
Boston, MA 02111 |
Blended Index for the Sustainable Allocation Fund is composed of 60% S&P 500 Index and 40% Bloomberg Barclays U.S. Aggregate Bond Index.
Bloomberg Barclays U.S. Aggregate Bond Index is a broad-based index, maintained by Bloomberg L.P. often used to represent investment grade bonds being traded in the United States.
FTSE Environmental Opportunities Index Series measures the performance of global companies that have significant involvement in environmental business activities, including renewable and alternative energy, energy efficiency, water technology and waste and pollution control. The FTSE Environmental Opportunities Index Series requires companies to have at least 20% of their business derived from environmental markets and technologies. The FTSE Environmental Opportunities Index Series is published by a joint venture of Impax Asset Management, Ltd. (“Impax”) with FTSE International. Impax is also the sub-adviser to the Pax Global Environmental Markets Fund.
ICE BofA Merrill Lynch U.S. High Yield - Cash Pay - BB-B (Constrained 2%) Index tracks the performance of BB- and B rated fixed income securities publicly issued in the major domestic or Eurobond markets, with total index allocation to an individual issuer limited to 2%.
Impax Global Women’s Leadership Index is a customized market capitalization-weighted index created and licensed by Impax Asset Management (“IAM”) consisting of equity securities of issuers organized or operating in countries around the world that demonstrate a commitment to advancing and empowering women through gender diversity on their boards, in management and through other policies and programs, and an understanding of the potential business advantages associated with greater gender diversity, as rated by the IAM Gender Analytics team, with final approval by the IAM Women’s Index Committee. In addition, the companies comprising the Women’s Index meet certain environmental, social and governance (ESG) or sustainability thresholds, as rated by MSCI ESG Research.
Lipper Core Bond Funds Index tracks the results of the 30 largest mutual funds in the Lipper Core Bond Funds Index Average. The Lipper Core Bond Index Funds Average is a total return performance average of mutual funds tracked by Lipper, Inc. that invest at least 85% in domestic investment-grade debt issues (rated in the top four grades) with any remaining investment in non-benchmark sectors such as high-yield, global and emerging market debt. These funds maintain dollar-weighted average maturities of five to ten years.
Lipper Equity Income Funds Index tracks the results of the 30 largest mutual funds in the Lipper Equity Income Funds Index Average. The Lipper Equity Income Funds Index Average is a total return performance average of mutual funds tracked by Lipper, Inc. that by prospectus language and portfolio practice, seek relatively high current income and growth of income by investing at least 65% of their portfolio in dividend-paying equity securities.
Lipper Global Multi-Cap Core Funds Index tracks the results of the 30 largest mutual funds in the Global Multi-Cap Core Funds Average. The Global Multi-Cap Core Funds Index Average is a total return performance average of mutual funds tracked by Lipper, Inc. that, by portfolio practice, invest in a variety of market capitalization ranges without concentrating 75% of their equity assets in any one market capitalization range over an extended period of time. Global multi-cap core funds typically have average characteristics compared to the MSCI World Index.
Lipper Global Multi-Cap Growth Funds Index tracks the results of funds that invest in a variety of market capitalization ranges without concentrating 75% of their equity assets in any one market capitalization range over an extended period of time. Multi-cap funds typically have 25% to 75% of their assets invested in companies both inside and outside of the U.S. with market capitalizations (on a three-year weighted basis) above 400% of the 75th market capitalization
percentile of the S&P/Citigroup World Broad Market Index. Multi-cap growth funds typically have an above-average price-to-cash flow ratio, price-to-book ratio, and three-year sales-per-share growth value compared to the S&P/Citigroup BMI. One cannot invest directly in an index.
Lipper High Yield Bond Funds Index tracks the results of the 30 largest mutual funds in the Lipper High Yield Bond Funds Average. The Lipper High Yield Bond Funds Average is a total return performance average of mutual funds tracked by Lipper, Inc. that aim at high (relative) current yield from fixed income securities, have no quality or maturity restrictions and tend to invest in lower grade debt issues.
Lipper International Large-Cap Core Funds Index tracks the results of the 30 largest mutual funds in the Lipper International Large-Cap Core Funds Index Average. The Lipper International Large-Cap Core Funds Index Average is a total return performance average of mutual funds tracked by Lipper, Inc. that, by portfolio practice, invest at least 75% of their equity assets in companies strictly outside of the U.S. with market capitalizations (on a three-year weighted basis) above Lipper’s international large-cap floor. International large-cap core funds typically have an average price-to-cash flow ratio, price-to-book ratio and three-year sales-per-share growth value compared to the S&P/Citigroup World ex-U.S. BMI.
Lipper Large-Cap Core Funds Index tracks the results of the 30 largest mutual funds in the Lipper Large Cap Core Funds Index Average. The Lipper Large Cap Core Funds Index Average is a total return performance average of mutual funds tracked by Lipper, Inc. that invest at least 75% of their equity assets in companies with market capitalizations (on a three-year weighted basis) above Lipper’s USDE large-cap floor. Large-cap core funds have more latitude in the companies in which they invest. These funds typically have average characteristics compared to the S&P 500 Index.
Lipper Multi-Cap Core Funds Index tracks the results of the 30 largest mutual funds in the Lipper Multi-Cap Core Funds Index Average. The Lipper Multi-Cap Core Funds Index Average is a total return performance average of mutual funds tracked by Lipper, Inc. that invest in a variety of market capitalization ranges without concentrating 75% of their equity assets in any one market capitalization range over an extended period of time. These funds typically have average characteristics compared to the S&P SuperComposite 1500 Index.
Lipper Small-Cap Core Funds Index tracks the results of the 30 largest mutual funds in the Lipper Small- Cap Core Funds Average. The Lipper Small-Cap Core Funds Average is a total return performance average of the mutual funds tracked by Lipper, Inc. that, by portfolio practice, invest at least 75% of their equity assets in companies with market capitalizations (on a three-year weighted basis) below Lipper’s USDE small-cap ceiling. Small-cap core funds have more latitude in the companies in which they invest. These funds typically have an average price-to-earnings ratio, price-to-book ratio, and three-year sales-per-share growth value, compared to the S&P SmallCap 600 Index.
Morningstar Allocation – 50% to 70% Equity seeks to provide both capital appreciation and income by investing in three major areas: stocks, bonds and cash. These portfolios tend to hold larger positions in stocks than conservative-allocation portfolios. These portfolios typically have 50% to 70% of assets in equities and the remainder in fixed income and cash.
MSCI All-Country World Index (“ACWI”) Index is a free float-adjusted market capitalization weighted index that is designed to measure the equity market performance of developed and emerging markets. The MSCI ACWI consists of 47 country indices comprising 23 developed and 24 emerging market country indices. The developed market country indices included are: Australia, Austria, Belgium, Canada, Denmark, Finland, France, Germany, Hong Kong, Ireland, Israel, Italy, Japan, Netherlands, New Zealand, Norway, Portugal, Singapore, Spain, Sweden, Switzerland, United Kingdom and United States. The emerging market country indices included
Glossary of Terms, continued |
are: Brazil, Chile, China, Colombia, Czech Republic, Egypt, Greece, Hungary, India, Indonesia, Korea, Malaysia, Mexico, Pakistan, Peru, Philippines, Poland, Qatar, Russia, South Africa, Taiwan, Thailand, Turkey and United Arab Emirates.
MSCI EAFE (Europe, Australasia, Far East) Index is a free float-adjusted market capitalization index that is designed to measure the equity market performance of developed markets, excluding the U.S. and Canada. The MSCI EAFE (Net) Index consists of the following 21 developed market country indices: Australia, Austria, Belgium, Denmark, Finland, France, Germany, Hong Kong, Ireland, Israel, Italy, Japan, Netherlands, New Zealand, Norway, Portugal, Singapore, Spain, Sweden, Switzerland, and United Kingdom.
MSCI EAFE ESG Leaders Index is a free float-adjusted market capitalization weighted index designed to measure the performance of equity securities of issuers organized or operating in developed market countries around the world excluding the U.S. and Canada that have high environmental, social and governance (ESG) ratings relative to their sector and industry group peers, as rated by MSCI ESG Research annually. MSCI ESG Research evaluates companies’ ESG characteristics and derives corresponding ESG scores and ratings. Companies are ranked by ESG score against their sector peers to determine their eligibility for the MSCI ESG indices. MSCI ESG Research identifies the highest-rated companies in each peer group to meet the float-adjusted market capitalization sector targets. The rating system is based on general and industry-specific ESG criteria, assigning ratings on a 7-point scale from AAA (highest) to CCC (lowest).
MSCI World Index is a free float-adjusted market capitalization weighted index that is designed to measure the equity market performance of developed markets. The MSCI World Index consists of the following 23 developed market country indices: Australia, Austria, Belgium, Canada, Denmark, Finland, France, Germany, Hong Kong, Ireland, Israel, Italy, Japan, Netherlands, New Zealand, Norway, Portugal, Singapore, Spain, Sweden, Switzerland, the United Kingdom, and the United States.
Russell 1000 Index measures the performance of the 1,000 largest U.S. companies, as measured by market capitalization. It is a subset of the Russell 3000 Index, which measures the largest 3,000 companies. The Russell 1000 Index is comprised of over 90% of the total market capitalization of all listed U.S stocks.
Russell 2000 Index measures the performance of the small-cap segment of the U.S. equity universe. The Russell 2000 Index is a subset of the Russell 3000 Index representing approximately 10% of the total market capitalization of that index. It includes approximately 2,000 of the smallest securities based on a combination of their market cap and current index membership.
The S&P 500 Stock Index is an unmanaged index of large capitalization common stocks.
Performance for the MSCI ACWI Index, the MSCI EAFE Index, the MSCI EAFE ESG Leaders Index, the MSCI World Index and the Impax Global Women’s Leadership Index are shown “net”, which includes dividend reinvestments after deduction of foreign withholding tax.
Securities Indices above assume reinvestment of all distributions and interest payments, have no policy of sustainable investing and do not take in to account brokerage fees or expenses.
Lipper Indices above are not what are typically considered to be an “index” because they track the performance of other mutual funds rather than changes in the value of a group of securities, a securities index or some other traditional economic indicator.
Diversification does not eliminate the risk of experiencing investment losses.
One cannot invest directly in any index.
Letter to Shareholders |
by Joseph Keefe, President & CEO |
 Dear fellow shareholders,
We enter the new year on the tailwinds of a strong fourth quarter that capped off exceptional 2019 performance across virtually all asset classes.
The S&P 500 Index rose 9.1% in the fourth quarter to deliver a total return of 31.5% for 2019, its best year since 2013. Small cap equities were up nearly 10% for the quarter, and while they lagged large caps for the year, the Russell 2000 Index still delivered a robust annual return of 25.5%. As has been the case over recent years, non-U.S. developed market stocks lagged U.S. stocks in 2019, but the MSCI EAFE Index still returned 22%. It was also a very strong year for fixed income, with the Bloomberg Barclays U.S. Aggregate Index returning 8.7% and the high yield market returning 14.4% as represented by the ICE BofA Merrill Lynch U.S. High Yield Cash Pay Index.
Although concerns about the impact of tariffs and trade wars on economic growth waxed and waned during 2019, falling interest rates steadily drove asset prices higher and encouraged more risk-taking across asset classes, contributing to higher equity prices.
For the one-year period ended December 31, 2019, the institutional class shares of eight out of the 11 Pax World Funds performed in the top half of their peer groups, and six of 11 were in the top third. We entered the new calendar year with eight out of the nine funds eligible for the Morningstar Sustainability Ratings receiving four or five globes, including our Pax Large Cap Fund and our Pax Sustainable Allocation Fund,* previously known as the Pax Balanced Fund – although the strategy remains unchanged, we changed the name of the fund late last year to better convey its unique investment strategy.
In 2020 we’ll continue to strengthen our portfolios by addressing climate risks and targeting high opportunity areas that we believe can drive investment returns. When we construct investment portfolios, we apply a sustainability lens to all 158 sub-industries of the global economy, carefully examining these risks and opportunities and identifying which companies are best poised for the transition to a more sustainable economy — and which ones are not. We believe this investment approach helps us build more resilient and ultimately better-performing portfolios.
We’re seeing evidence of this in our funds.
During the five and a half years since we launched our women’s leadership index and the Pax Ellevate Global Women’s Leadership Fund, the fund has outperformed its MSCI World benchmark index. Significantly, this outperformance has been accompanied by lower risk. At its five year anniversary, the Fund had lower Beta than the MSCI World Index, lower Standard Deviation, better Downside Capture, better Sharpe Ratio and better Information Ratio.1
Growing interest in climate change and environmental issues is attracting investors to our Pax Global Environmental Markets Fund, which brought in more inflows than any other environmental fund last year.2 As I write this in mid-January, the Fund is nearing $1 billion in assets under management.
We’re not resting on these results.
Since I last wrote, four more of our funds have become fossil fuel-free — we now offer nine fossil fuel-free funds.3 Plus, in three of those funds we’ve begun applying a proprietary process called SmartCarbon™, developed by our colleagues in London in partnership with Carbon Tracker, to substitute energy efficiency stocks in place of fossil fuel holdings.
We continue to engage in dialogue with the companies in our funds when we see room for sustainability improvements. Late in 2019, Bloomberg cast a spotlight on some of this work with a feature article about Heather Smith, our Vice President for Sustainability Research, and her efforts to help companies better understand the business benefits of gender pay equity. You can read that here: https://bloom.bg/3733byP.
All these developments and the growing interest in sustainable investing more generally are reasons for optimism.
1 | Steve Falci, Julie Gorte, Scott LaBreche, David Loehwing, Heather Smith, “Gender Diversity Delivered: Results from Five Years of Investing in Women,” Impax Asset Management | Pax World Funds, July 22, 2019. |
3 | In our fossil fuel-free funds, we seek to avoid investing in securities of companies significantly involved in the extraction and/or refining of fossil fuels (coal, oil and gas), which includes: exploration and production; refining and marketing; storage and transportation; and equipment and services. Collectively, these companies comprise the Energy sector according to the Global Industry Classification Standard (GICS®), a widely recognized industry standard. |
However, the public policy environment is as unfavorable as it ever has been, and the investment community will not be able to effectively transition to a more sustainable economy with government on the sidelines, or worse yet, actively opposing our efforts. Businesses and markets cannot do this work alone and won’t be properly incentivized to do this work without government as a fully engaged partner. The upcoming presidential election in the U.S. will certainly be a factor in how the transition to a more sustainable economy evolves from here.
The good news, which should give us hope, is that public attitudes are rapidly changing. In the face of global challenges such as climate change and gender inequality, there is a growing demand for solutions, and for a more sustainable form of capitalism. As investors, we have the great privilege to help build the next economy, the next society — one that is not only more sustainable but more equitable and just. This is important work. In the coming year, we pledge to continue pursuing it with the urgency it deserves.
On behalf of all of us here at Impax and Pax World Funds, I wish you and yours the very best in the year ahead.
Sincerely,

Joseph F. Keefe
President
Performance data quoted represent past performance, which does not guarantee future results. Investment return and principal value of an investment will fluctuate so that an investor’s shares, when redeemed, may be worth more or less than their original cost. Current performance may be lower or higher than the performance data quoted.
Investments involve risk, including potential loss of principal.
You should always consider Pax World Funds’ investment objectives, risks, and charges and expenses carefully before investing. For this and other important information, please download a fund prospectus. Please read it carefully before investing.
The Morningstar Sustainability Rating measures how well the companies in a fund’s portfolio manage their environmental, social and governance (ESG) risks and opportunities relative to the fund’s peers. First, a Morningstar Portfolio Sustainability Score™ ranging from 0 to 100
is derived from an asset weighted average of the underlying company ESG scores quarterly. Next, scored funds are rated monthly: the top 10% receive 5 globes (High), the next 22.5% receive 4 (Above Average), the next 35% receive 3 (Average), the next 22.5% receive 2 (Below Average), and the bottom 10% receive 1 (Low). Sustainalytics provides company-level analysis used in the calculation of Morningstar’s Sustainability Score. A higher score indicates that a fund, on average, has more of its assets invested in companies that score well according to the Sustainalytics methodology. For details, visit http://morningstar.com/company/sustainability.
Sustainability Score for the Pax Sustainable Allocation Fund as of 9/30/2019 is 22.44. Percent Rank in Category is 5 and Sustainability Rating is 5 globes as of 11/30/2019.
Sustainability Score for the Pax Ellevate Global Women’s Leadership Fund as of 09/30/2019 is 21.46. Percent Rank in Category is 11 and Sustainability Rating is 5 globes as of 11/30/2019.
Sustainability Score for the Pax ESG Beta Dividend Fund as of 09/30/2019 is 21.64. Percent Rank in Category is 4 and Sustainability Rating is 5 globes as of 11/30/2019.
Sustainability Score for the Pax ESG Beta Quality Fund as of 09/30/2019 is 21.81. Percent Rank in Category is 7 and Sustainability Rating is 5 globes as of 11/30/2019.
Sustainability Score for the Pax Global Environmental Markets Fund as of 09/30/2019 is 22.07. Percent Rank in Category is 9 and Sustainability Rating is 4 globes as of 11/30/2019.
Sustainability Score for the Pax Global Opportunities Fund as of 09/30/2019 is 21.64. Percent Rank in Category is 10 and Sustainability Rating is 4 globes as of 11/30/2019.
Sustainability Score for the Pax Large Cap Fund as of 09/30/2019 is 22.20. Percent Rank in Category is 5 and Sustainability Rating is 5 globes as of 11/30/2019.
Sustainability Score for the Pax MSCI EAFE ESG Leaders Index Fund as of 09/30/2019 is 20.94. Percent Rank in Category is 6 and Sustainability Rating is 5 globes as of 11/30/2019.
Lipper rankings are based on total returns (not including sales charges) for the periods indicated and compare total return performance with that of other funds in the category.
Data shown represents rankings for the Pax Ellevate Global Women’s Leadership Fund — Institutional Class (PXWIX) — as of 12/31/19 in the Lipper Global Multi-Cap Core category based on average annual returns. The Pax Ellevate Global Women’s Leadership Fund — Institutional Class (PXWIX) — 1-year 29th percentile rank out of 160 funds, 3-year 15th percentile rank out of 128 funds, 5-year 7th percentile rank out of 114 funds, 10-year 54th percentile rank out of 79 funds.
Data shown represents rankings for the Pax Large Cap Fund — Institutional Class (PXLIX) — as of 12/31/19 in the Lipper Large-Cap Core category based on average annual returns. The Pax Large Cap Fund — Institutional Class (PXLIX) — 1 year 5th percentile rank out of 674 funds, 3 year 15th percentile rank out of 621 funds.
Data shown represents rankings for the Pax Small Cap Fund — Institutional Class (PXSIX) — as of 12/31/2019 in the Lipper Small-Cap Core category based on average annual returns. The Pax Small Cap Fund — Institutional Class (PXSIX) — 1-year 51st percentile rank out of 930 funds, 3-year 78th percentile rank out of 848 funds, 5-year 80th percentile rank out of 701 funds, 10-year 45th percentile rank out of 535 funds.
Data shown represents rankings for the Pax ESG Beta Quality Fund — Institutional Class (PWGIX) — as of 12/31/2019 in the Lipper Multi Cap Core category based on average annual returns. The Pax ESG Beta Quality Fund — Institutional Class (PWGIX) — 1-year 59th percentile rank out of 723 funds, 3-year 26th percentile rank out of 632 funds, 5-year 27th percentile rank out of 544 funds, 10-year 32nd percentile rank out of 413 funds.
Data shown represents rankings for the Pax ESG Beta Dividend Fund — Institutional Class (PXDIX) — as of 12/31/2019 in the Lipper Equity Income category based on average annual returns. The Pax ESG Beta Dividend Fund — Institutional Class (PXDIX) — 1-year 37th percentile rank out of 531 funds, 3-year 14th percentile out of 482 funds.
Data shown represents rankings for the Pax Global Opportunities Fund — Institutional Class (PXGOX) — as of 12/31/2019 in the Lipper Global Multi-Cap Growth category based on average annual returns. The Pax Global Opportunities Fund — Institutional Class (PXGOX) — 1-year 19th percentile rank out of 203 funds.
Data shown represents rankings for the Pax Global Environmental Markets Fund — Institutional Class (PGINX) — as of 12/31/2019 in the Lipper Global Multi-Cap Core category based on average annual returns. The Pax Global Environmental Markets Fund — Institutional Class (PGINX) — 1-year 12th percentile rank out of 160 funds, 3-year 43rd percentile rank out of 128 funds, 5-year 9th percentile rank out of 114 funds, 10-year 46th percentile rank out of 79 funds.
Data shown represents rankings for the Pax MSCI EAFE ESG Leaders Index Fund — Institutional Class (PXNIX) — as of 12/31/2019 in the International Large-Cap Core category based on average annual returns. The Pax MSCI EAFE ESG Leaders Index Fund — Institutional Class (PXNIX) — 1-year 44th percentile rank out of 86 funds, 3-year 33rd percentile rank out of 74 funds, 5-year 20th percentile rank out of 63 funds.
Data shown represents rankings for the Pax High Yield Bond Fund — Institutional Class (PXHIX) — as of 12/31/2019 in the Lipper High Yield Bond category based on average annual returns. The Pax High Yield Bond Fund — Institutional Class (PXHIX) — 1-year 41st percentile rank out of 502 funds, 3-year 35th percentile rank out of 436 funds, 5-year 56th percentile rank out of 399 funds, 10-year 88th percentile rank out of 324 funds..
Data shown represents rankings for the Pax Sustainable Allocation Fund — Institutional Class (PAXIX) — as of 12/31/2019 in the Morningstar Allocation–50% to 70% Equity category based on average annual returns. The Pax Sustainable Allocation Fund — Institutional Class (PAXIX) — 1-year 24th percentile rank out of 697 funds, 3-year 27th percentile rank out of 643 funds, 5-year 31st percentile rank out of 570 funds, 10 year 44th percentile rank out of 420 funds.
Data shown represents rankings for the Pax Core Bond Fund — Institutional Class (PABIX) — as of 12/31/2019 in the Lipper Core Bond category based on average annual returns. The Pax Core Bond Fund — Institutional Class (PABIX) — 1-year 78th percentile rank out of 516 funds, 3-year 70th percentile rank out of 462 funds.
* | Effective December 18, 2019, the name of the Pax Balanced Fund changed to the Pax Sustainable Allocation Fund. |
Commentary The portfolio manager commentaries in this report provide insight from the respective fund managers in an effort to help you examine your fund. The views expressed therein are those of the portfolio managers and are for the period covered by this report. Such commentary does not necessarily represent the views of the Board of Trustees of your fund. The views expressed herein are subject to change at any time based upon market and/or other conditions and Impax Asset Management LLC, Pax Ellevate Management LLC and the funds disclaim any responsibility to update such views. The commentaries should not be relied upon as investment advice.
Historical performance Historical performance can be evaluated in several ways. Each fund’s portfolio highlights provide total and average annual total returns. A comparison of this historical data to an appropriate benchmark is also provided. These performance figures include changes in a fund’s share price, plus reinvestment of any dividends (generally income) and any capital gains (generally profits the fund earns when it sells securities that have grown in value). Past performance does not guarantee future results.
The Funds’ distributor, ALPS Distributors, Inc., is not affiliated with Impax Asset Management LLC, Pax Ellevate Management LLC, Aperio Group LLC, or Impax Asset Management, Ltd.
December 31, 2019 |
Pax Large Cap Fund |

|
Portfolio Manager
Andrew Braun |
| |

|
Portfolio Manager
Barbara Browning, CFA |
Portfolio Managers’ Comments |
How did the Pax Large Cap Fund (the Fund) perform for the period?
For the one-year period ended December 31, 2019, the Institutional Class and Investor Class of the Fund had total returns of 35.23% and 34.85%, respectively, compared to 31.49% for the S&P 500 Index and 28.79% for the Lipper Large-Cap Core Funds Index.
During the period, the Fund reached its three-year anniversary. Over the three-year period ending December 31, 2019, the Fund’s institutional class has outperformed the S&P 500 Index and ranks in the top 8% out of 1,203 Morningstar Large Blend peers.1 Also, the Fund has earned a 4-Star Overall Morningstar Rating based on risk-adjusted returns in the Large Blend category (1,203 peers).2 2019 was an especially strong year of performance with the Fund’s institutional class ranking in the top 4% of 1,387 Morningstar Large Blend peers and ending the year with three consecutive quarters of outperforming the S&P 500 Index.3
What factors contributed to the Fund’s performance?
The Fund outperformed the S&P 500 Index for calendar year 2019 and experienced broad-based contributions from nearly every sector. The sectors which contributed the most to relative performance were Consumer Discretionary, Real Estate, and Information Technology, while the Materials and Communication Services sectors marginally detracted from the Fund’s overall relative performance.
Can you discuss any significant changes to the Fund’s positioning throughout the period?
In the third quarter of 2019 we eliminated Fund holdings in the Energy sector, due to a combination of fundamental and sustainability considerations. We increased exposure to the Real Estate and Industrial sectors during the year, while reducing exposure to both the Consumer Discretionary and Consumer Staples sectors.
What portfolio holdings contributed positively to performance?
Target, Apple, and Celgene were notable contributors to performance in 2019. Target doubled in stock price during the year, as capital spent remodeling stores in prior years led to strong mid- to single-digit revenue growth, even amid a difficult retail backdrop. Apple rebounded steadily throughout 2019 after negatively pre-announcing weak earnings at the very beginning of the year, as new products and growth in their services division drove a re-rating of the stock. Celgene was acquired by Bristol-Myers Squibb early in 2019 at a substantial premium, and we held the stock until the acquisition closed late in the year as we viewed the earnings power uplift from the combination favorably.
What portfolio holdings detracted from performance?
Notably weak holdings were DuPont and Elanco. DuPont completed the separation of Dow and Corteva during the first half of 2019, and its Nutrition and Biosciences unit entered into a combination with International Flavors and Fragrances (IFF) in December. However, weak fundamentals kept a lid on Dupont’s stock price during the year. Elanco announced the acquisition of Bayer’s animal health business, which was not well received by investors, as the company was only recently spun out of Eli Lilly. We decided to exit the position as our investment thesis was disrupted by this unforeseen development.
Footnotes:
1, 3 Data shown represent rankings for the Pax Large Cap Fund – Institutional Class (PXWIX) in the Morningstar Large Blend category based on average annual returns. Morningstar percentile rank is a standardized way of ranking items within a peer group, in this case, funds with the same Morningstar Category. The observation with the largest numerical value is ranked one; the observation with the smallest numerical value is ranked 100. The remaining observations are placed equal distance from one another on the rating scale. Note that lower percentile ranks are generally more favorable for returns (high returns), while higher percentile ranks are generally more favorable for risk measures (low risk). The Pax Large Cap Fund – Institutional Class (PXWIX) 1-year 4th percentile rank (38 out of 1387 funds), 3-year 8th percentile rank (79 out of 1203 funds). The Pax Large Cap Fund – Investor Class (PAXLX) 1-year 5th percentile rank (50 out of 1387 funds), 3-year 12th percentile rank (120 out of 1203 funds).
2 The Morningstar Ratings™ shown are as of 12/31/19. The Morningstar Rating for funds, or “star rating,” is calculated for managed products (including mutual funds, variable annuity and variable life subaccounts, exchange-traded funds, closed end funds, and separate accounts) with at least a three-year history. Exchange-traded funds and open-ended mutual funds are considered a single population for comparative purposes. It is calculated based on a Morningstar Risk-Adjusted Return measure that accounts for variation in a managed product’s monthly excess performance, placing more emphasis on downward variations and rewarding consistent performance. The top 10% of products in each product category receive 5 stars, the next 22.5% receive 4 stars, the next 35% receive 3 stars the next 22.5% receive 2 stars, and the bottom 10% receive 1 star. The Overall Morningstar Rating for a managed product is derived from a weighted average of the performance figures associated with its three-, five- and ten- year (if applicable) Morningstar Rating metrics. The weights are 100% three-year rating for 36-59 months of total returns, 60% five-year rating, 40% three-year rating for 60-119 months of total returns, and 50% ten-year
December 31, 2019 |
Pax Large Cap Fund, continued |
rating, 30% five-year rating, 20% three-year rating for 120 or more months of total returns. While the ten-year overall rating formula seems to give the most weight to the ten-year period, the most recent three-year period actually has the greatest impact because it is included in all three rating periods.
The Pax Large Cap Fund (PXLIX) Morningstar ratings were 4 stars out of 1,203 funds overall, 4 stars out of 1,203 funds for 3-years. Ratings are subject to change every month.
Portfolio Highlights (Unaudited)
Since Inception Total Return—Historical Growth of $10,000

Returns—Period ended December 31, 2019
| | | | | Total
Return | Average Annual Return |
Share Class | Ticker
Symbol | | | 1 Year | 3 Years | Since
Inception1 |
Institutional Class2 | PXLIX | | | 35.23% | 15.90% | 15.37% |
Investor Class2 | PAXLX | | | 34.85% | 15.60% | 15.08% |
S&P 500 Index | | | | 31.49% | 15.27% | 14.75% |
Lipper Large-Cap Core Funds Index | | | 28.79% | 13.89% | 13.39% |
See ‘Glossary of Terms’ for descriptions of benchmarks.
These figures represent past performance, which is no guarantee of future results. Investment return and principal value of an investment will fluctuate so that an investor’s shares, when redeemed, may be worth more or less than their original cost. Current performance may be lower or higher than the performance data quoted. Total returns for periods of less than one year have not been annualized. For most recent month-end performance data, please visit www.impaxam.com or call 800.767.1729.
1 | The Fund’s inception date is December 16, 2016. |
2 | Total return figures include reinvested dividends and capital gains distributions, and changes in principal value, and do not reflect the taxes that a shareholder might pay on Fund distributions or on the redemption of Fund shares. |
Asset Allocation | Percent of Investments |
U.S. Stocks | 96.3% |
Cash & Cash Equivalents | 3.7% |
Total | 100.0% |
Top Ten Holdings
Company | Percent of Net Assets |
Apple, Inc. | 5.4% |
Microsoft Corp. | 5.4% |
Amazon.com, Inc. | 3.6% |
Procter & Gamble Co., The | 3.5% |
Merck & Co., Inc. | 3.5% |
JPMorgan Chase & Co. | 3.2% |
Ingersoll-Rand PLC | 2.9% |
AT&T, Inc. | 2.9% |
Alphabet, Inc., Class C | 2.7% |
Alphabet, Inc., Class A | 2.7% |
Total | 35.8% |
Holdings are subject to change.
Sector Diversification
Sector | Percent of Net Assets |
Information Technology | 22.5% |
Health Care | 16.0% |
Financials | 13.8% |
Communication Services | 12.1% |
Consumer Discretionary | 9.7% |
Industrials | 8.4% |
Consumer Staples | 5.9% |
Real Estate | 4.3% |
Materials | 2.7% |
Utilities | 0.9% |
Other assets and liabilities (net) | 3.7% |
Total | 100.0% |
May include companies representing multiple industries within a single “Sector”.
December 31, 2019 |
Pax Small Cap Fund |

|
Portfolio Manager
Nathan Moser, CFA |
Portfolio Manager’s Comments |
How did the Pax Small Cap Fund (the Fund) perform for the period?
For the one-year period ended December 31, 2019, the Investor Class, Class A, and Institutional Class shares of the Fund had total returns of 23.29%, 23.27% and 23.56%, respectively, compared to 25.52% for the Russell 2000 Index and 24.71% for the Lipper Small-Cap Core Funds Index.
What factors contributed to the Fund’s performance?
The Fund had very strong stock selection in the Financials and Consumer Discretionary sectors. This drove positive selection overall but was offset somewhat by negative selection within the Health Care sector. Allocation was also a detractor due to our underweight to Technology and our cash holdings.
Can you discuss any significant changes to the Fund’s positioning throughout the period?
Over the course of the period, we reduced our tilt toward value-oriented stocks by reducing our holdings in the Utilities, Materials and Energy sectors and increasing our exposure to Technology and Consumer Discretionary. We also reduced the magnitude of our sector weightings relative to the Index, which we believe should serve to increase the proportion of performance driven by stock selection rather than sector allocations.
What portfolio holdings contributed positively to performance?
Victory Capital, a multi-boutique asset manager, increased 106% during the period and was the Fund’s top contributor. The key driver of performance was the highly accretive acquisition of USAA Asset Management, which added important scale and diversification benefits. We continue to view the company favorably, finding its acquisition strategy compelling in a challenging environment for many asset managers.
Crocs, a shoe manufacturer, increased 115% during the period. The increase was driven by very strong financial results late in the period, which we believe increased investor comfort in the durability of Crocs’ growth. Prior to the end of the year, we exited our position as valuation met our estimate of fair value.
What portfolio holdings detracted from performance?
Natus Medical, a medical device company, declined 3% during the period and was our largest detractor. Early in 2019, financial results were below expectations and led to a sharp sell-off. As the year progressed, management improved results and we saw a modest recovery in shares. We continue to be positive on the company as management implements their turnaround, which we believe should drive meaningful margin expansion.
HomeTrust Bancshares, a North Carolina-based community bank, increased 3% during the year. While the shares did increase, they underperformed on a relative basis. Over the course of the period, financial results were generally in line with expectations. The defensive nature of the holding, and a lackluster interest rate environment for banks in general, were headwinds to performance. We continue to view the bank favorably and believe that in a geography with continued industry consolidation, HomeTrust’s valuation appears quite attractive.
Portfolio Highlights (Unaudited)
Ten Year Annual Total Return—Historical Growth of $10,000

* | Represents a hypothetical investment of $10,000 in the fund after deducting the maximum sales load of 5.5% ($10,000 investment minus $550 sales load = $9,450). |
December 31, 2019 |
Pax Small Cap Fund, continued |
Portfolio Highlights (Unaudited), continued |
Returns—Period ended December 31, 2019
| | | | | Total
Return | Average Annual Return |
Share Class | Ticker
Symbol | | | 1 Year | 3 Years | 5 Years | 10 Years |
Investor Class1 | PXSCX | | | 23.29% | 4.13% | 5.06% | 10.84% |
Class A1,2,4 | PXSAX | NAV3 | | 23.27% | 4.12% | 5.04% | 10.85% |
| | | POP | | 16.46% | 2.18% | 3.86% | 10.22% |
Institutional Class1 | PXSIX | | | 23.56% | 4.40% | 5.32% | 11.11% |
Russell 2000 Index | | | | 25.52% | 8.59% | 8.23% | 11.83% |
Lipper Small-Cap Core Funds Index | | | 24.71% | 8.07% | 8.17% | 11.40% |
See ‘Glossary of Terms’ for descriptions of benchmarks.
These figures represent past performance, which is no guarantee of future results. Investment return and principal value of an investment will fluctuate so that an investor’s shares, when redeemed, may be worth more or less than their original cost. Current performance may be lower or higher than the performance data quoted. Total returns for periods of less than one year have not been annualized. For most recent month-end performance data, please visit www.impaxam.com or call 800.767.1729.
1 | The Fund’s investment adviser assumed certain expenses during the 5-year and 10-year periods; total returns would have been lower had these expenses not been assumed. Total return figures include reinvested dividends and capital gains distributions, and changes in principal value, and do not reflect the taxes that a shareholder might pay on Fund distributions or on the redemption of Fund shares. |
2 | A 1.00% CDSC (contingent deferred sales charge) may be charged on any shares sold within 18 months of purchase over $1 million. POP (public offering price) reflects the maximum sales load for the Fund’s Class A Shares of 5.50%. NAV performance does not reflect the deduction of the sales load of the CDSC, which if reflected would reduce the performance shown. |
4 | Inception of Class A shares is May 1, 2013. The performance information shown for Class A shares includes the performance of Investor Class shares, adjusted to reflect the sales charge applicable to Class A shares, for the period prior to Class A inception. |
Asset Allocation | Percent of Investments |
Foreign Stocks | 3.6% |
U.S. Stocks | 91.7% |
Cash & Cash Equivalents | 4.7% |
Total | 100.0% |
Top Ten Holdings
Company | Percent of Net Assets |
HomeTrust Bancshares, Inc. | 5.6% |
Victory Capital Holdings, Inc., Class A | 5.1% |
Meridian Bancorp, Inc. | 4.9% |
Natus Medical, Inc. | 4.4% |
Healthcare Realty Trust, Inc., REIT | 2.6% |
Four Corners Property Trust, Inc., REIT | 2.6% |
Maple Leaf Foods, Inc. | 2.5% |
CatchMark Timber Trust, Inc, Class A, REIT | 2.5% |
EMCOR Group, Inc. | 2.4% |
Thermon Group Holdings, Inc. | 2.4% |
Total | 35.0% |
Holdings are subject to change.
Sector Diversification
Sector | Percent of Net Assets |
Financials | 21.6% |
Industrials | 16.6% |
Health Care | 13.6% |
Consumer Discretionary | 13.3% |
Information Technology | 12.5% |
Real Estate | 9.1% |
Consumer Staples | 4.2% |
Communication Services | 3.7% |
Utilities | 2.7% |
Other assets and liabilities (net) | 2.7% |
Total | 100.0% |
May include companies representing multiple industries within a single “Sector”.
December 31, 2019 |
Pax ESG Beta Quality Fund |

|
Portfolio Manager
Ran Leshem |
| |

|
Portfolio Manager
Robert Tymoczko |
| |

|
Portfolio Manager
Michael Branch, CFA |
| |

|
Portfolio Manager
Annie Tan Sub-Adviser
Aperio Group, LLC |
Portfolio Managers’ Comments |
How did the Pax ESG Beta Quality Fund (the Fund) perform for the period?
For the one-year period ended December 31, 2019, the ESG Beta Quality Fund Investor Class, Class A, and Institutional Class shares had total returns of 27.13%, 27.08% and 27.42%, respectively, compared to 31.43% for the Russell 1000 Index and 29.09% for the Lipper Multi-Cap Core Funds Index.
Can you discuss any changes to the Fund throughout the period?
Effective October 1, 2019, the Fund implemented SmartCarbon™ into its investment process. Our proprietary, risk-based investment process manages exposure to companies with fossil fuel reserves on their balance sheets, replacing energy company holdings with a diversified basket of energy efficiency stocks while maintaining the integrity of the investment process. This approach has been implemented in a way that preserves the multi-factor financial profile of the Fund. As a result of implementing the SmartCarbon approach, the Fund has become fossil fuel-free. Additional information about SmartCarbon is available at our website: www.impaxam.com/pax-world-funds/smartcarbon/.
What factors contributed positively to performance?
An underweight to the Energy sector, and particularly the lagging Oil and Gas Exploration and Production industry, added to relative performance as investors reacted to an increasingly weak outlook for global oil demand and drove down prices for energy stocks.
The Fund overweights its portfolio toward companies with ESG strength. During the period, this overweight to ESG leaders and accompanying underweight to companies with weaker ESG profiles had a modestly positive impact on performance. Companies with stronger ESG profiles outperformed companies with weaker ESG profiles, particularly those in the bottom quartile as measured by the Impax Sustainability Score. The Fund’s underweight to these ESG laggards added to relative performance.
What factors detracted from performance?
The portfolio’s tilt towards profitability, a traditional quality factor, detracted from relative performance for the period. Also, the tilt toward value stocks, as measured by earnings yield, was a detractor as value continued to underperform growth in 2019.
An underweight to Industrials hampered results following strong earnings and raised financial guidance across several of the industry’s major players.
Portfolio Highlights (Unaudited)
Ten Year Annual Total Return—Historical Growth of $10,000

Returns—Period ended December 31, 2019
| | | | | Total
Return | Average Annual Return |
Share Class | Ticker
Symbol | | | 1 Year | 3 Years | 5 Years | 10 Years |
Investor Class1 | PXWGX | | | 27.13% | 13.97% | 9.96% | 12.15% |
Class A1,2,4 | PXGAX | NAV3 | | 27.08% | 13.98% | 9.97% | 12.16% |
| | | POP | | 20.10% | 11.85% | 8.73% | 11.53% |
Institutional Class1 | PWGIX | | | 27.42% | 14.27% | 10.25% | 12.44% |
Russell 1000 Index | | | | 31.43% | 15.05% | 11.48% | 13.54% |
Lipper Multi-Cap Core Funds Index | | | 29.09% | 12.81% | 9.70% | 11.80% |
See ‘Glossary of Terms’ for descriptions of benchmarks.
* | Represents a hypothetical investment of $10,000 in the fund after deducting the maximum sales load of 5.5% ($10,000 investment minus $550 sales load = $9,450). |
December 31, 2019 |
Pax ESG Beta Quality Fund, continued |
Portfolio Highlights (Unaudited), continued |
These figures represent past performance, which is no guarantee of future results. Investment return and principal value of an investment will fluctuate so that an investor’s shares, when redeemed, may be worth more or less than their original cost. Current performance may be lower or higher than the performance data quoted. Total returns for periods of less than one year have not been annualized. For most recent month-end performance data, please visit www.impaxam.com or call 800.767.1729.
1 | The Fund’s investment adviser assumed certain expenses during the 5-year and 10-year periods; total returns would have been lower had these expenses not been assumed. Total return figures include reinvested dividends and capital gains distributions, and changes in principal value, and do not reflect the taxes that a shareholder might pay on Fund distributions or on the redemption of Fund shares. |
2 | A 1.00% CDSC (contingent deferred sales charge) may be charged on any shares sold within 18 months of purchase over $1 million. POP (public offering price) reflects the maximum sales load for the Fund’s Class A Shares of 5.50%. NAV performance does not reflect the deduction of the sales load of the CDSC, which if reflected would reduce the performance shown. |
4 | Inception of Class A shares is May 1, 2013. The performance information shown for Class A shares includes the performance of Investor Class shares, adjusted to reflect the sales charge applicable to Class A shares, for the period prior to Class A inception. |
Asset Allocation | Percent of Investments |
Foreign Stocks | 0.7% |
U.S. Stocks | 98.5% |
Cash & Cash Equivalents | 0.8% |
Total | 100.0% |
Top Ten Holdings
Company | Percent of Net Assets |
Apple, Inc. | 4.0% |
Microsoft Corp. | 3.5% |
MasterCard, Inc., Class A | 2.8% |
Amazon.com, Inc. | 2.8% |
Verizon Communications, Inc. | 2.6% |
Service Properties Trust, REIT | 2.6% |
PepsiCo, Inc. | 2.6% |
Johnson & Johnson | 2.5% |
Alphabet, Inc., Class A | 2.5% |
Texas Instruments, Inc. | 2.4% |
Total | 28.3% |
Holdings are subject to change.
Sector Diversification
Sector | Percent of Net Assets |
Information Technology | 23.6% |
Health Care | 14.5% |
Consumer Discretionary | 12.7% |
Consumer Staples | 10.0% |
Financials | 9.5% |
Communication Services | 8.0% |
Industrials | 7.6% |
Real Estate | 7.4% |
Utilities | 3.6% |
Materials | 2.3% |
Other assets and liabilities (net) | 0.8% |
Total | 100.0% |
May include companies representing multiple industries within a single “Sector”.
December 31, 2019 |
Pax ESG Beta Dividend Fund |

|
Portfolio Manager
Ran Leshem |
| |

|
Portfolio Manager
Robert Tymoczko |
| |

|
Portfolio Manager
Michael Branch, CFA |
| |

|
Portfolio Manager
Annie Tan Sub-Adviser
Aperio Group, LLC |
Portfolio Managers’ Comments |
How did the Pax ESG Beta Dividend Fund (the Fund) perform for the period?
For the one-year period ended December 31, 2019, the Fund’s Institutional Class and Investor Class shares had total returns of 26.18% and 25.85%, respectively, compared to 31.43% for the Russell 1000 Index and 26.38% for the Lipper Equity Income Funds Index.
Can you discuss any changes to the Fund throughout the period?
Effective October 1, 2019, the Fund implemented SmartCarbon™ into its investment process. Our proprietary, risk-based investment process manages exposure to companies with fossil fuel reserves on their balance sheets, replacing energy company holdings with a diversified basket of energy efficiency stocks while maintaining the integrity of the investment process. This approach has been implemented in a way that preserves the multi-factor financial profile of the Fund. As a result of implementing the SmartCarbon approach, the Fund has become fossil fuel-free. Additional information about SmartCarbon is available at our website: www.impaxam.com/pax-world-funds/smartcarbon/.
What factors contributed positively to performance?
The Fund’s exposure to companies with higher management quality – a measure of the extent of asset expansion, capital expenditure growth and share issuance growth – was the largest positive factor contributor for the period. The Fund’s exposure to companies with higher earnings quality – a measure of the uncertainty around a company’s operating fundamentals – also contributed to performance.
An underweight to the Energy sector, and particularly the lagging Oil and Gas Exploration and Production industry, added to relative performance as investors reacted to an increasingly weak outlook for global oil demand and drove down prices for energy stocks.
The Fund overweights its portfolio toward companies with ESG strength. During the period, this overweight to ESG leaders and accompanying underweight to companies with weaker ESG profiles had a modestly positive impact on performance. Companies with stronger ESG profiles outperformed companies with weaker ESG profiles, particularly those in the bottom quartile as measured by the Impax Sustainability Score. The Fund’s underweight to these ESG laggards added to relative performance.
What factors detracted from performance?
The tilt towards companies with higher dividend yield1 and higher profitability had a negative impact on returns as investors seemed to favor higher growth companies (with low dividend payouts) over more stable, dividend-paying companies.
1 | Dividend yield is the ratio of a company’s annual dividend compared to its share price. |
Portfolio Highlights (Unaudited)
Since Inception Total Return—Historical Growth of $10,000

Returns—Period ended December 31, 2019
| | | | | Total
Return | Average Annual Return |
Share Class | Ticker
Symbol | | | 1 Year | 3 Year | Since
Inception1 |
Institutional Class2 | PXDIX | | | 26.18% | 13.15% | 12.64% |
Investor Class2 | PAXDX | | | 25.85% | 12.84% | 12.34% |
Russell 1000 Index | | | | 31.43% | 15.05% | 14.54% |
Lipper Equity Income Funds Index | | | 26.38% | 11.18% | 10.82% |
See ‘Glossary of Terms’ for descriptions of benchmarks.
December 31, 2019 |
Pax ESG Beta Dividend Fund, continued |
Portfolio Highlights (Unaudited), continued |
These figures represent past performance, which is no guarantee of future results. Investment return and principal value of an investment will fluctuate so that an investor’s shares, when redeemed, may be worth more or less than their original cost. Current performance may be lower or higher than the performance data quoted. Total returns for periods of less than one year have not been annualized. For most recent month-end performance data, please visit www.impaxam.com or call 800.767.1729.
1 | The Fund’s inception date is December 16, 2016. |
2 | Total return figures include reinvested dividends and capital gains distributions, and changes in principal value, and do not reflect the taxes that a shareholder might pay on Fund distributions or on the redemption of Fund shares. |
Asset Allocation | Percent of Investments |
U.S. Stocks | 99.1% |
Cash & Cash Equivalents | 0.9% |
Total | 100.0% |
Top Ten Holdings
Company | Percent of Net Assets |
Apple, Inc. | 4.4% |
Microsoft Corp. | 4.0% |
Johnson & Johnson | 3.0% |
Amazon.com, Inc. | 2.8% |
Cisco Systems, Inc. | 2.5% |
AT&T, Inc. | 2.4% |
Texas Instruments, Inc. | 2.3% |
Procter & Gamble Co., The | 2.0% |
Alphabet, Inc., Class A | 2.0% |
PepsiCo, Inc. | 1.9% |
Total | 27.3% |
Holdings are subject to change.
Sector Diversification
Sector | Percent of Net Assets |
Information Technology | 27.9% |
Health Care | 13.7% |
Consumer Discretionary | 12.6% |
Industrials | 11.5% |
Financials | 10.8% |
Consumer Staples | 7.6% |
Communication Services | 7.1% |
Real Estate | 4.2% |
Materials | 2.6% |
Utilities | 1.0% |
Other assets and liabilities (net) | 1.0% |
Total | 100.0% |
May include companies representing multiple industries within a single “Sector”.
December 31, 2019 |
Pax Global Opportunities Fund |

|
Portfolio Manager
Kirsteen Morrison |
| |

|
Portfolio Manager
David Winborne Sub-Adviser
Impax Asset Management Ltd. |
Portfolio Managers’ Comments |
How did the Pax Global Opportunities Fund (the Fund) perform for the period?
For the one-year period ended December 31, 2019, the Fund’s Institutional Class and Investor Class shares had total returns of 33.72% and 33.51%, respectively, compared to 26.60% for the MSCI All-Country World (Net) Index (MSCI ACWI) and 29.20% for the Lipper Global Multi-Cap Growth Funds Index.
What factors contributed to the Fund’s performance?
Global equity markets and the Fund delivered strong performance in 2019 following a volatile and difficult end to 2018. Geopolitical concerns provided a headwind but failed to hamper growth. The UK election result in December removed some uncertainty around Brexit and there are expectations that a “phase-one” trade deal will be agreed to between China and the U.S. in early 2020. In Hong Kong, anti-government protests continue to be disruptive. All market sectors saw positive returns, led by Information Technology. Regionally, the U.S. produced the highest performance.
Can you discuss any significant changes to the Fund’s positioning throughout the period?
Broadly, the investment team continued to diversify the portfolio by sector and region to include, in our view, a good balance of cyclical and defensive exposure. Over the period, the portfolio managers sold several holdings based on valuations or less favorable outlooks which resulted in a reduced Materials sector position. Equinix (Real Estate, U.S.), a global leader in co-location data centers and a key beneficiary of the rise of off-premise and more energy efficient cloud computing, entered the portfolio which added exposure to Real Estate, a sector which previously did not have an allocation in the portfolio. Large-cap exposure and cyclical exposure increased slightly due to bottom-up individual stock opportunities. Regional exposures remained broadly unchanged.
What portfolio holdings contributed positively to performance relative to the MSCI ACWI?
Strong performance from the Information Technology (IT) sector was achieved despite the Fund’s lack of exposure to the large-cap internet stocks which drove returns in the broader market. Instead, the Fund benefited from the recovery in semiconductor markets with the proliferation of connected devices across all industries, and consistent, robust strength in enterprise IT spending as companies transition to the cloud from legacy software. Taiwan Semiconductor Manufacturing Company (Semiconductors, Taiwan) saw higher than expected revenue growth and capital spending plans, which we believe indicates a robust semiconductor chip outlook for 2020. The company is outperforming peers through its lower exposure to declining memory chip sales and its cutting edge five nanometer manufacturing technology. Microsoft (Systems Software, U.S.) demonstrated strong growth across the company’s core divisions, most notably in its Azure cloud computing platform.
After beating earnings expectations and announcing a share buyback earlier in the year, Royal DSM (Specialty Chemicals, Netherlands) continued to deliver steady progress. This specialty chemicals company, with its focus on sustainability and innovation, has, in our view, been making an impressive transition from a chemicals company to a nutrition and performance materials group.
What portfolio holdings detracted from performance relative to the MSCI ACWI?
In a strong year, underperformance was largely stock specific. Sprouts Farmers Market (Food Retail, U.S.) was squeezed by promotional activity and freight costs, as well as fears that the new CEO would reset growth expectations. Unilever (Personal Products, Netherlands) was hindered by a company warning that it will not achieve its full year revenue targets in 2020, with underlying sales growth remaining stable rather than improving as it faces challenges in some end markets.
2019 was a year of significant natural catastrophes and this impacted property & casualty insurance companies including Hiscox (Property & Casualty Insurance, UK). We have retained exposure to these companies on anticipation of rising premium prices in the Lloyds insurance market next year as well as our belief in the opportunities to capitalize on the rapidly developing market in cyber insurance.
December 31, 2019 |
Pax Global Opportunities Fund, continued |
Portfolio Highlights (Unaudited)
Since Inception Total Return—Historical Growth of $10,000

Returns—Period ended December 31, 2019
| | | | Total
Return | Average
Annual
Return |
Share Class | Ticker
Symbol | | 1 Year | Since
Inception1 |
Institutional Class2 | PXGOX | | 33.72% | 14.52% |
Investor Class2 | PAXGX | | 33.51% | 14.40% |
MSCI ACWI (Net) Index | | | 26.60% | 10.35% |
Lipper Global Multi-Cap Growth Funds Index | | 29.20% | 9.98% |
See ‘Glossary of Terms’ for descriptions of benchmarks.
These figures represent past performance, which is no guarantee of future results. Investment return and principal value of an investment will fluctuate so that an investor’s shares, when redeemed, may be worth more or less than their original cost. Current performance may be lower or higher than the performance data quoted. Total returns for periods of less than one year have not been annualized. For most recent month-end performance data, please visit www.impaxam.com or call 800.767.1729.
1 | The Fund’s inception date is June 27, 2018. |
2 | Total return figures include reinvested dividends and capital gains distributions, and changes in principal value, and do not reflect the taxes that a shareholder might pay on Fund distributions or on the redemption of Fund shares. |
Asset Allocation | Percent of Investments |
Foreign Stocks | 53.9% |
U.S. Stocks | 45.3% |
Cash & Cash Equivalents | 0.8% |
Total | 100.0% |
Top Ten Holdings
Company | Percent of Net Assets |
Microsoft Corp. | 4.2% |
AIA Group, Ltd. | 3.7% |
HDFC Bank, Ltd., ADR | 3.7% |
IQVIA Holdings, Inc. | 3.7% |
Taiwan Semiconductor Manufacturing Co, Ltd | 3.6% |
Thermo Fisher Scientific, Inc. | 3.4% |
Hiscox, Ltd. | 3.4% |
Danone SA | 3.1% |
Visa, Inc., Class A | 3.0% |
Keyence Corp. | 3.0% |
Total | 34.8% |
Holdings are subject to change.
Sector Diversification
Sector | Percent of Net Assets |
Information Technology | 26.8% |
Health Care | 19.9% |
Financials | 17.6% |
Consumer Staples | 9.5% |
Materials | 8.9% |
Industrials | 8.7% |
Consumer Discretionary | 2.9% |
Real Estate | 2.6% |
Communication Services | 2.4% |
Other assets and liabilities (net) | 0.7% |
Total | 100.0% |
May include companies representing multiple industries within a single “Sector”.
December 31, 2019 |
Pax Global Opportunities Fund, continued |
Portfolio Highlights (Unaudited), continued |
Geographical Diversification
Country | Percent of Net Assets |
United States | 45.3% |
United Kingdom | 13.8% |
Japan | 7.8% |
Netherlands | 5.9% |
India | 5.2% |
Germany | 4.3% |
Hong Kong | 3.7% |
Taiwan | 3.6% |
France | 3.1% |
Portugal | 2.6% |
Spain | 2.1% |
Norway | 1.9% |
Other Assets and liabilities (net) | 0.7% |
| | 100.0% |
December 31, 2019 |
Pax Global Environmental Markets Fund |

|
Portfolio Manager
Hubert Aarts |
| |

|
Portfolio Manager
Sid Jha |
| |

|
Portfolio Manager
David Winborne Sub-Adviser
Impax Asset Management Ltd. |
Portfolio Managers’ Comments |
How did the Pax Global Environmental Markets Fund perform for the period?
For the one-year period ended December 31, 2019, the Investor Class, Class A, and Institutional Class of the Fund had total returns of 27.75%, 27.77%, and 28.17%, respectively, versus 26.60% for the MSCI All-Country World (Net) Index (“MSCI ACWI”) and 31.53% for the FTSE Environmental Opportunities Index Series (“FTSE EOAS”).
What factors contributed to the Fund’s performance?
Following a volatile and difficult end to 2018, the first half of 2019 saw a strong rally for global equity markets and the Fund. The second half of the year saw larger cap stocks outside of the environmental markets universe lead performance, notably within the Information Technology (IT), Financials, and Communications sectors, yet the Fund still finished the year ahead of global equity markets. Performance was behind that of the FTSE EOAS during the period, primarily a result of an underweight position in the more cyclical energy efficiency sub-sector.
Against a backdrop of repeated extreme weather events around the world, 2019 saw school children on a climate strike, an unprecedented wave of public climate demonstrations around the world, and sustained media coverage of the topic. Consumers responded with unexpected speed – rejecting plastic packaging and meat; joining waiting lists for electric vehicle launches and seeking positive impact investments. Meanwhile, the concept of “net zero” captured the imagination of policy makers struggling to explain limited progress over the past 30 years. Impax believes this represents growing evidence of its investment belief: that a shift to a more sustainable global economy is underway, creating opportunity and risk for companies and their investors.
December 31, 2019 |
Pax Global Environmental Markets Fund, continued |
Can you discuss any significant changes to the Fund’s positioning throughout the period?
There were no material changes in positioning for the Fund with respect to the environmental markets sectors; however, exposure to Water Infrastructure & Technologies decreased approximately 4% over the year and was reallocated across the remaining environmental markets sectors. In terms of Global Industry Classification Standard (GICS) sectors, the portfolio reduced its exposure to Industrials by approximately 5% and added exposure to Real Estate over the period—though as of December 31, 2019 Real Estate only accounted for 1.28% of the total portfolio. Overall, turnover in the portfolio was relatively low which reflects the portfolio managers’ conviction in the stock holdings of the Fund.
What portfolio holdings contributed positively to performance relative to the MSCI ACWI?
2019 saw strong contributions to return from across the environmental markets, with the Fund’s exposures of Energy Efficiency and Water Infrastructure & Technologies outperforming. In line with broader global equities, cyclical holdings led performance, notably the Fund’s exposure to Industrials, Materials and IT. These companies are active in environmental solutions such as the digitization of factories, smart management of buildings, equipment for energy-efficient and waste-minimizing food preparation, computer-aided engineering for more sustainable design, sustainable consumer packaging, and the decarbonization of transportation. Regionally, the Fund’s North American exposure outperformed, followed by Europe, where UK companies gained ground after the election result at the end of the year.
Industrial companies delivering what we believe are compelling energy efficiency solutions and leading performance during the period included Schneider Electric (Power Network Efficiency, France). The company saw good results during the first half of the year and continued its strong run of performance, receiving a credit rating upgrade leading to more favorable analyst ratings. Ingersoll-Rand (Buildings Energy Efficiency, U.S.) announced improved earnings and continued positive guidance during the period, based on robust demand for more efficient heating, ventilation and air-conditioning (“HVAC”) equipment.
We believe demand for clean water remains a global priority, driven by rapid population growth, increasing water stress, and higher quality water standards. Aging infrastructure incurs costs from both an economic and health standpoint as quality of supply is hindered and leaks represent a costly waste of resources. We believe new projects are also required to address ever increasing extreme weather incidents and to support rising urbanization. Danaher Corporation (Diversified
Water Infrastructure & Technology, U.S.) announced strong quarterly earnings reports during the period and investors also reacted positively to the announcement that the company will purchase the GE biopharma business.
What portfolio holdings detracted from performance relative to the MSCI ACWI?
In a strong year, underperformance was largely stock specific. The biggest laggard was ZhuZhou CRRC Times Electric Company (Transport Energy Efficiency, China), a leading manufacturer of rail electronic control equipment, which was held back by a sustained delay in new rolling stock bidding activity, and from limited visibility on new rolling stock procurement and maintenance orders. The investment team remains positive about the outlook for Chinese rail investment in the coming years.
Delphi Technologies (Transport Energy Efficiency, U.S.) fell due to declines in the global automotive market together with divestment of its efficient diesel componentry division. The company’s power electronics business continued to perform well. 3M (Diversified Environmental, U.S.) announced disappointing earnings with organic growth that fell short of expectations. With what we believe is an increasing risk of disintermediation from e-commerce sales, particularly in the automotive and semiconductor adhesives end markets, the portfolio managers subsequently exited the position.
Portfolio Highlights (Unaudited)
Ten Year Annual Total Return—Historical Growth of $10,000

* | Represents a hypothetical investment of $10,000 in the fund after deducting the maximum sales load of 5.5% ($10,000 investment minus $550 sales load = $9,450). |
December 31, 2019 |
Pax Global Environmental Markets Fund, continued |
Portfolio Highlights (Unaudited), continued |
Returns—Period ended December 31, 2019
| | | | Total
Return | Average Annual Return |
Share Class | Ticker
Symbol | | 1 Year | 3 Years | 5 Years | 10 Years |
Investor Class1 | PGRNX | | 27.75% | 11.43% | 8.57% | 8.69% |
Class A1,2,4 | PXEAX | NAV3 | 27.77% | 11.43% | 8.57% | 8.69% |
| | | POP | 20.75% | 9.37% | 7.36% | 8.08% |
Institutional Class1 | PGINX | | 28.17% | 11.72% | 8.85% | 8.98% |
MSCI ACWI (Net) Index | | 26.60% | 12.44% | 8.41% | 8.79% |
FTSE Environmental Opportunities Index Series | | 31.53% | 14.63% | 10.53% | 10.01% |
See ‘Glossary of Terms’ for descriptions of benchmarks.
These figures represent past performance, which is no guarantee of future results. Investment return and principal value of an investment will fluctuate so that an investor’s shares, when redeemed, may be worth more or less than their original cost. Current performance may be lower or higher than the performance data quoted. Total returns for periods of less than one year have not been annualized. For most recent month-end performance data, please visit www.impaxam.com or call 800.767.1729.
1 | The Fund’s investment adviser assumed certain expenses during the 5-year and 10-year periods; total returns would have been lower had these expenses not been assumed. Total return figures include reinvested dividends and capital gains distributions, and changes in principal value, and do not reflect the taxes that a shareholder might pay on Fund distributions or on the redemption of Fund shares. |
2 | A 1.00% CDSC (contingent deferred sales charge) may be charged on any shares sold within 18 months of purchase over $1 million. POP (public offering price) reflects the maximum sales load for the Fund’s Class A Shares of 5.50%. NAV performance does not reflect the deduction of the sales load of the CDSC, which if reflected would reduce the performance shown. |
4 | Inception of Class A shares is May 1, 2013. The performance information shown for Class A shares includes the performance of Investor Class shares, adjusted to reflect the sales charge applicable to Class A shares, for the period prior to Class A inception. |
Asset Allocation | Percent of Investments |
Foreign Stocks | 42.6% |
U.S. Stocks | 55.3% |
Cash & Cash Equivalents | 2.1% |
Total | 100.0% |
Top Ten Holdings
Company | Percent of Net Assets |
Linde PLC | 3.6% |
Waste Management, Inc. | 3.5% |
Schneider Electric SE | 3.4% |
Suez | 3.2% |
Agilent Technologies, Inc. | 3.0% |
Ingersoll-Rand PLC | 3.0% |
East Japan Railway Co. | 2.9% |
Siemens AG | 2.9% |
TE Connectivity, Ltd. | 2.9% |
Aptiv PLC | 2.8% |
Total | 31.2% |
Ten largest holdings do not include money market securities, certificates of deposit, commercial paper or cash and equivalents, if applicable.
Holdings are subject to change.
December 31, 2019 |
Pax Global Environmental Markets Fund, continued |
Portfolio Highlights (Unaudited), continued |
Environmental Markets Classification System (EMCS)
Sector | Sub Sector | Percent of Net Assets |
Renewable & Alternative Energy | | 0.8% |
| | Renewable Energy Developers & Independent Power Producers (IPPs) | 0.8% | |
| | | |
Energy Efficiency | | 35.4% |
| | Power Network Efficiency | 5.3% | |
| | Industrial Energy Efficiency | 9.3% | |
| | Buildings Energy Efficiency | 9.6% | |
| | Transport Energy Efficiency | 10.1% | |
| | Consumer Energy Efficiency | 1.1% | |
| | | |
Water Infrastructure & Technologies | | 25.1% |
| | Water Infrastructure | 9.5% | |
| | Water Treatment Equipment | 3.4% | |
| | Water Utilities | 9.7% | |
| | Diversified Water Infrastructure & Technology | 2.5% | |
| | | | |
Pollution Control | | 12.1% |
| | Environmental Testing & Gas Sensing | 9.2% | |
| | Public Transportation | 2.9% | |
| | | | |
Waste Management & Technologies | | 4.3% |
| | Waste Technology Equipment | 0.8% | |
| | General Waste Management | 3.5% | |
| | | | |
Food, Agriculture & Forestry | | 15.3% |
| | Logistics, Food Safety & Packaging | 7.9% | |
| | Sustainable & Efficient Agriculture | 7.4% | |
| | | | |
Diversified Environmental | | 4.8% |
| | Diversified Environmental | 4.8% | |
| | | | |
Other assets and liabilities (net) | 2.2% | 2.2% |
| | | 100.0% | 100.0% |
May include companies representing multiple industries within a single “Sector”.
Geographical Diversification
Country | Percent of Net Assets |
United States | 55.3% |
United Kingdom | 7.9% |
Japan | 7.7% |
France | 6.6% |
Germany | 5.3% |
China | 4.8% |
Netherlands | 2.8% |
Taiwan | 2.1% |
Belgium | 1.5% |
Switzerland | 1.2% |
Ireland | 0.9% |
South Korea | 0.9% |
Spain | 0.8% |
Other Assets and liabilities (net) | 2.2% |
| | 100.0% |
December 31, 2019 |
Pax Ellevate Global Women’s Leadership Fund |

|
Portfolio Manager
Barbara Browning, CFA |
| |

|
Portfolio Manager
Scott LaBreche Pax Ellevate Management LLC |
Portfolio Managers’ Comments |
How did the Pax Ellevate Global Women’s Leadership Fund (the Fund) perform for the period?
For the one-year period ended December 31, 2019, the Investor Class and Institutional Class shares had total returns of 26.42% and 26.77%, respectively, compared to 26.62% for the Impax Global Women’s Leadership Index (Women’s Index), 27.67% for the MSCI World (Net) Index (World Index) and 24.19% for the Lipper Global Multi-Cap Core Funds Index.
During the year, the Fund crossed the five-year milestone since adopting a strategic beta strategy in June of 2014. The Fund has outperformed the MSCI World Index for the three-, five-year and since reorganization (06/04/14) periods ended December 31, 2019. Specifically, over the five-year period ended December 31, 2019, the Fund’s Institutional Class shares and Investor Class shares have returned 8.83% and 9.11%, respectively, versus the World Index return of 8.74%. The Fund’s overweight to the highest-rated quartile of companies within the World Index based on gender-diverse leadership has made the greatest contribution to the Fund’s relative outperformance, along with the Fund’s significant underweight to the bottom two quartiles of companies with less gender-diverse leadership, according to the Impax Gender Leadership Score.
In addition, the Fund has produced strong results compared with peers. The Institutional Class1 shares of the Fund (PXWIX) has posted a top 7% ranking (out of 114 funds) over the five-year period ended December 31, 2019, based on average annual returns within the Lipper Global Multi-Cap Core classification.2
What is the investment objective of the Fund?
The Fund seeks investment returns that closely correspond to or exceed the price and yield performance, before fees and expenses, of the Women’s Index. The Fund pursues a strategic beta strategy, investing in the companies comprising the Women’s Index, the first index of the highest-rated companies in the world for gender-diverse leadership, as rated by Impax Gender Analytics.3
The Fund overweights its portfolio toward Women’s Index companies with greater representation of women on boards and in senior management. Women hold 40% of the board seats and 32% of senior management positions in companies in the Fund, compared to 28% and 20%, respectively, within the World Index. In addition, 95% percent of companies in the Fund have three or more women on the board and 99% have two or more women on the board, compared with 51% and 75%, respectively, for companies in the World Index. 36% of companies in the Fund have a woman CEO or CFO, compared with 17% of companies in the World Index.
Can you discuss any changes to the Fund throughout the period?
In November 2019, the annual reconstitution of the Women’s Index was completed, which included enhancements to the gender and ESG criteria considered when assessing companies for potential inclusion in the Index.
While gender leadership in management and on boards remain the primary criteria for inclusion, new gender criteria used when assessing companies for potential inclusion within GWLI include: hiring, promotion and retention of women; gender pay equity; proactive gender goals and targets, and transparency about gender diversity data. These criteria are given different weights, with representation by women on boards and in management still receiving the highest weights. For more information about these criteria enhancements, along with the full list of gender criteria used to rate companies, see our website (www.impaxam.com).
The Fund is also fossil fuel-free, which means not invested in securities of companies that are significantly involved in the extraction and/or refining of fossil fuels within the Energy4 sector. We believe fossil fuel companies face substantial ESG risks and are not in alignment with the transition to a more sustainable global economy. The Energy sector has historically been a very small weight in the Fund, since it is a laggard relative to other sectors based on our gender diversity criteria. The Fund has divested its small amount of energy companies and re-allocated this weight to other highly-rated gender leadership companies within its investable universe, while maintaining its strong overall gender leadership profile.
What contributed positively and negatively to performance?
An overweight to the highest-rated 25% of companies within the World Index based on gender-diverse leadership was the Fund’s largest positive contributor to relative performance during the one-year period, along with the Fund’s significant underweight to the bottom quartile of companies with less gender-diverse leadership, according to the Impax Gender Leadership Score.
December 31, 2019 |
Pax Ellevate Global Women’s Leadership Fund, continued |
Over the one-year period, the Fund produced positive relative performance, compared to the MSCI World Index in eight out the 11 sectors. On a sector basis, selections in defensive sectors, notably Utilities and Consumer Staples, added to relative returns during the period. Strong results from Estee Lauder, Hershey, Sempra Energy, American Water Works and Procter & Gamble drove returns in these sectors. Fund holdings in Consumer Discretionary, driven by strong results from Lululemon, Best Buy, Target and Kering helped relative performance the most during the period.
In addition, the Fund’s underweight allocation to the Energy sector4 helped performance over the one-year period.
Conversely, holdings in Communication Services, driven by poor results from Viacom within the entertainment industry and Verizon and Telia within the telecommunications industry, detracted the most relative performance. No allocation to several FAANG5 stocks – including Apple, Facebook, Google and Netflix – detracted from performance during the one-year period.
In addition, holdings and an overweight allocation in Financials, driven by poor results from Swedbank, Svenska Handelsbanken and Banco Santander within the banks industry, detracted from relative performance during the year.
On a regional basis, the Fund’s North American and Pacific holdings added the most to relative performance during the year, while holdings in Europe detracted. Within North America, holdings in the U.S. were the dominant contributor to relative performance. Within the Pacific region, the Fund’s significant underweight to Japan – no Japanese companies rank in the top 400 companies in the World Index based on our gender leadership criteria – added to relative performance. Conversely, holdings in Europe detracted the most, driven by Sweden, France, Switzerland and Norway.
Footnotes:
1 | The minimum investment needed for investment in PXWIX is $250,000. |
2 | Data shown represents rankings for the Pax Ellevate Global Women’s Leadership Fund - Institutional Class (PXWIX) in the Lipper Global Multi-Cap Core category based on average annual returns. Lipper rankings are based on total returns (not including sales charges) for the periods indicated and compare total return performance with that of other funds in the category. The Pax Ellevate Global Women’s Leadership Fund - Institutional Class (PXWIX) 1-year 29th percentile rank out of 160 funds, 3-year 15th percentile rank out of 128 funds, 5-year 7th percentile rank out of 114 funds, since re-org (06/04/14) 9th percentile rank out of 107 funds and 10-year 54th percentile rank out of 79 funds. |
3 | Impax Gender Analytics, December 31, 2019. The Fund’s investable universe, the Women’s Index, had its annual reconstitution on 11/30/2019. |
4 | Energy sector is based on Global Industry Classification Standard (GICS), a widely recognized industry standard. |
5 | FAANG stocks is the acronym for the five most popular and best-performing tech stocks, Facebook, Apple, Amazon, Netflix and Google. |
Portfolio Highlights (Unaudited)
Ten Year Annual Total Return—Historical Growth of $10,000

Returns—Period ended December 31, 2019
| | | | Total
Return | Average Annual Return |
Share Class | Ticker
Symbol | | 1 Year | 3 Years | 5 Years | 10 Years |
Investor Class1 | PXWEX | | 26.42% | 13.34% | 8.83% | 8.65% |
Institutional Class1 | PXWIX | | 26.77% | 13.62% | 9.11% | 8.92% |
Impax Global Women’s Leadership (Net) Index* | | 26.62% | 13.40% | 9.60% | N/A |
MSCI World (Net) Index | | 27.67% | 12.57% | 8.74% | 9.47% |
Lipper Global Multi-Cap Core Funds Index | | 24.19% | 10.74% | 7.88% | 8.99% |
See ‘Glossary of Terms’ for descriptions of benchmarks.
These figures represent past performance, which is no guarantee of future results. Investment return and principal value of an investment will fluctuate so that an investor’s shares, when redeemed, may be worth more or less than their original cost. Current performance may be lower or higher than the performance data quoted. Total returns for periods of less than one year have not been annualized. For most recent month-end performance data, please visit www.impaxam.com or call 800.767.1729.
* | Inception date of Women’s Index is February 28, 2014. |
1 | On June 4, 2014 the Pax World Global Women’s Equality Fund merged into the Pax Ellevate Global Women’s Leadership Fund (the fund), pursuant to an Agreement and Plan of Reorganization dated March 4, 2014 (the “Reorganization”). Because the Fund had no investment operations prior to the closing of the Reorganization, Pax World Global Women’s Equality Fund (the “Predecessor Fund”) is treated as the survivor of the Reorganization for account and performance reporting purposes. Accordingly, all performance and other |
December 31, 2019 |
Pax Ellevate Global Women’s Leadership Fund, continued |
Portfolio Highlights (Unaudited), continued |
information shown for the Fund for periods prior to June 4, 2014 is that of the Predecessor Fund. Total return figures include reinvested dividends and capital gains distributions, and changes in principal value, and do not reflect the taxes that a shareholder might pay on Fund distributions or on the redemption of Fund shares.
Asset Allocation | Percent of Investments |
Foreign Stocks | 36.8% |
U.S. Stocks | 62.2% |
Exchange-Traded Funds | 0.6% |
Cash & Cash Equivalents | 0.4% |
Total | 100.0% |
Top Ten Holdings
Company | Percent of Net Assets |
Microsoft Corp. | 4.6% |
Best Buy Co., Inc. | 2.2% |
Estee Lauder Cos, Inc., The, Class A | 2.2% |
Ulta Beauty, Inc. | 2.1% |
Kellogg Co. | 2.1% |
lululemon athletica, Inc. | 2.0% |
American Water Works Co., Inc. | 2.0% |
Wolters Kluwer NV | 2.0% |
Bank of America Corp. | 2.0% |
Texas Instruments, Inc. | 2.0% |
Total | 23.2% |
Holdings are subject to change.
Sector Diversification
Sector | Percent of Net Assets |
Financials | 20.6% |
Information Technology | 16.5% |
Consumer Discretionary | 15.5% |
Consumer Staples | 13.1% |
Health Care | 11.6% |
Industrials | 6.2% |
Utilities | 6.2% |
Communication Services | 4.5% |
Materials | 3.4% |
Real Estate | 1.5% |
Exchange-Traded Funds | 0.6% |
Other assets and liabilities (net) | 0.3% |
Total | 100.0% |
May include companies representing multiple industries within a single “Sector”.
Geographical Diversification
Country | Percent of Net Assets |
United States | 62.4% |
France | 8.0% |
Canada | 7.4% |
Netherlands | 4.4% |
United Kingdom | 4.0% |
Australia | 3.6% |
Sweden | 2.9% |
Germany | 2.8% |
Denmark | 0.8% |
Norway | 0.5% |
Finland | 0.4% |
Spain | 0.4% |
Switzerland | 0.4% |
Hong Kong | 0.3% |
Italy | 0.2% |
Singapore | 0.2% |
Belgium | 0.2% |
New Zealand | 0.1% |
Israel | 0.1% |
Ireland | 0.0%* |
Other Assets and liabilities (net) | 0.9% |
| | 100.0% |
* | Rounds to less than 0.05%. |
December 31, 2019 |
Pax MSCI EAFE ESG Leaders Index Fund |

|
Portfolio Manager
Scott LaBreche |
Portfolio Manager’s Comments |
How did the Pax MSCI EAFE ESG Leaders Index Fund (the Fund) perform for the period?
For the one-year ended December 31, 2019, the Institutional Class and Investor Class had total returns of 23.01% and 22.78%, respectively, compared to 23.88% for the MSCI EAFE ESG Leaders (Net) Index (the “Index”) and 22.01% for the MSCI EAFE (Net) Index (“EAFE Index”), and 20.56% for the Lipper International Large-Cap Core Funds Index.
What is the investment objective of the Fund?
The Fund is designed to track the performance of the Index. The Fund and the Index are constructed to have a better ESG profile than the EAFE Index, and the Fund’s holdings averaged an overall score of 7.91 on MSCI ESG Research’s 0 to 10 scale compared to an overall score of 6.78 for the EAFE Index as of December 31, 2019.1 Long term, the Fund seeks to generate better risk-adjusted performance than the EAFE Index through its ESG focus.
Can you discuss any changes to the Fund throughout the period?
Effective October 1, 2019, the Fund implemented SmartCarbon™ into its investment process. Our proprietary, risk-based investment process manages exposure to companies with fossil fuel reserves on their balance sheets, replacing energy2 company holdings with a diversified basket of energy efficiency stocks while maintaining the integrity of the investment process and minimizing change in tracking error. This approach reduces the Fund’s carbon intensity,3 which is now 27% lower than the EAFE Index. As a result of implementing the SmartCarbon approach, the Fund has become fossil fuel-free. Additional information about SmartCarbon is available at our website: www.impaxam.com/pax-world-funds/smartcarbon/.
What contributed positively and negatively to performance?
The Fund’s ESG focus added to relative performance versus the EAFE Index during the period. An overweight to the highest-rated ESG companies contributed the most to relative performance during the year. The Fund’s large underweight to the average-rated ESG companies and ESG laggards in the bottom tier also
helped relative return during the year. Longer term, since the Fund’s inception, an overweight to the highest-rated ESG companies has contributed the most to relative performance.
Helping relative performance over the one-year period was the Fund’s overweight to Energy Efficiency companies within its investable universe, and its Energy sector underweight allocation and subsequent full divestment effective October 1, 2019.
From a sector perspective, the Fund produced positive relative results in nine out of eleven sectors. Fund holdings and an overweight allocation in Information Technology, led by Semiconductors, IT Services, Software and Electronic Equipment added the most to relative return during the year. Materials holdings added to relative return, led by chemical companies. In addition, holdings in Financials, driven by strong results within Insurance and Capital Markets, added to relative performance.
Conversely, portfolio holdings in Consumer Staples, led by poor results from companies held within the Food Products and Food & Staples Retailing industries, and the Fund’s underweight allocations in the Household Products and Personal Products industries, which performed well during the period, detracted the most from relative performance. Portfolio holdings in Communication Services, driven by poor results from Telecomm, also detracted from performance.
On a regional basis, Europe and the Pacific regions added to relative performance during the period versus the EAFE Index. Within Europe, companies with leading ESG profiles in Germany, UK and Netherlands helped performance. In the Pacific region, Japan, Australia and Singapore also produced positive relative results.
1 | MSCI ESG Research evaluates companies’ ESG characteristics and derives corresponding ESG scores and ratings. Companies are ranked by ESG score against their sector peers to determine their eligibility for the MSCI ESG indices. MSCI ESG Research identifies the highest-rated companies in each peer group to meet the float-adjusted market capitalization sector targets. The scoring system is based on general and industry specific ESG criteria, assigning a score on a 0 to 10-point scale (0 lowest to 10 highest). |
2 | The Energy sector is based on Global Industry Classification Standard (GICS), a widely recognized industry standard. |
3 | The MSCI Weighted Average Carbon Intensity (tons of CO2e/$M sales) measures a fund’s exposure to carbon intensive companies. It is calculated as the sum of security weight (normalized for corporate positions only) multiplied by the security Carbon Intensity. This allows for comparisons between funds and indices of different sizes. As of 12/31/19, the Pax MSCI EAFE ESG Leaders Index Fund had a carbon intensity score of 107.15 compared to 147.41 for the EAFE index. |
December 31, 2019 |
Pax MSCI EAFE ESG Leaders Index Fund, continued |
Portfolio Highlights (Unaudited)
Since Inception Total Return—Historical Growth of $10,000

Returns—Period ended December 31, 2019
| | | | Total
Return | Average Annual Return |
Share Class | Ticker
Symbol | | 1 Year | 3 Years | 5 Years | Since
Inception |
Institutional Class1 | PXNIX | | 23.01% | 9.73% | 5.63% | 5.12% |
Investor Class1,2 | PXINX | | 22.78% | 9.46% | 5.37% | 4.85% |
MSCI EAFE ESG Leaders (Net) Index | | | 23.88% | 9.78% | 6.15% | 5.59% |
MSCI EAFE (Net) Index | | | 22.01% | 9.56% | 5.67% | 4.89% |
Lipper International Large-Cap Core Funds Index | | 20.56% | 8.56% | 4.91% | 4.28% |
See ‘Glossary of Terms’ for descriptions of benchmarks.
These figures represent past performance, which is no guarantee of future results. Investment return and principal value of an investment will fluctuate so that an investor’s shares, when redeemed, may be worth more or less than their original cost. Current performance may be lower or higher than the performance data quoted. Total returns for periods of less than one year have not been annualized. For most recent month-end performance data, please visit www.impaxam.com or call 800.767.1729.
1 | The Fund’s inception date is January 27, 2011. On March 31, 2014, Pax World International Fund and Pax MSCI EAFE ESG Index ETF merged into the Pax MSCI EAFE ESG Leaders Index Fund (the Fund), a passively managed index fund which seeks investment returns that closely correspond to the price and yield performance, before fees and expenses, of the MSCI EAFE ESG Leaders Index. Based on the similarity of the Fund to Pax MSCI EAFE ESG Index ETF, Pax MSCI EAFE ESG Index ETF (the Predecessor Fund) is treated as the survivor of the mergers for accounting and performance reporting purposes. Accordingly, all performance and other information shown for the Fund for periods prior to March 31, 2014 is that of the Predecessor Fund. Total return figures include reinvested dividends and capital gains distributions, and changes in principal value, and do not reflect the taxes that a shareholder might pay on Fund distributions or on the redemption of Fund shares. |
2 | Inception of the Investor Class is March 31, 2014. The performance information shown for the Investor Class shares for periods prior to March 31, 2014 includes the performance of the Predecessor Fund. These returns have been adjusted to reflect the expenses allocable to Investor Class. |
Asset Allocation | Percent of Investments |
Foreign Stocks | 98.5% |
Exchange-Traded Funds | 1.1% |
Cash & Cash Equivalents | 0.4% |
Total | 100.0% |
Top Ten Holdings
Company | Percent of Net Assets |
Roche Holding AG | 3.2% |
SAP SE | 2.0% |
ASML Holding NV | 1.9% |
Siemens AG | 1.7% |
GlaxoSmithKline PLC | 1.6% |
Novo Nordisk A/S, Class B | 1.4% |
Allianz SE | 1.4% |
Commonwealth Bank of Australia | 1.3% |
Unilever NV | 1.2% |
Sony Corp. | 1.2% |
Total | 16.9% |
Holdings are subject to change.
Sector Diversification
Sector | Percent of Net Assets |
Financials | 18.9% |
Industrials | 16.9% |
Health Care | 12.3% |
Consumer Discretionary | 11.1% |
Consumer Staples | 10.0% |
Information Technology | 9.2% |
Materials | 7.7% |
Communication Services | 5.1% |
Utilities | 3.9% |
Real Estate | 3.4% |
Exchange-Traded Funds | 1.1% |
Other assets and liabilities (net) | 0.4% |
Total | 100.0% |
May include companies representing multiple industries within a single “Sector”.
December 31, 2019 |
Pax MSCI EAFE ESG Leaders Index Fund, continued |
Portfolio Highlights (Unaudited), continued |
Geographical Diversification
Country | Percent of Net Assets |
Japan | 23.4% |
United Kingdom | 12.3% |
Germany | 10.7% |
France | 9.9% |
Australia | 9.2% |
Switzerland | 8.0% |
Netherlands | 5.8% |
Spain | 3.8% |
Sweden | 3.4% |
Denmark | 2.7% |
Hong Kong | 2.2% |
Singapore | 1.7% |
Italy | 1.3% |
Norway | 0.8% |
Ireland | 0.8% |
Finland | 0.8% |
Belgium | 0.7% |
Israel | 0.3% |
Portugal | 0.3% |
New Zealand | 0.2% |
Austria | 0.2% |
Other Assets and liabilities (net) | 1.5% |
| | 100.0% |
December 31, 2019 |
Pax Core Bond Fund |

|
Portfolio Manager
Anthony Trzcinka, CFA |
Portfolio Manager’s Comments |
How did the Pax Core Bond Fund (the Fund) perform for the period?
For the one-year period ended December 31, 2019, the Institutional Class and Investor Class shares of the Fund had total returns of 8.04% and 7.78%, respectively, compared to 8.72% for the Bloomberg Barclays U.S. Aggregate Bond Index and 9.39% for the Lipper Core Bond Funds Index.
What factors contributed to the Fund’s performance?
Performance of the Fund’s Treasury sector was a positive contributor to performance. Conversely, the Fund’s Corporate and Securitized positions detracted from performance.
Can you discuss any significant changes to the Fund’s positioning throughout the period?
In general, the Fund continues to be positioned as a high credit quality portfolio. While we have added marginally to the Fund’s more credit-sensitive sectors, we have positioned the overall portfolio to be less sensitive to credit spread widening, which traditionally occurs as the economy slows down. We believe that the risks to the credit markets outweigh the steady economy, though we do recognize the Federal Reserve’s (Fed) and many other global central banks’ efforts to become more accommodative. In general, we believe the Fund is positioned to perform relatively well in a volatile “risk-off” environment.
Additionally, during the year the Fund continued to increase its impact holdings across multiple sectors. We currently own 115 impact bonds that represent 28.1% of the Fund, which is up from 18.5% one year ago. Included in this impact bond allocation are a number of asset-backed securities where we continue to find attractive risk-return characteristics.
What portfolio holdings contributed positively to performance?
The main drivers of positive relative performance were the Fund’s Treasury and agency mortgage-backed security positions. We have positioned our Treasury bonds to have more sensitivity to interest rate changes. This positioning benefited
December 31, 2019 |
Pax Core Bond Fund, continued |
the Fund as rates declined during the period. In addition, the Fund’s underweight to agency mortgage backed securities helped relative performance as falling rates drove an uptick in mortgage prepayments.
What portfolio holdings detracted from performance?
The Fund’s corporate bonds and asset-backed securities were the largest detractors to performance during the period. Many of the Fund’s holdings in these sectors are of high credit quality and have lower duration which have caused them to lag in the bond market rally. The Fed turned “dovish” during the period which caused interest rates to drop and longer duration securities to outperform. Many investors are calling this a “mini-Goldilocks” period with global growth perking up and inflation staying low. We believe this has been a very good environment for risk-assets.
Portfolio Highlights (Unaudited)
Since Inception Total Return—Historical Growth of $10,000

Returns—Period ended December 31, 2019
| | | | Total
Return | Average Annual Return |
Share Class | Ticker
Symbol | | 1 Year | 3 Years | Since
Inception1 |
Institutional Class2 | PXBIX | | 8.04% | 3.57% | 3.83% |
Investor Class2 | PAXBX | | 7.78% | 3.31% | 3.57% |
Bloomberg Barclays US Aggregate Bond Index | | 8.72% | 4.03% | 4.35% |
Lipper Core Bond Funds Index | | 9.39% | 4.22% | 4.49% |
See ‘Glossary of Terms’ for descriptions of benchmarks.
These figures represent past performance, which is no guarantee of future results. Investment return and principal value of an investment will fluctuate so that an investor’s shares, when redeemed, may be worth more or less than their original cost. Current performance may be lower or higher than the performance data quoted. Total returns for periods of less than one year have not been annualized. For most recent month-end performance data, please visit www.impaxam.com or call 800.767.1729.
1 | The Fund’s inception date is December 16, 2016. |
2 | Total return figures include reinvested dividends and capital gains distributions, and changes in principal value, and do not reflect the taxes that a shareholder might pay on Fund distributions or on the redemption of Fund shares. |
Asset Allocation | Percent of Investments |
U.S. Bonds | 86.8% |
Foreign Bonds | 7.6% |
Exchange-Traded Funds | 3.1% |
Cash & Cash Equivalents | 2.5% |
Total | 100.0% |
Top Ten Holdings
Company | Percent of Net Assets |
United States Treasury Note, 1.500%, 10/31/24 | 4.1% |
United States Treasury Note, 2.375%, 11/15/49 | 3.9% |
United States Treasury Note, 2.750%, 09/30/20 | 2.4% |
United States Treasury Note, 2.125%, 11/30/23 | 2.2% |
iShares Core U.S. Aggregate Bond ETF | 1.6% |
United States Treasury Note (TIPS), 0.375%, 07/15/27 | 1.5% |
iShares iBoxx $ Investment Grade Corporate Bond ETF | 1.5% |
United States Treasury Note, 4.500%, 02/15/36 | 1.3% |
United States Treasury Note, 4.375%, 11/15/39 | 1.1% |
United States Treasury Note, 3.500%, 02/15/39 | 1.0% |
Total | 20.6% |
Ten largest holdings do not include money market securities, certificates of deposit, commercial paper or cash and equivalents, if applicable.
Holdings are subject to change.
Fixed Income Sector Diversification
Sector | Percent of Net Assets |
Mortgage-Backed Bonds | 31.3% |
Corporate Bonds | 28.1% |
Treasury Bonds | 23.9% |
Municipal Bonds | 5.4% |
Supranational | 3.7% |
Agency/Gov’t Related Bonds | 1.0% |
Community Investment Notes | 0.5% |
Other assets and liabilities (net) | 6.1% |
Total | 100.0% |
December 31, 2019 |
Pax Core Bond Fund, continued |
Portfolio Highlights (Unaudited), continued |
Credit Quality*
Bond Rating | Percent of Bonds |
U.S. Government | 50.8% |
AAA | 10.7% |
AA+ | 1.8% |
AA | 2.5% |
AA- | 3.4% |
A+ | 2.2% |
A | 5.2% |
A- | 5.1% |
BBB+ | 4.9% |
BBB | 3.7% |
BBB- | 3.0% |
BB+ | 0.3% |
BB | 0.9% |
BB- | 0.7% |
B+ | 0.2% |
Not Rated | 4.6% |
| | 100.0% |
* | Credit quality ratings by Standard & Poor’s assist investors by evaluating the credit worthiness of many bond issues. AAA: An obligation rated ‘AAA’ has the highest rating assigned by S&P Global Ratings. The obligor’s capacity to meet its financial commitment on the obligation is extremely strong. AA: An obligation rated ‘AA’ differs from the highest-rated obligations only to a small degree. The obligor’s capacity to meet its financial commitment on the obligation is very strong. A: An obligation rated ‘A’ is somewhat more susceptible to the adverse effects of changes in circumstances and economic conditions than obligations in higher-rated categories. However, the obligor’s capacity to meet its financial commitment on the obligation is still strong. BBB: An obligation rated ‘BBB’ exhibits adequate protection parameters. However, adverse economic conditions or changing circumstances are more likely to lead to a weakened capacity of the obligor to meet its financial commitment on the obligation. BB: An obligation rated ‘BB’ is less vulnerable to nonpayment than other speculative issues. However, it faces major ongoing uncertainties or exposure to adverse business, financial, or economic conditions which could lead to the obligor’s inadequate capacity to meet its financial commitment on the obligation. Not Rated: This indicates that no rating has been requested, or that there is insufficient information on which to base a rating, or that Standard & Poor’s does not rate a particular obligation as a matter of policy. |
December 31, 2019 |
Pax High Yield Bond Fund |
Portfolio Managers’ Comments |

|
Portfolio Manager
Peter Schwab, CFA |
| |

|
Portfolio Manager
Kent Siefers |
How did the Pax High Yield Bond Fund (the Fund) perform for the period?
For the one-year period ended December 31, 2019, the Investor Class, Class A, and Institutional Class shares of the Fund had total returns of 14.11%, 14.10%, and 14.26%, respectively, compared to 15.08% for the ICE BofA Merrill Lynch U.S. High Yield—Cash Pay—BB-B (Constrained 2%) Index (the Index) and 14.46% for the Lipper High Yield Bond Funds Index.
The Fund’s performance in the period was broadly consistent with our expectations during the very strong market conditions. Positive credit selection in a number of areas helped offset the Fund’s relatively conservative positioning overall. The high yield asset class performed well in 2019, bouncing back strongly from a poor year in 2018. The strength was driven by a number of factors including positive economic growth, expectations for monetary easing, robust equity markets and a positive supply/demand picture for global corporate credit. In our view, the annualized return of 5.75% for the Index over the 2-year period ended December 31, 2019 is more reflective of the long-term potential asset class performance in the current low interest rate environment.
What factors contributed to the Fund’s performance?
The Fund’s performance was driven by positive credit selection in the Energy, Basic Industry and Capital Goods sectors. The Fund’s material underweight to the lagging Energy sector also added to relative performance. Our concerns about the demand outlook for fossil fuels coupled with high operating risks and low returns on capital led to a deliberate reduction in exposure to this sector in recent years. Conversely, negative credit selection in the Telecommunications, Consumer Products and Technology sectors hurt relative performance. The average cash balance of approximately 2.8% detracted from relative performance by approximately 39 basis points.
December 31, 2019 |
Pax High Yield Bond Fund, continued |
Can you discuss any significant changes to the Fund’s positioning throughout the period?
The Fund’s credit rating exposure changed modestly in 2019 as we reduced the Fund’s holdings of BB rated bonds and added B rated bonds. Over the course of the year, BB rated bonds decreased to 48.7% from 52.7%, B rated bonds increased to 37.4% from 33.8% and CCC rated bonds decreased to 5.2% from 7.0%. The duration of the Fund at year end was 3.08 years (versus the benchmark of 3.35 years).
By sector, the Fund increased exposure to the Media, Commercial Services and Financial Services sectors. The Fund reduced exposure to the Energy, Banking and Technology sectors.
What portfolio holdings contributed positively to performance?
PetSmart, a retailer, performed very well after a difficult 2018. They successfully launched an Initial Public Offering (IPO) for their on-line subsidiary Chewy which resulted in material debt repayment. Ardagh Group, a global packaging company, outperformed as their credit metrics improved as a result of an asset sale and strong operating performance. Springleaf Finance, a consumer lending company, also performed well as they continue to execute both operationally and on their de-leveraging plan.
What portfolio holdings detracted from performance?
Because Highridge Brands, a consumer products company, performed poorly due to severe competitive pressures, we exited the position early in the year. Charlotte Russe, an apparel retailer, also performed poorly as pressures continued in the branded apparel retail segment. We also exited this position early in the year. Party City, a retailer, was under pressure in late-2019 after a weak Halloween season and operational missteps. We believe we are seeing signs of stabilization and continue to hold the position.
Portfolio Highlights (Unaudited)
Ten Year Annual Total Return—Historical Growth of $10,000
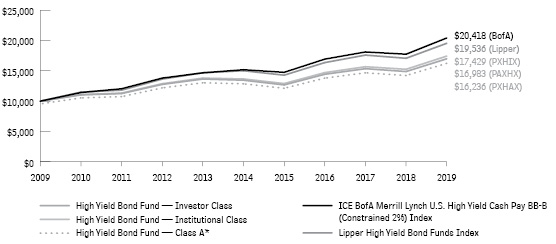
* | Represents a hypothetical investment in the fund after deducting the maximum sales load of 4.5% ($10,000 investment minus $450 sales load = $9,550). |
Returns—Period ended December 31, 2019
| | | | Total
Return | Average Annual Return |
Share Class | Ticker
Symbol | | 1 Year | 3 Years | 5 Years | 10 Years |
Investor Class1 | PAXHX | | 14.11% | 5.56% | 4.77% | 5.44% |
Class A1,2,4 | PXHAX | NAV3 | 14.10% | 5.56% | 4.76% | 5.45% |
| | | POP | 9.05% | 3.94% | 3.81% | 4.97% |
Institutional Class1 | PXHIX | | 14.26% | 5.83% | 4.99% | 5.71% |
ICE BofA Merrill Lynch U.S. High Yield - Cash Pay - BB-B (Constrained 2%) Index | 15.08% | 6.45% | 6.10% | 7.43% |
Lipper High Yield Bond Funds Index | | 14.46% | 6.09% | 5.41% | 6.93% |
See ‘Glossary of Terms’ for descriptions of benchmarks.
These figures represent past performance, which is no guarantee of future results. Investment return and principal value of an investment will fluctuate so that an investor’s shares, when redeemed, may be worth more or less than their original cost. Current performance may be lower or higher than the performance data quoted. Total returns for periods of less than one year have not been annualized. For most recent month-end performance data, please visit www.impaxam.com or call 800.767.1729.
1 | The Fund’s investment adviser assumed certain expenses during the 10-year period; average annual returns would have been lower had these expenses not been assumed. Total return figures include reinvested dividends and capital gains distributions, and changes in principal value, and do not reflect the taxes that a shareholder might pay on Fund distributions or on the redemption of Fund shares. |
December 31, 2019 |
Pax High Yield Bond Fund, continued |
Portfolio Highlights (Unaudited), continued |
2 | A 1.00% CDSC (contingent deferred sales charge) may be charged on any shares sold within 18 months of purchase over $1 million. POP (public offering price) reflects the maximum sales load for the Fund’s Class A Shares of 4.50%. NAV performance does not reflect the deduction of the sales load of the CDSC, which if reflected would reduce the performance shown. |
4 | Inception of Class A shares is May 1, 2013. The performance information shown for Class A shares includes the performance of Investor Class shares, adjusted to reflect the sales charge applicable to Class A shares, for the period prior to Class A inception. |
Asset Allocation | Percent of Investments |
U.S. Bonds | 79.9% |
Foreign Bonds | 15.2% |
Loans | 1.3% |
U.S. Stocks | 1.0% |
Cash & Cash Equivalents | 2.6% |
Total | 100.0% |
Credit Quality*
Bond Rating | Percent of Bonds |
BBB- | 7.9% |
BB+ | 10.0% |
BB | 20.4% |
BB- | 17.7% |
B+ | 14.6% |
B | 14.7% |
B- | 8.9% |
CCC+ | 5.1% |
CCC | 0.0%** |
CCC- | 0.1% |
Not Rated | 0.6% |
Total | 100.0% |
* | See bond rating descriptions on page 54. |
** | Rounds to less than 0.05%. |
Top Ten Holdings
Company | Percent of Net Assets |
HAT Holdings I, LLC/HAT Holdings II, LLC, 5.250%, 07/15/24 | 0.8% |
Fly Leasing, Ltd., 6.375%, 10/15/21 | 0.8% |
CCO Holdings, LLC/Capital Corp., 4.750%, 03/01/30 | 0.8% |
Bombardier, Inc., 8.750%, 12/01/21 | 0.7% |
CCO Holdings, LLC/Capital Corp., 5.375%, 06/01/29 | 0.7% |
CSC Holdings, LLC, 5.750%, 01/15/30 | 0.7% |
Air Canada, 7.750%, 04/15/21 | 0.7% |
Williams Scotsman International, Inc., 6.875%, 08/15/23 | 0.7% |
Performance Food Group, Inc., 5.500%, 06/01/24 | 0.7% |
RLJ Lodging Trust, REIT, 1.950% | 0.6% |
Total | 7.2% |
Ten largest holdings do not include money market securities, certificates of deposit, commercial paper or cash and equivalents, if applicable.
Holdings are subject to change.
Fixed Income Sector Diversification
Sector | Percent of Net Assets |
Media | 14.7% |
Basic Industry | 11.4% |
Services | 8.7% |
Telecommunications | 7.5% |
Energy | 7.3% |
Capital Goods | 6.7% |
Health Care | 6.5% |
Consumer Goods | 5.6% |
Financial Services | 4.9% |
Retail | 4.3% |
Leisure | 3.4% |
Real Estate | 3.1% |
Technology & Electronics | 2.4% |
Automotive | 2.4% |
Banking | 2.2% |
Utility | 2.1% |
Insurance | 1.1% |
Transportation | 1.0% |
Other assets and liabilities (net) | 4.7% |
Total | 100.0% |
May include companies representing multiple industries within a single “Sector”.
December 31, 2019 |
Pax Sustainable Allocation Fund |

|
Portfolio Manager
Andrew Braun |
| |

|
Portfolio Manager
Nathan Moser, CFA |
| |

|
Portfolio Manager
Anthony Trzcinka, CFA |
| |

|
Portfolio Manager
Peter Schwab, CFA |
Portfolio Managers’ Comments |
How did the Pax Sustainable Allocation Fund (the Fund) perform for the period?
For the one-year period ended December 31, 2019, the Investor Class and Institutional Class of the Fund had total returns of 20.83% and 21.17%, respectively, compared to 31.49% for the S&P 500 Index, 22.18% for the 60% S&P 500 Index / 40% Bloomberg Barclays U.S. Aggregate Bond Index blend (the Blended Index) and 19.23% for the Morningstar Allocation--50% to 70% Equity category average.
What factors contributed to the Fund’s performance?
2019 was an exceptional year for returns across virtually all asset classes and drove the strong total return of the Fund. The S&P 500 Index delivered a total return of 31.49% for 2019, its best year since 2013. Small-cap equities lagged large-cap equities for the year, but the Russell 2000 Index still delivered a robust annual return of 25.52%. As has been the case over recent years, non-U.S. developed market stocks lagged U.S. stocks in 2019, but again, the MSCI EAFE Index returned 22.01% for the year. It was also a very strong year for fixed income, as the Bloomberg Barclays US Aggregate Bond Index returned 8.72%.
With the MSCI EAFE Index trailing the S&P 500 Index by 9.48%, the Fund’s non-U.S. equity allocation was a headwind to performance relative to the Blended Index as it does not comprise securities outside the U.S. However, the Fund’s modest underweight position to non-U.S. stocks relative to peers contributed positively to the Fund’s outperformance versus the Morningstar Allocation--50% to 70% Equity category average.
As discussed in detail below, performance of the underlying funds in aggregate was a positive contributor.
Can you discuss any significant changes to the Fund’s positioning throughout the period?
The Fund’s equity and fixed income allocations were maintained near or modestly below their 60% equity / 40% fixed income neutral target throughout the year. Over the course of the year, modest initial allocations were made to Pax High Yield Bond Fund, the Pax Small Cap Fund and the Pax Ellevate Global Women’s Leadership Fund. During the latter part of the second quarter, the Fund gradually reduced its position in the Pax Mid Cap Fund, until the Pax Mid Cap Fund was liquidated in July, 2019.
Strong returns across equities and fixed income in 2019 presented a challenging environment for allocating between stocks and bonds. With a flat environment for earnings, approximately 90% of the 2019 return in the S&P 500 Index was due to Price-to-Earning (P/E)1 expansion, leaving stocks at the higher-end of historical valuations. Similarly, with interest rates near historic lows and tight credit spreads, it was hard to find value in bonds. In such an environment, our equity and bond allocations remained near their neutral targets as we continued to strive to add value through the underlying fund strategies.
What portfolio holdings contributed positively and negatively to performance?
The Pax Large Cap Fund, which represents the largest equity allocation, was a very strong contributor to the Fund’s performance during the period, as it outperformed the S&P 500 Index by 3.74% in 2019. The Pax Global Opportunities Fund was also a modest positive contributor as it outperformed its benchmark.
The Pax ESG Beta Dividend Fund modestly detracted from performance as it lagged the Russell 1000 Index in a growth-oriented environment. The Pax Core Bond Fund also modestly detracted from performance as its lower-risk orientation lagged in the strong fixed income market.
Can you discuss any changes to the Fund throughout the period?
During the period, effective December 18, 2019, the name of the Pax Balanced Fund changed to the Pax Sustainable Allocation Fund. We believe this new name better captures the Fund’s investment approach and its unique long-term track record of serving investors interested in pursuing sustainable investing strategies. Importantly, the investment strategy has not changed in any way — only the name has changed. Additional information about the name change is available at our website: https://impaxam.com/pax-balanced-fund-takes-a-new-name/.
1 | The P/E is the ratio for valuing a company that measures its current share price relative to its per-share earnings. |
December 31, 2019 |
Pax Sustainable Allocation Fund, continued |
Portfolio Highlights (Unaudited)
Ten Year Annual Total Return—Historical Growth of $10,000
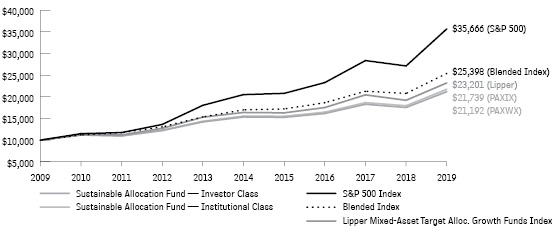
Returns—Period ended December 31, 2019
| | | | Total
Return | Average Annual Return |
Share Class | Ticker
Symbol | | 1 Year | 3 Years | 5 Years | 10 Years |
Investor Class1 | PAXWX | | 20.83% | 9.45% | 6.66% | 7.80% |
Institutional Class1 | PAXIX | | 21.17% | 9.73% | 6.93% | 8.07% |
S&P 500 Index | | | 31.49% | 15.27% | 11.70% | 13.56% |
Blended Index | | | 22.18% | 10.87% | 8.37% | 9.77% |
Morningstar Allocation--50% to 70% Equity | | 19.23% | 8.55% | 6.22% | 7.90% |
See ‘Glossary of Terms’ for descriptions of benchmarks.
These figures represent past performance, which is no guarantee of future results. Investment return and principal value of an investment will fluctuate so that an investor’s shares, when redeemed, may be worth more or less than their original cost. Current performance may be lower or higher than the performance data quoted. Total returns for periods of less than one year have not been annualized. For most recent month-end performance data, please visit www.impaxam.com or call 800.767.1729.
1 | Total return figures include reinvested dividends and capital gains distributions, and changes in principal value, and do not reflect the taxes that a shareholder might pay on Fund distributions or on the redemption of Fund shares. |
Manager Allocations
Fund Allocation | Percent of Net Assets |
Equity | |
Large-Cap/Multi-Cap Core Strategies | |
Pax Large Cap Fund | 40.1% |
Pax ESG Beta Dividend Fund | 6.7% |
Small Cap Core Strategies | |
Pax Small Cap Fund | 1.7% |
Foreign Strategies | |
Pax Ellevate Global Women’s Leadership Fund | 1.1% |
Pax Global Environmental Markets Fund | 1.3% |
Pax Global Opportunities Fund | 1.6% |
Pax MSCI EAFE ESG Leaders Index Fund | 7.7% |
Total Equity | 60.2% |
| | |
Fixed Income | |
Investment Grade/Intermediate | |
Pax Core Bond Fund | 36.2% |
High Yield | |
Pax High Yield Bond Fund | 1.2% |
Total Fixed Income | 37.4% |
| | |
Cash & Cash Equivalents | 2.4% |
Total | 100.0% |
December 31, 2019 |
Sustainable Investing Update (Unaudited) |

|
Senior Vice President
for Sustainable
Investing Julie Gorte, Ph.D. |
As I write this letter, Reuters is reporting that the number of weather disasters that cost a billion dollars or more has doubled during the past decade, with 14 such events in 2019 alone, carrying a total price tag of more than $45 billion. Australia is suffering one of the worst bushfire seasons ever, something that was forecast with spine-tingling accuracy in 2007 by the United Nations’ Intergovernmental Panel on Climate Change: “In south-east Australia, the frequency of very high and extreme fire danger days is likely to rise 4 - 25% by 2020.” It’s time we stop thinking of extreme weather events as acts of God and started seeing them as something we, ourselves, have brought about, and something we can and should do something about.
Everyone has something to contribute to avert a climate disaster. As investors, we see this as part of what we are supposed to do — invest in things that are more likely to create value and assure that the risks in our portfolios are priced appropriately. For many years, we have avoided investing in some of the most carbon-intensive human activities, such as coal and tar sands mining, as well as utilities that depend more heavily on coal. Maybe if everyone had done that we wouldn’t be on a path to 3 - 4 degree warming over this century. But that didn’t happen, and now we must up our game.
As of December 31, 2019, Pax World Funds is offering nine fossil fuel-free funds.1 In addition, we track the carbon intensity of our funds, and our ESG Beta funds are explicitly managed to strive to be at least 30 percent less carbon intensive than their benchmarks. Also for those two funds and one other, we have replaced the fossil fuel names in the portfolios with energy efficiency companies through an approach we call SmartCarbon™. We have engaged with all the companies in our global funds from the two most carbon-intensive sectors — utilities and materials — to urge them to establish science-based targets for emissions reduction and undertake climate risk reporting and scenario analysis recommended by the Task Force on Climate-Related Financial Disclosure. We’ve already had encouraging responses from some of those companies, and we intend to keep the pressure on. And, unlike many large investors, we generally vote for shareholder proposals
1 | In our fossil fuel-free funds, we seek to avoid investing in securities of companies significantly involved in the extraction and/or refining of fossil fuels (coal, oil and gas), which includes: exploration and production; refining and marketing; storage and transportation; and equipment and services. Collectively, these companies comprise the Energy sector according to the Global Industry Classification Standard (GICS®), a widely recognized industry standard. |
asking companies to report on climate risks, establish emissions reduction targets or discuss how they deal with the risks posed by a transition to a low-carbon economy.
None of what we are doing will be enough on its own to change the trajectory of the planet with respect to global warming. To prevent a climate catastrophe the human race needs to reduce greenhouse gas emissions to zero by 2050 and go negative thereafter. That is technically possible, but we’ll need every ounce of commitment and action we can muster to do it.
Right now, unfortunately, doing something about it is not getting easier, but harder, in part because of an effort to subdue shareholder voices about major value-related issues such as climate change and gender equality. Much of this effort has been financed and advanced by groups like the Business Roundtable, the U.S. Chamber of Commerce and the National Association of Manufacturers. In response, the Securities and Exchange Commission (“SEC”) has proposed a rulemaking that would make it significantly more difficult for investors to file shareholder proposals. We are working with other shareholders and investment institutions to express, through the formal comment process as well as press, social media and thought leadership, how bad an idea we think this is.
Even if the SEC’s rulemaking moves forward undeterred, we will continue to direct our efforts toward making better rules, because we know they are needed. Perhaps when we have an administration in place that understands that climate change is real and that investors have tens of trillions of dollars’ worth of value at risk if we keep pretending it’s a hoax, we can assure that management and boards are more attentive to shareholder interests in making the economy, and financial markets, more compatible with the needs of sustainability.
December 31, 2019 |
Shareholder Expense Examples (Unaudited) |
Examples As a shareholder of the Funds, you incur ongoing costs, including management fees, distribution and/or service (12b-1) fees, and other Fund expenses. The examples on the next page are intended to help you understand your ongoing costs (in dollars) of investing in each of the Funds and compare these costs with the ongoing costs of investing in other mutual funds. For more information, see the relevant Fund’s prospectus or talk to your financial adviser.
The examples are based on an investment of $1,000 invested at the beginning of the period and held for the entire period beginning on July 1, 2019 and ending on December 31, 2019.
Please note that Individual Retirement Account (IRA), Coverdell Education Savings, Roth IRA, SEP-IRA, SIMPLE IRA, and 403(b)(7) accounts are charged an annual custodial fee of fifteen dollars. If you are invested in one of these account types, you should add an additional $7.50 to the estimated expenses paid during the period.
Actual Expenses For each Fund, the first table on the next page provides information about actual account values and actual expenses. You may use the information in this table, together with the amount you invested, to estimate the expenses that you paid over the period. For the Fund, simply divide your account value by $1,000 (for example, an $8,600 account value divided by $1,000 = 8.6), then multiply the result by the number under the heading entitled “Expenses Paid During Period” to estimate the expenses you paid on your account during this period.
Hypothetical Examples for Comparison Purposes For each Fund, the second table on the following pages provides information about hypothetical account values and hypothetical expenses based on each Fund’s actual expense ratio and an assumed rate of return of 5% per year before expenses, which is not each Fund’s actual return. The hypothetical account values and expenses may not be used to estimate the actual ending account balance or expenses you paid for the period. You may use this information to compare the ongoing costs of investing in the Funds and other funds. To do so, compare these 5% hypothetical examples with the 5% hypothetical examples that appear in the shareholder reports of the other funds.
Please note that the expenses shown in the tables are meant to highlight your ongoing costs only and do not reflect any transactional costs. Therefore, the second table is useful in comparing ongoing costs only, and will not help you determine the relative total costs of owning different funds. In addition, if these transactional costs were included, our costs would have been higher.
Based on Actual Fund Return | | | | |
| Beginning
Account Value
7/1/2019 | Ending
Account Value
12/31/2019 | Annualized
Expense
Ratio | Expenses
Paid During
Period1 |
Large Cap Fund - Investor | $ 1,000.00 | $ 1,136.70 | 0.95% | $ 5.12 |
Large Cap Fund - Institutional | 1,000.00 | 1,138.80 | 0.70% | 3.77 |
Small Cap Fund - Investor | 1,000.00 | 1,050.10 | 1.15% | 5.94 |
Small Cap Fund - Class A | 1,000.00 | 1,050.30 | 1.15% | 5.94 |
Small Cap Fund - Institutional | 1,000.00 | 1,051.10 | 0.90% | 4.65 |
ESG Beta Quality Fund - Investor | 1,000.00 | 1,102.70 | 0.90% | 4.77 |
ESG Beta Quality Fund - Class A | 1,000.00 | 1,102.50 | 0.90% | 4.77 |
ESG Beta Quality Fund - Institutional | 1,000.00 | 1,104.00 | 0.65% | 3.45 |
ESG Beta Dividend Fund - Investor | 1,000.00 | 1,097.20 | 0.90% | 4.76 |
ESG Beta Dividend Fund - Institutional | 1,000.00 | 1,098.30 | 0.65% | 3.44 |
Global Opportunities Fund - Investor | 1,000.00 | 1,064.70 | 1.20% | 6.25 |
Global Opportunities Fund - Institutional | 1,000.00 | 1,065.90 | 0.93% | 4.84 |
Global Environmental Markets Fund - Investor | 1,000.00 | 1,064.00 | 1.22% | 6.35 |
Global Environmental Markets Fund - Class A | 1,000.00 | 1,064.70 | 1.22% | 6.35 |
Global Environmental Markets Fund - Institutional | 1,000.00 | 1,066.10 | 0.97% | 5.05 |
Global Women’s Leadership Fund - Investor | 1,000.00 | 1,070.30 | 0.80% | 4.17 |
Global Women’s Leadership Fund - Institutional | 1,000.00 | 1,071.60 | 0.55% | 2.87 |
MSCI EAFE ESG Leaders Index Fund - Investor | 1,000.00 | 1,080.90 | 0.80% | 4.20 |
MSCI EAFE ESG Leaders Index Fund - Institutional | 1,000.00 | 1,081.60 | 0.55% | 2.89 |
Core Bond Fund - Investor | 1,000.00 | 1,020.60 | 0.71% | 3.62 |
Core Bond Fund - Institutional | 1,000.00 | 1,020.80 | 0.46% | 2.34 |
High Yield Bond Fund - Investor | 1,000.00 | 1,044.20 | 0.96% | 4.95 |
High Yield Bond Fund - Class A | 1,000.00 | 1,044.10 | 0.96% | 4.95 |
High Yield Bond Fund - Institutional | 1,000.00 | 1,045.60 | 0.71% | 3.66 |
Sustainable Allocation Fund - Investor | 1,000.00 | 1,075.30 | 0.30% | 1.57 |
Sustainable Allocation Fund - Institutional | 1,000.00 | 1,076.70 | 0.05% | 0.26 |
1 | Expenses are equal to each Funds’ annualized expense ratio, multiplied by the average account value over the period, multiplied by 184/365 (to reflect the one-half year period beginning on July 1, 2019 and ending on December 31, 2019). |
December 31, 2019 |
Shareholder Expense Examples (Unaudited), continued |
Based on Hypothetical 5% Return (before expenses) |
| Beginning
Account Value
7/1/2019 | Ending
Account Value
12/31/2019 | Annualized
Expense
Ratio | Expenses
Paid During
Period1 |
Large Cap Fund - Investor | $ 1,000.00 | $ 1,020.42 | 0.95% | $ 4.84 |
Large Cap Fund - Institutional | 1,000.00 | 1,021.68 | 0.70% | 3.57 |
Small Cap Fund - Investor | 1,000.00 | 1,019.41 | 1.15% | 5.85 |
Small Cap Fund - Class A | 1,000.00 | 1,019.41 | 1.15% | 5.85 |
Small Cap Fund - Institutional | 1,000.00 | 1,020.67 | 0.90% | 4.58 |
ESG Beta Quality Fund - Investor | 1,000.00 | 1,020.67 | 0.90% | 4.58 |
ESG Beta Quality Fund - Class A | 1,000.00 | 1,020.67 | 0.90% | 4.58 |
ESG Beta Quality Fund - Institutional | 1,000.00 | 1,021.93 | 0.65% | 3.31 |
ESG Beta Dividend Fund - Investor | 1,000.00 | 1,020.67 | 0.90% | 4.58 |
ESG Beta Dividend Fund - Institutional | 1,000.00 | 1,021.93 | 0.65% | 3.31 |
Global Opportunities Fund - Investor | 1,000.00 | 1,019.16 | 1.20% | 6.11 |
Global Opportunities Fund - Institutional | 1,000.00 | 1,020.52 | 0.93% | 4.74 |
Global Environmental Markets Fund - Investor | 1,000.00 | 1,019.06 | 1.22% | 6.21 |
Global Environmental Markets Fund - Class A | 1,000.00 | 1,019.06 | 1.22% | 6.21 |
Global Environmental Markets Fund - Institutional | 1,000.00 | 1,020.32 | 0.97% | 4.94 |
Global Women’s Leadership Fund - Investor | 1,000.00 | 1,021.17 | 0.80% | 4.08 |
Global Women’s Leadership Fund - Institutional | 1,000.00 | 1,022.43 | 0.55% | 2.80 |
MSCI EAFE ESG Leaders Index Fund - Investor | 1,000.00 | 1,021.17 | 0.80% | 4.08 |
MSCI EAFE ESG Leaders Index Fund - Institutional | 1,000.00 | 1,022.43 | 0.55% | 2.80 |
Core Bond Fund - Investor | 1,000.00 | 1,021.63 | 0.71% | 3.62 |
Core Bond Fund - Institutional | 1,000.00 | 1,022.82 | 0.46% | 2.35 |
High Yield Bond Fund - Investor | 1,000.00 | 1,020.37 | 0.96% | 4.89 |
High Yield Bond Fund - Class A | 1,000.00 | 1,020.37 | 0.96% | 4.89 |
High Yield Bond Fund - Institutional | 1,000.00 | 1,021.63 | 0.71% | 3.62 |
Sustainable Allocation Fund - Investor | 1,000.00 | 1,023.69 | 0.30% | 1.53 |
Sustainable Allocation Fund - Institutional | 1,000.00 | 1,024.95 | 0.05% | 0.26 |
1 | Expenses are equal to each Funds’ annualized expense ratio, multiplied by the average account value over the period, multiplied by 184/365 (to reflect the one-half year period beginning on July 1, 2019 and ending on December 31, 2019). |
December 31, 2019 |
Schedules of Investments |
Pax Large Cap Fund
Percent of Net Assets
Name of Issuer and
Title of Issue | | Shares/
Principal | | | Value | |
COMMON STOCKS: 96.3% |
Communication Services: 12.1% |
Alphabet, Inc., Class A (a) | | | 15,223 | | | $ | 20,389,534 | |
Alphabet, Inc., Class C (a) | | | 15,275 | | | | 20,422,981 | |
AT&T, Inc. | | | 566,741 | | | | 22,148,237 | |
T-Mobile US, Inc. (a) | | | 172,700 | | | | 13,543,134 | |
ViacomCBS, Inc., Class B | | | 376,349 | | | | 15,795,368 | |
| | | | | | | | 92,299,254 | |
Consumer Discretionary: 9.7% |
Amazon.com, Inc. (a) | | | 14,732 | | | | 27,222,379 | |
Aptiv PLC | | | 131,500 | | | | 12,488,555 | |
Lowe’s Cos., Inc. | | | 146,562 | | | | 17,552,265 | |
Target Corp. | | | 135,122 | | | | 17,323,992 | |
| | | | | | | | 74,587,191 | |
Consumer Staples: 5.9% |
Mondelez International, Inc., Class A | | | 325,100 | | | | 17,906,508 | |
Procter & Gamble Co., The | | | 215,400 | | | | 26,903,460 | |
| | | | | | | | 44,809,968 | |
Financials: 13.8% |
American International Group, Inc. | | | 257,851 | | | | 13,235,492 | |
Bank of America Corp. | | | 396,400 | | | | 13,961,208 | |
BlackRock, Inc. | | | 27,100 | | | | 13,623,170 | |
Citizens Financial Group, Inc. | | | 307,000 | | | | 12,467,270 | |
JPMorgan Chase & Co. | | | 175,818 | | | | 24,509,029 | |
Prudential Financial, Inc. | | | 87,300 | | | | 8,183,502 | |
Voya Financial, Inc. | | | 323,500 | | | | 19,727,030 | |
| | | | | | | | 105,706,701 | |
Health Care: 16.0% |
Biogen, Inc. (a) | | | 28,518 | | | | 8,462,146 | |
Bristol-Myers Squibb Co. | | | 288,080 | | | | 18,491,856 | |
Cigna Corp. | | | 76,694 | | | | 15,683,156 | |
Humana, Inc. | | | 24,964 | | | | 9,149,805 | |
IQVIA Holdings, Inc. (a) | | | 69,200 | | | | 10,692,092 | |
Medtronic PLC | | | 107,704 | | | | 12,219,019 | |
Merck & Co., Inc. | | | 292,968 | | | | 26,645,440 | |
Thermo Fisher Scientific, Inc. | | | 38,359 | | | | 12,461,688 | |
Vertex Pharmaceuticals, Inc. (a) | | | 39,200 | | | | 8,582,840 | |
| | | | | | | | 122,388,042 | |
Industrials: 8.4% |
Eaton Corp PLC | | | 165,671 | | | | 15,692,357 | |
Ingersoll-Rand PLC | | | 168,203 | | | | 22,357,543 | |
Waste Management, Inc. | | | 117,827 | | | | 13,427,565 | |
Xylem, Inc. | | | 163,700 | | | | 12,897,923 | |
| | | | | | | | 64,375,388 | |
Percent of Net Assets
Name of Issuer and
Title of Issue | | Shares/
Principal | | | Value | |
COMMON STOCKS, continued |
Information Technology: 22.5% |
Accenture PLC, Class A | | | 87,994 | | | $ | 18,528,897 | |
Apple, Inc. | | | 139,995 | | | | 41,109,531 | |
Applied Materials, Inc. | | | 295,842 | | | | 18,058,196 | |
Microsoft Corp. | | | 260,594 | | | | 41,095,673 | |
salesforce.com, Inc. (a) | | | 110,618 | | | | 17,990,912 | |
TE Connectivity, Ltd. | | | 128,000 | | | | 12,267,520 | |
Visa, Inc., Class A | | | 84,500 | | | | 15,877,550 | |
Xilinx, Inc. | | | 78,800 | | | | 7,704,276 | |
| | | | | | | | 172,632,555 | |
Materials: 2.7% |
DuPont de Nemours, Inc. | | | 108,266 | | | | 6,950,677 | |
Vulcan Materials Co. | | | 97,800 | | | | 14,082,222 | |
| | | | | | | | 21,032,899 | |
Real Estate: 4.3% |
Equinix, Inc., REIT | | | 33,300 | | | | 19,437,210 | |
Prologis, Inc., REIT | | | 153,500 | | | | 13,682,990 | |
| | | | | | | | 33,120,200 | |
Utilities: 0.9% |
American Water Works Co., Inc. | | | 57,500 | | | | 7,063,875 | |
| | | | | | | | | |
TOTAL COMMON STOCKS |
(Cost $513,141,865) | | | 738,016,073 | |
| | | | | | | | | |
MONEY MARKET: 3.7% |
State Street Institutional U.S. Government Money Market Fund, 1.530% (b)(c) | | | 28,155,190 | | | | 28,155,190 | |
(Cost $28,155,190) |
| | | | | | | | | |
TOTAL INVESTMENTS: 100.0% |
(Cost $541,297,055) | | | 766,171,263 | |
| | | | | | | | | |
OTHER ASSETS AND LIABILITIES — (NET): 0.0% (d) | | | 103,662 | |
| | | | | | | | | |
NET ASSETS: 100.0% | | $ | 766,274,925 | |
(a) | Non-income producing security. |
(b) | Rate shown represents annualized 7-day yield as of December 31, 2019. |
(d) | Rounds to less than 0.05%. |
| | 69 | SEE NOTES TO FINANCIAL STATEMENTS |
December 31, 2019 |
Schedules of Investments, continued |
Pax Small Cap Fund
Percent of Net Assets
Name of Issuer and
Title of Issue | | Shares/
Principal | | | Value | |
COMMON STOCKS: 97.3% |
Communication Services: 3.7% |
AMC Networks, Inc., Class A (a) | | | 100,139 | | | $ | 3,955,491 | |
Lions Gate Entertainment Corp., Class B (a) | | | 300,000 | | | | 2,979,000 | |
ORBCOMM, Inc. (a) | | | 847,082 | | | | 3,566,215 | |
TechTarget, Inc. (a) | | | 207,197 | | | | 5,407,842 | |
| | | | | | | | 15,908,548 | |
Consumer Discretionary: 13.3% |
Callaway Golf Co. | | | 280,400 | | | | 5,944,480 | |
Carter’s, Inc. | | | 63,804 | | | | 6,976,329 | |
Columbia Sportswear Co. | | | 68,565 | | | | 6,869,527 | |
Crocs, Inc. (a) | | | 110,656 | | | | 4,635,380 | |
Dunkin’ Brands Group, Inc. | | | 70,000 | | | | 5,287,800 | |
Etsy, Inc. (a) | | | 39,000 | | | | 1,727,700 | |
National Vision Holdings, Inc. (a) | | | 157,724 | | | | 5,114,989 | |
Rubicon Project, Inc., The (a) | | | 750,000 | | | | 6,120,000 | |
Thor Industries, Inc. (b) | | | 65,000 | | | | 4,828,850 | |
Wyndham Hotels & Resorts, Inc. | | | 158,770 | | | | 9,972,345 | |
| | | | | | | | 57,477,400 | |
Consumer Staples: 4.2% |
Maple Leaf Foods, Inc. | | | 545,800 | | | | 10,877,752 | |
Performance Food Group Co. (a) | | | 120,559 | | | | 6,206,377 | |
Simply Good Foods Co., The (a) | | | 28,349 | | | | 809,080 | |
| | | | | | | | 17,893,209 | |
Financials: 21.6% |
CenterState Bank Corp. | | | 293,315 | | | | 7,327,009 | |
HomeTrust Bancshares, Inc. | | | 907,136 | | | | 24,338,459 | |
Meridian Bancorp, Inc. | | | 1,059,307 | | | | 21,281,477 | |
Univest Financial Corp. | | | 329,507 | | | | 8,824,197 | |
Victory Capital Holdings, Inc., Class A (b) | | | 1,050,736 | | | | 22,033,934 | |
White Mountains Insurance Group, Ltd. | | | 8,135 | | | | 9,074,674 | |
| | | | | | | | 92,879,750 | |
Health Care: 13.6% |
Coherus Biosciences, Inc. (a)(b) | | | 525,000 | | | | 9,452,625 | |
Horizon Therapeutics PLC (a) | | | 70,000 | | | | 2,534,000 | |
Integra LifeSciences Holdings Corp. (a) | | | 90,000 | | | | 5,245,200 | |
Percent of Net Assets
Name of Issuer and
Title of Issue | | Shares/
Principal | | | Value | |
COMMON STOCKS, continued |
Health Care, continued |
Ligand Pharmaceuticals, Inc. (a)(b) | | | 76,829 | | | $ | 8,012,496 | |
Natus Medical, Inc. (a) | | | 580,122 | | | | 19,138,225 | |
NuVasive, Inc. (a) | | | 60,000 | | | | 4,640,400 | |
Wright Medical Group NV (a) | | | 314,300 | | | | 9,579,864 | |
| | | | | | | | 58,602,810 | |
Industrials: 16.6% |
Advanced Drainage Systems, Inc. | | | 50,682 | | | | 1,968,489 | |
Beacon Roofing Supply, Inc. (a) | | | 120,191 | | | | 3,843,708 | |
Clarivate Analytics PLC (a)(b) | | | 294,275 | | | | 4,943,820 | |
Comfort Systems USA, Inc. | | | 168,228 | | | | 8,386,166 | |
EMCOR Group, Inc. | | | 120,002 | | | | 10,356,173 | |
Evoqua Water Technologies Corp. (a) | | | 225,000 | | | | 4,263,750 | |
Federal Signal Corp. | | | 80,430 | | | | 2,593,868 | |
Great Lakes Dredge & Dock Corp. (a) | | | 534,453 | | | | 6,055,352 | |
MasTec, Inc. (a) | | | 121,609 | | | | 7,802,433 | |
MRC Global, Inc. (a) | | | 628,702 | | | | 8,575,495 | |
MSA Safety, Inc. | | | 18,615 | | | | 2,352,191 | |
Thermon Group Holdings, Inc. (a) | | | 384,712 | | | | 10,310,282 | |
| | | | | | | | 71,451,727 | |
Information Technology: 12.5% |
Ciena Corp. (a) | | | 204,129 | | | | 8,714,267 | |
Comtech Telecommunications Corp. | | | 64,472 | | | | 2,288,110 | |
Everbridge, Inc. (a) | | | 36,709 | | | | 2,866,239 | |
Fastly, Inc., Class A (a) | | | 135,000 | | | | 2,709,450 | |
Flex, Ltd. (a) | | | 560,000 | | | | 7,067,200 | |
FormFactor, Inc. (a) | | | 32,680 | | | | 848,700 | |
Infinera Corp. (a)(b) | | | 557,835 | | | | 4,429,210 | |
Knowles Corp. (a) | | | 300,000 | | | | 6,345,000 | |
RealPage, Inc. (a) | | | 90,000 | | | | 4,837,500 | |
ScanSource, Inc. (a) | | | 71,528 | | | | 2,642,960 | |
Smartsheet, Inc., Class A (a) | | | 50,000 | | | | 2,246,000 | |
Verra Mobility Corp. (a) | | | 425,000 | | | | 5,945,750 | |
Zuora, Inc., Class A (a) | | | 215,000 | | | | 3,080,950 | |
| | | | | | | | 54,021,336 | |
Real Estate: 9.1% |
CatchMark Timber Trust, Inc, Class A, REIT | | | 936,169 | | | | 10,737,858 | |
CubeSmart, REIT | | | 200,000 | | | | 6,296,000 | |
SEE NOTES TO FINANCIAL STATEMENTS | 70 | |
December 31, 2019 |
Schedules of Investments, continued |
Pax Small Cap Fund, continued
Percent of Net Assets
Name of Issuer and
Title of Issue | | Shares/
Principal | | | Value | |
COMMON STOCKS, continued |
Real Estate, continued |
Four Corners Property Trust, Inc., REIT | | | 396,100 | | | $ | 11,166,059 | |
Healthcare Realty Trust, Inc., REIT | | | 335,720 | | | | 11,202,977 | |
| | | | | | | | 39,402,894 | |
Utilities: 2.7% |
ONE Gas, Inc. | | | 46,706 | | | | 4,370,280 | |
Unitil Corp. | | | 120,929 | | | | 7,475,831 | |
| | | | | | | | 11,846,111 | |
TOTAL COMMON STOCKS |
(Cost $366,167,397) | | | 419,483,785 | |
| | | | | | | | | |
MONEY MARKET: 4.7% |
State Street Institutional U.S. Government Money Market Fund, 1.530% (c)(d) | | | 20,456,386 | | | | 20,456,386 | |
(Cost $20,456,386) |
| |
Percent of Net Assets
Name of Issuer and
Title of Issue | | Shares/
Principal | | | Value | |
SECURITIES PURCHASED WITH CASH COLLATERAL FROM SECURITIES LENDING: 1.1% |
State Street Navigator Securities Lending Government Money Market Portfolio, 1.580% (c)(d) | | | 4,885,400 | | | $ | 4,885,400 | |
(Cost $4,885,400) |
| | | | | | | | | |
TOTAL INVESTMENTS: 103.1% |
(Cost $391,509,183) | | | 444,825,571 | |
| | | | | | | | | |
PAYABLE UPON RETURN OF SECURITIES LOANED: -1.1% | | | (4,885,400 | ) |
| | | | | |
OTHER ASSETS AND LIABILITIES — (NET): -2.0% | | | (8,830,420 | ) |
| | | | | | | | | |
NET ASSETS: 100.0% | | $ | 431,109,751 | |
(a) | Non-income producing security. |
(b) | Security or partial position of this security was on loan as of December 31, 2019. The total market value of securities on loan as of December 31, 2019 was $19,650,424. |
(c) | Rate shown represents annualized 7-day yield as of December 31, 2019. |
| | 71 | SEE NOTES TO FINANCIAL STATEMENTS |
December 31, 2019 |
Schedules of Investments, continued |
Pax ESG Beta Quality Fund
Percent of Net Assets
Name of Issuer and
Title of Issue | | Shares/
Principal | | | Value | |
COMMON STOCKS: 99.2% |
Communication Services: 8.0% |
Alphabet, Inc., Class A (a) | | | 4,465 | | | $ | 5,980,376 | |
Alphabet, Inc., Class C (a) | | | 1,456 | | | | 1,946,701 | |
AT&T, Inc. | | | 84,374 | | | | 3,297,336 | |
Verizon Communications, Inc. | | | 102,420 | | | | 6,288,589 | |
ViacomCBS, Inc., Class B | | | 39,295 | | | | 1,649,211 | |
Walt Disney Co., The | | | 40 | | | | 5,785 | |
| | | | | | | | 19,167,998 | |
Consumer Discretionary: 12.7% |
Amazon.com, Inc. (a) | | | 3,583 | | | | 6,620,811 | |
Best Buy Co., Inc. | | | 3,094 | | | | 271,653 | |
BorgWarner, Inc. | | | 8,566 | | | | 371,593 | |
Chipotle Mexican Grill, Inc. (a) | | | 336 | | | | 281,269 | |
Darden Restaurants, Inc. | | | 8,884 | | | | 968,445 | |
Gentex Corp. | | | 9,070 | | | | 262,849 | |
Grand Canyon Education, Inc. (a) | | | 3,494 | | | | 334,690 | |
Home Depot, Inc., The | | | 15,500 | | | | 3,384,890 | |
Lear Corp. (b) | | | 5,544 | | | | 760,637 | |
Lowe’s Cos., Inc. | | | 1,747 | | | | 209,221 | |
Marriott International, Inc., Class A | | | 5,093 | | | | 771,233 | |
McDonald’s Corp. | | | 8,195 | | | | 1,619,414 | |
NIKE, Inc., Class B | | | 26,027 | | | | 2,636,795 | |
Nordstrom, Inc. (b) | | | 2,179 | | | | 89,186 | |
Norwegian Cruise Line Holdings, Ltd. (a) | | | 2,680 | | | | 156,539 | |
NVR, Inc. (a) | | | 324 | | | | 1,233,925 | |
PulteGroup, Inc. | | | 15,163 | | | | 588,324 | |
Royal Caribbean Cruises, Ltd. | | | 2,155 | | | | 287,714 | |
Starbucks Corp. | | | 45,300 | | | | 3,982,776 | |
Target Corp. | | | 20,697 | | | | 2,653,562 | |
TJX Cos., Inc., The | | | 18,246 | | | | 1,114,101 | |
Tractor Supply Co. | | | 806 | | | | 75,313 | |
VF Corp. | | | 13,046 | | | | 1,300,164 | |
Wendy’s Co, The | | | 2,254 | | | | 50,061 | |
Williams-Sonoma, Inc. (b) | | | 7,543 | | | | 553,958 | |
| | | | | | | | 30,579,123 | |
Consumer Staples: 10.0% |
Casey’s General Stores, Inc. | | | 148 | | | | 23,531 | |
Clorox Co., The | | | 1,978 | | | | 303,702 | |
Colgate-Palmolive Co. | | | 10,980 | | | | 755,863 | |
Estee Lauder Cos, Inc., The, Class A | | | 8,219 | | | | 1,697,552 | |
Flowers Foods, Inc. | | | 3,634 | | | | 79,003 | |
General Mills, Inc. | | | 29,116 | | | | 1,559,453 | |
Hershey Co.,The | | | 14,882 | | | | 2,187,356 | |
Percent of Net Assets
Name of Issuer and
Title of Issue | | Shares/
Principal | | | Value | |
COMMON STOCKS, continued |
Consumer Staples, continued |
J.M. Smucker Co., The | | | 3,387 | | | $ | 352,688 | |
Kimberly-Clark Corp. | | | 17,588 | | | | 2,419,229 | |
Kroger Co., The | | | 53,205 | | | | 1,542,413 | |
PepsiCo, Inc. | | | 45,180 | | | | 6,174,752 | |
Procter & Gamble Co., The | | | 22,100 | | | | 2,760,290 | |
Sprouts Farmers Market, Inc. (a) | | | 9,829 | | | | 190,191 | |
Sysco Corp. | | | 17,693 | | | | 1,513,459 | |
US Foods Holding Corp. (a) | | | 14,177 | | | | 593,875 | |
Walgreens Boots Alliance, Inc. | | | 33,089 | | | | 1,950,927 | |
| | | | | | | | 24,104,284 | |
Financials: 9.5% |
Aflac, Inc. | | | 72,634 | | | | 3,842,339 | |
Allstate Corp., The | | | 12,331 | | | | 1,386,621 | |
Ally Financial, Inc. | | | 26,928 | | | | 822,920 | |
American Express Co. | | | 6,578 | | | | 818,895 | |
Capital One Financial Corp. | | | 699 | | | | 71,934 | |
Citizens Financial Group, Inc. | | | 23,648 | | | | 960,345 | |
Discover Financial Services | | | 16,188 | | | | 1,373,066 | |
East West Bancorp, Inc. | | | 22,447 | | | | 1,093,169 | |
FactSet Research Systems, Inc. | | | 379 | | | | 101,686 | |
Fifth Third Bancorp | | | 10,128 | | | | 311,335 | |
Lincoln National Corp. | | | 3,636 | | | | 214,560 | |
MarketAxess Holdings, Inc. | | | 1,383 | | | | 524,309 | |
MetLife, Inc. | | | 24,711 | | | | 1,259,520 | |
Morningstar, Inc. | | | 5,153 | | | | 779,700 | |
Navient Corp. | | | 55,681 | | | | 761,716 | |
Old Republic International Corp. | | | 9,579 | | | | 214,282 | |
OneMain Holdings, Inc. | | | 10,511 | | | | 443,039 | |
PNC Financial Services Group, Inc., The | | | 27,456 | | | | 4,382,801 | |
Prudential Financial, Inc. | | | 9,468 | | | | 887,530 | |
Reinsurance Group of America, Inc. | | | 6,161 | | | | 1,004,613 | |
Synchrony Financial | | | 289 | | | | 10,407 | |
U.S. Bancorp | | | 11,186 | | | | 663,218 | |
Unum Group | | | 31,801 | | | | 927,317 | |
| | | | | | | | 22,855,322 | |
Health Care: 14.5% |
AbbVie, Inc. | | | 10,191 | | | | 902,311 | |
Agilent Technologies, Inc. | | | 17,334 | | | | 1,478,764 | |
Amgen, Inc. | | | 8,492 | | | | 2,047,166 | |
Anthem, Inc. | | | 2,937 | | | | 887,062 | |
SEE NOTES TO FINANCIAL STATEMENTS | 72 | |
December 31, 2019 |
Schedules of Investments, continued |
Pax ESG Beta Quality Fund, continued
Percent of Net Assets
Name of Issuer and
Title of Issue | | Shares/
Principal | | | Value | |
COMMON STOCKS, continued |
Health Care, continued |
Biogen, Inc. (a) | | | 9,935 | | | $ | 2,948,013 | |
Bristol-Myers Squibb Co. | | | 20,818 | | | | 1,336,307 | |
Cardinal Health, Inc. | | | 25,679 | | | | 1,298,844 | |
Centene Corp. (a) | | | 1,692 | | | | 106,376 | |
CVS Health Corp. | | | 10,583 | | | | 786,211 | |
DaVita, Inc. (a) | | | 1,937 | | | | 145,333 | |
Eli Lilly & Co. | | | 13,746 | | | | 1,806,637 | |
Gilead Sciences, Inc. | | | 3,071 | | | | 199,554 | |
HCA Healthcare, Inc. | | | 9,802 | | | | 1,448,834 | |
Henry Schein, Inc. (a) | | | 9,420 | | | | 628,502 | |
Jazz Pharmaceuticals PLC (a) | | | 9,546 | | | | 1,425,027 | |
Johnson & Johnson | | | 41,747 | | | | 6,089,635 | |
Laboratory Corp of America Holdings (a) | | | 1,973 | | | | 333,772 | |
Merck & Co., Inc. | | | 37,405 | | | | 3,401,984 | |
Thermo Fisher Scientific, Inc. | | | 14,287 | | | | 4,641,418 | |
UnitedHealth Group, Inc. | | | 10,122 | | | | 2,975,666 | |
| | | | | | | | 34,887,416 | |
Industrials: 7.6% |
3M Co. | | | 15,710 | | | | 2,771,558 | |
Acuity Brands, Inc. | | | 1,768 | | | | 243,984 | |
Delta Air Lines, Inc. | | | 1,471 | | | | 86,024 | |
Eaton Corp PLC | | | 4,430 | | | | 419,610 | |
Expeditors International of Washington, Inc. | | | 1,330 | | | | 103,767 | |
Hexcel Corp. | | | 3,164 | | | | 231,953 | |
Landstar System, Inc. | | | 15,792 | | | | 1,798,235 | |
ManpowerGroup, Inc. | | | 12,670 | | | | 1,230,257 | |
PACCAR, Inc. | | | 6,863 | | | | 542,863 | |
Regal Beloit Corp. | | | 15,240 | | | | 1,304,696 | |
Robert Half International, Inc. | | | 3,188 | | | | 201,322 | |
Roper Technologies, Inc. | | | 7,540 | | | | 2,670,894 | |
Ryder System, Inc. | | | 7,334 | | | | 398,310 | |
Sensata Technologies Holding, PLC (a) | | | 12,260 | | | | 660,446 | |
United Parcel Service, Inc., Class B | | | 11,527 | | | | 1,349,351 | |
W.W. Grainger, Inc. | | | 2,189 | | | | 741,020 | |
Waste Management, Inc. | | | 13,039 | | | | 1,485,924 | |
WESCO International, Inc. (a) | | | 32,951 | | | | 1,956,960 | |
| | | | | | | | 18,197,174 | |
Information Technology: 23.6% |
Accenture PLC, Class A | | | 9,603 | | | | 2,022,104 | |
Akamai Technologies, Inc. (a) | | | 2,319 | | | | 200,315 | |
Apple, Inc. | | | 32,725 | | | | 9,609,695 | |
Percent of Net Assets
Name of Issuer and
Title of Issue | | Shares/
Principal | | | Value | |
COMMON STOCKS, continued |
Information Technology, continued |
Booz Allen Hamilton Holding Corp. | | | 2,506 | | | $ | 178,252 | |
CDW Corp. | | | 1,459 | | | | 208,404 | |
Cisco Systems, Inc. | | | 33,712 | | | | 1,616,828 | |
Citrix Systems, Inc. | | | 19,940 | | | | 2,211,346 | |
Cognizant Technology Solutions, Class A | | | 24,303 | | | | 1,507,272 | |
F5 Networks, Inc. (a) | | | 867 | | | | 121,077 | |
HP, Inc. | | | 106,836 | | | | 2,195,480 | |
IBM | | | 10,233 | | | | 1,371,631 | |
Intel Corp. | | | 60,776 | | | | 3,637,444 | |
Intuit, Inc. | | | 2,033 | | | | 532,504 | |
Manhattan Associates, Inc. (a) | | | 4,771 | | | | 380,487 | |
MasterCard, Inc., Class A | | | 22,599 | | | | 6,747,835 | |
Microsoft Corp. | | | 52,646 | | | | 8,302,274 | |
Oracle Corp. | | | 26,256 | | | | 1,391,043 | |
QUALCOMM, Inc. | | | 1,593 | | | | 140,550 | |
Seagate Technology PLC | | | 1,486 | | | | 88,417 | |
Synopsys, Inc. (a) | | | 7,939 | | | | 1,105,109 | |
TE Connectivity, Ltd. | | | 20,498 | | | | 1,964,528 | |
Texas Instruments, Inc. | | | 45,595 | | | | 5,849,383 | |
Visa, Inc., Class A | | | 7,634 | | | | 1,434,429 | |
VMware, Inc., Class A (a) | | | 3,252 | | | | 493,621 | |
Western Union Co., The (b) | | | 123,972 | | | | 3,319,970 | |
| | | | | | | | 56,629,998 | |
Materials: 2.3% |
Air Products & Chemicals, Inc. | | | 347 | | | | 81,542 | |
Celanese Corp. | | | 3,032 | | | | 373,300 | |
DuPont de Nemours, Inc. | | | 1,954 | | | | 125,447 | |
Eastman Chemical Co. | | | 5,014 | | | | 397,410 | |
Ecolab, Inc. | | | 602 | | | | 116,180 | |
Huntsman Corp. | | | 4,651 | | | | 112,368 | |
Linde PLC | | | 7,594 | | | | 1,616,762 | |
LyondellBasell Industries NV, Class A | | | 21,268 | | | | 2,009,400 | |
Reliance Steel & Aluminum Co. | | | 5,655 | | | | 677,243 | |
| | | | | | | | 5,509,652 | |
Real Estate: 7.4% |
Apartment Investment & Management Co., REIT | | | 28,833 | | | | 1,489,224 | |
CBRE Group, Inc., Class A (a) | | | 45,500 | | | | 2,788,695 | |
Host Hotels & Resorts, Inc., REIT | | | 18,641 | | | | 345,791 | |
| | 73 | SEE NOTES TO FINANCIAL STATEMENTS |
December 31, 2019 |
Schedules of Investments, continued |
Pax ESG Beta Quality Fund, continued
Percent of Net Assets
Name of Issuer and
Title of Issue | | Shares/
Principal | | | Value | |
COMMON STOCKS, continued |
Real Estate, continued |
Lamar Advertising Co., Class A, REIT | | | 794 | | | $ | 70,872 | |
Public Storage, REIT | | | 2,871 | | | | 611,408 | |
Service Properties Trust, REIT | | | 254,149 | | | | 6,183,445 | |
Simon Property Group, Inc., REIT | | | 29,314 | | | | 4,366,613 | |
VICI Properties, Inc., REIT (b) | | | 79,975 | | | | 2,043,362 | |
| | | | | | | | 17,899,410 | |
Utilities: 3.6% |
American Water Works Co., Inc. | | | 36,715 | | | | 4,510,438 | |
Eversource Energy (b) | | | 7,138 | | | | 607,230 | |
Exelon Corp. | | | 17,922 | | | | 817,064 | |
NextEra Energy, Inc. | | | 11,528 | | | | 2,791,620 | |
| | | | | | | | 8,726,352 | |
TOTAL COMMON STOCKS |
(Cost $131,907,609) | | | 238,556,729 | |
| | | | | | | | | |
MONEY MARKET: 0.8% |
State Street Institutional U.S. Government Money Market Fund, 1.530% (c)(d) | | | 1,838,244 | | | | 1,838,244 | |
(Cost $1,838,244) |
| | | | | | | | | |
Percent of Net Assets
Name of Issuer and
Title of Issue | | Shares/
Principal | | | Value | |
SECURITIES PURCHASED WITH CASH COLLATERAL FROM SECURITIES LENDING: 0.3% |
State Street Navigator Securities Lending Government Money Market Portfolio, 1.580% (c)(d) | | | 781,704 | | | $ | 781,704 | |
(Cost $781,704) |
| | | | | | | | | |
TOTAL INVESTMENTS: 100.3% |
(Cost $134,527,557) | | | 241,176,677 | |
| | | | | | | | | |
PAYABLE UPON RETURN OF SECURITIES LOANED: -0.3% | | | (781,704 | ) |
| | | | | | | | | |
OTHER ASSETS AND LIABILITIES — (NET): 0.0% (e) | | | 20,863 | |
| | | | | | | | | |
NET ASSETS: 100.0% | | $ | 240,415,836 | |
(a) | Non-income producing security. |
(b) | Security or partial position of this security was on loan as of December 31, 2019. The total market value of securities on loan as of December 31, 2019 was $7,235,253. |
(c) | Rate shown represents annualized 7-day yield as of December 31, 2019. |
(e) | Rounds to less than 0.05%. |
SEE NOTES TO FINANCIAL STATEMENTS | 74 | |
December 31, 2019 |
Schedules of Investments, continued |
Pax ESG Beta Dividend Fund
Percent of Net Assets
Name of Issuer and
Title of Issue | | Shares/
Principal | | | Value | |
COMMON STOCKS: 99.0% |
Communication Services: 7.1% |
Alphabet, Inc., Class A (a) | | | 1,953 | | | $ | 2,615,829 | |
AT&T, Inc. | | | 83,054 | | | | 3,245,749 | |
CenturyLink, Inc. | | | 5,210 | | | | 68,824 | |
Interpublic Group of Cos Inc., The | | | 24,735 | | | | 571,379 | |
John Wiley & Sons, Inc., Class A | | | 7,151 | | | | 346,967 | |
Omnicom Group, Inc. (b) | | | 3,209 | | | | 259,993 | |
Verizon Communications, Inc. | | | 34,732 | | | | 2,132,545 | |
Walt Disney Co., The | | | 615 | | | | 88,947 | |
Zynga, Inc., Class A (a) | | | 20,625 | | | | 126,225 | |
| | | | | | | | 9,456,458 | |
Consumer Discretionary: 12.6% |
Amazon.com, Inc. (a) | | | 2,000 | | | | 3,695,680 | |
Best Buy Co., Inc. | | | 3,970 | | | | 348,566 | |
Chipotle Mexican Grill, Inc. (a) | | | 248 | | | | 207,603 | |
Darden Restaurants, Inc. | | | 7,168 | | | | 781,384 | |
Home Depot, Inc., The | | | 11,372 | | | | 2,483,417 | |
Kohl’s Corp. | | | 6,846 | | | | 348,804 | |
Las Vegas Sands Corp. | | | 23,344 | | | | 1,611,670 | |
Leggett & Platt, Inc. | | | 5,977 | | | | 303,811 | |
Lowe’s Cos., Inc. | | | 2,325 | | | | 278,442 | |
lululemon athletica, Inc. (a) | | | 252 | | | | 58,381 | |
Macy’s, Inc. | | | 19,497 | | | | 331,449 | |
McDonald’s Corp. | | | 5,518 | | | | 1,090,412 | |
NIKE, Inc., Class B | | | 2,496 | | | | 252,870 | |
Nordstrom, Inc. (b) | | | 8,473 | | | | 346,800 | |
Ross Stores, Inc. | | | 963 | | | | 112,112 | |
Royal Caribbean Cruises, Ltd. | | | 4,368 | | | | 583,172 | |
Six Flags Entertainment Corp. | | | 3,565 | | | | 160,817 | |
Starbucks Corp. | | | 17,819 | | | | 1,566,646 | |
Tapestry, Inc. | | | 9,044 | | | | 243,917 | |
Target Corp. | | | 8,573 | | | | 1,099,144 | |
VF Corp. | | | 3,320 | | | | 330,871 | |
Whirlpool Corp. (b) | | | 1,574 | | | | 232,212 | |
Williams-Sonoma, Inc. (b) | | | 3,649 | | | | 267,983 | |
| | | | | | | | 16,736,163 | |
Consumer Staples: 7.6% |
Clorox Co., The | | | 751 | | | | 115,309 | |
Coca-Cola Co., The | | | 28,031 | | | | 1,551,516 | |
Colgate-Palmolive Co. | | | 391 | | | | 26,916 | |
Flowers Foods, Inc. | | | 7,724 | | | | 167,920 | |
General Mills, Inc. | | | 6,810 | | | | 364,744 | |
Kellogg Co. | | | 2,680 | | | | 185,349 | |
Kimberly-Clark Corp. | | | 7,918 | | | | 1,089,121 | |
PepsiCo, Inc. | | | 18,895 | | | | 2,582,379 | |
Percent of Net Assets
Name of Issuer and
Title of Issue | | Shares/
Principal | | | Value | |
COMMON STOCKS, continued |
Consumer Staples, continued |
Procter & Gamble Co., The | | | 21,163 | | | $ | 2,643,258 | |
Sysco Corp. | | | 6,781 | | | | 580,047 | |
Walgreens Boots Alliance, Inc. | | | 12,369 | | | | 729,276 | |
| | | | | | | | 10,035,835 | |
Financials: 10.8% |
Aflac, Inc. | | | 21,602 | | | | 1,142,746 | |
American Financial Group, Inc. | | | 13,769 | | | | 1,509,771 | |
Bank of America Corp. | | | 12,141 | | | | 427,606 | |
CME Group, Inc. | | | 1,876 | | | | 376,551 | |
Fidelity National Financial, Inc. | | | 14,493 | | | | 657,258 | |
Fifth Third Bancorp | | | 5,391 | | | | 165,719 | |
Invesco, Ltd. | | | 27,839 | | | | 500,545 | |
MarketAxess Holdings, Inc. | | | 210 | | | | 79,613 | |
MetLife, Inc. | | | 22,924 | | | | 1,168,436 | |
Morningstar, Inc. | | | 2,231 | | | | 337,573 | |
New York Community Bancorp, Inc. | | | 21,947 | | | | 263,803 | |
Principal Financial Group, Inc. | | | 17,163 | | | | 943,965 | |
Prudential Financial, Inc. | | | 15,013 | | | | 1,407,319 | |
Regions Financial Corp. | | | 39,696 | | | | 681,183 | |
T Rowe Price Group, Inc. | | | 3,529 | | | | 429,973 | |
TD Ameritrade Holding Corp. | | | 6,696 | | | | 332,791 | |
TFS Financial Corp. | | | 42,673 | | | | 839,805 | |
U.S. Bancorp | | | 18,253 | | | | 1,082,220 | |
Umpqua Holdings Corp. | | | 95,103 | | | | 1,683,323 | |
Unum Group | | | 9,006 | | | | 262,615 | |
| | | | | | | | 14,292,815 | |
Health Care: 13.7% |
Abbott Laboratories | | | 27,383 | | | | 2,378,487 | |
AbbVie, Inc. | | | 15,889 | | | | 1,406,812 | |
Align Technology, Inc. (a) | | | 154 | | | | 42,972 | |
AmerisourceBergen Corp. | | | 1,170 | | | | 99,473 | |
Amgen, Inc. | | | 6,726 | | | | 1,621,437 | |
Anthem, Inc. | | | 948 | | | | 286,324 | |
Baxter International, Inc. | | | 5,263 | | | | 440,092 | |
Cardinal Health, Inc. | | | 18,921 | | | | 957,024 | |
CVS Health Corp. | | | 6,676 | | | | 495,960 | |
Eli Lilly & Co. | | | 11,142 | | | | 1,464,393 | |
Humana, Inc. | | | 811 | | | | 297,248 | |
IDEXX Laboratories, Inc. (a) | | | 768 | | | | 200,548 | |
Illumina, Inc. (a) | | | 708 | | | | 234,872 | |
Johnson & Johnson | | | 27,306 | | | | 3,983,127 | |
Medtronic PLC | | | 5,342 | | | | 606,050 | |
| | 75 | SEE NOTES TO FINANCIAL STATEMENTS |
December 31, 2019 |
Schedules of Investments, continued |
Pax ESG Beta Dividend Fund, continued
Percent of Net Assets
Name of Issuer and
Title of Issue | | Shares/
Principal | | | Value | |
COMMON STOCKS, continued |
Health Care, continued |
Merck & Co., Inc. | | | 21,720 | | | $ | 1,975,434 | |
Quest Diagnostics, Inc. | | | 3,091 | | | | 330,088 | |
ResMed, Inc. | | | 1,747 | | | | 270,733 | |
UnitedHealth Group, Inc. | | | 3,590 | | | | 1,055,388 | |
| | | | | | | | 18,146,462 | |
Industrials: 11.5% |
3M Co. | | | 9,768 | | | | 1,723,271 | |
Cummins, Inc. | | | 2,019 | | | | 361,320 | |
Dover Corp. | | | 5,825 | | | | 671,390 | |
Eaton Corp PLC | | | 24,986 | | | | 2,366,673 | |
Emerson Electric Co. | | | 15,599 | | | | 1,189,580 | |
Fastenal Co. | | | 13,845 | | | | 511,573 | |
Hubbell, Inc. | | | 758 | | | | 112,048 | |
Illinois Tool Works, Inc. | | | 12,037 | | | | 2,162,205 | |
Ingersoll-Rand PLC | | | 5,429 | | | | 721,623 | |
Nielsen Holdings PLC | | | 14,566 | | | | 295,690 | |
PACCAR, Inc. | | | 12,366 | | | | 978,151 | |
Robert Half International, Inc. | | | 8,803 | | | | 555,909 | |
Rockwell Automation, Inc. | | | 1,118 | | | | 226,585 | |
Rollins, Inc. | | | 1,584 | | | | 52,525 | |
Stanley Black & Decker, Inc. | | | 1,914 | | | | 317,226 | |
Union Pacific Corp. | | | 5,221 | | | | 943,905 | |
United Parcel Service, Inc., Class B | | | 6,604 | | | | 773,064 | |
W.W. Grainger, Inc. | | | 2,851 | | | | 965,121 | |
Waste Management, Inc. | | | 3,509 | | | | 399,886 | |
| | | | | | | | 15,327,745 | |
Information Technology: 27.9% (c) |
Accenture PLC, Class A | | | 11,689 | | | | 2,461,353 | |
Adobe, Inc. (a) | | | 3,019 | | | | 995,696 | |
Apple, Inc. | | | 19,948 | | | | 5,857,730 | |
Autodesk, Inc. (a) | | | 2,294 | | | | 420,857 | |
Automatic Data Processing, Inc. | | | 4,917 | | | | 838,349 | |
Broadridge Financial Solutions, Inc. | | | 748 | | | | 92,408 | |
Cadence Design Systems, Inc. (a) | | | 3,789 | | | | 262,805 | |
Cisco Systems, Inc. | | | 68,483 | | | | 3,284,445 | |
Citrix Systems, Inc. | | | 2,759 | | | | 305,973 | |
HP, Inc. | | | 27,065 | | | | 556,186 | |
IBM | | | 18,257 | | | | 2,447,167 | |
Intel Corp. | | | 26,987 | | | | 1,615,172 | |
Jack Henry & Associates, Inc. | | | 3,956 | | | | 576,271 | |
Manhattan Associates, Inc. (a) | | | 6,196 | | | | 494,131 | |
Percent of Net Assets
Name of Issuer and
Title of Issue | | Shares/
Principal | | | Value | |
COMMON STOCKS, continued |
Information Technology, continued |
MasterCard, Inc., Class A | | | 1,507 | | | $ | 449,975 | |
Maxim Integrated Products, Inc. | | | 17,024 | | | | 1,047,146 | |
Microsoft Corp. | | | 33,374 | | | | 5,263,080 | |
National Instruments Corp. | | | 16,747 | | | | 709,068 | |
NetApp, Inc. | | | 12,511 | | | | 778,810 | |
Oracle Corp. | | | 1,660 | | | | 87,947 | |
Paychex, Inc. | | | 24,311 | | | | 2,067,894 | |
Pegasystems, Inc. | | | 1,154 | | | | 91,916 | |
QUALCOMM, Inc. | | | 6,044 | | | | 533,262 | |
salesforce.com, Inc. (a) | | | 5,385 | | | | 875,816 | |
Seagate Technology PLC | | | 9,055 | | | | 538,773 | |
Skyworks Solutions, Inc. | | | 4,679 | | | | 565,598 | |
Texas Instruments, Inc. | | | 23,940 | | | | 3,071,262 | |
VMware, Inc., Class A (a) | | | 184 | | | | 27,929 | |
Western Union Co., The (b) | | | 29,664 | | | | 794,402 | |
| | | | | | | | 37,111,421 | |
Materials: 2.6% |
Air Products & Chemicals, Inc. | | | 5,301 | | | | 1,245,682 | |
Avery Dennison Corp. | | | 1,191 | | | | 155,807 | |
Celanese Corp. | | | 2,005 | | | | 246,856 | |
Eastman Chemical Co. | | | 2,494 | | | | 197,674 | |
Ecolab, Inc. | | | 1,088 | | | | 209,973 | |
LyondellBasell Industries NV, Class A | | | 3,234 | | | | 305,548 | |
Reliance Steel & Aluminum Co. | | | 1,765 | | | | 211,376 | |
Royal Gold, Inc. | | | 2,466 | | | | 301,469 | |
Sonoco Products Co. | | | 2,504 | | | | 154,547 | |
WestRock Co. | | | 10,548 | | | | 452,615 | |
| | | | | | | | 3,481,547 | |
Real Estate: 4.2% |
AvalonBay Communities, Inc., REIT | | | 651 | �� | | | 136,515 | |
Brandywine Realty Trust, REIT | | | 9,944 | | | | 156,618 | |
Brixmor Property Group, Inc., REIT | | | 11,853 | | | | 256,143 | |
Healthpeak Properties, Inc., REIT | | | 9,088 | | | | 313,263 | |
Host Hotels & Resorts, Inc., REIT | | | 10,904 | | | | 202,269 | |
Iron Mountain, Inc., REIT (b) | | | 9,819 | | | | 312,932 | |
Kimco Realty Corp., REIT (b) | | | 5,179 | | | | 107,257 | |
Outfront Media, Inc., REIT | | | 2,659 | | | | 71,314 | |
Public Storage, REIT | | | 1,404 | | | | 298,996 | |
SEE NOTES TO FINANCIAL STATEMENTS | 76 | |
December 31, 2019 |
Schedules of Investments, continued |
Pax ESG Beta Dividend Fund, continued
Percent of Net Assets
Name of Issuer and
Title of Issue | | Shares/
Principal | | | Value | |
COMMON STOCKS, continued |
Real Estate, continued |
Rayonier, Inc., REIT | | | 6,805 | | | $ | 222,932 | |
Service Properties Trust, REIT | | | 24,020 | | | | 584,407 | |
Simon Property Group, Inc., REIT | | | 5,719 | | | | 851,902 | |
SITE Centers Corp., REIT | | | 269 | | | | 3,771 | |
Starwood Property Trust, Inc., REIT | | | 37,458 | | | | 931,207 | |
VICI Properties, Inc., REIT | | | 12,008 | | | | 306,804 | |
WP Carey, Inc., REIT | | | 10,906 | | | | 872,916 | |
| | | | | | | | 5,629,246 | |
Utilities: 1.0% |
Consolidated Edison, Inc. | | | 825 | | | | 74,638 | |
Dominion Energy, Inc. | | | 13,988 | | | | 1,158,486 | |
Edison International | | | 771 | | | | 58,141 | |
| | | | | | | | 1,291,265 | |
TOTAL COMMON STOCKS |
(Cost $89,735,069) | | | 131,508,957 | |
| | | | | | | | | |
MONEY MARKET: 0.9% |
State Street Institutional U.S. Government Money Market Fund, 1.530% (d)(e) | | | 1,193,469 | | | | 1,193,469 | |
(Cost $1,193,469) |
| |
Percent of Net Assets
Name of Issuer and
Title of Issue | | Shares/
Principal | | | Value | |
SECURITIES PURCHASED WITH CASH COLLATERAL FROM SECURITIES LENDING: 0.3% |
State Street Navigator Securities Lending Government Money Market Portfolio, 1.580% (d)(e) | | | 351,630 | | | $ | 351,630 | |
(Cost $351,630) |
| | | | | | | | | |
TOTAL INVESTMENTS: 100.2% |
(Cost $91,280,168) | | | 133,054,056 | |
| | | | | | | | | |
PAYABLE UPON RETURN OF SECURITIES LOANED: -0.3% | | | (351,630 | ) |
| | | | | | | | | |
OTHER ASSETS AND LIABILITIES — (NET): 0.1% | | | 156,683 | |
| | | | | | | | | |
NET ASSETS: 100.0% | | $ | 132,859,109 | |
(a) | Non-income producing security. |
(b) | Security or partial position of this security was on loan as of December 31, 2019. The total market value of securities on loan as of December 31, 2019 was $2,270,024. |
(c) | Broad industry sectors used for financial reporting. |
(d) | Rate shown represents annualized 7-day yield as of December 31, 2019. |
| | 77 | SEE NOTES TO FINANCIAL STATEMENTS |
December 31, 2019 |
Schedules of Investments, continued |
Pax Global Opportunities Fund
Percent of Net Assets
Name of Issuer and
Title of Issue | | Shares/
Principal | | | Value | |
COMMON STOCKS: 99.3% |
Communication Services: 2.4% |
KDDI Corp. | | | 34,300 | | | $ | 1,023,387 | |
| | | | | | | | | |
Consumer Discretionary: 2.9% |
Aptiv PLC | | | 12,993 | | | | 1,233,945 | |
| | | | | | | | | |
Consumer Staples: 9.5% |
Danone SA | | | 15,600 | | | | 1,295,516 | |
Jeronimo Martins SGPS SA | | | 65,119 | | | | 1,073,115 | |
Sprouts Farmers Market, Inc. (a) | | | 34,441 | | | | 666,433 | |
Unilever NV | | | 16,993 | | | | 975,240 | |
| | | | | | | | 4,010,304 | |
Financials: 17.6% |
AIA Group, Ltd. | | | 149,600 | | | | 1,573,487 | |
Bandhan Bank, Ltd. | | | 89,023 | | | | 636,070 | |
Beazley PLC | | | 144,508 | | | | 1,063,262 | |
HDFC Bank, Ltd., ADR | | | 24,496 | | | | 1,552,312 | |
Hiscox, Ltd. | | | 74,836 | | | | 1,411,579 | |
Prudential PLC | | | 60,794 | | | | 1,164,851 | |
| | | | | | | | 7,401,561 | |
Health Care: 19.9% |
Abcam PLC | | | 36,813 | | | | 659,269 | |
Alexion Pharmaceuticals, Inc. (a) | | | 5,882 | | | | 636,138 | |
Becton Dickinson & Co. | | | 3,126 | | | | 850,178 | |
Danaher Corp. | | | 4,786 | | | | 734,555 | |
Evotec SE (a) | | | 37,716 | | | | 972,375 | |
Genus PLC | | | 15,008 | | | | 632,146 | |
Grifols SA, ADR | | | 38,080 | | | | 886,883 | |
IQVIA Holdings, Inc. (a) | | | 9,940 | | | | 1,535,829 | |
Thermo Fisher Scientific, Inc. | | | 4,392 | | | | 1,426,829 | |
| | | | | | | | 8,334,202 | |
Industrials: 8.7% |
IDEX Corp. | | | 4,924 | | | | 846,928 | |
Kubota Corp. | | | 65,600 | | | | 1,030,132 | |
Tomra Systems ASA | | | 24,725 | | | | 785,926 | |
Xylem, Inc. | | | 12,645 | | | | 996,300 | |
| | | | | | | | 3,659,286 | |
Information Technology: 26.8% (b) |
ASML Holding NV | | | 2,332 | | | | 690,404 | |
Cadence Design Systems, Inc. (a) | | | 15,357 | | | | 1,065,162 | |
IPG Photonics Corp. (a) | | | 5,814 | | | | 842,565 | |
Keyence Corp. | | | 3,550 | | | | 1,246,541 | |
MasterCard, Inc., Class A | | | 4,067 | | | | 1,214,366 | |
Microsoft Corp. | | | 11,157 | | | | 1,759,458 | |
Percent of Net Assets
Name of Issuer and
Title of Issue | | Shares/
Principal | | | Value | |
COMMON STOCKS, continued |
Information Technology, continued |
SAP SE | | | 6,113 | | | $ | 822,798 | |
Taiwan Semiconductor Manufacturing Co, Ltd | | | 137,000 | | | | 1,516,291 | |
TE Connectivity, Ltd. | | | 8,795 | | | | 842,913 | |
Visa, Inc., Class A | | | 6,653 | | | | 1,250,099 | |
| | | | | | | | 11,250,597 | |
Materials: 8.9% |
Croda International PLC | | | 12,634 | | | | 858,210 | |
Ecolab, Inc. | | | 4,360 | | | | 841,436 | |
Koninklijke DSM NV | | | 6,196 | | | | 810,100 | |
Linde PLC | | | 5,847 | | | | 1,244,827 | |
| | | | | | | | 3,754,573 | |
Real Estate: 2.6% |
Equinix, Inc., REIT | | | 1,863 | | | | 1,087,433 | |
| | | | | | | | | |
TOTAL COMMON STOCKS |
(Cost $35,901,304) | | | 41,755,288 | |
| | | | | | | | | |
MONEY MARKET: 0.8% |
State Street Institutional U.S. Government Money Market Fund, 1.530% (c)(d) | | | 340,811 | | | | 340,811 | |
(Cost $340,811) |
| | | | | | | | | |
TOTAL INVESTMENTS: 100.1% |
(Cost $36,242,115) | | | 42,096,099 | |
| | | | | | | | | |
OTHER ASSETS AND LIABILITIES — (NET): -0.1% | | | (21,985 | ) |
| | | | | | | | | |
NET ASSETS: 100.0% | | $ | 42,074,114 | |
(a) | Non-income producing security. |
(b) | Broad industry sectors used for financial reporting. |
(c) | Rate shown represents annualized 7-day yield as of December 31, 2019. |
SEE NOTES TO FINANCIAL STATEMENTS | 78 | |
December 31, 2019 |
Schedules of Investments, continued |
Pax Global Opportunities Fund, continued
SUMMARY OF INVESTMENTS BY COUNTRY
Country | | Value | | | Percent of
Net Assets | |
France | | $ | 1,295,516 | | | | 3.1 | % |
Germany | | | 1,795,173 | | | | 4.3 | % |
Hong Kong | | | 1,573,487 | | | | 3.7 | % |
India | | | 2,188,381 | | | | 5.2 | % |
Japan | | | 3,300,061 | | | | 7.8 | % |
Netherlands | | | 2,475,743 | | | | 5.9 | % |
Norway | | | 785,926 | | | | 1.9 | % |
Portugal | | | 1,073,115 | | | | 2.6 | % |
Spain | | | 886,883 | | | | 2.1 | % |
Taiwan | | | 1,516,292 | | | | 3.6 | % |
United Kingdom | | | 5,789,317 | | | | 13.8 | % |
United States | | | 19,075,394 | | | | 45.3 | % |
Money Market | | | 340,811 | | | | 0.8 | % |
Other assets and liabilities (net) | | | (21,985 | ) | | | -0.1 | % |
TOTAL | | $ | 42,074,114 | | | | 100.0 | % |
| | 79 | SEE NOTES TO FINANCIAL STATEMENTS |
December 31, 2019 |
Schedules of Investments, continued |
Pax Global Environmental Markets Fund
Percent of Net Assets
Name of Issuer and
Title of Issue | | Shares/
Principal | | | Value | |
COMMON STOCKS: 97.8% |
RENEWABLE & ALTERNATIVE ENERGY: 0.8% |
Renewable Energy Developers & Independent Power Producers (IPPS): 0.8% |
Huaneng Renewables Corp., Ltd. | | | 18,747,107 | | | $ | 7,289,981 | |
ENERGY EFFICIENCY: 35.4% |
Power Network Efficiency: 5.3% |
Hubbell, Inc. | | | 123,166 | | | | 18,206,398 | |
Schneider Electric SE | | | 322,605 | | | | 33,144,348 | |
| | | | | | | | 51,350,746 | |
Industrial Energy Efficiency: 9.3% |
ANSYS, Inc. (a) | | | 57,291 | | | | 14,747,276 | |
Delta Electronics, Inc. | | | 4,012,475 | | | | 20,304,624 | |
PTC, Inc. (a) | | | 193,165 | | | | 14,466,127 | |
Rockwell Automation, Inc. | | | 61,311 | | | | 12,425,900 | |
Siemens AG | | | 215,683 | | | | 28,166,375 | |
| | | | | | | | 90,110,302 | |
Buildings Energy Efficiency: 9.6% |
A.O. Smith Corp. | | | 172,620 | | | | 8,223,617 | |
Autodesk, Inc. (a) | | | 110,550 | | | | 20,281,503 | |
Ingersoll-Rand PLC | | | 215,825 | | | | 28,687,460 | |
Kingspan Group PLC | | | 148,078 | | | | 9,044,095 | |
Sekisui Chemical Co., Ltd. | | | 774,400 | | | | 13,435,768 | |
Signify NV | | | 413,249 | | | | 12,934,189 | |
| | | | | | | | 92,606,632 | |
Transport Energy Efficiency: 10.1% |
Aptiv PLC | | | 282,660 | | | | 26,844,220 | |
Delphi Technologies PLC (a) | | | 648,957 | | | | 8,326,118 | |
TE Connectivity, Ltd. | | | 293,060 | | | | 28,086,870 | |
Umicore SA | | | 294,551 | | | | 14,354,645 | |
Zhuzhou CRRC Times Electric Co. Ltd. | | | 5,680,800 | | | | 20,553,617 | |
| | | | | | | | 98,165,470 | |
Consumer Energy Efficiency: 1.1% |
Murata Manufacturing Co., Ltd. | | | 180,900 | | | | 11,134,135 | |
WATER INFRASTRUCTURE & TECHNOLOGIES: 25.1% |
Water Infrastructure: 9.5% |
Ferguson PLC | | | 185,592 | | | | 16,890,141 | |
Georg Fischer AG | | | 11,217 | | | | 11,374,315 | |
IDEX Corp. | | | 134,102 | | | | 23,065,544 | |
Pentair PLC | | | 341,238 | | | | 15,652,587 | |
Xylem, Inc. | | | 312,475 | | | | 24,619,905 | |
| | | | | | | | 91,602,492 | |
Percent of Net Assets
Name of Issuer and
Title of Issue | | Shares/
Principal | | | Value | |
COMMON STOCKS, continued |
WATER INFRASTRUCTURE & TECHNOLOGIES, continued |
Water Treatment Equipment: 3.4% |
Ecolab, Inc. | | | 123,639 | | | $ | 23,861,091 | |
Woongjin Coway Co., Ltd. | | | 108,393 | | | | 8,726,178 | |
| | | | | | | | 32,587,269 | |
Water Utilities: 9.7% |
American Water Works Co., Inc. | | | 208,698 | | | | 25,638,549 | |
Beijing Enterprises Water Group, Ltd. (a) | | | 22,236,000 | | | | 11,246,682 | |
Pennon Group PLC | | | 1,426,869 | | | | 19,353,613 | |
Severn Trent PLC | | | 189,372 | | | | 6,308,679 | |
Suez | | | 2,045,625 | | | | 30,997,888 | |
| | | | | | | | 93,545,411 | |
Diversified Water Infrastructure & Technology: 2.5% |
Danaher Corp. | | | 154,991 | | | | 23,788,019 | |
POLLUTION CONTROL: 12.1% |
Environmental Testing & Gas Sensing: 9.2% |
Agilent Technologies, Inc. | | | 336,431 | | | | 28,700,929 | |
Applus Services SA | | | 623,683 | | | | 7,986,867 | |
Intertek Group PLC | | | 334,461 | | | | 25,916,760 | |
Waters Corp. (a) | | | 112,902 | | | | 26,379,552 | |
| | | | | | | | 88,984,108 | |
Public Transportation: 2.9% |
East Japan Railway Co. | | | 314,500 | | | | 28,387,374 | |
WASTE MANAGEMENT & TECHNOLOGIES: 4.3% |
Waste Technology Equipment: 0.8% |
China Everbright International, Ltd. | | | 9,464,555 | | | | 7,589,617 | |
General Waste Management: 3.5% |
Waste Management, Inc. | | | 297,848 | | | | 33,942,758 | |
FOOD, AGRICULTURE & FORESTRY: 15.3% |
Logistics, Food Safety & Packaging: 7.9% |
GEA Group AG | | | 690,478 | | | | 22,832,530 | |
Mettler-Toledo International, Inc. (a) | | | 18,590 | | | | 14,747,075 | |
Sealed Air Corp. | | | 355,597 | | | | 14,163,429 | |
WestRock Co. | | | 572,009 | | | | 24,544,906 | |
| | | | | | | | 76,287,940 | |
SEE NOTES TO FINANCIAL STATEMENTS | 80 | |
December 31, 2019 |
Schedules of Investments, continued |
Pax Global Environmental Markets Fund, continued
Percent of Net Assets
Name of Issuer and
Title of Issue | | Shares/
Principal | | | Value | |
COMMON STOCKS, continued |
FOOD, AGRICULTURE & FORESTRY, continued |
Sustainable & Efficient Agriculture: 7.4% |
Koninklijke DSM NV | | | 107,661 | | | $ | 14,076,201 | |
Kubota Corp. | | | 1,338,900 | | | | 21,025,068 | |
Trimble, Inc. (a) | | | 592,572 | | | | 24,704,327 | |
Welbilt, Inc. (a) | | | 784,022 | | | | 12,238,583 | |
| | | | | | | | 72,044,179 | |
DIVERSIFIED ENVIRONMENTAL: 4.8% |
Equinix, Inc., REIT | | | 21,240 | | | | 12,397,788 | |
Linde PLC | | | 161,507 | | | | 34,384,840 | |
| | | | | | | | 46,782,628 | |
TOTAL COMMON STOCKS |
(Cost $758,442,359) | | | 946,199,061 | |
| | | | | | | | | |
MONEY MARKET: 2.1% |
State Street Institutional U.S. Government Money Market Fund, 1.530% (b)(c) | | | 20,471,038 | | | | 20,471,038 | |
(Cost $20,471,038) |
| | | | | | | | | |
TOTAL INVESTMENTS: 99.9% |
(Cost $778,913,397) | | | 966,670,099 | |
| | | | | | | | | |
OTHER ASSETS AND LIABILITIES — (NET): 0.1% | | | 1,530,622 | |
| | | | | | | | | |
NET ASSETS: 100.0% | | $ | 968,200,721 | |
(a) | Non-income producing security. |
(b) | Rate shown represents annualized 7-day yield as of December 31, 2019. |
SUMMARY OF INVESTMENTS BY COUNTRY
Country | | Value | | | Percent of
Net Assets | |
Belgium | | $ | 14,354,645 | | | | 1.5 | % |
China | | | 46,679,897 | | | | 4.8 | % |
France | | | 64,142,235 | | | | 6.6 | % |
Germany | | | 50,998,904 | | | | 5.3 | % |
Ireland | | | 9,044,095 | | | | 0.9 | % |
Japan | | | 73,982,346 | | | | 7.7 | % |
Netherlands | | | 27,010,391 | | | | 2.8 | % |
South Korea | | | 8,726,178 | | | | 0.9 | % |
Spain | | | 7,986,867 | | | | 0.8 | % |
Switzerland | | | 11,374,315 | | | | 1.2 | % |
Taiwan | | | 20,304,624 | | | | 2.1 | % |
United Kingdom | | | 76,795,312 | | | | 7.9 | % |
United States | | | 534,799,252 | | | | 55.3 | % |
Money Market | | | 20,471,038 | | | | 2.1 | % |
Other assets and liabilities (net) | | | 1,530,622 | | | | 0.1 | % |
Total | | $ | 968,200,721 | | | | 100.0 | % |
| | 81 | SEE NOTES TO FINANCIAL STATEMENTS |
December 31, 2019 |
Schedules of Investments, continued |
Pax Ellevate Global Women’s Leadership Fund
Percent of Net Assets
Name of Issuer and
Title of Issue | | Shares/
Principal | | | Value | |
COMMON STOCKS: 99.0% |
Communication Services: 4.5% |
Auto Trader Group PLC | | | 19,384 | | | $ | 153,078 | |
CenturyLink, Inc. | | | 20,502 | | | | 270,831 | |
Deutsche Telekom AG | | | 69,525 | | | | 1,136,189 | |
Elisa OYJ | | | 2,968 | | | | 163,963 | |
Eutelsat Communications SA | | | 3,642 | | | | 59,195 | |
Iliad SA | | | 520 | | | | 67,637 | |
ITV PLC | | | 75,570 | | | | 151,199 | |
Netflix, Inc. (a) | | | 9,174 | | | | 2,968,432 | |
Omnicom Group, Inc. (b) | | | 4,608 | | | | 373,340 | |
Orange SA | | | 41,615 | | | | 611,582 | |
Proximus SADP | | | 3,174 | | | | 90,947 | |
Publicis Groupe SA | | | 9,732 | | | | 441,262 | |
Quebecor, Inc., Class B | | | 3,814 | | | | 97,336 | |
REA Group, Ltd. | | | 1,100 | | | | 79,911 | |
Schibsted ASA, Class B | | | 2,045 | | | | 58,440 | |
Singapore Press Holdings, Ltd. | | | 31,700 | | | | 51,351 | |
Singapore Telecommunications, Ltd. | | | 186,800 | | | | 468,120 | |
Spark New Zealand, Ltd. | | | 38,302 | | | | 111,689 | |
Tele2 AB, Class B | | | 10,417 | | | | 151,193 | |
Telefonica Deutschland Holding AG | | | 17,496 | | | | 50,712 | |
Telenet Group Holding NV | | | 909 | | | | 40,862 | |
Telenor ASA | | | 15,348 | | | | 275,123 | |
Telia Company AB | | | 57,076 | | | | 245,228 | |
Telstra Corp., Ltd. | | | 86,830 | | | | 215,685 | |
TELUS Corp. | | | 4,226 | | | | 163,631 | |
Twitter, Inc. (a) | | | 15,286 | | | | 489,916 | |
Ubisoft Entertainment SA (a) | | | 1,746 | | | | 120,968 | |
Verizon Communications, Inc. | | | 86,275 | | | | 5,297,286 | |
Vodafone Group PLC | | | 557,428 | | | | 1,082,176 | |
Walt Disney Co., The | | | 37,552 | | | | 5,431,147 | |
Zayo Group Holdings, Inc. (a) | | | 5,010 | | | | 173,597 | |
| | | | | | | | 21,092,026 | |
Consumer Discretionary: 15.5% |
Accor SA | | | 3,833 | | | | 179,916 | |
Aristocrat Leisure, Ltd. | | | 11,988 | | | | 283,266 | |
Barratt Developments PLC | | | 21,038 | | | | 208,306 | |
Best Buy Co., Inc. | | | 114,823 | | | | 10,081,460 | |
Burberry Group PLC | | | 8,584 | | | | 250,615 | |
Burlington Stores, Inc. (a) | | | 1,443 | | | | 329,047 | |
Capri Holdings, Ltd. (a) | | | 108,653 | | | | 4,145,112 | |
Compass Group PLC | | | 33,088 | | | | 829,244 | |
Daimler AG | | | 18,969 | | | | 1,048,688 | |
Dollar General Corp. | | | 5,460 | | | | 851,651 | |
Percent of Net Assets
Name of Issuer and
Title of Issue | | Shares/
Principal | | | Value | |
COMMON STOCKS, continued |
Consumer Discretionary, continued |
eBay, Inc. | | | 17,359 | | | $ | 626,833 | |
EssilorLuxottica SA | | | 5,913 | | | | 903,988 | |
Gap Inc., The | | | 4,785 | | | | 84,599 | |
H&R Block, Inc. (b) | | | 4,261 | | | | 100,048 | |
Hasbro, Inc. | | | 2,527 | | | | 266,876 | |
Hennes & Mauritz AB, Class B | | | 60,936 | | | | 1,242,944 | |
Hermes International | | | 661 | | | | 495,160 | |
Hilton Worldwide Holdings, Inc. | | | 5,804 | | | | 643,722 | |
Husqvarna AB, Class B | | | 8,189 | | | | 65,624 | |
InterContinental Hotels Group PLC | | | 3,608 | | | | 247,923 | |
Kering SA | | | 8,104 | | | | 5,339,843 | |
Kohl’s Corp. | | | 3,503 | | | | 178,478 | |
Lowe’s Cos., Inc. | | | 16,596 | | | | 1,987,537 | |
lululemon athletica, Inc. (a) | | | 40,748 | | | | 9,440,089 | |
LVMH Moet Hennessy Louis Vuitton SE | | | 5,795 | | | | 2,700,201 | |
Macy’s, Inc. (b) | | | 111,677 | | | | 1,898,509 | |
Marks & Spencer Group PLC | | | 40,676 | | | | 115,335 | |
Marriott International, Inc., Class A | | | 6,005 | | | | 909,337 | |
Michelin | | | 3,566 | | | | 438,829 | |
Moncler SpA | | | 3,767 | | | | 169,543 | |
Next PLC | | | 2,827 | | | | 263,427 | |
Nokian Renkaat OYJ | | | 2,594 | | | | 74,608 | |
Nordstrom, Inc. (b) | | | 2,186 | | | | 89,473 | |
PVH Corp. | | | 1,657 | | | | 174,234 | |
Ralph Lauren Corp. | | | 1,163 | | | | 136,327 | |
Renault SA | | | 4,010 | | | | 190,425 | |
Sodexo SA | | | 5,619 | | | | 665,894 | |
Starbucks Corp. | | | 70,029 | | | | 6,156,950 | |
Tapestry, Inc. | | | 6,139 | | | | 165,569 | |
Target Corp. | | | 10,775 | | | | 1,381,463 | |
Taylor Wimpey PLC | | | 68,409 | | | | 175,405 | |
Tiffany & Co. | | | 27,794 | | | | 3,714,668 | |
TJX Cos., Inc., The | | | 25,344 | | | | 1,547,505 | |
TUI AG | | | 9,198 | | | | 116,081 | |
Ulta Beauty, Inc. (a) | | | 39,325 | | | | 9,954,732 | |
Vail Resorts, Inc. | | | 915 | | | | 219,444 | |
Valeo SA | | | 5,012 | | | | 177,642 | |
Wesfarmers, Ltd. | | | 23,651 | | | | 687,339 | |
Whitbread PLC | | | 2,805 | | | | 180,021 | |
| | | | | | | | 72,133,930 | |
Consumer Staples: 13.0% |
a2 Milk Co., Ltd. (a) | | | 15,331 | | | | 155,232 | |
SEE NOTES TO FINANCIAL STATEMENTS | 82 | |
December 31, 2019 |
Schedules of Investments, continued |
Pax Ellevate Global Women’s Leadership Fund, continued
Percent of Net Assets
Name of Issuer and
Title of Issue | | Shares/
Principal | | | Value | |
COMMON STOCKS, continued |
Consumer Staples, continued |
Carrefour SA | | | 12,348 | | | $ | 207,677 | |
Clorox Co., The | | | 2,672 | | | | 410,259 | |
Coca-Cola Amatil, Ltd. | | | 10,138 | | | | 78,728 | |
Coca-Cola Co., The | | | 102,595 | | | | 5,678,633 | |
Coles Group, Ltd. | | | 23,652 | | | | 246,212 | |
Danone SA | | | 12,880 | | | | 1,069,631 | |
Diageo PLC | | | 49,557 | | | | 2,088,166 | |
Empire Co., Ltd., Class A | | | 3,678 | | | | 86,275 | |
Essity AB, Class B | | | 12,651 | | | | 407,441 | |
Estee Lauder Cos, Inc., The, Class A | | | 48,518 | | | | 10,020,907 | |
General Mills, Inc. | | | 12,522 | | | | 670,678 | |
George Weston, Ltd. | | | 1,617 | | | | 128,284 | |
Heineken Holding NV | | | 2,404 | | | | 233,651 | |
Heineken NV | | | 5,408 | | | | 577,184 | |
Henkel AG & Co. KGaA | | | 2,168 | | | | 203,776 | |
Hershey Co.,The | | | 41,270 | | | | 6,065,864 | |
ICA Gruppen AB | | | 1,888 | | | | 88,192 | |
Ingredion, Inc. | | | 1,489 | | | | 138,403 | |
J.M. Smucker Co., The | | | 6,715 | | | | 699,233 | |
Kellogg Co. | | | 140,876 | | | | 9,742,983 | |
Kimberly-Clark Corp. | | | 7,180 | | | | 987,609 | |
Kroger Co., The | | | 16,928 | | | | 490,743 | |
Loblaw Cos, Ltd. | | | 3,892 | | | | 200,812 | |
L’Oreal SA | | | 5,272 | | | | 1,558,969 | |
McCormick & Co., Inc. | | | 2,562 | | | | 434,848 | |
Metro, Inc. | | | 5,339 | | | | 220,336 | |
Mowi ASA | | | 9,150 | | | | 237,908 | |
Orkla ASA | | | 15,941 | | | | 161,655 | |
PepsiCo, Inc. | | | 29,305 | | | | 4,005,114 | |
Pernod Ricard SA | | | 4,429 | | | | 792,514 | |
Procter & Gamble Co., The | | | 52,325 | | | | 6,535,393 | |
Remy Cointreau SA | | | 443 | | | | 54,412 | |
Saputo, Inc. | | | 4,988 | | | | 154,417 | |
Tesco PLC | | | 206,436 | | | | 697,678 | |
Treasury Wine Estates, Ltd. | | | 15,000 | | | | 170,861 | |
Unilever NV | | | 30,403 | | | | 1,744,849 | |
Unilever PLC | | | 23,322 | | | | 1,335,013 | |
Walgreens Boots Alliance, Inc. | | | 16,302 | | | | 961,166 | |
Woolworths Group, Ltd. | | | 26,257 | | | | 665,968 | |
| | | | | | | | 60,407,674 | |
Financials: 20.6% |
Admiral Group PLC | | | 3,807 | | | | 116,336 | |
AIB Group PLC | | | 16,123 | | | | 56,173 | |
Allianz SE | | | 8,855 | | | | 2,169,721 | |
Percent of Net Assets
Name of Issuer and
Title of Issue | | Shares/
Principal | | | Value | |
COMMON STOCKS, continued |
Financials, continued |
Allstate Corp., The | | | 7,003 | | | $ | 787,487 | |
Ally Financial, Inc. | | | 8,371 | | | | 255,818 | |
American International Group, Inc. | | | 18,174 | | | | 932,871 | |
Amundi SA | | | 1,263 | | | | 99,318 | |
Aon PLC | | | 5,046 | | | | 1,051,031 | |
Assicurazioni Generali SpA | | | 22,919 | | | | 473,158 | |
Assurant, Inc. | | | 1,328 | | | | 174,074 | |
ASX, Ltd. | | | 4,038 | | | | 222,333 | |
Australia & New Zealand Banking Group, Ltd | | | 60,873 | | | | 1,049,814 | |
Aviva PLC | | | 81,699 | | | | 453,474 | |
AXA SA | | | 40,451 | | | | 1,142,993 | |
Banco Santander SA | | | 350,586 | | | | 1,469,919 | |
Bank Leumi Le-Israel BM | | | 31,149 | | | | 227,167 | |
Bank of America Corp. | | | 264,356 | | | | 9,310,617 | |
Bank of Montreal | | | 13,478 | | | | 1,044,570 | |
Bank of Nova Scotia, The | | | 25,565 | | | | 1,444,067 | |
Bank of Queensland, Ltd. | | | 8,246 | | | | 41,974 | |
Bankinter SA | | | 14,062 | | | | 103,288 | |
Bendigo & Adelaide Bank, Ltd. | | | 9,907 | | | | 67,980 | |
BNP Paribas SA | | | 23,463 | | | | 1,394,596 | |
CaixaBank SA | | | 74,861 | | | | 235,742 | |
Canadian Imperial Bank of Commerce | | | 32,761 | | | | 2,726,236 | |
CIT Group, Inc. | | | 2,073 | | | | 94,591 | |
Citigroup, Inc. | | | 48,242 | | | | 3,854,053 | |
CNP Assurances | | | 261,772 | | | | 5,215,845 | |
Commerzbank AG | | | 20,899 | | | | 129,073 | |
Commonwealth Bank of Australia | | | 36,926 | | | | 2,071,467 | |
Danske Bank A/S | | | 13,489 | | | | 218,229 | |
Deutsche Boerse AG | | | 3,963 | | | | 621,448 | |
Direct Line Insurance Group PLC | | | 28,681 | | | | 118,669 | |
Discover Financial Services | | | 6,762 | | | | 573,553 | |
DNB ASA | | | 73,739 | | | | 1,379,871 | |
E*TRADE Financial Corp. | | | 5,205 | | | | 236,151 | |
Eaton Vance Corp. | | | 2,474 | | | | 115,511 | |
Eurazeo SA | | | 789 | | | | 54,158 | |
EXOR NV | | | 2,264 | | | | 175,531 | |
First Republic Bank | | | 3,519 | | | | 413,307 | |
Gjensidige Forsikring ASA | | | 4,173 | | | | 87,595 | |
Globe Life, Inc. | | | 2,268 | | | | 238,707 | |
Groupe Bruxelles Lambert SA | | | 1,683 | | | | 177,592 | |
Hang Seng Bank, Ltd. | | | 16,000 | | | | 330,720 | |
| | 83 | SEE NOTES TO FINANCIAL STATEMENTS |
December 31, 2019 |
Schedules of Investments, continued |
Pax Ellevate Global Women’s Leadership Fund, continued
Percent of Net Assets
Name of Issuer and
Title of Issue | | Shares/
Principal | | | Value | |
COMMON STOCKS, continued |
Financials, continued |
Hargreaves Lansdown PLC | | | 5,936 | | | $ | 152,266 | |
Hartford Financial Services Group, Inc., The | | | 7,607 | | | | 462,277 | |
Huntington Bancshares, Inc. | | | 21,895 | | | | 330,177 | |
iA Financial Corp., Inc. | | | 2,264 | | | | 124,363 | |
Industrivarden AB, Class C | | | 3,484 | | | | 84,019 | |
Insurance Australia Group, Ltd. | | | 48,207 | | | | 259,022 | |
Intact Financial Corp. | | | 7,972 | | | | 862,060 | |
Intercontinental Exchange, Inc. | | | 11,854 | | | | 1,097,088 | |
Investor AB, Class B | | | 9,502 | | | | 518,750 | |
KeyCorp. | | | 21,083 | | | | 426,720 | |
Kinnevik AB | | | 5,047 | | | | 123,677 | |
Legal & General Group PLC | | | 124,341 | | | | 499,485 | |
Lincoln National Corp. | | | 4,286 | | | | 252,917 | |
Macquarie Group, Ltd. | | | 6,862 | | | | 664,545 | |
Manulife Financial Corp. | | | 41,535 | | | | 843,142 | |
Medibank Pvt, Ltd. | | | 57,446 | | | | 127,313 | |
MetLife, Inc. | | | 16,905 | | | | 861,648 | |
Moody’s Corp. | | | 3,608 | | | | 856,575 | |
Muenchener Rueckversicherungs AG | | | 3,011 | | | | 888,525 | |
National Australia Bank, Ltd. | | | 60,416 | | | | 1,045,444 | |
National Bank of Canada | | | 7,066 | | | | 392,220 | |
Natixis SA | | | 19,733 | | | | 87,901 | |
Onex Corp. | | | 1,855 | | | | 117,381 | |
PNC Financial Services Group, Inc., The | | | 9,418 | | | | 1,503,395 | |
Poste Italiane SpA | | | 10,898 | | | | 123,833 | |
Principal Financial Group, Inc. | | | 167,168 | | | | 9,194,240 | |
Progressive Corp., The | | | 12,278 | | | | 888,804 | |
Reinsurance Group of America, Inc. | | | 1,384 | | | | 225,675 | |
Royal Bank of Canada | | | 30,257 | | | | 2,394,137 | |
Royal Bank of Scotland Group PLC | | | 100,885 | | | | 323,633 | |
RSA Insurance Group PLC | | | 21,513 | | | | 161,234 | |
S&P Global, Inc. | | | 5,138 | | | | 1,402,931 | |
Schroders PLC | | | 2,594 | | | | 114,541 | |
Skandinaviska Enskilda Banken AB, Class A | | | 33,949 | | | | 319,252 | |
Societe Generale SA | | | 16,011 | | | | 558,751 | |
Standard Chartered PLC | | | 58,240 | | | | 548,801 | |
State Street Corp. | | | 7,808 | | | | 617,613 | |
Sun Life Financial, Inc. | | | 12,460 | | | | 568,139 | |
Percent of Net Assets
Name of Issuer and
Title of Issue | | Shares/
Principal | | | Value | |
COMMON STOCKS, continued |
Financials, continued |
Suncorp Group, Ltd. | | | 218,586 | | | $ | 1,985,598 | |
Svenska Handelsbanken AB, Class A | | | 88,329 | | | | 951,325 | |
Swedbank AB, Class A | | | 269,722 | | | | 4,009,682 | |
Synchrony Financial | | | 12,957 | | | | 466,582 | |
TD Ameritrade Holding Corp. | | | 5,780 | | | | 287,266 | |
Toronto-Dominion Bank, The | | | 38,199 | | | | 2,142,415 | |
Tryg A/S | | | 2,521 | | | | 74,739 | |
U.S. Bancorp | | | 31,637 | | | | 1,875,758 | |
Unum Group | | | 4,423 | | | | 128,975 | |
Voya Financial, Inc. | | | 119,797 | | | | 7,305,220 | |
Wendel SA | | | 565 | | | | 75,262 | |
Westpac Banking Corp. | | | 71,914 | | | | 1,228,056 | |
Willis Towers Watson PLC | | | 2,703 | | | | 545,844 | |
Zurich Insurance Group AG | | | 3,157 | | | | 1,294,999 | |
| | | | | | | | 95,551,043 | |
Health Care: 11.6% |
Abbott Laboratories | | | 36,812 | | | | 3,197,490 | |
Alcon, Inc. (a) | | | 8,665 | | | | 490,800 | |
Alexion Pharmaceuticals, Inc. (a) | | | 4,742 | | | | 512,847 | |
Alkermes PLC (a) | | | 3,298 | | | | 67,279 | |
Alnylam Pharmaceuticals, Inc. (a)(b) | | | 2,371 | | | | 273,068 | |
AmerisourceBergen Corp. | | | 3,299 | | | | 280,481 | |
Anthem, Inc. | | | 5,396 | | | | 1,629,754 | |
AstraZeneca PLC | | | 27,363 | | | | 2,738,816 | |
Becton Dickinson & Co. | | | 5,661 | | | | 1,539,622 | |
Cardinal Health, Inc. | | | 26,255 | | | | 1,327,978 | |
CSL, Ltd. | | | 9,452 | | | | 1,832,573 | |
CVS Health Corp. | | | 27,132 | | | | 2,015,636 | |
Eli Lilly & Co. | | | 18,314 | | | | 2,407,009 | |
Genmab A/S (a) | | | 1,356 | | | | 301,579 | |
Gilead Sciences, Inc. | | | 26,595 | | | | 1,728,143 | |
GlaxoSmithKline PLC | | | 104,044 | | | | 2,444,724 | |
Hologic, Inc. (a) | | | 5,635 | | | | 294,203 | |
IDEXX Laboratories, Inc. (a) | | | 1,892 | | | | 494,058 | |
Ipsen SA | | | 788 | | | | 69,948 | |
Johnson & Johnson | | | 55,408 | | | | 8,082,366 | |
Koninklijke Philips NV | | | 19,321 | | | | 944,482 | |
McKesson Corp. | | | 4,039 | | | | 558,674 | |
Medtronic PLC | | | 28,035 | | | | 3,180,571 | |
Mylan NV (a) | | | 10,824 | | | | 217,562 | |
Novo Nordisk A/S, Class B | | | 36,909 | | | | 2,138,834 | |
Orion OYJ, Class B | | | 2,179 | | | | 100,913 | |
Quest Diagnostics, Inc. | | | 65,844 | | | | 7,031,482 | |
SEE NOTES TO FINANCIAL STATEMENTS | 84 | |
December 31, 2019 |
Schedules of Investments, continued |
Pax Ellevate Global Women’s Leadership Fund, continued
Percent of Net Assets
Name of Issuer and
Title of Issue | | Shares/
Principal | | | Value | |
COMMON STOCKS, continued |
Health Care, continued |
Recordati SpA | | | 2,181 | | | $ | 91,939 | |
Ryman Healthcare, Ltd. | | | 8,344 | | | | 91,705 | |
Sanofi | | | 23,469 | | | | 2,356,931 | |
Smith & Nephew PLC | | | 18,247 | | | | 439,766 | |
Stryker Corp. | | | 7,109 | | | | 1,492,463 | |
UCB SA | | | 2,638 | | | | 209,918 | |
Varian Medical Systems, Inc. (a) | | | 1,954 | | | | 277,488 | |
Vertex Pharmaceuticals, Inc. (a) | | | 5,391 | | | | 1,180,359 | |
Waters Corp. (a) | | | 1,546 | | | | 361,223 | |
Zoetis, Inc. | | | 9,999 | | | | 1,323,368 | |
| | | | | | | | 53,726,052 | |
Industrials: 6.2% |
Aeroports de Paris | | | 620 | | | | 122,756 | |
Alfa Laval AB | | | 6,562 | | | | 165,259 | |
Allegion PLC | | | 2,001 | | | | 249,205 | |
Alstom SA | | | 3,978 | | | | 189,031 | |
Assa Abloy AB, Class B | | | 20,908 | | | | 488,734 | |
Atlas Copco AB, Class A | | | 14,008 | | | | 559,139 | |
Atlas Copco AB, Class B | | | 8,140 | | | | 282,629 | |
Auckland International Airport, Ltd. | | | 20,214 | | | | 119,149 | |
Aurizon Holdings, Ltd. | | | 41,513 | | | | 152,350 | |
Brambles, Ltd. | | | 33,266 | | | | 273,803 | |
Bureau Veritas SA | | | 5,994 | | | | 156,695 | |
Canadian National Railway Co. | | | 15,050 | | | | 1,361,460 | |
Cie de Saint-Gobain | | | 10,263 | | | | 420,432 | |
Cummins, Inc. | | | 3,140 | | | | 561,934 | |
Deutsche Lufthansa AG | | | 4,957 | | | | 91,244 | |
easyJet PLC | | | 3,116 | | | | 58,696 | |
GEA Group AG | | | 3,201 | | | | 105,850 | |
Getlink SE | | | 9,178 | | | | 160,017 | |
Ingersoll-Rand PLC | | | 5,092 | | | | 676,829 | |
Intertek Group PLC | | | 3,367 | | | | 260,903 | |
KION Group AG | | | 1,315 | | | | 90,429 | |
Kone OYJ, Class B | | | 7,090 | | | | 463,600 | |
Legrand SA | | | 45,822 | | | | 3,741,997 | |
ManpowerGroup, Inc. | | | 1,300 | | | | 126,230 | |
MTR Corp., Ltd. | | | 32,130 | | | | 189,873 | |
Pentair PLC | | | 3,505 | | | | 160,774 | |
Randstad NV | | | 2,486 | | | | 152,330 | |
Republic Services, Inc. | | | 4,742 | | | | 425,025 | |
Sandvik AB | | | 23,549 | | | | 458,672 | |
Schneider Electric SE | | | 11,473 | | | | 1,178,732 | |
Percent of Net Assets
Name of Issuer and
Title of Issue | | Shares/
Principal | | | Value | |
COMMON STOCKS, continued |
Industrials, continued |
Securitas AB, Class B | | | 6,532 | | | $ | 112,541 | |
SEEK, Ltd. | | | 6,959 | | | | 110,145 | |
Siemens AG | | | 15,958 | | | | 2,083,980 | |
Skanska AB, Class B | | | 7,097 | | | | 160,546 | |
Societe BIC SA | | | 497 | | | | 34,564 | |
Southwest Airlines Co. | | | 2,876 | | | | 155,246 | |
Sydney Airport | | | 23,070 | | | | 140,167 | |
Transurban Group | | | 55,806 | | | | 584,124 | |
Volvo AB, Class B | | | 147,552 | | | | 2,470,195 | |
Weir Group PLC, The | | | 5,416 | | | | 108,320 | |
Wolters Kluwer NV | | | 128,498 | | | | 9,382,344 | |
WSP Global, Inc. | | | 2,259 | | | | 154,253 | |
| | | | | | | | 28,940,202 | |
Information Technology: 16.5% |
Accenture PLC, Class A | | | 13,405 | | | | 2,822,691 | |
Alliance Data Systems Corp. | | | 928 | | | | 104,122 | |
ANSYS, Inc. (a) | | | 1,752 | | | | 450,982 | |
Atos SE | | | 2,050 | | | | 171,304 | |
Autodesk, Inc. (a) | | | 35,451 | | | | 6,503,840 | |
Capgemini SE | | | 3,316 | | | | 405,563 | |
CDW Corp. | | | 3,075 | | | | 439,233 | |
Cisco Systems, Inc. | | | 89,330 | | | | 4,284,267 | |
Computershare, Ltd. | | | 10,194 | | | | 120,186 | |
Dassault Systemes SA | | | 2,743 | | | | 452,390 | |
DocuSign,Inc. (a) | | | 2,268 | | | | 168,081 | |
Dropbox, Inc., Class A (a) | | | 4,123 | | | | 73,843 | |
Halma PLC | | | 7,920 | | | | 221,781 | |
Hewlett Packard Enterprise Co. | | | 27,992 | | | | 443,953 | |
Hexagon AB, Class B | | | 5,431 | | | | 304,414 | |
HP, Inc. | | | 31,491 | | | | 647,140 | |
IBM | | | 18,551 | | | | 2,486,576 | |
Ingenico Group SA | | | 1,251 | | | | 136,082 | |
Intuit, Inc. | | | 32,773 | | | | 8,584,232 | |
Micro Focus International PLC | | | 7,148 | | | | 100,327 | |
Microsoft Corp. | | | 135,538 | | | | 21,374,344 | |
Nokia OYJ | | | 117,562 | | | | 434,846 | |
Okta, Inc. (a)(b) | | | 2,268 | | | | 261,659 | |
PayPal Holdings Inc (a) | | | 23,296 | | | | 2,519,928 | |
salesforce.com, Inc. (a) | | | 17,431 | | | | 2,834,978 | |
SAP SE | | | 20,501 | | | | 2,759,396 | |
Splunk, Inc. (a) | | | 3,196 | | | | 478,665 | |
Square, Inc. (a) | | | 7,101 | | | | 444,239 | |
Texas Instruments, Inc. | | | 72,512 | | | | 9,302,564 | |
Twilio, Inc., Class A (a)(b) | | | 2,371 | | | | 233,022 | |
Visa, Inc., Class A | | | 36,328 | | | | 6,826,031 | |
| | 85 | SEE NOTES TO FINANCIAL STATEMENTS |
December 31, 2019 |
Schedules of Investments, continued |
Pax Ellevate Global Women’s Leadership Fund, continued
Percent of Net Assets
Name of Issuer and
Title of Issue | | Shares/
Principal | | | Value | |
COMMON STOCKS, continued |
Information Technology, continued |
Western Union Co., The (b) | | | 9,071 | | | $ | 242,921 | |
Wirecard AG | | | 2,450 | | | | 295,428 | |
| | | | | | | | 76,929,028 | |
Materials: 3.4% |
Air Liquide SA | | | 9,857 | | | | 1,397,434 | |
Arkema SA | | | 1,436 | | | | 153,548 | |
BlueScope Steel, Ltd. | | | 10,896 | | | | 115,406 | |
Boliden AB | | | 5,706 | | | | 151,544 | |
Boral, Ltd. | | | 24,454 | | | | 76,934 | |
Chr. Hansen Holding A/S | | | 2,201 | | | | 174,908 | |
Dow, Inc. | | | 15,668 | | | | 857,510 | |
Ecolab, Inc. | | | 5,456 | | | | 1,052,953 | |
Evonik Industries AG | | | 3,888 | | | | 118,748 | |
Fortescue Metals Group, Ltd. | | | 28,903 | | | | 217,881 | |
Incitec Pivot, Ltd. | | | 33,495 | | | | 74,831 | |
Johnson Matthey PLC | | | 4,038 | | | | 160,556 | |
Kinross Gold Corp. (a) | | | 26,217 | | | | 124,367 | |
Koninklijke DSM NV | | | 60,248 | | | | 7,877,161 | |
Newmont Mining Corp. | | | 27,944 | | | | 1,214,167 | |
Norsk Hydro ASA | | | 28,054 | | | | 104,322 | |
Novozymes A/S, Class B | | | 4,454 | | | | 217,958 | |
Orica, Ltd. | | | 100 | | | | 1,542 | |
PPG Industries, Inc. | | | 4,948 | | | | 660,509 | |
Solvay SA | | | 1,546 | | | | 179,943 | |
Stora Enso OYJ, Class R | | | 12,135 | | | | 176,574 | |
UPM-Kymmene OYJ | | | 11,134 | | | | 386,288 | |
Yara International ASA | | | 3,705 | | | | 154,364 | |
| | | | | | | | 15,649,448 | |
Real Estate: 1.5% |
Ascendas Real Estate Investment Trust, REIT | | | 52,700 | | | | 116,433 | |
Azrieli Group, Ltd. | | | 833 | | | | 61,019 | |
British Land Co. PLC, The, REIT | | | 18,764 | | | | 158,772 | |
Camden Property Trust, REIT | | | 2,074 | | | | 220,051 | |
CapitaLand Commercial Trust, REIT | | | 54,800 | | | | 81,159 | |
City Developments, Ltd. | | | 9,600 | | | | 78,133 | |
CK Asset Holdings, Ltd. | | | 54,000 | | | | 389,677 | |
Covivio, REIT | | | 956 | | | | 108,573 | |
Dexus, REIT | | | 22,770 | | | | 187,438 | |
Equity LifeStyle Properties, Inc., REIT | | | 3,608 | | | | 253,967 | |
First Capital Real Estate Investment Trust | | | 3,752 | | | | 59,723 | |
Gecina SA, REIT | | | 955 | | | | 170,967 | |
Percent of Net Assets
Name of Issuer and
Title of Issue | | Shares/
Principal | | | Value | |
COMMON STOCKS, continued |
Real Estate, continued |
GPT Group, The, REIT | | | 40,398 | | | $ | 159,129 | |
Host Hotels & Resorts, Inc., REIT | | | 15,553 | | | | 288,508 | |
ICADE, REIT | | | 587 | | | | 63,917 | |
Iron Mountain, Inc., REIT (b) | | | 6,030 | | | | 192,176 | |
Jones Lang LaSalle, Inc. | | | 1,128 | | | | 196,374 | |
Klepierre SA, REIT | | | 4,169 | | | | 158,605 | |
Land Securities Group PLC, REIT | | | 14,693 | | | | 192,868 | |
LendLease Group | | | 11,768 | | | | 145,494 | |
Link, REIT | | | 44,500 | | | | 471,432 | |
Mirvac Group, REIT | | | 81,584 | | | | 182,609 | |
RioCan Real Estate Investment Trust, REIT | | | 3,196 | | | | 65,862 | |
Scentre Group, REIT | | | 110,909 | | | | 298,484 | |
Stockland, REIT | | | 49,736 | | | | 161,372 | |
Suntec Real Estate Investment Trust, REIT | | | 38,400 | | | | 52,567 | |
Swire Properties, Ltd. | | | 24,600 | | | | 81,496 | |
Unibail-Rodamco-Westfield, REIT | | | 2,885 | | | | 455,158 | |
Vicinity Centres, REIT | | | 66,876 | | | | 116,970 | |
Vonovia SE | | | 10,594 | | | | 568,997 | |
Welltower, Inc., REIT | | | 8,453 | | | | 691,287 | |
Weyerhaeuser Co., REIT | | | 15,557 | | | | 469,821 | |
| | | | | | | | 6,899,038 | |
Utilities: 6.2% |
AGL Energy, Ltd. | | | 13,680 | | | | 196,904 | |
Alliant Energy Corp. | | | 4,974 | | | | 272,177 | |
American Electric Power Co., Inc. | | | 10,346 | | | | 977,800 | |
American Water Works Co., Inc. | | | 76,616 | | | | 9,412,275 | |
APA Group | | | 24,612 | | | | 191,591 | |
CMS Energy Corp. | | | 5,970 | | | | 375,155 | |
Consolidated Edison, Inc. | | | 6,866 | | | | 621,167 | |
Edison International | | | 7,482 | | | | 564,218 | |
Electricite de France SA | | | 12,558 | | | | 140,126 | |
Emera, Inc. | | | 4,988 | | | | 214,301 | |
Engie SA | | | 38,100 | | | | 617,156 | |
Entergy Corp. | | | 3,982 | | | | 477,044 | |
Fortis, Inc./Canada | | | 217,134 | | | | 9,009,418 | |
Fortum OYJ | | | 9,265 | | | | 228,692 | |
Hydro One, Ltd. | | | 6,904 | | | | 133,343 | |
Meridian Energy, Ltd. | | | 26,732 | | | | 90,047 | |
National Grid PLC | | | 71,168 | | | | 889,398 | |
SEE NOTES TO FINANCIAL STATEMENTS | 86 | |
December 31, 2019 |
Schedules of Investments, continued |
Pax Ellevate Global Women’s Leadership Fund, continued
Percent of Net Assets
Name of Issuer and
Title of Issue | | Shares/
Principal | | | Value | |
COMMON STOCKS, continued |
Utilities, continued |
Orsted A/S | | | 3,946 | | | $ | 408,114 | |
Red Electrica Corp. SA | | | 9,031 | | | | 181,972 | |
Sempra Energy | | | 22,200 | | | | 3,362,856 | |
Severn Trent PLC | | | 4,952 | | | | 164,969 | |
Suez | | | 7,129 | | | | 108,028 | |
United Utilities Group PLC | | | 14,224 | | | | 177,998 | |
| | | | | | | | 28,814,749 | |
TOTAL COMMON STOCKS |
(Cost $392,886,546) | | | 460,143,190 | |
| | | | | | | | | |
PREFERRED STOCKS: 0.1% |
Consumer Staples: 0.1% |
Henkel AG & Co. KGaA | | | 3,717 | | | | 383,968 | |
Materials: 0.0% (c) |
Fuchs Petrolub SE | | | 1,363 | | | | 67,719 | |
| | | | | | | | | |
TOTAL PREFERRED STOCKS |
(Cost $481,721) | | | 451,687 | |
| | | | | | | | | |
EXCHANGE-TRADED FUNDS: 0.6% |
iShares Core MSCI EAFE ETF | | | 14,973 | | | | 976,839 | |
iShares Core S&P 500 ETF | | | 6,245 | | | | 2,018,633 | |
(Cost $2,647,585) | | | 2,995,472 | |
| | | | | | | | | |
MONEY MARKET: 0.4% |
State Street Institutional U.S. Government Money Market Fund, 1.530% (d)(e) | | | 1,766,097 | | | | 1,766,097 | |
(Cost $1,766,097) |
| | | | | | | | | |
Percent of Net Assets
Name of Issuer and
Title of Issue | | Shares/
Principal | | | Value | |
SECURITIES PURCHASED WITH CASH COLLATERAL FROM SECURITIES LENDING: 0.0%(c) |
State Street Navigator Securities Lending Government Money Market Portfolio, 1.580% (d)(e) | | | 19,406 | | | $ | 19,406 | |
(Cost $19,406) |
| | | | | | | | | |
TOTAL INVESTMENTS: 100.1% |
(Cost $397,801,355) | | | 465,375,852 | |
| | | | | | | | | |
PAYABLE UPON RETURN OF SECURITIES LOANED: 0.0%(c) | | | (19,406 | ) |
| | | | | | | | | |
OTHER ASSETS AND LIABILITIES — (NET): -0.1% | | | (501,250 | ) |
| | | | | | | | | |
NET ASSETS: 100.0% | | $ | 464,855,196 | |
(a) | Non-income producing security. |
(b) | Security or partial position of this security was on loan as of December 31, 2019. The total market value of securities on loan as of December 31, 2019 was $2,759,039. |
(c) | Rounds to less than 0.05%. |
(d) | Rate shown represents annualized 7-day yield as of December 31, 2019. |
| | 87 | SEE NOTES TO FINANCIAL STATEMENTS |
December 31, 2019 |
Schedules of Investments, continued |
Pax Ellevate Global Women’s Leadership Fund, continued
SUMMARY OF INVESTMENTS BY COUNTRY
Country | | Value | | | Percent of
Net Assets | |
Australia | | $ | 16,531,450 | | | | 3.6 | % |
Belgium | | | 699,262 | | | | 0.2 | % |
Canada | | | 34,575,531 | | | | 7.4 | % |
Denmark | | | 3,534,360 | | | | 0.8 | % |
Finland | | | 2,029,485 | | | | 0.4 | % |
France | | | 37,674,528 | | | | 8.0 | % |
Germany | | | 12,813,890 | | | | 2.8 | % |
Hong Kong | | | 1,463,196 | | | | 0.3 | % |
Ireland | | | 56,173 | | | | 0.0 | %* |
Israel | | | 288,187 | | | | 0.1 | % |
Italy | | | 1,034,004 | | | | 0.2 | % |
Netherlands | | | 20,911,999 | | | | 4.4 | % |
New Zealand | | | 567,822 | | | | 0.1 | % |
Norway | | | 2,459,278 | | | | 0.5 | % |
Singapore | | | 847,763 | | | | 0.2 | % |
Spain | | | 1,990,921 | | | | 0.4 | % |
Sweden | | | 13,361,002 | | | | 2.9 | % |
Switzerland | | | 1,785,799 | | | | 0.4 | % |
United Kingdom | | | 18,499,998 | | | | 4.0 | % |
United States | | | 289,470,229 | | | | 62.4 | % |
Exchange-Traded Funds | | | 2,995,472 | | | | 0.6 | % |
Money Market | | | 1,766,097 | | | | 0.4 | % |
Other assets and liabilities (net) | | | (501,250 | ) | | | -0.1 | % |
TOTAL | | $ | 464,855,196 | | | | 100.0 | % |
* | Rounds to less than 0.05%. |
SEE NOTES TO FINANCIAL STATEMENTS | 88 | |
December 31, 2019 |
Schedules of Investments, continued |
Pax MSCI EAFE ESG Leaders Index Fund
Percent of Net Assets
Name of Issuer and
Title of Issue | | Shares/
Principal | | | Value | |
COMMON STOCKS: 98.3% |
Australia: 9.2% |
Aurizon Holdings, Ltd. | | | 194,683 | | | $ | 714,472 | |
Australia & New Zealand Banking Group, Ltd | | | 294,899 | | | | 5,085,820 | |
Bendigo & Adelaide Bank, Ltd. | | | 105,636 | | | | 724,858 | |
BlueScope Steel, Ltd. | | | 48,791 | | | | 516,774 | |
Brambles, Ltd. | | | 127,178 | | | | 1,046,764 | |
Coca-Cola Amatil, Ltd. | | | 78,446 | | | | 609,185 | |
Cochlear, Ltd. | | | 4,315 | | | | 680,070 | |
Coles Group, Ltd. | | | 91,070 | | | | 948,017 | |
Commonwealth Bank of Australia | | | 154,223 | | | | 8,651,570 | |
Computershare, Ltd. | | | 117,271 | | | | 1,382,614 | |
CSL, Ltd. | | | 36,774 | | | | 7,129,819 | |
Dexus, REIT | | | 208,944 | | | | 1,719,981 | |
Fortescue Metals Group, Ltd. | | | 243,259 | | | | 1,833,772 | |
Goodman Group, REIT | | | 157,105 | | | | 1,476,345 | |
GPT Group, The, REIT | | | 364,078 | | | | 1,434,119 | |
Insurance Australia Group, Ltd. | | | 254,209 | | | | 1,365,894 | |
LendLease Group | | | 42,900 | | | | 530,395 | |
Macquarie Group, Ltd. | | | 29,787 | | | | 2,884,701 | |
National Australia Bank, Ltd. | | | 258,896 | | | | 4,479,962 | |
Newcrest Mining, Ltd. | | | 66,843 | | | | 1,411,655 | |
Stockland, REIT | | | 309,024 | | | | 1,002,647 | |
Sydney Airport | | | 200,968 | | | | 1,221,025 | |
Telstra Corp., Ltd. | | | 374,639 | | | | 930,600 | |
Transurban Group | | | 250,645 | | | | 2,623,513 | |
Wesfarmers, Ltd. | | | 104,877 | | | | 3,047,906 | |
Westpac Banking Corp. | | | 357,442 | | | | 6,103,943 | |
| | | | | | | | 59,556,421 | |
Austria: 0.2% |
Voestalpine AG | | | 43,916 | | | | 1,218,038 | |
Belgium: 0.7% |
KBC Group NV | | | 16,978 | | | | 1,280,049 | |
Solvay SA | | | 4,761 | | | | 554,147 | |
UCB SA | | | 17,176 | | | | 1,366,773 | |
Umicore SA | | | 21,195 | | | | 1,032,917 | |
| | | | | | | | 4,233,886 | |
Denmark: 2.7% |
Chr. Hansen Holding A/S | | | 10,529 | | | | 836,712 | |
Coloplast A/S, Class B | | | 9,867 | | | | 1,224,110 | |
Genmab A/S (a) | | | 5,564 | | | | 1,237,453 | |
H Lundbeck A/S | | | 30,643 | | | | 1,171,498 | |
ISS A/S | | | 10,572 | | | | 253,673 | |
Novo Nordisk A/S, Class B | | | 156,493 | | | | 9,068,588 | |
Orsted A/S | | | 12,809 | | | | 1,324,767 | |
Percent of Net Assets
Name of Issuer and
Title of Issue | | Shares/
Principal | | | Value | |
COMMON STOCKS, continued |
Denmark, continued |
Pandora A/S | | | 8,119 | | | $ | 353,188 | |
Vestas Wind Systems A/S | | | 20,128 | | | | 2,033,057 | |
| | | | | | | | 17,503,046 | |
Finland: 0.8% |
Metso OYJ | | | 7,447 | | | | 294,194 | |
Nokian Renkaat OYJ | | | 43,607 | | | | 1,254,219 | |
Stora Enso OYJ, Class R | | | 33,598 | | | | 488,877 | |
UPM-Kymmene OYJ | | | 69,233 | | | | 2,402,004 | |
Wartsila OYJ Abp | | | 48,079 | | | | 531,440 | |
| | | | | | | | 4,970,734 | |
France: 9.9% |
Accor SA | | | 28,593 | | | | 1,342,120 | |
Air Liquide SA | | | 46,791 | | | | 6,633,594 | |
Atos SE | | | 19,573 | | | | 1,635,577 | |
AXA SA | | | 181,406 | | | | 5,125,852 | |
Bouygues SA | | | 41,337 | | | | 1,762,070 | |
Carrefour SA | | | 103,016 | | | | 1,732,590 | |
Cie de Saint-Gobain | | | 54,158 | | | | 2,218,628 | |
Credit Agricole SA | | | 162,630 | | | | 2,366,484 | |
Danone SA | | | 47,333 | | | | 3,930,812 | |
EssilorLuxottica SA | | | 30,181 | | | | 4,614,116 | |
Eurazeo SA | | | 17,089 | | | | 1,173,007 | |
Gecina SA, REIT | | | 9,291 | | | | 1,663,306 | |
Getlink SE | | | 55,311 | | | | 964,340 | |
Kering SA | | | 7,813 | | | | 5,148,099 | |
L’Oreal SA | | | 23,786 | | | | 7,033,695 | |
Michelin | | | 21,375 | | | | 2,630,388 | |
Natixis SA | | | 98,160 | | | | 437,255 | |
Orange SA | | | 217,034 | | | | 3,189,576 | |
Schneider Electric SE | | | 60,421 | | | | 6,207,637 | |
SES SA | | | 31,734 | | | | 444,950 | |
Unibail-Rodamco-Westfield, REIT | | | 12,097 | | | | 1,908,509 | |
Valeo SA | | | 27,236 | | | | 965,332 | |
Wendel SA | | | 4,872 | | | | 648,987 | |
| | | | | | | | 63,776,924 | |
Germany: 10.5% |
adidas AG | | | 14,763 | | | | 4,798,988 | |
Allianz SE | | | 35,980 | | | | 8,816,099 | |
BASF SE | | | 57,947 | | | | 4,365,531 | |
Bayerische Motoren Werke AG | | | 29,995 | | | | 2,456,761 | |
Beiersdorf AG | | | 4,809 | | | | 575,297 | |
Commerzbank AG | | | 84,920 | | | | 524,467 | |
Deutsche Boerse AG | | | 14,803 | | | | 2,321,297 | |
Deutsche Post AG | | | 71,651 | | | | 2,724,469 | |
Deutsche Wohnen SE | | | 17,011 | | | | 691,953 | |
| | 89 | SEE NOTES TO FINANCIAL STATEMENTS |
December 31, 2019 |
Schedules of Investments, continued |
Pax MSCI EAFE ESG Leaders Index Fund, continued
Percent of Net Assets
Name of Issuer and
Title of Issue | | Shares/
Principal | | | Value | |
COMMON STOCKS, continued |
Germany, continued |
E.ON SE | | | 172,788 | | | $ | 1,846,563 | |
Fraport AG Frankfurt Airport Services Worldwide | | | 5,971 | | | | 506,849 | |
Henkel AG & Co. KGaA | | | 11,788 | | | | 1,107,984 | |
Infineon Technologies AG | | | 136,143 | | | | 3,076,062 | |
Merck KGaA | | | 6,726 | | | | 792,953 | |
METRO AG | | | 38 | | | | 611 | |
MTU Aero Engines AG | | | 4,711 | | | | 1,342,285 | |
Muenchener Rueckversicherungs AG | | | 13,050 | | | | 3,850,963 | |
QIAGEN NV (a) | | | 15,760 | | | | 536,995 | |
RWE AG | | | 26,968 | | | | 826,352 | |
SAP SE | | | 96,310 | | | | 12,963,147 | |
Siemens AG | | | 84,404 | | | | 11,022,449 | |
Symrise AG | | | 16,015 | | | | 1,683,319 | |
Telefonica Deutschland Holding AG | | | 399,968 | | | | 1,159,296 | |
| | | | | | | | 67,990,690 | |
Hong Kong: 2.2% |
BOC Hong Kong Holdings, Ltd. | | | 524,057 | | | | 1,819,224 | |
CLP Holdings, Ltd. | | | 182,500 | | | | 1,915,778 | |
Hang Seng Bank, Ltd. | | | 110,700 | | | | 2,288,166 | |
HKT Trust & HKT, Ltd. | | | 601,000 | | | | 846,981 | |
Hong Kong & China Gas Co., Ltd. | | | 815,172 | | | | 1,592,739 | |
Hong Kong Exchanges and Clearing, Ltd. | | | 47,149 | | | | 1,531,764 | |
MTR Corp., Ltd. | | | 186,376 | | | | 1,101,392 | |
Sun Hung Kai Properties, Ltd. | | | 70,500 | | | | 1,079,698 | |
Swire Pacific, Ltd., Class A | | | 66,000 | | | | 613,120 | |
Swire Properties, Ltd. | | | 161,000 | | | | 533,368 | |
Techtronic Industries Co, Ltd. | | | 129,500 | | | | 1,056,939 | |
| | | | | | | | 14,379,169 | |
Ireland: 0.8% |
CRH PLC | | | 64,500 | | | | 2,587,024 | |
Kerry Group PLC, Class A | | | 20,455 | | | | 2,549,120 | |
| | | | | | | | 5,136,144 | |
Israel: 0.3% |
Bank Hapoalim BM | | | 121,533 | | | | 1,009,305 | |
Bank Leumi Le-Israel BM | | | 140,694 | | | | 1,026,072 | |
| | | | | | | | 2,035,377 | |
Italy: 1.3% |
Assicurazioni Generali SpA | | | 111,574 | | | | 2,303,422 | |
CNH Industrial NV | | | 85,902 | | | | 943,195 | |
EXOR NV | | | 9,174 | | | | 711,273 | |
Intesa Sanpaolo SpA | | | 1,131,438 | | | | 2,980,420 | |
Percent of Net Assets
Name of Issuer and
Title of Issue | | Shares/
Principal | | | Value | |
COMMON STOCKS, continued |
Italy, continued |
Snam SpA | | | 253,370 | | | $ | 1,332,169 | |
| | | | | | | | 8,270,479 | |
Japan: 23.4% |
Aeon Co., Ltd. | | | 55,300 | | | | 1,141,192 | |
AGC, Inc. | | | 22,900 | | | | 818,857 | |
Ajinomoto Co., Inc. | | | 43,600 | | | | 725,822 | |
ANA Holdings, Inc. | | | 38,100 | | | | 1,271,912 | |
Asahi Kasei Corp. | | | 138,600 | | | | 1,556,257 | |
Astellas Pharma, Inc. | | | 146,100 | | | | 2,493,924 | |
Bridgestone Corp. | | | 55,900 | | | | 2,076,691 | |
Central Japan Railway Co. | | | 10,300 | | | | 2,071,008 | |
Chugai Pharmaceutical Co., Ltd. | | | 22,000 | | | | 2,026,095 | |
Dai Nippon Printing Co., Ltd. | | | 54,800 | | | | 1,482,205 | |
Daifuku Co, Ltd. | | | 11,000 | | | | 664,783 | |
Daikin Industries, Ltd. | | | 27,600 | | | | 3,894,077 | |
Daiwa House Industry Co., Ltd. | | | 53,300 | | | | 1,650,000 | |
Denso Corp. | | | 47,500 | | | | 2,145,211 | |
East Japan Railway Co. | | | 36,000 | | | | 3,249,429 | |
Eisai Co., Ltd. | | | 25,200 | | | | 1,885,614 | |
Fast Retailing Co., Ltd. | | | 4,800 | | | | 2,851,555 | |
Fujitsu, Ltd. | | | 18,300 | | | | 1,721,222 | |
Hitachi Chemical Co., Ltd. | | | 15,200 | | | | 636,816 | |
Hitachi Construction Machinery Co., Ltd. | | | 16,400 | | | | 488,512 | |
Hitachi Metals, Ltd. | | | 27,100 | | | | 398,904 | |
Honda Motor Co., Ltd. | | | 164,100 | | | | 4,644,282 | |
Japan Retail Fund Investment Corp., REIT | | | 249 | | | | 535,825 | |
Kajima Corp. | | | 108,200 | | | | 1,438,539 | |
Kao Corp. | | | 51,200 | | | | 4,222,724 | |
KDDI Corp. | | | 138,100 | | | | 4,120,399 | |
Keio Corp. | | | 7,700 | | | | 465,921 | |
Keyence Corp. | | | 19,900 | | | | 6,987,653 | |
Kikkoman Corp. | | | 16,700 | | | | 817,544 | |
Komatsu, Ltd. | | | 113,900 | | | | 2,733,763 | |
Konica Minolta, Inc. | | | 154,100 | | | | 1,003,821 | |
Kubota Corp. | | | 147,500 | | | | 2,316,228 | |
Kuraray Co., Ltd. | | | 56,900 | | | | 689,506 | |
Kyocera Corp. | | | 37,800 | | | | 2,576,284 | |
Kyushu Railway Co. | | | 18,100 | | | | 605,944 | |
Lawson, Inc. | | | 4,900 | | | | 278,137 | |
Marui Group Co., Ltd. | | | 15,300 | | | | 373,053 | |
Mitsubishi Chemical Holdings Corp. | | | 109,700 | | | | 817,394 | |
SEE NOTES TO FINANCIAL STATEMENTS | 90 | |
December 31, 2019 |
Schedules of Investments, continued |
Pax MSCI EAFE ESG Leaders Index Fund, continued
Percent of Net Assets
Name of Issuer and
Title of Issue | | Shares/
Principal | | | Value | |
COMMON STOCKS, continued |
Japan, continued |
Mitsubishi Estate Co., Ltd. | | | 138,500 | | | $ | 2,650,178 | |
Mitsubishi Materials Corp. | | | 10,600 | | | | 287,681 | |
Mitsubishi UFJ Lease & Finance Co., Ltd. | | | 63,800 | | | | 410,725 | |
Mitsui Fudosan Co., Ltd. | | | 80,100 | | | | 1,957,637 | |
Mizuho Financial Group, Inc. | | | 1,996,100 | | | | 3,074,830 | |
Murata Manufacturing Co., Ltd. | | | 62,100 | | | | 3,822,166 | |
NEC Corp. | | | 39,600 | | | | 1,638,824 | |
NGK Insulators, Ltd. | | | 29,700 | | | | 516,662 | |
NGK Spark Plug Co., Ltd. | | | 17,400 | | | | 337,282 | |
Nikon Corp. | | | 60,000 | | | | 733,779 | |
Nintendo Co., Ltd. | | | 8,700 | | | | 3,479,653 | |
Nitto Denko Corp. | | | 12,400 | | | | 697,225 | |
Nomura Research Institute, Ltd. | | | 22,200 | | | | 474,770 | |
NSK, Ltd. | | | 39,500 | | | | 373,401 | |
NTT DOCOMO, Inc. | | | 96,600 | | | | 2,690,902 | |
Obayashi Corp. | | | 91,500 | | | | 1,016,259 | |
Odakyu Electric Railway Co., Ltd. | | | 20,500 | | | | 478,245 | |
Omron Corp. | | | 21,100 | | | | 1,229,880 | |
Ono Pharmaceutical Co., Ltd. | | | 25,500 | | | | 582,173 | |
Oriental Land Co., Ltd. | | | 16,300 | | | | 2,223,994 | |
Osaka Gas Co., Ltd. | | | 65,900 | | | | 1,260,217 | |
Panasonic Corp. | | | 193,700 | | | | 1,816,747 | |
Park24 Co., Ltd. | | | 20,900 | | | | 511,758 | |
Rakuten, Inc. | | | 45,300 | | | | 387,006 | |
Recruit Holdings Co, Ltd. | | | 102,300 | | | | 3,831,680 | |
Resona Holdings, Inc. | | | 206,600 | | | | 900,472 | |
Secom Co., Ltd. | | | 28,300 | | | | 2,525,568 | |
Sekisui Chemical Co., Ltd. | | | 40,000 | | | | 693,996 | |
Sekisui House, Ltd. | | | 68,600 | | | | 1,464,943 | |
Seven & i Holdings Co., Ltd. | | | 65,300 | | | | 2,393,598 | |
Shimadzu Corp. | | | 28,900 | | | | 903,795 | |
Shimizu Corp. | | | 59,400 | | | | 605,097 | |
Shin-Etsu Chemical Co., Ltd. | | | 28,600 | | | | 3,145,229 | |
Shiseido Co., Ltd. | | | 15,300 | | | | 1,086,453 | |
Showa Denko KK | | | 41,200 | | | | 1,085,847 | |
Sompo Holdings, Inc. | | | 30,200 | | | | 1,185,942 | |
Sony Corp. | | | 112,200 | | | | 7,618,118 | |
Stanley Electric Co., Ltd. | | | 14,300 | | | | 413,002 | |
Sumitomo Chemical Co., Ltd. | | | 79,900 | | | | 362,791 | |
Sumitomo Metal Mining Co., Ltd. | | | 26,900 | | | | 866,180 | |
Percent of Net Assets
Name of Issuer and
Title of Issue | | Shares/
Principal | | | Value | |
COMMON STOCKS, continued |
Japan, continued |
Sumitomo Mitsui Trust Holdings Inc | | | 27,900 | | | $ | 1,102,913 | |
Sysmex Corp. | | | 6,200 | | | | 422,126 | |
T&D Holdings, Inc. | | | 57,100 | | | | 722,070 | |
Taisei Corp. | | | 21,600 | | | | 894,694 | |
Takeda Pharmaceutical Co., Ltd. | | | 119,200 | | | | 4,714,621 | |
Teijin, Ltd. | | | 15,000 | | | | 280,232 | |
Tokyo Electron, Ltd. | | | 14,200 | | | | 3,100,286 | |
Tokyo Gas Co., Ltd. | | | 12,700 | | | | 308,596 | |
Tokyu Corp. | | | 84,500 | | | | 1,562,632 | |
Toray Industries, Inc. | | | 81,000 | | | | 548,817 | |
TOTO, Ltd. | | | 18,300 | | | | 772,756 | |
Unicharm Corp. | | | 25,600 | | | | 864,440 | |
West Japan Railway Co. | | | 12,900 | | | | 1,115,767 | |
Yamada Denki Co., Ltd. | | | 116,500 | | | | 618,152 | |
Yamaha Corp. | | | 10,000 | | | | 554,435 | |
Yaskawa Electric Corp. | | | 23,300 | | | | 877,733 | |
Yokogawa Electric Corp. | | | 25,400 | | | | 446,051 | |
| | | | | | | | 150,518,129 | |
Netherlands: 5.8% |
Aegon NV | | | 179,835 | | | | 823,214 | |
Akzo Nobel NV | | | 24,961 | | | | 2,549,115 | |
ASML Holding NV | | | 41,239 | | | | 12,209,071 | |
ING Groep NV | | | 161,826 | | | | 1,945,538 | |
Koninklijke Ahold Delhaize NV | | | 116,263 | | | | 2,914,992 | |
Koninklijke DSM NV | | | 13,670 | | | | 1,787,292 | |
Koninklijke Philips NV | | | 99,320 | | | | 4,855,129 | |
NN Group NV | | | 26,942 | | | | 1,024,409 | |
Unilever NV | | | 137,526 | | | | 7,892,710 | |
Wolters Kluwer NV | | | 23,424 | | | | 1,710,315 | |
| | | | | | | | 37,711,785 | |
New Zealand: 0.2% |
Auckland International Airport, Ltd. | | | 185,006 | | | | 1,090,496 | |
Fletcher Building, Ltd. | | | 97,043 | | | | 332,633 | |
| | | | | | | | 1,423,129 | |
Norway: 0.8% |
Mowi ASA | | | 72,223 | | | | 1,877,864 | |
Norsk Hydro ASA | | | 356,861 | | | | 1,327,027 | |
Orkla ASA | | | 66,814 | | | | 677,548 | |
Schibsted ASA, Class B | | | 11,218 | | | | 320,578 | |
Telenor ASA | | | 63,907 | | | | 1,145,576 | |
| | | | | | | | 5,348,593 | |
Portugal: 0.3% |
EDP - Energias de Portugal SA | | | 426,749 | | | | 1,851,832 | |
| | 91 | SEE NOTES TO FINANCIAL STATEMENTS |
December 31, 2019 |
Schedules of Investments, continued |
Pax MSCI EAFE ESG Leaders Index Fund, continued
Percent of Net Assets
Name of Issuer and
Title of Issue | | Shares/
Principal | | | Value | |
COMMON STOCKS, continued |
Singapore: 1.7% |
Ascendas Real Estate Investment Trust, REIT | | | 172,500 | | | $ | 381,113 | |
CapitaLand Mall Trust, REIT | | | 236,100 | | | | 432,196 | |
CapitaLand, Ltd. | | | 189,600 | | | | 529,082 | |
DBS Group Holdings, Ltd. | | | 152,683 | | | | 2,943,918 | |
Jardine Cycle & Carriage, Ltd. | | | 13,800 | | | | 308,606 | |
Keppel Corp., Ltd. | | | 163,100 | | | | 821,790 | |
Oversea-Chinese Banking Corp, Ltd. | | | 284,441 | | | | 2,326,886 | |
Singapore Airlines, Ltd. | | | 187,600 | | | | 1,261,290 | |
Singapore Press Holdings, Ltd. | | | 244,700 | | | | 396,389 | |
Singapore Telecommunications, Ltd. | | | 696,300 | | | | 1,745,706 | |
| | | | | | | | 11,146,976 | |
Spain: 3.8% |
Amadeus IT Group SA | | | 47,133 | | | | 3,860,039 | |
Banco Bilbao Vizcaya Argentaria SA | | | 520,822 | | | | 2,924,064 | |
Banco de Sabadell SA | | | 482,608 | | | | 565,089 | |
Bankinter SA | | | 60,032 | | | | 440,947 | |
CaixaBank SA | | | 293,862 | | | | 925,389 | |
Enagas SA | | | 15,844 | | | | 404,140 | |
Ferrovial SA | | | 31,019 | | | | 939,787 | |
Iberdrola SA | | | 568,447 | | | | 5,858,169 | |
Industria de Diseno Textil SA | | | 86,834 | | | | 3,068,757 | |
Naturgy Energy Group SA | | | 43,730 | | | | 1,101,165 | |
Red Electrica Corp. SA | | | 49,593 | | | | 999,287 | |
Telefonica SA | | | 488,092 | | | | 3,413,277 | |
| | | | | | | | 24,500,110 | |
Sweden: 3.4% |
Assa Abloy AB, Class B | | | 90,368 | | | | 2,112,392 | |
Atlas Copco AB, Class A | | | 72,641 | | | | 2,899,514 | |
Atlas Copco AB, Class B | | | 37,198 | | | | 1,291,553 | |
Boliden AB | | | 28,503 | | | | 757,001 | |
Essity AB, Class B | | | 42,436 | | | | 1,366,704 | |
Hennes & Mauritz AB, Class B | | | 80,183 | | | | 1,635,536 | |
Husqvarna AB, Class B | | | 58,608 | | | | 469,667 | |
Kinnevik AB | | | 34,583 | | | | 847,457 | |
Millicom International Cellular SA | | | 27,930 | | | | 1,341,307 | |
Sandvik AB | | | 124,757 | | | | 2,429,937 | |
Skandinaviska Enskilda Banken AB, Class A | | | 94,735 | | | | 890,876 | |
Skanska AB, Class B | | | 37,542 | | | | 849,260 | |
Percent of Net Assets
Name of Issuer and
Title of Issue | | Shares/
Principal | | | Value | |
COMMON STOCKS, continued |
Sweden, continued |
SKF AB, Class B | | | 41,401 | | | $ | 838,218 | |
Svenska Handelsbanken AB, Class A | | | 126,946 | | | | 1,367,240 | |
Swedbank AB, Class A | | | 79,937 | | | | 1,188,342 | |
Tele2 AB, Class B | | | 36,236 | | | | 525,931 | |
Telia Company AB | | | 288,455 | | | | 1,239,354 | |
| | | | | | | | 22,050,289 | |
Switzerland: 8.0% |
ABB, Ltd. | | | 199,432 | | | | 4,810,925 | |
Adecco Group AG | | | 18,361 | | | | 1,160,823 | |
Alcon, Inc. (a) | | | 45,637 | | | | 2,584,953 | |
Chocoladefabriken Lindt & Spruengli AG | | | 198 | | | | 1,537,477 | |
Coca-Cola HBC AG | | | 12,239 | | | | 416,003 | |
Givaudan SA | | | 712 | | | | 2,230,692 | |
Kuehne & Nagel International AG | | | 9,206 | | | | 1,552,745 | |
Lonza Group AG | | | 6,622 | | | | 2,415,754 | |
Roche Holding AG | | | 62,556 | | | | 20,330,866 | |
SGS SA | | | 617 | | | | 1,689,762 | |
Sika AG | | | 12,643 | | | | 2,374,297 | |
Sonova Holding AG | | | 4,322 | | | | 988,046 | |
Swiss Re AG | | | 23,429 | | | | 2,632,071 | |
Swisscom AG | | | 1,597 | | | | 845,413 | |
Vifor Pharma AG | | | 3,295 | | | | 601,355 | |
Zurich Insurance Group AG | | | 13,181 | | | | 5,406,836 | |
| | | | | | | | 51,578,018 | |
United Kingdom: 12.3% |
3i Group PLC | | | 133,113 | | | | 1,937,022 | |
Associated British Foods PLC | | | 38,139 | | | | 1,312,015 | |
Aviva PLC | | | 434,714 | | | | 2,412,900 | |
Barratt Developments PLC | | | 101,604 | | | | 1,006,025 | |
Berkeley Group Holdings PLC | | | 9,788 | | | | 629,978 | |
British Land Co. PLC, The, REIT | | | 75,077 | | | | 635,267 | |
BT Group PLC | | | 736,262 | | | | 1,876,135 | |
Burberry Group PLC | | | 16,959 | | | | 495,128 | |
Compass Group PLC | | | 124,254 | | | | 3,114,026 | |
Croda International PLC | | | 4,587 | | | | 311,589 | |
DCC PLC | | | 5,597 | | | | 485,479 | |
Ferguson PLC | | | 18,424 | | | | 1,676,710 | |
GlaxoSmithKline PLC | | | 451,157 | | | | 10,600,846 | |
Informa PLC | | | 119,603 | | | | 1,360,320 | |
InterContinental Hotels Group PLC | | | 20,624 | | | | 1,417,173 | |
Intertek Group PLC | | | 20,156 | | | | 1,561,851 | |
SEE NOTES TO FINANCIAL STATEMENTS | 92 | |
December 31, 2019 |
Schedules of Investments, continued |
Pax MSCI EAFE ESG Leaders Index Fund, continued
Percent of Net Assets
Name of Issuer and
Title of Issue | | Shares/
Principal | | | Value | |
COMMON STOCKS, continued |
United Kingdom, continued |
J Sainsbury PLC | | | 467,908 | | | $ | 1,426,768 | |
Kingfisher PLC | | | 168,783 | | | | 485,880 | |
Legal & General Group PLC | | | 741,528 | | | | 2,978,760 | |
London Stock Exchange Group PLC | | | 26,884 | | | | 2,762,922 | |
Marks & Spencer Group PLC | | | 141,180 | | | | 400,310 | |
Mondi PLC | | | 37,295 | | | | 874,537 | |
National Grid PLC | | | 268,250 | | | | 3,352,364 | |
Pearson PLC | | | 75,965 | | | | 641,760 | |
Prudential PLC | | | 217,283 | | | | 4,163,279 | |
Reckitt Benckiser Group PLC | | | 58,192 | | | | 4,726,848 | |
RELX PLC | | | 149,379 | | | | 3,770,823 | |
RSA Insurance Group PLC | | | 95,969 | | | | 719,259 | |
Segro PLC, REIT | | | 59,845 | | | | 712,602 | |
Smith & Nephew PLC | | | 65,891 | | | | 1,588,021 | |
Spirax-Sarco Engineering, PLC | | | 8,113 | | | | 955,009 | |
SSE PLC | | | 72,677 | | | | 1,386,113 | |
Standard Chartered PLC | | | 232,861 | | | | 2,194,269 | |
Standard Life Aberdeen PLC | | | 424,140 | | | | 1,845,273 | |
Taylor Wimpey PLC | | | 435,110 | | | | 1,115,653 | |
Tesco PLC | | | 829,898 | | | | 2,804,750 | |
Unilever PLC | | | 103,921 | | | | 5,948,712 | |
Whitbread PLC | | | 15,952 | | | | 1,023,777 | |
Wm Morrison Supermarkets PLC | | | 339,145 | | | | 897,564 | |
WPP PLC | | | 99,877 | | | | 1,405,495 | |
| | | | | | | | 79,013,212 | |
TOTAL COMMON STOCKS |
(Cost $535,049,086) | | | 634,212,981 | |
| | | | | | | | | |
PREFERRED STOCKS: 0.2% |
Germany: 0.2% |
Bayerische Motoren Werke AG | | | 5,338 | | | | 328,618 | |
Henkel AG & Co. KGaA | | | 6,400 | | | | 661,123 | |
| |
TOTAL PREFERRED STOCKS |
(Cost $979,942) | | | 989,741 | |
| | | | | | | | | |
EXCHANGE-TRADED FUNDS: 1.1% |
iShares Core MSCI EAFE ETF | | | 105,341 | | | | 6,872,447 | |
(Cost $6,359,770) |
| |
Percent of Net Assets
Name of Issuer and
Title of Issue | | Shares/
Principal | | | Value | |
MONEY MARKET: 0.1% |
State Street Institutional U.S. Government Money Market Fund, 1.530% (b)(c) | | | 924,513 | | | $ | 924,513 | |
(Cost $924,513) |
| | | | | | | | | |
TOTAL INVESTMENTS: 99.7% |
(Cost $543,313,311) | | | 642,999,682 | |
| | | | | | | | | |
OTHER ASSETS AND LIABILITIES — (NET): 0.3% | | | 1,793,783 | |
| | | | | | | | | |
NET ASSETS: 100.0% | | $ | 644,793,465 | |
(a) | Non-income producing security. |
(b) | Rate shown represents annualized 7-day yield as of December 31, 2019. |
REIT - Real Estate Investment Trust
SUMMARY OF INVESTMENTS BY SECTOR
Sector | | Value | | | Percent of
Net Assets | |
Communication Services | | $ | 33,119,597 | | | | 5.1 | % |
Consumer Discretionary | | | 71,062,496 | | | | 11.1 | % |
Consumer Staples | | | 64,478,300 | | | | 10.0 | % |
Financials | | | 122,173,766 | | | | 18.9 | % |
Health Care | | | 79,297,782 | | | | 12.3 | % |
Industrials | | | 109,060,500 | | | | 16.9 | % |
Information Technology | | | 59,031,260 | | | | 9.2 | % |
Materials | | | 49,481,428 | | | | 7.7 | % |
Real Estate | | | 22,137,341 | | | | 3.4 | % |
Utilities | | | 25,360,252 | | | | 3.9 | % |
Exchange-Traded Funds | | | 6,872,447 | | | | 1.1 | % |
Money Market | | | 924,513 | | | | 0.1 | % |
Other assets and liabilities (net) | | | 1,793,783 | | | | 0.3 | % |
Total | | $ | 644,793,465 | | | | 100.0 | % |
| | 93 | SEE NOTES TO FINANCIAL STATEMENTS |
December 31, 2019 |
Schedules of Investments, continued |
Pax Core Bond Fund
Percent of Net Assets
Name of Issuer and
Title of Issue | | Shares/
Principal | | | Value | |
EXCHANGE-TRADED FUNDS: 3.0% |
iShares Core U.S. Aggregate Bond ETF | | | 98,200 | | | $ | 11,034,734 | |
iShares iBoxx $ Investment Grade Corporate Bond ETF | | | 82,450 | | | | 10,550,302 | |
| |
TOTAL EXCHANGE-TRADED FUNDS |
(Cost $21,319,228) | | | 21,585,036 | |
| | | | | | | | | |
BONDS: 93.9% |
Community Investment Notes: 0.5% |
Calvert Social Investment Foundation, Inc., 1.500%, 04/30/20 (a) | | $ | 3,000,000 | | | | 3,000,000 | |
CINI Investment Note, 2.000%, 10/31/20 (a)(b) | | | 286,933 | | | | 286,933 | |
Envest Microfinance Fund, LLC, Sr. Note, Series A, 4.000%, 09/15/20 (a) | | | 100,000 | | | | 99,543 | |
| |
TOTAL COMMUNITY INVESTMENT NOTES |
(Cost $3,386,933) | | | 3,386,476 | |
| | | | | | | | | |
CORPORATE BONDS: 28.1% |
Communication Services: 3.0% |
AT&T, Inc., 3.600%, 02/17/23 | | | 2,000,000 | | | | 2,088,765 | |
AT&T, Inc., 4.350%, 03/01/29 | | | 1,500,000 | | | | 1,670,140 | |
AT&T, Inc., 4.300%, 02/15/30 | | | 1,000,000 | | | | 1,112,140 | |
CCO Holdings, LLC/Capital Corp., 144A, 4.750%, 03/01/30 (c) | | | 1,000,000 | | | | 1,019,880 | |
Charter Communications Operating LLC/Capital, 5.050%, 03/30/29 | | | 1,000,000 | | | | 1,135,573 | |
Discovery Communications, LLC, 3.950%, 03/20/28 | | | 1,500,000 | | | | 1,602,654 | |
Discovery Communications, LLC, 4.125%, 05/15/29 | | | 500,000 | | | | 540,881 | |
Level 3 Financing, Inc., 144A, 3.400%, 03/01/27 (c) | | | 500,000 | | | | 504,440 | |
Level 3 Financing, Inc., 144A, 3.875%, 11/15/29 (c) | | | 1,000,000 | | | | 1,009,350 | |
TWDC Enterprises 18 Corp., 3.750%, 06/01/21 | | | 2,026,000 | | | | 2,083,223 | |
Percent of Net Assets
Name of Issuer and
Title of Issue | | Shares/
Principal | | | Value | |
BONDS, continued |
CORPORATE BONDS, continued |
Communication Services, continued |
Verizon Communications, Inc., 3.875%, 02/08/29 | | $ | 3,000,000 | | | $ | 3,312,090 | |
Verizon Communications, Inc., 4.500%, 08/10/33 | | | 1,000,000 | | | | 1,168,286 | |
Virgin Media Secured Finance PLC, 144A, 5.500%, 08/15/26 (c) | | | 2,000,000 | | | | 2,104,645 | |
Walt Disney Co., The, 1.750%, 08/30/24 | | | 2,000,000 | | | | 1,986,149 | |
| | | | | | | | 21,338,216 | |
Consumer Discretionary: 2.7% |
Amazon.com, Inc., 2.800%, 08/22/24 | | | 1,000,000 | | | | 1,035,599 | |
Amazon.com, Inc., 3.875%, 08/22/37 | | | 500,000 | | | | 569,131 | |
Dollar General Corp., 4.125%, 05/01/28 | | | 1,000,000 | | | | 1,093,139 | |
eBay, Inc., 2.750%, 01/30/23 | | | 1,000,000 | | | | 1,014,463 | |
GLP Capital, LP/Financing II, Inc., 5.300%, 01/15/29 | | | 2,000,000 | | | | 2,226,045 | |
Hilton Domestic Operating Co., Inc., 4.875%, 01/15/30 | | | 1,000,000 | | | | 1,061,728 | |
Home Depot, Inc., The, 2.800%, 09/14/27 | | | 2,000,000 | | | | 2,082,231 | |
Marriott International, Inc., 3.250%, 09/15/22 | | | 1,000,000 | | | | 1,028,385 | |
Marriott International, Inc., 3.600%, 04/15/24 | | | 1,000,000 | | | | 1,053,964 | |
Ross Stores, Inc., 3.375%, 09/15/24 | | | 2,000,000 | | | | 2,090,144 | |
Sirius XM Radio, Inc., 144A, 4.625%, 05/15/23 (c) | | | 500,000 | | | | 508,543 | |
Sirius XM Radio, Inc., 144A, 4.625%, 07/15/24 (c) | | | 1,000,000 | | | | 1,052,085 | |
Starbucks Corp., 4.450%, 08/15/49 | | | 3,000,000 | | | | 3,485,358 | |
TJX Cos, Inc., The, 2.250%, 09/15/26 | | | 1,000,000 | | | | 1,005,725 | |
| | | | | | | | 19,306,540 | |
Consumer Staples: 1.3% |
Capital Impact Partners, 2.300%, 10/15/24 (a) | | | 500,000 | | | | 497,953 | |
SEE NOTES TO FINANCIAL STATEMENTS | 94 | |
December 31, 2019 |
Schedules of Investments, continued |
Pax Core Bond Fund, continued
Percent of Net Assets
Name of Issuer and
Title of Issue | | Shares/
Principal | | | Value | |
BONDS, continued |
CORPORATE BONDS, continued |
Consumer Staples, continued |
Constellation Brands, Inc., 3.200%, 02/15/23 | | $ | 2,000,000 | | | $ | 2,056,062 | |
CVS Health Corp., 2.515%, 03/09/20 (d) | | | 500,000 | | | | 500,424 | |
CVS Health Corp., 3.250%, 08/15/29 | | | 500,000 | | | | 509,193 | |
CVS Health Corp., 3 month LIBOR + 0.63%, 4.300%, 03/25/28 | | | 1,000,000 | | | | 1,093,333 | |
Ingles Markets Inc, 5.750%, 06/15/23 | | | 779,000 | | | | 795,546 | |
PepsiCo, Inc., 3.500%, 07/17/25 | | | 1,000,000 | | | | 1,074,850 | |
PepsiCo, Inc., 2.875%, 10/15/49 | | | 1,000,000 | | | | 970,097 | |
Performance Food Group, Inc., 144A, 5.500%, 06/01/24 (c) | | | 1,000,000 | | | | 1,027,915 | |
Raza Development Fund, Inc., 3.534%, 07/01/34 | | | 1,000,000 | | | | 998,050 | |
| | | | | | | | 9,523,423 | |
Energy: 0.3% |
MidAmerican Energy Co., 3.100%, 05/01/27 | | | 1,000,000 | | | | 1,043,716 | |
MidAmerican Energy Co., 3.650%, 04/15/29 | | | 1,000,000 | | | | 1,094,450 | |
| | | | | | | | 2,138,166 | |
Financials: 9.5% |
Allstate Corp., The, 3 month LIBOR + 0.43%, 2.391%, 03/29/21 (d) | | | 1,000,000 | | | | 1,002,584 | |
Allstate Corp., The, 3.150%, 06/15/23 | | | 2,000,000 | | | | 2,078,433 | |
Allstate Corp., The, 3.850%, 08/10/49 | | | 1,000,000 | | | | 1,112,605 | |
Avolon Holdings Funding, Ltd., 144A, 5.250%, 05/15/24 (c) | | | 500,000 | | | | 547,248 | |
Avolon Holdings Funding, Ltd., 144A, 4.375%, 05/01/26 (c) | | | 1,000,000 | | | | 1,057,550 | |
Bank of America Corp., 3.499%, 05/17/22 (d) | | | 3,000,000 | | | | 3,060,846 | |
Percent of Net Assets
Name of Issuer and
Title of Issue | | Shares/
Principal | | | Value | |
BONDS, continued |
CORPORATE BONDS, continued |
Financials, continued |
Bank of America Corp., 3.559%, 04/23/27 (d) | | $ | 1,000,000 | | | $ | 1,057,830 | |
Bank of Montreal, 2.050%, 11/01/22 | | | 1,000,000 | | | | 1,004,510 | |
Bank of New York Mellon Corp., The, 3.400%, 01/29/28 | | | 1,000,000 | | | | 1,067,890 | |
BlackRock, Inc., 3.250%, 04/30/29 | | | 2,000,000 | | | | 2,149,081 | |
Charles Schwab Corp., The, 3.550%, 02/01/24 | | | 1,000,000 | | | | 1,055,807 | |
Chubb INA Holdings, Inc., 3.350%, 05/03/26 | | | 2,000,000 | | | | 2,128,638 | |
CIT Bank NA, 2.969%, 09/27/25 (d) | | | 1,000,000 | | | | 999,375 | |
Digital Realty Trust LP, 3.950%, 07/01/22 | | | 1,750,000 | | | | 1,822,808 | |
Discover Bank, 3.200%, 08/09/21 | | | 1,000,000 | | | | 1,017,829 | |
Discover Bank, 2.450%, 09/12/24 | | | 1,000,000 | | | | 998,872 | |
Discover Bank, 4.650%, 09/13/28 | | | 1,000,000 | | | | 1,128,204 | |
Fifth Third Bancorp, 2.375%, 01/28/25 | | | 1,000,000 | | | | 1,002,458 | |
Ford Motor Credit Co., LLC, 3 month LIBOR + 0.83%, 2.853%, 04/05/21 (d) | | | 1,086,000 | | | | 1,081,202 | |
ING Groep NV, 144A, 4.625%, 01/06/26 (c) | | | 2,000,000 | | | | 2,226,468 | |
International Finance Corp., 2.500%, 04/15/23 (d) | | | 3,000,000 | | | | 3,003,890 | |
International Finance Corp., 1.750%, 04/15/26 (d) | | | 1,034,000 | | | | 1,023,717 | |
JPMorgan Chase & Co., 2.972%, 01/15/23 | | | 2,000,000 | | | | 2,038,701 | |
KeyCorp, 2.550%, 10/01/29 | | | 1,000,000 | | | | 979,188 | |
Kreditanstalt fuer Wiederaufbau, 2.125%, 06/15/22 | | | 1,000,000 | | | | 1,011,335 | |
| | 95 | SEE NOTES TO FINANCIAL STATEMENTS |
December 31, 2019 |
Schedules of Investments, continued |
Pax Core Bond Fund, continued
Percent of Net Assets
Name of Issuer and
Title of Issue | | Shares/
Principal | | | Value | |
BONDS, continued |
CORPORATE BONDS, continued |
Financials, continued |
Kreditanstalt fuer Wiederaufbau, 2.375%, 12/29/22 | | $ | 3,000,000 | | | $ | 3,062,736 | |
Kreditanstalt fuer Wiederaufbau, 2.625%, 02/28/24 | | | 3,000,000 | | | | 3,107,035 | |
MetLife, Inc., 4.875%, 11/13/43 | | | 1,000,000 | | | | 1,241,759 | |
Morgan Stanley, 3 month LIBOR + 1.18%, 3.146%, 01/20/22 (d) | | | 3,000,000 | | | | 3,027,812 | |
Morgan Stanley, 3.625%, 01/20/27 | | | 2,000,000 | | | | 2,131,420 | |
PNC Bank NA, 3.100%, 10/25/27 | | | 1,000,000 | | | | 1,044,138 | |
PNC Financial Services Group, Inc., The, 2.200%, 11/01/24 | | | 3,000,000 | | | | 3,013,177 | |
PNC Financial Services Group, Inc., The, 3.450%, 04/23/29 | | | 500,000 | | | | 534,132 | |
Prudential Financial, Inc., 4.350%, 02/25/50 | | | 1,000,000 | | | | 1,154,573 | |
Raymond James Financial, Inc., 3.625%, 09/15/26 | | | 1,000,000 | | | | 1,057,968 | |
Regions Financial Corp., 3.800%, 08/14/23 | | | 1,500,000 | | | | 1,588,939 | |
Toronto-Dominion Bank, The, 1.850%, 09/11/20 | | | 2,000,000 | | | | 2,000,017 | |
Toronto-Dominion Bank, The, 1.900%, 12/01/22 | | | 500,000 | | | | 500,691 | |
Toronto-Dominion Bank, The, 2.650%, 06/12/24 | | | 1,000,000 | | | | 1,025,035 | |
Toyota Motor Credit Corp., 3 month LIBOR + 0.10%, 2.110%, 01/10/20 (d) | | | 2,000,000 | | | | 2,000,106 | |
Toyota Motor Credit Corp., 3.450%, 09/20/23 | | | 3,000,000 | | | | 3,159,115 | |
Travelers Cos, Inc., The, 3.750%, 05/15/46 | | | 1,000,000 | | | | 1,093,879 | |
Travelers Cos, Inc., The, 4.100%, 03/04/49 | | | 1,000,000 | | | | 1,153,660 | |
| | | | | | | | 67,553,261 | |
Percent of Net Assets
Name of Issuer and
Title of Issue | | Shares/
Principal | | | Value | |
BONDS, continued |
CORPORATE BONDS, continued |
Health Care: 3.3% |
Abbott Laboratories, 3.750%, 11/30/26 | | $ | 1,133,000 | | | $ | 1,238,928 | |
AbbVie, Inc., 144A, 2.150%, 11/19/21 (c) | | | 1,000,000 | | | | 1,001,907 | |
AbbVie, Inc., 144A, 3.200%, 11/21/29 (c) | | | 1,000,000 | | | | 1,018,615 | |
Amgen, Inc., 3.625%, 05/22/24 | | | 2,000,000 | | | | 2,114,641 | |
Anthem, Inc., 2.375%, 01/15/25 | | | 500,000 | | | | 500,002 | |
Anthem, Inc., 4.101%, 03/01/28 | | | 1,000,000 | | | | 1,087,485 | |
Becton Dickinson & Co., 3.363%, 06/06/24 | | | 1,000,000 | | | | 1,042,181 | |
Becton Dickinson & Co., 3.700%, 06/06/27 | | | 1,000,000 | | | | 1,065,074 | |
Bristol-Myers Squibb Co., 144A, 2.900%, 07/26/24 (c) | | | 2,000,000 | | | | 2,066,496 | |
Bristol-Myers Squibb Co., 144A, 4.125%, 06/15/39 (c) | | | 1,000,000 | | | | 1,156,362 | |
Centene Corp., 144A, 4.250%, 12/15/27 (c) | | | 1,000,000 | | | | 1,030,600 | |
HCA, Inc., 4.500%, 02/15/27 | | | 1,000,000 | | | | 1,080,040 | |
HCA, Inc., 4.125%, 06/15/29 | | | 500,000 | | | | 531,558 | |
Kaiser Foundation Hospitals, 3.266%, 11/01/49 | | | 1,000,000 | | | | 1,006,526 | |
Merck & Co., Inc., 2.800%, 05/18/23 | | | 1,000,000 | | | | 1,031,007 | |
Merck & Co., Inc., 3.400%, 03/07/29 | | | 1,000,000 | | | | 1,084,266 | |
Quest Diagnostics, Inc., 3.450%, 06/01/26 | | | 1,000,000 | | | | 1,051,500 | |
UnitedHealth Group, Inc., 2.375%, 10/15/22 | | | 2,000,000 | | | | 2,025,699 | |
Zoetis, Inc., 3.000%, 09/12/27 | | | 1,000,000 | | | | 1,029,219 | |
Zoetis, Inc., 3.900%, 08/20/28 | | | 1,000,000 | | | | 1,086,036 | |
| | | | | | | | 23,248,142 | |
SEE NOTES TO FINANCIAL STATEMENTS | 96 | |
December 31, 2019 |
Schedules of Investments, continued |
Pax Core Bond Fund, continued
Percent of Net Assets
Name of Issuer and
Title of Issue | | Shares/
Principal | | | Value | |
BONDS, continued |
CORPORATE BONDS, continued |
Industrials: 2.1% |
Ashtead Capital, Inc., 144A, 4.000%, 05/01/28 (c) | | $ | 1,000,000 | | | $ | 1,012,500 | |
Burlington Northern Santa Fe, LLC, 3.550%, 02/15/50 | | | 1,000,000 | | | | 1,056,705 | |
Cummins, Inc., 7.125%, 03/01/28 (e) | | | 1,000,000 | | | | 1,322,200 | |
Masco Corp., 4.375%, 04/01/26 | | | 1,000,000 | | | | 1,081,506 | |
Mueller Water Products, Inc., 144A, 5.500%, 06/15/26 (c) | | | 1,000,000 | | | | 1,056,598 | |
Standard Industries, Inc., 144A, 6.000%, 10/15/25 (c) | | | 1,000,000 | | | | 1,053,740 | |
Standard Industries, Inc., 144A, 4.750%, 01/15/28 (c) | | | 1,000,000 | | | | 1,027,323 | |
Tesla Energy Operations, Inc., 4.700%, 05/29/25 (a) | | | 2,000,000 | | | | 2,005,996 | |
Union Pacific Corp., 3.700%, 03/01/29 | | | 2,000,000 | | | | 2,188,211 | |
Waste Management, Inc., 3.150%, 11/15/27 | | | 2,500,000 | | | | 2,610,915 | |
Waste Management, Inc., 3.450%, 06/15/29 | | | 500,000 | | | | 535,923 | |
| | | | | | | | 14,951,617 | |
Information Technology: 2.6% |
Adobe, Inc., 4.750%, 02/01/20 | | | 1,150,000 | | | | 1,152,336 | |
Adobe, Inc., 3.250%, 02/01/25 | | | 1,500,000 | | | | 1,585,642 | |
Apple, Inc., 2.850%, 02/23/23 | | | 1,000,000 | | | | 1,029,183 | |
Apple, Inc., 3.000%, 06/20/27 | | | 2,500,000 | | | | 2,622,926 | |
Dell International, LLC/EMC Corp., 144A, 6.020%, 06/15/26 (c) | | | 1,000,000 | | | | 1,152,047 | |
MasterCard, Inc., 3.500%, 02/26/28 | | | 1,000,000 | | | | 1,079,590 | |
MasterCard, Inc., 2.950%, 06/01/29 | | | 500,000 | | | | 522,431 | |
Microsoft Corp., 2.875%, 02/06/24 | | | 1,000,000 | | | | 1,038,276 | |
Percent of Net Assets
Name of Issuer and
Title of Issue | | Shares/
Principal | | | Value | |
BONDS, continued |
CORPORATE BONDS, continued |
Information Technology, continued |
Microsoft Corp., 2.400%, 08/08/26 | | $ | 3,000,000 | | | $ | 3,037,939 | |
NetApp, Inc., 3.250%, 12/15/22 | | | 671,000 | | | | 690,974 | |
salesforce.com, Inc., 3.700%, 04/11/28 | | | 2,000,000 | | | | 2,195,926 | |
Visa, Inc., 3.650%, 09/15/47 | | | 2,000,000 | | | | 2,244,219 | |
| | | | | | | | 18,351,489 | |
Materials: 0.1% |
Air Liquide Finance SA, 144A, 2.250%, 09/10/29 (c) | | | 1,000,000 | | | | 981,128 | |
| | | | | | | | | |
Real Estate: 1.5% |
Alexandria Real Estate Equities, Inc., 4.000%, 01/15/24 | | | 2,000,000 | | | | 2,132,282 | |
Boston Properties, LP, 3.400%, 06/21/29 | | | 2,000,000 | | | | 2,092,358 | |
Equinix, Inc., 5.375%, 05/15/27 | | | 1,000,000 | | | | 1,087,879 | |
HAT Holdings I, LLC/HAT Holdings II, LLC, 144A, 5.250%, 07/15/24 (c) | | | 1,000,000 | | | | 1,053,335 | |
Host Hotels & Resorts, LP, 3.375%, 12/15/29 | | | 1,000,000 | | | | 1,010,287 | |
Iron Mountain, Inc., 144A, 4.875%, 09/15/27 (c) | | | 1,000,000 | | | | 1,034,823 | |
Starwood Property Trust, Inc., 3.625%, 02/01/21 | | | 1,000,000 | | | | 1,009,150 | |
Welltower, Inc., 2.700%, 02/15/27 | | | 1,000,000 | | | | 1,005,235 | |
| | | | | | | | 10,425,349 | |
Utilities: 1.7% |
CenterPoint Energy Houston Electric LLC, 2.250%, 08/01/22 | | | 1,000,000 | | | | 1,006,702 | |
DTE Electric Co., 3.950%, 03/01/49 | | | 2,000,000 | | | | 2,292,681 | |
NextEra Energy Operating Partners, LP, 144A, 4.250%, 09/15/24 (c) | | | 1,000,000 | | | | 1,042,085 | |
| | 97 | SEE NOTES TO FINANCIAL STATEMENTS |
December 31, 2019 |
Schedules of Investments, continued |
Pax Core Bond Fund, continued
Percent of Net Assets
Name of Issuer and
Title of Issue | | Shares/
Principal | | | Value | |
BONDS, continued |
CORPORATE BONDS, continued |
Utilities, continued |
NextEra Energy Operating Partners, LP, 144A, 3.875%, 10/15/26 (c) | | $ | 1,000,000 | | | $ | 1,005,624 | |
NSTAR Electric Co., 3.250%, 05/15/29 | | | 3,000,000 | | | | 3,170,605 | |
Southern Power Co., 4.150%, 12/01/25 | | | 2,000,000 | | | | 2,171,219 | |
Southwestern Public Service Co., 3.750%, 06/15/49 | | | 1,000,000 | | | | 1,078,924 | |
| | | | | | | | 11,767,840 | |
TOTAL CORPORATE BONDS |
(Cost $189,554,671) | | | 199,585,171 | |
| | | | | | | | | |
U.S. GOVERNMENT AGENCY BONDS: 1.0% |
Federal Home Loan Bank System (Agency): 0.1% |
2.375%, 03/12/21 | | | 1,000,000 | | | | 1,008,726 | |
Agency Securities: 0.9% |
North American Development Bank, 2.400%, 10/26/22 | | | 2,000,000 | | | | 2,019,522 | |
Overseas Private Investment Corp., 1.980%, 09/15/26 (a)(d) | | | 2,000,000 | | | | 2,001,250 | |
Overseas Private Investment Corp., 3.520%, 09/20/32 | | | 1,821,429 | | | | 1,956,113 | |
| | | | | | | | 5,976,885 | |
TOTAL U.S. GOVERNMENT AGENCY BONDS |
(Cost $6,755,749) | | | 6,985,611 | |
| | | | | | | | | |
SUPRANATIONAL BONDS: 3.7% |
Asian Development Bank, 2.750%, 03/17/23 | | | 3,000,000 | | | | 3,101,568 | |
Asian Development Bank, 2.125%, 03/19/25 | | | 2,000,000 | | | | 2,032,418 | |
European Bank for Reconstruction & Development, 1.625%, 09/27/24 | | | 3,000,000 | | | | 2,980,585 | |
European Investment Bank, 1.625%, 03/16/20 | | | 2,000,000 | | | | 1,999,446 | |
Percent of Net Assets
Name of Issuer and
Title of Issue | | Shares/
Principal | | | Value | |
BONDS, continued |
SUPRANATIONAL BONDS, continued |
European Investment Bank, 1.625%, 08/14/20 | | $ | 3,000,000 | | | $ | 2,999,887 | |
European Investment Bank, 2.000%, 03/15/21 | | | 3,000,000 | | | | 3,012,750 | |
International Bank for Reconstruction & Development, 2.530%, 03/11/22 | | | 4,000,000 | | | | 4,066,388 | |
International Bank for Reconstruction & Development, 2.125%, 03/03/25 | | | 4,000,000 | | | | 4,072,893 | |
International Bank for Reconstruction & Development, 2.750%, 05/31/36 | | | 2,000,000 | | | | 1,946,922 | |
| |
TOTAL SUPRANATIONAL BONDS |
(Cost $25,783,483) | | | 26,212,857 | |
| | | | | | | | | |
MUNICIPAL BONDS: 5.4% |
California Health Facilities Financing Authority, 1.970%, 06/01/23 | | | 500,000 | | | | 499,045 | |
City & County of Honolulu HI, 3.138%, 10/01/32 | | | 1,000,000 | | | | 1,029,090 | |
City & County of Honolulu HI, 3.974%, 09/01/35 | | | 1,475,000 | | | | 1,598,443 | |
City & County of San Francisco CA Community Facilities District No 2014-1, 4.221%, 09/01/39 | | | 1,000,000 | | | | 1,059,570 | |
City & County of San Francisco CA Community Facilities District No 2014-1, 4.000%, 09/01/48 | | | 2,000,000 | | | | 2,079,780 | |
City of Los Angeles CA Wastewater System Revenue, 3.144%, 06/01/26 | | | 2,000,000 | | | | 2,094,620 | |
City of Los Angeles CA Wastewater System Revenue, 4.029%, 06/01/39 | | | 1,020,000 | | | | 1,095,388 | |
SEE NOTES TO FINANCIAL STATEMENTS | 98 | |
December 31, 2019 |
Schedules of Investments, continued |
Pax Core Bond Fund, continued
Percent of Net Assets
Name of Issuer and
Title of Issue | | Shares/
Principal | | | Value | |
BONDS, continued |
MUNICIPAL BONDS, continued |
City of San Francisco CA Public Utilities Commission Water Revenue, 6.000%, 11/01/40 | | $ | 2,815,000 | | | $ | 3,658,007 | |
Metropolitan Transportation Authority, 6.089%, 11/15/40 | | | 1,595,000 | | | | 2,144,414 | |
New York City Transitional Finance Authority Future Tax Secured Revenue, 5.767%, 08/01/36 | | | 2,000,000 | | | | 2,486,700 | |
New York City Water & Sewer System, 5.440%, 06/15/43 | | | 2,500,000 | | | | 3,441,600 | |
Ohio State University, The, 4.910%, 06/01/40 | | | 2,485,000 | | | | 3,171,357 | |
Santa Clara Valley Water District, 3.369%, 06/01/27 | | | 1,305,000 | | | | 1,382,126 | |
State of California, 7.550%, 04/01/39 | | | 2,000,000 | | | | 3,211,920 | |
State of Georgia, 4.310%, 10/01/26 | | | 2,000,000 | | | | 2,240,860 | |
State of Oregon, 3.227%, 05/01/24 | | | 1,000,000 | | | | 1,047,330 | |
University of Massachusetts Building Authority, 6.573%, 05/01/39 | | | 125,000 | | | | 125,410 | |
University of Massachusetts Building Authority, 5.450%, 11/01/40 | | | 2,225,000 | | | | 2,876,591 | |
Virginia Resources Authority, 5.790%, 11/01/40 | | | 2,655,000 | | | | 2,738,367 | |
| |
TOTAL MUNICIPAL BONDS |
(Cost $36,150,494) | | | 37,980,618 | |
| | | | | | | | | |
U.S. TREASURY NOTES: 23.9% |
1.250%, 07/15/20 (TIPS) | | | 4,719,760 | | | | 4,764,988 | |
2.750%, 09/30/20 | | | 17,000,000 | | | | 17,138,125 | |
2.375%, 03/15/21 | | | 7,000,000 | | | | 7,061,797 | |
0.125%, 04/15/21 (TIPS) | | | 3,257,220 | | | | 3,250,650 | |
0.125%, 04/15/22 (TIPS) | | | 6,348,660 | | | | 6,339,830 | |
2.125%, 11/30/23 | | | 15,000,000 | | | | 15,270,410 | |
Percent of Net Assets
Name of Issuer and
Title of Issue | | Shares/
Principal | | | Value | |
BONDS, continued |
U.S. TREASURY NOTES, continued |
0.125%, 07/15/24 (TIPS) | | $ | 4,334,920 | | | $ | 4,361,469 | |
1.500%, 10/31/24 | | | 29,000,000 | | | | 28,763,242 | |
0.625%, 01/15/26 (TIPS) | | | 3,248,910 | | | | 3,349,212 | |
2.250%, 03/31/26 | | | 7,000,000 | | | | 7,194,414 | |
0.375%, 07/15/27 (TIPS) | | | 10,519,500 | | | | 10,733,219 | |
2.750%, 02/15/28 | | | 1,000,000 | | | | 1,066,367 | |
4.500%, 02/15/36 (e) | | | 7,000,000 | | | | 9,296,191 | |
5.000%, 05/15/37 | | | 2,000,000 | | | | 2,835,781 | |
4.500%, 05/15/38 | | | 3,000,000 | | | | 4,061,367 | |
3.500%, 02/15/39 | | | 6,000,000 | | | | 7,205,508 | |
4.375%, 11/15/39 | | | 6,000,000 | | | | 8,045,977 | |
1.000%, 02/15/48 (TIPS) | | | 1,043,510 | | | | 1,155,685 | |
2.375%, 11/15/49 | | | 28,000,000 | | | | 27,993,437 | |
| | | | | | | | | |
TOTAL U.S. TREASURY NOTES |
(Cost $167,658,520) | | | 169,887,669 | |
| | | | | | | | | |
MORTGAGE-BACKED SECURITIES: 31.3% |
Ginnie Mae (Mortgage-Backed): 1.5% |
1.550%, 06/16/36 | | | 2,438,614 | | | | 2,411,920 | |
6.000%, 01/15/38 | | | 204,133 | | | | 230,998 | |
3.020%, 09/15/41 | | | 1,823,927 | | | | 1,844,041 | |
3.000%, 05/15/43 | | | 1,309,639 | | | | 1,351,385 | |
3.500%, 11/20/46 | | | 1,197,398 | | | | 1,244,481 | |
2.901%, 09/16/50 (d) | | | 2,000,000 | | | | 2,026,951 | |
2.677%, 03/16/55 (d) | | | 1,785,619 | | | | 1,808,950 | |
| | | | | | | | 10,918,726 | |
Freddie Mac (Mortgage-Backed): 7.5% |
4.000%, 06/01/26 | | | 1,853,628 | | | | 1,939,381 | |
2.939%, 04/25/29 | | | 3,000,000 | | | | 3,121,225 | |
2.412%, 08/25/29 | | | 2,000,000 | | | | 1,995,364 | |
3.500%, 12/01/30 | | | 1,187,549 | | | | 1,230,653 | |
3.000%, 07/01/33 | | | 1,511,278 | | | | 1,547,357 | |
4.500%, 01/01/34 | | | 1,837,172 | | | | 1,945,443 | |
3.500%, 01/01/34 | | | 1,284,092 | | | | 1,345,767 | |
3.000%, 12/01/34 | | | 2,000,000 | | | | 2,051,749 | |
4.000%, 10/01/35 | | | 2,595,251 | | | | 2,765,393 | |
3.500%, 04/01/42 | | | 1,115,729 | | | | 1,180,852 | |
2.436%, 01/01/43 (d) | | | 1,637,442 | | | | 1,655,374 | |
3.500%, 01/01/44 | | | 1,699,609 | | | | 1,798,732 | |
4.000%, 08/01/44 | | | 1,054,877 | | | | 1,134,011 | |
3.500%, 02/01/45 | | | 1,727,221 | | | | 1,851,938 | |
3.000%, 06/01/46 | | | 2,026,353 | | | | 2,097,317 | |
3.000%, 01/01/47 | | | 2,531,360 | | | | 2,606,570 | |
4.000%, 08/01/47 | | | 1,367,194 | | | | 1,438,028 | |
3.500%, 08/01/47 | | | 2,459,866 | | | | 2,555,019 | |
| | 99 | SEE NOTES TO FINANCIAL STATEMENTS |
December 31, 2019 |
Schedules of Investments, continued |
Pax Core Bond Fund, continued
Percent of Net Assets
Name of Issuer and
Title of Issue | | Shares/
Principal | | | Value | |
BONDS, continued |
MORTGAGE-BACKED SECURITIES, continued |
Freddie Mac (Mortgage-Backed), continued |
3.500%, 09/01/47 | | $ | 1,651,043 | | | $ | 1,715,012 | |
3.500%, 10/01/47 | | | 2,528,448 | | | | 2,626,458 | |
3.500%, 12/01/47 | | | 1,681,730 | | | | 1,747,040 | |
3.500%, 03/01/48 | | | 2,447,396 | | | | 2,545,772 | |
4.000%, 04/01/48 | | | 4,966,461 | | | | 5,193,728 | |
3.500%, 05/01/48 | | | 2,462,920 | | | | 2,552,323 | |
3.500%, 06/01/49 | | | 2,365,159 | | | | 2,443,773 | |
| | | | | | | | 53,084,279 | |
Fannie Mae (Mortgage-Backed): 13.8% |
2.480%, 08/01/26 | | | 1,952,922 | | | | 1,953,713 | |
2.894%, 02/25/27 (d) | | | 1,000,000 | | | | 1,031,893 | |
3.270%, 09/01/27 | | | 2,337,011 | | | | 2,430,686 | |
3.058%, 09/25/27 (d) | | | 2,000,000 | | | | 2,087,507 | |
3.436%, 06/25/28 (d) | | | 2,000,000 | | | | 2,132,340 | |
3.673%, 09/25/28 (d) | | | 2,034,000 | | | | 2,205,183 | |
3.660%, 01/01/29 | | | 1,972,296 | | | | 2,099,193 | |
2.937%, 04/25/29 | | | 2,000,000 | | | | 2,073,969 | |
4.500%, 04/01/34 | | | 1,170,019 | | | | 1,259,452 | |
3.500%, 07/01/35 | | | 1,539,032 | | | | 1,610,075 | |
3.500%, 09/01/37 | | | 1,436,223 | | | | 1,502,492 | |
4.000%, 03/01/38 | | | 2,300,264 | | | | 2,455,805 | |
4.000%, 02/01/41 | | | 3,015,904 | | | | 3,255,491 | |
4.000%, 01/01/42 | | | 2,946,426 | | | | 3,179,813 | |
4.000%, 07/01/42 | | | 2,615,706 | | | | 2,798,464 | |
3.500%, 01/01/43 | | | 3,342,331 | | | | 3,514,480 | |
4.125%, 09/01/43 (d) | | | 638,924 | | | | 664,104 | |
3.500%, 08/01/45 | | | 2,076,269 | | | | 2,191,446 | |
4.000%, 09/01/45 | | | 1,581,847 | | | | 1,694,642 | |
4.000%, 10/01/45 | | | 1,354,897 | | | | 1,419,933 | |
3.500%, 10/01/45 | | | 1,780,236 | | | | 1,867,304 | |
4.000%, 11/01/45 | | | 3,525,378 | | | | 3,736,932 | |
3.500%, 04/01/46 | | | 1,534,033 | | | | 1,609,272 | |
4.000%, 06/01/46 | | | 1,525,720 | | | | 1,613,378 | |
3.000%, 06/01/46 | | | 2,888,710 | | | | 2,959,541 | |
4.000%, 07/01/46 | | | 1,967,523 | | | | 2,085,031 | |
4.500%, 09/01/46 | | | 1,840,404 | | | | 1,997,507 | |
3.000%, 10/01/46 | | | 1,481,591 | | | | 1,517,918 | |
4.500%, 01/01/47 | | | 1,061,361 | | | | 1,122,703 | |
4.000%, 01/01/47 | | | 1,481,820 | | | | 1,560,604 | |
4.000%, 05/01/47 | | | 4,633,910 | | | | 4,886,488 | |
4.000%, 06/01/47 | | | 3,950,689 | | | | 4,142,994 | |
3.500%, 06/01/47 | | | 2,337,668 | | | | 2,463,019 | |
3.500%, 08/01/47 | | | 1,579,265 | | | | 1,640,578 | |
3.500%, 11/01/47 | | | 2,477,306 | | | | 2,616,875 | |
Percent of Net Assets
Name of Issuer and
Title of Issue | | Shares/
Principal | | | Value | |
BONDS, continued |
MORTGAGE-BACKED SECURITIES, continued |
Fannie Mae (Mortgage-Backed), continued |
4.000%, 01/01/48 | | $ | 2,470,891 | | | $ | 2,639,411 | |
3.500%, 03/01/48 | | | 1,814,983 | | | | 1,882,149 | |
3.500%, 04/01/48 | | | 3,506,710 | | | | 3,728,387 | |
4.500%, 06/01/48 | | | 1,390,762 | | | | 1,476,298 | |
3.500%, 06/01/48 | | | 2,823,689 | | | | 2,963,808 | |
3.000%, 10/01/48 | | | 1,690,479 | | | | 1,719,644 | |
3.500%, 07/01/49 | | | 1,960,115 | | | | 2,036,541 | |
3.500%, 09/01/49 | | | 1,920,946 | | | | 1,987,313 | |
3.000%, 09/01/49 | | | 1,980,550 | | | | 2,026,219 | |
| | | | | | | | 97,840,595 | |
Commercial Mortgage-Backed: 8.5% |
Aqua Finance Trust 2019-A, 144A, 3.140%, 07/16/40 (c) | | | 931,157 | | | | 934,482 | |
Arroyo Mortgage Trust 2018-1, 144A, 3.763%, 04/25/48 (c)(d) | | | 1,654,688 | | | | 1,678,420 | |
Avis Budget Rental Car Funding AESOP, LLC, 144A, 2.360%, 03/20/26 (c) | | | 2,000,000 | | | | 1,984,076 | |
Bayview Opportunity Master Fund IVa Trust 2016, 144A, 4.000%, 04/28/55 (c) | | | 1,149,966 | | | | 1,177,244 | |
Bellemeade Re 2018-1, Ltd., 1 month LIBOR + 1.35%, 144A, 3.308%, 04/25/28 (c)(d) | | | 768,330 | | | | 769,665 | |
Bellemeade Re 2018-2, Ltd., 1 month LIBOR + 1.35%, 144A, 3.058%, 08/25/28 (c)(d) | | | 2,000,000 | | | | 2,005,588 | |
Carmax Auto Owner Trust 2019-4, 2.800%, 04/15/26 | | | 2,000,000 | | | | 1,996,791 | |
COLT 2019-2 Mortgage Loan Trust, 144A, 3.337%, 05/25/49 (c)(d) | | | 1,380,165 | | | | 1,384,091 | |
Commonbond Student Loan Trust 2018-C-GS, 144A, 3.870%, 02/25/46 (c) | | | 2,380,807 | | | | 2,439,902 | |
SEE NOTES TO FINANCIAL STATEMENTS | 100 | |
December 31, 2019 |
Schedules of Investments, continued |
Pax Core Bond Fund, continued
Percent of Net Assets
Name of Issuer and
Title of Issue | | Shares/
Principal | | | Value | |
BONDS, continued |
MORTGAGE-BACKED SECURITIES, continued |
Commercial Mortgage-Backed, continued |
Commonbond Student Loan Trust 2019-A-GS, 144A, 2.540%, 01/25/47 (c) | | $ | 989,147 | | | $ | 980,859 | |
Deephaven Residential Mortgage Trust 2018-2, 144A, 3.479%, 04/25/58 (c)(d) | | | 840,514 | | | | 847,774 | |
Dell Equipment Finance Trust 2019-1, 144A, 3.450%, 03/24/25 (c) | | | 1,305,000 | | | | 1,325,356 | |
Drive Auto Receivables Trust, 4.090%, 01/15/26 | | | 2,000,000 | | | | 2,056,443 | |
Invitation Homes 2018-SFR4 Trust, 1 month LIBOR + 1.20%, 144A, 3.016%, 01/17/38 (c)(d) | | | 2,000,000 | | | | 2,002,876 | |
Mastr Asset Backed Securities Trust 2007-NCW, 1 month LIBOR + 0.60%, 144A, 2.308%, 05/25/37 (a)(c)(d) | | | 1,420,270 | | | | 1,384,243 | |
Mill City Mortgage Trust 2015-1, 144A, 3.812%, 06/25/56 (c)(d) | | | 2,000,000 | | | | 2,083,040 | |
Mill City Solar Loan 2019-1, Ltd., 144A, 4.340%, 03/20/43 (c) | | | 873,216 | | | | 904,433 | |
Mill City Solar Loan 2019-2, Ltd., 144A, 3.690%, 07/20/43 (c) | | | 945,622 | | | | 956,753 | |
Mosaic Solar Loan Trust 2018-1, 144A, 4.010%, 06/22/43 (c) | | | 1,304,579 | | | | 1,341,077 | |
Mosaic Solar Loan Trust 2019-2, 144A, 2.880%, 09/20/40 (c) | | | 987,702 | | | | 988,189 | |
Mosaic Solar Loans 2017-1 LLC, 144A, 4.450%, 06/20/42 (c) | | | 927,984 | | | | 965,098 | |
Mosaic Solar Loans 2017-2 LLC, 144A, 3.820%, 06/22/43 (c) | | | 623,681 | | | | 635,757 | |
Percent of Net Assets
Name of Issuer and
Title of Issue | | Shares/
Principal | | | Value | |
BONDS, continued |
MORTGAGE-BACKED SECURITIES, continued |
Commercial Mortgage-Backed, continued |
Mosaic Solar Loans 2017-2 LLC, 144A, 2.000%, 06/22/43 (c) | | $ | 1,574,037 | | | $ | 1,504,264 | |
Navistar Financial Dealer Note Master Owner Trust II, 1 month LIBOR + 1.05%, 144A, 2.758%, 09/25/23 (c)(d) | | | 2,890,000 | | | | 2,897,583 | |
New Residential Mortgage Loan Trust 2018-4, 1 month LIBOR + 0.90%, 144A, 2.608%, 01/25/48 (c)(d) | | | 1,285,212 | | | | 1,285,061 | |
New Residential Mortgage Loan Trust 2019-2, 144A, 4.250%, 12/25/57 (c)(d) | | | 2,227,080 | | | | 2,335,021 | |
New Residential Mortgage Loan Trust 2019-4, 144A, 3.500%, 12/25/58 (c)(d) | | | 920,503 | | | | 943,755 | |
New Residential Mortgage Loan Trust 2019-5, 144A, 3.500%, 08/25/59 (c)(d) | | | 1,349,147 | | | | 1,379,895 | |
Radnor RE 2018-1, Ltd., 1 month LIBOR + 1.40%, 144A, 3.108%, 03/25/28 (c)(d) | | | 1,344,289 | | | | 1,344,517 | |
Santander Drive Auto Receivables Trust 2018-5, 4.190%, 12/16/24 | | | 1,250,000 | | | | 1,286,734 | |
Sequoia Mortgage Trust 2017-CH2, 144A, 4.000%, 12/25/47 (c)(d) | | | 527,439 | | | | 547,840 | |
Sequoia Mortgage Trust 2018-CH1, 144A, 4.000%, 02/25/48 (c)(d) | | | 796,771 | | | | 809,020 | |
SoFi Professional Loan Program 2015-d, LLC, 144A, 3.590%, 10/26/37 (c) | | | 1,579,730 | | | | 1,604,185 | |
| | 101 | SEE NOTES TO FINANCIAL STATEMENTS |
December 31, 2019 |
Schedules of Investments, continued |
Pax Core Bond Fund, continued
Percent of Net Assets
Name of Issuer and
Title of Issue | | Shares/
Principal | | | Value | |
BONDS, continued |
MORTGAGE-BACKED SECURITIES, continued |
Commercial Mortgage-Backed, continued |
SoFi Professional Loan Program 2017-B, LLC, 144A, 3.700%, 05/25/40 (c)(d) | | $ | 1,400,000 | | | $ | 1,447,223 | |
Sofi Professional Loan Program 2018-B Trust, 144A, 3.340%, 08/25/47 (c) | | | 2,000,000 | | | | 2,035,022 | |
SoFi Professional Loan Program 2019-A, LLC, 144A, 3.180%, 06/15/48 (c) | | | 601,285 | | | | 606,670 | |
Sunrun Athena Issuer 2018-1, LLC, 144A, 5.310%, 04/30/49 (c) | | | 968,278 | | | | 1,042,906 | |
Sunrun Atlas Issuer 2019-2, LLC, 144A, 3.610%, 02/01/55 (c) | | | 1,000,000 | | | | 991,250 | |
Tesla Auto Lease Trust 2018-A, 144A, 2.750%, 02/20/20 (c) | | | 4,963 | | | | 4,964 | |
Tesla Auto Lease Trust 2018-B, 144A, 3.710%, 08/20/21 (c) | | | 1,464,730 | | | | 1,484,080 | |
Tesla Auto Lease Trust 2018-B, 144A, 5.290%, 11/22/21 (c) | | | 2,000,000 | | | | 2,064,720 | |
Towd Point Mortgage Trust, 144A, 3.799%, 11/25/60 (c)(d) | | | 2,000,000 | | | | 2,094,547 | |
Towd Point Mortgage Trust, 1 month LIBOR + 0.60%, 144A, 3.750%, 11/25/57 (c)(d) | | | 1,000,000 | | | | 1,031,116 | |
Percent of Net Assets
Name of Issuer and
Title of Issue | | Shares/
Principal | | | Value | |
BONDS, continued |
MORTGAGE-BACKED SECURITIES, continued |
Commercial Mortgage-Backed, continued |
Vivint Solar Financing V, LLC, 144A, 4.730%, 04/30/48 (c) | | $ | 980,844 | | | $ | 1,024,999 | |
| | | | | | | | 60,607,529 | |
TOTAL MORTGAGE-BACKED SECURITIES |
(Cost $218,791,395) | | | 222,451,129 | |
| | | | | | | | | |
TOTAL BONDS |
(Cost $648,081,245) | | | 666,489,531 | |
| | | | | | | | | |
CERTIFICATES OF DEPOSIT: 0.1% |
Community Credit Union of Lynn, 2.200%, 11/29/22 (a) | | | 250,000 | | | | 252,814 | |
Self-Help Federal Credit Union, 1.700%, 04/13/20 (a) | | | 250,000 | | | | 250,034 | |
Self-Help Federal Credit Union, 1.900%, 12/20/21 (a) | | | 250,000 | | | | 250,994 | |
| |
TOTAL CERTIFICATES OF DEPOSIT |
(Cost $750,000) | | | 753,842 | |
| | | | | | | | | |
MONEY MARKET: 2.4% |
State Street Institutional U.S. Government Money Market Fund, 1.530% (f)(g) | | | 16,777,039 | | | | 16,777,039 | |
(Cost $16,777,039) | | | | | | | | |
| |
SEE NOTES TO FINANCIAL STATEMENTS | 102 | |
December 31, 2019 |
Schedules of Investments, continued |
Pax Core Bond Fund, continued
Percent of Net Assets
Name of Issuer and
Title of Issue | | Shares/
Principal | | | Value | |
SECURITIES PURCHASED WITH CASH COLLATERAL FROM SECURITIES LENDING: 0.1% |
State Street Navigator Securities Lending Government Money Market Portfolio, 1.580% (f)(g) | | | 669,300 | | | $ | 669,300 | |
(Cost $669,300) |
| |
TOTAL INVESTMENTS: 99.5% |
(Cost $687,596,812) | | | 706,274,748 | |
| | | | | | | | | |
PAYABLE UPON RETURN OF SECURITIES LOANED (NET): -0.1% | | | (669,300 | ) |
| | | | | | | | | |
OTHER ASSETS AND LIABILITIES — (NET): 0.6% | | | 4,085,950 | |
| | | | | | | | | |
NET ASSETS: 100.0% | | $ | 709,691,398 | |
(b) | Security valued using significant unobservable inputs. |
(c) | Security purchased pursuant to Rule 144A of the Securities Act of 1933 and may be resold only to qualified institutional buyers. |
(d) | Rate shown reflects the accrual rate as of December 31, 2019 on securities with variable or step rates. |
(e) | Security of partial position of this security was on loan as of December 31, 2019. The total market value of securities on loan as of December 31, 2019 was $10,066,103. |
(f) | Rate shown represents annualized 7-day yield as of December 31, 2019. |
| LIBOR - | London Inter-bank Offered Rate. At December 31, 2019 the 1 month and 3 month LIBOR rates were 1.763% and 1.908%, respectively. |
| TIPS - | Treasury Inflation Protected Securities |
| | 103 | SEE NOTES TO FINANCIAL STATEMENTS |
December 31, 2019 |
Schedules of Investments, continued |
Pax High Yield Bond Fund
Percent of Net Assets
Name of Issuer and
Title of Issue | | Shares/
Principal/
Contracts | | | Value | |
COMMON STOCKS: 0.0% |
Health Care: 0.0% |
Interactive Health, Inc. (a)(b)(c) | | | 706 | | | $ | 0 | |
| | | | | | | | | |
TOTAL COMMON STOCKS |
(Cost $178,981) | | | 0 | |
| | | | | | | | | |
PREFERRED STOCKS: 1.0% |
Health Care: 0.4% |
Avantor, Inc., 6.250% | | | 20,000 | | | | 1,260,000 | |
Interactive Health, Inc., 0.000% (a)(b)(c) | | | 1,412 | | | | 0 | |
| | | | | | | | 1,260,000 | |
Leisure: 0.6% |
RLJ Lodging Trust, REIT, 1.950% | | | 80,000 | | | | 2,296,800 | |
| | | | | | | | | |
TOTAL PREFERRED STOCKS |
(Cost $3,479,066) | | | 3,556,800 | |
| | | | | | | | | |
BONDS: 95.3% |
CORPORATE BONDS: 94.1% |
Automotive: 2.4% |
Allison Transmission, Inc., 144A, 5.000%, 10/01/24 (d) | | $ | 1,000,000 | | | | 1,026,240 | |
Allison Transmission, Inc., 144A, 4.750%, 10/01/27 (d) | | | 500,000 | | | | 520,174 | |
Gates Global, LLC/Co., 144A, 6.250%, 01/15/26 (d) | | | 2,000,000 | | | | 2,038,090 | |
IHO Verwaltungs GmbH, 144A, 6.000%, 05/15/27 (d) | | | 2,000,000 | | | | 2,125,695 | |
Meritor, Inc., 6.250%, 02/15/24 | | | 2,225,000 | | | | 2,286,443 | |
Nexteer Automotive Group Ltd., 144A, 5.875%, 11/15/21 (d) | | | 1,000,000 | | | | 1,017,238 | |
| | | | | | | | 9,013,880 | |
Banking: 2.2% |
Ally Financial, Inc., 4.250%, 04/15/21 | | | 1,000,000 | | | | 1,024,320 | |
Percent of Net Assets
Name of Issuer and
Title of Issue | | Shares/
Principal/
Contracts | | | Value | |
BONDS, continued |
CORPORATE BONDS, continued |
Banking, continued |
Ally Financial, Inc., 4.125%, 02/13/22 | | $ | 1,500,000 | | | $ | 1,551,420 | |
Ally Financial, Inc., 3.875%, 05/21/24 | | | 1,000,000 | | | | 1,049,585 | |
Ally Financial, Inc., 5.750%, 11/20/25 | | | 2,000,000 | | | | 2,242,500 | |
Ally Financial, Inc., 8.000%, 11/01/31 | | | 1,000,000 | | | | 1,389,950 | |
CIT Bank NA, 2.969%, 09/27/25 (e) | | | 1,000,000 | | | | 999,375 | |
| | | | | | | | 8,257,150 | |
Basic Industry: 11.4% |
Advanced Drainage Systems, Inc., 144A, 5.000%, 09/30/27 (d) | | | 1,000,000 | | | | 1,034,098 | |
Alcoa Nederland Holding BV, 144A, 7.000%, 09/30/26 (d) | | | 1,000,000 | | | | 1,093,150 | |
Alcoa Nederland Holding BV, 144A, 6.125%, 05/15/28 (d) | | | 500,000 | | | | 542,175 | |
Arconic, Inc., 5.900%, 02/01/27 | | | 2,000,000 | | | | 2,292,366 | |
Boise Cascade Co., 144A, 5.625%, 09/01/24 (d) | | | 2,000,000 | | | | 2,085,830 | |
Cleveland-Cliffs, Inc., 144A, 4.875%, 01/15/24 (d) | | | 950,000 | | | | 972,909 | |
Core & Main Holdings, LP, 144A, 8.625%, 09/15/24 (d) | | | 1,000,000 | | | | 1,042,915 | |
Core & Main, LP, 144A, 6.125%, 08/15/25 (d) | | | 1,500,000 | | | | 1,567,485 | |
Foxtrot Escrow Issuer, LLC/Corp., 144A, 12.250%, 11/15/26 (d) | | | 1,000,000 | | | | 1,043,124 | |
FXI Holdings, Inc., 144A, 7.875%, 11/01/24 (d) | | | 1,000,000 | | | | 962,490 | |
Kaiser Aluminum Corp., 144A, 4.625%, 03/01/28 (d) | | | 1,000,000 | | | | 1,027,850 | |
Koppers, Inc., 144A, 6.000%, 02/15/25 (d) | | | 1,000,000 | | | | 1,049,990 | |
SEE NOTES TO FINANCIAL STATEMENTS | 104 | |
December 31, 2019 |
Schedules of Investments, continued |
Pax High Yield Bond Fund, continued
Percent of Net Assets
Name of Issuer and
Title of Issue | | Shares/
Principal/
Contracts | | | Value | |
BONDS, continued |
CORPORATE BONDS, continued |
Basic Industry, continued |
Kraton Polymers, LLC/Capital Corp., 144A, 7.000%, 04/15/25 (d) | | $ | 1,500,000 | | | $ | 1,549,215 | |
Lennar Corp., 4.750%, 05/30/25 | | | 500,000 | | | | 538,543 | |
Lennar Corp., 5.250%, 06/01/26 | | | 2,000,000 | | | | 2,195,694 | |
Mercer International, Inc., 7.375%, 01/15/25 | | | 1,000,000 | | | | 1,079,365 | |
Neon Holdings, Inc., 144A, 10.125%, 04/01/26 (d) | | | 1,000,000 | | | | 997,373 | |
New Enterprise Stone & Lime Co., Inc., 144A, 10.125%, 04/01/22 (d) | | | 1,500,000 | | | | 1,592,343 | |
New Enterprise Stone & Lime Co., Inc., 144A, 6.250%, 03/15/26 (d) | | | 950,000 | | | | 997,830 | |
New Gold, Inc., 144A, 6.250%, 11/15/22 (d) | | | 500,000 | | | | 498,903 | |
New Gold, Inc., 144A, 6.375%, 05/15/25 (d) | | | 1,000,000 | | | | 927,725 | |
Novelis Corp., 144A, 5.875%, 09/30/26 (d) | | | 1,500,000 | | | | 1,599,641 | |
SPCM SA, 144A, 4.875%, 09/15/25 (d) | | | 950,000 | | | | 990,366 | |
Standard Industries, Inc., 144A, 6.000%, 10/15/25 (d) | | | 1,500,000 | | | | 1,580,610 | |
Standard Industries, Inc., 144A, 5.000%, 02/15/27 (d) | | | 2,000,000 | | | | 2,089,645 | |
Starfruit Finco BV/US Holdco, LLC, 144A, 8.000%, 10/01/26 (d) | | | 1,000,000 | | | | 1,062,525 | |
Taylor Morrison Communities, Inc./Holdings II, Inc., 144A, 5.625%, 03/01/24 (d) | | | 1,550,000 | | | | 1,674,643 | |
TRI Pointe Group, Inc., 5.250%, 06/01/27 | | | 1,000,000 | | | | 1,047,848 | |
Univar Solutions USA, Inc., 144A, 5.125%, 12/01/27 (d) | | | 2,000,000 | | | | 2,091,260 | |
Percent of Net Assets
Name of Issuer and
Title of Issue | | Shares/
Principal/
Contracts | | | Value | |
BONDS, continued |
CORPORATE BONDS, continued |
Basic Industry, continued |
US Concrete, Inc., 6.375%, 06/01/24 | | $ | 2,000,000 | | | $ | 2,091,670 | |
USG Corp., 144A, 4.875%, 06/01/27 (d) | | | 2,000,000 | | | | 2,000,000 | |
WESCO Distribution, Inc., 5.375%, 06/15/24 | | | 1,500,000 | | | | 1,560,623 | |
| | | | | | | | 42,880,204 | |
Capital Goods: 6.7% |
ARD Finance SA, 144A, 6.500%, 06/30/27 (d) | | | 2,000,000 | | | | 2,071,600 | |
Ardagh Packaging Finance, PLC/Holdings USA, Inc., 144A, 4.125%, 08/15/26 (d) | | | 1,000,000 | | | | 1,026,874 | |
Ardagh Packaging Finance, PLC/Holdings USA, Inc., 144A, 5.250%, 08/15/27 (d) | | | 1,000,000 | | | | 1,054,370 | |
Bombardier, Inc., 144A, 8.750%, 12/01/21 (d) | | | 2,500,000 | | | | 2,744,688 | |
Bombardier, Inc., 144A, 7.500%, 12/01/24 (d) | | | 1,000,000 | | | | 1,052,715 | |
Bombardier, Inc., 144A, 7.500%, 03/15/25 (d) | | | 1,000,000 | | | | 1,033,740 | |
Crown Americas, LLC/Crown Americas Capital Corp. VI, 4.750%, 02/01/26 | | | 1,650,000 | | | | 1,747,511 | |
EnerSys, 144A, 4.375%, 12/15/27 (d) | | | 1,000,000 | | | | 990,100 | |
F-Brasile SpA/US, LLC, 144A, 7.375%, 08/15/26 (d) | | | 1,000,000 | | | | 1,060,000 | |
Manitowoc Co, Inc., The, 144A, 9.000%, 04/01/26 (d) | | | 1,500,000 | | | | 1,574,809 | |
Mueller Water Products, Inc., 144A, 5.500%, 06/15/26 (d) | | | 2,000,000 | | | | 2,113,194 | |
OI European Group BV, 144A, 4.000%, 03/15/23 (d) | | | 2,000,000 | | | | 2,020,830 | |
| | 105 | SEE NOTES TO FINANCIAL STATEMENTS |
December 31, 2019 |
Schedules of Investments, continued |
Pax High Yield Bond Fund, continued
Percent of Net Assets
Name of Issuer and
Title of Issue | | Shares/
Principal/
Contracts | | | Value | |
BONDS, continued |
CORPORATE BONDS, continued |
Capital Goods, continued |
Owens-Brockway Glass Container, Inc., 144A, 6.375%, 08/15/25 (d) | | $ | 1,500,000 | | | $ | 1,642,500 | |
RBS Global, Inc./Rexnord, LLC, 144A, 4.875%, 12/15/25 (d) | | | 1,000,000 | | | | 1,034,990 | |
Vertiv Group Corp., 144A, 9.250%, 10/15/24 (d) | | | 1,950,000 | | | | 2,100,316 | |
Vertiv Intermediate Holding Corp., 144A, 12.000%, 02/15/22 (d) | | | 500,000 | | | | 520,156 | |
Wolverine Escrow, LLC, 144A, 8.500%, 11/15/24 (d) | | | 1,000,000 | | | | 1,037,085 | |
Wolverine Escrow, LLC, 144A, 13.125%, 11/15/27 (d) | | | 500,000 | | | | 515,000 | |
| | | | | | | | 25,340,478 | |
Consumer Goods: 5.6% |
Central Garden & Pet Co, 5.125%, 02/01/28 | | | 1,000,000 | | | | 1,037,848 | |
Cott Holdings, Inc., 144A, 5.500%, 04/01/25 (d) | | | 1,500,000 | | | | 1,570,627 | |
KeHE Distributors, LLC/Finance Corp., 144A, 8.625%, 10/15/26 (d) | | | 1,000,000 | | | | 1,049,375 | |
Lamb Weston Holdings, Inc., 144A, 4.625%, 11/01/24 (d) | | | 1,000,000 | | | | 1,063,335 | |
Performance Food Group, Inc., 144A, 5.500%, 06/01/24 (d) | | | 2,500,000 | | | | 2,569,787 | |
Performance Food Group, Inc., 144A, 5.500%, 10/15/27 (d) | | | 250,000 | | | | 267,819 | |
Post Holdings, Inc., 144A, 5.000%, 08/15/26 (d) | | | 500,000 | | | | 529,050 | |
Post Holdings, Inc., 144A, 5.750%, 03/01/27 (d) | | | 1,000,000 | | | | 1,074,822 | |
Post Holdings, Inc., 144A, 5.500%, 12/15/29 (d) | | | 2,000,000 | | | | 2,136,300 | |
Prestige Brands, Inc., 144A, 6.375%, 03/01/24 (d) | | | 2,000,000 | | | | 2,084,170 | |
Percent of Net Assets
Name of Issuer and
Title of Issue | | Shares/
Principal/
Contracts | | | Value | |
BONDS, continued |
CORPORATE BONDS, continued |
Consumer Goods, continued |
Prestige Brands, Inc., 144A, 5.125%, 01/15/28 (d) | | $ | 500,000 | | | $ | 525,000 | |
Sigma Holdco BV, 144A, 7.875%, 05/15/26 (d) | | | 1,000,000 | | | | 1,001,900 | |
Spectrum Brands, Inc., 6.125%, 12/15/24 | | | 1,000,000 | | | | 1,035,415 | |
Spectrum Brands, Inc., 144A, 5.000%, 10/01/29 (d) | | | 1,000,000 | | | | 1,035,348 | |
Tempur Sealy International, Inc., 5.500%, 06/15/26 | | | 2,000,000 | | | | 2,111,200 | |
US Foods, Inc., 144A, 5.875%, 06/15/24 (d) | | | 2,000,000 | | | | 2,064,170 | |
| | | | | | | | 21,156,166 | |
Energy: 7.3% |
Antero Resources Corp., 5.625%, 06/01/23 | | | 1,000,000 | | | | 805,000 | |
Archrock Partners, LP/Finance Corp., 6.000%, 10/01/22 | | | 1,000,000 | | | | 1,010,312 | |
Archrock Partners, LP/Finance Corp., 144A, 6.875%, 04/01/27 (d) | | | 1,000,000 | | | | 1,059,823 | |
Archrock Partners, LP/Finance Corp., 144A, 6.250%, 04/01/28 (d) | | | 500,000 | | | | 516,250 | |
Ascent Resources Utica Holdings, LLC/ARU Finance Corp., 144A, 7.000%, 11/01/26 (d) | | | 500,000 | | | | 400,174 | |
Cheniere Corpus Christi Holdings, LLC, 5.125%, 06/30/27 | | | 1,000,000 | | | | 1,107,030 | |
DCP Midstream Operating, LP, 5.125%, 05/15/29 | | | 1,000,000 | | | | 1,039,349 | |
Extraction Oil & Gas, Inc., 144A, 7.375%, 05/15/24 (d) | | | 500,000 | | | | 313,958 | |
Extraction Oil & Gas, Inc., 144A, 5.625%, 02/01/26 (d) | | | 475,000 | | | | 286,353 | |
Genesis Energy, LP/Finance Corp., 5.625%, 06/15/24 | | | 1,000,000 | | | | 967,915 | |
SEE NOTES TO FINANCIAL STATEMENTS | 106 | |
December 31, 2019 |
Schedules of Investments, continued |
Pax High Yield Bond Fund, continued
Percent of Net Assets
Name of Issuer and
Title of Issue | | Shares/
Principal/
Contracts | | | Value | |
BONDS, continued |
CORPORATE BONDS, continued |
Energy, continued |
Genesis Energy, LP/Finance Corp., 6.500%, 10/01/25 | | $ | 250,000 | | | $ | 242,498 | |
Global Partners, LP/GLP Finance Corp., 144A, 7.000%, 08/01/27 (d) | | | 1,000,000 | | | | 1,065,348 | |
Hess Midstream Operations, LP, 144A, 5.625%, 02/15/26 (d) | | | 950,000 | | | | 991,047 | |
Laredo Petroleum, Inc., 6.250%, 03/15/23 | | | 1,500,000 | | | | 1,410,622 | |
Oasis Petroleum, Inc., 144A, 6.250%, 05/01/26 (d) | | | 2,000,000 | | | | 1,665,050 | |
Parkland Fuel Corp., 144A, 6.000%, 04/01/26 (d) | | | 2,000,000 | | | | 2,116,300 | |
Suburban Propane Partners, LP/Suburban Energy Finance Corp., 5.750%, 03/01/25 | | | 2,000,000 | | | | 2,060,830 | |
Suburban Propane Partners, LP/Suburban Energy Finance Corp., 5.875%, 03/01/27 | | | 1,500,000 | | | | 1,564,271 | |
Sunoco LP/Finance Corp., 6.000%, 04/15/27 | | | 1,000,000 | | | | 1,069,823 | |
Sunoco LP/Finance Corp., 5.875%, 03/15/28 | | | 1,000,000 | | | | 1,064,653 | |
Superior Plus, LP/General Partner, Inc., 144A, 7.000%, 07/15/26 (d) | | | 2,000,000 | | | | 2,153,194 | |
Targa Resources Partners, LP/Finance Corp., 5.250%, 05/01/23 | | | 1,000,000 | | | | 1,012,085 | |
Targa Resources Partners, LP/Finance Corp., 144A, 6.500%, 07/15/27 (d) | | | 500,000 | | | | 548,425 | |
Targa Resources Partners, LP/Finance Corp., 5.000%, 01/15/28 | | | 500,000 | | | | 511,161 | |
Targa Resources Partners, LP/Finance Corp., 144A, 6.875%, 01/15/29 (d) | | | 500,000 | | | | 555,925 | |
Percent of Net Assets
Name of Issuer and
Title of Issue | | Shares/
Principal/
Contracts | | | Value | |
BONDS, continued |
CORPORATE BONDS, continued |
Energy, continued |
TransMontaigne Partners LP/TLP Finance Corp., 6.125%, 02/15/26 | | $ | 1,750,000 | | | $ | 1,719,983 | |
| | | | | | | | 27,257,379 | |
Financial Services: 4.9% |
Avolon Holdings Funding, Ltd., 144A, 5.125%, 10/01/23 (d) | | | 500,000 | | | | 540,398 | |
Avolon Holdings Funding, Ltd., 144A, 4.375%, 05/01/26 (d) | | | 1,000,000 | | | | 1,057,550 | |
CIT Group, Inc., 5.000%, 08/01/23 | | | 2,000,000 | | | | 2,159,170 | |
CIT Group, Inc., 5.250%, 03/07/25 | | | 500,000 | | | | 551,043 | |
CIT Group, Inc., 6.125%, 03/09/28 | | | 1,000,000 | | | | 1,182,847 | |
Fair Isaac Corp, 144A, 5.250%, 05/15/26 (d) | | | 1,000,000 | | | | 1,102,848 | |
Fair Isaac Corp., 144A, 4.000%, 06/15/28 (d) | | | 500,000 | | | | 505,000 | |
Fly Leasing, Ltd., 6.375%, 10/15/21 | | | 3,000,000 | | | | 3,061,874 | |
MSCI, Inc., 144A, 4.000%, 11/15/29 (d) | | | 1,000,000 | | | | 1,015,600 | |
Park Aerospace Holdings, Ltd., 144A, 5.250%, 08/15/22 (d) | | | 500,000 | | | | 534,106 | |
Park Aerospace Holdings, Ltd., 144A, 5.500%, 02/15/24 (d) | | | 2,000,000 | | | | 2,198,320 | |
Springleaf Finance Corp., 6.875%, 03/15/25 | | | 1,000,000 | | | | 1,139,990 | |
Springleaf Finance Corp., 7.125%, 03/15/26 | | | 1,500,000 | | | | 1,737,112 | |
Springleaf Finance Corp., 6.625%, 01/15/28 | | | 1,000,000 | | | | 1,130,650 | |
Springleaf Finance Corp., 5.375%, 11/15/29 | | | 500,000 | | | | 522,825 | |
| | | | | | | | 18,439,333 | |
Health Care: 6.5% |
Avantor, Inc., 144A, 6.000%, 10/01/24 (d) | | | 1,500,000 | | | | 1,602,473 | |
| | 107 | SEE NOTES TO FINANCIAL STATEMENTS |
December 31, 2019 |
Schedules of Investments, continued |
Pax High Yield Bond Fund, continued
Percent of Net Assets
Name of Issuer and
Title of Issue | | Shares/
Principal/
Contracts | | | Value | |
BONDS, continued |
CORPORATE BONDS, continued |
Health Care, continued |
Centene Corp., 144A, 5.375%, 06/01/26 (d) | | $ | 950,000 | | | $ | 1,009,945 | |
Centene Corp., 144A, 4.250%, 12/15/27 (d) | | | 1,000,000 | | | | 1,030,600 | |
Encompass Health Corp., 4.500%, 02/01/28 | | | 500,000 | | | | 519,050 | |
Encompass Health Corp., 4.750%, 02/01/30 | | | 500,000 | | | | 519,675 | |
Endo Dac/Finance, LLC/Finco, Inc., 144A, 6.000%, 07/15/23 (d) | | | 819,000 | | | | 593,767 | |
Endo Finance, LLC/Endo Finco, Inc., 144A, 5.375%, 01/15/23 (d) | | | 1,000,000 | | | | 677,085 | |
HCA, Inc., 5.875%, 05/01/23 | | | 1,750,000 | | | | 1,937,679 | |
HCA, Inc., 5.375%, 02/01/25 | | | 1,000,000 | | | | 1,107,915 | |
HCA, Inc., 5.875%, 02/15/26 | | | 1,000,000 | | | | 1,138,980 | |
HCA, Inc., 5.375%, 09/01/26 | | | 475,000 | | | | 530,231 | |
Hill-Rom Holdings, Inc., 144A, 4.375%, 09/15/27 (d) | | | 2,000,000 | | | | 2,063,194 | |
IQVIA, Inc., 144A, 5.000%, 05/15/27 (d) | | | 1,000,000 | | | | 1,060,178 | |
MPT Operating Partnership LP/Finance Corp., 6.375%, 03/01/24 | | | 1,000,000 | | | | 1,041,220 | |
MPT Operating Partnership LP/Finance Corp., 5.000%, 10/15/27 | | | 1,000,000 | | | | 1,062,525 | |
MPT Operating Partnership, LP/Finance Corp., 4.625%, 08/01/29 | | | 1,000,000 | | | | 1,031,875 | |
Par Pharmaceutical, Inc., 144A, 7.500%, 04/01/27 (d) | | | 1,000,000 | | | | 997,525 | |
Sabra Health Care, LP, REIT, 5.125%, 08/15/26 | | | 1,000,000 | | | | 1,077,876 | |
Teva Pharmaceutical Finance Netherlands III BV, 6.000%, 04/15/24 | | | 1,000,000 | | | | 1,014,084 | |
Verscend Escrow Corp., 144A, 9.750%, 08/15/26 (d) | | | 2,000,000 | | | | 2,192,550 | |
Percent of Net Assets
Name of Issuer and
Title of Issue | | Shares/
Principal/
Contracts | | | Value | |
BONDS, continued |
CORPORATE BONDS, continued |
Health Care, continued |
Vizient, Inc., 144A, 6.250%, 05/15/27 (d) | | $ | 2,000,000 | | | $ | 2,145,695 | |
| | | | | | | | 24,354,122 | |
Insurance: 1.1% |
Fidelity & Guaranty Life Holdings, Inc., 144A, 5.500%, 05/01/25 (d) | | | 2,000,000 | | | | 2,134,980 | |
GTCR AP Finance, Inc., 144A, 8.000%, 05/15/27 (d) | | | 2,000,000 | | | | 2,085,695 | |
| | | | | | | | 4,220,675 | |
Leisure: 3.4% |
Cedar Fair LP, 5.375%, 04/15/27 | | | 1,500,000 | | | | 1,617,603 | |
ESH Hospitality, Inc., 144A, 4.625%, 10/01/27 (d) | | | 1,000,000 | | | | 1,014,350 | |
GLP Capital, LP/Financing II, Inc., 5.375%, 04/15/26 | | | 1,000,000 | | | | 1,107,250 | |
GLP Capital, LP/Financing II, Inc., 5.750%, 06/01/28 | | | 1,000,000 | | | | 1,137,722 | |
Hilton Domestic Operating Co., Inc., 4.875%, 01/15/30 | | | 1,000,000 | | | | 1,061,728 | |
Hilton Grand Vacations Borrower, LLC /Inc., 6.125%, 12/01/24 | | | 1,000,000 | | | | 1,082,915 | |
Hilton Worldwide Finance, LLC/Corp., 4.625%, 04/01/25 | | | 450,000 | | | | 463,687 | |
Hilton Worldwide Finance, LLC/Corp., 4.875%, 04/01/27 | | | 1,425,000 | | | | 1,516,699 | |
Scientific Games International, Inc., 144A, 8.250%, 03/15/26 (d) | | | 1,000,000 | | | | 1,104,374 | |
Scientific Games International, Inc., 144A, 7.000%, 05/15/28 (d) | | | 500,000 | | | | 537,175 | |
VICI Properties, LP/VICI Note Co., Inc., 144A, 4.250%, 12/01/26 (d) | | | 1,000,000 | | | | 1,031,835 | |
SEE NOTES TO FINANCIAL STATEMENTS | 108 | |
December 31, 2019 |
Schedules of Investments, continued |
Pax High Yield Bond Fund, continued
Percent of Net Assets
Name of Issuer and
Title of Issue | | Shares/
Principal/
Contracts | | | Value | |
BONDS, continued |
CORPORATE BONDS, continued |
Leisure, continued |
VICI Properties, LP/VICI Note Co., Inc., 144A, 4.625%, 12/01/29 (d) | | $ | 1,000,000 | | | $ | 1,044,350 | |
| | | | | | | | 12,719,688 | |
Media: 14.7% |
Altice Financing SA, 144A, 7.500%, 05/15/26 (d) | | | 2,000,000 | | | | 2,153,700 | |
Altice Finco SA, 144A, 7.625%, 02/15/25 (d) | | | 2,000,000 | | | | 2,075,830 | |
Altice France SA, 144A, 7.375%, 05/01/26 (d) | | | 2,000,000 | | | | 2,150,980 | |
Altice France SA, 144A, 8.125%, 02/01/27 (d) | | | 500,000 | | | | 564,050 | |
Altice France SA, 144A, 5.500%, 01/15/28 (d) | | | 1,000,000 | | | | 1,029,400 | |
Altice Luxembourg SA, 144A, 7.625%, 02/15/25 (d) | | | 500,000 | | | | 520,625 | |
Altice Luxembourg SA, 144A, 10.500%, 05/15/27 (d) | | | 1,000,000 | | | | 1,141,900 | |
AMC Networks, Inc., 4.750%, 12/15/22 | | | 1,000,000 | | | | 1,010,530 | |
AMC Networks, Inc., 4.750%, 08/01/25 | | | 1,000,000 | | | | 1,005,835 | |
Cablevision Systems Corp., 5.875%, 09/15/22 | | | 1,000,000 | | | | 1,079,280 | |
CCO Holdings, LLC/Capital Corp., 144A, 5.125%, 05/01/23 (d) | | | 1,000,000 | | | | 1,022,715 | |
CCO Holdings, LLC/Capital Corp., 144A, 5.375%, 05/01/25 (d) | | | 1,000,000 | | | | 1,034,585 | |
CCO Holdings, LLC/Capital Corp., 144A, 5.750%, 02/15/26 (d) | | | 2,000,000 | | | | 2,113,740 | |
CCO Holdings, LLC/Capital Corp., 144A, 5.500%, 05/01/26 (d) | | | 1,000,000 | | | | 1,056,073 | |
CCO Holdings, LLC/Capital Corp., 144A, 5.375%, 06/01/29 (d) | | | 2,500,000 | | | | 2,679,624 | |
CCO Holdings, LLC/Capital Corp., 144A, 4.750%, 03/01/30 (d) | | | 3,000,000 | | | | 3,059,640 | |
Percent of Net Assets
Name of Issuer and
Title of Issue | | Shares/
Principal/
Contracts | | | Value | |
BONDS, continued |
CORPORATE BONDS, continued |
Media, continued |
Clear Channel Worldwide Holdings, Inc., 144A, 9.250%, 02/15/24 (d) | | $ | 851,000 | | | $ | 944,257 | |
Clear Channel Worldwide Holdings, Inc., 144A, 5.125%, 08/15/27 (d) | | | 500,000 | | | | 521,575 | |
CSC Holdings, LLC, 144A, 5.375%, 07/15/23 (d) | | | 500,000 | | | | 513,543 | |
CSC Holdings, LLC, 144A, 10.875%, 10/15/25 (d) | | | 1,000,000 | | | | 1,119,375 | |
CSC Holdings, LLC, 144A, 5.500%, 05/15/26 (d) | | | 1,000,000 | | | | 1,061,063 | |
CSC Holdings, LLC, 144A, 7.500%, 04/01/28 (d) | | | 1,000,000 | | | | 1,132,323 | |
CSC Holdings, LLC, 144A, 5.750%, 01/15/30 (d) | | | 2,500,000 | | | | 2,671,874 | |
Entercom Media Corp., 144A, 7.250%, 11/01/24 (d) | | | 500,000 | | | | 527,708 | |
Entercom Media Corp., 144A, 6.500%, 05/01/27 (d) | | | 500,000 | | | | 536,424 | |
iHeartCommunications, Inc., 8.375%, 05/01/27 | | | 2,000,000 | | | | 2,213,700 | |
iHeartCommunications, Inc., 144A, 5.250%, 08/15/27 (d) | | | 1,000,000 | | | | 1,048,150 | |
iHeartCommunications, Inc., 144A, 4.750%, 01/15/28 (d) | | | 500,000 | | | | 513,425 | |
LCPR Senior Secured Financing DAC, 144A, 6.750%, 10/15/27 (d) | | | 1,000,000 | | | | 1,061,850 | |
MDC Partners, Inc., 144A, 6.500%, 05/01/24 (d) | | | 1,000,000 | | | | 907,500 | |
Nexstar Broadcasting, Inc., 144A, 5.625%, 07/15/27 (d) | | | 2,000,000 | | | | 2,111,300 | |
Neilsen Co. Luxembourg SARL, The, 144A, 5.000%, 02/01/25 (d) | | | 975,000 | | | | 1,006,678 | |
| | 109 | SEE NOTES TO FINANCIAL STATEMENTS |
December 31, 2019 |
Schedules of Investments, continued |
Pax High Yield Bond Fund, continued
Percent of Net Assets
Name of Issuer and
Title of Issue | | Shares/
Principal/
Contracts | | | Value | |
BONDS, continued |
CORPORATE BONDS, continued |
Media, continued |
Nielsen Finance, LLC/Co., 144A, 5.000%, 04/15/22 (d) | | $ | 1,500,000 | | | $ | 1,508,295 | |
Outfront Media Capital, LLC/Corp., 144A, 5.000%, 08/15/27 (d) | | | 1,000,000 | | | | 1,049,350 | |
Outfront Media Capital, LLC/Corp., 144A, 4.625%, 03/15/30 (d) | | | 1,000,000 | | | | 1,019,350 | |
Sirius XM Radio, Inc., 144A, 5.375%, 04/15/25 (d) | | | 1,100,000 | | | | 1,138,902 | |
Sirius XM Radio, Inc., 144A, 5.375%, 07/15/26 (d) | | | 1,450,000 | | | | 1,543,832 | |
Sirius XM Radio, Inc., 144A, 5.000%, 08/01/27 (d) | | | 500,000 | | | | 528,425 | |
TEGNA, Inc., 144A, 5.000%, 09/15/29 (d) | | | 2,000,000 | | | | 2,037,500 | |
Terrier Media Buyer, Inc., 144A, 8.875%, 12/15/27 (d) | | | 1,000,000 | | | | 1,060,000 | |
Virgin Media Secured Finance PLC, 144A, 5.500%, 08/15/26 (d) | | | 1,000,000 | | | | 1,052,323 | |
Virgin Media Secured Finance PLC, 144A, 5.500%, 05/15/29 (d) | | | 1,000,000 | | | | 1,060,600 | |
VTR Finance BV, 144A, 6.875%, 01/15/24 (d) | | | 1,707,000 | | | | 1,748,966 | |
| | | | | | | | 55,336,795 | |
Real Estate: 3.1% |
ESH Hospitality, Inc., 144A, 5.250%, 05/01/25 (d) | | | 950,000 | | | | 984,043 | |
Five Point Operating Co., LP/Capital Corp., 144A, 7.875%, 11/15/25 (d) | | | 1,450,000 | | | | 1,464,210 | |
Greystar Real Estate Partners, LLC, 144A, 5.750%, 12/01/25 (d) | | | 1,450,000 | | | | 1,507,986 | |
HAT Holdings I, LLC/HAT Holdings II, LLC, 144A, 5.250%, 07/15/24 (d) | | | 3,000,000 | | | | 3,160,005 | |
iStar, Inc., 4.250%, 08/01/25 | | | 1,000,000 | | | | 1,013,460 | |
Percent of Net Assets
Name of Issuer and
Title of Issue | | Shares/
Principal/
Contracts | | | Value | |
BONDS, continued |
CORPORATE BONDS, continued |
Real Estate, continued |
Kennedy-Wilson, Inc., 5.875%, 04/01/24 | | $ | 1,700,000 | | | $ | 1,746,733 | |
Realogy Group, LLC/Realogy Co-Issuer Corp., 144A, 9.375%, 04/01/27 (d) | | | 1,500,000 | | | | 1,568,977 | |
| | | | | | | | 11,445,414 | |
Retail: 3.9% |
Albertsons Cos., Inc./Safeway, Inc./New Albertsons, LP/Albertsons, LLC, 144A, 4.625%, 01/15/27 (d) | | | 1,000,000 | | | | 1,124,374 | |
Albertsons Cos., Inc./Safeway, Inc./New Albertsons, LP/Albertson’s, LLC, 144A, 7.500%, 03/15/26 (d) | | | 1,000,000 | | | | 1,000,650 | |
Ingles Markets Inc, 5.750%, 06/15/23 | | | 1,557,000 | | | | 1,590,070 | |
KFC Holding/Pizza Hut Holdings/Taco Bell of America, 144A, 4.750%, 06/01/27 (d) | | | 1,500,000 | | | | 1,582,234 | |
L Brands, Inc., 7.500%, 06/15/29 | | | 2,000,000 | | | | 2,063,700 | |
Michaels Stores, Inc., 144A, 8.000%, 07/15/27 (d) | | | 1,000,000 | | | | 956,850 | |
Murphy Oil USA, Inc., 4.750%, 09/15/29 | | | 1,000,000 | | | | 1,057,920 | |
New Albertsons, LP, 7.750%, 06/15/26 | | | 1,000,000 | | | | 1,012,847 | |
Party City Holdings, Inc., 144A, 6.625%, 08/01/26 (d) | | | 1,000,000 | | | | 707,323 | |
PetSmart, Inc., 144A, 7.125%, 03/15/23 (d) | | | 500,000 | | | | 491,250 | |
Sally Holdings LLC/Capital, Inc., 5.625%, 12/01/25 | | | 1,000,000 | | | | 1,049,215 | |
Yum! Brands, Inc., 144A, 4.750%, 01/15/30 (d) | | | 2,000,000 | | | | 2,098,700 | |
| | | | | | | | 14,735,133 | |
SEE NOTES TO FINANCIAL STATEMENTS | 110 | |
December 31, 2019 |
Schedules of Investments, continued |
Pax High Yield Bond Fund, continued
Percent of Net Assets
Name of Issuer and
Title of Issue | | Shares/
Principal/
Contracts | | | Value | |
BONDS, continued |
CORPORATE BONDS, continued |
Services: 8.2% |
Aramark Services, Inc., 144A, 5.000%, 04/01/25 (d) | | $ | 1,000,000 | | | $ | 1,044,990 | |
Avis Budget Car Rental, LLC/Finance, Inc., 144A, 5.750%, 07/15/27 (d) | | | 2,000,000 | | | | 2,085,050 | |
Cloud Crane, LLC, 144A, 10.125%, 08/01/24 (d) | | | 1,500,000 | | | | 1,578,128 | |
Diebold Nixdorf, Inc., 8.500%, 04/15/24 | | | 1,000,000 | | | | 967,915 | |
GFL Environmental, Inc., 144A, 5.375%, 03/01/23 (d) | | | 2,000,000 | | | | 2,065,000 | |
GFL Environmental, Inc., 144A, 7.000%, 06/01/26 (d) | | | 1,000,000 | | | | 1,059,248 | |
GFL Environmental, Inc., 144A, 5.125%, 12/15/26 (d) | | | 1,000,000 | | | | 1,053,880 | |
GFL Environmental, Inc., 144A, 8.500%, 05/01/27 (d) | | | 500,000 | | | | 550,925 | |
Harsco Corp., 144A, 5.750%, 07/31/27 (d) | | | 1,500,000 | | | | 1,603,193 | |
Herc Holdings, Inc., 144A, 5.500%, 07/15/27 (d) | | | 1,000,000 | | | | 1,055,025 | |
IAA, Inc., 144A, 5.500%, 06/15/27 (d) | | | 1,000,000 | | | | 1,064,350 | |
Iron Mountain, Inc., 5.750%, 08/15/24 | | | 1,950,000 | | | | 1,976,792 | |
Iron Mountain, Inc., 144A, 4.875%, 09/15/29 (d) | | | 1,000,000 | | | | 1,018,123 | |
KAR Auction Services, Inc., 144A, 5.125%, 06/01/25 (d) | | | 2,000,000 | | | | 2,084,170 | |
Korn Ferry, 144A, 4.625%, 12/15/27 (d) | | | 1,500,000 | | | | 1,511,250 | |
Prime Security Services Borrower, LLC/Finance, Inc., 144A, 9.250%, 05/15/23 (d) | | | 1,598,000 | | | | 1,678,898 | |
Percent of Net Assets
Name of Issuer and
Title of Issue | | Shares/
Principal/
Contracts | | | Value | |
BONDS, continued |
CORPORATE BONDS, continued |
Services, continued |
Prime Security Services Borrower, LLC/Finance, Inc., 144A, 5.250%, 04/15/24 (d) | | $ | 1,000,000 | | | $ | 1,060,085 | |
Prime Security Services Borrower, LLC/Finance, Inc., 144A, 5.750%, 04/15/26 (d) | | | 1,000,000 | | | | 1,088,754 | |
Staples, Inc., 144A, 7.500%, 04/15/26 (d) | | | 1,500,000 | | | | 1,559,061 | |
United Rentals North America, Inc., 6.500%, 12/15/26 | | | 1,000,000 | | | | 1,100,913 | |
United Rentals North America, Inc., 5.250%, 01/15/30 | | | 1,000,000 | | | | 1,078,150 | |
Williams Scotsman International, Inc., 144A, 6.875%, 08/15/23 (d) | | | 2,500,000 | | | | 2,638,537 | |
| | | | | | | | 30,922,437 | |
Technology & Electronics: 2.1% |
Camelot Finance SA, 144A, 4.500%, 11/01/26 (d) | | | 1,000,000 | | | | 1,029,374 | |
CommScope Technologies, LLC, 144A, 6.000%, 06/15/25 (d) | | | 500,000 | | | | 501,815 | |
CommScope, Inc., 144A, 5.500%, 06/15/24 (d) | | | 950,000 | | | | 964,260 | |
CommScope, Inc., 144A, 6.000%, 03/01/26 (d) | | | 500,000 | | | | 532,812 | |
CommScope, Inc., 144A, 8.250%, 03/01/27 (d) | | | 500,000 | | | | 527,175 | |
Dell International LLC/EMC Corp, 144A, 5.875%, 06/15/21 (d) | | | 1,323,000 | | | | 1,345,332 | |
Dell International LLC/EMC Corp, 144A, 7.125%, 06/15/24 (d) | | | 1,000,000 | | | | 1,056,250 | |
Rackspace Hosting, Inc., 144A, 8.625%, 11/15/24 (d) | | | 1,000,000 | | | | 980,000 | |
| | 111 | SEE NOTES TO FINANCIAL STATEMENTS |
December 31, 2019 |
Schedules of Investments, continued |
Pax High Yield Bond Fund, continued
Percent of Net Assets
Name of Issuer and
Title of Issue | | Shares/
Principal/
Contracts | | | Value | |
BONDS, continued |
CORPORATE BONDS, continued |
Technology & Electronics, continued |
TIBCO Software, Inc., 144A, 11.375%, 12/01/21 (d) | | $ | 1,000,000 | | | $ | 1,036,925 | |
| | | | | | | | 7,973,943 | |
Telecommunications: 7.5% |
C&W Senior Financing DAC, 144A, 6.875%, 09/15/27 (d) | | | 500,000 | | | | 535,826 | |
CenturyLink, Inc., 7.500%, 04/01/24 | | | 1,000,000 | | | | 1,129,585 | |
CenturyLink, Inc., 5.625%, 04/01/25 | | | 950,000 | | | | 1,011,403 | |
CenturyLink, Inc., 144A, 5.125%, 12/15/26 (d) | | | 1,000,000 | | | | 1,020,130 | |
Cogent Communications Group, Inc., 144A, 5.375%, 03/01/22 (d) | | | 700,000 | | | | 733,468 | |
Connect Finco SARL/LLC, 144A, 6.750%, 10/01/26 (d) | | | 1,000,000 | | | | 1,066,250 | |
Digicel Group One, Ltd., 144A, 8.250%, 12/30/22 (d) | | | 257,000 | | | | 144,000 | |
Frontier Communications Corp., 11.000%, 09/15/25 | | | 500,000 | | | | 243,750 | |
Level 3 Financing, Inc., 5.375%, 01/15/24 | | | 1,450,000 | | | | 1,477,789 | |
Level 3 Financing, Inc., 5.250%, 03/15/26 | | | 1,000,000 | | | | 1,041,850 | |
Level 3 Financing, Inc., 144A, 4.625%, 09/15/27 (d) | | | 2,000,000 | | | | 2,051,300 | |
Qwest Corp., 6.875%, 09/15/33 | | | 1,500,000 | | | | 1,509,000 | |
Sable International Finance, Ltd., 144A, 5.750%, 09/07/27 (d) | | | 1,000,000 | | | | 1,062,848 | |
Sprint Capital Corp., 6.875%, 11/15/28 | | | 1,000,000 | | | | 1,079,350 | |
Sprint Capital Corp., 8.750%, 03/15/32 | | | 500,000 | | | | 607,800 | |
Sprint Communications, Inc., 7.000%, 08/15/20 | | | 650,000 | | | | 664,560 | |
Percent of Net Assets
Name of Issuer and
Title of Issue | | Shares/
Principal/
Contracts | | | Value | |
BONDS, continued |
CORPORATE BONDS, continued |
Telecommunications, continued |
Sprint Communications, Inc., 6.000%, 11/15/22 | | $ | 2,000,000 | | | $ | 2,101,060 | |
Sprint Corp., 7.250%, 09/15/21 | | | 1,000,000 | | | | 1,059,320 | |
Sprint Corp., 7.875%, 09/15/23 | | | 1,500,000 | | | | 1,658,123 | |
Sprint Corp., 7.125%, 06/15/24 | | | 1,000,000 | | | | 1,080,835 | |
T-Mobile USA, Inc., 6.000%, 04/15/24 | | | 2,000,000 | | | | 2,069,980 | |
T-Mobile USA, Inc., 6.375%, 03/01/25 | | | 1,000,000 | | | | 1,035,415 | |
T-Mobile USA, Inc., 6.500%, 01/15/26 | | | 500,000 | | | | 537,030 | |
Zayo Group, LLC /Capital, Inc., 6.375%, 05/15/25 | | | 1,000,000 | | | | 1,032,915 | |
Zayo Group, LLC /Capital, Inc., 144A, 5.750%, 01/15/27 (d) | | | 2,000,000 | | | | 2,038,195 | |
| | | | | | | | 27,991,782 | |
Transportation: 1.0% |
Air Canada, 144A, 7.750%, 04/15/21 (d) | | | 2,500,000 | | | | 2,666,250 | |
Great Lakes Dredge & Dock Corp., 8.000%, 05/15/22 | | | 1,000,000 | | | | 1,060,312 | |
| | | | | | | | 3,726,562 | |
Utility: 2.1% |
Azure Power Solar Energy Pvt, Ltd., 144A, 5.650%, 12/24/24 (d) | | | 1,000,000 | | | | 1,023,930 | |
Clearway Energy Operating, LLC, 144A, 4.750%, 03/15/28 (d) | | | 1,000,000 | | | | 1,015,000 | |
NextEra Energy Operating Partners, LP, 144A, 4.250%, 07/15/24 (d) | | | 1,000,000 | | | | 1,043,335 | |
NextEra Energy Operating Partners, LP, 144A, 4.250%, 09/15/24 (d) | | | 500,000 | | | | 521,043 | |
NextEra Energy Operating Partners, LP, 144A, 4.500%, 09/15/27 (d) | | | 1,500,000 | | | | 1,567,233 | |
SEE NOTES TO FINANCIAL STATEMENTS | 112 | |
December 31, 2019 |
Schedules of Investments, continued |
Pax High Yield Bond Fund, continued
Percent of Net Assets
Name of Issuer and
Title of Issue | | Shares/
Principal/
Contracts | | | Value | |
BONDS, continued |
CORPORATE BONDS, continued |
Utility, continued |
TerraForm Power Operating, LLC, 144A, 5.000%, 01/31/28 (d) | | $ | 1,500,000 | | | $ | 1,588,740 | |
TerraForm Power Operating, LLC, 144A, 4.750%, 01/15/30 (d) | | | 1,000,000 | | | | 1,019,350 | |
| | | | | | | | 7,778,631 | |
TOTAL CORPORATE BONDS |
(Cost $338,785,432) | | | 353,549,772 | |
| | | | | | | | | |
LOANS: 1.2% |
Retail: 0.4% |
PetSmart, Inc., 3 month LIBOR + 3.00%, 4.878%, 03/11/22 (e) | | | 1,671,081 | | | | 1,656,543 | |
Services: 0.5% |
Dun & Bradstreet Corp., The, 3 month LIBOR + 5.00%, 6.901%, 02/08/26 (e) | | | 2,000,000 | | | | 2,020,000 | |
Technology & Electronics: 0.3% |
Rackspace Hosting, Inc., 3 month LIBOR + 3.00%, 4.935%, 11/03/23 (e) | | | 1,000,000 | | | | 974,100 | |
TOTAL LOANS |
(Cost $4,251,544) | | | 4,650,643 | |
| | | | | | | | | |
TOTAL BONDS |
(Cost $343,036,976) | | | 358,200,415 | |
| | | | | | | | | |
Percent of Net Assets
Name of Issuer and
Title of Issue | | Shares/
Principal/
Contracts | | | Value | |
CERTIFICATES OF DEPOSIT: 0.4% |
Beneficial State Bank, 1.650%, 01/21/20 (b) | | $ | 200,000 | | | $ | 200,000 | |
Providence Bank & Trust, 0.499%, 08/03/20 (b) | | | 201,203 | | | | 201,203 | |
Self-Help Federal Credit Union, 2.100%, 01/04/20 (b) | | | 100,000 | | | | 100,000 | |
Self-Help Federal Credit Union, 1.900%, 12/20/21 (b) | | | 400,000 | | | | 401,591 | |
Shared Interest, Inc., 2.400%, 09/30/21 (b) | | | 500,000 | | | | 500,000 | |
TOTAL CERTIFICATES OF DEPOSIT |
(Cost $1,401,203) | | | 1,402,794 | |
| | | | | | | | | |
MONEY MARKET: 2.2% |
State Street Institutional U.S. Government Money Market Fund, 1.530% (f)(g) | | | 8,427,875 | | | | 8,427,875 | |
(Cost $8,427,875) |
| | | | | | | | | |
TOTAL INVESTMENTS: 98.9% |
(Cost $356,524,101) | | | 371,587,884 | |
| | | | | | | | | |
OTHER ASSETS AND LIABILITIES — (NET): 1.1% | | | 4,220,232 | |
| | | | | | | | | |
NET ASSETS: 100.0% | | $ | 375,808,116 | |
(a) | Non-income producing security. |
(c) | Security valued using significant unobservable inputs. |
(d) | Security purchased pursuant to Rule 144A of the Securities Act of 1933 and may be resold only to qualified institutional buyers. |
(e) | Rate shown reflects the accrual rate as of December 31, 2019 on securities with variable or step rates. |
(f) | Rate shown represents annualized 7-day yield as of December 31, 2019. |
LIBOR- | London Inter-bank Offered Rate. At December 31, 2019 the 1 month and 3 month LIBOR rates were 1.763% and 1.908%, respectively. |
| | 113 | SEE NOTES TO FINANCIAL STATEMENTS |
December 31, 2019 |
Schedules of Investments, continued |
Pax Sustainable Allocation Fund
Percent of Net Assets
Name of Issuer and
Title of Issue | | Shares/
Principal | | | Value | |
AFFILIATED INVESTMENT COMPANIES: 97.6% |
Pax Core Bond Fund (a) | | | 66,778,157 | | | $ | 687,147,238 | |
Pax Ellevate Global Women’s Leadership Fund (a) | | | 785,900 | | | | 21,329,334 | |
Pax ESG Beta Dividend Fund (a) | | | 10,010,369 | | | | 128,232,821 | |
Pax Global Environmental Markets Fund (a) | | | 1,482,025 | | | | 25,149,965 | |
Pax Global Opportunities Fund (a) | | | 2,548,966 | | | | 30,689,545 | |
Pax High Yield Bond Fund (a) | | | 3,263,125 | | | | 22,058,723 | |
Pax Large Cap Fund (a) | | | 73,178,029 | | | | 761,051,498 | |
Pax MSCI EAFE ESG Leaders Index Fund (a) | | | 15,576,499 | | | | 145,484,501 | |
Pax Small Cap Fund (a) | | | 2,158,328 | | | | 31,986,423 | |
| |
TOTAL AFFILIATED INVESTMENT COMPANIES |
(Cost $1,715,464,992) | | | 1,853,130,048 | |
| | | | | | | | | |
MONEY MARKET: 3.3% |
State Street Institutional U.S. Government Money Market Fund, 1.530% (b)(c) | | | 62,176,992 | | | | 62,176,992 | |
(Cost $62,176,992) |
| | | | | | | | | |
TOTAL INVESTMENTS: 100.9% |
(Cost $1,777,641,984) | | | 1,915,307,040 | |
| | | | | | | | | |
OTHER ASSETS AND LIABILITIES — (NET): -0.9% | | | (17,459,717 | ) |
| | | | | | | | | |
NET ASSETS: 100.0% | | $ | 1,897,847,323 | |
(a) | Institutional Class shares |
(b) | Rate shown represents annualized 7-day yield as of December 31, 2019. |
SEE NOTES TO FINANCIAL STATEMENTS | 114 | |
THIS PAGE INTENTIONALLY LEFT BLANK
December 31, 2019 |
Statements of Assets and Liabilities |
| | Large Cap
Fund | | | Small Cap
Fund | | | ESG Beta
Quality
Fund | | | ESG Beta
Dividend
Fund | |
ASSETS | | | | | | | | | | | | | | | | |
Investments, at cost - Note A | | $ | 541,297,055 | | | $ | 391,509,183 | | | $ | 134,527,557 | | | $ | 91,280,168 | |
| | | | | | | | | | | | | | | | | |
Investments in unaffiliated issuers, at value | | $ | 766,171,263 | | | $ | 444,825,571 | | | $ | 241,176,677 | | | $ | 133,054,056 | |
Investments in affiliated issuers, at value | | | — | | | | — | | | | — | | | | — | |
Total investments, at value - Note A1 | | | 766,171,263 | | | | 444,825,571 | | | | 241,176,677 | | | | 133,054,056 | |
Cash | | | 89,148 | | | | — | | | | — | | | | 3,112 | |
Foreign currency at value (cost $51,508; $2,799,797; and $2,018,347, respectively) | | | — | | | | 51,804 | | | | — | | | | — | |
Prepaid expenses | | | 10,815 | | | | 7,581 | | | | — | | | | — | |
Receivables: | | | | | | | | | | | | | | | | |
Capital stock sold | | | 1,000 | | | | 1,104,564 | | | | 62,707 | | | | — | |
Dividends and interest - Note A | | | 475,785 | | | | 269,917 | | | | 210,844 | | | | 225,920 | |
Investment securities sold | | | — | | | | 353,876 | | | | — | | | | — | |
Investment Adviser reimbursement | | | — | | | | — | | | | — | | | | — | |
Other | | | — | | | | 3,111 | | | | 667 | | | | 212 | |
Total Assets | | | 766,748,011 | | | | 446,616,424 | | | | 241,450,895 | | | | 133,283,300 | |
| | | | | | | | | | | | | | | | | |
LIABILITIES | | | | | | | | | | | | | | | | |
Collateral on securities loaned, at value | | | — | | | | 4,885,400 | | | | 781,704 | | | | 351,630 | |
Payables: | | | | | | | | | | | | | | | | |
Capital stock reacquired | | | — | | | | 2,990,253 | | | | 88,105 | | | | — | |
Investment securities purchased | | | — | | | | 7,186,699 | | | | — | | | | — | |
Dividend payable - Note A | | | — | | | | — | | | | — | | | | — | |
Accrued expenses: | | | | | | | | | | | | | | | | |
Investment advisory fees - Note B | | | 414,603 | | | | 274,057 | | | | 130,066 | | | | 71,970 | |
Distribution expense | | | 663 | | | | 25,955 | | | | 35,184 | | | | 591 | |
Transfer agent fees | | | 1,531 | | | | 61,879 | | | | — | | | | — | |
Printing and other | | | | | | | | | | | | | | | | |
shareholder communication fees | | | 1,594 | | | | 5,135 | | | | — | | | | — | |
Custodian fees | | | 15,002 | | | | 11,438 | | | | — | | | | — | |
Legal and audit fees | | | 33,757 | | | | 29,980 | | | | — | | | | — | |
Other accrued expenses | | | 5,936 | | | | 35,877 | | | | — | | | | — | |
Total Liabilities | | | 473,086 | | | | 15,506,673 | | | | 1,035,059 | | | | 424,191 | |
NET ASSETS | | $ | 766,274,925 | | | $ | 431,109,751 | | | $ | 240,415,836 | | | $ | 132,859,109 | |
1 | Investments at market value include securities loaned. At December 31, 2019, the Small Cap Fund, ESG Beta Quality Fund, ESG Beta Dividend Fund, Global Women’s Leadership Fund, and Core Bond Fund had total market values of securities on loan of $19,650,424; $7,235,253; $2,270,024; $2,759,039; and $10,066,103, respectively. |
SEE NOTES TO FINANCIAL STATEMENTS | 116 | |
| | Global
Opportunities
Fund | | | Global
Environmental
Markets Fund | | | Global
Women’s
Leadership
Fund | | | EAFE
ESG Leaders
Index Fund | | | Core Bond
Fund | | | High Yield
Bond Fund | | | Sustainable
Allocation
Fund | | | | |
| | | | | | | | | | | | | | | | | | | | | | | | | | | | | | | | |
| | $ | 36,242,115 | | | $ | 778,913,397 | | | $ | 397,801,355 | | | $ | 543,313,311 | | | $ | 687,596,812 | | | $ | 356,524,101 | | | $ | 1,777,641,984 | | | | | |
| | | | | | | | | | | | | | | | | | | | | | | | | | | | | | | | |
| | $ | 42,096,099 | | | $ | 966,670,099 | | | $ | 465,375,852 | | | $ | 642,999,682 | | | $ | 706,274,748 | | | $ | 371,587,884 | | | $ | 62,176,992 | | | | | |
| | | — | | | | — | | | | — | | | | — | | | | — | | | | — | | | | 1,853,130,048 | | | | | |
| | | 42,096,099 | | | | 966,670,099 | | | | 465,375,852 | | | | 642,999,682 | | | | 706,274,748 | | | | 371,587,884 | | | | 1,915,307,040 | | | | | |
| | | — | | | | 106,523 | | | | 2,618 | | | | — | | | | 137 | | | | 24 | | | | — | | | | | |
| | | — | | | | — | | | | 2,858,171 | | | | 2,038,283 | | | | — | | | | — | | | | — | | | | | |
| | | 1,211 | | | | 12,351 | | | | — | | | | — | | | | 10,615 | | | | 5,944 | | | | — | | | | | |
| | | | | | | | | | | | | | | | | | | | | | | | | | | | | | | | |
| | | 1,050 | | | | 2,804,057 | | | | 1,111,862 | | | | 851,992 | | | | 828,250 | | | | 994,193 | | | | 1,720,247 | | | | | |
| | | 23,821 | | | | 580,419 | | | | 460,849 | | | | 618,368 | | | | 3,586,783 | | | | 5,194,651 | | | | 1,776,144 | | | | | |
| | | — | | | | 2,133,186 | | | | — | | | | — | | | | — | | | | — | | | | — | | | | | |
| | | 14,765 | | | | — | | | | — | | | | — | | | | — | | | | — | | | | — | | | | | |
| | | 2,360 | | | | 251,119 | | | | 73,522 | | | | 1,669,147 | | | | 3,298 | | | | — | | | | — | | | | | |
| | | 42,139,306 | | | | 972,557,754 | | | | 469,882,874 | | | | 648,177,472 | | | | 710,703,831 | | | | 377,782,696 | | | | 1,918,803,431 | | | | | |
| | | | | | | | | | | | | | | | | | | | | | | | | | | | | | | | |
| | | | | | | | | | | | | | | | | | | | | | | | | | | | | | | | |
| | | — | | | | — | | | | 19,406 | | | | — | | | | 669,300 | | | | — | | | | — | | | | | |
| | | | | | | | | | | | | | | | | | | | | | | | | | | | | | | | |
| | | — | | | | 635,569 | | | | 126,301 | | | | 493,156 | | | | 22,748 | | | | 542,683 | | | | 18,867,124 | | | | | |
| | | — | | | | 2,857,510 | | | | 4,648,525 | | | | 2,579,453 | | | | — | | | | 896,250 | | | | 1,689,069 | | | | | |
| | | — | | | | — | | | | — | | | | — | | | | 3,044 | | | | 225,432 | | | | — | | | | | |
| | | | | | | | | | | | | | | | | | | | | | | | | | | | | | | | |
| | | 26,389 | | | | 636,426 | | | | 208,742 | | | | 293,393 | | | | 240,111 | | | | 157,976 | | | | 80,523 | | | | | |
| | | 341 | | | | 34,593 | | | | 24,704 | | | | 18,005 | | | | 1,520 | | | | 40,034 | | | | 319,392 | | | | | |
| | | 572 | | | | 75,288 | | | | — | | | | — | | | | 1,167 | | | | 41,093 | | | | — | | | | | |
| | | | | | | | | | | | | | | | | | | | | | | | | | | | | | | | |
| | | 2,779 | | | | 2,795 | | | | — | | | | — | | | | 2,211 | | | | 7,260 | | | | — | | | | | |
| | | 5,419 | | | | 36,546 | | | | — | | | | — | | | | 27,910 | | | | 21,125 | | | | — | | | | | |
| | | 23,014 | | | | 36,780 | | | | — | | | | — | | | | 38,787 | | | | 32,706 | | | | — | | | | | |
| | | 6,678 | | | | 41,526 | | | | — | | | | — | | | | 5,635 | | | | 10,021 | | | | — | | | | | |
| | | 65,192 | | | | 4,357,033 | | | | 5,027,678 | | | | 3,384,007 | | | | 1,012,433 | | | | 1,974,580 | | | | 20,956,108 | | | | | |
| | $ | 42,074,114 | | | $ | 968,200,721 | | | $ | 464,855,196 | | | $ | 644,793,465 | | | $ | 709,691,398 | | | $ | 375,808,116 | | | $ | 1,897,847,323 | | | | | |
| | 117 | SEE NOTES TO FINANCIAL STATEMENTS |
December 31, 2019 |
Statements of Assets and Liabilities, continued |
| | Large Cap
Fund | | | Small Cap
Fund | | | ESG Beta
Quality
Fund | | | ESG Beta
Dividend
Fund | |
NET ASSETS REPRESENTED BY: | | | | | | | | | | | | | | | | |
Paid in Capital | | $ | 532,753,699 | | | $ | 376,402,429 | | | $ | 131,935,513 | | | $ | 90,425,214 | |
Total distributable earnings | | | 233,521,226 | | | | 54,707,322 | | | | 108,480,323 | | | | 42,433,895 | |
NET ASSETS | | $ | 766,274,925 | | | $ | 431,109,751 | | | $ | 240,415,836 | | | $ | 132,859,109 | |
| | | | | | | | | | | | | | | | | |
Investor Class | | | | | | | | | | | | | | | | |
Net assets | | $ | 3,271,211 | | | $ | 110,519,950 | | | $ | 161,020,641 | | | $ | 2,858,503 | |
Capital Shares Outstanding (unlimited/authorized) | | | 315,062 | | | | 7,535,312 | | | | 7,520,103 | | | | 223,715 | |
Net asset value per share | | $ | 10.38 | | | $ | 14.67 | | | $ | 21.41 | | | $ | 12.78 | |
Class A | | | | | | | | | | | | | | | | |
Net assets | | | | | | $ | 12,444,638 | | | $ | 6,658,952 | | | | | |
Capital Shares Outstanding (unlimited/authorized) | | | | | | | 850,737 | | | | 311,907 | | | | | |
Net asset value per share | | | | | | $ | 14.63 | | | $ | 21.35 | | | | | |
Institutional Class | | | | | | | | | | | | | | | | |
Net assets | | $ | 763,003,714 | | | $ | 308,145,163 | | | $ | 72,736,243 | | | $ | 130,000,606 | |
Capital Shares Outstanding (unlimited/authorized) | | | 73,392,745 | | | | 20,796,370 | | | | 3,296,169 | | | | 10,150,799 | |
Net asset value per share | | $ | 10.40 | | | $ | 14.82 | | | $ | 22.07 | | | $ | 12.81 | |
SEE NOTES TO FINANCIAL STATEMENTS | 118 | |
| | Global
Opportunities
Fund | | | Global
Environmental
Markets Fund | | | Global
Women’s
Leadership
Fund | | | EAFE
ESG Leaders
Index Fund | | | Core Bond
Fund | | | High Yield
Bond Fund | | | Sustainable
Allocation
Fund | | | | |
| | | | | | | | | | | | | | | | | | | | | | | | | | | | | | | | |
| | $ | 36,183,648 | | | $ | 783,304,855 | | | $ | 399,359,481 | | | $ | 578,647,367 | | | $ | 694,900,603 | | | $ | 431,401,826 | | | $ | 1,617,772,718 | | | | | |
| | | 5,890,466 | | | | 184,895,866 | | | | 65,495,715 | | | | 66,146,098 | | | | 14,790,795 | | | | (55,593,710 | ) | | | 280,074,605 | | | | | |
| | $ | 42,074,114 | | | $ | 968,200,721 | | | $ | 464,855,196 | | | $ | 644,793,465 | | | $ | 709,691,398 | | | $ | 375,808,116 | | | $ | 1,897,847,323 | | | | | |
| | | | | | | | | | | | | | | | | | | | | | | | | | | | | | | | |
| | | | | | | | | | | | | | | | | | | | | | | | | | | | | | | | |
| | $ | 1,682,538 | | | $ | 152,209,443 | | | $ | 118,712,927 | | | $ | 84,854,768 | | | $ | 7,400,520 | | | $ | 183,631,421 | | | $ | 1,523,009,025 | | | | | |
| | | 139,793 | | | | 9,032,310 | | | | 4,396,138 | | | | 8,905,034 | | | | 719,336 | | | | 27,063,587 | | | | 65,212,339 | | | | | |
| | $ | 12.04 | | | $ | 16.85 | | | $ | 27.00 | | | $ | 9.53 | | | $ | 10.29 | | | $ | 6.79 | | | $ | 23.35 | | | | | |
| | | | | | | | | | | | | | | | | | | | | | | | | | | | | | | | |
| | | | | | $ | 13,699,682 | | | | | | | | | | | | | | | $ | 5,826,575 | | | | | | | | | |
| | | | | | | 814,199 | | | | | | | | | | | | | | | | 857,276 | | | | | | | | | |
| | | | | | $ | 16.83 | | | | | | | | | | | | | | | $ | 6.80 | | | | | | | | | |
| | | | | | | | | | | | | | | | | | | | | | | | | | | | | | | | |
| | $ | 40,391,576 | | | $ | 802,291,596 | | | $ | 346,142,269 | | | $ | 559,938,697 | | | $ | 702,290,878 | | | $ | 186,350,120 | | | $ | 374,838,298 | | | | | |
| | | 3,355,402 | | | | 47,285,297 | | | | 12,754,191 | | | | 59,958,537 | | | | 68,239,840 | | | | 27,567,237 | | | | 15,775,514 | | | | | |
| | $ | 12.04 | | | $ | 16.97 | | | $ | 27.14 | | | $ | 9.34 | | | $ | 10.29 | | | $ | 6.76 | | | $ | 23.76 | | | | | |
| | 119 | SEE NOTES TO FINANCIAL STATEMENTS |
For the Year Ended December 31, 2019 |
Statements of Operations |
| | Large Cap
Fund | | | Small Cap
Fund | | | ESG Beta
Quality
Fund | | | ESG Beta
Dividend
Fund | |
INVESTMENT INCOME | | | | | | | | | | | | | | | | |
Income | | | | | | | | | | | | | | | | |
Dividends (net of foreign withholding tax of $0; $35,755; $273; $0; $35,258; $1,085,483; $517,285; $1,774,062; $0; $0 and $0 respectively) | | $ | 11,025,463 | | | $ | 8,546,748 | | | $ | 5,124,054 | | | $ | 3,734,986 | |
Dividends from affiliates - Note C | | | — | | | | — | | | | — | | | | — | |
Interest | | | 371,238 | | | | 403,198 | | | | 34,207 | | | | 24,206 | |
Income from securities lending - Note A | | | 115,851 | | | | 87,598 | | | | 10,412 | | | | 8,877 | |
Other income - Note B | | | — | | | | — | | | | — | | | | — | |
Total Income | | | 11,512,552 | | | | 9,037,544 | | | | 5,168,673 | | | | 3,768,069 | |
| | | | | | | | | | | | | | | | | |
Expenses | | | | | | | | | | | | | | | | |
Investment advisory fees - Note B | | | 4,399,347 | | | | 3,294,792 | | | | 1,440,722 | | | | 837,151 | |
Distribution expenses - Investor (Note B) | | | 5,997 | | | | 288,289 | | | | 375,948 | | | | 5,848 | |
Distribution expenses - Class A (Note B) | | | — | | | | 32,516 | | | | 15,340 | | | | — | |
Transfer agent fees - Note A | | | 17,369 | | | | 469,839 | | | | — | | | | — | |
Printing and other shareholder communication fees | | | 12,616 | | | | 66,868 | | | | — | | | | — | |
Custodian fees | | | 57,137 | | | | 71,699 | | | | — | | | | — | |
Legal fees and related expenses | | | 86,657 | | | | 71,942 | | | | — | | | | — | |
Trustees’ fees and expenses - Note B | | | 57,341 | | | | 45,502 | | | | — | | | | — | |
Compliance expense | | | 15,118 | | | | 14,400 | | | | — | | | | — | |
Audit fees | | | 46,849 | | | | 42,720 | | | | — | | | | — | |
Registration fees | | | 42,291 | | | | 64,148 | | | | — | | | | — | |
Other expenses | | | 25,510 | | | | 22,528 | | | | — | | | | — | |
Total Expenses | | | 4,766,232 | | | | 4,485,243 | | | | 1,832,010 | | | | 842,999 | |
Less: Advisory fee waiver - Note B | | | — | | | | — | | | | — | | | | — | |
Expenses assumed by Adviser - Note B | | | — | | | | — | | | | — | | | | — | |
Net expenses | | | 4,766,232 | | | | 4,485,243 | | | | 1,832,010 | | | | 842,999 | |
Net investment income | | | 6,746,320 | | | | 4,552,301 | | | | 3,336,663 | | | | 2,925,070 | |
REALIZED AND UNREALIZED GAIN (LOSS) - Notes A and C | | | | | | | | | | | | | | | | |
Net realized gain (loss) on: | | | | | | | | | | | | | | | | |
Investments in unaffiliated issuers | | | 28,252,754 | | | | 6,360,675 | | | | 6,522,693 | | | | 3,919,774 | |
Investment in affiliated issuers | | | — | | | | — | | | | — | | | | — | |
Foreign currency transactions | | | — | | | | (290 | ) | | | (308 | ) | | | — | |
Change in unrealized appreciation (depreciation) on: | | | | | | | | | | | | | | | | |
Investments in unaffiliated issuers | | | 168,139,590 | | | | 84,529,976 | | | | 42,568,347 | | | | 22,335,242 | |
Investment in affiliated issuers | | | — | | | | — | | | | — | | | | — | |
Foreign currency translation | | | — | | | | 207 | | | | 274 | | | | — | |
Net realized and unrealized gain | | | | | | | | | | | | | | | | |
on investments and foreign currency | | | 196,392,344 | | | | 90,890,568 | | | | 49,091,006 | | | | 26,255,016 | |
| | | | | | | | | | | | | | | | | |
Net increase in net assets resulting from operations | | $ | 203,138,664 | | | $ | 95,442,869 | | | $ | 52,427,669 | | | $ | 29,180,086 | |
SEE NOTES TO FINANCIAL STATEMENTS | 120 | |
For the Year Ended December 31, 2019 |
|
| | Global
Opportunities
Fund | | | Global
Environmental
Markets Fund | | | Global
Women’s
Leadership
Fund | | | EAFE
ESG Leaders
Index Fund | | | Core Bond
Fund | | | High Yield
Bond Fund | | | Sustainable
Allocation
Fund | | | | |
| | | | | | | | | | | | | | | | | | | | | | | | | | | | | | | | |
| | | | | | | | | | | | | | | | | | | | | | | | | | | | | | | | |
| | $ | 420,440 | | | $ | 15,069,170 | | | $ | 9,421,990 | | | $ | 18,476,228 | | | $ | 305,154 | | | $ | 214,356 | | | $ | — | | | | | |
| | | — | | | | — | | | | — | | | | — | | | | — | | | | — | | | | 32,469,331 | | | | | |
| | | 11,786 | | | | 505,332 | | | | 13,835 | | | | 20,726 | | | | 20,340,592 | | | | 21,804,377 | | | | 1,108,001 | | | | | |
| | | — | | | | 3,133 | | | | 9,140 | | | | — | | | | 16,213 | | | | — | | | | — | | | | | |
| | | 21,221 | | | | 298,328 | | | | — | | | | — | | | | 15 | | | | 143 | | | | — | | | | | |
| | | 453,447 | | | | 15,875,963 | | | | 9,444,965 | | | | 18,496,954 | | | | 20,661,974 | | | | 22,018,876 | | | | 33,577,332 | | | | | |
| | | | | | | | | | | | | | | | | | | | | | | | | | | | | | | | |
| | | | | | | | | | | | | | | | | | | | | | | | | | | | | | | | |
| | | 253,806 | | | | 6,404,305 | | | | 1,963,421 | | | | 3,192,729 | | | | 2,740,269 | | | | 1,862,360 | | | | 903,260 | | | | | |
| | | 2,188 | | | | 348,843 | | | | 263,659 | | | | 202,975 | | | | 14,340 | | | | 437,665 | | | | 3,586,010 | | | | | |
| | | — | | | | 32,732 | | | | — | | | | — | | | | — | | | | 14,734 | | | | — | | | | | |
| | | 4,002 | | | | 796,113 | | | | — | | | | — | | | | 17,269 | | | | 373,405 | | | | — | | | | | |
| | | 5,156 | | | | 59,497 | | | | — | | | | — | | | | 9,984 | | | | 63,845 | | | | — | | | | | |
| | | 25,258 | | | | 166,806 | | | | — | | | | — | | | | 108,455 | | | | 90,381 | | | | — | | | | | |
| | | 30,345 | | | | 93,937 | | | | — | | | | — | | | | 88,328 | | | | 65,951 | | | | — | | | | | |
| | | 27,331 | | | | 62,547 | | | | — | | | | — | | | | 58,871 | | | | 43,801 | | | | — | | | | | |
| | | 12,934 | | | | 15,497 | | | | — | | | | — | | | | 15,187 | | | | 14,113 | | | | — | | | | | |
| | | 35,000 | | | | 53,503 | | | | — | | | | — | | | | 56,199 | | | | 49,252 | | | | — | | | | | |
| | | 51,217 | | | | 85,254 | | | | — | | | | — | | | | 42,626 | | | | 59,510 | | | | — | | | | | |
| | | 4,849 | | | | 26,979 | | | | — | | | | — | | | | 26,135 | | | | 15,461 | | | | — | | | | | |
| | | 452,086 | | | | 8,146,013 | | | | 2,227,080 | | | | 3,395,704 | | | | 3,177,663 | | | | 3,090,478 | | | | 4,489,270 | | | | | |
| | | (17,590 | ) | | | — | | | | — | | | | — | | | | — | | | | — | | | | — | | | | | |
| | | (138,985 | ) | | | — | | | | — | | | | — | | | | — | | | | — | | | | — | | | | | |
| | | 295,511 | | | | 8,146,013 | | | | 2,227,080 | | | | 3,395,704 | | | | 3,177,663 | | | | 3,090,478 | | | | 4,489,270 | | | | | |
| | | 157,936 | | | | 7,729,950 | | | | 7,217,885 | | | | 15,101,250 | | | | 17,484,311 | | | | 18,928,398 | | | | 29,088,062 | | | | | |
| | | | | | | | | | | | | | | | | | | | | | | | | | | | | | | | |
| | | | | | | | | | | | | | | | | | | | | | | | | | | | | | | | |
| | | 790,961 | | | | 11,324,299 | | | | 1,952,953 | | | | (5,710,262 | ) | | | 7,048,964 | | | | (8,892,802 | ) | | | — | | | | | |
| | | — | | | | — | | | | — | | | | — | | | | — | | | | — | | | | 27,512,989 | | | | | |
| | | (14,284 | ) | | | (194,602 | ) | | | (28,466 | ) | | | (49,665 | ) | | | — | | | | — | | | | — | | | | | |
| | | | | | | | | | | | | | | | | | | | | | | | | | | | | | | | |
| | | 7,932,233 | | | | 170,187,197 | | | | 70,823,343 | | | | 110,240,828 | | | | 28,214,334 | | | | 39,322,008 | | | | — | | | | | |
| | | — | | | | — | | | | — | | | | — | | | | — | | | | — | | | | 284,650,514 | | | | | |
| | | 144 | | | | 1,512 | | | | 2,973 | | | | 29,550 | | | | — | | | | — | | | | — | | | | | |
| | | | | | | | | | | | | | | | | | | | | | | | | | | | | | | | |
| | | 8,709,054 | | | | 181,318,406 | | | | 72,750,803 | | | | 104,510,451 | | | | 35,263,298 | | | | 30,429,206 | | | | 312,163,503 | | | | | |
| | | | | | | | | | | | | | | | | | | | | | | | | | | | | | | | |
| | $ | 8,866,990 | | | $ | 189,048,356 | | | $ | 79,968,688 | | | $ | 119,611,701 | | | $ | 52,747,609 | | | $ | 49,357,604 | | | $ | 341,251,565 | | | | | |
| | 121 | SEE NOTES TO FINANCIAL STATEMENTS |
| |
Statements of Changes in Net Assets |
| | | Large Cap Fund | |
| | Year Ended
12/31/19 | | | Year Ended
12/31/18 | |
Increase (Decrease) in Net Assets | | | | | | | | |
Operations | | | | | | | | |
Investment income, net | | $ | 6,746,320 | | | $ | 5,956,816 | |
Net realized gain (loss) on investments and foreign currency transactions | | | 28,252,754 | | | | 93,935,443 | |
Change in unrealized appreciation (depreciation) on investments and foreign currency translations | | | 168,139,590 | | | | (123,969,436 | ) |
Net increase (decrease) in net assets resulting from operations | | | 203,138,664 | | | | (24,077,177 | ) |
Distributions from Investor Class | | | (105,410 | ) | | | (396,301 | ) |
Distributions from Class A | | | | | | | | |
Distributions from Institutional Class | | | (27,322,400 | ) | | | (121,081,230 | ) |
Total distributions to shareholders | | | (27,427,810 | ) | | | (121,477,531 | ) |
From capital share transactions: | | | | | | | | |
Investor Class | | | | | | | | |
Proceeds from shares sold | | | 1,381,152 | | | | 1,854,205 | |
Proceeds from reinvestment of distributions | | | 101,502 | | | | 378,040 | |
Cost of shares redeemed | | | (807,918 | ) | | | (469,237 | ) |
Net increase (decrease) from Investor Class transactions | | | 674,736 | | | | 1,763,008 | |
Class A | | | | | | | | |
Proceeds from shares sold | | | | | | | | |
Proceeds from reinvestment of distributions | | | | | | | | |
Cost of shares redeemed | | | | | | | | |
Net increase (decrease) from Class A transactions | | | | | | | | |
Institutional Class | | | | | | | | |
Proceeds from shares sold | | | 945,950 | | | | 2,183,271 | |
Proceeds from reinvestment of distributions | | | 27,303,786 | | | | 120,740,909 | |
Cost of shares redeemed | | | (30,999,229 | ) | | | (105,880,616 | ) |
Net increase (decrease) from Institutional Class transactions | | | (2,749,493 | ) | | | 17,043,564 | |
Net increase (decrease) from capital share transactions | | | (2,074,757 | ) | | | 18,806,572 | |
Net increase (decrease) in net assets | | | 173,636,097 | | | | (126,748,136 | ) |
Net assets | | | | | | | | |
Beginning of period | | | 592,638,828 | | | | 719,386,964 | |
End of period | | $ | 766,274,925 | | | $ | 592,638,828 | |
| | | | | | | | | |
Shares of Beneficial Interest: | | | | | | | | |
Investor Class | | | | | | | | |
Shares sold | | | 144,243 | | | | 168,351 | |
Shares issued in reinvestment of distributions | | | 9,881 | | | | 48,165 | |
Shares redeemed | | | (86,861 | ) | | | (43,179 | ) |
Net increase (decrease) in shares outstanding | | | 67,263 | | | | 173,337 | |
| | | | | | | | | |
Class A | | | | | | | | |
Shares sold | | | | | | | | |
Shares issued in reinvestment of distributions | | | | | | | | |
Shares redeemed | | | | | | | | |
Net increase (decrease) in shares outstanding | | | | | | | | |
| | | | | | | | | |
Institutional Class | | | | | | | | |
Shares sold | | | 99,082 | | | | 202,368 | |
Shares issued in reinvestment of distributions | | | 2,662,994 | | | | 15,305,123 | |
Shares redeemed | | | (3,390,826 | ) | | | (9,495,832 | ) |
Net increase (decrease) in shares outstanding | | | (628,750 | ) | | | 6,011,659 | |
SEE NOTES TO FINANCIAL STATEMENTS | 122 | |
| | | Small Cap Fund | | | ESG Beta Quality
Fund | | | ESG Beta
Dividend Fund | | |
| | Year Ended
12/31/19 | | | Year Ended
12/31/18 | | | Year Ended
12/31/19 | | | Year Ended
12/31/18 | | | Year Ended
12/31/19 | | | Year Ended
12/31/18 | | |
| | | | | | | | | | | | | | | | | | | | | | | | | | |
| | | | | | | | | | | | | | | | | | | | | | | | | | |
| | | $ | 4,552,301 | | | $ | 1,629,715 | | | $ | 3,336,663 | | | $ | 3,528,050 | | | $ | 2,925,070 | | | $ | 3,128,795 | | |
| | | | 6,360,385 | | | | 38,085,766 | | | | 6,522,385 | | | | 10,225,979 | | | | 3,919,774 | | | | 1,471,924 | | |
| | | | 84,530,183 | | | | (143,894,122 | ) | | | 42,568,621 | | | | (22,506,699 | ) | | | 22,335,242 | | | | (9,179,815 | ) | |
| | | | 95,442,869 | | | | (104,178,641 | ) | | | 52,427,669 | | | | (8,752,670 | ) | | | 29,180,086 | | | | (4,579,096 | ) | |
| | | | (1,074,371 | ) | | | (15,737,773 | ) | | | (5,328,473 | ) | | | (10,075,533 | ) | | | (124,784 | ) | | | (51,775 | ) | |
| | | | (123,378 | ) | | | (1,625,985 | ) | | | (219,743 | ) | | | (402,800 | ) | | | | | | | | | |
| | | | (2,994,551 | ) | | | (45,729,435 | ) | | | (2,488,325 | ) | | | (4,116,652 | ) | | | (6,221,250 | ) | | | (4,423,042 | ) | |
| | | | (4,192,300 | ) | | | (63,093,193 | ) | | | (8,036,541 | ) | | | (14,594,985 | ) | | | (6,346,034 | ) | | | (4,474,817 | ) | |
| | | | | | | | | | | | | | | | | | | | | | | | | | |
| | | | | | | | | | | | | | | | | | | | | | | | | | |
| | | | 13,677,304 | | | | 27,143,565 | | | | 6,826,013 | | | | 6,906,257 | | | | 1,247,672 | | | | 2,109,381 | | |
| | | | 1,017,639 | | | | 14,901,248 | | | | 5,208,768 | | | | 9,849,538 | | | | 122,435 | | | | 49,133 | | |
| | | | (44,744,405 | ) | | | (106,433,647 | ) | | | (15,699,436 | ) | | | (30,715,552 | ) | | | (755,355 | ) | | | (424,469 | ) | |
| | | | (30,049,462 | ) | | | (64,388,834 | ) | | | (3,664,655 | ) | | | (13,959,757 | ) | | | 614,752 | | | | 1,734,045 | | |
| | | | | | | | | | | | | | | | | | | | | | | | | | |
| | | | 1,709,333 | | | | 2,726,982 | | | | 399,058 | | | | 871,385 | | | | | | | | | | |
| | | | 110,555 | | | | 1,457,637 | | | | 210,714 | | | | 385,235 | | | | | | | | | | |
| | | | (4,229,884 | ) | | | (14,876,475 | ) | | | (602,219 | ) | | | (765,281 | ) | | | | | | | | | |
| | | | (2,409,996 | ) | | | (10,691,856 | ) | | | 7,553 | | | | 491,339 | | | | | | | | | | |
| | | | | | | | | | | | | | | | | | | | | | | | | | |
| | | | 105,566,974 | | | | 208,965,645 | | | | 13,543,838 | | | | 23,489,257 | | | | 1,014,394 | | | | 574,498 | | |
| | | | 2,285,599 | | | | 35,907,879 | | | | 2,358,813 | | | | 3,905,430 | | | | 6,220,386 | | | | 4,423,030 | | |
| | | | (182,128,560 | ) | | | (387,138,870 | ) | | | (10,204,044 | ) | | | (9,238,350 | ) | | | (15,032,201 | ) | | | (30,001,142 | ) | |
| | | | (74,275,987 | ) | | | (142,265,346 | ) | | | 5,698,607 | | | | 18,156,337 | | | | (7,797,421 | ) | | | (25,003,614 | ) | |
| | | | (106,735,445 | ) | | | (217,346,036 | ) | | | 2,041,505 | | | | 4,687,919 | | | | (7,182,669 | ) | | | (23,269,569 | ) | |
| | | | (15,484,876 | ) | | | (384,617,870 | ) | | | 46,432,633 | | | | (18,659,736 | ) | | | 15,651,383 | | | | (32,323,482 | ) | |
| | | | | | | | | | | | | | | | | | | | | | | | | | |
| | | | 446,594,627 | | | | 831,212,497 | | | | 193,983,203 | | | | 212,642,939 | | | | 117,207,726 | | | | 149,531,208 | | |
| | | $ | 431,109,751 | | | $ | 446,594,627 | | | $ | 240,415,836 | | | $ | 193,983,203 | | | $ | 132,859,109 | | | $ | 117,207,726 | | |
| | | | | | | | | | | | | | | | | | | | | | | | | | |
| | | | | | | | | | | | | | | | | | | | | | | | | | |
| | | | | | | | | | | | | | | | | | | | | | | | | | |
| | | | 1,004,391 | | | | 1,712,488 | | | | 345,853 | | | | 346,520 | | | | 103,324 | | | | 176,903 | | |
| | | | 73,054 | | | | 1,268,191 | | | | 247,071 | | | | 566,137 | | | | 9,677 | | | | 4,635 | | |
| | | | (3,274,454 | ) | | | (6,855,862 | ) | | | (788,361 | ) | | | (1,524,943 | ) | | | (62,731 | ) | | | (38,775 | ) | |
| | | | (2,197,009 | ) | | | (3,875,183 | ) | | | (195,437 | ) | | | (612,286 | ) | | | 50,270 | | | | 142,763 | | |
| | | | | | | | | | | | | | | | | | | | | | | | | | |
| | | | | | | | | | | | | | | | | | | | | | | | | | |
| | | | 125,548 | | | | 170,581 | | | | 19,876 | | | | 43,454 | | | | | | | | | | |
| | | | 7,959 | | | | 124,372 | | | | 10,026 | | | | 22,231 | | | | | | | | | | |
| | | | (308,730 | ) | | | (923,444 | ) | | | (29,771 | ) | | | (38,407 | ) | | | | | | | | | |
| | | | (175,223 | ) | | | (628,491 | ) | | | 131 | | | | 27,278 | | | | | | | | | | |
| | | | | | | | | | | | | | | | | | | | | | | | | | |
| | | | | | | | | | | | | | | | | | | | | | | | | | |
| | | | 7,701,571 | | | | 13,248,223 | | | | 667,483 | | | | 1,132,971 | | | | 82,856 | | | | 49,024 | | |
| | | | 162,691 | | | | 3,027,646 | | | | 108,662 | | | | 218,111 | | | | 491,692 | | | | 407,811 | | |
| | | | (13,265,181 | ) | | | (25,209,722 | ) | | | (497,959 | ) | | | (460,144 | ) | | | (1,241,588 | ) | | | (2,607,666 | ) | |
| | | | (5,400,919 | ) | | | (8,933,853 | ) | | | 278,186 | | | | 890,938 | | | | (667,040 | ) | | | (2,150,831 | ) | |
| | 123 | SEE NOTES TO FINANCIAL STATEMENTS |
| |
Statements of Changes in Net Assets, continued |
| | | Global
Opportunities
Fund | |
| | Year Ended
12/31/19 | | | Period Ended
12/31/181 | |
Increase (Decrease) in Net Assets | | | | | | | | |
Operations | | | | | | | | |
Investment income, net | | $ | 157,936 | | | $ | 1,560 | |
Net realized gain (loss) on investments and foreign currency transactions | | | 776,677 | | | | (137,157 | ) |
Change in unrealized appreciation (depreciation) on investments and foreign currency translations | | | 7,932,377 | | | | (2,081,324 | ) |
Net increase (decrease) in net assets resulting from operations | | | 8,866,990 | | | | (2,216,921 | ) |
Distributions from Investor Class | | | (26,709 | ) | | | — | |
Distributions from Class A | | | | | | | | |
Distributions from Institutional Class | | | (746,206 | ) | | | — | |
Total distributions to shareholders | | | (772,915 | ) | | | — | |
From capital share transactions: | | | | | | | | |
Investor Class | | | | | | | | |
Proceeds from shares sold | | | 1,558,192 | | | | 134,696 | |
Proceeds from reinvestment of distributions | | | 26,708 | | | | — | |
Cost of shares redeemed | | | (179,928 | ) | | | (30 | ) |
Net increase (decrease) from Investor Class transactions | | | 1,404,972 | | | | 134,666 | |
Class A | | | | | | | | |
Proceeds from shares sold | | | | | | | | |
Proceeds from reinvestment of distributions | | | | | | | | |
Cost of shares redeemed | | | | | | | | |
Net increase (decrease) from Class A transactions | | | | | | | | |
Institutional Class | | | | | | | | |
Proceeds from shares sold | | | 6,892,970 | | | | 27,024,652 | |
Proceeds from reinvestment of distributions | | | 743,145 | | | | — | |
Cost of shares redeemed | | | (3,445 | ) | | | — | |
Net increase (decrease) from Institutional Class transactions | | | 7,632,670 | | | | 27,024,652 | |
Net increase (decrease) from capital share transactions | | | 9,037,642 | | | | 27,159,318 | |
Net increase (decrease) in net assets | | | 17,131,717 | | | | 24,942,397 | |
Net assets | | | | | | | | |
Beginning of period | | | 24,942,397 | | | | — | |
End of period | | $ | 42,074,114 | | | $ | 24,942,397 | |
| | | | | | | | | |
Shares of Beneficial Interest: | | | | | | | | |
Investor Class | | | | | | | | |
Shares sold | | | 140,056 | | | | 13,741 | |
Shares issued in reinvestment of distributions | | | 2,235 | | | | — | |
Shares redeemed | | | (16,236 | ) | | | (3 | ) |
Net increase (decrease) in shares outstanding | | | 126,055 | | | | 13,738 | |
| | | | | | | | | |
Class A | | | | | | | | |
Shares sold | | | | | | | | |
Shares issued in reinvestment of distributions | | | | | | | | |
Shares redeemed | | | | | | | | |
Net increase (decrease) in shares outstanding | | | | | | | | |
| | | | | | | | | |
Institutional Class | | | | | | | | |
Shares sold | | | 590,890 | | | | 2,702,469 | |
Shares issued in reinvestment of distributions | | | 62,332 | | | | — | |
Shares redeemed | | | (289 | ) | | | — | |
Net increase (decrease) in shares outstanding | | | 652,933 | | | | 2,702,469 | |
1 | Commencement of Operations on June 27, 2018. |
SEE NOTES TO FINANCIAL STATEMENTS | 124 | |
| | | | | | Global
Environmental
Markets Fund | | | Global Women’s
Leadership Fund | | |
| | | | | Year Ended
12/31/19 | | | Year Ended
12/31/18 | | | Year Ended
12/31/19 | | | Year Ended
12/31/18 | | |
| | | | | | | | | | | | | | | | | | | | | |
| | | | | | | | | | | | | | | | | | | | | |
| | | | | | $ | 7,729,950 | | | $ | 7,180,029 | | | $ | 7,217,885 | | | $ | 4,594,621 | | |
| | | | | | | 11,129,697 | | | | 3,467,341 | | | | 1,924,487 | | | | 4,543,929 | | |
| | | | | | | 170,188,709 | | | | (115,307,007 | ) | | | 70,826,316 | | | | (30,295,038 | ) | |
| | | | | | | 189,048,356 | | | | (104,659,637 | ) | | | 79,968,688 | | | | (21,156,488 | ) | |
| | | | | | | (995,625 | ) | | | (4,395,006 | ) | | | (3,470,585 | ) | | | (4,136,633 | ) | |
| | | | | | | (87,611 | ) | | | (509,895 | ) | | | | | | | | | |
| | | | | | | (6,356,689 | ) | | | (19,696,318 | ) | | | (9,991,550 | ) | | | (7,107,965 | ) | |
| | | | | | | (7,439,925 | ) | | | (24,601,219 | ) | | | (13,462,135 | ) | | | (11,244,598 | ) | |
| | | | | | | | | | | | | | | | | | | | | |
| | | | | | | | | | | | | | | | | | | | | |
| | | | | | | 26,248,873 | | | | 24,299,647 | | | | 26,558,976 | | | | 27,719,215 | | |
| | | | | | | 915,312 | | | | 4,435,239 | | | | 3,304,467 | | | | 3,913,444 | | |
| | | | | | | (26,099,180 | ) | | | (38,687,270 | ) | | | (18,215,556 | ) | | | (21,848,645 | ) | |
| | | | | | | 1,065,005 | | | | (9,952,384 | ) | | | 11,647,887 | | | | 9,784,014 | | |
| | | | | | | | | | | | | | | | | | | | | |
| | | | | | | 1,491,935 | | | | 4,306,843 | | | | | | | | | | |
| | | | | | | 71,736 | | | | 456,482 | | | | | | | | | | |
| | | | | | | (3,810,989 | ) | | | (4,617,110 | ) | | | | | | | | | |
| | | | | | | (2,247,318 | ) | | | 146,215 | | | | | | | | | | |
| | | | | | | | | | | | | | | | | | | | | |
| | | | | | | 281,950,208 | | | | 263,433,141 | | | | 159,416,311 | | | | 94,660,752 | | |
| | | | | | | 5,793,704 | | | | 17,446,839 | | | | 8,789,343 | | | | 6,036,396 | | |
| | | | | | | (91,069,741 | ) | | | (160,411,403 | ) | | | (25,191,609 | ) | | | (16,544,918 | ) | |
| | | | | | | 196,674,171 | | | | 120,468,577 | | | | 143,014,045 | | | | 84,152,230 | | |
| | | | | | | 195,491,858 | | | | 110,662,408 | | | | 154,661,932 | | | | 93,936,244 | | |
| | | | | | | 377,100,289 | | | | (18,598,448 | ) | | | 221,168,485 | | | | 61,535,158 | | |
| | | | | | | | | | | | | | | | | | | | | |
| | | | | | | 591,100,432 | | | | 609,698,880 | | | | 243,686,711 | | | | 182,151,553 | | |
| | | | | | $ | 968,200,721 | | | $ | 591,100,432 | | | $ | 464,855,196 | | | $ | 243,686,711 | | |
| | | | | | | | | | | | | | | | | | | | | |
| | | | | | | | | | | | | | | | | | | | | |
| | | | | | | | | | | | | | | | | | | | | |
| | | | | | | 1,717,446 | | | | 1,570,344 | | | | 1,052,804 | | | | 1,104,657 | | |
| | | | | | | 57,130 | | | | 328,674 | | | | 124,452 | | | | 173,919 | | |
| | | | | | | (1,702,959 | ) | | | (2,518,707 | ) | | | (720,068 | ) | | | (870,126 | ) | |
| | | | | | | 71,617 | | | | (619,689 | ) | | | 457,188 | | | | 408,450 | | |
| | | | | | | | | | | | | | | | | | | | | |
| | | | | | | | | | | | | | | | | | | | | |
| | | | | | | 96,519 | | | | 273,883 | | | | | | | | | | |
| | | | | | | 4,486 | | | | 33,851 | | | | | | | | | | |
| | | | | | | (249,879 | ) | | | (300,947 | ) | | | | | | | | | |
| | | | | | | (148,874 | ) | | | 6,787 | | | | | | | | | | |
| | | | | | | | | | | | | | | | | | | | | |
| | | | | | | | | | | | | | | | | | | | | |
| | | | | | | 18,469,668 | | | | 16,808,306 | | | | 6,308,732 | | | | 3,776,638 | | |
| | | | | | | 357,002 | | | | 1,283,472 | | | | 328,700 | | | | 268,772 | | |
| | | | | | | (5,913,097 | ) | | | (10,844,638 | ) | | | (978,844 | ) | | | (682,478 | ) | |
| | | | | | | 12,913,573 | | | | 7,247,140 | | | | 5,658,588 | | | | 3,362,932 | | |
| | 125 | SEE NOTES TO FINANCIAL STATEMENTS |
| |
Statements of Changes in Net Assets, continued |
| | | EAFE ESG
Leaders Index
Fund | |
| | Year Ended
12/31/19 | | | Year Ended
12/31/18 | |
Increase (Decrease) in Net Assets | | | | | | | | |
Operations | | | | | | | | |
Investment income, net | | $ | 15,101,250 | | | $ | 16,417,367 | |
Net realized gain (loss) on investments and foreign currency transactions | | | (5,759,927 | ) | | | (13,512,247 | ) |
Change in unrealized appreciation (depreciation) on investments and foreign currency translations | | | 110,270,378 | | | | (88,136,375 | ) |
Net increase (decrease) in net assets resulting from operations | | | 119,611,701 | | | | (85,231,255 | ) |
Distributions from Investor Class | | | (1,983,451 | ) | | | (2,090,581 | ) |
Distributions from Class A | | | | | | | | |
Distributions from Institutional Class | | | (14,060,119 | ) | | | (13,328,976 | ) |
Total distributions to shareholders | | | (16,043,570 | ) | | | (15,419,557 | ) |
From capital share transactions: | | | | | | | | |
Investor Class | | | | | | | | |
Proceeds from shares sold | | | 17,043,389 | | | | 27,995,455 | |
Proceeds from reinvestment of distributions | | | 1,848,129 | | | | 1,866,131 | |
Cost of shares redeemed | | | (26,592,900 | ) | | | (61,228,193 | ) |
Net increase (decrease) from Investor Class transactions | | | (7,701,382 | ) | | | (31,366,607 | ) |
Class A | | | | | | | | |
Proceeds from shares sold | | | | | | | | |
Proceeds from reinvestment of distributions | | | | | | | | |
Cost of shares redeemed | | | | | | | | |
Net increase (decrease) from Class A transactions | | | | | | | | |
Institutional Class | | | | | | | | |
Proceeds from shares sold | | | 122,187,707 | | | | 198,395,377 | |
Proceeds from reinvestment of distributions | | | 13,223,070 | | | | 12,477,288 | |
Cost of shares redeemed | | | (102,270,983 | ) | | | (247,192,450 | ) |
Net increase (decrease) from Institutional Class transactions | | | 33,139,794 | | | | (36,319,785 | ) |
Net increase (decrease) from capital share transactions | | | 25,438,412 | | | | (67,686,392 | ) |
Net increase (decrease) in net assets | | | 129,006,543 | | | | (168,337,204 | ) |
Net assets | | | | | | | | |
Beginning of period | | | 515,786,922 | | | | 684,124,126 | |
End of period | | $ | 644,793,465 | | | $ | 515,786,922 | |
| | | | | | | | | |
Shares of Beneficial Interest: | | | | | | | | |
Investor Class | | | | | | | | |
Shares sold | | | 1,942,870 | | | | 3,063,037 | |
Shares issued in reinvestment of distributions | | | 203,929 | | | | 214,296 | |
Shares redeemed | | | (3,036,000 | ) | | | (6,705,211 | ) |
Net increase (decrease) in shares outstanding | | | (889,201 | ) | | | (3,427,878 | ) |
| | | | | | | | | |
Class A | | | | | | | | |
Shares sold | | | | | | | | |
Shares issued in reinvestment of distributions | | | | | | | | |
Shares redeemed | | | | | | | | |
Net increase (decrease) in shares outstanding | | | | | | | | |
| | | | | | | | | |
Institutional Class | | | | | | | | |
Shares sold | | | 14,236,908 | | | | 22,282,794 | |
Shares issued in reinvestment of distributions | | | 1,486,417 | | | | 1,467,047 | |
Shares redeemed | | | (11,932,268 | ) | | | (28,565,934 | ) |
Net increase (decrease) in shares outstanding | | | 3,791,057 | | | | (4,816,093 | ) |
SEE NOTES TO FINANCIAL STATEMENTS | 126 | |
| | | | | | Core Bond Fund | | | High Yield Bond
Fund | | | Sustainable
Allocation Fund | | | | | |
| | | | | Year Ended
12/31/19 | | | Year Ended
12/31/18 | | | Year Ended
12/31/19 | | | Year Ended
12/31/18 | | | Year Ended
12/31/19 | | | Year Ended
12/31/18 | | | | |
| | | | | | | | | | | | | | | | | | | | | | | | | | | | | | | | |
| | | | | | | | | | | | | | | | | | | | | | | | | | | | | | | | |
| | | | | | $ | 17,484,311 | | | $ | 17,146,769 | | | $ | 18,928,398 | | | $ | 19,951,720 | | | $ | 29,088,062 | | | $ | 27,923,855 | | | | | |
| | | | | | | 7,048,964 | | | | (8,889,342 | ) | | | (8,892,802 | ) | | | (7,322,455 | ) | | | 27,512,989 | | | | 136,089,940 | | | | | |
| | | | | | | 28,214,334 | | | | (8,759,690 | ) | | | 39,322,008 | | | | (23,448,233 | ) | | | 284,650,514 | | | | (236,378,335 | ) | | | | |
| | | | | | | 52,747,609 | | | | (502,263 | ) | | | 49,357,604 | | | | (10,818,968 | ) | | | 341,251,565 | | | | (72,364,540 | ) | | | | |
| | | | | | | (139,036 | ) | | | (82,861 | ) | | | (8,660,826 | ) | | | (9,217,524 | ) | | | (131,657,832 | ) | | | (38,484,397 | ) | | | | |
| | | | | | | | | | | | | | | (292,034 | ) | | | (310,370 | ) | | | | | | | | | | | | |
| | | | | | | (18,172,126 | ) | | | (18,002,713 | ) | | | (9,984,256 | ) | | | (10,415,292 | ) | | | (34,380,100 | ) | | | (11,413,188 | ) | | | | |
| | | | | | | (18,311,162 | ) | | | (18,085,574 | ) | | | (18,937,116 | ) | | | (19,943,186 | ) | | | (166,037,932 | ) | | | (49,897,585 | ) | | | | |
| | | | | | | | | | | | | | | | | | | | | | | | | | | | | | | | |
| | | | | | | | | | | | | | | | | | | | | | | | | | | | | | | | |
| | | | | | | 3,676,166 | | | | 2,631,988 | | | | 37,625,331 | | | | 33,908,204 | | | | 76,654,788 | | | | 77,259,243 | | | | | |
| | | | | | | 136,697 | | | | 79,120 | | | | 8,193,211 | | | | 8,745,497 | | | | 127,269,290 | | | | 36,965,250 | | | | | |
| | | | | | | (951,396 | ) | | | (1,320,396 | ) | | | (39,060,094 | ) | | | (67,312,690 | ) | | | (143,257,511 | ) | | | (192,583,681 | ) | | | | |
| | | | | | | 2,861,467 | | | | 1,390,712 | | | | 6,758,448 | | | | (24,658,989 | ) | | | 60,666,567 | | | | (78,359,188 | ) | | | | |
| | | | | | | | | | | | | | | | | | | | | | | | | | | | | | | | |
| | | | | | | | | | | | | | | 803,489 | | | | 1,867,173 | | | | | | | | | | | | | |
| | | | | | | | | | | | | | | 278,404 | | | | 294,312 | | | | | | | | | | | | | |
| | | | | | | | | | | | | | | (1,481,640 | ) | | | (1,738,221 | ) | | | | | | | | | | | | |
| | | | | | | | | | | | | | | (399,747 | ) | | | 423,264 | | | | | | | | | | | | | |
| | | | | | | | | | | | | | | | | | | | | | | | | | | | | | | | |
| | | | | | | 14,494,070 | | | | 821,250 | | | | 79,829,366 | | | | 46,486,488 | | | | 47,827,366 | | | | 76,179,161 | | | | | |
| | | | | | | 18,140,809 | | | | 17,970,721 | | | | 7,494,151 | | | | 7,390,756 | | | | 31,625,501 | | | | 10,559,398 | | | | | |
| | | | | | | (46,719,900 | ) | | | (15,135,419 | ) | | | (105,216,195 | ) | | | (55,263,696 | ) | | | (107,146,469 | ) | | | (198,822,395 | ) | | | | |
| | | | | | | (14,085,021 | ) | | | 3,656,552 | | | | (17,892,678 | ) | | | (1,386,452 | ) | | | (27,693,602 | ) | | | (112,083,836 | ) | | | | |
| | | | | | | (11,223,554 | ) | | | 5,047,264 | | | | (11,533,977 | ) | | | (25,622,177 | ) | | | 32,972,965 | | | | (190,443,024 | ) | | | | |
| | | | | | | 23,212,893 | | | | (13,540,573 | ) | | | 18,886,511 | | | | (56,384,331 | ) | | | 208,186,598 | | | | (312,705,149 | ) | | | | |
| | | | | | | | | | | | | | | | | | | | | | | | | | | | | | | | |
| | | | | | | 686,478,505 | | | | 700,019,078 | | | | 356,921,605 | | | | 413,305,936 | | | | 1,689,660,725 | | | | 2,002,365,874 | | | | | |
| | | | | | $ | 709,691,398 | | | $ | 686,478,505 | | | $ | 375,808,116 | | | $ | 356,921,605 | | | $ | 1,897,847,323 | | | $ | 1,689,660,725 | | | | | |
| | | | | | | | | | | | | | | | | | | | | | | | | | | | | | | | |
| | | | | | | | | | | | | | | | | | | | | | | | | | | | | | | | |
| | | | | | | | | | | | | | | | | | | | | | | | | | | | | | | | |
| | | | | | | 362,087 | | | | 269,286 | | | | 5,676,380 | | | | 5,131,750 | | | | 3,242,648 | | | | 3,426,578 | | | | | |
| | | | | | | 13,428 | | | | 8,114 | | | | 1,232,947 | | | | 1,331,014 | | | | 5,441,977 | | | | 1,689,865 | | | | | |
| | | | | | | (93,666 | ) | | | (135,570 | ) | | | (5,894,629 | ) | | | (10,216,674 | ) | | | (6,127,622 | ) | | | (8,481,918 | ) | | | | |
| | | | | | | 281,849 | | | | 141,830 | | | | 1,014,698 | | | | (3,753,910 | ) | | | 2,557,003 | | | | (3,365,475 | ) | | | | |
| | | | | | | | | | | | | | | | | | | | | | | | | | | | | | | | |
| | | | | | | | | | | | | | | | | | | | | | | | | | | | | | | | |
| | | | | | | | | | | | | | | 119,668 | | | | 281,595 | | | | | | | | | | | | | |
| | | | | | | | | | | | | | | 41,860 | | | | 44,764 | | | | | | | | | | | | | |
| | | | | | | | | | | | | | | (222,143 | ) | | | (262,747 | ) | | | | | | | | | | | | |
| | | | | | | | | | | | | | | (60,615 | ) | | | 63,612 | | | | | | | | | | | | | |
| | | | | | | | | | | | | | | | | | | | | | | | | | | | | | | | |
| | | | | | | | | | | | | | | | | | | | | | | | | | | | | | | | |
| | | | | | | 1,408,141 | | | | 84,734 | | | | 12,172,704 | | | | 7,078,778 | | | | 2,011,825 | | | | 3,286,107 | | | | | |
| | | | | | | 1,785,769 | | | | 1,842,152 | | | | 1,133,547 | | | | 1,129,286 | | | | 1,329,821 | | | | 475,858 | | | | | |
| | | | | | | (4,720,452 | ) | | | (1,574,756 | ) | | | (15,973,491 | ) | | | (8,417,614 | ) | | | (4,566,413 | ) | | | (8,758,108 | ) | | | | |
| | | | | | | (1,526,542 | ) | | | 352,130 | | | | (2,667,240 | ) | | | (209,550 | ) | | | (1,224,767 | ) | | | (4,996,143 | ) | | | | |
| | 127 | SEE NOTES TO FINANCIAL STATEMENTS |
December 31, 2019 |
Financial Highlights |
Selected data for a share outstanding throughout each period. |
| | | | | | | Income
(loss) from
investment
operations | | | | | | | Distributions to
shareholders | |
| | Net asset
value,
beginning of
period | | | Net
investment
income1 | | | Net
realized and
unrealized
gain (loss) | | | Total from
investment
operations | | | From net
investment
income | | | From net
realized
gains | |
Large Cap Fund | | | | | | | | | | | | | | | | | | | | | | | | |
Investor Class | | | | | | | | | | | | | | | | | | | | | | | | |
Year Ended December 31, 2019 | | $ | 7.97 | | | $ | 0.07 | | | $ | 2.71 | | | $ | 2.78 | | | $ | 0.07 | | | $ | 0.30 | |
Year Ended December 31, 2018 | | | 10.56 | | | | 0.07 | | | | (0.63 | ) | | $ | (0.56 | ) | | | 0.07 | | | | 1.96 | |
Year Ended December 31, 2017 | | | 9.91 | | | | 0.09 | | | | 1.95 | | | | 2.04 | | | | 0.09 | | | | 1.30 | |
Period Ended December 31, 20165 | | | 10.00 | | | | — | | | | (0.08 | ) | | | (0.08 | ) | | | 0.01 | | | | — | |
Institutional Class | | | | | | |
Year Ended December 31, 2019 | | $ | 7.98 | | | $ | 0.09 | | | $ | 2.72 | | | $ | 2.81 | | | $ | 0.09 | | | $ | 0.30 | |
Year Ended December 31, 2018 | | | 10.57 | | | | 0.10 | | | | (0.63 | ) | | | (0.53 | ) | | | 0.10 | | | | 1.96 | |
Year Ended December 31, 2017 | | | 9.91 | | | | 0.10 | | | | 1.97 | | | | 2.07 | | | | 0.11 | | | | 1.30 | |
Period Ended December 31, 20165 | | | 10.00 | | | | 0.01 | | | | (0.09 | ) | | | (0.08 | ) | | | 0.01 | | | | — | |
| | | | | | | | | | | | | | | | | | | | | | | | | |
Small Cap Fund | | | | | | | | | | | | | | | | | | | | | | | | |
Investor Class | | | | | | | | | | | | | | | | | | | | | | | | |
Year Ended December 31, 2019 | | $ | 12.01 | | | $ | 0.13 | | | $ | 2.66 | | | $ | 2.79 | | | $ | 0.13 | | | $ | — | |
Year Ended December 31, 2018 | | | 16.41 | | | | 0.00 | 7 | | | (2.64 | ) | | | (2.64 | ) | | | 0.00 | 7 | | | 1.76 | |
Year Ended December 31, 2017 | | | 15.34 | | | | 0.03 | | | | 1.30 | | | | 1.33 | | | | 0.02 | | | | 0.24 | |
Year Ended December 31, 2016 | | | 13.30 | | | | 0.12 | | | | 2.26 | | | | 2.38 | | | | 0.10 | | | | 0.24 | |
Year Ended December 31, 2015 | | | 13.92 | | | | 0.03 | | | | (0.56 | ) | | | (0.53 | ) | | | 0.02 | | | | 0.07 | |
Class A | | | | | | |
Year Ended December 31, 2019 | | $ | 11.98 | | | $ | 0.12 | | | $ | 2.66 | | | $ | 2.78 | | | $ | 0.13 | | | $ | — | |
Year Ended December 31, 2018 | | | 16.38 | | | | 0.00 | 7 | | | (2.63 | ) | | | (2.63 | ) | | | 0.01 | | | | 1.76 | |
Year Ended December 31, 2017 | | | 15.31 | | | | 0.03 | | | | 1.30 | | | | 1.33 | | | | 0.02 | | | | 0.24 | |
Year Ended December 31, 2016 | | | 13.28 | | | | 0.12 | | | | 2.25 | | | | 2.37 | | | | 0.10 | | | | 0.24 | |
Year Ended December 31, 2015 | | | 13.90 | | | | 0.03 | | | | (0.56 | ) | | | (0.53 | ) | | | 0.02 | | | | 0.07 | |
Institutional Class | | | | | | | | | | | | | | | | | | | | | | | | |
Year Ended December 31, 2019 | | $ | 12.12 | | | $ | 0.15 | | | $ | 2.70 | | | $ | 2.85 | | | $ | 0.15 | | | $ | — | |
Year Ended December 31, 2018 | | | 16.53 | | | | 0.05 | | | | (2.67 | ) | | | (2.62 | ) | | | 0.03 | | | | 1.76 | |
Year Ended December 31, 2017 | | | 15.44 | | | | 0.07 | | | | 1.32 | | | | 1.39 | | | | 0.06 | | | | 0.24 | |
Year Ended December 31, 2016 | | | 13.38 | | | | 0.16 | | | | 2.27 | | | | 2.43 | | | | 0.13 | | | | 0.24 | |
Year Ended December 31, 2015 | | | 14.00 | | | | 0.06 | | | | (0.56 | ) | | | (0.50 | ) | | | 0.05 | | | | 0.07 | |
1 | Based on average shares outstanding during the period. |
2 | Total return represents aggregate total return for the period indicated, includes reinvestment of all dividends and distributions, and does not reflect the deduction of any applicable sales charges. Total returns for periods of less than one year have not been annualized. |
3 | Ratios representing periods of less than one year have been annualized. |
SEE NOTES TO FINANCIAL STATEMENTS | 128 | |
| | | | | | | | | | | | | | | | | Ratios to
average net
assets3 | | | | | | | | | |
| | Total
distributions | | | Net asset
value,
end of
period | | | Total return2 | | | Net assets
end of period
(in $000’s) | | | Net
expenses
including
reimbursements
and waivers | | | Net
investment
income | | | Total
expenses
excluding
reimbursements
and waivers | | | Portfolio
Turnover4 | | | | |
| | | | | | | | | | | | | | | | | | | | | | | | | | | | | | | | | | | | |
| | | | | | | | | | | | | | | | | | | | | | | | | | | | | | | | | | | | |
| | $ | 0.37 | | | $ | 10.38 | | | | 34.85 | % | | $ | 3,271 | | | | 0.95 | % | | | 0.74 | % | | | 0.95 | % | | | 37 | % | | | | |
| | | 2.03 | | | | 7.97 | | | | (5.01 | %) | | | 1,975 | | | | 0.96 | % | | | 0.67 | % | | | 0.96 | % | | | 54 | % | | | | |
| | | 1.39 | | | | 10.56 | | | | 20.65 | % | | | 786 | | | | 0.95 | % | | | 0.82 | % | | | 0.95 | % | | | 57 | % | | | | |
| | | 0.01 | | | | 9.91 | | | | (0.83 | %) | | | 1 | | | | 0.96 | % | | | 1.06 | % | | | 0.96 | % | | | 3 | %6 | | | | |
| | | | | | | | |
| | $ | 0.39 | | | $ | 10.40 | | | | 35.23 | % | | $ | 763,004 | | | | 0.70 | % | | | 1.00 | % | | | 0.70 | % | | | 37 | % | | | | |
| | | 2.06 | | | | 7.98 | | | | (4.79 | %) | | | 590,664 | | | | 0.70 | % | | | 0.85 | % | | | 0.70 | % | | | 54 | % | | | | |
| | | 1.41 | | | | 10.57 | | | | 20.96 | % | | | 718,601 | | | | 0.70 | % | | | 0.94 | % | | | 0.70 | % | | | 57 | % | | | | |
| | | 0.01 | | | | 9.91 | | | | (0.83 | %) | | | 789,950 | | | | 0.71 | % | | | 1.31 | % | | | 0.71 | % | | | 3 | %6 | | | | |
| | | | | | | | | | | | | | | | | | | | | | | | | | | | | | | | | | | | |
| | | | | | | | | | | | | | | | | | | | | | | | | | | | | | | | | | | | |
| | | | | | | | | | | | | | | | | | | | | | | | | | | | | | | | | | | | |
| | $ | 0.13 | | | $ | 14.67 | | | | 23.29 | % | | $ | 110,520 | | | | 1.20 | % | | | 0.93 | % | | | 1.20 | % | | | 78 | % | | | | |
| | | 1.76 | | | | 12.01 | | | | (15.80 | %) | | | 116,887 | | | | 1.18 | % | | | 0.03 | % | | | 1.18 | % | | | 57 | % | | | | |
| | | 0.26 | | | | 16.41 | | | | 8.77 | % | | | 223,360 | | | | 1.19 | % | | | 0.18 | % | | | 1.19 | % | | | 56 | % | | | | |
| | | 0.34 | | | | 15.34 | | | | 17.90 | % | | | 272,159 | | | | 1.19 | % | | | 0.82 | % | | | 1.19 | % | | | 49 | % | | | | |
| | | 0.09 | | | | 13.30 | | | | (3.85 | %) | | | 216,844 | | | | 1.22 | % | | | 0.20 | % | | | 1.23 | % | | | 48 | % | | | | |
| | | | | | | | |
| | $ | 0.13 | | | $ | 14.63 | | | | 23.27 | % | | $ | 12,445 | | | | 1.20 | % | | | 0.90 | % | | | 1.20 | % | | | 78 | % | | | | |
| | | 1.77 | | | | 11.98 | | | | (15.82 | %) | | | 12,290 | | | | 1.18 | % | | | 0.02 | % | | | 1.18 | % | | | 57 | % | | | | |
| | | 0.26 | | | | 16.38 | | | | 8.80 | % | | | 27,100 | | | | 1.19 | % | | | 0.19 | % | | | 1.19 | % | | | 56 | % | | | | |
| | | 0.34 | | | | 15.31 | | | | 17.85 | % | | | 39,477 | | | | 1.19 | % | | | 0.84 | % | | | 1.19 | % | | | 49 | % | | | | |
| | | 0.09 | | | | 13.28 | | | | (3.87 | %) | | | 28,394 | | | | 1.22 | % | | | 0.19 | % | | | 1.23 | % | | | 48 | % | | | | |
| | | | | | | | | | | | | | | | | | | | | | | | | | | | | | | | | | | | |
| | $ | 0.15 | | | $ | 14.82 | | | | 23.56 | % | | $ | 308,145 | | | | 0.95 | % | | | 1.08 | % | | | 0.95 | % | | | 78 | % | | | | |
| | | 1.79 | | | | 12.12 | | | | (15.59 | %) | | | 317,417 | | | | 0.93 | % | | | 0.29 | % | | | 0.93 | % | | | 57 | % | | | | |
| | | 0.30 | | | | 16.53 | | | | 9.10 | % | | | 580,752 | | | | 0.95 | % | | | 0.45 | % | | | 0.95 | % | | | 56 | % | | | | |
| | | 0.37 | | | | 15.44 | | | | 18.17 | % | | | 482,315 | | | | 0.94 | % | | | 1.14 | % | | | 0.94 | % | | | 49 | % | | | | |
| | | 0.12 | | | | 13.38 | | | | (3.62 | %) | | | 260,786 | | | | 0.97 | % | | | 0.44 | % | | | 0.98 | % | | | 48 | % | | | | |
5 | Per share data is reflected from the Fund’s inception date of December 16, 2016. |
6 | For purposes of calculating the turnover ratio for the Large Cap Fund, transactions related to an in-kind subscription have been excluded. |
7 | Rounds to less than $0.01. |
| | 129 | SEE NOTES TO FINANCIAL STATEMENTS |
December 31, 2019 |
Financial Highlights, continued |
Selected data for a share outstanding throughout each period. |
| | | | | | | Income
(loss) from
investment
operations | | | | | | | Distributions to
shareholders | |
| | Net asset
value,
beginning of
period | | | Net
investment
income1 | | | Net
realized and
unrealized
gain (loss) | | | Total from
investment
operations | | | From net
investment
income | | | From net
realized
gains | |
ESG Beta Quality Fund | | | | | | | | | | | | | | | | | | | | | | | | |
Investor Class | | | | | | | | | | | | | | | | | | | | | | | | |
Year Ended December 31, 2019 | | $ | 17.42 | | | $ | 0.28 | | | $ | 4.43 | | | $ | 4.71 | | | $ | 0.28 | | | $ | 0.44 | |
Year Ended December 31, 2018 | | | 19.69 | | | | 0.32 | | | | (1.20 | ) | | | (0.88 | ) | | | 0.32 | | | | 1.07 | |
Year Ended December 31, 2017 | | | 16.90 | | | | 0.23 | | | | 3.45 | | | | 3.68 | | | | 0.23 | | | | 0.66 | |
Year Ended December 31, 2016 | | | 17.55 | | | | 0.16 | | | | 0.95 | | | | 1.11 | | | | 0.16 | | | | 1.60 | |
Year Ended December 31, 2015 | | | 18.26 | | | | 0.03 | | | | 0.38 | | | | 0.41 | | | | 0.03 | | | | 1.09 | |
Class A | | | | | | | | | | | | | | | | | | | | | | | | |
Year Ended December 31, 2019 | | $ | 17.38 | | | $ | 0.28 | | | $ | 4.41 | | | $ | 4.69 | | | $ | 0.28 | | | $ | 0.44 | |
Year Ended December 31, 2018 | | | 19.65 | | | | 0.32 | | | | (1.20 | ) | | | (0.88 | ) | | | 0.32 | | | | 1.07 | |
Year Ended December 31, 2017 | | | 16.86 | | | | 0.23 | | | | 3.45 | | | | 3.68 | | | | 0.23 | | | | 0.66 | |
Year Ended December 31, 2016 | | | 17.52 | | | | 0.17 | | | | 0.93 | | | | 1.10 | | | | 0.16 | | | | 1.60 | |
Year Ended December 31, 2015 | | | 18.23 | | | | 0.04 | | | | 0.38 | | | | 0.42 | | | | 0.04 | | | | 1.09 | |
Institutional Class | | | | | | | | | | | | | | | | | | | | | | | | |
Year Ended December 31, 2019 | | $ | 17.94 | | | $ | 0.34 | | | $ | 4.56 | | | $ | 4.90 | | | $ | 0.33 | | | $ | 0.44 | |
Year Ended December 31, 2018 | | | 20.23 | | | | 0.38 | | | | (1.23 | ) | | | (0.85 | ) | | | 0.37 | | | | 1.07 | |
Year Ended December 31, 2017 | | | 17.34 | | | | 0.28 | | | | 3.55 | | | | 3.83 | | | | 0.28 | | | | 0.66 | |
Year Ended December 31, 2016 | | | 17.97 | | | | 0.19 | | | | 0.99 | | | | 1.18 | | | | 0.21 | | | | 1.60 | |
Year Ended December 31, 2015 | | | 18.66 | | | | 0.08 | | | | 0.39 | | | | 0.47 | | | | 0.07 | | | | 1.09 | |
| | | | | | | | | | | | | | | | | | | | | | | | | |
ESG Beta Dividend Fund | | | | | | | | | | | | | | | | | | | | | | | | |
Investor Class | | | | | | | | | | | | | | | | | | | | | | | | |
Year Ended December 31, 2019 | | $ | 10.64 | | | $ | 0.25 | | | $ | 2.49 | | | $ | 2.74 | | | $ | 0.25 | | | $ | 0.35 | |
Year Ended December 31, 2018 | | | 11.50 | | | | 0.24 | | | | (0.73 | ) | | | (0.49 | ) | | | 0.24 | | | | 0.13 | |
Year Ended December 31, 2017 | | | 9.86 | | | | 0.22 | | | | 1.67 | | | | 1.89 | | | | 0.23 | | | | 0.02 | |
Period Ended December 31, 20165 | | | 9.96 | | | | 0.01 | | | | (0.10 | ) | | | (0.09 | ) | | | 0.01 | | | | — | |
Institutional Class | | | | | | |
Year Ended December 31, 2019 | | $ | 10.66 | | | $ | 0.28 | | | $ | 2.50 | | | $ | 2.78 | | | $ | 0.28 | | | $ | 0.35 | |
Year Ended December 31, 2018 | | | 11.50 | | | | 0.26 | | | | (0.70 | ) | | | (0.44 | ) | | | 0.27 | | | | 0.13 | |
Year Ended December 31, 2017 | | | 9.86 | | | | 0.24 | | | | 1.67 | | | | 1.91 | | | | 0.25 | | | | 0.02 | |
Period Ended December 31, 20165 | | | 9.96 | | | | 0.01 | | | | (0.10 | ) | | | (0.09 | ) | | | 0.01 | | | | — | |
1 | Based on average shares outstanding during the period. |
2 | Total return represents aggregate total return for the period indicated, includes reinvestment of all dividends and distributions, and does not reflect the deduction of any applicable sales charges. Total returns for periods of less than one year have not been annualized. |
3 | Ratios representing periods of less than one year have been annualized. |
SEE NOTES TO FINANCIAL STATEMENTS | 130 | |
| | | | | | | | | | | | | | | | | Ratios to
average net
assets3 | | | | | | | | | |
| | Total
distributions | | | Net asset
value,
end of
period | | | Total return2 | | | Net assets
end of period
(in $000’s) | | | Net
expenses
including
reimbursements
and waivers | | | Net
investment
income | | | Total
expenses
excluding
reimbursements
and waivers | | | Portfolio
Turnover4 | | | | |
| | | | | | | | | | | | | | | | | | | | | | | | | | | | | | | | | | | | |
| | | | | | | | | | | | | | | | | | | | | | | | | | | | | | | | | | | | |
| | $ | 0.72 | | | $ | 21.41 | | | | 27.13 | % | | $ | 161,021 | | | | 0.90 | % | | | 1.43 | % | | | 0.90 | % | | | 49 | % | | | | |
| | | 1.39 | | | | 17.42 | | | | (4.43 | %) | | | 134,435 | | | | 0.90 | % | | | 1.59 | % | | | 0.90 | % | | | 55 | % | | | | |
| | | 0.89 | | | | 19.69 | | | | 21.89 | % | | | 164,016 | | | | 0.90 | % | | | 1.25 | % | | | 0.90 | % | | | 36 | % | | | | |
| | | 1.76 | | | | 16.90 | | | | 6.26 | % | | | 161,041 | | | | 1.07 | % | | | 0.93 | % | | | 1.09 | % | | | 80 | % | | | | |
| | | 1.12 | | | | 17.55 | | | | 2.20 | % | | | 161,334 | | | | 1.24 | % | | | 0.18 | % | | | 1.28 | % | | | 26 | % | | | | |
| | | | | | | | | | | | | | | | | | | | | | | | | | | | | | | | | | | | |
| | $ | 0.72 | | | $ | 21.35 | | | | 27.08 | % | | $ | 6,659 | | | | 0.90 | % | | | 1.43 | % | | | 0.90 | % | | | 49 | % | | | | |
| | | 1.39 | | | | 17.38 | | | | (4.43 | %) | | | 5,417 | | | | 0.90 | % | | | 1.59 | % | | | 0.90 | % | | | 55 | % | | | | |
| | | 0.89 | | | | 19.65 | | | | 21.96 | % | | | 5,589 | | | | 0.90 | % | | | 1.25 | % | | | 0.90 | % | | | 36 | % | | | | |
| | | 1.76 | | | | 16.86 | | | | 6.24 | % | | | 4,296 | | | | 1.06 | % | | | 0.96 | % | | | 1.09 | % | | | 80 | % | | | | |
| | | 1.13 | | | | 17.52 | | | | 2.24 | % | | | 3,251 | | | | 1.24 | % | | | 0.20 | % | | | 1.28 | % | | | 26 | % | | | | |
| | | | | | | | | | | | | | | | | | | | | | | | | | | | | | | | | | | | |
| | $ | 0.77 | | | $ | 22.07 | | | | 27.42 | % | | $ | 72,736 | | | | 0.65 | % | | | 1.68 | % | | | 0.65 | % | | | 49 | % | | | | |
| | | 1.44 | | | | 17.94 | | | | (4.16 | %) | | | 54,131 | | | | 0.65 | % | | | 1.84 | % | | | 0.65 | % | | | 55 | % | | | | |
| | | 0.94 | | | | 20.23 | | | | 22.22 | % | | | 43,038 | | | | 0.65 | % | | | 1.48 | % | | | 0.65 | % | | | 36 | % | | | | |
| | | 1.81 | | | | 17.34 | | | | 6.49 | % | | | 27,580 | | | | 0.84 | % | | | 1.08 | % | | | 0.84 | % | | | 80 | % | | | | |
| | | 1.16 | | | | 17.97 | | | | 2.50 | % | | | 38,741 | | | | 0.99 | % | | | 0.44 | % | | | 1.03 | % | | | 26 | % | | | | |
| | | | | | | | | | | | | | | | | | | | | | | | | | | | | | | | | | | | |
| | | | | | | | | | | | | | | | | | | | | | | | | | | | | | | | | | | | |
| | | | | | | | | | | | | | | | | | | | | | | | | | | | | | | | | | | | |
| | $ | 0.60 | | | $ | 12.78 | | | | 25.85 | % | | $ | 2,859 | | | | 0.90 | % | | | 2.03 | % | | | 0.90 | % | | | 50 | % | | | | |
| | | 0.37 | | | | 10.64 | | | | (4.21 | %) | | | 1,846 | | | | 0.90 | % | | | 2.11 | % | | | 0.90 | % | | | 52 | % | | | | |
| | | 0.25 | | | | 11.50 | | | | 19.24 | % | | | 353 | | | | 0.90 | % | | | 2.10 | % | | | 0.90 | % | | | 31 | % | | | | |
| | | 0.01 | | | | 9.86 | | | | (0.89 | %) | | | 10 | | | | 0.90 | % | | | 1.93 | % | | | 0.90 | % | | | 0 | %6 | | | | |
| | | | | | | | |
| | $ | 0.63 | | | $ | 12.81 | | | | 26.18 | % | | $ | 130,001 | | | | 0.65 | % | | | 2.28 | % | | | 0.65 | % | | | 50 | % | | | | |
| | | 0.40 | | | | 10.66 | | | | (3.84 | %) | | | 115,362 | | | | 0.65 | % | | | 2.24 | % | | | 0.65 | % | | | 52 | % | | | | |
| | | 0.27 | | | | 11.50 | | | | 19.44 | % | | | 149,178 | | | | 0.65 | % | | | 2.31 | % | | | 0.65 | % | | | 31 | % | | | | |
| | | 0.01 | | | | 9.86 | | | | (0.89 | %) | | | 136,601 | | | | 0.65 | % | | | 2.18 | % | | | 0.65 | % | | | 0 | %6 | | | | |
5 | Per share data is reflected from the Fund’s inception date of December 16, 2016. |
6 | For purposes of calculating the turnover ratio for ESG Beta Dividend Fund, transactions related to an in-kind subscription have been excluded. |
| | 131 | SEE NOTES TO FINANCIAL STATEMENTS |
December 31, 2019 |
Financial Highlights, continued |
Selected data for a share outstanding throughout each period. |
| | | | | | | Income
(loss) from
investment
operations | | | | | | | Distributions to
shareholders | |
| | Net asset
value,
beginning of
period | | | Net
investment
income1 | | | Net
realized and
unrealized
gain (loss) | | | Total from
investment
operations | | | From net
investment
income | | | From net
realized
gains | |
Global Opportunities Fund | | | | | | | | | | | | | | | | | | | | | | | | |
Investor Class | | | | | | | | | | | | | | | | | | | | | | | | |
Year Ended December 31, 2019 | | $ | 9.18 | | | $ | 0.02 | | | $ | 3.05 | | | $ | 3.07 | | | $ | 0.03 | | | $ | 0.18 | |
Period Ended December 31, 20185 | | | 10.00 | | | | (0.01 | ) | | | (0.81 | ) | | | (0.82 | ) | | | — | | | | — | |
Institutional Class | | | | | | | | | | | | | | | | | | | | | | | | |
Year Ended December 31, 2019 | | $ | 9.18 | | | $ | 0.06 | | | $ | 3.03 | | | $ | 3.09 | | | $ | 0.05 | | | $ | 0.18 | |
Period Ended December 31, 20185 | | | 10.00 | | | | 0.00 | 6 | | | (0.82 | ) | | | (0.82 | ) | | | — | | | | — | |
| | | | | | | | | | | | | | | | | | | | | |
Global Environmental Markets Fund | | | | | | | | | | | | | | | | | | | | |
Investor Class | | | | | | | | | | | | | | | | | | | | | | | | |
Year Ended December 31, 2019 | | $ | 13.28 | | | $ | 0.12 | | | $ | 3.56 | | | $ | 3.68 | | | $ | 0.11 | | | $ | — | |
Year Ended December 31, 2018 | | | 16.11 | | | | 0.13 | | | | (2.43 | ) | | | (2.30 | ) | | | 0.12 | | | | 0.41 | |
Year Ended December 31, 2017 | | | 13.16 | | | | 0.07 | | | | 3.40 | | | | 3.47 | | | | 0.05 | | | | 0.47 | |
Year Ended December 31, 2016 | | | 11.96 | | | | 0.08 | | | | 1.19 | | | | 1.27 | | | | 0.07 | | | | — | |
Year Ended December 31, 2015 | | | 12.25 | | | | 0.04 | | | | (0.21 | ) | | | (0.17 | ) | | | 0.04 | | | | 0.08 | |
Class A | | | | | | | | | | | | | | | | | | | | | | | | |
Year Ended December 31, 2019 | | $ | 13.26 | | | $ | 0.12 | | | $ | 3.56 | | | $ | 3.68 | | | $ | 0.11 | | | $ | — | |
Year Ended December 31, 2018 | | | 16.09 | | | | 0.13 | | | | (2.43 | ) | | | (2.30 | ) | | | 0.12 | | | | 0.41 | |
Year Ended December 31, 2017 | | | 13.14 | | | | 0.07 | | | | 3.40 | | | | 3.47 | | | | 0.05 | | | | 0.47 | |
Year Ended December 31, 2016 | | | 11.94 | | | | 0.08 | | | | 1.19 | | | | 1.27 | | | | 0.07 | | | | — | |
Year Ended December 31, 2015 | | | 12.23 | | | | 0.04 | | | | (0.21 | ) | | | (0.17 | ) | | | 0.04 | | | | 0.08 | |
Institutional Class | | | | | | | | | | | | | | | | | | | | | | | | |
Year Ended December 31, 2019 | | $ | 13.36 | | | $ | 0.16 | | | $ | 3.60 | | | $ | 3.76 | | | $ | 0.15 | | | $ | — | |
Year Ended December 31, 2018 | | | 16.22 | | | | 0.17 | | | | (2.46 | ) | | | (2.29 | ) | | | 0.16 | | | | 0.41 | |
Year Ended December 31, 2017 | | | 13.24 | | | | 0.10 | | | | 3.44 | | | | 3.54 | | | | 0.09 | | | | 0.47 | |
Year Ended December 31, 2016 | | | 12.03 | | | | 0.11 | | | | 1.20 | | | | 1.31 | | | | 0.10 | | | | — | |
Year Ended December 31, 2015 | | | 12.31 | | | | 0.07 | | | | (0.21 | ) | | | (0.14 | ) | | | 0.06 | | | | 0.08 | |
1 | Based on average shares outstanding during the period. |
2 | Total return represents aggregate total return for the period indicated, includes reinvestment of all dividends and distributions, and does not reflect the deduction of any applicable sales charges. Total returns for periods of less than one year have not been annualized. |
3 | Ratios representing periods of less than one year have been annualized. |
SEE NOTES TO FINANCIAL STATEMENTS | 132 | |
| | | | | | | | | | | | | | | | | Ratios to
average net
assets3 | | | | | | | | | |
| | Total
distributions | | | Net asset
value,
end of
period | | | Total return2 | | | Net assets
end of period
(in $000’s) | | | Net
expenses
including
reimbursements
and waivers | | | Net
investment
income | | | Total
expenses
excluding
reimbursements
and waivers | | | Portfolio
Turnover4 | | | | |
| | | | | | | | | | | | | | | | | | | | | | | | | | | | | | | | | | | | |
| | | | | | | | | | | | | | | | | | | | | | | | | | | | | | | | | | | | |
| | $ | 0.21 | | | $ | 12.04 | | | | 33.51 | % | | $ | 1,683 | | | | 1.19 | % | | | 0.17 | % | | | 1.68 | % | | | 29 | % | | | | |
| | | — | | | | 9.18 | | | | (8.20 | %) | | | 126 | | | | 1.16 | % | | | (0.14 | %) | | | 2.06 | % | | | 17 | % | | | | |
| | | | | | | | | | | | | | | | | | | | | | | | | | | | | | | | | | | | |
| | $ | 0.23 | | | $ | 12.04 | | | | 33.72 | % | | $ | 40,392 | | | | 0.92 | % | | | 0.51 | % | | | 1.42 | % | | | 29 | % | | | | |
| | | — | | | | 9.18 | | | | (8.20 | %) | | | 24,816 | | | | 0.92 | % | | | 0.01 | % | | | 1.81 | % | | | 17 | % | | | | |
| | | | | | | | | | | | | | | | | | | | | | | | | | | | | | | | | | | | |
| | | | | | | | | | | | | | | | | | | | | | | | | | | | | | | | | | | | |
| | | | | | | | | | | | | | | | | | | | | | | | | | | | | | | | | | | | |
| | $ | 0.11 | | | $ | 16.85 | | | | 27.75 | % | | $ | 152,209 | | | | 1.22 | % | | | 0.78 | % | | | 1.22 | % | | | 14 | % | | | | |
| | | 0.53 | | | | 13.28 | | | | (14.31 | %) | | | 118,980 | | | | 1.22 | % | | | 0.83 | % | | | 1.24 | % | | | 26 | % | | | | |
| | | 0.52 | | | | 16.11 | | | | 26.42 | % | | | 154,325 | | | | 1.23 | % | | | 0.46 | % | | | 1.26 | % | | | 18 | % | | | | |
| | | 0.07 | | | | 13.16 | | | | 10.62 | % | | | 122,610 | | | | 1.29 | % | | | 0.61 | % | | | 1.34 | % | | | 30 | % | | | | |
| | | 0.12 | | | | 11.96 | | | | (1.45 | %) | | | 104,712 | | | | 1.40 | % | | | 0.31 | % | | | 1.41 | % | | | 22 | % | | | | |
| | | | | | | | | | | | | | | | | | | | | | | | | | | | | | | | | | | | |
| | $ | 0.11 | | | $ | 16.83 | | | | 27.77 | % | | $ | 13,700 | | | | 1.22 | % | | | 0.78 | % | | | 1.22 | % | | | 14 | % | | | | |
| | | 0.53 | | | | 13.26 | | | | (14.33 | %) | | | 12,766 | | | | 1.22 | % | | | 0.86 | % | | | 1.24 | % | | | 26 | % | | | | |
| | | 0.52 | | | | 16.09 | | | | 26.45 | % | | | 15,383 | | | | 1.23 | % | | | 0.47 | % | | | 1.26 | % | | | 18 | % | | | | |
| | | 0.07 | | | | 13.14 | | | | 10.62 | % | | | 13,042 | | | | 1.30 | % | | | 0.63 | % | | | 1.34 | % | | | 30 | % | | | | |
| | | 0.12 | | | | 11.94 | | | | (1.44 | %) | | | 13,330 | | | | 1.40 | % | | | 0.30 | % | | | 1.41 | % | | | 22 | % | | | | |
| | | | | | | | | | | | | | | | | | | | | | | | | | | | | | | | | | | | |
| | $ | 0.15 | | | $ | 16.97 | | | | 28.17 | % | | $ | 802,292 | | | | 0.97 | % | | | 1.01 | % | | | 0.97 | % | | | 14 | % | | | | |
| | | 0.57 | | | | 13.36 | | | | (14.17 | %) | | | 459,354 | | | | 0.97 | % | | | 1.10 | % | | | 0.99 | % | | | 26 | % | | | | |
| | | 0.56 | | | | 16.22 | | | | 26.79 | % | | | 439,991 | | | | 0.98 | % | | | 0.67 | % | | | 1.02 | % | | | 18 | % | | | | |
| | | 0.10 | | | | 13.24 | | | | 10.91 | % | | | 209,759 | | | | 1.04 | % | | | 0.86 | % | | | 1.09 | % | | | 30 | % | | | | |
| | | 0.14 | | | | 12.03 | | | | (1.21 | %) | | | 133,930 | | | | 1.15 | % | | | 0.55 | % | | | 1.16 | % | | | 22 | % | | | | |
5 | Per share data is reflected from the Fund’s inception date of June 27, 2018. |
6 | Rounds to less than $0.01. |
| | 133 | SEE NOTES TO FINANCIAL STATEMENTS |
December 31, 2019 |
Financial Highlights, continued |
Selected data for a share outstanding throughout each period. |
| | | | | | | Income
(loss) from
investment
operations | | | | | | | Distributions to
shareholders | |
| | Net asset
value,
beginning of
period | | | Net
investment
income1 | | | Net
realized and
unrealized
gain (loss) | | | Total from
investment
operations | | | From net
investment
income | | | From net
realized
gains | |
Global Women’s Leadership Fund | | | | | | | | | | | | | | | | | | | | |
Investor Class | | | | | | | | | | | | | | | | | | | | | | | | |
Year Ended December 31, 2019 | | $ | 22.02 | | | $ | 0.47 | | | $ | 5.33 | | | $ | 5.80 | | | $ | 0.44 | | | $ | 0.38 | |
Year Ended December 31, 2018 | | | 25.02 | | | | 0.47 | | | | (2.39 | ) | | | (1.92 | ) | | | 0.44 | | | | 0.64 | |
Year Ended December 31, 2017 | | | 20.56 | | | | 0.39 | | | | 4.69 | | | | 5.08 | | | | 0.36 | | | | 0.26 | |
Year Ended December 31, 2016 | | | 19.75 | | | | 0.39 | | | | 0.79 | | | | 1.18 | | | | 0.37 | | | | — | |
Year Ended December 31, 2015 | | | 20.43 | | | | 0.33 | | | | (0.53 | ) | | | (0.20 | ) | | | 0.32 | | | | 0.16 | |
Institutional Class | | | | | | |
Year Ended December 31, 2019 | | $ | 22.12 | | | $ | 0.53 | | | $ | 5.37 | | | $ | 5.90 | | | $ | 0.50 | | | $ | 0.38 | |
Year Ended December 31, 2018 | | | 25.13 | | | | 0.53 | | | | (2.40 | ) | | | (1.87 | ) | | | 0.50 | | | | 0.64 | |
Year Ended December 31, 2017 | | | 20.65 | | | | 0.43 | | | | 4.73 | | | | 5.16 | | | | 0.42 | | | | 0.26 | |
Year Ended December 31, 2016 | | | 19.83 | | | | 0.42 | | | | 0.82 | | | | 1.24 | | | | 0.42 | | | | — | |
Year Ended December 31, 2015 | | | 20.52 | | | | 0.38 | | | | (0.54 | ) | | | (0.16 | ) | | | 0.37 | | | | 0.16 | |
| | | | | | | | | | | | | | | | | | | | | |
EAFE ESG Leaders Index Fund | | | | | | | | | | | | | | | | | | | | | | | | |
Investor Class | | | | | | | | | | | | | | | | | | | | | | | | |
Year Ended December 31, 2019 | | $ | 7.95 | | | $ | 0.21 | | | $ | 1.59 | | | $ | 1.80 | | | $ | 0.22 | | | $ | — | |
Year Ended December 31, 2018 | | | 9.36 | | | | 0.22 | | | | (1.43 | ) | | | (1.21 | ) | | | 0.20 | | | | — | |
Year Ended December 31, 2017 | | | 7.79 | | | | 0.21 | | | | 1.57 | | | | 1.78 | | | | 0.21 | | | | — | |
Year Ended December 31, 2016 | | | 8.13 | | | | 0.20 | | | | (0.35 | ) | | | (0.15 | ) | | | 0.19 | | | | — | |
Year Ended December 31, 2015 | | | 8.19 | | | | 0.16 | | | | (0.08 | ) | | | 0.08 | | | | 0.14 | | | | 0.00 | 6 |
Institutional Class7 | | | | | | |
Year Ended December 31, 2019 | | $ | 7.80 | | | $ | 0.23 | | | $ | 1.55 | | | $ | 1.78 | | | $ | 0.24 | | | $ | — | |
Year Ended December 31, 2018 | | | 9.19 | | | | 0.23 | | | | (1.40 | ) | | | (1.17 | ) | | | 0.22 | | | | — | |
Year Ended December 31, 2017 | | | 7.65 | | | | 0.21 | | | | 1.56 | | | | 1.77 | | | | 0.23 | | | | — | |
Year Ended December 31, 2016 | | | 7.99 | | | | 0.21 | | | | (0.34 | ) | | | (0.13 | ) | | | 0.21 | | | | — | |
Year Ended December 31, 2015 | | | 8.05 | | | | 0.18 | | | | (0.08 | ) | | | 0.10 | | | | 0.16 | | | | 0.00 | 6 |
1 | Based on average shares outstanding during the period. |
2 | Total return represents aggregate total return for the period indicated, includes reinvestment of all dividends and distributions, and does not reflect the deduction of any applicable sales charges. Total returns for periods of less than one year have not been annualized. |
3 | Ratios representing periods of less than one year have been annualized. |
5 | To manage cash flows, minimize trading costs and equitize cash balances in between trading blocks of securities, the Global Women’s Leadership Fund utilizes one or more exchange-traded funds (ETFs), the combination of which is intended to track the Fund’s broad-based benchmark. These investments are frequent and short-term, however, the Fund is required to include such ETF investment activity in the calculation of its portfolio turnover. Had such transactions been excluded, the portfolio turnover would have been 25% for the year ended December 31, 2019, 30% for the year ended December 31, 2018, 25% for the year ended December 31, 2017, 21% for the year ended December 31, 2016, and 25% for the year ended December 31, 2015. |
SEE NOTES TO FINANCIAL STATEMENTS | 134 | |
| | | | | | | | | | | | | | | | | Ratios to
average net
assets3 | | | | | | | | | |
| | Total
distributions | | | Net asset
value,
end of
period | | | Total return2 | | | Net assets
end of period
(in $000’s) | | | Net
expenses
including
reimbursements
and waivers | | | Net
investment
income | | | Total
expenses
excluding
reimbursements
and waivers | | | Portfolio
Turnover4 | | | | |
| | | | | | | | | | | | | | | | | | | | | | | | | | | | | | | | | | | | |
| | | | | | | | | | | | | | | | | | | | | | | | | | | | | | | | | | | | |
| | $ | 0.82 | | | $ | 27.00 | | | | 26.42 | % | | $ | 118,713 | | | | 0.80 | % | | | 1.87 | % | | | 0.80 | % | | | 66 | %5 | | | | |
| | | 1.08 | | | | 22.02 | | | | (7.74 | %) | | | 86,727 | | | | 0.81 | % | | | 1.88 | % | | | 0.83 | % | | | 67 | %5 | | | | |
| | | 0.62 | | | | 25.02 | | | | 24.86 | % | | | 88,332 | | | | 0.90 | % | | | 1.69 | % | | | 0.90 | % | | | 56 | %5 | | | | |
| | | 0.37 | | | | 20.56 | | | | 6.01 | % | | | 72,771 | | | | 0.92 | % | | | 1.93 | % | | | 0.92 | % | | | 49 | %5 | | | | |
| | | 0.48 | | | | 19.75 | | | | (1.08 | %) | | | 64,587 | | | | 0.98 | % | | | 1.62 | % | | | 0.98 | % | | | 50 | %5 | | | | |
| | | | | | | | |
| | $ | 0.88 | | | $ | 27.14 | | | | 26.77 | % | | $ | 346,142 | | | | 0.55 | % | | | 2.07 | % | | | 0.55 | % | | | 66 | %5 | | | | |
| | | 1.14 | | | | 22.12 | | | | (7.51 | %) | | | 156,960 | | | | 0.56 | % | | | 2.09 | % | | | 0.58 | % | | | 67 | %5 | | | | |
| | | 0.68 | | | | 25.13 | | | | 25.14 | % | | | 93,820 | | | | 0.65 | % | | | 1.84 | % | | | 0.65 | % | | | 56 | %5 | | | | |
| | | 0.42 | | | | 20.65 | | | | 6.30 | % | | | 37,920 | | | | 0.67 | % | | | 2.09 | % | | | 0.67 | % | | | 49 | %5 | | | | |
| | | 0.53 | | | | 19.83 | | | | (0.86 | %) | | | 20,422 | | | | 0.74 | % | | | 1.85 | % | | | 0.74 | % | | | 50 | %5 | | | | |
| | | | | | | | | | | | | | | | | | | | | | | | | | | | | | | | | | | | |
| | | | | | | | | | | | | | | | | | | | | | | | | | | | | | | | | | | | |
| | | | | | | | | | | | | | | | | | | | | | | | | | | | | | | | | | | | |
| | $ | 0.22 | | | $ | 9.53 | | | | 22.78 | % | | $ | 84,855 | | | | 0.80 | % | | | 2.40 | % | | | 0.80 | % | | | 31 | %7 | | | | |
| | | 0.20 | | | | 7.95 | | | | (13.15 | %) | | | 77,880 | | | | 0.80 | % | | | 2.46 | % | | | 0.80 | % | | | 30 | %7 | | | | |
| | | 0.21 | | | | 9.36 | | | | 23.01 | % | | | 123,776 | | | | 0.80 | % | | | 2.38 | % | | | 0.80 | % | | | 42 | %7 | | | | |
| | | 0.19 | | | | 7.79 | | | | (1.85 | %) | | | 97,924 | | | | 0.80 | % | | | 2.55 | % | | | 0.80 | % | | | 44 | %7 | | | | |
| | | 0.14 | | | | 8.13 | | | | 0.91 | % | | | 67,823 | | | | 0.80 | % | | | 1.94 | % | | | 0.80 | % | | | 86 | %7 | | | | |
| | | | | | | | |
| | $ | 0.24 | | | $ | 9.34 | | | | 23.01 | % | | $ | 559,939 | | | | 0.55 | % | | | 2.63 | % | | | 0.55 | % | | | 31 | %7 | | | | |
| | | 0.22 | | | | 7.80 | | | | (12.90 | %) | | | 437,907 | | | | 0.55 | % | | | 2.55 | % | | | 0.55 | % | | | 30 | %7 | | | | |
| | | 0.23 | | | | 9.19 | | | | 23.34 | % | | | 560,348 | | | | 0.55 | % | | | 2.47 | % | | | 0.55 | % | | | 42 | %7 | | | | |
| | | 0.21 | | | | 7.65 | | | | (1.63 | %) | | | 402,694 | | | | 0.55 | % | | | 2.76 | % | | | 0.55 | % | | | 44 | %7 | | | | |
| | | 0.16 | | | | 7.99 | | | | 1.16 | % | | | 324,651 | | | | 0.55 | % | | | 2.13 | % | | | 0.55 | % | | | 86 | %7 | | | | |
6 | Rounds to less than $0.01. |
7 | To manage cash flows, minimize trading costs and equitize cash balances in between trading blocks of securities, the ESG Leaders Index Fund utilizes one or more exchange-traded funds (ETFs) which have an investment objective that tracks the Fund’s broad-based benchmark. These investments are frequent and short-term, however, the Fund is required to include such ETF investment activity in the calculation of its portfolio turnover. Had such transactions been excluded, the portfolio turnover would have been 19% for the year ended December 31, 2019, 18% for the year ended December 31, 2018, 16% for the year ended December 31, 2017, 10% for the year ended December 31, 2016, and 8% for the year ended December 31, 2015. |
| | 135 | SEE NOTES TO FINANCIAL STATEMENTS |
December 31, 2019 |
Financial Highlights, continued |
Selected data for a share outstanding throughout each period. |
| | | | | | | Income
(loss) from
investment
operations | | | | | | | Distributions to
shareholders | |
| | Net asset
value,
beginning of
period | | | Net
investment
income1 | | | Net
realized and
unrealized
gain (loss) | | | Total from
investment
operations | | | From net
investment
income | | | From net
realized
gains | |
Core Bond Fund | | | | | | | | | | | | | | | | | | | | | | | | |
Investor Class | | | | | | | | | | | | | | | | | | | | | | | | |
Year Ended December 31, 2019 | | $ | 9.78 | | | $ | 0.23 | | | $ | 0.53 | | | $ | 0.76 | | | $ | 0.25 | | | $ | — | |
Year Ended December 31, 2018 | | | 10.04 | | | | 0.22 | | | | (0.25 | ) | | | (0.03 | ) | | | 0.23 | | | | — | |
Year Ended December 31, 2017 | | | 10.01 | | | | 0.21 | | | | 0.04 | | | | 0.25 | | | | 0.21 | | | | 0.01 | |
Period Ended December 31, 20165 | | | 9.93 | | | | 0.01 | | | | 0.08 | | | | 0.09 | | | | 0.01 | | | | — | |
Institutional Class | | | | | | | | | | | | | | | | | | | | | | | | |
Year Ended December 31, 2019 | | $ | 9.78 | | | $ | 0.26 | | | $ | 0.52 | | | $ | 0.78 | | | $ | 0.27 | | | $ | — | |
Year Ended December 31, 2018 | | | 10.04 | | | | 0.24 | | | | (0.24 | ) | | | — | | | | 0.26 | | | | — | |
Year Ended December 31, 2017 | | | 10.01 | | | | 0.24 | | | | 0.04 | | | | 0.28 | | | | 0.24 | | | | 0.01 | |
Period Ended December 31, 20165 | | | 9.93 | | | | 0.01 | | | | 0.08 | | | | 0.09 | | | | 0.01 | | | | — | |
| | | | | | | | | | | | | | | | | | | | | | | | | |
High Yield Bond Fund | | | | | | | | | | | | | | | | | | | | | | | | |
Investor Class | | | | | | | | | | | | | | | | | | | | | | | | |
Year Ended December 31, 2019 | | $ | 6.25 | | | $ | 0.33 | | | $ | 0.54 | | | $ | 0.87 | | | $ | 0.33 | | | $ | — | |
Year Ended December 31, 2018 | | | 6.78 | | | | 0.33 | | | | (0.53 | ) | | | (0.20 | ) | | | 0.33 | | | | — | |
Year Ended December 31, 2017 | | | 6.71 | | | | 0.35 | | | | 0.07 | | | | 0.42 | | | | 0.35 | | | | — | |
Year Ended December 31, 2016 | | | 6.25 | | | | 0.38 | | | | 0.45 | | | | 0.83 | | | | 0.37 | | | | — | |
Year Ended December 31, 2015 | | | 7.03 | | | | 0.40 | | | | (0.78 | ) | | | (0.38 | ) | | | 0.40 | | | | — | |
Class A | | | | | | | | | | | | | | | | | | | | | | | | |
Year Ended December 31, 2019 | | $ | 6.26 | | | $ | 0.33 | | | $ | 0.54 | | | $ | 0.87 | | | $ | 0.33 | | | $ | — | |
Year Ended December 31, 2018 | | | 6.79 | | | | 0.33 | | | | (0.53 | ) | | | (0.20 | ) | | | 0.33 | | | | — | |
Year Ended December 31, 2017 | | | 6.72 | | | | 0.35 | | | | 0.07 | | | | 0.42 | | | | 0.35 | | | | — | |
Year Ended December 31, 2016 | | | 6.26 | | | | 0.38 | | | | 0.45 | | | | 0.83 | | | | 0.37 | | | | — | |
Year Ended December 31, 2015 | | | 7.04 | | | | 0.40 | | | | (0.78 | ) | | | (0.38 | ) | | | 0.40 | | | | — | |
Institutional Class | | | | | | | | | | | | | | | | | | | | | | | | |
Year Ended December 31, 2019 | | $ | 6.23 | | | $ | 0.34 | | | $ | 0.53 | | | $ | 0.87 | | | $ | 0.34 | | | $ | — | |
Year Ended December 31, 2018 | | | 6.75 | | | | 0.35 | | | | (0.52 | ) | | | (0.17 | ) | | | 0.35 | | | | — | |
Year Ended December 31, 2017 | | | 6.68 | | | | 0.36 | | | | 0.08 | | | | 0.44 | | | | 0.37 | | | | — | |
Year Ended December 31, 2016 | | | 6.23 | | | | 0.39 | | | | 0.45 | | | | 0.84 | | | | 0.39 | | | | — | |
Year Ended December 31, 2015 | | | 7.01 | | | | 0.42 | | | | (0.78 | ) | | | (0.36 | ) | | | 0.42 | | | | — | |
1 | Based on average shares outstanding during the period. |
2 | Total return represents aggregate total return for the period indicated, includes reinvestment of all dividends and distributions, and does not reflect the deduction of any applicable sales charges. Total returns for periods of less than one year have not been annualized. |
3 | Ratios representing periods of less than one year have been annualized. |
SEE NOTES TO FINANCIAL STATEMENTS | 136 | |
| | | | | | | | | | | | | | | | | Ratios to
average net
assets3 | | | | | | | | | |
| | Total
distributions | | | Net asset
value,
end of
period | | | Total return2 | | | Net assets
end of period
(in $000’s) | | | Net
expenses
including
reimbursements
and waivers | | | Net
investment
income | | | Total
expenses
excluding
reimbursements
and waivers | | | Portfolio
Turnover4 | | | | |
| | | | | | | | | | | | | | | | | | | | | | | | | | | | | | | | | | | | |
| | | | | | | | | | | | | | | | | | | | | | | | | | | | | | | | | | | | |
| | $ | 0.25 | | | $ | 10.29 | | | | 7.78 | % | | $ | 7,401 | | | | 0.71 | % | | | 2.30 | % | | | 0.71 | % | | | 63 | % | | | | |
| | | 0.23 | | | | 9.78 | | | | (0.24 | %) | | | 4,277 | | | | 0.71 | % | | | 2.23 | % | | | 0.71 | % | | | 62 | % | | | | |
| | | 0.22 | | | | 10.04 | | | | 2.56 | % | | | 2,969 | | | | 0.71 | % | | | 2.11 | % | | | 0.71 | % | | | 60 | % | | | | |
| | | 0.01 | | | | 10.01 | | | | 0.87 | % | | | 109 | | | | 0.74 | % | | | 1.99 | % | | | 0.74 | % | | | 1 | %6 | | | | |
| | | | | | | | | | | | | | | | | | | | | | | | | | | | | | | | | | | | |
| | $ | 0.27 | | | $ | 10.29 | | | | 8.04 | % | | $ | 702,291 | | | | 0.46 | % | | | 2.55 | % | | | 0.46 | % | | | 63 | % | | | | |
| | | 0.26 | | | | 9.78 | | | | 0.01 | % | | | 682,201 | | | | 0.46 | % | | | 2.50 | % | | | 0.46 | % | | | 62 | % | | | | |
| | | 0.25 | | | | 10.04 | | | | 2.82 | % | | | 697,050 | | | | 0.46 | % | | | 2.34 | % | | | 0.46 | % | | | 60 | % | | | | |
| | | 0.01 | | | | 10.01 | | | | 0.93 | % | | | 602,384 | | | | 0.49 | % | | | 2.23 | % | | | 0.49 | % | | | 1 | %6 | | | | |
| | | | | | | | | | | | | | | | | | | | | | | | | | | | | | | | | | | | |
| | | | | | | | | | | | | | | | | | | | | | | | | | | | | | | | | | | | |
| | | | | | | | | | | | | | | | | | | | | | | | | | | | | | | | | | | | |
| | $ | 0.33 | | | $ | 6.79 | | | | 14.11 | % | | $ | 183,631 | | | | 0.96 | % | | | 4.94 | % | | | 0.96 | % | | | 90 | % | | | | |
| | | 0.33 | | | | 6.25 | | | | (3.07 | %) | | | 162,841 | | | | 0.97 | % | | | 5.01 | % | | | 0.97 | % | | | 57 | % | | | | |
| | | 0.35 | | | | 6.78 | | | | 6.37 | % | | | 201,953 | | | | 0.99 | % | | | 5.14 | % | | | 0.99 | % | | | 91 | % | | | | |
| | | 0.37 | | | | 6.71 | | | | 13.81 | % | | | 228,936 | | | | 0.99 | % | | | 5.90 | % | | | 0.99 | % | | | 111 | % | | | | |
| | | 0.40 | | | | 6.25 | | | | (5.74 | %) | | | 242,038 | | | | 0.96 | % | | | 5.82 | % | | | 0.96 | % | | | 78 | % | | | | |
| | | | | | | | | | | | | | | | | | | | | | | | | | | | | | | | | | | | |
| | $ | 0.33 | | | $ | 6.80 | | | | 14.10 | % | | $ | 5,827 | | | | 0.96 | % | | | 4.95 | % | | | 0.96 | % | | | 90 | % | | | | |
| | | 0.33 | | | | 6.26 | | | | (3.05 | %) | | | 5,747 | | | | 0.97 | % | | | 5.01 | % | | | 0.97 | % | | | 57 | % | | | | |
| | | 0.35 | | | | 6.79 | | | | 6.36 | % | | | 5,798 | | | | 0.99 | % | | | 5.13 | % | | | 0.99 | % | | | 91 | % | | | | |
| | | 0.37 | | | | 6.72 | | | | 13.80 | % | | | 5,623 | | | | 0.98 | % | | | 5.88 | % | | | 0.98 | % | | | 111 | % | | | | |
| | | 0.40 | | | | 6.26 | | | | (5.73 | %) | | | 5,923 | | | | 0.96 | % | | | 5.87 | % | | | 0.96 | % | | | 78 | % | | | | |
| | | | | | | | | | | | | | | | | | | | | | | | | | | | | | | | | | | | |
| | $ | 0.34 | | | $ | 6.76 | | | | 14.26 | % | | $ | 186,350 | | | | 0.71 | % | | | 5.21 | % | | | 0.71 | % | | | 90 | % | | | | |
| | | 0.35 | | | | 6.23 | | | | (2.70 | %) | | | 188,333 | | | | 0.72 | % | | | 5.26 | % | | | 0.72 | % | | | 57 | % | | | | |
| | | 0.37 | | | | 6.75 | | | | 6.64 | % | | | 205,555 | | | | 0.74 | % | | | 5.37 | % | | | 0.74 | % | | | 91 | % | | | | |
| | | 0.39 | | | | 6.68 | | | | 13.96 | % | | | 166,051 | | | | 0.74 | % | | | 6.15 | % | | | 0.74 | % | | | 111 | % | | | | |
| | | 0.42 | | | | 6.23 | | | | (5.54 | %) | | | 162,425 | | | | 0.71 | % | | | 6.08 | % | | | 0.71 | % | | | 78 | % | | | | |
5 | Per share data is reflected from the Fund’s inception date of December 16, 2016. |
6 | For purposes of calculating the turnover rate for the Core Bond Fund, transactions related to an in-kind subscription have been excluded. |
| | 137 | SEE NOTES TO FINANCIAL STATEMENTS |
December 31, 2019 |
Financial Highlights, continued |
Selected data for a share outstanding throughout each period. |
| | | | | | | Income
(loss) from
investment
operations | | | | | | | Distributions to
shareholders | |
| | Net asset
value,
beginning of
period | | | Net
investment
income1 | | | Net
realized and
unrealized
gain (loss) | | | Total from
investment
operations | | | From net
investment
income | | | From net
realized
gains | |
Sustainable Allocation Fund | | | | | | | | | | | | | | | | | | | | | | | | |
Investor Class | | | | | | | | | | | | | | | | | | | | | | | | |
Year Ended December 31, 2019 | | $ | 21.14 | | | $ | 0.36 | | | $ | 4.02 | | | $ | 4.38 | | | $ | 0.37 | | | $ | 1.80 | |
Year Ended December 31, 2018 | | | 22.66 | | | | 0.33 | | | | (1.23 | ) | | | (0.90 | ) | | | 0.47 | | | | 0.15 | |
Year Ended December 31, 2017 | | | 22.34 | | | | 0.30 | | | | 2.55 | | | | 2.85 | | | | 0.20 | | | | 2.33 | |
Year Ended December 31, 2016 | | | 21.76 | | | | 0.29 | | | | 0.97 | | | | 1.26 | | | | 0.29 | | | | 0.39 | |
Year Ended December 31, 2015 | | | 23.70 | | | | 0.25 | | | | (0.37 | ) | | | (0.12 | ) | | | 0.20 | | | | 1.62 | |
Institutional Class | | | | | | | | | | | | | | | | | | | | | | | | |
Year Ended December 31, 2019 | | $ | 21.47 | | | $ | 0.43 | | | $ | 4.09 | | | $ | 4.52 | | | $ | 0.43 | | | $ | 1.80 | |
Year Ended December 31, 2018 | | | 23.01 | | | | 0.38 | | | | (1.24 | ) | | | (0.86 | ) | | | 0.53 | | | | 0.15 | |
Year Ended December 31, 2017 | | | 22.63 | | | | 0.41 | | | | 2.53 | | | | 2.94 | | | | 0.23 | | | | 2.33 | |
Year Ended December 31, 2016 | | | 22.04 | | | | 0.35 | | | | 0.98 | | | | 1.33 | | | | 0.35 | | | | 0.39 | |
Year Ended December 31, 2015 | | | 23.97 | | | | 0.32 | | | | (0.37 | ) | | | (0.05 | ) | | | 0.26 | | | | 1.62 | |
1 | Based on average shares outstanding during the period. |
2 | Total return represents aggregate total return for the period indicated, includes reinvestment of all dividends and distributions, and does not reflect the deduction of any applicable sales charges. Total returns for periods of less than one year have not been annualized. |
3 | Ratios representing periods of less than one year have been annualized. |
SEE NOTES TO FINANCIAL STATEMENTS | 138 | |
| | | | | | | | | | | | | | | | | Ratios to
average net
assets3 | | | | | | | | | |
| | Total
distributions | | | Net asset
value,
end of
period | | | Total return2 | | | Net assets
end of period
(in $000’s) | | | Net
expenses
including
reimbursements
and waivers | | | Net
investment
income | | | Total
expenses
excluding
reimbursements
and waivers | | | Portfolio
Turnover4 | | | | |
| | | | | | | | | | | | | | | | | | | | | | | | | | | | | | | | | | | | |
| | | | | | | | | | | | | | | | | | | | | | | | | | | | | | | | | | | | |
| | $ | 2.17 | | | $ | 23.35 | | | | 20.83 | % | | $ | 1,523,009 | | | | 0.30 | %5 | | | 1.56 | % | | | 0.30 | %5 | | | 8 | % | | | | |
| | | 0.62 | | | | 21.14 | | | | (4.08 | %) | | | 1,324,582 | | | | 0.30 | %5 | | | 1.44 | %6 | | | 0.30 | %5 | | | 12 | % | | | | |
| | | 2.53 | | | | 22.66 | | | | 13.16 | % | | | 1,496,146 | | | | 0.29 | %5 | | | 1.33 | % | | | 0.30 | %5 | | | 14 | % | | | | |
| | | 0.68 | | | | 22.34 | | | | 5.81 | % | | | 1,596,717 | | | | 0.77 | % | | | 1.31 | % | | | 0.87 | % | | | 49 | % | | | | |
| | | 1.82 | | | | 21.76 | | | | (0.53 | %) | | | 1,596,682 | | | | 0.87 | % | | | 1.08 | % | | | 0.90 | % | | | 61 | % | | | | |
| | | | | | | | | | | | | | | | | | | | | | | | | | | | | | | | | | | | |
| | $ | 2.23 | | | $ | 23.76 | | | | 21.17 | % | | $ | 374,838 | | | | 0.05 | %5 | | | 1.80 | % | | | 0.05 | %5 | | | 8 | % | | | | |
| | | 0.68 | | | | 21.47 | | | | (3.85 | %) | | | 365,079 | | | | 0.05 | %5 | | | 1.64 | %6 | | | 0.05 | %5 | | | 12 | % | | | | |
| | | 2.56 | | | | 23.01 | | | | 13.42 | % | | | 506,220 | | | | 0.04 | %5 | | | 1.79 | % | | | 0.05 | %5 | | | 14 | % | | | | |
| | | 0.74 | | | | 22.63 | | | | 6.06 | % | | | 279,574 | | | | 0.52 | % | | | 1.56 | % | | | 0.62 | % | | | 49 | % | | | | |
| | | 1.88 | | | | 22.04 | | | | (0.23 | %) | | | 256,640 | | | | 0.62 | % | | | 1.34 | % | | | 0.65 | % | | | 61 | % | | | | |
5 | The expense ratio of the Sustainable Allocation Fund does not include indirect expenses of the underlying funds the Fund invests in. Indirect expenses of the underlying funds were 0.62% for the year ended December 31, 2019, 0.61% for the year ended December 31, 2018, and 0.61% for the year ended December 31, 2017. |
6 | In 2018, the Adviser reimbursed the Fund for expense overpayments related to transfer agent fees in the amount of $223,088. Before the reimbursement by the adviser, total returns for Investor Class and Institutional Class would have remained the same at (4.08%) and (3.85%), respectively. The Net Investment Income for Investor Class and Institutional Class would have been 1.42% and 1.62%, respectively. |
| | 139 | SEE NOTES TO FINANCIAL STATEMENTS |
December 31, 2019 |
Notes to Financial Statements |
Pax World Funds Series Trust I and Pax World Fund Series Trust III
NOTE A—Organization and Summary of Significant Accounting Policies
Organization Pax World Funds Series Trust I (“Trust I”), which is registered under the Investment Company Act of 1940, as amended (the “1940 Act”), is an open-end management investment company organized under the laws of the Commonwealth of Massachusetts on May 25, 2006. As of December 31, 2019, Trust I offered ten investment funds: Pax Large Cap Fund (the “Large Cap Fund”), Pax Small Cap Fund (the “Small Cap Fund”), Pax ESG Beta Quality Fund (the “ESG Beta Quality Fund”), Pax ESG Beta Dividend Fund (the “ESG Beta Dividend Fund”), Pax Global Opportunities Fund (the “Global Opportunities Fund”), Pax Global Environmental Markets Fund (the “Global Environmental Markets Fund”), Pax MSCI EAFE ESG Leaders Index Fund (the “EAFE ESG Leaders Fund”), Pax Core Bond Fund (the “Core Bond Fund”), Pax High Yield Bond Fund (the “High Yield Bond Fund”), and Pax Sustainable Allocation Fund (the “Sustainable Allocation Fund”).
Pax World Funds Series Trust III (“Trust III”) is an open-end management investment company that was organized under the laws of the Commonwealth of Massachusetts on December 4, 2013 and registered under the 1940 Act. Pax Ellevate Global Women’s Leadership Fund (the “Global Women’s Leadership Fund”) is a diversified series of Trust III.
These financial statements relate to all funds (each a “Fund”, collectively, the “Funds”) offered under both Trust I and Trust III (each a “Trust”, collectively, the “Trusts”).
The Large Cap Fund, ESG Beta Dividend Fund, Global Opportunities Fund, Global Women’s Leadership Fund, EAFE ESG Leaders Fund, Core Bond Fund and Sustainable Allocation Fund each offer two classes of shares—Investor Class shares and Institutional Class shares. The Small Cap Fund, ESG Beta Quality Fund, Global Environmental Markets Fund and High Yield Bond Fund each offer three classes of shares—Investor Class shares, Class A shares and Institutional Class shares. Although all share classes generally have identical voting, dividend and liquidation rights, each class votes separately when required by law. Different share classes pay different distribution amounts to the extent the expenses of such classes differ, and distributions in liquidation will be proportional to the net asset value of each share class. Each share class has its own expense structure and sales charges, as applicable.
The Funds seek to avoid investing in issuers that their investment adviser has determined are involved in the manufacture or sale of weapons or manufacture of tobacco products or engage in business practices that their investment adviser determines to be sub-standard from an Environmental, Social and Governance (ESG) or sustainability perspective in relation to their industry, sector, asset class or universe peers.
The Large Cap Fund’s investment objective is to seek long-term growth of capital. The Fund seeks to achieve this objective by investing, under normal market conditions, at least 80% of its assets in equity securities (such as common stocks, securities convertible into common or preferred stocks and warrants) of companies that, when purchased, have market capitalizations within the range of the Standard & Poor’s 500 Index as measured by market capitalization.
The Small Cap Fund’s investment objective is to seek long-term growth of capital. The Fund seeks to achieve this objective by investing, under normal market conditions, at least 80% of its assets in equity securities (such as common stocks, securities convertible into common or preferred stocks and warrants) of companies that, when purchased, have capitalizations within the range of the Russell 2000 Index as measured by market capitalization.
The ESG Beta Quality Fund’s investment objective is to seek long-term growth of capital. The Fund seeks to achieve this objective by investing, under normal market conditions, primarily in large-capitalization domestic equity securities that the Adviser believes have strong ESG profiles and that exhibit higher “quality” characteristics and reasonable valuations.
The ESG Beta Dividend Fund’s primary investment objective is income and capital appreciation. As a secondary objective and to the extent consistent with its primary investment objective, the ESG Beta Dividend Fund seeks capital preservation. The Fund seeks to achieve its investment objective by investing, under normal market conditions, at least 80% of its assets in equity securities that pay dividends.
The Global Opportunities Fund’s investment objective is to seek long term growth of capital by investing in companies benefiting from the transition to a more sustainable global economy. The Fund seeks to achieve this objective by investing, under normal market conditions, at least 80% of its net assets in companies that its Adviser or Sub-Adviser believe will benefit from the transition to a more sustainable global economy - the shift away from a depletive economy to one that preserves ecological and societal balance for the benefit of future generations. The Fund seeks to invest in companies with durable business models that are well-positioned to benefit from or avoid the risks associated with this transition. Under
December 31, 2019 |
Notes to Financial Statements, continued |
normal market conditions, the Global Opportunities Fund will invest primarily in equity securities (such as common stocks, preferred stocks and securities convertible into common or preferred stocks) of companies located around the world, including at least 40% of its net assets in securities of companies organized or located outside the United States or doing a substantial amount of business outside the United States, including those located in emerging markets.
The Global Environmental Markets Fund’s investment objective is to seek long term growth of capital by investing in innovative companies around the world whose businesses and technologies focus on environmental markets, including alternative energy and energy efficiency; water infrastructure technologies and pollution control; environmental support services and waste management technologies; and sustainable food, agriculture and forestry. The Fund seeks to achieve this objective by investing, under normal market conditions, at least 80% of its net assets in the foregoing companies and will invest primarily in equity securities (such as common stocks, preferred stocks and securities convertible into common and preferred stocks) of companies located around the world, including at least 40% of its net assets in securities of non-U.S. issuers, including those located in emerging markets.
The Global Women’s Leadership Fund’s investment objective is to seek investment returns that closely correspond to or exceed the price and yield performance, before fees and expenses, of the Impax Global Women’s Leadership Index (the “Women’s Index”), while maintaining risk characteristics that the Adviser believes are generally similar to those of the Women’s Index. The Fund seeks to achieve this objective by investing, under normal market conditions, more than 80% of its total assets in the component securities of the Women’s Index and in American depositary receipts, global depositary receipts and euro depositary receipts representing the component securities of the Women’s Index, including at least 40% of its net assets (unless market conditions are not deemed favorable, in which case the Global Women’s Leadership Fund would normally invest at least 30% of its assets) in securities of companies organized or located outside the U.S. or doing a substantial amount of business outside the U.S.
The EAFE ESG Leaders Fund’s investment objective is to seek investment returns that closely correspond to the price and yield performance, before fees and expenses, of the MSCI EAFE ESG Leaders Index. The Fund seeks to achieve this objective by investing, under normal circumstances, more than 80% of its total assets in the component securities of the MSCI EAFE ESG Leaders Index and in American depositary receipts, global depositary receipts and euro depositary receipts representing the component securities of the MSCI EAFE ESG Leaders Index.
The Core Bond Fund’s investment objective is to seek income and conservation of principal. The Fund seeks to achieve this objective by investing, under normal market conditions, at least 80% of its assets in bonds, which include debt obligations such as mortgage-related securities, securities issued by the United States Government or its agencies and instrumentalities, municipal bonds, corporate bonds and high-impact bonds (which provide financing to support solutions to global sustainability challenges) across the spectrum of issuers, each of which is, at the time of purchase, rated at least investment grade (rated BBB- or higher by Standard and Poor’s Ratings Group or Baa3 or higher by Moody’s Investors Service) or unrated and determined by the Adviser to be of comparable quality.
The High Yield Bond Fund’s primary investment objective is to seek high current income. As a secondary investment objective, the High Yield Bond Fund seeks capital appreciation. The Fund seeks to achieve this objective by investing, under normal market conditions, at least 80% of its assets in high-yield, fixed income securities (such as bonds, notes or debentures) that are rated below BBB- by Standard & Poor’s Ratings Group or below Baa3 by Moody’s Investors Service, similarly rated by another major rating service, or unrated and determined by the High Yield Bond Fund’s investment adviser to be of comparable quality. These fixed income securities are commonly referred to as “junk bonds.”
The Sustainable Allocation Fund’s primary investment objective is to seek income and conservation of principal. As a secondary investment objective, the Fund seeks long-term growth of capital. The Fund uses a team approach to allocate among multiple affiliated funds managed by the Adviser (“Underlying Funds”) in order to seek to achieve its investment objectives. The Adviser will allocate the Fund’s assets among Underlying Funds in its sole discretion. The Fund seeks to achieve its investment objectives, under normal market conditions, by investing (indirectly through the use of Underlying Funds) approximately 50%-75% of its assets in equity securities (such as common stocks, preferred stocks and securities convertible into common or preferred stocks) and 25%-50% of its assets in debt securities (including but not limited to debt securities convertible into equity securities).
Under the Trusts’ organizational documents, its officers and trustees are indemnified against certain liabilities arising out of the performance of their duties to the Trusts. Additionally, in the normal course of business, the Trusts enter into contracts with service providers that contain general indemnification clauses. The Trusts’ maximum exposure under these arrangements is unknown as
December 31, 2019 |
Notes to Financial Statements, continued |
this could involve future claims that may be made against the Trusts that have not yet occurred. However, based on experience, the Trusts expect this risk of loss to be remote.
Accounting Estimates The preparation of financial statements in conformity with U.S. generally accepted accounting principles (“GAAP”) requires management to make estimates and assumptions that affect the reported amounts of assets and liabilities and disclosure of contingent assets and liabilities at the date of the financial statements and the reported amounts of revenues and expenses during the reporting period. Actual results could differ from those estimates. The Funds apply Investment Company accounting and reporting guidance.
Valuation of Investments For purposes of calculating the net asset value (“NAV”), determined ordinarily as of the close of regular trading (normally 4:00 p.m. Eastern time) (the “NYSE Close”) on the New York Stock Exchange (“NYSE”) on each day that the NYSE is open for trading, the Funds normally use pricing data for domestic equity securities received shortly after the NYSE Close and do not normally take into account trading, clearances or settlements that take place after the NYSE Close. U.S. fixed income and non-U.S. securities are normally priced using data reflecting the earlier closing of the principal markets for those securities, subject to possible fair value adjustments. Information that becomes known to the Funds or their agents after NAV has been calculated on a particular day will not generally be used to retroactively adjust the price of a security or NAV determined earlier that day.
For the purpose of these financial statements, fair values for various types of securities and other instruments are determined on the basis of closing prices or last sales prices on an exchange or other market, or based on quotes or other market information obtained from quotation reporting systems, established market makers or pricing services. Short-term investments having a maturity of 60 days or less are generally valued at amortized cost, which approximates fair value.
Investments denominated in currencies other than the U.S. dollar are converted to U.S. dollars using exchange rates obtained from pricing services. As a result, the NAV of a Fund’s shares may be affected by changes in the value of currencies in relation to the U.S. dollar.
If market quotations are not readily available (including in cases when available market quotations are deemed to be unreliable), the Funds’ investments will be valued as determined in good faith pursuant to policies and procedures approved by the Boards of Trustees of the Trusts (the “Boards” or “Boards of Trustees”)(so called “fair value pricing”). Fair value pricing may require subjective
determinations about the value of a security or other asset, and fair values used to determine a Fund’s NAV may differ from quoted or published prices, or from prices that are used by others, for the same investments. Also, the use of fair value pricing may not always result in adjustments to the prices of securities or other assets held by a Fund. The Boards have delegated to the Advisers’ Best Execution and Valuation Committee the day-to-day responsibility for making fair value pricing determinations with respect to Fund holdings.
The Funds may determine that market quotations are not readily available due to events relating to a single issuer (e.g., corporate actions or announcements) or events relating to multiple issuers (e.g., governmental actions or natural disasters). The Funds may determine the fair value of investments based on information provided by pricing services and other third-party vendors, which may recommend fair value prices or adjustments with reference to other securities, indices or assets. In considering whether fair value pricing is required and in determining fair values, the Funds may, among other things, consider significant events (which may be considered to include changes in the value of U.S. securities or securities indices) that occur after the close of the relevant market and the usual time of valuation. At December 31, 2019, three securities were fair valued in good faith pursuant to policies and procedures approved by the Boards of Trustees. The Core Bond Fund held one security fair valued at $286,933, representing 0.04% of the Fund’s net asset value and the High Yield Bond Fund held two securities fair valued at $0, representing 0.00% of the Fund’s net asset value.
For those Funds that invest in non-U.S. securities, investors should be aware that many securities markets and exchanges outside the U.S. close prior to the close of the NYSE, and the closing prices for securities in such markets or on such exchanges may not fully reflect events that occur after such close but before the close of the NYSE. As a result, the Funds’ fair value pricing procedures require the Funds to consider changes in the fair value of non-U.S. securities between the time of the closing of the local market’s exchange and the close of the NYSE. Generally, if there has been a movement in the U.S. market that exceeds a specified threshold, the Funds will assess whether the closing price on the local exchange is still appropriate. Although the threshold may be revised from time to time and the number of days on which fair value prices will be used will depend on market activity, it is possible that fair value prices will be used by the Funds to a significant extent. The value determined for an investment using the Funds’ fair value pricing procedures may differ from recent market prices for the investment.
December 31, 2019 |
Notes to Financial Statements, continued |
Fair Value Measurements Fair value is defined as the price that the Fund would receive upon selling an investment in an orderly transaction between market participants. The three-tier hierarchy of inputs is summarized in the three broad Levels listed below.
| | ● Level 1 – | unadjusted quoted prices in active markets for identical investments |
| | ● Level 2 – | other significant observable inputs (including quoted prices for similar securities, interest rates, prepayment speeds, credit risk, etc.) |
| | ● Level 3 – | significant unobservable inputs (including the Funds’ own assumptions in determining the fair value of investments) |
Observable inputs are inputs that reflect the assumptions market participants would use in pricing the asset or liability developed based on market data obtained from sources independent of the reporting entity. Unobservable inputs are inputs that reflect the reporting entity’s own assumptions about the assumptions market participants would use in pricing the asset or liability developed based on the best information available in the circumstances. The inputs or methodology used for valuing securities are not necessarily an indication of the risk associated with investing in those securities. The following is a general summary of valuation inputs and classifications for different categories of securities.
Equity Securities Equity securities, including common stocks, preferred stocks and exchange-traded funds, for which market quotations are readily available, valued at the last reported sale price or official closing price as reported by an independent pricing service, are generally categorized as Level 1 in the hierarchy. Non-U.S. equity securities may also be valued at official close, or may be valued based on the fair value pricing procedures noted above. When third-party fair value pricing of foreign securities methods are applied, they are generally categorized as Level 2. To the extent that inputs for equity securities are unobservable, values are categorized as Level 3 in the hierarchy.
Fixed Income Securities Fixed income securities, including Corporate Bonds (both investment-grade and high-yield), U.S. Treasury Obligations, Government Bonds, Mortgage-Backed and Asset-Backed Securities, Bank Loans and Municipal Bonds, are valued at evaluated prices received from independent pricing services, which are evaluated using various inputs and techniques which may include trade activity, broker-dealer quotes, yield curves, coupon rates, default rates, cash flows,
models and other inputs, and are generally categorized as Level 2 in the hierarchy. To the extent that inputs for fixed income securities are unobservable, values are categorized as Level 3 in the hierarchy.
Affiliated and Unaffiliated Investment Companies Investments in mutual funds are valued at the Funds’ closing net asset value and are generally categorized as Level 1.
Short-term Investments Short-term securities, including repurchase agreements, with remaining maturities of 60 days or less, which are valued at amortized cost, are generally categorized as Level 2 in the hierarchy.
The following is a summary of the inputs used to value the Funds’ net assets as of December 31, 2019:
| | Level 1 | | | Level 2 | | | Level 3* | | | Totals | |
Large Cap | | | | | | | | | | | | | | | | |
Common Stocks | | $ | 738,016,073 | | | $ | — | | | $ | — | | | $ | 738,016,073 | |
Cash Equivalents | | | 28,155,190 | | | | — | | | | — | | | | 28,155,190 | |
Total | | $ | 766,171,263 | | | $ | — | | | $ | — | | | $ | 766,171,263 | |
Small Cap | | | | | | | | | | | | | | | | |
Common Stocks | | $ | 419,483,785 | | | $ | — | | | $ | — | | | $ | 419,483,785 | |
Cash Equivalents | | | 25,341,786 | | | | — | | | | — | | | | 25,341,786 | |
Total | | $ | 444,825,571 | | | $ | — | | | $ | — | | | $ | 444,825,571 | |
ESG Beta Quality | | | | | | | | | | | | | | | | |
Common Stocks | | $ | 238,556,729 | | | $ | — | | | $ | — | | | $ | 238,556,729 | |
Cash Equivalents | | | 2,619,948 | | | | — | | | | — | | | | 2,619,948 | |
Total | | $ | 241,176,677 | | | $ | — | | | $ | — | | | $ | 241,176,677 | |
ESG Beta Dividend | | | | | | | | | | | | | | | | |
Common Stocks | | $ | 131,508,957 | | | $ | — | | | $ | — | | | $ | 131,508,957 | |
Cash Equivalents | | | 1,545,099 | | | | — | | | | — | | | | 1,545,099 | |
Total | | $ | 133,054,056 | | | $ | — | | | $ | — | | | $ | 133,054,056 | |
Global Opportunities | | | | | | | | | | | | | | | | |
Common Stocks | | $ | 23,585,437 | | | $ | 18,169,851 | | | $ | — | | | $ | 41,755,288 | |
Cash Equivalents | | | 340,811 | | | | — | | | | — | | | | 340,811 | |
Total | | $ | 23,926,248 | | | $ | 18,169,851 | | | $ | — | | | $ | 42,096,099 | |
Global Environmental Markets | | | | | | | | | | | | | | | | |
Common Stocks | | $ | 590,036,853 | | | $ | 356,162,208 | | | $ | — | | | $ | 946,199,061 | |
Cash Equivalents | | | 20,471,038 | | | | — | | | | — | | | | 20,471,038 | |
Total | | $ | 610,507,891 | | | $ | 356,162,208 | | | $ | — | | | $ | 966,670,099 | |
December 31, 2019 |
Notes to Financial Statements, continued |
| | Level 1 | | | Level 2 | | | Level 3* | | | Totals | |
Global Women’s Leadership | | | | | | | | | | | | | | | | |
Common Stocks | | $ | 327,768,034 | | | $ | 132,375,156 | | | $ | — | | | $ | 460,143,190 | |
Preferred Stocks | | | — | | | | 451,687 | | | | — | | | | 451,687 | |
Exchange-Traded Funds | | | 2,995,472 | | | | — | | | | — | | | | 2,995,472 | |
Cash Equivalents | | | 1,785,503 | | | | — | | | | — | | | | 1,785,503 | |
Total | | $ | 332,549,009 | | | $ | 132,826,843 | | | $ | — | | | $ | 465,375,852 | |
EAFE ESG Leaders | | | | | | | | | | | | | | | | |
Common Stocks | | $ | 20,863,108 | | | $ | 613,349,873 | | | $ | — | | | $ | 634,212,981 | |
Preferred Stocks | | | — | | | | 989,741 | | | | — | | | | 989,741 | |
Exchange-Traded Funds | | | 6,872,447 | | | | — | | | | — | | | | 6,872,447 | |
Cash Equivalents | | | 924,513 | | | | — | | | | — | | | | 924,513 | |
Total | | $ | 28,660,068 | | | $ | 614,339,614 | | | $ | — | | | $ | 642,999,682 | |
Core Bond | | | | | | | | | | | | | | | | |
Exchange-Traded Funds | | $ | 21,585,036 | | | $ | — | | | $ | — | | | $ | 21,585,036 | |
Community Investment Notes | | | — | | | | 3,099,543 | | | | 286,933 | | | | 3,386,476 | |
Corporate Bonds | | | — | | | | 199,585,171 | | | | — | | | | 199,585,171 | |
U.S. Gov’t Agency Bonds | | | — | | | | 6,985,611 | | | | — | | | | 6,985,611 | |
Supranational Bonds | | | — | | | | 26,212,857 | | | | — | | | | 26,212,857 | |
Municipal Bonds | | | — | | | | 37,980,618 | | | | — | | | | 37,980,618 | |
U.S. Treasury Notes | | | — | | | | 169,887,669 | | | | — | | | | 169,887,669 | |
Mortgage-Backed Securities | | | — | | | | 222,451,129 | | | | — | | | | 222,451,129 | |
Medium Term Certificates of Deposit | | | — | | | | 753,842 | | | | — | | | | 753,842 | |
Cash Equivalents | | | 17,446,339 | | | | — | | | | — | | | | 17,446,339 | |
Total | | $ | 39,031,375 | | | $ | 666,956,440 | | | $ | 286,933 | | | $ | 706,274,748 | |
High Yield Bond | | | | | | | | | | | | | | | | |
Common Stocks | | $ | — | | | $ | — | | | $ | 0 | | | $ | 0 | |
Preferred Stocks | | | 3,556,800 | | | | — | | | | 0 | | | | 3,556,800 | |
Corporate Bonds | | | — | | | | 353,549,772 | | | | — | | | | 353,549,772 | |
Loans | | | — | | | | 4,650,643 | | | | — | | | | 4,650,643 | |
Cash Equivalents | | | 8,427,875 | | | | 1,402,794 | | | | — | | | | 9,830,669 | |
Total | | $ | 11,984,675 | | | $ | 359,603,209 | | | $ | 0 | | | $ | 371,587,884 | |
Sustainable Allocation | | | | | | | | | | | | | | | | |
Affiliated Investment Companies | | $ | 1,853,130,048 | | | $ | — | | | $ | — | | | $ | 1,853,130,048 | |
Cash Equivalents | | | 62,176,992 | | | | — | | | | — | | | | 62,176,992 | |
Total | | $ | 1,915,307,040 | | | $ | — | | | $ | — | | | $ | 1,915,307,040 | |
* | Table includes securities valued at zero. |
See Schedules of Investments for additional detailed industry classifications.
Significant unobservable inputs were used by two Funds for Level 3 fair value measurements. The High Yield Bond Fund holds two securities of the same issuer which are deemed to be valued at zero based on company financial statements,
and one security based on broker valuation levels. The Core Bond Fund holds a position in a Community Investment note which is valued based on a general obligation by the parent entity to limit investment exposure on the note.
Investment Transactions Investment transactions are recorded as of the date of purchase, sale or maturity. Net realized gains and losses from the sale or disposition of securities are determined on the identified cost basis, which is also used for federal income tax purposes. Corporate actions (including cash dividends) are recorded net of foreign tax withholdings.
Investment Income Dividend income is recorded on the ex-dividend date. Interest income is recorded on the accrual basis and includes accretion of discount and amortization of premiums, if any. The value of additional securities received as dividend payments is recorded as income and as an increase to the cost basis of such securities. The Funds amortize purchase price premium and accrete discount on bonds, if any, over the remaining life of the bonds using the effective interest method of amortization; for callable bonds, the premium amortization period is to the earliest call date.
Distributions to Shareholders Distributions to shareholders are recorded by each of the Funds on the ex-dividend dates. The Funds (except Core Bond Fund and High Yield Bond Fund) expect to pay dividends of net investment income, if any, semiannually and to make distributions of capital gains, if any, at least annually.
The Core Bond Fund and High Yield Bond Fund expect to pay dividends of net investment income, if any, monthly and to make distributions of capital gains, if any, at least annually. A shareholder begins earning dividends on the Core Bond Fund and High Yield Bond Fund shares the day after the Funds receive his or her purchase payment. Income and capital gains distributions are determined in accordance with income tax regulations, which may differ from U.S. generally accepted accounting principles.
Class Accounting Expenses directly attributable to a class of shares, such as 12b-1 distribution fees, are charged to that class. Each Fund has adopted a 12b-1 plan, applicable to certain classes of each of the Funds. Expenses of the Funds that are directly identifiable to a specific Fund, such as transfer agent fees, custody fees and registration fees, are applied to that Fund. Expenses that are not readily identifiable to a specific Fund, such as printing expense, Trustees’ fees and legal fees, are allocated in such a manner as deemed equitable, taking into consideration the nature and type of expense and the relative net assets of the Funds. Investment income, realized and unrealized gains and losses are allocated based upon the relative daily net assets of each class of shares.
December 31, 2019 |
Notes to Financial Statements, continued |
Federal Income Taxes Each of the Funds intends to elect to be treated and qualify each year as a regulated investment company under Subchapter M of the Internal Revenue Code of 1986, as amended. If a Fund so qualifies and satisfies certain distribution requirements, such Fund will ordinarily not be subject to federal income tax on its net investment income (which includes short-term capital gains) and net capital gains that it distributes to shareholders. Each Fund expects to distribute all or substantially all of its income and gains to shareholders every year. Therefore, no federal income or excise tax provision is required. The Funds are treated as separate entities for federal income tax purposes.
Foreign Currency Transactions The accounting records of the Funds are maintained in U.S. dollars. In addition, purchases and sales of investment securities, dividend and interest income, and certain expenses are translated at the rates of exchange prevailing on the respective dates of such transactions. Net realized and unrealized foreign currency exchange gains or losses occurring during the holding period of investment securities are a component of realized gain (loss) on investment transactions and unrealized appreciation (depreciation) on investments, respectively.
Non-U.S. Securities Non-U.S. markets can be significantly more volatile than domestic markets, causing the prices of some Fund investments to fluctuate significantly, rapidly and unpredictably. Non-U.S. securities may be less liquid than domestic securities; consequently, a Fund may at times be unable to sell non-U.S. securities at desirable times or prices. Other risks related to non-U.S. securities include delays in the settlement of transactions; less publicly available information about issuers; different reporting, accounting and auditing standards; the effect of political, social, diplomatic or economic events; seizure, expropriation or nationalization of the issuer or its assets; fluctuation in foreign currency exchange rates and the possible imposition of currency exchange controls. If a Fund invests substantially in securities of non-U.S. issuers tied economically to a particular country or geographic region, it will be subject to the risks associated with such country or geographic region to a greater extent than a fund that is more diversified across countries or geographic regions.
Securities Lending The Funds may lend their securities pursuant to a securities lending agreement (Lending Agreement) with State Street Bank and Trust Company. Initial security loans made pursuant to the Lending Agreement are required to be secured by collateral not less than the percentage specified in the agreement, ranging from 102% to 105%, depending on the types of securities. Cash collateral received is invested in the State Street Navigator Securities Lending Government Money Market Portfolio, a registered Rule 2a-7 money market fund. Borrowers may also pledge non-cash collateral within the guidelines for acceptable forms of
non-cash collateral approved by the Boards of Trustees. At December 31, 2019, non-cash collateral consisted of U.S. Treasuries, short-term U.S. Government agency obligations and sovereign debt.
The Funds have the right under the Lending Agreement to recover the securities from the borrower on demand. The primary risk associated with securities lending is if the borrower defaults on its obligation to return the securities loaned because of insolvency or other reasons. The Funds could experience delays and costs in recovering securities loaned or in gaining access to the collateral. In the event the borrower fails to return loaned securities and the collateral received is insufficient to cover the value of the loaned securities and provided such collateral shortfall is not the result of investment losses, the lending agent has agreed to pay the amount of the shortfall to the Funds, or at the discretion of the lending agent, replace the loaned securities.
A portion of the income generated upon investment of the collateral is remitted to the borrower and the remainder is allocated between the Funds and the lending agent. The Funds record security lending income net of such allocation. The Funds continue to receive dividends on the securities loaned, which are accounted for in the same manner as other dividend and interest income.
As of December 31, 2019, the value of securities loaned, payable for collateral due to brokers and non-cash collateral pledged by brokers were as follows:
Fund | | Market Value
of Securities
Loaned | | | Payable on
Collateral Due
to Broker | | | Non-Cash
Collateral Value * | | | Over (Under)
Collateralized | |
Small Cap | | $ | 19,650,424 | | | $ | 4,885,400 | | | $ | 15,053,419 | | | $ | 288,395 | |
ESG Beta Quality | | | 7,235,253 | | | | 781,704 | | | | 6,619,367 | | | | 165,818 | |
ESG Beta Dividend | | | 2,270,024 | | | | 351,630 | | | | 1,966,420 | | | | 48,026 | |
Global Women’s Leadership | | | 2,759,039 | | | | 19,406 | | | | 2,786,741 | | | | 47,108 | |
Core Bond | | | 10,066,103 | | | | 669,300 | | | | 9,625,000 | | | | 228,197 | |
* | Non-cash collateral is not included in the financial statements. |
For the Small Cap Fund, ESG Beta Quality Fund, ESG Beta Dividend Fund and Women’s Leadership Fund all of the securities on loan at December 31, 2019 are classified as Common Stocks in each Fund’s Schedule of Investments. For the Core Bond Fund all of the securities on loan at December 31, 2019 are classified as Corporate Bonds or U.S. Treasury and Agency securities on the Fund’s Schedule of Investments.
December 31, 2019 |
Notes to Financial Statements, continued |
The following table displays a breakdown of transactions accounted for as secured borrowings, the gross obligation by class of collateral pledge, and the remaining contractual maturity of those transactions as of December 31, 2019.
| | | Remaining Contractual Maturity of the Agreements | |
Securities Lending Transactions | | Overnight
and
Continuous | | | Up to 30
days | | | 30-90 days | | | Greater than
90 days | | | Total | |
Core Bond Fund | | | | | | | | | | | | | | | | | | | | |
U.S. Treasury and Agency Securities | | $ | 9,625,000 | | | $ | — | | | $ | — | | | $ | — | | | $ | 9,625,000 | |
Corporate Debt | | | 669,300 | | | | — | | | | — | | | | — | | | | 669,300 | |
Total Borrowings | | $ | 10,294,300 | | | $ | — | | | $ | — | | | $ | — | | | $ | 10,294,300 | |
| | | | | | | | | | | | | | | | | | | | | |
Gross amount of recognized liabilities for securities lending transactions | | $ | 10,294,300 | |
NOTE B—Investment Advisory Fee and Transactions with Affiliated and Other Parties
Trust I and Trust III have entered into Investment Advisory Contracts (the “Management Contracts”) with Impax Asset Management LLC (“IAM”) and Pax Ellevate Management LLC (“PEM”), respectively (each, the “Adviser”, and collectively, the “Advisers”). Pursuant to the terms of the Management Contracts, the Advisers, subject to the supervision of the Boards of Trustees of the Trusts, are responsible for managing the assets of the Funds in accordance with the Funds’ investment objectives, investment programs and policies.
Pursuant to the Management Contracts, the Advisers have contracted to furnish the Funds continuously with an investment program, determining what investments to purchase, sell and exchange for the Funds and what assets to hold uninvested. The Advisers also have contracted to provide office space and certain management and administrative facilities for the Funds. In return for such services, the Funds pay an advisory fee to the Advisers at the following annual rates (expressed as a percentage of the average daily net assets of such Fund):
Fund | | Annual Rate | |
Large Cap | | | 0.65 | % |
Small Cap | | | 0.75 | % |
ESG Beta Quality1 | | | 0.65 | %* |
ESG Beta Dividend2 | | | 0.65 | %* |
Global Opportunities3 | | | 0.80 | % |
Global Environmental Markets4 | | | 0.80 | % |
Global Women’s Leadership5 | | | 0.55 | %* |
EAFE ESG Leaders6 | | | 0.55 | %* |
Core Bond | | | 0.40 | % |
High Yield Bond | | | 0.50 | % |
Sustainable Allocation | | | 0.05 | %* |
* | The management fee is a unified fee that includes all of the operating costs and expenses of the Fund (other than taxes, charges of governmental agencies, interest, brokerage commissions incurred in connection with portfolio transactions, distribution and/or service fees payable under a plan pursuant to Rule 12b-1 under the Investment Company Act of 1940, acquired fund fees and expenses and extraordinary expenses), including accounting expenses, administrator, transfer agent, custodian fees, legal fees and other expenses. |
1 | Effective September 1, 2019, the management fee changed to 0.65% of average net assets up to $225 million; 0.55% for assets of $225 million to $375 million; 0.50% for assets of $375 million to $500 million; and 0.45% for assets over $500 million. Prior to September 1, 2019, the Fund’s annual rate (expressed as percentage of the average daily net assets of the Fund) was 0.65% for all assets. |
2 | Effective September 1, 2019, the management fee changed to 0.65% of average net assets up to $150 million; 0.55% for assets of $150 million to $375 million; 0.50% for assets of $375 million to $500 million; and 0.45% for assets over $500 million. Prior to September 1, 2019, the Fund’s annual rate (expressed as percentage of the average daily net assets of the Fund) was 0.65% for all assets. |
3 | The Fund’s investment adviser has contractually agreed to waive a portion of its management fee equal to the management fee corresponding to the current market value of 200,000 shares (plus shares reinvested). This waiver may not be amended or terminated without the approval of the Board of Trustees before December 31, 2021. |
4 | The management fee is 0.80% based on average net assets up to $1 billion; 0.75% for assets of $1 billion to $1.5 billion; 0.70% for assets of $1.5 billion to $2 billion; 0.65% for assets of $2 billion to $3 billion; and 0.60% for assets over $3 billion. |
5 | Effective September 1, 2019, the management fee changed to 0.55% of average net assets up to $375 million; 0.50% for assets of $375 million to $750 million; and 0.45% for assets over $750 million. Prior to September 1, 2019, the Fund’s annual rate (expressed as percentage of the average daily net assets of the Fund) was 0.55% for all assets. |
December 31, 2019 |
Notes to Financial Statements, continued |
6 | Effective September 1, 2019, the management fee changed to 0.55% of average net assets up to $600 million; 0.45% for assets of $600 million to $750 million; and 0.40% for assets over $750 million. Prior to September 1, 2019, the Fund’s annual rate (expressed as percentage of the average daily net assets of the Fund) was 0.55% for all assets. |
For the year ended December 31, 2019, the Funds incurred the following advisory fees:
Fund | | Amount | |
Large Cap | | $ | 4,399,347 | |
Small Cap | | | 3,294,792 | |
ESG Beta Quality | | | 1,440,722 | |
ESG Beta Dividend | | | 837,151 | |
Global Opportunities | | | 253,806 | |
Global Environmental Markets | | | 6,404,305 | |
Global Women’s Leadership | | | 1,963,421 | |
EAFE ESG Leaders | | | 3,192,729 | |
Core Bond | | | 2,740,269 | |
High Yield Bond | | | 1,862,360 | |
Sustainable Allocation | | | 903,260 | |
The Adviser has contractually agreed to reimburse the Funds or limit expenses of the Funds to the extent that each Fund’s respective expenses exceed, on an annual basis, the following percentages of average daily net assets:
| | | Expense Caps | |
Fund | | Investor | | | Class A | | | Institutional | |
ESG Beta Quality 1 | | | 0.90 | % | | | 0.90 | % | | | 0.65 | % |
ESG Beta Dividend 1 | | | 0.90 | % | | | | | | | 0.65 | % |
Global Opportunities 2 | | | 1.23 | % | | | | | | | 0.98 | % |
Global Women’s Leadership 1 | | | 0.80 | % | | | | | | | 0.55 | % |
EAFE ESG Leaders 1 | | | 0.80 | % | | | | | | | 0.55 | % |
Sustainable Allocation 1 | | | 0.30 | % | | | | | | | 0.05 | % |
1 | Expense caps for funds represent their respective unified management fees plus distribution and/or service fees payable under a plan pursuant to Rule 12b-1, as applicable to particular classes of shares. |
2 | The Adviser has contractually agreed to reimburse expenses (other than interest, commissions, taxes, extraordinary expenses and acquired fund fees and expenses, if any) to the extent that they exceed the expense caps indicated. The reimbursement arrangement may not be amended or terminated without the approval of the Fund’s Board of Trustees before December 31, 2021. |
Such expenses include (i) management and distribution fees; (ii) the fees of affiliated and unaffiliated Trustees; (iii) the fees of the Funds’ custodian and transfer agent; (iv) the fees of the Funds’ legal counsel and independent registered public accounting firm; (v) the reimbursement of organizational expenses; and
(vi) expenses related to shareholder communications including all expenses of shareholders’ and Boards of Trustees’ meetings and of preparing, printing and mailing reports, proxy statements and prospectuses to shareholders.
For the year ended December 31, 2019, the dollar amounts of expense reimbursements were as follows:
| | | Total Expenses Reimbursed by Adviser | |
Fund | | Investor | | | Institutional | |
Global Opportunities | | $ | 3,797 | | | $ | 135,188 | |
In addition, the Adviser voluntarily waived $17,590 of its management fee from the Global Opportunities Fund.
The Trusts have adopted a plan (“Plan”) pursuant to Rule 12b-1 under the 1940 Act that allows the Funds to pay distribution fees for the sale and distribution of certain shares as described below and for personal services rendered to the Fund shareholders in connection with the maintenance of shareholder accounts. Under the Plan, each Fund will pay its Distributor a distribution fee equal to 0.25% of the annual average daily net assets attributable to the Investor Class shares and Class A shares. The Distributor may pay all or any portion of the distribution fee to securities dealers or other organizations (including, but not limited to, any affiliate of the Distributor) as commissions, asset-based sales charges or other compensation with respect to the sale of indicated shares of such Fund, or for providing personal services to investors in the indicated shares of such Fund and/or the maintenance of shareholder accounts, and may retain all or any portion of the distribution fee as compensation for the Distributor’s services as principal underwriter of the indicated shares of such Fund.
Several individuals who are officers and/or Trustees of the Trusts are also employees of the Adviser.
December 31, 2019 |
Notes to Financial Statements, continued |
NOTE C—Investment Information
Purchases and proceeds from sales of investments for the Funds for the year ended December 31, 2019 were as follows:
| | | Purchases | | | Sales | |
Fund | | Investments1 | | | U.S. Gov’t Bonds | | | Investments1 | | | U.S. Gov’t Bonds | |
Large Cap | | $ | 246,594,075 | | | $ | — | | | $ | 284,689,954 | | | $ | — | |
Small Cap | | | 329,227,202 | | | | — | | | | 449,240,039 | | | | — | |
ESG Beta Quality | | | 106,598,435 | | | | — | | | | 109,721,652 | | | | — | |
ESG Beta Dividend | | | 63,613,962 | | | | — | | | | 74,831,128 | | | | — | |
Global Opportunities | | | 17,607,416 | | | | — | | | | 9,116,825 | | | | — | |
Global Environmental Markets | | | 291,069,260 | | | | — | | | | 112,077,412 | | | | — | |
Global Women’s Leadership | | | 385,712,911 | | | | — | | | | 235,643,530 | | | | — | |
EAFE ESG Leaders | | | 205,950,419 | | | | — | | | | 179,723,229 | | | | — | |
Core Bond | | | 205,053,663 | | | | 247,909,304 | | | | 146,323,790 | | | | 277,083,453 | |
High Yield | | | 322,669,998 | | | | — | | | | 331,663,698 | | | | 2,497,266 | |
Sustainable Allocation | | | 132,587,412 | | | | — | | | | 216,878,743 | | | | — | |
1 | Excluding short-term investments and U.S. Government bonds. |
For federal income tax purposes, the identified cost of investments owned at December 31, 2019 as well as the gross unrealized appreciation (depreciation) of investments and resulting net unrealized appreciation (depreciation) as of December 31, 2019 were as follows for the Funds:
Fund | | Identified cost of
investments for
Federal income
tax basis | | | Gross unrealized
appreciation | | | Gross unrealized
depreciation | | | Net unrealized
appreciation
(depreciation) | |
Large Cap | | $ | 541,317,011 | | | $ | 231,009,089 | | | $ | 6,154,837 | | | $ | 224,854,252 | |
Small Cap | | | 391,649,016 | | | | 66,894,996 | | | | 13,718,441 | | | | 53,176,555 | |
ESG Beta Quality | | | 134,501,780 | | | | 107,785,461 | | | | 1,110,563 | | | | 106,674,897 | |
ESG Beta Dividend | | | 91,102,948 | | | | 42,065,714 | | | | 114,606 | | | | 41,951,108 | |
Global Opportunities | | | 36,282,623 | | | | 5,966,411 | | | | 156,058 | | | | 5,810,353 | |
Global Environmental Markets | | | 781,802,712 | | | | 207,357,819 | | | | 22,490,432 | | | | 184,867,387 | |
Global Women’s Leadership | | | 398,794,108 | | | | 75,423,232 | | | | 8,841,489 | | | | 66,581,744 | |
EAFE ESG Leaders | | | 548,233,135 | | | | 124,130,027 | | | | 29,363,480 | | | | 94,766,547 | |
Core Bond | | | 687,635,711 | | | | 19,961,652 | | | | 1,322,615 | | | | 18,639,037 | |
High Yield | | | 356,729,303 | | | | 16,731,627 | | | | 1,873,046 | | | | 14,858,581 | |
Sustainable Allocation | | | 1,667,714,527 | | | | 247,592,513 | | | | — | | | | 247,592,513 | |
At December 31, 2019 the Small Cap Fund, Global Opportunities Fund, Global Environmental Markets Fund, Global Women’s Leadership Fund and EAFE ESG Leaders Fund had unrealized foreign currency gains (losses) of $207; $192; $(3,386);$2,448 and $9,378, respectively.
Netting Agreements During the ordinary course of business, the Funds may enter into transactions subject to enforceable netting agreements or other similar arrangements (“netting agreements”). Generally, the right to offset in netting agreements allows a Fund to offset any exposure to a specific counterparty with any collateral received or delivered to that counterparty based on the terms of the agreement. Generally, a Fund manages its cash collateral and securities collateral on a counterparty basis. As of December 31, 2019, there is no collateral held at the counterparty that would be offset by a master netting agreement that the Funds have with the counterparty. The Funds did not hold any derivative instruments as of December 31, 2019.
Affiliated Investments The term “affiliated company” includes other investment companies that are managed by a Fund’s Adviser. At December 31, 2019, the Sustainable Allocation Fund held the following investments in affiliated Funds:
Fund | | Shares
Held at
12/31/18 | | | Gross
Additions | | | Gross
Reductions | | | Shares
Held at
12/31/2019 | |
Sustainable Allocation | | | | | | | | | | | | | | | | |
Large Cap | | | 73,702,287 | | | | 2,656,382 | | | | 3,180,640 | | | | 73,178,029 | |
Mid Cap | | | 11,550,983 | | | | 6,853 | | | | 11,557,836 | | | | — | |
Small Cap | | | — | | | | 2,158,328 | | | | — | | | | 2,158,328 | |
ESG Beta Dividend | | | 10,763,761 | | | | 485,509 | | | | 1,238,901 | | | | 10,010,369 | |
Global Opportunities | | | 2,500,000 | | | | 48,966 | | | | — | | | | 2,548,966 | |
Global Environmental Markets | | | 1,107,513 | | | | 374,512 | | | | — | | | | 1,482,025 | |
Global Women’s Leadership | | | — | | | | 785,900 | | | | — | | | | 785,900 | |
EAFE ESG Leaders | | | 16,289,028 | | | | 434,260 | | | | 1,146,789 | | | | 15,576,499 | |
Core Bond | | | 69,553,433 | | | | 1,776,553 | | | | 4,551,829 | | | | 66,778,157 | |
High Yield | | | — | | | | 3,263,125 | | | | — | | | | 3,263,125 | |
Fund | | Value at
12/31/18 | | | Dividend
Income | | | Realized
Gains/
Losses1 | | | Net change
in Unrealized
Appreciation/
Depreciation | | | Value at
12/31/2019 | |
Sustainable Allocation | | | | | | | | | | | | | | | | | | | | |
Large Cap | | $ | 588,144,250 | | | $ | 6,329,415 | | | $ | 18,100,064 | | | $ | 177,477,769 | | | $ | 761,051,498 | |
Mid Cap | | | 102,457,216 | | | | — | | | | 3,547,226 | | | | 11,874,301 | | | | — | |
Small Cap | | | — | | | | | | | | — | | | | 1,986,423 | | | | 31,986,423 | |
ESG Beta Dividend | | | 114,741,693 | | | | 2,746,754 | | | | 5,641,953 | | | | 20,102,422 | | | | 128,232,821 | |
Global Opportunities | | | 22,950,000 | | | | 127,632 | | | | 455,401 | | | | 7,156,512 | | | | 30,689,545 | |
Global Environmental Markets | | | 14,796,378 | | | | 214,608 | | | | — | | | | 5,138,978 | | | | 25,149,965 | |
Global Women’s Leadership | | | — | | | | 134,114 | | | | 289,367 | | | | — | | | | 21,329,334 | |
EAFE ESG Leaders | | | 127,054,421 | | | | 3,859,277 | | | | 90,589 | | | | 24,480,214 | | | | 145,484,501 | |
Core Bond | | | 680,232,578 | | | | 18,046,047 | | | | (612,188 | ) | | | 34,480,801 | | | | 687,147,238 | |
High Yield | | | — | | | | 1,011,484 | | | | — | | | | 1,047,239 | | | | 22,058,723 | |
Total | | $ | 1,650,376,536 | | | $ | 32,469,331 | | | $ | 27,512,412 | | | $ | 283,744,659 | | | $ | 1,853,130,048 | |
1 | Includes realized capital gain distributions from an affiliated fund, if any. |
December 31, 2019 |
Notes to Financial Statements, continued |
The Funds are permitted to purchase and sell securities (“cross-trade”) from and to other Funds within the Trusts or other accounts managed by the Advisers pursuant to “Cross-Trading” Procedures adopted by the Trusts’ Boards of Trustees. These procedures have been designed to ensure that any cross-trade of securities by the respective Fund from or to another Fund or account that is or could be considered an affiliate of the Fund under certain limited circumstances by virtue of having a common investment adviser complies with Rule 17a-7 of the 1940 Act. Further, as defined under these procedures, each cross-trade is effected at the current market price to save costs where allowed. Pursuant to these procedures, for the year ended December 31, 2019, the Global Women’s Leadership Fund and the EAFE ESG Leaders Fund engaged in cross-trades. The Global Women’s Leadership Fund and the EAFE ESG Leaders Fund had total purchases of $2,457,113 and $3,032,310, respectively, and total sales of $3,032,310 and $2,457,113, respectively. The Global Women’s Leadership Fund and EAFE ESG Leaders Fund had net losses of $17,816 and $26,987, respectively.
Restricted and Illiquid Securities The Funds may purchase certain restricted securities and limited amounts of illiquid securities. The Funds may invest in securities exempt from registration under Rule 144A of the Securities Act of 1933 (“the Act”) which are restricted from sale to the public and may only be sold to a qualified institutional buyer. The Funds do not have the right to demand that such securities be registered. The value of such securities is determined by valuations supplied by a pricing service or, if not available, in good faith by or at the direction of the Boards of Trustees. At December 31, 2019, the Core Bond Fund held $83,018,868 or 11.70% of net assets and the High Yield Bond Fund held $239,861,202 or 63.83% of net assets in securities exempt from registration under Rule 144A of the Act.
At December 31, 2019, the Core Bond Fund held $10,029,760 of illiquid securities representing 1.41% of net assets and High Yield Bond Fund held $1,402,794 of illiquid securities, representing 0.37% of net assets. The Fund will classify as “illiquid” all securities that the Fund reasonably expects cannot be sold or disposed of in current market conditions in seven calendar days or less without the sale or disposition significantly changing the market value of the investment. Illiquid investments may include restricted securities, repurchase agreements that mature in more than seven days or that have a notice or demand feature more than seven days, certain over-the-counter option contracts and participation interests in
loans. Because illiquid securities trade less frequently and in smaller volume than liquid securities, the Fund may experience difficulty in closing out positions at prevailing market prices.
Security | | Acquisition Date Range | | | Cost | | | Market Value | |
Core Bond | | | | | | | | | | | | |
Calvert Social Investment Foundation, Inc., 1.500%, 04/30/20 | 04/30/15 - 04/30/15 | | $ | 3,000,000 | | | $ | 3,000,000 | |
Capital Impact Partners, 2.300%, 10/15/24 | 10/21/19 - 10/21/19 | | | 500,000 | | | | 497,953 | |
CINI Investment Note, 2.000%, 10/31/20 | 11/01/17 - 09/30/19 | | | 286,933 | | | | 286,933 | |
Community Credit Union of Lynn, 2.200%, 11/29/22 | 11/14/17 - 11/14/17 | | | 250,000 | | | | 252,814 | |
Envest Microfinance Fund, LLC, Sr. Note, Series A, 4.000%, 09/15/20 | 09/15/16 - 09/15/16 | | | 100,000 | | | | 99,543 | |
Master Asset Backed Securities Trust 2007-NCW, 1 month LIBOR +0.600%, 144A, 2.691%, 05/25/37 | 07/06/17 - 07/06/17 | | | 1,375,714 | | | | 1,384,243 | |
Overseas Private Investment Corp., 1.980%, 09/15/26 | 12/02/19 - 12/02/19 | | | 1,821,429 | | | | 2,001,250 | |
Self-Help Federal Credit Union, 1.700%, 04/13/20 | 04/06/18 - 04/06/18 | | | 250,000 | | | | 250,034 | |
Self-Help Federal Credit Union, 1.900%, 12/20/21 | 12/17/19 - 12/17/19 | | | 250,000 | | | | 250,994 | |
Tesla Energy Operations, Inc., 4.700%, 05/29/25 | 05/26/15 - 05/26/15 | | | 1,987,111 | | | | 2,005,996 | |
| | | | | | | | | | | | | |
High Yield Bond | | | | | | | | | | | | |
Beneficial State Bank, 1.650%, 01/21/20 | 01/21/19 - 01/21/19 | | | 200,000 | | | | 200,000 | |
Interactive Health, Inc. | 03/19/04 - 10/01/13 | | | 178,981 | | | | 0 | |
Interactive Health, Inc., 0.000% | 03/19/04 - 10/01/13 | | | 357,962 | | | | 0 | |
Providence Bank & Trust, 0.499%, 08/03/20 | 08/03/19 - 08/03/19 | | | 201,203 | | | | 201,203 | |
Self-Help Credit Union, 2.100%, 01/04/20 | 01/04/19 - 01/04/19 | | | 100,000 | | | | 100,000 | |
Self-Help Credit Union, 1.900%, 12/20/21 | 12/17/19 - 12/17/19 | | | 400,000 | | | | 401,591 | |
Shared Interest, Inc., 2.400%, 09/30/21 | 09/30/18 - 09/30/18 | | | 500,000 | | | | 500,000 | |
NOTE D—Tax Information
The timing and characterization of certain income and capital gains distributions are determined annually in accordance with federal tax regulations, which may differ from GAAP. In addition to permanent differences previously noted, temporary differences may arise from recognition of certain items of income, expense, gain or loss in different periods for financial reporting and tax purposes. Such differences will reverse at some time in the future. As a result, net investment income (loss) and net realized gain (loss) on investment transactions for a reporting period may differ significantly from distributions during such period. For tax purposes, short-term capital gains are considered ordinary income.
December 31, 2019 |
Notes to Financial Statements, continued |
The tax character of distributions paid during 2019 and 2018 was as follows:
| | | Distributions paid in 2019 | | | Distributions paid in 2018 | |
Fund | | Ordinary
income | | | Long-term
capital gains | | | Ordinary
income | | | Long-term
capital gains | |
Large Cap | | $ | 8,866,803 | | | $ | 18,561,007 | | | $ | 16,966,833 | | | $ | 104,510,698 | |
Small Cap | | | 3,873,595 | | | | 318,705 | | | | 8,176,966 | | | | 54,916,227 | |
ESG Beta Quality | | | 3,203,047 | | | | 4,833,494 | | | | 3,479,497 | | | | 11,115,488 | |
ESG Beta Dividend | | | 2,720,704 | | | | 3,625,330 | | | | 3,008,950 | | | | 1,465,867 | |
Global Opportunities | | | 454,580 | | | | 318,335 | | | | — | | | | — | |
Global Environmental Markets | | | 7,439,925 | | | | — | | | | 12,646,378 | | | | 11,954,841 | |
Global Women’s Leadership | | | 7,152,818 | | | | 6,309,317 | | | | 7,662,777 | | | | 3,581,821 | |
EAFE ESG Leaders | | | 16,043,570 | | | | — | | | | 15,419,557 | | | | — | |
Core Bond | | | 18,311,162 | | | | — | | | | 18,085,574 | | | | — | |
High Yield Bond | | | 18,937,116 | | | | — | | | | 19,943,186 | | | | — | |
Sustainable Allocation | | | 42,603,462 | | | | 123,434,470 | | | | 43,557,388 | | | | 6,340,197 | |
As of December 31, 2019, the components of distributable earnings on a tax basis are as follows:
Fund | | Undistributed
Ordinary
Income | | | Undistributed
Long-Term
Capital Gain | | | Other
Temporary
Differences | | | Net Unrealized
Appreciation
(Depreciation) | |
Large Cap | | $ | 2,862,757 | | | $ | 5,804,217 | | | $ | — | | | $ | 224,854,252 | |
Small Cap | | | — | | | | 1,530,560 | | | | — | | | | 53,176,762 | |
ESG Beta Quality | | | — | | | | 1,805,426 | | | | — | | | | 106,674,897 | |
ESG Beta Dividend | | | — | | | | 482,787 | | | | — | | | | 41,951,108 | |
Global Opportunities | | | 125,674 | | | | — | | | | — | | | | 5,810,545 | |
Global Environmental Markets | | | 32,966 | | | | — | | | | (1,101 | ) | | | 184,864,001 | |
Global Women’s Leadership | | | 112,426 | | | | — | | | | (1,200,903 | ) | | | 66,584,192 | |
EAFE ESG Leaders | | | 499,042 | | | | — | | | | (29,128,869 | ) | | | 94,775,925 | |
Core Bond | | | 2,206 | | | | — | | | | (3,850,448 | ) | | | 18,639,037 | |
High Yield Bond | | | — | | | | — | | | | (70,452,291 | ) | | | 14,858,581 | |
Sustainable Allocation | | | 10,135,623 | | | | 22,346,469 | | | | — | | | | 247,592,513 | |
The Global Opportunities Fund and Global Women’s Leadership Fund elected to defer $45,753 and $1,200,903, respectively of capital losses recognized between November 1, 2019 and December 31, 2019 for the Funds’ fiscal year ending December 31, 2019. These losses are treated for federal income tax purposes as if they had occurred on January 1, 2020.
As of December 31, 2019, for federal income tax purposes, the following Funds had capital loss carryforwards available to offset future gains, if any, to the extent provided by the Treasury regulations:
| | | No Expiration | |
Fund | | Short-term | | | Long-term | |
Global Environmental Markets | | $ | 1,101 | | | $ | — | |
EAFE ESG Leaders | | | 400,939 | | | | 28,727,930 | |
Core Bond | | | — | | | | 3,850,448 | |
High Yield Bond | | | 27,069,995 | | | | 43,156,864 | |
For financial reporting purposes, the capital accounts are adjusted to reflect the tax character of permanent book/tax differences. Reclassifications are primarily due to tax treatment of gain (loss) on foreign currency transactions and tax treatment related to REITs and PFICs.
For the year ended December 31, 2019, the Funds recorded the following reclassifications:
Fund | | Undistributed
Net Investment
Income | | | Accumulated
Net Realized
Gain/(Loss) | | | Paid in
Capital | |
Large Cap | | $ | (314,788 | ) | | $ | 314,788 | | | $ | — | |
Small Cap | | | (358,743 | ) | | | 358,743 | | | | — | |
ESG Beta Quality | | | (200,338 | ) | | | 200,338 | | | | — | |
ESG Beta Dividend | | | (97,567 | ) | | | 97,567 | | | | — | |
Global Opportunities | | | (8,253 | ) | | | 8,253 | | | | — | |
Global Environmental Markets | | | (194,602 | ) | | | 194,602 | | | | — | |
Global Women’s Leadership | | | (60,642 | ) | | | 60,642 | | | | — | |
EAFE ESG Leaders | | | 31,079 | | | | (31,079 | ) | | | — | |
Core Bond | | | 825,871 | | | | (825,871 | ) | | | — | |
High Yield Bond | | | (11,513 | ) | | | 25,456 | | | | (13,943 | ) |
Sustainable Allocation | | | — | | | | — | | | | — | |
Uncertain Tax Positions Management has analyzed the Funds’ tax positions taken for all open tax years which remain subject to examination by the Funds’ major tax jurisdictions (years 2016 through 2019). The Funds recognize interest and penalties, if any, related to tax liabilities as income tax expense in the Statement of Operations. Management has concluded that, as of and during the year ended December 31, 2019, no provision for federal income tax is necessary and, therefore, the Funds did not have a liability for any unrecognized tax expenses.
December 31, 2019 |
Report of Independent Registered Public Accounting Firm |
To the Boards of Trustees and Shareholders of Pax World Funds Series Trust I and Pax World Funds Series Trust III:
Opinion on the Financial Statements
We have audited the accompanying statements of assets and liabilities of Pax World Funds Series Trust I (“Trust I”) (comprising Pax Sustainable Allocation Fund (formerly, Pax Balanced Fund), Pax ESG Beta Quality Fund, Pax Small Cap Fund, Pax High Yield Bond Fund, Pax Global Environmental Markets Fund, Pax MSCI EAFE ESG Leaders Index Fund, Pax Core Bond Fund, Pax Large Cap Fund, Pax Global Opportunities Fund, and Pax ESG Beta Dividend Fund (collectively, with Pax Ellevate Global Women’s Leadership Fund, the “Funds”)), and Pax World Funds Series Trust III (“Trust III” and collectively with Trust I, the “Trusts”) (comprising Pax Ellevate Global Women’s Leadership Fund), including the schedules of investments, as of December 31, 2019, and the related statements of operations for the year then ended, the statements of changes in net assets and the financial highlights for each of the periods indicated in the table below and the related notes (collectively referred to as the “financial statements”). In our opinion, the financial statements present fairly, in all material respects, the financial position of the Funds at December 31, 2019, the results of their operations for the year then ended, and the changes in their net assets and their financial highlights for each of the periods indicated in the table below, in conformity with U.S. generally accepted accounting principles.
Funds comprising Trust I | Statement of
Operations | Statements of
Changes in Net
Assets | Financial highlights |
Pax Sustainable Allocation Fund (formerly, Pax Balanced Fund) Pax ESG Beta Quality Fund Pax Small Cap Fund Pax High Yield Bond Fund Pax Global Environmental Markets Fund Pax MSCI EAFE ESG Leaders Index Fund | For the year ended December 31, 2019 | For each of the two years in the period ended December 31, 2019 | For each of the five years in the period ended December 31, 2019 |
Pax Large Cap Fund Pax ESG Beta Dividend Fund Pax Core Bond Fund | For the year ended December 31, 2019 | For each of the two years in the period ended December 31, 2019 | For each of the three years in the period ended December 31, 2019 and the period from December 16, 2016 (commencement of operations) through December 31, 2016 |
Pax Global Opportunities Fund | For the year ended December 31, 2019 | For the year ended December 31, 2019 and for the period from June 27, 2018 (commencement of operations) through December 31, 2018 | For the year ended December 31, 2019 and for the period from June 27, 2018 (commencement of operations) through December 31, 2018 |
Funds comprising Trust III | Statement of
Operations | Statements of
Changes in Net
Assets | Financial highlights |
Pax Ellevate Global Women’s Leadership Fund | For the year ended December 31, 2019 | For each of the two years in the period ended December 31, 2019 | For each of the five years in the period ended December 31, 2019 |
Basis for Opinion
These financial statements are the responsibility of the Trusts’ management. Our responsibility is to express an opinion on each of the Funds’ financial statements based on our audits. We are a public accounting firm registered with the Public Company Accounting Oversight Board (United States) (“PCAOB”) and are required to be independent with respect to the Trusts in accordance with the U.S. federal securities laws and the applicable rules and regulations of the Securities and Exchange Commission and the PCAOB.
We conducted our audits in accordance with the standards of the PCAOB. Those standards require that we plan and perform the audit to obtain reasonable assurance about whether the financial statements are free of material misstatement, whether due to error or fraud. The Trusts are not required to have, nor were we engaged to perform, an audit of the Trusts’ internal control over financial reporting. As part of our audits, we are required to obtain an understanding of internal control over financial reporting, but not for the purpose of expressing an opinion on the effectiveness of the Trusts’ internal control over financial reporting. Accordingly, we express no such opinion.
Our audits included performing procedures to assess the risks of material misstatement of the financial statements, whether due to error or fraud, and performing procedures that respond to those risks. Such procedures included examining, on a test basis, evidence regarding the amounts and disclosures in the financial statements. Our procedures included confirmation of securities owned as of December 31, 2019, by correspondence with the custodian and brokers or by other appropriate auditing procedures where replies from brokers were not received. Our audits also included evaluating the accounting principles used and significant estimates made by management, as well as evaluating the overall presentation of the financial statements. We believe that our audits provide a reasonable basis for our opinion.

We have served as the auditor of the Pax World Funds Series Trust I and Pax World Funds Series Trust III since 2003.
Boston, Massachusetts
February 19, 2020
Proxy Voting (Unaudited)
You may obtain a description of the Funds’ policies and procedures that the Funds use to determine how to vote proxies relating to their portfolio securities, without charge, upon request by contacting the Funds at 800.767.1729 or on the SEC’s website at www.sec.gov.
The information regarding how the Funds voted proxies relating to portfolio securities during the most recent 12-month period ended June 30 is available without charge, upon request, by telephoning Pax (toll-free) at 800.767.1729 or visiting Pax’s website at www.impaxam.com and will be available without charge by visiting the SEC’s website at www.sec.gov.
Portfolio Holdings (Unaudited)
Each Fund files its complete schedule of portfolio holdings with the U.S. Securities and Exchange Commission (“SEC”) for the first and third quarters of each fiscal year on Form N-Q (or as an exhibit to its reports on Form N-Q’s successor form, Form N-PORT). Each Fund’s Forms N-Q and Forms N-PORT are available on the SEC’s web site at www.sec.gov.
Special Meeting of Shareholders (Unaudited)
A Special Meeting of Shareholders of Pax World Funds Series Trust III (the “Trust”) was held on July 31, 2019 at 3:00 p.m. ET, at the offices of the Trust at 30 Penhallow Street, Suite 400, Portsmouth, NH.
The matter voted upon and the number of votes cast for, against, as well as the number of abstentions, as applicable to the matter, are as follows below.
Proposal 1. To approve a new investment advisory agreement between Pax Ellevate Management LLC (“PEM”) and the Trust, on behalf of the Global Women’s Leadership Fund (the “New Advisory Agreement”).*
Fund | | For | | | Against | | | Abstain | | | Passed | |
Pax Global Women’s Leadership | | | 6,504,917.507 | | | | 99,118.140 | | | | 223,232.096 | | | | Yes | |
* | For more information regarding the Trustees of Trust III considerations for approval of the new investment advisory agreement, please refer to the most recent Pax World funds semiannual report dated June 30, 2019. |
Board Approval of Sub-Advisory Agreement
Review Process.The 1940 Act requires that the Trustees of Trust I request and evaluate, and that IAM (or the “Adviser”) furnish, such information as may reasonably be necessary for the Trustees of Trust I to evaluate the terms of the Management Contract with the Adviser.Similarly, the 1940 Act requires that the Trustees of Trust I request and evaluate, and that Aperio (or the “Subadviser”) furnish such information as may reasonably be necessary for the Trustees of Trust I to evaluate the terms of the Subadvisory Contract among Trust I, IAM, and the Subadviser.
The Trustees, including the Trustees who are not “interested persons” (as defined in Section 2(a)(19) of the 1940 Act) of Trust I (the “Independent Trustees”), met in person on September 19, 2019 for the purpose of considering a reduction in the rate at which subadvisory fees are payable by the Adviser to the Subadviser under the Subadvisory Contract with respect to ESG Beta Quality Fund and ESG Beta Dividend Fund (each a “Fund” and together, the “Funds”). In addition, the Trustees of Trust I considered matters bearing on the Trust and its investment management and other arrangements at their regular meetings throughout the year, including reviews of investment results and performance data at each regular meeting and periodic presentations from the Adviser and the Subadviser.
The Independent Trustees were assisted in their evaluation of the Subadvisory Contract by independent legal counsel, from whom they received assistance and advice.
The Trustees considered that, at a meeting held on June 12, 2019 (the “June Meeting”), the Trustees, including a majority of the Independent Trustees, had approved an Amended and Restated Management Contract between Trust I and the Adviser reducing the rate at which advisory fees are payable thereunder with respect to the Funds. The Trustees considered management’s recommendation that the Trustees approve a similar reduction in the rate at which subadvisory fees are payable under the Subadvisory Contract with respect to the Funds, and received and considered information from the Adviser regarding the expected effect of the reduction in subadvisory fee rates on the Adviser’s profitability with respect to the Funds. The Trustees also considered that, at the June Meeting, they had noted that the total expenses of the Funds were at or below the median total expenses of their respective peer groups. Based on these observations, the Independent Trustees concluded that the Funds’ overall fee arrangements represent an appropriate sharing at the present time between Fund shareholders and the Adviser and Subadviser of any economies of scale or other efficiencies in the management of each Fund at current asset levels.
The Trustees, including the Independent Trustees, also considered their deliberations and conclusions in connection with their recent approval of the Subadvisory Contract, including with respect to (i) the nature, extent and quality of the Subadviser’s services; (ii) the investment performance of each Fund; (iii) the subadvisory fees paid by IAM to the Subadviser relative to each Fund’s Broadridge peer group; and (iv) the direct and indirect benefits to the Subadviser from its relationship with the Funds, including reputational and other “fall out” benefits.The Trustees noted that they had approved the continuation of the Subadvisory Contract for the Funds at their June 12-13, 2019 meeting, after evaluating materials provided in connection with the contract review process at their March and June 2019 meetings.
Conclusions.Based on the foregoing and other relevant considerations, the Trustees, including a majority of the Independent Trustees, voted to approve the Subadvisory Contract.Based on their evaluation of factors that they deemed to be material, including those factors described above, the Trustees, including the Independent Trustees, unanimously concluded that approval of the Subadvisory Contract would be in the best interests of shareholders of each Fund.
Management of the Funds (Unaudited)
Interested Trustees and Officers
Name and Age | Position(s) Held With the
Trust; Term of Office1; and
Length of Time Served | Principal Occupation(s) During Past
Five Years and Other Directorships
Held by Trustee or Officer | Number of
Funds in the
Pax World
Fund Family
Overseen by
Trustee |
Joseph Keefe (66) | Trust I: Trustee, Chief Executive Officer
(since 2006) Trust III: Trustee, Chief Executive Officer
(since 2013) | Chief Executive Officer (2005-2018) and President (2006-present) of IAM; Chief Executive Officer of PEM (2014-present); member of the Board of Impax Asset Management Ltd. and Impax Asset Management (AIFM) Ltd. (2018 - present); member of the Boards of Directors of Women Thrive Alliance (2009-2018) and New Hampshire Public Radio (2017 - present); Co-Chair of the Leadership Group of the Women’s Empowerment Principles (2014-present). | 11 |
Lindsey Brace Martinez
(52) | Trust I: Trustee
(since 2018) Trust III: Trustee
(since 2019) | Director, Seven Islands Management Co. (2018-present); Founder and Principal, Starpoint Advisors, LLC (2015-present); Director, Impax Asset Management Group plc (2015-present); Managing Director, Head of Global Client Service and Relations, Cambridge Associates (2009-2015); Chair of the Board of Directors, Novatus Energy, LLC (2016-present); Board Member, Yale Center for Business and Environment (2014-present); Investment Sub-Committee Member, National Geographic Society (2015-present); Member, Advisory Council, Quebec Labrador Foundation (2012-present). | 11 |
John Boese
(56) | Trust I: Chief Compliance Officer
(since 2006) Trust III: Chief Compliance Officer
(since 2013) | Chief Compliance Officer of IAM (2006-present) and of PEM (2014-present). | N/A |
Interested Trustees and Officers, continued
Name and Age | Position(s) Held With the
Trust; Term of Office1; and
Length of Time Served | Principal Occupation(s) During Past
Five Years and Other Directorships
Held by Trustee or Officer | Number of
Funds in the
Pax World
Fund Family
Overseen by
Trustee |
Maureen Conley (57) | Trust I: Secretary
(since 2006) Trust III: Secretary
(since 2013) | Senior Vice President of Shareholder Services/Operations for IAM (2005-present). | N/A |
Alicia K. DuBois (60) | Trust I: Treasurer
(since 2006) Trust III: Treasurer
(since 2013) | Chief Financial Officer for IAM (2006-present) and for PEM (2014-present). | N/A |
Robert Silva (53) | Trust I: Assistant Treasurer (Since 2015) Trust III: Assistant Treasurer (Since 2015) | Director of Fund Administration for IAM (2014-present) and for PEM (2014-present). | N/A |
Disinterested Trustees
Name and Age | Position(s) Held With the
Trust; Term of Office1; and
Length of Time Served | Principal Occupation(s) During Past
Five Years and Other Directorships
Held by Trustee or Officer | Number of
Funds in the
Pax World
Fund Family
Overseen by
Trustee |
Adrian P. Anderson
(65)2 | Trust I: Trustee
(since 2007) Trust III: Trustee
(since 2013) | Tax Accountant at Shwiff, Levy & Polo, LLP (2018-present); Chief Executive Officer and Consultant of North Point Advisors, LLC (2004-present). | 11 |
Anne M. Goggin (70)2 | Trust I and Trust III: Vice Chairperson of the Board of Trustees
(since 2019) Trust I and Trust III: Trustee
(since 2017) | Trustee of RS Investment Trust and RS Variable Products Trust (2006-2016); attorney; Retired, Chief Counsel, Metropolitan Life Insurance Company, an insurance company; Member, Governing Council of the Independent Directors Council (2012-present). | 11 |
Cynthia Hargadon
(64)3 | Trust I: Trustee
(since 2006) Trust III: Trustee
(since 2013) | Trustee of Pax World Funds Trust II (2008-2014); Senior Consultant and Partner of North Point Advisors, LLC (2010-present). | 11 |
D’Anne Hurd (69)2 | Trust I: Trustee
(since 2015) Trust III: Trustee
(since 2015) | Board Advisor, National Association of Corporate Directors, and private investor (2011-present); Chairman of the Board, Monzite Corporation (2013-2016); member of the Board of Directors, Audit (Chair) and Nominating and Governance Committees, Peckham Industries, Inc. (2013-present); member of the Board of Directors and Audit Committee of Martin Engineering, Inc. (2019-present); Business Advisory Board member, Myomo, Inc. (2012-2017). | 11 |
Disinterested Trustees, continued
Name and Age | Position(s) Held With the
Trust; Term of Office1; and
Length of Time Served | Principal Occupation(s) During Past
Five Years and Other Directorships
Held by Trustee or Officer | Number of
Funds in the
Pax World
Fund Family
Overseen by
Trustee |
John L. Liechty (65)3 | Trust I: Chairman of the Board of Trustees (since 2014); Trustee (since 2009) Trust III: Chairman of the Board of Trustees (since 2014); Trustee (since 2013) | Principal, Integrated Investment Solutions (2009-present); Principal, Integrated Financial Planning Solutions, LLC (2010-present). | 11 |
Nancy S. Taylor (64)3 | Trust I: Trustee
(since 2006) Trust III: Trustee
(since 2013) | Senior Minister & CEO, Old South Church in Boston (2005-present); Advisory Board, Yale Divinity School (2010-present); Advisory Board, Idaho Human Rights Education Center (2009-present); Board of Managers, Old South Meeting House (2005-present); Trustee Emeritus, Benjamin Franklin Institute of Technology (2011-present). | 11 |
1 | A Trustee of the Funds holds office until a successor is chosen and qualified. An Officer of the Funds is appointed by the respective Board of Trustees and holds office until a successor is chosen and qualified. |
2 | Designates a member of the Audit Committee. The Audit Committee has the responsibility of overseeing the establishment and maintenance of an effective financial control environment, for overseeing the procedures for evaluating the system of internal accounting control and for evaluating audit performance. The committee met three times in 2019. |
3 | Designates a member of the Governance and Compliance Committee. The Governance and Compliance Committee is responsible for considering and recommending Board candidates, reviewing and recommending Board compensation, and overseeing regulatory and fiduciary compliance matters. The committee met three times in 2019. |
Federal Tax Information (Unaudited)
The percentages of ordinary income distributed by each of the Funds that is Qualified Dividend Income (QDI) and that qualifies for corporate Dividends Received Deduction (DRD) are as follows:
| | QDI% | | | DRD% | |
Large Cap | | | 100.00 | % | | | 100.00 | % |
Small Cap | | | 100.00 | % | | | 100.00 | % |
ESG Beta Quality | | | 100.00 | % | | | 100.00 | % |
ESG Beta Dividend | | | 100.00 | % | | | 100.00 | % |
Global Opportunities | | | 100.00 | % | | | 63.75 | % |
Global Environmental Markets | | | 100.00 | % | | | 100.00 | % |
Global Women’s Leadership | | | 100.00 | % | | | 61.20 | % |
EAFE ESG Leaders | | | 100.00 | % | | | 0.00 | % |
Core Bond | | | 1.39 | % | | | 0.00 | % |
High Yield Bond | | | 0.80 | % | | | 0.80 | % |
Sustainable Allocation | | | 99.54 | % | | | 0.00 | % |
For the fiscal year ended December 31, 2019 the EAFE ESG Leaders Fund earned foreign source income totaling $19,831,076 and paid $1,662,768 foreign taxes which it intends to pass through to its shareholders.
December 31, 2019 |
Account Options and Services |
At Pax World, we are pleased to offer a variety of account options and shareholder services to help meet your investment needs.
Types of Accounts | Services |
Regular Accounts: Individual, business and trust accounts are available for all Pax World Funds. Traditional IRA Contributions to an IRA may be tax-deductible. Taxes are paid only when funds are withdrawn, when investors may be in a lower tax bracket. Roth IRA Contributions to a Roth IRA are not deductible, but after five years some types of withdrawals are tax-free. SIMPLE IRA This is an easy-to maintain retirement plan designed for small businesses. SEP IRA This is an employer funded retirement plan popular with small businesses and self-employed persons. Education Savings Account & Uniform Gift to Minors Account (UGMA) These plans provide excellent ways to save for a child’s education. | Automatic Investment Plan You may arrange to have a fixed amount automatically deducted from your checking or savings account and invested in your Pax World account on a monthly or quarterly basis. Automatic investment plans do not assure a profit and do not protect against loss in declining markets. Online Account Access Utilizing a unique ID number and PIN, you can access your Pax World account balances or histories; purchase or redeem fund shares; or make exchanges between different Pax World Funds. www.impaxam.com Learn all about Pax World Funds through our web site. You can check Fund performance, read about our portfolio managers, viewConnection—our quarterly newsletter, and see how we voted on various proxies for the companies in our portfolios. |
Please note that the information contained herein does not constitute tax advice. Always consult your tax advisor before making any tax-related investment decisions.
This annual report is intended for shareholders of the Pax World Funds only, and is not authorized for distribution to other persons unless accompanied or preceded by a prospectus. Please consider the Funds’ investment objectives, risks and charges and expenses carefully before investing. The Funds’ prospectus contains this and other information about the Funds and may be obtained by calling 800.767.1729, emailing paxfunds@impaxam.com or visiting www.impaxam.com.
Distributor: ALPS Distributors, Inc. member of FINRA 2/20.
THIS PAGE INTENTIONALLY LEFT BLANK
As of December 31, 2019, the Registrant has adopted a “code of ethics,” as such term is defined in paragraph (b) of this Item 2, that applies to all officers of the Registrant, including Registrant’s principal executive officer, principal financial officer, principal accounting officer or controller, or persons performing similar functions, regardless of whether these individuals are employed by the Registrant or by a third party. A copy of the code of ethics is filed as an exhibit to this Form N-CSR.
| Item 3. | Audit Committee Financial Expert. |
The Registrant’s Board of Trustees has determined that Adrian Anderson, who serves on the Board’s Audit Committee, qualifies as “audit committee financial expert” as such term is defined in paragraph (b) of this Item 3. The Board also has determined that Mr. Anderson is “independent,” as such term is interpreted by subparagraph (a)(2) of this Item 3. The Securities and Exchange Commission has stated that the designation of a person as an audit committee financial expert pursuant to this Item 3 of the Form N-CSR does not impose on such a person any duties, obligations or liability that are greater than the duties, obligations or liability imposed on such person as a member of the Audit Committee and the Board of Trustees in the absence of such designation or identification.
| Item 4. | Principal Accountant Fees and Services. |
(a)Audit Fees. The aggregate fees billed for each of the last two fiscal years for professional services rendered by the principal accountant for the audit of the Registrant’s annual financial statements or services that are normally provided by the accountant in connection with statutory and regulatory filings or engagements were $302,325 and $325,000 for the fiscal years ended December 31, 2019 and 2018, respectively.
(b)Audit-Related Fees. The aggregate fees billed in each of the last two fiscal years for assurance and related services by the principal accountant that are reasonably related to the performance of the audit of the Registrant’s financial statements and are not reported under paragraph (a) of this Item were $0 and $0 for the fiscal years ended December 31, 2019 and 2018, respectively.
(c)Tax Fees. The aggregate fees billed in each of the last two fiscal years for professional services rendered by the principal accountant for tax compliance, tax advice and tax planning were $139,930 and $137,492 for the fiscal years ended December 31, 2019 and 2018, respectively. Fees disclosed under this category are for professional services related to review and execution of federal, state and excise tax returns and advice concerning tax compliance and planning.
(d)All Other Fees. The aggregate fees billed in each of the last two fiscal years for products and services provided by the principal accountant, other than the services reported in paragraphs (a) through (c) of this Item, are $31,850 and $13,200 for the fiscal years ended December 31, 2019 and 2018, respectively.
(e) (1) To the extent required by applicable regulations, the Audit Committee approves in advance all audit and non-audit services rendered to the Registrant by the independent registered public accounting firm and all non-audit services to the Registrant’s investment adviser and any entity controlling, controlled by or under common control with the Registrant’s investment adviser that provide ongoing services to the Registrant, if the engagement relates directly to the operations and financial reporting of the Registrant.
(2) With respect to the services described in paragraphs (b) through (d) of this Item, no amount was approved by the Audit Committee pursuant to paragraph (c)(7)(i)(C) of Rule 2-01 of
Regulation S-X and no amount was required to be approved pursuant to paragraph (c)(7)(ii) of Rule 2-01 of Regulation S-X.
(f) Not applicable.
(g) The aggregate non-audit fees billed by the Registrant’s accountant for services rendered to the Registrant, or to the Registrant’s investment adviser, or to any entity controlling, controlled by or under common control with the adviser that provides ongoing services to the Registrant totaled $0 and $0, for the fiscal years ended December 31, 2019 and 2018, respectively.
(h) Not applicable.
| Item 5. | Audit Committee of Listed Registrants. |
Not applicable.
| Item 6. | Schedule of Investments. |
A complete series of schedules of investments is included as part of the report to shareholders filed under Item 1.
| Item 7. | Disclosure of Proxy Voting Policies and Procedures for Closed-End Management Investment Companies. |
Not applicable.
| Item 8. | Portfolio Managers of Closed-End Management Investment Companies. |
Not applicable.
| Item 9. | Purchase of Equity Securities by Closed-End Management Investment Company and Affiliated Purchasers. |
Not applicable.
| Item 10. | Submission of Matters to a Vote of Security Holders. |
There have been no material changes to the procedures by which shareholders may recommend nominees to the Registrant’s Board of Trustees that have been implemented since the Registrant last provided disclosure in response to the requirements of this Item.
| Item 11. | Controls and Procedures. |
(a) It is the conclusion of the Registrant’s principal executive officer and principal financial officer (or persons performing similar functions), based on an evaluation of the effectiveness of the design and operation of the Registrant’s disclosure controls and procedures (as defined in Rule 30a-3(c) under the Investment Company Act of 1940, as amended) (the “Disclosure Controls”) as of a date within 90 days of the filing date of this report on Form N-CSR, that the design and operation of the Disclosure Controls are effective to reasonably ensure that information required to be disclosed by the Registrant in this report on Form N-CSR has been recorded, processed, summarized and reported within the time periods specified in the rules and forms of the Securities and Exchange Commission.
(b) There has been no change in the Registrant’s internal control over financial reporting (as defined in Rule 30a-3(d) under the Investment Company Act of 1940, as amended) that occurred during the second fiscal quarter of the period covered by this report on Form N-CSR that has materially affected, or is reasonably likely to materially affect, the Registrant’s internal control over financial reporting.
| Item 12. | Disclosure of Securities Lending Activities for Closed-End Management Companies |
Not applicable.
| | (a) | (1) | The registrant’s code of ethics pursuant to Item 2 of Form N-CSR is filed with the registrant’s annual Form N-CSR. |
| | | | |
| | | (2) | Certifications of the principal executive officer and principal financial officer of the Registrant as required by Rule 30a-2(a) under the Investment Company Act of 1940, as amended, are attached. |
| | | | |
| | | (3) | Written solicitation to repurchase securities issued by closed-end companies: not applicable. |
| (b) | Certification of the principal executive officer and principal financial officer of the Registrant required by Rule 30a-2(b) under the Investment Company Act of 1940, as amended. |
SIGNATURES
Pursuant to the requirements of the Securities Exchange Act of 1934 and the Investment Company Act of 1940, the Registrant has duly caused this report to be signed on its behalf by the undersigned, thereunto duly authorized.
| (Registrant) | Pax World Funds Series Trust I | |
| | | |
| By (Signature and Title) | /s/ Joseph F. Keefe | |
| | Joseph F. Keefe, President | |
| | | |
| Date | February 18, 2020 | |
| | |
| Pursuant to the requirements of the Securities Exchange Act of 1934 and the Investment Company Act of 1940, this report has been signed below by the following persons on behalf of the Registrant and in the capacities and on the dates indicated. |
| | |
| By (Signature and Title) | /s/ Joseph F. Keefe | |
| | Joseph F. Keefe, President (Principal Executive Officer) | |
| | | |
| Date | February 18, 2020 | |
| | | |
| By (Signature and Title) | /s/ Alicia DuBois | |
| | Alicia K. DuBois, Treasurer (Principal Financial Officer) | |
| | | |
| Date | February 18, 2020 | |