UNITED STATES
SECURITIES AND EXCHANGE COMMISSION
Washington, D.C. 20549
FORM N-CSR
CERTIFIED SHAREHOLDER REPORT OF REGISTERED
MANAGEMENT INVESTMENT COMPANIES
| Investment Company Act file number | 811-02064 |
| |
| PAX WORLD FUNDS SERIES TRUST I |
| (Exact name of Registrant as specified in charter) |
| |
| 30 Penhallow Street, Suite 400, Portsmouth, NH | | 03801 |
| (Address of principal executive offices) | | (Zip code) |
| |
Pax World Management LLC
30 Penhallow Street, Suite 400, Portsmouth, NH 03801
Attn.: Joseph Keefe |
| (Name and address of agent for service) |
| |
| Registrant’s telephone number, including area code: | 800-767-1729 | |
| |
| Date of fiscal year end: | December 31 | |
| |
| Date of reporting period: | December 31, 2020 | |
| | | | | | | | | |
Form N-CSR is to be used by management investment companies to file reports with the Commission not later than 10 days after the transmission to stockholders of any report that is required to be transmitted to stockholders under Rule 30e-1 under the Investment Company Act of 1940 (17 CFR 270.30e-1). The Commission may use the information provided on Form N-CSR in its regulatory, disclosure review, inspection, and policymaking roles.
A registrant is required to disclose the information specified by Form N-CSR, and the Commission will make this information public. A registrant is not required to respond to the collection of information contained in Form N-CSR unless the Form displays a currently valid Office of Management and Budget (“OMB”) control number. Please direct comments concerning the accuracy of the information collection burden estimate and any suggestions for reducing the burden to Secretary, Securities and Exchange Commission, 450 Fifth Street, NW, Washington, DC 20549-0609. The OMB has reviewed this collection of information under the clearance requirements of 44 U.S.C. §3507.
| Item 1. | Reports to Stockholders |

| | |
Glossary of Terms | 2 |
Letter to Shareholders | 5 |
Sustainable Investing Update | 10 |
Portfolio Manager Comments and Highlights | 14 |
Pax Large Cap Fund | 14 |
Pax Small Cap Fund | 18 |
Pax ESG Beta Quality Fund | 22 |
Pax ESG Beta Dividend Fund | 25 |
Pax Global Opportunities Fund | 28 |
Pax Global Environmental Markets Fund | 32 |
Pax Ellevate Global Women’s Leadership Fund | 39 |
Pax MSCI EAFE ESG Leaders Index Fund | 45 |
Pax Core Bond Fund | 51 |
Pax High Yield Bond Fund | 55 |
Pax Sustainable Allocation Fund | 60 |
Shareholder Expense Examples | 64 |
Schedules of Investments | 67 |
Statements of Assets and Liabilities | 118 |
Statements of Operations | 122 |
Statements of Changes in Net Assets | 124 |
Financial Highlights | 130 |
Notes to Financial Statements | 142 |
Report of Independent Registered Public Accounting Firm | 164 |
Board Approval of New Advisory Agreement | 167 |
Trustees and Officers | 169 |
Account Options and Services | 174 |
For More Information |
General Fund Information 800.767.1729 Shareholder Account Information 800.372.7827 Account Inquiries Pax World
P.O. Box 9824
Providence, RI 02940-8024 Investment Adviser Impax Asset Management LLC
30 Penhallow Street, Suite 400
Portsmouth, NH 03801 | Transfer and Dividend Disbursing Agent BNY Mellon Investment
Servicing (U.S.) Inc.
P.O. Box 9824
Providence, RI 02940-8024 Custodian State Street Bank and Trust Company
1 Lincoln Street
Boston, MA 02111 |
Blended Index for the Sustainable Allocation Fund is composed of 60% S&P 500 Index and 40% Bloomberg Barclays U.S. Aggregate Bond Index.
Bloomberg Barclays U.S. Aggregate Bond Index is a broad-based index, maintained by Bloomberg L.P. often used to represent investment grade bonds being traded in the United States.
FTSE Environmental Opportunities Index Series measures the performance of global companies that have significant involvement in environmental business activities, including renewable and alternative energy, energy efficiency, water technology, waste and pollution control and food, agriculture and forestry. The FTSE Environmental Opportunities Index Series requires companies to have at least 20% of their business derived from environmental markets and technologies. The FTSE Environmental Opportunities Index Series is published by a joint venture of Impax Asset Management, Ltd. (“Impax”) with FTSE International. Impax is also the sub-adviser to the Pax Global Environmental Markets Fund.
ICE BofA Merrill Lynch U.S. High Yield - Cash Pay - BB-B (Constrained 2%) Index tracks the performance of BB- and B rated fixed income securities publicly issued in the major domestic or Eurobond markets, with total index allocation to an individual issuer limited to 2%.
Impax Global Women’s Leadership Index is a customized market capitalization-weighted index created and licensed by Impax Asset Management (“IAM”) consisting of equity securities of issuers organized or operating in countries around the world that demonstrate a commitment to advancing and empowering women through gender diversity on their boards, in management and through other policies and programs, and an understanding of the potential business advantages associated with greater gender diversity, as rated by the IAM Gender Analytics team, with final approval by the IAM Women’s Index Committee. In addition, the companies comprising the Women’s Index meet certain environmental, social and governance (ESG) or sustainability thresholds, as rated by MSCI ESG Research.
Lipper Core Bond Funds Index tracks the results of the 30 largest mutual funds in the Lipper Core Bond Funds Index Average. The Lipper Core Bond Funds Index Average is a total return performance average of mutual funds tracked by Lipper, Inc. that invest at least 85% in domestic investment-grade debt issues (rated in the top four grades) with any remaining investment in non-benchmark sectors such as high-yield, global and emerging market debt. These funds maintain dollar-weighted average maturities of five to ten years.
Lipper Equity Income Funds Index tracks the results of the 30 largest mutual funds in the Lipper Equity Income Funds Index Average. The Lipper Equity Income Funds Index Average is a total return performance average of mutual funds tracked by Lipper, Inc. that by prospectus language and portfolio practice, seek relatively high current income and growth of income by investing at least 65% of their portfolio in dividend-paying equity securities.
Lipper Global Multi-Cap Core Funds Index tracks the results of the 30 largest mutual funds in the Global Multi-Cap Core Funds Index Average. The Global Multi-Cap Core Funds Index Average is a total return performance average of mutual funds tracked by Lipper, Inc. that, by portfolio practice, invest in a variety of market capitalization ranges without concentrating 75% of their equity assets in any one market capitalization range over an extended period of time. Global multi-cap core funds typically have average characteristics compared to the MSCI World Index.
Lipper Global Multi-Cap Growth Funds Index tracks the results of funds that invest in a variety of market capitalization ranges without concentrating 75% of their equity assets in any one market capitalization range over an extended period of time. Multi-cap funds typically have 25% to 75% of their assets invested in companies both inside and outside of the U.S. with market capitalizations (on a three-year weighted basis) above 400% of the 75th market capitalization
percentile of the S&P/Citigroup World Broad Market Index. Multi-cap growth funds typically have an above-average price-to-cash flow ratio, price-to-book ratio, and three-year sales-per-share growth value compared to the S&P/Citigroup BMI. One cannot invest directly in an index.
Lipper High Yield Bond Funds Index tracks the results of the 30 largest mutual funds in the Lipper High Yield Bond Funds Average. The Lipper High Yield Bond Funds Average is a total return performance average of mutual funds tracked by Lipper, Inc. that aim at high (relative) current yield from fixed income securities, have no quality or maturity restrictions and tend to invest in lower grade debt issues.
Lipper International Large-Cap Core Funds Index tracks the results of the 30 largest mutual funds in the Lipper International Large-Cap Core Funds Index Average. The Lipper International Large-Cap Core Funds Index Average is a total return performance average of mutual funds tracked by Lipper, Inc. that, by portfolio practice, invest at least 75% of their equity assets in companies strictly outside of the U.S. with market capitalizations (on a three-year weighted basis) above Lipper’s international large-cap floor. International large-cap core funds typically have an average price-to-cash flow ratio, price-to-book ratio and three-year sales-per-share growth value compared to the S&P/Citigroup World ex-U.S. BMI.
Lipper Large-Cap Core Funds Index tracks the results of the 30 largest mutual funds in the Lipper Large Cap Core Funds Index Average. The Lipper Large Cap Core Funds Index Average is a total return performance average of mutual funds tracked by Lipper, Inc. that invest at least 75% of their equity assets in companies with market capitalizations (on a three-year weighted basis) above Lipper’s USDE large-cap floor. Large-cap core funds have more latitude in the companies in which they invest. These funds typically have average characteristics compared to the S&P 500 Index.
Lipper Multi-Cap Core Funds Index tracks the results of the 30 largest mutual funds in the Lipper Multi-Cap Core Funds Index Average. The Lipper Multi-Cap Core Funds Index Average is a total return performance average of mutual funds tracked by Lipper, Inc. that invest in a variety of market capitalization ranges without concentrating 75% of their equity assets in any one market capitalization range over an extended period of time. These funds typically have average characteristics compared to the S&P SuperComposite 1500 Index.
Lipper Small-Cap Core Funds Index tracks the results of the 30 largest mutual funds in the Lipper Small- Cap Core Funds Average. The Lipper Small-Cap Core Funds Average is a total return performance average of the mutual funds tracked by Lipper, Inc. that, by portfolio practice, invest at least 75% of their equity assets in companies with market capitalizations (on a three-year weighted basis) below Lipper’s USDE small-cap ceiling. Small-cap core funds have more latitude in the companies in which they invest. These funds typically have an average price-to-earnings ratio, price-to-book ratio, and three-year sales-per-share growth value, compared to the S&P SmallCap 600 Index.
Morningstar Allocation – 50% to 70% Equity seeks to provide both capital appreciation and income by investing in three major areas: stocks, bonds and cash. These portfolios tend to hold larger positions in stocks than conservative-allocation portfolios. These portfolios typically have 50% to 70% of assets in equities and the remainder in fixed income and cash.
MSCI All-Country World Index (“ACWI”) Index is a free float-adjusted market capitalization weighted index that is designed to measure the equity market performance of developed and emerging markets. The MSCI ACWI consists of 47 country indices comprising 23 developed and 24 emerging market country indices. The developed market country indices included are: Australia, Austria, Belgium, Canada, Denmark, Finland, France, Germany, Hong Kong, Ireland, Israel, Italy, Japan, Netherlands, New Zealand, Norway, Portugal, Singapore, Spain, Sweden, Switzerland, United Kingdom and United States. The emerging market country indices included
Glossary of Terms, continued |
are: Brazil, Chile, China, Colombia, Czech Republic, Egypt, Greece, Hungary, India, Indonesia, Korea, Malaysia, Mexico, Pakistan, Peru, Philippines, Poland, Qatar, Russia, South Africa, Taiwan, Thailand, Turkey and United Arab Emirates.
MSCI EAFE (Europe, Australasia, Far East) Index is a free float-adjusted market capitalization index that is designed to measure the equity market performance of developed markets, excluding the U.S. and Canada. The MSCI EAFE (Net) Index consists of the following 21 developed market country indices: Australia, Austria, Belgium, Denmark, Finland, France, Germany, Hong Kong, Ireland, Israel, Italy, Japan, Netherlands, New Zealand, Norway, Portugal, Singapore, Spain, Sweden, Switzerland, and United Kingdom.
MSCI EAFE ESG Leaders Index is a free float-adjusted market capitalization weighted index designed to measure the performance of equity securities of issuers organized or operating in developed market countries around the world excluding the U.S. and Canada that have high environmental, social and governance (ESG) ratings relative to their sector and industry group peers, as rated by MSCI ESG Research annually. MSCI ESG Research evaluates companies’ ESG characteristics and derives corresponding ESG scores and ratings. Companies are ranked by ESG score against their sector peers to determine their eligibility for the MSCI ESG indices. MSCI ESG Research identifies the highest-rated companies in each peer group to meet the float-adjusted market capitalization sector targets. The rating system is based on general and industry-specific ESG criteria, assigning ratings on a 7-point scale from AAA (highest) to CCC (lowest).
MSCI World Index is a free float-adjusted market capitalization weighted index that is designed to measure the equity market performance of developed markets. The MSCI World Index consists of the following 23 developed market country indices: Australia, Austria, Belgium, Canada, Denmark, Finland, France, Germany, Hong Kong, Ireland, Israel, Italy, Japan, Netherlands, New Zealand, Norway, Portugal, Singapore, Spain, Sweden, Switzerland, the United Kingdom, and the United States.
Russell 1000 Index measures the performance of the 1,000 largest U.S. companies, as measured by market capitalization. It is a subset of the Russell 3000 Index, which measures the largest 3,000 companies. The Russell 1000 Index is comprised of over 90% of the total market capitalization of all listed U.S stocks.
Russell 2000 Index measures the performance of the small-cap segment of the U.S. equity universe. The Russell 2000 Index is a subset of the Russell 3000 Index representing approximately 10% of the total market capitalization of that index. It includes approximately 2,000 of the smallest securities based on a combination of their market cap and current index membership.
The S&P 500 Index is an unmanaged index of large capitalization common stocks.
Performance for the MSCI ACWI Index, the MSCI EAFE Index, the MSCI EAFE ESG Leaders Index, the MSCI World Index and the Impax Global Women’s Leadership Index are shown “net”, which includes dividend reinvestments after deduction of foreign withholding tax.
Securities Indices above assume reinvestment of all distributions and interest payments, have no policy of sustainable investing and do not take into account brokerage fees or expenses.
Lipper Indices above are not what are typically considered to be an “index” because they track the performance of other mutual funds rather than changes in the value of a group of securities, a securities index or some other traditional economic indicator.
Diversification does not eliminate the risk of experiencing investment losses.
One cannot invest directly in any index.
Letter to Shareholders |
by Joseph Keefe, President & CEO |
 Dear fellow shareholders,
The year 2020 will be bookmarked in history for many reasons. At the top of the list is the COVID-19 pandemic, whose impact on human lives and the economy has been far reaching. The virus plunged equities to bear market levels in less than a month, U.S. Treasury rates fell to historically low levels and, almost just as suddenly, equity markets then soared in the fourth quarter against a backdrop of favorable vaccine news, the resolution of the U.S. presidential election and the prospects of additional fiscal stimulus and accommodative monetary policy. In Q4 alone, the S&P 500 Index rose 12.15%, the Russell 2000 Index posted its highest quarterly return ever at 31.4%, and the MSCI EAFE Index of non-U.S. developed market stocks returned 16.1%. Investment grade bonds delivered a modest return in the current environment of low interest rates and tight spreads as the Bloomberg Barclays U.S. Aggregate Bond Index was up 0.7%.
For the one-year period ended December 31, 2020, the institutional class shares of seven out of the 11 Pax World Funds performed in the top half of their Lipper peer groups, and all seven of 11 were in the top third. As we enter 2021, eight out of our nine funds eligible for the Morningstar Sustainability Ratings have also received four or five globes, including our Pax Large Cap Fund and our Pax Sustainable Allocation Fund, which will turn 50 in August.*
Our Pax Global Environmental Markets Fund had been growing quickly even before then President-elect Biden announced $2 trillion in clean energy, low-carbon transport, energy efficiency and other climate-related investments. As I write in mid-January, and despite the dark year behind us, there is reason for optimism and hope.
2021 begins with a vaccine rollout in progress and a new presidential administration in the U.S. that is committed to reversing damaging Trump-era regulatory rollbacks related to the environment and ESG investing. Today’s public policy environment appears much more promising for those of us who are investing in the transition to a more sustainable economy.
I am pleased to see the equal representation of women and men — 12 of each — in the Biden-Harris cabinet. The new administration is the most gender, racially and ethnically diverse in our nation’s history and, as the President said when announcing his final picks, “it taps into the full range of talent we have in our nation.” The
* | For complete Morningstar Sustainability ratings please refer to pages 7 - 9. |
importance of this cannot be overstated. Diverse organizations tend to make better decisions than homogeneous ones. We know this from the work we do, and we know this because it is underscored by a massive body of research. We believe that the diversity of the Biden-Harris team should lead to greater collaboration, less groupthink, less herd behavior, more innovation and better results.
2020 was a year of multiple disruptions, but disruptions can lead to awakenings that in turn spur innovation and change. Whether it be belatedly addressing climate change, or racial injustice, or reforming institutions from public health to education to the way we work, we emerge from 2020 hopefully not only older but wiser, and more committed than ever to promoting positive change.
Perhaps most importantly, we need to rededicate ourselves to the hard work of defending and advancing our democratic institutions. Those institutions have been gravely challenged by recent events. As investors, we understand that vibrant, well-functioning markets are inextricably linked to a vibrant, well-governed democracy. At Impax, we also understand that investing in the transition to a more sustainable economy is also investing in the transition to a more equitable society, and that both depend on the survival, indeed the expansion and flowering, of liberal democracy.
May our work in 2021 defend these institutions and advance this agenda.
On behalf of all of us here at Impax Asset Management and Pax World Funds, I wish you and yours a very healthy, safe and happy year ahead.
Sincerely,

Joseph F. Keefe
President
Performance data quoted represents past performance, which does not guarantee future results. Investment return and principal value of an investment will fluctuate so that an investor’s shares, when redeemed, may be worth more or less than their original cost. Current performance may be lower or higher than the performance data quoted.
Investments involve risk, including potential loss of principal.
You should always consider Pax World Funds’ investment objectives, risks, and charges and expenses carefully before investing. For this and other important information, please download the Funds’ prospectus. Please read it carefully before investing.
The S&P 500 Index is an unmanaged index of large capitalization common stocks. The Bloomberg Barclays U.S. Aggregate Bond Index represents securities that are U.S. domestic, taxable and dollar denominated. The index covers the U.S. investment grade fixed rate bond market, with index components for government and corporate securities and asset-backed securities. The Russell 2000 Index measures the performance of the small-cap segment of the U.S. equity universe. The Russell 2000 Index is a subset of the Russell 3000 Index representing approximately 10% of the total market capitalization of that index. It includes approximately 2,000 of the smallest securities based on a combination of their market cap and current index membership. The MSCI EAFE Index is designed to represent the performance of large and mid-cap securities across 21 developed markets, including countries in Europe, Australasia and the Far East, excluding the U.S. and Canada. The Index is available for a number of regions, market segments/sizes and covers approximately 85% of the free float-adjusted market capitalization in each of the 21 countries.
One cannot invest directly in any index.
The Morningstar Sustainability Rating measures how well the companies in a fund’s portfolio manage their environmental, social and governance (ESG) risks and opportunities relative to the fund’s peers. First, a Morningstar Portfolio Sustainability Score™ ranging from 0 to 100 is derived from an asset weighted average of the underlying company ESG scores quarterly. Next, scored funds are rated monthly: The top 10% receive 5 globes (High), the next 22.5% receive 4 (Above Average), the next 35% receive 3 (Average), the next 22.5% receive 2 (Below Average), and the bottom 10% receive 1 (Low). Sustainalytics provides company-level analysis used in the calculation of Morningstar’s Sustainability Score. A higher score indicates that a fund, on average, has more of its assets invested in companies that score well according to the Sustainalytics methodology. For details, visit http://morningstar.com/company/sustainability.
Sustainability Score for the Pax Sustainable Allocation Fund as of 11/30/2020 is 20.86. Percent Rank in Category is 4 and Sustainability Rating is 5 globes as of 11/30/2020.
Sustainability Score for the Pax Large Cap Fund as of 11/30/2020 is 20.71. Percent Rank in Category is 4 and Sustainability Rating is 5 globes as of 11/30/2020.
Sustainability Score for the Pax ESG Beta Quality Fund as of 11/30/2020 is 21.10. Percent Rank in Category is 14 and Sustainability Rating is 4 globes as of 11/30/2020.
Sustainability Score for the Pax ESG Beta Dividend Fund as of 11/30/2020 is 20.76. Percent Rank in Category is 5 and Sustainability Rating is 5 globes as of 11/30/2020.
Sustainability Score for the Pax Global Opportunities Fund as of 11/30/2020 is 19.70. Percent Rank in Category is 3 and Sustainability Rating is 5 globes as of 11/30/2020.
Sustainability Score for the Pax Global Environmental Markets Fund as of 11/30/2020 is 20.80. Percent Rank in Category is 12 and Sustainability Rating is 4 globes as of 11/30/2020.
Sustainability Score for the Pax Ellevate Global Women’s Leadership Fund as of 11/30/2020 is 20.84. Percent Rank in Category is 13 and Sustainability Rating is 4 globes as of 11/30/2020.
Sustainability Score for the Pax MSCI EAFE ESG Leaders Index Fund as of 11/30/2020 is 20.77. Percent Rank in Category is 12 and Sustainability Rating is 4 globes as of 11/30/2020.
Lipper Leader scores are subject to change every month and are calculated for the following time periods: 3-year, 5-year, 10-year, and overall. The overall calculation is based on an equal-weighted average of percentile rank for each category metric over three-, five-, and ten-year periods (if applicable). The top 20% of funds in each classification are rated 5 and are named Lipper Leaders, the next 20% are rated 4, the middle 20% are rated 3, the next 20% are rated 2, and the lowest 20% are rated 1.
Lipper rankings are based on total returns (not including sales charges) for the periods indicated and compare total return performance with that of other funds in the category.
Data shown represents rankings for the Pax Ellevate Global Women’s Index Fund — Institutional Class (PXWIX) — as of 12/31/20 in the Lipper Global Multi-Cap Core category based on average annual returns. The Pax Ellevate Global Women’s Index Fund — Institutional Class (PXWIX) — 1-year 58th percentile rank out of 136 funds, 3-year 21st percentile rank out of 111 funds, 5-year 27th percentile rank out of 90 funds, 10-year 40th percentile rank out of 64 funds.
Data shown represents rankings for the Pax Large Cap Fund — Institutional Class (PXLIX) — as of 12/31/20 in the Lipper Large-Cap Core category based on average annual returns. The Pax Large Cap Fund — Institutional Class (PXLIX) — 1 year 9th percentile rank out of 639 funds, 3 year 3rd percentile rank out of 584 funds.
Data shown represents rankings for the Pax Small Cap Fund — Institutional Class (PXSIX) — as of 12/31/2020 in the Lipper Small-Cap Core category based on average annual returns. The Pax Small Cap Fund — Institutional Class (PXSIX) — 1-year 36th percentile rank out of 900 funds, 3-year 54th percentile rank out of 853 funds, 5-year 67th percentile rank out of 745 funds, 10-year 50th percentile rank out of 544 funds.
Data shown represents rankings for the Pax ESG Beta Quality Fund — Institutional Class (PWGIX) — as of 12/31/2020 in the Lipper Multi Cap Core category based on average annual returns. The Pax ESG Beta Quality Fund — Institutional Class (PWGIX) — 1-year 66th percentile rank out of 661 funds, 3-year 52nd percentile rank out of 598 funds, 5-year 60th percentile rank out of 525 funds, 10-year 62nd percentile rank out of 387 funds.
Data shown represents rankings for the Pax ESG Beta Dividend Fund — Institutional Class (PXDIX) — as of 12/31/2020 in the Lipper Equity Income category based on average annual returns. The Pax ESG Beta Dividend Fund — Institutional Class (PXDIX) — 1-year 9th percentile rank out of 489 funds, 3-year 8th percentile out of 462 funds.
Data shown represents rankings for the Pax Global Opportunities Fund — Institutional Class (PXGOX) — as of 12/31/2020 in the Lipper Global Multi-Cap Growth category based on average annual returns. The Pax Global Opportunities Fund — Institutional Class (PXGOX) — 1-year 76th percentile rank out of 193 funds.
Data shown represents rankings for the Pax Global Environmental Markets Fund — Institutional Class (PGINX) — as of 12/31/2020 in the Lipper Global Multi-Cap Core category based on average annual returns. The Pax Global Environmental Markets Fund — Institutional Class (PGINX) — 1-year 10th percentile rank out of 136 funds, 3-year 8th percentile rank out of 111 funds, 5-year 4th percentile rank out of 90 funds, 10-year 10th percentile rank out of 64 funds.
Data shown represents rankings for the Pax MSCI EAFE ESG Leaders Index Fund — Institutional Class (PXNIX) — as of 12/31/2020 in the International Large-Cap Core category based on average annual returns. The Pax MSCI EAFE ESG Leaders Index Fund — Institutional Class (PXNIX) — 1-year 25th percentile rank out of 116 funds, 3-year 6th percentile rank out of 103 funds, 5-year 46th percentile rank out of 86 funds.
Data shown represents rankings for the Pax High Yield Bond Fund — Institutional Class (PXHIX) — as of 12/31/2020 in the Lipper High Yield Bond category based on average annual returns. The Pax High Yield Bond Fund — Institutional Class (PXHIX) — 1-year 9th percentile rank out of 509 funds, 3-year 9th percentile rank out of 474 funds, 5-year 17th percentile rank out of 418 funds, 10-year 66th percentile rank out of 324 funds.
Data shown represents rankings for the Pax Sustainable Allocation Fund — Institutional Class (PAXIX) — as of 12/31/2020 in the Morningstar Allocation–50% to 70% Equity category based on average annual returns. The Pax Sustainable Allocation Fund — Institutional Class (PAXIX) — 1-year 16th percentile rank out of 673 funds, 3-year 14th percentile rank out of 636 funds, 5-year 22nd percentile rank out of 575 funds, 10 year 35th percentile rank out of 414 funds.
Data shown represents rankings for the Pax Core Bond Fund — Institutional Class (PABIX) — as of 12/31/2020 in the Lipper Core Bond category based on average annual returns. The Pax Core Bond Fund — Institutional Class (PABIX) — 1-year 84th percentile rank out of 506 funds, 3-year 75th percentile rank out of 476 funds.
December 31, 2020 |
Sustainable Investing Update (Unaudited) |

|
Senior Vice President
for Sustainable
Investing Julie Gorte, Ph.D. |
2020: The Year Everything Changed
By most accounts, 2020 will go down as a rotten year. But for all its many, many negatives, it was a year that had much to teach us. Multiple crises offered a unique lens through which to view humanity and humans, and because humans, and the decisions they make and the companies they run, are at the very heart of our work in sustainable investing, it was also a fascinating year that offered great insight for the work that we do here at Impax.
A pandemic moves in
Crises, though painful, offer clues about companies’ true characters, and the pandemic has been no exception. Early in 2020 we began analyzing companies’ handling of the COVID-19 crisis, looking at such issues as how they were implementing furloughs, how they were handling executives’ pay amid company-wide cuts and how they were ensuring the safety of their employees and customers. Every company’s approach offered nuggets about its philosophy of people management, and because any company’s success is tied to the success of its workers, it also offered critical insight about the long-term prospects of the companies we looked at.
The information we gleaned — both the positive and negative examples of companies’ pandemic responses — provided fodder for our engagements on this topic throughout 2020. We asked companies to consider how they might extend or expand remote work arrangements and how they might modify their paid leave policies to help protect their entire workforce. Ensuring the long-term success of all workers will be key components of risk management and business continuity going forward, and we will continue engaging with companies on this topic to help them identify structural changes that could make them more resilient. For all it has wrought, the pandemic has also shown what is possible, and there’s much to be gained from that insight.
Public policy goes pear-shaped
Sustainable Investing Rules
Public policy demanded more of our attention than usual during 2020, on multiple fronts. The Department of Labor (DOL) produced new rules that would handicap sustainable investors. One proposed rule sought to discourage retirement plans from investing in funds that integrate environmental, social and governance (ESG) factors, falsely contending that ESG factors were nonpecuniary or detracted from
returns. We registered opposition, and our comment letter to the DOL included an appendix with more than 300 research citations that link ESG performance to financial performance, suggesting that ESG considerations can be very material to how companies and investment portfolios perform and that ignoring them would not be in the best interests of retirees. The final rule was significantly less restrictive than the original proposed rule, eliminating references to ESG, and simply reiterating that any considerations included in a fund on any ERISA platform must be pecuniary, or material to investment performance.
We also registered opposition to a DOL-proposed rule designed to hush the voices of certain shareholders by making proxy voting much more onerous. The original proposed rule would have required that every vote on every item on every proxy that investors vote must have a cost/benefit analysis, unless voted in line with management recommendations. Many of the comment letters about this rule, including ours, pointed out that this was both burdensome and costly, and not in the interests of shareholders. The final rule omitted that requirement but reiterated existing regulatory advice to vote every proxy in line with fiduciary duty.
Climate change
Despite a reduction in air travel, commuting and other greenhouse gas-producing activities in 2020, our planet continues to warm, and the physical risks associated with a changing climate continue to increase for investors. In June we filed a petition for rulemaking with the Securities and Exchange Commission asking that companies be required to disclose the precise locations of their significant assets so that investors, analysts and financial markets can better assess the physical risks they face connected with climate change. Where a company is located can say a lot about its vulnerability to climate change — e.g., whether it is vulnerable to or protected from risks such as sea level rise or coastal storm surge — but companies for the most part are not required to report their physical locations. Without that more precise physical location data, investors will be vulnerable to an increasingly frequent and severe set of climate-related events.
In the fall we teamed up with the New York State Common Retirement Fund to ask companies in the S&P 500 Index to voluntarily disclose the locations of their significant assets, including facilities, reserves, buildings and installations whose loss or impairment would impact financial results. To date, we’ve heard from back from many of the 500 companies, and we’ve had conversations with more than 50 of them as of the end of 2020. We have been encouraged to see that at least a few companies have given physical risk much thought, but others have a steeper learning curve to ascend on this topic. We believe that our engagement will help them understand its importance.
Racial injustice in action
As we have seen during the pandemic, environmental stressors can contribute significantly to the higher mortality rate among racial minorities in the United States. That’s why we have asked chemical companies that operate in areas where the surrounding demographics are disproportionately racial and ethnic minorities to: 1) take steps to curtail pollution and 2) to report publicly on their production, management, and use of cleaner alternatives in areas where their operations expose surrounding communities to harmful chemicals.
Investing in the transition to a more sustainable economy also means investing in the transition to a more just society — one that values the lives, livelihoods and talents of every single person. We’ll keep pressing companies and policymakers on these issues, and with the new presidential administration making environmental justice a big focus as well, we’ll hope to have some winds at our backs for a change.
Hope on the horizon
The Biden-Harris administration has made climate action and equality pillars of its plans to move America forward. This is a welcome development for us here at Impax since these are our major engagement focus areas. The timing couldn’t be better: The clock is ticking on climate, and hundreds of thousands of women lost or left their jobs in 2020 largely due to the ancillary effects of the pandemic, creating a “she-cession” that will take a multitude of public and private sector players to correct. Biden’s cabinet nominees and appointees have deep experience on these themes, but much of the administration’s agenda will require Congressional approval, and it remains to be seen whether they will be able to deliver their ambitious agenda with only a thin majority in the Senate.
We will not let up. We’ll continue urging companies to become more sustainable, because we believe that more sustainable companies are more resilient companies that will be better positioned to weather future crises and downturns — for there will be others. It is in our best interests as investors, and as global citizens, to ensure the companies in our portfolios are doing whatever they reasonably can to become more resilient. This is the core of our engagement work.
Sincerely,
Julie Gorte, Ph.D.
SVP for Sustainable Investing
Commentary The portfolio manager commentaries in this report provide insight from the respective fund managers in an effort to help you examine your fund. The views expressed therein are those of the portfolio managers and are for the period covered by this report. Such commentary does not necessarily represent the views of the Board of Trustees of your fund. The views expressed herein are subject to change at any time based upon market and/or other conditions and Impax Asset Management LLC and the funds disclaim any responsibility to update such views. The commentaries should not be relied upon as investment advice.
Historical performance Historical performance can be evaluated in several ways. Each fund’s portfolio highlights provide total and average annual total returns. A comparison of this historical data to an appropriate benchmark is also provided. These performance figures include changes in a fund’s share price, plus reinvestment of any dividends (generally income) and any capital gains (generally profits the fund earns when it sells securities that have grown in value). Past performance does not guarantee future results.
The Funds’ distributor, Foreside Financial Services, LLC is not affiliated with Impax Asset Management LLC or Impax Asset Management, Ltd.
December 31, 2020 |
Pax Large Cap Fund |

|
Portfolio Manager
Andrew Braun |
| |

|
Portfolio Manager
Barbara Browning, CFA |
Portfolio Managers’ Comments |
How did the Pax Large Cap Fund (the Fund) perform for the period?
For the one-year period ended December 31, 2020, the Institutional Class and Investor Class of the Fund had total returns of 23.99% and 23.75%, respectively, compared to 18.40% for the S&P 500 Index and 16.10% for the Lipper Large-Cap Core Funds Index.
What factors contributed to the Fund’s performance?
The Fund outperformed the S&P 500 Index for calendar year 2020 and experienced broad-based contributions from nearly every sector. The sectors which contributed the most to performance were Industrials, Consumer Discretionary and Real Estate, while only the Health Care and Materials sectors detracted from the Fund’s overall relative performance. In addition, The Fund is fossil fuel-free, which benefitted performance during the period as the Energy sector underperformed the broader market.
Can you discuss any significant changes to the Fund’s positioning throughout the period?
The Fund added to Information Technology and Health Care during the period, while trimming its weight in Communication Services. The Fund was positioned relatively defensively at the beginning of the period, and gradually we added more cyclically exposed and attractively valued companies as the year progressed, with a focus on prospects for attractive earnings and cash flow growth looking out to 2022.
What portfolio holdings contributed positively to performance?
Notable holdings that contributed positively to performance in 2020 were UPS, T-Mobile, and Trane Technologies. The Fund bought UPS early in 2020 based largely on its inexpensive valuation, and the company soon revalued upward as e-commerce demand skyrocketed due to COVID-19. T-Mobile finally closed on its acquisition of Sprint after a two-year regulatory review, reported strong growth in new subscribers all year, and has begun executing on the considerable cost
synergies associated with the merger. Trane separated from Ingersoll-Rand early in 2020 and has established itself as a leading provider of environmentally-friendly HVAC equipment.
What portfolio holdings detracted from performance?
Notably weak holdings were AIG and Merck. AIG stock price suffered from elevated COVID-related claims and the negative effect of lower interest rates on its businesses. After the company announced a separation of its life and retirement business from its core property/casualty operations, we decided to exit the stock. Merck stock price lagged despite its business performing in-line with expectations, as fears of drug price regulation and a more cautious approach to COVID-19 related drug discovery pressured the stock’s valuation in 2020.
Portfolio Highlights (Unaudited)
Since Inception Total Return—Historical Growth of $10,000

December 31, 2020 |
Pax Large Cap Fund, continued |
Portfolio Highlights (Unaudited), continued |
Returns—Period ended December 31, 2020
| | | | | | Total
Return | Average Annual Return |
Share Class | Ticker
Symbol | | | | 1 Year | 3 Years | Since
Inception1 |
Institutional Class2 | PXLIX | | | | 23.99% | 16.82% | 17.43% |
Investor Class2 | PAXLX | | | | 23.75% | 16.55% | 17.15% |
S&P 500 Index | | | | | 18.40% | 14.18% | 15.63% |
Lipper Large-Cap Core Funds Index | | | | 16.10% | 12.42% | 14.09% |
See ‘Glossary of Terms’ for descriptions of benchmarks.
These figures represent past performance, which is no guarantee of future results. Investment return and principal value of an investment will fluctuate so that an investor’s shares, when redeemed, may be worth more or less than their original cost. Current performance may be lower or higher than the performance data quoted. Total returns for periods of less than one year have not been annualized. For most recent month-end performance data, please visit www.impaxam.com or call 800.767.1729.
1 | The Fund’s inception date is December 16, 2016. |
2 | Total return figures include reinvested dividends and capital gains distributions, and changes in principal value, and do not reflect the taxes that a shareholder might pay on Fund distributions or on the redemption of Fund shares. |
Asset Allocation | Percent of Investments |
U.S. Stocks | 98.5% |
Cash & Cash Equivalents | 1.5% |
Total | 100.0% |
Top Ten Holdings
Company | Percent of Net Assets |
Microsoft Corp. | 5.4% |
Apple, Inc. | 4.9% |
Amazon.com, Inc. | 3.3% |
Voya Financial, Inc. | 3.1% |
Procter & Gamble Co., The | 2.8% |
Applied Materials, Inc. | 2.8% |
Alphabet, Inc., Class A | 2.6% |
Alphabet, Inc., Class C | 2.6% |
Lowe’s Cos., Inc. | 2.6% |
Target Corp. | 2.6% |
Total | 32.7% |
Ten largest holdings do not include money market securities, certificates of deposit, commercial paper or cash and equivalents, if applicable
Holdings are subject to change
Sector Diversification
Sector | Percent of Net Assets |
Information Technology | 28.7% |
Health Care | 16.7% |
Consumer Discretionary | 12.1% |
Financials | 11.3% |
Communication Services | 9.9% |
Industrials | 7.5% |
Real Estate | 4.8% |
Consumer Staples | 4.7% |
Materials | 1.7% |
Utilities | 1.0% |
Other assets and liabilities (net) | 1.6% |
Total | 100.0% |
May include companies representing multiple industries within a single “Sector”.
December 31, 2020 |
Pax Small Cap Fund |

|
Portfolio Manager
Nathan Moser, CFA |
Portfolio Manager’s Comments |
How did the Pax Small Cap Fund (the Fund) perform for the period?
For the one-year period ended December 31, 2020, the Investor Class, Class A, and Institutional Class shares of the Fund had total returns of 11.77%, 11.73% and 12.06%, respectively, compared to 19.96% for the Russell 2000 Index and 10.69% for the Lipper Small-Cap Core Funds Index.
What factors contributed to the Fund’s performance?
2020 was a volatile year in the equity markets due to the COVID-19 pandemic and its effect on society and the global economy. Aggressive fiscal stimulus and accommodative monetary policy helped equity markets perform well during the period, despite worsening COVID-19 trends. Positive vaccine data and subsequent approvals buoyed sentiment in the latter half of the year, allowing investors to look though near-term economic weakness to the eventual re-opening of the economy. This catalyzed small cap stocks in particular, leading to outperformance versus their large cap counterparts as smaller companies are more cyclically oriented.
While the Fund had strong performance in the Technology and Communication Services sectors, this was more than offset by poor results within Healthcare and Industrials. The Fund’s higher quality, lower risk positioning was a headwind to performance as low quality companies we believe are significantly outperformed during the year.
Can you discuss any significant changes to the Fund’s positioning throughout the period?
Over the period, we reduced exposure to the Technology and Utilities sectors, while increasing our allocation to the Industrials and Financials sectors. We are increasingly optimistic about an improving economy and have begun to position the Fund in sectors and companies we believe are poised to benefit from faster economic growth.
What portfolio holdings contributed positively to performance?
Darling Ingredients, an agricultural company with a growing biofuel business, increased 189% during the period. Their joint venture with Valero, Diamond Green Diesel, is increasingly viewed as a value driver for the overall business. The U.S. presidential election and subsequent Senate outcome increased the odds of the current favorable tax policy for the industry continuing into the future. While we acknowledge that valuation has expanded, we continue to view the shares as attractive given the potential upside to consensus earnings estimates.
Horizon Therapeutics, a bio-pharmaceutical company, increased 34% during the period that we held shares. Shares performed well on the better than expected launch of their thyroid eye disease drug, Tepezza. This drug provides a solution for a patient population with very few non-surgical options. This pent-up demand helped the company overcome industry challenges related to the COVID-19 pandemic. We exited the position as Horizon’s market cap moved above our small cap threshold.
What portfolio holdings detracted from performance?
Ligand Pharmaceuticals, a diversified bio-pharmaceutical company, declined -5% during the period. The company reported positive financial results and raised guidance several times due in large part to their product, Captisol, which is part of Gilead Sciences’ COVID-19 therapy, Remdesivir. However, Ligand’s underperformance reflected concerns over the durability of Captisol’s strong revenue growth as well as the early stage nature of Ligand’s partnered product pipeline. We used weakness in shares as an opportunity to add to our position because we believe investors are underestimating the earnings power of Ligand’s business.
MRC Global, an industrial distributor of pipes, valves and fittings, declined -51% during the year. The company was negatively impacted by reduced expenditures by their customers. We believe customers are poised to accelerate spending as economic growth improves. Over the course of the downturn, the company has cut costs, which should enable significant margin expansion as revenue growth returns. In addition, we are encouraged by management’s strategy of shifting their product mix towards higher value-add products, like valves. These valves not only carry higher margins but are critical in combatting the negative environmental impact from gas leaks.
December 31, 2020 |
Pax Small Cap Fund, continued |
Portfolio Highlights (Unaudited)
Ten Year Annual Total Return—Historical Growth of $10,000
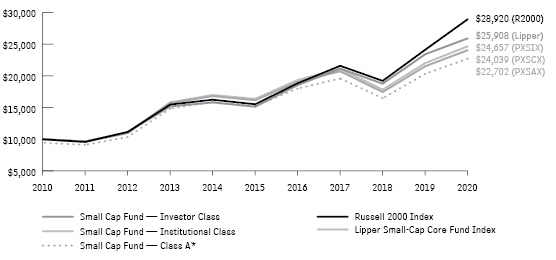
* | Represents a hypothetical investment of $10,000 in the fund after deducting the maximum sales load of 5.5% ($10,000 investment minus $550 sales load = $9,450). |
Returns—Period ended December 31, 2020
| | | | | | Total
Return | Average Annual Return |
Share Class | Ticker
Symbol | | | | 1 Year | 3 Years | 5 Years | 10 Years |
Investor Class1 | PXSCX | | | | 11.77% | 5.07% | 8.26% | 9.16% |
Class A1,2,4 | PXSAX | NAV3 | | | 11.73% | 5.04% | 8.24% | 9.15% |
| | | POP | | | 5.60% | 3.09% | 7.03% | 8.54% |
Institutional Class1 | PXSIX | | | | 12.06% | 5.32% | 8.54% | 9.44% |
Russell 2000 Index | | | | | 19.96% | 10.25% | 13.26% | 11.20% |
Lipper Small-Cap Core Funds Index | | | | 10.69% | 7.06% | 11.37% | 10.00% |
See ‘Glossary of Terms’ for descriptions of benchmarks.
These figures represent past performance, which is no guarantee of future results. Investment return and principal value of an investment will fluctuate so that an investor’s shares, when redeemed, may be worth more or less than their original cost. Current performance may be lower or higher than the performance data quoted. Total returns for periods of less than one year have not been annualized. For most recent month-end performance data, please visit www.impaxam.com or call 800.767.1729.
1 | The Fund’s investment adviser assumed certain expenses during the 10-year period; total returns would have been lower had these expenses not been assumed. Total return figures include reinvested dividends and capital gains distributions, and changes in principal value, and do not reflect the taxes that a shareholder might pay on Fund distributions or on the redemption of Fund shares. |
2 | A 1.00% CDSC (contingent deferred sales charge) may be charged on any shares sold within 18 months of purchase over $1 million. POP (public offering price) reflects the maximum sales load for the Fund’s Class A Shares of 5.50%. NAV performance does not reflect the deduction of the sales load of the CDSC, which if reflected would reduce the performance shown. |
4 | Inception of Class A shares is May 1, 2013. The performance information shown for Class A shares includes the performance of Investor Class shares, adjusted to reflect the sales charge applicable to Class A shares, for the period prior to Class A inception. |
Asset Allocation | Percent of Investments |
Foreign Stocks | 3.8% |
U.S. Stocks | 93.0% |
Cash & Cash Equivalents | 3.2% |
Total | 100.0% |
Top Ten Holdings
Company | Percent of Net Assets |
Victory Capital Holdings, Inc., Class A | 5.7% |
HomeTrust Bancshares, Inc. | 4.4% |
Meridian Bancorp, Inc. | 3.8% |
White Mountains Insurance Group, Ltd. | 2.9% |
Ligand Pharmaceuticals, Inc. | 2.7% |
Voya Financial, Inc. | 2.5% |
Coherus Biosciences, Inc. | 2.5% |
RealPage, Inc. | 2.4% |
Darling Ingredients, Inc. | 2.0% |
Natus Medical, Inc. | 2.0% |
Total | 30.9% |
Ten largest holdings do not include money market securities, certificates of deposit, commercial paper or cash and equivalents, if applicable
Holdings are subject to change
Sector Diversification
Sector | Percent of Net Assets |
Financials | 20.2% |
Industrials | 17.8% |
Health Care | 14.5% |
Information Technology | 13.9% |
Consumer Discretionary | 9.0% |
Real Estate | 7.8% |
Consumer Staples | 7.2% |
Communication Services | 4.3% |
Materials | 1.0% |
Other assets and liabilities (net) | 4.3% |
Total | 100.0% |
May include companies representing multiple industries within a single “Sector”.
December 31, 2020 |
Pax ESG Beta Quality Fund |
Portfolio Managers
Ran Leshem
Robert Tymoczko
Michael Branch, CFA
Annie Tan
Sub-Adviser
Aperio Group, LLC1
| | 1 | See Note F for additional information |
Portfolio Managers’ Comments |
How did the Pax ESG Beta Quality Fund (the Fund) perform for the period?
For the one-year period ended December 31, 2020, the Pax ESG Beta Quality Fund Investor Class, Class A, and Institutional Class shares had total returns of 13.34%, 13.33% and 13.57%, respectively, compared to 20.96% for the Russell 1000 Index and 21.20% for the Lipper Multi-Cap Core Funds Index.
What factors contributed positively to performance?
The Fund’s exposure to companies with higher profitability, a traditional quality factor, contributed to relative performance for the period.
As part of the Fund’s proprietary SmartCarbonTM approach, there is no fossil fuel exposure in the portfolio, which benefited performance as the Energy sector lagged due to a weak outlook for global oil demand.
What factors detracted from performance?
The tilt toward value stocks, as measured by the earnings yield, was a detractor as value underperformed growth during the economic recovery. A tilt towards companies with lower volatility (i.e., low beta) detracted from relative performance for the period.
An overweight to the Consumer Discretionary sector, which is driven by the factor and ESG tilts, detracted from relative returns as widespread shutdowns and economic uncertainty weighed heavily on hotels, restaurants and retailers.
Weighting the portfolio toward companies with stronger ESG characteristics is one of the five factors used in this smart beta strategy, which is designed to deliver strong long-term investment performance. On a short-term basis, however, ESG and other factors can negatively affect returns. During the period, companies with stronger ESG profiles, particularly those in the top quartile as measured by the Impax Sustainability Score, underperformed companies with weaker ESG profiles. The Fund’s overweight to companies with the strongest ESG profiles detracted from relative performance.
Portfolio Highlights (Unaudited)
Ten Year Annual Total Return—Historical Growth of $10,000

* | Represents a hypothetical investment of $10,000 in the fund after deducting the maximum sales load of 5.5% ($10,000 investment minus $550 sales load = $9,450). |
Returns—Period ended December 31, 2020
| | | | | | Total
Return | Average Annual Return |
Share Class | Ticker
Symbol | | | | 1 Year | 3 Years | 5 Years | 10 Years |
Investor Class1 | PXWGX | | | | 13.34% | 11.22% | 12.25% | 11.31% |
Class A1,2,4 | PXGAX | NAV3 | | | 13.33% | 11.20% | 12.25% | 11.31% |
| | | POP | | | 7.11% | 9.14% | 10.99% | 10.68% |
Institutional Class1 | PWGIX | | | | 13.57% | 11.49% | 12.52% | 11.58% |
Russell 1000 Index | | | | | 20.96% | 14.82% | 15.60% | 14.01% |
Lipper Multi-Cap Core Funds Index | | | | 21.20% | 13.09% | 14.37% | 12.25% |
See ‘Glossary of Terms’ for descriptions of benchmarks.
These figures represent past performance, which is no guarantee of future results. Investment return and principal value of an investment will fluctuate so that an investor’s shares, when redeemed, may be worth more or less than their original cost. Current performance may be lower or higher than the performance data quoted. Total returns for periods of less than one year have not been annualized. For most recent month-end performance data, please visit www.impaxam.com or call 800.767.1729.
1 | The Fund’s investment adviser assumed certain expenses during the 5-year and 10-year periods; total returns would have been lower had these expenses not been assumed. Total return figures include reinvested dividends and capital gains distributions, and changes in principal value, and do not reflect the taxes that a shareholder might pay on Fund distributions or on the redemption of Fund shares. |
2 | A 1.00% CDSC (contingent deferred sales charge) may be charged on any shares sold within 18 months of purchase over $1 million. POP (public offering price) reflects the maximum sales load for the Fund’s Class A Shares of 5.50%. NAV performance does not reflect the deduction of the sales load of the CDSC, which if reflected would reduce the performance shown. |
December 31, 2020 |
Pax ESG Beta Quality Fund, continued |
Portfolio Highlights (Unaudited), continued
4 | Inception of Class A shares is May 1, 2013. The performance information shown for Class A shares includes the performance of Investor Class shares, adjusted to reflect the sales charge applicable to Class A shares, for the period prior to Class A inception. |
Asset Allocation | Percent of Investments |
Foreign Stocks | 0.7% |
U.S. Stocks | 98.6% |
Cash & Cash Equivalents | 0.7% |
Total | 100.0% |
Top Ten Holdings
Company | Percent of Net Assets |
Apple, Inc. | 6.0% |
Microsoft Corp. | 4.7% |
Amazon.com, Inc. | 3.9% |
Alphabet, Inc., Class A | 3.0% |
Texas Instruments, Inc. | 2.8% |
Verizon Communications, Inc. | 2.7% |
Thermo Fisher Scientific, Inc. | 2.6% |
Johnson & Johnson | 2.2% |
Allstate Corp., The | 1.8% |
MetLife, Inc. | 1.8% |
Total | 31.5% |
Ten largest holdings do not include money market securities, certificates of deposit, commercial paper or cash and equivalents, if applicable.
Holdings are subject to change.
Sector Diversification
Sector | Percent of Net Assets |
Information Technology | 30.0% |
Health Care | 16.0% |
Consumer Discretionary | 11.8% |
Communication Services | 10.5% |
Financials | 9.4% |
Industrials | 8.3% |
Consumer Staples | 7.0% |
Materials | 2.2% |
Utilities | 2.2% |
Real Estate | 2.1% |
Other assets and liabilities (net) | 0.5% |
Total | 100.0% |
May include companies representing multiple industries within a single “Sector”.
December 31, 2020 |
Pax ESG Beta Dividend Fund |
Portfolio Managers
Ran Leshem
Robert Tymoczko
Michael Branch, CFA
Annie Tan
Sub-Adviser
Aperio Group, LLC1
| | 1 | See Note F for additional information |
Portfolio Managers’ Comments |
How did the Pax ESG Beta Dividend Fund (the Fund) perform for the period?
For the one-year period ended December 31, 2020, the Fund’s Institutional Class and Investor Class shares had total returns of 14.54% and 14.25%, respectively, compared to 20.96% for the Russell 1000 Index and 4.72% for the Lipper Equity Income Funds Index.
What factors contributed positively to performance?
The Fund’s exposure to companies with higher profitability, a traditional quality factor, contributed to relative performance for the period.
As part of the Fund’s proprietary SmartCarbonTM approach, there is no fossil fuel exposure in the portfolio, which benefited performance as the Energy sector lagged due to a weak outlook for global oil demand.
What factors detracted from performance?
The tilt towards companies with higher dividend yield1 had a negative impact on returns as investors favored higher growth companies (with low dividend payouts) over more stable, dividend paying companies.
The Fund’s exposure to companies with higher management quality — a measure of the extent of asset expansion, capital expenditure growth and share issuance growth – was a detractor for the period. The Fund’s exposure to companies with higher earnings quality – a measure of the uncertainty around a company’s operating fundamentals – also detracted from performance.
Weighting the portfolio toward companies with stronger ESG characteristics is one of the five factors used in this smart beta strategy, which is designed to deliver strong long-term investment performance. On a short-term basis, however, ESG and other factors can negatively affect returns. During the period, companies with stronger ESG profiles, particularly those in the top quartile as measured by the Impax Sustainability Score, underperformed companies with weaker ESG profiles. The Fund’s overweight to companies with the strongest ESG profiles detracted from relative performance.
December 31, 2020 |
Pax ESG Beta Dividend Fund, continued |
1 | Dividend yield is the ratio of a company’s annual dividend compared to its share price. |
Portfolio Highlights (Unaudited)
Since Inception Total Return—Historical Growth of $10,000

Returns—Period ended December 31, 2020
| | | | | Total
Return | Average Annual Return |
Share Class | Ticker
Symbol | | | 1 Year | 3 Year | Since
Inception1 |
Institutional Class2 | PXDIX | | | 14.54% | 11.56% | 13.10% |
Investor Class2 | PAXDX | | | 14.25% | 11.23% | 12.80% |
Russell 1000 Index | | | | 20.96% | 14.82% | 16.08% |
Lipper Equity Income Funds Index | | | 4.72% | 7.31% | 9.27% |
See ‘Glossary of Terms’ for descriptions of benchmarks.
These figures represent past performance, which is no guarantee of future results. Investment return and principal value of an investment will fluctuate so that an investor’s shares, when redeemed, may be worth more or less than their original cost. Current performance may be lower or higher than the performance data quoted. Total returns for periods of less than one year have not been annualized. For most recent month-end performance data, please visit www.impaxam.com or call 800.767.1729.
1 | The Fund’s inception date is December 16, 2016. |
2 | Total return figures include reinvested dividends and capital gains distributions, and changes in principal value, and do not reflect the taxes that a shareholder might pay on Fund distributions or on the redemption of Fund shares. |
Asset Allocation | Percent of Investments |
U.S. Stocks | 99.0% |
Cash & Cash Equivalents | 1.0% |
Total | 100.0% |
Top Ten Holdings
Company | Percent of Net Assets |
Apple, Inc. | 6.0% |
Microsoft Corp. | 4.6% |
Amazon.com, Inc. | 3.9% |
Texas Instruments, Inc. | 3.0% |
Johnson & Johnson | 2.6% |
Home Depot, Inc., The | 2.4% |
Prudential Financial, Inc. | 2.4% |
American Financial Group, Inc. | 2.3% |
Alphabet, Inc., Class A | 2.2% |
Cisco Systems, Inc. | 2.2% |
Total | 31.6% |
Ten largest holdings do not include money market securities, certificates of deposit, commercial paper or cash and equivalents, if applicable
Holdings are subject to change
Sector Diversification
Sector | Percent of Net Assets |
Information Technology | 32.5% |
Health Care | 13.1% |
Consumer Discretionary | 12.5% |
Industrials | 8.9% |
Financials | 7.7% |
Communication Services | 6.6% |
Consumer Staples | 5.9% |
Real Estate | 5.7% |
Materials | 5.6% |
Utilities | 0.4% |
Other assets and liabilities (net) | 1.1% |
Total | 100.0% |
May include companies representing multiple industries within a single “Sector”.
December 31, 2020 |
Pax Global Opportunities Fund |

|
Portfolio Manager
Kirsteen Morrison |
| |

|
Portfolio Manager
David Winborne Sub-Adviser
Impax Asset Management Ltd. |
Portfolio Managers’ Comments |
How did the Pax Global Opportunities Fund (the Fund) perform for the period?
For the one-year period ended December 31, 2020, the Fund’s Institutional Class and Investor Class shares had total returns of 23.12% and 22.76%, respectively, compared to 16.25% for the MSCI All-Country World (Net) Index (“MSCI ACWI”) and 36.37% for the Lipper Global Multi-Cap Growth Funds Index.
What factors contributed to the Fund’s performance?
Global equity markets delivered positive performance in 2020 despite economic disruptions and extreme market volatility caused by the COVID-19 pandemic. The sharp sell-off in markets in February and March was followed by a strong rebound, supported by fiscal and monetary emergency measures. The pandemic caused numerous disruptions and has highlighted some of the more vulnerable areas of the economy, as well as areas of resilience. Lockdown measures prompted what may turn out to be a structural shift in work patterns towards homeworking, facilitated by a dramatically increased use of technology, and accompanied by permanently altered patterns of consumption.
The market recovery was further powered in the second half of the year by steady improvements in economic data, with services and manufacturing sentiment surveys showing greater confidence in most economies. Support has also come from earnings which, despite disruptions across many sectors, have generally shown improvements. A resolution in the U.S. election and multiple vaccine approvals in November saw a rise in market sentiment and economic activity, with the S&P 500 Index reaching a new high.
Can you discuss any significant changes to the Fund’s positioning throughout the period?
The investment team took advantage of the market volatility during the year to initiate several new positions at attractive valuation levels in several names within Health Care, Consumer Staples, Industrials and Information Technology, while exiting holdings with lower conviction. Broadly speaking, these changes did not
result in significant sector changes. The portfolio’s overweight to Europe was lowered slightly with the relative allocation to North America increasing, although the portfolio remains underweight in this region. Importantly, the exposure to cyclical and defensive business models remains well balanced. With the strong move higher in share prices, the weighted average market cap for the portfolio has increased to approximately $165 billion compared to over $300 billion for MSCI ACWI.
What portfolio holdings contributed positively to performance relative to the MSCI ACWI?
Strong performance was achieved from the Information Technology sector as demand for digital products, greater connectivity and investment in cloud infrastructure surged as a result of the COVID-19 pandemic. Taiwan Semiconductor Manufacturing Company which benefitted from digitization trends and demand for high end semiconductors, continued to extend its technological lead in chip manufacturing following an announcement that competitor, Intel, may outsource leading edge chip fabrication in 2021. Cadence (Application Software, U.S.), which is linked to the research and development spending of the semiconductor companies, saw continued robust demand for its semiconductor design tools. Cadence holds a strong position within the chip design ecosystem, and benefits from the secular trend of semi-conductor miniaturization and energy reduction.
The strategy benefitted from good performance in Health Care, where holdings are focused on life science and diagnostic names, which saw strong tailwinds from COVID-19 spending. Thermo Fischer (Life Sciences Tools & Services, U.S.) saw steady earnings growth as it benefitted from unprecedented demand for virus testing and COVID-19 related products and services, and a recovery in its core business, backed by contributions from acquisitions made in previous years.
What portfolio holdings detracted from performance relative to the MSCI ACWI?
In what was generally a positive year, the Financials sector delivered negative returns, plagued by uncertainty over COVID-19-related business disruptions and the potential impact to profits and balance sheets. Hiscox (Property & Casualty Insurance, UK) fell on concerns about the magnitude of business interruption payments to small- and medium-enterprise customers in the wake of lockdown measures in the UK. Hiscox subsequently reported strong top-line growth, with the retail franchise in particular proving resilient and robust year-on-year increases in the pricing environment of risks underwritten through the London market.
December 31, 2020 |
Pax Global Opportunities Fund, continued |
Other sectors were also impacted by COVID-19 disruptions. Grifols (Biotechnology, Spain) was unable to fully operate its plasma collection centers, which raised concerns over product shortages hampering revenue and profit growth. Danone (Packaged Foods & Meats, France) was negatively impacted by the lockdown, which resulted in a sharp decline in demand for bottled water. We expect these stocks are set to benefit from the re-opening of economies as vaccines roll out throughout 2021.
Portfolio Highlights (Unaudited)
Since Inception Total Return—Historical Growth of $10,000

Returns—Period ended December 31, 2020
| | | | Total
Return | Average
Annual
Return |
Share Class | Ticker
Symbol | | 1 Year | Since
Inception1 |
Institutional Class2 | PXGOX | | 23.12% | 17.85% |
Investor Class2 | PAXGX | | 22.76% | 17.63% |
MSCI ACWI (Net) Index | | | 16.25% | 12.65% |
Lipper Global Multi-Cap Growth Funds Index | | 36.37% | 19.71% |
See ‘Glossary of Terms’ for descriptions of benchmarks.
These figures represent past performance, which is no guarantee of future results. Investment return and principal value of an investment will fluctuate so that an investor’s shares, when redeemed, may be worth more or less than their original cost. Current performance may be lower or higher than the performance data quoted. Total returns for periods of less than one year have not been annualized. For most recent month-end performance data, please visit www.impaxam.com or call 800.767.1729.
1 | The Fund’s inception date is June 27, 2018. |
2 | Total return figures include reinvested dividends and capital gains distributions, and changes in principal value, and do not reflect the taxes that a shareholder might pay on Fund distributions or on the redemption of Fund shares. |
Asset Allocation | Percent of Investments |
Foreign Stocks | 49.8% |
U.S. Stocks | 48.5% |
Cash & Cash Equivalents | 1.7% |
Total | 100.0% |
Top Ten Holdings
Company | Percent of Net Assets |
Microsoft Corp. | 4.0% |
Linde PLC | 3.8% |
IQVIA Holdings, Inc. | 3.7% |
AIA Group, Ltd. | 3.7% |
MasterCard, Inc., Class A | 3.7% |
Taiwan Semiconductor Manufacturing Co, Ltd. | 3.6% |
HDFC Bank, Ltd., ADR | 3.5% |
Evotec SE | 3.5% |
Cadence Design Systems, Inc. | 3.3% |
Equinix, Inc., REIT | 3.1% |
Total | 35.9% |
Ten largest holdings do not include money market securities, certificates of deposit, commercial paper or cash and equivalents, if applicable.
Holdings are subject to change.
Sector Diversification
Sector | Percent of Net Assets |
Information Technology | 27.2% |
Health Care | 20.8% |
Financials | 13.9% |
Materials | 11.9% |
Industrials | 10.0% |
Consumer Staples | 7.3% |
Real Estate | 3.1% |
Consumer Discretionary | 2.3% |
Communication Services | 1.9% |
Other assets and liabilities (net) | 1.6% |
Total | 100.0% |
May include companies representing multiple industries within a single “Sector”.
December 31, 2020 |
Pax Global Environmental Markets Fund |

|
Portfolio Manager
Hubert Aarts |
| |

|
Portfolio Manager
Sid Jha |
| |

|
Portfolio Manager
David Winborne Sub-Adviser
Impax Asset Management Ltd. |
Portfolio Managers’ Comments |
How did the Pax Global Environmental Markets Fund perform for the period?
For the one-year period ended December 31, 2020, the Investor Class, Class A, and Institutional Class of the Fund had total returns of 25.71%, 25.68%, and 26.00%, respectively, versus 16.25% for the MSCI All-Country World (Net) Index (“MSCI ACWI”) and 39.86% for the FTSE Environmental Opportunities Index Series (“FTSE EOAS”).
What factors contributed to the Fund’s performance?
Global equity markets delivered positive performance in 2020 despite economic disruptions and extreme market volatility caused by the COVID-19 pandemic. The sharp sell-off in markets in February and March was followed by a strong rebound, supported by fiscal and monetary emergency measures. The pandemic caused numerous disruptions and has highlighted some of the more vulnerable areas of the economy, as well as areas of resilience. Lockdown measures prompted what may turn out to be a structural shift in work patterns towards homeworking, facilitated by a dramatically increased use of technology, and accompanied by permanently altered patterns of consumption.
The second half of the year brought steady improvements in economic data, corporate earnings, a resolution in the U.S. election, and multiple vaccine approvals. Markets anticipated economic activity to return to normal during 2021 and thus saw a rotation towards more cyclical stocks and sectors. Commitments to net-zero carbon targets, notably including from China, numerous green policy initiatives in Europe, and anticipated redirection from the new U.S. administration brought tailwinds to the environmental and sustainability investment space. Within Environmental Markets, the anticipation of economic normalization and continued focus on net zero carbon emissions resulted in the highest returns being
generated by Renewables, followed by Energy Efficiency, in particular Industrial Energy Efficiency. The more defensive sectors such as Food, Waste, and Water Treatment lagged due to their more defensive business models.
Can you discuss any significant changes to the Fund’s positioning throughout the period?
The investment team slightly consolidated the number of portfolio holdings during the period, from 50 names to 48. The first and second quarter proved to be most active, as the team took advantage of the volatility in the markets to exit some positions with lower conviction or stronger performance and buy shares of what we believe are high quality companies at much more attractive valuations. At the same time, the portfolio managers worked to reduce the Industrials exposure of the portfolio by several percent, finishing the year 3% lower at 41%. In turn, the exposure to Technology was increased by 6% to 20%, closer to the MSCI AWCI Index benchmark weight. Allocation to Consumer Discretionary was slightly reduced as a result of these stock-specific changes.
In thematic terms, these changes meant a reduction in Water Infrastructure exposure (many companies in this subsector are Industrials) and an increase in Energy Efficiency, particularly Technology companies active in Industrial Energy Efficiency. Regional allocation to North America and Europe was increased, funded by exits from positions in Asia. Importantly, the balance between cyclical and defensive business models remained, with a larger allocation to defensive-oriented companies than the benchmark. The portfolio’s weighted average market capitalization size increased to $42 billion from around $30 billion a year earlier.
What portfolio holdings contributed positively to performance relative to the MSCI ACWI?
Strong contributions to return from companies in the Information Technology, Industrials and Health Care sectors led the way for the year 2020. Technology’s critical role in providing more efficient and cost-saving environmental solutions was demonstrated by top performing holdings such as Autodesk (Buildings Energy Efficiency, U.S.) which sells software tools for architecture, engineering and design. Agricultural machinery manufacturer Deere (Sustainable & Efficient Agriculture, U.S.) is an Industrials company which notched large gains during the year due to favorable earnings results and strength in the agricultural sector. The portfolio managers added this name at lower price levels during the volatility in the first quarter of the year. In the Health Care space, Agilent (Environmental Testing
December 31, 2020 |
Pax Global Environmental Markets Fund, continued |
& Gas Sensing, U.S.) performed well as a result of strong earnings and margins growth, aided by COVID testing, which was a tailwind that helped offset softer demand in more cyclical end markets.
North American and European holdings in the portfolio contributed most to returns, with the smaller allocation to Asia producing smaller gains.
What portfolio holdings detracted from performance relative to the MSCI ACWI?
While all sectors of the portfolio saw positive returns, more defensive areas added smaller returns for the year with markets focused on positive vaccine news and the anticipated resumption of more positive economic growth. Water Utilities and Waste names lagged the broader portfolio. The Asian region has a smaller allocation and thus contributed less.
On an individual company basis, certain portfolio holdings suffered more due to the structural impacts of COVID-19 on their business models. Share prices for the following laggards all finished the year lower, and the investment team exited all three positions during the second half of the year. Welbilt (Sustainable & Efficient Agriculture, U.S.) moved lower as foodservice end markets experienced a large shock due to restaurant and cafeteria closures. The position was exited in the fourth quarter after a recovery in the stock price. East Japan Railway (Pollution Control Solutions, Japan) shares also finished lower for the year with the pandemic impacting ridership volumes in public transportation in Japan, and the postponing of the Olympics originally planned for Tokyo in 2020. This stock was sold in the third quarter. Lastly, Applus (Environmental Testing & Gas Sensing, Spain) faced headwinds in the challenging economic environment due to end market exposure in the automotive and oil & gas markets. The position was sold during the third quarter.
Portfolio Highlights (Unaudited)
Ten Year Annual Total Return—Historical Growth of $10,000

* | Represents a hypothetical investment of $10,000 in the fund after deducting the maximum sales load of 5.5% ($10,000 investment minus $550 sales load = $9,450). |
Returns—Period ended December 31, 2020
| | | | Total
Return | Average Annual Return |
Share Class | Ticker
Symbol | | 1 Year | 3 Years | 5 Years | 10 Years |
Investor Class1 | PGRNX | | 25.71% | 11.19% | 13.97% | 10.02% |
Class A1,2,4 | PXEAX | NAV3 | 25.68% | 11.19% | 13.97% | 10.03% |
| | | POP | 18.77% | 9.11% | 12.70% | 9.41% |
Institutional Class1 | PGINX | | 26.00% | 11.46% | 14.26% | 10.31% |
MSCI ACWI (Net) Index | | 16.25% | 10.06% | 12.26% | 9.13% |
FTSE Environmental Opportunities Index Series | | 39.86% | 17.15% | 18.66% | 11.88% |
See ‘Glossary of Terms’ for descriptions of benchmarks.
These figures represent past performance, which is no guarantee of future results. Investment return and principal value of an investment will fluctuate so that an investor’s shares, when redeemed, may be worth more or less than their original cost. Current performance may be lower or higher than the performance data quoted. Total returns for periods of less than one year have not been annualized. For most recent month-end performance data, please visit www.impaxam.com or call 800.767.1729.
1 | The Fund’s investment adviser assumed certain expenses during the 5-year and 10-year periods; total returns would have been lower had these expenses not been assumed. Total return figures include reinvested dividends and capital gains distributions, and changes in principal value, and do not reflect the taxes that a shareholder might pay on Fund distributions or on the redemption of Fund shares. |
December 31, 2020 |
Pax Global Environmental Markets Fund, continued |
Portfolio Highlights (Unaudited), continued |
2 | A 1.00% CDSC (contingent deferred sales charge) may be charged on any shares sold within 18 months of purchase over $1 million. POP (public offering price) reflects the maximum sales load for the Fund’s Class A Shares of 5.50%. NAV performance does not reflect the deduction of the sales load of the CDSC, which if reflected would reduce the performance shown. |
4 | Inception of Class A shares is May 1, 2013. The performance information shown for Class A shares includes the performance of Investor Class shares, adjusted to reflect the sales charge applicable to Class A shares, for the period prior to Class A inception. |
Asset Allocation | Percent of Investments |
Foreign Stocks | 40.7% |
U.S. Stocks | 56.3% |
Cash & Cash Equivalents | 3.0% |
Total | 100.0% |
Top Ten Holdings
Company | Percent of Net Assets |
Linde PLC | 3.4% |
American Water Works Co., Inc. | 3.3% |
IDEX Corp. | 3.2% |
Waste Management, Inc. | 3.2% |
Agilent Technologies, Inc. | 3.2% |
Schneider Electric SE | 2.9% |
Autodesk, Inc. | 2.8% |
Koninklijke DSM NV | 2.7% |
Trimble, Inc. | 2.6% |
Siemens AG | 2.5% |
Total | 29.8% |
Ten largest holdings do not include money market securities, certificates of deposit, commercial paper or cash and equivalents, if applicable.
Holdings are subject to change.
Environmental Markets Classification System (EMCS)
Sector | Sub Sector | Percent of Net Assets |
Renewable & Alternative Energy | | 1.1% |
| | Renewable Energy Developers & Independent Power Producers (IPPs) | 1.1% | |
| | | |
Energy Efficiency | | 37.9% |
| | Power Network Efficiency | 5.2% | |
| | Industrial Energy Efficiency | 17.9% | |
| | Buildings Energy Efficiency | 6.3% | |
| | Transport Energy Efficiency | 8.5% | |
| | | |
Water Infrastructure & Technologies | | 21.8% |
| | Water Infrastructure | 10.5% | |
| | Water Treatment Equipment | 2.2% | |
| | Water Utilities | 8.2% | |
| | Diversified Water Infrastructure & Technology | 0.9% | |
| | | | |
Pollution Control | | 9.9% |
| | Pollution Control Solutions | 1.5% | |
| | Environmental Testing & Gas Sensing | 8.4% | |
| | | | |
Waste Management & Technologies | | 3.2% |
| | General Waste Management | 3.2% | |
| | | | |
Environmental Support Services | | 2.0% |
| | Environmental Consultancies | 2.0% | |
| | | | |
Food, Agriculture & Forestry | | 17.0% |
| | Logistics, Food Safety & Packaging | 6.1% | |
| | Sustainable & Efficient Agriculture | 10.9% | |
| | | | |
Diversified Environmental | | 3.4% |
| | Diversified Environmental | 3.4% | |
| | | | |
| | | | |
Other assets and liabilities (net) | 3.7% | 3.7% |
Total | 100.0% | 100.0% |
May include companies representing multiple industries within a single “Sector”.
December 31, 2020 |
Pax Global Environmental Markets Fund, continued |
Portfolio Highlights (Unaudited), continued |
Geographical Diversification
Country | Percent of Net Assets |
United States | 55.9% |
United Kingdom | 8.9% |
Germany | 7.8% |
France | 5.3% |
Japan | 4.0% |
Netherlands | 3.7% |
China | 2.2% |
Taiwan | 2.1% |
Switzerland | 1.5% |
Belgium | 1.3% |
Ireland | 1.3% |
Hong Kong | 1.2% |
Denmark | 1.1% |
Other Assets and liabilities (net) | 3.7% |
Total | 100.0% |
December 31, 2020 |
Pax Ellevate Global Women’s Leadership Fund |

|
Portfolio Manager
Barbara Browning, CFA |
| |

|
Portfolio Manager
Scott LaBreche |
Portfolio Managers’ Comments |
How did the Pax Ellevate Global Women’s Leadership Fund (the Fund) perform for the period?
For the one-year period ended December 31, 2020, the Investor and Institutional Class1 had total returns of 13.67% and 13.94%, respectively, compared to 13.46% for the Impax Global Women’s Leadership Index (Women’s Index), 15.90% for the MSCI World (Net) Index (World Index) and 15.25% for the Lipper Global Multi-Cap Core Funds Index.
COVID-19 fears contributed to the extreme market volatility during the year. Global equity markets, as measured by the World Index, decreased by 21.1% in the first quarter and rebounded sharply by 46.81% over the next three quarters, pushing the World Index annual return to 15.90%. High beta, momentum, and growth stocks dominated global market performance on expectations of a fuller reopening of the economy, which created a headwind given the Fund’s lower risk and higher quality orientation.
The Institutional Class of the Fund has outperformed the World Index for the period since reorganization (when the Fund adopted its current investment strategy), June 4, 2014 through December 31, 2020. The Fund’s overweight to the highest-rated quartile of companies within the World Index based on gender-diverse leadership has made the greatest contribution to the Fund’s relative outperformance, along with the Fund’s significant underweight to the bottom two quartiles of companies with less gender-diverse leadership.
In addition, the Fund has produced strong results compared with peers. The Institutional Class1 shares of the Fund (PXWIX) has posted a top 27% ranking (out of 90 funds) over the five-year period ended December 31, 2020, based on average annual returns within the Lipper Global Multi-Cap Core classification.1
December 31, 2020 |
Pax Ellevate Global Women’s Leadership Fund, continued |
What is the investment objective of the Fund?
The Fund seeks investment returns that closely correspond to or exceed the price and yield performance, before fees and expenses, of the As of December 31, 2020, Women’s Index. The Fund pursues a systematic strategy, investing in the companies comprising the Women’s Index, the first index of the highest-rated companies in the world for gender-diverse leadership, as rated by Impax Gender Analytics.2
The Fund overweights the portfolio toward Women’s Index companies with greater representation of women on boards and in senior management. As of December 31, 2020, Women hold 41% of the board seats and 30% of senior management positions in companies in the Fund, compared to 30% and 21%, respectively, within the World Index. In addition, 94% percent of companies in the Fund have three or more women on the board and 99% have two or more women on the board, compared with 58% and 79%, respectively, for companies in the World Index. 36% of companies in the Fund have a woman CEO or CFO, compared with 17% of companies in the World Index. In addition, 41% of companies in the Fund have disclosed pay equity analysis, compared with 23% of companies in the World Index.
What contributed positively and negatively to performance?
During the year, global equity markets were disproportionality impacted by a handful of growth-oriented, higher market cap companies, including Apple, Amazon, Tesla, NVIDIA, Netflix, Facebook and Alphabet. In fact, half of the World Index return for the year is attributable to the dominant performance results of those seven stocks. Not owning six of those seven stocks for most of the year, because they fall outside of the top 400 in the world based on our gender criteria, detracted from Fund performance. Netflix was held all year, while Amazon was a new addition to our gender leadership universe as of November 30, 2020, due to its continued improvement in gender diversity relative to peers.
On a sector basis, Consumer Discretionary holdings detracted the most during the year. An underweight allocation to Automotive, no exposure to Amazon for most of year, and poor results from Capri and Macy’s drove the negative results.
Also detracting from performance was an underweight allocation and portfolio holding in the strong-performing Information Technology sector4. The impact of not owning Apple and NVIDIA outweighed the strong results from Twilio, Autodesk, Microsoft, Intuit and Texas Instruments. Also, an overweight allocation
and holdings in Financials, one of the worst performing sectors3 during the year, detracted from relative return, led by poor results from CNP Assurances, Bank of America and Swedbank.
Conversely, the Fund’s zero allocation to the Energy sector and weapon companies and its underweight to REITs helped relative performance. Within the Industrials and Materials sectors, the Fund’s lower allocation to Metals & Mining and strong results from Koninklijke DSM, Wolters Kluwer and VINCI, added to the Fund’s relative performance.
Footnotes:
1 | Data shown represents rankings for the Pax Ellevate Global Women’s Leadership Fund - Institutional Class (PXWIX) in the Lipper Global Multi-Cap Core category based on average annual returns. Lipper rankings are based on total returns (not including sales charges) for the periods indicated and compare total return performance with that of other funds in the category. The Pax Ellevate Global Women’s Leadership Fund - Institutional Class (PXWIX) 1-year 58th percentile rank out of 136 funds, 3-year 21st percentile rank out of 111 funds, 5-year 27th percentile rank out of 90 funds, since re-org (06/04/14) 17th percentile rank out of 79 funds and 10-year 40th percentile rank out of 64 funds. |
2 | Impax Gender Analytics, December 31, 2020. The Fund’s investable universe, the Women’s Index, had its annual reconstitution on 11/30/2020. |
3 | Source FactSet attribution: Annual 12/31/2020 MSCI World Index Information Technology Sector return of 43.99% and MSCI World Index Financials -2.79%. |
Portfolio Highlights (Unaudited)
Ten Year Annual Total Return—Historical Growth of $10,000

December 31, 2020 |
Pax Ellevate Global Women’s Leadership Fund, continued |
Portfolio Highlights (Unaudited), continued |
Returns—Period ended December 31, 2020
| | | | Total
Return | Average Annual Return |
Share Class | Ticker
Symbol | | 1 Year | 3 Years | 5 Years | 10 Years |
Investor Class1 | PXWEX | | 13.67% | 9.83% | 11.89% | 8.95% |
Institutional Class1 | PXWIX | | 13.94% | 10.11% | 12.17% | 9.22% |
Impax Global Women’s Leadership (Net) Index* | | 13.46% | 10.46% | 11.96% | N/A |
MSCI World (Net) Index | | 15.90% | 10.54% | 12.19% | 9.87% |
Lipper Global Multi-Cap Core Funds Index | | 15.25% | 8.50% | 11.15% | 9.14% |
See ‘Glossary of Terms’ for descriptions of benchmarks.
These figures represent past performance, which is no guarantee of future results. Investment return and principal value of an investment will fluctuate so that an investor’s shares, when redeemed, may be worth more or less than their original cost. Current performance may be lower or higher than the performance data quoted. Total returns for periods of less than one year have not been annualized. For most recent month-end performance data, please visit www.impaxam.com or call 800.767.1729.
* | Inception date of Women’s Index is February 28. 2014. |
1 | On June 4, 2014 the Pax World Global Women’s Equality Fund merged into the Pax Ellevate Global Women’s Leadership Fund (the fund), pursuant to an Agreement and Plan of Reorganization dated March 4, 2014 (the “Reorganization”). Because the Fund had no investment operations prior to the closing of the Reorganization, Pax World Global Women’s Equality Fund (the “Predecessor Fund”) is treated as the survivor of the Reorganization for account and performance reporting purposes. Accordingly, all performance and other information shown for the Fund for periods prior to June 4, 2014 is that of the Predecessor Fund. Total return figures include reinvested dividends and capital gains distributions, and changes in principal value, and do not reflect the taxes that a shareholder might pay on Fund distributions or on the redemption of Fund shares. |
Asset Allocation | Percent of Investments |
Foreign Stocks | 32.0% |
U.S. Stocks | 67.5% |
Cash & Cash Equivalents | 0.5% |
Total | 100.0% |
Top Ten Holdings
Company | Percent of Net Assets |
Microsoft Corp. | 5.0% |
Amazon.com, Inc. | 4.7% |
Estee Lauder Cos, Inc., The, Class A | 2.1% |
Starbucks Corp. | 2.1% |
American Water Works Co., Inc. | 2.1% |
Principal Financial Group, Inc. | 2.1% |
Autodesk, Inc. | 1.8% |
Coca-Cola Co., The | 1.7% |
Koninklijke DSM NV | 1.6% |
Johnson & Johnson | 1.6% |
Total | 24.8% |
Holdings are subject to change.
Sector Diversification
Sector | Percent of Net Assets |
Financials | 17.5% |
Information Technology | 17.4% |
Consumer Discretionary | 16.5% |
Health Care | 13.4% |
Consumer Staples | 11.4% |
Materials | 6.9% |
Industrials | 6.6% |
Communication Services | 5.0% |
Utilities | 2.9% |
Real Estate | 1.6% |
Other assets and liabilities (net) | 0.8% |
Total | 100.0% |
May include companies representing multiple industries within a single “Sector”.
December 31, 2020 |
Pax Ellevate Global Women’s Leadership Fund, continued |
Portfolio Highlights (Unaudited), continued |
Geographical Diversification
Country | Percent of Net Assets |
United States | 67.3% |
France | 8.5% |
Canada | 4.6% |
United Kingdom | 4.4% |
Netherlands | 3.5% |
Australia | 3.1% |
Germany | 2.7% |
Sweden | 1.6% |
Denmark | 0.9% |
Norway | 0.7% |
Switzerland | 0.4% |
Italy | 0.3% |
Spain | 0.3% |
Belgium | 0.2% |
Finland | 0.2% |
Hong Kong | 0.2% |
Japan | 0.1% |
New Zealand | 0.1% |
Singapore | 0.1% |
Israel | 0.0%* |
Portugal | 0.0%* |
Other Assets and liabilities (net) | 0.8% |
Total | 100.0% |
* | Rounds to less than 0.05%. |
December 31, 2020 |
Pax MSCI EAFE ESG Leaders Index Fund |

|
Portfolio Manager
Scott LaBreche |
Portfolio Manager’s Comments |
How did the Pax MSCI EAFE ESG Leaders Index Fund (the Fund) perform for the period?
For the one-year period ended December 31, 2020, the Institutional Class1 and Investor Class had total returns of 10.78% and 10.51%, respectively, compared to 10.45% for the MSCI EAFE ESG Leaders (Net) Index (the “Index”) and 7.82% for the MSCI EAFE (Net) Index (“EAFE Index”), and 5.04% for the Lipper International Large-Cap Core Funds Index.
COVID-19 fears contributed to the extreme market volatility during the year. International equity markets, as measured by the World Index, decreased by -22.83% in the first quarter and rebounded sharply by 39.71% over the next three quarters, pushing the EAFE Index annual return to 7.82%. High beta, momentum, and growth stocks dominated global market performance during the year on expectations of a fuller reopening of the economy. Within these extreme conditions, the Fund outperformed the EAFE Index, demonstrating the Fund’s resilience in both declining and advancing markets.
During the period, the Fund crossed its nine-year since inception milestone. The Fund has outperformed the EAFE Index over the 1-, 3-, 5-year and since inception periods ending December 31, 2020. Specifically, over its since inception period (9 years and 11 months, ended December 31, 2020), the Fund’s Institutional Class shares and Investor Class shares have returned 5.67% and 5.41%, respectively, versus the EAFE Index return of 5.18%. We believe that this result, combined with the Fund’s lower volatility, demonstrates that focusing on the highest-rated ESG companies in international developed markets over the long-term can provide investors improved return with reduced risk.1
In addition, the Fund has produced strong results compared with peers. The Institutional Class shares of the Fund (PXNIX) has posted a top 6% ranking (out of 103 funds) over the three-year period, top 46% ranking (out of 86 funds) over the five-year period and top 17% ranking (out of 71 funds) since inception for the period ended December 31, 2020, based on average annual returns within the Lipper International Large-Cap Core classification.2
December 31, 2020 |
Pax MSCI EAFE ESG Leaders Index Fund, continued |
What is the investment objective of the Fund?
The Fund is designed to track the performance of the Index. The Fund and the Index are constructed to have a better ESG profile than the EAFE Index, and the Fund’s holdings averaged an overall score of 7.99 on MSCI ESG Research’s 0 to 10 scale compared to an overall score of 7.00 for the EAFE Index as of December 31, 2020.3 Long term, the Fund seeks to generate better risk-adjusted performance than the EAFE Index through its ESG focus.
Our Fund is fossil fuel-free and integrates our proprietary SmartCarbon™ approach into the investment process. This risk-based process manages exposure to companies with fossil fuel reserves on their balance sheets, replacing energy4 company holdings with a diversified basket of energy efficiency stocks while maintaining the integrity of the investment process and minimizing change in tracking error. The SmartCarbonTM approach helps reduce the Fund’s carbon intensity,5 which is 30% lower than the EAFE Index.
What contributed positively and negatively to performance?
The Fund’s ESG focus added the most to relative performance versus the EAFE Index during the period, driven by its overweight allocation to the highest-rated ESG companies.4
In addition, the Fund’s proprietary SmartCarbonTM approach contributed significantly to relative performance. Both aspects of this approach, an overweight exposure toward energy efficiency companies and no exposure to the Energy sector helped performance.
From a sector perspective, nine of the eleven sectors added relative return during the year. Financials was a top contributor for the year, driven by strong results from holdings in banks.
Industrials added to relative return during the period, led by the Fund’s avoidance of companies that manufacture weapons and strong results from Vestas Wind, Schneider Electric and Siemens AG. Also adding to relative return during the period were Fund holdings within the Information Technology sector, led by strong results from three companies providing energy efficiency solutions.
Conversely, portfolio holdings in the Communication Services and Consumer Discretionary sectors detracted the most during the period led by poor results from companies within the Diversified and Wireless Telecommunication Services
and Textiles Apparel & Luxury Goods industries, along with an underweight allocation to Internet & Direct Marketing, which had strong returns during the period.
Footnotes:
1 | Reduced risk is measured by standard deviation. PXNIX since inception standard deviation is 14.61 compared to 15.12 for the EAFE. |
2 | Data shown represents rankings for the Pax MSCI EAFE ESG Leaders Index Fund - Institutional Class (PXNIX) in the Lipper International Large-Cap Core category based on average annual returns. Lipper rankings are based on total returns (not including sales charges) for the periods indicated and compare total return performance with that of other funds in the category. The Pax MSCI EAFE ESG Leaders Index Fund - Institutional Class (PXNIX) 1-year 25th percentile rank out of 116 funds, 3-year 6th percentile rank out of 103 funds, 5-year 46th percentile rank out of 86 funds and since inception (01/27/11) 17th percentile rank out of 71 funds. |
3 | MSCI ESG Research evaluates companies’ ESG characteristics and derives corresponding ESG scores and ratings. Companies are ranked by ESG score against their sector peers to determine their eligibility for the MSCI ESG indices. MSCI ESG Research identifies the highest-rated companies in each peer group to meet the float-adjusted market capitalization sector targets. The scoring system is based on general and industry specific ESG criteria, assigning a score on a 0 to 10-point scale (0 lowest to 10 highest). |
4 | The Energy sector is based on Global Industry Classification Standard (GICS), a widely recognized industry standard. |
5 | The MSCI Weighted Average Carbon Intensity (tons of CO2e/$M sales) measures a fund’s exposure to carbon intensive companies. It is calculated as the sum of security weight (normalized for corporate positions only) multiplied by the security Carbon Intensity. This allows for comparisons between funds and indices of different sizes. As of 12/31/20, the Pax MSCI EAFE ESG Leaders Index Fund had a carbon intensity score of 100.38 compared to 143.51 for the EAFE index. |
Portfolio Highlights (Unaudited)
Since Inception Total Return—Historical Growth of $10,000

December 31, 2020 |
Pax MSCI EAFE ESG Leaders Index Fund, continued |
Portfolio Highlights (Unaudited), continued |
Returns—Period ended December 31, 2020
| | | | Total
Return | Average Annual Return |
Share Class | Ticker
Symbol | | 1 Year | 3 Years | 5 Years | Since
Inception |
Institutional Class1 | PXNIX | | 10.78% | 5.86% | 7.56% | 5.67% |
Investor Class1,2 | PXINX | | 10.51% | 5.61% | 7.30% | 5.41% |
MSCI EAFE ESG Leaders (Net) Index | | | 10.45% | 5.80% | 7.78% | 6.07% |
MSCI EAFE (Net) Index | | | 7.82% | 4.28% | 7.45% | 5.18% |
Lipper International Large-Cap Core Funds Index | | 5.04% | 2.32% | 6.64% | 4.36% |
See ‘Glossary of Terms’ for descriptions of benchmarks.
These figures represent past performance, which is no guarantee of future results. Investment return and principal value of an investment will fluctuate so that an investor’s shares, when redeemed, may be worth more or less than their original cost. Current performance may be lower or higher than the performance data quoted. Total returns for periods of less than one year have not been annualized. For most recent month-end performance data, please visit www.impaxam.com or call 800.767.1729.
1 | The Fund’s inception date is January 27, 2011. On March 31, 2014, Pax World International Fund and Pax MSCI EAFE ESG Index ETF merged into the Pax MSCI EAFE ESG Leaders Index Fund (the Fund), a passively managed index fund which seeks investment returns that closely correspond to the price and yield performance, before fees and expenses, of the MSCI EAFE ESG Leaders Index. Based on the similarity of the Fund to Pax MSCI EAFE ESG Index ETF, Pax MSCI EAFE ESG Index ETF (the Predecessor Fund) is treated as the survivor of the mergers for accounting and performance reporting purposes. Accordingly, all performance and other information shown for the Fund for periods prior to March 31, 2014 is that of the Predecessor Fund. Total return figures include reinvested dividends and capital gains distributions, and changes in principal value, and do not reflect the taxes that a shareholder might pay on Fund distributions or on the redemption of Fund shares. |
2 | Inception of the Investor Class is March 31, 2014. The performance information shown for the Investor Class shares for periods prior to March 31, 2014 includes the performance of the Predecessor Fund. These returns have been adjusted to reflect the expenses allocable to Investor Class. |
Asset Allocation | Percent of Investments |
Foreign Stocks | 98.9% |
Cash & Cash Equivalents | 1.1% |
Total | 100.0% |
Top Ten Holdings
Company | Percent of Net Assets |
Roche Holding AG | 3.1% |
ASML Holding NV | 3.0% |
SAP SE | 1.9% |
Unilever PLC | 1.9% |
Siemens AG | 1.6% |
Sony Corp. | 1.6% |
Commonwealth Bank of Australia | 1.5% |
Keyence Corp. | 1.4% |
Novo Nordisk A/S, Class B | 1.4% |
L’Oreal SA | 1.2% |
Total | 18.6% |
Holdings are subject to change.
Sector Diversification
Sector | Percent of Net Assets |
Communication Services | 4.7% |
Consumer Discretionary | 12.1% |
Consumer Staples | 10.1% |
Financials | 16.6% |
Health Care | 12.8% |
Industrials | 16.4% |
Information Technology | 10.2% |
Materials | 8.7% |
Real Estate | 3.2% |
Utilities | 3.8% |
Other assets and liabilities (net) | 1.4% |
Total | 100.0% |
May include companies representing multiple industries within a single “Sector”.
December 31, 2020 |
Pax MSCI EAFE ESG Leaders Index Fund, continued |
Portfolio Highlights (Unaudited), continued |
Geographical Diversification
Country | Percent of Net Assets |
Japan | 26.8% |
United Kingdom | 12.0% |
France | 10.0% |
Germany | 9.4% |
Switzerland | 8.6% |
Australia | 7.0% |
Netherlands | 6.1% |
Denmark | 3.8% |
Sweden | 3.2% |
Spain | 2.6% |
Italy | 2.0% |
Hong Kong | 1.6% |
Singapore | 1.4% |
Finland | 1.0% |
Ireland | 0.8% |
Belgium | 0.6% |
New Zealand | 0.6% |
Norway | 0.5% |
Austria | 0.3% |
Israel | 0.2% |
Portugal | 0.1% |
Other Assets and liabilities (net) | 1.4% |
Total | 100.0% |
December 31, 2020 |
Pax Core Bond Fund |

|
Portfolio Manager
Anthony Trzcinka, CFA |
Portfolio Manager’s Comments |
How did the Pax Core Bond Fund (the Fund) perform for the period?
For the one-year period ended December 31, 2020, the Institutional Class and Investor Class shares of the Fund had total returns of 7.16% and 6.89%, respectively, compared to 7.51% for the Bloomberg Barclays U.S. Aggregate Bond Index and 8.63% for the Lipper Core Bond Funds Index.
What factors contributed to the Fund’s performance?
The Fund’s Asset-Backed securities (ABS) positions detracted from performance during the period. In general, these securities are less liquid and underperformed during the volatility of the first quarter. The credit quality of our ABS holdings is strong and relative performance of the securities improved during the remainder of the year as markets recovered and liquidity improved, but not enough to completely offset underperformance in the quarter.
Conversely, the Fund’s underweight to Mortgage-Backed Securities (MBS) helped relative performance. MBS were a poor performing area of the fixed income market in 2020. An increase in prepayments hurt MBS throughout the year as interest rates remained relatively low.
Can you discuss any significant changes to the Fund’s positioning throughout the period?
At the start of the year, the Fund portfolio was less sensitive to credit spreads. This defensive positioning worked well through the first half of the year as credit spreads widened due to the economic impact of COVID-19. During the second half of the year we added increased corporate bond exposure as the fundamentals adjusted to a potential vaccine and re-opening of the economy.
The Fund continues to add impact holdings across multiple sectors and impact areas during the period, which at the end of December 2020 total 40% of the portfolio. The impact bond market continues to expand and in a positive development, the issuance of social bonds increased in 2020 as foundations, corporations and governments try to blunt the negative economic and social impact of the pandemic.
December 31, 2020 |
Pax Core Bond Fund, continued |
What portfolio holdings contributed positively to performance?
The Fund’s long-dated corporate and taxable municipal bonds benefited from falling rates during the period and were positive contributors. Holdings such as DTE Electric, Visa, and Starbucks were among the top contributors.
What portfolio holdings detracted from performance?
The Fund’s largest detractors were corporate bonds in cyclically sensitive sectors. Hilton and Marriot were two of our biggest corporate bond detractors that were negatively affected by the COVID-19 induced economic shutdown.
Portfolio Highlights (Unaudited)
Since Inception Total Return—Historical Growth of $10,000

Returns—Period ended December 31, 2020
| | | | Total
Return | Average Annual Return |
Share Class | Ticker
Symbol | | 1 Year | 3 Years | Since
Inception1 |
Institutional Class2 | PXBIX | | 7.16% | 4.99% | 4.64% |
Investor Class2 | PAXBX | | 6.89% | 4.74% | 4.38% |
Bloomberg Barclays U.S. Aggregate Bond Index | | 7.51% | 5.34% | 5.12% |
Lipper Core Bond Funds Index | | 8.63% | 5.73% | 5.48% |
See ‘Glossary of Terms’ for descriptions of benchmarks.
These figures represent past performance, which is no guarantee of future results. Investment return and principal value of an investment will fluctuate so that an investor’s shares, when redeemed, may be worth more or less than their original cost. Current performance may be lower or higher than the performance data quoted. Total returns for periods of less than one year have not been annualized. For most recent month-end performance data, please visit www.impaxam.com or call 800.767.1729.
1 | The Fund’s inception date is December 16, 2016. |
2 | Total return figures include reinvested dividends and capital gains distributions, and changes in principal value, and do not reflect the taxes that a shareholder might pay on Fund distributions or on the redemption of Fund shares. |
Asset Allocation | Percent of Investments |
U.S. Bonds | 93.3% |
Foreign Bonds | 5.2% |
Cash & Cash Equivalents | 1.5% |
Total | 100.0% |
Top Ten Holdings
Company | Percent of Net Assets |
United States Treasury Note, 1.125%, 08/15/40 | 2.9% |
United States Treasury Note, 0.375%, 11/30/25 | 2.0% |
United States Treasury Note, 1.625%, 11/15/50 | 2.0% |
United States Treasury Note, 0.625%, 11/30/27 | 1.4% |
European Investment Bank, 3.250%, 01/29/24 | 1.1% |
International Bank for Reconstruction & Development, 1.625%, 01/15/25 | 1.1% |
United States Treasury Note (TIPS), 0.375%, 07/15/27 | 1.1% |
Kreditanstalt fuer Wiederaufbau, 3.125%, 12/15/21 | 0.9% |
European Investment Bank, 0.250%, 09/15/23 | 0.9% |
United States Treasury Note (TIPS), 0.125%, 04/15/22 | 0.9% |
Total | 14.3% |
Ten largest holdings do not include money market securities, certificates of deposit, commercial paper or cash and equivalents, if applicable.
Holdings are subject to change.
Fixed Income Sector Diversification
Sector | Percent of Net Assets |
Corporate Bonds | 37.4% |
Mortgage-Backed Bonds | 25.9% |
Treasury Bonds | 13.4% |
Supranational | 11.3% |
Asset-Backed Securities | 7.2% |
Municipal Bonds | 2.4% |
Agency/Gov’t Related Bonds | 1.2% |
Community Investment Notes | 0.0%* |
Other assets and liabilities (net) | 1.2% |
Total | 100.0% |
* | Rounds to less than 0.05%. |
December 31, 2020 |
Pax Core Bond Fund, continued |
Portfolio Highlights (Unaudited), continued |
Credit Quality*
Bond Rating | Percent of Bonds |
U.S. Government | 39.1% |
AAA | 18.3% |
AA+ | 1.3% |
AA | 1.6% |
AA- | 2.8% |
A+ | 1.9% |
A | 5.0% |
A- | 6.4% |
BBB+ | 6.4% |
BBB | 4.8% |
BBB- | 3.6% |
BB+ | 1.0% |
BB | 1.0% |
BB- | 1.8% |
B+ | 0.1% |
B | 0.2% |
Not Rated | 4.7% |
Total | 100.0% |
* | Credit quality ratings by Standard & Poor’s assist investors by evaluating the credit worthiness of many bond issues. AAA: An obligation rated ‘AAA’ has the highest rating assigned by S&P Global Ratings. The obligor’s capacity to meet its financial commitment on the obligation is extremely strong. AA: An obligation rated ‘AA’ differs from the highest-rated obligations only to a small degree. The obligor’s capacity to meet its financial commitment on the obligation is very strong. A: An obligation rated ‘A’ is somewhat more susceptible to the adverse effects of changes in circumstances and economic conditions than obligations in higher-rated categories. However, the obligor’s capacity to meet its financial commitment on the obligation is still strong. BBB: An obligation rated ‘BBB’ exhibits adequate protection parameters. However, adverse economic conditions or changing circumstances are more likely to lead to a weakened capacity of the obligor to meet its financial commitment on the obligation. BB: An obligation rated ‘BB’ is less vulnerable to nonpayment than other speculative issues. However, it faces major ongoing uncertainties or exposure to adverse business, financial, or economic conditions which could lead to the obligor’s inadequate capacity to meet its financial commitment on the obligation. Not Rated: This indicates that no rating has been requested, or that there is insufficient information on which to base a rating, or that Standard & Poor’s does not rate a particular obligation as a matter of policy. |
December 31, 2020 |
Pax High Yield Bond Fund |

|
Portfolio Manager
Peter Schwab, CFA |
| |

|
Portfolio Manager
Kent Siefers |
Portfolio Managers’ Comments |
How did the Pax High Yield Bond Fund (the Fund) perform for the period?
For the one-year period ended December 31, 2020, the Investor Class, Class A, and Institutional Class shares of the Fund had total returns of 7.80%, 7.79%, and 8.08% respectively, compared to 6.32% for the ICE BofA Merrill Lynch U.S. High Yield—Cash Pay—BB-B (Constrained 2%) Index (the Index) and 4.81% for the Lipper High Yield Bond Funds Index.
The high yield asset class performed well in 2020 despite the COVID-induced volatility, large dispersion in sector performance and changes to the Index composition due to a number of “fallen angels.”1 The Fund outperformed during the period as positive credit selection in the majority of sectors helped offset our relatively conservative positioning during this period of volatility.
Sector performance in the high yield asset class was heavily influenced by the economic changes stemming from the pandemic. More defensive, non-discretionary sectors such as Food & Supermarkets performed well, as did the Technology sector due in part to increased demand emanating from mobile work arrangements. With interest rates falling in the period, higher quality (BB rated) and long duration bonds outperformed as well. Underperforming sectors included the entire Discretionary Leisure Chain, as well as the Energy sector which suffered from low commodity prices and concerns that oil demand may not fully recover after the pandemic subsides.
Lastly, 2020 was a record year for former investment grade rated companies entering the high yield indices (fallen angels). The Energy sector dominated this activity, but the Auto sector as well as the Retail and Travel-related sectors were also heavily represented. Sector weightings were impacted as a result of this and the BB rated cohort grew significantly and now represents approximately 60% of the benchmark versus approximately 45% a few years ago.
What factors contributed to the Fund’s performance?
The Fund’s performance was driven by very strong positive credit selection in the Services, Energy, Healthcare, Media and Basic Industry sectors. Offsetting this was poor relative performance of holdings in the Consumer Goods and Auto sectors.
December 31, 2020 |
Pax High Yield Bond Fund, continued |
Given the Fund’s more conservative profile, first quarter performance was particularly strong during the downturn. As the market recovered late in the year, the Fund gave back some of the gains. In aggregate, our emphasis on more durable sectors and credits with strong ESG profiles resulted in above benchmark performance and favorable peer rankings for the year. Relative to the Lipper High Yield Bond peer group, the Fund’s Institutional Class ranked in the 11th percentile for calendar year 2020 (55 out of 509 peers).
Can you discuss any significant changes to the Fund’s positioning throughout the period?
The Fund’s credit rating exposure changed in 2020 as we reduced BB rated bonds and added B rated and CCC rated bonds. Over the course of the year, BB rated bonds decreased to 43.3% from 48.7%, B rated bonds increased to 39.3% from 37.4% and CCC rated bonds increased to 9.7% from 5.2%. As of year-end 2020, the average credit quality of the Fund’s portfolio as measured by Standard & Poors was unchanged at B+. The effective duration of the Fund at year end was 3.48 years (versus the benchmark of 3.79 years).
By sector, the Fund increased exposure to the Automotive, Healthcare, Media and Technology sectors. The Fund reduced exposure to the Energy, Banking and Financial Service sectors.
What portfolio holdings contributed positively to performance?
Successfully avoiding Hertz, which underperformed when the lock downs began, was our largest single name contributor in 2020. Endo International, a generic drug company, added to performance as several of their important drug franchises outperformed expectations and allowed the company to re-finance near-term maturities. Avantor, a life sciences company, performed very well as their growth prospects improved materially on the back of growing demand for the raw materials used in vaccines.
What portfolio holdings detracted from performance?
Oasis Petroleum, an oil and gas producer, performed poorly as the sector came under extreme pressure with lower oil prices. Not owning the large fallen angel Occidental Petroleum, another large oil and gas producer, was a meaningful drag as it outperformed after entering the Index. Another fallen angel, Kraft Heinz, a packaged food company, detracted from performance as it also performed very well after becoming one of the largest issuers in the Index.
1 | A “fallen angel” is a bond that was initially given an investment-grade rating but has since been downgraded to junk bond status by one of the major rating services. |
Portfolio Highlights (Unaudited)
Ten Year Annual Total Return—Historical Growth of $10,000

* | Represents a hypothetical investment of $10,000 in the fund after deducting the maximum sales load of 5.5% ($10,000 investment minus $450 sales load = $9,550). |
Returns—Period ended December 31, 2020
| | | | Total
Return | Average Annual Return |
Share Class | Ticker
Symbol | | 1 Year | 3 Years | 5 Years | 10 Years |
Investor Class1 | PAXHX | | 7.80% | 6.02% | 7.61% | 5.19% |
Class A1,2,4 | PXHAX | NAV3 | 7.79% | 6.02% | 7.60% | 5.20% |
| | | POP | 2.95% | 4.41% | 6.64% | 4.72% |
Institutional Class1 | PXHIX | | 8.08% | 6.29% | 7.85% | 5.43% |
ICE BofA Merrill Lynch U.S. High Yield - Cash Pay - BB-B (Constrained 2%) Index | 6.32% | 6.22% | 8.03% | 6.63% |
Lipper High Yield Bond Funds Index | | 4.81% | 5.14% | 7.44% | 5.93% |
See ‘Glossary of Terms’ for descriptions of benchmarks.
These figures represent past performance, which is no guarantee of future results. Investment return and principal value of an investment will fluctuate so that an investor’s shares, when redeemed, may be worth more or less than their original cost. Current performance may be lower or higher than the performance data quoted. Total returns for periods of less than one year have not been annualized. For most recent month-end performance data, please visit www.impaxam.com or call 800.767.1729.
1 | Total return figures include reinvested dividends and capital gains distributions, and changes in principal value, and do not reflect the taxes that a shareholder might pay on Fund distributions or on the redemption of Fund shares. |
December 31, 2020 |
Pax High Yield Bond Fund, continued |
Portfolio Highlights (Unaudited), continued |
2 | A 1.00% CDSC (contingent deferred sales charge) may be charged on any shares sold within 18 months of purchase over $1 million. POP (public offering price) reflects the maximum sales load for the Fund’s Class A Shares of 4.50%. NAV performance does not reflect the deduction of the sales load of the CDSC, which if reflected would reduce the performance shown. |
4 | Inception of Class A shares is May 1, 2013. The performance information shown for Class A shares includes the performance of Investor Class shares, adjusted to reflect the sales charge applicable to Class A shares, for the period prior to Class A inception. |
Asset Allocation | Percent of Investments |
U.S. Bonds | 82.6% |
Foreign Bonds | 13.8% |
Loans | 1.1% |
U.S. Stocks | 0.6% |
Cash & Cash Equivalents | 1.9% |
Total | 100.0% |
Top Ten Holdings
Company | Percent of Net Assets |
CCO Holdings, LLC/Capital Corp., 4.750%, 03/01/30 | 1.1% |
Avantor Funding, Inc., 4.625%, 07/15/28 | 0.9% |
Ford Motor Co., 9.000%, 04/22/25 | 0.8% |
USG Corp., 4.875%, 06/01/27 | 0.8% |
Ally Financial, Inc., 5.750%, 11/20/25 | 0.7% |
Centene Corp., 4.625%, 12/15/29 | 0.7% |
CCO Holdings, LLC/Capital Corp., 5.375%, 06/01/29 | 0.7% |
Kraft Heinz Foods Co., 4.375%, 06/01/46 | 0.7% |
IQVIA, Inc., 5.000%, 05/15/27 | 0.7% |
SEG Holding, LLC/Finance Corp., 5.625%, 10/15/28 | 0.7% |
Total | 7.8% |
Ten largest holdings do not include money market securities, certificates of deposit, commercial paper or cash and equivalents, if applicable
Holdings are subject to change
Fixed Income Sector Diversification
Sector | Percent of Net Assets |
Media | 15.2% |
Basic Industry | 12.4% |
Health Care | 10.5% |
Telecommunications | 8.5% |
Technology & Electronics | 7.5% |
Services | 7.4% |
Capital Goods | 5.5% |
Consumer Goods | 5.4% |
Retail | 4.9% |
Automotive | 4.5% |
Leisure | 3.7% |
Financial Services | 2.9% |
Energy | 2.6% |
Utility | 1.8% |
Transportation | 1.4% |
Real Estate | 1.4% |
Banking | 0.9% |
Insurance | 0.5% |
Community Investment Notes | 0.1% |
Other assets and liabilities (net) | 2.9% |
Total | 100.0% |
May include companies representing multiple industries within a single “Sector”.
Credit Quality*
Bond Rating | Percent of Bonds |
BBB+ | 0.2% |
BBB- | 5.7% |
BB+ | 12.4% |
BB | 14.0% |
BB- | 17.1% |
B+ | 13.2% |
B | 17.7% |
B- | 8.8% |
CCC+ | 7.0% |
CCC | 2.1% |
CCC- | 0.1% |
Not Rated | 1.6% |
Total | 100.0% |
* | See bond rating descriptions on page 54. |
December 31, 2020 |
Pax Sustainable Allocation Fund |

|
Portfolio Manager
Andrew Braun |
| |

|
Portfolio Manager
Nathan Moser, CFA |
| |

|
Portfolio Manager
Anthony Trzcinka, CFA |
| |

|
Portfolio Manager
Peter Schwab, CFA |
Portfolio Managers’ Comments |
How did the Pax Sustainable Allocation Fund (the Fund) perform for the period?
For the one-year period ended December 31, 2020, the Investor Class and Institutional Class of the Fund had total returns of 16.24% and 16.49%, respectively, compared to 18.40% for the S&P 500 Index, 14.73% for the 60% S&P 500 Index / 40% Bloomberg Barclays U.S. Aggregate Bond Index blend (the Blended Index) and 11.72% for the Morningstar Allocation—50% to 70% Equity category average.
Relative to peers in the Morningstar Allocation--50% to 70% Equity category, the Fund’s Institutional Class ranks in the top 14th and 22nd percentile for the 3- and 5-year periods, respectively, ended December 31, 2020.1
What factors contributed to the Fund’s performance?
The COVID-19 crisis and subsequent policy responses drove unprecedented moves in markets in 2020. In the first quarter as the world went into quarantine, equity markets experienced the fastest retreat from a market high to a bear market in history with S&P 500 Index selling off -34% from its peak in February to its trough in March. Equities then rallied off March lows, with the S&P 500 Index delivering an astounding 70.2% for the remainder of the year, driven largely by massive fiscal and monetary stimulus as well as positive prospects for a virus vaccine.
An underweight to equities and overweight to bonds during the equity market sell off in the first quarter was a significant positive contributor to performance.
With the MSCI EAFE Index underperforming the S&P 500 Index by more than 10% for the year, the Fund’s non-U.S. equity allocation was a headwind for performance relative to the Blended Index, which contains only U.S. exposure.
However, the modest underweight position to non-US stocks relative to peers contributed positively to the Fund’s strong performance relative to the Morningstar Allocation – 50%-70% category average.
As discussed in detail below, performance of the underlying funds in aggregate was a positive contributor.
Can you discuss any significant changes to the Fund’s positioning throughout the period?
After benefitting relative to peers from an underweight to equities during the first quarter sell off, the Fund’s rebalancing discipline replenished the equity allocation as equity markets troughed, helping the Fund better participate in the subsequent rally in equities.
Equity market valuations remain near all-time highs, at least on an absolute basis, as investors appear willing to assume a return to normalized earnings power in 2022. However, with interest rates near historic lows, the relative valuation of equities to bonds does not appear as expensive. If we are in an extended period of low interest rates — as current Federal Reserve policy would imply — investors may be more tolerant of high equity valuations, but equities could potentially be susceptible to volatility as particular risks come into focus. In such an environment, we remain vigilant in balancing risk and return and are modestly overweight equity, with an underweight to fixed income and a modest allocation to cash.
What portfolio holdings contributed positively and negatively to performance?
The Pax Large Cap Fund, which represents the largest equity allocation, was the strongest contributor to the Fund’s performance during the period, as it outperformed the S&P 500 Index by 5.6%. Also, the Pax Global Environmental Markets Fund and Pax Global Opportunities Fund significantly outperformed the MSCI ACWI Index and were positive contributors to performance. Conversely, the Pax Small Cap Fund and Pax Core Bond Fund modestly detracted from performance as they trailed their respective benchmarks during the period.
1 | Rankings in other time periods may be lower. Comparison based on the Morningstar Allocation 50%-70% Equity peer group for the period ending 12/31/20. The Pax Sustainable Allocation Fund’s Institutional Class performance for the 1-year period ranked 95 out of 673 (16th percentile), for the 3-year period ranked 78 out of 636 (14th percentile), for the 5-year period ranked 117 out of 575 (22nd percentile), and for the 10-year period 148 out of 414 (35th percentile). The Pax Sustainable Allocation Fund’s Investor Class performance for the 1-year period ranked 104 out of 673 (17th percentile), for the 3-year period ranked 99 out of 636 (16th percentile), for the 5-year period ranked 157 out of 575 (28th percentile), and for the 10-year period 179 out of 414 (42nd percentile). |
December 31, 2020 |
Pax Sustainable Allocation Fund, continued |
Portfolio Highlights (Unaudited)
Ten Year Annual Total Return—Historical Growth of $10,000

Returns—Period ended December 31, 2020
| | | | Total
Return | Average Annual Return |
Share Class | Ticker
Symbol | | 1 Year | 3 Years | 5 Years | 10 Years |
Investor Class1 | PAXWX | | 16.24% | 10.42% | 10.03% | 8.21% |
Institutional Class1 | PAXIX | | 16.49% | 10.69% | 10.29% | 8.48% |
S&P 500 Index | | | 18.40% | 14.18% | 15.22% | 13.88% |
Blended Index | | | 14.73% | 11.03% | 11.11% | 10.02% |
Morningstar Allocation — 50% to 70% Equity | | 11.72% | 7.76% | 8.99% | 7.90% |
See ‘Glossary of Terms’ for descriptions of benchmarks.
These figures represent past performance, which is no guarantee of future results. Investment return and principal value of an investment will fluctuate so that an investor’s shares, when redeemed, may be worth more or less than their original cost. Current performance may be lower or higher than the performance data quoted. Total returns for periods of less than one year have not been annualized. For most recent month-end performance data, please visit www.impaxam.com or call 800.767.1729.
1 | Total return figures include reinvested dividends and capital gains distributions, and changes in principal value, and do not reflect the taxes that a shareholder might pay on Fund distributions or on the redemption of Fund shares. |
Manager Allocations
Fund Allocation | Percent of Net Assets |
Equity | |
Large-Cap/Multi-Cap Core Strategies | |
Pax ESG Beta Dividend Fund | 5.4% |
Pax Large Cap Fund | 41.0% |
Small Cap Core Strategies | |
Pax Small Cap Fund | 2.9% |
Foreign Strategies | |
Pax Ellevate Global Women’s Leadership Fund | 2.1% |
Pax Global Environmental Markets Fund | 2.2% |
Pax Global Opportunities Fund | 1.7% |
Pax MSCI EAFE ESG Leaders Index Fund | 7.4% |
Total Equity | 62.7% |
| | |
Fixed Income | |
Investment Grade/Intermediate | |
Pax Core Bond Fund | 32.3% |
Total Fixed Income | 32.3% |
| | |
Cash & Cash Equivalents | 5.0% |
Total | 100.0% |
December 31, 2020 |
Shareholder Expense Examples (Unaudited) |
Examples As a shareholder of the Funds, you incur ongoing costs, including management fees, distribution and/or service (12b-1) fees, and other Fund expenses. The examples on the next page are intended to help you understand your ongoing costs (in dollars) of investing in each of the Funds and compare these costs with the ongoing costs of investing in other mutual funds. For more information, see the relevant Fund’s prospectus or talk to your financial adviser.
The examples are based on an investment of $1,000 invested at the beginning of the period and held for the entire period beginning on July 1, 2020 and ending on December 31, 2020.
Please note that Individual Retirement Account (IRA), Coverdell Education Savings, Roth IRA, SEP-IRA, SIMPLE IRA, and 403(b)(7) accounts are charged an annual custodial fee of fifteen dollars. If you are invested in one of these account types, you should add an additional $7.50 to the estimated expenses paid during the period.
Actual Expenses For each Fund, the first table on the next page provides information about actual account values and actual expenses. You may use the information in this table, together with the amount you invested, to estimate the expenses that you paid over the period. For the Fund, simply divide your account value by $1,000 (for example, an $8,600 account value divided by $1,000 = 8.6), then multiply the result by the number under the heading entitled “Expenses Paid During Period” to estimate the expenses you paid on your account during this period.
Hypothetical Examples for Comparison Purposes For each Fund, the second table on the following pages provides information about hypothetical account values and hypothetical expenses based on each Fund’s actual expense ratio and an assumed rate of return of 5% per year before expenses, which is not each Fund’s actual return. The hypothetical account values and expenses may not be used to estimate the actual ending account balance or expenses you paid for the period. You may use this information to compare the ongoing costs of investing in the Funds and other funds. To do so, compare these 5% hypothetical examples with the 5% hypothetical examples that appear in the shareholder reports of the other funds.
Please note that the expenses shown in the tables are meant to highlight your ongoing costs only and do not reflect any transactional costs. Therefore, the second table is useful in comparing ongoing costs only, and will not help you determine the relative total costs of owning different funds. In addition, if these transactional costs were included, our costs would have been higher.
December 31, 2020 |
Shareholder Expense Examples (Unaudited), continued |
Based on Actual Fund Return | | | | |
| Beginning
Account Value
7/1/2020 | Ending
Account Value
12/31/2020 | Annualized
Expense
Ratio | Expenses
Paid During
Period1 |
Large Cap Fund - Investor | $ 1,000.00 | $ 1,262.80 | 0.95% | $ 5.40 |
Large Cap Fund - Institutional | 1,000.00 | 1,263.30 | 0.71% | 4.04 |
Small Cap Fund - Investor | 1,000.00 | 1,307.60 | 1.17% | 6.79 |
Small Cap Fund - Class A | 1,000.00 | 1,307.70 | 1.17% | 6.79 |
Small Cap Fund - Institutional | 1,000.00 | 1,309.70 | 0.92% | 5.34 |
ESG Beta Quality Fund - Investor | 1,000.00 | 1,196.00 | 0.89% | 4.91 |
ESG Beta Quality Fund - Class A | 1,000.00 | 1,196.00 | 0.90% | 4.97 |
ESG Beta Quality Fund - Institutional | 1,000.00 | 1,197.30 | 0.64% | 3.53 |
ESG Beta Dividend Fund - Investor | 1,000.00 | 1,190.40 | 0.90% | 4.96 |
ESG Beta Dividend Fund - Institutional | 1,000.00 | 1,192.10 | 0.65% | 3.58 |
Global Opportunities Fund - Investor | 1,000.00 | 1,255.80 | 1.20% | 6.80 |
Global Opportunities Fund - Institutional | 1,000.00 | 1,257.30 | 0.94% | 5.33 |
Global Environmental Markets Fund - Investor | 1,000.00 | 1,314.40 | 1.19% | 6.92 |
Global Environmental Markets Fund - Class A | 1,000.00 | 1,314.20 | 1.19% | 6.92 |
Global Environmental Markets Fund - Institutional | 1,000.00 | 1,316.30 | 0.94% | 5.47 |
Global Women’s Leadership Fund - Investor | 1,000.00 | 1,205.40 | 0.78% | 4.32 |
Global Women’s Leadership Fund - Institutional | 1,000.00 | 1,207.00 | 0.53% | 2.94 |
MSCI EAFE ESG Leaders Index Fund - Investor | 1,000.00 | 1,203.30 | 0.73% | 4.04 |
MSCI EAFE ESG Leaders Index Fund - Institutional | 1,000.00 | 1,204.20 | 0.48% | 2.66 |
Core Bond Fund - Investor | 1,000.00 | 1,012.20 | 0.72% | 3.64 |
Core Bond Fund - Institutional | 1,000.00 | 1,013.50 | 0.47% | 2.38 |
High Yield Bond Fund - Investor | 1,000.00 | 1,096.20 | 0.97% | 5.11 |
High Yield Bond Fund - Class A | 1,000.00 | 1,094.40 | 0.97% | 5.11 |
High Yield Bond Fund - Institutional | 1,000.00 | 1,096.20 | 0.72% | 3.79 |
Sustainable Allocation Fund - Investor | 1,000.00 | 1,153.60 | 0.30% | 1.62 |
Sustainable Allocation Fund - Institutional | 1,000.00 | 1,154.90 | 0.05% | 0.27 |
1 | Expenses are equal to each Funds’ annualized expense ratio, multiplied by the average account value over the period, multiplied by 184/366 (to reflect the one-half year period beginning on July 1, 2020 and ending on December 31, 2020). |
Based on Hypothetical 5% Return (before expenses) |
| Beginning
Account Value
7/1/2020 | Ending
Account Value
12/31/2020 | Annualized
Expense
Ratio | Expenses
Paid During
Period1 |
Large Cap Fund - Investor | $ 1,000.00 | $ 1,020.36 | 0.95% | $ 4.82 |
Large Cap Fund - Institutional | 1,000.00 | 1,021.57 | 0.71% | 3.61 |
Small Cap Fund - Investor | 1,000.00 | 1,019.25 | 1.17% | 5.94 |
Small Cap Fund - Class A | 1,000.00 | 1,019.25 | 1.17% | 5.94 |
Small Cap Fund - Institutional | 1,000.00 | 1,020.51 | 0.92% | 4.67 |
ESG Beta Quality Fund - Investor | 1,000.00 | 1,020.66 | 0.89% | 4.52 |
ESG Beta Quality Fund - Class A | 1,000.00 | 1,020.61 | 0.90% | 4.57 |
ESG Beta Quality Fund - Institutional | 1,000.00 | 1,021.92 | 0.64% | 3.25 |
ESG Beta Dividend Fund - Investor | 1,000.00 | 1,020.61 | 0.90% | 4.57 |
ESG Beta Dividend Fund - Institutional | 1,000.00 | 1,021.87 | 0.65% | 3.30 |
Global Opportunities Fund - Investor | 1,000.00 | 1,019.10 | 1.20% | 6.09 |
Global Opportunities Fund - Institutional | 1,000.00 | 1,020.41 | 0.94% | 4.77 |
Global Environmental Markets Fund - Investor | 1,000.00 | 1,019.15 | 1.19% | 6.04 |
Global Environmental Markets Fund - Class A | 1,000.00 | 1,019.15 | 1.19% | 6.04 |
Global Environmental Markets Fund - Institutional | 1,000.00 | 1,020.41 | 0.94% | 4.77 |
Global Women’s Leadership Fund - Investor | 1,000.00 | 1,021.22 | 0.78% | 3.96 |
Global Women’s Leadership Fund - Institutional | 1,000.00 | 1,022.47 | 0.53% | 2.69 |
MSCI EAFE ESG Leaders Index Fund - Investor | 1,000.00 | 1,021.47 | 0.73% | 3.71 |
MSCI EAFE ESG Leaders Index Fund - Institutional | 1,000.00 | 1,022.72 | 0.48% | 2.44 |
Core Bond Fund - Investor | 1,000.00 | 1,021.52 | 0.72% | 3.66 |
Core Bond Fund - Institutional | 1,000.00 | 1,022.77 | 0.47% | 2.39 |
High Yield Bond Fund - Investor | 1,000.00 | 1,020.26 | 0.97% | 4.93 |
High Yield Bond Fund - Class A | 1,000.00 | 1,020.26 | 0.97% | 4.93 |
High Yield Bond Fund - Institutional | 1,000.00 | 1,021.52 | 0.72% | 3.66 |
Sustainable Allocation Fund - Investor | 1,000.00 | 1,023.63 | 0.30% | 1.53 |
Sustainable Allocation Fund - Institutional | 1,000.00 | 1,024.89 | 0.05% | 0.25 |
1 | Expenses are equal to each Funds’ annualized expense ratio, multiplied by the average account value over the period, multiplied by 184/366 (to reflect the one-half year period beginning on July 1, 2020 and ending on December 31, 2020). |
December 31, 2020 |
Schedules of Investments |
Pax Large Cap Fund
Percent of Net Assets
Name of Issuer and
Title of Issue | | Shares/
Principal | | | Value | |
COMMON STOCKS: 98.4% |
Communication Services: 9.9% |
Alphabet, Inc., Class A (a) | | | 15,723 | | | $ | 27,556,758 | |
Alphabet, Inc., Class C (a) | | | 15,675 | | | | 27,460,719 | |
T-Mobile US, Inc. (a) | | | 192,400 | | | | 25,945,140 | |
ViacomCBS, Inc., Class B (b) | | | 594,676 | | | | 22,157,628 | |
| | | | | | | | 103,120,245 | |
Consumer Discretionary: 12.1% |
Amazon.com, Inc. (a) | | | 10,438 | | | | 33,995,835 | |
Aptiv PLC | | | 180,100 | | | | 23,465,229 | |
Lowe’s Cos., Inc. | | | 167,662 | | | | 26,911,428 | |
Mohawk Industries, Inc. (a) | | | 110,000 | | | | 15,504,500 | |
Target Corp. | | | 150,473 | | | | 26,562,999 | |
| | | | | | | | 126,439,991 | |
Consumer Staples: 4.7% |
Procter & Gamble Co., The | | | 212,700 | | | | 29,595,078 | |
Sysco Corp. | | | 252,700 | | | | 18,765,502 | |
| | | | | | | | 48,360,580 | |
Financials: 11.3% |
American Express Co. | | | 101,400 | | | | 12,260,274 | |
BlackRock, Inc. | | | 21,500 | | | | 15,513,110 | |
Citizens Financial Group, Inc. | | | 599,647 | | | | 21,443,377 | |
JPMorgan Chase & Co. | | | 176,760 | | | | 22,460,893 | |
Lincoln National Corp. | | | 259,300 | | | | 13,045,383 | |
Voya Financial, Inc. | | | 554,900 | | | | 32,633,669 | |
| | | | | | | | 117,356,706 | |
Health Care: 16.7% |
Becton Dickinson & Co. | | | 82,800 | | | | 20,718,216 | |
Bristol-Myers Squibb Co. | | | 410,880 | | | | 25,486,886 | |
Cigna Corp. | | | 101,594 | | | | 21,149,839 | |
CVS Health Corp. | | | 149,800 | | | | 10,231,340 | |
IQVIA Holdings, Inc. (a) | | | 81,200 | | | | 14,548,604 | |
Medtronic PLC | | | 214,204 | | | | 25,091,857 | |
Merck & Co., Inc. | | | 292,968 | | | | 23,964,782 | |
Quest Diagnostics, Inc. | | | 136,624 | | | | 16,281,482 | |
Vertex Pharmaceuticals, Inc. (a) | | | 67,500 | | | | 15,952,950 | |
| | | | | | | | 173,425,956 | |
Industrials: 7.5% |
Trane Technologies PLC | | | 178,803 | | | | 25,955,044 | |
United Parcel Service, Inc., Class B | | | 156,100 | | | | 26,287,240 | |
Waste Management, Inc. | | | 117,827 | | | | 13,895,338 | |
Xylem, Inc. | | | 118,100 | | | | 12,021,399 | |
| | | | | | | | 78,159,021 | |
Percent of Net Assets
Name of Issuer and
Title of Issue | | Shares/
Principal | | | Value | |
COMMON STOCKS, continued |
Information Technology: 28.7% (c) |
Apple, Inc. | | | 387,180 | | | $ | 51,374,915 | |
Applied Materials, Inc. | | | 341,854 | | | | 29,502,000 | |
Dell Technologies, Inc., Class C (a) | | | 274,900 | | | | 20,147,421 | |
Fiserv, Inc. (a) | | | 216,833 | | | | 24,688,605 | |
Fortinet, Inc. (a) | | | 149,000 | | | | 22,130,970 | |
Microsoft Corp. | | | 252,994 | | | | 56,270,925 | |
PTC, Inc. (a) | | | 198,600 | | | | 23,754,546 | |
salesforce.com, Inc. (a) | | | 99,418 | | | | 22,123,488 | |
TE Connectivity, Ltd. | | | 153,800 | | | | 18,620,566 | |
Trimble, Inc. (a) | | | 247,700 | | | | 16,538,929 | |
Visa, Inc., Class A | | | 64,100 | | | | 14,020,593 | |
| | | | | | | | 299,172,958 | |
Materials: 1.7% |
Vulcan Materials Co. | | | 121,000 | | | | 17,945,510 | |
| |
Real Estate: 4.8% |
Equinix, Inc., REIT | | | 21,200 | | | | 15,140,616 | |
Prologis, Inc., REIT | | | 208,100 | | | | 20,739,246 | |
Welltower, Inc., REIT | | | 223,500 | | | | 14,442,570 | |
| | | | | | | | 50,322,432 | |
Utilities: 1.0% |
American Water Works Co., Inc. | | | 67,000 | | | | 10,282,490 | |
| | | | | | | | | |
TOTAL COMMON STOCKS |
(Cost $655,533,242) | | | 1,024,585,889 | |
| | | | | | | | | |
MONEY MARKET: 1.5% |
State Street Institutional U.S. Government Money Market Fund, 0.030% (d)(e) | | | 15,692,738 | | | | 15,692,738 | |
(Cost $15,692,738) |
| | | | | | | | | |
TOTAL INVESTMENTS: 99.9% |
(Cost $671,225,980) | | | 1,040,278,627 | |
| | | | | | | | | |
OTHER ASSETS AND LIABILITIES — (NET): 0.1% | | | 1,314,598 | |
| | | | | | | | | |
NET ASSETS: 100.0% | | $ | 1,041,593,225 | |
| | 67 | SEE NOTES TO FINANCIAL STATEMENTS |
December 31, 2020 |
Schedules of Investments, continued |
Pax Large Cap Fund, continued
(a) | Non-income producing security. |
(b) | Security or partial position of this security was on loan as of December 31, 2020. The total market value of securities on loan as of December 31, 2020 was $8,352,723. |
(c) | Broad industry sectors used for financial reporting. |
(d) | Rate shown represents annualized 7-day yield as of December 31, 2020. |
REIT - Real Estate Investment Trust
SEE NOTES TO FINANCIAL STATEMENTS | 68 | |
December 31, 2020 |
Schedules of Investments, continued |
Pax Small Cap Fund
Percent of Net Assets
Name of Issuer and
Title of Issue | | Shares/
Principal | | | Value | |
COMMON STOCKS: 95.7% |
Communication Services: 4.3% |
Lions Gate Entertainment Corp., Class B (a) | | | 400,000 | | | $ | 4,152,000 | |
Nexstar Media Group, Inc., Class A | | | 55,000 | | | | 6,005,450 | |
ORBCOMM, Inc. (a) | | | 835,411 | | | | 6,198,750 | |
QuinStreet, Inc. (a) | | | 150,000 | | | | 3,216,000 | |
TechTarget, Inc. (a) | | | 5,632 | | | | 332,907 | |
| | | | | | | | 19,905,107 | |
Consumer Discretionary: 9.0% |
Callaway Golf Co. | | | 184,668 | | | | 4,433,879 | |
Carter’s, Inc. | | | 63,804 | | | | 6,002,042 | |
Crocs, Inc. (a) | | | 125,000 | | | | 7,832,500 | |
Deckers Outdoor Corp. (a) | | | 19,000 | | | | 5,448,820 | |
Fox Factory Holding Corp. (a) | | | 50,000 | | | | 5,285,500 | |
National Vision Holdings, Inc. (a) | | | 158,424 | | | | 7,175,023 | |
Planet Fitness, Inc., Class A (a) | | | 30,000 | | | | 2,328,900 | |
Williams-Sonoma, Inc. | | | 32,500 | | | | 3,309,800 | |
| | | | | | | | 41,816,464 | |
Consumer Staples: 7.2% |
BJ’s Wholesale Club Holdings, Inc. (a) | | | 115,000 | | | | 4,287,200 | |
Darling Ingredients, Inc. (a) | | | 165,000 | | | | 9,517,200 | |
Laird Superfood, Inc. (a)(b) | | | 60,000 | | | | 2,839,200 | |
Maple Leaf Foods, Inc. | | | 345,800 | | | | 7,666,334 | |
Simply Good Foods Co., The (a)(b) | | | 180,000 | | | | 5,644,800 | |
TreeHouse Foods, Inc. (a) | | | 85,000 | | | | 3,611,650 | |
| | | | | | | | 33,566,384 | |
Financials: 20.2% |
HomeTrust Bancshares, Inc. | | | 1,062,236 | | | | 20,511,777 | |
Meridian Bancorp, Inc. | | | 1,189,139 | | | | 17,730,062 | |
SuRo Capital Corp. (b) | | | 350,285 | | | | 4,585,231 | |
Victory Capital Holdings, Inc., Class A (b) | | | 1,063,234 | | | | 26,378,836 | |
Voya Financial, Inc. | | | 202,006 | | | | 11,879,973 | |
White Mountains Insurance Group, Ltd. | | | 13,335 | | | | 13,343,801 | |
| | | | | | | | 94,429,680 | |
Percent of Net Assets
Name of Issuer and
Title of Issue | | Shares/
Principal | | | Value | |
COMMON STOCKS, continued |
Health Care: 14.5% |
Coherus Biosciences, Inc. (a)(b) | | | 675,000 | | | $ | 11,731,500 | |
Exelixis, Inc. (a) | | | 250,000 | | | | 5,017,500 | |
Health Catalyst, Inc. (a)(b) | | | 200,000 | | | | 8,706,000 | |
Karuna Therapeutics, Inc. (a)(b) | | | 69,007 | | | | 7,010,421 | |
Ligand Pharmaceuticals, Inc. (a)(b) | | | 125,567 | | | | 12,487,638 | |
Natus Medical, Inc. (a) | | | 473,281 | | | | 9,484,551 | |
SI-BONE, Inc. (a) | | | 311,428 | | | | 9,311,697 | |
Vocera Communications, Inc. (a) | | | 90,790 | | | | 3,770,509 | |
| | | | | | | | 67,519,816 | |
Industrials: 17.8% |
AZEK Co Inc., The (a) | | | 135,000 | | | | 5,190,750 | |
CAE, Inc. | | | 220,000 | | | | 6,095,844 | |
Colfax Corp. (a) | | | 120,000 | | | | 4,588,800 | |
Comfort Systems USA, Inc. | | | 113,228 | | | | 5,962,586 | |
EMCOR Group, Inc. | | | 75,002 | | | | 6,859,683 | |
Evoqua Water Technologies Corp. (a) | | | 250,000 | | | | 6,745,000 | |
FTI Consulting, Inc. (a) | | | 25,000 | | | | 2,793,000 | |
Gates Industrial Corp PLC (a) | | | 361,910 | | | | 4,617,972 | |
Great Lakes Dredge & Dock Corp. (a) | | | 434,453 | | | | 5,721,746 | |
MasTec, Inc. (a) | | | 76,609 | | | | 5,223,202 | |
MRC Global, Inc. (a) | | | 1,153,702 | | | | 7,649,044 | |
MSA Safety, Inc. | | | 25,615 | | | | 3,826,625 | |
Quanex Building Products Corp. | | | 300,000 | | | | 6,651,000 | |
Thermon Group Holdings, Inc. (a) | | | 258,025 | | | | 4,032,931 | |
Vertiv Holdings Co. | | | 375,000 | | | | 7,001,250 | |
| | | | | | | | 82,959,433 | |
Information Technology: 13.9% |
8x8, Inc. (a) | | | 220,000 | | | | 7,583,400 | |
Ciena Corp. (a) | | | 94,129 | | | | 4,974,718 | |
Extreme Networks, Inc. (a) | | | 1,000,000 | | | | 6,890,000 | |
II-VI, Inc. (a)(b) | | | 100,000 | | | | 7,596,000 | |
Onto Innovation, Inc. (a) | | | 167,052 | | | | 7,943,323 | |
RealPage, Inc. (a) | | | 125,900 | | | | 10,983,515 | |
Semtech Corp. (a) | | | 66,591 | | | | 4,800,545 | |
Sprout Social, Inc., Class A (a) | | | 125,000 | | | | 5,676,250 | |
Workiva, Inc. (a) | | | 90,000 | | | | 8,245,800 | |
| | | | | | | | 64,693,551 | |
| | 69 | SEE NOTES TO FINANCIAL STATEMENTS |
December 31, 2020 |
Schedules of Investments, continued |
Pax Small Cap Fund, continued
Percent of Net Assets
Name of Issuer and
Title of Issue | | Shares/
Principal | | | Value | |
COMMON STOCKS, continued |
Materials: 1.0% |
Element Solutions, Inc. | | | 269,491 | | | $ | 4,778,075 | |
| |
Real Estate: 7.8% |
Altus Group, Ltd. | | | 100,000 | | | | 3,860,476 | |
CatchMark Timber Trust, Inc, Class A, REIT | | | 936,169 | | | | 8,762,542 | |
CubeSmart, REIT | | | 250,000 | | | | 8,402,500 | |
Healthcare Realty Trust, Inc., REIT | | | 300,720 | | | | 8,901,312 | |
Rayonier, Inc., REIT | | | 225,000 | | | | 6,610,500 | |
| | | | | | | | 36,537,330 | |
TOTAL COMMON STOCKS |
(Cost $367,874,946) | | | 446,205,840 | |
| | | | | | | | | |
MONEY MARKET: 3.2% |
State Street Institutional U.S. Government Money Market Fund, 0.030% (c)(d) | | | 14,701,471 | | | | 14,701,471 | |
(Cost $14,701,471) |
Percent of Net Assets
Name of Issuer and
Title of Issue | | Shares/
Principal | | | Value | |
SECURITIES PURCHASED WITH CASH COLLATERAL FROM SECURITIES LENDING: 3.6% |
State Street Navigator Securities Lending Government Money Market Portfolio, 0.101% (c)(d) | | | 16,801,446 | | | $ | 16,801,446 | |
(Cost $16,801,446) |
| | | | | | | | | |
TOTAL INVESTMENTS: 102.5% |
(Cost $399,377,863) | | | 477,708,757 | |
| | | | | | | | | |
PAYABLE UPON RETURN OF SECURITIES LOANED: -3.6% | | | (16,801,446 | ) |
| | | | | | | | | |
OTHER ASSETS AND LIABILITIES — (NET): 1.1% | | | 5,331,879 | |
| | | | | | | | | |
NET ASSETS: 100.0% | | $ | 466,239,190 | |
(a) | Non-income producing security. |
(b) | Security or partial position of this security was on loan as of December 31, 2020. The total market value of securities on loan as of December 31, 2020 was $42,798,518. |
(c) | Rate shown represents annualized 7-day yield as of December 31, 2020. |
REIT - Real Estate Investment Trust
SEE NOTES TO FINANCIAL STATEMENTS | 70 | |
December 31, 2020 |
Schedules of Investments, continued |
Pax ESG Beta Quality Fund
Percent of Net Assets
Name of Issuer and
Title of Issue | | Shares/
Principal | | | Value | |
COMMON STOCKS: 99.5% |
Communication Services: 10.5% |
Activision Blizzard, Inc. | | | 1,394 | | | $ | 129,433 | |
Alphabet, Inc., Class A (a) | | | 4,445 | | | | 7,790,485 | |
Alphabet, Inc., Class C (a) | | | 1,456 | | | | 2,550,737 | |
AT&T, Inc. | | | 43,979 | | | | 1,264,836 | |
Cable One, Inc. | | | 156 | | | | 347,524 | |
Comcast Corp., Class A | | | 43,817 | | | | 2,296,011 | |
Electronic Arts, Inc. | | | 4,567 | | | | 655,821 | |
Interpublic Group of Cos Inc., The | | | 24,831 | | | | 584,025 | |
Verizon Communications, Inc. | | | 117,779 | | | | 6,919,517 | |
ViacomCBS, Inc., Class B (b) | | | 75,438 | | | | 2,810,820 | |
Zynga, Inc., Class A (a) | | | 153,114 | | | | 1,511,235 | |
| | | | | | | | 26,860,444 | |
Consumer Discretionary: 11.8% |
Amazon.com, Inc. (a) | | | 3,036 | | | | 9,888,040 | |
AutoNation, Inc. (a) | | | 21,484 | | | | 1,499,368 | |
Best Buy Co., Inc. | | | 14,345 | | | | 1,431,488 | |
BorgWarner, Inc. | | | 13,632 | | | | 526,740 | |
Carter’s, Inc. | | | 1,782 | | | | 167,633 | |
Chipotle Mexican Grill, Inc. (a) | | | 336 | | | | 465,935 | |
Darden Restaurants, Inc. | | | 859 | | | | 102,324 | |
Dollar General Corp. | | | 2,211 | | | | 464,973 | |
Domino’s Pizza, Inc. | | | 1,185 | | | | 454,400 | |
eBay, Inc. | | | 14,854 | | | | 746,414 | |
Gentex Corp. | | | 8,073 | | | | 273,917 | |
Graham Holdings Co., Class B | | | 378 | | | | 201,618 | |
Grand Canyon Education, Inc. (a) | | | 11,918 | | | | 1,109,685 | |
Home Depot, Inc., The | | | 15,500 | | | | 4,117,110 | |
Lowe’s Cos., Inc. | | | 3,113 | | | | 499,668 | |
NIKE, Inc., Class B | | | 8,267 | | | | 1,169,532 | |
NVR, Inc. (a) | | | 77 | | | | 314,149 | |
Starbucks Corp. | | | 26,160 | | | | 2,798,597 | |
Target Corp. | | | 20,697 | | | | 3,653,641 | |
Tractor Supply Co. | | | 806 | | | | 113,307 | |
Williams-Sonoma, Inc. | | | 1,850 | | | | 188,404 | |
| | | | | | | | 30,186,943 | |
Consumer Staples: 7.0% |
Clorox Co., The | | | 5,691 | | | | 1,149,127 | |
Colgate-Palmolive Co. | | | 3,484 | | | | 297,917 | |
Estee Lauder Cos, Inc., The, Class A | | | 1,534 | | | | 408,335 | |
General Mills, Inc. | | | 29,116 | | | | 1,712,021 | |
Hershey Co., The | | | 6,551 | | | | 997,914 | |
J.M. Smucker Co., The | | | 6,378 | | | | 737,297 | |
Kellogg Co. | | | 915 | | | | 56,940 | |
Percent of Net Assets
Name of Issuer and
Title of Issue | | Shares/
Principal | | | Value | |
COMMON STOCKS, continued |
Consumer Staples, continued |
Kimberly-Clark Corp. | | | 20,933 | | | $ | 2,822,396 | |
Kroger Co., The | | | 76,245 | | | | 2,421,541 | |
PepsiCo, Inc. | | | 20,982 | | | | 3,111,631 | |
Procter & Gamble Co., The | | | 22,100 | | | | 3,074,994 | |
Sprouts Farmers Market, Inc. (a) | | | 28,966 | | | | 582,217 | |
Walgreens Boots Alliance, Inc. | | | 14,663 | | | | 584,760 | |
| | | | | | | | 17,957,090 | |
Financials: 9.4% |
Affiliated Managers Group, Inc. | | | 4,383 | | | | 445,751 | |
Aflac, Inc. | | | 52,059 | | | | 2,315,063 | |
Allstate Corp., The | | | 42,659 | | | | 4,689,503 | |
Ameriprise Financial, Inc. | | | 5,341 | | | | 1,037,917 | |
Bank of New York Mellon Corp., The | | | 24,845 | | | | 1,054,422 | |
FactSet Research Systems, Inc. | | | 379 | | | | 126,018 | |
Hartford Financial Services Group, Inc., The | | | 20,174 | | | | 988,123 | |
Invesco, Ltd. | | | 4,576 | | | | 79,760 | |
LPL Financial Holdings, Inc. | | | 13,777 | | | | 1,435,839 | |
MarketAxess Holdings, Inc. | | | 1,426 | | | | 813,619 | |
MetLife, Inc. | | | 96,328 | | | | 4,522,600 | |
Morningstar, Inc. | | | 9,932 | | | | 2,299,952 | |
PNC Financial Services Group, Inc., The | | | 1,970 | | | | 293,530 | |
Progressive Corp., The | | | 11,722 | | | | 1,159,071 | |
Unum Group | | | 126,513 | | | | 2,902,208 | |
| | | | | | | | 24,163,376 | |
Health Care: 16.0% |
AbbVie, Inc. | | | 15,652 | | | | 1,677,112 | |
Agilent Technologies, Inc. | | | 17,334 | | | | 2,053,906 | |
Amgen, Inc. | | | 8,492 | | | | 1,952,481 | |
Anthem, Inc. | | | 2,937 | | | | 943,041 | |
Biogen, Inc. (a) | | | 4,123 | | | | 1,009,558 | |
Bio-Rad Laboratories, Inc., Class A (a) | | | 848 | | | | 494,333 | |
Bristol-Myers Squibb Co. | | | 53,886 | | | | 3,342,549 | |
Cerner Corp. | | | 25,279 | | | | 1,983,896 | |
CVS Health Corp. | | | 33,961 | | | | 2,319,536 | |
DaVita, Inc. (a) | | | 3,978 | | | | 467,017 | |
Eli Lilly & Co. | | | 13,746 | | | | 2,320,875 | |
HCA Healthcare, Inc. | | | 24,646 | | | | 4,053,281 | |
Hill-Rom Holdings, Inc. | | | 1,637 | | | | 160,377 | |
| | 71 | SEE NOTES TO FINANCIAL STATEMENTS |
December 31, 2020 |
Schedules of Investments, continued |
Pax ESG Beta Quality Fund, continued
Percent of Net Assets
Name of Issuer and
Title of Issue | | Shares/
Principal | | | Value | |
COMMON STOCKS, continued |
Health Care, continued |
Humana, Inc. | | | 705 | | | $ | 289,240 | |
Johnson & Johnson | | | 36,360 | | | | 5,722,337 | |
Merck & Co., Inc. | | | 24,224 | | | | 1,981,523 | |
Pfizer, Inc. | | | 15,824 | | | | 582,481 | |
Thermo Fisher Scientific, Inc. | | | 14,287 | | | | 6,654,599 | |
UnitedHealth Group, Inc. | | | 8,303 | | | | 2,911,696 | |
| | | | | | | | 40,919,838 | |
Industrials: 8.3% |
Acuity Brands, Inc. | | | 96 | | | | 11,625 | |
C.H. Robinson Worldwide, Inc. | | | 8,910 | | | | 836,382 | |
Cummins, Inc. | | | 7,291 | | | | 1,655,786 | |
Emerson Electric Co. | | | 7,953 | | | | 639,183 | |
Expeditors International of Washington, Inc. | | | 1,330 | | | | 126,496 | |
Landstar System, Inc. | | | 22,520 | | | | 3,032,543 | |
MSC Industrial Direct Co., Inc., Class A | | | 7,534 | | | | 635,794 | |
Old Dominion Freight Line, Inc. | | | 4,761 | | | | 929,252 | |
PACCAR, Inc. | | | 9,240 | | | | 797,227 | |
Quanta Services, Inc. | | | 27,743 | | | | 1,998,051 | |
Roper Technologies, Inc. | | | 7,422 | | | | 3,199,550 | |
United Parcel Service, Inc., Class B | | | 11,527 | | | | 1,941,147 | |
United Rentals, Inc. (a) | | | 15,184 | | | | 3,521,322 | |
W.W. Grainger, Inc. | | | 845 | | | | 345,047 | |
Waste Management, Inc. | | | 13,039 | | | | 1,537,689 | |
| | | | | | | | 21,207,094 | |
Information Technology: 30.0% (c) |
Accenture PLC, Class A | | | 6,685 | | | | 1,746,189 | |
Adobe, Inc. (a) | | | 1,633 | | | | 816,696 | |
Akamai Technologies, Inc. (a) | | | 12,023 | | | | 1,262,295 | |
Apple, Inc. | | | 115,672 | | | | 15,348,517 | |
Autodesk, Inc. (a) | | | 7,622 | | | | 2,327,301 | |
Booz Allen Hamilton Holding Corp. | | | 2,506 | | | | 218,473 | |
Broadcom, Inc. | | | 3,580 | | | | 1,567,503 | |
Cadence Design Systems, Inc. (a) | | | 12,603 | | | | 1,719,427 | |
CDK Global, Inc. | | | 3,795 | | | | 196,695 | |
CDW Corp. | | | 1,459 | | | | 192,282 | |
Cisco Systems, Inc. | | | 33,712 | | | | 1,508,612 | |
Citrix Systems, Inc. | | | 18,830 | | | | 2,449,783 | |
Cognizant Technology Solutions Corp., Class A | | | 24,303 | | | | 1,991,631 | |
Percent of Net Assets
Name of Issuer and
Title of Issue | | Shares/
Principal | | | Value | |
COMMON STOCKS, continued |
Information Technology, continued |
Dell Technologies, Inc., Class C (a) | | | 6,601 | | | $ | 483,787 | |
DocuSign, Inc. (a) | | | 2,686 | | | | 597,098 | |
F5 Networks, Inc. (a) | | | 3,349 | | | | 589,223 | |
HP, Inc. | | | 41,184 | | | | 1,012,715 | |
IBM | | | 11,932 | | | | 1,502,000 | |
Intel Corp. | | | 60,776 | | | | 3,027,860 | |
Intuit, Inc. | | | 2,033 | | | | 772,235 | |
Jack Henry & Associates, Inc. | | | 4,534 | | | | 734,463 | |
Manhattan Associates, Inc. (a) | | | 10,612 | | | | 1,116,170 | |
Marvell Technology Group, Ltd. | | | 11,924 | | | | 566,867 | |
MasterCard, Inc., Class A | | | 11,041 | | | | 3,940,975 | |
Microsoft Corp. | | | 53,649 | | | | 11,932,610 | |
NCR Corp. (a) | | | 13,621 | | | | 511,741 | |
Nuance Communications, Inc. (a) | | | 38,297 | | | | 1,688,515 | |
NVIDIA Corp. | | | 2,073 | | | | 1,082,521 | |
Oracle Corp. | | | 26,256 | | | | 1,698,501 | |
PTC, Inc. (a) | | | 3,228 | | | | 386,101 | |
Seagate Technology PLC | | | 4,289 | | | | 266,604 | |
ServiceNow, Inc. (a) | | | 2,085 | | | | 1,147,647 | |
Skyworks Solutions, Inc. | | | 2,756 | | | | 421,337 | |
Synopsys, Inc. (a) | | | 7,939 | | | | 2,058,106 | |
Texas Instruments, Inc. | | | 44,149 | | | | 7,246,175 | |
Visa, Inc., Class A | | | 7,634 | | | | 1,669,785 | |
VMware, Inc., Class A (a)(b) | | | 1,680 | | | | 235,637 | |
Western Union Co., The | | | 36,327 | | | | 797,014 | |
Zscaler, Inc. (a) | | | 1,048 | | | | 209,296 | |
| | | | | | | | 77,040,387 | |
Materials: 2.2% |
Air Products & Chemicals, Inc. | | | 997 | | | | 272,400 | |
Eastman Chemical Co. | | | 3,602 | | | | 361,209 | |
Ecolab, Inc. | | | 602 | | | | 130,249 | |
Linde PLC | | | 7,594 | | | | 2,001,095 | |
LyondellBasell Industries NV, Class A | | | 21,161 | | | | 1,939,616 | |
Newmont Corp. | | | 4,046 | | | | 242,315 | |
Royal Gold, Inc. | | | 7,083 | | | | 753,348 | |
Sonoco Products Co. | | | 258 | | | | 15,287 | |
| | | | | | | | 5,715,519 | |
SEE NOTES TO FINANCIAL STATEMENTS | 72 | |
December 31, 2020 |
Schedules of Investments, continued |
Pax ESG Beta Quality Fund, continued
Percent of Net Assets
Name of Issuer and
Title of Issue | | Shares/
Principal | | | Value | |
COMMON STOCKS, continued |
Real Estate: 2.1% |
Boston Properties, Inc., REIT | | | 3,255 | | | $ | 307,695 | |
CBRE Group, Inc., Class A (a) | | | 45,500 | | | | 2,853,760 | |
Omega Healthcare Investors, Inc., REIT | | | 1,115 | | | | 40,497 | |
Paramount Group, Inc., REIT | | | 119,588 | | | | 1,081,075 | |
Public Storage, REIT | | | 2,717 | | | | 627,437 | |
Simon Property Group, Inc., REIT | | | 4,757 | | | | 405,677 | |
| | | | | | | | 5,316,141 | |
Utilities: 2.2% |
American Water Works Co., Inc. | | | 16,628 | | | | 2,551,899 | |
Eversource Energy | | | 3,182 | | | | 275,275 | |
NextEra Energy, Inc. | | | 35,908 | | | | 2,770,302 | |
Southern Co., The | | | 222 | | | | 13,638 | |
| | | | | | | | 5,611,114 | |
TOTAL COMMON STOCKS |
(Cost $122,361,621) | | | 254,977,946 | |
| | | | | | | | | |
Percent of Net Assets
Name of Issuer and
Title of Issue | | Shares/
Principal | | | Value | |
MONEY MARKET: 0.7% |
State Street Institutional U.S. Government Money Market Fund, 0.030% (d)(e) | | | 1,674,507 | | | $ | 1,674,507 | |
(Cost $1,674,507) |
| | | | | | | | | |
TOTAL INVESTMENTS: 100.2% |
(Cost $124,036,128) | | | 256,652,453 | |
| | | | | | | | | |
OTHER ASSETS AND LIABILITIES — (NET): -0.2% | | | (437,697 | ) |
| | | | | | | | | |
NET ASSETS: 100.0% | | $ | 256,214,756 | |
(a) | Non-income producing security. |
(b) | Security or partial position of this security was on loan as of December 31, 2020. The total market value of securities on loan as of December 31, 2020 was $2,980,114. |
(c) | Broad industry sectors used for financial reporting. |
(d) | Rate shown represents annualized 7-day yield as of December 31, 2020. |
REIT - Real Estate Investment Trust
| | 73 | SEE NOTES TO FINANCIAL STATEMENTS |
December 31, 2020 |
Schedules of Investments, continued |
Pax ESG Beta Dividend Fund
Percent of Net Assets
Name of Issuer and
Title of Issue | | Shares/
Principal | | | Value | |
COMMON STOCKS: 98.9% |
Communication Services: 6.6% |
Activision Blizzard, Inc. | | | 849 | | | $ | 78,830 | |
Alphabet, Inc., Class A (a) | | | 1,780 | | | | 3,119,699 | |
AT&T, Inc. | | | 54,455 | | | | 1,566,126 | |
Interpublic Group of Cos Inc., The | | | 48,146 | | | | 1,132,394 | |
New York Times Co., The, Class A | | | 3,648 | | | | 188,857 | |
Omnicom Group, Inc. | | | 2,390 | | | | 149,064 | |
Verizon Communications, Inc. | | | 41,793 | | | | 2,455,339 | |
Zillow Group, Inc., Class A (a) | | | 896 | | | | 121,802 | |
Zynga, Inc., Class A (a) | | | 50,168 | | | | 495,158 | |
| | | | | | | | 9,307,269 | |
Consumer Discretionary: 12.5% |
Amazon.com, Inc. (a) | | | 1,657 | | | | 5,396,734 | |
Aptiv PLC | | | 1,253 | | | | 163,253 | |
Best Buy Co., Inc. | | | 12,132 | | | | 1,210,652 | |
Chipotle Mexican Grill, Inc. (a) | | | 569 | | | | 789,038 | |
Darden Restaurants, Inc. | | | 4,665 | | | | 555,695 | |
Etsy, Inc. (a) | | | 5,706 | | | | 1,015,154 | |
Genuine Parts Co. | | | 803 | | | | 80,645 | |
Home Depot, Inc., The | | | 12,563 | | | | 3,336,985 | |
Lowe’s Cos., Inc. | | | 1,450 | | | | 232,740 | |
Newell Brands, Inc. | | | 17,979 | | | | 381,694 | |
NVR, Inc. (a) | | | 21 | | | | 85,677 | |
Polaris, Inc. | | | 2,062 | | | | 196,467 | |
Starbucks Corp. | | | 4,542 | | | | 485,903 | |
Target Corp. | | | 15,603 | | | | 2,754,398 | |
Wayfair, Inc., Class A (a)(b) | | | 1,346 | | | | 303,940 | |
Whirlpool Corp. | | | 2,390 | | | | 431,371 | |
Williams-Sonoma, Inc. | | | 1,185 | | | | 120,680 | |
| | | | | | | | 17,541,026 | |
Consumer Staples: 5.9% |
Clorox Co., The | | | 751 | | | | 151,642 | |
Coca-Cola Co., The | | | 11,683 | | | | 640,696 | |
Colgate-Palmolive Co. | | | 12,047 | | | | 1,030,138 | |
General Mills, Inc. | | | 318 | | | | 18,698 | |
Hershey Co., The | | | 827 | | | | 125,977 | |
Kimberly-Clark Corp. | | | 6,445 | | | | 868,979 | |
PepsiCo, Inc. | | | 10,447 | | | | 1,549,290 | |
Procter & Gamble Co., The | | | 21,163 | | | | 2,944,620 | |
Sysco Corp. | | | 9,299 | | | | 690,544 | |
US Foods Holding Corp. (a) | | | 2,149 | | | | 71,583 | |
Walgreens Boots Alliance, Inc. | | | 3,831 | | | | 152,781 | |
| | | | | | | | 8,244,948 | |
Percent of Net Assets
Name of Issuer and
Title of Issue | | Shares/
Principal | | | Value | |
COMMON STOCKS, continued |
Financials: 7.7% |
Aflac, Inc. | | | 14,684 | | | $ | 652,997 | |
American Financial Group, Inc. | | | 36,450 | | | | 3,193,749 | |
American International Group, Inc. | | | 1,053 | | | | 39,867 | |
Comerica, Inc. | | | 23,202 | | | | 1,296,064 | |
FactSet Research Systems, Inc. | | | 1,387 | | | | 461,178 | |
Hartford Financial Services Group, Inc., The | | | 4,435 | | | | 217,226 | |
LPL Financial Holdings, Inc. | | | 507 | | | | 52,840 | |
MetLife, Inc. | | | 7,473 | | | | 350,857 | |
Morningstar, Inc. | | | 2,669 | | | | 618,060 | |
OneMain Holdings, Inc. | | | 945 | | | | 45,511 | |
PNC Financial Services Group, Inc., The | | | 376 | | | | 56,024 | |
Progressive Corp., The | | | 4,025 | | | | 397,992 | |
Prudential Financial, Inc. | | | 42,414 | | | | 3,311,261 | |
Regions Financial Corp. | | | 3,493 | | | | 56,307 | |
| | | | | | | | 10,749,933 | |
Health Care: 13.1% |
Abbott Laboratories | | | 5,888 | | | | 644,677 | |
AbbVie, Inc. | | | 23,827 | | | | 2,553,063 | |
Align Technology, Inc. (a) | | | 937 | | | | 500,714 | |
Amgen, Inc. | | | 6,187 | | | | 1,422,515 | |
Bristol-Myers Squibb Co. | | | 1,580 | | | | 98,007 | |
Cardinal Health, Inc. | | | 21,539 | | | | 1,153,629 | |
Cerner Corp. | | | 13,509 | | | | 1,060,186 | |
Eli Lilly & Co. | | | 9,554 | | | | 1,613,097 | |
HCA Healthcare, Inc. | | | 3,565 | | | | 586,300 | |
Humana, Inc. | | | 2,872 | | | | 1,178,295 | |
IDEXX Laboratories, Inc. (a) | | | 348 | | | | 173,955 | |
Johnson & Johnson | | | 23,529 | | | | 3,702,995 | |
Medtronic PLC | | | 1,862 | | | | 218,115 | |
Merck & Co., Inc. | | | 18,580 | | | | 1,519,844 | |
UnitedHealth Group, Inc. | | | 4,231 | | | | 1,483,727 | |
Veeva Systems, Inc., Class A (a) | | | 403 | | | | 109,717 | |
West Pharmaceutical Services, Inc. | | | 985 | | | | 279,060 | |
| | | | | | | | 18,297,896 | |
Industrials: 8.9% |
C.H. Robinson Worldwide, Inc. | | | 2,433 | | | | 228,386 | |
Cummins, Inc. | | | 5,957 | | | | 1,352,834 | |
Eaton Corp PLC | | | 12,276 | | | | 1,474,839 | |
Emerson Electric Co. | | | 12,298 | | | | 988,390 | |
SEE NOTES TO FINANCIAL STATEMENTS | 74 | |
December 31, 2020 |
Schedules of Investments, continued |
Pax ESG Beta Dividend Fund, continued
Percent of Net Assets
Name of Issuer and
Title of Issue | | Shares/
Principal | | | Value | |
COMMON STOCKS, continued |
Industrials, continued |
Fastenal Co. | | | 18,747 | | | $ | 915,416 | |
Hubbell, Inc. | | | 1,907 | | | | 298,999 | |
Illinois Tool Works, Inc. | | | 5,300 | | | | 1,080,564 | |
Landstar System, Inc. | | | 2,195 | | | | 295,579 | |
MSC Industrial Direct Co., Inc., Class A | | | 9,336 | | | | 787,865 | |
Old Dominion Freight Line, Inc. | | | 548 | | | | 106,959 | |
Quanta Services, Inc. | | | 2,171 | | | | 156,355 | |
Robert Half International, Inc. | | | 12,299 | | | | 768,442 | |
Rockwell Automation, Inc. | | | 2,437 | | | | 611,224 | |
Ryder System, Inc. | | | 19,429 | | | | 1,199,935 | |
Trane Technologies PLC | | | 1,638 | | | | 237,772 | |
Union Pacific Corp. | | | 1,059 | | | | 220,505 | |
United Parcel Service, Inc., Class B | | | 3,544 | | | | 596,810 | |
W.W. Grainger, Inc. | | | 1,583 | | | | 646,402 | |
Waste Management, Inc. | | | 3,509 | | | | 413,816 | |
XPO Logistics, Inc. (a) | | | 741 | | | | 88,327 | |
| | | | | | | | 12,469,419 | |
Information Technology: 32.5% (c) |
Accenture PLC, Class A | | | 7,140 | | | | 1,865,039 | |
Adobe, Inc. (a) | | | 3,019 | | | | 1,509,862 | |
Anaplan, Inc. (a) | | | 987 | | | | 70,916 | |
Apple, Inc. | | | 63,274 | | | | 8,395,826 | |
Autodesk, Inc. (a) | | | 6,168 | | | | 1,883,337 | |
Automatic Data Processing, Inc. | | | 3,912 | | | | 689,294 | |
Broadcom, Inc. | | | 5,226 | | | | 2,288,204 | |
Cadence Design Systems, Inc. (a) | | | 6,980 | | | | 952,281 | |
Cisco Systems, Inc. | | | 67,638 | | | | 3,026,801 | |
Citrix Systems, Inc. | | | 7,533 | | | | 980,043 | |
Cognizant Technology Solutions Corp., Class A | | | 6,263 | | | | 513,253 | |
Corning, Inc. | | | 3,851 | | | | 138,636 | |
DocuSign, Inc. (a) | | | 1,975 | | | | 439,043 | |
IBM | | | 7,618 | | | | 958,954 | |
Intel Corp. | | | 20,318 | | | | 1,012,243 | |
Intuit, Inc. | | | 802 | | | | 304,640 | |
Jack Henry & Associates, Inc. | | | 4,736 | | | | 767,185 | |
Manhattan Associates, Inc. (a) | | | 4,066 | | | | 427,662 | |
Maxim Integrated Products, Inc. | | | 12,452 | | | | 1,103,870 | |
Percent of Net Assets
Name of Issuer and
Title of Issue | | Shares/
Principal | | | Value | |
COMMON STOCKS, continued |
Information Technology, continued |
Microsoft Corp. | | | 29,273 | | | $ | 6,510,900 | |
National Instruments Corp. | | | 1,118 | | | | 49,125 | |
NortonLifeLock, Inc. | | | 2,009 | | | | 41,747 | |
NVIDIA Corp. | | | 2,107 | | | | 1,100,275 | |
Paychex, Inc. | | | 17,865 | | | | 1,664,661 | |
PayPal Holdings Inc (a) | | | 4,823 | | | | 1,129,547 | |
QUALCOMM, Inc. | | | 2,781 | | | | 423,658 | |
Seagate Technology PLC | | | 6,694 | | | | 416,099 | |
ServiceNow, Inc. (a) | | | 1,916 | | | | 1,054,624 | |
Skyworks Solutions, Inc. | | | 2,792 | | | | 426,841 | |
Square, Inc., Class A (a) | | | 1,785 | | | | 388,487 | |
Texas Instruments, Inc. | | | 25,306 | | | | 4,153,474 | |
Western Union Co., The | | | 33,858 | | | | 742,845 | |
Workday, Inc., Class A (a) | | | 292 | | | | 69,966 | |
Zscaler, Inc. (a) | | | 254 | | | | 50,726 | |
| | | | | | | | 45,550,064 | |
Materials: 5.6% |
Air Products & Chemicals, Inc. | | | 3,006 | | | | 821,299 | |
Cabot Corp. | | | 10,549 | | | | 473,439 | |
Eastman Chemical Co. | | | 9,515 | | | | 954,164 | |
Ecolab, Inc. | | | 1,088 | | | | 235,400 | |
International Paper Co. | | | 50,331 | | | | 2,502,458 | |
LyondellBasell Industries NV, Class A | | | 23,736 | | | | 2,175,642 | |
Sonoco Products Co. | | | 10,939 | | | | 648,136 | |
WestRock Co. | | | 2,114 | | | | 92,022 | |
| | | | | | | | 7,902,560 | |
Real Estate: 5.7% |
American Campus Communities, Inc., REIT | | | 17,430 | | | | 745,481 | |
AvalonBay Communities, Inc., REIT | | | 4,453 | | | | 714,395 | |
Boston Properties, Inc., REIT | | | 847 | | | | 80,067 | |
Crown Castle International Corp., REIT | | | 378 | | | | 60,174 | |
CubeSmart, REIT | | | 8,804 | | | | 295,902 | |
Healthpeak Properties, Inc., REIT | | | 49,970 | | | | 1,510,592 | |
Highwoods Properties, Inc., REIT | | | 5,149 | | | | 204,055 | |
Iron Mountain, Inc., REIT (b) | | | 8,369 | | | | 246,718 | |
Lamar Advertising Co., Class A, REIT | | | 11,249 | | | | 936,142 | |
| | 75 | SEE NOTES TO FINANCIAL STATEMENTS |
December 31, 2020 |
Schedules of Investments, continued |
Pax ESG Beta Dividend Fund, continued
Percent of Net Assets
Name of Issuer and
Title of Issue | | Shares/
Principal | | | Value | |
COMMON STOCKS, continued |
Real Estate, continued |
Omega Healthcare Investors, Inc., REIT | | | 27,551 | | | $ | 1,000,652 | |
Public Storage, REIT | | | 3,334 | | | | 769,921 | |
Realty Income Corp., REIT | | | 9,086 | | | | 564,877 | |
Simon Property Group, Inc., REIT | | | 1,004 | | | | 85,621 | |
VICI Properties, Inc., REIT | | | 416 | | | | 10,608 | |
Welltower, Inc., REIT | | | 10,827 | | | | 699,641 | |
| | | | | | | | 7,924,846 | |
Utilities: 0.4% |
Exelon Corp. | | | 5,498 | | | | 232,126 | |
Public Service Enterprise Group, Inc. | | | 2,851 | | | | 166,213 | |
Southern Co., The | | | 1,897 | | | | 116,533 | |
| | | | | | | | 514,872 | |
TOTAL COMMON STOCKS |
(Cost $80,730,777) | | | 138,502,833 | |
| | | | | | | | | |
Percent of Net Assets
Name of Issuer and
Title of Issue | | Shares/
Principal | | Value |
| MONEY MARKET: 1.0% |
| State Street Institutional U.S. Government Money Market Fund, 0.030% (d)(e) | | | 1,432,650 | | | $ | 1,432,650 | |
| | | | | | | | | |
| (Cost $1,432,650) |
| | | | | | | | | |
| TOTAL INVESTMENTS: 99.9% |
| (Cost $82,163,427) | | | | | | | 139,935,483 | |
| | | | | | | | | |
| OTHER ASSETS AND LIABILITIES — (NET): 0.1% | | | | | | | 114,668 | |
| | | | | | | | | |
| NET ASSETS: 100.0% | | | | | | $ | 140,050,151 | |
(a) | Non-income producing security. |
(b) | Security or partial position of this security was on loan as of December 31, 2020. The total market value of securities on loan as of December 31, 2020 was $545,239. |
(c) | Broad industry sectors used for financial reporting. |
(d) | Rate shown represents annualized 7-day yield as of December 31, 2020. |
REIT - Real Estate Investment Trust
SEE NOTES TO FINANCIAL STATEMENTS | 76 | |
December 31, 2020 |
Schedules of Investments, continued |
Pax Global Opportunities Fund
Percent of Net Assets
Name of Issuer and
Title of Issue | | Shares/
Principal | | | Value | |
COMMON STOCKS: 98.4% |
Communication Services: 1.9% |
KDDI Corp. | | | 44,900 | | | $ | 1,331,296 | |
| | | | | | | | | |
Consumer Discretionary: 2.3% |
Aptiv PLC | | | 11,887 | | | | 1,548,757 | |
| | | | | | | | | |
Consumer Staples: 7.3% |
Danone SA | | | 20,776 | | | | 1,367,188 | |
Jeronimo Martins SGPS SA | | | 95,563 | | | | 1,606,387 | |
Unilever PLC | | | 20,649 | | | | 1,250,319 | |
Vitasoy International Holdings, Ltd. | | | 202,000 | | | | 786,824 | |
| | | | | | | | 5,010,718 | |
Financials: 13.9% |
AIA Group, Ltd. | | | 209,200 | | | | 2,549,337 | |
Bandhan Bank, Ltd. (a) | | | 240,034 | | | | 1,323,852 | |
HDFC Bank, Ltd., ADR (a) | | | 33,840 | | | | 2,445,278 | |
Hiscox, Ltd. | | | 108,592 | | | | 1,478,780 | |
Prudential PLC | | | 99,354 | | | | 1,826,918 | |
| | | | | | | | 9,624,165 | |
Health Care: 20.8% |
Alexion Pharmaceuticals, Inc. (a) | | | 10,455 | | | | 1,633,489 | |
Becton Dickinson & Co. | | | 5,546 | | | | 1,387,720 | |
Danaher Corp. | | | 5,962 | | | | 1,324,399 | |
Evotec SE (a) | | | 65,202 | | | | 2,409,337 | |
Grifols SA, ADR | | | 76,656 | | | | 1,413,537 | |
IQVIA Holdings, Inc. (a) | | | 14,301 | | | | 2,562,310 | |
Lonza Group AG | | | 2,669 | | | | 1,719,280 | |
Thermo Fisher Scientific, Inc. | | | 4,107 | | | | 1,912,958 | |
| | | | | | | | 14,363,030 | |
Industrials: 10.0% |
IDEX Corp. | | | 6,761 | | | | 1,346,791 | |
Kingspan Group PLC | | | 9,749 | | | | 683,626 | |
Kubota Corp. | | | 89,900 | | | | 1,964,101 | |
Verisk Analytics, Inc. | | | 6,246 | | | | 1,296,607 | |
Xylem, Inc. | | | 16,006 | | | | 1,629,251 | |
| | | | | | | | 6,920,376 | |
Information Technology: 27.2% (b) |
ASML Holding NV | | | 2,842 | | | | 1,376,031 | |
Cadence Design Systems, Inc. (a) | | | 16,816 | | | | 2,294,207 | |
IPG Photonics Corp. (a) | | | 6,248 | | | | 1,398,240 | |
Keyence Corp. | | | 3,150 | | | | 1,771,927 | |
MasterCard, Inc., Class A | | | 7,066 | | | | 2,522,138 | |
Microsoft Corp. | | | 12,343 | | | | 2,745,331 | |
Percent of Net Assets
Name of Issuer and
Title of Issue | | Shares/
Principal | | | Value | |
COMMON STOCKS, continued |
Information Technology, continued |
Taiwan Semiconductor Manufacturing Co, Ltd. | | | 131,000 | | | $ | 2,478,187 | |
TE Connectivity, Ltd. | | | 11,675 | | | | 1,413,492 | |
TeamViewer AG (a) | | | 21,322 | | | | 1,145,362 | |
Visa, Inc., Class A | | | 7,545 | | | | 1,650,318 | |
| | | | | | | | 18,795,233 | |
Materials: 11.9% |
Croda International PLC | | | 18,053 | | | | 1,623,505 | |
Ecolab, Inc. | | | 9,623 | | | | 2,082,032 | |
Koninklijke DSM NV | | | 10,804 | | | | 1,857,977 | |
Linde PLC | | | 9,980 | | | | 2,629,830 | |
| | | | | | | | 8,193,344 | |
Real Estate: 3.1% |
Equinix, Inc., REIT | | | 2,974 | | | | 2,123,971 | |
| | | | | | | | | |
TOTAL COMMON STOCKS |
(Cost $49,490,682) | | | 67,910,890 | |
| | | | | | | | | |
MONEY MARKET: 1.7% |
State Street Institutional U.S. Government Money Market Fund, 0.030% (c)(d) | | | 1,174,705 | | | | 1,174,705 | |
(Cost $1,174,705) |
| | | | | | | | | |
TOTAL INVESTMENTS: 100.1% |
(Cost $50,665,387) | | | 69,085,595 | |
| | | | | | | | | |
OTHER ASSETS AND LIABILITIES — (NET): -0.1% | | | (40,131 | ) |
| | | | | | | | | |
NET ASSETS: 100.0% | | $ | 69,045,464 | |
(a) | Non-income producing security. |
(b) | Broad industry sectors used for financial reporting. |
(c) | Rate shown represents annualized 7-day yield as of December 31, 2020. |
REIT - Real Estate Investment Trust
| | 77 | SEE NOTES TO FINANCIAL STATEMENTS |
December 31, 2020 |
Schedules of Investments, continued |
Pax Global Opportunities Fund, continued
SUMMARY OF INVESTMENTS BY COUNTRY
Country | | Value | | | Percent Of
Net Assets | |
France | | $ | 1,367,188 | | | | 2.0 | % |
Germany | | | 3,554,698 | | | | 5.2 | % |
Hong Kong | | | 3,336,160 | | | | 4.8 | % |
India | | | 3,769,131 | | | | 5.5 | % |
Ireland | | | 683,626 | | | | 1.0 | % |
Japan | | | 5,067,325 | | | | 7.3 | % |
Netherlands | | | 3,234,008 | | | | 4.7 | % |
Portugal | | | 1,606,386 | | | | 2.3 | % |
Spain | | | 1,413,537 | | | | 2.0 | % |
Switzerland | | | 1,719,280 | | | | 2.5 | % |
Taiwan | | | 2,478,187 | | | | 3.6 | % |
United Kingdom | | | 6,179,523 | | | | 9.0 | % |
United States | | | 33,501,841 | | | | 48.5 | % |
Money Market | | | 1,174,705 | | | | 1.7 | % |
Other assets and liabilities (net) | | | (40,131 | ) | | | -0.1 | % |
TOTAL | | $ | 69,045,464 | | | | 100.0 | % |
SEE NOTES TO FINANCIAL STATEMENTS | 78 | |
December 31, 2020 |
Schedules of Investments, continued |
Pax Global Environmental Markets Fund
Percent of Net Assets
Name of Issuer and
Title of Issue | | Shares/
Principal | | | Value | |
COMMON STOCKS: 96.3% |
RENEWABLE & ALTERNATIVE ENERGY: 1.1% |
Renewable Energy Developers & Independent Power Producers (Ipps): 1.1% |
Orsted A/S | | | 88,156 | | | $ | 18,037,175 | |
| |
ENERGY EFFICIENCY: 37.9% |
Power Network Efficiency: 5.2% |
Hubbell, Inc. | | | 245,176 | | | | 38,441,145 | |
Schneider Electric SE | | | 325,448 | | | | 47,036,159 | |
| | | | | | | | 85,477,304 | |
Industrial Energy Efficiency: 17.9% |
ANSYS, Inc. (a) | | | 111,085 | | | | 40,412,723 | |
ASML Holding NV | | | 35,108 | | | | 16,998,485 | |
Delta Electronics, Inc. | | | 3,733,475 | | | | 35,012,294 | |
Equinix, Inc., REIT | | | 44,678 | | | | 31,908,134 | |
Keyence Corp. | | | 43,500 | | | | 24,469,471 | |
PTC, Inc. (a) | | | 262,227 | | | | 31,364,971 | |
Rockwell Automation, Inc. | | | 124,902 | | | | 31,326,671 | |
SAP SE | | | 182,522 | | | | 23,640,008 | |
Siemens AG | | | 281,635 | | | | 40,568,508 | |
Spirax-Sarco Engineering, PLC | | | 105,214 | | | | 16,241,245 | |
| | | | | | | | 291,942,510 | |
Buildings Energy Efficiency: 6.3% |
Autodesk, Inc. (a) | | | 147,796 | | | | 45,128,030 | |
Kingspan Group PLC | | | 298,269 | | | | 20,915,432 | |
Trane Technologies PLC | | | 247,991 | | | | 35,998,374 | |
| | | | | | | | 102,041,836 | |
Transport Energy Efficiency: 8.5% |
Aptiv PLC | | | 297,418 | | | | 38,750,591 | |
TE Connectivity, Ltd. | | | 218,986 | | | | 26,512,635 | |
TeamViewer AG (a) | | | 460,545 | | | | 24,739,276 | |
Umicore SA | | | 444,868 | | | | 21,382,608 | |
Zhuzhou CRRC Times Electric Co. Ltd. | | | 6,139,300 | | | | 26,826,444 | |
| | | | | | | | 138,211,554 | |
| |
WATER INFRASTRUCTURE & TECHNOLOGIES: 21.8% |
Water Infrastructure: 10.5% |
Ferguson PLC | | | 199,210 | | | | 24,204,101 | |
Georg Fischer AG | | | 19,224 | | | | 24,810,871 | |
IDEX Corp. | | | 262,024 | | | | 52,195,181 | |
Pentair PLC | | | 660,784 | | | | 35,081,023 | |
Xylem, Inc. | | | 348,704 | | | | 35,494,580 | |
| | | | | | | | 171,785,756 | |
Water Treatment Equipment: 2.2% |
Ecolab, Inc. | | | 165,661 | | | | 35,842,414 | |
Percent of Net Assets
Name of Issuer and
Title of Issue | | Shares/
Principal | | | Value | |
COMMON STOCKS, continued |
WATER INFRASTRUCTURE & TECHNOLOGIES, continued |
Water Utilities: 8.2% |
American Water Works Co., Inc. | | | 346,278 | | | $ | 53,143,285 | |
Beijing Enterprises Water Group, Ltd. (a) | | | 22,236,000 | | | | 8,945,785 | |
Pennon Group PLC | | | 2,516,248 | | | | 32,567,718 | |
Suez | | | 1,935,246 | | | | 38,355,154 | |
| | | | | | | | 133,011,942 | |
Diversified Water Infrastructure & Technology: 0.9% |
Danaher Corp. | | | 63,416 | | | | 14,087,230 | |
| |
POLLUTION CONTROL: 9.9% |
Pollution Control Solutions: 1.5% |
Croda International PLC | | | 278,983 | | | | 25,088,922 | |
| |
Environmental Testing & Gas Sensing: 8.4% |
Agilent Technologies, Inc. | | | 435,165 | | | | 51,562,701 | |
Halma PLC | | | 257,312 | | | | 8,617,446 | |
Intertek Group PLC | | | 490,028 | | | | 37,849,875 | |
Waters Corp. (a) | | | 159,414 | | | | 39,442,212 | |
| | | | | | | | 137,472,234 | |
| |
WASTE MANAGEMENT & TECHNOLOGIES: 3.2% |
General Waste Management: 3.2% |
Waste Management, Inc. | | | 439,096 | | | | 51,782,591 | |
| |
ENVIRONMENTAL SUPPORT SERVICES: 2.0% |
Environmental Consultancies: 2.0% |
Verisk Analytics, Inc. | | | 157,084 | | | | 32,609,068 | |
| |
FOOD, AGRICULTURE & FORESTRY: 17.0% |
Logistics, Food Safety & Packaging: 6.1% |
GEA Group AG | | | 1,082,541 | | | | 38,719,455 | |
Mettler-Toledo International, Inc. (a) | | | 33,181 | | | | 37,815,722 | |
WestRock Co. | | | 520,206 | | | | 22,644,567 | |
| | | | | | | | 99,179,744 | |
Sustainable & Efficient Agriculture: 10.9% |
Deere & Co. | | | 117,236 | | | | 31,542,346 | |
Koninklijke DSM NV | | | 253,722 | | | | 43,632,871 | |
Kubota Corp. | | | 1,836,200 | | | | 40,116,594 | |
Trimble, Inc. (a) | | | 643,124 | | | | 42,941,389 | |
| | 79 | SEE NOTES TO FINANCIAL STATEMENTS |
December 31, 2020 |
Schedules of Investments, continued |
Pax Global Environmental Markets Fund, continued
Percent of Net Assets
Name of Issuer and
Title of Issue | | Shares/
Principal | | | Value | |
COMMON STOCKS, continued |
FOOD, AGRICULTURE & FORESTRY, continued |
Sustainable & Efficient Agriculture, continued |
Vitasoy International Holdings, Ltd. | | | 5,134,000 | | | $ | 19,997,796 | |
| | | | | | | | 178,230,996 | |
| |
DIVERSIFIED ENVIRONMENTAL: 3.4% |
Linde PLC | | | 209,256 | | | | 55,141,048 | |
| | | | | | | | | |
TOTAL COMMON STOCKS |
(Cost $1,063,377,343) | | | 1,569,942,324 | |
| | | | | | | | | |
MONEY MARKET: 3.0% |
State Street Institutional U.S. Government Money Market Fund, 0.030% (b)(c) | | | 48,491,782 | | | | 48,491,782 | |
(Cost $48,491,782) |
| | | | | | | | | |
| | | | | | | | | |
TOTAL INVESTMENTS: 99.3% |
(Cost $1,111,869,125) | | | 1,618,434,106 | |
| | | | | | | | | |
OTHER ASSETS AND LIABILITIES — (NET): 0.7% | | | 11,209,494 | |
| | | | | | | | | |
NET ASSETS: 100.0% | | $ | 1,629,643,600 | |
(a) | Non-income producing security. |
(b) | Rate shown represents annualized 7-day yield as of December 31, 2020. |
REIT - Real Estate Investment Trust
SUMMARY OF INVESTMENTS BY COUNTRY
Country | | Value | | | Percent Of
Net Assets | |
Belgium | | $ | 21,382,608 | | | | 1.3 | % |
China | | | 35,772,229 | | | | 2.2 | % |
Denmark | | | 18,037,175 | | | | 1.1 | % |
France | | | 85,391,313 | | | | 5.3 | % |
Germany | | | 127,667,247 | | | | 7.8 | % |
Hong Kong | | | 19,997,796 | | | | 1.2 | % |
Ireland | | | 20,915,432 | | | | 1.3 | % |
Japan | | | 64,586,065 | | | | 4.0 | % |
Netherlands | | | 60,631,356 | | | | 3.7 | % |
Switzerland | | | 24,810,871 | | | | 1.5 | % |
Taiwan | | | 35,012,294 | | | | 2.1 | % |
United Kingdom | | | 144,569,307 | | | | 8.9 | % |
United States | | | 911,168,633 | | | | 55.9 | % |
Money Market | | | 48,491,782 | | | | 3.0 | % |
Other assets and liabilities (net) | | | 11,209,492 | | | | 0.7 | % |
Total | | $ | 1,629,643,600 | | | | 100.0 | % |
SEE NOTES TO FINANCIAL STATEMENTS | 80 | |
December 31, 2020 |
Schedules of Investments, continued |
Pax Ellevate Global Women’s Leadership Fund
Percent of Net Assets
Name of Issuer and
Title of Issue | | Shares/
Principal | | | Value | |
COMMON STOCKS: 99.1% |
Communication Services: 5.0% |
Adevinta ASA (a) | | | 6,972 | | | $ | 117,200 | |
Auto Trader Group PLC | | | 70,212 | | | | 571,507 | |
BT Group PLC | | | 258,638 | | | | 466,184 | |
Cable One, Inc. | | | 200 | | | | 445,544 | |
Deutsche Telekom AG | | | 96,925 | | | | 1,769,132 | |
Elisa OYJ | | | 4,137 | | | | 226,787 | |
Iliad SA | | | 431 | | | | 88,469 | |
Infrastrutture Wireless Italiane SpA | | | 6,980 | | | | 84,615 | |
Interpublic Group of Cos Inc., The | | | 11,400 | | | | 268,128 | |
Match Group, Inc. (a) | | | 7,200 | | | | 1,088,568 | |
Netflix, Inc. (a) | | | 12,817 | | | | 6,930,536 | |
Omnicom Group, Inc. | | | 6,242 | | | | 389,314 | |
Orange SA | | | 58,016 | | | | 690,682 | |
Pearson PLC | | | 21,880 | | | | 200,820 | |
Pinterest, Inc., Class A (a) | | | 16,400 | | | | 1,080,760 | |
Proximus SADP | | | 4,424 | | | | 87,389 | |
Publicis Groupe SA | | | 34,182 | | | | 1,698,891 | |
Quebecor, Inc., Class B | | | 5,198 | | | | 133,778 | |
REA Group, Ltd. | | | 1,533 | | | | 175,601 | |
Schibsted ASA, Class B | | | 2,851 | | | | 105,831 | |
SEEK, Ltd. | | | 9,732 | | | | 213,373 | |
Singapore Telecommunications, Ltd. | | | 237,500 | | | | 414,708 | |
Spark New Zealand, Ltd. | | | 53,422 | | | | 180,952 | |
Tele2 AB, Class B | | | 14,523 | | | | 192,110 | |
Telefonica Deutschland Holding AG | | | 30,276 | | | | 83,389 | |
Telenor ASA | | | 20,975 | | | | 356,045 | |
Telia Company AB | | | 71,357 | | | | 294,694 | |
Telstra Corp., Ltd. | | | 121,051 | | | | 278,006 | |
TELUS Corp. | | | 12,242 | | | | 242,455 | |
Verizon Communications, Inc. | | | 120,395 | | | | 7,073,206 | |
Vodafone Group PLC | | | 778,567 | | | | 1,278,787 | |
Walt Disney Co., The | | | 52,598 | | | | 9,529,706 | |
WPP PLC | | | 35,633 | | | | 386,119 | |
Zillow Group, Inc. (a)(b) | | | 4,100 | | | | 532,180 | |
| | | | | | | | 37,675,466 | |
Consumer Discretionary: 16.5% |
Accor SA (a) | | | 5,510 | | | | 199,907 | |
Amazon.com, Inc. (a) | | | 10,800 | | | | 35,174,843 | |
Aristocrat Leisure, Ltd. | | | 16,712 | | | | 401,271 | |
Barratt Developments PLC | | | 29,612 | | | | 270,716 | |
Best Buy Co., Inc. | | | 71,979 | | | | 7,182,784 | |
Burberry Group PLC | | | 11,770 | | | | 287,425 | |
Percent of Net Assets
Name of Issuer and
Title of Issue | | Shares/
Principal | | | Value | |
COMMON STOCKS, continued |
Consumer Discretionary, continued |
Burlington Stores, Inc. (a) | | | 1,954 | | | $ | 511,069 | |
Compass Group PLC | | | 51,873 | | | | 967,502 | |
Daimler AG | | | 24,889 | | | | 1,764,115 | |
Dollar General Corp. | | | 7,340 | | | | 1,543,602 | |
eBay, Inc. | | | 20,476 | | | | 1,028,919 | |
Electrolux AB, Class B | | | 6,559 | | | | 152,608 | |
Expedia Group, Inc. | | | 4,000 | | | | 529,600 | |
Hennes & Mauritz AB, Class B | | | 131,582 | | | | 2,762,178 | |
Hermes International | | | 921 | | | | 990,331 | |
Hilton Worldwide Holdings, Inc. | | | 8,145 | | | | 906,213 | |
Husqvarna AB, Class B | | | 12,156 | | | | 157,760 | |
InterContinental Hotels Group PLC | | | 5,047 | | | | 327,122 | |
Kering SA | | | 7,876 | | | | 5,715,877 | |
La Francaise des Jeux SAEM | | | 2,500 | | | | 114,590 | |
Lowe’s Cos., Inc. | | | 21,992 | | | | 3,529,936 | |
lululemon athletica, Inc. (a) | | | 30,465 | | | | 10,602,734 | |
LVMH Moet Hennessy Louis Vuitton SE | | | 8,078 | | | | 5,056,836 | |
Marriott International, Inc., Class A | | | 8,033 | | | | 1,059,713 | |
Michelin | | | 4,935 | | | | 635,415 | |
Moncler SpA | | | 5,634 | | | | 346,382 | |
Next PLC | | | 3,868 | | | | 372,977 | |
Peloton Interactive, Inc., Class A (a) | | | 5,700 | | | | 864,804 | |
Renault SA | | | 5,590 | | | | 244,685 | |
SEB SA | | | 659 | | | | 119,828 | |
Starbucks Corp. | | | 147,118 | | | | 15,738,683 | |
Tabcorp Holdings, Ltd. | | | 64,473 | | | | 194,111 | |
Target Corp. | | | 14,609 | | | | 2,578,927 | |
Taylor Wimpey PLC | | | 105,974 | | | | 239,709 | |
Tiffany & Co. | | | 62,587 | | | | 8,227,061 | |
TJX Cos., Inc., The | | | 34,854 | | | | 2,380,180 | |
Ulta Beauty, Inc. (a) | | | 25,632 | | | | 7,360,485 | |
Vail Resorts, Inc. | | | 1,266 | | | | 353,163 | |
Valeo SA | | | 6,659 | | | | 262,659 | |
VF Corp. | | | 9,700 | | | | 828,477 | |
Wesfarmers, Ltd. | | | 32,973 | | | | 1,281,565 | |
Whitbread PLC (a) | | | 5,870 | | | | 248,633 | |
| | | | | | | | 123,515,395 | |
Consumer Staples: 11.3% |
a2 Milk Co., Ltd. (a) | | | 21,515 | | | | 187,126 | |
Beiersdorf AG | | | 2,932 | | | | 337,062 | |
| | 81 | SEE NOTES TO FINANCIAL STATEMENTS |
December 31, 2020 |
Schedules of Investments, continued |
Pax Ellevate Global Women’s Leadership Fund, continued
Percent of Net Assets
Name of Issuer and
Title of Issue | | Shares/
Principal | | | Value | |
COMMON STOCKS, continued |
Consumer Staples, continued |
Carrefour SA | | | 17,607 | | | $ | 301,510 | |
Clorox Co., The | | | 3,712 | | | | 749,527 | |
Coca-Cola Amatil, Ltd. | | | 14,738 | | | | 146,851 | |
Coca-Cola Co., The | | | 234,224 | | | | 12,844,843 | |
Coles Group, Ltd. | | | 38,791 | | | | 541,966 | |
Colruyt SA | | | 1,611 | | | | 95,393 | |
Danone SA | | | 62,057 | | | | 4,083,732 | |
Diageo PLC | | | 71,546 | | | | 2,830,987 | |
Empire Co., Ltd., Class A | | | 5,026 | | | | 137,367 | |
Essity AB, Class B | | | 17,645 | | | | 568,507 | |
Estee Lauder Cos, Inc., The, Class A | | | 59,767 | | | | 15,909,377 | |
General Mills, Inc. | | | 17,713 | | | | 1,041,524 | |
George Weston, Ltd. | | | 2,334 | | | | 174,339 | |
Heineken Holding NV | | | 3,352 | | | | 315,518 | |
Heineken NV | | | 7,538 | | | | 840,027 | |
Henkel AG & Co. KGaA | | | 3,022 | | | | 291,202 | |
Hershey Co., The | | | 4,315 | | | | 657,304 | |
ICA Gruppen AB | | | 2,925 | | | | 146,310 | |
J.M. Smucker Co., The | | | 3,320 | | | | 383,792 | |
Jeronimo Martins SGPS SA | | | 7,320 | | | | 123,047 | |
Kellogg Co. | | | 113,287 | | | | 7,049,850 | |
Kimberly-Clark Corp. | | | 9,949 | | | | 1,341,424 | |
Kroger Co., The | | | 22,895 | | | | 727,145 | |
Loblaw Cos, Ltd. | | | 5,266 | | | | 259,846 | |
L’Oreal SA | | | 23,011 | | | | 8,779,892 | |
McCormick & Co., Inc. | | | 7,644 | | | | 730,766 | |
Metro, Inc. | | | 7,407 | | | | 330,519 | |
Mowi ASA | | | 12,782 | | | | 284,732 | |
Orkla ASA | | | 21,842 | | | | 221,749 | |
Pernod Ricard SA | | | 6,175 | | | | 1,185,887 | |
Procter & Gamble Co., The | | | 72,078 | | | | 10,028,932 | |
Remy Cointreau SA | | | 657 | | | | 122,633 | |
Saputo, Inc. | | | 7,213 | | | | 201,901 | |
Shiseido Co., Ltd. | | | 11,700 | | | | 809,923 | |
Tesco PLC | | | 284,796 | | | | 898,750 | |
Treasury Wine Estates, Ltd. | | | 20,961 | | | | 151,629 | |
Unilever PLC | | | 115,131 | | | | 6,927,158 | |
Walgreens Boots Alliance, Inc. | | | 21,735 | | | | 866,792 | |
Woolworths Group, Ltd. | | | 36,731 | | | | 1,113,333 | |
| | | | | | | | 84,740,172 | |
Financials: 17.5% |
Admiral Group PLC | | | 5,558 | | | | 219,774 | |
Aegon NV | | | 52,035 | | | | 207,561 | |
Percent of Net Assets
Name of Issuer and
Title of Issue | | Shares/
Principal | | | Value | |
COMMON STOCKS, continued |
Financials, continued |
Allianz SE | | | 12,132 | | | $ | 2,980,503 | |
Allstate Corp., The | | | 9,190 | | | | 1,010,257 | |
Ally Financial, Inc. | | | 10,909 | | | | 389,015 | |
American Express Co. | | | 19,900 | | | | 2,406,109 | |
American International Group, Inc. | | | 25,123 | | | | 951,157 | |
Amundi SA | | | 1,764 | | | | 143,769 | |
Aon PLC, Class A | | | 6,731 | | | | 1,422,058 | |
Assicurazioni Generali SpA | | | 32,083 | | | | 561,722 | |
Assurant, Inc. | | | 1,784 | | | | 243,016 | |
ASX, Ltd. | | | 5,630 | | | | 312,448 | |
Australia & New Zealand Banking Group, Ltd | | | 82,477 | | | | 1,447,317 | |
Aviva PLC | | | 114,218 | | | | 508,045 | |
AXA SA | | | 56,246 | | | | 1,348,910 | |
Banco Santander SA | | | 504,267 | | | | 1,572,475 | |
Bank Leumi Le-Israel BM | | | 42,252 | | | | 249,403 | |
Bank of America Corp. | | | 227,133 | | | | 6,884,401 | |
Bank of Montreal | | | 18,623 | | | | 1,415,927 | |
Bank of Nova Scotia, The | | | 35,329 | | | | 1,909,526 | |
BNP Paribas SA | | | 32,710 | | | | 1,726,833 | |
CaixaBank SA | | | 104,365 | | | | 268,247 | |
Canadian Imperial Bank of Commerce | | | 63,747 | | | | 5,444,712 | |
Citigroup, Inc. | | | 60,568 | | | | 3,734,623 | |
CME Group, Inc. | | | 10,500 | | | | 1,911,525 | |
CNP Assurances | | | 4,992 | | | | 81,105 | |
Commerzbank AG | | | 29,135 | | | | 188,284 | |
Commonwealth Bank of Australia | | | 51,479 | | | | 3,272,108 | |
Credit Agricole SA (a) | | | 33,555 | | | | 424,200 | |
Danske Bank A/S | | | 20,058 | | | | 331,507 | |
Deutsche Boerse AG | | | 5,526 | | | | 940,925 | |
Direct Line Insurance Group PLC | | | 39,682 | | | | 173,557 | |
Discover Financial Services | | | 8,963 | | | | 811,420 | |
DNB ASA (a) | | | 74,791 | | | | 1,465,575 | |
Eurazeo SA (a) | | | 1,144 | | | | 77,734 | |
EXOR NV | | | 3,154 | | | | 256,190 | |
Fifth Third Bancorp | | | 20,800 | | | | 573,456 | |
FinecoBank Banca Fineco SpA | | | 17,726 | | | | 292,338 | |
First Republic Bank | | | 5,031 | | | | 739,205 | |
Gjensidige Forsikring ASA | | | 5,818 | | | | 129,854 | |
Globe Life, Inc. | | | 3,005 | | | | 285,355 | |
SEE NOTES TO FINANCIAL STATEMENTS | 82 | |
December 31, 2020 |
Schedules of Investments, continued |
Pax Ellevate Global Women’s Leadership Fund, continued
Percent of Net Assets
Name of Issuer and
Title of Issue | | Shares/
Principal | | | Value | |
COMMON STOCKS, continued |
Financials, continued |
Goldman Sachs Group, Inc., The | | | 9,600 | | | $ | 2,531,616 | |
Groupe Bruxelles Lambert SA | | | 3,285 | | | | 331,108 | |
Hang Seng Bank, Ltd. | | | 22,300 | | | | 384,854 | |
Hargreaves Lansdown PLC | | | 9,656 | | | | 201,058 | |
Hartford Financial Services Group, Inc., The | | | 10,474 | | | | 513,016 | |
Huntington Bancshares, Inc. | | | 29,583 | | | | 373,633 | |
iA Financial Corp., Inc. | | | 3,156 | | | | 136,812 | |
Industrivarden AB, Class C | | | 4,645 | | | | 150,137 | |
ING Groep NV | | | 113,427 | | | | 1,054,626 | |
Insurance Australia Group, Ltd. | | | 67,206 | | | | 243,895 | |
Intact Financial Corp. | | | 4,166 | | | | 493,283 | |
Intercontinental Exchange, Inc. | | | 15,952 | | | | 1,839,106 | |
Investor AB, Class B | | | 35,828 | | | | 2,607,681 | |
JPMorgan Chase & Co. | | | 88,700 | | | | 11,271,110 | |
KeyCorp. | | | 28,378 | | | | 465,683 | |
Kinnevik AB, Class B (a) | | | 7,922 | | | | 397,974 | |
Legal & General Group PLC | | | 173,480 | | | | 632,233 | |
Lincoln National Corp. | | | 5,672 | | | | 285,358 | |
M&G PLC | | | 75,606 | | | | 204,074 | |
Macquarie Group, Ltd. | | | 9,877 | | | | 1,054,265 | |
Manulife Financial Corp. | | | 57,136 | | | | 1,016,679 | |
Medibank Pvt, Ltd. | | | 80,087 | | | | 185,493 | |
MetLife, Inc. | | | 22,509 | | | | 1,056,798 | |
Moody’s Corp. | | | 4,965 | | | | 1,441,042 | |
Muenchener Rueckversicherungs AG | | | 4,075 | | | | 1,210,789 | |
National Australia Bank, Ltd. | | | 92,947 | | | | 1,620,423 | |
National Bank of Canada | | | 9,785 | | | | 550,709 | |
Natixis SA (a) | | | 27,532 | | | | 94,339 | |
Nordea Bank Apb (a) | | | 94,219 | | | | 772,161 | |
Onex Corp. | | | 2,452 | | | | 140,736 | |
PNC Financial Services Group, Inc., The | | | 12,363 | | | | 1,842,087 | |
Poste Italiane SpA | | | 15,193 | | | | 155,406 | |
Principal Financial Group, Inc. | | | 310,682 | | | | 15,412,934 | |
Progressive Corp., The | | | 17,096 | | | | 1,690,452 | |
QBE Insurance Group, Ltd. | | | 42,725 | | | | 278,500 | |
Reinsurance Group of America, Inc. | | | 1,996 | | | | 231,336 | |
Royal Bank of Canada | | | 41,491 | | | | 3,409,179 | |
Percent of Net Assets
Name of Issuer and
Title of Issue | | Shares/
Principal | | | Value | |
COMMON STOCKS, continued |
Financials, continued |
Royal Bank of Scotland Group PLC | | | 140,689 | | | $ | 321,613 | |
RSA Insurance Group PLC | | | 30,084 | | | | 278,844 | |
S&P Global, Inc. | | | 7,007 | | | | 2,303,411 | |
Schroders PLC | | | 3,616 | | | | 164,875 | |
SCOR SE | | | 4,611 | | | | 149,565 | |
Skandinaviska Enskilda Banken AB, Class A (a) | | | 47,329 | | | | 487,370 | |
Societe Generale SA | | | 23,576 | | | | 490,112 | |
Standard Chartered PLC | | | 78,015 | | | | 495,391 | |
Standard Life Aberdeen PLC | | | 66,324 | | | | 254,220 | |
State Street Corp. | | | 10,281 | | | | 748,251 | |
Sun Life Financial, Inc. | | | 17,016 | | | | 756,623 | |
Suncorp Group, Ltd. | | | 36,669 | | | | 275,952 | |
Svenska Handelsbanken AB, Class A | | | 45,245 | | | | 456,071 | |
Swedbank AB, Class A (a) | | | 26,337 | | | | 461,961 | |
Synchrony Financial | | | 15,317 | | | | 531,653 | |
T Rowe Price Group, Inc. | | | 6,700 | | | | 1,014,313 | |
Toronto-Dominion Bank, The | | | 52,704 | | | | 2,977,824 | |
Travelers Cos., Inc., The | | | 7,400 | | | | 1,038,738 | |
Tryg A/S | | | 3,515 | | | | 110,551 | |
U.S. Bancorp | | | 39,477 | | | | 1,839,233 | |
Voya Financial, Inc. | | | 100,991 | | | | 5,939,281 | |
Wendel SA | | | 780 | | | | 93,085 | |
Westpac Banking Corp. | | | 105,028 | | | | 1,562,955 | |
Willis Towers Watson PLC | | | 3,808 | | | | 802,269 | |
Zurich Insurance Group AG | | | 4,376 | | | | 1,844,138 | |
| | | | | | | | 130,991,030 | |
Health Care: 13.4% |
Abbott Laboratories | | | 51,486 | | | | 5,637,202 | |
AbbVie, Inc. | | | 51,400 | | | | 5,507,510 | |
Alcon, Inc. (a) | | | 14,299 | | | | 949,398 | |
Alexion Pharmaceuticals, Inc. (a) | | | 6,461 | | | | 1,009,467 | |
Alnylam Pharmaceuticals, Inc. (a) | | | 15,474 | | | | 2,011,156 | |
AmerisourceBergen Corp. | | | 4,488 | | | | 438,747 | |
Anthem, Inc. | | | 14,072 | | | | 4,518,378 | |
AstraZeneca PLC | | | 38,161 | | | | 3,805,158 | |
Becton Dickinson & Co. | | | 8,479 | | | | 2,121,615 | |
Cardinal Health, Inc. | | | 8,525 | | | | 456,599 | |
Cerner Corp. | | | 8,900 | | | | 698,472 | |
CSL, Ltd. | | | 13,204 | | | | 2,884,975 | |
CVS Health Corp. | | | 38,027 | | | | 2,597,244 | |
| | 83 | SEE NOTES TO FINANCIAL STATEMENTS |
December 31, 2020 |
Schedules of Investments, continued |
Pax Ellevate Global Women’s Leadership Fund, continued
Percent of Net Assets
Name of Issuer and
Title of Issue | | Shares/
Principal | | | Value | |
COMMON STOCKS, continued |
Health Care, continued |
DaVita, Inc. (a) | | | 2,400 | | | $ | 281,760 | |
Eli Lilly & Co. | | | 25,077 | | | | 4,234,001 | |
Genmab A/S (a) | | | 1,900 | | | | 770,438 | |
Gilead Sciences, Inc. | | | 36,554 | | | | 2,129,636 | |
GlaxoSmithKline PLC | | | 145,898 | | | | 2,669,636 | |
GN Store Nord AS | | | 3,724 | | | | 296,855 | |
Hologic, Inc. (a) | | | 7,571 | | | | 551,396 | |
IDEXX Laboratories, Inc. (a) | | | 2,559 | | | | 1,279,167 | |
Illumina, Inc. (a) | | | 4,300 | | | | 1,591,000 | |
Insulet Corp. (a) | | | 2,000 | | | | 511,260 | |
Ipsen SA | | | 1,097 | | | | 90,709 | |
Johnson & Johnson | | | 76,653 | | | | 12,063,650 | |
Koninklijke Philips NV | | | 26,612 | | | | 1,433,523 | |
McKesson Corp. | | | 9,777 | | | | 1,700,416 | |
Merck & Co., Inc. | | | 73,500 | | | | 6,012,300 | |
Merck KGaA | | | 3,759 | | | | 644,722 | |
Novo Nordisk A/S, Class B | | | 50,074 | | | | 3,493,119 | |
Orion OYJ, Class B | | | 14,808 | | | | 680,205 | |
Pfizer, Inc. | | | 161,600 | | | | 5,948,496 | |
Quest Diagnostics, Inc. | | | 51,448 | | | | 6,131,058 | |
Recordati SpA | | | 3,041 | | | | 169,106 | |
Ryman Healthcare, Ltd. | | | 11,633 | | | | 127,626 | |
Sanofi | | | 32,875 | | | | 3,186,344 | |
Sarepta Therapeutics, Inc. (a)(b) | | | 2,200 | | | | 375,078 | |
Smith & Nephew PLC | | | 25,438 | | | | 528,410 | |
Stryker Corp. | | | 23,636 | | | | 5,791,766 | |
UCB SA | | | 3,677 | | | | 379,824 | |
Varian Medical Systems, Inc. (a) | | | 2,700 | | | | 472,527 | |
Vertex Pharmaceuticals, Inc. (a) | | | 7,564 | | | | 1,787,676 | |
Waters Corp. (a) | | | 1,854 | | | | 458,717 | |
Zoetis, Inc. | | | 13,874 | | | | 2,296,147 | |
| | | | | | | | 100,722,489 | |
Industrials: 6.6% |
Aeroports de Paris | | | 864 | | | | 111,781 | |
Air Canada (a) | | | 4,200 | | | | 75,131 | |
Alfa Laval AB | | | 9,149 | | | | 252,663 | |
Allegion PLC | | | 2,752 | | | | 320,278 | |
Alstom SA (a) | | | 7,290 | | | | 415,231 | |
Assa Abloy AB, Class B | | | 29,147 | | | | 720,281 | |
Auckland International Airport, Ltd. | | | 36,399 | | | | 199,052 | |
Aurizon Holdings, Ltd. | | | 55,735 | | | | 167,452 | |
Percent of Net Assets
Name of Issuer and
Title of Issue | | Shares/
Principal | | | Value | |
COMMON STOCKS, continued |
Industrials, continued |
Brambles, Ltd. | | | 44,136 | | | $ | 362,016 | |
Bureau Veritas SA | | | 8,543 | | | | 228,053 | |
Canadian National Railway Co. | | | 20,690 | | | | 2,274,617 | |
Cie de Saint-Gobain | | | 15,048 | | | | 692,093 | |
Cummins, Inc. | | | 4,378 | | | | 994,244 | |
Deutsche Lufthansa AG (a) | | | 8,692 | | | | 115,011 | |
Equifax, Inc. | | | 3,600 | | | | 694,224 | |
FedEx Corp. | | | 7,300 | | | | 1,895,226 | |
GEA Group AG | | | 4,462 | | | | 159,593 | |
Getlink SE (a) | | | 12,796 | | | | 221,386 | |
KION Group AG | | | 1,903 | | | | 165,032 | |
Legrand SA | | | 26,253 | | | | 2,348,504 | |
MTR Corp., Ltd. | | | 44,888 | | | | 251,042 | |
Otis Worldwide Corp. | | | 21,400 | | | | 1,445,570 | |
Pentair PLC | | | 4,855 | | | | 257,752 | |
Qantas Airways, Ltd. | | | 26,554 | | | | 99,571 | |
Randstad NV | | | 3,465 | | | | 224,299 | |
RELX PLC | | | 56,164 | | | | 1,374,188 | |
Republic Services, Inc. | | | 6,513 | | | | 627,202 | |
Ritchie Bros Auctioneers, Inc. | | | 99,700 | | | | 6,930,203 | |
Schneider Electric SE | | | 16,078 | | | | 2,323,712 | |
Securitas AB, Class B | | | 9,106 | | | | 146,913 | |
Siemens AG | | | 22,247 | | | | 3,204,600 | |
Skanska AB, Class B | | | 9,893 | | | | 252,113 | |
Smiths Group PLC | | | 11,522 | | | | 236,996 | |
Sunrun, Inc. (a) | | | 55,900 | | | | 3,878,342 | |
Sydney Airport | | | 38,454 | | | | 190,340 | |
Teleperformance | | | 1,708 | | | | 567,024 | |
Transurban Group | | | 79,537 | | | | 838,145 | |
United Parcel Service, Inc., Class B | | | 20,500 | | | | 3,452,200 | |
Verisk Analytics, Inc. | | | 4,500 | | | | 934,155 | |
Wolters Kluwer NV | | | 110,737 | | | | 9,342,566 | |
WSP Global, Inc. | | | 3,299 | | | | 312,535 | |
| | | | | | | | 49,301,336 | |
Information Technology: 17.4% |
Accenture PLC, Class A | | | 23,981 | | | | 6,264,077 | |
Afterpay, Ltd. (a) | | | 6,221 | | | | 565,524 | |
ANSYS, Inc. (a) | | | 2,575 | | | | 936,785 | |
Arista Networks, Inc. (a) | | | 1,700 | | | | 493,969 | |
Atos SE (a) | | | 2,858 | | | | 260,980 | |
Autodesk, Inc. (a) | | | 43,534 | | | | 13,292,671 | |
Avalara, Inc. (a) | | | 2,400 | | | | 395,736 | |
SEE NOTES TO FINANCIAL STATEMENTS | 84 | |
December 31, 2020 |
Schedules of Investments, continued |
Pax Ellevate Global Women’s Leadership Fund, continued
Percent of Net Assets
Name of Issuer and
Title of Issue | | Shares/
Principal | | | Value | |
COMMON STOCKS, continued |
Information Technology, continued |
Booz Allen Hamilton Holding Corp. | | | 4,700 | | | $ | 409,746 | |
Capgemini SE | | | 4,682 | | | | 728,296 | |
CDW Corp. | | | 6,187 | | | | 815,385 | |
Cisco Systems, Inc. | | | 122,875 | | | | 5,498,656 | |
Computershare, Ltd. | | | 14,156 | | | | 159,299 | |
Dassault Systemes SA | | | 3,843 | | | | 779,435 | |
DocuSign, Inc. (a) | | | 5,113 | | | | 1,136,620 | |
Dropbox, Inc., Class A (a) | | | 7,266 | | | | 161,233 | |
Halma PLC | | | 51,030 | | | | 1,709,008 | |
Hexagon AB, Class B | | | 8,185 | | | | 750,417 | |
HP, Inc. | | | 41,641 | | | | 1,023,952 | |
IBM | | | 25,820 | | | | 3,250,222 | |
Intuit, Inc. | | | 7,637 | | | | 2,900,914 | |
Microsoft Corp. | | | 169,868 | | | | 37,782,040 | |
Nexi SpA (a) | | | 12,780 | | | | 254,311 | |
Nokia OYJ | | | 164,416 | | | | 635,028 | |
Okta, Inc. (a) | | | 3,401 | | | | 864,738 | |
PayPal Holdings Inc (a) | | | 32,501 | | | | 7,611,734 | |
Sage Group PLC, The | | | 31,721 | | | | 251,872 | |
salesforce.com, Inc. (a) | | | 26,209 | | | | 5,832,289 | |
SAP SE | | | 30,367 | | | | 3,933,094 | |
Shopify, Inc., Class A (a) | | | 3,200 | | | | 3,613,343 | |
Slack Technologies, Inc., Class A (a) | | | 11,200 | | | | 473,088 | |
Splunk, Inc. (a) | | | 4,629 | | | | 786,421 | |
Square, Inc., Class A (a) | | | 10,603 | | | | 2,307,637 | |
Texas Instruments, Inc. | | | 26,741 | | | | 4,389,000 | |
Twilio, Inc., Class A (a) | | | 25,169 | | | | 8,519,707 | |
Visa, Inc., Class A | | | 49,066 | | | | 10,732,206 | |
Western Union Co., The | | | 12,037 | | | | 264,092 | |
WiseTech Global, Ltd. | | | 4,237 | | | | 100,693 | |
Worldline SA (a) | | | 6,944 | | | | 674,596 | |
| | | | | | | | 130,558,814 | |
Materials: 6.9% |
Air Liquide SA | | | 68,490 | | | | 11,228,718 | |
Akzo Nobel NV | | | 5,612 | | | | 602,362 | |
Arkema SA | | | 2,009 | | | | 229,874 | |
BlueScope Steel, Ltd. | | | 14,617 | | | | 197,399 | |
Boliden AB | | | 7,954 | | | | 282,187 | |
Celanese Corp. | | | 59,900 | | | | 7,783,406 | |
Chr. Hansen Holding A/S (a) | | | 3,068 | | | | 316,991 | |
Covestro AG | | | 5,338 | | | | 328,892 | |
Dow, Inc. | | | 21,636 | | | | 1,200,798 | |
Ecolab, Inc. | | | 7,451 | | | | 1,612,098 | |
Percent of Net Assets
Name of Issuer and
Title of Issue | | Shares/
Principal | | | Value | |
COMMON STOCKS, continued |
Materials, continued |
Evonik Industries AG | | | 6,099 | | | $ | 199,343 | |
Fortescue Metals Group, Ltd. | | | 49,246 | | | | 889,501 | |
International Flavors & Fragrances, Inc. (b) | | | 2,500 | | | | 272,100 | |
Johnson Matthey PLC | | | 5,628 | | | | 186,459 | |
Kinross Gold Corp. | | | 36,596 | | | | 268,526 | |
Koninklijke DSM NV | | | 71,288 | | | | 12,259,482 | |
Lundin Mining Corp. | | | 19,200 | | | | 170,445 | |
Mondi PLC | | | 14,120 | | | | 330,858 | |
Newmont Corp. | | | 127,953 | | | | 7,663,105 | |
Norsk Hydro ASA | | | 39,109 | | | | 182,016 | |
Northern Star Resources, Ltd. | | | 21,521 | | | | 210,346 | |
Novozymes A/S, Class B | | | 6,053 | | | | 344,779 | |
Nutrien, Ltd. | | | 16,600 | | | | 798,636 | |
PPG Industries, Inc. | | | 6,942 | | | | 1,001,175 | |
Solvay SA | | | 2,156 | | | | 254,267 | |
Stora Enso OYJ, Class R | | | 16,918 | | | | 323,941 | |
Svenska Cellulosa AB SCA, Class B | | | 17,619 | | | | 308,053 | |
Yara International ASA | | | 54,336 | | | | 2,254,158 | |
| | | | | | | | 51,699,915 | |
Real Estate: 1.6% |
Ascendas Real Estate Investment Trust, REIT | | | 93,500 | | | | 211,072 | |
Azrieli Group, Ltd. | | | 1,235 | | | | 78,493 | |
British Land Co. PLC, The, REIT | | | 25,601 | | | | 171,463 | |
Camden Property Trust, REIT | | | 2,877 | | | | 287,470 | |
Canadian Apartment Properties, REIT | | | 2,500 | | | | 98,181 | |
City Developments, Ltd. | | | 13,300 | | | | 80,174 | |
Covivio, REIT | | | 1,512 | | | | 138,744 | |
Dexus, REIT | | | 31,733 | | | | 230,157 | |
Equity LifeStyle Properties, Inc., REIT | | | 5,081 | | | | 321,932 | |
Gecina SA, REIT | | | 14,428 | | | | 2,243,556 | |
GPT Group, The, REIT | | | 56,646 | | | | 197,033 | |
Healthpeak Properties, Inc., REIT | | | 15,700 | | | | 474,611 | |
Host Hotels & Resorts, Inc., REIT | | | 20,588 | | | | 301,202 | |
Iron Mountain, Inc., REIT (b) | | | 8,406 | | | | 247,809 | |
Klepierre SA, REIT | | | 5,721 | | | | 129,031 | |
Land Securities Group PLC, REIT | | | 20,484 | | | | 189,190 | |
| | 85 | SEE NOTES TO FINANCIAL STATEMENTS |
December 31, 2020 |
Schedules of Investments, continued |
Pax Ellevate Global Women’s Leadership Fund, continued
Percent of Net Assets
Name of Issuer and
Title of Issue | | Shares/
Principal | | | Value | |
COMMON STOCKS, continued |
Real Estate, continued |
LendLease Group | | | 19,235 | | | $ | 194,482 | |
Link, REIT | | | 61,084 | | | | 554,751 | |
Mapletree Logistics Trust, REIT | | | 84,000 | | | | 127,845 | |
Mirvac Group, REIT | | | 114,400 | | | | 232,343 | |
RioCan Real Estate Investment Trust, REIT | | | 4,596 | | | | 60,478 | |
Scentre Group, REIT | | | 150,937 | | | | 324,211 | |
Stockland, REIT | | | 69,338 | | | | 223,863 | |
Sun Communities, Inc., REIT | | | 2,900 | | | | 440,655 | |
Suntec Real Estate Investment Trust, REIT | | | 57,400 | | | | 64,736 | |
Swire Properties, Ltd. | | | 34,200 | | | | 99,434 | |
Unibail-Rodamco-Westfield, REIT | | | 4,025 | | | | 313,487 | |
Ventas, Inc., REIT | | | 10,900 | | | | 534,536 | |
VICI Properties, Inc., REIT | | | 13,700 | | | | 349,350 | |
Vicinity Centres, REIT | | | 111,964 | | | | 138,440 | |
Vonovia SE | | | 14,981 | | | | 1,094,124 | |
Welltower, Inc., REIT | | | 12,163 | | | | 785,973 | |
Weyerhaeuser Co., REIT | | | 21,737 | | | | 728,842 | |
| | | | | | | | 11,667,668 | |
Utilities: 2.9% |
American Water Works Co., Inc. | | | 100,958 | | | | 15,494,023 | |
Edison International | | | 10,999 | | | | 690,957 | |
Electricite de France SA | | | 18,051 | | | | 285,645 | |
Elia Group SA | | | 899 | | | | 107,305 | |
Engie SA (a) | | | 53,114 | | | | 814,238 | |
Essential Utilities, Inc. | | | 6,800 | | | | 321,572 | |
Hydro One, Ltd. | | | 9,565 | | | | 215,286 | |
Meridian Energy, Ltd. | | | 37,261 | | | | 199,555 | |
National Grid PLC | | | 102,066 | | | | 1,206,158 | |
Orsted A/S | | | 5,502 | | | | 1,125,738 | |
Red Electrica Corp. SA | | | 12,589 | | | | 258,466 | |
Severn Trent PLC | | | 6,920 | | | | 216,029 | |
Suez | | | 34,212 | | | | 678,057 | |
United Utilities Group PLC | | | 19,830 | | | | 242,540 | |
| | | | | | | | 21,855,569 | |
TOTAL COMMON STOCKS |
(Cost $587,252,278) | | | 742,727,854 | |
| | | | | | | | | |
Percent of Net Assets
Name of Issuer and
Title of Issue | | Shares/
Principal | | | Value | |
PREFERRED STOCKS: 0.1% |
Consumer Staples: 0.1% |
Henkel AG & Co. KGaA | | | 5,181 | | | $ | 584,181 | |
| |
Materials: 0.0% (c) |
Fuchs Petrolub SE | | | 2,022 | | | | 114,086 | |
| | | | | | | | | |
TOTAL PREFERRED STOCKS |
(Cost $640,365) | | | 698,267 | |
| | | | | | | | | |
MONEY MARKET: 0.5% |
State Street Institutional U.S. Government Money Market Fund, 0.030% (d)(e) | | | 3,614,895 | | | | 3,614,895 | |
(Cost $3,614,895) |
| | | | | | | | | |
TOTAL INVESTMENTS: 99.7% |
(Cost $591,507,538) | | | 747,041,016 | |
| | | | | | | | | |
OTHER ASSETS AND LIABILITIES — (NET): 0.3% | | | 2,382,086 | |
| | | | | | | | | |
NET ASSETS: 100.0% | | $ | 749,423,102 | |
(a) | Non-income producing security. |
(b) | Security or partial position of this security was on loan as of December 31, 2020. The total market value of securities on loan as of December 31, 2020 was $1,062,536. |
(c) | Rounds to less than 0.05%. |
(d) | Rate shown represents annualized 7-day yield as of December 31, 2020. |
REIT - Real Estate Investment Trust
SEE NOTES TO FINANCIAL STATEMENTS | 86 | |
December 31, 2020 |
Schedules of Investments, continued |
Pax Ellevate Global Women’s Leadership Fund, continued
SUMMARY OF INVESTMENTS BY COUNTRY
Country | | Value | | | Percent Of
Net Assets | |
Australia | | $ | 22,956,852 | | | | 3.1 | % |
Belgium | | | 1,147,981 | | | | 0.2 | % |
Canada | | | 34,281,070 | | | | 4.6 | % |
Denmark | | | 6,789,977 | | | | 0.9 | % |
Finland | | | 1,865,961 | | | | 0.2 | % |
France | | | 63,728,170 | | | | 8.5 | % |
Germany | | | 20,215,382 | | | | 2.7 | % |
Hong Kong | | | 1,290,082 | | | | 0.2 | % |
Israel | | | 327,896 | | | | 0.0 | %* |
Italy | | | 2,120,068 | | | | 0.3 | % |
Japan | | | 809,923 | | | | 0.1 | % |
Netherlands | | | 26,279,960 | | | | 3.5 | % |
New Zealand | | | 894,311 | | | | 0.1 | % |
Norway | | | 4,999,961 | | | | 0.7 | % |
Portugal | | | 123,047 | | | | 0.0 | %* |
Singapore | | | 898,536 | | | | 0.1 | % |
Spain | | | 2,099,188 | | | | 0.3 | % |
Sweden | | | 12,320,149 | | | | 1.6 | % |
Switzerland | | | 2,793,535 | | | | 0.4 | % |
United Kingdom | | | 32,846,045 | | | | 4.4 | % |
United States | | | 504,638,027 | | | | 67.3 | % |
Money Market | | | 3,614,895 | | | | 0.5 | % |
Other assets and liabilities (net) | | | 2,382,086 | | | | 0.3 | % |
TOTAL | | $ | 749,423,102 | | | | 100.0 | % |
* | Rounds to less than 0.05%. |
| | 87 | SEE NOTES TO FINANCIAL STATEMENTS |
December 31, 2020 |
Schedules of Investments, continued |
Pax MSCI EAFE ESG Leaders Index Fund
Percent of Net Assets
Name of Issuer and
Title of Issue | | Shares/
Principal | | | Value | |
COMMON STOCKS: 98.2% |
Australia: 7.0% |
ASX, Ltd. | | | 10,003 | | | $ | 555,137 | |
Aurizon Holdings, Ltd. | | | 211,925 | | | | 636,713 | |
Australia & New Zealand Banking Group, Ltd | | | 220,658 | | | | 3,872,135 | |
Brambles, Ltd. | | | 171,445 | | | | 1,406,242 | |
Coca-Cola Amatil, Ltd. | | | 98,089 | | | | 977,369 | |
Cochlear, Ltd. | | | 6,454 | | | | 941,737 | |
Coles Group, Ltd. | | | 94,287 | | | | 1,317,324 | |
Commonwealth Bank of Australia | | | 163,466 | | | | 10,390,224 | |
Computershare, Ltd. | | | 130,757 | | | | 1,471,424 | |
Dexus, REIT | | | 124,366 | | | | 902,018 | |
Evolution Mining, Ltd. | | | 161,800 | | | | 622,665 | |
Fortescue Metals Group, Ltd. | | | 185,589 | | | | 3,352,183 | |
Goodman Group, REIT | | | 146,512 | | | | 2,141,635 | |
GPT Group, The, REIT | | | 360,787 | | | | 1,254,936 | |
LendLease Group | | | 62,129 | | | | 628,175 | |
Macquarie Group, Ltd. | | | 32,001 | | | | 3,415,767 | |
Mirvac Group, REIT | | | 80,733 | | | | 163,966 | |
National Australia Bank, Ltd. | | | 307,569 | | | | 5,362,108 | |
Newcrest Mining, Ltd. | | | 107,182 | | | | 2,139,112 | |
Stockland, REIT | | | 349,094 | | | | 1,127,075 | |
Sydney Airport | | | 253,211 | | | | 1,253,349 | |
Telstra Corp., Ltd. | | | 393,844 | | | | 904,505 | |
Transurban Group | | | 331,869 | | | | 3,497,169 | |
Vicinity Centres, REIT | | | 476,644 | | | | 589,356 | |
| | | | | | | | 48,922,324 | |
Austria: 0.3% |
Erste Group Bank AG (a) | | | 48,925 | | | | 1,490,388 | |
Voestalpine AG | | | 25,585 | | | | 913,145 | |
| | | | | | | | 2,403,533 | |
Belgium: 0.6% |
KBC Group NV | | | 16,318 | | | | 1,141,952 | |
Solvay SA | | | 7,533 | | | | 888,400 | |
UCB SA | | | 16,706 | | | | 1,725,686 | |
Umicore SA | | | 15,056 | | | | 723,668 | |
| | | | | | | | 4,479,706 | |
Denmark: 3.8% |
Chr. Hansen Holding A/S (a) | | | 10,830 | | | | 1,118,974 | |
Coloplast A/S, Class B | | | 9,867 | | | | 1,508,949 | |
Genmab A/S (a) | | | 5,564 | | | | 2,256,168 | |
H Lundbeck A/S | | | 26,352 | | | | 902,135 | |
Novo Nordisk A/S, Class B | | | 141,421 | | | | 9,865,407 | |
Novozymes A/S, Class B | | | 18,869 | | | | 1,074,777 | |
Orsted A/S | | | 17,681 | | | | 3,617,624 | |
Pandora A/S | | | 14,401 | | | | 1,611,728 | |
Percent of Net Assets
Name of Issuer and
Title of Issue | | Shares/
Principal | | | Value | |
COMMON STOCKS, continued |
Denmark, continued |
Vestas Wind Systems A/S | | | 19,095 | | | $ | 4,510,799 | |
| | | | | | | | 26,466,561 | |
Finland: 1.0% |
Elisa OYJ | | | 26,593 | | | | 1,457,809 | |
Orion OYJ, Class B (b) | | | 27,997 | | | | 1,286,041 | |
UPM-Kymmene OYJ | | | 73,303 | | | | 2,733,590 | |
Wartsila OYJ Abp | | | 131,513 | | | | 1,316,232 | |
| | | | | | | | 6,793,672 | |
France: 10.0% |
Accor SA (a) | | | 28,593 | | | | 1,037,377 | |
Air Liquide SA | | | 48,582 | | | | 7,964,865 | |
Atos SE (a) | | | 8,301 | | | | 758,011 | |
AXA SA | | | 174,312 | | | | 4,180,409 | |
Bouygues SA | | | 44,119 | | | | 1,814,525 | |
Carrefour SA | | | 92,398 | | | | 1,582,261 | |
Cie de Saint-Gobain | | | 52,242 | | | | 2,402,734 | |
Covivio, REIT | | | 9,455 | | | | 867,609 | |
Credit Agricole SA (a) | | | 135,463 | | | | 1,712,513 | |
Danone SA | | | 56,724 | | | | 3,732,788 | |
Dassault Systemes SA | | | 13,155 | | | | 2,668,090 | |
EssilorLuxottica SA | | | 26,698 | | | | 4,160,467 | |
Gecina SA, REIT | | | 8,180 | | | | 1,271,991 | |
Getlink SE (a) | | | 55,311 | | | | 956,947 | |
Kering SA | | | 7,369 | | | | 5,347,930 | |
Klepierre SA, REIT | | | 45,935 | | | | 1,036,016 | |
L’Oreal SA | | | 22,774 | | | | 8,689,464 | |
Michelin | | | 20,945 | | | | 2,696,812 | |
Natixis SA (a) | | | 179,045 | | | | 613,500 | |
Orange SA | | | 213,989 | | | | 2,547,545 | |
Publicis Groupe SA | | | 14,356 | | | | 713,512 | |
Schneider Electric SE | | | 55,090 | | | | 7,962,014 | |
Teleperformance | | | 3,972 | | | | 1,318,629 | |
Ubisoft Entertainment SA (a) | | | 9,994 | | | | 963,107 | |
Unibail-Rodamco-Westfield, REIT | | | 17,627 | | | | 1,372,877 | |
Valeo SA | | | 23,666 | | | | 933,488 | |
Wendel SA | | | 5,987 | | | | 714,488 | |
| | | | | | | | 70,019,969 | |
Germany: 9.0% |
adidas AG | | | 16,069 | | | | 5,845,978 | |
Allianz SE | | | 31,569 | | | | 7,755,646 | |
BASF SE | | | 92,399 | | | | 7,303,463 | |
Bayerische Motoren Werke AG | | | 27,584 | | | | 2,434,469 | |
Beiersdorf AG | | | 4,809 | | | | 552,841 | |
SEE NOTES TO FINANCIAL STATEMENTS | 88 | |
December 31, 2020 |
Schedules of Investments, continued |
Pax MSCI EAFE ESG Leaders Index Fund, continued
Percent of Net Assets
Name of Issuer and
Title of Issue | | Shares/
Principal | | | Value | |
COMMON STOCKS, continued |
Germany, continued |
Delivery Hero SE (a) | | | 16,494 | | | $ | 2,579,478 | |
Deutsche Boerse AG | | | 13,902 | | | | 2,367,126 | |
HeidelbergCement AG | | | 9,225 | | | | 686,852 | |
Henkel AG & Co. KGaA | | | 7,911 | | | | 762,308 | |
Merck KGaA | | | 5,805 | | | | 995,641 | |
Muenchener Rueckversicherungs AG | | | 13,050 | | | | 3,877,497 | |
SAP SE | | | 104,761 | | | | 13,568,506 | |
Siemens AG | | | 79,104 | | | | 11,394,646 | |
Symrise AG | | | 16,015 | | | | 2,129,087 | |
Telefonica Deutschland Holding AG | | | 252,215 | | | | 694,670 | |
| | | | | | | | 62,948,208 | |
Hong Kong: 1.6% |
BOC Hong Kong Holdings, Ltd. | | | 524,057 | | | | 1,588,534 | |
Hang Seng Bank, Ltd. | | | 99,900 | | | | 1,724,079 | |
HKT Trust & HKT, Ltd. | | | 915,000 | | | | 1,186,691 | |
Hong Kong Exchanges and Clearing, Ltd. | | | 83,699 | | | | 4,591,031 | |
MTR Corp., Ltd. | | | 216,168 | | | | 1,208,949 | |
Swire Pacific, Ltd., Class A | | | 117,500 | | | | 647,238 | |
Swire Properties, Ltd. | | | 161,200 | | | | 468,678 | |
| | | | | | | | 11,415,200 | |
Ireland: 0.8% |
CRH PLC | | | 73,115 | | | | 3,109,330 | |
Kerry Group PLC, Class A | | | 19,131 | | | | 2,778,652 | |
| | | | | | | | 5,887,982 | |
Israel: 0.2% |
Bank Hapoalim BM (a) | | | 117,543 | | | | 807,314 | |
Bank Leumi Le-Israel BM | | | 140,694 | | | | 830,482 | |
Mizrahi Tefahot Bank, Ltd. | | | 2,046 | | | | 47,462 | |
| | | | | | | | 1,685,258 | |
Italy: 2.0% |
Assicurazioni Generali SpA | | | 151,230 | | | | 2,647,794 | |
CNH Industrial NV | | | 85,902 | | | | 1,079,823 | |
Enel SpA | | | 704,550 | | | | 7,168,605 | |
Intesa Sanpaolo SpA | | | 1,162,207 | | | | 2,747,128 | |
| | | | | | | | 13,643,350 | |
Japan: 26.8% |
Aeon Co., Ltd. | | | 65,500 | | | | 2,148,816 | |
Ajinomoto Co., Inc. | | | 43,600 | | | | 987,964 | |
ANA Holdings, Inc. (a) | | | 42,600 | | | | 941,273 | |
Asahi Kasei Corp. | | | 123,200 | | | | 1,262,816 | |
Astellas Pharma, Inc. | | | 178,300 | | | | 2,760,754 | |
Bridgestone Corp. | | | 55,900 | | | | 1,833,288 | |
Percent of Net Assets
Name of Issuer and
Title of Issue | | Shares/
Principal | | | Value | |
COMMON STOCKS, continued |
Japan, continued |
Capcom Co., Ltd. | | | 10,500 | | | $ | 680,953 | |
Central Japan Railway Co. | | | 8,500 | | | | 1,201,929 | |
Chugai Pharmaceutical Co., Ltd. | | | 66,300 | | | | 3,537,446 | |
Dai Nippon Printing Co., Ltd. (b) | | | 50,700 | | | | 911,973 | |
Daifuku Co, Ltd. | | | 9,900 | | | | 1,225,080 | |
Dai-ichi Life Holdings, Inc. | | | 82,800 | | | | 1,247,415 | |
Daiichi Sankyo Co., Ltd. | | | 146,100 | | | | 5,006,872 | |
Daiwa House Industry Co., Ltd. | | | 48,500 | | | | 1,442,035 | |
Denso Corp. | | | 42,700 | | | | 2,541,536 | |
East Japan Railway Co. | | | 32,500 | | | | 2,168,250 | |
Eisai Co., Ltd. | | | 25,200 | | | | 1,802,131 | |
Fast Retailing Co., Ltd. | | | 6,000 | | | | 5,380,075 | |
Fujitsu, Ltd. | | | 18,300 | | | | 2,644,998 | |
Hino Motors, Ltd. | | | 65,600 | | | | 560,013 | |
Hitachi Construction Machinery Co., Ltd. | | | 16,400 | | | | 466,309 | |
Honda Motor Co., Ltd. | | | 121,200 | | | | 3,419,813 | |
Japan Retail Fund Investment Corp., REIT | | | 807 | | | | 1,468,698 | |
JFE Holdings, Inc. (a) | | | 133,700 | | | | 1,283,693 | |
Kajima Corp. | | | 102,900 | | | | 1,380,404 | |
Kao Corp. | | | 45,500 | | | | 3,515,156 | |
KDDI Corp. | | | 144,300 | | | | 4,278,530 | |
Keio Corp. | | | 9,800 | | | | 760,333 | |
Keyence Corp. | | | 17,900 | | | | 10,069,047 | |
Kikkoman Corp. | | | 20,200 | | | | 1,405,858 | |
Kobe Bussan Co., Ltd. | | | 32,000 | | | | 983,199 | |
Komatsu, Ltd. | | | 111,200 | | | | 3,068,927 | |
Kubota Corp. | | | 135,900 | | | | 2,969,091 | |
Kuraray Co., Ltd. (b) | | | 98,300 | | | | 1,046,615 | |
Kurita Water Industries, Ltd. | | | 26,400 | | | | 1,009,132 | |
Kyushu Railway Co. | | | 52,700 | | | | 1,136,894 | |
Mazda Motor Corp. | | | 99,900 | | | | 668,721 | |
Mercari, Inc. (a) | | | 15,000 | | | | 664,932 | |
Mitsubishi Chemical Holdings Corp. | | | 156,200 | | | | 946,314 | |
Mitsubishi Estate Co., Ltd. | | | 129,000 | | | | 2,073,395 | |
Mitsubishi UFJ Lease & Finance Co., Ltd. | | | 119,200 | | | | 572,385 | |
Mitsui Fudosan Co., Ltd. | | | 81,900 | | | | 1,714,949 | |
Miura Co., Ltd. | | | 8,600 | | | | 480,122 | |
Mizuho Financial Group, Inc. | | | 146,050 | | | | 1,853,693 | |
| | 89 | SEE NOTES TO FINANCIAL STATEMENTS |
December 31, 2020 |
Schedules of Investments, continued |
Pax MSCI EAFE ESG Leaders Index Fund, continued
Percent of Net Assets
Name of Issuer and
Title of Issue | | Shares/
Principal | | | Value | |
COMMON STOCKS, continued |
Japan, continued |
MS&AD Insurance Group Holdings, Inc. | | | 38,200 | | | $ | 1,162,236 | |
Murata Manufacturing Co., Ltd. | | | 56,200 | | | | 5,087,758 | |
NEC Corp. | | | 36,200 | | | | 1,944,289 | |
NGK Insulators, Ltd. | | | 75,800 | | | | 1,171,240 | |
NGK Spark Plug Co., Ltd. | | | 15,100 | | | | 257,862 | |
Nintendo Co., Ltd. | | | 9,800 | | | | 6,291,023 | |
Nippon Paint Holdings Co., Ltd. | | | 14,200 | | | | 1,560,330 | |
Nitto Denko Corp. | | | 16,000 | | | | 1,433,280 | |
Nomura Real Estate Master Fund, Inc., REIT | | | 30 | | | | 42,931 | |
Nomura Research Institute, Ltd. | | | 27,900 | | | | 998,081 | |
NSK, Ltd. | | | 35,200 | | | | 306,332 | |
Obayashi Corp. | | | 91,500 | | | | 790,063 | |
Odakyu Electric Railway Co., Ltd. | | | 20,500 | | | | 643,868 | |
Omron Corp. | | | 18,200 | | | | 1,624,736 | |
Ono Pharmaceutical Co., Ltd. | | | 36,000 | | | | 1,084,853 | |
Oriental Land Co., Ltd. | | | 22,600 | | | | 3,734,228 | |
ORIX Corp. | | | 137,800 | | | | 2,119,931 | |
Otsuka Corp. | | | 13,500 | | | | 712,085 | |
Panasonic Corp. | | | 231,700 | | | | 2,700,979 | |
Rakuten, Inc. (b) | | | 84,600 | | | | 814,091 | |
Recruit Holdings Co, Ltd. | | | 127,500 | | | | 5,355,375 | |
Resona Holdings, Inc. | | | 206,600 | | | | 723,259 | |
Rohm Co., Ltd. | | | 8,500 | | | | 823,996 | |
Santen Pharmaceutical Co., Ltd. | | | 43,200 | | | | 701,621 | |
SCSK Corp. | | | 14,000 | | | | 800,596 | |
Secom Co., Ltd. | | | 26,200 | | | | 2,416,995 | |
Sekisui Chemical Co., Ltd. | | | 35,300 | | | | 669,335 | |
Sekisui House, Ltd. | | | 60,900 | | | | 1,240,643 | |
Seven & i Holdings Co., Ltd. | | | 65,300 | | | | 2,312,310 | |
SG Holdings Co., Ltd. | | | 57,700 | | | | 1,573,265 | |
Shimadzu Corp. | | | 28,900 | | | | 1,123,342 | |
Shimizu Corp. | | | 56,800 | | | | 413,464 | |
Shin-Etsu Chemical Co., Ltd. | | | 23,300 | | | | 4,089,516 | |
Shiseido Co., Ltd. | | | 34,400 | | | | 2,381,313 | |
Sompo Holdings, Inc. | | | 30,200 | | | | 1,224,393 | |
Sony Corp. | | | 109,700 | | | | 11,054,249 | |
Stanley Electric Co., Ltd. | | | 12,800 | | | | 412,921 | |
Percent of Net Assets
Name of Issuer and
Title of Issue | | Shares/
Principal | | | Value | |
COMMON STOCKS, continued |
Japan, continued |
Sumitomo Metal Mining Co., Ltd. | | | 29,900 | | | $ | 1,329,981 | |
Sumitomo Mitsui Trust Holdings Inc | | | 27,900 | | | | 860,846 | |
Suntory Beverage & Food, Ltd. | | | 16,800 | | | | 595,045 | |
Sysmex Corp. | | | 14,500 | | | | 1,744,735 | |
T&D Holdings, Inc. | | | 57,100 | | | | 675,427 | |
Taisei Corp. | | | 21,600 | | | | 745,168 | |
Takeda Pharmaceutical Co., Ltd. | | | 138,400 | | | | 5,008,607 | |
TDK Corp. | | | 9,700 | | | | 1,463,570 | |
Tokyo Electron, Ltd. | | | 10,500 | | | | 3,922,409 | |
Tokyu Corp. | | | 84,500 | | | | 1,049,905 | |
Toray Industries, Inc. | | | 176,900 | | | | 1,049,265 | |
TOTO, Ltd. | | | 20,600 | | | | 1,239,882 | |
Unicharm Corp. | | | 39,100 | | | | 1,854,356 | |
West Japan Railway Co. | | | 32,400 | | | | 1,696,467 | |
Yamada Holdings Co., Ltd. | | | 190,800 | | | | 1,013,724 | |
Yamaha Corp. | | | 23,500 | | | | 1,384,721 | |
Yaskawa Electric Corp. | | | 23,600 | | | | 1,176,586 | |
Yokogawa Electric Corp. | | | 22,700 | | | | 452,755 | |
Z Holdings Corp. | | | 221,700 | | | | 1,341,559 | |
| | | | | | | | 187,923,624 | |
Netherlands: 6.1% |
Aegon NV | | | 258,222 | | | | 1,030,013 | |
Akzo Nobel NV | | | 19,292 | | | | 2,070,699 | |
ASML Holding NV | | | 43,348 | | | | 20,988,103 | |
ING Groep NV | | | 304,242 | | | | 2,828,793 | |
Koninklijke Ahold Delhaize NV | | | 116,263 | | | | 3,279,934 | |
Koninklijke Philips NV | | | 91,652 | | | | 4,937,067 | |
NN Group NV | | | 41,602 | | | | 1,798,464 | |
Prosus NV (a) | | | 35,146 | | | | 3,795,019 | |
Wolters Kluwer NV | | | 23,424 | | | | 1,976,216 | |
| | | | | | | | 42,704,308 | |
New Zealand: 0.6% |
Auckland International Airport, Ltd. | | | 116,064 | | | | 634,709 | |
Fisher & Paykel Healthcare Corp., Ltd. | | | 48,472 | | | | 1,151,148 | |
Meridian Energy, Ltd. | | | 330,181 | | | | 1,768,318 | |
Ryman Healthcare, Ltd. | | | 43,647 | | | | 478,854 | |
| | | | | | | | 4,033,029 | |
Norway: 0.5% |
Mowi ASA | | | 42,876 | | | | 955,106 | |
SEE NOTES TO FINANCIAL STATEMENTS | 90 | |
December 31, 2020 |
Schedules of Investments, continued |
Pax MSCI EAFE ESG Leaders Index Fund, continued
Percent of Net Assets
Name of Issuer and
Title of Issue | | Shares/
Principal | | | Value | |
COMMON STOCKS, continued |
Norway, continued |
Norsk Hydro ASA | | | 203,326 | | | $ | 946,295 | |
Telenor ASA | | | 87,437 | | | | 1,484,221 | |
| | | | | | | | 3,385,622 | |
Portugal: 0.1% |
Jeronimo Martins SGPS SA | | | 37,025 | | | | 622,380 | |
| |
Singapore: 1.4% |
Ascendas Real Estate Investment Trust, REIT | | | 175,600 | | | | 396,410 | |
CapitaLand Integrated Commercial Trust, REIT | | | 749,236 | | | | 1,225,321 | |
CapitaLand, Ltd. | | | 82,526 | | | | 204,769 | |
DBS Group Holdings, Ltd. | | | 155,147 | | | | 2,940,148 | |
Keppel Corp., Ltd. | | | 365,500 | | | | 1,488,456 | |
Singapore Airlines, Ltd. (a) | | | 389,200 | | | | 1,262,846 | |
Singapore Telecommunications, Ltd. | | | 696,400 | | | | 1,216,012 | |
United Overseas Bank, Ltd. | | | 50,400 | | | | 859,038 | |
| | | | | | | | 9,593,000 | |
Spain: 2.6% |
Banco Bilbao Vizcaya Argentaria SA | | | 599,446 | | | | 2,971,215 | |
CaixaBank SA | | | 312,814 | | | | 804,018 | |
Iberdrola SA | | | 519,933 | | | | 7,471,588 | |
Industria de Diseno Textil SA | | | 99,001 | | | | 3,142,273 | |
Red Electrica Corp. SA | | | 88,192 | | | | 1,810,676 | |
Telefonica SA | | | 584,430 | | | | 2,324,646 | |
| | | | | | | | 18,524,416 | |
Sweden: 3.2% |
Assa Abloy AB, Class B | | | 80,772 | | | | 1,996,038 | |
Atlas Copco AB, Class A | | | 66,645 | | | | 3,425,314 | |
Atlas Copco AB, Class B | | | 32,289 | | | | 1,449,371 | |
Boliden AB | | | 43,112 | | | | 1,529,499 | |
Essity AB, Class B | | | 42,436 | | | | 1,367,252 | |
Hennes & Mauritz AB, Class B | | | 74,902 | | | | 1,572,348 | |
Husqvarna AB, Class B | | | 52,734 | | | | 684,378 | |
Investment AB Latour, Class B | | | 14,660 | | | | 355,105 | |
Kinnevik AB, Class B (a) | | | 34,185 | | | | 1,717,338 | |
Sandvik AB | | | 124,757 | | | | 3,076,951 | |
Skandinaviska Enskilda Banken AB, Class A (a) | | | 72,523 | | | | 746,805 | |
Skanska AB, Class B | | | 34,764 | | | | 885,926 | |
SKF AB, Class B | | | 37,739 | | | | 981,941 | |
Svenska Handelsbanken AB, Class A | | | 103,180 | | | | 1,040,057 | |
Tele2 AB, Class B | | | 38,449 | | | | 508,603 | |
Percent of Net Assets
Name of Issuer and
Title of Issue | | Shares/
Principal | | | Value | |
COMMON STOCKS, continued |
Sweden, continued |
Telia Company AB | | | 288,455 | | | $ | 1,191,277 | |
| | | | | | | | 22,528,203 | |
Switzerland: 8.6% |
ABB, Ltd. | | | 183,480 | | | | 5,146,464 | |
Adecco Group AG | | | 19,409 | | | | 1,292,704 | |
Alcon, Inc. (a) | | | 45,153 | | | | 2,997,982 | |
Chocoladefabriken Lindt & Spruengli AG-Reg | | | 16 | | | | 1,607,053 | |
Givaudan SA | | | 762 | | | | 3,223,886 | |
Kuehne & Nagel International AG | | | 9,040 | | | | 2,051,343 | |
Lonza Group AG | | | 7,578 | | | | 4,881,494 | |
Roche Holding AG | | | 62,242 | | | | 21,678,793 | |
SGS SA | | | 846 | | | | 2,550,158 | |
Sika AG | | | 14,114 | | | | 3,847,381 | |
Sonova Holding AG (a) | | | 4,890 | | | | 1,271,857 | |
Swiss Re AG | | | 32,729 | | | | 3,083,503 | |
Swisscom AG | | | 2,008 | | | | 1,081,383 | |
Zurich Insurance Group AG | | | 13,181 | | | | 5,554,749 | |
| | | | | | | | 60,268,750 | |
United Kingdom: 12.0% |
3i Group PLC | | | 141,524 | | | | 2,238,474 | |
Associated British Foods PLC | | | 38,625 | | | | 1,192,534 | |
Aviva PLC | | | 443,936 | | | | 1,974,642 | |
Barratt Developments PLC | | | 119,255 | | | | 1,090,242 | |
Berkeley Group Holdings PLC | | | 19,114 | | | | 1,236,438 | |
British Land Co. PLC, The, REIT | | | 198,118 | | | | 1,326,897 | |
BT Group PLC | | | 490,539 | | | | 884,176 | |
Burberry Group PLC | | | 37,501 | | | | 915,779 | |
Compass Group PLC | | | 187,629 | | | | 3,499,535 | |
Ferguson PLC | | | 18,751 | | | | 2,278,255 | |
GlaxoSmithKline PLC | | | 441,854 | | | | 8,085,027 | |
Informa PLC | | | 165,679 | | | | 1,238,843 | |
InterContinental Hotels Group PLC | | | 20,624 | | | | 1,336,746 | |
J Sainsbury PLC | | | 438,707 | | | | 1,348,457 | |
JD Sports Fashion PLC | | | 78,850 | | | | 926,350 | |
Legal & General Group PLC | | | 850,405 | | | | 3,099,228 | |
London Stock Exchange Group PLC | | | 26,884 | | | | 3,318,467 | |
Mondi PLC | | | 38,304 | | | | 897,534 | |
National Grid PLC | | | 398,122 | | | | 4,704,779 | |
Pearson PLC | | | 85,695 | | | | 786,530 | |
Prudential PLC | | | 238,097 | | | | 4,378,119 | |
| | 91 | SEE NOTES TO FINANCIAL STATEMENTS |
December 31, 2020 |
Schedules of Investments, continued |
Pax MSCI EAFE ESG Leaders Index Fund, continued
Percent of Net Assets
Name of Issuer and
Title of Issue | | Shares/
Principal | | | Value | |
COMMON STOCKS, continued |
United Kingdom, continued |
Reckitt Benckiser Group PLC | | | 62,713 | | | $ | 5,597,402 | |
RELX PLC | | | 191,073 | | | | 4,675,064 | |
Rentokil Initial, PLC | | | 115,302 | | | | 803,905 | |
RSA Insurance Group PLC | | | 79,104 | | | | 733,204 | |
Smith & Nephew PLC | | | 92,302 | | | | 1,917,341 | |
Spirax-Sarco Engineering, PLC | | | 7,320 | | | | 1,129,944 | |
Standard Chartered PLC | | | 232,861 | | | | 1,478,654 | |
Standard Life Aberdeen PLC | | | 257,051 | | | | 985,277 | |
Taylor Wimpey PLC | | | 435,110 | | | | 984,201 | |
Tesco PLC | | | 865,453 | | | | 2,731,168 | |
Unilever PLC | | | 225,859 | | | | 13,545,592 | |
Whitbread PLC (a) | | | 16,184 | | | | 685,500 | |
Wm Morrison Supermarkets PLC | | | 352,022 | | | | 851,789 | |
WPP PLC | | | 103,087 | | | | 1,117,050 | |
| | | | | | | | 83,993,143 | |
Total Common Stocks |
(Cost $525,486,477) | | | 688,242,238 | |
| | | | | | | | | |
PREFERRED STOCKS: 0.4% |
Germany: 0.4% |
Bayerische Motoren Werke AG | | | 12,785 | | | | 861,262 | |
Henkel AG & Co. KGaA | | | 6,400 | | | | 721,628 | |
Sartorius AG | | | 3,738 | | | | 1,574,369 | |
TOTAL PREFERRED STOCKS |
(Cost $2,163,821) | | | 3,157,259 | |
| | | | | | | | | |
MONEY MARKET: 1.1% |
State Street Institutional U.S. Government Money Market Fund, 0.030% (c)(d) | | | 7,592,518 | | | | 7,592,518 | |
(Cost $7,592,518) |
Percent of Net Assets
Name of Issuer and
Title of Issue | | Shares/
Principal | | | Value | |
SECURITIES PURCHASED WITH CASH COLLATERAL FROM SECURITIES LENDING: 0.3% |
State Street Navigator Securities Lending Government Money Market Portfolio, 0.101% (c)(d) | | | 1,842,875 | | | $ | 1,842,875 | |
(Cost $1,842,875) |
| | | | | | | | | |
TOTAL INVESTMENTS: 100.0% |
(Cost $537,085,691) | | | 700,834,890 | |
| | | | | |
PAYABLE UPON RETURN OF SECURITIES LOANED: -0.3% | | | (1,842,875 | ) |
| | | | | | | | | |
OTHER ASSETS AND LIABILITIES — (NET): 0.3% | | | 1,984,577 | |
| | | | | | | | | |
NET ASSETS: 100.0% | | $ | 700,976,592 | |
(a) | Security or partial position of this security was on loan as of December 31, 2020. The total market value of securities on loan as of December 31, 2020 was $2,546,905. |
(b) | Non-income producing security. |
(c) | Rate shown represents annualized 7-day yield as of December 31, 2020 |
REIT - Real Estate Investment Trust
SEE NOTES TO FINANCIAL STATEMENTS | 92 | |
December 31, 2020 |
Schedules of Investments, continued |
Pax MSCI EAFE ESG Leaders Index Fund, continued
SUMMARY OF INVESTMENTS BY SECTOR
Sector | | Value | | | Percent Of
Net Assets | |
Communication Services | | $ | 32,892,644 | | | | 4.7 | % |
Consumer Discretionary | | | 85,168,911 | | | | 12.1 | % |
Consumer Staples | | | 70,397,320 | | | | 10.1 | % |
Financials | | | 116,452,507 | | | | 16.6 | % |
Health Care | | | 88,528,346 | | | | 12.8 | % |
Industrials | | | 116,652,191 | | | | 16.4 | % |
Information Technology | | | 71,121,798 | | | | 10.2 | % |
Materials | | | 61,277,216 | | | | 8.7 | % |
Real Estate | | | 22,366,974 | | | | 3.2 | % |
Utilities | | | 26,541,590 | | | | 3.8 | % |
Money Market | | | 7,592,518 | | | | 1.1 | % |
Other assets and liabilities (net) | | | 1,984,577 | | | | 0.3 | % |
Total | | $ | 700,976,592 | | | | 100.0 | % |
| | 93 | SEE NOTES TO FINANCIAL STATEMENTS |
December 31, 2020 |
Schedules of Investments, continued |
Pax Core Bond Fund
Percent of Net Assets
Name of Issuer and
Title of Issue | | Shares/
Principal | | | Value | |
BONDS: 98.8% |
Community Investment Notes: 0.0% (a) |
CINI Investment Note, 2.000%, 10/31/2023 (b)(c) | | $ | 293,185 | | | $ | 293,185 | |
(Cost $293,185) |
| |
CORPORATE BONDS: 37.4% |
Communication Services: 3.7% |
Alphabet, Inc., 1.900%, 08/15/40 | | | 700,000 | | | | 688,142 | |
AT&T, Inc., 1.650%, 02/01/28 | | | 2,000,000 | | | | 2,043,248 | |
AT&T, Inc., 4.300%, 02/15/30 | | | 1,000,000 | | | | 1,195,437 | |
AT&T, Inc., 2.750%, 06/01/31 | | | 2,000,000 | | | | 2,139,147 | |
AT&T, Inc., 3.100%, 02/01/43 | | | 1,500,000 | | | | 1,527,243 | |
CCO Holdings, LLC/Capital Corp., 144A, 4.750%, 03/01/30 (d) | | | 1,000,000 | | | | 1,080,250 | |
Charter Communications Operating, LLC/Capital, 5.050%, 03/30/29 | | | 1,000,000 | | | | 1,216,684 | |
Discovery Communications, LLC, 3.950%, 03/20/28 | | | 1,500,000 | | | | 1,722,741 | |
Discovery Communications, LLC, 4.125%, 05/15/29 | | | 500,000 | | | | 584,484 | |
Level 3 Financing, Inc., 144A, 3.875%, 11/15/29 (d) | | | 1,000,000 | | | | 1,112,835 | |
Sprint Communications, Inc., 6.000%, 11/15/22 | | | 1,000,000 | | | | 1,083,750 | |
Switch, Ltd., 144A, 3.750%, 09/15/28 (d) | | | 1,000,000 | | | | 1,016,875 | |
T-Mobile USA, Inc., 4.750%, 02/01/28 | | | 1,000,000 | | | | 1,076,140 | |
T-Mobile USA, Inc., 144A, 2.250%, 11/15/31 (d) | | | 500,000 | | | | 514,108 | |
T-Mobile USA, Inc., 144A, 3.000%, 02/15/41 (d) | | | 1,000,000 | | | | 1,038,595 | |
T-Mobile USA, Inc., 144A, 4.500%, 04/15/50 (d) | | | 1,000,000 | | | | 1,235,260 | |
Verizon Communications, Inc., 3.875%, 02/08/29 | | | 2,000,000 | | | | 2,357,437 | |
Verizon Communications, Inc., 1.500%, 09/18/30 | | | 3,000,000 | | | | 2,958,003 | |
Verizon Communications, Inc., 4.500%, 08/10/33 | | | 1,000,000 | | | | 1,263,074 | |
Percent of Net Assets
Name of Issuer and
Title of Issue | | Shares/
Principal | | | Value | |
BONDS, continued |
CORPORATE BONDS, continued |
Communication Services, continued |
Walt Disney Co., The, 1.750%, 08/30/24 | | $ | 2,000,000 | | | $ | 2,086,838 | |
| | | | | | | | 27,940,291 | |
Consumer Discretionary: 2.3% |
Amazon.com, Inc., 2.500%, 06/03/50 | | | 1,000,000 | | | | 1,039,720 | |
Doris Duke Charitable Foundation, The, 2.345%, 07/01/50 | | | 2,000,000 | | | | 1,937,912 | |
eBay, Inc., 2.750%, 01/30/23 | | | 1,000,000 | | | | 1,047,726 | |
Expedia Group, Inc., 144A, 6.250%, 05/01/25 (d) | | | 1,000,000 | | | | 1,159,736 | |
Home Depot, Inc., The, 2.800%, 09/14/27 | | | 2,000,000 | | | | 2,228,779 | |
Home Depot, Inc., The, 2.950%, 06/15/29 | | | 1,000,000 | | | | 1,137,523 | |
Local Initiatives Support Corp., 1.000%, 11/15/25 | | | 1,000,000 | | | | 998,035 | |
Lowe’s Cos., Inc., 1.300%, 04/15/28 | | | 1,000,000 | | | | 1,009,505 | |
Lowe’s Cos., Inc., 3.000%, 10/15/50 | | | 250,000 | | | | 268,464 | |
Ross Stores, Inc., 3.375%, 09/15/24 | | | 2,000,000 | | | | 2,144,523 | |
Starbucks Corp., 4.450%, 08/15/49 | | | 2,000,000 | | | | 2,642,970 | |
TJX Cos Inc., The, 1.150%, 05/15/28 | | | 1,000,000 | | | | 1,006,085 | |
WK Kellogg Foundation Trust, 144A, 2.443%, 10/01/50 (d) | | | 1,000,000 | | | | 1,024,430 | |
| | | | | | | | 17,645,408 | |
Consumer Staples: 2.1% |
Albertsons Cos., Inc./Safeway, Inc./New Albertsons, LP/Albertsons, LLC, 144A, 3.250%, 03/15/26 (d) | | | 1,000,000 | | | | 1,016,250 | |
Albertsons Cos., Inc./Safeway, Inc./New Albertsons, LP/Albertsons, LLC, 144A, 4.625%, 01/15/27 (d) | | | 1,000,000 | | | | 1,064,805 | |
SEE NOTES TO FINANCIAL STATEMENTS | 94 | |
December 31, 2020 |
Schedules of Investments, continued |
Pax Core Bond Fund, continued
Percent of Net Assets
Name of Issuer and
Title of Issue | | Shares/
Principal | | | Value | |
BONDS, continued |
CORPORATE BONDS, continued |
Consumer Staples, continued |
Campbell Soup Co., 2.375%, 04/24/30 | | $ | 1,000,000 | | | $ | 1,058,036 | |
Capital Impact Partners, 2.300%, 10/15/24 (b) | | | 500,000 | | | | 511,719 | |
Clorox Co., The, 1.800%, 05/15/30 | | | 1,500,000 | | | | 1,551,247 | |
CVS Health Corp., 3.625%, 04/01/27 | | | 1,000,000 | | | | 1,139,545 | |
CVS Health Corp., 3 month LIBOR + 0.63%, 4.300%, 03/25/28 | | | 564,000 | | | | 671,550 | |
CVS Health Corp., 3.250%, 08/15/29 | | | 500,000 | | | | 563,742 | |
General Mills, Inc., 2.875%, 04/15/30 | | | 1,000,000 | | | | 1,110,571 | |
Kellogg Co., 2.100%, 06/01/30 | | | 1,000,000 | | | | 1,052,171 | |
Keurig Dr Pepper, Inc., 3.200%, 05/01/30 | | | 1,000,000 | | | | 1,134,029 | |
Kraft Heinz Foods Co., 144A, 4.250%, 03/01/31 (d) | | | 1,000,000 | | | | 1,115,970 | |
PepsiCo, Inc., 2.875%, 10/15/49 | | | 1,000,000 | | | | 1,121,781 | |
Raza Development Fund, Inc., 3.534%, 07/01/34 | | | 1,000,000 | | | | 1,125,445 | |
Sysco Corp., 2.400%, 02/15/30 | | | 1,500,000 | | | | 1,563,968 | |
| | | | | | | | 15,800,829 | |
Energy: 0.3% |
MidAmerican Energy Co., 3.100%, 05/01/27 | | | 1,000,000 | | | | 1,122,571 | |
MidAmerican Energy Co., 3.650%, 04/15/29 | | | 1,000,000 | | | | 1,188,582 | |
| | | | | | | | 2,311,153 | |
Financials: 13.4% |
Aflac, Inc., 3.600%, 04/01/30 | | | 1,000,000 | | | | 1,178,404 | |
Allstate Corp., The, 3 month LIBOR + 0.43%, 0.681%, 03/29/21 (e)(f) | | | 1,000,000 | | | | 1,000,909 | |
Allstate Corp., The, 0.750%, 12/15/25 | | | 2,000,000 | | | | 2,012,023 | |
Allstate Corp., The, 1.450%, 12/15/30 | | | 2,000,000 | | | | 1,999,913 | |
Percent of Net Assets
Name of Issuer and
Title of Issue | | Shares/
Principal | | | Value | |
BONDS, continued |
CORPORATE BONDS, continued |
Financials, continued |
Allstate Corp., The, 3.850%, 08/10/49 | | $ | 1,000,000 | | | $ | 1,259,497 | |
Andrew W Mellon Foundation, The, 0.947%, 08/01/27 | | | 1,000,000 | | | | 1,000,274 | |
Bank of America Corp., 3.499%, 05/17/22 (e) | | | 3,000,000 | | | | 3,035,660 | |
Bank of America Corp., 1.486%, 05/19/24 (e) | | | 1,650,000 | | | | 1,689,584 | |
Bank of America Corp., 0.981%, 09/25/25 (e) | | | 2,000,000 | | | | 2,023,235 | |
Bank of America Corp., 3.559%, 04/23/27 (e) | | | 1,000,000 | | | | 1,129,660 | |
Bank of America Corp., 4.083%, 03/20/51 (e) | | | 1,000,000 | | | | 1,266,370 | |
Bank of Montreal, 2.050%, 11/01/22 | | | 1,000,000 | | | | 1,032,517 | |
Bank of New York Mellon Corp., The, 1.850%, 01/27/23 | | | 250,000 | | | | 257,889 | |
Bank of New York Mellon Corp., The, 3.400%, 01/29/28 | | | 1,000,000 | | | | 1,144,305 | |
BlackRock, Inc., 3.250%, 04/30/29 | | | 2,000,000 | | | | 2,307,029 | |
BlueHub Loan Fund, Inc., 2.890%, 01/01/27 | | | 1,000,000 | | | | 1,002,664 | |
BNG Bank NV, 144A, 0.500%, 11/24/25 (d) | | | 250,000 | | | | 250,210 | |
Calvert Impact Capital, Inc., 3.000%, 03/14/25 | | | 2,000,000 | | | | 2,000,000 | |
Charles Schwab Corp., The, 3.550%, 02/01/24 | | | 1,000,000 | | | | 1,094,331 | |
Charles Schwab Corp., The, 0.900%, 03/11/26 | | | 2,000,000 | | | | 2,027,112 | |
Chubb INA Holdings, Inc., 1.375%, 09/15/30 | | | 2,000,000 | | | | 1,999,067 | |
Fifth Third Bank, 2.250%, 02/01/27 | | | 1,000,000 | | | | 1,067,946 | |
Ford Motor Credit Co., LLC, 3 month LIBOR + 0.81%, 1.044%, 04/05/21 (e) | | | 1,086,000 | | | | 1,081,376 | |
| | 95 | SEE NOTES TO FINANCIAL STATEMENTS |
December 31, 2020 |
Schedules of Investments, continued |
Pax Core Bond Fund, continued
Percent of Net Assets
Name of Issuer and
Title of Issue | | Shares/
Principal | | | Value | |
BONDS, continued |
CORPORATE BONDS, continued |
Financials, continued |
Ford Motor Credit Co., LLC, 3.810%, 01/09/24 | | $ | 1,000,000 | | | $ | 1,026,250 | |
Ford Motor Credit Co., LLC, 3.375%, 11/13/25 | | | 1,000,000 | | | | 1,028,610 | |
ING Groep NV, 144A, 4.625%, 01/06/26 (d) | | | 2,000,000 | | | | 2,355,481 | |
JPMorgan Chase & Co., 0.653%, 09/16/24 (e) | | | 3,000,000 | | | | 3,016,694 | |
JPMorgan Chase & Co., 3.964%, 11/15/48 (e) | | | 1,000,000 | | | | 1,260,763 | |
Kreditanstalt fuer Wiederaufbau, 3.125%, 12/15/21 | | | 7,000,000 | | | | 7,194,792 | |
Kreditanstalt fuer Wiederaufbau, 2.125%, 06/15/22 | | | 1,000,000 | | | | 1,028,424 | |
Kreditanstalt fuer Wiederaufbau, 2.375%, 12/29/22 | | | 3,000,000 | | | | 3,130,179 | |
Kreditanstalt fuer Wiederaufbau, 2.625%, 02/28/24 | | | 5,000,000 | | | | 5,375,145 | |
Kreditanstalt fuer Wiederaufbau, 2.000%, 05/02/25 | | | 3,000,000 | | | | 3,212,461 | |
Kreditanstalt fuer Wiederaufbau, 0.375%, 07/18/25 | | | 1,000,000 | | | | 998,152 | |
Kreditanstalt fuer Wiederaufbau, 0.750%, 09/30/30 | | | 1,800,000 | | | | 1,762,186 | |
MetLife, Inc., 4.875%, 11/13/43 | | | 1,000,000 | | | | 1,424,843 | |
Metropolitan Life Global Funding I, 144A, 0.950%, 07/02/25 (d) | | | 3,000,000 | | | | 3,041,782 | |
Morgan Stanley, 0.560%, 11/10/23 (e) | | | 3,000,000 | | | | 3,007,773 | |
Morgan Stanley, 3.625%, 01/20/27 | | | 2,000,000 | | | | 2,292,320 | |
Morgan Stanley, 4.457%, 04/22/39 (e) | | | 1,000,000 | | | | 1,301,933 | |
Percent of Net Assets
Name of Issuer and
Title of Issue | | Shares/
Principal | | | Value | |
BONDS, continued |
CORPORATE BONDS, continued |
Financials, continued |
Morgan Stanley, 5.597%, 03/24/51 (e) | | $ | 1,000,000 | | | $ | 1,612,772 | |
MSCI, Inc., 144A, 3.875%, 02/15/31 (d) | | | 1,000,000 | | | | 1,058,750 | |
National Bank of Canada, 0.900%, 08/15/23 (e) | | | 1,750,000 | | | | 1,761,219 | |
National Bank of Canada, 0.550%, 11/15/24 (e) | | | 1,600,000 | | | | 1,605,629 | |
Natwest Group, PLC, 2.359%, 05/22/24 (e) | | | 2,000,000 | | | | 2,082,290 | |
PNC Bank NA, 3.100%, 10/25/27 | | | 1,000,000 | | | | 1,120,986 | |
PNC Financial Services Group, Inc., The, 2.200%, 11/01/24 | | | 3,000,000 | | | | 3,190,098 | |
PNC Financial Services Group, Inc., The, 3.450%, 04/23/29 | | | 500,000 | | | | 576,756 | |
Progressive Corp., The, 3.200%, 03/26/30 | | | 1,500,000 | | | | 1,730,885 | |
Prudential Financial, Inc., 1.500%, 03/10/26 | | | 250,000 | | | | 259,649 | |
Prudential Financial, Inc., 4.350%, 02/25/50 | | | 1,000,000 | | | | 1,316,023 | |
Raymond James Financial, Inc., 3.625%, 09/15/26 | | | 1,000,000 | | | | 1,148,658 | |
Royal Bank of Canada, 1.150%, 06/10/25 | | | 2,000,000 | | | | 2,045,072 | |
Toronto-Dominion Bank, The, 1.900%, 12/01/22 | | | 500,000 | | | | 515,745 | |
Toronto-Dominion Bank, The, 2.650%, 06/12/24 | | | 1,000,000 | | | | 1,072,053 | |
Toyota Motor Credit Corp., 2.150%, 02/13/30 | | | 500,000 | | | | 537,609 | |
Travelers Cos, Inc., The, 4.100%, 03/04/49 | | | 1,000,000 | | | | 1,320,346 | |
USAA Capital Corp., 144A, 1.500%, 05/01/23 (d) | | | 2,500,000 | | | | 2,565,263 | |
USAA Capital Corp., 144A, 2.125%, 05/01/30 (d) | | | 1,000,000 | | | | 1,052,795 | |
| | | | | | | | 101,890,361 | |
SEE NOTES TO FINANCIAL STATEMENTS | 96 | |
December 31, 2020 |
Schedules of Investments, continued |
Pax Core Bond Fund, continued
Percent of Net Assets
Name of Issuer and
Title of Issue | | Shares/
Principal | | | Value | |
BONDS, continued |
CORPORATE BONDS, continued |
Health Care: 4.3% |
AbbVie, Inc., 3.200%, 11/21/29 | | $ | 1,000,000 | | | $ | 1,122,403 | |
AbbVie, Inc., 4.250%, 11/21/49 | | | 1,000,000 | | | | 1,258,295 | |
Amgen, Inc., 3.625%, 05/22/24 | | | 1,000,000 | | | | 1,098,155 | |
Amgen, Inc., 1.900%, 02/21/25 | | | 500,000 | | | | 526,577 | |
Anthem, Inc., 2.375%, 01/15/25 | | | 1,000,000 | | | | 1,070,158 | |
Anthem, Inc., 4.101%, 03/01/28 | | | 1,000,000 | | | | 1,183,267 | |
Anthem, Inc., 2.250%, 05/15/30 | | | 1,000,000 | | | | 1,063,544 | |
Avantor Funding, Inc., 144A, 4.625%, 07/15/28 (d) | | | 1,000,000 | | | | 1,058,750 | |
Becton Dickinson & Co., 3.363%, 06/06/24 | | | 1,000,000 | | | | 1,087,581 | |
Becton Dickinson & Co., 3.700%, 06/06/27 | | | 1,000,000 | | | | 1,148,253 | |
Becton Dickinson & Co., 4.669%, 06/06/47 | | | 1,000,000 | | | | 1,315,224 | |
Biogen, Inc., 2.250%, 05/01/30 | | | 1,000,000 | | | | 1,045,888 | |
Bristol-Myers Squibb Co., 2.900%, 07/26/24 | | | 2,000,000 | | | | 2,172,680 | |
Bristol-Myers Squibb Co., 2.350%, 11/13/40 | | | 500,000 | | | | 513,738 | |
Centene Corp., 4.250%, 12/15/27 | | | 1,000,000 | | | | 1,062,315 | |
CVS Health Corp., 1.750%, 08/21/30 | | | 500,000 | | | | 503,345 | |
CVS Health Corp., 5.125%, 07/20/45 | | | 1,000,000 | | | | 1,348,423 | |
Danaher Corp., 2.600%, 10/01/50 | | | 2,000,000 | | | | 2,080,873 | |
HCA, Inc., 5.875%, 05/01/23 | | | 1,000,000 | | | | 1,100,205 | |
IQVIA, Inc., 144A, 5.000%, 05/15/27 (d) | | | 2,000,000 | | | | 2,129,980 | |
Jaguar Holding Co. II/PPD Development, LP, 144A, 5.000%, 06/15/28 (d) | | | 1,000,000 | | | | 1,068,750 | |
Percent of Net Assets
Name of Issuer and
Title of Issue | | Shares/
Principal | | | Value | |
BONDS, continued |
CORPORATE BONDS, continued |
Health Care, continued |
Kaiser Foundation Hospitals, 3.266%, 11/01/49 | | $ | 1,000,000 | | | $ | 1,150,992 | |
Merck & Co., Inc., 3.400%, 03/07/29 | | | 1,000,000 | | | | 1,164,193 | |
Merck & Co., Inc., 2.350%, 06/24/40 | | | 1,000,000 | | | | 1,037,149 | |
Quest Diagnostics, Inc., 3.450%, 06/01/26 | | | 1,000,000 | | | | 1,129,946 | |
UnitedHealth Group, Inc., 1.250%, 01/15/26 | | | 500,000 | | | | 515,817 | |
UnitedHealth Group, Inc., 2.750%, 05/15/40 | | | 500,000 | | | | 543,220 | |
Zoetis, Inc., 3.000%, 09/12/27 | | | 1,000,000 | | | | 1,120,641 | |
Zoetis, Inc., 3.900%, 08/20/28 | | | 1,000,000 | | | | 1,179,647 | |
| | | | | | | | 32,800,009 | |
Industrials: 3.2% |
Ashtead Capital, Inc., 144A, 4.000%, 05/01/28 (d) | | | 1,000,000 | | | | 1,064,640 | |
Burlington Northern Santa Fe, LLC, 3.550%, 02/15/50 | | | 1,000,000 | | | | 1,236,030 | |
Caterpillar, Inc., 2.600%, 04/09/30 (f) | | | 1,000,000 | | | | 1,103,690 | |
Cummins, Inc., 7.125%, 03/01/28 | | | 1,000,000 | | | | 1,342,457 | |
Johnson Controls International plc/Tyco Fire & Security Finance SCA, 1.750%, 09/15/30 | | | 1,000,000 | | | | 1,021,619 | |
Masco Corp., 4.375%, 04/01/26 | | | 1,000,000 | | | | 1,171,901 | |
Meritor, Inc., 144A, 4.500%, 12/15/28 (d) | | | 1,000,000 | | | | 1,026,875 | |
Republic Services, Inc., 1.450%, 02/15/31 | | | 2,000,000 | | | | 1,959,240 | |
Roper Technologies, Inc., 2.000%, 06/30/30 | | | 1,500,000 | | | | 1,534,466 | |
Standard Industries, Inc., 144A, 4.750%, 01/15/28 (d) | | | 1,000,000 | | | | 1,053,750 | |
| | 97 | SEE NOTES TO FINANCIAL STATEMENTS |
December 31, 2020 |
Schedules of Investments, continued |
Pax Core Bond Fund, continued
Percent of Net Assets
Name of Issuer and
Title of Issue | | Shares/
Principal | | | Value | |
BONDS, continued |
CORPORATE BONDS, continued |
Industrials, continued |
Standard Industries, Inc., 144A, 4.375%, 07/15/30 (d) | | $ | 1,000,000 | | | $ | 1,071,265 | |
Tesla Energy Operations, Inc., 4.700%, 05/29/25 (b) | | | 2,000,000 | | | | 2,119,605 | |
Union Pacific Corp., 3.700%, 03/01/29 | | | 1,000,000 | | | | 1,161,614 | |
Union Pacific Corp., 2.400%, 02/05/30 | | | 500,000 | | | | 539,333 | |
United Rentals North America, Inc., 5.250%, 01/15/30 | | | 2,000,000 | | | | 2,223,750 | |
Waste Management, Inc., 3.150%, 11/15/27 | | | 2,500,000 | | | | 2,825,108 | |
Waste Management, Inc., 2.500%, 11/15/50 | | | 350,000 | | | | 354,360 | |
Xylem, Inc., 1.950%, 01/30/28 | | | 1,500,000 | | | | 1,582,662 | |
| | | | | | | | 24,392,365 | |
Information Technology: 3.3% |
Analog Devices, Inc., 2.950%, 04/01/25 | | | 1,000,000 | | | | 1,092,520 | |
Apple, Inc., 2.850%, 02/23/23 | | | 1,000,000 | | | | 1,050,436 | |
Apple, Inc., 3.000%, 06/20/27 | | | 2,500,000 | | | | 2,802,087 | |
Dell International, LLC/EMC Corp., 144A, 6.020%, 06/15/26 (d) | | | 1,000,000 | | | | 1,220,782 | |
Fiserv, Inc., 2.250%, 06/01/27 | | | 1,000,000 | | | | 1,067,303 | |
Gartner, Inc., 144A, 4.500%, 07/01/28 (d) | | | 1,000,000 | | | | 1,056,250 | |
Hewlett Packard Enterprise Co., 1.450%, 04/01/24 | | | 2,500,000 | | | | 2,569,988 | |
MasterCard, Inc., 3.300%, 03/26/27 | | | 500,000 | | | | 570,917 | |
MasterCard, Inc., 3.500%, 02/26/28 | | | 1,000,000 | | | | 1,154,330 | |
MasterCard, Inc., 2.950%, 06/01/29 | | | 500,000 | | | | 561,593 | |
Microchip Technology, Inc., 144A, 0.972%, 02/15/24 (d) | | | 2,000,000 | | | | 2,006,429 | |
Percent of Net Assets
Name of Issuer and
Title of Issue | | Shares/
Principal | | | Value | |
BONDS, continued |
CORPORATE BONDS, continued |
Information Technology, continued |
Microsoft Corp., 2.400%, 08/08/26 | | $ | 2,000,000 | | | $ | 2,183,074 | |
NetApp, Inc., 3.250%, 12/15/22 | | | 671,000 | | | | 699,247 | |
NetApp, Inc., 1.875%, 06/22/25 | | | 1,000,000 | | | | 1,045,404 | |
NXP BV/Funding, LLC/USA, Inc., 144A, 3.400%, 05/01/30 (d) | | | 1,000,000 | | | | 1,136,257 | |
TSMC Global, Ltd., 144A, 0.750%, 09/28/25 (d) | | | 500,000 | | | | 498,333 | |
Visa, Inc., 0.750%, 08/15/27 (f) | | | 2,000,000 | | | | 1,996,839 | |
Visa, Inc., 3.650%, 09/15/47 | | | 2,000,000 | | | | 2,513,386 | |
| | | | | | | | 25,225,175 | |
Materials: 0.3% |
Ecolab, Inc., 4.800%, 03/24/30 | | | 1,000,000 | | | | 1,276,954 | |
Ecolab, Inc., 2.125%, 08/15/50 | | | 500,000 | | | | 480,600 | |
Owens-Brockway Glass Container, Inc., 144A, 6.625%, 05/13/27 (d) | | | 500,000 | | | | 542,188 | |
| | | | | | | | 2,299,742 | |
Real Estate: 1.7% |
Alexandria Real Estate Equities, Inc., 1.875%, 02/01/33 | | | 1,000,000 | | | | 1,001,088 | |
American Tower Corp., 2.400%, 03/15/25 | | | 500,000 | | | | 531,794 | |
American Tower Corp., 1.300%, 09/15/25 | | | 500,000 | | | | 511,111 | |
American Tower Corp., 2.100%, 06/15/30 | | | 250,000 | | | | 257,031 | |
American Tower Corp., 1.875%, 10/15/30 | | | 500,000 | | | | 505,019 | |
American Tower Corp., 2.950%, 01/15/51 | | | 500,000 | | | | 502,178 | |
Crown Castle International Corp., 3.300%, 07/01/30 | | | 500,000 | | | | 560,540 | |
Equinix, Inc., 1.000%, 09/15/25 | | | 2,000,000 | | | | 2,007,798 | |
SEE NOTES TO FINANCIAL STATEMENTS | 98 | |
December 31, 2020 |
Schedules of Investments, continued |
Pax Core Bond Fund, continued
Percent of Net Assets
Name of Issuer and
Title of Issue | | Shares/
Principal | | | Value | |
BONDS, continued |
CORPORATE BONDS, continued |
Real Estate, continued |
Equinix, Inc., 1.550%, 03/15/28 | | $ | 500,000 | | | $ | 508,937 | |
HAT Holdings I, LLC/HAT Holdings II, LLC, 144A, 6.000%, 04/15/25 (d) | | | 1,000,000 | | | | 1,071,250 | |
HAT Holdings I, LLC/HAT Holdings II, LLC, 144A, 3.750%, 09/15/30 (d) | | | 1,000,000 | | | | 1,042,500 | |
Iron Mountain, Inc., 144A, 4.875%, 09/15/27 (d) | | | 1,000,000 | | | | 1,047,905 | |
Iron Mountain, Inc., 144A, 4.500%, 02/15/31 (d) | | | 1,000,000 | | | | 1,048,750 | |
Prologis, LP, 1.250%, 10/15/30 | | | 500,000 | | | | 495,797 | |
UDR, Inc., 1.900%, 03/15/33 | | | 1,000,000 | | | | 1,001,849 | |
Welltower, Inc., 2.700%, 02/15/27 | | | 1,000,000 | | | | 1,100,495 | |
| | | | | | | | 13,194,042 | |
Utilities: 2.8% |
AES Corp., The, 144A, 1.375%, 01/15/26 (d) | | | 2,000,000 | | | | 2,019,090 | |
AES Corp., The, 144A, 2.450%, 01/15/31 (d) | | | 1,000,000 | | | | 1,014,367 | |
American Water Capital Corp., 2.800%, 05/01/30 | | | 3,000,000 | | | | 3,321,014 | |
Avangrid, Inc., 3.200%, 04/15/25 | | | 1,000,000 | | | | 1,095,822 | |
Consolidated Edison Co. of New York, Inc., 3.350%, 04/01/30 | | | 1,000,000 | | | | 1,147,730 | |
DTE Electric Co., 3.950%, 03/01/49 | | | 2,000,000 | | | | 2,601,368 | |
Niagara Mohawk Power Corp., 144A, 1.960%, 06/27/30 (d) | | | 2,000,000 | | | | 2,063,918 | |
NSTAR Electric Co., 3.250%, 05/15/29 | | | 3,000,000 | | | | 3,453,607 | |
Pattern Energy Operations, LP/Inc., 144A, 4.500%, 08/15/28 (d) | | | 1,000,000 | | | | 1,056,875 | |
Southern Power Co., 4.150%, 12/01/25 | | | 1,000,000 | | | | 1,148,253 | |
Percent of Net Assets
Name of Issuer and
Title of Issue | | Shares/
Principal | | | Value | |
BONDS, continued |
CORPORATE BONDS, continued |
Utilities, continued |
Southwestern Public Service Co., 3.150%, 05/01/50 | | $ | 1,500,000 | | | $ | 1,669,864 | |
TerraForm Power Operating, LLC, 144A, 4.250%, 01/31/23 (d) | | | 1,000,000 | | | | 1,035,625 | |
| | | | | | | | 21,627,533 | |
TOTAL CORPORATE BONDS |
(Cost $267,387,707) | | | 285,126,908 | |
| | | | | | | | | |
U.S. GOVERNMENT AGENCY BONDS: 1.2% |
Agency Securities: 1.2% |
North American Development Bank, 2.400%, 10/26/22 | | | 2,000,000 | | | | 2,059,420 | |
United States International Development Finance Corp., 0.000%, 08/21/21 | | | 1,000,000 | | | | 1,024,030 | |
United States International Development Finance Corp., 0.130%, 09/15/26 (e) | | | 1,916,667 | | | | 1,917,864 | |
United States International Development Finance Corp., 0.130%, 03/15/30 (e) | | | 2,000,000 | | | | 2,001,250 | |
United States International Development Finance Corp., 3.520%, 09/20/32 | | | 1,678,571 | | | | 1,933,840 | |
| |
TOTAL U.S. GOVERNMENT AGENCY BONDS |
(Cost $8,552,889) | | | 8,936,404 | |
| | | | | | | | | |
SUPRANATIONAL BONDS: 11.3% |
European Bank for Reconstruction & Development, 0.250%, 07/10/23 (f) | | | 3,000,000 | | | | 3,001,629 | |
European Bank for Reconstruction & Development, 1.625%, 09/27/24 | | | 3,000,000 | | | | 3,146,420 | |
| | 99 | SEE NOTES TO FINANCIAL STATEMENTS |
December 31, 2020 |
Schedules of Investments, continued |
Pax Core Bond Fund, continued
Percent of Net Assets
Name of Issuer and
Title of Issue | | Shares/
Principal | | | Value | |
BONDS, continued |
SUPRANATIONAL BONDS, continued |
European Bank for Reconstruction & Development, 0.500%, 11/25/25 | | $ | 3,000,000 | | | $ | 3,002,349 | |
European Investment Bank, 2.375%, 05/13/21 | | | 2,000,000 | | | | 2,015,264 | |
European Investment Bank, 2.500%, 03/15/23 | | | 5,000,000 | | | | 5,256,786 | |
European Investment Bank, 0.250%, 09/15/23 | | | 7,000,000 | | | | 7,011,905 | |
European Investment Bank, 3.125%, 12/14/23 | | | 3,000,000 | | | | 3,258,454 | |
European Investment Bank, 3.250%, 01/29/24 | | | 8,000,000 | | | | 8,735,320 | |
European Investment Bank, 0.750%, 09/23/30 (f) | | | 3,000,000 | | | | 2,929,932 | |
Inter-American Development Bank, 0.250%, 11/15/23 | | | 4,000,000 | | | | 4,002,301 | |
Inter-American Development Bank, 2.625%, 01/16/24 | | | 3,000,000 | | | | 3,212,533 | |
Inter-American Development Bank, 0.340%, 10/15/24 | | | 4,000,000 | | | | 4,005,152 | |
Inter-American Development Bank, 1.750%, 03/14/25 | | | 3,000,000 | | | | 3,169,246 | |
Inter-American Development Bank, 0.625%, 07/15/25 | | | 3,000,000 | | | | 3,025,755 | |
Inter-American Development Bank, 0.625%, 09/16/27 | | | 600,000 | | | | 595,266 | |
International Bank for Reconstruction & Development, 2.530%, 03/11/22 | | | 4,000,000 | | | | 4,105,366 | |
International Bank for Reconstruction & Development, 2.125%, 07/01/22 | | | 2,000,000 | | | | 2,058,248 | |
Percent of Net Assets
Name of Issuer and
Title of Issue | | Shares/
Principal | | | Value | |
BONDS, continued |
SUPRANATIONAL BONDS, continued |
International Bank for Reconstruction & Development, 1.625%, 01/15/25 | | $ | 8,000,000 | | | $ | 8,404,088 | |
International Bank for Reconstruction & Development, 0.625%, 04/22/25 | | | 5,000,000 | | | | 5,050,441 | |
International Bank for Reconstruction & Development, 0.500%, 10/28/25 | | | 500,000 | | | | 501,174 | |
International Bank for Reconstruction & Development, 2.750%, 05/31/36 | | | 2,000,000 | | | | 2,004,585 | |
International Development Association, 144A, 0.375%, 09/23/25 (d) | | | 3,200,000 | | | | 3,185,724 | |
International Finance Corp., 0.375%, 07/16/25 | | | 1,000,000 | | | | 997,562 | |
Nordic Investment Bank, 0.375%, 09/11/25 | | | 3,000,000 | | | | 2,985,114 | |
TOTAL SUPRANATIONAL BONDS |
(Cost $84,532,092) | | | 85,660,614 | |
| | | | | | | | | |
MUNICIPAL BONDS: 2.4% |
California Health Facilities Financing Authority, 1.970%, 06/01/23 | | | 500,000 | | | | 518,405 | |
City & County of Honolulu HI, 3.974%, 09/01/35 | | | 1,475,000 | | | | 1,682,695 | |
City & County of San Francisco CA Community Facilities District No 2014-1, 4.221%, 09/01/39 | | | 1,000,000 | | | | 1,130,540 | |
City of Los Angeles CA Wastewater System Revenue, 3.144%, 06/01/26 | | | 2,000,000 | | | | 2,208,620 | |
City of Los Angeles CA Wastewater System Revenue, 4.029%, 06/01/39 | | | 1,020,000 | | | | 1,150,886 | |
SEE NOTES TO FINANCIAL STATEMENTS | 100 | |
December 31, 2020 |
Schedules of Investments, continued |
Pax Core Bond Fund, continued
Percent of Net Assets
Name of Issuer and
Title of Issue | | Shares/
Principal | | | Value | |
BONDS, continued |
MUNICIPAL BONDS, continued |
Ford Foundation, The, 2.415%, 06/01/50 | | $ | 750,000 | | | $ | 768,231 | |
Ontario Teachers’ Finance Trust, 144A, 1.250%, 09/27/30 (d) | | | 1,000,000 | | | | 993,922 | |
President & Fellows of Harvard College, 2.517%, 10/15/50 | | | 500,000 | | | | 534,546 | |
Santa Clara Valley Water District, 3.369%, 06/01/27 | | | 1,305,000 | | | | 1,467,629 | |
State of California, 7.550%, 04/01/39 | | | 2,000,000 | | | | 3,515,861 | |
State of Oregon, 3.227%, 05/01/24 | | | 1,000,000 | | | | 1,092,190 | |
Trustees of Princeton University, The, 2.516%, 07/01/50 | | | 1,000,000 | | | | 1,053,627 | |
University of Massachusetts Building Authority, 6.573%, 05/01/39 | | | 125,000 | | | | 125,451 | |
University of Massachusetts Building Authority, 5.450%, 11/01/40 | | | 1,225,000 | | | | 1,686,911 | |
TOTAL MUNICIPAL BONDS |
(Cost $16,273,998) | | | 17,929,514 | |
| | | | | | | | | |
U.S. TREASURY NOTES: 13.4% |
0.125%, 04/15/21 (TIPS) | | | 3,295,920 | | | | 3,307,406 | |
0.125%, 04/15/22 (TIPS) | | | 6,424,080 | | | | 6,559,679 | |
0.125%, 07/15/24 (TIPS) | | | 4,386,440 | | | | 4,698,131 | |
0.375%, 11/30/25 | | | 15,000,000 | | | | 15,022,266 | |
0.625%, 01/15/26 (TIPS) | | | 3,287,520 | | | | 3,671,232 | |
0.375%, 07/15/27 (TIPS) | | | 7,451,150 | | | | 8,387,907 | |
0.625%, 11/30/27 | | | 11,000,000 | | | | 11,000,000 | |
0.625%, 08/15/30 | | | 6,000,000 | | | | 5,850,938 | |
0.875%, 11/15/30 | | | 2,000,000 | | | | 1,993,594 | |
5.000%, 05/15/37 | | | 2,000,000 | | | | 3,135,234 | |
1.125%, 08/15/40 | | | 23,000,000 | | | | 21,781,718 | |
1.000%, 02/15/48 (TIPS) | | | 1,055,910 | | | | 1,472,902 | |
1.625%, 11/15/50 | | | 15,000,000 | | | | 14,946,093 | |
TOTAL U.S. TREASURY NOTES |
(Cost $100,193,693) | | | 101,827,100 | |
| | | | | | | | | |
Percent of Net Assets
Name of Issuer and
Title of Issue | | Shares/
Principal | | | Value | |
BONDS, continued |
ASSET-BACKED SECURITIES: 7.2% |
AMSR 2020-SFR4 Trust, 144A, 1.355%, 11/17/37 (d) | | $ | 3,000,000 | | | $ | 3,034,319 | |
Bayview Opportunity Master Fund IVa Trust 2016, 144A, 4.000%, 04/28/55 (d) | | | 817,774 | | | | 841,548 | |
Carmax Auto Owner Trust 2019-4, 2.800%, 04/15/26 | | | 2,000,000 | | | | 2,069,057 | |
CarMax Auto Owner Trust 2020-3, 2.530%, 01/15/27 | | | 2,000,000 | | | | 2,071,916 | |
Commonbond Student Loan Trust 2016-B, 144A, 2.730%, 10/25/40 (d) | | | 405,196 | | | | 412,543 | |
Commonbond Student Loan Trust 2018-C-GS, 144A, 3.870%, 02/25/46 (d) | | | 1,378,290 | | | | 1,422,835 | |
Commonbond Student Loan Trust 2019-A-GS, 144A, 2.540%, 01/25/47 (d) | | | 1,335,043 | | | | 1,369,707 | |
Commonbond Student Loan Trust 2020-A-GS, 144A, 1.980%, 08/25/50 (d) | | | 1,170,425 | | | | 1,199,797 | |
Dell Equipment Finance Trust 2019-1, 144A, 3.450%, 03/24/25 (d) | | | 1,305,000 | | | | 1,337,116 | |
Drive Auto Receivables Trust, 4.090%, 01/15/26 | | | 2,000,000 | | | | 2,077,769 | |
FirstKey Homes 2020-SFR1 Trust, 144A, 1.339%, 09/17/25 (d) | | | 1,000,000 | | | | 1,014,289 | |
Mastr Asset Backed Securities Trust 2007-NCW, 1 month LIBOR + 0.60%, 144A, 0.748%, 05/25/37 (b)(d)(e) | | | 1,266,755 | | | | 1,217,535 | |
Mill City Mortgage Trust 2015-1, 144A, 3.670%, 06/25/56 (d)(e) | | | 2,000,000 | | | | 2,101,187 | |
Mill City Solar Loan 2019-1, Ltd., 144A, 4.340%, 03/20/43 (d) | | | 695,942 | | | | 739,438 | |
| | 101 | SEE NOTES TO FINANCIAL STATEMENTS |
December 31, 2020 |
Schedules of Investments, continued |
Pax Core Bond Fund, continued
Percent of Net Assets
Name of Issuer and
Title of Issue | | Shares/
Principal | | | Value | |
BONDS, continued |
ASSET-BACKED SECURITIES, continued |
Mill City Solar Loan 2019-2, Ltd., 144A, 3.690%, 07/20/43 (d) | | $ | 740,824 | | | $ | 782,823 | |
Mosaic Solar Loan Trust 2018-1, 144A, 4.010%, 06/22/43 (d) | | | 1,083,169 | | | | 1,172,498 | |
Mosaic Solar Loan Trust 2019-2, 144A, 2.880%, 09/20/40 (d) | | | 607,011 | | | | 648,996 | |
Mosaic Solar Loan Trust 2020-1, 144A, 2.100%, 04/20/46 (d) | | | 466,905 | | | | 477,992 | |
Mosaic Solar Loan Trust 2020-2, 144A, 1.440%, 08/20/46 (d) | | | 1,466,409 | | | | 1,458,495 | |
Mosaic Solar Loans 2017-1 LLC, 144A, 4.450%, 06/20/42 (d) | | | 741,617 | | | | 799,468 | |
Mosaic Solar Loans 2017-2 LLC, 144A, 3.820%, 06/22/43 (d) | | | 719,305 | | | | 776,208 | |
Mosaic Solar Loans 2017-2 LLC, 144A, 2.000%, 06/22/43 (d) | | | 1,177,130 | | | | 1,178,378 | |
Santander Drive Auto Receivables Trust 2018-5, 4.190%, 12/16/24 | | | 1,250,000 | | | | 1,302,627 | |
SoFi Professional Loan Program 2015-D, LLC, 144A, 3.590%, 10/26/37 (d) | | | 1,022,766 | | | | 1,036,338 | |
SoFi Professional Loan Program 2017-B, LLC, 144A, 3.700%, 05/25/40 (d)(e) | | | 1,900,000 | | | | 1,984,693 | |
SoFi Professional Loan Program 2017-D, LLC, 144A, 2.650%, 09/25/40 (d) | | | 550,690 | | | | 567,820 | |
SoFi Professional Loan Program 2017-F, LLC, 144A, 3.620%, 01/25/41 (d) | | | 1,800,000 | | | | 1,887,223 | |
Percent of Net Assets
Name of Issuer and
Title of Issue | | Shares/
Principal | | | Value | |
BONDS, continued |
ASSET-BACKED SECURITIES, continued |
SoFi Professional Loan Program 2018-B Trust, 144A, 3.830%, 08/25/47 (d) | | $ | 500,000 | | | $ | 529,467 | |
SoFi Professional Loan Program 2018-B Trust, 144A, 3.340%, 08/25/47 (d) | | | 1,754,263 | | | | 1,806,306 | |
SoFi Professional Loan Program 2019-A, LLC, 144A, 3.180%, 06/15/48 (d) | | | 53,238 | | | | 53,325 | |
Sunnova Sol II Issuer, LLC, 144A, 2.730%, 11/01/55 (d) | | | 1,000,000 | | | | 1,008,594 | |
Sunnova Sol Issuer, LLC, 144A, 3.350%, 02/01/55 (d) | | | 984,088 | | | | 1,045,815 | |
Sunrun Athena Issuer 2018-1, LLC, 144A, 5.310%, 04/30/49 (d) | | | 951,743 | | | | 1,075,133 | |
Sunrun Atlas Issuer 2019-2, LLC, 144A, 3.610%, 02/01/55 (d) | | | 975,577 | | | | 1,046,300 | |
Tesla Auto Lease Trust 2018-B, 144A, 5.290%, 11/22/21 (d) | | | 2,000,000 | | | | 2,048,218 | |
Tesla Auto Lease Trust 2018-B, 144A, 7.870%, 06/20/22 (d) | | | 1,500,000 | | | | 1,557,738 | |
Tesla Auto Lease Trust 2019-A, 144A, 2.410%, 12/20/22 (d) | | | 1,015,000 | | | | 1,042,425 | |
Tesla Auto Lease Trust 2019-A, 144A, 5.480%, 05/22/23 (d) | | | 1,000,000 | | | | 1,056,707 | |
Tesla Auto Lease Trust 2020-A, 144A, 1.680%, 02/20/24 (d) | | | 1,630,000 | | | | 1,654,349 | |
Towd Point Mortgage Trust 2015-2, 144A, 3.567%, 11/25/60 (d)(e) | | | 2,000,000 | | | | 2,121,426 | |
SEE NOTES TO FINANCIAL STATEMENTS | 102 | |
December 31, 2020 |
Schedules of Investments, continued |
Pax Core Bond Fund, continued
Percent of Net Assets
Name of Issuer and
Title of Issue | | Shares/
Principal | | | Value | |
BONDS, continued |
ASSET-BACKED SECURITIES, continued |
Towd Point Mortgage Trust 2015-2, 1 month LIBOR + 0.60%, 144A, 3.750%, 11/25/57 (d)(e) | | $ | 1,000,000 | | | $ | 1,055,080 | |
Towd Point Mortgage Trust 2017-6, 144A, 3.000%, 10/25/57 (d)(e) | | | 1,000,000 | | | | 1,068,725 | |
Tricon American Homes 2020-SFR2 Trust, 144A, 1.482%, 11/17/39 (d) | | | 1,000,000 | | | | 1,010,314 | |
Vivint Solar Financing V, LLC, 144A, 4.730%, 04/30/48 (d) | | | 959,887 | | | | 1,056,233 | |
TOTAL ASSET-BACKED SECURITIES |
(Cost $53,679,485) | | | 55,218,770 | |
| | | | | | | | | |
MORTGAGE-BACKED SECURITIES: 25.9% |
Ginnie Mae (Mortgage-Backed): 0.9% |
1.550%, 06/16/36 | | | 1,318,791 | | | | 1,325,556 | |
3.020%, 09/15/41 | | | 1,765,809 | | | | 1,918,710 | |
2.850%, 09/16/50 (e) | | | 2,000,000 | | | | 2,107,838 | |
2.712%, 03/16/55 (e) | | | 1,444,559 | | | | 1,546,913 | |
| | | | | | | | 6,899,017 | |
Freddie Mac (Mortgage-Backed): 7.5% |
4.000%, 06/01/26 | | | 1,257,397 | | | | 1,337,402 | |
2.939%, 04/25/29 | | | 3,000,000 | | | | 3,407,209 | |
0.704%, 04/25/29 (e) | | | 500,000 | | | | 497,115 | |
2.412%, 08/25/29 | | | 2,000,000 | | | | 2,168,922 | |
1.487%, 11/25/30 | | | 2,750,000 | | | | 2,836,623 | |
3.000%, 07/01/33 | | | 1,199,850 | | | | 1,270,095 | |
4.500%, 01/01/34 | | | 1,137,294 | | | | 1,229,851 | |
3.500%, 01/01/34 | | | 1,051,237 | | | | 1,136,564 | |
3.000%, 12/01/34 | | | 1,527,367 | | | | 1,602,797 | |
4.000%, 10/01/35 | | | 1,909,437 | | | | 2,085,711 | |
3.500%, 04/01/42 | | | 817,815 | | | | 894,143 | |
3.500%, 01/01/44 | | | 1,415,833 | | | | 1,548,242 | |
3.500%, 02/01/45 | | | 1,346,056 | | | | 1,493,646 | |
3.000%, 06/01/46 | | | 1,760,833 | | | | 1,925,512 | |
3.000%, 01/01/47 | | | 2,074,641 | | | | 2,247,504 | |
4.000%, 08/01/47 | | | 780,796 | | | | 838,121 | |
3.500%, 08/01/47 | | | 1,607,494 | | | | 1,708,592 | |
3.500%, 09/01/47 | | | 1,067,655 | | | | 1,134,528 | |
3.500%, 10/01/47 | | | 1,626,794 | | | | 1,727,073 | |
3.500%, 12/01/47 | | | 1,136,236 | | | | 1,205,984 | |
3.500%, 03/01/48 | | | 1,310,818 | | | | 1,390,700 | |
Percent of Net Assets
Name of Issuer and
Title of Issue | | Shares/
Principal | | | Value | |
BONDS, continued |
MORTGAGE-BACKED SECURITIES, continued |
Freddie Mac (Mortgage-Backed), continued |
4.000%, 04/01/48 | | $ | 2,976,537 | | | $ | 3,199,608 | |
3.500%, 05/01/48 | | | 1,157,203 | | | | 1,225,577 | |
3.500%, 06/01/49 | | | 1,319,876 | | | | 1,395,038 | |
3.000%, 12/01/49 | | | 2,834,676 | | | | 2,981,293 | |
3.000%, 02/01/50 | | | 5,785,473 | | | | 6,100,697 | |
3.000%, 03/01/50 | | | 2,767,780 | | | | 2,917,137 | |
3.248%, 03/25/50, 144A (d)(e) | | | 2,000,000 | | | | 2,026,719 | |
2.500%, 05/01/50 | | | 2,344,979 | | | | 2,474,841 | |
1.648%, 06/25/50, 144A (d)(e) | | | 694,212 | | | | 695,270 | |
1.382%, 10/25/50, 144A (d)(e) | | | 500,000 | | | | 501,965 | |
| | | | | | | | 57,204,479 | |
Fannie Mae (Mortgage-Backed): 16.0% |
2.801%, 02/25/27 (e) | | | 2,820,000 | | | | 3,142,926 | |
3.270%, 09/01/27 | | | 2,301,045 | | | | 2,416,269 | |
2.902%, 01/25/28 (e) | | | 1,900,000 | | | | 2,138,833 | |
3.325%, 06/25/28 (e) | | | 2,000,000 | | | | 2,312,512 | |
3.555%, 09/25/28 (e) | | | 2,034,000 | | | | 2,406,527 | |
3.660%, 01/01/29 | | | 1,941,115 | | | | 2,039,343 | |
2.937%, 04/25/29 | | | 2,000,000 | | | | 2,267,674 | |
3.500%, 07/01/35 | | | 1,099,935 | | | | 1,184,000 | |
3.500%, 09/01/37 | | | 862,547 | | | | 918,423 | |
4.000%, 03/01/38 | | | 1,695,373 | | | | 1,859,610 | |
3.500%, 09/01/39 | | | 1,165,330 | | | | 1,231,280 | |
2.000%, 11/01/40 | | | 1,987,896 | | | | 2,084,670 | |
2.500%, 12/01/40 | | | 2,979,938 | | | | 3,155,865 | |
2.000%, 12/01/40 | | | 5,000,000 | | | | 5,226,454 | |
4.000%, 02/01/41 | | | 2,295,674 | | | | 2,552,624 | |
4.000%, 01/01/42 | | | 2,254,405 | | | | 2,504,459 | |
3.500%, 01/01/43 | | | 2,500,359 | | | | 2,732,592 | |
3.500%, 08/01/45 | | | 1,690,775 | | | | 1,857,393 | |
4.000%, 09/01/45 | | | 1,103,829 | | | | 1,210,399 | |
4.000%, 10/01/45 | | | 913,752 | | | | 992,978 | |
3.500%, 10/01/45 | | | 1,240,289 | | | | 1,342,186 | |
4.000%, 11/01/45 | | | 2,488,474 | | | | 2,729,957 | |
4.000%, 06/01/46 | | | 1,038,204 | | | | 1,127,521 | |
3.000%, 06/01/46 | | | 2,204,279 | | | | 2,327,284 | |
4.000%, 07/01/46 | | | 1,366,478 | | | | 1,494,622 | |
4.500%, 09/01/46 | | | 1,406,123 | | | | 1,581,975 | |
3.000%, 10/01/46 | | | 854,114 | | | | 898,030 | |
4.000%, 01/01/47 | | | 950,509 | | | | 1,031,152 | |
4.000%, 05/01/47 | | | 2,705,108 | | | | 2,925,742 | |
| | 103 | SEE NOTES TO FINANCIAL STATEMENTS |
December 31, 2020 |
Schedules of Investments, continued |
Pax Core Bond Fund, continued
Percent of Net Assets
Name of Issuer and
Title of Issue | | Shares/
Principal | | | Value | |
BONDS, continued |
MORTGAGE-BACKED SECURITIES, continued |
Fannie Mae (Mortgage-Backed), continued |
4.000%, 06/01/47 | | $ | 2,054,537 | | | $ | 2,217,002 | |
3.500%, 06/01/47 | | | 1,568,119 | | | | 1,690,330 | |
3.500%, 08/01/47 | | | 800,707 | | | | 846,144 | |
3.500%, 11/01/47 | | | 1,847,991 | | | | 2,019,769 | |
4.000%, 01/01/48 | | | 1,794,898 | | | | 1,963,080 | |
3.500%, 03/01/48 | | | 1,041,164 | | | | 1,104,218 | |
3.500%, 04/01/48 | | | 2,851,255 | | | | 3,147,487 | |
4.500%, 06/01/48 | | | 843,623 | | | | 923,914 | |
3.500%, 06/01/48 | | | 1,883,277 | | | | 2,041,095 | |
3.000%, 10/01/48 | | | 900,583 | | | | 918,427 | |
3.500%, 07/01/49 | | | 1,278,036 | | | | 1,378,293 | |
3.500%, 09/01/49 | | | 1,073,948 | | | | 1,134,843 | |
3.000%, 09/01/49 | | | 1,134,450 | | | | 1,198,522 | |
3.000%, 10/01/49 | | | 2,440,242 | | | | 2,606,290 | |
3.500%, 02/01/50 | | | 1,939,730 | | | | 2,049,178 | |
4.000%, 03/01/50 | | | 2,819,775 | | | | 3,046,513 | |
3.000%, 03/01/50 | | | 2,388,541 | | | | 2,534,567 | |
2.500%, 03/01/50 | | | 2,788,999 | | | | 2,943,450 | |
2.500%, 08/01/50 | | | 2,973,686 | | | | 3,149,989 | |
2.500%, 09/01/50 | | | 7,831,611 | | | | 8,273,562 | |
2.000%, 10/01/50 | | | 3,983,733 | | | | 4,157,219 | |
3.000%, 11/01/50 | | | 1,987,175 | | | | 2,105,377 | |
2.500%, 11/01/50 | | | 2,989,262 | | | | 3,154,804 | |
1.500%, 11/01/50 | | | 2,984,743 | | | | 3,033,670 | |
2.500%, 12/01/50 | | | 1,999,555 | | | | 2,110,288 | |
2.000%, 12/01/50 | | | 1,996,268 | | | | 2,076,476 | |
| | | | | | | | 121,517,807 | |
Commercial Mortgage-Backed: 1.5% |
Arroyo Mortgage Trust 2018-1, 144A, 3.763%, 04/25/48 (d)(e) | | | 1,159,796 | | | | 1,179,111 | |
Bellemeade Re 2018-1, Ltd., 1 month LIBOR + 1.60%, 144A, 1.748%, 04/25/28 (d)(e) | | | 373,364 | | | | 372,979 | |
COLT 2019-2 Mortgage Loan Trust, 144A, 3.337%, 05/25/49 (d)(e) | | | 707,200 | | | | 712,310 | |
COLT 2020-1 Mortgage Loan Trust, 144A, 2.693%, 02/25/50 (d)(e) | | | 1,733,716 | | | | 1,762,985 | |
BONDS, continued |
MORTGAGE-BACKED SECURITIES, continued |
Commercial Mortgage-Backed, continued |
New Residential Mortgage Loan Trust 2018-4, 1 month LIBOR + 0.90%, 144A, 1.048%, 01/25/48 (d)(e) | | $ | 948,937 | | | $ | 942,145 | |
New Residential Mortgage Loan Trust 2019-2, 144A, 4.250%, 12/25/57 (d)(e) | | | 1,728,173 | | | | 1,869,450 | |
New Residential Mortgage Loan Trust 2019-4, 144A, 3.500%, 12/25/58 (d)(e) | | | 711,173 | | | | 753,666 | |
New Residential Mortgage Loan Trust 2019-5, 144A, 3.500%, 08/25/59 (d)(e) | | | 1,048,178 | | | | 1,098,062 | |
New Residential Mortgage Loan Trust 2019-RPL3, 144A, 2.750%, 07/25/59 (d)(e) | | | 1,961,506 | | | | 2,065,107 | |
Radnor RE 2018-1, Ltd., 1 month LIBOR + 1.40%, 144A, 1.548%, 03/25/28 (d)(e) | | | 117,756 | | | | 117,745 | |
Sequoia Mortgage Trust 2018-CH1, 144A, 4.000%, 02/25/48 (d)(e) | | | 453,195 | | | | 465,995 | |
| | | | | | | | 11,339,555 | |
TOTAL MORTGAGE-BACKED SECURITIES |
(Cost $190,041,535) | | | 196,960,858 | |
| | | | | | | | | |
TOTAL BONDS |
(Cost $720,954,584) | | | 751,953,353 | |
| | | | | | | | | |
CERTIFICATES OF DEPOSIT: 0.1% |
Community Credit Union of Lynn, 2.200%, 11/29/22 (b) | | | 250,000 | | | | 260,119 | |
Self-Help Federal Credit Union, 1.900%, 12/20/21 (b) | | | 250,000 | | | | 254,532 | |
TOTAL CERTIFICATES OF DEPOSIT |
(Cost $500,000) | | | 514,651 | |
| | | | | | | | | |
SEE NOTES TO FINANCIAL STATEMENTS | 104 | |
December 31, 2020 |
Schedules of Investments, continued |
Pax Core Bond Fund, continued
Percent of Net Assets
Name of Issuer and
Title of Issue | | Shares/
Principal | | | Value | |
MONEY MARKET: 1.4% |
State Street Institutional U.S. Government Money Market Fund, 0.030% (g)(h) | | $ | 10,371,194 | | | $ | 10,371,194 | |
(Cost $10,371,194) |
| | | | | | | | | |
SECURITIES PURCHASED WITH CASH COLLATERAL FROM SECURITIES LENDING: 0.5% |
State Street Navigator Securities Lending Government Money Market Portfolio, 0.101% (g)(h) | | | 3,660,830 | | | | 3,660,830 | |
(Cost $3,660,830) |
| |
TOTAL INVESTMENTS: 100.8% |
(Cost $735,486,608) | | | 766,500,028 | |
| | | | | | | | | |
PAYABLE UPON RETURN OF SECURITIES LOANED (NET):- 0.5% | | | (3,660,830 | ) |
| | | | | | | | | |
OTHER ASSETS AND LIABILITIES — (NET):- 0.3% | | | (2,123,393 | ) |
| | | | | | | | | |
NET ASSETS: 100.0% | | $ | 760,715,805 | |
(a) | Rounds to less than 0.05%. |
(c) | Security valued using significant unobservable inputs. |
(d) | Security purchased pursuant to Rule 144A of the Securities Act of 1933 and may be resold only to qualified institutional buyers. |
(e) | Rate shown reflects the accrual rate as of December 31, 2020 on securities with variable or step rates. |
(f) | Security of partial position of this security was on loan as of December 31, 2020. The total market value of securities on loan as of December 31, 2020 was $3,587,349. |
(g) | Rate shown represents annualized 7-day yield as of December 31, 2020. |
LIBOR-London Inter-bank Offered Rate. At December 31, 2020 the 1 month and 3 month LIBOR rates were 0.144% and 0.238%, respectively.
LP - Limited Partnership
TIPS - Treasury Inflation Protected Securities
| | 105 | SEE NOTES TO FINANCIAL STATEMENTS |
December 31, 2020 |
Schedules of Investments, continued |
Pax High Yield Bond Fund
Percent of Net Assets
Name of Issuer and
Title of Issue | | Shares/
Principal/
Contracts | | | Value | |
COMMON STOCKS: 0.0% |
Health Care: 0.0% |
Interactive Health, Inc. (a)(b)(c) | | | 706 | | | $ | 0 | |
| | | | | | | | | |
TOTAL COMMON STOCKS |
(Cost $178,981) | | | 0 | |
| | | | | | | | | |
PREFERRED STOCKS: 0.6% |
Health Care: 0.4% |
Avantor, Inc., 6.250% | | | 20,000 | | | | 1,778,200 | |
Interactive Health, Inc., 0.000% (a)(b)(c) | | | 1,412 | | | | 0 | |
| | | | | | | | 1,778,200 | |
Leisure: 0.2% |
RLJ Lodging Trust, REIT, 1.950% | | | 40,000 | | | | 1,016,000 | |
| | | | | | | | | |
TOTAL PREFERRED STOCKS |
(Cost $2,381,940) | | | 2,794,200 | |
| | | | | | | | | |
BONDS: 96.5% |
Community Investment Notes: 0.1% |
CINI Investment Note, 2.000%, 09/30/23 (b) | | $ | 500,813 | | | | 500,813 | |
(Cost $500,813) |
| |
CORPORATE BONDS: 95.3% |
Automotive: 4.5% |
Allison Transmission, Inc., 144A, 4.750%, 10/01/27 (d) | | | 1,000,000 | | | | 1,055,000 | |
Allison Transmission, Inc., 144A, 3.750%, 01/30/31 (d) | | | 1,500,000 | | | | 1,537,500 | |
Ford Motor Co., 9.000%, 04/22/25 | | | 3,000,000 | | | | 3,681,885 | |
Ford Motor Credit Co., LLC, 4.250%, 09/20/22 | | | 1,000,000 | | | | 1,033,800 | |
Ford Motor Credit Co., LLC, 3.810%, 01/09/24 | | | 1,000,000 | | | | 1,026,250 | |
Ford Motor Credit Co., LLC, 3.664%, 09/08/24 | | | 2,000,000 | | | | 2,056,050 | |
Ford Motor Credit Co., LLC, 5.125%, 06/16/25 | | | 2,500,000 | | | | 2,721,375 | |
Percent of Net Assets
Name of Issuer and
Title of Issue | | Shares/
Principal/
Contracts | | | Value | |
BONDS, continued |
CORPORATE BONDS, continued |
Automotive, continued |
Ford Motor Credit Co., LLC, 4.000%, 11/13/30 | | $ | 1,000,000 | | | $ | 1,051,250 | |
Gates Global, LLC/Corp., 144A, 6.250%, 01/15/26 (d) | | | 1,000,000 | | | | 1,051,670 | |
IHO Verwaltungs GmbH, 144A, 4.750%, 09/15/26 (d) | | | 500,000 | | | | 519,375 | |
IHO Verwaltungs GmbH, 144A, 6.000%, 05/15/27 (d) | | | 1,000,000 | | | | 1,062,935 | |
IHO Verwaltungs GmbH, 144A, 6.375%, 05/15/29 (d) | | | 500,000 | | | | 551,780 | |
Meritor, Inc., 6.250%, 02/15/24 | | | 865,000 | | | | 884,912 | |
Meritor, Inc., 144A, 6.250%, 06/01/25 (d) | | | 1,000,000 | | | | 1,082,500 | |
Meritor, Inc., 144A, 4.500%, 12/15/28 (d) | | | 1,000,000 | | | | 1,026,875 | |
Nexteer Automotive Group Ltd., 144A, 5.875%, 11/15/21 (d) | | | 1,000,000 | | | | 1,001,182 | |
| | | | | | | | 21,344,339 | |
Banking: 0.9% |
Ally Financial, Inc., 5.750%, 11/20/25 | | | 3,000,000 | | | | 3,495,702 | |
Ally Financial, Inc., 8.000%, 11/01/31 | | | 500,000 | | | | 735,400 | |
| | | | | | | | 4,231,102 | |
Basic Industry: 12.4% |
Adams Homes, Inc., 144A, 7.500%, 02/15/25 (d) | | | 1,500,000 | | | | 1,575,938 | |
Advanced Drainage Systems, Inc., 144A, 5.000%, 09/30/27 (d) | | | 2,000,000 | | | | 2,107,880 | |
Alcoa Nederland Holding BV, 144A, 7.000%, 09/30/26 (d) | | | 2,000,000 | | | | 2,133,750 | |
Alcoa Nederland Holding BV, 144A, 6.125%, 05/15/28 (d) | | | 2,000,000 | | | | 2,188,750 | |
SEE NOTES TO FINANCIAL STATEMENTS | 106 | |
December 31, 2020 |
Schedules of Investments, continued |
Pax High Yield Bond Fund, continued
Percent of Net Assets
Name of Issuer and
Title of Issue | | Shares/
Principal/
Contracts | | | Value | |
BONDS, continued |
CORPORATE BONDS, continued |
Basic Industry, continued |
ArcelorMittal SA, 6.125%, 06/01/25 | | $ | 1,000,000 | | | $ | 1,195,569 | |
ArcelorMittal SA, 7.250%, 10/15/39 | | | 1,000,000 | | | | 1,404,752 | |
Big River Steel, LLC/BRS Finance Corp., 144A, 6.625%, 01/31/29 (d) | | | 2,000,000 | | | | 2,163,750 | |
Boise Cascade Co., 144A, 4.875%, 07/01/30 (d) | | | 1,000,000 | | | | 1,084,375 | |
Builders FirstSource, Inc., 144A, 5.000%, 03/01/30 (d) | | | 2,000,000 | | | | 2,168,740 | |
Carpenter Technology Corp., 6.375%, 07/15/28 | | | 1,000,000 | | | | 1,104,191 | |
Cleveland-Cliffs, Inc., 144A, 4.875%, 01/15/24 (d) | | | 950,000 | | | | 969,594 | |
Cleveland-Cliffs, Inc., 5.750%, 03/01/25 | | | 500,000 | | | | 508,438 | |
Cleveland-Cliffs, Inc., 144A, 9.875%, 10/17/25 (d) | | | 1,000,000 | | | | 1,177,500 | |
Cleveland-Cliffs, Inc., 144A, 6.750%, 03/15/26 (d) | | | 500,000 | | | | 540,625 | |
Foxtrot Escrow Issuer, LLC/Corp., 144A, 12.250%, 11/15/26 (d) | | | 1,000,000 | | | | 1,141,715 | |
FXI Holdings, Inc., 144A, 7.875%, 11/01/24 (d) | | | 983,000 | | | | 992,830 | |
Ingevity Corp., 144A, 4.500%, 02/01/26 (d) | | | 1,000,000 | | | | 1,022,310 | |
Ingevity Corp., 144A, 3.875%, 11/01/28 (d) | | | 1,750,000 | | | | 1,766,406 | |
Interface, Inc., 144A, 5.500%, 12/01/28 (d) | | | 1,800,000 | | | | 1,897,875 | |
Koppers, Inc., 144A, 6.000%, 02/15/25 (d) | | | 1,250,000 | | | | 1,289,843 | |
LBM Acquisition, LLC, 144A, 6.250%, 01/15/29 (d) | | | 1,000,000 | | | | 1,034,375 | |
Lennar Corp., 5.250%, 06/01/26 | | | 1,000,000 | | | | 1,186,875 | |
Neon Holdings, Inc., 144A, 10.125%, 04/01/26 (d) | | | 2,500,000 | | | | 2,743,750 | |
Novelis Corp., 144A, 5.875%, 09/30/26 (d) | | | 1,500,000 | | | | 1,569,375 | |
Percent of Net Assets
Name of Issuer and
Title of Issue | | Shares/
Principal/
Contracts | | | Value | |
BONDS, continued |
CORPORATE BONDS, continued |
Basic Industry, continued |
Novelis Corp., 144A, 4.750%, 01/30/30 (d) | | $ | 2,000,000 | | | $ | 2,158,480 | |
Shea Homes, LP/Funding Corp., 144A, 4.750%, 02/15/28 (d) | | | 1,000,000 | | | | 1,036,875 | |
Shea Homes, LP/Funding Corp., 144A, 4.750%, 04/01/29 (d) | | | 1,000,000 | | | | 1,030,000 | |
SPCM SA, 144A, 4.875%, 09/15/25 (d) | | | 1,150,000 | | | | 1,187,375 | |
Standard Industries, Inc., 144A, 5.000%, 02/15/27 (d) | | | 3,000,000 | | | | 3,140,625 | |
Standard Industries, Inc., 144A, 4.375%, 07/15/30 (d) | | | 1,000,000 | | | | 1,071,265 | |
Taylor Morrison Communities, Inc./Holdings II, Inc., 144A, 5.625%, 03/01/24 (d) | | | 1,550,000 | | | | 1,668,188 | |
Univar Solutions USA, Inc., 144A, 5.125%, 12/01/27 (d) | | | 2,500,000 | | | | 2,644,850 | |
USG Corp., 144A, 4.875%, 06/01/27 (d) | | | 3,500,000 | | | | 3,545,937 | |
Venator Finance Sarl/Venator Materials, LLC, 144A, 9.500%, 07/01/25 (d) | | | 1,500,000 | | | | 1,642,500 | |
WESCO Distribution, Inc., 5.375%, 06/15/24 | | | 1,000,000 | | | | 1,027,500 | |
WESCO Distribution, Inc., 144A, 7.125%, 06/15/25 (d) | | | 1,000,000 | | | | 1,101,155 | |
WESCO Distribution, Inc., 144A, 7.250%, 06/15/28 (d) | | | 1,000,000 | | | | 1,138,695 | |
White Cap Buyer, LLC, 144A, 6.875%, 10/15/28 (d) | | | 1,000,000 | | | | 1,068,125 | |
| | | | | | | | 58,430,776 | |
Capital Goods: 5.1% |
ARD Finance SA, 144A, 6.500%, 06/30/27 (d) | | | 1,500,000 | | | | 1,603,125 | |
| | 107 | SEE NOTES TO FINANCIAL STATEMENTS |
December 31, 2020 |
Schedules of Investments, continued |
Pax High Yield Bond Fund, continued
Percent of Net Assets
Name of Issuer and
Title of Issue | | Shares/
Principal/
Contracts | | | Value | |
BONDS, continued |
CORPORATE BONDS, continued |
Capital Goods, continued |
Ardagh Packaging Finance, PLC/Holdings USA, Inc., 144A, 4.125%, 08/15/26 (d) | | $ | 1,000,000 | | | $ | 1,046,250 | |
Ardagh Packaging Finance, PLC/Holdings USA, Inc., 144A, 5.250%, 08/15/27 (d) | | | 1,000,000 | | | | 1,050,810 | |
ATS Automation Tooling Systems, Inc., 144A, 4.125%, 12/15/28 (d) | | | 2,000,000 | | | | 2,040,000 | |
Bombardier, Inc., 144A, 7.500%, 12/01/24 (d) | | | 1,000,000 | | | | 961,775 | |
Canpack SA/Eastern PA Land Investment Holding, LLC, 144A, 3.125%, 11/01/25 (d) | | | 1,750,000 | | | | 1,760,938 | |
GrafTech Finance, Inc., 144A, 4.625%, 12/15/28 (d) | | | 2,000,000 | | | | 2,025,000 | |
Howmet Aerospace, Inc., 5.900%, 02/01/27 | | | 2,000,000 | | | | 2,363,760 | |
Howmet Aerospace, Inc., 6.750%, 01/15/28 | | | 1,000,000 | | | | 1,224,090 | |
Manitowoc Co, Inc., The, 144A, 9.000%, 04/01/26 (d) | | | 2,000,000 | | | | 2,163,750 | |
OI European Group BV, 144A, 4.000%, 03/15/23 (d) | | | 1,500,000 | | | | 1,534,687 | |
Owens-Brockway Glass Container, Inc., 144A, 6.375%, 08/15/25 (d) | | | 1,000,000 | | | | 1,110,625 | |
Owens-Brockway Glass Container, Inc., 144A, 6.625%, 05/13/27 (d) | | | 1,000,000 | | | | 1,084,375 | |
Vertical Holdco GmbH, 144A, 7.625%, 07/15/28 (d) | | | 1,000,000 | | | | 1,091,875 | |
Vertical US Newco, Inc., 144A, 5.250%, 07/15/27 (d) | | | 1,000,000 | | | | 1,061,875 | |
Percent of Net Assets
Name of Issuer and
Title of Issue | | Shares/
Principal/
Contracts | | | Value | |
BONDS, continued |
CORPORATE BONDS, continued |
Capital Goods, continued |
Wabash National Corp., 144A, 5.500%, 10/01/25 (d) | | $ | 1,000,000 | | | $ | 1,023,645 | |
Wolverine Escrow, LLC, 144A, 8.500%, 11/15/24 (d) | | | 1,000,000 | | | | 955,905 | |
| | | | | | | | 24,102,485 | |
Consumer Goods: 5.4% |
Cott Holdings, Inc., 144A, 5.500%, 04/01/25 (d) | | | 1,000,000 | | | | 1,033,750 | |
Del Monte Foods, Inc., 144A, 11.875%, 05/15/25 (d) | | | 1,000,000 | | | | 1,136,875 | |
Kraft Heinz Foods Co., 144A, 4.250%, 03/01/31 (d) | | | 1,000,000 | | | | 1,115,970 | |
Kraft Heinz Foods Co., 5.000%, 06/04/42 | | | 1,000,000 | | | | 1,174,892 | |
Kraft Heinz Foods Co., 4.375%, 06/01/46 | | | 3,000,000 | | | | 3,250,873 | |
Land O’ Lakes, Inc., 144A, 7.000%, 09/18/28 Not Applicable (d) | | | 1,500,000 | | | | 1,415,625 | |
Performance Food Group, Inc., 144A, 5.500%, 06/01/24 (d) | | | 1,500,000 | | | | 1,511,250 | |
Performance Food Group, Inc., 144A, 5.500%, 10/15/27 (d) | | | 1,000,000 | | | | 1,056,830 | |
Post Holdings, Inc., 144A, 5.000%, 08/15/26 (d) | | | 750,000 | | | | 775,676 | |
Post Holdings, Inc., 144A, 5.750%, 03/01/27 (d) | | | 1,000,000 | | | | 1,060,625 | |
Post Holdings, Inc., 144A, 5.500%, 12/15/29 (d) | | | 2,500,000 | | | | 2,731,313 | |
Prestige Brands, Inc., 144A, 6.375%, 03/01/24 (d) | | | 1,000,000 | | | | 1,023,750 | |
Prestige Brands, Inc., 144A, 5.125%, 01/15/28 (d) | | | 1,000,000 | | | | 1,068,125 | |
Spectrum Brands, Inc., 144A, 5.000%, 10/01/29 (d) | | | 1,000,000 | | | | 1,076,400 | |
Tempur Sealy International, Inc., 5.500%, 06/15/26 | | | 2,000,000 | | | | 2,083,900 | |
SEE NOTES TO FINANCIAL STATEMENTS | 108 | |
December 31, 2020 |
Schedules of Investments, continued |
Pax High Yield Bond Fund, continued
Percent of Net Assets
Name of Issuer and
Title of Issue | | Shares/
Principal/
Contracts | | | Value | |
BONDS, continued |
CORPORATE BONDS, continued |
Consumer Goods, continued |
United Natural Foods, Inc., 144A, 6.750%, 10/15/28 (d) | | $ | 3,000,000 | | | $ | 3,142,440 | |
US Foods, Inc., 144A, 6.250%, 04/15/25 (d) | | | 1,000,000 | | | | 1,070,085 | |
| | | | | | | | 25,728,379 | |
Energy: 2.6% |
Antero Resources Corp., 5.625%, 06/01/23 | | | 1,000,000 | | | | 981,250 | |
Ascent Resources Utica Holdings, LLC/ARU Finance Corp., 144A, 10.000%, 04/01/22 (d) | | | 500,000 | | | | 511,250 | |
Ascent Resources Utica Holdings, LLC/ARU Finance Corp., 144A, 7.000%, 11/01/26 (d) | | | 1,000,000 | | | | 949,000 | |
DCP Midstream Operating, LP, 5.125%, 05/15/29 | | | 1,000,000 | | | | 1,110,810 | |
Laredo Petroleum, Inc., 9.500%, 01/15/25 | | | 2,500,000 | | | | 2,189,850 | |
Parkland Fuel Corp., 144A, 6.000%, 04/01/26 (d) | | | 1,000,000 | | | | 1,051,875 | |
Suburban Propane Partners, LP/Suburban Energy Finance Corp., 5.750%, 03/01/25 | | | 1,000,000 | | | | 1,023,645 | |
Suburban Propane Partners, LP/Suburban Energy Finance Corp., 5.875%, 03/01/27 | | | 500,000 | | | | 524,062 | |
Sunoco, LP/Finance Corp., 5.875%, 03/15/28 | | | 1,000,000 | | | | 1,083,560 | |
Superior Plus, LP/General Partner, Inc., 144A, 7.000%, 07/15/26 (d) | | | 1,000,000 | | | | 1,071,250 | |
TransMontaigne Partners, LP/TLP Finance Corp., 6.125%, 02/15/26 | | | 1,750,000 | | | | 1,764,980 | |
| | | | | | | | 12,261,532 | |
Financial Services: 2.9% |
CIT Group, Inc., 5.000%, 08/01/23 | | | 500,000 | | | | 547,188 | |
Percent of Net Assets
Name of Issuer and
Title of Issue | | Shares/
Principal/
Contracts | | | Value | |
BONDS, continued |
CORPORATE BONDS, continued |
Financial Services, continued |
CIT Group, Inc., 5.250%, 03/07/25 | | $ | 500,000 | | | $ | 568,438 | |
HAT Holdings I, LLC/HAT Holdings II, LLC, 144A, 5.250%, 07/15/24 (d) | | | 2,000,000 | | | | 2,083,960 | |
HAT Holdings I, LLC/HAT Holdings II, LLC, 144A, 6.000%, 04/15/25 (d) | | | 2,000,000 | | | | 2,142,500 | |
HAT Holdings I, LLC/HAT Holdings II, LLC, 144A, 3.750%, 09/15/30 (d) | | | 1,000,000 | | | | 1,042,500 | |
New Residential Investment Corp., 144A, 6.250%, 10/15/25 (d) | | | 2,000,000 | | | | 2,013,750 | |
PennyMac Financial Services, Inc., 144A, 5.375%, 10/15/25 (d) | | | 1,000,000 | | | | 1,058,750 | |
Springleaf Finance Corp., 6.875%, 03/15/25 | | | 500,000 | | | | 581,562 | |
Springleaf Finance Corp., 7.125%, 03/15/26 | | | 1,000,000 | | | | 1,183,755 | |
Springleaf Finance Corp., 6.625%, 01/15/28 | | | 1,000,000 | | | | 1,189,190 | |
Springleaf Finance Corp., 5.375%, 11/15/29 | | | 1,000,000 | | | | 1,127,500 | |
| | | | | | | | 13,539,093 | |
Health Care: 10.1% |
AdaptHealth, LLC, 144A, 6.125%, 08/01/28 (d) | | | 2,000,000 | | | | 2,152,500 | |
AdaptHealth, LLC, 144A, 4.625%, 08/01/29 (d) | | | 1,000,000 | | | | 1,028,750 | |
Akumin, Inc., 144A, 7.000%, 11/01/25 (d) | | | 1,750,000 | | | | 1,844,063 | |
Avantor Funding, Inc., 144A, 4.625%, 07/15/28 (d) | | | 4,000,000 | | | | 4,235,000 | |
Centene Corp., 144A, 5.375%, 06/01/26 (d) | | | 2,000,000 | | | | 2,111,920 | |
Centene Corp., 4.250%, 12/15/27 | | | 1,000,000 | | | | 1,062,315 | |
Centene Corp., 4.625%, 12/15/29 | | | 3,000,000 | | | | 3,334,515 | |
Centene Corp., 3.375%, 02/15/30 | | | 500,000 | | | | 526,828 | |
| | 109 | SEE NOTES TO FINANCIAL STATEMENTS |
December 31, 2020 |
Schedules of Investments, continued |
Pax High Yield Bond Fund, continued
Percent of Net Assets
Name of Issuer and
Title of Issue | | Shares/
Principal/
Contracts | | | Value | |
BONDS, continued |
CORPORATE BONDS, continued |
Health Care, continued |
Centene Corp., 3.000%, 10/15/30 | | $ | 2,000,000 | | | $ | 2,122,300 | |
Cheplapharm Arzneimittel GmbH, 144A, 5.500%, 01/15/28 (d) | | | 2,000,000 | | | | 2,092,500 | |
DaVita, Inc., 144A, 4.625%, 06/01/30 (d) | | | 2,000,000 | | | | 2,123,750 | |
Emergent BioSolutions, Inc., 144A, 3.875%, 08/15/28 (d) | | | 3,000,000 | | | | 3,112,125 | |
Encompass Health Corp., 4.500%, 02/01/28 | | | 500,000 | | | | 523,345 | |
Encompass Health Corp., 4.750%, 02/01/30 | | | 1,500,000 | | | | 1,609,410 | |
Endo Dac/Endo Finance, LLC/Endo Finco, Inc., 144A, 9.500%, 07/31/27 (d) | | | 1,497,000 | | | | 1,673,832 | |
Endo Dac/Endo Finance, LLC/Endo Finco, Inc., 144A, 6.000%, 06/30/28 (d) | | | 374,000 | | | | 318,274 | |
HCA, Inc., 5.375%, 02/01/25 | | | 1,500,000 | | | | 1,689,023 | |
HCA, Inc., 5.875%, 02/15/26 | | | 1,000,000 | | | | 1,151,250 | |
HCA, Inc., 3.500%, 09/01/30 | | | 1,000,000 | | | | 1,063,411 | |
IQVIA, Inc., 144A, 5.000%, 05/15/27 (d) | | | 3,000,000 | | | | 3,194,970 | |
Jaguar Holding Co. II/PPD Development, LP, 144A, 4.625%, 06/15/25 (d) | | | 500,000 | | | | 528,120 | |
Jaguar Holding Co. II/PPD Development, LP, 144A, 5.000%, 06/15/28 (d) | | | 2,000,000 | | | | 2,137,500 | |
ModivCare, Inc., 144A, 5.875%, 11/15/25 (d) | | | 1,500,000 | | | | 1,589,062 | |
MPT Operating Partnership LP/Finance Corp., 5.000%, 10/15/27 | | | 1,500,000 | | | | 1,598,287 | |
Par Pharmaceutical, Inc., 144A, 7.500%, 04/01/27 (d) | | | 1,715,000 | | | | 1,863,022 | |
Percent of Net Assets
Name of Issuer and
Title of Issue | | Shares/
Principal/
Contracts | | | Value | |
BONDS, continued |
CORPORATE BONDS, continued |
Health Care, continued |
Verscend Escrow Corp., 144A, 9.750%, 08/15/26 (d) | | $ | 1,000,000 | | | $ | 1,085,625 | |
Vizient, Inc., 144A, 6.250%, 05/15/27 (d) | | | 2,000,000 | | | | 2,157,120 | |
| | | | | | | | 47,928,817 | |
Insurance: 0.5% |
GTCR AP Finance, Inc., 144A, 8.000%, 05/15/27 (d) | | | 2,000,000 | | | | 2,176,900 | |
| | | | | | | | | |
Leisure: 3.5% |
Boyne USA, Inc., 144A, 7.250%, 05/01/25 (d) | | | 1,500,000 | | | | 1,577,813 | |
Colt Merger Sub, Inc., 144A, 5.750%, 07/01/25 (d) | | | 2,000,000 | | | | 2,121,655 | |
ESH Hospitality, Inc., 144A, 5.250%, 05/01/25 (d) | | | 950,000 | | | | 975,151 | |
ESH Hospitality, Inc., 144A, 4.625%, 10/01/27 (d) | | | 1,500,000 | | | | 1,539,375 | |
FelCor Lodging, LP, 6.000%, 06/01/25 | | | 2,000,000 | | | | 2,047,290 | |
MGM Resorts International, 6.750%, 05/01/25 | | | 1,000,000 | | | | 1,083,975 | |
MGM Resorts International, 5.500%, 04/15/27 | | | 2,000,000 | | | | 2,231,810 | |
Scientific Games International, Inc., 144A, 8.250%, 03/15/26 (d) | | | 1,000,000 | | | | 1,079,305 | |
Scientific Games International, Inc., 144A, 7.250%, 11/15/29 (d) | | | 2,000,000 | | | | 2,198,380 | |
Winnebago Industries, Inc., 144A, 6.250%, 07/15/28 (d) | | | 1,500,000 | | | | 1,615,312 | |
| | | | | | | | 16,470,066 | |
Media: 15.2% |
Altice Financing SA, 144A, 7.500%, 05/15/26 (d) | | | 2,000,000 | | | | 2,113,100 | |
Altice France Holding SA, 144A, 10.500%, 05/15/27 (d) | | | 2,000,000 | | | | 2,248,750 | |
SEE NOTES TO FINANCIAL STATEMENTS | 110 | |
December 31, 2020 |
Schedules of Investments, continued |
Pax High Yield Bond Fund, continued
Percent of Net Assets
Name of Issuer and
Title of Issue | | Shares/
Principal/
Contracts | | | Value | |
BONDS, continued |
CORPORATE BONDS, continued |
Media, continued |
Altice France SA, 144A, 7.375%, 05/01/26 (d) | | $ | 2,500,000 | | | $ | 2,634,375 | |
Altice France SA, 144A, 8.125%, 02/01/27 (d) | | | 500,000 | | | | 551,827 | |
Altice France SA, 144A, 5.500%, 01/15/28 (d) | | | 2,000,000 | | | | 2,093,520 | |
CCO Holdings, LLC/Capital Corp., 144A, 5.750%, 02/15/26 (d) | | | 1,000,000 | | | | 1,033,100 | |
CCO Holdings, LLC/Capital Corp., 144A, 5.125%, 05/01/27 (d) | | | 1,000,000 | | | | 1,062,525 | |
CCO Holdings, LLC/Capital Corp., 144A, 5.375%, 06/01/29 (d) | | | 3,000,000 | | | | 3,292,170 | |
CCO Holdings, LLC/Capital Corp., 144A, 4.750%, 03/01/30 (d) | | | 5,000,000 | | | | 5,401,250 | |
CCO Holdings, LLC/Capital Corp., 144A, 4.500%, 05/01/32 (d) | | | 1,000,000 | | | | 1,068,970 | |
Cimpress, PLC, 144A, 7.000%, 06/15/26 (d) | | | 1,000,000 | | | | 1,054,810 | |
Clear Channel International BV, 144A, 6.625%, 08/01/25 (d) | | | 1,000,000 | | | | 1,058,750 | |
CSC Holdings, LLC, 144A, 7.500%, 04/01/28 (d) | | | 2,000,000 | | | | 2,252,770 | |
CSC Holdings, LLC, 144A, 5.750%, 01/15/30 (d) | | | 2,500,000 | | | | 2,743,762 | |
CSC Holdings, LLC, 144A, 4.625%, 12/01/30 (d) | | | 2,000,000 | | | | 2,090,270 | |
CSC Holdings, LLC, 144A, 4.125%, 12/01/30 (d) | | | 1,000,000 | | | | 1,046,600 | |
CSC Holdings, LLC, 144A, 3.375%, 02/15/31 (d) | | | 1,000,000 | | | | 982,500 | |
DISH DBS Corp., 6.750%, 06/01/21 | | | 1,000,000 | | | | 1,021,210 | |
DISH DBS Corp., 5.875%, 11/15/24 | | | 2,500,000 | | | | 2,625,000 | |
DISH DBS Corp., 7.375%, 07/01/28 | | | 1,000,000 | | | | 1,066,250 | |
Percent of Net Assets
Name of Issuer and
Title of Issue | | Shares/
Principal/
Contracts | | | Value | |
BONDS, continued |
CORPORATE BONDS, continued |
Media, continued |
iHeartCommunications, Inc., 8.375%, 05/01/27 | | $ | 1,500,000 | | | $ | 1,603,913 | |
iHeartCommunications, Inc., 144A, 5.250%, 08/15/27 (d) | | | 1,500,000 | | | | 1,577,535 | |
iHeartCommunications, Inc., 144A, 4.750%, 01/15/28 (d) | | | 1,000,000 | | | | 1,027,940 | |
Lamar Media Corp., 3.750%, 02/15/28 | | | 1,000,000 | | | | 1,029,575 | |
Lamar Media Corp., 4.000%, 02/15/30 | | | 1,500,000 | | | | 1,559,063 | |
LCPR Senior Secured Financing DAC, 144A, 6.750%, 10/15/27 (d) | | | 1,500,000 | | | | 1,616,250 | |
MDC Partners, Inc., 144A, 7.500%, 05/01/24 (d)(e) | | | 2,000,000 | | | | 2,030,520 | |
Netflix, Inc., 144A, 3.625%, 06/15/25 (d) | | | 1,000,000 | | | | 1,072,615 | |
Netflix, Inc., 4.875%, 04/15/28 | | | 1,000,000 | | | | 1,129,330 | |
Nexstar Broadcasting, Inc., 144A, 5.625%, 07/15/27 (d) | | | 2,000,000 | | | | 2,145,630 | |
Nexstar Broadcasting, Inc., 144A, 4.750%, 11/01/28 (d) | | | 1,000,000 | | | | 1,048,125 | |
Nielsen Co. Luxembourg SARL, The, 144A, 5.000%, 02/01/25 (d) | | | 1,000,000 | | | | 1,028,125 | |
Nielsen Finance, LLC/Co., 144A, 5.625%, 10/01/28 (d) | | | 1,000,000 | | | | 1,088,425 | |
Nielsen Finance, LLC/Co., 144A, 5.875%, 10/01/30 (d) | | | 1,000,000 | | | | 1,133,125 | |
Outfront Media Capital, LLC/Corp., 144A, 5.000%, 08/15/27 (d) | | | 1,000,000 | | | | 1,019,190 | |
Sirius XM Radio, Inc., 144A, 5.375%, 07/15/26 (d) | | | 450,000 | | | | 470,250 | |
Sirius XM Radio, Inc., 144A, 5.000%, 08/01/27 (d) | | | 500,000 | | | | 531,988 | |
| | 111 | SEE NOTES TO FINANCIAL STATEMENTS |
December 31, 2020 |
Schedules of Investments, continued |
Pax High Yield Bond Fund, continued
Percent of Net Assets
Name of Issuer and
Title of Issue | | Shares/
Principal/
Contracts | | | Value | |
BONDS, continued |
CORPORATE BONDS, continued |
Media, continued |
Sirius XM Radio, Inc., 144A, 5.500%, 07/01/29 (d) | | $ | 2,000,000 | | | $ | 2,204,375 | |
Sirius XM Radio, Inc., 144A, 4.125%, 07/01/30 (d) | | | 1,000,000 | | | | 1,065,625 | |
TEGNA, Inc., 5.000%, 09/15/29 | | | 2,000,000 | | | | 2,114,715 | |
Townsquare Media, Inc., 144A, 6.875%, 02/01/26 (d) | | | 1,000,000 | | | | 1,049,205 | |
Virgin Media Finance, PLC, 144A, 5.000%, 07/15/30 (d) | | | 2,000,000 | | | | 2,077,500 | |
Virgin Media Secured Finance PLC, 144A, 5.500%, 08/15/26 (d) | | | 1,000,000 | | | | 1,040,625 | |
Virgin Media Secured Finance PLC, 144A, 5.500%, 05/15/29 (d) | | | 1,500,000 | | | | 1,628,010 | |
VTR Comunicaciones SpA, 144A, 5.125%, 01/15/28 (d) | | | 1,000,000 | | | | 1,066,600 | |
VTR Finance NV, 144A, 6.375%, 07/15/28 (d) | | | 1,000,000 | | | | 1,093,750 | |
| | | | | | | | 71,893,513 | |
Real Estate: 1.4% |
Diversified Healthcare Trust, 9.750%, 06/15/25 | | | 2,000,000 | | | | 2,275,000 | |
Five Point Operating Co., LP/Capital Corp., 144A, 7.875%, 11/15/25 (d) | | | 1,000,000 | | | | 1,060,425 | |
Kennedy-Wilson, Inc., 5.875%, 04/01/24 | | | 3,000,000 | | | | 3,048,750 | |
| | | | | | | | 6,384,175 | |
Retail: 4.6% |
Albertsons Cos., Inc./Safeway, Inc./New Albertsons, LP/Albertsons, LLC, 144A, 4.625%, 01/15/27 (d) | | | 2,000,000 | | | | 2,129,610 | |
Percent of Net Assets
Name of Issuer and
Title of Issue | | Shares/
Principal/
Contracts | | | Value | |
BONDS, continued |
CORPORATE BONDS, continued |
Retail, continued |
Albertsons Cos., Inc./Safeway, Inc./New Albertsons, LP/Albertsons, LLC, 144A, 3.500%, 03/15/29 (d) | | $ | 1,000,000 | | | $ | 1,013,370 | |
Carvana Co., 144A, 5.625%, 10/01/25 (d) | | | 1,500,000 | | | | 1,541,250 | |
Carvana Co., 144A, 5.875%, 10/01/28 (d) | | | 1,000,000 | | | | 1,040,000 | |
Fresh Market, Inc., The, 144A, 9.750%, 05/01/23 (d) | | | 2,000,000 | | | | 2,063,750 | |
Michaels Stores, Inc., 144A, 8.000%, 07/15/27 (d) | | | 2,000,000 | | | | 2,153,380 | |
Michaels Stores, Inc., 144A, 4.750%, 10/01/27 (d) | | | 1,000,000 | | | | 1,026,500 | |
New Albertsons, LP, 7.750%, 06/15/26 | | | 1,000,000 | | | | 1,163,560 | |
PetSmart, Inc., 144A, 7.125%, 03/15/23 (d) | | | 2,000,000 | | | | 2,002,500 | |
Safeway, Inc., 7.250%, 02/01/31 | | | 1,000,000 | | | | 1,174,390 | |
Sally Holdings, LLC/Capital, Inc., 144A, 8.750%, 04/30/25 (d) | | | 1,000,000 | | | | 1,113,750 | |
Sally Holdings, LLC/Capital, Inc., 5.625%, 12/01/25 | | | 2,000,000 | | | | 2,058,000 | |
SEG Holding, LLC/Finance Corp., 144A, 5.625%, 10/15/28 (d) | | | 3,000,000 | | | | 3,172,500 | |
| | | | | | | | 21,652,560 | |
Services: 7.0% |
Ashtead Capital, Inc., 144A, 4.250%, 11/01/29 (d) | | | 2,000,000 | | | | 2,194,680 | |
Diebold Nixdorf, Inc., 8.500%, 04/15/24 | | | 1,500,000 | | | | 1,520,625 | |
Diebold Nixdorf, Inc., 144A, 9.375%, 07/15/25 (d) | | | 1,500,000 | | | | 1,682,813 | |
Dun & Bradstreet Corp., The, 144A, 10.250%, 02/15/27 (d) | | | 1,000,000 | | | | 1,129,815 | |
SEE NOTES TO FINANCIAL STATEMENTS | 112 | |
December 31, 2020 |
Schedules of Investments, continued |
Pax High Yield Bond Fund, continued
Percent of Net Assets
Name of Issuer and
Title of Issue | | Shares/
Principal/
Contracts | | | Value | |
BONDS, continued |
CORPORATE BONDS, continued |
Services, continued |
GFL Environmental, Inc., 144A, 5.125%, 12/15/26 (d) | | $ | 1,000,000 | | | $ | 1,065,100 | |
GFL Environmental, Inc., 144A, 8.500%, 05/01/27 (d) | | | 1,600,000 | | | | 1,779,000 | |
GFL Environmental, Inc., 144A, 4.000%, 08/01/28 (d) | | | 1,000,000 | | | | 1,009,375 | |
GFL Environmental, Inc., 144A, 3.500%, 09/01/28 (d) | | | 1,000,000 | | | | 1,019,375 | |
Harsco Corp., 144A, 5.750%, 07/31/27 (d) | | | 1,000,000 | | | | 1,059,375 | |
Iron Mountain, Inc., 144A, 4.875%, 09/15/29 (d) | | | 2,500,000 | | | | 2,640,000 | |
Iron Mountain, Inc., 144A, 5.625%, 07/15/32 (d) | | | 1,000,000 | | | | 1,103,865 | |
KAR Auction Services, Inc., 144A, 5.125%, 06/01/25 (d) | | | 1,500,000 | | | | 1,545,420 | |
Maxim Crane Works Holdings Capital LLC, 144A, 10.125%, 08/01/24 (d) | | | 2,500,000 | | | | 2,609,637 | |
Picasso Finance Sub, Inc., 144A, 6.125%, 06/15/25 (d) | | | 2,000,000 | | | | 2,142,900 | |
Prime Security Services Borrower, LLC/Finance, Inc., 144A, 5.750%, 04/15/26 (d) | | | 2,000,000 | | | | 2,192,500 | |
Prime Security Services Borrower, LLC/Finance, Inc., 144A, 6.250%, 01/15/28 (d) | | | 2,000,000 | | | | 2,150,000 | |
Staples, Inc., 144A, 7.500%, 04/15/26 (d) | | | 1,000,000 | | | | 1,045,940 | |
Staples, Inc., 144A, 10.750%, 04/15/27 (d) | | | 1,000,000 | | | | 996,250 | |
United Rentals North America, Inc., 5.250%, 01/15/30 | | | 2,500,000 | | | | 2,779,687 | |
Percent of Net Assets
Name of Issuer and
Title of Issue | | Shares/
Principal/
Contracts | | | Value | |
BONDS, continued |
CORPORATE BONDS, continued |
Services, continued |
Williams Scotsman International, Inc., 144A, 4.625%, 08/15/28 (d) | | $ | 1,500,000 | | | $ | 1,555,313 | |
| | | | | | | | 33,221,670 | |
Technology & Electronics: 7.5% |
Arches Buyer, Inc., 144A, 4.250%, 06/01/28 (d) | | | 1,000,000 | | | | 1,014,575 | |
Arches Buyer, Inc., 144A, 6.125%, 12/01/28 (d) | | | 1,000,000 | | | | 1,034,575 | |
Austin BidCo, Inc., 144A, 7.125%, 12/15/28 (d) | | | 2,000,000 | | | | 2,091,250 | |
Camelot Finance SA, 144A, 4.500%, 11/01/26 (d) | | | 2,000,000 | | | | 2,091,250 | |
Cars.com, Inc., 144A, 6.375%, 11/01/28 (d) | | | 2,000,000 | | | | 2,127,940 | |
Castle US Holding Corp., 144A, 9.500%, 02/15/28 (d) | | | 2,000,000 | | | | 2,004,690 | |
CommScope, Inc., 144A, 6.000%, 03/01/26 (d) | | | 500,000 | | | | 527,458 | |
CommScope, Inc., 144A, 7.125%, 07/01/28 (d) | | | 1,000,000 | | | | 1,066,320 | |
Fair Isaac Corp., 144A, 5.250%, 05/15/26 (d) | | | 1,000,000 | | | | 1,141,060 | |
Fair Isaac Corp., 144A, 4.000%, 06/15/28 (d) | | | 500,000 | | | | 527,188 | |
Gartner, Inc., 144A, 4.500%, 07/01/28 (d) | | | 2,000,000 | | | | 2,112,500 | |
Logan Merger Sub, Inc., 144A, 5.500%, 09/01/27 (d) | | | 2,000,000 | | | | 2,097,500 | |
Microchip Technology, Inc., 144A, 4.250%, 09/01/25 (d) | | | 1,500,000 | | | | 1,587,424 | |
MSCI, Inc., 144A, 4.000%, 11/15/29 (d) | | | 2,000,000 | | | | 2,133,380 | |
MSCI, Inc., 144A, 3.875%, 02/15/31 (d) | | | 1,000,000 | | | | 1,058,750 | |
Nokia Oyj, 6.625%, 05/15/39 | | | 1,050,000 | | | | 1,346,523 | |
Open Text Holdings, Inc., 144A, 4.125%, 02/15/30 (d) | | | 2,500,000 | | | | 2,664,100 | |
| | 113 | SEE NOTES TO FINANCIAL STATEMENTS |
December 31, 2020 |
Schedules of Investments, continued |
Pax High Yield Bond Fund, continued
Percent of Net Assets
Name of Issuer and
Title of Issue | | Shares/
Principal/
Contracts | | | Value | |
BONDS, continued |
CORPORATE BONDS, continued |
Technology & Electronics, continued |
Rackspace Technology Global, Inc., 144A, 5.375%, 12/01/28 (d) | | $ | 2,000,000 | | | $ | 2,099,150 | |
Seagate HDD Cayman, 144A, 3.125%, 07/15/29 (d) | | | 1,000,000 | | | | 1,001,985 | |
Seagate HDD Cayman, 144A, 3.375%, 07/15/31 (d) | | | 1,000,000 | | | | 1,007,285 | |
Unisys Corp., 144A, 6.875%, 11/01/27 (d) | | | 1,500,000 | | | | 1,642,500 | |
Veritas US, Inc./Bermuda, Ltd., 144A, 10.500%, 02/01/24 (d) | | | 1,000,000 | | | | 1,018,645 | |
Veritas US, Inc./Bermuda, Ltd., 144A, 7.500%, 09/01/25 (d) | | | 2,000,000 | | | | 2,055,000 | |
| | | | | | | | 35,451,048 | |
Telecommunications: 8.5% |
C&W Senior Financing DAC, 144A, 7.500%, 10/15/26 (d) | | | 1,000,000 | | | | 1,066,775 | |
CenturyLink, Inc., 6.750%, 12/01/23 | | | 1,000,000 | | | | 1,115,625 | |
CenturyLink, Inc., 144A, 5.125%, 12/15/26 (d) | | | 1,500,000 | | | | 1,586,122 | |
CenturyLink, Inc., 144A, 4.000%, 02/15/27 (d) | | | 1,000,000 | | | | 1,033,870 | |
CenturyLink, Inc., 144A, 4.500%, 01/15/29 (d) | | | 1,000,000 | | | | 1,019,375 | |
Cogent Communications Group, Inc., 144A, 5.375%, 03/01/22 (d) | | | 700,000 | | | | 722,586 | |
Consolidated Communications, Inc., 144A, 6.500%, 10/01/28 (d) | | | 1,000,000 | | | | 1,071,500 | |
Digicel Group 0.5, Ltd., 10.000%, 04/01/24 | | | 500,000 | | | | 448,750 | |
Embarq Corp., 7.995%, 06/01/36 | | | 1,000,000 | | | | 1,235,325 | |
Percent of Net Assets
Name of Issuer and
Title of Issue | | Shares/
Principal/
Contracts | | | Value | |
BONDS, continued |
CORPORATE BONDS, continued |
Telecommunications, continued |
Frontier Communications Corp., 144A, 5.875%, 10/15/27 (d) | | $ | 1,000,000 | | | $ | 1,083,125 | |
Frontier Communications Corp., 144A, 5.000%, 05/01/28 (d) | | | 1,000,000 | | | | 1,044,375 | |
Frontier Communications Corp., 144A, 6.750%, 05/01/29 (d) | | | 1,500,000 | | | | 1,607,812 | |
Level 3 Financing, Inc., 5.250%, 03/15/26 | | | 1,000,000 | | | | 1,034,550 | |
Level 3 Financing, Inc., 144A, 4.625%, 09/15/27 (d) | | | 2,000,000 | | | | 2,092,460 | |
Level 3 Financing, Inc., 144A, 4.250%, 07/01/28 (d) | | | 500,000 | | | | 514,250 | |
Level 3 Financing, Inc., 144A, 3.625%, 01/15/29 (d) | | | 500,000 | | | | 499,688 | |
Sable International Finance, Ltd., 144A, 5.750%, 09/07/27 (d) | | | 500,000 | | | | 533,655 | |
Sprint Capital Corp., 6.875%, 11/15/28 | | | 1,000,000 | | | | 1,320,355 | |
Sprint Capital Corp., 8.750%, 03/15/32 | | | 2,000,000 | | | | 3,168,750 | |
Sprint Corp., 7.875%, 09/15/23 | | | 500,000 | | | | 579,525 | |
Sprint Corp., 7.125%, 06/15/24 | | | 2,000,000 | | | | 2,342,520 | |
Switch, Ltd., 144A, 3.750%, 09/15/28 (d) | | | 2,250,000 | | | | 2,287,968 | |
Telecom Italia Capital SA, 7.200%, 07/18/36 | | | 1,500,000 | | | | 2,028,480 | |
Telecom Italia SpA, 144A, 5.303%, 05/30/24 (d) | | | 2,000,000 | | | | 2,178,050 | |
T-Mobile USA, Inc., 4.750%, 02/01/28 | | | 2,000,000 | | | | 2,152,280 | |
Uniti Group, LP/Fiber Holdings, Inc./CSL Capital, LLC, 144A, 7.875%, 02/15/25 (d) | | | 1,500,000 | | | | 1,613,633 | |
SEE NOTES TO FINANCIAL STATEMENTS | 114 | |
December 31, 2020 |
Schedules of Investments, continued |
Pax High Yield Bond Fund, continued
Percent of Net Assets
Name of Issuer and
Title of Issue | | Shares/
Principal/
Contracts | | | Value | |
BONDS, continued |
CORPORATE BONDS, continued |
Telecommunications, continued |
Uniti Group, LP/Uniti Fiber Holdings, Inc./CSL Capital, LLC, 144A, 7.125%, 12/15/24 (d) | | $ | 500,000 | | | $ | 505,938 | |
Uniti Group, LP/Uniti Group Finance, Inc./CSL Capital, LLC, 8.250%, 10/15/23 | | | 2,000,000 | | | | 2,018,750 | |
Zayo Group Holdings, Inc., 144A, 4.000%, 03/01/27 (d) | | | 2,500,000 | | | | 2,509,512 | |
| | | | | | | | 40,415,604 | |
Transportation: 1.4% |
Delta Air Lines, Inc., 144A, 7.000%, 05/01/25 (d) | | | 2,000,000 | | | | 2,310,855 | |
Delta Air Lines, Inc./SkyMiles IP, Ltd., 144A, 4.750%, 10/20/28 (d) | | | 1,000,000 | | | | 1,092,728 | |
Great Lakes Dredge & Dock Corp., 8.000%, 05/15/22 | | | 1,000,000 | | | | 1,029,095 | |
Mileage Plus Holdings, LLC/Intellectual Property Assets, Ltd., 144A, 6.500%, 06/20/27 (d) | | | 2,000,000 | | | | 2,153,750 | |
| | | | | | | | 6,586,428 | |
Utility: 1.8% |
Clearway Energy Operating, LLC, 144A, 4.750%, 03/15/28 (d) | | | 1,500,000 | | | | 1,610,160 | |
NextEra Energy Operating Partners, LP, 144A, 4.250%, 07/15/24 (d) | | | 1,000,000 | | | | 1,071,250 | |
NextEra Energy Operating Partners, LP, 144A, 4.250%, 09/15/24 (d) | | | 45,000 | | | | 48,206 | |
NextEra Energy Operating Partners, LP, 144A, 4.500%, 09/15/27 (d) | | | 1,500,000 | | | | 1,682,655 | |
Pattern Energy Operations, LP/Inc., 144A, 4.500%, 08/15/28 (d) | | | 2,000,000 | | | | 2,113,750 | |
Percent of Net Assets
Name of Issuer and
Title of Issue | | Shares/
Principal/
Contracts | | | Value | |
BONDS, continued |
CORPORATE BONDS, continued |
Utility, continued |
TerraForm Power Operating, LLC, 144A, 5.000%, 01/31/28 (d) | | $ | 1,000,000 | | | $ | 1,125,525 | |
TerraForm Power Operating, LLC, 144A, 4.750%, 01/15/30 (d) | | | 1,000,000 | | | | 1,072,210 | |
| | | | | | | | 8,723,756 | |
TOTAL CORPORATE BONDS |
(Cost $426,689,599) | | | 450,542,243 | |
| | | | | | | | | |
LOANS: 1.1% |
Capital Goods: 0.4% |
EWT Holdings III Corp., 1 month LIBOR + 2.75%, 2.880%, 12/20/24 (e) | | | 1,994,216 | | | | 1,992,561 | |
| |
Retail: 0.3% |
PetSmart, Inc., 3 month LIBOR + 3.50%, 4.000%, 03/11/22 (e) | | | 1,265,714 | | | | 1,268,776 | |
| |
Services: 0.4% |
Dun & Bradstreet Corp., The, 3 month LIBOR + 5.00%, 6.731%, 02/08/26 (e) | | | 1,985,000 | | | | 1,989,685 | |
| | | | | | | | | |
TOTAL LOANS |
(Cost $5,095,812) | | | 5,251,022 | |
| | | | | | | | | |
TOTAL BONDS |
(Cost $432,286,224) | | | 456,294,078 | |
| | | | | | | | | |
| | 115 | SEE NOTES TO FINANCIAL STATEMENTS |
December 31, 2020 |
Schedules of Investments, continued |
Pax High Yield Bond Fund, continued
Percent of Net Assets
Name of Issuer and
Title of Issue | | Shares/
Principal/
Contracts | | | Value | |
CERTIFICATES OF DEPOSIT: 0.3% |
Beneficial State Bank, 1.200%, 01/21/21 (b) | | | 200,000 | | | $ | 200,000 | |
Self-Help Federal Credit Union, 1.900%, 12/20/21 (b) | | | 400,000 | | | | 407,251 | |
Self-Help Federal Credit Union, 0.650%, 04/29/22 (b) | | | 100,000 | | | | 100,797 | |
Shared Interest, Inc., 2.400%, 09/30/21 (b) | | | 500,000 | | | | 500,000 | |
TOTAL CERTIFICATES OF DEPOSIT |
(Cost $1,200,000) | | | 1,208,048 | |
| | | | | | | | | |
MONEY MARKET: 1.6% |
State Street Institutional U.S. Government Money Market Fund, 0.030% (f)(g) | | | 7,451,254 | | | | 7,451,254 | |
(Cost $7,451,254) |
| | | | | | | | | |
TOTAL INVESTMENTS: 99.0% |
(Cost $443,498,399) | | | 467,747,580 | |
| | | | | | | | | |
OTHER ASSETS AND LIABILITIES — (NET): 1.0% | | | 4,579,650 | |
| | | | | | | | | |
NET ASSETS: 100.0% | | $ | 472,327,230 | |
(a) | Non-income producing security. |
(c) | Security valued using significant unobservable inputs. |
(d) | Security purchased pursuant to Rule 144A of the Securities Act of 1933 and may be resold only to qualified institutional buyers. |
(e) | Rate shown reflects the accrual rate as of December 31, 2020 on securities with variable or step rates. |
(f) | Rate shown represents annualized 7-day yield as of December 31, 2020 |
LIBOR-London Inter-bank Offered Rate. At December 31, 2020 the 1 month and 3 month LIBOR rates were 0.144% and 0.238%, respectively.
LP-Limited Partnership
SEE NOTES TO FINANCIAL STATEMENTS | 116 | |
December 31, 2020 |
Schedules of Investments, continued |
Pax Sustainable Allocation Fund
Percent of Net Assets
Name of Issuer and
Title of Issue | | Shares/
Principal | | | Value | |
AFFILIATED INVESTMENT COMPANIES: 95.0% |
Pax Core Bond Fund (a) | | | 66,559,119 | | | $ | 702,864,297 | |
Pax Ellevate Global Women’s Leadership Fund (a) | | | 1,533,441 | | | | 46,769,952 | |
Pax ESG Beta Dividend Fund (a) | | | 8,320,411 | | | | 118,233,034 | |
Pax Global Environmental Markets Fund (a) | | | 2,180,751 | | | | 46,297,333 | |
Pax Global Opportunities Fund (a) | | | 2,572,091 | | | | 37,784,018 | |
Pax Large Cap Fund (a) | | | 74,122,950 | | | | 893,181,549 | |
Pax MSCI EAFE ESG Leaders Index Fund (a) | | | 15,860,899 | | | | 160,829,518 | |
Pax Small Cap Fund (a) | | | 3,935,579 | | | | 62,929,908 | |
| | | | | | | | | |
TOTAL AFFILIATED INVESTMENT COMPANIES |
(Cost $1,741,633,097) | | | 2,068,889,609 | |
| | | | | | | | | |
MONEY MARKET: 4.7% |
State Street Institutional U.S. Government Money Market Fund, 0.030% (b)(c) | | | 101,977,753 | | | | 101,977,753 | |
(Cost $101,977,753) |
| | | | | | | | | |
TOTAL INVESTMENTS: 99.7% |
(Cost $1,843,610,850) | | | 2,170,867,362 | |
| | | | | | | | | |
OTHER ASSETS AND LIABILITIES — (NET): 0.3% | | | 6,004,444 | |
| | | | | | | | | |
NET ASSETS: 100.0% | | $ | 2,176,871,806 | |
(a) | Institutional Class shares |
(b) | Rate shown represents annualized 7-day yield as of December 31, 2020. |
| | 117 | SEE NOTES TO FINANCIAL STATEMENTS |
December 31, 2020 |
Statements of Assets and Liabilities |
| | Large Cap
Fund | | | Small Cap
Fund | | | ESG Beta
Quality
Fund | | | ESG Beta
Dividend
Fund | |
ASSETS | | | | | | | | | | | | | | | | |
Investments, at cost - Note A | | $ | 671,225,980 | | | $ | 399,377,863 | | | $ | 124,036,128 | | | $ | 82,163,427 | |
| | | | | | | | | | | | | | | | | |
Investments in unaffiliated issuers, at value | | $ | 1,040,278,627 | | | $ | 477,708,757 | | | $ | 256,652,453 | | | $ | 139,935,483 | |
Investments in affiliated issuers, at value | | | — | | | | — | | | | — | | | | — | |
Total investments, at value - Note A1 | | | 1,040,278,627 | | | | 477,708,757 | | | | 256,652,453 | | | | 139,935,483 | |
Cash | | | — | | | | — | | | | — | | | | — | |
Foreign currency at value (cost $36,845; $44,552; and $1,315, respectively) | | | — | | | | 36,882 | | | | — | | | | — | |
Prepaid expenses | | | 8,721 | | | | 4,508 | | | | — | | | | — | |
Receivables: | | | | | | | | | | | | | | | | |
Capital stock sold | | | 1,343,095 | | | | 2,333,775 | | | | 49,292 | | | | 75,095 | |
Dividends and interest - Note A | | | 659,410 | | | | 261,794 | | | | 199,996 | | | | 115,954 | |
Investment securities sold | | | — | | | | 3,503,423 | | | | — | | | | — | |
Investment Adviser reimbursement | | | — | | | | — | | | | — | | | | — | |
Other | | | 1,535 | | | | 17,901 | | | | 344 | | | | 61 | |
Total Assets | | | 1,042,291,388 | | | | 483,867,040 | | | | 256,902,085 | | | | 140,126,593 | |
| | | | | | | | | | | | | | | | | |
LIABILITIES | | | | | | | | | | | | | | | | |
Collateral on securities loaned, at value | | | — | | | | 16,801,446 | | | | — | | | | — | |
Payables: | | | | | | | | | | | | | | | | |
Capital stock reacquired | | | 87,344 | | | | 399,875 | | | | 513,478 | | | | — | |
Investment securities purchased | | | — | | | | — | | | | — | | | | — | |
Capital gains tax payable | | | — | | | | — | | | | — | | | | — | |
Dividend payable - Note A | | | — | | | | — | | | | — | | | | — | |
Accrued expenses: | | | | | | | | | | | | | | | | |
Investment advisory fees - Note B | | | 558,741 | | | | 285,191 | | | | 136,885 | | | | 75,610 | |
Distribution expense | | | 4,031 | | | | 23,468 | | | | 36,966 | | | | 832 | |
Transfer agent fees | | | 3,088 | | | | 45,497 | | | | — | | | | — | |
Printing and other shareholder communication fees | | | 1,441 | | | | 6,109 | | | | — | | | | — | |
Custodian fees | | | 12,202 | | | | 6,549 | | | | — | | | | — | |
Legal and audit fees | | | 31,316 | | | | 26,157 | | | | — | | | | — | |
Other accrued expenses | | | — | | | | 33,558 | | | | — | | | | — | |
Total Liabilities | | | 698,163 | | | | 17,627,850 | | | | 687,329 | | | | 76,442 | |
NET ASSETS | | $ | 1,041,593,225 | | | $ | 466,239,190 | | | $ | 256,214,756 | | | $ | 140,050,151 | |
1 | Investments at market value include securities loaned. At December 31, 2020, the Large Cap Fund, Small Cap Fund, ESG Beta Quality Fund, ESG Beta Dividend Fund, Global Women’s Leadership Fund, EAFE ESG Leaders Index Fund and Core Bond Fund had total market values of securities on loan of $8,352,723; $42,798,518; $2,980,114; $545,239; $1,062,536; $2,546,905; and $3,587,349, respectively. |
SEE NOTES TO FINANCIAL STATEMENTS | 118 | |
| | Global
Opportunities
Fund | | | Global
Environmental
Markets Fund | | | Global
Women’s
Leadership
Fund | | | EAFE
ESG Leaders
Index Fund | | | Core Bond
Fund | | | High Yield
Bond Fund | | | Sustainable
Allocation
Fund | | | | |
| | | | | | | | | | | | | | | | | | | | | | | | | | | | | | | | |
| | $ | 50,665,387 | | | $ | 1,111,869,125 | | | $ | 591,507,538 | | | $ | 537,085,691 | | | $ | 735,486,608 | | | $ | 443,498,399 | | | $ | 1,843,610,850 | | | | | |
| | | | | | | | | | | | | | | | | | | | | | | | | | | | | | | | |
| | $ | 69,085,595 | | | $ | 1,618,434,106 | | | $ | 747,041,016 | | | $ | 700,834,890 | | | $ | 766,500,028 | | | $ | 467,747,580 | | | $ | 101,977,753 | | | | | |
| | | — | | | | — | | | | — | | | | — | | | | — | | | | — | | | | 2,068,889,609 | | | | | |
| | | 69,085,595 | | | | 1,618,434,106 | | | | 747,041,016 | | | | 700,834,890 | | | | 766,500,028 | | | | 467,747,580 | | | | 2,170,867,362 | | | | | |
| | | — | | | | — | | | | 51 | | | | — | | | | — | | | | 518,602 | | | | — | | | | | |
| | | — | | | | — | | | | 45,193 | | | | 1,307 | | | | — | | | | — | | | | — | | | | | |
| | | 74 | | | | 10,393 | | | | — | | | | — | | | | 8,215 | | | | — | | | | — | | | | | |
| | | | | | | | | | | | | | | | | | | | | | | | | | | | | | | | |
| | | 3,567 | | | | 13,326,613 | | | | 2,195,119 | | | | 1,411,890 | | | | 306,333 | | | | 1,047,928 | | | | 7,623,144 | | | | | |
| | | 31,308 | | | | 515,374 | | | | 508,541 | | | | 547,427 | | | | 3,173,797 | | | | 6,287,175 | | | | 965,312 | | | | | |
| | | — | | | | — | | | | — | | | | — | | | | — | | | | — | | | | — | | | | | |
| | | 23,858 | | | | — | | | | — | | | | — | | | | — | | | | — | | | | — | | | | | |
| | | 10,961 | | | | 521,922 | | | | 141,673 | | | | 1,669,471 | | | | 1,079 | | | | 4,175 | | | | — | | | | | |
| | | 69,155,363 | | | | 1,632,808,408 | | | | 749,931,593 | | | | 704,464,985 | | | | 769,989,452 | | | | 475,605,460 | | | | 2,179,455,818 | | | | | |
| | | | | | | | | | | | | | | | | | | | | | | | | | | | | | | | |
| | | | | | | | | | | | | | | | | | | | | | | | | | | | | | | | |
| | | — | | | | — | | | | — | | | | 1,842,875 | | | | 3,660,830 | | | | — | | | | — | | | | | |
| | | | | | | | | | | | | | | | | | | | | | | | | | | | | | | | |
| | | — | | | | 664,729 | | | | 120,086 | | | | 1,353,315 | | | | 55,006 | | | | 693,277 | | | | 1,212,476 | | | | | |
| | | — | | | | 1,243,831 | | | | 44,220 | | | | — | | | | 5,229,975 | | | | 2,009,375 | | | | 963,206 | | | | | |
| | | 26,503 | | | | — | | | | — | | | | — | | | | — | | | | — | | | | — | | | | | |
| | | — | | | | — | | | | — | | | | — | | | | 2,340 | | | | 238,565 | | | | — | | | | | |
| | | | | | | | | | | | | | | | | | | | | | | | | | | | | | | | |
| | | 42,963 | | | | 1,010,619 | | | | 317,122 | | | | 275,908 | | | | 255,441 | | | | 196,081 | | | | 90,237 | | | | | |
| | | 679 | | | | 39,281 | | | | 27,063 | | | | 16,295 | | | | 2,953 | | | | 37,401 | | | | 318,093 | | | | | |
| | | 1,295 | | | | 91,008 | | | | — | | | | — | | | | 2,432 | | | | 32,785 | | | | — | | | | | |
| | | 1,542 | | | | 5,171 | | | | — | | | | — | | | | 2,935 | | | | 12,597 | | | | — | | | | | |
| | | 7,604 | | | | 31,187 | | | | — | | | | — | | | | 20,076 | | | | 14,930 | | | | — | | | | | |
| | | 24,048 | | | | 37,259 | | | | — | | | | — | | | | 36,015 | | | | 31,024 | | | | — | | | | | |
| | | 5,265 | | | | 41,723 | | | | — | | | | — | | | | 5,644 | | | | 12,195 | | | | — | | | | | |
| | | 109,899 | | | | 3,164,808 | | | | 508,491 | | | | 3,488,393 | | | | 9,273,647 | | | | 3,278,230 | | | | 2,584,012 | | | | | |
| | $ | 69,045,464 | | | $ | 1,629,643,600 | | | $ | 749,423,102 | | | $ | 700,976,592 | | | $ | 760,715,805 | | | $ | 472,327,230 | | | $ | 2,176,871,806 | | | | | |
| | 119 | SEE NOTES TO FINANCIAL STATEMENTS |
December 31, 2020 |
Statements of Assets and Liabilities, continued |
| | Large Cap
Fund | | | Small Cap
Fund | | | ESG Beta
Quality
Fund | | | ESG Beta
Dividend
Fund | |
NET ASSETS REPRESENTED BY: | | | | | | | | | | | | | | | | |
Paid in Capital | | $ | 670,534,695 | | | $ | 381,300,986 | | | $ | 122,796,442 | | | $ | 82,304,428 | |
Total distributable earnings | | | 371,058,530 | | | | 84,938,204 | | | | 133,418,314 | | | | 57,745,723 | |
NET ASSETS | | $ | 1,041,593,225 | | | $ | 466,239,190 | | | $ | 256,214,756 | | | $ | 140,050,151 | |
| | | | | | | | | | | | | | | | | |
Investor Class | | | | | | | | | | | | | | | | |
Net assets | | $ | 21,351,101 | | | $ | 102,582,472 | | | $ | 170,314,600 | | | $ | 4,014,388 | |
Capital Shares Outstanding (unlimited/authorized) | | | 1,775,983 | | | | 6,501,625 | | | | 7,162,694 | | | | 283,317 | |
Net asset value per share | | $ | 12.02 | | | $ | 15.78 | | | $ | 23.78 | | | $ | 14.17 | |
Class A | | | | | | | | | | | | | | | | |
Net assets | | | | | | $ | 10,947,927 | | | $ | 6,598,801 | | | | | |
Capital Shares Outstanding (unlimited/authorized) | | | | | | | 695,790 | | | | 278,328 | | | | | |
Net asset value per share | | | | | | $ | 15.73 | | | $ | 23.71 | | | | | |
Institutional Class | | | | | | | | | | | | | | | | |
Net assets | | $ | 1,020,242,124 | | | $ | 352,708,791 | | | $ | 79,301,355 | | | $ | 136,035,763 | |
Capital Shares Outstanding (unlimited/authorized) | | | 84,637,165 | | | | 22,059,837 | | | | 3,233,499 | | | | 9,574,233 | |
Net asset value per share | | $ | 12.05 | | | $ | 15.99 | | | $ | 24.52 | | | $ | 14.21 | |
SEE NOTES TO FINANCIAL STATEMENTS | 120 | |
| | Global
Opportunities
Fund | | | Global
Environmental
Markets Fund | | | Global
Women’s
Leadership
Fund | | | EAFE
ESG Leaders
Index Fund | | | Core Bond
Fund | | | High Yield
Bond Fund | | | Sustainable
Allocation
Fund | | | | |
| | | | | | | | | | | | | | | | | | | | | | | | | | | | | | | | |
| | $ | 51,300,325 | | | $ | 1,151,169,282 | | | $ | 604,000,099 | | | $ | 574,171,156 | | | $ | 728,717,821 | | | $ | 517,512,900 | | | $ | 1,659,373,493 | | | | | |
| | | 17,745,139 | | | | 478,474,318 | | | | 145,423,003 | | | | 126,805,436 | | | | 31,997,984 | | | | (45,185,670 | ) | | | 517,498,313 | | | | | |
| | $ | 69,045,464 | | | $ | 1,629,643,600 | | | $ | 749,423,102 | | | $ | 700,976,592 | | | $ | 760,715,805 | | | $ | 472,327,230 | | | $ | 2,176,871,806 | | | | | |
| | | | | | | | | | | | | | | | | | | | | | | | | | | | | | | | |
| | | | | | | | | | | | | | | | | | | | | | | | | | | | | | | | |
| | $ | 3,401,193 | | | $ | 175,040,305 | | | $ | 130,255,395 | | | $ | 77,962,971 | | | $ | 14,100,551 | | | $ | 171,837,616 | | | $ | 1,518,965,927 | | | | | |
| | | 232,008 | | | | 8,303,080 | | | | 4,293,469 | | | | 7,532,295 | | | | 1,335,553 | | | | 24,664,487 | | | | 57,628,494 | | | | | |
| | $ | 14.66 | | | $ | 21.08 | | | $ | 30.34 | | | $ | 10.35 | | | $ | 10.56 | | | $ | 6.97 | | | $ | 26.36 | | | | | |
| | | | | | | | | | | | | | | | | | | | | | | | | | | | | | | | |
| | | | | | $ | 16,651,195 | | | | | | | | | | | | | | | $ | 6,177,023 | | | | | | | | | |
| | | | | | | 791,122 | | | | | | | | | | | | | | | | 884,607 | | | | | | | | | |
| | | | | | $ | 21.05 | | | | | | | | | | | | | | | $ | 6.98 | | | | | | | | | |
| | | | | | | | | | | | | | | | | | | | | | | | | | | | | | | | |
| | $ | 65,644,271 | | | $ | 1,437,952,100 | | | $ | 619,167,707 | | | $ | 623,013,621 | | | $ | 746,615,254 | | | $ | 294,312,591 | | | $ | 657,905,879 | | | | | |
| | | 4,469,315 | | | | 67,735,359 | | | | 20,302,139 | | | | 61,435,898 | | | | 70,709,308 | | | | 42,393,140 | | | | 24,517,763 | | | | | |
| | $ | 14.69 | | | $ | 21.23 | | | $ | 30.50 | | | $ | 10.14 | | | $ | 10.56 | | | $ | 6.94 | | | $ | 26.83 | | | | | |
| | 121 | SEE NOTES TO FINANCIAL STATEMENTS |
For the Year Ended December 31, 2020 |
Statements of Operations |
| | Large Cap
Fund | | | Small Cap
Fund | | | ESG Beta
Quality
Fund | | | ESG Beta
Dividend
Fund | |
INVESTMENT INCOME | | | | | | | | | | | | | | | | |
Income | | | | | | | | | | | | | | | | |
Dividends (net of foreign withholding tax of $0; $35,044; $0; $0; $41,850; $917,506; $498,882; $1,361,549; $0; $0 and $0 respectively) | | $ | 12,501,605 | | | $ | 3,510,764 | | | $ | 4,557,492 | | | $ | 3,351,156 | |
Dividends from affiliates - Note C | | | — | | | | — | | | | — | | | | — | |
Interest | | | 97,838 | | | | 72,570 | | | | 6,170 | | | | 4,987 | |
Income from securities lending - Note A | | | 8,989 | | | | 59,531 | | | | 7,194 | | | | 1,336 | |
Other income - Note B | | | — | | | | — | | | | — | | | | — | |
Total Income | | | 12,608,432 | | | | 3,642,865 | | | | 4,570,856 | | | | 3,357,479 | |
| | | | | | | | | | | | | | | | | |
Expenses | | | | | | | | | | | | | | | | |
Investment advisory fees - Note B | | | 5,316,037 | | | | 2,852,994 | | | | 1,477,044 | | | | 806,820 | |
Distribution expenses - Investor (Note B) | | | 25,807 | | | | 225,599 | | | | 380,580 | | | | 7,529 | |
Distribution expenses - Class A (Note B) | | | — | | | | 24,715 | | | | 14,940 | | | | — | |
Transfer agent fees - Note A | | | 45,845 | | | | 372,623 | | | | — | | | | — | |
Printing and other shareholder communication fees | | | 14,193 | | | | 59,534 | | | | — | | | | — | |
Custodian fees | | | 67,772 | | | | 40,538 | | | | — | | | | — | |
Legal fees and related expenses | | | 87,655 | | | | 60,953 | | | | — | | | | — | |
Trustees’ fees and expenses - Note B | | | 63,440 | | | | 43,942 | | | | — | | | | — | |
Compliance expense | | | 18,513 | | | | 17,079 | | | | — | | | | — | |
Audit fees | | | 48,847 | | | | 40,187 | | | | — | | | | — | |
Registration fees | | | 69,603 | | | | 66,843 | | | | — | | | | — | |
Other expenses | | | 29,261 | | | | 17,940 | | | | — | | | | — | |
Total Expenses | | | 5,786,973 | | | | 3,822,947 | | | | 1,872,564 | | | | 814,349 | |
Less Advisory fee waiver - Note B | | | — | | | | — | | | | — | | | | — | |
Expenses assumed by Adviser - Note B | | | — | | | | — | | | | — | | | | — | |
Net expenses | | | 5,786,973 | | | | 3,822,947 | | | | 1,872,564 | | | | 814,349 | |
Net investment income (loss) | | | 6,821,459 | | | | (180,082 | ) | | | 2,698,292 | | | | 2,543,130 | |
REALIZED AND UNREALIZED GAIN (LOSS) - Notes A and C | | | | | | | | | | | | | | | | |
Net realized gain (loss) on: | | | | | | | | | | | | | | | | |
Investments in unaffiliated issuers | | | 52,507,245 | | | | 22,601,465 | | | | 1,304,995 | | | | 1,070,938 | |
Investment in affiliated issuers | | | — | | | | — | | | | — | | | | — | |
Foreign currency transactions | | | — | | | | (2,410 | ) | | | — | | | | — | |
Change in unrealized appreciation (depreciation) on: | | | | | | | | | | | | | | | | |
Investments in unaffiliated issuers | | | 144,178,440 | | | | 25,014,507 | | | | 25,967,205 | | | | 15,998,168 | |
Investment in affiliated issuers | | | — | | | | — | | | | — | | | | — | |
Foreign currency translation | | | — | | | | (148 | ) | | | — | | | | — | |
Net realized and unrealized gain | | | | | | | | | | | | | | | | |
on investments and foreign currency | | | 196,685,685 | | | | 47,613,414 | | | | 27,272,200 | | | | 17,069,106 | |
| | | | | | | | | | | | | | | | | |
Net increase in net assets resulting from operations | | $ | 203,507,144 | | | $ | 47,433,332 | | | $ | 29,970,492 | | | $ | 19,612,236 | |
SEE NOTES TO FINANCIAL STATEMENTS | 122 | |
For the Year Ended December 31, 2020 |
|
| | Global
Opportunities
Fund | | | Global
Environmental
Markets Fund | | | Global
Women’s
Leadership
Fund | | | EAFE
ESG Leaders
Index Fund | | | Core Bond
Fund | | | High Yield
Bond Fund | | | Sustainable
Allocation
Fund | | | | |
| | | | | | | | | | | | | | | | | | | | | | | | | | | | | | | | |
| | | | | | | | | | | | | | | | | | | | | | | | | | | | | | | | |
| | $ | 521,001 | | | $ | 18,875,800 | | | $ | 11,529,533 | | | $ | 15,559,968 | | | $ | 47,773 | | | $ | 207,754 | | | $ | — | | | | | |
| | | — | | | | — | | | | — | | | | — | | | | — | | | | — | | | | 26,264,122 | | | | | |
| | | 1,743 | | | | 99,848 | | | | 3,479 | | | | (442 | ) | | | 16,500,759 | | | | 21,738,157 | | | | 248,458 | | | | | |
| | | 100 | | | | 15,621 | | | | 4,464 | | | | 86,870 | | | | 22,980 | | | | — | | | | — | | | | | |
| | | 13,524 | | | | 194,948 | | | | — | | | | — | | | | — | | | | 125,973 | | | | — | | | | | |
| | | 536,368 | | | | 19,186,217 | | | | 11,537,476 | | | | 15,646,396 | | | | 16,571,512 | | | | 22,071,884 | | | | 26,512,580 | | | | | |
| | | | | | | | | | | | | | | | | | | | | | | | | | | | | | | | |
| | | | | | | | | | | | | | | | | | | | | | | | | | | | | | | | |
| | | 386,385 | | | | 8,773,270 | | | | 2,993,519 | | | | 2,955,639 | | | | 2,846,119 | | | | 1,901,098 | | | | 955,347 | | | | | |
| | | 5,805 | | | | 362,097 | | | | 286,163 | | | | 181,309 | | | | 28,358 | | | | 410,080 | | | | 3,707,314 | | | | | |
| | | — | | | | 32,958 | | | | — | | | | — | | | | — | | | | 14,249 | | | | — | | | | | |
| | | 29,809 | | | | 1,073,978 | | | | — | | | | — | | | | 31,574 | | | | 367,787 | | | | — | | | | | |
| | | 4,235 | | | | 76,623 | | | | — | | | | — | | | | 9,808 | | | | 82,579 | | | | — | | | | | |
| | | 40,663 | | | | 184,504 | | | | — | | | | — | | | | 120,390 | | | | 89,371 | | | | — | | | | | |
| | | 41,149 | | | | 104,211 | | | | — | | | | — | | | | 82,882 | | | | 60,837 | | | | — | | | | | |
| | | 29,592 | | | | 75,973 | | | | — | | | | — | | | | 58,794 | | | | 43,782 | | | | — | | | | | |
| | | 15,932 | | | | 19,407 | | | | — | | | | — | | | | 18,204 | | | | 17,056 | | | | — | | | | | |
| | | 38,955 | | | | 62,483 | | | | — | | | | — | | | | 55,986 | | | | 48,123 | | | | — | | | | | |
| | | 41,644 | | | | 91,893 | | | | — | | | | — | | | | 53,980 | | | | 90,126 | | | | — | | | | | |
| | | 4,930 | | | | 37,134 | | | | — | | | | — | | | | 29,187 | | | | 15,748 | | | | — | | | | | |
| | | 639,099 | | | | 10,894,531 | | | | 3,279,682 | | | | 3,136,948 | | | | 3,335,282 | | | | 3,140,836 | | | | 4,662,661 | | | | | |
| | | (19,827 | ) | | | — | | | | — | | | | — | | | | — | | | | — | | | | — | | | | | |
| | | (160,106 | ) | | | — | | | | — | | | | — | | | | — | | | | — | | | | — | | | | | |
| | | 459,166 | | | | 10,894,531 | | | | 3,279,682 | | | | 3,136,948 | | | | 3,335,282 | | | | 3,140,836 | | | | 4,662,661 | | | | | |
| | | 77,202 | | | | 8,291,686 | | | | 8,257,794 | | | | 12,509,448 | | | | 13,236,230 | | | | 18,931,048 | | | | 21,849,919 | | | | | |
| | | | | | | | | | | | | | | | | | | | | | | | | | | | | | | | |
| | | | | | | | | | | | | | | | | | | | | | | | | | | | | | | | |
| | | (140,982 | ) | | | (25,169,321 | ) | | | (7,915,951 | ) | | | (3,807,096 | ) | | | 23,244,416 | | | | 1,330,483 | | | | — | | | | | |
| | | — | | | | — | | | | — | | | | — | | | | — | | | | — | | | | 86,233,962 | | | | | |
| | | (22,994 | ) | | | (138,964 | ) | | | (9,421 | ) | | | (47,047 | ) | | | — | | | | — | | | | — | | | | | |
| | | | | | | | | | | | | | | | | | | | | | | | | | | | | | | | |
| | | 12,542,844 | | | | 318,808,279 | | | | 87,958,981 | | | | 64,062,828 | | | | 12,335,483 | | | | 9,185,399 | | | | — | | | | | |
| | | — | | | | — | | | | — | | | | — | | | | — | | | | — | | | | 189,591,456 | | | | | |
| | | 677 | | | | 43,552 | | | | 13,357 | | | | 137,409 | | | | — | | | | — | | | | — | | | | | |
| | | | | | | | | | | | | | | | | | | | | | | | | | | | | | | | |
| | | 12,379,545 | | | | 293,543,546 | | | | 80,046,966 | | | | 60,346,094 | | | | 35,579,899 | | | | 10,515,882 | | | | 275,825,418 | | | | | |
| | | | | | | | | | | | | | | | | | | | | | | | | | | | | | | | |
| | $ | 12,456,747 | | | $ | 301,835,232 | | | $ | 88,304,760 | | | $ | 72,855,542 | | | $ | 48,816,129 | | | $ | 29,446,930 | | | $ | 297,675,337 | | | | | |
| | 123 | SEE NOTES TO FINANCIAL STATEMENTS |
| |
Statements of Changes in Net Assets |
| | | Large Cap Fund | |
| | Year Ended
12/31/20 | | | Year Ended
12/31/19 | |
Increase (Decrease) in Net Assets | | | | | | | | |
Operations | | | | | | | | |
Investment income, net | | $ | 6,821,459 | | | $ | 6,746,320 | |
Net realized gain (loss) on investments and foreign currency transactions | | | 52,507,245 | | | | 28,252,754 | |
Change in unrealized appreciation (depreciation) on investments and foreign currency translations | | | 144,178,440 | | | | 168,139,590 | |
Net increase in net assets resulting from operations | | | 203,507,144 | | | | 203,138,664 | |
Distributions from Investor Class | | | (1,224,949 | ) | | | (105,410 | ) |
Distributions from Class A | | | | | | | | |
Distributions from Institutional Class | | | (64,744,892 | ) | | | (27,322,400 | ) |
Total distributions to shareholders | | | (65,969,841 | ) | | | (27,427,810 | ) |
From capital share transactions: | | | | | | | | |
Investor Class | | | | | | | | |
Proceeds from shares sold | | | 17,099,228 | | | | 1,381,152 | |
Proceeds from reinvestment of distributions | | | 1,213,177 | | | | 101,502 | |
Cost of shares redeemed | | | (2,688,171 | ) | | | (807,918 | ) |
Net increase (decrease) from Investor Class transactions | | | 15,624,234 | | | | 674,736 | |
Class A | | | | | | | | |
Proceeds from shares sold | | | | | | | | |
Proceeds from reinvestment of distributions | | | | | | | | |
Cost of shares redeemed | | | | | | | | |
Net increase (decrease) from Class A transactions | | | | | | | | |
Institutional Class | | | | | | | | |
Proceeds from shares sold | | | 143,392,236 | | | | 945,950 | |
Proceeds from reinvestment of distributions | | | 64,722,822 | | | | 27,303,786 | |
Cost of shares redeemed | | | (85,958,295 | ) | | | (30,999,229 | ) |
Net increase (decrease) from Institutional Class transactions | | | 122,156,763 | | | | (2,749,493 | ) |
Net increase (decrease) from capital share transactions | | | 137,780,997 | | | | (2,074,757 | ) |
Net increase (decrease) in net assets | | | 275,318,300 | | | | 173,636,097 | |
Net assets | | | | | | | | |
Beginning of period | | | 766,274,925 | | | | 592,638,828 | |
End of period | | $ | 1,041,593,225 | | | $ | 766,274,925 | |
| | | | | | | | | |
Shares of Beneficial Interest: | | | | | | | | |
Investor Class | | | | | | | | |
Shares sold | | | 1,610,196 | | | | 144,243 | |
Shares issued in reinvestment of distributions | | | 103,204 | | | | 9,881 | |
Shares redeemed | | | (252,479 | ) | | | (86,861 | ) |
Net increase (decrease) in shares outstanding | | | 1,460,921 | | | | 67,263 | |
| | | | | | | | | |
Class A | | | | | | | | |
Shares sold | | | | | | | | |
Shares issued in reinvestment of distributions | | | | | | | | |
Shares redeemed | | | | | | | | |
Net increase (decrease) in shares outstanding | | | | | | | | |
| | | | | | | | | |
Institutional Class | | | | | | | | |
Shares sold | | | 13,682,722 | | | | 99,082 | |
Shares issued in reinvestment of distributions | | | 5,506,613 | | | | 2,662,994 | |
Shares redeemed | | | (7,944,915 | ) | | | (3,390,826 | ) |
Net increase (decrease) in shares outstanding | | | 11,244,420 | | | | (628,750 | ) |
SEE NOTES TO FINANCIAL STATEMENTS | 124 | |
| | | Small Cap Fund | | | ESG Beta Quality
Fund | | | ESG Beta
Dividend Fund | | |
| | Year Ended
12/31/20 | | | Year Ended
12/31/19 | | | Year Ended
12/31/20 | | | Year Ended
12/31/19 | | | Year Ended
12/31/20 | | | Year Ended
12/31/19 | | |
| | | | | | | | | | | | | | | | | | | | | | | | | | |
| | | | | | | | | | | | | | | | | | | | | | | | | | |
| | | $ | (180,082 | ) | | $ | 4,552,301 | | | $ | 2,698,292 | | | $ | 3,336,663 | | | $ | 2,543,130 | | | $ | 2,925,070 | | |
| | | | 22,599,055 | | | | 6,360,385 | | | | 1,304,995 | | | | 6,522,385 | | | | 1,070,938 | | | | 3,919,774 | | |
| | | | 25,014,359 | | | | 84,530,183 | | | | 25,967,205 | | | | 42,568,621 | | | | 15,998,168 | | | | 22,335,242 | | |
| | | | 47,433,332 | | | | 95,442,869 | | | | 29,970,492 | | | | 52,427,669 | | | | 19,612,236 | | | | 29,180,086 | | |
| | | | (3,860,087 | ) | | | (1,074,371 | ) | | | (3,255,719 | ) | | | (5,328,473 | ) | | | (108,186 | ) | | | (124,784 | ) | |
| | | | (409,247 | ) | | | (123,378 | ) | | | (125,797 | ) | | | (219,743 | ) | | | | | | | | | |
| | | | (12,933,116 | ) | | | (2,994,551 | ) | | | (1,650,985 | ) | | | (2,488,325 | ) | | | (4,198,454 | ) | | | (6,221,250 | ) | |
| | | | (17,202,450 | ) | | | (4,192,300 | ) | | | (5,032,501 | ) | | | (8,036,541 | ) | | | (4,306,640 | ) | | | (6,346,034 | ) | |
| | | | | | | | | | | | | | | | | | | | | | | | | | |
| | | | | | | | | | | | | | | | | | | | | | | | | | |
| | | | 13,164,167 | | | | 13,677,304 | | | | 6,225,685 | | | | 6,826,013 | | | | 1,610,591 | | | | 1,247,672 | | |
| | | | 3,759,189 | | | | 1,017,639 | | | | 3,189,365 | | | | 5,208,768 | | | | 106,115 | | | | 122,435 | | |
| | | | (29,698,481 | ) | | | (44,744,405 | ) | | | (16,529,079 | ) | | | (15,699,436 | ) | | | (913,639 | ) | | | (755,355 | ) | |
| | | | (12,775,125 | ) | | | (30,049,462 | ) | | | (7,114,029 | ) | | | (3,664,655 | ) | | | 803,067 | | | | 614,752 | | |
| | | | | | | | | | | | | | | | | | | | | | | | | | |
| | | | 2,133,288 | | | | 1,709,333 | | | | 470,519 | | | | 399,058 | | | | | | | | | | |
| | | | 388,752 | | | | 110,555 | | | | 119,950 | | | | 210,714 | | | | | | | | | | |
| | | | (4,334,833 | ) | | | (4,229,884 | ) | | | (1,191,696 | ) | | | (602,219 | ) | | | | | | | | | |
| | | | (1,812,793 | ) | | | (2,409,996 | ) | | | (601,227 | ) | | | 7,553 | | | | | | | | | | |
| | | | | | | | | | | | | | | | | | | | | | | | | | |
| | | | 106,749,401 | | | | 105,566,974 | | | | 11,912,072 | | | | 13,543,838 | | | | 14,618,131 | | | | 1,014,394 | | |
| | | | 11,472,200 | | | | 2,285,599 | | | | 1,559,901 | | | | 2,358,813 | | | | 4,129,487 | | | | 6,220,386 | | |
| | | | (98,735,126 | ) | | | (182,128,560 | ) | | | (14,895,788 | ) | | | (10,204,044 | ) | | | (27,665,239 | ) | | | (15,032,201 | ) | |
| | | | 19,486,475 | | | | (74,275,987 | ) | | | (1,423,815 | ) | | | 5,698,607 | | | | (8,917,621 | ) | | | (7,797,421 | ) | |
| | | | 4,898,557 | | | | (106,735,445 | ) | | | (9,139,071 | ) | | | 2,041,505 | | | | (8,114,554 | ) | | | (7,182,669 | ) | |
| | | | 35,129,439 | | | | (15,484,876 | ) | | | 15,798,920 | | | | 46,432,633 | | | | 7,191,042 | | | | 15,651,383 | | |
| | | | | | | | | | | | | | | | | | | | | | | | | | |
| | | | 431,109,751 | | | | 446,594,627 | | | | 240,415,836 | | | | 193,983,203 | | | | 132,859,109 | | | | 117,207,726 | | |
| | | $ | 466,239,190 | | | $ | 431,109,751 | | | $ | 256,214,756 | | | $ | 240,415,836 | | | $ | 140,050,151 | | | $ | 132,859,109 | | |
| | | | | | | | | | | | | | | | | | | | | | | | | | |
| | | | | | | | | | | | | | | | | | | | | | | | | | |
| | | | | | | | | | | | | | | | | | | | | | | | | | |
| | | | 1,055,335 | | | | 1,004,391 | | | | 303,312 | | | | 345,853 | | | | 127,605 | | | | 103,324 | | |
| | | | 240,665 | | | | 73,054 | | | | 142,686 | | | | 247,071 | | | | 7,820 | | | | 9,677 | | |
| | | | (2,329,687 | ) | | | (3,274,454 | ) | | | (803,407 | ) | | | (788,361 | ) | | | (75,823 | ) | | | (62,731 | ) | |
| | | | (1,033,687 | ) | | | (2,197,009 | ) | | | (357,409 | ) | | | (195,437 | ) | | | 59,602 | | | | 50,270 | | |
| | | | | | | | | | | | | | | | | | | | | | | | | | |
| | | | | | | | | | | | | | | | | | | | | | | | | | |
| | | | 172,064 | | | | 125,548 | | | | 22,398 | | | | 19,876 | | | | | | | | | | |
| | | | 24,952 | | | | 7,959 | | | | 5,378 | | | | 10,026 | | | | | | | | | | |
| | | | (351,963 | ) | | | (308,730 | ) | | | (61,355 | ) | | | (29,771 | ) | | | | | | | | | |
| | | | (154,947 | ) | | | (175,223 | ) | | | (33,579 | ) | | | 131 | | | | | | | | | | |
| | | | | | | | | | | | | | | | | | | | | | | | | | |
| | | | | | | | | | | | | | | | | | | | | | | | | | |
| | | | 8,364,175 | | | | 7,701,571 | | | | 573,119 | | | | 667,483 | | | | 1,297,033 | | | | 82,856 | | |
| | | | 724,713 | | | | 162,691 | | | | 67,844 | | | | 108,662 | | | | 306,577 | | | | 491,692 | | |
| | | | (7,825,421 | ) | | | (13,265,181 | ) | | | (703,633 | ) | | | (497,959 | ) | | | (2,180,176 | ) | | | (1,241,588 | ) | |
| | | | 1,263,467 | | | | (5,400,919 | ) | | | (62,670 | ) | | | 278,186 | | | | (576,566 | ) | | | (667,040 | ) | |
| | 125 | SEE NOTES TO FINANCIAL STATEMENTS |
| |
Statements of Changes in Net Assets, continued |
| | | Global
Opportunities
Fund | |
| | Year Ended
12/31/20 | | | Year Ended
12/31/19 | |
Increase (Decrease) in Net Assets | | | | | | | | |
Operations | | | | | | | | |
Investment income, net | | $ | 77,202 | | | $ | 157,936 | |
Net realized gain (loss) on investments and foreign currency transactions | | | (163,976 | ) | | | 776,677 | |
Change in unrealized appreciation (depreciation) on investments and foreign currency translations | | | 12,543,521 | | | | 7,932,377 | |
Net increase in net assets resulting from operations | | | 12,456,747 | | | | 8,866,990 | |
Distributions from Investor Class | | | (83,069 | ) | | | (26,709 | ) |
Distributions from Class A | | | | | | | | |
Distributions from Institutional Class | | | (519,005 | ) | | | (746,206 | ) |
Total distributions to shareholders | | | (602,074 | ) | | | (772,915 | ) |
From capital share transactions: | | | | | | | | |
Investor Class | | | | | | | | |
Proceeds from shares sold | | | 1,773,549 | | | | 1,558,192 | |
Proceeds from reinvestment of distributions | | | 26,686 | | | | 26,708 | |
Cost of shares redeemed | | | (676,783 | ) | | | (179,928 | ) |
Net increase (decrease) from Investor Class transactions | | | 1,123,452 | | | | 1,404,972 | |
Class A | | | | | | | | |
Proceeds from shares sold | | | | | | | | |
Proceeds from reinvestment of distributions | | | | | | | | |
Cost of shares redeemed | | | | | | | | |
Net increase (decrease) from Class A transactions | | | | | | | | |
Institutional Class | | | | | | | | |
Proceeds from shares sold | | | 18,052,818 | | | | 6,892,970 | |
Proceeds from reinvestment of distributions | | | 559,156 | | | | 743,145 | |
Cost of shares redeemed | | | (4,618,749 | ) | | | (3,445 | ) |
Net increase (decrease) from Institutional Class transactions | | | 13,993,225 | | | | 7,632,670 | |
Net increase from capital share transactions | | | 15,116,677 | | | | 9,037,642 | |
Net increase in net assets | | | 26,971,350 | | | | 17,131,717 | |
Net assets | | | | | | | | |
Beginning of period | | | 42,074,114 | | | | 24,942,397 | |
End of period | | $ | 69,045,464 | | | $ | 42,074,114 | |
| | | | | | | | | |
Shares of Beneficial Interest: | | | | | | | | |
Investor Class | | | | | | | | |
Shares sold | | | 145,191 | | | | 140,056 | |
Shares issued in reinvestment of distributions | | | 1,866 | | | | 2,235 | |
Shares redeemed | | | (54,842 | ) | | | (16,236 | ) |
Net increase (decrease) in shares outstanding | | | 92,215 | | | | 126,055 | |
| | | | | | | | | |
Class A | | | | | | | | |
Shares sold | | | | | | | | |
Shares issued in reinvestment of distributions | | | | | | | | |
Shares redeemed | | | | | | | | |
Net decrease in shares outstanding | | | | | | | | |
| | | | | | | | | |
Institutional Class | | | | | | | | |
Shares sold | | | 1,460,070 | | | | 590,890 | |
Shares issued in reinvestment of distributions | | | 39,020 | | | | 62,332 | |
Shares redeemed | | | (385,177 | ) | | | (289 | ) |
Net increase in shares outstanding | | | 1,113,913 | | | | 652,933 | |
SEE NOTES TO FINANCIAL STATEMENTS | 126 | |
| | | | | | Global
Environmental
Markets Fund | | | Global Women’s
Leadership Fund | | |
| | | | | Year Ended
12/31/20 | | | Year Ended
12/31/19 | | | Year Ended
12/31/20 | | | Year Ended
12/31/19 | | |
| | | | | | | | | | | | | | | | | | | | | |
| | | | | | | | | | | | | | | | | | | | | |
| | | | | | $ | 8,291,686 | | | $ | 7,729,950 | | | $ | 8,257,794 | | | $ | 7,217,885 | | |
| | | | | | | (25,308,285 | ) | | | 11,129,697 | | | | (7,925,372 | ) | | | 1,924,487 | | |
| | | | | | | 318,851,831 | | | | 170,188,709 | | | | 87,972,338 | | | | 70,826,316 | | |
| | | | | | | 301,835,232 | | | | 189,048,356 | | | | 88,304,760 | | | | 79,968,688 | | |
| | | | | | | (710,364 | ) | | | (995,625 | ) | | | (1,364,676 | ) | | | (3,470,585 | ) | |
| | | | | | | (65,398 | ) | | | (87,611 | ) | | | | | | | | | |
| | | | | | | (7,481,018 | ) | | | (6,356,689 | ) | | | (7,012,796 | ) | | | (9,991,550 | ) | |
| | | | | | | (8,256,780 | ) | | | (7,439,925 | ) | | | (8,377,472 | ) | | | (13,462,135 | ) | |
| | | | | | | | | | | | | | | | | | | | | |
| | | | | | | | | | | | | | | | | | | | | |
| | | | | | | 19,830,477 | | | | 26,248,873 | | | | 21,311,776 | | | | 26,558,976 | | |
| | | | | | | 650,848 | | | | 915,312 | | | | 1,296,305 | | | | 3,304,467 | | |
| | | | | | | (31,785,866 | ) | | | (26,099,180 | ) | | | (24,619,673 | ) | | | (18,215,556 | ) | |
| | | | | | | (11,304,541 | ) | | | 1,065,005 | | | | (2,011,592 | ) | | | 11,647,887 | | |
| | | | | | | | | | | | | | | | | | | | | |
| | | | | | | 2,830,371 | | | | 1,491,935 | | | | | | | | | | |
| | | | | | | 57,783 | | | | 71,736 | | | | | | | | | | |
| | | | | | | (2,839,127 | ) | | | (3,810,989 | ) | | | | | | | | | |
| | | | | | | 49,027 | | | | (2,247,318 | ) | | | | | | | | | |
| | | | | | | | | | | | | | | | | | | | | |
| | | | | | | 626,670,119 | | | | 281,950,208 | | | | 271,898,017 | | | | 159,416,311 | | |
| | | | | | | 6,989,373 | | | | 5,793,704 | | | | 6,321,689 | | | | 8,789,343 | | |
| | | | | | | (254,539,551 | ) | | | (91,069,741 | ) | | | (71,567,496 | ) | | | (25,191,609 | ) | |
| | | | | | | 379,119,941 | | | | 196,674,171 | | | | 206,652,210 | | | | 143,014,045 | | |
| | | | | | | 367,864,427 | | | | 195,491,858 | | | | 204,640,618 | | | | 154,661,932 | | |
| | | | | | | 661,442,879 | | | | 377,100,289 | | | | 284,567,906 | | | | 221,168,485 | | |
| | | | | | | | | | | | | | | | | | | | | |
| | | | | | | 968,200,721 | | | | 591,100,432 | | | | 464,855,196 | | | | 243,686,711 | | |
| | | | | | $ | 1,629,643,600 | | | $ | 968,200,721 | | | $ | 749,423,102 | | | $ | 464,855,196 | | |
| | | | | | | | | | | | | | | | | | | | | |
| | | | | | | | | | | | | | | | | | | | | |
| | | | | | | | | | | | | | | | | | | | | |
| | | | | | | 1,170,813 | | | | 1,717,446 | | | | 813,533 | | | | 1,052,804 | | |
| | | | | | | 37,502 | | | | 57,130 | | | | 47,349 | | | | 124,452 | | |
| | | | | | | (1,937,545 | ) | | | (1,702,959 | ) | | | (963,551 | ) | | | (720,068 | ) | |
| | | | | | | (729,230 | ) | | | 71,617 | | | | (102,669 | ) | | | 457,188 | | |
| | | | | | | | | | | | | | | | | | | | | |
| | | | | | | | | | | | | | | | | | | | | |
| | | | | | | 163,882 | | | | 96,519 | | | | | | | | | | |
| | | | | | | 3,316 | | | | 4,486 | | | | | | | | | | |
| | | | | | | (190,275 | ) | | | (249,879 | ) | | | | | | | | | |
| | | | | | | (23,077 | ) | | | (148,874 | ) | | | | | | | | | |
| | | | | | | | | | | | | | | | | | | | | |
| | | | | | | | | | | | | | | | | | | | | |
| | | | | | | 35,139,316 | | | | 18,469,668 | | | | 10,044,900 | | | | 6,308,732 | | |
| | | | | | | 386,722 | | | | 357,002 | | | | 227,279 | | | | 328,700 | | |
| | | | | | | (15,075,976 | ) | | | (5,913,097 | ) | | | (2,724,231 | ) | | | (978,844 | ) | |
| | | | | | | 20,450,062 | | | | 12,913,573 | | | | 7,547,948 | | | | 5,658,588 | | |
| | 127 | SEE NOTES TO FINANCIAL STATEMENTS |
| |
Statements of Changes in Net Assets, continued |
| | | EAFE ESG
Leaders Index
Fund | |
| | Year Ended
12/31/2020 | | | Year Ended
12/31/19 | |
Increase (Decrease) in Net Assets | | | | | | | | |
Operations | | | | | | | | |
Investment income, net | | $ | 12,509,448 | | | $ | 15,101,250 | |
Net realized gain (loss) on investments and foreign currency transactions | | | (3,854,143 | ) | | | (5,759,927 | ) |
Change in unrealized appreciation (depreciation) on investments and foreign currency translations | | | 64,200,237 | | | | 110,270,378 | |
Net increase in net assets resulting from operations | | | 72,855,542 | | | | 119,611,701 | |
Distributions from Investor Class | | | (1,290,412 | ) | | | (1,983,451 | ) |
Distributions from Class A | | | | | | | | |
Distributions from Institutional Class | | | (10,905,792 | ) | | | (14,060,119 | ) |
Total distributions to shareholders | | | (12,196,204 | ) | | | (16,043,570 | ) |
From capital share transactions: | | | | | | | | |
Investor Class | | | | | | | | |
Proceeds from shares sold | | | 19,525,878 | | | | 17,043,389 | |
Proceeds from reinvestment of distributions | | | 1,219,923 | | | | 1,848,129 | |
Cost of shares redeemed | | | (32,740,806 | ) | | | (26,592,900 | ) |
Net increase (decrease) from Investor Class transactions | | | (11,995,005 | ) | | | (7,701,382 | ) |
Class A | | | | | | | | |
Proceeds from shares sold | | | | | | | | |
Proceeds from reinvestment of distributions | | | | | | | | |
Cost of shares redeemed | | | | | | | | |
Net increase (decrease) from Class A transactions | | | | | | | | |
Institutional Class | | | | | | | | |
Proceeds from shares sold | | | 185,628,598 | | | | 122,187,707 | |
Proceeds from reinvestment of distributions | | | 10,136,588 | | | | 13,223,070 | |
Cost of shares redeemed | | | (188,246,392 | ) | | | (102,270,983 | ) |
Net increase (decrease) from Institutional Class transactions | | | 7,518,794 | | | | 33,139,794 | |
Net increase (decrease) from capital share transactions | | | (4,476,211 | ) | | | 25,438,412 | |
Net increase in net assets | | | 56,183,127 | | | | 129,006,543 | |
Net assets | | | | | | | | |
Beginning of period | | | 644,793,465 | | | | 515,786,922 | |
End of period | | $ | 700,976,592 | | | $ | 644,793,465 | |
| | | | | | | | | |
Shares of Beneficial Interest: | | | | | | | | |
Investor Class | | | | | | | | |
Shares sold | | | 2,197,227 | | | | 1,942,870 | |
Shares issued in reinvestment of distributions | | | 132,152 | | | | 203,929 | |
Shares redeemed | | | (3,702,118 | ) | | | (3,036,000 | ) |
Net increase (decrease) in shares outstanding | | | (1,372,739 | ) | | | (889,201 | ) |
| | | | | | | | | |
Class A | | | | | | | | |
Shares sold | | | | | | | | |
Shares issued in reinvestment of distributions | | | | | | | | |
Shares redeemed | | | | | | | | |
Net increase (decrease) in shares outstanding | | | | | | | | |
| | | | | | | | | |
Institutional Class | | | | | | | | |
Shares sold | | | 22,122,226 | | | | 14,236,908 | |
Shares issued in reinvestment of distributions | | | 1,111,911 | | | | 1,486,417 | |
Shares redeemed | | | (21,756,776 | ) | | | (11,932,268 | ) |
Net increase (decrease) in shares outstanding | | | 1,477,361 | | | | 3,791,057 | |
SEE NOTES TO FINANCIAL STATEMENTS | 128 | |
| | | | | | Core Bond Fund | | | High Yield Bond
Fund | | | Sustainable
Allocation Fund | | | | | |
| | | | | Year Ended
12/31/20 | | | Year Ended
12/31/19 | | | Year Ended
12/31/20 | | | Year Ended
12/31/19 | | | Year Ended
12/31/20 | | | Year Ended
12/31/19 | | | | |
| | | | | | | | | | | | | | | | | | | | | | | | | | | | | | | | |
| | | | | | | | | | | | | | | | | | | | | | | | | | | | | | | | |
| | | | | | $ | 13,236,230 | | | $ | 17,484,311 | | | $ | 18,931,048 | | | $ | 18,928,398 | | | $ | 21,849,919 | | | $ | 29,088,062 | | | | | |
| | | | | | | 23,244,416 | | | | 7,048,964 | | | | 1,330,483 | | | | (8,892,802 | ) | | | 86,233,962 | | | | 27,512,989 | | | | | |
| | | | | | | 12,335,483 | | | | 28,214,334 | | | | 9,185,399 | | | | 39,322,008 | | | | 189,591,456 | | | | 284,650,514 | | | | | |
| | | | | | | 48,816,129 | | | | 52,747,609 | | | | 29,446,930 | | | | 49,357,604 | | | | 297,675,337 | | | | 341,251,565 | | | | | |
| | | | | | | (512,257 | ) | | | (139,036 | ) | | | (8,018,449 | ) | | | (8,660,826 | ) | | | (43,283,260 | ) | | | (131,657,832 | ) | | | | |
| | | | | | | | | | | | | | | (278,848 | ) | | | (292,034 | ) | | | | | | | | | | | | |
| | | | | | | (31,096,683 | ) | | | (18,172,126 | ) | | | (10,727,650 | ) | | | (9,984,256 | ) | | | (16,968,369 | ) | | | (34,380,100 | ) | | | | |
| | | | | | | (31,608,940 | ) | | | (18,311,162 | ) | | | (19,024,947 | ) | | | (18,937,116 | ) | | | (60,251,629 | ) | | | (166,037,932 | ) | | | | |
| | | | | | | | | | | | | | | | | | | | | | | | | | | | | | | | |
| | | | | | | | | | | | | | | | | | | | | | | | | | | | | | | | |
| | | | | | | 9,217,698 | | | | 3,676,166 | | | | 52,056,206 | | | | 37,625,331 | | | | 82,348,981 | | | | 76,654,788 | | | | | |
| | | | | | | 509,898 | | | | 136,697 | | | | 7,530,260 | | | | 8,193,211 | | | | 41,870,602 | | | | 127,269,290 | | | | | |
| | | | | | | (3,173,358 | ) | | | (951,396 | ) | | | (74,718,978 | ) | | | (39,060,094 | ) | | | (309,622,549 | ) | | | (143,257,511 | ) | | | | |
| | | | | | | 6,554,238 | | | | 2,861,467 | | | | (15,132,512 | ) | | | 6,758,448 | | | | (185,402,966 | ) | | | 60,666,567 | | | | | |
| | | | | | | | | | | | | | | | | | | | | | | | | | | | | | | | |
| | | | | | | | | | | | | | | 1,377,583 | | | | 803,489 | | | | | | | | | | | | | |
| | | | | | | | | | | | | | | 259,842 | | | | 278,404 | | | | | | | | | | | | | |
| | | | | | | | | | | | | | | (1,455,598 | ) | | | (1,481,640 | ) | | | | | | | | | | | | |
| | | | | | | | | | | | | | | 181,827 | | | | (399,747 | ) | | | | | | | | | | | | |
| | | | | | | | | | | | | | | | | | | | | | | | | | | | | | | | |
| | | | | | | 78,112,653 | | | | 14,494,070 | | | | 169,828,628 | | | | 79,829,366 | | | | 278,416,342 | | | | 47,827,366 | | | | | |
| | | | | | | 31,024,360 | | | | 18,140,809 | | | | 8,530,076 | | | | 7,494,151 | | | | 15,880,307 | | | | 31,625,501 | | | | | |
| | | | | | | (81,874,033 | ) | | | (46,719,900 | ) | | | (77,310,888 | ) | | | (105,216,195 | ) | | | (67,292,908 | ) | | | (107,146,469 | ) | | | | |
| | | | | | | 27,262,980 | | | | (14,085,021 | ) | | | 101,047,816 | | | | (17,892,678 | ) | | | 227,003,741 | | | | (27,693,602 | ) | | | | |
| | | | | | | 33,817,218 | | | | (11,223,554 | ) | | | 86,097,131 | | | | (11,533,977 | ) | | | 41,600,775 | | | | 32,972,965 | | | | | |
| | | | | | | 51,024,407 | | | | 23,212,893 | | | | 96,519,114 | | | | 18,886,511 | | | | 279,024,483 | | | | 208,186,598 | | | | | |
| | | | | | | | | | | | | | | | | | | | | | | | | | | | | | | | |
| | | | | | | 709,691,398 | | | | 686,478,505 | | | | 375,808,116 | | | | 356,921,605 | | | | 1,897,847,323 | | | | 1,689,660,725 | | | | | |
| | | | | | $ | 760,715,805 | | | $ | 709,691,398 | | | $ | 472,327,230 | | | $ | 375,808,116 | | | $ | 2,176,871,806 | | | $ | 1,897,847,323 | | | | | |
| | | | | | | | | | | | | | | | | | | | | | | | | | | | | | | | |
| | | | | | | | | | | | | | | | | | | | | | | | | | | | | | | | |
| | | | | | | | | | | | | | | | | | | | | | | | | | | | | | | | |
| | | | | | | 865,913 | | | | 362,087 | | | | 7,812,507 | | | | 5,676,380 | | | | 3,443,996 | | | | 3,242,648 | | | | | |
| | | | | | | 48,101 | | | | 13,428 | | | | 1,136,331 | | | | 1,232,947 | | | | 1,678,752 | | | | 5,441,977 | | | | | |
| | | | | | | (297,797 | ) | | | (93,666 | ) | | | (11,347,938 | ) | | | (5,894,629 | ) | | | (12,706,593 | ) | | | (6,127,622 | ) | | | | |
| | | | | | | 616,217 | | | | 281,849 | | | | (2,399,100 | ) | | | 1,014,698 | | | | (7,583,845 | ) | | | 2,557,003 | | | | | |
| | | | | | | | | | | | | | | | | | | | | | | | | | | | | | | | |
| | | | | | | | | | | | | | | | | | | | | | | | | | | | | | | | |
| | | | | | | | | | | | | | | 206,288 | | | | 119,668 | | | | | | | | | | | | | |
| | | | | | | | | | | | | | | 39,108 | | | | 41,860 | | | | | | | | | | | | | |
| | | | | | | | | | | | | | | (218,065 | ) | | | (222,143 | ) | | | | | | | | | | | | |
| | | | | | | | | | | | | | | 27,331 | | | | (60,615 | ) | | | | | | | | | | | | |
| | | | | | | | | | | | | | | | | | | | | | | | | | | | | | | | |
| | | | | | | | | | | | | | | | | | | | | | | | | | | | | | | | |
| | | | | | | 7,304,590 | | | | 1,408,141 | | | | 25,605,483 | | | | 12,172,704 | | | | 10,907,249 | | | | 2,011,825 | | | | | |
| | | | | | | 2,925,464 | | | | 1,785,769 | | | | 1,284,633 | | | | 1,133,547 | | | | 617,218 | | | | 1,329,821 | | | | | |
| | | | | | | (7,760,586 | ) | | | (4,720,452 | ) | | | (12,064,213 | ) | | | (15,973,491 | ) | | | (2,782,218 | ) | | | (4,566,413 | ) | | | | |
| | | | | | | 2,469,468 | | | | (1,526,542 | ) | | | 14,825,903 | | | | (2,667,240 | ) | | | 8,742,249 | | | | (1,224,767 | ) | | | | |
| | 129 | SEE NOTES TO FINANCIAL STATEMENTS |
December 31, 2020 |
Financial Highlights |
Selected data for a share outstanding throughout each period. |
| | | | | | | Income
(loss) from
investment
operations | | | | | | | Distributions to
shareholders | |
| | Net asset
value,
beginning of
period | | | Net
investment
income1 | | | Net
realized and
unrealized
gain (loss) | | | Total from
investment
operations | | | From net
investment
income | | | From net
realized
gains | |
Large Cap Fund | | | | | | | | | | | | | | | | | | | | | | | | |
Investor Class | | | | | | | | | | | | | | | | | | | | | | | | |
Year Ended December 31, 2020 | | $ | 10.38 | | | $ | 0.06 | | | $ | 2.38 | | | $ | 2.44 | | | $ | 0.07 | | | $ | 0.73 | |
Year Ended December 31, 2019 | | | 7.97 | | | | 0.07 | | | | 2.71 | | | | 2.78 | | | | 0.07 | | | | 0.30 | |
Year Ended December 31, 2018 | | | 10.56 | | | | 0.07 | | | | (0.63 | ) | | | (0.56 | ) | | | 0.07 | | | | 1.96 | |
Year Ended December 31, 2017 | | | 9.91 | | | | 0.09 | | | | 1.95 | | | | 2.04 | | | | 0.09 | | | | 1.30 | |
Period Ended December 31, 20165 | | | 10.00 | | | | — | | | | (0.08 | ) | | | (0.08 | ) | | | 0.01 | | | | — | |
Institutional Class | | | | | | | | | | | | | | | | | | | | | | | | |
Year Ended December 31, 2020 | | $ | 10.40 | | | $ | 0.09 | | | $ | 2.38 | | | $ | 2.47 | | | $ | 0.09 | | | $ | 0.73 | |
Year Ended December 31, 2019 | | | 7.98 | | | | 0.09 | | | | 2.72 | | | | 2.81 | | | | 0.09 | | | | 0.30 | |
Year Ended December 31, 2018 | | | 10.57 | | | | 0.10 | | | | (0.63 | ) | | | (0.53 | ) | | | 0.10 | | | | 1.96 | |
Year Ended December 31, 2017 | | | 9.91 | | | | 0.10 | | | | 1.97 | | | | 2.07 | | | | 0.11 | | | | 1.30 | |
Period Ended December 31, 20165 | | | 10.00 | | | | 0.01 | | | | (0.09 | ) | | | (0.08 | ) | | | 0.01 | | | | — | |
| | | | | | | | | | | | | | | | | | | | | | | | | |
Small Cap Fund | | | | | | | | | | | | | | | | | | | | | | | | |
Investor Class | | | | | | | | | | | | | | | | | | | | | | | | |
Year Ended December 31, 2020 | | $ | 14.67 | | | $ | (0.03 | ) | | $ | 1.75 | | | $ | 1.72 | | | $ | — | | | $ | 0.61 | |
Year Ended December 31, 2019 | | | 12.01 | | | | 0.13 | | | | 2.66 | | | | 2.79 | | | | 0.13 | | | | — | |
Year Ended December 31, 2018 | | | 16.41 | | | | 0.00 | 7 | | | (2.64 | ) | | | (2.64 | ) | | | 0.00 | | | | 1.76 | |
Year Ended December 31, 2017 | | | 15.34 | | | | 0.03 | | | | 1.30 | | | | 1.33 | | | | 0.02 | | | | 0.24 | |
Year Ended December 31, 2016 | | | 13.30 | | | | 0.12 | | | | 2.26 | | | | 2.38 | | | | 0.10 | | | | 0.24 | |
Class A | | | | | | | | | | | | | | | | | | | | | | | | |
Year Ended December 31, 2020 | | $ | 14.63 | | | $ | (0.03 | ) | | $ | 1.74 | | | $ | 1.71 | | | $ | — | | | $ | 0.61 | |
Year Ended December 31, 2019 | | | 11.98 | | | | 0.12 | | | | 2.66 | | | | 2.78 | | | | 0.13 | | | | — | |
Year Ended December 31, 2018 | | | 16.38 | | | | 0.00 | 7 | | | (2.63 | ) | | | (2.63 | ) | | | 0.01 | | | | 1.76 | |
Year Ended December 31, 2017 | | | 15.31 | | | | 0.03 | | | | 1.30 | | | | 1.33 | | | | 0.02 | | | | 0.24 | |
Year Ended December 31, 2016 | | | 13.28 | | | | 0.12 | | | | 2.25 | | | | 2.37 | | | | 0.10 | | | | 0.24 | |
Institutional Class | | | | | | | | | | | | | | | | | | | | | | | | |
Year Ended December 31, 2020 | | $ | 14.82 | | | $ | 0.00 | 7 | | $ | 1.78 | | | $ | 1.78 | | | $ | — | | | $ | 0.61 | |
Year Ended December 31, 2019 | | | 12.12 | | | | 0.15 | | | | 2.70 | | | | 2.85 | | | | 0.15 | | | | — | |
Year Ended December 31, 2018 | | | 16.53 | | | | 0.05 | | | | (2.67 | ) | | | (2.62 | ) | | | 0.03 | | | | 1.76 | |
Year Ended December 31, 2017 | | | 15.44 | | | | 0.07 | | | | 1.32 | | | | 1.39 | | | | 0.06 | | | | 0.24 | |
Year Ended December 31, 2016 | | | 13.38 | | | | 0.16 | | | | 2.27 | | | | 2.43 | | | | 0.13 | | | | 0.24 | |
1 | Based on average shares outstanding during the period. |
2 | Total return represents aggregate total return for the period indicated, includes reinvestment of all dividends and distributions, and does not reflect the deduction of any applicable sales charges. Total returns for periods of less than one year have not been annualized. |
3 | Ratios representing periods of less than one year have been annualized. |
SEE NOTES TO FINANCIAL STATEMENTS | 130 | |
| | | | | | | | | | | | | | | | | Ratios to
average net
assets3 | | | | | | | | | |
| | Total
distributions | | | Net asset
value,
end of
period | | | Total return2 | | | Net assets
end of period
(in $000’s) | | | Net
expenses
including
reimbursements
and waivers | | | Net
investment
income | | | Total
expenses
excluding
reimbursements
and waivers | | | Portfolio
Turnover4 | | | | |
| | | | | | | | | | | | | | | | | | | | | | | | | | | | | | | | | | | | |
| | | | | | | | | | | | | | | | | | | | | | | | | | | | | | | | | | | | |
| | $ | 0.80 | | | $ | 12.02 | | | | 23.75 | % | | $ | 21,351 | | | | 0.95 | % | | | 0.51 | % | | | 0.95 | % | | | 43 | % | | | | |
| | | 0.37 | | | | 10.38 | | | | 34.85 | % | | | 3,271 | | | | 0.95 | % | | | 0.74 | % | | | 0.95 | % | | | 37 | % | | | | |
| | | 2.03 | | | | 7.97 | | | | (5.01 | %) | | | 1,975 | | | | 0.96 | % | | | 0.67 | % | | | 0.96 | % | | | 54 | % | | | | |
| | | 1.39 | | | | 10.56 | | | | 20.65 | % | | | 786 | | | | 0.95 | % | | | 0.82 | % | | | 0.95 | % | | | 57 | % | | | | |
| | | 0.01 | | | | 9.91 | | | | (0.83 | %) | | | 1 | | | | 0.96 | % | | | 1.06 | % | | | 0.96 | % | | | 3 | %6 | | | | |
| | | | | | | | | | | | | | | | | | | | | | | | | | | | | | | | | | | | |
| | $ | 0.82 | | | $ | 12.05 | | | | 23.99 | % | | $ | 1,020,242 | | | | 0.70 | % | | | 0.84 | % | | | 0.70 | % | | | 43 | % | | | | |
| | | 0.39 | | | | 10.40 | | | | 35.23 | % | | | 763,004 | | | | 0.70 | % | | | 1.00 | % | | | 0.70 | % | | | 37 | % | | | | |
| | | 2.06 | | | | 7.98 | | | | (4.79 | %) | | | 590,664 | | | | 0.70 | % | | | 0.85 | % | | | 0.70 | % | | | 54 | % | | | | |
| | | 1.41 | | | | 10.57 | | | | 20.96 | % | | | 718,601 | | | | 0.70 | % | | | 0.94 | % | | | 0.70 | % | | | 57 | % | | | | |
| | | 0.01 | | | | 9.91 | | | | (0.83 | %) | | | 789,950 | | | | 0.71 | % | | | 1.31 | % | | | 0.71 | % | | | 3 | %6 | | | | |
| | | | | | | | | | | | | | | | | | | | | | | | | | | | | | | | | | | | |
| | | | | | | | | | | | | | | | | | | | | | | | | | | | | | | | | | | | |
| | | | | | | | | | | | | | | | | | | | | | | | | | | | | | | | | | | | |
| | $ | 0.61 | | | $ | 15.78 | | | | 11.77 | % | | $ | 102,582 | | | | 1.19 | % | | | (0.23 | %) | | | 1.19 | % | | | 73 | % | | | | |
| | | 0.13 | | | | 14.67 | | | | 23.29 | % | | | 110,520 | | | | 1.20 | % | | | 0.93 | % | | | 1.20 | % | | | 78 | % | | | | |
| | | 1.76 | | | | 12.01 | | | | (15.80 | %) | | | 116,887 | | | | 1.18 | % | | | 0.03 | % | | | 1.18 | % | | | 57 | % | | | | |
| | | 0.26 | | | | 16.41 | | | | 8.77 | % | | | 223,360 | | | | 1.19 | % | | | 0.18 | % | | | 1.19 | % | | | 56 | % | | | | |
| | | 0.34 | | | | 15.34 | | | | 17.90 | % | | | 272,159 | | | | 1.19 | % | | | 0.82 | % | | | 1.19 | % | | | 49 | % | | | | |
| | | | | | | | | | | | | | | | | | | | | | | | | | | | | | | | | | | | |
| | $ | 0.61 | | | $ | 15.73 | | | | 11.73 | % | | $ | 10,948 | | | | 1.19 | % | | | (0.23 | %) | | | 1.19 | % | | | 73 | % | | | | |
| | | 0.13 | | | | 14.63 | | | | 23.27 | % | | | 12,445 | | | | 1.20 | % | | | 0.90 | % | | | 1.20 | % | | | 78 | % | | | | |
| | | 1.77 | | | | 11.98 | | | | (15.82 | %) | | | 12,290 | | | | 1.18 | % | | | 0.02 | % | | | 1.18 | % | | | 57 | % | | | | |
| | | 0.26 | | | | 16.38 | | | | 8.80 | % | | | 27,100 | | | | 1.19 | % | | | 0.19 | % | | | 1.19 | % | | | 56 | % | | | | |
| | | 0.34 | | | | 15.31 | | | | 17.85 | % | | | 39,477 | | | | 1.19 | % | | | 0.84 | % | | | 1.19 | % | | | 49 | % | | | | |
| | | | | | | | | | | | | | | | | | | | | | | | | | | | | | | | | | | | |
| | $ | 0.61 | | | $ | 15.99 | | | | 12.06 | % | | $ | 352,709 | | | | 0.94 | % | | | 0.02 | % | | | 0.94 | % | | | 73 | % | | | | |
| | | 0.15 | | | | 14.82 | | | | 23.56 | % | | | 308,145 | | | | 0.95 | % | | | 1.08 | % | | | 0.95 | % | | | 78 | % | | | | |
| | | 1.79 | | | | 12.12 | | | | (15.59 | %) | | | 317,417 | | | | 0.93 | % | | | 0.29 | % | | | 0.93 | % | | | 57 | % | | | | |
| | | 0.30 | | | | 16.53 | | | | 9.10 | % | | | 580,752 | | | | 0.95 | % | | | 0.45 | % | | | 0.95 | % | | | 56 | % | | | | |
| | | 0.37 | | | | 15.44 | | | | 18.17 | % | | | 482,315 | | | | 0.94 | % | | | 1.14 | % | | | 0.94 | % | | | 49 | % | | | | |
5 | Per share data is reflected from the Fund’s inception date of December 16, 2016. |
6 | For purposes of calculating the turnover ratio for the Large Cap Fund, transactions related to an in-kind subscription have been excluded. |
7 | Rounds to less than $0.01 |
| | 131 | SEE NOTES TO FINANCIAL STATEMENTS |
December 31, 2020 |
Financial Highlights, continued |
Selected data for a share outstanding throughout each period. |
| | | | | | | Income
(loss) from
investment
operations | | | | | | | Distributions to
shareholders | |
| | Net asset
value,
beginning of
period | | | Net
investment
income1 | | | Net
realized and
unrealized
gain (loss) | | | Total from
investment
operations | | | From net
investment
income | | | From net
realized
gains | |
ESG Beta Quality Fund | | | | | | | | | | | | | | | | | | | | | | | | |
Investor Class | | | | | | | | | | | | | | | | | | | | | | | | |
Year Ended December 31, 2020 | | $ | 21.41 | | | $ | 0.23 | | | $ | 2.60 | | | $ | 2.83 | | | $ | 0.22 | | | $ | 0.24 | |
Year Ended December 31, 2019 | | | 17.42 | | | | 0.28 | | | | 4.43 | | | | 4.71 | | | | 0.28 | | | | 0.44 | |
Year Ended December 31, 2018 | | | 19.69 | | | | 0.32 | | | | (1.20 | ) | | | (0.88 | ) | | | 0.32 | | | | 1.07 | |
Year Ended December 31, 2017 | | | 16.90 | | | | 0.23 | | | | 3.45 | | | | 3.68 | | | | 0.23 | | | | 0.66 | |
Year Ended December 31, 2016 | | | 17.55 | | | | 0.16 | | | | 0.95 | | | | 1.11 | | | | 0.16 | | | | 1.60 | |
Class A | | | | | | | | | | | | | | | | | | | | | | | | |
Year Ended December 31, 2020 | | $ | 21.35 | | | $ | 0.23 | | | $ | 2.59 | | | $ | 2.82 | | | $ | 0.22 | | | $ | 0.24 | |
Year Ended December 31, 2019 | | | 17.38 | | | | 0.28 | | | | 4.41 | | | | 4.69 | | | | 0.28 | | | | 0.44 | |
Year Ended December 31, 2018 | | | 19.65 | | | | 0.32 | | | | (1.20 | ) | | | (0.88 | ) | | | 0.32 | | | | 1.07 | |
Year Ended December 31, 2017 | | | 16.86 | | | | 0.23 | | | | 3.45 | | | | 3.68 | | | | 0.23 | | | | 0.66 | |
Year Ended December 31, 2016 | | | 17.52 | | | | 0.17 | | | | 0.93 | | | | 1.10 | | | | 0.16 | | | | 1.60 | |
Institutional Class | | | | | | | | | | | | | | | | | | | | | | | | |
Year Ended December 31, 2020 | | $ | 22.07 | | | $ | 0.29 | | | $ | 2.67 | | | $ | 2.96 | | | $ | 0.27 | | | $ | 0.24 | |
Year Ended December 31, 2019 | | | 17.94 | | | | 0.34 | | | | 4.56 | | | | 4.90 | | | | 0.33 | | | | 0.44 | |
Year Ended December 31, 2018 | | | 20.23 | | | | 0.38 | | | | (1.23 | ) | | | (0.85 | ) | | | 0.37 | | | | 1.07 | |
Year Ended December 31, 2017 | | | 17.34 | | | | 0.28 | | | | 3.55 | | | | 3.83 | | | | 0.28 | | | | 0.66 | |
Year Ended December 31, 2016 | | | 17.97 | | | | 0.19 | | | | 0.99 | | | | 1.18 | | | | 0.21 | | | | 1.60 | |
| | | | | | | | | | | | | | | | | | | | | | | | | |
ESG Beta Dividend Fund | | | | | | | | | | | | | | | | | | | | | | | | |
Investor Class | | | | | | | | | | | | | | | | | | | | | | | | |
Year Ended December 31, 2020 | | $ | 12.78 | | | $ | 0.23 | | | $ | 1.56 | | | $ | 1.79 | | | $ | 0.21 | | | $ | 0.19 | |
Year Ended December 31, 2019 | | | 10.64 | | | | 0.25 | | | | 2.49 | | | | 2.74 | | | | 0.25 | | | | 0.35 | |
Year Ended December 31, 2018 | | | 11.50 | | | | 0.24 | | | | (0.73 | ) | | | (0.49 | ) | | | 0.24 | | | | 0.13 | |
Year Ended December 31, 2017 | | | 9.86 | | | | 0.22 | | | | 1.67 | | | | 1.89 | | | | 0.23 | | | | 0.02 | |
Period Ended December 31, 20165 | | | 9.96 | | | | 0.01 | | | | (0.10 | ) | | | (0.09 | ) | | | 0.01 | | | | — | |
Institutional Class | | | | | | | | | | | | | | | | | | | | | | | | |
Year Ended December 31, 2020 | | $ | 12.81 | | | $ | 0.26 | | | $ | 1.57 | | | $ | 1.83 | | | $ | 0.24 | | | $ | 0.19 | |
Year Ended December 31, 2019 | | | 10.66 | | | | 0.28 | | | | 2.50 | | | | 2.78 | | | | 0.28 | | | | 0.35 | |
Year Ended December 31, 2018 | | | 11.50 | | | | 0.26 | | | | (0.70 | ) | | | (0.44 | ) | | | 0.27 | | | | 0.13 | |
Year Ended December 31, 2017 | | | 9.86 | | | | 0.24 | | | | 1.67 | | | | 1.91 | | | | 0.25 | | | | 0.02 | |
Period Ended December 31, 20165 | | | 9.96 | | | | 0.01 | | | | (0.10 | ) | | | (0.09 | ) | | | 0.01 | | | | — | |
1 | Based on average shares outstanding during the period. |
2 | Total return represents aggregate total return for the period indicated, includes reinvestment of all dividends and distributions, and does not reflect the deduction of any applicable sales charges. Total returns for periods of less than one year have not been annualized. |
3 | Ratios representing periods of less than one year have been annualized. |
SEE NOTES TO FINANCIAL STATEMENTS | 132 | |
| | | | | | | | | | | | | | | | | Ratios to
average net
assets3 | | | | | | | | | |
| | Total
distributions | | | Net asset
value,
end of
period | | | Total return2 | | | Net assets
end of period
(in $000’s) | | | Net
expenses
including
reimbursements
and waivers | | | Net
investment
income | | | Total
expenses
excluding
reimbursements
and waivers | | | Portfolio
Turnover4 | | | | |
| | | | | | | | | | | | | | | | | | | | | | | | | | | | | | | | | | | | |
| | | | | | | | | | | | | | | | | | | | | | | | | | | | | | | | | | | | |
| | $ | 0.46 | | | $ | 23.78 | | | | 13.34 | % | | $ | 170,315 | | | | 0.90 | % | | | 1.10 | % | | | 0.90 | % | | | 65 | % | | | | |
| | | 0.72 | | | | 21.41 | | | | 27.13 | % | | | 161,021 | | | | 0.90 | % | | | 1.43 | % | | | 0.90 | % | | | 49 | % | | | | |
| | | 1.39 | | | | 17.42 | | | | (4.43 | %) | | | 134,435 | | | | 0.90 | % | | | 1.59 | % | | | 0.90 | % | | | 55 | % | | | | |
| | | 0.89 | | | | 19.69 | | | | 21.89 | % | | | 164,016 | | | | 0.90 | % | | | 1.25 | % | | | 0.90 | % | | | 36 | % | | | | |
| | | 1.76 | | | | 16.90 | | | | 6.26 | % | | | 161,041 | | | | 1.07 | % | | | 0.93 | % | | | 1.09 | % | | | 80 | % | | | | |
| | | | | | | | | | | | | | | | | | | | | | | | | | | | | | | | | | | | |
| | $ | 0.46 | | | $ | 23.71 | | | | 13.33 | % | | $ | 6,599 | | | | 0.90 | % | | | 1.11 | % | | | 0.90 | % | | | 65 | % | | | | |
| | | 0.72 | | | | 21.35 | | | | 27.08 | % | | | 6,659 | | | | 0.90 | % | | | 1.43 | % | | | 0.90 | % | | | 49 | % | | | | |
| | | 1.39 | | | | 17.38 | | | | (4.43 | %) | | | 5,417 | | | | 0.90 | % | | | 1.59 | % | | | 0.90 | % | | | 55 | % | | | | |
| | | 0.89 | | | | 19.65 | | | | 21.96 | % | | | 5,589 | | | | 0.90 | % | | | 1.25 | % | | | 0.90 | % | | | 36 | % | | | | |
| | | 1.76 | | | | 16.86 | | | | 6.24 | % | | | 4,296 | | | | 1.06 | % | | | 0.96 | % | | | 1.09 | % | | | 80 | % | | | | |
| | | | | | | | | | | | | | | | | | | | | | | | | | | | | | | | | | | | |
| | $ | 0.51 | | | $ | 24.52 | | | | 13.57 | % | | $ | 79,301 | | | | 0.65 | % | | | 1.35 | % | | | 0.65 | % | | | 65 | % | | | | |
| | | 0.77 | | | | 22.07 | | | | 27.42 | % | | | 72,736 | | | | 0.65 | % | | | 1.68 | % | | | 0.65 | % | | | 49 | % | | | | |
| | | 1.44 | | | | 17.94 | | | | (4.16 | %) | | | 54,131 | | | | 0.65 | % | | | 1.84 | % | | | 0.65 | % | | | 55 | % | | | | |
| | | 0.94 | | | | 20.23 | | | | 22.22 | % | | | 43,038 | | | | 0.65 | % | | | 1.48 | % | | | 0.65 | % | | | 36 | % | | | | |
| | | 1.81 | | | | 17.34 | | | | 6.49 | % | | | 27,580 | | | | 0.84 | % | | | 1.08 | % | | | 0.84 | % | | | 80 | % | | | | |
| | | | | | | | | | | | | | | | | | | | | | | | | | | | | | | | | | | | |
| | | | | | | | | | | | | | | | | | | | | | | | | | | | | | | | | | | | |
| | | | | | | | | | | | | | | | | | | | | | | | | | | | | | | | | | | | |
| | $ | 0.40 | | | $ | 14.17 | | | | 14.25 | % | | $ | 4,014 | | | | 0.90 | % | | | 1.80 | % | | | 0.90 | % | | | 93 | % | | | | |
| | | 0.60 | | | | 12.78 | | | | 25.85 | % | | | 2,859 | | | | 0.90 | % | | | 2.03 | % | | | 0.90 | % | | | 50 | % | | | | |
| | | 0.37 | | | | 10.64 | | | | (4.21 | %) | | | 1,846 | | | | 0.90 | % | | | 2.11 | % | | | 0.90 | % | �� | | 52 | % | | | | |
| | | 0.25 | | | | 11.50 | | | | 19.24 | % | | | 353 | | | | 0.90 | % | | | 2.10 | % | | | 0.90 | % | | | 31 | % | | | | |
| | | 0.01 | | | | 9.86 | | | | (0.89 | %) | | | 10 | | | | 0.90 | % | | | 1.93 | % | | | 0.90 | % | | | 0 | %6 | | | | |
| | | | | | | | | | | | | | | | | | | | | | | | | | | | | | | | | | | | |
| | $ | 0.43 | | | $ | 14.21 | | | | 14.54 | % | | $ | 136,036 | | | | 0.65 | % | | | 2.06 | % | | | 0.65 | % | | | 93 | % | | | | |
| | | 0.63 | | | | 12.81 | | | | 26.18 | % | | | 130,001 | | | | 0.65 | % | | | 2.28 | % | | | 0.65 | % | | | 50 | % | | | | |
| | | 0.40 | | | | 10.66 | | | | (3.84 | %) | | | 115,362 | | | | 0.65 | % | | | 2.24 | % | | | 0.65 | % | | | 52 | % | | | | |
| | | 0.27 | | | | 11.50 | | | | 19.44 | % | | | 149,178 | | | | 0.65 | % | | | 2.31 | % | | | 0.65 | % | | | 31 | % | | | | |
| | | 0.01 | | | | 9.86 | | | | (0.89 | %) | | | 136,601 | | | | 0.65 | % | | | 2.18 | % | | | 0.65 | % | | | 0 | %6 | | | | |
5 | Per share data is reflected from the Fund’s inception date of December 16, 2016. |
6 | For purposes of calculating the turnover ratio for ESG Beta Dividend Fund, transactions related to an in-kind subscription have been excluded. |
| | 133 | SEE NOTES TO FINANCIAL STATEMENTS |
December 31, 2020 |
Financial Highlights, continued |
Selected data for a share outstanding throughout each period. |
| | | | | | | Income
(loss) from
investment
operations | | | | | | | Distributions to
shareholders | |
| | Net asset
value,
beginning of
period | | | Net
investment
income1 | | | Net
realized and
unrealized
gain (loss) | | | Total from
investment
operations | | | From net
investment
income | | | From net
realized
gains | |
Global Opportunities Fund | | | | | | | | | | | | | | | | | | | | | | | | |
Investor Class | | | | | | | | | | | | | | | | | | | | | | | | |
Year Ended December 31, 2020 | | $ | 12.04 | | | $ | (0.01 | ) | | $ | 2.75 | | | $ | 2.74 | | | $ | — | | | $ | 0.12 | |
Year Ended December 31, 2019 | | | 9.18 | | | | 0.02 | | | | 3.05 | | | | 3.07 | | | | 0.03 | | | | 0.18 | |
Period Ended December 31, 20185 | | | 10.00 | | | | (0.01 | ) | | | (0.81 | ) | | | (0.82 | ) | | | — | | | | — | |
Institutional Class | | | | | | | | | | | | | | | | | | | | | | | | |
Year Ended December 31, 2020 | | $ | 12.04 | | | $ | 0.02 | | | $ | 2.76 | | | $ | 2.78 | | | $ | 0.01 | | | $ | 0.12 | |
Year Ended December 31, 2019 | | | 9.18 | | | | 0.06 | | | | 3.03 | | | | 3.09 | | | | 0.05 | | | | 0.18 | |
Period Ended December 31, 20185 | | | 10.00 | | | | 0.00 | 6 | | | (0.82 | ) | | | (0.82 | ) | | | — | | | | — | |
| | | | | | | | | | | | | | | | | | | | | |
Global Environmental Markets Fund | | | | | | | | | | | | | | | | | | | | |
Investor Class | | | | | | | | | | | | | | | | | | | | | | | | |
Year Ended December 31, 2020 | | $ | 16.85 | | | $ | 0.09 | | | $ | 4.22 | | | $ | 4.31 | | | $ | 0.08 | | | $ | — | |
Year Ended December 31, 2019 | | | 13.28 | | | | 0.12 | | | | 3.56 | | | | 3.68 | | | | 0.11 | | | | — | |
Year Ended December 31, 2018 | | | 16.11 | | | | 0.13 | | | | (2.43 | ) | | | (2.30 | ) | | | 0.12 | | | | 0.41 | |
Year Ended December 31, 2017 | | | 13.16 | | | | 0.07 | | | | 3.40 | | | | 3.47 | | | | 0.05 | | | | 0.47 | |
Year Ended December 31, 2016 | | | 11.96 | | | | 0.08 | | | | 1.19 | | | | 1.27 | | | | 0.07 | | | | — | |
Class A | | | | | | | | | | | | | | | | | | | | | | | | |
Year Ended December 31, 2020 | | $ | 16.83 | | | $ | 0.09 | | | $ | 4.21 | | | $ | 4.30 | | | $ | 0.08 | | | $ | — | |
Year Ended December 31, 2019 | | | 13.26 | | | | 0.12 | | | | 3.56 | | | | 3.68 | | | | 0.11 | | | | — | |
Year Ended December 31, 2018 | | | 16.09 | | | | 0.13 | | | | (2.43 | ) | | | (2.30 | ) | | | 0.12 | | | | 0.41 | |
Year Ended December 31, 2017 | | | 13.14 | | | | 0.07 | | | | 3.40 | | | | 3.47 | | | | 0.05 | | | | 0.47 | |
Year Ended December 31, 2016 | | | 11.94 | | | | 0.08 | | | | 1.19 | | | | 1.27 | | | | 0.07 | | | | — | |
Institutional Class | | | | | | | | | | | | | | | | | | | | | | | | |
Year Ended December 31, 2020 | | $ | 16.97 | | | $ | 0.14 | | | $ | 4.25 | | | $ | 4.39 | | | $ | 0.13 | | | $ | — | |
Year Ended December 31, 2019 | | | 13.36 | | | | 0.16 | | | | 3.60 | | | | 3.76 | | | | 0.15 | | | | — | |
Year Ended December 31, 2018 | | | 16.22 | | | | 0.17 | | | | (2.46 | ) | | | (2.29 | ) | | | 0.16 | | | | 0.41 | |
Year Ended December 31, 2017 | | | 13.24 | | | | 0.10 | | | | 3.44 | | | | 3.54 | | | | 0.09 | | | | 0.47 | |
Year Ended December 31, 2016 | | | 12.03 | | | | 0.11 | | | | 1.20 | | | | 1.31 | | | | 0.10 | | | | — | |
1 | Based on average shares outstanding during the period. |
2 | Total return represents aggregate total return for the period indicated, includes reinvestment of all dividends and distributions, and does not reflect the deduction of any applicable sales charges. Total returns for periods of less than one year have not been annualized. |
3 | Ratios representing periods of less than one year have been annualized. |
SEE NOTES TO FINANCIAL STATEMENTS | 134 | |
| | | | | | | | | | | | | | | | | Ratios to
average net
assets3 | | | | | | | | | |
| | Total
distributions | | | Net asset
value,
end of
period | | | Total return2 | | | Net assets
end of period
(in $000’s) | | | Net
expenses
including
reimbursements
and waivers | | | Net
investment
income | | | Total
expenses
excluding
reimbursements
and waivers | | | Portfolio
Turnover4 | | | | |
| | | | | | | | | | | | | | | | | | | | | | | | | | | | | | | | | | | | |
| | | | | | | | | | | | | | | | | | | | | | | | | | | | | | | | | | | | |
| | $ | 0.12 | | | $ | 14.66 | | | | 22.76 | % | | $ | 3,401 | | | | 1.18 | % | | | (0.06 | %) | | | 1.56 | % | | | 34 | % | | | | |
| | | 0.21 | | | | 12.04 | | | | 33.51 | % | | | 1,683 | | | | 1.19 | % | | | 0.17 | % | | | 1.68 | % | | | 29 | % | | | | |
| | | — | | | | 9.18 | | | | (8.20 | %) | | | 126 | | | | 1.16 | % | | | (0.14 | %) | | | 2.06 | % | | | 17 | % | | | | |
| | | | | | | | | | | | | | | | | | | | | | | | | | | | | | | | | | | | |
| | $ | 0.13 | | | $ | 14.69 | | | | 23.12 | % | | $ | 65,644 | | | | 0.94 | % | | | 0.17 | % | | | 1.31 | % | | | 34 | % | | | | |
| | | 0.23 | | | | 12.04 | | | | 33.72 | % | | | 40,392 | | | | 0.92 | % | | | 0.51 | % | | | 1.42 | % | | | 29 | % | | | | |
| | | — | | | | 9.18 | | | | (8.20 | %) | | | 24,816 | | | | 0.92 | % | | | 0.01 | % | | | 1.81 | % | | | 17 | % | | | | |
| | | | | | | | | | | | | | | | | | | | | | | | | | | | | | | | | | | | |
| | | | | | | | | | | | | | | | | | | | | | | | | | | | | | | | | | | | |
| | | | | | | | | | | | | | | | | | | | | | | | | | | | | | | | | | | | |
| | $ | 0.08 | | | $ | 21.08 | | | | 25.71 | % | | $ | 175,040 | | | | 1.20 | % | | | 0.55 | % | | | 1.20 | % | | | 25 | % | | | | |
| | | 0.11 | | | | 16.85 | | | | 27.75 | % | | | 152,209 | | | | 1.22 | % | | | 0.78 | % | | | 1.22 | % | | | 14 | % | | | | |
| | | 0.53 | | | | 13.28 | | | | (14.31 | %) | | | 118,980 | | | | 1.22 | % | | | 0.83 | % | | | 1.24 | % | | | 26 | % | | | | |
| | | 0.52 | | | | 16.11 | | | | 26.42 | % | | | 154,325 | | | | 1.23 | % | | | 0.46 | % | | | 1.26 | % | | | 18 | % | | | | |
| | | 0.07 | | | | 13.16 | | | | 10.62 | % | | | 122,610 | | | | 1.29 | % | | | 0.61 | % | | | 1.34 | % | | | 30 | % | | | | |
| | | | | | | | | | | | | | | | | | | | | | | | | | | | | | | | | | | | |
| | $ | 0.08 | | | $ | 21.05 | | | | 25.68 | % | | $ | 16,651 | | | | 1.20 | % | | | 0.54 | % | | | 1.20 | % | | | 25 | % | | | | |
| | | 0.11 | | | | 16.83 | | | | 27.77 | % | | | 13,700 | | | | 1.22 | % | | | 0.78 | % | | | 1.22 | % | | | 14 | % | | | | |
| | | 0.53 | | | | 13.26 | | | | (14.33 | %) | | | 12,766 | | | | 1.22 | % | | | 0.86 | % | | | 1.24 | % | | | 26 | % | | | | |
| | | 0.52 | | | | 16.09 | | | | 26.45 | % | | | 15,383 | | | | 1.23 | % | | | 0.47 | % | | | 1.26 | % | | | 18 | % | | | | |
| | | 0.07 | | | | 13.14 | | | | 10.62 | % | | | 13,042 | | | | 1.30 | % | | | 0.63 | % | | | 1.34 | % | | | 30 | % | | | | |
| | | | | | | | | | | | | | | | | | | | | | | | | | | | | | | | | | | | |
| | $ | 0.13 | | | $ | 21.23 | | | | 26.00 | % | | $ | 1,437,952 | | | | 0.95 | % | | | 0.78 | % | | | 0.95 | % | | | 25 | % | | | | |
| | | 0.15 | | | | 16.97 | | | | 28.17 | % | | | 802,292 | | | | 0.97 | % | | | 1.01 | % | | | 0.97 | % | | | 14 | % | | | | |
| | | 0.44 | | | | 13.36 | | | | (14.17 | %) | | | 459,354 | | | | 0.97 | % | | | 1.10 | % | | | 0.99 | % | | | 26 | % | | | | |
| | | 0.56 | | | | 16.22 | | | | 26.79 | % | | | 439,991 | | | | 0.98 | % | | | 0.67 | % | | | 1.02 | % | | | 18 | % | | | | |
| | | 0.10 | | | | 13.24 | | | | 10.91 | % | | | 209,759 | | | | 1.04 | % | | | 0.86 | % | | | 1.09 | % | | | 30 | % | | | | |
5 | Per share data is reflected from the Fund’s inception date of June 27, 2018. |
6 | Rounds to less than $0.01 |
| | 135 | SEE NOTES TO FINANCIAL STATEMENTS |
December 31, 2020 |
Financial Highlights, continued |
Selected data for a share outstanding throughout each period. |
| | | | | | | Income
(loss) from
investment
operations | | | | | | | Distributions to
shareholders | |
| | Net asset
value,
beginning of
period | | | Net
investment
income1 | | | Net
realized and
unrealized
gain (loss) | | | Total from
investment
operations | | | From net
investment
income | | | From net
realized
gains | |
Global Women’s Leadership Fund | | | | | | | | | | | | | | | | | | | | |
Investor Class | | | | | | | | | | | | | | | | | | | | | | | | |
Year Ended December 31, 2020 | | $ | 27.00 | | | $ | 0.33 | | | $ | 3.32 | | | $ | 3.65 | | | $ | 0.31 | | | $ | — | |
Year Ended December 31, 2019 | | | 22.02 | | | | 0.47 | | | | 5.33 | | | | 5.80 | | | | 0.44 | | | | 0.38 | |
Year Ended December 31, 2018 | | | 25.02 | | | | 0.47 | | | | (2.39 | ) | | | (1.92 | ) | | | 0.44 | | | | 0.64 | |
Year Ended December 31, 2017 | | | 20.56 | | | | 0.39 | | | | 4.69 | | | | 5.08 | | | | 0.36 | | | | 0.26 | |
Year Ended December 31, 2016 | | | 19.75 | | | | 0.39 | | | | 0.79 | | | | 1.18 | | | | 0.37 | | | | — | |
Institutional Class | | | | | | | | | | | | | | | | | | | | | | | | |
Year Ended December 31, 2020 | | $ | 27.14 | | | $ | 0.40 | | | $ | 3.34 | | | $ | 3.74 | | | $ | 0.38 | | | $ | — | |
Year Ended December 31, 2019 | | | 22.12 | | | | 0.53 | | | | 5.37 | | | | 5.90 | | | | 0.50 | | | | 0.38 | |
Year Ended December 31, 2018 | | | 25.13 | | | | 0.53 | | | | (2.40 | ) | | | (1.87 | ) | | | 0.50 | | | | 0.64 | |
Year Ended December 31, 2017 | | | 20.65 | | | | 0.43 | | | | 4.73 | | | | 5.16 | | | | 0.42 | | | | 0.26 | |
Year Ended December 31, 2016 | | | 19.83 | | | | 0.42 | | | | 0.82 | | | | 1.24 | | | | 0.42 | | | | — | |
| | | | | | | | | | | | | | | | | | | | | |
EAFE ESG Leaders Index Fund | | | | | | | | | | | | | | | | | | | | | | | | |
Investor Class | | | | | | | | | | | | | | | | | | | | | | | | |
Year Ended December 31, 2020 | | $ | 9.53 | | | $ | 0.17 | | | $ | 0.81 | | | $ | 0.98 | | | $ | 0.16 | | | $ | — | |
Year Ended December 31, 2019 | | | 7.95 | | | | 0.21 | | | | 1.59 | | | | 1.80 | | | | 0.22 | | | | — | |
Year Ended December 31, 2018 | | | 9.36 | | | | 0.22 | | | | (1.43 | ) | | | (1.21 | ) | | | 0.20 | | | | — | |
Year Ended December 31, 2017 | | | 7.79 | | | | 0.21 | | | | 1.57 | | | | 1.78 | | | | 0.21 | | | | — | |
Year Ended December 31, 2016 | | | 8.13 | | | | 0.20 | | | | (0.35 | ) | | | (0.15 | ) | | | 0.19 | | | | — | |
Institutional Class | | | | | | | | | | | | | | | | | | | | | | | | |
Year Ended December 31, 2020 | | $ | 9.34 | | | $ | 0.19 | | | $ | 0.79 | | | $ | 0.98 | | | $ | 0.18 | | | $ | — | |
Year Ended December 31, 2019 | | | 7.80 | | | | 0.23 | | | | 1.55 | | | | 1.78 | | | | 0.24 | | | | — | |
Year Ended December 31, 2018 | | | 9.19 | | | | 0.23 | | | | (1.40 | ) | | | (1.17 | ) | | | 0.22 | | | | — | |
Year Ended December 31, 2017 | | | 7.65 | | | | 0.21 | | | | 1.56 | | | | 1.77 | | | | 0.23 | | | | — | |
Year Ended December 31, 2016 | | | 7.99 | | | | 0.21 | | | | (0.34 | ) | | | (0.13 | ) | | | 0.21 | | | | — | |
1 | Based on average shares outstanding during the period. |
2 | Total return represents aggregate total return for the period indicated, includes reinvestment of all dividends and distributions, and does not reflect the deduction of any applicable sales charges. Total returns for periods of less than one year have not been annualized. |
3 | Ratios representing periods of less than one year have been annualized. |
5 | To manage cash flows, minimize trading costs and equitize cash balances in between trading blocks of securities, the Global Women’s Index Fund utilizes one or more exchange-traded funds (ETFs), the combination of which is intended to track the Fund’s broad-based benchmark. These investments are frequent and short-term, however, the Fund is required to include such ETF investment activity in the calculation of its portfolio turnover. Had such transactions been excluded, the portfolio turnover would have been 37% for the year ended December 31, 2020, 25% for the year ended December 31, 2019, 47% for the year ended December 31, 2018, 25% for the year ended December 31, 2017, and 21% for the year ended December 31, 2016. |
SEE NOTES TO FINANCIAL STATEMENTS | 136 | |
| | | | | | | | | | | | | | | | | Ratios to
average net
assets3 | | | | | | | | | |
| | Total
distributions | | | Net asset
value,
end of
period | | | Total return2 | | | Net assets
end of period
(in $000’s) | | | Net
expenses
including
reimbursements
and waivers | | | Net
investment
income | | | Total
expenses
excluding
reimbursements
and waivers | | | Portfolio
Turnover4 | | | | |
| | | | | | | | | | | | | | | | | | | | | | | | | | | | | | | | | | | | |
| | | | | | | | | | | | | | | | | | | | | | | | | | | | | | | | | | | | |
| | $ | 0.31 | | | $ | 30.34 | | | | 13.67 | % | | $ | 130,255 | | | | 0.78 | % | | | 1.27 | % | | | 0.78 | % | | | 69 | %5 | | | | |
| | | 0.82 | | | | 27.00 | | | | 26.42 | % | | | 118,713 | | | | 0.80 | % | | | 1.87 | % | | | 0.80 | % | | | 66 | %5 | | | | |
| | | 1.08 | | | | 22.02 | | | | (7.74 | %) | | | 86,727 | | | | 0.81 | % | | | 1.88 | % | | | 0.83 | % | | | 67 | %5 | | | | |
| | | 0.62 | | | | 25.02 | | | | 24.86 | % | | | 88,332 | | | | 0.90 | % | | | 1.69 | % | | | 0.90 | % | | | 56 | %5 | | | | |
| | | 0.37 | | | | 20.56 | | | | 6.01 | % | | | 72,771 | | | | 0.92 | % | | | 1.93 | % | | | 0.92 | % | | | 49 | %5 | | | | |
| | | | | | | | | | | | | | | | | | | | | | | | | | | | | | | | | | | | |
| | $ | 0.38 | | | $ | 30.50 | | | | 13.94 | % | | $ | 619,168 | | | | 0.53 | % | | | 1.52 | % | | | 0.53 | % | | | 69 | %5 | | | | |
| | | 0.88 | | | | 27.14 | | | | 26.77 | % | | | 346,142 | | | | 0.55 | % | | | 2.07 | % | | | 0.55 | % | | | 66 | %5 | | | | |
| | | 1.14 | | | | 22.12 | | | | (7.51 | %) | | | 156,960 | | | | 0.56 | % | | | 2.09 | % | | | 0.58 | % | | | 67 | %5 | | | | |
| | | 0.68 | | | | 25.13 | | | | 25.14 | % | | | 93,820 | | | | 0.65 | % | | | 1.84 | % | | | 0.65 | % | | | 56 | %5 | | | | |
| | | 0.42 | | | | 20.65 | | | | 6.30 | % | | | 37,920 | | | | 0.67 | % | | | 2.09 | % | | | 0.67 | % | | | 49 | %5 | | | | |
| | | | | | | | | | | | | | | | | | | | | | | | | | | | | | | | | | | | |
| | | | | | | | | | | | | | | | | | | | | | | | | | | | | | | | | | | | |
| | | | | | | | | | | | | | | | | | | | | | | | | | | | | | | | | | | | |
| | $ | 0.16 | | | $ | 10.35 | | | | 10.51 | % | | $ | 77,963 | | | | 0.75 | % | | | 1.91 | % | | | 0.75 | % | | | 43 | %6 | | | | |
| | | 0.22 | | | | 9.53 | | | | 22.78 | % | | | 84,855 | | | | 0.80 | % | | | 2.40 | % | | | 0.80 | % | | | 31 | %6 | | | | |
| | | 0.20 | | | | 7.95 | | | | (13.15 | %) | | | 77,880 | | | | 0.80 | % | | | 2.46 | % | | | 0.80 | % | | | 30 | %6 | | | | |
| | | 0.21 | | | | 9.36 | | | | 23.01 | % | | | 123,776 | | | | 0.80 | % | | | 2.38 | % | | | 0.80 | % | | | 42 | %6 | | | | |
| | | 0.19 | | | | 7.79 | | | | (1.85 | %) | | | 97,924 | | | | 0.80 | % | | | 2.55 | % | | | 0.80 | % | | | 44 | %6 | | | | |
| | | | | | | | | | | | | | | | | | | | | | | | | | | | | | | | | | | | |
| | $ | 0.18 | | | $ | 10.14 | | | | 10.78 | % | | $ | 623,014 | | | | 0.50 | % | | | 2.15 | % | | | 0.50 | % | | | 43 | %6 | | | | |
| | | 0.24 | | | | 9.34 | | | | 23.01 | % | | | 559,939 | | | | 0.55 | % | | | 2.63 | % | | | 0.55 | % | | | 31 | %6 | | | | |
| | | 0.22 | | | | 7.80 | | | | (12.90 | %) | | | 437,907 | | | | 0.55 | % | | | 2.55 | % | | | 0.55 | % | | | 30 | %6 | | | | |
| | | 0.23 | | | | 9.19 | | | | 23.34 | % | | | 560,348 | | | | 0.55 | % | | | 2.47 | % | | | 0.55 | % | | | 42 | %6 | | | | |
| | | 0.21 | | | | 7.65 | | | | (1.63 | %) | | | 402,694 | | | | 0.55 | % | | | 2.76 | % | | | 0.55 | % | | | 44 | %6 | | | | |
6 | To manage cash flows, minimize trading costs and equitize cash balances in between trading blocks of securities, the ESG Leaders Index Fund utilizes one or more exchange-traded funds (ETFs) which have an investment objective that tracks the Fund’s broad-based benchmark. These investments are frequent and short-term, however, the Fund is required to include such ETF investment activity in the calculation of its portfolio turnover. Had such transactions been excluded, the portfolio turnover would have been 27% for the year ended December 31, 2020, 19% for the year ended December 31, 2019, 18% for the year ended December 31, 2018, 16% for the year ended December 31, 2017, and 10% for the year ended December 31, 2016. |
| | 137 | SEE NOTES TO FINANCIAL STATEMENTS |
December 31, 2020 |
Financial Highlights, continued |
Selected data for a share outstanding throughout each period. |
| | | | | | | Income
(loss) from
investment
operations | | | | | | | Distributions to
shareholders | |
| | Net asset
value,
beginning of
period | | | Net
investment
income1 | | | Net
realized and
unrealized
gain (loss) | | | Total from
investment
operations | | | From net
investment
income | | | From net
realized
gains | |
Core Bond Fund | | | | | | | | | | | | | | | | | | | | | | | | |
Investor Class | | | | | | | | | | | | | | | | | | | | | | | | |
Year Ended December 31, 2020 | | $ | 10.29 | | | $ | 0.17 | | | $ | 0.53 | | | $ | 0.70 | | | $ | 0.19 | | | $ | 0.24 | |
Year Ended December 31, 2019 | | | 9.78 | | | | 0.23 | | | | 0.53 | | | | 0.76 | | | | 0.25 | | | | — | |
Year Ended December 31, 2018 | | | 10.04 | | | | 0.22 | | | | (0.25 | ) | | | (0.03 | ) | | | 0.23 | | | | — | |
Year Ended December 31, 2017 | | | 10.01 | | | | 0.21 | | | | 0.04 | | | | 0.25 | | | | 0.21 | | | | 0.01 | |
Period Ended December 31, 20165 | | | 9.93 | | | | 0.01 | | | | 0.08 | | | | 0.09 | | | | 0.01 | | | | — | |
Institutional Class | | | | | | | | | | | | | | | | | | | | | | | | |
Year Ended December 31, 2020 | | $ | 10.29 | | | $ | 0.20 | | | $ | 0.53 | | | $ | 0.73 | | | $ | 0.22 | | | $ | 0.24 | |
Year Ended December 31, 2019 | | | 9.78 | | | | 0.26 | | | | 0.52 | | | | 0.78 | | | | 0.27 | | | | — | |
Year Ended December 31, 2018 | | | 10.04 | | | | 0.24 | | | | (0.24 | ) | | | — | | | | 0.26 | | | | — | |
Year Ended December 31, 2017 | | | 10.01 | | | | 0.24 | | | | 0.04 | | | | 0.28 | | | | 0.24 | | | | 0.01 | |
Period Ended December 31, 20165 | | | 9.93 | | | | 0.01 | | | | 0.08 | | | | 0.09 | | | | 0.01 | | | | — | |
| | | | | | | | | | | | | | | | | | | | | | | | | |
High Yield Bond Fund | | | | | | | | | | | | | | | | | | | | | | | | |
Investor Class | | | | | | | | | | | | | | | | | | | | | | | | |
Year Ended December 31, 2020 | | $ | 6.79 | | | $ | 0.32 | | | $ | 0.18 | | | $ | 0.50 | | | $ | 0.32 | | | $ | — | |
Year Ended December 31, 2019 | | | 6.25 | | | | 0.33 | | | | 0.54 | | | | 0.87 | | | | 0.33 | | | | — | |
Year Ended December 31, 2018 | | | 6.78 | | | | 0.33 | | | | (0.53 | ) | | | (0.20 | ) | | | 0.33 | | | | — | |
Year Ended December 31, 2017 | | | 6.71 | | | | 0.35 | | | | 0.07 | | | | 0.42 | | | | 0.35 | | | | — | |
Year Ended December 31, 2016 | | | 6.25 | | | | 0.38 | | | | 0.45 | | | | 0.83 | | | | 0.37 | | | | — | |
Class A | | | | | | | | | | | | | | | | | | | | | | | | |
Year Ended December 31, 2020 | | $ | 6.80 | | | $ | 0.32 | | | $ | 0.19 | | | $ | 0.51 | | | $ | 0.33 | | | $ | — | |
Year Ended December 31, 2019 | | | 6.26 | | | | 0.33 | | | | 0.54 | | | | 0.87 | | | | 0.33 | | | | — | |
Year Ended December 31, 2018 | | | 6.79 | | | | 0.33 | | | | (0.53 | ) | | | (0.20 | ) | | | 0.33 | | | | — | |
Year Ended December 31, 2017 | | | 6.72 | | | | 0.35 | | | | 0.07 | | | | 0.42 | | | | 0.35 | | | | — | |
Year Ended December 31, 2016 | | | 6.26 | | | | 0.38 | | | | 0.45 | | | | 0.83 | | | | 0.37 | | | | — | |
Institutional Class | | | | | | | | | | | | | | | | | | | | | | | | |
Year Ended December 31, 2020 | | $ | 6.76 | | | $ | 0.33 | | | $ | 0.19 | | | $ | 0.52 | | | $ | 0.34 | | | $ | — | |
Year Ended December 31, 2019 | | | 6.23 | | | | 0.34 | | | | 0.53 | | | | 0.87 | | | | 0.34 | | | | — | |
Year Ended December 31, 2018 | | | 6.75 | | | | 0.35 | | | | (0.52 | ) | | | (0.17 | ) | | | 0.35 | | | | — | |
Year Ended December 31, 2017 | | | 6.68 | | | | 0.36 | | | | 0.08 | | | | 0.44 | | | | 0.37 | | | | — | |
Year Ended December 31, 2016 | | | 6.23 | | | | 0.39 | | | | 0.45 | | | | 0.84 | | | | 0.39 | | | | — | |
1 | Based on average shares outstanding during the period. |
2 | Total return represents aggregate total return for the period indicated, includes reinvestment of all dividends and distributions, and does not reflect the deduction of any applicable sales charges. Total returns for periods of less than one year have not been annualized. |
3 | Ratios representing periods of less than one year have been annualized. |
SEE NOTES TO FINANCIAL STATEMENTS | 138 | |
| | | | | | | | | | | | | | | | | Ratios to
average net
assets3 | | | | | | | | | |
| | Total
distributions | | | Net asset
value,
end of
period | | | Total return2 | | | Net assets
end of period
(in $000’s) | | | Net
expenses
including
reimbursements
and waivers | | | Net
investment
income | | | Total
expenses
excluding
reimbursements
and waivers | | | Portfolio
Turnover4 | | | | |
| | | | | | | | | | | | | | | | | | | | | | | | | | | | | | | | | | | | |
| | | | | | | | | | | | | | | | | | | | | | | | | | | | | | | | | | | | |
| | $ | 0.43 | | | $ | 10.56 | | | | 6.89 | % | | $ | 14,101 | | | | 0.72 | % | | | 1.58 | % | | | 0.72 | % | | | 79 | % | | | | |
| | | 0.25 | | | | 10.29 | | | | 7.78 | % | | | 7,401 | | | | 0.71 | % | | | 2.30 | % | | | 0.71 | % | | | 63 | % | | | | |
| | | 0.23 | | | | 9.78 | | | | (0.24 | %) | | | 4,277 | | | | 0.71 | % | | | 2.23 | % | | | 0.71 | % | | | 62 | % | | | | |
| | | 0.22 | | | | 10.04 | | | | 2.56 | % | | | 2,969 | | | | 0.71 | % | | | 2.11 | % | | | 0.71 | % | | | 60 | % | | | | |
| | | 0.01 | | | | 10.01 | | | | 0.87 | % | | | 109 | | | | 0.74 | % | | | 1.99 | % | | | 0.74 | % | | | 1 | %6 | | | | |
| | | | | | | | | | | | | | | | | | | | | | | | | | | | | | | | | | | | |
| | $ | 0.46 | | | $ | 10.56 | | | | 7.16 | % | | $ | 746,615 | | | | 0.46 | % | | | 1.86 | % | | | 0.46 | % | | | 79 | % | | | | |
| | | 0.27 | | | | 10.29 | | | | 8.04 | % | | | 702,291 | | | | 0.46 | % | | | 2.55 | % | | | 0.46 | % | | | 63 | % | | | | |
| | | 0.26 | | | | 9.78 | | | | 0.01 | % | | | 682,201 | | | | 0.46 | % | | | 2.50 | % | | | 0.46 | % | | | 62 | % | | | | |
| | | 0.25 | | | | 10.04 | | | | 2.82 | % | | | 697,050 | | | | 0.46 | % | | | 2.34 | % | | | 0.46 | % | | | 60 | % | | | | |
| | | 0.01 | | | | 10.01 | | | | 0.93 | % | | | 602,384 | | | | 0.49 | % | | | 2.23 | % | | | 0.49 | % | | | 1 | %6 | | | | |
| | | | | | | | | | | | | | | | | | | | | | | | | | | | | | | | | | | | |
| | | | | | | | | | | | | | | | | | | | | | | | | | | | | | | | | | | | |
| | | | | | | | | | | | | | | | | | | | | | | | | | | | | | | | | | | | |
| | $ | 0.32 | | | $ | 6.97 | | | | 7.80 | % | | $ | 171,838 | | | | 0.96 | % | | | 4.87 | % | | | 0.96 | % | | | 97 | % | | | | |
| | | 0.33 | | | | 6.79 | | | | 14.11 | % | | | 183,631 | | | | 0.96 | % | | | 4.94 | % | | | 0.96 | % | | | 90 | % | | | | |
| | | 0.33 | | | | 6.25 | | | | (3.07 | %) | | | 162,841 | | | | 0.97 | % | | | 5.01 | % | | | 0.97 | % | | | 57 | % | | | | |
| | | 0.35 | | | | 6.78 | | | | 6.37 | % | | | 201,953 | | | | 0.99 | % | | | 5.14 | % | | | 0.99 | % | | | 91 | % | | | | |
| | | 0.37 | | | | 6.71 | | | | 13.81 | % | | | 228,936 | | | | 0.99 | % | | | 5.90 | % | | | 0.99 | % | | | 111 | % | | | | |
| | | | | | | | | | | | | | | | | | | | | | | | | | | | | | | | | | | | |
| | $ | 0.33 | | | $ | 6.98 | | | | 7.79 | % | | $ | 6,177 | | | | 0.96 | % | | | 4.87 | % | | | 0.96 | % | | | 97 | % | | | | |
| | | 0.33 | | | | 6.80 | | | | 14.10 | % | | | 5,827 | | | | 0.96 | % | | | 4.95 | % | | | 0.96 | % | | | 90 | % | | | | |
| | | 0.33 | | | | 6.26 | | | | (3.05 | %) | | | 5,747 | | | | 0.97 | % | | | 5.01 | % | | | 0.97 | % | | | 57 | % | | | | |
| | | 0.35 | | | | 6.79 | | | | 6.36 | % | | | 5,798 | | | | 0.99 | % | | | 5.13 | % | | | 0.99 | % | | | 91 | % | | | | |
| | | 0.37 | | | | 6.72 | | | | 13.80 | % | | | 5,623 | | | | 0.98 | % | | | 5.88 | % | | | 0.98 | % | | | 111 | % | | | | |
| | | | | | | | | | | | | | | | | | | | | | | | | | | | | | | | | | | | |
| | $ | 0.34 | | | $ | 6.94 | | | | 8.08 | % | | $ | 294,313 | | | | 0.72 | % | | | 5.07 | % | | | 0.72 | % | | | 97 | % | | | | |
| | | 0.34 | | | | 6.76 | | | | 14.26 | % | | | 186,350 | | | | 0.71 | % | | | 5.21 | % | | | 0.71 | % | | | 90 | % | | | | |
| | | 0.35 | | | | 6.23 | | | | (2.70 | %) | | | 188,333 | | | | 0.72 | % | | | 5.26 | % | | | 0.72 | % | | | 57 | % | | | | |
| | | 0.37 | | | | 6.75 | | | | 6.64 | % | | | 205,555 | | | | 0.74 | % | | | 5.37 | % | | | 0.74 | % | | | 91 | % | | | | |
| | | 0.39 | | | | 6.68 | | | | 13.96 | % | | | 166,051 | | | | 0.74 | % | | | 6.15 | % | | | 0.74 | % | | | 111 | % | | | | |
5 | Per share data is reflected from the Fund’s inception date of December 16, 2016. |
6 | For purposes of calculating the turnover rate for the Core Bond Fund, transactions related to an in-kind subscription have been excluded. |
| | 139 | SEE NOTES TO FINANCIAL STATEMENTS |
December 31, 2020 |
Financial Highlights, continued |
Selected data for a share outstanding throughout each period. |
| | | | | | | Income
(loss) from
investment
operations | | | | | | | Distributions to
shareholders | |
| | Net asset
value,
beginning of
period | | | Net
investment
income1 | | | Net
realized and
unrealized
gain (loss) | | | Total from
investment
operations | | | From net
investment
income | | | From net
realized
gains | |
Sustainable Allocation Fund | | | | | | | | | | | | | | | | | | | | | | | | |
Investor Class | | | | | | | | | | | | | | | | | | | | | | | | |
Year Ended December 31, 2020 | | $ | 23.35 | | | $ | 0.26 | | | $ | 3.49 | | | $ | 3.75 | | | $ | 0.26 | | | $ | 0.48 | |
Year Ended December 31, 2019 | | | 21.14 | | | | 0.36 | | | | 4.02 | | | | 4.38 | | | | 0.37 | | | | 1.80 | |
Year Ended December 31, 2018 | | | 22.66 | | | | 0.33 | | | | (1.23 | ) | | | (0.90 | ) | | | 0.47 | | | | 0.15 | |
Year Ended December 31, 2017 | | | 22.34 | | | | 0.30 | | | | 2.55 | | | | 2.85 | | | | 0.20 | | | | 2.33 | |
Year Ended December 31, 2016 | | | 21.76 | | | | 0.29 | | | | 0.97 | | | | 1.26 | | | | 0.29 | | | | 0.39 | |
Institutional Class | | | | | | | | | | | | | | | | | | | | | | | | |
Year Ended December 31, 2020 | | $ | 23.76 | | | $ | 0.33 | | | $ | 3.54 | | | $ | 3.87 | | | $ | 0.32 | | | $ | 0.48 | |
Year Ended December 31, 2019 | | | 21.47 | | | | 0.43 | | | | 4.09 | | | | 4.52 | | | | 0.43 | | | | 1.80 | |
Year Ended December 31, 2018 | | | 23.01 | | | | 0.38 | | | | (1.24 | ) | | | (0.86 | ) | | | 0.53 | | | | 0.15 | |
Year Ended December 31, 2017 | | | 22.63 | | | | 0.41 | | | | 2.53 | | | | 2.94 | | | | 0.23 | | | | 2.33 | |
Year Ended December 31, 2016 | | | 22.04 | | | | 0.35 | | | | 0.98 | | | | 1.33 | | | | 0.35 | | | | 0.39 | |
1 | Based on average shares outstanding during the period. |
2 | Total return represents aggregate total return for the period indicated, includes reinvestment of all dividends and distributions, and does not reflect the deduction of any applicable sales charges. Total returns for periods of less than one year have not been annualized. |
3 | Ratios representing periods of less than one year have been annualized. |
SEE NOTES TO FINANCIAL STATEMENTS | 140 | |
| | | | | | | | | | | | | | | | | Ratios to
average net
assets3 | | | | | | | | | |
| | Total
distributions | | | Net asset
value,
end of
period | | | Total return2 | | | Net assets
end of period
(in $000’s) | | | Net
expenses
including
reimbursements
and waivers | | | Net
investment
income | | | Total
expenses
excluding
reimbursements
and waivers | | | Portfolio
Turnover4 | | | | |
| | | | | | | | | | | | | | | | | | | | | | | | | | | | | | | | | | | | |
| | | | | | | | | | | | | | | | | | | | | | | | | | | | | | | | | | | | |
| | $ | 0.74 | | | $ | 26.36 | | | | 16.24 | % | | $ | 1,518,966 | | | | 0.30 | %5 | | | 1.08 | % | | | 0.30 | %5 | | | 13 | % | | | | |
| | | 2.17 | | | | 23.35 | | | | 20.83 | % | | | 1,523,009 | | | | 0.30 | %5 | | | 1.56 | % | | | 0.30 | %5 | | | 8 | % | | | | |
| | | 0.62 | | | | 21.14 | | | | (4.08 | %) | | | 1,324,582 | | | | 0.30 | %5 | | | 1.44 | %6 | | | 0.30 | %5 | | | 12 | % | | | | |
| | | 2.53 | | | | 22.66 | | | | 13.16 | % | | | 1,496,146 | | | | 0.29 | %5 | | | 1.33 | % | | | 0.30 | %5 | | | 14 | % | | | | |
| | | 0.68 | | | | 22.34 | | | | 5.81 | % | | | 1,596,717 | | | | 0.77 | % | | | 1.31 | % | | | 0.87 | % | | | 49 | % | | | | |
| | | | | | | | | | | | | | | | | | | | | | | | | | | | | | | | | | | | |
| | $ | 0.80 | | | $ | 26.83 | | | | 16.49 | % | | $ | 657,906 | | | | 0.05 | %5 | | | 1.36 | % | | | 0.05 | %5 | | | 13 | % | | | | |
| | | 2.23 | | | | 23.76 | | | | 21.17 | % | | | 374,838 | | | | 0.05 | %5 | | | 1.80 | % | | | 0.05 | %5 | | | 8 | % | | | | |
| | | 0.68 | | | | 21.47 | | | | (3.85 | %) | | | 365,079 | | | | 0.05 | %5 | | | 1.64 | %6 | | | 0.05 | %5 | | | 12 | % | | | | |
| | | 2.56 | | | | 23.01 | | | | 13.42 | % | | | 506,220 | | | | 0.04 | %5 | | | 1.79 | % | | | 0.05 | %5 | | | 14 | % | | | | |
| | | 0.74 | | | | 22.63 | | | | 6.06 | % | | | 279,574 | | | | 0.52 | %5 | | | 1.56 | % | | | 0.62 | % | | | 49 | % | | | | |
5 | The expense ratio of the Sustainable Allocation Fund does not include indirect expenses of the underlying funds the Fund invests in. Indirect expenses of the underlying funds were 0.57% for the year ended December 31, 2020, 0.62% for the year ended December 31, 2019, 0.61% for the year ended December 31, 2018, and 0.61% for the year ended December 31, 2017. |
6 | In 2018, the Adviser reimbursed the Fund for expense overpayments related to transfer agent fees in the amount of $223,088. Before the reimbursement by the adviser, the difference in total returns for Investor Class and Institutional Class would have remained the same at (4.08)% and (3.85)%, respectively. The Net Investment Income for Investor Class and Institutional Class would have been 1.42% and 1.62%, respectively. |
| | 141 | SEE NOTES TO FINANCIAL STATEMENTS |
December 31, 2020 |
Notes to Financial Statements |
Pax World Funds Series Trust I and Pax World Fund Series Trust III
NOTE A—Organization and Summary of Significant Accounting Policies
Organization Pax World Funds Series Trust I (“Trust I”), which is registered under the Investment Company Act of 1940, as amended (the “1940 Act”), is an open-end management investment company organized under the laws of the Commonwealth of Massachusetts on May 25, 2006. As of December 31, 2020, Trust I offered ten investment funds: Pax Large Cap Fund (the “Large Cap Fund”), Pax Small Cap Fund (the “Small Cap Fund”), Pax ESG Beta Quality Fund (the “ESG Beta Quality Fund”), Pax ESG Beta Dividend Fund (the “ESG Beta Dividend Fund”), Pax Global Opportunities Fund (the “Global Opportunities Fund”), Pax Global Environmental Markets Fund (the “Global Environmental Markets Fund”), Pax MSCI EAFE ESG Leaders Index Fund (the “EAFE ESG Leaders Fund”), Pax Core Bond Fund (the “Core Bond Fund”), Pax High Yield Bond Fund (the “High Yield Bond Fund”), and Pax Sustainable Allocation Fund (the “Sustainable Allocation Fund”).
Pax World Funds Series Trust III (“Trust III”) is an open-end management investment company that was organized under the laws of the Commonwealth of Massachusetts on December 4, 2013 and registered under the 1940 Act. Pax Ellevate Global Women’s Leadership Fund (the “Global Women’s Leadership Fund”) is a diversified series of Trust III.
These financial statements relate to all funds (each a “Fund”, collectively, the “Funds”) offered under both Trust I and Trust III (each a “Trust”, collectively, the “Trusts”).
The Large Cap Fund, ESG Beta Dividend Fund, Global Opportunities Fund, Global Women’s Leadership Fund, EAFE ESG Leaders Fund, Core Bond Fund and Sustainable Allocation Fund each offer two classes of shares—Investor Class shares and Institutional Class shares. The Small Cap Fund, ESG Beta Quality Fund, Global Environmental Markets Fund and High Yield Bond Fund each offer three classes of shares—Investor Class shares, Class A shares and Institutional Class shares. Although all share classes generally have identical voting, dividend and liquidation rights, each class votes separately when required by law. Different share classes pay different distribution amounts to the extent the expenses of such classes differ, and distributions in liquidation will be proportional to the net asset value of each share class. Each share class has its own expense structure and sales charges, as applicable.
The Funds seek to avoid investing in issuers that their investment adviser has determined are involved in the manufacture or sale of weapons or manufacture of tobacco products or engage in business practices that their investment adviser determines to be sub-standard from an Environmental, Social and Governance (ESG) or sustainability perspective in relation to their industry, sector, asset class or universe peers.
The Large Cap Fund’s investment objective is to seek long-term growth of capital. The Fund seeks to achieve this objective by investing, under normal market conditions, at least 80% of its assets in equity securities (such as common stocks, securities convertible into common or preferred stocks and warrants) of companies that, when purchased, have capitalizations within the range of the Standard & Poor’s 500 Index as measured by market capitalization.
The Small Cap Fund’s investment objective is to seek long-term growth of capital. The Fund seeks to achieve this objective by investing, under normal market conditions, at least 80% of its assets in equity securities (such as common stocks, securities convertible into common or preferred stocks and warrants) of companies that, when purchased, have capitalizations within the range of the Russell 2000 Index as measured by market capitalization.
The ESG Beta Quality Fund’s investment objective is to seek long-term growth of capital. The Fund seeks to achieve this objective by investing, under normal market conditions, primarily in large-capitalization domestic equity securities that the Adviser believes have strong ESG profiles and that exhibit higher “quality” characteristics and reasonable valuations.
The ESG Beta Dividend Fund’s primary investment objective is income and capital appreciation. As a secondary objective and to the extent consistent with its primary investment objective, the ESG Beta Dividend Fund seeks capital preservation. The Fund seeks to achieve its investment objective by investing, under normal market conditions, at least 80% of its assets in equity securities that pay dividends.
The Global Opportunities Fund’s investment objective is to seek long term growth of capital by investing in companies benefiting from the transition to a more sustainable global economy. The Fund seeks to achieve this objective by investing, under normal market conditions, at least 80% of its net assets in companies that its Adviser or Sub-Adviser believe will benefit from the transition to a more sustainable global economy - the shift away from a depletive economy to one that preserves ecological and societal balance for the benefit of future generations. The Fund seeks to invest in companies with durable business models that are well-positioned to benefit from or avoid the risks associated with this transition. Under
December 31, 2020 |
Notes to Financial Statements, continued |
normal market conditions, the Global Opportunities Fund will invest primarily in equity securities (such as common stocks, preferred stocks and securities convertible into common or preferred stocks) of companies located around the world, including at least 40% of its net assets in securities of companies organized or located outside the United States or doing a substantial amount of business outside the United States, including those located in emerging markets.
The Global Environmental Markets Fund’s investment objective is to seek long term growth of capital by investing in innovative companies around the world whose businesses and technologies focus on environmental markets, including alternative energy and energy efficiency; water infrastructure technologies and pollution control; environmental support services and waste management technologies; and sustainable food, agriculture and forestry. The Fund seeks to achieve this objective by investing, under normal market conditions, at least 80% of its net assets in the foregoing companies and will invest primarily in equity securities (such as common stocks, preferred stocks and securities convertible into common and preferred stocks) of companies located around the world, including at least 40% of its net assets in securities of non-U.S. issuers, including those located in emerging markets.
The Global Women’s Leadership Fund’s investment objective is to seek investment returns that closely correspond to or exceed the price and yield performance, before fees and expenses, of the Impax Global Women’s Leadership Index (the “Women’s Index”), while maintaining risk characteristics that the Adviser believes are generally similar to those of the Women’s Index. The Fund seeks to achieve this objective by investing, under normal market conditions, more than 80% of its total assets in the component securities of the Women’s Index and in American depositary receipts, global depositary receipts and euro depositary receipts representing the component securities of the Women’s Index, including at least 40% of its net assets (unless market conditions are not deemed favorable, in which case the Global Women’s Leadership Fund would normally invest at least 30% of its assets) in securities of companies organized or located outside the U.S. or doing a substantial amount of business outside the U.S.
The EAFE ESG Leaders Fund’s investment objective is to seek investment returns that closely correspond to the price and yield performance, before fees and expenses, of the MSCI EAFE ESG Leaders Index. The Fund seeks to achieve this objective by investing, under normal circumstances, more than 80% of its total assets in the component securities of the MSCI EAFE ESG Leaders Index and in American depositary receipts, global depositary receipts and euro depositary receipts representing the component securities of the MSCI EAFE ESG Leaders Index.
The Core Bond Fund’s investment objective is to seek income and conservation of principal. The Fund seeks to achieve this objective by investing, under normal market conditions, at least 80% of its assets in bonds, which include debt obligations such as mortgage-related securities, securities issued by the United States government or its agencies and instrumentalities, municipal bonds, corporate bonds and high-impact bonds (which provide financing to support solutions to global sustainability challenges) across the spectrum of issuers, each of which is, at the time of purchase, rated at least investment grade (rated BBB- or higher by Standard & Poor’s Ratings Group or Baa3 or higher by Moody’s Investors Service) or unrated and determined by the Adviser to be of comparable quality.
The High Yield Bond Fund’s primary investment objective is to seek high current income. As a secondary investment objective, the High Yield Bond Fund seeks capital appreciation. The Fund seeks to achieve this objective by investing, under normal market conditions, at least 80% of its assets in high-yield, fixed income securities (such as bonds, notes or debentures) that are rated below BBB- by Standard & Poor’s Ratings Group or below Baa3 by Moody’s Investors Service, similarly rated by another major rating service, or unrated and determined by the High Yield Bond Fund’s investment adviser to be of comparable quality. These fixed income securities are commonly referred to as “junk bonds.”
The Sustainable Allocation Fund’s primary investment objective is to seek income and conservation of principal. As a secondary investment objective, the Fund seeks long-term growth of capital. The Fund uses a team approach to allocate among multiple funds managed by the Adviser (“Underlying Funds”) in order to seek to achieve its investment objectives. The Adviser will allocate the Fund’s assets among Underlying Funds in its sole discretion. The Fund seeks to achieve its investment objectives, under normal market conditions, by investing (indirectly through the use of Underlying Funds) approximately 50%-75% of its assets in equity securities (such as common stocks, preferred stocks and securities convertible into common or preferred stocks) and 25%-50% of its assets in debt securities (including but not limited to debt securities convertible into equity securities).
Under the Trusts’ organizational documents, its officers and trustees are indemnified against certain liabilities arising out of the performance of their duties to the Trusts. Additionally, in the normal course of business, the Trusts enter into contracts with service providers that contain general indemnification clauses. The Trusts’ maximum exposure under these arrangements is unknown as this could involve future claims that may be made against the Trusts that have not yet occurred. However, based on experience, the Trusts expect this risk of loss to be remote.
December 31, 2020 |
Notes to Financial Statements, continued |
Accounting Estimates The preparation of financial statements in conformity with U.S. generally accepted accounting principles (“GAAP”) requires management to make estimates and assumptions that affect the reported amounts of assets and liabilities and disclosure of contingent assets and liabilities at the date of the financial statements and the reported amounts of revenues and expenses during the reporting period. Actual results could differ from those estimates. The Funds apply Investment Company accounting and reporting guidance.
Valuation of Investments For purposes of calculating the net asset value (“NAV”), determined ordinarily as of the close of regular trading (normally 4:00 p.m. Eastern time) (the “NYSE Close”) on the New York Stock Exchange (“NYSE”) on each day that the NYSE is open for trading, the Funds normally use pricing data for domestic equity securities received shortly after the NYSE Close and do not normally take into account trading, clearances or settlements that take place after the NYSE Close. U.S. fixed income and non-U.S. securities are normally priced using data reflecting the earlier closing of the principal markets for those securities, subject to possible fair value adjustments. Information that becomes known to the Funds or their agents after NAV has been calculated on a particular day will not generally be used to retroactively adjust the price of a security or NAV determined earlier that day.
For the purpose of these financial statements, fair values for various types of securities and other instruments are determined on the basis of closing prices or last sales prices on an exchange or other market, or based on quotes or other market information obtained from quotation reporting systems, established market makers or pricing services. Short-term investments having a maturity of 60 days or less are generally valued at amortized cost, which approximates fair value.
Investments denominated in currencies other than the U.S. dollar are converted to U.S. dollars using exchange rates obtained from pricing services. As a result, the NAV of a Fund’s shares may be affected by changes in the value of currencies in relation to the U.S. dollar.
If market quotations are not readily available (including in cases when available market quotations are deemed to be unreliable), the Funds’ investments will be valued as determined in good faith pursuant to policies and procedures approved by the Boards of Trustees of the Trusts (the “Boards” or “Boards of Trustees”)(so called “fair value pricing”). Fair value pricing may require subjective determinations about the value of a security or other asset, and fair values used to determine a Fund’s NAV may differ from quoted or published prices, or from prices that are used by others, for the same investments. Also, the use of fair value pricing may not always result in adjustments to the prices of securities or other
assets held by a Fund. The Boards have delegated to the Adviser’s Best Execution and Valuation Committee the day-to-day responsibility for making fair value pricing determinations with respect to Fund holdings.
The Funds may determine that market quotations are not readily available due to events relating to a single issuer (e.g., corporate actions or announcements) or events relating to multiple issuers (e.g., governmental actions or natural disasters). The Funds may determine the fair value of investments based on information provided by pricing services and other third-party vendors, which may recommend fair value prices or adjustments with reference to other securities, indices or assets. In considering whether fair value pricing is required and in determining fair values, the Funds may, among other things, consider significant events (which may be considered to include changes in the value of U.S. securities or securities indices) that occur after the close of the relevant market and the usual time of valuation. At December 31, 2020, three securities were fair valued in good faith pursuant to policies and procedures approved by the Boards of Trustees. The Core Bond Fund held one security fair valued at $293,185, representing 0.04% of the Fund’s net asset value and the High Yield Bond Fund held two securities fair valued at $0, representing 0.00% of the Fund’s net asset value.
For those Funds that invest in non-U.S. securities, investors should be aware that many securities markets and exchanges outside the U.S. close prior to the close of the NYSE, and the closing prices for securities in such markets or on such exchanges may not fully reflect events that occur after such close but before the close of the NYSE. As a result, the Funds’ fair value pricing procedures require the Funds to consider changes in the fair value of non-U.S. securities between the time of the closing of the local market’s exchange and the close of the NYSE. Generally, if there has been a movement in the U.S. market that exceeds a specified threshold, the Funds will assess whether the closing price on the local exchange is still appropriate. Although the threshold may be revised from time to time and the number of days on which fair value prices will be used will depend on market activity, it is possible that fair value prices will be used by the Funds to a significant extent. The value determined for an investment using the Funds’ fair value pricing procedures may differ from recent market prices for the investment.
Fair Value Measurements Fair value is defined as the price that the Fund would receive upon selling an investment in an orderly transaction between market participants. The three-tier hierarchy of inputs is summarized in the three broad Levels listed below.
| | ● | Level 1 – unadjusted quoted prices in active markets for identical investments |
December 31, 2020 |
Notes to Financial Statements, continued |
| | ● | Level 2 – other significant observable inputs (including quoted prices for similar securities, interest rates, prepayment speeds, credit risk, etc.) |
| | ● | Level 3 – significant unobservable inputs (including the Funds’ own assumptions in determining the fair value of investments) |
Observable inputs are inputs that reflect the assumptions market participants would use in pricing the asset or liability developed based on market data obtained from sources independent of the reporting entity. Unobservable inputs are inputs that reflect the reporting entity’s own assumptions about the assumptions market participants would use in pricing the asset or liability developed based on the best information available in the circumstances. The inputs or methodology used for valuing securities are not necessarily an indication of the risk associated with investing in those securities. The following is a general summary of valuation inputs and classifications for different categories of securities.
Equity Securities Equity securities, including common stocks, preferred stocks and exchange-traded funds, for which market quotations are readily available, valued at the last reported sale price or official closing price as reported by an independent pricing service, are generally categorized as Level 1 in the hierarchy. Non-U.S. equity securities may also be valued at official close, or may be valued based on the fair value pricing procedures noted above. When third-party fair value pricing of foreign securities methods are applied, they are generally categorized as Level 2. To the extent that inputs for equity securities are unobservable, values are categorized as Level 3 in the hierarchy.
Fixed Income Securities Fixed income securities, including Corporate Bonds (both investment-grade and high-yield), U.S. Treasury Obligations, Government Bonds, Mortgage-Backed and Asset-Backed Securities, Bank Loans and Municipal Bonds, are valued at evaluated prices received from independent pricing services, which are evaluated using various inputs and techniques which may include trade activity, broker-dealer quotes, yield curves, coupon rates, default rates, cash flows, models and other inputs, and are generally categorized as Level 2 in the hierarchy. To the extent that inputs for fixed income securities are unobservable, values are categorized as Level 3 in the hierarchy.
Affiliated and Unaffiliated Investment Companies Investments in mutual funds are valued at the Funds’ closing net asset value and are generally categorized as Level 1.
Short-term Investments Short-term securities, including repurchase agreements, with remaining maturities of 60 days or less, which are valued at amortized cost, are generally categorized as Level 2 in the hierarchy.
The following is a summary of the inputs used to value the Funds’ net assets as of December 31, 2020:
| | Level 1 | | | Level 2 | | | Level 3* | | | Totals | |
Large Cap | | | | | | | | | | | | | | | | |
Common Stocks | | $ | 1,024,585,889 | | | $ | — | | | $ | — | | | $ | 1,024,585,889 | |
Cash Equivalents | | | 15,692,738 | | | | — | | | | — | | | | 15,692,738 | |
Total | | $ | 1,040,278,627 | | | $ | — | | | $ | — | | | $ | 1,040,278,627 | |
Small Cap | | | | | | | | | | | | | | | | |
Common Stocks | | $ | 446,205,840 | | | $ | — | | | $ | — | | | $ | 446,205,840 | |
Cash Equivalents | | | 31,502,917 | | | | — | | | | — | | | | 31,502,917 | |
Total | | $ | 477,708,757 | | | $ | — | | | $ | — | | | $ | 477,708,757 | |
ESG Beta Quality | | | | | | | | | | | | | | | | |
Common Stocks | | $ | 254,977,946 | | | $ | — | | | $ | — | | | $ | 254,977,946 | |
Cash Equivalents | | | 1,674,507 | | | | — | | | | — | | | | 1,674,507 | |
Total | | $ | 256,652,453 | | | $ | — | | | $ | — | | | $ | 256,652,453 | |
ESG Beta Dividend | | | | | | | | | | | | | | | | |
Common Stocks | | $ | 138,502,833 | | | $ | — | | | $ | — | | | $ | 138,502,833 | |
Cash Equivalents | | | 1,432,650 | | | | — | | | | — | | | | 1,432,650 | |
Total | | $ | 139,935,483 | | | $ | — | | | $ | — | | | $ | 139,935,483 | |
Global Opportunities | | | | | | | | | | | | | | | | |
Common Stocks | | $ | 39,294,601 | | | $ | 28,616,289 | | | $ | — | | | $ | 67,910,890 | |
Cash Equivalents | | | 1,174,705 | | | | — | | | | — | | | | 1,174,705 | |
Total | | $ | 40,469,306 | | | $ | 28,616,289 | | | $ | — | | | $ | 69,085,595 | |
Global Environmental Markets | | | | | | | | | | | | | | | | |
Common Stocks | | $ | 932,084,063 | | | $ | 637,858,261 | | | $ | — | | | $ | 1,569,942,324 | |
Cash Equivalents | | | 48,491,782 | | | | — | | | | — | | | | 48,491,782 | |
Total | | $ | 980,575,845 | | | $ | 637,858,261 | | | $ | — | | | $ | 1,618,434,106 | |
Global Women’s Leadership | | | | | | | | | | | | | | | | |
Common Stocks | | $ | 552,138,957 | | | $ | 190,588,897 | | | $ | — | | | $ | 742,727,854 | |
Preferred Stocks | | | — | | | | 698,267 | | | | — | | | | 698,267 | |
Cash Equivalents | | | 3,614,895 | | | | — | | | | — | | | | 3,614,895 | |
Total | | $ | 555,753,852 | | | $ | 191,287,164 | | | $ | — | | | $ | 747,041,016 | |
December 31, 2020 |
Notes to Financial Statements, continued |
| | Level 1 | | | Level 2 | | | Level 3* | | | Totals | |
EAFE ESG Leaders | | | | | | | | | | | | | | | | |
Common Stocks | | $ | 2,931,322 | | | $ | 685,310,916 | | | $ | — | | | $ | 688,242,238 | |
Preferred Stocks | | | — | | | | 3,157,259 | | | | — | | | | 3,157,259 | |
Cash Equivalents | | | 9,435,393 | | | | — | | | | — | | | | 9,435,393 | |
Total | | $ | 12,366,715 | | | $ | 688,468,175 | | | $ | — | | | $ | 700,834,890 | |
Core Bond | | | | | | | | | | | | | | | | |
Community Investment Notes | | $ | — | | | $ | — | | | $ | 293,185 | | | $ | 293,185 | |
Corporate Bonds | | | — | | | | 285,126,908 | | | | — | | | | 285,126,908 | |
U.S. Gov’t Agency Bonds | | | — | | | | 8,936,404 | | | | — | | | | 8,936,404 | |
Supranational Bonds | | | — | | | | 85,660,614 | | | | — | | | | 85,660,614 | |
Municipal Bonds | | | — | | | | 17,929,514 | | | | — | | | | 17,929,514 | |
U.S. Treasury Notes | | | — | | | | 101,827,100 | | | | — | | | | 101,827,100 | |
Asset-Backed Securities | | | — | | | | 55,218,770 | | | | — | | | | 55,218,770 | |
Mortgage-Backed Securities | | | — | | | | 196,960,858 | | | | — | | | | 196,960,858 | |
Medium Term Certificates of Deposit | | | — | | | | 260,119 | | | | — | | | | 260,119 | |
Cash Equivalents | | | 14,032,024 | | | | 254,532 | | | | — | | | | 14,286,556 | |
Total | | $ | 14,032,024 | | | $ | 752,174,819 | | | $ | 293,185 | | | $ | 766,500,028 | |
High Yield Bond | | | | | | | | | | | | | | | | |
Community Investment Notes | | $ | — | | | $ | — | | | $ | 500,813 | | | $ | 500,813 | |
Common Stocks | | | — | | | | — | | | | 0 | | | | 0 | |
Preferred Stocks | | | 2,794,200 | | | | — | | | | 0 | | | | 2,794,200 | |
Corporate Bonds | | | — | | | | 450,542,243 | | | | — | | | | 450,542,243 | |
Loans | | | — | | | | 5,251,022 | | | | — | | | | 5,251,022 | |
Medium Term Certificates of Deposit | | | — | | | | 100,797 | | | | — | | | | 100,797 | |
Cash Equivalents | | | 7,451,254 | | | | 1,107,251 | | | | — | | | | 8,558,505 | |
Total | | $ | 10,245,454 | | | $ | 457,001,313 | | | $ | 500,813 | | | $ | 467,747,580 | |
Sustainable Allocation | | | | | | | | | | | | | | | | |
Affiliated Investment Companies | | $ | 2,068,889,609 | | | $ | — | | | $ | — | | | $ | 2,068,889,609 | |
Cash Equivalents | | | 101,977,753 | | | | — | | | | — | | | | 101,977,753 | |
Total | | $ | 2,170,867,362 | | | $ | — | | | $ | — | | | $ | 2,170,867,362 | |
* | Table includes securities valued at zero. |
See Schedules of Investments for additional detailed industry classifications.
Significant unobservable inputs were used by two Funds for Level 3 fair value measurements. The High Yield Bond Fund holds two securities of the same issuer which are deemed to be valued at zero based on company financial statements, and one security based on broker valuation levels. The Core Bond Fund holds a position in a Community Investment note which is valued based on a general obligation by the parent entity to limit investment exposure on the note.
Investment Transactions Investment transactions are recorded as of the date of purchase, sale or maturity. Net realized gains and losses from the sale or disposition of securities are determined on the identified cost basis, which is also used for federal income tax purposes. Corporate actions (including cash dividends) are recorded net of foreign tax withholdings.
Investment Income Dividend income is recorded on the ex-dividend date. Interest income is recorded on the accrual basis and includes accretion of discount and amortization of premiums, if any. The value of additional securities received as dividend payments is recorded as income and as an increase to the cost basis of such securities. The Funds amortize purchase price premium and accrete discount on bonds, if any, over the remaining life of the bonds using the effective interest method of amortization; for callable bonds, the premium amortization period is to the earliest call date.
Distributions to Shareholders Distributions to shareholders are recorded by each of the Funds on the ex-dividend dates. The Funds (except Core Bond Fund and High Yield Bond Fund) expect to pay dividends of net investment income, if any, semiannually and to make distributions of capital gains, if any, at least annually.
The Core Bond Fund and High Yield Bond Fund expect to pay dividends of net investment income, if any, monthly and to make distributions of capital gains, if any, at least annually. A shareholder begins earning dividends on the Core Bond Fund and High Yield Bond Fund shares the day after the Funds receive his or her purchase payment. Income and capital gains distributions are determined in accordance with income tax regulations, which may differ from U.S. generally accepted accounting principles.
Class Accounting Expenses directly attributable to a class of shares, such as 12b-1 distribution fees, are charged to that class. Each Fund has adopted a 12b-1 plan, applicable to certain classes of each of the Funds. Expenses of the Funds that are directly identifiable to a specific Fund, such as transfer agent fees, custody fees and registration fees, are applied to that Fund. Expenses that are not readily identifiable to a specific Fund, such as printing expense, Trustees’ fees and legal fees, are allocated in such a manner as deemed equitable, taking into consideration the nature and type of expense and the relative net assets of the Funds. Investment income, realized and unrealized gains and losses are allocated based upon the relative daily net assets of each class of shares.
Federal Income Taxes Each of the Funds has elected to be treated and intends to qualify each year as a regulated investment company under Subchapter M of the Internal Revenue Code of 1986, as amended. If a Fund so qualifies and satisfies
December 31, 2020 |
Notes to Financial Statements, continued |
certain distribution requirements, such Fund will ordinarily not be subject to federal income tax on its net investment income (which includes short-term capital gains) and net capital gains that it distributes to shareholders. Each Fund expects to distribute all or substantially all of its income and gains to shareholders every year. Therefore, no federal income or excise tax provision is required. The Funds are treated as separate entities for federal income tax purposes.
Foreign Currency Transactions The accounting records of the Funds are maintained in U.S. dollars. In addition, purchases and sales of investment securities, dividend and interest income, and certain expenses are translated at the rates of exchange prevailing on the respective dates of such transactions. Net realized and unrealized foreign currency exchange gains or losses occurring during the holding period of investment securities are a component of realized gain (loss) on investment transactions and unrealized appreciation (depreciation) on investments, respectively.
Non-U.S. Securities Non-U.S. markets can be significantly more volatile than domestic markets, causing the prices of some Fund investments to fluctuate significantly, rapidly and unpredictably. Non-U.S. securities may be less liquid than domestic securities; consequently, a Fund may at times be unable to sell non-U.S. securities at desirable times or prices. Other risks related to non-U.S. securities include delays in the settlement of transactions; less publicly available information about issuers; different reporting, accounting and auditing standards; the effect of political, social, diplomatic or economic events; seizure, expropriation or nationalization of the issuer or its assets; fluctuation in foreign currency exchange rates and the possible imposition of currency exchange controls. If a Fund invests substantially in securities of non-U.S. issuers tied economically to a particular country or geographic region, it will be subject to the risks associated with such country or geographic region to a greater extent than a fund that is more diversified across countries or geographic regions.
Securities Lending The Funds may lend their securities pursuant to a securities lending agreement (Lending Agreement) with State Street Bank and Trust Company. Initial security loans made pursuant to the Lending Agreement are required to be secured by collateral not less than the percentage specified in the agreement, ranging from 102% to 105%, depending on the types of securities. Cash collateral received is invested in the State Street Navigator Securities Lending Government Money Market Portfolio, a registered Rule 2a-7 money market fund. Borrowers may also pledge non-cash collateral within the guidelines for acceptable forms of non-cash collateral approved by the Boards of Trustees. At December 31, 2020, non-cash collateral consisted of U.S. Treasuries, short-term U.S. Government agency obligations and sovereign debt.
The Funds have the right under the Lending Agreement to recover the securities from the borrower on demand. The primary risk associated with securities lending is if the borrower defaults on its obligation to return the securities loaned because of insolvency or other reasons. The Funds could experience delays and costs in recovering securities loaned or in gaining access to the collateral. In the event the borrower fails to return loaned securities and the collateral received is insufficient to cover the value of the loaned securities and provided such collateral shortfall is not the result of investment losses, the lending agent has agreed to pay the amount of the shortfall to the Funds, or at the discretion of the lending agent, replace the loaned securities.
A portion of the income generated upon investment of the collateral is remitted to the borrower and the remainder is allocated between the Funds and the lending agent. The Funds record security lending income net of such allocation. The Funds continue to receive dividends on the securities loaned, which are accounted for in the same manner as other dividend and interest income.
As of December 31, 2020, the value of securities loaned, payable for collateral due to brokers and non-cash collateral pledged by brokers were as follows:
Fund | | Market Value
of Securities
Loaned | | | Payable on
Collateral Due
to Broker | | | Non-Cash
Collateral Value * | | | Over (Under)
Collateralized | |
Large Cap | | $ | 8,352,723 | | | $ | — | | | $ | 8,462,569 | | | $ | 109,846 | |
Small Cap | | | 42,798,518 | | | | 16,801,446 | | | | 27,103,921 | | | | 1,106,849 | |
ESG Beta Quality | | | 2,980,114 | | | | — | | | | 3,017,972 | | | | 37,858 | |
ESG Beta Dividend | | | 545,239 | | | | — | | | | 562,401 | | | | 17,162 | |
Global Women’s Leadership | | | 1,062,536 | | | | — | | | | 1,093,105 | | | | 30,569 | |
EAFE ESG Leaders | | | 2,546,905 | | | | 1,842,875 | | | | 841,516 | | | | 137,486 | |
Core Bond | | | 3,587,349 | | | | 3,660,830 | | | | — | | | | 73,481 | |
* | Non-cash collateral is not included in the financial statements. |
For the Small Cap Fund, ESG Beta Quality Fund, ESG Beta Dividend Fund and Women’s Leadership Fund all of the securities on loan at December 31, 2020 are classified as Common Stocks in each Fund’s Schedule of Investments. For the Core Bond Fund all of the securities on loan at December 31, 2020 are classified as Corporate Bonds on the Fund’s Schedule of Investments.
NOTE B—Investment Advisory Fee and Transactions with Affiliated and Other Parties
Trust I and Trust III have entered into an Investment Advisory Contract (the “Management Contract”) with Impax Asset Management LLC (“IAM”) (the “Adviser”). Pursuant to the terms of the Management Contract, the Adviser,
December 31, 2020 |
Notes to Financial Statements, continued |
subject to the supervision of the Boards of Trustees of the Trusts, is responsible for managing the assets of the Funds in accordance with the Funds’ investment objectives, investment programs and policies.
Pursuant to the Management Contract, the Adviser has contracted to furnish the Funds continuously with an investment program, determining what investments to purchase, sell and exchange for the Funds and what assets to hold uninvested. The Adviser also has contracted to provide office space and certain management and administrative facilities for the Funds. In return for such services, the Funds pay an advisory fee to the Adviser at the following annual rates (expressed as a percentage of the average daily net assets of such Fund):
Fund | | Annual Rate | |
Large Cap | | | 0.65 | % |
Small Cap | | | 0.75 | % |
ESG Beta Quality1 | | | 0.65 | %* |
ESG Beta Dividend2 | | | 0.65 | %* |
Global Opportunities3 | | | 0.80 | % |
Global Environmental Markets4 | | | 0.80 | % |
Global Women’s Leadership5 | | | 0.55 | %* |
EAFE ESG Leaders6 | | | 0.48 | %* |
Core Bond | | | 0.40 | % |
High Yield Bond | | | 0.50 | % |
Sustainable Allocation | | | 0.05 | %* |
* | The management fee is a unified fee that includes all of the operating costs and expenses of the Fund (other than taxes, charges of governmental agencies, interest, brokerage commissions incurred in connection with portfolio transactions, distribution and/or service fees payable under a plan pursuant to Rule 12b-1 under the Investment Company Act of 1940, acquired fund fees and expenses and extraordinary expenses), including accounting expenses, administrator, transfer agent, custodian fees, legal fees and other expenses. |
1 | The management fee is 0.65% based on average net assets up to $225 million; 0.55% for assets of $225 million to $375 million; 0.50% for assets of $375 million to $500 million; and 0.45% for assets over $500 million. |
2 | The management fee is 0.65% based on average net assets up to $150 million; 0.55% for assets of $150 million to $375 million; 0.50% for assets of $375 million to $500 million; and 0.45% for assets over $500 million. |
3 | The Fund’s investment adviser has contractually agreed to waive a portion of its management fee equal to the management fee corresponding to the current market value of 200,000 shares (plus shares reinvested). This waiver may not be amended or terminated without the approval of the Board of Trustees before December 31, 2021. |
4 | The management fee is 0.80% based on average net assets up to $1 billion; 0.75% for assets of $1 billion to $1.5 billion; 0.70% for assets of $1.5 billion to $2 billion; 0.65% for assets of $2 billion to $3 billion; and 0.60% for assets over $3 billion. |
5 | The management fee is 0.55% based on average net assets up to $375 million; 0.50% for assets of $375 million to $750 million; and 0.45% for assets over $750 million. |
6 | Effective May 1, 2020, the management fee changed to 0.48% based on average net assets up to $600 million; 0.45% for assets of $600 million to $750 million; and 0.40% for assets over $750 million. Prior to May 1, 2020, the Fund’s annual rate (expressed as percentage of the average daily net assets of the Fund) was 0.55% on the first $600 million, 0.45% for assets of $600 million to $750 million; and 0.40% for assets over $750 million. |
For the year ended December 31, 2020, the Funds incurred the following advisory fees:
Fund | | Amount | |
Large Cap | | $ | 5,316,037 | |
Small Cap | | | 2,852,994 | |
ESG Beta Quality | | | 1,477,044 | |
ESG Beta Dividend | | | 806,820 | |
Global Opportunities | | | 386,385 | |
Global Environmental Markets | | | 8,773,270 | |
Global Women’s Leadership | | | 2,993,519 | |
EAFE ESG Leaders | | | 2,955,639 | |
Core Bond | | | 2,846,119 | |
High Yield Bond | | | 1,901,098 | |
Sustainable Allocation | | | 955,347 | |
The Adviser has contractually agreed to reimburse the Funds or limit expenses of the Funds to the extent that each Fund’s respective expenses exceed, on an annual basis, the following percentages of average daily net assets:
| | | Expense Caps | |
Fund | | Investor | | | Class A | | | Institutional | |
ESG Beta Quality 1 | | | 0.90 | % | | | 0.90 | % | | | 0.65 | % |
ESG Beta Dividend 1 | | | 0.90 | % | | | | | | | 0.65 | % |
Global Opportunities 2 | | | 1.23 | % | | | | | | | 0.98 | % |
Global Women’s Leadership 1 | | | 0.80 | % | | | | | | | 0.55 | % |
EAFE ESG Leaders 1 | | | 0.73 | % | | | | | | | 0.48 | % |
Sustainable Allocation 1 | | | 0.30 | % | | | | | | | 0.05 | % |
1 | Expense caps for funds represent their respective unified management fees plus distribution and/or service fees payable under a plan pursuant to Rule 12b-1, as applicable to particular classes of shares. |
2 | The Adviser has contractually agreed to reimburse expenses (other than interest, commissions, taxes, extraordinary expenses and acquired fund fees and expenses, if any) to the extent that they exceed the expense caps indicated. The reimbursement arrangement may not be amended or terminated without the approval of the Fund’s Board of Trustees before December 31, 2021. |
Such expenses include (i) management and distribution fees; (ii) the fees of affiliated and unaffiliated Trustees; (iii) the fees of the Funds’ custodian and transfer agent; (iv) the fees of the Funds’ legal counsel and independent registered public accounting firm; (v) the reimbursement of organizational expenses; and
December 31, 2020 |
Notes to Financial Statements, continued |
(vi) expenses related to shareholder communications including all expenses of shareholders’ and Boards of Trustees’ meetings and of preparing, printing and mailing reports, proxy statements and prospectuses to shareholders.
For the year ended December 31, 2020, the dollar amounts of expense reimbursements were as follows:
| | | Total Expenses Reimbursed by Adviser | |
Fund | | Investor | | | Institutional | |
Global Opportunities | | $ | 7,719 | | | $ | 152,387 | |
In addition, the Adviser waived $19,827 of its management fee from the Global Opportunities Fund.
The Trusts have adopted a plan (“Plan”) pursuant to Rule 12b-1 under the 1940 Act that allows the Funds to pay distribution fees for the sale and distribution of certain shares as described below and for personal services rendered to the Fund shareholders in connection with the maintenance of shareholder accounts. Under the Plan, each Fund will pay its Distributor a distribution fee equal to 0.25% of the annual average daily net assets attributable to the Investor Class shares and Class A shares. The Distributor may pay all or any portion of the distribution fee to securities dealers or other organizations (including, but not limited to, any affiliate of the Distributor) as commissions, asset-based sales charges or other compensation with respect to the sale of indicated shares of such Fund, or for providing personal services to investors in the indicated shares of such Fund and/or the maintenance of shareholder accounts, and may retain all or any portion of the distribution fee as compensation for the Distributor’s services as principal underwriter of the indicated shares of such Fund.
Several individuals who are officers and/or Trustees of the Trusts are also employees of the Adviser.
NOTE C—Investment Information
Purchases and proceeds from sales of investments for the Funds for the year ended December 31, 2020 were as follows:
| | | Purchases | | | Sales | |
Fund | | Investments1 | | | U.S. Gov’t Bonds | | | Investments1 | | | U.S. Gov’t Bonds | |
Large Cap | | $ | 432,973,198 | | | $ | — | | | $ | 343,089,067 | | | $ | — | |
Small Cap | | | 268,506,380 | | | | — | | | | 289,400,296 | | | | — | |
ESG Beta Quality | | | 147,759,355 | | | | — | | | | 158,610,339 | | | | — | |
ESG Beta Dividend | | | 114,251,578 | | | | — | | | | 124,326,809 | | | | — | |
Global Opportunities | | | 30,178,030 | | | | — | | | | 16,447,670 | | | | — | |
Global Environmental Markets | | | 601,265,672 | | | | — | | | | 271,161,365 | | | | — | |
Global Women’s Leadership | | | 585,729,310 | | | | — | | | | 385,935,630 | | | | — | |
EAFE ESG Leaders | | | 253,071,063 | | | | — | | | | 264,002,479 | | | | — | |
Core Bond | | | 345,079,507 | | | | 296,240,315 | | | | 242,611,463 | | | | 307,935,231 | |
High Yield | | | 450,086,442 | | | | — | | | | 363,214,061 | | | | — | |
Sustainable Allocation | | | 242,779,550 | | | | — | | | | 231,824,241 | | | | — | |
1 | Excluding short-term investments and U.S. Government bonds. |
For federal income tax purposes, the identified cost of investments owned at December 31, 2020 as well as the gross unrealized appreciation (depreciation) of investments and resulting net unrealized appreciation (depreciation) as of December 31, 2020 were as follows for the Funds:
Fund | | Identified cost of
investments for
Federal income
tax basis | | | Gross unrealized
appreciation | | | Gross unrealized
depreciation | | | Net unrealized
appreciation
(depreciation) | |
Large Cap | | $ | 672,066,054 | | | $ | 368,380,591 | | | $ | 168,018 | | | $ | 368,212,573 | |
Small Cap | | | 398,951,963 | | | | 96,208,762 | | | | 17,451,968 | | | | 78,756,794 | |
ESG Beta Quality | | | 124,083,776 | | | | 132,571,676 | | | | 2,999 | | | | 132,568,677 | |
ESG Beta Dividend | | | 82,050,266 | | | | 57,903,245 | | | | 18,028 | | | | 57,885,217 | |
Global Opportunities | | | 51,506,967 | | | | 17,870,683 | | | | 292,055 | | | | 17,578,628 | |
Global Environmental Markets | | | 1,117,187,426 | | | | 506,467,207 | | | | 5,220,527 | | | | 501,246,680 | |
Global Women’s Leadership | | | 594,345,843 | | | | 161,713,365 | | | | 9,018,192 | | | | 152,695,173 | |
EAFE ESG Leaders | | | 541,257,535 | | | | 188,873,178 | | | | 29,295,823 | | | | 159,577,355 | |
Core Bond | | | 735,488,538 | | | | 32,466,787 | | | | 1,455,297 | | | | 31,011,490 | |
High Yield | | | 444,501,404 | | | | 24,135,147 | | | | 888,971 | | | | 23,246,176 | |
Sustainable Allocation | | | 1,735,733,473 | | | | 435,133,889 | | | | — | | | | 435,133,889 | |
At December 31, 2020 the Small Cap Fund, Global Opportunities Fund, Global Environmental Markets Fund, Global Women’s Leadership Fund and EAFE ESG Leaders Fund had unrealized foreign currency gains (losses) of $60; $25,634; $40,166; $15,804; and $146,787, respectively.
December 31, 2020 |
Notes to Financial Statements, continued |
Netting Agreements During the ordinary course of business, the Funds may enter into transactions subject to enforceable netting agreements or other similar arrangements (“netting agreements”). Generally, the right to offset in netting agreements allows a Fund to offset any exposure to a specific counterparty with any collateral received or delivered to that counterparty based on the terms of the agreement. Generally, a Fund manages its cash collateral and securities collateral on a counterparty basis. As of December 31, 2020, there is no collateral held at the counterparty that would be offset by a master netting agreement that the Funds have with the counterparty. The Funds did not hold any derivative instruments as of December 31, 2020.
Affiliated Investments The term “affiliated company” includes other investment companies that are managed by a Fund’s Adviser. At December 31, 2020, the Sustainable Allocation Fund held the following investments in affiliated Funds:
Fund | | Shares
Held at
12/31/19 | | | Gross
Additions | | | Gross
Reductions | | | Shares
Held at
12/31/20 | |
Sustainable Allocation | | | | | | | | | | | | | | | | |
Large Cap | | | 73,178,029 | | | | 8,368,234 | | | | 7,423,313 | | | | 74,122,950 | |
Small Cap | | | 2,158,328 | | | | 1,777,251 | | | | — | | | | 3,935,579 | |
ESG Beta Dividend | | | 10,010,369 | | | | 274,015 | | | | 1,963,973 | | | | 8,320,411 | |
Global Opportunities | | | 2,548,966 | | | | 23,125 | | | | — | | | | 2,572,091 | |
Global Environmental Markets | | | 1,482,025 | | | | 698,726 | | | | — | | | | 2,180,751 | |
Global Women’s Leadership | | | 785,900 | | | | 747,541 | | | | — | | | | 1,533,441 | |
EAFE ESG Leaders | | | 15,576,499 | | | | 3,411,924 | | | | 3,127,524 | | | | 15,860,899 | |
Core Bond | | | 66,778,157 | | | | 6,943,954 | | | | 7,162,992 | | | | 66,559,119 | |
High Yield | | | 3,263,125 | | | | 69,071 | | | | 3,332,196 | | | | — | |
Fund | | Value at
12/31/19 | | | Dividend
Income | | | Realized
Gains/
Losses1 | | | Net change
in Unrealized
Appreciation/
Depreciation | | | Value at
12/31/20 | |
Sustainable Allocation | | | | | | | | | | | | | | | | | | | | |
Large Cap | | $ | 761,051,498 | | | $ | 6,184,319 | | | $ | 55,877,389 | | | $ | 120,068,343 | | | $ | 893,181,549 | |
Small Cap | | | 31,986,423 | | | | — | | | | 2,314,800 | | | | 8,628,685 | | | | 62,929,908 | |
ESG Beta Dividend | | | 128,232,821 | | | | 2,102,449 | | | | 5,703,747 | | | | 7,194,016 | | | | 118,233,034 | |
Global Opportunities | | | 30,689,545 | | | | 32,446 | | | | 298,943 | | | | 6,763,084 | | | | 37,784,018 | |
Global Environmental Markets | | | 25,149,965 | | | | 275,663 | | | | — | | | | 12,371,705 | | | | 46,297,333 | |
Global Women’s Leadership | | | 21,329,334 | | | | 578,439 | | | | — | | | | 4,862,179 | | | | 46,769,952 | |
EAFE ESG Leaders | | | 145,484,501 | | | | 2,985,967 | | | | 2,967,571 | | | | 17,391,480 | | | | 160,829,518 | |
Core Bond | | | 687,147,238 | | | | 13,656,252 | | | | 19,201,603 | | | | 13,359,203 | | | | 702,864,297 | |
High Yield | | | 22,058,723 | | | | 448,587 | | | | (130,091 | ) | | | (1,047,239 | ) | | | — | |
Total | | $ | 1,853,130,048 | | | $ | 26,264,122 | | | $ | 86,233,962 | | | $ | 189,591,456 | | | $ | 2,068,889,609 | |
The Funds are permitted to purchase and sell securities (“cross-trade”) from and to other Funds within the Trusts or other accounts managed by the Adviser pursuant to “Cross-Trading” Procedures adopted by the Trusts’ Boards of Trustees. These procedures have been designed to ensure that any cross-trade of securities by the respective Fund from or to another Fund or account that is or could be considered an affiliate of the Fund under certain limited circumstances by virtue of having a common investment adviser complies with Rule 17a-7 of the 1940 Act. Further, as defined under these procedures, each cross-trade is effected at the current market price to save costs where allowed. Pursuant to these procedures, for the year ended December 31, 2020, the Global Women’s Leadership Fund and the EAFE ESG Leaders Fund engaged in cross-trades. The Global Women’s Leadership Fund and the EAFE ESG Leaders Fund had total purchases of $1,102,044 and $1,657,546, respectively, and total sales of $1,657,546 and $1,102,044, respectively. The Global Women’s Leadership Fund and EAFE ESG Leaders Fund had net gains of $180,717 and $62,901, respectively.
Restricted and Illiquid Securities The Funds may purchase certain restricted securities and limited amounts of illiquid securities. The Funds may invest in securities exempt from registration under Rule 144A of the Securities Act of 1933 (“the Act”) which are restricted from sale to the public and may only be sold to a qualified institutional buyer. The Funds do not have the right to demand that such securities be registered. The value of such securities is determined by valuations supplied by a pricing service or, if not available, in good faith by or at the direction of the Boards of Trustees. At December 31, 2020, the Core Bond Fund held $114,478,481 or 15.05% of net assets and the High Yield Bond Fund held $337,421,634 or 71.44% of net assets in securities exempt from registration under Rule 144A of the Act.
At December 31, 2020 the Core Bond Fund held $4,656,695 of illiquid securities representing 0.61% of net assets and High Yield Bond Fund held $1,708,861 of illiquid securities, representing 0.36% of net assets. The Fund will classify as “illiquid” all securities that the Fund reasonably expects cannot be sold or disposed of in current market conditions in seven calendar days or less without the sale or disposition significantly changing the market value of the investment. Illiquid investments may include restricted securities, repurchase agreements that mature in more than seven days or that have a notice or demand feature more than seven days, certain over-the-counter option contracts and participation interests in
December 31, 2020 |
Notes to Financial Statements, continued |
loans. Because illiquid securities trade less frequently and in smaller volume than liquid securities, the Fund may experience difficulty in closing out positions at prevailing market prices.
Security | | Acquisition Date Range | | | Cost | | | Market Value | |
Core Bond | | | | | | | | | | | | |
Capital Impact Partners, 2.300%, 10/15/24 | 10/21/19 - 10/21/19 | | $ | 500,000 | | | $ | 511,719 | |
CINI Investment Note, 2.000%, 10/31/23 | 11/03/20 - 11/03/20 | | | 293,185 | | | | 293,185 | |
Community Credit Union of Lynn, 2.200%, 11/29/22 | 11/14/17 - 11/14/17 | | | 250,000 | | | | 260,119 | |
Master Asset Backed Securities Trust 2007-NCW, 1 month LIBOR +0.748%, 144A, 2.691%, 05/25/37 | 07/06/17 - 07/06/17 | | | 1,228,939 | | | | 1,217,535 | |
Self-Help Federal Credit Union, 1.900%, 12/20/21 | 12/17/19 - 12/17/19 | | | 250,000 | | | | 254,532 | |
Tesla Energy Operations, Inc., 4.700%, 05/29/25 | 05/26/15 - 05/26/15 | | | 1,989,251 | | | | 2,119,605 | |
| Security | | Acquisition Date Range | | Cost | | Market Value |
| High Yield Bond | | | | | | | | | | |
| Beneficial State Bank, 1.200%, 01/21/21 | | 01/21/20 - 01/21/20 | | $ | 200,000 | | | $ | 200,000 | |
| CINI Investment Note, 2.000%, 09/30/23 | | 09/01/20 - 09/01/20 | | | 500,813 | | | | 500,813 | |
| Interactive Health, Inc. | | 03/19/04 - 10/01/13 | | | 178,981 | | | | 0 | |
| Interactive Health, Inc., 0.000% | | 03/19/04 - 10/01/13 | | | 357,962 | | | | 0 | |
| Self-Help Credit Union, 0.650%, 04/29/22 | | 04/22/20 - 04/22/20 | | | 100,000 | | | | 100,797 | |
| Self-Help Credit Union, 1.900%, 12/20/21 | | 12/17/19 - 12/17/19 | | | 400,000 | | | | 407,251 | |
| Shared Interest, Inc., 2.400%, 09/30/21 | | 09/30/18 - 09/30/18 | | | 500,000 | | | | 500,000 | |
NOTE D—Tax Information
The timing and characterization of certain income and capital gains distributions are determined annually in accordance with federal tax regulations, which may differ from GAAP. In addition to permanent differences previously noted, temporary differences may arise from recognition of certain items of income, expense, gain or loss in different periods for financial reporting and tax purposes. Such differences will reverse at some time in the future. As a result, net investment income (loss) and net realized gain (loss) on investment transactions for a reporting period may differ significantly from distributions during such period. For tax purposes, short-term capital gains are considered ordinary income.
The tax character of distributions paid during 2020 and 2019 was as follows:
| | | Distributions paid in 2020 | | | Distributions paid in 2019 | |
Fund | | Ordinary
income | | | Long-term
capital gains | | | Ordinary
income | | | Long-term
capital gains | |
Large Cap | | $ | 17,065,871 | | | $ | 48,903,970 | | | $ | 8,866,803 | | | $ | 18,561,007 | |
Small Cap | | | 12,545,619 | | | | 4,656,831 | | | | 3,873,595 | | | | 318,705 | |
ESG Beta Quality | | | 2,498,849 | | | | 2,533,652 | | | | 3,203,047 | | | | 4,833,494 | |
ESG Beta Dividend | | | 2,432,461 | | | | 1,874,179 | | | | 2,720,704 | | | | 3,625,330 | |
Global Opportunities | | | 601,990 | | | | 84 | | | | 454,580 | | | | 318,335 | |
Global Environmental Markets | | | 8,256,780 | | | | — | | | | 7,439,925 | | | | — | |
Global Women’s Leadership | | | 8,377,472 | | | | — | | | | 7,152,818 | | | | 6,309,317 | |
EAFE ESG Leaders | | | 12,196,204 | | | | — | | | | 16,043,570 | | | | — | |
Core Bond | | | 24,750,437 | | | | 6,858,503 | | | | 18,311,162 | | | | — | |
High Yield Bond | | | 19,024,947 | | | | — | | | | 18,937,116 | | | | — | |
Sustainable Allocation | | | 24,868,963 | | | | 35,382,666 | | | | 42,603,462 | | | | 123,434,470 | |
The Large Cap Fund, Small Cap Fund, ESG Beta Dividend Fund and Core Bond Fund elected to defer $382,502; $302,428; $139,494; and $303,532, respectively, of capital losses recognized between November 1, 2020 and December 31, 2020 for the Funds’ fiscal year ending December 2020. In addition, the Global Opportunities Fund and Global Environmental Markets Fund incurred late-year ordinary losses of $2,122 and $71,092, respectively. These losses are treated for federal income tax purposes as if they had occurred on January 1, 2021.
For the year ended December 31, 2020, the components of distributable earnings on a tax basis are as follows:
Fund | | Undistributed
Ordinary
Income | | | Undistributed
Long-Term
Capital Gain | | | Other
Temporary
Differences | | | Net Unrealized
Appreciation
(Depreciation) | |
Large Cap | | $ | 3,228,459 | | | $ | — | | | $ | (382,502 | ) | | $ | 368,212,573 | |
Small Cap | | | 6,483,778 | | | | — | | | | (302,428 | ) | | | 78,756,854 | |
ESG Beta Quality | | | 165,125 | | | | 684,512 | | | | — | | | | 132,568,677 | |
ESG Beta Dividend | | | — | | | | — | | | | (139,494 | ) | | | 57,885,217 | |
Global Opportunities | | | 194,267 | | | | — | | | | (2,122 | ) | | | 17,552,994 | |
Global Environmental Markets | | | — | | | | — | | | | (22,812,528 | ) | | | 501,286,846 | |
Global Women’s Leadership | | | 326,361 | | | | — | | | | (7,614,335 | ) | | | 152,710,977 | |
EAFE ESG Leaders | | | 1,601,921 | | | | — | | | | (34,520,627 | ) | | | 159,724,142 | |
Core Bond | | | — | | | | 1,290,026 | | | | (303,532 | ) | | | 31,011,490 | |
High Yield | | | — | | | | — | | | | (68,431,846 | ) | | | 23,246,176 | |
Sustainable Allocation | | | 28,167,975 | | | | 54,196,449 | | | | — | | | | 435,133,889 | |
As of December 31, 2020, for federal income tax purposes, the following Funds had capital loss carryforwards available to offset future gains, if any, to the extent provided by the Treasury regulations:
December 31, 2020 |
Notes to Financial Statements, continued |
| | | No Expiration | |
Fund | | Short-term | | | Long-term | |
Global Environmental Markets | | $ | — | | | $ | 22,741,436 | |
Global Women’s Leadership | | | 7,614,335 | | | | — | |
EAFE ESG Leaders | | | 823,849 | | | | 33,696,778 | |
High Yield Bond | | | 25,102,246 | | | | 43,243,868 | |
For financial reporting purposes, the capital accounts are adjusted to reflect the tax character of permanent book/tax differences. Reclassifications are primarily due to tax treatment of gain (loss) on foreign currency transactions and tax treatment related to REITs and PFICs.
For the year ended December 31, 2020, the Funds recorded the following reclassifications:
| Fund | | Undistributed
Net Investment
Income | | Accumulated Net
Realized Gain/
(Loss) | | Paid In
Capital |
| Large Cap | | $ | (189,795 | ) | | $ | 189,795 | | | $ | — | |
| Small Cap | | | 180,083 | | | | (180,083 | ) | | | — | |
| ESG Beta Quality | | | (34,318 | ) | | | 34,318 | | | | — | |
| ESG Beta Dividend | | | (110,669 | ) | | | 116,901 | | | | (6,232 | ) |
| Global Opportunities | | | (22,994 | ) | | | 22,994 | | | | — | |
| Global Environmental Markets | | | (138,964 | ) | | | 138,964 | | | | — | |
| Global Women’s Leadership | | | (32,550 | ) | | | 32,550 | | | | — | |
| EAFE ESG Leaders | | | 563,419 | | | | (563,419 | ) | | | ��� | |
| Core Bond | | | 1,260,979 | | | | (1,260,979 | ) | | | — | |
| High Yield | | | 233,599 | | | | (247,542 | ) | | | 13,943 | |
Uncertain Tax Positions Management has analyzed the Funds’ tax positions taken for all open tax years which remain subject to examination by the Funds’ major tax jurisdictions (years 2017 through 2020). The Funds recognize interest and penalties, if any, related to tax liabilities as income tax expense in the Statement of Operations. Management has concluded that, as of and during the year ended December 31, 2020, no provision for federal income tax is necessary and, therefore, the Funds did not have a liability for any unrecognized tax expenses.
Note E – Other Matters
The impact of the COVID-19 outbreak has led, and in the future may lead, to increased short-term market volatility and may have adverse long-term effects on U.S. and world economies and markets generally. The duration of the COVID-19
pandemic and its effects cannot be determined with certainty, and could prevent a Fund from executing advantageous investment decisions in a timely manner and negatively impact a Fund’s ability to achieve its investment objective.
Note F – Subsequent Events
On September 10, 2020, the Board of Trustees of Pax World Funds Series Trust I and Trust III approved a change in the Funds’ distributor from ALPS Distributors, Inc. to Foreside Financial Services, LLC. (“Foreside”). This change took effect on January 11, 2021.
Effective January 31, 2021, the IAM sub-advisory agreement with Aperio Group, LLC has been discontinued. Accordingly, on February 1, 2021, Pax ESG Beta Quality Fund and Pax ESG Beta Dividend Fund will be solely managed by IAM.
Effective March 31, 2021, the sustainability profiles of three of the Pax World Funds will be enhanced and the Funds’ names will be changed to better reflect their core focus of investing in the transition to a more sustainable economy. The new Fund names will be Pax U.S. Sustainable Economy Fund (currently, Pax ESG Beta Quality Fund), the Pax International Sustainable Economy Fund (currently, Pax MSCI EAFE ESG Leaders Index Fund) and Pax Global Sustainable Infrastructure Fund (currently, Pax ESG Beta Dividend Fund). Certain changes to all three Funds’ investment strategies will be implemented and the expense ratios of the two former ESG Beta Funds will be lowered.
December 31, 2020 |
Report of Independent Registered Public Accounting Firm |
To the Boards of Trustees and Shareholders of Pax World Funds Series Trust I and Pax World Funds Series Trust III:
Opinion on the Financial Statements
We have audited the accompanying statements of assets and liabilities of Pax World Funds Series Trust I (“Trust I”) (comprising Pax Sustainable Allocation Fund, Pax ESG Beta Quality Fund, Pax Small Cap Fund, Pax High Yield Bond Fund, Pax Global Environmental Markets Fund, Pax MSCI EAFE ESG Leaders Index Fund, Pax Core Bond Fund, Pax Large Cap Fund, Pax Global Opportunities Fund, and Pax ESG Beta Dividend Fund (collectively, with Pax Ellevate Global Women’s Leadership Fund, the “Funds”)), and Pax World Funds Series Trust III (“Trust III” and collectively with Trust I, the “Trusts”) (comprising Pax Ellevate Global Women’s Leadership Fund), including the schedules of investments, as of December 31, 2020, and the related statements of operations, changes in net assets, and the financial highlights for each of the periods indicated in the table below and the related notes (collectively referred to as the “financial statements”). In our opinion, the financial statements present fairly, in all material respects, the financial position of the Funds at December 31, 2020, the results of their operations, changes in net assets and financial highlights for each of the periods indicated in the table below, in conformity with U.S. generally accepted accounting principles.
Funds comprising Trust I | Statement of
Operations | Statements of
Changes in Net
Assets | Financial highlights |
Pax Sustainable Allocation Fund Pax ESG Beta Quality Fund Pax Small Cap Fund Pax High Yield Bond Fund Pax Global Environmental Markets Fund Pax MSCI EAFE ESG Leaders Index Fund | For the year ended December 31, 2020 | For each of the two years in the period ended December 31, 2020 | For each of the five years in the period ended December 31, 2020 |
Pax Large Cap Fund Pax ESG Beta Dividend Fund Pax Core Bond Fund | For the year ended December 31, 2020 | For each of the two years in the period ended December 31, 2020 | For each of the four years in the period ended December 31, 2020 and the period from December 16, 2016 (commencement of operations) through December 31, 2016 |
Pax Global Opportunities Fund | For the year ended December 31, 2020 | For each of the two years in the period ended December 31, 2020 | For each of the two years in the period ended December 31, 2020 and the period from June 27, 2018 (commencement of operations) through December 31, 2018 |
Funds comprising Trust III | Statement of
Operations | Statements of
Changes in Net
Assets | Financial highlights |
Pax Ellevate Global Women’s Leadership Fund | For the year ended December 31, 2020 | For each of the two years in the period ended December 31, 2020 | For each of the five years in the period ended December 31, 2020 |
Basis for Opinion
These financial statements are the responsibility of the Trusts’ management. Our responsibility is to express an opinion on each of the Funds’ financial statements based on our audits. We are a public accounting firm registered with the Public Company Accounting Oversight Board (United States) (“PCAOB”) and are required to be independent with respect to the Trusts in accordance with the U.S. federal securities laws and the applicable rules and regulations of the Securities and Exchange Commission and the PCAOB.
We conducted our audits in accordance with the standards of the PCAOB. Those standards require that we plan and perform the audit to obtain reasonable assurance about whether the financial statements are free of material misstatement, whether due to error or fraud. The Trusts are not required to have, nor were we engaged to perform, an audit of the Trusts’ internal control over financial reporting. As part of our audits we are required to obtain an understanding of internal control over financial reporting but not for the purpose of expressing an opinion on the effectiveness of the Trusts’ internal control over financial reporting. Accordingly, we express no such opinion.
Our audits included performing procedures to assess the risks of material misstatement of the financial statements, whether due to error or fraud, and performing procedures that respond to those risks. Such procedures included examining, on a test basis, evidence regarding the amounts and disclosures in the financial statements. Our procedures included confirmation of securities owned as of December 31, 2020, by correspondence with the custodian and brokers or by other appropriate auditing procedures where replies from brokers were not received. Our audits also included evaluating the accounting principles used and significant estimates made by management, as well as evaluating the overall presentation of the financial statements. We believe that our audits provide a reasonable basis for our opinion.

We have served as the auditor of the Pax World Funds Series Trust I and Pax World Funds Series Trust III since 2003.
Boston, Massachusetts
February 18, 2021
Proxy Voting (Unaudited)
You may obtain a description of the Funds’ policies and procedures that the Funds use to determine how to vote proxies relating to their portfolio securities, without charge, upon request by contacting the Funds at 800.767.1729 or on the SEC’s website at www.sec.gov.
The information regarding how the Funds voted proxies relating to portfolio securities during the most recent 12-month period ended June 30 is available without charge, upon request, by telephoning Pax (toll-free) at 800.767.1729 or visiting Pax’s website at www.impaxam.com and will be available without charge by visiting the SEC’s website at www.sec.gov.
Portfolio Holdings (Unaudited)
Each Fund files its complete schedule of portfolio holdings with the U.S. Securities and Exchange Commission (“SEC”) for the first and third quarters of each fiscal year (or as an exhibit to its reports Form N-PORT). Each Fund’s Forms N-PORT are available on the SEC’s web site at www.sec.gov.
Liquidity Risk Management Program (Unaudited)
The Funds have adopted a liquidity risk management program pursuant to Rule 22e-4 under the Investment Company Act of 1940, as amended (the “Program”). The Funds’ Boards have designated a committee consisting of several advisory personnel as the administrator of the Program. The Program’s principal objectives are to support the Funds’ compliance with limits on investments in illiquid assets and to mitigate the risk that a Fund is unable to meet its redemption obligations in a timely manner. In this regard, the Program includes a number of elements that support the management or assessment of liquidity risk, including an assessment of factors that influence a Fund’s liquidity and the periodic classification and, as determined necessary, re-classification of a Fund’s investments into buckets that reflect their relative liquidity under current market conditions.
The Funds’ Boards reviewed a written report from the administrator on March 4, 2020 addressing the Program’s operation, adequacy, and effectiveness (the “Report”). From December 1, 2018 through December 31, 2019, the period covered by the Report, the Program supported each Fund’s ability to honor redemption requests timely and the Adviser’s management of each Fund’s liquidity risk profile, including during any periods of market volatility and net redemptions. There can be no assurance that the Program will achieve its objectives under
all circumstances in the future. Please refer to your Fund’s prospectus for more information regarding the Fund’s exposure to liquidity risk and other risks to which it may be subject.
Board Approval of New Advisory Agreement (Unaudited)
Review Process. The 1940 Act requires that both the full Board of Trustees of Trust III (the “Trust”) and a majority of the Independent Trustees, voting separately, approve any new investment advisory contract or subadvisory contract, or any amendment thereof, for any series of the Trust.
The 1940 Act also requires that the Trustees request and evaluate, and that IAM (or “Adviser”) and Pax Ellevate Management LLC (“PEM”) furnish, such information as may reasonably be necessary for the Trustees of the Trust to evaluate the terms of the Trust’s new advisory agreement (the “New Advisory Agreement”) with IAM.
At a meeting held on September 10, 2020, the Trustees, including a majority of the Independent Trustees, approved the New Advisory Agreement of Pax Ellevate Global Women’s Leadership Fund, the only series of the Trust (the “Fund”). The Trustees took such action after discussion among themselves and with representatives of PEM and IAM, the owner of PEM, of the information provided to them by PEM and IAM in connection with the transfer of the advisory agreement for the Fund from PEM to IAM.
The Independent Trustees were assisted in their evaluation of the New Advisory Agreement by independent legal counsel, from whom they received assistance and advice, including a review of the legal standards applicable to the consideration of advisory arrangements, and with whom they met separately from management. The Independent Trustees requested information and discussed with PEM and IAM information that was provided.
The Trustees, including the Independent Trustees, considered that, following IAM’s evaluation of the utility of maintaining PEM, a wholly-owned subsidiary of IAM, as an investment adviser separate from IAM, the Adviser had determined that, in light of legal, compliance, financial and operational considerations, it would be in the best interests of the Fund and shareholders to transfer management of the Fund to IAM. The Trustees considered management’s representation that such action would not adversely impact Fund shareholders or undermine distribution efforts for the Fund.
The Trustees, including the Independent Trustees, considered management’s representation that the change in the Fund’s investment adviser would not result in any changes to the investment process of, nature, extent or quality of services and resources provided to, personnel responsible for, or fee structure of the Fund. The Trustees considered that all of the portfolio managers and other personnel who provided services to the Fund immediately prior to the change in investment adviser as employees of PEM would continue to provide such services as employees of IAM. The Trustees further considered that, except for the name of the investment adviser and dates, the terms of the New Advisory Agreement would be identical to those of the Fund’s advisory contract with PEM (the “Current Advisory Agreement”).
The Trustees, including the Independent Trustees, considered management’s representation, as well as IAM’s legal counsel’s representation, that the transfer of the Current Advisory Agreement from PEM to IAM would not result in an “assignment” of the agreement within the meaning of the 1940 Act, or the Investment Advisers Act of 1940, as amended, and that shareholder approval of the New Advisory Agreement would not be required. The Trustees concluded that management of the Fund by IAM would benefit the Fund.
The Trustees, including the Independent Trustees, also took into account their deliberations and conclusions in connection with their most recent approval of the Current Advisory Agreement, including with respect to (i) the nature, extent and quality of services provided by PEM; (ii) the investment performance of the Fund; (iii) the advisory fee of 0.55% of the average daily net assets relative to the advisory fees of the Fund’s Broadridge peer group; (iv) the costs of the services provided by PEM and the estimated profitability of PEM’s relationship with Trust III; (v) the direct and indirect benefits to PEM from its relationship with the Fund, including reputational and other “fall out” benefits; and (vi) the extent to which PEM may realize economies of scale or other efficiencies in managing and supporting the Fund. The Trustees noted that they had approved the continuation of the Current Advisory Agreement for the Fund at their June 11, 2020 meeting, after evaluating materials provided in connection with the contract review process at their March and June 2020 meetings.
Conclusions. Based on the foregoing and other relevant considerations, the Trustees, including a majority of the Independent Trustees, voted to approve the New Advisory Agreement. Based on their evaluation of factors that they deemed to be material, including those factors described above, the Trustees, including the Independent Trustees, unanimously concluded that approval of the New Advisory Agreement would be in the best interests of shareholders of the Fund.
Management of the Funds (Unaudited)
Interested Trustees and Officers
Name and Age | Position(s) Held With the
Trust; Term of Office1; and
Length of Time Served | Principal Occupation(s) During Past
Five Years and Other Directorships
Held by Trustee or Officer | Number of
Funds in the
Pax World
Fund Family
Overseen by
Trustee |
Joseph Keefe (67) | Trust I: Trustee, President
(since 2006) Trust III: Trustee, President
(since 2013) | Chief Executive Officer (2005-2018) and President (2006-present) and Chief Executive Officer (2005-2018) of IAM; Chief Executive Officer of PEM (2014-2020); member of the Board of Impax Asset Management Ltd. and Impax Asset Management (AIFM) Ltd. (2018 - present); member of the Boards of Directors of Women Thrive Alliance (2009-2018) and New Hampshire Public Radio (2017 - present); Co-Chair of the Leadership Group of the Women’s Empowerment Principles (2014-2018). | 11 |
Lindsey Brace Martinez
(53) | Trust I: Trustee
(since 2018) Trust III: Trustee
(since 2019) | Director, Seven Islands Management Co. (2018-present); Founder and Principal, Starpoint Advisors, LLC (2015-present); Director, Impax Asset Management Group plc (2015-present); Managing Director, Head of Global Client Service and Relations, Cambridge Associates (2009-2015); Chair of the Board of Directors, Novatus Energy, LLC (2016-present); Board Member, Yale Center for Business and Environment (2014-present); Investment Sub-Committee Member, National Geographic Society (2015-present); Member, Advisory Council, Quebec Labrador Foundation (2012-present). | 11 |
John Boese
(57) | Trust I: Chief Compliance Officer
(since 2006) Trust III: Chief Compliance Officer
(since 2013) | Chief Compliance Officer of IAM (2006-present) and of PEM (2014-2020). | N/A |
Interested Trustees and Officers, continued
Name and Age | Position(s) Held With the
Trust; Term of Office1; and
Length of Time Served | Principal Occupation(s) During Past
Five Years and Other Directorships
Held by Trustee or Officer | Number of
Funds in the
Pax World
Fund Family
Overseen by
Trustee |
Vanessa Pearl (38) | Trust I: Secretary
(since 2020) Trust III: Secretary
(since 2020) | Director of Finance of IAM (2018-present). Director of Finance, and Financial Controller of Lindt & Sprungli (USA), Inc (2007-2018). | N/A |
Alicia K. DuBois (61) | Trust I: Treasurer
(since 2006) Trust III: Treasurer
(since 2013) | Chief Financial Officer for IAM (2006-present) and for PEM (2014-2020). | N/A |
Robert Silva (54) | Trust I: Assistant Treasurer (Since 2015) Trust III: Assistant Treasurer (Since 2015) | Director of Fund Administration for IAM (2014-present) and for PEM (2014-2020). | N/A |
Disinterested Trustees
Name and Age | Position(s) Held With the
Trust; Term of Office1; and
Length of Time Served | Principal Occupation(s) During Past
Five Years and Other Directorships
Held by Trustee or Officer | Number of
Funds in the
Pax World
Fund Family
Overseen by
Trustee |
Adrian P. Anderson
(66)2,3 | Trust I: Trustee
(since 2007) Trust III: Trustee
(since 2013) | Tax Accountant at Shwiff, Levy & Polo, LLP (2018-present); Chief Executive Officer and Consultant of North Point Advisors, LLC (2004-present). | 11 |
Anne M. Goggin (71)3,4 | Trust I and Trust III: Vice Chairperson of the Board of Trustees
(since 2019) Trust I and Trust III: Trustee
(since 2017) | Trustee of RS Investment Trust and RS Variable Products Trust (2006-2016); attorney; Retired, Chief Counsel, Metropolitan Life Insurance Company, an insurance company; Member, Governing Council of the Independent Directors Council (2012-present). | 11 |
D’Anne Hurd (70)2,3 | Trust I: Trustee
(since 2015) Trust III: Trustee
(since 2015) | Board Advisor, National Association of Corporate Directors, Governance public speaker and private investor (2011-present) Board member, Nominating and Governance Chair, Audit Committee and Technology Committee member, EILEEN FISHER, Inc. (2017-present) Board member, Audit Committee Chair, Nominating and Governance Committee member, Peckham Industries, Inc. (2013-present) Board member, Audit Committee Chair, Martin Engineering, Inc. (2019-present) Board Chair, Monzite Corporation (2013-2016) | 11 |
Disinterested Trustees, continued
Name and Age | Position(s) Held With the
Trust; Term of Office1; and
Length of Time Served | Principal Occupation(s) During Past
Five Years and Other Directorships
Held by Trustee or Officer | Number of
Funds in the
Pax World
Fund Family
Overseen by
Trustee |
John L. Liechty (66)3,5 | Trust I: Chairman of the Board of Trustees (since 2014); Trustee (since 2009) Trust III: Chairman of the Board of Trustees (since 2014); Trustee (since 2013) | Principal, Integrated Investment Solutions (2009-present); Principal, Integrated Financial Planning Solutions, LLC (2010-present). | 11 |
Nancy S. Taylor (65)3,4 | Trust I: Trustee
(since 2006) Trust III: Trustee
(since 2013) | Senior Minister & CEO, Old South Church in Boston (2005-present); Advisory Board, Yale Divinity School (2010-present); Advisory Board, Idaho Human Rights Education Center (2009-present); Board of Managers, Old South Meeting House (2005-present); Trustee Emeritus, Benjamin Franklin Institute of Technology (2011-present). | 11 |
1 | A Trustee of the Funds holds office until a successor is chosen and qualified. An Officer of the Funds is appointed by the respective Board of Trustees and holds office until a successor is chosen and qualified. |
2 | Designates a member of the Audit Committee. The Audit Committee has the responsibility of overseeing the establishment and maintenance of an effective financial control environment, for overseeing the procedures for evaluating the system of internal accounting control and for evaluating audit performance. The committee met three times in 2020. |
3 | Designates a member of the Governance and Nomination Committee and Compliance Committee. The Governance and Nomination Committee is responsible for recommending Board candidates, reviewing and recommending Board compensation. The committee met two times in 2020. |
4 | Designates a member of the Compliance Committee. The Compliance Committee is responsible for overseeing regulatory and compliance matters, as well as Fund-related compliance activities of the Funds’ service providers. The committee met three times in 2020. |
5 | Mr. Liechty, as Chair, is a floating member of each of the Audit Committee and the Compliance Committee, and, as such, he will attend meetings of the committees based upon the matters to be discussed at each meeting or as otherwise determined by the Board or the committees. |
Federal Tax Information (Unaudited)
The percentages of ordinary income distributed by each of the Funds that is Qualified Dividend Income (QDI) and that qualifies for corporate Dividends Received Deduction (DRD) are as follows:
| | QDI% | | | DRD% | |
Large Cap | | | 100.00 | % | | | 100.00 | % |
Small Cap | | | 100.00 | % | | | 0.00 | % |
ESG Beta Quality | | | 100.00 | % | | | 100.00 | % |
ESG Beta Dividend | | | 100.00 | % | | | 100.00 | % |
Global Opportunities | | | 100.00 | % | | | 100.00 | % |
Global Environmental Markets | | | 100.00 | % | | | 57.44 | % |
Global Women’s Leadership | | | 100.00 | % | | | 74.02 | % |
EAFE ESG Leaders | | | 100.00 | % | | | 0.00 | % |
Core Bond | | | 0.33 | % | | | 0.00 | % |
High Yield Bond | | | 1.06 | % | | | 1.05 | % |
Sustainable Allocation | | | 99.84 | % | | | 0.00 | % |
For the fiscal year ended December 31, 2020 the EAFE ESG Leaders Fund earned foreign source income totaling $16,545,151 and paid $1,281,281 foreign taxes which it intends to pass through to its shareholders.
December 31, 2020 |
Account Options and Services |
At Pax World, we are pleased to offer a variety of account options and shareholder services to help meet your investment needs.
Types of Accounts | Services |
Regular Accounts: Individual, business and trust accounts are available for all Pax World Funds. Traditional IRA Contributions to an IRA may be tax-deductible. Taxes are paid only when funds are withdrawn, when investors may be in a lower tax bracket. Roth IRA Contributions to a Roth IRA are not deductible, but after five years some types of withdrawals are tax-free. SIMPLE IRA This is an easy-to maintain retirement plan designed for small businesses. SEP IRA This is an employer funded retirement plan popular with small businesses and self-employed persons. Education Savings Account & Uniform Gift to Minors Account (UGMA) These plans provide excellent ways to save for a child’s education. | Automatic Investment Plan You may arrange to have a fixed amount automatically deducted from your checking or savings account and invested in your Pax World account on a monthly or quarterly basis. Automatic investment plans do not assure a profit and do not protect against loss in declining markets. Online Account Access Utilizing a unique ID number and PIN, you can access your Pax World account balances or histories; purchase or redeem fund shares; or make exchanges between different Pax World Funds. www.impaxam.com Learn all about Pax World Funds through our web site. You can check Fund performance, read about our portfolio managers, view Connection—our quarterly newsletter, and see how we voted on various proxies for the companies in our portfolios. |
Please note that the information contained herein does not constitute tax advice. Always consult your tax advisor before making any tax-related investment decisions.
This annual report is intended for shareholders of the Pax World Funds only, and is not authorized for distribution to other persons unless accompanied or preceded by a prospectus. Please consider the Funds’ investment objectives, risks and charges and expenses carefully before investing. The Funds’ prospectus contains this and other information about the Funds and may be obtained by calling 800.767.1729, emailing paxfunds@impaxam.com or visiting www.impaxam.com.
Distributor: Foreside Financial Services, LLC Member of FINRA 2/21.
THIS PAGE INTENTIONALLY LEFT BLANK
THIS PAGE INTENTIONALLY LEFT BLANK
THIS PAGE INTENTIONALLY LEFT BLANK

As of December 31, 2020, the Registrant has adopted a “code of ethics,” as such term is defined in paragraph (b) of this Item 2, that applies to all officers of the Registrant, including Registrant’s principal executive officer, principal financial officer, principal accounting officer or controller, or persons performing similar functions, regardless of whether these individuals are employed by the Registrant or by a third party. A copy of the code of ethics is filed as an exhibit to this Form N-CSR.
| Item 3. | Audit Committee Financial Expert. |
The Registrant’s Board of Trustees has determined that Adrian Anderson and Dorothy Ann Hurd, who serve on the Board’s Audit Committee, qualify as “audit committee financial experts,” as such term is defined in paragraph (b) of this Item 3. The Board also has determined that Mr. Anderson and Ms. Hurd are “independent,” as such term is interpreted by subparagraph (a)(2) of this Item 3. The Securities and Exchange Commission has stated that the designation of a person as an audit committee financial expert pursuant to this Item 3 of the Form N-CSR does not impose on such a person any duties, obligations or liability that are greater than the duties, obligations or liability imposed on such person as a member of the Audit Committee and the Board of Trustees in the absence of such designation or identification.
| Item 4. | Principal Accountant Fees and Services. |
(a) Audit Fees. The aggregate fees billed for each of the last two fiscal years for professional services rendered by the principal accountant for the audit of the Registrant’s annual financial statements or services that are normally provided by the accountant in connection with statutory and regulatory filings or engagements were $308,372 and $302,325 for the fiscal years ended December 31, 2020 and 2019, respectively.
(b) Audit-Related Fees. The aggregate fees billed in each of the last two fiscal years for assurance and related services by the principal accountant that are reasonably related to the performance of the audit of the Registrant’s financial statements and are not reported under paragraph (a) of this Item were $0 and $0 for the fiscal years ended December 31, 2020 and 2019, respectively.
(c) Tax Fees. The aggregate fees billed in each of the last two fiscal years for professional services rendered by the principal accountant for tax compliance, tax advice and tax planning were $135,550 and $139,930 for the fiscal years ended December 31, 2020 and 2019, respectively. Fees disclosed under this category are for professional services related to review and execution of federal, state and excise tax returns and advice concerning tax compliance and planning.
(d) All Other Fees. The aggregate fees billed in each of the last two fiscal years for products and services provided by the principal accountant, other than the services reported in paragraphs (a) through (c) of this Item, are $17,034 and $31,850 for the fiscal years ended December 31, 2020 and 2019, respectively.
(e) (1) To the extent required by applicable regulations, the Audit Committee approves in advance all audit and non-audit services rendered to the Registrant by the independent registered public accounting firm and all non-audit services to the Registrant’s investment adviser and any entity controlling, controlled by or under common control with the Registrant’s investment adviser that provide ongoing services to the Registrant, if the engagement relates directly to the operations and financial reporting of the Registrant.
(2) With respect to the services described in paragraphs (b) through (d) of this Item, no amount was approved by the Audit Committee pursuant to paragraph (c)(7)(i)(C) of Rule 2-01 of Regulation S-X and no amount was required to be approved pursuant to paragraph (c)(7)(ii) of Rule 2-01 of Regulation S-X.
(f) Not applicable.
(g) The aggregate non-audit fees billed by the Registrant’s accountant for services rendered to the Registrant, or to the Registrant’s investment adviser, or to any entity controlling, controlled by or under common control with the adviser that provides ongoing services to the Registrant totaled $0 and $0, for the fiscal years ended December 31, 2020 and 2019, respectively.
(h) Not applicable.
| Item 5. | Audit Committee of Listed Registrants. |
Not applicable.
| Item 6. | Schedule of Investments. |
A complete series of schedules of investments is included as part of the report to shareholders filed under Item 1.
| Item 7. | Disclosure of Proxy Voting Policies and Procedures for Closed-End Management Investment Companies. |
Not applicable.
| Item 8. | Portfolio Managers of Closed-End Management Investment Companies. |
Not applicable.
| Item 9. | Purchase of Equity Securities by Closed-End Management Investment Company and Affiliated Purchasers. |
Not applicable.
| Item 10. | Submission of Matters to a Vote of Security Holders. |
There have been no material changes to the procedures by which shareholders may recommend nominees to the Registrant’s Board of Trustees that have been implemented since the Registrant last provided disclosure in response to the requirements of this Item.
| Item 11. | Controls and Procedures. |
(a) It is the conclusion of the Registrant’s principal executive officer and principal financial officer (or persons performing similar functions), based on an evaluation of the effectiveness of the design and operation of the Registrant’s disclosure controls and procedures (as defined in Rule 30a-3(c) under the Investment Company Act of 1940, as amended) (the “Disclosure Controls”) as of a date within 90 days of the filing date of this report on Form N-CSR, that the design and operation of the Disclosure Controls are effective to reasonably ensure that information required to be disclosed by the Registrant in this report on Form N-CSR has been recorded, processed, summarized and reported within the time periods specified in the rules and forms of the Securities and Exchange Commission.
(b) There has been no change in the Registrant’s internal control over financial reporting (as defined in Rule 30a-3(d) under the Investment Company Act of 1940, as amended) that occurred during the second fiscal quarter of the period covered by this report on Form N-CSR that has materially affected, or is reasonably likely to materially affect, the Registrant’s internal control over financial reporting.
| Item 12. | Disclosure of Securities Lending Activities for Closed-End Management Companies |
Not applicable.
SIGNATURES
Pursuant to the requirements of the Securities Exchange Act of 1934 and the Investment Company Act of 1940, the Registrant has duly caused this report to be signed on its behalf by the undersigned, thereunto duly authorized.
| (Registrant) | Pax World Funds Series Trust I | |
| By (Signature and Title) | /s/ Joseph F. Keefe | |
| | Joseph F. Keefe, President | |
Pursuant to the requirements of the Securities Exchange Act of 1934 and the Investment Company Act of 1940, this report has been signed below by the following persons on behalf of the Registrant and in the capacities and on the dates indicated.
| By (Signature and Title) | /s/ Joseph F. Keefe | |
| | Joseph F. Keefe, President (Principal Executive Officer) | |
| By (Signature and Title) | /s/ Alicia K. DuBois | |
| | Alicia K. DuBois, Treasurer (Principal Financial Officer) | |