UNITED STATES
SECURITIES AND EXCHANGE COMMISSION
Washington, D.C. 20549
FORM N-CSR
CERTIFIED SHAREHOLDER REPORT OF REGISTERED
MANAGEMENT INVESTMENT COMPANIES
| Investment Company Act file number | 811-02064 | |
| PAX WORLD FUNDS SERIES TRUST I |
| (Exact name of Registrant as specified in charter) |
| 30 Penhallow Street, Suite 400, Portsmouth, NH | 03801 |
| (Address of principal executive offices) | (Zip code) |
Pax World Management LLC
30 Penhallow Street, Suite 400, Portsmouth, NH 03801
Attn.: Joseph Keefe |
| (Name and address of agent for service) |
| Registrant’s telephone number, including area code: | 800-767-1729 | |
| Date of fiscal year end: | December 31 | |
| | | |
| Date of reporting period: | December 31, 2021 | |
EXPLANATORY NOTE: On March 4, 2022, the undersigned registrant filed its Certified Shareholder Report on Form N-CSR for the annual period ended December 31, 2021. The registrant hereby amends the original Certified Shareholder Report on Form N-CSR by amending the response under Item 11(b) and replacing Exhibit 13(a)(2) as filed on March 4, 2022 with Exhibit 13(a)(2) attached hereto.
This amendment does not reflect events occurring after the filing of the original Certified Shareholder Report on Form N-CSR for the annual period ended December 31, 2021, and, other than amending the response under Item 11(b) and replacing Exhibit 13(a)(2), as stated above, does not modify or update the disclosures in the original Certified Shareholder Report on Form N-CSR in any way.
Form N-CSR is to be used by management investment companies to file reports with the Commission not later than 10 days after the transmission to stockholders of any report that is required to be transmitted to stockholders under Rule 30e-1 under the Investment Company Act of 1940 (17 CFR 270.30e-1). The Commission may use the information provided on Form N-CSR in its regulatory, disclosure review, inspection, and policymaking roles.
A registrant is required to disclose the information specified by Form N-CSR, and the Commission will make this information public. A registrant is not required to respond to the collection of information contained in Form N-CSR unless the Form displays a currently valid Office of Management and Budget (“OMB”) control number. Please direct comments concerning the accuracy of the information collection burden estimate and any suggestions for reducing the burden to Secretary, Securities and Exchange Commission, 450 Fifth Street, NW, Washington, DC 20549-0609. The OMB has reviewed this collection of information under the clearance requirements of 44 U.S.C. §3507.
| Item 1. | Reports to Stockholders |

| | |
Glossary of Terms | 2 |
Letter to Shareholders | 6 |
Sustainable Investing Update | 11 |
Portfolio Manager Comments and Highlights | 14 |
Pax Large Cap Fund | 14 |
Pax Small Cap Fund | 18 |
Pax US Sustainable Economy Fund | 22 |
Pax Global Sustainable Infrastructure Fund | 26 |
Pax Global Opportunities Fund | 31 |
Pax Global Environmental Markets Fund | 36 |
Pax Ellevate Global Women’s Leadership Fund | 42 |
Pax International Sustainable Economy Fund | 47 |
Pax Core Bond Fund | 53 |
Pax High Yield Bond Fund | 57 |
Pax Sustainable Allocation Fund | 63 |
Shareholder Expense Examples | 67 |
Schedules of Investments | 70 |
Statements of Assets and Liabilities | 122 |
Statements of Operations | 126 |
Statements of Changes in Net Assets | 128 |
Financial Highlights | 134 |
Notes to Financial Statements | 146 |
Report of Independent Registered Public Accounting Firm | 169 |
Trustees and Officers | 172 |
Account Options and Services | 177 |
For More Information |
General Fund Information 800.767.1729 Shareholder Account Information 800.372.7827 Account Inquiries Pax World
P.O. Box 9824
Providence, RI 02940-8024 Investment Adviser Impax Asset Management LLC
30 Penhallow Street, Suite 400
Portsmouth, NH 03801 | Transfer and Dividend Disbursing Agent BNY Mellon Investment
Servicing (U.S.) Inc.
P.O. Box 9824
Providence, RI 02940-8024 Custodian State Street Bank and Trust Company
1 Lincoln Street
Boston, MA 02111 |
Blended Index for the Pax Sustainable Allocation Fund is composed of 60% S&P 500 Index and 40% Bloomberg U.S. Aggregate Bond Index.
Bloomberg U.S. Aggregate Bond Index is a broad-based index, maintained by Bloomberg L.P. often used to represent investment grade bonds being traded in the United States.
FTSE Environmental Opportunities Index Series measures the performance of global companies that have significant involvement in environmental business activities, including renewable and alternative energy, energy efficiency, water technology, waste and pollution control and food, agriculture and forestry. The FTSE Environmental Opportunities Index Series requires companies to have at least 20% of their business derived from environmental markets and technologies. The FTSE Environmental Opportunities Index Series is published by a joint venture of Impax Asset Management, Ltd. (“Impax”) with FTSE International. Impax is also the sub-adviser to the Pax Global Environmental Markets Fund.
ICE BofA Merrill Lynch U.S. High Yield - Cash Pay - BB-B (Constrained 2%) Index tracks the performance of BB- and B rated fixed income securities publicly issued in the major domestic or Eurobond markets, with total index allocation to an individual issuer limited to 2%.
Impax Global Women’s Leadership Index is a customized market capitalization-weighted index created and licensed by Impax Asset Management (“IAM”) consisting of equity securities of issuers organized or operating in countries around the world that demonstrate a commitment to advancing and empowering women through gender diversity on their boards, in management and through other policies and programs, and an understanding of the potential business advantages associated with greater gender diversity, as rated by the IAM Gender Analytics team, with final approval by the IAM Women’s Index Committee. In addition, the companies comprising the Women’s Index meet certain environmental, social and governance (ESG) or sustainability thresholds, as rated by MSCI ESG Research.
Lipper Core Bond Funds Index tracks the results of the 30 largest mutual funds in the Lipper Core Bond Funds Index Average. The Lipper Core Bond Funds Index Average is a total return performance average of mutual funds tracked by Lipper, Inc. that invest at least 85% in domestic investment-grade debt issues (rated in the top four grades) with any remaining investment in non-benchmark sectors such as high-yield, global and emerging market debt. These funds maintain dollar-weighted average maturities of five to ten years.
Lipper Global Infrastructure Funds Index tracks the results of the 10 largest mutual funds in the Lipper Global Infrastructure Fund Index Average. The Lipper Global Infrastructure Funds Index Average is a total return performance average of mutual funds tracked by Lipper, Inc. that, by portfolio practice, invest predominantly across energy, industrials, utilities and materials sectors. Funds must contain a diverse mix of listed & liquid equities that reflect companies which engaged in core infrastructure activities. These generally include large geographic projects leading to the construction of energy supplies, utilities, education, health, social and transportation facilities.
Lipper Global Multi-Cap Core Funds Index tracks the results of the 30 largest mutual funds in the Global Multi-Cap Core Funds Index Average. The Global Multi-Cap Core Funds Index Average is a total return performance average of mutual funds tracked by Lipper, Inc. that, by portfolio practice, invest in a variety of market capitalization ranges without concentrating 75% of their equity assets in any one market capitalization range over an extended period of time. Global multi-cap core funds typically have average characteristics compared to the MSCI World Index.
Lipper Global Multi-Cap Growth Funds Index tracks the results of funds that invest in a variety of market capitalization ranges without concentrating 75% of their equity assets in any one market capitalization range over an extended period of time. Multi-cap funds typically have 25% to 75% of their assets invested in companies both inside and outside of the U.S. with market
capitalizations (on a three-year weighted basis) above 400% of the 75th market capitalization Glossary of Terms 3 percentile of the S&P/Citigroup World Broad Market Index. Multi-cap growth funds typically have an above-average price-to-cash flow ratio, price-to-book ratio, and three-year sales-per-share growth value compared to the S&P/Citigroup BMI. One cannot invest directly in an index.
Lipper High Yield Bond Funds Index tracks the results of the 30 largest mutual funds in the Lipper High Yield Bond Funds Average. The Lipper High Yield Bond Funds Average is a total return performance average of mutual funds tracked by Lipper, Inc. that aim at high (relative) current yield from fixed income securities, have no quality or maturity restrictions and tend to invest in lower grade debt issues.
Lipper International Large-Cap Core Funds Index tracks the results of funds that, by portfolio practice, invest at least 75% of their equity assets in companies strictly outside of the U.S. with market capitalizations (on a three-year weighted basis) above Lipper’s international large-cap floor. International large-cap core funds typically have an average price-to-cash flow ratio, price-to-book ratio and three-year sales-per-share growth value compared to the S&P/Citigroup World ex-U.S. BMI.
Lipper Large-Cap Core Funds Index tracks the results of the 30 largest mutual funds in the Lipper Large Cap Core Funds Index Average. The Lipper Large Cap Core Funds Index Average is a total return performance average of mutual funds tracked by Lipper, Inc. that invest at least 75% of their equity assets in companies with market capitalizations (on a three-year weighted basis) above Lipper’s USDE large-cap floor. Large-cap core funds have more latitude in the companies in which they invest. These funds typically have average characteristics compared to the S&P 500 Index.
Lipper Multi-Cap Core Funds Index tracks the results of the 30 largest mutual funds in the Lipper Multi-Cap Core Funds Index Average. The Lipper Multi-Cap Core Funds Index Average is a total return performance average of mutual funds tracked by Lipper, Inc. that invest in a variety of market capitalization ranges without concentrating 75% of their equity assets in any one market capitalization range over an extended period of time. These funds typically have average characteristics compared to the S&P SuperComposite 1500 Index.
Lipper Small-Cap Core Funds Index tracks the results of the 30 largest mutual funds in the Lipper Small-Cap Core Funds Average. The Lipper Small-Cap Core Funds Average is a total return performance average of the mutual funds tracked by Lipper, Inc. that, by portfolio practice, invest at least 75% of their equity assets in companies with market capitalizations (on a three-year weighted basis) below Lipper’s USDE small-cap ceiling. Small-cap core funds have more latitude in the companies in which they invest. These funds typically have an average price-to-earnings ratio, price-to-book ratio, and three-year sales-per-share growth value, compared to the S&P SmallCap 600 Index.
Morningstar Allocation – 50% to 70% Equity seeks to provide both capital appreciation and income by investing in three major areas: stocks, bonds and cash. These portfolios tend to hold larger positions in stocks than conservative-allocation portfolios. These portfolios typically have 50% to 70% of assets in equities and the remainder in fixed income and cash.
MSCI All-Country World Index (“ACWI”) Index is a free float-adjusted market capitalization weighted index that is designed to measure the equity market performance of developed and emerging markets. The MSCI ACWI consists of 48 country indices comprising 23 developed and 25 emerging market country indices. The developed market country indices included are: Australia, Austria, Belgium, Canada, Denmark, Finland, France, Germany, Hong Kong, Ireland, Israel, Italy, Japan, Netherlands, New Zealand, Norway, Portugal, Singapore, Spain, Sweden, Switzerland, United Kingdom and United States. The emerging market country indices included
Glossary of Terms, continued |
are: Brazil, Chile, China, Colombia, Czech Republic, Egypt, Greece, Hungary, India, Indonesia, Korea, Kuwait, Malaysia, Mexico, Peru, Philippines, Poland, Qatar, Russia, Saudi Arabia, South Africa, Taiwan, Thailand, Turkey and United Arab Emirates.
MSCI EAFE (Europe, Australasia, Far East) Index is a free float-adjusted market capitalization index that is designed to measure the equity market performance of developed markets, excluding the U.S. and Canada. The MSCI EAFE (Net) Index consists of the following 21 developed market country indices: Australia, Austria, Belgium, Denmark, Finland, France, Germany, Hong Kong, Ireland, Israel, Italy, Japan, Netherlands, New Zealand, Norway, Portugal, Singapore, Spain, Sweden, Switzerland, and United Kingdom.
MSCI EAFE ESG Leaders Index is a free float-adjusted market capitalization weighted index designed to measure the performance of equity securities of issuers organized or operating in developed market countries around the world excluding the U.S. and Canada that have high environmental, social and governance (ESG) ratings relative to their sector and industry group peers, as rated by MSCI ESG Research annually. MSCI ESG Research evaluates companies’ ESG characteristics and derives corresponding ESG scores and ratings. Companies are ranked by ESG score against their sector peers to determine their eligibility for the MSCI ESG indices. MSCI ESG Research identifies the highest-rated companies in each peer group to meet the float-adjusted market capitalization sector targets. The rating system is based on general and industry-specific ESG criteria, assigning ratings on a 7-point scale from AAA (highest) to CCC (lowest).
MSCI World Index is a free float-adjusted market capitalization weighted index that is designed to measure the equity market performance of developed markets. The MSCI World Index consists of the following 23 developed market country indices: Australia, Austria, Belgium, Canada, Denmark, Finland, France, Germany, Hong Kong, Ireland, Israel, Italy, Japan, Netherlands, New Zealand, Norway, Portugal, Singapore, Spain, Sweden, Switzerland, the United Kingdom, and the United States.
Russell 1000 Index measures the performance of the 1,000 largest U.S. companies, as measured by market capitalization. It is a subset of the Russell 3000 Index, which measures the largest 3,000 companies. The Russell 1000 Index is comprised of over 90% of the total market capitalization of all listed U.S stocks.
Russell 2000 Index measures the performance of the small-cap segment of the U.S. equity universe. The Russell 2000 Index is a subset of the Russell 3000 Index representing approximately 10% of the total market capitalization of that index. It includes approximately 2,000 of the smallest securities based on a combination of their market cap and current index membership.
The S&P 500 Index is an unmanaged index of large capitalization common stocks.
The S&P Global Infrastructure Index is designed to track 75 companies from around the world chosen to represent the listed infrastructure industry while maintaining liquidity and tradability. To create diversified exposure, the index includes three distinct infrastructure clusters: energy, transportation, and utilities.
Performance for the MSCI ACWI Index, the MSCI EAFE Index, the MSCI EAFE ESG Leaders Index, the MSCI World Index, the S&P Global Infrastructure Index and the Impax Global Women’s Leadership Index are shown “net”, which includes dividend reinvestments after deduction of foreign withholding tax.
Securities Indices above assume reinvestment of all distributions and interest payments, have no policy of sustainable investing and do not take into account brokerage fees or expenses.
Lipper Indices above are not what are typically considered to be an “index” because they track the performance of other mutual funds rather than changes in the value of a group of securities, a securities index or some other traditional economic indicator.
Diversification does not eliminate the risk of experiencing investment losses.
One cannot invest directly in any index.
Letter to Shareholders |
by Joseph Keefe, President |
Dear fellow shareholders,

2021 began with a persisting global pandemic and the sacking of the US capitol — not a fortuitous start by any measure. The months that followed brought supply chain challenges, new virus variants, worsening inflation, deep societal divisions over masks, vaccines, and other issues, as well as continued gridlock in Washington, DC. Yet despite the ongoing disruptions, the stock market rose, with the S&P 500 gaining 26.9%,1 the Russell 2000 Index gaining 13.7%2 and the MSCI EAFE Index of non-U.S. developed market stocks returning 11.26 %.3
We also saw soaring demand for sustainable investment solutions in 2021. During the first quarter alone, inflows to sustainable funds reached $185 billion globally.4 Inflows to Pax World Funds reached all-time highs. 2021 also brought the fifth anniversary of the Pax Large Cap Fund and the 50th anniversary — yes, 50th — of the Pax Sustainable Allocation Fund, the first mutual fund in the United States to incorporate social and environmental criteria into its investment process.
More and more investors are realizing that environmental, social and governance (ESG) factors have financial relevance, or materiality, that could affect business outcomes and investment portfolio returns. A 2021 RBC Wealth Management survey of 1,000 clients revealed that 61% want to increase the amount of environmental, social and governance-focused holdings in their portfolios,5 suggesting that demand for sustainable solutions will continue to surge.
Meanwhile, there is continued evidence that sustainable funds can and often do deliver strong investment performance. At the end of 2021, seven of the 11 Pax World Funds had received four- or five-star ratings from Morningstar, including the Pax Global Environmental Markets Fund and Pax Large Cap Fund, both of which received overall 5-star ratings. Barron’s recently named the Pax Large Cap Fund together with our Pax US Sustainable Economy Fund to its list of the top-performing sustainable funds.6
1 | Anna-Louise Jackson and John Schmidt, “2021 Stock Market Year in Review,” Forbes Advisor, Jan. 3, 2022. |
2 | Alex Veiga, “Stocks Notch Big Yearly Gain Despite Ending 2021 on a Weak Note,” PBS News Hour, Dec. 31, 2021. |
3 | MSCI, “MSCI EAFE Index (USD),” Dec. 31, 2021. |
4 | Jon Hale, “US Sustainable Funds Continued to Break Records in 2020,” Morningstar, Feb. 25, 2021. |
5 | Jacqueline Sergeant, “Female Investors Expect Advisors To Be Informed About ESG,” Financial Advisor, April 8, 2021. |
6 | Lauren Foster, “Here Are Barron’s Top-Performing Sustainable Funds,” Barron’s, Jan. 21, 2022. |
Though 2021 brought much to celebrate as a firm, the ongoing pandemic and its ancillary “Great Resignation” also cast a spotlight on the persistent, systemic inequalities embedded in our economy and society, including the continuing challenges faced by women in the workforce. Moreover, we witnessed another year rife with climate-related weather disasters without meaningful government action to address climate change, a looming threat that only grows more serious each day.
While the public sector continues to dither on climate, we saw increased private sector involvement in 2021, culminating in the COP26 global climate summit in November, where organizations, including Impax, offered input and commitments, striving to fill the public policy void with innovative capital market solutions.
Heading into 2022, there are signs that the public policy environment may be more promising to those of us who are investing in the transition to more sustainable economy. For starters, the Biden-Harris administration released its National Strategy on Gender Equity and Equality, which is designed to address gender discrimination and systemic barriers to full participation that have held back women and girls. In November, the Department of Labor, reversing a hastily enacted and ill-advised rule of the previous presidential administration, proposed a new rule empowering ERISA7 fiduciaries to consider ESG factors when making investment decisions on behalf of plan participants and when voting corporate proxy ballots. This is good news. Environmental and social issues are increasingly relevant to how companies and investment portfolios perform, and careful consideration of ESG factors can help ERISA fiduciaries spotlight risks and opportunities that must be managed on behalf of retirement investors.
As I write in early February, we are anticipating new Securities and Exchange Commission rulemaking requiring companies operating in the US to make certain climate change-related disclosures on an annual basis. Such disclosure is critically important if we are to successfully transition to a more sustainable economy. At Impax, we are very much focused on the investment opportunities we believe will unfold. The transition from a fossil fuel-based economy that is overheating the planet to a sustainable economy powered by innovation, efficiency and clean energy is the great investment opportunity of our era; we must seize it.
7 | ERISA, the Employee Retirement Income Security Act of 1974, is a federal law that sets minimum standards for most voluntarily established retirement and health plans in private industry to provide protection for individuals in these plans. |
On behalf of the entire team here at Impax and the Pax World Funds, I wish you and yours a safe and prosperous 2022.
Sincerely,

Joseph F. Keefe
President
Performance data quoted represents past performance, which does not guarantee future results. Investment return and principal value of an investment will fluctuate so that an investor’s shares, when redeemed, may be worth more or less than their original cost. Current performance may be lower or higher than the performance data quoted.
Investments involve risk, including potential loss of principal.
You should always consider Pax World Funds’ investment objectives, risks, and charges and expenses carefully before investing. For this and other important information, please download a fund prospectus at impaxam.com. Please read it carefully before investing.
The S&P 500 Stock Index is an unmanaged index of large capitalization common stocks. The Russell 2000 Index measures the performance of the small-cap segment of the U.S. equity universe. The Russell 2000 Index is a subset of the Russell 3000 Index representing approximately 10% of the total market capitalization of that index. It includes approximately 2,000 of the smallest securities based on a combination of their market cap and current index membership. The MSCI EAFE Index is designed to represent the performance of large and mid-cap securities across 21 developed markets, including countries in Europe, Australasia and the Far East, excluding the U.S. and Canada. The Index is available for a number of regions, market segments/sizes and covers approximately 85% of the free float-adjusted market capitalization in each of the 21 countries.
One cannot invest directly in any index.
The Morningstar Ratings™ shown are as of 12/31/2021. The Morningstar Rating for funds, or “star rating,” is calculated for managed products (including mutual funds, variable annuity and variable life subaccounts, exchange-traded funds, closed-end funds, and separate accounts) with at least a three-year history. Exchange-traded funds and open-ended mutual funds are considered a single population for comparative purposes. It is calculated based on a Morningstar Risk-Adjusted Return measure that accounts for variation in a managed product’s monthly excess performance, placing more emphasis on downward variations and rewarding consistent performance. The Morningstar Rating does not include any adjustments for sales loads. The top 10% of products in each product category receive 5 stars, the next 22.5% receive 4 stars, the next 35% receive 3 stars the next 22.5% receive 2 stars, and the bottom 10% receive 1 star. The Overall Morningstar Rating for a managed product is derived from a weighted average of the performance figures associated with its three-, five- and 10-year (if applicable) Morningstar Rating metrics. The weights are 100% three-year rating for 36-59 months of total returns, 60% five-year rating, 40% three-year rating for 60-119 months of total returns, and 50% 10-year rating, 30% five-year rating, 20% three-year rating for 120 or more months of total returns. While the 10-year overall rating formula seems to give the most weight to the 10-year period, the most recent three-year period actually has the greatest impact because it is included in all three rating periods.
©2022 Morningstar, Inc. All Rights Reserved. The information contained herein: (1) is proprietary to Morningstar and/or its content providers; (2) may not be copied or distributed; and (3) is not warranted to be accurate, complete or timely. Neither Morningstar nor its content providers are responsible for any damages or losses arising from any use of this information. Morningstar, Inc. is an independent investment research firm that compiles and analyzes fund, stock and general market data.
Pax Large Cap Fund Investor Class (PAXLX) Morningstar ratings were five stars out of 1,244 funds overall, five stars out of 1,244 funds for three years, five stars out of 1,109 for five year. Pax Large Cap Fund Institutional Class (PXLIX) Morningstar ratings were five stars out of 1,244 funds overall, five stars out of 1,244 funds for three years, five stars out of 1,109 for five years.
Pax Global Environmental Markets Fund Investor Class (PGRNX) Morningstar ratings were four stars out of 283 funds overall, five stars out of 283 funds for three years, four stars out of 236 funds for five years, four stars out of 145 funds for 10 years. Pax Global Environmental Markets Fund Institutional Class (PGINX) Morningstar ratings were five stars out of 283 funds overall, five stars out of 283 funds for three years, four stars out of 236 funds for five years, five stars out of 145 funds for 10 years.
Pax Small Cap Fund Investor Class (PXSCX) Morningstar ratings were four stars out of 596 funds overall, four stars out of 596 funds for three years, three stars out of 528 funds for five years, four stars out of 352 funds for 10 years. Pax Small Cap Fund Institutional Class (PXSIX) Morningstar ratings were four stars out of 596 funds overall, four stars out of 596 funds for three years, three stars out of 528 funds for five years, four stars out of 352 funds for 10 years.
Pax Ellevate Global Women’s Leadership Fund Investor Class (PXWEX) Morningstar ratings were three stars out of 283 funds overall, three stars out of 283 funds for three years, three stars out of 236 funds for five years, three stars out of 145 funds for 10 years. Pax Ellevate Global Women’s Leadership Fund Institutional Class (PXWIX) Morningstar ratings were four stars out of 283 funds overall, three stars out of 283 funds for three years, three stars out of 236 funds for five years, four stars out of 145 funds for 10 years.
Pax International Sustainable Economy Fund (formerly the Pax MSCI EAFE ESG Leaders Index Fund) Investor Class (PXINX) Morningstar ratings were four stars out of 698 funds overall, four stars out of 698 funds for three years, four stars out of 601 funds for five years, three stars out of 409 funds for 10 years. Pax International Sustainable Economy Fund Institutional Class (PXNIX) Morningstar ratings were four stars out of 698 funds overall, four stars out of 698 funds for 3 years, four stars out of 601 funds for five years, four stars out of 409 funds for 10 years.
Pax High Yield Bond Fund Investor Class (PAXHX) Morningstar ratings were three stars out of 634 funds overall, four stars out of 634 funds for three years, four stars out of 558 funds for five years, two stars out of 370 funds for 10 years. Pax High Yield Bond Fund Institutional Class (PXHIX) Morningstar ratings were four stars out of 634 funds overall, four stars out of 634 funds for three years, four stars out of 558 funds for five years, three stars out of 370 funds for 10 years.
Pax Sustainable Allocation Fund Investor Class (PAXWX) Morningstar ratings were four stars out of 665 funds overall, four stars out of 665 funds for three years, four stars out of 601 funds for five years, four stars out of 433 funds for 10 years. Pax Sustainable Allocation Fund Institutional Class (PAXIX) Morningstar ratings were four stars out of 665 funds overall, five stars out of 665 funds for three years, four stars out of 601 funds for five years, four stars out of 433 funds for 10 years.
The investment techniques and decisions of the investment adviser and the Fund’s portfolio manager(s), including the investment adviser’s assessment of a company’s ESG profile when selecting investments for the Fund, may not produce the desired results and may adversely impact the Fund’s performance, including relative to other Funds that do not consider ESG factors or come to different conclusions regarding such factors.
Pax Large Cap Fund RISKS: Equity investments are subject to market fluctuations, the fund’s share price can fall because of weakness in the broad market, a particular industry, or specific holdings.
Pax Small Cap Fund RISKS: Equity investments are subject to market fluctuations, the fund’s share price can fall because of weakness in the broad market, a particular industry, or specific holdings. Funds that emphasize investments in smaller companies generally will experience greater price volatility.
Pax Global Environmental Markets Fund RISKS: Equity investments are subject to market fluctuations, the fund’s share price can fall because of weakness in the broad market, a particular industry, or specific holdings. Emerging market and international investments involve risk of capital loss from unfavorable fluctuations in currency values, differences in generally accepted accounting principles, economic or political instability in other nations or increased volatility and lower trading volume.
Pax Ellevate Global Women’s Leadership Fund RISKS: The Fund does not take defensive positions in declining markets. The Fund’s performance would likely be adversely affected by a decline in the Index. There is no guarantee that the objective will be met and diversification does not eliminate risk. Equity investments are subject to market fluctuations, the fund’s share price can fall because of weakness in the broad market, a particular industry, or specific holdings. Emerging market and international investments involve risk of capital loss from unfavorable fluctuations in currency values, differences in generally accepted accounting principles, economic or political instability in other nations or increased volatility and lower trading volume.
Pax International Sustainable Economy Fund RISKS: Equity investments are subject to market fluctuations, the fund’s share price can fall because of weakness in the broad market, a particular industry, or specific holdings. Emerging market and international investments involve risk of capital loss from unfavorable fluctuations in currency values, differences in generally accepted accounting principles, economic or political instability in other nations or increased volatility and lower trading volume.
Pax High Yield Bond Fund RISKS: The Fund can invest in “junk bonds” which are considered predominately speculative with respect to the issuer’s continuing ability to make principal and interest payments when due. Yield and share price will vary with changes in interest rates and market conditions. Investors should note that if interest rates rise significantly from current levels, bond fund total returns will decline and may even turn negative in the short term. Mortgage related securities tend to become more sensitive to interest rate changes as interest rates rise, increasing their volatility. There is also a chance that some of the fund’s holdings may have their credit rating downgraded or may default.
Pax Sustainable Allocation Fund RISKS: The Pax Sustainable Allocation Fund is a fund-of-funds. The funds’ allocations may change due to market fluctuations and other factors. Equity investments are subject to market fluctuations, the fund’s share price can fall because of weakness in the broad market, a particular industry, or specific holdings. Emerging market and international investments involve risk of capital loss from unfavorable fluctuations in currency values, differences in generally accepted accounting principles, economic or political instability in other nations or increased volatility and lower trading volume. Funds that emphasize investments in smaller companies generally will experience greater price volatility. Yield and share price will vary with changes in interest rates and market conditions. Investors should note that if interest rates rise significantly from current levels, bond fund total returns will decline and may even turn negative in the short term. Mortgage related securities tend to become more sensitive to interest rate changes as interest rates rise, increasing their volatility. There is also a chance that some of the fund’s holdings may have their credit rating downgraded or may default.
December 31, 2021 |
Sustainable Investing Update (Unaudited) |
| | 
|
| | Senior Vice President
for Sustainable
Investing Julie Gorte, Ph.D. |
The World Meteorological Organization reported in 2021 that climate- and weather-related disasters have risen five-fold over the last half century, comprising 11,000 individual events, more than two million lives lost and $3.64 trillion in financial losses.1
In 2021 alone, almost one in three Americans experienced a weather disaster.2 In western Europe, two months’ worth of rain fell in two days, causing several flood-related deaths. In central China, a three-day downpour delivered a year’s worth of rain in one city. A “heat dome” that enveloped much of the Pacific Northwest and Canada during the summer of 2021 caused several hundred deaths and damaged transportation infrastructures and crops. Fires forced evacuations and damaged property and infrastructure in the American west, the Mediterranean and Russia.3
2021 was the year climate change topped the charts, not only in terms of disasters and costs but also awareness. More than ever, people, companies and governments are realizing that climate change is here today; it is taking lives; and it is perhaps the greatest threat to prosperity that humankind has ever faced.
We saw evidence of this in November, at the COP26 global climate summit. Though governmental commitments to phase out coal or correct carbon markets didn’t match up to pre-COP hopes — aside from India’s net-zero pledge — we saw businesses and NGOs (“non-governmental organizations”) make notable advances to stop deforestation and reduce methane emissions. The private sector is taking climate change seriously now, and that’s significant because the private sector has a huge role to play in preventing a climate catastrophe, especially as governments wring their hands. Impax was one of the organizations at COP26; you can read much more about how we were involved and what we observed on the COP26 page of our website: www.impaxam.com/cop26.
But it will take more than the private sector to avoid a climate disaster. Everyone — from private citizens to governments to NGOs to investors and companies — has a key role to play. Today’s climate change costs pale in comparison to what future costs and damages will be. Swiss Re estimates that climate change could cost the world 10% of its total economic value by 2050 if we stay on our current warming trajectory.4 We need governments to step up and take bold action. We need investors to do the same.
1 | United Nations, “Climate and Weather related Disasters Surge Five-fold Over 50 Years, but Early Warnings Save Lives – WMO report,” UN News, Sept. 1, 2021. |
2 | Sarah Kaplan and Andrew Ba Tran, “Nearly 1 in 3 Americans Experienced a Weather Disaster This Summer,” The Washington Post, Sept. 4, 2021. |
3 | Agence France-Presse, “A Round-up of the World’s Worst Climate Change Events in 2021,” July 26, 2021. |
4 | Swiss Re Institute, “The Economics of Climate Change: No Action Not an Option,” April 2021. |
Investing now in low-carbon technologies and solutions is likely to be less expensive than coping with increasingly severe and frequent disasters and heat waves. The IPCC estimates5 that it will take $1.6 – 3.8 trillion every year to avoid surpassing 1.5°C in additional warming between now and 2050. That is a hefty price tag, but technology to stem the damages, costs and suffering caused by climate change exists, and by investing in it, we also create jobs and add to economic output. Investing in both mitigation of additional emissions and adaptation to the changes that are unavoidable will be a far less chaotic approach to the problem of climate change than simply awaiting the effects.
And investing in climate mitigation need not be expensive in terms of financial outcomes for both equity and fixed income investors. In fact, it should be profitable. As mounting evidence shows, investing in mitigation and low-carbon solutions, or at least incorporating climate risks into investment portfolios, can provide competitive, if not superior, financial results to investors.6
We can’t avoid all the costs of climate change, even if we succeed in limiting future warming to levels established by the Paris Agreement. We need to assess our vulnerability to heat, floods, droughts, sea level rise, hurricanes and cyclones, wildfires, and the expansion of diseases and pests from the tropics into temperate regions, and we need to take steps to manage and adapt to those risks. Our options are far more numerous when we prepare for a crisis rather than trying to cope in the middle of one. That’s why last year we conducted an extensive engagement with companies in the S&P 500 focusing on the physical risks of climate change.7 While we found a small number of companies that are preparing, most are not. Because of this, investors cannot accurately price climate physical risks, since much of the information we need to do that would have to come from companies.
At Impax we are doing the best we can to prepare for climate change. We do this through our research and investments, by managing our funds’ carbon intensity, by engaging with companies to help them understand the implications of not taking climate into account in their operations and the advantages of managing and mitigating their climate risks. More and more companies are beginning to pay attention, and more investors like you are proactively seeking climate-friendly investment solutions. The more the merrier: averting a climate disaster will take every person in our global village.
5 | Intergovernmental Panel on Climate Change, “Headline Statements from the Summary for Policymakers,” Sixth Assessment Report, Working Group 1 – The Physical Science Basis, Aug. 9, 2021. |
6 | Julie Gorte, “The Financial Impacts of Climate Change: 2022 Update,” Impax Asset Management, Jan. 26, 2022. |
7 | Julie Gorte and Matthew Wright, “Seeking Coordinates: A Unique Engagement on Physical Climate Risk,” Impax Asset Management, Oct. 25, 2021. |
Commentary The portfolio manager commentaries in this report provide insight from the respective fund managers in an effort to help you examine your fund. The views expressed therein are those of the portfolio managers and are for the period covered by this report. Such commentary does not necessarily represent the views of the Board of Trustees of your fund. The views expressed herein are subject to change at any time based upon market and/or other conditions and Impax Asset Management LLC and the funds disclaim any responsibility to update such views. The commentaries should not be relied upon as investment advice.
Historical performance Historical performance can be evaluated in several ways. Each fund’s portfolio highlights provide total and average annual total returns. A comparison of this historical data to an appropriate benchmark is also provided. These performance figures include changes in a fund’s share price, plus reinvestment of any dividends (generally income) and any capital gains (generally profits the fund earns when it sells securities that have grown in value). Past performance does not guarantee future results.
The Funds’ distributor, Foreside Financial Services, LLC, is not affiliated with Impax Asset Management LLC or Impax Asset Management, Ltd.
December 31, 2021 |
Pax Large Cap Fund |
| | 
|
| | Portfolio Manager
Andrew Braun |
| | |
| | 
|
| | Portfolio Manager
Barbara Browning, CFA |
| Portfolio Managers’ Comments |
How did the Pax Large Cap Fund (the Fund) perform for the period?
For the one-year period ended December 31, 2021, the Institutional Class and Investor Class of the Fund had total returns of 30.92% and 30.57%, respectively, compared to 28.71% for the S&P 500 Index and 26.04% for the Lipper Large-Cap Core Funds Index.
What factors contributed to the Fund’s performance?
The Fund outperformed the S&P 500 Index for calendar year 2021 and experienced broad-based contributions from nearly every sector. The sectors which contributed the most to performance were Communications Services, Information Technology, and Industrials, while the Health Care sector detracted from the Fund’s overall relative performance. In addition, the Fund is fossil fuel-free, which hurt relative performance during the period as the Energy sector bounced back from a difficult 2020 to outperform the broader market in 2021.
Can you discuss any significant changes to the Fund’s positioning throughout the period?
The Fund added to Industrials and Consumer Staples during the period, while trimming its weight in Consumer Discretionary stocks. As the market strengthened during the year, we proactively took action to moderate some of the risk in the portfolio. The Fund ended the year with a beta1 of 0.93, an all-time low. We remain focused on companies with attractive prospects for earnings and cash flow growth looking out to 2022 and beyond.
What portfolio holdings contributed positively to performance?
Notable holdings that contributed positively to performance in 2021 were ViacomCBS, Applied Materials, and Fortinet. ViacomCBS had a volatile first half of the year, tripling in value through March before giving up most of those gains in a single week. We were able to take advantage of the volatility and lock in substantial gains. Even though the Fund sold its position in ViacomCBS by June of 2021, it still represents the single largest source of excess return for the full year.
Applied Materials has been a strong performer for the Fund since we purchased the security in early 2019, benefiting from secular and cyclical trends in the semiconductor capital equipment industry and we continue to like the positioning of the company. Fortinet performed well during the relatively short period that we owned the stock, as favorable cybersecurity trends and strong company execution combined to produce strong stock price gains. Based on our valuation discipline, we exited out of our position in Fortinet and redeployed the proceeds in Akamai, a more attractively priced cybersecurity stock.
What portfolio holdings detracted from performance?
Notably weak holdings were T-Mobile and Medtronic. T-Mobile has been a consistent market share gainer during our holding period, but the company encountered more resistance during 2021 as its large competitors focused on stabilizing their market share through aggressive pricing and promotions. We are focused on what we believe will be the likely growth of T-Mobile’s free cash flow over the next few years as the company is able to generate substantial cost savings from the integration of Sprint customers and by decommissioning Sprint’s network assets. A difficult period for Medtronic was characterized by delayed procedure volumes due to COVID-19, which was exacerbated by hospital labor shortages, and a quality control issue in one of their diabetes product facilities.
1 | Beta reflects the sensitivity of a Fund’s return to fluctuations in its benchmark; a beta for a benchmark is 1.00: a beta greater than 1.00 indicates above average volatility and risk. |
Portfolio Highlights (Unaudited)
Since Inception Total Return—Historical Growth of $10,000

December 31, 2021 |
Pax Large Cap Fund, continued |
Portfolio Highlights (Unaudited), continued |
Returns—Period ended December 31, 2021
| | | | | Total
Return | Average Annual Return |
Share Class | Ticker
Symbol | | | 1 Year | 3 Years | 5 Years | Since
Inception1 |
Institutional Class2 | PXLIX | | | 30.92% | 29.93% | 20.36% | 19.99% |
Investor Class2 | PAXLX | | | 30.57% | 29.61% | 20.06% | 19.70% |
S&P 500 Index | | | | 28.71% | 26.07% | 18.47% | 18.12% |
Lipper Large-Cap Core Funds Index | | | 26.04% | 23.59% | 16.71% | 16.37% |
See ‘Glossary of Terms’ for descriptions of benchmarks.
These figures represent past performance, which is no guarantee of future results. Investment return and principal value of an investment will fluctuate so that an investor’s shares, when redeemed, may be worth more or less than their original cost. Current performance may be lower or higher than the performance data quoted. Total returns for periods of less than one year have not been annualized. For most recent month-end performance data, please visit www.impaxam.com or call 800.767.1729.
1 | The Fund’s inception date is December 16, 2016. |
2 | Total return figures include reinvested dividends and capital gains distributions, and changes in principal value, and do not reflect the taxes that a shareholder might pay on Fund distributions or on the redemption of Fund shares. |
Asset Allocation | Percent of Investments |
U.S. Stocks | 97.1% |
Cash & Cash Equivalents | 2.9% |
Total | 100.0% |
Top Ten Holdings
Company | Percent of Net Assets |
Microsoft Corp. | 6.7% |
Apple, Inc. | 4.4% |
Alphabet, Inc., Class A | 3.6% |
Procter & Gamble Co., The | 2.8% |
Amazon.com, Inc. | 2.6% |
Alphabet, Inc., Class C | 2.5% |
Lowe’s Cos., Inc. | 2.5% |
Citizens Financial Group, Inc. | 2.4% |
Applied Materials, Inc. | 2.4% |
CVS Health Corp. | 2.3% |
Total | 32.2% |
Ten largest holdings do not include money market securities, certificates of deposit, commercial paper or cash and equivalents, if applicable.
Holdings are subject to change.
Sector Diversification
Sector | Percent of Net Assets |
Information Technology | 28.1% |
Health Care | 15.5% |
Financials | 10.1% |
Industrials | 9.6% |
Consumer Discretionary | 9.4% |
Communication Services | 8.4% |
Consumer Staples | 6.4% |
Real Estate | 5.8% |
Materials | 3.3% |
Utilities | 1.0% |
Other assets and liabilities (net) | 2.4% |
Total | 100.0% |
May include companies representing multiple industries within a single “Sector”.
December 31, 2021 |
Pax Small Cap Fund |
| | 
|
| | Portfolio Manager
Nathan Moser, CFA |
| Portfolio Manager’s Comments |
How did the Pax Small Cap Fund (the Fund) perform for the period?
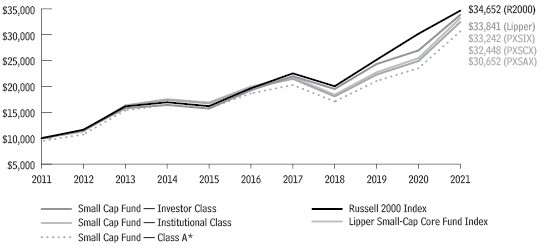
For the one-year period ended December 31, 2021, the Investor Class, Class A and Institutional Class shares of the Fund had total returns of 30.26%, 30.29% and 30.54%, respectively, compared to 14.82% for the Russell 2000 Index and 25.55% for the Lipper Small Cap Core Funds Index.
Impax is pleased to announce that Diederik Basch and Curtis Kim have been named Impax Portfolio Managers and will serve as co-Portfolio Managers of the Pax Small Cap Fund as of January 1, 2022. Diederik and Curtis have been members of the Fund’s Portfolio Construction Team (PCT) for several years — Diederik since 2016 and Curtis since 2018. Both have made significant contributions to the Fund as analysts and have clearly demonstrated their capabilities and competence as members of the PCT. We are delighted to recognize their contributions and to support their career progression as Portfolio Managers at Impax. Nathan Moser continues in the role of Portfolio Manager for the Fund, and the investment process remains unchanged.
What factors contributed to the Fund’s performance?
Equity markets were strong during the period as the US economy grew rapidly. Corporations have managed through the COVID-19 pandemic well and reported robust earnings growth despite continued waves of infection. From a style perspective, investors rotated from highly valued growth stocks and favored more cyclically-oriented value stocks during the course of the year. Due to the Fund’s exposure to higher quality, growth stocks, this represented a modest headwind to performance.
Fund performance was driven by strong stock selection, particularly in the Healthcare, Financials and Technology sectors. With respect to sector allocation, an underweight to Healthcare and overweight to Financials were positive contributors. The Fund’s lack of exposure to Energy and its cash holdings detracted from performance.
Can you discuss any significant changes to the Fund’s positioning throughout the period?
Over the course of the year, we increased our relative allocation to Healthcare and Consumer Discretionary. These were offset by reductions to Industrials and Financials. We continue to focus our efforts on security selection, to reduce the magnitude of sector over and underweights.
What portfolio holdings contributed positively to performance?
Onto Innovation, the product of an October 2019 merger, has successfully leveraged its newfound scale in a dynamic semiconductor equipment market. The scale has allowed Onto to become a consultative partner as compared to just a point solutions provider. We believe the well-publicized need for more advanced semiconductor capacity continues to play to Onto’s competitive strengths. Shares advanced 113% during the year.
Meridian Bancorp, a Massachusetts-based community bank, increased 64% during the period. Strong economic growth and the prospects of higher interest rates created a positive tailwind for shares. In addition, shares were further buoyed by the bank’s sale to Independent Bank. We believe this combination is attractive as it increases scale and enhances profitability.
What portfolio holdings detracted from performance?
8x8 came into 2021 with heighted optimism as David Sipes, former COO at RingCentral, became CEO. Sipes has “right-sized” the business, sacrificing high churn and low margin for small and medium-sized business revenue. We believe this is the right strategic focus; however, the change in strategy has weighed on near-term revenue growth. As a result, shares decreased -51% for the period. Despite this weakness, we continue to find the valuation compelling and keenly look for continued success in the enterprise channel.
SI-Bone, a medical device company, declined -26%. The company has developed an innovative device that has proven to not only reduce lower back pain, but also significantly reduce the potential for opioid addiction. The company and broader industry have been negatively impacted by COVID and its impact on procedure volumes. This is due to hospitals focusing on COVID cases as well as prospective patients deferring procedures due to fears of infection. We remain positive on SI-Bone’s outlook and used the weakness in its share price as an opportunity to add to our holding.
December 31, 2021 |
Pax Small Cap Fund, continued |
Portfolio Highlights (Unaudited)
Since Inception Total Return—Historical Growth of $10,000
Returns—Period ended December 31, 2021
| | | | | Total
Return | Average Annual Return |
Share Class | Ticker
Symbol | | | 1 Year | 3 Years | 5 Years | 10 Years |
Investor Class1 | PXSCX | | | 30.26% | 21.51% | 10.44% | 12.48% |
Class A1,2,4 | PXSAX | NAV3 | | 30.29% | 21.50% | 10.44% | 12.47% |
| | | POP | | 23.03% | 19.20% | 9.19% | 11.83% |
Institutional Class1 | PXSIX | | | 30.54% | 21.79% | 10.72% | 12.75% |
Russell 2000 Index | | | | 14.82% | 20.02% | 12.02% | 13.23% |
Lipper Small-Cap Core Funds Index | | | 25.55% | 20.15% | 11.91% | 12.97% |
See ‘Glossary of Terms’ for descriptions of benchmarks.
These figures represent past performance, which is no guarantee of future results. Investment return and principal value of an investment will fluctuate so that an investor’s shares, when redeemed, may be worth more or less than their original cost. Current performance may be lower or higher than the performance data quoted. Total returns for periods of less than one year have not been annualized. For most recent month-end performance data, please visit www.impaxam.com or call 800.767.1729.
1 | The Fund’s investment adviser assumed certain expenses during the 10-year period; total returns would have been lower had these expenses not been assumed. Total return figures include reinvested dividends and capital gains distributions, and changes in principal value, and do not reflect the taxes that a shareholder might pay on Fund distributions or on the redemption of Fund shares. |
2 | A 1.00% CDSC (contingent deferred sales charge) may be charged on any shares sold within 18 months of purchase over $1 million. POP (public offering price) reflects the maximum sales load for the Fund’s Class A Shares of 5.50%. NAV performance does not reflect the deduction of the sales load of the CDSC, which if reflected would reduce the performance shown. |
4 | Inception of Class A shares is May 1, 2013. The performance information shown for Class A shares includes the performance of Investor Class shares, adjusted to reflect the sales charge applicable to Class A shares, for the period prior to Class A inception. |
Asset Allocation | Percent of Investments |
Foreign Stocks | 1.9% |
U.S. Stocks | 94.2% |
Total | 3.9% |
| | 100.0% |
Top Ten Holdings
Company | Percent of Net Assets |
Victory Capital Holdings, Inc., Class A | 4.8% |
HomeTrust Bancshares, Inc. | 3.2% |
Independent Bank Corp. | 3.0% |
Brightsphere Investment Group, Inc. | 2.8% |
Ligand Pharmaceuticals, Inc. | 2.8% |
AZEK Co Inc., The | 2.6% |
Rayonier, Inc., REIT | 2.5% |
Onto Innovation, Inc. | 2.4% |
Ciena Corp. | 2.3% |
Vocera Communications, Inc. | 2.2% |
Total | 28.6% |
Ten largest holdings do not include money market securities, certificates of deposit, commercial paper or cash and equivalents, if applicable.
Holdings are subject to change.
Sector Diversification
Sector | Percent of Net Assets |
Financials | 18.8% |
Health Care | 18.8% |
Industrials | 15.5% |
Information Technology | 13.7% |
Consumer Discretionary | 10.0% |
Real Estate | 7.6% |
Consumer Staples | 4.3% |
Materials | 3.8% |
Communication Services | 2.2% |
Other assets and liabilities (net) | 5.3% |
Total | 100.0% |
May include companies representing multiple industries within a single “Sector”.
December 31, 2021 |
Pax US Sustainable Economy Fund |
| | 
|
| | Portfolio Manager
Scott LaBreche |
| | |
| | 
|
| | Portfolio Manager
Christine Cappabianca |
| Portfolio Managers’ Comments |
How did the Pax US Sustainable Economy Fund (the Fund) perform for the period?
For the one-year period ended December 31, 2021, the Pax US Sustainable Economy Fund Investor Class, Class A, and Institutional Class shares had total returns of 30.02%, 29.99% and 30.35%, respectively, compared to 26.45% for the Russell 1000 Index and 23.28% for the Lipper Multi-Cap Core Funds Index.
What is the investment objective and strategy of the Fund?
The US Sustainable Economy Fund’s investment objective is to seek long-term growth of capital. The Fund uses a systematic strategy to invest in US companies that we believe are positioned to benefit from the transition to a more sustainable economy.
Effective March 31, 2021, the Pax ESG Beta Quality Fund was renamed the Pax US Sustainable Economy Fund to better reflect this core focus of investing in the transition to a more sustainable economy. The Fund’s investment process was also enhanced with the integration of the Impax Sustainability Lens into portfolio construction. The Impax Sustainability Lens, which is already used in several of our actively managed funds, is a tool that facilitates a systematic review of the economic opportunities and risks associated with the transition to a more sustainable economy. The Fund continues to integrate the Impax Systematic ESG Rating (formerly called the Impax Sustainability Score) and SmartCarbon™ discipline into its systematic process and we believe that the portfolio continues to be comprised of quality companies in US markets.
What contributed positively/negatively to performance?
The Fund outperformed the Russell 1000 Index in the first quarter as well as for the three quarters that followed the mandate change discussed above. The Fund has also produced strong results compared to peers under the new mandate. The Institutional Class shares of the Fund posted a top 10% ranking (out of 642 funds) for the one-year period ended December 31, 2021, based on average annual returns within the Lipper Multi-Cap Core category.1
The main drivers of outperformance in the first quarter were the Fund’s overweight to earnings yield, and profitability factors used in the ESG Beta Quality strategy. Additionally, the Fund’s overweight to companies with high ESG scores that fell in the top two quartiles, as determined by the Impax Systematic ESG Rating, helped performance for the first quarter.
In the nine months since the mandate change and the incorporation of the Impax Sustainability Lens into the investment process, the Fund’s overweight exposure to high-opportunity sub-industries, as determined by the Lens, has been beneficial. These are the areas of the market where we see the potential for strong future growth driven by products and services facilitating advancements in spaces such as automation, environmental analysis and health and wellness. Examples of strong performing sub-industries for the year in this category include Healthcare Facilities, Semiconductors, Environmental and Facilities Management, Life Sciences Tools and Railroads. In addition, the Fund’s avoidance of some low-opportunity areas, where we see less opportunity in the transition to a more sustainable economy, such as Movies & Entertainment and Airlines, also helped Fund performance.
The Impax Systematic ESG Rating was particularly additive in selecting highly-rated ESG companies. NVIDIA and Zoetis were two notable, top performing names based on their strong ESG Ratings. The Fund’s underweight, relative to its benchmark, to companies with lower ESG Ratings, also contributed positively to performance over the course of the year.
Not owning Tesla, which is excluded from the Fund’s investable universe from both a Lens (considered low-opportunity and high risk) and ESG Rating (low ESG score) perspective, was a primary detractor from performance during the annual reporting period.
1 | Data shown represents rankings for the Pax US Sustainable Economy Fund- Institutional Class (PWGIX) in the Lipper Multi-Cap Core category based on average annual returns. Lipper rankings are based on total returns (not including sales charges) for the periods indicated and compare total return performance with that of other funds in the category. The Pax US Sustainable Economy Fund- Institutional Class (PWGIX) 1-year 10th percentile rank out of 642 funds, 3-year 51st percentile rank out of 586 funds, 5-year 35th percentile rank out of 518 funds and 10-year 51st percentile rank out of 369 funds. The Pax US Sustainable Economy Fund– Individual Class (PXWGX) 1-year 12th percentile rank out of 642 funds, 3-year 54th percentile rank out of 586 funds, 5-year 39th percentile rank out of 518 funds and 10-year 60th percentile rank out of 369 funds. |
December 31, 2021 |
Pax US Sustainable Economy Fund, continued |
Portfolio Highlights (Unaudited)
Since Inception Total Return—Historical Growth of $10,000

Returns—Period ended December 31, 2021
| | | | | Total
Return | Average Annual Return |
Share Class | Ticker
Symbol | | | 1 Year | 3 Years | 5 Years | 10 Years |
Investor Class1 | PXWGX | | | 30.02% | 23.25% | 16.87% | 14.50% |
Class A1,2,4 | PXGAX | NAV3 | | 29.99% | 23.22% | 16.87% | 14.50% |
| | | POP | | 22.84% | 20.93% | 15.56% | 13.85% |
Institutional Class1 | PWGIX | | | 30.35% | 23.53% | 17.16% | 14.78% |
Russell 1000 Index | | | | 26.45% | 26.21% | 18.43% | 16.54% |
Lipper Multi-Cap Core Funds Index | | | 23.28% | 24.55% | 16.53% | 14.95% |
See ‘Glossary of Terms’ for descriptions of benchmarks.
These figures represent past performance, which is no guarantee of future results. Investment return and principal value of an investment will fluctuate so that an investor’s shares, when redeemed, may be worth more or less than their original cost. Current performance may be lower or higher than the performance data quoted. Total returns for periods of less than one year have not been annualized. For most recent month-end performance data, please visit www.impaxam.com or call 800.767.1729.
1 | The Fund’s investment adviser waived a portion of its fees and assumed certain expenses during all periods shown; total returns would have been lower had these expenses not been assumed. Total return figures include reinvested dividends and capital gains distributions, and changes in principal value, and do not reflect the taxes that a shareholder might pay on Fund distributions or on the redemption of Fund shares. |
2 | A 1.00% CDSC (contingent deferred sales charge) may be charged on any shares sold within 18 months of purchase over $1 million. POP (public offering price) reflects the maximum sales load for the Fund’s Class A Shares of 5.50%. NAV performance does not reflect the deduction of the sales load of the CDSC, which if reflected would reduce the performance shown. |
4 | Inception of Class A shares is May 1, 2013. The performance information shown for Class A shares includes the performance of Investor Class shares, adjusted to reflect the sales charge applicable to Class A shares, for the period prior to Class A inception. |
Asset Allocation | Percent of Investments |
Foreign Stocks | 0.6% |
U.S. Stocks | 98.4% |
Cash & Cash Equivalents | 0.0%* |
Total | 1.0% |
| | 100.0% |
* | Rounds to less than 0.05%. |
Top Ten Holdings
Company | Percent of Net Assets |
Apple, Inc. | 6.2% |
Microsoft Corp. | 5.4% |
NVIDIA Corp. | 3.5% |
Alphabet, Inc., Class A | 3.4% |
Thermo Fisher Scientific, Inc. | 2.2% |
Home Depot, Inc., The | 2.0% |
Johnson & Johnson | 1.9% |
Zoetis, Inc. | 1.9% |
Lam Research Corp. | 1.7% |
Waste Management, Inc. | 1.7% |
Total | 29.9% |
Ten largest holdings do not include money market securities, certificates of deposit, commercial paper or cash and equivalents, if applicable.
Holdings are subject to change.
Sector Diversification
Sector | Percent of Net Assets |
Information Technology | 34.2% |
Health Care | 17.3% |
Financials | 8.6% |
Communication Services | 7.9% |
Industrials | 7.9% |
Consumer Discretionary | 6.7% |
Consumer Staples | 6.4% |
Real Estate | 4.1% |
Materials | 4.1% |
Utilities | 1.8% |
Other assets and liabilities (net) | 1.0% |
Total | 100.0% |
May include companies representing multiple industries within a single “Sector”.
December 31, 2021 |
Pax Global Sustainable Infrastructure Fund |
| | 
|
| | Portfolio Manager
Scott LaBreche |
| | |
| | 
|
| | Portfolio Manager
Christine Cappabianca |
Portfolio Managers’ Comments |
How did the Pax Global Sustainable Infrastructure (the Fund) perform for the period?
For the one-year period ended December 31, 2021, the Fund’s Institutional Class and Investor Class shares had total returns of 14.27% and 13.98%, respectively. The Fund outperformed its primary benchmark, the Russell 1000 Index, in the first quarter of 2021, however, after changes to the Fund’s investment strategy in the second quarter, the Fund ended the year underperforming its new primary benchmark, the S&P Global Infrastructure Index.
The Fund’s investment strategy was modified at the beginning of the second quarter to focus primarily on stocks the Adviser defines as sustainable infrastructure offerings, and its primary performance benchmark thereby changed from the Russell 1000 Index to the S&P Global Infrastructure Index.
In the first quarter, the Fund’s Institutional Class and Investor Class shares had total returns of 7.81% and 7.76%, respectively, compared to 5.91% for the Russell 1000 Index. For the remaining nine months of the year, the Fund’s Institutional Class and Investor Class had total returns of 5.89% and 5.66%, respectively, compared to 8.01% for the S&P Global Infrastructure Index.
What is the investment objective of the Fund?
The Global Sustainable Infrastructure Fund’s investment objective is capital appreciation and income. The Fund follows a sustainable investing approach, using a systematic process to invest in sectors, industries, and companies that the Adviser believes are positioned to provide infrastructure essential for the transition to a more sustainable global economy, integrating environmental, social and governance (ESG) analysis and ratings into portfolio construction.
Effective March 31, 2021, the Pax ESG Beta Dividend Fund was renamed the Pax Global Sustainable Infrastructure Fund. The Fund continues to seek both capital appreciation and income on behalf of shareholders by investing in companies that, in our view, are more likely to offer higher dividend yields. The Fund’s strategy was enhanced to better reflect a core focus on investing in the transition to a more sustainable economy. The Fund invests primarily in companies that support
“sustainable infrastructure” — companies that conserve, enable, or increase access to vital resources such as clean energy, water, food and agriculture, healthcare, education, finance, transportation and data and communications that advance well-being.
What contributed positively to performance?
The Fund outperformed the Russell 1000 Index benchmark in the first quarter. The main drivers of outperformance were the factors used in the ESG Beta Dividend Fund strategy. The portfolio’s tilt toward two dividend sustainability factors, profitability and earnings quality, contributed to relative performance. The tilt toward companies with higher dividend yields also had a positive impact on returns as companies with larger dividend payouts outperformed the broader market.
While the Fund did not outperform the S&P Global Infrastructure Index benchmark for the remainder of the year, the Fund’s tilt toward profitability and investment quality factors continued to have a positive impact. In addition, the Fund’s holdings in Water Infrastructure helped performance. The Water Utilities sub-sector performed strongly due to consolidation in the industry, which was reflected in Veolia’s purchase of Suez. The Fund benefitted from holding both companies involved in the merger. UK water utilities also contributed positively, partly due to government-backed cash flow.
Within the portion of the portfolio that we classify as Social and Economic Infrastructure, positive contributors included Building and Facilities, which continued to perform well amid a strong real estate market, and Healthcare infrastructure companies. The Fund’s exposure to sustainable REITs within both Building and Facilities and Healthcare infrastructure helped performance. The Fund also benefited from avoiding traditional transportation during this period.
What detracted from performance?
In the first quarter, industry exposures, which were driven by the ESG Beta Dividend strategy and its ESG tilts, modestly detracted from returns relative to the Russell 1000 Index. Notably, the portfolio’s underweight to the Energy and Financials sectors hurt relative performance.
For the remainder of the year, the main detractor from performance was an underweight in Energy exposure relative to the S&P Global Infrastructure Index. Not owning traditional oil and gas transport and storage companies was a drag on Fund performance as oil prices rose during the reporting period. Portfolio holdings in New
December 31, 2021 |
Pax Global Sustainable Infrastructure Fund, continued |
Energy that are focused on renewable power generation and distribution also detracted from performance. We believe that the scale of the opportunity for companies within New Energy, and particularly in the Energy Generation & Distribution sub-sector, remains strong in the medium- to long-term as countries formulate Net Zero plans, power grids evolve and as clean electricity consumption increases.
Additionally, the Communications & Data sector, an exposure that is a significant differentiator for the Fund since it is not included in our traditional infrastructure benchmark, underperformed during the last three quarters of 2021. Despite the short-term underperformance in this sector, we remain optimistic that this sector’s access to information, communication, banking, education, and employment will be a growing and foundational component of the modern global sustainable economy.
Portfolio Highlights (Unaudited)
Since Inception Total Return—Historical Growth of $10,000

Returns—Period ended December 31, 2021
| | | | Total
Return | Average Annual Return |
Share Class | Ticker
Symbol | | 1 Year | 3 Year | 5 Year | Since
Inception1 |
Institutional Class2 | PXDIX | | 14.27% | 18.19% | 13.64% | 13.31% |
Investor Class2 | PAXDX | | 13.98% | 17.88% | 13.34% | 13.01% |
S&P Global Infrastructure Index | | | 11.04% | 9.30% | 6.86% | 6.89% |
Russell 1000 Index | | | 26.45% | 26.21% | 18.43% | 18.07% |
Lipper Global Infrastructure Funds Index | | 14.65% | 12.08% | N/A | 9.63% |
See ‘Glossary of Terms’ for descriptions of benchmarks.
These figures represent past performance, which is no guarantee of future results. Investment return and principal value of an investment will fluctuate so that an investor’s shares, when redeemed, may be worth more or less than their original cost. Current performance may be lower or higher than the performance data quoted. Total returns for periods of less than one year have not been annualized. For most recent month-end performance data, please visit www.impaxam.com or call 800.767.1729.
1 | The Fund’s inception date is December 16, 2016. |
2 | The Fund’s investment adviser waived a portion of its fee during all periods shown; total returns would have been lower had these waivers not taken place. Total return figures include reinvested dividends and capital gains distributions, and changes in principal value, and do not reflect the taxes that a shareholder might pay on Fund distributions or on the redemption of Fund shares. |
Asset Allocation | Percent of Investments |
Foreign Stocks | 58.7% |
U.S. Stocks | 39.5% |
Exchange-Traded Funds | 0.8% |
Cash & Cash Equivalents | 1.0% |
Total | 100.0% |
Top Ten Holdings
Company | Percent of Net Assets |
Iberdrola SA | 2.5% |
Enel SpA | 2.5% |
Waste Management, Inc. | 2.4% |
Schneider Electric SE | 2.0% |
Taiwan Semiconductor Manufacturing Co., Ltd. | 1.9% |
AT&T, Inc. | 1.7% |
American Water Works Co., Inc. | 1.7% |
Union Pacific Corp. | 1.5% |
SSE PLC | 1.5% |
Edison International | 1.4% |
Total | 19.1% |
Ten largest holdings do not include money market securities, certificates of deposit, commercial paper or cash and equivalents, if applicable.
Holdings are subject to change.
December 31, 2021 |
Pax Global Sustainable Infrastructure Fund, continued |
Portfolio Highlights (Unaudited), continued |
Sector Diversification
Sector | Percent of Net Assets |
Utilities | 31.4% |
Industrials | 22.7% |
Communication Services | 19.8% |
Real Estate | 9.9% |
Information Technology | 8.5% |
Health Care | 4.9% |
Exchange-Traded Funds | 0.7% |
Financials | 0.6% |
Consumer Discretionary | 0.1% |
Other assets and liabilities (net) | 1.4% |
Total | 100.0% |
May include companies representing multiple industries within a single “Sector”.
December 31, 2021 |
Pax Global Opportunities Fund |
| | 
|
| | Portfolio Manager
Kirsteen Morrison |
| | |
| | 
|
| | Portfolio Manager
David Winborne Sub-Adviser
Impax Asset Management Ltd. |
| Portfolio Managers’ Comments |
How did the Pax Global Opportunities Fund (the Fund) perform for the period?
For the one-year period ended December 31, 2021, the Fund’s Institutional Class and Investor Class shares had total returns of 18.96% and 18.69%, respectively, compared to 18.54% for the MSCI All-Country World (Net) Index (“MSCI ACWI”) and 12.93% for the Lipper Global Multi-Cap Growth Funds Index.
What factors contributed to the Fund’s performance?
In 2021 the Fund modestly outperformed the MSCI ACWI, with contributions from both positive sector allocation and stock selection. The lack of exposure to the Energy sector was a headwind to portfolio performance, as Energy performed well during the reporting period. This was offset, however, by the Fund’s underweight positions in the Consumer Discretionary and the Communication Services sectors which underperformed the broader market. In Health Care, companies engaged in the outsourcing of drug discovery, development and manufacturing performed strongly, as did Life Science Tools companies. Materials stocks enabling the transition to biofuels, more nutritious ingredients and energy efficiency also benefitted the portfolio. In Industrials, a broad range of companies contributed to performance, including businesses with exposure to the sharing economy, software-as-a-service and water optimization. The Financials sector was the largest detractor from performance due to disruptions from COVID- 19, with Indian Financials experiencing temporary business disruptions and Asian insurance names impacted by delays to reopening the Hong Kong/China border.
Can you discuss any significant changes to the Fund’s positioning throughout the period?
While there have been some changes to the sizing of the positions, the overall positioning of the Fund relative to the MSCI ACWI Index has not changed significantly over the year. The Fund has maintained overweight positions in Health Care, Materials and Information Technology and underweight positions in Consumer Discretionary, Communication Services, and Energy. The notable
December 31, 2021 |
Pax Global Opportunities Fund, continued |
changes were a decrease in Consumer Staples from a benchmark neutral allocation to an underweight allocation and an increase in Industrials from a neutral allocation, to an overweight allocation. In the case of Consumer Staples, the portfolio exited names which had been negatively impacted by COVID-19 restrictions and where there was lower conviction. In the case of Industrials, the Fund increased exposure to companies with strong secular growth drivers that benefitted from a return to more normal economic activity as well as quality names which, in our view, had been overlooked by the market and had been exhibiting stable growth and more defensive characteristics.
What portfolio holdings contributed positively to performance relative to the MSCI ACWI?
Information Technology names have continued to benefit from investment in digitalization and in growth in demand for semiconductors. Microsoft (Systems Software, US) performed well on the back of strong quarterly results indicating significant momentum behind the company’s Azure cloud computing segment. In addition, the stock has benefited from the emergence of newer growth drivers such as LinkedIn and Teams.
ASML (Semiconductor Equipment, Netherlands) has benefitted from rapid growth in demand for the company’s leading-edge semiconductor manufacturing equipment from TSMC and Intel, both of which announced large increases in capital expenditure plans, as well as rising demand for legacy products as semiconductor chip shortages widen.
In Health Care, IQVIA (Life Sciences Tools & Services, US) has performed well after producing a series of positive results showing revenue acceleration across its business divisions. Most recently, the company announced good Q3 results with a third guidance raise for the full year, followed by a Capital Markets Day where the company indicated stronger than expected mid-term growth prospects. The company has seen an acceleration to top-line growth, driven by strong demand in its core Clinical Research Organization (CRO) business and Technology & Analytics Solutions division.
What portfolio holdings detracted from performance relative to the MSCI ACWI?
Portfolio holdings that detracted from performance during the period tended to be affected by stock specific factors.
Bandhan Bank (Regional Banks, India) underperformed earlier in the year as they adopted a more conservative approach to provisioning for non-performing loans ahead of regional elections. However, these levels of provisioning proved appropriate, as the stock faced headwinds from strict local lockdowns and movement restrictions during India’s second COVID wave, resulting in lower collection efficiency and an increase in non-performing loans. Recently the name has been negatively impacted by fears about the impact of the new COVID-19 variant Omicron on business activity, despite the progress in the national vaccination program. The investment team continues to monitor the situation.
TeamViewer’s (Application Software, Germany) share price declined as the market discounted an increase in advertising spending, aimed at increasing brand awareness with both personal and enterprises users. The stock also reacted negatively to cautious comments by management which highlighted a reduction in average contract values as customers re-evaluated their needs one year on from the start of the pandemic. The company disclosed higher churn in the Enterprise business, which crystallized lower conviction, and the stock was exited during the third quarter.
AIA Group’s (Insurance, Hong Kong) share price has struggled amid industry wide weak new business growth in the China market, negative sentiment due to COVID-19-related delays of re-opening the Hong Kong-China border and generally weaker sentiment toward insurance names.
Portfolio Highlights (Unaudited)
Since Inception Total Return—Historical Growth of $10,000
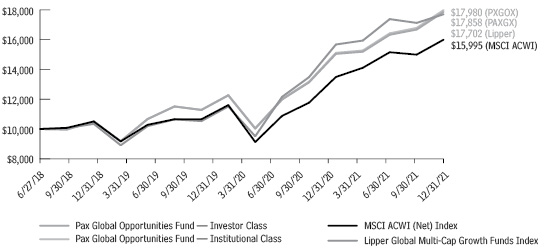
December 31, 2021 |
Pax Global Opportunities Fund, continued |
Portfolio Highlights (Unaudited), continued |
Returns—Period ended December 31, 2021
| | | | Total
Return | Average Annual Return |
Share Class | Ticker
Symbol | | 1 Year | 3 Year | Since
Inception1 |
Institutional Class2 | PXGOX | | 18.96% | 25.09% | 18.16% |
Investor Class2 | PAXGX | | 18.69% | 24.81% | 17.93% |
MSCI ACWI (Net) Index | | | 18.54% | 20.38% | 14.30% |
Lipper Global Multi-Cap Growth Funds Index | | 12.93% | 25.71% | 17.74% |
See ‘Glossary of Terms’ for descriptions of benchmarks.
These figures represent past performance, which is no guarantee of future results. Investment return and principal value of an investment will fluctuate so that an investor’s shares, when redeemed, may be worth more or less than their original cost. Current performance may be lower or higher than the performance data quoted. Total returns for periods of less than one year have not been annualized. For most recent month-end performance data, please visit www.impaxam.com or call 800.767.1729.
1 | The Fund’s inception date is June 27, 2018. |
2 | The Fund’s investment adviser assumed certain expenses during all periods shown; total returns would have been lower had these expenses not been assumed. Total return figures include reinvested dividends and capital gains distributions, and changes in principal value, and do not reflect the taxes that a shareholder might pay on Fund distributions or on the redemption of Fund shares. |
Asset Allocation | Percent of Investments |
Foreign Stocks | 47.9% |
U.S. Stocks | 50.0% |
Cash & Cash Equivalents | 2.1% |
Total | 100.0% |
Top Ten Holdings
Company | Percent of Net Assets |
Microsoft Corp. | 4.2% |
Linde PLC | 3.8% |
IQVIA Holdings, Inc. | 3.8% |
MasterCard, Inc., Class A | 3.6% |
Thermo Fisher Scientific, Inc. | 3.2% |
HDFC Bank, Ltd., ADR | 3.1% |
Lonza Group AG | 3.0% |
Analog Devices, Inc. | 3.0% |
Ecolab, Inc. | 3.0% |
Taiwan Semiconductor Manufacturing Co, Ltd. | 3.0% |
Total | 33.7% |
Ten largest holdings do not include money market securities, certificates of deposit, commercial paper or cash and equivalents, if applicable.
Holdings are subject to change.
Sector Diversification
Sector | Percent of Net Assets |
Information Technology | 26.0% |
Health Care | 22.1% |
Industrials | 14.1% |
Materials | 12.6% |
Financials | 11.9% |
Consumer Staples | 4.1% |
Real Estate | 2.9% |
Consumer Discretionary | 2.6% |
Communication Services | 2.0% |
Other assets and liabilities (net) | 1.7% |
Total | 100.0% |
May include companies representing multiple industries within a single “Sector”.
December 31, 2021 |
Pax Global Environmental Markets Fund |
| | 
|
| | Portfolio Manager
Hubert Aarts |
| | |
| | 
|
| | Portfolio Manager
Sid Jha |
| | |
| | 
|
| | Portfolio Manager
David Winborne Sub-Adviser
Impax Asset Management Ltd. |
Portfolio Managers’ Comments |
How did the Pax Global Environmental Markets Fund perform for the period?
For the one-year period ended December 31, 2021, the Investor Class, Class A, and Institutional Class of the Fund had total returns of 21.95%, 21.89%, and 22.23%, respectively, versus 18.54% for the MSCI All-Country World (Net) Index (“MSCI ACWI”) and 20.46% for the FTSE Environmental Opportunities Index Series (“FTSE EOAS”).
What factors contributed to the Fund’s performance?
Global equity markets delivered strong performance in 2021 despite ongoing concerns over new variants of COVID-19. Supportive fiscal and monetary policies, lifting of COVID-19 restrictions, and rapid progress of vaccination programs resulted in an acceleration in economic activity. Earnings growth by companies in the portfolio continued to surprise on the upside, driven by pent up demand, rising consumer and business confidence, supportive policy, and strong demand for environmental solutions. Economic pace, coupled with supply chain disruptions and low base effects, also brought a rise in inflation, resulting in central banks taking action to tighten monetary policy. Swift sector and style rotations followed, as market participants balanced COVID and inflation risks. The rally was tempered by the emergence of the Omicron variant in mid-November, which led to heightened volatility during the last six weeks of the year.
Environmental markets saw tailwinds from several sources in 2021. The 26th United Nations Climate Change Conference widened the ranks of countries adopting Net Zero pledges. The emergence of coalitions of key actors around issues such as reducing coal power, deforestation, and methane emissions was a notable success. Business and finance drove ambitious commitments alongside governments, while various global policy efforts to ‘build back better’ continued with positive momentum.
Within Environmental Markets, the Water Infrastructure & Technologies and Energy Efficiency themes, particularly Industrial Energy Efficiency, contributed the most to returns. Renewable energy stocks closed lower during the period after posting large gains in 2020, as companies in this subsector were negatively affected by rising supply chain costs and logistical challenges.
Can you discuss any significant changes to the Fund’s positioning throughout the period?
The overall number of portfolio holdings remained relatively steady at 49 names, with low turnover around 14%. From a GICS1 sector perspective, we added to holdings within Information Technology as the role of both hardware and software solutions continue to increase for areas such as resource and energy efficiency. One such addition was Microsoft, whose use of highly energy efficient and often renewable energy-powered cloud datacenters plays an important role in resource efficiency. New technology names in the portfolio translated into increased Industrials Energy Efficiency exposure by environmental markets sector. Given some larger market capitalizations, the weighted average market cap for the Fund rose from around $45 billion to just over $100 billion. Regionally, North American holdings exposure rose slightly, primarily due to the strong performance of the US equity market. Overall, the investment team deems the portfolio well positioned, with roughly half of the holdings representing more defensive business models, and half more cyclical. On a relative basis, the portfolio is less cyclically oriented, and more defensively positioned compared to MSCI ACWI, as we expect the market is entering a more volatile period in anticipation of higher US interest rates.
What portfolio holdings contributed positively to performance relative to the MSCI ACWI?
Positive effects from stock selection continue to be an important driver of outperformance compared to MSCI ACWI. This was particularly evident for Industrials holdings in the portfolio, which generated much higher returns than their peers in the broader index, but good stock selection was also evident in Health Care, Materials, and Consumer Discretionary portfolio holdings. Holdings in these sectors are active in businesses as varied as food preparation resource efficiency, waste management, climate equipment for buildings, water infrastructure, the resiliency of the electrical grid, environmental testing, and green data centers.
December 31, 2021 |
Pax Global Environmental Markets Fund, continued |
What portfolio holdings detracted from performance relative to the MSCI ACWI?
Information Technology and Utilities were GICS sectors in which the strategy lagged the broader market on a comparative basis. This was partly a result of specific headwinds or challenges at the company level – such as for a number of holdings in software technology, but also because during a strong sector rotation, the overall market rotated out of higher growth names and toward more value-oriented parts of the market. In addition, several mega cap technology stocks notched strong performance for the year, and while these names are in the Fund’s benchmark, they are not included in the environmental markets universe. Within Utilities, Orsted A/S, a Danish renewable energy company, posted negative returns during the period and detracted from relative performance in this sector.
1 | The Global Industry Classification Standard (GICS) is a widely recognized industry standard for assigning a public company to the economic sector and industry group that best defines its business. It was developed jointly by MSCI and Standard & Poor’s and is used by the MSCI indexes. |
Portfolio Highlights (Unaudited)
Since Inception Total Return—Historical Growth of $10,000
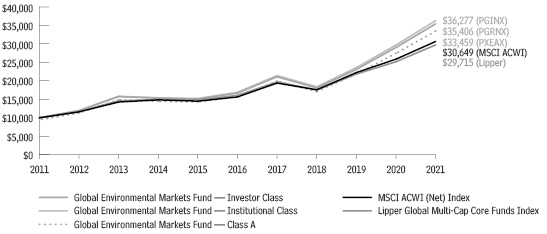
Returns—Period ended December 31, 2021
| | | | Total
Return | Average Annual Return |
Share Class | Ticker
Symbol | | 1 Year | 3 Years | 5 Years | 10 Years |
Investor Class1 | PGRNX | | 21.95% | 25.09% | 16.21% | 13.46% |
Class A1,2,4 | PXEAX | NAV3 | 21.89% | 25.06% | 16.20% | 13.46% |
| | | POP | 15.16% | 22.74% | 14.90% | 12.82% |
Institutional Class1 | PGINX | | 22.23% | 25.41% | 16.50% | 13.74% |
MSCI ACWI (Net) Index | | 18.54% | 20.38% | 14.40% | 11.85% |
FTSE Environmental Opportunities Index Series | | 20.46% | 30.37% | 20.47% | 15.66% |
See ‘Glossary of Terms’ for descriptions of benchmarks.
These figures represent past performance, which is no guarantee of future results. Investment return and principal value of an investment will fluctuate so that an investor’s shares, when redeemed, may be worth more or less than their original cost. Current performance may be lower or higher than the performance data quoted. Total returns for periods of less than one year have not been annualized. For most recent month-end performance data, please visit www.impaxam.com or call 800.767.1729.
1 | The Fund’s investment adviser assumed certain expenses during the 5-year and 10-year periods; total returns would have been lower had these expenses not been assumed. Total return figures include reinvested dividends and capital gains distributions, and changes in principal value, and do not reflect the taxes that a shareholder might pay on Fund distributions or on the redemption of Fund shares. |
2 | A 1.00% CDSC (contingent deferred sales charge) may be charged on any shares sold within 18 months of purchase over $1 million. POP (public offering price) reflects the maximum sales load for the Fund’s Class A Shares of 5.50%. NAV performance does not reflect the deduction of the sales load of the CDSC, which if reflected would reduce the performance shown. |
4 | Inception of Class A shares is May 1, 2013. The performance information shown for Class A shares includes the performance of Investor Class shares, adjusted to reflect the sales charge applicable to Class A shares, for the period prior to Class A inception. |
Asset Allocation | Percent of Investments |
Foreign Stocks | 39.7% |
U.S. Stocks | 57.8% |
Cash & Cash Equivalents | 2.5% |
Total | 100.0% |
December 31, 2021 |
Pax Global Environmental Markets Fund, continued |
Portfolio Highlights (Unaudited), continued |
Top Ten Holdings
Company | Percent of Net Assets |
Linde PLC | 3.4% |
Waste Management, Inc. | 3.4% |
American Water Works Co., Inc. | 3.4% |
Agilent Technologies, Inc. | 3.2% |
Schneider Electric SE | 3.1% |
GEA Group AG | 2.7% |
Koninklijke DSM NV | 2.7% |
IDEX Corp. | 2.6% |
Hubbell, Inc. | 2.6% |
Siemens AG | 2.6% |
Total | 29.7% |
Ten largest holdings do not include money market securities, certificates of deposit, commercial paper or cash and equivalents, if applicable.
Holdings are subject to change.
Sector Diversification
Sector | Sub Sector | Percent of Net Assets |
Renewable & Alternative Energy | | 3.4% |
| | Wind Power Generation Equipment | 1.5% | |
| | Renewable Energy Developers & Independent Power Producers (IPPs) | 1.9% | |
| | | |
Energy Efficiency | | 38.2% |
| | Power Network Efficiency | 5.7% | |
| | Industrial Energy Efficiency | 21.8% | |
| | Buildings Energy Efficiency | 4.9% | |
| | Transport Energy Efficiency | 5.8% | |
| | | |
Water Infrastructure & Technologies | | 17.3% |
| | Water Infrastructure | 9.1% | |
| | Water Treatment Equipment | 2.2% | |
| | Water Utilities | 6.0% | |
| | | | |
Pollution Control | | 11.5% |
| | Pollution Control Solutions | 1.4% | |
| | Environmental Testing & Gas Sensing | 10.1% | |
| | | | |
Waste Management & Technologies | | 3.4% |
| | General Waste Management | 3.4% | |
| | | | |
Environmental Support Services | | 2.5% |
| | Environmental Consultancies | 2.5% | |
| | | | |
Sector | Sub Sector | Percent of Net Assets |
Food, Agriculture & Forestry | | 15.4% |
| | Logistics, Food Safety & Packaging | 6.3% | |
| | Sustainable & Efficient Agriculture | 9.1% | |
| | | | |
Diversified Environmental | | 5.3% |
| | Diversified Environmental | 5.3% | |
| | | | |
Other assets and liabilities (net) | 3.0% | 3.0% |
Total | 100.0% | 100.0% |
May include companies representing multiple industries within a single “Sector”.
Geographical Diversification
Country | Percent of Net Assets |
United States | 57.5% |
United Kingdom | 9.9% |
Germany | 6.8% |
France | 6.2% |
Netherlands | 4.3% |
Japan | 4.0% |
Denmark | 3.4% |
Taiwan | 3.0% |
Switzerland | 1.4% |
Hong Kong | 0.5% |
Other assets and liabilities (net) | 3.0% |
Total | 100.0% |
December 31, 2021 |
Pax Ellevate Global Women’s Leadership Fund |
| | 
|
| | Portfolio Manager
Scott LaBreche |
| | |
| | 
|
| | Portfolio Manager
Christine Cappabianca |
| Portfolio Managers’ Comments |
How did the Pax Ellevate Global Women’s Leadership Fund (the Fund) perform for the period?
For the one-year period ended December 31, 2021, the Investor and Institutional Class had total returns of 17.27% and 17.56%, respectively, compared to 19.46% for the Impax Global Women’s Leadership Index (Women’s Index), 21.82% for the MSCI World (Net) Index (World Index) and 18.11% for the Lipper Global Multi-Cap Core Funds Index.
Global equity markets, as measured by the World Index, increased by 21.82% during the year. Momentum and high beta stocks dominated global market performance, creating a headwind given the Fund’s lower risk and higher quality profile.
What is the investment objective of the Fund?
The Fund seeks investment returns that closely correspond to or exceed the price and yield performance, before fees and expenses, of the Women’s Index. The Fund pursues a systematic strategy, investing in the companies comprising the Women’s Index, the first index of the highest-rated companies in the world for gender-diverse leadership, as rated by Impax Gender Analytics.1
The Fund’s systematic investment process overweights the portfolio toward Women’s Index companies with the most favorable gender leadership characteristics seeking to capture the increased investment returns we believe gender-diverse leadership will deliver over time. The Fund exceeds global markets on key gender characteristics including greater representation of women on boards and in senior management. Women hold 42% of the board seats and 35% of senior management positions in companies in the Fund, compared to 32% and 24%, respectively, within the World Index. In addition, 97% percent of companies in the Fund have three or more women on the board and 99% have two or more women on the board, compared with 60% and 80%, respectively, for companies in the World Index. 39% of companies in the Fund have a woman CEO or CFO, compared with 17% of companies in the World Index. In addition, 53% of companies in the Fund have disclosed pay equity analysis, an increase of 12% year-over-year from constituents within our gender leadership universe.
What contributed positively to performance?
The Fund benefited from strong results from several higher-rated companies across multiple sectors. Principal Financial, Microsoft, Bank of America and JPMorgan Chase within Financials and Technology outperformed. Within Heath Care, Pfizer, Eli Lilly and Novo Nordisk in Pharmaceuticals added to performance, along with Quest Diagnostics and Anthem in Health Care Providers & Services. In addition, Estee Lauder and L’Oréal within Consumer Staples outperformed.
What detracted from performance?
During the year, the highest-rated quartile of companies within the World Index, based on the Impax Gender Score, trailed performance of the second and third quartiles, creating a headwind to Fund performance. However, the Fund’s avoidance of companies ranked in the bottom quartile, the worst performing segment, helped performance.
Not owning a few high performing stocks that fall outside the Fund’s universe, like Apple2, NVIDIA, Alphabet and Tesla hurt relative performance. In addition, several highly rated gender leadership companies based on the Impax Gender Score, across a few sectors underperformed. Within Industrials, Sunrun detracted, along with DocuSign, Autodesk and Pinterest within Technology. Additionally, the Fund’s lack of exposure to the Energy sector, due to being fossil fuel free, detracted from relative performance as the Energy sector posted robust returns, due to the continued rise in oil prices throughout the year.
1 | Impax Gender Analytics, 12/31/2021. The Fund’s investable universe, the Women’s Index, had its annual reconstitution on 12/15/2021. |
2 | Apple was added to the Fund’s investable universe at the Women’s Index annual reconstitution on 12/15/2021. Apple is now the Fund’s largest holding and prior to its addition on 12/15/21 was a large negative relative contributor to performance. |
December 31, 2021 |
Pax Ellevate Global Women’s Leadership Fund, continued |
Portfolio Highlights (Unaudited)
Since Inception Total Return—Historical Growth of $10,000

Returns—Period ended December 31, 2021
| | | | Total
Return | Average Annual Return |
Share Class | Ticker
Symbol | | 1 Year | 3 Years | 5 Years | 10 Years |
Investor Class1 | PXWEX | | 17.27% | 18.98% | 14.17% | 11.70% |
Institutional Class1 | PXWIX | | 17.56% | 19.28% | 14.45% | 11.97% |
Impax Global Women’s Leadership (Net) Index* | | 19.46% | 19.73% | 14.60% | N/A |
MSCI World (Net) Index | | 21.82% | 21.70% | 15.03% | 12.70% |
Lipper Global Multi-Cap Core Funds Index | | 18.11% | 19.13% | 13.08% | 11.51% |
See ‘Glossary of Terms’ for descriptions of benchmarks.
These figures represent past performance, which is no guarantee of future results. Investment return and principal value of an investment will fluctuate so that an investor’s shares, when redeemed, may be worth more or less than their original cost. Current performance may be lower or higher than the performance data quoted. Total returns for periods of less than one year have not been annualized. For most recent month-end performance data, please visit www.impaxam.com or call 800.767.1729.
* | Inception date of Women’s Index is February 28, 2014. |
1 | On June 4, 2014 the Pax World Global Women’s Equality Fund merged into the Pax Ellevate Global Women’s Leadership Fund (the Fund), pursuant to an Agreement and Plan of Reorganization dated March 4, 2014 (the “Reorganization”). Because the Fund had no investment operations prior to the closing of the Reorganization, Pax World Global Women’s Equality Fund (the “Predecessor Fund”) is treated as the survivor of the Reorganization for account and performance reporting purposes. Accordingly, all performance and other information shown for the Fund for periods prior to June 4, 2014 is that of the Predecessor Fund. Total return figures include reinvested dividends and capital gains distributions, and changes in principal value, and do not reflect the taxes that a shareholder might pay on Fund distributions or on the redemption of Fund shares. |
Asset Allocation | Percent of Investments |
Foreign Stocks | 29.6% |
U.S. Stocks | 69.1% |
Cash & Cash Equivalents | 1.3% |
Total | 100.0% |
Top Ten Holdings
Company | Percent of Net Assets |
Apple, Inc. | 4.6% |
Microsoft Corp. | 4.4% |
Amazon.com, Inc. | 3.0% |
Diageo PLC | 2.2% |
Estee Lauder Cos, Inc., The, Class A | 2.1% |
Ulta Beauty, Inc. | 2.1% |
lululemon athletica, Inc. | 2.1% |
Celanese Corp. | 2.0% |
American Water Works Co., Inc. | 2.0% |
Omnicom Group, Inc. | 2.0% |
Total | 26.5% |
Ten largest holdings do not include money market securities, certificates of deposit, commercial paper or cash and equivalents, if applicable.
Holdings are subject to change.
Sector Diversification
Sector | Percent of Net Assets |
Information Technology | 22.1% |
Consumer Discretionary | 16.0% |
Financials | 15.7% |
Health Care | 13.1% |
Consumer Staples | 10.2% |
Materials | 6.3% |
Communication Services | 6.3% |
Industrials | 5.1% |
Utilities | 2.8% |
Real Estate | 1.3% |
Other assets and liabilities (net) | 1.1% |
Total | 100.0% |
May include companies representing multiple industries within a single “Sector”.
December 31, 2021 |
Pax Ellevate Global Women’s Leadership Fund, continued |
Portfolio Highlights (Unaudited), continued |
Geographical Diversification
Country | Percent of Net Assets |
United States | 69.3% |
France | 7.0% |
United Kingdom | 5.3% |
Canada | 4.1% |
Netherlands | 3.1% |
Australia | 2.7% |
Germany | 1.6% |
Sweden | 1.2% |
Switzerland | 1.1% |
Denmark | 1.0% |
Spain | 0.5% |
Hong Kong | 0.4% |
Italy | 0.3% |
Brazil | 0.3% |
Norway | 0.2% |
Finland | 0.2% |
Belgium | 0.1% |
New Zealand | 0.1% |
Singapore | 0.1% |
Japan | 0.1% |
Portugal | 0.1% |
Israel | 0.1% |
Austria | 0.0%* |
Chile | 0.0%* |
Other Assets and liabilities (net) | 1.1% |
Total | 100.0% |
* | Rounds to less than 0.05%. |
December 31, 2021 |
Pax International Sustainable Economy Fund |
| | 
|
| | Portfolio Manager
Scott LaBreche |
| | |
| | 
|
| | Portfolio Manager
Christine Cappabianca |
Portfolio Managers’ Comments |
How did the Pax International Sustainable Economy Fund (the Fund) perform for the period?
For the one-year period ended December 31, 2021, the Institutional Class and Investor Class had total returns of 11.19% and 10.88%, respectively, compared to 11.26% for the MSCI EAFE (Net) Index (EAFE Index), 11.29% for the MSCI EAFE ESG Leaders (Net) Index and 12.16% for the Lipper International Large-Cap Core Funds Index.
During the period, the Fund modestly underperformed the EAFE Index, with strong relative performance during the second half of the year bringing returns for the year just shy of the benchmark.
During the period, the Fund crossed its ten-year since inception milestone. The Fund has outperformed the EAFE Index over the 3-year, 5-year, 10-year and since inception periods ending December 31, 2021. Specifically, over its since inception period (10 years and 11 months, ended December 31, 2021), the Fund’s Institutional Class shares and Investor Class shares have returned 6.17% and 5.90%, respectively, versus the EAFE Index return of 5.72%. We believe that this result, combined with the Fund’s lower risk1 profile, demonstrates the Fund’s long-term risk-adjusted advantage relative to the EAFE Index.
In addition, the Fund has produced strong long-term results compared with its peers. The Institutional Class shares of the Fund (PXNIX) has posted a top 35% ranking (out of 117 funds) over the three-year period, top 22% ranking (out of 101 funds) over the five-year period, top 25% ranking (out of 87 funds) over the ten-year period, and top 16% ranking (out of 71 funds) since inception for the period ended December 31, 2021, based on average annual returns within the Lipper International Large-Cap Core category.2
What is the investment objective of the Fund?
The International Sustainable Economy Fund’s investment objective is to seek long-term growth of capital. The Fund uses a systematic strategy to invest in non-US developed markets companies that we believe are positioned to benefit from the transition to a more sustainable economy.
December 31, 2021 |
Pax International Sustainable Economy Fund, continued |
Effective March 31, 2021, the Pax MSCI EAFE ESG Leaders Index Fund was renamed the Pax International Sustainable Economy Fund to better reflect this core focus of investing in the transition to a more sustainable economy. The Fund’s investment process was also enhanced with the integration of the Impax Sustainability Lens (Lens) into portfolio construction. The Lens, which is already used in several of our actively managed funds, is a tool that facilitates a systematic review of the economic opportunities and risks associated with the transition to a more sustainable economy. The Fund continues to integrate SmartCarbonTM into its systematic process and we believe that the Fund continues to be a well-diversified portfolio, comprised of companies in non-US developed markets that we feel are ESG leaders.
What contributed positively to performance?
Stock selection of companies with higher ESG ratings as well as those companies within high-opportunity sub-industries was the largest contributor to relative performance. Straumann, Lonza, RELX and CNP Assurance within the Health Care Equipment, Life Sciences Tools & Services, Research & Consulting Services and Life & Health Insurance sub-industries, respectively, were standout relative performers for the year.
Companies with higher ESG ratings outperformed average and lower ESG rated companies during the year. The Fund’s overweight positioning towards top tier MSCI ESG Rating3 companies along with its underweight allocation to lower-rated ESG companies, significantly helped performance.
The Fund utilizes SmartCarbonTM, a proprietary tool that replaces energy sector holdings with energy efficiency stocks. During the period, the Fund’s SmartCarbonTM approach added to relative return. The overweight allocation to energy efficiency companies had a positive impact on performance, with ASML, Schneider Electric and Tokyo Electron posting strong stock specific results. The Fund’s avoidance of the Energy sector detracted from returns due to rising oil prices throughout the year, partially offsetting positive results from the energy efficiency allocation.
In addition, over the period since the SmartCarbon™ approach was integrated into the investment process, it has added 2.39% of relative annualized return compared to the EAFE Index (27-month period: 9/30/2019 – 12/31/2021). Both the Fund’s overweight toward energy efficiency companies and avoidance of the Energy sector have benefited performance.
What detracted from performance?
During the period, the Fund modestly underperformed the EAFE Index, with strong relative performance during the second half of the year bringing returns for the year just shy of the benchmark. Overall Lens positioning was a slight detractor from performance, as low-opportunity and high-risk sub-industries outperformed high-opportunity sub-industries.
The Fund’s avoidance of high-risk low-opportunity sub-industries detracted, as many of these sub-industries outperformed during the year. Apparel Accessories & Luxury Goods was the largest relative detractor in this group. We believe companies in this sub-industry do not have meaningful alignment with opportunities associated with the transition to a sustainable economy and exhibit higher risk due to environmental and social issues within their supply chains. In addition, Fund holdings in the Utilities sector detracted, driven by poor results from Orsted, Iberdrola and Enel, three electric utility companies focused on renewable energy production and goals to reduce GHG emissions in line with the Paris Agreement.
1 | Risk is measured by standard deviation. PXNIX since inception standard deviation is 14.26 compared to 14.70 for the EAFE Index. |
2 | Data shown represents rankings for the Pax International Sustainable Economy Fund - Institutional Class (PXNIX) in the Lipper International Large-Cap Core category based on average annual returns. Lipper rankings are based on total returns (not including sales charges) for the periods indicated and compare total return performance with that of other funds in the category. The Pax International Sustainable Economy Fund - Institutional Class (PXNIX) 1-year 48th percentile rank out of 117 funds, 3-year 22th percentile rank out of 101 funds, 5-year 25th percentile rank out of 87 funds, 10-year 25th percentile rank out of 87 funds and since inception (01/27/11) 16th percentile rank out of 85 funds. |
3 | MSCI ESG Ratings uses a rules-based methodology designed to measure a company’s resilience to long-term, industry material environmental, social and governance (ESG) risks. Leveraging Artificial Intelligence (AI), machine learning and natural language processing augmented with our 200+ strong team of analysts, MSCI researches and rate companies on a ‘AAA‘ to ‘CCC’ scale according to their exposure to industry-material ESG risks and their ability to manage those risks relative to peers. |
December 31, 2021 |
Pax International Sustainable Economy Fund, continued |
Portfolio Highlights (Unaudited)
Since Inception Total Return—Historical Growth of $10,000
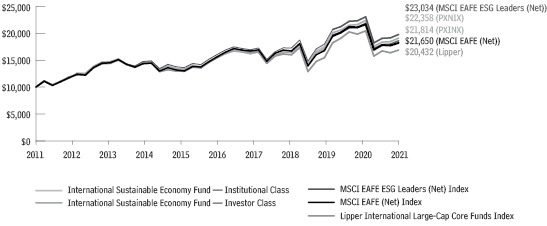
Returns—Period ended December 31, 2021
| | | | Total
Return | Average Annual Return |
Share Class | Ticker
Symbol | | 1 Year | 3 Years | 5 Years | 10 Years |
Institutional Class1 | PXNIX | | 11.19% | 14.84% | 10.22% | 8.37% |
Investor Class1,2 | PXINX | | 10.88% | 14.57% | 9.95% | 8.10% |
MSCI EAFE (Net) Index | | | 11.26% | 13.54% | 9.55% | 8.03% |
MSCI EAFE ESG Leaders (Net) Index | | | 11.29% | 15.03% | 10.21% | 8.69% |
Lipper International Large-Cap Core Funds Index | | 12.16% | 12.41% | 8.55% | 7.41% |
See ‘Glossary of Terms’ for descriptions of benchmarks.
These figures represent past performance, which is no guarantee of future results. Investment return and principal value of an investment will fluctuate so that an investor’s shares, when redeemed, may be worth more or less than their original cost. Current performance may be lower or higher than the performance data quoted. Total returns for periods of less than one year have not been annualized. For most recent month-end performance data, please visit www.impaxam.com or call 800.767.1729.
1 | The Fund’s inception date is January 27, 2011. Prior to March 31, 2021, Pax International Sustainable Economy Fund was known as Pax MSCI EAFE ESG Leaders Index Fund (the “EAFE ESG Index Fund”) and the strategy of the Fund differed from its current strategy. Accordingly, performance of the Fund for periods prior to March 31, 2021 may not be representative of the performance the Fund would have achieved had the Fund been following its current strategy. Effective March 31, 2014, the EAFE ESG Index Fund acquired the assets of Pax World International Fund, a series of Pax World Funds Series Trust I, and of Pax MSCI EAFE ESG Index ETF, a series of Pax World Funds Trust II, pursuant to an Agreement and Plan of Reorganization dated December 13, 2013 (the “Reorganizations”). Because the EAFE ESG Index Fund had no investment operations prior to the closing of the Reorganizations, and based on the similarity of the EAFE ESG Index Fund to Pax MSCI EAFE ESG Index ETF, Pax MSCI EAFE ESG Index ETF (the “Predecessor Fund”) is treated as the survivor of the Reorganizations for accounting and performance reporting purposes. Accordingly, all performance and other information shown for the International Sustainable Economy Fund for periods prior to March 31, 2014 is that |
of the Predecessor Fund. Total return figures include reinvested dividends and capital gains distributions, and changes in principal value, and do not reflect the taxes that a shareholder might pay on Fund distributions or on the redemption of Fund shares.
2 | Inception of the Investor Class is March 31, 2014. The performance information shown for the Investor Class shares for periods prior to March 31, 2014 includes the performance of the Predecessor Fund. These returns have been adjusted to reflect the expenses allocable to Investor Class. |
Asset Allocation | Percent of Investments |
Foreign Stocks | 99.8% |
Cash & Cash Equivalents | 0.2% |
Total | 100.0% |
Top Ten Holdings
Company | Percent of Net Assets |
ASML Holding NV | 4.1% |
Roche Holding AG | 3.6% |
Novo Nordisk A/S, Class B | 2.5% |
AstraZeneca PLC | 2.3% |
SAP SE | 2.0% |
GlaxoSmithKline PLC | 1.5% |
Commonwealth Bank of Australia | 1.5% |
Schneider Electric SE | 1.5% |
Unilever PLC | 1.4% |
BNP Paribas SA | 1.3% |
Total | 21.7% |
Ten largest holdings do not include money market securities, certificates of deposit, commercial paper or cash and equivalents, if applicable.
Holdings are subject to change.
Sector Diversification
Sector | Percent of Net Assets |
Financials | 18.0% |
Industrials | 17.8% |
Health Care | 17.1% |
Information Technology | 11.1% |
Consumer Staples | 9.2% |
Materials | 8.5% |
Consumer Discretionary | 6.7% |
Communication Services | 5.1% |
Utilities | 3.0% |
Real Estate | 2.8% |
Other assets and liabilities (net) | 0.7% |
Total | 100.0% |
May include companies representing multiple industries within a single “Sector”.
December 31, 2021 |
Pax International Sustainable Economy Fund, continued |
Portfolio Highlights (Unaudited), continued |
Geographical Diversification
Country | Percent of Net Assets |
Japan | 23.5% |
United Kingdom | 12.5% |
France | 10.8% |
Switzerland | 10.0% |
Germany | 8.1% |
Netherlands | 7.1% |
Australia | 6.1% |
Sweden | 4.1% |
Denmark | 3.9% |
Spain | 2.1% |
Italy | 1.9% |
Hong Kong | 1.6% |
Finland | 1.4% |
Singapore | 1.3% |
New Zealand | 1.3% |
Norway | 1.0% |
Ireland | 0.9% |
Belgium | 0.6% |
Austria | 0.4% |
Israel | 0.4% |
Portugal | 0.3% |
Other assets and liabilities (net) | 0.7% |
Total | 100.0% |
December 31, 2021 |
Pax Core Bond Fund |
| | 
|
| | Portfolio Manager
Anthony Trzcinka,
CFA |
| Portfolio Managers’ Comments |
How did the Pax Core Bond Fund (the Fund) perform for the period?
For the one-year period ended December 31, 2021, the Institutional Class and Investor Class shares of the Fund had total returns of -1.38% and -1.63%, respectively, compared to -1.54% for the Bloomberg U.S. Aggregate Bond Index and -1.17% for the Lipper Core Bond Funds Index.
What factors contributed to the Fund’s performance?
During the period, the Fund benefited from both security selection and allocation across multiple sectors. The primary contributors were Treasury holdings and asset-backed securities (ABS).
The Fund was underweight Treasuries for the period which helped performance in a rising rate environment. Additionally, the Fund’s allocation to Treasury Inflation Protection Securities (TIPS) performed well as inflation expectations have risen.
The Fund’s ABS holdings benefited from shorter duration positioning. In addition, most ABS experienced strong collateral performance in the year due to monetary and fiscal stimulus programs.
Can you discuss any significant changes to the Fund’s positioning throughout the period?
Since the beginning of the year, we positioned the portfolio for continued improvement in the economy and slightly rising interest rates. Our approach is to maintain a duration-neutral portfolio and, as such, we do not try to predict interest rate movements.
Our strategy to blunt the potential rise in rates is to overweight credit sectors, including corporate bonds and ABS. Both corporate bonds and ABS have benefited in this fixed income environment, and we believe should continue to benefit from the monetary and fiscal stimulus programs and the re-opening of global economies.
As we head into 2022, while the Fund remains overweight corporate bonds, we have trimmed some of the positions we feel were fully valued. We plan to allocate more resources to the ABS sector given current valuations.
December 31, 2021 |
Pax Core Bond Fund, continued |
What portfolio holdings contributed positively to performance?
A number of our holdings within the Corporate and ABS sectors were positive contributors. Holdings such as American Museum of Natural History, USAA Capital Corp and Tesla Auto Lease Trust were among top contributors.
What portfolio holdings detracted from performance?
The Fund’s long-dated Treasury holdings with maturities in 2040, 2050 and 2051 detracted from performance. These securities did not perform well in the rising interest rate environment during the period. We manage a duration-neutral portfolio and we believe that our Treasury holdings help offset shorter-duration positions in other sectors.
Portfolio Highlights (Unaudited)
Since Inception Total Return—Historical Growth of $10,000
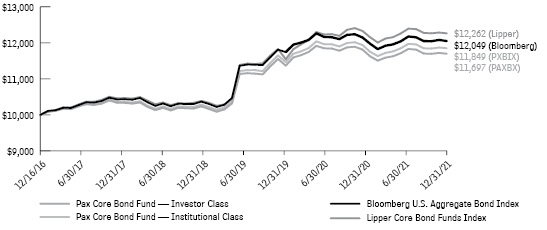
Returns—Period ended December 31, 2021
| | | | Total
Return | Average Annual Return |
Share Class | Ticker
Symbol | | 1 Year | 3 Years | 5 Years | Since
Inception1 |
Institutional Class2 | PXBIX | | -1.38% | 4.51% | 3.26% | 3.42% |
Investor Class2 | PAXBX | | -1.63% | 4.26% | 3.00% | 3.16% |
Bloomberg US Aggregate Bond Index | | -1.54% | 4.79% | 3.57% | 3.77% |
Lipper Core Bond Funds Index | | -1.17% | 5.48% | 3.96% | 4.13% |
See ‘Glossary of Terms’ for descriptions of benchmarks.
These figures represent past performance, which is no guarantee of future results. Investment return and principal value of an investment will fluctuate so that an investor’s shares, when redeemed, may be worth more or less than their original cost. Current performance may be lower or higher than the performance data quoted. Total returns for periods of less than one year have not been annualized. For most recent month-end performance data, please visit www.impaxam.com or call 800.767.1729.
1 | The Fund’s inception date is December 16, 2016. |
2 | Total return figures include reinvested dividends and capital gains distributions, and changes in principal value, and do not reflect the taxes that a shareholder might pay on Fund distributions or on the redemption of Fund shares. |
Asset Allocation | Percent of Investments |
U.S. Bonds | 90.7% |
Foreign Bonds | 5.9% |
Cash & Cash Equivalents | 3.4% |
Total | 100.0% |
Top Ten Holdings
Company | Percent of Net Assets |
United States Treasury Note, 2.000%, 11/15/41 | 3.7% |
United States Treasury Note, 1.875%, 11/15/51 | 2.7% |
United States Treasury Note, 1.250%, 11/30/26 | 2.1% |
United States Treasury Note, 1.500%, 11/30/28 | 1.5% |
United States Treasury Note (TIPS), 0.375%, 07/15/27 | 1.1% |
European Investment Bank, 3.250%, 01/29/24 | 1.1% |
International Bank for Reconstruction & Development, 1.625%, 01/15/25 | 1.0% |
United States Treasury Note (TIPS), 0.125%, 04/15/22 | 0.9% |
Kreditanstalt fuer Wiederaufbau, 2.625%, 02/28/24 | 0.7% |
European Investment Bank, 2.500%, 03/15/23 | 0.7% |
Total | 15.5% |
Ten largest holdings do not include money market securities, certificates of deposit, commercial paper or cash and equivalents, if applicable.
Holdings are subject to change.
Fixed Income Sector Diversification
Sector | Percent of Net Assets |
Corporate Bonds | 36.8% |
Mortgage-Backed Bonds | 23.0% |
Treasury Bonds | 14.6% |
Supranational Bonds | 12.0% |
Asset-Backed Securities | 6.8% |
Municipal Bonds | 1.6% |
Agency/Gov’t Related Bonds | 1.5% |
Community Investment Notes | 0.0%* |
Other assets and liabilities (net) | 3.7% |
Total | 100.0% |
December 31, 2021 |
Pax Core Bond Fund, continued |
Portfolio Highlights (Unaudited), continued |
* | Rounds to less than 0.05%. |
Credit Quality*
Bond Rating | Percent of Bonds |
U.S. Government | 38.4% |
AAA | 18.9% |
AA+ | 1.0% |
AA | 1.2% |
AA- | 2.9% |
A+ | 1.7% |
A | 5.0% |
A- | 6.5% |
BBB+ | 6.8% |
BBB | 5.8% |
BBB- | 2.4% |
BB+ | 1.4% |
BB | 1.5% |
BB- | 0.9% |
B+ | 0.1% |
B | 0.1% |
Not Rated | 5.4% |
Total | 100.0% |
* | Credit quality ratings by Standard & Poor’s assist investors by evaluating the credit worthiness of many bond issues. AAA: An obligation rated ‘AAA’ has the highest rating assigned by S&P Global Ratings. The obligor’s capacity to meet its financial commitment on the obligation is extremely strong. AA: An obligation rated ‘AA’ differs from the highest-rated obligations only to a small degree. The obligor’s capacity to meet its financial commitment on the obligation is very strong. A: An obligation rated ‘A’ is somewhat more susceptible to the adverse effects of changes in circumstances and economic conditions than obligations in higher-rated categories. However, the obligor’s capacity to meet its financial commitment on the obligation is still strong. BBB: An obligation rated ‘BBB’ exhibits adequate protection parameters. However, adverse economic conditions or changing circumstances are more likely to lead to a weakened capacity of the obligor to meet its financial commitment on the obligation. BB: An obligation rated ‘BB’ is less vulnerable to nonpayment than other speculative issues. However, it faces major ongoing uncertainties or exposure to adverse business, financial, or economic conditions which could lead to the obligor’s inadequate capacity to meet its financial commitment on the obligation. Not Rated: This indicates that no rating has been requested, or that there is insufficient information on which to base a rating, or that Standard & Poor’s does not rate a particular obligation as a matter of policy. |
December 31, 2021 |
Pax High Yield Bond Fund |
| | 
|
| | Portfolio Manager
Peter Schwab, CFA |
| | |
| | 
|
| | Portfolio Manager
Kent Siefers |
Portfolio Managers’ Comments |
How did the Pax High Yield Bond Fund (the Fund) perform for the period?
For the one-year period ended December 31, 2021, the Investor Class, Class A, and Institutional Class shares of the Fund had total returns of 2.96%, 3.11%, and 3.36% respectively, compared to 4.58% for the ICE BofA Merrill Lynch U.S. High Yield—Cash Pay—BB-B (Constrained 2%) Index (the Index) and 5.85% for the Lipper High Yield Bond Funds Index.
What factors contributed to the Fund’s performance?
During the period, high yield asset class returns were relatively strong at 5.36% as represented by the ICE BofA US High Yield Index.1 Credit spreads declined by -71 basis points during 2021 due to subsiding COVID concerns and robust global equity market performance. The high yield market absorbed meaningfully higher interest rates and performed well, relative to most fixed income asset classes.
The Fund’s underweight in the Energy sector, which notably outperformed during the reporting period, was the primary driver of the Fund’s underperformance. We finalized the implementation of the Fund’s fossil fuel free approach earlier in the year and continue to believe the high yield Energy sector’s longer-term fundamentals remain challenged despite the recent improvement in commodity prices.
In addition, several of the sectors that we consider as being well positioned for the transition to a more sustainable economy, did not rebound as strongly as we anticipated from COVID-induced weakness in 2020. We believe that these sectors tend to be more stable and durable and remain core to our long-term approach. The Fund’s overweights in Media, Healthcare and Telecommunications detracted as these sectors lagged.
Credit selection was a positive contributor, slightly offsetting the sector allocation drag mentioned previously. Media, Consumer Goods and Utilities were three areas of strong credit selection during the period.
December 31, 2021 |
Pax High Yield Bond Fund, continued |
In aggregate, during a period of significantly higher commodity prices and a preference for lower quality credits, our emphasis on more durable sectors and credits with strong environmental, social and governance (ESG) profiles detracted from performance.
Can you discuss any significant changes to the Fund’s positioning throughout the period?
During the period, the Fund divested from fossil fuels. The decision to limit exposure to fossil fuels reflects our concern about the high yield energy sector’s challenging future fundamentals and poor return prospects, as well as our explicit alignment with the transition to a more sustainable economy. By reducing exposure to fossil fuel companies, we aim to build a more resilient portfolio for our investors, to mitigate climate-related risks and accelerate the low carbon energy transition. We recognize there may be short-term periods of underperformance if the Energy sector performs well, as it did during 2021; however, we believe this will also be accompanied by periods of outperformance when Energy lags. In aggregate, we believe that avoiding the Energy sector in the high yield asset class will result in higher returns and lower volatility over medium- and long-term horizons.
In terms of other sector allocations, the Fund increased exposure to the Services, Technology and Utility sectors while reducing exposure to Basic Industry, Telecommunications and Financial Services.
The Fund’s credit rating exposure changed modestly in 2021. We reduced allocations to BBB and BB rated bonds and added B rated bonds where we found strong relative value. CCC rated bonds ended the year at approximately 9% of the portfolio, down slightly from the end of 2020. Over the course of the year, BB rated bonds decreased to 41.5% from 42.8%, and B rated bonds increased to 42.5% from 38.9%. As of December 31, 2021, the average credit quality of the Fund as measured by S&P was unchanged at B+. We continue to manage the Fund’s duration to be generally in-line with its benchmark. The effective duration of the Fund at year-end was 3.84 years versus the benchmark effective duration of 4.05 years.
What portfolio holdings contributed positively to performance?
Avantor, a healthcare and life sciences company, performed well as they experienced strong organic growth and have a rapidly improving debt profile.
Land O’Lakes, a leading dairy and animal feed producer, had a strong year and, in our view, is executing its farmer-cooperative owned strategy well.
Michaels Stores, a leading retailer of arts and craft products, performed strongly under new ownership and pandemic-induced demand.
Lastly, our underweight in Bausch Health contributed to relative performance as this large index constituent underperformed.
What portfolio holdings detracted from performance?
Altice USA, a cable and broadband provider, had a challenging year due to growing competitive pressures. As a relatively large core holding, the modest underperformance presented a headwind.
Emergent BioSolutions, a specialty biopharmaceutical company, experienced a number of operational challenges and underperformed.
Endo International, a generic drug maker, is facing several legal challenges and growing competition for one of their larger products, which resulted in a difficult year.
Finally, not owning Occidental Petroleum and our underweight to Bath & Body Works detracted as both companies performed well.
1 | The ICE BofA Merrill Lynch High Yield Index tracks the performance of below investment grade, but not in default, US dollar denominated corporate bonds publicly issued in the US domestic market, and includes issues with a credit rating of BBB or below, as rated by Moody’s and S&P. One cannot invest directly in an index. |
Portfolio Highlights (Unaudited)
Since Inception Total Return—Historical Growth of $10,000
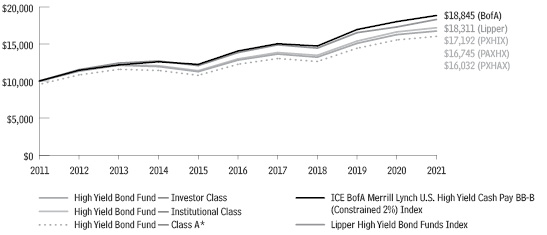
December 31, 2021 |
Pax High Yield Bond Fund, continued |
Portfolio Highlights (Unaudited), continued |
Returns—Period ended December 31, 2021
| | | | Total
Return | Average Annual Return |
Share Class | Ticker
Symbol | | 1 Year | 3 Years | 5 Years | 10 Years |
Investor Class1 | PAXHX | | 2.96% | 8.18% | 5.47% | 5.28% |
Class A1,2,4 | PXHAX | NAV3 | 3.11% | 8.23% | 5.50% | 5.31% |
| | | POP | -1.55% | 6.61% | 4.53% | 4.83% |
Institutional Class1,2 | PXHIX | | 3.36% | 8.47% | 5.77% | 5.56% |
ICE BofA Merrill Lynch U.S. High Yield - Cash Pay - BB-B (Constrained 2%) Index | 4.58% | 8.56% | 6.04% | 6.54% |
Lipper High Yield Bond Funds Index | | 5.85% | 8.23% | 5.76% | 6.24% |
See ‘Glossary of Terms’ for descriptions of benchmarks.
These figures represent past performance, which is no guarantee of future results. Investment return and principal value of an investment will fluctuate so that an investor’s shares, when redeemed, may be worth more or less than their original cost. Current performance may be lower or higher than the performance data quoted. Total returns for periods of less than one year have not been annualized. For most recent month-end performance data, please visit www.impaxam.com or call 800.767.1729.
1 | The Fund’s investment adviser assumed certain expenses during the 10-year period; total returns would have been lower had these expenses not been assumed. Total return figures include reinvested dividends and capital gains distributions, and changes in principal value, and do not reflect the taxes that a shareholder might pay on Fund distributions or on the redemption of Fund shares. |
2 | A 1.00% CDSC (contingent deferred sales charge) may be charged on any shares sold within 18 months of purchase over $1 million. POP (public offering price) reflects the maximum sales load for the Fund’s Class A Shares of 4.50%. NAV performance does not reflect the deduction of the sales load of the CDSC, which if reflected would reduce the performance shown. |
4 | Inception of Class A shares is May 1, 2013. The performance information shown for Class A shares includes the performance of Investor Class shares, adjusted to reflect the sales charge applicable to Class A shares, for the period prior to Class A inception. |
Asset Allocation | Percent of Investments |
U.S. Bonds | 84.3% |
Foreign Bonds | 10.2% |
Loans | 2.3% |
U.S. Stocks | 0.4% |
Cash & Cash Equivalents | 2.8% |
Total | 100.0% |
Top Ten Holdings
Company | Percent of Net Assets |
CCO Holdings, LLC/Capital Corp., 4.750%, 03/01/30 | 1.0% |
Avantor Funding, Inc., 4.625%, 07/15/28 | 0.9% |
Centene Corp., 4.625%, 12/15/29 | 0.9% |
Kraft Heinz Foods Co., 4.375%, 06/01/46 | 0.8% |
Prime Security Services Borrower, LLC/Finance, Inc., 6.250%, 01/15/28 | 0.8% |
Standard Industries, Inc., 5.000%, 02/15/27 | 0.7% |
Mileage Plus Holdings, LLC, aka United Air, 6.250%, 06/20/27 | 0.6% |
NCR Corp., 5.125%, 04/15/29 | 0.6% |
Ardagh Packaging Finance, PLC/Holdings USA, Inc., 5.250%, 08/15/27 | 0.6% |
Altice France Holding SA, 10.500%, 05/15/27 | 0.6% |
Total | 7.5% |
Ten largest holdings do not include money market securities, certificates of deposit, commercial paper or cash and equivalents, if applicable.
Holdings are subject to change.
Credit Quality*
Bond Rating | Percent of Bonds |
BBB+ | 0.4% |
BBB | 0.5% |
BBB- | 2.8% |
BB+ | 11.2% |
BB | 18.3% |
BB- | 13.3% |
B+ | 17.0% |
B | 16.2% |
B- | 10.4% |
CCC+ | 7.0% |
CCC | 1.9% |
CCC- | 0.5% |
Not Rated | 0.5% |
Total | 100.0% |
* | See bond rating descriptions on page 55. |
December 31, 2021 |
Pax High Yield Bond Fund, continued |
Portfolio Highlights (Unaudited), continued |
Fixed Income Sector Diversification
Sector | Percent of Net Assets |
Media | 14.5% |
Health Care | 10.5% |
Technology & Electronics | 10.0% |
Services | 9.4% |
Basic Industry | 9.3% |
Retail | 8.3% |
Consumer Goods | 7.5% |
Telecommunications | 6.2% |
Capital Goods | 5.6% |
Automotive | 4.7% |
Leisure | 2.7% |
Financial Services | 2.2% |
Utility | 2.2% |
Transportation | 1.5% |
Real Estate | 0.8% |
Banking | 0.5% |
Insurance | 0.4% |
Community Investment Notes | 0.1% |
Other assets and liabilities (net) | 3.6% |
Total | 100.0% |
May include companies representing multiple industries within a single “Sector”.
December 31, 2021 |
Pax Sustainable Allocation Fund |
| | 
|
| | Portfolio Manager
Andrew Braun |
| | |
| | 
|
| | Portfolio Manager
Nathan Moser, CFA |
| | |
| | 
|
| | Portfolio Manager
Anthony Trzcinka, CFA |
| | |
| | 
|
| | Portfolio Manager
Peter Schwab, CFA |
| Portfolio Managers’ Comments |
How did the Pax Sustainable Allocation Fund (the Fund) perform for the period?
For the one-year period ended December 31, 2021, the Investor Class and Institutional Class of the Fund had total returns of 15.31% and 15.64%, respectively, compared to 28.71% for the S&P 500 Index, 15.86% for the 60% S&P 500/40% Bloomberg US Aggregate Bond Index blend (the Blended Index), and 13.89% for the Morningstar Allocation – 50% to 70% Equity category average.
Relative to peers in the Morningstar Allocation – 50% to 70% Equity category, the Fund’s Institutional Class ranked in the 32nd percentile for the annual reporting period. The Fund’s Institutional Class performance ranked in the 12th percentile (out of 665 funds) for the 3-year and in the 16th percentile (out of 601 funds) for the 5-year period ending December 31, 20211 in the Morningstar Allocation – 50% to 70% Equity category. During the reporting period, the Pax Sustainable Allocation Fund reached a significant milestone and celebrated its 50th anniversary. Having launched in August 1971, the Fund was the first publicly available mutual fund in the US to use social and environmental as well as financial criteria in the investment process.
What factors contributed to the Fund’s performance?
Global equity markets delivered a robust performance in 2021, despite ongoing concerns over new COVID variants. At the start of the reporting period, global economic activity was accelerated by supportive fiscal and monetary policies, the lifting of COVID restrictions and the rapid progress of vaccination programs. Corporate earnings growth continued to surprise to the upside, driven by pent up demand and rising consumer and business confidence. Growth in demand, coupled with supply chain disruptions and low base effects have resulted in a continuing rise in inflation throughout the year, which resulted in central banks taking action to tighten monetary policy.
December 31, 2021 |
Pax Sustainable Allocation Fund, continued |
US large capitalization stocks delivered strong performance for the annual reporting period, with the S&P 500 Index returning 28.7%, considerably outperforming international stocks, as measured by the MSCI EAFE Index which returned 11.2%. Fixed income returns finished the year in negative territory, as measured by the Bloomberg US Aggregate Bond Index, which was down -1.5%. In this environment, the Fund’s slight overweight to stocks and underweight to bonds was a significant positive contributor to performance relative to the Blended Index. However, the Fund’s allocation to international stocks detracted from relative performance as non-US stocks underperformed their US counterparts and international stocks are not included in the 60% S&P 500/40% Bloomberg US Aggregate Bond Blended Index. The Fund’s small allocation to cash also detracted from performance.
Can you discuss any significant changes to the Fund’s positioning throughout the period?
Throughout 2021, the Fund remained modestly overweight equities and underweight fixed income. The Fund established initial positions in the Pax High Yield Bond Fund and the Pax Global Sustainable Infrastructure Fund (GSI Fund) to provide enhanced diversification and potentially new sources of alpha. Equity valuations remain stretched, but interest rates remain low relative to historical levels and low rates combined with very tight spreads limit the upside to bond returns. In this environment, the Fund continues to be slightly overweight equity, with an underweight to fixed income and a modest allocation to cash.
What portfolio holdings contributed positively and negatively to performance?
The Pax Large Cap Fund, the Fund’s largest equity holding, was also the largest contributor to return as it outperformed its benchmark, the S&P 500 Index, returning 30.9% (Institutional Class) versus 28.7%. The Fund’s allocation to the Pax Small Cap Fund was also a positive contributor as it meaningfully outperformed its benchmark, the Russell 2000 Index, returning 30.5% (Institutional Class) versus 14.8%, in a year where small cap stocks significantly lagged the performance of large cap stocks. The GSI Fund detracted from performance as conventionally more defensive infrastructure companies lagged the performance of the broader US and global markets. Additionally, traditionally more carbon intensive energy companies outperformed the GSI Fund’s allocation to companies engaged in more sustainable energy practices.
1 | Rankings in other time periods may be lower. Comparison based on the Morningstar 50%-70% Equity peer group for the period ending 12/31/21. The Pax Sustainable Allocation Fund’s Institutional Class performance for the 1-year period ranked 183 out of 710 (32nd percentile), for the 3-year period ranked 70 out of 665 (12th percentile), for the 5-year period ranked 77 out of 601 (16th percentile), and for the 10-year period 123 |
out of 433 (29th percentile). The Pax Sustainable Allocation Fund’s Investor Class performance for the 1-year period ranked 204 out of 710 (34th percentile), for the 3-year period ranked 96 out of 665 (17th percentile), for the 5-year period ranked 102 out of 601 (21st percentile), and for the 10-year period 154 out of 433 (36th percentile).
Portfolio Highlights (Unaudited)
Since Inception Total Return—Historical Growth of $10,000
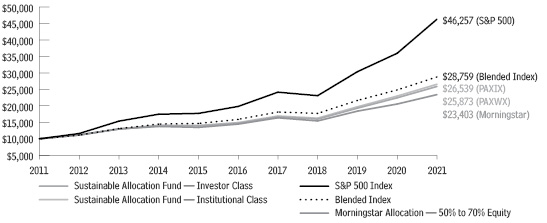
Returns—Period ended December 31, 2021
| | | | Total
Return | Average Annual Return |
Share Class | Ticker
Symbol | | 1 Year | 3 Years | 5 Years | 10 Years |
Investor Class1 | PAXWX | | 15.31% | 17.42% | 11.93% | 9.96% |
Institutional Class1 | PAXIX | | 15.64% | 17.73% | 12.21% | 10.24% |
S&P 500 Index | | | 28.71% | 26.07% | 18.47% | 16.55% |
Blended Index | | | 15.86% | 17.54% | 12.62% | 11.14% |
Morningstar Allocation — 50% to 70% Equity | | 13.89% | 14.85% | 10.39% | 9.33% |
See ‘Glossary of Terms’ for descriptions of benchmarks.
These figures represent past performance, which is no guarantee of future results. Investment return and principal value of an investment will fluctuate so that an investor’s shares, when redeemed, may be worth more or less than their original cost. Current performance may be lower or higher than the performance data quoted. Total returns for periods of less than one year have not been annualized. For most recent month-end performance data, please visit www.impaxam.com or call 800.767.1729.
1 | Total return figures include reinvested dividends and capital gains distributions, and changes in principal value, and do not reflect the taxes that a shareholder might pay on Fund distributions or on the redemption of Fund shares. |
December 31, 2021 |
Pax Sustainable Allocation Fund, continued |
Portfolio Highlights (Unaudited), continued |
Manager Allocations
Fund Allocation | Percent of Net Assets |
Equity | |
Large-Cap/Multi-Cap Core Strategies | |
Pax Large Cap Fund | 43.1% |
Small Cap Core Strategies | |
Pax Small Cap Fund | 3.2% |
Foreign Strategies | |
Pax Ellevate Global Women’s Leadership Fund | 2.7% |
Pax Global Environmental Markets Fund | 2.7% |
Pax Global Opportunities Fund | 2.6% |
Pax Global Sustainable Infrastructure Fund | 3.0% |
Pax International Sustainable Economy Fund | 6.5% |
Total Equity | 63.8% |
| | |
Fixed Income | |
Investment Grade/Intermediate | |
Pax Core Bond Fund | 27.6% |
High Yield Strategies | |
Pax High Yield Bond Fund | 3.5% |
Total Fixed Income | 31.1% |
| | |
Cash & Cash Equivalents | 5.1% |
Total | 100.0% |
December 31, 2021 |
Shareholder Expense Examples (Unaudited) |
Examples As a shareholder of the Funds, you incur ongoing costs, including management fees, distribution and/or service (12b-1) fees, and other Fund expenses. The examples on the next page are intended to help you understand your ongoing costs (in dollars) of investing in each of the Funds and compare these costs with the ongoing costs of investing in other mutual funds. For more information, see the relevant Fund’s prospectus or talk to your financial adviser.
The examples are based on an investment of $1,000 invested at the beginning of the period and held for the entire period beginning on July 1, 2021 and ending on December 31, 2021.
Please note that Individual Retirement Account (IRA), Coverdell Education Savings, Roth IRA, SEP-IRA, SIMPLE IRA, and 403(b)(7) accounts are charged an annual custodial fee of fifteen dollars. If you are invested in one of these account types, you should add an additional $7.50 to the estimated expenses paid during the period.
Actual Expenses For each Fund, the first table on the next page provides information about actual account values and actual expenses. You may use the information in this table, together with the amount you invested, to estimate the expenses that you paid over the period. For the Fund, simply divide your account value by $1,000 (for example, an $8,600 account value divided by $1,000 = 8.6), then multiply the result by the number under the heading entitled “Expenses Paid During Period” to estimate the expenses you paid on your account during this period.
Hypothetical Examples for Comparison Purposes For each Fund, the second table on the following pages provides information about hypothetical account values and hypothetical expenses based on each Fund’s actual expense ratio and an assumed rate of return of 5% per year before expenses, which is not each Fund’s actual return. The hypothetical account values and expenses may not be used to estimate the actual ending account balance or expenses you paid for the period. You may use this information to compare the ongoing costs of investing in the Funds and other funds. To do so, compare these 5% hypothetical examples with the 5% hypothetical examples that appear in the shareholder reports of the other funds.
Please note that the expenses shown in the tables are meant to highlight your ongoing costs only and do not reflect any transactional costs. Therefore, the second table is useful in comparing ongoing costs only, and will not help you determine the relative total costs of owning different funds. In addition, if these transactional costs were included, our costs would have been higher.
December 31, 2021 |
Shareholder Expense Examples (Unaudited), continued |
Based on Actual Fund Return | | | | |
| Beginning
Account Value
7/1/2021 | Ending
Account Value
12/31/2021 | Annualized
Expense
Ratio | Expenses
Paid During
Period1 |
Large Cap Fund - Investor | $ 1,000.00 | $ 1,094.50 | 0.97% | $ 5.12 |
Large Cap Fund - Institutional | 1,000.00 | 1,096.30 | 0.73% | 3.86 |
Small Cap Fund - Investor | 1,000.00 | 1,053.60 | 1.16% | 6.00 |
Small Cap Fund - Class A | 1,000.00 | 1,053.30 | 1.16% | 6.00 |
Small Cap Fund - Institutional | 1,000.00 | 1,054.70 | 0.91% | 4.71 |
US Sustainable Economy Fund - Investor | 1,000.00 | 1,116.80 | 0.70% | 3.73 |
US Sustainable Economy Fund - Class A | 1,000.00 | 1,116.40 | 0.71% | 3.79 |
US Sustainable Economy Fund - Institutional | 1,000.00 | 1,118.00 | 0.45% | 2.40 |
Global Sustainable Infrastructure Fund - Investor | 1,000.00 | 1,031.30 | 0.82% | 4.20 |
Global Sustainable Infrastructure Fund - Institutional | 1,000.00 | 1,033.10 | 0.55% | 2.82 |
Global Opportunities Fund - Investor | 1,000.00 | 1,093.70 | 1.23% | 6.49 |
Global Opportunities Fund - Institutional | 1,000.00 | 1,094.80 | 0.98% | 5.17 |
Global Environmental Markets Fund - Investor | 1,000.00 | 1,092.60 | 1.18% | 6.22 |
Global Environmental Markets Fund - Class A | 1,000.00 | 1,092.40 | 1.18% | 6.22 |
Global Environmental Markets Fund - Institutional | 1,000.00 | 1,093.80 | 0.93% | 4.91 |
Global Women’s Leadership Fund - Investor | 1,000.00 | 1,044.20 | 0.76% | 3.92 |
Global Women’s Leadership Fund - Institutional | 1,000.00 | 1,045.30 | 0.51% | 2.63 |
International Sustainable Economy Fund - Investor | 1,000.00 | 1,039.90 | 0.72% | 3.70 |
International Sustainable Economy Fund - Institutional | 1,000.00 | 1,041.10 | 0.47% | 2.42 |
Core Bond Fund - Investor | 1,000.00 | 998.80 | 0.71% | 3.58 |
Core Bond Fund - Institutional | 1,000.00 | 1,000.10 | 0.46% | 2.32 |
High Yield Bond Fund - Investor | 1,000.00 | 1,010.20 | 0.95% | 4.81 |
High Yield Bond Fund - Class A | 1,000.00 | 1,010.20 | 0.95% | 4.81 |
High Yield Bond Fund - Institutional | 1,000.00 | 1,011.40 | 0.70% | 3.55 |
Sustainable Allocation Fund - Investor | 1,000.00 | 1,051.00 | 0.30% | 1.55 |
Sustainable Allocation Fund - Institutional | 1,000.00 | 1,052.70 | 0.05% | 0.26 |
1 | Expenses are equal to each Funds’ annualized expense ratio, multiplied by the average account value over the period, multiplied by 184/365 (to reflect the one-half year period beginning on July 1, 2021 and ending on December 31, 2021). |
December 31, 2021 |
Shareholder Expense Examples (Unaudited), continued |
Based on Hypothetical 5% Return (before expenses) |
| Beginning
Account Value
7/1/2021 | Ending
Account Value
12/31/2021 | Annualized
Expense
Ratio | Expenses
Paid During
Period1 |
Large Cap Fund - Investor | $ 1,000.00 | $ 1,020.32 | 0.97% | $ 4.94 |
Large Cap Fund - Institutional | 1,000.00 | 1,021.53 | 0.73% | 3.72 |
Small Cap Fund - Investor | 1,000.00 | 1,019.36 | 1.16% | 5.90 |
Small Cap Fund - Class A | 1,000.00 | 1,019.36 | 1.16% | 5.90 |
Small Cap Fund - Institutional | 1,000.00 | 1,020.62 | 0.91% | 4.63 |
US Sustainable Economy Fund - Investor | 1,000.00 | 1,021.68 | 0.70% | 3.57 |
US Sustainable Economy Fund - Class A | 1,000.00 | 1,021.63 | 0.71% | 3.62 |
US Sustainable Economy Fund - Institutional | 1,000.00 | 1,022.94 | 0.45% | 2.29 |
Global Sustainable Infrastructure Fund - Investor | 1,000.00 | 1,021.07 | 0.82% | 4.18 |
Global Sustainable Infrastructure Fund - Institutional | 1,000.00 | 1,022.43 | 0.55% | 2.80 |
Global Opportunities Fund - Investor | 1,000.00 | 1,019.00 | 1.23% | 6.26 |
Global Opportunities Fund - Institutional | 1,000.00 | 1,020.27 | 0.98% | 4.99 |
Global Environmental Markets Fund - Investor | 1,000.00 | 1,019.26 | 1.18% | 6.01 |
Global Environmental Markets Fund - Class A | 1,000.00 | 1,019.26 | 1.18% | 6.01 |
Global Environmental Markets Fund - Institutional | 1,000.00 | 1,020.52 | 0.93% | 4.74 |
Global Women’s Leadership Fund - Investor | 1,000.00 | 1,021.37 | 0.76% | 3.87 |
Global Women’s Leadership Fund - Institutional | 1,000.00 | 1,022.63 | 0.51% | 2.60 |
International Sustainable Economy Fund - Investor | 1,000.00 | 1,021.58 | 0.72% | 3.67 |
International Sustainable Economy Fund - Institutional | 1,000.00 | 1,022.84 | 0.47% | 2.40 |
Core Bond Fund- Investor | 1,000.00 | 1,021.63 | 0.71% | 3.62 |
Core Bond Fund - Institutional | 1,000.00 | 1,022.82 | 0.46% | 2.35 |
High Yield Bond Fund - Investor | 1,000.00 | 1,020.42 | 0.95% | 4.84 |
High Yield Bond Fund - Class A | 1,000.00 | 1,020.42 | 0.95% | 4.84 |
High Yield Bond Fund - Institutional | 1,000.00 | 1,021.68 | 0.70% | 3.57 |
Sustainable Allocation Fund - Investor | 1,000.00 | 1,023.69 | 0.30% | 1.53 |
Sustainable Allocation Fund - Institutional | 1,000.00 | 1,024.95 | 0.05% | 0.26 |
1 | Expenses are equal to each Funds’ annualized expense ratio, multiplied by the average account value over the period, multiplied by 184/365 (to reflect the one-half year period beginning on July 1, 2021 and ending on December 31, 2021). |
December 31, 2021 |
Schedules of Investments |
Pax Large Cap Fund
Percent of Net Assets
Name of Issuer and
Title of Issue | | Shares/
Principal | | | Value | |
COMMON STOCKS: 97.6% |
Communication Services: 8.4% |
Alphabet, Inc., Class A (a) | | | 19,263 | | | $ | 55,805,681 | |
Alphabet, Inc., Class C (a) | | | 13,788 | | | | 39,896,819 | |
T-Mobile US, Inc. (a) | | | 308,808 | | | | 35,815,552 | |
| | | | | | | | 131,518,052 | |
Consumer Discretionary: 9.4% |
Amazon.com, Inc. (a) | | | 12,028 | | | | 40,105,442 | |
Aptiv PLC (a) | | | 180,100 | | | | 29,707,495 | |
Lowe’s Cos., Inc. | | | 150,730 | | | | 38,960,690 | |
Mohawk Industries, Inc. (a) | | | 71,852 | | | | 13,089,997 | |
Target Corp. | | | 113,482 | | | | 26,264,274 | |
| | | | | | | | 148,127,898 | |
Consumer Staples: 6.4% |
McCormick & Co., Inc. | | | 309,700 | | | | 29,920,117 | |
Procter & Gamble Co., The | | | 268,407 | | | | 43,906,017 | |
Sysco Corp. | | | 342,705 | | | | 26,919,478 | |
| | | | | | | | 100,745,612 | |
Financials: 10.1% |
BlackRock, Inc. | | | 27,026 | | | | 24,743,925 | |
Citizens Financial Group, Inc. | | | 797,284 | | | | 37,671,669 | |
JPMorgan Chase & Co. | | | 206,060 | | | | 32,629,601 | |
Lincoln National Corp. | | | 419,382 | | | | 28,627,015 | |
Voya Financial, Inc. | | | 533,613 | | | | 35,383,878 | |
| | | | | | | | 159,056,088 | |
Health Care: 15.5% |
Becton Dickinson & Co. | | | 100,094 | | | | 25,171,639 | |
Bristol-Myers Squibb Co. | | | 577,181 | | | | 35,987,235 | |
CVS Health Corp. | | | 353,760 | | | | 36,493,881 | |
IQVIA Holdings, Inc. (a) | | | 94,400 | | | | 26,634,016 | |
Medtronic PLC | | | 331,875 | | | | 34,332,469 | |
Merck & Co., Inc. | | | 367,068 | | | | 28,132,092 | |
Organon & Co. | | | 906,971 | | | | 27,617,267 | |
Vertex Pharmaceuticals, Inc. (a) | | | 130,300 | | | | 28,613,880 | |
| | | | | | | | 242,982,479 | |
Industrials: 9.6% |
Otis Worldwide Corp. | | | 280,900 | | | | 24,457,963 | |
Stanley Black & Decker, Inc. | | | 128,300 | | | | 24,199,946 | |
Trane Technologies PLC | | | 169,403 | | | | 34,224,488 | |
United Parcel Service, Inc., Class B | | | 155,588 | | | | 33,348,732 | |
Waste Management, Inc. | | | 120,712 | | | | 20,146,833 | |
Xylem, Inc. | | | 118,100 | | | | 14,162,552 | |
| | | | | | | | 150,540,514 | |
Information Technology: 28.1% (b) |
Akamai Technologies, Inc. (a) | | | 274,400 | | | | 32,115,776 | |
Apple, Inc. | | | 387,180 | | | | 68,751,553 | |
Percent of Net Assets
Name of Issuer and
Title of Issue | | Shares/
Principal | | | Value | |
COMMON STOCKS, continued |
Information Technology, continued |
Applied Materials, Inc. | | | 235,894 | | | $ | 37,120,280 | |
Arista Networks, Inc. (a) | | | 186,400 | | | | 26,795,000 | |
Fiserv, Inc. (a) | | | 287,633 | | | | 29,853,429 | |
Microsoft Corp. | | | 313,224 | | | | 105,343,496 | |
NortonLifeLock, Inc. | | | 640,000 | | | | 16,627,200 | |
PTC, Inc. (a) | | | 191,300 | | | | 23,175,995 | |
salesforce.com, Inc. (a) | | | 128,818 | | | | 32,736,518 | |
TE Connectivity, Ltd. | | | 153,800 | | | | 24,814,092 | |
Trimble, Inc. (a) | | | 207,700 | | | | 18,109,363 | |
Visa, Inc., Class A | | | 114,362 | | | | 24,783,389 | |
| | | | | | | | 440,226,091 | |
Materials: 3.3% |
International Flavors & Fragrances, Inc. | | | 158,948 | | | | 23,945,516 | |
PPG Industries, Inc. | | | 162,892 | | | | 28,089,097 | |
| | | | | | | | 52,034,613 | |
Real Estate: 5.8% |
American Tower Corp., REIT | | | 79,200 | | | | 23,166,000 | |
Equinix, Inc., REIT | | | 26,542 | | | | 22,450,285 | |
Prologis, Inc., REIT | | | 153,300 | | | | 25,809,588 | |
Welltower, Inc., REIT | | | 223,500 | | | | 19,169,595 | |
| | | | | | | | 90,595,468 | |
Utilities: 1.0% |
American Water Works Co., Inc. | | | 83,300 | | | | 15,732,038 | |
| | | | | | | | | |
TOTAL COMMON STOCKS |
(Cost $922,605,750) | | | 1,531,558,853 | |
| | | | | | | | | |
MONEY MARKET: 2.3% |
State Street Institutional U.S. Government Money Market Fund, 0.030% (c)(d) | | | 36,734,062 | | | | 36,734,062 | |
(Cost $36,734,062) |
| | | | | | | | | |
TOTAL INVESTMENTS: 99.9% |
(Cost $959,339,812) | | | 1,568,292,915 | |
| | | | | | | | | |
OTHER ASSETS AND LIABILITIES — (NET): 0.1% | | | 1,219,515 | |
| | | | | | | | | |
NET ASSETS: 100.0% | | $ | 1,569,512,430 | |
(a) | Non-income producing security. |
(b) | Broad industry sectors used for financial reporting. |
SEE NOTES TO FINANCIAL STATEMENTS | 70 | |
December 31, 2021 |
Schedules of Investments, continued |
Pax Large Cap Fund, continued
(c) | Rate shown represents annualized 7-day yield as of December 31, 2021. |
REIT - Real Estate Investment Trust
| | 71 | SEE NOTES TO FINANCIAL STATEMENTS |
December 31, 2021 |
Schedules of Investments, continued |
Pax Small Cap Fund
Percent of Net Assets
Name of Issuer and
Title of Issue | | Shares/
Principal | | | Value | |
COMMON STOCKS: 94.7% |
Communication Services: 2.2% |
QuinStreet, Inc. (a) | | | 896,390 | | | $ | 16,305,334 | |
| | | | | | | | | |
Consumer Discretionary: 10.0% |
Carter’s, Inc. | | | 89,826 | | | | 9,092,188 | |
Columbia Sportswear Co. | | | 95,515 | | | | 9,306,982 | |
Crocs, Inc. (a) | | | 35,964 | | | | 4,611,304 | |
Deckers Outdoor Corp. (a) | | | 28,000 | | | | 10,256,680 | |
Fox Factory Holding Corp. (a) | | | 72,331 | | | | 12,303,503 | |
Leslie’s, Inc. (a) | | | 346,021 | | | | 8,186,857 | |
National Vision Holdings, Inc. (a) | | | 210,669 | | | | 10,110,005 | |
Planet Fitness, Inc., Class A (a) | | | 114,271 | | | | 10,350,667 | |
| | | | | | | | 74,218,186 | |
Consumer Staples: 4.3% |
BJ’s Wholesale Club Holdings, Inc. (a) | | | 154,955 | | | | 10,377,336 | |
Darling Ingredients, Inc. (a) | | | 158,294 | | | | 10,968,192 | |
Simply Good Foods Co., The (a) | | | 258,620 | | | | 10,750,833 | |
| | | | | | | | 32,096,361 | |
Financials: 18.8% |
Brightsphere Investment Group, Inc. | | | 823,745 | | | | 21,087,872 | |
Hannon Armstrong Sustainable Infrastructure Capital, Inc., REIT (b) | | | 213,505 | | | | 11,341,386 | |
HomeTrust Bancshares, Inc. | | | 762,236 | | | | 23,614,071 | |
Independent Bank Corp. | | | 275,000 | | | | 22,420,750 | |
SuRo Capital Corp. (b) | | | 703,800 | | | | 9,114,210 | |
Victory Capital Holdings, Inc., Class A | | | 972,198 | | | | 35,514,393 | |
Voya Financial, Inc. (b) | | | 246,040 | | | | 16,314,912 | |
| | | | | | | | 139,407,594 | |
Health Care: 18.8% |
CryoPort, Inc. (a) | | | 157,375 | | | | 9,311,879 | |
Health Catalyst, Inc. (a) | | | 385,056 | | | | 15,255,919 | |
Karuna Therapeutics, Inc. (a) | | | 99,463 | | | | 13,029,653 | |
Ligand Pharmaceuticals, Inc. (a) | | | 134,820 | | | | 20,824,297 | |
Natus Medical, Inc. (a) | | | 656,049 | | | | 15,568,043 | |
Percent of Net Assets
Name of Issuer and
Title of Issue | | Shares/
Principal | | | Value | |
COMMON STOCKS, continued |
Health Care, continued |
Omnicell, Inc. (a) | | | 83,163 | | | $ | 15,005,932 | |
Pacira BioSciences, Inc. (a) | | | 258,936 | | | | 15,580,179 | |
R1 RCM, Inc. (a) | | | 150,000 | | | | 3,823,500 | |
SI-BONE, Inc. (a) | | | 645,343 | | | | 14,333,068 | |
Vocera Communications, Inc. (a) | | | 256,724 | | | | 16,645,984 | |
| | | | | | | | 139,378,454 | |
Industrials: 15.5% |
AZEK Co Inc., The (a) | | | 419,349 | | | | 19,390,699 | |
Colfax Corp. (a) | | | 241,892 | | | | 11,119,775 | |
Comfort Systems USA, Inc. | | | 75,695 | | | | 7,489,263 | |
Evoqua Water Technologies Corp. (a) | | | 314,343 | | | | 14,695,535 | |
Gates Industrial Corp PLC (a) | | | 597,713 | | | | 9,509,614 | |
GrafTech International, Ltd. | | | 600,000 | | | | 7,098,000 | |
Great Lakes Dredge & Dock Corp. (a) | | | 476,704 | | | | 7,493,787 | |
Herc Holdings, Inc. | | | 45,000 | | | | 7,044,750 | |
MSA Safety, Inc. | | | 60,089 | | | | 9,071,035 | |
Stericycle, Inc. (a) | | | 137,906 | | | | 8,224,714 | |
Vertiv Holdings Co. | | | 561,461 | | | | 14,019,681 | |
| | | | | | | | 115,156,853 | |
Information Technology: 13.7% |
8x8, Inc. (a) | | | 373,491 | | | | 6,259,709 | |
Belden, Inc. | | | 145,000 | | | | 9,530,850 | |
Ciena Corp. (a) | | | 223,064 | | | | 17,169,236 | |
Extreme Networks, Inc. (a) | | | 636,784 | | | | 9,997,509 | |
Mitek Systems, Inc. (a) | | | 452,579 | | | | 8,033,277 | |
Napco Security Technologies, Inc. (a) | | | 13,901 | | | | 694,772 | |
Onto Innovation, Inc. (a) | | | 177,557 | | | | 17,974,095 | |
Ribbon Communications, Inc. (a) | | | 1,087,819 | | | | 6,581,305 | |
Sprout Social, Inc., Class A (a) | | | 51,724 | | | | 4,690,850 | |
Verra Mobility Corp. (a) | | | 548,661 | | | | 8,465,839 | |
Workiva, Inc. (a) | | | 96,814 | | | | 12,633,259 | |
| | | | | | | | 102,030,701 | |
Materials: 3.8% |
Element Solutions, Inc. | | | 586,946 | | | | 14,251,049 | |
Graphic Packaging Holding Co. | | | 733,585 | | | | 14,304,907 | |
| | | | | | | | 28,555,956 | |
SEE NOTES TO FINANCIAL STATEMENTS | 72 | |
December 31, 2021 |
Schedules of Investments, continued |
Pax Small Cap Fund, continued
Percent of Net Assets
Name of Issuer and
Title of Issue | | Shares/
Principal | | | Value | |
COMMON STOCKS, continued |
Real Estate: 7.6% |
Altus Group, Ltd. | | | 247,910 | | | $ | 13,908,987 | |
CatchMark Timber Trust, Inc, Class A, REIT | | | 1,196,169 | | | | 10,418,632 | |
Healthcare Realty Trust, Inc., REIT | | | 421,352 | | | | 13,331,577 | |
Rayonier, Inc., REIT | | | 461,676 | | | | 18,633,243 | |
| | | | | | | | 56,292,439 | |
TOTAL COMMON STOCKS |
(Cost $538,909,670) | | | 703,441,878 | |
| | | | | | | | | |
MONEY MARKET: 3.9% |
State Street Institutional U.S. Government Money Market Fund, 0.030% (c)(d) | | | 28,631,950 | | | | 28,631,950 | |
(Cost $28,631,950) |
| |
SECURITIES PURCHASED WITH CASH COLLATERAL FROM SECURITIES LENDING: 1.2% |
State Street Navigator Securities Lending Government Money Market Portfolio, 0.032% (c)(d) | | | 8,711,743 | | | | 8,711,743 | |
(Cost $8,711,743) |
| | | | | | | | | |
TOTAL INVESTMENTS: 99.8% |
(Cost $576,253,363) | | | 740,785,571 | |
| | | | | | | | | |
PAYABLE UPON RETURN OF SECURITIES LOANED: -1.2% | | | (8,711,743 | ) |
| | | | | | | | | |
OTHER ASSETS AND LIABILITIES — (NET): 1.4% | | | 10,588,096 | |
| | | | | | | | | |
NET ASSETS: 100.0% | | $ | 742,661,924 | |
(a) | Non-income producing security. |
(b) | Security or partial position of this security was on loan as of December 31, 2021. The total market value of securities on loan as of December 31, 2021 was $11,676,146. |
(c) | Rate shown represents annualized 7-day yield as of December 31, 2021. |
REIT - Real Estate Investment Trust
| | 73 | SEE NOTES TO FINANCIAL STATEMENTS |
December 31, 2021 |
Schedules of Investments, continued |
Pax US Sustainable Economy Fund
Percent of Net Assets
Name of Issuer and
Title of Issue | | Shares/
Principal | | | Value | |
COMMON STOCKS: 99.0% |
Communication Services: 7.9% |
Alphabet, Inc., Class A (a) | | | 3,646 | | | $ | 10,562,608 | |
Alphabet, Inc., Class C (a) | | | 1,416 | | | | 4,097,323 | |
AT&T, Inc. | | | 5,803 | | | | 142,754 | |
Cable One, Inc. | | | 152 | | | | 268,044 | |
Electronic Arts, Inc. | | | 4,419 | | | | 582,866 | |
Interpublic Group of Cos Inc., The | | | 24,158 | | | | 904,717 | |
T-Mobile US, Inc. (a) | | | 2,151 | | | | 249,473 | |
Verizon Communications, Inc. | | | 96,573 | | | | 5,017,933 | |
ViacomCBS, Inc., Class B | | | 72,705 | | | | 2,194,237 | |
Zynga, Inc., Class A (a) | | | 147,902 | | | | 946,573 | |
| | | | | | | | 24,966,528 | |
Consumer Discretionary: 6.7% |
Amazon.com, Inc. (a) | | | 292 | | | | 973,627 | |
Aptiv PLC (a) | | | 6,198 | | | | 1,022,360 | |
Best Buy Co., Inc. | | | 16,089 | | | | 1,634,642 | |
BorgWarner, Inc. | | | 18,878 | | | | 850,831 | |
Brunswick Corp. | | | 21,081 | | | | 2,123,489 | |
DR Horton, Inc. | | | 2,991 | | | | 324,374 | |
eBay, Inc. | | | 18,502 | | | | 1,230,383 | |
Etsy, Inc. (a) | | | 1,346 | | | | 294,693 | |
Gentex Corp. | | | 7,787 | | | | 271,377 | |
Grand Canyon Education, Inc. (a) | | | 14,692 | | | | 1,259,251 | |
Harley-Davidson, Inc. | | | 7,214 | | | | 271,896 | |
Hasbro, Inc. | | | 2,717 | | | | 276,536 | |
Home Depot, Inc., The | | | 15,025 | | | | 6,235,526 | |
Lear Corp. | | | 1,548 | | | | 283,207 | |
Lowe’s Cos., Inc. | | | 6,007 | | | | 1,552,689 | |
MGM Resorts International | | | 7,052 | | | | 316,494 | |
Nordstrom, Inc. (a)(b) | | | 6,831 | | | | 154,517 | |
NVR, Inc. (a) | | | 61 | | | | 360,441 | |
Planet Fitness, Inc., Class A (a) | | | 3,379 | | | | 306,070 | |
PulteGroup, Inc. | | | 5,022 | | | | 287,058 | |
Tractor Supply Co. | | | 772 | | | | 184,199 | |
Vail Resorts, Inc. | | | 954 | | | | 312,817 | |
Whirlpool Corp. | | | 1,251 | | | | 293,560 | |
Williams-Sonoma, Inc. | | | 1,790 | | | | 302,743 | |
| | | | | | | | 21,122,780 | |
Consumer Staples: 6.4% |
Archer-Daniels-Midland Co. | | | 5,061 | | | | 342,073 | |
Clorox Co., The | | | 3,992 | | | | 696,045 | |
Colgate-Palmolive Co. | | | 15,191 | | | | 1,296,400 | |
Estee Lauder Cos, Inc., The, Class A | | | 1,475 | | | | 546,045 | |
Percent of Net Assets
Name of Issuer and
Title of Issue | | Shares/
Principal | | | Value | |
COMMON STOCKS, continued |
Consumer Staples, continued |
General Mills, Inc. | | | 27,830 | | | $ | 1,875,185 | |
Hershey Co., The | | | 6,329 | | | | 1,224,472 | |
J.M. Smucker Co., The | | | 10,279 | | | | 1,396,094 | |
Kimberly-Clark Corp. | | | 16,988 | | | | 2,427,925 | |
Kroger Co., The | | | 55,595 | | | | 2,516,230 | |
PepsiCo, Inc. | | | 20,192 | | | | 3,507,551 | |
Procter & Gamble Co., The | | | 21,222 | | | | 3,471,495 | |
Walgreens Boots Alliance, Inc. | | | 14,218 | | | | 741,611 | |
| | | | | | | | 20,041,126 | |
Financials: 8.6% |
Affiliated Managers Group, Inc. | | | 4,199 | | | | 690,777 | |
Aflac, Inc. | | | 50,315 | | | | 2,937,893 | |
Allstate Corp., The | | | 33,677 | | | | 3,962,100 | |
Ally Financial, Inc. | | | 5,840 | | | | 278,042 | |
American Express Co. | | | 1,752 | | | | 286,627 | |
Ameriprise Financial, Inc. | | | 5,128 | | | | 1,546,912 | |
Bank of New York Mellon Corp., The | | | 46,042 | | | | 2,674,119 | |
FactSet Research Systems, Inc. | | | 366 | | | | 177,880 | |
Hartford Financial Services Group, Inc., The | | | 19,707 | | | | 1,360,571 | |
Huntington Bancshares, Inc. | | | 16,359 | | | | 252,256 | |
Loews Corp. | | | 5,005 | | | | 289,089 | |
LPL Financial Holdings, Inc. | | | 13,313 | | | | 2,131,278 | |
MarketAxess Holdings, Inc. | | | 1,064 | | | | 437,591 | |
MetLife, Inc. | | | 69,888 | | | | 4,367,302 | |
PNC Financial Services Group, Inc., The | | | 1,906 | | | | 382,191 | |
Progressive Corp., The | | | 11,355 | | | | 1,165,591 | |
Prudential Financial, Inc. | | | 2,920 | | | | 316,061 | |
Regions Financial Corp. | | | 15,088 | | | | 328,918 | |
Reinsurance Group of America, Inc. | | | 2,531 | | | | 277,119 | |
Synchrony Financial | | | 6,230 | | | | 289,010 | |
Unum Group | | | 122,069 | | | | 2,999,235 | |
| | | | | | | | 27,150,562 | |
Health Care: 17.3% |
AbbVie, Inc. | | | 22,704 | | | | 3,074,122 | |
Agilent Technologies, Inc. | | | 16,677 | | | | 2,662,483 | |
Amgen, Inc. | | | 8,201 | | | | 1,844,979 | |
Anthem, Inc. | | | 1,660 | | | | 769,476 | |
Baxter International, Inc. | | | 3,077 | | | | 264,130 | |
SEE NOTES TO FINANCIAL STATEMENTS | 74 | |
December 31, 2021 |
Schedules of Investments, continued |
Pax US Sustainable Economy Fund, continued
Percent of Net Assets
Name of Issuer and
Title of Issue | | Shares/
Principal | | | Value | |
COMMON STOCKS, continued |
Health Care, continued |
Bio-Rad Laboratories, Inc., Class A (a) | | | 1,174 | | | $ | 887,039 | |
Bristol-Myers Squibb Co. | | | 65,258 | | | | 4,068,836 | |
Catalent, Inc. (a) | | | 2,434 | | | | 311,625 | |
Cerner Corp. | | | 24,499 | | | | 2,275,222 | |
Charles River Laboratories International, Inc. (a) | | | 950 | | | | 357,941 | |
CVS Health Corp. | | | 32,880 | | | | 3,391,901 | |
Eli Lilly & Co. | | | 13,352 | | | | 3,688,089 | |
Encompass Health Corp. | | | 3,601 | | | | 235,001 | |
Hologic, Inc. (a) | | | 3,626 | | | | 277,607 | |
Humana, Inc. | | | 681 | | | | 315,889 | |
IDEXX Laboratories, Inc. (a) | | | 575 | | | | 378,615 | |
Illumina, Inc. (a) | | | 7,185 | | | | 2,733,461 | |
Johnson & Johnson | | | 35,068 | | | | 5,999,084 | |
Merck & Co., Inc. | | | 27,277 | | | | 2,090,509 | |
Mettler-Toledo International, Inc. (a) | | | 287 | | | | 487,099 | |
Organon & Co. | | | 2,361 | | | | 71,892 | |
Thermo Fisher Scientific, Inc. | | | 10,598 | | | | 7,071,410 | |
West Pharmaceutical Services, Inc. | | | 10,744 | | | | 5,039,043 | |
Zoetis, Inc. | | | 24,546 | | | | 5,989,960 | |
| | | | | | | | 54,285,413 | |
Industrials: 7.9% |
A.O. Smith Corp. | | | 4,186 | | | | 359,368 | |
Acuity Brands, Inc. | | | 1,915 | | | | 405,444 | |
Allegion PLC | | | 2,124 | | | | 281,303 | |
Booz Allen Hamilton Holding Corp. | | | 2,409 | | | | 204,259 | |
C.H. Robinson Worldwide, Inc. | | | 8,632 | | | | 929,062 | |
CSX Corp. | | | 8,142 | | | | 306,139 | |
Cummins, Inc. | | | 7,064 | | | | 1,540,941 | |
Emerson Electric Co. | | | 10,777 | | | | 1,001,938 | |
Expeditors International of Washington, Inc. | | | 1,279 | | | | 171,757 | |
FedEx Corp. | | | 961 | | | | 248,553 | |
Gates Industrial Corp PLC (a) | | | 16,431 | | | | 261,417 | |
Graco, Inc. | | | 3,646 | | | | 293,941 | |
Hexcel Corp. (a) | | | 4,557 | | | | 236,053 | |
Hubbell, Inc. | | | 1,459 | | | | 303,866 | |
IDEX Corp. | | | 1,355 | | | | 320,214 | |
Illinois Tool Works, Inc. | | | 1,159 | | | | 286,041 | |
Johnson Controls International PLC | | | 21,216 | | | | 1,725,073 | |
Norfolk Southern Corp. | | | 6,318 | | | | 1,880,932 | |
Percent of Net Assets
Name of Issuer and
Title of Issue | | Shares/
Principal | | | Value | |
COMMON STOCKS, continued |
Industrials, continued |
Owens Corning | | | 2,875 | | | $ | 260,188 | |
Regal Rexnord Corp | | | 1,781 | | | | 303,091 | |
Rockwell Automation, Inc. | | | 3,573 | | | | 1,246,441 | |
Sensata Technologies Holding, PLC (a) | | | 4,418 | | | | 272,546 | |
Trane Technologies PLC | | | 6,924 | | | | 1,398,856 | |
Union Pacific Corp. | | | 4,186 | | | | 1,054,579 | |
United Parcel Service, Inc., Class B | | | 13,483 | | | | 2,889,945 | |
United Rentals, Inc. (a) | | | 3,358 | | | | 1,115,830 | |
W.W. Grainger, Inc. | | | 822 | | | | 425,993 | |
Waste Management, Inc. | | | 31,178 | | | | 5,203,607 | |
| | | | | | | | 24,927,377 | |
Information Technology: 34.2% (c) |
Accenture PLC, Class A | | | 6,399 | | | | 2,652,705 | |
Adobe, Inc. (a) | | | 1,568 | | | | 889,150 | |
Analog Devices, Inc. | | | 13,909 | | | | 2,444,785 | |
ANSYS, Inc. (a) | | | 3,510 | | | | 1,407,931 | |
Apple, Inc. | | | 110,376 | | | | 19,599,465 | |
Applied Materials, Inc. | | | 20,065 | | | | 3,157,428 | |
Autodesk, Inc. (a) | | | 6,162 | | | | 1,732,693 | |
Avnet, Inc. | | | 4,179 | | | | 172,300 | |
Cadence Design Systems, Inc. (a) | | | 8,007 | | | | 1,492,104 | |
Cisco Systems, Inc. | | | 32,372 | | | | 2,051,414 | |
Citrix Systems, Inc. | | | 7,220 | | | | 682,940 | |
Cognex Corp. | | | 3,268 | | | | 254,120 | |
Corning, Inc. | | | 6,100 | | | | 227,103 | |
Dell Technologies, Inc., Class C (a) | | | 3,366 | | | | 189,068 | |
DocuSign,Inc. (a) | | | 5,764 | | | | 877,915 | |
F5 Networks, Inc. (a) | | | 144 | | | | 35,238 | |
First Solar, Inc. (a) | | | 3,136 | | | | 273,334 | |
HP, Inc. | | | 47,603 | | | | 1,793,205 | |
HubSpot, Inc. (a) | | | 5,196 | | | | 3,424,943 | |
IBM | | | 11,495 | | | | 1,536,422 | |
Intel Corp. | | | 58,333 | | | | 3,004,150 | |
Intuit, Inc. | | | 1,959 | | | | 1,260,068 | |
Keysight Technologies, Inc. (a) | | | 3,377 | | | | 697,384 | |
Kyndryl Holdings, Inc. (a) | | | 2,320 | | | | 41,992 | |
Lam Research Corp. | | | 7,612 | | | | 5,474,169 | |
MasterCard, Inc., Class A | | | 10,628 | | | | 3,818,853 | |
Microsoft Corp. | | | 50,455 | | | | 16,969,025 | |
National Instruments Corp. | | | 6,039 | | | | 263,723 | |
Nuance Communications, Inc. (a) | | | 17,158 | | | | 949,181 | |
| | 75 | SEE NOTES TO FINANCIAL STATEMENTS |
December 31, 2021 |
Schedules of Investments, continued |
Pax US Sustainable Economy Fund, continued
Percent of Net Assets
Name of Issuer and
Title of Issue | | Shares/
Principal | | | Value | |
COMMON STOCKS, continued |
Information Technology, continued |
NVIDIA Corp. | | | 37,619 | | | $ | 11,064,123 | |
NXP Semiconductors NV | | | 8,468 | | | | 1,928,841 | |
Okta, Inc. (a) | | | 5,646 | | | | 1,265,664 | |
PayPal Holdings Inc (a) | | | 1,870 | | | | 352,645 | |
PTC, Inc. (a) | | | 3,090 | | | | 374,354 | |
QUALCOMM, Inc. | | | 2,011 | | | | 367,752 | |
salesforce.com, Inc. (a) | | | 8,695 | | | | 2,209,660 | |
ServiceNow, Inc. (a) | | | 4,362 | | | | 2,831,418 | |
Splunk, Inc. (a) | | | 2,017 | | | | 233,407 | |
Square, Inc., Class A (a) | | | 1,168 | | | | 188,644 | |
Synopsys, Inc. (a) | | | 4,423 | | | | 1,629,876 | |
Texas Instruments, Inc. | | | 19,280 | | | | 3,633,702 | |
Trimble, Inc. (a) | | | 3,561 | | | | 310,484 | |
Universal Display Corp. | | | 3,957 | | | | 653,024 | |
Visa, Inc., Class A | | | 7,342 | | | | 1,591,085 | |
VMware, Inc., Class A | | | 7,211 | | | | 835,611 | |
Western Digital Corp. (a) | | | 3,942 | | | | 257,058 | |
Wolfspeed, Inc. (a) | | | 3,189 | | | | 356,435 | |
| | | | | | | | 107,456,591 | |
Materials: 4.1% |
Air Products & Chemicals, Inc. | | | 6,643 | | | | 2,021,199 | |
Amcor PLC | | | 22,272 | | | | 267,487 | |
Axalta Coating Systems, Ltd. (a) | | | 8,903 | | | | 294,867 | |
Celanese Corp. | | | 1,754 | | | | 294,777 | |
Chemours Co., The | | | 9,485 | | | | 318,317 | |
Eastman Chemical Co. | | | 3,486 | | | | 421,492 | |
Ecolab, Inc. | | | 13,537 | | | | 3,175,644 | |
Graphic Packaging Holding Co. | | | 16,351 | | | | 318,845 | |
International Flavors & Fragrances, Inc. | | | 18,549 | | | | 2,794,407 | |
International Paper Co. | | | 4,822 | | | | 226,538 | |
Martin Marietta Materials, Inc. | | | 775 | | | | 341,403 | |
Packaging Corp of America | | | 2,026 | | | | 275,840 | |
PPG Industries, Inc. | | | 8,865 | | | | 1,528,681 | |
Sherwin-Williams Co., The | | | 1,157 | | | | 407,449 | |
Sonoco Products Co. | | | 250 | | | | 14,473 | |
Sylvamo Corp (a) | | | 442 | | | | 12,327 | |
WestRock Co. | | | 4,900 | | | | 217,364 | |
| | | | | | | | 12,931,110 | |
Percent of Net Assets
Name of Issuer and
Title of Issue | | Shares/
Principal | | | Value | |
COMMON STOCKS, continued |
Real Estate: 4.1% |
Boston Properties, Inc., REIT (b) | | | 3,133 | | | $ | 360,859 | |
CBRE Group, Inc., Class A (a) | | | 43,354 | | | | 4,704,343 | |
Equinix, Inc., REIT | | | 1,625 | | | | 1,374,490 | |
Equity Residential, REIT | | | 3,678 | | | | 332,859 | |
Healthpeak Properties, Inc., REIT | | | 52,420 | | | | 1,891,838 | |
Host Hotels & Resorts, Inc., REIT (a) | | | 15,303 | | | | 266,119 | |
Omega Healthcare Investors, Inc., REIT | | | 1,090 | | | | 32,253 | |
Park Hotels & Resorts, Inc., REIT (a) | | | 11,993 | | | | 226,428 | |
Prologis, Inc., REIT | | | 12,975 | | | | 2,184,471 | |
Rayonier, Inc., REIT | | | 820 | | | | 33,095 | |
UDR, Inc., REIT | | | 5,889 | | | | 353,281 | |
Ventas, Inc., REIT | | | 4,810 | | | | 245,887 | |
Welltower, Inc., REIT | | | 8,421 | | | | 722,269 | |
Weyerhaeuser Co., REIT | | | 7,495 | | | | 308,644 | |
| | | | | | | | 13,036,836 | |
Utilities: 1.8% |
American Water Works Co., Inc. | | | 26,336 | | | | 4,973,817 | |
Avangrid, Inc. (b) | | | 5,363 | | | | 267,506 | |
Edison International | | | 4,335 | | | | 295,864 | |
| | | | | | | | 5,537,187 | |
TOTAL COMMON STOCKS |
(Cost $166,864,331) | | | 311,455,510 | |
| | | | | | | | | |
MONEY MARKET: 1.0% |
State Street Institutional U.S. Government Money Market Fund, 0.030% (d)(e) | | | 2,979,475 | | | | 2,979,475 | |
(Cost $2,979,475) |
| | | | | | | | | |
SEE NOTES TO FINANCIAL STATEMENTS | 76 | |
December 31, 2021 |
Schedules of Investments, continued |
Pax US Sustainable Economy Fund, continued
Percent of Net Assets
Name of Issuer and
Title of Issue | | Shares/
Principal | | | Value | |
SECURITIES PURCHASED WITH CASH COLLATERAL FROM SECURITIES LENDING: 0.0% (f) |
State Street Navigator Securities Lending Government Money Market Portfolio, 0.032% (d)(e) | | | 110,051 | | | $ | 110,051 | |
(Cost $110,051) |
| | | | | | | | | |
TOTAL INVESTMENTS: 100.0% |
(Cost $169,953,857) | | | 314,545,036 | |
| | | | | | | | | |
PAYABLE UPON RETURN OF SECURITIES LOANED: 0.0% (f) | | | (110,051 | ) |
| | | | | | | | | |
OTHER ASSETS AND LIABILITIES — (NET): 0.0% (f) | | | (12,220 | ) |
| | | | | | | | | |
NET ASSETS: 100.0% | | $ | 314,422,765 | |
(a) | Non-income producing security. |
(b) | Security or partial position of this security was on loan as of December 31, 2021. The total market value of securities on loan as of December 31, 2021 was $748,297. |
(c) | Broad industry sectors used for financial reporting. |
(d) | Rate shown represents annualized 7-day yield as of December 31, 2021. |
(f) | Rounds to less than 0.05%. |
| | 77 | SEE NOTES TO FINANCIAL STATEMENTS |
December 31, 2021 |
Schedules of Investments, continued |
Pax Global Sustainable Infrastructure Fund
Percent of Net Assets
Name of Issuer and
Title of Issue | | Shares/
Principal | | | Value | |
COMMON STOCKS: 97.9% |
Communication Services: 19.8% |
AT&T, Inc. | | | 68,757 | | | $ | 1,691,423 | |
BCE, Inc. | | | 22,177 | | | | 1,153,776 | |
Globe Telecom, Inc. | | | 5,405 | | | | 352,119 | |
Hellenic Telecommunications Organization SA | | | 10,579 | | | | 195,778 | |
HKT Trust & HKT, Ltd. | | | 676,000 | | | | 908,321 | |
Koninklijke KPN NV | | | 49,516 | | | | 153,901 | |
Lumen Technologies, Inc. | | | 78,498 | | | | 985,150 | |
Orange SA | | | 87,361 | | | | 933,206 | |
PCCW, Ltd. | | | 1,121,000 | | | | 567,978 | |
Proximus SADP (a) | | | 39,714 | | | | 775,604 | |
Singapore Telecommunications, Ltd. | | | 551,500 | | | | 949,396 | |
SK Telecom Co., Ltd. | | | 8,426 | | | | 409,473 | |
SoftBank Corp. | | | 77,500 | | | | 978,869 | |
Spark New Zealand, Ltd. | | | 212,668 | | | | 657,673 | |
Swisscom AG | | | 632 | | | | 356,526 | |
Tele2 AB, Class B | | | 66,640 | | | | 950,664 | |
Telecom Italia SpA | | | 1,781,044 | | | | 845,510 | |
Telefonica Deutschland Holding AG | | | 345,413 | | | | 958,102 | |
Telefonica SA | | | 246,972 | | | | 1,070,923 | |
Telenor ASA | | | 55,893 | | | | 878,585 | |
Telia Company AB | | | 219,496 | | | | 858,441 | |
Telstra Corp., Ltd. | | | 105,982 | | | | 322,100 | |
Verizon Communications, Inc. | | | 26,455 | | | | 1,374,602 | |
Vodafone Group PLC | | | 671,625 | | | | 1,011,626 | |
| | | | | | | | 19,339,746 | |
Consumer Discretionary: 0.1% |
China Education Group Holdings, Ltd. | | | 45,000 | | | | 73,125 | |
| | | | | | | | | |
Financials: 0.6% |
Hannon Armstrong Sustainable Infrastructure Capital, Inc., REIT (a) | | | 11,630 | | | | 617,786 | |
| | | | | | | | | |
Health Care: 4.9% |
Cigna Corp. | | | 3,302 | | | | 758,238 | |
CVS Health Corp. | | | 8,899 | | | | 918,020 | |
Encompass Health Corp. | | | 6,707 | | | | 437,699 | |
HCA Healthcare, Inc. | | | 2,752 | | | | 707,044 | |
Premier, Inc., Class A | | | 17,636 | | | | 726,074 | |
Quest Diagnostics, Inc. | | | 3,273 | | | | 566,262 | |
Select Medical Holdings Corp. | | | 4,910 | | | | 144,354 | |
Percent of Net Assets
Name of Issuer and
Title of Issue | | Shares/
Principal | | | Value | |
COMMON STOCKS, continued |
Health Care, continued |
Sonic Healthcare, Ltd. | | | 15,956 | | | $ | 541,169 | |
| | | | | | | | 4,798,860 | |
Industrials: 22.7% |
Advanced Drainage Systems, Inc. | | | 4,350 | | | | 592,166 | |
Andritz AG | | | 14,001 | | | | 720,114 | |
Bloom Energy Corp., Class A (a)(b) | | | 21,570 | | | | 473,030 | |
Brambles, Ltd. | | | 91,820 | | | | 710,349 | |
Canadian Pacific Railway, Ltd. | | | 7,050 | | | | 507,063 | |
Carlisle Companies, Inc. | | | 2,124 | | | | 527,007 | |
China Conch Venture Holdings, Ltd. | | | 124,500 | | | | 608,959 | |
Clean Harbors, Inc. (b) | | | 3,558 | | | | 354,982 | |
CSX Corp. | | | 28,898 | | | | 1,086,565 | |
Geberit AG | | | 268 | | | | 218,456 | |
Generac Holdings, Inc. (b) | | | 1,256 | | | | 442,012 | |
Hankyu Hanshin Holdings, Inc. | | | 100 | | | | 2,842 | |
Herc Holdings, Inc. | | | 93 | | | | 14,559 | |
Hubbell, Inc. | | | 3,351 | | | | 697,913 | |
ITM Power PLC (a)(b) | | | 19,483 | | | | 104,579 | |
MTR Corp., Ltd. | | | 172,224 | | | | 924,507 | |
NEL ASA (b) | | | 63,883 | | | | 109,202 | |
Nexans SA | | | 1,935 | | | | 189,203 | |
Norfolk Southern Corp. | | | 4,129 | | | | 1,229,245 | |
Pentair PLC | | | 9,814 | | | | 716,716 | |
Plug Power, Inc. (b) | | | 12,449 | | | | 351,435 | |
Prysmian SpA | | | 18,037 | | | | 678,482 | |
Quanta Services, Inc. | | | 7,027 | | | | 805,716 | |
Schneider Electric SE | | | 9,864 | | | | 1,939,216 | |
Shimizu Corp. | | | 51,500 | | | | 319,318 | |
Sunrun, Inc. (a)(b) | | | 8,275 | | | | 283,833 | |
Union Pacific Corp. | | | 5,980 | | | | 1,506,541 | |
United Rentals, Inc. (b) | | | 1,329 | | | | 441,613 | |
Vestas Wind Systems A/S | | | 4,808 | | | | 146,428 | |
Waste Management, Inc. | | | 13,901 | | | | 2,320,076 | |
Watts Water Technologies, Inc., Class A | | | 3,184 | | | | 618,237 | |
West Japan Railway Co. | | | 11,500 | | | | 480,964 | |
Xinjiang Goldwind Science & Technology Co., Ltd., Class H | | | 583,600 | | | | 1,139,331 | |
Xylem, Inc. | | | 7,274 | | | | 872,298 | |
| | | | | | | | 22,132,957 | |
SEE NOTES TO FINANCIAL STATEMENTS | 78 | |
December 31, 2021 |
Schedules of Investments, continued |
Pax Global Sustainable Infrastructure Fund, continued
Percent of Net Assets
Name of Issuer and
Title of Issue | | Shares/
Principal | | | Value | |
COMMON STOCKS, continued |
Information Technology: 8.5% |
ASML Holding NV | | | 116 | | | $ | 92,918 | |
Check Point Software Technologies, Ltd. (b) | | | 3,038 | | | | 354,109 | |
China Railway Signal & Communication Corp., Ltd., Class H | | | 1,418,000 | | | | 518,278 | |
Cisco Systems, Inc. | | | 19,932 | | | | 1,263,091 | |
Enphase Energy, Inc. (b) | | | 2,501 | | | | 457,533 | |
First Solar, Inc. (b) | | | 5,443 | | | | 474,412 | |
Itron, Inc. (b) | | | 3,538 | | | | 242,424 | |
Juniper Networks, Inc. | | | 14,921 | | | | 532,829 | |
Motorola Solutions, Inc. | | | 1,558 | | | | 423,309 | |
Oracle Corp. | | | 6,100 | | | | 463,438 | |
SolarEdge Technologies, Inc. (b) | | | 1,536 | | | | 430,956 | |
SunPower Corp. (b) | | | 22,770 | | | | 475,210 | |
Taiwan Semiconductor Manufacturing Co., Ltd. | | | 15,708 | | | | 1,889,829 | |
Xinyi Solar Holdings, Ltd. | | | 395,389 | | | | 671,269 | |
| | | | | | | | 8,289,605 | |
Real Estate: 9.9% |
American Campus Communities, Inc., REIT | | | 14,501 | | | | 830,762 | |
Ascendas Real Estate Investment Trust, REIT | | | 95,900 | | | | 210,115 | |
Boston Properties, Inc., REIT | | | 1,583 | | | | 182,330 | |
Cousins Properties, Inc., REIT | | | 4,668 | | | | 188,027 | |
Covivio, REIT | | | 10,107 | | | | 829,641 | |
Dexus, REIT | | | 23,389 | | | | 189,120 | |
Douglas Emmett, Inc., REIT | | | 5,138 | | | | 172,123 | |
Healthpeak Properties, Inc., REIT | | | 28,401 | | | | 1,024,991 | |
ICADE, REIT | | | 8,797 | | | | 632,955 | |
Omega Healthcare Investors, Inc., REIT | | | 34,858 | | | | 1,031,447 | |
SL Green Realty Corp., REIT | | | 9,318 | | | | 668,101 | |
STAG Industrial, Inc., Class A, REIT | | | 18,581 | | | | 891,145 | |
Stockland, REIT | | | 49,932 | | | | 154,041 | |
Ventas, Inc., REIT | | | 14,721 | | | | 752,538 | |
Welltower, Inc., REIT | | | 10,128 | | | | 868,679 | |
WP Carey, Inc., REIT | | | 12,452 | | | | 1,021,687 | |
| | | | | | | | 9,647,702 | |
Percent of Net Assets
Name of Issuer and
Title of Issue | | Shares/
Principal | | | Value | |
COMMON STOCKS, continued |
Utilities: 31.4% (c) |
Acciona SA | | | 5,485 | | | $ | 1,044,006 | |
American Water Works Co., Inc. | | | 8,938 | | | | 1,688,031 | |
Beijing Enterprises Water Group, Ltd. | | | 532,000 | | | | 206,707 | |
BKW AG | | | 5,833 | | | | 757,384 | |
Boralex, Inc., Class A | | | 13,641 | | | | 373,983 | |
Brookfield Renewable Partners, LP | | | 34,921 | | | | 1,250,856 | |
Edison International | | | 20,688 | | | | 1,411,956 | |
EDP - Energias de Portugal SA | | | 233,604 | | | | 1,283,258 | |
EDP Renovaveis SA | | | 43,758 | | | | 1,088,151 | |
Encavis AG | | | 26,605 | | | | 469,191 | |
Enel Americas SA | | | 8,995,320 | | | | 981,884 | |
Enel Chile SA | | | 8,402,841 | | | | 293,902 | |
Enel SpA | | | 301,700 | | | | 2,412,417 | |
Engie Brasil Energia SA | | | 105,500 | | | | 727,514 | |
Falck Renewables SpA | | | 21,810 | | | | 214,682 | |
Guangdong Investment, Ltd. | | | 826,000 | | | | 1,049,982 | |
Iberdrola SA | | | 208,909 | | | | 2,473,477 | |
Innergex Renewable Energy, Inc. | | | 32,011 | | | | 470,694 | |
Mercury NZ, Ltd. | | | 48,845 | | | | 204,632 | |
Meridian Energy, Ltd. | | | 281,223 | | | | 933,455 | |
Neoenergia SA | | | 158,200 | | | | 460,115 | |
Ormat Technologies, Inc. (a) | | | 9,519 | | | | 754,857 | |
Orsted A/S | | | 10,289 | | | | 1,317,682 | |
Pennon Group PLC | | | 42,751 | | | | 676,841 | |
Scatec ASA | | | 5,969 | | | | 103,055 | |
Severn Trent PLC | | | 29,001 | | | | 1,158,066 | |
Solaria Energia y Medio Ambiente SA (b) | | | 8,143 | | | | 157,346 | |
SSE PLC | | | 65,180 | | | | 1,457,110 | |
Suez SA | | | 49,480 | | | | 1,115,956 | |
Sunnova Energy International, Inc. (b) | | | 14,275 | | | | 398,558 | |
United Utilities Group PLC | | | 78,344 | | | | 1,156,000 | |
Veolia Environnement SA | | | 36,690 | | | | 1,347,399 | |
Verbund AG | | | 10,831 | | | | 1,217,234 | |
| | | | | | | | 30,656,381 | |
TOTAL COMMON STOCKS |
(Cost $91,138,436) | | | 95,556,162 | |
| | | | | | | | | |
| | 79 | SEE NOTES TO FINANCIAL STATEMENTS |
December 31, 2021 |
Schedules of Investments, continued |
Pax Global Sustainable Infrastructure Fund, continued
Percent of Net Assets
Name of Issuer and
Title of Issue | | Shares/
Principal | | | Value | |
EXCHANGE-TRADED FUNDS: 0.7% |
Renewables Infrastructure Group Ltd., The | | | 401,502 | | | $ | 732,098 | |
(Cost $699,548) |
| |
MONEY MARKET: 1.0% |
State Street Institutional U.S. Government Money Market Fund, 0.030% (d)(e) | | | 1,002,104 | | | | 1,002,104 | |
(Cost $1,002,104) |
| |
SECURITIES PURCHASED WITH CASH COLLATERAL FROM SECURITIES LENDING: 0.9% |
State Street Navigator Securities Lending Government Money Market Portfolio, 0.032% | | | 910,028 | | | | 910,028 | |
(Cost $910,028) |
| | | | | | | | | |
TOTAL INVESTMENTS: 100.5% |
(Cost $93,750,116) | | | 98,200,392 | |
| | | | | | | | | |
PAYABLE UPON RETURN OF SECURITIES LOANED (NET): -0.9% | | | (910,028 | ) |
| | | | | | | | | |
OTHER ASSETS AND LIABILITIES — (NET): 0.4% | | | 386,275 | |
| | | | | | | | | |
NET ASSETS: 100.0% | | $ | 97,676,639 | |
(a) | Security or partial position of this security was on loan as of December 31, 2021. The total market value of securities on loan as of December 31, 2021 was $1,793,694. |
(b) | Non-income producing security. |
(c) | Broad industry sectors used for financial reporting. |
(d) | Rate shown represents annualized 7-day yield as of December 31, 2021. |
REIT - Real Estate Investment Trust
SUMMARY OF INVESTMENTS BY COUNTRY
Country | | Value | | | Percent of
Net Assets | |
Australia | | $ | 1,916,779 | | | | 2.0 | % |
Austria | | | 1,937,348 | | | | 2.0 | % |
Belgium | | | 775,604 | | | | 0.8 | % |
Brazil | | | 1,187,629 | | | | 1.2 | % |
Canada | | | 3,756,372 | | | | 3.8 | % |
Chile | | | 1,275,786 | | | | 1.3 | % |
China | | | 4,267,652 | | | | 4.4 | % |
Denmark | | | 1,464,110 | | | | 1.5 | % |
France | | | 6,987,576 | | | | 7.2 | % |
Germany | | | 1,427,293 | | | | 1.5 | % |
Greece | | | 195,778 | | | | 0.2 | % |
Hong Kong | | | 2,400,807 | | | | 2.4 | % |
Israel | | | 354,109 | | | | 0.4 | % |
Italy | | | 4,151,091 | | | | 4.2 | % |
Japan | | | 2,245,430 | | | | 2.3 | % |
Netherlands | | | 246,819 | | | | 0.3 | % |
New Zealand | | | 1,795,760 | | | | 1.8 | % |
Norway | | | 1,090,842 | | | | 1.1 | % |
Philippines | | | 352,119 | | | | 0.4 | % |
Portugal | | | 1,283,258 | | | | 1.3 | % |
Singapore | | | 1,159,512 | | | | 1.2 | % |
South Korea | | | 409,473 | | | | 0.4 | % |
Spain | | | 5,833,903 | | | | 6.0 | % |
Sweden | | | 1,809,105 | | | | 1.9 | % |
Switzerland | | | 1,332,367 | | | | 1.4 | % |
Taiwan | | | 1,889,829 | | | | 1.9 | % |
United Kingdom | | | 6,296,320 | | | | 6.4 | % |
United States | | | 38,445,589 | | | | 39.3 | % |
Money Market | | | 1,002,104 | | | | 1.0 | % |
Other assets and liabilities (net) | | | 386,275 | | | | 0.4 | % |
| | | $ | 97,676,639 | | | | 100.0 | % |
SEE NOTES TO FINANCIAL STATEMENTS | 80 | |
December 31, 2021 |
Schedules of Investments, continued |
Pax Global Opportunities Fund
Percent of Net Assets
Name of Issuer and
Title of Issue | | Shares/
Principal | | | Value | |
COMMON STOCKS: 98.3% |
Communication Services: 2.0% |
KDDI Corp. | | | 98,100 | | | $ | 2,868,807 | |
| | | | | | | | | |
Consumer Discretionary: 2.6% |
Aptiv PLC (a) | | | 22,386 | | | | 3,692,571 | |
| | | | | | | | | |
Consumer Staples: 4.1% |
Jeronimo Martins SGPS SA | | | 125,315 | | | | 2,867,689 | |
Unilever PLC | | | 54,802 | | | | 2,937,728 | |
| | | | | | | | 5,805,417 | |
Financials: 11.9% |
AIA Group, Ltd. | | | 386,600 | | | | 3,901,892 | |
Bandhan Bank, Ltd. | | | 320,677 | | | | 1,083,696 | |
Hannover Rueck SE | | | 11,301 | | | | 2,142,630 | |
HDFC Bank, Ltd., ADR | | | 67,573 | | | | 4,396,975 | |
Hiscox, Ltd. | | | 173,889 | | | | 2,042,164 | |
Prudential PLC | | | 204,244 | | | | 3,531,960 | |
| | | | | | | | 17,099,317 | |
Health Care: 22.1% |
Alcon, Inc. | | | 31,221 | | | | 2,753,859 | |
Becton Dickinson & Co. | | | 11,362 | | | | 2,857,316 | |
Cooper Cos, Inc., The | | | 5,099 | | | | 2,136,175 | |
Danaher Corp. | | | 8,631 | | | | 2,839,685 | |
Evotec SE (a) | | | 78,172 | | | | 3,773,662 | |
IQVIA Holdings, Inc. (a) | | | 19,293 | | | | 5,443,328 | |
Lonza Group AG | | | 5,183 | | | | 4,315,303 | |
Thermo Fisher Scientific, Inc. | | | 6,885 | | | | 4,593,947 | |
Vertex Pharmaceuticals, Inc. (a) | | | 13,124 | | | | 2,882,030 | |
| | | | | | | | 31,595,305 | |
Industrials: 14.1% |
Ashtead Group PLC | | | 36,695 | | | | 2,958,150 | |
Cintas Corp. | | | 6,430 | | | | 2,849,583 | |
Kubota Corp. | | | 177,900 | | | | 3,955,793 | |
Schneider Electric SE | | | 11,803 | | | | 2,320,415 | |
United Rentals, Inc. (a) | | | 6,438 | | | | 2,139,283 | |
Verisk Analytics, Inc. | | | 12,909 | | | | 2,952,676 | |
Wolters Kluwer NV | | | 25,044 | | | | 2,947,701 | |
| | | | | | | | 20,123,601 | |
Information Technology: 26.0% (b) |
Analog Devices, Inc. | | | 24,454 | | | | 4,298,280 | |
ASML Holding NV | | | 4,646 | | | | 3,721,538 | |
Cadence Design Systems, Inc. (a) | | | 22,837 | | | | 4,255,675 | |
Keyence Corp. | | | 5,850 | | | | 3,678,235 | |
MasterCard, Inc., Class A | | | 14,198 | | | | 5,101,625 | |
Microsoft Corp. | | | 17,777 | | | | 5,978,761 | |
Percent of Net Assets
Name of Issuer and
Title of Issue | | Shares/
Principal | | | Value | |
COMMON STOCKS, continued |
Information Technology, continued |
Taiwan Semiconductor Manufacturing Co, Ltd. | | | 193,000 | | | $ | 4,269,352 | |
TE Connectivity, Ltd. | | | 18,695 | | | | 3,016,251 | |
Visa, Inc., Class A | | | 13,062 | | | | 2,830,666 | |
| | | | | | | | 37,150,383 | |
Materials: 12.6% |
Croda International PLC | | | 30,220 | | | | 4,139,277 | |
Ecolab, Inc. | | | 18,277 | | | | 4,287,601 | |
Koninklijke DSM NV | | | 18,650 | | | | 4,200,097 | |
Linde PLC | | | 15,749 | | | | 5,455,927 | |
| | | | | | | | 18,082,902 | |
Real Estate: 2.9% |
Equinix, Inc., REIT | | | 4,937 | | | | 4,175,912 | |
| | | | | | | | | |
TOTAL COMMON STOCKS |
(Cost $105,797,454) | | | 140,594,215 | |
| | | | | | | | | |
MONEY MARKET: 2.1% |
State Street Institutional U.S. Government Money Market Fund, 0.030% (c)(d) | | | 3,046,992 | | | | 3,046,992 | |
(Cost $3,046,992) |
| | | | | | | | | |
TOTAL INVESTMENTS: 100.4% |
(Cost $108,844,446) | | | 143,641,207 | |
| | | | | | | | | |
OTHER ASSETS AND LIABILITIES — (NET): -0.4% | | | (620,901 | ) |
| | | | | | | | | |
NET ASSETS: 100.0% | | $ | 143,020,306 | |
(a) | Non-income producing security. |
(b) | Broad industry sectors used for financial reporting. |
(c) | Rate shown represents annualized 7-day yield as of December 31, 2021. |
REIT - Real Estate Investment Trust
| | 81 | SEE NOTES TO FINANCIAL STATEMENTS |
December 31, 2021 |
Schedules of Investments, continued |
Pax Global Opportunities Fund, continued
SUMMARY OF INVESTMENTS BY COUNTRY
Country | | Value | | | Percent Of
Net Assets | |
France | | $ | 2,320,415 | | | | 1.6 | % |
Germany | | | 5,916,292 | | | | 4.1 | % |
Hong Kong | | | 3,901,892 | | | | 2.7 | % |
India | | | 5,480,671 | | | | 3.8 | % |
Japan | | | 10,502,835 | | | | 7.4 | % |
Netherlands | | | 10,869,336 | | | | 7.7 | % |
Portugal | | | 2,867,689 | | | | 2.0 | % |
Switzerland | | | 7,069,162 | | | | 4.9 | % |
Taiwan | | | 4,269,352 | | | | 3.0 | % |
United Kingdom | | | 15,609,279 | | | | 10.9 | % |
United States | | | 71,787,292 | | | | 50.2 | % |
Money Market | | | 3,046,992 | | | | 2.1 | % |
Other assets and liabilities (net) | | | (620,901 | ) | | | -0.4 | % |
TOTAL | | $ | 143,020,306 | | | | 100.0 | % |
SEE NOTES TO FINANCIAL STATEMENTS | 82 | |
December 31, 2021 |
Schedules of Investments, continued |
Pax Global Environmental Markets Fund
Percent of Net Assets
Name of Issuer and
Title of Issue | | Shares/
Principal | | | Value | |
COMMON STOCKS: 97.0% |
RENEWABLE & ALTERNATIVE ENERGY: 3.4% |
Wind Power Generation Equipment 1.5% |
Vestas Wind Systems A/S | | | 1,337,009 | | | $ | 40,718,776 | |
| |
Renewable Energy Developers & Independent Power Producers (IPPs): 1.9% |
Orsted A/S | | | 409,522 | | | | 52,446,282 | |
| |
ENERGY EFFICIENCY: 38.2% |
Power Network Efficiency: 5.7% |
Hubbell, Inc. | | | 341,034 | | | | 71,027,151 | |
Schneider Electric SE | | | 432,085 | | | | 84,945,921 | |
| | | | | | | | 155,973,072 | |
Industrial Energy Efficiency: 21.8% |
ANSYS, Inc. (a) | | | 172,813 | | | | 69,318,751 | |
ASML Holding NV | | | 54,014 | | | | 43,266,285 | |
Delta Electronics, Inc. | | | 4,014,475 | | | | 39,832,365 | |
Equinix, Inc., REIT | | | 66,199 | | | | 55,993,762 | |
Keyence Corp. | | | 62,000 | | | | 38,983,001 | |
MediaTek, Inc. | | | 1,019,000 | | | | 43,724,787 | |
Microsoft Corp. | | | 167,887 | | | | 56,463,756 | |
PTC, Inc. (a) | | | 469,223 | | | | 56,846,366 | |
Rockwell Automation, Inc. | | | 156,596 | | | | 54,628,515 | |
SAP SE | | | 288,096 | | | | 40,546,488 | |
Siemens AG | | | 409,750 | | | | 70,969,839 | |
Spirax-Sarco Engineering, PLC | | | 122,871 | | | | 26,740,462 | |
| | | | | | | | 597,314,377 | |
Buildings Energy Efficiency: 4.9% |
Autodesk, Inc. (a) | | | 235,753 | | | | 66,291,386 | |
Trane Technologies PLC | | | 339,089 | | | | 68,506,151 | |
| | | | | | | | 134,797,537 | |
Transport Energy Efficiency: 5.8% |
Aptiv PLC (a) | | | 301,584 | | | | 49,746,281 | |
TE Connectivity, Ltd. | | | 280,562 | | | | 45,265,873 | |
Texas Instruments, Inc. | | | 337,491 | | | | 63,606,929 | |
| | | | | | | | 158,619,083 | |
| |
WATER INFRASTRUCTURE & TECHNOLOGIES: 17.3% |
Water Infrastructure: 9.1% |
Ferguson PLC | | | 250,231 | | | | 44,447,687 | |
Georg Fischer AG | | | 26,227 | | | | 39,681,890 | |
IDEX Corp. | | | 303,109 | | | | 71,630,719 | |
Pentair PLC | | | 832,223 | | | | 60,777,246 | |
Xylem, Inc. | | | 281,093 | | | | 33,708,673 | |
| | | | | | | | 250,246,215 | |
Percent of Net Assets
Name of Issuer and
Title of Issue | | Shares/
Principal | | | Value | |
COMMON STOCKS, continued |
WATER INFRASTRUCTURE & TECHNOLOGIES, continued |
Water Treatment Equipment: 2.2% |
Ecolab, Inc. | | | 251,995 | | | $ | 59,115,507 | |
| |
Water Utilities: 6.0% |
American Water Works Co., Inc. | | | 493,788 | | | | 93,256,802 | |
Pennon Group PLC | | | 2,337,066 | | | | 37,000,847 | |
Veolia Environnement SA | | | 903,902 | | | | 33,194,791 | |
| | | | | | | | 163,452,440 | |
| |
POLLUTION CONTROL: 11.5% |
Pollution Control Solutions: 1.4% |
Croda International PLC | | | 285,238 | | | | 39,069,462 | |
| |
Environmental Testing & Gas Sensing: 10.1% |
Agilent Technologies, Inc. | | | 556,671 | | | | 88,872,525 | |
Halma PLC | | | 1,275,547 | | | | 55,306,265 | |
Intertek Group PLC | | | 920,224 | | | | 70,201,488 | |
Waters Corp. (a) | | | 171,934 | | | | 64,062,608 | |
| | | | | | | | 278,442,886 | |
| |
WASTE MANAGEMENT & TECHNOLOGIES: 3.4% |
General Waste Management: 3.4% |
Waste Management, Inc. | | | 564,895 | | | | 94,280,976 | |
| |
ENVIRONMENTAL SUPPORT SERVICES: 2.5% |
Environmental Consultancies: 2.5% |
Verisk Analytics, Inc. | | | 302,820 | | | | 69,264,019 | |
| |
FOOD, AGRICULTURE & FORESTRY: 15.4% |
Logistics, Food Safety & Packaging: 6.3% |
GEA Group AG | | | 1,362,984 | | | | 74,445,332 | |
Mettler-Toledo International, Inc. (a) | | | 25,873 | | | | 43,911,914 | |
WestRock Co. | | | 1,210,021 | | | | 53,676,532 | |
| | | | | | | | 172,033,778 | |
Sustainable & Efficient Agriculture: 9.1% |
Deere & Co. | | | 115,841 | | | | 39,720,720 | |
Koninklijke DSM NV | | | 326,333 | | | | 73,492,245 | |
Kubota Corp. | | | 3,169,200 | | | | 70,470,490 | |
Trimble, Inc. (a) | | | 613,559 | | | | 53,496,209 | |
Vitasoy International Holdings, Ltd. | | | 6,478,000 | | | | 13,099,145 | |
| | | | | | | | 250,278,809 | |
| | 83 | SEE NOTES TO FINANCIAL STATEMENTS |
December 31, 2021 |
Schedules of Investments, continued |
Pax Global Environmental Markets Fund, continued
Percent of Net Assets
Name of Issuer and
Title of Issue | | Shares/
Principal | | | Value | |
COMMON STOCKS, continued |
FOOD, AGRICULTURE & FORESTRY, continued |
DIVERSIFIED ENVIRONMENTAL: 5.3% |
Air Liquide SA | | | 295,532 | | | $ | 51,542,050 | |
Linde PLC | | | 272,609 | | | | 94,439,936 | |
| | | | | | | | 145,981,986 | |
TOTAL COMMON STOCKS |
(Cost $1,802,079,725) | | | 2,662,035,205 | |
| | | | | | | | | |
MONEY MARKET: 2.5% |
State Street Institutional U.S. Government Money Market Fund, 0.030% (b)(c) | | | 69,848,645 | | | | 69,848,645 | |
(Cost $69,848,645) |
| | | | | | | | | |
TOTAL INVESTMENTS: 99.5% |
(Cost $1,871,928,370) | | | 2,731,883,850 | |
| | | | | | | | | |
OTHER ASSETS AND LIABILITIES — (NET): 0.5% | | | 13,636,539 | |
| | | | | | | | | |
NET ASSETS: 100.0% | | $ | 2,745,520,389 | |
(a) | Non-income producing security. |
(b) | Rate shown represents annualized 7-day yield as of December 31, 2021. |
SUMMARY OF INVESTMENTS BY COUNTRY
Country | | Value | | | Percent Of
Net Assets | |
Denmark | | $ | 93,165,058 | | | | 3.4 | % |
France | | | 169,682,763 | | | | 6.2 | % |
Germany | | | 185,961,659 | | | | 6.8 | % |
Hong Kong | | | 13,099,145 | | | | 0.5 | % |
Japan | | | 109,453,492 | | | | 4.0 | % |
Netherlands | | | 116,758,531 | | | | 4.2 | % |
Switzerland | | | 39,681,890 | | | | 1.4 | % |
Taiwan | | | 83,557,152 | | | | 3.1 | % |
United Kingdom | | | 272,766,211 | | | | 10.0 | % |
United States | | | 1,577,909,304 | | | | 57.4 | % |
Money Market | | | 69,848,645 | | | | 2.5 | % |
Other assets and liabilities (net) | | | 13,636,539 | | | | 0.5 | % |
Total | | $ | 2,745,520,389 | | | | 100.0 | % |
SEE NOTES TO FINANCIAL STATEMENTS | 84 | |
December 31, 2021 |
Schedules of Investments, continued |
Pax Ellevate Global Women’s Leadership Fund
Percent of Net Assets
Name of Issuer and
Title of Issue | | Shares/
Principal | | | Value | |
COMMON STOCKS: 98.9% |
Communication Services: 6.3% |
Adevinta ASA (a) | | | 9,740 | | | $ | 129,387 | |
Auto Trader Group PLC | | | 32,647 | | | | 326,955 | |
BT Group PLC (a) | | | 276,771 | | | | 636,711 | |
Cable One, Inc. | | | 200 | | | | 352,690 | |
Deutsche Telekom AG | | | 106,452 | | | | 1,966,965 | |
Elisa OYJ | | | 4,565 | | | | 281,094 | |
Infrastrutture Wireless Italiane SpA | | | 10,213 | | | | 123,843 | |
Interpublic Group of Cos Inc., The | | | 11,600 | | | | 434,420 | |
Koninklijke KPN NV | | | 105,993 | | | | 329,437 | |
Match Group, Inc. (a) | | | 8,300 | | | | 1,097,675 | |
Netflix, Inc. (a) | | | 15,417 | | | | 9,287,818 | |
Omnicom Group, Inc. | | | 273,442 | | | | 20,035,096 | |
Orange SA | | | 66,249 | | | | 707,684 | |
Pearson PLC | | | 24,445 | | | | 202,789 | |
Pinterest, Inc., Class A (a) | | | 19,800 | | | | 719,730 | |
Proximus SADP | | | 4,536 | | | | 88,587 | |
Publicis Groupe SA | | | 44,866 | | | | 3,022,804 | |
Quebecor, Inc., Class B | | | 5,698 | | | | 128,604 | |
REA Group, Ltd. | | | 1,727 | | | | 210,593 | |
Schibsted ASA, Class A | | | 2,811 | | | | 108,377 | |
Schibsted ASA, Class B | | | 3,680 | | | | 124,108 | |
SEEK, Ltd. | | | 11,727 | | | | 279,568 | |
Singapore Telecommunications, Ltd. | | | 271,981 | | | | 468,210 | |
Snap, Inc., Class A (a) | | | 32,700 | | | | 1,537,881 | |
Spark New Zealand, Ltd. | | | 61,293 | | | | 189,548 | |
Tele2 AB, Class B | | | 17,139 | | | | 244,499 | |
Telenor ASA | | | 21,890 | | | | 344,090 | |
Telia Company AB | | | 87,379 | | | | 341,736 | |
Telstra Corp., Ltd. | | | 133,131 | | | | 404,611 | |
TELUS Corp. | | | 14,440 | | | | 340,067 | |
Verizon Communications, Inc. | | | 127,795 | | | | 6,640,228 | |
ViacomCBS, Inc., Class B | | | 64,600 | | | | 1,949,628 | |
Vodafone Group PLC | | | 881,073 | | | | 1,327,104 | |
Walt Disney Co., The (a) | | | 56,998 | | | | 8,828,420 | |
WPP PLC | | | 37,237 | | | | 567,035 | |
| | | | | | | | 63,777,992 | |
Consumer Discretionary: 16.0% |
Accor SA (a) | | | 5,287 | | | | 171,370 | |
Amazon.com, Inc. (a) | | | 9,200 | | | | 30,675,928 | |
Aristocrat Leisure, Ltd. | | | 19,961 | | | | 633,214 | |
Barratt Developments PLC | | | 31,982 | | | | 324,761 | |
Bath & Body Works, Inc. | | | 9,500 | | | | 663,005 | |
Best Buy Co., Inc. | | | 177,479 | | | | 18,031,866 | |
Percent of Net Assets
Name of Issuer and
Title of Issue | | Shares/
Principal | | | Value | |
COMMON STOCKS, continued |
Consumer Discretionary, continued |
Burberry Group PLC | | | 13,283 | | | $ | 327,854 | |
Burlington Stores, Inc. (a) | | | 2,354 | | | | 686,215 | |
Compass Group PLC (a) | | | 53,661 | | | | 1,208,107 | |
Daimler AG | | | 33,777 | | | | 2,580,703 | |
Dollar General Corp. | | | 7,740 | | | | 1,825,324 | |
eBay, Inc. | | | 23,576 | | | | 1,567,804 | |
Electrolux AB | | | 7,207 | | | | 174,551 | |
Etsy, Inc. (a) | | | 5,200 | | | | 1,138,488 | |
Expedia Group, Inc. (a) | | | 4,300 | | | | 777,096 | |
General Motors Co. (a) | | | 45,500 | | | | 2,667,665 | |
H & M Hennes & Mauritz AB, Class B | | | 22,333 | | | | 438,220 | |
Hasbro, Inc. | | | 4,300 | | | | 437,654 | |
Hermes International | | | 1,112 | | | | 1,943,079 | |
Hilton Worldwide Holdings, Inc. (a) | | | 8,345 | | | | 1,301,737 | |
InterContinental Hotels Group PLC (a) | | | 5,850 | | | | 378,197 | |
Kering SA | | | 7,876 | | | | 6,319,321 | |
La Francaise des Jeux SAEM | | | 3,370 | | | | 149,351 | |
Lowe’s Cos., Inc. | | | 22,992 | | | | 5,942,972 | |
lululemon athletica, Inc. (a) | | | 53,265 | | | | 20,850,584 | |
LVMH Moet Hennessy Louis Vuitton SE | | | 8,866 | | | | 7,327,160 | |
Marriott International, Inc., Class A (a) | | | 8,433 | | | | 1,393,469 | |
Michelin | | | 5,158 | | | | 844,799 | |
Moncler SpA | | | 6,900 | | | | 498,651 | |
Next PLC | | | 4,331 | | | | 479,022 | |
Peloton Interactive, Inc., Class A (a) | | | 10,400 | | | | 371,904 | |
Renault SA (a) | | | 6,131 | | | | 212,686 | |
Rivian Automotive, Inc., Class A (a) | | | 2,100 | | | | 217,749 | |
Ross Stores, Inc. | | | 11,800 | | | | 1,348,504 | |
SEB SA | | | 876 | | | | 136,508 | |
Starbucks Corp. | | | 112,818 | | | | 13,196,321 | |
Tabcorp Holdings, Ltd. | | | 71,812 | | | | 262,351 | |
Target Corp. | | | 17,909 | | | | 4,144,859 | |
Taylor Wimpey PLC | | | 110,698 | | | | 263,918 | |
TJX Cos., Inc., The | | | 36,954 | | | | 2,805,548 | |
Tractor Supply Co. | | | 3,900 | | | | 930,540 | |
Ulta Beauty, Inc. (a) | | | 52,432 | | | | 21,619,811 | |
Vail Resorts, Inc. | | | 1,366 | | | | 447,911 | |
VF Corp. | | | 11,200 | | | | 820,064 | |
| | 85 | SEE NOTES TO FINANCIAL STATEMENTS |
December 31, 2021 |
Schedules of Investments, continued |
Pax Ellevate Global Women’s Leadership Fund, continued
Percent of Net Assets
Name of Issuer and
Title of Issue | | Shares/
Principal | | | Value | |
COMMON STOCKS, continued |
Consumer Discretionary, continued |
Wesfarmers, Ltd. | | | 35,499 | | | $ | 1,531,655 | |
Yum! Brands, Inc. | | | 9,000 | | | | 1,249,740 | |
Zalando SE (a) | | | 8,430 | | | | 679,091 | |
| | | | | | | | 161,997,327 | |
Consumer Staples: 10.2% |
Beiersdorf AG | | | 3,272 | | | | 335,396 | |
Carrefour SA | | | 19,084 | | | | 349,876 | |
Clorox Co., The | | | 3,912 | | | | 682,096 | |
Coca-Cola Co., The | | | 234,224 | | | | 13,868,403 | |
Coles Group, Ltd. | | | 43,826 | | | | 571,845 | |
Danone SA | | | 20,798 | | | | 1,292,792 | |
Diageo PLC | | | 402,247 | | | | 21,993,273 | |
Empire Co., Ltd., Class A | | | 5,226 | | | | 159,224 | |
Essity AB, Class B | | | 20,413 | | | | 665,970 | |
Estee Lauder Cos, Inc., The, Class A | | | 58,867 | | | | 21,792,563 | |
Etablissements Franz Colruyt NV | | | 1,949 | | | | 82,701 | |
General Mills, Inc. | | | 19,013 | | | | 1,281,096 | |
Heineken Holding NV | | | 3,502 | | | | 322,901 | |
Heineken NV | | | 7,628 | | | | 858,453 | |
Henkel AG & Co. KGaA | | | 3,315 | | | | 258,408 | |
Hershey Co., The | | | 4,615 | | | | 892,864 | |
ICA Gruppen AB | | | 3,324 | | | | 196,581 | |
J Sainsbury PLC | | | 55,675 | | | | 208,111 | |
J.M. Smucker Co., The | | | 3,520 | | | | 478,086 | |
Jeronimo Martins SGPS SA | | | 8,807 | | | | 201,538 | |
Kellogg Co. | | | 8,187 | | | | 527,407 | |
Kimberly-Clark Corp. | | | 10,349 | | | | 1,479,079 | |
Kroger Co., The | | | 22,295 | | | | 1,009,072 | |
Loblaw Cos, Ltd. | | | 5,266 | | | | 431,454 | |
L’Oreal SA | | | 7,888 | | | | 3,761,098 | |
McCormick & Co., Inc. | | | 7,544 | | | | 728,826 | |
Metro, Inc. | | | 7,407 | | | | 394,197 | |
Mowi ASA | | | 14,382 | | | | 340,375 | |
Orkla ASA | | | 22,825 | | | | 228,788 | |
Pernod Ricard SA | | | 6,601 | | | | 1,588,053 | |
Procter & Gamble Co., The | | | 109,178 | | | | 17,859,337 | |
Remy Cointreau SA | | | 730 | | | | 177,440 | |
Saputo, Inc. | | | 8,204 | | | | 184,841 | |
Shiseido Co., Ltd. | | | 13,000 | | | | 725,224 | |
Tesco PLC | | | 242,083 | | | | 953,099 | |
Treasury Wine Estates, Ltd. | | | 23,427 | | | | 211,226 | |
Unilever PLC | | | 83,746 | | | | 4,492,675 | |
Walgreens Boots Alliance, Inc. | | | 22,435 | | | | 1,170,210 | |
Percent of Net Assets
Name of Issuer and
Title of Issue | | Shares/
Principal | | | Value | |
COMMON STOCKS, continued |
Consumer Staples, continued |
Woolworths Group, Ltd. | | | 43,962 | | | $ | 1,215,265 | |
| | | | | | | | 103,969,843 | |
Financials: 15.7% |
ABN AMRO Bank NV | | | 13,952 | | | | 205,090 | |
Abrdn PLC | | | 71,057 | | | | 231,505 | |
Admiral Group PLC | | | 6,021 | | | | 257,725 | |
Aegon NV | | | 55,246 | | | | 274,659 | |
Ally Financial, Inc. | | | 12,009 | | | | 571,748 | |
American Express Co. | | | 21,200 | | | | 3,468,320 | |
Amundi SA | | | 2,084 | | | | 171,898 | |
Annaly Capital Management, Inc., REIT | | | 45,900 | | | | 358,938 | |
Aon PLC, Class A | | | 7,431 | | | | 2,233,461 | |
Assicurazioni Generali SpA | | | 35,043 | | | | 740,624 | |
ASX, Ltd. | | | 6,218 | | | | 420,238 | |
Australia & New Zealand Banking Group, Ltd | | | 92,551 | | | | 1,853,920 | |
Aviva PLC | | | 122,281 | | | | 681,615 | |
AXA SA | | | 60,508 | | | | 1,800,915 | |
Banco Santander SA | | | 553,496 | | | | 1,838,202 | |
Bank Leumi Le-Israel BM | | | 46,175 | | | | 495,274 | |
Bank of America Corp. | | | 252,033 | | | | 11,212,948 | |
Bank of Montreal | | | 21,291 | | | | 2,292,281 | |
Bank of Nova Scotia, The | | | 36,255 | | | | 2,566,612 | |
BNP Paribas SA | | | 34,343 | | | | 2,374,510 | |
Canadian Imperial Bank of Commerce | | | 85,232 | | | | 9,935,142 | |
Citigroup, Inc. | | | 80,968 | | | | 4,889,658 | |
CME Group, Inc. | | | 11,500 | | | | 2,627,290 | |
CNP Assurances | | | 5,570 | | | | 137,775 | |
Commerzbank AG (a) | | | 30,446 | | | | 230,341 | |
Commonwealth Bank of Australia | | | 53,871 | | | | 3,960,126 | |
Credit Agricole SA | | | 37,728 | | | | 537,900 | |
Danske Bank A/S | | | 22,400 | | | | 386,713 | |
Discover Financial Services | | | 9,363 | | | | 1,081,988 | |
DNB Bank ASA | | | 30,334 | | | | 693,852 | |
Eurazeo SA | | | 1,261 | | | | 110,016 | |
Euronext NV | | | 2,000 | | | | 207,928 | |
FactSet Research Systems, Inc. | | | 1,300 | | | | 631,813 | |
Fifth Third Bancorp | | | 22,800 | | | | 992,940 | |
FinecoBank Banca Fineco SpA | | | 20,353 | | | | 356,432 | |
First Republic Bank | | | 6,031 | | | | 1,245,462 | |
Gjensidige Forsikring ASA | | | 6,078 | | | | 147,458 | |
Globe Life, Inc. | | | 3,105 | | | | 291,001 | |
SEE NOTES TO FINANCIAL STATEMENTS | 86 | |
December 31, 2021 |
Schedules of Investments, continued |
Pax Ellevate Global Women’s Leadership Fund, continued
Percent of Net Assets
Name of Issuer and
Title of Issue | | Shares/
Principal | | | Value | |
COMMON STOCKS, continued |
Financials, continued |
Goldman Sachs Group, Inc., The | | | 11,100 | | | $ | 4,246,305 | |
Groupe Bruxelles Lambert SA | | | 3,657 | | | | 408,439 | |
Hang Seng Bank, Ltd. | | | 24,300 | | | | 444,971 | |
Hargreaves Lansdown PLC | | | 11,586 | | | | 212,906 | |
Hartford Financial Services Group, Inc., The | | | 11,474 | | | | 792,165 | |
Hong Kong Exchanges and Clearing, Ltd. | | | 37,900 | | | | 2,216,542 | |
Huntington Bancshares, Inc. | | | 47,383 | | | | 730,646 | |
iA Financial Corp., Inc. | | | 29 | | | | 1,659 | |
Industrivarden AB, Class A | | | 4,316 | | | | 137,138 | |
Industrivarden AB, Class C | | | 5,235 | | | | 164,016 | |
ING Groep NV | | | 128,429 | | | | 1,785,549 | |
Insurance Australia Group, Ltd. | | | 83,587 | | | | 259,038 | |
Intact Financial Corp. | | | 5,651 | | | | 734,525 | |
Intercontinental Exchange, Inc. | | | 18,052 | | | | 2,468,972 | |
Investor AB, Class B | | | 58,600 | | | | 1,470,468 | |
JPMorgan Chase & Co. | | | 100,000 | | | | 15,835,001 | |
KeyCorp. | | | 31,278 | | | | 723,460 | |
Kinnevik AB, Class B (a) | | | 49,034 | | | | 1,743,336 | |
Legal & General Group PLC | | | 189,997 | | | | 767,263 | |
Lincoln National Corp. | | | 5,972 | | | | 407,649 | |
London Stock Exchange Group PLC | | | 10,260 | | | | 965,159 | |
M&G PLC | | | 82,607 | | | | 223,478 | |
Macquarie Group, Ltd. | | | 10,808 | | | | 1,615,637 | |
Manulife Financial Corp. | | | 62,700 | | | | 1,195,065 | |
Medibank Pvt, Ltd. | | | 91,229 | | | | 222,197 | |
Mediobanca Banca di Credito Finanziario SpA | | | 20,133 | | | | 231,136 | |
MetLife, Inc. | | | 23,409 | | | | 1,462,828 | |
Moody’s Corp. | | | 5,565 | | | | 2,173,578 | |
Muenchener Rueckversicherungs AG | | | 4,318 | | | | 1,274,711 | |
Nasdaq, Inc. | | | 3,800 | | | | 798,038 | |
National Australia Bank, Ltd. | | | 104,154 | | | | 2,186,932 | |
National Bank of Canada | | | 11,504 | | | | 877,067 | |
Natwest Group PLC | | | 180,120 | | | | 551,584 | |
NN Group NV | | | 8,381 | | | | 453,247 | |
Nordea Bank Apb | | | 107,735 | | | | 1,314,210 | |
Onex Corp. | | | 2,552 | | | | 200,295 | |
PNC Financial Services Group, Inc., The | | | 13,763 | | | | 2,759,757 | |
Percent of Net Assets
Name of Issuer and
Title of Issue | | Shares/
Principal | | | Value | |
COMMON STOCKS, continued |
Financials, continued |
Poste Italiane SpA | | | 17,031 | | | $ | 223,111 | |
Principal Financial Group, Inc. | | | 8,682 | | | | 627,969 | |
Progressive Corp., The | | | 17,796 | | | | 1,826,759 | |
QBE Insurance Group, Ltd. | | | 49,274 | | | | 406,892 | |
Robinhood Markets, Inc. (a) | | | 10,500 | | | | 186,480 | |
Royal Bank of Canada | | | 44,892 | | | | 4,764,418 | |
S&P Global, Inc. | | | 7,707 | | | | 3,637,165 | |
Schroders PLC | | | 4,007 | | | | 193,407 | |
Skandinaviska Enskilda Banken AB, Class A | | | 57,980 | | | | 804,969 | |
Societe Generale SA | | | 25,021 | | | | 859,939 | |
Standard Chartered PLC | | | 82,794 | | | | 503,452 | |
State Street Corp. | | | 11,481 | | | | 1,067,733 | |
Sun Life Financial, Inc. | | | 18,820 | | | | 1,047,564 | |
Suncorp Group, Ltd. | | | 41,376 | | | | 333,121 | |
Svenska Handelsbanken AB, Class A | | | 48,623 | | | | 525,515 | |
Swedbank AB, Class A | | | 30,611 | | | | 615,153 | |
T Rowe Price Group, Inc. | | | 7,800 | | | | 1,533,792 | |
Toronto-Dominion Bank, The | | | 56,901 | | | | 4,362,432 | |
Travelers Cos., Inc., The | | | 7,700 | | | | 1,204,511 | |
Tryg A/S | | | 11,718 | | | | 289,172 | |
U.S. Bancorp | | | 45,577 | | | | 2,560,060 | |
UniCredit SpA | | | 55,271 | | | | 849,590 | |
Upstart Holdings, Inc. (a) | | | 1,400 | | | | 211,820 | |
Wendel SA | | | 79,232 | | | | 9,494,009 | |
Westpac Banking Corp. | | | 116,251 | | | | 1,803,461 | |
Willis Towers Watson PLC | | | 4,008 | | | | 951,860 | |
Zurich Insurance Group AG | | | 4,725 | | | | 2,069,923 | |
| | | | | | | | 159,523,562 | |
Health Care: 13.1% |
Abbott Laboratories | | | 54,286 | | | | 7,640,212 | |
AbbVie, Inc. | | | 51,100 | | | | 6,918,940 | |
Alcon, Inc. | | | 15,355 | | | | 1,354,393 | |
Alnylam Pharmaceuticals, Inc. (a) | | | 3,574 | | | | 606,079 | |
AmerisourceBergen Corp. | | | 4,588 | | | | 609,699 | |
Anthem, Inc. | | | 18,072 | | | | 8,377,096 | |
AstraZeneca PLC | | | 48,612 | | | | 5,676,391 | |
Bristol-Myers Squibb Co. | | | 63,600 | | | | 3,965,460 | |
Cardinal Health, Inc. | | | 8,825 | | | | 454,399 | |
Cerner Corp. | | | 7,700 | | | | 715,099 | |
CSL, Ltd. | | | 15,778 | | | | 3,337,050 | |
CVS Health Corp. | | | 37,927 | | | | 3,912,549 | |
DaVita, Inc. (a) | | | 2,000 | | | | 227,520 | |
Eli Lilly & Co. | | | 25,077 | | | | 6,926,769 | |
| | 87 | SEE NOTES TO FINANCIAL STATEMENTS |
December 31, 2021 |
Schedules of Investments, continued |
Pax Ellevate Global Women’s Leadership Fund, continued
Percent of Net Assets
Name of Issuer and
Title of Issue | | Shares/
Principal | | | Value | |
COMMON STOCKS, continued |
Health Care, continued |
Exact Sciences Corp (a) | | | 6,000 | | | $ | 466,980 | |
Fresenius Medical Care AG & Co KGaA | | | 6,455 | | | | 418,466 | |
Genmab A/S (a) | | | 2,111 | | | | 842,612 | |
Gilead Sciences, Inc. | | | 39,254 | | | | 2,850,233 | |
GlaxoSmithKline PLC | | | 155,769 | | | | 3,391,519 | |
GN Store Nord AS | | | 3,891 | | | | 244,144 | |
Hologic, Inc. (a) | | | 8,171 | | | | 625,572 | |
Illumina, Inc. (a) | | | 4,600 | | | | 1,750,024 | |
Insulet Corp. (a) | | | 2,400 | | | | 638,568 | |
Ipsen SA | | | 1,339 | | | | 122,532 | |
Jazz Pharmaceuticals PLC (a) | | | 1,900 | | | | 242,060 | |
Johnson & Johnson | | | 80,253 | | | | 13,728,882 | |
Koninklijke Philips NV | | | 30,048 | | | | 1,112,125 | |
Lonza Group AG | | | 2,430 | | | | 2,023,189 | |
McKesson Corp. | | | 4,777 | | | | 1,187,419 | |
Merck & Co., Inc. | | | 82,100 | | | | 6,292,144 | |
Merck KGaA | | | 4,096 | | | | 1,053,725 | |
Novartis AG | | | 67,061 | | | | 5,892,782 | |
Novo Nordisk A/S, Class B | | | 55,592 | | | | 6,244,419 | |
Oak Street Health, Inc. (a)(b) | | | 2,900 | | | | 96,106 | |
Orion OYJ, Class B | | | 3,516 | | | | 146,050 | |
Orpea SA | | | 1,608 | | | | 161,263 | |
Pfizer, Inc. | | | 167,100 | | | | 9,867,255 | |
Quest Diagnostics, Inc. | | | 51,448 | | | | 8,901,018 | |
Ramsay Health Care, Ltd. | | | 5,648 | | | | 293,527 | |
Ryman Healthcare, Ltd. | | | 14,066 | | | | 117,948 | |
Sanofi | | | 35,409 | | | | 3,553,079 | |
Smith & Nephew PLC | | | 27,957 | | | | 487,916 | |
Stryker Corp. | | | 10,236 | | | | 2,737,311 | |
UCB SA | | | 4,018 | | | | 458,558 | |
Vertex Pharmaceuticals, Inc. (a) | | | 7,364 | | | | 1,617,134 | |
Waters Corp. (a) | | | 1,954 | | | | 728,060 | |
Zimmer Biomet Holdings, Inc. | | | 6,700 | | | | 851,168 | |
Zoetis, Inc. | | | 14,674 | | | | 3,580,896 | |
| | | | | | | | 133,446,340 | |
Industrials: 5.1% |
Adecco Group AG | | | 4,869 | | | | 248,111 | |
Aena SME SA (a) | | | 2,364 | | | | 372,292 | |
Aeroports de Paris (a) | | | 903 | | | | 116,490 | |
Air Canada (a) | | | 5,700 | | | | 95,214 | |
Alstom SA | | | 10,889 | | | | 386,673 | |
Assa Abloy AB, Class B | | | 31,380 | | | | 956,493 | |
Auckland International Airport, Ltd. (a) | | | 42,658 | | | | 224,545 | |
Percent of Net Assets
Name of Issuer and
Title of Issue | | Shares/
Principal | | | Value | |
COMMON STOCKS, continued |
Industrials, continued |
Booz Allen Hamilton Holding Corp. | | | 4,800 | | | $ | 406,992 | |
Brambles, Ltd. | | | 44,125 | | | | 341,365 | |
Bureau Veritas SA | | | 9,574 | | | | 317,847 | |
Canadian National Railway Co. | | | 24,590 | | | | 3,020,510 | |
Cie de Saint-Gobain | | | 15,725 | | | | 1,106,200 | |
Cummins, Inc. | | | 4,778 | | | | 1,042,273 | |
Daimler Truck Holding AG (a) | | | 13,004 | | | | 478,055 | |
Equifax, Inc. | | | 4,000 | | | | 1,171,160 | |
Experian PLC | | | 28,692 | | | | 1,413,249 | |
FedEx Corp. | | | 7,600 | | | | 1,965,664 | |
GEA Group AG | | | 4,806 | | | | 262,501 | |
Getlink SE | | | 13,387 | | | | 221,719 | |
Husqvarna AB, Class B | | | 12,609 | | | | 201,604 | |
KION Group AG | | | 2,423 | | | | 264,654 | |
Legrand SA | | | 8,491 | | | | 994,475 | |
MTR Corp., Ltd. | | | 51,556 | | | | 276,755 | |
Otis Worldwide Corp. | | | 12,800 | | | | 1,114,496 | |
Qantas Airways, Ltd. (a) | | | 31,486 | | | | 114,857 | |
Randstad NV | | | 3,773 | | | | 257,384 | |
RELX PLC | | | 62,723 | | | | 2,047,712 | |
Republic Services, Inc. | | | 7,313 | | | | 1,019,798 | |
Ritchie Bros Auctioneers, Inc. | | | 4,400 | | | | 269,263 | |
Schneider Electric SE | | | 16,508 | | | | 3,245,397 | |
Skanska AB, Class B | | | 10,338 | | | | 267,146 | |
Smiths Group PLC | | | 12,040 | | | | 257,720 | |
Sunrun, Inc. (a)(b) | | | 276,600 | | | | 9,487,379 | |
Sydney Airport (a) | | | 41,419 | | | | 261,498 | |
Teleperformance | | | 1,864 | | | | 833,350 | |
Transurban Group | | | 98,304 | | | | 987,394 | |
United Parcel Service, Inc., Class B | | | 22,600 | | | | 4,844,084 | |
Verisk Analytics, Inc. | | | 5,200 | | | | 1,189,396 | |
Vestas Wind Systems A/S | | | 37,722 | | | | 1,148,828 | |
Wartsila OYJ Abp | | | 16,121 | | | | 226,109 | |
Wolters Kluwer NV | | | 64,970 | | | | 7,647,024 | |
WSP Global, Inc. | | | 3,836 | | | | 556,864 | |
| | | | | | | | 51,660,540 | |
Information Technology: 22.1% |
Accenture PLC, Class A | | | 19,381 | | | | 8,034,394 | |
Adobe, Inc. (a) | | | 19,100 | | | | 10,830,846 | |
Affirm Holdings, Inc. (a) | | | 1,900 | | | | 191,064 | |
Afterpay, Ltd. (a) | | | 9,240 | | | | 557,793 | |
ANSYS, Inc. (a) | | | 2,875 | | | | 1,153,220 | |
Apple, Inc. | | | 263,600 | | | | 46,807,451 | |
SEE NOTES TO FINANCIAL STATEMENTS | 88 | |
December 31, 2021 |
Schedules of Investments, continued |
Pax Ellevate Global Women’s Leadership Fund, continued
Percent of Net Assets
Name of Issuer and
Title of Issue | | Shares/
Principal | | | Value | |
COMMON STOCKS, continued |
Information Technology, continued |
Arista Networks, Inc. (a) | | | 6,900 | | | $ | 991,875 | |
Autodesk, Inc. (a) | | | 43,534 | | | | 12,241,325 | |
Avalara, Inc. (a) | | | 2,900 | | | | 374,419 | |
AVEVA Group PLC | | | 3,839 | | | | 177,140 | |
Block, Inc., Class A (a) | | | 16,103 | | | | 2,600,796 | |
Broadcom, Inc. | | | 11,600 | | | | 7,718,756 | |
Capgemini SE | | | 5,230 | | | | 1,281,771 | |
CDW Corp. | | | 4,587 | | | | 939,326 | |
Ceridian HCM Holding, Inc. (a) | | | 4,800 | | | | 501,408 | |
Cisco Systems, Inc. | | | 123,975 | | | | 7,856,296 | |
Cloudflare, Inc., Class A (a) | | | 10,100 | | | | 1,328,150 | |
Computershare, Ltd. | | | 17,308 | | | | 251,955 | |
Dassault Systemes SE | | | 22,387 | | | | 1,328,564 | |
DocuSign,Inc. (a) | | | 10,313 | | | | 1,570,773 | |
Dropbox, Inc., Class A (a) | | | 10,366 | | | | 254,382 | |
F5 Networks, Inc. (a) | | | 1,900 | | | | 464,949 | |
Fair Isaac Corp. (a) | | | 800 | | | | 346,936 | |
Guidewire Software, Inc. (a) | | | 2,800 | | | | 317,884 | |
Halma PLC | | | 12,074 | | | | 523,515 | |
Hexagon AB, Class B | | | 63,141 | | | | 1,000,188 | |
HP, Inc. | | | 39,241 | | | | 1,478,208 | |
HubSpot, Inc. (a) | | | 1,800 | | | | 1,186,470 | |
Intel Corp. | | | 128,700 | | | | 6,628,050 | |
Intuit, Inc. | | | 9,537 | | | | 6,134,389 | |
Lam Research Corp. | | | 4,700 | | | | 3,380,005 | |
Lightspeed Commerce, Inc. (a) | | | 4,300 | | | | 173,638 | |
Microsoft Corp. | | | 133,652 | | | | 44,949,840 | |
Nokia OYJ (a) | | | 163,955 | | | | 1,038,439 | |
NortonLifeLock, Inc. | | | 18,500 | | | | 480,630 | |
Okta, Inc. (a) | | | 3,901 | | | | 874,487 | |
PayPal Holdings Inc (a) | | | 36,101 | | | | 6,807,927 | |
Sage Group PLC, The | | | 33,203 | | | | 384,190 | |
salesforce.com, Inc. (a) | | | 36,232 | | | | 9,207,638 | |
SAP SE | | | 31,733 | | | | 4,466,087 | |
Shopify, Inc., Class A (a) | | | 4,200 | | | | 5,782,915 | |
Texas Instruments, Inc. | | | 31,341 | | | | 5,906,838 | |
Twilio, Inc., Class A (a) | | | 5,569 | | | | 1,466,540 | |
Unity Software, Inc. (a) | | | 2,200 | | | | 314,578 | |
Visa, Inc., Class A | | | 49,766 | | | | 10,784,790 | |
Western Union Co., The | | | 11,837 | | | | 211,172 | |
WiseTech Global, Ltd. | | | 4,255 | | | | 180,461 | |
Workday, Inc., Class A (a) | | | 6,200 | | | | 1,693,716 | |
Worldline SA (a) | | | 7,489 | | | | 416,839 | |
Xero, Ltd. (a) | | | 4,457 | | | | 456,215 | |
Percent of Net Assets
Name of Issuer and
Title of Issue | | Shares/
Principal | | | Value | |
COMMON STOCKS, continued |
Information Technology, continued |
Zendesk, Inc. (a) | | | 3,900 | | | $ | 406,731 | |
| | | | | | | | 224,455,969 | |
Materials: 6.3% |
Air Liquide SA | | | 65,252 | | | | 11,380,229 | |
Akzo Nobel NV | | | 6,224 | | | | 683,799 | |
Arkema SA | | | 1,936 | | | | 273,256 | |
BlueScope Steel, Ltd. | | | 15,198 | | | | 232,018 | |
Boliden AB | | | 8,038 | | | | 309,943 | |
Celanese Corp. | | | 123,800 | | | | 20,805,829 | |
Chr. Hansen Holding A/S | | | 3,357 | | | | 264,701 | |
Covestro AG | | | 6,087 | | | | 374,642 | |
Dow, Inc. | | | 24,636 | | | | 1,397,354 | |
Ecolab, Inc. | | | 8,251 | | | | 1,935,602 | |
Evonik Industries AG | | | 6,538 | | | | 211,213 | |
Fortescue Metals Group, Ltd. | | | 47,238 | | | | 664,013 | |
Johnson Matthey PLC | | | 6,676 | | | | 185,512 | |
Kinross Gold Corp. | | | 43,996 | | | | 255,291 | |
Koninklijke DSM NV | | | 75,497 | | | | 17,002,400 | |
Lundin Mining Corp. | | | 24,300 | | | | 189,797 | |
Mondi PLC | | | 15,166 | | | | 376,176 | |
Newmont Corp. | | | 24,553 | | | | 1,522,777 | |
Norsk Hydro ASA | | | 37,273 | | | | 293,286 | |
Northern Star Resources, Ltd. | | | 35,569 | | | | 244,620 | |
Novozymes A/S, Class B | | | 6,432 | | | | 528,130 | |
Nutrien, Ltd. | | | 17,100 | | | | 1,285,322 | |
Solvay SA | | | 2,411 | | | | 280,293 | |
Stora Enso OYJ, Class R | | | 18,398 | | | | 337,665 | |
Svenska Cellulosa AB SCA, Class B | | | 19,264 | | | | 341,826 | |
Yara International ASA | | | 53,132 | | | | 2,678,819 | |
| | | | | | | | 64,054,513 | |
Real Estate: 1.3% |
Azrieli Group, Ltd. | | | 1,404 | | | | 133,956 | |
British Land Co. PLC, The, REIT | | | 28,215 | | | | 203,750 | |
Camden Property Trust, REIT | | | 3,077 | | | | 549,798 | |
Canadian Apartment Properties, REIT | | | 2,659 | | | | 126,039 | |
CapitaLand Integrated Commercial Trust, REIT | | | 170,100 | | | | 257,356 | |
Covivio, REIT | | | 1,774 | | | | 145,620 | |
Dexus, REIT | | | 34,844 | | | | 281,744 | |
Gecina SA, REIT | | | 1,494 | | | | 209,056 | |
GPT Group, The, REIT | | | 62,014 | | | | 244,533 | |
Healthpeak Properties, Inc., REIT | | | 16,400 | | | | 591,876 | |
| | 89 | SEE NOTES TO FINANCIAL STATEMENTS |
December 31, 2021 |
Schedules of Investments, continued |
Pax Ellevate Global Women’s Leadership Fund, continued
Percent of Net Assets
Name of Issuer and
Title of Issue | | Shares/
Principal | | | Value | |
COMMON STOCKS, continued |
Real Estate, continued |
Klepierre SA, REIT (a) | | | 6,312 | | | $ | 149,356 | |
Land Securities Group PLC, REIT | | | 22,204 | | | | 234,340 | |
LendLease Corp., Ltd. | | | 22,559 | | | | 175,657 | |
Link, REIT | | | 71,105 | | | | 626,383 | |
Mapletree Logistics Trust, REIT | | | 101,700 | | | | 143,431 | |
Mirvac Group, REIT | | | 125,163 | | | | 264,942 | |
Realty Income Corp., REIT | | | 17,900 | | | | 1,281,461 | |
RioCan Real Estate Investment Trust, REIT | | | 4,896 | | | | 88,789 | |
Stockland, REIT | | | 77,473 | | | | 239,005 | |
Sun Communities, Inc., REIT | | | 3,500 | | | | 734,895 | |
Swire Properties, Ltd. | | | 37,200 | | | | 93,256 | |
Unibail-Rodamco-Westfield, REIT (a) | | | 4,035 | | | | 282,366 | |
Ventas, Inc., REIT | | | 12,300 | | | | 628,776 | |
VICI Properties, Inc., REIT | | | 50,000 | | | | 1,505,501 | |
Vicinity Centres, REIT | | | 124,113 | | | | 152,638 | |
Vonovia SE | | | 24,676 | | | | 1,359,702 | |
Welltower, Inc., REIT | | | 13,163 | | | | 1,128,991 | |
Weyerhaeuser Co., REIT | | | 24,137 | | | | 993,962 | |
Zillow Group, Inc., Class A (a) | | | 1,900 | | | | 118,218 | |
Zillow Group, Inc., Class C (a) | | | 4,800 | | | | 306,480 | |
| | | | | | | | 13,251,877 | |
Utilities: 2.8% |
American Water Works Co., Inc. | | | 106,758 | | | | 20,162,315 | |
Edison International | | | 11,999 | | | | 818,932 | |
EDP - Energias de Portugal SA | | | 92,019 | | | | 505,488 | |
Electricite de France SA | | | 18,402 | | | | 216,431 | |
Elia Group SA | | | 939 | | | | 123,766 | |
Hydro One, Ltd. | | | 10,305 | | | | 268,104 | |
Iberdrola SA | | | 193,255 | | | | 2,288,134 | |
Meridian Energy, Ltd. | | | 39,973 | | | | 132,681 | |
Orsted A/S | | | 6,227 | | | | 797,474 | |
Red Electrica Corp. SA | | | 13,974 | | | | 302,179 | |
Severn Trent PLC | | | 8,034 | | | | 320,813 | |
Suez SA | | | 58,451 | | | | 1,318,285 | |
Terna - Rete Elettrica Nazionale | | | 42,603 | | | | 344,643 | |
United Utilities Group PLC | | | 21,874 | | | | 322,761 | |
| | | | | | | | 27,922,006 | |
TOTAL COMMON STOCKS |
(Cost $747,338,041) | | | 1,004,059,969 | |
| | | | | | | | | |
Percent of Net Assets
Name of Issuer and
Title of Issue | | Shares/
Principal | | | Value | |
PREFERRED STOCKS: 0.0% (c) |
Consumer Staples: 0.0% (c) |
Henkel AG & Co. KGaA | | | 5,828 | | | $ | 470,268 | |
| |
Materials: 0.0% (c) |
Fuchs Petrolub SE | | | 2,317 | | | | 104,703 | |
| | | | | | | | | |
TOTAL PREFERRED STOCKS |
(Cost $710,420) | | | 574,971 | |
| | | | | | | | | |
MONEY MARKET: 1.3% |
State Street Institutional U.S. Government Money Market Fund, 0.030% (d)(e) | | | 13,136,843 | | | | 13,136,843 | |
(Cost $13,136,843) |
| |
SECURITIES PURCHASED WITH CASH COLLATERAL FROM SECURITIES LENDING: 0.0% (c) |
State Street Navigator Securities Lending Government Money Market Portfolio, 0.032% (d)(e) | | | 104,400 | | | | 104,400 | |
(Cost $104,400) |
| | | | | | | | | |
TOTAL INVESTMENTS: 100.2% |
(Cost $761,289,704) | | | 1,017,876,183 | |
| | | | | | | | | |
PAYABLE UPON RETURN OF SECURITIES LOANED: 0.0% (c) | | | (104,400 | ) |
| | | | | | | | | |
OTHER ASSETS AND LIABILITIES — (NET): -0.2% | | | (2,482,031 | ) |
| | | | | | | | | |
NET ASSETS: 100.0% | | $ | 1,015,289,752 | |
(a) | Non-income producing security. |
(b) | Security or partial position of this security was on loan as of December 31, 2021. The total market value of securities on loan as of December 31, 2021 was $6,180,549. |
(c) | Rounds to less than 0.05%. |
(d) | Rate shown represents annualized 7-day yield as of December 31, 2021. |
REIT - Real Estate Investment Trust
SEE NOTES TO FINANCIAL STATEMENTS | 90 | |
December 31, 2021 |
Schedules of Investments, continued |
Pax Ellevate Global Women’s Leadership Fund, continued
SUMMARY OF INVESTMENTS BY COUNTRY
Country | | Value | | | Percent Of
Net Assets | |
Australia | | $ | 27,206,961 | | | | 2.7 | % |
Austria | | | 376,176 | | | | 0 | %* |
Belgium | | | 1,318,578 | | | | 0.1 | % |
Brazil | | | 2,678,819 | | | | 0.3 | % |
Canada | | | 41,282,105 | | | | 4.1 | % |
Chile | | | 189,797 | | | | 0 | %* |
Denmark | | | 10,746,194 | | | | 1.0 | % |
Finland | | | 2,029,358 | | | | 0.2 | % |
France | | | 71,681,167 | | | | 7.0 | % |
Germany | | | 16,913,396 | | | | 1.6 | % |
Hong Kong | | | 3,657,908 | | | | 0.4 | % |
Israel | | | 629,230 | | | | 0.1 | % |
Italy | | | 3,368,030 | | | | 0.3 | % |
Japan | | | 725,224 | | | | 0.1 | % |
Netherlands | | | 31,139,996 | | | | 3.1 | % |
New Zealand | | | 1,120,936 | | | | 0.1 | % |
Norway | | | 2,280,333 | | | | 0.2 | % |
Portugal | | | 707,026 | | | | 0.1 | % |
Singapore | | | 868,997 | | | | 0.1 | % |
Spain | | | 4,800,808 | | | | 0.5 | % |
Sweden | | | 11,913,561 | | | | 1.2 | % |
Switzerland | | | 11,588,399 | | | | 1.1 | % |
United Kingdom | | | 53,904,234 | | | | 5.3 | % |
United States | | | 703,507,707 | | | | 69.3 | % |
Money Market | | | 13,136,843 | | | | 1.3 | % |
Other assets and liabilities (net) | | | (2,482,031 | ) | | | -0.2 | % |
TOTAL | | $ | 1,015,289,752 | | | | 100.0 | % |
* | Rounds to less than 0.05%. |
| | 91 | SEE NOTES TO FINANCIAL STATEMENTS |
December 31, 2021 |
Schedules of Investments, continued |
Pax International Sustainable Economy Fund
Percent of Net Assets
Name of Issuer and
Title of Issue | | Shares/
Principal | | | Value | |
COMMON STOCKS: 99.2% |
Australia: 6.1% |
Aristocrat Leisure, Ltd. | | | 193,869 | | | $ | 6,150,020 | |
ASX, Ltd. | | | 23,592 | | | | 1,594,446 | |
Australia & New Zealand Banking Group, Ltd | | | 232,075 | | | | 4,648,771 | |
BlueScope Steel, Ltd. | | | 51,737 | | | | 789,835 | |
Cochlear, Ltd. | | | 6,414 | | | | 1,006,680 | |
Coles Group, Ltd. | | | 2,035 | | | | 26,553 | |
Commonwealth Bank of Australia | | | 181,200 | | | | 13,320,243 | |
Computershare, Ltd. | | | 199,773 | | | | 2,908,124 | |
Dexus, REIT | | | 214,832 | | | | 1,737,103 | |
Fortescue Metals Group, Ltd. | | | 187,589 | | | | 2,636,892 | |
Goodman Group, REIT | | | 146,512 | | | | 2,824,285 | |
Insurance Australia Group, Ltd. | | | 205,991 | | | | 638,371 | |
Macquarie Group, Ltd. | | | 39,749 | | | | 5,941,889 | |
Mirvac Group, REIT | | | 80,733 | | | | 170,894 | |
QBE Insurance Group, Ltd. | | | 490,022 | | | | 4,046,471 | |
Ramsay Health Care, Ltd. | | | 14,320 | | | | 744,211 | |
REA Group, Ltd. (a) | | | 12,087 | | | | 1,473,908 | |
SEEK, Ltd. (a) | | | 42,885 | | | | 1,022,364 | |
Telstra Corp., Ltd. | | | 403,971 | | | | 1,227,747 | |
Vicinity Centres, REIT | | | 387,758 | | | | 476,878 | |
| | | | | | | | 53,385,685 | |
Austria: 0.4% |
Mondi PLC | | | 69,164 | | | | 1,715,538 | |
Voestalpine AG | | | 51,664 | | | | 1,874,533 | |
| | | | | | | | 3,590,071 | |
Belgium: 0.6% |
KBC Group NV | | | 16,318 | | | | 1,402,063 | |
Solvay SA | | | 15,631 | | | | 1,817,195 | |
UCB SA | | | 18,385 | | | | 2,098,206 | |
Umicore SA | | | 1,498 | | | | 61,110 | |
| | | | | | | | 5,378,574 | |
Denmark: 3.9% |
Coloplast A/S, Class B | | | 9,867 | | | | 1,737,334 | |
Genmab A/S (b) | | | 2,986 | | | | 1,191,871 | |
GN Store Nord AS | | | 9,404 | | | | 590,061 | |
Novo Nordisk A/S, Class B | | | 193,406 | | | | 21,724,496 | |
Orsted A/S | | | 22,242 | | | | 2,848,468 | |
Vestas Wind Systems A/S | | | 188,955 | | | | 5,754,648 | |
| | | | | | | | 33,846,878 | |
Finland: 1.4% |
Kesko Oyj, Class B | | | 24,979 | | | | 832,570 | |
Stora Enso OYJ, Class R | | | 176,574 | | | | 3,240,725 | |
UPM-Kymmene OYJ | | | 145,809 | | | | 5,547,828 | |
Percent of Net Assets
Name of Issuer and
Title of Issue | | Shares/
Principal | | | Value | |
COMMON STOCKS, continued |
Finland, continued |
Wartsila OYJ Abp | | | 201,760 | | | $ | 2,829,839 | |
| | | | | | | | 12,450,962 | |
France: 10.8% |
Air Liquide SA | | | 53,827 | | | | 9,387,660 | |
Amundi SA | | | 10,153 | | | | 837,464 | |
AXA SA | | | 223,700 | | | | 6,658,041 | |
BNP Paribas SA | | | 171,009 | | | | 11,823,738 | |
Bouygues SA | | | 143,368 | | | | 5,132,001 | |
Carrefour SA | | | 92,398 | | | | 1,693,977 | |
CNP Assurances | | | 98,879 | | | | 2,445,785 | |
Danone SA | | | 67,224 | | | | 4,178,607 | |
Eiffage SA | | | 49,303 | | | | 5,083,322 | |
Eurazeo SA | | | 1 | | | | 87 | |
Gecina SA, REIT | | | 565 | | | | 79,061 | |
L’Oreal SA | | | 22,774 | | | | 10,858,932 | |
Michelin | | | 40,403 | | | | 6,617,373 | |
Orange SA | | | 213,989 | | | | 2,285,869 | |
Schneider Electric SE | | | 64,972 | | | | 12,773,196 | |
SEB SA | | | 4,197 | | | | 654,022 | |
Societe Generale SA | | | 150,229 | | | | 5,163,177 | |
Teleperformance | | | 7,231 | | | | 3,232,806 | |
Unibail-Rodamco-Westfield, REIT (b) | | | 73,450 | | | | 5,139,975 | |
Valeo SA | | | 27,365 | | | | 825,229 | |
| | | | | | | | 94,870,322 | |
Germany: 8.0% |
Allianz SE | | | 46,423 | | | | 10,949,264 | |
BASF SE | | | 105,697 | | | | 7,418,381 | |
Beiersdorf AG | | | 4,809 | | | | 492,947 | |
Commerzbank AG (b) | | | 117,888 | | | | 891,890 | |
Delivery Hero SE (b) | | | 16,494 | | | | 1,825,730 | |
Deutsche Boerse AG | | | 37,088 | | | | 6,192,746 | |
Deutsche Post AG | | | 91,141 | | | | 5,862,258 | |
HeidelbergCement AG | | | 358 | | | | 24,228 | |
HelloFresh SE (b) | | | 16,010 | | | | 1,226,975 | |
Henkel AG & Co. KGaA | | | 2,719 | | | | 211,949 | |
Merck KGaA | | | 28,938 | | | | 7,444,505 | |
Muenchener Rueckversicherungs AG | | | 26,026 | | | | 7,683,101 | |
Puma SE | | | 20,551 | | | | 2,509,775 | |
SAP SE | | | 127,297 | | | | 17,915,716 | |
| | | | | | | | 70,649,465 | |
Hong Kong: 1.6% |
BOC Hong Kong Holdings, Ltd. | | | 326,557 | | | | 1,070,945 | |
Hang Seng Bank, Ltd. | | | 3,900 | | | | 71,415 | |
SEE NOTES TO FINANCIAL STATEMENTS | 92 | |
December 31, 2021 |
Schedules of Investments, continued |
Pax International Sustainable Economy Fund, continued
Percent of Net Assets
Name of Issuer and
Title of Issue | | Shares/
Principal | | | Value | |
COMMON STOCKS, continued |
Hong Kong, continued |
Hong Kong Exchanges and Clearing, Ltd. | | | 192,299 | | | $ | 11,246,408 | |
Swire Pacific, Ltd., Class A | | | 221,500 | | | | 1,259,890 | |
Swire Properties, Ltd. | | | 200 | | | | 501 | |
| | | | | | | | 13,649,159 | |
Ireland: 0.9% |
CRH PLC | | | 105,830 | | | | 5,602,642 | |
Kerry Group PLC, Class A | | | 581 | | | | 74,958 | |
Kingspan Group PLC | | | 18,406 | | | | 2,195,559 | |
| | | | | | | | 7,873,159 | |
Israel: 0.4% |
Bank Hapoalim BM | | | 9,453 | | | | 97,290 | |
Bank Leumi Le-Israel BM | | | 140,694 | | | | 1,509,086 | |
CyberArk Software, Ltd. (b) | | | 10,200 | | | | 1,767,456 | |
| | | | | | | | 3,373,832 | |
Italy: 1.9% |
Assicurazioni Generali SpA (a) | | | 151,230 | | | | 3,196,203 | |
CNH Industrial NV | | | 320,253 | | | | 6,191,835 | |
Enel SpA | | | 630,505 | | | | 5,041,567 | |
Intesa Sanpaolo SpA | | | 890,487 | | | | 2,300,060 | |
| | | | | | | | 16,729,665 | |
Japan: 23.5% |
Aeon Co., Ltd. | | | 65,500 | | | | 1,543,585 | |
Ajinomoto Co., Inc. | | | 43,600 | | | | 1,327,276 | |
Astellas Pharma, Inc. | | | 223,900 | | | | 3,644,091 | |
Azbil Corp. | | | 13,400 | | | | 611,155 | |
Bridgestone Corp. | | | 64,500 | | | | 2,769,156 | |
Capcom Co., Ltd. | | | 100 | | | | 2,355 | |
Central Japan Railway Co. | | | 8,500 | | | | 1,131,112 | |
Chugai Pharmaceutical Co., Ltd. (a) | | | 117,300 | | | | 3,823,511 | |
Daifuku Co, Ltd. | | | 11,000 | | | | 899,523 | |
Dai-ichi Life Holdings, Inc. | | | 316,600 | | | | 6,385,812 | |
Daiwa House Industry Co., Ltd. | | | 48,500 | | | | 1,393,845 | |
Denso Corp. | | | 51,700 | | | | 4,284,421 | |
East Japan Railway Co. | | | 42,400 | | | | 2,606,562 | |
Eisai Co., Ltd. | | | 51,400 | | | | 2,917,865 | |
Fujitsu, Ltd. | | | 23,300 | | | | 4,003,557 | |
Hankyu Hanshin Holdings, Inc. | | | 21,700 | | | | 616,687 | |
Hitachi Construction Machinery Co., Ltd. | | | 40,500 | | | | 1,170,244 | |
Hitachi Metals, Ltd. (b) | | | 43,300 | | | | 802,308 | |
Hoya Corp. | | | 51,700 | | | | 7,671,852 | |
Hulic Co., Ltd. | | | 179,700 | | | | 1,708,854 | |
Percent of Net Assets
Name of Issuer and
Title of Issue | | Shares/
Principal | | | Value | |
COMMON STOCKS, continued |
Japan, continued |
JFE Holdings, Inc. | | | 172,600 | | | $ | 2,202,031 | |
Kajima Corp. | | | 248,400 | | | | 2,854,741 | |
Kansai Paint Co., Ltd. | | | 27,900 | | | | 606,713 | |
Kao Corp. | | | 56,700 | | | | 2,969,623 | |
KDDI Corp. | | | 263,300 | | | | 7,699,866 | |
Keio Corp. | | | 20,600 | | | | 908,916 | |
Kikkoman Corp. | | | 20,200 | | | | 1,701,063 | |
Kobayashi Pharmaceutical Co., Ltd. | | | 100 | | | | 7,866 | |
Komatsu, Ltd. | | | 111,200 | | | | 2,600,522 | |
Kubota Corp. | | | 159,600 | | | | 3,548,874 | |
Lawson, Inc. | | | 14,800 | | | | 702,250 | |
Lixil Corp. | | | 15,600 | | | | 416,160 | |
Mercari, Inc. (b) | | | 15,000 | | | | 763,161 | |
Mitsubishi Chemical Holdings Corp. | | | 156,200 | | | | 1,158,593 | |
Mitsui Fudosan Co., Ltd. | | | 149,800 | | | | 2,969,152 | |
Miura Co., Ltd. | | | 9,800 | | | | 337,369 | |
Mizuho Financial Group, Inc. | | | 193,850 | | | | 2,462,138 | |
MS&AD Insurance Group Holdings, Inc. | | | 38,200 | | | | 1,176,265 | |
Murata Manufacturing Co., Ltd. | | | 70,500 | | | | 5,623,254 | |
NEC Corp. | | | 48,500 | | | | 2,242,625 | |
Nintendo Co., Ltd. | | | 14,500 | | | | 6,783,928 | |
Nippon Building Fund, Inc., REIT | | | 123 | | | | 716,432 | |
Nippon Express Co., Ltd. | | | 9,600 | | | | 574,510 | |
Nippon Paint Holdings Co., Ltd. | | | 80,500 | | | | 879,123 | |
Nissin Foods Holdings Co., Ltd. | | | 100 | | | | 7,298 | |
Nitori Holdings Co, Ltd. | | | 3,900 | | | | 583,329 | |
Nitto Denko Corp. | | | 16,000 | | | | 1,236,039 | |
Nomura Real Estate Holdings, Inc. | | | 29,800 | | | | 686,650 | |
Nomura Real Estate Master Fund, Inc., REIT | | | 30 | | | | 42,220 | |
Nomura Research Institute, Ltd. | | | 27,900 | | | | 1,192,747 | |
NTT Data Corp. | | | 264,200 | | | | 5,667,412 | |
Obayashi Corp. | | | 615,300 | | | | 4,762,016 | |
Odakyu Electric Railway Co., Ltd. | | | 46,600 | | | | 866,363 | |
Omron Corp. | | | 20,400 | | | | 2,032,805 | |
| | 93 | SEE NOTES TO FINANCIAL STATEMENTS |
December 31, 2021 |
Schedules of Investments, continued |
Pax International Sustainable Economy Fund, continued
Percent of Net Assets
Name of Issuer and
Title of Issue | | Shares/
Principal | | | Value | |
COMMON STOCKS, continued |
Japan, continued |
Oriental Land Co., Ltd. | | | 40,200 | | | $ | 6,778,808 | |
Recruit Holdings Co, Ltd. | | | 160,500 | | | | 9,767,339 | |
Rohm Co., Ltd. | | | 9,600 | | | | 873,306 | |
SCSK Corp. | | | 42,000 | | | | 835,892 | |
Secom Co., Ltd. | | | 26,200 | | | | 1,820,540 | |
Sekisui Chemical Co., Ltd. | | | 41,300 | | | | 690,707 | |
Sekisui House, Ltd. | | | 70,100 | | | | 1,508,253 | |
Seven & i Holdings Co., Ltd. | | | 118,900 | | | | 5,230,172 | |
Shimizu Corp. | | | 56,800 | | | | 352,179 | |
Shin-Etsu Chemical Co., Ltd. | | | 27,700 | | | | 4,808,038 | |
Shionogi & Co., Ltd. | | | 33,600 | | | | 2,363,637 | |
Shiseido Co., Ltd. | | | 34,400 | | | | 1,919,054 | |
SoftBank Corp. | | | 242,100 | | | | 3,057,861 | |
Sohgo Security Services Co., Ltd. | | | 15,300 | | | | 607,958 | |
Sompo Holdings, Inc. | | | 30,200 | | | | 1,273,646 | |
Stanley Electric Co., Ltd. | | | 14,300 | | | | 359,031 | |
Sumitomo Chemical Co., Ltd. | | | 138,300 | | | | 652,197 | |
Suntory Beverage & Food, Ltd. | | | 36,100 | | | | 1,307,288 | |
Sysmex Corp. | | | 14,500 | | | | 1,957,232 | |
T&D Holdings, Inc. | | | 57,100 | | | | 729,496 | |
Taisei Corp. | | | 21,600 | | | | 656,858 | |
Takeda Pharmaceutical Co., Ltd. | | | 285,500 | | | | 7,796,517 | |
TDK Corp. | | | 49,800 | | | | 1,943,489 | |
Tobu Railway Co., Ltd. | | | 100 | | | | 2,282 | |
Tokyo Electron, Ltd. | | | 17,900 | | | | 10,302,746 | |
Tokyu Corp. | | | 5,400 | | | | 71,786 | |
TOTO, Ltd. | | | 32,700 | | | | 1,508,697 | |
USS Co., Ltd. | | | 38,200 | | | | 596,826 | |
West Japan Railway Co. | | | 94,200 | | | | 3,939,719 | |
Yakult Honsha Co., Ltd. | | | 13,800 | | | | 719,935 | |
Yamaha Corp. | | | 23,500 | | | | 1,159,382 | |
Yamaha Motor Co., Ltd. (a) | | | 192,500 | | | | 4,623,678 | |
Yaskawa Electric Corp. | | | 28,200 | | | | 1,383,651 | |
Yokogawa Electric Corp. | | | 25,300 | | | | 456,650 | |
Z Holdings Corp. | | | 865,300 | | | | 4,992,772 | |
ZOZO, Inc. | | | 25,000 | | | | 779,503 | |
| | | | | | | | 206,122,950 | |
Netherlands: 7.1% |
Aegon NV | | | 267,647 | | | | 1,330,622 | |
Akzo Nobel NV | | | 20,509 | | | | 2,253,219 | |
ASML Holding NV | | | 45,010 | | | | 36,053,902 | |
Koninklijke Ahold Delhaize NV | | | 161,377 | | | | 5,537,867 | |
Koninklijke DSM NV | | | 4,323 | | | | 973,567 | |
Percent of Net Assets
Name of Issuer and
Title of Issue | | Shares/
Principal | | | Value | |
COMMON STOCKS, continued |
Netherlands, continued |
NN Group NV | | | 43,983 | | | $ | 2,378,613 | |
Prosus NV (b) | | | 142,116 | | | | 11,770,758 | |
Wolters Kluwer NV | | | 16,832 | | | | 1,981,141 | |
| | | | | | | | 62,279,689 | |
New Zealand: 1.3% |
Auckland International Airport, Ltd. (b) | | | 254,961 | | | | 1,342,072 | |
Fisher & Paykel Healthcare Corp., Ltd. | | | 48,472 | | | | 1,085,945 | |
Mercury NZ, Ltd. | | | 156,928 | | | | 657,435 | |
Meridian Energy, Ltd. | | | 1,418,208 | | | | 4,707,417 | |
Ryman Healthcare, Ltd. | | | 111,789 | | | | 937,385 | |
Spark New Zealand, Ltd. | | | 242,943 | | | | 751,298 | |
Xero, Ltd. (b) | | | 19,339 | | | | 1,979,524 | |
| | | | | | | | 11,461,076 | |
Norway: 1.0% |
DNB Bank ASA | | | 8,672 | | | | 198,361 | |
Mowi ASA | | | 83,265 | | | | 1,970,610 | |
Norsk Hydro ASA | | | 580,129 | | | | 4,564,795 | |
Orkla ASA | | | 74,208 | | | | 743,828 | |
Telenor ASA | | | 87,437 | | | | 1,374,427 | |
| | | | | | | | 8,852,021 | |
Portugal: 0.3% |
Jeronimo Martins SGPS SA | | | 121,391 | | | | 2,777,892 | |
| | | | | | | | | |
Singapore: 1.3% |
CapitaLand Integrated Commercial Trust, REIT | | | 1,439,311 | | | | 2,177,636 | |
Capitaland Investment, Ltd. (b) | | | 530,826 | | | | 1,342,152 | |
City Developments, Ltd. | | | 126,100 | | | | 637,989 | |
DBS Group Holdings, Ltd. | | | 192,696 | | | | 4,666,895 | |
Keppel Corp., Ltd. | | | 19,200 | | | | 73,018 | |
Singapore Exchange, Ltd. | | | 99,900 | | | | 689,606 | |
Singapore Telecommunications, Ltd. | | | 1,131,364 | | | | 1,947,621 | |
UOL Group, Ltd. | | | 35,200 | | | | 185,286 | |
| | | | | | | | 11,720,203 | |
Spain: 2.1% |
Banco Bilbao Vizcaya Argentaria SA | | | 867,723 | | | | 5,146,447 | |
CaixaBank SA | | | 132,215 | | | | 361,164 | |
Iberdrola SA | | | 857,017 | | | | 10,147,060 | |
Red Electrica Corp. SA (a) | | | 130,969 | | | | 2,832,125 | |
| | | | | | | | 18,486,796 | |
SEE NOTES TO FINANCIAL STATEMENTS | 94 | |
December 31, 2021 |
Schedules of Investments, continued |
Pax International Sustainable Economy Fund, continued
Percent of Net Assets
Name of Issuer and
Title of Issue | | Shares/
Principal | | | Value | |
COMMON STOCKS, continued |
Sweden: 4.1% |
Assa Abloy AB, Class B | | | 217,582 | | | $ | 6,632,112 | |
Atlas Copco AB, Class A | | | 82,041 | | | | 5,669,101 | |
Atlas Copco AB, Class B | | | 112,863 | | | | 6,629,600 | |
Electrolux AB, Class B (a) | | | 24,985 | | | | 605,128 | |
Evolution AB | | | 6,335 | | | | 895,395 | |
Husqvarna AB, Class B | | | 203,675 | | | | 3,256,539 | |
Nibe Industrier AB, Class B | | | 153,519 | | | | 2,319,662 | |
Sandvik AB | | | 152,577 | | | | 4,252,859 | |
SKF AB, Class B | | | 63,550 | | | | 1,502,939 | |
Svenska Cellulosa AB SCA, Class B | | | 23,179 | | | | 411,295 | |
Tele2 AB, Class B | | | 38,449 | | | | 548,500 | |
Telefonaktiebolaget LM Ericsson, Class B | | | 121,570 | | | | 1,337,640 | |
Telia Company AB | | | 589,565 | | | | 2,305,767 | |
| | | | | | | | 36,366,537 | |
Switzerland: 10.0% |
ABB, Ltd. | | | 197,771 | | | | 7,537,602 | |
Chocoladefabriken Lindt & Spruengli AG-PC | | | 85 | | | | 1,178,172 | |
Clariant AG (b) | | | 36,712 | | | | 762,610 | |
Coca-Cola HBC AG (b) | | | 23,462 | | | | 812,379 | |
Geberit AG | | | 1,633 | | | | 1,331,113 | |
Givaudan SA | | | 952 | | | | 4,994,767 | |
Lonza Group AG | | | 11,946 | | | | 9,946,096 | |
Roche Holding AG | | | 75,363 | | | | 31,265,179 | |
SGS SA | | | 1,183 | | | | 3,943,763 | |
Sika AG | | | 15,341 | | | | 6,375,983 | |
Straumann Holding AG | | | 2,956 | | | | 6,250,731 | |
Swiss Re AG | | | 54,633 | | | | 5,393,012 | |
Swisscom AG | | | 138 | | | | 77,849 | |
Zurich Insurance Group AG | | | 18,447 | | | | 8,081,243 | |
| | | | | | | | 87,950,499 | |
United Kingdom: 12.5% |
Ashtead Group PLC | | | 49,845 | | | | 4,018,231 | |
Associated British Foods PLC | | | 70,734 | | | | 1,936,268 | |
AstraZeneca PLC | | | 172,857 | | | | 20,184,396 | |
BT Group PLC (a)(b) | | | 490,539 | | | | 1,128,484 | |
Percent of Net Assets
Name of Issuer and
Title of Issue | | Shares/
Principal | | | Value | |
COMMON STOCKS, continued |
United Kingdom, continued |
Coca-Cola European Partners PLC | | | 14,700 | | | $ | 822,171 | |
Croda International PLC | | | 8,473 | | | | 1,160,559 | |
GlaxoSmithKline PLC | | | 615,417 | | | | 13,399,320 | |
Informa PLC (b) | | | 148,471 | | | | 1,039,531 | |
J Sainsbury PLC | | | 455,130 | | | | 1,701,260 | |
JD Sports Fashion PLC | | | 394,250 | | | | 1,162,447 | |
Johnson Matthey PLC | | | 18,417 | | | | 511,771 | |
Legal & General Group PLC | | | 1,570,308 | | | | 6,341,360 | |
Lloyds Banking Group, PLC | | | 2,824,058 | | | | 1,833,919 | |
Next PLC | | | 4,611 | | | | 509,991 | |
Reckitt Benckiser Group PLC | | | 64,447 | | | | 5,547,831 | |
RELX PLC | | | 316,586 | | | | 10,335,552 | |
Rentokil Initial, PLC | | | 117,015 | | | | 926,261 | |
Schroders PLC | | | 2,915 | | | | 140,699 | |
Segro PLC, REIT | | | 58,523 | | | | 1,138,959 | |
Spirax-Sarco Engineering, PLC | | | 8,027 | | | | 1,746,919 | |
St James’s Place, PLC | | | 202,374 | | | | 4,624,697 | |
Standard Chartered PLC | | | 232,861 | | | | 1,415,977 | |
Taylor Wimpey PLC | | | 317,479 | | | | 756,911 | |
Tesco PLC | | | 1,859,891 | | | | 7,322,528 | |
Unilever PLC | | | 234,146 | | | | 12,561,101 | |
Vodafone Group PLC | | | 4,961,999 | | | | 7,473,941 | |
| | | | | | | | 109,741,084 | |
TOTAL COMMON STOCKS |
(Cost $696,186,512) | | | 871,556,519 | |
| | | | | | | | | |
PREFERRED STOCKS: 0.1% |
Germany: 0.1% |
Henkel AG & Co. KGaA | | | 6,400 | | | | 516,423 | |
(Cost $614,911) |
| |
MONEY MARKET: 0.2% |
State Street Institutional U.S. Government Money Market Fund, 0.030% (c)(d) | | | 2,076,800 | | | | 2,076,800 | |
(Cost $2,076,800) |
| |
| | 95 | SEE NOTES TO FINANCIAL STATEMENTS |
December 31, 2021 |
Schedules of Investments, continued |
Pax International Sustainable Economy Fund, continued
Percent of Net Assets
Name of Issuer and
Title of Issue | | Shares/
Principal | | | Value | |
SECURITIES PURCHASED WITH CASH COLLATERAL FROM SECURITIES LENDING: 0.9% |
State Street Navigator Securities Lending Government Money Market Portfolio, 0.032% (c)(d) | | | 8,284,299 | | | $ | 8,284,299 | |
(Cost $8,284,299) |
| | | | | | | | | |
TOTAL INVESTMENTS: 100.4% |
(Cost $707,162,522) | | | 882,434,041 | |
| | | | | | | | | |
PAYABLE UPON RETURN OF SECURITIES LOANED (NET): -0.9% | | | (8,284,299 | ) |
| | | | | | | | | |
OTHER ASSETS AND LIABILITIES — (NET): 0.5% | | | 4,671,855 | |
| | | | | | | | | |
NET ASSETS: 100.0% | | $ | 878,821,597 | |
(a) | Security or partial position of this security was on loan as of December 31, 2021. The total market value of securities on loan as of December 31, 2021 was $15,873,795. |
(b) | Non-income producing security. |
(c) | Rate shown represents annualized 7-day yield as of December 31, 2021 |
REIT - Real Estate Investment Trust
SUMMARY OF INVESTMENTS BY SECTOR
Sector | | Value | | | Percent Of
Net Assets | |
Communication Services | | $ | 45,194,089 | | | | 5.1 | % |
Consumer Discretionary | | | 59,179,035 | | | | 6.7 | % |
Consumer Staples | | | 80,461,210 | | | | 9.2 | % |
Financials | | | 158,358,926 | | | | 18.0 | % |
Health Care | | | 149,781,122 | | | | 17.1 | % |
Industrials | | | 155,958,553 | | | | 17.8 | % |
Information Technology | | | 97,747,999 | | | | 11.1 | % |
Materials | | | 74,470,176 | | | | 8.5 | % |
Real Estate | | | 24,687,761 | | | | 2.8 | % |
Utilities | | | 26,234,071 | | | | 3.0 | % |
Money Market | | | 2,076,800 | | | | 0.2 | % |
Other assets and liabilities (net) | | | 4,671,855 | | | | 0.5 | % |
Total | | $ | 878,821,597 | | | | 100.0 | % |
SEE NOTES TO FINANCIAL STATEMENTS | 96 | |
December 31, 2021 |
Schedules of Investments, continued |
Pax Core Bond Fund
Percent of Net Assets
Name of Issuer and
Title of Issue | | Shares/
Principal | | | Value | |
BONDS: 96.3% |
Community Investment Notes: 0.0% (a) |
CINI Investment Note, 2.000%, 11/3/2023 (b)(c) | | $ | 298,550 | | | $ | 298,550 | |
(Cost $298,550) |
| |
CORPORATE BONDS: 36.8% |
Communication Services: 2.7% |
Alphabet, Inc., 1.900%, 08/15/40 | | | 700,000 | | | | 640,905 | |
Altice France Holding SA, 144A, 10.500%, 05/15/27 (d) | | | 1,000,000 | | | | 1,076,410 | |
AT&T, Inc., 0.900%, 03/25/24 | | | 1,500,000 | | | | 1,494,233 | |
AT&T, Inc., 4.300%, 02/15/30 | | | 1,000,000 | | | | 1,127,696 | |
AT&T, Inc., 2.750%, 06/01/31 | | | 2,000,000 | | | | 2,044,947 | |
AT&T, Inc., 3.100%, 02/01/43 | | | 1,500,000 | | | | 1,465,723 | |
CCO Holdings, LLC/Capital Corp., 144A, 4.750%, 03/01/30 (d) | | | 1,000,000 | | | | 1,041,775 | |
Charter Communications Operating, LLC/Capital, 5.050%, 03/30/29 | | | 1,000,000 | | | | 1,146,797 | |
Discovery Communications, LLC, 3.950%, 03/20/28 | | | 1,500,000 | | | | 1,632,720 | |
Discovery Communications, LLC, 4.125%, 05/15/29 | | | 500,000 | | | | 553,820 | |
Level 3 Financing, Inc., 144A, 3.750%, 07/15/29 (d) | | | 1,000,000 | | | | 951,620 | |
Level 3 Financing, Inc., 144A, 3.875%, 11/15/29 (d) | | | 1,000,000 | | | | 1,018,935 | |
Switch, Ltd., 144A, 4.125%, 06/15/29 (d) | | | 1,000,000 | | | | 1,023,935 | |
T-Mobile USA, Inc., 4.750%, 02/01/28 | | | 1,000,000 | | | | 1,054,230 | |
T-Mobile USA, Inc., 3.000%, 02/15/41 | | | 1,000,000 | | | | 980,914 | |
Verizon Communications, Inc., 144A, 2.355%, 03/15/32 (d) | | | 1,011,000 | | | | 998,547 | |
Verizon Communications, Inc., 3.400%, 03/22/41 | | | 1,500,000 | | | | 1,577,556 | |
Percent of Net Assets
Name of Issuer and
Title of Issue | | Shares/
Principal | | | Value | |
BONDS, continued |
CORPORATE BONDS, continued |
Communication Services, continued |
Verizon Communications, Inc., 2.850%, 09/03/41 | | $ | 1,500,000 | | | $ | 1,487,120 | |
| | | | | | | | 21,317,883 | |
Consumer Discretionary: 2.6% |
Amazon.com, Inc., 2.875%, 05/12/41 | | | 800,000 | | | | 834,244 | |
Amazon.com, Inc., 2.500%, 06/03/50 | | | 1,000,000 | | | | 958,816 | |
American Museum of Natural History, The, 3.121%, 07/15/52 | | | 750,000 | | | | 848,941 | |
American University, The, 3.672%, 04/01/49 | | | 1,000,000 | | | | 1,162,545 | |
California Endowment, The, 2.498%, 04/01/51 | | | 1,000,000 | | | | 990,370 | |
Doris Duke Charitable Foundation, The, 2.345%, 07/01/50 | | | 2,000,000 | | | | 1,858,593 | |
Expedia Group, Inc., 144A, 6.250%, 05/01/25 (d) | | | 1,000,000 | | | | 1,129,408 | |
Ford Motor Co., 3.250%, 02/12/32 | | | 2,350,000 | | | | 2,411,100 | |
Ford Motor Co., 4.750%, 01/15/43 | | | 1,000,000 | | | | 1,105,525 | |
Local Initiatives Support Corp., 1.000%, 11/15/25 (b) | | | 1,000,000 | | | | 966,700 | |
Lowe’s Cos., Inc., 1.300%, 04/15/28 | | | 1,000,000 | | | | 960,059 | |
Lowe’s Cos., Inc., 2.800%, 09/15/41 | | | 750,000 | | | | 735,618 | |
Lowe’s Cos., Inc., 3.000%, 10/15/50 | | | 250,000 | | | | 248,197 | |
Lowe’s Cos., Inc., 3.500%, 04/01/51 | | | 750,000 | | | | 815,579 | |
Macy’s Retail Holdings, LLC, 5.125%, 01/15/42 | | | 1,000,000 | | | | 956,440 | |
Starbucks Corp., 4.450%, 08/15/49 | | | 2,000,000 | | | | 2,476,866 | |
Whirlpool Corp., 2.400%, 05/15/31 | | | 1,000,000 | | | | 1,003,521 | |
| | 97 | SEE NOTES TO FINANCIAL STATEMENTS |
December 31, 2021 |
Schedules of Investments, continued |
Pax Core Bond Fund, continued
Percent of Net Assets
Name of Issuer and
Title of Issue | | Shares/
Principal | | | Value | |
BONDS, continued |
CORPORATE BONDS, continued |
Consumer Discretionary, continued |
WK Kellogg Foundation Trust, 144A, 2.443%, 10/01/50 (d) | | $ | 1,000,000 | | | $ | 1,007,143 | |
| | | | | | | | 20,469,665 | |
Consumer Staples: 2.3% |
Albertsons Cos., Inc./Safeway, Inc./New Albertsons, LP/Albertsons, LLC, 144A, 3.250%, 03/15/26 (d) | | | 1,000,000 | | | | 1,019,805 | |
Albertsons Cos., Inc./Safeway, Inc./New Albertsons, LP/Albertsons, LLC, 144A, 4.625%, 01/15/27 (d) | | | 1,000,000 | | | | 1,050,570 | |
Campbell Soup Co., 2.375%, 04/24/30 (e) | | | 1,000,000 | | | | 994,956 | |
Capital Impact Partners, 2.300%, 10/15/24 (b) | | | 500,000 | | | | 499,582 | |
Clorox Co., The, 1.800%, 05/15/30 | | | 1,500,000 | | | | 1,456,981 | |
CVS Health Corp., 4.300%, 03/25/28 | | | 219,000 | | | | 246,139 | |
CVS Health Corp., 2.125%, 09/15/31 | | | 2,000,000 | | | | 1,963,094 | |
CVS Health Corp., 5.125%, 07/20/45 | | | 1,000,000 | | | | 1,306,877 | |
General Mills, Inc., 2.875%, 04/15/30 | | | 1,000,000 | | | | 1,045,828 | |
General Mills, Inc., 2.250%, 10/14/31 (e) | | | 750,000 | | | | 742,806 | |
Kellogg Co., 2.100%, 06/01/30 | | | 1,000,000 | | | | 982,638 | |
Keurig Dr Pepper, Inc., 0.750%, 03/15/24 | | | 1,000,000 | | | | 993,694 | |
Keurig Dr Pepper, Inc., 3.200%, 05/01/30 | | | 1,000,000 | | | | 1,059,405 | |
Keurig Dr Pepper, Inc., 3.350%, 03/15/51 | | | 250,000 | | | | 261,592 | |
Kraft Heinz Foods Co., 4.250%, 03/01/31 (e) | | | 1,000,000 | | | | 1,139,432 | |
PepsiCo, Inc., 2.875%, 10/15/49 | | | 1,000,000 | | | | 1,055,577 | |
Percent of Net Assets
Name of Issuer and
Title of Issue | | Shares/
Principal | | | Value | |
BONDS, continued |
CORPORATE BONDS, continued |
Consumer Staples, continued |
Raza Development Fund, Inc., 3.534%, 07/01/34 | | $ | 1,000,000 | | | $ | 1,126,495 | |
Sysco Corp., 5.950%, 04/01/30 | | | 995,000 | | | | 1,244,336 | |
| | | | | | | | 18,189,807 | |
Energy: 0.3% |
MidAmerican Energy Co., 3.100%, 05/01/27 | | | 1,000,000 | | | | 1,064,021 | |
MidAmerican Energy Co., 3.650%, 04/15/29 | | | 1,000,000 | | | | 1,103,916 | |
| | | | | | | | 2,167,937 | |
Financials: 12.4% |
Aflac, Inc., 1.125%, 03/15/26 | | | 1,500,000 | | | | 1,474,755 | |
Aflac, Inc., 3.600%, 04/01/30 (e) | | | 1,000,000 | | | | 1,104,508 | |
Allstate Corp., The, 1.450%, 12/15/30 | | | 2,000,000 | | | | 1,895,204 | |
Allstate Corp., The, 3.850%, 08/10/49 | | | 1,000,000 | | | | 1,175,503 | |
Assured Guaranty US Holdings, Inc., 3.150%, 06/15/31 | | | 1,000,000 | | | | 1,034,656 | |
Astrazeneca Finance, LLC, 1.750%, 05/28/28 | | | 1,000,000 | | | | 995,699 | |
Bank of America Corp., 1.486%, 05/19/24 (f) | | | 1,650,000 | | | | 1,662,624 | |
Bank of America Corp., 0.981%, 09/25/25 (f) | | | 2,000,000 | | | | 1,977,390 | |
Bank of America Corp., 3.559%, 04/23/27 (f) | | | 1,000,000 | | | | 1,070,513 | |
Bank of America Corp., 2.572%, 10/20/32 (f) | | | 1,000,000 | | | | 1,006,725 | |
Bank of America Corp., 4.083%, 03/20/51 (f) | | | 1,000,000 | | | | 1,208,743 | |
Bank of Montreal, 1.250%, 09/15/26 | | | 2,000,000 | | | | 1,960,426 | |
Bank of New York Mellon Corp., The, 3.400%, 01/29/28 | | | 1,000,000 | | | | 1,086,995 | |
BlueHub Loan Fund, Inc., 2.890%, 01/01/27 | | | 1,000,000 | | | | 1,018,822 | |
BNG Bank NV, 144A, 0.500%, 11/24/25 (d) | | | 250,000 | | | | 243,015 | |
SEE NOTES TO FINANCIAL STATEMENTS | 98 | |
December 31, 2021 |
Schedules of Investments, continued |
Pax Core Bond Fund, continued
Percent of Net Assets
Name of Issuer and
Title of Issue | | Shares/
Principal | | | Value | |
BONDS, continued |
CORPORATE BONDS, continued |
Financials, continued |
Calvert Impact Capital, Inc., 3.000%, 03/14/25 | | $ | 1,000,000 | | | $ | 1,062,930 | |
Century Housing Corp., 0.375%, 03/15/22 | | | 1,000,000 | | | | 999,949 | |
Chubb INA Holdings, Inc., 1.375%, 09/15/30 | | | 2,000,000 | | | | 1,888,080 | |
Chubb INA Holdings, Inc., 2.850%, 12/15/51 | | | 250,000 | | | | 252,290 | |
Citigroup, Inc., 1.281%, 11/03/25 (f) | | | 1,500,000 | | | | 1,497,239 | |
Fifth Third Bancorp, 1.707%, 11/01/27 (f) | | | 1,000,000 | | | | 988,944 | |
Fifth Third Bank, 2.250%, 02/01/27 | | | 1,000,000 | | | | 1,024,212 | |
Goldman Sachs Group Inc., The, 0.855%, 02/12/26 (f) | | | 2,500,000 | | | | 2,453,702 | |
Goldman Sachs Group, Inc., The, 3.210%, 04/22/42 (f) | | | 750,000 | | | | 781,488 | |
ING Groep NV, 144A, 4.625%, 01/06/26 (d) | | | 2,000,000 | | | | 2,225,368 | |
JPMorgan Chase & Co., 0.653%, 09/16/24 (f) | | | 3,000,000 | | | | 2,987,411 | |
JPMorgan Chase & Co., 0.563%, 02/16/25 (f) | | | 2,000,000 | | | | 1,972,303 | |
JPMorgan Chase & Co., 0.768%, 08/09/25 (f) | | | 2,000,000 | | | | 1,969,851 | |
JPMorgan Chase & Co., 1.470%, 09/22/27 (f) | | | 1,000,000 | | | | 981,256 | |
JPMorgan Chase & Co., 3.964%, 11/15/48 (f) | | | 1,000,000 | | | | 1,179,796 | |
Kreditanstalt fuer Wiederaufbau, 2.125%, 06/15/22 | | | 1,000,000 | | | | 1,008,008 | |
Kreditanstalt fuer Wiederaufbau, 2.375%, 12/29/22 | | | 3,000,000 | | | | 3,057,283 | |
Kreditanstalt fuer Wiederaufbau, 2.625%, 02/28/24 | | | 5,000,000 | | | | 5,196,558 | |
Kreditanstalt fuer Wiederaufbau, 0.500%, 09/20/24 | | | 1,000,000 | | | | 988,502 | |
Percent of Net Assets
Name of Issuer and
Title of Issue | | Shares/
Principal | | | Value | |
BONDS, continued |
CORPORATE BONDS, continued |
Financials, continued |
Kreditanstalt fuer Wiederaufbau, 2.000%, 05/02/25 | | $ | 3,000,000 | | | $ | 3,088,938 | |
Kreditanstalt fuer Wiederaufbau, 0.375%, 07/18/25 | | | 1,000,000 | | | | 974,523 | |
Kreditanstalt fuer Wiederaufbau, 0.625%, 01/22/26 | | | 5,000,000 | | | | 4,882,967 | |
Kreditanstalt fuer Wiederaufbau, 1.000%, 10/01/26 | | | 1,500,000 | | | | 1,479,553 | |
MetLife, Inc., 4.875%, 11/13/43 | | | 1,000,000 | | | | 1,303,549 | |
Metropolitan Life Global Funding I, 144A, 0.950%, 07/02/25 (d) | | | 3,000,000 | | | | 2,961,119 | |
Morgan Stanley, 0.560%, 11/10/23 (f) | | | 3,000,000 | | | | 2,996,588 | |
Morgan Stanley, 3.625%, 01/20/27 | | | 2,000,000 | | | | 2,171,144 | |
Morgan Stanley, 4.457%, 04/22/39 (f) | | | 1,000,000 | | | | 1,204,618 | |
Morgan Stanley, 5.597%, 03/24/51 (f) | | | 1,000,000 | | | | 1,502,495 | |
MSCI, Inc., 144A, 3.625%, 09/01/30 (d) | | | 1,000,000 | | | | 1,024,040 | |
MSCI, Inc., 144A, 3.875%, 02/15/31 (d) | | | 1,000,000 | | | | 1,042,795 | |
National Bank of Canada, 0.900%, 08/15/23 (f) | | | 1,750,000 | | | | 1,751,688 | |
National Bank of Canada, 0.550%, 11/15/24 (f) | | | 1,600,000 | | | | 1,582,241 | |
Natwest Group, PLC, 2.359%, 05/22/24 (f) | | | 2,000,000 | | | | 2,033,145 | |
OneMain Finance Corp., 3.500%, 01/15/27 | | | 1,000,000 | | | | 989,985 | |
PNC Financial Services Group Inc., The, 1.150%, 08/13/26 | | | 1,500,000 | | | | 1,481,189 | |
PNC Financial Services Group, Inc., The, 3.450%, 04/23/29 | | | 500,000 | | | | 545,388 | |
| | 99 | SEE NOTES TO FINANCIAL STATEMENTS |
December 31, 2021 |
Schedules of Investments, continued |
Pax Core Bond Fund, continued
Percent of Net Assets
Name of Issuer and
Title of Issue | | Shares/
Principal | | | Value | |
BONDS, continued |
CORPORATE BONDS, continued |
Financials, continued |
Progressive Corp., The, 3.200%, 03/26/30 | | $ | 1,500,000 | | | $ | 1,622,907 | |
Prudential Financial, Inc., 1.500%, 03/10/26 | | | 250,000 | | | | 250,493 | |
Prudential Financial, Inc., 4.350%, 02/25/50 | | | 1,000,000 | | | | 1,255,030 | |
Royal Bank of Canada, 1.150%, 06/10/25 | | | 2,000,000 | | | | 1,985,159 | |
Sumitomo Mitsui Financial Group, Inc., 0.508%, 01/12/24 | | | 2,000,000 | | | | 1,978,377 | |
Toronto-Dominion Bank, The, 2.650%, 06/12/24 | | | 1,000,000 | | | | 1,038,046 | |
Travelers Cos, Inc., The, 4.100%, 03/04/49 | | | 1,000,000 | | | | 1,219,690 | |
Truist Financial Corp., 1.267%, 03/02/27 (f) | | | 2,500,000 | | | | 2,455,510 | |
USAA Capital Corp., 144A, 2.125%, 05/01/30 (d) | | | 1,000,000 | | | | 1,002,863 | |
| | | | | | | | 97,254,788 | |
Health Care: 3.9% |
AbbVie, Inc., 3.200%, 11/21/29 | | | 1,000,000 | | | | 1,071,301 | |
AbbVie, Inc., 4.250%, 11/21/49 | | | 1,000,000 | | | | 1,201,964 | |
Agilent Technologies, Inc., 2.300%, 03/12/31 | | | 2,000,000 | | | | 1,984,872 | |
Amgen, Inc., 3.625%, 05/22/24 | | | 1,000,000 | | | | 1,053,940 | |
Amgen, Inc., 1.900%, 02/21/25 | | | 500,000 | | | | 509,903 | |
Anthem, Inc., 2.375%, 01/15/25 | | | 1,000,000 | | | | 1,032,149 | |
Anthem, Inc., 1.500%, 03/15/26 | | | 500,000 | | | | 500,152 | |
Anthem, Inc., 4.101%, 03/01/28 | | | 1,000,000 | | | | 1,110,222 | |
Anthem, Inc., 2.250%, 05/15/30 | | | 1,000,000 | | | | 998,584 | |
Avantor Funding, Inc., 144A, 4.625%, 07/15/28 (d) | | | 1,000,000 | | | | 1,044,165 | |
Becton Dickinson & Co., 3.363%, 06/06/24 | | | 454,000 | | | | 475,641 | |
Percent of Net Assets
Name of Issuer and
Title of Issue | | Shares/
Principal | | | Value | |
BONDS, continued |
CORPORATE BONDS, continued |
Health Care, continued |
Becton Dickinson & Co., 3.700%, 06/06/27 | | $ | 1,000,000 | | | $ | 1,091,278 | |
Becton Dickinson & Co., 1.957%, 02/11/31 | | | 500,000 | | | | 481,720 | |
Becton Dickinson & Co., 4.669%, 06/06/47 | | | 1,000,000 | | | | 1,268,163 | |
Bristol-Myers Squibb Co., 2.350%, 11/13/40 | | | 500,000 | | | | 476,623 | |
Bristol-Myers Squibb Co., 2.550%, 11/13/50 | | | 500,000 | | | | 476,305 | |
Danaher Corp., 2.600%, 10/01/50 | | | 1,000,000 | | | | 960,095 | |
HealthEquity, Inc., 144A, 4.500%, 10/01/29 (d) | | | 1,000,000 | | | | 991,250 | |
Kaiser Foundation Hospitals, 2.810%, 06/01/41 | | | 1,000,000 | | | | 1,010,216 | |
Kaiser Foundation Hospitals, 3.266%, 11/01/49 | | | 1,000,000 | | | | 1,076,832 | |
Laboratory Corp of America Holdings, 1.550%, 06/01/26 | | | 1,000,000 | | | | 990,091 | |
Merck & Co., Inc., 2.350%, 06/24/40 | | | 1,000,000 | | | | 957,364 | |
Novant Health, Inc., 2.637%, 11/01/36 | | | 1,500,000 | | | | 1,516,502 | |
Pfizer, Inc., 1.750%, 08/18/31 | | | 2,250,000 | | | | 2,201,661 | |
Quest Diagnostics, Inc., 3.450%, 06/01/26 | | | 1,000,000 | | | | 1,068,260 | |
Seattle Children’s Hospital, 1.208%, 10/01/27 | | | 1,000,000 | | | | 966,270 | |
Thermo Fisher Scientific, Inc., 1.750%, 10/15/28 | | | 500,000 | | | | 497,607 | |
UnitedHealth Group, Inc., 2.750%, 05/15/40 | | | 500,000 | | | | 510,103 | |
UnitedHealth Group, Inc., 3.050%, 05/15/41 | | | 750,000 | | | | 788,296 | |
Zoetis, Inc., 3.000%, 09/12/27 | | | 1,000,000 | | | | 1,055,644 | |
Zoetis, Inc., 3.900%, 08/20/28 | | | 1,000,000 | | | | 1,111,795 | |
| | | | | | | | 30,478,968 | |
SEE NOTES TO FINANCIAL STATEMENTS | 100 | |
December 31, 2021 |
Schedules of Investments, continued |
Pax Core Bond Fund, continued
Percent of Net Assets
Name of Issuer and
Title of Issue | | Shares/
Principal | | | Value | |
BONDS, continued |
CORPORATE BONDS, continued |
Industrials: 3.2% |
Burlington Northern Santa Fe, LLC, 3.550%, 02/15/50 | | $ | 1,000,000 | | | $ | 1,127,261 | |
Caterpillar, Inc., 2.600%, 04/09/30 | | | 1,000,000 | | | | 1,044,172 | |
Cummins, Inc., 7.125%, 03/01/28 | | | 1,000,000 | | | | 1,287,246 | |
Johnson Controls International PLC/Tyco Fire & Security Finance SCA, 1.750%, 09/15/30 | | | 1,000,000 | | | | 959,300 | |
Masco Corp., 1.500%, 02/15/28 | | | 1,000,000 | | | | 969,463 | |
Meritor, Inc., 144A, 4.500%, 12/15/28 (d) | | | 1,000,000 | | | | 1,004,015 | |
Nature Conservancy, The, 1.861%, 07/01/33 | | | 266,000 | | | | 258,125 | |
Norfolk Southern Corp., 2.300%, 05/15/31 (e) | | | 2,500,000 | | | | 2,518,027 | |
Norfolk Southern Corp., 2.900%, 08/25/51 | | | 1,500,000 | | | | 1,485,045 | |
Republic Services, Inc., 1.450%, 02/15/31 | | | 2,000,000 | | | | 1,864,428 | |
Roper Technologies, Inc., 2.000%, 06/30/30 | | | 1,500,000 | | | | 1,445,360 | |
Standard Industries, Inc., 144A, 4.750%, 01/15/28 (d) | | | 1,000,000 | | | | 1,034,315 | |
Tesla Energy Operations, Inc., 4.700%, 05/29/25 (b) | | | 2,000,000 | | | | 2,037,581 | |
Union Pacific Corp., 2.400%, 02/05/30 | | | 500,000 | | | | 510,607 | |
Union Pacific Corp., 3.200%, 05/20/41 | | | 1,000,000 | | | | 1,069,643 | |
United Rentals North America, Inc., 5.250%, 01/15/30 | | | 2,000,000 | | | | 2,167,830 | |
Waste Management, Inc., 3.150%, 11/15/27 | | | 2,500,000 | | | | 2,673,450 | |
Waste Management, Inc., 2.500%, 11/15/50 | | | 350,000 | | | | 335,420 | |
Xylem, Inc., 1.950%, 01/30/28 | | | 1,500,000 | | | | 1,485,493 | |
| | | | | | | | 25,276,781 | |
Percent of Net Assets
Name of Issuer and
Title of Issue | | Shares/
Principal | | | Value | |
BONDS, continued |
CORPORATE BONDS, continued |
Information Technology: 3.6% |
Analog Devices, Inc., 2.950%, 04/01/25 | | $ | 1,000,000 | | | $ | 1,051,295 | |
Analog Devices, Inc., 1.700%, 10/01/28 | | | 750,000 | | | | 748,847 | |
Apple, Inc., 3.000%, 06/20/27 | | | 2,500,000 | | | | 2,682,129 | |
Apple, Inc., 2.375%, 02/08/41 | | | 1,000,000 | | | | 977,623 | |
Apple, Inc., 2.400%, 08/20/50 (e) | | | 1,000,000 | | | | 945,519 | |
Broadcom, Inc., 144A, 3.500%, 02/15/41 (d) | | | 1,000,000 | | | | 1,026,861 | |
Dell International, LLC/EMC Corp., 6.020%, 06/15/26 | | | 1,000,000 | | | | 1,157,572 | |
Fiserv, Inc., 2.250%, 06/01/27 | | | 1,000,000 | | | | 1,018,821 | |
Gartner, Inc., 144A, 4.500%, 07/01/28 (d) | | | 1,000,000 | | | | 1,046,010 | |
Hewlett Packard Enterprise Co., 1.450%, 04/01/24 | | | 2,500,000 | | | | 2,517,755 | |
HP, Inc., 144A, 2.650%, 06/17/31 (d) | | | 1,500,000 | | | | 1,482,100 | |
MasterCard, Inc., 2.950%, 06/01/29 | | | 500,000 | | | | 536,623 | |
Mastercard, Inc., 2.950%, 03/15/51 | | | 1,000,000 | | | | 1,041,480 | |
Microchip Technology, Inc., 0.972%, 02/15/24 | | | 1,000,000 | | | | 991,880 | |
NetApp, Inc., 3.250%, 12/15/22 | | | 671,000 | | | | 681,226 | |
NetApp, Inc., 1.875%, 06/22/25 | | | 1,000,000 | | | | 1,008,788 | |
NXP BV/Funding, LLC/USA, Inc., 144A, 2.500%, 05/11/31 (d) | | | 1,500,000 | | | | 1,512,639 | |
Square, Inc., 144A, 3.500%, 06/01/31 (d) | | | 1,000,000 | | | | 1,026,730 | |
TSMC Arizona Corp., 3.125%, 10/25/41 | | | 750,000 | | | | 785,036 | |
TSMC Global, Ltd., 144A, 0.750%, 09/28/25 (d)(e) | | | 500,000 | | | | 483,706 | |
TSMC Global, Ltd., 144A, 1.250%, 04/23/26 (d) | | | 2,000,000 | | | | 1,962,066 | |
Visa, Inc., 3.650%, 09/15/47 | | | 2,000,000 | | | | 2,344,554 | |
| | 101 | SEE NOTES TO FINANCIAL STATEMENTS |
December 31, 2021 |
Schedules of Investments, continued |
Pax Core Bond Fund, continued
Percent of Net Assets
Name of Issuer and
Title of Issue | | Shares/
Principal | | | Value | |
BONDS, continued |
CORPORATE BONDS, continued |
Information Technology, continued |
Western Digital Corp., 2.850%, 02/01/29 | | $ | 1,000,000 | | | $ | 1,011,255 | |
| | | | | | | | 28,040,515 | |
Materials: 0.3% |
Ardagh Metal Packaging Finance USA, LLC/Finance PLC, 144A, 4.000%, 09/01/29 (d) | | | 1,000,000 | | | | 990,525 | |
Ecolab, Inc., 2.125%, 08/15/50 | | | 500,000 | | | | 443,948 | |
Ecolab, Inc., 2.750%, 08/18/55 | | | 950,000 | | | | 939,192 | |
| | | | | | | | 2,373,665 | |
Real Estate: 2.2% |
Alexandria Real Estate Equities, Inc., 2.000%, 05/18/32 | | | 500,000 | | | | 478,702 | |
Alexandria Real Estate Equities, Inc., 1.875%, 02/01/33 | | | 1,000,000 | | | | 942,388 | |
American Tower Corp., 2.400%, 03/15/25 | | | 500,000 | | | | 513,982 | |
American Tower Corp., 1.600%, 04/15/26 | | | 1,500,000 | | | | 1,486,942 | |
American Tower Corp., 2.100%, 06/15/30 | | | 250,000 | | | | 241,249 | |
American Tower Corp., 1.875%, 10/15/30 | | | 500,000 | | | | 473,607 | |
American Tower Corp., 2.950%, 01/15/51 | | | 500,000 | | | | 476,865 | |
Crown Castle International Corp, 1.050%, 07/15/26 | | | 1,000,000 | | | | 967,290 | |
Crown Castle International Corp., 3.300%, 07/01/30 | | | 500,000 | | | | 528,561 | |
Crown Castle International Corp., 2.500%, 07/15/31 | | | 500,000 | | | | 497,422 | |
Equinix, Inc., 1.000%, 09/15/25 | | | 1,000,000 | | | | 971,271 | |
HAT Holdings I ,LLC/HAT Holdings II, LLC, 144A, 3.375%, 06/15/26 (d) | | | 850,000 | | | | 859,639 | |
Percent of Net Assets
Name of Issuer and
Title of Issue | | Shares/
Principal | | | Value | |
BONDS, continued |
CORPORATE BONDS, continued |
Real Estate, continued |
HAT Holdings I, LLC/HAT Holdings II, LLC, 144A, 3.750%, 09/15/30 (d) | | $ | 1,000,000 | | | $ | 998,935 | |
Prologis, LP, 1.250%, 10/15/30 | | | 500,000 | | | | 466,079 | |
Prologis, LP, 1.625%, 03/15/31 | | | 1,000,000 | | | | 955,108 | |
SBA Tower Trust, 144A, 1.631%, 11/15/26 (d) | | | 1,000,000 | | | | 985,332 | |
SBA Tower Trust, 144A, 1.840%, 04/15/27 (d) | | | 2,000,000 | | | | 1,988,533 | |
UDR, Inc., 1.900%, 03/15/33 | | | 1,000,000 | | | | 925,256 | |
Welltower, Inc., 2.050%, 01/15/29 | | | 750,000 | | | | 739,501 | |
Welltower, Inc., 2.800%, 06/01/31 | | | 1,500,000 | | | | 1,532,125 | |
Welltower, Inc., 2.750%, 01/15/32 | | | 500,000 | | | | 505,556 | |
| | | | | | | | 17,534,343 | |
Utilities: 3.3% |
AES Corp., The, 1.375%, 01/15/26 | | | 2,000,000 | | | | 1,944,574 | |
AES Corp., The, 2.450%, 01/15/31 | | | 1,000,000 | | | | 976,423 | |
American Water Capital Corp., 2.800%, 05/01/30 | | | 3,000,000 | | | | 3,115,811 | |
Avangrid, Inc., 3.200%, 04/15/25 | | | 1,000,000 | | | | 1,052,132 | |
Clearway Energy Operating, LLC, 144A, 3.750%, 02/15/31 (d) | | | 1,000,000 | | | | 999,040 | |
Consolidated Edison Co. of New York, Inc., 3.350%, 04/01/30 | | | 1,000,000 | | | | 1,077,638 | |
DTE Electric Co., 1.900%, 04/01/28 | | | 1,500,000 | | | | 1,487,498 | |
DTE Electric Co., 3.950%, 03/01/49 | | | 1,000,000 | | | | 1,188,950 | |
Georgia Power Co., 3.250%, 03/15/51 | | | 1,000,000 | | | | 1,009,273 | |
Leeward Renewable Energy Operations, LLC, 144A, 4.250%, 07/01/29 (d) | | | 1,000,000 | | | | 1,011,480 | |
SEE NOTES TO FINANCIAL STATEMENTS | 102 | |
December 31, 2021 |
Schedules of Investments, continued |
Pax Core Bond Fund, continued
Percent of Net Assets
Name of Issuer and
Title of Issue | | Shares/
Principal | | | Value | |
BONDS, continued |
CORPORATE BONDS, continued |
Utilities, continued |
Niagara Mohawk Power Corp., 144A, 1.960%, 06/27/30 (d) | | $ | 2,000,000 | | | $ | 1,915,482 | |
NSTAR Electric Co., 3.250%, 05/15/29 | | | 3,000,000 | | | | 3,218,408 | |
Pattern Energy Operations, LP/Inc., 144A, 4.500%, 08/15/28 (d) | | | 1,000,000 | | | | 1,039,060 | |
PG&E Energy Recovery Funding, LLC, 2.822%, 07/15/46 | | | 750,000 | | | | 749,716 | |
Southern Power Co., 4.150%, 12/01/25 | | | 1,000,000 | | | | 1,089,268 | |
Southern Power Co., 0.900%, 01/15/26 | | | 500,000 | | | | 483,898 | |
Southwestern Public Service Co., 3.150%, 05/01/50 | | | 1,500,000 | | | | 1,573,620 | |
Sunnova Energy Corp., 144A, 5.875%, 09/01/26 (d) | | | 1,000,000 | | | | 1,021,040 | |
Union Electric Co., 2.150%, 03/15/32 | | | 1,000,000 | | | | 983,896 | |
| | | | | | | | 25,937,207 | |
TOTAL CORPORATE BONDS |
(Cost $284,368,186) | | | 289,041,559 | |
| | | | | | | | | |
U.S. GOVERNMENT AGENCY BONDS: 1.1% |
Agency Securities: 1.1% |
North American Development Bank, 2.400%, 10/26/22 | | | 2,000,000 | | | | 2,032,176 | |
United States International Development Finance Corp., 0.090%, 09/15/26 (f) | | | 1,583,333 | | | | 1,583,333 | |
United States International Development Finance Corp., 1.650%, 04/15/28 | | | 500,000 | | | | 500,129 | |
United States International Development Finance Corp., 1.440%, 04/15/28 | | | 1,000,000 | | | | 989,206 | |
Percent of Net Assets
Name of Issuer and
Title of Issue | | Shares/
Principal | | | Value | |
BONDS, continued |
U.S. GOVERNMENT AGENCY BONDS, continued |
Agency Securities, continued |
United States International Development Finance Corp., 0.090%, 03/15/30 (f) | | $ | 2,000,000 | | | $ | 2,000,000 | |
United States International Development Finance Corp., 3.520%, 09/20/32 | | | 1,535,714 | | | | 1,685,032 | |
TOTAL U.S. GOVERNMENT AGENCY BONDS |
(Cost $8,599,692) | | | 8,789,876 | |
| | | | | | | | | |
GOVERNMENT BONDS: 0.4% |
Kommunalbanken AS, 144A, 0.500%, 10/21/24 (d) | | | 500,000 | | | | 492,009 | |
Kommunalbanken AS, 144A, 1.125%, 10/26/26 (d) | | | 1,500,000 | | | | 1,483,902 | |
Kommunalbanken AS, 144A, 1.125%, 06/14/30 (d) | | | 1,000,000 | | | | 962,753 | |
TOTAL GOVERNMENT BONDS |
(Cost $2,944,650) | | | 2,938,664 | |
| | | | | | | | | |
SUPRANATIONAL BONDS: 12.0% |
European Bank for Reconstruction & Development, 0.250%, 07/10/23 | | | 3,000,000 | | | | 2,981,685 | |
European Bank for Reconstruction & Development, 1.625%, 09/27/24 | | | 3,000,000 | | | | 3,052,533 | |
European Bank for Reconstruction & Development, 0.500%, 11/25/25 | | | 3,000,000 | | | | 2,915,945 | |
European Investment Bank, 2.500%, 03/15/23 | | | 5,000,000 | | | | 5,117,820 | |
European Investment Bank, 0.250%, 09/15/23 | | | 5,000,000 | | | | 4,961,977 | |
European Investment Bank, 3.125%, 12/14/23 | | | 3,000,000 | | | | 3,137,694 | |
European Investment Bank, 3.250%, 01/29/24 | | | 8,000,000 | | | | 8,403,823 | |
| | 103 | SEE NOTES TO FINANCIAL STATEMENTS |
December 31, 2021 |
Schedules of Investments, continued |
Pax Core Bond Fund, continued
Percent of Net Assets
Name of Issuer and
Title of Issue | | Shares/
Principal | | | Value | |
BONDS, continued |
SUPRANATIONAL BONDS, continued |
European Investment Bank, 0.750%, 09/23/30 | | $ | 1,000,000 | | | $ | 937,620 | |
European Investment Bank, 1.250%, 02/14/31 | | | 2,000,000 | | | | 1,951,818 | |
Inter-American Development Bank, 0.250%, 11/15/23 | | | 4,000,000 | | | | 3,964,353 | |
Inter-American Development Bank, 2.625%, 01/16/24 | | | 3,000,000 | | | | 3,112,126 | |
Inter-American Development Bank, 0.340%, 10/15/24 | | | 4,000,000 | | | | 3,922,019 | |
Inter-American Development Bank, 1.750%, 03/14/25 | | | 3,000,000 | | | | 3,062,983 | |
Inter-American Development Bank, 0.625%, 07/15/25 | | | 3,000,000 | | | | 2,945,778 | |
Inter-American Development Bank, 0.875%, 04/20/26 | | | 2,000,000 | | | | 1,969,533 | |
Inter-American Development Bank, 0.625%, 09/16/27 | | | 600,000 | | | | 572,741 | |
Inter-American Development Bank, 1.125%, 01/13/31 | | | 3,250,000 | | | | 3,128,339 | |
International Bank for Reconstruction & Development, 2.530%, 03/11/22 | | | 4,000,000 | | | | 4,017,871 | |
International Bank for Reconstruction & Development, 2.125%, 07/01/22 | | | 2,000,000 | | | | 2,017,091 | |
International Bank for Reconstruction & Development, 1.625%, 01/15/25 | | | 8,000,000 | | | | 8,139,637 | |
International Bank for Reconstruction & Development, 0.625%, 04/22/25 | | | 5,000,000 | | | | 4,920,150 | |
Percent of Net Assets
Name of Issuer and
Title of Issue | | Shares/
Principal | | | Value | |
BONDS, continued |
SUPRANATIONAL BONDS, continued |
International Bank for Reconstruction & Development, 0.500%, 10/28/25 | | $ | 500,000 | | | $ | 487,493 | |
International Bank for Reconstruction & Development, 0.750%, 11/24/27 | | | 1,000,000 | | | | 960,489 | |
International Bank for Reconstruction & Development, 1.375%, 04/20/28 | | | 1,500,000 | | | | 1,495,960 | |
International Bank for Reconstruction & Development, 0.420%, 02/11/31 (f) | | | 2,000,000 | | | | 2,014,527 | |
International Bank for Reconstruction & Development, 1.625%, 11/03/31 | | | 1,500,000 | | | | 1,503,417 | |
International Bank for Reconstruction & Development, 2.750%, 05/31/36 | | | 2,000,000 | | | | 2,000,063 | |
International Development Association, 144A, 0.375%, 09/23/25 (d) | | | 3,200,000 | | | | 3,101,975 | |
International Finance Corp., 0.375%, 07/16/25 | | | 1,000,000 | | | | 973,537 | |
International Finance Corp., 0.750%, 10/08/26 | | | 2,250,000 | | | | 2,193,076 | |
Nordic Investment Bank, 0.375%, 09/20/24 | | | 1,500,000 | | | | 1,474,992 | |
Nordic Investment Bank, 0.375%, 09/11/25 | | | 3,000,000 | | | | 2,914,996 | |
TOTAL SUPRANATIONAL BONDS |
(Cost $94,965,818) | | | 94,354,061 | |
| | | | | | | | | |
MUNICIPAL BONDS: 1.6% |
California Health Facilities Financing Authority, 1.970%, 06/01/23 | | | 500,000 | | | | 508,690 | |
SEE NOTES TO FINANCIAL STATEMENTS | 104 | |
December 31, 2021 |
Schedules of Investments, continued |
Pax Core Bond Fund, continued
Percent of Net Assets
Name of Issuer and
Title of Issue | | Shares/
Principal | | | Value | |
BONDS, continued |
MUNICIPAL BONDS, continued |
California State University, 2.795%, 11/01/41 | | $ | 500,000 | | | $ | 497,941 | |
California State University, 2.939%, 11/01/52 | | | 905,000 | | | | 907,778 | |
City of Los Angeles CA Wastewater System Revenue, 4.029%, 06/01/39 | | | 1,020,000 | | | | 1,118,019 | |
Ford Foundation, The, 2.415%, 06/01/50 | | | 750,000 | | | | 713,659 | |
Massachusetts School Building Authority, 3.395%, 10/15/40 | | | 1,000,000 | | | | 1,047,222 | |
Ontario Teachers’ Finance Trust, 144A, 1.250%, 09/27/30 (d) | | | 1,000,000 | | | | 950,862 | |
Santa Clara Valley Water District, 3.369%, 06/01/27 | | | 1,305,000 | | | | 1,407,853 | |
State of California, 7.550%, 04/01/39 | | | 2,000,000 | | | | 3,341,545 | |
University of Massachusetts Building Authority, 6.573%, 05/01/39 | | | 125,000 | | | | 125,475 | |
University of Massachusetts Building Authority, 5.450%, 11/01/40 | | | 1,225,000 | | | | 1,634,683 | |
TOTAL MUNICIPAL BONDS |
(Cost $11,670,977) | | | 12,253,727 | |
| | | | | | | | | |
U.S. TREASURY NOTES: 14.6% |
0.125%, 04/15/22 (TIPS) | | | 6,822,060 | | | | 6,921,923 | |
0.125%, 07/15/24 (TIPS) | | | 4,658,160 | | | | 4,967,216 | |
0.625%, 01/15/26 (TIPS) | | | 3,491,190 | | | | 3,836,399 | |
1.250%, 11/30/26 | | | 16,500,000 | | | | 16,502,578 | |
0.375%, 07/15/27 (TIPS) | | | 7,912,800 | | | | 8,785,745 | |
1.500%, 11/30/28 | | | 11,500,000 | | | | 11,558,398 | |
0.875%, 11/15/30 | | | 2,000,000 | | | | 1,904,063 | |
1.625%, 05/15/31 | | | 5,000,000 | | | | 5,069,922 | |
5.000%, 05/15/37 | | | 2,000,000 | | | | 2,917,813 | |
2.000%, 11/15/41 | | | 29,000,000 | | | | 29,432,734 | |
1.000%, 02/15/48 (TIPS) | | | 1,121,330 | | | | 1,576,993 | |
1.875%, 11/15/51 | | | 21,500,000 | | | | 21,434,491 | |
TOTAL U.S. TREASURY NOTES |
(Cost $111,819,930) | | | 114,908,275 | |
| | | | | | | | | |
Percent of Net Assets
Name of Issuer and
Title of Issue | | Shares/
Principal | | | Value | |
BONDS, continued |
ASSET-BACKED SECURITIES: 6.8% |
Bayview Opportunity Master Fund IVa Trust 2016, 144A, 4.000%, 04/28/55 (d) | | $ | 475,823 | | | $ | 478,179 | |
CarMax Auto Owner Trust 2019-4, 2.800%, 04/15/26 | | | 2,000,000 | | | | 2,042,821 | |
CarMax Auto Owner Trust 2020-3, 2.530%, 01/15/27 | | | 2,000,000 | | | | 2,037,089 | |
College Avenue Student Loans 2021-B, LLC, 144A, 1.760%, 06/25/52 (d) | | | 467,686 | | | | 461,116 | |
Commonbond Student Loan Trust 2018-C-GS, 144A, 3.870%, 02/25/46 (d) | | | 786,043 | | | | 805,856 | |
Commonbond Student Loan Trust 2019-A-GS, 144A, 2.540%, 01/25/47 (d) | | | 780,901 | | | | 792,447 | |
Commonbond Student Loan Trust 2020-A-GS, 144A, 1.980%, 08/25/50 (d) | | | 693,054 | | | | 692,752 | |
Commonbond Student Loan Trust 2021-A-GS, 144A, 1.200%, 03/25/52 (d) | | | 372,950 | | | | 370,020 | |
Commonbond Student Loan Trust 2021-B-GS, 144A, 1.170%, 09/25/51 (d) | | | 469,150 | | | | 460,148 | |
Foundation Finance Trust 2021-1, 144A, 1.270%, 05/15/41 (d) | | | 1,908,682 | | | | 1,879,879 | |
Foundation Finance Trust 2021-2, 144A, 2.190%, 01/15/42 (d) | | | 750,000 | | | | 747,892 | |
FRTKL 2021-SFR1, 144A, 1.571%, 09/17/38 (d) | | | 1,000,000 | | | | 980,415 | |
Loanpal Solar Loan 2021-2 Ltd, 144A, 2.220%, 03/20/48 (d) | | | 645,525 | | | | 642,231 | |
Mill City Mortgage Trust 2015-1, 144A, 3.577%, 06/25/56 (d)(f) | | | 278,364 | | | | 278,997 | |
Mill City Solar Loan 2019-1, Ltd., 144A, 4.340%, 03/20/43 (d) | | | 563,547 | | | | 606,901 | |
| | 105 | SEE NOTES TO FINANCIAL STATEMENTS |
December 31, 2021 |
Schedules of Investments, continued |
Pax Core Bond Fund, continued
Percent of Net Assets
Name of Issuer and
Title of Issue | | Shares/
Principal | | | Value | |
BONDS, continued |
ASSET-BACKED SECURITIES, continued |
Mill City Solar Loan 2019-2, Ltd., 144A, 3.690%, 07/20/43 (d) | | $ | 612,138 | | | $ | 643,294 | |
Mosaic Solar Loan Trust 2018-1, 144A, 4.010%, 06/22/43 (d) | | | 923,425 | | | | 976,490 | |
Mosaic Solar Loan Trust 2019-2, 144A, 2.880%, 09/20/40 (d) | | | 472,024 | | | | 486,947 | |
Mosaic Solar Loan Trust 2020-1, 144A, 2.100%, 04/20/46 (d) | | | 556,204 | | | | 559,178 | |
Mosaic Solar Loan Trust 2020-2, 144A, 3.000%, 08/20/46 (d) | | | 1,071,021 | | | | 1,081,814 | |
Mosaic Solar Loan Trust 2020-2, 144A, 1.440%, 08/20/46 (d) | | | 1,157,364 | | | | 1,128,062 | |
Mosaic Solar Loan Trust 2021-1, 144A, 1.510%, 12/20/46 (d) | | | 1,040,765 | | | | 1,012,900 | |
Mosaic Solar Loan Trust 2021-2, 144A, 2.090%, 04/22/47 (d) | | | 949,226 | | | | 931,540 | |
Mosaic Solar Loans 2017-1 LLC, 144A, 4.450%, 06/20/42 (d) | | | 546,298 | | | | 572,731 | |
Mosaic Solar Loans 2017-2 LLC, 144A, 3.820%, 06/22/43 (d) | | | 642,508 | | | | 669,728 | |
Mosaic Solar Loans 2017-2 LLC, 144A, 2.000%, 06/22/43 (d) | | | 616,172 | | | | 615,003 | |
PACEWell 5 Trust, 144A, 2.628%, 10/10/59 (d) | | | 1,100,000 | | | | 1,104,674 | |
Progress Residential 2021-SFR1, 144A, 1.052%, 04/17/38 (d) | | | 750,000 | | | | 722,063 | |
Service Experts Issuer 2021-1, LLC, 144A, 2.670%, 02/02/32 (d) | | | 1,441,176 | | | | 1,439,457 | |
Percent of Net Assets
Name of Issuer and
Title of Issue | | Shares/
Principal | | | Value | |
BONDS, continued |
ASSET-BACKED SECURITIES, continued |
SoFi Professional Loan Program 2015-d, LLC, 144A, 3.590%, 10/26/37 (d) | | $ | 662,660 | | | $ | 664,952 | |
SoFi Professional Loan Program 2017-B, LLC, 144A, 3.700%, 05/25/40 (d)(f) | | | 1,900,000 | | | | 1,938,008 | |
SoFi Professional Loan Program 2017-D, LLC, 144A, 3.610%, 09/25/40 (d) | | | 500,000 | | | | 515,219 | |
SoFi Professional Loan Program 2017-E, LLC, 144A, 3.490%, 11/26/40 (d) | | | 750,000 | | | | 771,310 | |
SoFi Professional Loan Program 2017-F, LLC, 144A, 3.620%, 01/25/41 (d) | | | 1,800,000 | | | | 1,858,159 | |
SoFi Professional Loan Program 2018-B Trust, 144A, 3.830%, 08/25/47 (d) | | | 500,000 | | | | 515,025 | |
Sofi Professional Loan Program 2019-C, LLC, 144A, 2.370%, 11/16/48 (d) | | | 2,136,537 | | | | 2,163,630 | |
Sunnova Helios II Issuer, LLC 2019-A, 144A, 3.750%, 06/20/46 (d) | | | 1,733,675 | | | | 1,803,152 | |
Sunnova Helios II Issuer, LLC 2021-A, 144A, 1.800%, 02/20/48 (d) | | | 460,069 | | | | 453,827 | |
Sunnova Helios II Issuer, LLC 2021-B, 144A, 1.620%, 07/20/48 (d) | | | 2,386,740 | | | | 2,341,987 | |
Sunnova Helios VII Issuer, LLC, 144A, 2.330%, 10/20/48 (d) | | | 988,363 | | | | 980,878 | |
Sunnova Sol Issuer, LLC, 144A, 3.350%, 02/01/55 (d) | | | 952,367 | | | | 981,018 | |
SEE NOTES TO FINANCIAL STATEMENTS | 106 | |
December 31, 2021 |
Schedules of Investments, continued |
Pax Core Bond Fund, continued
Percent of Net Assets
Name of Issuer and
Title of Issue | | Shares/
Principal | | | Value | |
BONDS, continued |
ASSET-BACKED SECURITIES, continued |
Sunrun Athena Issuer 2018-1, LLC, 144A, 5.310%, 04/30/49 (d) | | $ | 931,462 | | | $ | 1,023,070 | |
Sunrun Atlas Issuer 2019-2, LLC, 144A, 3.610%, 02/01/55 (d) | | | 948,513 | | | | 995,514 | |
Tesla Auto Lease Trust 2019-A, 144A, 5.480%, 05/22/23 (d) | | | 1,000,000 | | | | 1,028,637 | |
Tesla Auto Lease Trust 2020-A, 144A, 4.640%, 08/20/24 (d) | | | 1,000,000 | | | | 1,032,180 | |
Tesla Auto Lease Trust 2021-A, 144A, 1.340%, 03/20/25 (d) | | | 500,000 | | | | 496,943 | |
Tesla Auto Lease Trust 2021-A, 144A, 1.180%, 03/20/25 (d) | | | 750,000 | | | | 745,331 | |
Tesla Auto Lease Trust 2021-B, 144A, 1.120%, 09/22/25 (d) | | | 500,000 | | | | 492,946 | |
Towd Point Mortgage Trust 2015-2, 144A, 3.750%, 11/25/57 (d)(f) | | | 910,671 | | | | 918,624 | |
Towd Point Mortgage Trust 2015-2, 144A, 3.360%, 11/25/60 (d)(f) | | | 2,000,000 | | | | 2,052,309 | |
Tricon American Homes 2020-SFR2 Trust, 144A, 1.482%, 11/17/39 (d) | | | 1,488,730 | | | | 1,438,952 | |
TRP - TRIP Rail Master Funding, LLC, 144A, 2.150%, 06/19/51 (d) | | | 983,318 | | | | 980,226 | |
TRP 2021, LLC, 144A, 2.070%, 06/19/51 (d) | | | 991,808 | | | | 983,920 | |
Vivint Solar Financing V, LLC, 144A, 4.730%, 04/30/48 (d) | | | 941,856 | | | | 1,005,835 | |
TOTAL ASSET-BACKED SECURITIES |
(Cost $53,246,988) | | | 53,402,276 | |
| | | | | | | | | |
Percent of Net Assets
Name of Issuer and
Title of Issue | | Shares/
Principal | | | Value | |
BONDS, continued |
MORTGAGE-BACKED SECURITIES: 23.0% |
Ginnie Mae (Mortgage-Backed): 0.7% |
1.550%, 06/16/36 | | $ | 398,828 | | | $ | 399,380 | |
3.020%, 09/15/41 | | | 1,705,727 | | | | 1,790,791 | |
2.879%, 09/16/50 (f) | | | 2,000,000 | | | | 2,034,924 | |
2.912%, 03/16/55 (f) | | | 941,451 | | | | 971,523 | |
| | | | | | | | 5,196,618 | |
Freddie Mac (Mortgage-Backed): 5.6% |
4.000%, 06/01/26 | | | 842,562 | | | | 887,983 | |
2.939%, 04/25/29 | | | 3,000,000 | | | | 3,246,996 | |
0.704%, 04/25/29 (f) | | | 500,000 | | | | 483,673 | |
2.412%, 08/25/29 | | | 2,000,000 | | | | 2,089,106 | |
1.503%, 09/25/30 | | | 651,000 | | | | 638,156 | |
1.487%, 11/25/30 | | | 2,750,000 | | | | 2,689,080 | |
1.204%, 09/25/31 | | | 736,678 | | | | 721,852 | |
3.000%, 07/01/33 | | | 864,232 | | | | 901,674 | |
4.500%, 01/01/34 | | | 677,378 | | | | 733,366 | |
3.500%, 01/01/34 | | | 779,934 | | | | 834,724 | |
1.700%, 01/25/34, 144A (d)(f) | | | 500,000 | | | | 502,475 | |
3.000%, 12/01/34 | | | 873,202 | | | | 917,367 | |
4.000%, 10/01/35 | | | 1,313,731 | | | | 1,426,033 | |
2.500%, 11/01/36 | | | 1,646,133 | | | | 1,697,320 | |
3.500%, 01/01/44 | | | 1,081,497 | | | | 1,168,544 | |
3.500%, 02/01/45 | | | 1,110,165 | | | | 1,210,920 | |
3.000%, 06/01/46 | | | 1,416,461 | | | | 1,509,489 | |
3.000%, 01/01/47 | | | 1,606,121 | | | | 1,697,200 | |
4.000%, 08/01/47 | | | 417,132 | | | | 444,903 | |
3.500%, 08/01/47 | | | 958,198 | | | | 1,018,529 | |
3.500%, 09/01/47 | | | 671,032 | | | | 714,111 | |
3.500%, 10/01/47 | | | 842,755 | | | | 893,119 | |
3.500%, 12/01/47 | | | 700,600 | | | | 743,966 | |
3.500%, 03/01/48 | | | 642,350 | | | | 679,877 | |
4.000%, 04/01/48 | | | 1,600,069 | | | | 1,714,727 | |
3.500%, 05/01/48 | | | 561,646 | | | | 594,069 | |
3.500%, 06/01/49 | | | 628,058 | | | | 662,605 | |
3.000%, 12/01/49 | | | 2,022,151 | | | | 2,105,894 | |
3.000%, 02/01/50 | | | 3,391,502 | | | | 3,547,992 | |
3.000%, 03/01/50 | | | 1,757,287 | | | | 1,838,072 | |
1 month LIBOR +3.10%, 3.190%, 03/25/50, 144A (d)(f) | | | 1,279,781 | | | | 1,296,015 | |
2.500%, 05/01/50 | | | 1,728,458 | | | | 1,767,047 | |
2.000%, 02/01/51 | | | 2,778,566 | | | | 2,780,746 | |
| | | | | | | | 44,157,630 | |
| | 107 | SEE NOTES TO FINANCIAL STATEMENTS |
December 31, 2021 |
Schedules of Investments, continued |
Pax Core Bond Fund, continued
Percent of Net Assets
Name of Issuer and
Title of Issue | | Shares/
Principal | | | Value | |
BONDS, continued |
MORTGAGE-BACKED SECURITIES, continued |
Fannie Mae (Mortgage-Backed): 15.2% |
2.784%, 02/25/27 (f) | | $ | 2,658,202 | | | $ | 2,810,756 | |
2.902%, 01/25/28 (f) | | | 1,900,000 | | | | 2,037,254 | |
3.059%, 03/25/28 (f) | | | 1,299,191 | | | | 1,408,746 | |
3.325%, 06/25/28 (f) | | | 2,000,000 | | | | 2,190,976 | |
3.552%, 09/25/28 (f) | | | 2,034,000 | | | | 2,270,100 | |
3.660%, 01/01/29 | | | 1,908,168 | | | | 1,999,470 | |
2.937%, 06/25/29 | | | 2,000,000 | | | | 2,166,181 | |
1.383%, 12/25/30 (f) | | | 2,700,000 | | | | 2,612,128 | |
3.500%, 07/01/35 | | | 738,197 | | | | 789,953 | |
2.000%, 03/01/36 | | | 2,728,768 | | | | 2,806,000 | |
4.000%, 03/01/38 | | | 1,095,451 | | | | 1,190,145 | |
3.500%, 09/01/39 | | | 608,969 | | | | 641,246 | |
2.000%, 11/01/40 | | | 1,828,772 | | | | 1,857,414 | |
2.500%, 12/01/40 | | | 2,721,856 | | | | 2,805,617 | |
2.000%, 12/01/40 | | | 4,537,579 | | | | 4,613,458 | |
4.000%, 02/01/41 | | | 1,791,954 | | | | 1,968,671 | |
2.050%, 11/25/41, 144A (d)(f) | | | 1,500,000 | | | | 1,504,689 | |
4.000%, 01/01/42 | | | 1,639,948 | | | | 1,800,971 | |
3.500%, 01/01/43 | | | 1,632,741 | | | | 1,756,818 | |
3.500%, 08/01/45 | | | 1,117,798 | | | | 1,204,565 | |
4.000%, 09/01/45 | | | 590,452 | | | | 639,575 | |
3.500%, 10/01/45 | | | 812,599 | | | | 870,190 | |
4.000%, 11/01/45 | | | 1,228,776 | | | | 1,332,796 | |
4.000%, 06/01/46 | | | 580,676 | | | | 629,007 | |
3.000%, 06/01/46 | | | 1,421,798 | | | | 1,484,042 | |
4.000%, 07/01/46 | | | 861,241 | | | | 944,556 | |
4.500%, 09/01/46 | | | 999,768 | | | | 1,107,878 | |
4.000%, 01/01/47 | | | 544,506 | | | | 590,663 | |
4.000%, 05/01/47 | | | 1,597,228 | | | | 1,726,505 | |
4.000%, 06/01/47 | | | 1,110,920 | | | | 1,194,329 | |
3.500%, 06/01/47 | | | 973,062 | | | | 1,043,760 | |
3.500%, 08/01/47 | | | 358,094 | | | | 377,692 | |
3.500%, 11/01/47 | | | 1,316,269 | | | | 1,416,829 | |
4.000%, 01/01/48 | | | 1,156,377 | | | | 1,252,676 | |
3.500%, 03/01/48 | | | 525,163 | | | | 555,687 | |
3.500%, 04/01/48 | | | 2,135,023 | | | | 2,314,379 | |
3.500%, 06/01/48 | | | 1,403,354 | | | | 1,508,031 | |
3.000%, 10/01/48 | | | 424,649 | | | | 428,325 | |
3.500%, 07/01/49 | | | 690,536 | | | | 739,367 | |
3.500%, 09/01/49 | | | 514,521 | | | | 543,059 | |
3.000%, 09/01/49 | | | 641,320 | | | | 670,149 | |
3.000%, 10/01/49 | | | 1,605,313 | | | | 1,685,643 | |
3.500%, 02/01/50 | | | 839,821 | | | | 884,136 | |
4.000%, 03/01/50 | | | 1,476,703 | | | | 1,583,444 | |
Percent of Net Assets
Name of Issuer and
Title of Issue | | Shares/
Principal | | | Value | |
BONDS, continued |
MORTGAGE-BACKED SECURITIES, continued |
Fannie Mae (Mortgage-Backed), continued |
3.000%, 03/01/50 | | $ | 1,165,253 | | | $ | 1,211,278 | |
2.500%, 03/01/50 | | | 1,998,008 | | | | 2,042,014 | |
2.500%, 08/01/50 | | | 2,166,655 | | | | 2,217,534 | |
2.500%, 09/01/50 | | | 6,670,073 | | | | 6,825,778 | |
2.000%, 10/01/50 | | | 3,536,027 | | | | 3,546,584 | |
3.000%, 11/01/50 | | | 1,608,395 | | | | 1,682,017 | |
2.500%, 11/01/50 | | | 2,186,814 | | | | 2,234,978 | |
1.500%, 11/01/50 | | | 2,717,715 | | | | 2,633,975 | |
2.500%, 12/01/50 | | | 4,392,584 | | | | 4,497,489 | |
2.000%, 12/01/50 | | | 1,800,088 | | | | 1,799,368 | |
2.500%, 01/01/51 | | | 1,732,995 | | | | 1,776,811 | |
2.500%, 05/01/51 | | | 1,728,967 | | | | 1,771,614 | |
2.500%, 07/01/51 | | | 8,807,624 | | | | 9,009,013 | |
2.000%, 09/01/51 | | | 2,966,066 | | | | 2,962,073 | |
2.500%, 10/01/51 | | | 2,985,642 | | | | 3,054,674 | |
2.000%, 10/01/51 | | | 2,978,988 | | | | 2,975,968 | |
2.500%, 11/01/51 | | | 2,971,263 | | | | 3,039,964 | |
| | | | | | | | 119,239,008 | |
Commercial Mortgage-Backed: 1.5% |
Bellemeade Re 2018-1, Ltd., 1 month LIBOR + 1.60%, 144A, 1.690%, 04/25/28 (d)(f) | | | 102,876 | | | | 102,885 | |
Connecticut Avenue Securities Trust 2021-R01, 144A, 1.600%, 10/25/41 (d)(f) | | | 645,000 | | | | 646,363 | |
Flagstar Mortgage Trust 2021-5INV, 144A, 2.500%, 07/25/51 (d)(f) | | | 911,488 | | | | 921,955 | |
Flagstar Mortgage Trust 2021-6INV, 144A, 2.500%, 08/25/51 (d)(f) | | | 1,842,142 | | | | 1,863,310 | |
Mello Mortgage Capital Acceptance 2021-INV1, 144A, 2.500%, 06/25/51 (d)(f) | | | 906,126 | | | | 916,559 | |
New Residential Mortgage Loan Trust 2019-2, 144A, 4.250%, 12/25/57 (d)(f) | | | 1,211,156 | | | | 1,266,671 | |
New Residential Mortgage Loan Trust 2019-4, 144A, 3.500%, 12/25/58 (d)(f) | | | 516,195 | | | | 535,579 | |
SEE NOTES TO FINANCIAL STATEMENTS | 108 | |
December 31, 2021 |
Schedules of Investments, continued |
Pax Core Bond Fund, continued
Percent of Net Assets
Name of Issuer and
Title of Issue | | Shares/
Principal | | | Value | |
BONDS, continued |
MORTGAGE-BACKED SECURITIES, continued |
Commercial Mortgage-Backed, continued |
New Residential Mortgage Loan Trust 2019-5, 144A, 3.500%, 08/25/59 (d)(f) | | $ | 724,977 | | | $ | 745,040 | |
New Residential Mortgage Loan Trust 2019-RPL3, 144A, 2.750%, 07/25/59 (d)(f) | | | 1,515,159 | | | | 1,545,389 | |
Radnor RE 2018-1, Ltd., 1 month LIBOR + 1.40%, 144A, 1.490%, 03/25/28 (d)(f) | | | 117,756 | | | | 117,805 | |
Sequoia Mortgage Trust 2018-CH1, 144A, 4.000%, 03/25/48 (d)(f) | | | 150,522 | | | | 151,717 | |
Sequoia Mortgage Trust 2021-4, 144A, 2.500%, 06/25/51 (d)(f) | | | 1,912,029 | | | | 1,933,768 | |
SLG Office Trust 2021-OVA, 144A, 2.585%, 07/15/41 (d) | | | 750,000 | | | | 770,017 | |
| | | | | | | | 11,517,058 | |
TOTAL MORTGAGE-BACKED SECURITIES |
(Cost $178,874,459) | | | 180,110,314 | |
| | | | | | | | | |
TOTAL BONDS |
(Cost $746,789,250) | | | 756,097,302 | |
| | | | | | | | | |
CERTIFICATES OF DEPOSIT: 0.0% (a) |
Community Credit Union of Lynn, 2.200%, 11/29/22 (b) | | | 250,000 | | | | 254,280 | |
(Cost $250,000) |
| |
MONEY MARKET: 3.3% |
State Street Institutional U.S. Government Money Market Fund, 0.030% (g)(h) | | | 26,338,076 | | | | 26,338,076 | |
(Cost $26,338,076) |
| |
Percent of Net Assets
Name of Issuer and
Title of Issue | | Shares/
Principal | | | Value | |
SECURITIES PURCHASED WITH CASH COLLATERAL FROM SECURITIES LENDING: 0.9% |
State Street Navigator Securities Lending Government Money Market Portfolio, 0.032% (g)(h) | | | 7,064,485 | | | $ | 7,064,485 | |
(Cost $7,064,485) |
| | | | | | | | | |
TOTAL INVESTMENTS: 100.5% |
(Cost $780,441,811) | | | 789,754,143 | |
| | | | | | | | | |
PAYABLE UPON RETURN OF SECURITIES LOANED (NET): -0.9% | | | (7,064,485 | ) |
| | | | | | | | | |
OTHER ASSETS AND LIABILITIES — (NET): 0.4% | | | 2,880,395 | |
| | | | | | | | | |
NET ASSETS: 100.0% | | $ | 785,570,053 | |
(a) | Rounds to less than 0.05%. |
(c) | Security valued using significant unobservable inputs. |
(d) | Security purchased pursuant to Rule 144A of the Securities Act of 1933 and may be resold only to qualified institutional buyers. |
(e) | Security of partial position of this security was on loan as of December 31, 2021. The total market value of securities on loan as of December 31, 2021 was $6,912,083. |
(f) | Rate shown reflects the accrual rate as of December 31, 2021 on securities with variable or step rates. |
(g) | Rate shown represents annualized 7-day yield as of December 31, 2021. |
LIBOR-London Inter-bank Offered Rate. Interest rate shown reflects rates in effect as of December 31, 2021.
LP - Limited Partnership
TIPS - Treasury Inflation Protected Securities
| | 109 | SEE NOTES TO FINANCIAL STATEMENTS |
December 31, 2021 |
Schedules of Investments, continued |
Pax High Yield Bond Fund
Percent of Net Assets
Name of Issuer and
Title of Issue | | Shares/
Principal/
Contracts | | | Value | |
COMMON STOCKS: 0.0% |
Health Care: 0.0% |
Interactive Health, Inc. (a)(b)(c) | | | 706 | | | $ | 0 | |
| | | | | | | | | |
TOTAL COMMON STOCKS |
(Cost $178,981) | | | | | | | 0 | |
| | | | | | | | | |
PREFERRED STOCKS: 0.3% |
Health Care: 0.3% |
Avantor, Inc., 6.250% | | | 20,000 | | | | 2,584,200 | |
Interactive Health, Inc., 0.000% (a)(b)(c) | | | 1,412 | | | | 0 | |
| | | | | | | | | |
TOTAL PREFERRED STOCKS |
(Cost $1,358,340) | | | | | | | 2,584,200 | |
| | | | | | | | | |
BONDS: 96.4% |
Community Investment Notes: 0.1% |
CINI Investment Note (b)(c) | | $ | 510,838 | | | | 510,838 | |
(Cost $510,838) | | | | | | | | |
| | | | | | | | | |
CORPORATE BONDS: 94.0% |
Automotive: 4.7% |
Allison Transmission, Inc., 144A, 3.750%, 01/30/31 (d) | | | 1,475,000 | | | | 1,440,743 | |
Allison Transmission, Inc., 144A, 4.750%, 10/01/27 (d) | | | 2,575,000 | | | | 2,684,438 | |
Allison Transmission, Inc., 144A, 5.875%, 06/01/29 (d) | | | 1,025,000 | | | | 1,116,102 | |
Ford Motor Co., 3.250%, 02/12/32 | | | 3,250,000 | | | | 3,334,500 | |
Ford Motor Co., 4.750%, 01/15/43 | | | 2,325,000 | | | | 2,570,346 | |
Ford Motor Credit Co., LLC, 2.700%, 08/10/26 | | | 1,750,000 | | | | 1,767,500 | |
Ford Motor Credit Co., LLC, 3.664%, 09/08/24 | | | 2,075,000 | | | | 2,157,595 | |
Ford Motor Credit Co., LLC, 3.810%, 01/09/24 | | | 1,025,000 | | | | 1,064,442 | |
Ford Motor Credit Co., LLC, 4.000%, 11/13/30 | | | 3,600,000 | | | | 3,879,107 | |
Percent of Net Assets
Name of Issuer and
Title of Issue | | Shares/
Principal/
Contracts | | | Value | |
CORPORATE BONDS, continued |
Automotive, continued |
Ford Motor Credit Co., LLC, 5.125%, 06/16/25 | | $ | 3,550,000 | | | $ | 3,865,240 | |
Gates Global, LLC/Corp., 144A, 6.250%, 01/15/26 (d) | | | 2,075,000 | | | | 2,144,710 | |
IHO Verwaltungs GmbH, 144A, 4.750%, 09/15/26 (d) | | | 2,075,000 | | | | 2,120,972 | |
IHO Verwaltungs GmbH, 144A, 6.000%, 05/15/27 (d) | | | 1,025,000 | | | | 1,059,184 | |
IHO Verwaltungs GmbH, 144A, 6.375%, 05/15/29 (d) | | | 1,925,000 | | | | 2,072,898 | |
Meritor, Inc., 144A, 4.500%, 12/15/28 (d) | | | 2,325,000 | | | | 2,334,335 | |
Meritor, Inc., 144A, 6.250%, 06/01/25 (d) | | | 1,025,000 | | | | 1,069,603 | |
| | | | | | | | 34,681,715 | |
Banking: 0.5% |
Ally Financial, Inc., 5.750%, 11/20/25 | | | 3,100,000 | | | | 3,501,044 | |
| | | | | | | | | |
Basic Industry: 9.3% |
Advanced Drainage Systems, Inc., 144A, 5.000%, 09/30/27 (d) | | | 2,075,000 | | | | 2,151,370 | |
Alcoa Nederland Holding BV, 144A, 4.125%, 03/31/29 (d) | | | 1,025,000 | | | | 1,057,221 | |
Allegheny Technologies, Inc., 4.875%, 10/01/29 | | | 900,000 | | | | 902,255 | |
Allegheny Technologies, Inc., 5.125%, 10/01/31 | | | 900,000 | | | | 908,046 | |
BCPE Ulysses Intermediate, Inc., 144A, 7.750%, 04/01/27 (d) | | | 1,525,000 | | | | 1,507,463 | |
Carpenter Technology Corp., 6.375%, 07/15/28 | | | 3,197,000 | | | | 3,400,133 | |
CVR Partners, LP/CVR Nitrogen Finance Corp., 144A, 6.125%, 06/15/28 (d) | | | 3,525,000 | | | | 3,724,074 | |
SEE NOTES TO FINANCIAL STATEMENTS | 110 | |
December 31, 2021 |
Schedules of Investments, continued |
Pax High Yield Bond Fund, continued
Percent of Net Assets
Name of Issuer and
Title of Issue | | Shares/
Principal/
Contracts | | | Value | |
CORPORATE BONDS, continued |
Basic Industry, continued |
FXI Holdings, Inc., 144A, 12.250%, 11/15/26 (d) | | $ | 1,025,000 | | | $ | 1,154,458 | |
FXI Holdings, Inc., 144A, 7.875%, 11/01/24 (d) | | | 1,008,000 | | | | 1,028,100 | |
GPD Cos., Inc., 144A, 10.125%, 04/01/26 (d) | | | 3,100,000 | | | | 3,305,856 | |
GYP Holdings III Corp., 144A, 4.625%, 05/01/29 (d) | | | 3,825,000 | | | | 3,840,415 | |
Ingevity Corp., 144A, 4.500%, 02/01/26 (d) | | | 1,550,000 | | | | 1,555,579 | |
Interface, Inc., 144A, 5.500%, 12/01/28 (d) | | | 2,900,000 | | | | 3,042,028 | |
Koppers, Inc., 144A, 6.000%, 02/15/25 (d) | | | 3,297,000 | | | | 3,358,093 | |
LBM Acquisition, LLC, 144A, 6.250%, 01/15/29 (d) | | | 2,575,000 | | | | 2,549,662 | |
LSF11 A5 HoldCo, LLC, 144A, 6.625%, 10/15/29 (d) | | | 2,275,000 | | | | 2,244,071 | |
Mercer International, Inc., 5.500%, 01/15/26 | | | 1,025,000 | | | | 1,040,508 | |
Mercer International, Inc., 5.125%, 02/01/29 | | | 1,725,000 | | | | 1,764,778 | |
Novelis Corp., 144A, 4.750%, 01/30/30 (d) | | | 1,925,000 | | | | 2,026,987 | |
Olympus Water US Holding Corp., 144A, 4.250%, 10/01/28 (d) | | | 1,875,000 | | | | 1,867,303 | |
Olympus Water US Holding Corp., 144A, 6.250%, 10/01/29 (d) | | | 1,750,000 | | | | 1,708,709 | |
Shea Homes, LP/Funding Corp., 144A, 4.750%, 02/15/28 (d) | | | 2,000,000 | | | | 2,048,060 | |
Shea Homes, LP/Funding Corp., 144A, 4.750%, 04/01/29 (d) | | | 1,025,000 | | | | 1,046,043 | |
Standard Industries, Inc., 144A, 4.375%, 07/15/30 (d) | | | 1,925,000 | | | | 1,967,148 | |
Standard Industries, Inc., 144A, 5.000%, 02/15/27 (d) | | | 5,175,000 | | | | 5,333,535 | |
Percent of Net Assets
Name of Issuer and
Title of Issue | | Shares/
Principal/
Contracts | | | Value | |
CORPORATE BONDS, continued |
Basic Industry, continued |
Taseko Mines, Ltd., 144A, 7.000%, 02/15/26 (d) | | $ | 2,750,000 | | | $ | 2,862,860 | |
Univar Solutions USA, Inc., 144A, 5.125%, 12/01/27 (d) | | | 4,125,000 | | | | 4,310,151 | |
USG Corp., 144A, 4.875%, 06/01/27 (d) | | | 3,500,000 | | | | 3,383,888 | |
Venator Finance Sarl/Materials, LLC, 144A, 9.500%, 07/01/25 (d) | | | 1,550,000 | | | | 1,696,025 | |
White Cap Buyer, LLC, 144A, 6.875%, 10/15/28 (d) | | | 1,800,000 | | | | 1,879,056 | |
| | | | | | | | 68,663,875 | |
Capital Goods: 5.6% |
ARD Finance SA, 144A, 6.500%, 06/30/27 (d) | | | 1,550,000 | | | | 1,598,112 | |
Ardagh Metal Packaging Finance USA, LLC/Finance PLC, 144A, 3.250%, 09/01/28 (d) | | | 1,025,000 | | | | 1,014,965 | |
Ardagh Metal Packaging Finance USA, LLC/Finance PLC, 144A, 4.000%, 09/01/29 (d) | | | 2,075,000 | | | | 2,055,339 | |
Ardagh Packaging Finance, PLC/Holdings USA, Inc., 144A, 4.125%, 08/15/26 (d) | | | 1,025,000 | | | | 1,049,344 | |
Ardagh Packaging Finance, PLC/Holdings USA, Inc., 144A, 5.250%, 08/15/27 (d) | | | 4,400,000 | | | | 4,432,449 | |
ATS Automation Tooling Systems, Inc., 144A, 4.125%, 12/15/28 (d) | | | 2,975,000 | | | | 3,001,745 | |
GrafTech Finance, Inc., 144A, 4.625%, 12/15/28 (d) | | | 3,100,000 | | | | 3,152,034 | |
Graphic Packaging International, LLC, 144A, 3.750%, 02/01/30 (d) | | | 3,000,000 | | | | 3,036,405 | |
Howmet Aerospace, Inc., 5.900%, 02/01/27 | | | 1,025,000 | | | | 1,172,088 | |
| | 111 | SEE NOTES TO FINANCIAL STATEMENTS |
December 31, 2021 |
Schedules of Investments, continued |
Pax High Yield Bond Fund, continued
Percent of Net Assets
Name of Issuer and
Title of Issue | | Shares/
Principal/
Contracts | | | Value | |
CORPORATE BONDS, continued |
Capital Goods, continued |
Howmet Aerospace, Inc., 5.950%, 02/01/37 | | $ | 1,000,000 | | | $ | 1,183,960 | |
Howmet Aerospace, Inc., 6.750%, 01/15/28 | | | 1,025,000 | | | | 1,218,669 | |
MajorDrive Holdings IV, LLC, 144A, 6.375%, 06/01/29 (d) | | | 3,525,000 | | | | 3,415,390 | |
Manitowoc Co, Inc., The, 144A, 9.000%, 04/01/26 (d) | | | 3,100,000 | | | | 3,266,408 | |
OI European Group BV, 144A, 4.750%, 02/15/30 (d) | | | 2,000,000 | | | | 2,030,019 | |
Owens-Brockway Glass Container, Inc., 144A, 6.375%, 08/15/25 (d) | | | 1,025,000 | | | | 1,105,519 | |
Owens-Brockway Glass Container, Inc., 144A, 6.625%, 05/13/27 (d) | | | 2,575,000 | | | | 2,719,200 | |
Spectrum Brands, Inc., 144A, 5.500%, 07/15/30 (d) | | | 1,025,000 | | | | 1,100,809 | |
Terex Corp., 144A, 5.000%, 05/15/29 (d) | | | 2,975,000 | | | | 3,061,335 | |
Unifrax Escrow Issuer Corp., 144A, 7.500%, 09/30/29 (d) | | | 1,875,000 | | | | 1,896,413 | |
| | | | | | | | 41,510,203 | |
Consumer Goods: 6.8% |
Del Monte Foods, Inc., 144A, 11.875%, 05/15/25 (d) | | | 3,350,000 | | | | 3,736,741 | |
Kraft Heinz Foods Co., 4.250%, 03/01/31 | | | 2,075,000 | | | | 2,364,322 | |
Kraft Heinz Foods Co., 4.375%, 06/01/46 | | | 5,175,000 | | | | 6,081,667 | |
Kraft Heinz Foods Co., 5.000%, 06/04/42 | | | 1,025,000 | | | | 1,277,364 | |
Lamb Weston Holdings, Inc., 144A, 4.125%, 01/31/30 (d) | | | 2,000,000 | | | | 2,055,840 | |
Lamb Weston Holdings, Inc., 144A, 4.375%, 01/31/32 (d) | | | 2,000,000 | | | | 2,065,870 | |
Percent of Net Assets
Name of Issuer and
Title of Issue | | Shares/
Principal/
Contracts | | | Value | |
CORPORATE BONDS, continued |
Consumer Goods, continued |
Land O’ Lakes, Inc., 144A, 7.000%, 09/18/28 (d) | | $ | 1,685,000 | | | $ | 1,801,636 | |
Mattel, Inc., 144A, 3.750%, 04/01/29 (d) | | | 1,025,000 | | | | 1,063,627 | |
Mattel, Inc., 144A, 3.375%, 04/01/26 (d) | | | 1,550,000 | | | | 1,591,191 | |
Mattel, Inc., 5.450%, 11/01/41 | | | 1,525,000 | | | | 1,822,634 | |
Natura Cosmeticos SA, 144A, 4.125%, 05/03/28 (d) | | | 3,600,000 | | | | 3,533,832 | |
Performance Food Group, Inc., 144A, 4.250%, 08/01/29 (d) | | | 3,850,000 | | | | 3,825,668 | |
Performance Food Group, Inc., 144A, 5.500%, 10/15/27 (d) | | | 2,075,000 | | | | 2,167,887 | |
Post Holdings, Inc., 144A, 4.500%, 09/15/31 (d) | | | 1,925,000 | | | | 1,913,681 | |
Post Holdings, Inc., 144A, 5.500%, 12/15/29 (d) | | | 3,100,000 | | | | 3,260,921 | |
Post Holdings, Inc., 144A, 5.750%, 03/01/27 (d) | | | 2,075,000 | | | | 2,144,938 | |
Prestige Brands, Inc., 144A, 5.125%, 01/15/28 (d) | | | 2,075,000 | | | | 2,163,561 | |
Spectrum Brands, Inc., 144A, 3.875%, 03/15/31 (d) | | | 1,025,000 | | | | 1,013,699 | |
Spectrum Brands, Inc., 144A, 5.000%, 10/01/29 (d) | | | 1,025,000 | | | | 1,076,476 | |
Tempur Sealy International, Inc., 144A, 3.875%, 10/15/31 (d) | | | 2,000,000 | | | | 2,006,890 | |
United Natural Foods, Inc., 144A, 6.750%, 10/15/28 (d) | | | 2,975,000 | | | | 3,190,018 | |
| | | | | | | | 50,158,463 | |
Financial Services: 2.2% |
HAT Holdings I ,LLC/HAT Holdings II, LLC, 144A, 3.375%, 06/15/26 (d) | | | 2,550,000 | | | | 2,578,916 | |
SEE NOTES TO FINANCIAL STATEMENTS | 112 | |
December 31, 2021 |
Schedules of Investments, continued |
Pax High Yield Bond Fund, continued
Percent of Net Assets
Name of Issuer and
Title of Issue | | Shares/
Principal/
Contracts | | | Value | |
CORPORATE BONDS, continued |
Financial Services, continued |
HAT Holdings I, LLC/HAT Holdings II, LLC, 144A, 6.000%, 04/15/25 (d) | | $ | 2,200,000 | | | $ | 2,290,200 | |
New Residential Investment Corp., 144A, 6.250%, 10/15/25 (d) | | | 2,075,000 | | | | 2,086,350 | |
OneMain Finance Corp., 3.500%, 01/15/27 | | | 1,000,000 | | | | 989,985 | |
OneMain Finance Corp., 5.375%, 11/15/29 | | | 2,075,000 | | | | 2,259,156 | |
OneMain Finance Corp., 6.625%, 01/15/28 | | | 1,025,000 | | | | 1,149,461 | |
OneMain Finance Corp., 6.875%, 03/15/25 | | | 500,000 | | | | 556,883 | |
OneMain Finance Corp., 7.125%, 03/15/26 | | | 1,025,000 | | | | 1,170,012 | |
PennyMac Financial Services, Inc., 144A, 4.250%, 02/15/29 (d) | | | 1,025,000 | | | | 986,988 | |
PennyMac Financial Services, Inc., 144A, 5.750%, 09/15/31 (d) | | | 1,000,000 | | | | 1,011,405 | |
PennyMac Financial Services, Inc., 144A, 5.375%, 10/15/25 (d) | | | 1,025,000 | | | | 1,054,346 | |
| | | | | | | | 16,133,702 | |
Health Care: 10.5% |
180 Medical, Inc., 144A, 3.875%, 10/15/29 (d) | | | 2,000,000 | | | | 2,027,870 | |
AdaptHealth, LLC, 144A, 4.625%, 08/01/29 (d) | | | 1,025,000 | | | | 1,026,553 | |
AdaptHealth, LLC, 144A, 5.125%, 03/01/30 (d) | | | 900,000 | | | | 917,109 | |
AdaptHealth, LLC, 144A, 6.125%, 08/01/28 (d) | | | 2,075,000 | | | | 2,202,561 | |
Akumin Escrow, Inc., 144A, 7.500%, 08/01/28 (d) | | | 900,000 | | | | 845,271 | |
Akumin, Inc., 144A, 7.000%, 11/01/25 (d) | | | 2,075,000 | | | | 1,976,936 | |
Avantor Funding, Inc., 144A, 3.875%, 11/01/29 (d) | | | 3,000,000 | | | | 3,037,034 | |
Avantor Funding, Inc., 144A, 4.625%, 07/15/28 (d) | | | 6,200,000 | | | | 6,473,822 | |
Percent of Net Assets
Name of Issuer and
Title of Issue | | Shares/
Principal/
Contracts | | | Value | |
CORPORATE BONDS, continued |
Health Care, continued |
Bausch Health Cos, Inc., 144A, 5.000%, 02/15/29 (d) | | $ | 900,000 | | | $ | 795,659 | |
Bausch Health Cos, Inc., 144A, 7.000%, 01/15/28 (d) | | | 2,700,000 | | | | 2,690,321 | |
Cano Health, LLC, 144A, 6.250%, 10/01/28 (d) | | | 2,900,000 | | | | 2,904,155 | |
Centene Corp., 3.000%, 10/15/30 | | | 2,075,000 | | | | 2,112,848 | |
Centene Corp., 3.375%, 02/15/30 | | | 500,000 | | | | 510,938 | |
Centene Corp., 4.250%, 12/15/27 | | | 1,025,000 | | | | 1,070,336 | |
Centene Corp., 4.625%, 12/15/29 | | | 5,900,000 | | | | 6,373,120 | |
Cheplapharm Arzneimittel GmbH, 144A, 5.500%, 01/15/28 (d) | | | 3,100,000 | | | | 3,143,152 | |
Encompass Health Corp., 4.500%, 02/01/28 | | | 500,000 | | | | 515,098 | |
Encompass Health Corp., 4.750%, 02/01/30 | | | 3,575,000 | | | | 3,687,523 | |
Endo Dac/Endo Finance, LLC/Endo Finco, Inc., 144A, 9.500%, 07/31/27 (d) | | | 1,547,000 | | | | 1,576,331 | |
Grifols Escrow Issuer SA, 144A, 4.750%, 10/15/28 (d) | | | 2,050,000 | | | | 2,094,834 | |
IQVIA, Inc., 144A, 5.000%, 05/15/27 (d) | | | 4,125,000 | | | | 4,274,943 | |
ModivCare Escrow Issuer, Inc., 144A, 5.000%, 10/01/29 (d) | | | 1,075,000 | | | | 1,099,489 | |
ModivCare, Inc., 144A, 5.875%, 11/15/25 (d) | | | 2,075,000 | | | | 2,181,240 | |
MPT Operating Partnership, LP/Finance Corp., 4.625%, 08/01/29 | | | 2,375,000 | | | | 2,509,734 | |
MPT Operating Partnership, LP/Finance Corp., 5.000%, 10/15/27 | | | 2,575,000 | | | | 2,697,261 | |
| | 113 | SEE NOTES TO FINANCIAL STATEMENTS |
December 31, 2021 |
Schedules of Investments, continued |
Pax High Yield Bond Fund, continued
Percent of Net Assets
Name of Issuer and
Title of Issue | | Shares/
Principal/
Contracts | | | Value | |
CORPORATE BONDS, continued |
Health Care, continued |
Organon & Co./Foreign Debt Co-Issuer BV, 144A, 4.125%, 04/30/28 (d) | | $ | 2,250,000 | | | $ | 2,290,455 | |
Organon & Co./Foreign Debt Co-Issuer BV, 144A, 5.125%, 04/30/31 (d) | | | 1,225,000 | | | | 1,281,932 | |
Par Pharmaceutical, Inc., 144A, 7.500%, 04/01/27 (d) | | | 1,565,000 | | | | 1,601,668 | |
Tenet Healthcare Corp., 144A, 4.250%, 06/01/29 (d) | | | 2,950,000 | | | | 3,000,947 | |
Tenet Healthcare Corp., 144A, 4.375%, 01/15/30 (d) | | | 900,000 | | | | 913,019 | |
Tenet Healthcare Corp., 144A, 5.125%, 11/01/27 (d) | | | 3,975,000 | | | | 4,145,089 | |
Tenet Healthcare Corp., 144A, 6.125%, 10/01/28 (d) | | | 2,375,000 | | | | 2,513,356 | |
Vizient, Inc., 144A, 6.250%, 05/15/27 (d) | | | 3,100,000 | | | | 3,238,725 | |
| | | | | | | | 77,729,329 | |
Insurance: 0.4% |
GTCR AP Finance, Inc., 144A, 8.000%, 05/15/27 (d) | | | 3,100,000 | | | | 3,219,350 | |
| | | | | | | | | |
Leisure: 2.7% |
Boyne USA, Inc., 144A, 4.750%, 05/15/29 (d) | | | 2,075,000 | | | | 2,140,809 | |
MGM Growth Properties Operating Partnership, LP/MGP Finance Co-Issuer, Inc., 144A, 3.875%, 02/15/29 (d) | | | 1,800,000 | | | | 1,892,583 | |
MGM Resorts International, 5.500%, 04/15/27 | | | 3,875,000 | | | | 4,131,059 | |
MGM Resorts International, 6.750%, 05/01/25 | | | 1,025,000 | | | | 1,072,150 | |
Percent of Net Assets
Name of Issuer and
Title of Issue | | Shares/
Principal/
Contracts | | | Value | |
CORPORATE BONDS, continued |
Leisure, continued |
Park Intermediate Holdings, LLC/PK Domestic Property, LLC/PK Finance Co-Issuer, 144A, 4.875%, 05/15/29 (d) | | $ | 2,975,000 | | | $ | 3,046,460 | |
Park Intermediate Holdings, LLC/PK Domestic Property, LLC/PK Finance Co-Issuer, 144A, 5.875%, 10/01/28 (d) | | | 1,000,000 | | | | 1,041,475 | |
VICI Properties, LP/VICI Note Co., Inc., 144A, 4.625%, 12/01/29 (d) | | | 3,400,000 | | | | 3,624,230 | |
Viking Ocean Cruises Ship VII, Ltd., 144A, 5.625%, 02/15/29 (d) | | | 2,975,000 | | | | 2,975,461 | |
| | | | | | | | 19,924,227 | |
Media: 14.3% |
Altice Financing SA, 144A, 5.750%, 08/15/29 (d) | | | 2,000,000 | | | | 1,983,030 | |
Altice France Holding SA, 144A, 10.500%, 05/15/27 (d) | | | 4,100,000 | | | | 4,413,280 | |
Altice France Holding SA, 144A, 6.000%, 02/15/28 (d) | | | 1,025,000 | | | | 980,720 | |
Altice France SA, 144A, 5.500%, 01/15/28 (d) | | | 3,100,000 | | | | 3,077,634 | |
Altice France SA, 144A, 5.125%, 07/15/29 (d) | | | 1,800,000 | | | | 1,758,942 | |
CCO Holdings, LLC/Capital Corp., 144A, 4.250%, 01/15/34 (d) | | | 1,000,000 | | | | 985,638 | |
CCO Holdings, LLC/Capital Corp., 4.500%, 05/01/32 | | | 1,925,000 | | | | 1,983,549 | |
CCO Holdings, LLC/Capital Corp., 144A, 4.750%, 03/01/30 (d) | | | 7,075,000 | | | | 7,370,558 | |
CCO Holdings, LLC/Capital Corp., 144A, 5.125%, 05/01/27 (d) | | | 1,025,000 | | | | 1,057,005 | |
CCO Holdings, LLC/Capital Corp., 144A, 5.375%, 06/01/29 (d) | | | 3,100,000 | | | | 3,350,635 | |
SEE NOTES TO FINANCIAL STATEMENTS | 114 | |
December 31, 2021 |
Schedules of Investments, continued |
Pax High Yield Bond Fund, continued
Percent of Net Assets
Name of Issuer and
Title of Issue | | Shares/
Principal/
Contracts | | | Value | |
CORPORATE BONDS, continued |
Media, continued |
Cimpress, PLC, 144A, 7.000%, 06/15/26 (d) | | $ | 2,975,000 | | | $ | 3,093,375 | |
Clarivate Science Holdings Corp., 144A, 3.875%, 07/01/28 (d) | | | 2,300,000 | | | | 2,316,135 | |
Clear Channel Outdoor Holdings, Inc., 144A, 7.750%, 04/15/28 (d) | | | 2,050,000 | | | | 2,196,637 | |
CSC Holdings, LLC, 144A, 4.125%, 12/01/30 (d) | | | 1,925,000 | | | | 1,882,400 | |
CSC Holdings, LLC, 144A, 4.625%, 12/01/30 (d) | | | 3,075,000 | | | | 2,914,916 | |
CSC Holdings, LLC, 144A, 5.750%, 01/15/30 (d) | | | 2,575,000 | | | | 2,570,404 | |
CSC Holdings, LLC, 144A, 7.500%, 04/01/28 (d) | | | 2,075,000 | | | | 2,228,726 | |
DIRECTV Holdings, LLC/Financing Co., Inc., 144A, 5.875%, 08/15/27 (d) | | | 1,100,000 | | | | 1,127,302 | |
DISH DBS Corp., 5.875%, 11/15/24 | | | 3,100,000 | | | | 3,185,684 | |
DISH DBS Corp., 7.375%, 07/01/28 | | | 1,025,000 | | | | 1,039,458 | |
Gray Escrow II, Inc., 144A, 5.375%, 11/15/31 (d) | | | 2,725,000 | | | | 2,808,235 | |
Gray Television, Inc., 144A, 4.750%, 10/15/30 (d) | | | 3,000,000 | | | | 2,986,365 | |
iHeartCommunications, Inc., 144A, 4.750%, 01/15/28 (d) | | | 1,925,000 | | | | 1,955,126 | |
iHeartCommunications, Inc., 144A, 5.250%, 08/15/27 (d) | | | 3,100,000 | | | | 3,227,409 | |
iHeartCommunications, Inc., 8.375%, 05/01/27 | | | 1,950,000 | | | | 2,058,469 | |
Lamar Media Corp., 3.750%, 02/15/28 | | | 1,925,000 | | | | 1,932,575 | |
Lamar Media Corp., 4.000%, 02/15/30 | | | 2,000,000 | | | | 2,031,870 | |
LCPR Senior Secured Financing DAC, 144A, 5.125%, 07/15/29 (d) | | | 1,550,000 | | | | 1,560,075 | |
Percent of Net Assets
Name of Issuer and
Title of Issue | | Shares/
Principal/
Contracts | | | Value | |
CORPORATE BONDS, continued |
Media, continued |
LCPR Senior Secured Financing DAC, 144A, 6.750%, 10/15/27 (d) | | $ | 2,205,000 | | | $ | 2,317,455 | |
Netflix, Inc., 144A, 3.625%, 06/15/25 (d) | | | 1,025,000 | | | | 1,081,226 | |
Netflix, Inc., 4.875%, 04/15/28 | | | 2,575,000 | | | | 2,939,942 | |
Nexstar Media, Inc., 144A, 4.750%, 11/01/28 (d) | | | 1,550,000 | | | | 1,581,891 | |
Nexstar Media, Inc., 144A, 5.625%, 07/15/27 (d) | | | 2,575,000 | | | | 2,694,184 | |
Nielsen Finance, LLC/Co., 144A, 4.500%, 07/15/29 (d) | | | 2,650,000 | | | | 2,610,926 | |
Nielsen Finance, LLC/Co., 144A, 5.625%, 10/01/28 (d) | | | 4,150,000 | | | | 4,291,909 | |
Nielsen Finance, LLC/Co., 144A, 5.875%, 10/01/30 (d) | | | 1,025,000 | | | | 1,083,733 | |
Sirius XM Radio, Inc., 144A, 4.000%, 07/15/28 (d) | | | 2,275,000 | | | | 2,291,653 | |
Sirius XM Radio, Inc., 144A, 4.125%, 07/01/30 (d) | | | 1,475,000 | | | | 1,477,618 | |
Sirius XM Radio, Inc., 144A, 5.500%, 07/01/29 (d) | | | 2,075,000 | | | | 2,239,299 | |
Univision Communications, Inc., 144A, 4.500%, 05/01/29 (d) | | | 4,325,000 | | | | 4,375,948 | |
Virgin Media Finance, PLC, 144A, 5.000%, 07/15/30 (d) | | | 2,075,000 | | | | 2,067,861 | |
Virgin Media Secured Finance, PLC, 144A, 5.500%, 05/15/29 (d) | | | 1,550,000 | | | | 1,634,049 | |
Vmed O2 UK Financing I, PLC, 144A, 4.750%, 07/15/31 (d) | | | 2,000,000 | | | | 2,028,620 | |
VTR Comunicaciones SpA, 144A, 5.125%, 01/15/28 (d) | | | 1,378,000 | | | | 1,407,620 | |
VTR Finance NV, 144A, 6.375%, 07/15/28 (d) | | | 2,025,000 | | | | 2,108,957 | |
| | | | | | | | 106,309,043 | |
| | 115 | SEE NOTES TO FINANCIAL STATEMENTS |
December 31, 2021 |
Schedules of Investments, continued |
Pax High Yield Bond Fund, continued
Percent of Net Assets
Name of Issuer and
Title of Issue | | Shares/
Principal/
Contracts | | | Value | |
CORPORATE BONDS, continued |
Real Estate: 0.8% |
Five Point Operating Co., LP/Capital Corp., 144A, 7.875%, 11/15/25 (d) | | $ | 2,075,000 | | | $ | 2,166,591 | |
Kennedy-Wilson, Inc., 4.750%, 02/01/30 | | | 875,000 | | | | 888,318 | |
Kennedy-Wilson, Inc., 4.750%, 03/01/29 | | | 1,025,000 | | | | 1,049,615 | |
Kennedy-Wilson, Inc., 5.000%, 03/01/31 | | | 1,525,000 | | | | 1,573,045 | |
| | | | | | | | 5,677,569 | |
Retail: 8.3% |
Albertsons Cos., Inc./Safeway, Inc./New Albertsons, LP/Albertsons, LLC, 144A, 3.500%, 03/15/29 (d) | | | 2,075,000 | | | | 2,082,657 | |
Albertsons Cos., Inc./Safeway, Inc./New Albertsons, LP/Albertsons, LLC, 144A, 4.625%, 01/15/27 (d) | | | 4,000,000 | | | | 4,202,280 | |
Albertsons Cos., Inc./Safeway, Inc./New Albertsons, LP/Albertsons, LLC, 144A, 5.875%, 02/15/28 (d) | | | 2,075,000 | | | | 2,202,364 | |
Bath & Body Works, Inc., 144A, 6.625%, 10/01/30 (d) | | | 1,750,000 | | | | 1,984,806 | |
Bath & Body Works, Inc., 6.950%, 03/01/33 | | | 2,400,000 | | | | 2,811,504 | |
Carvana Co., 144A, 5.500%, 04/15/27 (d) | | | 1,800,000 | | | | 1,783,890 | |
Carvana Co., 144A, 5.625%, 10/01/25 (d) | | | 2,000,000 | | | | 2,002,500 | |
Crocs, Inc., 144A, 4.250%, 03/15/29 (d) | | | 2,075,000 | | | | 2,052,154 | |
Crocs, Inc., 144A, 4.125%, 08/15/31 (d) | | | 2,900,000 | | | | 2,839,028 | |
Fresh Market, Inc., The, 144A, 9.750%, 05/01/23 (d) | | | 2,775,000 | | | | 2,858,111 | |
Gap, Inc., The, 144A, 3.625%, 10/01/29 (d) | | | 875,000 | | | | 866,823 | |
Percent of Net Assets
Name of Issuer and
Title of Issue | | Shares/
Principal/
Contracts | | | Value | |
CORPORATE BONDS, continued |
Retail, continued |
Gap, Inc., The, 144A, 3.875%, 10/01/31 (d) | | $ | 2,650,000 | | | $ | 2,617,909 | |
Macy’s Retail Holdings, LLC, 5.125%, 01/15/42 | | | 1,000,000 | | | | 956,440 | |
Macy’s Retail Holdings, LLC, 144A, 5.875%, 04/01/29 (d) | | | 2,575,000 | | | | 2,749,843 | |
Macy’s Retail Holdings, LLC, 144A, 6.700%, 07/15/34 (d) | | | 2,700,000 | | | | 3,056,454 | |
Michaels Cos., Inc., The, 144A, 5.250%, 05/01/28 (d) | | | 3,075,000 | | | | 3,076,245 | |
Michaels Cos., Inc., The, 144A, 7.875%, 05/01/29 (d) | | | 2,075,000 | | | | 2,047,413 | |
New Albertsons, LP, 7.750%, 06/15/26 | | | 1,025,000 | | | | 1,166,501 | |
NMG Holding Co., Inc./Neiman Marcus Group, LLC, 144A, 7.125%, 04/01/26 (d) | | | 4,000,000 | | | | 4,251,760 | |
PetSmart, Inc./Finance Corp., 144A, 4.750%, 02/15/28 (d) | | | 2,575,000 | | | | 2,647,267 | |
PetSmart, Inc./Finance Corp., 144A, 7.750%, 02/15/29 (d) | | | 2,075,000 | | | | 2,257,631 | |
Safeway, Inc., 7.250%, 02/01/31 | | | 2,925,000 | | | | 3,453,387 | |
SEG Holding, LLC/Finance Corp., 144A, 5.625%, 10/15/28 (d) | | | 4,025,000 | | | | 4,222,123 | |
Victoria’s Secret & Co., 144A, 4.625%, 07/15/29 (d) | | | 3,125,000 | | | | 3,200,094 | |
| | | | | | | | 61,389,184 | |
Services: 9.2% |
Albion Financing 1 SARL/Aggreko Holdings, Inc., 144A, 6.125%, 10/15/26 (d) | | | 1,350,000 | | | | 1,364,890 | |
SEE NOTES TO FINANCIAL STATEMENTS | 116 | |
December 31, 2021 |
Schedules of Investments, continued |
Pax High Yield Bond Fund, continued
Percent of Net Assets
Name of Issuer and
Title of Issue | | Shares/
Principal/
Contracts | | | Value | |
CORPORATE BONDS, continued |
Services, continued |
Albion Financing 2SARL, 144A, 8.750%, 04/15/27 (d) | | $ | 1,350,000 | | | $ | 1,373,625 | |
Cengage Learning, Inc., 144A, 9.500%, 06/15/24 (d) | | | 1,250,000 | | | | 1,259,113 | |
Diamond BC BV, 144A, 4.625%, 10/01/29 (d) | | | 2,900,000 | | | | 2,881,107 | |
Diebold Nixdorf, Inc., 8.500%, 04/15/24 | | | 2,000,000 | | | | 2,002,080 | |
Diebold Nixdorf, Inc., 144A, 9.375%, 07/15/25 (d) | | | 2,575,000 | | | | 2,775,425 | |
Dycom Industries, Inc., 144A, 4.500%, 04/15/29 (d) | | | 3,075,000 | | | | 3,137,792 | |
GFL Environmental, Inc., 144A, 3.500%, 09/01/28 (d) | | | 1,025,000 | | | | 1,011,291 | |
GFL Environmental, Inc., 144A, 4.000%, 08/01/28 (d) | | | 2,725,000 | | | | 2,675,119 | |
GFL Environmental, Inc., 144A, 5.125%, 12/15/26 (d) | | | 2,075,000 | | | | 2,160,542 | |
Harsco Corp., 144A, 5.750%, 07/31/27 (d) | | | 2,925,000 | | | | 2,982,769 | |
Hertz Corp, The, 144A, 5.000%, 12/01/29 (d) | | | 3,300,000 | | | | 3,308,778 | |
Iron Mountain, Inc., 144A, 4.875%, 09/15/29 (d) | | | 3,575,000 | | | | 3,705,845 | |
Iron Mountain, Inc., 144A, 5.000%, 07/15/28 (d) | | | 1,025,000 | | | | 1,054,729 | |
KAR Auction Services, Inc., 144A, 5.125%, 06/01/25 (d) | | | 2,975,000 | | | | 3,023,225 | |
Maxim Crane Works Holdings Capital, LLC, 144A, 10.125%, 08/01/24 (d) | | | 1,833,000 | | | | 1,878,394 | |
NESCO Holdings II, Inc., 144A, 5.500%, 04/15/29 (d) | | | 2,825,000 | | | | 2,921,827 | |
Percent of Net Assets
Name of Issuer and
Title of Issue | | Shares/
Principal/
Contracts | | | Value | |
CORPORATE BONDS, continued |
Services, continued |
Picasso Finance Sub, Inc., 144A, 6.125%, 06/15/25 (d) | | $ | 1,670,000 | | | $ | 1,746,845 | |
Prime Security Services Borrower, LLC/Finance, Inc., 144A, 5.750%, 04/15/26 (d) | | | 1,550,000 | | | | 1,665,987 | |
Prime Security Services Borrower, LLC/Finance, Inc., 144A, 6.250%, 01/15/28 (d) | | | 5,350,000 | | | | 5,586,871 | |
Ritchie Bros Holdings, Inc., 144A, 4.750%, 12/15/31 (d) | | | 1,950,000 | | | | 2,039,095 | |
Staples, Inc., 144A, 10.750%, 04/15/27 (d) | | | 3,375,000 | | | | 3,184,448 | |
Staples, Inc., 144A, 7.500%, 04/15/26 (d) | | | 3,475,000 | | | | 3,575,080 | |
United Rentals North America, Inc., 5.250%, 01/15/30 | | | 1,575,000 | | | | 1,707,166 | |
WASH Multifamily Acquisition, Inc., 144A, 5.750%, 04/15/26 (d) | | | 2,975,000 | | | | 3,130,280 | |
Williams Scotsman International, Inc., 144A, 4.625%, 08/15/28 (d) | | | 3,100,000 | | | | 3,205,229 | |
WW International, Inc., 144A, 4.500%, 04/15/29 (d) | | | 3,075,000 | | | | 2,948,033 | |
| | | | | | | | 68,305,585 | |
Technology & Electronics: 10.0% |
Arches Buyer, Inc., 144A, 4.250%, 06/01/28 (d) | | | 3,375,000 | | | | 3,378,071 | |
Arches Buyer, Inc., 144A, 6.125%, 12/01/28 (d) | | | 1,025,000 | | | | 1,032,841 | |
Asteroid Private Merger Sub, Inc., 144A, 8.500%, 11/15/29 (d) | | | 1,575,000 | | | | 1,653,010 | |
Block, Inc., 144A, 2.750%, 06/01/26 (d) | | | 1,025,000 | | | | 1,027,568 | |
Block, Inc., 144A, 3.500%, 06/01/31 (d) | | | 2,300,000 | | | | 2,361,479 | |
| | 117 | SEE NOTES TO FINANCIAL STATEMENTS |
December 31, 2021 |
Schedules of Investments, continued |
Pax High Yield Bond Fund, continued
Percent of Net Assets
Name of Issuer and
Title of Issue | | Shares/
Principal/
Contracts | | | Value | |
CORPORATE BONDS, continued |
Technology & Electronics, continued |
Camelot Finance SA, 144A, 4.500%, 11/01/26 (d) | | $ | 2,075,000 | | | $ | 2,149,845 | |
Cars.com, Inc., 144A, 6.375%, 11/01/28 (d) | | | 3,550,000 | | | | 3,785,844 | |
Castle US Holding Corp., 144A, 9.500%, 02/15/28 (d) | | | 1,625,000 | | | | 1,696,361 | |
CommScope, Inc., 144A, 7.125%, 07/01/28 (d) | | | 1,550,000 | | | | 1,525,068 | |
CommScope, Inc., 144A, 8.250%, 03/01/27 (d) | | | 1,425,000 | | | | 1,465,000 | |
Elastic NV, 144A, 4.125%, 07/15/29 (d) | | | 3,350,000 | | | | 3,319,900 | |
Endure Digital, Inc., 144A, 6.000%, 02/15/29 (d) | | | 1,975,000 | | | | 1,839,525 | |
Gartner, Inc., 144A, 3.625%, 06/15/29 (d) | | | 1,000,000 | | | | 1,012,675 | |
Gartner, Inc., 144A, 4.500%, 07/01/28 (d) | | | 3,100,000 | | | | 3,242,631 | |
HealthEquity, Inc., 144A, 4.500%, 10/01/29 (d) | | | 1,950,000 | | | | 1,932,938 | |
II-VI, Inc., 144A, 5.000%, 12/15/29 (d) | | | 3,000,000 | | | | 3,068,759 | |
Imola Merger Corp., 144A, 4.750%, 05/15/29 (d) | | | 3,425,000 | | | | 3,515,523 | |
LogMeIn, Inc., 144A, 5.500%, 09/01/27 (d) | | | 3,550,000 | | | | 3,596,292 | |
MSCI, Inc., 144A, 3.625%, 09/01/30 (d) | | | 1,000,000 | | | | 1,024,040 | |
MSCI, Inc., 144A, 3.875%, 02/15/31 (d) | | | 1,025,000 | | | | 1,068,864 | |
MSCI, Inc., 144A, 4.000%, 11/15/29 (d) | | | 2,075,000 | | | | 2,171,820 | |
NCR Corp., 144A, 5.125%, 04/15/29 (d) | | | 4,575,000 | | | | 4,744,321 | |
Nokia Oyj, 6.625%, 05/15/39 | | | 950,000 | | | | 1,315,874 | |
Plantronics, Inc., 144A, 4.750%, 03/01/29 (d) | | | 2,525,000 | | | | 2,411,905 | |
Rackspace Technology Global, Inc., 144A, 5.375%, 12/01/28 (d) | | | 3,100,000 | | | | 3,026,964 | |
Twilio, Inc., 3.625%, 03/15/29 | | | 1,650,000 | | | | 1,667,144 | |
Twilio, Inc., 3.875%, 03/15/31 | | | 1,650,000 | | | | 1,668,373 | |
Unisys Corp., 144A, 6.875%, 11/01/27 (d) | | | 3,100,000 | | | | 3,360,400 | |
Percent of Net Assets
Name of Issuer and
Title of Issue | | Shares/
Principal/
Contracts | | | Value | |
CORPORATE BONDS, continued |
Technology & Electronics, continued |
Veritas US, Inc./Bermuda, Ltd., 144A, 7.500%, 09/01/25 (d) | | $ | 2,500,000 | | | $ | 2,590,763 | |
VM Consolidated, Inc., 144A, 5.500%, 04/15/29 (d) | | | 3,400,000 | | | | 3,421,828 | |
ZoomInfo Technologies, LLC/Finance Corp., 144A, 3.875%, 02/01/29 (d) | | | 3,900,000 | | | | 3,872,213 | |
| | | | | | | | 73,947,839 | |
Telecommunications: 6.1% |
Digicel Group Holdings, Ltd., 10.000%, 04/01/24 | | | 1,085,750 | | | | 1,086,933 | |
Digicel International Finance, Ltd./Holdings, Ltd., 144A, 8.750%, 05/25/24 (d) | | | 1,000,000 | | | | 1,027,300 | |
Digicel, Ltd., 144A, 6.750%, 03/01/23 (d) | | | 900,000 | | | | 869,666 | |
Frontier Communications Holdings, LLC, 144A, 5.000%, 05/01/28 (d) | | | 2,050,000 | | | | 2,115,211 | |
Frontier Communications Holdings, LLC, 144A, 6.750%, 05/01/29 (d) | | | 1,975,000 | | | | 2,057,022 | |
Level 3 Financing, Inc., 144A, 4.625%, 09/15/27 (d) | | | 2,975,000 | | | | 3,039,006 | |
Ligado Networks, LLC, 144A, 15.500%, 11/01/23 (d) | | | 2,410,246 | | | | 1,894,060 | |
Lumen Technologies, Inc., 144A, 5.125%, 12/15/26 (d) | | | 2,075,000 | | | | 2,162,441 | |
Lumen Technologies, Inc., 6.750%, 12/01/23 | | | 1,025,000 | | | | 1,108,148 | |
Sable International Finance, Ltd., 144A, 5.750%, 09/07/27 (d) | | | 2,314,000 | | | | 2,371,271 | |
Sprint Capital Corp., 6.875%, 11/15/28 | | | 1,925,000 | | | | 2,438,359 | |
Sprint Capital Corp., 8.750%, 03/15/32 | | | 1,400,000 | | | | 2,102,352 | |
Sprint Corp., 7.125%, 06/15/24 | | | 3,100,000 | | | | 3,484,152 | |
SEE NOTES TO FINANCIAL STATEMENTS | 118 | |
December 31, 2021 |
Schedules of Investments, continued |
Pax High Yield Bond Fund, continued
Percent of Net Assets
Name of Issuer and
Title of Issue | | Shares/
Principal/
Contracts | | | Value | |
CORPORATE BONDS, continued |
Telecommunications, continued |
Switch, Ltd., 144A, 4.125%, 06/15/29 (d) | | $ | 2,775,000 | | | $ | 2,841,419 | |
Telecom Italia Capital SA, 7.200%, 07/18/36 | | | 1,550,000 | | | | 1,779,709 | |
Telecom Italia SpA, 144A, 5.303%, 05/30/24 (d) | | | 2,075,000 | | | | 2,186,531 | |
T-Mobile USA, Inc., 2.625%, 04/15/26 | | | 825,000 | | | | 830,202 | |
T-Mobile USA, Inc., 144A, 3.375%, 04/15/29 (d) | | | 2,950,000 | | | | 3,010,977 | |
T-Mobile USA, Inc., 4.750%, 02/01/28 | | | 2,100,000 | | | | 2,213,883 | |
Uniti Group, LP/Fiber Holdings, Inc./CSL Capital, LLC, 144A, 7.875%, 02/15/25 (d) | | | 1,550,000 | | | | 1,619,673 | |
Uniti Group, LP/Finance, Inc./CSL Capital, LLC, 144A, 4.750%, 04/15/28 (d) | | | 1,025,000 | | | | 1,018,076 | |
Uniti Group, LP/Finance, Inc./CSL Capital, LLC, 144A, 6.500%, 02/15/29 (d) | | | 2,075,000 | | | | 2,071,016 | |
Zayo Group Holdings, Inc., 144A, 4.000%, 03/01/27 (d) | | | 1,700,000 | | | | 1,676,447 | |
| | | | | | | | 45,003,854 | |
Transportation: 0.4% |
Great Lakes Dredge & Dock Corp., 144A, 5.250%, 06/01/29 (d) | | | 2,975,000 | | | | 3,068,727 | |
| | | | | | | | | |
Utility: 2.2% |
Clearway Energy Operating, LLC, 144A, 3.750%, 01/15/32 (d) | | | 1,100,000 | | | | 1,093,329 | |
Clearway Energy Operating, LLC, 144A, 3.750%, 02/15/31 (d) | | | 1,525,000 | | | | 1,523,536 | |
Clearway Energy Operating, LLC, 144A, 4.750%, 03/15/28 (d) | | | 2,075,000 | | | | 2,184,394 | |
Percent of Net Assets
Name of Issuer and
Title of Issue | | Shares/
Principal/
Contracts | | | Value | |
CORPORATE BONDS, continued |
Utility, continued |
Leeward Renewable Energy Operations, LLC, 144A, 4.250%, 07/01/29 (d) | | $ | 2,000,000 | | | $ | 2,022,960 | |
Pattern Energy Operations, LP/Inc., 144A, 4.500%, 08/15/28 (d) | | | 2,525,000 | | | | 2,623,627 | |
Sunnova Energy Corp., 144A, 5.875%, 09/01/26 (d) | | | 3,900,000 | | | | 3,982,055 | |
TerraForm Power Operating, LLC, 144A, 4.750%, 01/15/30 (d) | | | 1,925,000 | | | | 2,021,019 | |
TerraForm Power Operating, LLC, 144A, 5.000%, 01/31/28 (d) | | | 1,025,000 | | | | 1,087,141 | |
| | | | | | | | 16,538,061 | |
TOTAL CORPORATE BONDS |
(Cost $687,029,497) | | | | | | | 695,761,770 | |
| | | | | | | | | |
LOANS: 2.3% |
Consumer Goods: 0.7% |
AI Aqua Merger Sub, Inc., aka Culligan, 1 month LIBOR + 4.00%, 4.500%, 07/30/28 (e) | | | 1,777,778 | | | | 1,784,916 | |
AI Aqua Merger Sub, Inc., aka Culligan, 1 month LIBOR + 4.00%, 4.500%, 07/30/28 (e) | | | 222,222 | | | | 223,114 | |
Whole Earth Brands, Inc., 3 month LIBOR + 4.500%, 5.500%, 02/05/28 (e) | | | 3,054,612 | | | | 3,043,157 | |
| | | | | | | | 5,051,187 | |
Media: 0.2% |
Directv Financing, LLC, 5.750%, 08/02/27 (e) | | | 1,270,750 | | | | 1,273,558 | |
| | | | | | | | | |
Services: 0.2% |
Cengage Learning, Inc., 1 month LIBOR + 4.750%, 5.750%, 07/14/26 (e) | | | 1,745,625 | | | | 1,752,625 | |
| | | | | | | | | |
| | 119 | SEE NOTES TO FINANCIAL STATEMENTS |
December 31, 2021 |
Schedules of Investments, continued |
Pax High Yield Bond Fund, continued
Percent of Net Assets
Name of Issuer and
Title of Issue | | Shares/
Principal/
Contracts | | | Value | |
LOANS, continued |
Telecommunications: 0.1% |
Digicel International Finance, Ltd., 3 month LIBOR + 3.250%, 3.382%, 05/27/24 (e) | | $ | 989,667 | | | $ | 965,667 | |
| | | | | | | | | |
Transportation: 1.1% | | | | | | | | |
Mileage Plus Holdings, LLC, aka United Air, 3 month LIBOR + 5.250%, 6.250%, 06/20/27 (e) | | | 4,500,000 | | | | 4,757,648 | |
SkyMiles IP, Ltd., aka Delta Airlines, Inc., 3 month LIBOR + 3.750%, 4.750%, 10/20/27 (e) | | | 3,000,000 | | | | 3,180,000 | |
| | | | | | | | 7,937,648 | |
TOTAL LOANS |
(Cost $16,933,020) | | | | | | | 16,980,685 | |
| | | | | | | | | |
TOTAL BONDS |
(Cost $704,473,355) | | | | | | | 713,253,293 | |
| | | | | | | | | |
Certificates Of Deposit: 0.1% |
Self-Help Federal Credit Union, 0.650%, 04/29/22 | | | 100,000 | | | | 100,137 | |
Shared Interest, Inc., 0.550%, 09/30/24 | | | 500,000 | | | | 500,000 | |
| | | | | | | | | |
TOTAL CERTIFICATES OF DEPOSIT |
(Cost $600,000) | | | | | | | 600,137 | |
| | | | | | | | | |
MONEY MARKET: 2.6% |
State Street Institutional U.S. Government Money Market Fund, 0.030% (f)(g) | | | 19,513,149 | | | | 19,513,149 | |
(Cost $19,513,149) | | | | | | | | |
| | | | | | | | | |
TOTAL INVESTMENTS: 99.4% |
(Cost $726,123,825) | | | | | | | 735,950,779 | |
| | | | | | | | | |
OTHER ASSETS AND LIABILITIES — (NET): 0.6% | | | 4,500,802 | |
| | | | | | | | | |
Net Assets: 100.0% | | $ | 740,451,581 | |
(a) | Non-income producing security. |
(c) | Security valued using significant unobservable inputs. |
(d) | Security purchased pursuant to Rule 144A of the Securities Act of 1933 and may be resold |
(e) | Rate shown reflects the accrual rate as of December 31, 2021 on securities with variable or step rates. |
(f) | Rate shown represents annualized 7-day yield as of December 31, 2021. |
LIBOR-London Inter-bank Offered Rate. Interest rate shown reflects rates in effect as of December 31, 2021.
LP - Limited Partnership
SEE NOTES TO FINANCIAL STATEMENTS | 120 | |
December 31, 2021 |
Schedules of Investments, continued |
Pax Sustainable Allocation Fund
Percent of Net Assets
Name of Issuer and
Title of Issue | | Shares/
Principal | | | Value | |
Affiliated Investment Companies: 94.9% |
Pax Core Bond Fund (a) | | | 71,152,536 | | | $ | 726,467,396 | |
Pax Ellevate Global Women’s Leadership Fund (a) | | | 1,992,667 | | | | 70,400,912 | |
Pax Global Environmental Markets Fund (a) | | | 2,851,724 | | | | 72,433,778 | |
Pax Global Opportunities Fund (a) | | | 4,015,222 | | | | 68,861,063 | |
Pax Global Sustainable Infrastructure Fund (a) | | | 7,758,860 | | | | 78,752,429 | |
Pax High Yield Bond Fund (a) | | | 13,284,046 | | | | 91,394,238 | |
Pax International Sustainable Economy Fund (a) | | | 15,930,405 | | | | 171,411,156 | |
Pax Large Cap Fund (a) | | | 76,137,343 | | | | 1,132,162,284 | |
Pax Small Cap Fund (a) | | | 4,377,966 | | | | 83,137,569 | |
| |
TOTAL AFFILIATED INVESTMENT COMPANIES |
(Cost $1,972,998,712) | | | 2,495,020,825 | |
| | | | | | | | | |
Money Market: 4.7% |
State Street Institutional U.S. Government Money Market Fund, 0.030% (b)(c) | | | 123,058,531 | | | | 123,058,531 | |
(Cost $123,058,531) |
| | | | | | | | | |
TOTAL INVESTMENTS: 99.6% |
(Cost $2,096,057,243) | | | 2,618,079,356 | |
| | | | | | | | | |
OTHER ASSETS AND LIABILITIES — (NET): 0.4% | | | 9,752,426 | |
| | | | | | | | | |
NET ASSETS: 100.0% | | $ | 2,627,831,782 | |
(a) | Institutional Class shares |
(b) | Rate shown represents annualized 7-day yield as of December 31, 2021. |
| | 121 | SEE NOTES TO FINANCIAL STATEMENTS |
December 31, 2021 |
Statements of Assets and Liabilities |
| | Large Cap
Fund | | | Small Cap
Fund | | | US
Sustainable
Economy
Fund | | | Global
Sustainable
Infrastructure
Fund | |
ASSETS | | | | | | | | | | | | | | | | |
Investments, at cost - Note A | | $ | 959,339,812 | | | $ | 576,253,363 | | | $ | 169,953,857 | | | $ | 93,750,116 | |
| | | | | | | | | | | | | | | | | |
Investments in unaffiliated issuers, at value | | $ | 1,568,292,915 | | | $ | 740,785,571 | | | $ | 314,545,036 | | | $ | 98,200,392 | |
Investments in affiliated issuers, at value | | | — | | | | — | | | | — | | | | — | |
Total investments, at value - Note A1 | | | 1,568,292,915 | | | | 740,785,571 | | | | 314,545,036 | | | | 98,200,392 | |
Cash | | | 8,902,622 | | | | — | | | | 4,170 | | | | — | |
Foreign currency at value (cost $2,825,402; and $109,700, respectively) | | | — | | | | — | | | | — | | | | — | |
Prepaid expenses | | | 167 | | | | 124 | | | | — | | | | — | |
Receivables: | | | | | | | | | | | | | | | | |
Capital stock sold | | | 1,520,725 | | | | 9,938,377 | | | | 215,308 | | | | 178,701 | |
Dividends and interest - Note A | | | 813,496 | | | | 1,232,813 | | | | 237,862 | | | | 193,909 | |
Investment securities sold | | | — | | | | 388,179 | | | | — | | | | — | |
Investment Adviser reimbursement | | | — | | | | — | | | | — | | | | — | |
Other | | | — | | | | 237,893 | | | | 75 | | | | 60,390 | |
Total Assets | | | 1,579,529,925 | | | | 752,582,957 | | | | 315,002,451 | | | | 98,633,392 | |
| | | | | | | | | | | | | | | | | |
LIABILITIES | | | | | | | | | | | | | | | | |
Collateral on securities loaned, at value | | | — | | | | 8,711,743 | | | | 110,051 | | | | 910,028 | |
Payables: | | | | | | | | | | | | | | | | |
Capital stock reacquired | | | 231,179 | | | | 150,047 | | | | 307,595 | | | | 1,274 | |
Investment securities purchased | | | 8,802,675 | | | | 416,074 | | | | — | | | | — | |
Dividend payable - Note A | | | — | | | | — | | | | — | | | | — | |
Accrued expenses: | | | | | | | | | | | | | | | | |
Investment advisory fees - Note B | | | 837,416 | | | | 450,809 | | | | 117,918 | | | | 44,343 | |
Distribution expense | | | 11,943 | | | | 28,692 | | | | 44,122 | | | | 1,108 | |
Trustees fees | | | — | | | | — | | | | — | | | | — | |
Compliance expense | | | 1,041 | | | | 1,156 | | | | — | | | | — | |
Transfer agent fees | | | 22,228 | | | | 70,247 | | | | — | | | | — | |
Printing and other shareholder communication fees | | | 902 | | | | 3,878 | | | | — | | | | — | |
Custodian fees | | | 10,548 | | | | 7,666 | | | | — | | | | — | |
Legal and audit fees | | | 52,988 | | | | 41,348 | | | | — | | | | — | |
Other accrued expenses | | | 46,575 | | | | 39,373 | | | | — | | | | — | |
Total Liabilities | | | 10,017,495 | | | | 9,921,033 | | | | 579,686 | | | | 956,753 | |
NET ASSETS | | $ | 1,569,512,430 | | | $ | 742,661,924 | | | $ | 314,422,765 | | | $ | 97,676,639 | |
1 | Investments at market value include securities loaned. At December 31, 2021, the Small Cap Fund, US Sustainable Economy Fund, Global Sustainable Infrastructure Fund, Global Women’s Leadership Fund, International Sustainable Economy Fund and Core Bond Fund had total market values of securities on loan of $11,676,146; $748,297; $1,793,694; $6,180,549; $15,873,795 and $6,912,083, respectively. |
SEE NOTES TO FINANCIAL STATEMENTS | 122 | |
| | Global
Opportunities
Fund | | | Global
Environmental
Markets Fund | | | Global
Women’s
Leadership
Fund | | | International
Sustainable
Economy
Fund | | | Core Bond
Fund | | | High Yield
Bond Fund | | | Sustainable
Allocation
Fund | |
| | | | | | | | | | | | | | | | | | | | | | | | | | | | |
| | $ | 108,844,446 | | | $ | 1,871,928,370 | | | $ | 761,289,704 | | | $ | 707,162,522 | | | $ | 780,441,811 | | | $ | 726,123,825 | | | $ | 2,096,057,243 | |
| | | | | | | | | | | | | | | | | | | | | | | | | | | | |
| | $ | 143,641,207 | | | $ | 2,731,883,850 | | | $ | 1,017,876,183 | | | $ | 882,434,041 | | | $ | 789,754,143 | | | $ | 735,950,779 | | | $ | 123,058,531 | |
| | | — | | | | — | | | | — | | | | — | | | | — | | | | — | | | | 2,495,020,825 | |
| | | 143,641,207 | | | | 2,731,883,850 | | | | 1,017,876,183 | | | | 882,434,041 | | | | 789,754,143 | | | | 735,950,779 | | | | 2,618,079,356 | |
| | | — | | | | 200,063 | | | | 49,777 | | | | — | | | | — | | | | 1,776,356 | | | | — | |
| | | — | | | | — | | | | 2,841,407 | | | | 109,485 | | | | — | | | | — | | | | — | |
| | | — | | | | 697 | | | | — | | | | — | | | | — | | | | 227 | | | | — | |
| | | | | | | | | | | | | | | | | | | | | | | | | | | | |
| | | 78,488 | | | | 14,377,903 | | | | 790,976 | | | | 1,979,276 | | | | 219,374 | | | | 813,899 | | | | 10,836,283 | |
| | | 54,461 | | | | 898,872 | | | | 694,521 | | | | 796,611 | | | | 3,123,873 | | | | 9,368,752 | | | | 1,411,486 | |
| | | 745,940 | | | | — | | | | — | | | | — | | | | — | | | | 2,583 | | | | — | |
| | | 18,295 | | | | — | | | | — | | | | — | | | | — | | | | — | | | | — | |
| | | 19,943 | | | | 988,858 | | | | 341,495 | | | | 2,423,282 | | | | 718 | | | | — | | | | — | |
| | | 144,558,334 | | | | 2,748,350,243 | | | | 1,022,594,359 | | | | 887,742,695 | | | | 793,098,108 | | | | 747,912,596 | | | | 2,630,327,125 | |
| | | | | | | | | | | | | | | | | | | | | | | | | | | | |
| | | | | | | | | | | | | | | | | | | | | | | | | | | | |
| | | — | | | | — | | | | 104,400 | | | | 8,284,299 | | | | 7,064,485 | | | | — | | | | — | |
| | | | | | | | | | | | | | | | | | | | | | | | | | | | |
| | | 22,991 | | | | 563,979 | | | | 3,890,229 | | | | 176,001 | | | | 90,284 | | | | 850,218 | | | | 630,716 | |
| | | 1,352,705 | | | | — | | | | 2,851,304 | | | | 109,485 | | | | — | | | | 5,816,147 | | | | 1,408,784 | |
| | | — | | | | — | | | | — | | | | — | | | | 4,351 | | | | 234,598 | | | | — | |
| | | | | | | | | | | | | | | | | | | | | | | | | | | | |
| | | 89,856 | | | | 1,634,380 | | | | 425,297 | | | | 332,603 | | | | 265,660 | | | | 307,174 | | | | 108,676 | |
| | | 1,201 | | | | 51,654 | | | | 33,377 | | | | 18,710 | | | | 2,979 | | | | 38,006 | | | | 347,167 | |
| | | — | | | | — | | | | — | | | | — | | | | 579 | | | | — | | | | — | |
| | | 1,253 | | | | 860 | | | | — | | | | — | | | | 1,163 | | | | 1,165 | | | | — | |
| | | 7,443 | | | | 346,153 | | | | — | | | | — | | | | 3,897 | | | | 86,583 | | | | — | |
| | | 1,515 | | | | 1,740 | | | | — | | | | — | | | | 3,066 | | | | 14,580 | | | | — | |
| | | 12,393 | | | | 56,705 | | | | — | | | | — | | | | 23,790 | | | | 21,194 | | | | — | |
| | | 39,072 | | | | 71,696 | | | | — | | | | — | | | | 54,349 | | | | 48,921 | | | | — | |
| | | 9,599 | | | | 102,687 | | | | — | | | | — | | | | 13,452 | | | | 42,429 | | | | — | |
| | | 1,538,028 | | | | 2,829,854 | | | | 7,304,607 | | | | 8,921,098 | | | | 7,528,055 | | | | 7,461,015 | | | | 2,495,343 | |
| | $ | 143,020,306 | | | $ | 2,745,520,389 | | | $ | 1,015,289,752 | | | $ | 878,821,597 | | | $ | 785,570,053 | | | $ | 740,451,581 | | | $ | 2,627,831,782 | |
| | 123 | SEE NOTES TO FINANCIAL STATEMENTS |
December 31, 2021 |
Statements of Assets and Liabilities, continued |
| | Large Cap
Fund | | | Small Cap
Fund | | | US
Sustainable
Economy
Fund | | | Global
Sustainable
Infrastructure
Fund | |
NET ASSETS REPRESENTED BY: | | | | | | | | | | | | | | | | |
Paid in Capital | | $ | 937,943,004 | | | $ | 571,178,352 | | | $ | 167,819,864 | | | $ | 93,431,297 | |
Total distributable earnings | | | 631,569,426 | | | | 171,483,572 | | | | 146,602,901 | | | | 4,245,342 | |
NET ASSETS | | $ | 1,569,512,430 | | | $ | 742,661,924 | | | $ | 314,422,765 | | | $ | 97,676,639 | |
| | | | | | | | | | | | | | | | | |
Investor Class | | | | | | | | | | | | | | | | |
Net assets | | $ | 57,965,114 | | | $ | 125,234,211 | | | $ | 205,406,582 | | | $ | 5,432,381 | |
Capital Shares Outstanding (unlimited/authorized) | | | 3,911,109 | | | | 6,691,028 | | | | 8,126,192 | | | | 537,439 | |
Net asset value per share | | $ | 14.82 | | | $ | 18.72 | | | $ | 25.28 | | | $ | 10.11 | |
Class A | | | | | | | | | | | | | | | | |
Net assets | | | | | | $ | 14,304,814 | | | $ | 10,150,474 | | | | | |
Capital Shares Outstanding (unlimited/authorized) | | | | | | | 766,651 | | | | 403,100 | | | | | |
Net asset value per share | | | | | | $ | 18.66 | | | $ | 25.18 | | | | | |
Institutional Class | | | | | | | | | | | | | | | | |
Net assets | | $ | 1,511,547,317 | | | $ | 603,122,899 | | | $ | 98,865,709 | | | $ | 92,244,258 | |
Capital Shares Outstanding (unlimited/authorized) | | | 101,651,264 | | | | 31,755,144 | | | | 3,765,971 | | | | 9,080,540 | |
Net asset value per share | | $ | 14.87 | | | $ | 18.99 | | | $ | 26.25 | | | $ | 10.16 | |
SEE NOTES TO FINANCIAL STATEMENTS | 124 | |
| | Global
Opportunities
Fund | | | Global
Environmental
Markets Fund | | | Global
Women’s
Leadership
Fund | | | International
Sustainable
Economy
Fund | | | Core Bond
Fund | | | High Yield
Bond Fund | | | Sustainable
Allocation
Fund | |
| | | | | | | | | | | | | | | | | | | | | | | | | | | | |
| | $ | 107,790,564 | | | $ | 1,883,228,381 | | | $ | 743,370,679 | | | $ | 708,121,978 | | | $ | 779,887,362 | | | $ | 790,920,043 | | | $ | 1,890,206,159 | |
| | | 35,229,742 | | | | 862,292,008 | | | | 271,919,073 | | | | 170,699,619 | | | | 5,682,691 | | | | (50,468,462 | ) | | | 737,625,623 | |
| | $ | 143,020,306 | | | $ | 2,745,520,389 | | | $ | 1,015,289,752 | | | $ | 878,821,597 | | | $ | 785,570,053 | | | $ | 740,451,581 | | | $ | 2,627,831,782 | |
| | | | | | | | | | | | | | | | | | | | | | | | | | | | |
| | | | | | | | | | | | | | | | | | | | | | | | | | | | |
| | $ | 5,784,091 | | | $ | 227,901,870 | | | $ | 160,749,492 | | | $ | 90,992,984 | | | $ | 14,075,535 | | | $ | 172,880,515 | | | $ | 1,652,891,571 | |
| | | 338,484 | | | | 9,037,987 | | | | 4,575,110 | | | | 8,278,814 | | | | 1,378,970 | | | | 25,045,003 | | | | 57,030,214 | |
| | $ | 17.09 | | | $ | 25.22 | | | $ | 35.14 | | | $ | 10.99 | | | $ | 10.21 | | | $ | 6.90 | | | $ | 28.98 | |
| | | | | | | | | | | | | | | | | | | | | | | | | | | | |
| | | | | | $ | 22,613,239 | | | | | | | | | | | | | | | $ | 7,102,354 | | | | | |
| | | | | | | 898,279 | | | | | | | | | | | | | | | | 1,026,593 | | | | | |
| | | | | | $ | 25.17 | | | | | | | | | | | | | | | $ | 6.92 | | | | | |
| | | | | | | | | | | | | | | | | | | | | | | | | | | | |
| | $ | 137,236,215 | | | $ | 2,495,005,280 | | | $ | 854,540,260 | | | $ | 787,828,613 | | | $ | 771,494,518 | | | $ | 560,468,712 | | | $ | 974,940,211 | |
| | | 8,001,758 | | | | 98,229,288 | | | | 24,190,429 | | | | 73,225,382 | | | | 75,587,415 | | | | 81,483,373 | | | | 33,007,267 | |
| | $ | 17.15 | | | $ | 25.40 | | | $ | 35.33 | | | $ | 10.76 | | | $ | 10.21 | | | $ | 6.88 | | | $ | 29.54 | |
| | 125 | SEE NOTES TO FINANCIAL STATEMENTS |
For the Year Ended December 31, 2021 |
Statements of Operations |
| | Large Cap
Fund | | | Small Cap
Fund | | | US
Sustainable
Economy
Fund | | | Global
Sustainable
Infrastructure
Fund | |
INVESTMENT INCOME | | | | | | | | | | | | | | | | |
Income | | | | | | | | | | | | | | | | |
Dividends (net of foreign withholding tax of $0; $22,568; $1,463; $199,535; $65,132; $1,233,779; $863,698; $1,923,076; $0; $0 and $0 respectively) | | $ | 15,949,327 | | | $ | 9,804,086 | | | $ | 4,297,415 | | | $ | 3,670,647 | |
Dividends from affiliates - Note C | | | — | | | | — | | | | — | | | | — | |
Interest | | | 11,142 | | | | 7,597 | | | | 212 | | | | 258 | |
Income from securities lending - Note A | | | 1,408 | | | | 362,865 | | | | 8,269 | | | | 4,426 | |
Other income - Note B | | | — | | | | — | | | | 766 | | | | 4,139 | |
Total Income | | | 15,961,877 | | | | 10,174,548 | | | | 4,306,662 | | | | 3,679,470 | |
| | | | | | | | | | | | | | | | | |
Expenses | | | | | | | | | | | | | | | | |
Investment advisory fees - Note B | | | 8,752,861 | | | | 4,696,995 | | | | 1,825,433 | | | | 704,119 | |
Distribution expenses - Investor (Note B) | | | 102,231 | | | | 295,632 | | | | 472,864 | | | | 12,293 | |
Distribution expenses - Class A (Note B) | | | — | | | | 30,957 | | | | 20,727 | | | | — | |
Transfer agent fees - Note A | | | 322,088 | | | | 561,973 | | | | — | | | | — | |
Printing and other shareholder communication fees | | | 25,972 | | | | 46,598 | | | | — | | | | — | |
Custodian fees | | | 104,178 | | | | 59,145 | | | | — | | | | — | |
Legal fees and related expenses | | | 99,956 | | | | 68,073 | | | | — | | | | — | |
Trustees’ fees and expenses - Note B | | | 64,169 | | | | 43,899 | | | | — | | | | — | |
Compliance expense | | | 17,610 | | | | 16,200 | | | | — | | | | — | |
Audit fees | | | 50,630 | | | | 40,671 | | | | — | | | | — | |
Registration fees | | | 96,964 | | | | 69,038 | | | | — | | | | — | |
Other expenses | | | 76,885 | | | | 33,952 | | | | — | | | | — | |
Total Expenses | | | 9,713,544 | | | | 5,963,133 | | | | 2,319,024 | | | | 716,412 | |
Less: Advisory fee waiver - Note B | | | — | | | | — | | | | (396,592 | ) | | | (75,156 | ) |
Expenses assumed by Adviser - Note B | | | — | | | | — | | | | — | | | | — | |
Net expenses | | | 9,713,544 | | | | 5,963,133 | | | | 1,922,432 | | | | 641,256 | |
Net investment income | | | 6,248,333 | | | | 4,211,415 | | | | 2,384,230 | | | | 3,038,214 | |
REALIZED AND UNREALIZED GAIN (LOSS) - Notes A and C | | | | | | | | | | | | | | | | |
Net realized gain (loss) on: | | | | | | | | | | | | | | | | |
Investments in unaffiliated issuers | | | 102,690,737 | | | | 61,651,683 | | | | 61,665,649 | | | | 65,945,779 | |
Investment in affiliated issuers | | | — | | | | — | | | | — | | | | — | |
Foreign currency transactions | | | — | | | | (3,169 | ) | | | (13,773 | ) | | | (49,422 | ) |
Change in unrealized appreciation (depreciation) on: | | | | | | | | | | | | | | | | |
Investments in unaffiliated issuers | | | 239,900,456 | | | | 86,201,314 | | | | 11,974,854 | | | | (53,321,780 | ) |
Investment in affiliated issuers | | | — | | | | — | | | | — | | | | — | |
Foreign currency translation | | | — | | | | 210 | | | | — | | | | (1,071 | ) |
Net realized and unrealized gain (loss) on investments and foreign currency | | | 342,591,193 | | | | 147,850,038 | | | | 73,626,730 | | | | 12,573,506 | |
| | | | | | | | | | | | | | | | | |
Net increase (decrease) in net assets resulting from operations | | $ | 348,839,526 | | | $ | 152,061,453 | | | $ | 76,010,960 | | | $ | 15,611,720 | |
SEE NOTES TO FINANCIAL STATEMENTS | 126 | |
For the Year Ended December 31, 2021 |
|
| | Global
Opportunities
Fund | | | Global
Environmental
Markets Fund | | | Global
Women’s
Leadership
Fund | | | International
Sustainable
Economy
Fund | | | Core Bond
Fund | | | High Yield
Bond Fund | | | Sustainable
Allocation
Fund | |
| | | | | | | | | | | | | | | | | | | | | | | | | | | | |
| | | | | | | | | | | | | | | | | | | | | | | | | | | | |
| | $ | 1,202,613 | | | $ | 38,903,328 | | | $ | 17,418,301 | | | $ | 21,242,620 | | | $ | — | | | $ | 120,900 | | | $ | — | |
| | | — | | | | — | | | | — | | | | — | | | | — | | | | — | | | | 27,073,448 | |
| | | — | | | | 14,836 | | | | 806 | | | | 771 | | | | 15,799,233 | | | | 29,177,496 | | | | 29,842 | |
| | | — | | | | — | | | | 8,932 | | | | 67,417 | | | | 11,891 | | | | — | | | | — | |
| | | 50,654 | | | | 643,984 | | | | 1,000 | | | | — | | | | — | | | | 14,899 | | | | — | |
| | | 1,253,267 | | | | 39,562,148 | | | | 17,429,039 | | | | 21,310,808 | | | | 15,811,124 | | | | 29,313,295 | | | | 27,103,290 | |
| | | | | | | | | | | | | | | | | | | | | | | | | | | | |
| | | | | | | | | | | | | | | | | | | | | | | | | | | | |
| | | 936,703 | | | | 16,761,299 | | | | 4,605,721 | | | | 3,723,497 | | | | 3,068,045 | | | | 3,071,380 | | | | 1,211,934 | |
| | | 11,562 | | | | 506,160 | | | | 370,871 | | | | 215,728 | | | | 36,545 | | | | 428,199 | | | | 4,017,027 | |
| | | — | | | | 48,638 | | | | — | | | | — | | | | — | | | | 16,646 | | | | — | |
| | | 74,686 | | | | 2,321,944 | | | | — | | | | — | | | | 42,496 | | | | 616,006 | | | | — | |
| | | 5,812 | | | | 95,921 | | | | — | | | | — | | | | 10,083 | | | | 97,749 | | | | — | |
| | | 50,574 | | | | 344,983 | | | | — | | | | — | | | | 132,269 | | | | 110,240 | | | | — | |
| | | 46,150 | | | | 138,471 | | | | — | | | | — | | | | 76,698 | | | | 67,518 | | | | — | |
| | | 29,625 | | | | 88,220 | | | | — | | | | — | | | | 49,372 | | | | 43,396 | | | | — | |
| | | 15,224 | | | | 19,288 | | | | — | | | | — | | | | 16,512 | | | | 16,184 | | | | — | |
| | | 41,069 | | | | 70,346 | | | | — | | | | — | | | | 54,778 | | | | 49,280 | | | | — | |
| | | 42,205 | | | | 143,397 | | | | — | | | | — | | | | 44,376 | | | | 86,421 | | | | — | |
| | | 12,374 | | | | 155,326 | | | | — | | | | — | | | | 46,826 | | | | 50,443 | | | | — | |
| | | 1,265,984 | | | | 20,693,993 | | | | 4,976,592 | | | | 3,939,225 | | | | 3,578,000 | | | | 4,653,462 | | | | 5,228,961 | |
| | | (26,400 | ) | | | — | | | | — | | | | — | | | | — | | | | — | | | | — | |
| | | (106,961 | ) | | | — | | | | — | | | | — | | | | — | | | | — | | | | — | |
| | | 1,132,623 | | | | 20,693,993 | | | | 4,976,592 | | | | 3,939,225 | | | | 3,578,000 | | | | 4,653,462 | | | | 5,228,961 | |
| | | 120,644 | | | | 18,868,155 | | | | 12,452,447 | | | | 17,371,583 | | | | 12,233,124 | | | | 24,659,833 | | | | 21,874,329 | |
| | | | | | | | | | | | | | | | | | | | | | | | | | | | |
| | | | | | | | | | | | | | | | | | | | | | | | | | | | |
| | | 3,537,594 | | | | 66,900,116 | | | | 26,658,025 | | | | 53,211,017 | | | | (1,691,566 | ) | | | 9,454,171 | | | | — | |
| | | — | | | | — | | | | — | | | | — | | | | — | | | | — | | | | 126,292,168 | |
| | | (24,866 | ) | | | (739,405 | ) | | | (37,829 | ) | | | (38,309 | ) | | | — | | | | — | | | | — | |
| | | | | | | | | | | | | | | | | | | | | | | | | | | | |
| | | 16,403,056 | | | | 353,350,333 | | | | 101,053,001 | | | | 11,522,320 | | | | (21,701,087 | ) | | | (14,422,227 | ) | | | — | |
| | | — | | | | — | | | | — | | | | — | | | | — | | | | — | | | | 194,765,601 | |
| | | (628 | ) | | | (25,242 | ) | | | (22,714 | ) | | | (130,199 | ) | | | — | | | | — | | | | — | |
| | | 19,915,156 | | | | 419,485,802 | | | | 127,650,483 | | | | 64,564,829 | | | | (23,392,653 | ) | | | (4,968,056 | ) | | | 321,057,769 | |
| | | | | | | | | | | | | | | | | | | | | | | | | | | | |
| | $ | 20,035,800 | | | $ | 438,353,957 | | | $ | 140,102,930 | | | $ | 81,936,412 | | | $ | (11,159,529 | ) | | $ | 19,691,777 | | | $ | 342,932,098 | |
| | 127 | SEE NOTES TO FINANCIAL STATEMENTS |
| |
Statements of Changes in Net Assets |
| | | Large Cap Fund | |
| | Year Ended
12/31/21 | | | Year Ended
12/31/20 | |
Increase (Decrease) in Net Assets | | | | | | | | |
Operations | | | | | | | | |
Investment income, net | | $ | 6,248,333 | | | $ | 6,821,459 | |
Net realized gain (loss) on investments and foreign currency transactions | | | 102,690,737 | | | | 52,507,245 | |
Change in unrealized appreciation (depreciation) on investments and foreign currency translations | | | 239,900,456 | | | | 144,178,440 | |
Net increase (decrease) in net assets resulting from operations | | | 348,839,526 | | | | 203,507,144 | |
Distributions from Investor Class | | | (3,158,195 | ) | | | (1,224,949 | ) |
Distributions from Class A | | | | | | | | |
Distributions from Institutional Class | | | (85,170,435 | ) | | | (64,744,892 | ) |
Total distributions to shareholders | | | (88,328,630 | ) | | | (65,969,841 | ) |
From capital share transactions: | | | | | | | | |
Investor Class | | | | | | | | |
Proceeds from shares sold | | | 37,427,614 | | | | 17,099,228 | |
Proceeds from reinvestment of distributions | | | 3,142,083 | | | | 1,213,177 | |
Cost of shares redeemed | | | (10,546,023 | ) | | | (2,688,171 | ) |
Net increase (decrease) from Investor Class transactions | | | 30,023,674 | | | | 15,624,234 | |
Class A | | | | | | | | |
Proceeds from shares sold | | | | | | | | |
Proceeds from reinvestment of distributions | | | | | | | | |
Cost of shares redeemed | | | | | | | | |
Net increase (decrease) from Class A transactions | | | | | | | | |
Institutional Class | | | | | | | | |
Proceeds from shares sold | | | 230,237,473 | | | | 143,392,236 | |
Proceeds from reinvestment of distributions | | | 85,078,019 | | | | 64,722,822 | |
Cost of shares redeemed | | | (77,930,857 | ) | | | (85,958,295 | ) |
Net increase (decrease) from Institutional Class transactions | | | 237,384,635 | | | | 122,156,763 | |
Net increase (decrease) from capital share transactions | | | 267,408,309 | | | | 137,780,997 | |
Net increase (decrease) in net assets | | | 527,919,205 | | | | 275,318,300 | |
Net assets | | | | | | | | |
Beginning of period | | | 1,041,593,225 | | | | 766,274,925 | |
End of period | | $ | 1,569,512,430 | | | $ | 1,041,593,225 | |
| | | | | | | | | |
Shares of Beneficial Interest: | | | | | | | | |
Investor Class | | | | | | | | |
Shares sold | | | 2,648,428 | | | | 1,610,196 | |
Shares issued in reinvestment of distributions | | | 215,464 | | | | 103,204 | |
Shares redeemed | | | (728,765 | ) | | | (252,479 | ) |
Net increase (decrease) in shares outstanding | | | 2,135,127 | | | | 1,460,921 | |
| | | | | | | | | |
Class A | | | | | | | | |
Shares sold | | | | | | | | |
Shares issued in reinvestment of distributions | | | | | | | | |
Shares redeemed | | | | | | | | |
Net increase (decrease) in shares outstanding | | | | | | | | |
| | | | | | | | | |
Institutional Class | | | | | | | | |
Shares sold | | | 16,533,881 | | | | 13,682,722 | |
Shares issued in reinvestment of distributions | | | 5,817,100 | | | | 5,506,613 | |
Shares redeemed | | | (5,336,882 | ) | | | (7,944,915 | ) |
Net increase (decrease) in shares outstanding | | | 17,014,099 | | | | 11,244,420 | |
SEE NOTES TO FINANCIAL STATEMENTS | 128 | |
| | | Small Cap Fund | | | US Sustainable
Economy Fund | | | Global
Sustainable
Infrastructure
Fund | |
| | Year Ended
12/31/21 | | | Year Ended
12/31/20 | | | Year Ended
12/31/21 | | | Year Ended
12/31/20 | | | Year Ended
12/31/21 | | | Year Ended
12/31/20 | |
| | | | | | | | | | | | | | | | | | | | | | | | | |
| | | | | | | | | | | | | | | | | | | | | | | | | |
| | | $ | 4,211,415 | | | $ | (180,082 | ) | | $ | 2,384,230 | | | $ | 2,698,292 | | | $ | 3,038,214 | | | $ | 2,543,130 | |
| | | | 61,648,514 | | | | 22,599,055 | | | | 61,651,876 | | | | 1,304,995 | | | | 65,896,357 | | | | 1,070,938 | |
| | | | 86,201,524 | | | | 25,014,359 | | | | 11,974,854 | | | | 25,967,205 | | | | (53,322,851 | ) | | | 15,998,168 | |
| | | | 152,061,453 | | | | 47,433,332 | | | | 76,010,960 | | | | 29,970,492 | | | | 15,611,720 | | | | 19,612,236 | |
| | | | (11,054,274 | ) | | | (3,860,087 | ) | | | (37,377,935 | ) | | | (3,255,719 | ) | | | (2,102,512 | ) | | | (108,186 | ) |
| | | | (1,256,019 | ) | | | (409,247 | ) | | | (1,896,075 | ) | | | (125,797 | ) | | | | | | | | |
| | | | (53,205,792 | ) | | | (12,933,116 | ) | | | (18,599,306 | ) | | | (1,650,985 | ) | | | (35,014,441 | ) | | | (4,198,454 | ) |
| | | | (65,516,085 | ) | | | (17,202,450 | ) | | | (57,873,316 | ) | | | (5,032,501 | ) | | | (37,116,953 | ) | | | (4,306,640 | ) |
| | | | | | | | | | | | | | | | | | | | | | | | | |
| | | | | | | | | | | | | | | | | | | | | | | | | |
| | | | 19,724,514 | | | | 13,164,167 | | | | 7,930,403 | | | | 6,225,685 | | | | 2,320,098 | | | | 1,610,591 | |
| | | | 10,830,710 | | | | 3,759,189 | | | | 36,657,331 | | | | 3,189,365 | | | | 2,086,262 | | | | 106,115 | |
| | | | (26,908,980 | ) | | | (29,698,481 | ) | | | (21,477,707 | ) | | | (16,529,079 | ) | | | (1,474,622 | ) | | | (913,639 | ) |
| | | | 3,646,244 | | | | (12,775,125 | ) | | | 23,110,027 | | | | (7,114,029 | ) | | | 2,931,738 | | | | 803,067 | |
| | | | | | | | | | | | | | | | | | | | | | | | | |
| | | | 2,806,783 | | | | 2,133,288 | | | | 2,451,108 | | | | 470,519 | | | | | | | | | |
| | | | 1,216,828 | | | | 388,752 | | | | 1,497,802 | | | | 119,950 | | | | | | | | | |
| | | | (2,605,612 | ) | | | (4,334,833 | ) | | | (613,410 | ) | | | (1,191,696 | ) | | | | | | | | |
| | | | 1,417,999 | | | | (1,812,793 | ) | | | 3,335,500 | | | | (601,227 | ) | | | | | | | | |
| | | | | | | | | | | | | | | | | | | | | | | | | |
| | | | 234,543,988 | | | | 106,749,401 | | | | 16,372,652 | | | | 11,912,072 | | | | 13,549,347 | | | | 14,618,131 | |
| | | | 45,032,698 | | | | 11,472,200 | | | | 17,620,167 | | | | 1,559,901 | | | | 33,960,664 | | | | 4,129,487 | |
| | | | (94,763,563 | ) | | | (98,735,126 | ) | | | (20,367,981 | ) | | | (14,895,788 | ) | | | (71,310,028 | ) | | | (27,665,239 | ) |
| | | | 184,813,123 | | | | 19,486,475 | | | | 13,624,838 | | | | (1,423,815 | ) | | | (23,800,017 | ) | | | (8,917,621 | ) |
| | | | 189,877,366 | | | | 4,898,557 | | | | 40,070,365 | | | | (9,139,071 | ) | | | (20,868,279 | ) | | | (8,114,554 | ) |
| | | | 276,422,734 | | | | 35,129,439 | | | | 58,208,009 | | | | 15,798,920 | | | | (42,373,512 | ) | | | 7,191,042 | |
| | | | | | | | | | | | | | | | | | | | | | | | | |
| | | | 466,239,190 | | | | 431,109,751 | | | | 256,214,756 | | | | 240,415,836 | | | | 140,050,151 | | | | 132,859,109 | |
| | | $ | 742,661,924 | | | $ | 466,239,190 | | | $ | 314,422,765 | | | $ | 256,214,756 | | | $ | 97,676,639 | | | $ | 140,050,151 | |
| | | | | | | | | | | | | | | | | | | | | | | | | |
| | | | | | | | | | | | | | | | | | | | | | | | | |
| | | | | | | | | | | | | | | | | | | | | | | | | |
| | | | 1,024,793 | | | | 1,055,335 | | | | 294,876 | | | | 303,312 | | | | 155,708 | | | | 127,605 | |
| | | | 590,205 | | | | 240,665 | | | | 1,474,216 | | | | 142,686 | | | | 206,837 | | | | 7,820 | |
| | | | (1,425,595 | ) | | | (2,329,687 | ) | | | (805,594 | ) | | | (803,407 | ) | | | (108,422 | ) | | | (75,823 | ) |
| | | | 189,403 | | | | (1,033,687 | ) | | | 963,498 | | | | (357,409 | ) | | | 254,123 | | | | 59,602 | |
| | | | | | | | | | | | | | | | | | | | | | | | | |
| | | | | | | | | | | | | | | | | | | | | | | | | |
| | | | 145,066 | | | | 172,064 | | | | 87,078 | | | | 22,398 | | | | | | | | | |
| | | | 66,493 | | | | 24,952 | | | | 60,453 | | | | 5,378 | | | | | | | | | |
| | | | (140,698 | ) | | | (351,963 | ) | | | (22,759 | ) | | | (61,355 | ) | | | | | | | | |
| | | | 70,861 | | | | (154,947 | ) | | | 124,772 | | | | (33,579 | ) | | | | | | | | |
| | | | | | | | | | | | | | | | | | | | | | | | | |
| | | | | | | | | | | | | | | | | | | | | | | | | |
| | | | 12,184,778 | | | | 8,364,175 | | | | 583,840 | | | | 573,119 | | | | 893,052 | | | | 1,297,033 | |
| | | | 2,417,012 | | | | 724,713 | | | | 682,021 | | | | 67,844 | | | | 3,342,614 | | | | 306,577 | |
| | | | (4,906,483 | ) | | | (7,825,421 | ) | | | (733,389 | ) | | | (703,633 | ) | | | (4,729,359 | ) | | | (2,180,176 | ) |
| | | | 9,695,307 | | | | 1,263,467 | | | | 532,472 | | | | (62,670 | ) | | | (493,693 | ) | | | (576,566 | ) |
| | 129 | SEE NOTES TO FINANCIAL STATEMENTS |
| |
Statements of Changes in Net Assets, continued |
| | | Global
Opportunities
Fund | |
| | Year Ended
12/31/21 | | | Year Ended
12/31/20 | |
Increase (Decrease) in Net Assets | | | | | | | | |
Operations | | | | | | | | |
Investment income, net | | $ | 120,644 | | | $ | 77,202 | |
Net realized gain (loss) on investments and foreign currency transactions | | | 3,512,728 | | | | (163,976 | ) |
Change in unrealized appreciation (depreciation) on investments and foreign currency translations | | | 16,402,428 | | | | 12,543,521 | |
Net increase (decrease) in net assets resulting from operations | | | 20,035,800 | | | | 12,456,747 | |
Distributions from Investor Class | | | (102,606 | ) | | | (83,069 | ) |
Distributions from Class A | | | | | | | | |
Distributions from Institutional Class | | | (2,448,591 | ) | | | (519,005 | ) |
Total distributions to shareholders | | | (2,551,197 | ) | | | (602,074 | ) |
From capital share transactions: | | | | | | | | |
Investor Class | | | | | | | | |
Proceeds from shares sold | | | 2,781,513 | | | | 1,773,549 | |
Proceeds from reinvestment of distributions | | | 102,525 | | | | 26,686 | |
Cost of shares redeemed | | | (1,203,824 | ) | | | (676,783 | ) |
Net increase (decrease) from Investor Class transactions | | | 1,680,214 | | | | 1,123,452 | |
Class A | | | | | | | | |
Proceeds from shares sold | | | | | | | | |
Proceeds from reinvestment of distributions | | | | | | | | |
Cost of shares redeemed | | | | | | | | |
Net increase (decrease) from Class A transactions | | | | | | | | |
Institutional Class | | | | | | | | |
Proceeds from shares sold | | | 57,255,548 | | | | 18,052,818 | |
Proceeds from reinvestment of distributions | | | 2,448,160 | | | | 559,156 | |
Cost of shares redeemed | | | (4,893,683 | ) | | | (4,618,749 | ) |
Net increase (decrease) from Institutional Class transactions | | | 54,810,025 | | | | 13,993,225 | |
Net increase (decrease) from capital share transactions | | | 56,490,239 | | | | 15,116,677 | |
Net increase (decrease) in net assets | | | 73,974,842 | | | | 26,971,350 | |
Net assets | | | | | | | | |
Beginning of period | | | 69,045,464 | | | | 42,074,114 | |
End of period | | $ | 143,020,306 | | | $ | 69,045,464 | |
| | | | | | | | | |
Shares of Beneficial Interest: | | | | | | | | |
Investor Class | | | | | | | | |
Shares sold | | | 175,949 | | | | 145,191 | |
Shares issued in reinvestment of distributions | | | 6,103 | | | | 1,866 | |
Shares redeemed | | | (75,576 | ) | | | (54,842 | ) |
Net increase (decrease) in shares outstanding | | | 106,476 | | | | 92,215 | |
| | | | | | | | | |
Class A | | | | | | | | |
Shares sold | | | | | | | | |
Shares issued in reinvestment of distributions | | | | | | | | |
Shares redeemed | | | | | | | | |
Net increase (decrease) in shares outstanding | | | | | | | | |
| | | | | | | | | |
Institutional Class | | | | | | | | |
Shares sold | | | 3,682,281 | | | | 1,460,070 | |
Shares issued in reinvestment of distributions | | | 145,508 | | | | 39,020 | |
Shares redeemed | | | (295,346 | ) | | | (385,177 | ) |
Net increase in shares outstanding | | | 3,532,443 | | | | 1,113,913 | |
SEE NOTES TO FINANCIAL STATEMENTS | 130 | |
| | | Global
Environmental
Markets Fund | | | Global Women’s
Leadership Fund | |
| | | Year Ended
12/31/21 | | | Year Ended
12/31/20 | | | Year Ended
12/31/21 | | | Year Ended
12/31/20 | |
| | | | | | | | | | | | | | | | | |
| | | | | | | | | | | | | | | | | |
| | | $ | 18,868,155 | | | $ | 8,291,686 | | | $ | 12,452,447 | | | $ | 8,257,794 | |
| | | | 66,160,711 | | | | (25,308,285 | ) | | | 26,620,196 | | | | (7,925,372 | ) |
| | | | 353,325,091 | | | | 318,851,831 | | | | 101,030,287 | | | | 87,972,338 | |
| | | | 438,353,957 | | | | 301,835,232 | | | | 140,102,930 | | | | 88,304,760 | |
| | | | (4,204,981 | ) | | | (710,364 | ) | | | (1,906,707 | ) | | | (1,364,676 | ) |
| | | | (419,080 | ) | | | (65,398 | ) | | | | | | | | |
| | | | (49,912,206 | ) | | | (7,481,018 | ) | | | (11,700,153 | ) | | | (7,012,796 | ) |
| | | | (54,536,267 | ) | | | (8,256,780 | ) | | | (13,606,860 | ) | | | (8,377,472 | ) |
| | | | | | | | | | | | | | | | | |
| | | | | | | | | | | | | | | | | |
| | | | 43,946,672 | | | | 19,830,477 | | | | 25,410,536 | | | | 21,311,776 | |
| | | | 3,911,624 | | | | 650,848 | | | | 1,804,274 | | | | 1,296,305 | |
| | | | (30,289,911 | ) | | | (31,785,866 | ) | | | (17,875,127 | ) | | | (24,619,673 | ) |
| | | | 17,568,385 | | | | (11,304,541 | ) | | | 9,339,683 | | | | (2,011,592 | ) |
| | | | | | | | | | | | | | | | | |
| | | | 4,181,876 | | | | 2,830,371 | | | | | | | | | |
| | | | 376,219 | | | | 57,783 | | | | | | | | | |
| | | | (1,983,282 | ) | | | (2,839,127 | ) | | | | | | | | |
| | | | 2,574,813 | | | | 49,027 | | | | | | | | | |
| | | | | | | | | | | | | | | | | |
| | | | 1,047,193,335 | | | | 626,670,119 | | | | 211,284,728 | | | | 271,898,017 | |
| | | | 46,824,725 | | | | 6,989,373 | | | | 10,594,606 | | | | 6,321,689 | |
| | | | (382,102,159 | ) | | | (254,539,551 | ) | | | (91,848,437 | ) | | | (71,567,496 | ) |
| | | | 711,915,901 | | | | 379,119,941 | | | | 130,030,897 | | | | 206,652,210 | |
| | | | 732,059,099 | | | | 367,864,427 | | | | 139,370,580 | | | | 204,640,618 | |
| | | | 1,115,876,789 | | | | 661,442,879 | | | | 265,866,650 | | | | 284,567,906 | |
| | | | | | | | | | | | | | | | | |
| | | | 1,629,643,600 | | | | 968,200,721 | | | | 749,423,102 | | | | 464,855,196 | |
| | | $ | 2,745,520,389 | | | $ | 1,629,643,600 | | | $ | 1,015,289,752 | | | $ | 749,423,102 | |
| | | | | | | | | | | | | | | | | |
| | | | | | | | | | | | | | | | | |
| | | | | | | | | | | | | | | | | |
| | | | 1,863,872 | | | | 1,170,813 | | | | 767,077 | | | | 813,533 | |
| | | | 158,973 | | | | 37,502 | | | | 52,934 | | | | 47,349 | |
| | | | (1,287,937 | ) | | | (1,937,545 | ) | | | (538,370 | ) | | | (963,551 | ) |
| | | | 734,908 | | | | (729,230 | ) | | | 281,641 | | | | (102,669 | ) |
| | | | | | | | | | | | | | | | | |
| | | | | | | | | | | | | | | | | |
| | | | 178,593 | | | | 163,882 | | | | | | | | | |
| | | | 15,313 | | | | 3,316 | | | | | | | | | |
| | | | (86,749 | ) | | | (190,275 | ) | | | | | | | | |
| | | | 107,157 | | | | (23,077 | ) | | | | | | | | |
| | | | | | | | | | | | | | | | | |
| | | | | | | | | | | | | | | | | |
| | | | 44,675,996 | | | | 35,139,316 | | | | 6,326,440 | | | | 10,044,900 | |
| | | | 1,892,866 | | | | 386,722 | | | | 308,961 | | | | 227,279 | |
| | | | (16,074,933 | ) | | | (15,075,976 | ) | | | (2,747,111 | ) | | | (2,724,231 | ) |
| | | | 30,493,929 | | | | 20,450,062 | | | | 3,888,290 | | | | 7,547,948 | |
| | 131 | SEE NOTES TO FINANCIAL STATEMENTS |
| |
Statements of Changes in Net Assets, continued |
| | | International
Sustainable
Economy Fund | |
| | Year Ended
12/31/21 | | | Year Ended
12/31/20 | |
Increase (Decrease) in Net Assets | | | | | | | | |
Operations | | | | | | | | |
Investment income, net | | $ | 17,371,583 | | | $ | 12,509,448 | |
Net realized gain (loss) on investments and foreign currency transactions | | | 53,172,708 | | | | (3,854,143 | ) |
Change in unrealized appreciation (depreciation) on investments and foreign currency translations | | | 11,392,121 | | | | 64,200,237 | |
Net increase (decrease) in net assets resulting from operations | | | 81,936,412 | | | | 72,855,542 | |
Distributions from Investor Class | | | (3,798,028 | ) | | | (1,290,412 | ) |
Distributions from Class A | | | | | | | | |
Distributions from Institutional Class | | | (34,244,201 | ) | | | (10,905,792 | ) |
Total distributions to shareholders | | | (38,042,229 | ) | | | (12,196,204 | ) |
From capital share transactions: | | | | | | | | |
Investor Class | | | | | | | | |
Proceeds from shares sold | | | 24,094,242 | | | | 19,525,878 | |
Proceeds from reinvestment of distributions | | | 3,642,036 | | | | 1,219,923 | |
Cost of shares redeemed | | | (19,788,569 | ) | | | (32,740,806 | ) |
Net increase (decrease) from Investor Class transactions | | | 7,947,709 | | | | (11,995,005 | ) |
Class A | | | | | | | | |
Proceeds from shares sold | | | | | | | | |
Proceeds from reinvestment of distributions | | | | | | | | |
Cost of shares redeemed | | | | | | | | |
Net increase (decrease) from Class A transactions | | | | | | | | |
Institutional Class | | | | | | | | |
Proceeds from shares sold | | | 203,918,580 | | | | 185,628,598 | |
Proceeds from reinvestment of distributions | | | 32,538,625 | | | | 10,136,588 | |
Cost of shares redeemed | | | (110,454,092 | ) | | | (188,246,392 | ) |
Net increase (decrease) from Institutional Class transactions | | | 126,003,113 | | | | 7,518,794 | |
Net increase (decrease) from capital share transactions | | | 133,950,822 | | | | (4,476,211 | ) |
Net increase (decrease) in net assets | | | 177,845,005 | | | | 56,183,127 | |
Net assets | | | | | | | | |
Beginning of period | | | 700,976,592 | | | | 644,793,465 | |
End of period | | $ | 878,821,597 | | | $ | 700,976,592 | |
| | | | | | | | | |
Shares of Beneficial Interest: | | | | | | | | |
Investor Class | | | | | | | | |
Shares sold | | | 2,206,790 | | | | 2,197,227 | |
Shares issued in reinvestment of distributions | | | 334,417 | | | | 132,152 | |
Shares redeemed | | | (1,794,688 | ) | | | (3,702,118 | ) |
Net increase (decrease) in shares outstanding | | | 746,519 | | | | (1,372,739 | ) |
| | | | | | | | | |
Class A | | | | | | | | |
Shares sold | | | | | | | | |
Shares issued in reinvestment of distributions | | | | | | | | |
Shares redeemed | | | | | | | | |
Net increase in shares outstanding | | | | | | | | |
| | | | | | | | | |
Institutional Class | | | | | | | | |
Shares sold | | | 18,999,876 | | | | 22,122,226 | |
Shares issued in reinvestment of distributions | | | 3,052,283 | | | | 1,111,911 | |
Shares redeemed | | | (10,262,675 | ) | | | (21,756,776 | ) |
Net increase in shares outstanding | | | 11,789,484 | | | | 1,477,361 | |
SEE NOTES TO FINANCIAL STATEMENTS | 132 | |
| | | Core Bond Fund | | | High Yield Bond
Fund | | | Sustainable
Allocation Fund | | | | |
| | | Year Ended
12/31/21 | | | Year Ended
12/31/20 | | | Year Ended
12/31/21 | | | Year Ended
12/31/20 | | | Year Ended
12/31/21 | | | Year Ended
12/31/20 | | | | |
| | | | | | | | | | | | | | | | | | | | | | | | | | | | |
| | | | | | | | | | | | | | | | | | | | | | | | | | | | |
| | | $ | 12,233,124 | | | $ | 13,236,230 | | | $ | 24,659,833 | | | $ | 18,931,048 | | | $ | 21,874,329 | | | $ | 21,849,919 | | | | |
| | | | (1,691,566 | ) | | | 23,244,416 | | | | 9,454,171 | | | | 1,330,483 | | | | 126,292,168 | | | | 86,233,962 | | | | |
| | | | (21,701,087 | ) | | | 12,335,483 | | | | (14,422,227 | ) | | | 9,185,399 | | | | 194,765,601 | | | | 189,591,456 | | | | |
| | | | (11,159,529 | ) | | | 48,816,129 | | | | 19,691,777 | | | | 29,446,930 | | | | 342,932,098 | | | | 297,675,337 | | | | |
| | | | (251,624 | ) | | | (512,257 | ) | | | (6,714,467 | ) | | | (8,018,449 | ) | | | (77,305,027 | ) | | | (43,283,260 | ) | | | |
| | | | | | | | | | | | (260,354 | ) | | | (278,848 | ) | | | | | | | | | | | |
| | | | (14,904,140 | ) | | | (31,096,683 | ) | | | (17,999,748 | ) | | | (10,727,650 | ) | | | (45,499,761 | ) | | | (16,968,369 | ) | | | |
| | | | (15,155,764 | ) | | | (31,608,940 | ) | | | (24,974,569 | ) | | | (19,024,947 | ) | | | (122,804,788 | ) | | | (60,251,629 | ) | | | |
| | | | | | | | | | | | | | | | | | | | | | | | | | | | |
| | | | | | | | | | | | | | | | | | | | | | | | | | | | |
| | | | 5,000,323 | | | | 9,217,698 | | | | 43,776,751 | | | | 52,056,206 | | | | 63,840,958 | | | | 82,348,981 | | | | |
| | | | 248,993 | | | | 509,898 | | | | 6,365,147 | | | | 7,530,260 | | | | 74,966,361 | | | | 41,870,602 | | | | |
| | | | (4,764,721 | ) | | | (3,173,358 | ) | | | (47,483,859 | ) | | | (74,718,978 | ) | | | (155,485,810 | ) | | | (309,622,549 | ) | | | |
| | | | 484,595 | | | | 6,554,238 | | | | 2,658,039 | | | | (15,132,512 | ) | | | (16,678,491 | ) | | | (185,402,966 | ) | | | |
| | | | | | | | | | | | | | | | | | | | | | | | | | | | |
| | | | | | | | | | | | 1,892,599 | | | | 1,377,583 | | | | | | | | | | | | |
| | | | | | | | | | | | 245,113 | | | | 259,842 | | | | | | | | | | | | |
| | | | | | | | | | | | (1,150,616 | ) | | | (1,455,598 | ) | | | | | | | | | | | |
| | | | | | | | | | | | 987,096 | | | | 181,827 | | | | | | | | | | | | |
| | | | | | | | | | | | | | | | | | | | | | | | | | | | |
| | | | 53,513,717 | | | | 78,112,653 | | | | 329,580,029 | | | | 169,828,628 | | | | 275,253,593 | | | | 278,416,342 | | | | |
| | | | 14,858,521 | | | | 31,024,360 | | | | 15,644,178 | | | | 8,530,076 | | | | 43,658,795 | | | | 15,880,307 | | | | |
| | | | (17,687,292 | ) | | | (81,874,033 | ) | | | (75,462,199 | ) | | | (77,310,888 | ) | | | (71,401,231 | ) | | | (67,292,908 | ) | | | |
| | | | 50,684,946 | | | | 27,262,980 | | | | 269,762,008 | | | | 101,047,816 | | | | 247,511,157 | | | | 227,003,741 | | | | |
| | | | 51,169,541 | | | | 33,817,218 | | | | 273,407,143 | | | | 86,097,131 | | | | 230,832,666 | | | | 41,600,775 | | | | |
| | | | 24,854,248 | | | | 51,024,407 | | | | 268,124,351 | | | | 96,519,114 | | | | 450,959,976 | | | | 279,024,483 | | | | |
| | | | | | | | | | | | | | | | | | | | | | | | | | | | |
| | | | 760,715,805 | | | | 709,691,398 | | | | 472,327,230 | | | | 375,808,116 | | | | 2,176,871,806 | | | | 1,897,847,323 | | | | |
| | | $ | 785,570,053 | | | $ | 760,715,805 | | | $ | 740,451,581 | | | $ | 472,327,230 | | | $ | 2,627,831,782 | | | $ | 2,176,871,806 | | | | |
| | | | | | | | | | | | | | | | | | | | | | | | | | | | |
| | | | | | | | | | | | | | | | | | | | | | | | | | | | |
| | | | | | | | | | | | | | | | | | | | | | | | | | | | |
| | | | 481,933 | | | | 865,913 | | | | 6,311,673 | | | | 7,812,507 | | | | 2,244,186 | | | | 3,443,996 | | | | |
| | | | 24,206 | | | | 48,101 | | | | 920,172 | | | | 1,136,331 | | | | 2,590,484 | | | | 1,678,752 | | | | |
| | | | (462,723 | ) | | | (297,797 | ) | | | (6,851,331 | ) | | | (11,347,938 | ) | | | (5,432,950 | ) | | | (12,706,593 | ) | | | |
| | | | 43,416 | | | | 616,217 | | | | 380,514 | | | | 2,399,100 | | | | (598,280 | ) | | | (7,583,845 | ) | | | |
| | | | | | | | | | | | | | | | | | | | | | | | | | | | |
| | | | | | | | | | | | | | | | | | | | | | | | | | | | |
| | | | | | | | | | | | 272,513 | | | | 206,288 | | | | | | | | | | | | |
| | | | | | | | | | | | 35,365 | | | | 39,108 | | | | | | | | | | | | |
| | | | | | | | | | | | (165,892 | ) | | | (218,065 | ) | | | | | | | | | | | |
| | | | | | | | | | | | 141,986 | | | | 27,331 | | | | | | | | | | | | |
| | | | | | | | | | | | | | | | | | | | | | | | | | | | |
| | | | | | | | | | | | | | | | | | | | | | | | | | | | |
| | | | 5,158,690 | | | | 7,304,590 | | | | 47,772,061 | | | | 25,605,483 | | | | 9,469,106 | | | | 10,907,249 | | | | |
| | | | 1,444,328 | | | | 2,925,464 | | | | 2,270,613 | | | | 1,284,633 | | | | 1,480,365 | | | | 617,218 | | | | |
| | | | (1,724,911 | ) | | | (7,760,586 | ) | | | (10,952,441 | ) | | | (12,064,213 | ) | | | (2,459,967 | ) | | | (2,782,218 | ) | | | |
| | | | 4,878,107 | | | | 2,469,468 | | | | 39,090,233 | | | | 14,825,903 | | | | 8,489,504 | | | | 8,742,249 | | | | |
| | 133 | SEE NOTES TO FINANCIAL STATEMENTS |
December 31, 2021 |
Financial Highlights |
Selected data for a share outstanding throughout each period. |
| | | | | | | Income
(loss) from
investment
operations | | | | | | | Distributions to
shareholders | |
| | Net asset
value,
beginning of
period | | | Net
investment
income1 | | | Net
realized and
unrealized
gain (loss) | | | Total from
investment
operations | | | From net
investment
income | | | From net
realized
gains | |
Large Cap Fund | | | | | | | | | | | | | | | | | | | | | | | | |
Investor Class | | | | | | | | | | | | | | | | | | | | | | | | |
Year Ended December 31, 2021 | | $ | 12.02 | | | $ | 0.03 | | | $ | 3.63 | | | $ | 3.66 | | | $ | 0.03 | | | $ | 0.83 | |
Year Ended December 31, 2020 | | | 10.38 | | | | 0.06 | | | | 2.38 | | | | 2.44 | | | | 0.07 | | | | 0.73 | |
Year Ended December 31, 2019 | | | 7.97 | | | | 0.07 | | | | 2.71 | | | | 2.78 | | | | 0.07 | | | | 0.30 | |
Year Ended December 31, 2018 | | | 10.56 | | | | 0.07 | | | | (0.63 | ) | | | (0.56 | ) | | | 0.07 | | | | 1.96 | |
Year Ended December 31, 2017 | | | 9.91 | | | | 0.09 | | | | 1.95 | | | | 2.04 | | | | 0.09 | | | | 1.30 | |
Institutional Class | | | | | | | | | | | | | | | | | | | | | | | | |
Year Ended December 31, 2021 | | $ | 12.05 | | | $ | 0.07 | | | $ | 3.64 | | | $ | 3.71 | | | $ | 0.06 | | | $ | 0.83 | |
Year Ended December 31, 2020 | | | 10.40 | | | | 0.09 | | | | 2.38 | | | | 2.47 | | | | 0.09 | | | | 0.73 | |
Year Ended December 31, 2019 | | | 7.98 | | | | 0.09 | | | | 2.72 | | | | 2.81 | | | | 0.09 | | | | 0.30 | |
Year Ended December 31, 2018 | | | 10.57 | | | | 0.10 | | | | (0.63 | ) | | | (0.53 | ) | | | 0.10 | | | | 1.96 | |
Year Ended December 31, 2017 | | | 9.91 | | | | 0.10 | | | | 1.97 | | | | 2.07 | | | | 0.11 | | | | 1.30 | |
| | | | | | | | | | | | | | | | | | | | | | | | | |
Small Cap Fund | | | | | | | | | | | | | | | | | | | | | | | | |
Investor Class | | | | | | | | | | | | | | | | | | | | | | | | |
Year Ended December 31, 2021 | | $ | 15.78 | | | $ | 0.08 | | | $ | 4.66 | | | $ | 4.74 | | | $ | 0.04 | | | $ | 1.76 | |
Year Ended December 31, 2020 | | | 14.67 | | | | (0.03 | ) | | | 1.75 | | | | 1.72 | | | | — | | | | 0.61 | |
Year Ended December 31, 2019 | | | 12.01 | | | | 0.13 | | | | 2.66 | | | | 2.79 | | | | 0.13 | | | | — | |
Year Ended December 31, 2018 | | | 16.41 | | | | 0.00 | 5 | | | (2.64 | ) | | | (2.64 | ) | | | 0.00 | 5 | | | 1.76 | |
Year Ended December 31, 2017 | | | 15.34 | | | | 0.03 | | | | 1.30 | | | | 1.33 | | | | 0.02 | | | | 0.24 | |
Class A | | | | | | | | | | | | | | | | | | | | | | | | |
Year Ended December 31, 2021 | | $ | 15.73 | | | $ | 0.08 | | | $ | 4.65 | | | $ | 4.73 | | | $ | 0.04 | | | $ | 1.76 | |
Year Ended December 31, 2020 | | | 14.63 | | | | (0.03 | ) | | | 1.74 | | | | 1.71 | | | | — | | | | 0.61 | |
Year Ended December 31, 2019 | | | 11.98 | | | | 0.12 | | | | 2.66 | | | | 2.78 | | | | 0.13 | | | | — | |
Year Ended December 31, 2018 | | | 16.38 | | | | 0.00 | 5 | | | (2.63 | ) | | | (2.63 | ) | | | 0.01 | | | | 1.76 | |
Year Ended December 31, 2017 | | | 15.31 | | | | 0.03 | | | | 1.30 | | | | 1.33 | | | | 0.02 | | | | 0.24 | |
Institutional Class | | | | | | | | | | | | | | | | | | | | | | | | |
Year Ended December 31, 2021 | | $ | 15.99 | | | $ | 0.14 | | | $ | 4.71 | | | $ | 4.85 | | | $ | 0.09 | | | $ | 1.76 | |
Year Ended December 31, 2020 | | | 14.82 | | | | 0.00 | 5 | | | 1.78 | | | | 1.78 | | | | — | | | | 0.61 | |
Year Ended December 31, 2019 | | | 12.12 | | | | 0.15 | | | | 2.70 | | | | 2.85 | | | | 0.15 | | | | — | |
Year Ended December 31, 2018 | | | 16.53 | | | | 0.05 | | | | (2.67 | ) | | | (2.62 | ) | | | 0.03 | | | | 1.76 | |
Year Ended December 31, 2017 | | | 15.44 | | | | 0.07 | | | | 1.32 | | | | 1.39 | | | | 0.06 | | | | 0.24 | |
1 | Based on average shares outstanding during the period. |
2 | Total return represents aggregate total return for the period indicated, includes reinvestment of all dividends and distributions, and does not reflect the deduction of any applicable sales charges. Total returns for periods of less than one year have not been annualized. |
3 | Ratios representing periods of less than one year have been annualized. |
5 | Rounds to less than $0.01 |
SEE NOTES TO FINANCIAL STATEMENTS | 134 | |
| | | | | | | | | | | | | | | | | Ratios to
average net
assets3 | | | | | | | | | |
| | Total
distributions | | | Net asset
value,
end of
period | | | Total return2 | | | Net assets
end of period
(in $000’s) | | | Net
expenses
including
reimbursements
and waivers | | | Net
investment
income | | | Total
expenses
excluding
reimbursements
and waivers | | | Portfolio
Turnover4 | | | | |
| | | | | | | | | | | | | | | | | | | | | | | | | | | | | | | | | | | | |
| | | | | | | | | | | | | | | | | | | | | | | | | | | | | | | | | | | | |
| | $ | 0.86 | | | $ | 14.82 | | | | 30.57 | % | | $ | 57,965 | | | | 0.97 | % | | | 0.22 | % | | | 0.97 | % | | | 25 | % | | | | |
| | | 0.80 | | | | 12.02 | | | | 23.75 | % | | | 21,351 | | | | 0.95 | % | | | 0.51 | % | | | 0.95 | % | | | 43 | % | | | | |
| | | 0.37 | | | | 10.38 | | | | 34.85 | % | | | 3,271 | | | | 0.95 | % | | | 0.74 | % | | | 0.95 | % | | | 37 | % | | | | |
| | | 2.03 | | | | 7.97 | | | | (5.01 | %) | | | 1,975 | | | | 0.96 | % | | | 0.67 | % | | | 0.96 | % | | | 54 | % | | | | |
| | | 1.39 | | | | 10.56 | | | | 20.65 | % | | | 786 | | | | 0.95 | % | | | 0.82 | % | | | 0.95 | % | | | 57 | % | | | | |
| | | | | | | | | | | | | | | | | | | | | | | | | | | | | | | | | | | | |
| | $ | 0.89 | | | $ | 14.87 | | | | 30.92 | % | | $ | 1,511,547 | | | | 0.71 | % | | | 0.47 | % | | | 0.71 | % | | | 25 | % | | | | |
| | | 0.82 | | | | 12.05 | | | | 23.99 | % | | | 1,020,242 | | | | 0.70 | % | | | 0.84 | % | | | 0.70 | % | | | 43 | % | | | | |
| | | 0.39 | | | | 10.40 | | | | 35.23 | % | | | 763,004 | | | | 0.70 | % | | | 1.00 | % | | | 0.70 | % | | | 37 | % | | | | |
| | | 2.06 | | | | 7.98 | | | | (4.79 | %) | | | 590,664 | | | | 0.70 | % | | | 0.85 | % | | | 0.70 | % | | | 54 | % | | | | |
| | | 1.41 | | | | 10.57 | | | | 20.96 | % | | | 718,601 | | | | 0.70 | % | | | 0.94 | % | | | 0.70 | % | | | 57 | % | | | | |
| | | | | | | | | | | | | | | | | | | | | | | | | | | | | | | | | | | | |
| | | | | | | | | | | | | | | | | | | | | | | | | | | | | | | | | | | | |
| | | | | | | | | | | | | | | | | | | | | | | | | | | | | | | | | | | | |
| | $ | 1.80 | | | $ | 18.72 | | | | 30.26 | % | | $ | 125,234 | | | | 1.15 | % | | | 0.44 | % | | | 1.15 | % | | | 44 | % | | | | |
| | | 0.61 | | | | 15.78 | | | | 11.77 | % | | | 102,582 | | | | 1.19 | % | | | (0.23 | %) | | | 1.19 | % | | | 73 | % | | | | |
| | | 0.13 | | | | 14.67 | | | | 23.29 | % | | | 110,520 | | | | 1.20 | % | | | 0.93 | % | | | 1.20 | % | | | 78 | % | | | | |
| | | 1.76 | | | | 12.01 | | | | (15.80 | %) | | | 116,887 | | | | 1.18 | % | | | 0.03 | % | | | 1.18 | % | | | 57 | % | | | | |
| | | 0.26 | | | | 16.41 | | | | 8.77 | % | | | 223,360 | | | | 1.19 | % | | | 0.18 | % | | | 1.19 | % | | | 56 | % | | | | |
| | | | | | | | | | | | | | | | | | | | | | | | | | | | | | | | | | | | |
| | $ | 1.80 | | | $ | 18.66 | | | | 30.29 | % | | $ | 14,305 | | | | 1.15 | % | | | 0.44 | % | | | 1.15 | % | | | 44 | % | | | | |
| | | 0.61 | | | | 15.73 | | | | 11.73 | % | | | 10,948 | | | | 1.19 | % | | | (0.23 | %) | | | 1.19 | % | | | 73 | % | | | | |
| | | 0.13 | | | | 14.63 | | | | 23.27 | % | | | 12,445 | | | | 1.20 | % | | | 0.90 | % | | | 1.20 | % | | | 78 | % | | | | |
| | | 1.77 | | | | 11.98 | | | | (15.82 | %) | | | 12,290 | | | | 1.18 | % | | | 0.02 | % | | | 1.18 | % | | | 57 | % | | | | |
| | | 0.26 | | | | 16.38 | | | | 8.80 | % | | | 27,100 | | | | 1.19 | % | | | 0.19 | % | | | 1.19 | % | | | 56 | % | | | | |
| | | | | | | | | | | | | | | | | | | | | | | | | | | | | | | | | | | | |
| | $ | 1.85 | | | $ | 18.99 | | | | 30.54 | % | | $ | 603,123 | | | | 0.90 | % | | | 0.73 | % | | | 0.90 | % | | | 44 | % | | | | |
| | | 0.61 | | | | 15.99 | | | | 12.06 | % | | | 352,709 | | | | 0.94 | % | | | 0.02 | % | | | 0.94 | % | | | 73 | % | | | | |
| | | 0.15 | | | | 14.82 | | | | 23.56 | % | | | 308,145 | | | | 0.95 | % | | | 1.08 | % | | | 0.95 | % | | | 78 | % | | | | |
| | | 1.79 | | | | 12.12 | | | | (15.59 | %) | | | 317,417 | | | | 0.93 | % | | | 0.29 | % | | | 0.93 | % | | | 57 | % | | | | |
| | | 0.30 | | | | 16.53 | | | | 9.10 | % | | | 580,752 | | | | 0.95 | % | | | 0.45 | % | | | 0.95 | % | | | 56 | % | | | | |
| | 135 | SEE NOTES TO FINANCIAL STATEMENTS |
December 31, 2021 |
Financial Highlights, continued |
Selected data for a share outstanding throughout each period. |
| | | | | | | Income
(loss) from
investment
operations | | | | | | | Distributions to
shareholders | |
| | Net asset
value,
beginning of
period | | | Net
investment
income1 | | | Net
realized and
unrealized
gain (loss) | | | Total from
investment
operations | | | From net
investment
income | | | From net
realized
gains | |
US Sustainable Economy Fund | | | | | | | | | | | | | | | | | | | | | | | | |
Investor Class | | | | | | | | | | | | | | | | | | | | | | | | |
Year Ended December 31, 2021 | | $ | 23.78 | | | $ | 0.20 | | | $ | 6.83 | | | $ | 7.03 | | | $ | 0.20 | | | $ | 5.33 | |
Year Ended December 31, 2020 | | | 21.41 | | | | 0.23 | | | | 2.60 | | | | 2.83 | | | | 0.22 | | | | 0.24 | |
Year Ended December 31, 2019 | | | 17.42 | | | | 0.28 | | | | 4.43 | | | | 4.71 | | | | 0.28 | | | | 0.44 | |
Year Ended December 31, 2018 | | | 19.69 | | | | 0.32 | | | | (1.20 | ) | | | (0.88 | ) | | | 0.32 | | | | 1.07 | |
Year Ended December 31, 2017 | | | 16.90 | | | | 0.23 | | | | 3.45 | | | | 3.68 | | | | 0.23 | | | | 0.66 | |
Class A | | | | | | | | | | | | | | | | | | | | | | | | |
Year Ended December 31, 2021 | | $ | 23.71 | | | $ | 0.20 | | | $ | 6.80 | | | $ | 7.00 | | | $ | 0.20 | | | $ | 5.33 | |
Year Ended December 31, 2020 | | | 21.35 | | | | 0.23 | | | | 2.59 | | | | 2.82 | | | | 0.22 | | | | 0.24 | |
Year Ended December 31, 2019 | | | 17.38 | | | | 0.28 | | | | 4.41 | | | | 4.69 | | | | 0.28 | | | | 0.44 | |
Year Ended December 31, 2018 | | | 19.65 | | | | 0.32 | | | | (1.20 | ) | | | (0.88 | ) | | | 0.32 | | | | 1.07 | |
Year Ended December 31, 2017 | | | 16.86 | | | | 0.23 | | | | 3.45 | | | | 3.68 | | | | 0.23 | | | | 0.66 | |
Institutional Class | | | | | | | | | | | | | | | | | | | | | | | | |
Year Ended December 31, 2021 | | $ | 24.52 | | | $ | 0.28 | | | $ | 7.05 | | | $ | 7.33 | | | $ | 0.27 | | | $ | 5.33 | |
Year Ended December 31, 2020 | | | 22.07 | | | | 0.29 | | | | 2.67 | | | | 2.96 | | | | 0.27 | | | | 0.24 | |
Year Ended December 31, 2019 | | | 17.94 | | | | 0.34 | | | | 4.56 | | | | 4.90 | | | | 0.33 | | | | 0.44 | |
Year Ended December 31, 2018 | | | 20.23 | | | | 0.38 | | | | (1.23 | ) | | | (0.85 | ) | | | 0.37 | | | | 1.07 | |
Year Ended December 31, 2017 | | | 17.34 | | | | 0.28 | | | | 3.55 | | | | 3.83 | | | | 0.28 | | | | 0.66 | |
| | | | | | | | | | | | | | | | | | | | | | | | | |
Global Sustainable Infrastructure Fund | | | | | | | | | | | | | | | | | | | | | | | | |
Investor Class | | | | | | | | | | | | | | | | | | | | | | | | |
Year Ended December 31, 2021 | | $ | 14.17 | | | $ | 0.41 | | | $ | 1.48 | | | $ | 1.89 | | | $ | 0.32 | | | $ | 5.63 | |
Year Ended December 31, 2020 | | | 12.78 | | | | 0.23 | | | | 1.56 | | | | 1.79 | | | | 0.21 | | | | 0.19 | |
Year Ended December 31, 2019 | | | 10.64 | | | | 0.25 | | | | 2.49 | | | | 2.74 | | | | 0.25 | | | | 0.35 | |
Year Ended December 31, 2018 | | | 11.50 | | | | 0.24 | | | | (0.73 | ) | | | (0.49 | ) | | | 0.24 | | | | 0.13 | |
Year Ended December 31, 2017 | | | 9.86 | | | | 0.22 | | | | 1.67 | | | | 1.89 | | | | 0.23 | | | | 0.02 | |
Institutional Class | | | | | | | | | | | | | | | | | | | | | | �� | | |
Year Ended December 31, 2021 | | $ | 14.21 | | | $ | 0.43 | | | $ | 1.51 | | | $ | 1.84 | | | $ | 0.36 | | | $ | 5.63 | |
Year Ended December 31, 2020 | | | 12.81 | | | | 0.26 | | | | 1.57 | | | | 1.83 | | | | 0.24 | | | | 0.19 | |
Year Ended December 31, 2019 | | | 10.66 | | | | 0.28 | | | | 2.50 | | | | 2.78 | | | | 0.28 | | | | 0.35 | |
Year Ended December 31, 2018 | | | 11.50 | | | | 0.26 | | | | (0.70 | ) | | | (0.44 | ) | | | 0.27 | | | | 0.13 | |
Year Ended December 31, 2017 | | | 9.86 | | | | 0.24 | | | | 1.67 | | | | 1.91 | | | | 0.25 | | | | 0.02 | |
1 | Based on average shares outstanding during the period. |
2 | Total return represents aggregate total return for the period indicated, includes reinvestment of all dividends and distributions, and does not reflect the deduction of any applicable sales charges. Total returns for periods of less than one year have not been annualized. |
3 | Ratios representing periods of less than one year have been annualized. |
SEE NOTES TO FINANCIAL STATEMENTS | 136 | |
| | | | | | | | | | | | | | | | | Ratios to
average net
assets3 | | | | | | | | | |
| | Total
distributions | | | Net asset
value,
end of
period | | | Total return2 | | | Net assets
end of period
(in $000’s) | | | Net
expenses
including
reimbursements
and waivers | | | Net
investment
income | | | Total
expenses
excluding
reimbursements
and waivers | | | Portfolio
Turnover4 | | | | |
| | | | | | | | | | | | | | | | | | | | | | | | | | | | | | | | | | | | |
| | | | | | | | | | | | | | | | | | | | | | | | | | | | | | | | | | | | |
| | $ | 5.53 | | | $ | 25.28 | | | | 30.02 | % | | $ | 205,407 | | | | 0.74 | % | | | 0.74 | % | | | 0.88 | % | | | 47 | % | | | | |
| | | 0.46 | | | | 23.78 | | | | 13.34 | % | | | 170,315 | | | | 0.90 | % | | | 1.10 | % | | | 0.90 | % | | | 65 | % | | | | |
| | | 0.72 | | | | 21.41 | | | | 27.13 | % | | | 161,021 | | | | 0.90 | % | | | 1.43 | % | | | 0.90 | % | | | 49 | % | | | | |
| | | 1.39 | | | | 17.42 | | | | (4.43 | %) | | | 134,435 | | | | 0.90 | % | | | 1.59 | % | | | 0.90 | % | | | 55 | % | | | | |
| | | 0.89 | | | | 19.69 | | | | 21.89 | % | | | 164,016 | | | | 0.90 | % | | | 1.25 | % | | | 0.90 | % | | | 36 | % | | | | |
| | | | | | | | | | | | | | | | | | | | | | | | | | | | | | | | | | | | |
| | $ | 5.53 | | | $ | 25.18 | | | | 29.99 | % | | $ | 10,150 | | | | 0.74 | % | | | 0.74 | % | | | 0.88 | % | | | 47 | % | | | | |
| | | 0.46 | | | | 23.71 | | | | 13.33 | % | | | 6,599 | | | | 0.90 | % | | | 1.11 | % | | | 0.90 | % | | | 65 | % | | | | |
| | | 0.72 | | | | 21.35 | | | | 27.08 | % | | | 6,659 | | | | 0.90 | % | | | 1.43 | % | | | 0.90 | % | | | 49 | % | | | | |
| | | 1.39 | | | | 17.38 | | | | (4.43 | %) | | | 5,417 | | | | 0.90 | % | | | 1.59 | % | | | 0.90 | % | | | 55 | % | | | | |
| | | 0.89 | | | | 19.65 | | | | 21.96 | % | | | 5,589 | | | | 0.90 | % | | | 1.25 | % | | | 0.90 | % | | | 36 | % | | | | |
| | | | | | | | | | | | | | | | | | | | | | | | | | | | | | | | | | | | |
| | $ | 5.60 | | | $ | 26.25 | | | | 30.35 | % | | $ | 98,866 | | | | 0.49 | % | | | 0.99 | % | | | 0.63 | % | | | 47 | % | | | | |
| | | 0.51 | | | | 24.52 | | | | 13.57 | % | | | 79,301 | | | | 0.65 | % | | | 1.35 | % | | | 0.65 | % | | | 65 | % | | | | |
| | | 0.77 | | | | 22.07 | | | | 27.42 | % | | | 72,736 | | | | 0.65 | % | | | 1.68 | % | | | 0.65 | % | | | 49 | % | | | | |
| | | 1.44 | | | | 17.94 | | | | (4.16 | %) | | | 54,131 | | | | 0.65 | % | | | 1.84 | % | | | 0.65 | % | | | 55 | % | | | | |
| | | 0.94 | | | | 20.23 | | | | 22.22 | % | | | 43,038 | | | | 0.65 | % | | | 1.48 | % | | | 0.65 | % | | | 36 | % | | | | |
| | | | | | | | | | | | | | | | | | | | | | | | | | | | | | | | | | | | |
| | | | | | | | | | | | | | | | | | | | | | | | | | | | | | | | | | | | |
| | | | | | | | | | | | | | | | | | | | | | | | | | | | | | | | | | | | |
| | $ | 5.95 | | | $ | 10.11 | | | | 13.98 | % | | $ | 5,432 | | | | 0.83 | % | | | 2.70 | % | | | 0.90 | % | | | 127 | % | | | | |
| | | 0.40 | | | | 14.17 | | | | 14.25 | % | | | 4,014 | | | | 0.90 | % | | | 1.80 | % | | | 0.90 | % | | | 93 | % | | | | |
| | | 0.60 | | | | 12.78 | | | | 25.85 | % | | | 2,859 | | | | 0.90 | % | | | 2.03 | % | | | 0.90 | % | | | 50 | % | | | | |
| | | 0.37 | | | | 10.64 | | | | (4.21 | %) | | | 1,846 | | | | 0.90 | % | | | 2.11 | % | | | 0.90 | % | | | 52 | % | | | | |
| | | 0.25 | | | | 11.50 | | | | 19.24 | % | | | 353 | | | | 0.90 | % | | | 2.10 | % | | | 0.90 | % | | | 31 | % | | | | |
| | | | | | | | | | | | | | | | | | | | | | | | | | | | | | | | | | | | |
| | $ | 5.99 | | | $ | 10.16 | | | | 14.27 | % | | $ | 92,244 | | | | 0.58 | % | | | 2.81 | % | | | 0.65 | % | | | 127 | % | | | | |
| | | 0.43 | | | | 14.21 | | | | 14.54 | % | | | 136,036 | | | | 0.65 | % | | | 2.06 | % | | | 0.65 | % | | | 93 | % | | | | |
| | | 0.63 | | | | 12.81 | | | | 26.18 | % | | | 130,001 | | | | 0.65 | % | | | 2.28 | % | | | 0.65 | % | | | 50 | % | | | | |
| | | 0.40 | | | | 10.66 | | | | (3.84 | %) | | | 115,362 | | | | 0.65 | % | | | 2.24 | % | | | 0.65 | % | | | 52 | % | | | | |
| | | 0.27 | | | | 11.50 | | | | 19.44 | % | | | 149,178 | | | | 0.65 | % | | | 2.31 | % | | | 0.65 | % | | | 31 | % | | | | |
| | 137 | SEE NOTES TO FINANCIAL STATEMENTS |
December 31, 2021 |
Financial Highlights, continued |
Selected data for a share outstanding throughout each period. |
| | | | | | | Income
(loss) from
investment
operations | | | | | | | Distributions to
shareholders | |
| | Net asset
value,
beginning of
period | | | Net
investment
income1 | | | Net
realized and
unrealized
gain (loss) | | | Total from
investment
operations | | | From net
investment
income | | | From net
realized
gains | |
Global Opportunities Fund | | | | | | | | | | | | | | | | | | | | | | | | |
Investor Class | | | | | | | | | | | | | | | | | | | | | | | | |
Year Ended December 31, 2021 | | $ | 14.66 | | | $ | (0.02 | ) | | $ | 2.76 | | | $ | 2.74 | | | $ | — | | | $ | 0.31 | |
Year Ended December 31, 2020 | | | 12.04 | | | | (0.01 | ) | | | 2.75 | | | | 2.74 | | | | — | | | | 0.12 | |
Year Ended December 31, 2019 | | | 9.18 | | | | 0.02 | | | | 3.05 | | | | 3.07 | | | | 0.03 | | | | 0.18 | |
Period Ended December 31, 20185 | | | 10.00 | | | | (0.01 | ) | | | (0.81 | ) | | | (0.82 | ) | | | — | | | | — | |
Institutional Class | | | | | | | | | | | | | | | | | | | | | | | | |
Year Ended December 31, 2021 | | $ | 14.69 | | | $ | 0.02 | | | $ | 2.76 | | | $ | 2.78 | | | $ | 0.01 | | | $ | 0.31 | |
Year Ended December 31, 2020 | | | 12.04 | | | | 0.02 | | | | 2.76 | | | | 2.78 | | | | 0.01 | | | | 0.12 | |
Year Ended December 31, 2019 | | | 9.18 | | | | 0.06 | | | | 3.03 | | | | 3.09 | | | | 0.05 | | | | 0.18 | |
Period Ended December 31, 20185 | | | 10.00 | | | | 0.00 | 6 | | | (0.82 | ) | | | (0.82 | ) | | | — | | | | — | |
| | | | | | | | | | | | | | | | | | | | | |
Global Environmental Markets Fund | | | | | | | | | | | | | | | | | | | | |
Investor Class | | | | | | | | | | | | | | | | | | | | | | | | |
Year Ended December 31, 2021 | | $ | 21.08 | | | $ | 0.14 | | | $ | 4.48 | | | $ | 4.62 | | | $ | 0.13 | | | $ | 0.35 | |
Year Ended December 31, 2020 | | | 16.85 | | | | 0.09 | | | | 4.22 | | | | 4.31 | | | | 0.08 | | | | — | |
Year Ended December 31, 2019 | | | 13.28 | | | | 0.12 | | | | 3.56 | | | | 3.68 | | | | 0.11 | | | | — | |
Year Ended December 31, 2018 | | | 16.11 | | | | 0.13 | | | | (2.43 | ) | | | (2.30 | ) | | | 0.12 | | | | 0.41 | |
Year Ended December 31, 2017 | | | 13.16 | | | | 0.07 | | | | 3.40 | | | | 3.47 | | | | 0.05 | | | | 0.47 | |
Class A | | | | | | | | | | | | | | | | | | | | | | | | |
Year Ended December 31, 2021 | | $ | 21.05 | | | $ | 0.14 | | | $ | 4.46 | | | $ | 4.60 | | | $ | 0.13 | | | $ | 0.35 | |
Year Ended December 31, 2020 | | | 16.83 | | | | 0.09 | | | | 4.21 | | | | 4.30 | | | | 0.08 | | | | — | |
Year Ended December 31, 2019 | | | 13.26 | | | | 0.12 | | | | 3.56 | | | | 3.68 | | | | 0.11 | | | | — | |
Year Ended December 31, 2018 | | | 16.09 | | | | 0.13 | | | | (2.43 | ) | | | (2.30 | ) | | | 0.12 | | | | 0.41 | |
Year Ended December 31, 2017 | | | 13.14 | | | | 0.07 | | | | 3.40 | | | | 3.47 | | | | 0.05 | | | | 0.47 | |
Institutional Class | | | | | | | | | | | | | | | | | | | | | | | | |
Year Ended December 31, 2021 | | $ | 21.23 | | | $ | 0.21 | | | $ | 4.49 | | | $ | 4.70 | | | $ | 0.18 | | | $ | 0.35 | |
Year Ended December 31, 2020 | | | 16.97 | | | | 0.14 | | | | 4.25 | | | | 4.39 | | | | 0.13 | | | | — | |
Year Ended December 31, 2019 | | | 13.36 | | | | 0.16 | | | | 3.60 | | | | 3.76 | | | | 0.15 | | | | — | |
Year Ended December 31, 2018 | | | 16.22 | | | | 0.17 | | | | (2.46 | ) | | | (2.29 | ) | | | 0.16 | | | | 0.41 | |
Year Ended December 31, 2017 | | | 13.24 | | | | 0.10 | | | | 3.44 | | | | 3.54 | | | | 0.09 | | | | 0.47 | |
1 | Based on average shares outstanding during the period. |
2 | Total return represents aggregate total return for the period indicated, includes reinvestment of all dividends and distributions, and does not reflect the deduction of any applicable sales charges. Total returns for periods of less than one year have not been annualized. |
3 | Ratios representing periods of less than one year have been annualized. |
SEE NOTES TO FINANCIAL STATEMENTS | 138 | |
| | | | | | | | | | | | | | | | | Ratios to
average net
assets3 | | | | | | | | | |
| | Total
distributions | | | Net asset
value,
end of
period | | | Total return2 | | | Net assets
end of period
(in $000’s) | | | Net
expenses
including
reimbursements
and waivers | | | Net
investment
income | | | Total
expenses
excluding
reimbursements
and waivers | | | Portfolio
Turnover4 | | | | |
| | | | | | | | | | | | | | | | | | | | | | | | | | | | | | | | | | | | |
| | | | | | | | | | | | | | | | | | | | | | | | | | | | | | | | | | | | |
| | $ | 0.31 | | | $ | 17.09 | | | | 18.69 | % | | $ | 5,784 | | | | 1.21 | % | | | (0.15 | %) | | | 1.32 | % | | | 30 | % | | | | |
| | | 0.12 | | | | 14.66 | | | | 22.76 | % | | | 3,401 | | | | 1.18 | % | | | (0.06 | %) | | | 1.56 | % | | | 34 | % | | | | |
| | | 0.21 | | | | 12.04 | | | | 33.51 | % | | | 1,683 | | | | 1.19 | % | | | 0.17 | % | | | 1.68 | % | | | 29 | % | | | | |
| | | — | | | | 9.18 | | | | (8.20 | %) | | | 126 | | | | 1.16 | % | | | (0.14 | %) | | | 2.06 | % | | | 17 | % | | | | |
| | | | | | | | | | | | | | | | | | | | | | | | | | | | | | | | | | | | |
| | $ | 0.32 | | | $ | 17.15 | | | | 18.96 | % | | $ | 137,236 | | | | 0.96 | % | | | 0.11 | % | | | 1.07 | % | | | 30 | % | | | | |
| | | 0.13 | | | | 14.69 | | | | 23.12 | % | | | 65,644 | | | | 0.94 | % | | | 0.17 | % | | | 1.31 | % | | | 34 | % | | | | |
| | | 0.23 | | | | 12.04 | | | | 33.72 | % | | | 40,392 | | | | 0.92 | % | | | 0.51 | % | | | 1.42 | % | | | 29 | % | | | | |
| | | — | | | | 9.18 | | | | (8.20 | %) | | | 24,816 | | | | 0.92 | % | | | 0.01 | % | | | 1.81 | % | | | 17 | % | | | | |
| | | | | | | | | | | | | | | | | | | | | | | | | | | | | | | | | | | | |
| | | | | | | | | | | | | | | | | | | | | | | | | | | | | | | | | | | | |
| | | | | | | | | | | | | | | | | | | | | | | | | | | | | | | | | | | | |
| | $ | 0.48 | | | $ | 25.22 | | | | 21.95 | % | | $ | 227,902 | | | | 1.15 | % | | | 0.61 | % | | | 1.15 | % | | | 18 | % | | | | |
| | | 0.08 | | | | 21.08 | | | | 25.71 | % | | | 175,040 | | | | 1.20 | % | | | 0.55 | % | | | 1.20 | % | | | 25 | % | | | | |
| | | 0.11 | | | | 16.85 | | | | 27.75 | % | | | 152,209 | | | | 1.22 | % | | | 0.78 | % | | | 1.22 | % | | | 14 | % | | | | |
| | | 0.53 | | | | 13.28 | | | | (14.31 | %) | | | 118,980 | | | | 1.22 | % | | | 0.83 | % | | | 1.24 | % | | | 26 | % | | | | |
| | | 0.52 | | | | 16.11 | | | | 26.42 | % | | | 154,325 | | | | 1.23 | % | | | 0.46 | % | | | 1.26 | % | | | 18 | % | | | | |
| | | | | | | | | | | | | | | | | | | | | | | | | | | | | | | | | | | | |
| | $ | 0.48 | | | $ | 25.17 | | | | 21.89 | % | | $ | 22,613 | | | | 1.15 | % | | | 0.61 | % | | | 1.15 | % | | | 18 | % | | | | |
| | | 0.08 | | | | 21.05 | | | | 25.68 | % | | | 16,651 | | | | 1.20 | % | | | 0.54 | % | | | 1.20 | % | | | 25 | % | | | | |
| | | 0.11 | | | | 16.83 | | | | 27.77 | % | | | 13,700 | | | | 1.22 | % | | | 0.78 | % | | | 1.22 | % | | | 14 | % | | | | |
| | | 0.53 | | | | 13.26 | | | | (14.33 | %) | | | 12,766 | | | | 1.22 | % | | | 0.86 | % | | | 1.24 | % | | | 26 | % | | | | |
| | | 0.52 | | | | 16.09 | | | | 26.45 | % | | | 15,383 | | | | 1.23 | % | | | 0.47 | % | | | 1.26 | % | | | 18 | % | | | | |
| | | | | | | | | | | | | | | | | | | | | | | | | | | | | | | | | | | | |
| | $ | 0.53 | | | $ | 25.40 | | | | 22.23 | % | | $ | 2,495,005 | | | | 0.90 | % | | | 0.87 | % | | | 0.90 | % | | | 18 | % | | | | |
| | | 0.13 | | | | 21.23 | | | | 26.00 | % | | | 1,437,952 | | | | 0.95 | % | | | 0.78 | % | | | 0.95 | % | | | 25 | % | | | | |
| | | 0.15 | | | | 16.97 | | | | 28.17 | % | | | 802,292 | | | | 0.97 | % | | | 1.01 | % | | | 0.97 | % | | | 14 | % | | | | |
| | | 0.44 | | | | 13.36 | | | | (14.17 | %) | | | 459,354 | | | | 0.97 | % | | | 1.10 | % | | | 0.99 | % | | | 26 | % | | | | |
| | | 0.56 | | | | 16.22 | | | | 26.79 | % | | | 439,991 | | | | 0.98 | % | | | 0.67 | % | | | 1.02 | % | | | 18 | % | | | | |
5 | Per share data is reflected from the Fund’s inception date of June 27, 2018. |
6 | Rounds to less than $0.01 |
| | 139 | SEE NOTES TO FINANCIAL STATEMENTS |
December 31, 2021 |
Financial Highlights, continued |
Selected data for a share outstanding throughout each period. |
| | | | | | | Income
(loss) from
investment
operations | | | | | | | Distributions to
shareholders | |
| | Net asset
value,
beginning of
period | | | Net
investment
income1 | | | Net
realized and
unrealized
gain (loss) | | | Total from
investment
operations | | | From net
investment
income | | | From net
realized
gains | |
Global Women’s Leadership Fund | | | | | | | | | | | | | | | | | | | | |
Investor Class | | | | | | | | | | | | | | | | | | | | | | | | |
Year Ended December 31, 2021 | | $ | 30.34 | | | $ | 0.39 | | | $ | 4.84 | | | $ | 5.23 | | | $ | 0.43 | | | $ | — | |
Year Ended December 31, 2020 | | | 27.00 | | | | 0.33 | | | | 3.32 | | | | 3.65 | | | | 0.31 | | | | — | |
Year Ended December 31, 2019 | | | 22.02 | | | | 0.47 | | | | 5.33 | | | | 5.80 | | | | 0.44 | | | | 0.38 | |
Year Ended December 31, 2018 | | | 25.02 | | | | 0.47 | | | | (2.39 | ) | | | (1.92 | ) | | | 0.44 | | | | 0.64 | |
Year Ended December 31, 2017 | | | 20.56 | | | | 0.39 | | | | 4.69 | | | | 5.08 | | | | 0.36 | | | | 0.26 | |
Institutional Class | | | | | | | | | | | | | | | | | | | | | | | | |
Year Ended December 31, 2021 | | $ | 30.50 | | | $ | 0.48 | | | $ | 4.86 | | | $ | 5.34 | | | $ | 0.51 | | | $ | — | |
Year Ended December 31, 2020 | | | 27.14 | | | | 0.40 | | | | 3.34 | | | | 3.74 | | | | 0.38 | | | | — | |
Year Ended December 31, 2019 | | | 22.12 | | | | 0.53 | | | | 5.37 | | | | 5.90 | | | | 0.50 | | | | 0.38 | |
Year Ended December 31, 2018 | | | 25.13 | | | | 0.53 | | | | (2.40 | ) | | | (1.87 | ) | | | 0.50 | | | | 0.64 | |
Year Ended December 31, 2017 | | | 20.65 | | | | 0.43 | | | | 4.73 | | | | 5.16 | | | | 0.42 | | | | 0.26 | |
| | | | | | | | | | | | | | | | | | | | | |
International Sustainable Economy Fund | | | | | | | | | | | | | | | | | | | | |
Investor Class | | | | | | | | | | | | | | | | | | | | | | | | |
Year Ended December 31, 2021 | | $ | 10.35 | | | $ | 0.22 | | | $ | 0.90 | | | $ | 1.12 | | | $ | 0.23 | | | $ | 0.25 | |
Year Ended December 31, 2020 | | | 9.53 | | | | 0.17 | | | | 0.81 | | | | 0.98 | | | | 0.16 | | | | — | |
Year Ended December 31, 2019 | | | 7.95 | | | | 0.21 | | | | 1.59 | | | | 1.80 | | | | 0.22 | | | | — | |
Year Ended December 31, 2018 | | | 9.36 | | | | 0.22 | | | | (1.43 | ) | | | (1.21 | ) | | | 0.20 | | | | — | |
Year Ended December 31, 2017 | | | 7.79 | | | | 0.21 | | | | 1.57 | | | | 1.78 | | | | 0.21 | | | | — | |
Institutional Class | | | | | | | | | | | | | | | | | | | | | | | | |
Year Ended December 31, 2021 | | $ | 10.14 | | | $ | 0.24 | | | $ | 0.89 | | | $ | 1.13 | | | $ | 0.26 | | | $ | 0.25 | |
Year Ended December 31, 2020 | | | 9.34 | | | | 0.19 | | | | 0.79 | | | | 0.98 | | | | 0.18 | | | | — | |
Year Ended December 31, 2019 | | | 7.80 | | | | 0.23 | | | | 1.55 | | | | 1.78 | | | | 0.24 | | | | — | |
Year Ended December 31, 2018 | | | 9.19 | | | | 0.23 | | | | (1.40 | ) | | | (1.17 | ) | | | 0.22 | | | | — | |
Year Ended December 31, 2017 | | | 7.65 | | | | 0.21 | | | | 1.56 | | | | 1.77 | | | | 0.23 | | | | — | |
1 | Based on average shares outstanding during the period. |
2 | Total return represents aggregate total return for the period indicated, includes reinvestment of all dividends and distributions, and does not reflect the deduction of any applicable sales charges. Total returns for periods of less than one year have not been annualized. |
3 | Ratios representing periods of less than one year have been annualized. |
5 | To manage cash flows, minimize trading costs and equitize cash balances in between trading blocks of securities, the Global Women’s Leadership Fund utilizes one or more exchange-traded funds (ETFs), the combination of which is intended to track the Fund’s broad-based benchmark. These investments are frequent and short-term, however, the Fund is required to include such ETF investment activity in the calculation of its portfolio turnover. Had such transactions been excluded, the portfolio turnover would have been 26% for the year ended December 31, 2021, 37% for the year ended December 31, 2020, 25% for the year ended December 31, 2019, 47% for the year ended December 31, 2018, and 25% for the year ended December 31, 2017. |
SEE NOTES TO FINANCIAL STATEMENTS | 140 | |
| | | | | | | | | | | | | | | | | Ratios to
average net
assets3 | | | | | | | | | |
| | Total
distributions | | | Net asset
value,
end of
period | | | Total return2 | | | Net assets
end of period
(in $000’s) | | | Net
expenses
including
reimbursements
and waivers | | | Net
investment
income | | | Total
expenses
excluding
reimbursements
and waivers | | | Portfolio
Turnover4 | | | | |
| | | | | | | | | | | | | | | | | | | | | | | | | | | | | | | | | | | | |
| | | | | | | | | | | | | | | | | | | | | | | | | | | | | | | | | | | | |
| | $ | 0.43 | | | $ | 35.14 | | | | 17.27 | % | | $ | 160,749 | | | | 0.76 | % | | | 1.18 | % | | | 0.76 | % | | | 43 | %5 | | | | |
| | | 0.31 | | | | 30.34 | | | | 13.67 | % | | | 130,255 | | | | 0.78 | % | | | 1.27 | % | | | 0.78 | % | | | 69 | %5 | | | | |
| | | 0.82 | | | | 27.00 | | | | 26.42 | % | | | 118,713 | | | | 0.80 | % | | | 1.87 | % | | | 0.80 | % | | | 66 | %5 | | | | |
| | | 1.08 | | | | 22.02 | | | | (7.74 | %) | | | 86,727 | | | | 0.81 | % | | | 1.88 | % | | | 0.83 | % | | | 67 | %5 | | | | |
| | | 0.62 | | | | 25.02 | | | | 24.86 | % | | | 88,332 | | | | 0.90 | % | | | 1.69 | % | | | 0.90 | % | | | 56 | %5 | | | | |
| | | | | | | | | | | | | | | | | | | | | | | | | | | | | | | | | | | | |
| | $ | 0.51 | | | $ | 35.33 | | | | 17.56 | % | | $ | 854,540 | | | | 0.51 | % | | | 1.43 | % | | | 0.51 | % | | | 43 | %5 | | | | |
| | | 0.38 | | | | 30.50 | | | | 13.94 | % | | | 619,168 | | | | 0.53 | % | | | 1.52 | % | | | 0.53 | % | | | 69 | %5 | | | | |
| | | 0.88 | | | | 27.14 | | | | 26.77 | % | | | 346,142 | | | | 0.55 | % | | | 2.07 | % | | | 0.55 | % | | | 66 | %5 | | | | |
| | | 1.14 | | | | 22.12 | | | | (7.51 | %) | | | 156,960 | | | | 0.56 | % | | | 2.09 | % | | | 0.58 | % | | | 67 | %5 | | | | |
| | | 0.68 | | | | 25.13 | | | | 25.14 | % | | | 93,820 | | | | 0.65 | % | | | 1.84 | % | | | 0.65 | % | | | 56 | %5 | | | | |
| | | | | | | | | | | | | | | | | | | | | | | | | | | | | | | | | | | | |
| | | | | | | | | | | | | | | | | | | | | | | | | | | | | | | | | | | | |
| | | | | | | | | | | | | | | | | | | | | | | | | | | | | | | | | | | | |
| | $ | 0.48 | | | $ | 10.99 | | | | 10.88 | % | | $ | 90,993 | | | | 0.72 | % | | | 1.98 | % | | | 0.72 | % | | | 55 | %6 | | | | |
| | | 0.16 | | | | 10.35 | | | | 10.51 | % | | | 77,963 | | | | 0.75 | % | | | 1.91 | % | | | 0.75 | % | | | 43 | %6 | | | | |
| | | 0.22 | | | | 9.53 | | | | 22.78 | % | | | 84,855 | | | | 0.80 | % | | | 2.40 | % | | | 0.80 | % | | | 31 | %6 | | | | |
| | | 0.20 | | | | 7.95 | | | | (13.15 | %) | | | 77,880 | | | | 0.80 | % | | | 2.46 | % | | | 0.80 | % | | | 30 | %6 | | | | |
| | | 0.21 | | | | 9.36 | | | | 23.01 | % | | | 123,776 | | | | 0.80 | % | | | 2.38 | % | | | 0.80 | % | | | 42 | %6 | | | | |
| | | | | | | | | | | | | | | | | | | | | | | | | | | | | | | | | | | | |
| | $ | 0.51 | | | $ | 10.76 | | | | 11.19 | % | | $ | 787,829 | | | | 0.47 | % | | | 2.22 | % | | | 0.47 | % | | | 55 | %6 | | | | |
| | | 0.18 | | | | 10.14 | | | | 10.78 | % | | | 623,014 | | | | 0.50 | % | | | 2.15 | % | | | 0.50 | % | | | 43 | %6 | | | | |
| | | 0.24 | | | | 9.34 | | | | 23.01 | % | | | 559,939 | | | | 0.55 | % | | | 2.63 | % | | | 0.55 | % | | | 31 | %6 | | | | |
| | | 0.22 | | | | 7.80 | | | | (12.90 | %) | | | 437,907 | | | | 0.55 | % | | | 2.55 | % | | | 0.55 | % | | | 30 | %6 | | | | |
| | | 0.23 | | | | 9.19 | | | | 23.34 | % | | | 560,348 | | | | 0.55 | % | | | 2.47 | % | | | 0.55 | % | | | 42 | %6 | | | | |
6 | To manage cash flows, minimize trading costs and equitize cash balances in between trading blocks of securities, the International Sustainable Economy Fund utilizes one or more exchange-traded funds (ETFs) which have an investment objective that tracks the Fund’s broad-based benchmark. These investments are frequent and short-term, however, the Fund is required to include such ETF investment activity in the calculation of its portfolio turnover. Had such transactions been excluded, the portfolio turnover would have been 41% for the year ended December 31, 2021, 27% for the year ended December 31, 2020, 19% for the year ended December 31, 2019, 18% for the year ended December 31, 2018, and 16% for the year ended December 31, 2017. |
| | 141 | SEE NOTES TO FINANCIAL STATEMENTS |
December 31, 2021 |
Financial Highlights, continued |
Selected data for a share outstanding throughout each period. |
| | | | | | | Income
(loss) from
investment
operations | | | | | | | Distributions to
shareholders | |
| | Net asset
value,
beginning of
period | | | Net
investment
income1 | | | Net
realized and
unrealized
gain (loss) | | | Total from
investment
operations | | | From net
investment
income | | | From net
realized
gains | |
Core Bond Fund | | | | | | | | | | | | | | | | | | | | | | | | |
Investor Class | | | | | | | | | | | | | | | | | | | | | | | | |
Year Ended December 31, 2021 | | $ | 10.56 | | | $ | 0.14 | | | $ | (0.31 | ) | | $ | (0.17 | ) | | $ | 0.16 | | | $ | 0.02 | |
Year Ended December 31, 2020 | | | 10.29 | | | | 0.17 | | | | 0.53 | | | | 0.70 | | | | 0.19 | | | | 0.24 | |
Year Ended December 31, 2019 | | | 9.78 | | | | 0.23 | | | | 0.53 | | | | 0.76 | | | | 0.25 | | | | — | |
Year Ended December 31, 2018 | | | 10.04 | | | | 0.22 | | | | (0.25 | ) | | | (0.03 | ) | | | 0.23 | | | | — | |
Year Ended December 31, 2017 | | | 10.01 | | | | 0.21 | | | | 0.04 | | | | 0.25 | | | | 0.21 | | | | 0.01 | |
Institutional Class | | | | | | | | | | | | | | | | | | | | | | | | |
Year Ended December 31, 2021 | | $ | 10.56 | | | $ | 0.16 | | | $ | (0.30 | ) | | $ | (0.14 | ) | | $ | 0.19 | | | $ | 0.02 | |
Year Ended December 31, 2020 | | | 10.29 | | | | 0.20 | | | | 0.53 | | | | 0.73 | | | | 0.22 | | | | 0.24 | |
Year Ended December 31, 2019 | | | 9.78 | | | | 0.26 | | | | 0.52 | | | | 0.78 | | | | 0.27 | | | | — | |
Year Ended December 31, 2018 | | | 10.04 | | | | 0.24 | | | | (0.24 | ) | | | — | | | | 0.26 | | | | — | |
Year Ended December 31, 2017 | | | 10.01 | | | | 0.24 | | | | 0.04 | | | | 0.28 | | | | 0.24 | | | | 0.01 | |
| | | | | | | | | | | | | | | | | | | | | | | | | |
High Yield Bond Fund | | | | | | | | | | | | | | | | | | | | | | | | |
Investor Class | | | | | | | | | | | | | | | | | | | | | | | | |
Year Ended December 31, 2021 | | $ | 6.97 | | | $ | 0.27 | | | $ | (0.07 | ) | | $ | 0.20 | | | $ | 0.27 | | | $ | — | |
Year Ended December 31, 2020 | | | 6.79 | | | | 0.32 | | | | 0.18 | | | | 0.50 | | | | 0.32 | | | | — | |
Year Ended December 31, 2019 | | | 6.25 | | | | 0.33 | | | | 0.54 | | | | 0.87 | | | | 0.33 | | | | — | |
Year Ended December 31, 2018 | | | 6.78 | | | | 0.33 | | | | (0.53 | ) | | | (0.20 | ) | | | 0.33 | | | | — | |
Year Ended December 31, 2017 | | | 6.71 | | | | 0.35 | | | | 0.07 | | | | 0.42 | | | | 0.35 | | | | — | |
Class A | | | | | | | | | | | | | | | | | | | | | | | | |
Year Ended December 31, 2021 | | $ | 6.98 | | | $ | 0.27 | | | $ | (0.06 | ) | | $ | 0.21 | | | $ | 0.27 | | | $ | — | |
Year Ended December 31, 2020 | | | 6.80 | | | | 0.32 | | | | 0.19 | | | | 0.51 | | | | 0.33 | | | | — | |
Year Ended December 31, 2019 | | | 6.26 | | | | 0.33 | | | | 0.54 | | | | 0.87 | | | | 0.33 | | | | — | |
Year Ended December 31, 2018 | | | 6.79 | | | | 0.33 | | | | (0.53 | ) | | | (0.20 | ) | | | 0.33 | | | | — | |
Year Ended December 31, 2017 | | | 6.72 | | | | 0.35 | | | | 0.07 | | | | 0.42 | | | | 0.35 | | | | — | |
Institutional Class | | | | | | | | | | | | | | | | | | | | | | | | |
Year Ended December 31, 2021 | | $ | 6.94 | | | $ | 0.28 | | | $ | (0.04 | ) | | $ | 0.24 | | | $ | 0.30 | | | $ | — | |
Year Ended December 31, 2020 | | | 6.76 | | | | 0.33 | | | | 0.19 | | | | 0.52 | | | | 0.34 | | | | — | |
Year Ended December 31, 2019 | | | 6.23 | | | | 0.34 | | | | 0.53 | | | | 0.87 | | | | 0.34 | | | | — | |
Year Ended December 31, 2018 | | | 6.75 | | | | 0.35 | | | | (0.52 | ) | | | (0.17 | ) | | | 0.35 | | | | — | |
Year Ended December 31, 2017 | | | 6.68 | | | | 0.36 | | | | 0.08 | | | | 0.44 | | | | 0.37 | | | | — | |
1 | Based on average shares outstanding during the period. |
2 | Total return represents aggregate total return for the period indicated, includes reinvestment of all dividends and distributions, and does not reflect the deduction of any applicable sales charges. Total returns for periods of less than one year have not been annualized. |
3 | Ratios representing periods of less than one year have been annualized. |
SEE NOTES TO FINANCIAL STATEMENTS | 142 | |
| | | | | | | | | | | | | | | | | Ratios to
average net
assets3 | | | | | | | | | |
| | Total
distributions | | | Net asset
value,
end of
period | | | Total return2 | | | Net assets
end of period
(in $000’s) | | | Net
expenses
including
reimbursements
and waivers | | | Net
investment
income | | | Total
expenses
excluding
reimbursements
and waivers | | | Portfolio
Turnover4 | | | | |
| | | | | | | | | | | | | | | | | | | | | | | | | | | | | | | | | | | | |
| | | | | | | | | | | | | | | | | | | | | | | | | | | | | | | | | | | | |
| | $ | 0.18 | | | $ | 10.21 | | | | (1.63 | %) | | $ | 14,076 | | | | 0.71 | % | | | 1.35 | % | | | 0.71 | % | | | 48 | % | | | | |
| | | 0.43 | | | | 10.56 | | | | 6.89 | % | | | 14,101 | | | | 0.72 | % | | | 1.58 | % | | | 0.72 | % | | | 79 | % | | | | |
| | | 0.25 | | | | 10.29 | | | | 7.78 | % | | | 7,401 | | | | 0.71 | % | | | 2.30 | % | | | 0.71 | % | | | 63 | % | | | | |
| | | 0.23 | | | | 9.78 | | | | (0.24 | %) | | | 4,277 | | | | 0.71 | % | | | 2.23 | % | | | 0.71 | % | | | 62 | % | | | | |
| | | 0.22 | | | | 10.04 | | | | 2.56 | % | | | 2,969 | | | | 0.71 | % | | | 2.11 | % | | | 0.71 | % | | | 60 | % | | | | |
| | | | | | | | | | | | | | | | | | | | | | | | | | | | | | | | | | | | |
| | $ | 0.21 | | | $ | 10.21 | | | | (1.38 | %) | | $ | 771,495 | | | | 0.46 | % | | | 1.60 | % | | | 0.46 | % | | | 48 | % | | | | |
| | | 0.46 | | | | 10.56 | | | | 7.16 | % | | | 746,615 | | | | 0.46 | % | | | 1.86 | % | | | 0.46 | % | | | 79 | % | | | | |
| | | 0.27 | | | | 10.29 | | | | 8.04 | % | | | 702,291 | | | | 0.46 | % | | | 2.55 | % | | | 0.46 | % | | | 63 | % | | | | |
| | | 0.26 | | | | 9.78 | | | | 0.01 | % | | | 682,201 | | | | 0.46 | % | | | 2.50 | % | | | 0.46 | % | | | 62 | % | | | | |
| | | 0.25 | | | | 10.04 | | | | 2.82 | % | | | 697,050 | | | | 0.46 | % | | | 2.34 | % | | | 0.46 | % | | | 60 | % | | | | |
| | | | | | | | | | | | | | | | | | | | | | | | | | | | | | | | | | | | |
| | | | | | | | | | | | | | | | | | | | | | | | | | | | | | | | | | | | |
| | | | | | | | | | | | | | | | | | | | | | | | | | | | | | | | | | | | |
| | $ | 0.27 | | | $ | 6.90 | | | | 2.96 | % | | $ | 172,881 | | | | 0.93 | % | | | 3.86 | % | | | 0.93 | % | | | 51 | % | | | | |
| | | 0.32 | | | | 6.97 | | | | 7.80 | % | | | 171,838 | | | | 0.96 | % | | | 4.87 | % | | | 0.96 | % | | | 97 | % | | | | |
| | | 0.33 | | | | 6.79 | | | | 14.11 | % | | | 183,631 | | | | 0.96 | % | | | 4.94 | % | | | 0.96 | % | | | 90 | % | | | | |
| | | 0.33 | | | | 6.25 | | | | (3.07 | %) | | | 162,841 | | | | 0.97 | % | | | 5.01 | % | | | 0.97 | % | | | 57 | % | | | | |
| | | 0.35 | | | | 6.78 | | | | 6.37 | % | | | 201,953 | | | | 0.99 | % | | | 5.14 | % | | | 0.99 | % | | | 91 | % | | | | |
| | | | | | | | | | | | | | | | | | | | | | | | | | | | | | | | | | | | |
| | $ | 0.27 | | | $ | 6.92 | | | | 3.11 | % | | $ | 7,102 | | | | 0.93 | % | | | 3.85 | % | | | 0.93 | % | | | 51 | % | | | | |
| | | 0.33 | | | | 6.98 | | | | 7.79 | % | | | 6,177 | | | | 0.96 | % | | | 4.87 | % | | | 0.96 | % | | | 97 | % | | | | |
| | | 0.33 | | | | 6.80 | | | | 14.10 | % | | | 5,827 | | | | 0.96 | % | | | 4.95 | % | | | 0.96 | % | | | 90 | % | | | | |
| | | 0.33 | | | | 6.26 | | | | (3.05 | %) | | | 5,747 | | | | 0.97 | % | | | 5.01 | % | | | 0.97 | % | | | 57 | % | | | | |
| | | 0.35 | | | | 6.79 | | | | 6.36 | % | | | 5,798 | | | | 0.99 | % | | | 5.13 | % | | | 0.99 | % | | | 91 | % | | | | |
| | | | | | | | | | | | | | | | | | | | | | | | | | | | | | | | | | | | |
| | $ | 0.30 | | | $ | 6.88 | | | | 3.36 | % | | $ | 560,469 | | | | 0.69 | % | | | 4.08 | % | | | 0.69 | % | | | 51 | % | | | | |
| | | 0.34 | | | | 6.94 | | | | 8.08 | % | | | 294,313 | | | | 0.72 | % | | | 5.07 | % | | | 0.72 | % | | | 97 | % | | | | |
| | | 0.34 | | | | 6.76 | | | | 14.26 | % | | | 186,350 | | | | 0.71 | % | | | 5.21 | % | | | 0.71 | % | | | 90 | % | | | | |
| | | 0.35 | | | | 6.23 | | | | (2.70 | %) | | | 188,333 | | | | 0.72 | % | | | 5.26 | % | | | 0.72 | % | | | 57 | % | | | | |
| | | 0.37 | | | | 6.75 | | | | 6.64 | % | | | 205,555 | | | | 0.74 | % | | | 5.37 | % | | | 0.74 | % | | | 91 | % | | | | |
| | 143 | SEE NOTES TO FINANCIAL STATEMENTS |
December 31, 2021 |
Financial Highlights, continued |
Selected data for a share outstanding throughout each period. |
| | | | | | | Income
(loss) from
investment
operations | | | | | | | Distributions to
shareholders | |
| | Net asset
value,
beginning of
period | | | Net
investment
income1 | | | Net
realized and
unrealized
gain (loss) | | | Total from
investment
operations | | | From net
investment
income | | | From net
realized
gains | |
Sustainable Allocation Fund | | | | | | | | | | | | | | | | | | | | | | | | |
Investor Class | | | | | | | | | | | | | | | | | | | | | | | | |
Year Ended December 31, 2021 | | $ | 26.36 | | | $ | 0.23 | | | $ | 3.79 | | | $ | 4.02 | | | $ | 0.23 | | | $ | 1.17 | |
Year Ended December 31, 2020 | | | 23.35 | | | | 0.26 | | | | 3.49 | | | | 3.75 | | | | 0.26 | | | | 0.48 | |
Year Ended December 31, 2019 | | | 21.14 | | | | 0.36 | | | | 4.02 | | | | 4.38 | | | | 0.37 | | | | 1.80 | |
Year Ended December 31, 2018 | | | 22.66 | | | | 0.33 | | | | (1.23 | ) | | | (0.90 | ) | | | 0.47 | | | | 0.15 | |
Year Ended December 31, 2017 | | | 22.34 | | | | 0.30 | | | | 2.55 | | | | 2.85 | | | | 0.20 | | | | 2.33 | |
Institutional Class | | | | | | | | | | | | | | | | | | | | | | | | |
Year Ended December 31, 2021 | | $ | 26.83 | | | $ | 0.32 | | | $ | 3.86 | | | $ | 4.18 | | | $ | 0.30 | | | $ | 1.17 | |
Year Ended December 31, 2020 | | | 23.76 | | | | 0.33 | | | | 3.54 | | | | 3.87 | | | | 0.32 | | | | 0.48 | |
Year Ended December 31, 2019 | | | 21.47 | | | | 0.43 | | | | 4.09 | | | | 4.52 | | | | 0.43 | | | | 1.80 | |
Year Ended December 31, 2018 | | | 23.01 | | | | 0.38 | | | | (1.24 | ) | | | (0.86 | ) | | | 0.53 | | | | 0.15 | |
Year Ended December 31, 2017 | | | 22.63 | | | | 0.41 | | | | 2.53 | | | | 2.94 | | | | 0.23 | | | | 2.33 | |
1 | Based on average shares outstanding during the period. |
2 | Total return represents aggregate total return for the period indicated, includes reinvestment of all dividends and distributions, and does not reflect the deduction of any applicable sales charges. Total returns for periods of less than one year have not been annualized. |
3 | Ratios representing periods of less than one year have been annualized. |
SEE NOTES TO FINANCIAL STATEMENTS | 144 | |
| | | | | | | | | | | | | | | | | Ratios to
average net
assets3 | | | | | | | | | |
| | Total
distributions | | | Net asset
value,
end of
period | | | Total return2 | | | Net assets
end of period
(in $000’s) | | | Net
expenses
including
reimbursements
and waivers | | | Net
investment
income | | | Total
expenses
excluding
reimbursements
and waivers | | | Portfolio
Turnover4 | | | | |
| | | | | | | | | | | | | | | | | | | | | | | | | | | | | | | | | | | | |
| | | | | | | | | | | | | | | | | | | | | | | | | | | | | | | | | | | | |
| | $ | 1.40 | | | $ | 28.98 | | | | 15.31 | % | | $ | 1,652,892 | | | | 0.30 | %5 | | | 0.80 | % | | | 0.30 | %5 | | | 4 | % | | | | |
| | | 0.74 | | | | 26.36 | | | | 16.24 | % | | | 1,518,966 | | | | 0.30 | %5 | | | 1.08 | % | | | 0.30 | %5 | | | 13 | % | | | | |
| | | 2.17 | | | | 23.35 | | | | 20.83 | % | | | 1,523,009 | | | | 0.30 | %5 | | | 1.56 | % | | | 0.30 | %5 | | | 8 | % | | | | |
| | | 0.62 | | | | 21.14 | | | | (4.08 | %) | | | 1,324,582 | | | | 0.30 | %5 | | | 1.44 | %6 | | | 0.30 | %5 | | | 12 | % | | | | |
| | | 2.53 | | | | 22.66 | | | | 13.16 | % | | | 1,496,146 | | | | 0.29 | %5 | | | 1.33 | % | | | 0.30 | %5 | | | 14 | % | | | | |
| | | | | | | | | | | | | | | | | | | | | | | | | | | | | | | | | | | | |
| | $ | 1.47 | | | $ | 29.54 | | | | 15.64 | % | | $ | 974,940 | | | | 0.05 | %5 | | | 1.10 | % | | | 0.05 | %5 | | | 4 | % | | | | |
| | | 0.80 | | | | 26.83 | | | | 16.49 | % | | | 657,906 | | | | 0.05 | %5 | | | 1.36 | % | | | 0.05 | %5 | | | 13 | % | | | | |
| | | 2.23 | | | | 23.76 | | | | 21.17 | % | | | 374,838 | | | | 0.05 | %5 | | | 1.80 | % | | | 0.05 | %5 | | | 8 | % | | | | |
| | | 0.68 | | | | 21.47 | | | | (3.85 | %) | | | 365,079 | | | | 0.05 | %5 | | | 1.64 | %6 | | | 0.05 | %5 | | | 12 | % | | | | |
| | | 2.56 | | | | 23.01 | | | | 13.42 | % | | | 506,220 | | | | 0.04 | %5 | | | 1.79 | % | | | 0.05 | %5 | | | 14 | % | | | | |
5 | The expense ratio of the Sustainable Allocation Fund does not include indirect expenses of the underlying funds the Fund invests in. Indirect expenses of the underlying funds were 0.59% for the year ended December 31, 2021, 0.57% for the year ended December 31, 2020, 0.62% for the year ended December 31, 2019, 0.61% for the year ended December 31, 2018, and 0.61% for the year ended December 31, 2017. |
6 | In 2018, the Adviser reimbursed the Fund for expense overpayments related to transfer agent fees in the amount of $223,088. Before the reimbursement by the adviser, the difference in total returns for Investor Class and Institutional Class would have remained the same at (4.08)% and (3.85)%, respectively. The Net Investment Income for Investor Class and Institutional Class would have been 1.42% and 1.62%, respectively. |
| | 145 | SEE NOTES TO FINANCIAL STATEMENTS |
December 31, 2021 |
Notes to Financial Statements |
Pax World Funds Series Trust I and Pax World Fund Series Trust III
NOTE A—Organization and Summary of Significant Accounting Policies
Organization Pax World Funds Series Trust I (“Trust I”), which is registered under the Investment Company Act of 1940, as amended (the “1940 Act”), is an open-end management investment company organized under the laws of the Commonwealth of Massachusetts on May 25, 2006. As of December 31, 2021, Trust I offered ten investment funds: Pax Large Cap Fund (the “Large Cap Fund”), Pax Small Cap Fund (the “Small Cap Fund”), Pax US Sustainable Economy Fund (the “US Sustainable Economy Fund”, formerly known as Pax ESG Beta Quality Fund), Pax Global Sustainable Infrastructure Fund (the “Global Sustainable Infrastructure Fund”, formerly known as Pax ESG Beta Dividend Fund), Pax Global Opportunities Fund (the “Global Opportunities Fund”), Pax Global Environmental Markets Fund (the “Global Environmental Markets Fund”), Pax International Sustainable Economy Fund (the “International Sustainable Economy Fund”, formerly known as Pax MSCI EAFE ESG Leaders Index Fund), Pax Core Bond Fund (the “Core Bond Fund”), Pax High Yield Bond Fund (the “High Yield Bond Fund”), and Pax Sustainable Allocation Fund (the “Sustainable Allocation Fund”).
Pax World Funds Series Trust III (“Trust III”) is an open-end management investment company that was organized under the laws of the Commonwealth of Massachusetts on December 4, 2013 and registered under the 1940 Act. Pax Ellevate Global Women’s Leadership Fund (the “Global Women’s Leadership Fund”) is a diversified series of Trust III.
These financial statements relate to all funds (each a “Fund”, collectively, the “Funds”) offered under both Trust I and Trust III (each a “Trust”, collectively, the “Trusts”).
The Large Cap Fund, Global Sustainable Infrastructure Fund, Global Opportunities Fund, Global Women’s Leadership Fund, International Sustainable Economy Fund, Core Bond Fund and Sustainable Allocation Fund each offer two classes of shares—Investor Class shares and Institutional Class shares. The Small Cap Fund, US Sustainable Economy Fund, Global Environmental Markets Fund and High Yield Bond Fund each offer three classes of shares—Investor Class shares, Class A shares and Institutional Class shares. Although all share classes generally have identical voting, dividend and liquidation rights, each class votes separately when required by law. Different share classes pay different distribution amounts to the
extent the expenses of such classes differ, and distributions in liquidation will be proportional to the net asset value of each share class. Each share class has its own expense structure and sales charges, as applicable.
The Funds seek to avoid investing in issuers that their investment adviser has determined are involved in the manufacture or sale of weapons or manufacture of tobacco products or engage in business practices that their investment adviser determines to be sub-standard from an Environmental, Social and Governance (ESG) or sustainability perspective in relation to their industry, sector, asset class or universe peers.
The Large Cap Fund’s investment objective is to seek long-term growth of capital. The Fund seeks to achieve this objective by investing, under normal market conditions, at least 80% of its assets in equity securities (such as common stocks, securities convertible into common or preferred stocks and warrants) of companies that, when purchased, have capitalizations within the range of the Standard & Poor’s 500 Index as measured by market capitalization.
The Small Cap Fund’s investment objective is to seek long-term growth of capital. The Fund seeks to achieve this objective by investing, under normal market conditions, at least 80% of its assets in equity securities (such as common stocks, securities convertible into common or preferred stocks and warrants) of companies that, when purchased, have capitalizations within the range of the Russell 2000 Index as measured by market capitalization.
The US Sustainable Economy Fund’s investment objective is to seek long-term growth of capital. The Fund seeks to achieve this objective by investing, under normal market conditions, at least 80% of its assets in large-capitalization U.S. equity securities.
The Global Sustainable Infrastructure Fund’s investment objective is capital appreciation and income. The Fund seeks to achieve its investment objective by investing, under normal market conditions, at least 80% of its assets in equity securities of companies that the Adviser determines derive significant revenues (i.e., at least 20% of revenues) from owning, operating, developing or distributing sustainable infrastructure-related goods, services or assets.
The Global Opportunities Fund’s investment objective is to seek long term growth of capital by investing in companies benefiting from the transition to a more sustainable global economy. The Fund seeks to achieve this objective by investing, under normal market conditions, at least 80% of its net assets in companies that its Adviser or Sub-Adviser believe will benefit from the transition to a more
December 31, 2021 |
Notes to Financial Statements, continued |
sustainable global economy - the shift away from a depletive economy to one that preserves ecological and societal balance for the benefit of future generations. The Fund seeks to invest in companies with durable business models that are well-positioned to benefit from or avoid the risks associated with this transition. Under normal market conditions, the Global Opportunities Fund will invest primarily in equity securities (such as common stocks, preferred stocks and securities convertible into common or preferred stocks) of companies located around the world, including at least 40% of its net assets in securities of companies organized or located outside the United States or doing a substantial amount of business outside the United States, including those located in emerging markets.
The Global Environmental Markets Fund’s investment objective is to seek long term growth of capital by investing in innovative companies around the world whose businesses and technologies focus on environmental markets, including alternative energy and energy efficiency; water infrastructure technologies and pollution control; environmental support services and waste management technologies; and sustainable food, agriculture and forestry. The Fund seeks to achieve this objective by investing, under normal market conditions, at least 80% of its net assets in the foregoing companies and will invest primarily in equity securities (such as common stocks, preferred stocks and securities convertible into common and preferred stocks) of companies located around the world, including at least 40% of its net assets in securities of non-U.S. issuers, including those located in emerging markets.
The Global Women’s Leadership Fund’s investment objective is to seek investment returns that closely correspond to or exceed the price and yield performance, before fees and expenses, of the Impax Global Women’s Leadership Index (the “Women’s Index”), while maintaining risk characteristics that the Adviser believes are generally similar to those of the Women’s Index. The Fund seeks to achieve this objective by investing, under normal market conditions, more than 80% of its total assets in the component securities of the Women’s Index and in American depositary receipts, global depositary receipts and European depositary receipts representing the component securities of the Women’s Index, including at least 40% of its net assets (unless market conditions are not deemed favorable, in which case the Global Women’s Leadership Fund would normally invest at least 30% of its assets) in securities of companies organized or located outside the U.S. or doing a substantial amount of business outside the U.S.
The International Sustainable Economy Fund’s investment objective is to seek long-term growth of capital. The Fund seeks to achieve this objective by investing, under normal circumstances, more than 80% of its assets in large-capitalization equity securities in non-U.S. developed markets, including American Depositary
Receipts, Global Depositary Receipts and Euro Depositary Receipts. The Fund may take significant positions in one or more non-U.S. developed markets, including the Asia and Pacific region and the European Union.
The Core Bond Fund’s investment objective is to seek income and conservation of principal. The Fund seeks to achieve this objective by investing, under normal market conditions, at least 80% of its assets in bonds, which include debt obligations such as mortgage-related securities, securities issued by the United States government or its agencies and instrumentalities, municipal bonds, corporate bonds and high-impact bonds (which provide financing to support solutions to global sustainability challenges) across the spectrum of issuers, each of which is, at the time of purchase, rated at least investment grade (rated BBB- or higher by Standard & Poor’s Ratings Group or Baa3 or higher by Moody’s Investors Service) or unrated and determined by the Adviser to be of comparable quality.
The High Yield Bond Fund’s primary investment objective is to seek high current income. As a secondary investment objective, the High Yield Bond Fund seeks capital appreciation. The Fund seeks to achieve this objective by investing, under normal market conditions, at least 80% of its assets in high-yield, fixed income securities (such as bonds, notes or debentures) that are rated below BBB- by Standard & Poor’s Ratings Group or below Baa3 by Moody’s Investors Service, similarly rated by another major rating service, or unrated and determined by the High Yield Bond Fund’s investment adviser to be of comparable quality. These fixed income securities are commonly referred to as “junk bonds.”
The Sustainable Allocation Fund’s primary investment objective is to seek income and conservation of principal. As a secondary investment objective, the Fund seeks long-term growth of capital. The Fund uses a team approach to allocate among multiple funds managed by the Adviser (“Underlying Funds”) in order to seek to achieve its investment objectives. The Adviser will allocate the Fund’s assets among Underlying Funds in its sole discretion. The Fund seeks to achieve its investment objectives, under normal market conditions, by investing (indirectly through the use of Underlying Funds) approximately 50%-75% of its assets in equity securities (such as common stocks, preferred stocks and securities convertible into common or preferred stocks) and 25%-50% of its assets in debt securities (including but not limited to debt securities convertible into equity securities).
Under the Trusts’ organizational documents, its officers and trustees are indemnified against certain liabilities arising out of the performance of their duties to the Trusts. Additionally, in the normal course of business, the Trusts enter into contracts with service providers that contain general indemnification clauses. The Trusts’ maximum exposure under these arrangements is unknown as
December 31, 2021 |
Notes to Financial Statements, continued |
this could involve future claims that may be made against the Trusts that have not yet occurred. However, based on experience, the Trusts expect this risk of loss to be remote.
Accounting Estimates The preparation of financial statements in conformity with U.S. generally accepted accounting principles (“GAAP”) requires management to make estimates and assumptions that affect the reported amounts of assets and liabilities and disclosure of contingent assets and liabilities at the date of the financial statements and the reported amounts of revenues and expenses during the reporting period. Actual results could differ from those estimates. The Funds apply Investment Company accounting and reporting guidance.
Valuation of Investments For purposes of calculating the net asset value (“NAV”), determined ordinarily as of the close of regular trading (normally 4:00 p.m. Eastern time) (the “NYSE Close”) on the New York Stock Exchange (“NYSE”) on each day that the NYSE is open for trading, the Funds normally use pricing data for domestic equity securities received shortly after the NYSE Close and do not normally take into account trading, clearances or settlements that take place after the NYSE Close. U.S. fixed income and non-U.S. securities are normally priced using data reflecting the earlier closing of the principal markets for those securities, subject to possible fair value adjustments. Information that becomes known to the Funds or their agents after NAV has been calculated on a particular day will not generally be used to retroactively adjust the price of a security or NAV determined earlier that day.
For the purpose of these financial statements, fair values for various types of securities and other instruments are determined on the basis of closing prices or last sales prices on an exchange or other market, or based on quotes or other market information obtained from quotation reporting systems, established market makers or pricing services. Short-term investments having a maturity of 60 days or less are generally valued at amortized cost, which approximates fair value.
Investments denominated in currencies other than the U.S. dollar are converted to U.S. dollars using exchange rates obtained from pricing services. As a result, the NAV of a Fund’s shares may be affected by changes in the value of currencies in relation to the U.S. dollar.
If market quotations are not readily available (including in cases when available market quotations are deemed to be unreliable), the Funds’ investments will be valued as determined in good faith pursuant to policies and procedures approved by the Boards of Trustees of the Trusts (the “Boards” or “Boards of Trustees”)(so called “fair value pricing”). Fair value pricing may require subjective
determinations about the value of a security or other asset, and fair values used to determine a Fund’s NAV may differ from quoted or published prices, or from prices that are used by others, for the same investments. Also, the use of fair value pricing may not always result in adjustments to the prices of securities or other assets held by a Fund. The Boards have delegated to the Adviser’s Best Execution and Valuation Committee the day-to-day responsibility for making fair value pricing determinations with respect to Fund holdings.
The Funds may determine that market quotations are not readily available due to events relating to a single issuer (e.g., corporate actions or announcements) or events relating to multiple issuers (e.g., governmental actions or natural disasters). The Funds may determine the fair value of investments based on information provided by pricing services and other third-party vendors, which may recommend fair value prices or adjustments with reference to other securities, indices or assets. In considering whether fair value pricing is required and in determining fair values, the Funds may, among other things, consider significant events (which may be considered to include changes in the value of U.S. securities or securities indices) that occur after the close of the relevant market and the usual time of valuation. At December 31, 2021, three securities were fair valued in good faith pursuant to policies and procedures approved by the Boards of Trustees. The Core Bond Fund held one security fair valued at $298,550, representing 0.04% of the Fund’s net asset value and the High Yield Bond Fund held three securities fair valued at $510,838, representing 0.08% of the Fund’s net asset value.
For those Funds that invest in non-U.S. securities, investors should be aware that many securities markets and exchanges outside the U.S. close prior to the close of the NYSE, and the closing prices for securities in such markets or on such exchanges may not fully reflect events that occur after such close but before the close of the NYSE. As a result, the Funds’ fair value pricing procedures require the Funds to consider changes in the fair value of non-U.S. securities between the time of the closing of the local market’s exchange and the close of the NYSE. Generally, if there has been a movement in the U.S. market that exceeds a specified threshold, the Funds will assess whether the closing price on the local exchange is still appropriate. Although the threshold may be revised from time to time and the number of days on which fair value prices will be used will depend on market activity, it is possible that fair value prices will be used by the Funds to a significant extent. The value determined for an investment using the Funds’ fair value pricing procedures may differ from recent market prices for the investment.
December 31, 2021 |
Notes to Financial Statements, continued |
Fair Value Measurements Fair value is defined as the price that the Fund would receive upon selling an investment in an orderly transaction between market participants. The three-tier hierarchy of inputs is summarized in the three broad Levels listed below.
| | ● | Level 1 – unadjusted quoted prices in active markets for identical investments |
| | ● | Level 2 – other significant observable inputs (including quoted prices for similar securities, interest rates, prepayment speeds, credit risk, etc.) |
| | ● | Level 3 – significant unobservable inputs (including the Funds’ own assumptions in determining the fair value of investments) |
Observable inputs are inputs that reflect the assumptions market participants would use in pricing the asset or liability developed based on market data obtained from sources independent of the reporting entity. Unobservable inputs are inputs that reflect the reporting entity’s own assumptions about the assumptions market participants would use in pricing the asset or liability developed based on the best information available in the circumstances. The inputs or methodology used for valuing securities are not necessarily an indication of the risk associated with investing in those securities. The following is a general summary of valuation inputs and classifications for different categories of securities.
Equity Securities Equity securities, including common stocks, preferred stocks and exchange-traded funds, for which market quotations are readily available, valued at the last reported sale price or official closing price as reported by an independent pricing service, are generally categorized as Level 1 in the hierarchy. Non-U.S. equity securities may also be valued at official close, or may be valued based on the fair value pricing procedures noted above. When third-party fair value pricing of foreign securities methods are applied, they are generally categorized as Level 2. To the extent that inputs for equity securities are unobservable, values are categorized as Level 3 in the hierarchy.
Fixed Income Securities Fixed income securities, including Corporate Bonds (both investment-grade and high-yield), U.S. Treasury Obligations, Government Bonds, Mortgage-Backed and Asset-Backed Securities, Bank Loans and Municipal Bonds, are valued at evaluated prices received from independent pricing services, which are evaluated using various inputs and techniques which may include trade activity, broker-dealer quotes, yield curves, coupon rates, default rates, cash flows,
models and other inputs, and are generally categorized as Level 2 in the hierarchy. To the extent that inputs for fixed income securities are unobservable, values are categorized as Level 3 in the hierarchy.
Affiliated and Unaffiliated Investment Companies Investments in mutual funds are valued at the Funds’ closing net asset value and are generally categorized as Level 1.
Short-term Investments Short-term securities, including repurchase agreements, with remaining maturities of 60 days or less, which are valued at amortized cost, are generally categorized as Level 2 in the hierarchy.
The following is a summary of the inputs used to value the Funds’ net assets as of December 31, 2021:
| | Level 1 | | | Level 2 | | | Level 3* | | | Totals | |
Large Cap | | | | | | | | | | | | | | | | |
Common Stocks | | $ | 1,531,558,853 | | | $ | — | | | $ | — | | | $ | 1,531,558,853 | |
Cash Equivalents | | | 36,734,062 | | | | — | | | | — | | | | 36,734,062 | |
Total | | $ | 1,568,292,915 | | | $ | — | | | $ | — | | | $ | 1,568,292,915 | |
Small Cap | | | | | | | | | | | | | | | | |
Common Stocks | | $ | 703,441,878 | | | $ | — | | | $ | — | | | $ | 703,441,878 | |
Cash Equivalents | | | 37,343,693 | | | | — | | | | — | | | | 37,343,693 | |
Total | | $ | 740,785,571 | | | $ | — | | | $ | — | | | $ | 740,785,571 | |
US Sustainable Economy | | | | | | | | | | | | | | | | |
Common Stocks | | $ | 311,455,510 | | | $ | — | | | $ | — | | | $ | 311,455,510 | |
Cash Equivalents | | | 3,089,526 | | | | — | | | | — | | | | 3,089,526 | |
Total | | $ | 314,545,036 | | | $ | — | | | $ | — | | | $ | 314,545,036 | |
Global Sustainable Infrastructure | | | | | | | | | | | | | | | | |
Common Stocks | | $ | 49,245,349 | | | $ | 46,310,813 | | | $ | — | | | $ | 95,556,162 | |
Exchange-Traded Funds | | | — | | | | 732,098 | | | | — | | | | 732,098 | |
Cash Equivalents | | | 1,912,132 | | | | — | | | | — | | | | 1,912,132 | |
Total | | $ | 51,157,481 | | | $ | 47,042,911 | | | $ | — | | | $ | 98,200,392 | |
Global Opportunities | | | | | | | | | | | | | | | | |
Common Stocks | | $ | 79,051,956 | | | $ | 61,542,259 | | | $ | — | | | $ | 140,594,215 | |
Cash Equivalents | | | 3,046,992 | | | | — | | | | — | | | | 3,046,992 | |
Total | | $ | 82,098,948 | | | $ | 61,542,259 | | | $ | — | | | $ | 143,641,207 | |
Global Environmental Markets | | | | | | | | | | | | | | | | |
Common Stocks | | $ | 1,577,909,307 | | | $ | 1,084,125,898 | | | $ | — | | | $ | 2,662,035,205 | |
Cash Equivalents | | | 69,848,645 | | | | — | | | | — | | | | 69,848,645 | |
Total | | $ | 1,647,757,952 | | | $ | 1,084,125,898 | | | $ | — | | | $ | 2,731,883,850 | |
December 31, 2021 |
Notes to Financial Statements, continued |
| | Level 1 | | | Level 2 | | | Level 3* | | | Totals | |
Global Women’s Leadership | | | | | | | | | | | | | | | | |
Common Stocks | | $ | 747,627,615 | | | $ | 256,432,354 | | | $ | — | | | $ | 1,004,059,969 | |
Preferred Stocks | | | — | | | | 574,971 | | | | — | | | | 574,971 | |
Cash Equivalents | | | 13,241,243 | | | | — | | | | — | | | | 13,241,243 | |
Total | | $ | 760,868,858 | | | $ | 257,007,325 | | | $ | — | | | $ | 1,017,876,183 | |
International Sustainable Economy | | | | | | | | | | | | | | | | |
Common Stocks | | $ | 6,545,691 | | | $ | 865,010,828 | | | $ | — | | | $ | 871,556,519 | |
Preferred Stocks | | | — | | | | 516,423 | | | | — | | | | 516,423 | |
Cash Equivalents | | | 10,361,099 | | | | — | | | | — | | | | 10,361,099 | |
Total | | $ | 16,906,790 | | | $ | 865,527,251 | | | $ | — | | | $ | 882,434,041 | |
Core Bond | | | | | | | | | | | | | | | | |
Community Investment Notes | | $ | — | | | $ | — | | | $ | 298,550 | | | $ | 298,550 | |
Corporate Bonds | | | — | | | | 289,041,559 | | | | — | | | | 289,041,559 | |
U.S. Gov’t Agency Bonds | | | — | | | | 8,789,876 | | | | — | | | | 8,789,876 | |
Government Bonds | | | — | | | | 2,938,664 | | | | — | | | | 2,938,664 | |
Supranational Bonds | | | — | | | | 94,354,061 | | | | — | | | | 94,354,061 | |
Municipal Bonds | | | — | | | | 12,253,727 | | | | — | | | | 12,253,727 | |
U.S. Treasury Notes | | | — | | | | 114,908,275 | | | | — | | | | 114,908,275 | |
Asset-Backed Securities | | | — | | | | 53,402,276 | | | | — | | | | 53,402,276 | |
Mortgage-Backed Securities | | | — | | | | 180,110,314 | | | | — | | | | 180,110,314 | |
Cash Equivalents | | | 33,402,561 | | | | 254,280 | | | | — | | | | 33,656,841 | |
Total | | $ | 33,402,561 | | | $ | 756,053,032 | | | $ | 298,550 | | | $ | 789,754,143 | |
High Yield Bond | | | | | | | | | | | | | | | | |
Community Investment Notes | | $ | — | | | $ | — | | | $ | 510,838 | | | $ | 510,838 | |
Common Stocks | | | — | | | | — | | | | 0 | | | | 0 | |
Preferred Stocks | | | 2,584,200 | | | | — | | | | 0 | | | | 2,584,200 | |
Corporate Bonds | | | — | | | | 695,761,770 | | | | — | | | | 695,761,770 | |
Loans | | | — | | | | 16,980,685 | | | | — | | | | 16,980,685 | |
Medium Term Certificates of Deposit | | | — | | | | 500,000 | | | | — | | | | 500,000 | |
Certificates of Deposit | | | — | | | | 100,137 | | | | — | | | | 100,137 | |
Cash Equivalents | | | 19,513,149 | | | | — | | | | — | | | | 19,513,149 | |
Total | | $ | 22,097,349 | | | $ | 713,342,592 | | | $ | 510,838 | | | $ | 735,950,779 | |
Sustainable Allocation | | | | | | | | | | | | | | | | |
Affiliated Investment Companies | | $ | 2,495,020,825 | | | $ | — | | | $ | — | | | $ | 2,495,020,825 | |
Cash Equivalents | | | 123,058,531 | | | | — | | | | — | | | | 123,058,531 | |
Total | | $ | 2,618,079,356 | | | $ | — | | | $ | — | | | $ | 2,618,079,356 | |
Table includes securities valued at zero.
See Schedules of Investments for additional detailed industry classifications.
Significant unobservable inputs were used by two Funds for Level 3 fair value measurements. The High Yield Bond Fund holds two securities of the same issuer which are deemed to be valued at zero based on company financial statements, and one security based on broker valuation levels. The Core Bond Fund holds a position in a Community Investment note which is valued based on a general obligation by the parent entity to limit investment exposure on the note.
Investment Transactions Investment transactions are recorded as of the date of purchase, sale or maturity. Net realized gains and losses from the sale or disposition of securities are determined on the identified cost basis, which is also used for federal income tax purposes. Corporate actions (including cash dividends) are recorded net of foreign tax withholdings.
Investment Income Dividend income is recorded on the ex-dividend date. Interest income is recorded on the accrual basis and includes accretion of discount and amortization of premiums, if any. The value of additional securities received as dividend payments is recorded as income and as an increase to the cost basis of such securities. The Funds amortize purchase price premium and accrete discount on bonds, if any, over the remaining life of the bonds using the effective interest method of amortization; for callable bonds, the premium amortization period is to the earliest call date.
Distributions to Shareholders Distributions to shareholders are recorded by each of the Funds on the ex-dividend dates. The Funds (except Core Bond Fund and High Yield Bond Fund) expect to pay dividends of net investment income, if any, semiannually and to make distributions of capital gains, if any, at least annually.
The Core Bond Fund and High Yield Bond Fund expect to pay dividends of net investment income, if any, monthly and to make distributions of capital gains, if any, at least annually. A shareholder begins earning dividends on the Core Bond Fund and High Yield Bond Fund shares the day after the Funds receive his or her purchase payment. Income and capital gains distributions are determined in accordance with income tax regulations, which may differ from U.S. generally accepted accounting principles.
Class Accounting Expenses directly attributable to a class of shares, such as 12b-1 distribution fees, are charged to that class. Each Fund has adopted a 12b-1 plan, applicable to certain classes of each of the Funds. Expenses of the Funds that are directly identifiable to a specific Fund, such as transfer agent fees, custody fees and registration fees, are applied to that Fund. Expenses that are not readily identifiable to a specific Fund, such as printing expense, Trustees’ fees and legal fees, are allocated in such a manner as deemed equitable, taking into consideration
December 31, 2021 |
Notes to Financial Statements, continued |
the nature and type of expense and the relative net assets of the Funds. Investment income, realized and unrealized gains and losses are allocated based upon the relative daily net assets of each class of shares.
Federal Income Taxes Each of the Funds has elected to be treated and intends to qualify each year as a regulated investment company under Subchapter M of the Internal Revenue Code of 1986, as amended. If a Fund so qualifies and satisfies certain distribution requirements, such Fund will ordinarily not be subject to federal income tax on its net investment income (which includes short-term capital gains) and net capital gains that it distributes to shareholders. Each Fund expects to distribute all or substantially all of its income and gains to shareholders every year. Therefore, no federal income or excise tax provision is required. The Funds are treated as separate entities for federal income tax purposes.
Foreign Currency Transactions The accounting records of the Funds are maintained in U.S. dollars. In addition, purchases and sales of investment securities, dividend and interest income, and certain expenses are translated at the rates of exchange prevailing on the respective dates of such transactions. Net realized and unrealized foreign currency exchange gains or losses occurring during the holding period of investment securities are a component of realized gain (loss) on investment transactions and unrealized appreciation (depreciation) on investments, respectively.
Non-U.S. Securities Non-U.S. markets can be significantly more volatile than domestic markets, causing the prices of some Fund investments to fluctuate significantly, rapidly and unpredictably. Non-U.S. securities may be less liquid than domestic securities; consequently, a Fund may at times be unable to sell non-U.S. securities at desirable times or prices. Other risks related to non-U.S. securities include delays in the settlement of transactions; less publicly available information about issuers; different reporting, accounting and auditing standards; the effect of political, social, diplomatic or economic events; seizure, expropriation or nationalization of the issuer or its assets; fluctuation in foreign currency exchange rates and the possible imposition of currency exchange controls. If a Fund invests substantially in securities of non-U.S. issuers tied economically to a particular country or geographic region, it will be subject to the risks associated with such country or geographic region to a greater extent than a fund that is more diversified across countries or geographic regions.
Securities Lending The Funds may lend their securities pursuant to a securities lending agreement (Lending Agreement) with State Street Bank and Trust Company. Initial security loans made pursuant to the Lending Agreement are required to be secured by collateral not less than the percentage specified in the agreement,
ranging from 102% to 105%, depending on the types of securities. Cash collateral received is invested in the State Street Navigator Securities Lending Government Money Market Portfolio, a registered Rule 2a-7 money market fund. Borrowers may also pledge non-cash collateral within the guidelines for acceptable forms of non-cash collateral approved by the Boards of Trustees. At December 31, 2021, non-cash collateral consisted of U.S. Treasuries, short-term U.S. Government agency obligations and sovereign debt.
The Funds have the right under the Lending Agreement to recover the securities from the borrower on demand. The primary risk associated with securities lending is if the borrower defaults on its obligation to return the securities loaned because of insolvency or other reasons. The Funds could experience delays and costs in recovering securities loaned or in gaining access to the collateral. In the event the borrower fails to return loaned securities and the collateral received is insufficient to cover the value of the loaned securities and provided such collateral shortfall is not the result of investment losses, the lending agent has agreed to pay the amount of the shortfall to the Funds, or at the discretion of the lending agent, replace the loaned securities.
A portion of the income generated upon investment of the collateral is remitted to the borrower and the remainder is allocated between the Funds and the lending agent. The Funds record security lending income net of such allocation. The Funds continue to receive dividends on the securities loaned, which are accounted for in the same manner as other dividend and interest income.
As of December 31, 2021, the value of securities loaned, payable for collateral due to brokers and non-cash collateral pledged by brokers were as follows:
Fund | | Market Value
of Securities
Loaned | | | Payable on
Collateral Due
to Broker | | | Non-Cash
Collateral Value * | | | Over (Under)
Collateralized | |
Small Cap | | $ | 11,676,146 | | | $ | 8,711,743 | | | $ | 3,249,447 | | | $ | 285,044 | |
US Sustainable Economy | | | 748,297 | | | | 110,051 | | | | 661,218 | | | | 22,972 | |
Global Sustainable Infrastructure | | | 1,793,694 | | | | 910,028 | | | | 928,551 | | | | 44,885 | |
Global Women’s Leadership | | | 6,180,549 | | | | 104,400 | | | | 6,164,268 | | | | 88,119 | |
International Sustainable Economy | | | 15,873,795 | | | | 8,284,299 | | | | 8,376,809 | | | | 787,313 | |
Core Bond | | | 6,912,083 | | | | 7,064,485 | | | | — | | | | 152,402 | |
* | Non-cash collateral is not included in the financial statements. |
December 31, 2021 |
Notes to Financial Statements, continued |
For the Small Cap Fund, US Sustainable Economy Fund, Global Sustainable Infrastructure Fund, Global Women’s Leadership Fund and International Sustainable Economy Fund all of the securities on loan at December 31, 2021 are classified as Common Stocks in each Fund’s Schedule of Investments.
For the Core Bond Fund, the following table displays a breakdown of transactions accounted for as secured borrowings, the gross obligation by class of collateral pledged, and the remaining contractual maturity of those transactions as of December 31, 2021.
| | | Remaining Contractual Maturity of the Agreements | |
Securities Lending Transactions | | Overnight
and
Continuous | | | Up to 30
days | | | 30-90 days | | | Greater than
90 days | | | Total | |
Core Bond Fund | | | | | | | | | | | | | | | | | | | | |
U.S. Treasury and Agency Securities | | $ | 1,945,000 | | | $ | — | | | $ | — | | | $ | — | | | $ | 1,945,000 | |
Corporate Debt | | | 5,119,485 | | | | — | | | | — | | | | — | | | | 5,119,485 | |
Total Borrowings | | $ | 7,064,485 | | | $ | — | | | $ | — | | | $ | — | | | $ | 7,064,485 | |
| | | | | | | | | | | | | | | | | | | | | |
Gross amount of recognized liabilities for securities lending transactions | | $ | 7,064,485 | |
NOTE B—Investment Advisory Fee and Transactions with Affiliated and Other Parties
Each of Trust I and Trust III have entered into an Investment Advisory Contract (the “Management Contract”) with Impax Asset Management LLC (“IAM”) (the “Adviser”). Pursuant to the terms of the Management Contract, the Adviser, subject to the supervision of the Boards of Trustees of the Trusts, is responsible for managing the assets of the Funds in accordance with the Funds’ investment objectives, investment programs and policies.
Pursuant to the Management Contract, the Adviser has contracted to furnish the Funds continuously with an investment program, determining what investments to purchase, sell and exchange for the Funds and what assets to hold uninvested. The Adviser also has contracted to provide office space and certain management and
administrative facilities for the Funds. In return for such services, the Funds pay an advisory fee to the Adviser at the following annual rates (expressed as a percentage of the average daily net assets of such Fund):
Fund | | Annual Rate | |
Large Cap | | | 0.65 | % |
Small Cap | | | 0.75 | % |
US Sustainable Economy1 | | | 0.45 | %* |
Global Sustainable Infrastructure2 | | | 0.55 | %* |
Global Opportunities | | | 0.80 | % |
Global Environmental Markets3 | | | 0.75 | % |
Global Women’s Leadership4 | | | 0.51 | %* |
International Sustainable Economy | | | 0.47 | %* |
Core Bond | | | 0.40 | % |
High Yield Bond | | | 0.50 | % |
Sustainable Allocation | | | 0.05 | %* |
* | The management fee is a unified fee that includes all of the operating costs and expenses of the Fund (other than taxes, charges of governmental agencies, interest, brokerage commissions incurred in connection with portfolio transactions, distribution and/or service fees payable under a plan pursuant to Rule 12b-1 under the Investment Company Act of 1940, acquired fund fees and expenses and extraordinary expenses), including accounting expenses, administrator, transfer agent, custodian fees, legal fees and other expenses. |
1 | Effective March 31, 2021, management agreed to contractually waive a portion of its management fee not to exceed 0.45% of average daily net assets. This fee waiver may not be amended or terminated without the approval of the Fund’s Board of Trustees before April 30, 2024. The gross management fee (before waiver) is 0.65% based on average net assets up to $225 million; 0.55% for assets of $225 million to $375 million; 0.50% for assets of $375 million to $500 million; and 0.45% for assets over $500 million. |
2 | Effective March 31, 2021, management agreed to contractually waive a portion of its management fee not to exceed 0.55% of average daily net assets. This fee waiver may not be amended or terminated without the approval of the Fund’s Board of Trustees before April 30, 2024. The gross management fee (before waiver) is 0.65% based on average net assets up to $150 million; 0.55% for assets of $150 million to $375 million; 0.50% for assets of $375 million to $500 million; and 0.45% for assets over $500 million. |
3 | The management fee is 0.80% based on average net assets up to $1 billion; 0.75% for assets of $1 billion to $1.5 billion; 0.70% for assets of $1.5 billion to $2 billion; 0.65% for assets of $2 billion to $3 billion; and 0.60% for assets over $3 billion. The blended management fee for the year ended December 31, 2021 was 0.75%. |
4 | The management fee is 0.55% based on average net assets up to $375 million; 0.50% for assets of $375 million to $750 million; and 0.45% for assets over $750 million. The blended management fee for the year ended December 31, 2021 was 0.51%. |
December 31, 2021 |
Notes to Financial Statements, continued |
For the year ended December 31, 2021, the Funds incurred the following advisory fees:
Fund | | Amount | |
Large Cap | | $ | 8,752,861 | |
Small Cap | | | 4,696,995 | |
US Sustainable Economy | | | 1,428,841 | |
Global Sustainable Infrastructure | | | 628,963 | |
Global Opportunities | | | 803,342 | |
Global Environmental Markets | | | 16,761,299 | |
Global Women’s Leadership | | | 4,605,721 | |
International Sustainable Economy | | | 3,723,497 | |
Core Bond | | | 3,068,045 | |
High Yield Bond | | | 3,071,380 | |
Sustainable Allocation | | | 1,211,934 | |
The Adviser has contractually agreed to reimburse the Funds or limit expenses of the Funds to the extent that each Fund’s respective expenses exceed, on an annual basis, the following percentages of average daily net assets:
| | | Expense Caps | |
Fund | | Individual
Investor | | | Class A | | | Institutional | |
US Sustainable Economy 1,2 | | | 0.70 | % | | | 0.70 | % | | | 0.45 | % |
Global Sustainable Infrastructure 1,2 | | | 0.80 | % | | | | | | | 0.55 | % |
Global Opportunities 3 | | | 1.23 | % | | | | | | | 0.98 | % |
Global Women’s Leadership 1 | | | 0.80 | % | | | | | | | 0.55 | % |
International Sustainable Economy 1 | | | 0.73 | % | | | | | | | 0.48 | % |
Sustainable Allocation 1 | | | 0.30 | % | | | | | | | 0.05 | % |
1 | Expense caps for funds represent their respective unified management fees plus distribution and/or service fees payable under a plan pursuant to Rule 12b-1, as applicable to particular classes of shares. |
2 | The Adviser has contractually agreed to waive a portion of its management fee. This fee waiver may not be amended or terminated without the approval of the Funds’ Board of Trustees before April 30, 2024. |
3 | The Adviser has contractually agreed to reimburse expenses (other than interest, commissions, taxes, extraordinary expenses and acquired fund fees and expenses, if any) to the extent that they exceed the expense caps indicated. The reimbursement arrangement may not be amended or terminated without the approval of the Funds’ Board of Trustees before December 31, 2022. |
Such expenses include (i) management and distribution fees; (ii) the fees of affiliated and unaffiliated Trustees; (iii) the fees of the Funds’ custodian and transfer agent; (iv) the fees of the Funds’ legal counsel and independent registered public accounting firm; (v) the reimbursement of organizational expenses; and (vi) expenses related to shareholder communications including all expenses of shareholders’ and Boards of Trustees’ meetings and of preparing, printing and mailing reports, proxy statements and prospectuses to shareholders.
For the year ended December 31, 2021, the dollar amounts of expense reimbursements were as follows:
| | | Total Expenses Reimbursed by Adviser | |
Fund | | Individual Investor | | | Institutional | |
Global Opportunities | | $ | 4,246 | | | $ | 102,715 | |
In addition, the Adviser waived $396,592, $75,156 and $26,400 of its management fee from the US Sustainable Economy Fund, Global Sustainable Infrastructure Fund, and Global Opportunities Fund, respectively.
The Trusts have adopted a plan (“Plan”) pursuant to Rule 12b-1 under the 1940 Act that allows the Funds to pay distribution fees for the sale and distribution of certain shares as described below and for personal services rendered to the Fund shareholders in connection with the maintenance of shareholder accounts. Under the Plan, each Fund will pay its Distributor a distribution fee equal to 0.25% of the annual average daily net assets attributable to the Investor Class shares and Class A shares. The Distributor may pay all or any portion of the distribution fee to securities dealers or other organizations (including, but not limited to, any affiliate of the Distributor) as commissions, asset-based sales charges or other compensation with respect to the sale of indicated shares of such Fund, or for providing personal services to investors in the indicated shares of such Fund and/or the maintenance of shareholder accounts, and may retain all or any portion of the distribution fee as compensation for the Distributor’s services as principal underwriter of the indicated shares of such Fund.
Several individuals who are officers and/or Trustees of the Trusts are also employees of the Adviser.
December 31, 2021 |
Notes to Financial Statements, continued |
NOTE C—Investment Information
Purchases and proceeds from sales of investments for the Funds for the year ended December 31, 2021 were as follows:
| | | Purchases | | | Sales | |
Fund | | Investments1 | | | U.S. Gov’t Bonds | | | Investments1 | | | U.S. Gov’t Bonds | |
Large Cap | | $ | 494,321,192 | | | $ | — | | | $ | 329,939,422 | | | $ | — | |
Small Cap | | | 367,324,780 | | | | — | | | | 257,941,739 | | | | — | |
US Sustainable Economy | | | 134,257,620 | | | | — | | | | 151,323,001 | | | | — | |
Global Sustainable Infrastructure | | | 135,299,461 | | | | — | | | | 190,138,055 | | | | — | |
Global Opportunities | | | 86,394,000 | | | | — | | | | 33,624,821 | | | | — | |
Global Environmental Markets | | | 1,067,028,063 | | | | — | | | | 395,224,983 | | | | — | |
Global Women’s Leadership | | | 513,774,449 | | | | — | | | | 380,319,703 | | | | — | |
International Sustainable Economy | | | 539,584,496 | | | | — | | | | 423,644,199 | | | | — | |
Core Bond | | | 209,249,358 | | | | 247,655,972 | | | | 172,762,649 | | | | 191,221,422 | |
High Yield | | | 569,741,329 | | | | — | | | | 305,249,256 | | | | — | |
Sustainable Allocation | | | 307,994,197 | | | | — | | | | 102,000,000 | | | | — | |
1 | Excluding short-term investments and U.S. Government bonds. |
For federal income tax purposes, the identified cost of investments owned at December 31, 2021 as well as the gross unrealized appreciation (depreciation) of investments and resulting net unrealized appreciation (depreciation) as of December 31, 2021 were as follows for the Funds:
Fund | | Identified cost of
investments for
Federal income
tax basis | | | Gross unrealized
appreciation | | | Gross unrealized
depreciation | | | Net unrealized
appreciation
(depreciation) | |
Large Cap | | $ | 960,015,773 | | | $ | 610,865,722 | | | $ | 2,588,580 | | | $ | 608,277,142 | |
Small Cap | | | 574,174,380 | | | | 181,167,644 | | | | 14,556,453 | | | | 166,611,191 | |
US Sustainable Economy | | | 169,982,184 | | | | 146,945,332 | | | | 2,382,480 | | | | 144,562,852 | |
Global Sustainable Infrastructure | | | 93,953,979 | | | | 10,029,184 | | | | 5,782,771 | | | | 4,246,413 | |
Global Opportunities | | | 109,831,495 | | | | 35,012,835 | | | | 1,203,123 | | | | 33,809,712 | |
Global Environmental Markets | | | 1,876,870,414 | | | | 884,453,402 | | | | 29,439,966 | | | | 855,013,436 | |
Global Women’s Leadership | | | 763,168,290 | | | | 269,576,912 | | | | 14,869,019 | | | | 254,707,893 | |
International Sustainable Economy | | | 708,676,455 | | | | 201,055,064 | | | | 27,297,477 | | | | 173,757,587 | |
Core Bond | | | 780,449,064 | | | | 16,194,451 | | | | 6,889,372 | | | | 9,305,079 | |
High Yield | | | 726,714,979 | | | | 14,028,174 | | | | 4,792,374 | | | | 9,235,800 | |
Sustainable Allocation | | | 1,988,912,465 | | | | 629,223,531 | | | | 56,640 | | | | 629,166,891 | |
At December 31, 2021 the Small Cap Fund, Global Sustainable Infrastructure Fund, Global Opportunities Fund, Global Environmental Markets Fund, Global Women’s Leadership Fund and International Sustainable Economy Fund had unrealized foreign currency gains (losses) of $270; $(1,017); $241; $(25,242); $(6,910);and $16,588, respectively.
Netting Agreements During the ordinary course of business, the Funds may enter into transactions subject to enforceable netting agreements or other similar arrangements (“netting agreements”). Generally, the right to offset in netting agreements allows a Fund to offset any exposure to a specific counterparty with any collateral received or delivered to that counterparty based on the terms of the agreement. Generally, a Fund manages its cash collateral and securities collateral on a counterparty basis. As of December 31, 2021, there is no collateral held at the counterparty that would be offset by a master netting agreement that the Funds have with the counterparty. The Funds did not hold any derivative instruments as of December 31, 2021.
Affiliated Investments The term “affiliated company” includes other investment companies that are managed by a Fund’s Adviser. At December 31, 2021, the Sustainable Allocation Fund held the following investments in affiliated Funds:
Fund | | Shares
Held at
12/31/20 | | | Gross
Additions | | | Gross
Reductions | | | Shares
Held at
12/31/21 | |
Sustainable Allocation | | | | | | | | | | | | | | | | |
Large Cap | | | 74,122,950 | | | | 4,376,750 | | | | 2,362,357 | | | | 76,137,343 | |
Small Cap | | | 3,935,579 | | | | 819,271 | | | | 376,884 | | | | 4,377,966 | |
Global Sustainable Infrastructure | | | 8,320,411 | | | | 2,904,078 | | | | 3,465,629 | | | | 7,758,860 | |
Global Opportunities | | | 2,572,091 | | | | 1,443,131 | | | | — | | | | 4,015,222 | |
Global Environmental Markets | | | 2,180,751 | | | | 670,973 | | | | — | | | | 2,851,724 | |
Global Women’s Leadership | | | 1,533,441 | | | | 459,226 | | | | — | | | | 1,992,667 | |
International Sustainable Economy | | | 15,860,899 | | | | 738,551 | | | | 669,044 | | | | 15,930,405 | |
Core Bond | | | 66,559,119 | | | | 4,593,417 | | | | — | | | | 71,152,536 | |
High Yield | | | — | | | | 13,284,046 | | | | — | | | | 13,284,046 | |
December 31, 2021 |
Notes to Financial Statements, continued |
Fund | | Value at
12/31/20 | | | Dividend
Income | | | Realized
Gains/
Losses1 | | | Net change
in Unrealized
Appreciation/
Depreciation | | | Value at
12/31/21 | |
Sustainable Allocation | | | | | | | | | | | | | | | | | | | | |
Large Cap | | $ | 893,181,549 | | | $ | 4,578,677 | | | $ | 66,040,291 | | | $ | 203,361,768 | | | $ | 1,132,162,284 | |
Small Cap | | | 62,929,908 | | | | 340,896 | | | | 7,844,468 | | | | 11,522,296 | | | | 83,137,569 | |
Global Sustainable Infrastructure | | | 118,233,034 | | | | 1,755,058 | | | | 44,331,351 | | | | (33,567,014 | ) | | | 78,752,429 | |
Global Opportunities | | | 37,784,018 | | | | 52,297 | | | | 1,151,267 | | | | 8,873,481 | | | | 68,861,063 | |
Global Environmental Markets | | | 46,297,333 | | | | 487,003 | | | | 921,679 | | | | 10,727,762 | | | | 72,433,778 | |
Global Women’s Leadership | | | 46,769,952 | | | | 946,299 | | | | — | | | | 8,684,661 | | | | 70,400,912 | |
International Sustainable Economy | | | 160,829,518 | | | | 4,074,235 | | | | 4,810,841 | | | | 9,196,563 | | | | 171,411,156 | |
Core Bond | | | 702,864,297 | | | | 12,888,105 | | | | 1,192,271 | | | | (23,977,277 | ) | | | 726,467,396 | |
High Yield | | | — | | | | 1,950,878 | | | | — | | | | (56,640 | ) | | | 91,394,238 | |
Total | | $ | 2,068,889,609 | | | $ | 27,073,448 | | | $ | 126,292,168 | | | $ | 194,765,600 | | | $ | 2,495,020,825 | |
The Funds are permitted to purchase and sell securities (“cross-trade”) from and to other Funds within the Trusts or other accounts managed by the Adviser pursuant to “Cross-Trading” Procedures adopted by the Trusts’ Boards of Trustees. These procedures have been designed to ensure that any cross-trade of securities by the respective Fund from or to another Fund or account that is or could be considered an affiliate of the Fund under certain limited circumstances by virtue of having a common investment adviser complies with Rule 17a-7 of the 1940 Act. Further, as defined under these procedures, each cross-trade is effected at the current market price to save costs where allowed. Pursuant to these procedures, for the year ended December 31, 2021, the Global Women’s Leadership Fund and the International Sustainable Economy Fund engaged in cross-trades. The Global Women’s Leadership Fund and the International Sustainable Economy Fund had total purchases of $0 and $461,543, respectively, and total sales of $461,543 and $0, respectively. The Global Women’s Leadership Fund and International Sustainable Economy Fund had net gains of $5,681 and $0, respectively.
Restricted and Illiquid Securities The Funds may purchase certain restricted securities and limited amounts of illiquid securities. The Funds may invest in securities exempt from registration under Rule 144A of the Securities Act of 1933 (“the Act”) which are restricted from sale to the public and may only be sold to a qualified institutional buyer. The Funds do not have the right to demand that such securities be registered. The value of such securities is determined by valuations supplied by a pricing service or, if not available, in good faith by or at the direction of the Boards of Trustees. At December 31, 2021, the Core Bond
Fund held $114,374,375 or 14.56% of net assets and the High Yield Bond Fund held $569,205,276 or 76.87% of net assets in securities exempt from registration under Rule 144A of the Act.
At December 31, 2021 the Core Bond Fund held $4,056,693 of illiquid securities representing 0.52% of net assets and High Yield Bond Fund held $1,110,975 of illiquid securities, representing 0.15% of net assets. The Fund will classify as “illiquid” all securities that the Fund reasonably expects cannot be sold or disposed of in current market conditions in seven calendar days or less without the sale or disposition significantly changing the market value of the investment. Illiquid investments may include restricted securities, repurchase agreements that mature in more than seven days or that have a notice or demand feature more than seven days, certain over-the-counter option contracts and participation interests in loans. Because illiquid securities trade less frequently and in smaller volume than liquid securities, the Fund may experience difficulty in closing out positions at prevailing market prices.
Security | | Acquisition Date Range | | | Cost | | | Market Value | |
Core Bond | | | | | | | | | | | | |
Capital Impact Partners, 2.300%, 10/15/24 | 10/21/19 - 10/21/19 | | $ | 500,000 | | | $ | 499,582 | |
CINI Investment Note, 2.000%, 10/31/23 | 11/03/20 - 10/01/21 | | | 298,550 | | | | 298,550 | |
Community Credit Union of Lynn, 2.200%, 11/29/22 | 11/14/17 - 11/14/17 | | | 250,000 | | | | 254,280 | |
Local Initiatives Support Corp., 1.000%, 11/15/25 | 11/23/20 - 11/23/20 | | | 1,000,000 | | | | 966,700 | |
Tesla Energy Operations, Inc., 4.700%, 05/29/25 | 05/26/15 - 05/26/15 | | | 1,991,495 | | | | 2,037,581 | |
| | | | | | | | | | | | | |
High Yield Bond | | | | | | | | | | | | |
CINI Investment Note, 2.000%, 09/30/23 | 09/01/20 - 10/01/21 | | | 510,838 | | | | 510,838 | |
Interactive Health, Inc. | 03/19/04 - 10/01/13 | | | 178,981 | | | | 0 | |
Interactive Health, Inc., 0.000% | 03/19/04 - 10/01/13 | | | 357,962 | | | | 0 | |
Self-Help Credit Union, 0.650%, 04/29/22 | 04/22/20 - 04/22/20 | | | 100,000 | | | | 100,137 | |
Shared Interest, Inc., 0.549%, 09/30/24 | 09/30/21 - 09/30/21 | | | 500,000 | | | | 500,000 | |
NOTE D—Tax Information
The timing and characterization of certain income and capital gains distributions are determined annually in accordance with federal tax regulations, which may differ from GAAP. In addition to permanent differences previously noted, temporary differences may arise from recognition of certain items of income, expense, gain or loss in different periods for financial reporting and tax purposes. Such differences will reverse at some time in the future. As a result, net investment income (loss)
December 31, 2021 |
Notes to Financial Statements, continued |
and net realized gain (loss) on investment transactions for a reporting period may differ significantly from distributions during such period. For tax purposes, short-term capital gains are considered ordinary income.
The tax character of distributions paid during 2021 and 2020 was as follows:
| | | Distributions paid in 2021 | | | Distributions paid in 2020 | |
Fund | | Ordinary income | | | Long-term capital gains | | | Ordinary income | | | Long-term capital gains | |
Large Cap | | $ | 52,345,561 | | | $ | 35,983,069 | | | $ | 17,065,871 | | | $ | 48,903,970 | |
Small Cap | | | 25,885,304 | | | | 39,630,781 | | | | 12,545,619 | | | | 4,656,831 | |
US Sustainable Economy | | | 18,509,486 | | | | 39,363,830 | | | | 2,498,849 | | | | 2,533,652 | |
Global Sustainable Infrastructure | | | 8,250,932 | | | | 28,866,021 | | | | 2,432,461 | | | | 1,874,179 | |
Global Opportunities | | | 1,646,662 | | | | 904,535 | | | | 601,990 | | | | 84 | |
Global Environmental Markets | | | 31,220,367 | | | | 23,315,900 | | | | 8,256,780 | | | | — | |
Global Women’s Leadership | | | 13,606,860 | | | | — | | | | 8,377,472 | | | | — | |
International Sustainable Economy | | | 24,509,409 | | | | 13,532,820 | | | | 12,196,204 | | | | — | |
Core Bond | | | 13,865,738 | | | | 1,290,026 | | | | 24,750,437 | | | | 6,858,503 | |
High Yield Bond | | | 24,974,569 | | | | — | | | | 19,024,947 | | | | — | |
Sustainable Allocation | | | 50,575,753 | | | | 72,229,035 | | | | 24,868,963 | | | | 35,382,666 | |
The International Sustainable Economy Fund elected to defer $3,074,556 of capital losses recognized between November 1, 2021 and December 31, 2021 for the Fund’s fiscal year ending December 2021. These losses are treated for federal income tax purposes as if they had occurred on January 1, 2022.
For the year ended December 31, 2021, the components of distributable earnings on a tax basis are as follows:
Fund | | Undistributed Ordinary Income | | | Undistributed Long-Term Capital Gain | | | Other Temporary Differences | | | Net Unrealized Appreciation (Depreciation) | |
Large Cap | | $ | 10,838,090 | | | $ | 12,454,194 | | | $ | — | | | $ | 608,277,142 | |
Small Cap | | | 2,384,264 | | | | 2,487,847 | | | | — | | | | 166,611,461 | |
US Sustainable Economy | | | 634,602 | | | | 1,405,447 | | | | — | | | | 144,562,852 | |
Global Sustainable Infrastructure | | | — | | | | — | | | | — | | | | 4,245,342 | |
Global Opportunities | | | 201,076 | | | | 1,218,713 | | | | — | | | | 33,809,953 | |
Global Environmental Markets | | | 963,491 | | | | 6,340,323 | | | | — | | | | 854,988,194 | |
Global Women’s Leadership | | | 173,581 | | | | 17,044,509 | | | | — | | | | 254,700,983 | |
International Sustainable Economy | | | — | | | | — | | | | (3,074,556 | ) | | | 173,774,175 | |
Core Bond | | | 150,817 | | | | — | | | | (3,773,205 | ) | | | 9,305,079 | |
High Yield | | | — | | | | — | | | | (59,704,262 | ) | | | 9,235,800 | |
Sustainable Allocation | | | 50,398,005 | | | | 58,060,727 | | | | — | | | | 629,166,891 | |
As of December 31, 2021, for federal income tax purposes, the following Funds had capital loss carryforwards available to offset future gains, if any, to the extent provided by the Treasury regulations:
| | | | No Expiration | |
| Fund | | | Short-term | | | | Long-term | |
| Core Bond | | $ | 3,773,206 | | | $ | — | |
| High Yield | | | 21,834,700 | | | | 37,734,043 | |
For financial reporting purposes, the capital accounts are adjusted to reflect the tax character of permanent book/tax differences. Reclassifications are primarily due to tax treatment of gain (loss) on foreign currency transactions and tax treatment related to REITs, PFICs, paydowns, bond amortization and tax equalization adjustments.
For the year ended December 31, 2021, the Funds recorded the following reclassifications:
| Fund | | Undistributed
Net Investment
Income | | | Accumulated Net
Realized Gain/
(Loss) | | | Paid In
Capital | |
| Large Cap | | $ | (192,379 | ) | | $ | 192,379 | | | $ | — | |
| Small Cap | | | (1,073,246 | ) | | | 1,073,246 | | | | — | |
| US Sustainable Economy | | | (200,746 | ) | | | (4,752,311 | ) | | | 4,953,057 | |
| Global Sustainable Infrastructure | | | (850,346 | ) | | | (31,144,802 | ) | | | 31,995,148 | |
| Global Opportunities | | | (18,024 | ) | | | 18,024 | | | | — | |
| Global Environmental Markets | | | (695,718 | ) | | | 695,718 | | | | — | |
| Global Women’s Leadership | | | 568,308 | | | | (568,308 | ) | | | — | |
| International Sustainable Economy | | | 2,206,487 | | | | (2,206,487 | ) | | | — | |
| Core Bond | | | 1,783,431 | | | | (1,783,431 | ) | | | — | |
| High Yield | | | 264,949 | | | | (264,949 | ) | | | — | |
Uncertain Tax Positions Management has analyzed the Funds’ tax positions taken for all open tax years which remain subject to examination by the Funds’ major tax jurisdictions (years 2018 through 2021). The Funds recognize interest and penalties, if any, related to tax liabilities as income tax expense in the Statement of Operations. Management has concluded that, as of and during the year ended December 31, 2021, no provision for federal income tax is necessary and, therefore, the Funds did not have a liability for any unrecognized tax expenses.
December 31, 2021 |
Notes to Financial Statements, continued |
Note E—Other Matters
The impact of the COVID-19 pandemic has led, and in the future may lead, to increased short-term market volatility and may have adverse long-term effects on U.S. and world economies, markets generally, and a Fund’s ability to achieve its investment objective.
Note F – Subsequent Events
The Company evaluated all subsequent events for potential recognition or disclosure in these financial statements through February 22, 2022, the date the financial statements were available to be issued. No subsequent events were identified.
December 31, 2021 |
Report of Independent Registered Public Accounting Firm |
To the Boards of Trustees and Shareholders of Pax World Funds Series Trust I and Pax World Funds Series Trust III:
Opinion on the Financial Statements
We have audited the accompanying statements of assets and liabilities of Pax World Funds Series Trust I (“Trust I”) (comprising Pax Sustainable Allocation Fund, Pax U.S. Sustainable Economy Fund (formerly, Pax ESG Beta Quality Fund), Pax Small Cap Fund, Pax High Yield Bond Fund, Pax Global Environmental Markets Fund, Pax International Sustainable Economy Fund (formerly, Pax MSCI EAFE ESG Leaders Index Fund), Pax Core Bond Fund, Pax Large Cap Fund, Pax Global Opportunities Fund, and Pax Global Sustainable Infrastructure Fund (formerly, Pax ESG Beta Dividend Fund) (collectively, with Pax Ellevate Global Women’s Leadership Fund, the “Funds”)), and Pax World Funds Series Trust III (“Trust III” and collectively with Trust I, the “Trusts”) (comprising Pax Ellevate Global Women’s Leadership Fund), including the schedules of investments, as of December 31, 2021, and the related statements of operations, changes in net assets, and the financial highlights for each of the periods indicated in the table below and the related notes (collectively referred to as the “financial statements”). In our opinion, the financial statements present fairly, in all material respects, the financial position of the Funds at December 31, 2021, the results of their operations, changes in net assets and financial highlights for each of the periods indicated in the table below, in conformity with U.S. generally accepted accounting principles.
Funds comprising Trust I | Statement of
Operations | Statements of
Changes in Net
Assets | Financial highlights |
Pax Sustainable Allocation Fund Pax U.S. Sustainable Economy Fund (formerly, Pax ESG Beta Quality Fund) Pax Small Cap Fund Pax High Yield Bond Fund Pax Global Environmental Markets Fund Pax International Sustainable Economy Fund (formerly, Pax MSCI EAFE ESG Leaders Index Fund) Pax Large Cap Fund Pax Global Sustainable Infrastructure Fund (formerly, Pax ESG Beta Dividend Fund) Pax Core Bond Fund | For the year ended December 31, 2021 | For each of the two years in the period ended December 31, 2021 | For each of the five years in the period ended December 31, 2021 |
Pax Global Opportunities Fund | For the year ended December 31, 2021 | For each of the two years in the period ended December 31, 2021 | For each of the three years in the period ended December 31, 2021 and the period from June 27, 2018 (commencement of operations) through December 31, 2018 |
Funds comprising Trust III | Statement of
Operations | Statements of
Changes in Net
Assets | Financial highlights |
Pax Ellevate Global Women’s Leadership Fund | For the year ended December 31, 2021 | For each of the two years in the period ended December 31, 2021 | For each of the five years in the period ended December 31, 2021 |
Basis for Opinion
These financial statements are the responsibility of the Trusts’ management. Our responsibility is to express an opinion on each of the Funds’ financial statements based on our audits. We are a public accounting firm registered with the Public Company Accounting Oversight Board (United States) (“PCAOB”) and are required to be independent with respect to the Trusts in accordance with the U.S. federal securities laws and the applicable rules and regulations of the Securities and Exchange Commission and the PCAOB.
We conducted our audits in accordance with the standards of the PCAOB. Those standards require that we plan and perform the audit to obtain reasonable assurance about whether the financial statements are free of material misstatement, whether due to error or fraud. The Trusts are not required to have, nor were we engaged to perform, an audit of the Trusts’ internal control over financial reporting. As part of our audits we are required to obtain an understanding of internal control over financial reporting but not for the purpose of expressing an opinion on the effectiveness of the Trusts’ internal control over financial reporting. Accordingly, we express no such opinion.
Our audits included performing procedures to assess the risks of material misstatement of the financial statements, whether due to error or fraud, and performing procedures that respond to those risks. Such procedures included examining, on a test basis, evidence regarding the amounts and disclosures in the financial statements. Our procedures included confirmation of securities owned as of December 31, 2021, by correspondence with the custodian and brokers or by other appropriate auditing procedures where replies from brokers were not received. Our audits also included evaluating the accounting principles used and significant estimates made by management, as well as evaluating the overall presentation of the financial statements. We believe that our audits provide a reasonable basis for our opinion.

We have served as the auditor of the Pax World Funds Series Trust I and Pax World Funds Series Trust III since 2003.
Boston, Massachusetts
February 22, 2022
Proxy Voting (Unaudited)
You may obtain a description of the Funds’ policies and procedures that the Funds use to determine how to vote proxies relating to their portfolio securities, without charge, upon request by contacting the Funds at 800.767.1729 or on the SEC’s website at www.sec.gov.
The information regarding how the Funds voted proxies relating to portfolio securities during the most recent 12-month period ended June 30 is available without charge, upon request, by telephoning Pax (toll-free) at 800.767.1729 or visiting Pax’s website at www.impaxam.com and will be available without charge by visiting the SEC’s website at www.sec.gov.
Portfolio Holdings (Unaudited)
Each Fund files its complete schedule of portfolio holdings with the U.S. Securities and Exchange Commission (“SEC”) for the first and third quarters of each fiscal year (or as an exhibit to its reports Form N-PORT). Each Fund’s Forms N-PORT are available on the SEC’s web site at www.sec.gov.
Management of the Funds (Unaudited)
Interested Trustees and Officers
Name and Age | Position(s) Held With the
Trust; Term of Office1; and
Length of Time Served | Principal Occupation(s) During Past
Five Years and Other Directorships
Held by Trustee or Officer | Number of
Funds in the
Pax World
Fund Family
Overseen by
Trustee |
Joseph Keefe (68) | Trust I: Trustee, President
(since 2006) Trust III: Trustee, President
(since 2013) | President (2006-present) and Chief Executive Officer (2005-2018) of IAM; Chief Executive Officer of Pax Ellevate Management LLC (“PEM”) (2014-2020); member of the Board of Impax Asset Management Ltd. and Impax Asset Management (AIFM) Ltd. (2018-present); member of the Boards of Directors of Women Thrive Alliance (2009-2018) and New Hampshire Public Radio (2017-present); Co-Chair of the Leadership Group of the Women’s Empowerment Principles (2014-2018). | 11 |
Lindsey Brace Martinez
(54) | Trust I: Trustee
(since 2018) Trust III: Trustee
(since 2019) | Chair, People & Culture Committee, Onward Energy LLC (2021-present); Director, Seven Islands Management Co. (2018-present); Founder and Managing Member, Starpoint Advisors, LLC (2015-present); Director, Impax Asset Management Group plc (2015-present); Chair of the Board of Directors, Novatus Energy, LLC (2016-present); Board Member, Yale Center for Business and Environment (2014-present); Investment Sub-Committee Member, National Geographic Society (2015-present); Member, Advisory Council, Quebec Labrador Foundation (2012-present). | 11 |
John Boese
(58) | Trust I: Chief Compliance Officer
(since 2006) Trust III: Chief Compliance Officer
(since 2013) | Chief Compliance Officer of IAM (2006-present), Pax Ellevate Management LLC (2014-2020), Impax Asset Management Ltd (2020-present) and Impax Asset Management (AIFM) Ltd (2020-present). | N/A |
Interested Trustees and Officers, continued
Name and Age | Position(s) Held With the
Trust; Term of Office1; and
Length of Time Served | Principal Occupation(s) During Past
Five Years and Other Directorships
Held by Trustee or Officer | Number of
Funds in the
Pax World
Fund Family
Overseen by
Trustee |
Vanessa Pearl (39) | Trust I: Secretary
(2021-2022) Trust III: Secretary
(2021-2022) | Director of Finance of IAM (2018-2022). Director of Finance, and Financial Controller of Lindt & Sprungli (USA), Inc (2007-2018). | N/A |
Alicia K. DuBois (62) | Trust I: Treasurer
(since 2006) Trust III: Treasurer
(since 2013) | Chief Financial Officer for IAM (2006-present) and for PEM (2014-2021). Director of Impax Asset Management LLC and Director of IAM Holdco, Inc. (December 2021-present). | N/A |
Robert Silva (55) | Trust I: Assistant Treasurer (Since 2015) Trust III: Assistant Treasurer (Since 2015) | Director of Fund Administration for IAM (2014-present) and for PEM (2014-2021). | N/A |
Disinterested Trustees
Name and Age | Position(s) Held With the
Trust; Term of Office1; and
Length of Time Served | Principal Occupation(s) During Past
Five Years and Other Directorships
Held by Trustee or Officer | Number of
Funds in the
Pax World
Fund Family
Overseen by
Trustee |
Adrian P. Anderson
(67)2,3 | Trust I: Trustee
(since 2007) Trust III: Trustee
(since 2013) | Tax Director at Blue Sky Utility, a renewable energy finance firm (2022-present); Chair of Investment Committee, Zanick Advisors, a real estate advisory firm (2020-2021); Tax Associate at H+R Block (2020-2021); Tax Accountant at Shwiff, Levy & Polo, LLP (2018-2019); Tax Accountant at Watson Tax CPA (November 2021 - January 2022); Chief Executive Officer and Consultant of North Point Advisors, LLC (2004-2021). | 11 |
Anne M. Goggin (72)3,4 | Trust I and Trust III: Vice Chairperson of the Board of Trustees
(since 2019) Trust I and Trust III: Trustee
(since 2017) | Trustee of RS Investment Trust and RS Variable Products Trust (2006-2016); attorney; Retired, Chief Counsel, Metropolitan Life Insurance Company, an insurance company; Member, Governing Council of the Independent Directors Council (2012-present). | 11 |
D’Anne Hurd (71)2,3 | Trust I: Trustee
(since 2015) Trust III: Trustee
(since 2015) | Independent Member of and Independent Advisor to Corporate Boards of Directors (1993 to present). Private investor (2011– present); member of the Board of Directors, Audit (Chair) and Nominating and Governance Committees, Peckham Industries, Inc. (2013–present); member of the Board of Directors and Audit (Chair) Committee of Martin Engineering, Inc. (2019-present); Chief Executive Officer of Crawford Consulting LLC (2011-present). | 11 |
Disinterested Trustees, continued
Name and Age | Position(s) Held With the
Trust; Term of Office1; and
Length of Time Served | Principal Occupation(s) During Past
Five Years and Other Directorships
Held by Trustee or Officer | Number of
Funds in the
Pax World
Fund Family
Overseen by
Trustee |
John L. Liechty (67)3,5 | Trust I: Chairman of the Board of Trustees (since 2014); Trustee (since 2009) Trust III: Chairman of the Board of Trustees (since 2014); Trustee (since 2013) | Principal, Integrated Investment Solutions (2009-present); Principal, Integrated Financial Planning Solutions, LLC (2010-2021). | 11 |
Nancy S. Taylor (66)3,4 | Trust I: Trustee
(since 2006) Trust III: Trustee
(since 2013) | Senior Minister, Old South Church in Boston (2005-present); Advisory Board, Yale Divinity School (2010-present); Advisory Board, Idaho Human Rights Education Center (2009-present); Board of Managers, Old South Meeting House (2005-present); Trustee Emeritus, Benjamin Franklin Institute of Technology (2011-present). | 11 |
1 | A Trustee of the Funds holds office until a successor is chosen and qualified. An Officer of the Funds is appointed by the respective Board of Trustees and holds office until a successor is chosen and qualified. |
2 | Designates a member of the Audit Committee. The Audit Committee has the responsibility of overseeing the establishment and maintenance of an effective financial control environment, for overseeing the procedures for evaluating the system of internal accounting control and for evaluating audit performance. The committee met three times in 2021. |
3 | Designates a member of the Governance and Nomination Committee and Compliance Committee. The Governance and Nomination Committee is responsible for recommending Board candidates, reviewing and recommending Board compensation. The committee met two times in 2021. |
4 | Designates a member of the Compliance Committee. The Compliance Committee is responsible for overseeing regulatory and compliance matters, as well as Fund-related compliance activities of the Funds’ service providers. The committee met three times in 2021. |
5 | Mr. Liechty, as Chair, is a floating member of each of the Audit Committee and the Compliance Committee, and, as such, he will attend meetings of the committees based upon the matters to be discussed at each meeting or as otherwise determined by the Board or the committees. |
Federal Tax Information (Unaudited)
The percentages of ordinary income distributed by each of the Funds that is Qualified Dividend Income (QDI) and that qualifies for corporate Dividends Received Deduction (DRD) are as follows:
| | QDI% | | | DRD% | |
Large Cap | | | 100.00 | % | | | 100.00 | % |
Small Cap | | | 100.00 | % | | | 100.00 | % |
US Sustainable Economy | | | 100.00 | % | | | 100.00 | % |
Global Sustainable Infrastructure | | | 95.59 | % | | | 48.46 | % |
Global Opportunities | | | 100.00 | % | | | 100.00 | % |
Global Environmental Markets | | | 100.00 | % | | | 45.97 | % |
Global Women’s Leadership | | | 100.00 | % | | | 62.79 | % |
International Sustainable Economy | | | 100.00 | % | | | 0.00 | % |
Core Bond | | | 0.00 | % | | | 0.00 | % |
High Yield Bond | | | 0.00 | % | | | 0.48 | % |
Sustainable Allocation | | | 99.95 | % | | | 0.00 | % |
For the fiscal year ended December 31, 2021 the International Sustainable Economy Fund earned foreign source income totaling $22,302,858 and paid $1,939,051 foreign taxes which it intends to pass through to its shareholders.
December 31, 2021 |
Account Options and Services |
At Pax World, we are pleased to offer a variety of account options and shareholder services to help meet your investment needs.
Types of Accounts | Services |
Regular Accounts: Individual, business and trust accounts are available for all Pax World Funds. Traditional IRA Contributions to an IRA may be tax-deductible. Taxes are paid only when funds are withdrawn, when investors may be in a lower tax bracket. Roth IRA Contributions to a Roth IRA are not deductible, but after five years some types of withdrawals are tax-free. SIMPLE IRA This is an easy-to maintain retirement plan designed for small businesses. SEP IRA This is an employer funded retirement plan popular with small businesses and self-employed persons. Education Savings Account & Uniform Gift to Minors Account (UGMA) These plans provide excellent ways to save for a child’s education. | Automatic Investment Plan You may arrange to have a fixed amount automatically deducted from your checking or savings account and invested in your Pax World account on a monthly or quarterly basis. Automatic investment plans do not assure a profit and do not protect against loss in declining markets. Online Account Access Utilizing a unique ID number and PIN, you can access your Pax World account balances or histories; purchase or redeem fund shares; or make exchanges between different Pax World Funds. www.impaxam.com Learn all about Pax World Funds through our web site. You can check Fund performance, read about our portfolio managers, view Connection—our quarterly newsletter, and see how we voted on various proxies for the companies in our portfolios. |
Please note that the information contained herein does not constitute tax advice. Always consult your tax advisor before making any tax-related investment decisions.
This annual report is intended for shareholders of the Pax World Funds only, and is not authorized for distribution to other persons unless accompanied or preceded by a prospectus. Please consider the Funds’ investment objectives, risks and charges and expenses carefully before investing. The Funds’ prospectus contains this and other information about the Funds and may be obtained by calling 800.767.1729, emailing paxfunds@impaxam.com or visiting www.impaxam.com.
Distributor: Foreside Financial Services, LLC Member of FINRA 2/22.
THIS PAGE INTENTIONALLY LEFT BLANK
THIS PAGE INTENTIONALLY LEFT BLANK
THIS PAGE INTENTIONALLY LEFT BLANK
THIS PAGE INTENTIONALLY LEFT BLANK

Printed on recycled paper using soy-based inks.
30 Penhallow Street, Suite 400
Portsmouth NH 03801
800.767.1729
www.impaxam.com

Item 2. Code of Ethics.
As of December 31, 2021, the Registrant has adopted a “code of ethics,” as such term is defined in paragraph (b) of this Item 2, that applies to all officers of the Registrant, including Registrant’s principal executive officer, principal financial officer, principal accounting officer or controller, or persons performing similar functions, regardless of whether these individuals are employed by the Registrant or by a third party. A copy of the code of ethics is filed as an exhibit to this Form N-CSR.
Item 3. Audit Committee Financial Expert.
The Registrant’s Board of Trustees has determined that Adrian Anderson and Dorothy Ann Hurd, who serve on the Board’s Audit Committee, qualify as “audit committee financial experts,” as such term is defined in paragraph (b) of this Item 3. The Board also has determined that Mr. Anderson and Ms. Hurd are “independent,” as such term is interpreted by subparagraph (a)(2) of this Item 3. The Securities and Exchange Commission has stated that the designation of a person as an audit committee financial expert pursuant to this Item 3 of the Form N-CSR does not impose on such a person any duties, obligations or liability that are greater than the duties, obligations or liability imposed on such person as a member of the Audit Committee and the Board of Trustees in the absence of such designation or identification.
Item 4. Principal Accountant Fees and Services.
(a) Audit Fees. The aggregate fees billed for each of the last two fiscal years for professional services rendered by the principal accountant for the audit of the Registrant’s annual financial statements or services that are normally provided by the accountant in connection with statutory and regulatory filings or engagements were $314,539 and $308,372 for the fiscal years ended December 31, 2021 and 2020, respectively.
(b) Audit-Related Fees. The aggregate fees billed in each of the last two fiscal years for assurance and related services by the principal accountant that are reasonably related to the performance of the audit of the Registrant’s financial statements and are not reported under paragraph (a) of this Item were $0 and $0 for the fiscal years ended December 31, 2021 and 2020, respectively.
(c) Tax Fees. The aggregate fees billed in each of the last two fiscal years for professional services rendered by the principal accountant for tax compliance, tax advice and tax planning were $138,250 and $135,550 for the fiscal years ended December 31, 2021 and 2020, respectively. Fees disclosed under this category are for professional services related to review and execution of federal, state and excise tax returns and advice concerning tax compliance and planning.
(d) All Other Fees. The aggregate fees billed in each of the last two fiscal years for products and services provided by the principal accountant, other than the services reported in paragraphs (a) through (c) of this Item, are $19,155 and $17,034 for the fiscal years ended December 31, 2021 and 2020, respectively.
(e) (1) To the extent required by applicable regulations, the Audit Committee approves in advance all audit and non-audit services rendered to the Registrant by the independent registered public accounting firm and all non-audit services to the Registrant’s investment adviser and any entity controlling, controlled by or under common control with the Registrant’s investment adviser that provide ongoing services to the Registrant, if the engagement relates directly to the operations and financial reporting of the Registrant.
(2) With respect to the services described in paragraphs (b) through (d) of this Item, no amount was approved by the Audit Committee pursuant to paragraph (c)(7)(i)(C) of Rule 2-01 of Regulation S-X and no amount was required to be approved pursuant to paragraph (c)(7)(ii) of Rule 2-01 of Regulation S-X.
(f) Not applicable.
(g) The aggregate non-audit fees billed by the Registrant’s accountant for services rendered to the Registrant, or to the Registrant’s investment adviser, or to any entity controlling, controlled by or under common control with the adviser that provides ongoing services to the Registrant totaled $0 and $0, for the fiscal years ended December 31, 2021 and 2020, respectively.
(h) Not applicable.
Item 5. Audit Committee of Listed Registrants.
Not applicable.
Item 6. Schedule of Investments.
A complete series of schedules of investments is included as part of the report to shareholders filed under Item 1.
Item 7. Disclosure of Proxy Voting Policies and Procedures for Closed-End Management Investment Companies.
Not applicable.
Item 8. Portfolio Managers of Closed-End Management Investment Companies.
Not applicable.
Item 9. Purchase of Equity Securities by Closed-End Management Investment Company and Affiliated Purchasers.
Not applicable.
Item 10. Submission of Matters to a Vote of Security Holders.
There have been no material changes to the procedures by which shareholders may recommend nominees to the Registrant’s Board of Trustees that have been implemented since the Registrant last provided disclosure in response to the requirements of this Item.
Item 11. Controls and Procedures.
(a) It is the conclusion of the Registrant’s principal executive officer and principal financial officer (or persons performing similar functions), based on an evaluation of the effectiveness of the design and operation of the Registrant’s disclosure controls and procedures (as defined in Rule 30a-3(c) under the Investment Company Act of 1940, as amended) (the “Disclosure Controls”) as of a date within 90 days of the filing date of this report on Form N-CSR, that the design and operation of the Disclosure Controls are effective to reasonably ensure that information required to be disclosed by the Registrant in this report on Form N-CSR has been recorded, processed, summarized and reported within the time periods specified in the rules and forms of the Securities and Exchange Commission.
(b) There has been no change in the Registrant’s internal control over financial reporting (as defined in Rule 30a-3(d) under the Investment Company Act of 1940, as amended) that occurred during the period covered by this report on Form N-CSR that has materially affected, or is reasonably likely to materially affect, the Registrant’s internal control over financial reporting.
Item 12. Disclosure of Securities Lending Activities for Closed-End Management Companies
Not applicable.
Item 13. Exhibits.
SIGNATURES
Pursuant to the requirements of the Securities Exchange Act of 1934 and the Investment Company Act of 1940, the Registrant has duly caused this report to be signed on its behalf by the undersigned, thereunto duly authorized.
| (Registrant) | Pax World Funds Series Trust I | | |
| | | | |
| By (Signature and Title) | /s/ Joseph F. Keefe | |
| | | Joseph F. Keefe, President | |
| | | | |
| Date | May 25, 2022 | | |
| | |
| Pursuant to the requirements of the Securities Exchange Act of 1934 and the Investment Company Act of 1940, this report has been signed below by the following persons on behalf of the Registrant and in the capacities and on the dates indicated. |
| By (Signature and Title) | /s/ Joseph F. Keefe | |
| | | Joseph F. Keefe, President (Principal Executive Officer) | |
| | | | |
| Date | May 25, 2022 | | |
| | | | |
| By (Signature and Title) | /s/ Alicia K. DuBois | |
| | | Alicia K. DuBois, Treasurer (Principal Financial Officer) | |
| | | | |
| Date | May 25, 2022 | | |