|
| UNITED STATES |
| SECURITIES AND EXCHANGE COMMISSION |
| WASHINGTON, D.C. 20549 |
| -------- |
| |
| FORM N-CSR |
| -------- |
| |
| CERTIFIED SHAREHOLDER REPORT OF REGISTERED MANAGEMENT |
| INVESTMENT COMPANIES |
| |
| INVESTMENT COMPANY ACT FILE NUMBER 811-4325 |
| |
| FIRST INVESTORS LIFE SERIES FUNDS |
| (Exact name of registrant as specified in charter) |
| |
| 110 Wall Street |
| New York, NY 10005 |
| (Address of principal executive offices) (Zip code) |
| |
| Joseph I. Benedek |
| First Investors Management Company, Inc. |
| Raritan Plaza I |
| Edison, NJ 08837-3620 |
| 1-732-855-2712 |
| (Name and address of agent for service) |
| |
| REGISTRANT'S TELEPHONE NUMBER, INCLUDING AREA CODE: |
| 1-212-858-8000 |
| |
| DATE OF FISCAL YEAR END: DECEMBER 31, 2008 |
| |
| DATE OF REPORTING PERIOD: DECEMBER 31, 2008 |
| |
| Item 1. | Reports to Stockholders |
| |
| | The Annual Report to Stockholders follows |
This report is for the information of the shareholders of the Funds. It is the Funds’ practice to mail only one copy of their annual and semi-annual reports to all family members who reside in the same household. Additional copies of the reports will be mailed if requested by any shareholder in writing or by calling 1-800-423-4026. The Funds will ensure that separate reports are sent to any shareholder who subsequently changes his or her mailing address.
The views expressed in the portfolio manager letters reflect those views of the portfolio managers only through the end of the period covered. Any such views are subject to change at any time based upon market or other conditions and we disclaim any responsibility to update such views. These views may not be relied on as investment advice.
You may obtain a free prospectus for any of the Funds by contacting your representative, calling 1-800-423-4026, writing to us at the following address: First Investors Corporation, 110 Wall Street, New York, NY 10005, or by visiting our website at www.firstinvestors.com. You should consider the investment objectives, risks, charges and expenses of a Fund carefully before investing. The prospectus contains this and other information about the Fund, and should be read carefully before investing.
An investment in a Fund is not a bank deposit and is not insured or guaranteed by the Federal Deposit Insurance Corporation (FDIC) or any other government agency. Although the Cash Management Fund seeks to preserve a net asset value at $1.00 per share, it is possible to lose money by investing in it, just as it is possible to lose money by investing in any of the other Funds. Past performance is no guarantee of future results.
A Statement of Additional Information (“SAI”) for any of the Funds may also be obtained, without charge, upon request by calling 1-800-423-4026, writing to us at our address or by visiting our website listed above. The SAI contains more detailed information about the Fund, including information about its Trustees.
Portfolio Manager’s Letter
BLUE CHIP FUND
Dear Investor:
This is the annual report for the First Investors Life Blue Chip Fund for the year ended December 31, 2008. During the period, the Fund’s return on a net asset value basis was –32.08%, including dividends of 31.3 cents per share.
The value of the Fund’s investments in all major economic sectors came under immense pressure as the U.S. economy and stock market accelerated their decline during the latter half of the year. The freezing up of the credit markets, which began with the subprime mortgage fallout in mid-2007, continued to be a drag on equity performance during the period. Despite the difficult investment environment, the Fund substantially outperformed its benchmark, the S&P 500 Index, during the period.
The primary reasons for this outperformance were the Fund’s overweight in consumer staples stocks and its underweight in financials. The Fund exited some of its positions in financial companies early in the downturn, though it didn’t avoid the sector altogether. In addition, the Fund’s holdings within the financials sector outperformed those within the Index. The Fund’s investments in the health care sector also contributed positively to its relative performance.
In particular, giant retailer Wal-Mart Stores and brewing company Anheuser-Busch provided solid returns. Within the health care sector, biotechnology company Amgen also provided a significant positive contribution during the period.
The materials and financials sectors were the worst absolute performers during the period; however, the energy sector was the only sector in which the Fund underper-formed on a relative basis. The worst performing holdings included industry titan General Electric, software giant Microsoft and oilfield services provider Schlumberger.
The Fund continues to look for companies that it believes can generate earnings beyond what the market is expecting. As long-term investors, we are anticipating what will happen one or two years into a company’s future, rather than the next few quarters. The Fund also seeks out stocks of companies that are trading at a price that appears to be undervalued.
Although the market has been experiencing an unprecedented period of volatility, the Fund has tried to use this instability as an opportunity to find good values. We believe attractive equity valuations have presented increased buying opportunities for long-term investors.
Portfolio Manager’s Letter (continued)
BLUE CHIP FUND
Thank you for placing your trust in First Investors. We appreciate the opportunity to serve your investment needs.
Sincerely,

Matthew S. Wright
Portfolio Manager
January 30, 2009
Understanding Your Fund’s Expenses
FIRST INVESTORS LIFE SERIES FUNDS
As a mutual fund shareholder, you incur two types of costs: (1) transaction costs, and (2) ongoing costs, including advisory fees and other expenses. This example is intended to help you understand your ongoing costs (in dollars) of investing in the Fund and to compare these costs with the ongoing costs of investing in other mutual funds.
The examples are based on an investment of $1,000 in each Fund at the beginning of the period, July 1, 2008, and held for the entire six-month period ended December 31, 2008. The calculations assume that no shares were bought or sold during the period. Your actual costs may have been higher or lower, depending on the amount of your investment and the timing of any purchases or redemptions.
Actual Expense Example:
These amounts help you to estimate the actual expenses that you paid over the period. The “Ending Account Value” shown is derived from the Fund’s actual return, and the “Expenses Paid During Period” shows the dollar amount that would have been paid by an investor who started with $1,000 in the Fund. You may use the information here, together with the amount you invested, to estimate the expenses that you paid during the period.
To estimate the expenses you paid on your account during this period simply divide your ending account value by $1,000 (for example, an $8,600 account value divided by $1,000 = 8.60), then multiply the result by the number given for your Fund under the heading “Expenses Paid During Period”.
Hypothetical Expense Example:
These amounts provide information about hypothetical account values and hypothetical expenses based on the Fund’s actual expense ratio and an assumed rate of return of 5% per year before expenses, which is not the Fund’s actual return. The hypothetical account values and expenses may not be used to estimate the actual ending account balance or expenses you paid for the period. You may use this information to compare the ongoing costs of investing in the Fund and other funds. To do so, compare this 5% hypothetical example with the 5% hypothetical examples that appear in the shareholder reports of the other funds.
Please note that the expenses shown in the table are meant to highlight and help you compare your ongoing costs only and do not reflect any transactional costs. Therefore, the hypothetical expense example is useful in comparing ongoing costs only, and will not help you determine the relative total costs of owning different funds. In addition, if these transactional costs were included, your costs would have been higher.
Fund Expenses (unaudited)
BLUE CHIP FUND
The examples below show the ongoing costs (in dollars) of investing in your Fund and will help you in comparing these costs with costs of other mutual funds. Please refer to page 3 for a detailed explanation of the information presented in these examples.
| | | |
| |
| | Beginning | Ending | |
| | Account | Account | Expenses Paid |
| | Value | Value | During Period |
| | (7/1/08) | (12/31/08) | (7/1/08–12/31/08)* |
| Expense Examples | | | |
| Actual | $1,000.00 | $773.45 | $3.70 |
| Hypothetical | | | |
| (5% annual return before expenses) | $1,000.00 | $1,020.97 | $4.22 |
| * | Expenses are equal to the annualized expense ratio of .83%, multiplied by the average account |
| | value over the period, multiplied by 184/366 (to reflect the one-half year period). |
Portfolio Composition
TOP TEN SECTORS
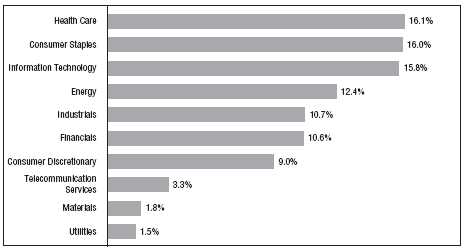
Portfolio holdings and allocations are subject to change. Percentages are as of December 31, 2008,
and are based on the total value of investments.
Cumulative Performance Information (unaudited)
BLUE CHIP FUND
Comparison of change in value of $10,000 investment in the First Investors Life Series Blue Chip Fund and the Standard & Poor’s 500 Index.
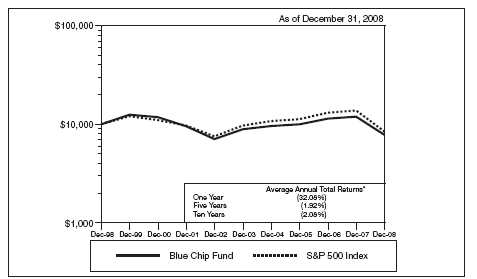
The graph compares a $10,000 investment in the First Investors Life Series Blue Chip Fund beginning 12/31/98 with a theoretical investment in the Standard & Poor’s 500 Index (the “Index”). The Index is an unmanaged capitalization-weighted index of 500 stocks designed to measure performance of the broad domestic economy through changes in the aggregate market value of such stocks, which represent all major industries. It is not possible to invest directly in this Index. In addition, the Index does not reflect fees and expenses associated with the active management of a mutual fund portfolio. For purposes of the graph and the accompanying table it is assumed that all dividends and distributions were reinvested.
* The Average Annual Total Return figures are for the periods ended 12/31/08.
The returns shown do not reflect any sales charges, since the Fund sells its shares solely to variable annuity and/or variable life insurance subaccounts at net asset value. The returns do not reflect the fees and charges that an individual would pay in connection with an investment in a variable annuity or life contract or policy. Results represent past performance and do not indicate future results. The graph and the returns shown do not reflect the deduction of taxes that an investor would pay on distributions or the redemption of fund shares. Investment return and principal value of an investment will fluctuate so that an investor’s shares, when redeemed, may be worth more or less than the original cost. Standard & Poor’s 500 Index figures are from Standard & Poor’s and all other figures are from First Investors Management Compan y, Inc.
Portfolio of Investments
BLUE CHIP FUND
December 31, 2008
| | | | | |
| |
| | | | | | |
| Shares | | | Security | | Value |
| |
| | | | COMMON STOCKS—96.7% | | |
| | | | Consumer Discretionary—9.0% | | |
| 9,100 | | | Best Buy Company, Inc. | | $ 255,801 |
| 14,900 | | | Carnival Corporation | | 362,368 |
| 29,700 | | | CBS Corporation – Class “B” | | 243,243 |
| 16,971 | | | Comcast Corporation – Class “A” | | 286,470 |
| 27,150 | | | Comcast Corporation – Special Class “A” | | 438,473 |
| 15,800 | | | H&R Block, Inc. | | 358,976 |
| 49,900 | | | Home Depot, Inc. | | 1,148,698 |
| 11,400 | | * | Kohl’s Corporation | | 412,680 |
| 40,900 | | | Lowe’s Companies, Inc. | | 880,168 |
| 16,400 | | | McDonald’s Corporation | | 1,019,916 |
| 53,600 | | | News Corporation – Class “A” | | 487,224 |
| 9,500 | | | NIKE, Inc. – Class “B” | | 484,500 |
| 20,600 | | | Staples, Inc. | | 369,152 |
| 14,800 | | | Target Corporation | | 511,044 |
| 89,700 | | | Time Warner, Inc. | | 902,382 |
| 22,400 | | * | Viacom, Inc. – Class “B” | | 426,944 |
| 45,900 | | | Walt Disney Company | | 1,041,471 |
| |
| | | | | | 9,629,510 |
| |
| | | | Consumer Staples—15.9% | | |
| 26,100 | | | Altria Group, Inc. | | 393,066 |
| 25,400 | | | Avon Products, Inc. | | 610,362 |
| 46,100 | | | Coca-Cola Company | | 2,086,947 |
| 11,200 | | | Colgate-Palmolive Company | | 767,648 |
| 10,800 | | | Costco Wholesale Corporation | | 567,000 |
| 29,400 | | | CVS Caremark Corporation | | 844,956 |
| 10,900 | | | Hershey Company | | 378,666 |
| 19,900 | | | Kimberly-Clark Corporation | | 1,049,526 |
| 39,861 | | | Kraft Foods, Inc. – Class “A” | | 1,070,268 |
| 35,000 | | | PepsiCo, Inc. | | 1,916,950 |
| 30,300 | | | Philip Morris International, Inc. | | 1,318,353 |
| 40,335 | | | Procter & Gamble Company | | 2,493,510 |
| 14,400 | | | Safeway, Inc. | | 342,288 |
| 34,800 | | | Walgreen Company | | 858,516 |
| 41,200 | | | Wal-Mart Stores, Inc. | | 2,309,672 |
| |
| | | | | | 17,007,728 |
| | | | | |
| |
| | | | | | |
| Shares | | | Security | | Value |
| |
| | | | Energy—12.3% | | |
| 12,700 | | | BP PLC (ADR) | | $ 593,598 |
| 39,200 | | | Chevron Corporation | | 2,899,624 |
| 25,771 | | | ConocoPhillips | | 1,334,938 |
| 5,500 | | | Devon Energy Corporation | | 361,405 |
| 57,400 | | | ExxonMobil Corporation | | 4,582,242 |
| 27,400 | | | Halliburton Company | | 498,132 |
| 5,500 | | | Hess Corporation | | 295,020 |
| 19,600 | | | Marathon Oil Corporation | | 536,256 |
| 24,100 | | | Schlumberger, Ltd. | | 1,020,153 |
| 25,250 | | | Spectra Energy Corporation | | 397,435 |
| 8,724 | | * | Transocean, Ltd. | | 412,209 |
| 11,135 | | | Valero Energy Corporation | | 240,961 |
| |
| | | | | | 13,171,973 |
| |
| | | | Financials—10.6% | | |
| 13,600 | | | ACE, Ltd. | | 719,712 |
| 15,600 | | | Allstate Corporation | | 511,056 |
| 32,500 | | | American Express Company | | 602,875 |
| 43,214 | | | Bank of America Corporation | | 608,453 |
| 45,705 | | | Bank of New York Mellon Corporation | | 1,294,823 |
| 250 | | * | Berkshire Hathaway, Inc. – Class “B” | | 803,500 |
| 14,000 | | | Capital One Financial Corporation | | 446,460 |
| 15,500 | | | Chubb Corporation | | 790,500 |
| 38,600 | | | Citigroup, Inc. | | 259,006 |
| 21,800 | | | Financial Select Sector SPDR Fund | | 275,116 |
| 56,032 | | | JPMorgan Chase & Company | | 1,766,689 |
| 15,600 | | | Marsh & McLennan Companies, Inc. | | 378,612 |
| 13,500 | | | Merrill Lynch & Company, Inc. | | 157,140 |
| 21,000 | | | Morgan Stanley | | 336,840 |
| 6,400 | | | PNC Financial Services Group, Inc. | | 313,600 |
| 15,700 | | | Travelers Companies, Inc. | | 709,640 |
| 20,500 | | | U.S. Bancorp | | 512,705 |
| 27,900 | | | Wells Fargo & Company | | 822,492 |
| |
| | | | | | 11,309,219 |
| |
| | | | Health Care—16.0% | | |
| 28,900 | | | Abbott Laboratories | | 1,542,393 |
| 17,800 | | | Aetna, Inc. | | 507,300 |
| 22,600 | | * | Amgen, Inc. | | 1,305,150 |
| 8,700 | | | Baxter International, Inc. | | 466,233 |
| 46,200 | | | Bristol-Myers Squibb Company | | 1,074,150 |
Portfolio of Investments (continued)
BLUE CHIP FUND
December 31, 2008
| | | | | |
| |
| | | | | | |
| Shares | | | Security | | Value |
| |
| 15,425 | | | Covidien, Ltd. | | $ 559,002 |
| 8,300 | | * | Genentech, Inc. | | 688,153 |
| 4,400 | | * | Genzyme Corporation | | 292,028 |
| 59,200 | | | Johnson & Johnson | | 3,541,936 |
| 13,500 | | | McKesson Corporation | | 522,855 |
| 29,300 | | | Medtronic, Inc. | | 920,606 |
| 29,200 | | | Merck & Company, Inc. | | 887,680 |
| 23,700 | | | Novartis AG (ADR) | | 1,179,312 |
| 103,340 | | | Pfizer, Inc. | | 1,830,151 |
| 8,300 | | * | St. Jude Medical, Inc. | | 273,568 |
| 13,200 | | | Teva Pharmaceutical Industries, Ltd. (ADR) | | 561,924 |
| 11,400 | | | UnitedHealth Group, Inc. | | 303,240 |
| 18,000 | | | Wyeth | | 675,180 |
| |
| | | | | | 17,130,861 |
| |
| | | | Industrials—10.7% | | |
| 18,500 | | | 3M Company | | 1,064,490 |
| 6,800 | | | Boeing Company | | 290,156 |
| 4,900 | | | Caterpillar, Inc. | | 218,883 |
| 6,800 | | | Danaher Corporation | | 384,948 |
| 12,000 | | | Dover Corporation | | 395,040 |
| 6,900 | | | Eaton Corporation | | 342,999 |
| 22,700 | | | Emerson Electric Company | | 831,047 |
| 139,400 | | | General Electric Company | | 2,258,280 |
| 16,500 | | | Honeywell International, Inc. | | 541,695 |
| 14,800 | | | Illinois Tool Works, Inc. | | 518,740 |
| 12,200 | | | ITT Corporation | | 561,078 |
| 9,100 | | | Lockheed Martin Corporation | | 765,128 |
| 10,000 | | | Northrop Grumman Corporation | | 450,400 |
| 17,525 | | | Tyco International, Ltd. | | 378,540 |
| 11,200 | | | United Parcel Service, Inc. – Class “B” | | 617,792 |
| 33,700 | | | United Technologies Corporation | | 1,806,320 |
| |
| | | | | | 11,425,536 |
| |
| | | | Information Technology—15.7% | | |
| 13,100 | | | Accenture, Ltd. – Class “A” | | 429,549 |
| 13,200 | | * | Adobe Systems, Inc. | | 281,028 |
| 11,500 | | | Analog Devices, Inc. | | 218,730 |
| 5,600 | | * | Apple, Inc. | | 477,960 |
| 23,400 | | | Applied Materials, Inc. | | 237,042 |
| 10,200 | | | Automatic Data Processing, Inc. | | 401,268 |
| 84,800 | | * | Cisco Systems, Inc. | | 1,382,240 |
| | | | | |
| |
| | | | | | |
| Shares | | | Security | | Value |
| |
| | | | Information Technology (continued) | | |
| 49,100 | | * | Dell, Inc. | | $ 502,784 |
| 74,300 | | * | EMC Corporation | | 777,921 |
| 43,000 | | | Hewlett-Packard Company | | 1,560,470 |
| 80,600 | | | Intel Corporation | | 1,181,596 |
| 19,200 | | | International Business Machines Corporation | | 1,615,872 |
| 173,000 | | | Microsoft Corporation | | 3,363,120 |
| 44,600 | | | Nokia Corporation – Class “A” (ADR) | | 695,760 |
| 59,700 | | * | Oracle Corporation | | 1,058,481 |
| 16,800 | | | QUALCOMM, Inc. | | 601,944 |
| 31,900 | | * | Symantec Corporation | | 431,288 |
| 35,300 | | | Texas Instruments, Inc. | | 547,856 |
| 16,025 | | | Tyco Electronics, Ltd. | | 259,765 |
| 33,800 | | | Western Union Company | | 484,692 |
| 21,900 | | * | Yahoo!, Inc. | | 267,180 |
| | | | | | 16,776,546 |
| |
| | | | Materials—1.8% | | |
| 19,400 | | | Alcoa, Inc. | | 218,444 |
| 29,100 | | | Dow Chemical Company | | 439,119 |
| 24,800 | | | DuPont (E.I.) de Nemours & Company | | 627,440 |
| 9,000 | | | Newmont Mining Corporation | | 366,300 |
| 5,500 | | | PPG Industries, Inc. | | 233,365 |
| | | | | | 1,884,668 |
| |
| | | | Telecommunication Services—3.2% | | |
| 61,000 | | | AT&T, Inc. | | 1,738,500 |
| 51,000 | | | Verizon Communications, Inc. | | 1,728,900 |
| | | | | | 3,467,400 |
| |
| | | | Utilities—1.5% | | |
| 12,000 | | | American Electric Power Company, Inc. | | 399,360 |
| 51,400 | | | Duke Energy Corporation | | 771,514 |
| 9,000 | | | FPL Group, Inc. | | 452,970 |
| | | | | | 1,623,844 |
| Total Value of Common Stocks (cost $98,249,215) | | 103,427,285 |
Portfolio of Investments (continued)
BLUE CHIP FUND
December 31, 2008
| | | | | | | | | |
| |
| Principal | | | | | | | | | |
| Amount | | | Security | | | | | | Value |
| |
| | | | SHORT-TERM INVESTMENTS—2.8% | | | | | |
| | | | Money Market Fund | | | | | | |
| $2,975 | M | | First Investors Cash Reserve Fund, 1.39% (cost $2,975,000)** | | | | | $2,975,000 |
| |
| Total Value of Investments (cost $101,224,215) | 99.5 | % | | | | 106,402,285 |
| Other Assets, Less Liabilities | .5 | | | | | 520,467 |
| |
| Net Assets | | | | 100.0 | % | | | | $106,922,752 |
| |
| * | Non-income producing |
| * * | Affiliated unregistered money market fund available only to First Investors funds and certain |
| accounts managed by First Investors Management Company, Inc. Rate shown is the 7-day yield |
| at December 31, 2008 (see Note 3). |
| |
| Summary of Abbreviations: |
| ADR American Depositary Receipts |
| |
| 10 | See notes to financial statements |
Portfolio Manager’s Letter
CASH MANAGEMENT FUND
Dear Investor:
This is the annual report for the First Investors Life Cash Management Fund for the year ended December 31, 2008. During the period, the Fund’s return on a net asset value basis was 2.03%, including dividends of 2.0 cents per share. The Fund maintained a $1.00 net asset value per share throughout the year.
During the reporting period, performance was primarily driven by historically low short-term interest rates, which resulted from the Federal Reserve’s efforts to combat the slowing economy.
The failure of Lehman Brothers late in the third quarter aggravated an already dislocated market and accelerated changes and consolidation in the financial industry. Severe stress in the financial markets, coupled with a heightened aversion to risk, resulted in markedly reduced liquidity in the money markets. Over the course of the year, the Federal Reserve dramatically reduced its target federal funds rate by more than 400 basis points to an all-time low range of 0% – 0.25%.
During the period, the Fund effectively used corporate bonds and notes for incremental return, in addition to floating rate securities and various types of callable securities. The Fund maintained a longer-than-average weighted average maturity during the period, which helped performance. In addition, the Fund maintained a significant portion of its assets in U.S. government and agency securities. Furthermore, the Fund continued to commit a significant portion of its assets to floating rate securities. Although floating rate securities generally underperform in declining interest rate environments, market dislocation resulted in inflated LIBOR levels, which was beneficial to holders of most floating rate securities. The Fund did not invest in asset-backed commercial paper during the period.
As mentioned previously, short-term interest rates are at historic lows. If current conditions in the money markets persist, as is expected, the return on the Fund will decline sharply. Although money market funds are relatively conservative vehicles, there can be no assurance that they will be able to maintain a stable net asset value of $1.00 per share. Money market mutual funds are neither insured nor guaranteed by the Federal Deposit Insurance Corporation (FDIC) or any other government agency.
Portfolio Manager’s Letter (continued)
CASH MANAGEMENT FUND
Thank you for placing your trust in First Investors. We appreciate the opportunity to serve your investment needs.
Sincerely,

Michael J. O’Keefe
Portfolio Manager
January 30, 2009
Fund Expenses (unaudited)
CASH MANAGEMENT FUND
The examples below show the ongoing costs (in dollars) of investing in your Fund and will help you in comparing these costs with costs of other mutual funds. Please refer to page 3 for a detailed explanation of the information presented in these examples.
| | | |
| |
| | Beginning | Ending | |
| | Account | Account | Expenses Paid |
| | Value | Value | During Period |
| | (7/1/08) | (12/31/08) | (7/1/08–12/31/08)* |
| Expense Examples | | | |
| Actual | $1,000.00 | $1,007.92 | $3.53 |
| Hypothetical | | | |
| (5% annual return before expenses) | $1,000.00 | $1,021.62 | $3.56 |
| |
| * | Expenses are equal to the annualized expense ratio of .70%, multiplied by the average account |
| value over the period, multiplied by 184/366 (to reflect the one-half year period). Expenses paid |
| during the period are net of expenses waived. |
Portfolio Composition
BY SECTOR
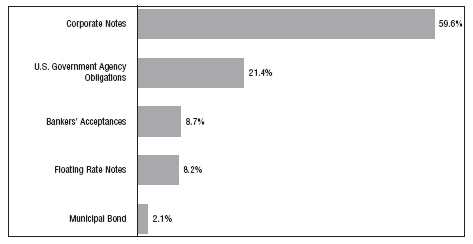
Portfolio holdings and allocations are subject to change. Percentages are as of December 31, 2008,
and are based on the total value of investments.
13
Portfolio of Investments (continued)
CASH MANAGEMENT FUND
December 31, 2008
| | | | | | | | | |
| |
| Principal | | | | | | | Interest | | |
| Amount | | | Security | | | | Rate | * | Value |
| |
| | | | CORPORATE NOTES—58.5% | | | | | | |
| $ 200 | M | | Abbott Laboratories, 5/15/09 | | | | 2.80 | % | $ 201,862 |
| 100 | M | | Abbott Laboratories, 5/15/09 | | | | 2.29 | | 101,127 |
| 400 | M | | BASF SE, 1/14/09 (a) | | | | 1.90 | | 399,725 |
| 500 | M | | Campbell Soup Co., 1/14/09 (a) | | | | 1.50 | | 499,728 |
| 600 | M | | Caterpillar, Inc., 1/7/09 (a) | | | | 1.25 | | 599,875 |
| 400 | M | | Chevron Funding Corp., 1/5/09 | | | | 0.17 | | 399,992 |
| 500 | M | | ConocoPhillips Qatar, 1/12/09 (a) | | | | 2.23 | | 499,658 |
| 500 | M | | Eli Lilly & Co., 2/12/09 (a) | | | | 1.45 | | 499,152 |
| 300 | M | | General Electric Capital Corp., 1/5/09 | | | | 1.35 | | 299,955 |
| | | | Hershey Co.: | | | | | | |
| 300 | M | | 1/26/09 (a) | | | | 2.25 | | 299,529 |
| 250 | M | | 1/27/09 (a) | | | | 1.15 | | 249,793 |
| 100 | M | | Johnson & Johnson, 9/1/09 | | | | 2.21 | | 102,863 |
| 500 | M | | Madison Gas & Electric Co., 1/9/09 | | | | 0.95 | | 499,894 |
| 500 | M | | New Jersey Natural Gas Co., 2/2/09 | | | | 1.30 | | 499,422 |
| 600 | M | | Northwest Natural Gas Co., 1/22/09 (a) | | | | 1.25 | | 599,562 |
| 436 | M | | Paccar Financial Corp., 1/23/09 | | | | 1.20 | | 435,680 |
| 300 | M | | Proctor & Gamble Co., 2/11/09 (a) | | | | 1.75 | | 299,400 |
| 400 | M | | Toyota Motor Credit Corp., 1/15/09 | | | | 1.60 | | 399,751 |
| 250 | M | | Wal-Mart Stores, Inc., 8/10/09 | | | | 2.50 | | 256,519 |
| 500 | M | | Washington Gas Light Co., 1/30/09 | | | | 1.12 | | 499,548 |
| |
| Total Value of Corporate Notes (cost $7,643,035) | | | | | | 7,643,035 |
| |
| | | | U.S. GOVERNMENT AGENCY | | | | | | |
| | | | OBLIGATIONS—21.0% | | | | | | |
| 350 | M | | Fannie Mae, 1/26/09 | | | | 2.25 | | 349,451 |
| | | | Federal Home Loan Bank: | | | | | | |
| 150 | M | | 2/17/09 | | | | 4.08 | | 150,000 |
| 400 | M | | 4/7/09 | | | | 2.48 | | 400,000 |
| 100 | M | | 4/8/09 | | | | 3.49 | | 100,000 |
| 250 | M | | 12/15/09 (b) | | | | 1.55 | | 250,000 |
| | | | Freddie Mac: | | | | | | |
| 700 | M | | 1/20/09 | | | | 2.35 | | 699,128 |
| 200 | M | | 3/10/09 | | | | 0.35 | | 199,868 |
| 500 | M | | 4/21/09 | | | | 2.61 | | 500,301 |
| 100 | M | | 7/28/09 | | | | 2.75 | | 100,107 |
| |
| Total Value of U.S. Government Agency Obligations (cost $2,748,855) | | | | | | 2,748,855 |
| | | | | | | | | |
| |
| Principal | | | | | | | Interest | | |
| Amount | | | Security | | | | Rate | * | Value |
| |
| | | | BANKERS’ ACCEPTANCES—8.5% | | | | | | |
| | | | Bank of America, NA: | | | | | | |
| $ 385 | M | | 1/22/09 | | | | 0.50 | % | $ 384,888 |
| 171 | M | | 2/13/09 | | | | 2.88 | | 170,719 |
| 562 | M | | JPMorgan Chase Bank, 5/11/09 | | | | 0.75 | | 560,478 |
| |
| Total Value of Bankers’ Acceptances (cost $1,116,085) | | | | | | 1,116,085 |
| |
| | | | FLOATING RATE NOTES—8.0% | | | | | | |
| 300 | M | | General Electric Capital Corp., 4/30/09 | | | | 3.57 | | 300,073 |
| 250 | M | | IBM International Group Capital, LLC, 7/29/09 | | | 3.85 | | 249,028 |
| 200 | M | | Procter & Gamble International Finance, 7/6/09 (c) | | | 4.22 | | 200,135 |
| 300 | M | | Walt Disney Co., 9/10/09 | | | | 2.29 | | 300,121 |
| |
| Total Value of Floating Rate Notes (cost $1,049,357) | | | | | | 1,049,357 |
| |
| | | | MUNICIPAL BONDS—2.1% | | | | | | |
| 260 | M | | New Jersey State Hwy. Auth. (Garden State Parkway) | | | | | |
| | | | 1/1/2010 (cost $269,221) | | | | 6.20 | | 269,221 |
| |
| Total Value of Investments (cost $12,826,553)** | 98.1 | % | | | | 12,826,553 |
| Other Assets, Less Liabilities | 1.9 | | | | | 246,492 |
| |
| Net Assets | | | | 100.0 | % | | | | $13,073,045 |
| |
| * | The interest rates shown are the effective rates at the time of purchase by the Fund. The interest |
| rates shown on floating rate notes are adjusted periodically; the rates shown are the rates in effect |
| at December 31, 2008. |
| ** | Aggregate cost for federal income tax purposes is the same. |
| (a) | Security exempt from registration under Secton 4(2) of the Securities Act of 1933 (see Note 5). |
| (b) | Denotes a step bond (a zero coupon bond that converts to a fixed interest rate at a designated date) |
| (c) | Security exempt from registration under Rule 144A of the Securities Act of 1933 (see Note 5). |
| |
| See notes to financial statements | 15 |
Portfolio Managers’ Letter
DISCOVERY FUND
Dear Investor:
This is the annual report for the First Investors Life Discovery Fund for the year ended December 31, 2008. During the period, the Fund’s return on a net asset value basis was –33.25%, including dividends of 11.3 cents per share and capital gains distributions of $1.44 per share.
The reporting period was very difficult for the financial markets, as problems arising from subprime mortgages spread to other asset classes, and developed into a full-blown financial crisis. While the Fund’s value still fell substantially, it slightly outperformed its benchmark, the Russell 2000 Index.
Within the Fund’s consumer staples holdings, companies like Church & Dwight, which owns the Arm & Hammer brand, and J.M. Smucker remained relatively flat throughout the period. Financials were another positive relative contributor, as the Fund mostly avoided the banking industry, and instead focused on companies without significant credit exposure. Two names that the Fund owned for the period — MFA Mortgage REIT and Anworth Mortgage REIT — have done well because they invest in U.S. agency mortgage-backed securities, which are guaranteed directly or indirectly by the government. These REITs have yielded close to 15%, as the Federal Reserve’s program to lower interest rates reduced their cost of funds substantially. The Fund also added to its insurance holdings, as panic regarding the investment portfolios of larger competitors affected even the most conservatively run niche players.
Offsetting these positive returns were the Fund’s investments in the consumer discretionary sector, which was buffeted by the collapse in consumer confidence right before the Christmas selling season. Several transportation names also hurt Fund performance this year.
Though the issues that have affected the stock market may take time to resolve, we believe that equity valuations now are as cheap as they have been since the early 1980s. In our opinion, this presents the Fund with increased buying opportunities.
Thank you for placing your trust in First Investors. We appreciate the opportunity to serve your investment needs.
Sincerely,

Jason Ronovech
Portfolio Manager
January 30, 2009
Jonathan S. Vyorst
Portfolio Manager
Fund Expenses (unaudited)
DISCOVERY FUND
The examples below show the ongoing costs (in dollars) of investing in your Fund and will help you in comparing these costs with costs of other mutual funds. Please refer to page 3 for a detailed explanation of the information presented in these examples.
| | | |
| |
| | Beginning | Ending | |
| | Account | Account | Expenses Paid |
| | Value | Value | During Period |
| | (7/1/08) | (12/31/08) | (7/1/08–12/31/08)* |
| Expense Examples | | | |
| Actual | $1,000.00 | $735.80 | $3.62 |
| Hypothetical | | | |
| (5% annual return before expenses) | $1,000.00 | $1,020.97 | $4.22 |
| |
| * | Expenses are equal to the annualized expense ratio of .83%, multiplied by the average account |
| value over the period, multiplied by 184/366 (to reflect the one-half year period). |
Portfolio Composition
TOP TEN SECTORS
Portfolio holdings and allocations are subject to change. Percentages are as of December 31, 2008,
and are based on the total value of investments.
Cumulative Performance Information (unaudited)
DISCOVERY FUND
Comparison of change in value of $10,000 investment in the First Investors Life Series Discovery Fund and the Russell 2000 Index.

The graph compares a $10,000 investment in the First Investors Life Series Discovery Fund beginning 12/31/98 with a theoretical investment in the Russell 2000 Index (the “Index”). The Index is an unmanaged Index that measures the performance of the small-cap segment of the U.S. equity universe. The Index is a subset of the Russell 3000 Index representing approximately 10% of the total market capitalization of that index. The Index includes approximately 2,000 of the smallest securities based on a combination of their market cap and current index membership. It is not possible to invest directly in this Index. In addition, the Index does not reflect fees and expenses associated with the active management of a mutual fund portfolio. For purposes of the graph and the accompanying table, it is assumed that all dividend and distributions were reinvested.
* The Average Annual Total Return figures are for the periods ended 12/31/08.
The returns shown do not reflect any sales charges, since the Fund sells its shares solely to variable annuity and/or variable life insurance subaccounts at net asset value. The returns do not reflect the fees and charges that an individual would pay in connection with an investment in a variable annuity or life contract or policy. Results represent past performance and do not indicate future results. The graph and the returns shown do not reflect the deduction of taxes that an investor would pay on distributions or the redemption of fund shares. Investment return and principal value of an investment will fluctuate so that an investor’s shares, when redeemed, may be worth more or less than the original cost. Russell 2000 Index figures are from Frank Russell and Company and all other figures are from First Investors Management Company, Inc.
Portfolio of Investments (continued)
DISCOVERY FUND
December 31, 2008
| | | | | |
| |
| | | | | | |
| Shares | | | Security | | Value |
| |
| | | | COMMON STOCKS—90.5% | | |
| | | | Consumer Discretionary—8.7% | | |
| 174,000 | | | Callaway Golf Company | | $ 1,616,460 |
| 99,700 | | | Interactive Data Corporation | | 2,458,602 |
| 64,700 | | | PetSmart, Inc. | | 1,193,715 |
| 81,200 | | | Phillips Van-Heusen Corporation | | 1,634,556 |
| 181,800 | | | Regal Entertainment Group – Class “A” | | 1,856,178 |
| |
| | | | | | 8,759,511 |
| |
| | | | Consumer Staples—6.9% | | |
| 27,975 | | | Church & Dwight Company, Inc. | | 1,569,957 |
| 74,800 | | | Flowers Foods, Inc. | | 1,822,128 |
| 49,100 | | | Hormel Foods Corporation | | 1,526,028 |
| 47,500 | | | J. M. Smucker Company | | 2,059,600 |
| |
| | | | | | 6,977,713 |
| |
| | | | Energy—4.5% | | |
| 42,900 | | * | Denbury Resources, Inc. | | 468,468 |
| 58,700 | | * | Plains Exploration & Production Company | | 1,364,188 |
| 70,400 | | | St. Mary Land & Exploration Company | | 1,429,824 |
| 37,400 | | * | Whiting Petroleum Corporation | | 1,251,404 |
| |
| | | | | | 4,513,884 |
| |
| | | | Financials—22.4% | | |
| 8,427 | | * | Alleghany Corporation | | 2,376,414 |
| 100,800 | | | American Financial Group, Inc. | | 2,306,304 |
| 406,200 | | | Anworth Mortgage Asset Corporation (REIT) | | 2,611,866 |
| 87,400 | | | Arthur J. Gallagher & Company | | 2,264,534 |
| 17,600 | | | Everest Re Group, Ltd. | | 1,340,064 |
| 85,100 | | | Harleysville Group, Inc. | | 2,955,523 |
| 116,600 | | | Jefferies Group, Inc. | | 1,639,396 |
| 4,700 | | * | Markel Corporation | | 1,405,300 |
| 349,000 | | | MFA Mortgage Investments, Inc. (REIT) | | 2,055,610 |
| 4,783 | | | National Western Life Insurance Company – Class “A” | | 809,140 |
| 49,900 | | * | Piper Jaffray Companies, Inc. | | 1,984,024 |
| 37,200 | | | Wilmington Trust Corporation | | 827,328 |
| |
| | | | | | 22,575,503 |
| | | | | |
| |
| | | | | | |
| Shares | | | Security | | Value |
| |
| | | | Health Care—14.6% | | |
| 132,200 | | * | Endo Pharmaceuticals Holdings, Inc. | | $ 3,421,336 |
| 85,500 | | * | Life Technologies Corporation | | 1,993,005 |
| 56,800 | | * | Lincare Holdings, Inc. | | 1,529,624 |
| 67,900 | | * | Magellan Health Services, Inc. | | 2,658,964 |
| 123,600 | | | PerkinElmer, Inc. | | 1,719,276 |
| 65,700 | | | STERIS Corporation | | 1,569,573 |
| 48,800 | | | West Pharmaceutical Services, Inc. | | 1,843,176 |
| |
| | | | | | 14,734,954 |
| |
| | | | Industrials—11.0% | | |
| 49,100 | | | Alexander & Baldwin, Inc. | | 1,230,446 |
| 22,500 | | * | Alliant Techsystems, Inc. | | 1,929,600 |
| 54,900 | | | Curtiss-Wright Corporation | | 1,833,111 |
| 175,500 | | | Interface, Inc. – Class “A” | | 814,320 |
| 64,954 | | * | Kansas City Southern, Inc. | | 1,237,374 |
| 36,500 | | | Pentair, Inc. | | 863,955 |
| 8,800 | | | Precision Castparts Corporation | | 523,424 |
| 45,400 | | | Robbins & Myers, Inc. | | 734,118 |
| 19,600 | | | Rockwell Collins, Inc. | | 766,164 |
| 48,800 | | | Woodward Governor Company | | 1,123,376 |
| |
| | | | | | 11,055,888 |
| |
| | | | Information Technology—11.0% | | |
| 159,300 | | * | Aspen Technology, Inc. | | 1,182,006 |
| 106,700 | | * | Avnet, Inc. | | 1,943,007 |
| 50,200 | | * | Cabot Microelectronics Corporation | | 1,308,714 |
| 270,800 | | * | Compuware Corporation | | 1,827,900 |
| 140,600 | | * | Convergys Corporation | | 901,246 |
| 71,100 | | | Fair Isaac Corporation | | 1,198,746 |
| 80,100 | | * | Sybase, Inc. | | 1,984,077 |
| 77,900 | | * | Verigy Ltd. | | 749,398 |
| |
| | | | | | 11,095,094 |
| |
| | | | Materials—4.7% | | |
| 56,800 | | | AptarGroup, Inc. | | 2,001,632 |
| 78,900 | | * | Crown Holdings, Inc. | | 1,514,880 |
| 90,700 | | | Innospec, Inc. | | 534,223 |
| 81,700 | | | Titanium Metals Corporation | | 719,777 |
| |
| | | | | | 4,770,512 |
Portfolio of Investments (continued)
DISCOVERY FUND
December 31, 2008
| | | | | | | | | |
| |
| Shares or | | | | | | | | | |
| Principal | | | | | | | | | |
| Amount | | | Security | | | | | | Value |
| |
| | | | Telecommunication Services—3.1% | | | | | | |
| 192,900 | | * | Premiere Global Services, Inc. | | | | | | $ 1,660,869 |
| 52,775 | | | Telephone & Data Systems, Inc. – Special Shares | | | | | 1,482,977 |
| |
| | | | | | | | | | 3,143,846 |
| |
| | | | Utilities—3.6% | | | | | | |
| 134,100 | | | CMS Energy Corporation | | | | | | 1,354,410 |
| 182,200 | | * | Dynegy, Inc. – Class “A” | | | | | | 364,400 |
| 98,000 | | | Portland General Electric Company | | | | | | 1,908,060 |
| |
| | | | | | | | | | 3,626,870 |
| |
| Total Value of Common Stocks (cost $108,240,258) | | | | | | 91,253,775 |
| |
| | | | SHORT-TERM INVESTMENTS—9.7% | | | | | |
| | | | Money Market Fund | | | | | | |
| $9,765 | M | | First Investors Cash Reserve Fund, 1.39% (cost $9,765,000)** | | | | | 9,765,000 |
| |
| Total Value of Investments (cost $118,005,258) | 100.2 | % | | | | 101,018,775 |
| Excess of Liabilities Over Other Assets | (.2 | ) | | | | (236,378) |
| |
| Net Assets | | | | 100.0 | % | | | | $100,782,397 |
| |
| * | Non-income producing |
| ** | Affiliated unregistered money market fund available only to First Investors funds and certain |
| accounts managed by First Investors Management Company, Inc. Rate shown is the 7-day yield |
| at December 31, 2008 (see Note 3). |
| |
| Summary of Abbreviations: |
| REIT Real Estate Investment Trust |
| |
| 22 | See notes to financial statements |
Portfolio Manager’s Letter
GOVERNMENT FUND
Dear Investor:
This is the annual report for the First Investors Life Government Fund for the year ended December 31, 2008. During the period, the Fund’s return on a net asset value basis was 6.93%, including dividends of 44.8 cents per share.
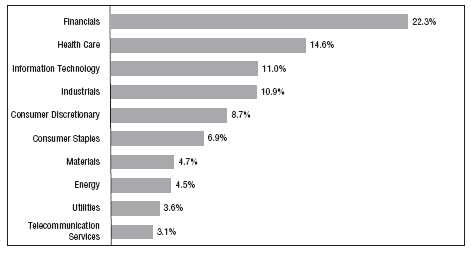
The Fund invests in mortgage-backed securities and debt issued or guaranteed by the U.S. government and its agencies. The investments held by the Fund all have the highest possible credit rating (AAA). The majority of the Fund’s investments are in GNMA mortgage-backed bonds (Ginnie Maes), which are backed by the full faith and credit of the U.S. government. The Fund does not invest in subprime mortgage-backed debt.
The bond market was extremely volatile during the review period due to extraordinary stresses in the financial system related to the subprime mortgage crisis that began in 2007. In this environment, high quality investments — such as U.S. Treasury securities and Ginnie Maes — performed well primarily for two reasons. First, benchmark U.S. Treasury rates declined to the lowest level in generations during the review period due to multiple reductions in short-term interest rates by the Federal Reserve and the economic recession. Second, a flight-to-safety bid by investors benefited high quality bonds.
With respect to its mortgage-backed holdings, the Fund began the reporting period with approximately 22% of its assets in current coupon Fannie Mae and Freddie Mac mortgage-backed bonds. Fannie Mae and Freddie Mac mortgage-backed bonds outperformed Ginnie Maes due to the government’s takeover of both Fannie Mae and Freddie Mac in September (which strengthened the government’s implicit support of their debt), and a substantial increase in Ginnie Mae mortgage-backed issuance relative to Fannie Mae and Freddie Mac issuance. As a result, the Fund’s Fannie Mae and Freddie Mac mortgage-backed holdings had a positive impact on performance.
Falling interest rates caused lower coupon mortgage-backed bonds to outperform higher coupon mortgage-backed bonds. The Fund was underweight lower coupon mortgage-backed bonds, which consequently detracted from performance.
The Fund generally had approximately 15% of its assets in non-mortgage-backed government securities, primarily U.S. agency securities, throughout the reporting period. The substantial rally in the Treasury market benefited these securities to a greater extent than mortgage-backed securities. Consequently, these securities
Portfolio Manager’s Letter (continued)
GOVERNMENT FUND
enhanced the Fund’s performance.
Thank you for placing your trust in First Investors. We appreciate the opportunity to serve your investment needs.

Clark D. Wagner
Portfolio Manager and
Director of Fixed Income, First Investors Management Company, Inc.
January 30, 2009
Fund Expenses (unaudited)
GOVERNMENT FUND
The examples below show the ongoing costs (in dollars) of investing in your Fund and will help you in comparing these costs with costs of other mutual funds. Please refer to page 3 for a detailed explanation of the information presented in these examples.
| | | |
| |
| | Beginning | Ending | |
| | Account | Account | Expenses Paid |
| | Value | Value | During Period |
| | (7/1/08) | (12/31/08) | (7/1/08–12/31/08)* |
| Expense Examples | | | |
| Actual | $1,000.00 | $1,052.09 | $3.97 |
| Hypothetical | | | |
| (5% annual return before expenses) | $1,000.00 | $1,021.27 | $3.91 |
| |
| * | Expenses are equal to the annualized expense ratio of .77%, multiplied by the average account |
| value over the period, multiplied by 184/366 (to reflect the one-half year period). Expenses paid |
| during the period are net of expenses waived. |
Portfolio Composition
BY SECTOR
Portfolio holdings and allocations are subject to change. Percentages are as of December 31, 2008,
and are based on the total value of investments.
Cumulative Performance Information (unaudited)
GOVERNMENT FUND
Comparison of change in value of $10,000 investment in the First Investors Life Series Government Fund and the Merrill Lynch GNMA Master Index.

The graph compares a $10,000 investment in the First Investors Life Series Government Fund beginning 12/31/98 with a theoretical investment in the Merrill Lynch GNMA Master Index (the “Index”). The Merrill Lynch GNMA Master Index is a market capitalization-weighted index, including generic-coupon GNMA mortgages, with at least $150 million principal amounts outstanding. Every issue included in the Index is trader-priced and the Index follows consistent and realistic availability limits, including only those securities with sufficient amounts outstanding. It is not possible to invest directly in this Index. . In addition, the Index does not reflect fees and expenses associated with the active management of a mutual fund portfolio. For purposes of the graph and the accompanying table, it is assumed that all dividends and distributions were reinvested.
* The Average Annual Total Return figures are for the periods ended 12/31/08. During the periods shown, some of the expenses of the Fund were waived or assumed. If such expenses had been paid by the Fund, the Average Annual Total Returns for One Year,
Five Years and Ten Years would have been 6.77%, 4.52% and 5.30%, respectively. |
The returns shown do not reflect any sales charge, since the Fund sells its shares solely to variable annuity and/or variable life insurance subaccounts at net asset value. The returns do not reflect the fees and charges that an individual would pay in connection with an investment in a variable annuity or life contract or policy. Results represent past performance and do not indicate future results. The graph and the returns shown do not reflect the deduction of taxes that an investor would pay on distributions or the redemption of fund shares. Investment return and principal value of an investment will fluctuate so that an investor’s shares, when redeemed, may be worth more or less than the original cost. Merrill Lynch GNMA Master Index figures are from Merrill Lynch & Co. and all other figures are from First Investors Management Company, Inc.
Portfolio of Investments (continued)
GOVERNMENT FUND
December 31, 2008
| | | | |
| Principal | | | | |
| Amount | | | Security | Value |
| |
| | | | MORTGAGE-BACKED CERTIFICATES—78.6% | |
| | | | Fannie Mae—14.2% | |
| $ 862 | M | | 5%, 1/1/2035 – 7/1/2035 | $ 881,488 |
| 910 | M | | 5.5%, 10/1/2032 – 7/1/2034 | 935,056 |
| 833 | M | | 6%, 2/1/2036 – 7/1/2037 | 858,677 |
| 433 | M | | 9%, 6/1/2015 – 11/1/2026 | 473,847 |
| 233 | M | | 11%, 10/1/2015 | 266,260 |
| |
| | | | | 3,415,328 |
| |
| | | | Freddie Mac—10.0% | |
| 2,345 | M | | 6%, 8/1/2032 – 12/1/2038 | 2,420,169 |
| |
| | | | Government National Mortgage Association I | |
| | | | Program—54.4% | |
| 2,127 | M | | 5%, 3/15/2033 – 6/15/2034 | 2,189,823 |
| 6,010 | M | | 5.5%, 2/15/2033 – 12/15/2038 | 6,206,640 |
| 2,608 | M | | 6%, 11/15/2032 – 3/15/2038 | 2,699,641 |
| 901 | M | | 6.5%, 7/15/2032 – 8/15/2036 | 950,488 |
| 998 | M | | 7%, 1/15/2030 – 10/15/2032 | 1,056,047 |
| |
| | | | | 13,102,639 |
| |
| Total Value of Mortgage-Backed Certificates (cost $18,554,798) | 18,938,136 |
| |
| | | | U.S. GOVERNMENT AGENCY | |
| | | | OBLIGATIONS—10.7% | |
| 1,000 | M | | Federal Farm Credit Bank, 4.74%, 2015 | 1,009,804 |
| 1,000 | M | | Federal Home Loan Bank, 5%, 2014 | 1,015,222 |
| 500 | M | | Tennessee Valley Authority, 4.5%, 2018 | 552,653 |
| |
| Total Value of U.S. Government Agency Obligations (cost $2,509,515) | 2,577,679 |
| |
| | | | U.S. GOVERNMENT FDIC | |
| | | | GUARANTEED DEBT—3.9% | |
| 500 | M | | Bank of America Corp, 3.125%, 2012 | 520,015 |
| 400 | M | | JPMorgan Chase & Co., 2.625%, 2010 | 408,220 |
| |
| Total Value of U.S. Government FDIC Guaranteed Debt (cost $914,301) | 928,235 |
| |
| | | | U.S. GOVERNMENT OBLIGATIONS—3.7% | |
| 745 | M | | FDA Queens LP, 6.99%, 2017 (cost $846,668) (a) | 892,961 |
Portfolio of Investments (continued)
GOVERNMENT FUND
December 31, 2008
| | | | | | | | | |
| |
| Principal | | | | | | | | | |
| Amount | | | Security | | | | | | Value |
| | | | SHORT-TERM U.S. GOVERNMENT | | | | | | |
| | | | OBLIGATIONS—2.1% | | | | | | |
| $500 | M | | U.S. Treasury Bills, 0.9295%, 11/19/09 (cost $495,840) | | | | | $ 495,840 |
| |
| Total Value of Investments (cost $23,321,122) | 99.0 | % | | | | 23,832,851 |
| Other Assets, Less Liabilities | 1.0 | | | | | 259,037 |
| |
| Net Assets | | | | 100.0 | % | | | | $24,091,888 |
| |
| (a) | Security exempt from registration under Rule 144A of Securities Act of 1933 (see Note 5). |
| |
| 28 | See notes to financial statements |
Portfolio Manager’s Letter
GROWTH & INCOME FUND
Dear Investor:
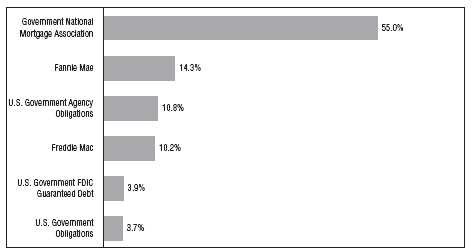
This is the annual report for the First Investors Life Growth & Income Fund for the year ended December 31, 2008. During the period, the Fund’s return on a net asset value basis was –35.22%, including dividends of 41.2 cents per share and capital gains of $2.24 per share.
The Fund outperformed the S&P 500 Index during the period, though absolute returns were still deep in negative territory. The Fund’s results were driven by the overall weak performance of the equity markets. The ongoing effects of the credit market maelstrom, which started with subprime mortgages in mid-2007, have been the overwhelming factor influencing equity returns during the past year. Despite some brief periods of respite, stocks have been battered due to the ongoing credit market paralysis and the ensuing deleveraging of financial firms’ balance sheets to stave off insolvency.
The Fund was underweight in financials for most of the year and moved to an underweighting in energy around mid-year. This positioning helped performance relative to the S&P 500 Index. Stock selection benefited the Fund’s relative performance most notably within investments in the financials, technology, health care, energy and telecommunications sectors. The Fund’s overweighting in the industrials, materials and consumer discretionary sectors detracted from performance.
The Fund’s weightings in consumer staples and health care increased throughout the year. Notable performers within consumer staples included shares of small-cap personal products maker Chattem and candy maker Tootsie Roll. Shares of giant retailer Wal-Mart also provided solid returns. Within health care, shares of biotech-nology companies Amgen and Genentech, as well as Barr Pharmaceuticals, TriZetto Group, Johnson & Johnson and Abbott Labs were top contributors. Among technology names, investments in government IT services providers NCI and SI International aided performance.
The Fund continued to benefit from merger and acquisition activity among its holdings despite the challenging market environment. During the reporting period, five of the Fund’s holdings received takeover or merger offers, two of which are still pending. Of the offers completed during the period, the most notable were the takeovers of government information technology services firm SI International by British defense firm Serco, and of health care technology provider TriZetto Group by the investment group Apax Partners.
Portfolio Manager’s Letter (continued)
GROWTH & INCOME FUND
Overall, the Fund’s fundamental investment strategy remained patient and long-term focused, selectively taking advantage of market volatility to add attractively valued stocks and eliminate fundamentally weaker names. In addition, the Fund shifted its portfolio toward a more defensive posture. The Fund has focused on dividend paying issuers, with underweightings versus peers in the volatile financials and energy sectors and shifting assets toward less economically sensitive areas such as consumer staples and healthcare. The Fund carried more cash to provide liquidity, if needed, and the flexibility to be opportunistic. The Fund continued to accentuate the “growth” and “income” aspects of its mandate.
The black clouds of negativity that dominated 2008 appeared to recede slightly by year-end, though markets remain unsettled and volatile. Throughout the year, the Fund maintained its investment strategy based on long-term company fundamentals, rather than simply reacting to volatile stock prices. The Fund maintained its multi-cap market capitalization strategy, as small- and mid-cap stocks retain their longer-term attractiveness. At year-end, the Fund had an allocation of: 62% large-cap, 11% mid-cap and 27% small-cap stocks.
Thank you for placing your trust in First Investors. We appreciate the opportunity to serve your investment needs.
Sincerely,

Edwin D. Miska
Portfolio Manager and
Director of Equities, First Investors Management Company, Inc.
January 30, 2009
Fund Expenses (unaudited)
GROWTH & INCOME FUND
The examples below show the ongoing costs (in dollars) of investing in your Fund and will help you in comparing these costs with costs of other mutual funds. Please refer to page 3 for a detailed explanation of the information presented in these examples.
| | | |
| |
| | Beginning | Ending | |
| | Account | Account | Expenses Paid |
| | Value | Value | During Period |
| | (7/1/08) | (12/31/08) | (7/1/08–12/31/08)* |
| Expense Examples | | | |
| Actual | $1,000.00 | $734.85 | $3.62 |
| Hypothetical | | | |
| (5% annual return before expenses) | $1,000.00 | $1,020.97 | $4.22 |
| | |
| * | Expenses are equal to the annualized expense ratio of .83%, multiplied by the average account |
| value over the period, multiplied by 184/366 (to reflect the one-half year period). |
Portfolio Composition
TOP TEN SECTORS

Portfolio holdings and allocations are subject to change. Percentages are as of December 31, 2008,
and are based on the total value of investments.
Cumulative Performance Information (unaudited)
GROWTH & INCOME FUND
Comparison of change in value of $10,000 investment in the First Investors Life Series Growth & Income Fund and the Standard & Poor’s 500 Index.
The graph compares a $10,000 investment in the First Investors Life Series Growth & Income Fund beginning 12/31/98 with a theoretical investment in the Standard & Poor’s 500 Index (the “Index”). The Index is an unmanaged capitalization-weighted index of 500 stocks designed to measure performance of the broad domestic economy through changes in the aggregate market value of such stocks, which represent all major industries. It is not possible to invest directly in this Index. In addition, the Index does not reflect fees and expenses associated with the active management of a mutual fund portfolio. For purposes of the graph and the accompanying table it is assumed that all dividends and distributions were reinvested.
* The Average Annual Total Return figures are for the periods ended 12/31/08.
The returns shown do not reflect any sales charges, since the Fund sells its shares solely to variable annuity and/or variable life insurance subaccounts at net asset value. The returns do not reflect the fees and charges that an individual would pay in connection with an investment in a variable annuity or life contract or policy. Results represent past performance and do not indicate future results. The graph and the returns shown do not reflect the deduction of taxes that an investor would pay on distributions or the redemption of fund shares. Investment return and principal value of an investment will fluctuate so that an investor’s shares, when redeemed, may be worth more or less than the original cost. Standard & Poor’s 500 Index figures are from Standard & Poor’s and all other figures are from First Investors Management Company, Inc .
Portfolio of Investments
GROWTH & INCOME FUND
December 31, 2008
| | | | | |
| |
| | | | | | |
| Shares | | | Security | | Value |
| |
| | | | COMMON STOCKS—97.7% | | |
| | | | Consumer Discretionary—11.9% | | |
| 33,900 | | | BorgWarner, Inc. | | $ 738,003 |
| 77,269 | | | Brown Shoe Company, Inc. | | 654,468 |
| 59,485 | | | CBS Corporation – Class “B” | | 487,182 |
| 56,761 | | * | CEC Entertainment, Inc. | | 1,376,454 |
| 45,164 | | | Cinemark Holdings, Inc. | | 335,569 |
| 42,364 | | * | Coach, Inc. | | 879,900 |
| 32,943 | | * | Eddie Bauer Holdings, Inc. | | 16,801 |
| 21,570 | | | Genuine Parts Company | | 816,640 |
| 30,943 | | | H&R Block, Inc. | | 703,025 |
| 61,000 | | | Home Depot, Inc. | | 1,404,220 |
| 68,300 | | * | Jack in the Box, Inc. | | 1,508,747 |
| 61,426 | | * | Lincoln Educational Services Corporation | | 813,894 |
| 27,018 | | | Luxottica Group SpA (ADR) | | 489,566 |
| 43,302 | | | McDonald’s Corporation | | 2,692,951 |
| 143,800 | | * | Morgans Hotel Group Company | | 670,108 |
| 31,843 | | | Newell Rubbermaid, Inc. | | 311,425 |
| 15,221 | | | Polo Ralph Lauren Corporation – Class “A” | | 691,186 |
| 77,845 | | * | Ruby Tuesday, Inc. | | 121,438 |
| 57,937 | | | Staples, Inc. | | 1,038,231 |
| 30,674 | | * | Steiner Leisure Ltd. | | 905,496 |
| 204,070 | | | Stewart Enterprises, Inc. – Class “A” | | 614,251 |
| 33,098 | | * | Viacom, Inc. – Class “B” | | 630,848 |
| 72,083 | | | Wyndham Worldwide Corporation | | 472,144 |
| |
| | | | | | 18,372,547 |
| |
| | | | Consumer Staples—15.6% | | |
| 116,700 | | | Altria Group, Inc. | | 1,757,502 |
| 30,700 | | | Avon Products, Inc. | | 737,721 |
| 24,100 | | * | Chattem, Inc. | | 1,723,873 |
| 25,089 | | | Coca-Cola Company | | 1,135,779 |
| 69,558 | | | CVS Caremark Corporation | | 1,999,097 |
| 15,500 | | * | Dean Foods Company | | 278,535 |
| 32,934 | | | Kraft Foods, Inc. – Class “A” | | 884,278 |
| 38,800 | | | McCormick & Company, Inc. | | 1,236,168 |
| 167,427 | | | Nu Skin Enterprises, Inc. – Class “A” | | 1,746,264 |
| 32,000 | | | PepsiCo, Inc. | | 1,752,640 |
| 71,500 | | | Philip Morris International, Inc. | | 3,110,965 |
| 24,813 | | | Procter & Gamble Company | | 1,533,940 |
| 75,507 | | | Safeway, Inc. | | 1,794,801 |
| 3,196 | | | Tootsie Roll Industries, Inc. | | 81,850 |
Portfolio of Investments (continued)
GROWTH & INCOME FUND
December 31, 2008
| | | | |
| |
| | | | | |
| Shares | | | Security | Value |
| |
| | | | Consumer Staples (continued) | |
| 78,000 | | | Walgreen Company | $ 1,924,260 |
| 44,564 | | | Wal-Mart Stores, Inc. | 2,498,258 |
| �� |
| | | | | 24,195,931 |
| |
| | | | Energy—7.2% | |
| 76,769 | | * | Cal Dive International, Inc. | 499,766 |
| 26,818 | | | ConocoPhillips | 1,389,172 |
| 36,329 | | | ExxonMobil Corporation | 2,900,144 |
| 19,122 | | | Marathon Oil Corporation | 523,178 |
| 49,788 | | | Noble Corporation | 1,098,323 |
| 23,794 | | | Sasol, Ltd. (ADR) | 721,672 |
| 17,500 | | | Schlumberger, Ltd. | 740,775 |
| 56,007 | | | Suncor Energy, Inc. | 1,092,136 |
| 20,500 | | | World Fuel Services Corporation | 758,500 |
| 40,500 | | | XTO Energy, Inc. | 1,428,435 |
| |
| | | | | 11,152,101 |
| |
| | | | Financials—8.7% | |
| 17,106 | | | American Express Company | 317,316 |
| 31,766 | | | Astoria Financial Corporation | 523,504 |
| 29,243 | | | Bank of America Corporation | 411,741 |
| 59,900 | | | Brookline Bancorp, Inc. | 637,935 |
| 19,905 | | | Capital One Financial Corporation | 634,770 |
| 34,437 | | | Citigroup, Inc. | 231,072 |
| 31,643 | | | Discover Financial Services | 301,558 |
| 123,500 | | | Financial Select Sector SPDR Fund | 1,558,570 |
| 53,037 | | * | First Mercury Financial Corporation | 756,308 |
| 16,021 | | | Hartford Financial Services Group, Inc. | 263,065 |
| 54,656 | | | JPMorgan Chase & Company | 1,723,304 |
| 26,968 | | | KeyCorp | 229,767 |
| 6,149 | | | Merrill Lynch & Company, Inc. | 71,574 |
| 48,113 | | | Morgan Stanley | 771,733 |
| 61,000 | | | New York Community Bancorp, Inc. | 729,560 |
| 89,800 | | | NewAlliance Bancshares, Inc. | 1,182,666 |
| 23,000 | | | SPDR KBW Regional Banking ETF | 670,680 |
| 100,277 | | | Sunstone Hotel Investors, Inc. (REIT) | 620,715 |
| 29,688 | | | U.S. Bancorp | 742,497 |
| 18,046 | | | Webster Financial Corporation | 248,674 |
| 25,567 | | | Wells Fargo & Company | 753,715 |
| |
| | | | | 13,380,724 |
| | | | |
| |
| | | | | |
| Shares | | | Security | Value |
| |
| | | | Health Care—15.9% | |
| 45,000 | | | Abbott Laboratories | $ 2,401,650 |
| 14,946 | | * | Amgen, Inc. | 863,132 |
| 17,730 | | | Baxter International, Inc. | 950,151 |
| 24,470 | | | Becton, Dickinson & Company | 1,673,503 |
| 16,400 | | * | Cephalon, Inc. | 1,263,456 |
| 20,600 | | * | Genentech, Inc. | 1,707,946 |
| 14,100 | | * | Genzyme Corporation | 935,817 |
| 56,375 | | | Johnson & Johnson | 3,372,916 |
| 14,921 | | * | Laboratory Corporation of America Holdings | 961,062 |
| 42,432 | | | Medtronic, Inc. | 1,333,213 |
| 30,743 | | | Merck & Company, Inc. | 934,587 |
| 33,600 | | | Perrigo Company | 1,085,616 |
| 128,282 | | | Pfizer, Inc. | 2,271,874 |
| 24,600 | | * | PSS World Medical, Inc. | 462,972 |
| 32,453 | | | Sanofi-Aventis (ADR) | 1,043,688 |
| 15,000 | | * | St. Jude Medical, Inc. | 494,400 |
| 27,143 | | * | Thermo Fisher Scientific, Inc. | 924,762 |
| 52,175 | | | Wyeth | 1,957,084 |
| |
| | | | | 24,637,829 |
| |
| | | | Industrials—15.1% | |
| 24,394 | | | 3M Company | 1,403,631 |
| 63,012 | | * | AAR Corporation | 1,160,051 |
| 27,859 | | | Alexander & Baldwin, Inc. | 698,147 |
| 40,095 | | * | Altra Holdings, Inc. | 317,151 |
| 58,000 | | | Armstrong World Industries, Inc. | 1,253,960 |
| 14,368 | | | Avery Dennison Corporation | 470,265 |
| 18,600 | | | Barnes Group, Inc. | 269,700 |
| 31,343 | | * | BE Aerospace, Inc. | 241,028 |
| 13,100 | | | Burlington Northern Santa Fe Corporation | 991,801 |
| 54,537 | | | Chicago Bridge & Iron Company NV – NY Shares | 548,097 |
| 35,500 | | * | Esterline Technologies Corporation | 1,345,095 |
| 67,196 | | | General Electric Company | 1,088,575 |
| 31,300 | | | Harsco Corporation | 866,384 |
| 38,640 | | | Honeywell International, Inc. | 1,268,551 |
| 38,153 | | | IDEX Corporation | 921,395 |
| 24,200 | | | Illinois Tool Works, Inc. | 848,210 |
| 18,700 | | | Lockheed Martin Corporation | 1,572,296 |
| 66,919 | | * | Mobile Mini, Inc. | 964,972 |
| 22,918 | | | Northrop Grumman Corporation | 1,032,227 |
| 36,762 | | * | PGT, Inc. | 41,541 |
Portfolio of Investments (continued)
GROWTH & INCOME FUND
December 31, 2008
| | | | | |
| |
| | | | | | |
| Shares | | | Security | | Value |
| |
| | | | Industrials (continued) | | |
| 17,200 | | | Raytheon Company | | $ 877,888 |
| 13,950 | | | Republic Services, Inc. | | 345,821 |
| 93,300 | | | TAL International Group, Inc. | | 1,315,530 |
| 46,200 | | | Textainer Group Holdings, Ltd. | | 489,720 |
| 31,268 | | | Tyco International, Ltd. | | 675,389 |
| 43,402 | | | United Technologies Corporation | | 2,326,347 |
| |
| | | | | | 23,333,772 |
| |
| | | | Information Technology—15.8% | | |
| 23,900 | | * | CACI International, Inc. – Class “A” | | 1,077,651 |
| 65,000 | | * | Cisco Systems, Inc. | | 1,059,500 |
| 61,148 | | * | Electronics for Imaging, Inc. | | 584,575 |
| 110,790 | | * | EMC Corporation | | 1,159,971 |
| 82,728 | | * | Entrust, Inc. | | 130,710 |
| 56,161 | | | Harris Corporation | | 2,136,926 |
| 39,240 | | | Hewlett-Packard Company | | 1,424,020 |
| 58,699 | | | Intel Corporation | | 860,527 |
| 33,529 | | | International Business Machines Corporation | | 2,821,801 |
| 60,485 | | * | Macrovision Corporation | | 765,135 |
| 122,071 | | | Microsoft Corporation | | 2,373,060 |
| 37,225 | | * | NCI, Inc. – Class “A” | | 1,121,589 |
| 82,317 | | | Nokia Corporation – Class “A” (ADR) | | 1,284,145 |
| 77,855 | | * | Parametric Technology Corporation | | 984,866 |
| 48,088 | | | QUALCOMM, Inc. | | 1,722,993 |
| 10,450 | | * | SRA International, Inc. – Class “A” | | 180,263 |
| 110,860 | | * | Symantec Corporation | | 1,498,827 |
| 118,060 | | | TIBCO Software, Inc. | | 612,731 |
| 22,020 | | | Tyco Electronics, Ltd. | | 356,944 |
| 60,200 | | | Western Union Company | | 863,268 |
| 28,876 | | | Wright Express Corporation | | 363,838 |
| 60,085 | | | Xilinx, Inc. | | 1,070,715 |
| |
| | | | | | 24,454,055 |
| |
| | | | Materials—4.0% | | |
| 15,000 | | | Agrium, Inc. | | 511,950 |
| 67,700 | | | Celanese Corporation – Series “A” | | 841,511 |
| 20,870 | | | Freeport-McMoRan Copper & Gold, Inc. | | 510,063 |
| 36,000 | | | Lubrizol Corporation | | 1,310,040 |
| 13,862 | | | PPG Industries, Inc. | | 588,165 |
| | | | | | | | | |
| |
| Shares or | | | | | | | | | |
| Principal | | | | | | | | | |
| Amount | | Security | | | | | | Value |
| |
| 21,108 | | | Praxair, Inc. | | | | | | $ 1,252,971 |
| 71,320 | | | RPM International, Inc. | | | | | | 947,843 |
| 44,964 | | | Temple-Inland, Inc. | | | | | | 215,827 |
| |
| | | | | | | | | | 6,178,370 |
| |
| | | | Telecommunication Services—3.1% | | | | | | |
| 75,583 | | | AT&T, Inc. | | | | | | 2,154,116 |
| 79,493 | | | Verizon Communications, Inc. | | | | | | 2,694,813 |
| |
| | | | | | | | | | 4,848,929 |
| |
| | | | Utilities—.4% | | | | | | |
| 24,126 | | | Atmos Energy Corporation | | | | | | 571,786 |
| |
| Total Value of Common Stocks (cost $198,237,480) | | | | | | 151,126,044 |
| |
| | | | SHORT-TERM INVESTMENTS—2.3% | | | | | |
| | | | Money Market Fund | | | | | | |
| $3,620 | M | | First Investors Cash Reserve Fund, 1.39% | | | | | | |
| | | | (cost $3,620,000)** | | | | | | 3,620,000 |
| |
| Total Value of Investments (cost $201,857,480) | 100.0 | % | | | | 154,746,044 |
| Excess of Liabilities Over Other Assets | — | | | | | (49,973) |
| |
| Net Assets | | | | 100.0 | % | | | | $154,696,071 |
* Non-income producing
** Affiliated unregistered money market fund available only to First Investors funds and certain accounts managed by First Investors Management Company, Inc. Rate shown is the 7-day yield at December 31, 2008 (see Note 3).
Summary of Abbreviations:
ADR American Depositary Receipts
REIT Real Estate Investment Trust
| |
| See notes to financial statements | 37 |
Portfolio Managers’ Letter
HIGH YIELD FUND
Dear Investor:
This is the annual report for the First Investors Life High Yield Fund for the year ended December 31, 2008. During the period, the Fund’s return on a net asset value basis was –25.86%, including dividends of 59.3 cents per share.
The most important factors driving the Fund’s performance during the reporting period were the overall performance of the high yield market and the Fund’s individual security selections. While the high yield market had its worst year in history, the Fund slightly outperformed its benchmark, the Credit Suisse High Yield II Index.
The reporting period began poorly as the combination of a weak economy and probable recession, poor liquidity, financial system distress and an increase in defaults weighed on the market and left participants wondering how soon conditions would improve. The Federal Reserve (the “Fed”) and the U.S. government took unprecedented action with a combination of rate cuts, various liquidity facilities to provide stability to the financial system and a stimulus package to mitigate the effects of a recession. These actions, along with the Fed’s “bailout” of Bear Stearns, contributed to a strong rally in the high yield market, resulting in April being the best performing month in over five years. While performance and earnings were strong in April, the economic picture was deteriorating. A lower-than-expected second quarter GDP, a weakening employment picture and declining consumer confidence dragged on the markets throughout the summer.
Then in September 2008, the financial crisis deepened. The Fed placed Freddie Mac and Fannie Mae under conservatorship, Lehman Brothers filed for bankruptcy, AIG was bailed out, Washington Mutual was sold to JP Morgan, and Wachovia was sold to Wells Fargo. In all cases the equity holders were wiped out or severely diluted, while Lehman, AIG, and Washington Mutual bondholders also suffered severe losses. As a result, September’s selloff turned into a rout in October for all markets associated with risk, including the high yield market. As the fourth quarter progressed, investors’ focus shifted away from risks of the collapse in the financial system toward the increasing likelihood of a global recession and its implications. In fact, in early December, the National Bureau of Economic Research announced that the United States was in a recession that had begun in December 2007. On a positive note, the high yield market did rally the last two weeks of the year and p osted a positive return for the month of December.
Aiding the Fund’s performance were investments in Constellation Brands, DRS Technologies, Six Flags, Roadway and Allied Waste Industries. Constellation Brands, a producer and marketer of alcoholic beverages reported improving year-over-year results and is considered a defensive holding. Defense contractor DRS Technologies
was acquired by Finmeccanica and its bonds traded on the premise that a change in control redemption will be offered. Roadway, a freight transportation service provider, called its bonds prior to their December maturity. Amusement park operator Six Flags completed a bond exchange to improve its liquidity and the Fund exited its position during the subsequent rally. Republic Services and Allied Waste Industries announced a merger of the second and third largest waste services companies. The combined entity will seek to maintain an investment grade rating.
Detracting from performance were Idearc, Delta Petroleum, MediaNews Group, Young Broadcasting and Avis Budget Group. Yellow pages publisher Idearc and newspaper publisher MediaNews Group have both suffered from declining advertising revenues in the publishing industry. Delta Petroleum, a lower rated exploration and production company, traded off along with falling energy prices. Television broadcaster Young Broadcasting announced that it would not meet its previously stated goal of concluding a sale agreement for KRON-TV, raising investor concerns about liquidity. Avis Budget Group has traded off as investors become increasingly concerned about a slowdown in the travel industry.
Thank you for placing your trust in First Investors. We appreciate the opportunity to serve your investment needs.
Sincerely,

Richard T. Bourke
Portfolio Manager

Greg Miller
Portfolio Manager
January 30, 2009
Fund Expenses (unaudited)
HIGH YIELD FUND
The examples below show the ongoing costs (in dollars) of investing in your Fund and will help you in comparing these costs with costs of other mutual funds. Please refer to page 3 for a detailed explanation of the information presented in these examples.
| | | | |
| | Beginning | Ending | |
| | Account | Account | Expenses Paid |
| | Value | Value | During Period |
| | (7/1/08) | (12/31/08) | (7/1/08–12/31/08)* |
| Expense Examples | | | |
| Actual | $1,000.00 | $752.18 | $3.79 |
| Hypothetical | | | |
| (5% annual return before expenses) | $1,000.00 | $1,020.82 | $4.37 |
| |
| * | Expenses are equal to the annualized expense ratio of .86%, multiplied by the average account |
| | value over the period, multiplied by 184/366 (to reflect the one-half year period). |
Portfolio Composition
TOP TEN SECTORS

Portfolio holdings and allocations are subject to change. Percentages are as of December 31, 2008,
and are based on the total value of investments.
Cumulative Performance Information (unaudited)
HIGH YIELD FUND
Comparison of change in value of $10,000 investment in the First Investors Life Series High Yield Fund and the Credit Suisse High Yield Index II.

The graph compares a $10,000 investment in the First Investors Life Series High Yield Fund beginning 12/31/98 with a theoretical investment in the Credit Suisse High Yield Index II (the “Index”). The Index is designed to measure the performance of the high yield bond market. As of 12/31/08, the Index consisted of 1,117 different issues, most of which are cash-pay, also included in the Index are zero coupon bonds, step bonds, payment-in-kind bonds and bonds which are in default. As of 12/31/08, approximately 0.58% of the market value of the Index was in default. The bonds included in the Index have an average maturity of 6.38 years, an average duration of 3.89 years and an average coupon of 8.28% . It is not possible to invest directly in this Index. In addition, the Index does not reflect fees and expenses associated with the active management of a mutual fund portfolio. For purposes of the graph and the accompanying table it is assu med that all dividends and distributions were reinvested.
* The Average Annual Total Return figures are for the periods ended 12/31/08.
The returns shown do not reflect any sales charges, since the Fund sells its shares solely to variable annuity and/or variable life insurance subaccounts at net asset value. The returns do not reflect the fees and charges that an individual would pay in connection with an investment in a variable annuity or life contract or policy. Results represent past performance and do not indicate future results. The graph and the returns shown do not reflect the deduction of taxes that an investor would pay on distributions or the redemption of fund shares. Investment return and principal value of an investment will fluctuate so that an investor’s shares, when redeemed, may be worth more or less than the original cost. The issuers of the high yield bonds, in which the Fund primarily invests, pay higher interest rates because they have a greater likelihood of financial difficulty, which could result in their inability to repay the bonds fully when due. Prices of high yield bonds are also subject to greater fluctuations. Credit Suisse High Yield Index II figures are from Credit Suisse Corporation and all other figures are from First Investors Management Company, Inc.
Portfolio of Investments
HIGH YIELD FUND
December 31, 2008
| | | | | |
| |
| Principal | | | | | |
| Amount | | | Security | | Value |
| |
| | | | CORPORATE BONDS—87.3% | | |
| | | | Aerospace/Defense—5.2% | | |
| $ 725 | M | | Alliant Techsystems, Inc., 6.75%, 2016 | | $ 656,125 |
| 750 | M | | DRS Technologies, Inc., 6.875%, 2013 | | 747,009 |
| 660 | M | | DynCorp International, LLC, 9.5%, 2013 | | 575,025 |
| 190 | M | | GenCorp, Inc., 9.5%, 2013 | | 152,950 |
| 625 | M | | L-3 Communications Corp., 7.625%, 2012 | | 612,500 |
| |
| | | | | | 2,743,609 |
| |
| | | | Automotive—3.6% | | |
| 300 | M | | Accuride Corp., 8.5%, 2015 (a) | | 99,750 |
| | | | Asbury Automotive Group, Inc.: | | |
| 600 | M | | 8%, 2014 | | 288,000 |
| 250 | M | | 7.625%, 2017 | | 117,500 |
| 1,025 | M | | Avis Budget Car Rental, LLC, 7.75%, 2016 | | 302,375 |
| | | | General Motors Corp.: | | |
| 500 | M | | 7.7%, 2016 | | 93,750 |
| 500 | M | | 8.375%, 2033 | | 90,000 |
| 750 | M | | Tenneco Automotive, Inc., 8.625%, 2014 | | 288,750 |
| 925 | M | | United Auto Group, Inc., 7.75%, 2016 | | 434,750 |
| 400 | M | | United Components, Inc., 9.375%, 2013 | | 170,000 |
| |
| | | | | | 1,884,875 |
| |
| | | | Chemicals—3.5% | | |
| | | | Huntsman, LLC: | | |
| 250 | M | | 11.625%, 2010 | | 219,375 |
| 569 | M | | 11.5%, 2012 | | 458,045 |
| 625 | M | | Nell AF S.a.r.l., 8.375%, 2015 (b) | | 18,750 |
| 700 | M | | Newmarket Corp., 7.125%, 2016 | | 528,500 |
| 500 | M | | Terra Capital, Inc., 7%, 2017 | | 370,000 |
| 425 | M | | Westlake Chemical Corp., 6.625%, 2016 | | 248,625 |
| |
| | | | | | 1,843,295 |
| |
| | | | Consumer Non-Durables—1.3% | | |
| 477 | M | | GFSI, Inc., 10.5%, 2011 (b)(c) | | 407,835 |
| 375 | M | | Levi Strauss & Co., 9.75%, 2015 | | 279,375 |
| |
| | | | | | 687,210 |
| | | | | |
| |
| Principal | | | | | |
| Amount | | | Security | | Value |
| |
| | | | Energy—12.2% | | |
| $725 | M | | Basic Energy Services, Inc., 7.125%, 2016 | | $ 416,875 |
| 400 | M | | Calfrac Holdings, 7.75%, 2015 (b) | | 190,000 |
| | | | Chesapeake Energy Corp.: | | |
| 200 | M | | 7.5%, 2014 | | 170,000 |
| 500 | M | | 6.375%, 2015 | | 397,500 |
| 1,150 | M | | 6.625%, 2016 | | 914,250 |
| 500 | M | | Cimarex Energy Co., 7.125%, 2017 | | 392,500 |
| | | | Compagnie Generale de Geophysique: | | |
| 650 | M | | 7.5%, 2015 | | 406,250 |
| 400 | M | | 7.75%, 2017 | | 234,000 |
| 625 | M | | Complete Production Services, Inc., 8%, 2016 | | 396,875 |
| 200 | M | | Connacher Oil & Gas, Ltd.,10.25%, 2015 (b) | | 81,000 |
| 1,300 | M | | Delta Petroleum Corp., 7%, 2015 | | 266,500 |
| 400 | M | | Hilcorp Energy I, LP, 9%, 2016 (b) | | 288,000 |
| 501 | M | | National Oilwell Varco, Inc., 6.125%, 2015 | | 435,529 |
| 500 | M | | Pacific Energy Partners LP, 7.125%, 2014 | | 437,190 |
| | | | Petroplus Finance, Ltd.: | | |
| 100 | M | | 6.75%, 2014 (b) | | 64,000 |
| 550 | M | | 7%, 2017 (b) | | 338,250 |
| 375 | M | | Plains Exploration & Production Co., 7.625%, 2018 | | 258,750 |
| 400 | M | | Stallion Oilfield Services, Ltd., 9.75%, 2015 (b) | | 106,000 |
| 400 | M | | Stewart & Stevenson, LLC, 10%, 2014 | | 250,000 |
| 510 | M | | Tesoro Corp., 6.25%, 2012 | | 354,450 |
| |
| | | | | | 6,397,919 |
| |
| | | | Food/Beverage/Tobacco—3.3% | | |
| 1,250 | M | | Constellation Brands, Inc., 7.25%, 2016 | | 1,187,500 |
| | | | Land O’Lakes, Inc.: | | |
| 200 | M | | 9%, 2010 | | 199,500 |
| 42 | M | | 8.75%, 2011 | | 41,370 |
| 375 | M | | Southern States Cooperative, Inc., 10.5%, 2010 (b) | | 313,125 |
| |
| | | | | | 1,741,495 |
| |
| | | | Food/Drug—1.7% | | |
| 1,000 | M | | Ingles Markets, Inc., 8.875%, 2011 | | 875,000 |
Portfolio of Investments (continued)
HIGH YIELD FUND
December 31, 2008
| | | | |
| |
| Principal | | | | |
| Amount | | | Security | Value |
|
| | | | Forest Products/Containers—2.2% | |
| $ 350 | M | | Jefferson Smurfit Corp., 8.25%, 2012 | $ 61,250 |
| 500 | M | | Packaging Dynamics Finance Corp., 10%, 2016 (b) | 230,000 |
| 600 | M | | Sappi Papier Holding AG, 6.75%, 2012 (b) | 448,559 |
| 500 | M | | Tekni-Plex, Inc., 8.75%, 2013 (a) | 292,500 |
| 475 | M | | Verso Paper Holdings, LLC, 6.943%, 2014 (c) | 140,125 |
|
| | | | | 1,172,434 |
|
| | | | Gaming/Leisure—5.3% | |
| 750 | M | | Circus & Eldorado/Silver Legacy, 10.125%, 2012 | 483,750 |
| 500 | M | | Isle of Capri Casinos, Inc., 7%, 2014 | 215,000 |
| 780 | M | | Mandalay Resort Group, 6.375%, 2011 | 549,900 |
| 1,040 | M | | MGM Mirage, Inc., 6.625%, 2015 | 639,600 |
| 200 | M | | Pinnacle Entertainment, Inc., 7.5%, 2015 | 117,000 |
| 1,055 | M | | Speedway Motorsports, Inc., 6.75%, 2013 | 764,875 |
| 500 | M | | Station Casinos, Inc., 6.875%, 2016 | 31,250 |
|
| | | | | 2,801,375 |
|
| | | | Health Care—10.4% | |
| | | | Alliance Imaging, Inc.: | |
| 200 | M | | 7.25%, 2012 | 171,000 |
| 450 | M | | 7.25%, 2012 | 384,750 |
| 625 | M | | Community Health Systems, 8.875%, 2015 | 578,125 |
| 500 | M | | Cooper Companies, Inc., 7.125%, 2015 | 422,500 |
| 900 | M | | DaVita, Inc., 7.25%, 2015 | 859,500 |
| 520 | M | | Fisher Scientific International, Inc., 6.125%, 2015 | 458,840 |
| 600 | M | | Genesis Health Ventures, Inc., 9.75%, 2011 (d)(e) | 375 |
| 800 | M | | HCA, Inc., 6.75%, 2013 | 508,000 |
| 1,000 | M | | Omnicare, Inc., 6.875%, 2015 | 825,000 |
| 343 | M | | Res-Care, Inc., 7.75%, 2013 | 281,260 |
| | | | Tenet Healthcare Corp.: | |
| 550 | M | | 7.375%, 2013 | 394,625 |
| 250 | M | | 9.25%, 2015 (a) | 202,500 |
| 600 | M | | Universal Hospital Services, Inc., 5.943%, 2015 (c) | 369,000 |
|
| | | | | 5,455,475 |
|
| | | | Housing—1.5% | |
| 320 | M | | Beazer Homes USA, Inc., 6.875%, 2015 | 110,400 |
| 900 | M | | Builders FirstSource, Inc., 6.399%, 2012 (c) | 297,000 |
| 100 | M | | NTK Holdings, Inc., 0%—10.75%, 2014 (a)(f) | 22,000 |
| 220 | M | | Ply Gem Industries, Inc., 9%, 2012 (a) | 53,900 |
| | | | |
| |
| Principal | | | | |
| Amount | | | Security | Value |
| |
| | | | Housing (continued) | |
| $ 500 | M | | Realogy Corp., 12.375%, 2015 (a) | $ 70,000 |
| | | | William Lyon Homes, Inc.: | |
| 500 | M | | 7.625%, 2012 | 132,500 |
| 300 | M | | 10.75%, 2013 | 76,500 |
| |
| | | | | 762,300 |
| |
| | | | Information Technology—2.7% | |
| 850 | M | | Belden CDT, Inc., 7%, 2017 | 641,750 |
| 500 | M | | Exodus Communications, Inc., 10.75%, 2009 (d)(e) | 313 |
| | | | Freescale Semiconductor, Inc.: | |
| 750 | M | | 9.125%, 2014 | 176,250 |
| 125 | M | | 10.125%, 2016 (a) | 51,875 |
| 500 | M | | Iron Mountain, Inc., 8%, 2020 | 403,750 |
| | | | Sanmina – SCI Corp.: | |
| 125 | M | | 4.74625%, 2014 (b)(c) | 68,125 |
| 200 | M | | 8.125%, 2016 | 79,000 |
| |
| | | | | 1,421,063 |
| |
| | | | Investment/Finance Companies—1.2% | |
| 700 | M | | LaBranche & Co., Inc., 11%, 2012 | 612,500 |
| |
| | | | Manufacturing—1.5% | |
| 260 | M | | Case New Holland, Inc., 7.125%, 2014 | 185,900 |
| 250 | M | | ESCO Corp., 8.625%, 2013 (b) | 176,250 |
| 500 | M | | Terex Corp., 8%, 2017 | 427,500 |
| |
| | | | | 789,650 |
| |
| | | | Media-Broadcasting—2.6% | |
| 1,250 | M | | Block Communications, Inc., 8.25%, 2015 (b) | 831,250 |
| 600 | M | | LBI Media, Inc., 8.5%, 2017 (b) | 213,000 |
| 320 | M | | Nexstar Finance Holding LLC, 11.375%, 2013 | 139,421 |
| 224 | M | | Sinclair Broadcasting Group, Inc., 8%, 2012 | 169,120 |
| | | | Young Broadcasting, Inc.: | |
| 476 | M | | 10%, 2011 | 7,140 |
| 600 | M | | 8.75%, 2014 | 9,000 |
| |
| | | | | 1,368,931 |
Portfolio of Investments (continued)
HIGH YIELD FUND
December 31, 2008
| | | | |
| |
| Principal | | | | |
| Amount | | | Security | Value |
| |
| | | | Media-Cable TV—9.0% | |
| $1,255 | M | | Adelphia Communications Escrow Bond, 10.25%, 2011 (d) | $ 42,356 |
| 850 | M | | Atlantic Broadband Finance, LLC, 9.375%, 2014 | 586,500 |
| 1,000 | M | | Cablevision Systems Corp., 8%, 2012 | 895,000 |
| | | | Charter Communications Holdings, LLC: | |
| 1,281 | M | | 10%, 2009 | 899,902 |
| 250 | M | | 11.75%, 2011 | 31,250 |
| | | | CSC Holdings, Inc.: | |
| 250 | M | | 8.125%, 2009 | 249,375 |
| 125 | M | | 6.75%, 2012 | 115,000 |
| 1,060 | M | | Echostar DBS Corp., 6.375%, 2011 | 988,450 |
| 1,000 | M | | Mediacom LLC/Mediacom Capital Corp., 7.875%, 2011 | 786,250 |
| 200 | M | | Quebecor Media, Inc., 7.75%, 2016 | 136,000 |
| |
| | | | | 4,730,083 |
| |
| | | | Media-Diversified—2.4% | |
| 800 | M | | Cenveo, Inc., 7.875%, 2013 | 422,000 |
| 100 | M | | Deluxe Corp., 7.375%, 2015 | 60,500 |
| 1,125 | M | | Idearc, Inc., 8%, 2016 | 90,000 |
| | | | MediaNews Group, Inc.: | |
| 375 | M | | 6.875%, 2013 | 25,781 |
| 400 | M | | 6.375%, 2014 | 27,500 |
| 650 | M | | R.H. Donnelley Corp., 8.875%, 2017 | 100,750 |
| 800 | M | | Universal City Development Partners, Ltd., 11.75%, 2010 | 518,000 |
| |
| | | | | 1,244,531 |
| |
| | | | Metals/Mining—1.5% | |
| 250 | M | | Metals USA, Inc., 11.125%, 2015 | 148,750 |
| 830 | M | | Russell Metals, Inc., 6.375%, 2014 | 643,250 |
| |
| | | | | 792,000 |
| |
| | | | Retail-General Merchandise—2.3% | |
| 650 | M | | GSC Holdings Corp., 8%, 2012 | 607,750 |
| 900 | M | | Neiman Marcus Group, Inc., 10.375%, 2015 (a) | 391,500 |
| 500 | M | | Yankee Acquisition Corp., 9.75%, 2017 (a) | 212,500 |
| |
| | | | | 1,211,750 |
| | | | |
| |
| Principal | | | | |
| Amount | | | | |
| or Shares | | | Security | Value |
| |
| | | | Services—7.3% | |
| | | | Allied Waste NA, Inc.: | |
| $ 200 | M | | 7.875%, 2013 | $ 190,169 |
| 1,000 | M | | 7.375%, 2014 | 946,010 |
| 750 | M | | 6.875%, 2017 | 698,581 |
| 550 | M | | Ashtead Capital, Inc., 9%, 2016 (b) | 286,000 |
| 550 | M | | First Data Corp., 9.875%, 2015 | 335,500 |
| | | | United Rentals, Inc.: | |
| 323 | M | | 6.5%, 2012 | 256,984 |
| 650 | M | | 7%, 2014 | 399,750 |
| 1,000 | M | | Waste Services, Inc., 9.5%, 2014 | 715,000 |
| |
| | | | | 3,827,994 |
| |
| | | | Telecommunications—1.7% | |
| 750 | M | | Citizens Communications Co., 7.125%, 2019 | 506,250 |
| 500 | M | | Qwest Communications International, Inc., 7.5%, 2014 | 360,000 |
| |
| | | | | 866,250 |
| |
| | | | Utilities—2.6% | |
| 750 | M | | Dynegy Holdings, Inc., 7.75%, 2019 | 521,250 |
| 400 | M | | Energy Future Holdings Corp., 10.875%, 2017 (b) | 286,000 |
| 625 | M | | NRG Energy, Inc., 7.375%, 2017 | 576,563 |
| |
| | | | | 1,383,813 |
| |
| | | | Wireless Communications—2.3% | |
| 1,000 | M | | Nextel Communications, Inc., 5.95%, 2014 | 420,379 |
| 800 | M | | Rogers Wireless, Inc., 6.375%, 2014 | 761,294 |
| |
| | | | | 1,181,673 |
| |
| Total Value of Corporate Bonds (cost $72,448,677) | 45,795,225 |
| |
| | | | COMMON STOCKS—1.7% | |
| | | | Media-Broadcasting—.2% | |
| 32,500 | | | Sinclair Broadcasting Group, Inc. | 100,750 |
| |
| | | | Media-Cable TV—1.1% | |
| 1,253,066 | | * | Adelphia Recovery Trust | 16,916 |
| 25,940 | | * | Time Warner Cable, Inc. – Class “A” | 556,413 |
| |
| | | | | 573,329 |
Portfolio of Investments (continued)
HIGH YIELD FUND
December 31, 2008
| | | | | |
| |
| Shares, | | | | | |
| Warrants | | | | | |
| or Principal | | | | | |
| Amount | | | Security | | Value |
| |
| | | | Media-Diversified—.0% | | |
| 2,500 | | * | MediaNews Group, Inc. – Class “A” (e) | | $ 25 |
| |
| | | | Telecommunications—.4% | | |
| 25,000 | | | Frontier Communications Corp. | | 218,500 |
| 3 | | * | Viatel Holding (Bermuda), Ltd. (e) | | 11 |
| 5,970 | | * | World Access, Inc. | | 2 |
| |
| | | | | | 218,513 |
| |
| Total Value of Common Stocks (cost $1,945,595) | | 892,617 |
| |
| | | | WARRANTS—.0% | | |
| | | | Telecommunication Services | | |
| 250 | | * | GT Group Telecom, Inc. (expiring 2/1/10) (cost $22,587) (b)(e) | | — |
| |
| | | | SHORT-TERM INVESTMENTS—6.6% | | |
| | | | Money Market Fund | | |
| $3,470 | M | | First Investors Cash Reserve Fund, 1.39% | | |
| | | | (cost $3,470,000) (g) | | 3,470,000 |
| |
| | | | REPURCHASE AGREEMENTS—2.8% | | |
| 1,470 | M | | Barclays Bank PLC, .05%, dated 12/31/08, to be | | |
| | | | repurchased at $1,470,004 on 1/2/09 (collateralized by | | |
| | | | Freddie Mac 4.15%, 1/29/13, valued at $1,499,879) | | |
| | | | (cost $1,470,000) (h) | | 1,470,000 |
| | | | | | | | | |
| |
| Principal | | | | | | | | | |
| Amount | | | Security | | | | | | Value |
| |
|
| | | SHORT-TERM TAX EXEMPT INVESTMENTS—1.6% | | | | | | |
| | | | Auction Rate Securities (i) | | | | | | |
| $475 | M | | New York State Twy. Auth. Svc. Contract Rev., | | | | | |
| | | | 1.173%, 2021 | | | | | | $ 475,000 |
| 350 | M | | Winter Park, FL Elec. Rev. Bonds, .807%, 2034 | | | | | 350,000 |
| |
| Total Value of Short-Term Tax Exempt Investments (cost $825,000) | | | | | 825,000 |
| |
| Total Value of Investments (cost $80,181,859) | 100.0 | % | | | | 52,452,842 |
| Other Assets, Less Liabilities | — | | | | | 17,388 |
| |
| Net Assets | | | | 100.0 | % | | | | $52,470,230 |
| | |
| * | Non-income producing |
| (a) | Loaned security; a portion or all of the security is on loan as of December 31, 2008 |
| (see Note 1G). |
| (b) | Security exempt from registration under Rule 144A of Securities Act of 1933 (see Note 5). |
| (c) | Interest rates on adjustable rate bonds are determined and reset quarterly by the indentures. The |
| interest rates above are the rates in effect on December 31, 2008. |
| (d) | In default as to principal and/or interest payment. |
| (e) | Securities valued at fair value (see Note 1A). |
| (f) | Denotes a step bond (a zero coupon bond that converts to a fixed interest rate at a designated date) |
| (g) | Affiliated unregistered money market fund available only to First Investors funds and certain |
| accounts managed by First Investors Management Company, Inc. Rate shown is the 7-day yield |
| at December 31, 2008 (see Note 3). |
| (h) | Collateral for securities loaned. |
| (i) | Interest rates on auction rate securities are determined and reset periodically by the issuer and |
| are the rates in effect at December 31, 2008. |
| |
| See notes to financial statements | 49 |
Portfolio Manager’s Letter
INTERNATIONAL FUND
Dear Investor:
This is the annual report for the First Investors Life International Fund for the year ended December 31, 2008. During the period, the Fund’s return on a net asset value basis was –41.89%, including dividends of 3.9 cents per share and capital gains of $2.65 per share.
Challenging financial and economic conditions hurt investor confidence in 2008, creating opportunities in the marketplace. During the period, and the fourth quarter in particular, many investors sold indiscriminately, pushing valuations lower, and creating opportunities for investors who recognized them as such. The Fund took advantage of pricing weakness by adding companies that it believed to be positioned to deliver strong performance over the intermediate- and longer-term — companies that previously were too richly priced for inclusion in the Fund’s portfolio. The Fund also added to current positions, concentrating its positions in select high quality names.
The Fund outperformed its benchmark, the MSCI EAFE Index, during the reporting period, though absolute returns were still significantly negative. The Fund’s stock selection in developed countries, such as Switzerland, Spain and France, made strong positive contributions to relative performance during the period. Among the top individual contributors were Synthes, a Swiss health care company; Red Electrica, which owns and operates most of Spain’s power transmission grid; Essilor, France’s leading producer of ophthalmic lenses, coatings, products and supplies and Air Liquide, a French company and world leader in the supply of industrial and medical gases. RWE, a German utilities company, was also a key contributor to relative outperformance in Germany during the period. The Fund was underweight financials compared to its benchmark, which also helped relative performance during the year.
The Fund had meaningful positions in companies in emerging markets, particularly India. This overweight position in India hurt relative performance during the period, though the poor performance was offset by the stronger relative performance of holdings in developed countries. Going forward, we expect emerging markets’ share of global growth to continue to increase. Although these countries’ short-term performance may be tempered by the forces of global recession, they do not have the structural problems of more developed countries. We particularly like countries such as India that are less reliant on exports to developed countries.
During the period, the Fund reduced its very aggressive position in the energy sector, finishing the year with a sector weighting roughly in line with that of the Index. However, stock selection still hurt the sector, and energy was the worst performing sector in the Fund on a relative basis.
Although many of the issues that have affected the stock market remain unresolved, relatively attractive equity valuations have presented the Fund with increased buying opportunities. While difficult in the short-term, volatile markets have the potential to benefit patient, long-term investors.
Thank you for placing your trust in First Investors. We appreciate the opportunity to serve your investment needs.
Sincerely,

Rajiv Jain
Portfolio Manager
January 30, 2009
Fund Expenses (unaudited)
INTERNATIONAL FUND
The examples below show the ongoing costs (in dollars) of investing in your Fund and will help you in comparing these costs with costs of other mutual funds. Please refer to page 3 for a detailed explanation of the information presented in these examples.
| | | |
| |
| | Beginning | Ending | |
| | Account | Account | Expenses Paid |
| | Value | Value | During Period |
| | (7/1/08) | (12/31/08) | (7/1/08–12/31/08)* |
| Expense Examples | | | |
| Actual | $1,000.00 | $664.39 | $4.06 |
| Hypothetical | | | |
| (5% annual return before expenses) | $1,000.00 | $1,020.26 | $4.93 |
| |
| * | Expenses are equal to the annualized expense ratio of .97%, multiplied by the average account |
| value over the period, multiplied by 184/366 (to reflect the one-half year period). |
Portfolio Composition
BY SECTOR

Portfolio holdings and allocations are subject to change. Percentages are as of December 31, 2008,
and are based on the total value of investments.
Cumulative Performance Information (unaudited)
INTERNATIONAL FUND
Comparison of change in value of $10,000 investment in the First Investors Life Series International Fund and the Morgan Stanley Capital International (“MSCI”) EAFE Index (Net).

The graph compares a $10,000 investment in the First Investors Life Series International Fund beginning 12/31/98 with a theoretical investment in the MSCI EAFE Index (Net) (the “Index”). The Index is a free float-adjusted market capitalization index that measures developed foreign market equity performance, excluding the U.S. and Canada. The index is calculated on a total-return basis with net dividends reinvested. The Indices are unmanaged and it is not possible to invest directly in this Index. In addition, the Index does not reflect fees and expenses associated with the active management of a mutual fund portfolio. For purposes of the graph and the accompanying table, it is assumed that all dividends and distributions were reinvested.
* The Average Annual Total Return figures are for the periods ended 12/31/08.
The returns shown do not reflect any sales charges, since the Fund sells its shares solely to variable annuity and/or variable life insurance subaccounts at net asset value. The returns do not reflect the fees and charges that an individual would pay in connection with an investment in a variable annuity or life contract or policy. Results represent past performance and do not indicate future results. The graph and the returns shown do not reflect the deduction of taxes that an investor would pay on distributions or the redemption of fund shares. Investment return and principal value of an investment will fluctuate so that an investor’s shares, when redeemed, may be worth more or less than the original cost. MSCI EAFE Index (Net) figures are from Morgan Stanley & Company, Inc. and all other figures are from First Investors Management Company, Inc.
Portfolio of Investments (continued)
INTERNATIONAL FUND
December 31, 2008
| | | | |
| |
| | | | | |
| Shares | | | Security | Value |
| |
| | | | COMMON STOCKS—92.4% | |
| | | | United Kingdom—16.3% | |
| 89,192 | | | BG Group PLC | $ 1,234,559 |
| 167,201 | | | British American Tobacco PLC | 4,361,750 |
| 100,296 | | | Diageo PLC | 1,409,245 |
| 86,365 | | | Imperial Tobacco Group PLC | 2,306,896 |
| 51,155 | | | Reckitt Benckiser Group PLC | 1,916,827 |
| 513,348 | | | Tesco PLC | 2,673,019 |
| |
| | | | | 13,902,296 |
| |
| | | | India—10.8% | |
| 104,007 | | * | Bharti Airtel, Ltd. | 1,533,148 |
| 33,423 | | | HDFC Bank, Ltd. (ADR) | 2,385,734 |
| 228,974 | | | Hindustan Unilever, Ltd. | 1,183,857 |
| 67,000 | | | Housing Development Finance Corporation, Ltd. | 2,050,326 |
| 308,900 | | | ITC, Ltd. | 1,092,682 |
| 52,104 | | | United Spirits, Ltd. | 952,596 |
| |
| | | | | 9,198,343 |
| |
| | | | Switzerland—10.2% | |
| 493 | | | Lindt & Spruengli AG | 922,438 |
| 79,860 | | | Nestle SA – Registered | 3,162,308 |
| 16,700 | | | Novartis AG – Registered | 836,360 |
| 17,258 | | | Roche Holding AG – Genusscheine | 2,671,834 |
| 8,800 | | | Synthes, Inc. | 1,115,892 |
| |
| | | | | 8,708,832 |
| |
| | | | Spain—8.5% | |
| 177,820 | | | Enagas | 3,926,493 |
| 65,800 | | | Red Electrica Corporacion SA | 3,354,267 |
| |
| | | | | 7,280,760 |
| |
| | | | Japan—7.9% | |
| 2,700 | | | Nintendo Company, Ltd. | 1,031,810 |
| 58,700 | | | Secom Company, Ltd. | 3,029,066 |
| 90,500 | | | Tokio Marine Holdings, Inc. | 2,681,464 |
| |
| | | | | 6,742,340 |
| | | | |
| |
| | | | | |
| Shares | | | Security | Value |
| |
| | | | Brazil—5.8% | |
| 123,625 | | | Banco Itau Holding Financeira SA (ADR) | $1,434,050 |
| 16,500 | | | Companhia de Bebidas das Americas (ADR) | 731,115 |
| 25,400 | | | Petroleo Brasileiro SA – Petrobras (ADR) | 518,414 |
| 36,135 | | | Petroleo Brasileiro SA – Petrobras (ADR) | 884,946 |
| 28,900 | | | Redecard SA | 318,495 |
| 54,008 | | | Souza Cruz SA | 1,021,335 |
| |
| | | | | 4,908,355 |
| |
| | | | France—5.6% | |
| 12,172 | | | Air Liquide SA | 1,114,704 |
| 32,259 | | | Essilor International SA | 1,515,365 |
| 38,952 | | | Total SA | 2,141,547 |
| |
| | | | | 4,771,616 |
| |
| | | | United States—5.3% | |
| 104,800 | | | Philip Morris International, Inc. | 4,559,848 |
| |
| | | | Australia—5.0% | |
| 116,800 | | | Coca-Cola Amatil, Ltd. | 750,568 |
| 84,404 | | | QBE Insurance Group, Ltd. | 1,525,460 |
| 108,762 | | | Woolworths, Ltd. | 2,027,999 |
| |
| | | | | 4,304,027 |
| |
| | | | Netherlands—4.4% | |
| 43,477 | | | Core Laboratories NV | 2,602,533 |
| 47,228 | | | Unilever NV-CVA | 1,144,710 |
| |
| | | | | 3,747,243 |
| |
| | | | Denmark—3.0% | |
| 49,984 | | | Novo Nordisk A/S – Series “B” | 2,578,369 |
| |
| | | | China—2.0% | |
| 37,029 | | | China Mobile, Ltd. | 375,701 |
| 14,300 | | | China Mobile, Ltd. (ADR) | 727,155 |
| 624,684 | | | CNOOC, Ltd. | 594,184 |
| |
| | | | | 1,697,040 |
Portfolio of Investments (continued)
INTERNATIONAL FUND
December 31, 2008
| | | | | | | | | |
| |
| Shares or | | | | | | | | | |
| Principal | | | | | | | | | |
| Amount | | | Security | | | | | | Value |
| |
| | | | Mexico—1.9% | | | | | | |
| 20,324 | | | America Movil SAB de CV (ADR) – Series “L” | | | | | $ 629,841 |
| 33,300 | | | Fomento Economico Mexicano, SAB de CV (ADR) | | | | | 1,003,329 |
| |
| | | | | | | | | | 1,633,170 |
| |
| | | | Norway—1.0% | | | | | | |
| 131,613 | | | Orkla ASA | | | | | | 875,715 |
| |
| | | | South Korea—1.0% | | | | | | |
| 13,457 | | * | KT&G Corporation | | | | | | 851,203 |
| |
| | | | Canada—1.0% | | | | | | |
| 21,500 | | | Canadian Natural Resources, Ltd. | | | | | | 847,983 |
| |
| | | | Germany—1.0% | | | | | | |
| 9,479 | | | RWE AG | | | | | | 837,005 |
| |
| | | | Netherlands Antilles—.9% | | | | | | |
| 2,537 | | | Schlumberger, Ltd. | | | | | | 104,996 |
| 14,917 | | | Schlumberger, Ltd. (ADR) | | | | | | 631,437 |
| |
| | | | | | | | | | 736,433 |
| |
| | | | Hong Kong—.8% | | | | | | |
| 38,532 | | | Jardine Matheson Holdings, Ltd. | | | | | | 714,481 |
| |
| | | | Luxembourg—.0% | | | | | | |
| 1,984 | | * | Reinet Investments SCA | | | | | | 19,305 |
| |
| Total Value of Common Stocks (cost $90,076,222) | | | | | | 78,914,364 |
| |
| | | | SHORT-TERM INVESTMENTS—3.5% | | | | | |
| | | | Money Market Fund | | | | | | |
| $2,995 | M | | First Investors Cash Reserve Fund, 1.39% (cost $2,995,000)** | | | | | 2,995,000 |
| |
| Total Value of Investments (cost $93,071,222) | 95.9 | % | | | | 81,909,364 |
| Other Assets, Less Liabilities | 4.1 | | | | | 3,466,668 |
| |
| Net Assets | | | | 100.0 | % | | | | $85,376,032 |
* Non-income producing
** Affiliated unregistered money market fund available only to First Investors funds and certain accounts managed by First Investors Management Company, Inc. Rate shown is the 7-day yield at December 31, 2008 (see Note 3).
Summary of Abbreviations:
ADR American Depositary Receipts
| |
| 56 | See notes to financial statements |
Portfolio Managers’ Letter
INVESTMENT GRADE FUND
Dear Investor:
This is the annual report for the First Investors Life Investment Grade Fund for the year ended December 31, 2008. During the period, the Fund’s return on a net asset value basis was –11.60%, including dividends of 57.0 cents per share.
The Fund invests primarily in investment grade fixed income securities. While the majority of the Fund’s holdings are investment grade corporate bonds, the Fund also generally had positions in each of the following types of fixed income securities during the reporting period: mortgage-backed bonds issued by Fannie Mae and Freddie Mac, U.S. government agency securities, U.S. Treasury notes and high-yield, high-risk corporate bonds. In addition, the Fund had investments in preferred stocks. The Fund did not invest in subprime mortgage-backed securities, commercial mortgage-backed securities or structured finance products during the reporting period.
At the beginning of 2008, investment grade corporate bond market valuations appeared attractive by historical standards, compared to other fixed income asset classes. However, the ongoing global credit crunch drove investors to safe haven investments, such as U.S. Treasury notes, agency debts and conventional mortgage-backed securities. As a result, those assets enjoyed substantial positive performance for the year while corporate bonds in general suffered heavy losses.
Relative to the Merrill Lynch U.S. Corporate Master Index, the Fund’s performance was negatively affected by the price decline of certain securities issued by financial institutions that experienced extreme distress during the course of the year. In particular, positions in AIG and Lehman Brothers detracted from the Fund’s performance. In addition, the Fund’s investments in preferred stock also contributed to its underperformance relative to the Index.
Thank you for placing your trust in First Investors. We appreciate the opportunity to serve your investment needs.
Sincerely,

Steve Chan
Portfolio Manager
January 30, 2009

Clark D. Wagner
Portfolio Manager and
Director of Fixed Income,
First Investors Management Company, Inc.
Fund Expenses (unaudited)
INVESTMENT GRADE FUND
The examples below show the ongoing costs (in dollars) of investing in your Fund and will help you in comparing these costs with costs of other mutual funds. Please refer to page 3 for a detailed explanation of the information presented in these examples.
| | | |
| | Beginning | Ending | |
| | Account | Account | Expenses Paid |
| | Value | Value | During Period |
| | (7/1/08) | (12/31/08) | (7/1/08–12/31/08)* |
| Expense Examples | | | |
| Actual | $1,000.00 | $891.05 | $3.52 |
| Hypothetical | | | |
| (5% annual return before expenses) | $1,000.00 | $1,021.42 | $3.76 |
| |
| * | Expenses are equal to the annualized expense ratio of .74%, multiplied by the average account |
| value over the period, multiplied by 184/366 (to reflect the one-half year period). Expenses paid |
| during the period are net of expenses waived. |
Portfolio Composition
TOP TEN SECTORS

Portfolio holdings and allocations are subject to change. Percentages are as of December 31, 2008,
and are based on the total value of investments.
Cumulative Performance Information (unaudited)
INVESTMENT GRADE FUND
Comparison of change in value of $10,000 investment in the First Investors Life Series Investment Grade Fund and the Merrill Lynch U.S. Corporate Master Index.

The graph compares a $10,000 investment in the First Investors Life Series Investment Grade Fund beginning 12/31/98 with a theoretical investment in the Merrill Lynch U.S. Corporate Master Index (the “Index”). The Index tracks the performance of U.S. dollar-denominated investment grade Corporate public debt issued in the U.S. domestic bond market. Qualifying bonds must have at least one year remaining term to maturity, a fixed coupon schedule and a minimum amount outstanding of $150 million. Bonds must be rated investment grade based on a composite of Moody’s and S&P. It is not possible to invest directly in this Index. In addition, the Index does not reflect fees and expenses associated with the active management of a mutual fund portfolio. For purposes of the graph and the accompanying table, it is assumed that all dividends and distributions were reinvested.
* The Average Annual Total Return figures are for the periods ended 12/31/08. During the periods shown, some of the expenses of the Fund were waived or assumed. If such expenses had been paid by the Fund, the Average Annual Total Returns for One Year,
Five Years and Ten Years would have been (11.73%), .29% and 3.11%, respectively. |
The returns shown do not reflect any sales charges, since the Fund sells its shares solely to variable annuity and/or variable life insurance subaccounts at net asset value. The returns do not reflect the fees and charges that an individual would pay in connection with an investment in a variable annuity or life contract or policy. Results represent past performance and do not indicate future results. The graph and the returns shown do not reflect the deduction of taxes that an investor would pay on distributions or the redemption of fund shares. Investment return and principal value of an investment will fluctuate so that an investor’s shares, when redeemed, may be worth more or less than the original cost. Merrill Lynch U.S. Corporate Master Index figures are from Merrill Lynch & Co. and all other figures are from First Investors Management Company, Inc.
Portfolio of Investments (continued)
INVESTMENT GRADE FUND
December 31, 2008
| | | | | |
| |
| Principal | | | | | |
| Amount | | | Security | | Value |
| |
| | | | CORPORATE BONDS—74.1% | | |
| | | | Automotive—2.4% | | |
| $1,000 | M | | Daimler Chrysler NA Holdings Corp., 6.5%, 2013 | | $ 780,774 |
| |
| | | | Chemicals—1.9% | | |
| 300 | M | | Air Products & Chemicals, Inc., 4.125%, 2010 | | 296,965 |
| 300 | M | | Cabot Corp., 5.25%, 2013 (a) | | 316,303 |
| |
| | | | | | 613,268 |
| |
| | | | Consumer Durables—.9% | | |
| 350 | M | | Black & Decker Corp., 5.75%, 2016 | | 294,246 |
| |
| | | | Consumer Non-Durables—1.1% | | |
| 300 | M | | Newell Rubbermaid, Inc., 6.75%, 2012 | | 285,673 |
| 65 | M | | Procter & Gamble Co., 4.6%, 2014 | | 68,190 |
| |
| | | | | | 353,863 |
| |
| | | | Energy—10.4% | | |
| 300 | M | | Canadian Natural Resources, Ltd., 5.9%, 2018 | | 259,630 |
| 150 | M | | Kinder Morgan Finance Co., 5.35%, 2011 | | 134,625 |
| 200 | M | | Nabors Industries, Inc., 6.15%, 2018 | | 172,355 |
| 300 | M | | Nexen, Inc., 5.05%, 2013 | | 277,081 |
| 300 | M | | Northern Border Pipeline Co., 7.1%, 2011 | | 293,614 |
| 269 | M | | Pacific Energy Partners LP, 7.125%, 2014 | | 235,207 |
| 800 | M | | Rockies Express Pipeline, 6.25%, 2013 (a) | | 788,410 |
| 60 | M | | Shell International Finance, 6.375%, 2038 | | 67,739 |
| 700 | M | | Spectra Energy Capital, LLC, 6.2%, 2018 | | 608,449 |
| 200 | M | | Suncor Energy, Inc., 6.85%, 2039 | | 159,552 |
| 400 | M | | TransOcean, Inc., 6%, 2018 | | 364,944 |
| |
| | | | | | 3,361,606 |
| |
| | | | Financial Services—9.7% | | |
| 375 | M | | Amvescap PLC, 5.375%, 2013 | | 333,370 |
| 300 | M | | Citigroup, Inc., 5.5%, 2013 | | 292,378 |
| 650 | M | | CoBank, ACB, 7.875%, 2018 (a) | | 657,698 |
| 200 | M | | Compass Bank, 6.4%, 2017 | | 165,550 |
| 300 | M | | Fleet Capital Trust II, 7.92%, 2026 | | 262,554 |
| 300 | M | | Hibernia Corp., 5.35%, 2014 | | 251,824 |
| 400 | M | | Royal Bank of Scotland Group PLC, 5%, 2014 | | 343,285 |
| | | | | |
| |
| Principal | | | | | |
| Amount | | | Security | | Value |
| |
| | | | Financial Services (continued) | | |
| | | | Sun Trust Banks, Inc.: | | |
| $400 | M | | 7.25%, 2018 | | $ 421,169 |
| 445 | M | | 5.853%, 2049 | | 240,438 |
| 200 | M | | Wachovia Corp., 5.5%, 2013 | | 197,956 |
| |
| | | | | | 3,166,222 |
| |
| | | | Financials—8.4% | | |
| | | | American General Finance Corp.: | | |
| 125 | M | | 8.125%, 2009 | | 93,890 |
| 200 | M | | 6.9%, 2017 | | 86,662 |
| 355 | M | | ERAC USA Finance Enterprise Co., 8%, 2011 (a) | | 333,171 |
| 252 | M | | Ford Motor Credit Co., 9.75%, 2010 | | 201,670 |
| 400 | M | | HSBC Finance Corp., 4.75%, 2010 | | 396,608 |
| 400 | M | | Lehman Brothers Holdings, Inc., 5.625%, 2013 (b) | | 40,000 |
| 800 | M | | Merrill Lynch & Co., 5.45%, 2013 | | 769,687 |
| 900 | M | | Morgan Stanley, 6.625%, 2018 | | 790,865 |
| |
| | | | | | 2,712,553 |
| |
| | | | Food/Beverage/Tobacco—3.0% | | |
| 350 | M | | Bunge Limited Finance Corp., 5.875%, 2013 | | 237,853 |
| 200 | M | | Cargill, Inc., 6%, 2017 (a) | | 179,627 |
| 150 | M | | ConAgra Foods, Inc., 6.75%, 2011 | | 151,721 |
| 400 | M | | Philip Morris International, Inc., 5.65%, 2018 | | 397,246 |
| |
| | | | | | 966,447 |
| |
| | | | Food/Drug—1.5% | | |
| 300 | M | | Kroger Co., 6.75%, 2012 | | 303,027 |
| 200 | M | | Safeway, Inc., 6.5%, 2011 | | 200,688 |
| |
| | | | | | 503,715 |
| |
| | | | Gaming/Leisure—.3% | | |
| 125 | M | | MGM Mirage, Inc., 8.5%, 2010 | | 105,625 |
| |
| | | | Housing—.8% | | |
| 250 | M | | D.R. Horton, Inc., 8%, 2009 | | 249,375 |
| |
| | | | Industrials—.5% | | |
| 310 | M | | Harley-Davidson Funding Corp., 6.8%, 2018 (a) | | 167,522 |
Portfolio of Investments (continued)
INVESTMENT GRADE FUND
December 31, 2008
| | | | | |
| |
| Principal | | | | | |
| Amount | | | Security | | Value |
| |
| | | | Information Technology—.7% | | |
| $250 | M | | Xerox Corp., 6.875%, 2011 | | $ 216,224 |
| |
| | | | Manufacturing—2.6% | | |
| 250 | M | | Briggs & Stratton Corp., 8.875%, 2011 | | 233,750 |
| 300 | M | | Crane Co., 6.55%, 2036 | | 233,369 |
| 123 | M | | Hanson Australia Funding, Ltd., 5.25%, 2013 | | 41,852 |
| 125 | M | | Ingersoll-Rand Co., 9%, 2021 | | 138,534 |
| 110 | M | | John Deere Capital Corp., 5.5%, 2017 | | 105,120 |
| 90 | M | | United Technologies Corp., 6.125%, 2019 | | 96,473 |
| |
| | | | | | 849,098 |
| |
| | | | Media-Broadcasting—1.6% | | |
| 250 | M | | Comcast Cable Communications, Inc., 7.125%, 2013 | | 245,834 |
| 300 | M | | Cox Communications, Inc., 4.625%, 2013 | | 260,251 |
| |
| | | | | | 506,085 |
| |
| | | | Media-Diversified—9.9% | | |
| 400 | M | | Dun & Bradstreet Corp., 6%, 2013 | | 378,164 |
| 200 | M | | McGraw-Hill Cos., Inc., 5.9%, 2017 | | 168,672 |
| 800 | M | | News America, Inc., 5.3%, 2014 | | 737,710 |
| 500 | M | | Thomson Reuters Corp., 5.95%, 2013 | | 465,964 |
| | | | Time Warner Cable, Inc.: | | |
| 570 | M | | 6.2%, 2013 | | 539,675 |
| 300 | M | | 6.75%, 2018 | | 289,337 |
| 450 | M | | Time Warner, Inc., 6.875%, 2012 | | 432,627 |
| 200 | M | | Walt Disney Co., 4.5%, 2013 | | 201,541 |
| |
| | | | | | 3,213,690 |
| |
| | | | Metals/Mining—1.6% | | |
| 200 | M | | Alcoa, Inc., 6%, 2012 | | 181,837 |
| 500 | M | | ArcelorMittal, 6.125%, 2018 | | 342,927 |
| |
| | | | | | 524,764 |
| |
| | | | Real Estate Investment Trusts—1.3% | | |
| 270 | M | | AvalonBay Communities, Inc., 7.5%, 2010 | | 248,056 |
| 185 | M | | Duke Weeks Realty Corp., 7.75%, 2009 | | 172,394 |
| |
| | | | | | 420,450 |
| | | | |
| |
| Principal | | | | |
| Amount | | | Security | Value |
| |
| | | | Telecommunications—6.3% | |
| $1,000 | M | | Deutsche Telekom International Finance BV, 5.875%, 2013 | $ 990,104 |
| 250 | M | | GTE Corp., 6.84%, 2018 | 253,646 |
| 300 | M | | SBC Communications, Inc., 6.25%, 2011 | 306,904 |
| 250 | M | | Sprint Capital Corp., 6.375%, 2009 | 248,457 |
| 250 | M | | Vodafone AirTouch PLC, 7.75%, 2010 | 255,571 |
| |
| | | | | 2,054,682 |
| |
| | | | Transportation—1.4% | |
| 500 | M | | Burlington Northern Santa Fe Corp., 4.3%, 2013 | 464,485 |
| |
| | | | Utilities—6.6% | |
| 750 | M | | E. ON International Finance BV, 5.8%, 2018 (a) | 702,460 |
| 400 | M | | Entergy Gulf States, Inc., 5.25%, 2015 | 341,802 |
| 218 | M | | Great River Energy Co., 5.829%, 2017 (a) | 182,817 |
| | | | NiSource Finance Corp.: | |
| 200 | M | | 7.875%, 2010 | 183,094 |
| 400 | M | | 6.15%, 2013 | 308,480 |
| 100 | M | | OGE Energy Corp., 5%, 2014 | 93,589 |
| 305 | M | | Public Service Electric & Gas Co., 6.75%, 2016 | 325,500 |
| |
| | | | | 2,137,742 |
| |
| | | | Waste Management—1.2% | |
| 100 | M | | Allied Waste NA, Inc., 5.75%, 2011 | 93,795 |
| 300 | M | | Waste Management, Inc., 6.875%, 2009 | 298,634 |
| |
| | | | | 392,429 |
| |
| Total Value of Corporate Bonds (cost $26,831,292) | 24,054,865 |
| |
| | | | U.S. GOVERNMENT AGENCY | |
| | | | OBLIGATIONS—5.7% | |
| 500 | M | | Fannie Mae, 4.02%, 2015 | 513,144 |
| 925 | M | | Federal Farm Credit Bank, 5.37%, 2018 | 938,750 |
| 400 | M | | Federal Home Loan Bank, 4.05%, 2013 | 400,895 |
| |
| Total Value of U.S. Government Agency Obligations (cost $1,801,499) | 1,852,789 |
| |
| | | | U.S. GOVERNMENT OBLIGATIONS—5.2% | |
| 238 | M | | FDA Queens LP, 6.99%, 2017 (a) | 285,748 |
| 1,200 | M | | U.S. Treasury Note, 4%, 2018 | 1,386,095 |
| |
| Total Value of U.S. Government Obligations (cost $1,513,329) | 1,671,843 |
Portfolio of Investments (continued)
INVESTMENT GRADE FUND
December 31, 2008
| | | | | |
| |
| Principal | | | | | |
| Amount | | | | | |
| or Shares | | | Security | | Value |
| |
| | | | MORTGAGE-BACKED CERTIFICATES—4.3% | | |
| | | | Fannie Mae—3.5% | | |
| $199 | M | | 5.5%, 10/1/2038 | | $ 204,716 |
| 894 | M | | 6%, 9/1/2037 – 11/1/2038 | | 921,794 |
| |
| | | | | | 1,126,510 |
| |
| | | | Freddie Mac—.8% | | |
| 250 | M | | 5%, 6/1/2038 | | 255,508 |
| |
| Total Value of Mortgage-Backed Certificates (cost $1,360,286) | | 1,382,018 |
| |
| | | | PREFERRED STOCKS—2.8% | | |
| | | | Financial Services | | |
| 35,000 | | | Citigroup, Inc. – Series “AA”, 8.125%, 2049 | | 558,250 |
| 400,000 | | | JPMorgan Chase & Co., 7.9%, 2049 | | 333,610 |
| |
| Total Value of Preferred Stocks (cost $1,265,073) | | 891,860 |
| |
| | | | MUNICIPAL BONDS—2.0% | | |
| $500 | M | | Miami-Dade Cnty. FL, Wtr. & Swr. Rev., 5.125%, 2025 | | 498,570 |
| 245 | M | | Tobacco Settlement Fin. Auth. West Virginia – Series “A”, | | |
| | | | 7.467%, 2047 | | 140,412 |
| |
| Total Value of Municipal Bonds (cost $723,543) | | 638,982 |
| |
|
| | | U.S. GOVERNMENT FDIC GUARANTEED DEBT—.6% | | |
| 200 | M | | American Express Bank FSB, 3.15%, 2011 (cost $199,845) | | 201,732 |
| |
| | | | PASS THROUGH CERTIFICATES—.3% | | |
| | | | Transportation | | |
| 51 | M | | American Airlines, Inc., 7.377%, 2019 | | 20,844 |
| 151 | M | | Continental Airlines, Inc., 8.388%, 2020 | | 89,337 |
| |
| Total Value of Pass Through Certificates (cost $202,521) | | 110,181 |
| | | | | | | | | |
| |
| Principal | | | | | | | | | |
| Amount | | | Security | | | | | | Value |
| |
| | | | SHORT-TERM INVESTMENTS—3.0% | | | | | |
| | | | Money Market Fund | | | | | | |
| $985 | M | | First Investors Cash Reserve Fund, 1.39% (cost $985,000) (c) | | | | | $ 985,000 |
| |
| Total Value of Investments (cost $34,882,388) | 98.0 | % | | | | 31,789,270 |
| Other Assets, Less Liabilities | 2.0 | | | | | 654,068 |
| |
| Net Assets | | | | 100.0 | % | | | | $32,443,338 |
|
| (a) Security exempt from registration under Rule 144A of Securities Act of 1933 (see Note 5). |
| (b) In default as to principal and/or interest payment |
| (c) Affiliated unregistered money market fund available only to First Investors funds and certain |
| accounts managed by First Investors Management Company, Inc. Rate shown is the 7-day yield |
| at December 31, 2008 (see Note 3). |
| |
| See notes to financial statements | 65 |
Portfolio Manager’s Letter
SELECT GROWTH FUND
Dear Investor:
This is the annual report for the First Investors Life Select Growth Fund for the year ended December 31, 2008. During the period, the Fund’s return on a net asset value basis was –41.47%, including dividends of 1.4 cents per share and capital gains of 8.9 cents per share.
The Fund’s performance was driven principally by the financial crisis that unfolded over the year. Historic levels of economic turbulence, and the interventions by the Federal Reserve and U.S. Treasury that followed, caused investors to focus on stocks perceived to have relatively low downside risk. Among the factors driving the best performing stocks over the period were low beta, high dividend yield and high earnings quality. By contrast, positive earnings surprises, usually among the factors driving positive relative performance in most economic and stock market environments, were a negative factor in 2008.
The Fund’s underperformance relative to the Russell 3000 Growth Index was attributable to stock selection in the industrials and health care sectors. Compared to its benchmark, the Fund was overweight financials, which also detracted from performance. The three worst performing holdings in the portfolio during the period were oil and drilling manufacturer National Oilwell Varco, exchange company NASDAQ OMX Group and agricultural equipment manufacturer AGCO.
Relative to the Index, the Fund was slightly overweight energy and underweight technology, which aided performance. Stock selection within materials boosted relative performance in that sector. The three best performing holdings in the portfolio were higher education provider Apollo Group, bank holding company UnionBanCal and defense and aerospace systems supplier Raytheon.
The Fund maintained a diverse market capitalization allocation during the year, ending with 50% large-cap, 33% mid-cap and 17% small-cap stocks, according to Lipper’s market capitalization ranges. During the period, market-cap weighting had little impact on performance, as investors sold indiscriminately across all categories.
Although many of the issues that have affected the stock market remain unresolved, relatively attractive equity valuations have presented the Fund with increased buying opportunities. While difficult in the short-term, volatile markets have the potential to benefit patient, long-term investors.
Thank you for placing your trust in First Investors. We appreciate the opportunity to serve your investment needs.
Sincerely,

John D. Brim
Portfolio Manager
January 30, 2009
Fund Expenses (unaudited)
SELECT GROWTH FUND
The examples below show the ongoing costs (in dollars) of investing in your Fund and will help you in comparing these costs with costs of other mutual funds. Please refer to page 3 for a detailed explanation of the information presented in these examples.
| | | |
| |
| | Beginning | Ending | |
| | Account | Account | Expenses Paid |
| | Value | Value | During Period |
| | (7/1/08) | (12/31/08) | (7/1/08–12/31/08)* |
| Expense Examples | | | |
| Actual | $1,000.00 | $676.34 | $3.83 |
| Hypothetical | | | |
| (5% annual return before expenses) | $1,000.00 | $1,020.57 | $4.62 |
| |
| * | Expenses are equal to the annualized expense ratio of .91%, multiplied by the average account |
| value over the period, multiplied by 184/366 (to reflect the one-half year period). |
Portfolio Composition
TOP SECTORS

Portfolio holdings and allocations are subject to change. Percentages are as of December 31, 2008,
and are based on the total value of investments.
Cumulative Performance Information (unaudited)
SELECT GROWTH FUND
Comparison of change in value of $10,000 investment in the First Investors Life Series Select Growth Fund and the Russell 3000 Growth Index.

The graph compares a $10,000 investment in the First Investors Life Series Select Growth Fund beginning 11/8/99 (inception date) with a theoretical investment in the Russell 3000 Growth Index (the “Index”). The Index is an unmanaged index that measures the performance of those Russell 3000 Index companies with higher price-to-book ratios and higher forecasted growth values (the Index is an unmanaged index that measures the performance of the 3,000 largest U.S. companies based on total market capitalization). It is not possible to invest directly in this Index. In addition, the Index does not reflect fees and expenses associated with the active management of a mutual fund portfolio. For purposes of the graph and the accompanying table it is assumed that all dividends and distributions were reinvested.
* The Average Annual Total Return figures are for the periods ended 12/31/08.
The returns shown do not reflect any sales charges, since the Fund sells its shares solely to variable annuity and/or variable life insurance subaccounts at net asset value. The returns do not reflect the fees and charges that an individual would pay in connection with an investment in a variable annuity or life contract or policy. Results represent past performance and do not indicate future results. The graph and the returns shown do not reflect the deduction of taxes that an investor would pay on distributions or the redemption of fund shares. Investment return and principal value of an investment will fluctuate so that an investor’s shares, when redeemed, may be worth more or less than the original cost. Russell 3000 Growth Index figures are from Frank Russell and Company and all other figures are from First Investors Management Company, Inc.
Portfolio of Investments
SELECT GROWTH FUND
December 31, 2008
| | | | | |
| |
| | | | | |
| Shares | | | Security | | Value |
| |
| | | | COMMON STOCKS—98.1% | | |
| | | | Consumer Discretionary—14.1% | | |
| 10,400 | | * | Aeropostale, Inc. | | $ 167,440 |
| 3,200 | | * | Apollo Group, Inc. – Class “A” | | 245,184 |
| 1,500 | | * | AutoZone, Inc. | | 209,205 |
| 7,200 | | | Family Dollar Stores, Inc. | | 187,704 |
| 3,700 | | | McDonald’s Corporation | | 230,103 |
| 830 | | | Strayer Education, Inc. | | 177,960 |
| |
| | | | | 1,217,596 |
| |
| | | | Consumer Staples—14.1% | | |
| 4,500 | | | Church & Dwight Company, Inc. | | 252,540 |
| 4,065 | | | Colgate-Palmolive Company | | 278,615 |
| 3,600 | | | General Mills, Inc. | | 218,700 |
| 3,500 | | | Procter & Gamble Company | | 216,370 |
| 4,600 | | | Wal-Mart Stores, Inc. | | 257,876 |
| |
| | | | | 1,224,101 |
| |
| | | | Energy—8.5% | | |
| 8,000 | | * | Cameron International Corporation | | 164,000 |
| 2,900 | | | ExxonMobil Corporation | | 231,507 |
| 4,600 | | * | National-Oilwell Varco, Inc. | | 112,424 |
| 10,500 | | | Valero Energy Corporation | | 227,220 |
| |
| | | | | | 735,151 |
| |
| | | | Financials—6.9% | | |
| 4,400 | | | Aon Corporation | | 200,992 |
| 5,775 | | | JPMorgan Chase & Company | | 182,086 |
| 8,600 | | * | NASDAQ OMX Group, Inc. | | 212,506 |
| |
| | | | | | 595,584 |
| |
| | | | Health Care—19.8% | | |
| 3,615 | | | Becton, Dickinson & Company | | 247,230 |
| 9,200 | | | Bristol-Myers Squibb Company | | 213,900 |
| 2,600 | | | Cephalon, Inc. | | 200,304 |
| 4,100 | | * | Express Scripts, Inc. | | 225,418 |
| 1,095 | | * | Intuitive Surgical, Inc. | | 139,054 |
| | | | | | |
| |
| | | | | | |
| Shares | | | Security | | | Value |
| |
| | | | Health Care (continued) | | | |
| 9,600 | | | Omnicare, Inc. | | | $ 266,496 |
| 5,900 | | * | OSI Pharmaceuticals, Inc. | | | 230,395 |
| 5,400 | | * | Varian Medical Systems, Inc. | | | 189,216 |
| |
| | | | | | | 1,712,013 |
| |
| | | | Industrials—9.4% | | | |
| 3,800 | | * | Jacobs Engineering Group, Inc. | | | 182,780 |
| 4,200 | | | Norfolk Southern Corporation | | | 197,610 |
| 4,400 | | | Raytheon Company | | | 224,576 |
| 3,900 | | | United Technologies Corporation | | | 209,040 |
| |
| | | | | | | 814,006 |
| |
| | | | Information Technology—20.8% | | | |
| 4,585 | | * | Affiliated Computer Services, Inc. | | | 210,681 |
| 8,700 | | * | BMC Software, Inc. | | | 234,117 |
| 6,100 | | | Harris Corporation | | | 232,105 |
| 6,700 | | | Hewlett-Packard Company | | | 243,143 |
| 12,167 | | * | Juniper Networks, Inc. | | | 213,044 |
| 7,050 | | * | McAfee, Inc. | | | 243,718 |
| 12,900 | | * | NCR Corporation | | | 182,406 |
| 12,200 | | * | SAIC, Inc. | | | 237,656 |
| |
| | | | | | | 1,796,870 |
| |
| | | | Materials—2.6% | | | |
| 8,900 | | * | Pactiv Corporation | | | 221,432 |
| |
| | | | Utilities—1.9% | | | |
| 3,400 | | | FirstEnergy Corporation | | | 165,172 |
| |
| Total Value of Common Stocks (cost $9,625,990) | 98.1 | % | 8,481,925 |
| Other Assets, Less Liabilities | 1.9 | | 163,655 |
| |
| Net Assets | | | | 100.0 | % | $8,645,580 |
| |
| See notes to financial statements | 71 |
Portfolio Manager’s Letter
TARGET MATURITY 2010 FUND
TARGET MATURITY 2015 FUND
Dear Investor:
This is the annual report for the First Investors Life Target Maturity 2010 Fund and the First Investors Life Target Maturity 2015 Fund for the year ended December 31, 2008. During the period, the Funds’ returns on a net asset value basis were 7.33% for Life Target Maturity 2010 and 14.56% for Life Target Maturity 2015, including dividends of 70.3 cents and 58.1 cents per share, respectively. Returns for Life Target Maturity 2010 also include capital gains of 4.6 cents per share.
The Funds’ investment objective is to seek a predictable compounded return for the investors who hold the Funds until maturity. In order to meet this objective, the Funds are fully invested in high-quality zero coupon bonds. These bonds are very sensitive to changes in interest rates. The primary factor affecting the performance of the Funds was the decline in U.S. Treasury interest rates during the year to the lowest level in generations.
During the year, short- and intermediate-term benchmark U.S. Treasury interest rates fell over 200 basis points (2%). Falling interest rates caused the price of the Funds’ holdings to rise. Reflecting the higher interest rate sensitivity of longer-term bonds, the Target Maturity 2015 Fund had a higher return than the Target Maturity 2010 Fund.
Thank you for placing your trust in First Investors. We appreciate the opportunity to serve your investment needs.
Sincerely,

Clark D. Wagner
Portfolio Manager and
Director of Fixed Income, First Investors Management Company, Inc.
January 30, 2009
Fund Expenses (unaudited)
TARGET MATURITY 2010 FUND
The examples below show the ongoing costs (in dollars) of investing in your Fund and will help you in comparing these costs with costs of other mutual funds. Please refer to page 3 for a detailed explanation of the information presented in these examples.
| | | |
| |
| | Beginning | Ending | |
| | Account | Account | Expenses Paid |
| | Value | Value | During Period |
| | (7/1/08) | (12/31/08) | (7/1/08–12/31/08)* |
| Expense Examples | | | |
| Actual | $1,000.00 | $1,048.97 | $3.81 |
| Hypothetical | | | |
| (5% annual return before expenses) | $1,000.00 | $1,021.42 | $3.76 |
| |
| * | Expenses are equal to the annualized expense ratio of .74%, multiplied by the average account |
| value over the period, multiplied by 184/366 (to reflect the one-half year period). Expenses paid |
| during the period are net of expenses waived. |
Portfolio Composition
BY SECTOR
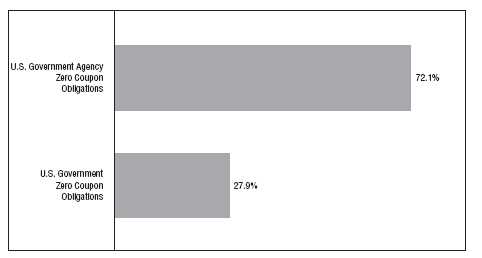
Portfolio holdings and allocations are subject to change. Percentages are as of December 31, 2008,
and are based on the total value of investments.
Cumulative Performance Information (unaudited)
TARGET MATURITY 2010 FUND
Comparison of change in value of $10,000 investment in the First Investors Life Series Target Maturity 2010 Fund and the Citigroup Treasury/ Government Sponsored Index.
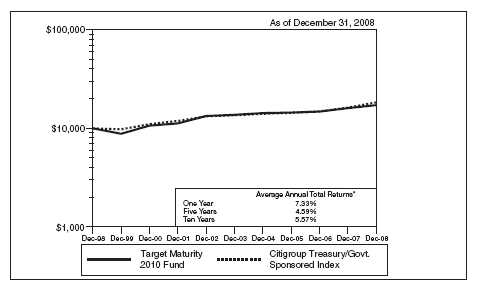
The graph compares a $10,000 investment in the First Investors Life Series Target Maturity 2010 Fund beginning 12/31/98 with a theoretical investment in the Citigroup Treasury/Government Sponsored Index (the “Index”). The Index is a market capitalization-weighted index that consists of debt issued by the U.S. Treasury and U.S. Government sponsored agencies. Every issue included in the Index is trader-priced, and the Index follows consistent and realistic availability limits, including only those securities with sufficient amounts outstanding. It is not possible to invest directly in this Index. In addition, the Index does not reflect fees and expenses associated with the active management of a mutual fund portfolio. For purposes of the graph and the accompanying table it is assumed that all dividends and distributions were reinvested.
* The Average Annual Total Return figures are for the periods ended 12/31/08. During the periods shown, some of the expenses of the Fund were waived or assumed. If such expenses had been paid by the Fund, the Average Annual Total Returns for One Year,
Five Years and Ten Years would have been 7.17%, 4.43% and 5.41% respectively. |
The returns shown do not reflect any sales charges, since the Fund sells its shares solely to variable annuity and/or variable life insurance subaccounts at net asset value. The returns do not reflect the fees and charges that an individual would pay in connection with an investment in a variable annuity or life contract or policy. Results represent past performance and do not indicate future results. The graph and the returns shown do not reflect the deduction of taxes that an investor would pay on distributions or the redemption of fund shares. Investment return and principal value of an investment will fluctuate so that an investor’s shares, when redeemed, may be worth more or less than the original cost. Citigroup Treasury/Government Sponsored Index figures are from Citigroup and all other figures are from First Investors Management Company, Inc.
Portfolio of Investments
TARGET MATURITY 2010 FUND
December 31, 2008
| | | | | | | | | |
| |
| Principal | | | | Effective | | |
| Amount | | | Security | | | | Yield | † | Value |
| |
| | | | U.S. GOVERNMENT AGENCY ZERO COUPON | | | | | |
| | | | OBLIGATIONS—72.1% | | | | | | |
| | | | Agency For International Development – Israel: | | | | | |
| $ 1,303 | M | | 8/15/2010 | | | | .61 | % | $ 1,290,210 |
| 495 | M | | 9/15/2010 | | | | .60 | | 489,988 |
| | | | Fannie Mae: | | | | | | |
| 1,260 | M | | 8/7/2010 | | | | 1.02 | | 1,239,612 |
| 800 | M | | 12/15/2010 | | | | 1.12 | | 782,661 |
| 1,100 | M | | Freddie Mac, 9/15/2010 | | | | 1.11 | | 1,079,337 |
| 500 | M | | Government Trust Certificate – Israel Trust, 11/15/2010 | | | .64 | | 494,008 |
| 2,031 | M | | Government Trust Certificate – Turkey Trust, 11/15/2010 | | | .64 | | 2,006,660 |
| 1,400 | M | | Resolution Funding Corporation, 1/15/2011 | | | | 1.12 | | 1,368,415 |
| 1,250 | M | | Tennessee Valley Authority, 11/1/2010 | | | | .82 | | 1,231,382 |
| |
| Total Value of U.S. Government Agency Zero Coupon | | | | | | |
| Obligations (cost $9,056,535) | | | | | | 9,982,273 |
| |
| | | | U.S. GOVERNMENT ZERO COUPON | | | | | | |
| | | | OBLIGATIONS—28.0% | | | | | | |
| 3,900 | M | | U.S. Treasury Strips, 11/15/2010 (cost $3,441,451) | | | .39 | | 3,871,292 |
| |
| Total Value of Investments (cost $12,497,986) | 100.1 | % | | | | 13,853,565 |
| Excess of Liabilities Over Other Assets | (.1) | | | | | (8,536) |
| |
| Net Assets | | | | 100.0 | % | | | | $ 13,845,029 |
| |
| † | The effective yields shown for the zero coupon obligations are the effective yields at December 31, 2008. |
| |
| |
| See notes to financial statements | 75 |
Fund Expenses (unaudited)
TARGET MATURITY 2015 FUND
The examples below show the ongoing costs (in dollars) of investing in your Fund and will help you in comparing these costs with costs of other mutual funds. Please refer to page 3 for a detailed explanation of the information presented in these examples.
| | | |
| |
| | Beginning | Ending | |
| | Account | Account | Expenses Paid |
| | Value | Value | During Period |
| | (7/1/08) | (12/31/08) | (7/1/08–12/31/08)* |
| Expense Examples | | | |
| Actual | $1,000.00 | $1,115.02 | $3.62 |
| Hypothetical | | | |
| (5% annual return before expenses) | $1,000.00 | $1,021.72 | $3.46 |
| |
| * | Expenses are equal to the annualized expense ratio of .68%, multiplied by the average account |
| value over the period, multiplied by 184/366 (to reflect the one-half year period). Expenses paid |
| during the period are net of expenses waived. |
|
| Portfolio Composition |
| BY SECTOR |
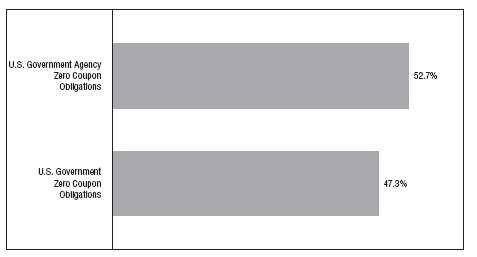
Portfolio holdings and allocations are subject to change. Percentages are as of December 31, 2008,
and are based on the total value of investments.
Cumulative Performance Information (unaudited)
TARGET MATURITY 2015 FUND
Comparison of change in value of $10,000 investment in the First Investors Life Series Target Maturity 2015 Fund and the Citigroup Treasury/Government Sponsored Index.

The graph compares a $10,000 investment in the First Investors Life Target Series Maturity 2015 Fund beginning 11/8/99 (inception date) with a theoretical investment in the Citigroup Treasury/Government Sponsored Index (the “Index”). The Index is a market capitalization-weighted index that consists of debt issued by the U.S. Treasury and U.S. Government sponsored agencies. Every issue included in the Index is trader-priced, and the Index follows consistent and realistic availability limits, including only those securities with sufficient amounts outstanding. It is not possible to invest directly in this Index. In addition, the Index does not reflect fees and expenses associated with the active management of a mutual fund portfolio. For purposes of the graph and the accompanying table, it is assumed that all dividends and distributions were reinvested.
* The Average Annual Total Return figures are for the periods ended 12/31/08. During the periods shown, some of the expenses of the Fund were waived or assumed. If such expenses had been paid by the Fund, the Average Annual Total Returns for One Year,
Five Years and Since Inception would have been 14.39%, 7.54% and 8.88%, respectively. |
The returns shown do not reflect any sales charges, since the Fund sells its shares solely to variable annuity and/or variable life insurance subaccounts at net asset value. The returns do not reflect the fees and charges that an individual would pay in connection with an investment in a variable annuity or life contract or policy. Results represent past performance and do not indicate future results. The graph and the returns shown do not reflect the deduction of taxes that an investor would pay on distributions or the redemption of fund shares. Investment return and principal value of an investment will fluctuate so that an investor’s shares, when redeemed, may be worth more or less than the original cost. Citigroup Treasury/Government Sponsored Index figures are from Citigroup and all other figures are from First Investors Management Company, Inc.
Portfolio of Investments
TARGET MATURITY 2015 FUND
December 31, 2008
| | | | | | | | | |
| |
| Principal | | | | | | | Effective | | |
| Amount | | | Security | | | | Yield | † | Value |
| |
| | | | U.S. GOVERNMENT AGENCY ZERO COUPON | | |
| | | | OBLIGATIONS—52.6% | | | | | | |
| | | | Agency For International Development – Israel: | | | | | |
| $ 698 | M | | 9/15/2015 | | | | 2.73 | % | $ 581,879 |
| 2,784 | M | | 11/15/2015 | | | | 2.60 | | 2,331,191 |
| | | | Fannie Mae: | | | | | | |
| 243 | M | | 8/12/2015 | | | | 3.12 | | 198,002 |
| 600 | M | | 9/23/2015 | | | | 3.14 | | 486,500 |
| 4,643 | M | | 11/15/2015 | | | | 3.03 | | 3,777,132 |
| 650 | M | | Federal Judiciary Office Building, 2/15/2015 | | | | 2.71 | | 551,109 |
| | | | Freddie Mac: | | | | | | |
| 550 | M | | 3/15/2015 | | | | 3.25 | | 450,309 |
| 930 | M | | 9/15/2015 | | | | 3.26 | | 748,869 |
| 830 | M | | 9/15/2015 | | | | 3.26 | | 668,261 |
| 625 | M | | 1/15/2016 | | | | 3.28 | | 497,014 |
| 210 | M | | Government Trust Certificate – Turkey Trust, 5/15/2015 | | | 2.88 | | 175,008 |
| 200 | M | | International Bank for Reconstruction & | | | | | | |
| | | | Development, 2/15/2015 | | | | 3.02 | | 166,429 |
| 3,957 | M | | Resolution Funding Corporation, 10/15/2015 | | | | 3.02 | | 3,227,693 |
| 2,000 | M | | Tennessee Valley Authority, 11/1/2015 | | | | 2.86 | | 1,647,630 |
| |
| Total Value of U.S. Government Agency Zero Coupon Obligations | | | | | |
| (cost $13,176,531) | | | | | | 15,507,026 |
| |
| | | | U.S. GOVERNMENT ZERO COUPON | | | | | | |
| | | | OBLIGATIONS—47.3% | | | | | | |
| 16,325 | M | | U.S. Treasury Strips, 11/15/2015 (cost $11,394,465) | | | 2.33 | | 13,923,364 |
| |
| Total Value of Investments (cost $24,570,996) | 99.9 | % | | | | 29,430,390 |
| Excess of Liabilities Over Other Assets | .1 | | | | | 23,318 |
| |
| Net Assets | | | | 100.0 | % | | | $ 29,453,708 |
|
| † The effective yields shown for the zero coupon obligations are the effective yields at |
| December 31, 2008. |
| |
| 78 | See notes to financial statements |
Portfolio Manager’s Letter
VALUE FUND
Dear Investor:
This is the annual report for the First Investors Life Value Fund for the year ended December 31, 2008. During the period, the Fund’s return on a net asset value basis was –29.41%, including dividends of 28.7 cents per share.
The value of the Fund’s investments in all major economic sectors came under immense pressure as the U.S. economy and stock market accelerated their decline during the latter half of the year. The freezing up of the credit markets, which began with the subprime mortgage fallout in mid-2007, continued to be a drag on equity performance during the period. Despite the difficult investment environment, the Fund substantially outperformed its benchmark, the S&P 500 Index, during the period.
The primary reason for this relative outperformance was that the Fund’s investments in the financials sector lost less value than those in the Index. The Fund’s overweight position in consumer staples also made a positive contribution to relative performance. In addition, the Fund turned in good relative performance in the industrials, information technology and consumer discretionary sectors.
Within consumer staples, brewing company Anheuser-Busch made a strong positive contribution to performance. Compass Minerals International, a leading producer of inorganic minerals, and Investors Real Estate Trust, which owns a diversified portfolio of real estate properties in the upper Midwest, were also among the best performing holdings, each generating a substantial positive return.
While no sector generated a positive return during the period, the value of the Fund’s investments in the energy, materials and information technology sectors fell the most dramatically on an absolute basis. Within energy, the worst performing holdings included Marathon Oil and Diamond Offshore Drilling, while Dow Chemical detracted from performance in the materials sector.
Though the market has been experiencing an unprecedented period of volatility, the Fund has tried to use this instability as an opportunity to find good values, continuing to seek out companies that have solid balance sheets and a history of regularly paying out dividends.
Portfolio Manager’s Letter (continued)
VALUE FUND
Thank you for placing your trust in First Investors. We appreciate the opportunity to serve your investment needs.
Sincerely,

Matthew S. Wright
Portfolio Manager
January 30, 2009
Fund Expenses (unaudited)
VALUE FUND
The examples below show the ongoing costs (in dollars) of investing in your Fund and will help you in comparing these costs with costs of other mutual funds. Please refer to page 3 for a detailed explanation of the information presented in these examples.
| | | |
| |
| | Beginning | Ending | |
| | Account | Account | Expenses Paid |
| | Value | Value | During Period |
| | (7/1/08) | (12/31/08) | (7/1/08–12/31/08)* |
| Expense Examples | | | |
| Actual | $1,000.00 | $788.15 | $3.82 |
| Hypothetical | | | |
| (5% annual return before expenses) | $1,000.00 | $1,020.87 | $4.32 |
| |
| * | Expenses are equal to the annualized expense ratio of .85%, multiplied by the average account |
| value over the period, multiplied by 184/366 (to reflect the one-half year period). |
Portfolio Composition
TOP TEN SECTORS
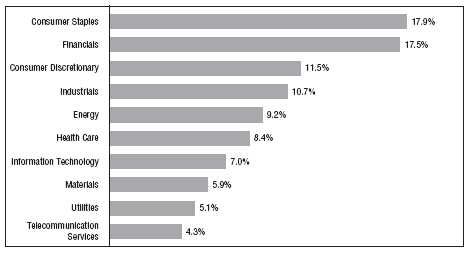
Portfolio holdings and allocations are subject to change. Percentages are as of December 31, 2008, and are based on the total value of investments.
Cumulative Performance Information (unaudited)
VALUE FUND
Comparison of change in value of $10,000 investment in the First Investors Life Series Value Fund and the Standard & Poor’s 500 Index.

The graph compares a $10,000 investment in the First Investors Life Series Value Fund beginning 12/31/98 with a theoretical investment in the Standard & Poor’s 500 Index (the “Index”). The Index is an unmanaged capitalization-weighted index of 500 stocks designed to measure performance of the broad domestic economy through changes in the aggregate market value of such stocks, which represent all major industries. It is not possible to invest directly in this Index. In addition, the Index does not reflect fees and expenses associated with the active management of a mutual fund portfolio. For purposes of the graph and the accompanying table it is assumed that all dividends and distributions were reinvested.
* The Average Annual Total Return figures are for the periods ended 12/31/08. During certain of the periods shown, some of the expenses of the Fund were waived or assumed. If such expenses had been paid by the Fund, the Average Annual Total
Returns for Ten Years would have been (.25%). |
The returns shown do not reflect any sales charges, since the Fund sells its shares solely to variable annuity and/or variable life insurance subaccounts at net asset value. The returns do not reflect the fees and charges that an individual would pay in connection with an investment in a variable annuity or life contract or policy. Results represent past performance and do not indicate future results. The graph and the returns shown do not reflect the deduction of taxes that an investor would pay on distributions or the redemption of fund shares. Investment return and principal value of an investment will fluctuate so that an investor’s shares, when redeemed, may be worth more or less than the original cost. Standard & Poor’s 500 Index figures are from Standard & Poor’s and all other figures are from First Investors Management Company, In c.
Portfolio of Investments
VALUE FUND
December 31, 2008
| | | | | |
| |
| | | | | |
| Shares | | | Security | | Value |
| |
| | | | COMMON STOCKS—96.2% | | |
| | | | Consumer Discretionary—11.4% | | |
| 13,500 | | | bebe stores, inc. | | $ 100,845 |
| 5,500 | | | Best Buy Company, Inc. | | 154,605 |
| 13,300 | | | Bob Evans Farms, Inc. | | 271,719 |
| 12,200 | | | Carnival Corporation | | 296,704 |
| 11,900 | | | CBS Corporation – Class “B” | | 97,461 |
| 16,500 | | | Cinemark Holdings, Inc. | | 122,595 |
| 25,400 | | | Family Dollar Stores, Inc. | | 662,178 |
| 5,000 | | | Gannett Company, Inc. | | 40,000 |
| 10,900 | | | Genuine Parts Company | | 412,674 |
| 11,800 | | | H&R Block, Inc. | | 268,096 |
| 21,100 | | | Home Depot, Inc. | | 485,722 |
| 6,100 | | | J.C. Penney Company, Inc. | | 120,170 |
| 19,700 | | | Leggett & Platt, Inc. | | 299,243 |
| 13,200 | | | Lowe’s Companies, Inc. | | 284,064 |
| 20,100 | | | Marine Products Corporation | | 112,962 |
| 11,800 | | | McDonald’s Corporation | | 733,842 |
| 11,800 | | | Newell Rubbermaid, Inc. | | 115,404 |
| 26,600 | | | Pearson PLC (ADR) | | 253,764 |
| 24,600 | | * | Ruby Tuesday, Inc. | | 38,376 |
| 17,000 | | | Staples, Inc. | | 304,640 |
| 15,400 | | | Tiffany & Company | | 363,902 |
| 43,700 | | | Time Warner, Inc. | | 439,622 |
| 28,000 | | | Walt Disney Company | | 635,320 |
| 8,580 | | | Wyndham Worldwide Corporation | | 56,199 |
| |
| | | | | | 6,670,107 |
| |
| | | | Consumer Staples—17.8% | | |
| 15,800 | | | Avon Products, Inc. | | 379,674 |
| 20,000 | | | Coca-Cola Company | | 905,400 |
| 2,200 | | | Colgate-Palmolive Company | | 150,788 |
| 13,400 | | | ConAgra Foods, Inc. | | 221,100 |
| 7,100 | | | Costco Wholesale Corporation | | 372,750 |
| 10,200 | | | Diageo PLC (ADR) | | 578,748 |
| 7,000 | | | Estee Lauder Companies, Inc. – Class “A” | | 216,720 |
| 3,800 | | | Fomento Economico Mexicano SA de CV (ADR) | | 114,494 |
| 12,100 | | | H.J. Heinz Company | | 454,960 |
| 18,900 | | | Hershey Company | | 656,586 |
| 13,100 | | | Kimberly-Clark Corporation | | 690,894 |
| 35,300 | | | Kraft Foods, Inc. – Class “A” | | 947,805 |
| 10,300 | | | McCormick & Company, Inc. | | 328,158 |
Portfolio of Investments (continued)
VALUE FUND
December 31, 2008
| | | | | |
| |
| | | | | | |
| Shares | | | Security | | Value |
| |
| 15,000 | | | PepsiAmericas, Inc. | | $ 305,400 |
| 8,900 | | | PepsiCo, Inc. | | 487,453 |
| 17,000 | | | Philip Morris International, Inc. | | 739,670 |
| 7,700 | | | Ruddick Corporation | | 212,905 |
| 7,800 | | | Safeway, Inc. | | 185,406 |
| 37,500 | | | Sara Lee Corporation | | 367,125 |
| 7,400 | | | UST, Inc. | | 513,412 |
| 16,700 | | | Walgreen Company | | 411,989 |
| 20,600 | | | Wal-Mart Stores, Inc. | | 1,154,836 |
| |
| | | | | 10,396,273 |
| |
| | | | Energy—9.1% | | |
| 11,400 | | | Anadarko Petroleum Corporation | | 439,470 |
| 11,200 | | | BP PLC (ADR) | | 523,488 |
| 12,812 | | | Chevron Corporation | | 947,704 |
| 13,500 | | | ConocoPhillips | | 699,300 |
| 6,600 | | | Diamond Offshore Drilling, Inc. | | 389,004 |
| 4,800 | | | ExxonMobil Corporation | | 383,184 |
| 4,800 | | | Hess Corporation | | 257,472 |
| 22,400 | | | Marathon Oil Corporation | | 612,864 |
| 11,700 | | | Royal Dutch Shell PLC – Class “A” (ADR) | | 619,398 |
| 11,600 | | | Tidewater, Inc. | | 467,132 |
| |
| | | | | | 5,339,016 |
| |
| | | | Financials—17.3% | | |
| 4,000 | | | ACE, Ltd. | | 211,680 |
| 8,300 | | | Allstate Corporation | | 271,908 |
| 9,700 | | | Aon Corporation | | 443,096 |
| 10,000 | | | Aspen Insurance Holdings, Ltd. | | 242,500 |
| 34,800 | | | Bank Mutual Corporation | | 401,592 |
| 20,055 | | | Bank of America Corporation | | 282,374 |
| 20,273 | | | Bank of New York Mellon Corporation | | 574,334 |
| 15,179 | | | Brookfield Asset Management, Inc. – Class “A” | | 231,783 |
| 5,594 | | | Capital One Financial Corporation | | 178,393 |
| 9,622 | | | Chubb Corporation | | 490,722 |
| 12,422 | | | Cincinnati Financial Corporation | | 361,108 |
| 21,600 | | | Citigroup, Inc. | | 144,936 |
| 10,000 | | | Comerica, Inc. | | 198,500 |
| 6,900 | | | EMC Insurance Group, Inc. | | 176,985 |
| 8,600 | | | Erie Indemnity Company – Class “A” | | 323,618 |
| 10,600 | | | Financial Select Sector SPDR Fund | | 133,772 |
| 19,100 | | | First Potomac Realty Trust (REIT) | | 177,630 |
| | | | | |
| |
| | | | | |
| Shares | | | Security | | Value |
| |
| | | | Financials (continued) | | |
| 19,100 | | | Hudson City Bancorp, Inc. | | $ 304,836 |
| 14,300 | | | Invesco, Ltd. | | 206,492 |
| 42,800 | | | Investors Real Estate Trust (REIT) | | 458,388 |
| 21,700 | | | JPMorgan Chase & Company | | 684,201 |
| 12,800 | | | KeyCorp | | 109,056 |
| 8,632 | | | Lincoln National Corporation | | 162,627 |
| 9,600 | | | Merrill Lynch & Company, Inc. | | 111,744 |
| 11,900 | | | Morgan Stanley | | 190,876 |
| 25,700 | | | NewAlliance Bancshares, Inc. | | 338,469 |
| 26,400 | | | People’s United Financial, Inc. | | 470,712 |
| 10,300 | | | Plum Creek Timber Company, Inc. (REIT) | | 357,822 |
| 9,400 | | | PNC Financial Services Group, Inc. | | 460,600 |
| 10,700 | | | Protective Life Corporation | | 153,545 |
| 3,700 | | | State Street Corporation | | 145,521 |
| 3,500 | | | SunTrust Banks, Inc. | | 103,390 |
| 25,600 | | | U-Store-It Trust (REIT) | | 113,920 |
| 7,400 | | | Waddell & Reed Financial, Inc. – Class “A” | | 114,404 |
| 18,400 | | | Wells Fargo & Company | | 542,432 |
| 22,600 | | | Westfield Financial, Inc. | | 233,232 |
| |
| | | | | 10,107,198 |
| |
| | | | Health Care—8.4% | | |
| 15,700 | | | Abbott Laboratories | | 837,909 |
| 4,300 | | | Becton, Dickinson & Company | | 294,077 |
| 9,225 | | | Covidien, Ltd. | | 334,314 |
| 12,100 | | | GlaxoSmithKline PLC (ADR) | | 450,967 |
| 20,300 | | | Johnson & Johnson | | 1,214,549 |
| 10,100 | | | Medtronic, Inc. | | 317,342 |
| 10,900 | | | Novartis AG (ADR) | | 542,384 |
| 38,300 | | | Pfizer, Inc. | | 678,293 |
| 14,300 | | | Schering-Plough Corporation | | 243,529 |
| |
| | | | | | 4,913,364 |
| |
| | | | Industrials—10.7% | | |
| 8,400 | | | 3M Company | | 483,336 |
| 1,800 | | | Alexander & Baldwin, Inc. | | 45,108 |
| 6,400 | | | Armstrong World Industries, Inc. | | 138,368 |
| 12,400 | | | Avery Dennison Corporation | | 405,852 |
| 16,000 | | | Dover Corporation | | 526,720 |
| 6,600 | | | Emerson Electric Company | | 241,626 |
| 7,200 | | | General Dynamics Corporation | | 414,648 |
Portfolio of Investments (continued)
VALUE FUND
December 31, 2008
| | | | |
| |
| | | | |
| Shares | | Security | | Value |
| |
| | | Industrials (continued) | | |
| 32,200 | | General Electric Company | | $ 521,640 |
| 15,000 | | Honeywell International, Inc. | | 492,450 |
| 5,100 | | Hubbell, Inc. – Class “B” | | 166,668 |
| 13,300 | | Illinois Tool Works, Inc. | | 466,165 |
| 7,000 | | ITT Corporation | | 321,930 |
| 8,170 | | Lawson Products, Inc. | | 186,685 |
| 7,700 | | Norfolk Southern Corporation | | 362,285 |
| 10,800 | | Pitney Bowes, Inc. | | 275,184 |
| 9,300 | | Textainer Group Holdings, Ltd. | | 98,580 |
| 6,625 | | Tyco International, Ltd. | | 143,100 |
| 10,000 | | United Parcel Service, Inc. – Class “B” | | 551,600 |
| 22,500 | | Werner Enterprises, Inc. | | 390,150 |
| |
| | | | | 6,232,095 |
| |
| | | Information Technology—7.0% | | |
| 16,300 | | Automatic Data Processing, Inc. | | 641,242 |
| 23,000 | | AVX Corporation | | 182,620 |
| 9,000 | | Bel Fuse, Inc. – Class “B” | | 190,800 |
| 18,200 | | Hewlett-Packard Company | | 660,478 |
| 12,700 | | Intel Corporation | | 186,182 |
| 3,300 | | International Business Machines Corporation | | 277,728 |
| 36,100 | | Methode Electronics, Inc. | | 243,314 |
| 30,100 | | Microsoft Corporation | | 585,144 |
| 16,850 | | Molex, Inc. | | 244,157 |
| 25,600 | | Nokia Corporation – Class “A” (ADR) | | 399,360 |
| 11,400 | | Texas Instruments, Inc. | | 176,928 |
| 10,125 | | Tyco Electronics, Ltd. | | 164,126 |
| 7,500 | | Xilinx, Inc. | | 133,650 |
| |
| | | | | 4,085,729 |
| |
| | | Materials—5.9% | | |
| 7,700 | | Air Products & Chemicals, Inc. | | 387,079 |
| 14,800 | | Alcoa, Inc. | | 166,648 |
| 8,400 | | Bemis Company, Inc. | | 198,912 |
| 6,000 | | Compass Minerals International, Inc. | | 351,960 |
| 23,300 | | Dow Chemical Company | | 351,597 |
| 22,300 | | DuPont (E.I.) de Nemours & Company | | 564,190 |
| 15,700 | | Glatfelter | | 146,010 |
| 10,900 | | Lubrizol Corporation | | 396,651 |
| 11,600 | | MeadWestvaco Corporation | | 129,804 |
| | | | |
| Shares | | Security | | Value |
| |
| | | Materials (continued) | | |
| 16,270 | | Myers Industries, Inc. | | $ 130,160 |
| 6,400 | | PPG Industries, Inc. | | 271,552 |
| 14,900 | | Sonoco Products Company | | 345,084 |
| |
| | | | | 3,439,647 |
| |
| | | Telecommunication Services—3.9% | | |
| 31,910 | | AT&T, Inc. | | 909,435 |
| 13,232 | | D&E Communications, Inc. | | 88,654 |
| 4,730 | | Embarq Corporation | | 170,091 |
| 5,600 | | Telephone & Data Systems, Inc. | | 177,800 |
| 6,600 | | Telephone & Data Systems, Inc. – Special Shares | | 185,460 |
| 21,918 | | Verizon Communications, Inc. | | 743,020 |
| |
| | | | | 2,274,460 |
| |
| | | Utilities—4.7% | | |
| 4,450 | | American States Water Company | | 146,761 |
| 12,900 | | Duke Energy Corporation | | 193,629 |
| 6,700 | | FPL Group, Inc. | | 337,211 |
| 3,225 | | Integrys Energy Group, Inc. | | 138,610 |
| 17,000 | | MDU Resources Group, Inc. | | 366,860 |
| 28,300 | | NiSource, Inc. | | 310,451 |
| 9,200 | | ONEOK, Inc. | | 267,904 |
| 11,800 | | Portland General Electric Company | | 229,746 |
| 12,300 | | Southwest Gas Corporation | | 310,206 |
| 8,577 | | United Utilites Group PLC (ADR) | | 159,532 |
| 12,300 | | Vectren Corporation | | 307,623 |
| |
| | | | | 2,768,533 |
| |
| Total Value of Common Stocks (cost $61,341,968) | 56,226,422 |
| |
| | | PREFERRED STOCKS—.9% | | |
| | | Financials—.2% | | |
| 7,500 | | Citigroup Capital XVI , 6.45%, 2066 – Series “W” | | 105,150 |
| |
| | | Telecommunication Services—.4% | | |
| 10,200 | | AT&T, Inc., 6.375%, 2056 | | 254,388 |
| |
| | | Utilities—.3% | | |
| 7,400 | | Entergy Louisiana, LLC., 7.6%, 2032 | | 179,450 |
| |
| Total Value of Preferred Stocks (cost $629,707) | | 538,988 |
Portfolio of Investments (continued)
VALUE FUND
December 31, 2008
| | | | | | | |
| |
| Principal | | | | | | | |
| Amount | | | Security | | | | Value |
| |
| | | | SHORT-TERM INVESTMENTS—2.5% | | | |
| | | | Money Market Fund | | | | |
| $1,480 | M | | First Investors Cash Reserve Fund, 1.39% (cost $1,480,000)** | | | $ 1,480,000 |
| |
| Total Value of Investments (cost $63,451,675) | 99.6 | % | | 58,245,410 |
| Other Assets, Less Liabilities | .4 | | | 194,657 |
| |
| Net Assets | | | | 100.0 | % | | $58,440,067 |
| |
| * | Non-income producing |
| ** | Affiliated unregistered money market fund available only to First Investors funds and certain |
| accounts managed by First Investors Management Company, Inc. Rate shown is the 7-day yield |
| at December 31, 2008 (see Note 3). |
| |
| Summary of Abbreviations: |
| ADR American Depositary Receipts |
| REIT Real Estate Investment Trust |
| |
| 88 | See notes to financial statements |
| |
| |
| |
| This page left intentionally blank. |
| |
|
| |
Statements of Assets and Liabilities
FIRST INVESTORS LIFE SERIES FUNDS
December 31, 2008
| | | | | | | | | | | | | |
| | | | |
| | | | | CASH | | | | | | GROWTH & | | | |
| | | BLUE CHIP | | MANAGEMENT | | DISCOVERY | | GOVERNMENT | | INCOME | | HIGH YIELD | |
| Assets | | | | | | | | | | | | | |
| Investments in securities: | | | | | | | | | | | | | |
| Cost — Unaffiliated issuers | | $ 98,249,215 | | $ 12,826,553 | | $108,240,258 | | $ 23,321,122 | | $198,237,480 | | $ 76,711,859 | * |
| Cost — Affiliated money market fund (Note 3) | | 2,975,000 | | — | | 9,765,000 | | — | | 3,620,000 | | 3,470,000 | |
| | |
| Total cost of investments | | $101,224,215 | | $ 12,826,553 | | $118,005,258 | | $ 23,321,122 | | $201,857,480 | | $ 80,181,859 | |
| | |
| Value — Unaffiliated issuers (Note 1A) | | $103,427,285 | | $ 12,826,553 | | $ 91,253,775 | | $ 23,832,851 | | $151,126,044 | | $ 48,982,842 | * |
| Value — Affiliated money market fund (Note 3) | | 2,975,000 | | — | | 9,765,000 | | — | | 3,620,000 | | 3,470,000 | |
| | |
| Total value of investments | | 106,402,285 | | 12,826,553 | | 101,018,775 | | 23,832,851 | | 154,746,044 | | 52,452,842 | |
| | |
| Cash | | 93,180 | | 289,637 | | 104,570 | | 553,349 | | 90,855 | | 102,660 | |
| Receivables: | | | | | | | | | | | | | |
| Investment securities sold | | 345,708 | | — | | 6,443 | | 188,399 | | 51,001 | | 133,069 | |
| Interest and dividends | | 241,751 | | 34,632 | | 230,880 | | 107,023 | | 371,492 | | 1,382,230 | |
| Trust shares sold | | 40,296 | | 38,015 | | 14,255 | | 47,689 | | 40,501 | | 9,883 | |
| Other assets | | 1,134 | | 688 | | 1,508 | | 138 | | 1,995 | | 5,401 | |
| | |
| Total Assets | | 107,124,354 | | 13,189,525 | | 101,376,431 | | 24,729,449 | | 155,301,888 | | 54,086,085 | |
| | |
| Liabilities | | | | | | | | | | | | | |
| Payables: | | | | | | | | | | | | | |
| Collateral for securities loaned (Note 1G) | | — | | — | | — | | — | | — | | 1,470,000 | |
| Investment securities purchased | | 55,552 | | — | | 340,141 | | 615,432 | | 319,455 | | — | |
| Trust shares redeemed | | 54,081 | | 108,310 | | 165,473 | | 2,519 | | 168,586 | | 86,117 | |
| Accrued advisory fees | | 70,582 | | 3,872 | | 65,370 | | 12,914 | | 100,612 | | 34,441 | |
| Accrued expenses | | 21,387 | | 4,298 | | 23,050 | | 6,696 | | 17,164 | | 25,297 | |
| | |
| Total Liabilities | | 201,602 | | 116,480 | | 594,034 | | 637,561 | | 605,817 | | 1,615,855 | |
| | |
| Net Assets | | $106,922,752 | | $ 13,073,045 | | $100,782,397 | | $ 24,091,888 | | $154,696,071 | | $ 52,470,230 | |
| | |
| Net Assets Consist of: | | | | | | | | | | | | | |
| Capital paid in | | $130,052,827 | | $ 13,073,045 | | $124,893,253 | | $ 23,287,998 | | $212,543,620 | | $ 98,239,685 | |
| Undistributed net investment income | | 2,356,058 | | — | | 1,370,209 | | 1,023,541 | | 3,091,075 | | 5,620,377 | |
| Accumulated net realized loss on investments | | (30,664,203) | | — | | (8,494,582 | ) | (731,380 | ) | (13,827,188 | ) | (23,660,815 | ) |
| Net unrealized appreciation (depreciation) | | | | | | | | | | | | | |
| of investments | | 5,178,070 | | — | | (16,986,483 | ) | 511,729 | | (47,111,436 | ) | (27,729,017 | ) |
| | |
| Total | | $106,922,752 | | $ 13,073,045 | | $100,782,397 | | $ 24,091,888 | | $154,696,071 | | $ 52,470,230 | |
| | |
| Shares of beneficial interest outstanding (Note 2) | | 6,549,770 | | 13,073,045 | | 5,184,205 | | 2,338,290 | | 7,829,057 | | 10,103,738 | |
| | |
| Net asset value, offering and redemption price per share — | | | | | | | | | | | | | |
| (Net assets divided by shares outstanding) | | $ 16.32 | | $ 1.00 | | $ 19.44 | | $ 10.30 | | $ 19.76 | | $ 5.19 | |
* Investments at cost and value include $1,470,000 of collateral for securities loaned (Note 1G).
| | |
| 90 | See notes to financial statements | 91 |
Statements of Assets and Liabilities
FIRST INVESTORS LIFE SERIES FUNDS
December 31, 2008
| | | | | | | | | | | | | |
| | | | |
| | | | | INVESTMENT | | SELECT | | TARGET | | TARGET | | | |
| | | INTERNATIONAL | | GRADE | | GROWTH | | MATURITY 2010 | | MATURITY 2015 | | VALUE | |
| Assets | | | | | | | | | | | | | |
| Investments in securities: | | | | | | | | | | | | | |
| Cost — Unaffiliated issuers | | $ 90,076,222 | | $ 33,897,388 | | $ 9,625,990 | | $ 12,497,986 | | $ 24,570,996 | | $ 61,971,675 | |
| Cost — Affiliated money market fund (Note 3) | | 2,995,000 | | 985,000 | | — | | — | | — | | 1,480,000 | |
| | |
| Total cost of investments | | $ 93,071,222 | | $ 34,882,388 | | $ 9,625,990 | | $ 12,497,986 | | $ 24,570,996 | | $ 63,451,675 | |
| | |
| Value — Unaffiliated issuers (Note 1A) | | $ 78,914,364 | | $ 30,804,270 | | $ 8,481,925 | | $ 13,853,565 | | $ 29,430,390 | | $ 56,765,410 | |
| Value — Affiliated money market fund (Note 3) | | 2,995,000 | | 985,000 | | — | | — | | — | | 1,480,000 | |
| | |
| Total value of investments | | 81,909,364 | | 31,789,270 | | 8,481,925 | | 13,853,565 | | 29,430,390 | | 58,245,410 | |
| | |
| Cash | | 99,606 | | 79,573 | | 179,534 | | 3,271 | | 17,960 | | 79,295 | |
| Receivables: | | | | | | | | | | | | | |
| Investment securities sold | | 39,498 | | 371,875 | | — | | — | | — | | 64,255 | |
| Interest and dividends | | 218,545 | | 489,624 | | 7,901 | | — | | — | | 174,942 | |
| Trust shares sold | | 10,106 | | 23,661 | | 20,805 | | — | | 30,467 | | 15,128 | |
| Foreign exchange contracts (Note 6) | | 4,143,347 | | — | | — | | — | | — | | — | |
| Forward currency contracts (Note 6) | | 8,893 | | — | | — | | — | | — | | — | |
| Other assets | | 899 | | 192 | | 64 | | 72 | | 125 | | 751 | |
| | |
| Total Assets | | 86,430,258 | | 32,754,195 | | 8,690,229 | | 13,856,908 | | 29,478,942 | | 58,579,781 | |
| | |
| Liabilities | | | | | | | | | | | | | |
| Payables: | | | | | | | | | | | | | |
| Investment securities purchased | | 877,941 | | 254,206 | | 17,154 | | — | | — | | 73,766 | |
| Trust shares redeemed | | 95,615 | | 30,814 | | 16,040 | | 46 | | 256 | | 19,241 | |
| Accrued advisory fees | | 55,261 | | 17,340 | | 5,601 | | 7,484 | | 15,660 | | 38,377 | |
| Accrued expenses | | 25,409 | | 8,497 | | 5,854 | | 4,349 | | 9,318 | | 8,330 | |
| | |
| Total Liabilities | | 1,054,226 | | 310,857 | | 44,649 | | 11,879 | | 25,234 | | 139,714 | |
| | |
| Net Assets | | $ 85,376,032 | | $ 32,443,338 | | $ 8,645,580 | | $ 13,845,029 | | $ 29,453,708 | | $ 58,440,067 | |
| | |
| Net Assets Consist of: | | | | | | | | | | | | | |
| Capital paid in | | $116,590,295 | | $ 38,409,216 | | $ 13,129,422 | | $ 11,591,658 | | $ 23,442,607 | | $ 69,672,603 | |
| Undistributed net investment income | | — | | 1,439,193 | | — | | 726,847 | | 1,124,303 | | 1,816,517 | |
| Accumulated net realized gain (loss) on investments | | | | | | | | | | | | | |
| and foreign currency transactions | | (24,203,276 | ) | (4,311,953 | ) | (3,339,777 | ) | 170,945 | | 27,404 | | (7,842,788 | ) |
| Net unrealized appreciation (depreciation) | | | | | | | | | | | | | |
| of investments and foreign currency transactions | | (7,010,987 | ) | (3,093,118 | ) | (1,144,065 | ) | 1,355,579 | | 4,859,394 | | (5,206,265 | ) |
| | |
| Total | | $ 85,376,032 | | $ 32,443,338 | | $ 8,645,580 | | $ 13,845,029 | | $ 29,453,708 | | $ 58,440,067 | |
| | |
| Shares of beneficial interest outstanding (Note 2) | | 6,761,648 | | 3,542,084 | | 1,427,597 | | 964,651 | | 1,787,273 | | 5,051,925 | |
| | |
| Net asset value, offering and redemption price per share — | | | | | | | | | | | | | |
| (Net assets divided by shares outstanding) | | $ 12.63 | | $ 9.16 | | $ 6.06 | | $ 14.35 | | $ 16.48 | | $11.57 | |
| | |
| 92 | See notes to financial statements | 93 |
Statements of Operations
FIRST INVESTORS LIFE SERIES FUNDS
Year Ended December 31, 2008
| | | | | | | | | | | | | |
| | | | |
| | | | | CASH | | | | | GROWTH & | | | |
| | | BLUE CHIP | MANAGEMENT | | DISCOVERY | | GOVERNMENT | | INCOME | | HIGH YIELD | |
| Investment Income | | | | | | | | | | | | | |
| Income: | | | | | | | | | | | | | |
| Interest | | $ 14,627 | | $381,890 | | $ 82,274 | | $ 1,196,570 | | $ 277 | | $ 6,173,870 | |
| Dividends | | 3,484,567 | (a) | — | | 2,282,658 | | — | | 4,805,012 | (b) | 40,765 | |
| Dividends from affiliate (Note 3) | | 20,585 | | — | | 124,161 | | — | | 28,840 | | 43,403 | |
| Securities lending income | | — | | — | | — | | — | | — | | 67,024 | |
| | |
| Total income | | 3,519,779 | | 381,890 | | 2,489,093 | | 1,196,570 | | 4,834,129 | | 6,325,062 | |
| | |
| Expenses (Notes 1 and 4): | | | | | | | | | | | | | |
| Advisory fees | | 1,062,029 | | 105,131 | | 1,016,982 | | 168,364 | | 1,589,232 | | 520,448 | |
| Professional fees | | 37,351 | | 13,934 | | 33,959 | | 13,083 | | 42,636 | | 23,998 | |
| Custodian fees and expenses | | 14,699 | | 7,524 | | 14,664 | | 11,181 | | 27,103 | | 11,064 | |
| Reports and notices to shareholders | | 18,725 | | 2,806 | | 17,716 | | 3,657 | | 27,685 | | 10,506 | |
| Registration fees | | 1,366 | | 1,366 | | 1,366 | | 1,366 | | 1,366 | | 1,417 | |
| Trustees’ fees | | 8,124 | | 779 | | 7,741 | | 1,246 | | 12,132 | | 4,144 | |
| Other expenses | | 31,947 | | 3,602 | | 29,184 | | 11,976 | | 45,535 | | 22,270 | |
| | |
| Total expenses | | 1,174,241 | | 135,142 | | 1,121,612 | | 210,873 | | 1,745,689 | | 593,847 | |
| Less: Expenses waived | | — | | (35,660 | ) | — | | (33,673 | ) | — | | — | |
| Expenses paid indirectly | | (10,760 | ) | (1,339 | ) | (2,808 | ) | (4,193 | ) | (2,766 | ) | (3,048 | ) |
| | |
| Net expenses | | 1,163,481 | | 98,143 | | 1,118,804 | | 173,007 | | 1,742,923 | | 590,799 | |
| | |
| Net investment income | | 2,356,298 | | 283,747 | | 1,370,289 | | 1,023,563 | | 3,091,206 | | 5,734,263 | |
| | |
| Realized and Unrealized Gain (Loss) on Investments | | | | | | | | | | | | | |
| (Note 3): | | | | | | | | | | | | | |
| Net realized gain (loss) on investments | | (2,989,594 | ) | — | | (8,462,366 | ) | 115,259 | | (13,747,844 | ) | (3,663,814 | ) |
| | |
| Net unrealized appreciation (depreciation) of investments | | (51,875,344 | ) | — | | (44,385,365 | ) | 389,109 | | (76,017,353 | ) | (20,958,356 | ) |
| | |
| Net gain (loss) on investments | | (54,864,938 | ) | — | | (52,847,731 | ) | 504,368 | | (89,765,197 | ) | (24,622,170 | ) |
| Net Increase (Decrease) in Net Assets Resulting | | | | | | | | | | | | | |
| from Operations | | $(52,508,640 | ) | $283,747 | | $ (51,477,442 | ) | $ 1,527,931 | | $(86,673,991 | ) | $ (18,887,907 | ) |
(a) Net of $11,958 foreign taxes withheld
(b) Net of $26,187 foreign taxes withheld
| | |
| 94 | See notes to financial statements | 95 |
Statements of Operations
FIRST INVESTORS LIFE SERIES FUNDS
Year Ended December 31, 2008
| | | | | | | | | | | | | |
| | | | |
| | | | | INVESTMENT | | SELECT | | TARGET | | TARGET | | | |
| | | INTERNATIONAL | | GRADE | | GROWTH | | MATURITY 2010 | | MATURITY 2015 | | VALUE | |
| Investment Income | | | | | | | | | | | | | |
| Income: | | | | | | | | | | | | | |
| Interest | | $ 87,790 | | $ 2,013,724 | | $ 3,130 | | $ 834,252 | | $ 1,314,538 | | $ 25,583 | |
| Dividends | | 2,711,001 | (c) | 210,159 | | 102,900 | | — | | — | | 2,393,110 | (d) |
| Dividends from affiliate (Note 3) | | 23,587 | | 13,695 | | — | | — | | — | | 32,356 | |
| | |
| Total income | | 2,822,378 | | 2,237,578 | | 106,030 | | 834,252 | | 1,314,538 | | 2,451,049 | |
| | |
| Expenses (Notes 1 and 4): | | | | | | | | | | | | | |
| Advisory fees | | 903,622 | | 278,602 | | 85,368 | | 108,450 | | 209,942 | | 569,579 | |
| Professional fees | | 32,506 | | 15,933 | | 9,707 | | 10,730 | | 9,007 | | 22,284 | |
| Custodian fees and expenses | | 136,150 | | 10,882 | | 695 | | 2,651 | | 1,654 | | 14,034 | |
| Reports and notices to shareholders | | 16,382 | | 6,279 | | 11,036 | | 2,710 | | 4,182 | | 11,171 | |
| Registration fees | | 1,366 | | 1,366 | | 346 | | 1,366 | | 166 | | 166 | |
| Trustees’ fees | | 6,947 | | 2,102 | | 645 | | 814 | | 1,560 | | 4,339 | |
| Other expenses | | 32,867 | | 14,909 | | 4,978 | | 4,383 | | 7,457 | | 23,247 | |
| | |
| Total expenses | | 1,129,840 | | 330,073 | | 112,775 | | 131,104 | | 233,968 | | 644,820 | |
| Less: Expenses waived | | — | | (55,720 | ) | — | | (21,690 | ) | (41,989 | ) | — | |
| Expenses paid indirectly | | (703 | ) | (3,204 | ) | (861 | ) | (2,009 | ) | (1,780 | ) | (10,295 | ) |
| | |
| Net expenses | | 1,129,137 | | 271,149 | | 111,914 | | 107,405 | | 190,199 | | 634,525 | |
| | |
| Net investment income (loss) | | 1,693,241 | | 1,966,429 | | (5,884 | ) | 726,847 | | 1,124,339 | | 1,816,524 | |
| | |
| Realized and Unrealized Gain (Loss) on Investments | | | | | | | | | | | | | |
| and Foreign Currency Transactions (Note 3): | | | | | | | | | | | | | |
| Net realized gain (loss) on: | | | | | | | | | | | | | |
| Investments | | (24,096,665 | ) | (3,042,615 | ) | (3,333,193 | ) | 171,080 | | 115,629 | | (3,102,059 | ) |
| Foreign currency transactions | | (1,902,560 | ) | — | | — | | — | | — | | — | |
| | |
| Net realized gain (loss) on investments and foreign | | | | | | | | | | | | | |
| currency transactions | | (25,999,225 | ) | (3,042,615 | ) | (3,333,193 | ) | 171,080 | | 115,629 | | (3,102,059 | ) |
| Net unrealized appreciation (depreciation) of: | | | | | | | | | | | | | |
| Investments | | (43,370,324 | ) | (3,431,412 | ) | (2,492,301 | ) | 132,578 | | 2,573,680 | | (24,030,552 | ) |
| Foreign currency transactions | | 4,254,250 | | — | | — | | — | | — | | — | |
| | |
| Net unrealized appreciation (depreciation) on investments | | | | | | | | | | | | | |
| and foreign currency transactions | | (39,116,074 | ) | (3,431,412 | ) | (2,492,301 | ) | 132,578 | | 2,573,680 | | (24,030,552 | ) |
| Net gain (loss) on investments and foreign | | | | | | | | | | | | | |
| currency transactions | | (65,115,299 | ) | (6,474,027 | ) | (5,825,494 | ) | 303,658 | | 2,689,309 | | (27,132,611 | ) |
| | |
| Net Increase (Decrease) in Net Assets Resulting | | | | | | | | | | | | | |
| from Operations | | $ (63,422,058 | ) | $ (4,507,598 | ) | $ (5,831,378 | ) | $ 1,030,505 | | $ 3,813,648 | | $(25,316,087 | ) |
(c) Net of $307,849 foreign taxes withheld
(d) Net of $11,800 foreign taxes withheld
| | |
| 96 | See notes to financial statements | 97 |
Statements of Changes in Net Assets
FIRST INVESTORS LIFE SERIES FUNDS
| | | | | | | | | | | | | | | | | |
| | |
| | | |
| | | BLUE CHIP | | CASH MANAGEMENT | | DISCOVERY | | GOVERNMENT | |
| Year Ended December 31 | | 2008 | | 2007 | | 2008 | | 2007 | | 2008 | | 2007 | | 2008 | | 2007 | |
| Increase (Decrease) in Net Assets From Operations | | | | | | | | | | | | | | | | | |
| Net investment income | | $ 2,356,298 | | $ 2,189,331 | | $ 283,747 | | $ 315,057 | | $ 1,370,289 | | $ 587,284 | | $ 1,023,563 | | $ 992,700 | |
| Net realized gain (loss) on investments | | (2,989,594 | ) | 6,340,170 | | — | | — | | (8,462,366 | ) | 7,630,728 | | 115,259 | | (66,155 | ) |
| Net unrealized appreciation (depreciation) | | | | | | | | | | | | | | | | | |
| of investments | | (51,875,344 | ) | (856,310 | ) | — | | — | | (44,385,365 | ) | 2,247,221 | | 389,109 | | 356,509 | |
| Net increase (decrease) in net assets resulting | | | | | | | | | | | | | | | | | |
| from operations | | (52,508,640 | ) | 7,673,191 | | 283,747 | | 315,057 | | (51,477,442 | ) | 10,465,233 | | 1,527,931 | | 1,283,054 | |
| Distributions to Shareholders | | | | | | | | | | | | | | | | | |
| Net investment income | | (2,189,370 | ) | (1,975,764 | ) | (283,747 | ) | (315,057 | ) | (587,286 | ) | (280,470 | ) | (941,789 | ) | (1,016,156 | ) |
| Net realized gains | | — | | — | | — | | — | | (7,438,838 | ) | (13,314,932 | ) | — | | — | |
| Total distributions. | | (2,189,370 | ) | (1,975,764 | ) | (283,747 | ) | (315,057 | ) | (8,026,124 | ) | (13,595,402 | ) | (941,789 | ) | (1,016,156 | ) |
| Trust Share Transactions * | | | | | | | | | | | | | | | | | |
| Proceeds from shares sold | | 2,162,822 | | 2,951,951 | | 8,753,615 | | 14,080,221 | | 2,842,291 | | 3,849,854 | | 4,621,393 | | 2,610,472 | |
| Reinvestment of distributions. | | 2,189,370 | | 1,975,764 | | 283,747 | | 315,057 | | 8,026,124 | | 13,595,402 | | 941,789 | | 1,016,156 | |
| Cost of shares redeemed | | (15,396,641 | ) | (19,082,076 | ) | (11,032,879 | ) | (6,260,271 | ) | (11,607,742 | ) | (11,735,817 | ) | (3,040,592 | ) | (2,890,358 | ) |
| Net increase (decrease) from trust share transactions | | (11,044,449 | ) | (14,154,361 | ) | (1,995,517 | ) | 8,135,007 | | (739,327 | ) | 5,709,439 | | 2,522,590 | | 736,270 | |
| Net increase (decrease) in net assets | | (65,742,459 | ) | (8,456,934 | ) | (1,995,517 | ) | 8,135,007 | | (60,242,893 | ) | 2,579,270 | | 3,108,732 | | 1,003,168 | |
| Net Assets | | | | | | | | | | | | | | | | | |
| Beginning of year | | 172,665,211 | | 181,122,145 | | 15,068,562 | | 6,933,555 | | 161,025,290 | | 158,446,020 | | 20,983,156 | | 19,979,988 | |
| End of year † | | $ 106,922,752 | | $ 172,665,211 | | $ 13,073,045 | | $ 15,068,562 | | $ 100,782,397 | | $ 161,025,290 | | $ 24,091,888 | | $ 20,983,156 | |
| | |
| †Includes undistributed net investment income of | | $ 2,356,058 | | $ 2,189,282 | | $ — | | $ — | | $ 1,370,209 | | $ 587,242 | | $ 1,023,541 | | $ 941,767 | |
| | |
| *Trust Shares Issued and Redeemed | | | | | | | | | | | | | | | | | |
| Sold | | 106,419 | | 121,415 | | 8,753,616 | | 14,080,221 | | 114,417 | | 123,970 | | 464,759 | | 267,226 | |
| Issued for distributions reinvested | | 99,472 | | 85,642 | | 283,747 | | 315,057 | | 298,480 | | 460,862 | | 95,613 | | 106,181 | |
| Redeemed | | (741,807 | ) | (780,475 | ) | (11,032,879 | ) | (6,260,271 | ) | (457,195 | ) | (378,136 | ) | (304,780 | ) | (296,290 | ) |
| Net increase (decrease) in trust shares outstanding | | (535,916 | ) | (573,418 | ) | (1,995,516 | ) | 8,135,007 | | (44,298 | ) | 206,696 | | 255,592 | | 77,117 | |
| | |
| 98 | See notes to financial statements | 99 |
Statements of Changes in Net Assets
FIRST INVESTORS LIFE SERIES FUNDS
| | | | | | | | | | | | | | | | | |
| | |
| | | |
| | | GROWTH & INCOME | | HIGH YIELD | | INTERNATIONAL | | INVESTMENT GRADE | |
| Year Ended December 31 | | 2008 | | 2007 | | 2008 | | 2007 | | 2008 | | 2007 | | 2008 | | 2007 | |
| Increase (Decrease) in Net Assets From Operations | | | | | | | | | | | | | | | | | |
| Net investment income | | $ 3,091,206 | | $ 3,142,316 | | $ 5,734,263 | | $ 5,049,444 | | $1,693,241 | | $ 1,842,378 | | $ 1,966,429 | | $ 1,876,829 | |
| Net realized gain (loss) on investments and foreign | | | | | | | | | | | | | | | | | |
| currency transactions | | (13,747,844 | ) | 17,294,553 | | (3,663,814 | ) | (394,309 | ) | (25,999,225 | ) | 16,690,535 | | (3,042,615 | ) | 67,338 | |
| Net unrealized appreciation (depreciation) of investments | | | | | | | | | | | | | | | | | |
| and foreign currency transactions | | (76,017,353 | ) | (14,694,507 | ) | (20,958,356 | ) | (3,943,572 | ) | (39,116,074 | ) | 8,515,441 | | (3,431,412 | ) | 84,029 | |
| | |
| Net increase (decrease) in net assets resulting | | | | | | | | | | | | | | | | | |
| from operations | | (86,673,991 | ) | 5,742,362 | | (18,887,907 | ) | 711,563 | | (63,422,058 | ) | 27,048,354 | | (4,507,598 | ) | 2,028,196 | |
| | |
| Distributions to Shareholders | | | | | | | | | | | | | | | | | |
| Net investment income | | (3,140,040 | ) | (1,392,478 | ) | (5,998,094 | ) | (5,214,980 | ) | (241,951 | ) | (4,361,060 | ) | (2,055,553 | ) | (2,023,887 | ) |
| Net realized gains | | (17,037,484 | ) | (37,602,922 | ) | — | | — | | (16,470,165 | ) | (17,736,172 | ) | — | | — | |
| | |
| Total distributions | | (20,177,524 | ) | (38,995,400 | ) | (5,998,094 | ) | (5,214,980 | ) | (16,712,116 | ) | (22,097,232 | ) | (2,055,553 | ) | (2,023,887 | ) |
| | |
| Trust Share Transactions * | | | | | | | | | | | | | | | | | |
| Proceeds from shares sold | | 4,178,289 | | 5,908,951 | | 1,518,054 | | 2,528,285 | | 3,642,018 | | 6,868,157 | | 3,176,818 | | 4,296,663 | |
| Value of shares issued for acquisition** | | — | | — | | — | | 13,341,374 | | — | | — | | — | | — | |
| Reinvestment of distributions | | 20,177,524 | | 38,995,400 | | 5,998,094 | | 5,214,980 | | 16,712,116 | | 22,097,232 | | 2,055,553 | | 2,023,887 | |
| Cost of shares redeemed | | (20,441,409 | ) | (21,701,178 | ) | (8,699,633 | ) | (6,419,407 | ) | (9,277,881 | ) | (8,889,297 | ) | (5,513,700 | ) | (4,068,030 | ) |
| | |
| Net increase (decrease) from trust share transactions | | 3,914,404 | | 23,203,173 | | (1,183,485 | ) | 14,665,232 | | 11,076,253 | | 20,076,092 | | (281,329 | ) | 2,252,520 | |
| | |
| Net increase (decrease) in net assets | | (102,937,111 | ) | (10,049,865 | ) | (26,069,486 | ) | 10,161,815 | | (69,057,921 | ) | 25,027,214 | | (6,844,480 | ) | 2,256,829 | |
| | |
| Net Assets | | | | | | | | | | | | | | | | | |
| Beginning of year | | 257,633,182 | | 267,683,047 | | 78,539,716 | | 68,377,901 | | 154,433,953 | | 129,406,739 | | 39,287,818 | | 37,030,989 | |
| | |
| End of year † | | $ 154,696,071 | | $ 257,633,182 | | $ 52,470,230 | | $ 78,539,716 | | $ 85,376,032 | | $ 154,433,953 | | $ 32,443,338 | | $ 39,287,818 | |
| | |
| † Includes undistributed net investment income of | | $ 3,091,075 | | $ 3,139,964 | | $ 5,620,377 | | $ 5,884,208 | | $ — | | $ 574,089 | | $ 1,439,193 | | $ 1,529,781 | |
| |
| *Trust Shares Issued and Redeemed | | | | | | | | | | | | | | | | | |
| Sold | | 164,826 | | 168,508 | | 233,054 | | 323,450 | | 198,584 | | 299,283 | | 309,941 | | 402,066 | |
| Issued for acquisition** | | — | | — | | — | | 1,747,119 | | — | | — | | — | | — | |
| Issued for distributions reinvested | | 721,657 | | 1,188,884 | | 882,073 | | 675,515 | | 847,900 | | 1,078,440 | | 194,103 | | 192,020 | |
| Redeemed | | (773,979 | ) | (618,484 | ) | (1,332,303 | ) | (823,154 | ) | (536,174 | ) | (388,835 | ) | (558,169 | ) | (381,437 | ) |
| | |
| Net increase (decrease) in trust shares outstanding | | 112,504 | | 738,908 | | (217,176 | ) | 1,922,930 | | 510,310 | | 988,888 | | (54,125 | ) | 212,649 | |
**See Note 9.
| | |
| 100 | See notes to financial statements | 101 |
Statements of Changes in Net Assets
FIRST INVESTORS LIFE SERIES FUNDS
| | | | | | | | | | | | | | | | | |
| | | | |
| | | SELECT GROWTH | | TARGET MATURITY 2010 | | TARGET MATURITY 2015 | | VALUE | |
| Year ended December 31 | | 2008 | | 2007 | | 2008 | | 2007 | | 2008 | | 2007 | | 2008 | | 2007 | |
| Increase (Decrease) in Net Assets From Operations | | | | | | | | | | | | | | | | | |
| Net investment income (loss) | | $ (5,884 | ) | $18,113 | | $ 726,847 | | $730,766 | | $ 1,124,339 | | $ 1,064,266 | | $ 1,816,524 | | $ 1,699,212 | |
| Net realized gain (loss) on investments | | (3,333,193 | ) | 1,649,616 | | 171,080 | | 49,639 | | 115,629 | | (13,417 | ) | (3,102,059 | ) | 4,991,669 | |
| Net unrealized appreciation (depreciation) | | | | | | | | | | | | | | | | | |
| of investments | | (2,492,301 | ) | (375,281 | ) | 132,578 | | 303,684 | | 2,573,680 | | 1,277,197 | | (24,030,552 | ) | (7,193,547 | ) |
| Net increase (decrease) in net assets resulting | | | | | | | | | | | | | | | | | |
| from operations | | (5,831,378 | ) | 1,292,448 | | 1,030,505 | | 1,084,089 | | 3,813,648 | | 2,328,046 | | (25,316,087 | ) | (502,666 | ) |
| Distributions to Shareholders | | | | | | | | | | | | | | | | | |
| Net investment income | | (18,122 | ) | (87,643 | ) | (761,937 | ) | (761,230 | ) | (1,064,287 | ) | (978,165 | ) | (1,535,490 | ) | (1,493,871 | ) |
| Net realized gains | | (113,779 | ) | — | | (16,448 | ) | — | | — | | — | | — | | — | |
| Total distributions | | (131,901 | ) | (87,643 | ) | (778,385 | ) | (761,230 | ) | (1,064,287 | ) | (978,165 | ) | (1,535,490 | ) | (1,493,871 | ) |
| Trust Share Transactions* | | | | | | | | | | | | | | | | | |
| Proceeds from shares sold | | 2,703,339 | | 1,234,769 | | 622,532 | | 1,969,668 | | 2,791,995 | | 3,537,892 | | 2,989,496 | | 5,174,146 | |
| Reinvestment of distributions | | 131,901 | | 87,643 | | 778,385 | | 761,230 | | 1,064,287 | | 978,165 | | 1,535,490 | | 1,493,871 | |
| Cost of shares redeemed | | (965,527 | ) | (1,523,498 | ) | (2,654,972 | ) | (2,352,313 | ) | (4,322,752 | ) | (2,539,118 | ) | (10,491,931 | ) | (7,646,283 | ) |
| Net increase (decrease) from trust share transactions | | 1,869,713 | | (201,086 | ) | (1,254,055 | ) | 378,585 | | (466,470 | ) | 1,976,939 | | (5,966,945 | ) | (978,266 | ) |
| Net increase (decrease) in net assets | | (4,093,566 | ) | 1,003,719 | | (1,001,935 | ) | 701,444 | | 2,282,891 | | 3,326,820 | | (32,818,522 | ) | (2,974,803 | ) |
| Net Assets | | | | | | | | | | | | | | | | | |
| Beginning of year | | 12,739,146 | | 11,735,427 | | 14,846,964 | | 14,145,520 | | 27,170,817 | | 23,843,997 | | 91,258,589 | | 94,233,392 | |
| End of year † | | $ 8,645,580 | | $12,739,146 | | $ 13,845,029 | | $14,846,964 | | $ 29,453,708 | | $ 27,170,817 | | $ 58,440,067 | | $ 91,258,589 | |
| | |
| †Includes undistributed net investment income of | | $ — | | $ 18,110 | | $ 726,847 | | $761,937 | | $ 1,124,303 | | $ 1,064,251 | | $ 1,816,517 | | $ 1,663,443 | |
| | |
| *Trust Shares Issued and Redeemed | | | | | | | | | | | | | | | | | |
| Sold | | 317,189 | | 121,487 | | 44,172 | | 142,072 | | 183,481 | | 248,330 | | 209,076 | | 298,071 | |
| Issued for distributions reinvested | | 14,463 | | 9,444 | | 55,999 | | 57,756 | | 70,623 | | 70,473 | | 101,352 | | 88,552 | |
| Redeemed | | (120,246 | ) | (153,539 | ) | (189,485 | ) | (173,848 | ) | (285,020 | ) | (181,296 | ) | (723,109 | ) | (439,104 | ) |
| Net increase (decrease) in trust shares outstanding | | 211,406 | | (22,608 | ) | (89,314 | ) | 25,980 | | (30,916 | ) | 137,507 | | (412,681 | ) | (52,481 | ) |
| | |
| 102 | See notes to financial statements | 103 |
Notes to Financial Statements
FIRST INVESTORS LIFE SERIES FUNDS
December 31, 2008
1. Significant Accounting Policies—First Investors Life Series Funds, a Delaware statutory trust (“the Trust”), is registered under the Investment Company Act of 1940 (“the 1940 Act”) as a diversified, open-end management investment company. The Trust operates as a series fund, issuing shares of beneficial interest in the Blue Chip Fund, Cash Management Fund, Discovery Fund, Government Fund, Growth & Income Fund, High Yield Fund, International Fund, Investment Grade Fund, Select Growth Fund, Target Maturity 2010 Fund, Target Maturity 2015 Fund and Value Fund (each a “Fund”, collectively, “the Funds”), and accounts separately for the assets, liabilities and operations of each Fund. The objective of each Fund is as follows:
Blue Chip Fund seeks high total investment return.
Cash Management Fund seeks to earn a high rate of current income consistent with the preservation of capital and maintenance of liquidity.
Discovery Fund seeks long-term growth of capital.
Government Fund seeks to achieve a significant level of current income which is consistent with security and liquidity of principal.
Growth & Income Fund seeks long-term growth of capital and current income.
High Yield Fund seeks high current income.
International Fund primarily seeks long-term capital growth.
Investment Grade Fund seeks to generate a maximum level of income consistent with investment in investment grade debt securities.
Select Growth Fund seeks long-term growth of capital.
Target Maturity 2010 and Target Maturity 2015 Funds seek a predictable compounded investment return for investors who hold their Fund shares until the Fund’s maturity, consistent with the preservation of capital.
Value Fund seeks total return.
A. Security Valuation—Except as provided below, a security listed or traded on an exchange or the Nasdaq Stock Market is valued at its last sale price on the exchange or market where the security is principally traded, and lacking any sales, the security is valued at the mean between the closing bid and asked prices. Securities traded in the over-the-counter (“OTC”) market (including securities listed on exchanges whose primary market is believed to be OTC) are valued at the mean between the last bid and asked prices based on quotes furnished by a market maker for such securities. Securities may also be priced by a pricing service approved by the Trust’s Board of
Trustees (“the Board”). The pricing service considers security type, rating, market condition and yield data as well as market quotations, prices provided by market makers and other available information in determining value. Short-term debt securities that mature in 60 days or less are valued at amortized cost.
The Funds monitor for significant events occurring prior to the close of trading on the New York Stock Exchange that could have a material impact on the value of any securities that are held by the Funds. Examples of such events include trading halts, natural disasters, political events and issuer-specific developments. If the Valuation Committee decides that such events warrant using fair value estimates for securities, it will take such events into consideration in determining the fair values of such securities. If market quotations or prices are not readily available or determined to be unreliable, the securities will be valued at fair value as determined in good faith pursuant to procedures adopted by the Board. The Funds also use a pricing service to fair value foreign securities in the event that fluctuation in U.S. securities markets exceed a predetermined level. For valuation purposes, where applicable, quotations of foreign securities in foreign currency are translated to U.S. dollar equivalents using the foreign exchange quotation in effect. At December 31, 2008, the High Yield Fund held five securities that were fair valued by the Valuation Committee with an aggregate value of $724 representing .0% of the Fund’s net assets. At December 31, 2008, fair value pricing was used for certain foreign securities in the International Fund portfolio.
The Cash Management Fund values its portfolio securities in accordance with the amortized cost method of valuation under Rule 2a-7 under the 1940 Act. Amortized cost is an approximation of market value of an instrument, whereby the difference between its acquisition cost and market value at maturity is amortized on a straight-line basis over the remaining life of the instrument. The effect of changes in the market value of a security as a result of fluctuating interest rates is not taken into account and thus the amortized cost method of valuation may result in the value of a security being higher or lower than its actual market value.
Adoption of Statement of Financial Accounting Standards No. 157 “Fair Value Measurements” (“FAS 157”) — In September 2006, the Financial Accounting Standards Board issued FAS 157 effective for fiscal years beginning after November 15, 2007. This standard clarifies the definition of fair value for financial reporting, establishes a framework for measuring fair value and requires additional disclosures about the use of fair value measurements. The Funds have adopted FAS 157 as of January 1, 2008. The three levels of the fair value hierarchy under FAS 157 are described below:
Notes to Financial Statements (continued)
FIRST INVESTORS LIFE SERIES FUNDS
December 31, 2008
Level 1 – quoted prices in active markets for identical securities
Level 2 – other significant observable inputs (including quoted prices for similar securities, interest rates, prepayment speeds, credit risk, etc.)
Level 3 – significant unobservable inputs (including the Fund’s own assumptions in determining the fair value of investments)
The inputs methodology used for valuing securities are not necessarily an indication of the risk associated with investing in those securities.
The summary of inputs used to value each Fund’s net assets as of December 31, 2008 is as follows:
| | | | | | | | |
| | | | | | | | |
| | | | | | | | |
| | | | | | | | |
| | | | | | | | |
| | | | |
| | | | Level 2 | |
| | | | Other | Level 3 |
| | | Level 1 | Significant | Significant |
| | | Quoted | Observable | Unobservable |
| Fund | Total | Prices | Inputs | Inputs |
| Blue Chip | | $106,402,285 | | $106,402,285 | | $ — | | $ — |
| Cash Management | 12,826,553 | — | 12,826,553 | — |
| Discovery | 101,018,775 | 101,018,775 | — | — |
| Government | 23,832,851 | — | 23,832,851 | — |
| Growth & Income | 154,746,044 | 154,746,044 | — | — |
| High Yield | 52,452,842 | 4,362,581 | 48,089,537 | 724 |
| International | 81,909,364 | 21,310,519 | 60,598,845 | — |
| Investment Grade | 31,789,270 | 1,876,860 | 29,912,410 | — |
| Select Growth | 8,481,925 | 8,481,925 | — | — |
| Target Maturity 2010 | 13,853,565 | — | 13,853,565 | — |
| Target Maturity 2015 | 29,430,390 | — | 29,430,390 | — |
| Value | 58,245,410 | 58,245,410 | — | — |
The following is a reconciliation of Fund investments valued using Level 3 inputs for the period:
| | | |
| | |
| Balance, December 31, 2007 | | $ | 329,316 |
| Net purchases (sales) | | (8,703) |
| Change in unrealized appreciation (depreciation) | 1,215,499 |
| Realized gain (loss) | (1,535,388) |
| Transfer in and/or out of Level 3 | | — |
| Balance, December 31, 2008 | | $ 724 |
B. Federal Income Tax—No provision has been made for federal income taxes on net income or capital gains since it is the policy of each Fund to continue to comply with the special provisions of the Internal Revenue Code applicable to investment companies, and to make sufficient distributions of income and capital gains (in excess of any available capital loss carryovers), to relieve each Fund from all, or substantially all, federal income taxes. At December 31, 2008, capital loss carryovers were as follows:
| | | | | | | | | | | | | | | | | |
| | | | | | | | Year Capital Loss Carryovers Expire | | | | | | |
| |
| Fund | Total | | 2009 | | 2010 | | 2011 | | 2012 | | 2013 | | 2014 | | 2015 | | 2016 |
| |
| Blue Chip | $28,102,422 | | $ — | | $20,477,223 | | $4,132,026 | | $ — | | $ — | | $ — | | $ — | | $ 3,493,173 |
| Discovery | 466,376 | | — | | — | | — | | — | | — | | — | | — | | 466,376 |
| Government | 731,380 | | — | | — | | 272,546 | | 51,149 | | 193,688 | | 177,059 | | 36,938 | | — |
| Growth & Income | 11,930,936 | | — | | — | | —- | | — | | — | | — | | — | | 11,930,936 |
| High Yield* | 20,544,221 | 3,751,289 | | 4,873,032 | | 4,736,272 | 790,779 | | 632,307 | | 1,944,836 | | 433,726 | | 3,381,980 |
| International | 14,866,817 | | — | | — | | — | | — | | — | | — | | — | | 14,866,817 |
| Investment Grade | 4,607,401 | | 37,096 | | 17,173 | | 517,182 | | — | | 108,453 | | 531,982 | | 57,928 | | 3,337,587 |
| Select Growth | 2,094,369 | | — | | — | | — | | — | | — | | — | | — | | 2,094,369 |
| Value | 7,835,565 | | — | | 3,581,578 | | 1,198,371 | | — | | — | | — | | — | | 3,055,616 |
*For High Yield Fund, $651,681 of the $4,873,032 capital loss carryover expiring in 2010 was acquired in the reorganization with Special Bond Fund. Due to the reorganization, the Fund will have available for utilization $2,833,541 in capital loss carryovers that will become available at $601,552 per year for taxable years 2009 through 2012 and $427,333 for taxable year 2013. These capital loss carryovers will expire as follows: $1,575,155 in 2010; $881,182 in 2011; $212,617 in 2012; $153,634 in 2013; and $662,634 in 2014.
Effective June 29, 2007, the Funds adopted the Financial Accounting Standards Board (“FASB”) Interpretation No. 48 “Accounting for Uncertainty in Income Taxes” (“FIN 48”). FIN 48 provides guidance for how uncertain tax positions should be recognized, measured, presented and disclosed in the financial statements. FIN 48 requires the evaluation of tax positions taken or expected to be taken in the course of preparing the each Fund’s tax returns to determine whether tax positions are “more-likely-than-not” of being sustained by the applicable tax authority. Tax positions not deemed to meet the more-likely-than-not threshold would be recorded as a tax benefit or expense in the current year. Management has reviewed the tax positions for each of the open tax years 2005 to 2008 and has determined the adoption of FIN 48 had no impact on the financial statements of the Funds.
C. Foreign Currency Translations—The accounting records of the International Fund are maintained in U.S. dollars. Portfolio securities and other assets and liabilities denominated in foreign currencies are translated into U.S. dollars at the date of valuation. Purchases and sales of investment securities, dividend income and certain
Notes to Financial Statements (continued)
FIRST INVESTORS LIFE SERIES FUNDS
December 31, 2008
expenses are translated to U.S. dollars at the rates of exchange prevailing on the respective dates of such transactions.
The International Fund does not isolate that portion of gains and losses on investments which is due to changes in foreign exchange rates from that which is due to changes in market prices of the investments. Such fluctuations are included with the net realized and unrealized gains and losses from investments.
Net realized and unrealized gains and losses on foreign currency transactions include gains and losses from the sales of foreign currency and gains and losses on accrued foreign dividends and related withholding taxes.
D. Distributions to Shareholders—Distributions to shareholders from net investment income and net realized capital gains are generally declared and paid annually on all Funds, except for the Cash Management Fund which declares dividends from the total of net investment income (plus or minus all realized short-term gains and losses on investments) daily and pays monthly. Dividends from net investment income and capital gain distributions are determined in accordance with income tax regulations which may differ from accounting principles generally accepted in the United States of America. These differences are primarily due to differing treatments for foreign currency transactions, capital loss carryforwards and deferral of wash sales.
E. Expense Allocation—Expenses directly charged or attributable to a Fund are paid from the assets of that Fund. General expenses of the Trust are allocated among and charged to the assets of each Fund on a fair and equitable basis, which may be based on the relative assets of each Fund or the nature of the services performed and relative applicability to each Fund.
F. Use of Estimates—The preparation of the financial statements in conformity with accounting principles generally accepted in the United States of America requires management to make estimates and assumptions that affect the reported amounts of assets and liabilities at the date of the financial statements and the reported amounts of revenue and expense during the reporting period. Actual results could differ from those estimates.
G. Security Lending—High Yield Fund may loan securities to other investors through the Securities Lending Management Agreement (“the Agreement”) with Credit Suisse. Under the terms of the Agreement, the Fund is required to maintain collateral with a market value not less than 101% of the market value of loaned securities. Collateral is adjusted daily in connection with changes in market value of securities on loan. Collateral may consist of cash or securities issued or guaranteed
by the U.S. government or its agencies. Cash collateral may be invested in permissible instruments authorized by the Agreement. Interest earned on the collateral and premiums paid by the broker are recorded as income by the Fund net of fees and rebates charged by Credit Suisse for its services in connection with this securities lending program. The Fund is subject to all of the investment risks associated with the securities that are being loaned and the investments made with the cash collateral. The Fund is also subject to the risks associated with a delay in recovering the loaned securities or an inability to recover the loaned securities in the event the collateral is not sufficient. The market value of securities on loan at December 31, 2008, was $1,447,183 (including $81,478 of accrued interest), for which the Fund received cash collateral of $1,470,000.
H. Other—Security transactions are generally accounted for on the first business day following the date the securities are purchased or sold. Cost is determined and gains and losses are based, on the identified cost basis for securities, for both financial statement and federal income tax purposes. Dividend income is recorded on the ex-dividend date. Shares of stock received in lieu of cash dividends on certain preferred stock holdings of the High Yield Fund are recognized as dividend income and recorded at the market value of the shares received. Interest income and estimated expenses are accrued daily. Bond premiums and discounts are accreted or amortized using the interest method. Interest income on zero coupon bonds and stepbonds is accrued daily at the effective interest rate. For the year ended December 31, 2008, the Bank of New York Mellon, custodian for all the Funds, except the International Fund, has provided credits in the amount of $38,771 against custod ian charges based on the uninvested cash balances of the Funds. The Funds also reduced expenses through brokerage service arrangements. For the year ended December 31, 2008, the Funds’ expenses were reduced by $4,995 under these arrangements.
2. Trust Shares—The Trust is authorized to issue an unlimited number of shares of beneficial interest without par value. The Trust consists of the Funds listed on the cover page, each of which is a separate and distinct series of the Trust. Shares in the Funds are acquired through the purchase of variable annuity or variable life insurance contracts sold by First Investors Life Insurance Company.
3. Security Transactions—For the year ended December 31, 2008, purchases and sales (including pay-downs on Government Fund) of securities and long-term U.S. Government obligations (excluding short-term U.S. Government obligations, repurchase agreements, foreign currencies and short-term securities), were as follows:
Notes to Financial Statements (continued)
FIRST INVESTORS LIFE SERIES FUNDS
December 31, 2008
| | | | | | | |
| | | | | | Long-Term U.S. |
| | Securities | | Government Obligations |
| | Cost of | | Proceeds | | Cost of | | Proceeds |
| Fund | Purchases | | of Sales | | Purchases | | of Sales |
| Blue Chip | $ 11,019,027 | | $ 22,901,666 | | $ — | | $ — |
| Discovery | 67,036,709 | | 78,064,835 | | — | | — |
| Government | 7,335,961 | | 5,162,610 | | 3,928,006 | | 3,164,815 |
| Growth & Income | 60,183,231 | | 76,650,673 | | — | | — |
| High Yield | 11,998,558 | | 13,067,934 | | — | | — |
| International | 150,948,353 | | 154,279,683 | | — | | — |
| Investment Grade | 11,241,743 | | 10,948,333 | | 36,050,036 | | 36,906,801 |
| Select Growth | 13,852,118 | | 11,833,737 | | — | | — |
| Target Maturity 2010 | — | | — | | — | | 2,013,795 |
| Target Maturity 2015 | — | | — | | — | | 1,610,259 |
| Value | 10,978,354 | | 15,157,199 | | — | | — |
At December 31, 2008, aggregate cost and net unrealized appreciation (depreciation) of securities for federal income tax purposes were as follows:
| | | | | | | |
| | | | | | | | Net |
| | | | Gross | | Gross | | Unrealized |
| | Aggregate | | Unrealized | | Unrealized | | Appreciation |
| Fund | Cost | | Appreciation | | Depreciation | | (Depreciation) |
| Blue Chip | $103,995,724 | | $20,141,095 | | $17,734,534 | | $ 2,406,561 |
| Discovery | 118,042,224 | | 6,206,090 | | 23,229,539 | | (17,023,449) |
| Government | 23,321,122 | | 527,460 | | 15,731 | | 511,729 |
| Growth & Income | 201,983,867 | | 12,401,419 | | 59,639,242 | | (47,237,823) |
| High Yield | 78,861,141 | | 9,571 | | 27,887,870 | | (27,878,299) |
| International | 93,649,582 | | 2,530,463 | | 14,270,681 | | (11,740,218) |
| Investment Grade | 35,179,262 | | 341,518 | | 3,731,510 | | (3,389,992) |
| Select Growth | 9,625,990 | | 238,602 | | 1,382,667 | | (1,144,065) |
| Target Maturity 2010 | 12,497,986 | | 1,355,579 | | — | | 1,355,579 |
| Target Maturity 2015 | 24,584,761 | | 4,845,628 | | — | | 4,845,628 |
| Value | 63,458,898 | | 7,787,690 | | 13,001,178 | | (5,213,488) |
Certain of the Funds may invest in First Investors Cash Reserve Fund, LLC (“Cash Reserve Fund”), an affiliated unregistered money market fund managed by First Investors Management Company, Inc. During the year ended December 31, 2008, purchases, sales and dividend income earned by the Funds that invested in the Cash Reserve Fund were as follows:
| | | | | |
| | Value at | Purchases | Sales | Value at | Dividend |
| Fund | 12/31/07 | Shares/Cost | Shares/Cost | 12/31/08 | Income |
| Blue Chip | — | $12,225,000 | $ 9,250,000 | $2,975,000 | $ 20,585 |
| Discovery | — | 39,435,000 | 29,670,000 | 9,765,000 | 124,161 |
| Growth & Income | — | 22,780,000 | 19,160,000 | 3,620,000 | 28,840 |
| High Yield | — | 14,595,000 | 11,125,000 | 3,470,000 | 43,403 |
| International | — | 41,995,000 | 39,000,000 | 2,995,000 | 23,587 |
| Investment Grade | — | 16,245,000 | 15,260,000 | 985,000 | 13,695 |
| Value | — | 8,185,000 | 6,705,000 | 1,480,000 | 32,356 |
4. Advisory Fee and Other Transactions With Affiliates—Certain officers and trustees of the Trust are officers and trustees of its investment adviser, First Investors Management Company, Inc. (“FIMCO”) and/or its transfer agent, Administrative Data Management Corp. Trustees of the Trust who are not “interested persons” of the Trust as defined in the 1940 Act are remunerated by the Funds. For the year December 31, 2008, total trustee fees accrued by the Funds amounted to $50,573.
The Investment Advisory Agreement provides as compensation to FIMCO an annual fee, payable monthly, at the rate of .75% on the first $250 million of each Fund’s average daily net assets, .72% on the next $250 million, .69% on the next $250 million, .66% on the next $500 million, declining by .02% on each $500 million thereafter, down to .60% on average daily net assets over $2.25 billion. For the year ended December 31, 2008, FIMCO has voluntarily waived 20% of the .75% annual fee on the first $250 million of average daily net assets of the Government, Investment Grade, Target Maturity 2010 and Target Maturity 2015 Funds. In addition, FIMCO has voluntarily waived $35,660 in advisory fees on the Cash Management Fund to limit the Fund’s overall expense ratio to .70%. For the year ended December 31, 2008, total advisory fees accrued to FIMCO were $6,617,749 of which $188,732 was waived as noted above.
Paradigm Capital Management, Inc. serves as investment subadviser to the Discovery Fund. Vontobel Asset Management, Inc. serves as investment subadviser to the International Fund. Smith Asset Management Group, L.P. serves as investment subadviser to Select Growth Fund. The subadvisers are paid by FIMCO and not by the Funds.
Notes to Financial Statements (continued)
FIRST INVESTORS LIFE SERIES FUNDS
December 31, 2008
5. Restricted Securities—Certain restricted securities are exempt from the registration requirements under Rule 144A of the Securities Act of 1933 and may only be sold to qualified institutional investors. At December 31, 2008, the Cash Management Fund held one 144A security with a value of $200,135 representing 1.5% of the Fund’s net assets, the Government Fund held one 144A security with a value of $892,961 representing 3.7% of the Fund’s net assets, the High Yield Fund held eighteen 144A securities with an aggregate value of $4,346,144 representing 8.3% of the Fund’s net assets, and the Investment Grade Fund held nine 144A securities with an aggregate value of $3,613,756 representing 11.1% of the Fund’s net assets. Certain restricted securities are exempt from the registration requirements under Section 4(2) of the Securities Act of 1933 and may only be sold to qualified investors. At December 31, 2008, th e Cash Management Fund held nine Section 4(2) securities with an aggregate value of $3,946,422 representing 30.2% of the Fund’s net assets. These securities are valued as set forth in Note 1A.
6. Forward Currency Contracts and Foreign Exchange Contracts—Forward currency contracts and foreign exchange contracts are obligations to purchase or sell a specific currency for an agreed-upon price at a future date. When the International Fund purchases or sells foreign securities, it may enter into a forward currency contract to minimize the foreign exchange risk between the trade date and the settlement date of such transactions. The International Fund could be exposed to risk if counter parties to the contracts are unable to meet the terms of their contracts or if the value of the foreign currency changes unfavorably. Forward currency contracts and foreign exchange contracts are “marked-to-market” daily at the applicable translation rate and the resulting unrealized gains or losses are reflected in the Fund’s assets.
The International Fund had the following forward currency contracts open at December 31, 2008:
| | | | | | | | | | |
| | | | | | | | |
| Contracts to Buy | | | | | | Unrealized |
| Foreign Currency | | In Exchange for | | Settlement Date | | Gain (Loss) |
| 45,240 | | British Pound | | US$ | 66,593 | | 12/31/08 | | US $ | 86 |
| 9,022 | | British Pound | | 13,135 | | 1/2/09 | | (7) |
| 1,812 | | British Pound | | 2,614 | | 1/5/09 | | 2 |
| 902,525 | | Swiss Franc | | | 862,191 | | 1/5/09 | | | 8,812 |
| | | | | | $944,533 | | | | |
| |
| Net Unrealized Gain on Forward Currency Contracts | | | | | $8,893 |
The International Fund has the following foreign exchange contracts outstanding at December 31, 2008:
| | | | | | | | | |
| | | | | | | | |
| Contracts to Buy | | | | | | Unrealized |
| Foreign Currency | | | In Exchange for | | Settlement Date | | Gain (Loss) |
| 16,750,000 | | British Pound | | US $ 30,092,708 | | 2/11/09 | | US$(6,010,353) |
| 9,616,000 | | Euro | | 13,602,911 | | 2/11/09 | | (236,217) |
| 7,846,000 | | Canadian Dollar | | 7,362,414 | | 2/12/09 | | (1,006,805) |
| 6,422,000 | | Australian Dollar | | 5,199,356 | | 2/13/09 | | (721,941) |
| 5,745,000 | | Swiss Franc | | 5,150,487 | | 2/13/09 | | 247,173 |
| 2,674,000 | | Australian Dollar | | 2,119,934 | | 3/4/09 | | (255,623) |
| 85,383,000 | | Indian Rupee | | 1,709,198 | | 3/16/09 | | 43,326 |
| 2,924,000 | | Australian Dollar | | 1,830,202 | | 4/17/09 | | 208,409 |
| 7,710,000 | | British Pound | | 11,422,417 | | 4/17/09 | | (337,345) |
| 5,072,000 | | Euro | | 6,368,180 | | 4/17/09 | | 682,140 |
| 4,098,000 | | Swiss Franc | | 3,375,437 | | 4/23/09 | | 474,800 |
| 3,444,000 | | Australian Dollar | | 2,258,059 | | 5/29/09 | | 143,096 |
| 7,584,000 | | British Pound | | 11,502,672 | | 5/29/09 | | (598,757) |
| 7,320,000 | | Euro | | 9,487,525 | | 5/29/09 | | 687,621 |
| 5,650,000 | | Swiss Franc | | | 4,757,134 | | 5/29/09 | | 551,271 |
| | | | | | $116,238,634 | | | | $(6,129,205) |
Notes to Financial Statements (continued)
FIRST INVESTORS LIFE SERIES FUNDS
December 31, 2008
| | | | | | | | | |
| | | | | | | | |
| Contracts to Sell | | | | | | Unrealized |
| Foreign Currency | | | In Exchange for | | Settlement Date | | Gain (Loss) |
| 16,750,000 | | British Pound | | US $ 30,288,483 | | 2/11/09 | | US $ 6,206,129 |
| 9,616,000 | | Euro | | 14,045,109 | | 2/11/09 | | 678,414 |
| 7,846,000 | | Canadian Dollar | | 7,333,206 | | 2/12/09 | | 977,597 |
| 6,422,000 | | Australian Dollar | | 5,573,461 | | 2/13/09 | | 1,096,047 |
| 5,745,000 | | Swiss Franc | | 5,322,204 | | 2/13/09 | | (75,456) |
| 2,674,000 | | Australian Dollar | | 2,225,557 | | 3/4/09 | | 361,246 |
| 85,383,000 | | Indian Rupee | | 1,810,092 | | 3/16/09 | | 57,567 |
| 2,924,000 | | Australian Dollar | | 1,961,801 | | 4/17/09 | | (76,810) |
| 7,710,000 | | British Pound | | 13,344,915 | | 4/17/09 | | 2,259,843 |
| 5,072,000 | | Euro | | 6,884,099 | | 4/17/09 | | (166,221) |
| 4,098,000 | | Swiss Franc | | 3,558,836 | | 4/23/09 | | (291,401) |
| 3,444,000 | | Australian Dollar | | 2,202,128 | | 5/29/09 | | (199,027) |
| 7,584,000 | | British Pound | | 11,590,903 | | 5/29/09 | | 686,988 |
| 7,320,000 | | Euro | | 9,452,819 | | 5/29/09 | | (722,327) |
| 5,650,000 | | Swiss Franc | | | 4,788,367 | | 5/29/09 | | (520,037) |
| | | | | | $120,381,980 | | | | $10,272,552 |
| |
| Net Unrealized Gain on Foreign Exchange Contracts | | | | $ 4,143,347 |
7. High Yield Credit Risk—The High Yield Fund’s investment in high yield securities, whether rated or unrated, may be considered speculative and subject to greater market fluctuations and risks of loss of income and principal than lower yielding, higher-rated, fixed-income securities. The risk of loss due to default by the issuer may be signifi-cantly greater for the holders of high yielding securities, because such securities are generally unsecured and are often subordinated to other creditors of the issuer.
8. Tax Components of Capital and Distributions to Shareholders – The tax character of distributions declared for the years ended December 31, 2008 and 2007 were as follows:
| | | | | | | | |
| | | | | | |
| | | | |
| | Distributions | | Distributions | |
| | Declared in 2008 | | Declared in 2007 | |
| |
| | Ordinary | Long-Term | | Ordinary | Long-Term | |
| Fund | Income | Capital Gain | Total | Income | Capital Gain | Total |
| |
| Blue Chip | $2,189,370 | $ | — | $ 2,189,370 | $ 1,975,764 | $ | — | $ 1,975,764 |
| Cash Management | 283,747 | — | 283,747 | 315,057 | — | 315,057 |
| Discovery | 2,133,308 | 5,892,816 | 8,026,124 | 4,626,532 | 8,968,870 | 13,595,402 |
| Government | 941,789 | — | 941,789 | 10,778,452 | 28,216,948 | 38,995,400 |
| Growth & Income | 9,625,749 | 10,551,775 | 20,177,524 | 5,214,979 | — | 5,214,979 |
| High Yield | 5,998,094 | — | 5,998,094 | 8,926,027 | 13,171,206 | 22,097,233 |
| International | 5,070,014 | 11,642,102 | 16,712,116 | 2,023,887 | — | 2,023,887 |
| Investment Grade | 2,055,553 | — | 2,055,553 | 87,643 | — | 87,643 |
| Select Growth | 18,128 | 113,773 | 131,901 | 1,016,156 | — | 1,016,156 |
| Target Maturity 2010 | 761,937 | 16,448 | 778,385 | 730,057 | 31,172 | 761,229 |
| Target Maturity 2015 | 1,064,287 | — | 1,064,287 | 978,165 | — | 978,165 |
| Value | 1,535,490 | — | 1,535,490 | 1,493,871 | — | 1,493,871 |
As of December 30, 2008, the components of distributable earnings (deficit) on a tax basis were as follows:
| | | | | | | | |
| | | | | | |
| | | | | | | Total |
| | Undistributed | Accumulated | Capital | Other | Unrealized | Distributable |
| | Ordinary | Capital | Loss | Accumulated | Appreciation | Earnings |
| Fund | Income | Gains | Carryover | Losses | (Depreciation) | (Deficit)* |
| |
| Blue Chip | $2,356,058 | $ | — | $(28,102,422) | $ | — | $ 2,616,289 | $(23,130,075) |
| Discovery | 1,370,209 | — | (466,376) | (7,991,240) | (17,023,449) | (24,110,856) |
| Government | 1,023,541 | — | (731,380) | — | 511,729 | 803,890 |
| Growth & Income | 3,091,075 | — | (11,930,936) | (1,769,865) | (47,237,823) | (57,847,549) |
| High Yield | 5,799,512 | — | (23,377,762) | (312,906) | (27,878,299) | (45,769,455) |
| International | 3,943,956 | — | (14,866,817) | (8,758,060) | (11,630,433) | (31,311,354) |
| Investment Grade | 2,115,835 | — | (4,607,401) | (84,320) | (3,389,992) | (5,965,878) |
| Select Growth | — | — | (2,094,369) | (1,245,408) | (1,144,065) | (4,483,842) |
| Target Maturity 2010 | 726,847 | 170,945 | — | — | 1,355,579 | 2,253,371 |
| Target Maturity 2015 | 1,124,303 | 41,170 | — | — | 4,845,628 | 6,011,101 |
| Value | 1,816,517 | — | (7,835,565) | — | (5,213,488) | (11,232,536) |
*Differences between book distributable earnings and tax distributable earnings consist primarily of wash sales, passive foreign investment companies and amortization of bond premium and discounts.
Other accumulated losses consist primarily of post-October loss deferrals.
For the year ended December 31, 2008, the following reclassifications were made to reflect permanent differences between book and tax reporting which are primarily due to the differences between book and tax treatment of investments in real estate trusts and passive foreign investment companies, foreign currency transactions and expiration of capital loss carryovers.
| | | | | | | | |
| | | | | | |
| | | | Undistributed | Accumulated |
| | | Capital | | Ordinary | | Capital |
| Fund | | Paid In | | Income | Gains (Losses) |
| Blue Chip | | $ | — | | $ | (152) | $ | 152 |
| Discovery | | — | | (36) | | 36 |
| Government | | (19,194) | | — | | 19,194 |
| Growth & Income | | — | | (45,162) | | 45,162 |
| High Yield | | (1,503,018) | | —- | 1,503,018 |
| International | | 122,819 | | (2,025,379) | 1,902,560 |
| Investment Grade | | (612,688) | | — | | 612,688 |
| Select Growth | | (5,902) | | 5,895 | | 7 |
| Value | | — | | (151,804) | | 151,804 |
9. Reorganization—On November 16, 2007, First Investors Life Series High Yield Fund (“High Yield Fund”) acquired all of the net assets of the First Investors Life Series Special Bond Fund (“Special Bond Fund”) in connection with a tax-free reorganization that was approved by the shareholders of Special Bond Fund at a special meeting of shareholders held on October 29, 2007. The High Yield Fund issued 1,747,119 shares to the Special Bond Fund in connection with the reorganization. In return, it received net assets of $13,341,374 from the Special Bond Fund (which included $1,209,299 of unrealized depreciation and $7,664,701 of accumulated net realized losses). The High Yield Fund’s shares were issued at their current net asset values as of the date of the reorganization. The aggregate net assets of the High Yield Fund and Special Bond Fund immediately before the acquisition were $79,336,014 consisting of H igh Yield Fund $65,994,640 and Special Bond Fund $13,341,374, respectively.
10. New Accounting Pronouncements—In March 2008, Statement of Financial Accounting Standards No. 161, “Disclosures about Derivative Instruments and Hedging Activities” (“SFAS 161”) was issued and is effective for fiscal years beginning after November 15, 2008. SFAS 161 is intended to improve financial reporting for derivative instruments by requiring enhanced disclosure that enables investors to understand how and why an entity uses derivatives, how derivatives are accounted for, and how derivative instruments affect an entity’s results of operation and financial position. Management is currently evaluating the implications of SFAS 161. The impact on the Funds’ financial statement disclosures, if any, is currently being assessed.
Financial Highlights
FIRST INVESTORS LIFE SERIES FUNDS
The following table sets forth the per share operating data for a trust share outstanding, total return,
ratios to average net assets and other supplemental data for each year indicated.
| | | | | | | | | | | | | | | | | | | | | | | | | | | | |
| |
| | | | | | | | | | | | | | |
| | | | | | P E R S H A R E D A T A | | | | | | | R A T I O S / S U P P L E M E N T A L D A T A | | | |
| | | | | | | | | | Less Distributions | | | | | | | | | | | | Ratio to Average Net | | | |
| | | | Investment Operations | | from | | | | | | | | Ratio to Average Net | | Assets Before Expenses | | | |
| | Net Asset | | Net | | Net Realized | | | | | | | | | | Net Asset | | | | Assets** | | Waived or Assumed | | | |
| | Value, | | Investment | | and Unrealized | | Total from | | Net | | Net | | | | Value, | | | Net Assets | Expenses | | Net Invest- | | | | Net | | Portfolio | |
| | Beginning | | Income | | Gain (Loss) on | | Investment | | Investment | | Realized | | Total | | End of | Total | | End of Year | Before Fee | | ment Income | | | | Investment | | Turnover | |
| | of Year | | (Loss) | | Investments | | Operations | | Income | | Gains | | Distributions | | Year | Return* | | (in millions) | Credits | (a) | (Loss) | | Expenses | | Income | | Rate | |
| |
| BLUE CHIP FUND | | | | | | | | | | | | | | | | | | | | | | | | | | | | |
| 2004 | $ 18.91 | | $ .19 | | $ 1.20 | | $ 1.39 | | $ .12 | | — | | $ .12 | | $ 20.18 | 7.37 | % | $ 181 | .83 | % | .99 | % | N/A | | N/A | | 100 | % |
| 2005 | 20.18 | | .20 | | .67 | | .87 | | .20 | | — | | .20 | | 20.85 | 4.34 | | 174 | .85 | | .93 | | N/A | | N/A | | 34 | |
| 2006 | 20.85 | | .26 | | 2.74 | | 3.00 | | .20 | | — | | .20 | | 23.65 | 14.49 | | 181 | .82 | | 1.13 | | N/A | | N/A | | 4 | |
| 2007 | 23.65 | | .31 | | .67 | | .98 | | .26 | | — | | .26 | | 24.37 | 4.21 | | 173 | .81 | | 1.20 | | N/A | | N/A | | 5 | |
| 2008 | 24.37 | | .36 | | (8.10 | ) | (7.74 | ) | .31 | | — | | .31 | | 16.32 | (32.08 | ) | 107 | .83 | | 1.67 | | N/A | | N/A | | 8 | |
| |
| CASH MANAGEMENT FUND | | | | | | | | | | | | | | | | | | | | | | | | | | | | |
| 2004 | $ 1.00 | | $ .007 | | — | | $ .007 | | $ .007 | | — | | $ .007 | | $ 1.00 | .71 | % | $ 7 | .71 | % (b) | .69 | % | 1.04 | % | .35 | % | N/A | |
| 2005 | 1.00 | | .024 | | — | | .024 | | .024 | | — | | .024 | | 1.00 | 2.44 | | 6 | .72 | (b) | 2.38 | | 1.09 | | 1.99 | | N/A | |
| 2006 | 1.00 | | .043 | | — | | .043 | | .043 | | — | | .043 | | 1.00 | 4.35 | | 7 | .74 | (b) | 4.26 | | 1.09 | | 3.87 | | N/A | |
| 2007 | 1.00 | | .045 | | — | | .045 | | .045 | | — | | .045 | | 1.00 | 4.62 | | 15 | .72 | (b) | 4.49 | | 1.04 | | 4.14 | | N/A | |
| 2008 | 1.00 | | .020 | | — | | .020 | | .020 | | — | | .020 | | 1.00 | 2.03 | | 13 | .71 | (b) | 2.02 | | .96 | | 1.77 | | N/A | |
| |
| DISCOVERY FUND | | | | | | | | | | | | | | | | | | | | | | | | | | | | |
| 2004 | $ 21.75 | | $ (.04 | ) | $ 2.82 | | $ 2.78 | | $ — | | $ — | | $ — | | $ 24.53 | 12.78 | % | $ 134 | .83 | % | (.18 | )% | N/A | | N/A | | 93 | % |
| 2005 | 24.53 | | .08 | | 1.18 | | 1.26 | | — | | — | | — | | 25.79 | 5.14 | | 137 | .90 | | .15 | | N/A | | N/A | | 111 | |
| 2006 | 25.79 | | .06 | | 5.74 | | 5.80 | | .04 | | — | | .04 | | 31.55 | 22.51 | | 158 | .82 | | .19 | | N/A | | N/A | | 58 | |
| 2007 | 31.55 | | .11 | | 1.86 | | 1.97 | | .06 | | 2.66 | | 2.72 | | 30.80 | 6.62 | | 161 | .82 | | .35 | | N/A | | N/A | | 55 | |
| 2008 | 30.80 | | .30 | | (10.11 | ) | (9.81 | ) | .11 | | 1.44 | | 1.55 | | 19.44 | (33.25 | ) | 101 | .83 | | 1.15 | | N/A | | N/A | | 52 | |
| |
| GOVERNMENT FUND | | | | | | | | | | | | | | | | | | | | | | | | | | | | |
| 2004 | $ 10.59 | | $ .54 | | $ (.17 | ) | $ .37 | | $ .58 | | — | | $ .58 | | $ 10.38 | 3.62 | % | $ 21 | .76 | % | 4.81 | % | .91 | % | 4.66 | % | 62 | % |
| 2005 | 10.38 | | .51 | | (.26 | ) | .25 | | .53 | | — | | .53 | | 10.10 | 2.54 | | 20 | .81 | | 4.85 | | .96 | | 4.70 | | 52 | |
| 2006 | 10.10 | | .51 | | (.14 | ) | .37 | | .51 | | — | | .51 | | 9.96 | 3.80 | | 20 | .78 | | 5.10 | | .93 | | 4.95 | | 28 | |
| 2007 | 9.96 | | .48 | | .15 | | .63 | | .52 | | — | | .52 | | 10.07 | 6.55 | | 21 | .80 | | 4.94 | | .95 | | 4.75 | | 24 | |
| 2008 | 10.07 | | .44 | | .24 | | .68 | | .45 | | — | | .45 | | 10.30 | 6.93 | | 24 | .79 | | 4.56 | | .94 | | 4.41 | | 39 | |
| |
| GROWTH & INCOME FUND(c) | | | | | | | | | | | | | | | | | | | | | | | | | | | | |
| 2004 | $ 30.62 | | $ .25 | | $ 3.04 | | $ 3.29 | | $ .16 | | $ — | | $ .16 | | $ 33.75 | 10.77 | % | $ 239 | .83 | % | .79 | % | N/A | | N/A | | 76 | % |
| 2005 | 33.75 | | .16 | | 2.25 | | 2.41 | | .25 | | — | | .25 | | 35.91 | 7.20 | | 249 | .85 | | .46 | | N/A | | N/A | | 93 | |
| 2006 | 35.91 | | .20 | | 4.68 | | 4.88 | | .16 | | 2.27 | | 2.43 | | 38.36 | 14.35 | | 268 | .82 | | .55 | | N/A | | N/A | | 127 | |
| 2007 | 38.36 | | .41 | | .25 | | .66 | | .20 | | 5.43 | | 5.63 | | 33.39 | 1.98 | | 258 | .81 | | 1.14 | | N/A | | N/A | | 38 | |
| 2008 | 33.39 | | .40 | | (11.38 | ) | (10.98 | ) | .41 | | 2.24 | | 2.65 | | 19.76 | (35.22 | ) | 155 | .83 | | 1.48 | | N/A | | N/A | | 28 | |
Financial Highlights (continued)
FIRST INVESTORS LIFE SERIES FUNDS
| | | | | | | | | | | | | | | | | | | | | | | | | | | | | | | |
| | | | | | | | | | | | | | | | | | | | | | | | | | | | | | |
| | | | | | | | | | | | | | | | | | | | | | | | | | | | | |
| |
| | | | | | | P E R S H A R E D A T A | | | | | | | | | | R A T I O S / S U P P L E M E N T A L D A T A | | | | | |
| | | | | | | | | | | | | | | | | | | | | | | | | | |
| | | | | | | | | | | Less Distributions | | | | | | | | Ratio to Average Net | | Ratio to Average Net | | | |
| | | | | Investment Operations | | from | | | | | | | | Ratio to Average Net | | Assets Before Expenses | | | |
| | | Net Asset | | | | Net Realized | | | | | | | | | | Net Asset | | | | | Assets** | | Waived or Assumed | | | |
| | | Value, | | Net | | and Unrealized | | Total from | | Net | | Net | | | | Value, | | | | Net Assets | Expenses | | Net Invest- | | | | Net | | Portfolio | |
| | | Beginning | | Investment | | Gain (Loss) on | | Investment | | Investment | | Realized | | Total | | End of | | Total | | End of Year | Before Fee | | ment Income | | | | Investment | | Turnover | |
| | | of Year | | Income | | Investments | | Operations | | Income | | Gains | | Distributions | | Year | | Return* | | (in millions) | Credits | (a) | (Loss) | | Expenses | | Income | | Rate | |
| |
| HIGH YIELD FUND | | | | | | | | | | | | | | | | | | | | | | | | | | | |
| 2004 | | $ 8.50 | | $ .62 | | $ .17 | | $ .79 | | $ .63 | | — | | $ .63 | | $ 8.66 | 9.94 | % | $ 70 | .85 | % | 7.55 | % | N/A | | N/A | | 33 | % |
| 2005 | | 8.66 | | .65 | | (.61 | ) | .04 | | .63 | | — | | .63 | | 8.07 | .41 | | 69 | .87 | | 8.01 | | N/A | | N/A | | 35 | |
| 2006 | | 8.07 | | .62 | | .12 | | .74 | | .67 | | — | | .67 | | 8.14 | 9.77 | | 68 | .85 | | 7.63 | | N/A | | N/A | | 31 | |
| 2007 | | 8.14 | | .57 | | (.47 | ) | .10 | | .63 | | — | | .63 | | 7.61 | 1.06 | | 79 | .86 | | 7.19 | | N/A | | N/A | | 28 | |
| 2008 | | 7.61 | | .56 | | (2.39 | ) | (1.83 | ) | .59 | | — | | .59 | | 5.19 | (25.86 | ) | 52 | .86 | | 8.27 | | N/A | | N/A | | 17 | |
| |
| INTERNATIONAL FUND(d) | | | | | | | | | | | | | | | | | | | | | | | | | | | |
| 2004 | | $ 16.38 | | $ .09 | | $ 2.28 | | $ 2.37 | | $ .20 | | $ — | | $ .20 | | $ 18.55 | 14.58 | % | $ 99 | 1.02 | % | .94 | % | N/A | | N/A | | 114 | % |
| 2005 | | 18.55 | | .28 | | 1.41 | | 1.69 | | .24 | | — | | .24 | | 20.00 | 9.22 | | 105 | .99 | | .80 | | N/A | | N/A | | 104 | |
| 2006 | | 20.00 | | .29 | | 5.09 | | 5.38 | | .15 | | .64 | | .79 | | 24.59 | 27.79 | | 129 | .97 | | 1.24 | | N/A | | N/A | | 157 | |
| 2007 | | 24.59 | | .04 | | 4.26 | | 4.30 | | .83 | | 3.36 | | 4.19 | | 24.70 | 20.99 | | 154 | .90 | | 1.30 | | N/A | | N/A | | 97 | |
| 2008 | | 24.70 | | .30 | | (9.68 | ) | (9.38 | ) | .04 | | 2.65 | | 2.69 | | 12.63 | (41.89 | ) | 85 | .94 | | 1.41 | | N/A | | N/A | | 128 | |
| |
| INVESTMENT GRADE FUND | | | | | | | | | | | | | | | | | | | | | | | | | |
| 2004 | | $ 11.87 | | $ .59 | | $ (.12 | ) | $ .47 | | $ .67 | | — | | $ .67 | | $ 11.67 | 4.04 | % | $ 38 | .72 | % | 5.03 | % | .87 | % | 4.88 | % | 16 | % |
| 2005 | | 11.67 | | .56 | | (.42 | ) | .14 | | .67 | | — | | .67 | | 11.14 | 1.31 | | 38 | .75 | | 4.91 | | .90 | | 4.76 | | 24 | |
| 2006 | | 11.14 | | .53 | | (.11 | ) | .42 | | .62 | | — | | .62 | | 10.94 | 3.99 | | 37 | .74 | | 4.82 | | .89 | | 4.67 | | 86 | |
| 2007 | | 10.94 | | .43 | | .15 | | .58 | | .60 | | — | | .60 | | 10.92 | 5.52 | | 39 | .73 | | 4.97 | | .88 | | 4.81 | | 38 | |
| 2008 | | 10.92 | | .41 | | (1.60 | ) | (1.19 | ) | .57 | | — | | .57 | | 9.16 | (11.60 | ) | 32 | .74 | | 5.30 | | .89 | | 5.15 | | 133 | |
| |
| SELECT GROWTH FUND(e) | | | | | | | | | | | | | | | | | | | | | | | | | | | |
| 2004 | | $ 7.92 | | $ .10 | | $ .36 | | $ .46 | | $ .04 | | $ — | | $ .04 | | $ 8.34 | 5.87 | % | $ 11 | .96 | % | 1.23 | % | N/A | | N/A | | 50 | % |
| 2005 | | 8.34 | | .05 | | .41 | | .46 | | .10 | | — | | .10 | | 8.70 | 5.55 | | 11 | .99 | | .57 | | N/A | | N/A | | 66 | |
| 2006 | | 8.70 | | .07 | | .75 | | .82 | | .05 | | — | | .05 | | 9.47 | 9.47 | | 12 | .92 | | .77 | | N/A | | N/A | | 80 | |
| 2007 | | 9.47 | | .01 | | 1.06 | | 1.07 | | .07 | | — | | .07 | | 10.47 | 11.42 | | 13 | 1.14 | | .15 | | N/A | | N/A | | 161 | |
| 2008 | | 10.47 | | — | | (4.31 | ) | (4.31 | ) | .01 | | .09 | | .10 | | 6.06 | (41.47 | ) | 9 | .99 | | (.05 | ) | N/A | | N/A | | 107 | |
| |
| TARGET MATURITY 2010 FUND | | | | | | | | | | | | | | | | | | | | | | | | | |
| 2004 | | $ 15.18 | | $ .72 | | $ (.13 | ) | $ .59 | | $ .73 | | $ .06 | | $ .79 | | $ 14.98 | 3.96 | % | $ 17 | .75 | % | 4.70 | % | .90 | % | 4.55 | % | 4 | % |
| 2005 | | 14.98 | | .70 | | (.50 | ) | .20 | | .70 | | .14 | | .84 | | 14.34 | 1.46 | | 16 | .76 | | 4.74 | | .91 | | 4.59 | | 3 | |
| 2006 | | 14.34 | | .75 | | (.49 | ) | .26 | | .72 | | .12 | | .84 | | 13.76 | 2.02 | | 14 | .76 | | 5.13 | | .91 | | 4.98 | | 3 | |
| 2007 | | 13.76 | | .69 | | .41 | | 1.10 | | .77 | | — | | .77 | | 14.09 | 8.35 | | 15 | .76 | | 5.33 | | .91 | | 5.16 | | 11 | |
| 2008 | | 14.09 | | .75 | | .26 | | 1.01 | | .73 | | .02 | | .75 | | 14.35 | 7.33 | | 14 | .76 | | 5.03 | | .91 | | 4.88 | | 0 | |
Financial Highlights (continued)
FIRST INVESTORS LIFE SERIES FUNDS
| | | | | | | | | | | | | | | | | | | | | | | | | | | | | |
| | | | | | | | | | | | | | | | | | | | | | | | | | | | |
|
| | | | | | | P E R S H A R E D A T A | | | | | | | | | R A T I O S / S U P P L E M E N T A L D A T A | | | | | |
| | | | | | | | | | | Less Distributions | | | | | | | | | | | | Ratio to Average Net | | | |
| | | | | Investment Operations | | from | | | | | | | | Ratio to Average Net | | Assets Before Expenses | | | |
| | | Net Asset | | | | Net Realized | | | | | | | | | Net Asset | | | | Assets** | | Waived or Assumed | | | |
| | | Value, | | Net | | and Unrealized | | Total from | | Net | Net | | | | Value, | | | Net Assets | Expenses | | Net | | | | Net | | Portfolio | |
| | | Beginning | | Investment | | Gain (Loss) on | | Investment | | Investment | Realized | | Total | | End of | Total | | End of Year | Before Fee | | Investment | | | | Investment | | Turnover | |
| | | of Year | | Income | | Investments | | Operations | | Income | Gains | | Distributions | | Year | Return* | | (in millions) | Credits(a) | | Income | | Expenses | | Income | | Rate | |
| |
| TARGET MATURITY 2015 FUND | | | | | | | | | | | | | | | | | | | | | | | | |
| 2004 | | $ 13.74 | | $ .53 | | $ .61 | | $ 1.14 | | $ .51 | — | | $ .51 | | $ 14.37 | 8.47 | % | $ 17 | .75 | % | 4.34 | % | .90 | % | 4.19 | % | 2 | % |
| 2005 | | 14.37 | | .53 | | .08 | | .61 | | .52 | — | | .52 | | 14.46 | 4.39 | | 22 | .73 | | 4.14 | | .88 | | 3.99 | | 0 | |
| 2006 | | 14.46 | | .57 | | (.32 | ) | .25 | | .52 | — | | .52 | | 14.19 | 1.85 | | 24 | .70 | | 4.38 | | .85 | | 4.23 | | 2 | |
| 2007 | | 14.19 | | .59 | | .74 | | 1.33 | | .58 | — | | .58 | | 14.94 | 9.70 | | 27 | .70 | | 4.32 | | .85 | | 4.16 | | 3 | |
| 2008 | | 14.94 | | .63 | | 1.49 | | 2.12 | | .58 | — | | .58 | | 16.48 | 14.56 | | 29 | .69 | | 4.01 | | .84 | | 3.86 | | 0 | |
| |
| VALUE FUND | | | | | | | | | | | | | | | | | | | | | | | | | | | | |
| 2004 | | $ 11.99 | | $ .23 | | $ 1.71 | | $ 1.94 | | $ .22 | — | | $ .22 | | $ 13.71 | 16.39 | % | $ 69 | .84 | % | 1.87 | % | N/A | | N/A | | 20 | % |
| 2005 | | 13.71 | | .25 | | .57 | | .82 | | .22 | — | | .22 | | 14.31 | 6.09 | | 79 | .87 | | 1.89 | | N/A | | N/A | | 21 | |
| 2006 | | 14.31 | | .27 | | 2.76 | | 3.03 | | .26 | — | | .26 | | 17.08 | 21.43 | | 94 | .83 | | 1.73 | | N/A | | N/A | | 15 | |
| 2007 | | 17.08 | | .31 | | (.42 | ) | (.11 | ) | .27 | — | | .27 | | 16.70 | (.66 | ) | 91 | .83 | | 1.75 | | N/A | | N/A | | 17 | |
| 2008 | | 16.70 | | .40 | | (5.24 | ) | (4.84 | ) | .29 | — | | .29 | | 11.57 | (29.41 | ) | 58 | .85 | | 2.47 | | N/A | | N/A | | 15 | |
* The effect of fees and charges incurred at the separate account level are not reflected in these performance figures.
** Net of expenses waived or assumed by the investment adviser (Note 4).
(a) The ratios do not include a reduction of expenses from cash balances maintained with the Bank of New York Mellon or from brokerage service arrangements (Note 1H).
(b) For each of the years shown, the expense ratio after fee credits was .70%. FIMCO has voluntarily waived advisory fees to limit the Fund’s overall expense to .70%.
(c) Prior to October 18, 2006, known as Growth Fund.
(d) Prior to June 27, 2006, known as International Securities Fund.
(e) Prior to July 26, 2007 known as Focused Equity Fund.
| | |
| See notes to financial statements |
| 122 | | 123 |
Report of Independent Registered Public Accounting Firm
To the Shareholders and Board of Trustees of
First Investors Life Series Funds
We have audited the accompanying statements of assets and liabilities of the twelve Funds comprising First Investors Life Series Funds, including the portfolios of investments, as of December 31, 2008, the related statements of operations for the year then ended, the statements of changes in net assets for each of the two years in the period then ended, and the financial highlights for each of the five years in the period then ended. These financial statements and financial highlights are the responsibility of the Life Series Funds’ management. Our responsibility is to express an opinion on these financial statements and financial highlights based on our audits.
We conducted our audits in accordance with the standards of the Public Company Accounting Oversight Board (United States). Those standards require that we plan and perform the audit to obtain reasonable assurance about whether the financial statements and financial highlights are free of material misstatement. The Funds are not required to have, nor were we engaged to perform, an audit of the Funds’ internal control over financial reporting. Our audits included consideration of internal control over financial reporting as a basis for designing audit procedures that are appropriate in the circumstances, but not for the purpose of expressing an opinion on the effectiveness of the Funds’ internal control over financial reporting. Accordingly, we express no such opinion. An audit includes examining, on a test basis, evidence supporting the amounts and disclosures in the financial statements. Our procedures included confirmation of securities owned as of December 31 , 2008, by correspondence with the custodian and brokers. Where brokers have not replied to our confirmation requests, we have carried out other appropriate auditing procedures. An audit also includes assessing the accounting principles used and significant estimates made by management, as well as evaluating the overall financial statement presentation. We believe that our audits provide a reasonable basis for our opinion.
In our opinion, the financial statements and financial highlights referred to above present fairly, in all material respects, the financial position of each of the twelve Funds comprising First Investors Life Series Funds, as of December 31, 2008, and the results of their operations for the year then ended, changes in their net assets for each of the two years in the period then ended, and their financial highlights for each of the five years in the period then ended, in conformity with accounting principles generally accepted in the United States of America.
Philadelphia, Pennsylvania
February 27, 2009
FIRST INVESTORS LIFE SERIES FUNDS
Trustees and Officers*
| | | | |
| | Position(s) | | | |
| | Held with | Principal | Number of | Other |
| | Funds and | Occupation(s) | Portfolios in | Trusteeships |
| Name, Year of Birth | Length of | During Past | Fund Complex | Directorships |
| and Address | Service | 5 Years | Overseen | Held |
| |
| DISINTERESTED TRUSTEES |
| |
| Charles R. Barton, III 1965 | Trustee since | Chief Operating | 39 | None |
| c/o First Investors | 1/1/06 | Officer (since | | |
| Management Company, Inc. | | 2007) and Direc- | | |
| 110 Wall Street | | tor and Trustee of | | |
| New York, NY 10005 | | the Barton Group, | | |
| | | LLC; President | | |
| | | of Noe Pierson | | |
| | | Corporation | | |
| |
| |
| Stefan L. Geiringer 1934 | Trustee since | Co-Founder | 39 | None |
| c/o First Investors | 1/1/06 | and Senior Vide | | |
| Management Company, Inc. | | President of Real | | |
| 110 Wall Street | | Time Energy So- | | |
| New York, NY 10005 | | lutions, Inc. since | | |
| | | 2005; Founder/ | | |
| | | Owner of SLG, | | |
| | | Inc. since 2005; | | |
| | | Senior Vice | | |
| | | President of | | |
| | | Pepco Energy | | |
| | | Services (North- | | |
| | | east Division) | | |
| | | from 2003-2006; | | |
| | | Founder/Owner | | |
| | | and President of | | |
| | | North Atlantic | | |
| | | Utilities, Inc. | | |
| | | from 1987-2003 | | |
| |
| |
| Robert M. Grohol 1932 | Trustee since | None/Retired | 39 | None |
| c/o First Investors | 8/18/05; | | | |
| Management Company, Inc. | Director/Trustee | | | |
| 110 Wall Street | of predecessor | | | |
| New York, NY 10005 | funds since | | | |
| | 6/30/00 | | | |
FIRST INVESTORS LIFE SERIES FUNDS
Trustees and Officers* (continued)
| | | | |
| | Position(s) | | | |
| | Held with | Principal | Number of | Other |
| | Funds and | Occupation(s) | Portfolios in | Trusteeships |
| Name, Year of Birth | Length of | During Past | Fund Complex | Directorships |
| and Address | Service | 5 Years | Overseen | Held |
| |
| DISINTERESTED TRUSTEES (continued) |
| |
| Arthur M. Scutro, Jr. 1941 | Trustee since | None/Retired | 39 | None |
| c/o First Investors | 1/1/06 | | | |
| Management Company, Inc. | | | | |
| 110 Wall Street | | | | |
| New York, NY 10005 | | | | |
| |
| |
| James M. Srygley 1932 | Trustee since | Retired; | 39 | None |
| c/o First Investors | 8/18/05; | Owner | | |
| Management Company, Inc. | Director/Trustee | Hampton | | |
| 110 Wall Street | of predecessor | Properties | | |
| New York, NY 10005 | funds since | | | |
| | 1/19/95 | | | |
| |
| |
| Robert F. Wentworth 1929 | Trustee since | None/Retired | 39 | None |
| c/o First Investors | 8/18/05; | | | |
| Management Company, Inc. | Director/Trustee | | | |
| 110 Wall Street | of predecessor | | | |
| New York, NY 10005 | funds since | | | |
| | 10/15/92 | | | |
| | | | |
| | Position(s) | | | |
| | Held with | Principal | Number of | Other |
| | Funds and | Occupation(s) | Portfolios in | Trusteeships |
| Name, Year of Birth | Length of | During Past | Fund Complex | Directorships |
| and Address | Service | 5 Years | Overseen | Held |
| |
| INTERESTED TRUSTEES** |
| |
| Kathryn S. Head 1955 | Trustee and | Chairman, Of- | 39 | None |
| c/o First Investors | President since | ficer and Director | | |
| Management Company, Inc. | 8/18/05; Direc- | of First Investors | | |
| Raritan Plaza I | tor/Trustee of | Corporation; | | |
| Edison, NJ 08837 | predecessor funds | First Investors | | |
| | since 3/17/94; | Consolidated | | |
| | President of | Corporation; | | |
| | predecessor funds | First Investors | | |
| | since 2001 | Management | | |
| | | Company, Inc.; | | |
| | | Administrative | | |
| | | Data Manage- | | |
| | | ment Corp.; First | | |
| | | Investors Federal | | |
| | | Savings Bank; | | |
| | | First Investors | | |
| | | Name Saver, | | |
| | | Inc.; and | | |
| | | other affiliated | | |
| | | companies*** | | |
*Each Trustee serves for an indefinite term with the Funds, until his/her successor is elected.
**Ms. Head is an interested trustee because (a) she indirectly owns more than 5% of the voting stock of the adviser and principal underwriter of the Funds, (b) she is an officer, director and employee of the adviser and principal underwriter of the Funds, and (c) she is an officer of the Funds.
*** Other affiliated companies consist of: First Investors Realty Company, Inc., First Investors Life Insurance Company, First Investors Leverage Corporation, Route 33 Realty Corporation, First Investors Credit Funding Corporation, N.A.K. Realty Corporation, Real Property Development Corporation, First Investors Credit Corporation and First Investors Resources, Inc.
FIRST INVESTORS LIFE SERIES FUNDS
Trustees and Officers* (continued)
| | | | |
| | Position(s) | | | |
| | Held with | Principal | Number of | Other |
| | Funds and | Occupation(s) | Portfolios in | Trusteeships |
| Name, Year of Birth | Length of | During Past | Fund Complex | Directorships |
| and Address | Service | 5 Years | Overseen | Held |
| |
| OFFICER (S) WHO ARE NOT TRUSTEES |
| |
| Joseph I. Benedek 1957 | Treasurer | Treasurer of | 39 | None |
| c/o First Investors | since 8/18/05; | First Investors | | |
| Management Company, Inc. | Treasurer of | Management | | |
| Raritan Plaza I | predecessor fund | Company, Inc. | | |
| Edison, NJ 08837 | since 1988 | | | |
| |
| |
| Larry R. Lavoie 1947 | Chief | General Counsel | 39 | None |
| c/o First Investors | Compliance | of First Investors | | |
| Management Company, Inc. | Officer since | Corporation and | | |
| 110 Wall Street | 8/18/05; | its affiliates; | | |
| New York, NY 10005 | Chief | Director of | | |
| | Compliance | First Investors | | |
| | Officer of | Corporation | | |
| | predecessor funds | and various | | |
| | since 2004 | affiliates | | |
FIRST INVESTORS LIFE SERIES FUNDS
| |
| Shareholder Information | |
| | |
| Investment Adviser | Custodian |
| First Investors Management | The Bank of New York Mellon |
| Company, Inc. | One Wall Street |
| 110 Wall Street | New York, NY 10286 |
| New York, NY 10005 | |
| | Custodian |
| Subadviser | (International Fund) |
| (Discovery Fund) | Brown Brothers Harriman & Co. |
| Paradigm Capital Management, Inc. | 40 Water Street |
| Nine Elk Street | Boston, MA 02109 |
| Albany, NY 12207 | |
| | Transfer Agent |
| Subadviser | Administrative Data |
| (International Fund) | Management Corp. |
| Vontobel Asset Management, Inc. | Raritan Plaza I—8th Floor |
| 1540 Broadway | Edison, NJ 08837-3620 |
| New York, NY 10036 | |
| | Independent Registered |
| Subadviser | Public Accounting Firm |
| (Select Growth Fund) | Tait, Weller & Baker LLP |
| Smith Asset Management Group, L.P. | 1818 Market Street |
| 100 Crescent Court | Philadelphia, PA 19103 |
| Dallas, TX 75201 | |
| | Legal Counsel |
| | K&L Gates LLP |
| | 1601 K Street, N.W. |
| | Washington, D.C. 20006 |
FIRST INVESTORS LIFE SERIES FUNDS
A description of the policies and procedures that the Funds use to vote proxies relating to a portfolio’s securities is available, without charge, upon request by calling toll free 800-423-4026 or can be viewed online or downloaded from the EDGAR database on the Securities and Exchange Commission’s (“SEC”) internet website at http://www.sec.gov. In addition, information regarding how the Funds voted proxies relating to portfolio securities during the most recent 12-month period ended June 30, is available, without charge, upon request in writing or by calling 800-423-4026 and on the SEC’s internet website at http://www.sec.gov.
The Funds file their complete schedule of portfolio holdings with the SEC on Form N-Q, for the first and third quarters of each fiscal year. The Funds’ Form N-Q will be available on the SEC’s website at http://www.sec.gov; and may also be reviewed and copied at the SEC’s Public Reference Room in Washington D.C. Information on the operation of the Public Reference Room may be obtained by calling 800-SEC-0330. The schedule of portfolio holdings is available, without charge, upon request in writing or by calling 800-423-4026.
NOTES
NOTES
NOTES

Item 2. Code of Ethics
As of December 31, 2008, the Registrant has adopted a code of ethics that applies to the Registrant's President/Principal Executive Officer and Treasurer/Principal Financial Officer.
For the year ended December 31, 2008, there were no waivers granted from a provision of the code of ethics.
A copy of the Registrant's code of ethics is filed under Item 12(a)(1).
Item 3. Audit Committee Financial Expert
The Registrant's Board has determined that it has at least two "audit committee financial experts" serving on its audit committee. Robert F. Wentworth and Arthur M. Scutro, Jr. are the "audit committee financial experts" and are considered to be "independent" as defined in Item 3 of Form N-CSR.
Item 4. Principal Accountant Fees and Services
| | | | |
| |
| | | |
| | Fiscal Year Ended |
| | December 31, |
| | ----------------- |
| | 2008 | | 2007 |
| | ---- | | ---- |
| (a) Audit Fees | $ | 140,100 | $ | 149,900 |
| |
| (b) Audit-Related Fees | $ | 0 | $ | 0 |
| |
| (c) Tax Fees | $ | 34,800 | $ | 39,200 |
| |
| Nature of fees: tax returns preparation and tax compliance |
| |
| (d) All Other Fees | $ | 0 | $ | 0 |
(e)(1) Audit committee's pre-approval policies
The Charter of the Audit Committee requires the Audit Committee:
(a) to pre-approve, and to recommend to the full Board, the selection, retention or termination of the independent auditors to provide audit, review or attest services to the Funds and, in connection therewith, evaluate the independence of the auditors and to obtain the auditors' specific representations as to their independence;
(b) to pre-approve all non-audit services to be provided to the Funds by the independent auditor;
(c) to pre-approve all non-audit services to be provided by the Funds' independent auditor to the Funds' investment adviser or to any entity that controls, is controlled by or is under common control with the Funds' investment adviser ("adviser affiliate") and that provides ongoing services to the Funds, if the engagement relates directly to the operations and financial reporting of the Funds;
(d) to establish, if deemed necessary or appropriate as an alternative to Audit Committee pre-approval of services to be provided by the independent auditor as required by paragraphs (b) and (c) above, policies and procedures to permit such services to be pre-approved by other means, such as by action of a designated member and members of the Audit Committee, subject to subsequent Committee review and oversight;
(e) to consider whether the non-audit services provided by the Funds' independent auditors to the Funds' investment adviser or any adviser affiliate that provides ongoing services to the Funds, which services were not pre-approved by the Audit Committee, are compatible with maintaining the auditors' independence;
(f) to review and approve the fees proposed to be charged to the Funds by the auditors for each audit and non-audit service;
(e)(2) None, or 0%, of the services relating to the Audit-Related Fees, Tax Fees and All Other Fees paid by the Registrant and Related Entities disclosed above were approved by the audit committee pursuant to paragraph (c)(7)(i)(C) of Rule 2-01 of Regulation S-X (which permits audit committee approval after the start of the engagement with respect to services other than audit review or attest services, if certain conditions are satisfied).
(f) Not Applicable
(g) Aggregate non-audit fees billed by the Registrant's accountant for services rendered to the Registrant and the Registrant's investment adviser or any entity controlling, controlled by, or under
common control with the adviser that provides ongoing services to the Registrant for the two fiscal years ended December 31, 2008 and 2007 were $83,750 and $61,500, respectively.
(h) Not Applicable
Item 5. Audit Committee of Listed Registrants
Not applicable
Item 6. Schedule of Investments
Schedule is included as part of the report to stockholders filed under Item 1 of this Form.
Item 7. Disclosure of Proxy Voting Policies & Procedures for Closed-End Management Investment Companies
Not applicable
Item 8. Portfolio Managers of Closed-End Management Investment Companies
Not applicable
Item 9. Purchases of Equity Securities by Closed-End Management Investment Companies and Affiliated Purchasers
Not applicable
Item 10. Submission of Matters to a Vote of Security Holders
There were no material changes to the procedure by which shareholders may recommend nominees to the Registrant's Board of Trustees.
Item 11. Controls and Procedures
(a) The Registrant's Principal Executive Officer and Principal Financial Officer have concluded that the Registrant's disclosure controls and procedures (as defined in Rule 30a-3(c) under the Investment Company Act of 1940, as amended) are effective, based on their evaluation of these disclosure controls and procedures as of a date within 90 days of the filing date of this report.
(b) There were no changes in the Registrant's internal controls over financial reporting that occurred during the second fiscal quarter of the period covered by this report that has materially affected, or is reasonably likely to materially affect, the Registrant's internal control over financial reporting.
Item 12. Exhibits
(a)(1) Code of Ethics - Filed herewith
(a)(2) Certifications pursuant to Section 302 of the Sarbanes-Oxley Act of 2002 - Filed herewith
(b) Certifications pursuant to Section 906 of the Sarbanes-Oxley Act of 2002 - Filed herewith
SIGNATURES
Pursuant to the requirements of the Securities Exchange Act of 1934 and the Investment Company Act of 1940, the Registrant has duly caused this report to be signed on its behalf by the undersigned, thereunto duly authorized.
First Investors Life Series Funds
(Registrant)
By /S/ KATHRYN S. HEAD
Kathryn S. Head
President and Principal Executive Officer
Date: March 9, 2009
Pursuant to the requirements of the Securities Exchange Act of 1934 and the Investment Company Act of 1940, this report has been signed below by the following persons on behalf of the Registrant and in the capacities and on the dates indicated.
First Investors Life Series Funds
(Registrant)
By /S/ JOSEPH I. BENEDEK
Joseph I. Benedek
Treasurer and Principal Financial Officer
Date: March 9, 2009