|
| UNITED STATES |
| SECURITIES AND EXCHANGE COMMISSION |
| WASHINGTON, D.C. 20549 |
| -------- |
| |
| FORM N-CSR |
| -------- |
| |
| CERTIFIED SHAREHOLDER REPORT OF REGISTERED MANAGEMENT |
| INVESTMENT COMPANIES |
| |
| INVESTMENT COMPANY ACT FILE NUMBER 811-4325 |
FIRST INVESTORS LIFE SERIES FUNDS
(Exact name of registrant as specified in charter)
110 Wall Street
New York, NY 10005
(Address of principal executive offices) (Zip code)
Joseph I. Benedek
First Investors Management Company, Inc.
Raritan Plaza I
Edison, NJ 08837-3620
(Name and address of agent for service)
REGISTRANT'S TELEPHONE NUMBER, INCLUDING AREA CODE:
1-212-858-8000
DATE OF FISCAL YEAR END: DECEMBER 31, 2010
DATE OF REPORTING PERIOD: DECEMBER 31, 2010
| |
| Item 1. | Reports to Stockholders |
| |
| | The annual report to stockholders follows |
This report is for the information of the shareholders of the Funds. It is the Funds’ practice to mail only one copy of their annual and semi-annual reports to all family members who reside at the same address and share the same last name. Additional copies of the reports will be mailed if requested by any shareholder in writing or by calling 1-800-423-4026. The Funds will ensure that separate reports are sent to any shareholder who subsequently changes his or her mailing address.
The views expressed in the portfolio manager letters reflect those views of the portfolio managers through the end of the period covered. Any such views are subject to change at any time based upon market or other conditions and we disclaim any responsibility to update such views. These views may not be relied on as investment advice.
You may obtain a free prospectus for any of the Funds by contacting your representative, calling 1-800-423-4026, writing to us at the following address: First Investors Corporation, 110 Wall Street, New York, NY 10005, or by visiting our website at www.firstinvestors.com. You should consider the investment objectives, risks, charges and expenses of a Fund carefully before investing. The prospectus contains this and other information about the Fund, and should be read carefully before investing.
An investment in a Fund is not a bank deposit and is not insured or guaranteed by the Federal Deposit Insurance Corporation (FDIC) or any other government agency. Although the Cash Management Fund seeks to preserve a net asset value at $1.00 per share, it is possible to lose money by investing in it, just as it is possible to lose money by investing in any of the other Funds. Past performance is no guarantee of future results.
A Statement of Additional Information (“SAI”) for any of the Funds may also be obtained, without charge, upon request by calling 1-800-423-4026, writing to us at our address or by visiting our website listed above. The SAI contains more detailed information about the Funds, including information about their Trustees.
Portfolio Manager’s Letter
BLUE CHIP FUND
Dear Investor:
This is the annual report for the First Investors Life Blue Chip Fund for the year ended December 31, 2010. During the period, the Fund’s return on a net asset value basis was 10.2%, including dividends of 30.9 cents per share.
During the year, the equity markets settled into a more stable pattern of positive results, boosted by a slowly improving economy. However, the markets remained highly susceptible to short-term headline shocks, causing periods of high volatility. The environment remained more macro driven, as the Federal Reserve (the “Fed”), the Obama administration and Congress continued to be aggressively involved in economic affairs, proposing new regulations and increasing government oversight of businesses.
The business community viewed many of these actions negatively, which had a chilling effect on entire sectors and industries. Government initiatives had a significant impact on industries such as health care, energy, financials and education, which saw their share prices fluctuate during the year. The catalyst for the significant rally at the end of the year was sparked by the Fed’s decision to take additional measures to stimulate growth in the form of further quantitative easing, or “QE2.” Additionally, better than expected growth of corporate profits and more encouraging economic data helped spur the markets during the year’s final months.
The Fund’s return lagged the S&P 500 Index during 2010, as its holdings in several sectors failed to keep pace. The worst performing sectors on a relative basis were consumer discretionary, information technology and industrials. Within consumer discretionary, H&R Block and retailers such as Best Buy and Staples were weak. Among technology companies, shares in companies such as software behemoth Microsoft and printer giant Hewlett-Packard detracted from performance. While the Fund benefited from a gain of more than 50% in Apple, the weighting was smaller than its weight in the benchmark Index. Within industrials, the Fund’s defense holdings such as Lockheed Martin were laggards. The Fund was also underexposed to many deep cyclical stocks that drove performance in the Index.
Another headwind the Fund faced is that it focuses primarily on the large-cap sector of the market, which generally lagged mid- and small-cap stocks. The Fund had a greater percentage of large-cap holdings than the S&P 500 Index.
Relative to the S&P 500 Index, the utilities sector was the top performer for the Fund — primarily because of our underweight position in the sector. The materials and financials sectors also turned in positive relative performance. Within materials, leading chemical company DuPont was a strong contributor and financials sector holdings in Berkshire Hathaway and insurer and asset manager Ameriprise Financial produced solid returns.
Portfolio Manager’s Letter (continued)
BLUE CHIP FUND
Thank you for placing your trust in First Investors. As always, we appreciate the opportunity to serve your investment needs.

Understanding Your Fund’s Expenses
FIRST INVESTORS LIFE SERIES FUNDS
As a mutual fund shareholder, you incur two types of costs: (1) transaction costs, and (2) ongoing costs, including advisory fees and other expenses. This example is intended to help you understand your ongoing costs (in dollars) of investing in the Fund and to compare these costs with the ongoing costs of investing in other mutual funds.
The examples are based on an investment of $1,000 in each Fund at the beginning of the period, July 1, 2010, and held for the entire six-month period ended December 31, 2010. The calculations assume that no shares were bought or sold during the period. Your actual costs may have been higher or lower, depending on the amount of your investment and the timing of any purchases or redemptions.
Actual Expense Example:
These amounts help you to estimate the actual expenses that you paid over the period. The “Ending Account Value” shown is derived from the Fund’s actual return, and the “Expenses Paid During Period” shows the dollar amount that would have been paid by an investor who started with $1,000 in the Fund. You may use the information here, together with the amount you invested, to estimate the expenses that you paid during the period.
To estimate the expenses you paid on your account during this period simply divide your ending account value by $1,000 (for example, an $8,600 account value divided by $1,000 = 8.60), then multiply the result by the number given for your Fund under the heading “Expenses Paid During Period”.
Hypothetical Expense Example:
These amounts provide information about hypothetical account values and hypothetical expenses based on the Fund’s actual expense ratio and an assumed rate of return of 5% per year before expenses, which is not the Fund’s actual return. The hypothetical account values and expenses may not be used to estimate the actual ending account balance or expenses you paid for the period. You may use this information to compare the ongoing costs of investing in the Fund and other funds. To do so, compare this 5% hypothetical example with the 5% hypothetical examples that appear in the shareholder reports of the other funds.
Please note that the expenses shown in the table are meant to highlight and help you compare your ongoing costs only and do not reflect any transactional costs. Therefore, the hypothetical expense example is useful in comparing ongoing costs only, and will not help you determine the relative total costs of owning different funds. In addition, if these transactional costs were included, your costs would have been higher.
Fund Expenses (unaudited)
BLUE CHIP FUND
The examples below show the ongoing costs (in dollars) of investing in your Fund and will help you in comparing these costs with costs of other mutual funds. Please refer to page 3 for a detailed explanation of the information presented in these examples.
| | | |
| | Beginning | Ending | |
| | Account | Account | Expenses Paid |
| | Value | Value | During Period |
| | (7/1/10) | (12/31/10) | (7/1/10–12/31/10)* |
| Expense Examples | | | |
| Actual | $1,000.00 | $1,197.94 | $4.54 |
| Hypothetical | | | |
| (5% annual return before expenses) | $1,000.00 | $1,021.08 | $4.18 |
| |
| * | Expenses are equal to the annualized expense ratio of .82%, multiplied by the average account |
| value over the period, multiplied by 184/365 (to reflect the one-half year period). |
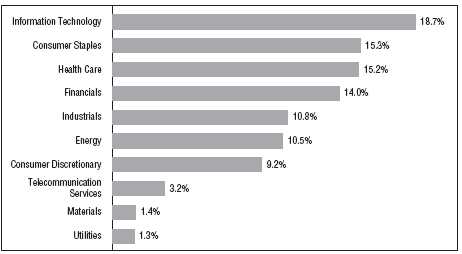
Portfolio Composition
TOP TEN SECTORS
|
| Portfolio holdings and allocations are subject to change. Percentages are as of December 31, 2010, |
| and are based on the total value of investments. |
Cumulative Performance Information (unaudited)
BLUE CHIP FUND
Comparison of change in value of $10,000 investment in the First Investors Life Series Blue Chip Fund and the Standard & Poor’s 500 Index.
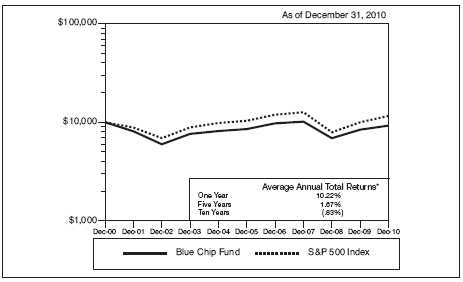
The graph compares a $10,000 investment in the First Investors Life Series Blue Chip Fund beginning 12/31/00 with a theoretical investment in the Standard & Poor’s 500 Index (the “Index”). The Index is an unmanaged capitalization-weighted index of 500 stocks designed to measure performance of the broad domestic economy through changes in the aggregate market value of such stocks, which represent all major industries. It is not possible to invest directly in this Index. In addition, the Index does not reflect fees and expenses associated with the active management of a mutual fund portfolio. For purposes of the graph and the accompanying table it is assumed that all dividends and distributions were reinvested.
* The Average Annual Total Return figures are for the periods ended 12/31/10.
The returns shown do not reflect any sales charges, since the Fund sells its shares solely to variable annuity and/or variable life insurance subaccounts at net asset value. The returns do not reflect the fees and charges that an individual would pay in connection with an investment in a variable annuity or life contract or policy. Results represent past performance and do not indicate future results. The graph and the returns shown do not reflect the deduction of taxes that an investor would pay on distributions or the redemption of fund shares. Investment return and principal value of an investment will fluctuate so that an investor’s shares, when redeemed, may be worth more or less than the original cost. Index figures are from Standard & Poor’s and all other figures are from First Investors Management Company, Inc.
Portfolio of Investments
BLUE CHIP FUND
December 31, 2010
| | | | |
| | | | | |
| | | | | |
| | | | | |
| | | | | |
| Shares | | Security | | Value |
| | | | | |
| | | COMMON STOCKS—99.4% | | |
| | | Consumer Discretionary—9.2% | | |
| 27,300 | | Best Buy Company, Inc. | | $ 936,117 |
| 53,150 | | Comcast Corporation – Special Class “A” | | 1,106,052 |
| 44,700 | | H&R Block, Inc. | | 532,377 |
| 18,300 | | Home Depot, Inc. | | 641,598 |
| 17,200 | * | Kohl’s Corporation | | 934,648 |
| 54,900 | | Lowe’s Companies, Inc. | | 1,376,892 |
| 8,900 | | McDonald’s Corporation | | 683,164 |
| 13,700 | | Omnicom Group, Inc. | | 627,460 |
| 35,000 | | Staples, Inc. | | 796,950 |
| 17,500 | | Target Corporation | | 1,052,275 |
| 26,800 | | Time Warner, Inc. | | 862,156 |
| 16,100 | | Viacom, Inc. – Class “B” | | 637,721 |
| 32,200 | | Walt Disney Company | | 1,207,822 |
| | | | | |
| | | | | 11,395,232 |
| | | | | |
| | | Consumer Staples—15.2% | | |
| 31,200 | | Avon Products, Inc. | | 906,672 |
| 12,600 | | Clorox Company | | 797,328 |
| 27,700 | | Coca-Cola Company | | 1,821,829 |
| 13,200 | | Costco Wholesale Corporation | | 953,172 |
| 39,000 | | CVS Caremark Corporation | | 1,356,030 |
| 11,700 | | Kellogg Company | | 597,636 |
| 22,600 | | Kimberly-Clark Corporation | | 1,424,704 |
| 39,561 | | Kraft Foods, Inc. – Class “A” | | 1,246,567 |
| 31,300 | | Kroger Company | | 699,868 |
| 35,300 | | PepsiCo, Inc. | | 2,306,149 |
| 25,500 | | Philip Morris International, Inc. | | 1,492,515 |
| 28,140 | | Procter & Gamble Company | | 1,810,246 |
| 35,000 | | Walgreen Company | | 1,363,600 |
| 38,900 | | Wal-Mart Stores, Inc. | | 2,097,877 |
| | | | | |
| | | | | 18,874,193 |
| | | | | |
| | | Energy—10.5% | | |
| 31,100 | | Chevron Corporation | | 2,837,875 |
| 25,771 | | ConocoPhillips | | 1,755,005 |
| 14,700 | | Devon Energy Corporation | | 1,154,097 |
| 50,900 | | ExxonMobil Corporation | | 3,721,808 |
| 8,200 | | Hess Corporation | | 627,628 |
| | | | |
| | | | | |
| | | | | |
| | | | | |
| | | | | |
| Shares | | Security | | Value |
| | | | | |
| | | Energy (continued) | | |
| 25,300 | | Marathon Oil Corporation | | $ 936,859 |
| 21,200 | | Noble Corporation | | 758,324 |
| 15,100 | | Schlumberger, Ltd. | | 1,260,850 |
| | | | | |
| | | | | 13,052,446 |
| | | | | |
| | | Financials—13.9% | | |
| 16,200 | | ACE, Ltd. | | 1,008,450 |
| 19,600 | | Allstate Corporation | | 624,848 |
| 28,200 | | American Express Company | | 1,210,344 |
| 16,000 | | Ameriprise Financial, Inc. | | 920,800 |
| 52,817 | | Bank of America Corporation | | 704,579 |
| 44,905 | | Bank of New York Mellon Corporation | | 1,356,131 |
| 16,800 | | Capital One Financial Corporation | | 715,008 |
| 15,300 | | Chubb Corporation | | 912,492 |
| 55,800 | | Hudson City Bancorp, Inc. | | 710,892 |
| 52,732 | | JPMorgan Chase & Company | | 2,236,892 |
| 9,300 | | M&T Bank Corporation | | 809,565 |
| 17,000 | | MetLife, Inc. | | 755,480 |
| 25,700 | | Morgan Stanley | | 699,297 |
| 14,100 | | Northern Trust Corporation | | 781,281 |
| 22,900 | | State Street Corporation | | 1,061,186 |
| 17,700 | | Travelers Companies, Inc. | | 986,067 |
| 26,500 | | U.S. Bancorp | | 714,705 |
| 34,000 | | Wells Fargo & Company | | 1,053,660 |
| | | | | |
| | | | | 17,261,677 |
| | | | | |
| | | Health Care—15.1% | | |
| 38,300 | | Abbott Laboratories | | 1,834,953 |
| 21,500 | * | Amgen, Inc. | | 1,180,350 |
| 21,400 | | Bristol-Myers Squibb Company | | 566,672 |
| 9,400 | | C.R. Bard, Inc. | | 862,638 |
| 17,100 | * | Gilead Sciences, Inc. | | 619,704 |
| 51,800 | | Johnson & Johnson | | 3,203,830 |
| 11,200 | * | Life Technologies Corporation | | 621,600 |
| 8,200 | | McKesson Corporation | | 577,116 |
| 31,700 | | Medtronic, Inc. | | 1,175,753 |
| 34,200 | | Merck & Company. Inc. | | 1,232,568 |
| 23,700 | | Novartis AG (ADR) | | 1,397,115 |
| 107,157 | | Pfizer, Inc. | | 1,876,319 |
| 12,600 | | Quest Diagnostics, Inc. | | 680,022 |
| 18,900 | * | St. Jude Medical, Inc. | | 807,975 |
Portfolio of Investments (continued)
BLUE CHIP FUND
December 31, 2010
| | | | |
| | | | | |
| | | | | |
| | | | | |
| | | | | |
| Shares | | Security | | Value |
| |
| | | Health Care (continued) | | |
| 14,800 | | Teva Pharmaceutical Industries, Ltd. (ADR) | | $ 771,524 |
| 12,500 | * | Thermo Fisher Scientific, Inc. | | 692,000 |
| 12,100 | * | Zimmer Holdings, Inc. | | 649,528 |
| |
| | | | | 18,749,667 |
| |
| | | Industrials—10.8% | | |
| 13,200 | | 3M Company | | 1,139,160 |
| 117,700 | | General Electric Company | | 2,152,733 |
| 16,800 | | Honeywell International, Inc. | | 893,088 |
| 13,500 | | Illinois Tool Works, Inc. | | 720,900 |
| 24,200 | | Ingersoll-Rand, PLC | | 1,139,578 |
| 20,700 | | ITT Corporation | | 1,078,677 |
| 9,100 | | Lockheed Martin Corporation | | 636,181 |
| 11,100 | | Northrop Grumman Corporation | | 719,058 |
| 16,300 | | Raytheon Company | | 755,342 |
| 31,700 | | Republic Services, Inc. | | 946,562 |
| 20,525 | | Tyco International, Ltd. | | 850,556 |
| 10,200 | | United Parcel Service, Inc. – Class “B” | | 740,316 |
| 19,700 | | United Technologies Corporation | | 1,550,784 |
| |
| | | | | 13,322,935 |
| |
| | | Information Technology—18.7% | | |
| 50,500 | * | Activision Blizzard, Inc. | | 628,220 |
| 25,700 | * | Adobe Systems, Inc. | | 791,046 |
| 5,100 | * | Apple, Inc. | | 1,645,056 |
| 15,000 | | Automatic Data Processing, Inc. | | 694,200 |
| 29,800 | | CA, Inc. | | 728,312 |
| 93,500 | * | Cisco Systems, Inc. | | 1,891,505 |
| 35,000 | * | eBay, Inc. | | 974,050 |
| 40,800 | * | EMC Corporation | | 934,320 |
| 43,000 | | Hewlett-Packard Company | | 1,810,300 |
| 86,300 | | Intel Corporation | | 1,814,889 |
| 12,400 | | International Business Machines Corporation | | 1,819,824 |
| 154,200 | | Microsoft Corporation | | 4,305,264 |
| 52,000 | | Oracle Corporation | | 1,627,600 |
| 24,100 | | QUALCOMM, Inc. | | 1,192,709 |
| 40,100 | * | Symantec Corporation | | 671,274 |
| 23,000 | | Texas Instruments, Inc. | | 747,500 |
| 43,800 | | Western Union Company | | 813,366 |
| |
| | | | | 23,089,435 |
| | | | | | | |
| | | | | | | | |
| | | | | | | |
| Shares or | | | | | | | |
| Principal | | | | | | | |
| Amount | | Security | | | | | Value |
| |
| | | Materials—1.4% | | | | | |
| 27,800 | | Dow Chemical Company | | | | | $ 949,092 |
| 15,000 | | DuPont (E.I.) de Nemours & Company | | | | | 748,200 |
| |
| | | | | | | | 1,697,292 |
| |
| | | Telecommunication Services—3.3% | | | | | |
| 61,700 | | AT&T, Inc. | | | | | 1,812,746 |
| 61,700 | | Verizon Communications, Inc. | | | | | 2,207,626 |
| |
| | | | | | | | 4,020,372 |
| |
| | | Utilities—1.3% | | | | | |
| 20,400 | | American Electric Power, Inc. | | | | | 733,992 |
| 17,800 | | NextEra Energy, Inc. | | | | | 925,422 |
| |
| | | | | | | | 1,659,414 |
| |
| Total Value of Common Stocks (cost $89,990,231) | | | | | 123,122,663 |
| |
| | | SHORT-TERM INVESTMENTS—.5% | | | | | |
| | | Money Market Fund | | | | | |
| $ 600M | | First Investors Cash Reserve Fund, .19% (cost $600,000)** | | | | 600,000 |
| |
| Total Value of Investments (cost $90,590,231) | 99.9 | % | | | 123,722,663 |
| Other Assets, Less Liabilities | .1 | | | | 139,069 |
| |
| Net Assets | | | 100.0 | % | | $123,861,732 |
| | |
| * | Non-income producing |
| | |
| ** | Affiliated unregistered money market fund available only to First Investors funds and certain |
| accounts managed by First Investors Management Company, Inc. Rate shown is the 7-day yield at |
| December 31, 2010 (see Note 3). |
| | |
| Summary of Abbreviations: |
| ADR | American Depositary Receipts |
Portfolio of Investments (continued)
BLUE CHIP FUND
December 31, 2010
Accounting Standards Codification (“ASC”) 820 established a three-tier hierarchy of inputs to establish a classification of fair value measurements for disclosure purposes. The three-tier hierarchy of inputs is summarized in the three broad Levels listed below:
| Level 1 — quoted prices in active markets for identical securities |
| Level 2 — other significant observable inputs (including quoted prices for similar securities, interest rates, prepayment speeds, credit risk, etc.) |
| Level 3 — significant unobservable inputs (including the fund’s own assumptions in determining the fair value of investments) |
The inputs methodology used for valuing securities are not necessarily an indication of the risk associated with investing in those securities.
The following is a summary, by category of Level, of inputs used to value the Fund’s investments as of December 31, 2010:
| | | | | | | | | | | | |
| | | | | | | Level 2 | | | | | | |
| | | | | | | Other | | | Level 3 | | | |
| | | | Level 1 | | | Significant | | | Significant | | | |
| | | | Quoted | | | Observable | | | Unobservable | | | |
| | | | Prices | | | Inputs | | | Inputs | | | Total |
| Common Stocks | | $ | 123,122,663 | | $ | — | | $ | — | | $ | 123,122,663 |
| Money Market Fund | | | 600,000 | | | — | | | — | | | 600,000 |
| Total Investments | | | | | | | | | | | | |
| in Securities* | | $ | 123,722,663 | | $ | — | | $ | — | | $ | 123,722,663 |
| |
| * | The Portfolio of Investments provides information on the industry categorization for the portfolio. |
| There were no transfers into or from Level 1 and Level 2 by the Fund during the year ended |
| December 31, 2010. |
| |
| 10 | See notes to financial statements |
Portfolio Manager’s Letter
CASH MANAGEMENT FUND
Dear Investor:
This is the annual report for the First Investors Life Cash Management Fund for the year ended December 31, 2010. During the period, the Fund’s return on a net asset value basis was 0%. The Fund maintained a $1.00 net asset value per share throughout the year.
2010 was another challenging year for money market investors. During the year, the Federal Reserve (the “Fed”) remained vigilant in its efforts to preserve the broader economic recovery and maintained a substantial amount of liquidity in the market. As such, the Fed kept short-term interest rates at record lows, near zero, throughout the entire reporting period. This was the major factor in determining the Fund’s return.
In 2010, the Securities and Exchange Commission amended the rules regarding money market funds. These amendments were aimed at further reducing the risks of money market funds to shareholders by increasing the credit quality, portfolio liquidity and diversification of these funds. In an effort to meet these new requirements and to respond to the conditions in the market, the Fund continued to invest conservatively throughout the period. The Fund increased its holdings in U.S. Treasury and government obligations, which generally have the highest credit ratings and exceptional liquidity, although with a lower return.
First Investors Management Company (“FIMCO”), the investment adviser, continued to absorb a significant portion of expenses of the Fund and waived management fees in an effort to avoid a negative yield for Fund shareholders. FIMCO expects this situation to continue and consequently, the yield to shareholders should be at or near zero for the foreseeable future.
Although money market funds in general are relatively conservative vehicles, there can be no assurance that the Fund will be able to maintain a stable net asset value of $1.00 per share. Money market mutual funds are neither insured nor guaranteed by the Federal Deposit Insurance Corporation (FDIC) or any other government agency.
Portfolio Manager’s Letter (continued)
CASH MANAGEMENT FUND
Thank you for placing your trust in First Investors. As always, we appreciate the opportunity to serve your investment needs.

Fund Expenses (unaudited)
CASH MANAGEMENT FUND
The examples below show the ongoing costs (in dollars) of investing in your Fund and will help you in comparing these costs with costs of other mutual funds. Please refer to page 3 for a detailed explanation of the information presented in these examples.
| | | |
| | Beginning | Ending | |
| | Account | Account | Expenses Paid |
| | Value | Value | During Period |
| | (7/1/10) | (12/31/10) | (7/1/10–12/31/10)* |
| Expense Examples | | | |
| Actual | $1,000.00 | $1,000.00 | $1.16 |
| Hypothetical | | | |
| (5% annual return before expenses) | $1,000.00 | $1,024.05 | $1.17 |
| |
| * | Expenses are equal to the annualized expense ratio of .23%, multiplied by the average account |
| value over the period, multiplied by 184/365 (to reflect the one-half year period). Expenses paid |
| during the period are net of expenses waived or assumed. |
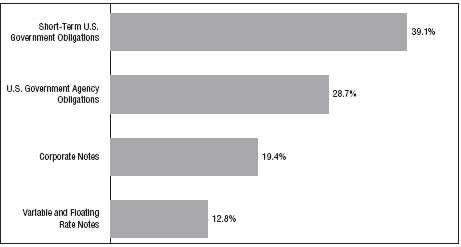
Portfolio Composition
BY SECTOR
|
| Portfolio holdings and allocations are subject to change. Percentages are as of December 31, 2010, |
| and are based on the total value of investments. |
Portfolio of Investments
CASH MANAGEMENT FUND
December 31, 2010
| | | | | |
| | | | | | |
| | | | | |
| | | | | |
| Principal | | | Interest | | |
| Amount | | Security | Rate | * | Value |
| |
| | | SHORT-TERM U.S. GOVERNMENT | | | |
| | | OBLIGATIONS—39.7% | | | |
| | | U.S. Treasury Bills: | | | |
| $ 4,200M | | 2/10/11 | 0.12 | % | $ 4,199,440 |
| 700M | | 3/17/11 | 0.13 | | 699,815 |
| |
| Total Value of Short-Term U.S. Government Obligations (cost $4,899,255) | | 4,899,255 |
| |
| | | U.S. GOVERNMENT AGENCY | | | |
| | | OBLIGATIONS—29.1% | | | |
| | | Fannie Mae: | | | |
| 400M | | 2/1/11 | 0.17 | | 399,942 |
| 400M | | 2/9/11 | 0.18 | | 399,922 |
| 226M | | 3/28/11 | 0.18 | | 225,903 |
| 422M | | 3/28/11 | 0.20 | | 421,798 |
| 325M | | 4/20/11 | 0.19 | | 324,813 |
| 250M | | Federal Farm Credit Bank, 7/11/11 | 0.28 | | 255,218 |
| | | Federal Home Loan Bank: | | | |
| 300M | | 2/4/11 | 0.17 | | 299,953 |
| 200M | | 2/9/11 | 0.15 | | 199,968 |
| 400M | | 3/11/11 | 0.16 | | 399,877 |
| 660M | | Freddie Mac, 5/2/11 | 0.20 | | 659,556 |
| |
| Total Value of U.S. Government Agency Obligations (cost $3,586,950) | | | 3,586,950 |
| |
| | | CORPORATE NOTES—19.7% | | | |
| 430M | | Archer-Daniels-Midland, Co., 2/17/11 (a) | 0.23 | | 429,871 |
| 400M | | Coca-Cola Co., 2/7/11 (a) | 0.24 | | 399,901 |
| 100M | | General Electric Capital Corp., 2/1/11 | 0.73 | | 100,375 |
| 300M | | Johnson & Johnson 3/21/11 (a) | 0.19 | | 299,875 |
| 400M | | New Jersey Natural Gas Co., 1/21/11 | 0.18 | | 399,960 |
| 400M | | PepsiCo, Inc., 2/14/11 (a) | 0.16 | | 399,922 |
| 400M | | Walt Disney Co., 2/22/11 (a) | 0.17 | | 399,902 |
| |
| Total Value of Corporate Notes (cost $2,429,806) | | | 2,429,806 |
| | | | | | | |
| | | | | | | | |
| | | | | | | |
| | | | | | | |
| Principal | | | | | Interest | | |
| Amount | | Security | | | Rate | * | Value |
| |
| | | VARIABLE AND FLOATING RATE NOTES—12.9% | | |
| $ 400M | | Federal Farm Credit Bank, 9/20/11 | | | 0.24 | % | $ 400,000 |
| 300M | | Freddie Mac, 11/9/11 | | | 0.18 | | 299,856 |
| 400M | | Mississippi Business Finance Corp. | | | | | |
| | | (Chevron USA, Inc.), 12/1/30 | | | 0.28 | | 400,000 |
| | | Valdez, Alaska Marine Terminal Rev.: | | | | | |
| 300M | | Exxon Pipeline Co., Project B 12/1/33 | | | 0.25 | | 300,000 |
| 200M | | Exxon Pipeline Co., Project C 12/1/33 | | | 0.25 | | 200,000 |
| |
| Total Value of Variable and Floating Rate Notes (cost $1,599,856) | | | | 1,599,856 |
| |
| Total Value of Investments (cost $12,515,867) | 101.4 | % | | | 12,515,867 |
| Excess of Liabilities Over Other Assets | (1.4 | ) | | | (176,993) |
| |
| Net Assets | | | 100.0 | % | | | $12,338,874 |
| |
| * | The interest rates shown are the effective rates at the time of purchase by the Fund. The interest |
| rates shown on variable and floating rate notes are adjusted periodically; the rates shown are the |
| rates in effect at December 31, 2010. |
| |
| ** | Aggregate cost for federal income tax purposes is the same. |
| |
| (a) | Security exempt from registration under Section 4(2) of the Securities Act of 1933 (see Note 5). |
Portfolio of Investments (continued)
CASH MANAGEMENT FUND
December 31, 2010
Accounting Standards Codification (“ASC”) 820 established a three-tier hierarchy of inputs to establish a classification of fair value measurements for disclosure purposes. The three-tier hierarchy of inputs is summarized in the three broad Levels listed below:
| Level 1 — quoted prices in active markets for identical securities |
| Level 2 — other significant observable inputs (including quoted prices for similar securities, interest rates, prepayment speeds, credit risk, etc.) |
| Level 3 — significant unobservable inputs (including the fund’s own assumptions in determining the fair value of investments) |
The inputs methodology used for valuing securities are not necessarily an indication of the risk associated with investing in those securities.
The following is a summary, by category of Level, of inputs used to value the Fund’s investments as of December 31, 2010:
| | | | | | | | | | | | |
| | | | | | | Level 2 | | | | | | |
| | | | | | | Other | | | Level 3 | | | |
| | | | Level 1 | | | Significant | | | Significant | | | |
| | | | Quoted | | | Observable | | Unobservable | | | |
| | | | Prices | | | Inputs | | | Inputs | | | Total |
| Short-Term U.S. Government | | | | | | | | | | | | |
| Obligations | | $ | — | | $ | 4,899,255 | | $ | — | | $ | 4,899,255 |
| U.S. Government Agency | | | | | | | | | | | | |
| Obligations | | | — | | | 3,586,950 | | | — | | | 3,586,950 |
| Corporate Notes | | | — | | | 2,429,806 | | | — | | | 2,429,806 |
| Variable and Floating | | | | | | | | | | | | |
| Rate Notes: | | | | | | | | | | | | |
| Municipal Bonds | | | — | | | 900,000 | | | — | | | 900,000 |
| U.S. Government Agency | | | | | | | | | | | | |
| Obligations | | | — | | | 699,856 | | | — | | | 699,856 |
| Total Investments in | | | | | | | | | | | | |
| Securities | | $ | — | | $ | 12,515,867 | | $ | — | | $ | 12,515,867 |
There were no transfers into or from Level 1 and Level 2 by the Fund during the year ended December 31, 2010.
| |
| 16 | See notes to financial statements |
Portfolio Managers’ Letter
DISCOVERY FUND
Dear Investor:
This is the annual report for the First Investors Life Discovery Fund for the year ended December 31, 2010. During the period, the Fund’s return on a net asset value basis was 26.6%, including dividends of 22.3 cents per share.
The year 2010 was another strong one for equity returns. Small-cap stocks continued to significantly outperform large-cap stocks, with the Russell 2000 Index beating the S&P 500 Index by nearly 12%. The stock market remained volatile, however, and experienced a sharp summer correction before rallying from late August through year end. In our view, the primary drivers of the ensuing rally were low valuations after the summer sell-off; better-than-expected corporate earnings growth; heightened mergers and acquisition (“M&A”) activity; expansionary monetary policy; and, finally, a recognition that the economy had not fallen back into recession.
The Fund’s top performing sector for the year was materials, which returned 47.3%. Innospec, a “special situation” purchased during the financial crisis, rose 102%. Innospec makes additives for diesel fuel and benefited from strong demand from emerging markets. Westlake Chemical, an integrated producer of petrochemicals, rose 81%. Westlake uses natural gas for its feedstock, and has profited from the increased price differential between oil and natural gas.
Health care was the Fund’s second-best performing sector, returning 41.3%. The sector had fallen out of favor during the debate over health care reform. We added to two existing positions, Endo Pharmaceuticals and Magellan Health Care, and initiated a third position in AMERIGROUP, all at valuations of less than 10 times free cash flow. We had followed each of these companies for several years, and felt quite comfortable with their business plans, management teams and ability to generate cash flow over time. When health care legislation finally passed, the market once again focused on each company’s individual financial prospects, and the three stocks were top performers for the Fund.
The Fund also benefited from the increased pace of M&A activity during the period. Two of the Fund’s positions were acquired in 2010: Sybase and American Italian Pasta Company.
Industrials was the Fund’s most challenging sector during the reporting period. The Fund was underweight the industrials sector in 2010, and instead chose to invest more heavily in materials and energy companies. The companies that the Fund did have in the sector underperformed, returning 10.5%.
Portfolio Managers’ Letter (continued)
DISCOVERY FUND
The Fund’s financials sector positions also underperformed, returning 12.4%. In 2009, financials was our top performing sector due to our decision to avoid bank stocks. This year, as bank stocks recovered from the financial crisis, the Fund’s lack of exposure to the industry had a negative impact on results. Performance in financials was also affected by a slowdown in trading volumes at two of our brokerage holdings, Piper Jaffray and Knight Capital Group.
The fourth quarter saw a strong rally in small-cap stocks. Given the recent run-up, we view the market with a certain degree of caution; we do not believe that volatility in the equity markets is behind us. Nonetheless, we are happy with the valuations we are finding, and believe that low interest rates and a resurgent M&A market will help us to realize value going forward.
Thank you for placing your trust in First Investors. As always, we appreciate the opportunity to serve your investment needs.

Fund Expenses (unaudited)
DISCOVERY FUND
The examples below show the ongoing costs (in dollars) of investing in your Fund and will help you in comparing these costs with costs of other mutual funds. Please refer to page 3 for a detailed explanation of the information presented in these examples.
| | | |
| | Beginning | Ending | |
| | Account | Account | Expenses Paid |
| | Value | Value | During Period |
| | (7/1/10) | (12/31/10) | (7/1/10–12/31/10)* |
| Expense Examples | | | |
| Actual | $1,000.00 | $1,299.80 | $4.70 |
| Hypothetical | | | |
| (5% annual return before expenses) | $1,000.00 | $1,021.13 | $4.13 |
| |
| * | Expenses are equal to the annualized expense ratio of .81%, multiplied by the average account |
| value over the period, multiplied by 184/365 (to reflect the one-half year period). |
Portfolio Composition
TOP TEN SECTORS
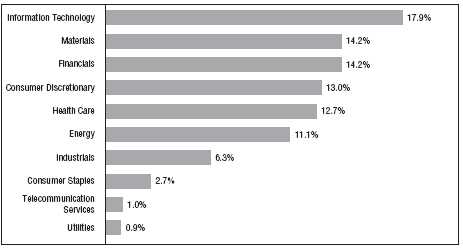
|
| Portfolio holdings and allocations are subject to change. Percentages are as of December 31, 2010, |
| and are based on the total value of investments. |
Cumulative Performance Information (unaudited)
DISCOVERY FUND
Comparison of change in value of $10,000 investment in the First Investors Life Series Discovery Fund and the Russell 2000 Index.
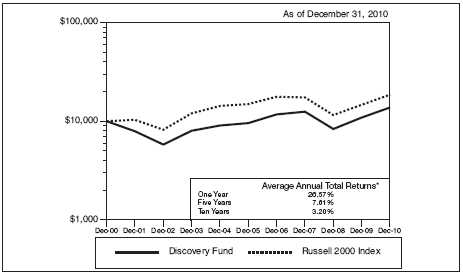
The graph compares a $10,000 investment in the First Investors Life Series Discovery Fund beginning 12/31/00 with a theoretical investment in the Russell 2000 Index (the “Index”). The Index is an unmanaged index that measures the performance of the small-cap segment of the U.S. equity universe. The Index is a subset of the Russell 3000 Index representing approximately 10% of the total market capitalization of that index. The Index includes approximately 2,000 of the smallest securities based on a combination of their market cap and current index membership. It is not possible to invest directly in this Index. In addition, the Index does not reflect fees and expenses associated with the active management of a mutual fund portfolio. For purposes of the graph and the accompanying table, it is assumed that all dividend and distributions were reinvested.
* The Average Annual Total Return figures are for the periods ended 12/31/10.
The returns shown do not reflect any sales charges, since the Fund sells its shares solely to variable annuity and/or variable life insurance subaccounts at net asset value. The returns do not reflect the fees and charges that an individual would pay in connection with an investment in a variable annuity or life contract or policy. Results represent past performance and do not indicate future results. The graph and the returns shown do not reflect the deduction of taxes that an investor would pay on distributions or the redemption of fund shares. Investment return and principal value of an investment will fluctuate so that an investor’s shares, when redeemed, may be worth more or less than the original cost. Index figures are from Frank Russell and Company and all other figures are from First Investors Management Company, Inc.
Portfolio of Investments
DISCOVERY FUND
December 31, 2010
| | | | |
| | | | | |
| | | | |
| | | | | |
| | | | |
| Shares | | Security | | Value |
| |
| | | COMMON STOCKS—94.3% | | |
| | | Consumer Discretionary—13.0% | | |
| 173,100 | | American Eagle Outfitters, Inc. | | $ 2,532,453 |
| 85,000 | * | Big Lots, Inc. | | 2,589,100 |
| 124,100 | * | Career Education Corporation | | 2,572,593 |
| 602,800 | * | CKX, Inc. | | 2,429,284 |
| 100,900 | | Foot Locker, Inc. | | 1,979,658 |
| 86,700 | | Men’s Wearhouse, Inc. | | 2,165,766 |
| 48,700 | | Phillips Van-Heusen Corporation | | 3,068,587 |
| 213,000 | | Regal Entertainment Group – Class “A” | | 2,500,620 |
| |
| | | | | 19,838,061 |
| |
| | | Consumer Staples—2.7% | | |
| 165,200 | * | Dole Food Company, Inc. | | 2,231,852 |
| 29,200 | | J. M. Smucker Company | | 1,916,980 |
| |
| | | | | 4,148,832 |
| |
| | | Energy—11.1% | | |
| 74,200 | * | Carrizo Oil & Gas, Inc. | | 2,559,158 |
| 129,800 | | EXCO Resources, Inc. | | 2,520,716 |
| 147,100 | * | Matrix Service Company | | 1,791,678 |
| 108,700 | * | Plains Exploration & Production Company | | 3,493,618 |
| 172,300 | * | Resolute Energy Corporation | | 2,543,148 |
| 33,200 | | SM Energy Company | | 1,956,476 |
| 16,900 | * | Whiting Petroleum Corporation | | 1,980,511 |
| |
| | | | | 16,845,305 |
| |
| | | Financials—14.2% | | |
| 6,939 | * | Alleghany Corporation | | 2,125,902 |
| 51,200 | | American Financial Group, Inc. | | 1,653,248 |
| 325,000 | | Anworth Mortgage Asset Corporation (REIT) | | 2,275,000 |
| 83,300 | * | EZCORP, Inc. – Class “A” | | 2,259,929 |
| 54,100 | | Harleysville Group, Inc. | | 1,987,634 |
| 91,700 | | Jefferies Group, Inc. | | 2,441,971 |
| 204,000 | * | Knight Capital Group, Inc. – Class “A” | | 2,813,160 |
| 3,400 | * | Markel Corporation | | 1,285,642 |
| 274,800 | | MFA Financial, Inc. (REIT) | | 2,242,368 |
| 39,200 | | Mid-America Apartment Communities, Inc. (REIT) | | 2,488,808 |
| |
| | | | | 21,573,662 |
Portfolio of Investments (continued)
DISCOVERY FUND
December 31, 2010
| | | | |
| | | | | |
| | | | | |
| | | | | |
| | | | | |
| Shares | | Security | | Value |
| |
| | | Health Care—12.7% | | |
| 63,200 | * | AMERIGROUP Corporation | | $ 2,775,744 |
| 82,300 | * | Endo Pharmaceuticals Holdings, Inc. | | 2,938,933 |
| 51,100 | * | Life Technologies Corporation | | 2,836,050 |
| 54,200 | * | Magellan Health Services, Inc. | | 2,562,576 |
| 41,000 | * | MEDNAX, Inc. | | 2,758,890 |
| 126,800 | * | Myriad Genetics, Inc. | | 2,896,112 |
| 97,800 | | PerkinElmer, Inc. | | 2,525,196 |
| |
| | | | | 19,293,501 |
| |
| | | Industrials—6.4% | | |
| 30,700 | * | Alliant Techsystems, Inc. | | 2,285,001 |
| 88,000 | * | EMCOR Group, Inc. | | 2,550,240 |
| 44,900 | * | FTI Consulting, Inc. | | 1,673,872 |
| 45,000 | * | Oshkosh Corporation | | 1,585,800 |
| 11,300 | | Precision Castparts Corporation | | 1,573,073 |
| |
| | | | | 9,667,986 |
| |
| | | Information Technology—18.0% | | |
| 299,200 | * | Brightpoint, Inc. | | 2,612,016 |
| 191,600 | * | Compuware Corporation | | 2,235,972 |
| 185,100 | * | Convergys Corporation | | 2,437,767 |
| 67,000 | * | Cymer, Inc. | | 3,019,690 |
| 88,900 | * | Diodes, Inc. | | 2,399,411 |
| 75,500 | | EarthLink, Inc. | | 649,300 |
| 45,400 | | Fair Isaac Corporation | | 1,060,998 |
| 246,100 | * | Lawson Software, Inc. | | 2,276,425 |
| 54,300 | | Lender Processing Services, Inc. | | 1,602,936 |
| 88,200 | * | Microsemi Corporation | | 2,019,780 |
| 170,800 | * | QLogic Corporation | | 2,907,016 |
| 56,000 | * | Verigy, Ltd. | | 729,120 |
| 228,300 | * | Vishay Intertechnology, Inc. | | 3,351,444 |
| |
| | | | | 27,301,875 |
| | | | | | | |
| | | | | | | | |
| | | | | | | | |
| Shares or | | | | | | | |
| Principal | | | | | | | |
| Amount | | Security | | | | | Value |
| |
| | | Materials—14.3% | | | | | |
| 48,100 | | AptarGroup, Inc. | | | | | $ 2,288,117 |
| 157,000 | * | Chemtura Corporation | | | | | 2,508,860 |
| 26,600 | | Compass Minerals International, Inc. | | | | | 2,374,582 |
| 87,100 | * | Innospec, Inc. | | | | | 1,776,840 |
| 96,300 | | Olin Corporation | | | | | 1,976,076 |
| 42,000 | | Schnitzer Steel Industries, Inc. – Class “A” | | | | | 2,788,380 |
| 84,100 | | Sensient Technologies Corporation | | | | | 3,088,993 |
| 89,400 | * | Smurfit-Stone Container Corporation | | | | | 2,288,640 |
| 59,700 | | Westlake Chemical Corporation | | | | | 2,595,159 |
| |
| | | | | | | | 21,685,647 |
| |
| | | Telecommunication Services—1.0% | | | | | |
| 222,074 | * | Premiere Global Services, Inc. | | | | | 1,510,103 |
| |
| | | Utilities—.9% | | | | | |
| 77,100 | | CMS Energy Corporation | | | | | 1,434,060 |
| |
| Total Value of Common Stocks (cost $106,946,542) | | | | | 143,299,032 |
| |
| | | SHORT-TERM INVESTMENTS—6.0% | | | | |
| | | Money Market Fund | | | | | |
| $ 9,070M | | First Investors Cash Reserve Fund, .19% (cost $9,070,000)** | | | | 9,070,000 |
| |
| Total Value of Investments (cost $116,016,542) | 100.3 | % | | | 152,369,032 |
| Excess of Liabilities Over Other Assets | (.3 | ) | | | (474,596) |
| |
| Net Assets | | | 100.0 | % | | | $151,894,436 |
| | |
| * | Non-income producing |
| |
| ** | Affiliated unregistered money market fund available only to First Investors funds and certain |
| accounts managed by First Investors Management Company, Inc. Rate shown is the 7-day yield at |
| December 31, 2010 (see Note 3). |
| |
| Summary of Abbreviations: |
| |
| REIT | Real Estate Investment Trust |
Portfolio of Investments (continued)
DISCOVERY FUND
December 31, 2010
Accounting Standards Codification (“ASC”) 820 established a three-tier hierarchy of inputs to establish a classification of fair value measurements for disclosure purposes. The three-tier hierarchy of inputs is summarized in the three broad Levels listed below:
| Level 1 — quoted prices in active markets for identical securities |
| Level 2 — other significant observable inputs (including quoted prices for similar securities, interest rates, prepayment speeds, credit risk, etc.) |
| Level 3 — significant unobservable inputs (including the fund’s own assumptions in determining the fair value of investments) |
The inputs methodology used for valuing securities are not necessarily an indication of the risk associated with investing in those securities.
The following is a summary, by category of Level, of inputs used to value the Fund’s investments as of December 31, 2010:
| | | | | | | | | | | | |
| | | | | | | Level 2 | | | | | | |
| | | | | | | Other | | | Level 3 | | | |
| | | | Level 1 | | | Significant | | | Significant | | | |
| | | | Quoted | | | Observable | | | Unobservable | | | |
| | | | Prices | | | Inputs | | | Inputs | | | Total |
| Common Stocks | | $ | 143,299,032 | | $ | — | | $ | — | | $ | 143,299,032 |
| Money Market Fund | | | 9,070,000 | | | — | | | — | | | 9,070,000 |
| Total Investments | | | | | | | | | | | | |
| in Securities* | | $ | 152,369,032 | | $ | — | | $ | — | | $ | 152,369,032 |
| |
| * | The Portfolio of Investments provides information on the industry categorization for the portfolio. |
| |
| There were no transfers into or from Level 1 and Level 2 by the Fund during the year ended |
| December 31, 2010. |
| |
| 24 | See notes to financial statements |
Portfolio Manager’s Letter
GOVERNMENT FUND
Dear Investor:
This is the annual report for the First Investors Life Government Fund for the year ended December 31, 2010. During the period, the Fund’s return on a net asset value basis was 4.8%, including dividends of 42.3 cents per share.
The Fund invests in securities and debt issued or guaranteed by the U.S. government and its agencies. These include mortgage-backed bonds guaranteed by the Government National Mortgage Association (Ginnie Mae), the Federal National Mortgage Association (Fannie Mae), and the Federal Home Loan Mortgage Corporation (Freddie Mac); debt issued by these and other agencies; and U.S. Treasury securities. The investments held by the Fund all have the highest possible credit rating (AAA).
As the review period began, most forecasters expected interest rates in the United States to rise as the economy’s recovery gained strength. In fact, interest rates moved sharply lower from April to October, reaching levels only seen in the past 50 years in the period immediately following Lehman’s bankruptcy, as investors reacted to disappointing economic data, fears of deflation and the sovereign debt crisis in Europe. In the fourth quarter, interest rates reversed direction and moved sharply higher as the economic outlook improved, following additional Federal Reserve action, the November elections and additional fiscal stimulus. For the year, the benchmark 10-year U.S. Treasury interest rate fell to 3.3% from 3.8%.
Reflecting the positive impact of declining interest rates, the Treasury market had a total return for the review period of 5.9%, according to Bank of America Merrill Lynch. The mortgage-backed market returned 5.7%. It slightly underperformed the Treasury market due to an elevated level of prepayments on mortgage-backed securities as residential mortgage rates fell to generational lows in October. Lastly, the U.S. agency market gained 4.6% in 2010.
The Fund was conservatively positioned with respect to interest rate risk relative to its benchmark, the Citigroup Government/Mortgage Index. In particular, on average the Fund had 67% of its assets invested in mortgage-backed bonds and only 5% in U.S. Treasuries, a substantial underweight of Treasuries and overweight of mortgage-backed securities versus the benchmark. In addition, the Fund had an average of 3% of its assets in cash equivalents during the year. These two factors contributed to the Fund’s slight underperformance versus the benchmark as the Treasury market outperformed the mortgage-backed market, and cash equivalents provided virtually no return in 2010 versus the benchmark’s 5.6% gain.
Portfolio Manager’s Letter (continued)
GOVERNMENT FUND
Thank you for placing your trust in First Investors. As always, we appreciate the opportunity to serve your investment needs.

Fund Expenses (unaudited)
GOVERNMENT FUND
The examples below show the ongoing costs (in dollars) of investing in your Fund and will help you in comparing these costs with costs of other mutual funds. Please refer to page 3 for a detailed explanation of the information presented in these examples.
| | | |
| | Beginning | Ending | |
| | Account | Account | Expenses Paid |
| | Value | Value | During Period |
| | (7/1/10) | (12/31/10) | (7/1/10–12/31/10)* |
| Expense Examples | | | |
| Actual | $1,000.00 | $1,005.83 | $3.94 |
| Hypothetical | | | |
| (5% annual return before expenses) | $1,000.00 | $1,021.28 | $3.97 |
| |
| * | Expenses are equal to the annualized expense ratio of .78%, multiplied by the average account |
| value over the period, multiplied by 184/365 (to reflect the one-half year period). Expenses paid |
| during the period are net of expenses waived. |
Portfolio Composition
BY SECTOR
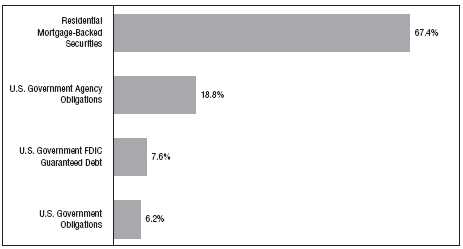
|
| Portfolio holdings and allocations are subject to change. Percentages are as of December 31, 2010, |
| and are based on the total value of investments. |
Cumulative Performance Information (unaudited)
GOVERNMENT FUND
Comparison of change in value of $10,000 investment in the First Investors Life Series Government Fund and the Citigroup Government/Mortgage Index.
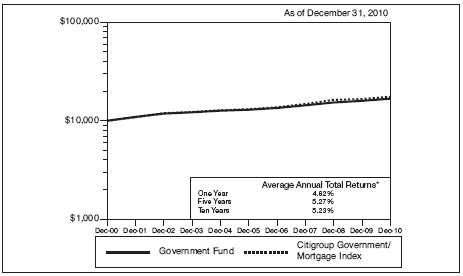
The graph compares a $10,000 investment in the First Investors Life Series Government Fund beginning 12/31/00 with a theoretical investment in the Citigroup Government/Mortgage Index (the “Index”). The Index is an unmanaged index that is a combination of the Citigroup Government Index and the Citigroup Mortgage Index. The Government Index tracks the performance of the U.S. Treasury and U.S. Government-sponsored indices within the Citigroup U.S. Broad Investment Grade Bond Index. The Mortgage Index tracks the performance of the mortgage component of the Citigroup U.S. Broad Investment Grade Bond Index, which is comprised of 30- and 15-year GNMA, FNMA and FHLMC pass-throughs and FNMA and FHLMC balloon mortgages. It is not possible to invest directly in this Index. In addition, the Index does not reflect fees and expenses associated with the active management of a mutual fund portfolio. For purposes of the graph and the accompanying table, it is assumed that all dividends and distributions were reinvested.
* The Average Annual Total Return figures are for the periods ended 12/31/10. During the periods shown, some of the expenses of the Fund were waived or assumed. If such expenses had been paid by the Fund, the Average Annual Total Returns for One Year, Five Years and Ten Years would have been 4.66%, 5.11% and 5.07%, respectively.
The returns shown do not reflect any sales charge, since the Fund sells its shares solely to variable annuity and/or variable life insurance subaccounts at net asset value. The returns do not reflect the fees and charges that an individual would pay in connection with an investment in a variable annuity or life contract or policy. Results represent past performance and do not indicate future results. The graph and the returns shown do not reflect the deduction of taxes that an investor would pay on distributions or the redemption of fund shares. Investment return and principal value of an investment will fluctuate so that an investor’s shares, when redeemed, may be worth more or less than the original cost. Index figures are from Citigroup and all other figures are from First Investors Management Company, Inc.
Portfolio of Investments
GOVERNMENT FUND
December 31, 2010
| | | | |
| | | | | |
| | | | | |
| | | | | |
| Principal | | | | |
| Amount | | Security | | Value |
| |
| | | RESIDENTIAL MORTGAGE-BACKED | | |
| | | SECURITIES—66.3% | | |
| | | Fannie Mae—15.2% | | |
| $ 1,224M | | 5%, 1/1/2035 – 4/1/2039 | | $ 1,289,936 |
| 2,297M | | 5.5%, 9/1/2033 – 10/1/2039 | | 2,478,304 |
| 210M | | 9%, 11/1/2026 | | 245,238 |
| 169M | | 11%, 10/1/2015 | | 196,750 |
| |
| | | | | 4,210,228 |
| |
| | | Freddie Mac—8.8% | | |
| 885M | | 5.5%, 1/1/2040 | | 943,520 |
| 1,374M | | 6%, 8/1/2032 – 12/1/2038 | | 1,501,179 |
| |
| | | | | 2,444,699 |
| |
| | | Government National Mortgage Association I | | |
| | | Program—42.3% | | |
| 1,498M | | 4%, 10/15/2040 – 12/15/2040 | | 1,511,954 |
| 3,424M | | 4.5%, 6/15/2039 – 8/15/2040 (a) | | 3,568,788 |
| 2,849M | | 5%, 6/15/2033 – 6/15/2040 | | 3,041,350 |
| 2,640M | | 5.5%, 2/15/2033 – 4/15/2039 | | 2,880,973 |
| 312M | | 6%, 11/15/2032 – 4/15/2036 | | 346,959 |
| 323M | | 6.5%, 8/15/2032 | | 366,955 |
| |
| | | | | 11,716,979 |
| |
| Total Value of Residential Mortgage-Backed Securities (cost $17,826,589) | | 18,371,906 |
| |
| | | U.S. GOVERNMENT AGENCY | | |
| | | OBLIGATIONS—18.4% | | |
| 1,000M | | Fannie Mae, 1.625%, 2015 | | 975,799 |
| | | Federal Farm Credit Bank: | | |
| 1,000M | | 1.75%, 2013 | | 1,019,300 |
| 1,000M | | 1.5%, 2015 | | 972,001 |
| 1,000M | | Freddie Mac, 3%, 2014 | | 1,053,571 |
| 1,000M | | Tennessee Valley Authority, 4.5%, 2018 | | 1,085,654 |
| |
| Total Value of U.S. Government Agency Obligations (cost $5,085,064) | | 5,106,325 |
| |
| | | U.S. GOVERNMENT FDIC | | |
| | | GUARANTEED DEBT—7.5% | | |
| 1,000M | | Bank of America Corp, 3.125%, 2012 | | 1,036,083 |
| 1,000M | | JPMorgan Chase & Co., 2.125%, 2012 | | 1,028,040 |
| |
| Total Value of U.S. Government FDIC Guaranteed Debt (cost $2,040,100) | | 2,064,123 |
Portfolio of Investments (continued)
GOVERNMENT FUND
December 31, 2010
| | | | | | | |
| | | | | | | | |
| | | | | | | | |
| | | | | | | | |
| Principal | | | | | | | |
| Amount | | Security | | | | | Value |
| |
| | | U.S. GOVERNMENT OBLIGATIONS—6.1% | | | | |
| $ 591M | | FDA Queens LP, 6.99%, 2017 (b) | | | | | $ 669,781 |
| 1,000M | | U.S. Treasury Note, 2.375%, 2015 | | | | | 1,030,787 |
| |
| Total Value of U.S. Government Obligations (cost $1,670,998) | | | | 1,700,568 |
| |
| Total Value of Investments (cost $26,622,751) | 98.3 | % | | | 27,242,922 |
| Other Assets, Less Liabilities | 1.7 | | | | 476,485 |
| |
| Net Assets | | | 100.0 | % | | | $27,719,407 |
| |
| (a) | A portion or all of the security purchased on a when-issued or delayed delivery basis (see Note 1G). |
| |
| (b) | Security exempt from registration under Rule 144A of Securities Act of 1933 (see Note 5). |
Accounting Standards Codification (“ASC”) 820 established a three-tier hierarchy of inputs to establish a classification of fair value measurements for disclosure purposes. The three-tier hierarchy of inputs is summarized in the three broad Levels listed below:
| Level 1 — quoted prices in active markets for identical securities |
| Level 2 — other significant observable inputs (including quoted prices for similar securities, interest rates, prepayment speeds, credit risk, etc.) |
| Level 3 — significant unobservable inputs (including the fund’s own assumptions in determining the fair value of investments) |
The inputs methodology used for valuing securities are not necessarily an indication of the risk associated with investing in those securities.
The following is a summary, by category of Level, of inputs used to value the Fund’s investments as of December 31, 2010:
| | | | | | | | | | | | |
| | | | | | | Level 2 | | | | | | |
| | | | | | | Other | | | Level 3 | | | |
| | | | Level 1 | | | Significant | | | Significant | | | |
| | | | Quoted | | | Observable | | Unobservable | | | |
| | | | Prices | | | Inputs | | | Inputs | | | Total |
| Residential Mortgage- | | | | | | | | | | | | |
| Backed Securities | | $ | — | | $ | 18,371,906 | | $ | — | | $ | 18,371,906 |
| U.S. Government Agency | | | | | | | | | | | | |
| Obligations | | | — | | | 5,106,325 | | | — | | | 5,106,325 |
| U.S. Government FDIC | | | | | | | | | | | | |
| Guaranteed Debt | | | — | | | 2,064,123 | | | — | | | 2,064,123 |
| U.S. Government | | | | | | | | | | | | |
| Obligations | | | — | | | 1,700,568 | | | — | | | 1,700,568 |
| Total Investments | | | | | | | | | | | | |
| in Securities | | $ | — | | $ | 27,242,922 | | $ | — | | $ | 27,242,922 |
There were no transfers into or from Level 1 and Level 2 by the Fund during the year ended December 31, 2010.
| |
| 30 | See notes to financial statements |
Portfolio Manager’s Letter
GROWTH & INCOME FUND
Dear Investor:
This is the annual report for the First Investors Life Growth & Income Fund for the year ended December 31, 2010. During the period, the Fund’s return on a net asset value basis was 16.2%, including dividends of 27.2 cents per share.
The Fund’s performance was the result of strong equity market gains, especially during the final quarter of the year. Over the entire period under review, the equity markets settled into a more stable pattern of positive results, boosted by a slowly improving economy. The Fund’s returns reflected that performance. However, the markets remained highly susceptible to short-term headline shocks, causing periods of high volatility. The environment remained more macro driven, as the Federal Reserve (the “Fed”), the Obama administration and Congress continued to be aggressively involved in economic affairs, proposing new regulations and increasing government oversight of businesses.
The business community viewed many of these actions negatively, which had a chilling effect on entire sectors and industries. Government initiatives had a significant impact on industries such as health care, energy, financials and education, which saw their share prices fluctuate during the year. The catalyst for the significant rally at the end of the year was sparked by the Fed’s decision to take additional measures to stimulate growth in the form of further quantitative easing, or “QE2.” Additionally, better than expected growth of corporate profits and more encouraging economic data helped spur the markets during the year’s final months.
The Fund’s weightings in the consumer discretionary, consumer staples and industrials sectors increased throughout the year. These areas demonstrated solid growth in earnings and benefited from cost control programs, share repurchases and mergers and acquisition activity. Overall stock selection and weightings benefited the Fund’s relative performance, most notably within these sectors. Additional areas of contribution came from investments in the basic materials and financials sectors. Areas of weakness were in the energy sector, as well as technology, where long-term holdings of larger companies lagged the S&P 500 Index.
The Fund has continued to maintain a diverse market capitalization allocation, ending the year with 57% large cap, 13% mid cap and 30% small cap, according to Lipper’s market capitalization ranges. This is consistent with the Fund’s long-term strategy. While the large-cap segment underperformed the S&P 500 Index, the mid- and small-cap components delivered strong absolute and relative results.
Notable individual performers within industrials demonstrated the strength of the multi-cap approach. The overall top performers were two investments in ocean freight container leasing companies, both small cap, TAL International and Textainer Group. Both benefited from a strong resurgence of global commerce, positively impacting
Portfolio Manager’s Letter (continued)
GROWTH & INCOME FUND
their pricing and utilization, and causing earnings to rise dramatically. Honeywell, United Technologies, 3M and Caterpillar were the top larger-cap companies.
The Fund also benefited from its diverse investments in other smaller- and mid-cap names as well. Shares of aerospace electronic components maker Esterline Technologies, flooring and ceiling tile maker Armstrong Worldwide and motor and compressor maker Baldor Electric were top contributors. Baldor is in fact the subject of a pending takeover offer from Swiss conglomerate ABB Ltd. Among consumer discretionary names, shares of auto parts makers Borg Warner and TRW Automotive were dramatic contributors, each rising in excess of 100% for the year. Among consumer staples, shares of spice and flavorings maker McCormick, and tobacco giants Altria Group and Philip Morris International led performers.
Among other factors influencing returns during the period was the strength of “growth” investments over “value.” With our investment strategy, valuation metrics tend to be important in our process, as we have followed a “growth at a reasonable price” philosophy. These stocks have tended to have a more “value” bias, and the market’s shift had a negative impact. In addition, shares of dividend-paying issues also lagged. As the Fund believes strongly in the value of dividends, and had more than 80% of its portfolio invested in dividend-paying companies, this headwind created a challenge to achieve relative performance gains during the year.
Thank you for placing your trust in First Investors. As always, we appreciate the opportunity to serve your investment needs.

Fund Expenses (unaudited)
GROWTH & INCOME FUND
The examples below show the ongoing costs (in dollars) of investing in your Fund and will help you in comparing these costs with costs of other mutual funds. Please refer to page 3 for a detailed explanation of the information presented in these examples.
| | | |
| | Beginning | Ending | |
| | Account | Account | Expenses Paid |
| | Value | Value | During Period |
| | (7/1/10) | (12/31/10) | (7/1/10–12/31/10)* |
| Expense Examples | | | |
| Actual | $1,000.00 | $1,243.74 | $4.64 |
| Hypothetical | | | |
| (5% annual return before expenses) | $1,000.00 | $1,021.08 | $4.18 |
| |
| * | Expenses are equal to the annualized expense ratio of .82%, multiplied by the average account |
| value over the period, multiplied by 184/365 (to reflect the one-half year period). |
Portfolio Composition
TOP TEN SECTORS

|
| Portfolio holdings and allocations are subject to change. Percentages are as of December 31, 2010, |
| and are based on the total value of investments. |
Cumulative Performance Information (unaudited)
GROWTH & INCOME FUND
Comparison of change in value of $10,000 investment in the First Investors Life Series Growth & Income Fund and the Standard & Poor’s 500 Index.
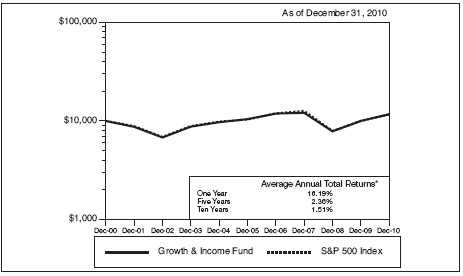
The graph compares a $10,000 investment in the First Investors Life Series Growth & Income Fund beginning 12/31/00 with a theoretical investment in the Standard & Poor’s 500 Index (the “Index”). The Index is an unmanaged capitalization-weighted index of 500 stocks designed to measure performance of the broad domestic economy through changes in the aggregate market value of such stocks, which represent all major industries. It is not possible to invest directly in this Index. In addition, the Index does not reflect fees and expenses associated with the active management of a mutual fund portfolio. For purposes of the graph and the accompanying table it is assumed that all dividends and distributions were reinvested.
* The Average Annual Total Return figures are for the periods ended 12/31/10.
The returns shown do not reflect any sales charges, since the Fund sells its shares solely to variable annuity and/or variable life insurance subaccounts at net asset value. The returns do not reflect the fees and charges that an individual would pay in connection with an investment in a variable annuity or life contract or policy. Results represent past performance and do not indicate future results. The graph and the returns shown do not reflect the deduction of taxes that an investor would pay on distributions or the redemption of fund shares. Investment return and principal value of an investment will fluctuate so that an investor’s shares, when redeemed, may be worth more or less than the original cost. Index figures are from Standard & Poor’s and all other figures are from First Investors Management Company, Inc.
Portfolio of Investments
GROWTH & INCOME FUND
December 31, 2010
| | | | |
| | | | | |
| | | | | |
| | | | | |
| | | | | |
| Shares | | Security | | Value |
| |
| | | COMMON STOCKS—99.8% | | |
| | | Consumer Discretionary—17.0% | | |
| 59,100 | | American Greetings Corporation – Class “A” | | $ 1,309,656 |
| 21,600 | | Best Buy Company, Inc. | | 740,664 |
| 31,800 | * | BorgWarner, Inc. | | 2,301,048 |
| 91,369 | | Brown Shoe Company, Inc. | | 1,272,770 |
| 80,885 | | CBS Corporation – Class “B” | | 1,540,859 |
| 22,361 | * | CEC Entertainment, Inc. | | 868,278 |
| 20,064 | | Coach, Inc. | | 1,109,740 |
| 45,700 | * | GameStop Corporation – Class “A” | | 1,045,616 |
| 31,800 | | Guess?, Inc. | | 1,504,776 |
| 113,000 | | H&R Block, Inc. | | 1,345,830 |
| 45,800 | | Home Depot, Inc. | | 1,605,748 |
| 36,500 | | Limited Brands, Inc. | | 1,121,645 |
| 76,100 | | Lincoln Educational Services Corporation | | 1,180,311 |
| 24,300 | | McDonald’s Corporation | | 1,865,268 |
| 133,800 | * | Morgans Hotel Group Company | | 1,213,566 |
| 114,343 | | Newell Rubbermaid, Inc. | | 2,078,756 |
| 7,100 | | NIKE, Inc. – Class “B” | | 606,482 |
| 6,700 | | Oxford Industries, Inc. | | 171,587 |
| 162,400 | * | Pier 1 Imports, Inc. | | 1,705,200 |
| 129,145 | * | Ruby Tuesday, Inc. | | 1,686,634 |
| 39,498 | * | Steiner Leisure, Ltd. | | 1,844,557 |
| 191,870 | | Stewart Enterprises, Inc. – Class “A” | | 1,283,610 |
| 40,100 | * | TRW Automotive Holdings Corporation | | 2,113,270 |
| 40,500 | | Tupperware Brands Corporation | | 1,930,635 |
| 62,583 | | Wyndham Worldwide Corporation | | 1,874,987 |
| |
| | | | | 35,321,493 |
| |
| | | Consumer Staples—11.5% | | |
| 116,100 | | Altria Group, Inc. | | 2,858,382 |
| 50,900 | | Avon Products, Inc. | | 1,479,154 |
| 35,789 | | Coca-Cola Company | | 2,353,843 |
| 55,700 | | CVS Caremark Corporation | | 1,936,689 |
| 16,500 | * | Dole Food Company, Inc. | | 222,915 |
| 27,100 | | McCormick & Company, Inc. | | 1,260,963 |
| 70,427 | | Nu Skin Enterprises, Inc. – Class “A” | | 2,131,121 |
| 21,600 | | PepsiCo, Inc. | | 1,411,128 |
| 62,300 | | Philip Morris International, Inc. | | 3,646,419 |
| 25,713 | | Procter & Gamble Company | | 1,654,117 |
Portfolio of Investments (continued)
GROWTH & INCOME FUND
December 31, 2010
| | | | |
| | | | | |
| | | | | |
| | | | | |
| | | | | |
| Shares | | Security | | Value |
| |
| | | Consumer Staples (continued) | | |
| 47,100 | | Snyders-Lance, Inc. | | $ 1,104,024 |
| 39,400 | | Walgreen Company | | 1,535,024 |
| 41,564 | | Wal-Mart Stores, Inc. | | 2,241,546 |
| |
| | | | | 23,835,325 |
| |
| | | Energy—7.1% | | |
| 11,000 | | Chevron Corporation | | 1,003,750 |
| 23,818 | | ConocoPhillips | | 1,622,006 |
| 21,700 | | Ensco, PLC (ADR) | | 1,158,346 |
| 38,611 | | ExxonMobil Corporation | | 2,823,236 |
| 39,322 | | Marathon Oil Corporation | | 1,456,094 |
| 58,400 | | Noble Corporation | | 2,088,968 |
| 22,294 | | Sasol, Ltd. (ADR) | | 1,160,403 |
| 10,000 | | Schlumberger, Ltd. | | 835,000 |
| 68,107 | | Suncor Energy, Inc. | | 2,607,817 |
| |
| | | | | 14,755,620 |
| |
| | | Financials—13.5% | | |
| 35,306 | | American Express Company | | 1,515,333 |
| 35,500 | | Ameriprise Financial, Inc. | | 2,043,025 |
| 68,400 | | Brookline Bancorp, Inc. | | 742,140 |
| 18,405 | | Capital One Financial Corporation | | 783,317 |
| 29,143 | | Discover Financial Services | | 540,020 |
| 113,500 | | Financial Select Sector SPDR Fund (ETF) | | 1,810,325 |
| 42,737 | | First Mercury Financial Corporation | | 700,887 |
| 85,500 | | FirstMerit Corporation | | 1,692,045 |
| 13,600 | * | FXCM, Inc. – Class “A” | | 180,200 |
| 123,100 | | Hudson City Bancorp, Inc. | | 1,568,294 |
| 11,600 | | IBERIABANK Corporation | | 685,908 |
| 37,800 | | Invesco, Ltd. | | 909,468 |
| 49,456 | | JPMorgan Chase & Company | | 2,097,924 |
| 24,500 | | M&T Bank Corporation | | 2,132,725 |
| 48,113 | | Morgan Stanley | | 1,309,155 |
| 133,900 | | New York Community Bancorp, Inc. | | 2,524,015 |
| 75,700 | | NewAlliance Bancshares, Inc. | | 1,133,986 |
| 56,900 | | SPDR KBW Regional Banking (ETF) | | 1,505,005 |
| 103,279 | * | Sunstone Hotel Investors, Inc. (REIT) | | 1,066,872 |
| | | | |
| | | | | |
| | | | | |
| | | | | |
| | | | | |
| Shares | | Security | | Value |
| |
| | | Financials (continued) | | |
| 29,688 | | U.S. Bancorp | | $ 800,685 |
| 68,600 | | Urstadt Biddle Properties – Class “A” (REIT) | | 1,334,270 |
| 31,367 | | Wells Fargo & Company | | 972,063 |
| |
| | | | | 28,047,662 |
| |
| | | Health Care—8.6% | | |
| 44,100 | | Abbott Laboratories | | 2,112,831 |
| 13,446 | * | Amgen, Inc. | | 738,185 |
| 15,730 | | Baxter International, Inc. | | 796,253 |
| 24,000 | * | Genzyme Corporation | | 1,708,800 |
| 33,900 | * | Gilead Sciences, Inc. | | 1,228,536 |
| 48,375 | | Johnson & Johnson | | 2,991,994 |
| 22,800 | | Medtronic, Inc. | | 845,652 |
| 28,043 | | Merck & Company. Inc. | | 1,010,670 |
| 148,482 | | Pfizer, Inc. | | 2,599,920 |
| 34,953 | | Sanofi-Aventis (ADR) | | 1,126,535 |
| 18,500 | * | St. Jude Medical, Inc. | | 790,875 |
| 32,643 | * | Thermo Fisher Scientific, Inc. | | 1,807,116 |
| |
| | | | | 17,757,367 |
| |
| | | Industrials—16.9% | | |
| 32,394 | | 3M Company | | 2,795,602 |
| 36,895 | * | Altra Holdings, Inc. | | 732,735 |
| 50,100 | | Armstrong World Industries, Inc. | | 2,154,300 |
| 23,300 | | Baldor Electric Company | | 1,468,832 |
| 21,800 | | Caterpillar, Inc. | | 2,041,788 |
| 54,537 | * | Chicago Bridge & Iron Company NV – NY Shares | | 1,794,267 |
| 24,000 | * | Esterline Technologies Corporation | | 1,646,160 |
| 47,600 | * | Generac Holdings, Inc. | | 769,692 |
| 36,796 | | General Electric Company | | 672,999 |
| 38,640 | | Honeywell International, Inc. | | 2,054,102 |
| 39,153 | | IDEX Corporation | | 1,531,665 |
| 15,700 | | Lockheed Martin Corporation | | 1,097,587 |
| 50,419 | * | Mobile Mini, Inc. | | 992,750 |
| 17,118 | | Northrop Grumman Corporation | | 1,108,904 |
| 57,768 | * | PGT, Inc. | | 141,532 |
| 21,900 | | Raytheon Company | | 1,014,846 |
| 28,950 | | Republic Services, Inc. | | 864,447 |
| 36,000 | | Snap-on, Inc. | | 2,036,880 |
| 114,600 | | TAL International Group, Inc. | | 3,537,702 |
Portfolio of Investments (continued)
GROWTH & INCOME FUND
December 31, 2010
| | | | |
| | | | | |
| | | | | |
| | | | | |
| | | | | |
| Shares | | Security | | Value |
| |
| | | Industrials (continued) | | |
| 55,000 | | Textainer Group Holdings, Ltd. | | $ 1,566,950 |
| 64,368 | | Tyco International, Ltd. | | 2,667,410 |
| 28,700 | | United Technologies Corporation | | 2,259,264 |
| |
| | | | | 34,950,414 |
| |
| | | Information Technology—16.4% | | |
| 45,400 | | Avago Technologies, Ltd. | | 1,292,538 |
| 160,400 | * | Brocade Communications Systems, Inc. | | 848,516 |
| 19,400 | * | CACI International, Inc. – Class “A” | | 1,035,960 |
| 87,700 | * | Cisco Systems, Inc. | | 1,774,171 |
| 26,400 | * | CommScope, Inc. | | 824,208 |
| 100,000 | * | EMC Corporation | | 2,290,000 |
| 51,240 | | Hewlett-Packard Company | | 2,157,204 |
| 55,352 | | Intel Corporation | | 1,164,053 |
| 30,729 | | International Business Machines Corporation | | 4,509,788 |
| 43,900 | | Intersil Corporation – Class “A” | | 670,353 |
| 129,800 | | Microsoft Corporation | | 3,624,016 |
| 103,100 | | National Semiconductor Corporation | | 1,418,656 |
| 53,825 | * | NCI, Inc. – Class “A” | | 1,237,437 |
| 70,855 | * | Parametric Technology Corporation | | 1,596,363 |
| 59,788 | | QUALCOMM, Inc. | | 2,958,908 |
| 48,650 | * | SRA International, Inc. – Class “A” | | 994,892 |
| 95,160 | * | Symantec Corporation | | 1,592,978 |
| 57,400 | | Tyco Electronics, Ltd. | | 2,031,960 |
| 105,200 | | Western Union Company | | 1,953,564 |
| |
| | | | | 33,975,565 |
| |
| | | Materials—6.0% | | |
| 48,700 | | Bemis Company, Inc. | | 1,590,542 |
| 34,700 | | Buckeye Technologies, Inc. | | 729,047 |
| 31,400 | | Celanese Corporation – Series “A” | | 1,292,738 |
| 22,670 | | Freeport-McMoRan Copper & Gold, Inc. | | 2,722,440 |
| 37,800 | | Olin Corporation | | 775,656 |
| 11,600 | | Praxair, Inc. | | 1,107,452 |
| 73,920 | | RPM International, Inc. | | 1,633,632 |
| 16,700 | | Schweitzer-Mauduit International, Inc. | | 1,050,764 |
| 72,964 | | Temple-Inland, Inc. | | 1,549,755 |
| |
| | | | | 12,452,026 |
| | | | | | | |
| | | | | | | | |
| | | | | | | | |
| Shares or | | | | | | | |
| Principal | | | | | | | |
| Amount | | Security | | | | | Value |
| |
| | | Telecommunication Services—2.4% | | | | | |
| 71,083 | | AT&T, Inc. | | | | | $ 2,088,419 |
| 82,200 | | Verizon Communications, Inc. | | | | | 2,941,116 |
| |
| | | | | | | | 5,029,535 |
| |
| | | Utilities—.4% | | | | | |
| 24,126 | | Atmos Energy Corporation | | | | | 752,731 |
| |
| Total Value of Common Stocks (cost $179,261,272) | | | | | 206,877,738 |
| |
| | | SHORT-TERM INVESTMENTS—.1% | | | | | |
| | | Money Market Fund | | | | | |
| $ 275M | | First Investors Cash Reserve Fund, .19% (cost $275,000)** | | | | 275,000 |
| |
| Total Value of Investments (cost $179,536,272) | 99.9 | % | | | 207,152,738 |
| Other Assets, Less Liabilities | .1 | | | | 147,600 |
| |
| Net Assets | | | 100.0 | % | | | $207,300,338 |
| | |
| * | Non-income producing |
| |
| ** | Affiliated unregistered money market fund available only to First Investors funds and certain |
| accounts managed by First Investors Management Company, Inc. Rate shown is the 7-day yield at |
| December 31, 2010 (see Note 3). |
| |
| Summary of Abbreviations: |
| ADR | American Depositary Receipts |
| ETF | Exchange Traded Fund |
| REIT | Real Estate Investment Trust |
Portfolio of Investments (continued)
GROWTH & INCOME FUND
December 31, 2010
Accounting Standards Codification (“ASC”) 820 established a three-tier hierarchy of inputs to establish a classification of fair value measurements for disclosure purposes. The three-tier hierarchy of inputs is summarized in the three broad Levels listed below:
| Level 1 — quoted prices in active markets for identical securities |
| Level 2 — other significant observable inputs (including quoted prices for similar securities, interest rates, prepayment speeds, credit risk, etc.) |
| Level 3 — significant unobservable inputs (including the fund’s own assumptions in determining the fair value of investments) |
The inputs methodology used for valuing securities are not necessarily an indication of the risk associated with investing in those securities.
The following is a summary, by category of Level, of inputs used to value the Fund’s investments as of December 31, 2010:
| | | | | | | | | | | | |
| | | | | | | Level 2 | | | | | | |
| | | | | | | Other | | | Level 3 | | | |
| | | | Level 1 | | | Significant | | | Significant | | | |
| | | | Quoted | | | Observable | | | Unobservable | | | |
| | | | Prices | | | Inputs | | | Inputs | | | Total |
| Common Stocks | | $ | 206,877,738 | | $ | — | | $ | — | | $ | 206,877,738 |
| Money Market Fund | | | 275,000 | | | — | | | — | | | 275,000 |
| Total Investments in | | | | | | | | | | | | |
| Securities* | | $ | 207,152,738 | | $ | — | | $ | — | | $ | 207,152,738 |
* The Portfolio of Investments provides information on the industry categorization for the portfolio.
There were no transfers into or from Level 1 and Level 2 by the Fund during the year ended December 31, 2010.
| |
| 40 | See notes to financial statements |
Portfolio Manager’s Letter
HIGH YIELD FUND
Dear Investor:
This is the annual report for the First Investors Life High Yield Fund for the year ended December 31, 2010. During the period, the Fund’s return on a net asset value basis was 13.7%, including dividends of 49.4 cents per share.
In 2010, the U.S. high yield market had a very positive tone and attractive, double-digit returns. Within high yield, risk was rewarded, with CCC credits outperforming BB and B credits for the year. Positive trends that were begun in 2009 continued in 2010. Most notably, new issuance remained robust as high yield companies issued a record $284 billion in bonds for the year, using the majority of proceeds to refinance existing debt and improve their balance sheets. Default rates continued to trend lower with the par-weighted high yield bond default rate ending 2010 at 0.8% for the full year, according to JP Morgan. In this environment, the Fund generated strong performance for the year, in line with the Bank of America Merrill Lynch BB-B U.S. Cash Pay High Yield Constrained Index.
However, the Fund’s performance did not come from merely mirroring the Index. Rather, the Fund maintained a low exposure to certain more speculative — but high returning — industries such as banking, insurance and diversified financial services. The Fund made up for underexposure in these sectors with strong credit selection in industries as diverse as energy, gaming, health care, leisure and homebuilding.
Fund and market returns were positive in each month with just two exceptions —May and November — when headline news outside the high yield bond sector rocked markets. Although the high yield market suffered a downdraft in both months, followed by a rapid recovery, the two situations were not entirely analogous for other fixed income investments. In May, Greek sovereign debt fears, rising tensions on the Korean peninsula and fallout from the BP oil spill prompted investors to de-risk their portfolios. High yield declined, greatly underperforming Treasuries, which enjoyed strong gains as a result of a flight to quality.
By November, however, headline risk led to different results that we think are more indicative of what we may experience in the coming year. Once again, investors were made nervous by the weakness of European sovereign debt — this time in Ireland. However, Ireland was not alone. The Federal Reserve issued their second round of Quantitative Easing, dubbed “QE2,” causing investors to fear that the U.S. government might be borrowing more than it ought to, leading potentially to U.S. inflation and to rising government rates down the road. This time, so-called risky assets such as high yield bonds sold off modestly in November and bounced back in December, while higher-rated bonds, especially Treasuries, were hit hard over the two-month period.
Portfolio Manager’s Letter (continued)
HIGH YIELD FUND
In short, investors have become nervous that a rising interest rate environment could hurt high-rated bond investments, particularly government bonds, in 2011. High yield bond investments, by contrast, are more sensitive to the individual credit risk of the companies borrowing money through the bond market than to interest rate risk. We believe this is particularly true when, as now, high yield bond yields offer an attractively wide spread over current government rates, creating room for the high yield bond market to “absorb” potential interest rate increases without backing up in price. As a result, despite unprecedented returns of the last two years, we believe high yield remains an attractive asset class for 2011.
Thank you for placing your trust in First Investors. As always, we appreciate the opportunity to serve your investment needs.

Fund Expenses (unaudited)
HIGH YIELD FUND
The examples below show the ongoing costs (in dollars) of investing in your Fund and will help you in comparing these costs with costs of other mutual funds. Please refer to page 3 for a detailed explanation of the information presented in these examples.
| | | |
| | Beginning | Ending | |
| | Account | Account | Expenses Paid |
| | Value | Value | During Period |
| | (7/1/10) | (12/31/10) | (7/1/10–12/31/10)* |
| Expense Examples | | | |
| Actual | $1,000.00 | $1,095.48 | $4.54 |
| Hypothetical | | | |
| (5% annual return before expenses) | $1,000.00 | $1,020.87 | $4.38 |
| |
| * | Expenses are equal to the annualized expense ratio of .86%, multiplied by the average account |
| value over the period, multiplied by 184/365 (to reflect the one-half year period). |
Portfolio Composition
TOP TEN SECTORS
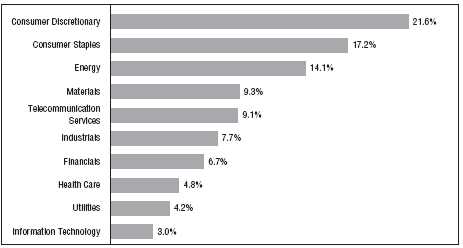
|
| Portfolio holdings and allocations are subject to change. Percentages are as of December 31, 2010, |
| and are based on the total value of investments. |
Cumulative Performance Information (unaudited)
HIGH YIELD FUND
Comparison of change in value of $10,000 investment in the First Investors Life Series High Yield Fund and the Bank of America (“BofA”) Merrill Lynch BB-B US Cash Pay High Yield Constrained Index.
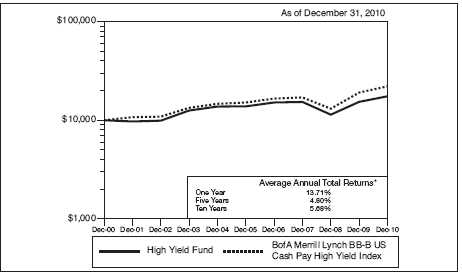
The graph compares a $10,000 investment in the First Investors Life Series High Yield Fund beginning 12/31/00 with a theoretical investment in the BofA Merrill Lynch BB-B US Cash Pay High Yield Constrained Index (the “Index”). The Index contains all securities in the BofA Merrill Lynch US Cash Pay High Yield Index rated BB1 through B3, based on an average of Moody’s, S&P and Fitch, but caps issuer exposure at 2%. Index constituents are capitalization-weighted, based on their current amount outstanding, provided the total allocation to an individual issuer does not exceed 2%. It is not possible to invest directly in this Index. In addition, the Index does not reflect fees and expenses associated with the active management of a mutual fund portfolio. For purposes of the graph and the accompanying table it is assumed that all dividends and distributions were reinvested.
* The Average Annual Total Return figures are for the periods ended 12/31/10.
The returns shown do not reflect any sales charges, since the Fund sells its shares solely to variable annuity and/or variable life insurance subaccounts at net asset value. The returns do not reflect the fees and charges that an individual would pay in connection with an investment in a variable annuity or life contract or policy. Results represent past performance and do not indicate future results. The graph and the returns shown do not reflect the deduction of taxes that an investor would pay on distributions or the redemption of fund shares. Investment return and principal value of an investment will fluctuate so that an investor’s shares, when redeemed, may be worth more or less than the original cost. The issuers of the high yield bonds, in which the Fund primarily invests, pay higher interest rates because they have a greater likelihood of financial difficulty, which could result in their inability to repay the bonds fully when due. Prices of high yield bonds are also subject to greater fluctuations. Index figures from Bank of America Merrill Lynch and all other figures are from First Investors Management Company, Inc.
Portfolio of Investments
HIGH YIELD FUND
December 31, 2010
| | | | |
| | | | | |
| | | | | |
| | | | | |
| Principal | | | | |
| Amount | | Security | | Value |
| |
| | | CORPORATE BONDS—95.9% | | |
| | | Aerospace/Defense—.1% | | |
| $ 100M | | Spirit Aerosystems, Inc., 6.75%, 2020 (a) | | $ 100,500 |
| |
| | | Automotive—2.8% | | |
| 425M | | Cooper Tire & Rubber Co., 8%, 2019 | | 442,000 |
| 300M | | Cooper-Standard Automotive, Inc., 8.5%, 2018 (a) | | 319,500 |
| | | Goodyear Tire & Rubber Co.: | | |
| 350M | | 10.5%, 2016 | | 400,750 |
| 225M | | 8.25%, 2020 | | 234,000 |
| 250M | | Navistar International Corp., 8.25%, 2021 | | 270,000 |
| 300M | | Oshkosh Corp., 8.5%, 2020 | | 330,750 |
| |
| | | | | 1,997,000 |
| |
| | | Building Materials—3.3% | | |
| 350M | | Associated Materials, LLC, 9.125%, 2017 (a) | | 366,625 |
| | | Building Materials Corp.: | | |
| 200M | | 6.875%, 2018 (a) | | 199,000 |
| 575M | | 7.5%, 2020 (a) | | 587,938 |
| 350M | | Interface, Inc., 7.625%, 2018 (a) | | 363,125 |
| 250M | | Mohawk Industries, Inc., 6.875%, 2016 | | 269,375 |
| 500M | | Texas Industries, Inc., 9.25%, 2020 (a) | | 533,750 |
| |
| | | | | 2,319,813 |
| |
| | | Capital Goods—.6% | | |
| 375M | | Belden CDT, Inc., 9.25%, 2019 | | 412,969 |
| |
| | | Chemicals—4.3% | | |
| 200M | | Chemtura Corp., 7.875%, 2018 (a) | | 213,000 |
| 300M | | Ferro Corp., 7.875%, 2018 | | 318,000 |
| 950M | | Georgia Gulf Corp., 9%, 2017 (a) | | 1,035,500 |
| 425M | | Lyondell Chemical Co., 11%, 2018 | | 483,438 |
| 200M | | PolyOne Corp., 7.375%, 2020 | | 207,750 |
| | | Solutia, Inc.: | | |
| 525M | | 8.75%, 2017 | | 577,500 |
| 175M | | 7.875%, 2020 | | 188,125 |
| |
| | | | | 3,023,313 |
Portfolio of Investments (continued)
HIGH YIELD FUND
December 31, 2010
| | | | |
| | | | | |
| | | | | |
| | | | | |
| Principal | | | | |
| Amount | | Security | | Value |
| |
| | | Consumer Durables—1.1% | | |
| | | Sealy Mattress Co.: | | |
| $ 500M | | 8.25%, 2014 | | $ 513,750 |
| 228M | | 10.875%, 2016 (a) | | 258,780 |
| |
| | | | | 772,530 |
| |
| | | Consumer Non-Durables—1.8% | | |
| 350M | | Acco Brands Corp., 10.625%, 2015 | | 395,500 |
| 125M | | Easton-Bell Sports, Inc., 9.75%, 2016 | | 137,812 |
| 75M | | Hanesbrands, Inc., 6.375%, 2020 (a) | | 71,625 |
| 325M | | Jarden Corp., 7.5%, 2020 | | 340,437 |
| 325M | | Phillips-Van Heusen Corp., 7.375%, 2020 | | 346,937 |
| |
| | | | | 1,292,311 |
| |
| | | Energy—13.8% | | |
| | | Anadarko Petroleum Corp.: | | |
| 325M | | 6.375%, 2017 | | 354,510 |
| 225M | | 6.95%, 2019 | | 252,845 |
| | | Berry Petroleum Co.: | | |
| 375M | | 10.25%, 2014 | | 432,187 |
| 400M | | 8.25%, 2016 | | 419,000 |
| | | Chesapeake Energy Corp.: | | |
| 250M | | 9.5%, 2015 | | 283,125 |
| 275M | | 7.25%, 2018 | | 286,000 |
| | | Concho Resources, Inc.: | | |
| 325M | | 8.625%, 2017 | | 355,875 |
| 75M | | 7%, 2021 | | 77,062 |
| | | Consol Energy, Inc.: | | |
| 225M | | 8%, 2017 (a) | | 240,750 |
| 600M | | 8.25%, 2020 (a) | | 651,000 |
| 75M | | Continental Resources, 7.125%, 2021 (a) | | 79,125 |
| 75M | | Copano Energy, LLC, 7.75%, 2018 | | 76,875 |
| 675M | | Crosstex Energy, LP, 8.875%, 2018 | | 726,469 |
| 175M | | Denbury Resources, Inc., 8.25%, 2020 | | 190,750 |
| | | El Paso Corp.: | | |
| 575M | | 7%, 2017 | | 609,681 |
| 50M | | 7.75%, 2032 | | 49,987 |
| 100M | | Encore Acquisition Co., 9.5%, 2016 | | 111,500 |
| 550M | | Expro Finance Luxembourg SCA, 8.5%, 2016 (a) | | 528,000 |
| | | Ferrellgas Partners, LP: | | |
| 475M | | 9.125%, 2017 | | 524,875 |
| 350M | | 8.625%, 2020 | | 378,000 |
| | | | |
| | | | | |
| | | | | |
| | | | | |
| Principal | | | | |
| Amount | | Security | | Value |
| |
| | | Energy (continued) | | |
| $ 450M | | Genesis Energy, LP, 7.875%, 2018 (a) | | $ 448,875 |
| 275M | | Helix Energy Solutions Group, Inc., 9.5%, 2016 (a) | | 283,937 |
| | | Hilcorp Energy I, LP: | | |
| 25M | | 7.75%, 2015 (a) | | 25,938 |
| 225M | | 9%, 2016 (a) | | 239,062 |
| 575M | | 8%, 2020 (a) | | 611,656 |
| 325M | | Inergy, LP, 7%, 2018 (a) | | 329,062 |
| 200M | | Linn Energy, LLC, 9.875%, 2018 | | 220,000 |
| 150M | | Penn Virginia Corp., 10.375%, 2016 | | 168,000 |
| | | Quicksilver Resources, Inc.: | | |
| 75M | | 8.25%, 2015 | | 78,187 |
| 300M | | 11.75%, 2016 | | 351,000 |
| 250M | | 9.125%, 2019 | | 275,625 |
| 100M | | Whiting Petroleum Corp., 6.5%, 2018 | | 101,500 |
| |
| | | | | 9,760,458 |
| |
| | | Financials—3.3% | | |
| 175M | | Ally Financial, Inc., 8%, 2020 | | 191,625 |
| | | Ford Motor Credit Co., LLC: | | |
| 375M | | 8.7%, 2014 | | 422,649 |
| 150M | | 5.625%, 2015 | | 155,482 |
| 175M | | 6.625%, 2017 | | 184,169 |
| 50M | | GMAC, LLC, 8%, 2031 | | 54,125 |
| | | International Lease Finance Corp.: | | |
| 200M | | 6.375%, 2013 | | 206,000 |
| 100M | | 6.625%, 2013 | | 102,625 |
| 175M | | 8.625%, 2015 (a) | | 188,563 |
| 275M | | 8.75%, 2017 (a) | | 295,625 |
| 75M | | 8.25%, 2020 | | 77,344 |
| 425M | | Pinafore, LLC, 9%, 2018 (a) | | 461,125 |
| |
| | | | | 2,339,332 |
| |
| | | Food/Beverage/Tobacco—2.9% | | |
| 375M | | CF Industries, Inc., 7.125%, 2020 | | 411,563 |
| 150M | | Dean Foods Co., 9.75%, 2018 (a) | | 151,875 |
| 1,025M | | JBS Finance II, Ltd., 8.25%, 2018 (a) | | 1,035,250 |
| 375M | | Smithfield Foods, Inc., 10%, 2014 (a) | | 434,063 |
| |
| | | | | 2,032,751 |
Portfolio of Investments (continued)
HIGH YIELD FUND
December 31, 2010
| | | | |
| | | | | |
| | | | | |
| | | | | |
| Principal | | | | |
| Amount | | Security | | Value |
| |
| | | Food/Drug—1.2% | | |
| $ 175M | | McJunkin Red Man Corp., 9.5%, 2016 (a) | | $ 166,250 |
| 400M | | NBTY, Inc., 9%, 2018 (a) | | 429,000 |
| 250M | | Tops Holding Corp./Tops Markets, LLC, 10.125%, 2015 | | 258,125 |
| |
| | | | | 853,375 |
| |
| | | Forest Products/Containers—1.8% | | |
| 50M | | Ball Corp., 5.75%, 2021 | | 48,500 |
| 200M | | Graham Packaging Co., LP, 8.25%, 2018 | | 211,000 |
| 250M | | Mercer International, Inc., 9.5%, 2017 (a) | | 258,125 |
| 525M | | Reynolds Group Escrow, LLC, 7.75%, 2016 (a) | | 557,813 |
| 225M | | Reynolds Group Issuer, Inc., 9%, 2019 (a) | | 234,281 |
| |
| | | | | 1,309,719 |
| |
| | | Gaming/Leisure—3.9% | | |
| 325M | | Equinox Holdings, Inc., 9.5%, 2016 (a) | | 344,906 |
| 275M | | Las Vegas Sands Corp., 6.375%, 2015 | | 282,219 |
| 325M | | MCE Finance, Ltd., 10.25%, 2018 | | 374,156 |
| 275M | | MGM Mirage, Inc., 9%, 2020 (a) | | 303,875 |
| | | NCL Corp., Ltd.: | | |
| 425M | | 11.75%, 2016 | | 497,781 |
| 200M | | 9.5%, 2018 (a) | | 207,000 |
| 325M | | Wynn Las Vegas, LLC, 7.75%, 2020 | | 353,438 |
| 327M | | Yonkers Racing Corp., 11.375%, 2016 (a) | | 361,744 |
| |
| | | | | 2,725,119 |
| |
| | | Health Care—4.8% | | |
| 175M | | Capella Healthcare, 9.25%, 2017 (a) | | 185,937 |
| 925M | | Community Health Systems, Inc., 8.875%, 2015 | | 973,562 |
| 350M | | ConvaTec Healthcare, 10.5%, 2018 (a) | | 356,562 |
| | | DaVita, Inc.: | | |
| 200M | | 6.375%, 2018 | | 199,500 |
| 100M | | 6.625%, 2020 | | 99,250 |
| 50M | | Endo Pharmaceuticals Holdings, Inc., 7%, 2020 (a) | | 51,250 |
| 600M | | Genesis Health Ventures, Inc., 9.75%, 2011 (b)(c) | | 375 |
| 700M | | HCA, Inc., 9.25%, 2016 | | 748,562 |
| | | Healthsouth Corp.: | | |
| 250M | | 7.25%, 2018 | | 255,625 |
| 125M | | 7.75%, 2022 | | 129,375 |
| 75M | | LVB Acquisition Holdings, LLC (Biomet, Inc.), 10%, 2017 | | 82,312 |
| 325M | | Valeant Pharmaceuticals International, 6.75%, 2017 (a) | | 324,188 |
| |
| | | | | 3,406,498 |
| | | | |
| | | | | |
| | | | | |
| | | | | |
| Principal | | | | |
| Amount | | Security | | Value |
| |
| | | Information Technology—2.9% | | |
| | | Brocade Communications Systems, Inc.: | | |
| $ 100M | | 6.625%, 2018 | | $ 105,750 |
| 125M | | 6.875%, 2020 | | 133,750 |
| 550M | | Equinix, Inc., 8.125%, 2018 | | 577,500 |
| | | Fidelity National Information Services, Inc.: | | |
| 175M | | 7.625%, 2017 (a) | | 185,063 |
| 50M | | 7.875%, 2020 (a) | | 53,125 |
| | | Jabil Circuit, Inc.: | | |
| 50M | | 7.75%, 2016 | | 56,375 |
| 550M | | 8.25%, 2018 | | 625,625 |
| 200M | | JDA Software Group, Inc., 8%, 2014 | | 216,500 |
| 125M | | Seagate HDD Cayman, 7.75%, 2018 (a) | | 127,188 |
| |
| | | | | 2,080,876 |
| |
| | | Manufacturing—4.0% | | |
| 325M | | Amsted Industries, 8.125%, 2018 (a) | | 346,531 |
| 275M | | Case New Holland, Inc., 7.875%, 2017 (a) | | 301,813 |
| 400M | | Coleman Cable, Inc., 9%, 2018 | | 416,000 |
| 525M | | Manitowoc Company, Inc., 8.5%, 2020 | | 560,438 |
| | | Terex Corp.: | | |
| 425M | | 10.875%, 2016 | | 495,656 |
| 675M | | 8%, 2017 | | 685,125 |
| |
| | | | | 2,805,563 |
| |
| | | Media-Broadcasting—4.1% | | |
| 375M | | Allbritton Communication Co., 8%, 2018 | | 380,625 |
| | | Belo Corp.: | | |
| 575M | | 7.25%, 2027 | | 501,687 |
| 100M | | 7.75%, 2027 | | 90,500 |
| | | Lin Television Corp.: | | |
| 275M | | 6.5%, 2013 | | 276,375 |
| 75M | | 6.5%, 2013 | | 75,562 |
| 350M | | Nexstar/Mission Broadcasting, Inc., 8.875%, 2017 (a) | | 373,625 |
| | | Sinclair Television Group: | | |
| 575M | | 9.25%, 2017 (a) | | 625,312 |
| 100M | | 8.375%, 2018 (a) | | 103,750 |
| 475M | | XM Satellite Radio, Inc., 7.625%, 2018 (a) | | 492,812 |
| |
| | | | | 2,920,248 |
Portfolio of Investments (continued)
HIGH YIELD FUND
December 31, 2010
| | | | |
| | | | | |
| | | | | |
| | | | | |
| Principal | | | | |
| Amount | | Security | | Value |
| |
| | | Media-Cable TV—7.2% | | |
| $ 850M | | Atlantic Broadband Finance, LLC, 9.375%, 2014 | | $ 867,000 |
| 550M | | Cablevision Systems Corp., 8.625%, 2017 | | 601,562 |
| 150M | | CCH II, LLC, 13.5%, 2016 | | 179,625 |
| 250M | | Cequel Communications Holdings I, Inc., 8.625%, 2017 (a) | | 262,500 |
| | | Clear Channel Worldwide: | | |
| 350M | | 9.25%, 2017 Series “A” | | 382,375 |
| 675M | | 9.25%, 2017 Series “B” | | 742,500 |
| | | Echostar DBS Corp.: | | |
| 325M | | 6.625%, 2014 | | 338,000 |
| 325M | | 7.75%, 2015 | | 346,937 |
| 175M | | Quebecor Media, Inc., 7.75%, 2016 | | 181,562 |
| 675M | | UPC Germany GmbH, 8.125%, 2017 (a) | | 708,750 |
| 100M | | Videotron LTEE, 6.375%, 2015 | | 102,750 |
| 300M | | Virgin Media Finance, PLC, 9.5%, 2016 | | 340,500 |
| |
| | | | | 5,054,061 |
| |
| | | Media-Diversified—1.0% | | |
| 325M | | Entravision Communications Corp., 8.75%, 2017 (a) | | 344,500 |
| 225M | | Lamar Media Corp., 7.875%, 2018 | | 240,188 |
| 125M | | NAI Entertainment Holdings, LLC, 8.25%, 2017 (a) | | 131,875 |
| |
| | | | | 716,563 |
| |
| | | Metals/Mining—3.3% | | |
| 350M | | AK Steel Corp., 7.625%, 2020 | | 352,625 |
| | | FMG Resources (August 2006) Property, Ltd.: | | |
| 200M | | 7%, 2015 (a) | | 206,000 |
| 175M | | 6.375%, 2016 (a) | | 175,875 |
| 125M | | 6.875%, 2018 (a) | | 125,000 |
| 375M | | Metals USA, Inc., 11.125%, 2015 | | 396,563 |
| 675M | | Novelis, Inc., 8.375%, 2017 (a) | | 702,000 |
| 325M | | Vedanta Resources, PLC, 9.5%, 2018 (a) | | 357,094 |
| |
| | | | | 2,315,157 |
| |
| | | Real Estate Investment Trusts—3.0% | | |
| 200M | | Brandywine Operating Partnership, LP, 5.7%, 2017 | | 199,757 |
| | | CB Richard Ellis Service: | | |
| 650M | | 11.625%, 2017 | | 756,438 |
| 125M | | 6.625%, 2020 (a) | | 125,625 |
| | | | |
| | | | | |
| | | | | |
| | | | | |
| Principal | | | | |
| Amount | | Security | | Value |
| |
| | | Real Estate Investment Trusts (continued) | | |
| | | Developers Diversified Realty Corp.: | | |
| $ 100M | | 9.625%, 2016 | | $ 118,797 |
| 100M | | 7.875%, 2020 | | 112,179 |
| 375M | | Dupont Fabros Technology, LP, 8.5%, 2017 | | 403,125 |
| 150M | | HRPT Properties Trust, 6.25%, 2017 | | 153,653 |
| 250M | | Omega Heathcare Investors, Inc., 6.75%, 2022 (a) | | 248,438 |
| |
| | | | | 2,118,012 |
| |
| | | Retail-General Merchandise—6.8% | | |
| 600M | | DineEquity, Inc., 9.5%, 2018 (a) | | 639,000 |
| 275M | | Federated Retail Holdings, Inc., 5.9%, 2016 | | 294,938 |
| 400M | | HSN, Inc., 11.25%, 2016 | | 458,500 |
| 325M | | J.C. Penney Corp., Inc., 7.95%, 2017 | | 355,875 |
| | | Limited Brands, Inc.: | | |
| 225M | | 8.5%, 2019 | | 258,188 |
| 75M | | 7%, 2020 | | 79,500 |
| 400M | | Macys Retail Holdings, Inc., 7.45%, 2017 | | 442,000 |
| 275M | | QVC, Inc., 7.5%, 2019 (a) | | 290,813 |
| 500M | | Sears Holding Corp., 6.625%, 2018 (a) | | 468,750 |
| 275M | | Susser Holdings & Finance, 8.5%, 2016 | | 296,313 |
| 550M | | Toys R Us Property Co. I, Inc., 10.75%, 2017 | | 629,750 |
| 175M | | Toys R Us Property Co. II, Inc., 8.5%, 2017 | | 189,000 |
| 400M | | Yankee Acquisition Corp., 8.5%, 2015 | | 418,000 |
| |
| | | | | 4,820,627 |
| |
| | | Services—1.8% | | |
| 175M | | FTI Consulting, Inc., 7.75%, 2016 | | 181,125 |
| 325M | | Kar Holdings, Inc., 8.75%, 2014 | | 339,625 |
| 350M | | PHH Corp., 9.25%, 2016 (a) | | 371,000 |
| 375M | | Reliance Intermediate Holdings, LP, 9.5%, 2019 (a) | | 396,094 |
| |
| | | | | 1,287,844 |
| |
| | | Telecommunications—8.4% | | |
| 225M | | Buccaneer Merger Sub. Inc. | | |
| | | (Syniverse Holdings, Inc.), 9.125%, 2019 (a) | | 233,437 |
| | | Citizens Communications Co.: | | |
| 750M | | 7.125%, 2019 | | 774,375 |
| 100M | | 9%, 2031 | | 103,250 |
| | | Frontier Communications Corp.: | | |
| 275M | | 8.125%, 2018 | | 303,187 |
| 200M | | 8.5%, 2020 | | 219,500 |
Portfolio of Investments (continued)
HIGH YIELD FUND
December 31, 2010
| | | | |
| | | | | |
| | | | | |
| | | | | |
| Principal | | | | |
| Amount | | Security | | Value |
| |
| | | Telecommunications (continued) | | |
| $ 300M | | GCI, Inc., 8.625%, 2019 | | $ 326,250 |
| 750M | | Inmarsat Finance, PLC, 7.375%, 2017 (a) | | 791,250 |
| 100M | | Intelsat Jackson Holdings, Ltd., 9.5%, 2016 | | 106,000 |
| 650M | | Nextel Communications, Inc., 7.375%, 2015 | | 654,062 |
| | | Qwest Communications International, Inc.: | | |
| 500M | | 7.5%, 2014 | | 508,750 |
| 225M | | 8%, 2015 | | 243,000 |
| 700M | | Sprint Capital Corp., 6.875%, 2028 | | 616,000 |
| 250M | | Wind Acquisition Finance SA, 11.75%, 2017 (a) | | 283,125 |
| | | Windstream Corp.: | | |
| 450M | | 8.625%, 2016 | | 475,875 |
| 150M | | 7.875%, 2017 | | 158,437 |
| 125M | | 7.75%, 2020 | | 129,375 |
| |
| | | | | 5,925,873 |
| |
| | | Transportation—2.9% | | |
| 350M | | Aircastle, Ltd., 9.75%, 2018 | | 384,125 |
| 550M | | CHC Helicopter SA, 9.25%, 2020 (a) | | 572,000 |
| | | Navios Maritime Holdings: | | |
| 575M | | 9.5%, 2014 | | 600,875 |
| 100M | | 8.875%, 2017 | | 108,750 |
| 350M | | Swift Services Holdings, Inc., 10%, 2018 (a) | | 368,375 |
| |
| | | | | 2,034,125 |
| |
| | | Utilities—4.2% | | |
| 125M | | AES Corp., 9.75%, 2016 | | 140,313 |
| 350M | | Calpine Construction Finance Co., LP, 8%, 2016 (a) | | 373,625 |
| 375M | | Calpine Corp., 7.5%, 2021 (a) | | 371,250 |
| 250M | | Energy Future Holdings Corp., 10%, 2020 (a) | | 258,443 |
| 500M | | Intergen NV, 9%, 2017 (a) | | 532,500 |
| | | NRG Energy, Inc.: | | |
| 625M | | 7.375%, 2017 | | 645,313 |
| 225M | | 8.5%, 2019 | | 233,438 |
| 400M | | NSG Holdings, LLC, 7.75%, 2025 (a) | | 374,000 |
| |
| | | | | 2,928,882 |
| | | | | | | |
| | | | | | | | |
| Principal | | | | | | | |
| Amount, | | | | | | | |
| Shares or | | | | | | | |
| Warrants | | Security | | | | | Value |
| |
| | | Wireless Communications—.6% | | | | | |
| $ 100M | | Crown Castle International Corp., 9%, 2015 | | | | | $ 110,750 |
| 350M | | MetroPCS Wireless, Inc., 6.625%, 2020 | | | | | 334,250 |
| |
| | | | | | | | 445,000 |
| |
| Total Value of Corporate Bonds (cost $64,067,821) | | | | | 67,798,519 |
| |
| | | COMMON STOCKS—.0% | | | | | |
| | | Telecommunications | | | | | |
| 3 | * | Viatel Holding (Bermuda), Ltd. (b) | | | | | — |
| 5,970 | * | World Access, Inc. | | | | | 6 |
| |
| Total Value of Common Stocks (cost $97,360) | | | | | 6 |
| |
| | | WARRANTS—.0% | | | | | |
| | | Media-Diversified | | | | | |
| 2,144 | * | MediaNews Group, Inc. (expiring 3/19/17) (cost $753,584) (b) | | | | 21 |
| |
| | | SHORT-TERM INVESTMENTS—1.9% | | | | |
| | | Money Market Fund | | | | | |
| $ 1,330M | | First Investors Cash Reserve Fund, .19% (cost $1,330,000) (d) | | | | 1,330,000 |
| |
| Total Value of Investments (cost $66,248,765) | 97.8 | % | | | 69,128,546 |
| Other Assets, Less Liabilities | 2.2 | | | | 1,527,013 |
| |
| Net Assets | | | 100.0 | % | | | $70,655,559 |
| |
| * | Non-income producing |
| |
| (a) | Security exempt from registration under Rule 144A of Securities Act of 1933 (see Note 5). |
| |
| (b) | Securities valued at fair value (see Note 1A). |
| |
| (c) | In default as to principal and/or interest payment |
| |
| (d) | Affiliated unregistered money market fund available only to First Investors funds and certain |
| accounts managed by First Investors Management Company, Inc. Rate shown is the 7-day yield |
| at December 31, 2010 (see Note 3). |
Accounting Standards Codification (“ASC”) 820 established a three-tier hierarchy of inputs to establish a classification of fair value measurements for disclosure purposes. The three-tier hierarchy of inputs is summarized in the three broad Levels listed below:
| Level 1 — quoted prices in active markets for identical securities |
| Level 2 — other significant observable inputs (including quoted prices for similar securities, interest rates, prepayment speeds, credit risk, etc.) |
| Level 3 — significant unobservable inputs (including the fund’s own assumptions in determining the fair value of investments) |
Portfolio of Investments (continued)
HIGH YIELD FUND
December 31, 2010
The inputs methodology used for valuing securities are not necessarily an indication of the risk associated with investing in those securities.
The following is a summary, by category of Level, of inputs used to value the Fund’s investments as of December 31, 2010:
| | | | | | | | | | | | |
| | | | | | | Level 2 | | | | | | |
| | | | | | | Other | | | Level 3 | | | |
| | | | Level 1 | | | Significant | | | Significant | | | |
| | | | Quoted | | | Observable | | | Unobservable | | | |
| | | | Prices | | | Inputs | | | Inputs | | | Total |
| Corporate Bonds | | $ | — | | $ | 67,798,144 | | $ | 375 | | $ | 67,798,519 |
| Common Stocks | | | 6 | | | — | | | — | | | 6 |
| Warrants | | | — | | | — | | | 21 | | | 21 |
| Money Market Fund | | | 1,330,000 | | | — | | | — | | | 1,330,000 |
| Total Investments | | | | | | | | | | | | |
| in Securities* | | $ | 1,330,006 | | $ | 67,798,144 | | $ | 396 | | $ | 69,128,546 |
* The Portfolio of Investments provides information on the industry categorization for the portfolio.
There were no transfers into or from Level 1 and Level 2 by the Fund during the year ended December 31, 2010.
The following is a reconciliation of Fund investments valued using Level 3 inputs for the period:
| | | | | | | | | | | | |
| | | Investments | | Investments | | | | | | |
| | | in Corporate | | in Common | | | Investments | | | |
| | | | Bonds | | | Stocks | | | in Warrants | | | Total |
| Balance, | | | | | | | | | | | | |
| December 31, 2009 | | $ | 859 | | $ | 1,552 | | $ | 22,502 | | $ | 24,913 |
| Net purchases (sales) | | | — | | | (1,785) | | | 738,191 | | | 736,406 |
| Change in unrealized appreciation | | | | | | | | | | | | |
| (depreciation) | | | 753,099 | | | 78,070 | | | 828,389 | | | 1,659,558 |
| Realized gain (loss) | | | (753,583) | | | (77,837) | | | (1,589,061) | | | (2,420,481) |
| Transfer in and/or out of Level 3 | | | — | | | — | | | — | | | — |
| |
| Balance, December 31, 2010 | | $ | 375 | | $ | — | | $ | 21 | | $ | 396 |
| |
| The following is a summary of Level 3 inputs by industry: | | | | | | | |
| Health Care | | | | | | | | | | $ | | 375 |
| Media – Diversified | | | | | | | | | | | | 21 |
| | | | | | | | | | | $ | | 396 |
| |
| 54 | See notes to financial statements |
Portfolio Manager’s Letter
INTERNATIONAL FUND
Dear Investor:
This is the annual report for the First Investors Life International Fund for the year ended December 31, 2010. During the period, the Fund’s return on a net asset value basis was 13.5%.
Overall, it was a positive year for global markets, with investors realizing a second year of solid equity returns. During 2010, markets benefited from the stabilization of the financials sector, general improvement in global economies and massive monetary stimulus in the United States. In Europe, stronger economies continued to improve while weaker ones generally continued to languish. Germany and Scandinavia saw gains in exports and capital goods, Greece embraced austerity measures, Ireland struggled for financial stability and Spain’s housing market failed to rebound. America saw stabilization and incremental improvement, although significant macroeconomic issues remain. Emerging countries and Asia continued to thrive, although strong capital inflows and rising inflation have caused larger emerging markets to initiate tightening measures.
We believe that owning companies with consistent earnings growth is the most important principle of good stock investing. Earnings growth, driven by business fundamentals, underpins stock valuation and wealth creation. We focus on finding companies with strong fundamentals and then wait until reason prevails in the marketplace.
The Fund outperformed its benchmark, the MSCI EAFE Index during the reporting period, aided by strong results from its emerging market investments. The Index does not include any emerging market companies. These companies, located primarily in India and Brazil, represented approximately 25% of the portfolio and made strong contributions to the Fund’s absolute and relative performance.
In India, HDFC Bank, Housing Development Finance and ITC delivered strong absolute and relative returns. In Brazil, Souza Cruz, Ambev and CETIP made strong contributions to absolute and relative performance as well.
As opposed to the Index, the Fund did not hold any positions in Greece and Portugal and only small positions in Italy and Spain. This positioning also contributed to the Fund’s positive relative performance.
Financials were the top performing sector in the portfolio during the period due to strong stock selection and sound allocation. Even though the portfolio was underweight in the sector, its holdings performed substantially better than the positions the Index held. Consumer staples companies also made attractive contributions to performance over the reporting period. The portfolio had greater exposure to consumer staples companies than the benchmark, which helped performance, as did strong
Portfolio Manager’s Letter (continued)
INTERNATIONAL FUND
stock selection in the sector. Currency hedging made a small positive contribution to relative performance during the year.
Thank you for placing your trust in First Investors. As always, we appreciate the opportunity to serve your investment needs.

Fund Expenses (unaudited)
INTERNATIONAL FUND
The examples below show the ongoing costs (in dollars) of investing in your Fund and will help you in comparing these costs with costs of other mutual funds. Please refer to page 3 for a detailed explanation of the information presented in these examples.
| | | |
| | Beginning | Ending | |
| | Account | Account | Expenses Paid |
| | Value | Value | During Period |
| | (7/1/10) | (12/31/10) | (7/1/10–12/31/10)* |
| Expense Examples | | | |
| Actual | $1,000.00 | $1,171.10 | $5.14 |
| Hypothetical | | | |
| (5% annual return before expenses) | $1,000.00 | $1,020.47 | $4.79 |
| |
| * | Expenses are equal to the annualized expense ratio of .94%, multiplied by the average account |
| value over the period, multiplied by 184/365 (to reflect the one-half year period). |
Portfolio Composition
BY SECTOR
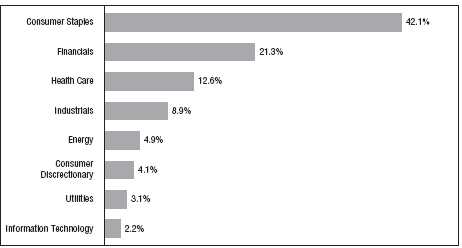
|
| Portfolio holdings and allocations are subject to change. Percentages are as of December 31, 2010, |
| and are based on the total value of investments. |
Cumulative Performance Information (unaudited)
INTERNATIONAL FUND
Comparison of change in value of $10,000 investment in the First Investors Life Series International Fund, the Morgan Stanley Capital International (“MSCI”) EAFE Index (Gross) and the Morgan Stanley Capital International (“MSCI”) EAFE Index (Net).

The graph compares a $10,000 investment in the First Investors Life Series International Fund beginning 12/31/00 with theoretical investments in the MSCI EAFE Index (Gross) and the MSCI EAFE Index (Net) (the “Indices”). The Indices are free float-adjusted market capitalization indices that measure developed foreign market equity performance, excluding the U.S. and Canada. The MSCI EAFE Index (Gross) is calculated on a total-return basis with the maximum possible dividend reinvestment (before taxes). The MSCI EAFE Index (Net) is calculated on a total-return basis with the minimum possible dividend reinvestment (after taxes). The Indices are unmanaged and it is not possible to invest directly in these Indices. In addition, the Indices do not reflect fees and expenses associated with the active management of a mutual fund portfolio. For purposes of the graph and the accompanying table, it is assumed that all dividends and distributions were reinvested.
* The Average Annual Total Return figures are for the periods ended 12/31/10.
The returns shown do not reflect any sales charges, since the Fund sells its shares solely to variable annuity and/or variable life insurance subaccounts at net asset value. The returns do not reflect the fees and charges that an individual would pay in connection with an investment in a variable annuity or life contract or policy. Results represent past performance and do not indicate future results. The graph and the returns shown do not reflect the deduction of taxes that an investor would pay on distributions or the redemption of fund shares. Investment return and principal value of an investment will fluctuate so that an investor’s shares, when redeemed, may be worth more or less than the original cost. Indices figures are from Morgan Stanley & Company, Inc. and all other figures are from First Investors Management Company, Inc.
Portfolio of Investments
INTERNATIONAL FUND
December 31, 2010
| | | | |
| | | | | |
| | | | | |
| | | | | |
| | | | | |
| Shares | | Security | | Value |
| |
| | | COMMON STOCKS—99.8% | | |
| | | United Kingdom—28.9% | | |
| 50,582 | | Admiral Group, PLC | | $ 1,199,789 |
| 236,956 | | Amlin, PLC | | 1,516,984 |
| 149,247 | | British American Tobacco, PLC | | 5,756,446 |
| 66,700 | | Bunzl, PLC | | 750,846 |
| 115,993 | | Capita Group, PLC | | 1,264,880 |
| 119,579 | | Diageo, PLC | | 2,218,552 |
| 123,038 | | Domino’s Pizza UK & IRL, PLC | | 1,062,383 |
| 153,385 | | G4S, PLC | | 611,417 |
| 138,238 | | Imperial Tobacco Group, PLC | | 4,259,404 |
| 54,759 | | Reckitt Benckiser Group, PLC | | 3,022,114 |
| 63,735 | | SABMiller, PLC | | 2,251,695 |
| 44,675 | | Scottish and Southern Energy, PLC | | 856,834 |
| 120,269 | | Standard Chartered, PLC | | 3,249,114 |
| 509,050 | | Tesco, PLC | | 3,387,238 |
| |
| | | | | 31,407,696 |
| |
| | | India—16.7% | | |
| 24,692 | | Bharat Heavy Electricals, Ltd. | | 1,283,167 |
| 117,300 | | HDFC Bank, Ltd. | | 6,155,135 |
| 24,239 | | Hero Honda Motors, Ltd. | | 1,077,732 |
| 336,035 | | Housing Development Finance Corporation, Ltd. | | 5,473,579 |
| 679,012 | | ITC, Ltd. | | 2,652,118 |
| 89,100 | | Jain Irrigation Systems, Ltd. | | 418,849 |
| 12,742 | | Nestle India, Ltd. | | 1,086,767 |
| |
| | | | | 18,147,347 |
| |
| | | Brazil—9.3% | | |
| 94,490 | | AES Tiete SA | | 1,366,121 |
| 70,330 | | CETIP SA – Balcao Organizado de Ativos e Derivativos | | 999,872 |
| 124,500 | | Cielo SA | | 1,008,750 |
| 86,350 | | Companhia de Bebidas das Americas (ADR) | | 2,679,441 |
| 45,000 | | CPFL Energia SA | | 1,116,867 |
| 57,500 | | Redecard SA | | 729,142 |
| 40,577 | | Souza Cruz SA | | 2,209,491 |
| |
| | | | | 10,109,684 |
Portfolio of Investments (continued)
INTERNATIONAL FUND
December 31, 2010
| | | | |
| | | | | |
| | | | | |
| | | | | |
| | | | | |
| Shares | | Security | | Value |
| |
| | | Switzerland—8.3% | | |
| 8,700 | | Kuehne & Nagel International AG | | $ 1,214,186 |
| 85,160 | | Nestle SA – Registered | | 5,004,507 |
| 34,796 | | Novartis AG – Registered | | 2,054,660 |
| 5,352 | | Roche Holding AG – Genusscheine | | 787,006 |
| |
| | | | | 9,060,359 |
| |
| | | Australia—5.8% | | |
| 123,425 | | Coca-Cola Amatil, Ltd. | | 1,373,975 |
| 107,141 | | QBE Insurance Group, Ltd. | | 1,993,326 |
| 104,372 | | Woolworths, Ltd. | | 2,885,433 |
| |
| | | | | 6,252,734 |
| |
| | | United States—5.3% | | |
| 97,607 | | Philip Morris International, Inc. | | 5,712,938 |
| |
| | | France—4.5% | | |
| 17,283 | | bioMerieux | | 1,711,583 |
| 19,100 | | Bureau Veritas SA | | 1,453,364 |
| 26,822 | | Essilor International SA | | 1,733,475 |
| |
| | | | | 4,898,422 |
| |
| | | Denmark—3.9% | | |
| 37,356 | | Novo Nordisk A/S – Series “B” | | 4,226,274 |
| |
| | | Japan—3.7% | | |
| 26,400 | | Nitori Company, Ltd. | | 2,309,362 |
| 35,900 | | Secom Company, Ltd. | | 1,698,082 |
| |
| | | | | 4,007,444 |
| |
| | | Canada—3.5% | | |
| 15,900 | | Canadian National Railway Company | | 1,060,587 |
| 61,742 | | Canadian Natural Resources, Ltd. | | 2,752,029 |
| |
| | | | | 3,812,616 |
| |
| | | Ireland—3.0% | | |
| 70,919 | | Covidien, PLC | | 3,238,162 |
| |
| | | Netherlands—2.4% | | |
| 29,140 | | Core Laboratories NV | | 2,594,917 |
| | | | | | | |
| | | | | | | | |
| | | | | | | | |
| Shares or | | | | | | | |
| Principal | | | | | | | |
| Amount | | Security | | | | | Value |
| |
| | | Germany—1.5% | | | | | |
| 10,764 | | Muenchener Rueckversicherungs-Gesellschaft AG – Registered | | | | $ 1,635,779 |
| |
| | | Belgium—1.4% | | | | | |
| 28,905 | | Colruyt SA | | | | | 1,475,477 |
| |
| | | Singapore—1.0% | | | | | |
| 142,300 | | Oversea-Chinese Banking Corporation, Ltd. | | | | | 1,097,478 |
| |
| | | China—.6% | | | | | |
| 7,216 | * | Baidu.com, Inc. (ADR) | | | | | 696,560 |
| |
| Total Value of Common Stocks (cost $79,103,739) | | | | | 108,373,887 |
| |
| | | SHORT-TERM INVESTMENTS—.9% | | | | | |
| | | Money Market Fund | | | | | |
| $ 950M | | First Investors Cash Reserve Fund, .19% (cost $950,000)** | | | | 950,000 |
| |
| Total Value of Investments (cost $80,053,739) | 100.7 | % | | | 109,323,887 |
| Excess of Liabilities Over Other Assets | (.7 | ) | | | (775,977) |
| |
| Net Assets | | | 100.0 | % | | | $108,547,910 |
| | |
| * | Non-income producing |
| |
| ** | Affiliated unregistered money market fund available only to First Investors funds and certain |
| accounts managed by First Investors Management Company, Inc. Rate shown is the 7-day yield at |
| December 31, 2010 (see Note 3). |
| |
| Summary of Abbreviations: |
| ADR | American Depositary Receipts |
Portfolio of Investments (continued)
INTERNATIONAL FUND
December 31, 2010
Accounting Standards Codification (“ASC”) 820 established a three-tier hierarchy of inputs to establish a classification of fair value measurements for disclosure purposes. The three-tier hierarchy of inputs is summarized in the three broad Levels listed below:
| Level 1 — quoted prices in active markets for identical securities |
| Level 2 — other significant observable inputs (including quoted prices for similar securities, interest rates, prepayment speeds, credit risk, etc.) |
| Level 3 — significant unobservable inputs (including the fund’s own assumptions in determining the fair value of investments) |
The inputs methodology used for valuing securities are not necessarily an indication of the risk associated with investing in those securities.
The following is a summary, by category of Level, of inputs used to value the Fund’s investments as of December 31, 2010:
| | | | | | | | | | | | |
| | | | | | | Level 2 | | | | | | |
| | | | | | | Other | | | Level 3 | | | |
| | | | Level 1 | | | Significant | | | Significant | | | |
| | | | Quoted | | | Observable | | Unobservable | | | |
| | | | Prices | | | Inputs | | | Inputs | | | Total |
| Common Stocks | | | | | | | | | | | | |
| Consumer Staples | | $ | 38,761,598 | | $ | 7,213,998 | | $ | — | | $ | 45,975,596 |
| Financials | | | 20,685,405 | | | 2,635,651 | | | — | | | 23,321,056 |
| Health Care | | | 6,683,220 | | | 7,067,940 | | | — | | | 13,751,160 |
| Industrials | | | 6,843,110 | | | 2,912,268 | | | — | | | 9,755,378 |
| Energy | | | 5,346,946 | | | — | | | — | | | 5,346,946 |
| Consumer Discretionary | | | 2,140,115 | | | 2,309,362 | | | — | | | 4,449,477 |
| Utilities | | | 856,834 | | | 2,482,988 | | | — | | | 3,339,822 |
| Information Technology | | | 696,560 | | | 1,737,892 | | | — | | | 2,434,452 |
| Money Market Fund | | | 950,000 | | | — | | | — | | | 950,000 |
| Total Investments | | | | | | | | | | | | |
| in Securities* | | $ | 82,963,788 | | $ | 26,360,099 | ** | $ | — | | $ | 109,323,887 |
| Other Financial | | | | | | | | | | | | |
| Instruments*** | | $ | — | | $ | (904,214) | | $ | — | | $ | (904,214) |
| |
| * | The Portfolio of Investments provides information on the country categorization for the portfolio. |
| |
| ** | Includes certain securities trading outside of the U.S. whose values were adjusted as a result of |
| significant market movements following the close of local trading; therefore, $26,360,099 of the |
| investment securities were classified as Level 2 instead of Level 1. |
| |
| *** | Other financial instruments are foreign exchange contracts, which are considered derivative |
| instruments, which are valued at the net unrealized depreciation on the instrument (see Note 7). |
| |
| 62 | See notes to financial statements |
Portfolio Managers’ Letter
INVESTMENT GRADE FUND
Dear Investor:
This is the annual report for the First Investors Life Investment Grade Fund for the year ended December 31, 2010. During the period, the Fund’s return on a net asset value basis was 9.3%, including dividends of 53.2 cents per share.
The review period began with increased optimism for a continued global economic recovery and confidence in the credit markets. However, over the next several months the positive tone was somewhat offset by certain systemic concerns. Weak economic data pointed to a slower than expected economic recovery. In addition, concern about rising Eurozone deficits and debt levels led to downgrades of European government debt and increased market scrutiny of sovereign risk. Benchmark U.S. Treasury yields moved much lower as investors flocked to Treasuries for their relative safety. For the corporate bond market, spreads remained range bound. Sentiments shifted from concerns about event risk and regulatory reform risk to confidence in the increased financial strength of corporate issuers. By the end of the review period, the corporate bond market had registered strong 12-month returns, led by falling interest rates.
The Fund had strong returns over the period. The majority of the Fund’s assets were invested in investment grade corporate bonds. The Fund increased its corporate bond holdings to over 95% of assets during the review period. In addition, the Fund had a substantial overweight in BBB-rated corporate bonds, which had the highest returns among all investment grade rating classes. Furthermore, the Fund had limited exposure to corporate names associated with the European debt crisis. An additional factor that enhanced performance was the Fund’s underweight in corporate bonds with maturities between one and three years. Shorter maturity bonds had the lowest returns during the review period, as falling two-year U.S. Treasury yields reached all-time lows.
Portfolio Managers’ Letter (continued)
INVESTMENT GRADE FUND
Thank you for placing your trust in First Investors. As always, we appreciate the opportunity to serve your investment needs.

Fund Expenses (unaudited)
INVESTMENT GRADE FUND
The examples below show the ongoing costs (in dollars) of investing in your Fund and will help you in comparing these costs with costs of other mutual funds. Please refer to page 3 for a detailed explanation of the information presented in these examples.
| | | |
| | Beginning | Ending | |
| | Account | Account | Expenses Paid |
| | Value | Value | During Period |
| | (7/1/10) | (12/31/10) | (7/1/10–12/31/10)* |
| Expense Examples | | | |
| Actual | $1,000.00 | $1,028.73 | $3.73 |
| Hypothetical | | | |
| (5% annual return before expenses) | $1,000.00 | $1,021.53 | $3.72 |
| |
| * | Expenses are equal to the annualized expense ratio of .73%, multiplied by the average account |
| value over the period, multiplied by 184/365 (to reflect the one-half year period). Expenses paid |
| during the period are net of expenses waived. |
Portfolio Composition
TOP TEN SECTORS
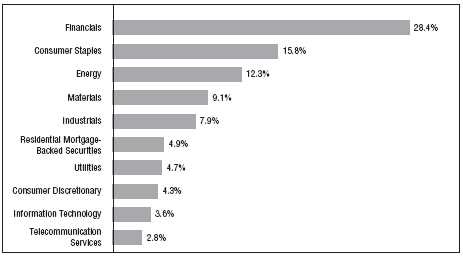
|
| Portfolio holdings and allocations are subject to change. Percentages are as of December 31, 2010, |
| and are based on the total value of investments. |
Cumulative Performance Information (unaudited)
INVESTMENT GRADE FUND
Comparison of change in value of $10,000 investment in the First Investors Life Series Investment Grade Fund and the Bank of America (“BofA”) Merrill Lynch U.S. Corporate Master Index.
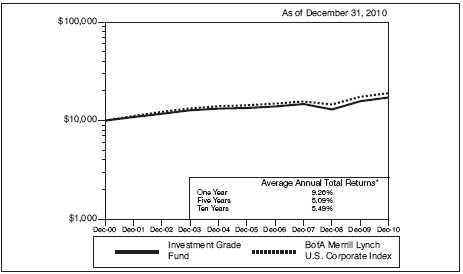
The graph compares a $10,000 investment in the First Investors Life Series Investment Grade Fund beginning 12/31/00 with a theoretical investment in the BofA Merrill Lynch U.S. Corporate Master Index (the “Index”). The Index tracks the performance of U.S. dollar-denominated investment grade corporate public debt issued in the U.S. domestic bond market. Qualifying bonds must have at least one year remaining term to maturity, a fixed coupon schedule and a minimum amount outstanding of $150 million. Bonds must be rated investment grade based on a composite of Moody’s and S&P. It is not possible to invest directly in this Index. In addition, the Index does not reflect fees and expenses associated with the active management of a mutual fund portfolio. For purposes of the graph and the accompanying table, it is assumed that all dividends and distributions were reinvested.
* The Average Annual Total Return figures are for the periods ended 12/31/10. During the periods shown, some of the expenses of the Fund were waived or assumed. If such expenses had been paid by the Fund, the Average Annual Total Returns for One Year, Five Years and Ten Years would have been 9.10%, 4.93% and 5.33%, respectively.
The returns shown do not reflect any sales charges, since the Fund sells its shares solely to variable annuity and/or variable life insurance subaccounts at net asset value. The returns do not reflect the fees and charges that an individual would pay in connection with an investment in a variable annuity or life contract or policy. Results represent past performance and do not indicate future results. The graph and the returns shown do not reflect the deduction of taxes that an investor would pay on distributions or the redemption of fund shares. Investment return and principal value of an investment will fluctuate so that an investor’s shares, when redeemed, may be worth more or less than the original cost. Index figures are from Bank of America Merrill Lynch & Co. and all other figures are from First Investors Management Company, Inc.
Portfolio of Investments
INVESTMENT GRADE FUND
December 31, 2010
| | | | |
| | | | | |
| | | | | |
| | | | | |
| Principal | | | | |
| Amount | | Security | | Value |
| |
| | | CORPORATE BONDS—94.4% | | |
| | | Aerospace/Defense—.5% | | |
| $ 200M | | BAE Systems Holdings, Inc., 4.95%, 2014 (a) | | $ 214,587 |
| |
| | | Agriculture—.9% | | |
| 340M | | Cargill, Inc., 6%, 2017 (a) | | 385,284 |
| |
| | | Automotive—1.1% | | |
| 400M | | Daimler Chrysler NA, LLC, 6.5%, 2013 | | 453,127 |
| |
| | | Chemicals—2.1% | | |
| 425M | | Chevron Phillips Chemicals Co., LLC, 8.25%, 2019 (a) | | 513,450 |
| 400M | | Dow Chemical Co., 4.25%, 2020 | | 384,681 |
| |
| | | | | 898,131 |
| |
| | | Consumer Durables—2.4% | | |
| 400M | | Black & Decker Corp., 5.75%, 2016 | | 445,343 |
| 300M | | Newell Rubbermaid, Inc., 6.75%, 2012 | | 319,535 |
| 300M | | Stanley Black & Decker, Inc., 5.2%, 2040 | | 282,922 |
| |
| | | | | 1,047,800 |
| |
| | | Energy—12.7% | | |
| 400M | | Canadian Oil Sands, Ltd., 7.75%, 2019 (a) | | 473,542 |
| 200M | | DCP Midstream, LLC, 9.75%, 2019 (a) | | 258,850 |
| 200M | | Energy Transfer Partners, LP, 8.5%, 2014 | | 232,382 |
| 150M | | Kinder Morgan Finance Co., 5.35%, 2011 | | 150,000 |
| 135M | | Marathon Oil Corp., 7.5%, 2019 | | 167,926 |
| 469M | | Maritime & Northeast Pipeline, LLC, 7.5%, 2014 (a) | | 507,073 |
| 400M | | Nabors Industries, Inc., 6.15%, 2018 | | 427,558 |
| | | Nexen, Inc.: | | |
| 200M | | 5.05%, 2013 | | 213,083 |
| 400M | | 6.4%, 2037 | | 388,762 |
| 300M | | Northern Border Partners, LP, 7.1%, 2011 | | 303,619 |
| 100M | | Plains All American Pipeline, LP, 8.75%, 2019 | | 124,291 |
| 400M | | Reliance Holdings USA, Inc., 4.5%, 2020 (a) | | 382,404 |
| 400M | | Spectra Energy Capital, LLC, 6.2%, 2018 | | 444,923 |
| 489M | | Suncor Energy, Inc., 6.85%, 2039 | | 564,122 |
| 200M | | Valero Energy Corp., 9.375%, 2019 | | 248,628 |
| | | Weatherford International, Inc.: | | |
| 400M | | 6.35%, 2017 | | 444,490 |
| 100M | | 5.125%, 2020 | | 99,691 |
| |
| | | | | 5,431,344 |
Portfolio of Investments (continued)
INVESTMENT GRADE FUND
December 31, 2010
| | | | |
| | | | | |
| | | | | |
| | | | | |
| Principal | | | | |
| Amount | | Security | | Value |
| |
| | | Financial Services—11.1% | | |
| $ 600M | | American Express Co., 7%, 2018 | | $ 699,874 |
| 375M | | Amvescap, PLC, 5.375%, 2013 | | 396,867 |
| 400M | | BlackRock, Inc., 5%, 2019 | | 418,440 |
| 350M | | CoBank, ACB, 7.875%, 2018 (a) | | 389,630 |
| 200M | | Compass Bank, 6.4%, 2017 | | 201,485 |
| | | ERAC USA Finance Co.: | | |
| 355M | | 8%, 2011 (a) | | 355,619 |
| 200M | | 6.375%, 2017 (a) | | 222,335 |
| | | General Electric Capital Corp.: | | |
| 400M | | 5.625%, 2017 | | 439,216 |
| 300M | | 5.5%, 2020 | | 321,418 |
| | | Harley-Davidson Funding Corp.: | | |
| 200M | | 5.75%, 2014 (a) | | 210,369 |
| 210M | | 6.8%, 2018 (a) | | 221,529 |
| 400M | | Protective Life Corp., 7.375%, 2019 | | 433,755 |
| 400M | | Prudential Financial Corp., 4.75%, 2015 | | 423,640 |
| |
| | | | | 4,734,177 |
| |
| | | Financials—15.2% | | |
| 200M | | Bank of America Corp., 5.65%, 2018 | | 204,659 |
| 300M | | Barclays Bank, PLC, 5.125%, 2020 | | 306,927 |
| 200M | | Bear Stearns Cos., Inc., 7.25%, 2018 | | 237,349 |
| | | Citigroup, Inc.: | | |
| 650M | | 6.375%, 2014 | | 718,966 |
| 500M | | 6.125%, 2017 | | 548,717 |
| | | Goldman Sachs Group, Inc.: | | |
| 300M | | 6.15%, 2018 | | 330,845 |
| 400M | | 6.75%, 2037 | | 410,235 |
| 500M | | JPMorgan Chase & Co., 6%, 2018 | | 559,182 |
| 800M | | Merrill Lynch & Co., Inc., 5%, 2015 | | 833,792 |
| | | Morgan Stanley: | | |
| 600M | | 5.95%, 2017 | | 635,731 |
| 500M | | 6.625%, 2018 | | 543,169 |
| 500M | | SunTrust Banks, Inc., 6%, 2017 | | 525,809 |
| 300M | | UBS AG, 5.875%, 2017 | | 330,422 |
| 300M | | Wells Fargo & Co., 5.625%, 2017 | | 332,636 |
| |
| | | | | 6,518,439 |
| | | | |
| | | | | |
| | | | | |
| | | | | |
| Principal | | | | |
| Amount | | Security | | Value |
| |
| | | Food/Beverage/Tobacco—8.3% | | |
| $ 400M | | Altria Group, Inc., 9.7%, 2018 | | $ 528,462 |
| 500M | | Anheuser-Busch InBev Worldwide, Inc., 5.375%, 2020 | | 542,769 |
| 300M | | Bottling Group, LLC, 5.125%, 2019 | | 327,812 |
| 200M | | Bunge Limited Finance Corp., 5.35%, 2014 | | 210,381 |
| 500M | | Corn Products International, Inc., 4.625%, 2020 | | 494,102 |
| 400M | | Dr. Pepper Snapple Group, Inc., 6.82%, 2018 | | 477,350 |
| 500M | | Lorillard Tobacco Co., 6.875%, 2020 | | 517,303 |
| 400M | | Philip Morris International, Inc., 5.65%, 2018 | | 451,658 |
| |
| | | | | 3,549,837 |
| |
| | | Forest Products/Container—.5% | | |
| 150M | | International Paper Co., 9.375%, 2019 | | 193,239 |
| |
| | | Health Care—2.6% | | |
| 400M | | Biogen IDEC, Inc., 6.875%, 2018 | | 451,591 |
| 200M | | Novartis, 5.125%, 2019 | | 221,577 |
| 100M | | Pfizer, Inc., 6.2%, 2019 | | 117,329 |
| 100M | | Roche Holdings, Inc., 6%, 2019 (a) | | 116,475 |
| 200M | | Watson Pharmaceuticals, Inc., 5%, 2014 | | 215,116 |
| |
| | | | | 1,122,088 |
| |
| | | Information Technology—4.9% | | |
| 300M | | Dell, Inc., 5.875%, 2019 | | 328,807 |
| 300M | | Dun & Bradstreet Corp., 6%, 2013 | | 326,999 |
| 400M | | Harris Corp., 4.4%, 2020 | | 400,778 |
| 500M | | Motorola, Inc., 6%, 2017 | | 530,849 |
| | | Pitney Bowes, Inc.: | | |
| 100M | | 5%, 2015 | | 105,178 |
| 400M | | 5.75%, 2017 | | 421,698 |
| |
| | | | | 2,114,309 |
| |
| | | Manufacturing—3.4% | | |
| 250M | | Briggs & Stratton Corp., 8.875%, 2011 | | 256,250 |
| 300M | | General Electric Co., 5.25%, 2017 | | 324,500 |
| 300M | | Ingersoll-Rand Global Holdings Co., 6.875%, 2018 | | 345,803 |
| 300M | | Johnson Controls, Inc., 5%, 2020 | | 319,257 |
| 200M | | Tyco Electronics Group SA, 6.55%, 2017 | | 227,597 |
| |
| | | | | 1,473,407 |
Portfolio of Investments (continued)
INVESTMENT GRADE FUND
December 31, 2010
| | | | |
| | | | | |
| | | | | |
| | | | | |
| Principal | | | | |
| Amount | | Security | | Value |
| |
| | | Media-Broadcasting—6.0% | | |
| $ 400M | | British Sky Broadcasting Group, PLC, 9.5%, 2018 (a) | | $ 524,689 |
| 400M | | Comcast Corp., 5.15%, 2020 | | 420,906 |
| | | Cox Communications, Inc.: | | |
| 300M | | 4.625%, 2013 | | 321,228 |
| 400M | | 8.375%, 2039 (a) | | 520,001 |
| 400M | | DirecTV Holdings, LLC, 7.625%, 2016 | | 443,992 |
| 300M | | Time Warner Cable, Inc., 6.75%, 2018 | | 350,229 |
| |
| | | | | 2,581,045 |
| |
| | | Media-Diversified—2.0% | | |
| | | McGraw-Hill Cos., Inc.: | | |
| 200M | | 5.9%, 2017 | | 216,787 |
| 200M | | 6.55%, 2037 | | 216,681 |
| 400M | | News America, Inc., 5.3%, 2014 | | 442,410 |
| |
| | | | | 875,878 |
| |
| | | Metals/Mining—5.9% | | |
| 400M | | Alcoa, Inc., 6.15%, 2020 | | 411,503 |
| 400M | | AngloGold Ashanti Holdings, PLC, 5.375%, 2020 | | 416,759 |
| 500M | | ArcelorMittal, 6.125%, 2018 | | 533,538 |
| 400M | | Newmont Mining Corp., 5.125%, 2019 | | 440,470 |
| 260M | | Rio Tinto Finance USA, Ltd., 6.5%, 2018 | | 303,581 |
| 400M | | Vale Overseas, Ltd., 5.625%, 2019 | | 428,040 |
| |
| | | | | 2,533,891 |
| |
| | | Real Estate Investment Trusts—3.1% | | |
| 400M | | Boston Properties, LP, 5.875%, 2019 | | 434,528 |
| 400M | | ProLogis, 7.625%, 2014 | | 451,408 |
| 400M | | Simon Property Group, LP, 5.75%, 2015 | | 444,875 |
| |
| | | | | 1,330,811 |
| |
| | | Retail-General Merchandise—1.0% | | |
| 400M | | Home Depot, Inc., 5.875%, 2036 | | 417,466 |
| |
| | | Telecommunications—2.9% | | |
| 400M | | AT&T, Inc., 5.8%, 2019 | | 450,971 |
| 400M | | Deutsche Telekom Intl. Finance BV, 5.875%, 2013 | | 440,841 |
| 309M | | GTE Corp., 6.84%, 2018 | | 350,798 |
| |
| | | | | 1,242,610 |
| | | | | | | |
| | | | | | | | |
| | | | | | | | |
| | | | | | | | |
| Principal | | | | | | | |
| Amount | | Security | | | | | Value |
| |
| | | Transportation—2.0% | | | | | |
| $ 300M | | Con-way, Inc., 7.25%, 2018 | | | | | $ 324,113 |
| 459M | | GATX Corp., 8.75%, 2014 | | | | | 532,946 |
| |
| | | | | | | | 857,059 |
| |
| | | Utilities—4.8% | | | | | |
| 300M | | E.ON International Finance BV, 5.8%, 2018 (a) | | | | 339,481 |
| 100M | | Electricite de France SA, 6.5%, 2019 (a) | | | | | 116,864 |
| 400M | | Exelon Generation Co., LLC, 6.2%, 2017 | | | | | 448,294 |
| | | Great River Energy Co.: | | | | | |
| 162M | | 5.829%, 2017 (a) | | | | | 183,726 |
| 300M | | 4.478%, 2030 (a) | | | | | 281,171 |
| 400M | | Ohio Power Co., 5.375%, 2021 | | | | | 426,778 |
| 200M | | Sempra Energy, 9.8%, 2019 | | | | | 269,275 |
| |
| | | | | | | | 2,065,589 |
| |
| | | Waste Management—1.0% | | | | | |
| 400M | | Allied Waste NA, Inc., 7.125%, 2016 | | | | | 423,971 |
| |
| Total Value of Corporate Bonds (cost $37,879,986) | | | | | 40,464,089 |
| |
| | | RESIDENTIAL MORTGAGE-BACKED | | | | |
| | | SECURITIES—5.1% | | | | | |
| | | Fannie Mae | | | | | |
| 2,048M | | 5%, 12/1/2039 – 1/13/2041 (cost $2,141,812) (b) | | | | 2,166,252 |
| |
| | | SHORT-TERM INVESTMENTS—3.8% | | | | |
| | | Money Market Fund | | | | | |
| 1,615M | | First Investors Cash Reserve Fund, .19% (cost $1,615,000) (c) | | | | 1,615,000 |
| |
| Total Value of Investments (cost $41,636,798) | 103.3 | % | | | 44,245,341 |
| Excess of Liabilities Over Other Assets | (3.3 | ) | | | (1,421,966) |
| |
| Net Assets | | | 100.0 | % | | | $42,823,375 |
| |
| (a) | Security exempt from registration under Rule 144A of Securities Act of 1933 (see Note 5). |
| |
| (b) | A portion or all of the security purchased on a when-issued or delayed delivery basis (see Note 1G). |
| |
| (c) | Affiliated unregistered money market fund available only to First Investors funds and certain |
| accounts managed by First Investors Management Company, Inc. Rate shown is the 7-day yield at |
| December 31, 2010 (see Note 3). |
Portfolio of Investments (continued)
INVESTMENT GRADE FUND
December 31, 2010
Accounting Standards Codification (“ASC”) 820 established a three-tier hierarchy of inputs to establish a classification of fair value measurements for disclosure purposes. The three-tier hierarchy of inputs is summarized in the three broad Levels listed below:
| Level 1 — quoted prices in active markets for identical securities |
| Level 2 — other significant observable inputs (including quoted prices for similar securities, interest rates, prepayment speeds, credit risk, etc.) |
| Level 3 — significant unobservable inputs (including the fund’s own assumptions in determining the fair value of investments) |
The inputs methodology used for valuing securities are not necessarily an indication of the risk associated with investing in those securities.
The following is a summary, by category of Level, of inputs used to value the Fund’s investments as of December 31, 2010:
| | | | | | | | | | | | |
| | | | | | | Level 2 | | | | | | |
| | | | | | | Other | | | Level 3 | | | |
| | | | Level 1 | | | Significant | | | Significant | | | |
| | | | Quoted | | | Observable | | Unobservable | | | |
| | | | Prices | | | Inputs | | | Inputs | | | Total |
| Corporate Bonds | | $ | — | | $ | 40,464,089 | | $ | — | | $ | 40,464,089 |
| Residential Mortgage- | | | | | | | | | | | | |
| Backed Securities | | | — | | | 2,166,252 | | | — | | | 2,166,252 |
| Money Market Fund | | | 1,615,000 | | | — | | | — | | | 1,615,000 |
| Total Investments | | | | | | | | | | | | |
| in Securities* | | $ | 1,615,000 | | $ | 42,630,341 | | $ | — | | $ | 44,245,341 |
* The Portfolio of Investments provides information on the industry categorization for corporate bonds.
There were no transfers into or from Level 1 and Level 2 by the Fund during the year ended December 31, 2010.
| |
| 72 | See notes to financial statements |
Portfolio Manager’s Letter
SELECT GROWTH FUND
Dear Investor:
This is the annual report for the First Investors Life Select Growth Fund for the year ended December 31, 2010. During the period, the Fund’s return on a net asset value basis was 21.1%, including dividends of 1.3 cents per share.
During the first part of the review period, the markets continued their upward move from the market bottom reached in early 2009. The initial period of this rally, characterized by significant moves in low quality stocks, gave way to more normal market behavior during the first half of 2010. Thus stocks that were projected to have better than expected earnings, the types of stocks the Fund favors, were leaders in the market during the first two quarters and again to a stronger degree in the fourth quarter. As the economy continues its recovery, albeit at a slower pace than desired, the Fund has continued to find companies with desirable earnings growth and earnings quality characteristics that allowed the Fund to generate better results as the year progressed.
The Fund outperformed the Russell 3000 Growth Index, largely due to increasing outperformance by stocks with good growth characteristics and earnings quality, with the health care and consumer staples sectors generating the best performance. These were lagging sectors in the benchmark, but the Fund’s portfolio holdings delivered sizeable returns.
The Fund’s positions in Valeant Pharmaceuticals and Express Scripts helped push the health care sector returns to 33.9% on a net asset value basis. Valeant Pharmaceuticals has continued to deliver increases in revenues and earnings as the company has grown by both product sales and the acquisition of new products in existing markets and new geographies. Express Scripts, a large pharmacy benefit manager, grew dramatically this year with the purchase of NextRx, the pharmacy benefit subsidiary of health insurer Wellpoint. In consumer staples, outperformance was due to the position the Fund held in Whole Foods Market. The company, a grocer that caters to consumers’ increasing demand for organic and higher quality foods, has delivered a solid series of better than expected results.
Portfolio Manager’s Letter (continued)
SELECT GROWTH FUND
We believe our focus on high quality companies with strong earnings expectations has begun to be rewarded in the current market cycle. Thank you for placing your trust in First Investors. As always, we appreciate the opportunity to serve your investment needs.

Fund Expenses (unaudited)
SELECT GROWTH FUND
The examples below show the ongoing costs (in dollars) of investing in your Fund and will help you in comparing these costs with costs of other mutual funds. Please refer to page 3 for a detailed explanation of the information presented in these examples.
| | | |
| | Beginning | Ending | |
| | Account | Account | Expenses Paid |
| | Value | Value | During Period |
| | (7/1/10) | (12/31/10) | (7/1/10–12/31/10)* |
| Expense Examples | | | |
| Actual | $1,000.00 | $1,281.85 | $5.64 |
| Hypothetical | | | |
| (5% annual return before expenses) | $1,000.00 | $1,020.27 | $4.99 |
| |
| * | Expenses are equal to the annualized expense ratio of .98%, multiplied by the average account |
| value over the period, multiplied by 184/365 (to reflect the one-half year period). |
Portfolio Composition
TOP SECTORS

|
| Portfolio holdings and allocations are subject to change. Percentages are as of December 31, 2010, |
| and are based on the total value of investments. |
Cumulative Performance Information (unaudited)
SELECT GROWTH FUND
Comparison of change in value of $10,000 investment in the First Investors Life Series Select Growth Fund and the Russell 3000 Growth Index.
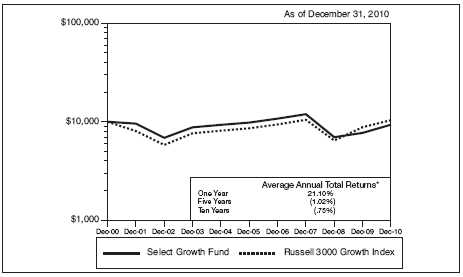
The graph compares a $10,000 investment in the First Investors Life Series Select Growth Fund beginning 12/31/00 with a theoretical investment in the Russell 3000 Growth Index (the “Index”). The Index is an unmanaged index that measures the performance of those Russell 3000 Index companies with higher price-to-book ratios and higher forecasted growth values (the Russell 3000 Index is an unmanaged index that measures the performance of the 3,000 largest U.S. companies based on total market capitalization). It is not possible to invest directly in this Index. In addition, the Index does not reflect fees and expenses associated with the active management of a mutual fund portfolio. For purposes of the graph and the accompanying table it is assumed that all dividends and distributions were reinvested.
* The Average Annual Total Return figures are for the periods ended 12/31/10.
The returns shown do not reflect any sales charges, since the Fund sells its shares solely to variable annuity and/or variable life insurance subaccounts at net asset value. The returns do not reflect the fees and charges that an individual would pay in connection with an investment in a variable annuity or life contract or policy. Results represent past performance and do not indicate future results. The graph and the returns shown do not reflect the deduction of taxes that an investor would pay on distributions or the redemption of fund shares. Investment return and principal value of an investment will fluctuate so that an investor’s shares, when redeemed, may be worth more or less than the original cost. Index figures are from Frank Russell and Company and all other figures are from First Investors Management Company, Inc.
Portfolio of Investments
SELECT GROWTH FUND
December 31, 2010
| | | | |
| | | | | |
| | | | | |
| | | | | |
| | | | | |
| Shares | | Security | | Value |
| |
| | | COMMON STOCKS—98.5% | | |
| | | Consumer Discretionary—16.2% | | |
| 3,450 | | Autoliv, Inc. | | $ 272,343 |
| 8,390 | * | Bed Bath & Beyond, Inc. | | 412,368 |
| 2,110 | * | Chipotle Mexican Grill, Inc. | | 448,713 |
| 7,210 | | Limited Brands, Inc. | | 221,563 |
| 7,780 | | Mattel, Inc. | | 197,845 |
| 690 | * | Priceline.com, Inc. | | 275,690 |
| 6,570 | | Ross Stores, Inc. | | 415,553 |
| |
| | | | | 2,244,075 |
| |
| | | Consumer Staples—6.6% | | |
| 6,030 | * | Hansen Natural Corporation | | 315,248 |
| 11,830 | * | Whole Foods Market, Inc. | | 598,480 |
| |
| | | | | 913,728 |
| |
| | | Energy—6.3% | | |
| 2,350 | | Cimarex Energy Company | | 208,046 |
| 2,900 | | ExxonMobil Corporation | | 212,048 |
| 5,910 | | Halliburton Company | | 241,305 |
| 4,430 | | Helmerich & Payne, Inc. | | 214,766 |
| |
| | | | | 876,165 |
| |
| | | Financials—6.6% | | |
| 7,420 | | American Express Company | | 318,466 |
| 4,110 | | Capital One Financial Corporation | | 174,922 |
| 1,930 | | Franklin Resources, Inc. | | 214,635 |
| 6,390 | | Raymond James Financial, Inc. | | 208,953 |
| |
| | | | | 916,976 |
| |
| | | Health Care—13.2% | | |
| 5,010 | * | Celgene Corporation | | 296,291 |
| 10,770 | * | Endo Pharmaceuticals Holdings, Inc. | | 384,597 |
| 9,460 | * | Express Scripts, Inc. | | 511,313 |
| 4,300 | | McKesson Corporation | | 302,634 |
| 6,520 | * | Watson Pharmaceuticals, Inc. | | 336,758 |
| |
| | | | | 1,831,593 |
Portfolio of Investments (continued)
SELECT GROWTH FUND
December 31, 2010
| | | | | | | |
| | | | | | | | |
| | | | | | | | |
| | | | | | | | |
| | | | | | | | |
| Shares | | Security | | | | | Value |
| |
| | | Industrials—13.5% | | | | | |
| 2,590 | | Eaton Corporation | | | | | $ 262,911 |
| 6,570 | | Illinois Tool Works, Inc. | | | | | 350,838 |
| 4,750 | | Manpower, Inc. | | | | | 298,110 |
| 4,490 | | Parker Hannifin Corporation | | | | | 387,487 |
| 5,437 | * | Thomas & Betts Corporation | | | | | 262,607 |
| 4,380 | | United Parcel Service, Inc. – Class “B” | | | | | 317,900 |
| |
| | | | | | | | 1,879,853 |
| |
| | | Information Technology—27.2% | | | | | |
| 6,140 | * | ANSYS, Inc. | | | | | 319,710 |
| 1,880 | * | Apple, Inc. | | | | | 606,413 |
| 7,260 | * | Arrow Electronics, Inc. | | | | | 248,655 |
| 9,900 | * | BMC Software, Inc. | | | | | 466,686 |
| 7,310 | * | Check Point Software Technologies, Ltd. | | | | | 338,161 |
| 296 | * | Google, Inc. – Class “A” | | | | | 175,815 |
| 5,600 | | Hewlett-Packard Company | | | | | 235,760 |
| 2,690 | | International Business Machines Corporation | | | | | 394,784 |
| 6,410 | * | NetApp, Inc. | | | | | 352,294 |
| 13,350 | * | TIBCO Software, Inc. | | | | | 263,129 |
| 4,130 | * | VMware, Inc. – Class “A” | | | | | 367,198 |
| |
| | | | | | | | 3,768,605 |
| |
| | | Materials—6.6% | | | | | |
| 5,050 | | Freeport-McMoRan Copper & Gold, Inc. | | | | | 606,455 |
| 2,930 | | Lubrizol Corporation | | | | | 313,158 |
| |
| | | | | | | | 919,613 |
| |
| | | Telecommunication Services—2.3% | | | | | |
| 25,130 | * | MetroPCS Communications, Inc. | | | | | 317,392 |
| |
| Total Value of Common Stocks (cost $10,560,373) | 98.5 | % | | | 13,668,000 |
| Other Assets, Less Liabilities | 1.5 | | | | 205,449 |
| |
| Net Assets | | | 100.0 | % | | | $ 13,873,449 |
Accounting Standards Codification (“ASC”) 820 established a three-tier hierarchy of inputs to establish a classification of fair value measurements for disclosure purposes. The three-tier hierarchy of inputs is summarized in the three broad Levels listed below:
| Level 1 — quoted prices in active markets for identical securities |
| Level 2 — other significant observable inputs (including quoted prices for similar securities, interest rates, prepayment speeds, credit risk, etc.) |
| Level 3 — significant unobservable inputs (including the fund’s own assumptions in determining the fair value of investments) |
The inputs methodology used for valuing securities are not necessarily an indication of the risk associated with investing in those securities.
The following is a summary, by category of Level, of inputs used to value the Fund’s investments as of December 31, 2010:
| | | | | | | | | | | | |
| | | | | | | Level 2 | | | | | | |
| | | | | | | Other | | | Level 3 | | | |
| | | | Level 1 | | Significant | | | Significant | | | |
| | | | Quoted | | Observable | | | Unobservable | | | |
| | | | Prices | | | Inputs | | | Inputs | | | Total |
| |
| Common Stocks* | | $ | 13,668,000 | | $ | — | | $ | — | | $ | 13,668,000 |
* The Portfolio of Investments provides information on the industry categorization for the portfolio.
There were no transfers into or from Level 1 and Level 2 by the Fund during the year ended December 31, 2010.
| |
| See notes to financial statements | 79 |
Portfolio Manager’s Letter
TARGET MATURITY 2015 FUND
Dear Investor:
This is the annual report for the First Investors Life Target Maturity 2015 Fund for the year ended December 31, 2010. During the period, the Fund’s return on a net asset value basis was 8.6%, including dividends of 64.0 cents per share and capital gains of 7.6 cents per share.
The Fund’s investment objective is to seek a predictable compounded return for the investors who hold the Fund’s shares until maturity, consistent with preservation of capital. To meet this objective, the Fund is fully invested in high-quality zero coupon bonds that are due to mature on or around the Fund’s maturity date. These bonds are very sensitive to changes in interest rates.
The primary factor affecting the performance of the Fund was the decrease in U.S. Treasury interest rates during the year. Five-year benchmark U.S. Treasury note interest rates fell 67 basis points (0.67%) in 2010. Falling interest rates caused the price of the Fund’s holdings to increase during the review period.
The Fund outperformed its benchmark, the Citigroup Treasury/Government Sponsored Index. The Fund’s longer duration — a measurement of interest rate risk —allowed it to benefit more than the benchmark from the decline in interest rates.
Thank you for placing your trust in First Investors. As always, we appreciate the opportunity to serve your investment needs.
Fund Expenses (unaudited)
TARGET MATURITY 2015 FUND
The examples below show the ongoing costs (in dollars) of investing in your Fund and will help you in comparing these costs with costs of other mutual funds. Please refer to page 3 for a detailed explanation of the information presented in these examples.
| | | |
| | Beginning | Ending | |
| | Account | Account | Expenses Paid |
| | Value | Value | During Period |
| | (7/1/10) | (12/31/10) | (7/1/10–12/31/10)* |
| Expense Examples | | | |
| Actual | $1,000.00 | $1,012.64 | $3.55 |
| Hypothetical | | | |
| (5% annual return before expenses) | $1,000.00 | $1,021.68 | $3.57 |
| |
| * | Expenses are equal to the annualized expense ratio of .70%, multiplied by the average account |
| value over the period, multiplied by 184/365 (to reflect the one-half year period). Expenses paid |
| during the period are net of expenses waived. |
Portfolio Composition
BY SECTOR

|
| Portfolio holdings and allocations are subject to change. Percentages are as of December 31, 2010, |
| and are based on the total value of investments. |
Cumulative Performance Information (unaudited)
TARGET MATURITY 2015 FUND
Comparison of change in value of $10,000 investment in the First Investors Life Series Target Maturity 2015 Fund and the Citigroup Treasury/Government Sponsored Index.
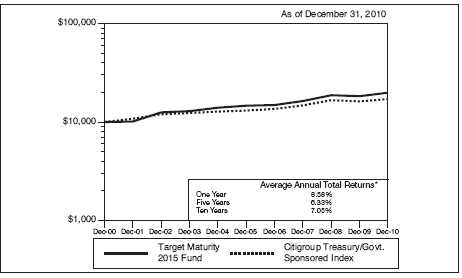
The graph compares a $10,000 investment in the First Investors Life Series Target Maturity 2015 Fund beginning 12/31/00 with a theoretical investment in the Citigroup Treasury/Government Sponsored Index (the “Index”). The Index is a market capitalization-weighted index that consists of debt issued by the U.S. Treasury and U.S. Government sponsored agencies. Every issue included in the Index is trader-priced, and the Index follows consistent and realistic availability limits, including only those securities with sufficient amounts outstanding. It is not possible to invest directly in this Index. In addition, the Index does not reflect fees and expenses associated with the active management of a mutual fund portfolio. For purposes of the graph and the accompanying table, it is assumed that all dividends and distributions were reinvested.
* The Average Annual Total Return figures are for the periods ended 12/31/10. During the periods shown, some of the expenses of the Fund were waived or assumed. If such expenses had been paid by the Fund, the Average Annual Total Returns for One Year, Five Years and Ten Years would have been 8.42%, 6.17% and 6.89%, respectively.
The returns shown do not reflect any sales charges, since the Fund sells its shares solely to variable annuity and/or variable life insurance subaccounts at net asset value. The returns do not reflect the fees and charges that an individual would pay in connection with an investment in a variable annuity or life contract or policy. Results represent past performance and do not indicate future results. The graph and the returns shown do not reflect the deduction of taxes that an investor would pay on distributions or the redemption of fund shares. Investment return and principal value of an investment will fluctuate so that an investor’s shares, when redeemed, may be worth more or less than the original cost. Index figures are from Citigroup and all other figures are from First Investors Management Company, Inc.
Portfolio of Investments
TARGET MATURITY 2015 FUND
December 31, 2010
| | | | | | | |
| | | | | | | | |
| | | | | | | | |
| | | | | | | | |
| Principal | | | | | Effective | | |
| Amount | | Security | | | Yield | † | Value |
| |
| | | U.S. GOVERNMENT AGENCY ZERO COUPON | | | | |
| | | OBLIGATIONS—56.4% | | | | | |
| | | Agency For International Development – Israel: | | | | |
| $ 698M | | 9/15/2015 | | | 2.23 | % | $ 628,812 |
| 2,784M | | 11/15/2015 | | | 2.31 | | 2,489,016 |
| | | Fannie Mae: | | | | | |
| 243M | | 8/12/2015 | | | 2.39 | | 217,737 |
| 600M | | 9/23/2015 | | | 2.48 | | 534,066 |
| 4,343M | | 11/15/2015 | | | 2.55 | | 3,838,591 |
| 650M | | Federal Judiciary Office Building, 2/15/2015 | | | 2.50 | | 586,663 |
| | | Freddie Mac: | | | | | |
| 550M | | 3/15/2015 | | | 2.24 | | 500,865 |
| 930M | | 9/15/2015 | | | 2.46 | | 828,756 |
| 830M | | 9/15/2015 | | | 2.47 | | 739,572 |
| 210M | | Government Trust Certificate – Turkey Trust, 5/15/2015 | | 2.61 | | 187,470 |
| 200M | | International Bank for Reconstruction & | | | | | |
| | | Development, 2/15/2015 | | | 2.11 | | 183,399 |
| 3,657M | | Resolution Funding Corporation, 10/15/2015 | | | 2.21 | | 3,291,969 |
| 2,000M | | Tennessee Valley Authority, 11/1/2015 | | | 2.65 | | 1,760,978 |
| |
| Total Value of U.S. Government Agency Zero Coupon | | | | | |
| Obligations (cost $13,711,516) | | | | | 15,787,894 |
| |
| | | U.S. GOVERNMENT ZERO COUPON | | | | | |
| | | OBLIGATIONS—43.3% | | | | | |
| 13,325M | | U.S. Treasury Strips, 11/15/2015 (cost $10,401,115) | | 1.99 | | 12,099,073 |
| |
| Total Value of Investments (cost $24,112,631) | 99.7 | % | | | 27,886,967 |
| Other Assets, Less Liabilities | .3 | | | | 82,647 |
| |
| Net Assets | | | 100.0 | % | | | $27,969,614 |
| |
| † | The effective yields shown for the zero coupon obligations are the effective yields at |
| December 31, 2010. |
Portfolio of Investments (continued)
TARGET MATURITY 2015 FUND
December 31, 2010
Accounting Standards Codification (“ASC”) 820 established a three-tier hierarchy of inputs to establish a classification of fair value measurements for disclosure purposes. The three-tier hierarchy of inputs is summarized in the three broad Levels listed below:
| Level 1 — quoted prices in active markets for identical securities |
| Level 2 — other significant observable inputs (including quoted prices for similar securities, interest rates, prepayment speeds, credit risk, etc.) |
| Level 3 — significant unobservable inputs (including the fund’s own assumptions in determining the fair value of investments) |
The inputs methodology used for valuing securities are not necessarily an indication of the risk associated with investing in those securities.
The following is a summary, by category of Level, of inputs used to value the Fund’s investments as of December 31, 2010:
| | | | | | | | | | | | |
| | | | | | | Level 2 | | | | | | |
| | | | | | | Other | | | Level 3 | | | |
| | | | Level 1 | | | Significant | | | Significant | | | |
| | | | Quoted | | | Observable | | Unobservable | | | |
| | | | Prices | | | Inputs | | | Inputs | | | Total |
| U.S. Government Agency Zero | | | | | | | | | | | | |
| Coupon Obligations | | $ | — | | $ | 15,787,894 | | $ | — | | $ | 15,787,894 |
| U.S. Government Zero Coupon | | | | | | | | | | | | |
| Obligations | | | — | | | 12,099,073 | | | — | | | 12,099,073 |
| Total Investments | | | | | | | | | | | | |
| in Securities | | $ | — | | $ | 27,886,967 | | $ | — | | $ | 27,886,967 |
There were no transfers into or from Level 1 and Level 2 by the Fund during the year ended December 31, 2010.
| |
| 84 | See notes to financial statements |
Portfolio Manager’s Letter
VALUE FUND
Dear Investor:
This is the annual report for the First Investors Life Value Fund for the year ended December 31, 2010. During the period, the Fund’s return on a net asset value basis was 14.3%, including dividends of 28.7 cents per share.
During the year, the equity markets settled into a more stable pattern of positive results, boosted by a slowly improving economy. However, the markets remained highly susceptible to short-term headline shocks, causing periods of high volatility. The environment remained more macro driven, as the Federal Reserve (the “Fed”), the Obama administration and Congress continued to be aggressively involved in economic affairs, proposing new regulations and increasing government oversight of businesses.
The business community viewed many of these actions negatively, which had a chilling effect on entire sectors and industries. Government initiatives had a significant impact on industries such as health care, energy, financials and education, which saw their share prices fluctuate during the year. The catalyst for the significant rally at the end of the year was sparked by the Fed’s decision to take additional measures to stimulate growth in the form of further quantitative easing, or “QE2.” Additionally, better than expected growth of corporate profits and more encouraging economic data helped spur the markets during the year’s final months.
The materials sector provided the Fund’s highest return, as holdings in companies such as chemical makers DuPont and PPG Industries led the way. Consumer discretionary was also an area of strength for the Fund, reflecting good performance from discount retailer Family Dollar, restaurant operator Ruby Tuesday, and auto parts distributor Genuine Parts, among others. Strong performance in the industrials sector was led by motor and compressor maker Baldor Electric and by Dover, a diversified manufacturer. Telecom giant Verizon Communications and ConocoPhillips, a large oil company, were also among the top contributors to overall results during the year.
Relative to the benchmark S&P 500 Index, materials and financials were the leading sectors. Fund holdings in insurers such as Erie Indemnity, Protective Life and Ameriprise Financial, which also has an asset management arm, were the biggest winners in the financials sector. The Fund also demonstrated good relative performance in the utilities and health care sectors.
The energy sector was the weakest sector for the Fund relative to the benchmark. Diamond Offshore Drilling, an oil driller, was the biggest reason for sector underperformance as the company was subject to restrictions on deepwater drilling in the Gulf of Mexico after the BP oil spill. The Fund also had exposure to BP during the year, but sold the position after the company struggled to plug the well. Tax preparation
Portfolio Manager’s Letter (continued)
VALUE FUND
leader H&R Block and technology giant Hewlett-Packard were also among the holdings that hurt performance the most during 2010.
Thank you for placing your trust in First Investors. As always, we appreciate the opportunity to serve your investment needs.
Fund Expenses (unaudited)
VALUE FUND
The examples below show the ongoing costs (in dollars) of investing in your Fund and will help you in comparing these costs with costs of other mutual funds. Please refer to page 3 for a detailed explanation of the information presented in these examples.
| | | |
| | Beginning | Ending | |
| | Account | Account | Expenses Paid |
| | Value | Value | During Period |
| | (7/1/10) | (12/31/10) | (7/1/10–12/31/10)* |
| Expense Examples | | | |
| Actual | $1,000.00 | $1,224.39 | $4.77 |
| Hypothetical | | | |
| (5% annual return before expenses) | $1,000.00 | $1,020.93 | $4.33 |
| |
| * | Expenses are equal to the annualized expense ratio of .85%, multiplied by the average account |
| value over the period, multiplied by 184/365 (to reflect the one-half year period). |
Portfolio Composition
TOP TEN SECTORS
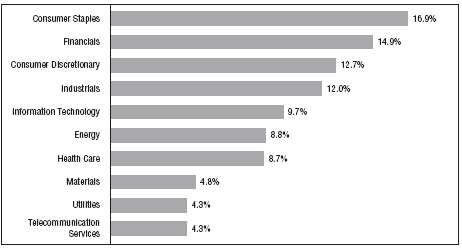
|
| Portfolio holdings and allocations are subject to change. Percentages are as of December 31, 2010, |
| and are based on the total value of investments. |
Cumulative Performance Information (unaudited)
VALUE FUND
Comparison of change in value of $10,000 investment in the First Investors Life Series Value Fund and the Standard & Poor’s 500 Index.

The graph compares a $10,000 investment in the First Investors Life Series Value Fund beginning 12/31/00 with a theoretical investment in the Standard & Poor’s 500 Index (the “Index”). The Index is an unmanaged capitalization-weighted index of 500 stocks designed to measure performance of the broad domestic economy through changes in the aggregate market value of such stocks, which represent all major industries. It is not possible to invest directly in this Index. In addition, the Index does not reflect fees and expenses associated with the active management of a mutual fund portfolio. For purposes of the graph and the accompanying table it is assumed that all dividends and distributions were reinvested.
* The Average Annual Total Return figures are for the periods ended 12/31/10.
The returns shown do not reflect any sales charges, since the Fund sells its shares solely to variable annuity and/or variable life insurance subaccounts at net asset value. The returns do not reflect the fees and charges that an individual would pay in connection with an investment in a variable annuity or life contract or policy. Results represent past performance and do not indicate future results. The graph and the returns shown do not reflect the deduction of taxes that an investor would pay on distributions or the redemption of fund shares. Investment return and principal value of an investment will fluctuate so that an investor’s shares, when redeemed, may be worth more or less than the original cost. Index figures are from Standard & Poor’s and all other figures are from First Investors Management Company, Inc.
Portfolio of Investments
VALUE FUND
December 31, 2010
| | | | |
| | | | | |
| | | | | |
| | | | | |
| | | | | |
| Shares | | Security | | Value |
| |
| | | COMMON STOCKS—96.4% | | |
| | | Consumer Discretionary—12.6% | | |
| 26,300 | | American Eagle Outfitters, Inc. | | $ 384,769 |
| 16,100 | | American Greetings Corporation – Class “A” | | 356,776 |
| 10,200 | | Best Buy Company, Inc. | | 349,758 |
| 2,600 | | Bob Evans Farms, Inc. | | 85,696 |
| 9,900 | | Carnival Corporation | | 456,489 |
| 6,000 | | Chico’s FAS, Inc. | | 72,180 |
| 7,700 | | Cinemark Holdings, Inc. | | 132,748 |
| 19,600 | | Comcast Corporation – Special Shares “A” | | 407,876 |
| 6,800 | | Fortune Brands Inc. | | 409,700 |
| 10,300 | | Genuine Parts Company | | 528,802 |
| 24,700 | | H&R Block, Inc. | | 294,177 |
| 12,900 | | Home Depot, Inc. | | 452,274 |
| 12,500 | | International Game Technology | | 221,125 |
| 15,100 | | J.C. Penney Company, Inc. | | 487,881 |
| 30,900 | | Lowe’s Companies, Inc. | | 774,972 |
| 16,900 | | Macy’s, Inc. | | 427,570 |
| 4,400 | | McDonald’s Corporation | | 337,744 |
| 16,100 | | Newell Rubbermaid, Inc. | | 292,698 |
| 7,100 | | Omnicom Group, Inc. | | 325,180 |
| 20,700 | * | Ruby Tuesday, Inc. | | 270,342 |
| 18,900 | | Stage Stores, Inc. | | 327,726 |
| 19,200 | | Staples, Inc. | | 437,184 |
| 12,466 | | Time Warner, Inc. | | 401,031 |
| 19,200 | | Walt Disney Company | | 720,192 |
| |
| | | | | 8,954,890 |
| |
| | | Consumer Staples—16.8% | | |
| 11,600 | | Archer-Daniels-Midland Company | | 348,928 |
| 17,300 | | Avon Products, Inc. | | 502,738 |
| 5,300 | | Clorox Company | | 335,384 |
| 13,100 | | Coca-Cola Company | | 861,587 |
| 15,400 | | ConAgra Foods, Inc. | | 347,732 |
| 7,600 | | Costco Wholesale Corporation | | 548,796 |
| 16,300 | | CVS Caremark Corporation | | 566,751 |
| 10,500 | | Diageo, PLC (ADR) | | 780,465 |
| 8,400 | | H.J. Heinz Company | | 415,464 |
| 9,000 | | Hershey Company | | 424,350 |
| 13,700 | | Kimberly-Clark Corporation | | 863,648 |
| 32,600 | | Kraft Foods, Inc. – Class “A” | | 1,027,226 |
| 18,600 | | Kroger Company | | 415,896 |
Portfolio of Investments (continued)
VALUE FUND
December 31, 2010
| | | | |
| | | | | |
| | | | | |
| | | | | |
| | | | | |
| Shares | | Security | | Value |
| |
| | | Consumer Staples (continued) | | |
| 15,146 | | PepsiCo, Inc. | | $ 989,488 |
| 14,300 | | Philip Morris International, Inc. | | 836,979 |
| 5,400 | | Procter & Gamble Company | | 347,382 |
| 12,800 | | Safeway, Inc. | | 287,872 |
| 12,300 | | Snyders-Lance, Inc. | | 288,312 |
| 17,000 | | Walgreen Company | | 662,320 |
| 20,000 | | Wal-Mart Stores, Inc. | | 1,078,600 |
| |
| | | | | 11,929,918 |
| |
| | | Energy—8.8% | | |
| 11,312 | | Chevron Corporation | | 1,032,220 |
| 13,500 | | ConocoPhillips | | 919,350 |
| 7,700 | | Devon Energy Corporation | | 604,527 |
| 6,100 | | Diamond Offshore Drilling, Inc. | | 407,907 |
| 10,500 | | ExxonMobil Corporation | | 767,760 |
| 5,300 | | Hess Corporation | | 405,662 |
| 20,400 | | Marathon Oil Corporation | | 755,412 |
| 12,100 | | Royal Dutch Shell, PLC – Class “A” (ADR) | | 808,038 |
| 10,300 | | Tidewater, Inc. | | 554,552 |
| |
| | | | | 6,255,428 |
| |
| | | Financials—14.8% | | |
| 7,400 | | ACE, Ltd. | | 460,650 |
| 11,100 | | Allstate Corporation | | 353,868 |
| 7,800 | | Ameriprise Financial, Inc. | | 448,890 |
| 9,900 | | Aspen Insurance Holdings, Ltd. | | 283,338 |
| 17,600 | | Bank Mutual Corporation | | 84,128 |
| 26,306 | | Bank of America Corporation | | 350,922 |
| 18,573 | | Bank of New York Mellon Corporation | | 560,905 |
| 8,694 | | Capital One Financial Corporation | | 370,017 |
| 9,122 | | Chubb Corporation | | 544,036 |
| 11,222 | | Cincinnati Financial Corporation | | 355,625 |
| 9,100 | | Comerica, Inc. | | 384,384 |
| 7,800 | | EMC Insurance Group, Inc. | | 176,592 |
| 12,900 | | First Potomac Realty Trust (REIT) | | 216,978 |
| 23,000 | | FirstMerit Corporation | | 455,170 |
| 10,800 | * | FXCM, Inc. – Class “A” | | 143,100 |
| 28,700 | | Hudson City Bancorp, Inc. | | 365,638 |
| 6,700 | | IBERIABANK Corporation | | 396,171 |
| 17,700 | | Invesco, Ltd. | | 425,862 |
| 41,400 | | Investors Real Estate Trust (REIT) | | 371,358 |
| | | | |
| | | | | |
| | | | | |
| | | | | |
| | | | | |
| Shares | | Security | | Value |
| |
| | | Financials (continued) | | |
| 19,900 | | JPMorgan Chase & Company | | $ 844,158 |
| 13,200 | | Morgan Stanley | | 359,172 |
| 26,900 | | NewAlliance Bancshares, Inc. | | 402,962 |
| 28,700 | | People’s United Financial, Inc. | | 402,087 |
| 6,100 | | PNC Financial Services Group, Inc. | | 370,392 |
| 11,400 | | Protective Life Corporation | | 303,696 |
| 10,000 | | Tower Group, Inc. | | 255,800 |
| 19,500 | | Wells Fargo & Company | | 604,305 |
| 24,500 | | Westfield Financial, Inc. | | 226,625 |
| |
| | | | | 10,516,829 |
| |
| | | Health Care—8.7% | | |
| 20,300 | | Abbott Laboratories | | 972,573 |
| 8,200 | | Baxter International, Inc. | | 415,084 |
| 4,500 | | Becton, Dickinson & Company | | 380,340 |
| 12,700 | | GlaxoSmithKline, PLC (ADR) | | 498,094 |
| 18,600 | | Johnson & Johnson | | 1,150,410 |
| 13,400 | | Medtronic, Inc. | | 497,006 |
| 15,270 | | Merck & Company. Inc. | | 550,331 |
| 10,900 | | Novartis AG (ADR) | | 642,555 |
| 39,900 | | Pfizer, Inc. | | 698,649 |
| 6,800 | | Quest Diagnostics, Inc. | | 366,996 |
| |
| | | | | 6,172,038 |
| |
| | | Industrials—12.0% | | |
| 7,400 | | 3M Company | | 638,620 |
| 6,150 | | Alexander & Baldwin, Inc. | | 246,184 |
| 6,400 | | Armstrong World Industries, Inc. | | 275,200 |
| 11,100 | | Avery Dennison Corporation | | 469,974 |
| 4,000 | | Baldor Electric Company | | 252,160 |
| 11,200 | | Con-way, Inc. | | 409,584 |
| 14,200 | | Curtiss-Wright Corporation | | 471,440 |
| 9,400 | | Dover Corporation | | 549,430 |
| 10,600 | | Equifax, Inc. | | 377,360 |
| 8,700 | | General Dynamics Corporation | | 617,352 |
| 30,200 | | General Electric Company | | 552,358 |
| 10,100 | | Honeywell International, Inc. | | 536,916 |
| 11,100 | | Illinois Tool Works, Inc. | | 592,740 |
| 13,900 | | ITT Corporation | | 724,329 |
| 5,900 | | Lockheed Martin Corporation | | 412,469 |
| 9,800 | | Pitney Bowes, Inc. | | 236,964 |
Portfolio of Investments (continued)
VALUE FUND
December 31, 2010
| | | | |
| | | | | |
| | | | | |
| | | | | |
| | | | | |
| Shares | | Security | | Value |
| |
| | | Industrials (continued) | | |
| 7,800 | | Textainer Group Holdings, Ltd. | | $ 222,222 |
| 6,925 | | Tyco International, Ltd. | | 286,972 |
| 8,700 | | United Parcel Service, Inc. – Class “B” | | 631,446 |
| |
| | | | | 8,503,720 |
| |
| | | Information Technology—9.6% | | |
| 16,300 | | Automatic Data Processing, Inc. | | 754,364 |
| 9,500 | | AVX Corporation | | 146,585 |
| 12,100 | | Bel Fuse, Inc. – Class “B” | | 289,190 |
| 17,600 | * | Cisco Systems, Inc. | | 356,048 |
| 11,100 | * | Electronic Arts, Inc. | | 181,818 |
| 20,500 | | Hewlett-Packard Company | | 863,050 |
| 17,000 | | Intel Corporation | | 357,510 |
| 26,700 | | Intersil Corporation – Class “A” | | 407,709 |
| 33,800 | | Microsoft Corporation | | 943,696 |
| 16,950 | | Molex, Inc. | | 385,104 |
| 25,700 | | National Semiconductor Corporation | | 353,632 |
| 25,100 | | Nokia Corporation – Class “A” (ADR) | | 259,032 |
| 9,300 | | QUALCOMM, Inc. | | 460,257 |
| 10,800 | | Texas Instruments, Inc. | | 351,000 |
| 10,225 | | Tyco Electronics, Ltd. | | 361,965 |
| 19,400 | | Western Union Company | | 360,258 |
| |
| | | | | 6,831,218 |
| |
| | | Materials—4.8% | | |
| 14,800 | | Alcoa, Inc. | | 227,772 |
| 17,600 | | Bemis Company, Inc. | | 574,816 |
| 4,400 | | Compass Minerals International, Inc. | �� | 392,788 |
| 20,900 | | Dow Chemical Company | | 713,526 |
| 14,200 | | DuPont (E.I.) de Nemours & Company | | 708,296 |
| 22,000 | | Glatfelter | | 269,940 |
| 8,200 | | H.B. Fuller Company | | 168,264 |
| 10,500 | | Sonoco Products Company | | 353,535 |
| |
| | | | | 3,408,937 |
| |
| | | Telecommunication Services—4.0% | | |
| 33,610 | | AT&T, Inc. | | 987,462 |
| 5,780 | | CenturyLink, Inc. | | 266,862 |
| 9,100 | | Telephone & Data Systems, Inc. – Special Shares | | 286,832 |
| 35,218 | | Verizon Communications, Inc. | | 1,260,100 |
| |
| | | | | 2,801,256 |
| | | | | | | |
| | | | | | | | |
| | | | | | | | |
| Shares or | | | | | | | |
| Principal | | | | | | | |
| Amount | | Security | | | | | Value |
| |
| | | Utilities—4.3% | | | | | |
| 10,100 | | American Electric Power Company, Inc. | | | | | $ 363,398 |
| 4,700 | | Duke Energy Corporation | | | | | 83,707 |
| 14,400 | | MDU Resources Group, Inc. | | | | | 291,888 |
| 8,400 | | NextEra Energy, Inc. | | | | | 436,716 |
| 25,600 | | NiSource, Inc. | | | | | 451,072 |
| 6,300 | | ONEOK, Inc. | | | | | 349,461 |
| 16,900 | | Portland General Electric Company | | | | | 366,730 |
| 10,700 | | Southwest Gas Corporation | | | | | 392,369 |
| 12,600 | | Vectren Corporation | | | | | 319,788 |
| |
| | | | | | | | 3,055,129 |
| |
| Total Value of Common Stocks (cost $57,946,040) | | | | | 68,429,363 |
| |
| | | PREFERRED STOCKS—.4% | | | | | |
| | | Telecommunication Services | | | | | |
| 9,500 | | AT&T, Inc., 6.375%, 2056 (cost $237,359) | | | | | 252,795 |
| |
| | | SHORT-TERM INVESTMENTS—2.8% | | | | |
| | | Money Market Fund | | | | | |
| $ 2,015M | | First Investors Cash Reserve Fund, .19% (cost $2,015,000)** | | | | 2,015,000 |
| |
| Total Value of Investments (cost $60,198,399) | 99.6 | % | | | 70,697,158 |
| Other Assets, Less Liabilities | .4 | | | | 256,019 |
| |
| Net Assets | | | 100.0 | % | | | $70,953,177 |
| | |
| * | Non-income producing |
| |
| ** | Affiliated unregistered money market fund available only to First Investors funds and certain |
| accounts managed by First Investors Management Company, Inc. Rate shown is the 7-day yield at |
| December 31, 2010 (see Note 3). |
| |
| Summary of Abbreviations: |
| ADR | American Depositary Receipts |
| REIT | Real Estate Investment Trust |
Portfolio of Investments (continued)
VALUE FUND
December 31, 2010
Accounting Standards Codification (“ASC”) 820 established a three-tier hierarchy of inputs to establish a classification of fair value measurements for disclosure purposes. The three-tier hierarchy of inputs is summarized in the three broad Levels listed below:
| Level 1 — quoted prices in active markets for identical securities |
| Level 2 — other significant observable inputs (including quoted prices for similar securities, interest rates, prepayment speeds, credit risk, etc.) |
| Level 3 — significant unobservable inputs (including the fund’s own assumptions in determining the fair value of investments) |
The inputs methodology used for valuing securities are not necessarily an indication of the risk associated with investing in those securities.
The following is a summary, by category of Level, of inputs used to value the Fund’s investments as of December 31, 2010:
| | | | | | | | | | | | |
| | | | | | | Level 2 | | | | | | |
| | | | | | | Other | | | Level 3 | | | |
| | | | Level 1 | | | Significant | | | Significant | | | |
| | | | Quoted | | | Observable | | Unobservable | | | |
| | | | Prices | | | Inputs | | | Inputs | | | Total |
| Common Stocks | | $ | 68,429,363 | | $ | — | | $ | — | | $ | 68,429,363 |
| Preferred Stocks | | | 252,795 | | | — | | | — | | | 252,795 |
| Money Market Fund | | | 2,015,000 | | | — | | | — | | | 2,015,000 |
| Total Investments | | | | | | | | | | | | |
| in Securities* | | $ | 70,697,158 | | $ | — | | $ | — | | $ | 70,697,158 |
* The Portfolio of Investments provides information on the industry categorization for the portfolio.
There were no transfers into or from Level 1 and Level 2 by the Fund during the year ended December 31, 2010.
| |
| 94 | See notes to financial statements |
|
| This page left intentionally blank. |
Statements of Assets and Liabilities
FIRST INVESTORS LIFE SERIES FUNDS
December 31, 2010
| | | | | | | | | | | | | | | | | | |
| | | | |
| | | | | | CASH | | | | | | | | | GROWTH & | | | | |
| | | BLUE CHIP | | | MANAGEMENT | | | DISCOVERY | | | GOVERNMENT | | | INCOME | | | HIGH YIELD | |
| Assets | | | | | | | | | | | | | | | | | | |
| Investments in securities: | | | | | | | | | | | | | | | | | | |
| Cost — Unaffiliated issuers | $ | 89,990,231 | | $ | 12,515,867 | | $ | 106,946,542 | | $ | 26,622,751 | | $ | 179,261,272 | | $ | 64,918,765 | |
| Cost — Affiliated money market fund (Note 3) | | 600,000 | | | — | | | 9,070,000 | | | — | | | 275,000 | | | 1,330,000 | |
| |
| Total cost of investments | $ | 90,590,231 | | $ | 12,515,867 | | $ | 116,016,542 | | $ | 26,622,751 | | $ | 179,536,272 | | $ | 66,248,765 | |
| |
| Value — Unaffiliated issuers (Note 1A) | $ | 123,122,663 | | $ | 12,515,867 | | $ | 143,299,032 | | $ | 27,242,922 | | $ | 206,877,738 | | $ | 67,798,546 | |
| Value — Affiliated money market fund (Note 3) | | 600,000 | | | — | | | 9,070,000 | | | — | | | 275,000 | | | 1,330,000 | |
| |
| Total value of investments | | 123,722,663 | | | 12,515,867 | | | 152,369,032 | | | 27,242,922 | | | 207,152,738 | | | 69,128,546 | |
| | | | | | | | | | | | | | | | | | | |
| Cash | | 112,029 | | | 45,527 | | | 205,822 | | | 826,909 | | | 158,903 | | | 267,787 | |
| Receivables: | | | | | | | | | | | | | | | | | | |
| Investment securities sold | | 430,396 | | | — | | | — | | | — | | | 299,526 | | | — | |
| Interest and dividends | | 182,728 | | | 7,451 | | | 136,417 | | | 120,897 | | | 205,204 | | | 1,287,399 | |
| Trust shares sold | | 11,050 | | | 23,358 | | | 5,524 | | | 58,959 | | | 8,442 | | | 46,918 | |
| Other assets | | 8,189 | | | 758 | | | 8,763 | | | 1,824 | | | 12,558 | | | 4,424 | |
| |
| Total Assets | | 124,467,055 | | | 12,592,961 | | | 152,725,558 | | | 28,251,511 | | | 207,837,371 | | | 70,735,074 | |
| |
| Liabilities | | | | | | | | | | | | | | | | | | |
| Payables: | | | | | | | | | | | | | | | | | | |
| Investment securities purchased | | 414,919 | | | — | | | 565,657 | | | 498,059 | | | 224,530 | | | — | |
| Trust shares redeemed | | 92,627 | | | 245,851 | | | 149,929 | | | 7,262 | | | 157,320 | | | 17,550 | |
| Accrued advisory fees | | 77,877 | | | — | | | 96,078 | | | 14,046 | | | 130,248 | | | 44,704 | |
| Accrued expenses | | 19,900 | | | 8,236 | | | 19,458 | | | 12,737 | | | 24,935 | | | 17,261 | |
| |
| Total Liabilities | | 605,323 | | | 254,087 | | | 831,122 | | | 532,104 | | | 537,033 | | | 79,515 | |
| |
| Net Assets | $ | 123,861,732 | | $ | 12,338,874 | | $ | 151,894,436 | | $ | 27,719,407 | | $ | 207,300,338 | | $ | 70,655,559 | |
| |
| Net Assets Consist of: | | | | | | | | | | | | | | | | | | |
| Capital paid in | $ | 101,134,080 | | $ | 12,338,874 | | $ | 116,115,109 | | $ | 26,719,912 | | $ | 199,733,111 | | $ | 92,060,160 | |
| Undistributed net investment income | | 1,761,754 | | | — | | | 777,221 | | | 941,746 | | | 3,610,430 | | | 5,082,372 | |
| Accumulated net realized loss on investments | | (12,166,534 | ) | | — | | | (1,350,384 | ) | | (562,422 | ) | | (23,659,669 | ) | | (29,366,754 | ) |
| Net unrealized appreciation of investments | | 33,132,432 | | | — | | | 36,352,490 | | | 620,171 | | | 27,616,466 | | | 2,879,781 | |
| |
| Total | $ | 123,861,732 | | $ | 12,338,874 | | $ | 151,894,436 | | $ | 27,719,407 | | $ | 207,300,338 | | $ | 70,655,559 | |
| |
| Shares of beneficial interest outstanding (Note 2) | | 5,913,880 | | | 12,338,874 | | | 4,838,619 | | | 2,678,803 | | | 7,306,936 | | | 10,809,159 | |
| |
| Net asset value, offering and redemption price per share — | | | | | | | | | | | | | | | |
| (Net assets divided by shares outstanding) | $ | 20.94 | | $ | 1.00 | | $ | 31.39 | | $ | 10.35 | | $ | 28.37 | | $ | 6.54 | |
| | |
| 96 | See notes to financial statements | 97 |
Statements of Assets and Liabilities
FIRST INVESTORS LIFE SERIES FUNDS
December 31, 2010
| | | | | | | | | | | | | | | |
| | | | |
| | | | | | INVESTMENT | | | SELECT | | | TARGET | | | | |
| | | INTERNATIONAL | | | GRADE | | | GROWTH | | MATURITY 2015 | | | VALUE | |
| Assets | | | | | | | | | | | | | | | |
| Investments in securities: | | | | | | | | | | | | | | | |
| Cost — Unaffiliated issuers | $ | 79,103,739 | | $ | 40,021,798 | | $ | 10,560,373 | | $ | 24,112,631 | | $ | 58,183,399 | |
| Cost — Affiliated money market fund (Note 3) | | 950,000 | | | 1,615,000 | | | — | | | — | | | 2,015,000 | |
| |
| Total cost of investments | $ | 80,053,739 | | $ | 41,636,798 | | $ | 10,560,373 | | $ | 24,112,631 | | $ | 60,198,399 | |
| |
| Value — Unaffiliated issuers (Note 1A) | $ | 108,373,887 | | $ | 42,630,341 | | $ | 13,668,000 | | $ | 27,886,967 | | $ | 68,682,158 | |
| Value — Affiliated money market fund (Note 3) | | 950,000 | | | 1,615,000 | | | — | | | — | | | 2,015,000 | |
| |
| Total value of investments | | 109,323,887 | | | 44,245,341 | | | 13,668,000 | | | 27,886,967 | | | 70,697,158 | |
| |
| Cash | | 80,665 | | | 220,888 | | | 618,237 | | | 249,776 | | | 167,417 | |
| Receivables: | | | | | | | | | | | | | | | |
| Investment securities sold | | — | | | — | | | — | | | — | | | 82,163 | |
| Interest and dividends | | 241,702 | | | 545,241 | | | 4,186 | | | — | | | 138,810 | |
| Trust shares sold | | 3,581 | | | 36,561 | | | 12,311 | | | 28,270 | | | 10,615 | |
| Unrealized appreciation of foreign exchange contracts | | | | | | | | | | | | | | | |
| (Note 7) | | 151,626 | | | — | | | — | | | — | | | — | |
| Other assets | | 6,769 | | | 2,674 | | | 670 | | | 1,957 | | | 4,450 | |
| |
| Total Assets | | 109,808,230 | | | 45,050,705 | | | 14,303,404 | | | 28,166,970 | | | 71,100,613 | |
| |
| Liabilities | | | | | | | | | | | | | | | |
| Payables: | | | | | | | | | | | | | | | |
| Investment securities purchased | | — | | | 2,145,225 | | | 389,451 | | | — | | | 61,797 | |
| Trust shares redeemed | | 113,604 | | | 47,374 | | | 21,300 | | | 171,257 | | | 25,663 | |
| Unrealized depreciation of foreign exchange contracts | | | | | | | | | | | | | | | |
| (Note 7) | | 1,055,840 | | | — | | | — | | | — | | | — | |
| Accrued advisory fees | | 67,705 | | | 21,650 | | | 8,756 | | | 14,297 | | | 44,489 | |
| Accrued expenses | | 23,171 | | | 13,081 | | | 10,448 | | | 11,802 | | | 15,487 | |
| |
| Total Liabilities | | 1,260,320 | | | 2,227,330 | | | 429,955 | | | 197,356 | | | 147,436 | |
| |
| Net Assets | $ | 108,547,910 | | $ | 42,823,375 | | $ | 13,873,449 | | $ | 27,969,614 | | $ | 70,953,177 | |
| |
| Net Assets Consist of: | | | | | | | | | | | | | | | |
| Capital paid in | $ | 110,890,140 | | $ | 42,644,927 | | $ | 15,081,663 | | $ | 22,769,301 | | $ | 64,396,981 | |
| Undistributed net investment income | | 3,254,243 | | | 1,820,798 | | | 22,808 | | | 1,064,143 | | | 1,450,241 | |
| Accumulated net realized gain (loss) on investments | | | | | | | | | | | | | | | |
| and foreign currency transactions | | (33,974,895 | ) | | (4,250,893 | ) | | (4,338,649 | ) | | 361,834 | | | (5,392,804 | ) |
| Net unrealized appreciation in value of | | | | | | | | | | | | | | | |
| investments and foreign currency transactions | | 28,378,422 | | | 2,608,543 | | | 3,107,627 | | | 3,774,336 | | | 10,498,759 | |
| |
| Total | $ | 108,547,910 | | $ | 42,823,375 | | $ | 13,873,449 | | $ | 27,969,614 | | $ | 70,953,177 | |
| |
| Shares of beneficial interest outstanding (Note 2) | | 6,498,449 | | | 3,988,584 | | | 1,724,032 | | | 1,745,446 | | | 4,712,490 | |
| |
| Net asset value, offering and redemption price per share — | | | | | | | | | | | | | |
| (Net assets divided by shares outstanding) | $ | 16.70 | | $ | 10.74 | | $ | 8.05 | | $ | 16.02 | | $ | 15.06 | |
| | |
| 98 | See notes to financial statements | 99 |
Statements of Operations
FIRST INVESTORS LIFE SERIES FUNDS
Year Ended December 31, 2010
| | | | | | | | | | | | | | | | | | |
| | | | |
| | | | | | CASH | | | | | | | | | GROWTH & | | | | |
| | | BLUE CHIP | | | MANAGEMENT | | | DISCOVERY | | | GOVERNMENT | | | INCOME | | | HIGH YIELD | |
| Investment Income | | | | | | | | | | | | | | | | | | |
| Income: | | | | | | | | | | | | | | | | | | |
| Interest | $ | — | | $ | 21,965 | | $ | — | | $ | 1,050,165 | | $ | — | | $ | 5,645,000 | |
| Dividends | | 2,734,260 | (a) | | — | | | 1,858,839 | | | — | | | 5,162,032 | (b) | | — | |
| Dividends from affiliate (Note 3) | | 615 | | | — | | | 11,858 | | | — | | | 3,297 | | | 1,865 | |
| |
| Total income | | 2,734,875 | | | 21,965 | | | 1,870,697 | | | 1,050,165 | | | 5,165,329 | | | 5,646,865 | |
| |
| Expenses (Notes 1 and 4): | | | | | | | | | | | | | | | | | | |
| Advisory fees | | 883,213 | | | 72,785 | | | 990,697 | | | 202,276 | | | 1,417,186 | | | 509,946 | |
| Professional fees | | 31,567 | | | 14,618 | | | 32,198 | | | 16,923 | | | 46,071 | | | 20,822 | |
| Custodian fees and expenses | | 10,757 | | | 5,337 | | | 22,138 | | | 11,865 | | | 22,786 | | | 15,157 | |
| Reports and notices to shareholders | | 16,898 | | | 2,745 | | | 17,971 | | | 4,656 | | | 25,881 | | | 11,592 | |
| Registration fees | | 645 | | | 78 | | | 78 | | | 78 | | | 78 | | | 46 | |
| Trustees’ fees | | 5,903 | | | 491 | | | 6,495 | | | 1,334 | | | 9,396 | | | 3,371 | |
| Other expenses | | 24,880 | | | 5,261 | | | 24,780 | | | 14,206 | | | 34,689 | | | 32,140 | |
| |
| Total expenses | | 973,863 | | | 101,315 | | | 1,094,357 | | | 251,338 | | | 1,556,087 | | | 593,074 | |
| Less: Expenses waived | | — | | | (79,134 | ) | | — | | | (40,455 | ) | | — | | | — | |
| Expenses paid indirectly | | (789 | ) | | (216 | ) | | (885 | ) | | (157 | ) | | (1,266 | ) | | (307 | ) |
| |
| Net expenses | | 973,074 | | | 21,965 | | | 1,093,472 | | | 210,726 | | | 1,554,821 | | | 592,767 | |
| |
| Net investment income | | 1,761,801 | | | — | | | 777,225 | | | 839,439 | | | 3,610,508 | | | 5,054,098 | |
| |
| Realized and Unrealized Gain (Loss) on Investments | | | | | | | | | | | | | | | | |
| (Note 3): | | | | | | | | | | | | | | | | | | |
| Net realized gain (loss) on investments | | 3,948,811 | | | — | | | 12,465,705 | | | 258,494 | | | (4,294,539 | ) | | 916,983 | |
| |
| Net unrealized appreciation of investments | | 5,846,267 | | | — | | | 19,044,427 | | | 135,067 | | | 29,726,354 | | | 2,687,951 | |
| |
| Net gain on investments | | 9,795,078 | | | — | | | 31,510,132 | | | 393,561 | | | 25,431,815 | | | 3,604,934 | |
| Net Increase in Net Assets Resulting | | | | | | | | | | | | | | | | | | |
| from Operations | $ | 11,556,879 | | $ | — | | $ | 32,287,357 | | $ | 1,233,000 | | $ | 29,042,323 | | $ | 8,659,032 | |
(a) Net of $11,869 foreign taxes withheld
(b) Net of $23,990 foreign taxes withheld
| | |
| 100 | See notes to financial statements | 101 |
Statements of Operations
FIRST INVESTORS LIFE SERIES FUNDS
Year Ended December 31, 2010
| | | | | | | | | | | | | | | |
| | | | |
| | | | | | INVESTMENT | | | SELECT | | | TARGET | | | | |
| | | INTERNATIONAL | | | GRADE | | | GROWTH | | | MATURITY 2015 | | | VALUE | |
| Investment Income | | | | | | | | | | | | | | | |
| Income: | | | | | | | | | | | | | | | |
| Interest | $ | 201 | | $ | 2,204,056 | | $ | — | | $ | 1,258,491 | | $ | — | |
| Dividends | | 3,185,518 | (c) | | — | | | 134,569 | | | — | | | 2,011,021 | (d) |
| Dividends from affiliate (Note 3) | | 2,880 | | | 738 | | | — | | | — | | | 2,087 | |
| |
| Total income | | 3,188,599 | | | 2,204,794 | | | 134,569 | | | 1,258,491 | | | 2,013,108 | |
| |
| Expenses (Notes 1 and 4): | | | | | | | | | | | | | | | |
| Advisory fees | | 762,213 | | | 309,151 | | | 85,415 | | | 206,120 | | | 493,444 | |
| Professional fees | | 50,106 | | | 19,663 | | | 12,714 | | | 13,786 | | | 25,744 | |
| Custodian fees and expenses | | 141,866 | | | 9,173 | | | 5,081 | | | 1,885 | | | 10,778 | |
| Reports and notices to shareholders | | 14,185 | | | 7,140 | | | 2,859 | | | 4,626 | | | 10,472 | |
| Registration fees | | 78 | | | 78 | | | 78 | | | 78 | | | 78 | |
| Trustees’ fees | | 5,068 | | | 2,034 | | | 555 | | | 1,368 | | | 3,281 | |
| Other expenses | | 29,656 | | | 15,810 | | | 5,117 | | | 7,810 | | | 19,472 | |
| |
| Total expenses | | 1,003,172 | | | 363,049 | | | 111,819 | | | 235,673 | | | 563,269 | |
| Less: Expenses waived | | — | | | (61,830 | ) | | — | | | (41,224 | ) | | — | |
| Expenses paid indirectly | | (681 | ) | | (182 | ) | | (77 | ) | | (122 | ) | | (441 | ) |
| |
| Net expenses | | 1,002,491 | | | 301,037 | | | 111,742 | | | 194,327 | | | 562,828 | |
| |
| Net investment income | | 2,186,108 | | | 1,903,757 | | | 22,827 | | | 1,064,164 | | | 1,450,280 | |
| |
| Realized and Unrealized Gain (Loss) on Investments | | | | | | | | | | | | | |
| and Foreign Currency Transactions (Note 3): | | | | | | | | | | | | | | | |
| Net realized gain (loss) on: | | | | | | | | | | | | | | | |
| Investments | | (688,888 | ) | | 1,585,170 | | | 503,659 | | | 375,640 | | | 2,968,227 | |
| Foreign currency transactions | | 624,791 | | | — | | | — | | | — | | | — | |
| |
| Net realized gain (loss) on investments and foreign | | | | | | | | | | | | | |
| currency transactions | | (64,097 | ) | | 1,585,170 | | | 503,659 | | | 375,640 | | | 2,968,227 | |
| | | | | | | | | | | | | | | | |
| Net unrealized appreciation (depreciation) of: | | | | | | | | | | | | | | | |
| Investments | | 11,401,737 | | | 104,952 | | | 1,823,595 | | | 795,110 | | | 4,538,379 | |
| Foreign currency transactions | | (457,997 | ) | | — | | | — | | | — | | | — | |
| |
| Net unrealized appreciation on investments and | | | | | | | | | | | | | | | |
| foreign currency transactions | | 10,943,740 | | | 104,952 | | | 1,823,595 | | | 795,110 | | | 4,538,379 | |
| | | | | | | | | | | | | | | | |
| Net gain on investments and foreign | | | | | | | | | | | | | | | |
| currency transactions | | 10,879,643 | | | 1,690,122 | | | 2,327,254 | | | 1,170,750 | | | 7,506,606 | |
| |
| Net Increase in Net Assets Resulting | | | | | | | | | | | | | | | |
| from Operations | $ | 13,065,751 | | $ | 3,593,879 | | $ | 2,350,081 | | $ | 2,234,914 | | $ | 8,956,886 | |
(c) Net of $220,391 foreign taxes withheld
(d) Net of $11,421 foreign taxes withheld
| | |
| 102 | See notes to financial statements | 103 |
Statements of Changes in Net Assets
FIRST INVESTORS LIFE SERIES FUNDS
| | | | | | | | | | | | | | | | | | | | | | | | |
| |
| | | BLUE CHIP | | | CASH MANAGEMENT | | | DISCOVERY | | | GOVERNMENT | |
| Year Ended December 31 | | 2010 | | | 2009 | | | 2010 | | | 2009 | | | 2010 | | | 2009 | | | 2010 | | | 2009 | |
| Increase (Decrease) in Net Assets From Operations | | | | | | | | | | | | | | | | | | | | | | | | |
| Net investment income | $ | 1,761,801 | | $ | 1,905,246 | | $ | — | | $ | 22,436 | | $ | 777,225 | | $ | 1,116,701 | | $ | 839,439 | | $ | 973,569 | |
| Net realized gain (loss) on investments | | 3,948,811 | | | (2,361,710 | ) | | — | | | — | | | 12,465,705 | | | (5,321,507 | ) | | 258,494 | | | 101,854 | |
| Net unrealized appreciation (depreciation) | | | | | | | | | | | | | | | | | | | | | | | | |
| of investments | | 5,846,267 | | | 22,108,095 | | | — | | | — | | | 19,044,427 | | | 34,294,546 | | | 135,067 | | | (26,625 | ) |
| | | | | | | | | | | | | | | | | | | | | | | | |
| Net increase in net assets resulting | | | | | | | | | | | | | | | | | | | | | | | | |
| from operations | | 11,556,879 | | | 21,651,631 | | | — | | | 22,436 | | | 32,287,357 | | | 30,089,740 | | | 1,233,000 | | | 1,048,798 | |
| |
| Dividends to Shareholders | | | | | | | | | | | | | | | | | | | | | | | | |
| Net investment income | | (1,905,253 | ) | | (2,356,098 | ) | | — | | | (22,436 | ) | | (1,116,657 | ) | | (1,370,258 | ) | | (1,061,623 | ) | | (1,023,566 | ) |
| |
| Trust Share Transactions * | | | | | | | | | | | | | | | | | | | | | | | | |
| Proceeds from shares sold | | 1,700,928 | | | 1,865,951 | | | 10,508,677 | | | 5,080,479 | | | 2,310,619 | | | 2,504,467 | | | 4,159,375 | | | 4,712,816 | |
| Reinvestment of dividends | | 1,905,253 | | | 2,356,098 | | | — | | | 22,436 | | | 1,116,657 | | | 1,370,258 | | | 1,061,623 | | | 1,023,566 | |
| Cost of shares redeemed | | (10,258,555 | ) | | (9,577,854 | ) | | (9,080,933 | ) | | (7,264,830 | ) | | (9,336,535 | ) | | (6,743,609 | ) | | (3,681,458 | ) | | (3,845,012 | ) |
| |
| Net increase (decrease) from trust share transactions | | (6,652,374 | ) | | (5,355,805 | ) | | 1,427,744 | | | (2,161,915 | ) | | (5,909,259 | ) | | (2,868,884 | ) | | 1,539,540 | | | 1,891,370 | |
| |
| Net increase (decrease) in net assets | | 2,999,252 | | | 13,939,728 | | | 1,427,744 | | | (2,161,915 | ) | | 25,261,441 | | | 25,850,598 | | | 1,710,917 | | | 1,916,602 | |
| |
| Net Assets | | | | | | | | | | | | | | | | | | | | | | | | |
| Beginning of year | | 120,862,480 | | | 106,922,752 | | | 10,911,130 | | | 13,073,045 | | | 126,632,995 | | | 100,782,397 | | | 26,008,490 | | | 24,091,888 | |
| |
| End of year † | $ | 123,861,732 | | $ | 120,862,480 | | $ | 12,338,874 | | $ | 10,911,130 | | $ | 151,894,436 | | $ | 126,632,995 | | $ | 27,719,407 | | $ | 26,008,490 | |
| |
| †Includes undistributed net investment income of | $ | 1,761,754 | | $ | 1,905,206 | | $ | — | | $ | — | | $ | 777,221 | | $ | 1,116,653 | | $ | 941,746 | | $ | 1,061,598 | |
| |
| *Trust Shares Issued and Redeemed | | | | | | | | | | | | | | | | | | | | | | | | |
| Sold | | 87,553 | | | 112,620 | | | 10,508,677 | | | 5,080,479 | | | 85,919 | | | 119,657 | | | 404,081 | | | 462,455 | |
| Issued for dividends reinvested | | 101,074 | | | 180,130 | | | — | | | 22,436 | | | 44,400 | | | 82,446 | | | 105,740 | | | 103,286 | |
| Redeemed | | (532,405 | ) | | (584,862 | ) | | (9,080,933 | ) | | (7,264,830 | ) | | (352,295 | ) | | (325,713 | ) | | (357,487 | ) | | (377,562 | ) |
| |
| Net increase (decrease) in trust shares outstanding | | (343,778 | ) | | (292,112 | ) | | 1,427,744 | | | (2,161,915 | ) | | (221,976 | ) | | (123,610 | ) | | 152,334 | | | 188,179 | |
| | |
| 104 | See notes to financial statements | 105 |
Statements of Changes in Net Assets
FIRST INVESTORS LIFE SERIES FUNDS
| | | | | | | | | | | | | | | | | | | | | | | | |
| | |
| | | GROWTH & INCOME | | | HIGH YIELD | | | INTERNATIONAL | | | INVESTMENT GRADE | |
| Year Ended December 31 | | 2010 | | | 2009 | | | 2010 | | | 2009 | | | 2010 | | | 2009 | | | 2010 | | | 2009 | |
| Increase (Decrease) in Net Assets From Operations | | | | | | | | | | | | | | | | | | | | | | | | |
| Net investment income | $ | 3,610,508 | | $ | 2,050,759 | | $ | 5,054,098 | | $ | 5,123,812 | | $ | 2,186,108 | | $ | 2,003,370 | | $ | 1,903,757 | | $ | 1,891,370 | |
| Net realized gain (loss) on investments and foreign | | | | | | | | | | | | | | | | | | | | | | | | |
| currency transactions | | (4,294,539 | ) | | (5,537,942 | ) | | 916,983 | | | (15,346,412 | ) | | (64,097 | ) | | (7,304,133 | ) | | 1,585,170 | | | (877,842 | ) |
| Net unrealized appreciation of investments | | | | | | | | | | | | | | | | | | | | | | | | |
| and foreign currency transactions | | 29,726,354 | | | 45,001,548 | | | 2,687,951 | | | 27,920,827 | | | 10,943,740 | | | 24,445,669 | | | 104,952 | | | 5,596,709 | |
| |
| Net increase in net assets resulting | | | | | | | | | | | | | | | | | | | | | | | | |
| from operations | | 29,042,323 | | | 41,514,365 | | | 8,659,032 | | | 17,698,227 | | | 13,065,751 | | | 19,144,906 | | | 3,593,879 | | | 6,610,237 | |
| |
| Dividends to Shareholders | | | | | | | | | | | | | | | | | | | | | | | | |
| Net investment income | | (2,050,814 | ) | | (3,091,098 | ) | | (5,168,287 | ) | | (5,799,581 | ) | | — | | | (3,944,011 | ) | | (1,995,057 | ) | | (2,115,858 | ) |
| |
| Trust Share Transactions * | | | | | | | | | | | | | | | | | | | | | | | | |
| Proceeds from shares sold | | 3,788,063 | | | 4,027,522 | | | 2,458,561 | | | 1,489,381 | | | 2,221,935 | | | 2,192,746 | | | 4,542,717 | | | 3,427,054 | |
| Reinvestment of dividends | | 2,050,814 | | | 3,091,098 | | | 5,168,287 | | | 5,799,581 | | | — | | | 3,944,011 | | | 1,995,057 | | | 2,115,858 | |
| Cost of shares redeemed | | (12,930,165 | ) | | (12,837,841 | ) | | (6,379,151 | ) | | (5,740,721 | ) | | (7,574,668 | ) | | (5,878,792 | ) | | (4,320,083 | ) | | (3,473,767 | ) |
| |
| Net increase (decrease) from trust share transactions | | (7,091,288 | ) | | (5,719,221 | ) | | 1,247,697 | | | 1,548,241 | | | (5,352,733 | ) | | 257,965 | | | 2,217,691 | | | 2,069,145 | |
| |
| Net increase in net assets | | 19,900,221 | | | 32,704,046 | | | 4,738,442 | | | 13,446,887 | | | 7,713,018 | | | 15,458,860 | | | 3,816,513 | | | 6,563,524 | |
| |
| Net Assets | | | | | | | | | | | | | | | | | | | | | | | | |
| Beginning of year | | 187,400,117 | | | 154,696,071 | | | 65,917,117 | | | 52,470,230 | | | 100,834,892 | | | 85,376,032 | | | 39,006,862 | | | 32,443,338 | |
| |
| End of year † | $ | 207,300,338 | | $ | 187,400,117 | | $ | 70,655,559 | | $ | 65,917,117 | | $ | 108,547,910 | | $ | 100,834,892 | | $ | 42,823,375 | | $ | 39,006,862 | |
| |
| †Includes undistributed net investment income of | $ | 3,610,430 | | $ | 2,050,736 | | $ | 5,082,372 | | $ | 5,130,041 | | $ | 3,254,243 | | $ | 443,345 | | $ | 1,820,798 | | $ | 1,861,730 | |
| |
| *Trust Shares Issued and Redeemed | | | | | | | | | | | | | | | | | | | | | | | | |
| Sold | | 148,800 | | | 195,145 | | | 393,361 | | | 266,340 | | | 145,824 | | | 177,230 | | | 429,611 | | | 354,193 | |
| Issued for dividends reinvested | | 84,084 | | | 192,113 | | | 889,550 | | | 1,236,585 | | | — | | | 385,534 | | | 198,513 | | | 246,603 | |
| Redeemed | | (514,577 | ) | | (627,686 | ) | | (1,029,775 | ) | | (1,050,640 | ) | | (495,382 | ) | | (476,405 | ) | | (409,825 | ) | | (372,595 | ) |
| |
| Net increase (decrease) in trust shares outstanding | | (281,693 | ) | | (240,428 | ) | | 253,136 | | | 452,285 | | | (349,558 | ) | | 86,359 | | | 218,299 | | | 228,201 | |
| | |
| 106 | See notes to financial statements | 107 |
Statements of Changes in Net Assets
FIRST INVESTORS LIFE SERIES FUNDS
| | | | | | | | | | | | | | | | | | |
| | |
| | | SELECT GROWTH | | | TARGET MATURITY 2015 | | | VALUE | |
| Year Ended December 31 | | 2010 | | | 2009 | | | 2010 | | | 2009 | | | 2010 | | | 2009 | |
| Increase (Decrease) in Net Assets From Operations | | | | | | | | | | | | | | | | | | |
| Net investment income | $ | 22,827 | | $ | 20,078 | | $ | 1,064,164 | | $ | 1,102,348 | | $ | 1,450,280 | | $ | 1,385,131 | |
| Net realized gain (loss) on investments | | 503,659 | | | (1,502,531 | ) | | 375,640 | | | 130,512 | | | 2,968,227 | | | (1,131,593 | ) |
| Net unrealized appreciation (depreciation) | | | | | | | | | | | | | | | | | | |
| of investments | | 1,823,595 | | | 2,428,097 | | | 795,110 | | | (1,880,168 | ) | | 4,538,379 | | | 11,166,645 | |
| Net increase (decrease) in net assets resulting | | | | | | | | | | | | | | | | | | |
| from operations | | 2,350,081 | | | 945,644 | | | 2,234,914 | | | (647,308 | ) | | 8,956,886 | | | 11,420,183 | |
| Distributions to Shareholders | | | | | | | | | | | | | | | | | | |
| Net investment income | | (20,097 | ) | | — | | | (1,102,367 | ) | | (1,124,305 | ) | | (1,385,162 | ) | | (1,816,526 | ) |
| Net realized gains | | — | | | — | | | (130,516 | ) | | (41,204 | ) | | — | | | — | |
| |
| Total distributions | | (20,097 | ) | | — | | | (1,232,883 | ) | | (1,165,509 | ) | | (1,385,162 | ) | | (1,816,526 | ) |
| |
| Trust Share Transactions* | | | | | | | | | | | | | | | | | | |
| Proceeds from shares sold | | 1,795,150 | | | 1,434,316 | | | 2,702,248 | | | 1,825,953 | | | 2,912,201 | | | 2,148,935 | |
| Reinvestment of distributions | | 20,097 | | | — | | | 1,232,883 | | | 1,165,509 | | | 1,385,162 | | | 1,816,526 | |
| Cost of shares redeemed | | (715,099 | ) | | (582,223 | ) | | (4,459,020 | ) | | (3,140,881 | ) | | (6,733,297 | ) | | (6,191,798 | ) |
| |
| Net increase (decrease) from trust share transactions | | 1,100,148 | | | 852,093 | | | (523,889 | ) | | (149,419 | ) | | (2,435,934 | ) | | (2,226,337 | ) |
| |
| Net increase (decrease) in net assets | | 3,430,132 | | | 1,797,737 | | | 478,142 | | | (1,962,236 | ) | | 5,135,790 | | | 7,377,320 | |
| |
| Net Assets | | | | | | | | | | | | | | | | | | |
| Beginning of year | | 10,443,317 | | | 8,645,580 | | | 27,491,472 | | | 29,453,708 | | | 65,817,387 | | | 58,440,067 | |
| |
| End of year † | $ | 13,873,449 | | $ | 10,443,317 | | $ | 27,969,614 | | $ | 27,491,472 | | $ | 70,953,177 | | $ | 65,817,387 | |
| |
| †Includes undistributed net investment income of | $ | 22,808 | | $ | 20,078 | | $ | 1,064,143 | | $ | 1,102,346 | | $ | 1,450,241 | | $ | 1,385,122 | |
| |
| *Trust Shares Issued and Redeemed | | | | | | | | | | | | | | | | | | |
| Sold | | 255,872 | | | 238,990 | | | 166,796 | | | 117,618 | | | 211,998 | | | 185,337 | |
| Issued for distributions reinvested | | 3,036 | | | — | | | 81,218 | | | 76,982 | | | 105,176 | | | 201,612 | |
| Redeemed | | (102,987 | ) | | (98,476 | ) | | (281,934 | ) | | (202,507 | ) | | (495,982 | ) | | (547,576 | ) |
| |
| Net increase (decrease) in trust shares outstanding | | 155,921 | | | 140,514 | | | (33,920 | ) | | (7,907 | ) | | (178,808 | ) | | (160,627 | ) |
| | |
| 108 | See notes to financial statements | 109 |
Notes to Financial Statements
FIRST INVESTORS LIFE SERIES FUNDS
December 31, 2010
1. Significant Accounting Policies—First Investors Life Series Funds, a Delaware statutory trust (“the Trust”), is registered under the Investment Company Act of 1940 (“the 1940 Act”) as a diversified, open-end management investment company. The Trust operates as a series fund, issuing shares of beneficial interest in the Blue Chip Fund, Cash Management Fund, Discovery Fund, Government Fund, Growth & Income Fund, High Yield Fund, International Fund, Investment Grade Fund, Select Growth Fund, Target Maturity 2015 Fund and Value Fund (each a “Fund”, collectively, “the Funds”), and accounts separately for the assets, liabilities and operations of each Fund. The objective of each Fund is as follows:
Blue Chip Fund seeks high total investment return.
Cash Management Fund seeks to earn a high rate of current income consistent with the preservation of capital and maintenance of liquidity.
Discovery Fund seeks long-term growth of capital.
Government Fund seeks to achieve a significant level of current income which is consistent with security and liquidity of principal.
Growth & Income Fund seeks long-term growth of capital and current income.
High Yield Fund seeks high current income.
International Fund primarily seeks long-term capital growth.
Investment Grade Fund seeks to generate a maximum level of income consistent with investment in investment grade debt securities.
Select Growth Fund seeks long-term growth of capital.
Target Maturity 2015 Fund seeks a predictable compounded investment return for investors who hold their Fund shares until the Fund’s maturity, consistent with the preservation of capital.
Value Fund seeks total return.
A. Security Valuation—Except as provided below, a security listed or traded on an exchange or the Nasdaq Stock Market is valued at its last sale price on the exchange or market where the security is principally traded, and lacking any sales, the security is valued at the mean between the closing bid and asked prices. Securities traded in the over-the-counter (“OTC”) market (including securities listed on exchanges whose primary market is believed to be OTC) are valued at the mean between the last bid and asked prices based on quotes furnished by a market maker for such securities. Securities may also be priced by pricing services approved by the Trust’s Board of Trustees (“the Board”). The pricing services consider security type, rating, market
condition and yield data as well as market quotations, prices provided by market makers and other available information in determining value. Short-term debt securities that mature in 60 days or less are valued at amortized cost.
The Funds monitor for significant events occurring prior to the close of trading on the New York Stock Exchange that could have a material impact on the value of any securities that are held by the Funds. Examples of such events include trading halts, natural disasters, political events and issuer-specific developments. If the Valuation Committee decides that such events warrant using fair value estimates, it will take such events into consideration in determining the fair values of such securities. If market quotations or prices are not readily available or determined to be unreliable, the securities will be valued at fair value as determined in good faith pursuant to procedures adopted by the Board. The Funds also use a pricing service to fair value foreign securities in the event that fluctuations in U.S. securities markets exceed a predetermined level or if a foreign market is closed. For valuation purposes, where applicable, quotations of foreign securities in foreign currency are translated to U.S. dollar equivalents using the foreign exchange quotation in effect. At December 31, 2010, the High Yield Fund held three securities that were fair valued by the Valuation Committee with an aggregate value of $396 representing .0% of the Fund’s net assets. At December 31, 2010, fair value pricing was used for certain foreign securities in the International Fund portfolio.
The Cash Management Fund values its portfolio securities in accordance with the amortized cost method of valuation under Rule 2a-7 under the 1940 Act. Amortized cost is an approximation of market value of an instrument, whereby the difference between its acquisition cost and market value at maturity is amortized on a straight-line basis over the remaining life of the instrument. The effect of changes in the market value of a security as a result of fluctuating interest rates is not taken into account and thus the amortized cost method of valuation may result in the value of a security being higher or lower than its actual market value.
In accordance with Accounting Standards Codification (“ASC”) 820 “Fair Value Measurements and Disclosures” (“ASC 820”), formerly known as Financial Accounting Standards Board (“FASB”) Statement of Financial Accounting Standards No. 157, Fair Value Measurements, investments held by the Funds are carried at “fair value”. As defined by ASC 820, fair value is the price that a fund would receive upon selling an investment in an orderly transaction to an independent buyer in the principal or most advantageous market for the investment under current market conditions. Various inputs are used in determining the value of the Funds’ investments.
In addition to defining fair value, ASC 820 established a three-tier hierarchy of inputs to establish a classification of fair value measurements for disclosure purposes. The three-tier hierarchy of inputs is summarized in the three broad Levels listed below:
Notes to Financial Statements (continued)
FIRST INVESTORS LIFE SERIES FUNDS
December 31, 2010
Level 1 – quoted prices in active markets for identical securities
Level 2 – other significant observable inputs (including quoted prices for similar securities, interest rates, prepayment speeds, credit risk, etc.)
Level 3 – significant unobservable inputs (including the fund’s own assumptions in determining the fair value of investments)
Equity securities traded on an exchange or the Nasdaq Stock Market are categorized in Level 1 of the fair value hierarchy to the extent that they are actively traded and valuation adjustments are not applied. Foreign securities that are fair valued in the event that fluctuations in U.S. securities markets exceed a predetermined level or if a foreign market is closed are categorized in Level 2. Corporate and municipal bonds, asset backed, U.S. Government and U.S. Agency securities are categorized in Level 2 to the extent that the inputs are observable and timely, otherwise they would be categorized as Level 3. Short-term notes that are valued at amortized cost are categorized in Level 2. Investments in the affiliated unregistered money market fund are categorized as Level 1. Foreign exchange contracts that are considered derivative instruments and are valued at the net unrealized appreciation or depreciation on the instruments are categorized in Level 2. Restricted securities and securities that are fair valued by the Valuation Committee may be categorized in either Level 2 or Level 3 of the fair value hierarchy depending on the relative significance of valuation inputs.
The aggregate value by input level, as of December 31, 2010, for each Fund’s investments is included at the end of each Fund’s portfolio of investments.
In January 2010, FASB released Accounting Standards Update (“ASU”) No. 2010-06, Improving Disclosures about Fair Value Measurements (“ASU No. 2010-06”). Among the new disclosures and clarifications of existing disclosures ASU No. 2010-06 requires the Funds to disclose separately the amounts of significant transfers in and out of Level 1 and 2 fair value measurements and to describe the reasons for the transfers. Significance shall be judged with respect to total earnings and total assets or total liabilities. ASU No. 2010-06 requires the Level 3 roll forward reconciliation of beginning and ending balances to be prepared on a gross basis, in particular separately presenting information about purchases, sales, issuances, and settlements. ASU No. 2010-06 also requires disclosure of the reasons for significant transfers in and out of Level 3. The Funds adopted ASU No. 2010-06 on January 1, 2010, except for the Level 3 gross basis roll forward reconciliation, which is effective for fiscal years beginning after December 15, 2010 and for interim periods within those fiscal years.
B. Federal Income Tax—No provision has been made for federal income taxes on net income or capital gains since it is the policy of each Fund to continue to comply with
the special provisions of the Internal Revenue Code applicable to investment companies, and to make sufficient distributions of income and capital gains (in excess of any available capital loss carryovers), to relieve each Fund from all, or substantially all, federal income taxes. At December 31, 2010, capital loss carryovers were as follows:
| | | | | | | | | | | | | | | | | | | | | | | |
| | | | | | | | | | | | | | | | | | |
| | | Year Capital Loss Carryovers Expire |
| Fund | | Total | | 2011 | | 2012 | | 2013 | | 2014 | | 2015 | | 2016 | | 2017 | | 2018 |
| Blue Chip | | $10,146,550 | | $4,132,026 | | $ | — | | $ | — | | $ | — | | $ | — | | $3,493,173 | | $ 2,521,351 | | $ | — |
| Discovery | | 551,263 | | — | | — | | — | | — | | — | | — | | 551,263 | | — |
| Government | | 562,422 | | 102,584 | | 51,149 | | 193,688 | | 177,059 | | 37,942 | | — | | — | | — |
| Growth & Income | | 23,482,697 | | — | | — | | — | | — | | — | | 13,700,802 | | 5,518,321 | | 4,263,574 |
| High Yield* | | 29,365,254 | | 5,337,824 | | 1,392,331 | | 1,059,640 | | 1,944,836 | | 433,726 | | 3,694,844 | | 15,502,053 | | — |
| International | | 33,046,863 | | — | | — | | — | | — | | — | | 23,624,881 | | 8,389,229 | | 1,032,753 |
| Investment Grade | | 4,250,893 | | — | | — | | — | | — | | — | | 3,105,792 | | 1,145,101 | | — |
| Select Growth | | 4,337,113 | | — | | — | | — | | — | | — | | 2,834,582 | | 1,502,531 | | — |
| Value | | 5,385,580 | | 1,198,371 | | — | | — | | — | | — | | 3,055,616 | | 1,131,593 | | — |
*Due to a tax free reorganization on August 10, 2007 with the Special Bond Fund that was approved by the Life Series Funds’ Board of Trustees, the Fund will have available for utilization $1,630,437 in capital loss carryovers that will become available at $601,552 per year for the taxable years 2011 through 2012 and $427,333 for taxable year 2013. These capital loss carryovers will expire as follows: $601,552 in 2011; $212,617 in 2012; $153,634 in 2013; and $662,634 in 2014.
The Funds recognize the tax benefits of uncertain tax positions only where the position is “more likely than not” to be sustained assuming examination by tax authorities. Management has analyzed the Funds’ tax positions, and has concluded that no liability for unrecognized tax benefits should be recorded related to uncertain tax positions taken on returns filed for open tax years 2007–2009, or expected to be taken in the Funds’ 2010 tax returns. The Funds identify their major tax jurisdictions as U.S. Federal, New York State, New York City and foreign jurisdictions where the Funds make significant investments; however, the Funds are not aware of any tax position for which it is reasonably possible that the total amounts of unrecognized tax benefits will change materially in the next twelve months.
C. Foreign Currency Translations—The accounting records of the International Fund are maintained in U.S. dollars. Portfolio securities and other assets and liabilities denominated in foreign currencies are translated into U.S. dollars at the date of valuation. Purchases and sales of investment securities, dividend income and certain expenses are translated to U.S. dollars at the prevailing rates of exchange on the respective dates of such transactions.
Notes to Financial Statements (continued)
FIRST INVESTORS LIFE SERIES FUNDS
December 31, 2010
The International Fund does not isolate that portion of gains and losses on investments which is due to changes in foreign exchange rates from that which is due to changes in market prices of the investments. These changes are included with the net realized and unrealized gains and losses from investments.
Net realized and unrealized gains and losses on foreign currency transactions include gains and losses from the sales of foreign currency and gains and losses on accrued foreign dividends and related withholding taxes.
D. Distributions to Shareholders—Distributions to shareholders from net investment income and net realized capital gains are generally declared and paid annually on all Funds, except for the Cash Management Fund which declares dividends, if any, from the total of net investment income (plus or minus all realized short-term gains and losses on investments) daily and pays monthly. Dividends from net investment income and capital gain distributions are determined in accordance with income tax regulations which may differ from accounting principles generally accepted in the United States of America. These differences are primarily due to differing treatments for foreign currency transactions, capital loss carryforwards, deferral of wash sales and post-October capital losses.
E. Expense Allocation—Expenses directly charged or attributable to a Fund are paid from the assets of that Fund. General expenses of the Trust are allocated among and charged to the assets of each Fund on a fair and equitable basis, which may be based on the relative assets of each Fund or the nature of the services performed and relative applicability to each Fund.
F. Use of Estimates—The preparation of the financial statements in conformity with accounting principles generally accepted in the United States of America requires management to make estimates and assumptions that affect the reported amounts of assets and liabilities at the date of the financial statements and the reported amounts of revenue and expense during the reporting period. Actual results could differ from those estimates.
G. Other—Security transactions are generally accounted for on the first business day following the date the securities are purchased or sold except for financial reporting purposes which is trade date. Investments in securities issued on a when-issued or delayed delivery basis are generally reflected in the assets of the Funds on the first business day following the date the securities are purchased and the Funds segregated assets for these transactions. Cost is determined and gains and losses are based, on the identified cost basis for securities, for both financial statement and federal income tax purposes. Dividend income is recorded on the ex-dividend date. Interest income and estimated expenses are accrued daily. Bond premiums and discounts are accreted or
amortized using the interest method. Interest income on zero coupon bonds and step bonds is accrued daily at the effective interest rate. For the year ended December 31, 2010, The Bank of New York Mellon, custodian for the Cash Management, Government, High Yield, Investment Grade and Target Maturity 2015 Funds, has provided credits in the amount of $48 against custodian charges based on the uninvested cash balances of the Funds. Brown Brothers Harriman & Co. serves as custodian for the Blue Chip, Discovery, Growth & Income, International, Select Growth and Value Funds. The Funds reduced expenses through brokerage service arrangements. For the year ended December 31, 2010, the Funds’ expenses were reduced by $5,075 under these arrangements.
2. Trust Shares—The Trust is authorized to issue an unlimited number of shares of beneficial interest without par value. The Trust consists of the Funds listed on the cover page, each of which is a separate and distinct series of the Trust. Shares in the Funds are acquired through the purchase of variable annuity or variable life insurance contracts sold by First Investors Life Insurance Company.
3. Security Transactions—For the year ended December 31, 2010, purchases and sales (including pay-downs on Government Fund) of securities and long-term U.S. Government obligations (excluding short-term U.S. Government obligations, foreign currencies and short-term securities), were as follows:
| | | | | | | | | | |
| | | | | | | | |
| | | | | | | Long-Term U.S. |
| | | Securities | | Government Obligations |
| | | Cost of | | Proceeds | | Cost of | | Proceeds |
| Fund | | Purchases | | of Sales | | Purchases | | of Sales |
| Blue Chip | | $17,955,983 | | $23,676,820 | | $ | — | | $ | — |
| Discovery | | 79,369,070 | | 84,684,810 | | — | | — |
| Government | | 9,970,016 | | 9,590,418 | | 6,580,875 | | 3,600,867 |
| Growth & Income | | 50,360,733 | | 55,237,749 | | — | | — |
| High Yield | | 48,189,453 | | 47,135,284 | | — | | — |
| International | | 35,251,363 | | 37,722,973 | | — | | — |
| Investment Grade | | 25,147,561 | | 22,357,784 | | — | | — |
| Select Growth | | 10,822,729 | | 9,658,754 | | — | | — |
| Target Maturity 2015 | | 1,155,720 | | 3,245,068 | | — | | — |
| Value | | 13,244,583 | | 15,673,789 | | — | | — |
Notes to Financial Statements (continued)
FIRST INVESTORS LIFE SERIES FUNDS
December 31, 2010
At December 31, 2010, aggregate cost and net unrealized appreciation of securities for federal income tax purposes were as follows:
| | | | | | | | |
| | | | | Gross | | Gross | | Net |
| | | Aggregate | | Unrealized | | Unrealized | | Unrealized |
| Fund | | Cost | | Appreciation | | Depreciation | | Appreciation |
| Blue Chip | | $ 92,610,215 | | $35,097,344 | | $ 3,984,896 | | $31,112,448 |
| Discovery | | 116,815,663 | | 37,349,171 | | 1,795,802 | | 35,553,369 |
| Government | | 26,622,751 | | 748,991 | | 128,820 | | 620,171 |
| Growth & Income | | 179,713,244 | | 38,667,683 | | 11,228,189 | | 27,439,494 |
| High Yield | | 66,327,889 | | 4,355,418 | | 1,554,761 | | 2,800,657 |
| International | | 80,981,771 | | 28,625,339 | | 283,223 | | 28,342,116 |
| Investment Grade | | 41,897,712 | | 2,538,171 | | 190,542 | | 2,347,629 |
| Select Growth | | 10,561,909 | | 3,136,673 | | 30,582 | | 3,106,091 |
| Target Maturity 2015 | | 24,126,397 | | 3,760,570 | | — | | 3,760,570 |
| Value | | 60,205,623 | | 13,888,910 | | 3,397,375 | | 10,491,535 |
Certain of the Funds may invest in First Investors Cash Reserve Fund, LLC (“Cash Reserve Fund”), an affiliated unregistered money market fund managed by First Investors Management Company, Inc. During the year ended December 31, 2010, purchases, sales and dividend income earned by the Funds that invested in the Cash Reserve Fund were as follows:
| | | | | | | | | | |
| | | Value at | | Purchases | | Sales | | Value at | | Dividend |
| Fund | | 12/31/09 | | Shares/Cost | | Shares/Cost | | 12/31/10 | | Income |
| Blue Chip | | $1,785,000 | | $ 9,125,000 | | $10,310,000 | | $ 600,000 | | $ 615 |
| Discovery | | 7,920,000 | | 47,915,000 | | 46,765,000 | | 9,070,000 | | 11,858 |
| Growth & Income | | 775,000 | | 26,035,000 | | 26,535,000 | | 275,000 | | 3,297 |
| High Yield | | 790,000 | | 19,905,000 | | 19,365,000 | | 1,330,000 | | 1,865 |
| International | | 1,005,000 | | 22,845,000 | | 22,900,000 | | 950,000 | | 2,880 |
| Investment Grade | | 125,000 | | 8,630,000 | | 7,140,000 | | 1,615,000 | | 738 |
| Value | | 2,200,000 | | 8,300,000 | | 8,485,000 | | 2,015,000 | | 2,087 |
4. Advisory Fee and Other Transactions With Affiliates—Certain officers and trustees of the Trust are officers and trustees of its investment adviser, First Investors Management Company, Inc. (“FIMCO”) and/or its transfer agent, Administrative Data Management Corp. Trustees of the Trust who are not “interested persons” of the Trust as defined in the 1940 Act are remunerated by the Funds. For the year ended December 31, 2010, total trustee fees accrued by the Funds amounted to $39,296.
The Investment Advisory Agreement provides as compensation to FIMCO an annual fee, payable monthly, at the rate of .75% on the first $250 million of each Fund’s average daily net assets, .72% on the next $250 million, .69% on the next $250 million,
.66% on the next $500 million, declining by .02% on each $500 million thereafter, down to .60% on average daily net assets over $2.25 billion. For the year ended December 31, 2010, FIMCO has voluntarily waived 20% of the .75% annual fee on the first $250 million of average daily net assets of the Government, Investment Grade and Target Maturity 2015 Funds. During the year ended December 31, 2010, FIMCO has voluntarily waived $42,916 in advisory fees to limit the Cash Management Fund’s over all expense ratio to .60%. Also, FIMCO has voluntarily waived an additional $29,869 in advisory fees and assumed $6,349 of other expenses to prevent a negative yield on the Fund’s shares. For the year ended December 31, 2010, total advisory fees accrued to FIMCO were $5,932,446 of which $216,294 was waived as noted above.
Paradigm Capital Management, Inc. serves as investment subadviser to the Discovery Fund. Muzinich & Co., Inc. serves as investment subadviser to the High Yield Fund. Vontobel Asset Management, Inc. serves as investment subadviser to the International Fund. Smith Asset Management Group, L.P. serves as investment subadviser to Select Growth Fund. The subadvisers are paid by FIMCO and not by the Funds.
5. Restricted Securities—Certain restricted securities are exempt from the registration requirements under Rule 144A of the Securities Act of 1933 and may only be sold to qualified institutional investors. At December 31, 2010, the Government Fund held one 144A security with a value of $669,781 representing 2.4% of the Fund’s net assets, the High Yield Fund held seventy-five 144A securities with an aggregate value of $26,154,718 representing 37.0% of the Fund’s net assets, and the Investment Grade Fund held nineteen 144A securities with an aggregate value of $6,217,079 representing 14.5% of the Fund’s net assets. Unless otherwise noted, 144A securities are deemed to be liquid. Certain restricted securities are exempt from the registration requirements under Section 4(2) of the Securities Act of 1933 and may only be sold to qualified investors. At December 31, 2010, the Cash Management Fund held five Section 4(2) securities with an aggregate value of $1,929,471 representing 15.6% of the Fund’s net assets. These securities are valued as set forth in Note 1A.
6. Forward Currency Contracts—Forward currency contracts are obligations to purchase or sell a specific currency for an agreed-upon price at a future date. When the International Fund purchases or sells foreign securities the Fund may enter into a forward currency contract to attempt to manage exposure to foreign exchange risk between the trade date and the settlement date of such transactions. The Fund could be exposed to risk if counter parties to the contracts are unable to meet the terms of their contracts or if the value of the foreign currency changes unfavorably. Forward currency contracts are “marked-to-market” daily at the applicable translation rate and the resulting unrealized gains or losses are reflected in the Fund’s assets.
Notes to Financial Statements (continued)
FIRST INVESTORS LIFE SERIES FUNDS
December 31, 2010
The International Fund had no forward currency contracts outstanding at December 31, 2010.
7. Foreign Exchange Contracts—The International Fund may enter into foreign exchange contracts for the purchase or sale of foreign currencies at negotiated rates at future dates. These contracts are considered derivative instruments and are used to decrease exposure to foreign exchange risk associated with foreign currency denominated securities held by the Fund. The Fund could be exposed to risk if counter parties to the contracts are unable to meet the terms of their contracts or if the value of the foreign currency changes unfavorably. Foreign exchange contracts are “marked-to-market” daily at the applicable translation rate and the resulting unrealized gains and losses are reflected in the Fund’s assets.
The International Fund had the following foreign exchange contracts open at December 31, 2010:
| | | | | | | | | |
| Contracts to Buy | | | | | | Unrealized | |
| Foreign Currency | | In Exchange for | | Settlement Date | | Loss | |
| |
| 10,577,000 | | British Pound | | US $17,169,221 | | 2/14/11 | | US $(609,280 | ) |
| 2,266,000 | | Euro | | 3,048,201 | | 2/14/11 | | (8,263 | ) |
| 2,990,000 | | Euro | | 4,214,608 | | 4/21/11 | | (203,393 | ) |
| | | | | $24,432,030 | | | | $(820,936 | ) |
| |
| Contracts to Sell | | | | | | Unrealized | |
| Foreign Currency | | In Exchange for | | Settlement Date | | Gain (Loss) | |
| |
| 10,577,000 | | British Pound | | US $16,606,778 | | 2/14/11 | | US $ 46,837 | |
| 2,266,000 | | Euro | | 2,942,945 | | 2/14/11 | | (96,993 | ) |
| 2,990,000 | | Euro | | 4,116,004 | | 4/21/11 | | 104,789 | |
| 4,054,000 | | British Pound | | 6,291,240 | | 6/1/11 | | (55,928 | ) |
| 2,404,000 | | Euro | | 3,143,088 | | 6/1/11 | | (81,983 | ) |
| | | | | $33,100,055 | | | | $ (83,278 | ) |
| |
| Net Unrealized Loss on Foreign Exchange Contracts | | | | $ (904,214 | ) |
Fair Value of Derivative Instruments — The fair value of derivative instruments as of December 31, 2010, was as follows:
| | | | | |
| | Assets Derivatives | | Liability Derivatives |
| |
| Derivatives not accounted | Statements of | | | Statements of | |
| for as hedging instruments | Assets and | | | Assets and | |
| under ASC 815 | Liabilities Location | Value | | Liabilities Location | Value |
| Foreign exchange contracts: | Unrealized | | | Unrealized | |
| | appreciation of | | | depreciation of | |
| | foreign exchange | | | foreign exchange | |
| | contracts | $151,626 | | contracts | $1,055,840 |
The effect of derivative instruments on the Statement of Operations is as follows:
| | |
| Amount of Realized Gain or Loss Recognized on Derivatives | |
| Derivatives not accounted | Net Realized Gain |
| for as hedging instruments | on Foreign Currency |
| under ASC 815 | Transactions |
| Foreign currency transactions: | | $624,791 |
| |
| Amount of Change in Unrealized Gain or Loss Recognized on Derivatives | |
| Derivatives not accounted | Net Unrealized Depreciation |
| for as hedging instruments | on Foreign Currency |
| under ASC 815 | Transactions |
| Foreign currency transactions: | | $(457,997) |
8. High Yield Credit Risk—The High Yield Fund’s investment in high yield securities, whether rated or unrated, may be considered speculative and subject to greater market fluctuations and risks of loss of income and principal than lower-yielding, higher-rated, fixed-income securities. The risk of loss due to default by the issuer may be significantly greater for the holders of high-yielding securities, because such securities are generally unsecured and are often subordinated to other creditors of the issuer.
Notes to Financial Statements (continued)
FIRST INVESTORS LIFE SERIES FUNDS
December 31, 2010
9. Tax Components of Capital and Distributions to Shareholders—The tax character of distributions declared for the years ended December 31, 2010 and 2009 were as follows:
| | | | | | | | | | | | | | |
| | | | | | | | | | | | |
| | | Distributions | | | | Distributions | | |
| | | Declared in 2010 | | | | Declared in 2009 | | |
| |
| | | Ordinary | Long-Term | | | | Ordinary | Long-Term | | |
| Fund | | Income | | Capital Gain | | Total | | Income | | Capital Gain | | Total |
| |
| Blue Chip | | $1,905,253 | | $ | — | | $1,905,253 | | $2,356,098 | | $ | — | | $2,356,098 |
| Cash Management | | — | | — | | — | | 22,436 | | — | | 22,436 |
| Discovery | | 1,116,657 | | — | | 1,116,657 | | 1,370,258 | | — | | 1,370,258 |
| Government | | 1,061,623 | | — | | 1,061,623 | | 1,023,566 | | — | | 1,023,566 |
| Growth & Income | | 2,050,814 | | — | | 2,050,814 | | 3,091,098 | | — | | 3,091,098 |
| High Yield | | 5,168,287 | | — | | 5,168,287 | | 5,799,581 | | — | | 5,799,581 |
| International | | — | | — | | — | | 3,944,011 | | — | | 3,944,011 |
| Investment Grade | | 1,995,057 | | — | | 1,995,057 | | 2,115,858 | | — | | 2,115,858 |
| Select Growth | | 20,097 | | — | | 20,097 | | — | | — | | — |
| Target Maturity 2015 | | 1,102,367 | | 130,516 | | 1,232,883 | | 1,124,305 | | 41,204 | | 1,165,509 |
| Value | | 1,385,162 | | — | | 1,385,162 | | 1,816,526 | | — | | 1,816,526 |
As of December 31, 2010, the components of distributable earnings (deficit) on a tax basis were as follows:
| | | | | | | | | | | | |
| | | | | | | | | | | |
| | | | | | | | | | | Total | |
| | | Undistributed | | Accumulated | | | | | | Distributable | |
| | | Ordinary | | Capital | | Capital Loss | | Unrealized | | Earnings | |
| Fund | | Income | | Gains | | Carryover | | Appreciation | | (Deficit) | |
| |
| Blue Chip | | $1,761,754 | | $ | — | | $(10,146,550 | ) | $31,112,448 | | $22,727,652 | |
| Discovery | | 777,221 | | — | | (551,263 | ) | 35,553,369 | | 35,779,327 | |
| Government | | 941,746 | | — | | (562,422 | ) | 620,171 | | 999,495 | |
| Growth & Income | | 3,610,430 | | — | | (23,482,697 | ) | 27,439,494 | | 7,567,227 | |
| High Yield | | 5,159,996 | | — | | (29,365,254 | ) | 2,800,657 | | (21,404,601 | ) |
| International | | 2,350,028 | | — | | (33,046,863 | ) | 28,354,605 | | (2,342,230 | ) |
| Investment Grade | | 2,081,712 | | — | | (4,250,893 | ) | 2,347,629 | | 178,448 | |
| Select Growth | | 22,808 | | — | | (4,337,113 | ) | 3,106,091 | | (1,208,214 | ) |
| Target Maturity 2015 | | 1,064,143 | | 375,600 | | — | | 3,760,570 | | 5,200,313 | |
| Value | | 1,450,241 | | — | | (5,385,580 | ) | 10,491,535 | | 6,556,196 | |
Differences between book distributable earnings and tax distributable earnings consist primarily of wash sales, foreign currency transactions, passive foreign investment companies and amortization of bond premium and discounts.
For the year ended December 31, 2010, the following reclassifications were made to reflect permanent differences between book and tax reporting which are primarily due to the differences between book and tax treatment of foreign currency transactions, paydowns, premium amortization and expiration of capital loss carryovers.
| | | | | | | | |
| | | | | | | |
| | | | | | | Accumulated | |
| | | Capital | | Undistributed | | Capital | |
| Fund | | Paid In | | Ordinary Income | | Gains (Losses) | |
| Blue Chip | | $(16,910,568 | ) | $ | — | | $16,910,568 | |
| Government | | — | | 102,332 | | (102,332 | ) |
| High Yield | | (5,224,174 | ) | 70,014 | | 5,154,160 | |
| International | | — | | 624,790 | | (624,790 | ) |
| Investment Grade | | — | | 50,368 | | (50,368 | ) |
| Value | | (613,351 | ) | — | | 613,351 | |
10. New Accounting Pronouncements—On December 22, 2010, The Regulated Investment Company Modernization Act of 2010 (the “Modernization Act”) was signed by the President of the United States. The Modernization Act is the first major piece of legislation affecting Regulated Investment Companies (“RICs”) since 1986 and it modernizes several of the federal income and excise tax provisions related to RICs. Some highlights of the enacted provisions are as follows:
New capital losses may now be carried forward indefinitely, and retain the character of the original loss. Under pre-enactment law, capital losses could be carried forward for eight years, and carried forward as short-term capital losses, irrespective of the character of the original loss.
The Modernization Act contains simplification provisions, which are aimed at preventing disqualification of a RIC for “inadvertent” failures of the asset diversification and/or qualifying income tests. Additionally, the Modernization Act exempts RICs from the preferential dividend rule, and repealed the 60-day designation requirement for certain types of pay-through income and gains.
Finally, the Modernization Act contains several provisions aimed at preserving the character of distributions made by a fiscal year RIC during the portion of its taxable year ending after October 31 or December 31, reducing the circumstances under which a RIC might be required to file amended Forms 1099 to restate previously reported distributions.
Except for the simplification provisions related to RIC qualification, the Modernization Act is effective for taxable years beginning after December 22, 2010. The provisions related to RIC qualification are effective for taxable years for which the extended due date of the tax return is after December 22, 2010.
11. Subsequent Events—Subsequent events occurring after December 31, 2010 have been evaluated for potential impact to this report through the date the financial statements were issued. There were no subsequent events to report that would have a material impact on the Funds’ financial statements.
12. Foresters Transaction—On September 21, 2010, First Investors Consolidated Corporation (“FICC”), the parent company of FIMCO, entered into an agreement with The Independent Order of Foresters (“Foresters”) pursuant to which FICC would be acquired by Foresters (the “Transaction”). The Transaction was completed on January 19, 2011, after the parties obtained the required regulatory and shareholder approvals. FICC, FIMCO, First Investors Corporation, the principal underwriter of the First Investors Funds and Administrative Data Management Corp., the transfer agent for the First Investors Funds are now subsidiaries of Foresters. Foresters is a fraternal benefit society with financial services operations in Canada, the United States and the United Kingdom.
13. Litigation—The Blue Chip and Value Funds have received notice that they may be putative members of the proposed defendant class of shareholders in a lawsuit filed in the United States Bankruptcy Court for the District of Delaware on November 1, 2010, by the Official Committee of Unsecured Creditors of the Tribune Company (the “Committee”). The Committee is seeking to recover some or all payments made to beneficial owners of common stock in connection with a leveraged buyout of the Tribune Company, including those made in connection with a 2007 tender offer into which the Blue Chip and Value Funds tendered their shares of common stock of the Tribune Company. The complaint alleges no misconduct by the Funds. The amounts sought from the Blue Chip and Value Funds, excluding interest and court costs, are $288,456 and $376,754, respectively, representing 0.23% and 0.53% of net assets, respectively, as of December 31, 2010. The Blue Chip and Value Funds cannot predict the outcome of this proceeding, and thus have not accrued any of the amounts sought by the Committee in this matter in the accompanying financial statements.
|
| This page left intentionally blank. |
Financial Highlights
FIRST INVESTORS LIFE SERIES FUNDS
|
| The following table sets forth the per share operating performance data for a trust share outstanding, |
| total return, ratios to average net assets and other supplemental data for each year indicated. |
| | | | | | | | | | | | | | | | | | | | | | | | | | | | | | | | | | | | | | | | | | | | | | | | | | | | | | | | | | | |
| | |
| | | P E R S H A R E D A T A | | | | | | | | R A T I O S / S U P P L E M E N T A L D A T A | |
| | | | | | | | | | | | | | | | | | | Less Distributions | | | | | | | | | | | | | | | | | | | | | | | | | | | | Ratio to Average Net | | | | | |
| | | | | | | Investment Operations | | | | from | | | | | | | | | | | | | | | | | | | | Ratio to Average Net | | | | Assets Before Expenses | | | | | |
| | | Net Asset | | | | | | | | Net Realized | | | | | | | | | | | | | | | | | | | | Net Asset | | | | | | | | | | | | Assets** | | | | Waived or Assumed | | | | | |
| | | Value, | | | | Net | | | | and Unrealized | | | | Total from | | | | Net | | | | Net | | | | | | | | Value, | | | | | | | | Net Assets | | | | Expenses | | | | Net | | | | | | | | Net | | | | Portfolio | |
| | | Beginning | | | | Investment | | | | Gain (Loss) on | | | | Investment | | | | Investment | | | | Realized | | | | Total | | | | End of | | | | Total | | | | End of Year | | | | Before Fee | | | | Investment | | | | | | | | Investment | | | | Turnover | |
| | | of Year | | | | Income | | | | Investments | | | | Operations | | | | Income | | | | Gains | | | | Distributions | | | | Year | | | | Return | * | | | (in millions) | | | | Credits | (a) | | | Income | | | | Expenses | | | | Income (Loss) | | | | Rate | |
| |
| BLUE CHIP FUND | | | | | | | | | | | | | | | | | | | | | | | | | | | | | | | | | | | | | | | | | | | | | | | | | | | | | | | | | | | |
| 2006 | | $20.85 | | | | $ .26 | | | | $ 2.74 | | | | $ 3.00 | | | | $ .20 | | | | — | | | | $ .20 | | | | $23.65 | | | | 14.49 | % | | | $181 | | | | .82 | % | | | 1.13 | % | | | N/A | | | | N/A | | | | 4 | % |
| 2007 | | 23.65 | | | | .31 | | | | .67 | | | | .98 | | | | .26 | | | | — | | | | .26 | | | | 24.37 | | | | 4.21 | | | | 173 | | | | .81 | | | | 1.20 | | | | N/A | | | | N/A | | | | 5 | |
| 2008 | | 24.37 | | | | .36 | | | | (8.10 | ) | | | (7.74 | ) | | | .31 | | | | — | | | | .31 | | | | 16.32 | | | | (32.08 | ) | | | 107 | | | | .83 | | | | 1.67 | | | | N/A | | | | N/A | | | | 8 | |
| 2009 | | 16.32 | | | | .31 | | | | 3.04 | | | | 3.35 | | | | .36 | | | | — | | | | .36 | | | | 19.31 | | | | 21.61 | | | | 121 | | | | .84 | | | | 1.78 | | | | N/A | | | | N/A | | | | 15 | |
| 2010 | | 19.31 | | | | .30 | | | | 1.64 | | | | 1.94 | | | | .31 | | | | — | | | | .31 | | | | 20.94 | | | | 10.22 | | | | 124 | | | | .83 | | | | 1.49 | | | | N/A | | | | N/A | | | | 15 | |
| |
| CASH MANAGEMENT FUND | | | | | | | | | | | | | | | | | | | | | | | | | | | | | | | | | | | | | | | | | | | | | | | | | | |
| 2006 | | $ 1.00 | | | | $.043 | | | | — | | | | $ .043 | | | | $ .043 | | | | — | | | | $ .043 | | | | $ 1.00 | | | | 4.35 | % | | | $ 7 | | | | .74 | %(b) | | | 4.26 | % | | | 1.09 | % | | | 3.87 | % | | | N/A | |
| 2007 | | 1.00 | | | | .045 | | | | — | | | | .045 | | | | .045 | | | | — | | | | .045 | | | | 1.00 | | | | 4.62 | | | | 15 | | | | .72 | (b) | | | 4.49 | | | | 1.04 | | | | 4.14 | | | | N/A | |
| 2008 | | 1.00 | | | | .020 | | | | — | | | | .020 | | | | .020 | | | | — | | | | .020 | | | | 1.00 | | | | 2.03 | | | | 13 | | | | .71 | (b) | | | 2.02 | | | | .96 | | | | 1.77 | | | | N/A | |
| 2009 | | 1.00 | | | | .002 | | | | — | | | | .002 | | | | .002 | | | | — | | | | .002 | | | | 1.00 | | | | .17 | | | | 11 | | | | .56 | (b) | | | .18 | | | | .98 | | | | (.24 | ) | | | N/A | |
| 2010 | | 1.00 | | | | — | | | | — | | | | — | | | | — | | | | — | | | | — | | | | 1.00 | | | | .00 | | | | 12 | | | | .23 | (b) | | | .00 | | | | 1.04 | | | | (.81 | ) | | | N/A | |
| |
| DISCOVERY FUND | | | | | | | | | | | | | | | | | | | | | | | | | | | | | | | | | | | | | | | | | | | | | | | | | | | | | | |
| 2006 | | $25.79 | | | | $ .06 | | | | $ 5.74 | | | | $ 5.80 | | | | $ .04 | | | $ | — | | | | $ .04 | | | | $31.55 | | | | 22.51 | % | | | $158 | | | | .82 | % | | | .19 | % | | | N/A | | | | N/A | | | | 58 | % |
| 2007 | | 31.55 | | | | .11 | | | | 1.86 | | | | 1.97 | | | | .06 | | | | 2.66 | | | | 2.72 | | | | 30.80 | | | | 6.62 | | | | 161 | | | | .82 | | | | .35 | | | | N/A | | | | N/A | | | | 55 | |
| 2008 | | 30.80 | | | | .30 | | | | (10.11 | ) | | | (9.81 | ) | | | .11 | | | | 1.44 | | | | 1.55 | | | | 19.44 | | | | (33.25 | ) | | | 101 | | | | .83 | | | | 1.15 | | | | N/A | | | | N/A | | | | 52 | |
| 2009 | | 19.44 | | | | .22 | | | | 5.63 | | | | 5.85 | | | | .27 | | | | — | | | | .27 | | | | 25.02 | | | | 30.77 | | | | 127 | | | | .84 | | | | 1.03 | | | | N/A | | | | N/A | | | | 66 | |
| 2010 | | 25.02 | | | | .16 | | | | 6.43 | | | | 6.59 | | | | .22 | | | | — | | | | .22 | | | | 31.39 | | | | 26.57 | | | | 152 | | | | .83 | | | | .59 | | | | N/A | | | | N/A | | | | 64 | |
| |
| GOVERNMENT FUND | | | | | | | | | | | | | | | | | | | | | | | | | | | | | | | | | | | | | | | | | | | | | | | | | | | | | | |
| 2006 | | $10.10 | | | | $ .51 | | | | $ (.14 | ) | | | $ .37 | | | | $ .51 | | | | — | | | | $ .51 | | | | $ 9.96 | | | | 3.80 | % | | | $ 20 | | | | .78 | % | | | 5.10 | % | | | .93 | % | | | 4.95 | % | | | 28 | % |
| 2007 | | 9.96 | | | | .48 | | | | .15 | | | | .63 | | | | .52 | | | | — | | | | .52 | | | | 10.07 | | | | 6.55 | | | | 21 | | | | .80 | | | | 4.94 | | | | .95 | | | | 4.75 | | | | 24 | |
| 2008 | | 10.07 | | | | .44 | | | | .24 | | | | .68 | | | | .45 | | | | — | | | | .45 | | | | 10.30 | | | | 6.93 | | | | 24 | | | | .79 | | | | 4.56 | | | | .94 | | | | 4.41 | | | | 39 | |
| 2009 | | 10.30 | | | | .42 | | | | — | | | | .42 | | | | .43 | | | | — | | | | .43 | | | | 10.29 | | | | 4.28 | | | | 26 | | | | .80 | | | | 3.87 | | | | .95 | | | | 3.72 | | | | 51 | |
| 2010 | | 10.29 | | | | .32 | | | | .16 | | | | .48 | | | | .42 | | | | — | | | | .42 | | | | 10.35 | | | | 4.82 | | | | 28 | | | | .78 | | | | 3.11 | | | | .93 | | | | 2.96 | | | | 54 | |
| |
| GROWTH & INCOME FUND(c) | | | | | | | | | | | | | | | | | | | | | | | | | | | | | | | | | | | | | | | | | | | | | | | | | | |
| 2006 | | $35.91 | | | | $ .20 | | | | $ 4.68 | | | | $ 4.88 | | | | $ .16 | | | $ | 2.27 | | | | $ 2.43 | | | | $38.36 | | | | 14.35 | % | | | $268 | | | | .82 | % | | | .55 | % | | | N/A | | | | N/A | | | | 127 | % |
| 2007 | | 38.36 | | | | .41 | | | | .25 | | | | .66 | | | | .20 | | | | 5.43 | | | | 5.63 | | | | 33.39 | | | | 1.98 | | | | 258 | | | | .81 | | | | 1.14 | | | | N/A | | | | N/A | | | | 38 | |
| 2008 | | 33.39 | | | | .40 | | | | (11.38 | ) | | | (10.98 | ) | | | .41 | | | | 2.24 | | | | 2.65 | | | | 19.76 | | | | (35.22 | ) | | | 155 | | | | .83 | | | | 1.48 | | | | N/A | | | | N/A | | | | 28 | |
| 2009 | | 19.76 | | | | .27 | | | | 5.06 | | | | 5.33 | | | | .40 | | | | — | | | | .40 | | | | 24.69 | | | | 28.05 | | | | 187 | | | | .84 | | | | 1.27 | | | | N/A | | | | N/A | | | | 25 | |
| 2010 | | 24.69 | | | | .50 | | | | 3.45 | | | | 3.95 | | | | .27 | | | | — | | | | .27 | | | | 28.37 | | | | 16.19 | | | | 207 | | | | .82 | | | | 1.91 | | | | N/A | | | | N/A | | | | 27 | |
Financial Highlights (continued)
FIRST INVESTORS LIFE SERIES FUNDS
| | | | | | | | | | | | | | | | | | | | | | | | | | | | | | | | | | | | | | | | | | | | | | | | | | | | | | | | | | | |
| | |
| | | P E R S H A R E D A T A | | | | | | | | R A T I O S / S U P P L E M E N T A L D A T A | |
| | | | | | | | | | | | | | | | | | | Less Distributions | | | | | | | | | | | | | | | | | | | | | | | | | | | | Ratio to Average Net | | | | | |
| | | | | | | Investment Operations | | | | from | | | | | | | | | | | | | | | | | | | | Ratio to Average Net | | | | Assets Before Expenses | | | | | |
| | | Net Asset | | | | | | | | Net Realized | | | | | | | | | | | | | | | | | | | | Net Asset | | | | | | | | | | | | Assets** | | | | Waived or Assumed | | | | | |
| | | Value, | | | | Net | | | | and Unrealized | | | | Total from | | | | Net | | | | Net | | | | | | | | Value, | | | | | | | | Net Assets | | | | Expenses | | | | Net | | | | | | | | Net | | | | Portfolio | |
| | | Beginning | | | | Investment | | | | Gain (Loss) on | | | | Investment | | | | Investment | | | | Realized | | | | Total | | | | End of | | | | Total | | | | End of Year | | | | Before Fee | | | | Investment | | | | | | | | Investment | | | | Turnover | |
| | | of Year | | | | Income | | | | Investments | | | | Operations | | | | Income | | | | Gains | | | | Distributions | | | | Year | | | | Return | * | | | (in millions) | | | | Credits | (a) | | | Income (Loss) | | | | Expenses | | | | Income | | | | Rate | |
| |
| HIGH YIELD FUND | | | | | | | | | | | | | | | | | | | | | | | | | | | | | | | | | | | | | | | | | | | | | | | | | | | | | | |
| 2006 | | $ 8.07 | | | | $.62 | | | | $ .12 | | | | $ .74 | | | | $.67 | | | | — | | | | $ .67 | | | | $ 8.14 | | | | 9.77 | % | | | $ 68 | | | | .85 | % | | | 7.63 | % | | | N/A | | | | N/A | | | | 31 | % |
| 2007 | | 8.14 | | | | .57 | | | | (.47 | ) | | | .10 | | | | .63 | | | | — | | | | .63 | | | | 7.61 | | | | 1.06 | | | | 79 | | | | .86 | | | | 7.19 | | | | N/A | | | | N/A | | | | 28 | |
| 2008 | | 7.61 | | | | .56 | | | | (2.39 | ) | | | (1.83 | ) | | | .59 | | | | — | | | | .59 | | | | 5.19 | | | | (25.86 | ) | | | 52 | | | | .86 | | | | 8.27 | | | | N/A | | | | N/A | | | | 17 | |
| 2009 | | 5.19 | | | | .51 | | | | 1.12 | | | | 1.63 | | | | .58 | | | | — | | | | .58 | | | | 6.24 | | | | 35.15 | | | | 66 | | | | .90 | | | | 8.66 | | | | N/A | | | | N/A | | | | 102 | |
| 2010 | | 6.24 | | | | .48 | | | | .31 | | | | .79 | | | | .49 | | | | — | | | | .49 | | | | 6.54 | | | | 13.71 | | | | 71 | | | | .87 | | | | 7.43 | | | | N/A | | | | N/A | | | | 71 | |
| |
| INTERNATIONAL FUND(d) | | | | | | | | | | | | | | | | | | | | | | | | | | | | | | | | | | | | | | | | | | | | | | | | | | | | | | |
| 2006 | | $20.00 | | | | $.29 | | | | $ 5.09 | | | | $ 5.38 | | | | $.15 | | | | $ .64 | | | | $ .79 | | | | $24.59 | | | | 27.79 | % | | | $129 | | | | .97 | % | | | 1.24 | % | | | N/A | | | | N/A | | | | 157 | % |
| 2007 | | 24.59 | | | | .04 | | | | 4.26 | | | | 4.30 | | | | .83 | | | | 3.36 | | | | 4.19 | | | | 24.70 | | | | 20.99 | | | | 154 | | | | .90 | | | | 1.30 | | | | N/A | | | | N/A | | | | 97 | |
| 2008 | | 24.70 | | | | .30 | | | | (9.68 | ) | | | (9.38 | ) | | | .04 | | | | 2.65 | | | | 2.69 | | | | 12.63 | | | | (41.89 | ) | | | 85 | | | | .94 | | | | 1.41 | | | | N/A | | | | N/A | | | | 128 | |
| 2009 | | 12.63 | | | | .65 | | | | 2.03 | | | | 2.68 | | | | .59 | | | | — | | | | .59 | | | | 14.72 | | | | 23.24 | | | | 101 | | | | 1.01 | | | | 2.30 | | | | N/A | | | | N/A | | | | 53 | |
| 2010 | | 14.72 | | | | .34 | | | | 1.64 | | | | 1.98 | | | | — | | | | — | | | | — | | | | 16.70 | | | | 13.45 | | | | 109 | | | | .99 | | | | 2.15 | | | | N/A | | | | N/A | | | | 35 | |
| |
| INVESTMENT GRADE FUND | | | | | | | | | | | | | | | | | | | | | | | | | | | | | | | | | | | | | | | | | | | | | | | | | | |
| 2006 | | $11.14 | | | | $.53 | | | | $ (.11 | ) | | | $ .42 | | | | $.62 | | | | — | | | | $ .62 | | | | $10.94 | | | | 3.99 | % | | | $ 37 | | | | .74 | % | | | 4.82 | % | | | .89 | % | | | 4.67 | % | | | 86 | % |
| 2007 | | 10.94 | | | | .43 | | | | .15 | | | | .58 | | | | .60 | | | | — | | | | .60 | | | | 10.92 | | | | 5.52 | | | | 39 | | | | .73 | | | | 4.97 | | | | .88 | | | | 4.81 | | | | 38 | |
| 2008 | | 10.92 | | | | .41 | | | | (1.60 | ) | | | (1.19 | ) | | | .57 | | | | — | | | | .57 | | | | 9.16 | | | | (11.60 | ) | | | 32 | | | | .74 | | | | 5.30 | | | | .89 | | | | 5.15 | | | | 133 | |
| 2009 | | 9.16 | | | | .69 | | | | 1.10 | | | | 1.79 | | | | .60 | | | | — | | | | .60 | | | | 10.35 | | | | 20.94 | | | | 39 | | | | .76 | | | | 5.38 | | | | .91 | | | | 5.23 | | | | 79 | |
| 2010 | | 10.35 | | | | .51 | | | | .41 | | | | .92 | | | | .53 | | | | — | | | | .53 | | | | 10.74 | | | | 9.26 | | | | 43 | | | | .73 | | | | 4.62 | | | | .88 | | | | 4.47 | | | | 55 | |
| |
| SELECT GROWTH FUND(e) | | | | | | | | | | | | | | | | | | | | | | | | | | | | | | | | | | | | | | | | | | | | | | | | | | | | | | |
| 2006 | | $ 8.70 | | | | $.07 | | | | $ .75 | | | | $ .82 | | | | $.05 | | | | $ — | | | | $ .05 | | | | $ 9.47 | | | | 9.47 | % | | | $ 12 | | | | .92 | % | | | .77 | % | | | N/A | | | | N/A | | | | 80 | % |
| 2007 | | 9.47 | | | | .01 | | | | 1.06 | | | | 1.07 | | | | .07 | | | | — | | | | .07 | | | | 10.47 | | | | 11.42 | | | | 13 | | | | 1.14 | | | | .15 | | | | N/A | | | | N/A | | | | 161 | |
| 2008 | | 10.47 | | | | — | | | | (4.31 | ) | | | (4.31 | ) | | | .01 | | | | .09 | | | | .10 | | | | 6.06 | | | | (41.47 | ) | | | 9 | | | | .99 | | | | (.05 | ) | | | N/A | | | | N/A | | | | 107 | |
| 2009 | | 6.06 | | | | .01 | | | | .59 | | | | .60 | | | | — | | | | — | | | | — | | | | 6.66 | | | | 9.90 | | | | 10 | | | | 1.00 | | | | .22 | | | | N/A | | | | N/A | | | | 102 | |
| 2010 | | 6.66 | | | | .01 | | | | 1.39 | | | | 1.40 | | | | .01 | | | | — | | | | .01 | | | | 8.05 | | | | 21.10 | | | | 14 | | | | .98 | | | | .20 | | | | N/A | | | | N/A | | | | 87 | |
| |
| TARGET MATURITY 2015 FUND | | | | | | | | | | | | | | | | | | | | | | | | | | | | | | | | | | | | | | | | | | | | | | | | | | |
| 2006 | | $14.46 | | | | $.57 | | | | $ (.32 | ) | | | $ .25 | | | | $.52 | | | | $ — | | | | $ .52 | | | | $14.19 | | | | 1.85 | % | | | $ 24 | | | | .70 | % | | | 4.38 | % | | | .85 | % | | | 4.23 | % | | | 2 | % |
| 2007 | | 14.19 | | | | .59 | | | | .74 | | | | 1.33 | | | | .58 | | | | — | | | | .58 | | | | 14.94 | | | | 9.70 | | | | 27 | | | | .70 | | | | 4.32 | | | | .85 | | | | 4.16 | | | | 3 | |
| 2008 | | 14.94 | | | | .63 | | | | 1.49 | | | | 2.12 | | | | .58 | | | | — | | | | .58 | | | | 16.48 | | | | 14.56 | | | | 29 | | | | .69 | | | | 4.01 | | | | .84 | | | | 3.86 | | | | 0 | |
| 2009 | | 16.48 | | | | .62 | | | | (1.00 | ) | | | (.38 | ) | | | .63 | | | | .02 | | | | .65 | | | | 15.45 | | | | (2.22 | ) | | | 27 | | | | .71 | | | | 3.91 | | | | .86 | | | | 3.76 | | | | 0 | |
| 2010 | | 15.45 | | | | .63 | | | | .66 | | | | 1.29 | | | | .64 | | | | .08 | | | | .72 | | | | 16.02 | | | | 8.58 | | | | 28 | | | | .71 | | | | 3.87 | | | | .86 | | | | 3.72 | | | | 4 | |
Financial Highlights (continued)
FIRST INVESTORS LIFE SERIES FUNDS
| | | | | | | | | | | | | | | | | | | | | | | | | | | | | | | | | | | | | | | | | | | | | | | | | | | | | | | | | | | |
| | |
| | | P E R S H A R E D A T A | | | | | | | | R A T I O S / S U P P L E M E N T A L D A T A | |
| | | | | | | | | | | | | | | | | | | Less Distributions | | | | | | | | | | | | | | | | | | | | | | | | | | | | Ratio to Average Net | | | | | |
| | | | | | | Investment Operations | | | | from | | | | | | | | | | | | | | | | | | | | Ratio to Average Net | | | | Assets Before Expenses | | | | | |
| | | Net Asset | | | | | | | | Net Realized | | | | | | | | | | | | | | | | | | | | Net Asset | | | | | | | | | | | | Assets** | | | | Waived or Assumed | | | | | |
| | | Value, | | | | Net | | | | and Unrealized | | | | Total from | | | | Net | | | | Net | | | | | | | | Value, | | | | | | | | Net Assets | | | | Expenses | | | | Net | | | | | | | | Net | | | | Portfolio | |
| | | Beginning | | | | Investment | | | | Gain (Loss) on | | | | Investment | | | | Investment | | | | Realized | | | | Total | | | | End of | | | | Total | | | | End of Year | | | | Before Fee | | | | Investment | | | | | | | | Investment | | | | Turnover | |
| | | of Year | | | | Income | | | | Investments | | | | Operations | | | | Income | | | | Gains | | | | Distributions | | | | Year | | | | Return | * | | | (in millions) | | | | Credits | (a) | | | Income | | | | Expenses | | | | Income | | | | Rate | |
| |
| VALUE FUND | | | | | | | | | | | | | | | | | | | | | | | | | | | | | | | | | | | | | | | | | | | | | | | | | | | | | | | | | | | |
| 2006 | | $14.31 | | | | $.27 | | | | $ 2.76 | | | | $ 3.03 | | | | $.26 | | | | | | | | $.26 | | | | $17.08 | | | | 21.43 | % | | | $94 | | | | .83 | % | | | 1.73 | % | | | N/A | | | | N/A | | | | 15 | % |
| 2007 | | 17.08 | | | | .31 | | | | (.42 | ) | | | (.11 | ) | | | .27 | | | | — | | | | .27 | | | | 16.70 | | | | (.66 | ) | | | 91 | | | | .83 | | | | 1.75 | | | | N/A | | | | N/A | | | | 17 | |
| 2008 | | 16.70 | | | | .40 | | | | (5.24 | ) | | | (4.84 | ) | | | .29 | | | | — | | | | .29 | | | | 11.57 | | | | (29.41 | ) | | | 58 | | | | .85 | | | | 2.47 | | | | N/A | | | | N/A | | | | 15 | |
| 2009 | | 11.57 | | | | .29 | | | | 1.96 | | | | 2.25 | | | | .36 | | | | — | | | | .36 | | | | 13.46 | | | | 21.03 | | | | 66 | | | | .88 | | | | 2.45 | | | | N/A | | | | N/A | | | | 11 | |
| 2010 | | 13.46 | | | | .31 | | | | 1.58 | | | | 1.89 | | | | .29 | | | | — | | | | .29 | | | | 15.06 | | | | 14.32 | | | | 71 | | | | .86 | | | | 2.25 | | | | N/A | | | | N/A | | | | 21 | |
| |
| * | The effect of fees and charges incurred at the separate account level are not reflected in these |
| | performance figures. |
| |
| ** | Net of expenses waived or assumed by the investment adviser (Note 4). |
| |
| (a) | The ratios do not include a reduction of expenses from cash balances maintained with the Bank of |
| | New York Mellon or from brokerage service arrangements (Note 1H). |
| |
| (b) | For the years ended December 31, 2006 through December 31, 2008, the expense ratio after fee |
| | credits was .70%. FIMCO has voluntarily waived advisory fees to limit the Fund’s overall expense |
| | to .70% for those years. For the period January 1, 2009 to December 31, 2009, the expense ratio after |
| | fee credits was .62%. FIMCO has voluntarily waived advisory fees to limit the Fund’s overall expense |
| | to .70% for the period January 1, 2009 to January 31, 2009 and .60% for the period February 1, 2009 |
| | to December 31, 2009. For the period January 1, 2010 to December 31, 2010, the expense ratio after |
| | fee credits was .23%. FIMCO has voluntarily waived advisory fees to limit the Fund’s overall expense |
| | to .60% (Note 4). |
| |
| (c) | Prior to October 18, 2006, known as Growth Fund. |
| |
| (d) | Prior to June 27, 2006, known as International Securities Fund. |
| |
| (e) | Prior to July 26, 2007 known as Focused Equity Fund. |
| | |
| See notes to financial statements |
| 128 | | 129 |
Report of Independent Registered Public
Accounting Firm
To the Shareholders and Board of Trustees of
First Investors Life Series Funds
We have audited the accompanying statements of assets and liabilities of the eleven Funds comprising First Investors Life Series Funds, including the portfolios of investments, as of December 31, 2010, the related statements of operations for the year then ended, the statements of changes in net assets for each of the two years then ended, and the financial highlights for each of the periods indicated therein. These financial statements and financial highlights are the responsibility of the Life Series Funds’ management. Our responsibility is to express an opinion on these financial statements and financial highlights based on our audits.
We conducted our audits in accordance with the standards of the Public Company Accounting Oversight Board (United States). Those standards require that we plan and perform the audit to obtain reasonable assurance about whether the financial statements and financial highlights are free of material misstatement. The Funds are not required to have, nor were we engaged to perform, an audit of the Funds’ internal control over financial reporting. Our audits included consideration of internal control over financial reporting as a basis for designing audit procedures that are appropriate in the circumstances, but not for the purpose of expressing an opinion on the effectiveness of the Funds’ internal control over financial reporting. Accordingly, we express no such opinion. An audit includes examining, on a test basis, evidence supporting the amounts and disclosures in the financial statements. Our procedures included confirmation of securities owned as of December 31, 2010, by correspondence with the custodian and brokers. Where brokers have not replied to our confirmation requests, we have carried out other appropriate auditing procedures. An audit also includes assessing the accounting principles used and significant estimates made by management, as well as evaluating the overall financial statement presentation. We believe that our audits provide a reasonable basis for our opinion.
In our opinion, the financial statements and financial highlights referred to above present fairly, in all material respects, the financial position of each of the eleven Funds comprising First Investors Life Series Funds, as of December 31, 2010, and the results of their operations for the year then ended, changes in their net assets for each of the two years in the period then ended, and their financial highlights for the periods indicated therein, in conformity with accounting principles generally accepted in the United States of America.
Philadelphia, Pennsylvania
February 25, 2011
Board Consideration of New Advisory Contracts and Fees
(unaudited)
FIRST INVESTORS LIFE SERIES FUNDS
Approval of a New Advisory Agreement and New Sub-Advisory Agreements
At a meeting held on September 19, 2010 (the “September Meeting”), the Board of Trustees (the “Board”) of the Funds, including a majority of the non-interested or independent Trustees of the Board, approved a new Advisory Agreement (the “New Advisory Agreement”) between FIMCO and each of the Funds. The Board also approved new Sub-Advisory Agreements (the “New Sub-Advisory Agreements”) with Paradigm Capital Management, Inc. (“Paradigm”) with respect to the Life Series Discovery Fund, Smith Asset Management Group, L.P. (“Smith Group”) with respect to the Life Series Select Growth Fund, Vontobel Asset Management, Inc. (“Vontobel”) with respect to the Life Series International Fund and Muzinich & Co., Inc. (“Muzinich”) with respect to the Life Series High Yield Fund (together, the “Sub-Advised Funds”).
The Board approved the New Advisory Agreement, and the New Sub-Advisory Agreements for the Sub-Advised Funds, due to the then-pending acquisition (the “Transaction”) of FICC, the parent company of FIMCO, by Foresters. The change in control of FIMCO caused by the Transaction is deemed to be an “assignment” under the Investment Company Act of 1940 (the “1940 Act”) of each Fund’s existing advisory agreement (the “Existing Advisory Agreement”). As required by the 1940 Act, each Fund’s Existing Advisory Agreement provides for its automatic termination in the event of an assignment and, thus, each Existing Advisory Agreement would terminate upon the closing (the “Closing”) of the Transaction. The existing sub-advisory agreements (the “Existing Sub-Advisory Agreements”) would terminate upon the termination of the Existing Advisory Agreement.
The Board also approved an interim advisory agreement (the “Interim Agreement”) with FIMCO with respect to each Fund in the event that the Closing of the Transaction was scheduled to occur prior to approval of the New Advisory Agreement by the shareholders of one or more Funds, and also approved interim Sub-Advisory Agreements (the “Interim Sub-Advisory Agreements”) with respect to its Sub-Advised Funds. The shareholders of the Funds have approved the New Advisory Agreement and, therefore, the Interim Agreement and Interim Sub-Advisory Agreements will not become effective.
The Board reviewed the materials furnished by Foresters and FIMCO, including responses to certain questions relating to the Transaction and reports relating to each Fund’s performance, advisory fees and total operating expenses, and other relevant data. Information provided by Foresters and FIMCO for the Board’s consideration included Foresters’ responses to questions relating to the terms of the Transaction, how Foresters will finance the Transaction, the effect of the Transaction on the Funds, their service providers or fee structure, and any significant changes (actual or
Board Consideration of New Advisory Contracts and Fees (continued)
(unaudited)
FIRST INVESTORS LIFE SERIES FUNDS
anticipated) to the composition of the Board, Trust officers, operations of the Funds, FIMCO’s investment personnel, FIMCO’s compensation structure, the Existing Advisory Agreement, or the Funds’ distribution arrangements. In addition, information on the Funds’ investment performance is regularly provided to the Board. Information furnished at Board meetings throughout the year included FIMCO’s analysis of each Fund’s investment performance, presentations given by the portfolio managers of the Funds and various reports on compliance and other services provided by FIMCO and its affiliates.
In considering the information and materials described above, the Independent Trustees received assistance from and met separately with independent legal counsel and were provided with a written description of their statutory responsibilities and the legal standards that are applicable to approvals of advisory agreements. Although the New Advisory Agreement and New Sub-Advisory Agreements for all of the Funds were considered at the same Board meeting, the Trustees addressed each Fund separately.
The Board did not identify any single factor or group of factors as being of paramount importance in reaching its conclusions and determinations with respect to the approval of the New Advisory Agreement or, for the Sub-Advised Funds, the New Sub-Advisory Agreements. Although not meant to be all-inclusive, included below is a description of certain of the factors that were considered by the Board in deciding to approve the New Advisory Agreement and the New Sub-Advisory Agreements for the Sub-Advised Funds.
Nature, Extent and Quality of Services
In examining the nature, extent and quality of the services to be provided by FIMCO under the New Advisory Agreement and to be provided by the subadvisers to the Sub-Advised Funds under the New Sub-Advisory Agreements, the Board considered that the terms of the New Advisory Agreement are substantially the same as the terms of the Existing Advisory Agreement and the terms of the New Sub-Advisory Agreements are substantially the same as the terms of their respective Existing Sub-Advisory Agreements. The Board also considered that the Transaction is expected to have minimal impact on FIMCO’s day-to-day operations and is not expected to result in any change in the structure or operations of the Funds. The Board noted that Foresters currently does not intend to implement any changes to the core services provided to the Funds by FIMCO or its affiliates. The Board also noted that Foresters currently intends to retain the key personnel employed by FIMCO who provide services to the Funds (other than two senior officers who indicated their intent to retire from FIMCO). The same people who manage the Funds are expected to do so
after the Closing and the subadvisers that manage the Sub-Advised Funds are expected to continue to manage those Funds after the Closing. The level of service and the manner in which each Fund’s assets are managed are expected to remain the same. The Board also considered that Foresters does not currently contemplate modifying the Funds’ current service provider relationships.
In evaluating Foresters, the Board considered the history, reputation, qualification and background of Foresters, the qualifications of its personnel and Foresters financial condition. The Board also considered Foresters capabilities, experience, corporate structure and capital resources, as well as Foresters long-term business goals with regard to FIMCO and the Funds.
The Board gave substantial consideration to its evaluation of the nature, extent and quality of the services provided by FIMCO under the Existing Agreement and provided by the subadvisers under the Existing Sub-Advisory Agreements at the Board’s May 2010 meeting (the “May Meeting”). The Board recognized that FIMCO is dedicated to providing investment management services exclusively to the Funds and that, unlike many other mutual fund managers, FIMCO is not in the business of providing management services to hedge funds, pension funds or separately managed accounts. As a result, the Board considered that FIMCO’s personnel devote substantially all of their time to serving the Funds.
The Board also recognized that it is the philosophy of FIMCO and its affiliates to provide personal service to the shareholders of the Funds, that FIMCO and its affiliates strive to service the needs of a shareholder base that includes many investors who are less affluent and that the average account size of many of the Funds is small by comparison to the industry average account size. The Board also considered management’s explanation regarding the significant costs involved in providing the level of personal service that the First Investors fund complex seeks to deliver to its shareholders.
The Board noted that FIMCO has undertaken extensive responsibilities as manager of the Funds, including: (1) the provision of investment advice to the Funds; (2) the implementation of policies and procedures designed to ensure compliance with each Fund’s investment objectives and policies; (3) the review of brokerage arrangements; (4) oversight of general portfolio compliance with applicable laws; (5) the provision of certain administrative services to the Funds, including Fund accounting; (6) the implementation of Board directives as they relate to the Funds; and (7) the evaluation and monitoring of subadvisers. The Board noted that FIMCO provides not only advisory services but historically has provided certain administrative personnel and services that many other advisers do not provide without imposition of separate fees. The Board also noted the steps that FIMCO has taken to encourage strong
Board Consideration of New Advisory Contracts and Fees (continued)
(unaudited)
FIRST INVESTORS LIFE SERIES FUNDS
performance, including providing significant incentives to portfolio managers and analysts based on Fund performance, and FIMCO’s willingness to make changes in portfolio managers and subadvisers when necessary to address performance issues. In addition, the Board considered information regarding the overall financial strength of FIMCO and its affiliates and the resources and staffing in place with respect to the services provided to the Funds in light of the current market environment. The Board also considered the nature, extent and quality of the services provided to the Funds by FIMCO’s affiliates.
The Board also considered the nature, extent and quality of the investment management services provided by Paradigm, Muzinich, Smith Group and Vontobel to the Sub-Advised Funds. The Board considered Paradigm’s, Muzinich’s, Smith Group’s and Vontobel’s investment management process in managing the Sub-Advised Funds and the experience and capability of their respective personnel responsible for the portfolio management of the Sub-Advised Funds. In light of the current market environment, the Board also considered information regarding the resources and staffing in place with respect to the services provided by each subadviser.
Based on the information considered, the Board concluded that the nature, extent and quality of FIMCO’s, and, for the Sub-Advised Funds, Paradigm’s, Muzinich’s, Smith Group’s and Vontobel’s services, as well as the services of FIMCO’s affiliates, supported approval of the New Advisory Agreement and the New Sub-Advisory Agreements.
Investment Performance
While the Board considered more recent performance information, the Board placed significant emphasis on consideration of the investment performance of each of the Funds at the May Meeting. While consideration was given to performance reports and discussions held at prior and subsequent Board or Committee meetings, as applicable, particular attention was given to the performance information compiled by Lipper, Inc. (“Lipper”). In particular, the Board reviewed the performance of the Funds over the most recent calendar year and, to the extent provided by Lipper, the annualized performance over the most recent three calendar year and five calendar year periods as compared to a comparable group of funds as determined by Lipper (“Peer Group”). In addition, the Board considered the performance information provided by FIMCO for each Fund (other than the Life Series Target Maturity 2015 Fund) through April 30, 2010 (the “year-to-date period”). As applicable, the Board also reviewed the annual yield of each Fund for each of the past five calendar years on an absolute and comparative basis. With regard to the performance information, the Board considered the performance and/or yield, as applicable, of each Fund on a percentile and quintile basis as compared to its Peer Group. For purposes of the
data provided, the first quintile is defined as 20% of the funds in the applicable Peer Group with the highest performance or yield, as applicable, and the fifth quintile is defined as 20% of the funds in the applicable Peer Group with the lowest performance or yield. For each Fund, the Board also considered the volatility versus total return data provided by Lipper as well as FIMCO’s representation that it believes that the Funds use a more conservative investment style than many of their peers.
On a Fund-by-Fund basis, the performance reports indicated, and the Board noted, that each Fund, except for the Life Series Select Growth Fund and Life Series High Yield Fund, fell within one of the top three quintiles for at least one of the performance periods provided by Lipper. With respect to the performance of the Life Series Select Growth Fund, although the performance of the Fund did not fall within one of the top three quintiles for at least one of the performance periods provided by Lipper, the Fund’s performance had improved during the year-to-date period and fell within one of the top three quintiles for such year-to-date period. The Board also considered that the sub-adviser for the Life Series Select Growth Fund had been changed in 2007 and did not have a full three years of history managing the Fund. The Board also took note of the improved performance of the Life Series Select Growth Fund reviewed at the Board’s August 2010 meeting. With respect to the Life Series High Yield Fund, the Board considered that the sub-adviser, which was hired in April 2009, had only approximately one year of history in managing the Fund.
Fund Expenses, Costs of Services, Economies of Scale and Related Benefits
Management Fees, Subadvisory Fees and Expenses. The Board noted that the advisory fees payable by each Fund under the New Advisory Agreement are the same as the fee rates payable under the Existing Advisory Agreement. The Board gave substantial consideration to its evaluation of the advisory fees payable by the Funds and each Fund’s total expense ratio at the May Meeting. The Board considered that the Funds’ expense ratios were not expected to increase as a result of the Transaction. The Board also considered that Foresters currently does not intend to change any Fund’s expense reimbursement or advisory fee waiver arrangements. In addition, the Board noted that shareholders would not bear any costs in connection with the Transaction, inasmuch as FICC and Foresters will bear the costs, fees and expenses incurred by the Funds in connection with the proxy statement, the fees and expenses of accountants and attorneys relating to the Transaction and proxy statement, and any other fees and expenses incurred by the Funds in connection with the Transaction.
At the May Meeting, the Board reviewed the information compiled by Lipper comparing each Fund’s contractual management fee rate (at common asset levels) and actual management fee rate (which included the effect of any fee waivers) as a
Board Consideration of New Advisory Contracts and Fees (continued)
(unaudited)
FIRST INVESTORS LIFE SERIES FUNDS
percentage of average net assets to a customized group of comparable funds within its Peer Group selected by Lipper (“Expense Group”). In this regard, the Board considered the contractual and actual management fees of each Fund on a quintile basis as compared to its Expense Group and noted the relative position of each fund within the Expense Group.
The Board also considered that FIMCO provides not only advisory services but also certain administrative personnel to the Funds under each Fund’s advisory agreement and that many other advisers do not provide such administrative personnel under their advisory agreements and that FIMCO also provides certain administrative services without the imposition of a separate fee.
The Board considered that, at the May Meeting, FIMCO had extended, and, thereafter, Foresters agreed to keep in place, the existing voluntary: (1) total expense cap limitations for the Life Series Cash Management Fund; and (2) the management fee caps for the Life Series Government Fund, Life Series Investment Grade Fund and Life Series Target Maturity 2015 Fund until May 31, 2011. In addition, the Board considered that, with respect to the Life Series Cash Management Fund, FIMCO is currently waiving additional management fees to maintain total expense levels below the total expense cap for the Fund due to the low interest rate environment.
In considering the subadvisory fee rates charged by and costs and profitability of Paradigm, Muzinich, Smith Group and Vontobel with regard to their respective Sub-Advised Funds, the Board noted that FIMCO pays Paradigm, Muzinich, Smith Group or Vontobel, as the case may be, a subadvisory fee from its own advisory fee rather than each Sub-Advised Fund paying Paradigm, Muzinich, Smith Group or Vontobel a fee directly. At the May meeting, Paradigm, Muzinich, Smith Group and Vontobel provided, and the Board reviewed, information comparing the fees charged by Paradigm, Muzinich, Smith Group and Vontobel for services to the respective Sub-Advised Funds versus the fee rates of Paradigm, Muzinich, Smith Group and Vontobel for providing advisory services to other comparable investment companies or accounts or compared to their standard fee schedule, as applicable. Based on a review of this information, the Board noted that the fees charged by Paradigm, Muzinich, Smith Group and Vontobel for services to each applicable Sub-Advised Fund appeared competitive to the fees Paradigm, Muzinich, Smith Group and Vontobel charge to their other comparable investment companies or accounts or compared to their standard fee schedule, as applicable.
In considering the level of the total expense ratio and the ratio of the sum of actual management and other non-management fees, the Board took into account management’s explanation that Lipper expense comparisons do not take into account the size
of a fund complex, and as a result, in certain cases the Funds are compared to funds in complexes that are much larger than First Investors. The Board also noted that the Expense Groups tend to be fairly small in number and the funds included in the Peer Group generally change from year to year, thereby introducing an element of randomness that affects comparative results each year. While recognizing the limitations inherent in Lipper’s methodology, the Board believed that the data provided by Lipper was a generally appropriate measure of comparative expenses.
The foregoing comparisons assisted the Trustees by providing them with a basis for evaluating each Fund’s management fee and expense ratio and, for the Sub-Advised Funds, the subadvisory fee, on a relative basis. Based on the information considered, the Trustees concluded that each Fund’s advisory fees and expense ratio and, for the Sub-Advised Funds, the subadvisory fee, relative to comparable mutual funds was reasonable given the nature, extent and quality of the services to be provided under the New Advisory Agreement and, for the Sub-Advised Funds, the New Sub-Advisory Agreements.
Profitability. At the September Meeting, the Board reviewed the materials it received regarding Foresters capital resources. The Board also reviewed the materials provided by FIMCO at the May Meeting regarding its revenues and costs in providing investment management and certain administrative services to the Funds. In particular, the Board considered the analysis of FIMCO’s profitability with respect to each Fund, calculated for the year ended December 31, 2009, as well as overall profitability information relating to the past five calendar years. The Board also considered the information provided by FIMCO comparing the profitability of certain publicly-traded mutual fund asset managers as analyzed by FIMCO based on publicly available financial statements. In reviewing the profitability information, the Board also considered the “fall-out” or ancillary benefits that may accrue to FIMCO and its affiliates as a result of their relationship with the Funds, which are discussed below. The Board acknowledged that, as a business matter, FIMCO was entitled to earn reasonable profits for its services to the Funds.
Economies of Scale. With respect to economies of scale, the Board considered that the Transaction could provide certain benefits to the Funds, including opportunities to increase the distribution of Fund shares and realize cost savings by leveraging certain available resources at Foresters. The Board considered that any resulting growth of Fund assets might produce economies of scale that could benefit Fund shareholders. The Board also considered that the fee schedules for each Fund, which will remain the same under the New Advisory Agreement, include breakpoints to account for management economies of scale.
Board Consideration of New Advisory Contracts and Fees (continued)
(unaudited)
FIRST INVESTORS LIFE SERIES FUNDS
The Board also placed significant emphasis on its consideration at the May Meeting of whether economies of scale are benefiting the Funds based on breakpoints in each Fund’s fee schedule. The Board recognized that, although each Fund is not currently at an asset level at which it can take advantage of the breakpoints contained in its fee schedule, each schedule is structured so that when the assets of the Fund increase, economies of scale may be shared for the benefit of shareholders.
“Fall Out” or Ancillary Benefits. The Board considered the “fall-out” or ancillary benefits that may accrue to FIMCO, Paradigm, Muzinich, Smith Group, Vontobel and Foresters as a result of their relationships with the Funds. In that regard, the Board considered that the Funds may offer Foresters the opportunity to promote its fraternal mission by offering Foresters membership to existing shareholders. The Board noted that, at the May Meeting, the Board had considered the benefits that may accrue to FIMCO, Paradigm, Muzinich, Smith Group and Vontobel. The Board considered that FIMCO, Paradigm, Smith Group and Vontobel receive research from broker-dealers that execute brokerage transactions for the Funds. The Board noted that FIMCO and these three subadvisers must select brokers based on each Fund’s requirements for seeking best execution. The Board also considered that Paradigm executes brokerage transactions for the Discovery Fund through the use of an affiliated broker-dealer and that this also provides a source of fall-out benefits to Paradigm. The Board also considered the fact that Muzinich does not engage in any soft dollar arrangements. The Board also considered the income received by FIC and FIMCO’s affiliated bank as a result of FIMCO’s management of the Funds.
In summary, after evaluation of the comparative performance, fee and expense information and the profitability, ancillary benefits and other considerations as described above, the Board concluded that the level of fees to be paid to FIMCO with respect to each Fund and to Paradigm, Muzinich, Smith Group and Vontobel with respect to each Sub-Advised Fund is reasonable. As a result, the Board, including a majority of the Independent Trustees, approved the New Advisory Agreement and the New Sub-Advisory Agreements for the Sub-Advised Funds.
| | | | | | | | |
| FIRST INVESTORS LIFE SERIES FUNDS | | | | |
| Trustees and Officers* | | | | | | | | |
| |
| |
| |
| | | Position(s) | | | | | | |
| | | Held with | | | | | | |
| | | Funds and | | | | | | |
| | | Length of | | | | | | |
| | | Service | | | | Number of | | |
| | | (Including | | Principal Occupation(s) | | Portfolios | | Other |
| | | with | | During Past 5 Years and | | in Fund | | Trusteeships/ |
| Name, Year of Birth | | Predecessor | | Other Directorships | | Complex | | Directorships |
| and Address** | | Funds) | | held by Trustee | | Overseen | | Held |
| ___________ | | ______ | | ____________________ | | ________ | | _____ |
| |
| DISINTERESTED TRUSTEES |
| |
| Charles R. Barton, III | | Trustee since | | Chief Operating Officer | | 38 | | None |
| 1965 | | 1/1/06 | | (since 2007), Board | | | | |
| | | | | Director (since 1989) and | | | | |
| | | | | Trustee (since 1994) of | | | | |
| | | | | The Barton Group/Bar- | | | | |
| | | | | ton Mines Corporation | | | | |
| | | | | (mining and industrial | | | | |
| | | | | abrasives distribution); | | | | |
| | | | | President of Noe Pierson | | | | |
| | | | | Corporation (land holding | | | | |
| | | | | and management services | | | | |
| | | | | provider) (since 2004) | | | | |
| |
| |
| Stefan L. Geiringer | | Trustee since | | President and owner of | | 38 | | None |
| 1934 | | 1/1/06 | | SLG Energy LLC | | | | |
| | | | | (energy consulting) | | | | |
| | | | | (since 2010); Co-Founder | | | | |
| | | | | and Senior Vice President | | | | |
| | | | | of Real Time Energy | | | | |
| | | | | Solutions, Inc. (energy | | | | |
| | | | | consulting) (since 2005); | | | | |
| | | | | President and owner | | | | |
| | | | | of SLG, Inc. (energy | | | | |
| | | | | consulting) (since 2003) | | | | |
| | | | | | | | |
| FIRST INVESTORS LIFE SERIES FUNDS | | | | |
| Trustees and Officers* (continued) | |
| |
| |
| |
| | | Position(s) | | | | | | |
| | | Held with | | | | | | |
| | | Funds and | | | | | | |
| | | Length of | | | | | | |
| | | Service | | | | Number of | | |
| | | (Including | | Principal Occupation(s) | | Portfolios | | Other |
| | | with | | During Past 5 Years and | | in Fund | | Trusteeships/ |
| Name, Year of Birth | | Predecessor | | Other Directorships | | Complex | | Directorships |
| and Address** | | Funds) | | held by Trustee | | Overseen | | Held |
| ___________ | | ______ | | ______________________ | | ________ | | _____ |
| |
| DISINTERESTED TRUSTEES (continued) |
| |
| Robert M. Grohol | | Trustee since | | None/Retired | | 38 | | None |
| 1932 | | 6/30/00 and | | | | | | |
| | | Chairman | | | | | | |
| | | since 1/1/10 | | | | | | |
| |
| |
| Arthur M. Scutro, Jr. | | Trustee since | | None/Retired | | 38 | | None |
| 1941 | | 1/1/06 | | | | | | |
| |
| |
| Mark R. Ward | | Trustee since | | Self-employed, consul- | | 38 | | None |
| 1952 | | 1/1/10 | | tant (since 2008); Senior | | | | |
| | | | | Partner, Ernst & Young, | | | | |
| | | | | LLP, Leader, Mid-Atlan- | | | | |
| | | | | tic Asset Management | | | | |
| | | | | Practice (2003–2007) | | | | |
| | | | | | | | |
| | | Position(s) | | | | | | |
| | | Held with | | | | | | |
| | | Funds and | | | | | | |
| | | Length of | | | | | | |
| | | Service | | | | Number of | | |
| | | (Including | | Principal Occupation(s) | | Portfolios | | Other |
| | | with | | During Past 5 Years and | | in Fund | | Trusteeships/ |
| Name, Year of Birth | | Predecessor | | Other Directorships | | Complex | | Directorships |
| and Address** | | Funds) | | held by Trustee | | Overseen | | Held |
| ___________ | | ______ | | ______________________ | | ________ | | ____ |
| |
| INTERESTED TRUSTEES*** |
| |
| Kathryn S. Head | | Trustee since | | Chairman, President and | | 38 | | None |
| 1955 | | 3/17/94 and | | Director of First Investors | | | | |
| c/o First Investors | | President | | Consolidated Corporation, | | | | |
| Management Company, Inc. | | since 2001 | | First Investors Manage- | | | | |
| Raritan Plaza I | | | | ment Company, Inc., | | | | |
| Edison, NJ 08837 | | | | Administrative Data Man- | | | | |
| | | | | agement Corp., N.A.K. | | | | |
| | | | | Realty Corporation, | | | | |
| | | | | Real Property Develop- | | | | |
| | | | | ment Corporation and | | | | |
| | | | | Route 33 Realty Corpora- | | | | |
| | | | | tion; and Chairman and | | | | |
| | | | | Director of First Investors | | | | |
| | | | | Corporation, First | | | | |
| | | | | Investors Federal Savings | | | | |
| | | | | Bank, First Investors Life | | | | |
| | | | | Insurance Company and | | | | |
| | | | | First Investors Credit | | | | |
| | | | Corporation.** | | | | |
| | | | | | | | |
| FIRST INVESTORS LIFE SERIES FUNDS | |
| Trustees and Officers* (continued) | | |
| |
| |
| |
| | | Position(s) | | | | | | |
| | | Held with | | | | | | |
| | | Funds and | | | | | | |
| | | Length of | | | | | | |
| | | Service | | | | Number of | | |
| | | (Including | | Principal Occupation(s) | | Portfolios | | Other |
| | | with | | During Past 5 Years and | | in Fund | | Trusteeships/ |
| Name, Year of Birth | | Predecessor | | Other Directorships | | Complex | | Directorships |
| and Address** | | Funds) | | held by Trustee | | Overseen | | Held |
| ___________ | | ______ | | _____________________ | | ________ | | _____ |
| |
| Christopher H. Pinkerton | | Trustee and | | Chairman of First | | 38 | | None |
| 1958 | | President | | Investors Management | | | | |
| | | since | | Company, Inc. and Admin- | | | | |
| | | 1/19/2011 | | istrative Data Management | | | | |
| | | | | Corp. since 2/4/2011; | | | | |
| | | | | President and Director of | | | | |
| | | | | First Investors Consoli- | | | | |
| | | | | dated Corporation, First | | | | |
| | | | | Investors Management | | | | |
| | | | | Company, Inc. and Admin- | | | | |
| | | | | istrative Data Management | | | | |
| | | | | Corp. since 1/19/2011; | | | | |
| | | | | Chairman and Director of | | | | |
| | | | | First Investors Corporation | | | | |
| | | | | since 1/19/2011; Director | | | | |
| | | | | of First Investors Life | | | | |
| | | | | Insurance Company since | | | | |
| | | | | 1/19/2011; President, US | | | | |
| | | | | Division, The Independent | | | | |
| | | | | Order of Foresters, Chair- | | | | |
| | | | | man, Foresters Equity | | | | |
| | | | | Services (broker-dealer), | | | | |
| | | | | Chairman, Foresters | | | | |
| | | | | Financial Partners | | | | |
| | | | | (independent marketing | | | | |
| | | | | organization) since 2005; | | | | |
| | | | | Senior Vice President, | | | | |
| | | | | Foresters North American | | | | |
| | | | | Sales and Marketing | | | | |
| | | | | (2005-2007); President | | | | |
| | | | | and CEO, USAllianz | | | | |
| | | | | Investor Services (variable | | | | |
| | | | | insurance); and Chairman, | | | | |
| | | | | President and CEO, | | | | |
| | | | | USAllianz Investment Ad- | | | | |
| | | | | visor (investment adviser) | | | | |
| | | | (1999-2005). | | | | |
* Each Trustee serves for an indefinite term with the Funds, until his/her successor is elected.
** The address of each Trustee and officer listed above is c/o First Investors Legal Department, 110 Wall Street, New York, NY 10005 unless specified otherwise.
*** Effective January 19, 2011, Mr. Pinkerton became a Trustee of the Funds. He is an interested Trustee because he is an officer of FIMCO and the Funds. Ms. Kathryn S. Head retired from the Board of Trustees effective January 19, 2011.
| | | | | | | | |
| | | Position(s) | | | | | | |
| | | Held with | | | | | | |
| | | Funds and | | | | | | |
| | | Length of | | | | | | |
| | | Service | | | | Number of | | |
| | | (Including | | Principal Occupation(s) | | Portfolios | | Other |
| | | with | | During Past 5 Years and | | in Fund | | Trusteeships/ |
| Name, Year of Birth | | Predecessor | | Other Directorships | | Complex | | Directorships |
| and Address** | | Funds) | | held by Trustee | | Overseen | | Held |
| ___________ | | ______ | | _____________________ | | ________ | | _____ |
| |
| OFFICER (S) WHO ARE NOT TRUSTEES |
| |
| Joseph I. Benedek | | Treasurer | | Treasurer of First | | N/A | | None |
| 1957 | | since 1988 | | Investors Management | | | | |
| c/o First Investors | | | | Company, Inc. | | | | |
| Management Company, Inc. | | | | | | | | |
| Raritan Plaza I | | | | | | | | |
| Edison, NJ 08837 | | | | | | | | |
| |
| Mary Carty | | Secretary | | Assistant Counsel of First | | N/A | | None |
| 1950 | | since | | Investors Management | | | | |
| | | 11/19/2010 | | Company, Inc., since | | | | |
| | | | | 2010. Special Counsel | | | | |
| | | | | and Associate at Willkie | | | | |
| | | | | Farr & Gallagher LLP | | | | |
| (1998-2009). | | | | |
| |
| Marc S. Milgram | | Chief | | Investment Compliance | | N/A | | None |
| 1957 | | Compliance | | Manager of First Inves- | | | | |
| | | Officer since | | tors Management Com- | | | | |
| | | 11/22/2010 | | pany, Inc., since 2009; | | | | |
| | | | | First Investors Federal | | | | |
| | | | | Savings Bank, President | | | | |
| | | | | since 2000, Treasurer | | | | |
| | | | | since 1987 and Director | | | | |
| | | | | since 2004; First Inves- | | | | |
| | | | | tors Corporation, Vice | | | | |
| | | | | President (2008-2009); | | | | |
| | | | | Administrative Data | | | | |
| | | | | Management Corp., Vice | | | | |
| | | | | President (2008-2009); | | | | |
| | | | | and First Investors Name | | | | |
| | | | | Saver, Inc. f/k/a/ School | | | | |
| | | | | Financial Management | | | | |
| | | | | Services, Inc., Treasurer | | | | |
| | | | | since 1992 and Director | | | | |
| | | | (1992–2007). | | | | |
| |
| FIRST INVESTORS LIFE SERIES FUNDS |
| |
| |
| |
| |
| Shareholder Information | |
| ________________________________ | |
| | |
| Investment Adviser | Custodian |
| First Investors Management | (Cash Management, Government, |
| Company, Inc. | High Yield, Investment Grade and |
| 110 Wall Street | Target Maturity 2015 Funds) |
| New York, NY 10005 | The Bank of New York Mellon |
| | One Wall Street |
| | New York, NY 10286 |
| |
| Subadviser | Custodian |
| (Discovery Fund) | (Blue Chip, Discovery, Growth & Income, |
| Paradigm Capital Management, Inc. | International, Select Growth and Value Funds) |
| Nine Elk Street | Brown Brothers Harriman & Co. |
| Albany, NY 12207 | 40 Water Street |
| | Boston, MA 02109 |
| |
| Subadviser | Transfer Agent |
| (High Yield Fund) | Administrative Data Management Corp. |
| Muzinich & Co., Inc. | Raritan Plaza I – 8th Floor |
| 450 Park Avenue | Edison, NJ 08837-3620 |
| New York, NY 10022 | |
| |
| Subadviser | Independent Registered |
| (International Fund) | Public Accounting Firm |
| Vontobel Asset Management, Inc. | Tait, Weller & Baker LLP |
| 1540 Broadway | 1818 Market Street |
| New York, NY 10036 | Philadelphia, PA 19103 |
| |
| Subadviser | Legal Counsel |
| (Select Growth Fund) | K&L Gates LLP |
| Smith Asset Management Group, L.P. | 1601 K Street, N.W. |
| 100 Crescent Court | Washington, D.C. 20006 |
| Dallas, TX 75201 | |
A description of the policies and procedures that the Funds use to vote proxies relating to a portfolio’s securities is available, without charge, upon request by calling toll free 1-800-423-4026 or can be viewed online or downloaded from the EDGAR database on the Securities and Exchange Commission’s (“SEC”) internet website at http://www.sec.gov. In addition, information regarding how the Funds voted proxies relating to portfolio securities during the most recent 12-month period ended December 31, is available, without charge, upon request in writing or by calling 1-800-423-4026 and on the SEC’s internet website at http://www.sec.gov.
The Funds file their complete schedule of portfolio holdings with the SEC on Form N-Q for the first and third quarters of each fiscal year. The Funds’ Form N-Q is available on the SEC’s website at http://www.sec.gov; and may also be reviewed and copied at the SEC’s Public Reference Room in Washington D.C. Information on the operation of the Public Reference Room may be obtained by calling 1-800-SEC-0330. The schedule of portfolio holdings is available, without charge, upon request in writing or by calling 1-800-423-4026.

Item 2. Code of Ethics
As of December 31, 2010, the Registrant has adopted a code of ethics that applies to the Registrant's principal executive officer and principal financial officer.
For the year ended December 31, 2010, there were no waivers granted from a provision of the code of ethics.
A copy of the Registrant's code of ethics is filed under Item 12(a)(1).
Item 3. Audit Committee Financial Expert
During the reporting period the Registrant's Board determined that it had at least two "audit committee financial experts" serving on its audit committee. Arthur M. Scutro, Jr. and Mark R. Ward were the "audit committee financial experts" during all or part of the period and were considered to be "independent" as defined in Item 3 of Form N-CSR.
| | | | | | | |
| Item 4. Principal Accountant Fees and Services | | | |
| | |
| | Fiscal Year Ended | |
| | December 31, | |
| | ----------------- | |
| | 2010 | 2009 | |
| | ---- | ---- | |
| (a) Audit Fees | $ | 130,000 | | $ | 124,700 | | |
| | |
| (b) Audit-Related Fees | $ | 0 | | $ | 0 | | |
| | |
| (c) Tax Fees | $ | 37,200 | | $ | 36,000 | | |
Nature of services: tax returns preparation and tax compliance
| | | | | | | |
| (d) All Other Fees | $ | 0 | | $ | 0 | | |
(e)(1) Audit committee's pre-approval policies
The Charter of the Audit Committee requires the Audit Committee (a) to pre-approve, and to recommend to the full Board, the selection, retention or termination of the independent auditors to provide audit, review or attest services to the First Investors Funds (“Funds”) and, in connection therewith, evaluate the independence of the auditors and to obtain the auditors’ specific representations as to their independence; (b) to pre-approve all non-audit services to be provided to the Funds by the independent auditor; and (c) to pre-approve all non-audit services to be provided by the Funds’ independent auditor to the Funds’ investment adviser or to any entity that controls, is controlled by or is under common control with the Funds’ investment adviser and that provides
ongoing services to the Funds, if the engagement relates directly to the operations and financial reporting of the Funds. The Audit Committee has not adopted pre-approval policies or procedures to permit the services in (b) and (c) above to be pre-approved by other means.
(e)(2) None, or 0%, of the services relating to the Audit-Related Fees, Tax Fees and All Other Fees paid by the Registrant and Related Entities disclosed above were approved by the Audit Committee pursuant to paragraph (c)(7)(i)(C) of Rule 2-01 of Regulation S-X (which permits audit committee approval after the start of the engagement with respect to services other than audit review or attest services, if certain conditions are satisfied).
(f) Not Applicable
(g) Aggregate non-audit fees billed by the Registrant's accountant for services rendered to the Registrant and the Registrant's investment adviser and any entity controlling, controlled by, or under common control with the adviser that provides ongoing services to the Registrant for the two fiscal years ended December 31, 2010 and 2009 were $77,900 and $82,100, respectively.
(h) Not Applicable
Item 5. Audit Committee of Listed Registrants
Not applicable
Item 6. Schedule of Investments
Schedule is included as part of the report to shareholders filed under Item 1 of this Form.
Item 7. Disclosure of Proxy Voting Policies & Procedures for Closed-End Management Investment Companies
Not applicable
Item 8. Portfolio Managers of Closed-End Management Investment Companies
Not applicable
Item 9. Purchases of Equity Securities by Closed-End Management Investment Companies and Affiliated Purchasers
Not applicable
Item 10. Submission of Matters to a Vote of Security Holders
There were no material changes to the procedure by which shareholders may recommend nominees to the Registrant's Board of Trustees.
Item 11. Controls and Procedures
(a) The Registrant's Principal Executive Officer and Principal Financial Officer have concluded that the Registrant's disclosure controls and procedures (as defined in Rule 30a-3(c) under the Investment Company Act of 1940, as amended) are effective, based on their evaluation of these disclosure controls and procedures as of a date within 90 days of the filing date of this report.
(b) There were no changes in the Registrant's internal control over financial reporting that occurred during the second fiscal quarter of the period covered by this report that have materially affected, or are reasonably likely to materially affect, the Registrant's internal control over financial reporting.
Item 12. Exhibits
(a)(1) Code of Ethics - Filed herewith
(a)(2) Certifications pursuant to Section 302 of the Sarbanes-Oxley Act of 2002 - Filed herewith
(b) Certifications pursuant to Section 906 of the Sarbanes-Oxley Act of 2002 - Filed herewith
SIGNATURES
Pursuant to the requirements of the Securities Exchange Act of 1934 and the Investment Company Act of 1940, the Registrant has duly caused this report to be signed on its behalf by the undersigned, thereunto duly authorized.
First Investors Life Series Funds
| | |
| By | /S/ | CHRISTOPHER H. PINKERTON |
| | | Christopher H. Pinkerton |
| | | President and Principal Executive Officer |
| |
| Date: | | March 9, 2011 |
Pursuant to the requirements of the Securities Exchange Act of 1934 and the Investment Company Act of 1940, this report has been signed below by the following persons on behalf of the Registrant and in the capacities and on the dates indicated.
First Investors Life Series Funds
| | |
| By | /S/ | CHRISTOPHER H. PINKERTON |
| | | Christopher H. Pinkerton |
| | | President and Principal Executive Officer |
| |
| |
| By | | /S/ JOSEPH I. BENEDEK |
| | | Joseph I. Benedek |
| | | Treasurer and Principal Financial Officer |
| |
| Date: | | March 9, 2011 |