|
| UNITED STATES |
| SECURITIES AND EXCHANGE COMMISSION |
| WASHINGTON, D.C. 20549 |
| -------- |
| |
| FORM N-CSR |
| -------- |
| |
| CERTIFIED SHAREHOLDER REPORT OF REGISTERED MANAGEMENT |
| INVESTMENT COMPANIES |
| |
| INVESTMENT COMPANY ACT FILE NUMBER 811-4325 |
| |
| FIRST INVESTORS LIFE SERIES FUNDS |
| (Exact name of registrant as specified in charter) |
| |
| 110 Wall Street |
| New York, NY 10005 |
| (Address of principal executive offices) (Zip code) |
| |
| Joseph I. Benedek |
| First Investors Management Company, Inc. |
| Raritan Plaza I |
| Edison, NJ 08837-3620 |
| 1-732-855-2712 |
| (Name and address of agent for service) |
| |
| REGISTRANT'S TELEPHONE NUMBER, INCLUDING AREA CODE: |
| 1-212-858-8000 |
| |
| DATE OF FISCAL YEAR END: DECEMBER 31, 2009 |
| |
| DATE OF REPORTING PERIOD: DECEMBER 31, 2009 |
| |
| Item 1. | Reports to Stockholders |
| |
| The Annual Report to Stockholders follows |

This report is for the information of the shareholders of the Funds. It is the Funds’ practice to mail only one copy of their annual and semi-annual reports to all family members who reside in the same household. Additional copies of the reports will be mailed if requested by any shareholder in writing or by calling 1-800-423-4026. The Funds will ensure that separate reports are sent to any shareholder who subsequently changes his or her mailing address.
The views expressed in the portfolio manager letters reflect those views of the portfolio managers only through the end of the period covered. Any such views are subject to change at any time based upon market or other conditions and we disclaim any responsibility to update such views. These views may not be relied on as investment advice.
You may obtain a free prospectus for any of the Funds by contacting your representative, calling 1-800-423-4026, writing to us at the following address: First Investors Corporation, 110 Wall Street, New York, NY 10005, or by visiting our website at www.firstinvestors.com. You should consider the investment objectives, risks, charges and expenses of a Fund carefully before investing. The prospectus contains this and other information about the Fund, and should be read carefully before investing.
An investment in a Fund is not a bank deposit and is not insured or guaranteed by the Federal Deposit Insurance Corporation (FDIC) or any other government agency. Although the Cash Management Fund seeks to preserve a net asset value at $1.00 per share, it is possible to lose money by investing in it, just as it is possible to lose money by investing in any of the other Funds. Past performance is no guarantee of future results.
A Statement of Additional Information (“SAI”) for any of the Funds may also be obtained, without charge, upon request by calling 1-800-423-4026, writing to us at our address or by visiting our website listed above. The SAI contains more detailed information about the Fund, including information about its Trustees.
Portfolio Manager’s Letter
BLUE CHIP FUND
Dear Investor:
This is the annual report for the First Investors Life Blue Chip Fund for the year ended December 31, 2009. During the period, the Fund’s return on a net asset value basis was 21.61%, including dividends of 36.4 cents per share.
During the first part of the review period, the markets were in a steep free fall, culminating with a multi-decade market low achieved on March 9, 2009. Only after U.S. and global regulators took extraordinary measures to supply massive financial aid and intervention, such as through the TARP program, did the markets stabilize. The markets then rallied convincingly, ending the year with a significant gain.
Despite its strong performance, the Fund underperformed the overall market, as measured by the S&P 500 Index, due to its focus on high-quality companies. During 2008 and into 2009, share prices of lower-quality companies were driven sharply lower as investors prepared for the worst-case scenario: an economic depression. Then, late in the first quarter, as fears of depression dissipated, the market rallied, and shares of lower-quality companies rebounded more sharply than shares of more stable companies, which had lost less ground when investors’ fears were peaking.
The Fund’s defensive positioning had the biggest negative impact on relative performance in the information technology and consumer discretionary sectors. While information technology was the best performing sector for the Fund, returns did not keep up with the comparable sector of the S&P 500 Index because the Fund did not own some strong performers that it believed were overvalued. Similarly, in the consumer discretionary sector, the Fund did not own momentum stocks like Amazon. com, which traded at valuations beyond those which the Fund deemed appropriate, or troubled companies like Ford Motor, which snapped back from the brink of disaster.
Overall, however, the Fund generated a substantial positive return led by technology stocks such as Microsoft and International Business Machines, which both gained more than 50%. The materials sector also generated strong returns, led by Dow Chemical as it stabilized its balance sheet and cut costs after making a large acquisition. Media companies such as Walt Disney and Time Warner helped the Fund turn in a positive performance in the consumer discretionary sector. Financial firms JPMorgan Chase and American Express were also among the best stocks in the portfolio as their business outlook improved as the year progressed. Individual positions that hurt Fund performance the most included ExxonMobil, which announced a large acquisition near the end of the year, Procter & Gamble, which suffered as consumers traded down to cheaper brands, and General Electric, whose finance arm was heavily affected by the meltdown in the real estate and credit markets.
Portfolio Manager’s Letter (continued)
BLUE CHIP FUND
Thank you for placing your trust in First Investors. We appreciate the opportunity to serve your investment needs.
Sincerely,

Matthew S. Wright
Portfolio Manager
January 29, 2010
Understanding Your Fund’s Expenses
FIRST INVESTORS LIFE SERIES FUNDS
As a mutual fund shareholder, you incur two types of costs: (1) transaction costs, and (2) ongoing costs, including advisory fees and other expenses. This example is intended to help you understand your ongoing costs (in dollars) of investing in the Fund and to compare these costs with the ongoing costs of investing in other mutual funds.
The examples are based on an investment of $1,000 in each Fund at the beginning of the period, July 1, 2009, and held for the entire six-month period ended December 31, 2009. The calculations assume that no shares were bought or sold during the period. Your actual costs may have been higher or lower, depending on the amount of your investment and the timing of any purchases or redemptions.
Actual Expense Example:
These amounts help you to estimate the actual expenses that you paid over the period. The “Ending Account Value” shown is derived from the Fund’s actual return, and the “Expenses Paid During Period” shows the dollar amount that would have been paid by an investor who started with $1,000 in the Fund. You may use the information here, together with the amount you invested, to estimate the expenses that you paid during the period.
To estimate the expenses you paid on your account during this period simply divide your ending account value by $1,000 (for example, an $8,600 account value divided by $1,000 = 8.60), then multiply the result by the number given for your Fund under the heading “Expenses Paid During Period”.
Hypothetical Expense Example:
These amounts provide information about hypothetical account values and hypothetical expenses based on the Fund’s actual expense ratio and an assumed rate of return of 5% per year before expenses, which is not the Fund’s actual return. The hypothetical account values and expenses may not be used to estimate the actual ending account balance or expenses you paid for the period. You may use this information to compare the ongoing costs of investing in the Fund and other funds. To do so, compare this 5% hypothetical example with the 5% hypothetical examples that appear in the shareholder reports of the other funds.
Please note that the expenses shown in the table are meant to highlight and help you compare your ongoing costs only and do not reflect any transactional costs. Therefore, the hypothetical expense example is useful in comparing ongoing costs only, and will not help you determine the relative total costs of owning different funds. In addition, if these transactional costs were included, your costs would have been higher.
Fund Expenses (unaudited)
BLUE CHIP FUND
The examples below show the ongoing costs (in dollars) of investing in your Fund and will help you in comparing these costs with costs of other mutual funds. Please refer to page 3 for a detailed explanation of the information presented in these examples.
| | | |
| | Beginning | Ending | |
| | Account | Account | Expenses Paid |
| | Value | Value | During Period |
| | (7/1/09) | (12/31/09) | (7/1/09–12/31/09)* |
| Expense Examples | | | |
| Actual | $1,000.00 | $1,203.11 | $4.61 |
| Hypothetical | | | |
| (5% annual return before expenses) | $1,000.00 | $1,021.03 | $4.23 |
| |
| * | Expenses are equal to the annualized expense ratio of .83%, multiplied by the average account |
| value over the period, multiplied by 184/365 (to reflect the one-half year period). |
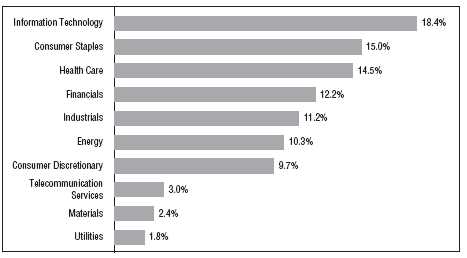
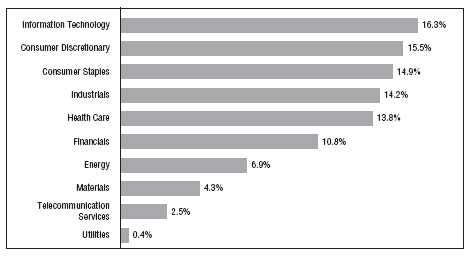
Portfolio Composition
TOP TEN SECTORS
|
| Portfolio holdings and allocations are subject to change. Percentages are as of December 31, 2009, |
| and are based on the total value of investments. |
Cumulative Performance Information
BLUE CHIP FUND
Comparison of change in value of $10,000 investment in the First Investors Life Series Blue
Chip Fund and the Standard & Poor’s 500 Index.
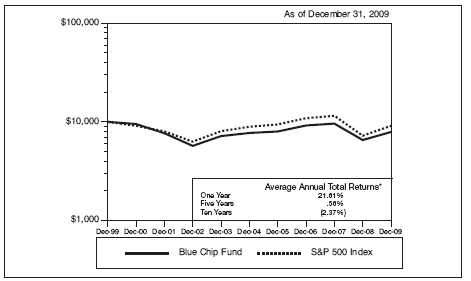
The graph compares a $10,000 investment in the First Investors Life Series Blue Chip Fund beginning 12/31/99 with a theoretical investment in the Standard & Poor’s 500 Index (the “Index”). The Index is an unmanaged capitalization-weighted index of 500 stocks designed to measure performance of the broad domestic economy through changes in the aggregate market value of such stocks, which represent all major industries. It is not possible to invest directly in this Index. In addition, the Index does not reflect fees and expenses associated with the active management of a mutual fund portfolio. For purposes of the graph and the accompanying table it is assumed that all dividends and distributions were reinvested.
* The Average Annual Total Return figures are for the periods ended 12/31/09.
The returns shown do not reflect any sales charges, since the Fund sells its shares solely to variable annuity and/or variable life insurance subaccounts at net asset value. The returns do not reflect the fees and charges that an individual would pay in connection with an investment in a variable annuity or life contract or policy. Results represent past performance and do not indicate future results. The graph and the returns shown do not reflect the deduction of taxes that an investor would pay on distributions or the redemption of fund shares. Investment return and principal value of an investment will fluctuate so that an investor’s shares, when redeemed, may be worth more or less than the original cost. Standard & Poor’s 500 Index figures are from Standard & Poor’s and all other figures are from First Investors Management Company, Inc.
Portfolio of Investments
BLUE CHIP FUND
December 31, 2009
| | | | |
| Shares | | | Security | Value |
| |
| | | | COMMON STOCKS—98.5% | |
| | | | Consumer Discretionary—9.7% | |
| 14,800 | | | Best Buy Company, Inc. | $ 584,008 |
| 51,850 | | | Comcast Corporation – Special Class “A” | 830,119 |
| 33,000 | | | H&R Block, Inc. | 746,460 |
| 39,700 | | | Home Depot, Inc. | 1,148,521 |
| 13,200 | | * | Kohl’s Corporation | 711,876 |
| 50,000 | | | Lowe’s Companies, Inc. | 1,169,500 |
| 15,700 | | | McDonald’s Corporation | 980,308 |
| 9,000 | | | NIKE, Inc. – Class “B” | 594,630 |
| 15,300 | | | Omnicom Group, Inc. | 598,995 |
| 24,900 | | | Staples, Inc. | 612,291 |
| 14,800 | | | Target Corporation | 715,876 |
| 29,900 | | | Time Warner, Inc. | 871,286 |
| 22,400 | | * | Viacom, Inc. – Class “B” | 665,952 |
| 44,900 | | | Walt Disney Company | 1,448,025 |
| |
| | | | | 11,677,847 |
| |
| | | | Consumer Staples—15.0% | |
| 30,700 | | | Altria Group, Inc. | 602,641 |
| 20,900 | | | Avon Products, Inc. | 658,350 |
| 9,900 | | | Clorox Company | 603,900 |
| 37,300 | | | Coca-Cola Company | 2,126,100 |
| 14,700 | | | Costco Wholesale Corporation | 869,799 |
| 34,900 | | | CVS Caremark Corporation | 1,124,129 |
| 21,200 | | | Kimberly-Clark Corporation | 1,350,652 |
| 39,861 | | | Kraft Foods, Inc. – Class “A” | 1,083,422 |
| 29,800 | | | Kroger Company | 611,794 |
| 35,300 | | | PepsiCo, Inc. | 2,146,240 |
| 29,600 | | | Philip Morris International, Inc. | 1,426,424 |
| 31,935 | | | Procter & Gamble Company | 1,936,219 |
| 34,900 | | | Walgreen Company | 1,281,528 |
| 42,000 | | | Wal-Mart Stores, Inc. | 2,244,900 |
| |
| | | | | 18,066,098 |
| |
| | | | Energy—10.3% | |
| 13,000 | | | BP PLC (ADR) | 753,610 |
| 32,500 | | | Chevron Corporation | 2,502,175 |
| 25,771 | | | ConocoPhillips | 1,316,125 |
| 11,000 | | | Devon Energy Corporation | 808,500 |
| 48,100 | | | ExxonMobil Corporation | 3,279,939 |
| 21,300 | | | Halliburton Company | 640,917 |
| | | | |
| Shares | | | Security | Value |
| |
| | | | Energy (continued) | |
| 10,300 | | | Hess Corporation | $ 623,150 |
| 19,700 | | | Marathon Oil Corporation | 615,034 |
| 19,600 | | | Schlumberger, Ltd. | 1,275,764 |
| 7,424 | | * | Transocean, Ltd. | 614,707 |
| |
| | | | | 12,429,921 |
| |
| | | | Financials—12.2% | |
| 14,400 | | | ACE, Ltd. | 725,760 |
| 20,000 | | | Allstate Corporation | 600,800 |
| 29,900 | | | American Express Company | 1,211,548 |
| 15,500 | | | Ameriprise Financial, Inc. | 601,710 |
| 52,817 | | | Bank of America Corporation | 795,424 |
| 41,205 | | | Bank of New York Mellon Corporation | 1,152,504 |
| 250 | | * | Berkshire Hathaway, Inc. – Class “B” | 821,500 |
| 15,700 | | | Capital One Financial Corporation | 601,938 |
| 15,800 | | | Chubb Corporation | 777,044 |
| 42,900 | | | Financial Select Sector SPDR Fund (ETF) | 617,331 |
| 44,200 | | | Hudson City Bancorp, Inc. | 606,866 |
| 53,432 | | | JPMorgan Chase & Company | 2,226,511 |
| 27,500 | | | Marsh & McLennan Companies, Inc. | 607,200 |
| 20,000 | | | Morgan Stanley | 592,000 |
| 11,600 | | | Northern Trust Corporation | 607,840 |
| 17,700 | | | Travelers Companies, Inc. | 882,522 |
| 26,500 | | | U.S. Bancorp | 596,515 |
| 26,900 | | | Wells Fargo & Company | 726,031 |
| |
| | | | | 14,751,044 |
| |
| | | | Health Care—14.5% | |
| 37,400 | | | Abbott Laboratories | 2,019,226 |
| 21,500 | | * | Amgen, Inc. | 1,216,255 |
| 46,200 | | | Bristol-Myers Squibb Company | 1,166,550 |
| 8,200 | | | C.R. Bard, Inc. | 638,780 |
| 15,200 | | * | Gilead Sciences, Inc. | 657,856 |
| 57,200 | | | Johnson & Johnson | 3,684,252 |
| 9,700 | | | McKesson Corporation | 606,250 |
| 29,300 | | | Medtronic, Inc. | 1,288,614 |
| 27,300 | | | Merck & Company. Inc. | 997,542 |
| 23,700 | | | Novartis AG (ADR) | 1,289,991 |
| 106,257 | | | Pfizer, Inc. | 1,932,815 |
| 18,900 | | * | St. Jude Medical, Inc. | 695,142 |
Portfolio of Investments (continued)
BLUE CHIP FUND
December 31, 2009
| | | | |
| Shares | | | Security | Value |
| |
| | | | Health Care (continued) | |
| 13,200 | | | Teva Pharmaceutical Industries, Ltd. (ADR) | $ 741,576 |
| 10,200 | | * | Zimmer Holdings, Inc. | 602,922 |
| |
| | | | | 17,537,771 |
| |
| | | | Industrials—11.2% | |
| 14,900 | | | 3M Company | 1,231,783 |
| 12,500 | | | Danaher Corporation | 940,000 |
| 22,700 | | | Emerson Electric Company | 967,020 |
| 133,900 | | | General Electric Company | 2,025,907 |
| 19,800 | | | Honeywell International, Inc. | 776,160 |
| 13,500 | | | Illinois Tool Works, Inc. | 647,865 |
| 13,900 | | | ITT Corporation | 691,386 |
| 12,600 | | | Lockheed Martin Corporation | 949,410 |
| 11,100 | | | Northrop Grumman Corporation | 619,935 |
| 14,500 | | | Raytheon Company | 747,040 |
| 20,525 | | | Tyco International, Ltd. | 732,332 |
| 11,300 | | | United Parcel Service, Inc. – Class “B” | 648,281 |
| 28,800 | | | United Technologies Corporation | 1,999,008 |
| 17,400 | | | Waste Management, Inc. | 588,294 |
| |
| | | | | 13,564,421 |
| |
| | | | Information Technology—18.4% | |
| 55,500 | | * | Activision Blizzard, Inc. | 616,605 |
| 16,900 | | * | Adobe Systems, Inc. | 621,582 |
| 5,600 | | * | Apple, Inc. | 1,180,816 |
| 15,000 | | | Automatic Data Processing, Inc. | 642,300 |
| 84,800 | | * | Cisco Systems, Inc. | 2,030,112 |
| 55,500 | | * | EMC Corporation | 969,585 |
| 42,100 | | | Hewlett-Packard Company | 2,168,571 |
| 84,300 | | | Intel Corporation | 1,719,720 |
| 16,800 | | | International Business Machines Corporation | 2,199,120 |
| 156,800 | | | Microsoft Corporation | 4,780,832 |
| 46,100 | | | Nokia Corporation – Class “A” (ADR) | 592,385 |
| 55,000 | | | Oracle Corporation | 1,349,700 |
| 17,200 | | | QUALCOMM, Inc. | 795,672 |
| 34,200 | | * | Symantec Corporation | 611,838 |
| 30,600 | | | Texas Instruments, Inc. | 797,436 |
| 32,000 | | | Western Union Company | 603,200 |
| 34,200 | | * | Yahoo!, Inc. | 573,876 |
| |
| | | | | 22,253,350 |
| | | | | | |
| Shares or | | | | | | |
| Principal | | | | | | |
| Amount | | | Security | | | Value |
| |
| | | | Materials—2.4% | | | |
| 28,100 | | | Dow Chemical Company | | | $ 776,403 |
| 27,800 | | | DuPont (E.I.) de Nemours & Company | | | 936,026 |
| 12,700 | | | Newmont Mining Corporation | | | 600,837 |
| 10,300 | | | PPG Industries, Inc. | | | 602,962 |
| |
| | | | | | | 2,916,228 |
| |
| | | | Telecommunication Services—3.0% | | | |
| 64,700 | | | AT&T, Inc. | | | 1,813,541 |
| 55,800 | | | Verizon Communications, Inc. | | | 1,848,654 |
| |
| | | | | | | 3,662,195 |
| |
| | | | Utilities—1.8% | | | |
| 20,000 | | | American Electric Power, Inc. | | | 695,800 |
| 51,500 | | | Duke Energy Corporation | | | 886,315 |
| 11,500 | | | FPL Group, Inc. | | | 607,430 |
| |
| | | | | | | 2,189,545 |
| |
| Total Value of Common Stocks (cost $91,762,255) | | | 119,048,420 |
| |
| | | | SHORT-TERM INVESTMENTS—1.5% | | |
| | | | Money Market Fund | | | |
| $1,785 | M | | First Investors Cash Reserve Fund, .24% (cost $1,785,000)** | | 1,785,000 |
| |
| Total Value of Investments (cost $93,547,255) | 100.0 | % | 120,833,420 |
| Other Assets, Less Liabilities | — | | 29,060 |
| |
| Net Assets | | | | 100.0 | % | $120,862,480 |
| |
| * | Non-income producing |
| ** | Affiliated unregistered money market fund available only to First Investors funds and certain |
| accounts managed by First Investors Management Company, Inc. Rate shown is the 7-day yield |
| at December 31, 2009 (see Note 3). |
| | |
| Summary of Abbreviations: |
| ADR | American Depositary Receipts |
| ETF | Exchange Traded Fund |
Portfolio of Investments (continued)
BLUE CHIP FUND
December 31, 2009
Accounting Standards Codification (“ASC”) 820 established a three-tier hierarchy of inputs to establish a classification of fair value measurements for disclosure purposes. The three-tier hierarchy of inputs is summarized in the three broad Levels listed below:
| Level 1 — quoted prices in active markets for identical securities |
| |
| Level 2 — other significant observable inputs (including quoted prices for similar securities, interest rates, prepayment speeds, credit risk, etc.) |
| |
| Level 3 — significant unobservable inputs (including the fund’s own assumptions in determining the fair value of investments) |
The inputs methodology used for valuing securities are not necessarily an indication of the risk associated with investing in those securities.
The following is a summary, by category of Level, of inputs used to value the Fund’s investments as of December 31, 2009:
| | | | | | | | | | | | |
| | | | | | | Level 2 | | | | | | |
| | | | | | | Other | | | Level 3 | | | |
| | | | Level 1 | | | Significant | | | Significant | | | |
| | | | Quoted | | | Observable | | | Unobservable | | | |
| | | | Prices | | | Inputs | | | Inputs | | | Total |
| Common Stocks | | $ | 119,048,420 | | $ | — | | $ | — | | $ | 119,048,420 |
| Money Market Fund | | | 1,785,000 | | | — | | | — | | | 1,785,000 |
| Total Investments | | | | | | | | | | | | |
| in Securities* | | $ | 120,833,420 | | $ | — | | $ | — | | $ | 120,833,420 |
|
| * The Portfolio of Investments provides information on the industry categorization for the portfolio. |
| | |
| 10 | See notes to financial statements | |
Portfolio Manager’s Letter
CASH MANAGEMENT FUND
Dear Investor:
This is the annual report for the First Investors Life Cash Management Fund for the year ended December 31, 2009. During the period, the Fund’s return on a net asset value basis was 0.17%, including dividends of 0.2 cents per share. The Fund maintained a $1.00 net asset value per share throughout the year.
Short-term interest rates remained at historically low levels as the Federal Reserve maintained its benchmark federal funds rate at a range of 0 – 0.25% throughout the year. With rates at record lows for such an extended period, the Fund’s yield fell steadily through the year and, like many money market funds, was at 0% by year-end.
Conditions in the money markets were characterized by low yields, tight spreads and a flat yield curve. Consequently, there were few places to realize incremental return in 2009. Even floating rate notes, which were a positive contributor to the portfolio through the first half of the year, were of no solace as resets declined sharply when LIBOR levels reverted to pre-crisis relationships. The LIBOR—London Interbank Offered Rate—is the world’s most widely used benchmark for short-term interest rates.
The Fund’s yield was buffered during the first half of the period by its longer-than-average weighted maturity. In addition, with LIBOR levels elevated, floating rate securities were a major positive for the portfolio, especially during the first half of the year. The Fund also used short maturity corporate and municipal bonds to supplement performance.
The Fund continued to invest conservatively through the period, and attempted to mitigate credit risk by generally limiting corporate security investments to shorter maturities and smaller position sizes while maintaining a significant portion of its assets in U.S. government and agency securities. The Fund did not invest in asset-backed commercial paper or second-tier securities during the review period and it avoided negative credit events as well.
The Fund’s performance was aided by financial support provided by its Investment Adviser. By the end of the review period, First Investors Management Company, Inc. (“FIMCO”) was not only waiving its management fees, but also assuming certain other expenses otherwise payable by the Fund in order to avoid a negative yield to the Fund’s shareholders. FIMCO expects this situation to continue, and as a result, the yield to shareholders should be at or near zero for the foreseeable future.
Although money market funds in general are relatively conservative vehicles, there can be no assurance that the Fund will be able to maintain a stable net asset value of $1.00 per share. Money market mutual funds are neither insured nor guaranteed by the Federal Deposit Insurance Corporation (FDIC) or any other government agency.
Portfolio Manager’s Letter (continued)
CASH MANAGEMENT FUND
Thank you for placing your trust in First Investors. We appreciate the opportunity to serve your investment needs.
Sincerely,

Michael J. O’Keefe
Portfolio Manager
January 29, 2010
Fund Expenses (unaudited)
CASH MANAGEMENT FUND
The examples below show the ongoing costs (in dollars) of investing in your Fund and will help you in comparing these costs with costs of other mutual funds. Please refer to page 3 for a detailed explanation of the information presented in these examples.
| | | |
| | Beginning | Ending | |
| | Account | Account | Expenses Paid |
| | Value | Value | During Period |
| | (7/1/09) | (12/31/09) | (7/1/09–12/31/09)* |
| Expense Examples | | | |
| Actual | $1,000.00 | $1,000.18 | $2.52 |
| Hypothetical | | | |
| (5% annual return before expenses) | $1,000.00 | $1,022.69 | $2.55 |
| |
| * | Expenses are equal to the annualized expense ratio of .50%, multiplied by the average account |
| value over the period, multiplied by 184/365 (to reflect the one-half year period). Expenses paid |
| during the period are net of expenses waived. |
Portfolio Composition
BY SECTOR

|
| Portfolio holdings and allocations are subject to change. Percentages are as of December 31, 2009, |
| and are based on the total value of investments. |
Portfolio of Investments
CASH MANAGEMENT FUND
December 31, 2009
| | | | | | | | | |
| Principal | | | | | | | Interest | | |
| Amount | | | Security | | | | Rate | * | Value |
| |
| | | | CORPORATE NOTES—42.8% | | | | | | |
| $ 400 | M | | Abbott Laboratories, 3/8/10 (a) | | | | 0.11 | % | $ 399,919 |
| 250 | M | | BP Capital Markets PLC, 3/15/10 | | | | 1.55 | | 251,656 |
| 500 | M | | Coca-Cola Co., 1/20/10 (a) | | | | 0.14 | | 499,963 |
| 450 | M | | Dell, Inc., 2/9/10 (a) | | | | 0.13 | | 449,937 |
| 200 | M | | General Electric Capital Corp., 1/19/10 | | | | 1.30 | | 200,588 |
| 350 | M | | John Deere, Ltd., 1/13/10 (a) | | | | 0.13 | | 349,985 |
| 500 | M | | Johnson & Johnson, 3/26/10 (a) | | | | 0.12 | | 499,860 |
| 300 | M | | Medtronic, Inc., 2/3/10 (a) | | | | 0.14 | | 299,961 |
| 525 | M | | Northwest Natural Gas Co., 2/5/10 (a) | | | | 0.27 | | 524,862 |
| 500 | M | | Paccar Financial Corp., 2/16/10 | | | | 0.19 | | 499,879 |
| 500 | M | | Philip Morris International, Inc., 1/11/10 (a) | | | | 0.17 | | 499,976 |
| 190 | M | | United Technologies Corp., 5/1/10 | | | | 0.63 | | 192,349 |
| |
| Total Value of Corporate Notes (cost $4,668,935) | | | | | | 4,668,935 |
| |
| | | | FLOATING RATE NOTES—25.9% | | | | | | |
| 100 | M | | BP Capital Markets PLC, 3/17/10 | | | | 0.18 | | 100,076 |
| 400 | M | | Federal Farm Credit Bank, 4/9/10 | | | | 0.59 | | 400,009 |
| 200 | M | | Freddie Mac, 1/8/10 | | | | 0.57 | | 200,002 |
| 320 | M | | GlaxoSmithKline Capital, Inc., 5/13/10 | | | | 0.90 | | 320,912 |
| 400 | M | | Mississippi Business Finance Corp. | | | | | | |
| | | | (Chevron USA, Inc.), 12/1/30 | | | | 0.18 | | 400,000 |
| 310 | M | | Procter & Gamble Co., 3/9/10 | | | | 0.44 | | 310,154 |
| 300 | M | | Roche Holdings, Inc., 2/25/10 (b) | | | | 1.26 | | 300,514 |
| 300 | M | | Toyota Motor Credit Corp., 2/26/10 | | | | 0.29 | | 299,921 |
| 500 | M | | Valdez, Alaska Marine Terminal Rev. | | | | | | |
| | | | (Exxon Pipeline Co.), 12/1/33 | | | | 0.18 | | 500,000 |
| |
| Total Value of Floating Rate Notes (cost $2,831,588) | | | | | | 2,831,588 |
| |
| | | | U.S. GOVERNMENT AGENCY | | | | | | |
| | | | OBLIGATIONS—23.6% | | | | | | |
| | | | Fannie Mae: | | | | | | |
| 170 | M | | 4/28/10 | | | | 0.76 | | 171,831 |
| 600 | M | | 5/5/10 | | | | 0.15 | | 599,690 |
| | | | Federal Home Loan Bank: | | | | | | |
| 250 | M | | 1/6/10 | | | | 0.93 | | 250,087 |
| 500 | M | | 1/13/10 | | | | 0.08 | | 499,987 |
| 300 | M | | 7/29/10 | | | | 0.06 | | 300,000 |
| | | | | | | | | |
| Principal | | | | | | | Interest | | |
| Amount | | | Security | | | | Rate | * | Value |
| |
| | | | U.S. GOVERNMENT AGENCY | | | | | | |
| | | | OBLIGATIONS (continued) | | | | | | |
| | | | Freddie Mac: | | | | | | |
| $ 250 | M | | 1/28/10 | | | | 0.11 | | $ 249,980 |
| 500 | M | | 2/16/10 | | | | 0.07 | | 499,955 |
| |
| Total Value of U.S. Government Agency Obligations (cost $2,571,530) | | | | | 2,571,530 |
| |
| | | | BANKERS’ ACCEPTANCES—4.2% | | | | | | |
| | | | JPMorgan Chase Bank: | | | | | | |
| 235 | M | | 1/21/10 | | | | 0.23 | | 234,970 |
| 220 | M | | 2/3/10 | | | | 0.23 | | 219,954 |
| |
| Total Value of Bankers’ Acceptances (cost $454,924) | | | | | | 454,924 |
| |
| | | | MUNICIPAL BONDS—2.4% | | | | | | |
| 260 | M | | New Jersey State Highway Authority, 1/1/10 | | | | | | |
| | | | (cost $260,000) | | | | 2.56 | | 260,000 |
| |
| Total Value of Investments (cost $10,786,977)** | 98.9 | % | | | | 10,786,977 |
| Other Assets, Less Liabilities | 1.1 | | | | | 124,153 |
| |
| Net Assets | | | | 100.0 | % | | | | $10,911,130 |
| |
| * | The interest rates shown are the effective rates at the time of purchase by the Fund. The interest |
| rates shown on floating rate notes are adjusted periodically; the rates shown are the rates in effect |
| at December 31, 2009. |
| ** | Aggregate cost for federal income tax purposes is the same. |
| (a) | Security exempt from registration under Section 4(2) of the Securities Act of 1933 (see Note 5). |
| (b) | Security exempt from registration under Rule 144A of Securities Act of 1933 (see Note 5). |
Portfolio of Investments (continued)
CASH MANAGEMENT FUND
December 31, 2009
Accounting Standards Codification (“ASC”) 820 established a three-tier hierarchy of inputs to establish a classification of fair value measurements for disclosure purposes. The three-tier hierarchy of inputs is summarized in the three broad Levels listed below:
| Level 1 — quoted prices in active markets for identical securities |
| |
| Level 2 — other significant observable inputs (including quoted prices for similar securities, interest rates, prepayment speeds, credit risk, etc.) |
| |
| Level 3 — significant unobservable inputs (including the fund’s own assumptions in determining the fair value of investments) |
The inputs methodology used for valuing securities are not necessarily an indication of the risk associated with investing in those securities.
The following is a summary, by category of Level, of inputs used to value the Fund’s investments as of December 31, 2009:
| | | | | | | | | | | | |
| | | | | | | Level 2 | | | | | | |
| | | | | | | Other | | | Level 3 | | | |
| | | | Level 1 | | | Significant | | | Significant | | | |
| | | | Quoted | | | Observable | | | Unobservable | | | |
| | | | Prices | | | Inputs | | | Inputs | | | Total |
| Corporate Notes | | $ | — | | $ | 4,668,935 | | $ | — | | $ | 4,668,935 |
| U.S. Government Agency | | | | | | | | | | | | |
| Obligations | | | — | | | 2,571,530 | | | — | | | 2,571,530 |
| Floating Rate Notes: | | | | | | | | | | | | |
| Corporate Notes | | | — | | | 1,331,577 | | | — | | | 1,331,577 |
| Municipal Bonds | | | — | | | 900,000 | | | — | | | 900,000 |
| U.S. Government Agency | | | — | | | 600,011 | | | — | | | 600,011 |
| Obligations | | | | | | | | | | | | |
| Bankers’ Acceptances | | | — | | | 454,924 | | | — | | | 454,924 |
| |
| Municipal Bonds | | | — | | | 260,000 | | | — | | | 260,000 |
| Total Investments in | | | | | | | | | | | | |
| Securities | | $ | — | | $ | 10,786,977 | | $ | — | | $ | 10,786,977 |
| | |
| 16 | See notes to financial statements | |
Portfolio Managers’ Letter
DISCOVERY FUND
Dear Investor:
This is the annual report for the First Investors Life Discovery Fund for the year ended December 31, 2009. During the period, the Fund’s return on a net asset value basis was 30.77%, including dividends of 26.6 cents per share.
In 2008, the stock market experienced its worst panic since the 1970s, as the banking system seemed close to collapse. Fortunately, the Federal Reserve and U.S. Treasury were able to restore confidence in the system by the early spring of 2009, and the stock market has rallied strongly since mid-March. We approached these markets in a conservative fashion, and over the course of the year outperformed our benchmark, the Russell 2000 Index. Our best performing sector was the financials sector, which did well because of our decision to eschew bank stocks. Information technology was our largest detractor, both because we were underweight this top-performing sector, and because our technology picks did not keep up with some of the more speculative names in the sector.
During the sell-off in the late winter and early spring of 2009, the Fund was able to pick up several high quality names that made significant contributions to Fund returns, including Jefferies Group, Micros Systems, and Mednax. Jefferies Group, a mid-tier brokerage house, wisely raised excess capital in early 2008. Because of its strong balance sheet, the firm did not have to accept TARP funds from the government, and managed to recruit top talent away from former powerhouses that had to go hat-in-hand to the government to maintain solvency. Micros Systems, a software company with a solid balance sheet, was another top contributor to Fund performance. Through the strength of its franchise and flexibility of its business model, Micros managed to generate record operating margins, despite tough economic headwinds. During the sell-off, we also invested in Mednax, a company that manages neonatal units and anesthesiology practices for hospitals. The market had been concerned about neonatal unit volumes and reimbursement rates, allowing us to purchase shares in this top quality health care company for only nine times trailing earnings. Subsequent to our purchase, Mednax reported double-digit earnings growth, and continued high operating margins and cash flow generation.
On a macroeconomic level, we are still somewhat concerned about the high level of unemployment in the U.S., although we have seen some positive data on the economy recently. Our conversations with company managements indicate to us that a bottom to the downturn may have been reached. The timing of a recovery is harder to predict. However, we are long-term value investors, not market timers, and we remain focused on finding good companies at attractive valuations.
Portfolio Managers’ Letter (continued)
DISCOVERY FUND
Thank you for placing your trust in First Investors. We appreciate the opportunity to serve your investment needs.
Sincerely,

Jason Ronovech
Portfolio Manager

Jonathan S. Vyorst
Portfolio Manager
January 29, 2010
Fund Expenses (unaudited)
DISCOVERY FUND
The examples below show the ongoing costs (in dollars) of investing in your Fund and will help you in comparing these costs with costs of other mutual funds. Please refer to page 3 for a detailed explanation of the information presented in these examples.
| | | |
| | Beginning | Ending | |
| | Account | Account | Expenses Paid |
| | Value | Value | During Period |
| | (7/1/09) | (12/31/09) | (7/1/09–12/31/09)* |
| Expense Examples | | | |
| Actual | $1,000.00 | $1,203.46 | $4.61 |
| Hypothetical | | | |
| (5% annual return before expenses) | $1,000.00 | $1,021.03 | $4.23 |
| |
| * | Expenses are equal to the annualized expense ratio of .83%, multiplied by the average account |
| value over the period, multiplied by 184/365 (to reflect the one-half year period). |
Portfolio Composition
TOP TEN SECTORS
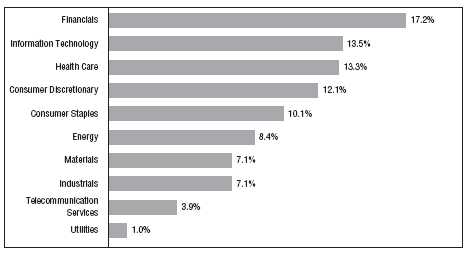
Portfolio holdings and allocations are subject to change. Percentages are as of December 31, 2009,
and are based on the total value of investments.
Cumulative Performance Information
DISCOVERY FUND
Comparison of change in value of $10,000 investment in the First Investors Life Series Discovery
Fund and the Russell 2000 Index.

The graph compares a $10,000 investment in the First Investors Life Series Discovery Fund beginning 12/31/99 with a theoretical investment in the Russell 2000 Index (the “Index”). The Index is an unmanaged Index that measures the performance of the small-cap segment of the U.S. equity universe. The Index is a subset of the Russell 3000 Index representing approximately 10% of the total market capitalization of that index. The Index includes approximately 2,000 of the smallest securities based on a combination of their market cap and current index membership. It is not possible to invest directly in this Index. In addition, the Index does not reflect fees and expenses associated with the active management of a mutual fund portfolio. For purposes of the graph and the accompanying table, it is assumed that all dividend and distributions were reinvested.
* The Average Annual Total Return figures are for the periods ended 12/31/09.
The returns shown do not reflect any sales charges, since the Fund sells its shares solely to variable annuity and/or variable life insurance subaccounts at net asset value. The returns do not reflect the fees and charges that an individual would pay in connection with an investment in a variable annuity or life contract or policy. Results represent past performance and do not indicate future results. The graph and the returns shown do not reflect the deduction of taxes that an investor would pay on distributions or the redemption of fund shares. Investment return and principal value of an investment will fluctuate so that an investor’s shares, when redeemed, may be worth more or less than the original cost. Russell 2000 Index figures are from Frank Russell and Company and all other figures are from First Investors Management Company, Inc.
Portfolio of Investments
DISCOVERY FUND
December 31, 2009
| | | | |
| Shares | | | Security | Value |
| |
| | | | COMMON STOCKS—92.5% | |
| | | | Consumer Discretionary—11.9% | |
| 119,800 | | | American Eagle Outfitters, Inc. | $ 2,034,204 |
| 38,600 | | * | Big Lots, Inc. | 1,118,628 |
| 75,200 | | * | Career Education Corporation | 1,752,912 |
| 157,000 | | | Foot Locker, Inc. | 1,748,980 |
| 67,700 | | * | GameStop Corporation – Class “A” | 1,485,338 |
| 58,700 | | | Hasbro, Inc. | 1,881,922 |
| 102,800 | | * | Pacific Sunwear of California, Inc. | 409,144 |
| 48,700 | | | Phillips Van-Heusen Corporation | 1,981,116 |
| 187,800 | | | Regal Entertainment Group – Class “A” | 2,711,832 |
| |
| | | | | 15,124,076 |
| |
| | | | Consumer Staples—10.0% | |
| 38,600 | | * | American Italian Pasta Company – Class “A” | 1,342,894 |
| 32,975 | | | Church & Dwight Company, Inc. | 1,993,339 |
| 65,400 | | | Corn Products International, Inc. | 1,911,642 |
| 149,100 | | | Dole Food Company, Inc. | 1,850,331 |
| 68,100 | | | Flowers Foods, Inc. | 1,618,056 |
| 80,400 | | * | Fresh Del Monte Produce, Inc. | 1,776,840 |
| 34,700 | | | J. M. Smucker Company | 2,142,725 |
| |
| | | | | 12,635,827 |
| |
| | | | Energy—8.3% | |
| 113,100 | | | EXCO Resources, Inc. | 2,401,113 |
| 129,100 | | * | Matrix Service Company | 1,374,915 |
| 54,700 | | * | Plains Exploration & Production Company | 1,513,002 |
| 172,300 | | * | Resolute Energy Corporation | 1,984,896 |
| 53,500 | | | St. Mary Land & Exploration Company | 1,831,840 |
| 20,300 | | * | Whiting Petroleum Corporation | 1,450,841 |
| |
| | | | | 10,556,607 |
| |
| | | | Financials—17.0% | |
| 7,795 | | * | Alleghany Corporation | 2,151,420 |
| 51,200 | | | American Financial Group, Inc. | 1,277,440 |
| 240,900 | | | Anworth Mortgage Asset Corporation (REIT) | 1,686,300 |
| 23,200 | | | Everest Re Group, Ltd. | 1,987,776 |
| 116,200 | | * | EZCORP, Inc. – Class “A” | 1,999,802 |
| 54,100 | | | Harleysville Group, Inc. | 1,719,839 |
| 119,800 | | * | Hilltop Holdings, Inc. | 1,394,472 |
| 91,700 | | * | Jefferies Group, Inc. | 2,176,041 |
Portfolio of Investments (continued)
DISCOVERY FUND
December 31, 2009
| | | | |
| Shares | | | Security | Value |
| |
| | | | Financials (continued) | |
| 3,400 | | * | Markel Corporation | $ 1,156,000 |
| 228,700 | | | MFA Financial, Inc. (REIT) | 1,680,945 |
| 4,683 | | | National Western Life Insurance Company – Class “A” | 813,062 |
| 37,100 | | * | Piper Jaffray Companies, Inc. | 1,877,631 |
| 113,200 | | | Walter Investment Management Corporation (REIT) | 1,622,156 |
| |
| | | | | 21,542,884 |
| |
| | | | Health Care—13.1% | |
| 75,200 | | * | AMERIGROUP Corporation | 2,027,392 |
| 113,100 | | * | Endo Pharmaceuticals Holdings, Inc. | 2,319,681 |
| 38,900 | | * | Life Technologies Corporation | 2,031,747 |
| 51,300 | | * | Lincare Holdings, Inc. | 1,904,256 |
| 67,000 | | * | Magellan Health Services, Inc. | 2,728,910 |
| 30,100 | | * | MEDNAX, Inc. | 1,809,612 |
| 108,000 | | | PerkinElmer, Inc. | 2,223,720 |
| 55,700 | | | STERIS Corporation | 1,557,929 |
| |
| | | | | 16,603,247 |
| |
| | | | Industrials—7.0% | |
| 20,700 | | * | Alliant Techsystems, Inc. | 1,827,189 |
| 36,100 | | | Curtiss-Wright Corporation | 1,130,652 |
| 60,100 | | * | DXP Enterprises, Inc. | 785,507 |
| 78,800 | | * | EMCOR Group, Inc. | 2,119,720 |
| 17,500 | | | Precision Castparts Corporation | 1,931,125 |
| 43,500 | | | Robbins & Myers, Inc. | 1,023,120 |
| |
| | | | | 8,817,313 |
| |
| | | | Information Technology—13.3% | |
| 333,700 | | * | Compuware Corporation | 2,412,651 |
| 172,700 | | * | Convergys Corporation | 1,856,525 |
| 207,300 | | | EarthLink, Inc. | 1,722,663 |
| 68,800 | | | Fair Isaac Corporation | 1,466,128 |
| 52,200 | | * | MICROS Systems, Inc. | 1,619,766 |
| 106,500 | | * | QLogic Corporation | 2,009,655 |
| 48,500 | | * | Sybase, Inc. | 2,104,900 |
| 176,100 | | * | Verigy, Ltd. | 2,266,407 |
| 172,700 | | * | Vishay Intertechnology, Inc. | 1,442,045 |
| |
| | | | | 16,900,740 |
| | | | | | |
| Shares or | | | | | | |
| Principal | | | | | | |
| Amount | | | Security | | | Value |
| |
| | | | Materials—7.0% | | | |
| 31,900 | | | AptarGroup, Inc. | | | $ 1,140,106 |
| 23,200 | | | Compass Minerals International, Inc. | | | 1,558,808 |
| 130,200 | | | Innospec, Inc. | | | 1,313,718 |
| 86,000 | | | Olin Corporation | | | 1,506,720 |
| 50,900 | | | Sensient Technologies Corporation | | | 1,338,670 |
| 34,200 | | | Silgan Holdings, Inc. | | | 1,979,496 |
| |
| | | | | | | 8,837,518 |
| |
| | | | Telecommunication Services—3.9% | | | |
| 152,900 | | * | Iridium Communications, Inc. | | | 1,227,787 |
| 262,200 | | * | Premiere Global Services, Inc. | | | 2,163,150 |
| 49,275 | | | Telephone & Data Systems, Inc. – Special Shares | | 1,488,105 |
| |
| | | | | | | 4,879,042 |
| |
| | | | Utilities—1.0% | | | |
| 77,100 | | | CMS Energy Corporation | | | 1,207,386 |
| |
| Total Value of Common Stocks (cost $99,796,577) | | | 117,104,640 |
| |
| | | | SHORT-TERM INVESTMENTS—6.2% | | |
| | | | Money Market Fund | | | |
| $ 7,920 | M | | First Investors Cash Reserve Fund, .24% (cost $7,920,000)** | | 7,920,000 |
| |
| Total Value of Investments (cost $107,716,577) | 98.7 | % | 125,024,640 |
| Other Assets, Less Liabilities | 1.3 | | 1,608,355 |
| |
| Net Assets | | | | 100.0 | % | $126,632,995 |
| |
| * | Non-income producing |
| ** | Affiliated unregistered money market fund available only to First Investors funds and certain |
| accounts managed by First Investors Management Company, Inc. Rate shown is the 7-day yield at |
| December 31, 2009 (see Note 3). |
| |
| Summary of Abbreviations: |
| REIT Real Estate Investment Trust |
Portfolio of Investments (continued)
DISCOVERY FUND
December 31, 2009
Accounting Standards Codification (“ASC”) 820 established a three-tier hierarchy of inputs to establish a classification of fair value measurements for disclosure purposes. The three-tier hierarchy of inputs is summarized in the three broad Levels listed below:
| Level 1 — quoted prices in active markets for identical securities |
| |
| Level 2 — other significant observable inputs (including quoted prices for similar securities, interest rates, prepayment speeds, credit risk, etc.) |
| |
| Level 3 — significant unobservable inputs (including the fund’s own assumptions in determining the fair value of investments) |
The inputs methodology used for valuing securities are not necessarily an indication of the risk associated with investing in those securities.
The following is a summary, by category of Level, of inputs used to value the Fund’s investments as of December 31, 2009:
| | | | | | | | | | | | |
| | | | | | | Level 2 | | | | | | |
| | | | | | | Other | | | Level 3 | | | |
| | | | Level 1 | | | Significant | | | Significant | | | |
| | | | Quoted | | | Observable | | | Unobservable | | | |
| | | | Prices | | | Inputs | | | Inputs | | | Total |
| Common Stocks | | $ | 117,104,640 | | $ | — | | $ | — | | $ | 117,104,640 |
| Money Market Fund | | | 7,920,000 | | | — | | | — | | | 7,920,000 |
| Total Investments | | | | | | | | | | | | |
| in Securities* | | $ | 125,024,640 | | $ | — | | $ | — | | $ | 125,024,640 |
* The Portfolio of Investments provides information on the industry categorization for the portfolio.
| | |
| 24 | See notes to financial statements | |
Portfolio Manager’s Letter
GOVERNMENT FUND
Dear Investor:
This is the annual report for the First Investors Life Government Fund for the year ended December 31, 2009. During the period, the Fund’s return on a net asset value basis was 4.28%, including dividends of 43.4 cents per share.
The Fund invests in securities and debt issued or guaranteed by the U.S. government and its agencies. These include mortgage-backed bonds guaranteed by the Government National Mortgage Association (Ginnie Mae), the Federal National Mortgage Association (Fannie Mae), and the Federal Home Loan Mortgage Corporation (Freddie Mac); debt issued by these and other agencies; and U.S. Treasury securities. The investments held by the Fund all have the highest possible credit rating (AAA). The Fund does not invest in subprime mortgage-backed debt.
The review period began with considerable uncertainty in the financial markets and with the economy in its longest and deepest downturn since the Great Depression. As the year progressed, the extraordinary actions taken by the U.S. government and the Federal Reserve (the “Fed”) helped to stabilize the markets and the economy. In particular, the Fed provided support to the bond market by purchasing over $1.5 trillion of mortgage-backed, agency, and U.S. Treasury securities, while keeping the benchmark federal funds rate at a historic low range of 0 – 0.25%.
By year-end, the financial markets had stabilized and the economy had exited the recession. With a return to a more normal environment, Treasury securities lost their safe haven status and longer-term yields moved sharply higher from historically low levels. Consequently, the Treasury market was the worst performing sector of the bond market in 2009, falling 3.7% according to BofA Merrill Lynch. The U.S. agency market fared slightly better due to the Fed’s support, returning .9%. The biggest beneficiary, though, of the Fed’s purchase program was the mortgage-backed market, where the Fed bought over $1 trillion of securities during the year. As a result, the mortgage-backed market returned 5.8%.
The Fund substantially outperformed the Citigroup Government/Mortgage Index. In particular, the Fund benefited from its asset allocation. It had approximately 80% of its assets invested in mortgage-backed securities with the balance in U.S. agency notes and a small amount in cash equivalents for most of the review period. The Fund had negligible exposure to the Treasury market. Security selection also contributed to the Fund’s performance, as the Fund was underweight lower coupon mortgage-backed bonds, which had the weakest returns among mortgage-backed securities.
Portfolio Manager’s Letter (continued)
GOVERNMENT FUND
Thank you for placing your trust in First Investors. We appreciate the opportunity to serve your investment needs.
Sincerely,

Clark D. Wagner
Portfolio Manager and
Director of Fixed Income, First Investors Management Company, Inc.
January 29, 2010
Fund Expenses (unaudited)
GOVERNMENT FUND
The examples below show the ongoing costs (in dollars) of investing in your Fund and will help you in comparing these costs with costs of other mutual funds. Please refer to page 3 for a detailed explanation of the information presented in these examples.
| | | |
| | Beginning | Ending | |
| | Account | Account | Expenses Paid |
| | Value | Value | During Period |
| | (7/1/09) | (12/31/09) | (7/1/09–12/31/09)* |
| Expense Examples | | | |
| Actual | $1,000.00 | $1,023.88 | $4.08 |
| Hypothetical | | | |
| (5% annual return before expenses) | $1,000.00 | $1,021.18 | $4.08 |
| |
| * | Expenses are equal to the annualized expense ratio of .80%, multiplied by the average account |
| value over the period, multiplied by 184/365 (to reflect the one-half year period). Expenses paid |
| during the period are net of expenses waived. |
Portfolio Composition
BY SECTOR
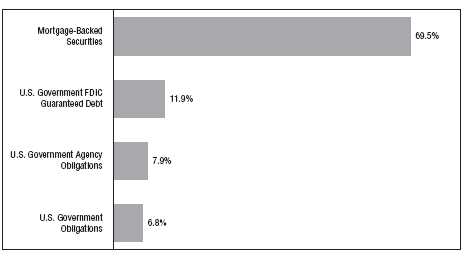
Portfolio holdings and allocations are subject to change. Percentages are as of December 31, 2009,
and are based on the total value of investments.
Cumulative Performance Information
GOVERNMENT FUND
Comparison of change in value of $10,000 investment in the First Investors Life Series Government Fund, the Bank of America (“BofA”) Merrill Lynch GNMA Master Index and the Citigroup Government/Mortgage Index†.

The graph compares a $10,000 investment in the First Investors Life Series Government Fund beginning 12/31/99 with theoretical investments in the BofA Merrill Lynch GNMA Master Index and the Citigroup Government/Mortgage Index (the “Indices”). The BofA Merrill Lynch GNMA Master Index is a market capitalization-weighted index, including generic-coupon GNMA mortgages, with at least $150 million principal amounts outstanding. Every issue included in the Index is trader-priced and the Index follows consistent and realistic availability limits, including only those securities with sufficient amounts outstanding. The Citigroup Government/Mortgage Index is an unmanaged index that is a combination of the Citigroup Government Index and the Citigroup Mortgage Index. The Government Index tracks the performance of the U.S. Treasury and U.S. Government-sponsored indices within the Citigroup U.S. Broad Investment Grade Bond Index. The Mortgage Index tracks t he performance of the mortgage component of the Citigroup U.S. Broad Investment Grade Bond Index, which is comprised of 30- and 15-year GNMA, FNMA and FHLMC pass-throughs and FNMA and FHLMC balloon mortgages. It is not possible to invest directly in these Indices. In addition, the Indices do not reflect fees and expenses associated with the active management of a mutual fund portfolio. For purposes of the graph and the accompanying table, it is assumed that all dividends and distributions were reinvested.
* The Average Annual Total Return figures are for the periods ended 12/31/09. During the periods shown, some of the expenses of the Fund were waived or assumed. If such expenses had been paid by the Fund, the Average Annual Total Returns for One Year, Five Years and Ten Years would have been 4.12%, 4.65% and 5.63%, respectively.
The returns shown do not reflect any sales charge, since the Fund sells its shares solely to variable annuity and/or variable life insurance subaccounts at net asset value. The returns do not reflect the fees and charges that an individual would pay in connection with an investment in a variable annuity or life contract or policy. Results represent past performance and do not indicate future results. The graph and the returns shown do not reflect the deduction of taxes that an investor would pay on distributions or the redemption of fund shares. Investment return and principal value of an investment will fluctuate so that an investor’s shares, when redeemed, may be worth more or less than the original cost. BofA Merrill Lynch GNMA Master Index figures are from Bank of America Merrill Lynch & Co., Citigroup Government/Mortgage Index figures are from Citigroup and a ll other figures are from First Investors Management Company, Inc.
† We have added a comparison to the Citigroup Government/Mortgage Index this year since it more closely reflects the performance of the securities in which the Fund invests. After this year we will not show a comparison to the BofA Merrill Lynch GNMA Master Index.
Portfolio of Investments
GOVERNMENT FUND
December 31, 2009
| | | | |
| Principal | | | | |
| Amount | | | Security | Value |
| |
| | | | MORTGAGE-BACKED SECURITIES—68.5% | |
| | | | Fannie Mae—18.1% | |
| $ 1,578 | M | | 5%, 1/1/2035 – 4/1/2039 | $ 1,622,280 |
| 2,004 | M | | 5.5%, 6/1/2033 – 7/1/2034 | 2,106,489 |
| 333 | M | | 6%, 6/1/2039 | 353,498 |
| 342 | M | | 9%, 6/1/2015 – 11/1/2026 | 388,302 |
| 200 | M | | 11%, 10/1/2015 | 226,808 |
| |
| | | | | 4,697,377 |
| |
| | | | Freddie Mac—10.0% | |
| 2,436 | M | | 6%, 8/1/2032 – 12/1/2038 | 2,595,266 |
| |
| | | | Government National Mortgage Association I | |
| | | | Program—40.4% | |
| 2,985 | M | | 5%, 3/15/2033 – 4/15/2039 | 3,086,918 |
| 5,561 | M | | 5.5%, 2/15/2033 – 4/15/2039 | 5,846,035 |
| 782 | M | | 6%, 11/15/2032 – 4/15/2036 | 835,576 |
| 690 | M | | 6.5%, 7/15/2032 – 8/15/2036 | 746,740 |
| |
| | | | | 10,515,269 |
| |
| Total Value of Mortgage-Backed Securities (cost $17,274,821) | 17,807,912 |
| |
| | | | U.S. GOVERNMENT FDIC | |
| | | | GUARANTEED DEBT—11.7% | |
| 1,000 | M | | Bank of America Corp., 3.125%, 2012 | 1,036,807 |
| 1,000 | M | | Citigroup Funding, Inc., 1.875%, 2012 | 998,113 |
| 1,000 | M | | JPMorgan Chase & Co., 2.125%, 2012 | 1,005,130 |
| |
| Total Value of U.S. Government FDIC Guaranteed Debt (cost $3,048,262) | 3,040,050 |
| |
| | | | U.S. GOVERNMENT AGENCY | |
| | | | OBLIGATIONS—7.8% | |
| 1,000 | M | | Federal Farm Credit Bank, 4.25%, 2016 | 1,008,404 |
| 1,000 | M | | Tennessee Valley Authority, 4.5%, 2018 | 1,019,391 |
| |
| Total Value of U.S. Government Agency Obligations (cost $2,028,156) | 2,027,795 |
| |
| | | | U.S. GOVERNMENT OBLIGATIONS—6.7% | |
| 670 | M | | FDA Queens LP, 6.99%, 2017 (a) | 754,401 |
| 1,000 | M | | U.S. Treasury Notes, 3.625%, 2019 | 983,438 |
| |
| Total Value of U.S. Government Obligations (cost $1,777,253) | 1,737,839 |
Portfolio of Investments (continued)
GOVERNMENT FUND
December 31, 2009
| | | | | | |
| Principal | | | | | | |
| Amount | | | Security | | | Value |
| | | | SHORT-TERM U.S. GOVERNMENT AGENCY | | |
| | | | OBLIGATIONS—3.8% | | | |
| $ 1,000 | M | | Federal Home Loan Bank, 0.005%, 2/24/10 (cost $999,993) | | $ 999,993 |
| Total Value of Investments (cost $25,128,485) | 98.5 | % | 25,613,589 |
| Other Assets, Less Liabilities | 1.5 | | 394,901 |
| |
| Net Assets | | | | 100.0 | % | $26,008,490 |
| | |
| (a) | Security exempt from registration under Rule 144A of Securities Act of 1933 (see Note 5). |
| |
| Accounting Standards Codification (“ASC”) 820 established a three-tier hierarchy of inputs to establish a classification of fair value measurements for disclosure purposes. The three-tier hierarchy of inputs is summarized in the three broad Levels listed below: |
| | |
| | Level 1 — quoted prices in active markets for identical securities |
| | |
| | Level 2 — other significant observable inputs (including quoted prices for similar securities, interest rates, prepayment speeds, credit risk, etc.) |
| | |
| | Level 3 — significant unobservable inputs (including the fund’s own assumptions in determining the fair value of investments) |
| | |
| The inputs methodology used for valuing securities are not necessarily an indication of the risk associated with investing in those securities. |
| |
| The following is a summary, by category of Level, of inputs used to value the Fund’s investments as of December 31, 2009: |
| | | | | | | | | | | | |
| | | | | | | Level 2 | | | | | | |
| | | | | | | Other | | | Level 3 | | | |
| | | | Level 1 | | | Significant | | | Significant | | | |
| | | | Quoted | | | Observable | | Unobservable | | | |
| | | | Prices | | | Inputs | | | Inputs | | | Total |
| Mortgage-Backed | | | | | | | | | | | | |
| Certificates | | $ | — | | $ | 17,807,912 | | $ | — | | $ | 17,807,912 |
| U.S. Government Agency | | | | | | | | | | | | |
| Obligations | | | — | | | 2,027,795 | | | — | | | 2,027,795 |
| U.S. Government FDIC | | | | | | | | | | | | |
| Guaranteed Debt | | | — | | | 3,040,050 | | | — | | | 3,040,050 |
| U.S. Government | | | | | | | | | | | | |
| Obligations | | | — | | | 1,737,839 | | | — | | | 1,737,839 |
| Short-Term U.S. Government | | | | | | | | | | | | |
| Agency Obligations | | | — | | | 999,993 | | | — | | | 999,993 |
| Total Investments | | | | | | | | | | | | |
| in Securities | | $ | — | | $ | 25,613,589 | | $ | — | | $ | 25,613,589 |
| | |
| 30 | See notes to financial statements | |
Portfolio Manager’s Letter
GROWTH & INCOME FUND
Dear Investor:
This is the annual report for the First Investors Life Growth & Income Fund for the year ended December 31, 2009. During the period, the Fund’s return on a net asset value basis was 28.05%, including dividends of 39.9 cents per share.
During the first part of the review period, the markets were in a steep free fall, culminating with a multi-decade market low reached on March 9, 2009. Only after U.S. and global regulators took extraordinary measures to supply massive financial aid and intervention, such as through the TARP program, did the markets stabilize. The markets then rallied convincingly, ending the year with a significant gain.
With this as a backdrop, the Fund assumed a relatively conservative position, choosing to underweight or avoid volatile and uncertain areas of the market. This strategy benefited the Fund during the market decline, but caused the Fund to lag during the recovery phase that began in March 2009. For the period overall, the Fund slightly outperformed the S&P 500 Index. Following the strategy from 2008, the Fund remained underweight the financials sector for the entire year, as we were concerned that uncertainty over continuing loan losses, inadequate capital structures and ongoing governmental involvement would impair valuations for equity holders for some time to come. The Fund likewise reduced its holdings in the volatile energy sector, as global recession has dampened usage, and energy pricing still seems to hold a speculative bias that is not reflective of true underlying supply and demand.
The Fund’s weightings in consumer staples and health care increased throughout the year, as these sectors demonstrated solid earnings and were generally immune from the economic chaos. Overall stock selection within consumer staples and weightings within both consumer staples and health care benefited the Fund’s relative performance. Additionally, stock selection aided investments within the materials, energy and industrials sectors. The Fund’s underweighting in the energy and utilities sectors also helped performance. On the negative side, the Fund’s performance was hurt by its investments in the technology, telecommunications and financials sectors.
Notable individual performers within consumer staples included shares of small-cap direct seller of nutritional and personal products NuSkin Enterprises, which rose 158%. Additionally, shares of Chattem rose 30% on news of its being acquired by French drug maker Sanofi-Aventis. In addition, shares of large-cap pharmacy and drugstore operator Walgreen’s, and tobacco giants Altria and Philip Morris International provided solid returns. Within health care, Wyeth was a top contributor after agreeing to merge with competitor Pfizer. Biotech firm Genentech was also a top performer after it agreed to a merger offer from rival Novartis. The overall top performer was Temple Inland, a maker of paper and corrugated packaging, which
Portfolio Manager’s Letter (continued)
GROWTH & INCOME FUND
benefited from cost controls and a cyclical upturn in its businesses. The stock rose 340% during 2009.
The Fund maintained a diverse market capitalization allocation during the period, ending with 60% large cap, 14% mid cap and 26% small cap, according to Lipper’s market capitalization ranges. The small-cap component outperformed similar-size companies within the S&P 500 Index, the large-cap segment performed in line with those in the Index, while the mid-cap segment delivered results slightly below similar-size companies in the S&P 500 Index during the review period.
Thank you for placing your trust in First Investors. We appreciate the opportunity to serve your investment needs.
Sincerely,

Edwin D. Miska
Portfolio Manager and
Director of Equities, First Investors Management Company, Inc.
January 29, 2010
Fund Expenses (unaudited)
GROWTH & INCOME FUND
The examples below show the ongoing costs (in dollars) of investing in your Fund and will help you in comparing these costs with costs of other mutual funds. Please refer to page 3 for a detailed explanation of the information presented in these examples.
| | | |
| | Beginning | Ending | |
| | Account | Account | Expenses Paid |
| | Value | Value | During Period |
| | (7/1/09) | (12/31/09) | (7/1/09–12/31/09)* |
| Expense Examples | | | |
| Actual | $1,000.00 | $1,216.85 | $4.64 |
| Hypothetical | | | |
| (5% annual return before expenses) | $1,000.00 | $1,021.03 | $4.23 |
| |
| * | Expenses are equal to the annualized expense ratio of .83%, multiplied by the average account |
| value over the period, multiplied by 184/365 (to reflect the one-half year period). |
Portfolio Composition
TOP TEN SECTORS
|
| Portfolio holdings and allocations are subject to change. Percentages are as of December 31, 2009, |
| and are based on the total value of investments. |
Cumulative Performance Information
GROWTH & INCOME FUND
Comparison of change in value of $10,000 investment in the First Investors Life Series
Growth & Income Fund and the Standard & Poor’s 500 Index.

The graph compares a $10,000 investment in the First Investors Life Series Growth & Income Fund beginning 12/31/99 with a theoretical investment in the Standard & Poor’s 500 Index (the “Index”). The Index is an unmanaged capitalization-weighted index of 500 stocks designed to measure performance of the broad domestic economy through changes in the aggregate market value of such stocks, which represent all major industries. It is not possible to invest directly in this Index. In addition, the Index does not reflect fees and expenses associated with the active management of a mutual fund portfolio. For purposes of the graph and the accompanying table it is assumed that all dividends and distributions were reinvested.
* The Average Annual Total Return figures are for the periods ended 12/31/09.
The returns shown do not reflect any sales charges, since the Fund sells its shares solely to variable annuity and/or variable life insurance subaccounts at net asset value. The returns do not reflect the fees and charges that an individual would pay in connection with an investment in a variable annuity or life contract or policy. Results represent past performance and do not indicate future results. The graph and the returns shown do not reflect the deduction of taxes that an investor would pay on distributions or the redemption of fund shares. Investment return and principal value of an investment will fluctuate so that an investor’s shares, when redeemed, may be worth more or less than the original cost. Standard & Poor’s 500 Index figures are from Standard & Poor’s and all other figures are from First Investors Management Company, Inc.
Portfolio of Investments
GROWTH & INCOME FUND
December 31, 2009
| | | | |
| Shares | | | Security | Value |
| |
| | | | COMMON STOCKS—99.4% | |
| | | | Consumer Discretionary—15.5% | |
| 40,200 | | * | Big Lots, Inc. | $ 1,164,996 |
| 32,400 | | | BorgWarner, Inc. | 1,076,328 |
| 29,469 | | | Brown Shoe Company, Inc. | 290,859 |
| 7,300 | | | Burger King Holdings, Inc. | 137,386 |
| 57,485 | | | CBS Corporation – Class “B” | 807,664 |
| 48,661 | | * | CEC Entertainment, Inc. | 1,553,259 |
| 42,364 | | | Coach, Inc. | 1,547,557 |
| 37,600 | | * | Corinthian Colleges, Inc. | 517,752 |
| 53,700 | | * | GameStop Corporation – Class “A” | 1,178,178 |
| 20,070 | | | Genuine Parts Company | 761,857 |
| 55,500 | | | H&R Block, Inc. | 1,255,410 |
| 59,500 | | | Home Depot, Inc. | 1,721,335 |
| 62,200 | | * | Jack in the Box, Inc. | 1,223,474 |
| 51,000 | | | Limited Brands, Inc. | 981,240 |
| 62,500 | | * | Lincoln Educational Services Corporation | 1,354,375 |
| 34,000 | | | McDonald’s Corporation | 2,122,960 |
| 143,800 | | * | Morgans Hotel Group Company | 651,414 |
| 106,943 | | | Newell Rubbermaid, Inc. | 1,605,214 |
| 18,400 | | | NIKE, Inc. – Class “B” | 1,215,688 |
| 14,421 | | | Polo Ralph Lauren Corporation – Class “A” | 1,167,813 |
| 121,645 | | * | Ruby Tuesday, Inc. | 875,844 |
| 200 | | * | Rue21, Inc. | 5,618 |
| 50,237 | | | Staples, Inc. | 1,235,328 |
| 30,574 | | * | Steiner Leisure, Ltd. | 1,215,622 |
| 224,370 | | | Stewart Enterprises, Inc. – Class “A” | 1,155,506 |
| 16,000 | | | Tupperware Brands Corporation | 745,120 |
| 72,083 | | | Wyndham Worldwide Corporation | 1,453,914 |
| |
| | | | | 29,021,711 |
| |
| | | | Consumer Staples—14.9% | |
| 124,000 | | | Altria Group, Inc. | 2,434,120 |
| 29,700 | | | Avon Products, Inc. | 935,550 |
| 32,700 | | * | Chattem, Inc. | 3,050,910 |
| 33,589 | | | Coca-Cola Company | 1,914,573 |
| 63,000 | | | CVS Caremark Corporation | 2,029,230 |
| 2,700 | | * | Dean Foods Company | 48,708 |
| 16,500 | | * | Dole Food Company, Inc. | 204,765 |
| 47,000 | | | McCormick & Company, Inc. | 1,698,110 |
| 102,127 | | | Nu Skin Enterprises, Inc. – Class “A” | 2,744,152 |
| 29,400 | | | PepsiCo, Inc. | 1,787,520 |
Portfolio of Investments (continued)
GROWTH & INCOME FUND
December 31, 2009
| | | | |
| Shares | | | Security | Value |
| |
| | | | Consumer Staples (continued) | |
| 65,300 | | | Philip Morris International, Inc. | $ 3,146,807 |
| 26,713 | | | Procter & Gamble Company | 1,619,609 |
| 52,407 | | | Safeway, Inc. | 1,115,745 |
| 3,291 | | | Tootsie Roll Industries, Inc. | 90,108 |
| 74,500 | | | Walgreen Company | 2,735,640 |
| 43,564 | | | Wal-Mart Stores, Inc. | 2,328,496 |
| |
| | | | | 27,884,043 |
| |
| | | | Energy—6.9% | |
| 110,569 | | * | Cal Dive International, Inc. | 835,902 |
| 26,018 | | | ConocoPhillips | 1,328,739 |
| 29,029 | | | ExxonMobil Corporation | 1,979,488 |
| 22,522 | | | Marathon Oil Corporation | 703,137 |
| 53,500 | | | Noble Corporation | 2,177,450 |
| 23,194 | | | Sasol, Ltd. (ADR) | 926,368 |
| 13,000 | | | Schlumberger, Ltd. | 846,170 |
| 72,107 | | | Suncor Energy, Inc. | 2,546,098 |
| 32,600 | | | XTO Energy, Inc. | 1,516,878 |
| |
| | | | | 12,860,230 |
| |
| | | | Financials—10.8% | |
| 15,006 | | | American Express Company | 608,043 |
| 41,000 | | | Ameriprise Financial, Inc. | 1,591,620 |
| 31,766 | | | Astoria Financial Corporation | 394,851 |
| 19,428 | | | Bank of America Corporation | 292,586 |
| 59,900 | | | Brookline Bancorp, Inc. | 593,609 |
| 19,905 | | | Capital One Financial Corporation | 763,158 |
| 18,937 | | | Citigroup, Inc. | 62,681 |
| 29,143 | | | Discover Financial Services | 428,694 |
| 170,000 | | | Financial Select Sector SPDR Fund (ETF) | 2,446,300 |
| 53,037 | | | First Mercury Financial Corporation | 727,137 |
| 14,121 | | | Hartford Financial Services Group, Inc. | 328,455 |
| 74,500 | | | Hudson City Bancorp, Inc. | 1,022,885 |
| 52,656 | | | JPMorgan Chase & Company | 2,194,176 |
| 26,968 | | | KeyCorp | 149,672 |
| 48,113 | | | Morgan Stanley | 1,424,145 |
| 122,300 | | | New York Community Bancorp, Inc. | 1,774,573 |
| 89,800 | | | NewAlliance Bancshares, Inc. | 1,078,498 |
| 60,000 | | | SPDR KBW Regional Banking (ETF) | 1,335,000 |
| 109,779 | | * | Sunstone Hotel Investors, Inc. (REIT) | 974,838 |
| 29,688 | | | U.S. Bancorp | 668,277 |
| | | | |
| Shares | | | Security | Value |
| |
| | | | Financials (continued) | |
| 26,400 | | | Urstadt Biddle Properties – Class “A” (REIT) | $ 403,128 |
| 18,046 | | | Webster Financial Corporation | 214,206 |
| 26,367 | | | Wells Fargo & Company | 711,645 |
| |
| | | | | 20,188,177 |
| |
| | | | Health Care—13.8% | |
| 45,700 | | | Abbott Laboratories | 2,467,343 |
| 14,946 | | * | Amgen, Inc. | 845,495 |
| 16,730 | | | Baxter International, Inc. | 981,716 |
| 30,000 | | | Becton, Dickinson & Company | 2,365,800 |
| 19,300 | | * | Cephalon, Inc. | 1,204,513 |
| 20,800 | | * | Genzyme Corporation | 1,019,408 |
| 36,400 | | * | Gilead Sciences, Inc. | 1,575,392 |
| 51,375 | | | Johnson & Johnson | 3,309,064 |
| 21,121 | | * | Laboratory Corporation of America Holdings | 1,580,696 |
| 38,832 | | | Medtronic, Inc. | 1,707,831 |
| 29,043 | | | Merck & Company. Inc. | 1,061,231 |
| 42,200 | | | Perrigo Company | 1,681,248 |
| 123,282 | | | Pfizer, Inc. | 2,242,500 |
| 46,700 | | * | PSS World Medical, Inc. | 1,054,019 |
| 32,453 | | | Sanofi-Aventis (ADR) | 1,274,429 |
| 18,500 | | * | St. Jude Medical, Inc. | 680,430 |
| 17,443 | | * | Thermo Fisher Scientific, Inc. | 831,857 |
| |
| | | | | 25,882,972 |
| |
| | | | Industrials—14.1% | |
| 23,294 | | | 3M Company | 1,925,715 |
| 38,200 | | * | AAR Corporation | 877,836 |
| 24,559 | | | Alexander & Baldwin, Inc. | 840,655 |
| 38,095 | | * | Altra Holdings, Inc. | 470,473 |
| 52,300 | | * | Armstrong World Industries, Inc. | 2,036,039 |
| 18,400 | | | Baldor Electric Company | 516,856 |
| 28,843 | | * | BE Aerospace, Inc. | 677,811 |
| 10,000 | | | Burlington Northern Santa Fe Corporation | 986,200 |
| 54,537 | | | Chicago Bridge & Iron Company NV – NY Shares | 1,102,738 |
| 45,500 | | * | DynCorp International, Inc. – Class “A” | 652,925 |
| 34,000 | | * | Esterline Technologies Corporation | 1,386,180 |
| 67,196 | | | General Electric Company | 1,016,676 |
| 14,700 | | | Harsco Corporation | 473,781 |
| 38,640 | | | Honeywell International, Inc. | 1,514,688 |
| 36,553 | | | IDEX Corporation | 1,138,626 |
Portfolio of Investments (continued)
GROWTH & INCOME FUND
December 31, 2009
| | | | |
| Shares | | | Security | Value |
| |
| | | | Industrials (continued) | |
| 16,400 | | | Lockheed Martin Corporation | $ 1,235,740 |
| 29,500 | | * | Mistras Group, Inc. | 444,270 |
| 63,919 | | * | Mobile Mini, Inc. | 900,619 |
| 17,618 | | | Northrop Grumman Corporation | 983,965 |
| 36,762 | | * | PGT, Inc. | 77,200 |
| 27,900 | | | Raytheon Company | 1,437,408 |
| 23,150 | | | Republic Services, Inc. | 655,377 |
| 89,200 | | | TAL International Group, Inc. | 1,180,116 |
| 53,900 | | | Textainer Group Holdings, Ltd. | 910,910 |
| 29,168 | | | Tyco International, Ltd. | 1,040,714 |
| 29,400 | | | United Technologies Corporation | 2,040,654 |
| |
| | | | | 26,524,172 |
| |
| | | | Information Technology—16.2% | |
| 131,700 | | * | Brocade Communications Systems, Inc. | 1,004,871 |
| 21,400 | | * | CACI International, Inc. – Class “A” | 1,045,390 |
| 58,600 | | * | Cisco Systems, Inc. | 1,402,884 |
| 106,690 | | * | EMC Corporation | 1,863,874 |
| 22,000 | | | Harris Corporation | 1,046,100 |
| 44,340 | | | Hewlett-Packard Company | 2,283,953 |
| 55,352 | | | Intel Corporation | 1,129,181 |
| 31,529 | | | International Business Machines Corporation | 4,127,146 |
| 131,300 | | | Microsoft Corporation | 4,003,337 |
| 88,100 | | | National Semiconductor Corporation | 1,353,216 |
| 49,425 | | * | NCI, Inc. – Class “A” | 1,366,601 |
| 94,117 | | | Nokia Corporation – Class “A” (ADR) | 1,209,403 |
| 72,355 | | * | Parametric Technology Corporation | 1,182,281 |
| 48,088 | | | QUALCOMM, Inc. | 2,224,551 |
| 72,650 | | * | SRA International, Inc. – Class “A” | 1,387,615 |
| 123,460 | | * | Symantec Corporation | 2,208,699 |
| 60,200 | | | Western Union Company | 1,134,770 |
| 18,185 | | | Xilinx, Inc. | 455,716 |
| |
| | | | | 30,429,588 |
| |
| | | | Materials—4.3% | |
| 51,200 | | | Bemis Company, Inc. | 1,518,080 |
| 36,800 | | | Celanese Corporation – Series “A” | 1,181,280 |
| 23,370 | | * | Freeport-McMoRan Copper & Gold, Inc. | 1,876,377 |
| 7,300 | | | Olin Corporation | 127,896 |
| | | | | | |
| Shares or | | | | | | |
| Principal | | | | | | |
| Amount | | | Security | | | Value |
| |
| | | | Materials (continued) | | | |
| 12,200 | | | Praxair, Inc. | | | $ 979,782 |
| 68,320 | | | RPM International, Inc. | | | 1,388,946 |
| 49,464 | | | Temple-Inland, Inc. | | | 1,044,185 |
| |
| | | | | | | 8,116,546 |
| |
| | | | Telecommunication Services—2.5% | | | |
| 71,083 | | | AT&T, Inc. | | | 1,992,457 |
| 82,200 | | | Verizon Communications, Inc. | | | 2,723,286 |
| |
| | | | | | | 4,715,743 |
| |
| | | | Utilities—.4% | | | |
| 24,126 | | | Atmos Energy Corporation | | | 709,304 |
| |
| Total Value of Common Stocks (cost $188,442,374) | | | 186,332,486 |
| |
| | | | SHORT-TERM INVESTMENTS—.4% | | | |
| | | | Money Market Fund | | | |
| $775 | M | | First Investors Cash Reserve Fund, .24% (cost $775,000)** | | 775,000 |
| |
| Total Value of Investments (cost $189,217,374) | 99.8 | % | 187,107,486 |
| Other Assets, Less Liabilities | .2 | | 292,631 |
| |
| Net Assets | | | | 100.0 | % | $187,400,117 |
| |
| * | Non-income producing |
| ** | Affiliated unregistered money market fund available only to First Investors funds and certain |
| accounts managed by First Investors Management Company, Inc. Rate shown is the 7-day yield at |
| December 31, 2009 (see Note 3). |
| | |
| Summary of Abbreviations: |
| ADR | American Depositary Receipts |
| ETF | Exchange Traded Fund |
| REIT | Real Estate Investment Trust |
Portfolio of Investments (continued)
GROWTH & INCOME FUND
December 31, 2009
Accounting Standards Codification (“ASC”) 820 established a three-tier hierarchy of inputs to establish a classification of fair value measurements for disclosure purposes. The three-tier hierarchy of inputs is summarized in the three broad Levels listed below:
| Level 1 — quoted prices in active markets for identical securities |
| |
| Level 2 — other significant observable inputs (including quoted prices for similar securities, interest rates, prepayment speeds, credit risk, etc.) |
| |
| Level 3 — significant unobservable inputs (including the fund’s own assumptions in determining the fair value of investments) |
The inputs methodology used for valuing securities are not necessarily an indication of the risk associated with investing in those securities.
The following is a summary, by category of Level, of inputs used to value the Fund’s investments as of December 31, 2009:
| | | | | | | | | | | | |
| | | | | | | Level 2 | | | | | | |
| | | | | | | Other | | | Level 3 | | | |
| | | | Level 1 | | | Significant | | | Significant | | | |
| | | | Quoted | | | Observable | | | Unobservable | | | |
| | | | Prices | | | Inputs | | | Inputs | | | Total |
| Common Stocks | | $ | 186,332,486 | | $ | — | | $ | — | | $ | 186,332,486 |
| Money Market Fund | | | 775,000 | | | — | | | — | | | 775,000 |
| Total Investments in | | | | | | | | | | | | |
| Securities* | | $ | 187,107,486 | | $ | — | | $ | — | | $ | 187,107,486 |
|
| * The Portfolio of Investments provides information on the industry categorization for the portfolio. |
| | |
| 40 | See notes to financial statements | |
Portfolio Manager’s Letter
HIGH YIELD FUND
Dear Investor:
This is the annual report for the First Investors Life High Yield Fund for the year ended December 31, 2009. During the period, the Fund’s return on a net asset value basis was 35.15%, including dividends of 58.2 cents per share.
The Fund underwent significant changes during the review period. Muzinich & Co., Inc. (“Muzinich”) became subadviser of the Fund on April 24, 2009. Muzinich is an institutional asset manager specializing in high yield, with more than $5.5 billion in high yield assets under management for clients in the U.S. and Europe. Muzinich emphasizes rigorous research to carefully select credits that it believes offer good value for the risk they present relative to other offerings in the marketplace.
The review period began in the midst of the worst financial crisis since the Great Depression. Beginning in the third quarter of 2008 and continuing over the next several months, extraordinary actions by the U.S. government and the Federal Reserve helped stabilize both the markets and the economy. By the end of 2009, the financial markets had experienced a significant recovery. For the corporate bond market, this environment resulted in significant volatility as the market priced itself for a worst-case outcome (and valuations moved to historically cheap levels) and then staged a terrific rebound. By the end of the review period, the corporate bond market had registered very strong 12-month returns.
Throughout the second, third and fourth quarters of the year, significant cash flowed into the high yield market as investors became more confident about the broad economy. High yield enjoyed a noticeable bounce through the summer as earnings reports exceeded the marketplace’s very low expectations. Interest in high yield continued to climb through the summer as more positive economic news made it easier for a growing number of high yield companies to regain liquidity they had lost during the credit crisis.
Since taking over the Fund, we took advantage of rising market bids for high yield bonds and a growing market appetite for risk, by replacing many of the Fund’s least liquid and highest-default risk positions with higher quality credits. We believe the Fund’s relatively more conservative approach positions it well for the future. However, in the last year, when the most speculative risk was favored, the Fund’s more cautious approach caused it to underperform the Credit Suisse High Yield II Index. Particularly in the second, third and fourth quarters of 2009, the vast majority of the market’s returns went to credits priced at very distressed levels, or to those in the financial services sectors. In a rally such as this one, the Fund’s higher-quality portfolio was bound to underperform. In 2009, massive risk-taking, not credit analysis, was rewarded.
Portfolio Manager’s Letter (continued)
HIGH YIELD FUND
Thank you for placing your trust in First Investors. We appreciate the opportunity to serve your investment needs.
Sincerely,

John Ingallinera
Senior Portfolio Manager*
January 29, 2010
*Mr. Ingallinera is part of a portfolio management team that began managing the Fund on April 24, 2009.
Fund Expenses (unaudited)
HIGH YIELD FUND
The examples below show the ongoing costs (in dollars) of investing in your Fund and will help you in comparing these costs with costs of other mutual funds. Please refer to page 3 for a detailed explanation of the information presented in these examples.
| | | |
| | Beginning | Ending | |
| | Account | Account | Expenses Paid |
| | Value | Value | During Period |
| | (7/1/09) | (12/31/09) | (7/1/09–12/31/09)* |
| Expense Examples | | | |
| Actual | $1,000.00 | $1,144.95 | $4.76 |
| Hypothetical | | | |
| (5% annual return before expenses) | $1,000.00 | $1,020.77 | $4.48 |
| |
| * | Expenses are equal to the annualized expense ratio of .88%, multiplied by the average account |
| value over the period, multiplied by 184/365 (to reflect the one-half year period). |
Portfolio Composition
TOP TEN SECTORS

|
| Portfolio holdings and allocations are subject to change. Percentages are as of December 31, 2009, |
| and are based on the total value of investments. |
Cumulative Performance Information
HIGH YIELD FUND
Comparison of change in value of $10,000 investment in the First Investors Life Series High Yield Fund, the Bank of America (“BofA”) Merrill Lynch BB-B US Cash Pay High Yield Constrained Index† and the Credit Suisse High Yield Index II.

The graph compares a $10,000 investment in the First Investors Life Series High Yield Fund beginning 12/31/99 with theoretical investments in the BofA Merrill Lynch BB-B US Cash Pay High Yield Constrained Index and the Credit Suisse High Yield Index II (the “Indices”). The BofA Merrill Lynch BB-B US Cash Pay High Yield Constrained Index contains all securities in the BofA Merrill Lynch US Cash Pay High Yield Index rated BB1 through B3, based on an average of Moody’s, S&P and Fitch, but caps issuer exposure at 2%. As of 12/31/09, the Index consisted of 1,398 different issues, all cash-pay, with an average maturity of 7.17 years, an average duration of 4.71 years and an average coupon of 8.08%. The Credit Suisse High Yield Index II is designed to measure the performance of the high yield bond market. As of 12/31/09, the Index consisted of 1,220 different issues, most of which are cash-pay; also included in the Index are zero-coupon bonds , step bonds, payment-in-kind bonds and bonds which are in default. As of 12/31/09, approximately 0.75% of the market value of the Index was in default. The bonds included in the Index have an average maturity of 6.45 years, an average duration of 3.87 years and an average coupon of 8.50%. It is not possible to invest directly in these Indices. In addition, the Indices do not reflect fees and expenses associated with the active management of a mutual fund portfolio. For purposes of the graph and the accompanying table it is assumed that all dividends and distributions were reinvested.
* The Average Annual Total Return figures are for the periods ended 12/31/09.
The returns shown do not reflect any sales charges, since the Fund sells its shares solely to variable annuity and/or variable life insurance subaccounts at net asset value. The returns do not reflect the fees and charges that an individual would pay in connection with an investment in a variable annuity or life contract or policy. Results represent past performance and do not indicate future results. The graph and the returns shown do not reflect the deduction of taxes that an investor would pay on distributions or the redemption of fund shares. Investment return and principal value of an investment will fluctuate so that an investor’s shares, when redeemed, may be worth more or less than the original cost. The issuers of the high yield bonds, in which the Fund primarily invests, pay higher interest rates because they have a greater likelihood of financial difficulty , which could result in their inability to repay the bonds fully when due. Prices of high yield bonds are also subject to greater fluctuations. BofA Merrill Lynch BB-B US Cash Pay High Yield Constrained Index figures from Bank of America Merrill Lynch, Credit Suisse High Yield Index II figures are from Credit Suisse Corporation and all other figures are from First Investors Management Company, Inc.
† We have added a comparison to the BofA Merrill Lynch BB-B US Cash Pay High Yield Constrained Index this year since it more closely reflects the performance of the securities in which the Fund invests. After this year we will not show a comparison to the Credit Suisse High Yield Index II.
Portfolio of Investments
HIGH YIELD FUND
December 31, 2009
| | | | |
| Principal | | | | |
| Amount | | | Security | Value |
| |
| | | | CORPORATE BONDS—95.5% | |
| | | | Aerospace/Defense—2.1% | |
| $ 725 | M | | Alliant Techsystems, Inc., 6.75%, 2016 | $ 721,375 |
| 660 | M | | DynCorp International, LLC, 9.5%, 2013 | 671,550 |
| |
| | | | | 1,392,925 |
| |
| | | | Airlines—.4% | |
| 225 | M | | American Airlines, Inc., 10.5%, 2012 (a) | 236,250 |
| |
| | | | Automotive—1.7% | |
| 300 | M | | Cooper Tire & Rubber Co., 8%, 2019 | 291,000 |
| 350 | M | | Goodyear Tire & Rubber Co., 10.5%, 2016 | 388,500 |
| 450 | M | | Navistar International Corp., 8.25%, 2021 | 463,500 |
| |
| | | | | 1,143,000 |
| |
| | | | Building Materials—1.4% | |
| 450 | M | | Building Materials Corp., 7.75%, 2014 | 447,750 |
| 200 | M | | Interface, Inc., 11.375%, 2013 | 224,500 |
| 225 | M | | Mohawk Industries, Inc., 6.875%, 2016 | 225,000 |
| |
| | | | | 897,250 |
| |
| | | | Capital Goods—.6% | |
| 375 | M | | Belden CDT, Inc., 9.25%, 2019 (a) | 397,969 |
| |
| | | | Chemicals—2.5% | |
| 475 | M | | Georgia Gulf Corp., 9%, 2017 (a) | 482,125 |
| 325 | M | | Huntsman International, LLC, 5.5%, 2016 (a) | 290,062 |
| 200 | M | | Invista, 9.25%, 2012 (a) | 204,000 |
| 400 | M | | Solutia, Inc., 8.75%, 2017 | 418,500 |
| 275 | M | | Westlake Chemical Corp., 6.625%, 2016 | 264,344 |
| |
| | | | | 1,659,031 |
| |
| | | | Consumer Durables—1.2% | |
| | | | Sealy Mattress Co.: | |
| 500 | M | | 8.25%, 2014 | 502,500 |
| 250 | M | | 10.875%, 2016 (a) | 279,375 |
| |
| | | | | 781,875 |
Portfolio of Investments (continued)
HIGH YIELD FUND
December 31, 2009
| | | | |
| Principal | | | | |
| Amount | | | Security | Value |
| |
| | | | Consumer Non-Durables—1.4% | |
| $ 325 | M | | Acco Brands Corp., 10.625%, 2015 (a) | $ 359,125 |
| 175 | M | | Hanesbrands, Inc., 8%, 2016 | 179,156 |
| 375 | M | | Levi Strauss & Co., 9.75%, 2015 | 395,625 |
| |
| | | | | 933,906 |
| |
| | | | Energy—10.7% | |
| | | | Berry Petroleum Co.: | |
| 375 | M | | 10.25%, 2014 | 409,687 |
| 250 | M | | 8.25%, 2016 | 247,500 |
| 200 | M | | Chesapeake Energy Corp., 7.5%, 2014 | 205,000 |
| 125 | M | | Complete Production Services, Inc., 8%, 2016 | 123,906 |
| 125 | M | | Concho Resources, Inc., 8.625%, 2017 | 131,875 |
| 25 | M | | Continental Resources, Inc., 8.25%, 2019 (a) | 26,375 |
| 150 | M | | Copano Energy, LLC, 8.125%, 2016 | 152,250 |
| | | | El Paso Corp.: | |
| 150 | M | | 12%, 2013 | 176,625 |
| 150 | M | | 8.25%, 2016 | 160,875 |
| 650 | M | | 7%, 2017 | 647,915 |
| 50 | M | | 7.25%, 2018 | 49,650 |
| 50 | M | | 7.75%, 2032 | 47,531 |
| 350 | M | | Expro Finance Luxembourg SCA, 8.5%, 2016 (a) | 349,125 |
| 325 | M | | Ferrellgas Partners, LP, 9.125%, 2017 (a) | 345,312 |
| 275 | M | | Helix Energy Solutions Group, Inc., 9.5%, 2016 (a) | 283,250 |
| 400 | M | | Hilcorp Energy I, LP, 9%, 2016 (a) | 408,000 |
| | | | Linn Energy, LLC: | |
| 175 | M | | 11.75%, 2017 (a) | 197,313 |
| 225 | M | | 9.875%, 2018 | 240,187 |
| 400 | M | | Mariner Energy, Inc., 11.75%, 2016 | 448,000 |
| 225 | M | | Penn Virginia Corp., 10.375%, 2016 | 246,375 |
| 150 | M | | Pioneer Natural Resource Co., 7.5%, 2020 | 150,818 |
| | | | Plains Exploration & Production Co.: | |
| 75 | M | | 7.75%, 2015 | 76,687 |
| 375 | M | | 7.625%, 2018 | 385,312 |
| | | | Quicksilver Resources, Inc.: | |
| 175 | M | | 7.125%, 2016 | 164,062 |
| 300 | M | | 11.75%, 2016 | 342,000 |
| 250 | M | | 9.125%, 2019 | 262,500 |
| 200 | M | | Sandridge Energy, Inc., 9.875%, 2016 (a) | 211,500 |
| 550 | M | | Williams Partners, LP, 7.25%, 2017 | 556,366 |
| |
| | | | | 7,045,996 |
| | | | |
| Principal | | | | |
| Amount | | | Security | Value |
| |
| | | | Food/Beverage/Tobacco—3.9% | |
| $ 475 | M | | Bumble Bee Foods, LLC, 7.75%, 2015 (a) | $ 477,375 |
| 525 | M | | Constellation Brands, Inc., 7.25%, 2016 | 535,500 |
| 125 | M | | Dole Foods Co., 8%, 2016 (a) | 127,500 |
| 550 | M | | JBS USA, LLC, 11.625%, 2014 (a) | 625,625 |
| | | | Smithfield Foods, Inc.: | |
| 375 | M | | 10%, 2014 (a) | 408,750 |
| 425 | M | | 7.75%, 2017 | 394,188 |
| |
| | | | | 2,568,938 |
| |
| | | | Food/Drug—1.8% | |
| 825 | M | | Ingles Markets, Inc., 8.875%, 2017 | 862,125 |
| 75 | M | | Rite Aid Corp., 9.75%, 2016 | 81,750 |
| 250 | M | | Tops Markets, LLC, 10.125%, 2015 (a) | 258,750 |
| |
| | | | | 1,202,625 |
| |
| | | | Forest Products/Containers—2.2% | |
| 150 | M | | Cascades, Inc., 7.875%, 2020 (a) | 153,000 |
| 150 | M | | Crown Americas, LLC, 7.625%, 2017 (a) | 156,375 |
| 300 | M | | PE Paper Escrow GmbH, 12%, 2014 (a) | 332,088 |
| 525 | M | | Reynolds Group Escrow, LLC, 7.75%, 2016 (a) | 539,438 |
| 240 | M | | Sappi Papier Holding, AG, 6.75%, 2012 (a) | 230,052 |
| 5 | M | | Tekni-Plex, Inc., 8.75%, 2013 | 3,706 |
| |
| | | | | 1,414,659 |
| |
| | | | Gaming/Leisure—6.2% | |
| 150 | M | | Ameristar Casinos, Inc., 9.25%, 2014 (a) | 156,375 |
| 300 | M | | Las Vegas Sands Corp., 6.375%, 2015 | 267,000 |
| 390 | M | | Mandalay Resort Group, 6.375%, 2011 | 354,412 |
| | | | MGM Mirage, Inc.: | |
| 125 | M | | 13%, 2013 | 144,062 |
| 200 | M | | 11.125%, 2017 (a) | 222,500 |
| 650 | M | | 11.375%, 2018 (a) | 585,000 |
| | | | Mohegan Tribal Gaming Authority: | |
| 350 | M | | 8%, 2012 | 299,687 |
| 75 | M | | 6.125%, 2013 | 60,469 |
| 250 | M | | NCL Corp., 11.75%, 2016 (a) | 248,125 |
| | | | Pinnacle Entertainment, Inc.: | |
| 325 | M | | 7.5%, 2015 | 300,625 |
| 175 | M | | 8.625%, 2017 (a) | 179,375 |
Portfolio of Investments (continued)
HIGH YIELD FUND
December 31, 2009
| | | | |
| Principal | | | | |
| Amount | | | Security | Value |
| |
| | | | Gaming/Leisure (continued) | |
| $ 405 | M | | Speedway Motorsports, Inc., 6.75%, 2013 | $ 405,000 |
| 475 | M | | Wynn Las Vegas, LLC, 7.875%, 2017 (a) | 483,312 |
| 375 | M | | Yonkers Racing Corp., 11.375%, 2016 (a) | 395,625 |
| |
| | | | | 4,101,567 |
| |
| | | | Health Care—5.6% | |
| 275 | M | | Biomet, Inc., 11.625%, 2017 | 305,250 |
| 925 | M | | Community Health Systems, Inc., 8.875%, 2015 | 959,687 |
| 600 | M | | Genesis Health Ventures, Inc., 9.75%, 2011 (b)(c) | 375 |
| | | | HCA, Inc.: | |
| 800 | M | | 6.75%, 2013 | 792,000 |
| 400 | M | | 6.375%, 2015 | 379,500 |
| 343 | M | | Res-Care, Inc., 7.75%, 2013 | 343,000 |
| 150 | M | | Talecris Biotherapeutics Holdings Corp., 7.75%, 2016 (a) | 153,000 |
| 250 | M | | Tenet Healthcare Corp., 9.25%, 2015 | 267,500 |
| 600 | M | | Universal Hospital Services, Inc., 3.859%, 2015 (d) | 508,500 |
| |
| | | | | 3,708,812 |
| |
| | | | Information Technology—1.1% | |
| | | | Jabil Circuit, Inc.: | |
| 50 | M | | 7.75%, 2016 | 52,750 |
| 75 | M | | 8.25%, 2018 | 80,625 |
| 200 | M | | JDA Software Group, Inc., 8%, 2014 (a) | 205,000 |
| 225 | M | | Seagate Technology HDD Holdings, 6.8%, 2016 | 218,812 |
| 150 | M | | Seagate Technology International, Inc., 10%, 2014 (a) | 166,500 |
| |
| | | | | 723,687 |
| |
| | | | Manufacturing—3.0% | |
| 375 | M | | Baldor Electric Co., 8.625%, 2017 | 385,313 |
| 175 | M | | Case New Holland, Inc., 7.75%, 2013 (a) | 179,813 |
| 100 | M | | CPM Holdings, Inc., 10.625%, 2014 (a) | 106,000 |
| 250 | M | | ESCO Corp., 8.625%, 2013 (a) | 250,000 |
| | | | Terex Corp.: | |
| 350 | M | | 10.875%, 2016 | 392,000 |
| 675 | M | | 8%, 2017 | 653,063 |
| |
| | | | | 1,966,189 |
| | | | |
| Principal | | | | |
| Amount | | | Security | Value |
| |
| | | | Media-Broadcasting—2.8% | |
| | | | Belo Corp.: | |
| $ 275 | M | | 6.75%, 2013 | $ 271,906 |
| 75 | M | | 8%, 2016 | 77,438 |
| 500 | M | | 7.25%, 2027 | 397,500 |
| 100 | M | | 7.75%, 2027 | 80,500 |
| 150 | M | | Lin Television Corp., 6.5%, 2013 | 143,250 |
| 320 | M | | Nexstar Finance Holdings, LLC, 11.375%, 2013 | 243,288 |
| 575 | M | | Sinclair Television Group, 9.25%, 2017 (a) | 600,875 |
| |
| | | | | 1,814,757 |
| |
| | | | Media-Cable TV—7.7% | |
| 850 | M | | Atlantic Broadband Finance, LLC, 9.375%, 2014 | 851,062 |
| 225 | M | | Cablevision Systems Corp., 8.625%, 2017 (a) | 235,406 |
| 250 | M | | CCO Holdings, LLC, 8.75%, 2013 | 257,813 |
| 275 | M | | Cequel Communications Holdings I, Inc., 8.625%, 2017 (a) | 279,125 |
| | | | Clear Channel Worldwide: | |
| 250 | M | | 9.25%, 2017 (a) | 256,250 |
| 725 | M | | 9.25%, 2017 (a) | 750,375 |
| 125 | M | | CSC Holdings, Inc., 8.5%, 2014 (a) | 133,750 |
| 325 | M | | Echostar DBS Corp., 6.625%, 2014 | 328,656 |
| 250 | M | | Mediacom LLC/Mediacom Capital Corp., 9.125%, 2019 (a) | 256,250 |
| 300 | M | | Quebecor Media, Inc., 7.75%, 2016 | 300,750 |
| 425 | M | | UPC Germany GmbH, 8.125%, 2017 (a) | 431,906 |
| 50 | M | | UPC Holding BV, 9.875%, 2018 (a) | 53,000 |
| | | | Virgin Media Finance PLC: | |
| 725 | M | | 9.5%, 2016 | 782,094 |
| 150 | M | | 8.375%, 2019 | 155,063 |
| |
| | | | | 5,071,500 |
| |
| | | | Media-Diversified—.8% | |
| | | | Gannett Company, Inc.: | |
| 125 | M | | 8.75%, 2014 (a) | 130,000 |
| 100 | M | | 9.375%, 2017 (a) | 103,750 |
| 175 | M | | Interpublic Group of Cos., Inc., 10%, 2017 | 195,125 |
| | | | MediaNews Group, Inc.: | |
| 375 | M | | 6.875%, 2013 (b)(c) | 234 |
| 400 | M | | 6.375%, 2014 (b)(c) | 250 |
| 50 | M | | Scholastic Corp., 5%, 2013 | 47,000 |
| 50 | M | | WMG Acquisition Corp., 9.5%, 2016 (a) | 53,813 |
| |
| | | | | 530,172 |
Portfolio of Investments (continued)
HIGH YIELD FUND
December 31, 2009
| | | | |
| Principal | | | | |
| Amount | | | Security | Value |
| |
| | | | Metals/Mining—5.3% | |
| | | | Cloud Peak Energy Resources, LLC: | |
| $ 150 | M | | 8.25%, 2017 (a) | $ 150,750 |
| 250 | M | | 8.5%, 2019 (a) | 256,250 |
| 175 | M | | Drummond Co. Inc., 7.375%, 2016 (a) | 171,937 |
| 350 | M | | Essar Steel Algoma, Inc., 9.375%, 2015 (a) | 346,937 |
| | | | Novelis, Inc.: | |
| 300 | M | | 7.25%, 2015 | 287,250 |
| 225 | M | | 11.5%, 2015 (a) | 242,156 |
| 830 | M | | Russell Metals, Inc., 6.375%, 2014 | 792,650 |
| | | | Teck Resources, Ltd.: | |
| 75 | M | | 9.75%, 2014 | 86,906 |
| 625 | M | | 10.25%, 2016 | 731,250 |
| 200 | M | | 10.75%, 2019 | 240,000 |
| 200 | M | | Vedanta Resources PLC, 9.5%, 2018 (a) | 204,000 |
| |
| | | | | 3,510,086 |
| |
| | | | Real Estate Investment Trusts—2.9% | |
| 250 | M | | Brandywine Operating Partnership, LP, 5.7%, 2017 | 224,570 |
| 425 | M | | CB Richard Ellis Service, 11.625%, 2017 | 473,875 |
| | | | Developers Diversified Realty Corp.: | |
| 105 | M | | 5.5%, 2015 | 92,600 |
| 425 | M | | 9.625%, 2016 | 444,202 |
| 375 | M | | Dupont Fabros Technology, LP, 8.5%, 2017 (a) | 382,969 |
| | | | HRPT Properties Trust: | |
| 75 | M | | 6.25%, 2016 | 71,071 |
| 275 | M | | 6.25%, 2017 | 248,814 |
| |
| | | | | 1,938,101 |
| |
| | | | Retail-General Merchandise—8.6% | |
| 425 | M | | Federated Retail Holdings, Inc., 5.9%, 2016 | 416,500 |
| 400 | M | | HSN, Inc., 11.25%, 2016 | 451,000 |
| 325 | M | | J.C. Penney Corp., Inc., 7.95%, 2017 | 356,688 |
| 250 | M | | Landry’s Restaurants, Inc., 11.625%, 2015 (a) | 266,250 |
| | | | Macys Retail Holdings, Inc.: | |
| 400 | M | | 7.45%, 2017 | 416,000 |
| 150 | M | | 6.65%, 2024 | 137,250 |
| 250 | M | | Netflix, Inc., 8.5%, 2017 (a) | 260,625 |
| 475 | M | | Payless ShoeSource, Inc., 8.25%, 2013 | 484,500 |
| 625 | M | | QVC, Inc., 7.5%, 2019 (a) | 640,625 |
| 100 | M | | Regal Cinemas Corp., 8.625%, 2019 | 104,500 |
| 1,000 | M | | Toys R Us Property Co. I, Inc., 10.75%, 2017 (a) | 1,100,000 |
| | | | |
| Principal | | | | |
| Amount | | | Security | Value |
| |
| | | | Retail-General Merchandise (continued) | |
| $ 175 | M | | Toys R Us Property Co. II, Inc., 8.5%, 2017 (a) | $ 178,938 |
| 350 | M | | Wendy’s/Arby’s Restaurants, LLC, 10%, 2016 | 383,250 |
| 475 | M | | Yankee Acquisition Corp., 8.5%, 2015 | 473,812 |
| |
| | | | | 5,669,938 |
| |
| | | | Services—3.6% | |
| 550 | M | | Ashtead Capital, Inc., 9%, 2016 (a) | 553,438 |
| 325 | M | | Hertz Corp., 10.5%, 2016 | 348,562 |
| | | | Iron Mountain, Inc.: | |
| 25 | M | | 8.75%, 2018 | 26,062 |
| 450 | M | | 8%, 2020 | 459,000 |
| 150 | M | | 8.375%, 2021 | 155,625 |
| 450 | M | | Kar Holdings, Inc., 8.75%, 2014 | 466,313 |
| 375 | M | | Reliance Intermediate Holdings, LP, 9.5%, 2019 (a) | 392,344 |
| |
| | | | | 2,401,344 |
| |
| | | | Telecommunications—11.6% | |
| 300 | M | | Cincinnati Bell, Inc., 8.375%, 2014 | 306,750 |
| 750 | M | | Citizens Communications Co., 7.125%, 2019 | 712,500 |
| 350 | M | | Crown Castle International Corp., 7.125%, 2019 | 348,250 |
| 275 | M | | Frontier Communications Corp., 8.125%, 2018 | 279,813 |
| 300 | M | | GCI, Inc., 8.625%, 2019 (a) | 304,125 |
| 750 | M | | Inmarsat Finance PLC, 7.375%, 2017 (a) | 770,625 |
| 350 | M | | Intelsat Corp., 9.25%, 2014 | 361,375 |
| | | | Intelsat Jackson Holdings, Ltd.: | |
| 100 | M | | 9.5%, 2016 | 107,500 |
| 100 | M | | 8.5%, 2019 (a) | 103,500 |
| 300 | M | | Intelsat Subsidiary Holdings Co., Ltd., 8.5%, 2013 | 307,500 |
| | | | Nextel Communications, Inc.: | |
| 450 | M | | 5.95%, 2014 | 422,438 |
| 825 | M | | 7.375%, 2015 | 806,438 |
| | | | Qwest Communications International, Inc.: | |
| 500 | M | | 7.5%, 2014 | 504,375 |
| 300 | M | | 8%, 2015 (a) | 309,750 |
Portfolio of Investments (continued)
HIGH YIELD FUND
December 31, 2009
| | | | |
| Principal | | | | |
| Amount | | | Security | Value |
| |
| | | | Telecommunications (continued) | |
| | | | SBA Telecommunications, Inc.: | |
| $ 25M | M | | 8%, 2016 (a) | $ 26,250 |
| 225M | M | | 8.25%, 2019 (a) | 239,625 |
| 175M | M | | Sprint Nextel Corp., 8.375%, 2017 | 179,375 |
| 500M | M | | Wind Acquisition Finance SA, 11.75%, 2017 (a) | 548,750 |
| | | | Windstream Corp.: | |
| 450M | M | | 8.625%, 2016 | 460,125 |
| 525M | M | | 7.875%, 2017 (a) | 521,063 |
| |
| | | | | 7,620,127 |
| |
| | | | Transportation—.9% | |
| | | | Navios Maritime Holdings: | |
| 475M | M | | 9.5%, 2014 | 475,000 |
| 100M | M | | 8.875%, 2017 (a) | 104,375 |
| |
| | | | | 579,375 |
| |
| | | | Utilities—5.5% | |
| 125M | M | | AES Corp., 9.75%, 2016 (a) | 137,500 |
| 350M | M | | Calpine Construction Finance Co., LP, 8%, 2016 (a) | 362,250 |
| 125M | M | | CMS Energy Corp., 8.75%, 2019 | 137,442 |
| | | | Dynegy Holdings, Inc.: | |
| 200M | M | | 7.5%, 2015 (a) | 185,000 |
| 750M | M | | 7.75%, 2019 | 654,375 |
| 225M | M | | Edison Mission Energy, 7.5%, 2013 | 212,625 |
| 575M | M | | Intergen NV, 9%, 2017 (a) | 602,312 |
| 150M | M | | Mirant North America, LLC, 7.375%, 2013 | 149,063 |
| | | | NRG Energy, Inc.: | |
| 625M | M | | 7.375%, 2017 | 628,125 |
| 225M | M | | 8.5%, 2019 | 231,750 |
| 300M | M | | NSG Holdings, LLC, 7.75%, 2025 (a) | 270,000 |
| 84M | M | | Tenaska Alabama Partners, LP, 7%, 2021 (a) | 77,948 |
| |
| | | | | 3,648,390 |
| |
| Total Value of Corporate Bonds (cost $61,005,776) | 62,958,469 |
| | | | | | |
| Warrants, | | | | | | |
| Shares or | | | | | | |
| Principal | | | | | | |
| Amount | | | Security | | | Value |
| | | | WARRANTS—.0% | | | |
| | | | Building Materials—.0% | | | |
| 115 | | * | Nortek, Inc. (expiring 12/17/14) (c) | | | $ 1,916 |
| |
| | | | Media-Cable TV—.0% | | | |
| 3,431 | | * | Charter Communications, Inc. – Class “A” (expiring 11/30/14) (c) | | 20,586 |
| |
| | | | Telecommunication Services—.0% | | | |
| 250 | | * | GT Group Telecom, Inc. (expiring 2/1/10) (a)(c) | | — |
| Total Value of Warrants (cost $1,606,995) | | | 22,502 |
| |
| | | | COMMON STOCKS—.0% | | | |
| | | | Building Materials—.0% | | | |
| 43 | | * | Nortek, Inc. (c) | | | 1,527 |
| |
| | | | Media-Diversified—.0% | | | |
| 2,500 | | * | MediaNews Group, Inc. – Class “A” (c) | | | 25 |
| |
| | | | Telecommunications—.0% | | | |
| 3 | | * | Viatel Holding (Bermuda), Ltd. (c) | | | — |
| 5,970 | | * | World Access, Inc. | | | 10 |
| | | | | | | 10 |
| Total Value of Common Stocks (cost $177,933) | | | 1,562 |
| |
| | | | SHORT-TERM INVESTMENTS—1.2% | | |
| | | | Money Market Fund | | | |
| $790 | M | | First Investors Cash Reserve Fund, .24% (cost $790,000) (e) | | 790,000 |
| Total Value of Investments (cost $63,580,704) | 96.7 | % | 63,772,533 |
| Other Assets, Less Liabilities | 3.3 | | 2,144,584 |
| |
| Net Assets | | | | 100.0 | % | $65,917,117 |
| |
| * | Non-income producing |
| (a) | Security exempt from registration under Rule 144A of Securities Act of 1933 (see Note 5). |
| (b) | In default as to principal and/or interest payment. |
| (c) | Securities valued at fair value (see Note 1A). |
| (d) | Interest rates on adjustable rate bonds are determined and reset periodically. The interest rates |
| shown are the rates in effect of December 31, 2009. |
| (e) | Affiliated unregistered money market fund available only to First Investors funds and certain |
| accounts managed by First Investors Management Company, Inc. Rate shown is the 7-day yield |
| at December 31, 2009 (see Note 3). |
Portfolio of Investments (continued)
HIGH YIELD FUND
December 31, 2009
Accounting Standards Codification (“ASC”) 820 established a three-tier hierarchy of inputs to establish a classification of fair value measurements for disclosure purposes. The three-tier hierarchy of inputs is summarized in the three broad Levels listed below:
| Level 1 — quoted prices in active markets for identical securities |
| |
| Level 2 — other significant observable inputs (including quoted prices for similar securities, interest rates, prepayment speeds, credit risk, etc.) |
| |
| Level 3 — significant unobservable inputs (including the fund’s own assumptions in determining the fair value of investments) |
The inputs methodology used for valuing securities are not necessarily an indication of the risk associated with investing in those securities.
The following is a summary, by category of Level, of inputs used to value the Fund’s investments as of December 31, 2009:
| | | | | | | | | | | | |
| | | | | | | Level 2 | | | | | | |
| | | | | | | Other | | | Level 3 | | | |
| | | | Level 1 | | | Significant | | | Significant | | | |
| | | | Quoted | | | Observable | | | Unobservable | | | |
| | | | Prices | | | Inputs | | | Inputs | | | Total |
| Corporate Bonds | | $ | — | | $ | 62,957,610 | | $ | 859 | | $ | 62,958,469 |
| Warrants | | | — | | | — | | | 22,502 | | | 22,502 |
| Common Stocks | | | 10 | | | — | | | 1,552 | | | 1,562 |
| Money Market Fund | | | 790,000 | | | — | | | — | | | 790,000 |
| Total Investments | | | | | | | | | | | | |
| in Securities* | | $ | 790,010 | | $ | 62,957,610 | | $ | 24,913 | | $ | 63,772,533 |
|
| * The Portfolio of Investments provides information on the industry categorization for the portfolio. |
The following is a reconciliation of Fund investments valued using Level 3 inputs for the period:
| | | | | | | | | | | | | | | |
|
| | | | Investments | | | | | | | | |
| | | Investments | | in Auction | | Investments | | | | | | |
| | | in Corporate | | | Rate | | in Common | | | Investments | | | |
| | | | Bonds | | | Securities | | | Stocks | | | in Warrants | | | Total |
| Balance, | | | | | | | | | | | | | | | |
| December 31, 2008 | | $ | 688 | | $ | — | | $ | 36 | | $ | — | | $ | 724 |
| Net purchases (sales) | | | (14) | | | (793,500) | | | — | | | — | | | (793,514) |
| Change in unrealized | | | | | | | | | | | | | | | |
| appreciation (depreciation) | | | 378,034 | | | 131,687 | | | (26,651) | | | (1,561,906) | | | (1,078,836) |
| Realized gain (loss) | | | (378,333) | | | (31,500) | | | — | | | — | | | (409,833) |
| Transfer in and/or out of | | | | | | | | | | | | | | | |
| Level 3 | | | 484 | | | 693,313 | | | 28,167 | | | 1,584,408 | | | 2,306,372 |
| Balance, December 31, 2009 | | $ | 859 | | $ | — | | $ | 1,552 | | $ | 22,502 | | $ | 24,913 |
| | |
| The following is a summary of Level 3 inputs by industry: | | |
| Media – Diversified | $ | 21,095 |
| Consumer Discretionary | | 3,443 |
| Health Care | | 375 |
| | $ | 24,913 |
| | |
| See notes to financial statements | 55 |
Portfolio Manager’s Letter
INTERNATIONAL FUND
Dear Investor:
This is the annual report for the First Investors Life International Fund for the year ended December 31, 2009. During the period, the Fund’s return on a net asset value basis was 23.24%, including dividends of 58.7 cents per share.
During the first part of the review period, the markets were in a steep free fall, as the bankruptcy of Lehman Brothers and the ensuing freeze up of the credit markets caused aftershocks in the global markets. Only after U.S. and global regulators took extraordinary measures to supply massive financial aid and intervention, such as through the TARP program, did the markets stabilize. The markets then rallied convincingly.
Despite the Fund’s strong performance, it underperformed its benchmark, the MSCI EAFE Index, during the year. The Fund’s performance relative to the Index was principally driven by its focus on high-quality companies. During 2008 and into 2009, share prices of lower-quality companies were driven sharply lower as investors prepared for the worst-case scenario: an economic depression. Then, late in the first quarter, as fears of depression dissipated, the market rallied, and shares of lower-quality companies rebounded sharply. Meanwhile, shares of higher-quality, more stable companies, which had lost less ground when investors’ fears were peaking, appreciated but underperformed on a relative basis.
Investors’ enthusiasm for more cyclical businesses was apparent in the relative performance of various sectors during the year. The Fund’s underexposure to names in the materials and industrials sectors contributed to relative underperformance, as did its strong weighting in higher quality utilities and consumer staples sector names. All of these sectors delivered positive absolute returns.
Underexposure to Japanese markets, coupled with exposure to quality names in the Netherlands and India, helped relative performance for the year. These positives were offset by the weaker relative performance of countries like Switzerland, the U.K. and Spain. In Switzerland and the U.K., Philip Morris International and Imperial Tobacco Group, both quality consumer staples companies, detracted the most from relative performance. In Spain, the Fund’s concentrated positions in Enagas and Red Electrica, which are the national monopolies in natural gas and electricity transmission, respectively, detracted from performance.
After weathering an investment storm in 2009—a storm that did not favor our investment tilt toward higher quality businesses—we look forward to the coming year. As usual, our expectations are unrelated to macroeconomic conditions. We believe in focusing on the long term, and companies with stable operating performances, rather than short-term market fluctuations and cyclical businesses.
Thank you for placing your trust in First Investors. We appreciate the opportunity to serve your investment needs.
Sincerely,
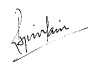
Rajiv Jain
Portfolio Manager
January 29, 2010
Fund Expenses (unaudited)
INTERNATIONAL FUND
The examples below show the ongoing costs (in dollars) of investing in your Fund and will help you in comparing these costs with costs of other mutual funds. Please refer to page 3 for a detailed explanation of the information presented in these examples.
| | | |
| | Beginning | Ending | |
| | Account | Account | Expenses Paid |
| | Value | Value | During Period |
| | (7/1/09) | (12/31/09) | (7/1/09–12/31/09)* |
| Expense Examples | | | |
| Actual | $1,000.00 | $1,195.78 | $5.53 |
| Hypothetical | | | |
| (5% annual return before expenses) | $1,000.00 | $1,020.17 | $5.09 |
| |
| * | Expenses are equal to the annualized expense ratio of 1.00%, multiplied by the average account |
| value over the period, multiplied by 184/365 (to reflect the one-half year period). |
Portfolio Composition
BY SECTOR
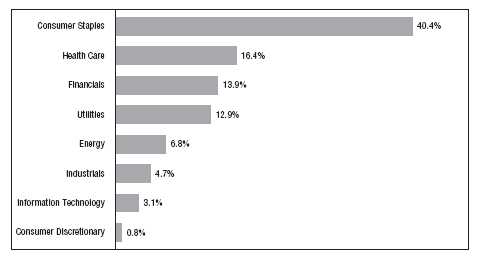
Portfolio holdings and allocations are subject to change. Percentages are as of December 31, 2009,
and are based on the total value of investments.
Cumulative Performance Information
INTERNATIONAL FUND
Comparison of change in value of $10,000 investment in the First Investors Life Series
International Fund and the Morgan Stanley Capital International (“MSCI”) EAFE Index (Net).
The graph compares a $10,000 investment in the First Investors Life Series International Fund beginning 12/31/99 with a theoretical investment in the MSCI EAFE Index (Net) (the “Index”). The Index is a free float-adjusted market capitalization index that measures developed foreign market equity performance, excluding the U.S. and Canada. The index is calculated on a total-return basis with net dividends reinvested. The Indices are unmanaged and it is not possible to invest directly in this Index. In addition, the Index does not reflect fees and expenses associated with the active management of a mutual fund portfolio. For purposes of the graph and the accompanying table, it is assumed that all dividends and distributions were reinvested.
* The Average Annual Total Return figures are for the periods ended 12/31/09.
The returns shown do not reflect any sales charges, since the Fund sells its shares solely to variable annuity and/or variable life insurance subaccounts at net asset value. The returns do not reflect the fees and charges that an individual would pay in connection with an investment in a variable annuity or life contract or policy. Results represent past performance and do not indicate future results. The graph and the returns shown do not reflect the deduction of taxes that an investor would pay on distributions or the redemption of fund shares. Investment return and principal value of an investment will fluctuate so that an investor’s shares, when redeemed, may be worth more or less than the original cost. MSCI EAFE Index (Net) figures are from Morgan Stanley & Company, Inc. and all other figures are from First Investors Management Company, Inc.
Portfolio of Investments
INTERNATIONAL FUND
December 31, 2009
| | | | |
| Shares | | | Security | Value |
| |
| | | | COMMON STOCKS—96.2% | |
| | | | United Kingdom—24.9% | |
| 178,444 | | | Amlin PLC | $ 1,030,136 |
| 41,218 | | | BG Group PLC | 744,086 |
| 158,230 | | | British American Tobacco PLC | 5,135,585 |
| 129,534 | | | Capita Group PLC | 1,565,929 |
| 71,855 | | | De La Rue PLC | 1,141,801 |
| 127,995 | | | Diageo PLC | 2,232,544 |
| 123,200 | | | G4S PLC | 516,293 |
| 146,590 | | | Imperial Tobacco Group PLC | 4,623,548 |
| 59,748 | | | Reckitt Benckiser Group PLC | 3,233,480 |
| 82,768 | | | Scottish and Southern Energy PLC | 1,548,903 |
| 489,629 | | | Tesco PLC | 3,377,130 |
| |
| | | | | 25,149,435 |
| |
| | | | India—13.9% | |
| 14,536 | | | Bharat Heavy Electricals, Ltd. | 748,316 |
| 188,349 | | | Cipla, Ltd. | 1,350,956 |
| 120,100 | | | HDFC Bank, Ltd. | 4,376,135 |
| 228,522 | | | Hindustan Unilever, Ltd. | 1,295,165 |
| 70,467 | | | Housing Development Finance Corporation, Ltd. | 4,031,772 |
| 293,285 | | | ITC, Ltd. | 1,574,996 |
| 11,298 | | | Nestle India, Ltd. | 617,349 |
| |
| | | | | 13,994,689 |
| |
| | | | Switzerland—12.6% | |
| 245 | | | Lindt & Spruengli AG | 526,368 |
| 83,660 | | | Nestle SA – Registered | 4,063,073 |
| 49,985 | | | Novartis AG – Registered | 2,731,491 |
| 23,696 | | | Roche Holding AG – Genusscheine | 4,055,065 |
| 9,993 | | | Synthes, Inc. | 1,310,856 |
| |
| | | | | 12,686,853 |
| |
| | | | Australia—5.5% | |
| 84,199 | | | Coca-Cola Amatil, Ltd. | 869,204 |
| 91,786 | | | QBE Insurance Group, Ltd. | 2,097,163 |
| 100,772 | | | Woolworths, Ltd. | 2,530,553 |
| |
| | | | | 5,496,920 |
| | | | |
| Shares | | | Security | Value |
| |
| | | | Spain—5.3% | |
| 131,810 | | | Enagas | $ 2,924,430 |
| 43,800 | | | Red Electrica Corporacion SA | 2,446,175 |
| |
| | | | | 5,370,605 |
| |
| | | | Brazil—5.2% | |
| 135,700 | | | Cielo SA | 1,194,148 |
| 49,100 | | | CPFL Energia SA | 994,562 |
| 84,800 | | | Redecard SA | 1,410,739 |
| 49,908 | | | Souza Cruz SA | 1,653,675 |
| |
| | | | | 5,253,124 |
| |
| | | | United States—4.7% | |
| 99,195 | | | Philip Morris International, Inc. | 4,780,207 |
| |
| | | | France—4.0% | |
| 29,622 | | | Essilor International SA | 1,773,211 |
| 35,527 | | | Total SA | 2,283,794 |
| |
| | | | | 4,057,005 |
| |
| | | | Canada—3.6% | |
| 14,821 | | | Canadian Natural Resources, Ltd. | 1,069,781 |
| 38,680 | | | Power Corporation of Canada | 1,074,783 |
| 34,634 | | | Shoppers Drug Mart Corporation | 1,499,535 |
| |
| | | | | 3,644,099 |
| |
| | | | Germany—3.2% | |
| 6,170 | | | Deutsche Boerse AG | 510,655 |
| 10,039 | | | Fresenius Medical Care AG & Company | 534,136 |
| 5,864 | | | Muenchener Rueckversicherungs-Gesellschaft AG – Registered | 915,817 |
| 13,279 | | | RWE AG | 1,294,820 |
| |
| | | | | 3,255,428 |
| |
| | | | Denmark—3.2% | |
| 50,786 | | | Novo Nordisk A/S – Series “B” | 3,245,141 |
| |
| | | | Netherlands—2.8% | |
| 23,877 | | | Core Laboratories NV | 2,820,351 |
Portfolio of Investments (continued)
INTERNATIONAL FUND
December 31, 2009
| | | | | | |
| Shares or | | | | | | |
| Principal | | | | | | |
| Amount | | | Security | | | Value |
| |
| | | | Japan—2.1% | | | |
| 2,300 | | | Nintendo Company, Ltd. | | | $ 549,561 |
| 10,600 | | | Nitori Company, Ltd. | | | 789,319 |
| 16,100 | | | Secom Company, Ltd. | | | 765,040 |
| |
| | | | | | | 2,103,920 |
| |
| | | | Italy—2.1% | | | |
| 480,800 | | | Terna-Rete Elettrica Nationale SpA | | | 2,069,434 |
| |
| | | | Ireland—1.6% | | | |
| 32,784 | | | Covidien PLC | | | 1,570,026 |
| |
| | | | Belgium—1.5% | | | |
| 6,281 | | | Colruyt SA | | | 1,516,572 |
| |
| Total Value of Common Stocks (cost $80,385,780) | | | 97,013,809 |
| |
| | | | PREFERRED STOCKS—3.1% | | | |
| | | | Brazil | | | |
| 87,053 | | | AES Tiete SA | | | 998,773 |
| 12,800 | | | Companhia de Bebidas das Americas (ADR) | | | 1,293,952 |
| 45,605 | | | Companhia Energetica de Minas Gerais | | | 826,708 |
| |
| Total Value of Preferred Stocks (cost $1,878,458) | | | 3,119,433 |
| |
| | | | SHORT-TERM INVESTMENTS—1.0% | | |
| | | | Money Market Fund | | | |
| $1,005 | M | | First Investors Cash Reserve Fund, .24% (cost $1,005,000)* | | 1,005,000 |
| |
| Total Value of Investments (cost $83,269,238) | 100.3 | % | 101,138,242 |
| Excess of Liabilities Over Other Assets | (.3 | ) | (303,350) |
| |
| Net Assets | | | | 100.0 | % | $100,834,892 |
| |
| * | Affiliated unregistered money market fund available only to First Investors funds and certain |
| accounts managed by First Investors Management Company, Inc. Rate shown is the 7-day yield at |
| December 31, 2009 (see Note 3). |
| |
| Summary of Abbreviations: |
| ADR American Depositary Receipts |
Accounting Standards Codification (“ASC”) 820 established a three-tier hierarchy of inputs to establish a classification of fair value measurements for disclosure purposes. The three-tier hierarchy of inputs is summarized in the three broad Levels listed below:
| Level 1 — quoted prices in active markets for identical securities |
| |
| Level 2 — other significant observable inputs (including quoted prices for similar securities, interest rates, prepayment speeds, credit risk, etc.) |
| |
| Level 3 — significant unobservable inputs (including the fund’s own assumptions in determining the fair value of investments) |
The inputs methodology used for valuing securities are not necessarily an indication of the risk associated with investing in those securities.
The following is a summary, by category of Level, of inputs used to value the Fund’s investments as of December 31, 2009:
| | | | | | | | | | | | |
| | | | | | | Level 2 | | | | | | |
| | | | | | | Other | | | Level 3 | | | |
| | | | Level 1 | | | Significant | | | Significant | | | |
| | | | Quoted | | | Observable | | Unobservable | | | |
| | | | Prices | | | Inputs | | | Inputs | | | Total |
| Common Stocks | | $ | 18,067,806 | | $ | 78,946,003 | | $ | — | | $ | 97,013,809 |
| Preferred Stocks | | | 3,119,433 | | | | | | | | | 3,119,433 |
| Money Market Fund | | | 1,005,000 | | | — | | | — | | | 1,005,000 |
| Total Investments | | | | | | | | | | | | |
| in Securities* | | $ | 22,192,239 | | $ | 78,946,003 | | $ | — | | $ | 101,138,242 |
| Other Financial | | | | | | | | | | | | |
| Instruments** | | $ | — | | $ | (443,343) | | $ | — | | $ | (443,343) |
| |
| * | The Portfolio of Investments provides information on the country categorization for the portfolio. |
| |
| ** | Other financial instruments are foreign exchange contracts, which are considered derivative |
| instruments, which are valued at the net unrealized depreciation on the instrument. |
| | |
| See notes to financial statements | 63 |
Portfolio Managers’ Letter
INVESTMENT GRADE FUND
Dear Investor:
This is the annual report for the First Investors Life Investment Grade Fund for the year ended December 31, 2009. During the period, the Fund’s return on a net asset value basis was 20.94%, including dividends of 60.4 cents per share.
The Fund invests primarily in investment grade fixed income securities. While the majority of the Fund’s holdings were investment grade corporate bonds, the Fund also had as much as 25% of its assets invested in a combination of U.S. agency debt, mortgage-backed securities, U.S. Treasury notes, high yield corporate bonds, municipal bonds, and preferred stocks.
The review period began with investment grade corporate bond valuations at extremely attractive levels. Over the next several months, investors gained confidence as the financial markets stabilized and reports indicated that the recession had come to an end. By the conclusion of the review period, the financial markets had experienced a significant recovery and the economy had begun to grow again. For the corporate bond market, this environment resulted in an unprecedented rebound. By the end of the review period, corporate bonds had registered very strong 12-month returns.
The Fund had strong double-digit returns over the period and outperformed the BofA Merrill Lynch Corporate Index. The Fund went from an underweight position in BBB-rated corporate bonds to an overweight position. During the period, BBB-rated corporate bonds provided the highest returns when compared with other investment grade categories. An additional factor that helped relative performance was the Fund’s underweight position in corporate bonds with maturities of one to three years. Short maturity bonds had the lowest returns during the review period.
The Fund began the review period with only approximately 75% of its assets in corporate bonds. As the market stabilized, the Fund gradually increased its corporate bond holdings to over 90% of assets. With a rally in the credit markets, the increased allocation of corporate bond holdings enhanced performance in the last half of the review period.
Thank you for placing your trust in First Investors. We appreciate the opportunity to serve your investment needs.
Sincerely,

Rajeev Sharma
Portfolio Manager*

Clark D. Wagner
Portfolio Manager and
Director of Fixed Income,
First Investors Management Company, Inc.
January 29, 2010
|
| * Mr. Sharma became the Fund’s Co-Portfolio Manager on July 27, 2009. |
Fund Expenses (unaudited)
INVESTMENT GRADE FUND
The examples below show the ongoing costs (in dollars) of investing in your Fund and will help you in comparing these costs with costs of other mutual funds. Please refer to page 3 for a detailed explanation of the information presented in these examples.
| | | |
| | Beginning | Ending | |
| | Account | Account | Expenses Paid |
| | Value | Value | During Period |
| | (7/1/09) | (12/31/09) | (7/1/09–12/31/09)* |
| Expense Examples | | | |
| Actual | $1,000.00 | $1,092.93 | $4.01 |
| Hypothetical | | | |
| (5% annual return before expenses) | $1,000.00 | $1,021.38 | $3.87 |
| |
| * | Expenses are equal to the annualized expense ratio of .76%, multiplied by the average account |
| value over the period, multiplied by 184/365 (to reflect the one-half year period). Expenses paid |
| during the period are net of expenses waived. |
Portfolio Composition
TOP TEN SECTORS
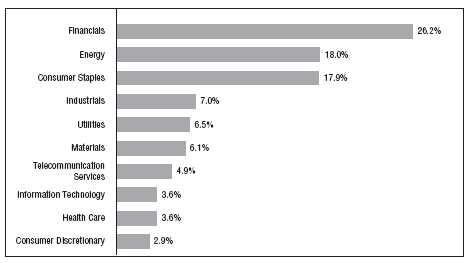
Portfolio holdings and allocations are subject to change. Percentages are as of December 31, 2009,
and are based on the total value of investments.
Cumulative Performance Information
INVESTMENT GRADE FUND
Comparison of change in value of $10,000 investment in the First Investors Life Series
Investment Grade Fund and the Bank of America (“BofA”) Merrill Lynch U.S. Corporate
Master Index.
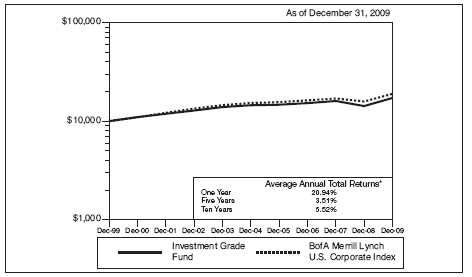
The graph compares a $10,000 investment in the First Investors Life Series Investment Grade Fund beginning 12/31/99 with a theoretical investment in the BofA Merrill Lynch U.S. Corporate Master Index (the “Index”). The Index tracks the performance of U.S. dollar-denominated investment grade corporate public debt issued in the U.S. domestic bond market. Qualifying bonds must have at least one year remaining term to maturity, a fixed coupon schedule and a minimum amount outstanding of $250 million. Bonds must be rated investment grade based on a composite of Moody’s and S&P. It is not possible to invest directly in this Index. In addition, the Index does not reflect fees and expenses associated with the active management of a mutual fund portfolio. For purposes of the graph and the accompanying table, it is assumed that all dividends and distributions were reinvested.
* The Average Annual Total Return figures are for the periods ended 12/31/09. During the periods shown, some of the expenses of the Fund were waived or assumed. If such expenses had been paid by the Fund, the Average Annual Total Returns for One Year, Five Years and Ten Years would have been 20.76%, 3.36% and 5.36%, respectively.
The returns shown do not reflect any sales charges, since the Fund sells its shares solely to variable annuity and/or variable life insurance subaccounts at net asset value. The returns do not reflect the fees and charges that an individual would pay in connection with an investment in a variable annuity or life contract or policy. Results represent past performance and do not indicate future results. The graph and the returns shown do not reflect the deduction of taxes that an investor would pay on distributions or the redemption of fund shares. Investment return and principal value of an investment will fluctuate so that an investor’s shares, when redeemed, may be worth more or less than the original cost. Index figures are from Bank of America Merrill Lynch & Co. and all other figures are from First Investors Management Company, Inc.
Portfolio of Investments
INVESTMENT GRADE FUND
December 31, 2009
| | | | |
| Principal | | | | |
| Amount | | | Security | Value |
| |
| | | | CORPORATE BONDS—95.3% | |
| | | | Aerospace/Defense—1.5% | |
| $ 200 | M | | BAE Systems Holdings, Inc., 4.95%, 2014 (a) | $ 208,454 |
| 400 | M | | Lockheed Martin Corp., 4.25%, 2019 | 386,872 |
| |
| | | | | 595,326 |
| |
| | | | Agriculture—1.4% | |
| 340 | M | | Cargill, Inc., 6%, 2017 (a) | 362,955 |
| 200 | M | | Potash Corp. of Saskatchewan, Inc., 4.875%, 2020 | 197,718 |
| |
| | | | | 560,673 |
| |
| | | | Automotive—1.1% | |
| 400 | M | | Daimler Chrysler NA, LLC, 6.5%, 2013 | 438,870 |
| |
| | | | Chemicals—1.4% | |
| 300 | M | | Cabot Corp., 5.25%, 2013 (a) | 309,778 |
| 200 | M | | Chevron Phillips Chemicals Co., LLC, 8.25%, 2019 (a) | 235,789 |
| |
| | | | | 545,567 |
| |
| | | | Consumer Durables—1.8% | |
| 350 | M | | Black & Decker Corp., 5.75%, 2016 | 361,293 |
| 300 | M | | Newell Rubbermaid, Inc., 6.75%, 2012 | 321,796 |
| |
| | | | | 683,089 |
| |
| | | | Energy—17.1% | |
| 600 | M | | Canadian Oil Sands, Ltd., 7.75%, 2019 (a) | 678,056 |
| 200 | M | | DCP Midstream, LLC, 9.75%, 2019 (a) | 246,484 |
| 100 | M | | Enbridge Energy Partners LP, 7.5%, 2038 | 114,192 |
| 200 | M | | Energy Transfer Partners LP, 8.5%, 2014 | 231,069 |
| 400 | M | | Husky Energy, Inc., 7.25%, 2019 | 463,081 |
| 150 | M | | Kinder Morgan Finance Co., 5.35%, 2011 | 152,250 |
| 200 | M | | Marathon Oil Corp., 7.5%, 2019 | 231,214 |
| 490 | M | | Maritime & Northeast Pipeline, LLC, 7.5%, 2014 (a) | 537,273 |
| 200 | M | | Nabors Industries, Inc., 6.15%, 2018 | 208,200 |
| | | | Nexen, Inc.: | |
| 300 | M | | 5.05%, 2013 | 313,174 |
| 408 | M | | 7.875%, 2032 | 467,265 |
| 200 | M | | 6.4%, 2037 | 202,154 |
| 300 | M | | Northern Border Partners, LP, 7.1%, 2011 | 315,826 |
| 340 | M | | Pacific Energy Partners, LP, 6.25%, 2015 | 350,214 |
| 100 | M | | Plains All American Pipeline, LP, 8.75%, 2019 | 118,104 |
| 700 | M | | Spectra Energy Capital, LLC, 6.2%, 2018 | 744,617 |
| | | | |
| Principal | | | | |
| Amount | | | Security | Value |
| |
| | | | Energy (continued) | |
| $ 489 | M | | Suncor Energy, Inc., 6.85%, 2039 | $ 540,535 |
| 425 | M | | Trans-Canada Pipelines, Ltd., 7.625%, 2039 | 525,158 |
| | | | Valero Energy Corp.: | |
| 100 | M | | 6.125%, 2017 | 102,495 |
| 100 | M | | 10.5%, 2039 | 128,827 |
| |
| | | | | 6,670,188 |
| |
| | | | Financial Services—9.2% | |
| 400 | M | | American Express Co., 7%, 2018 | 441,204 |
| 200 | M | | American General Finance Corp., 6.9%, 2017 | 139,061 |
| 375 | M | | Amvescap PLC, 5.375%, 2013 | 381,914 |
| 350 | M | | CoBank, ACB, 7.875%, 2018 (a) | 379,816 |
| 200 | M | | Compass Bank, 6.4%, 2017 | 202,674 |
| | | | ERAC USA Finance Co.: | |
| 355 | M | | 8%, 2011 (a) | 372,312 |
| 200 | M | | 6.375%, 2017 (a) | 202,320 |
| 252 | M | | Ford Motor Credit Co., 9.75%, 2010 | 260,070 |
| 200 | M | | General Electric Capital Corp., 4.375%, 2015 | 202,741 |
| | | | Harley-Davidson Funding Corp.: | |
| 200 | M | | 5%, 2010 (a) | 202,423 |
| 310 | M | | 6.8%, 2018 (a) | 309,628 |
| 100 | M | | Protective Life Corp., 7.375%, 2019 | 100,389 |
| 400 | M | | Prudential Financial, Inc., 4.75%, 2015 | 406,109 |
| |
| | | | | 3,600,661 |
| |
| | | | Financials—14.7% | |
| 200 | M | | Bank of America Corp., 5.65%, 2018 | 203,457 |
| 100 | M | | Bank of New York Mellon Corp., 4.6%, 2020 | 97,934 |
| 200 | M | | Bear Stearns Companies, Inc., 7.25%, 2018 | 229,929 |
| | | | Citigroup, Inc.: | |
| 300 | M | | 6.375%, 2014 | 314,384 |
| 600 | M | | 6.125%, 2017 | 605,722 |
| 400 | M | | Goldman Sachs Group, Inc., 6.75%, 2037 | 412,460 |
| 300 | M | | Hibernia Corp., 5.35%, 2014 | 296,966 |
| 200 | M | | JPMorgan Chase & Co., 3.7%, 2015 | 200,821 |
| 800 | M | | Merrill Lynch & Co., Inc., 5.45%, 2013 | 842,413 |
| | | | Morgan Stanley: | |
| 200 | M | | 5.95%, 2017 | 206,614 |
| 900 | M | | 6.625%, 2018 | 974,606 |
| 500 | M | | Royal Bank of Scotland Group PLC, 5%, 2014 | 442,333 |
Portfolio of Investments (continued)
INVESTMENT GRADE FUND
December 31, 2009
| | | | |
| Principal | | | | |
| Amount | | | Security | Value |
| |
| | | | Financials (continued) | |
| $ 400 | M | | SunTrust Bank, Inc., 7.25%, 2018 | $ 418,304 |
| 300 | M | | UBS AG, 5.875%, 2016 | 304,149 |
| 200 | M | | Wells Fargo & Co., 3.75%, 2014 | 199,625 |
| |
| | | | | 5,749,717 |
| |
| | | | Food/Beverage/Tobacco—4.3% | |
| 400 | M | | Altria Group, Inc., 10.2%, 2039 | 535,131 |
| 200 | M | | Bottling Group, LLC, 5.5%, 2016 | 216,656 |
| 350 | M | | Bunge Limited Finance Corp., 5.875%, 2013 | 364,600 |
| 130 | M | | ConAgra Foods, Inc., 5.875%, 2014 | 141,802 |
| 400 | M | | Philip Morris International, Inc., 5.65%, 2018 | 421,333 |
| |
| | | | | 1,679,522 |
| |
| | | | Food/Drug—.5% | |
| 190 | M | | CVS/Caremark Corp., 6.125%, 2039 | 188,948 |
| |
| | | | Forest Products/Container—.5% | |
| 150 | M | | International Paper Co., 9.375%, 2019 | 184,678 |
| |
| | | | Health Care—3.5% | |
| 400 | M | | Biogen IDEC, Inc., 6.875%, 2018 | 431,214 |
| 200 | M | | Novartis, 5.125%, 2019 | 210,488 |
| 100 | M | | Pfizer, Inc., 6.2%, 2019 | 111,360 |
| 100 | M | | Roche Holdings, Inc., 6%, 2019 | 110,081 |
| 200 | M | | St. Jude Medical, Inc., 4.875%, 2019 | 201,972 |
| 200 | M | | Watson Pharmaceuticals, Inc., 5%, 2014 | 204,404 |
| 100 | M | | Wyeth, 5.5%, 2016 | 107,627 |
| |
| | | | | 1,377,146 |
| |
| | | | Industrials—1.0% | |
| | | | Pitney Bowes, Inc.: | |
| 100 | M | | 5%, 2015 | 104,891 |
| 290 | M | | 5.25%, 2037 | 296,802 |
| |
| | | | | 401,693 |
| | | | |
| Principal | | | | |
| Amount | | | Security | Value |
| |
| | | | Information Technology—4.6% | |
| $ 400 | M | | CA, Inc., 5.375%, 2019 | $ 403,011 |
| 300 | M | | Cisco Systems, Inc., 4.45%, 2020 | 294,883 |
| 300 | M | | Dell, Inc., 5.875%, 2019 | 318,047 |
| 400 | M | | Dun & Bradstreet Corp., 6%, 2013 | 412,081 |
| 100 | M | | Oracle Corp., 5%, 2019 | 103,324 |
| 250 | M | | Xerox Corp., 6.875%, 2011 | 267,243 |
| |
| | | | | 1,798,589 |
| |
| | | | Manufacturing—.7% | |
| 250 | M | | Briggs & Stratton Corp., 8.875%, 2011 | 263,437 |
| |
| | | | Manufacturing-Diversified—1.6% | |
| 400 | M | | General Electric Co., 5.25%, 2017 | 409,404 |
| 200 | M | | Tyco Electronics Group SA, 6.55%, 2017 | 207,105 |
| |
| | | | | 616,509 |
| |
| | | | Media-Broadcasting—4.4% | |
| 710 | M | | British Sky Broadcasting Group PLC, 9.5%, 2018 (a) | 911,692 |
| | | | Cox Communications, Inc.: | |
| 300 | M | | 4.625%, 2013 | 312,211 |
| 400 | M | | 8.375%, 2039 (a) | 499,628 |
| |
| | | | | 1,723,531 |
| |
| | | | Media-Diversified—8.4% | |
| | | | McGraw-Hill Cos., Inc.: | |
| 200 | M | | 5.9%, 2017 | 203,749 |
| 200 | M | | 6.55%, 2037 | 197,083 |
| 800 | M | | News America, Inc., 5.3%, 2014 | 865,660 |
| 500 | M | | Thomson Reuters Corp., 5.95%, 2013 | 547,793 |
| | | | Time Warner Cable, Inc.: | |
| 1,020 | M | | 6.2%, 2013 | 1,121,309 |
| 300 | M | | 6.75%, 2018 | 330,107 |
| |
| | | | | 3,265,701 |
| |
| | | | Metals/Mining—3.4% | |
| 400 | M | | ArcelorMittal, 6.125%, 2018 | 413,410 |
| 200 | M | | Newmont Mining Corp., 5.125%, 2019 | 200,474 |
| 260 | M | | Rio Tinto Finance USA Ltd., 6.5%, 2018 | 286,077 |
| 400 | M | | Vale Overseas, Ltd., 5.625%, 2019 | 405,891 |
| |
| | | | | 1,305,852 |
Portfolio of Investments (continued)
INVESTMENT GRADE FUND
December 31, 2009
| | | | |
| Principal | | | | |
| Amount | | | Security | Value |
| |
| | | | Real Estate Investment Trusts—.8% | |
| $300 | M | | ProLogis, 7.625%, 2014 | $ 314,019 |
| |
| | | | Telecommunications—4.9% | |
| 400 | M | | AT&T, Inc., 5.8%, 2019 | 427,142 |
| 900 | M | | Deutsche Telekom Intl., Finance BV, 5.875%, 2013 | 974,698 |
| 250 | M | | GTE Corp., 6.84%, 2018 | 274,302 |
| 200 | M | | Verizon Wireless Capital, LLC, 5.55%, 2014 | 217,254 |
| |
| | | | | 1,893,396 |
| |
| | | | Transportation—.6% | |
| 200 | M | | GATX Corp., 8.75%, 2014 | 225,109 |
| |
| | | | Utilities—7.1% | |
| 750 | M | | E. ON International Finance BV, 5.8%, 2018 (a) | 806,836 |
| | | | Electricite de France SA: | |
| 100 | M | | 6.5%, 2019 (a) | 112,457 |
| 300 | M | | 6.95%, 2039 (a) | 356,017 |
| 175 | M | | Entergy Gulf States, Inc., 5.25%, 2015 | 172,881 |
| 400 | M | | Exelon Generation Co., LLC, 6.2%, 2017 | 429,438 |
| 189 | M | | Great River Energy Co., 5.829%, 2017 (a) | 206,242 |
| 200 | M | | NiSource Finance Corp., 7.875%, 2010 | 209,716 |
| 200 | M | | Ohio Power Co., 5.375%, 2021 | 200,968 |
| 200 | M | | Sempra Energy, 9.8%, 2019 | 250,022 |
| |
| | | | | 2,744,577 |
| |
| | | | Waste Management—.8% | |
| 300 | M | | Allied Waste NA, Inc., 7.125%, 2016 | 319,909 |
| |
| Total Value of Corporate Bonds (cost $34,645,322) | 37,146,707 |
| |
| | | | MUNICIPAL BONDS—2.8% | |
| 150 | M | | Houston TX Ref. Pub. Impt., 5%, 2023 | 164,607 |
| 150 | M | | Maryland State Ref. State & Loc. Facs. Ln., 5%, 2019 | 176,790 |
| 200 | M | | Massachusetts State Cons. Ln., 5%, 2039 | 210,580 |
| 150 | M | | Minnesota State Ref. Various Purpose, 5%, 2022 | 172,276 |
| 200 | M | | Salt River Proj. AZ Agric. Impt. & Pwr. Dist. Elec. Sys. Rev., 5%, 2038 | 208,636 |
| 150 | M | | Washington State Various Purpose, 5%, 2027 | 164,403 |
| |
| Total Value of Municipal Bonds (cost $1,085,921) | 1,097,292 |
| | | | | | |
| Principal | | | | | | |
| Amount | | | Security | | | Value |
| | | | PASS THROUGH CERTIFICATES—.1% | | |
| | | | Transportation | | | |
| $ 47 | M | | American Airlines, Inc., 7.377%, 2019 (cost $45,805) | | $ 36,640 |
| |
| | | | SHORT-TERM CORPORATE NOTES—.3% | | |
| | | | Money Market Fund | | | |
| 125 | M | | First Investors Cash Reserve Fund, .24% (cost $125,000) (b) | | 125,000 |
| Total Value of Investments (cost $35,902,048) | 98.5 | % | 38,405,639 |
| Other Assets, Less Liabilities | 1.5 | | 601,223 |
| |
| Net Assets | | | | 100.0 | % | $39,006,862 |
| | |
| (a) | Security exempt from registration under Rule 144A of Securities Act of 1933 (see Note 5). |
| |
| (b) | Affiliated unregistered money market fund available only to First Investors funds and certain accounts managed by First Investors Management Company, Inc. Rate shown is the 7-day yield at December 31, 2009 (see Note 3). |
| |
| Accounting Standards Codification (“ASC”) 820 established a three-tier hierarchy of inputs to establish a classification of fair value measurements for disclosure purposes. The three-tier hierarchy of inputs is summarized |
| in the three broad Levels listed below: |
| |
| | Level 1 — quoted prices in active markets for identical securities |
| | |
| | Level 2 — other significant observable inputs (including quoted prices for similar securities, interest rates, prepayment speeds, credit risk, etc.) |
| | |
| | Level 3 — significant unobservable inputs (including the fund’s own assumptions in determining the fair value of investments) |
| | |
| The inputs methodology used for valuing securities are not necessarily an indication of the risk associated with investing in those securities. |
| |
| The following is a summary, by category of Level, of inputs used to value the Fund’s investments as of December 31, 2009: |
| | | | | | | | | | | | |
| | | | | | | Level 2 | | | | | | |
| | | | | | | Other | | | Level 3 | | | |
| | | | Level 1 | | | Significant | | | Significant | | | |
| | | | Quoted | | | Observable | | Unobservable | | | |
| | | | Prices | | | Inputs | | | Inputs | | | Total |
| Corporate Bonds | | $ | — | | $ | 37,146,707 | | $ | — | | $ | 37,146,707 |
| Municipal Bonds | | | — | | | 1,097,292 | | | — | | | 1,097,292 |
| Pass Through Certificates | | | — | | | 36,640 | | | — | | | 36,640 |
| Money Market Fund | | | 125,000 | | | — | | | — | | | 125,000 |
| Total Investments | | | | | | | | | | | | |
| in Securities* | | $ | 125,000 | | $ | 38,280,639 | | $ | — | | $ | 38,405,639 |
* The Portfolio of Investments provides information on the industry categorization for corporate bonds.
| | |
| See notes to financial statements | 73 |
Portfolio Manager’s Letter
SELECT GROWTH FUND
Dear Investor:
This is the annual report for the First Investors Life Select Growth Fund for the year ended December 31, 2009. During the period, the Fund’s return on a net asset value basis was 9.90%.
During the first part of the review period, the markets were in a steep free fall, culminating with a multi-decade market low achieved on March 9, 2009. Only after U.S. and global regulators took extraordinary measures to supply massive financial aid and intervention, such as through the TARP program, did the markets stabilize. The markets then rallied convincingly, ending the year with a significant gain.
The Fund’s underperformance relative to its benchmark, the Russell 3000 Growth Index, was principally driven by the financial crisis that began in 2008, and the subsequent rally of low-quality stocks in 2009. During 2009, the best performing stocks were those stocks with low earnings quality and high price volatility. Consequently, the Fund’s performance was hurt due to the Fund’s focus on investing in high-quality companies that are expected to have positive earnings surprises.
Earnings are an integral part of the investment process used to manage the Fund. Criteria relating to both earnings growth and earnings quality are primary metrics used by the Fund in selecting stocks. Over the course of the year, as the economy was deteriorating, the focus on earnings naturally concentrated the Fund in companies with greater stability. Thus, over time, the portfolio was more exposed to consumer staples, health care, and counter-cyclical consumer discretionary companies. This also led the Fund to have significantly less exposure to companies with high price volatility and low earnings quality.
As the economy has shown signs of recovery, the Fund has found more opportunities to buy better earnings quality companies with improving growth potential in the more cyclical sectors. Thus the Fund’s exposure to companies with higher price volatility has recently increased closer to market levels. While our focus on high-quality companies with strong earnings expectations was not rewarded over the past year, we remain confident in our approach over the long term.
The Fund’s underperformance relative to the Russell 3000 Growth Index was broad-based among all sectors, but its two worst performing sectors were information technology and consumer discretionary. While the Fund enjoyed strong returns in some holdings in information technology—for example, Red Hat was up 109% on demand for its services competing with Microsoft’s Windows—the typical holdings trailed the benchmark’s return. The worst performing information technology stocks during the year were SAIC and NCR. These companies provide technology and services in the
fields of intelligence for the Department of Defense and the financial services sector, respectively. With an enduring uncertainty about government actions impacting both of these companies, the outlook for growth has become more challenging.
The Fund maintained a diverse market capitalization allocation during the year, ending with 56% large cap, 30% mid cap and 14% small cap, according to Lipper’s market capitalization ranges.
Thank you for placing your trust in First Investors. We appreciate the opportunity to serve your investment needs.
Sincerely,

John D. Brim
Portfolio Manager
January 29, 2010
Fund Expenses (unaudited)
SELECT GROWTH FUND
The examples below show the ongoing costs (in dollars) of investing in your Fund and will help you in comparing these costs with costs of other mutual funds. Please refer to page 3 for a detailed explanation of the information presented in these examples.
| | | |
| | Beginning | Ending | |
| | Account | Account | Expenses Paid |
| | Value | Value | During Period |
| | (7/1/09) | (12/31/09) | (7/1/09–12/31/09)* |
| Expense Examples | | | |
| Actual | $1,000.00 | $1,148.28 | $5.04 |
| Hypothetical | | | |
| (5% annual return before expenses) | $1,000.00 | $1,020.52 | $4.74 |
| |
| * | Expenses are equal to the annualized expense ratio of .93%, multiplied by the average account |
| value over the period, multiplied by 184/365 (to reflect the one-half year period). |
Portfolio Composition
TOP SECTORS

Portfolio holdings and allocations are subject to change. Percentages are as of December 31, 2009,
and are based on the total value of investments.
Cumulative Performance Information
SELECT GROWTH FUND
Comparison of change in value of $10,000 investment in the First Investors Life Series Select
Growth Fund and the Russell 3000 Growth Index.
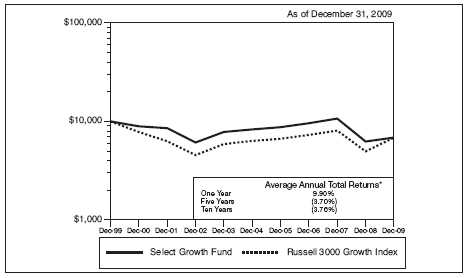
The graph compares a $10,000 investment in the First Investors Life Series Select Growth Fund beginning 12/31/99 with a theoretical investment in the Russell 3000 Growth Index (the “Index”). The Index is an unmanaged index that measures the performance of those Russell 3000 Index companies with higher price-to-book ratios and higher forecasted growth values (the Russell 3000 Index is an unmanaged index that measures the performance of the 3,000 largest U.S. companies based on total market capitalization). It is not possible to invest directly in this Index. In addition, the Index does not reflect fees and expenses associated with the active management of a mutual fund portfolio. For purposes of the graph and the accompanying table it is assumed that all dividends and distributions were reinvested.
* The Average Annual Total Return figures are for the periods ended 12/31/09.
The returns shown do not reflect any sales charges, since the Fund sells its shares solely to variable annuity and/or variable life insurance subaccounts at net asset value. The returns do not reflect the fees and charges that an individual would pay in connection with an investment in a variable annuity or life contract or policy. Results represent past performance and do not indicate future results. The graph and the returns shown do not reflect the deduction of taxes that an investor would pay on distributions or the redemption of fund shares. Investment return and principal value of an investment will fluctuate so that an investor’s shares, when redeemed, may be worth more or less than the original cost. Russell 3000 Growth Index figures are from Frank Russell and Company and all other figures are from First Investors Management Company, Inc.
Portfolio of Investments
SELECT GROWTH FUND
December 31, 2009
| | | | |
| Shares | | | Security | Value |
| |
| | | | COMMON STOCKS—97.5% | |
| | | | Consumer Discretionary—10.3% | |
| 3,000 | | * | Apollo Group, Inc. – Class “A” | $ 181,740 |
| 3,700 | | | McDonald’s Corporation | 231,028 |
| 5,600 | | | Ross Stores, Inc. | 239,176 |
| 1,030 | | | Strayer Education, Inc. | 218,865 |
| 5,200 | | * | WMS Industries, Inc. | 208,000 |
| |
| | | | | 1,078,809 |
| |
| | | | Consumer Staples—12.0% | |
| 4,700 | | | Brown-Forman Corporation – Class “B” | 251,779 |
| 4,800 | | | Church & Dwight Company, Inc. | 290,160 |
| 2,865 | | | Colgate-Palmolive Company | 235,360 |
| 4,600 | | | Wal-Mart Stores, Inc. | 245,870 |
| 8,300 | | * | Whole Foods Market, Inc. | 227,835 |
| |
| | | | | 1,251,004 |
| |
| | | | Energy—6.2% | |
| 3,800 | | | ConocoPhillips | 194,066 |
| 3,000 | | | ExxonMobil Corporation | 204,570 |
| 5,100 | | * | Newfield Exploration Company | 245,973 |
| |
| | | | | 644,609 |
| |
| | | | Financials—12.6% | |
| 6,900 | | | American Express Company | 279,588 |
| 6,500 | | | Capital One Financial Corporation | 249,210 |
| 2,400 | | | Franklin Resources, Inc. | 252,840 |
| 1,400 | | | Goldman Sachs Group, Inc. | 236,376 |
| 5,600 | | | PNC Financial Services Group, Inc. | 295,624 |
| |
| | | | | 1,313,638 |
| |
| | | | Health Care—13.4% | |
| 5,200 | | | Abbott Laboratories | 280,748 |
| 10,200 | | | Bristol-Myers Squibb Company | 257,550 |
| 3,300 | | * | Express Scripts, Inc. | 285,285 |
| 4,400 | | | McKesson Corporation | 275,000 |
| 9,400 | | * | Valeant Pharmaceuticals International | 298,826 |
| |
| | | | | 1,397,409 |
| | | | | | |
| Shares | | | Security | | | Value |
| |
| | | | Industrials—8.6% | | | |
| 5,800 | | | Avery Dennison Corporation | | | $ 211,642 |
| 16,000 | | * | GrafTech International, Ltd. | | | 248,800 |
| 5,600 | | | Illinois Tool Works, Inc. | | | 268,744 |
| 4,657 | | * | Thomas & Betts Corporation | | | 166,674 |
| |
| | | | | | | 895,860 |
| |
| | | | Information Technology—29.4% | | | |
| 1,500 | | * | Apple, Inc. | | | 316,290 |
| 7,100 | | * | BMC Software, Inc. | | | 284,710 |
| 11,500 | | * | Cisco Systems, Inc. | | | 275,310 |
| 5,200 | | | Hewlett-Packard Company | | | 267,852 |
| 13,700 | | | Intel Corporation | | | 279,480 |
| 1,900 | | | International Business Machines Corporation | | | 248,710 |
| 5,700 | | | Lender Processing Services, Inc. | | | 231,762 |
| 6,350 | | * | McAfee, Inc. | | | 257,619 |
| 10,535 | | * | Red Hat, Inc. | | | 325,531 |
| 13,000 | | * | SAIC, Inc. | | | 246,220 |
| 7,800 | | * | Western Digital Corporation | | | 344,370 |
| |
| | | | | | | 3,077,854 |
| |
| | | | Materials—5.0% | | | |
| 3,500 | | | Freeport-McMoRan Copper & Gold, Inc. | | | 281,015 |
| 9,800 | | | Pactiv Corporation | | | 236,572 |
| |
| | | | | | | 517,587 |
| |
| Total Value of Common Stocks (cost $8,892,738) | 97.5 | % | 10,176,770 |
| Other Assets, Less Liabilities | 2.5 | | 266,547 |
| |
| Net Assets | | | | 100.0 | % | $10,443,317 |
| |
| * | Non-income producing |
| |
| Accounting Standards Codification (“ASC”) 820 established a three-tier hierarchy of inputs to establish a classification of fair value measurements for disclosure purposes. The three-tier hierarchy of inputs is |
| in the three broad Levels listed below: |
| |
| |
| Level 1 — quoted prices in active markets for identical securities |
| |
| Level 2 — other significant observable inputs (including quoted prices for similar securities, interest rates, prepayment speeds, credit risk, etc.) |
| |
| Level 3 — significant unobservable inputs (including the fund’s own assumptions in determining the fair value of investments) |
Portfolio of Investments (continued)
SELECT GROWTH FUND
December 31, 2009
The inputs methodology used for valuing securities are not necessarily an indication of the risk associated with investing in those securities.
The following is a summary, by category of Level, of inputs used to value the Fund’s investments as of December 31, 2009:
| | | | | | | | | | | | |
| | | | | | | Level 2 | | | | | | |
| | | | | | | Other | | | Level 3 | | | |
| | | | Level 1 | | Significant | | | Significant | | | |
| | | | Quoted | | Observable | | | Unobservable | | | |
| | | | Prices | | | Inputs | | | Inputs | | | Total |
| |
| Common Stocks* | | $ | 10,176,770 | | $ | — | | $ | — | | $ | 10,176,770 |
|
| * The Portfolio of Investments provides information on the industry categorization for the portfolio. |
| | |
| 80 | See notes to financial statements | |
Portfolio Manager’s Letter
TARGET MATURITY 2010 FUND
TARGET MATURITY 2015 FUND
Dear Investor:
This is the annual report for the First Investors Life Target Maturity 2010 Fund and the First Investors Life Target Maturity 2015 Fund for the year ended December 31, 2009. During the period, the Funds’ returns on a net asset value basis were –0.23% for Life Target Maturity 2010 and –2.22% for Life Target Maturity 2015, including dividends of 77.9 cents per share and capital gains of 18.3 cents per share for Life Target Maturity 2010, and dividends of 62.8 cents per share and capital gains of 2.3 cents per share for Life Target Maturity 2015.
The Funds’ investment objective is to seek a predictable compounded return for the investors who hold the Funds’ shares until the Funds’ maturity, consistent with preservation of capital. In order to meet this objective, the Funds are fully invested in high-quality zero coupon bonds that are due to mature on or around the Funds’ maturity dates. These bonds are very sensitive to changes in interest rates. The primary factor affecting the performance of the Funds was therefore the increase in U.S. Treasury interest rates during the year.
Two-year and seven-year benchmark U.S. Treasury interest rates rose 37 basis points (.37%) and 134 basis points (1.34%), respectively, in 2009. Rising interest rates caused the price of the Funds’ holdings to decline. Reflecting the higher interest rate sensitivity of longer-term bonds, and the greater increase in longer-term interest rates, the Target Maturity 2015 Fund had a lower return than the Target Maturity 2010 Fund.
Thank you for placing your trust in First Investors. We appreciate the opportunity to serve your investment needs.
Sincerely,

Clark D. Wagner
Portfolio Manager and
Director of Fixed Income, First Investors Management Company, Inc.
January 29, 2010
Fund Expenses (unaudited)
TARGET MATURITY 2010 FUND
The examples below show the ongoing costs (in dollars) of investing in your Fund and will help you in comparing these costs with costs of other mutual funds. Please refer to page 3 for a detailed explanation of the information presented in these examples.
| | | |
| | Beginning | Ending | |
| | Account | Account | Expenses Paid |
| | Value | Value | During Period |
| | (7/1/09) | (12/31/09) | (7/1/09–12/31/09)* |
| Expense Examples | | | |
| Actual | $1,000.00 | $1,005.27 | $3.94 |
| Hypothetical | | | |
| (5% annual return before expenses) | $1,000.00 | $1,021.28 | $3.97 |
| |
| * | Expenses are equal to the annualized expense ratio of .78%, multiplied by the average account |
| value over the period, multiplied by 184/365 (to reflect the one-half year period). Expenses paid |
| during the period are net of expenses waived. |
Portfolio Composition
BY SECTOR

Portfolio holdings and allocations are subject to change. Percentages are as of December 31, 2009,
and are based on the total value of investments.
Cumulative Performance Information
TARGET MATURITY 2010 FUND
Comparison of change in value of $10,000 investment in the First Investors Life Series Target Maturity 2010 Fund and the Citigroup Treasury/Government Sponsored Index.
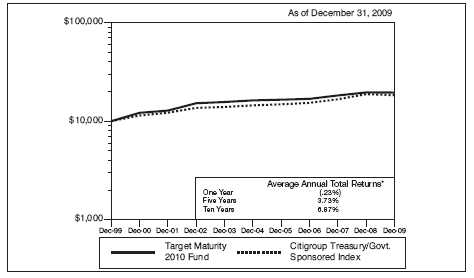
The graph compares a $10,000 investment in the First Investors Life Series Target Maturity 2010 Fund beginning 12/31/99 with a theoretical investment in the Citigroup Treasury/Government Sponsored Index (the “Index”). The Index is a market capitalization-weighted index that consists of debt issued by the U.S. Treasury and U.S. Government sponsored agencies. Every issue included in the Index is trader-priced, and the Index follows consistent and realistic availability limits, including only those securities with sufficient amounts outstanding. It is not possible to invest directly in this Index. In addition, the Index does not reflect fees and expenses associated with the active management of a mutual fund portfolio. For purposes of the graph and the accompanying table it is assumed that all dividends and distributions were reinvested.
* The Average Annual Total Return figures are for the periods ended 12/31/09. During the periods shown, some of the expenses of the Fund were waived or assumed. If such expenses had been paid by the Fund, the Average Annual Total Returns for One Year, Five Years and Ten Years would have been (.38%), 3.58% and 6.71%, respectively.
The returns shown do not reflect any sales charges, since the Fund sells its shares solely to variable annuity and/or variable life insurance subaccounts at net asset value. The returns do not reflect the fees and charges that an individual would pay in connection with an investment in a variable annuity or life contract or policy. Results represent past performance and do not indicate future results. The graph and the returns shown do not reflect the deduction of taxes that an investor would pay on distributions or the redemption of fund shares. Investment return and principal value of an investment will fluctuate so that an investor’s shares, when redeemed, may be worth more or less than the original cost. Citigroup Treasury/Government Sponsored Index figures are from Citigroup and all other figures are from First Investors Management Company, Inc.
Portfolio of Investments
TARGET MATURITY 2010 FUND
December 31, 2009
| | | | | | | | |
| Principal | | | | Effective | | |
| Amount | | | Security | | | Yield | † | Value |
| |
| | | | U.S. GOVERNMENT AGENCY ZERO COUPON | | | | |
| | | | OBLIGATIONS—71.8% | | | | | |
| | | | Agency For International Development – Israel: | | | | |
| $ 1,303 | M | | 8/15/2010 | | | 0.68 | % | $ 1,297,452 |
| 495 | M | | 9/15/2010 | | | 0.73 | | 492,464 |
| | | | Fannie Mae: | | | | | |
| 1,060 | M | | 8/7/2010 | | | 0.86 | | 1,054,536 |
| 800 | M | | 12/15/2010 | | | 1.09 | | 791,736 |
| 1,100 | M | | Freddie Mac, 9/15/2010 | | | 0.92 | | 1,092,866 |
| 500 | M | | Government Trust Certificate – Israel Trust, 11/15/2010 | | 1.26 | | 494,540 |
| 1,700 | M | | Government Trust Certificate – Turkey Trust, 11/15/2010 | | 1.26 | | 1,681,434 |
| 1,250 | M | | Tennessee Valley Authority, 11/1/2010 | | | 1.06 | | 1,238,996 |
| |
| Total Value of U.S. Government Agency Zero Coupon | | | | | |
| Obligations (cost $7,829,837) | | | | | 8,144,024 |
| |
| | | | U.S. GOVERNMENT ZERO COUPON | | | | | |
| | | | OBLIGATIONS—28.1% | | | | | |
| 3,200 | M | | U.S. Treasury Strips, 11/15/2010 (cost $3,017,999) | | 0.45 | | 3,187,395 |
| |
| Total Value of Investments (cost $10,847,836) | 99.9 | % | | | 11,331,419 |
| Other Assets, Less Liabilities | .1 | | | | 2,636 |
| |
| Net Assets | | | | 100.0 | % | | | $ 11,334,055 |
| |
| † | The effective yields shown for the zero coupon obligations are the effective yields at |
| December 31, 2009. |
Accounting Standards Codification (“ASC”) 820 established a three-tier hierarchy of inputs to establish a classification of fair value measurements for disclosure purposes. The three-tier hierarchy of inputs is summarized in the three broad Levels listed below:
| Level 1 — quoted prices in active markets for identical securities |
| |
| Level 2 — other significant observable inputs (including quoted prices for similar securities, interest rates, prepayment speeds, credit risk, etc.) |
| |
| Level 3 — significant unobservable inputs (including the fund’s own assumptions in determining the fair value of investments) |
The inputs methodology used for valuing securities are not necessarily an indication of the risk associated with investing in those securities.
The following is a summary, by category of Level, of inputs used to value the Fund’s investments as of December 31, 2009:
| | | | | | | | | | | | |
| | | | | | | Level 2 | | | | | | |
| | | | | | | Other | | | Level 3 | | | |
| | | | Level 1 | | | Significant | | | Significant | | | |
| | | | Quoted | | | Observable | | Unobservable | | | |
| | | | Prices | | | Inputs | | | Inputs | | | Total |
| U.S. Government Agency Zero | | | | | | | | | | | | |
| Coupon Obligations | | $ | — | | $ | 8,144,024 | | $ | — | | $ | 8,144,024 |
| U.S. Government Zero Coupon | | | | | | | | | | | | |
| Obligations | | | — | | | 3,187,395 | | | — | | | 3,187,395 |
| Total Investments | | | | | | | | | | | | |
| in Securities | | $ | — | | $ | 11,331,419 | | $ | — | | $ | 11,331,419 |
| | | |
| | See notes to financial statements | 85 |
Fund Expenses (unaudited)
TARGET MATURITY 2015 FUND
The examples below show the ongoing costs (in dollars) of investing in your Fund and will help you in comparing these costs with costs of other mutual funds. Please refer to page 3 for a detailed explanation of the information presented in these examples.
| | | |
| | Beginning | Ending | |
| | Account | Account | Expenses Paid |
| | Value | Value | During Period |
| | (7/1/09) | (12/31/09) | (7/1/09–12/31/09)* |
| Expense Examples | | | |
| Actual | $1,000.00 | $1,024.54 | $3.62 |
| Hypothetical | | | |
| (5% annual return before expenses) | $1,000.00 | $1,021.63 | $3.62 |
| |
| * | Expenses are equal to the annualized expense ratio of .71%, multiplied by the average account |
| value over the period, multiplied by 184/365 (to reflect the one-half year period). Expenses paid |
| during the period are net of expenses waived. |
Portfolio Composition
BY SECTOR
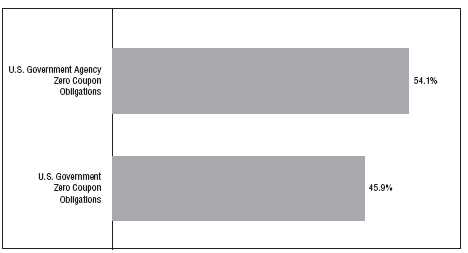
Portfolio holdings and allocations are subject to change. Percentages are as of December 31, 2009,
and are based on the total value of investments.
Cumulative Performance Information
TARGET MATURITY 2015 FUND
Comparison of change in value of $10,000 investment in the First Investors Life Series Target
Maturity 2015 Fund and the Citigroup Treasury/Government Sponsored Index.

The graph compares a $10,000 investment in the First Investors Life Target Series Maturity 2015 Fund beginning 12/31/99 with a theoretical investment in the Citigroup Treasury/Government Sponsored Index (the “Index”). The Index is a market capitalization-weighted index that consists of debt issued by the U.S. Treasury and U.S. Government sponsored agencies. Every issue included in the Index is trader-priced, and the Index follows consistent and realistic availability limits, including only those securities with sufficient amounts outstanding. It is not possible to invest directly in this Index. In addition, the Index does not reflect fees and expenses associated with the active management of a mutual fund portfolio. For purposes of the graph and the accompanying table, it is assumed that all dividends and distributions were reinvested.
* The Average Annual Total Return figures are for the periods ended 12/31/09. During the periods shown, some of the expenses of the Fund were waived or assumed. If such expenses had been paid by the Fund, the Average Annual Total Returns for One Year, Five Years and Ten Years would have been (2.37%), 5.33% and 8.41%, respectively.
The returns shown do not reflect any sales charges, since the Fund sells its shares solely to variable annuity and/or variable life insurance subaccounts at net asset value. The returns do not reflect the fees and charges that an individual would pay in connection with an investment in a variable annuity or life contract or policy. Results represent past performance and do not indicate future results. The graph and the returns shown do not reflect the deduction of taxes that an investor would pay on distributions or the redemption of fund shares. Investment return and principal value of an investment will fluctuate so that an investor’s shares, when redeemed, may be worth more or less than the original cost. Citigroup Treasury/Government Sponsored Index figures are from Citigroup and all other figures are from First Investors Management Company, Inc.
Portfolio of Investments
TARGET MATURITY 2015 FUND
December 31, 2009
| | | | | | | | |
| Principal | | | | | | Effective | | |
| Amount | | | Security | | | Yield | † | Value |
| |
| | | | U.S. GOVERNMENT AGENCY ZERO COUPON | | |
| | | | OBLIGATIONS—54.2% | | | | | |
| | | | Agency For International Development – Israel: | | | | |
| $ 698 | M | | 9/1l5/2015 | | | 3.41 | % | $ 575,456 |
| 2,784 | M | | 11/15/2015 | | | 3.49 | | 2,271,602 |
| | | | Fannie Mae: | | | | | |
| 24 | M | | 8/12/2015 | | | 3.64 | | 198,388 |
| 600 | M | | 9/23/2015 | | | 3.69 | | 486,719 |
| 4,643 | M | | 11/15/2015 | | | 3.75 | | 3,732,856 |
| 650 | M | | Federal Judiciary Office Building, 2/15/2015 | | | 3.61 | | 541,129 |
| | | | Freddie Mac: | | | | | |
| 550 | M | | 3/15/2015 | | | 3.49 | | 459,307 |
| 930 | M | | 9/15/2015 | | | 3.70 | | 754,469 |
| 830 | M | | 9/15/2015 | | | 3.70 | | 673,247 |
| 210 | M | | Government Trust Certificate – Turkey Trust, 5/15/2015 | | 3.71 | | 172,376 |
| 200 | M | | International Bank for Reconstruction & | | | | | |
| | | | Development, 2/15/2015 | | | 3.22 | | 169,804 |
| 3,957 | M | | Resolution Funding Corporation, 10/15/2015 | | | 3.39 | | 3,257,861 |
| 2,000 | M | | Tennessee Valley Authority, 11/1/2015 | | | 3.73 | | 1,611,662 |
| |
| Total Value of U.S. Government Agency Zero Coupon | | | | | |
| Obligations (cost $13,453,865) | | | | | 14,904,876 |
| |
| | | | U.S. GOVERNMENT ZERO COUPON | | | | | |
| | | | OBLIGATIONS—46.0% | | | | | |
| 15,375 | M | | U.S. Treasury Strips, 11/15/2015 (cost $11,113,986) | | 3.13 | | 12,642,201 |
| |
| Total Value of Investments (cost $24,567,851) | 100.2 | % | | | 27,547,077 |
| Excess of Liabilities Over Other Assets | (.2 | ) | | | (55,605) |
| |
| Net Assets | | | | 100.0 | % | | $ 27,491,472 |
| |
| † | The effective yields shown for the zero coupon obligations are the effective yields at |
| December 31, 2009. |
Accounting Standards Codification (“ASC”) 820 established a three-tier hierarchy of inputs to establish a classification of fair value measurements for disclosure purposes. The three-tier hierarchy of inputs is summarized in the three broad Levels listed below:
| Level 1 — quoted prices in active markets for identical securities |
| |
| Level 2 — other significant observable inputs (including quoted prices for similar securities, interest rates, prepayment speeds, credit risk, etc.) |
| |
| Level 3 — significant unobservable inputs (including the fund’s own assumptions in determining the fair value of investments) |
The inputs methodology used for valuing securities are not necessarily an indication of the risk associated with investing in those securities.
The following is a summary, by category of Level, of inputs used to value the Fund’s investments as of December 31, 2009:
| | | | | | | | | | | | |
| | | | | | | Level 2 | | | | | | |
| | | | | | | Other | | | Level 3 | | | |
| | | | Level 1 | | | Significant | | | Significant | | | |
| | | | Quoted | | | Observable | | Unobservable | | | |
| | | | Prices | | | Inputs | | | Inputs | | | Total |
| U.S. Government Agency Zero | | | | | | | | | | | | |
| Coupon Obligations | | $ | — | | $ | 14,904,876 | | $ | — | | $ | 14,904,876 |
| U.S. Government Zero Coupon | | | | | | | | | | | | |
| Obligations | | | — | | | 12,642,201 | | | — | | | 12,642,201 |
| Total Investments | | | | | | | | | | | | |
| in Securities | | $ | — | | $ | 27,547,077 | | $ | — | | $ | 27,547,077 |
| | |
| See notes to financial statements | 89 |
Portfolio Manager’s Letter
VALUE FUND
Dear Investor:
This is the annual report for the First Investors Life Value Fund for the year ended December 31, 2009. During the period, the Fund’s return on a net asset value basis was 21.03%, including dividends of 36.4 cents per share.
During the first part of the review period, the markets were in a steep free fall, culminating with a multi-decade market low achieved on March 9, 2009. Only after U.S. and global regulators took extraordinary measures to supply massive financial aid and intervention, such as through the TARP program, did the markets stabilize. The markets then rallied convincingly, ending the year with a significant gain.
Despite its strong performance, the Fund underperformed the overall market, as measured by the S&P 500 Index, due to its defensive positioning. Also, the Fund’s emphasis on dividend-paying stocks hurt, as these companies underperformed when compared with more volatile companies that do not pay dividends. In addition, value stocks did not keep up with growth stocks in 2009.
The defensive positioning of the Fund was most evident within the information technology and financials sectors, which had the most pronounced underperformance when compared to the S&P 500 Index. In the case of information technology, being underweight the sector hurt relative returns. Additionally, the top-performing technology stocks held in the S&P 500 Index mainly consisted of non-dividend paying companies such as Google and Apple. In financials, the Fund’s holdings of several well-capitalized, small- and mid-cap companies did not perform as well as many larger financial companies that had been in greater danger during the economic crisis.
The materials sector was the top-performing sector for the Fund as shares of holdings such as Dow Chemical and Air Products & Chemicals gained more than 50%. Dow Chemical’s value rose as it stabilized its balance sheet and cut costs after making a large acquisition, while Air Products & Chemicals’ earnings exceeded expectations. Other top performing holdings included Microsoft, which rolled out its new Windows 7 upgrade, and Tiffany & Co., which benefited from an improved earnings outlook as the year progressed. Lincoln National, a life insurer, and Bank Mutual, a bank holding company in Wisconsin, were the two biggest detractors from performance in the Fund over the course of the year. Lincoln National felt financial stress due to pressure on its variable annuity business and related concerns over capital adequacy, while Bank Mutual increased its loan loss provisions.
Thank you for placing your trust in First Investors. We appreciate the opportunity to serve your investment needs.
Sincerely,

Matthew S. Wright
Portfolio Manager
January 29, 2010
Fund Expenses (unaudited)
VALUE FUND
The examples below show the ongoing costs (in dollars) of investing in your Fund and will help you in comparing these costs with costs of other mutual funds. Please refer to page 3 for a detailed explanation of the information presented in these examples.
| | | |
| | Beginning | Ending | |
| | Account | Account | Expenses Paid |
| | Value | Value | During Period |
| | (7/1/09) | (12/31/09) | (7/1/09–12/31/09)* |
| Expense Examples | | | |
| Actual | $1,000.00 | $1,210.43 | $4.85 |
| Hypothetical | | | |
| (5% annual return before expenses) | $1,000.00 | $1,020.82 | $4.43 |
| |
| * | Expenses are equal to the annualized expense ratio of .87%, multiplied by the average account |
| value over the period, multiplied by 184/365 (to reflect the one-half year period). |
Portfolio Composition
TOP TEN SECTORS

Portfolio holdings and allocations are subject to change. Percentages are as of December 31, 2009,
and are based on the total value of investments.
Cumulative Performance Information
VALUE FUND
Comparison of change in value of $10,000 investment in the First Investors Life Series Value
Fund and the Standard & Poor’s 500 Index.
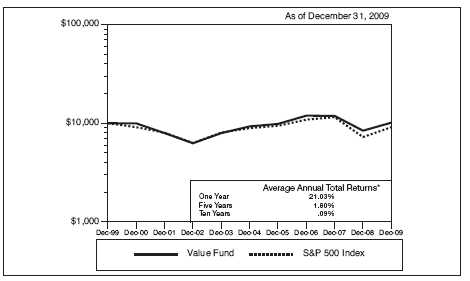
The graph compares a $10,000 investment in the First Investors Life Series Value Fund beginning 12/31/99 with a theoretical investment in the Standard & Poor’s 500 Index (the “Index”). The Index is an unmanaged capitalization-weighted index of 500 stocks designed to measure performance of the broad domestic economy through changes in the aggregate market value of such stocks, which represent all major industries. It is not possible to invest directly in this Index. In addition, the Index does not reflect fees and expenses associated with the active management of a mutual fund portfolio. For purposes of the graph and the accompanying table it is assumed that all dividends and distributions were reinvested.
* The Average Annual Total Return figures are for the periods ended 12/31/09. During certain of the periods shown, some of the expenses of the Fund were waived or assumed. If such expenses had been paid by the Fund, the Average Annual Total Return for Ten Years would have been .07%.
The returns shown do not reflect any sales charges, since the Fund sells its shares solely to variable annuity and/or variable life insurance subaccounts at net asset value. The returns do not reflect the fees and charges that an individual would pay in connection with an investment in a variable annuity or life contract or policy. Results represent past performance and do not indicate future results. The graph and the returns shown do not reflect the deduction of taxes that an investor would pay on distributions or the redemption of fund shares. Investment return and principal value of an investment will fluctuate so that an investor’s shares, when redeemed, may be worth more or less than the original cost. Standard & Poor’s 500 Index figures are from Standard & Poor’s and all other figures are from First Investors Management Company, Inc.
Portfolio of Investments
VALUE FUND
December 31, 2009
| | | | |
| Shares | | | Security | Value |
| |
| | | | COMMON STOCKS—96.0% | |
| | | | Consumer Discretionary—11.9% | |
| 5,600 | | | Best Buy ompany, Inc. | $ 220,976 |
| 7,400 | | | Bob Evans Farms, Inc. | 214,230 |
| 8,700 | | * | Carnival Corporation | 275,703 |
| 15,500 | | | Cinemark Holdings, Inc. | 222,735 |
| 17,200 | | | Comcast Corporation – Special Shares “A” | 275,372 |
| 19,500 | | | Family Dollar Stores, Inc. | 542,685 |
| 6,400 | | | Fortune Brands, Inc. | 276,480 |
| 12,800 | | | Genuine Parts Company | 485,888 |
| 18,900 | | | H&R Block, Inc. | 427,518 |
| 16,600 | | | Home Depot, Inc. | 480,238 |
| 6,100 | | | J.C. Penney Company, Inc. | 162,321 |
| 19,600 | | | Lowe’s Companies, Inc. | 458,444 |
| 9,900 | | | McDonald’s Corporation | 618,156 |
| 14,400 | | | Newell Rubbermaid, Inc. | 216,144 |
| 7,100 | | | Omnicom Group, Inc. | 277,965 |
| 20,700 | | | Pearson PLC (ADR) | 297,252 |
| 25,600 | | * | Ruby Tuesday, Inc. | 184,320 |
| 17,100 | | | Staples, Inc. | 420,489 |
| 8,100 | | | Tiffany & Company | 348,300 |
| 13,166 | | | Time Warner, Inc. | 383,657 |
| 25,800 | | | Walt Disney Company | 832,050 |
| 8,580 | | | Wyndham Worldwide Corporation | 173,059 |
| |
| | | | | 7,793,982 |
| |
| | | | Consumer Staples—17.1% | |
| 14,300 | | | Avon Products, Inc. | 450,450 |
| 3,300 | | | Clorox Company | 201,300 |
| 18,100 | | | Coca-Cola Company | 1,031,700 |
| 13,400 | | | ConAgra Foods, Inc. | 308,870 |
| 9,200 | | | Costco Wholesale Corporation | 544,364 |
| 10,900 | | | CVS/Caremark Corporation | 351,089 |
| 10,200 | | | Diageo PLC (ADR) | 707,982 |
| 12,100 | | | H.J. Heinz Company | 517,396 |
| 9,600 | | | Hershey Company | 343,584 |
| 13,100 | | | Kimberly-Clark Corporation | 834,601 |
| 33,300 | | | Kraft Foods, Inc. – Class “A” | 905,094 |
| 10,700 | | | Kroger Company | 219,671 |
| 11,000 | | | McCormick & Company, Inc. | 397,430 |
| 7,500 | | | PepsiAmericas, Inc. | 219,450 |
| 10,600 | | | PepsiCo, Inc. | 644,480 |
| | | | |
| Shares | | | Security | Value |
| |
| | | | Consumer Staples (continued) | |
| 16,000 | | | Philip Morris International, Inc. | $ 771,040 |
| 5,400 | | | Procter & Gamble Company | 327,402 |
| 8,900 | | | Ruddick Corporation | 228,997 |
| 8,900 | | | Safeway, Inc. | 189,481 |
| 37,500 | | | Sara Lee Corporation | 456,750 |
| 15,100 | | | Walgreen Company | 554,472 |
| 20,000 | | | Wal-Mart Stores, Inc. | 1,069,000 |
| |
| | | | | 11,274,603 |
| |
| | | | Energy—9.0% | |
| 8,300 | | | Anadarko Petroleum Corporation | 518,086 |
| 10,500 | | | BP PLC (ADR) | 608,685 |
| 11,712 | | | Chevron Corporation | 901,707 |
| 13,500 | | | ConocoPhillips | 689,445 |
| 6,100 | | | Diamond Offshore Drilling, Inc. | 600,362 |
| 6,900 | | | ExxonMobil Corporation | 470,511 |
| 4,900 | | | Hess Corporation | 296,450 |
| 21,400 | | | Marathon Oil Corporation | 668,108 |
| 11,000 | | | Royal Dutch Shell PLC – Class “A” (ADR) | 661,210 |
| 10,800 | | | Tidewater, Inc. | 517,860 |
| |
| | | | | 5,932,424 |
| |
| | | | Financials—15.0% | |
| 6,700 | | | ACE, Ltd. | 337,680 |
| 8,300 | | | Allstate Corporation | 249,332 |
| 7,000 | | | Ameriprise Financial, Inc. | 271,740 |
| 9,700 | | | Aon Corporation | 371,898 |
| 7,300 | | | Aspen Insurance Holdings, Ltd. | 185,785 |
| 34,800 | | | Bank Mutual Corporation | 240,816 |
| 26,306 | | | Bank of America Corporation | 396,168 |
| 17,973 | | | Bank of New York Mellon Corporation | 502,705 |
| 8,179 | | | Brookfield Asset Management, Inc. – Class “A” | 181,410 |
| 5,594 | | | Capital One Financial Corporation | 214,474 |
| 9,622 | | | Chubb Corporation | 473,210 |
| 12,622 | | | Cincinnati Financial Corporation | 331,201 |
| 19,000 | | | Citigroup, Inc. | 62,890 |
| 9,000 | | | Comerica, Inc. | 266,130 |
| 7,100 | | | EMC Insurance Group, Inc. | 152,721 |
| 8,600 | | | Erie Indemnity Company – Class “A” | 335,572 |
| 12,300 | | | Financial Select Sector SPDR Fund (ETF) | 176,997 |
| 17,100 | | | First Potomac Realty Trust (REIT) | 214,947 |
Portfolio of Investments (continued)
VALUE FUND
December 31, 2009
| | | | |
| Shares | | | Security | Value |
| |
| | | | Financials (continued) | |
| 20,700 | | | Hudson City Bancorp, Inc. | $ 284,211 |
| 13,400 | | | Invesco, Ltd. | 314,766 |
| 46,800 | | | Investors Real Estate Trust (REIT) | 421,200 |
| 19,800 | | | JPMorgan Chase & Company | 825,066 |
| 10,900 | | | Morgan Stanley | 322,640 |
| 26,900 | | | NewAlliance Bancshares, Inc. | 323,069 |
| 28,700 | | | People’s United Financial, Inc. | 479,290 |
| 9,500 | | | Plum Creek Timber Company, Inc. (REIT) | 358,720 |
| 8,400 | | | PNC Financial Services Group, Inc. | 443,436 |
| 9,700 | | | Protective Life Corporation | 160,535 |
| 3,500 | | | SunTrust Banks, Inc. | 71,015 |
| 7,400 | | | Waddell & Reed Financial, Inc. – Class “A” | 225,996 |
| 17,300 | | | Wells Fargo & Company | 466,927 |
| 22,600 | | | Westfield Financial, Inc. | 186,450 |
| |
| | | | | 9,848,997 |
| |
| | | | Health Care—8.7% | |
| 20,200 | | | Abbott Laboratories | 1,090,598 |
| 6,600 | | | Becton, Dickinson & Company | 520,476 |
| 7,525 | | | Covidien PLC | 360,372 |
| 12,100 | | | GlaxoSmithKline PLC (ADR) | 511,225 |
| 19,700 | | | Johnson & Johnson | 1,268,877 |
| 10,100 | | | Medtronic, Inc. | 444,198 |
| 7,670 | | | Merck & Company. Inc. | 280,262 |
| 10,900 | | | Novartis AG (ADR) | 593,287 |
| 37,300 | | | Pfizer, Inc. | 678,487 |
| |
| | | | | 5,747,782 |
| |
| | | | Industrials—11.1% | |
| 8,000 | | | 3M Company | 661,360 |
| 4,200 | | | ABM Industries, Inc. | 86,772 |
| 3,000 | | | Alexander & Baldwin, Inc. | 102,690 |
| 6,400 | | * | Armstrong World Industries, Inc. | 249,152 |
| 9,600 | | | Avery Dennison Corporation | 350,304 |
| 14,200 | | | Dover Corporation | 590,862 |
| 6,600 | | | Emerson Electric Company | 281,160 |
| 6,800 | | | Equifax, Inc. | 210,052 |
| 8,700 | | | General Dynamics Corporation | 593,079 |
| 30,200 | | | General Electric Company | 456,926 |
| 15,000 | | | Honeywell International, Inc. | 588,000 |
| 5,100 | | | Hubbell, Inc. – Class “B” | 241,230 |
| 11,100 | | | Illinois Tool Works, Inc. | 532,689 |
| | | | |
| Shares | | | Security | Value |
| |
| | | | Industrials (continued) | |
| 8,200 | | | ITT Corporation | $ 407,868 |
| 8,170 | | | Lawson Products, Inc. | 144,201 |
| 2,300 | | | Lockheed Martin Corporation | 173,305 |
| 3,100 | | | Norfolk Southern Corporation | 162,502 |
| 10,800 | | | Pitney Bowes, Inc. | 245,808 |
| 9,300 | | | Textainer Group Holdings, Ltd. | 157,170 |
| 7,825 | | | Tyco International, Ltd. | 279,196 |
| 10,000 | | | United Parcel Service, Inc. – Class “B” | 573,700 |
| 6,000 | | | Waste Management, Inc. | 202,860 |
| |
| | | | | 7,290,886 |
| |
| | | | Information Technology—8.9% | |
| 16,300 | | | Automatic Data Processing, Inc. | 697,966 |
| 21,300 | | | AVX Corporation | 269,871 |
| 10,900 | | | Bel Fuse, Inc. – Class “B” | 234,241 |
| 11,100 | | * | Electronic Arts, Inc. | 197,025 |
| 17,500 | | | Hewlett-Packard Company | 901,425 |
| 11,700 | | | Intel Corporation | 238,680 |
| 2,900 | | | International Business Machines Corporation | 379,610 |
| 6,300 | | | Intersil Corporation – Class “A” | 96,642 |
| 27,600 | | | Methode Electronics, Inc. | 239,568 |
| 30,100 | | | Microsoft Corporation | 917,749 |
| 16,950 | | | Molex, Inc. | 365,273 |
| 14,000 | | | National Semiconductor Corporation | 215,040 |
| 26,600 | | | Nokia Corporation – Class “A” (ADR) | 341,810 |
| 10,500 | | | Texas Instruments, Inc. | 273,630 |
| 10,125 | | | Tyco Electronics, Ltd. | 248,569 |
| 8,200 | | | Xilinx, Inc. | 205,492 |
| |
| | | | | 5,822,591 |
| |
| | | | Materials—5.8% | |
| 4,100 | | | Air Products & Chemicals, Inc. | 332,346 |
| 14,800 | | | Alcoa, Inc. | 238,576 |
| 18,200 | | | Bemis Company, Inc. | 539,630 |
| 5,200 | | | Compass Minerals International, Inc. | 349,388 |
| 21,500 | | | Dow Chemical Company | 594,045 |
| 22,400 | | | DuPont (E.I.) de Nemours & Company | 754,208 |
| 15,700 | | | Glatfelter | 190,755 |
| 5,900 | | | PPG Industries, Inc. | 345,386 |
| 17,000 | | | Sonoco Products Company | 497,250 |
| |
| | | | | 3,841,584 |
Portfolio of Investments (continued)
VALUE FUND
December 31, 2009
| | | | | | |
| Shares or | | | | | | |
| Principal | | | | | | |
| Amount | | | Security | | | Value |
| |
| | | | Telecommunication Services—3.5% | | | |
| 35,210 | | | AT&T, Inc. | | | $ 986,936 |
| 5,780 | | | CenturyTel, Inc. | | | 209,294 |
| 4,700 | | | Telephone & Data Systems, Inc. | | | 159,424 |
| 6,600 | | | Telephone & Data Systems, Inc. – Special Shares | | 199,320 |
| 22,718 | | | Verizon Communications, Inc. | | | 752,647 |
| |
| | | | | | | 2,307,621 |
| |
| | | | Utilities—5.0% | | | |
| 10,100 | | | American Electric Power Company, Inc. | | | 351,379 |
| 4,450 | | | American States Water Company | | | 157,574 |
| 12,900 | | | Duke Energy Corporation | | | 222,009 |
| 6,800 | | | FPL Group, Inc. | | | 359,176 |
| 14,400 | | | MDU Resources Group, Inc. | | | 339,840 |
| 25,600 | | | NiSource, Inc. | | | 393,728 |
| 7,600 | | | ONEOK, Inc. | | | 338,732 |
| 14,000 | | | Portland General Electric Company | | | 285,740 |
| 11,300 | | | Southwest Gas Corporation | | | 322,389 |
| 12,300 | | | Vectren Corporation | | | 303,564 |
| 4,400 | | | Wisconsin Energy Corporation | | | 219,252 |
| |
| | | | | | | 3,293,383 |
| |
| Total Value of Common Stocks (cost $57,216,085) | | | 63,153,853 |
| |
| | | | PREFERRED STOCKS—.7% | | | |
| | | | Telecommunication Services—.4% | | | |
| 10,200 | | | AT&T, Inc., 6.375%, 2056 | | | 272,238 |
| |
| | | | Utilities—.3% | | | |
| 7,400 | | | Entergy Louisiana, LLC., 7.6%, 2032 | | | 190,476 |
| |
| Total Value of Preferred Stocks (cost $440,102) | | | 462,714 |
| |
| | | | SHORT-TERM INVESTMENTS—3.3% | | |
| | | | Money Market Fund | | | |
| $2,200 | M | | First Investors Cash Reserve Fund, .24% (cost $2,200,000) | | 2,200,000 |
| |
| Total Value of Investments (cost $59,856,187) | 100.0 | % | 65,816,567 |
| Other Assets, Less Liabilities | — | | 820 |
| |
| Net Assets | | | | 100.0 | % | $65,817,387 |
| | |
| * | Non-income producing |
| |
| ** | Affiliated unregistered money market fund available only to First Investors funds and certain |
| accounts managed by First Investors Management Company, Inc. Rate shown is the 7-day yield |
| at December 31, 2009 (see Note 3). |
| |
| Summary of Abbreviations: |
| ADR | American Depositary Receipts |
| ETF | Exchange Traded Fund |
| REIT | Real Estate Investment Trust |
| |
| Accounting Standards Codification (“ASC”) 820 established a three-tier hierarchy of inputs to establish a classification of fair value measurements for disclosure purposes. The three-tier |
| hierarchy of inputs is summarized in the three broad Levels listed below: |
| |
| | Level 1 — quoted prices in active markets for identical securities |
| |
| | Level 2 — other significant observable inputs (including quoted prices for similar securities, interest rates, prepayment speeds, credit risk, etc.) |
| | |
| | Level 3 — significant unobservable inputs (including the fund’s own assumptions in determining the fair value of investments) |
| |
| The inputs methodology used for valuing securities are not necessarily an indication of the risk associated with investing in those securities. |
| |
| The following is a summary, by category of Level, of inputs used to value the Fund’s investments as of December 31, 2009: |
| | | | | | | | | | | | |
| | | | | | | Level 2 | | | | | | |
| | | | | | | Other | | | Level 3 | | | |
| | | | Level 1 | | | Significant | | | Significant | | | |
| | | | Quoted | | | Observable | | Unobservable | | | |
| | | | Prices | | | Inputs | | | Inputs | | | Total |
| Common Stocks | | $ | 63,153,853 | | $ | — | | $ | — | | $ | 63,153,853 |
| Preferred Stocks | | | 462,714 | | | — | | | — | | | 462,714 |
| Money Market Fund | | | 2,200,000 | | | — | | | — | | | 2,200,000 |
| Total Investments | | | | | | | | | | | | |
| in Securities* | | $ | 65,816,567 | | $ | — | | $ | — | | $ | 65,816,567 |
* The Portfolio of Investments provides information on the industry categorization for the portfolio.
| | |
| See notes to financial statements | 99 |
Statements of Assets and Liabilities
FIRST INVESTORS LIFE SERIES FUNDS
December 31, 2009
| | | | | | | | | | | | | |
| | | | |
| | | | CASH | | | | | GROWTH & | | | |
| | | BLUE CHIP | MANAGEMENT | | DISCOVERY | GOVERNMENT | | INCOME | | HIGH YIELD | |
| Assets | | | | | | | | | | | | | |
| Investments in securities: | | | | | | | | | | | | | |
| Cost — Unaffiliated issuers | $ | 91,762,255 | $ | 10,786,977 | $ | 99,796,577 | $ | 25,128,485 | $ | 188,442,374 | $ | 62,790,704 | |
| Cost — Affiliated money market fund (Note 3) | | 1,785,000 | | — | | 7,920,000 | | — | | 775,000 | | 790,000 | |
| | |
| Total cost of investments | $ | 93,547,255 | $ | 10,786,977 | $ | $107,716,577 | $ | 25,128,485 | $ | 189,217,374 | $ | 63,580,704 | |
| | |
| Value — Unaffiliated issuers (Note 1A) | $ | 119,048,420 | $ | 10,786,977 | $ | 117,104,640 | $ | 25,613,589 | $ | 186,332,486 | $ | 62,982,533 | |
| Value — Affiliated money market fund (Note 3) | | 1,785,000 | | — | | 7,920,000 | | — | | 775,000 | | 790,000 | |
| | |
| Total value of investments | | 120,833,420 | | 10,786,977 | | 125,024,640 | | 25,613,589 | | 187,107,486 | | 63,772,533 | |
| Cash | | 47,390 | | 161,891 | | 42,591 | | 328,062 | | 31,835 | | 121,184 | |
| Receivables: | | | | | | | | | | | | | |
| Investment securities sold | | 1,738,016 | | — | | 1,936,755 | | — | | 595,102 | | 1,075,055 | |
| Interest and dividends | | 193,255 | | 27,855 | | 206,667 | | 113,661 | | 231,819 | | 1,291,125 | |
| Trust shares sold | | 11,751 | | 29 | | 21,614 | | 4,682 | | 20,262 | | 5,510 | |
| Other assets | | 18,010 | | 1,789 | | 18,537 | | 3,369 | | 27,263 | | 9,636 | |
| | |
| Total Assets | | 122,841,842 | | 10,978,541 | | 127,250,804 | | 26,063,363 | | 188,013,767 | | 66,275,043 | |
| | |
| Liabilities | | | | | | | | | | | | | |
| Payables: | | | | | | | | | | | | | |
| Investment securities purchased | | 1,750,126 | | — | | 401,168 | | — | | 229,464 | | 265,831 | |
| Trust shares redeemed | | 132,691 | | 60,355 | | 117,907 | | 32,791 | | 242,994 | | 33,781 | |
| Accrued advisory fees | | 77,068 | | 2,528 | | 78,890 | | 13,313 | | 118,537 | | 41,691 | |
| Accrued expenses | | 19,477 | | 4,528 | | 19,844 | | 8,769 | | 22,655 | | 16,623 | |
| | |
| Total Liabilities | | 1,979,362 | | 67,411 | | 617,809 | | 54,873 | | 613,650 | | 357,926 | |
| | |
| Net Assets | $ | 120,862,480 | $ | 10,911,130 | $ | 126,632,995 | $ | 26,008,490 | $ | 187,400,117 | $ | 65,917,117 | |
| | |
| Net Assets Consist of: | | | | | | | | | | | | | |
| Capital paid in | $ | 124,697,022 | $ | 10,911,130 | $ | 122,024,368 | $ | 25,180,372 | $ | 206,824,399 | $ | 96,036,637 | |
| Undistributed net investment income | | 1,905,206 | | — | | 1,116,653 | | 1,061,598 | | 2,050,736 | | 5,130,041 | |
| Accumulated net realized loss on investments | | (33,025,913 | ) | — | | (13,816,089 | ) | (718,584 | ) | (19,365,130 | ) | (35,441,390 | ) |
| Net unrealized appreciation (depreciation) | | | | | | | | | | | | | |
| of investments | | 27,286,165 | | — | | 17,308,063 | | 485,104 | | (2,109,888) | | 191,829 | |
| | |
| Total | $ | 120,862,480 | $ | 10,911,130 | $ | 126,632,995 | $ | 26,008,490 | $ | 187,400,117 | $ | 65,917,117 | |
| | |
| Shares of beneficial interest outstanding (Note 2) | | 6,257,658 | | 10,911,130 | | 5,060,595 | | 2,526,469 | | 7,588,629 | | 10,556,023 | |
| | |
| Net asset value, offering and redemption price per share — | | | | | | | | | | | | | |
| (Net assets divided by shares outstanding) | $ | 19.31 | $ | 1.00 | $ | 25.02 | $ | 10.29 | $ | 24.69 | $ | 6.24 | |
| | |
| 100 | See notes to financial statements | 101 |
Statements of Assets and Liabilities
FIRST INVESTORS LIFE SERIES FUNDS
December 31, 2009
| | | | | | | | | | | | | |
| | | | |
| | | | INVESTMENT | | SELECT | TARGET | TARGET | | | |
| | | INTERNATIONAL | GRADE | GROWTH | MATURITY 2010 | MATURITY 2015 | | VALUE | |
| Assets | | | | | | | | | | | | | |
| Investments in securities: | | | | | | | | | | | | | |
| Cost — Unaffiliated issuers | $ | 82,264,238 | $ | 35,777,048 | $ | $ 8,892,738 | $ | 10,847,836 | $ | 24,567,851 | $ | 57,656,187 | |
| Cost — Affiliated money market fund (Note 3) | | 1,005,000 | | 125,000 | | — | | — | | — | | 2,200,000 | |
| | |
| Total cost of investments | $ | 83,269,238 | $ | 35,902,048 | $ | 8,892,738 | $ | 10,847,836 | $ | 24,567,851 | $ | 59,856,187 | |
| | |
| Value — Unaffiliated issuers (Note 1A) | $ | 100,133,242 | $ | 38,280,639 | $ | 10,176,770 | $ | 11,331,419 | $ | 27,547,077 | $ | 63,616,567 | |
| Value — Affiliated money market fund (Note 3) | | 1,005,000 | | 125,000 | | — | | — | | — | | 2,200,000 | |
| | |
| Total value of investments | | 101,138,242 | | 38,405,639 | | 10,176,770 | | 11,331,419 | | 27,547,077 | | 65,816,567 | |
| | |
| Cash | | 68,067 | | 42,780 | | 256,201 | | 36,272 | | — | | 34,541 | |
| Receivables: | | | | | | | | | | | | | |
| Investment securities sold | | 29,191 | | — | | 766,582 | | — | | — | | — | |
| Interest and dividends | | 219,707 | | 577,951 | | 7,702 | | — | | — | | 149,438 | |
| Trust shares sold | | 19,453 | | 30,481 | | 16,902 | | — | | 352 | | 27,349 | |
| Unrealized appreciation of foreign exchange contracts | | | | | | | | | | | | | |
| (Note 6) | | 162,844 | | — | | — | | — | | — | | — | |
| Other assets | | 14,083 | | 5,076 | | 1,461 | | 1,874 | | 3,910 | | 9,758 | |
| | |
| Total Assets | | 101,651,587 | | 39,061,927 | | 11,225,618 | | 11,369,565 | | 27,551,339 | | 66,037,653 | |
| | |
| Liabilities | | | | | | | | | | | | | |
| Cash overdraft | | — | | — | | — | | — | | 6,517 | | — | |
| Payables: | | | | | | | | | | | | | |
| Investment securities purchased | | — | | — | | 761,878 | | — | | — | | 43,182 | |
| Trust shares redeemed | | 117,746 | | 25,940 | | 4,930 | | 24,754 | | 27,293 | | 123,812 | |
| Unrealized depreciation of foreign exchange contracts | | | | | | | | | | | | | |
| (Note 6) | | 606,187 | | — | | — | | — | | — | | — | |
| Accrued advisory fees | | 63,771 | | 19,872 | | 6,550 | | 5,800 | | 14,308 | | 41,900 | |
| Accrued expenses | | 28,991 | | 9,253 | | 8,943 | | 4,956 | | 11,749 | | 11,372 | |
| | |
| Total Liabilities | | 816,695 | | 55,065 | | 782,301 | | 35,510 | | 59,867 | | 220,266 | |
| | |
| Net Assets | $ | 100,834,892 | $ | 39,006,862 | $ | 10,443,317 | $ | 11,334,055 | $ | 27,491,472 | $ | 65,817,387 | |
| | |
| Net Assets Consist of: | | | | | | | | | | | | | |
| Capital paid in | $ | 116,242,873 | $ | 40,427,237 | $ | $ 13,981,515 | $ | 10,024,319 | $ | 23,293,187 | $ | 67,446,266 | |
| Undistributed net investment income | | 443,345 | | 1,861,730 | | 20,078 | | 634,283 | | 1,102,346 | | 1,385,122 | |
| Accumulated net realized gain (loss) on investments | | | | | | | | | | | | | |
| and foreign security transactions | | (33,286,008 | ) | (5,785,696 | ) | (4,842,308 | ) | 191,870 | | 116,713 | | (8,974,381 | ) |
| Net unrealized appreciation in value of investments | | | | | | | | | | | | | |
| and foreign security transactions | | 17,434,682 | | 2,503,591 | | 1,284,032 | | 483,583 | | 2,979,226 | | 5,960,380 | |
| | |
| Total | $ | 100,834,892 | $ | 39,006,862 | $ | 10,443,317 | $ | 11,334,055 | $ | 27,491,472 | $ | 65,817,387 | |
| | |
| Shares of beneficial interest outstanding (Note 2) | | 6,848,007 | | 3,770,285 | | 1,568,111 | | 849,270 | | 1,779,366 | | 4,891,298 | |
| | |
| Net asset value, offering and redemption price per share — | | | | | | | | | | | | | |
| (Net assets divided by shares outstanding) | $ | 14.72 | $ | 10.35 | $ | 6.66 | $ | 13.35 | $ | 15.45 | $ | $ 13.46 | |
| | |
| 102 | See notes to financial statements | 103 |
Statements of Operations
FIRST INVESTORS LIFE SERIES FUNDS
Year Ended December 31, 2009
| | | | | | | | | | | | | |
| | | | |
| | | | | CASH | | | | | GROWTH & | | | |
| | | BLUE CHIP | MANAGEMENT | | DISCOVERY | | GOVERNMENT | | INCOME | | HIGH YIELD | |
| Investment Income | | | | | | | | | | | | | |
| Income: | | | | | | | | | | | | | |
| Interest | $ | — | $ | 91,633 | $ | — | $ | 1,174,405 | $ | — | $ | 5,351,505 | |
| Dividends | | 2,797,066 | (a) | — | | 1,995,634 | | — | | 3,390,881 | (b) | 278,904 | |
| Dividends from affiliate (Note 3) | | 8,455 | | — | | 31,100 | | — | | 7,053 | | 18,298 | |
| Securities lending income | | — | | — | | — | | — | | — | | 5,458 | |
| | |
| Total income | | 2,805,521 | | 91,633 | | 2,026,734 | | 1,174,405 | | 3,397,934 | | 5,654,165 | |
| | |
| Expenses (Notes 1 and 4): | | | | | | | | | | | | | |
| Advisory fees | | 801,702 | | 92,760 | | 813,688 | | 188,595 | | 1,209,010 | | 443,307 | |
| Professional fees | | 32,785 | | 10,930 | | 30,887 | | 18,037 | | 47,935 | | 23,854 | |
| Custodian fees and expenses | | 12,145 | | 6,035 | | 14,939 | | 12,050 | | 17,223 | | 15,244 | |
| Reports and notices to shareholders | | 15,732 | | 3,425 | | 15,611 | | 5,092 | | 22,423 | | 15,285 | |
| Registration fees | | 171 | | 171 | | 171 | | 171 | | 171 | | 201 | |
| Trustees’ fees | | 6,430 | | 793 | | 6,427 | | 1,541 | | 9,588 | | 3,519 | |
| Other expenses | | 32,165 | | 7,262 | | 29,188 | | 13,433 | | 42,099 | | 29,262 | |
| | |
| Total expenses | | 901,130 | | 121,376 | | 910,911 | | 238,919 | | 1,348,449 | | 530,672 | |
| Less: Expenses waived | | — | | (51,933 | ) | — | | (37,719 | ) | — | | — | |
| Expenses paid indirectly | | (855 | ) | (246 | ) | (878 | ) | (364 | ) | (1,274 | ) | (319 | ) |
| | |
| Net expenses | | 900,275 | | 69,197 | | 910,033 | | 200,836 | | 1,347,175 | | 530,353 | |
| | |
| Net investment income | | 1,905,246 | | 22,436 | | 1,116,701 | | 973,569 | | 2,050,759 | | 5,123,812 | |
| | |
| Realized and Unrealized Gain (Loss) on Investments | | | | | | | | | | | | | |
| Net realized gain (loss) on investments | | (2,361,710 | ) | — | | (5,321,507 | ) | 101,854 | | (5,537,942 | ) | (15,346,412 | ) |
| | |
| Net unrealized appreciation (depreciation) of investments | | 22,108,095 | | — | | 34,294,546 | | (26,625 | ) | 45,001,548 | | 27,920,827 | |
| | |
| Net gain on investments | | 19,746,385 | | — | | 28,973,039 | | 75,229 | | 39,463,606 | | 12,574,415 | |
| Net Increase in Net Assets Resulting | | | | | | | | | | | | | |
| from Operations | $ | 21,651,631 | $ | 22,436 | $ | 30,089,740 | $ | 1,048,798 | $ | 41,514,365 | | $ 17,698,227 | |
(a) Net of $11,296 foreign taxes withheld
(b) Net of $19,806 foreign taxes withheld
| | |
| 104 | See notes to financial statements | 105 |
Statements of Operations
FIRST INVESTORS LIFE SERIES FUNDS
Year Ended December 31, 2009
| | | | | | | | | | | | | | | |
| | | | |
| | | | | INVESTMENT | | SELECT | | TARGET | | TARGET | | | |
| | | INTERNATIONAL | | GRADE | | GROWTH | MATURITY 2010 | | MATURITY 2015 | | VALUE | |
| Investment Income | | | | | | | | | | | | | |
| Income: | | | | | | | | | | | | | |
| Interest | $ | 285 | $ | 2,130,239 | $ | — | $ | 732,552 | $ | 1,301,042 | $ | — | |
| Dividends | | 2,877,249 | (c) | 23,596 | | 110,262 | | — | | — | | 1,883,696 | (d) |
| Dividends from affiliate (Note 3) | | 7,328 | | 3,517 | | — | | — | | — | | 9,159 | |
| | |
| Total income | | 2,884,862 | | 2,157,352 | | 110,262 | | 732,552 | | 1,301,042 | | 1,892,855 | |
| | |
| Expenses (Notes 1 and 4): | | | | | | | | | | | | | |
| Advisory fees | | 651,854 | | 263,457 | | 67,983 | | 92,707 | | 211,428 | | 434,016 | |
| Professional fees | | 46,361 | | 21,324 | | 12,163 | | 10,812 | | 11,785 | | 23,629 | |
| Custodian fees and expenses | | 129,602 | | 9,541 | | 1,200 | | 2,426 | | 1,783 | | 11,191 | |
| Reports and notices to shareholders | | 12,880 | | 6,832 | | 2,694 | | 3,183 | | 5,310 | | 9,640 | |
| Registration fees | | 171 | | 171 | | 184 | | 171 | | 186 | | 1,386 | |
| Trustees’ fees | | 5,170 | | 2,104 | | 542 | | 791 | | 1,759 | | 3,483 | |
| Other expenses | | 36,131 | | 15,436 | | 5,690 | | 6,790 | | 9,155 | | 24,851 | |
| | |
| Total expenses | | 882,169 | | 318,865 | | 90,456 | | 116,880 | | 241,406 | | 508,196 | |
| Less: Expenses waived | | — | | (52,692 | ) | — | | (18,541 | ) | (42,286 | ) | — | |
Expenses paid indirectly | | (677 | ) | (191 | ) | (272 | ) | (80 | ) | (426 | ) | (472 | ) |
| | |
| Net expenses | | 881,492 | | 265,982 | | 90,184 | | 98,259 | | 198,694 | | 507,724 | |
| | |
| Net investment income | | 2,003,370 | | 1,891,370 | | 20,078 | | 634,293 | | 1,102,348 | | 1,385,131 | |
| | |
| Realized and Unrealized Gain (Loss) on Investments | | | | | | | | | | | | | |
| and Foreign Currency Transactions | | | | | | | | | | | | | |
| Net realized gain (loss) on: | | | | | | | | | | | | | |
| Investments | | (9,082,766 | ) | (877,842 | ) | (1,502,531 | ) | 191,900 | | 130,512 | | (1,131,593 | ) |
| Foreign currency transactions | | 1,778,633 | | — | | — | | — | | — | | — | |
| | |
| Net realized gain (loss) on investments and foreign | | | | | | | | | | | | | |
| currency transactions | | (7,304,133 | ) | (877,842 | ) | (1,502,531 | ) | 191,900 | | 130,512 | | (1,131,593 | ) |
| Net unrealized appreciation (depreciation) of: | | | | | | | | | | | | | |
| Investments | | 29,021,377 | | 5,596,709 | | 2,428,097 | | (871,996 | ) | (1,880,168 | ) | 11,166,645 | |
| Foreign currency transactions | | (4,575,708 | ) | — | | — | | — | | — | | — | |
| | |
| Net unrealized appreciation (depreciation) on investments | | | | | | | | | | | | | |
| and foreign currency transactions | | 24,445,669 | | 5,596,709 | | 2,428,097 | | (871,996 | ) | (1,880,168 | ) | 11,166,645 | |
| Net gain (loss) on investments and foreign | | | | | | | | | | | | | |
| currency transactions | | 17,141,536 | | 4,718,867 | | 925,566 | | (680,096 | ) | (1,749,656 | ) | 10,035,052 | |
| | |
| Net Increase (Decrease) in Net Assets Resulting | | | | | | | | | | | | | |
| from Operations | $ | 19,144,906 | $ | 6,610,237 | $ | 945,644 | $ | (45,803 | ) | $ | (647,308 | ) | $ | 11,420,183 | |
(c) Net of $278,637 foreign taxes withheld
(d) Net of $11,421 foreign taxes withheld
| | |
| 106 | See notes to financial statements | 107 |
Statements of Changes in Net Assets
FIRST INVESTORS LIFE SERIES FUNDS
| | | | | | | | | | | | | | | | | |
| | | | |
| | | BLUE CHIP | | CASH MANAGEMENT | | DISCOVERY | | GOVERNMENT | |
| Year Ended December 31 | | 2009 | | 2008 | | 2009 | | 2008 | | 2009 | | 2008 | | 2009 | | 2008 | |
| Increase (Decrease) in Net Assets From Operations | | | | | | | | | | | | | | | | | |
| Net investment income | $ | 1,905,246 | $ | 2,356,298 | $ | 22,436 | $ | 283,747 | $ | 1,116,701 | $ | 1,370,289 | $ | 973,569 | $ | 1,023,563 | |
| Net realized gain (loss) on investments | | (2,361,710 | ) | (2,989,594 | ) | — | | — | | (5,321,507 | ) | (8,462,366 | ) | 101,854 | | 115,259 | |
| Net unrealized appreciation (depreciation) | | | | | | | | | | | | | | | | | |
| of investments | | 22,108,095 | | (51,875,344 | ) | — | | — | | 34,294,546 | | (44,385,365 | ) | (26,625 | ) | 389,109 | |
| Net increase (decrease) in net assets resulting | | | | | | | | | | | | | | | | | |
| from operations | | 21,651,631 | | (52,508,640 | ) | 22,436 | | 283,747 | | 30,089,740 | | (51,477,442 | ) | 1,048,798 | | 1,527,931 | |
| | |
| Distributions to Shareholders | | | | | | | | | | | | | | | | | |
| Net investment income | | (2,356,098 | ) | (2,189,370 | ) | (22,436 | ) | (283,747 | ) | (1,370,258 | ) | (587,286 | ) | (1,023,566 | ) | (941,789 | ) |
| Net realized gains | | — | | — | | — | | — | | — | | (7,438,838 | ) | — | | — | |
| | |
| Total distributions | | (2,356,098 | ) | (2,189,370 | ) | (22,436 | ) | (283,747 | ) | (1,370,258 | ) | (8,026,124 | ) | (1,023,566 | ) | (941,789 | ) |
| | |
| Trust Share Transactions * | | | | | | | | | | | | | | | | | |
| Proceeds from shares sold | | 1,865,951 | | 2,162,822 | | 5,080,479 | | 8,753,615 | | 2,504,467 | | 2,842,291 | | 4,712,816 | | 4,621,393 | |
| Reinvestment of distributions | | 2,356,098 | | 2,189,370 | | 22,436 | | 283,747 | | 1,370,258 | | 8,026,124 | | 1,023,566 | | 941,789 | |
| Cost of shares redeemed | | (9,577,854 | ) | (15,396,641 | ) | (7,264,830 | ) | (11,032,879 | ) | (6,743,609 | ) | (11,607,742 | ) | (3,845,012 | ) | (3,040,592 | ) |
| | |
| Net increase (decrease) from trust share transactions | | (5,355,805 | ) | (11,044,449 | ) | (2,161,915 | ) | (1,995,517 | ) | (2,868,884 | ) | (739,327 | ) | 1,891,370 | | 2,522,590 | |
| | |
| Net increase (decrease) in net assets | | 13,939,728 | | (65,742,459 | ) | (2,161,915 | ) | (1,995,517 | ) | 25,850,598 | | (60,242,893 | ) | 1,916,602 | | 3,108,732 | |
| | |
| Net Assets | | | | | | | | | | | | | | | | | |
| Beginning of year | | 106,922,752 | | 172,665,211 | | 13,073,045 | | 15,068,562 | | 100,782,397 | | 161,025,290 | | 24,091,888 | | 20,983,156 | |
| | |
| End of year † | $ | 120,862,480 | $ | 106,922,752 | $ | 10,911,130 | $ | 13,073,045 | $ | 126,632,995 | $ | 100,782,397 | $ | 26,008,490 | $ | 24,091,888 | |
| | |
| †Includes undistributed net investment income of | $ | 1,905,206 | $ | 2,356,058 | $ | — | $ | — | $ | 1,116,653 | $ | 1,370,209 | $ | 1,061,598 | $ | 1,023,541 | |
| | |
| *Trust Shares Issued and Redeemed | | | | | | | | | | | | | | | | | |
| Sold | | 112,620 | | 106,419 | | 5,080,479 | | 8,753,616 | | 119,657 | | 114,417 | | 462,455 | | 464,759 | |
| Issued for distributions reinvested | | 180,130 | | 99,472 | | 22,436 | | 283,747 | | 82,446 | | 298,480 | | 103,286 | | 95,613 | |
| Redeemed | | (584,862 | ) | (741,807 | ) | (7,264,830 | ) | (11,032,879 | ) | (325,713 | ) | (457,195 | ) | (377,562 | ) | (304,780 | ) |
| | |
| Net increase (decrease) in trust shares outstanding | | (292,112 | ) | (535,916 | ) | (2,161,915 | ) | (1,995,516 | ) | (123,610 | ) | (44,298 | ) | 188,179 | | 255,592 | |
| | |
| 108 | See notes to financial statements | 109 |
Statements of Changes in Net Assets
FIRST INVESTORS LIFE SERIES FUNDS
| | | | | | | | | | | | | | | | | |
| | | | |
| | | GROWTH & INCOME | | HIGH YIELD | | INTERNATIONAL | | INVESTMENT GRADE | |
| Year Ended December 31 | | 2009 | | 2008 | | 2009 | | 2008 | | 2009 | | 2008 | | 2009 | | 2008 | |
| Increase (Decrease) in Net Assets From Operations | | | | | | | | | | | | | | | | | |
| Net investment income | $ | 2,050,759 | $ | 3,091,206 | $ | 5,123,812 | $ | 5,734,263 | $ | 2,003,370 | $ | 1,693,241 | $ | 1,891,370 | $ | 1,966,429 | |
| Net realized loss on investments and foreign | | | | | | | | | | | | | | | | | |
| currency transactions | | (5,537,942 | ) | (13,747,844 | ) | (15,346,412 | ) | (3,663,814 | ) | (7,304,133 | ) | (25,999,225 | ) | (877,842 | ) | (3,042,615 | ) |
| Net unrealized appreciation (depreciation) of investments | | | | | | | | | | | | | | | | | |
| and foreign currency transactions | | 45,001,548 | | (76,017,353 | ) | 27,920,827 | | (20,958,356 | ) | 24,445,669 | | (39,116,074 | ) | 5,596,709 | | (3,431,412 | ) |
| | |
| Net increase (decrease) in net assets resulting | | | | | | | | | | | | | | | | | |
| from operations | | 41,514,365 | | (86,673,991 | ) | 17,698,227 | | (18,887,907 | ) | 19,144,906 | | (63,422,058 | ) | 6,610,237 | | (4,507,598 | ) |
| | |
| Distributions to Shareholders | | | | | | | | | | | | | | | | | |
| Net investment income | | (3,091,098 | ) | (3,140,040 | ) | (5,799,581 | ) | (5,998,094 | ) | (3,944,011 | ) | (241,951 | ) | (2,115,858 | ) | (2,055,553 | ) |
| Net realized gains | | — | | (17,037,484 | ) | — | | — | | — | | (16,470,165 | ) | — | | — | |
| | |
| Total distributions | | (3,091,098 | ) | (20,177,524 | ) | (5,799,581 | ) | (5,998,094 | ) | (3,944,011 | ) | (16,712,116 | ) | (2,115,858 | ) | (2,055,553 | ) |
| | |
| Trust Share Transactions * | | | | | | | | | | | | | | | | | |
| Proceeds from shares sold | | 4,027,522 | | 4,178,289 | | 1,489,381 | | 1,518,054 | | 2,192,746 | | 3,642,018 | | 3,427,054 | | 3,176,818 | |
| Reinvestment of distributions | | 3,091,098 | | 20,177,524 | | 5,799,581 | | 5,998,094 | | 3,944,011 | | 16,712,116 | | 2,115,858 | | 2,055,553 | |
| Cost of shares redeemed | | (12,837,841 | ) | (20,441,409 | ) | (5,740,721 | ) | (8,699,633 | ) | (5,878,792 | ) | (9,277,881 | ) | (3,473,767 | ) | (5,513,700 | ) |
| | |
| Net increase (decrease) from trust share transactions | | (5,719,221 | ) | 3,914,404 | | 1,548,241 | | (1,183,485 | ) | 257,965 | | 11,076,253 | | 2,069,145 | | (281,329 | ) |
| | |
| Net increase (decrease) in net assets | | 32,704,046 | | (102,937,111 | ) | 13,446,887 | | (26,069,486 | ) | 15,458,860 | | (69,057,921 | ) | 6,563,524 | | (6,844,480 | ) |
| | |
| Net Assets | | | | | | | | | | | | | | | | | |
| Beginning of year | | 154,696,071 | | 257,633,182 | | 52,470,230 | | 78,539,716 | | 85,376,032 | | 154,433,953 | | 32,443,338 | | 39,287,818 | |
| | |
| End of year † | $ | 187,400,117 | $ | 154,696,071 | $ | 65,917,117 | $ | 52,470,230 | $ | 100,834,892 | $ | 85,376,032 | $ | 39,006,862 | $ | 32,443,338 | |
| | |
| †Includes undistributed net investment income of | $ | 2,050,736 | $ | 3,091,075 | $ | 5,130,041 | $ | 5,620,377 | $ | 443,345 | $ | — | $ | 1,861,730 | $ | 1,439,193 | |
| | |
| *Trust Shares Issued and Redeemed | | | | | | | | | | | | | | | | | |
| Sold | | 195,145 | | 164,826 | | 266,340 | | 233,054 | | 177,230 | | 198,584 | | 354,193 | | 309,941 | |
| Issued for distributions reinvested | | 192,113 | | 721,657 | | 1,236,585 | | 882,073 | | 385,534 | | 847,900 | | 246,603 | | 194,103 | |
| Redeemed | | (627,686 | ) | (773,979 | ) | (1,050,640 | ) | (1,332,303) | | (476,405 | ) | (536,174 | ) | (372,595 | ) | (558,169 | ) |
| | |
| Net increase (decrease) in trust shares outstanding | | (240,428 | ) | 112,504 | | 452,285 | | (217,176 | ) | 86,359 | | 510,310 | | 228,201 | | (54,125 | ) |
| | |
| 110 | See notes to financial statements | 111 |
Statements of Changes in Net Assets
FIRST INVESTORS LIFE SERIES FUNDS
| | | | | | | | | | | | | | | | | |
| | | | |
| | | SELECT GROWTH | | TARGET MATURITY 2010 | | TARGET MATURITY 2015 | | VALUE | |
| Year Ended December 31 | | 2009 | | 2008 | | 2009 | | 2008 | | 2009 | | 2008 | | 2009 | | 2008 | |
| Increase (Decrease) in Net Assets From Operations | | | | | | | | | | | | | | | | | |
| Net investment income (loss) | $ | 20,078 | $ | (5,884) | $ | 634,293 | $ | 726,847 | $ | 1,102,348 | $ | 1,124,339 | $ | 1,385,131 | $ | 1,816,524 | |
| Net realized gain (loss) on investments | | (1,502,531 | ) | (3,333,193 | ) | 191,900 | | 171,080 | | 130,512 | | 115,629 | | (1,131,593 | ) | (3,102,059 | ) |
| Net unrealized appreciation (depreciation) | | | | | | | | | | | | | | | | | |
| of investments | | 2,428,097 | | (2,492,301 | ) | (871,996 | ) | 132,578 | | (1,880,168 | ) | 2,573,680 | | 11,166,645 | | (24,030,552 | ) |
| Net increase (decrease) in net assets resulting | | | | | | | | | | | | | | | | | |
| from operations | | 945,644 | | (5,831,378 | ) | (45,803 | ) | 1,030,505 | | (647,308 | ) | 3,813,648 | | 11,420,183 | | (25,316,087 | ) |
| Distributions to Shareholders | | | | | | | | | | | | | | | | | |
| Net investment income | | — | | (18,122 | ) | (726,857 | ) | (761,937 | ) | (1,124,305 | ) | (1,064,287 | ) | (1,816,526 | ) | (1,535,490 | ) |
| Net realized gains | | — | | (113,779 | ) | (170,975 | ) | (16,448 | ) | (41,204 | ) | — | | — | | — | |
| | |
| Total distributions | | — | | (131,901 | ) | (897,832 | ) | (778,385 | ) | (1,165,509 | ) | (1,064,287 | ) | (1,816,526 | ) | (1,535,490 | ) |
| | |
| Trust Share Transactions* | | | | | | | | | | | | | | | | | |
| Proceeds from shares sold | | 1,434,316 | | 2,703,339 | | 154,630 | | 622,532 | | 1,825,953 | | 2,791,995 | | 2,148,935 | | 2,989,496 | |
| Reinvestment of distributions | | — | | 131,901 | | 897,832 | | 778,385 | | 1,165,509 | | 1,064,287 | | 1,816,526 | | 1,535,490 | |
| Cost of shares redeemed | | (582,223 | ) | (965,527 | ) | (2,619,801 | ) | (2,654,972 | ) | (3,140,881 | ) | (4,322,752 | ) | (6,191,798 | ) | (10,491,931 | ) |
| | |
| Net increase (decrease) from trust share transactions | | 852,093 | | 1,869,713 | | (1,567,339 | ) | (1,254,055 | ) | (149,419 | ) | (466,470 | ) | (2,226,337 | ) | (5,966,945 | ) |
| | |
| Net increase (decrease) in net assets | | 1,797,737 | | (4,093,566 | ) | (2,510,974 | ) | (1,001,935 | ) | (1,962,236 | ) | 2,282,891 | | 7,377,320 | | (32,818,522 | ) |
| | |
| Net Assets | | | | | | | | | | | | | | | | | |
| Beginning of year | | 8,645,580 | | 12,739,146 | | 13,845,029 | | 14,846,964 | | 29,453,708 | | 27,170,817 | | 58,440,067 | | 91,258,589 | |
| | |
| End of year † | $ | 10,443,317 | $ | 8,645,580 | $ | 11,334,055 | $ | 13,845,029 | $ | 27,491,472 | $ | 29,453,708 | $ | 65,817,387 | $ | 58,440,067 | |
| | |
| †Includes undistributed net investment income of | $ | 20,078 | $ | — | $ | 634,283 | $ | 726,847 | $ | 1,102,346 | $ | 1,124,303 | $ | 1,385,122 | $ | 1,816,517 | |
| | |
| *Trust Shares Issued and Redeemed | | | | | | | | | | | | | | | | | |
| Sold | | 238,990 | | 317,189 | | 11,177 | | 44,172 | | 117,618 | | 183,481 | | 185,337 | | 209,076 | |
| Issued for distributions reinvested | | — | | 14,463 | | 67,659 | | 55,999 | | 76,982 | | 70,623 | | 201,612 | | 101,352 | |
| Redeemed | | (98,476 | ) | (120,246 | ) | (194,217 | ) | (189,485 | ) | (202,507 | ) | (285,020 | ) | (547,576 | ) | (723,109 | ) |
| | |
| Net increase (decrease) in trust shares outstanding | | 140,514 | | 211,406 | | (115,381 | ) | (89,314 | ) | (7,907 | ) | (30,916 | ) | (160,627 | ) | (412,681 | ) |
| | |
| 112 | See notes to financial statements | 113 |
Notes to Financial Statements
FIRST INVESTORS LIFE SERIES FUNDS
December 31, 2009
1. Significant Accounting Policies—First Investors Life Series Funds, a Delaware statutory trust (“the Trust”), is registered under the Investment Company Act of 1940 (“the 1940 Act”) as a diversified, open-end management investment company. The Trust operates as a series fund, issuing shares of beneficial interest in the Blue Chip Fund, Cash Management Fund, Discovery Fund, Government Fund, Growth & Income Fund, High Yield Fund, International Fund, Investment Grade Fund, Select Growth Fund, Target Maturity 2010 Fund, Target Maturity 2015 Fund and Value Fund (each a “Fund”, collectively, “the Funds”), and accounts separately for the assets, liabilities and operations of each Fund. The objective of each Fund is as follows:
Blue Chip Fund seeks high total investment return.
Cash Management Fund seeks to earn a high rate of current income consistent with the preservation of capital and maintenance of liquidity.
Discovery Fund seeks long-term growth of capital.
Government Fund seeks to achieve a significant level of current income which is consistent with security and liquidity of principal.
Growth & Income Fund seeks long-term growth of capital and current income.
High Yield Fund seeks high current income.
International Fund primarily seeks long-term capital growth.
Investment Grade Fund seeks to generate a maximum level of income consistent with investment in investment grade debt securities.
Select Growth Fund seeks long-term growth of capital.
Target Maturity 2010 and Target Maturity 2015 Funds seek a predictable compounded investment return for investors who hold their Fund shares until the Fund’s maturity, consistent with the preservation of capital.
Value Fund seeks total return.
A. Security Valuation—Except as provided below, a security listed or traded on an exchange or the Nasdaq Stock Market is valued at its last sale price on the exchange or market where the security is principally traded, and lacking any sales, the security is valued at the mean between the closing bid and asked prices. Securities traded in the over-the-counter (“OTC”) market (including securities listed on exchanges whose primary market is believed to be OTC) are valued at the mean between the last bid and asked prices based on quotes furnished by a market maker for such securities. Securities may also be priced by pricing services approved by the Trust’s Board of Trustees (“the Board”). The pricing services consider security type, rating, market condition and yield
data as well as market quotations, prices provided by market makers and other available information in determining value. Short-term debt securities that mature in 60 days or less are valued at amortized cost.
The Funds monitor for significant events occurring prior to the close of trading on the New York Stock Exchange that could have a material impact on the value of any securities that are held by the Funds. Examples of such events include trading halts, natural disasters, political events and issuer-specific developments. If the Valuation Committee decides that such events warrant using fair value estimates, it will take such events into consideration in determining the fair values of such securities. If market quotations or prices are not readily available or determined to be unreliable, the securities will be valued at fair value as determined in good faith pursuant to procedures adopted by the Board. The Funds also use a pricing service to fair value foreign securities in the event that fluctuation in U.S. securities markets exceed a predetermined level or if a foreign market is closed. For valuation purposes, where applicable, quotations of foreign securi ties in foreign currency are translated to U.S. dollar equivalents using the foreign exchange quotation in effect. At December 31, 2009, the High Yield Fund held nine securities that were fair valued by the Valuation Committee with an aggregate value of $24,913 representing .0% of the Fund’s net assets. At December 31, 2009, fair value pricing was used for certain foreign securities in the International Fund portfolio.
The Cash Management Fund values its portfolio securities in accordance with the amortized cost method of valuation under Rule 2a-7 under the 1940 Act. Amortized cost is an approximation of market value of an instrument, whereby the difference between its acquisition cost and market value at maturity is amortized on a straight-line basis over the remaining life of the instrument. The effect of changes in the market value of a security as a result of fluctuating interest rates is not taken into account and thus the amortized cost method of valuation may result in the value of a security being higher or lower than its actual market value.
In accordance with Accounting Standards Codification (“ASC”) 820 “Fair Value Measurements and Disclosures” (“ASC 820”), formerly known as Financial Accounting Standards Board (“FASB”) Statement of Financial Accounting Standards No. 157, Fair Value Measurements, investments held by the Funds are carried at “fair value”. As defined by ASC 820, fair value is defined as the price that a fund would receive upon selling an investment in an orderly transaction to an independent buyer in the principal or most advantageous market for the investment under current market conditions. Various inputs are used in determining the value of the Funds’ investments.
In addition, effective June 15, 2009, the Funds adopted FASB Staff position (“FSP) No. 157-4, “Determining Fair Value When the Volume and Level of Activity for the Asset or Liability Have Significantly Decreased and Identifying Transactions That Are
Notes to Financial Statements (continued)
FIRST INVESTORS LIFE SERIES FUNDS
December 31, 2009
Not Orderly” (“FSP No. 157-4”). FSP No. 157-4 emphasizes that the objective of fair value measurement described in ASC 820 remains unchanged and provides additional guidance for estimating fair value in accordance with ASC 820 when the volume and level of activity for the asset or liability have significantly decreased, as well as identifying circumstances that indicate that transactions are not orderly. FSP No. 157-4 identifies factors to be considered when determining whether or not a market is inactive and indicates that if a market is determined to be inactive and/or current market prices are reflective of “distressed sales”, significant management judgment may be necessary to estimate fair value in accordance with ASC 820.
In addition to defining fair value, ASC 820 established a three-tier hierarchy of inputs to establish a classification of fair value measurements for disclosure purposes. The three-tier hierarchy of inputs is summarized in the three broad Levels listed below:
Level 1 – quoted prices in active markets for identical securities
Level 2 – other significant observable inputs (including quoted prices for similar securities, interest rates, prepayment speeds, credit risk, etc.)
Level 3 – significant unobservable inputs (including the fund’s own assumptions in determining the fair value of investments)
The aggregate value by input level, as of December 31, 2009, for each Fund’s investments is included at the end of each Fund’s portfolio of investments.
In January 2010, FASB released Accounting Standards Update (“ASU”) No. 2010-06, Improving Disclosures about Fair Value Measurements. Among the new disclosures and clarifications of existing disclosures the ASU requires the Funds to disclose separately the amounts of significant transfers in and out of Level 1 and 2 fair value measurements and to describe the reasons for the transfers. Significance shall be judged with respect to total earnings and total assets or total liabilities. The ASU requires the Level 3 roll forward reconciliation of beginning and ending balances to be prepared on a gross basis, in particular separately presenting information about purchases, sales, issuances, and settlements. The ASU also requires disclosure of the reasons for significant transfers in and out of Level 3. The ASU is effective for interim and annual periods beginning after December 15, 2009, except for the Level 3 gross basis roll forward reconciliation whic h is effective for fiscal years beginning after December 15, 2010 and for interim periods within those fiscal years. The impact on the Funds’ financial statements disclosures is being assessed.
B. Federal Income Tax—No provision has been made for federal income taxes on net income or capital gains since it is the policy of each Fund to continue to comply with the special provisions of the Internal Revenue Code applicable to investment
companies, and to make sufficient distributions of income and capital gains (in excess of any available capital loss carryovers), to relieve each Fund from all, or substantially all, federal income taxes.
At December 31, 2009, capital loss carryovers were as follows:
| | | | | | | | | | | | | | | | | | |
| | | Year Capital Loss Carryovers Expire |
| Fund | | Total | | 2010 | | 2011 | | 2012 | | 2013 | | 2014 | | 2015 | | 2016 | | 2017 |
| Blue Chip | | $30,623,773 | | $20,477,223 | | $ 4,132,026 | | $ — | | $ — | | $ — | | $ — | | $ 3,493,173 | | $ 2,521,351 |
| Discovery | | 13,113,881 | | — | | — | | — | | — | | — | | — | | 8,457,613 | | 4,656,268 |
| Government | | 718,584 | | — | | 258,746 | | 51,149 | | 193,688 | | 177,059 | | 37,942 | | — | | — |
| Growth & Income | | 19,219,123 | | — | | — | | — | | — | | — | | — | | 13,700,802 | | 5,518,321 |
| High Yield* | | 33,209,401 | | 5,474,584 | | 4,736,272 | | 790,779 | | 632,307 | | 1,944,836 | | 433,726 | | 3,694,844 | | 15,502,053 |
| International | | 32,014,110 | | — | | — | | — | | — | | — | | — | | 23,624,881 | | 8,389,229 |
| Investment Grade | | 5,785,696 | | 17,173 | | 517,182 | | — | | 108,453 | | 531,982 | | 43,898 | | 3,421,907 | | 1,145,101 |
| Select Growth | | 4,842,308 | | — | | — | | — | | — | | — | | — | | 3,339,778 | | 1,502,530 |
| Value | | 8,967,158 | | 3,581,578 | | 1,198,371 | | — | | — | | — | | — | | 3,055,616 | | 1,131,593 |
| |
| * | For High Yield Fund, $1,253,233 of the $5,474,584 capital loss carryover expiring in 2010 was acquired on |
| August 10, 2007 in the tax free reorganization with Special Bond Fund that was approved by the Life Series |
| Funds’ Board of Trustees. Due to the reorganization the Fund will have available for utilization $2,231,989 |
| capital loss carryovers that will become available at $601,552 per year for taxable years 2010 through 2012 |
| and $427,333 for taxable year 2013. These capital loss carryovers will expire as follows: $1,575,155 in 2010; |
| $881,182 in 2011; $212,617 in 2012; $153,634 in 2013; $662,634 in 2014. |
The Funds recognize the tax benefits of uncertain tax positions only where the position is “more likely than not” to be sustained assuming examination by tax authorities. Management has analyzed the Funds’ tax positions, and has concluded that no liability for unrecognized tax benefits should be recorded related to uncertain tax positions taken on returns filed for open tax years 2006–2008, or expected to be taken in the Funds’ 2009 tax returns. The Funds identify their major tax jurisdictions as U.S. Federal, New York State, New York City and foreign jurisdictions where the Funds make significant investments; however the Funds are not aware of any tax position for which it is reasonably possible that the total amounts of unrecognized tax benefits will change materially in the next twelve months.
C. Foreign Currency Translations—The accounting records of the International Fund are maintained in U.S. dollars. Portfolio securities and other assets and liabilities denominated in foreign currencies are translated into U.S. dollars at the date of valuation. Purchases and sales of investment securities, dividend income and certain expenses are translated to U.S. dollars at the prevailing rates of exchange on the respective dates of such transactions. The International Fund does not isolate that portion of gains and
Notes to Financial Statements (continued)
FIRST INVESTORS LIFE SERIES FUNDS
December 31, 2009
losses on investments which is due to changes in foreign exchange rates from that which is due to changes in market prices of the investments. Such fluctuations are included with the net realized and unrealized gains and losses from investments. Net realized and unrealized gains and losses on foreign currency transactions include gains and losses from the sales of foreign currency and gains and losses on accrued foreign dividends and related withholding taxes.
D. Distributions to Shareholders—Distributions to shareholders from net investment income and net realized capital gains are generally declared and paid annually on all Funds, except for the Cash Management Fund which declares dividends from the total of net investment income (plus or minus all realized short-term gains and losses on investments) daily and pays monthly. Dividends from net investment income and capital gain distributions are determined in accordance with income tax regulations which may differ from accounting principles generally accepted in the United States of America. These differences are primarily due to differing treatments for foreign currency transactions, capital loss carryforwards and deferral of wash sales.
E. Expense Allocation—Expenses directly charged or attributable to a Fund are paid from the assets of that Fund. General expenses of the Trust are allocated among and charged to the assets of each Fund on a fair and equitable basis, which may be based on the relative assets of each Fund or the nature of the services performed and relative applicability to each Fund.
F. Use of Estimates—The preparation of the financial statements in conformity with accounting principles generally accepted in the United States of America requires management to make estimates and assumptions that affect the reported amounts of assets and liabilities at the date of the financial statements and the reported amounts of revenue and expense during the reporting period. Actual results could differ from those estimates.
G. Security Lending—High Yield Fund loaned securities to other investors through the Securities Lending Management Agreement (“the Agreement”) with Credit Suisse. Under the terms of the Agreement, the Fund was required to maintain collateral with a market value not less than 101% of the market value of loaned securities. Collateral was adjusted daily in connection with changes in market value of securities on loan. Collateral consisted of cash or securities issued or guaranteed by the U.S. government or its agencies. Cash collateral was invested in permissible instruments authorized by the Agreement. Interest earned on the collateral and premiums paid by the broker were recorded as income by the Fund net of fees and rebates charged by Credit Suisse for its services in connection with this securities lending program. The Fund was subject to all of the investment risks associated with the securities that were being loaned and the investments ma de with the cash collateral. The Fund was
also subject to the risks associated with a delay in recovering the loaned securities or an inability to recover the loaned securities in the event the collateral was not sufficient. As of December 31, 2009, the Fund had no securities on loan. The program was terminated prior to December 31, 2009.
H. Other—Security transactions are generally accounted for on the first business day following the date the securities are purchased or sold, except for financial reporting purposes, which is trade date. Cost is determined and gains and losses are based, on the identified cost basis for securities, for both financial statement and federal income tax purposes. Dividend income is recorded on the ex-dividend date. Interest income and estimated expenses are accrued daily. Bond premiums and discounts are accreted or amortized using the interest method. Interest income on zero coupon bonds and step bonds is accrued daily at the effective interest rate. For the year ended December 31, 2009, The Bank of New York Mellon, custodian for the Cash Management, Government, High Yield, Investment Grade, Target Maturity 2010 and Target Maturity 2015 Funds, has provided credits in the amount of $656 against custodian charges based on the uninvested cash balances of the Funds. For the period January 1, 2009 through October 7, 2009, The Bank of New York Mellon, custodian for the Blue Chip, Discovery, Growth & Income, Select Growth and Value Funds, has provided credits in the amount of $296 against custodian charges based on the uninvested cash balances of the Funds. Effective October 8, 2009, Brown Brothers Harriman & Co. serves as custodian for the Blue Chip, Discovery, Growth & Income, Select Growth and Value Funds. Brown Brothers Harriman & Co. has served as custodian for the International Fund since inception. The Funds also reduced expenses through brokerage service arrangements. For the year ended December 31, 2009, the Funds’ expenses were reduced by $5,102 under these arrangements.
2. Trust Shares—The Trust is authorized to issue an unlimited number of shares of beneficial interest without par value. The Trust consists of the Funds listed on the cover page, each of which is a separate and distinct series of the Trust. Shares in the Funds are acquired through the purchase of variable annuity or variable life insurance contracts sold by First Investors Life Insurance Company.
3. Security Transactions—For the year ended December 31, 2009, purchases and sales (including pay-downs on Government Fund) of securities and long-term U.S. Government obligations (excluding short-term U.S. Government obligations, foreign currencies and short-term securities), were as follows:
Notes to Financial Statements (continued)
FIRST INVESTORS LIFE SERIES FUNDS
December 31, 2009
| | | | | | | | |
| | | | | | | Long-Term U.S. |
| | | Securities | | Government Obligations |
| | | Cost of | | Proceeds | | Cost of | | Proceeds |
| Fund | | Purchases | | of Sales | | Purchases | | of Sales |
| Blue Chip | | $16,216,193 | | $20,341,442 | | $ — | | $ — |
| Discovery | | 68,006,395 | | 71,128,569 | | — | | — |
| Government | | 8,829,372 | | 9,124,686 | | 4,568,171 | | 3,485,306 |
| Growth & Income | | 39,647,939 | | 43,902,739 | | — | | — |
| High Yield | | 58,815,176 | | 56,234,911 | | — | | — |
| International | | 46,016,607 | | 44,745,909 | | — | | — |
| Investment Grade | | 29,646,884 | | 23,272,713 | | 100,000 | | 3,723,013 |
| Select Growth | | 9,819,097 | | 9,049,818 | | — | | — |
| Target Maturity 2010 | | — | | — | | — | | 2,574,603 |
| Target Maturity 2015 | | — | | — | | — | | 1,434,699 |
| Value | | 6,164,072 | | 9,313,488 | | — | | — |
At December 31, 2009, aggregate cost and net unrealized appreciation (depreciation) of securities for federal income tax purposes were as follows:
| | | | | | | | |
| | | | | | | | | Net |
| | | | | Gross | | Gross | | Unrealized |
| | | Aggregate | | Unrealized | | Unrealized | | Appreciation |
| Fund | | Cost | | Appreciation | | Depreciation | | (Depreciation) |
| Blue Chip | | $ 95,949,395 | | $31,554,630 | | $ 6,670,605 | | $24,884,025 |
| Discovery | | 108,418,785 | | 20,185,715 | | 3,579,860 | | 16,605,855 |
| Government | | 25,128,485 | | 562,073 | | 76,969 | | 485,104 |
| Growth & Income | | 189,363,380 | | 24,655,510 | | 26,911,405 | | (2,255,895) |
| High Yield | | 63,618,861 | | 3,642,305 | | 3,488,633 | | 153,672 |
| International | | 84,541,135 | | 17,296,601 | | 699,494 | | 16,597,107 |
| Investment Grade | | 36,035,346 | | 2,595,234 | | 224,942 | | 2,370,292 |
| Select Growth | | 8,892,738 | | 1,439,303 | | 155,271 | | 1,284,032 |
| Target Maturity 2010 | | 10,847,836 | | 483,583 | | — | | 483,583 |
| Target Maturity 2015 | | 24,581,617 | | 2,965,460 | | — | | 2,965,460 |
| Value | | 59,863,410 | | 12,355,318 | | 6,402,161 | | 5,953,157 |
Certain of the Funds may invest in First Investors Cash Reserve Fund, LLC (“Cash Reserve Fund”), an affiliated unregistered money market fund managed by First Investors Management Company, Inc. During the year ended December 31, 2009, purchases, sales and dividend income earned by the Funds that invested in the Cash Reserve Fund were as follows:
| | | | | | | | | | |
| | | Value at | | Purchases | | Sales | | Value at | | Dividend |
| Fund | | 12/31/08 | | Shares/Cost | | Shares/Cost | | 12/31/09 | | Income |
| Blue Chip | | $2,975,000 | | $10,300,000 | | $11,490,000 | | $1,785,000 | | $ 8,455 |
| Discovery | | 9,765,000 | | 44,965,000 | | 46,810,000 | | 7,920,000 | | 31,100 |
| Growth & Income | 3,620,000 | | 16,967,000 | | 19,812,000 | | 775,000 | | 7,053 |
| High Yield | | 3,470,000 | | 28,198,000 | | 30,878,000 | | 790,000 | | 18,298 |
| International | 2,995,000 | | 24,795,000 | | 26,785,000 | | 1,005,000 | | 7,328 |
| Investment Grade | 985,000 | | 14,548,000 | | 15,408,000 | | 125,000 | | 3,517 |
| Value | | 1,480,000 | | 6,183,000 | | 5,463,000 | | 2,200,000 | | 9,159 |
4. Advisory Fee and Other Transactions With Affiliates—Certain officers and trustees of the Trust are officers and trustees of its investment adviser, First Investors Management Company, Inc. (“FIMCO”) and/or its transfer agent, Administrative Data Management Corp. Trustees of the Trust who are not “interested persons” of the Trust as defined in the 1940 Act are remunerated by the Funds. For the year ended December 31, 2009, total trustee fees accrued by the Funds amounted to $42,147.
The Investment Advisory Agreement provides as compensation to FIMCO an annual fee, payable monthly, at the rate of .75% on the first $250 million of each Fund’s average daily net assets, .72% on the next $250 million, .69% on the next $250 million, .66% on the next $500 million, declining by .02% on each $500 million thereafter, down to .60% on average daily net assets over $2.25 billion. For the year ended December 31, 2009, FIMCO has voluntarily waived 20% of the .75% annual fee on the first $250 million of average daily net assets of the Government, Investment Grade, Target Maturity 2010 and Target Maturity 2015 Funds. In addition, during the period January 1, 2009 to January 31, 2009, FIMCO has voluntarily waived $4,060 in advisory fees to limit the Cash Management Fund’s overall expense ratio to .70%. During the period February 1, 2009 to December 31, 2009, FIMCO has voluntarily waived $41,734 in advisory fees to limit the Cash Management Fun d’s overall expense ratio to .60%. In addition, FIMCO has voluntarily waived $6,139 in advisory fees to prevent a negative yield on the Fund’s shares. For the year ended December 31, 2009, total advisory fees accrued to FIMCO were $5,270,507 of which $203,171 was waived as noted above.
Paradigm Capital Management, Inc. serves as investment subadviser to the Discovery Fund. Vontobel Asset Management, Inc. serves as investment subadviser to the International Fund. Smith Asset Management Group, L.P. serves as investment subadviser to Select Growth Fund. Effective April 24, 2009, Muzinich & Co., Inc. serves as investment subadviser to the High Yield Fund. The subadvisers are paid by FIMCO and not by the Funds.
Notes to Financial Statements (continued)
FIRST INVESTORS LIFE SERIES FUNDS
December 31, 2009
5. Restricted Securities—Certain restricted securities are exempt from the registration requirements under Rule 144A of the Securities Act of 1933 and may only be sold to qualified institutional investors. At December 31, 2009, the Cash Management Fund held one 144A security with a value of $300,514 representing 2.8% of the Fund’s net assets, the Government Fund held one 144A security with a value of $754,401 representing 2.9% of the Fund’s net assets, the High Yield Fund held seventy-nine 144A securities with an aggregate value of $23,704,151 representing 36.0% of the Fund’s net assets, and the Investment Grade Fund held eighteen 144A securities with an aggregate value of $6,938,160 representing 17.8% of the Fund’s net assets. Unless otherwise noted, 144A securities are deemed to be liquid. Certain restricted securities are exempt from the registration requirements under Section 4(2) of the Sec urities Act of 1933 and may only be sold to qualified investors. At December 31, 2009, the Cash Management Fund held eight Section 4(2) securities with an aggregate value of $3,524,463 representing 32.3% of the Fund’s net assets. These securities are valued as set forth in Note 1A.
6. Forward Currency Contracts—Forward currency contracts are obligations to purchase or sell a specific currency for an agreed-upon price at a future date. When the International Fund purchases or sells foreign securities the Fund may enter into a forward currency contract to minimize foreign exchange risk between the trade date and the settlement date of such transactions. The Fund could be exposed to risk if counter parties to the contracts are unable to meet the terms of their contracts or if the value of the foreign currency changes unfavorably. Forward currency contracts are “marked-to-market” daily at the applicable translation rate and the resulting unrealized gains or losses are reflected in the Fund’s assets.
The International Fund had one forward currency contract outstanding at December 31, 2009, which is included in Other Assets.
7. Foreign Exchange Contracts—The International Fund may enter into foreign exchange contracts for the purchase or sale of foreign currencies at negotiated rates at future dates. These contracts are considered derivative instruments and are used to decrease exposure to foreign exchange risk associated with foreign currency denominated securities held by the Fund. The Fund could be exposed to risk if counter parties to the contracts are unable to meet the terms of their contracts or if the value of the foreign currency changes unfavorably. Foreign exchange contracts are “marked-to-market” daily at the applicable translation rate and the resulting unrealized gains and losses are reflected in the Fund’s assets.
The International Fund had the following foreign exchange contracts open at December 31, 2009:
| | | | | | | | | |
| Contracts to Buy | | | | | | Unrealized |
| Foreign Currency | | In Exchange for | | Settlement Date | | Gain (Loss) |
| |
| 1,576,000 | Euro | | US $2,347,799 | | 3/29/10 | | US $(86,647) |
| 1,884,000 | Swiss Franc | | 1,855,426 | | 3/29/10 | | (32,936) |
| 3,729,000 | Brazilian Real | | 2,115,133 | | 4/5/10 | | 24,037 |
| 2,120,000 | Australian Dollar | | | 1,879,263 | | 4/6/10 | | | 27,366 |
| | | | | $8,197,621 | | | | | $(68,180) |
| |
| Contracts to Sell | | | | | | Unrealized |
| Foreign Currency | | In Exchange for | | Settlement Date | | Gain (Loss) |
| |
| 4,496,000 | British Pound | | US $ 7,179,332 | | 3/29/10 | | US $ (81,063) |
| 1,576,000 | Euro | | 2,306,224 | | 3/29/10 | | 45,072 |
| 1,884,000 | Swiss Franc | | 1,829,446 | | 3/29/10 | | 6,955 |
| 3,729,000 | Brazilian Real | | 2,017,966 | | 4/5/10 | | (121,203) |
| 2,120,000 | Australian Dollar | | 1,802,890 | | 4/6/10 | | (103,739) |
| 1,157,000 | Australian Dollar | | 1,029,834 | | 6/10/10 | | (10,718) |
| 2,853,000 | Euro | | 4,143,288 | | 6/10/10 | | 49,972 |
| 2,613,000 | Swiss Franc | | 2,537,132 | | 6/10/10 | | 9,442 |
| 4,951,000 | Brazilian Real | | | 2,670,298 | | 6/21/10 | | | (169,881) |
| | | | | $25,516,410 | | | | | $(375,163) |
| Net Unrealized Loss on Foreign Exchange Contracts | | | | | $(443,343) |
Fair Value of Derivative Instruments — The fair value of derivative instruments as of December 31, 2009, was as follows:
| | | | | | | |
| | Assets Derivatives | | Liability Derivatives |
| |
| Derivatives not accounted | Statements of | | | Statements of | |
| for as hedging instruments | Assets and | | | Assets and | |
| under ASC 815* | Liabilities Location | Value | | Liabilities Location | Value |
| Foreign exchange contracts: | Unrealized | | | Unrealized | |
| | appreciation of | | | depreciation of | |
| | foreign exchange | | | foreign exchange | |
| | contracts | | $162,844 | | contracts | | $606,187 |
Notes to Financial Statements (continued)
FIRST INVESTORS LIFE SERIES FUNDS
December 31, 2009
The effect of derivative instruments on the Statement of Operations are as follows:
| | |
| Amount of Realized Gain or Loss Recognized on Derivatives | |
| Derivatives not accounted | Net Realized Gain (Loss) |
| for as hedging instruments | on Foreign Currency |
| under ASC 815* | Transactions |
| Foreign currency transactions: | | $1,778,633 |
| |
| Amount of Change in Unrealized Gain or Loss Recognized on Derivatives | |
| Derivatives not accounted | Net Unrealized Appreciation |
| for as hedging instruments | (Depreciation) on Foreign |
| under ASC 815* | Currency Transactions |
| Foreign currency transactions: | | $(4,575,708) |
|
| *Formerly known as Statement 133 |
8. High Yield Credit Risk—The High Yield Fund’s investment in high yield securities, whether rated or unrated, may be considered speculative and subject to greater market fluctuations and risks of loss of income and principal than lower-yielding, higher-rated, fixed-income securities. The risk of loss due to default by the issuer may be significantly greater for the holders of high-yielding securities, because such securities are generally unsecured and are often subordinated to other creditors of the issuer.
9. Tax Components of Capital and Distributions to Shareholders—The tax character of distributions declared for the years ended December 31, 2009 and 2008 were as follows:
| | | | | | | | | | | | |
| | | Distributions | | | | Distributions | | |
| | | Declared in 2009 | | | | Declared in 2008 | | |
| |
| | | Ordinary | | Long-Term | | | | Ordinary | | Long-Term | | |
| Fund | | Income | | Capital Gain | | Total | | Income | | Capital Gain | | Total |
| |
| Blue Chip | | $2,356,098 | | $ — | | $2,356,098 | | $2,189,370 | | $ — | | $ 2,189,370 |
| Cash Management | | 22,436 | | — | | 22,436 | | 283,747 | | — | | |
| Discovery | | 1,370,258 | | — | | 1,370,258 | | 2,133,308 | | 5,892,816 | | 8,026,124 |
| Government | | 1,023,566 | | — | | 1,023,566 | | 941,789 | | — | | 941,789 |
| Growth & Income | | 3,091,098 | | — | | 3,091,098 | | 9,625,749 | | 10,551,775 | | 20,177,524 |
| High Yield | | 5,799,581 | | — | | 5,799,581 | | 5,998,094 | | — | | 5,998,094 |
| International | | 3,944,011 | | — | | 3,944,011 | | 5,070,014 | | 11,642,102 | | 16,712,116 |
| Investment Grade | | 2,115,858 | | — | | 2,115,858 | | 2,055,553 | | — | | 2,055,553 |
| Select Growth | | — | | — | | — | | 18,121 | | 113,773 | | 131,894 |
| Target Maturity 2010 | | 729,608 | | 168,224 | | 897,832 | | 761,937 | | 16,448 | | 778,385 |
| Target Maturity 2015 | | 1,124,305 | | 41,204 | | 1,165,509 | | 1,064,287 | | — | | 1,064,287 |
| Value | | 1,816,526 | | — | | 1,816,526 | | 1,535,490 | | — | | 1,535,490 |
As of December 31, 2009, the components of distributable earnings (deficit) on a tax basis were as follows:
| | | | | | | | | | |
| | | | | | | | | | | Total |
| | | Undistributed | | Accumulated | | Capital | | Unrealized | | Distributable |
| | | Ordinary | | Capital | | Loss | | Appreciation | | Earnings |
| Fund | | Income | | Gains | | Carryover | | (Depreciation) | | (Deficit) |
| |
| Blue Chip | | $1,905,206 | | $ — | | $(30,623,773) | | $24,884,025 | | $ (3,834,542) |
| Discovery | | 1,116,653 | | — | | (13,113,881) | | 16,605,855 | | 4,608,627 |
| Government | | 1,061,598 | | — | | (718,584) | | 485,104 | | 828,118 |
| Growth & Income | 2,050,736 | | — | | (19,219,123) | | (2,255,895) | | (19,424,282) |
| High Yield | | 5,168,198 | | — | | (35,441,390) | | 153,672 | | (30,119,520) |
| International | | — | | — | | (32,014,110) | | 16,606,129 | | (15,407,981) |
| Investment Grade | 1,995,031 | | — | | (5,785,696) | | 2,370,292 | | (1,420,373) |
| Select Growth | | 20,078 | | — | | (4,842,308) | | 1,284,032 | | (3,538,198) |
| Target Maturity 2010 | 634,283 | | 191,870 | | — | | 483,583 | | 1,309,736 |
| Target Maturity 2015 | 1,102,346 | | 130,479 | | — | | 2,965,460 | | 4,198,285 |
| Value | | 1,385,122 | | — | | (8,967,158) | | 5,953,157 | | (1,628,879) |
Differences between book distributable earnings and tax distributable earnings consist primarily of wash sales and amortization of bond premium and discounts.
For the year ended December 31, 2009, the following reclassifications were made to reflect permanent differences between book and tax reporting which are primarily due to the differences between book and tax treatment of investments in real estate trusts, foreign currency transactions and expiration of capital loss carryovers.
| | | | | | |
| | | | | | | Accumulated |
| | | Capital | | Undistributed | | Capital |
| Fund | | Paid In | | Ordinary Income | | Gains (Losses) |
| Government | | $ 1,003 | | $ 88,055 | | $ (89,058) |
| High Yield | | (3,751,289) | | 185,452 | | 3,565,837 |
| International | | (605,388) | | 2,383,986 | | (1,778,598) |
| Investment Grade | | (51,126) | | 647,028 | | (595,902) |
10. New Accounting Pronouncements—In accordance with the provision set forth in ASC 855 “Subsequent Events” (“ASC 855”), formerly known as Financial Accounting Standards No. 165, “Subsequent Events”, Management has evaluated the possibility of subsequent events existing in the Funds’ financial statements through February 26, 2010. Management has determined that there are no subsequent events that, in accordance with ASC 855, would require recognition or disclosure in the Fund’s financial statements through this date.
Financial Highlights
FIRST INVESTORS LIFE SERIES FUNDS
The following table sets forth the per share operating performance data for a trust share outstanding,
total return, ratios to average net assets and other supplemental data for each year indicated.
| | | | | | | | | | | | | | | | | | | | | | | | | | | | | | | | |
| | |
| | | | | | | P E R S H A R E D A T A | | | | | | | | | | R A T I O S / S U P P L E M E N T A L D A T A | | | | | |
| | | | | | | | | | | Less Distributions | | | | | | | | | | | | | | | Ratio to Average Net | | | |
| | | | | Investment Operations | | from | | | | | | | | | | Ratio to Average Net | | Assets Before Expenses | | | |
| | | Net Asset | | | | Net Realized | | | | | | | | | | Net Asset | | | | | | Assets** | | Waived or Assumed | | | |
| | | Value, | | Net | | and Unrealized | | Total from | | Net | | Net | | | | Value, | | | | Net Assets | | Expenses | | | Net | | | | Net | | Portfolio | |
| | | Beginning | | Investment | | Gain (Loss) on | | Investment | | Investment | | Realized | | Total | | End of | | Total | | End of Year | | Before Fee | | | Investment | | | | Investment | | Turnover | |
| | | of Year | | Income | | Investments | | Operations | | Income | | Gains | | Distributions | | Year | | Return | * | (in millions | ) | Credits | (a) | | Income | | Expenses | | Income (Loss | ) | Rate | |
| | |
| BLUE CHIP FUND | | | | | | | | | | | | | | | | | | | | | | | | | | | | |
| 2005 | | $ 20.18 | | $ .20 | | $ .67 | | $ .87 | | $ .20 | | — | | $ .20 | | $ 20.85 | | 4.34 | % | 174 | | .85 | % | | .93 | % | N/A | | N/A | | 34 | % |
| 2006 | | 20.85 | | .26 | | 2.74 | | 3.00 | | .20 | | — | | .20 | | 23.65 | | 14.49 | | 181 | | .82 | | | 1.13 | | N/A | | N/A | | 4 | |
| 2007 | | 23.65 | | .31 | | .67 | | .98 | | .26 | | — | | .26 | | 24.37 | | 4.21 | | 173 | | .81 | | | 1.20 | | N/A | | N/A | | 5 | |
| 2008 | | 24.37 | | .36 | | (8.10 | ) | (7.74 | ) | .31 | | — | | .31 | | 16.32 | | (32.08 | ) | 107 | | .83 | | | 1.67 | | N/A | | N/A | | 8 | |
| 2009 | | 16.32 | | .31 | | 3.04 | | 3.35 | | .36 | | — | | .36 | | 19.31 | | 21.61 | | 121 | | .84 | | | 1.78 | | N/A | | N/A | | 15 | |
| | |
| CASH MANAGEMENT FUND | | | | | | | | | | | | | | | | | | | | | | | | | |
| 2005 | | $ 1.00 | | $ .024 | | — | | $ .024 | | $.024 | | — | | $ .024 | | $ 1.00 | | 2.44 | % | $ 6 | | .72 | % | (b) | 2.38 | % | 1.09 | % | 1.99 | % | N/A | |
| 2006 | | 1.00 | | .043 | | — | | .043 | | .043 | | — | | .043 | | 1.00 | | 4.35 | | 7 | | .74 | | (b) | 4.26 | | 1.09 | | 3.87 | | N/A | |
| 2007 | | 1.00 | | .045 | | — | | .045 | | .045 | | — | | .045 | | 1.00 | | 4.62 | | 15 | | .72 | | (b) | 4.49 | | 1.04 | | 4.14 | | N/A | |
| 2008 | | 1.00 | | .020 | | — | | .020 | | .020 | | — | | .020 | | 1.00 | | 2.03 | | 13 | | .71 | | (b) | 2.02 | | .96 | | 1.77 | | N/A | |
| 2009 | | 1.00 | | .002 | | — | | .002 | | .002 | | — | | .002 | | 1.00 | | .17 | | 11 | | .56 | | (c) | .18 | | .98 | | (.24 | ) | N/A | |
| | |
| DISCOVERY FUND | | | | | | | | | | | | | | | | | | | | | | | | | | | | |
| 2005 | | $ 24.53 | | $ .08 | | $ 1.18 | | $1.26 | | $ — | | $ — | | $ — | | $ 25.79 | | 5.14 | % | $ 137 | | .90 | % | | .15 | % | N/A | | N/A | | 111 | % |
| 2006 | | 25.79 | | .06 | | 5.74 | | 5.80 | | .04 | | — | | .04 | | 31.55 | | 22.51 | | 158 | | .82 | | | .19 | | N/A | | N/A | | 58 | |
| 2007 | | 31.55 | | .11 | | 1.86 | | 1.97 | | .06 | | 2.66 | | 2.72 | | 30.80 | | 6.62 | | 161 | | .82 | | | .35 | | N/A | | N/A | | 55 | |
| 2008 | | 30.80 | | .30 | | (10.11 | ) | (9.81 | ) | .11 | | 1.44 | | 1.55 | | 19.44 | | (33.25) | | 101 | | .83 | | | 1.15 | | N/A | | N/A | | 52 | |
| 2009 | | 19.44 | | .22 | | 5.63 | | 5.85 | | .27 | | — | | .27 | | 25.02 | | 30.77 | | 127 | | .84 | | | 1.03 | | N/A | | N/A | | 66 | |
| | |
| GOVERNMENT FUND | | | | | | | | | | | | | | | | | | | | | | | | | | | | |
| 2005 | | $ 10.38 | | $ .51 | | $ (.26 | ) | $ .25 | $ .53 | | — | | $ .53 | | $ 10.10 | | 2.54 | % | $ 20 | | .81 | % | | 4.85 | % | .96 | % | 4.70 | | 52 | % |
| 2006 | | 10.10 | | .51 | | (.14 | ) | .37 | | .51 | | — | | .51 | | 9.96 | | 3.80 | | 20 | | .78 | | | 5.10 | | .93 | | 4.95 | | 28 | |
| 2007 | | 9.96 | | .48 | | .15 | | .63 | | .52 | | — | | .52 | | 10.07 | | 6.55 | | 21 | | .80 | | | 4.94 | | .95 | | 4.75 | | 24 | |
| 2008 | | 10.07 | | .44 | | .24 | | .68 | | .45 | | — | | .45 | | 10.30 | | 6.93 | | 24 | | .79 | | | 4.56 | | .94 | | 4.41 | | 39 | |
| 2009 | | 10.30 | | .42 | | — | | .42 | | .43 | | — | | .43 | | 10.29 | | 4.28 | | 26 | | .80 | | | 3.87 | | .95 | | 3.72 | | 51 | |
| | |
| GROWTH & INCOME FUND(d) | | | | | | | | | | | | | | | | | | | | | | | | | | | | |
| 2005 | | $ 33.75 | | $ .16 | | $ 2.25 | | $ 2.41 | $ .25 | | $ — | | $ .25 | | $ 35.91 | | 7.20 | % | $ 249 | | .85 | % | | .46 | % | N/A | | N/A | | 93 | % |
| 2006 | | 35.91 | | .20 | | 4.68 | | 4.88 | | .16 | | 2.27 | | 2.43 | | 38.36 | | 14.35 | | 268 | | .82 | | | .55 | | N/A | | N/A | | 127 | |
| 2007 | | 38.36 | | .41 | | .25 | | .66 | | .20 | | 5.43 | | 5.63 | | 33.39 | | 1.98 | | 258 | | .81 | | | 1.14 | | N/A | | N/A | | 38 | |
| 2008 | | 33.39 | | .40 | | (11.38 | ) | (10.98 | ) | .41 | | 2.24 | | 2.65 | | 19.76 | | (35.22 | ) | 155 | | .83 | | | 1.48 | | N/A | | N/A | | 28 | |
| 2009 | | 19.76 | | .27 | | 5.06 | | 5.33 | | .40 | | — | | .40 | | 24.69 | | 28.05 | | 187 | | .84 | | | 1.27 | | N/A | | N/A | | 25 | |
| | |
Financial Highlights (continued)
FIRST INVESTORS LIFE SERIES FUNDS
| | | | | | | | | | | | | | | | | | | | | | | | | | | | | | | |
| | |
| | | | | | | P E R S H A R E D A T A | | | | | | | | | | R A T I O S / S U P P L E M E N T A L D A T A | | | | | |
| | | | | | | | | Less Distributions | | | | | | | | | | | | | | Ratio to Average Net | | | |
| | | | | Investment Operations | | from | | | | | | | | | | Ratio to Average Net | | Assets Before Expenses | | | |
| | | Net Asset | | | | Net Realized | | | | | | | | | | Net Asset | | | | | | Assets** | | Waived or Assumed | | | |
| | | Value, | | Net | | and Unrealized | | Total from | | Net | | Net | | | | Value, | | | | Net Assets | | Expenses | | Net Invest- | | | | Net | | Portfolio | |
| | | Beginning | | Investment | | Gain (Loss) on | | Investment | | Investment | | Realized | | Total | | End of | | Total | | End of Year | | Before Fee | | ment Income | | | | Investment | | Turnover | |
| | | of Year | | Income | | Investments s | | Operation | | Income | | Gains | | Distributions | | Year | | Return* | | (in millions | ) | Credits | (a) | (Loss | ) | Expenses | | Income | | Rate | |
| | |
| HIGH YIELD FUND | | | | | | | | | | | | | | | | | | | | | | | | | | | | |
| 2005 | | $ 8.66 | | $ .65 | | $ .61 | | $ .04 | | $.63 | | — | | $ .63 | | $ 8.07 | | .41 | % | $ 69 | | .87 | % | 8.01 | % | N/A | | N/A | | 35 | % |
| 2006 | | 8.07 | | .62 | | .12 | | .74 | | .67 | | — | | .67 | | 8.14 | | 9.77 | | 68 | | .85 | | 7.63 | | N/A | | N/A | | 31 | |
| 2007 | | 8.14 | | .57 | | (.47 | ) | .10 | | .63 | | — | | .63 | | 7.61 | | 1.06 | | 79 | | .86 | | 7.19 | | N/A | | N/A | | 28 | |
| 2008 | | 7.61 | | .56 | | (2.39 | ) | (1.83 | ) | .59 | | — | | .59 | | 5.19 | | (25.86 | ) | 52 | | .86 | | 8.27 | | N/A | | N/A | | 17 | |
| 2009 | | 5.19 | | .51 | | 1.12 | | 1.63 | | .58 | | — | | .58 | | 6.24 | | 35.15 | | 66 | | .90 | | 8.66 | | N/A | | N/A | | 102 | |
| | |
| INTERNATIONAL FUND(e) | | | | | | | | | | | | | | | | | | | | | | | | | | | |
| 2005 | | $18.55 | | $ .28 | | $ 1.41 | | $ 1.69 | | $.24 | | $ — | | $ .24 | | $ 20.00 | | 9.22% | | $ 105 | | .99 | % | .80 | % | N/A | | N/A | | 104 | % |
| 2006 | | 20.00 | | .29 | | 5.09 | | 5.38 | | .15 | | .64 | | .79 | | 24.59 | | 27.79 | | 129 | | .97 | | 1.24 | | N/A | | N/A | | 157 | |
| 2007 | | 24.59 | | .04 | | 4.26 | | 4.30 | | .83 | | 3.36 | | 4.19 | | 24.70 | | 20.99 | | 154 | | .90 | | 1.30 | | N/A | | N/A | | 97 | |
| 2008 | | 24.70 | | .30 | | (9.68 | ) | (9.38 | ) | .04 | | 2.65 | | 2.69 | | 12.63 | | (41.89 | ) | 85 | | .94 | | 1.41 | | N/A | | N/A | | 128 | |
| 2009 | | 12.63 | | .65 | | 2.03 | | 2.68 | | .59 | | — | | .59 | | 14.72 | | 23.24 | | 101 | | 1.01 | | 2.30 | | N/A | | N/A | | 53 | |
| | |
| INVESTMENT GRADE FUND | | | | | | | | | | | | | | | | | | | | | | | | | | | |
| 2005 | | $11.67 | | $ .56 | | $ (.42 | ) | $ .14 | | $ .67 | | — | | $ .67 | | $ 11.14 | | 1.31 | % | $ 38 | | .75 | % | 4.91 | % | .90 | % | 4.76% | | 24 | % |
| 2006 | | 11.14 | | .53 | | (.11 | ) | .42 | | .62 | | — | | .62 | | 10.94 | | 3.99 | | 37 | | .74 | | 4.82 | | .89 | | 4.67 | | 86 | |
| 2007 | | 10.94 | | .43 | | .15 | | .58 | | .60 | | — | | .60 | | 10.92 | | 5.52 | | 39 | | .73 | | 4.97 | | .88 | | 4.81 | | 38 | |
| 2008 | | 10.92 | | .41 | | (1.60 | ) | (1.19 | ) | .57 | | — | | .57 | | 9.16 | | (11.60 | ) | 32 | | .74 | | 5.30 | | .89 | | 5.15 | | 133 | |
| 2009 | | 9.16 | | .69 | | 1.10 | | 1.79 | | .60 | | — | | .60 | | 10.35 | | 20.94 | | 39 | | .76 | | 5.38 | | .91 | | 5.23 | | 79 | |
| | |
| SELECT GROWTH FUND(f) | | | | | | | | | | | | | | | | | | | | | | | | |
| 2005 | | $ 8.34 | | $.05 | | $ .41 | | $ .46 | | $.10 | | $ — | | $ .10 | | $ 8.70 | | 5.55 | % | $ 11 | | .99 | % | .57 | % | N/A | | N/A | | 66 | % |
| 2006 | | 8.70 | | .07 | | .75 | | .82 | | .05 | | — | | .05 | | 9.47 | | 9.47 | | 12 | | .92 | | .77 | | N/A | | N/A | | 80 | |
| 2007 | | 9.47 | | .01 | | 1.06 | | 1.07 | | .07 | | — | | .07 | | 10.47 | | 11.42 | | 13 | | 1.14 | | .15 | | N/A | | N/A | | 161 | |
| 2008 | | 10.47 | | — | | (4.31 | ) | (4.31 | ) | .01 | | .09 | | .10 | | 6.06 | | (41.47 | ) | 9 | | .99 | | (.05 | ) | N/A | | N/A | | 107 | |
| 2009 | | 6.06 | | .01 | | .59 | | .60 | | — | | — | | — | | 6.66 | | 9.90 | | 10 | | 1.00 | | .22 | | N/A | | N/A | | 102 | |
| | |
| TARGET MATURITY 2010 FUND | | | | | | | | | | | | | | | | | | | | | | | | | | | |
| 2005 | | $14.98 | | $.70 | | $ (.50 | ) | $ .20 | | $.70 | | $ .14 | | $ .84 | | $ 14.34 | | 1.46 | % | $ 16 | | .76 | % | 4.74 | % | .91 | % | 4.59% | | 3 | % |
| 2006 | | 14.34 | | .75 | | (.49 | ) | .26 | | .72 | | .12 | | .84 | | 13.76 | | 2.02 | | 14 | | .76 | | 5.13 | | .91 | | 4.98 | | 3 | |
| 2007 | | 13.76 | | .69 | | .41 | | 1.10 | | .77 | | — | | .77 | | 14.09 | | 8.35 | | 15 | | .76 | | 5.33 | | .91 | | 5.16 | | 11 | |
| 2008 | | 14.09 | | .75 | | .26 | | 1.01 | | .73 | | .02 | | .75 | | 14.35 | | 7.33 | | 14 | | .76 | | 5.03 | | .91 | | 4.88 | | 0 | |
| 2009 | | 14.35 | | .77 | | (.81 | ) | (.04 | ) | .78 | | .18 | | .96 | | 13.35 | | (.23 | ) | 11 | | .80 | | 5.13 | | .95 | | 4.98 | | 0 | |
| | |
Financial Highlights (continued)
FIRST INVESTORS LIFE SERIES FUNDS
| | | | | | | | | | | | | | | | | | | | | | | | | | | | | | | |
| | |
| | | | | | | P E R S H A R E D A T A | | | | | | | | | | R A T I O S / S U P P L E M E N T A L D A T A | | | | | |
| | | | | | | | | | | Less Distributions | | | | | | | | | | | | | | Ratio to Average Net | | | |
| | | | | Investment Operations | | from | | | | | | | | | | Ratio to Average Net | | Assets Before Expenses | | | |
| | | Net Asset | | | | Net Realized | | | | | | | | | | Net Asset | | | | | | Assets** | | Waived or Assumed | | | |
| | | Value, | | Net | | and Unrealized | | Total from | | Net | | Net | | | | Value, | | | | Net Assets | | Expenses | | Net | | | | Net | | Portfolio | |
| | | Beginning | | Investment | | Gain (Loss) on | | Investment | | Investment | | Realized | | Total | | End of | | Total | | End of Year | | Before Fee | | Investment | | | | Investment | | Turnover | |
| | | of Year | | Income | | Investments | | Operations | | Income | | Gains | | Distributions | | Year | | Return | * | (in millions | ) | Credits | (a) | Income | | Expenses | | Income | | Rate | |
| | |
| TARGET MATURITY 2015 FUND | | | | | | | | | | | | | | | | | | | | | | | | | | | |
| 2005 | | $14.37 | | $.53 | | $ .08 | | $ .61 | | $.52 | | $ — | | $.52 | | $14.46 | | 4.39 | % | $22 | | .73 | % | 4.14 | % | .88 | % | 3.99 | % | 0 | % |
| 2006 | | 14.46 | | .57 | | (.32 | ) | .25 | | .52 | | — | | .52 | | 14.19 | | 1.85 | | 24 | | .70 | | 4.38 | | .85 | | 4.23 | | 2 | |
| 2007 | | 14.19 | | .59 | | .74 | | 1.33 | | .58 | | — | | .58 | | 14.94 | | 9.70 | | 27 | | .70 | | 4.32 | | .85 | | 4.16 | | 3 | |
| 2008 | | 14.94 | | .63 | | 1.49 | | 2.12 | | .58 | | — | | .58 | | 16.48 | | 14.56 | | 29 | | .69 | | 4.01 | | .84 | | 3.86 | | 0 | |
| 2009 | | 16.48 | | .62 | | (1.00 | ) | (.38 | ) | .63 | | .02 | | .65 | | 15.45 | | (2.22 | ) | 27 | | .71 | | 3.91 | | .86 | | 3.76 | | 0 | |
| | |
| VALUE FUND | | | | | | | | | | | | | | | | | | | | | | | | | | | |
| 2005 | | $13.71 | | $.25 | | $ .57 | | $ .82 | | $.22 | | — | | $.22 | | $14.31 | | 6.09 | % | $79 | | .87 | % | 1.89 | % | N/A | | N/A | | 21 | % |
| 2006 | | 14.31 | | .27 | | 2.76 | | 3.03 | | .26 | | — | | .26 | | 17.08 | | 21.43 | | 94 | | .83 | | 1.73 | | N/A | | N/A | | 15 | |
| 2007 | | 17.08 | | .31 | | (.42 | ) | (.11 | ) | .27 | | — | | .27 | | 16.70 | | (.66 | ) | 91 | | .83 | | 1.75 | | N/A | | N/A | | 17 | |
| 2008 | | 16.70 | | .40 | | (5.24 | ) | (4.84 | ) | .29 | | — | | .29 | | 11.57 | | (29.41 | ) | 58 | | .85 | | 2.47 | | N/A | | N/A | | 15 | |
| 2009 | | 11.57 | | .29 | | 1.96 | | 2.25 | | .36 | | — | | .36 | | 13.46 | | 21.03 | | 66 | | .88 | | 2.45 | | N/A | | N/A | | 11 | |
| | |
| | |
| * | The effect of fees and charges incurred at the separate account level are not reflected in these | |
| | performance figures. | |
| ** | Net of expenses waived or assumed by the investment adviser (Note 4). | |
| (a) | The ratios do not include a reduction of expenses from cash balances maintained with the | |
| | Bank of New York Mellon or from brokerage service arrangements (Note 1H). | |
| (b) | For the years ended December 31, 2005 through December 31, 2008, the expense ratio after | |
| | fee credits was .70%. FIMCO has voluntarily waived advisory fees to limit the Fund’s overall | |
| | expense ratio to .70% for those years. | |
| (c) | For the period January 1, 2009 to December 31, 2009, the expense ratio after fee credits was .56%. | |
| | FIMCO has voluntarily waived advisory fees during the period (see Note 4). | |
| (d) | Prior to October 18, 2006, known as Growth Fund. | |
| (e) | Prior to June 27, 2006, known as International Securities Fund. | |
| (f) | Prior to July 26, 2007, known as Focused Equity Fund. | |
| | |
| | See notes to financial statements | |
| 130 | | 131 |
Report of Independent Registered Public
Accounting Firm
To the Shareholders and Board of Trustees of
First Investors Life Series Funds
We have audited the accompanying statements of assets and liabilities of the twelve Funds comprising First Investors Life Series Funds, including the portfolios of investments, as of December 31, 2009, the related statements of operations for the year then ended, the statements of changes in net assets for each of the two years then ended, and the financial highlights for each of the periods indicated therein. These financial statements and financial highlights are the responsibility of the Life Series Funds’ management. Our responsibility is to express an opinion on these financial statements and financial highlights based on our audits.
We conducted our audits in accordance with the standards of the Public Company Accounting Oversight Board (United States). Those standards require that we plan and perform the audit to obtain reasonable assurance about whether the financial statements and financial highlights are free of material misstatement. The Funds are not required to have, nor were we engaged to perform, an audit of the Funds’ internal control over financial reporting. Our audits included consideration of internal control over financial reporting as a basis for designing audit procedures that are appropriate in the circumstances, but not for the purpose of expressing an opinion on the effectiveness of the Funds’ internal control over financial reporting. Accordingly, we express no such opinion. An audit includes examining, on a test basis, evidence supporting the amounts and disclosures in the financial statements. Our procedures included confirmation of securities owned as of December 31, 2009, by correspondence with the custodian and brokers. Where brokers have not replied to our confirmation requests, we have carried out other appropriate auditing procedures. An audit also includes assessing the accounting principles used and significant estimates made by management, as well as evaluating the overall financial statement presentation. We believe that our audits provide a reasonable basis for our opinion.
In our opinion, the financial statements and financial highlights referred to above present fairly, in all material respects, the financial position of each of the twelve Funds comprising First Investors Life Series Funds, as of December 31, 2009, and the results of their operations for the year then ended, changes in their net assets for each of the two years in the period then ended and their financial highlights for the periods indicated therein, in conformity with accounting principles generally accepted in the United States of America.
Philadelphia, Pennsylvania
February 26, 2010
FIRST INVESTORS LIFE SERIES FUNDS
Trustees and Officers*
| | | | |
| | Position(s) | | | |
| | Held with | Principal | Number of | Other |
| | Funds and | Occupation(s) | Portfolios in | Trusteeships/ |
| Name, Year of Birth | Length of | During Past | Fund Complex | Directorships |
| and Address | Service | 5 Years | Overseen | Held |
| ——————— | ———— | ———— | ————— | ——— |
| |
| DISINTERESTED TRUSTEES | |
| |
| Charles R. Barton, III 1965 | Trustee since | Chief Operating | 39 | None |
| c/o First Investors | 1/1/06 | Officer (since | | |
| Management Company, Inc. | | 2007) and Trustee | | |
| 110 Wall Street | | of the Barton | | |
| New York, NY 10005 | | Group, LLC | | |
| | | since 1989; | | |
| | | President of | | |
| | | Noe Pierson | | |
| | | Corporation | | |
| | | since 2000 | | |
| |
| |
| Stefan L. Geiringer 1934 | Trustee since | Co-Founder | 39 | None |
| c/o First Investors | 1/1/06 | and Senior Vice | | |
| Management Company, Inc. | | President of Real | | |
| 110 Wall Street | | Time Energy | | |
| New York, NY 10005 | | Solutions, Inc. | | |
| | | since 2005; | | |
| | | Founder/Owner | | |
| | | of SLG, Inc. | | |
| | | Since 2005; | | |
| | | Senior Vice | | |
| | | President of | | |
| | | Pepco Energy | | |
| | | Services (North- | | |
| | | east Region) | | |
| | | From 2003-2005; | | |
| | | Founder/Owner | | |
| | | and President of | | |
| | | North Atlantic | | |
| | | Utilities, Inc. | | |
| | | from 1987-2005 | | |
FIRST INVESTORS LIFE SERIES FUNDS
Trustees and Officers* (continued)
| | | | |
| | Position(s) | | | |
| | Held with | Principal | Number of | Other |
| | Funds and | Occupation(s) | Portfolios in | Trusteeships/ |
| Name, Year of Birth | Length of | During Past | Fund Complex | Directorships |
| and Address | Service | 5 Years | Overseen | Held |
| ——————— | ———— | ———— | ————— | ——— |
| |
| DISINTERESTED TRUSTEES (continued) | |
| |
| Robert M. Grohol 1932 | Trustee since | None/Retired | 39 | None |
| c/o First Investors | 8/15/05; | | | |
| Management Company, Inc. | Director/Trustee | | | |
| 110 Wall Street | of predecessor | | | |
| New York, NY 10005 | funds | | | |
| | since 10/15/92 | | | |
| |
| |
| |
| Arthur M. Scutro, Jr. 1941 | Trustee since | None/Retired | 39 | None |
| c/o First Investors | 1/1/06 | | | |
| Management Company, Inc. | | | | |
| 110 Wall Street | | | | |
| New York, NY 10005 | | | | |
| |
| |
| |
| Robert F. Wentworth 1929 | Trustee since | None/Retired | 39 | None |
| c/o First Investors | 8/18/05†; | | | |
| Management Company, Inc. | Director/Trustee | | | |
| 110 Wall Street | of predecessor | | | |
| New York, NY 10005 | funds since | | | |
| | 10/15/92 | | | |
| |
| † | Mr. Wentworth retired effective December 31, 2009. |
| Mark R. Ward became a Trustee effective January 1, 2010. |
| | | | |
| | Position(s) | | | |
| | Held with | Principal | Number of | Other |
| | Funds and | Occupation(s) | Portfolios in | Trusteeships/ |
| Name, Year of Birth | Length of | During Past | Fund Complex | Directorships |
| and Address | Service | 5 Years | Overseen | Held |
| ——————— | ———— | ———— | ————— | ——— |
| |
| INTERESTED TRUSTEES** | |
| |
| Kathryn S. Head 1955 | Trustee and | Chairman, Of- | 39 | None |
| c/o First Investors | President | ficer and Director | | |
| Management Company, Inc. | since 8/15/05; | of First Investors | | |
| Raritan Plaza I | Director/Trustee | Corporation; | | |
| Edison, NJ 08837 | of predecessor | First Investors | | |
| | funds since | Consolidated | | |
| | 3/17/94; | Corporation; | | |
| | President of | First Investors | | |
| | Predecessor | Management | | |
| | funds since | Company, Inc.; | | |
| | 2001 | Administrative | | |
| | | Data Manage- | | |
| | | ment Corp.; | | |
| | | First Investors | | |
| | | Federal Savings | | |
| | | Bank; and other | | |
| | | affiliated | | |
| | | companies*** | | |
| |
| * | Each Trustee serves for an indefinite term with the Funds, until his/her successor is elected. |
| ** | Ms. Head is an interested trustee because (a) she indirectly owns more than 5% of the voting stock of |
| the adviser and principal underwriter of the Funds, (b) she is an officer, director and employee of the |
| adviser and principal underwriter of the Funds, and (c) she is an officer of the Funds |
| *** | Other affiliated companies consist of: First Investors Realty Company, Inc., First Investors Life Insur- |
| ance Company, First Investors Leverage Corporation, Route 33 Realty Corporation, First Investors |
| Credit Funding Corporation, N.A.K. Realty Corporation, Real Property Development Corporation, |
| First Investors Credit Corporation, First Investors Resources, Inc. and First Investors Name Saver, Inc. |
FIRST INVESTORS LIFE SERIES FUNDS
Trustees and Officers* (continued)
| | | | |
| | Position(s) | | | |
| | Held with | Principal | Number of | Other |
| | Funds and | Occupation(s) | Portfolios in | Trusteeships/ |
| Name, Year of Birth | Length of | During Past | Fund Complex | Directorships |
| and Address | Service | 5 Years | Overseen | Held |
| ——————— | ———— | ———— | ————— | ——— |
| |
| OFFICER (S) WHO ARE NOT TRUSTEES | |
| |
| Joseph I. Benedek 1957 | Treasurer | Treasurer of | 39 | None |
| c/o First Investors | since 8/18/05; | First Investors | | |
| Management Company, Inc. | Treasurer of | Management | | |
| Raritan Plaza I | predecessor funds | Company, Inc. | | |
| Edison, NJ 08837 | since 1988 | | | |
| |
| |
| Larry R. Lavoie 1947 | Chief | General Counsel | 39 | None |
| c/o First Investors | Compliance | of First Investors | | |
| Management Company, Inc. | Officer since | Corporation and | | |
| 110 Wall Street | 8/18/05; | its affiliates; | | |
| New York, NY 10005 | Chief | Director of | | |
| | Compliance | First Investors | | |
| | Officer of | Corporation | | |
| | predecessor funds | and various | | |
| | since 2004 | affiliates | | |
FIRST INVESTORS LIFE SERIES FUNDS
| |
| Shareholder Information | |
| ——————————————————— | |
| |
| Investment Adviser | Custodian |
| First Investors Management | (Cash Management, Government, High |
| Company, Inc. | Yield, Investment Grade, Target Maturity |
| 110 Wall Street | 2010 and Target Maturity 2015 Funds) |
| New York, NY 10005 | The Bank of New York Mellon |
| | One Wall Street |
| | New York, NY 10286 |
| |
| Subadviser | Custodian |
| (Discovery Fund) | (Blue Chip, Discovery, Growth & Income, |
| Paradigm Capital Management, Inc. | International, Select Growth and Value Funds) |
| Nine Elk Street | Brown Brothers Harriman & Co. |
| Albany, NY 12207 | 40 Water Street |
| | Boston, MA 02109 |
| |
| Subadviser | Transfer Agent |
| (High Yield Fund) | Administrative Data Management Corp. |
| Muzinich & Co., Inc. | Raritan Plaza I – 8th Floor |
| 450 Park Avenue | Edison, NJ 08837-3620 |
| New York, NY 10022 | |
| |
| Subadviser | Independent Registered |
| (International Fund) | Public Accounting Firm |
| Vontobel Asset Management, Inc. | Tait, Weller & Baker LLP |
| 1540 Broadway | 1818 Market Street |
| New York, NY 10036 | Philadelphia, PA 19103 |
| |
| Subadviser | Legal Counsel |
| (Select Growth Fund) | K&L Gates LLP |
| Smith Asset Management Group, L.P. | 1601 K Street, N.W. |
| 100 Crescent Court | Washington, D.C. 20006 |
| Dallas, TX 75201 | |
FIRST INVESTORS LIFE SERIES FUNDS
A description of the policies and procedures that the Funds use to vote proxies relating to a portfolio’s securities is available, without charge, upon request by calling toll free 1-800-423-4026 or can be viewed online or downloaded from the EDGAR database on the Securities and Exchange Commission’s (“SEC”) internet website at http://www.sec.gov. In addition, information regarding how the Funds voted proxies relating to portfolio securities during the most recent 12-month period ended June 30, is available, without charge, upon request in writing or by calling 1-800-423-4026 and on the SEC’s internet website at http://www.sec.gov.
The Funds file their complete schedule of portfolio holdings with the SEC on Form N-Q, for the first and third quarters of each fiscal year. The Funds’ Form N-Q will be available on the SEC’s website at http://www.sec.gov; and may also be reviewed and copied at the SEC’s Public Reference Room in Washington D.C. Information on the operation of the Public Reference Room may be obtained by calling 1-800-SEC-0330. The schedule of portfolio holdings is available, without charge, upon request in writing or by calling 1-800-423-4026.
NOTES
NOTES

Item 2. Code of Ethics
As of December 31, 2009, the Registrant has adopted a code of ethics that applies to the Registrant's President/Principal Executive Officer and Treasurer/Principal Financial Officer.
For the year ended December 31, 2009, there were no waivers granted from a provision of the code of ethics.
A copy of the Registrant's code of ethics is filed under Item 12(a)(1).
Item 3. Audit Committee Financial Expert
During the reporting period the Registrant's Board determined that it had at least two "audit committee financial experts" serving on its audit committee. Robert F. Wentworth and Arthur M. Scutro, Jr. were the "audit committee financial experts" during the period and were considered to be "independent" as defined in Item 3 of Form N-CSR.
Item 4. Principal Accountant Fees and Services
| | | | | | | | |
| | | | Fiscal Year Ended | | |
| | | | December 31, | | |
| | | | ----------------- | | | |
| | | 2009 | | | 2008 | | |
| | | ---- | | | ---- | | |
| (a) Audit Fees | $ | 124,700 | | $ | 140,100 | | |
| | | |
| (b) Audit-Related Fees | $ | 0 | | $ | 0 | | |
| | | |
| (c) Tax Fees | $ | 36,000 | | $ | 34,800 | | |
| | | |
| Nature of fees: tax returns preparation and tax compliance | | |
| | | |
| (d) All Other Fees | $ | 0 | | $ | 0 | | |
(e)(1) Audit committee's pre-approval policies
The Charter of the Audit Committee requires the Audit Committee:
(a) to pre-approve, and to recommend to the full Board, the selection, retention or termination of the independent auditors to provide audit, review or attest services to the Funds and, in connection therewith, evaluate the independence of the auditors and to obtain the auditors' specific representations as to their independence;
(b) to pre-approve all non-audit services to be provided to the Funds by the independent auditor;
(c) to pre-approve all non-audit services to be provided by the Funds' independent auditor to the Funds' investment adviser or to any entity that controls, is controlled by or is under common control with the Funds investment adviser ("adviser affiliate") and that provides ongoing services to the Funds, if the engagement relates directly to the operations and financial reporting of the Funds;
(d) to establish, if deemed necessary or appropriate as an alternative to Audit Committee pre-approval of services to be provided by the independent auditor as required by paragraphs (b) and (c) above, policies and procedures to permit such services to be pre-approved by other means, such as by action of a designated member and members of the Audit Committee, subject to subsequent Committee review and oversight;
(e) to consider whether the non-audit services provided by the Funds' independent auditors to the Funds' investment adviser or any adviser affiliate that provides ongoing services to the Funds, which services were not pre-approved by the Audit Committee, are compatible with maintaining the auditors' independence;
(f) to meet with the Funds’ independent auditors, including meetings without management representatives, as necessary (i) to review the arrangements for, and scope of, the annual audit, any special audits and any other services to be provided to the Fund’s by the auditors; (ii) to discuss any matters of concern relating to the Fund’s financial statements, including any adjustments to such statements recommended by the auditors, or other results of said audit(s); and (iii) to review the form of opinion the auditors propose to render to the Board and shareholders;
(g) to receive and consider (i) information and comments from the auditors with respect to the Funds’ accounting and financial reporting policies, procedures and internal control over financial reporting (including the Funds’ critical accounting policies and practices) and to consider management’s responses to any such comments; (ii) reports from the auditors regarding any material written communications between the auditors and management; and (iii) reports from the auditors regarding all non-audit services provided to any entity in the Funds’ investment company complex that were not pre-approved by the Audit Committee or pursuant to pre-approved policies and procedures established by the Audit Committee and associated fees;
(h) to consider the effect upon the Funds of any changes in accounting principles or practices proposed by management or the auditors;
(i) to review and approve the fees proposed to be charged to the Funds by the auditors for each audit and non-audit service;
(j) to receive reports from Fund management in connection with the required certifications on Form N-CSR under the 1940 Act of any significant deficiencies in the design or operation of the Funds’ internal control over financial reporting or material weakness therein and any reported evidence of fraud, whether or not material, involving management or other employees of the Funds who have a significant role in the Funds’ internal control over financial reporting;
(k) to investigate improprieties or suspected improprieties in the Funds’ accounting or financial reporting brought to the attention of the Audit Committee;
(l) to receive and consider reports from attorneys, in accordance with the “Up-the-Ladder” Reporting Policies for attorneys who appear or practice before the Securities and Exchange Commission in the representation of the Funds and in accordance with applicable federal law, and auditors relating to possible material violations of federal or state law or fiduciary duty;
(m) to report its activities to the full Board on a regular basis and to make such recommendations with respect to the above and other matters as the Audit Committee may deem necessary or appropriate;
(n) to meet with the Treasurer of the Funds and, as necessary, with internal auditors, if any, for the management company;
(o) to meet in executive session with the Chief Compliance Officer of the Funds at least annually; and,
(p) to perform such other functions and to have such powers as may be necessary or appropriate in the efficient and lawful discharge of the powers provided in this Charter.
(e)(2) None, or 0%, of the services relating to the Audit-Related Fees, Tax Fees and All Other Fees paid by the Registrant and Related Entities disclosed above were approved by the audit committee pursuant to paragraph (c)(7)(i)(C) of Rule 2-01 of Regulation S-X (which permits audit committee approval after the start of the engagement with respect to services other than audit review or attest services, if certain conditions are satisfied).
(f) Not Applicable
(g) Aggregate non-audit fees billed by the Registrant's accountant for services rendered to the Registrant and the Registrant's investment adviser or any entity controlling, controlled by, or under common control with the adviser that provides ongoing services to the Registrant for the two fiscal years ended December 31, 2009 and 2008 were $82,100 and $83,750, respectively.
| |
| (h) Not Applicable |
| |
| Item 5. | Audit Committee of Listed Registrants |
| |
| Not applicable |
| |
| Item 6. | Schedule of Investments |
| |
| Schedule is included as part of the report to |
| stockholders filed under Item 1 of this Form. |
| |
| Item 7. | Disclosure of Proxy Voting Policies & Procedures for |
| Closed-End Management Investment Companies |
| |
| Not applicable |
| |
| Item 8. | Portfolio Managers of Closed-End Management Investment Companies |
| |
| Not applicable |
| |
| Item 9. | Purchases of Equity Securities by Closed-End Management |
| Investment Companies and Affiliated Purchasers |
| |
| Not applicable |
| |
| Item 10. | Submission of Matters to a Vote of Security Holders |
There were no material changes to the procedure by which shareholders may recommend nominees to the Registrant's Board of Trustees.
Item 11. Controls and Procedures
(a) The Registrant's Principal Executive Officer and Principal Financial Officer have concluded that the Registrant's disclosure controls and procedures (as defined in Rule 30a-3(c) under the Investment Company Act of 1940, as amended) are effective, based on their evaluation of these disclosure controls and procedures as of a date within 90 days of the filing date of this report.
(b) There were no changes in the Registrant's internal controls over financial reporting that occurred during the second fiscal quarter of the period covered by this report that has materially affected, or is reasonably likely to materially affect, the Registrant's internal control over financial reporting.
| |
| Item 12. Exhibits |
| |
| (a)(1) | Code of Ethics - Filed herewith |
| |
| (a)(2) | Certifications pursuant to Section 302 of the Sarbanes-Oxley Act |
| | of 2002 - Filed herewith |
| |
| (b) | Certifications pursuant to Section 906 of the Sarbanes-Oxley Act |
| | of 2002 - Filed herewith |
SIGNATURES
Pursuant to the requirements of the Securities Exchange Act of 1934 and the Investment Company Act of 1940, the Registrant has duly caused this report to be signed on its behalf by the undersigned, thereunto duly authorized.
First Investors Life Series Funds
| |
| By | /S/ KATHRYN S. HEAD |
| | Kathryn S. Head |
| | President and Principal Executive Officer |
| |
| Date: | March 5, 2010 |
Pursuant to the requirements of the Securities Exchange Act of 1934 and the Investment Company Act of 1940, this report has been signed below by the following persons on behalf of the Registrant and in the capacities and on the dates indicated.
First Investors Life Series Funds
| |
| By | /S/ KATHRYN S. HEAD |
| | Kathryn S. Head |
| | President and Principal Executive Officer |
| |
| |
| By | /S/ JOSEPH I. BENEDEK |
| | Joseph I. Benedek |
| | Treasurer and Principal Financial Officer |
| |
| Date: | March 5, 2010 |