|
| UNITED STATES |
| SECURITIES AND EXCHANGE COMMISSION |
| WASHINGTON, D.C. 20549 |
| -------- |
| |
| FORM N-CSR |
| -------- |
| |
| CERTIFIED SHAREHOLDER REPORT OF REGISTERED MANAGEMENT |
| INVESTMENT COMPANIES |
| |
| INVESTMENT COMPANY ACT FILE NUMBER 811-4325 |
| |
| FIRST INVESTORS LIFE SERIES FUNDS |
| (Exact name of registrant as specified in charter) |
| |
| 40 Wall Street |
| New York, NY 10005 |
| (Address of principal executive offices) (Zip code) |
| |
| Joseph I. Benedek |
| First Investors Management Company, Inc. |
| Raritan Plaza I |
| Edison, NJ 08837-3620 |
| (Name and address of agent for service) |
| |
| REGISTRANT'S TELEPHONE NUMBER, INCLUDING AREA CODE: |
| 1-212-858-8000 |
| |
| DATE OF FISCAL YEAR END: DECEMBER 31 |
| |
| DATE OF REPORTING PERIOD: DECEMBER 31, 2013 |
| |
| Item 1. | Reports to Stockholders |
| |
| | The annual report to stockholders follows |

This report is for the information of the shareholders of the Funds. It is the policy of each Fund described in this report to mail only one copy of a Fund’s prospectus, annual report, semi-annual report and proxy statements to all shareholders who share the same mailing address and share the same last name and have invested in a Fund covered by the same document. You are deemed to consent to this policy unless you specifically revoke this policy and request that separate copies of such documents be mailed to you. In such case, you will begin to receive your own copies within 30 days after our receipt of the revocation. You may request that separate copies of these disclosure documents be mailed to you by writing to us at: Administrative Data Management Corp., Raritan Plaza I, Edison, NJ 08837-3620 or calling us at 1-800-423-4026.
You may obtain a free prospectus for any of the Funds by contacting your representative, calling 1-800-423-4026, writing to us at the following address: First Investors Corporation, 40 Wall Street, New York, NY 10005, or by visiting our website at www.firstinvestors.com. You should consider the investment objectives, risks, charges and expenses of a Fund carefully before investing. The prospectus contains this and other information about the Fund, and should be read carefully before investing.
An investment in a Fund is not a bank deposit and is not insured or guaranteed by the Federal Deposit Insurance Corporation (FDIC) or any other government agency. Although the Cash Management Fund seeks to preserve a net asset value at $1.00 per share, it is possible to lose money by investing in it, just as it is possible to lose money by investing in any of the other Funds. Past performance is no guarantee of future results.
A Statement of Additional Information (“SAI”) for any of the Funds may also be obtained, without charge, upon request by calling 1-800-423-4026, writing to us at our address or by visiting our website listed above. The SAI contains more detailed information about the Funds, including information about their Trustees.
Portfolio Manager’s Letter
CASH MANAGEMENT FUND
Dear Investor:
I’m pleased to send you the First Investors Life Cash Management Fund annual report for the year ended December 31, 2013. During the period, the Fund’s return on a net asset value basis was 0.0%. The Fund maintained a $1.00 net asset value per share throughout the year.
Yields on money-market funds and the instruments that they invest in have remained at record lows for the last few years. The Federal Reserve, which has had an extremely accommodative interest-rate policy since late 2008, has indicated a willingness to maintain extraordinarily low short-term interest rates until certain economic conditions improve. Market expectations vary on when this may occur, but it appears that the current policy will basically remain intact through 2014. Despite the returns that money-market funds currently offer, they remain a part of many investment strategies, as evidenced by the nearly 2.7 trillion dollars invested in this yield-challenged product.
First Investors Management Company, Inc. (“FIMCO”), the Fund’s investment advisor, continued to absorb expenses of the Fund and waive management fees in an effort to avoid a negative yield to its shareholders — a strategy that FIMCO expects will be ongoing. As a result, the yield to shareholders should be at or near zero for the foreseeable future.
Although money market funds in general are relatively conservative vehicles, there can be no assurance that the Fund will be able to maintain a stable net asset value of $1.00 per share. Money market mutual funds are neither insured nor guaranteed by the Federal Deposit Insurance Corporation (FDIC) or any other government agency.
Thank you for placing your trust in First Investors. As always, we appreciate the opportunity to serve your investment needs.

Understanding Your Fund’s Expenses
FIRST INVESTORS LIFE SERIES FUNDS
As a mutual fund shareholder, you incur two types of costs: (1) transaction costs, and (2) ongoing costs, including advisory fees and other expenses. This example is intended to help you understand your ongoing costs (in dollars) of investing in the Fund and to compare these costs with the ongoing costs of investing in other mutual funds.
The examples are based on an investment of $1,000 in each Fund at the beginning of the period, July 1, 2013, and held for the entire six-month period ended December 31, 2013. The calculations assume that no shares were bought or sold during the period. Your actual costs may have been higher or lower, depending on the amount of your investment and the timing of any purchases or redemptions.
Actual Expense Example:
These amounts help you to estimate the actual expenses that you paid over the period. The “Ending Account Value” shown is derived from the Fund’s actual return, and the “Expenses Paid During Period” shows the dollar amount that would have been paid by an investor who started with $1,000 in the Fund. You may use the information here, together with the amount you invested, to estimate the expenses that you paid during the period.
To estimate the expenses you paid on your account during this period simply divide your ending account value by $1,000 (for example, an $8,600 account value divided by $1,000 = 8.60), then multiply the result by the number given for your Fund under the heading “Expenses Paid During Period”.
Hypothetical Expense Example:
These amounts provide information about hypothetical account values and hypothetical expenses based on the Fund’s actual expense ratio and an assumed rate of return of 5% per year before expenses, which is not the Fund’s actual return. The hypothetical account values and expenses may not be used to estimate the actual ending account balance or expenses you paid for the period. You may use this information to compare the ongoing costs of investing in the Fund and other funds. To do so, compare this 5% hypothetical example with the 5% hypothetical examples that appear in the shareholder reports of the other funds.
Please note that the expenses shown in the table are meant to highlight and help you compare your ongoing costs only and do not reflect any transactional costs. Therefore, the hypothetical expense example is useful in comparing ongoing costs only, and will not help you determine the relative total costs of owning different funds. In addition, if these transactional costs were included, your costs would have been higher.
Fund Expenses (unaudited)
CASH MANAGEMENT FUND
The examples below show the ongoing costs (in dollars) of investing in your Fund and will help you in comparing these costs with costs of other mutual funds. Please refer to page 2 for a detailed explanation of the information presented in these examples.
| | | |
| | | | |
| | Beginning | Ending | |
| | Account | Account | Expenses Paid |
| | Value | Value | During Period |
| | (7/1/13) | (12/31/13) | (7/1/13–12/31/13)* |
| Expense Examples | | | |
| Actual | $1,000.00 | $1,000.00 | $0.35 |
| Hypothetical | | | |
| (5% annual return before expenses) | $1,000.00 | $1,024.86 | $0.36 |
| |
| * | Expenses are equal to the annualized expense ratio of .07%, multiplied by the average account value over |
| the period, multiplied by 184/365 (to reflect the one-half year period). Expenses paid during the period |
| are net of expenses waived and/or assumed. |
Portfolio Composition
BY SECTOR

|
| Portfolio holdings and allocations are subject to change. Percentages are as of December 31, 2013, |
| and are based on the total value of investments. |
Portfolio of Investments
CASH MANAGEMENT FUND
December 31, 2013
| | | | | | | |
| | | | | | | | |
| | | | | | | |
| | | | | | | |
| Principal | | | | | Interest | | |
| Amount | | Security | | | Rate | * | Value |
| | | U.S. GOVERNMENT AGENCY | | | | | |
| | | OBLIGATIONS—67.5% | | | | | |
| | | Federal Home Loan Bank: | | | | | |
| $ 200M | | 1/8/14 | | | 0.04 | % | $ 199,998 |
| 700M | | 1/15/14 | | | 0.07 | | 699,981 |
| 575M | | 1/15/14 | | | 0.08 | | 574,982 |
| 500M | | 1/17/14 | | | 0.14 | | 499,969 |
| 390M | | 1/22/14 | | | 0.05 | | 389,990 |
| 500M | | 1/29/14 | | | 0.05 | | 499,981 |
| 1,000M | | 3/14/14 | | | 0.09 | | 999,830 |
| 700M | | 4/4/14 | | | 0.11 | | 699,801 |
| 500M | | 4/9/14 | | | 0.10 | | 499,871 |
| | | Freddie Mac: | | | | | |
| 476M | | 2/4/14 | | | 0.10 | | 475,955 |
| 400M | | 2/11/14 | | | 0.09 | | 399,959 |
| 250M | | 3/3/14 | | | 0.07 | | 249,970 |
| 700M | | 3/20/14 | | | 0.09 | | 699,863 |
| 500M | | 5/14/14 | | | 0.11 | | 499,797 |
| Total Value of U.S. Government Agency Obligations (cost $7,389,947) | | | | | 7,389,947 |
| |
| | | CORPORATE NOTES—22.8% | | | | | |
| 500M | | Abbott Laboratories, 3/6/2014 (a) | | | 0.09 | | 499,920 |
| 500M | | Coca-Cola Co., 2/27/2014 (a) | | | 0.19 | | 499,849 |
| 500M | | General Electric Capital Corp., 3/12/2014 | | | 0.14 | | 499,864 |
| 500M | | Google, Inc., 2/13/2014 (a) | | | 0.07 | | 499,958 |
| 500M | | PepsiCo, Inc., 1/6/2014 (a) | | | 0.06 | | 499,996 |
| Total Value of Corporate Notes (cost $2,499,587) | | | | | 2,499,587 |
| |
| | | VARIABLE AND FLOATING RATE NOTES—12.8% | | |
| 500M | | Federal Farm Credit Bank, 3/18/2014 | | | 0.13 | | 499,990 |
| 400M | | Mississippi Business Finance Corp. | | | | | |
| | | (Chevron USA, Inc.), 12/1/2030 | | | 0.02 | | 400,000 |
| | | Valdez, Alaska Marine Terminal Rev.: | | | | | |
| 200M | | Exxon Pipeline Co. Project B 12/1/33 | | | 0.02 | | 200,000 |
| 300M | | Exxon Pipeline Co. Project C 12/1/33 | | | 0.02 | | 300,000 |
| Total Value of Variable and Floating Rate Notes (cost $1,399,990) | | | | | 1,399,990 |
| | | | | | | | |
| | | | | | | | | |
| | | | | | | | |
| | | | | | | | | |
| Principal | | | | | Interest | | | |
| Amount | | Security | | | Rate | * | Value | |
| | SHORT-TERM U.S. GOVERNMENT | | | | | | |
| | OBLIGATIONS—12.8% | | | | | | |
| $1,400M | | U.S. Treasury Bills, 3/13/2014 | | | | | | |
| | | (cost $1,399,834) | | | 0.06 | % | $ 1,399,834 | |
| Total Value of Investments (cost $12,689,358)** | 115.9 | % | | | 12,689,358 | |
| Excess of Liabilities Over Other Assets | (15.9 | ) | | | (1,737,198 | ) |
| | |
| Net Assets | | 100.0 | % | | | $10,952,160 | |
| | |
| * | The interest rates shown are the effective rates at the time of purchase by the Fund. The interest |
| rates shown on variable and floating rate notes are adjusted periodcally; the rates shown are the |
| rates in effect at December 31, 2013. |
| ** | Aggregate cost for federal income tax purposes is the same. |
| (a) | Security exempt from registration under Section 4(2) of the Securities Act of 1933 (see Note 5). |
Portfolio of Investments (continued)
CASH MANAGEMENT FUND
December 31, 2013
Accounting Standards Codification 820 established a three-tier hierarchy of inputs to establish a classification of fair value measurements for disclosure purposes. The three-tier hierarchy of inputs is summarized in the three broad Levels listed below:
Level 1 — Unadjusted quoted prices in active markets for identical securities that the Fund has the ability to access.
Level 2 — Observable inputs other than quoted prices included in Level 1 that are observable for the asset or liability, either directly or indirectly. These inputs may include quoted prices for the identical instrument on an inactive market, prices for similar instruments, interest rates, prepayment speeds, credit risk, yield curves, default rates and similar data.
Level 3 — Unobservable inputs for the asset or liability, to the extent relevant observable inputs are not available, representing the Fund’s own assumption about the assumptions a market participant would use in valuing the asset or liability, and would be based on the best information available.
The inputs methodology used for valuing securities are not necessarily an indication of the risk associated with investing in those securities. For example, amortized cost approximates the current fair value of a security, but since the value is not obtained from a quoted price in an active market, such securities are reflected as Level 2.
The following is a summary, by category of Level, of inputs used to value the Fund’s investments as of December 31, 2013:
| | | | | | | | | | | | |
| | | | Level 1 | | | Level 2 | | | Level 3 | | | Total |
| U.S. Government Agency | | | | | | | | | | | | |
| Obligations | | $ | — | | $ | 7,389,947 | | $ | — | | $ | 7,389,947 |
| Corporate Notes | | | — | | | 2,499,587 | | | — | | | 2,499,587 |
| Variable and Floating Rate Notes: | | | | | | | | | | | | |
| U.S. Government Agency | | | | | | | | | | | | |
| Obligations | | | — | | | 499,990 | | | — | | | 499,990 |
| Municipal Bonds | | | — | | | 900,000 | | | — | | | 900,000 |
| Short-Term U.S. Government | | | | | | | | | | | | |
| Obligations | | | — | | | 1,399,834 | | | — | | | 1,399,834 |
| Total Investments in Securities | | $ | — | | $ | 12,689,358 | | $ | — | | $ | 12,689,358 |
There were no transfers into or from Level 1 and Level 2 by the Fund for the year ended December 31, 2013. Transfers, if any, between Levels are recognized at the end of the reporting period.
| |
| 6 | See notes to financial statements |
Portfolio Manager’s Letter
EQUITY INCOME FUND
Dear Investor:
I’m pleased to send you the First Investors Life Equity Income Fund annual report for the year ended December 31, 2013. During the period, the Fund’s return on a net asset value basis was 30.53%, including dividends of 38 cents per share.
2013 was the best return year for the S&P 500 since 1997, with U.S. equity markets outperforming all other asset classes. Consumer discretionary and health care were the top-performing sectors in the S&P 500, while telecom and utilities were the worst performing sectors.
During the year we saw a dramatic move in ten-year Treasuries as the yield moved from a low of 1.63% in early May to a high of 3.03% in late December. This move had a negative effect on high-dividend yielding stocks as they sold off and failed to match the high returns of the rest of the market. As rates move closer to 3%, investors looking for yield can move back to fixed-income assets without the volatility of equities. With a balance of high-dividend growth names in the portfolio to offset our higher-yielding stocks, the fund was able to produce a return of 30.53% even though our style was generally out of favor with the markets.
The Fund’s absolute performance was attributable to positive stock selection in the industrial, consumer discretionary and health-care sectors.
In industrials, recent mega storms increased the need for reliable back-up power for both residential and commercial customers. This benefited companies like Generac, the leader in standby generators, which got a boost after Hurricane Sandy from consumers looking to protect themselves from future power outages. In the past year, the company’s sales grew almost 50%, with earnings growth even higher. Not only has Generac’s stock appreciated over 87% in the past year, but as a shareholder, the Fund received more than $5 per share in special dividends during the period. With standby generators becoming a necessity for homeowners, Generac’s outlook remains positive.
As one of the Fund’s largest positions in industrials, Honeywell gives the Fund a way to participate in worldwide growth in emerging markets at a reasonable valuation. Its aerospace segment is seeing renewed growth with increased plane orders coming from emerging market countries. In automotive, governments are setting higher mandates for fuel efficiency and Honeywell’s turbo chargers are helping car manufacturers meet these stringent requirements.
In the consumer discretionary sector, the Fund’s position in GNC Holdings has been riding a consumer wave of healthy living with its vitamin and supplement business, which continues to grow at a double-digit pace. Given its present level of product
Portfolio Manager’s Letter (continued)
EQUITY INCOME FUND
innovation and overseas growth, GNC should continue to outperform its peers. The stock was up over 77% in 2013.
Delphi Automotive was up over 59% in 2013, as the rebound in North American auto sales coupled with the tremendous growth in cars on the road in China fueled strong revenue and earnings growth. The Fund purchased Delphi shortly after its IPO, and has been rewarded with price appreciation and dividend growth, both key measures that the Fund seeks in an investment.
In health care, the Fund’s strong absolute performance benefited from the merger of Warner Chilcott, which was first purchased by the Fund after it announced a special dividend back in 2012. We purchased more stock after it became clear the company was going to be purchased by bigger rival, Actavis. Warner Chilcott had a 92% return for the Fund in 2013.
On a relative basis, the Fund outperformed its benchmark in the consumer staples, materials and utilities sector.
In consumer staples, Nu Skin, a direct seller of personal care and nutrition products, consistently beat earnings expectations on the back of its emerging market growth. Altria Group also had a strong year, with the company continuing to return cash to shareholders with a 5% dividend yield and a healthy stock buyback program.
In materials, the Fund benefited from the strong performance of Rock-Tenn and International Paper, both big players in corrugated packaging. The industry has been consolidating over the past few years, and pricing has become better as inventory management has improved industry-wide. Earnings and cash flow have improved significantly for both companies as well, and shareholders have been rewarded with bigger dividends and share buybacks.
Both the technology and financial sectors underperformed their peers on a relative basis. Notwithstanding that Google was a top performer in technology and one of the highest weighted stocks in the S&P 500 Index, because Google doesn’t pay a dividend (or plan to in the immediate future) the Fund did not own any. This caused our relative performance to suffer. Likewise, the Fund tends to avoid lower-quality financial stocks, which had a strong year. We like to invest in solid financial companies that have analyzable business models and return cash to shareholders. After the financial crisis, new regulations are making it much harder for companies to return cash to shareholders.
As we look forward, we believe that dividend-paying stocks should be a focus for any investor. These stocks tend to outperform non-dividend-paying stocks when interest rates are either rising or falling. If we look at stock returns since the 1970’s,
dividend-paying stocks have outperformed the S&P 500 Index. The Fund is therefore focused on finding those stocks that not only provide yield and stability but provide dividend growth and appreciation.
Thank you for placing your trust in First Investors. As always, we appreciate the opportunity to serve your investment needs.
Fund Expenses (unaudited)
EQUITY INCOME FUND
The examples below show the ongoing costs (in dollars) of investing in your Fund and will help you in comparing these costs with costs of other mutual funds. Please refer to page 2 for a detailed explanation of the information presented in these examples.
| | | |
| | | | |
| | Beginning | Ending | |
| | Account | Account | Expenses Paid |
| | Value | Value | During Period |
| | (7/1/13) | (12/31/13) | (7/1/13–12/31/13)* |
| Expense Examples | | | |
| Actual | $1,000.00 | $1,134.10 | $4.25 |
| Hypothetical | | | |
| (5% annual return before expenses) | $1,000.00 | $1,021.23 | $4.02 |
| |
| * | Expenses are equal to the annualized expense ratio of .79%, multiplied by the average |
| account value over the period, multiplied by 184/365 (to reflect the one-half year period). |
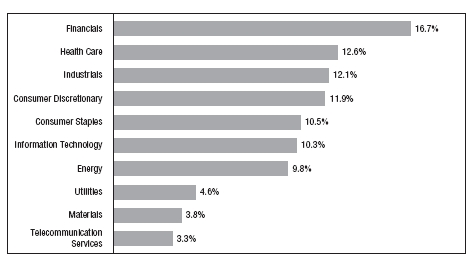
Portfolio Composition
TOP TEN SECTORS
|
| Portfolio holdings and allocations are subject to change. Percentages are as of December 31, 2013, |
| and are based on the total value of investments. |
Cumulative Performance Information (unaudited)
EQUITY INCOME FUND
Comparison of change in value of $10,000 investment in the First Investors Life Series Equity Income Fund and the Standard & Poor’s 500 Index.
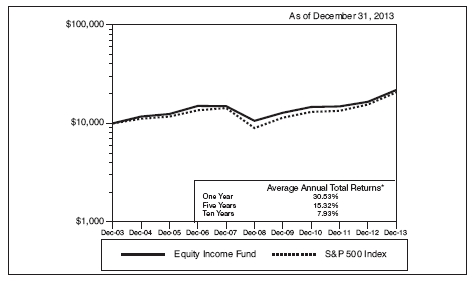
The graph compares a $10,000 investment in the First Investors Life Series Equity Income Fund beginning 12/31/03 with a theoretical investment in the Standard & Poor’s 500 Index (the “Index”). The Index is an unmanaged capitalization-weighted index of 500 stocks designed to measure performance of the broad domestic economy through changes in the aggregate market value of such stocks, which represent all major industries. It is not possible to invest directly in this Index. In addition, the Index does not reflect fees and expenses associated with the active management of a mutual fund portfolio. For purposes of the graph and the accompanying table it is assumed that all dividends and distributions were reinvested.
* The Average Annual Total Return figures are for the periods ended 12/31/13.
The returns shown do not reflect any sales charges, since the Fund sells its shares solely to variable annuity and/or variable life insurance subaccounts at net asset value. The returns do not reflect the fees and charges that an individual would pay in connection with an investment in a variable annuity or life contract or policy. Results represent past performance and do not indicate future results. The graph and the returns shown do not reflect the deduction of taxes that an investor would pay on distributions or the redemption of fund shares. Investment return and principal value of an investment will fluctuate so that an investor’s shares, when redeemed, may be worth more or less than the original cost. Index figures are from Standard & Poor’s and all other figures are from First Investors Management Company, Inc.
Portfolio of Investments
EQUITY INCOME FUND
December 31, 2013
| | | | |
| | | | | |
| | | | | |
| | | | | |
| Shares | | Security | | Value |
| |
| | | COMMON STOCKS—95.1% | | |
| | | Consumer Discretionary—11.9% | | |
| 7,200 | | BorgWarner, Inc. | | $ 402,552 |
| 5,400 | | CBS Corporation – Class “B” | | 344,196 |
| 28,000 | | Comcast Corporation – Special Shares “A” | | 1,396,640 |
| 14,600 | | Delphi Automotive, PLC | | 877,898 |
| 25,400 | * | Extended Stay America, Inc. | | 667,004 |
| 28,800 | | Ford Motor Company | | 444,384 |
| 16,500 | | GNC Holdings, Inc. – Class “A” | | 964,425 |
| 8,200 | | Hanesbrands, Inc. | | 576,214 |
| 10,000 | | Harman International Industries, Inc. | | 818,500 |
| 7,700 | | Home Depot, Inc. | | 634,018 |
| 8,150 | | Lowe’s Companies, Inc. | | 403,833 |
| 7,600 | | McDonald’s Corporation | | 737,428 |
| 16,900 | | Newell Rubbermaid, Inc. | | 547,729 |
| 22,800 | * | Orient-Express Hotels, Ltd. – Class “A” | | 344,508 |
| 34,800 | | Regal Entertainment Group – Class “A” | | 676,860 |
| 4,600 | | Staples, Inc. | | 73,094 |
| 14,566 | | Time Warner, Inc. | | 1,015,542 |
| 2,600 | | Tupperware Brands Corporation | | 245,778 |
| 7,700 | | Walt Disney Company | | 588,280 |
| | | | | 11,758,883 |
| | | Consumer Staples—10.5% | | |
| 42,800 | | Altria Group, Inc. | | 1,643,092 |
| 10,100 | | Avon Products, Inc. | | 173,922 |
| 9,700 | | Beam, Inc. | | 660,182 |
| 11,750 | | Coca-Cola Company | | 485,392 |
| 10,700 | | ConAgra Foods, Inc. | | 360,590 |
| 16,750 | | CVS Caremark Corporation | | 1,198,797 |
| 4,600 | | Dr. Pepper Snapple Group, Inc. | | 224,112 |
| 4,800 | | Herbalife, Ltd. | | 377,760 |
| 4,200 | | Kimberly-Clark Corporation | | 438,732 |
| 14,366 | | Kraft Foods Group, Inc. | | 774,615 |
| 4,400 | | Nu Skin Enterprises, Inc. – Class “A” | | 608,168 |
| 7,100 | | PepsiCo, Inc. | | 588,874 |
| 13,200 | | Philip Morris International, Inc. | | 1,150,116 |
| 11,000 | * | Prestige Brands Holdings, Inc. | | 393,800 |
| 10,100 | | Procter & Gamble Company | | 822,241 |
| 5,300 | | Wal-Mart Stores, Inc. | | 417,057 |
| | | | | 10,317,450 |
| | | | |
| | | | | |
| | | | |
| | | | | |
| Shares | | Security | | Value |
| | | Energy—9.8% | | |
| 14,350 | | Chevron Corporation | | $ 1,792,458 |
| 13,200 | | ConocoPhillips | | 932,580 |
| 11,200 | | Devon Energy Corporation | | 692,944 |
| 13,300 | | Ensco, PLC – Class “A” | | 760,494 |
| 10,500 | | ExxonMobil Corporation | | 1,062,600 |
| 18,500 | | Marathon Oil Corporation | | 653,050 |
| 5,000 | | Marathon Petroleum Corporation | | 458,650 |
| 5,400 | | National Oilwell Varco, Inc. | | 429,462 |
| 16,200 | | Noble Corporation, PLC | | 607,014 |
| 12,200 | | Occidental Petroleum Corporation | | 1,160,220 |
| 7,500 | | Royal Dutch Shell, PLC – Class “A” (ADR) | | 534,525 |
| 14,700 | | Seadrill, Ltd. | | 603,876 |
| | | | | 9,687,873 |
| | | Financials—16.2% | | |
| 9,600 | | ACE, Ltd. | | 993,888 |
| 5,400 | | American Express Company | | 489,942 |
| 2,900 | | Ameriprise Financial, Inc. | | 333,645 |
| 24,000 | | Armada Hoffler Properties, Inc. (REIT) | | 222,720 |
| 22,500 | | Berkshire Hills Bancorp, Inc. | | 613,575 |
| 24,000 | * | Brixmor Property Group, Inc. (REIT) | | 487,920 |
| 4,922 | | Chubb Corporation | | 475,613 |
| 15,600 | | Discover Financial Services | | 872,820 |
| 40,800 | | Financial Select Sector SPDR Fund (ETF) | | 891,888 |
| 16,800 | | FirstMerit Corporation | | 373,464 |
| 7,200 | | Invesco, Ltd. | | 262,080 |
| 5,500 | | iShares S&P U.S. Preferred Stock Index Fund (ETF) | | 202,565 |
| 34,200 | | JPMorgan Chase & Company | | 2,000,016 |
| 2,200 | | M&T Bank Corporation | | 256,124 |
| 13,500 | | MetLife, Inc. | | 727,920 |
| 25,900 | | Oritani Financial Corporation | | 415,695 |
| 9,700 | | PNC Financial Services Group, Inc. | | 752,526 |
| 13,100 | | Protective Life Corporation | | 663,646 |
| 25,500 | | Select Income REIT (REIT) | | 681,870 |
| 44,600 | | Sterling Bancorp | | 596,302 |
| 8,100 | | Travelers Companies, Inc. | | 733,374 |
| 17,000 | | U.S. Bancorp | | 686,800 |
| 20,100 | | Urstadt Biddle Properties, Inc. – Class “A” (REIT) | | 370,845 |
| 38,000 | | Wells Fargo & Company | | 1,725,200 |
| 24,000 | | Westfield Financial, Inc. | | 179,040 |
| | | | | 16,009,478 |
Portfolio of Investments (continued)
EQUITY INCOME FUND
December 31, 2013
| | | | |
| | | | | |
| | | | |
| | | | |
| Shares | | Security | | Value |
| | | Health Care—12.6% | | |
| 7,900 | | Abbott Laboratories | | $ 302,807 |
| 15,700 | | AbbVie, Inc. | | 829,117 |
| 5,920 | * | Actavis, PLC | | 994,560 |
| 6,500 | | Baxter International, Inc. | | 452,075 |
| 10,100 | | Covidien, PLC | | 687,810 |
| 12,350 | | GlaxoSmithKline, PLC (ADR) | | 659,367 |
| 20,800 | | Johnson & Johnson | | 1,905,072 |
| 3,960 | | McKesson Corporation | | 639,144 |
| 35,770 | | Merck & Company, Inc. | | 1,790,289 |
| 5,900 | | Novartis AG (ADR) | | 474,242 |
| 10,200 | | Omnicare, Inc. | | 615,672 |
| 65,585 | | Pfizer, Inc. | | 2,008,869 |
| 7,400 | | Thermo Fisher Scientific, Inc. | | 823,990 |
| 7,790 | | Zoetis, Inc. | | 254,655 |
| |
| | | | | 12,437,669 |
| | | Industrials—12.1% | | |
| 7,050 | | 3M Company | | 988,762 |
| 7,200 | | A.O. Smith Corporation | | 388,368 |
| 6,411 | | ADT Corporation | | 259,453 |
| 8,800 | | Altra Industrial Motion Corporation | | 301,136 |
| 7,200 | | Chicago Bridge & Iron Company NV – NY Shares | | 598,608 |
| 5,600 | | Dover Corporation | | 540,624 |
| 5,800 | | Eaton Corporation, PLC | | 441,496 |
| 7,500 | | G&K Services, Inc. – Class “A” | | 466,725 |
| 12,900 | | Generac Holdings, Inc. | | 730,656 |
| 3,100 | | General Dynamics Corporation | | 296,205 |
| 67,900 | | General Electric Company | | 1,903,237 |
| 13,500 | | Honeywell International, Inc. | | 1,233,495 |
| 9,250 | | ITT Corporation | | 401,635 |
| 6,789 | | Pentair, Ltd. | | 527,302 |
| 3,600 | | Snap-On, Inc. | | 394,272 |
| 4,400 | * | TAL International Group, Inc. | | 252,340 |
| 14,525 | | Tyco International, Ltd. | | 596,106 |
| 5,500 | | United Parcel Service, Inc. – Class “B” | | 577,940 |
| 9,000 | | United Technologies Corporation | | 1,024,200 |
| | | | | 11,922,560 |
| | | Information Technology—10.3% | | |
| 1,780 | | Apple, Inc. | | 998,776 |
| 3,800 | | Automatic Data Processing, Inc. | | 307,078 |
| 10,800 | | Avago Technologies, Ltd. | | 571,212 |
| | | | |
| | | | | |
| | | | |
| | | | |
| | | | |
| Shares | | Security | | Value |
| | | Information Technology (continued) | | |
| 55,900 | | Cisco Systems, Inc. | | $ 1,254,955 |
| 56,500 | | Intel Corporation | | 1,466,740 |
| 14,950 | | Intersil Corporation – Class “A” | | 171,476 |
| 24,500 | | Mentor Graphics Corporation | | 589,715 |
| 14,700 | | Methode Electronics, Inc. | | 502,593 |
| 18,900 | | Microchip Technology, Inc. | | 845,775 |
| 50,350 | | Microsoft Corporation | | 1,884,600 |
| 9,500 | | Oracle Corporation | | 363,470 |
| 10,100 | | QUALCOMM, Inc. | | 749,925 |
| 7,350 | | TE Connectivity, Ltd. | | 405,058 |
| | | | | 10,111,373 |
| | | Materials—3.8% | | |
| 2,600 | | Cytec Industries, Inc. | | 242,216 |
| 10,400 | | Dow Chemical Company | | 461,760 |
| 9,390 | | DuPont (E.I.) de Nemours & Company | | 610,068 |
| 13,950 | | Freeport-McMoRan Copper & Gold, Inc. | | 526,473 |
| 8,500 | | International Paper Company | | 416,755 |
| 10,100 | | LyondellBasell Industries NV – Class “A” | | 810,828 |
| 2,500 | | Rock-Tenn Company – Class “A” | | 262,525 |
| 3,200 | | Westlake Chemical Corporation | | 390,624 |
| | | | | 3,721,249 |
| | | Telecommunication Services—3.3% | | |
| 39,410 | | AT&T, Inc. | | 1,385,656 |
| 24,000 | | NTELOS Holdings Corporation | | 485,520 |
| 28,300 | | Verizon Communications, Inc. | | 1,390,662 |
| | | | | 3,261,838 |
| | | Utilities—4.6% | | |
| 17,700 | | American Electric Power Company, Inc. | | 827,298 |
| 5,900 | | Dominion Resources, Inc. | | 381,671 |
| 6,300 | | Duke Energy Corporation | | 434,763 |
| 6,400 | | NextEra Energy, Inc. | | 547,968 |
| 19,400 | | NiSource, Inc. | | 637,872 |
| 12,800 | | Portland General Electric Company | | 386,560 |
| 20,200 | | PPL Corporation | | 607,818 |
| 19,400 | | Vectren Corporation | | 688,700 |
| | | | | 4,512,650 |
| |
| Total Value of Common Stocks (cost $66,025,319) | | 93,741,023 |
Portfolio of Investments (continued)
EQUITY INCOME FUND
December 31, 2013
| | | | | | | |
| | | | | | | | |
| | | | | | | |
| | | | | | | |
| Shares or | | | | | | | |
| Principal | | | | | | | |
| Amount | | Security | | | | | Value |
| | | PREFERRED STOCKS—.4% | | | | | |
| | | Financials | | | | | |
| 11,400 | | Digital Realty Trust, Inc., Series G, 5.875%, 2049 (REIT) | | | $ 206,910 |
| 9,000 | | Urstadt Biddle Properties, Inc., Series F, 7.125%, 2049 (REIT) | | | 207,270 |
| Total Value of Preferred Stocks (cost $507,929) | | | | | 414,180 |
| | | SHORT-TERM U.S. GOVERNMENT AGENCY | | | |
| | | OBLIGATIONS—3.4% | | | | | |
| $ 2,000M | | Federal Home Loan Bank, 0.025%, 1/8/2014 | | | | | 1,999,990 |
| 1,400M | | Freddie Mac, 0.035%, 1/13/2014 | | | | | 1,399,984 |
| Total Value of Short-Term U.S. Government Agency Obligations (cost $3,399,974) | | | 3,399,974 |
| | | SHORT-TERM U.S. GOVERNMENT | | | | | |
| | | OBLIGATIONS—1.0% | | | | | |
| 1,000M | | U.S. Treasury Bills, 0.019%, 2/20/2014 (cost $999,974) | | | 999,974 |
| Total Value of Investments (cost $70,933,196) | 99.9 | % | | | 98,555,151 |
| Other Assets, Less Liabilities | .1 | | | | 73,266 |
| Net Assets | | | 100.0 | % | | | $98,628,417 |
| | | |
| * | Non-income producing | |
| | |
| Summary of Abbreviations: | |
| ADR | American Depositary Receipts | |
| ETF | Exchange Traded Fund | |
| REIT | Real Estate Investment Trust | |
Accounting Standards Codification 820 established a three-tier hierarchy of inputs to establish a classification of fair value measurements for disclosure purposes. The three-tier hierarchy of inputs is summarized in the three broad Levels listed below:
Level 1 — Unadjusted quoted prices in active markets for identical securities that the Fund has the ability to access.
Level 2 — Observable inputs other than quoted prices included in Level 1 that are observable for the asset or liability, either directly or indirectly. These inputs may include quoted prices for the identical instrument on an inactive market, prices for similar instruments, interest rates, prepayment speeds, credit risk, yield curves, default rates and similar data.
Level 3 — Unobservable inputs for the asset or liability, to the extent relevant observable inputs are not available, representing the Fund’s own assumption about the assumptions a market participant would use in valuing the asset or liability, and would be based on the best information available.
The inputs methodology used for valuing securities are not necessarily an indication of the risk associated with investing in those securities. For example, amortized cost approximates the current fair value of a security, but since the value is not obtained from a quoted price in an active market, such securities are reflected as Level 2.
The following is a summary, by category of Level, of inputs used to value the Fund’s investments as of December 31, 2013:
| | | | | | | | | | | | |
| | | | Level 1 | | | Level 2 | | | Level 3 | | | Total |
| Common Stocks | | $ | 93,741,023 | | $ | — | | $ | — | | $ | 93,741,023 |
| Preferred Stocks | | | 414,180 | | | — | | | — | | | 414,180 |
| Short-Term U.S. Government | | | | | | | | | | | | |
| Agency Obligations | | | — | | | 3,399,974 | | | — | | | 3,399,974 |
| Short-Term U.S. Government | | | | | | | | | | | | |
| Obligations | | | — | | | 999,974 | | | — | | | 999,974 |
| Total Investments in Securities* | | $ | 94,155,203 | | $ | 4,399,948 | | $ | — | | $ | 98,555,151 |
* The Portfolio of Investments provides information on the industry categorization for common stocks and preferred stocks.
There were no transfers into or from Level 1 and Level 2 by the Fund for the year ended December 31, 2013. Transfers, if any, between Levels are recognized at the end of the reporting period.
| |
| See notes to financial statements | 17 |
Portfolio Managers’ Letter
FUND FOR INCOME
Dear Investor:
We’re pleased to send you the First Investors Life Fund For Income annual report for the year ended December 31, 2013. During the period, the Fund’s return on a net asset value basis was 6.88%, including dividends of 42 cents per share. This return, even fully net of fees and expenses, eclipsed that of the Fund’s market benchmark, the Bank of America Merrill Lynch High Yield Constrained BB/B Rated Index (JUC4).
The High Yield Market
During the first half of the year, U.S. corporate credit markets, led by high yield bonds, generated strong, positive performance despite headwinds like the looming U.S. fiscal cliff, the Cyprus bank crisis and the Italian elections. Starting in late May, however, actions of the U.S. Federal Reserve (“the Fed”) started having a big impact on corporate credit markets that would persist into the back end of the year.
In late May/early June the Fed issued statements about a potential reduction in quantitative easing (“QE”) that resulted in a sell-off of global fixed-income. The global credit markets then rebounded strongly in July, when investors turned back to riskier investments in search of yield. Markets once again dipped in August as investors feared a potential reduction of QE on the back of increasingly strong economic data, but quickly surged ahead in September and October after the Fed made clear that distractions such as the U.S. government debt ceiling talks would keep QE flowing in the near term. Comfortable with Fed assurances, investors particularly favored longer-duration bonds, which can be sensitive to interest-rate increases.
November saw high yield returns stay positive, but on a more muted trajectory through December. A traditionally quiet new issue market near year-end meant that strong demand for bonds, in the absence of new issues, translated into modestly higher prices for the market at large.
The Portfolio
2013 marked an unusual year for U.S. high yield bonds as the market delivered a return within 100 bps (or 1.00%) of the average high yield bond coupon. More typically, the market either widely underperforms or outperforms the coupon rate after accounting for price changes of the bonds. But even in this “coupon-clipping” year, credit selection mattered. The Fund derived its outperformance of similarly-rated credit markets largely from outperformance among credits in the BB credit rating spectrum. From an industry perspective, outperformance was concentrated in energy, wireless telecommunications, chemicals, and utilities — all sectors in which the Fund’s high credit selectivity was rewarded with attractive outperformance.
Finally, in a year in which duration — also described as interest-rate sensitivity — mattered a great deal at short-lived inflection points, the Fund outperformed incrementally across every part of the duration spectrum.
Outlook
As we move into 2014, it behooves us to review the key trends of 2013. U.S. high yield generated an attractive, coupon-like return. New issuance in 2013 surpassed 2012’s record. As in the previous year, new issue proceeds were primarily used for lender-friendly refinancing of existing debt, pushing out the debt maturity wall beyond 2016.
Corporate fundamentals remain strong and the default outlook remains benign given the limited refinancing risk facing most companies. Going forward, Fed policy and the future of quantitative easing should remain key drivers of rate movements and fixed-income performance in 2014. We anticipate increased volatility around economic releases and Federal Reserve statements, with downturns potentially representing attractive buying opportunities based on our positive view of credit fundamentals.
Thank you for placing your trust in First Investors. As always, we appreciate the opportunity to serve your investment needs.

Fund Expenses (unaudited)
FUND FOR INCOME
The examples below show the ongoing costs (in dollars) of investing in your Fund and will help you in comparing these costs with costs of other mutual funds. Please refer to page 2 for a detailed explanation of the information presented in these examples.
| | | |
| | Beginning | Ending | |
| | Account | Account | Expenses Paid |
| | Value | Value | During Period |
| | (7/1/13) | (12/31/13) | (7/1/13–12/31/13)* |
| Expense Examples | | | |
| Actual | $1,000.00 | $1,057.19 | $4.61 |
| Hypothetical | | | |
| (5% annual return before expenses) | $1,000.00 | $1,020.72 | $4.53 |
| |
| * | Expenses are equal to the annualized expense ratio of .89%, multiplied by the average account |
| | value over the period, multiplied by 184/365 (to reflect the one-half year period). |
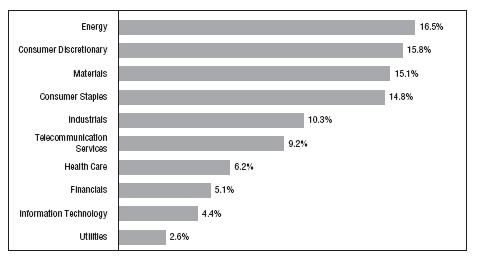
Portfolio Composition
BY SECTOR
|
| Portfolio holdings and allocations are subject to change. Percentages are as of December 31, 2013, |
| and are based on the total value of investments. |
Cumulative Performance Information (unaudited)
FUND FOR INCOME
Comparison of change in value of $10,000 investment in the First Investors Life Series Fund For Income and the Bank of America (“BofA”) Merrill Lynch BB-B U.S. Cash Pay High Yield Constrained Index.
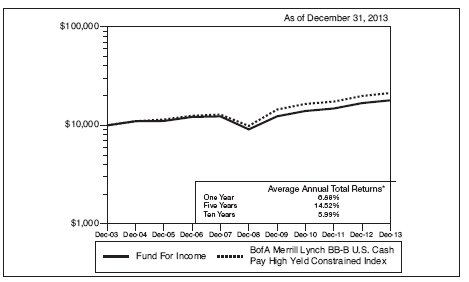
The graph compares a $10,000 investment in the First Investors Life Series Fund For Income beginning 12/31/03 with a theoretical investment in the BofA Merrill Lynch BB-B U.S. Cash Pay High Yield Constrained Index (the “Index”). The Index contains all securities in the BofA Merrill Lynch US Cash Pay High Yield Index rated BB1 through B3, based on an average of Moody’s, S&P and Fitch, but caps issuer exposure at 2%. It is not possible to invest directly in this Index. In addition, the Index does not reflect fees and expenses associated with the active management of a mutual fund portfolio. For purposes of the graph and the accompanying table it is assumed that all dividends and distributions were reinvested.
* The Average Annual Total Return figures are for the periods ended 12/31/13.
The returns shown do not reflect any sales charges, since the Fund sells its shares solely to variable annuity and/or variable life insurance subaccounts at net asset value. The returns do not reflect the fees and charges that an individual would pay in connection with an investment in a variable annuity or life contract or policy. Results represent past performance and do not indicate future results. The graph and the returns shown do not reflect the deduction of taxes that an investor would pay on distributions or the redemption of fund shares. Investment return and principal value of an investment will fluctuate so that an investor’s shares, when redeemed, may be worth more or less than the original cost. The issuers of the high yield bonds in which the Fund primarily invests pay higher interest rates because they have a greater likelihood of financial difficulty, which could result in their inability to repay the bonds fully when due. Prices of high yield bonds are also subject to greater fluctuations. Index figures from Bank of America Merrill Lynch & Co. and all other figures are from First Investors Management Company, Inc.
Portfolio of Investments
FUND FOR INCOME
December 31, 2013
| | | | | | | |
| | | | | | | | |
| | | | | | | |
| | | | | | | |
| Principal | | | | | | | |
| Amount | | Security | | | | | Value |
| | CORPORATE BONDS—87.4% | | | | | |
| | Aerospace/Defense—.5% | | | | | |
| $ 475M | | Meccanica Holdings USA, Inc., 6.25%, 7/15/2019 (a) | | | | | $ 493,135 |
| | Automotive—3.5% | | | | | |
| | American Axle & Manufacturing, Inc.: | | | | | |
| 300M | | 6.25%, 3/15/2021 | | | | | 320,250 |
| 250M | | 6.625%, 10/15/2022 | | | | | 264,375 |
| 300M | | Cooper-Standard Automotive, Inc., 8.5%, 5/1/2018 | | | | | 319,125 |
| | General Motors Financial Co., Inc.: | | | | | |
| 75M | | 3.25%, 5/15/2018 (a) | | | | | 75,188 |
| 25M | | 4.25%, 5/15/2023 (a) | | | | | 23,844 |
| 450M | | Gestamp Funding Luxembourg SA, 5.625%, 5/31/2020 (a) | | | | | 460,125 |
| 375M | | Goodyear Tire & Rubber Co., 8.25%, 8/15/2020 | | | | | 420,938 |
| 200M | | Jaguar Land Rover Automotive, PLC, 8.125%, 5/15/2021 (a) | | | | | 228,500 |
| 375M | | Oshkosh Corp., 8.5%, 3/1/2020 | | | | | 416,250 |
| | Schaeffler Finance BV: | | | | | |
| 400M | | 8.5%, 2/15/2019 (a) | | | | | 452,000 |
| 325M | | 4.75%, 5/15/2021 (a) | | | | | 325,813 |
| | | | | | | | 3,306,408 |
| | Building Materials—1.9% | | | | | |
| | Building Materials Corp.: | | | | | |
| 475M | | 6.875%, 8/15/2018 (a) | | | | | 507,062 |
| 250M | | 7.5%, 3/15/2020 (a) | | | | | 271,250 |
| 200M | | Cemex Finance, LLC, 9.375%, 10/12/2022 (a) | | | | | 226,500 |
| | Cemex SAB de CV: | | | | | |
| 200M | | 9.5%, 6/15/2018 (a) | | | | | 228,000 |
| 200M | | 5.875%, 3/25/2019 (a) | | | | | 201,000 |
| 300M | | Texas Industries, Inc., 9.25%, 8/15/2020 | | | | | 335,625 |
| | | | | | | | 1,769,437 |
| | Chemicals—1.8% | | | | | |
| 400M | | Ferro Corp., 7.875%, 8/15/2018 | | | | | 424,000 |
| 225M | | Huntsman International, LLC, 8.625%, 3/15/2020 | | | | | 250,031 |
| 150M | | LSB Industries, Inc., 7.75%, 8/1/2019 (a) | | | | | 158,250 |
| 225M | | Orion Engineered Carbon Bondco GmbH, 9.625%, 6/15/2018 (a) | | | | | 249,750 |
| 575M | | TPC Group, Inc., 8.75%, 12/15/2020 (a) | | | | | 613,813 |
| | | | | | | | 1,695,844 |
| | | | |
| | | | | |
| | | | |
| | | | |
| Principal | | | | |
| Amount | | Security | | Value |
| | | Consumer Non-Durables—3.3% | | |
| $ 450M | | Hanesbrands, Inc., 6.375%, 12/15/2020 | | $ 493,875 |
| | | Levi Strauss & Co.: | | |
| 350M | | 7.625%, 5/15/2020 | | 385,875 |
| 375M | | 6.875%, 5/1/2022 | | 414,375 |
| 142M | | Libbey Glass, Inc., 6.875%, 5/15/2020 | | 154,070 |
| 325M | | Phillips Van-Heusen Corp., 7.375%, 5/15/2020 | | 359,531 |
| | | Reynolds Group Issuer, Inc.: | | |
| 400M | | 7.125%, 4/15/2019 | | 428,000 |
| 475M | | 5.75%, 10/15/2020 | | 486,875 |
| | | Spectrum Brands Escrow Corp.: | | |
| 250M | | 6.375%, 11/15/2020 (a) | | 267,500 |
| 125M | | 6.625%, 11/15/2022 (a) | | 133,281 |
| | | | | 3,123,382 |
| | | Energy—15.1% | | |
| | | AmeriGas Finance, LLC: | | |
| 50M | | 6.75%, 5/20/2020 | | 54,875 |
| 175M | | 7%, 5/20/2022 | | 190,750 |
| | | Antero Resources Finance Corp.: | | |
| 100M | | 6%, 12/1/2020 | | 105,500 |
| 125M | | 5.375%, 11/1/2021 (a) | | 126,328 |
| | | Atlas Pipeline Partners, LP: | | |
| 350M | | 4.75%, 11/15/2021 (a) | | 322,000 |
| 525M | | 5.875%, 8/1/2023 (a) | | 502,687 |
| | | Basic Energy Services, Inc.: | | |
| 150M | | 7.75%, 2/15/2019 | | 157,500 |
| 275M | | 7.75%, 10/15/2022 | | 285,312 |
| | | Berry Petroleum Co.: | | |
| 90M | | 6.75%, 11/1/2020 | | 93,825 |
| 300M | | 6.375%, 9/15/2022 | | 306,750 |
| | | Calumet Specialty Products Partners, LP: | | |
| 325M | | 9.625%, 8/1/2020 | | 366,437 |
| 75M | | 7.625%, 1/15/2022 (a) | | 75,937 |
| | | Chesapeake Energy Corp.: | | |
| 275M | | 7.25%, 12/15/2018 | | 319,000 |
| 100M | | 6.625%, 8/15/2020 | | 112,250 |
| 250M | | 6.875%, 11/15/2020 | | 283,750 |
| 200M | | 5.75%, 3/15/2023 | | 207,000 |
| 100M | | Concho Resources, Inc., 5.5%, 4/1/2023 | | 103,500 |
Portfolio of Investments (continued)
FUND FOR INCOME
December 31, 2013
| | | | |
| | | | | |
| | | | |
| | | | |
| Principal | | | | |
| Amount | | Security | | Value |
| | | Energy (continued) | | |
| | | Consol Energy, Inc.: | | |
| $ 125M | | 8%, 4/1/2017 | | $ 132,187 |
| 625M | | 8.25%, 4/1/2020 | | 679,687 |
| 400M | | Crestwood Midstream Partners, LP, 6%, 12/15/2020 | | 414,000 |
| 600M | | Eagle Rock Energy Partners, LP, 8.375%, 6/1/2019 | | 657,000 |
| 375M | | El Paso Corp., 6.5%, 9/15/2020 | | 403,996 |
| 350M | | Energy XXI Gulf Coast, Inc., 7.5%, 12/15/2021 (a) | | 366,625 |
| 415M | | Expro Finance Luxembourg SCA, 8.5%, 12/15/2016 (a) | | 434,712 |
| 175M | | Forum Energy Technologies, Inc., 6.25%, 10/1/2021 (a) | | 184,625 |
| 450M | | Genesis Energy, LP, 7.875%, 12/15/2018 | | 487,125 |
| 150M | | Gibson Energy, Inc., 6.75%, 7/15/2021 (a) | | 159,375 |
| | | Kinder Morgan, Inc.: | | |
| 100M | | 5%, 2/15/2021 (a) | | 98,999 |
| 225M | | 5.625%, 11/15/2023 (a) | | 218,978 |
| | | Legacy Reserves, LP: | | |
| 400M | | 8%, 12/1/2020 (a) | | 418,000 |
| 225M | | 6.625%, 12/1/2021 (a) | | 218,813 |
| | | Linn Energy, LLC: | | |
| 75M | | 6.5%, 5/15/2019 | | 76,875 |
| 225M | | 7%, 11/1/2019 (a) | | 228,375 |
| 175M | | 8.625%, 4/15/2020 | | 189,875 |
| 300M | | 7.75%, 2/1/2021 | | 318,750 |
| 375M | | Memorial Production Partners, LP, 7.625%, 5/1/2021 (a) | | 387,188 |
| | | Newfield Exploration Co.: | | |
| 50M | | 7.125%, 5/15/2018 | | 52,050 |
| 150M | | 5.75%, 1/30/2022 | | 155,250 |
| 200M | | NuStar Logistics, LP, 6.75%, 2/1/2021 | | 207,383 |
| | | Offshore Group Investment, Ltd.: | | |
| 250M | | 7.5%, 11/1/2019 | | 273,125 |
| 150M | | 7.125%, 4/1/2023 | | 153,750 |
| 225M | | Pacific Drilling SA, 5.375%, 6/1/2020 (a) | | 227,250 |
| | | Penn Virginia Resource Partners, LP: | | |
| 275M | | 8.25%, 4/15/2018 | | 292,875 |
| 104M | | 8.375%, 6/1/2020 | | 115,180 |
| 200M | | PetroLogistics, LP, 6.25%, 4/1/2020 (a) | | 201,500 |
| 100M | | Plains Exploration & Production Co., 6.125%, 6/15/2019 | | 109,432 |
| 400M | | Rain CII Carbon, LLC, 8.25%, 1/15/2021 (a) | | 410,000 |
| 250M | | RKI Exploration and Production, LLC, 8.5%, 8/1/2021 (a) | | 264,375 |
| 500M | | Sabine Pass Liquefaction, 6.25%, 3/15/2022 (a) | | 496,875 |
| 150M | | Samson Investment Co., 10.5%, 2/15/2020 (a) | | 164,250 |
| 275M | | SandRidge Energy, Inc., 7.5%, 2/15/2023 | | 280,500 |
| | | | |
| | | | | |
| | | | |
| | | | |
| Principal | | | | |
| Amount | | Security | | Value |
| | | Energy (continued) | | |
| | | SM Energy Co.: | | |
| $ 75M | | 6.625%, 2/15/2019 | | $ 80,063 |
| 150M | | 6.5%, 11/15/2021 | | 159,750 |
| 150M | | 6.5%, 1/1/2023 | | 158,063 |
| | | Suburban Propane Partners, LP: | | |
| 274M | | 7.5%, 10/1/2018 | | 295,235 |
| 57M | | 7.375%, 8/1/2021 | | 62,415 |
| 75M | | Ultra Petroleum Corp., 5.75%, 12/15/2018 (a) | | 77,250 |
| 425M | | Unit Corp., 6.625%, 5/15/2021 | | 450,500 |
| | | | | 14,375,657 |
| | | Financials—4.0% | | |
| | | Algeco Scotsman Global Finance, PLC: | | |
| 200M | | 8.5%, 10/15/2018 (a) | | 217,500 |
| 200M | | 10.75%, 10/15/2019 (a) | | 212,000 |
| | | Ally Financial, Inc.: | | |
| 475M | | 6.25%, 12/1/2017 | | 531,406 |
| 175M | | 4.75%, 9/10/2018 | | 183,750 |
| 700M | | 8%, 3/15/2020 | | 842,625 |
| 100M | | CNH Capital, LLC, 6.25%, 11/1/2016 | | 110,875 |
| | | International Lease Finance Corp.: | | |
| 650M | | 8.75%, 3/15/2017 | | 768,625 |
| 100M | | 6.25%, 5/15/2019 | | 108,750 |
| 575M | | 8.25%, 12/15/2020 | | 674,188 |
| 125M | | Nielsen Co. (Luxembourg) Sarl, 5.5%, 10/1/2021 (a) | | 127,188 |
| | | | | 3,776,907 |
| | | Food/Beverage/Tobacco—1.3% | | |
| 275M | | B&G Foods, Inc., 4.625%, 6/1/2021 | | 264,687 |
| 400M | | Barry Callebaut Services SA, 5.5%, 6/15/2023 (a) | | 410,000 |
| 100M | | Chiquita Brands International, Inc., 7.875%, 2/1/2021 (a) | | 108,500 |
| 250M | | Darling Escrow Corp., 5.375%, 1/15/2022 (a)(e) | | 252,187 |
| 225M | | JBS USA, LLC, 7.25%, 6/1/2021 (a) | | 235,125 |
| | | | | 1,270,499 |
| | | Food/Drug—1.3% | | |
| 375M | | BI-LO, LLC, 8.625%, 9/15/2018 (a) | | 393,750 |
| 475M | | NBTY, Inc., 9%, 10/1/2018 | | 523,094 |
| 275M | | Tops Holding Corp., 8.875%, 12/15/2017 (a) | | 303,531 |
| | | | | 1,220,375 |
Portfolio of Investments (continued)
FUND FOR INCOME
December 31, 2013
| | | | |
| | | | | |
| | | | |
| | | | |
| Principal | | | | |
| Amount | | Security | | Value |
| | | Forest Products/Containers—2.8% | | |
| $ 400M | | Ardagh Packaging Finance, PLC, 7.375%, 10/15/2017 (a) | | $ 432,000 |
| | | Ball Corp.: | | |
| 325M | | 7.375%, 9/1/2019 | | 352,625 |
| 150M | | 4%, 11/15/2023 | | 135,000 |
| 325M | | Clearwater Paper Corp., 7.125%, 11/1/2018 | | 348,562 |
| 250M | | CROWN Americas, LLC, 4.5%, 1/15/2023 | | 235,000 |
| 300M | | Greif, Inc., 7.75%, 8/1/2019 | | 342,000 |
| | | Sealed Air Corp.: | | |
| 175M | | 8.125%, 9/15/2019 (a) | | 197,313 |
| 165M | | 8.375%, 9/15/2021 (a) | | 188,100 |
| 420M | | Tekni-Plex, Inc., 9.75%, 6/1/2019 (a) | | 478,800 |
| | | | | 2,709,400 |
| | | Gaming/Leisure—1.3% | | |
| | | GLP Capital, LP: | | |
| 25M | | 4.375%, 11/1/2018 (a) | | 25,625 |
| 150M | | 4.875%, 11/1/2020 (a) | | 150,375 |
| 150M | | 5.375%, 11/1/2023 (a) | | 148,125 |
| 175M | | Hilton Worldwide Finance, LLC, 5.625%, 10/15/2021 (a) | | 181,891 |
| 100M | | Nai Entertainment Holdings, LLC, 5%, 8/1/2018 (a) | | 103,750 |
| 450M | | National CineMedia, LLC, 7.875%, 7/15/2021 | | 497,250 |
| 175M | | Six Flags Entertainment Corp., 5.25%, 1/15/2021 (a) | | 171,500 |
| | | | | 1,278,516 |
| | | Health Care—5.9% | | |
| | | Aviv Healthcare Properties, LP: | | |
| 115M | | 7.75%, 2/15/2019 | | 124,200 |
| 100M | | 6%, 10/15/2021 (a) | | 102,250 |
| 425M | | Biomet, Inc., 6.5%, 8/1/2020 | | 448,375 |
| | | Community Health Systems, Inc.: | | |
| 325M | | 5.125%, 8/15/2018 | | 336,375 |
| 175M | | 8%, 11/15/2019 | | 190,750 |
| 325M | | 7.125%, 7/15/2020 | | 337,594 |
| 275M | | DaVita, Inc., 6.375%, 11/1/2018 | | 289,266 |
| 200M | | Endo Finance Co., 5.75%, 1/15/2022 (a) | | 201,500 |
| 150M | | Fresenius Medical Care US Finance II, Inc., 5.625%, 7/31/2019 (a) | | 162,750 |
| 600M | | Genesis Health Ventures, Inc., 9.75%, 6/15/2005 (b)(c) | | — |
| | | | |
| | | | | |
| | | | |
| | | | |
| Principal | | | | |
| Amount | | Security | | Value |
| | | Health Care (continued) | | |
| | | HCA, Inc.: | | |
| $ 75M | | 8%, 10/1/2018 | | $ 88,781 |
| 125M | | 8.5%, 4/15/2019 | | 132,813 |
| 175M | | 6.5%, 2/15/2020 | | 192,719 |
| 25M | | 7.25%, 9/15/2020 | | 27,313 |
| 175M | | 6.25%, 2/15/2021 | | 183,531 |
| 275M | | 7.75%, 5/15/2021 | | 301,125 |
| 300M | | 7.5%, 2/15/2022 | | 330,000 |
| | | HealthSouth Corp.: | | |
| 100M | | 8.125%, 2/15/2020 | | 110,125 |
| 99M | | 7.75%, 9/15/2022 | | 108,900 |
| 75M | | LifePoint Hospitals, Inc., 5.5%, 12/1/2021 (a) | | 75,469 |
| 450M | | Tenet Healthcare Corp., 6.75%, 2/1/2020 | | 462,938 |
| 325M | | Universal Hospital Services, Inc., 7.625%, 8/15/2020 | | 344,500 |
| | | Valeant Pharmaceuticals International, Inc.: | | |
| 200M | | 6.875%, 12/1/2018 (a) | | 215,000 |
| 500M | | 6.375%, 10/15/2020 (a) | | 529,375 |
| 175M | | 5.625%, 12/1/2021 (a) | | 176,313 |
| 150M | | WellCare Health Plans, Inc., 5.75%, 11/15/2020 | | 154,125 |
| | | | | 5,626,087 |
| | | Information Technology—3.3% | | |
| | | Activision Blizzard, Inc.: | | |
| 125M | | 5.625%, 9/15/2021 (a) | | 129,687 |
| 50M | | 6.125%, 9/15/2023 (a) | | 52,250 |
| 325M | | Advanced Micro Devices, Inc., 7.5%, 8/15/2022 | | 316,875 |
| | | Audatex North America, Inc.: | | |
| 325M | | 6%, 6/15/2021 (a) | | 342,062 |
| 125M | | 6.125%, 11/1/2023 (a) | | 129,375 |
| 200M | | CyrusOne, LP, 6.375%, 11/15/2022 | | 208,000 |
| 250M | | Denali Borrower, LLC, 5.625%, 10/15/2020 (a) | | 248,437 |
| 275M | | Equinix, Inc., 7%, 7/15/2021 | | 301,469 |
| 425M | | Healthcare Technology Intermediate, Inc., 7.375%, 9/1/2018 (a) | | 444,125 |
| 300M | | IAC/InterActiveCorp, 4.875%, 11/30/2018 (a) | | 308,250 |
| 250M | | Lender Processing Services, Inc., 5.75%, 4/15/2023 | | 260,000 |
| 325M | | MEMC Electronic Materials, Inc., 7.75%, 4/1/2019 | | 349,375 |
| | | | | 3,089,905 |
Portfolio of Investments (continued)
FUND FOR INCOME
December 31, 2013
| | | | |
| | | | | |
| | | | |
| | | | |
| Principal | | | | |
| Amount | | Security | | Value |
| | | Manufacturing—4.2% | | |
| $ 200M | | Amsted Industries, 8.125%, 3/15/2018 (a) | | $ 211,250 |
| | | Bombardier, Inc.: | | |
| 325M | | 7.5%, 3/15/2018 (a) | | 371,312 |
| 300M | | 7.75%, 3/15/2020 (a) | | 342,000 |
| 375M | | 6.125%, 1/15/2023 (a) | | 374,062 |
| 225M | | Brand Energy & Infrastructure Services, Inc., 8.5%, 12/1/2021 (a) | | 229,219 |
| 515M | | Case New Holland, Inc., 7.875%, 12/1/2017 | | 610,275 |
| 325M | | Dematic SA, 7.75%, 12/15/2020 (a) | | 346,937 |
| 300M | | EDP Finance BV, 6%, 2/2/2018 (a) | | 322,800 |
| 275M | | H&E Equipment Services, Inc., 7%, 9/1/2022 | | 301,125 |
| | | Rexel SA: | | |
| 675M | | 6.125%, 12/15/2019 (a) | | 708,750 |
| 200M | | 5.25%, 6/15/2020 (a) | | 202,000 |
| | | | | 4,019,730 |
| | | Media-Broadcasting—2.2% | | |
| 325M | | Allbritton Communication Co., 8%, 5/15/2018 | | 345,312 |
| | | Belo Corp.: | | |
| 100M | | 7.75%, 6/1/2027 | | 108,250 |
| 25M | | 7.25%, 9/15/2027 | | 26,062 |
| 225M | | Block Communications, Inc., 7.25%, 2/1/2020 (a) | | 239,625 |
| 300M | | LIN Television Corp., 8.375%, 4/15/2018 | | 318,000 |
| 425M | | Nexstar Broadcasting, Inc., 6.875%, 11/15/2020 | | 456,875 |
| | | Sinclair Television Group, Inc.: | | |
| 250M | | 5.375%, 4/1/2021 | | 247,500 |
| 125M | | 6.375%, 11/1/2021 (a) | | 130,000 |
| | | Sirius XM Radio, Inc.: | | |
| 125M | | 5.75%, 8/1/2021 (a) | | 126,875 |
| 100M | | 4.625%, 5/15/2023 (a) | | 90,750 |
| | | | | 2,089,249 |
| | | Media-Cable TV—6.1% | | |
| | | Cablevision Systems Corp.: | | |
| 300M | | 8.625%, 9/15/2017 | | 350,250 |
| 175M | | 7.75%, 4/15/2018 | | 196,000 |
| | | CCO Holdings, LLC: | | |
| 250M | | 7%, 1/15/2019 | | 264,062 |
| 175M | | 7.375%, 6/1/2020 | | 190,312 |
| 75M | | 5.25%, 3/15/2021 (a) | | 72,000 |
| 100M | | 5.125%, 2/15/2023 | | 93,250 |
| 425M | | Cequel Communications Holdings I, LLC, 6.375%, 9/15/2020 (a) | | 437,750 |
| | | | |
| | | | | |
| | | | |
| | | | |
| Principal | | | | |
| Amount | | Security | | Value |
| | | Media-Cable TV (continued) | | |
| | | Clear Channel Worldwide Holdings, Inc.: | | |
| $ 25M | | 7.625%, 3/15/2020 Series “A” | | $ 26,125 |
| 125M | | 7.625%, 3/15/2020 Series “B” | | 132,031 |
| 150M | | 6.5%, 11/15/2022 Series “A” | | 152,812 |
| 325M | | 6.5%, 11/15/2022 Series “B” | | 333,531 |
| | | DISH DBS Corp.: | | |
| 700M | | 7.875%, 9/1/2019 | | 803,250 |
| 125M | | 5%, 3/15/2023 | | 117,187 |
| 150M | | Echostar DBS Corp., 7.125%, 2/1/2016 | | 166,500 |
| 400M | | Gray Television, Inc., 7.5%, 10/1/2020 | | 427,000 |
| 450M | | Harron Communications, LP, 9.125%, 4/1/2020 (a) | | 500,625 |
| 225M | | Midcontinent Communications Corp., 6.25%, 8/1/2021 (a) | | 227,813 |
| 400M | | Nara Cable Funding, Ltd., 8.875%, 12/1/2018 (a) | | 432,000 |
| | | Quebecor Media, Inc.: | | |
| 251M | | 7.75%, 3/15/2016 | | 254,765 |
| 25M | | 5.75%, 1/15/2023 | | 24,313 |
| 575M | | UPC Holding BV, 9.875%, 4/15/2018 (a) | | 618,125 |
| | | | | 5,819,701 |
| | | Media-Diversified—1.0% | | |
| | | Gannett Company, Inc.: | | |
| 200M | | 5.125%, 7/15/2020 (a) | | 203,500 |
| 225M | | 6.375%, 10/15/2023 (a) | | 233,438 |
| 475M | | Lamar Media Corp., 7.875%, 4/15/2018 | | 502,906 |
| | | | | 939,844 |
| | | Metals/Mining—7.7% | | |
| 550M | | Alcoa, Inc., 6.15%, 8/15/2020 | | 593,547 |
| 325M | | Aleris International, Inc., 7.875%, 11/1/2020 | | 346,937 |
| | | ArcelorMittal: | | |
| 250M | | 6.125%, 6/1/2018 | | 275,312 |
| 575M | | 10.35%, 6/1/2019 | | 730,250 |
| 300M | | 6.75%, 2/25/2022 | | 327,750 |
| | | Arch Coal, Inc.: | | |
| 50M | | 7%, 6/15/2019 | | 40,000 |
| 325M | | 7.25%, 10/1/2020 | | 255,125 |
| 325M | | 7.25%, 6/15/2021 | | 250,250 |
| | | FMG Resources (August 2006) Property, Ltd.: | | |
| 125M | | 6%, 4/1/2017 (a) | | 133,438 |
| 475M | | 6.875%, 2/1/2018 (a) | | 501,125 |
| 200M | | 8.25%, 11/1/2019 (a) | | 225,250 |
| 50M | | 6.875%, 4/1/2022 (a) | | 54,750 |
Portfolio of Investments (continued)
FUND FOR INCOME
December 31, 2013
| | | | |
| | | | | |
| | | | |
| | | | |
| Principal | | | | |
| Amount | | Security | | Value |
| | | Metals/Mining (continued) | | |
| $ 600M | | JMC Steel Group, 8.25%, 3/15/2018 (a) | | $ 607,500 |
| 150M | | Kaiser Aluminum Corp., 8.25%, 6/1/2020 | | 170,250 |
| | | Novelis, Inc.: | | |
| 825M | | 8.375%, 12/15/2017 | | 882,234 |
| 175M | | 8.75%, 12/15/2020 | | 195,563 |
| | | Peabody Energy Corp.: | | |
| 275M | | 6%, 11/15/2018 | | 294,250 |
| 175M | | 6.5%, 9/15/2020 | | 185,063 |
| 375M | | 6.25%, 11/15/2021 | | 380,625 |
| | | Steel Dynamics, Inc.: | | |
| 175M | | 6.125%, 8/15/2019 | | 190,313 |
| 100M | | 6.375%, 8/15/2022 | | 108,500 |
| | | United States Steel Corp.: | | |
| 75M | | 7%, 2/1/2018 | | 81,938 |
| 125M | | 7.375%, 4/1/2020 | | 135,625 |
| 100M | | 7.5%, 3/15/2022 | | 107,000 |
| 250M | | Wise Metals Group, LLC, 8.75%, 12/15/2018 (a) | | 264,375 |
| | | | | 7,336,970 |
| | | Real Estate Investment Trusts—.3% | | |
| 277M | | Taylor Morrison Communities, Inc., 7.75%, 4/15/2020 (a) | | 306,085 |
| | | Retail-General Merchandise—2.6% | | |
| 100M | | Chinos Intermediate Holdings A, Inc., 7.75%, 5/1/2019 (a) | | 102,500 |
| 375M | | Landry’s, Inc., 9.375%, 5/1/2020 (a) | | 410,625 |
| 400M | | Limited Brands, Inc., 8.5%, 6/15/2019 | | 482,000 |
| 275M | | Michaels Stores, Inc., 7.75%, 11/1/2018 | | 299,750 |
| 600M | | Needle Merger Sub Corp., 8.125%, 3/15/2019 (a) | | 630,750 |
| 300M | | Party City Holdings, Inc., 8.875%, 8/1/2020 | | 337,500 |
| 200M | | Sally Holdings, LLC, 6.875%, 11/15/2019 | | 222,000 |
| | | | | 2,485,125 |
| | | Services—4.6% | | |
| | | ADT Corp.: | | |
| 150M | | 6.25%, 10/15/2021 (a) | | 157,687 |
| 425M | | 3.5%, 7/15/2022 | | 370,605 |
| 75M | | 4.125%, 6/15/2023 | | 66,690 |
| 175M | | APX Group, Inc., 6.375%, 12/1/2019 | | 178,500 |
| 400M | | Ashtead Capital, Inc., 6.5%, 7/15/2022 (a) | | 428,500 |
| 175M | | CoreLogic, Inc., 7.25%, 6/1/2021 | | 190,750 |
| | | | |
| | | | | |
| | | | |
| | | | |
| Principal | | | | |
| Amount | | Security | | Value |
| | | Services (continued) | | |
| | | Covanta Holding Corp.: | | |
| $ 100M | | 7.25%, 12/1/2020 | | $ 109,669 |
| 300M | | 6.375%, 10/1/2022 | | 309,515 |
| 100M | | Geo Group, Inc., 5.875%, 1/15/2022 (a) | | 99,625 |
| | | Iron Mountain, Inc.: | | |
| 225M | | 7.75%, 10/1/2019 | | 252,000 |
| 450M | | 5.75%, 8/15/2024 | | 419,625 |
| 400M | | Live Nation Entertainment, Inc., 7%, 9/1/2020 (a) | | 436,000 |
| 275M | | Monitronics International, Inc., 9.125%, 4/1/2020 | | 292,875 |
| | | PHH Corp.: | | |
| 200M | | 7.375%, 9/1/2019 | | 214,500 |
| 175M | | 6.375%, 8/15/2021 | | 175,875 |
| 375M | | Reliance Intermediate Holdings, LP, 9.5%, 12/15/2019 (a) | | 412,500 |
| 275M | | Safway Group Holding, LLC, 7%, 5/15/2018 (a) | | 291,500 |
| | | | | 4,406,416 |
| | | Telecommunications—6.0% | | |
| | | CenturyLink, Inc.: | | |
| 25M | | 5.625%, 4/1/2020 | | 25,562 |
| 200M | | 5.8%, 3/15/2022 | | 198,500 |
| 175M | | 6.75%, 12/1/2023 | | 178,062 |
| | | Citizens Communications Co.: | | |
| 725M | | 7.125%, 3/15/2019 | | 784,812 |
| 300M | | 9%, 8/15/2031 | | 296,250 |
| 350M | | GCI, Inc., 8.625%, 11/15/2019 | | 373,625 |
| 750M | | Inmarsat Finance, PLC, 7.375%, 12/1/2017 (a) | | 783,750 |
| | | Intelsat Jackson Holdings SA: | | |
| 350M | | 7.25%, 4/1/2019 | | 379,750 |
| 150M | | 8.5%, 11/1/2019 | | 164,250 |
| 250M | | 7.25%, 10/15/2020 | | 274,688 |
| 100M | | PAETEC Holding Corp., 9.875%, 12/1/2018 | | 112,250 |
| | | Sprint Capital Corp.: | | |
| 375M | | 6.9%, 5/1/2019 | | 411,563 |
| 400M | | 6.875%, 11/15/2028 | | 379,000 |
| 225M | | Telesat Canada, 6%, 5/15/2017 (a) | | 234,844 |
| | | Wind Acquisition Finance SA: | | |
| 200M | | 11.75%, 7/15/2017 (a) | | 213,000 |
| 200M | | 7.25%, 2/15/2018 (a) | | 211,500 |
Portfolio of Investments (continued)
FUND FOR INCOME
December 31, 2013
| | | | |
| | | | | |
| | | | |
| | | | |
| Principal | | | | |
| Amount | | Security | | Value |
| | | Telecommunications (continued) | | |
| | | Windstream Corp.: | | |
| $ 225M | | 7.875%, 11/1/2017 | | $ 258,188 |
| 325M | | 7.75%, 10/15/2020 | | 346,531 |
| 100M | | 6.375%, 8/1/2023 | | 94,000 |
| | | | | 5,720,125 |
| | | Transportation—1.2% | | |
| | | Aircastle, Ltd.: | | |
| 75M | | 4.625%, 12/15/2018 | | 75,750 |
| 775M | | 6.25%, 12/1/2019 | | 834,094 |
| 175M | | Navios Maritime Holdings, 8.125%, 2/15/2019 | | 180,688 |
| | | | | 1,090,532 |
| | | Utilities—2.4% | | |
| | | AES Corp.: | | |
| 125M | | 9.75%, 4/15/2016 | | 147,812 |
| 100M | | 8%, 10/15/2017 | | 118,000 |
| 100M | | 7.375%, 7/1/2021 | | 113,250 |
| | | Calpine Corp.: | | |
| 38M | | 7.875%, 7/31/2020 (a) | | 41,800 |
| 312M | | 7.5%, 2/15/2021 (a) | | 342,030 |
| 275M | | Dynegy, Inc., 5.875%, 6/1/2023 (a) | | 261,250 |
| 144M | | Indiantown Cogeneration Utilities, LP, 9.77%, 12/15/2020 | | 157,658 |
| 400M | | InterGen NV, 7%, 6/30/2023 (a) | | 416,000 |
| 275M | | NRG Energy, Inc., 7.625%, 5/15/2019 | | 292,188 |
| 398M | | NSG Holdings, LLC, 7.75%, 12/15/2025 (a) | | 425,860 |
| | | | | 2,315,848 |
| | | Waste Management—.3% | | |
| 275M | | ADS Waste Holdings, Inc., 8.25%, 10/1/2020 | | 299,750 |
| | | Wireless Communications—2.8% | | |
| 200M | | Altice Financing SA, 6.5%, 1/15/2022 (a) | | 202,500 |
| 375M | | Intelsat Luxembourg SA, 8.125%, 6/1/2023 (a) | | 403,594 |
| | | MetroPCS Wireless, Inc.: | | |
| 200M | | 6.625%, 11/15/2020 | | 212,750 |
| 450M | | 6.25%, 4/1/2021 (a) | | 468,563 |
| 450M | | 6.625%, 4/1/2023 (a) | | 466,313 |
| | | | |
| | | | | |
| | | | |
| | | | |
| Principal | | | | |
| Amount | | Security | | Value |
| | | Wireless Communications (continued) | | |
| | | Sprint Nextel Corp.: | | |
| $ 100M | | 9.125%, 3/1/2017 | | $ 118,000 |
| 175M | | 8.375%, 8/15/2017 | | 203,438 |
| 300M | | 7%, 8/15/2020 | | 326,250 |
| 225M | | 6%, 11/15/2022 | | 220,500 |
| | | | | 2,621,908 |
| Total Value of Corporate Bonds (cost $80,590,866) | | 83,186,835 |
| | | LOAN PARTICIPATIONS—7.4% | | |
| | | Chemicals—.4% | | |
| 373M | | Axalta Coating Systems, Inc., 4.75%, 2/1/2020 (d) | | 375,502 |
| | | Consumer Non-Durables—.1% | | |
| 104M | | Sun Products Corp., 5.5%, 3/15/2020 (d) | | 98,582 |
| | | Energy—.9% | | |
| | | Drillships Financing Holding, Inc.: | | |
| 224M | | 6%, 2/2/2021 (d) | | 230,048 |
| 274M | | 6%, 3/31/2021 (d) | | 281,170 |
| 125M | | Fieldwood Energy, LLC, 8.375%, 9/30/2020 (d) | | 127,906 |
| 225M | | Samson Investment Co., 5%, 9/25/2018 (d) | | 226,219 |
| | | | | 865,343 |
| | | Financial—.4% | | |
| 402M | | Ocwen Financial Corp., 5%, 1/31/2018 (d) | | 408,432 |
| | | Food/Drug—1.3% | | |
| 498M | | Albertson’s, LLC, 4.75%, 2/20/2016 (d) | | 500,298 |
| | | Rite Aid Corp.: | | |
| 180M | | 4.875%, 6/7/2021 (d) | | 183,195 |
| 250M | | 4.875%, 6/21/2021 (d) | | 254,438 |
| | | Supervalu, Inc.: | | |
| 298M | | 5%, 3/21/2019 (d) | | 300,914 |
| 40M | | 5%, 3/31/2019 (d) | | 40,026 |
| | | | | 1,278,871 |
| | | Gaming/Leisure—.2% | | |
| 224M | | Seminole Hard Rock Entertainment, Inc., 3.5%, 4/28/2020 (d) | | 224,341 |
Portfolio of Investments (continued)
FUND FOR INCOME
December 31, 2013
| | | | |
| | | | | |
| | | | |
| | | | |
| Principal | | | | |
| Amount | | Security | | Value |
| | | Information Technology—1.0% | | |
| $ 299M | | ARRIS Group, Inc., 3.5%, 2/7/2020 (d) | | $ 298,301 |
| 650M | | BMC Software Finance, Inc., 5%, 8/9/2020 (d) | | 653,656 |
| | | | | 951,957 |
| | | Manufacturing—.9% | | |
| 382M | | Apex Tool Group, LLC, 4.5%, 1/8/2020 (d) | | 384,788 |
| 464M | | Gardner Denver, Inc., 4.25%, 7/30/2020 (d) | | 464,233 |
| | | | | 849,021 |
| | | Media-Diversified—.9% | | |
| 150M | | Kasima, LLC , 3.25%, 5/14/2021 (d) | | 150,063 |
| 675M | | Tribune Co., 4%, 11/20/2020 (d)(e) | | 671,520 |
| | | | | 821,583 |
| | | Metals/Mining—.6% | | |
| 369M | | Arch Coal, Inc., 6.25%, 5/16/2018 (d) | | 364,530 |
| 170M | | Oxbow Carbon & Minerals, LLC, 8%, 1/18/2020 (d) | | 173,506 |
| | | | | 538,036 |
| | | Retail-General Merchandise—.5% | | |
| 149M | | Burger King Corp., 3.75%, 9/27/2019 (d) | | 149,106 |
| 299M | | General Nutrition Centers, Inc., 3.25%, 3/4/2019 (d) | | 299,131 |
| | | | | 448,237 |
| | | Services—.2% | | |
| | | Brickman Group Ltd., LLC: | | |
| 85M | | 4%, 12/18/2020 (d)(e) | | 85,531 |
| 65M | | 7.5%, 12/17/2021 (d)(e) | | 66,609 |
| | | | | 152,140 |
| |
| Total Value of Loan Participations (cost $6,951,290) | | 7,012,045 |
| | | | | | | |
| | | | | | | | |
| | | | | | | |
| | | | | | | |
| Principal | | | | | | | |
| Amount | | | | | | | |
| or Shares | | Security | | | | | Value |
| | | PASS THROUGH CERTIFICATES—.2% | |
| | | Transportation | | | | | |
| $ 200M | | American Airlines, Series “B” PTT, | | | | | |
| | | 5.6%, 7/15/2020 (cost $200,000) (a) | | | | | $ 202,000 |
| | | COMMON STOCKS—.0% | | | | | |
| | | Telecommunications | | | | | |
| 5,970 | * | World Access, Inc. (cost $97,360) (b) | | | | | — |
| |
| Total Value of Investments (cost $87,839,516) | 95.0 | % | | | 90,400,880 |
| Other Assets, Less Liabilities | 5.0 | | | | 4,787,441 |
| |
| Net Assets | | | 100.0 | % | | | $95,188,321 |
| |
| * | Non-income producing |
| |
| Summary of Abbreviations: |
| |
| PTT Pass Through Trust |
| |
| (a) | Security exempt from registration under Rule 144A of the Securities Act of 1933 (see Note 5). |
| |
| (b) | Securities valued at fair value (see Note 1A). |
| |
| (c) | In default as to principal and/or interest payment |
| |
| (d) | Interest rates are determined and reset periodically. The interest rates above are the rates in effect |
| at December 31, 2013. |
| |
| (e) | A portion or all of the security purchased on a when-issued or delayed delivery basis (see Note 1G). |
Accounting Standards Codification 820 established a three-tier hierarchy of inputs to establish a classification of fair value measurements for disclosure purposes. The three-tier hierarchy of inputs is summarized in the three broad Levels listed below:
Level 1 — Unadjusted quoted prices in active markets for identical securities that the Fund has the ability to access.
Level 2 — Observable inputs other than quoted prices included in Level 1 that are observable for the asset or liability, either directly or indirectly. These inputs may include quoted prices for the identical instrument on an inactive market, prices for similar instruments, interest rates, prepayment speeds, credit risk, yield curves, default rates and similar data.
Level 3 — Unobservable inputs for the asset or liability, to the extent relevant observable inputs are not available, representing the Fund’s own assumption about the assumptions a market participant would use in valuing the asset or liability, and would be based on the best information available.
Portfolio of Investments (continued)
FUND FOR INCOME
December 31, 2013
The inputs methodology used for valuing securities are not necessarily an indication of the risk associated with investing in those securities. For example, amortized cost approximates the current fair value of a security, but since the value is not obtained from a quoted price in an active market, such securities are reflected as Level 2.
The following is a summary, by category of Level, of inputs used to value the Fund’s investments as of December 31, 2013:
| | | | | | | | | | | | |
| | | | Level 1 | | | Level 2 | | | Level 3 | | | Total |
| Corporate Bonds | | $ | — | | $ | 83,186,835 | | $ | — | | $ | 83,186,835 |
| Loan Participations | | | — | | | 7,012,045 | | | — | | | 7,012,045 |
| Pass Through Certificates | | | — | | | 202,000 | | | — | | | 202,000 |
| Common Stocks | | | — | | | — | | | — | | | — |
| Total Investments in Securities* | | $ | — | | $ | 90,400,880 | | $ | — | | $ | 90,400,880 |
* The Portfolio of Investments provides information on the industry categorization for corporate bonds, loan participations, pass through certificates and common stocks.
There were no transfers into or from Level 1 and Level 2 by the Fund for the year ended December 31, 2013. Transfers, if any, between Levels are recognized at the end of the reporting period.
The following is a reconciliation of Fund investments valued using Level 3 inputs for the year:
| | | | | | | | | | | | |
| | | | | | | Investments | | | Investments | | | |
| | | | | | | in Corporate | | | in Common | | | |
| | | | | | | Bonds | | | Stocks | | | Total |
| Balance, December 31, 2012 | | | | | $ | 375 | | $ | — | | $ | 375 |
| Purchases | | | | | | — | | | — | | | — |
| Sales | | | | | | — | | | — | | | — |
| Change in unrealized | | | | | | | | | | | | |
| appreciation (depreciation) | | | | | | (375) | | | — | | | (375) |
| Realized gain (loss) | | | | | | — | | | — | | | — |
| Transfer into Level 3 | | | | | | — | | | — | | | — |
| Transfer out of Level 3 | | | | | | — | | | — | | | — |
| Balance, December 31, 2013 | | | | | $ | — | | $ | — | | $ | — |
| | | | | | | |
| The following is a summary of Level 3 inputs by industry: | | | | | | |
| Health Care | | | | | $ | — | | | | | | |
| Telecommunications | | | | | | — | | | | | | |
| | | | | | $ | — | | | | | | |
The following table presents additional information about valuation methodologies and inputs used for investments that are measured at fair value and categorized within Level 3 as of December 31, 2013.
| | | | | | | | | | |
| | | | | | | | | | | Impact to |
| | | Fair Value | | | | | | | | Valuation from |
| | | December 31, | | Valuation | | Unobservable | | | | a Decrease |
| | | 2013 | | Methodologies | | Input(s)(1) | | Range | | in Input(2) |
| | | | | | | | | | | |
| Corporate Bonds | | $ | — | | Market | | Probability of | | 100% | | Increase |
| | | | | Comparables | | Bankruptcy | | | | |
| |
| Common Stocks | | $ | — | | Market | | Probability of | | 100% | | Increase |
| | | | | Comparables | | Bankruptcy | | | | |
| |
| (1) | In determining certain of these inputs, management evaluates a variety of factors including economic conditions, industry and market developments, market valuations of comparable companies and company specific developments including exit strategies and realization opportunities. |
| Management has determined that market participants would take these inputs into account when valuing the investments. |
| |
| (2) | This column represents the directional change in the fair value of the Level 3 investments that would result from a decrease to the corresponding unobservable input. An increase to the unobservable input would have the opposite effect. |
| |
| See notes to financial statements | 37 |
Portfolio Managers’ Letter
GOVERNMENT FUND
Dear Investor:
We’re pleased to send you the First Investors Life Government Fund annual report for the year ended December 31, 2013. During the period, the Fund’s return on a net asset value basis was –2.47%, including dividends of 27 cents per share.
For 2013, the broad bond market returned –2.2%, according to Bank of America Merrill Lynch, its worst year since 1994. The market’s performance resulted from a substantial increase in long-term interest rates from historically low levels caused by the Federal Reserve’s (the “Fed’s”) decision to begin to taper — or slow — its bond-buying program due to an improved economic outlook.
In particular, the housing market rebounded strongly during the year and the U.S. unemployment rate fell from 7.9% to 6.7%. The benchmark ten-year Treasury-note yield rose from 1.76% to 3.03%, ending 2013 at its highest level in two-and-a-half years. In contrast, short-term interest rates remained very low due to the Fed’s commitment to maintain the federal funds rate close to zero. Consequently, the two-year Treasury-note yield moved from 0.25% to 0.38% year-over-year.
Within the fixed-income market, lower-quality and shorter-maturity bonds tended to outperform higher-quality and longer-maturity bonds. In particular, corporate bond spreads tightened substantially during the year. This contributed to positive returns of 7.4% and 5.7% for high-yield bonds and floating rate securities, respectively.
Tighter spreads also helped investment-grade corporate bonds offset part of the impact of higher interest rates, resulting in a return for the sector of –1.5%. In contrast, and reflecting the large move higher in interest rates, the broad Treasury market lost 3.4% and 10+ year Treasuries lost 12.4%. Mortgage-backed securities returned –1.4% as spreads widened in response to the Fed’s decision to taper its bond-buying program, including mortgage-backed bonds.
Within the mortgage-backed securities market, 30-year Ginnie Mae mortgage-backed securities had total returns of –2.10% and 30-year Fannie Mae mortgage-backed securities returned –1.34%. Lower coupon agency mortgage-backed securities returned –3.5% as investors shunned them in favor of higher coupon mortgages, which were less sensitive to changes in interest rates.
The Fund outperformed its benchmark, the Citigroup U.S. Government/Mortgage Index, after adjusting for expenses. During 2013, the Fund had the following average allocations: agency mortgage-backed securities (59.8%), U.S. agency securities (31.3%), U.S. Treasury notes (6.6%), agency commercial mortgage-backed securities (1.4%), and cash (0.9%). The Fund’s outperformance versus its peers was primarily attributable to the Fund’s overweight in agency mortgage-backed securities and
underweight in Treasuries, particularly longer maturity Treasuries. Additionally, the Fund benefited from its underweight in lower coupon agency mortgage-backed securities and overweight in higher coupon agency mortgage-backed securities.
Thank you for placing your trust in First Investors. As always, we appreciate the opportunity to serve your investment needs.
Fund Expenses (unaudited)
GOVERNMENT FUND
The examples below show the ongoing costs (in dollars) of investing in your Fund and will help you in comparing these costs with costs of other mutual funds. Please refer to page 2 for a detailed explanation of the information presented in these examples.
| | | |
| | Beginning | Ending | |
| | Account | Account | Expenses Paid |
| | Value | Value | During Period |
| | (7/1/13) | (12/31/13) | (7/1/13–12/31/13)* |
| Expense Examples | | | |
| Actual | $1,000.00 | $1,000.00 | $3.93 |
| Hypothetical | | | |
| (5% annual return before expenses) | $1,000.00 | $1,021.28 | $3.97 |
| |
| * | Expenses are equal to the annualized expense ratio of .78%, multiplied by the average account |
| value over the period, multiplied by 184/365 (to reflect the one-half year period). Expenses paid |
| during the period are net of expenses waived. |
Portfolio Composition
BY SECTOR
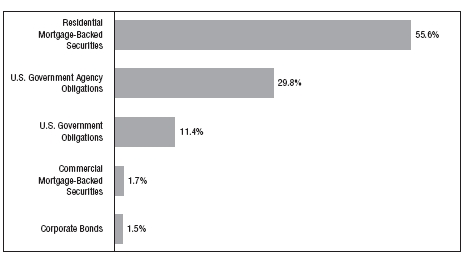
|
| Portfolio holdings and allocations are subject to change. Percentages are as of December 31, 2013, |
| and are based on the total value of investments. |
Cumulative Performance Information (unaudited)
GOVERNMENT FUND
Comparison of change in value of $10,000 investment in the First Investors Life Series Government Fund and the Citigroup U.S. Government/Mortgage Index.

The graph compares a $10,000 investment in the First Investors Life Series Government Fund beginning 12/31/03 with a theoretical investment in the Citigroup U.S. Government/Mortgage Index (the “Index”). The Index is an unmanaged index that is a combination of the Citigroup U.S. Government Index and the Citigroup Mortgage Index. The Citigroup U.S. Government Index tracks the performance of the U.S. Treasury and U.S. Government-sponsored indices within the Citigroup U.S. Broad Investment Grade Bond Index. The Citigroup Mortgage Index tracks the performance of the mortgage component of the Citigroup U.S. Broad Investment Grade Bond Index, which is comprised of 30- and 15-year GNMA, FNMA and FHLMC pass-throughs and FNMA and FHLMC balloon mortgages. It is not possible to invest directly in this Index. In addition, the Index does not reflect fees and expenses associated with the active management of a mutual fund portfolio. For purposes of the graph and the accompanying table, it is assumed that all dividends and distributions were reinvested.
* The Average Annual Total Return figures are for the periods ended 12/31/13. During the periods shown, some of the expenses of the Fund were waived. If such expenses had been paid by the Fund, the Average Annual Total Returns for One Year, Five Years and Ten Years would have been (2.62%), 2.60% and 3.55%, respectively.
The returns shown do not reflect any sales charges, since the Fund sells its shares solely to variable annuity and/or variable life insurance subaccounts at net asset value. The returns do not reflect the fees and charges that an individual would pay in connection with an investment in a variable annuity or life contract or policy. Results represent past performance and do not indicate future results. The graph and the returns shown do not reflect the deduction of taxes that an investor would pay on distributions or the redemption of fund shares. Investment return and principal value of an investment will fluctuate so that an investor’s shares, when redeemed, may be worth more or less than the original cost. Index figures are from Citigroup and all other figures are from First Investors Management Company, Inc.
Portfolio of Investments
GOVERNMENT FUND
December 31, 2013
| | | | | | | |
| | | | | | | | |
| | | | | | | |
| | | | | | | |
| Principal | | | | | | | |
| Amount | | Security | | | | | Value |
| | | RESIDENTIAL MORTGAGE-BACKED | | | | | |
| | | SECURITIES—52.9% | | | | | |
| | | Fannie Mae—25.2% | | | | | |
| $1,813M | | 2.5%, 9/1/2023 – 11/1/2027 | | | | | $ 1,840,255 |
| 1,587M | | 3%, 7/1/2021 – 10/1/2027 | | | | | 1,633,657 |
| 820M | | 3.5%, 4/1/2033 – 5/1/2033 | | | | | 835,010 |
| 1,355M | | 4%, 1/16/2029 – 1/1/2041 (a) | | | | | 1,422,993 |
| 566M | | 4.5%, 11/1/2040 – 8/1/2041 | | | | | 601,523 |
| 269M | | 5%, 4/1/2040 | | | | | 293,066 |
| 693M | | 5.5%, 7/1/2034 – 10/1/2039 | | | | | 768,346 |
| 183M | | 9%, 11/1/2026 | | | | | 213,327 |
| 55M | | 11%, 10/1/2015 | | | | | 58,111 |
| | | | | | | | 7,666,288 |
| | | Freddie Mac—3.9% | | | | | |
| 447M | | 2.5%, 1/1/2028 | | | | | 444,015 |
| 732M | | 4%, 11/1/2040 – 12/1/2040 | | | | | 759,798 |
| | | | | | | | 1,203,813 |
| | | Government National Mortgage Association I | | | | | |
| | | Program—23.8% | | | | | |
| 946M | | 4%, 11/15/2025 – 8/15/2041 | | | | | 999,190 |
| 1,760M | | 4.5%, 12/15/2039 – 6/15/2040 | | | | | 1,895,235 |
| 2,933M | | 5%, 6/15/2033 – 6/15/2040 | | | | | 3,220,248 |
| 815M | | 5.5%, 2/15/2033 – 11/15/2038 | | | | | 912,017 |
| 198M | | 6%, 11/15/2032 – 4/15/2036 | | | | | 221,235 |
| | | | | | | | 7,247,925 |
| Total Value of Residential Mortgage-Backed Securities (cost $15,970,972) | | | | | 16,118,026 |
| | | | | | | |
| | | | | | | | |
| | | | | | | |
| | | | | | | |
| Principal | | | | | | | |
| Amount | | Security | | | | | Value |
| | | U.S. GOVERNMENT AGENCY | | | | | |
| | | OBLIGATIONS—28.3% | | | | | |
| $3,500M | | Fannie Mae, 1.625%, 11/27/2018 | | | | | $ 3,474,874 |
| | | Federal Farm Credit Bank: | | | | | |
| 1,000M | | 4.875%, 1/17/2017 | | | | | 1,121,839 |
| 300M | | 2.79%, 11/12/2020 | | | | | 297,007 |
| 1,250M | | Federal Home Loan Bank, 5.375%, 5/18/2016 | 1,392,476 |
| | | Freddie Mac: | | | | | |
| 300M | | 0.875%, 3/7/2018 | | | | | 291,714 |
| 1,000M | | 1.25%, 8/1/2019 | | | | | 953,175 |
| 1,000M | | Tennessee Valley Authority, 4.5%, 4/1/2018 | | | | | 1,110,648 |
| Total Value of U.S. Government Agency Obligations (cost $8,769,416) | 8,641,733 |
| | | U.S. GOVERNMENT OBLIGATIONS—10.8% | |
| 328M | | FDA Queens, LP, 6.99%, 6/15/2017 (b) | | | | | 354,590 |
| | | U.S. Treasury Notes: | | | | | |
| 1,750M | | 1.25%, 10/31/2018 | | | | | 1,715,889 |
| 1,250M | | 1.25%, 11/30/2018 | | | | | 1,223,340 |
| Total Value of U.S. Government Obligations (cost $3,347,949) | 3,293,819 |
| | | COMMERCIAL MORTGAGE-BACKED | |
| | | SECURITIES—1.6% | | | | | |
| | | Federal Home Loan Mortgage Corporation | |
| 500M | | Multifamily Structured Pass Through, 2.13%, 1/25/2019 | |
| | | (cost $517,266) | | | | | 498,543 |
| | | CORPORATE BONDS—1.5% | | | | | |
| | | Financials | | | | | |
| 468M | | Excalibur One 77B, LLC, 1.491%, 1/1/2025 (cost $466,121) | 442,298 |
| Total Value of Investments (cost $29,071,724) | 95.1 | % | | | 28,994,419 |
| Other Assets, Less Liabilities | 4.9 | | | | 1,488,261 |
| Net Assets | | | 100.0 | % | | | $30,482,680 |
| |
| (a) | A portion or all of the security purchased on a when-issued or delayed delivery basis |
| (see Note 1G). |
| | |
| (b) | Security exempt from registration under Rule 144A of Securities Act of 1933 (see Note 5). |
Portfolio of Investments (continued)
GOVERNMENT FUND
December 31, 2013
Accounting Standards Codification 820 established a three-tier hierarchy of inputs to establish a classification of fair value measurements for disclosure purposes. The three-tier hierarchy of inputs is summarized in the three broad Levels listed below:
Level 1 — Unadjusted quoted prices in active markets for identical securities that the Fund has the ability to access.
Level 2 — Observable inputs other than quoted prices included in Level 1 that are observable for the asset or liability, either directly or indirectly. These inputs may include quoted prices for the identical instrument on an inactive market, prices for similar instruments, interest rates, prepayment speeds, credit risk, yield curves, default rates and similar data.
Level 3 — Unobservable inputs for the asset or liability, to the extent relevant observable inputs are not available, representing the Fund’s own assumption about the assumptions a market participant would use in valuing the asset or liability, and would be based on the best information available.
The inputs methodology used for valuing securities are not necessarily an indication of the risk associated with investing in those securities. For example, amortized cost approximates the current fair value of a security, but since the value is not obtained from a quoted price in an active market, such securities are reflected as Level 2.
The following is a summary, by category of Level, of inputs used to value the Fund’s investments as of December 31, 2013:
| | | | | | | | | | | | |
| | | | Level 1 | | | Level 2 | | | Level 3 | | | Total |
| Residential Mortgage-Backed | | | | | | | | | | | | |
| Securities | | $ | — | | $ | 16,118,026 | | $ | — | | $ | 16,118,026 |
| U.S. Government Agency | | | | | | | | | | | | |
| Obligations | | | — | | | 8,641,733 | | | — | | | 8,641,733 |
| U.S. Government Obligations | | | — | | | 3,293,819 | | | — | | | 3,293,819 |
| Commercial Mortgage-Backed | | | | | | | | | | | | |
| Securities | | | — | | | 498,543 | | | — | | | 498,543 |
| Corporate Bonds | | | — | | | 442,298 | | | — | | | 442,298 |
| Total Investments in Securities | | $ | — | | $ | 28,994,419 | | $ | — | | $ | 28,994,419 |
There were no transfers into or from Level 1 and Level 2 by the Fund for the year ended December 31, 2013. Transfers, if any, between Levels are recognized at the end of the reporting period.
| |
| 44 | See notes to financial statements |
Portfolio Manager’s Letter
GROWTH & INCOME FUND
Dear Investor:
I’m pleased to send you the First Investors Life Growth & Income Fund annual report for the year ended December 31, 2013. During the period, the Fund’s return on a net asset value basis was 38.06%, including dividends of 61 cents per share.
During the year under review, strong equity performance and the market rally were driven by a combination of slow-but-gradually-improving economic conditions, accommodative monetary policy from the Federal Reserve (“the Fed”), low volatility and improving corporate fundamentals.
Investor sentiment also improved, with stocks benefitting from a positive re-rating of market-valuation metrics toward more normalized historical levels, which erased the bearish views toward stocks that prevailed after the 2008–2009 market correction.
Despite numerous challenges throughout the year — including worries over whether or not the Fed would “taper” its bond buying stimulus of the economy; disagreements between President Obama and the U.S. Congress on government budget and spending matters; and geopolitical conflicts around the globe — equity markets remained resilient and investors’ restored confidence barely wavered.
This year’s market results were broadly positive overall, with all U.S. market sectors, styles and sizes participating. Companies with strong profitability, earnings growth, solid balance sheets and strong, free cash-flows led results. Small and mid-cap stocks flourished as investors felt comfortable adding more risk to their portfolios. Companies with the ability to pay and raise dividends and execute share repurchases of their own stocks were also rewarded. Mergers and acquisitions also continued to drive strong performance.
These conditions produced a solid year for the Fund, which continued to invest across all market capitalization segments, allocating 69% of its holdings to large cap stocks, 16% to midcap stocks and 15% to small-cap stocks (ranges defined by Lipper) as of period end. The Fund, as is its practice, sought to be fully invested throughout the year, maintaining minimal cash positions.
All segments produced positive returns, with the large-cap segment slightly exceeding the benchmark and small- and mid-cap segments outperforming strongly. Results were also buoyed by the Fund’s stock selection within consumer staples, industrials, basic materials, consumer discretionary and healthcare — all sectors in which the Fund was overweighted relative to the benchmark. The worst relative performing sector was financials.
Portfolio Manager’s Letter (continued)
GROWTH & INCOME FUND
In consumer staples good stock selection and an overweighting of the sector added to the Fund’s strong relative performance for the year. Nu Skin Enterprises had an impressive year, as the stock was up over 270% in 2013. The company reported a series of earnings and guidance increases driven by accelerated distributor momentum and the launch of a new weight-management product that greatly exceeded expectations.
Also in the consumer staples area, Herbalife had a great year for the Fund as well, with the stock up over 138%. The company posted a series of strong revenue and earnings growth quarters driven by robust core business fundamentals and the anticipation of some substantially accretive capital deployment. The stock also benefited from a significant short position at the beginning of the year by a high-profile investor, which turned into a short squeeze when results were better than expected, exacerbating the positive returns. The Fund also benefited from strong performance out of CVS as the drugstore chain utilized its strong free cash-flow to return a significant amount of capital to shareholders while also restructuring its integrated retail/pharmacy business.
In industrials, 3M, the diversified industrial company, delivered solid earnings throughout the year and also gave an upbeat outlook for growth in 2014, as many of the headwinds that the company had been facing are finally starting to recede. Generac, the maker of backup generators, again rewarded its shareholders this past year with strong earnings growth and a $5 special dividend as the company continued to benefit from the effects of Hurricane Sandy, which drove demand for standby generators and awareness for the need to have backup power solutions. TAL International was another solid performer for the Fund as the stock was up over 57% in 2013. Despite slowing container market fundamentals, TAL continued to put-up record earnings in 2013. These earnings, combined with a very high dividend yield, drove the stock to all-time highs.
In materials, LyondellBasell, the chemical and polymer maker, was up 40% having delivered consistent, near-record profitability all year as the company benefited from its de-bottlenecking efforts and the continued low-cost of ethanol feedstock. Rock-Tenn, the containerboard manufacturer, was up more than 50% as strong box prices and additional cost synergies from an M&A transaction led to strong earnings growth and cash generation. The Fund also benefited from strong performance out of International Paper, a manufacturer of containerboard and paper products, which also profited from strong containerboard prices and additional synergies from its Temple-Inland acquisition.
In consumer discretionary, Best Buy was up more than 236% for the year as management continued to execute on its turnaround plan that looks to boost cash flow, gross margins, comparable store sales and significantly cut costs. CBS was up 67% as the company announced that it would be unlocking value by converting CBS’
outdoor advertising division into a Real Estate Investment Trust. GNC Holdings, the retailer of health and wellness products, was up more than 75% as its new gold loyalty card drove upside to earnings and projected earnings in 2014. The Fund also benefited from significant investment in Tier 1 auto suppliers as Delphi Automotive, BorgWarner, Harman International, TRW Automotive, and Lear Corp. all contributed to the Fund’s performance.
In health care, top holding Gilead Science delivered strong core business growth and received FDA approval for its potential blockbuster next-generation hepatitis C drug. Another name, Thermo Fisher, announced the acquisition of Life Technologies, which expands its presence in high-growth markets and provides the opportunity for meaningful synergies and earnings accretion. The Fund also benefited from strong performance out of Actavis as that company completed the acquisition of Warner Chilcott (also a Fund position), which brought significant cost, sales, and tax synergies.
On a relative basis, the Fund performed well, outperforming its benchmark. It did underperform the S&P 500 within the financial sector, where the Fund remains underweight. With seemingly no end to quantitative easing and increased costs from greater regulation now looking permanent, financial-sector profits and growth prospects remain anemic, impacting these companies’ ability to raise dividends and repurchase stock.
Thank you for placing your trust in First Investors. As always, we appreciate the opportunity to serve your investment needs.

Fund Expenses (unaudited)
GROWTH & INCOME FUND
The examples below show the ongoing costs (in dollars) of investing in your Fund and will help you in comparing these costs with costs of other mutual funds. Please refer to page 2 for a detailed explanation of the information presented in these examples.
| | | |
| | Beginning | Ending | |
| | Account | Account | Expenses Paid |
| | Value | Value | During Period |
| | (7/1/13) | (12/31/13) | (7/1/13–12/31/13)* |
| Expense Examples | | | |
| Actual | $1,000.00 | $1,184.74 | $4.35 |
| Hypothetical | | | |
| (5% annual return before expenses) | $1,000.00 | $1,021.23 | $4.02 |
| |
| * | Expenses are equal to the annualized expense ratio of .79%, multiplied by the average account |
| value over the period, multiplied by 184/365 (to reflect the one-half year period). |
Portfolio Composition
TOP TEN SECTORS
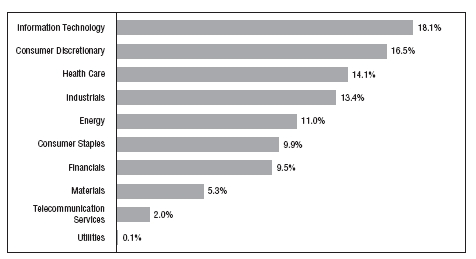
|
| Portfolio holdings and allocations are subject to change. Percentages are as of December 31, 2013, |
| and are based on the total value of investments. |
Cumulative Performance Information (unaudited)
GROWTH & INCOME FUND
Comparison of change in value of $10,000 investment in the First Investors Life Series Growth & Income Fund and the Standard & Poor’s 500 Index.
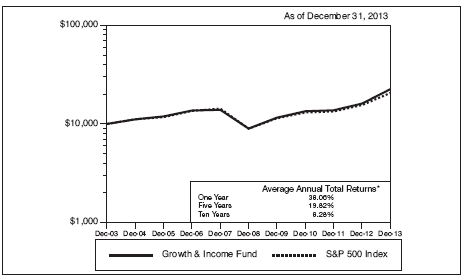
The graph compares a $10,000 investment in the First Investors Life Series Growth & Income Fund beginning 12/31/03 with a theoretical investment in the Standard & Poor’s 500 Index (the “Index”). The Index is an unmanaged capitalization-weighted index of 500 stocks designed to measure performance of the broad domestic economy through changes in the aggregate market value of such stocks, which represent all major industries. It is not possible to invest directly in this Index. In addition, the Index does not reflect fees and expenses associated with the active management of a mutual fund portfolio. For purposes of the graph and the accompanying table it is assumed that all dividends and distributions were reinvested.
* The Average Annual Total Return figures are for the periods ended 12/31/13.
The returns shown do not reflect any sales charges, since the Fund sells its shares solely to variable annuity and/or variable life insurance subaccounts at net asset value. The returns do not reflect the fees and charges that an individual would pay in connection with an investment in a variable annuity or life contract or policy. Results represent past performance and do not indicate future results. The graph and the returns shown do not reflect the deduction of taxes that an investor would pay on distributions or the redemption of fund shares. Investment return and principal value of an investment will fluctuate so that an investor’s shares, when redeemed, may be worth more or less than the original cost. Index figures are from Standard & Poor’s and all other figures are from First Investors Management Company, Inc.
Portfolio of Investments
GROWTH & INCOME FUND
December 31, 2013
| | | | | | | |
| | | | | | | | |
| | | | | | | |
| | | | | | | |
| Shares | | Security | | | | | Value |
| | | COMMON STOCKS—99.6% | | | | | |
| | | Consumer Discretionary—16.4% | | | | | |
| 20,000 | * | ARAMARK Holdings Corporation | | | | | $ 524,400 |
| 110,600 | | Best Buy Company, Inc. | | | | | 4,410,728 |
| 69,600 | | BorgWarner, Inc. | | | | | 3,891,336 |
| 116,100 | | CBS Corporation – Class “B” | | | | | 7,400,214 |
| 45,100 | | Dana Holding Corporation | | | | | 884,862 |
| 82,600 | | Delphi Automotive, PLC | | | | | 4,966,738 |
| 114,800 | * | Express, Inc. | | | | | 2,143,316 |
| 1,700 | * | Extended Stay America, Inc. | | | | | 44,642 |
| 136,900 | | Ford Motor Company | | | | | 2,112,367 |
| 102,900 | | GNC Holdings, Inc. – Class “A” | | | | | 6,014,505 |
| 57,500 | | Harman International Industries, Inc. | | | | | 4,706,375 |
| 50,100 | | Home Depot, Inc. | | | | | 4,125,234 |
| 68,800 | * | Jarden Corporation | | | | | 4,220,880 |
| 85,600 | | L Brands, Inc. | | | | | 5,294,360 |
| 35,600 | | Lear Corporation | | | | | 2,882,532 |
| 27,000 | | McDonald’s Corporation | | | | | 2,619,810 |
| 88,300 | | Newell Rubbermaid, Inc. | | | | | 2,861,803 |
| 83,500 | * | Orient-Express Hotels, Ltd. – Class “A” | | | | | 1,261,685 |
| 12,800 | | Penske Automotive Group, Inc. | | | | | 603,648 |
| 122,700 | | Pier 1 Imports, Inc. | | | | | 2,831,916 |
| 37,298 | * | Steiner Leisure, Ltd. | | | | | 1,834,689 |
| 34,200 | * | TRW Automotive Holdings Corporation | | | | | 2,544,138 |
| 23,500 | | Tupperware Brands Corporation | | | | | 2,221,455 |
| 1,400 | * | Vince Holding Corporation | | | | | 42,938 |
| 43,500 | | Walt Disney Company | | | | | 3,323,400 |
| 57,000 | | Wyndham Worldwide Corporation | | | | | 4,200,330 |
| | | | | | | | 77,968,301 |
| | | Consumer Staples—9.9% | | | | | |
| 116,000 | | Altria Group, Inc. | | | | | 4,453,240 |
| 94,400 | * | Amira Nature Foods, Ltd. | | | | | 1,487,744 |
| 67,500 | | Avon Products, Inc. | | | | | 1,162,350 |
| 116,778 | | Coca-Cola Company | | | | | 4,824,099 |
| 78,700 | | CVS Caremark Corporation | | | | | 5,632,559 |
| 50,700 | | Herbalife, Ltd. | | | | | 3,990,090 |
| 67,400 | | Nu Skin Enterprises, Inc. – Class “A” | | | | | 9,316,028 |
| 35,000 | | PepsiCo, Inc. | | | | | 2,902,900 |
| | | | |
| | | | | |
| | | | |
| | | | |
| | | | |
| Shares | | Security | | Value |
| |
| | | Consumer Staples (continued) | | |
| 74,300 | | Philip Morris International, Inc. | | $ 6,473,759 |
| 37,313 | | Procter & Gamble Company | | 3,037,651 |
| 43,350 | | Wal-Mart Stores, Inc. | | 3,411,211 |
| | | | | 46,691,631 |
| | | Energy—11.0% | | |
| 38,400 | | Anadarko Petroleum Corporation | | 3,045,888 |
| 39,600 | | Chevron Corporation | | 4,946,436 |
| 62,100 | | ConocoPhillips | | 4,387,365 |
| 66,700 | | Devon Energy Corporation | | 4,126,729 |
| 61,000 | | Ensco, PLC – Class “A” | | 3,487,980 |
| 65,011 | | ExxonMobil Corporation | | 6,579,113 |
| 9,000 | | Hess Corporation | | 747,000 |
| 96,022 | | Marathon Oil Corporation | | 3,389,577 |
| 39,611 | | Marathon Petroleum Corporation | | 3,633,517 |
| 39,550 | | National Oilwell Varco, Inc. | | 3,145,412 |
| 131,500 | | Noble Corporation, PLC | | 4,927,305 |
| 27,200 | | Occidental Petroleum Corporation | | 2,586,720 |
| 31,050 | | Phillips 66 | | 2,394,887 |
| 13,700 | | Schlumberger, Ltd. | | 1,234,507 |
| 96,907 | | Suncor Energy, Inc. | | 3,396,590 |
| | | | | 52,029,026 |
| | | Financials—9.5% | | |
| 62,506 | | American Express Company | | 5,671,169 |
| 38,200 | | Ameriprise Financial, Inc. | | 4,394,910 |
| 35,500 | | Armada Hoffler Properties, Inc. (REIT) | | 329,440 |
| 125,400 | * | Brixmor Property Group, Inc. (REIT) | | 2,549,382 |
| 74,743 | | Discover Financial Services | | 4,181,871 |
| 26,600 | | Financial Select Sector SPDR Fund (ETF) | | 581,476 |
| 61,100 | | FirstMerit Corporation | | 1,358,253 |
| 52,100 | * | Health Insurance Innovations, Inc. – Class “A” | | 526,731 |
| 23,500 | | Invesco, Ltd. | | 855,400 |
| 107,088 | | JPMorgan Chase & Company | | 6,262,506 |
| 10,800 | | M&T Bank Corporation | | 1,257,336 |
| 27,600 | | MetLife, Inc. | | 1,488,192 |
| 27,000 | | Morgan Stanley | | 846,720 |
| 45,000 | | PNC Financial Services Group, Inc. | | 3,491,100 |
Portfolio of Investments (continued)
GROWTH & INCOME FUND
December 31, 2013
| | | | |
| | | | | |
| | | | |
| | | | |
| | | | |
| Shares | | Security | | Value |
| | | Financials (continued) | | |
| 27,000 | | SPDR S&P Regional Banking (ETF) | | $ 1,096,470 |
| 96,979 | | Sunstone Hotel Investors, Inc. (REIT) | | 1,299,519 |
| 98,000 | | U.S. Bancorp | | 3,959,200 |
| 106,800 | | Urstadt Biddle Properties, Inc. – Class “A” (REIT) | | 1,970,460 |
| 63,967 | | Wells Fargo & Company | | 2,904,102 |
| | | | | 45,024,237 |
| | | Health Care—14.1% | | |
| 111,200 | | Abbott Laboratories | | 4,262,296 |
| 63,900 | | AbbVie, Inc. | | 3,374,559 |
| 40,400 | * | Actavis, PLC | | 6,787,200 |
| 37,330 | | Baxter International, Inc. | | 2,596,302 |
| 20,300 | | Covidien, PLC | | 1,382,430 |
| 54,322 | * | Express Scripts Holding Company | | 3,815,577 |
| 110,400 | * | Gilead Sciences, Inc. | | 8,296,560 |
| 73,075 | | Johnson & Johnson | | 6,692,939 |
| 2,612 | * | Mallinckrodt, PLC | | 136,503 |
| 27,500 | | McKesson Corporation | | 4,438,500 |
| 89,643 | | Merck & Company, Inc. | | 4,486,632 |
| 41,800 | | Omnicare, Inc. | | 2,523,048 |
| 223,893 | | Pfizer, Inc. | | 6,857,843 |
| 27,000 | * | Salix Pharmaceuticals, Ltd. | | 2,428,380 |
| 70,343 | | Thermo Fisher Scientific, Inc. | | 7,832,693 |
| 29,572 | | Zoetis, Inc. | | 966,709 |
| | | | | 66,878,171 |
| | | Industrials—13.3% | | |
| 47,794 | | 3M Company | | 6,703,109 |
| 22,400 | | ADT Corporation | | 906,528 |
| 67,800 | | Altra Industrial Motion Corporation | | 2,320,116 |
| 35,100 | * | Armstrong World Industries, Inc. | | 2,022,111 |
| 29,000 | | Caterpillar, Inc. | | 2,633,490 |
| 49,537 | | Chicago Bridge & Iron Company NV – NY Shares | | 4,118,506 |
| 43,200 | | Dover Corporation | | 4,170,528 |
| 74,200 | | Generac Holdings, Inc. | | 4,202,688 |
| 104,196 | | General Electric Company | | 2,920,614 |
| 57,900 | | Honeywell International, Inc. | | 5,290,323 |
| 32,600 | | ITT Corporation | | 1,415,492 |
| 5,600 | | Lockheed Martin Corporation | | 832,496 |
| 40,496 | | Pentair, Ltd. | | 3,145,324 |
| 9,800 | | Raytheon Company | | 888,860 |
| | | | |
| | | | | |
| | | | |
| | | | |
| | | | |
| Shares | | Security | | Value |
| | | Industrials (continued) | | |
| 39,600 | | Ryder System, Inc. | | $ 2,921,688 |
| 27,000 | | Snap-on, Inc. | | 2,957,040 |
| 62,400 | * | TAL International Group, Inc. | | 3,578,640 |
| 29,800 | | Textainer Group Holdings, Ltd. | | 1,198,556 |
| 54,000 | | Textron, Inc. | | 1,985,040 |
| 101,200 | | Tyco International, Ltd. | | 4,153,248 |
| 43,000 | | United Technologies Corporation | | 4,893,400 |
| | | | | 63,257,797 |
| | | Information Technology—18.1% | | |
| 13,650 | | Apple, Inc. | | 7,659,152 |
| 96,300 | * | ARRIS Group, Inc. | | 2,346,349 |
| 88,300 | | Avago Technologies, Ltd. | | 4,670,187 |
| 68,700 | * | Blackhawk Network Holdings, Inc. | | 1,735,362 |
| 71,325 | | CDW Corporation | | 1,666,152 |
| 234,900 | | Cisco Systems, Inc. | | 5,273,505 |
| 27,200 | * | eBay, Inc. | | 1,493,008 |
| 222,300 | | EMC Corporation | | 5,590,845 |
| 113,000 | | Hewlett-Packard Company | | 3,161,740 |
| 160,000 | | Intel Corporation | | 4,153,600 |
| 42,129 | | International Business Machines Corporation | | 7,902,137 |
| 117,900 | | Intersil Corporation – Class “A” | | 1,352,313 |
| 160,200 | | Mentor Graphics Corporation | | 3,856,014 |
| 237,000 | | Microsoft Corporation | | 8,870,910 |
| 78,200 | * | NeuStar, Inc. – Class “A” | | 3,899,052 |
| 95,000 | | Oracle Corporation | | 3,634,700 |
| 40,700 | * | PTC, Inc. | | 1,440,373 |
| 84,088 | | QUALCOMM, Inc. | | 6,243,534 |
| 123,160 | | Symantec Corporation | | 2,904,113 |
| 135,700 | * | Take-Two Interactive Software, Inc. | | 2,357,109 |
| 61,100 | | TE Connectivity, Ltd. | | 3,367,221 |
| 57,000 | * | Yahoo!, Inc. | | 2,305,080 |
| | | | | 85,882,456 |
| | | Materials—5.2% | | |
| 43,300 | | Celanese Corporation – Series “A” | | 2,394,923 |
| 35,100 | | Cytec Industries, Inc. | | 3,269,916 |
| 117,340 | | Freeport-McMoRan Copper & Gold, Inc. | | 4,428,412 |
| 66,500 | | International Paper Company | | 3,260,495 |
| 59,700 | | LyondellBasell Industries NV – Class “A” | | 4,792,716 |
Portfolio of Investments (continued)
GROWTH & INCOME FUND
December 31, 2013
| | | | | | | |
| | | | | | | | |
| | | | | | | |
| | | | | | | |
| Shares or | | | | | | | |
| Principal | | | | | | | |
| Amount | | Security | | | | | Value |
| | | Materials (continued) | | | | | |
| 11,200 | | Praxair, Inc. | | | | | $ 1,456,336 |
| 35,700 | | Rock-Tenn Company – Class “A” | | | | | 3,748,857 |
| 36,750 | | RPM International, Inc. | | | | | 1,525,492 |
| | | | | | | | 24,877,147 |
| | | Telecommunication Services—2.0% | | | | | |
| 117,500 | | AT&T, Inc. | | | | | 4,131,300 |
| 108,100 | | Verizon Communications, Inc. | | | | | 5,312,034 |
| | | | | | | | 9,443,334 |
| | | Utilities—.1% | | | | | |
| 13,826 | | Atmos Energy Corporation | | | | | 627,977 |
| Total Value of Common Stocks (cost $270,609,695) | | | | | 472,680,077 |
| | | SHORT-TERM U.S. GOVERNMENT | | | | | |
| | | OBLIGATIONS—.2% | | | | | |
| $1,000M | | U.S. Treasury Bills, 0.019%, 2/20/2014 (cost $999,973) | 999,973 |
| Total Value of Investments (cost $271,609,668) | 99.8 | % | | | 473,680,050 |
| Other Assets, Less Liabilities | .2 | | | | 742,544 |
| Net Assets | | | 100.0 | % | | | $474,422,594 |
| |
| * | Non-income producing |
| | |
| Summary of Abbreviations: |
| ETF Exchange Traded Fund |
| REIT Real Estate Investment Trust |
Accounting Standards Codification 820 established a three-tier hierarchy of inputs to establish a classification of fair value measurements for disclosure purposes. The three-tier hierarchy of inputs is summarized in the three broad Levels listed below:
Level 1 — Unadjusted quoted prices in active markets for identical securities that the Fund has the ability to access.
Level 2 — Observable inputs other than quoted prices included in Level 1 that are observable for the asset or liability, either directly or indirectly. These inputs may include quoted prices for the identical instrument on an inactive market, prices for similar instruments, interest rates, prepayment speeds, credit risk, yield curves, default rates and similar data.
Level 3 — Unobservable inputs for the asset or liability, to the extent relevant observable inputs are not available, representing the Fund’s own assumption about the assumptions a market participant would use in valuing the asset or liability, and would be based on the best information available.
The inputs methodology used for valuing securities are not necessarily an indication of the risk associated with investing in those securities. For example, amortized cost approximates the current fair value of a security, but since the value is not obtained from a quoted price in an active market, such securities are reflected as Level 2.
The following is a summary, by category of Level, of inputs used to value the Fund’s investments as of December 31, 2013:
| | | | | | | | | | | | |
| | | | Level 1 | | | Level 2 | | | Level 3 | | | Total |
| Common Stocks | | $ | 472,680,077 | | $ | — | | $ | — | | $ | 472,680,077 |
| Short-Term U.S. Government | | | | | | | | | | | | |
| Obligations | | | — | | | 999,973 | | | — | | | 999,973 |
| Total Investments in Securities* | | $ | 472,680,077 | | $ | 999,973 | | $ | — | | $ | 473,680,050 |
* The Portfolio of Investments provides information on the industry categorization for common stocks.
There were no transfers into or from Level 1 and Level 2 by the Fund for the year ended December 31, 2013. Transfers, if any, between Levels are recognized at the end of the reporting period.
| |
| See notes to financial statements | 55 |
Portfolio Manager’s Letter
INTERNATIONAL FUND
Dear Investor:
I’m pleased to send you the First Investors Life International Fund annual report for the year ended December 31, 2013. During the period, the Fund’s return on a net asset value basis was 6.77%, including dividends of 27 cents per share.
From May 2013 onwards, global benchmarks were driven by a strong “risk-on” bull-market rally in the developed markets (“DM”). This was supported by significant central bank intervention in the U.S. and Japan, and Europe managing to hold the euro together with stability helped by the re-election of German Chancellor Angela Merkel. During the year, several emerging market (“EM”) countries saw a slowdown in their growth outlook after a good run for a range of different reasons. As funds flowed towards the DM, a number of EM currencies fell sharply against the U.S. dollar over the year.
Bullish sentiment towards the DM has been driven by strong U.S. employment numbers and an initial recovery in the housing market, minimal blow-ups in Europe and the aggressive monetary program in Japan that depressed the yen and lifted consumer confidence, at least for now. The U.S. has benefited from both a positive outlook reflected in the Fed’s decision to start pulling back on its quantitative easing program while simultaneously benefiting from the aggressive new investment into the market.
During the year, the weakest emerging market currencies hailed from countries in need of foreign investment to cover high current account deficits (“CAD”) relative to GDP. As a result of the sell-off, central banks across the EM raised rates to attract/hold investors and some governments took measures to cut their CAD — notably India.
The Indian rupee, which recovered considerable ground from its trough, was important to our performance over the past year due to the Fund’s exposure to a number of companies with significant business in India. The combination of a weaker rupee and government measures taken to reduce imports have resulted in the CAD falling to US $5 billion in the third quarter (July/September) of 2013 (latest reported by year end) from US$21 billion in the same quarter of 2012. Reasons for this change and more recent positive sentiment towards the rupee include:
1. The rupee fell 12.4% against the U.S. dollar in 2013 — a cumulative fall of 38% over 30 months to year-end, 2013. This benefited Indian exports, which rose 12% in the July/September quarter, driven by textiles, leather and chemicals.
2. Imports (July/September 2013) fell 5%, primarily due to a US$3.9 billion fall in gold imports resulting from an increase in the gold import tax from 2% to 10% at the beginning of 2013.
3. Confidence in Raghuram Rajan, the new governor at RBI, the central bank.
India’s central bank’s move to stem the rupee’s fall has proven successful, prompting a sharp fall in the CAD. However, the Indian economy is slowing and inflation has remained stubbornly high due to the price of food. With food inflation diminishing consumers’ ability to pay for discretionary goods such as motor bikes and refrigerators, the economy has slowed, and interest rates remain high.
India has national elections coming up in 2014. The early signals point to a change of government from Congress to a Bharatiya Janata Party (“BJP”)-led coalition headed by Gujarat Chief Minister Narendra Modi. This was illustrated by the Delhi State election that took place in November. Congress fell from the governing power with 43 of the state’s 70 seats to just eight. BJP took 31 seats followed by a new anti-corruption party with 28. We believe change is needed and that a move to BJP, particularly if accompanied by a strong win in terms of seats, would provide much needed momentum to the reforms India needs to continue building the foundations needed for growth — such as infrastructure, electricity and refrigerated distribution and storage.
In our view, the market may be getting ahead of itself in assuming that a strong European recovery is around the corner. Since the summer of 2012 — when many commentators were predicting the break-up of the euro — the sentiment has swung to the other extreme. Discussions of the system’s structural flaws, such as high unemployment in the periphery, German reliance on exports to Asia and arguably inappropriate monetary policy elsewhere, seem to have stopped. While the “muddling through” scenario seems the most likely for the eurozone, it will probably come at the cost of slower growth for an extended period.
It’s important to keep in mind that the likely structural growth potential of the eurozone is around 1.5% real GDP growth. This means that, in the absence of major shocks (such as the disintegration of the euro), the region’s output should expand at an average pace that’s less than one-third of the real rate at which India is expected to grow over the next decade.
Across Europe, we continue to invest in a number of leading global franchises with strong operations capable of taking advantage of demand growth across the EM but also benefiting from a stable and strong home market, depth of product knowledge, strong brand awareness and solid management.
For the year, relative performance was negatively affected by our out-of-index exposure to India and stock selection in the United Kingdom. The Fund’s stock selection in Energy, combined with its underweight to the sector, helped relative performance for the year, while our selection of Financials and Materials stocks detracted.
Portfolio Manager’s Letter (continued)
INTERNATIONAL FUND
Taking a step back, we find it helpful to revisit constantly the foundations on which we invest. Our investment philosophy is built on the premise that long-term returns, which many of us will need to retire on, are driven by the underlying profit growth of the companies we invest in. We believe an important driver of growth into the future will be derived from the creation of wealth and national assets across the EM.
Thank you for placing your trust in First Investors. As always, we appreciate the opportunity to serve your investment needs.

Fund Expenses (unaudited)
INTERNATIONAL FUND
The examples below show the ongoing costs (in dollars) of investing in your Fund and will help you in comparing these costs with costs of other mutual funds. Please refer to page 2 for a detailed explanation of the information presented in these examples.
| | | |
| | Beginning | Ending | |
| | Account | Account | Expenses Paid |
| | Value | Value | During Period |
| | (7/1/13) | (12/31/13) | (7/1/13–12/31/13)* |
| Expense Examples | | | |
| Actual | $1,000.00 | $1,068.94 | $4.85 |
| Hypothetical | | | |
| (5% annual return before expenses) | $1,000.00 | $1,020.52 | $4.74 |
| |
| * | Expenses are equal to the annualized expense ratio of .93%, multiplied by the average account |
| value over the period, multiplied by 184/365 (to reflect the one-half year period). |
Portfolio Composition
TOP TEN SECTORS
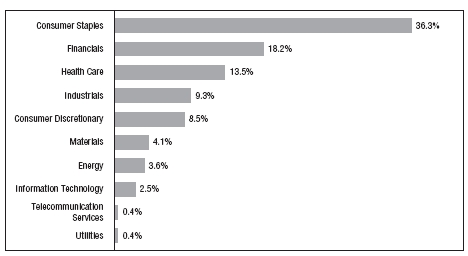
|
| Portfolio holdings and allocations are subject to change. Percentages are as of December 31, 2013, |
| and are based on the total value of investments. |
Cumulative Performance Information (unaudited)
INTERNATIONAL FUND
Comparison of change in value of $10,000 investment in the First Investors Life Series International Fund, the Morgan Stanley Capital International (“MSCI”) EAFE Index (Gross) and the Morgan Stanley Capital International (“MSCI”) EAFE Index (Net).

The graph compares a $10,000 investment in the First Investors Life Series International Fund beginning 12/31/03 with theoretical investments in the MSCI EAFE Index (Gross) and the MSCI EAFE Index (Net) (the “Indices”). The Indices are free float-adjusted market capitalization indices that measure developed foreign market equity performance, excluding the U.S. and Canada. The MSCI EAFE Index (Gross) is calculated on a total-return basis with the maximum possible dividend reinvestment (before taxes). The MSCI EAFE Index (Net) is calculated on a total-return basis with net dividends reinvested after deduction of foreign withholding taxes. The Indices are unmanaged and it is not possible to invest directly in these Indices. In addition, the Indices do not reflect fees and expenses associated with the active management of a mutual fund portfolio. For purposes of the graph and the accompanying table, it is assumed that all dividends and distributions were reinvested.
* The Average Annual Total Return figures are for the periods ended 12/31/13. The returns shown do not reflect any sales charges, since the Fund sells its shares solely to variable annuity and/or variable life insurance subaccounts at net asset value.
The returns do not reflect the fees and charges that an individual would pay in connection with an investment in a variable annuity or life contract or policy. Results represent past performance and do not indicate future results. The graph and the returns shown do not reflect the deduction of taxes that an investor would pay on distributions or the redemption of fund shares. Investment return and principal value of an investment will fluctuate so that an investor’s shares, when redeemed, may be worth more or less than the original cost. Indices figures are from Morgan Stanley & Company, Inc. and all other figures are from First Investors Management Company, Inc.
Portfolio of Investments
INTERNATIONAL FUND
December 31, 2013
| | | | |
| | | | | |
| | | | |
| | | | |
| | | | |
| Shares | | Security | | Value |
| | | COMMON STOCKS—96.0% | | |
| | | United Kingdom—23.2% | | |
| 173,988 | | Barratt Developments, PLC | | $ 1,005,711 |
| 130,543 | | British American Tobacco, PLC | | 7,000,981 |
| 111,667 | | Diageo, PLC | | 3,698,991 |
| 139,159 | | Domino’s Pizza Group, PLC | | 1,182,380 |
| 132,373 | | Fresnillo, PLC | | 1,634,465 |
| 254,029 | | HSBC Holdings, PLC | | 2,786,964 |
| 3,325 | | Intertek Group, PLC | | 173,362 |
| 85,728 | * | Persimmon, PLC | | 1,759,229 |
| 20,713 | | Reckitt Benckiser Group, PLC | | 1,644,292 |
| 125,122 | * | Rolls-Royce Holdings, PLC | | 2,642,241 |
| 11,027,092 | * | Rolls-Royce Holdings, PLC – “C” Shares (a) | | 18,264 |
| 73,427 | | SABMiller, PLC | | 3,771,256 |
| 108,722 | | Standard Chartered, PLC | | 2,448,978 |
| | | | | 29,767,114 |
| | | Switzerland—17.5% | | |
| 27,128 | | DKSH Holding, Ltd. | | 2,116,904 |
| 549 | | Lindt & Spruengli AG | | 2,482,183 |
| 76,139 | | Nestle SA – Registered | | 5,597,173 |
| 10,890 | | Novartis AG – Registered | | 875,477 |
| 10,087 | | Roche Holding AG – Genusscheine | | 2,834,212 |
| 1,531 | | SGS SA – Registered | | 3,535,450 |
| 264,715 | * | UBS AG – Registered | | 5,083,980 |
| | | | | 22,525,379 |
| | | India—9.3% | | |
| 333,735 | | HDFC Bank, Ltd. | | 3,592,554 |
| 232 | | HDFC Bank, Ltd. (ADR) | | 7,990 |
| 84,435 | | Hindustan Unilever, Ltd. | | 778,964 |
| 337,390 | | Housing Development Finance Corporation, Ltd. | | 4,334,443 |
| 618,690 | | ITC, Ltd. | | 3,219,228 |
| | | | | 11,933,179 |
Portfolio of Investments (continued)
INTERNATIONAL FUND
December 31, 2013
| | | | |
| | | | | |
| | | | |
| | | | |
| | | | |
| Shares | | Security | | Value |
| | | France—8.0% | | |
| 115,968 | | Bureau Veritas SA | | $ 3,394,891 |
| 17,948 | | Essilor International SA | | 1,911,235 |
| 2,899 | | Hermes International | | 1,052,591 |
| 11,632 | | L’Oreal SA | | 2,046,804 |
| 16,455 | | Pernod Ricard SA | | 1,877,637 |
| | | | | 10,283,158 |
| | | Canada—7.3% | | |
| 16,481 | | Alimentation Couche-Tard – Class “B” | | 1,239,216 |
| 35,885 | | Bank of Nova Scotia | | 2,243,277 |
| 52,941 | | Enbridge, Inc. | | 2,312,463 |
| 105,467 | | Goldcorp, Inc. | | 2,285,036 |
| 26,582 | | Shaw Communications, Inc. – Class “B” | | 646,849 |
| 30,463 | | Silver Wheaton Corporation | | 614,994 |
| | | | | 9,341,835 |
| | | Netherlands—6.5% | | |
| 15,080 | | Core Laboratories NV | | 2,879,526 |
| 134,247 | | Unilever NV – CVA | | 5,415,423 |
| | | | | 8,294,949 |
| | | United States—6.5% | | |
| 30,800 | | Covidien, PLC | | 2,097,480 |
| 70,893 | | Philip Morris International, Inc. | | 6,176,907 |
| | | | | 8,274,387 |
| | | Hong Kong—3.4% | | |
| 81,655 | | Cheung Kong Infrastructure Holdings, Ltd. | | 515,494 |
| 246,412 | | Link REIT (REIT) | | 1,194,917 |
| 329,941 | | L’Occitane International SA | | 702,115 |
| 239,385 | | Sands China, Ltd. | | 1,955,833 |
| | | | | 4,368,359 |
| | | Denmark—3.2% | | |
| 22,343 | | Novo Nordisk A/S – Series “B” | | 4,102,056 |
| | | Australia—2.3% | | |
| 18,699 | | CSL, Ltd. | | 1,153,631 |
| 46,338 | | Ramsay Health Care, Ltd. | | 1,793,392 |
| | | | | 2,947,023 |
| | | | | | | |
| | | | | | | | |
| | | | | | | |
| | | | | | | |
| Shares or | | | | | | | |
| Principal | | | | | | | |
| Amount | | Security | | | | | Value |
| | | Germany—1.6% | | | | | |
| 23,915 | | SAP AG | | | | | $ 2,077,328 |
| | | Ireland—1.2% | | | | | |
| 18,453 | | Paddy Power, PLC | | | | | 1,576,484 |
| | | Spain—1.2% | | | | | |
| 32,470 | | Grifols SA | | | | | 1,555,448 |
| | | Japan—1.1% | | | | | |
| 15,600 | | Daito Trust Construction Company, Ltd. | | | | | 1,461,257 |
| | | Mexico—.9% | | | | | |
| 463,259 | | Wal-Mart de Mexico SAB de CV | | | | | 1,211,810 |
| | | Brazil—.9% | | | | | |
| 42,048 | | Cielo SA | | | | | 1,164,655 |
| | | Italy—.8% | | | | | |
| 17,940 | | Luxottica Group SpA | | | | | 962,997 |
| | | Sweden—.7% | | | | | |
| 58,877 | | Elekta AB – Class “B” | | | | | 902,300 |
| | | Indonesia—.4% | | | | | |
| 3,225,221 | | PT Telekomunikasi Indonesia Persero Tbk | | | | | 570,828 |
| Total Value of Common Stocks (cost $87,659,888) | | | | | 123,320,546 |
| | | SHORT-TERM U.S. GOVERNMENT | | | | | |
| | | OBLIGATIONS—3.1% | | | | | |
| $4,000M | | U.S. Treasury Bills, 0.019%, 2/20/2014 (cost $3,999,894) | 3,999,894 |
| Total Value of Investments (cost $91,659,782) | 99.1 | % | | | 127,320,440 |
| Other Assets, Less Liabilities | .9 | | | | 1,160,966 |
| Net Assets | | | 100.0 | % | | | $128,481,406 |
| | |
| * | Non-income producing |
| |
| (a) | Securities valued at fair value (see Note 1A). |
| |
| Summary of Abbreviations: |
| ADR | American Depositary Receipts |
| REIT | Real Estate Investment Trust |
Portfolio of Investments (continued)
INTERNATIONAL FUND
December 31, 2013
Accounting Standards Codification 820 established a three-tier hierarchy of inputs to establish a classification of fair value measurements for disclosure purposes. The three-tier hierarchy of inputs is summarized in the three broad Levels listed below:
Level 1 — Unadjusted quoted prices in active markets for identical securities that the Fund has the ability to access.
Level 2 — Observable inputs other than quoted prices included in Level 1 that are observable for the asset or liability, either directly or indirectly. These inputs may include quoted prices for the identical instrument on an inactive market, prices for similar instruments, interest rates, prepayment speeds, credit risk, yield curves, default rates and similar data.
Level 3 — Unobservable inputs for the asset or liability, to the extent relevant observable inputs are not available, representing the Fund’s own assumption about the assumptions a market participant would use in valuing the asset or liability, and would be based on the best information available.
The inputs methodology used for valuing securities are not necessarily an indication of the risk associated with investing in those securities. For example, amortized cost approximates the current fair value of a security, but since the value is not obtained from a quoted price in an active market, such securities are reflected as Level 2.
The following is a summary, by category of Level, of inputs used to value the Fund’s investments as of December 31, 2013:
| | | | | | | | | | | | |
| | | | Level 1 | | | Level 2 | | | Level 3 | | | Total |
| Common Stocks | | | | | | | | | | | | |
| United Kingdom | | $ | 29,748,850 | | $ | — | | $ | 18,264 | | $ | 29,767,114 |
| Switzerland | | | — | | | 22,525,379 | | | — | | | 22,525,379 |
| India | | | 11,933,179 | | | — | | | — | | | 11,933,179 |
| France | | | 10,283,158 | | | — | | | — | | | 10,283,158 |
| Canada | | | 9,341,835 | | | — | | | — | | | 9,341,835 |
| Netherlands | | | 8,294,949 | | | — | | | — | | | 8,294,949 |
| United States | | | 8,274,387 | | | — | | | — | | | 8,274,387 |
| Hong Kong | | | 4,368,359 | | | — | | | — | | | 4,368,359 |
| Denmark | | | — | | | 4,102,056 | | | — | | | 4,102,056 |
| Australia | | | 2,947,023 | | | — | | | — | | | 2,947,023 |
| Germany | | | — | | | 2,077,328 | | | — | | | 2,077,328 |
| Ireland | | | 1,576,484 | | | — | | | — | | | 1,576,484 |
| Spain | | | 1,555,448 | | | — | | | — | | | 1,555,448 |
| Japan | | | — | | | 1,461,257 | | | — | | | 1,461,257 |
| Mexico | | | 1,211,810 | | | — | | | — | | | 1,211,810 |
| Brazil | | | — | | | 1,164,655 | | | — | | | 1,164,655 |
| Italy | | | — | | | 962,997 | | | — | | | 962,997 |
| Sweden | | | — | | | 902,300 | | | — | | | 902,300 |
| Indonesia | | | — | | | 570,828 | | | — | | | 570,828 |
| Short-Term U.S. Government | | | | | | | | | | | | |
| Obligations | | | — | | | 3,999,894 | | | — | | | 3,999,894 |
| Total Investments in Securities | | $ | 89,535,482 | | $ | 37,766,694 | * | $ | 18,264 | | $ | 127,320,440 |
* Includes certain foreign securities that were fair valued due to fluctuation in U.S. securities markets exceeding a predetermined level or a foreign market being closed; therefore, $33,766,800 of investment securities were classified as Level 2 instead of Level 1.
Transfers between Level 1 and Level 2 securities as of December 31, 2013 resulted from securities priced previously with an official close price (Level 1 securities) or on days where there is not an official close price the mean price used (Level 2 securities). Transfers from Level 2 to Level 1 as of December 31, 2013 were $51,361,875. Transfers, if any, between Levels are recognized at the end of the reporting period.
The following is a reconciliation of Fund investments valued using Level 3 inputs for the year:
| | | | | | |
| | | Investments | | | | |
| | | in Common | | | | |
| | | | Stocks | | | | |
| Balance, December 31, 2012 | | | $ | 16,371 | | | | |
| Purchases | | — | | | | |
| Sales | | (16,083) | | | | |
| Change in unrealized | | | | | | |
| appreciation | | 1,893 | | | | |
| Realized gain | | 16,083 | | | | |
| Transfer into Level 3 | | — | | | | |
| Transfer out of Level 3 | | | — | | | | |
| Balance, December 31, 2013 | | | $ | 18,264 | | | | |
The following is a summary of Level 3 inputs by industry:
The following table presents additional information about valuation methodologies and inputs used for investments that are measured at fair value and categorized within Level 3 as of December 31, 2013.
| | | | | | | | | | | | | |
| | | | | | | | | | | Impact to | | | |
| | | Fair Value | | | | | | | | Valuation from | | | |
| | | December 31, | | Valuation | | Unobservable | | | | an Increase in | | | |
| | | 2013 | | Methodologies | | Input(s)(1) | | Range | | Input(2) | | | |
| Common Stocks | | $ | 18,264 | | Discounted | | Discount | | 0% | | Decrease | | | |
| | | | | Cash Flows | | Rate | | | | | | | |
| | | | | on Proceeds | | | | | | | | | |
| |
| (1) | In determining certain of these inputs, management evaluates a variety of factors including eco- |
| nomic conditions, industry and market developments, market valuations of comparable compa- |
| nies and company specific developments including exit strategies and realization opportunities. |
| Management has determined that market participants would take these inputs into account when |
| valuing the investments. |
| |
| (2) | This column represents the directional change in the fair value of the Level 3 investments |
| that would result from a decrease to the corresponding unobservable input. An increase to the |
| unobservable input would have the opposite effect. |
| |
| See notes to financial statements | 65 |
Portfolio Managers’ Letter
INVESTMENT GRADE FUND
Dear Investor:
We’re pleased to send you the First Investors Life Investment Grade Fund annual report for the year ended December 31, 2013. During the period, the Fund’s return on a net asset value basis was –0.80%, including dividends of 45 cents per share.
The Fund invests in U.S. investment-grade fixed-income securities. During 2013, the majority of the Fund’s assets were invested in investment-grade corporate bonds.
For 2013, the broad bond market returned –2.2%, according to Bank of America Merrill Lynch, its worst year since 1994. The market’s decline resulted in large part from a substantial increase in long-term interest rates from historically low levels caused by the Federal Reserve’s (the “Fed’s”) decision to begin to taper — or slow — its bond-buying program due to an improved economic outlook.
In particular, the housing market rebounded strongly during the year and the unemployment rate fell from 7.9% to 6.7%. The benchmark ten-year Treasury-note yield rose from 1.76% to 3.03%, ending 2013 at its highest level in two-and-a-half years. In contrast, short-term interest rates remained very low due to the Fed’s commitment to maintain the federal funds rate close to zero. Consequently, the two-year Treasury-note yield moved from 0.25% to 0.38% year-over-year.
Within the fixed-income market, lower-quality and shorter-maturity bonds tended to outperform higher-quality and longer-maturity bonds. In particular, corporate bond spreads tightened substantially during the year. This contributed to positive returns of 7.4% and 5.7% for high-yield bonds and floating-rate securities, respectively.
Tighter spreads also helped investment-grade corporate bonds offset part of the impact of higher interest rates, resulting in a return for the sector of –1.5%. In contrast, and reflecting the large move higher in interest rates, the broad Treasury market lost 3.4% and 10+ year Treasuries lost 12.4%. Mortgage-backed securities returned –1.4% as spreads widened in response to the Fed’s decision to taper its bond-buying program, including mortgage-backed bonds.
Turning to the corporate bond market, the review period began with continued confidence in the financial strength of corporate issuers. Deleveraging of corporate balance sheets, credit availability and accommodative monetary policy supported a favorable outlook for corporate credit. However, the positive tone was offset by fears of the Fed tapering its stimulus program and increased shareholder-friendly activity by issuers, including share repurchases, dividend increases, and mergers and acquisitions. By the end of the review period, when the Fed finally began to taper its bond-buying program, the demand for corporate credit over other asset classes increased, bringing
corporate bond spreads substantially tighter. Treasury yields, however, continued to reach higher levels. The negative returns of the corporate bond market during the review period were predominantly the result of rising interest rates, partially offset by modest tightening of corporate bond spreads.
The Fund outperformed the Bank of America Merrill Lynch Corporate Index during the review period. The relative outperformance was predominantly a function of the Fund’s industry/sector allocations and overweight in lower-rated corporate bonds. Specifically, the Fund benefited from its overweight in BBB-rated corporate bonds, which had the highest returns among investment grade ratings categories during the review period. The Fund’s underweight in corporate bonds with maturities greater than 10 years, which were negatively impacted by rising 30-year U.S. Treasury yields, further benefited performance during the review period. This was partially offset by the Fund’s underweight in corporate bonds with maturities ranging from 1–3 years, which were less sensitive to interest rate risk.
Thank you for placing your trust in First Investors. As always, we appreciate the opportunity to serve your investment needs.
Fund Expenses (unaudited)
INVESTMENT GRADE FUND
The examples below show the ongoing costs (in dollars) of investing in your Fund and will help you in comparing these costs with costs of other mutual funds. Please refer to page 2 for a detailed explanation of the information presented in these examples.
| | | |
| | Beginning | Ending | |
| | Account | Account | Expenses Paid |
| | Value | Value | During Period |
| | (7/1/13) | (12/31/13) | (7/1/13–12/31/13)* |
| Expense Examples | | | |
| Actual | $1,000.00 | $1,022.24 | $3.62 |
| Hypothetical | | | |
| (5% annual return before expenses) | $1,000.00 | $1,021.63 | $3.62 |
| |
| * | Expenses are equal to the annualized expense ratio of .71%, multiplied by the average account |
| value over the period, multiplied by 184/365 (to reflect the one-half year period). Expenses paid |
| during the period are net of expenses waived. |
Portfolio Composition
BY SECTOR
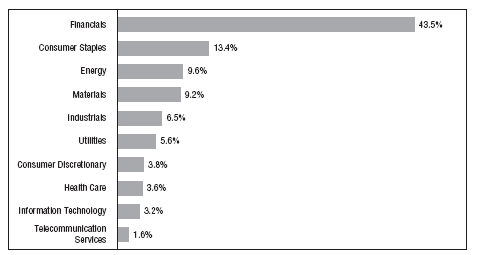
|
| Portfolio holdings and allocations are subject to change. Percentages are as of December 31, 2013, |
| and are based on the total value of investments. |
Cumulative Performance Information (unaudited)
INVESTMENT GRADE FUND
Comparison of change in value of $10,000 investment in the First Investors Life Series Investment Grade Fund and the Bank of America (“BofA”) Merrill Lynch U.S. Corporate Master Index.
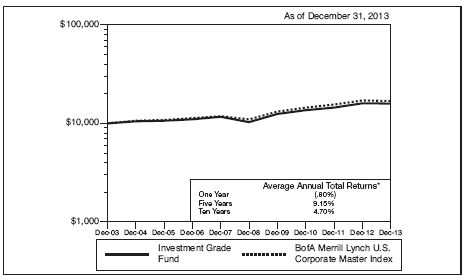
The graph compares a $10,000 investment in the First Investors Life Series Investment Grade Fund beginning 12/31/03 with a theoretical investment in the BofA Merrill Lynch U.S. Corporate Master Index (the “Index”). The Index includes publicly-issued, fixed-rate, non-convertible investment grade dollar-denominated, S.E.C.-registered corporate debt having at least one year to maturity and an outstanding par value of at least $250 million. It is not possible to invest directly in this Index. In addition, the Index does not reflect fees and expenses associated with the active management of a mutual fund portfolio. For purposes of the graph and the accompanying table, it is assumed that all dividends and distributions were reinvested.
* The Average Annual Total Return figures are for the periods ended 12/31/13. During the periods shown, some of the expenses of the Fund were waived. If such expenses had been paid by the Fund, the Average Annual Total Returns for One Year, Five Years and Ten Years would have been (.95%), 8.98% and 4.55%, respectively.
The returns shown do not reflect any sales charges, since the Fund sells its shares solely to variable annuity and/or variable life insurance subaccounts at net asset value. The returns do not reflect the fees and charges that an individual would pay in connection with an investment in a variable annuity or life contract or policy. Results represent past performance and do not indicate future results. The graph and the returns shown do not reflect the deduction of taxes that an investor would pay on distributions or the redemption of fund shares. Investment return and principal value of an investment will fluctuate so that an investor’s shares, when redeemed, may be worth more or less than the original cost. Index figures are from Bank of America Merrill Lynch & Co. and all other figures are from First Investors Management Company, Inc.
Portfolio of Investments
INVESTMENT GRADE FUND
December 31, 2013
| | | | |
| | | | | |
| | | | |
| | | | |
| Principal | | | | |
| Amount | | Security | | Value |
| | | CORPORATE BONDS—96.3% | | |
| | | Aerospace/Defense—.3% | | |
| $ 200M | | BAE Systems Holdings, Inc., 4.95%, 6/1/2014 (a) | | $ 203,475 |
| | | Agriculture—.7% | | |
| 340M | | Cargill, Inc., 6%, 11/27/2017 (a) | | 388,557 |
| | | Automotive—1.8% | | |
| 200M | | Daimler Finance NA, LLC, 2.95%, 1/11/2017 (a) | | 206,669 |
| 400M | | General Motors Co., 3.5%, 10/2/2018 (a) | | 411,000 |
| 400M | | Johnson Controls, Inc., 5%, 3/30/2020 | | 437,565 |
| | | | | 1,055,234 |
| | | Chemicals—2.6% | | |
| 450M | | CF Industries, Inc., 7.125%, 5/1/2020 | | 528,151 |
| 400M | | Dow Chemical Co., 4.25%, 11/15/2020 | | 427,329 |
| 500M | | LyondellBasell Industries NV, 6%, 11/15/2021 | | 575,975 |
| | | | | 1,531,455 |
| | | Consumer Durables—.5% | | |
| 265M | | Newell Rubbermaid, Inc., 4.7%, 8/15/2020 | | 278,341 |
| | | Energy—9.2% | | |
| 575M | | Canadian Oil Sands, Ltd., 7.75%, 5/15/2019 (a) | | 690,127 |
| 400M | | DCP Midstream, LLC, 9.75%, 3/15/2019 (a) | | 498,221 |
| 500M | | Enbridge Energy Partners, LP, 4.2%, 9/15/2021 | | 503,880 |
| 500M | | Kinder Morgan Energy Partners, LP, 3.45%, 2/15/2023 | | 465,313 |
| 411M | | Maritime & Northeast Pipeline, LLC, 7.5%, 5/31/2014 (a) | | 420,391 |
| 400M | | Nabors Industries, Inc., 6.15%, 2/15/2018 | | 449,905 |
| 400M | | ONEOK Partners, LP, 3.375%, 10/1/2022 | | 374,620 |
| 500M | | Petrobras International Finance Co., 5.375%, 1/27/2021 | | 498,694 |
| 400M | | Spectra Energy Capital, LLC, 6.2%, 4/15/2018 | | 451,737 |
| 466M | | Valero Energy Corp., 9.375%, 3/15/2019 | | 601,219 |
| 400M | | Weatherford International, Inc., 6.35%, 6/15/2017 | | 452,560 |
| | | | | 5,406,667 |
| | | Financial Services—15.8% | | |
| 250M | | Aflac, Inc., 8.5%, 5/15/2019 | | 319,658 |
| 600M | | American Express Co., 7%, 3/19/2018 | | 717,575 |
| | | American International Group, Inc.: | | |
| 300M | | 8.25%, 8/15/2018 | | 376,010 |
| 300M | | 6.4%, 12/15/2020 | | 355,067 |
| | | | |
| | | | | |
| | | | |
| | | | |
| Principal | | | | |
| Amount | | Security | | Value |
| |
| | | Financial Services (continued) | | |
| $ 300M | | Ameriprise Financial, Inc., 5.3%, 3/15/2020 | | $ 338,777 |
| 400M | | Berkshire Hathaway, Inc., 3.4%, 1/31/2022 | | 398,572 |
| 400M | | BlackRock, Inc., 5%, 12/10/2019 | | 452,224 |
| 400M | | CoBank, ACB, 7.875%, 4/16/2018 (a) | | 481,228 |
| 200M | | Compass Bank, 6.4%, 10/1/2017 | | 220,648 |
| 500M | | ERAC USA Finance Co., 4.5%, 8/16/2021 (a) | | 521,912 |
| 600M | | Ford Motor Credit Co., LLC, 8.125%, 1/15/2020 | | 751,198 |
| | | General Electric Capital Corp.: | | |
| 1,000M | | 5.3%, 2/11/2021 | | 1,120,295 |
| 700M | | 6.75%, 3/15/2032 | | 869,259 |
| 400M | | Glencore Funding, LLC, 6%, 4/15/2014 (a) | | 405,781 |
| 400M | | Harley-Davidson Funding Corp., 5.75%, 12/15/2014 (a) | | 417,844 |
| 400M | | Liberty Mutual Group, Inc., 4.95%, 5/1/2022 (a) | | 414,309 |
| 500M | | Protective Life Corp., 7.375%, 10/15/2019 | | 610,532 |
| 400M | | Prudential Financial, Inc., 7.375%, 6/15/2019 | | 491,642 |
| | | | | 9,262,531 |
| | | Financials—20.9% | | |
| | | Bank of America Corp.: | | |
| 1,000M | | 5.65%, 5/1/2018 | | 1,139,377 |
| 450M | | 5%, 5/13/2021 | | 492,511 |
| 800M | | Barclays Bank, PLC, 5.125%, 1/8/2020 | | 888,222 |
| | | Citigroup, Inc.: | | |
| 1,250M | | 6.125%, 11/21/2017 | | 1,442,151 |
| 200M | | 4.5%, 1/14/2022 | | 212,300 |
| 200M | | Cooperatieve Centrale Raiffeisen-Boerenleenbank BA, | | |
| | | 4.625%, 12/1/2023 | | 201,801 |
| 200M | | Fifth Third Bancorp, 3.5%, 3/15/2022 | | 195,374 |
| | | Goldman Sachs Group, Inc.: | | |
| 600M | | 5.375%, 3/15/2020 | | 668,165 |
| 200M | | 5.75%, 1/24/2022 | | 225,506 |
| 300M | | 3.625%, 1/22/2023 | | 291,060 |
| 500M | | 6.75%, 10/1/2037 | | 557,998 |
| | | JPMorgan Chase & Co.: | | |
| 900M | | 6%, 1/15/2018 | | 1,037,272 |
| 400M | | 4.5%, 1/24/2022 | | 423,809 |
| | | Morgan Stanley: | | |
| 600M | | 5.95%, 12/28/2017 | | 686,128 |
| 600M | | 6.625%, 4/1/2018 | | 702,718 |
| 750M | | 5.5%, 7/28/2021 | | 839,406 |
| 600M | | SunTrust Banks, Inc., 6%, 9/11/2017 | | 680,084 |
Portfolio of Investments (continued)
INVESTMENT GRADE FUND
December 31, 2013
| | | | |
| | | | | |
| | | | |
| | | | |
| Principal | | | | |
| Amount | | Security | | Value |
| | | Financials (continued) | | |
| $ 400M | | UBS AG, 4.875%, 8/4/2020 | | $ 445,756 |
| | | Wells Fargo & Co.: | | |
| 600M | | 4.6%, 4/1/2021 | | 658,757 |
| 500M | | 3.45%, 2/13/2023 | | 473,628 |
| | | | | 12,262,023 |
| | | Food/Beverage/Tobacco—8.5% | | |
| 400M | | Altria Group, Inc., 9.7%, 11/10/2018 | | 526,290 |
| 500M | | Anheuser-Busch InBev Worldwide, Inc., 5.375%, 1/15/2020 | | 574,579 |
| 300M | | Bottling Group, LLC, 5.125%, 1/15/2019 | | 339,130 |
| 550M | | Bunge Ltd. Finance Corp., 8.5%, 6/15/2019 | | 676,426 |
| 400M | | Dr. Pepper Snapple Group, Inc., 6.82%, 5/1/2018 | | 472,588 |
| 300M | | Ingredion, Inc., 4.625%, 11/1/2020 | | 313,265 |
| 400M | | Lorillard Tobacco Co., 6.875%, 5/1/2020 | | 462,232 |
| 300M | | Mead Johnson Nutrition Co., 4.9%, 11/1/2019 | | 327,554 |
| 400M | | Philip Morris International, Inc., 5.65%, 5/16/2018 | | 459,860 |
| | | SABMiller Holdings, Inc.: | | |
| 400M | | 3.75%, 1/15/2022 (a) | | 402,184 |
| 400M | | 4.95%, 1/15/2042 (a) | | 398,796 |
| | | | | 4,952,904 |
| | | Food/Drug—.7% | | |
| 400M | | Safeway, Inc., 4.75%, 12/1/2021 | | 402,324 |
| | | Forest Products/Containers—.7% | | |
| 300M | | International Paper Co., 9.375%, 5/15/2019 | | 393,938 |
| | | Gaming/Leisure—.6% | | |
| 400M | | Marriott International, Inc., 3.25%, 9/15/2022 | | 373,619 |
| | | Health Care—3.5% | | |
| 400M | | Biogen IDEC, Inc., 6.875%, 3/1/2018 | | 472,012 |
| 450M | | Express Scripts Holding Co., 4.75%, 11/15/2021 | | 476,280 |
| 400M | | Laboratory Corp. of America Holdings, 3.75%, 8/23/2022 | | 388,163 |
| 400M | | Mylan, Inc., 3.125%, 1/15/2023 (a) | | 363,693 |
| 200M | | Novartis Securities Investments, Ltd., 5.125%, 2/10/2019 | | 226,731 |
| 90M | | Roche Holdings, Inc., 6%, 3/1/2019 (a) | | 105,440 |
| | | | | 2,032,319 |
| | | | |
| | | | | |
| | | | |
| | | | |
| Principal | | | | |
| Amount | | Security | | Value |
| | | Information Technology—3.1% | | |
| $ 400M | | Harris Corp., 4.4%, 12/15/2020 | | $ 415,256 |
| 500M | | Motorola Solutions, Inc., 6%, 11/15/2017 | | 569,225 |
| 400M | | Pitney Bowes, Inc., 5.75%, 9/15/2017 | | 441,166 |
| 400M | | Symantec Corp., 3.95%, 6/15/2022 | | 388,758 |
| | | | | 1,814,405 |
| | | Manufacturing—2.9% | | |
| 500M | | CRH America, Inc., 8.125%, 7/15/2018 | | 613,059 |
| 400M | | Ingersoll-Rand Global Holdings Co., Ltd., 6.875%, 8/15/2018 | | 471,232 |
| 200M | | Pentair Finance SA, 3.15%, 9/15/2022 | | 180,990 |
| 400M | | Tyco Electronics Group SA, 6.55%, 10/1/2017 | | 458,144 |
| | | | | 1,723,425 |
| | | Media-Broadcasting—3.1% | | |
| 400M | | British Sky Broadcasting Group, PLC, 9.5%, 11/15/2018 (a) | | 521,941 |
| 200M | | CBS Corp., 8.875%, 5/15/2019 | | 255,990 |
| 300M | | Comcast Corp., 4.25%, 1/15/2033 | | 279,561 |
| 400M | | DirecTV Holdings, LLC, 3.8%, 3/15/2022 | | 384,922 |
| 300M | | Time Warner Entertainment Co., LP, 8.375%, 3/15/2023 | | 345,623 |
| | | | | 1,788,037 |
| | | Media-Diversified—.7% | | |
| | | McGraw-Hill Cos., Inc.: | | |
| 200M | | 5.9%, 11/15/2017 | | 217,430 |
| 200M | | 6.55%, 11/15/2037 | | 191,396 |
| | | | | 408,826 |
| | | Metals/Mining—4.9% | | |
| 500M | | Alcoa, Inc., 6.15%, 8/15/2020 | | 539,588 |
| 400M | | ArcelorMittal, 6.125%, 6/1/2018 | | 440,500 |
| 500M | | Newmont Mining Corp., 5.125%, 10/1/2019 | | 519,190 |
| 500M | | Rio Tinto Finance USA, Ltd., 3.75%, 9/20/2021 | | 505,640 |
| 400M | | Vale Overseas, Ltd., 5.625%, 9/15/2019 | | 435,954 |
| 400M | | Xstrata Canada Financial Corp., 4.95%, 11/15/2021 (a) | | 405,829 |
| | | | | 2,846,701 |
| | | Real Estate Investment Trusts—5.1% | | |
| 500M | | Boston Properties, LP, 5.875%, 10/15/2019 | | 574,886 |
| 550M | | Digital Realty Trust, LP, 5.25%, 3/15/2021 | | 562,163 |
| 500M | | HCP, Inc., 5.375%, 2/1/2021 | | 545,071 |
Portfolio of Investments (continued)
INVESTMENT GRADE FUND
December 31, 2013
| | | | | | | |
| | | | | | | | |
| | | | | | | |
| | | | | | | |
| Principal | | | | | | | |
| Amount | | Security | | | | | Value |
| | | Real Estate Investment Trusts (continued) | | |
| $ 400M | | ProLogis, LP, 6.625%, 5/15/2018 | | | | | $ 467,639 |
| 400M | | Simon Property Group, LP, 5.75%, 12/1/2015 | | | | | 433,438 |
| 400M | | Ventas Realty, LP, 4.75%, 6/1/2021 | | | | | 420,285 |
| | | | | | | | 3,003,482 |
| | | Retail-General Merchandise—1.5% | | | | | |
| 600M | | GAP, Inc., 5.95%, 4/12/2021 | | | | | 663,973 |
| 200M | | Home Depot, Inc., 5.875%, 12/16/2036 | | | | | 231,548 |
| | | | | | | | 895,521 |
| | | Telecommunications—1.6% | | | | | |
| 200M | | AT&T, Inc., 2.375%, 11/27/2018 | | | | | 200,402 |
| 309M | | GTE Corp., 6.84%, 4/15/2018 | | | | | 360,250 |
| 400M | | Rogers Communications, Inc., 3%, 3/15/2023 | | | | | 369,719 |
| | | | | | | | 930,371 |
| | | Transportation—2.2% | | | | | |
| 300M | | Burlington North Santa Fe, LLC, 3%, 3/15/2023 | | 279,931 |
| 300M | | Con-way, Inc., 7.25%, 1/15/2018 | | | | | 345,124 |
| 440M | | GATX Corp., 4.75%, 6/15/2022 | | | | | 448,247 |
| 200M | | Penske Truck Leasing Co., LP, 4.875%, 7/11/2022 (a) | | 205,532 |
| | | | | | | | 1,278,834 |
| | | Utilities—5.4% | | | | | |
| 300M | | E.ON International Finance BV, 5.8%, 4/30/2018 (a) | | 343,605 |
| 200M | | Electricite de France SA, 6.5%, 1/26/2019 (a) | | | | | 236,720 |
| 400M | | Entergy Arkansas, Inc., 3.75%, 2/15/2021 | | | | | 409,262 |
| 400M | | Exelon Generation Co., LLC, 5.2%, 10/1/2019 | | 431,606 |
| | | Great River Energy Co.: | | | | | |
| 89M | | 5.829%, 7/1/2017 (a) | | | | | 94,803 |
| 284M | | 4.478%, 7/1/2030 (a) | | | | | 284,130 |
| 400M | | National Fuel Gas Co., 8.75%, 5/1/2019 | | | | | 498,783 |
| 300M | | Ohio Power Co., 5.375%, 10/1/2021 | | | | | 335,247 |
| 400M | | Sempra Energy, 9.8%, 2/15/2019 | | | | | 528,974 |
| | | | | | | | 3,163,130 |
| Total Value of Investments (cost $54,133,975) | 96.3 | % | | | 56,396,119 |
| Other Assets, Less Liabilities | 3.7 | | | | 2,167,283 |
| Net Assets | | 100.0 | % | | $58,563,402 |
| |
| (a) | Security exempt from registration under Rule 144A of the Securities Act of 1933 (see Note 5). |
Accounting Standards Codification 820 established a three-tier hierarchy of inputs to establish a classification of fair value measurements for disclosure purposes. The three-tier hierarchy of inputs is summarized in the three broad Levels listed below:
Level 1 — Unadjusted quoted prices in active markets for identical securities that the Fund has the ability to access.
Level 2 — Observable inputs other than quoted prices included in Level 1 that are observable for the asset or liability, either directly or indirectly. These inputs may include quoted prices for the identical instrument on an inactive market, prices for similar instruments, interest rates, prepayment speeds, credit risk, yield curves, default rates and similar data.
Level 3 — Unobservable inputs for the asset or liability, to the extent relevant observable inputs are not available, representing the Fund’s own assumption about the assumptions a market participant would use in valuing the asset or liability, and would be based on the best information available.
The inputs methodology used for valuing securities are not necessarily an indication of the risk associated with investing in those securities. For example, amortized cost approximates the current fair value of a security, but since the value is not obtained from a quoted price in an active market, such securities are reflected as Level 2.
The following is a summary, by category of Level, of inputs used to value the Fund’s investments as of December 31, 2013:
| | | | | | | | | | | | |
| | | | Level 1 | | | Level 2 | | | Level 3 | | | Total |
| Corporate Bonds* | | $ | — | | $ | 56,396,119 | | $ | — | | $ | 56,396,119 |
* The Portfolio of Investments provides information on the industry categorization for corporate bonds.
There were no transfers into or from Level 1 and Level 2 by the Fund for the year ended December 31, 2013. Transfers, if any, between Levels are recognized at the end of the reporting period.
| |
| See notes to financial statements | 75 |
Portfolio Managers’ Letter
OPPORTUNITY FUND
Dear Investor:
We’re pleased to send you the First Investors Life Opportunity Fund annual report for the year ended December 31, 2013. During the period, the Fund’s return on a net asset value basis was 39.96%.
During the year under review, strong equity performance and the market rally were driven by a combination of slow-but-gradually-improving economic conditions, accommodative monetary policy from the Federal Reserve (“the Fed”), low volatility and improving corporate fundamentals.
Investor sentiment also improved, with stocks benefitting from a positive re-rating of market-valuation metrics toward more normalized historical levels, which erased the bearish views toward stocks that prevailed after the 2008–9 market correction.
Despite numerous challenges throughout the year — including worries over whether or not the Fed would “taper” its bond buying stimulus of the economy; disagreements between President Obama and the U.S. Congress on government budget and spending matters; and geopolitical conflicts around the globe — equity markets remained resilient and investors’ restored confidence barely wavered.
This year’s market results were broadly positive overall, with all U.S. market sectors, styles and sizes participating. Companies with strong profitability, earnings growth, solid balance sheets and strong, free cash-flows led results. Small and mid-cap stocks flourished as investors felt comfortable adding more risk to their portfolios. Companies with the ability to pay and raise dividends and execute share repurchases of their own stocks were also rewarded. Mergers and acquisitions also continued to drive strong performance.
These conditions produced a solid year for the Fund, which continued to emphasize its investment focus within the small- and mid-capitalization segments of the market.
The Fund’s strong absolute performance was mainly attributable to investments in industrial and healthcare stocks. Among our industrial stocks, Generac Holdings Inc. — which primarily makes residential standby power generators — continues to benefit from a new and higher baseline level of demand created by Hurricanes Irene (2011) and Sandy (2012). Among our health care stocks, Actavis PLC — which makes generic and specialty pharmaceuticals — announced an acquisition even as it was integrating an earlier acquisition made in 2012. The resulting cost-cutting from both acquisitions created better-than-expected earnings growth.
On a relative basis, the Fund outperformed the S&P 400 Mid-Cap index primarily due to stock selection in the consumer staple and health care sectors. In the consumer staples sector, Nu Skin Enterprises — a direct seller of personal care products and nutritional supplements — reported positive earnings surprises driven by accelerated distributor momentum and the launch of a new weight-management product. In the health care sector, Actavis PLC — which is discussed above — was the primary driver of outperformance.
Among negatives to relative performance, the Fund’s stock selection in the information technology sector hurt. Cirrus Logic Inc. — which makes semiconductors that convert incoming audio signals into digital signals — fell on concerns that order cuts at Apple Inc. (Cirrus Logic’s largest customer) would disproportionately hurt the share price. The shares were sold out of the portfolio during the year.
Thank you for placing your trust in First Investors. As always, we appreciate the opportunity to serve your investment needs.

Fund Expenses (unaudited)
OPPORTUNITY FUND
The examples below show the ongoing costs (in dollars) of investing in your Fund and will help you in comparing these costs with costs of other mutual funds. Please refer to page 2 for a detailed explanation of the information presented in these examples.
| | | |
| | Beginning | Ending | |
| | Account | Account | Expenses Paid |
| | Value | Value | During Period |
| | (7/1/13) | (12/31/13) | (7/1/13–12/31/13)* |
| Expense Examples | | | |
| Actual | $1,000.00 | $1,208.58 | $12.19 |
| Hypothetical | | | |
| (5% annual return before expenses) | $1,000.00 | $1,014.17 | $11.12 |
| |
| * | Expenses are equal to the annualized expense ratio of 2.19%, multiplied by the average account |
| value over the period, multiplied by 184/365 (to reflect the one-half year period). |
Portfolio Composition
TOP TEN SECTORS

|
| Portfolio holdings and allocations are subject to change. Percentages are as of December 31, 2013, |
| and are based on the total value of investments. |
Cumulative Performance Information (unaudited)
OPPORTUNITY FUND
Comparison of change in value of $10,000 investment in the First Investors Life Series Growth & Income Fund and the Standard & Poor’s MidCap 400 Index.

The graph compares a $10,000 investment in the First Investors Life Series Opportunity Fund beginning 12/17/12 (commencement of operations) with a theoretical investment in the Standard & Poor’s MidCap 400 Index (the “Index”). The Index is an unmanaged capitalization-weighted index of 400 stocks designed to measure performance of the mid-range sector of the U.S. stock market. It is not possible to invest directly in this Index. In addition, the Index does not reflect fees and expenses associated with the active management of a mutual fund portfolio. For purposes of the graph and the accompanying table it is assumed that all dividends and distributions were reinvested.
* The Average Annual Total Return figures are for the periods ended 12/31/13.
The returns shown do not reflect any sales charges, since the Fund sells its shares solely to variable annuity and/or variable life insurance subaccounts at net asset value. The returns do not reflect the fees and charges that an individual would pay in connection with an investment in a variable annuity or life contract or policy. Results represent past performance and do not indicate future results. The graph and the returns shown do not reflect the deduction of taxes that an investor would pay on distributions or the redemption of fund shares. Investment return and principal value of an investment will fluctuate so that an investor’s shares, when redeemed, may be worth more or less than the original cost. Index figures are from Standard & Poor’s and all other figures are from First Investors Management Company, Inc.
Portfolio of Investments
OPPORTUNITY FUND
December 31, 2013
| | | | |
| | | | | |
| | | | |
| | | | |
| Shares | | Security | | Value |
| | | COMMON STOCKS—93.2% | | |
| | | Consumer Discretionary—17.6% | | |
| 750 | * | ARAMARK Holdings Corporation | | $ 19,665 |
| 2,325 | | BorgWarner, Inc. | | 129,991 |
| 100 | * | Container Store Group, Inc. | | 4,661 |
| 3,125 | | CST Brands, Inc. | | 114,750 |
| 350 | | Dana Holding Corporation | | 6,867 |
| 2,975 | * | Del Frisco’s Restaurant Group, Inc. | | 70,121 |
| 3,800 | | Delphi Automotive, PLC | | 228,494 |
| 5,450 | * | Express, Inc. | | 101,751 |
| 3,575 | * | Extended Stay America, Inc. | | 93,879 |
| 3,275 | | GNC Holdings, Inc. – Class “A” | | 191,424 |
| 2,335 | | Harman International Industries, Inc. | | 191,120 |
| 2,325 | * | Jarden Corporation | | 142,639 |
| 2,575 | | L Brands, Inc. | | 159,264 |
| 2,875 | | Newell Rubbermaid, Inc. | | 93,179 |
| 775 | | Nordstrom, Inc. | | 47,895 |
| 6,775 | * | Orient-Express Hotels, Ltd. – Class “A” | | 102,370 |
| 100 | | Oxford Industries, Inc. | | 8,067 |
| 1,550 | | Penske Automotive Group, Inc. | | 73,098 |
| 5,200 | | Pier 1 Imports, Inc. | | 120,016 |
| 350 | | Ralph Lauren Corporation | | 61,799 |
| 3,200 | | Ruth’s Hospitality Group, Inc. | | 45,472 |
| 2,250 | * | TRW Automotive Holdings Corporation | | 167,378 |
| 1,325 | | Tupperware Brands Corporation | | 125,252 |
| 50 | * | Vince Holding Corporation | | 1,534 |
| 1,400 | | Wyndham Worldwide Corporation | | 103,166 |
| | | | | 2,403,852 |
| | | Consumer Staples—7.1% | | |
| 2,725 | * | Amira Nature Foods, Ltd. | | 42,946 |
| 2,325 | | Avon Products, Inc. | | 40,036 |
| 150 | * | Fairway Group Holdings Corporation | | 2,718 |
| 2,175 | | Herbalife, Ltd. | | 171,173 |
| 300 | | McCormick & Company, Inc. | | 20,676 |
| 2,850 | | Nu Skin Enterprises, Inc. – Class “A” | | 393,927 |
| 1,275 | | Pinnacle Foods, Inc. | | 35,011 |
| 6,210 | * | Prestige Brands Holdings, Inc. | | 222,318 |
| 1,079 | | Tootsie Roll Industries, Inc. | | 35,111 |
| | | | | 963,916 |
| | | | |
| | | | | |
| | | | |
| | | | |
| | | | |
| Shares | | Security | | Value |
| | | Energy—7.3% | | |
| 475 | * | Dril-Quip, Inc. | | $ 52,217 |
| 2,800 | | Ensco, PLC – Class “A” | | 160,104 |
| 575 | | EOG Resources, Inc. | | 96,508 |
| 1,400 | | EQT Corporation | | 125,692 |
| 4,275 | * | Helix Energy Solutions Group, Inc. | | 99,095 |
| 625 | | Hess Corporation | | 51,875 |
| 2,175 | | National Oilwell Varco, Inc. | | 172,978 |
| 4,275 | | Noble Corporation, PLC | | 160,184 |
| 3,500 | | Talisman Energy, Inc. | | 40,775 |
| 1,950 | * | Weatherford International, Ltd. | | 30,206 |
| | | | | 989,634 |
| | | Financials—11.3% | | |
| 925 | | Ameriprise Financial, Inc. | | 106,421 |
| 3,100 | | Berkshire Hills Bancorp, Inc. | | 84,537 |
| 2,575 | * | Brixmor Property Group, Inc. (REIT) | | 52,350 |
| 1,625 | | City National Corporation | | 128,732 |
| 3,425 | | Discover Financial Services | | 191,629 |
| 2,325 | | Douglas Emmett, Inc. (REIT) | | 54,149 |
| 650 | | Federal Realty Investment Trust (REIT) | | 65,917 |
| 1,400 | | Financial Select Sector SPDR Fund (ETF) | | 30,604 |
| 2,725 | | FirstMerit Corporation | | 60,577 |
| 2,650 | * | Health Insurance Innovations, Inc. – Class “A” | | 26,791 |
| 230 | | Invesco, Ltd. | | 8,372 |
| 325 | | M&T Bank Corporation | | 37,836 |
| 1,870 | | NASDAQ OMX Group, Inc. | | 74,426 |
| 1,550 | | Oritani Financial Corporation | | 24,878 |
| 4,275 | | Protective Life Corporation | | 216,571 |
| 1,400 | * | Realogy Holdings Corporation | | 69,258 |
| 350 | | Rexford Industrial Realty, Inc. (REIT) | | 4,620 |
| 1,425 | | SPDR S&P Regional Banking (ETF) | | 57,869 |
| 5,050 | | Sterling Bancorp | | 67,519 |
| 2,725 | | Waddell & Reed Financial, Inc. – Class “A” | | 177,452 |
| | | | | 1,540,508 |
| | | Health Care—12.4% | | |
| 2,634 | * | Actavis, PLC | | 442,512 |
| 1,950 | * | Centene Corporation | | 114,952 |
| 1,175 | | DENTSPLY International, Inc. | | 56,964 |
| 2,500 | * | Gilead Sciences, Inc. | | 187,875 |
Portfolio of Investments (continued)
OPPORTUNITY FUND
December 31, 2013
| | | | |
| | | | |
| | | | | |
| | | | |
| | | | |
| | | | |
| Shares | | Security | | Value |
| | | Health Care (continued) | | |
| 1,700 | | McKesson Corporation | | $ 274,380 |
| 1,900 | | Omnicare, Inc. | | 114,684 |
| 300 | | Perrigo Company, PLC | | 46,038 |
| 1,800 | * | Salix Pharmaceuticals, Ltd. | | 161,892 |
| 1,950 | | Thermo Fisher Scientific, Inc. | | 217,133 |
| 3,575 | * | Triple-S Management Corporation – Class “B” | | 69,498 |
| | | | | 1,685,928 |
| | | Industrials—15.2% | | |
| 2,175 | | A.O. Smith Corporation | | 117,320 |
| 2,800 | | Altra Industrial Motion Corporation | | 95,816 |
| 1,475 | * | Armstrong World Industries, Inc. | | 84,975 |
| 1,550 | * | B/E Aerospace, Inc. – Class “B” | | 134,896 |
| 2,500 | | Chicago Bridge & Iron Company NV – NY Shares | | 207,850 |
| 1,575 | | Dover Corporation | | 152,050 |
| 1,775 | | G&K Services, Inc. – Class “A” | | 110,458 |
| 2,810 | | Generac Holdings, Inc. | | 159,158 |
| 925 | | IDEX Corporation | | 68,311 |
| 2,025 | | ITT Corporation | | 87,926 |
| 1,275 | | J.B. Hunt Transport Services, Inc. | | 98,557 |
| 1,175 | | Pentair, Ltd. | | 91,262 |
| 575 | | Roper Industries, Inc. | | 79,741 |
| 2,030 | | Ryder System, Inc. | | 149,773 |
| 1,325 | | Snap-on, Inc. | | 145,114 |
| 1,400 | * | TAL International Group, Inc. | | 80,290 |
| 925 | | Textainer Group Holdings, Ltd. | | 37,204 |
| 2,250 | * | United Rentals, Inc. | | 175,387 |
| | | | | 2,076,088 |
| | | Information Technology—12.4% | | |
| 3,875 | * | ARRIS Group, Inc. | | 94,414 |
| 400 | * | ATMI, Inc. | | 12,084 |
| 3,575 | | Avago Technologies, Ltd. | | 189,082 |
| 4,675 | * | Blackhawk Network Holdings, Inc. | | 118,090 |
| 3,075 | | CDW Corporation | | 71,832 |
| 1,400 | * | Fiserv, Inc. | | 82,670 |
| 5,050 | | Intersil Corporation – Class “A” | | 57,924 |
| 5,600 | | Mentor Graphics Corporation | | 134,792 |
| 2,025 | | Methode Electronics, Inc. | | 69,235 |
| 2,800 | | Microchip Technology, Inc. | | 125,300 |
| 3,925 | * | NeuStar, Inc. – Class “A” | | 195,701 |
| | | | | | | |
| | | | | | | | |
| | | | | | | |
| | | | | | | |
| Shares or | | | | | | | |
| Principal | | | | | | | |
| Amount | | Security | | | | | Value |
| | | Information Technology (continued) | | | | | |
| 5,050 | | Symantec Corporation | | | | | $ 119,079 |
| 7,775 | * | Take-Two Interactive Software, Inc. | | | | | 135,052 |
| 2,500 | | TE Connectivity, Ltd. | | | | | 137,775 |
| 4,275 | | Technology Select Sector SPDR Fund (ETF) | | | | | 152,788 |
| | | | | | | | 1,695,818 |
| | | Materials—6.5% | | | | | |
| 1,095 | | Cytec Industries, Inc. | | | | | 102,010 |
| 4,147 | | Freeport-McMoRan Copper & Gold, Inc. | | | | | 156,508 |
| 2,225 | | International Paper Company | | | | | 109,092 |
| 2,250 | | Methanex Corporation | | | | | 133,290 |
| 575 | | Praxair, Inc. | | | | | 74,767 |
| 1,305 | | Rock-Tenn Company – Class “A” | | | | | 137,038 |
| 850 | | Sigma-Aldrich Corporation | | | | | 79,908 |
| 825 | | Westlake Chemical Corporation | | | | | 100,708 |
| | | | | | | | 893,321 |
| | | Telecommunication Services—.6% | | | | | |
| 4,225 | | NTELOS Holdings Corporation | | | | | 85,472 |
| | | Utilities—2.8% | | | | | |
| 1,725 | | AGL Resources, Inc. | | | | | 81,472 |
| 2,250 | | Portland General Electric Company | | | | | 67,950 |
| 2,100 | | SCANA Corporation | | | | | 98,553 |
| 3,100 | | Wisconsin Energy Corporation | | | | | 128,154 |
| | | | | | | | 376,129 |
| Total Value of Common Stocks (cost $11,010,084) | | | | | 12,710,666 |
| | | SHORT-TERM U.S. GOVERNMENT | | | | | |
| | | OBLIGATIONS—3.7% | | | | | |
| $500M | | U.S. Treasury Bills, 0.019%, 2/20/2014 (cost $499,987) | 499,987 |
| Total Value of Investments (cost $11,510,071) | 96.9 | % | | | 13,210,653 |
| Other Assets, Less Liabilities | 3.1 | | | | 416,531 |
| Net Assets | | | 100.0 | % | | | $13,627,184 |
| | |
| * | Non-income producing |
| |
| Summary of Abbreviations: |
| ETF | Exchange Traded Fund |
| REIT | Real Estate Investment Trust |
Portfolio of Investments (continued)
OPPORTUNITY FUND
December 31, 2013
Accounting Standards Codification 820 established a three-tier hierarchy of inputs to establish a classification of fair value measurements for disclosure purposes. The three-tier hierarchy of inputs is summarized in the three broad Levels listed below:
Level 1 — Unadjusted quoted prices in active markets for identical securities that the Fund has the ability to access.
Level 2 — Observable inputs other than quoted prices included in Level 1 that are observable for the asset or liability, either directly or indirectly. These inputs may include quoted prices for the identical instrument on an inactive market, prices for similar instruments, interest rates, prepayment speeds, credit risk, yield curves, default rates and similar data.
Level 3 — Unobservable inputs for the asset or liability, to the extent relevant observable inputs are not available, representing the Fund’s own assumption about the assumptions a market participant would use in valuing the asset or liability, and would be based on the best information available.
The inputs methodology used for valuing securities are not necessarily an indication of the risk associated with investing in those securities. For example, amortized cost approximates the current fair value of a security, but since the value is not obtained from a quoted price in an active market, such securities are reflected as Level 2.
The following is a summary, by category of Level, of inputs used to value the Fund’s investments as of December 31, 2013:
| | | | | | | | | | | | |
| | | | Level 1 | | | Level 2 | | | Level 3 | | | Total |
| Common Stocks | | $ | 12,710,666 | | $ | — | | $ | — | | $ | 12,710,666 |
| Short-Term U.S. Government | | | | | | | | | | | | |
| Obligations | | | — | | | 499,987 | | | — | | | 499,987 |
| Total Investments in Securities* | | $ | 12,710,666 | | $ | 499,987 | | $ | — | | $ | 13,210,653 |
* The Portfolio of Investments provides information on the industry categorization for common stocks.
There were no transfers into or from Level 1 and Level 2 by the Fund for the year ended December 31, 2013. Transfers, if any, between Levels are recognized at the end of the reporting period.
| |
| 84 | See notes to financial statements |
Portfolio Manager’s Letter
SELECT GROWTH FUND
Dear Investor:
I’m pleased to send you the First Investors Life Select Growth Fund annual report for the year ended December 31, 2013. During the period, the Fund’s return on a net asset value basis was 33.15%, including dividends of 5 cents per share.
The Fund’s performance was heavily influenced by value drivers — stocks with the lowest price-to earnings and price-to-book value ratios — which showed the best returns in the market during the year. Though the Fund’s focus on companies exhibiting unexpected good business fundamentals that result in positive earnings revisions and positive earnings surprises was generally not rewarded with strong performance, the Fund’s attention to quality of earnings and reasonable valuation levels did positively impact performance.
From a sector perspective, the industrials and financials sectors delivered most of the positive performance relative to the benchmark during the year. Wabtec, a manufacturer of components for railcars, and regional airline Alaska Air Group both gained more than 70% for the year on strong revenues and solid margin trends. In financials, American Express returned almost 60% as transaction volumes continued to show strength, while U.S. Bancorp gained 30%.
On the negative side, the information technology and materials sectors proved challenging for the Fund during the year. Despite great returns in Alliance Data Systems and Western Digital, up 67% and 45%, respectively, negative moves in several holdings, including SolarWinds (down 35% on disappointing outlook despite great earnings results), and Nuance Communications (down 18% on generally disappointing results), generated significant underperformance. In the materials sector, disappointing results from fertilizer manufacturer CF Industries made the shares decline 6% before the position was sold mid-year.
While a strong 33.15% absolute return was slightly shy of the benchmark performance, we are encouraged by the strong business fundamentals most of the portfolio companies are delivering, combined with how investors are starting to reward these characteristics with better performance. We continue to believe our focus on high-quality companies where earnings will exceed market expectations is the key to generating excess returns over the long term.
Portfolio Manager’s Letter (continued)
SELECT GROWTH FUND
Thank you for placing your trust in First Investors. As always, we appreciate the opportunity to serve your investment needs.

Fund Expenses (unaudited)
SELECT GROWTH FUND
The examples below show the ongoing costs (in dollars) of investing in your Fund and will help you in comparing these costs with costs of other mutual funds. Please refer to page 2 for a detailed explanation of the information presented in these examples.
| | | |
| | Beginning | Ending | |
| | Account | Account | Expenses Paid |
| | Value | Value | During Period |
| | (7/1/13) | (12/31/13) | (7/1/13–12/31/13)* |
| Expense Examples | | | |
| Actual | $1,000.00 | $1,214.36 | $4.80 |
| Hypothetical | | | |
| (5% annual return before expenses) | $1,000.00 | $1,020.87 | $4.38 |
| |
| * | Expenses are equal to the annualized expense ratio of .86%, multiplied by the average account |
| value over the period, multiplied by 184/365 (to reflect the one-half year period). |
Portfolio Composition
BY SECTOR

|
| Portfolio holdings and allocations are subject to change. Percentages are as of December 31, 2013, |
| and are based on the total value of investments. |
Cumulative Performance Information (unaudited)
SELECT GROWTH FUND
Comparison of change in value of $10,000 investment in the First Investors Life Series Select Growth Fund and the Russell 3000 Growth Index.
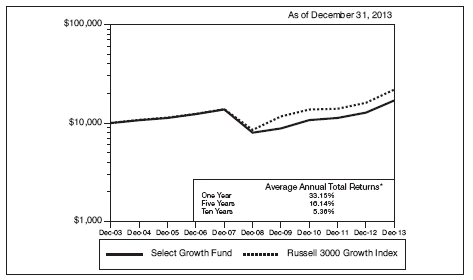
The graph compares a $10,000 investment in the First Investors Life Series Select Growth Fund beginning 12/31/03 with a theoretical investment in the Russell 3000 Growth Index (the “Index”). The Index is an unmanaged index that measures the performance of those Russell 3000 Index companies with higher price-to-book ratios and higher forecasted growth values (the Russell 3000 Index is an unmanaged index that measures the performance of the 3,000 largest U.S. companies based on total market capitalization). It is not possible to invest directly in this Index. In addition, the Index does not reflect fees and expenses associated with the active management of a mutual fund portfolio. For purposes of the graph and the accompanying table it is assumed that all dividends and distributions were reinvested.
* The Average Annual Total Return figures are for the periods ended 12/31/13.
The returns shown do not reflect any sales charges, since the Fund sells its shares solely to variable annuity and/or variable life insurance subaccounts at net asset value. The returns do not reflect the fees and charges that an individual would pay in connection with an investment in a variable annuity or life contract or policy. Results represent past performance and do not indicate future results. The graph and the returns shown do not reflect the deduction of taxes that an investor would pay on distributions or the redemption of fund shares. Investment return and principal value of an investment will fluctuate so that an investor’s shares, when redeemed, may be worth more or less than the original cost. Index figures are from Frank Russell and Company and all other figures are from First Investors Management Company, Inc.
Portfolio of Investments
SELECT GROWTH FUND
December 31, 2013
| | | | |
| | | | | |
| | | | |
| | | | |
| | | | |
| Shares | | Security | | Value |
| | | COMMON STOCKS—96.0% | | |
| | | Consumer Discretionary—19.9% | | |
| 14,400 | | BorgWarner, Inc. | | $ 805,104 |
| 28,730 | | Gentex Corporation | | 947,803 |
| 12,925 | | Home Depot, Inc. | | 1,064,244 |
| 1,040 | * | Priceline.com, Inc. | | 1,208,896 |
| 12,320 | | Starbucks Corporation | | 965,765 |
| 20,710 | | TJX Companies, Inc. | | 1,319,848 |
| 4,247 | | Whirlpool Corporation | | 666,184 |
| | | | | 6,977,844 |
| | | Consumer Staples—9.4% | | |
| 18,200 | | Coca-Cola Enterprises, Inc. | | 803,166 |
| 7,600 | | Energizer Holdings, Inc. | | 822,624 |
| 6,740 | | Kimberly-Clark Corporation | | 704,060 |
| 24,400 | | Kroger Company | | 964,532 |
| | | | | 3,294,382 |
| | | Energy—6.5% | | |
| 4,160 | | Chevron Corporation | | 519,626 |
| 4,480 | | ExxonMobil Corporation | | 453,376 |
| 6,820 | | Helmerich & Payne, Inc. | | 573,426 |
| 14,190 | | Valero Energy Corporation | | 715,176 |
| | | | | 2,261,604 |
| | | Financials—8.4% | | |
| 14,350 | | American Express Company | | 1,301,976 |
| 12,090 | | Discover Financial Services | | 676,435 |
| 5,200 | | Travelers Companies, Inc. | | 470,808 |
| 12,170 | | U.S. Bancorp | | 491,668 |
| | | | | 2,940,887 |
| | | Health Care—14.7% | | |
| 7,620 | * | Actavis, PLC | | 1,280,160 |
| 14,500 | * | Align Technology, Inc. | | 828,675 |
| 5,390 | | Johnson & Johnson | | 493,670 |
| 6,620 | | McKesson Corporation | | 1,068,468 |
| 10,420 | | Omnicare, Inc. | | 628,951 |
| 18,150 | | ResMed, Inc. | | 854,502 |
| | | | | 5,154,426 |
Portfolio of Investments (continued)
SELECT GROWTH FUND
December 31, 2013
| | | | | | | |
| | | | | | | | |
| | | | | | | |
| | | | | | | |
| | | | | | | |
| Shares | | Security | | | | | Value |
| | | Industrials—14.5% | | | | | |
| 10,130 | | Alaska Air Group, Inc. | | | | | $ 743,238 |
| 19,030 | | AMETEK, Inc. | | | | | 1,002,310 |
| 8,440 | | Boeing Company | | | | | 1,151,976 |
| 8,820 | | Rockwell Automation, Inc. | | | | | 1,042,171 |
| 15,390 | | Wabtec Corporation | | | | | 1,143,015 |
| | | | | | | | 5,082,710 |
| | | Information Technology—22.6% | | | | | |
| 5,130 | * | Alliance Data Systems Corporation | | | | | 1,348,831 |
| 15,380 | * | AOL, Inc. | | | | | 717,016 |
| 2,650 | | Apple, Inc. | | | | | 1,486,942 |
| 17,906 | * | CoreLogic, Inc. | | | | | 636,200 |
| 9,100 | | DST Systems, Inc. | | | | | 825,734 |
| 22,710 | | Hewlett-Packard Company | | | | | 635,426 |
| 8,030 | | SanDisk Corporation | | | | | 566,436 |
| 10,550 | * | VMware, Inc. – Class “A” | | | | | 946,440 |
| 8,692 | | Western Digital Corporation | | | | | 729,259 |
| | | | | | | | 7,892,284 |
| Total Value of Common Stocks (cost $23,492,036) | 96.0 | % | | | 33,604,137 |
| Other Assets, Less Liabilities | 4.0 | | | | 1,402,068 |
| Net Assets | | | 100.0 | % | | | $35,006,205 |
Accounting Standards Codification 820 established a three-tier hierarchy of inputs to establish a classification of fair value measurements for disclosure purposes. The three-tier hierarchy of inputs is summarized in the three broad Levels listed below:
Level 1 — Unadjusted quoted prices in active markets for identical securities that the Fund has the ability to access.
Level 2 — Observable inputs other than quoted prices included in Level 1 that are observable for the asset or liability, either directly or indirectly. These inputs may include quoted prices for the identical instrument on an inactive market, prices for similar instruments, interest rates, prepayment speeds, credit risk, yield curves, default rates and similar data.
Level 3 — Unobservable inputs for the asset or liability, to the extent relevant observable inputs are not available, representing the Fund’s own assumption about the assumptions a market participant would use in valuing the asset or liability, and would be based on the best information available.
The inputs methodology used for valuing securities are not necessarily an indication of the risk associated with investing in those securities. For example, amortized cost approximates the current fair value of a security, but since the value is not obtained from a quoted price in an active market, such securities are reflected as Level 2.
The following is a summary, by category of Level, of inputs used to value the Fund’s investments as of December 31, 2013:
| | | | | | | | | | | | |
| | | | Level 1 | | | Level 2 | | | Level 3 | | | Total |
| Common Stocks* | | $ | 33,604,137 | | $ | — | | $ | — | | $ | $ 33,604,137 |
* The Portfolio of Investments provides information on the industry categorization for common stocks.
There were no transfers into or from Level 1 and Level 2 by the Fund for the year ended December 31, 2013. Transfers, if any, between Levels are recognized at the end of the reporting period.
| |
| See notes to financial statements | 91 |
Portfolio Manager’s Letter
SPECIAL SITUATIONS FUND
Dear Investor:
I’m pleased to send you the First Investors Life Special Situations Fund annual report for the year ended December 31, 2013. During the period, the Fund’s return on a net asset value basis was 30.88%, including dividends of 34 cents per share and capital gains of $1.56 per share.
First Investors Management Company, Inc. assumed portfolio management responsibilities for the Fund effective September 23, 2013. We use a “bottom-up” approach to selecting investments that emphasizes fundamental research. We also have increased the number of holdings in the Fund to increase diversification. We will continue to invest primarily in common stocks of small-size companies that we believe are undervalued and that — generally — are experiencing a “special situation” that makes them undervalued. Developments creating special situations may include mergers, spin-offs, litigation resolution, new products, or management changes. As of period end, portfolio repositioning is well under way.
Fund performance for fiscal year 2013 was positive; however it did not keep up with the broader market, as stocks rallied in anticipation of another round of quantitative easing by the Federal Reserve. The Fund’s underperformance this year was exacerbated by poor stock selection.
The Fund’s absolute performance was mainly attributable to investments in consumer discretionary and information technology. Among our consumer discretionary stocks, Deckers Outdoor Corporation — which is best known for its UGG Australia brand of sheepskin boots — rose during the year on news that its retail sales were improving and its raw material costs were falling. Among our information technology stocks, TriQuint Semiconductor — which makes components for the consumer smartphone market — benefitted from strong demand for its radio frequency components used in 4G LTE networks.
On a relative basis, the Fund underperformed the Russell 2000 Index primarily due to stock selection in the health care and financial sectors. Among financial stocks, EZCORP Inc. — which operates pawn shops that rely on gold jewelry as collateral —fell as gold prices dropped 28% during the year. Among health care stocks, Centene Corporation — which provides Medicaid managed-care programs — fell on concerns that recent state contract wins would be less profitable than existing state contracts.
The Fund’s top-performing sector on a relative basis for the reporting period was consumer discretionary. Deckers Outdoor Corporation — which is discussed above —was the primary driver of outperformance. Live Nation Entertainment Inc. — which
manages concert venues and owns Ticketmaster — prevailed in an arbitration dispute in Europe. The company also reported stronger-than-expected concert attendance during the year.
Thank you for placing your trust in First Investors. As always, we appreciate the opportunity to serve your investment needs.

Fund Expenses (unaudited)
SPECIAL SITUATIONS FUND
The examples below show the ongoing costs (in dollars) of investing in your Fund and will help you in comparing these costs with costs of other mutual funds. Please refer to page 2 for a detailed explanation of the information presented in these examples.
| | | |
| | Beginning | Ending | |
| | Account | Account | Expenses Paid |
| | Value | Value | During Period |
| | (7/1/13) | (12/31/13) | (7/1/13–12/31/13)* |
| Expense Examples | | | |
| Actual | $1,000.00 | $1,179.86 | $4.51 |
| Hypothetical | | | |
| (5% annual return before expenses) | $1,000.00 | $1,021.08 | $4.18 |
| |
| * | Expenses are equal to the annualized expense ratio of .82%, multiplied by the average account |
| value over the period, multiplied by 184/365 (to reflect the one-half year period). |
Portfolio Composition
TOP TEN SECTORS

|
| Portfolio holdings and allocations are subject to change. Percentages are as of December 31, 2013, |
| and are based on the total value of investments. |
Cumulative Performance Information (unaudited)
SPECIAL SITUATIONS FUND
Comparison of change in value of $10,000 investment in the First Investors Life Series Special Situations Fund and the Russell 2000 Index.

The graph compares a $10,000 investment in the First Investors Life Series Special Situations Fund beginning 12/31/03 with a theoretical investment in the Russell 2000 Index (the “Index”). The Index is an unmanaged Index that measures the performance of the small-cap segment of the U.S. equity universe. The Index consists of the smallest 2,000 companies in the Russell 3000 Index (which represents approximately 98% of the investable U.S. equity market). It is not possible to invest directly in this Index. In addition, the Index does not reflect fees and expenses associated with the active management of a mutual fund portfolio. For purposes of the graph and the accompanying table, it is assumed that all dividend and distributions were reinvested.
* The Average Annual Total Return figures are for the periods ended 12/31/13.
The returns shown do not reflect any sales charges, since the Fund sells its shares solely to variable annuity and/or variable life insurance subaccounts at net asset value. The returns do not reflect the fees and charges that an individual would pay in connection with an investment in a variable annuity or life contract or policy. Results represent past performance and do not indicate future results. The graph and the returns shown do not reflect the deduction of taxes that an investor would pay on distributions or the redemption of fund shares. Investment return and principal value of an investment will fluctuate so that an investor’s shares, when redeemed, may be worth more or less than the original cost. Index figures are from Frank Russell and Company and all other figures are from First Investors Management Company, Inc.
Portfolio of Investments
SPECIAL SITUATIONS FUND
December 31, 2013
| | | | |
| | | | | |
| | | | |
| | | | |
| | | | |
| Shares | | Security | | Value |
| | | COMMON STOCKS—98.0% | | |
| | | Consumer Discretionary—18.8% | | |
| 12,100 | * | ARAMARK Holdings Corporation | | $ 317,262 |
| 77,025 | | Best Buy Company, Inc. | | 3,071,757 |
| 1,200 | * | Container Store Group, Inc. | | 55,932 |
| 77,600 | | CST Brands, Inc. | | 2,849,472 |
| 30,900 | | Dana Holding Corporation | | 606,258 |
| 26,450 | * | Deckers Outdoor Corporation | | 2,233,967 |
| 87,950 | * | Express, Inc. | | 1,642,026 |
| 94,550 | * | Fox Factory Holding Corporation | | 1,665,971 |
| 24,550 | | Hanesbrands, Inc. | | 1,725,128 |
| 45,400 | | Harman International Industries, Inc. | | 3,715,990 |
| 39,800 | * | Jarden Corporation | | 2,441,730 |
| 55,000 | * | Live Nation Entertainment, Inc. | | 1,086,800 |
| 110,500 | * | Orient-Express Hotels, Ltd. – Class “A” | | 1,669,655 |
| 26,500 | | Penske Automotive Group, Inc. | | 1,249,740 |
| 110,200 | | Pier 1 Imports, Inc. | | 2,543,416 |
| 7,900 | | PVH Corporation | | 1,074,558 |
| 88,500 | | Regal Entertainment Group – Class “A” | | 1,721,325 |
| 100,025 | | Ruth’s Hospitality Group, Inc. | | 1,421,355 |
| 42,075 | * | Starz – Class “A” | | 1,230,273 |
| 28,625 | | Tupperware Brands Corporation | | 2,705,921 |
| 1,000 | * | Vince Holding Corporation | | 30,670 |
| 33,050 | * | Visteon Corporation | | 2,706,465 |
| | | | | 37,765,671 |
| | | Consumer Staples—3.1% | | |
| 1,600 | * | Amira Nature Foods, Ltd. | | 25,216 |
| 29,275 | | Herbalife, Ltd. | | 2,303,942 |
| 20,050 | | Nu Skin Enterprises, Inc. – Class “A” | | 2,771,311 |
| 44,000 | | Pinnacle Foods, Inc. | | 1,208,240 |
| | | | | 6,308,709 |
| | | Energy—10.6% | | |
| 87,800 | * | Approach Resources, Inc. | | 1,693,662 |
| 41,875 | | Ensco, PLC – Class “A” | | 2,394,413 |
| 70,400 | * | Helix Energy Solutions Group, Inc. | | 1,631,872 |
| 122,062 | * | Matrix Service Company | | 2,986,857 |
| 52,900 | | Noble Corporation, PLC | | 1,982,163 |
| 265,225 | * | PetroQuest Energy, Inc. | | 1,145,772 |
| | | | |
| | | | | |
| | | | |
| | | | |
| | | | |
| Shares | | Security | | Value |
| | | Energy (continued) | | |
| 93,975 | * | Stone Energy Corporation | | $ 3,250,595 |
| 87,450 | | Western Refining, Inc. | | 3,708,755 |
| 39,175 | * | Whiting Petroleum Corporation | | 2,423,757 |
| | | | | 21,217,846 |
| | | Financials—17.5% | | |
| 60,000 | | American Financial, Inc. | | 3,463,200 |
| 6,400 | | Armada Hoffler Properties, Inc. (REIT) | | 59,392 |
| 44,075 | | Aspen Insurance Holdings, Ltd. | | 1,820,738 |
| 66,500 | | Berkshire Hills Bancorp, Inc. | | 1,813,455 |
| 49,650 | * | Brixmor Property Group, Inc. (REIT) | | 1,009,384 |
| 26,550 | | City National Corporation | | 2,103,291 |
| 66,500 | | Douglas Emmett, Inc. (REIT) | | 1,548,785 |
| 17,600 | | Federal Realty Investment Trust (REIT) | | 1,784,816 |
| 179,875 | | Financial Select Sector SPDR Fund (ETF) | | 3,932,068 |
| 77,500 | | FirstMerit Corporation | | 1,722,825 |
| 77,025 | | Montpelier Re Holdings, Ltd. | | 2,241,428 |
| 39,550 | | OceanFirst Financial Corporation | | 677,491 |
| 66,175 | | Oritani Financial Corporation | | 1,062,109 |
| 68,600 | | Protective Life Corporation | | 3,475,276 |
| 43,950 | | SPDR S&P Regional Banking (ETF) | | 1,784,810 |
| 200,175 | | Sterling Bancorp | | 2,676,340 |
| 101,125 | | TCF Financial Corporation | | 1,643,281 |
| 30,000 | | United Fire Group, Inc. | | 859,800 |
| 24,550 | | Waddell & Reed Financial, Inc. – Class “A” | | 1,598,696 |
| | | | | 35,277,185 |
| | | Health Care—7.2% | | |
| 50,625 | * | Centene Corporation | | 2,984,344 |
| 37,150 | * | Exactech, Inc. | | 882,684 |
| 34,700 | | Health Care Select Sector SPDR Fund (ETF) | | 1,923,768 |
| 25,075 | * | Life Technologies Corporation | | 1,900,685 |
| 44,000 | * | Masimo Corporation | | 1,286,120 |
| 44,075 | | Omnicare, Inc. | | 2,660,367 |
| 37,000 | | PerkinElmer, Inc. | | 1,525,510 |
| 14,300 | * | Salix Pharmaceuticals, Ltd. | | 1,286,142 |
| 700 | * | Surgical Care Affilates, Inc. | | 24,388 |
| | | | | 14,474,008 |
Portfolio of Investments (continued)
SPECIAL SITUATIONS FUND
December 31, 2013
| | | | |
| | | | | |
| | | | |
| | | | |
| | | | |
| Shares | | Security | | Value |
| | | Industrials—13.6% | | |
| 33,450 | | Altra Industrial Motion Corporation | | $ 1,144,659 |
| 19,350 | | Applied Industrial Technologies, Inc. | | 949,891 |
| 37,575 | | G&K Services, Inc. – Class “A” | | 2,338,292 |
| 54,900 | | Generac Holdings, Inc. | | 3,109,536 |
| 79,950 | | Industrial Select Sector SPDR Fund (ETF) | | 4,178,187 |
| 55,100 | | ITT Corporation | | 2,392,442 |
| 94,800 | | Kforce, Inc. | | 1,939,608 |
| 41,400 | * | Korn/Ferry International | | 1,081,368 |
| 1,500 | * | Navigator Holdings, Ltd. | | 40,410 |
| 4,500 | | Precision Castparts Corporation | | 1,211,850 |
| 52,900 | | Ryder System, Inc. | | 3,902,962 |
| 20,050 | | Snap-On, Inc. | | 2,195,876 |
| 37,850 | * | United Rentals, Inc. | | 2,950,408 |
| | | | | 27,435,489 |
| | | Information Technology—19.3% | | |
| 68,225 | * | Advanced Energy Industries, Inc. | | 1,559,623 |
| 46,300 | * | ATMI, Inc. | | 1,398,723 |
| 77,025 | | Avnet, Inc. | | 3,397,573 |
| 83,750 | * | Blackhawk Network Holdings, Inc. | | 2,115,525 |
| 88,600 | | CDW Corporation | | 2,069,696 |
| 55,000 | * | CommScope Holding Company, Inc. | | 1,040,600 |
| 19,800 | | IAC/InterActiveCorp | | 1,360,062 |
| 275,600 | | Intersil Corporation – Class “A” | | 3,161,132 |
| 91,025 | | Lender Processing Services, Inc. | | 3,402,514 |
| 93,100 | | Mentor Graphics Corporation | | 2,240,917 |
| 61,275 | | Methode Electronics, Inc. | | 2,094,992 |
| 55,100 | | Microchip Technology, Inc. | | 2,465,725 |
| 52,825 | * | Microsemi Corporation | | 1,317,984 |
| 61,925 | * | NeuStar, Inc. – Class “A” | | 3,087,581 |
| 84,650 | * | Progress Software Corporation | | 2,186,509 |
| 140,400 | * | Take-Two Interactive Software, Inc. | | 2,438,748 |
| 28,725 | | Technology Select Sector SPDR Fund (ETF) | | 1,026,632 |
| 153,625 | * | TriQuint Semiconductor, Inc. | | 1,281,233 |
| 26,500 | * | Verint Systems, Inc. | | 1,137,910 |
| | | | | 38,783,679 |
| | | | | | | |
| | | | | | | | |
| | | | | | | |
| | | | | | | |
| | | | | | | |
| Shares or | | | | | | | |
| Principal | | | | | | | |
| Amount | | Security | | | | | Value |
| | | Materials—4.0% | | | | | |
| 47,175 | | AptarGroup, Inc. | | | | | $ 3,198,937 |
| 22,000 | | Sensient Technologies Corporation | | | | | 1,067,440 |
| 31,225 | | Westlake Chemical Corporation | | | | | 3,811,636 |
| | | | | | | | 8,078,013 |
| | | Telecommunication Services—.7% | | | | | |
| 68,500 | | NTELOS Holdings Corporation | | | | | 1,385,755 |
| | | Utilities—3.2% | | | | | |
| 40,050 | | AGL Resources, Inc. | | | | | 1,891,561 |
| 40,000 | | Portland General Electric Company | | | | | 1,208,000 |
| 33,050 | | SCANA Corporation | | | | | 1,551,036 |
| 44,075 | | Wisconsin Energy Corporation | | | | | 1,822,061 |
| | | | | | | | 6,472,658 |
| Total Value of Common Stocks (cost $156,756,573) | | | | | 197,199,013 |
| | | SHORT TERM U.S. GOVERNMENT AGENCY | |
| | | OBLIGATIONS—1.2% | | | | | |
| $2,500M | | Federal Home Loan Bank, 0.03%, 1/3/2014 (cost $2,499,996) | 2,499,996 |
| | | SHORT-TERM U.S. GOVERNMENT | | | | | |
| | | OBLIGATIONS—.5% | | | | | |
| 1,000M | | U.S. Treasury Bills, (0.0075)%, 1/2/2014 (cost $1,000,000) | 1,000,000 |
| Total Value of Investments (cost $160,256,569) | 99.7 | % | | | 200,699,009 |
| Other Assets, Less Liabilities | .3 | | | | 515,115 |
| Net Assets | | | 100.0 | % | | | $201,214,124 |
| | |
| * | Non-income producing |
| |
| Summary of Abbreviations: |
| ETF | Exchange Traded Fund |
| REIT | Real Estate Investment Trust |
Portfolio of Investments (continued)
SPECIAL SITUATIONS FUND
December 31, 2013
Accounting Standards Codification 820 established a three-tier hierarchy of inputs to establish a classification of fair value measurements for disclosure purposes. The three-tier hierarchy of inputs is summarized in the three broad Levels listed below:
Level 1 — Unadjusted quoted prices in active markets for identical securities that the Fund has the ability to access.
Level 2 — Observable inputs other than quoted prices included in Level 1 that are observable for the asset or liability, either directly or indirectly. These inputs may include quoted prices for the identical instrument on an inactive market, prices for similar instruments, interest rates, prepayment speeds, credit risk, yield curves, default rates and similar data.
Level 3 — Unobservable inputs for the asset or liability, to the extent relevant observable inputs are not available, representing the Fund’s own assumption about the assumptions a market participant would use in valuing the asset or liability, and would be based on the best information available.
The inputs methodology used for valuing securities are not necessarily an indication of the risk associated with investing in those securities. For example, amortized cost approximates the current fair value of a security, but since the value is not obtained from a quoted price in an active market, such securities are reflected as Level 2.
The following is a summary, by category of Level, of inputs used to value the Fund’s investments as of December 31, 2013:
| | | | | | | | | | | |
| | | Level 1 | | | Level 2 | | | Level 3 | | | Total |
| Common Stocks | $ | 197,199,013 | | $ | — | | $ | — | | $ | 197,199,013 |
| Short-Term U.S. Government | | | | | | | | | | | |
| Agency Obligations | | — | | | 2,499,996 | | | — | | | 2,499,996 |
| Short-Term U.S. Government | | | | | | | | | | | |
| Obligations | | — | | | 1,000,000 | | | — | | | 1,000,000 |
| Total Investments in Securities* | $ | 197,199,013 | | $ | 3,499,996 | | $ | — | | $ | 200,699,009 |
* The Portfolio of Investments provides information on the industry categorization for common stocks.
There were no transfers into or from Level 1 and Level 2 by the Fund for the year ended December 31, 2013. Transfers, if any, between Levels are recognized at the end of the reporting period.
| |
| 100 | See notes to financial statements |
Portfolio Managers’ Letter
TARGET MATURITY 2015 FUND
Dear Investor:
We’re pleased to send you the First Investors Life Target Maturity 2015 Fund annual report for the year ended December 31, 2013. During the period, the Fund’s return on a net asset value basis was –0.20%, including dividends of 68 cents per share and capital gains of 22 cents per share.
The Fund’s investment objective is to seek a predictable compounded return consistent with preservation of capital for the investors who hold the Fund’s shares until maturity. To meet this objective, the Fund is fully invested in high-quality zero-coupon bonds that are due to mature on or around the Fund’s maturity date.
The primary factor affecting the performance of the Fund was the movement of two-year U.S. Treasury note interest rates. Because of the Federal Reserve’s commitment to keep short-term interest rates at their current very low levels, two-year Treasury rates increased by only 13 basis points (0.13%) from 0.25% to 0.38%. Consequently, almost all of the Fund’s return was due to the accretion of its zero-coupon holdings as they moved closer to maturity in 2015.
The Fund — which is nearing its target maturity date — outperformed its benchmark, the Citigroup U.S. Treasury/Government Sponsored Index, whose longer duration during a year that has seen a substantial rise in long-term interest rates, exposes it to greater risk.
Thank you for placing your trust in First Investors. As always, we appreciate the opportunity to serve your investment needs.
Fund Expenses (unaudited)
TARGET MATURITY 2015 FUND
The examples below show the ongoing costs (in dollars) of investing in your Fund and will help you in comparing these costs with costs of other mutual funds. Please refer to page 2 for a detailed explanation of the information presented in these examples.
| | | |
| | Beginning | Ending | |
| | Account | Account | Expenses Paid |
| | Value | Value | During Period |
| | (7/1/13) | (12/31/13) | (7/1/13–12/31/13)* |
| Expense Examples | | | |
| Actual | $1,000.00 | $1,002.73 | $3.89 |
| Hypothetical | | | |
| (5% annual return before expenses) | $1,000.00 | $1,021.33 | $3.92 |
| |
| * | Expenses are equal to the annualized expense ratio of .77%, multiplied by the average account |
| value over the period, multiplied by 184/365 (to reflect the one-half year period). Expenses paid |
| during the period are net of expenses waived. |
Portfolio Composition
BY SECTOR
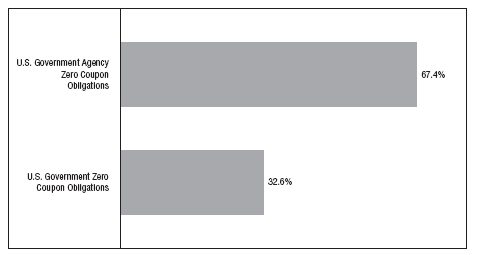
|
| Portfolio holdings and allocations are subject to change. Percentages are as of December 31, 2013, |
| and are based on the total value of investments. |
Cumulative Performance Information (unaudited)
TARGET MATURITY 2015 FUND
Comparison of change in value of $10,000 investment in the First Investors Life Series Target Maturity 2015 Fund and the Citigroup U.S. Treasury/Government Sponsored Index.

The graph compares a $10,000 investment in the First Investors Life Series Target Maturity 2015 Fund beginning 12/31/03 with a theoretical investment in the Citigroup U.S. Treasury/Government Sponsored Index (the “Index”). The Index is a market capitalization-weighted index that consists of debt issued by the U.S. Treasury and U.S. Government sponsored agencies. Every issue included in the Index is trader-priced, and the Index follows consistent and realistic availability limits, including only those securities with sufficient amounts outstanding. It is not possible to invest directly in this Index. In addition, the Index does not reflect fees and expenses associated with the active management of a mutual fund portfolio. For purposes of the graph and the accompanying table, it is assumed that all dividends and distributions were reinvested.
* The Average Annual Total Return figures are for the periods ended 12/31/13. During the periods shown, some of the expenses of the Fund were waived. If such expenses had been paid by the Fund, the Average Annual Total Returns for One Year, Five Years and Ten Years would have been (0.35%), 2.59% and 5.04%, respectively.
The returns shown do not reflect any sales charges, since the Fund sells its shares solely to variable annuity and/or variable life insurance subaccounts at net asset value. The returns do not reflect the fees and charges that an individual would pay in connection with an investment in a variable annuity or life contract or policy. Results represent past performance and do not indicate future results. The graph and the returns shown do not reflect the deduction of taxes that an investor would pay on distributions or the redemption of fund shares. Investment return and principal value of an investment will fluctuate so that an investor’s shares, when redeemed, may be worth more or less than the original cost. Index figures are from Citigroup and all other figures are from First Investors Management Company, Inc.
Portfolio of Investments
TARGET MATURITY 2015 FUND
December 31, 2013
| | | | | | | |
| | | | | | | | |
| | | | | | | |
| | | | | | | |
| Principal | | | | | Effective | | |
| Amount | | Security | | | Yield† | | Value |
| | | U.S. GOVERNMENT AGENCY ZERO COUPON | | |
| | | OBLIGATIONS-67.3% | | | | | |
| | | Agency For International Development – Israel: | | | | |
| $ 698M | | 9/15/2015 | | | 0.59 | % | $ 691,039 |
| 2,134M | | 11/15/2015 | | | 0.61 | | 2,109,805 |
| | | Fannie Mae: | | | | | |
| 243M | | 8/12/2015 | | | 0.41 | | 241,389 |
| 600M | | 9/23/2015 | | | 0.46 | | 595,214 |
| 2,358M | | 11/15/2015 | | | 0.50 | | 2,336,177 |
| 650M | | Federal Judiciary Office Building, 2/15/2015 | | | 1.04 | | 642,434 |
| | | Freddie Mac: | | | | | |
| 550M | | 3/15/2015 | | | 0.73 | | 545,182 |
| 930M | | 9/15/2015 | | | 0.78 | | 917,724 |
| 830M | | 9/15/2015 | | | 0.78 | | 819,019 |
| 210M | | Government Trust Certificate – Turkey Trust, 5/15/2015 | | 1.09 | | 206,875 |
| 200M | | International Bank for Reconstruction & | | | | | |
| | | Development, 2/15/2015 | | | 0.45 | | 198,988 |
| 2,727M | | Resolution Funding Corporation, 10/15/2015 | | | 0.50 | | 2,702,792 |
| 2,000M | | Tennessee Valley Authority, 11/1/2015 | | | 1.02 | | 1,963,158 |
| Total Value of U.S. Government Agency Zero | | | | | |
| Coupon Obligations (cost $12,829,873) | | | | | 13,969,796 |
| | | U.S. GOVERNMENT ZERO COUPON | | | | | |
| | | OBLIGATIONS-32.5% | | | | | |
| 6,790M | | U.S. Treasury Strips, 11/15/2015 (cost $6,087,270) | | 0.35 | | 6,746,184 |
| Total Value of Investments (cost $18,917,143) | 99.8 | % | | | 20,715,980 |
| Other Assets, Less Liabilities | .2 | | | | 39,918 |
| Net Assets | | | 100.0 | % | | | $ 20,755,898 |
| |
| † | The effective yields shown for the zero coupon obligations are the effective yields at |
| December 31, 2013. |
Accounting Standards Codification 820 established a three-tier hierarchy of inputs to establish a classification of fair value measurements for disclosure purposes. The three-tier hierarchy of inputs is summarized in the three broad Levels listed below:
Level 1 — Unadjusted quoted prices in active markets for identical securities that the Fund has the ability to access.
Level 2 — Observable inputs other than quoted prices included in Level 1 that are observable for the asset or liability, either directly or indirectly. These inputs may include quoted prices for the identical instrument on an inactive market, prices for similar instruments, interest rates, prepayment speeds, credit risk, yield curves, default rates and similar data.
Level 3 — Unobservable inputs for the asset or liability, to the extent relevant observable inputs are not available, representing the Fund’s own assumption about the assumptions a market participant would use in valuing the asset or liability, and would be based on the best information available.
The inputs methodology used for valuing securities are not necessarily an indication of the risk associated with investing in those securities. For example, amortized cost approximates the current fair value of a security, but since the value is not obtained from a quoted price in an active market, such securities are reflected as Level 2.
The following is a summary, by category of Level, of inputs used to value the Fund’s investments as of December 31, 2013:
| | | | | | | | | | | | |
| | | | Level 1 | | | Level 2 | | | Level 3 | | | Total |
| U.S. Government Agency Zero | | | | | | | | | | | | |
| Coupon Obligations | | $ | — | | $ | 13,969,796 | | $ | — | | $ | 13,969,796 |
| U.S. Government Zero Coupon | | | | | | | | | | | | |
| Obligations | | | — | | | 6,746,184 | | | — | | | 6,746,184 |
| Total Investments in Securities | | $ | — | | $ | 20,715,980 | | $ | — | | $ | 20,715,980 |
There were no transfers into or from Level 1 and Level 2 by the Fund for the year ended December 31, 2013. Transfers, if any, between Levels are recognized at the end of the reporting period.
| |
| See notes to financial statements | 105 |
Portfolio Managers’ Letter
TOTAL RETURN FUND
Dear Investor:
We’re pleased to send you the First Investors Life Total Return Fund annual report for the year ended December 31, 2013. The Fund’s return on a net asset value basis was 17.02%.
The Fund’s performance this year was driven in substantial part by its policy of allocating its assets among equities, fixed-income investments and cash. On average, the Fund maintained allocations of 55% in equities, 32% in fixed income, and 13% in cash.
Fixed Income
For 2013, the broad bond market returned –2.2%, its worst year since 1994. The market’s performance was the result of a substantial increase in long-term interest rates from historically low levels. The catalyst for higher rates was the Fed’s decision to begin to taper quantitative easing which, in turn, was due to an improved economic outlook. The benchmark ten year U.S. Treasury note yield rose from 1.76% to 3.03%, its highest level in two-and-a-half years. In contrast, short-term interest rates remained very low due to the Fed’s commitment to maintain the federal funds rate close to zero. Consequently, the two year Treasury note yield moved from 0.25% to 0.38% year-over-year.
Corporate bond spreads tightened substantially during the year. This contributed to positive returns of 7.4% and 5.7% for high yield bonds and floating rate securities, respectively. Tighter spreads also helped investment grade corporate bonds offset part of the impact of higher interest rates, resulting in a return for the sector of –1.5%. In contrast, and reflecting the large move higher in interest rates, the broad Treasury market lost 3.4% and 10+ year Treasuries lost 12.4%. Mortgage-backed securities returned –1.4% as spreads widened in response to the Fed’s decision to taper its bond buying program.
During the review period, the Fund had average bond and cash allocations of 36.1% and 3.6%, respectively. Sector allocations as a percent of Fund assets were relatively stable throughout the year: 25.2% in investment grade corporate bonds, 5.6% in MBS, 1.9% in agency securities, 1.8% in Treasury notes, and 1.6% in municipal bonds.
The Fund’s bond allocation returned –0.62% compared to –1.46% for the Merrill Lynch U.S. Broad Market Index. Security selection was a positive contributor to performance primarily due to the corporate bond holdings which were concentrated in BBB-rated, intermediate maturity securities. Sector weightings also added to the Fund’s performance primarily due to the Fund’s 6% overweight in investment grade corporate bonds and underweight in Treasuries.
Equities
During the year under review, strong equity performance and the market rally were driven by a combination of slow-but-gradually-improving economic conditions, accommodative monetary policy from the Federal Reserve (“the Fed”), low volatility and improving corporate fundamentals.
Investor sentiment also improved, with stocks benefitting from a positive re-rating of market-valuation metrics toward more normalized historical levels, which erased the bearish views toward stocks that prevailed after the 2008–2009 market correction.
Despite numerous challenges throughout the year — including worries over whether or not the Fed would “taper” its bond buying stimulus of the economy; disagreements between President Obama and the U.S. Congress on government budget and spending matters; and geopolitical conflicts around the globe — equity markets remained resilient and investors’ restored confidence barely wavered.
This year’s market results were broadly positive overall, with all market sectors, styles and sizes participating. Companies with strong profitability, earnings growth, solid balance sheets and strong, free cash-flows led results. Small and mid-cap stocks flourished, as investors felt comfortable adding more risk to their portfolios. Companies with the ability to pay and raise dividends and execute share repurchases of their own stocks were also rewarded. Mergers and acquisitions also continued to drive strong performance.
These conditions produced a solid year for the Fund, which continued to invest across all market capitalization segments, allocating 67% of equity holdings to large cap, 18% to midcap and 15% to small-cap stocks (ranges defined by Lipper) as of period end.
All equity segments produced positive returns, with the large-cap segment slightly exceeding the benchmark and small- and mid-cap segments outperforming strongly. Results were also buoyed by the Fund’s stock selection within consumer staples, industrials, basic materials, consumer discretionary and healthcare — all sectors in which the Fund was overweighted relative to the benchmark. The worst relative performing sector was financials.
In consumer staples, good stock selection and an overweighting of the sector added to strong relative performance for the year. Nu Skin Enterprises had an amazing year, as the stock was the Fund’s top-performing investment. The company reported a series of earnings and guidance increases driven by accelerated distributor momentum and the launch of a new weight-management product that greatly exceeded expectations.
Portfolio Managers’ Letter (continued)
TOTAL RETURN FUND
Herbalife had a great year for the Fund as well. The company posted a series of strong revenue and earnings growth quarters driven by robust core business fundamentals and the anticipation of some substantially accretive capital deployment. The stock also benefited from a significant short position at the beginning of the year by a high-profile investor, which turned into a short squeeze when results were better than expected, exacerbating the positive returns. The Fund also benefited from strong performance out of CVS as the drugstore chain utilized its strong free cash-flow to return a lot of capital to shareholders while also restructuring its integrated retail/pharmacy business.
In industrials, 3M, the diversified industrial company, delivered solid earnings throughout the year and also gave an upbeat outlook for growth in 2014 as many of the headwinds that the company had been facing are finally starting to recede. Generac, the maker of backup generators, again rewarded its shareholders this past year with strong earnings growth and a $5 special dividend as the company continued to benefit from the effects of Hurricane Sandy, which drove demand for standby generators and awareness for the need to have backup power solutions. TAL International continued to be a solid performer. Despite slowing fundamentals, TAL continued to put-up record earnings in 2013. These earnings, combined with a very high dividend yield, drove the stock to all-time highs.
In materials, LyondellBasell, the chemical and polymer maker, was up strongly, having delivered consistent, near-record profitability all year as the company benefited from its de-bottlenecking efforts and the continued low-cost of ethanol feedstock. Rock-Tenn, the containerboard manufacturer, was up as strong box prices and additional cost synergies from an M&A transaction led to strong earnings growth and cash generation. The Fund also benefited from strong performance out of International Paper, a manufacturer of containerboard and paper products, which also profited from strong containerboard prices and additional synergies from its Temple-Inland acquisition.
In consumer discretionary, Best Buy was up significantly for the year as management continued to execute on its turnaround plan that looks to boost cash flow, gross margins, comparable store sales, and significantly cut costs. CBS was up as well, as the company announced that it would be unlocking value by converting CBS’ outdoor advertising division into a Real Estate Investment Trust. GNC Holdings, the retailer of health and wellness products, was up strongly as its new gold loyalty card drove upside to earnings and projected earnings in 2014. The Fund also benefited from significant investment in Tier 1 auto suppliers as Delphi Automotive, BorgWarner, Harman International, TRW Automotive, and Lear Corp. all contributed to the Fund’s performance.
In health care, top holding Gilead Science delivered strong core business growth and received FDA approval for its potential blockbuster next-generation hepatitis C drug. Another name, Thermo Fisher, announced the acquisition of Life Technologies, which expands its presence in high-growth markets and provides the opportunity for meaningful synergies and earnings accretion. The Fund also benefited from strong performance out of Actavis as that company completed the acquisition of Warner Chilcott (also a Fund position) which brought significant cost, sales, and tax synergies.
On a relative basis, the Fund performed well, outperforming its benchmark. It did underperform the benchmark within the financial sector, where the fund remains underweight. With seemingly no end to quantitative easing and increased costs from greater regulation now looking permanent, financial-sector profits and growth prospects remain anemic, impacting these companies’ ability to raise dividends and repurchase stock.
Thank you for placing your trust in First Investors. As always, we appreciate the opportunity to serve your investment needs.
Fund Expenses (unaudited)
TOTAL RETURN FUND
The examples below show the ongoing costs (in dollars) of investing in your Fund and will help you in comparing these costs with costs of other mutual funds. Please refer to page 2 for a detailed explanation of the information presented in these examples.
| | | |
| | Beginning | Ending | |
| | Account | Account | Expenses Paid |
| | Value | Value | During Period |
| | (7/1/13) | (12/31/13) | (7/1/13–12/31/13)* |
| Expense Examples | | | |
| Actual | $1,000.00 | $1,098.30 | $9.89 |
| Hypothetical | | | |
| (5% annual return before expenses) | $1,000.00 | $1,015.78 | $9.50 |
| |
| * | Expenses are equal to the annualized expense ratio of 1.87%, multiplied by the average account |
| value over the period, multiplied by 184/365 (to reflect the one-half year period). |
Portfolio Composition
TOP TEN SECTORS
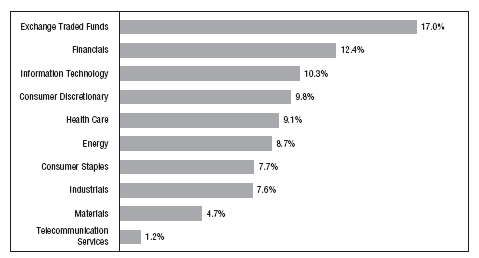
|
| Portfolio holdings and allocations are subject to change. Percentages are as of December 31, 2013, |
| and are based on the total value of investments. |
Cumulative Performance Information (unaudited)
TOTAL RETURN FUND
Comparison of change in value of $10,000 investment in the First Investors Life Series Total Return Fund, the Bank of America (“BofA”) Merrill Lynch U.S. Corporate, Government & Mortgage Index and the Standard & Poor’s 500 Index.
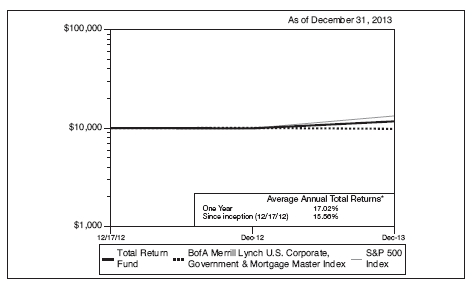
The graph compares a $10,000 investment in the First Investors Life Series Total Return Fund beginning 12/17/12 (commencement of operations) with theoretical investments in the BofA Merrill Lynch U.S. Corporate, Government & Mortgage Index and the Standard & Poor’s 500 Index (the “Indices”). The BofA Merrill Lynch U.S. Corporate, Government & Mortgage Index tracks the performance of U.S. dollar denominated investment grade debt publicly issued in the U.S. domestic market, including U.S. Treasuries, quasi-government, corporate and residential mortgage pass-through securities. The Standard & Poor’s 500 Index is an unmanaged capitalization-weighted index of 500 stocks designed to measure performance of the broad domestic economy through changes in the aggregate market value of such stocks, which represent all major industries. It is not possible to invest directly in these Indices. In addition, the Indices do not reflect fees and expenses associated with the active management of a mutual fund portfolio. For purposes of the graph and the accompanying table it is assumed that all dividends and distributions were reinvested.
* The Average Annual Total Return figures are for the periods ended 12/31/13.
The returns shown do not reflect any sales charges, since the Fund sells its shares solely to variable annuity and/or variable life insurance subaccounts at net asset value. The returns do not reflect the fees and charges that an individual would pay in connection with an investment in a variable annuity or life contract or policy. Results represent past performance and do not indicate future results. The graph and the returns shown do not reflect the deduction of taxes that an investor would pay on distributions or the redemption of fund shares. Investment return and principal value of an investment will fluctuate so that an investor’s shares, when redeemed, may be worth more or less than the original cost. Index figures are from Standard & Poor’s and all other figures are from First Investors Management Company, Inc.
Portfolio of Investments
TOTAL RETURN FUND
December 31, 2013
| | | | |
| | | | | |
| | | | |
| | | | |
| | | | |
| Shares | | Security | | Value |
| | | COMMON STOCKS—58.4% | | |
| | | Consumer Discretionary—9.9% | | |
| 1,000 | * | ARAMARK Holdings Corporation | | $ 26,220 |
| 1,800 | | Best Buy Company, Inc. | | 71,784 |
| 1,100 | | BorgWarner, Inc. | | 61,501 |
| 1,950 | | CBS Corporation – Class “B” | | 124,293 |
| 500 | | Dana Holding Corporation | | 9,810 |
| 1,400 | | Delphi Automotive, PLC | | 84,182 |
| 2,000 | * | Express, Inc. | | 37,340 |
| 2,300 | | Ford Motor Company | | 35,489 |
| 1,800 | | GNC Holdings, Inc. – Class “A” | | 105,210 |
| 1,000 | | Harman International Industries, Inc. | | 81,850 |
| 900 | | Home Depot, Inc. | | 74,106 |
| 1,200 | * | Jarden Corporation | | 73,620 |
| 1,400 | | L Brands, Inc. | | 86,590 |
| 500 | | Lear Corporation | | 40,485 |
| 350 | | McDonald’s Corporation | | 33,960 |
| 1,550 | | Newell Rubbermaid, Inc. | | 50,235 |
| 1,450 | * | Orient-Express Hotels, Ltd. – Class “A” | | 21,910 |
| 300 | | Penske Automotive Group, Inc. | | 14,148 |
| 2,100 | | Pier 1 Imports, Inc. | | 48,468 |
| 600 | * | Steiner Leisure, Ltd. | | 29,514 |
| 650 | * | TRW Automotive Holdings Corporation | | 48,353 |
| 350 | | Tupperware Brands Corporation | | 33,086 |
| 800 | | Walt Disney Company | | 61,120 |
| 1,050 | | Wyndham Worldwide Corporation | | 77,375 |
| | | | | 1,330,649 |
| | | Consumer Staples—6.0% | | |
| 2,000 | | Altria Group, Inc. | | 76,780 |
| 1,600 | * | Amira Nature Foods, Ltd. | | 25,216 |
| 1,150 | | Avon Products, Inc. | | 19,803 |
| 2,050 | | Coca-Cola Company | | 84,685 |
| 1,300 | | CVS Caremark Corporation | | 93,041 |
| 900 | | Herbalife, Ltd. | | 70,830 |
| 1,200 | | Nu Skin Enterprises, Inc. – Class “A” | | 165,864 |
| 500 | | PepsiCo, Inc. | | 41,470 |
| 1,300 | | Philip Morris International, Inc. | | 113,269 |
| 550 | | Procter & Gamble Company | | 44,776 |
| 800 | | Wal-Mart Stores, Inc. | | 62,952 |
| | | | | 798,686 |
| | | | |
| | | | |
| | | | | |
| | | | |
| | | | |
| | | | |
| Shares | | Security | | Value |
| | | Energy—6.1% | | |
| 550 | | Anadarko Petroleum Corporation | | $ 43,626 |
| 600 | | Chevron Corporation | | 74,946 |
| 1,100 | | ConocoPhillips | | 77,715 |
| 1,100 | | Devon Energy Corporation | | 68,057 |
| 1,050 | | Ensco, PLC – Class “A” | | 60,039 |
| 1,100 | | ExxonMobil Corporation | | 111,320 |
| 100 | | Hess Corporation | | 8,300 |
| 1,500 | | Marathon Oil Corporation | | 52,950 |
| 550 | | Marathon Petroleum Corporation | | 50,451 |
| 550 | | National Oilwell Varco, Inc. | | 43,741 |
| 2,200 | | Noble Corporation, PLC | | 82,434 |
| 450 | | Occidental Petroleum Corporation | | 42,795 |
| 450 | | Phillips 66 | | 34,709 |
| 200 | | Schlumberger, Ltd. | | 18,022 |
| 1,500 | | Suncor Energy, Inc. | | 52,575 |
| | | | | 821,680 |
| | | Financials—5.6% | | |
| 1,000 | | American Express Company | | 90,730 |
| 700 | | Ameriprise Financial, Inc. | | 80,535 |
| 500 | | Armada Hoffler Properties, Inc. (REIT) | | 4,640 |
| 2,100 | * | Brixmor Property Group, Inc. (REIT) | | 42,693 |
| 1,300 | | Discover Financial Services | | 72,735 |
| 500 | | Financial Select Sector SPDR Fund (ETF) | | 10,930 |
| 900 | | FirstMerit Corporation | | 20,007 |
| 625 | * | Health Insurance Innovations, Inc. – Class “A” | | 6,319 |
| 450 | | Invesco, Ltd. | | 16,380 |
| 1,900 | | JPMorgan Chase & Company | | 111,112 |
| 100 | | M&T Bank Corporation | | 11,642 |
| 500 | | MetLife, Inc. | | 26,960 |
| 400 | | Morgan Stanley | | 12,544 |
| 650 | | PNC Financial Services Group, Inc. | | 50,427 |
| 500 | | SPDR S&P Regional Banking (ETF) | | 20,305 |
| 1,700 | | Sunstone Hotel Investors, Inc. (REIT) | | 22,780 |
| 1,650 | | U.S. Bancorp | | 66,660 |
| 1,850 | | Urstadt Biddle Properties, Inc. – Class “A” (REIT) | | 34,132 |
| 1,150 | | Wells Fargo & Company | | 52,210 |
| | | | | 753,741 |
Portfolio of Investments (continued)
TOTAL RETURN FUND
December 31, 2013
| | | | |
| | | | | |
| | | | |
| | | | |
| | | | |
| Shares | | Security | | Value |
| | | Health Care—8.3% | | |
| 1,900 | | Abbott Laboratories | | $ 72,827 |
| 1,050 | | AbbVie, Inc. | | 55,450 |
| 650 | * | Actavis, PLC | | 109,200 |
| 550 | | Baxter International, Inc. | | 38,253 |
| 250 | | Covidien, PLC | | 17,025 |
| 950 | * | Express Scripts Holding Company | | 66,728 |
| 1,900 | * | Gilead Sciences, Inc. | | 142,785 |
| 1,300 | | Johnson & Johnson | | 119,067 |
| 18 | * | Mallinckrodt, PLC | | 941 |
| 450 | | McKesson Corporation | | 72,630 |
| 1,500 | | Merck & Company, Inc. | | 75,075 |
| 700 | | Omnicare, Inc. | | 42,252 |
| 3,800 | | Pfizer, Inc. | | 116,394 |
| 400 | * | Salix Pharmaceuticals, Ltd. | | 35,976 |
| 1,250 | | Thermo Fisher Scientific, Inc. | | 139,187 |
| 400 | | Zoetis, Inc. | | 13,076 |
| | | | | 1,116,866 |
| | | Industrials—7.7% | | |
| 800 | | 3M Company | | 112,200 |
| 300 | | ADT Corporation | | 12,141 |
| 1,200 | | Altra Industrial Motion Corporation | | 41,064 |
| 500 | * | Armstrong World Industries, Inc. | | 28,805 |
| 450 | | Caterpillar, Inc. | | 40,864 |
| 750 | | Chicago Bridge & Iron Company NV – NY Shares | | 62,355 |
| 800 | | Dover Corporation | | 77,232 |
| 1,150 | | Generac Holdings, Inc. | | 65,136 |
| 1,800 | | General Electric Company | | 50,454 |
| 1,050 | | Honeywell International, Inc. | | 95,939 |
| 450 | | ITT Corporation | | 19,539 |
| 50 | | Lockheed Martin Corporation | | 7,433 |
| 750 | | Pentair, Ltd. | | 58,253 |
| 150 | | Raytheon Company | | 13,605 |
| 600 | | Ryder System, Inc. | | 44,268 |
| 500 | | Snap-on, Inc. | | 54,760 |
| 1,050 | * | TAL International Group, Inc. | | 60,218 |
| 450 | | Textainer Group Holdings, Ltd. | | 18,099 |
| 1,000 | | Textron, Inc. | | 36,760 |
| 1,600 | | Tyco International, Ltd. | | 65,664 |
| 600 | | United Technologies Corporation | | 68,280 |
| | | | | 1,033,069 |
| | | | |
| | | | | |
| | | | |
| | | | |
| | | | |
| Shares | | Security | | Value |
| | | Information Technology—10.4% | | |
| 175 | | Apple, Inc. | | $ 98,194 |
| 1,650 | * | ARRIS Group, Inc. | | 40,202 |
| 1,400 | | Avago Technologies, Ltd. | | 74,046 |
| 1,200 | * | Blackhawk Network Holdings, Inc. | | 30,312 |
| 1,200 | | CDW Corporation | | 28,032 |
| 4,000 | | Cisco Systems, Inc. | | 89,800 |
| 450 | * | eBay, Inc. | | 24,700 |
| 3,700 | | EMC Corporation | | 93,055 |
| 2,000 | | Hewlett-Packard Company | | 55,960 |
| 2,700 | | Intel Corporation | | 70,092 |
| 650 | | International Business Machines Corporation | | 121,921 |
| 2,000 | | Intersil Corporation – Class “A” | | 22,940 |
| 2,700 | | Mentor Graphics Corporation | | 64,989 |
| 4,000 | | Microsoft Corporation | | 149,720 |
| 1,350 | * | NeuStar, Inc. – Class “A” | | 67,311 |
| 1,500 | | Oracle Corporation | | 57,390 |
| 600 | * | PTC, Inc. | | 21,234 |
| 1,350 | | QUALCOMM, Inc. | | 100,237 |
| 2,150 | | Symantec Corporation | | 50,697 |
| 2,300 | * | Take-Two Interactive Software, Inc. | | 39,951 |
| 1,050 | | TE Connectivity, Ltd. | | 57,866 |
| 1,000 | * | Yahoo!, Inc. | | 40,440 |
| | | | | 1,399,089 |
| | | Materials—3.1% | | |
| 800 | | Celanese Corporation – Series “A” | | 44,248 |
| 500 | | Cytec Industries, Inc. | | 46,580 |
| 2,000 | | Freeport-McMoRan Copper & Gold, Inc. | | 75,480 |
| 1,200 | | International Paper Company | | 58,836 |
| 1,100 | | LyondellBasell Industries NV – Class “A” | | 88,308 |
| 200 | | Praxair, Inc. | | 26,006 |
| 500 | | Rock-Tenn Company – Class “A” | | 52,505 |
| 700 | | RPM International, Inc. | | 29,057 |
| | | | | 421,020 |
| | | Telecommunication Services—1.2% | | |
| 2,050 | | AT&T, Inc. | | 72,078 |
| 1,850 | | Verizon Communications, Inc. | | 90,909 |
| | | | | 162,987 |
Portfolio of Investments (continued)
TOTAL RETURN FUND
December 31, 2013
| | | | |
| | | | | |
| | | | |
| | | | |
| Shares or | | | | |
| Principal | | | | |
| Amount | | Security | | Value |
| | | Utilities—.1% | | |
| 200 | | Atmos Energy Corporation | | $ 9,084 |
| Total Value of Common Stocks (cost $6,920,001) | | 7,846,871 |
| | | EXCHANGE TRADED FUNDS—17.2% | | |
| | | Intermediate Term Bond Fund—15.6% | | |
| 26,131 | | Vanquard Total Bond Market ETF | | 2,090,219 |
| | | Municipal Bond Fund—1.6% | | |
| 2,100 | | iShares National AMT – Free Muni Bond ETF | | 217,854 |
| Total Value of Exchange Traded Funds (cost $2,362,532) | | 2,308,073 |
| | | CORPORATE BONDS—14.0% | | |
| | | Chemicals—.9% | | |
| $100M | | CF Industries, Inc., 7.125%, 5/1/2020 | | 117,367 |
| | | Energy—2.7% | | |
| 100M | | Canadian Oil Sands, Ltd., 7.75%, 5/15/2019 (a) | | 120,022 |
| 100M | | Suncor Energy, Inc., 6.1%, 6/1/2018 | | 115,709 |
| 100M | | Valero Energy Corp., 9.375%, 3/15/2019 | | 129,017 |
| | | | | 364,748 |
| | | Financial Services—2.6% | | |
| 100M | | American Express Co., 7%, 3/19/2018 | | 119,596 |
| 100M | | Ford Motor Credit Co., LLC, 8.125%, 1/15/2020 | | 125,199 |
| 100M | | General Electric Capital Corp., 5.625%, 9/15/2017 | | 113,856 |
| | | | | 358,651 |
| | | Financials—4.3% | | |
| 100M | | Bank of America Corp., 5.65%, 5/1/2018 | | 113,938 |
| 100M | | Citigroup, Inc., 6.125%, 11/21/2017 | | 115,372 |
| 100M | | Goldman Sachs Group, Inc., 6.15%, 4/1/2018 | | 114,776 |
| 100M | | JPMorgan Chase & Co., 6%, 1/15/2018 | | 115,252 |
| 100M | | Morgan Stanley, 6.625%, 4/1/2018 | | 117,120 |
| | | | | 576,458 |
| | | Food/Beverage/Tobacco—1.0% | | |
| 100M | | Altria Group, Inc., 9.7%, 11/10/2018 | | 131,573 |
| | | Healthcare—.9% | | |
| 100M | | Biogen IDEC, Inc., 6.875%, 3/1/2018 | | 118,003 |
| | | | | | | |
| | | | | | | | |
| | | | | | | |
| | | | | | | |
| Principal | | | | | | | |
| Amount | | Security | | | | | Value |
| | | Media-Broadcasting—.8% | | | | | |
| $100M | | Comcast Corp., 5.15%, 3/1/2020 | | | | | $ 111,706 |
| | | Metals/Mining—.8% | | | | | |
| 100M | | Newmont Mining Corp., 5.125%, 10/1/2019 | | | | | 103,838 |
| Total Value of Corporate Bonds (cost $1,888,139) | | | | | 1,882,344 |
| | | U.S. GOVERNMENT AGENCY | | | | | |
| | | OBLIGATIONS—2.2% | | | | | |
| 200M | | Fannie Mae, 1.625%, 11/27/2018 | | | | | 198,564 |
| 100M | | Federal Farm Credit Bank, 2.79%, 11/12/2020 | 99,003 |
| Total Value of U.S. Government Agency Obligations (cost $298,060) | 297,567 |
| | | SHORT-TERM U.S. GOVERNMENT | | | | | |
| | | OBLIGATIONS—6.3% | | | | | |
| | | U.S. Treasury Bills: | | | | | |
| 300M | | (0.0075)%, 1/2/2014 | | | | | 300,000 |
| 550M | | 0.023%, 1/9/2014 | | | | | 549,997 |
| Total Value of Short-Term U.S. Government Obligations (cost $849,997) | 849,997 |
| | | SHORT-TERM U.S. GOVERNMENT AGENCY | |
| | | OBLIGATIONS—3.0% | | | | | |
| 400M | | Federal Home Loan Bank, 0.049%, 2/7/2014 (cost $399,980) | 399,980 |
| Total Value of Investments (cost $12,718,709) | 101.1 | % | | | 13,584,832 |
| Excess of Liabilities Over Other Assets | (1.1 | ) | | | (142,537) |
| Net Assets | | | 100.0 | % | | | $13,442,295 |
| | |
| * | Non-income producing |
| (a) | Security exempt from registration under Rule 144A of the Securities Act of 1933 (see Note 5). |
| |
| Summary of Abbreviations: |
| AMT | Alternative Minimum Tax |
| ETF | Exchange Traded Fund |
| REIT | Real Estate Investment Trust |
Portfolio of Investments (continued)
TOTAL RETURN FUND
December 31, 2013
Accounting Standards Codification 820 established a three-tier hierarchy of inputs to establish a classification of fair value measurements for disclosure purposes. The three-tier hierarchy of inputs is summarized in the three broad Levels listed below:
Level 1 — Unadjusted quoted prices in active markets for identical securities that the Fund has the ability to access.
Level 2 — Observable inputs other than quoted prices included in Level 1 that are observable for the asset or liability, either directly or indirectly. These inputs may include quoted prices for the identical instrument on an inactive market, prices for similar instruments, interest rates, prepayment speeds, credit risk, yield curves, default rates and similar data.
Level 3 — Unobservable inputs for the asset or liability, to the extent relevant observable inputs are not available, representing the Fund’s own assumption about the assumptions a market participant would use in valuing the asset or liability, and would be based on the best information available.
The inputs methodology used for valuing securities are not necessarily an indication of the risk associated with investing in those securities. For example, amortized cost approximates the current fair value of a security, but since the value is not obtained from a quoted price in an active market, such securities are reflected as Level 2.
The following is a summary, by category of Level, of inputs used to value the Fund’s investments as of December 31, 2013:
| | | | | | | | | | | | |
| | | | Level 1 | | | Level 2 | | | Level 3 | | | Total |
| Common Stocks | | $ | 7,846,871 | | $ | — | | $ | — | | $ | 7,846,871 |
| Exchange Traded Funds | | | 2,308,073 | | | — | | | — | | | 2,308,073 |
| Corporate Bonds | | | — | | | 1,882,344 | | | — | | | 1,882,344 |
| U.S. Government Agency | | | | | | | | | | | | |
| Obligations | | | — | | | 297,567 | | | — | | | 297,567 |
| Short-Term U.S. Government | | | | | | | | | | | | |
| Obligations | | | — | | | 849,997 | | | — | | | 849,997 |
| Short-Term U.S. Government | | | | | | | | | | | | |
| Agency Obligations | | | — | | | 399,980 | | | — | | | 399,980 |
| Total Investments in Securities* | | $ | 10,154,944 | | $ | 3,429,888 | | $ | — | | $ | 13,584,832 |
* The Portfolio of Investments provides information on the industry categorization for common stocks, exchange traded funds and corporate bonds.
There were no transfers into or from Level 1 and Level 2 by the Fund for the year ended December 31, 2013. Transfers, if any, between Levels are recognized at the end of the reporting period.
| |
| 118 | See notes to financial statements |
|
| This page left intentionally blank. |
Statements of Assets and Liabilities
FIRST INVESTORS LIFE SERIES FUNDS
December 31, 2013
| | | | | | | | | | | | | | | | | | |
| | | | |
| | | CASH | | | EQUITY | | | FUND FOR | | | | | | GROWTH & | | | | |
| | | MANAGEMENT | | | INCOME | | | INCOME | | | GOVERNMENT | | | INCOME | | | INTERNATIONAL | |
| Assets | | | | | | | | | | | | | | | | | | |
| Investments in securities: | | | | | | | | | | | | | | | | | | |
| At identified cost | $ | 12,689,358 | | $ | 70,933,196 | | $ | 87,839,516 | | $ | 29,071,724 | | $ | 271,609,668 | | $ | 91,659,782 | |
| |
| At value (Note 1A) | $ | 12,689,358 | | $ | 98,555,151 | | $ | 90,400,880 | | $ | 28,994,419 | | $ | 473,680,050 | | $ | 127,320,440 | |
| | | | | | | | | | | | | | | | | | | |
| Cash | | 254,325 | | | 572,902 | | | 4,786,967 | | | 1,684,986 | | | 1,796,207 | | | 755,909 | |
| Receivables: | | | | | | | | | | | | | | | | | | |
| Investment securities sold | | 1,199,932 | | | — | | | 431,885 | | | 590,437 | | | — | | | — | |
| Interest and dividends | | 41 | | | 163,412 | | | 1,266,163 | | | 113,968 | | | 456,627 | | | 169,597 | |
| Trust shares sold | | 229,682 | | | 377,690 | | | 356,537 | | | 87,068 | | | 863,985 | | | 372,099 | |
| Other assets | | 566 | | | 4,162 | | | 4,280 | | | 1,543 | | | 20,098 | | | 5,962 | |
| |
| Total Assets | | 14,373,904 | | | 99,673,317 | | | 97,246,712 | | | 31,472,421 | | | 476,816,967 | | | 128,624,007 | |
| |
| Liabilities | | | | | | | | | | | | | | | | | | |
| Payables: | | | | | | | | | | | | | | | | | | |
| Investment securities purchased | | — | | | 932,568 | | | 1,948,487 | | | 956,531 | | | 1,976,784 | | | — | |
| Trust shares redeemed | | 3,407,887 | | | 32,845 | | | 23,216 | | | 18 | | | 86,500 | | | 15,735 | |
| Accrued advisory fees | | — | | | 62,861 | | | 61,694 | | | 15,991 | | | 297,305 | | | 82,068 | |
| Accrued expenses | | 13,857 | | | 16,626 | | | 24,994 | | | 17,201 | | | 33,784 | | | 44,798 | |
| |
| Total Liabilities | | 3,421,744 | | | 1,044,900 | | | 2,058,391 | | | 989,741 | | | 2,394,373 | | | 142,601 | |
| |
| Net Assets | $ | 10,952,160 | | $ | 98,628,417 | | $ | 95,188,321 | | $ | 30,482,680 | | $ | 474,422,594 | | $ | 128,481,406 | |
| |
| Net Assets Consist of: | | | | | | | | | | | | | | | | | | |
| Capital paid in | $ | 10,952,160 | | $ | 65,251,228 | | $ | 108,461,687 | | $ | 30,561,520 | | $ | 265,182,193 | | $ | 106,107,075 | |
| Undistributed net investment income | | — | | | 1,692,587 | | | 4,675,623 | | | 784,013 | | | 5,573,481 | | | 1,477,791 | |
| Accumulated net realized gain (loss) on investments, | | | | | | | | | | | | | | | | | | |
| futures contracts and foreign currency transactions | | — | | | 4,062,647 | | | (20,510,353 | ) | | (785,548 | ) | | 1,596,538 | | | (14,769,831 | ) |
| Net unrealized appreciation (depreciation) in value | | | | | | | | | | | | | | | | | | |
| of investments and foreign currency transactions | | — | | | 27,621,955 | | | 2,561,364 | | | (77,305 | ) | | 202,070,382 | | | 35,666,371 | |
| |
| Total | $ | 10,952,160 | | $ | 98,628,417 | | $ | 95,188,321 | | $ | 30,482,680 | | $ | 474,422,594 | | $ | 128,481,406 | |
| |
| Shares of beneficial interest outstanding (Note 2) | | 10,952,160 | | | 4,720,663 | | | 13,925,151 | | | 3,077,868 | | | 10,568,925 | | | 6,230,697 | |
| |
| Net asset value, offering and redemption price per share — | | | | | | | | | | | | | | | | | | |
| (Net assets divided by shares outstanding) | $ | 1.00 | | $ | 20.89 | | $ | 6.84 | | $ | 9.90 | | $ | 44.89 | | $ | 20.62 | |
| | |
| 120 | See notes to financial statements | 121 |
Statements of Assets and Liabilities
FIRST INVESTORS LIFE SERIES FUNDS
December 31, 2013
| | | | | | | | | | | | | | | | | | |
| | | | |
| | | INVESTMENT | | | | | | SELECT | | | SPECIAL | | | TARGET | | | TOTAL | |
| | | GRADE | | | OPPORTUNITY | | | GROWTH | | | SITUATIONS | | MATURITY 2015 | | | RETURN | |
| Assets | | | | | | | | | | | | | | | | | | |
| Investments in securities: | | | | | | | | | | | | | | | | | | |
| At identified cost | $ | 54,133,975 | | $ | 11,510,071 | | $ | 23,492,036 | | $ | 160,256,569 | | $ | 18,917,143 | | $ | 12,718,709 | |
| |
| At value (Note 1A) | $ | 56,396,119 | | $ | 13,210,653 | | $ | 33,604,137 | | $ | 200,699,009 | | $ | 20,715,980 | | $ | 13,584,832 | |
| |
| Cash | | 1,203,269 | | | 650,863 | | | 1,172,457 | | | 667,820 | | | 73,931 | | | 281,904 | |
| Receivables: | | | | | | | | | | | | | | | | | | |
| Investment securities sold | | — | | | — | | | — | | | — | | | — | | | — | |
| Interest and dividends | | 270,923 | | | 6,728 | | | 15,752 | | | 133,488 | | | — | | | 35,085 | |
| Trust shares sold | | 736,391 | | | 648,511 | | | 259,779 | | | 191,380 | | | 2,843 | | | 424,356 | |
| Other assets | | 2,655 | | | 327 | | | 1,397 | | | 9,155 | | | 1,032 | | | 368 | |
| |
| Total Assets | | 58,609,357 | | | 14,517,082 | | | 35,053,522 | | | 201,700,852 | | | 20,793,786 | | | 14,326,545 | |
| |
| Liabilities | | | | | | | | | | | | | | | | | | |
| Payables: | | | | | | | | | | | | | | | | | | |
| Investment securities purchased | | — | | | 864,152 | | | — | | | 282,528 | | | — | | | 860,626 | |
| Trust shares redeemed | | 1,858 | | | 258 | | | 11,831 | | | 48,233 | | | 11,697 | | | 240 | |
| Accrued advisory fees | | 30,384 | | | 7,567 | | | 22,265 | | | 128,389 | | | 10,978 | | | 7,671 | |
| Accrued expenses | | 13,713 | | | 17,921 | | | 13,221 | | | 27,578 | | | 15,213 | | | 15,713 | |
| |
| Total Liabilities | | 45,955 | | | 889,898 | | | 47,317 | | | 486,728 | | | 37,888 | | | 884,250 | |
| |
| Net Assets | $ | 58,563,402 | | $ | 13,627,184 | | $ | 35,006,205 | | $ | 201,214,124 | | $ | 20,755,898 | | $ | 13,442,295 | |
| |
| Net Assets Consist of: | | | | | | | | | | | | | | | | | | |
| Capital paid in | $ | 57,134,358 | | $ | 11,927,723 | | $ | 24,727,662 | | $ | 126,040,442 | | $ | 17,616,551 | | $ | 12,573,735 | |
| Undistributed net investment income | | 1,682,913 | | | — | | | 125,763 | | | 948,774 | | | 961,274 | | | 9,540 | |
| Accumulated net realized gain (loss) on investments and | | | | | | | | | | | | | | | | | | |
| futures contracts | | (2,516,013 | ) | | (1,121 | ) | | 40,679 | | | 33,782,468 | | | 379,236 | | | (7,103 | ) |
| Net unrealized appreciation in value of investments | | 2,262,144 | | | 1,700,582 | | | 10,112,101 | | | 40,442,440 | | | 1,798,837 | | | 866,123 | |
| |
| Total | $ | 58,563,402 | | $ | 13,627,184 | | $ | 35,006,205 | | $ | 201,214,124 | | $ | 20,755,898 | | $ | 13,442,295 | |
| |
| Shares of beneficial interest outstanding (Note 2) | | 5,310,681 | | | 967,745 | | | 2,758,491 | | | 5,162,844 | | | 1,415,360 | | | 1,157,305 | |
| |
| Net asset value, offering and redemption price per share — | | | | | | | | | | | | | | | | | | |
| (Net assets divided by shares outstanding) | $ | 11.03 | | $ | 14.08 | | $ | 12.69 | | $ | 38.97 | | $ | 14.66 | | $ | 11.62 | |
| | |
| 122 | See notes to financial statements | 123 |
Statements of Operations
FIRST INVESTORS LIFE SERIES FUNDS
Year Ended December 31, 2013
| | | | | | | | | | | | | | | | | | |
| | | | |
| | | CASH | | | EQUITY | | | FUND FOR | | | | | | GROWTH & | | | | |
| | | MANAGEMENT | | | INCOME | | | INCOME | | | GOVERNMENT | | | INCOME | | | INTERNATIONAL | |
| Investment Income | | | |
| Income: | | | | | | | | | | | | | | | | | | |
| Interest | $ | 10,167 | | $ | 975 | | $ | 5,524,483 | | $ | 781,801 | | $ | 218 | | $ | 394 | |
| Dividends | | — | | | 2,394,432 | (a) | | — | | | — | | | 8,863,443 | (b) | | 2,679,382 | (c) |
| |
| Total income | | 10,167 | | | 2,395,407 | | | 5,524,483 | | | 781,801 | | | 8,863,661 | | | 2,679,776 | |
| | | | | | | | | | | | | | | | | | |
| Expenses (Notes 1 and 4): | | | | | | | | | | | | | | | | | | |
| Advisory fees | | 80,099 | | | 644,438 | | | 663,104 | | | 233,375 | | | 3,066,722 | | | 944,557 | |
| Professional fees | | 12,690 | | | 24,855 | | | 28,851 | | | 17,198 | | | 99,068 | | | 40,723 | |
| Custodian fees and expenses | | 5,112 | | | 6,391 | | | 18,229 | | | 8,885 | | | 22,347 | | | 116,137 | |
| Reports and notices to shareholders | | 3,849 | | | 9,494 | | | 12,291 | | | 4,821 | | | 36,977 | | | 14,462 | |
| Registration fees | | 250 | | | 383 | | | 1,478 | | | 1,378 | | | 1,378 | | | 1,378 | |
| Trustees’ fees | | 523 | | | 4,185 | | | 4,400 | | | 1,582 | | | 20,223 | | | 6,334 | |
| Other expenses | | 3,125 | | | 12,823 | | | 50,723 | | | 15,043 | | | 41,619 | | | 36,636 | |
| |
| Total expenses | | 105,648 | | | 702,569 | | | 779,076 | | | 282,282 | | | 3,288,334 | | | 1,160,227 | |
| Less: Expenses waived and/or assumed | | (95,481 | ) | | — | | | — | | | (46,675 | ) | | — | | | — | |
| Expenses paid indirectly | | — | | | (614 | ) | | — | | | — | | | (2,964 | ) | | — | |
| |
| Net expenses | | 10,167 | | | 701,955 | | | 779,076 | | | 235,607 | | | 3,285,370 | | | 1,160,227 | |
| |
| Net investment income | | — | | | 1,693,452 | | | 4,745,407 | | | 546,194 | | | 5,578,291 | | | 1,519,549 | |
| |
| Realized and Unrealized Gain (Loss) on Investments, | | | | | | | | | | | | | | | | | | |
| Futures Contracts and Foreign Currency | | | | | | | | | | | | | | | | | | |
| Transactions (Note 3): | | | | | | | | | | | | | | | | | | |
| Net realized gain (loss) on: | | | | | | | | | | | | | | | | | | |
| Investments | | — | | | 5,331,448 | | | 1,988,045 | | | (270,049 | ) | | 21,689,011 | | | 6,105,297 | |
| Futures contracts | | — | | | — | | | — | | | (1,851 | ) | | — | | | — | |
| Foreign currency transactions | | — | | | — | | | — | | | — | | | — | | | (41,014 | ) |
| |
| Net realized gain (loss) on investments, futures contracts | | | | | | | | | | | | | | | | | | |
| and foreign currency transactions | | — | | | 5,331,448 | | | 1,988,045 | | | (271,900 | ) | | 21,689,011 | | | 6,064,283 | |
| | | | | | | | | | | | | | | | | | | |
| Net unrealized appreciation (depreciation) on investments | | — | | | 15,610,770 | | | (932,205 | ) | | (1,050,919 | ) | | 105,622,192 | | | 623,668 | |
| |
| Net gain (loss) on investments, futures contracts and | | | | | | | | | | | | | | | | | | |
| foreign currency transactions | | — | | | 20,942,218 | | | 1,055,840 | | | (1,322,819 | ) | | 127,311,203 | | | 6,687,951 | |
| | | | | | | | | | | | | | | | | | | |
| Net Increase (Decrease) in Net Assets Resulting | | | | | | | | | | | | | | | | | | |
| from Operations | $ | — | | $ | 22,635,670 | | $ | 5,801,247 | | $ | (776,625 | ) | $ | 132,889,494 | | $ | 8,207,500 | |
(a) Net of $9,809 foreign taxes withheld
(b) Net of $13,804 foreign taxes withheld
(c) Net of $198,728 foreign taxes withheld
| | |
| 124 | See notes to financial statements | 125 |
Statements of Operations
FIRST INVESTORS LIFE SERIES FUNDS
Year Ended December 31, 2013
| | | | | | | | | | | | | | | | | |
| | | | |
| | | INVESTMENT | | | | | | SELECT | | SPECIAL | | | TARGET | | | TOTAL | |
| | | GRADE | | | OPPORTUNITY | | | GROWTH | | SITUATIONS | | | MATURITY 2015 | | | RETURN | |
| Investment Income | | | |
| Income: | | | | | | | | | | | | | | | | | |
| Interest | $ | 2,384,647 | | $ | — | | $ | — | $ | 2,825 | | $ | 1,128,676 | | $ | 7,115 | |
| Dividends | | — | | | 72,955 | (d) | | 372,533 | | 2,404,720 | | | — | | | 108,306 | (e) |
| |
| Total income | | 2,384,647 | | | 72,955 | | | 372,533 | | 2,407,545 | | | 1,128,676 | | | 115,421 | |
| |
| Expenses (Notes 1 and 4): | | | | | | | | | | | | | | | | | |
| Advisory fees | | 427,668 | | | 36,842 | | | 217,930 | | 1,339,551 | | | 168,363 | | | 41,230 | |
| Professional fees | | 17,871 | | | 49,692 | | | 16,416 | | 51,535 | | | 14,820 | | | 49,748 | |
| Custodian fees and expenses | | 9,330 | | | 17,045 | | | 1,752 | | 15,477 | | | 5,025 | | | 7,553 | |
| Reports and notices to shareholders | | 7,859 | | | 2,043 | | | 4,096 | | 19,917 | | | 4,399 | | | 2,200 | |
| Registration fees | | 1,378 | | | 1,300 | | | 250 | | 1,450 | | | 233 | | | 1,300 | |
| Trustees’ fees | | 2,877 | | | 180 | | | 1,402 | | 8,760 | | | 1,157 | | | 206 | |
| Other expenses | | 17,687 | | | 4,810 | | | 4,922 | | 22,405 | | | 7,071 | | | 3,642 | |
| |
| Total expenses | | 484,670 | | | 111,912 | | | 246,768 | | 1,459,095 | | | 201,068 | | | 105,879 | |
| Less: Expenses waived | | (85,534 | ) | | — | | | — | | — | | | (33,673 | ) | | — | |
| Expenses paid indirectly | | — | | | (18 | ) | | — | | (328 | ) | | — | | | (22 | ) |
| |
| Net expenses | | 399,136 | | | 111,894 | | | 246,768 | | 1,458,767 | | | 167,395 | | | 105,857 | |
| |
| Net investment income (loss) | | 1,985,511 | | | (38,939 | ) | | 125,765 | | 948,778 | | | 961,281 | | | 9,564 | |
| |
| Realized and Unrealized Gain (Loss) on Investments | | | | | | | | | | | | | | | | | |
| and Futures Contracts (Note 3): | | | | | | | | | | | | | | | | | |
| | | | | | | | | | | | | | | | | | |
| Net realized gain (loss) on: | | | | | | | | | | | | | | | | | |
| Investments | | 758,902 | | | 24,772 | | | 2,889,317 | | 34,411,827 | | | 385,833 | | | (5,959 | ) |
| Futures contracts | | (6,327 | ) | | — | | | — | | — | | | — | | | — | |
| Net realized gain (loss) on investments and | | | | | | | | | | | | | | | | | |
| futures contracts | | 752,575 | | | 24,772 | | | 2,889,317 | | 34,411,827 | | | 385,833 | | | (5,959 | ) |
| |
| Net unrealized appreciation (depreciation) on investments | | (3,197,695 | ) | | 1,689,676 | | | 5,421,909 | | 12,833,797 | | | (1,392,216 | ) | | 866,528 | |
| |
| Net gain (loss) on investments and futures contracts | | (2,445,120 | ) | | 1,714,448 | | | 8,311,226 | | 47,245,624 | | | (1,006,383 | ) | | 860,569 | |
| |
| Net Increase (Decrease) in Net Assets Resulting | | | | | | | | | | | | | | | | | |
| from Operations | $ | (459,609 | ) | $ | 1,675,509 | | $ | 8,436,991 | $ | 48,194,402 | | $ | (45,102 | ) | $ | 870,133 | |
(d) Net of $258 foreign taxes withheld
(e) Net of $173 foreign taxes withheld
| | |
| 126 | See notes to financial statements | 127 |
Statements of Changes in Net Assets
FIRST INVESTORS LIFE SERIES FUNDS
| | | | | | | | | | | | | | | | | | | | | | | | |
| | | | |
| | | CASH MANAGEMENT | | | EQUITY INCOME | | | FUND FOR INCOME | | | GOVERNMENT | |
| Year Ended December 31 | | 2013 | | | 2012 | | | 2013 | | | 2012 | | | 2013 | | | 2012 | | | 2013 | | | 2012 | |
| Increase (Decrease) in Net Assets From Operations | | | |
| Net investment income | $ | — | | $ | — | | $ | 1,693,452 | | $ | 1,722,353 | | $ | 4,745,407 | | $ | 4,854,875 | | $ | 546,194 | | $ | 632,294 | |
| Net realized gain (loss) on investments and | | — | | | — | | | 5,331,448 | | | 2,596,405 | | | 1,988,045 | | | 1,987,179 | | | (271,900 | ) | | 128,376 | |
| futures contracts | | | | | | | | | | | | | | | | | | | | | | | | |
| Net unrealized appreciation (depreciation) | | | | | | | | | | | | | | | | | | | | | | | | |
| of investments | | — | | | — | | | 15,610,770 | | | 3,298,775 | | | (932,205 | ) | | 3,252,443 | | | (1,050,919 | ) | | (169,676 | ) |
| |
| Net increase (decrease) in net assets resulting | | | | | | | | | | | | | | | | | | | | | | | | |
| from operations | | — | | | — | | | 22,635,670 | | | 7,617,533 | | | 5,801,247 | | | 10,094,497 | | | (776,625 | ) | | 590,994 | |
| |
| Dividends to Shareholders | | | | | | | | | | | | | | | | | | | | | | | | |
| Net investment income | | — | | | — | | | (1,722,352 | ) | | (1,353,452 | ) | | (5,167,402 | ) | | (5,098,995 | ) | | (821,479 | ) | | (863,206 | ) |
| |
| Trust Share Transactions | | | | | | | | | | | | | | | | | | | | | | | | |
| Proceeds from shares sold | | 43,924,902 | | | 22,717,335 | | | 7,240,009 | | | 4,046,518 | | | 10,029,473 | | | 5,820,019 | | | 3,026,404 | | | 5,659,459 | |
| Reinvestment of dividends | | — | | | — | | | 1,722,352 | | | 1,353,452 | | | 5,167,402 | | | 5,098,995 | | | 821,479 | | | 863,206 | |
| Cost of shares redeemed | | (44,497,316 | ) | | (23,616,279 | ) | | (5,607,732 | ) | | (6,328,801 | ) | | (5,036,414 | ) | | (5,739,644 | ) | | (3,912,565 | ) | | (2,655,218 | ) |
| |
| Net increase (decrease) from trust share transactions | | (572,414 | ) | | (898,944 | ) | | 3,354,629 | | | (928,831 | ) | | 10,160,461 | | | 5,179,370 | | | (64,682 | ) | | 3,867,447 | |
| |
| Net increase (decrease) in net assets | | (572,414 | ) | | (898,944 | ) | | 24,267,947 | | | 5,335,250 | | | 10,794,306 | | | 10,174,872 | | | (1,662,786 | ) | | 3,595,235 | |
| |
| Net Assets | | | | | | | | | | | | | | | | | | | | | | | | |
| Beginning of year | | 11,524,574 | | | 12,423,518 | | | 74,360,470 | | | 69,025,220 | | | 84,394,015 | | | 74,219,143 | | | 32,145,466 | | | 28,550,231 | |
| |
| End of year † | $ | 10,952,160 | | $ | 11,524,574 | �� | $ | 98,628,417 | | $ | 74,360,470 | | $ | 95,188,321 | | $ | 84,394,015 | | $ | 30,482,680 | | $ | 32,145,466 | |
| |
| †Includes undistributed net investment income of | $ | — | | $ | — | | $ | 1,692,587 | | $ | 1,722,322 | | $ | 4,675,623 | | $ | 4,812,094 | | $ | 784,013 | | $ | 821,463 | |
| |
| Trust Shares Issued and Redeemed | | | | | | | | | | | | | | | | | | | | | | | | |
| Sold | | 43,924,902 | | | 22,717,335 | | | 378,153 | | | 256,064 | | | 1,500,127 | | | 891,423 | | | 301,498 | | | 544,276 | |
| Issued for dividends reinvested | | — | | | — | | | 100,605 | | | 86,372 | | | 793,764 | | | 809,364 | | | 81,094 | | | 84,297 | |
| Redeemed | | (44,497,316 | ) | | (23,616,279 | ) | | (304,550 | ) | | (401,229 | ) | | (753,826 | ) | | (882,225 | ) | | (389,217 | ) | | (255,947 | ) |
| |
| Net increase (decrease) in trust shares outstanding | | (572,414 | ) | | (898,944 | ) | | 174,208 | | | (58,793 | ) | | 1,540,065 | | | 818,562 | | | (6,625 | ) | | 372,626 | |
| | |
| 128 | See notes to financial statements | 129 |
Statements of Changes in Net Assets
FIRST INVESTORS LIFE SERIES FUNDS
| | | | | | | | | | | | | | | | | | | | | | | | |
| | | | |
| | | GROWTH & INCOME | | | INTERNATIONAL | | | INVESTMENT GRADE | | | OPPORTUNITY | |
| Year Ended December 31 | | 2013 | | | 2012 | | | 2013 | | | 2012 | | | 2013 | | | 2012 | | | 2013 | | | 2012 | * |
| Increase (Decrease) in Net Assets From Operations | | | |
| Net investment income (loss) | $ | 5,578,291 | | $ | 6,511,194 | | $ | 1,519,549 | | $ | 1,751,293 | | $ | 1,985,511 | | $ | 1,941,519 | | $ | (38,939 | ) | $ | (5,181 | ) |
| Net realized gain on investments, futures contracts and | | | | | | | | | | | | | | | | | | | | | | | | |
| foreign currency transactions | | 21,689,011 | | | 12,684,018 | | | 6,064,283 | | | 11,040,801 | | | 752,575 | | | 1,033,660 | | | 24,772 | | | — | |
| Net unrealized appreciation (depreciation) of investments | | | | | | | | | | | | | | | | | | | | | | | | |
| and foreign currency transactions | | 105,622,192 | | | 35,740,929 | | | 623,668 | | | 8,785,147 | | | (3,197,695 | ) | | 2,457,373 | | | 1,689,676 | | | 10,906 | |
| |
| Net increase (decrease) in net assets resulting | | | | | | | | | | | | | | | | | | | | | | | | |
| from operations | | 132,889,494 | | | 54,936,141 | | | 8,207,500 | | | 21,577,241 | | | (459,609 | ) | | 5,432,552 | | | 1,675,509 | | | 5,725 | |
| |
| Dividends to Shareholders | | | | | | | | | | | | | | | | | | | | | | | | |
| Net investment income | | (6,511,151 | ) | | (4,893,388 | ) | | (1,658,517 | ) | | (1,731,413 | ) | | (2,247,136 | ) | | (2,108,865 | ) | | — | | | — | |
| |
| Trust Share Transactions | | | | | | | | | | | | | | | | | | | | | | | | |
| Proceeds from shares sold | | 10,668,396 | | | 6,558,564 | | | 5,452,191 | | | 2,944,238 | | | 6,934,948 | | | 8,746,998 | | | 11,208,177 | | | 1,023,221 | |
| Reinvestment of dividends | | 6,511,151 | | | 4,893,388 | | | 1,658,517 | | | 1,731,413 | | | 2,247,136 | | | 2,108,865 | | | — | | | — | |
| Cost of shares redeemed | | (26,371,797 | ) | | (25,063,569 | ) | | (6,963,696 | ) | | (8,402,525 | ) | | (5,376,721 | ) | | (3,666,506 | ) | | (285,448 | ) | | — | |
| |
| Net increase (decrease) from trust share transactions | | (9,192,250 | ) | | (13,611,617 | ) | | 147,012 | | | (3,726,874 | ) | | 3,805,363 | | | 7,189,357 | | | 10,922,729 | | | 1,023,221 | |
| |
| Net increase in net assets | | 117,186,093 | | | 36,431,136 | | | 6,695,995 | | | 16,118,954 | | | 1,098,618 | | | 10,513,044 | | | 12,598,238 | | | 1,028,946 | |
| |
| Net Assets | | | | | | | | | | | | | | | | | | | | | | | | |
| Beginning of year | | 357,236,501 | | | 320,805,365 | | | 121,785,411 | | | 105,666,457 | | | 57,464,784 | | | 46,951,740 | | | 1,028,946 | | | — | |
| |
| End of year † | $ | 474,422,594 | | $ | 357,236,501 | | $ | 128,481,406 | | $ | 121,785,411 | | $ | 58,563,402 | | $ | 57,464,784 | | $ | 13,627,184 | | $ | 1,028,946 | |
| |
| †Includes undistributed net investment income of | $ | 5,573,481 | | $ | 6,511,086 | | $ | 1,477,791 | | $ | 1,658,461 | | $ | 1,682,913 | | $ | 1,742,316 | | $ | — | | $ | — | |
| |
| Trust Shares Issued and Redeemed | | | | | | | | | | | | | | | | | | | | | | | | |
| Sold | | 264,218 | | | 208,180 | | | 269,539 | | | 162,937 | | | 626,140 | | | 779,078 | | | 887,333 | | | 102,305 | |
| Issued for dividends reinvested | | 185,980 | | | 156,288 | | | 82,719 | | | 97,107 | | | 201,537 | | | 195,446 | | | — | | | — | |
| Redeemed | | (682,069 | ) | | (796,099 | ) | | (343,605 | ) | | (464,973 | ) | | (483,891 | ) | | (329,679 | ) | | (21,893 | ) | | — | |
| |
| Net increase (decrease) in trust shares outstanding | | (231,871 | ) | | (431,631 | ) | | 8,653 | | | (204,929 | ) | | 343,786 | | | 644,845 | | | 865,440 | | | 102,305 | |
*For the period December 17, 2012 (commencement of operations) to December 31, 2012.
| | |
| 130 | See notes to financial statements | 131 |
Statements of Changes in Net Assets
FIRST INVESTORS LIFE SERIES FUNDS
| | | | | | | | | | | | | | | | | | | | | | | | |
| | | | |
| | | SELECT GROWTH | | | SPECIAL SITUATIONS | | | TARGET MATURITY 2015 | | | TOTAL RETURN | |
| Year Ended December 31 | | 2013 | | | 2012 | | | 2013 | | | 2012 | | | 2013 | | | 2012 | | | 2013 | | | 2012 | * |
| Increase (Decrease) in Net Assets From Operations | | | |
| Net investment income (loss) | $ | 125,765 | | $ | 134,093 | | $ | 948,778 | | $ | 1,691,876 | | $ | 961,281 | | $ | 1,016,103 | | $ | 9,564 | | $ | (5,740 | ) |
| Net realized gain (loss) on investments | | 2,889,317 | | | 416,200 | | | 34,411,827 | | | 7,699,139 | | | 385,833 | | | 332,440 | | | (5,959 | ) | | (507 | ) |
| Net unrealized appreciation (depreciation) | | | | | | | | | | | | | | | | | | | | | | | | |
| of investments | | 5,421,909 | | | 1,945,866 | | | 12,833,797 | | | 5,480,027 | | | (1,392,216 | ) | | (1,133,929 | ) | | 866,528 | | | (405 | ) |
| | | | | | | | | | | | | | | | | | | | | | | | | |
| Net increase (decrease) in net assets resulting | | | | | | | | | | | | | | | | | | | | | | | | |
| from operations | | 8,436,991 | | | 2,496,159 | | | 48,194,402 | | | 14,871,042 | | | (45,102 | ) | | 214,614 | | | 870,133 | | | (6,652 | ) |
| |
| Distributions to Shareholders | | | | | | | | | | | | | | | | | | | | | | | | |
| Net investment income | | (134,084 | ) | | (12,001 | ) | | (1,691,850 | ) | | (932,467 | ) | | (1,016,095 | ) | | (1,049,176 | ) | | — | | | — | |
| Net realized gains | | — | | | — | | | (7,848,959 | ) | | (15,843,166 | ) | | (325,271 | ) | | (261,791 | ) | | — | | | — | |
| |
| Total distributions | | (134,084 | ) | | (12,001 | ) | | (9,540,809 | ) | | (16,775,633 | ) | | (1,341,366 | ) | | (1,310,967 | ) | | — | | | — | |
| |
| Trust Share Transactions | | | | | | | | | | | | | | | | | | | | | | | | |
| Proceeds from shares sold | | 4,491,084 | | | 4,809,095 | | | 4,585,685 | | | 4,401,985 | | | 487,495 | | | 934,426 | | | 12,224,476 | | | 1,074,020 | |
| Reinvestment of distributions | | 134,084 | | | 12,001 | | | 9,540,809 | | | 16,775,633 | | | 1,341,366 | | | 1,310,967 | | | — | | | — | |
| Cost of shares redeemed | | (2,297,644 | ) | | (985,335 | ) | | (11,211,160 | ) | | (9,904,431 | ) | | (3,984,977 | ) | | (3,342,303 | ) | | (719,682 | ) | | — | |
| |
| Net increase (decrease) from trust share transactions | | 2,327,524 | | | 3,835,761 | | | 2,915,334 | | | 11,273,187 | | | (2,156,116 | ) | | (1,096,910 | ) | | 11,504,794 | | | 1,074,020 | |
| |
| Net increase (decrease) in net assets | | 10,630,431 | | | 6,319,919 | | | 41,568,927 | | | 9,368,596 | | | (3,542,584 | ) | | (2,193,263 | ) | | 12,374,927 | | | 1,067,368 | |
| |
| Net Assets | | | | | | | | | | | | | | | | | | | | | | | | |
| Beginning of year | | 24,375,774 | | | 18,055,855 | | | 159,645,197 | | | 150,276,601 | | | 24,298,482 | | | 26,491,745 | | | 1,067,368 | | | — | |
| |
| End of year † | $ | 35,006,205 | | $ | 24,375,774 | | $ | 201,214,124 | | $ | 159,645,197 | | $ | 20,755,898 | | $ | 24,298,482 | | $ | 13,442,295 | | $ | 1,067,368 | |
| |
| †Includes undistributed net investment income of | $ | 125,763 | | $ | 134,082 | | $ | 948,774 | | $ | 1,691,846 | | $ | 961,274 | | $ | 1,016,088 | | $ | 9,540 | | $ | — | |
| |
| Trust Shares Issued and Redeemed | | | | | | | | | | | | | | | | | | | | | | | | |
| Sold | | 406,909 | | | 513,581 | | | 129,208 | | | 140,935 | | | 33,181 | | | 58,817 | | | 1,113,967 | | | 107,514 | |
| Issued for distributions reinvested | | 13,422 | | | 1,282 | | | 303,172 | | | 527,370 | | | 91,312 | | | 84,688 | | | — | | | — | |
| Redeemed | | (205,666 | ) | | (105,429 | ) | | (326,530 | ) | | (315,816 | ) | | (268,363 | ) | | (212,093 | ) | | (64,176 | ) | | — | |
| |
| Net increase (decrease) in trust shares outstanding | | 214,665 | | | 409,434 | | | 105,850 | | | 352,489 | | | (143,870 | ) | | (68,588 | ) | | 1,049,791 | | | 107,514 | |
*For the period December 17, 2012 (commencement of operations) to December 31, 2012.
| | |
| 132 | See notes to financial statements | 133 |
Notes to Financial Statements
FIRST INVESTORS LIFE SERIES FUNDS
December 31, 2013
1. Significant Accounting Policies—First Investors Life Series Funds, a Delaware statutory trust (“the Trust”), is registered under the Investment Company Act of 1940 (the “1940 Act”) as an open-end management investment company. The Trust operates as a series fund, issuing shares of beneficial interest in the Cash Management Fund, Equity Income Fund (formerly Value Fund), Fund For Income (formerly High Yield Fund), Government Fund, Growth & Income Fund, International Fund, Investment Grade Fund, Opportunity Fund, Select Growth Fund, Special Situations Fund (formerly Discovery Fund), Target Maturity 2015 Fund and Total Return Fund (each a “Fund”, collectively, “the Funds”), and accounts separately for the assets, liabilities and operations of each Fund. The objective of each Fund as of December 31, 2013 is as follows:
Cash Management Fund seeks to earn a high rate of current income consistent with the preservation of capital and maintenance of liquidity.
Equity Income Fund seeks total return.
Fund For Income seeks high current income.
Government Fund seeks to achieve a significant level of current income which is consistent with security and liquidity of principal.
Growth & Income Fund seeks long-term growth of capital and current income.
International Fund primarily seeks long-term capital growth.
Investment Grade Fund seeks to generate a maximum level of income consistent with investment in investment grade debt securities.
Opportunity Fund seeks long-term capital growth.
Select Growth Fund seeks long-term growth of capital.
Special Situations Fund seeks long-term growth of capital.
Target Maturity 2015 Fund seeks a predictable compounded investment return for investors who hold their Fund shares until the Fund’s maturity, consistent with the preservation of capital.
Total Return Fund seeks high, long-term total investment return consistent with moderate investment risk.
A. Security Valuation—Except as provided below, a security listed or traded on an exchange or the Nasdaq Stock Market is valued at its last sale price on the exchange or market where the security is principally traded, and lacking any sales, the security is valued at the mean between the closing bid and asked prices. Securities traded
in the over-the-counter (“OTC”) market (including securities listed on exchanges whose primary market is believed to be OTC) are valued at the mean between the last bid and asked prices based on quotes furnished by a market maker for such securities. Securities may also be priced by pricing services approved by the Trust’s Board of Trustees (“the Board”). The pricing services consider security type, rating, market condition and yield data as well as market quotations, prices provided by market makers and other available information in determining value. Short-term debt securities that mature in 60 days or less are valued at amortized cost.
The Funds monitor for significant events occurring prior to the close of trading on the New York Stock Exchange that could have a material impact on the value of any securities that are held by the Funds. Examples of such events include trading halts, natural disasters, political events and issuer-specific developments. If First Investors Management Company, Inc.’s (“FIMCO”) Valuation Committee decides that such events warrant using fair value estimates, it will take such events into consideration in determining the fair values of such securities. If market quotations or prices are not readily available or determined to be unreliable, the securities will be valued at fair value as determined in good faith pursuant to procedures adopted by the Board. The Funds also use a pricing service to fair value foreign equity securities in the event that fluctuations in U.S. securities markets exceed a predetermined level or if a foreign market is closed. For valuation purposes, where applicable, quotations of foreign securities in foreign currency are translated to U.S. dollar equivalents using the foreign exchange quotation in effect. As of December 31, 2013, the Fund For Income held two securities that were fair valued by FIMCO’s Valuation Committee with an aggregate value of $0 representing 0% of the Fund’s net assets and the International Fund held one security that was fair valued by FIMCO’s Valuation Committee with a value of $18,264 representing 0% of the Fund’s net assets.
The Cash Management Fund values its portfolio securities in accordance with the amortized cost method of valuation under Rule 2a-7 under the 1940 Act. Amortized cost is an approximation of market value of an instrument, whereby the difference between its acquisition cost and market value at maturity is amortized on a straight-line basis over the remaining life of the instrument. The effect of changes in the market value of a security as a result of fluctuating interest rates is not taken into account and thus the amortized cost method of valuation may result in the value of a security being higher or lower than its actual market value.
In accordance with Accounting Standards Codification 820 “Fair Value Measurements and Disclosures” (“ASC 820”), investments held by the Funds are carried at “fair value”. As defined by ASC 820, fair value is the price that a fund would receive upon selling an investment in an orderly transaction to an independent buyer in the principal
Notes to Financial Statements (continued)
FIRST INVESTORS LIFE SERIES FUNDS
December 31, 2013
or most advantageous market for the investment under current market conditions. Various inputs are used in determining the value of the Funds’ investments.
In addition to defining fair value, ASC 820 established a three-tier hierarchy of inputs to establish a classification of fair value measurements for disclosure purposes. The three-tier hierarchy of inputs is summarized in the three broad Levels listed below:
Level 1 – Unadjusted quoted prices in active markets for identical securities that the Fund has the ability to access.
Level 2 – Observable inputs other than quoted prices included in Level 1 that are observable for the asset or liability, either directly or indirectly. These inputs may include quoted prices for the identical instrument on an inactive market, prices for similar instruments, interest rates, prepayment speeds, credit risk, yield curves, default rates and similar data.
Level 3 – Unobservable inputs for the asset or liability, to the extent relevant observable inputs are not available, representing the Fund’s own assumption about the assumptions a market participant would use in valuing the asset or liability, and would be based on the best information available.
Equity securities traded on an exchange or the Nasdaq Stock Market are categorized in Level 1 of the fair value hierarchy to the extent that they are actively traded and valuation adjustments are not applied. Foreign securities that are fair valued in the event that fluctuations in U.S. securities markets exceed a predetermined level or if a foreign market is closed are categorized in Level 2. Corporate and municipal bonds, asset backed U.S. Government and U.S. Government Agency securities and Loan Participations are categorized in Level 2 to the extent that the inputs are observable and timely, otherwise they would be categorized as Level 3. Short-term notes that are valued at amortized cost are categorized in Level 2. Foreign exchange contracts that are considered derivative instruments and are valued at the net unrealized appreciation or depreciation on the instruments are categorized in Level 2. Restricted securities and securities that are fair valued by FIMCO’s Valuation Committee may be categorized in either Level 2 or Level 3 of the fair value hierarchy depending on the relative significance of valuation inputs.
The aggregate value by input level, as of December 31, 2013, for each Fund’s investments is included at the end of each Fund’s portfolio of investments.
B. Federal Income Tax—No provision has been made for federal income taxes on net income or capital gains since it is the policy of each Fund to continue to comply with the special provisions of the Internal Revenue Code applicable to investment companies, and to make sufficient distributions of income and capital gains (in excess
of any available capital loss carryovers), to relieve each Fund from all, or substantially all, federal income taxes. At December 31, 2013, capital loss carryovers were as follows:
| | | | | | | | | | | | | | | | | | | | | | | | |
| | | Year Capital Loss Carryovers Expire | | Not Subject to Expiration |
| Fund | | | Total | | | 2014 | | | 2015 | | | 2016 | | | 2017 | | | 2018 | | | Long Term | | | Short Term |
| Fund For Income | | $ | 20,508,604 | | $ | 877,981 | | $ | 433,726 | | $ | 3,694,844 | | $ | 15,502,053 | | $ | — | | $ | — | | $ | — |
| Government | | | 785,548 | | | 177,059 | | | 37,942 | | | — | | | — | | | — | | | 3,297 | | | 567,250 |
| International | | | 14,228,705 | | | — | | | — | | | 4,806,723 | | | 8,389,229 | | | 1,032,753 | | | — | | | — |
| Investment Grade | | | 2,508,998 | | | — | | | — | | | 1,363,897 | | | 1,145,101 | | | — | | | — | | | — |
| Total Return | | | 2,753 | | | — | | | — | | | — | | | — | | | — | | | — | | | 2,753 |
As a result of the passage of the Regulated Investment Company Modernization Act of 2010 (“the Modernization Act of 2010”), losses incurred in this fiscal year and beyond retain their character as short-term or long-term, have no expiration date and are utilized prior to capital loss carryovers occurring prior to the enactment of the Modernization Act of 2010.
The Funds recognize the tax benefits of uncertain tax positions only where the position is “more likely than not” to be sustained assuming examination by tax authorities. Management has analyzed the Funds’ tax positions, and has concluded that no liability for unrecognized tax benefits should be recorded related to uncertain tax positions taken on returns filed for open tax years 2010 –2012, or expected to be taken in the Funds’ 2013 tax returns. The Funds identify their major tax jurisdictions as U.S. Federal, New York State, New York City and foreign jurisdictions where the Funds make significant investments; however, the Funds are not aware of any tax position for which it is reasonably possible that the total amounts of unrecognized tax benefits will change materially in the next twelve months.
C. Foreign Currency Translations and Transactions—The accounting records of the International Fund (the “Fund”) are maintained in U.S. dollars. Portfolio securities and other assets and liabilities denominated in foreign currencies are translated into U.S. dollars at the date of valuation. Purchases and sales of investment securities, dividend income and certain expenses are translated to U.S. dollars at the prevailing rates of exchange on the respective dates of such transactions.
The Fund does not isolate that portion of gains and losses on investments which is due to changes in foreign exchange rates from that which is due to changes in market prices of the investments. These changes are included with the net realized and unrealized gains and losses from investments.
The Fund may enter into spot currency transactions in connection with the settlement of transactions in securities traded in foreign currency to manage exposure to foreign
Notes to Financial Statements (continued)
FIRST INVESTORS LIFE SERIES FUNDS
December 31, 2013
exchange risk between the trade date and the settlement date of such transactions. The Fund could be exposed to risk if counter parties to the contracts are unable to meet the terms of their contracts or if the value of the foreign currency changes unfavorably. Net realized and unrealized gains and losses on foreign currency transactions include gains and losses from the sales of spot currency transactions and gains and losses on accrued foreign dividends and related withholding taxes.
D. Distributions to Shareholders—Distributions to shareholders from net investment income and net realized capital gains are generally declared and paid annually on all Funds, except for the Cash Management Fund which declares dividends, if any, from the total of net investment income (plus or minus all realized short-term gains and losses on investments) daily and pays monthly. Dividends from net investment income and capital gain distributions are determined in accordance with income tax regulations which may differ from accounting principles generally accepted in the United States of America. These differences are primarily due to differing treatments for capital loss carryforwards, deferral of wash sale losses, late loss deferrals, post-October capital losses, net operating losses and foreign currency transactions.
E. Expense Allocation—Expenses directly charged or attributable to a Fund are paid from the assets of that Fund. General expenses of the Trust are allocated among and charged to the assets of each Fund on a fair and equitable basis, which may be based on the relative assets of each Fund or the nature of the services performed and relative applicability to each Fund.
F. Use of Estimates—The preparation of the financial statements in conformity with accounting principles generally accepted in the United States of America requires management to make estimates and assumptions that affect the reported amounts of assets and liabilities at the date of the financial statements and the reported amounts of revenue and expense during the reporting period. Actual results could differ from those estimates.
G. Other—Security transactions are generally accounted for on the first business day following the date the securities are purchased or sold, except for financial reporting purposes which is trade date. Investments in securities issued on a when-issued or delayed delivery basis are generally reflected in the assets of the Funds and the Funds segregate assets for these transactions on the first business day following the date the securities are purchased. Cost is determined and gains and losses are based on the identified cost basis for securities for both financial statement and federal income tax purposes. Dividend income is recorded on the ex-dividend date or for certain foreign dividends, as soon as the Fund becomes aware of the dividends. Interest income and estimated expenses are accrued daily. Bond premiums and discounts are accreted or
amortized using the interest method. Interest income on zero coupon bonds and step bonds is accrued daily at the effective interest rate. Withholding taxes on foreign dividends have been provided in accordance with the Funds’ understanding of the applicable country’s tax rules and rates. The Bank of New York Mellon, custodian for the Cash Management, Fund For Income, Government, Investment Grade and Target Maturity 2015 Funds, may provide credits against custodian charges based on uninvested cash balances of the Funds. For the year ended December 31, 2013, the Funds did not receive any credits. Brown Brothers Harriman & Co. serves as custodian for the Equity Income, Growth & Income, International, Opportunity, Select Growth, Special Situations and Total Return Funds. Certain of the Funds reduced expenses through brokerage service arrangements. For the year ended December 31, 2013, the Equity Income, Growth & Income, Opportunity, Special Situations and Total Return Funds’ expenses were reduced by a total of $3,946 under these arrangements.
2. Trust Shares—The Trust is authorized to issue an unlimited number of shares of beneficial interest without par value. The Trust consists of the Funds listed on the cover page, each of which is a separate and distinct series of the Trust. Shares in the Funds are acquired through the purchase of variable annuity or variable life insurance contracts for which a Fund is an investment option.
3. Security Transactions—For the year ended December 31, 2013, purchases and sales (including paydowns on Government Fund) of securities and long-term U.S. Government obligations (excluding short-term U.S. Government obligations, foreign currencies and short-term securities), were as follows:
| | | | | | | | | | | |
| | | | | | | | | Long-Term U.S. |
| | | Securities | | | Government Obligations |
| | | Cost of | | | Proceeds | | | Cost of | | | Proceeds |
| Fund | | Purchases | | | of Sales | | | Purchases | | | of Sales |
| Equity Income | $ | 28,348,204 | | $ | 25,541,275 | | $ | — | | $ | — |
| Fund For Income | | 56,806,171 | | | 47,619,068 | | | — | | | — |
| Government | | 29,430,040 | | | 31,633,797 | | | 6,812,980 | | | 5,343,637 |
| Growth & Income | | 94,739,499 | | | 105,782,485 | | | — | | | — |
| International | | 43,229,659 | | | 46,122,780 | | | — | | | — |
| Investment Grade | | 25,433,805 | | | 21,727,522 | | | — | | | — |
| Opportunity | | 11,489,455 | | | 1,501,771 | | | — | | | — |
| Select Growth | | 19,948,164 | | | 18,044,583 | | | — | | | — |
| Special Situations | | 186,619,559 | | | 190,035,958 | | | — | | | — |
| Target Maturity 2015 | | — | | | 3,606,735 | | | — | | | — |
| Total Return | | 11,223,608 | | | 716,413 | | | — | | | — |
Notes to Financial Statements (continued)
FIRST INVESTORS LIFE SERIES FUNDS
December 31, 2013
At December 31, 2013, aggregate cost and net unrealized appreciation (depreciation) of securities for federal income tax purposes were as follows:
| | | | | | | | | | | | | |
| | | | | | | | | | | | | Net | |
| | | | | | | Gross | | | Gross | | | Unrealized | |
| | | | Aggregate | | | Unrealized | | | Unrealized | | | Appreciation | |
| Fund | | | Cost | | | Appreciation | | | Depreciation | | | (Depreciation | ) |
| Equity Income | | $ | 70,999,665 | | $ | 27,897,539 | | $ | 342,053 | | $ | 27,555,486 | |
| Fund For Income | | | 88,334,847 | | | 3,249,279 | | | 1,183,246 | | | 2,066,033 | |
| Government | | | 29,071,724 | | | 441,611 | | | 518,916 | | | (77,305 | ) |
| Growth & Income | | | 273,106,636 | | | 202,891,073 | | | 2,317,659 | | | 200,573,414 | |
| International | | | 92,200,908 | | | 38,634,998 | | | 3,515,466 | | | 35,119,532 | |
| Investment Grade | | | 54,901,137 | | | 2,197,670 | | | 702,688 | | | 1,494,982 | |
| Opportunity | | | 11,518,979 | | | 1,721,348 | | | 29,674 | | | 1,691,674 | |
| Select Growth | | | 23,492,372 | | | 10,111,765 | | | — | | | 10,111,765 | |
| Special Situations | | | 160,451,066 | | | 41,926,012 | | | 1,678,069 | | | 40,247,943 | |
| Target Maturity 2015 | | | 18,921,812 | | | 1,794,168 | | | — | | | 1,794,168 | |
| Total Return | | | 12,730,553 | | | 955,578 | | | 101,299 | | | 854,279 | |
4. Advisory Fee and Other Transactions With Affiliates—Certain officers of the Trust are officers of the Trust’s investment adviser, FIMCO and its transfer agent, Administrative Data Management Corp. (“ADM”). Trustees of the Trust who are not officers or directors of FIMCO or its affiliates are remunerated by the Funds. For the year ended December 31, 2013, total trustee fees accrued by the Funds amounted to $51,829.
The Investment Advisory Agreement provides as compensation to FIMCO for each Fund, an annual fee, payable monthly, at the rate of .75% on the first $250 million of each Fund’s average daily net assets, .72% on the next $250 million, .69% on the next $250 million, .66% on the next $500 million, declining by .02% on each $500 million thereafter, down to .60% on average daily net assets over $2.25 billion. For the year ended December 31, 2013, FIMCO has voluntarily waived $46,675 in advisory fees on Government Fund, $85,534 in advisory fees on Investment Grade Fund and $33,673 in advisory fees on Target Maturity 2015 Fund. During the year ended December 31, 2013, FIMCO has voluntarily waived $41,575 in advisory fees to limit the Cash Management Fund’s overall expense ratio to .60%. Also, FIMCO has voluntarily waived an additional $38,524 in advisory fees and assumed $15,382 of other Fund expenses to prevent a negative yield on the Fund’s shares. For the year ended December 31, 2013, total advisory fees accrued to FIMCO were $7,863,879 of which $245,981 was voluntarily waived by FIMCO as noted above.
Muzinich & Co., Inc. serves as investment subadviser to Fund For Income, Vontobel Asset Management, Inc. serves as investment subadviser to International Fund and Smith Asset Management Group, L.P. serves as investment subadviser to Select Growth Fund. Paradigm Capital Management, Inc. served as investment subadviser to Special Situations Fund for the period January 1, 2013 through September 20, 2013. The subadvisers are paid by FIMCO and not by the Funds.
5. Restricted Securities—Certain restricted securities are exempt from the registration requirements under Rule 144A of the Securities Act of 1933 and may only be sold to qualified institutional investors. Unless otherwise noted, 144A securities are deemed to be liquid. At December 31, 2013, the Fund For Income held one hundred twenty-two 144A securities with an aggregate value of $34,109,301 representing 35.8% of the Fund’s net assets, the Government Fund held one 144A security with a value of $354,590 representing 1.2% of the Fund’s net assets, the Investment Grade Fund held twenty-three 144A securities with an aggregate value of $8,422,187 representing 14.4% of the Fund’s net assets and the Total Return Fund held one 144A security with a value of $120,022 representing 0.9% of the Fund’s net assets. Certain restricted securities are exempt from the registration requirements under Section 4(2) of the Securities Act of 1933 and may only be sold to qualified investors. Unless otherwise noted, these Section 4(2) securities are deemed to be liquid. At December 31, 2013, the Cash Management Fund held four Section 4(2) securities with an aggregate value of $1,999,723 representing 18.3% of the Fund’s net assets. These securities are valued as set forth in Note 1A.
6. Derivatives—The Funds (other than Cash Management Fund) may invest in derivatives such as futures contracts and options on futures contracts (“options”), to increase income, hedge against changes in interest rates or enhance potential return.
The Funds may enter into interest rate futures contracts on U.S. Treasury obligations and options thereon that are traded on a U.S. exchange. An interest rate futures contract provides for the future sale by one party and the purchase by another party of a specified amount of a particular financial instrument (debt security) at a specified price, date, time and place. Such investments may be used for the purpose of hedging against changes in the value of a Fund’s portfolio securities due to anticipated changes in interest rates and market conditions. A public market exists for interest rate futures contracts covering a number of debt securities, including long-term U.S. Treasury Bonds, 10-year U.S. Treasury Notes and three-month U.S. Treasury Bills. No price is paid upon entering into futures contracts. Instead, upon entering into a futures contract, the Funds are required to deposit with their custodian in a segregated
Notes to Financial Statements (continued)
FIRST INVESTORS LIFE SERIES FUNDS
December 31, 2013
account in the name of the futures broker through which the transaction is effected an amount of cash or U.S. Government securities generally equal to 3%–5% or less of the contract value. This amount is known as “initial margin.”
An option on an interest rate futures contract generally gives the purchaser the right, in return for the premium paid, to assume a position in a futures contract at a specified exercise price at any time prior to the expiration date of the option. The Funds may purchase put and call options on interest rate futures contracts on U.S. Treasury obligations which are traded on a U.S. exchange as a hedge against changes in interest rates, and may enter into closing transactions with respect to such options to terminate existing positions. There is no guarantee such closing transactions can be effected. When writing a call or put option on a futures contract, margin also must be deposited in accordance with applicable exchange rules. Initial margin on futures contracts is in the nature of a performance bond or good-faith deposit that is returned to a Fund upon termination of the transaction, assuming all obligations have been satisfied. Under certain circumstances, such as periods of high volatility, a Fund may be required by an exchange to increase the level of its initial margin payment. Subsequent payments, called “variation margin,” to and from the broker, are made on a daily basis as the value of the futures position varies, a process known as “marking to market.” Variation margin does not involve borrowing to finance the futures transactions, but rather represents a daily settlement of a Fund’s obligation to or from a clearing organization. A Fund is also obligated to make initial and variation margin payments when it writes options on futures contracts.
To the extent that a Fund participates in the futures or options markets, it will incur investment risks and transaction costs to which it would not be subject absent the use of these strategies. The use of these strategies involves certain special risks, including: (1) dependence on the ability of the Funds’ investment adviser, FIMCO to predict correctly movements in the direction of interest rates and securities prices; (2) imperfect correlation between the price of futures contracts and options thereon and movements in the prices of the securities or currencies being hedged; (3) the fact that skills needed to use these strategies are different from those needed to select portfolio securities; (4) the leverage (if any) that is created by investing in the option or futures contract; and (5) the possible absence of a liquid secondary market for any particular instrument at any time. If FIMCO’s prediction of movements in the direction of the securities and interest rate markets is inaccurate, the adverse consequences to that Fund may leave it in a worse position than if such strategies were not used.
During the year ended December 31, 2013, the Government and Investment Grade Funds participated in interest rate futures contracts. At December 31, 2013, the Funds had no open investments in futures contracts or options.
For the year ended December 31, 2013, the effect of derivative instruments in the Statements of Operations is as follows:
| | |
| | Net Realized Gains (Losses | ) |
| Fund | on Futures Contracts | |
| Government | $(1,851 | ) |
| Investment Grade | (6,327 | ) |
7. High Yield Credit Risk—The investments of Fund For Income in high yield securities, whether rated or unrated, may be considered speculative and subject to greater market fluctuations and risks of loss of income and principal than lower-yielding, higher-rated, fixed-income securities. The risk of loss due to default by the issuer may be significantly greater for the holders of high-yielding securities, because such securities are generally unsecured and are often subordinated to other creditors of the issuer.
8. Tax Components of Capital and Distributions to Shareholders—The tax character of distributions declared for the years ended December 31, 2013 and 2012 were as follows:
| | | | | | | | | | | | | | | | | |
| | Distributions | | Distributions |
| | Declared in 2013 | | Declared in 2012 |
| | | Ordinary | | Long-Term | | | | | | Ordinary | | Long-Term | | | |
| Fund | | Income | | Capital Gain | | | Total | | | Income | | Capital Gain | | | Total |
| Equity Income | $ | 1,722,352 | | $ | — | | $ | 1,722,352 | | $ | 1,353,452 | | $ | — | | $ | 1,353,452 |
| Fund For Income | | 5,167,402 | | | — | | | 5,167,402 | | | 5,098,995 | | | — | | | 5,098,995 |
| Government | | 821,479 | | | — | | | 821,479 | | | 863,206 | | | — | | | 863,206 |
| Growth & Income | | 6,511,151 | | | — | | | 6,511,151 | | | 4,893,388 | | | — | | | 4,893,388 |
| International | | 1,658,517 | | | — | | | 1,658,517 | | | 1,731,413 | | | — | | | 1,731,413 |
| Investment Grade | | 2,247,136 | | | — | | | 2,247,136 | | | 2,108,865 | | | — | | | 2,108,865 |
| Select Growth | | 134,084 | | | — | | | 134,084 | | | 12,001 | | | — | | | 12,001 |
| Special Situations | | 3,382,573 | | | 6,158,236 | | | 9,540,809 | | | 4,679,567 | | | 12,096,066 | | | 16,775,633 |
| Target Maturity 2015 | | 1,016,095 | | | 325,271 | | | 1,341,366 | | | 1,049,169 | | | 261,798 | | | 1,310,967 |
Notes to Financial Statements (continued)
FIRST INVESTORS LIFE SERIES FUNDS
December 31, 2013
As of December 31, 2013, the components of distributable earnings (deficit) on a tax basis were as follows:
| | | | | | | | | | | | | | | | |
| | | | | | | | | | | | | | | | Total | |
| | | | Undistributed | | | Accumulated | | | Capital | | | Unrealized | | | Distributable | |
| | | | Ordinary | | | Capital | | | Loss | | | Appreciation | | | Earnings | |
| Fund | | | Income | | | Gains | | | Carryover | | | (Depreciation | ) | | (Deficit | )* |
| |
| Equity Income | | $ | 1,692,587 | | $ | 4,129,116 | | $ | — | | $ | 27,555,486 | | $ | 33,377,189 | |
| Fund for Income | | | 5,169,205 | | | — | | | (20,508,604 | ) | | 2,066,033 | | | (13,273,366 | ) |
| Government | | | 784,013 | | | — | | | (785,548 | ) | | (77,305 | ) | | (78,840 | ) |
| Growth & Income | | | 5,573,481 | | | 3,093,506 | | | — | | | 200,573,414 | | | 209,240,401 | |
| International | | | 1,477,791 | | | — | | | (14,228,705 | ) | | 35,125,245 | | | 22,374,331 | |
| Investment Grade | | | 2,443,060 | | | — | | | (2,508,998 | ) | | 1,494,982 | | | 1,429,044 | |
| Opportunity | | | — | | | 7,787 | | | — | | | 1,691,674 | | | 1,699,461 | |
| Select Growth | | | 125,763 | | | 41,015 | | | — | | | 10,111,765 | | | 10,278,543 | |
| Special Situations | | | 6,191,672 | | | 28,734,067 | | | — | | | 40,247,943 | | | 75,173,682 | |
| Target Maturity 2015 | | | 961,279 | | | 383,900 | | | — | | | 1,794,168 | | | 3,139,347 | |
| Total Return | | | 17,034 | | | — | | | (2,753 | ) | | 854,279 | | | 868,560 | |
*Differences between book distributable earnings and tax distributable earnings consist primarily of wash sales, foreign currency transactions and amortization of bond premium and discounts.
For the year ended December 31, 2013, the following reclassifications were made to reflect permanent differences between book and tax reporting which are primarily due to the differences between book and tax treatment of investments in real estate investment trusts, bond premium amortization, foreign currency transactions, paydowns on securities and expiration of capital loss carryovers.
| | | | | | | | | |
| | | | | | Undistributed | | | Accumulated | |
| | | Capital | | | Net Investment | | | Net Realized | |
| Fund | | Paid In | | | Income (Deficit | ) | | Gains (Losses | ) |
| Equity Income | $ | — | | $ | (835 | ) | $ | 835 | |
| Fund for Income | | — | | | 285,525 | | | (285,525 | ) |
| Government | | (193,688 | ) | | 237,835 | | | (44,147 | ) |
| Growth & Income | | — | | | (4,745 | ) | | 4,745 | |
| International | | — | | | (41,702 | ) | | 41,702 | |
| Investment Grade | | — | | | 195,895 | | | (195,895 | ) |
| Opportunity | | (13,046 | ) | | 38,939 | | | (25,893 | ) |
| Target Maturity 2015 | | — | | | 5 | | | (5 | ) |
| Total Return | | — | | | (24 | ) | | 24 | |
9. Litigation—The Blue Chip and Equity Income Funds have been named, and have received notice that they may be putative members of the proposed defendant class of shareholders, in a lawsuit filed in the United States Bankruptcy Court for the District of Delaware on November 1, 2010, by the Official Committee of Unsecured Creditors of Tribune Company (the “Committee”). The Committee is seeking to recover all payments made to beneficial owners of common stock in connection with a leveraged buyout of the Tribune Company (“LBO”), including payments made in connection with a 2007 tender offer into which the Blue Chip and Equity Income Funds tendered their shares of common stock of the Tribune Company. On December 9, 2011, the Blue Chip Fund was reorganized into the Growth & Income Fund pursuant to a Plan of Reorganization and Termination, whereby all of the assets of the Blue Chip Fund were transferred to the Growth & Income Fund, the Growth & Income Fund assumed all of the liabilities of the Blue Chip Fund, including any contingent liabilities with respect to pending or threatened litigation or actions, and shareholders of Blue Chip Fund became shareholders of Growth & Income Fund. The adversary proceeding brought by the Committee has been transferred to the Southern District of New York and administratively consolidated with other similar suits as discussed below. In addition, on June 2, 2011, the Blue Chip and Equity Income Funds were named as defendants in a lawsuit brought in connection with the Tribune Company’s LBO by Deutsche Bank Trust Company Americas, in its capacity as successor indenture trustee for a certain series of Senior Notes, Law Debenture Trust Company of New York, in its capacity as successor indenture trustee for a certain series of Senior Notes, and Wilmington Trust Company, in its capacity as successor indenture trustee for the PHONES Notes (together, the “Bondholder Plaintiffs”) in the Supreme Court of the State of New York. Also on June 2, 2011, the Blue Chip and Equity Income Funds were named as defendants in a lawsuit brought in connection with the Tribune LBO by certain former employees of Tribune (the “Employee Plaintiffs”) in the Supreme Court of the State of New York. (Both of these suits have been removed to the United States District Court for the Southern District of New York and consolidated with other substantially similar suits against other former Tribune shareholders (the “MDL Proceeding”)). On September 23, 2013, the Judge in the MDL Proceeding dismissed various state law constructive fraudulent transfer suits, resulting in the Funds being dismissed from the Bondholder and Employee Plaintiffs’ actions. On September 30, 2013, counsel for the plaintiffs in those suits appealed the MDL Judge’s dismissal ruling to the Second Circuit. The Bondholder and Employee Plaintiffs also seek to recover payments of the proceeds of the LBO. The extent of the Funds’ potential liability in any such actions has not been determined. The Funds have been advised by counsel that the Funds could be held liable to return all or part of the proceeds received in any of these actions, as well as interest and court costs, even though the
Notes to Financial Statements (continued)
FIRST INVESTORS LIFE SERIES FUNDS
December 31, 2013
Funds had no knowledge of, or participation in, any misconduct. The Equity Income Fund received proceeds of $376,754 in connection with the LBO, representing 0.38% of its net assets as of December 31, 2013. The Blue Chip Fund received proceeds of $288,456 in connection with the LBO, representing 0.06% of the net assets of Growth & Income Fund as of December 31, 2013. The Equity Income and Growth & Income Funds cannot predict the outcomes of these proceedings, and thus have not accrued any of the amounts sought in the various actions in the accompanying financial statements.
10. Subsequent Events—Subsequent events occurring after December 31, 2013 have been evaluated for potential impact to this report through the date the financial statements were issued. There were no subsequent events to report that would have a material impact on the Funds’ financial statements.
|
| This page left intentionally blank. |
Financial Highlights
FIRST INVESTORS LIFE SERIES FUNDS
|
| The following table sets forth the per share operating performance data for a trust share outstanding, |
| total return, ratios to average net assets and other supplemental data for each year ended December 31, |
| unless otherwise indicated. |
| | | | | | | | | | | | | | | | | | | | | | | | | | | | | | | | | | | | | | | | | | | | | | |
| | |
| | | | P E R S H A R E D A T A | | | | | | R A T I O S / S U P P L E M E N T A L D A T A | |
| | | | | | | | | | | | | | | | Less Distributions | | | | | | | | | | | | | | | | | | Ratio to Average Net | | | | |
| | | | | | | Investment Operations | | | from | | | | | | | | | | | | Ratio to Average Net | | | Assets Before Expenses | | | | |
| | | | Net Asset | | | | | | Net Realized | | | | | | | | | | | | | | | Net Asset | | | | | | | | | Assets** | | | Waived or Assumed | | | | |
| | | | Value, | | | Net | | | and Unrealized | | | Total from | | | Net | | | Net | | | | | | Value, | | | | | | Net Assets | | | Expenses | | | Net | | | | | | Net | | | Portfolio | |
| | | | Beginning | | | Investment | | | Gain (Loss) on | | | Investment | | | Investment | | | Realized | | | Total | | | End | | | Total | | | End of Year | | | Before Fee | | | Investment | | | | | | Investment | | | Turnover | |
| | | | of Year | | | Income | | | Investments | | | Operations | | | Income | | | Gains | | | Distributions | | | of Year | | | Return | * | | (in millions | ) | | Credits | (a) | | Income | | | Expenses | (a) | | Income (Loss | ) | | Rate | |
| |
| CASH MANAGEMENT FUND | | | | | | | | | | | | | | | | | | | | | | | | | | | | | | | | | | | | | | | | |
| 2009 | | | $ 1.00 | | | $.002 | | | — | | | $ .002 | | | $.002 | | | — | | | $.002 | | | $ 1.00 | | | .17 | % | | $ 11 | | | .56 | %(b) | | .18 | % | | .98 | % | | (.24 | )% | | N/A | |
| 2010 | | | 1.00 | | | — | | | — | | | — | | | — | | | — | | | — | | | 1.00 | | | .00 | | | 12 | | | .23 | (b) | | .00 | | | 1.04 | | | (.81 | ) | | N/A | |
| 2011 | | | 1.00 | | | — | | | — | | | — | | | — | | | — | | | — | | | 1.00 | | | .00 | | | 12 | | | .13 | (b) | | .00 | | | .99 | | | (.86 | ) | | N/A | |
| 2012 | | | 1.00 | | | — | | | — | | | — | | | — | | | — | | | — | | | 1.00 | | | .00 | | | 12 | | | .12 | (b) | | .00 | | | .99 | | | (.87 | ) | | N/A | |
| 2013 | | | 1.00 | | | — | | | — | | | — | | | — | | | — | | | — | | | 1.00 | | | .00 | | | 11 | | | .10 | (b) | | .00 | | | .99 | | | (.89 | ) | | N/A | |
| |
| EQUITY INCOME FUND(c) | | | | | | | | | | | | | | | | | | | | | | | | | | | | | | | | | | | | | | | | | | | |
| 2009 | | | $11.57 | | | $ .29 | | | $ 1.96 | | | $ 2.25 | | | $ .36 | | | — | | | $ .36 | | | $13.46 | | | 21.03 | % | | $ 66 | | | .88 | % | | 2.45 | % | | N/A | | | N/A | | | 11 | % |
| 2010 | | | 13.46 | | | .31 | | | 1.58 | | | 1.89 | | | .29 | | | — | | | .29 | | | 15.06 | | | 14.32 | | | 71 | | | .86 | | | 2.25 | | | N/A | | | N/A | | | 21 | |
| 2011 | | | 15.06 | | | .30 | | | (.06 | ) | | .24 | | | .31 | | | — | | | .31 | | | 14.99 | | | 1.53 | | | 69 | | | .87 | | | 1.94 | | | N/A | | | N/A | | | 32 | |
| 2012 | | | 14.99 | | | .38 | | | 1.29 | | | 1.67 | | | .30 | | | — | | | .30 | | | 16.36 | | | 11.20 | | | 74 | | | .87 | | | 2.37 | | | N/A | | | N/A | | | 39 | |
| 2013 | | | 16.36 | | | .36 | | | 4.55 | | | 4.91 | | | .38 | | | — | | | .38 | | | 20.89 | | | 30.53 | | | 99 | | | .82 | | | 1.97 | | | N/A | | | N/A | | | 31 | |
| |
| FUND FOR INCOME(d) | | | | | | | | | | | | | | | | | | | | | | | | | | | | | | | | | | | | | | | | | | | |
| 2009 | | | $ 5.19 | | | $ .51 | | | $ 1.12 | | | $ 1.63 | | | $ .58 | | | — | | | $ .58 | | | $ 6.24 | | | 35.15 | % | | $ 66 | | | .90 | % | | 8.66 | % | | N/A | | | N/A | | | 102 | % |
| 2010 | | | 6.24 | | | .48 | | | .31 | | | .79 | | | .49 | | | — | | | .49 | | | 6.54 | | | 13.71 | | | 71 | | | .87 | | | 7.43 | | | N/A | | | N/A | | | 71 | |
| 2011 | | | 6.54 | | | .43 | | | (.07 | ) | | .36 | | | .48 | | | — | | | .48 | | | 6.42 | | | 5.66 | | | 74 | | | .88 | | | 6.68 | | | N/A | | | N/A | | | 63 | |
| 2012 | | | 6.42 | | | .41 | | | .42 | | | .83 | | | .44 | | | — | | | .44 | | | 6.81 | | | 13.51 | | | 84 | | | .88 | | | 6.11 | | | N/A | | | N/A | | | 61 | |
| 2013 | | | 6.81 | | | .36 | | | .09 | | | .45 | | | .42 | | | — | | | .42 | | | 6.84 | | | 6.88 | | | 95 | | | .88 | | | 5.37 | | | N/A | | | N/A | | | 56 | |
| |
| GOVERNMENT FUND | | | | | | | | | | | | | | | | | | | | | | | | | | | | | | | | | | | | | | | | | | | |
| 2009 | | | $10.30 | | | $ .42 | | | $ — | | | $ .42 | | | $ .43 | | | — | | | $ .43 | | | $10.29 | | | 4.28 | % | | $ 26 | | | .80 | % | | 3.87 | % | | .95 | % | | 3.72 | % | | 51 | % |
| 2010 | | | 10.29 | | | .32 | | | .16 | | | .48 | | | .42 | | | — | | | .42 | | | 10.35 | | | 4.82 | | | 28 | | | .78 | | | 3.11 | | | .93 | | | 2.96 | | | 54 | |
| 2011 | | | 10.35 | | | .28 | | | .26 | | | .54 | | | .36 | | | — | | | .36 | | | 10.53 | | | 5.41 | | | 29 | | | .81 | | | 2.70 | | | .96 | | | 2.55 | | | 33 | |
| 2012 | | | 10.53 | | | .20 | | | — | | | .20 | | | .31 | | | — | | | .31 | | | 10.42 | | | 1.95 | | | 32 | | | .75 | | | 2.10 | | | .90 | | | 1.95 | | | 46 | |
| 2013 | | | 10.42 | | | .18 | | | (.43 | ) | | (.25 | ) | | .27 | | | — | | | .27 | | | 9.90 | | | (2.47 | ) | | 30 | | | .76 | | | 1.76 | | | .91 | | | 1.61 | | | 118 | |
| |
| GROWTH & INCOME FUND | | | | | | | | | | | | | | | | | | | | | | | | | | | | | | | | | | | | | | | | | | | |
| 2009 | | | $19.76 | | | $ .27 | | | $ 5.06 | | | $ 5.33 | | | $ .40 | | | — | | | $ .40 | | | $24.69 | | | 28.05 | % | | $187 | | | .84 | % | | 1.27 | % | | N/A | | | N/A | | | 25 | % |
| 2010 | | | 24.69 | | | .50 | | | 3.45 | | | 3.95 | | | .27 | | | — | | | .27 | | | 28.37 | | | 16.19 | | | 207 | | | .82 | | | 1.91 | | | N/A | | | N/A | | | 27 | |
| 2011 | | | 28.37 | | | .44 | | | .25 | | | .69 | | | .50 | | | — | | | .50 | | | 28.56 | | | 2.37 | | | 321 | | | .81 | | | 1.51 | | | N/A | | | N/A | | | 26 | |
| 2012 | | | 28.56 | | | .61 | | | 4.35 | | | 4.96 | | | .44 | | | — | | | .44 | | | 33.08 | | | 17.45 | | | 357 | | | .80 | | | 1.87 | | | N/A | | | N/A | | | 21 | |
| 2013 | | | 33.08 | | | .53 | | | 11.89 | | | 12.42 | | | .61 | | | — | | | .61 | | | 44.89 | | | 38.06 | | | 474 | | | .79 | | | 1.34 | | | N/A | | | N/A | | | 23 | |
Financial Highlights (continued)
FIRST INVESTORS LIFE SERIES FUNDS
| | | | | | | | | | | | | | | | | | | | | | | | | | | | | | | | | | | | | | | | | | | | | |
| | |
| | | | P E R S H A R E D A T A | | | | | | R A T I O S / S U P P L E M E N T A L D A T A | |
| | | | | | | | | | | | | | | | Less Distributions | | | | | | | | | | | | | | | | | | | | Ratio to Average Net | | | | |
| | | | | | | Investment Operations | | | from | | | | | | | | | | | | | | | Ratio to Average Net | | | Assets Before Expenses | | | | |
| | | | | | | | | | | | | | | | | | | | | | | | | | | | | | | | | | Assets** | | | Waived or Assumed | | | | |
| | | | Net Asset | | | Net | | | Net Realized | | | | | | | | | | | | | | | Net Asset | | | | | | | | | | | | | | | | | | | | | |
| | | | Value, | | | Investment | | | and Unrealized | | | Total from | | | Net | | | Net | | | | | | Value, | | | | | | Net Assets | | | Expenses | | Net | | | | | | Net | | | Portfolio | |
| | | | Beginning | | | Income | | | Gain (Loss) on | | | Investment | | | Investment | | | Realized | | | Total | | | End | | | Total | | | End of Year | | | Before Fee | | Investment | | | | | | Investment | | | Turnover | |
| | | | of Year | | | (Loss | ) | | Investments | | | Operations | | | Income | | | Gains | | | Distributions | | | of Year | | | Return | * | | (in millions | ) | | Credits | (a) | Income (Loss | ) | | Expenses | (a) | | Income | | | Rate | |
| | | | | | | | | | | | | | | | | | | | | | | | | | | | | | | | | | | | | | | | | | | |
| INTERNATIONAL FUND | | | | | | | | | | | | | | | | | | | | | | | | | | | | | | | | | | | | | | | | | | |
| 2009 | | | $12.63 | | | $ .65 | | | $2.03 | | | $2.68 | | | $.59 | | | — | | | $ .59 | | | $14.72 | | | 23.24 | % | | $101 | | | 1.01 | % | 2.30 | % | | N/A | | | N/A | | | 53 | % |
| 2010 | | | 14.72 | | | .34 | | | 1.64 | | | 1.98 | | | — | | | — | | | — | | | 16.70 | | | 13.45 | | | 109 | | | .99 | | 2.15 | | | N/A | | | N/A | | | 35 | |
| 2011 | | | 16.70 | | | .39 | | | (.29 | ) | | .10 | | | .36 | | | — | | | .36 | | | 16.44 | | | .64 | | | 106 | | | .96 | | 2.26 | | | N/A | | | N/A | | | 32 | |
| 2012 | | | 16.44 | | | .28 | | | 3.12 | | | 3.40 | | | .27 | | | — | | | .27 | | | 19.57 | | | 20.85 | | | 122 | | | .94 | | 1.53 | | | N/A | | | N/A | | | 41 | |
| 2013 | | | 19.57 | | | .24 | | | 1.08 | | | 1.32 | | | .27 | | | — | | | .27 | | | 20.62 | | | 6.77 | | | 128 | | | .92 | | 1.21 | | | N/A | | | N/A | | | 35 | |
| | | | | | | | | | | | | | | | | | | | | | | | | | | | | | | | | | | | | | | | |
| INVESTMENT GRADE FUND | | | | | | | | | | | | | | | | | | | | | | | | | | | | | | | | | | | | | | | |
| 2009 | | | $ 9.16 | | | $ .69 | | | $1.10 | | | $1.79 | | | $.60 | | | — | | | $ .60 | | | $10.35 | | | 20.94 | % | | $ 39 | | | .76 | % | 5.38 | % | | .91 | % | | 5.23 | % | | 79 | % |
| 2010 | | | 10.35 | | | .51 | | | .41 | | | .92 | | | .53 | | | — | | | .53 | | | 10.74 | | | 9.26 | | | 43 | | | .73 | | 4.62 | | | .88 | | | 4.47 | | | 55 | |
| 2011 | | | 10.74 | | | .47 | | | .17 | | | .64 | | | .52 | | | — | | | .52 | | | 10.86 | | | 6.23 | | | 47 | | | .71 | | 4.17 | | | .86 | | | 4.02 | | | 29 | |
| 2012 | | | 10.86 | | | .43 | | | .76 | | | 1.19 | | | .48 | | | — | | | .48 | | | 11.57 | | | 11.23 | | | 57 | | | .70 | | 3.73 | | | .85 | | | 3.58 | | | 28 | |
| 2013 | | | 11.57 | | | .42 | | | (.51 | ) | | (.09 | ) | | .45 | | | — | | | .45 | | | 11.03 | | | (.80 | ) | | 59 | | | .70 | | 3.49 | | | .85 | | | 3.34 | | | 39 | |
| | | | | | | | | | | | | | | | | | | | | | | | | | | | | | | | | | | | | | | | | | | |
| OPPORTUNITY FUND | | | | | | | | | | | | | | | | | | | | | | | | | | | | | | | | | | | | | | | | | | |
| 2012▪ | | | $10.00 | | | $(.05 | ) | | $ .11 | | | $ .06 | | | — | | | — | | | — | | | $10.06 | | | .60 | %† | | $ 1 | | | 16.84 | %†† | (13.27 | )%†† | | N/A | | | N/A | | | 0 | %† |
| 2013 | | | 10.06 | | | (.04 | ) | | 4.06 | | | 4.02 | | | — | | | — | | | — | | | 14.08 | | | 39.96 | | | 14 | | | 2.28 | | (.79 | ) | | N/A | | | N/A | | | 32 | |
| | | | | | | | | | | | | | | | | | | | | | | | | | | | | | | | | | | | | | | | | | | |
| SELECT GROWTH FUND | | | | | | | | | | | | | | | | | | | | | | | | | | | | | | | | | | | | | | | | | | |
| 2009 | | | $ 6.06 | | | $ .01 | | | $ .59 | | | $ .60 | | | $ — | | | — | | | $ — | | | $ 6.66 | | | 9.90 | % | | $ 10 | | | 1.00 | % | .22 | % | | N/A | | | N/A | | | 102 | % |
| 2010 | | | 6.66 | | | .01 | | | 1.39 | | | 1.40 | | | .01 | | | — | | | .01 | | | 8.05 | | | 21.10 | | | 14 | | | .98 | | .20 | | | N/A | | | N/A | | | 87 | |
| 2011 | | | 8.05 | | | .01 | | | .41 | | | .42 | | | .01 | | | — | | | .01 | | | 8.46 | | | 5.25 | | | 18 | | | .90 | | .07 | | | N/A | | | N/A | | | 61 | |
| 2012 | | | 8.46 | | | .05 | | | 1.08 | | | 1.13 | | | .01 | | | — | | | .01 | | | 9.58 | | | 13.30 | | | 24 | | | .87 | | .61 | | | N/A | | | N/A | | | 52 | |
| 2013 | | | 9.58 | | | .04 | | | 3.12 | | | 3.16 | | | .05 | | | — | | | .05 | | | 12.69 | | | 33.15 | | | 35 | | | .85 | | .43 | | | N/A | | | N/A | | | 64 | |
| | | | | | | | | | | | | | | | | | | | | | | | | | | | | | | | | | | | | | | | |
| SPECIAL SITUATIONS FUND(e) | | | | | | | | | | | | | | | | | | | | | | | | | | | | | | | | | | | | | | | |
| 2009 | | | $19.44 | | | $ .22 | | | $5.63 | | | $5.85 | | | $.27 | | | $ — | | | $ .27 | | | $25.02 | | | 30.77 | % | | $127 | | | .84 | % | 1.03 | % | | N/A | | | N/A | | | 66 | % |
| 2010 | | | 25.02 | | | .16 | | | 6.43 | | | 6.59 | | | .22 | | | — | | | .22 | | | 31.39 | | | 26.57 | | | 152 | | | .83 | | .59 | | | N/A | | | N/A | | | 64 | |
| 2011 | | | 31.39 | | | .20 | | | .51 | | | .71 | | | .16 | | | — | | | .16 | | | 31.94 | | | 2.24 | | | 150 | | | .81 | | .61 | | | N/A | | | N/A | | | 59 | |
| 2012 | | | 31.94 | | | .34 | | | 2.88 | | | 3.22 | | | .20 | | | 3.39 | | | 3.59 | | | 31.57 | | | 10.01 | | | 160 | | | .81 | | 1.07 | | | N/A | | | N/A | | | 61 | |
| 2013 | | | 31.57 | | | .19 | | | 9.11 | | | 9.30 | | | .34 | | | 1.56 | | | 1.90 | | | 38.97 | | | 30.88 | | | 201 | | | .82 | | .53 | | | N/A | | | N/A | | | 108 | |
Financial Highlights (continued)
FIRST INVESTORS LIFE SERIES FUNDS
| | | | | | | | | | | | | | | | | | | | | | | | | | | | | | | | | | | | | | | | | | | | | | |
| | |
| | | | P E R S H A R E D A T A | | | | | | R A T I O S / S U P P L E M E N T A L D A T A | |
| | | | | | | | | | | | | | | | Less Distributions | | | | | | | | | | | | | | | | | | | | | Ratio to Average Net | | | | |
| | | | | | | Investment Operations | | | from | | | | | | | | | | | | | | | Ratio to Average Net | | | Assets Before Expenses | | | | |
| | | | | | | | | | | | | | | | | | | | | | | | | | | | | | | | | | Assets** | | | Waived or Assumed | | | | |
| | | | Net Asset | | | Net | | | Net Realized | | | | | | | | | | | | | | | Net Asset | | | | | | | | | | | | | | | | | | | | | | |
| | | | Value, | | | Investment | | | and Unrealized | | | Total from | | | Net | | | Net | | | | | | Value, | | | | | | Net Assets | | | Expenses | | | Net | | | | | | Net | | | Portfolio | |
| | | | Beginning | | | Income | | | Gain (Loss) on | | | Investment | | | Investment | | | Realized | | | Total | | | End | | | Total | | | End of Year | | | Before Fee | | | Investment | | | | | | Investment | | | Turnover | |
| | | | of Year | | | (Loss | ) | | Investments | | | Operations | | | Income | | | Gains | | | Distributions | | | of Year | | | Return | * | | (in millions | ) | | Credits | (a) | | Income (Loss | ) | | Expenses | (a) | | Income | | | Rate | |
| | | | | | | | | | | | | | | | | | | | | | | | | | | | | | | | | | | | | | | | | |
| TARGET MATURITY 2015 FUND | | | | | | | | | | | | | | | | | | | | | | | | | | | | | | | |
| 2009 | | | $16.48 | | | $ .62 | | | $(1.00 | ) | | $ (.38 | ) | | $.63 | | | $.02 | | | $.65 | | | $15.45 | | | (2.22 | )% | | $27 | | | .71 | % | | 3.91 | % | | .86 | % | | 3.76 | % | | 0 | % |
| 2010 | | | 15.45 | | | .63 | | | .66 | | | 1.29 | | | .64 | | | .08 | | | .72 | | | 16.02 | | | 8.58 | | | 28 | | | .71 | | | 3.87 | | | .86 | | | 3.72 | | | 4 | |
| 2011 | | | 16.02 | | | .65 | | | .44 | | | 1.09 | | | .62 | | | .22 | | | .84 | | | 16.27 | | | 7.14 | | | 26 | | | .72 | | | 3.87 | | | .87 | | | 3.72 | | | 0 | |
| 2012 | | | 16.27 | | | .66 | | | (.53 | ) | | .13 | | | .66 | | | .16 | | | .82 | | | 15.58 | | | .84 | | | 24 | | | .73 | | | 4.00 | | | .88 | | | 3.85 | | | 0 | |
| 2013 | | | 15.58 | | | .70 | | | (.72 | ) | | (.02 | ) | | .68 | | | .22 | | | .90 | | | 14.66 | | | (.20 | ) | | 21 | | | .75 | | | 4.28 | | | .90 | | | 4.13 | | | 0 | |
| | | | | | | | | | | | | | | | | | | | | | | | | | | | | | | | | | | | | | | | | | | | |
| TOTAL RETURN FUND | | | | | | | | | | | | | | | | | | | | | | | | | | | | | | | | | | | | | |
| 2012▪ | | | $10.00 | | | $(.05 | ) | | $ (.02 | ) | | $ (.07 | ) | | — | | | — | | | — | | | $ 9.93 | | | (.70 | )%† | | $ 1 | | | 16.99 | %†† | | (14.84 | )%†† | | N/A | | | N/A | | | 64 | %† |
| 2013 | | | 9.93 | | | — | | | 1.69 | | | 1.69 | | | — | | | — | | | — | | | 11.62 | | | 17.02 | | | 13 | | | 1.93 | | | .16 | | | N/A | | | N/A | | | 14 | |
| |
| * | The effect of fees and charges incurred at the separate account level are not reflected in these |
| | performance figures. |
| ** | Net of expenses waived or assumed by the investment adviser (Note 4). |
| ▪ | For the period December 17, 2012 (commencement of operations) to December 31, 2012. |
| † | Not annualized |
| †† | Annualized |
| (a) | The ratios do not include a reduction of expenses from cash balances maintained with the Bank of |
| | New York Mellon or from brokerage service arrangements (Note 1G). |
| (b) | FIMCO voluntarily waived advisory fees to limit the Fund’s overall expense ratio to .70% for the |
| | period January 1, 2009 to January 31, 2009 and .60% for the period February 1, 2009 to December 31, |
| | 2013. Also, during the period January 1, 2009 to December 31, 2013, FIMCO waived additional |
| | advisory fees and assumed other expenses to prevent a negative yield on the Fund’s shares (Note 4). |
| (c) | Prior to September 4, 2012, known as Value Fund. |
| (d) | Prior to December 17, 2012, known as High Yield Fund. |
| (e) | Prior to December 17, 2012, known as Discovery Fund. |
| | |
| 152 | See notes to financial statements | 153 |
Report of Independent Registered Public
Accounting Firm
To the Shareholders and Board of Trustees of
First Investors Life Series Funds
We have audited the accompanying statements of assets and liabilities of the twelve Funds comprising First Investors Life Series Funds, including the portfolios of investments, as of December 31, 2013, the related statements of operations for the year then ended, the statements of changes in net assets for each of the periods indicated thereon, and the financial highlights for each of the periods indicated thereon. These financial statements and financial highlights are the responsibility of the Life Series Funds’ management. Our responsibility is to express an opinion on these financial statements and financial highlights based on our audits.
We conducted our audits in accordance with the standards of the Public Company Accounting Oversight Board (United States). Those standards require that we plan and perform the audit to obtain reasonable assurance about whether the financial statements and financial highlights are free of material misstatement. The Funds are not required to have, nor were we engaged to perform, an audit of the Funds’ internal control over financial reporting. Our audits included consideration of internal control over financial reporting as a basis for designing audit procedures that are appropriate in the circumstances, but not for the purpose of expressing an opinion on the effectiveness of the Funds’ internal control over financial reporting. Accordingly, we express no such opinion. An audit includes examining, on a test basis, evidence supporting the amounts and disclosures in the financial statements. Our procedures included confirmation of securities owned as of December 31, 2013, by correspondence with the custodian and brokers. Where brokers have not replied to our confirmation requests, we have carried out other appropriate auditing procedures. An audit also includes assessing the accounting principles used and significant estimates made by management, as well as evaluating the overall financial statement presentation. We believe that our audits provide a reasonable basis for our opinion.
In our opinion, the financial statements and financial highlights referred to above present fairly, in all material respects, the financial position of each of the twelve Funds comprising First Investors Life Series Funds, as of December 31, 2013, and the results of their operations, changes in their net assets, and their financial highlights for the periods presented, in conformity with accounting principles generally accepted in the United States of America.
Philadelphia, Pennsylvania
February 27, 2014
FIRST INVESTORS LIFE SERIES FUNDS
Trustees and Officers*
| | | | |
| | | Length of | | |
| | | Time Served | Number of | Other |
| | Position(s) | (including with | Portfolios in | Trusteeships/ |
| Name, Year of Birth | Held with | Predecessor | Fund Complex | Directorships |
| and Address | Funds | Funds) | Overseen | Held |
| |
| DISINTERESTED TRUSTEES |
| |
| Susan E. Artmann (1954) | Trustee | Since 11/1/12 | 41 | None |
| c/o First Investors | | | | |
| Legal Department | | | | |
| 40 Wall Street | | | | |
| New York, NY 10005 | | | | |
| | | | |
| Principal Occupation During Past 5 Years: | | | |
| Retired. Executive Vice President and Chief Financial Officer of HSBC Insurance North America | |
| (2012-September 2013); Executive Vice President and President (2008-2011) and Chief Financial Officer |
| (2000-2008) of HSBC Taxpayer Financial Services. | | | |
| |
| |
| Mary J. Barneby (1952) | Trustee | Since 11/1/12 | 41 | None |
| c/o First Investors | | | | |
| Legal Department | | | | |
| 40 Wall Street | | | | |
| New York, NY 10005 | | | | |
| | | | |
| Principal Occupation During Past 5 Years: | | | |
| Chief Executive Officer, Girl Scouts of Connecticut (since October 2012); Executive Director of UBS Financial |
| Services, Inc. and Head of Stamford Private Wealth Office (2002-2012). | | |
| |
| |
| Charles R. Barton, III (1965) | Trustee | Since 1/1/06 | 41 | None |
| c/o First Investors | | | | |
| Legal Department | | | | |
| 40 Wall Street | | | | |
| New York, NY 10005 | | | | |
| | | | |
| Principal Occupation During Past 5 Years: | | | |
| Chief Operating Officer (since 2007), Board Director (since 1989, currently Ex-officio) and Trustee (since 1994) |
| of The Barton Group/Barton Mines Corporation (mining and industrial abrasives distribution); President of Noe |
| Pierson Corporation (land holding and management services provider) (since 2004). | |
| |
| Arthur M. Scutro, Jr. (1941) | Trustee | Since 1/1/06 | 41 | None |
| c/o First Investors | and Chairman | | | |
| Legal Department | | | | |
| 40 Wall Street | | | | |
| New York, NY 10005 | | | | |
| | | | |
| Principal Occupation During Past 5 Years: | | | |
| None/Retired | | | | |
FIRST INVESTORS LIFE SERIES FUNDS
Trustees and Officers* (continued)
| | | | |
| | | | Number of | Other |
| | Position | | Portfolios in | Trusteeships/ |
| Name, Year of Birth | Held with | Length of | Fund Complex | Directorships |
| and Address | Funds | Time Served | Overseen | Held |
| |
| DISINTERESTED TRUSTEES (continued) |
| |
| Mark R. Ward (1952) | Trustee | Since 1/1/10 | 41 | None |
| c/o First Investors | | | | |
| Legal Department | | | | |
| 40 Wall Street | | | | |
| New York, NY 10005 | | | | |
| | | | |
| Principal Occupation During Past 5 Years: | | | |
| Self-employed, consultant (since 2008). | | | |
| |
| *Each Trustee serves for an indefinite term with the Funds, until his/her successor is elected. |
| |
| |
| |
| | | | Number of | Other |
| | Position | | Portfolios in | Trusteeships/ |
| Name, Year of Birth | Held with | Length of | Fund Complex | Directorships |
| and Address | Funds | Time Served | Overseen | Held |
| |
| OFFICERS WHO ARE NOT TRUSTEES |
| |
| Derek Burke (1963) | President | Since 2012 | N/A | None |
| c/o First Investors | | | | |
| Management Company, Inc. | | | | |
| Raritan Plaza I | | | | |
| Edison, NJ 08837 | | | | |
| | | | |
| Principal Occupation During Past 5 Years: | | | |
| Director (since 2012) and President (since 2011) of First Investors Management Company, Inc., and Administrative |
| Data Management Corp.; Board of Managers and Chief Executive Officer of First Investors Advisory Services, |
| LLC (since 2012); Consultant, Burke Consulting (2010-2011); UBS - Managing Director, Co-Head of Investment |
| Solutions (2009-2010) and Managing Director, Head of Institutional, Retirement and Fund Services (2004-2009). |
| | | | |
| | | Length of | | |
| | | Time Served | Number of | Other |
| | Position | (including with | Portfolios in | Trusteeships/ |
| Name, Year of Birth | Held with | Predecessor | Fund Complex | Directorships |
| and Address | Funds | Funds) | Overseen | Held |
| |
| OFFICERS WHO ARE NOT TRUSTEES (continued) |
| |
| Joseph I. Benedek (1957) | Treasurer | Since 1988 | N/A | None |
| c/o First Investors | | | | |
| Management Company, Inc. | | | | |
| Raritan Plaza I | | | | |
| Edison, NJ 08837 | | | | |
| |
| Principal Occupation During Past 5 Years: | | | |
| Treasurer of First Investors Management Company, Inc. | | | |
| |
| |
| Mary Carty (1950) | Secretary | Since 2010 | N/A | None |
| c/o First Investors | | | | |
| Legal Department | | | | |
| 40 Wall Street | | | | |
| New York, NY 10005 | | | | |
| | | | |
| Principal Occupation During Past 5 Years: | | | |
| General Counsel of First Investors Management Company, Inc. and various affiliated companies (since |
| December 2012); Assistant Counsel of First Investors Management Company, Inc., (2010-2012). Special |
| Counsel and Associate at Willkie Farr & Gallagher LLP (1998-2009). | | |
| |
| |
| Marc S. Milgram (1957) | Chief | Since 2010 | N/A | None |
| c/o First Investors | Compliance | | | |
| Legal Department | Officer | | | |
| 40 Wall Street | | | | |
| New York, NY 10005 | | | | |
| |
| Principal Occupation During Past 5 Years: | | | |
| Investment Compliance Manager of First Investors Management Company, Inc., (2009-2010); First Investors |
| Federal Savings Bank, President (2000-2011), Treasurer (1987-2011) and Director (2004-2011); First Investors |
| Corporation, Vice President (2008-2009); Administrative Data Management Corp., Vice President (2008-2009). |
FIRST INVESTORS LIFE SERIES FUNDS
| |
Shareholder Information
| | |
| |
| Investment Adviser | Custodian |
| First Investors Management | (Cash Management, Fund For Income, |
| Company, Inc. | Government, Investment Grade and Target |
| 40 Wall Street | Maturity 2015 Funds) |
| New York, NY 10005 | The Bank of New York Mellon |
| | One Wall Street |
| | New York, NY 10286 |
| |
| Subadviser | Custodian |
| (Fund For Income) | (Equity Income, Growth & Income, |
| Muzinich & Co., Inc. | International, Opportunity, Select Growth, |
| 450 Park Avenue | Special Situations and Total Return Funds) |
| New York, NY 10022 | Brown Brothers Harriman & Co. |
| | 50 Post Office Square |
| | Boston, MA 02110 |
| |
| Subadviser | Transfer Agent |
| (International Fund) | Administrative Data Management Corp. |
| Vontobel Asset Management, Inc. | Raritan Plaza I – 8th Floor |
| 1540 Broadway | Edison, NJ 08837-3920 |
| New York, NY 10036 | |
| |
| Subadviser | Independent Registered |
| (Select Growth Fund) | Public Accounting Firm |
| Smith Asset Management Group, L.P. | Tait, Weller & Baker LLP |
| 100 Crescent Court | 1818 Market Street – 24th Floor |
| Dallas, TX 75201 | Philadelphia, PA 19103 |
| |
| | Legal Counsel |
| | K&L Gates LLP |
| | 1601 K Street, N.W. |
| | Washington, D.C. 20006 |
A description of the policies and procedures that the Funds use to vote proxies relating to a portfolio’s securities is available, without charge, upon request by calling toll free 1-800-423-4026 or can be viewed online or downloaded from the EDGAR database on the Securities and Exchange Commission’s (“SEC”) internet website at http://www.sec.gov. In addition, information regarding how the Funds voted proxies relating to portfolio securities during the most recent 12-month period ended June 30, is available, without charge, upon request in writing or by calling 1-800-423-4026 and on the SEC’s internet website at http://www.sec.gov.
The Funds file their complete schedule of portfolio holdings with the SEC on Form N-Q for the first and third quarters of each fiscal year. The Funds’ Form N-Q is available on the SEC’s website at http://www.sec.gov; and may also be reviewed and copied at the SEC’s Public Reference Room in Washington D.C. Information on the operation of the Public Reference Room may be obtained by calling 1-800-SEC-0330. The schedule of portfolio holdings is available, without charge, upon request in writing or by calling 1-800-423-4026.

|
| Item 2. | Code of Ethics |
| |
| As of December 31, 2013, the Registrant has adopted a code of ethics that applies to the |
| Registrant's principal executive officer and principal financial officer. On October 30, 2013 |
| revisions were made to the code of ethics to reflect our new 40 Wall Street address on the |
| certification forms. |
| |
| For the year ended December 31, 2013, there were no waivers granted from a provision of the code |
| of ethics. |
| |
| A copy of the Registrant's code of ethics is filed under Item 12(a)(1). |
| |
| |
| Item 3. | Audit Committee Financial Expert |
| |
| During the reporting period the Registrant's Board determined that it had at least one "audit |
| committee financial expert" serving on its audit committee. Arthur M. Scutro, Jr. and Mark R. |
| Ward were the "audit committee financial experts" during all or part of the period and were |
| considered to be "independent" as defined in Item 3 of Form N-CSR. |
| |
| |
| Item 4. | Principal Accountant Fees and Services |
| | | | | | | |
| | | | Fiscal Year Ended | | | |
| | | | December 31, | | | |
| | | | ----------------- | | | |
| | | 2013 | | | 2012 | | |
| | | ---- | | | ---- | | |
| (a) Audit Fees | $ | 127,400 | | $ | 115,600 | | |
| | | |
| (b) Audit-Related Fees | $ | 0 | | $ | 0 | | |
| | | |
| (c) Tax Fees | $ | 41,400 | | $ | 37,000 | | |
| | | |
| Nature of services: tax returns preparation and tax compliance | | |
| | | |
| (d) All Other Fees | $ | 0 | | $ | 0 | | |
| | | |
| (e)(1) Audit committee's pre-approval policies | | | | | |
|
| The Charter of the Audit Committee requires the Audit Committee (a) to pre-approve, and to |
| recommend to the full Board, the selection, retention or termination of the independent auditors to |
| provide audit, review or attest services to the First Investors Funds (“Funds”) and, in connection |
| therewith, evaluate the independence of the auditors and to obtain the auditors’ specific |
| representations as to their independence; (b) to pre-approve all non-audit services to be provided to |
| the Funds by the independent auditor; and (c) to pre-approve all non-audit services to be provided |
|
| by the Funds’ independent auditor to the Funds’ investment adviser or to any entity that controls, is |
| controlled by or is under common control with the Funds’ investment adviser and that provides |
| ongoing services to the Funds, if the engagement relates directly to the operations and financial |
| reporting of the Funds. The Audit Committee has not adopted pre-approval policies or procedures |
| to permit the services in (b) and (c) above to be pre-approved by other means. |
| |
| (e)(2) None, or 0%, of the services relating to the Audit-Related Fees, Tax Fees and All Other Fees |
| paid by the Registrant and Related Entities disclosed above were approved by the Audit Committee |
| pursuant to paragraph (c)(7)(i)(C) of Rule 2-01 of Regulation S-X (which permits audit committee |
| approval after the start of the engagement with respect to services other than audit review or attest |
| services, if certain conditions are satisfied). |
| |
| (f) Not Applicable |
| |
| (g) Aggregate non-audit fees billed by the Registrant's accountant for services rendered to the |
| Registrant and the Registrant's investment adviser and any entity controlling, controlled by, or |
| under common control with the adviser that provides ongoing services to the Registrant for the two |
| fiscal years ended December 31, 2013 and 2012 were $121,200 and $49,500, respectively. |
| |
| (h) Not Applicable |
| |
| Item 5. | Audit Committee of Listed Registrants |
| |
| | Not applicable |
| |
| Item 6. | Schedule of Investments |
| |
| | Schedule is included as part of the report to shareholders filed under Item 1 of this |
| | Form. |
| |
| Item 7. | Disclosure of Proxy Voting Policies & Procedures for |
| | Closed-End Management Investment Companies |
| |
| | Not applicable |
| |
| Item 8. | Portfolio Managers of Closed-End Management Investment Companies |
| |
| | Not applicable |
| |
| Item 9. | Purchases of Equity Securities by Closed-End Management |
| | Investment Companies and Affiliated Purchasers |
| |
| | Not applicable |
| |
| Item 10. | Submission of Matters to a Vote of Security Holders |
| |
| There were no material changes to the procedure by which shareholders may recommend nominees |
| to the Registrant's Board of Trustees. |
| |
| |
| Item 11. | Controls and Procedures |
| |
| (a) | The Registrant's Principal Executive Officer and Principal Financial Officer have concluded |
| that the Registrant's disclosure controls and procedures (as defined in Rule 30a-3(c) under the |
| Investment Company Act of 1940, as amended) are effective, based on their evaluation of these |
| disclosure controls and procedures as of a date within 90 days of the filing date of this report. |
| |
| (b) | There were no changes in the Registrant's internal control over financial reporting (as defined |
| in Rule 30a-3(d) under the Investment Company Act of 1940, as amended) that occurred during the second |
| fiscal quarter of the period covered by this report that have materially affected, or are reasonably likely to |
| materially affect, the Registrant's internal control over financial reporting. |
| |
| |
| Item 12. | Exhibits |
| |
| (a)(1) | Code of Ethics - Filed herewith |
| |
| |
| (a)(2) | Certifications pursuant to Section 302 of the Sarbanes-Oxley Act |
| | of 2002 - Filed herewith |
| |
| (b) | Certifications pursuant to Section 906 of the Sarbanes-Oxley Act |
| | of 2002 - Filed herewith |
| |
| SIGNATURES |
| |
| | Pursuant to the requirements of the Securities Exchange Act of 1934 and the Investment |
| Company Act of 1940, the Registrant has duly caused this report to be signed on its behalf by the |
| undersigned, thereunto duly authorized. |
| |
| First Investors Life Series Funds |
| |
| By | /S/ | DEREK BURKE |
| | | Derek Burke |
| | | President and Principal Executive Officer |
| |
| Date: | March 6, 2014 |
| |
| |
| | Pursuant to the requirements of the Securities Exchange Act of 1934 and the Investment |
| Company Act of 1940, this report has been signed below by the following persons on behalf of the |
| Registrant and in the capacities and on the dates indicated. |
| |
| |
| |
| By | /S/ | DEREK BURKE |
| | | Derek Burke |
| | | President and Principal Executive Officer |
| |
| |
| By | /S/ | JOSEPH I. BENEDEK |
| | | Joseph I. Benedek |
| | | Treasurer and Principal Financial Officer |
| |
| Date: | March 6, 2014 |