|
| UNITED STATES |
| SECURITIES AND EXCHANGE COMMISSION |
| WASHINGTON, D.C. 20549 |
| -------- |
| |
| FORM N-CSR |
| -------- |
| |
| CERTIFIED SHAREHOLDER REPORT OF REGISTERED MANAGEMENT |
| INVESTMENT COMPANIES |
| |
| INVESTMENT COMPANY ACT FILE NUMBER 811-4325 |
FIRST INVESTORS LIFE SERIES FUNDS
(Exact name of registrant as specified in charter)
40 Wall Street
New York, NY 10005
(Address of principal executive offices) (Zip code)
Joseph I. Benedek
First Investors Management Company, Inc.
Raritan Plaza I
Edison, NJ 08837-3620
(Name and address of agent for service)
REGISTRANT'S TELEPHONE NUMBER, INCLUDING AREA CODE:
1-212-858-8000
DATE OF FISCAL YEAR END: DECEMBER 31
DATE OF REPORTING PERIOD: JUNE 30, 2015
Item 1. Reports to Stockholders
The semi-annual report to stockholders follows
This report is for the information of the shareholders of the Funds. It is the policy of each Fund described in this report to mail only one copy of a Fund’s prospectus, annual report, semi-annual report and proxy statements to all shareholders who share the same mailing address and share the same last name and have invested in a Fund covered by the same document. You are deemed to consent to this policy unless you specifically revoke this policy and request that separate copies of such documents be mailed to you. In such case, you will begin to receive your own copies within 30 days after our receipt of the revocation. You may request that separate copies of these disclosure documents be mailed to you by writing to us at: Administrative Data Management Corp., Raritan Plaza I, Edison, NJ 08837-3620 or calling us at 1-800-423-4026.
You may obtain a free prospectus for any of the Funds by contacting your representative, calling 1-800-423-4026, writing to us at the following address: First Investors Corporation, 40 Wall Street, New York, NY 10005, or by visiting our website at www.firstinvestors.com. You should consider the investment objectives, risks, charges and expenses of a Fund carefully before investing. The prospectus contains this and other information about the Fund, and should be read carefully before investing.
An investment in a Fund is not a bank deposit and is not insured or guaranteed by the Federal Deposit Insurance Corporation (FDIC) or any other government agency. Although the Cash Management Fund seeks to preserve a net asset value at $1.00 per share, it is possible to lose money by investing in it, just as it is possible to lose money by investing in any of the other Funds. Past performance is no guarantee of future results.
A Statement of Additional Information (“SAI”) for any of the Funds may also be obtained, without charge, upon request by calling 1-800-423-4026, writing to us at our address or by visiting our website listed above. The SAI contains more detailed information about the Funds, including information about their Trustees.
Equity & Bond Markets Overview
FIRST INVESTORS LIFE SERIES FUNDS
Dear Investor:
We are pleased to provide you with our report for the six-month period ended June 30, 2015 (“the review period”).
Economic Overview
For the second year in a row, first half U.S. economic growth was disappointing, although there were some bright spots. First quarter gross domestic product (“GDP”) in particular was weak at 0.6% due to several unexpected factors: the harsh winter, labor disputes at west coast ports, a decline in capital investments in the energy sector as a result of the fall in oil prices, and weaker exports because of the strong U.S. dollar.
GDP growth in the second quarter rebounded to 2.3% and the economy showed improvement in key areas. The unemployment rate declined to a post-recession low of 5.3% and housing starts rose to a post-recession high. Despite the decline in the unemployment rate, wage gains remained weak, a headwind to a more robust recovery. Inflation also remained subdued, in large part because of the decline in oil prices in the fourth quarter of last year, with consumer prices up only 0.1% year-over-year.
At the beginning of the year, the market expected the Federal Reserve (“the Fed”) to finally end its zero interest rate policy, which dates back to 2008, and raise interest rates in June. But the Fed took no action during the review period due to the unexpectedly weak economy in the first quarter. At this point, the Fed appears to want to raise rates later this year, with September the earliest likely date.
The Equity Market
Equities were mixed during the period under review. After an anemic January, the markets started to rally steadily, with gains during February, April and May. The environment was constructive and steady — with low volatility. However, after probing new highs in mid-May, equities saw their gains erode as June brought increased market volatility. Global economic events took center stage, as the deadline for a Greek debt resolution was fast approaching and weaker economic data flowing from China weighed on the markets. The S&P 500 ended the period up 1.23%, while the Dow Jones Industrial Average only managed to end fractionally higher at 0.03% and the NASDAQ Composite was up 6.0%.
Despite the uncertainties in Greece and China, the equity markets held their own during the six months ended June 30, fueled in part by underlying market fundamentals, robust merger and acquisition activity, and positive corporate earnings growth. Underlying corporate earnings were solid and are expected to grow about 7–10% in 2015, when adjusting for the strong U.S. dollar, which has appreciated significantly versus the other leading foreign currencies, most notably the euro, yen and British pound. Share repurchases and dividends continue to be popular uses of excess cash flow, as repurchase levels are at all-time highs and dividends are increasing at an 8% rate (S&P 500). Market valuations remain constructive, having moved towards
Equity & Bond Markets Overview (continued)
FIRST INVESTORS LIFE SERIES FUNDS
longer-term average levels — meaning stocks are neither cheap nor expensive. Robust merger and acquisition activity — deal flow is 30% versus the same period in 2014, especially in pharmaceuticals, and semiconductors — also helped support the market’s momentum.
With low interest rates, low gas prices, muted inflation, unemployment below the 50 year average, and lower consumer debt levels, individuals have more discretionary income to spend elsewhere. Two bright spots have been new auto and home sales, both of which were better-than-expected. June automobile sales were tracking at 17 million units per year, which is 2 million above the long-term average. Even though housing starts are rising, they are still below the historical average, which means they have room to grow. Retail sales are also positive, particularly for big ticket items.
Large-cap stocks underperformed small-caps for the period under review. This was mostly due to the strong U.S. dollar which makes products exported to other countries more expensive to purchase overseas, thereby hurting U.S. corporate sales. Small-cap stocks (fueled by technology and health care) were up 4.75% year-to-date, according to the Russell 2000 Index. Among styles, growth stocks outperformed value stocks within both the large-cap and small-cap categories.
Sector performance bounced around a bit during the semi-annual period. Utilities, Energy and Industrials were the weakest areas, impacted by rising interest rates, falling oil prices and the strong U.S. currency. Health Care and Consumer Discretionary were the best performing sectors, posting gains of 8.7% and 6.0%, respectively — helped by mergers and acquisitions and robust consumer confidence.
On the international side, despite concerns in Greece, slowing growth in China, and deflation in Japan and Europe, the MSCI EAFE Index returned 5.18% year-to-date. In local currency terms, the Index was up over 9%, proof that the U.S. dollar remains strong. The international markets still look solid, particularly Western Europe, notably Germany, and the United Kingdom, Japan and several emerging markets, which are showing improvement. Even though China was weak in May and June, it is still up about 10% for the year; however, growth there appears to be moderating, resulting in increased volatility in the neighboring Asian markets.
The Bond Market
Interest rates rose slightly during the review period, but it was really a tale of two quarters. The broad U.S. high grade bond market, as measured by the Bank of Ameri-ca Merrill Lynch U.S. Broad Market Index, returned 1.7% in the first quarter as the European Central Bank initiated quantitative easing – a program of buying bonds to stimulate the economy. This drove European bond yields to all-time historical lows, pulling down U.S. interest rates, as well. Conversely, in the second quarter, European bond yields spiked higher, followed by U.S. yields, and the broad U.S. bond market fell 1.7%, the fourth worst quarter in 20 years.
Consequently, for the review period, the broad U.S. bond market returned –0.06%. The benchmark 10-year U.S. Treasury note yield rose from 2.17% to 2.35%. The two-year Treasury note yield, which is very sensitive to changes in the Fed’s policy, was almost unchanged, moving from 0.67% to 0.65%.
Thank you for placing your trust in First Investors. As always, we appreciate the opportunity to serve your investment needs.

July 31, 2015
The Funds are only available through the purchase of variable life insurance policies and variable annuity contracts issued by First Investors Life Insurance Company. The reports do not reflect the additional expenses and charges that are applicable to variable life insurance policies and variable annuity contracts.
This Equity & Bond Markets Overview is not part of the Funds’ financial report and is submitted for the general information of the shareholders of the Funds. It is not authorized for distribution to prospective investors in the Funds, unless preceded or accompanied by an effective prospectus. The views expressed in this Overview reflect those views of the Director of Equities and Director of Fixed Income of First Investors Management Company, Inc. through the end of the period covered. Any such views are subject to change at any time based upon market or other conditions and we disclaim any responsibility to update such views. This Overview may not be relied upon as investment advice or an indication of current or future trading intent on behalf of any Fund.
There are a variety of risks associated with investing in variable life and annuity sub-accounts. For all subaccounts, there is the risk that securities selected by the portfolio manager may perform differently than the overall market or may not meet the portfolio manager’s expectations. For stock subaccounts, the risks include market risk (the risk that the entire stock market will decline because of an event such as a deterioration in the economy or a rise in interest rates), as well as special risks associated with investing in certain types of stock subaccounts such as small-cap, global or international funds. For bond subaccounts, the risks include interest rate risk and credit risk. Interest rate risk is the risk that bonds will decrease in value as interest rates rise. As a general matter, bonds with longer maturities fluctuate more than bonds with shorter maturities in reaction to changes in interest rates. Credit risk is the risk that bonds will decline in value as the result of a decline in the credit rating of the bonds or the economy as a whole, or that the issuer will be unable to pay interest and/or principal when due. There are also special risks associated with investing in certain types of bond subaccounts, including liquidity risk and prepayment and extension risk. You should consult your prospectus for a precise explanation of the risks associated with your subaccounts.
Understanding Your Fund’s Expenses (unaudited)
FIRST INVESTORS LIFE SERIES FUNDS
As a mutual fund shareholder, you incur two types of costs: (1) transaction costs, and (2) ongoing costs, including advisory fees and other expenses. This example is intended to help you understand your ongoing costs (in dollars) of investing in the Fund and to compare these costs with the ongoing costs of investing in other mutual funds.
The examples are based on an investment of $1,000 in each Fund at the beginning of the period, January 1, 2015, and held for the entire six-month period ended June 30, 2015. The calculations assume that no shares were bought or sold during the period. Your actual costs may have been higher or lower, depending on the amount of your investment and the timing of any purchases or redemptions.
Actual Expense Example:
These amounts help you to estimate the actual expenses that you paid over the period. The “Ending Account Value” shown is derived from the Fund’s actual return, and the “Expenses Paid During Period” shows the dollar amount that would have been paid by an investor who started with $1,000 in the Fund. You may use the information here, together with the amount you invested, to estimate the expenses that you paid during the period.
To estimate the expenses you paid on your account during this period simply divide your ending account value by $1,000 (for example, an $8,600 account value divided by $1,000 = 8.60), then multiply the result by the number given for your Fund under the heading “Expenses Paid During Period”.
Hypothetical Expense Example:
These amounts provide information about hypothetical account values and hypothetical expenses based on the Fund’s actual expense ratio and an assumed rate of return of 5% per year before expenses, which is not the Fund’s actual return. The hypothetical account values and expenses may not be used to estimate the actual ending account balance or expenses you paid for the period. You may use this information to compare the ongoing costs of investing in the Fund and other funds. To do so, compare this 5% hypothetical example with the 5% hypothetical examples that appear in the shareholder reports of the other funds.
Please note that the expenses shown in the table are meant to highlight and help you compare your ongoing costs only and do not reflect any transactional costs. Therefore, the hypothetical expense example is useful in comparing ongoing costs only, and will not help you determine the relative total costs of owning different funds. In addition, if these transactional costs were included, your costs would have been higher.
Fund Expenses (unaudited)
CASH MANAGEMENT FUND
The examples below show the ongoing costs (in dollars) of investing in your Fund and will help you in comparing these costs with costs of other mutual funds. Please refer to page 4 for a detailed explanation of the information presented in these examples.
| | | |
| | Beginning | Ending | |
| | Account | Account | Expenses Paid |
| | Value | Value | During Period |
| | (1/1/15) | (6/30/15) | (1/1/15–6/30/15)* |
| Expense Examples | | | |
| Actual | $1,000.00 | $1,000.00 | $0.50 |
| Hypothetical | | | |
| (5% annual return before expenses) | $1,000.00 | $1,024.29 | $0.50 |
* Expenses are equal to the annualized expense ratio of .10%, multiplied by the average account value over the period, multiplied by 181/365 (to reflect the one-half year period). Expenses paid during the period are net of expenses waived and/or assumed.
Portfolio Composition
BY SECTOR
Portfolio holdings and allocations are subject to change. Percentages are as of June 30, 2015, and are based on the total value of investments.
Portfolio of Investments
CASH MANAGEMENT FUND
June 30, 2015
| | | | | |
| |
| | | | | | |
| | | | | | |
| Principal | | | Interest | | |
| Amount | | Security | Rate* | | Value |
| | | U.S. GOVERNMENT AGENCY | | | |
| | | OBLIGATIONS—39.4% | | | |
| | | Federal Farm Credit Bank: | | | |
| $300M | | 7/15/2015 | 0.10 | % | $ 299,988 |
| 300M | | 7/27/2015 | 0.12 | | 299,974 |
| | | Federal Home Loan Bank: | | | |
| 300M | | 8/3/2015 | 0.11 | | 299,971 |
| 400M | | 8/12/2015 | 0.07 | | 399,967 |
| 300M | | 8/26/2015 | 0.10 | | 299,956 |
| 263M | | 10/1/2015 | 0.10 | | 262,933 |
| 225M | | 11/12/2015 | 0.14 | | 224,883 |
| 406M | | 11/27/2015 | 0.15 | | 405,748 |
| 216M | | 12/15/2015 | 0.22 | | 215,780 |
| Total Value of U.S. Government Agency Obligations (cost $2,709,200) | | | 2,709,200 |
| | | CORPORATE NOTES—33.4% | | | |
| 300M | | Abbott Laboratories, 9/1/2015 (a) | 0.12 | | 299,938 |
| 350M | | Apple, Inc., 7/23/2015 (a) | 0.09 | | 349,981 |
| 350M | | Coca-Cola Co., 10/30/2015 (a) | 0.23 | | 349,729 |
| 300M | | Google, Inc., 7/8/2015 (a) | 0.11 | | 299,994 |
| 350M | | Johnson & Johnson, 9/14/2015 (a) | 0.10 | | 349,927 |
| 300M | | Pfizer, Inc., 8/3/2015 (a) | 0.14 | | 299,961 |
| 350M | | Wal-Mart Stores, Inc., 7/31/2015 (a) | 0.10 | | 349,971 |
| Total Value of Corporate Notes (cost $2,299,501) | | | 2,299,501 |
| | | VARIABLE AND FLOATING RATE NOTES—17.5% | | |
| | | Federal Farm Credit Bank: | | | |
| 200M | | 11/20/2015 | 0.12 | | 199,996 |
| 400M | | 4/20/2016 | 0.26 | | 400,392 |
| 250M | | Federal Home Loan Bank, 4/20/2016 | 0.14 | | 250,010 |
| 350M | | Mississippi Business Finance Corp. | | | |
| | | (Chevron USA, Inc.), 11/1/2035 | 0.02 | | 350,000 |
| Total Value of Variable and Floating Rate Notes (cost $1,200,398) | | | 1,200,398 |
| | | | | | | |
| |
| | | | | | | | |
| | | | | | | | |
| Principal | | | | | Interest | | |
| Amount | | Security | | | Rate* | | Value |
| | | SHORT-TERM U.S. GOVERNMENT | | | | | |
| | | OBLIGATIONS—14.5% | | | | | |
| | | U.S. Treasury Bills: | | | | | |
| $500M | | 7/23/2015 | | | 0.05 | % | $ 499,985 |
| 500M | | 9/17/2015 | | | 0.14 | | 499,846 |
| Total Value of Short-Term U.S. Government Obligations (cost $999,831) | | 999,831 |
| Total Value of Investments (cost $7,208,930)** | 104.8 | % | | | 7,208,930 |
| Excess Of Liabilities Over Other Assets | (4.8 | ) | | | (330,649) |
| Net Assets | | | 100.0 | % | | | $ 6,878,281 |
| |
| * | The interest rates shown are the effective rates at the time of purchase by the Fund. The interest |
| rates shown on variable and floating rate notes are adjusted periodically; the rates shown are the |
| rates in effect at June 30, 2015. |
| ** | Aggregate cost for federal income tax purposes is the same. |
| (a) | Security exempt from registration under Section 4(2) of the Securities Act of 1933 (see Note 5). |
Portfolio of Investments (continued)
CASH MANAGEMENT FUND
June 30, 2015
The Fund’s asset and liabilities are classified into the following three levels based on the inputs used to value the assets and liabilities:
Level 1 — Unadjusted quoted prices in active markets for identical securities that the Fund has the ability to access.
Level 2 — Observable inputs other than quoted prices included in Level 1 that are observable for the asset or liability, either directly or indirectly. These inputs may include quoted prices for the identical instrument on an inactive market, prices for similar instruments, interest rates, prepayment speeds, credit risk, yield curves, default rates and similar data.
Level 3 — Unobservable inputs for the asset or liability, to the extent relevant observable inputs are not available, representing the Fund’s own assumption about the assumptions a market participant would use in valuing the asset or liability, and would be based on the best information available.
The inputs methodology used for valuing securities are not necessarily an indication of the risk associated with investing in those securities. For example, U.S. Government securities are reflected as Level 2 because the inputs used to determine fair value may not always be quoted prices in an active market.
The following is a summary, by category of Level, of inputs used to value the Fund’s investments as of June 30, 2015
| | | | | | | | | | | | |
| | | | Level 1 | | | Level 2 | | | Level 3 | | | Total |
| U.S. Government Agency | | | | | | | | | | | | |
| Obligations | | $ | — | | $ | 2,709,200 | | $ | — | | $ | 2,709,200 |
| Corporate Notes | | | — | | | 2,299,501 | | | — | | | 2,299,501 |
| Variable and Floating Rate Notes: | | | | | | | | | | | | |
| U.S. Government Agency | | | | | | | | | | | | |
| Obligations | | | — | | | 850,398 | | | — | | | 850,398 |
| Municipal Bonds | | | — | | | 350,000 | | | — | | | 350,000 |
| Short-Term U.S. Government | | | | | | | | | | | | |
| Obligations | | | — | | | 999,831 | | | — | | | 999,831 |
| Total Investments in Securities | | $ | — | | $ | 7,208,930 | | $ | — | | $ | 7,208,930 |
There were no transfers into or from Level 1 and Level 2 by the Fund for the period ended June 30, 2015. Transfers, if any, between Levels are recognized at the end of the reporting period.
| |
| 8 | See notes to financial statements |
Fund Expenses (unaudited)
EQUITY INCOME FUND
The examples below show the ongoing costs (in dollars) of investing in your Fund and will help you in comparing these costs with costs of other mutual funds. Please refer to page 4 for a detailed explanation of the information presented in these examples.
| | | |
| | Beginning | Ending | |
| | Account | Account | Expenses Paid |
| | Value | Value | During Period |
| | (1/1/15) | (6/30/15) | (1/1/15–6/30/15)* |
| Expense Examples | | | |
| Actual | $1,000.00 | $1,006.04 | $4.08 |
| Hypothetical | | | |
| (5% annual return before expenses) | $1,000.00 | $1,020.72 | $4.11 |
* Expenses are equal to the annualized expense ratio of .82%, multiplied by the average account value over the period, multiplied by 181/365 (to reflect the one-half year period).
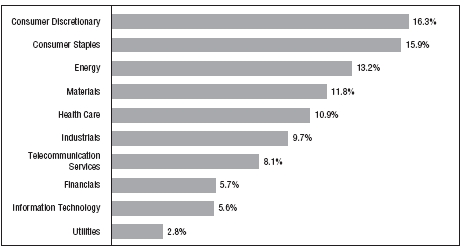
Portfolio Composition
BY SECTOR
Portfolio holdings and allocations are subject to change. Percentages are as of June 30, 2015, and are based on the total value of investments.
Portfolio of Investments
EQUITY INCOME FUND
June 30, 2015
| | | | | |
| |
| | | | | | |
| | | | | | |
| Shares | | Security | | | Value |
| | | COMMON STOCKS—94.3% | | | |
| | | Consumer Discretionary—12.3% | | | |
| 23,700 | | American Eagle Outfitters, Inc. | | | $ 408,114 |
| 3,780 | | BorgWarner, Inc. | | | 214,855 |
| 8,687 | | CBS Corporation – Class “B” | | | 482,128 |
| 24,350 | | Comcast Corporation – Special Shares “A” | | | 1,459,539 |
| 6,600 | | CST Brands, Inc. | | | 257,796 |
| 9,500 | | Delphi Automotive, PLC | | | 808,355 |
| 38,150 | | Ford Motor Company | | | 572,632 |
| 34,400 | | Hanesbrands, Inc. | | | 1,146,208 |
| 4,050 | | Harman International Industries, Inc. | | | 481,707 |
| 8,050 | | Home Depot, Inc. | | | 894,597 |
| 11,400 | | Johnson Controls, Inc. | | | 564,642 |
| 8,350 | | Lear Corporation | | | 937,371 |
| 6,900 | | McDonald’s Corporation | | | 655,983 |
| 15,600 | | Newell Rubbermaid, Inc. | | | 641,316 |
| 47,100 | | Regal Entertainment Group – Class “A” | | | 984,861 |
| 12,716 | | Time Warner, Inc. | | | 1,111,506 |
| 10,300 | | Tupperware Brands Corporation | | | 664,762 |
| 5,200 | | Walt Disney Company | | | 593,528 |
| 3,700 | | Whirlpool Corporation | | | 640,285 |
| | | | | | 13,520,185 |
| | | Consumer Staples—8.7% | | | |
| 35,200 | | Altria Group, Inc. | | | 1,721,632 |
| 15,100 | | Coca-Cola Company | | | 592,373 |
| 14,600 | | CVS Health Corporation | | | 1,531,248 |
| 3,850 | | Dr. Pepper Snapple Group, Inc. | | | 280,665 |
| 4,500 | | Kimberly-Clark Corporation | | | 476,865 |
| 5,566 | | Kraft Foods Group, Inc. | | | 473,889 |
| 12,500 | | Nu Skin Enterprises, Inc. – Class “A” | | | 589,125 |
| 12,000 | | PepsiCo, Inc. | | | 1,120,080 |
| 15,900 | | Philip Morris International, Inc. | | | 1,274,703 |
| 13,700 | | Procter & Gamble Company | | | 1,071,888 |
| 6,500 | | Wal-Mart Stores, Inc. | | | 461,045 |
| | | | | | 9,593,513 |
| | | | |
| |
| | | | | |
| | | | | |
| Shares | | Security | | Value |
| | | Energy—8.1% | | |
| 13,300 | * | Black Stone Minerals, LP | | $ 229,026 |
| 14,200 | | Chevron Corporation | | 1,369,874 |
| 19,250 | | ConocoPhillips | | 1,182,142 |
| 9,100 | | Devon Energy Corporation | | 541,359 |
| 18,100 | | Enable Midstream Partners, LP | | 289,238 |
| 12,700 | | ExxonMobil Corporation | | 1,056,640 |
| 9,400 | | Halliburton Company | | 404,858 |
| 15,000 | | Marathon Oil Corporation | | 398,100 |
| 14,200 | | Marathon Petroleum Corporation | | 742,802 |
| 14,100 | | Occidental Petroleum Corporation | | 1,096,557 |
| 12,500 | | Royal Dutch Shell, PLC – Class “A” (ADR) | | 712,625 |
| 8,700 | | Suncor Energy, Inc. | | 239,424 |
| 11,800 | | Williams Companies, Inc. | | 677,202 |
| | | | | 8,939,847 |
| | | Financials—19.1% | | |
| 10,000 | | ACE, Ltd. | | 1,016,800 |
| 27,900 | | AllianceBernstein Holding, LP | | 823,887 |
| 6,650 | | American Express Company | | 516,838 |
| 3,150 | | Ameriprise Financial, Inc. | | 393,529 |
| 21,900 | | Bank of New York Mellon Corporation | | 919,143 |
| 28,950 | | Berkshire Hills Bancorp, Inc. | | 824,496 |
| 37,300 | | Brixmor Property Group, Inc. (REIT) | | 862,749 |
| 12,300 | | Chesapeake Lodging Trust (REIT) | | 374,904 |
| 6,372 | | Chubb Corporation | | 606,232 |
| 12,350 | | Discover Financial Services | | 711,607 |
| 47,270 | | Financial Select Sector SPDR Fund (ETF) | | 1,152,443 |
| 10,500 | | Invesco, Ltd. | | 393,645 |
| 18,100 | | iShares S&P U.S. Preferred Stock Index Fund (ETF) | | 708,977 |
| 6,600 | | iShares U.S. Real Estate ETF (ETF) | | 470,580 |
| 24,400 | | JPMorgan Chase & Company | | 1,653,344 |
| 29,600 | | MetLife, Inc. | | 1,657,304 |
| 16,700 | | Oritani Financial Corporation | | 268,035 |
| 24,410 | | Outfront Media, Inc. | | 616,108 |
| 10,000 | | PNC Financial Services Group, Inc. | | 956,500 |
| 7,000 | | Select Income REIT (REIT) | | 144,480 |
| 11,400 | | SPDR S&P Regional Banking (ETF) | | 503,424 |
| 47,500 | | Sterling Bancorp | | 698,250 |
| 5,400 | | Travelers Companies, Inc. | | 521,964 |
| 19,700 | | U.S. Bancorp | | 854,980 |
Portfolio of Investments (continued)
EQUITY INCOME FUND
June 30, 2015
| | | | |
| |
| | | | | |
| | | | | |
| Shares | | Security | | Value |
| | | Financials (continued) | | |
| 30,100 | | Urstadt Biddle Properties, Inc. – Class “A” (REIT) | | $ 562,268 |
| 34,950 | | Wells Fargo & Company | | 1,965,588 |
| 58,300 | | WP Glimcher, Inc. (REIT) | | 788,799 |
| | | | | 20,966,874 |
| | | Health Care—13.6% | | |
| 8,200 | | Abbott Laboratories | | 402,456 |
| 19,300 | | AbbVie, Inc. | | 1,296,767 |
| 2,270 | * | Allergan, PLC | | 688,854 |
| 8,500 | | Baxter International, Inc. | | 594,405 |
| 5,700 | | Gilead Sciences, Inc. | | 667,356 |
| 10,050 | | GlaxoSmithKline, PLC (ADR) | | 418,583 |
| 18,250 | | Johnson & Johnson | | 1,778,645 |
| 4,210 | | McKesson Corporation | | 946,450 |
| 9,512 | | Medtronic, PLC | | 704,839 |
| 35,120 | | Merck & Company, Inc. | | 1,999,382 |
| 13,200 | | Omnicare, Inc. | | 1,244,100 |
| 3,050 | | Perrigo Company, PLC | | 563,732 |
| 76,885 | | Pfizer, Inc. | | 2,577,954 |
| 4,950 | | Thermo Fisher Scientific, Inc. | | 642,312 |
| 9,990 | | Zoetis, Inc. | | 481,718 |
| | | | | 15,007,553 |
| | | Industrials—11.4% | | |
| 5,400 | | 3M Company | | 833,220 |
| 9,000 | | A.O. Smith Corporation | | 647,820 |
| 6,961 | | ADT Corporation | | 233,681 |
| 9,100 | | Altra Industrial Motion Corporation | | 247,338 |
| 7,700 | | Eaton Corporation, PLC | | 519,673 |
| 2,900 | | G&K Services, Inc. – Class “A” | | 200,506 |
| 5,750 | * | Generac Holdings, Inc. | | 228,563 |
| 3,400 | | General Dynamics Corporation | | 481,746 |
| 75,430 | | General Electric Company | | 2,004,175 |
| 4,800 | | Greenbrier Companies, Inc. | | 224,880 |
| 11,800 | | Honeywell International, Inc. | | 1,203,246 |
| 7,600 | | Industrial Select Sector SPDR Fund (ETF) | | 410,856 |
| 17,250 | | ITT Corporation | | 721,740 |
| 12,300 | | KAR Auction Services, Inc. | | 460,020 |
| 3,680 | | Lockheed Martin Corporation | | 684,112 |
| 12,400 | | Nielsen NV | | 555,148 |
| 3,850 | | Snap-On, Inc. | | 613,113 |
| | | | |
| |
| | | | | |
| | | | | |
| Shares | | Security | | Value |
| | | Industrials (continued) | | |
| 12,125 | | Tyco International, PLC | | $ 466,570 |
| 8,000 | | United Parcel Service, Inc. – Class “B” | | 775,280 |
| 9,000 | | United Technologies Corporation | | 998,370 |
| | | | | 12,510,057 |
| | | Information Technology—9.8% | | |
| 11,490 | | Apple, Inc. | | 1,441,133 |
| 4,150 | | Automatic Data Processing, Inc. | | 332,954 |
| 4,700 | | Avago Technologies, Ltd. | | 624,771 |
| 55,700 | | Cisco Systems, Inc. | | 1,529,522 |
| 17,300 | | EMC Corporation | | 456,547 |
| 46,600 | | Intel Corporation | | 1,417,339 |
| 13,550 | | Intersil Corporation – Class “A” | | 169,511 |
| 11,600 | | Juniper Networks, Inc. | | 301,252 |
| 11,700 | | Lexmark International Group, Inc. – Class “A” | | 517,140 |
| 19,850 | | Mentor Graphics Corporation | | 524,636 |
| 9,000 | | Methode Electronics, Inc. | | 247,050 |
| 7,600 | | Microchip Technology, Inc. | | 360,430 |
| 41,850 | | Microsoft Corporation | | 1,847,678 |
| 8,100 | | QUALCOMM, Inc. | | 507,303 |
| 7,500 | | TE Connectivity, Ltd. | | 482,250 |
| | | | | 10,759,516 |
| | | Materials—3.8% | | |
| 7,100 | | Cytec Industries, Inc. | | 429,763 |
| 18,350 | | Dow Chemical Company | | 938,969 |
| 8,990 | | DuPont (E.I.) de Nemours & Company | | 574,910 |
| 18,200 | | International Paper Company | | 866,138 |
| 6,400 | | LyondellBasell Industries NV – Class “A” | | 662,528 |
| 10,500 | | MeadWestvaco Corporation | | 495,495 |
| 8,400 | | Olin Corporation | | 226,380 |
| | | | | 4,194,183 |
| | | Telecommunication Services—3.1% | | |
| 40,160 | | AT&T, Inc. | | 1,426,483 |
| 43,200 | | Verizon Communications, Inc. | | 2,013,552 |
| | | | | 3,440,035 |
Portfolio of Investments (continued)
EQUITY INCOME FUND
June 30, 2015
| | | | | |
| |
| | | | | | |
| Shares or | | | | | |
| Principal | | | | | |
| Amount | | Security | | | Value |
| | | Utilities—4.4% | | | |
| 12,250 | | American Electric Power Company, Inc. | | | $ 648,882 |
| 25,800 | | CenterPoint Energy, Inc. | | | 490,974 |
| 7,550 | | Dominion Resources, Inc. | | | 504,868 |
| 7,700 | | Duke Energy Corporation | | | 543,774 |
| 12,400 | | Exelon Corporation | | | 389,608 |
| 5,700 | | NextEra Energy, Inc. | | | 558,771 |
| 9,300 | | Portland General Electric Company | | | 308,388 |
| 29,400 | | PPL Corporation | | | 866,418 |
| 14,400 | | Vectren Corporation | | | 554,112 |
| | | | | | 4,865,795 |
| Total Value of Common Stocks (cost $76,361,088) | | | 103,797,558 |
| | | PREFERRED STOCKS—1.8% | | | |
| | | Financials—1.4% | | | |
| 200 | | Citizens Financial Group, Inc., Series A, 5.5%, 2049 | | 194,875 |
| 11,400 | | Digital Realty Trust, Inc., Series G, 5.875%, 2049 (REIT) | | 269,610 |
| 21,200 | | JPMorgan Chase & Co., Series Y, 6.125%, 2020 | | 528,092 |
| | | Urstadt Biddle Properties, Inc. (REIT): | | | |
| 9,000 | | Series F, 7.125%, 2049 | | | 236,340 |
| 11,000 | | Series G, 6.75%, 2049 | | | 291,280 |
| | | | | | 1,520,197 |
| | | Health Care—.4% | | | |
| 400 | | Allergan, PLC, Series A, 5.5%, 2018 | | | 417,032 |
| Total Value of Preferred Stocks (cost $1,918,699) | | | 1,937,229 |
| | | SHORT-TERM U.S. GOVERNMENT AGENCY | | |
| | | OBLIGATIONS—1.7% | | | |
| $1,900M | | Federal Home Loan Bank, 0.045%, 8/18/2015 (cost $1,899,886) | | 1,899,924 |
| Total Value of Investments (cost $80,179,673) | 97.8 | % | 107,634,711 |
| Other Assets, Less Liabilities | 2.2 | | 2,395,878 |
| Net Assets | | | 100.0 | % | $ 110,030,589 |
* Non-income producing
| |
| Summary of Abbreviations: |
| ADR | American Depositary Receipts |
| ETF | Exchange Traded Fund |
| REIT | Real Estate Investment Trust |
The Fund’s asset and liabilities are classified into the following three levels based on the inputs used to value the assets and liabilities:
Level 1 — Unadjusted quoted prices in active markets for identical securities that the Fund has the ability to access.
Level 2 — Observable inputs other than quoted prices included in Level 1 that are observable for the asset or liability, either directly or indirectly. These inputs may include quoted prices for the identical instrument on an inactive market, prices for similar instruments, interest rates, prepayment speeds, credit risk, yield curves, default rates and similar data.
Level 3 — Unobservable inputs for the asset or liability, to the extent relevant observable inputs are not available, representing the Fund’s own assumption about the assumptions a market participant would use in valuing the asset or liability, and would be based on the best information available.
The inputs methodology used for valuing securities are not necessarily an indication of the risk associated with investing in those securities. For example, U.S. Government securities are reflected as Level 2 because the inputs used to determine fair value may not always be quoted prices in an active market.
The following is a summary, by category of Level, of inputs used to value the Fund’s investments as of June 30, 2015:
| | | | | | | | | | | | |
| | | | Level 1 | | | Level 2 | | | Level 3 | | | Total |
| Common Stocks | | $ | 103,797,558 | | $ | — | | $ | — | | $ | 103,797,558 |
| Preferred Stocks | | | 1,937,229 | | | — | | | — | | | 1,937,229 |
| Short-Term U.S. Government | | | | | | | | | | | | |
| Agency Obligations | | | — | | | 1,899,924 | | | — | | | 1,899,924 |
| Total Investments in Securities* | | $ | 105,734,787 | | $ | 1,899,924 | | $ | — | | $ | 107,634,711 |
* The Portfolio of Investments provides information on the industry categorization for common stocks and preferred stocks.
There were no transfers into or from Level 1 and Level 2 by the Fund for the period ended June 30, 2015. Transfers, if any, between Levels are recognized at the end of the reporting period.
| | |
| See notes to financial statements | 15 |
Fund Expenses (unaudited)
FUND FOR INCOME
The examples below show the ongoing costs (in dollars) of investing in your Fund and will help you in comparing these costs with costs of other mutual funds. Please refer to page 4 for a detailed explanation of the information presented in these examples.
| | | |
| | Beginning | Ending | |
| | Account | Account | Expenses Paid |
| | Value | Value | During Period |
| | (1/1/15) | (6/30/15) | (1/1/15–6/30/15)* |
| Expense Examples | | | |
| Actual | $1,000.00 | $1,026.80 | $4.32 |
| Hypothetical | | | |
| (5% annual return before expenses) | $1,000.00 | $1,020.53 | $4.31 |
* Expenses are equal to the annualized expense ratio of .86%, multiplied by the average account value over the period, multiplied by 181/365 (to reflect the one-half year period).
Portfolio Composition
BY SECTOR
Portfolio holdings and allocations are subject to change. Percentages are as of June 30, 2015, and are based on the total value of investments.
Portfolio of Investments
FUND FOR INCOME
June 30, 2015
| | | | |
| |
| | | | | |
| | | | | |
| Principal | | | | |
| Amount | | Security | | Value |
| | | CORPORATE BONDS—89.6% | | |
| | | Aerospace/Defense—.7% | | |
| | | Meccanica Holdings USA, Inc.: | | |
| $475M | | 6.25%, 7/15/2019 (a) | | $ 510,625 |
| 150M | | 7.375%, 7/15/2039 (a) | | 162,375 |
| | | | | 673,000 |
| | | Automotive—3.9% | | |
| | | American Axle & Manufacturing, Inc.: | | |
| 400M | | 6.25%, 3/15/2021 | | 422,000 |
| 250M | | 6.625%, 10/15/2022 | | 263,750 |
| 175M | | Asbury Automotive Group, Inc., 6%, 12/15/2024 | | 182,875 |
| 100M | | ATS Automation Tooling Systems, Inc., 6.5%, 6/15/2023 | | 102,375 |
| 250M | | Fiat Chrysler Automobiles NV, 5.25%, 4/15/2023 (a) | | 245,675 |
| | | General Motors Co.: | | |
| 225M | | 4.875%, 10/2/2023 | | 238,336 |
| 200M | | 6.25%, 10/2/2043 | | 223,892 |
| 225M | | 5.2%, 4/1/2045 | | 223,686 |
| 650M | | Gestamp Funding Luxembourg SA, 5.625%, 5/31/2020 (a) | | 669,500 |
| 325M | | Group 1 Automotive, Inc., 5%, 6/1/2022 | | 325,000 |
| 425M | | Omega U.S. Sub, LLC, 8.75%, 7/15/2023 (a)(b) | | 426,063 |
| 75M | | Oshkosh Corp., 5.375%, 3/1/2022 | | 77,063 |
| 325M | | Schaeffler Finance BV, 4.75%, 5/15/2021 (a) | | 328,250 |
| 150M | | ZF North America Capital, Inc., 4%, 4/29/2020 (a) | | 150,375 |
| | | | | 3,878,840 |
| | | Building Materials—1.8% | | |
| | | Building Materials Corp.: | | |
| 750M | | 6.75%, 5/1/2021 (a) | | 784,687 |
| 350M | | 5.375%, 11/15/2024 (a) | | 345,397 |
| 200M | | Cemex SAB de CV, 9.5%, 6/15/2018 (a) | | 221,000 |
| 425M | | Griffon Corp., 5.25%, 3/1/2022 | | 424,469 |
| | | | | 1,775,553 |
| | | Chemicals—1.3% | | |
| 325M | | Platform Specialty Products Corp., 6.5%, 2/1/2022 (a) | | 337,188 |
| 200M | | Rayonier AM Products, Inc., 5.5%, 6/1/2024 (a) | | 179,500 |
| 550M | | TPC Group, Inc., 8.75%, 12/15/2020 (a) | | 511,500 |
| | | W.R. Grace & Co.: | | |
| 175M | | 5.125%, 10/1/2021 (a) | | 176,750 |
| 75M | | 5.625%, 10/1/2024 (a) | | 76,219 |
| | | | | 1,281,157 |
Portfolio of Investments (continued)
FUND FOR INCOME
June 30, 2015
| | | | |
| |
| | | | | |
| | | | | |
| Principal | | | | |
| Amount | | Security | | Value |
| | | Consumer Non-Durables—2.5% | | |
| $375M | | Levi Strauss & Co., 6.875%, 5/1/2022 | | $ 402,188 |
| | | Reynolds Group Issuer, Inc.: | | |
| 300M | | 7.125%, 4/15/2019 | | 309,375 |
| 775M | | 5.75%, 10/15/2020 | | 796,313 |
| | | Spectrum Brands Escrow Corp.: | | |
| 300M | | 6.375%, 11/15/2020 | | 318,750 |
| 175M | | 6.625%, 11/15/2022 | | 187,250 |
| 450M | | Wolverine World Wide, Inc., 6.125%, 10/15/2020 | | 479,250 |
| | | | | 2,493,126 |
| | | Energy—11.9% | | |
| | | AmeriGas Finance, LLC: | | |
| 50M | | 6.75%, 5/20/2020 | | 52,875 |
| 175M | | 7%, 5/20/2022 | | 186,375 |
| | | Antero Resources Finance Corp.: | | |
| 100M | | 6%, 12/1/2020 | | 101,000 |
| 125M | | 5.375%, 11/1/2021 | | 120,625 |
| | | Berry Petroleum Co.: | | |
| 90M | | 6.75%, 11/1/2020 | | 71,550 |
| 300M | | 6.375%, 9/15/2022 | | 235,500 |
| 75M | | Blue Racer Midstream, LLC, 6.125%, 11/15/2022 (a) | | 77,625 |
| | | California Resources Corp.: | | |
| 150M | | 5%, 1/15/2020 | | 132,750 |
| 150M | | 5.5%, 9/15/2021 | | 131,280 |
| 225M | | 6%, 11/15/2024 | | 194,625 |
| | | Calumet Specialty Products Partners, LP: | | |
| 225M | | 6.5%, 4/15/2021 | | 222,750 |
| 75M | | 7.625%, 1/15/2022 | | 76,875 |
| 300M | | 7.75%, 4/15/2023 (a) | | 309,750 |
| | | Chesapeake Energy Corp.: | | |
| 525M | | 7.25%, 12/15/2018 | | 543,375 |
| 125M | | 6.625%, 8/15/2020 | | 122,500 |
| 250M | | 6.875%, 11/15/2020 | | 245,000 |
| 200M | | 5.75%, 3/15/2023 | | 182,000 |
| 25M | | Concho Resources, Inc., 5.5%, 4/1/2023 | | 25,125 |
| | | CONSOL Energy, Inc.: | | |
| 500M | | 8.25%, 4/1/2020 | | 501,875 |
| 175M | | 5.875%, 4/15/2022 | | 149,625 |
| | | Crestwood Midstream Partners, LP: | | |
| 350M | | 6%, 12/15/2020 | | 364,000 |
| 50M | | 6.25%, 4/1/2023 (a) | | 52,250 |
| | | | |
| |
| | | | | |
| | | | | |
| Principal | | | | |
| Amount | | Security | | Value |
| | | Energy (continued) | | |
| | | Denbury Resources, Inc.: | | |
| $150M | | 6.375%, 8/15/2021 | | $ 144,750 |
| 275M | | 5.5%, 5/1/2022 | | 246,812 |
| 250M | | Eclipse Resources Corp., 8.875%, 7/15/2023 (a)(b) | | 242,450 |
| | | Energy XXI Gulf Coast, Inc.: | | |
| 300M | | 11%, 3/15/2020 (a) | | 264,000 |
| 50M | | 7.5%, 12/15/2021 | | 16,375 |
| 225M | | Exterran Partners, LP, 6%, 10/1/2022 | | 214,875 |
| 175M | | Ferrellgas Partners, LP, 6.75%, 6/15/2023 (a) | | 176,750 |
| 250M | | Forum Energy Technologies, Inc., 6.25%, 10/1/2021 | | 248,750 |
| 150M | | Genesis Energy, LP, 6%, 5/15/2023 | | 150,450 |
| 300M | | Gibson Energy, Inc., 6.75%, 7/15/2021 (a) | | 311,250 |
| 250M | | Hilcorp Energy I, 5.75%, 10/1/2025 (a) | | 241,250 |
| 250M | | Laredo Petroleum, Inc., 5.625%, 1/15/2022 | | 248,750 |
| | | Legacy Reserves, LP: | | |
| 400M | | 8%, 12/1/2020 | | 350,000 |
| 400M | | 6.625%, 12/1/2021 | | 326,000 |
| | | Linn Energy, LLC: | | |
| 75M | | 6.5%, 5/15/2019 | | 60,938 |
| 225M | | 6.25%, 11/1/2019 | | 177,188 |
| 225M | | MarkWest Energy Partners, LP, 4.875%, 12/1/2024 | | 221,063 |
| 100M | | Matador Resources Co., 6.875%, 4/15/2023 (a) | | 102,625 |
| 375M | | Memorial Production Partners, LP, 7.625%, 5/1/2021 | | 359,063 |
| 285M | | Northern Blizzard Resources, Inc., 7.25%, 2/1/2022 (a) | | 273,600 |
| | | NuStar Logistics, LP: | | |
| 50M | | 4.8%, 9/1/2020 | | 50,750 |
| 200M | | 6.75%, 2/1/2021 | | 216,002 |
| 200M | | Rain CII Carbon, LLC, 8.25%, 1/15/2021 (a) | | 195,500 |
| 300M | | Rex Energy Corp., 6.25%, 8/1/2022 | | 238,500 |
| 100M | | Rice Energy, Inc., 7.25%, 5/1/2023 (a) | | 103,000 |
| 400M | | RKI Exploration and Production, LLC, 8.5%, 8/1/2021 (a) | | 398,000 |
| | | Sabine Pass Liquefaction, LLC: | | |
| 500M | | 6.25%, 3/15/2022 | | 520,000 |
| 225M | | 5.625%, 4/15/2023 | | 225,351 |
| 325M | | 5.75%, 5/15/2024 | | 325,406 |
| 250M | | 5.625%, 3/1/2025 (a) | | 248,438 |
| | | SM Energy Co.: | | |
| 150M | | 6.5%, 11/15/2021 | | 157,125 |
| 125M | | 5.625%, 6/1/2025 | | 124,038 |
| 57M | | Suburban Propane Partners, LP, 7.375%, 8/1/2021 | | 61,133 |
Portfolio of Investments (continued)
FUND FOR INCOME
June 30, 2015
| | | | |
| |
| | | | | |
| | | | | |
| Principal | | | | |
| Amount | | Security | | Value |
| | | Energy (continued) | | |
| $100M | | Tesoro Logistics, LP, 6.25%, 10/15/2022 (a) | | $ 104,000 |
| 125M | | Ultra Petroleum Corp., 5.75%, 12/15/2018 (a) | | 120,625 |
| 425M | | Unit Corp., 6.625%, 5/15/2021 | | 414,375 |
| | | | | 11,978,512 |
| | | Financials—5.0% | | |
| | | Ally Financial, Inc.: | | |
| 525M | | 6.25%, 12/1/2017 | | 561,750 |
| 175M | | 4.75%, 9/10/2018 | | 180,906 |
| 488M | | 8%, 3/15/2020 | | 575,840 |
| 175M | | 8%, 11/1/2031 | | 210,219 |
| 350M | | Argos Merger Sub, Inc., 7.125%, 3/15/2023 (a) | | 367,500 |
| 674M | | Consolidated Energy Finance SA, 6.75%, 10/15/2019 (a) | | 687,480 |
| | | General Motors Financial Co., Inc.: | | |
| 75M | | 3.25%, 5/15/2018 | | 76,758 |
| 150M | | 4.375%, 9/25/2021 | | 156,108 |
| 300M | | 4.25%, 5/15/2023 | | 304,062 |
| | | International Lease Finance Corp.: | | |
| 375M | | 8.75%, 3/15/2017 | | 411,229 |
| 950M | | 8.25%, 12/15/2020 | | 1,130,500 |
| 125M | | Nielsen Co., (Luxembourg) Sarl, 5.5%, 10/1/2021 (a) | | 126,719 |
| 250M | | Quicken Loans, Inc., 5.75%, 5/1/2025 (a) | | 240,000 |
| | | | | 5,029,071 |
| | | Food/Beverage/Tobacco—2.6% | | |
| 325M | | Barry Callebaut Services SA, 5.5%, 6/15/2023 (a) | | 347,337 |
| | | Constellation Brands, Inc.: | | |
| 75M | | 4.25%, 5/1/2023 | | 74,062 |
| 125M | | 4.75%, 11/15/2024 | | 125,625 |
| 275M | | Dean Foods Co., 6.5%, 3/15/2023 (a) | | 281,187 |
| 125M | | H.J. Heinz Co., 4.25%, 10/15/2020 | | 127,656 |
| 400M | | JBS Investments GmbH, 7.25%, 4/3/2024 (a) | | 415,000 |
| | | JBS USA, LLC: | | |
| 150M | | 7.25%, 6/1/2021 (a) | | 158,812 |
| 150M | | 5.875%, 7/15/2024 (a) | | 151,313 |
| 200M | | 5.75%, 6/15/2025 (a) | | 198,190 |
| 100M | | Pilgrim’s Pride Corp., 5.75%, 3/15/2025 (a) | | 101,250 |
| | | | |
| |
| | | | | |
| | | | | |
| Principal | | | | |
| Amount | | Security | | Value |
| | | Food/Beverage/Tobacco (continued) | | |
| $ 50M | | Smithfield Foods, Inc., 6.625%, 8/15/2022 | | $ 53,563 |
| 450M | | Sun Merger Sub, Inc., 5.875%, 8/1/2021 (a) | | 465,750 |
| 100M | | Treehouse Foods, Inc., 4.875%, 3/15/2022 | | 101,000 |
| | | | | 2,600,745 |
| | | Food/Drug—.4% | | |
| 200M | | BI-LO, LLC, 8.625%, 9/15/2018 (a) | | 186,000 |
| 225M | | Rite Aid Corp., 6.125%, 4/1/2023 (a) | | 232,594 |
| | | | | 418,594 |
| | | Forest Products/Containers—3.9% | | |
| 225M | | Ardagh Packaging Finance, PLC, 6%, 6/30/2021 (a) | | 225,562 |
| 250M | | Ball Corp., 5.25%, 7/1/2025 | | 247,500 |
| 250M | | Berry Plastics Corp., 5.125%, 7/15/2023 | | 244,375 |
| | | CROWN Americas, LLC: | | |
| 75M | | 6.25%, 2/1/2021 | | 78,562 |
| 300M | | 4.5%, 1/15/2023 | | 284,814 |
| 150M | | Graphic Packaging International, Inc., 4.875%, 11/15/2022 | | 151,125 |
| 450M | | Greif, Inc., 7.75%, 8/1/2019 | | 502,875 |
| | | Mercer International, Inc.: | | |
| 50M | | 7%, 12/1/2019 | | 52,500 |
| 200M | | 7.75%, 12/1/2022 | | 216,000 |
| | | Owens-Brockway Glass Container, Inc.: | | |
| 75M | | 5%, 1/15/2022 (a) | | 74,344 |
| 250M | | 5.375%, 1/15/2025 (a) | | 245,313 |
| 275M | | Resolute Forest Products, Inc., 5.875%, 5/15/2023 | | 251,625 |
| | | Sealed Air Corp.: | | |
| 625M | | 6.5%, 12/1/2020 (a) | | 692,188 |
| 175M | | 4.875%, 12/1/2022 (a) | | 173,031 |
| 500M | | Silgan Holdings, Inc., 5%, 4/1/2020 | | 516,250 |
| | | | | 3,956,064 |
| | | Gaming/Leisure—3.3% | | |
| 375M | | 24 Hour Holdings III, LLC, 8%, 6/1/2022 (a) | | 302,813 |
| 225M | | AMC Entertainment, Inc., 5.75%, 6/15/2025 (a) | | 221,062 |
| 250M | | GLP Capital, LP, 4.875%, 11/1/2020 | | 255,625 |
| 175M | | Hilton Worldwide Finance, LLC, 5.625%, 10/15/2021 | | 182,647 |
| | | International Game Technology, PLC: | | |
| 200M | | 5.625%, 2/15/2020 (a) | | 196,500 |
| 200M | | 6.25%, 2/15/2022 (a) | | 192,000 |
| 200M | | 6.5%, 2/15/2025 (a) | | 186,000 |
Portfolio of Investments (continued)
FUND FOR INCOME
June 30, 2015
| | | | |
| |
| | | | | |
| | | | | |
| Principal | | | | |
| Amount | | Security | | Value |
| | | Gaming/Leisure (continued) | | |
| $300M | | National CineMedia, LLC, 7.875%, 7/15/2021 | | $ 315,750 |
| 250M | | NCL Corp., Ltd., 5.25%, 11/15/2019 (a) | | 257,188 |
| 225M | | Regal Entertainment Group, 5.75%, 3/15/2022 | | 228,364 |
| 450M | | Scientific Games International, Inc., 6.625%, 5/15/2021 | | 351,000 |
| 450M | | Six Flags Entertainment Corp., 5.25%, 1/15/2021 (a) | | 462,375 |
| 150M | | Viking Cruises, Ltd., 6.25%, 5/15/2025 (a) | | 149,625 |
| | | | | 3,300,949 |
| | | Health Care—9.6% | | |
| | | Community Health Systems, Inc.: | | |
| 250M | | 5.125%, 8/15/2018 | | 256,875 |
| 425M | | 8%, 11/15/2019 | | 448,906 |
| 475M | | 7.125%, 7/15/2020 | | 504,450 |
| 250M | | Concordia Healthcare, 7%, 4/1/2022 (a) | | 257,812 |
| | | DaVita HealthCare Partners, Inc.: | | |
| 250M | | 5.125%, 7/15/2024 | | 246,250 |
| 125M | | 5%, 5/1/2025 | | 120,625 |
| | | Endo Finance, LLC: | | |
| 225M | | 6%, 7/15/2023 (a)(b) | | 230,344 |
| 525M | | 5.75%, 1/15/2022 (a) | | 532,875 |
| 575M | | 7.25%, 1/15/2022 (a) | | 613,094 |
| | | Fresenius Medical Care U.S. Finance II, Inc.: | | |
| 150M | | 5.625%, 7/31/2019 (a) | | 162,937 |
| 75M | | 4.125%, 10/15/2020 (a) | | 76,312 |
| 100M | | 4.75%, 10/15/2024 (a) | | 99,500 |
| | | HCA, Inc.: | | |
| 75M | | 8%, 10/1/2018 | | 87,187 |
| 800M | | 6.5%, 2/15/2020 | | 896,000 |
| 250M | | 6.25%, 2/15/2021 | | 270,000 |
| 50M | | 5.375%, 2/1/2025 | | 50,940 |
| | | HealthSouth Corp.: | | |
| 288M | | 7.75%, 9/15/2022 | | 302,040 |
| 175M | | 5.125%, 3/15/2023 | | 174,562 |
| 100M | | 5.75%, 11/1/2024 | | 102,500 |
| 155M | | IMS Health, Inc., 6%, 11/1/2020 (a) | | 160,037 |
| 300M | | Kindred Escrow Corp. II, 8.75%, 1/15/2023 (a) | | 327,000 |
| | | Mallinckrodt Finance SB: | | |
| 100M | | 4.875%, 4/15/2020 (a) | | 102,130 |
| 225M | | 5.75%, 8/1/2022 (a) | | 230,906 |
| 75M | | 5.5%, 4/15/2025 (a) | | 73,031 |
| 100M | | NBTY, Inc., 9%, 10/1/2018 | | 103,625 |
| | | | |
| |
| | | | | |
| | | | | |
| Principal | | | | |
| Amount | | Security | | Value |
| | | Health Care (continued) | | |
| | | Tenet Healthcare Corp.: | | |
| $450M | | 6.75%, 2/1/2020 | | $ 471,938 |
| 425M | | 6%, 10/1/2020 | | 454,219 |
| 125M | | 6.75%, 6/15/2023 (a) | | 127,656 |
| 89M | | Universal Hospital Services, Inc., 7.625%, 8/15/2020 | | 82,770 |
| | | Valeant Pharmaceuticals International, Inc.: | | |
| 275M | | 6.75%, 8/15/2018 (a) | | 288,922 |
| 600M | | 6.375%, 10/15/2020 (a) | | 633,375 |
| 150M | | 5.625%, 12/1/2021 (a) | | 153,750 |
| 100M | | 5.5%, 3/1/2023 (a) | | 101,250 |
| 200M | | 5.875%, 5/15/2023 (a) | | 205,500 |
| 75M | | 6.125%, 4/15/2025 (a) | | 77,344 |
| 625M | | WellCare Health Plans, Inc., 5.75%, 11/15/2020 | | 652,344 |
| | | | | 9,679,006 |
| | | Information Technology—4.3% | | |
| 125M | | Activision Blizzard, Inc., 5.625%, 9/15/2021 (a) | | 131,250 |
| | | Advanced Micro Devices, Inc.: | | |
| 50M | | 6.75%, 3/1/2019 | | 45,625 |
| 425M | | 7.5%, 8/15/2022 | | 377,187 |
| 100M | | Anixter, Inc., 5.125%, 10/1/2021 | | 102,125 |
| | | Audatex North America, Inc.: | | |
| 725M | | 6%, 6/15/2021 (a) | | 747,656 |
| 225M | | 6.125%, 11/1/2023 (a) | | 232,031 |
| 375M | | Belden, Inc., 5.5%, 9/1/2022 (a) | | 374,062 |
| 325M | | CommScope Technologies Finance, LLC, 6%, 6/15/2025 (a) | | 324,594 |
| 650M | | Denali Borrower, LLC, 5.625%, 10/15/2020 (a) | | 684,937 |
| 450M | | IAC/InterActiveCorp, 4.875%, 11/30/2018 | | 465,750 |
| | | Micron Technology, Inc.: | | |
| 150M | | 5.875%, 2/15/2022 | | 153,188 |
| 375M | | 5.5%, 2/1/2025 (a) | | 352,313 |
| 175M | | Open Text Corp., 5.625%, 1/15/2023 (a) | | 173,688 |
| 125M | | Sensata Technologies BV, 5%, 10/1/2025 (a) | | 122,031 |
| | | | | 4,286,437 |
| | | Manufacturing—2.5% | | |
| 325M | | Amkor Technology, Inc., 6.375%, 10/1/2022 | | 330,281 |
| 400M | | Brand Energy & Infrastructure Services, Inc., 8.5%, 12/1/2021 (a) | | 374,000 |
| 515M | | Case New Holland, Inc., 7.875%, 12/1/2017 | | 566,500 |
| 325M | | Dematic SA, 7.75%, 12/15/2020 (a) | | 338,812 |
Portfolio of Investments (continued)
FUND FOR INCOME
June 30, 2015
| | | | |
| |
| | | | | |
| | | | | |
| Principal | | | | |
| Amount | | Security | | Value |
| | | Manufacturing (continued) | | |
| $300M | | EDP Finance BV, 6%, 2/2/2018 (a) | | $ 322,158 |
| 225M | | EnPro Industries, Inc., 5.875%, 9/15/2022 | | 230,062 |
| 375M | | H&E Equipment Services, Inc., 7%, 9/1/2022 | | 388,594 |
| | | | | 2,550,407 |
| | | Media-Broadcasting—2.6% | | |
| | | Belo Corp.: | | |
| 100M | | 7.75%, 6/1/2027 | | 110,750 |
| 25M | | 7.25%, 9/15/2027 | | 26,375 |
| 100M | | Media General Financial Sub, 5.875%, 11/15/2022 (a) | | 101,500 |
| 425M | | Nexstar Broadcasting, Inc., 6.875%, 11/15/2020 | | 452,094 |
| | | Sinclair Television Group, Inc.: | | |
| 475M | | 5.375%, 4/1/2021 | | 480,344 |
| 225M | | 6.375%, 11/1/2021 | | 233,438 |
| | | Sirius XM Radio, Inc.: | | |
| 375M | | 5.75%, 8/1/2021 (a) | | 386,719 |
| 250M | | 6%, 7/15/2024 (a) | | 253,125 |
| 175M | | 5.375%, 4/15/2025 (a) | | 169,313 |
| 375M | | Tribune Media Co., 5.875%, 7/15/2022 (a) | | 378,750 |
| | | | | 2,592,408 |
| | | Media-Cable TV—7.4% | | |
| 325M | | Altice Financing SA, 6.625%, 2/15/2023 (a) | | 323,472 |
| 225M | | Altice U.S. Financing SA, 7.75%, 7/15/2025 (a) | | 216,562 |
| 150M | | Cable One, Inc., 5.75%, 6/15/2022 (a) | | 152,250 |
| | | Cablevision Systems Corp.: | | |
| 350M | | 8.625%, 9/15/2017 | | 382,375 |
| 375M | | 7.75%, 4/15/2018 | | 405,937 |
| | | CCO Holdings, LLC: | | |
| 102M | | 7%, 1/15/2019 | | 106,080 |
| 175M | | 7.375%, 6/1/2020 | | 185,281 |
| 75M | | 5.25%, 3/15/2021 | | 75,000 |
| 100M | | 5.125%, 2/15/2023 | | 97,750 |
| 300M | | 5.875%, 5/1/2027 (a) | | 293,625 |
| 625M | | Cequel Communications Holdings I, LLC, 6.375%, 9/15/2020 (a) | | 623,125 |
| | | Clear Channel Worldwide Holdings, Inc.: | | |
| 25M | | 7.625%, 3/15/2020 – Series “A” | | 25,906 |
| 550M | | 7.625%, 3/15/2020 – Series “B” | | 575,437 |
| 150M | | 6.5%, 11/15/2022 – Series “A” | | 154,312 |
| 250M | | 6.5%, 11/15/2022 – Series “B” | | 261,250 |
| | | | |
| |
| | | | | |
| | | | | |
| Principal | | | | |
| Amount | | Security | | Value |
| | | Media-Cable TV (continued) | | |
| | | DISH DBS Corp.: | | |
| $725M | | 7.875%, 9/1/2019 | | $ 805,837 |
| 125M | | 5%, 3/15/2023 | | 115,937 |
| 250M | | 5.875%, 11/15/2024 | | 240,781 |
| 400M | | Gray Television, Inc., 7.5%, 10/1/2020 | | 425,500 |
| 775M | | Harron Communications, LP, 9.125%, 4/1/2020 (a) | | 840,875 |
| 300M | | Midcontinent Communications Corp., 6.25%, 8/1/2021 (a) | | 307,500 |
| | | Numericable Group SA: | | |
| 425M | | 6%, 5/15/2022 (a) | | 419,953 |
| 200M | | 6.25%, 5/15/2024 (a) | | 197,250 |
| 200M | | VTR Finance BV, 6.875%, 1/15/2024 (a) | | 204,870 |
| | | | | 7,436,865 |
| | | Media-Diversified—.6% | | |
| | | Gannett Co., Inc.: | | |
| 225M | | 5.125%, 7/15/2020 | | 231,469 |
| 225M | | 6.375%, 10/15/2023 | | 235,125 |
| 175M | | Lamar Media Corp., 5.375%, 1/15/2024 | | 177,844 |
| | | | | 644,438 |
| | | Metals/Mining—4.8% | | |
| | | Alcoa, Inc.: | | |
| 575M | | 6.15%, 8/15/2020 | | 627,036 |
| 100M | | 5.125%, 10/1/2024 | | 101,750 |
| | | Aleris International, Inc.: | | |
| 100M | | 7.625%, 2/15/2018 | | 103,000 |
| 550M | | 7.875%, 11/1/2020 | | 573,375 |
| | | ArcelorMittal: | | |
| 175M | | 6.125%, 6/1/2018 | | 186,812 |
| 325M | | 10.6%, 6/1/2019 | | 390,406 |
| 75M | | 6.25%, 3/1/2021 | | 78,844 |
| 200M | | Commercial Metals Co., 4.875%, 5/15/2023 | | 189,000 |
| 250M | | Constellium NV, 5.75%, 5/15/2024 (a) | | 223,750 |
| 600M | | JMC Steel Group, 8.25%, 3/15/2018 (a) | | 551,250 |
| 225M | | Kaiser Aluminum Corp., 8.25%, 6/1/2020 | | 244,125 |
| | | Novelis, Inc.: | | |
| 725M | | 8.375%, 12/15/2017 | | 752,188 |
| 175M | | 8.75%, 12/15/2020 | | 185,938 |
Portfolio of Investments (continued)
FUND FOR INCOME
June 30, 2015
| | | | |
| |
| | | | | |
| | | | | |
| Principal | | | | |
| Amount | | Security | | Value |
| | | Metals/Mining (continued) | | |
| | | Steel Dynamics, Inc.: | | |
| $ 75M | | 5.125%, 10/1/2021 | | $ 75,525 |
| 100M | | 6.375%, 8/15/2022 | | 105,125 |
| 125M | | 5.5%, 10/1/2024 | | 125,313 |
| 250M | | Wise Metals Group, LLC, 8.75%, 12/15/2018 (a) | | 265,313 |
| | | | | 4,778,750 |
| | | Real Estate—.5% | | |
| | | Communications Sales & Leasing, Inc.: | | |
| 100M | | 6%, 4/15/2023 (a) | | 98,051 |
| 175M | | 8.25%, 10/15/2023 (a) | | 172,375 |
| 225M | | Dupont Fabros Technology, LP, 5.625%, 6/15/2023 | | 222,187 |
| | | | | 492,613 |
| | | Retail-General Merchandise—1.7% | | |
| 500M | | Jo-Ann Stores, Inc., 8.125%, 3/15/2019 (a) | | 473,125 |
| 450M | | Limited Brands, Inc., 8.5%, 6/15/2019 | | 532,967 |
| | | Netflix, Inc.: | | |
| 275M | | 5.5%, 2/15/2022 (a) | | 285,313 |
| 125M | | 5.875%, 2/15/2025 (a) | | 130,014 |
| 300M | | Party City Holdings, Inc., 8.875%, 8/1/2020 | | 321,750 |
| | | | | 1,743,169 |
| | | Services—6.1% | | |
| | | ADT Corp.: | | |
| 575M | | 3.5%, 7/15/2022 | | 523,250 |
| 50M | | 4.125%, 6/15/2023 | | 47,000 |
| | | Aecom Technology Corp.: | | |
| 125M | | 5.75%, 10/15/2022 (a) | | 126,875 |
| 225M | | 5.875%, 10/15/2024 (a) | | 228,656 |
| 400M | | Ashtead Capital, Inc., 6.5%, 7/15/2022 (a) | | 426,000 |
| 250M | | CEB, Inc., 5.625%, 6/15/2023 (a) | | 251,875 |
| 325M | | CoreLogic, Inc., 7.25%, 6/1/2021 | | 345,312 |
| | | Covanta Holding Corp.: | | |
| 125M | | 7.25%, 12/1/2020 | | 131,719 |
| 300M | | 6.375%, 10/1/2022 | | 315,375 |
| | | Geo Group, Inc.: | | |
| 175M | | 5.875%, 1/15/2022 | | 182,875 |
| 175M | | 5.125%, 4/1/2023 | | 175,437 |
| 175M | | 5.875%, 10/15/2024 | | 181,125 |
| 75M | | IHS, Inc., 5%, 11/1/2022 (a) | | 74,812 |
| | | | |
| |
| | | | | |
| | | | | |
| Principal | | | | |
| Amount | | Security | | Value |
| | | Services (continued) | | |
| | | Iron Mountain, Inc.: | | |
| $225M | | 7.75%, 10/1/2019 | | $ 235,687 |
| 650M | | 5.75%, 8/15/2024 | | 652,844 |
| 650M | | Live Nation Entertainment, Inc., 7%, 9/1/2020 (a) | | 693,875 |
| 500M | | LKQ Corp., 4.75%, 5/15/2023 | | 479,375 |
| 175M | | Monitronics International, Inc., 9.125%, 4/1/2020 | | 169,750 |
| 275M | | PHH Corp., 7.375%, 9/1/2019 | | 292,188 |
| 300M | | Reliance Intermediate Holdings, LP, 6.5%, 4/1/2023 (a) | | 313,500 |
| 300M | | Safway Group Holding, LLC, 7%, 5/15/2018 (a) | | 308,187 |
| | | | | 6,155,717 |
| | | Telecommunications—4.4% | | |
| | | CenturyLink, Inc.: | | |
| 100M | | 5.625%, 4/1/2020 | | 100,500 |
| 700M | | 5.8%, 3/15/2022 | | 671,125 |
| 175M | | 6.75%, 12/1/2023 | | 176,203 |
| | | Citizens Communications Co.: | | |
| 575M | | 7.125%, 3/15/2019 | | 596,562 |
| 200M | | 9%, 8/15/2031 | | 183,000 |
| 175M | | Frontier Communications Corp., 8.5%, 4/15/2020 | | 183,400 |
| 175M | | GCI, Inc., 6.75%, 6/1/2021 | | 178,062 |
| 250M | | Inmarsat Finance, PLC, 4.875%, 5/15/2022 (a) | | 241,875 |
| | | Sprint Capital Corp.: | | |
| 175M | | 6.9%, 5/1/2019 | | 178,938 |
| 375M | | 6.875%, 11/15/2028 | | 323,438 |
| | | Wind Acquisition Finance SA: | | |
| 275M | | 4.75%, 7/15/2020 (a) | | 271,563 |
| 675M | | 7.375%, 4/23/2021 (a) | | 684,281 |
| | | Windstream Corp.: | | |
| 200M | | 7.875%, 11/1/2017 | | 213,250 |
| 325M | | 7.75%, 10/15/2020 | | 319,313 |
| 100M | | 6.375%, 8/1/2023 | | 81,750 |
| | | | | 4,403,260 |
| | | Transportation—1.6% | | |
| | | Aircastle, Ltd.: | | |
| 75M | | 4.625%, 12/15/2018 | | 77,437 |
| 775M | | 6.25%, 12/1/2019 | | 841,805 |
| 125M | | American Airlines Group, Inc., 5.5%, 10/1/2019 (a) | | 126,250 |
Portfolio of Investments (continued)
FUND FOR INCOME
June 30, 2015
| | | | |
| |
| | | | |
| | | | |
| Principal | | | | |
| Amount | | Security | | Value |
| | | Transportation (continued) | | |
| | | Fly Leasing, Ltd.: | | |
| $200M | | 6.75%, 12/15/2020 | | $ 206,500 |
| 275M | | 6.375%, 10/15/2021 | | 279,125 |
| 103M | | Mobile Mini, Inc., 7.875%, 12/1/2020 | | 108,408 |
| | | | | 1,639,525 |
| | | Utilities—2.4% | | |
| | | AES Corp.: | | |
| 75M | | 8%, 6/1/2020 | | 87,000 |
| 275M | | 7.375%, 7/1/2021 | | 303,187 |
| 200M | | 5.5%, 3/15/2024 | | 193,500 |
| 275M | | Dynegy Finance I/II, Inc., 7.375%, 11/1/2022 (a) | | 289,437 |
| 93M | | Indiantown Cogeneration Utilities, LP, 9.77%, 12/15/2020 | | 106,977 |
| 400M | | InterGen NV, 7%, 6/30/2023 (a) | | 358,000 |
| 200M | | NRG Energy, Inc., 6.25%, 5/1/2024 | | 199,500 |
| 373M | | NSG Holdings, LLC, 7.75%, 12/15/2025 (a) | | 413,142 |
| 175M | | Talen Energy Supply, LLC, 6.5%, 6/1/2025 (a) | | 175,219 |
| 225M | | Terraform Power Operating, LLC, 5.875%, 2/1/2023 (a) | | 229,500 |
| | | | | 2,355,462 |
| | | Waste Management—.3% | | |
| 275M | | ADS Waste Holdings, Inc., 8.25%, 10/1/2020 | | 286,000 |
| | | Wireless Communications—3.5% | | |
| | | Level 3 Financing, Inc.: | | |
| 350M | | 6.125%, 1/15/2021 | | 367,920 |
| 75M | | 5.125%, 5/1/2023 (a) | | 73,219 |
| 75M | | 5.375%, 5/1/2025 (a) | | 72,375 |
| 450M | | MetroPCS Wireless, Inc., 6.625%, 11/15/2020 | | 469,125 |
| | | Sprint Nextel Corp.: | | |
| 100M | | 9.125%, 3/1/2017 | | 108,500 |
| 175M | | 8.375%, 8/15/2017 | | 189,875 |
| 600M | | 7%, 8/15/2020 | | 597,000 |
| 275M | | 6%, 11/15/2022 | | 251,969 |
| | | T-Mobile USA, Inc.: | | |
| 450M | | 6.25%, 4/1/2021 | | 462,375 |
| 450M | | 6.625%, 4/1/2023 | | 468,563 |
| 275M | | UPCB Finance IV, Ltd., 5.375%, 1/15/2025 (a) | | 263,863 |
| 158M | | UPCB Finance V, Ltd., 7.25%, 11/15/2021 (a) | | 170,888 |
| | | | | 3,495,672 |
| Total Value of Corporate Bonds (cost $89,768,137) | | 89,925,340 |
| | | | |
| |
| | | | | |
| | | | | |
| Principal | | | | |
| Amount | | Security | | Value |
| | | LOAN PARTICIPATIONS†—6.3% | | |
| | | Aerospace/Defense—.4% | | |
| $444M | | TransDigm, Inc., 3.75%, 2/28/2020 | | $ 440,763 |
| | | Automotive—.2% | | |
| 223M | | CS Intermediate Holdco 2, LLC, 4%, 4/4/2021 | | 222,680 |
| | | Chemicals—.4% | | |
| 351M | | Axalta Coating Systems Dutch Holdings BBV, 3.75%, 2/1/2020 | | 351,415 |
| | | Energy—.8% | | |
| 500M | | EP Energy, LLC, 3.5%, 5/24/2018 | | 497,188 |
| 300M | | Jonah Energy, LLC, 7.5%, 5/12/2021 | | 283,875 |
| | | | | 781,063 |
| | | Food/Drug—1.0% | | |
| 269M | | Albertson’s, Inc., 5.375%, 3/21/2019 | | 270,772 |
| 430M | | Rite Aid Corp., 4.875%, 6/21/2021 | | 431,478 |
| 331M | | Supervalu, Inc., 4.5%, 3/21/2019 | | 332,520 |
| | | | | 1,034,770 |
| | | Gaming/Leisure—.2% | | |
| 221M | | Seminole Hard Rock Entertainment, Inc., 3.5%, 5/14/2020 | | 220,018 |
| | | Health Care—.9% | | |
| | | Community Health Systems, Inc.: | | |
| 88M | | 3.75%, 12/31/2019 | | 87,935 |
| 162M | | 4%, 1/27/2021 | | 162,100 |
| 500M | | ConvaTec, Inc., 4.25%, 6/15/2020 (b) | | 500,313 |
| 100M | | Sterigenics-Nordion Holdings, LLC, 4.25%, 5/15/2022 | | 100,000 |
| | | | | 850,348 |
| | | Information Technology—1.0% | | |
| 234M | | ARRIS Enterprises, Inc., 3.25%, 4/17/2020 | | 234,004 |
| 431M | | Avago Technologies Cayman, Ltd., 3.75%, 5/6/2021 | | 431,585 |
| 375M | | Dell International, LLC, 3.75%, 10/29/2018 (b) | | 375,390 |
| | | | | 1,040,979 |
| | | Media-Diversified—.4% | | |
| 426M | | Tribune Media Co., 3.75%, 11/20/2020 | | 425,900 |
| | | Retail-General Merchandise—.4% | | |
| 444M | | Restaurant Brands, Inc., 3.75%, 12/10/2021 | | 444,253 |
Portfolio of Investments (continued)
FUND FOR INCOME
June 30, 2015
| | | | | |
| |
| | | | | | |
| | | | | | |
| Principal | | | | | |
| Amount | | Security | | | Value |
| | | Services—.2% | | | |
| $109M | | Allied Security Holdings, LLC, 4.25%, 2/12/2021 | | $ 109,443 |
| 84M | | Brickman Group, Ltd., LLC, 4%, 12/18/2020 | | 83,518 |
| | | | | | 192,961 |
| | | Utilities—.4% | | | |
| 350M | | Calpine Corp., 3.5%, 5/27/2022 | | | 348,162 |
| Total Value of Loan Participations (cost $6,343,465) | | | 6,353,312 |
| | | PASS-THROUGH CERTIFICATES—.7% | | |
| | | Transportation | | | |
| 720M | | American Airlines 13-2 B PTT, 5.6%, 1/15/2022 (cost $735,872) (a) | | 745,535 |
| Total Value of Investments (cost $96,847,474) | 96.6 | % | 97,024,187 |
| Other Assets, Less Liabilities | 3.4 | | 3,411,031 |
| Net Assets | | | 100.0 | % | $100,435,218 |
| |
| (a) | Security exempt from registration under Rule 144A of the Securities Act of 1933 (see Note 5). |
| (b) | A portion or all of the security purchased on a when-issued or delayed delivery basis (see |
| Note 1G). |
| † | Interest rates are determined and reset periodically. The interest rates above are the rates in effect |
| at June 30, 2015. |
|
| Summary of Abbreviations: |
| PTT Pass-Through Trust |
The Fund’s asset and liabilities are classified into the following three levels based on the inputs used to value the assets and liabilities:
Level 1 — Unadjusted quoted prices in active markets for identical securities that the Fund has the ability to access.
Level 2 — Observable inputs other than quoted prices included in Level 1 that are observable for the asset or liability, either directly or indirectly. These inputs may include quoted prices for the identical instrument on an inactive market, prices for similar instruments, interest rates, prepayment speeds, credit risk, yield curves, default rates and similar data.
Level 3 — Unobservable inputs for the asset or liability, to the extent relevant observable inputs are not available, representing the Fund’s own assumption about the assumptions a market participant would use in valuing the asset or liability, and would be based on the best information available.
The inputs methodology used for valuing securities are not necessarily an indication of the risk associated with investing in those securities. For example, U.S. Government securities are reflected as Level 2 because the inputs used to determine fair value may not always be quoted prices in an active market.
The following is a summary, by category of Level, of inputs used to value the Fund’s investments as of June 30, 2015:
| | | | | | | | | | | | |
| | | | Level 1 | | | Level 2 | | | Level 3 | | | Total |
| Corporate Bonds | | $ | — | | $ | 89,925,340 | | $ | — | | $ | 89,925,340 |
| Loan Participations | | | — | | | 6,353,312 | | | — | | | 6,353,312 |
| Pass-Through Certificates | | | — | | | 745,535 | | | — | | | 745,535 |
| Total Investments in Securities* | | $ | — | | $ | 97,024,187 | | $ | — | | $ | 97,024,187 |
* The Portfolio of Investments provides information on the industry categorization of corporate bonds, loan participations and pass-through certificates.
There were no transfers into or from Level 1 and Level 2 by the Fund for the period ended June 30, 2015. Transfers, if any, between Levels are recognized at the end of the reporting period.
| |
| See notes to financial statements | 31 |
Fund Expenses (unaudited)
GOVERNMENT FUND
The examples below show the ongoing costs (in dollars) of investing in your Fund and will help you in comparing these costs with costs of other mutual funds. Please refer to page 4 for a detailed explanation of the information presented in these examples.
| | | |
| | Beginning | Ending | |
| | Account | Account | Expenses Paid |
| | Value | Value | During Period |
| | (1/1/15) | (6/30/15) | (1/1/15–6/30/15)* |
| Expense Examples | | | |
| Actual | $1,000.00 | $997.35 | $3.81 |
| Hypothetical | | | |
| (5% annual return before expenses) | $1,000.00 | $1,020.97 | $3.86 |
* Expenses are equal to the annualized expense ratio of .77%, multiplied by the average account value over the period, multiplied by 181/365 (to reflect the one-half year period). Expenses paid during the period are net of expenses waived.
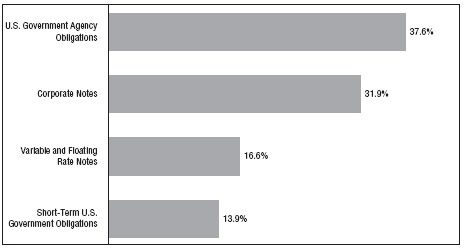
Portfolio Composition
BY SECTOR
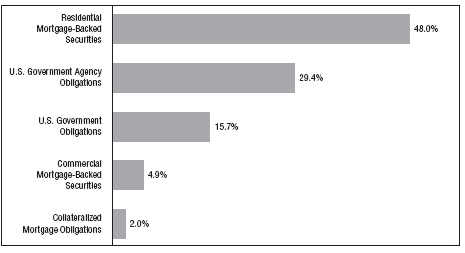
Portfolio holdings and allocations are subject to change. Percentages are as of June 30, 2015, and are based on the total value of investments.
Portfolio of Investments
GOVERNMENT FUND
June 30, 2015
| | | |
| |
| | | | |
| | | | |
| Principal | | | |
| Amount | | Security | Value |
| | | RESIDENTIAL MORTGAGE-BACKED | |
| | | SECURITIES—46.9% | |
| | | Fannie Mae—25.9% | |
| $1,840M | | 3%, 7/1/2021 – 1/1/2045 | $ 1,862,202 |
| 2,248M | | 3.5%, 11/1/2028 – 4/1/2045 | 2,333,754 |
| 2,366M | | 4%, 1/1/2041 – 7/14/2045 (a) | 2,511,609 |
| 390M | | 4.5%, 11/1/2040 – 8/1/2041 | 423,379 |
| 477M | | 5.5%, 7/1/2034 – 10/1/2039 | 540,794 |
| 166M | | 9%, 11/1/2026 | 192,948 |
| 1M | | 11%, 10/1/2015 | 1,124 |
| | | | 7,865,810 |
| | | Freddie Mac—7.7% | |
| 683M | | 3.5%, 11/1/2042 – 10/1/2044 | 704,867 |
| 1,295M | | 4%, 11/1/2040 – 8/1/2044 | 1,372,651 |
| 245M | | 4.5%, 5/1/2044 | 264,232 |
| | | | 2,341,750 |
| | | Government National Mortgage Association I | |
| | | Program—13.3% | |
| 687M | | 4%, 11/15/2025 – 8/15/2041 | 734,098 |
| 1,275M | | 4.5%, 12/15/2039 – 6/15/2040 | 1,394,024 |
| 1,293M | | 5%, 6/15/2033 – 4/15/2040 | 1,454,593 |
| 231M | | 5.5%, 2/15/2033 – 1/15/2036 | 263,688 |
| 160M | | 6%, 11/15/2032 – 4/15/2036 | 183,732 |
| | | | 4,030,135 |
| Total Value of Residential Mortgage-Backed Securities (cost $14,027,745) | 14,237,695 |
| | | U.S. GOVERNMENT AGENCY | |
| | | OBLIGATIONS—28.7% | |
| | | Fannie Mae: | |
| 500M | | 0.875%, 5/21/2018 | 497,149 |
| 400M | | 0.875%, 8/28/2017 | 401,077 |
| 2,450M | | 1.625%, 11/27/2018 | 2,480,466 |
| 125M | | 1.75%, 11/26/2019 | 125,736 |
| 260M | | 2.625%, 9/6/2024 | 260,417 |
| 700M | | Federal Farm Credit Bank, 4.875%, 1/17/2017 | 745,457 |
| | | Federal Home Loan Bank: | |
| 450M | | 1%, 5/21/2020 | 449,281 |
| 1,000M | | 1.6%, 7/30/2019 | 991,474 |
| 950M | | 5.375%, 5/18/2016 | 991,831 |
Portfolio of Investments (continued)
GOVERNMENT FUND
June 30, 2015
| | | | | |
| |
| | | | | | |
| | | | | | |
| Principal | | | | | |
| Amount | | Security | | | Value |
| | | U.S. GOVERNMENT AGENCY OBLIGATIONS (continued) | | |
| | | Freddie Mac: | | | |
| $ 800M | | 0.875%, 3/7/2018 | | | $ 797,431 |
| 1,000M | | 1.25%, 8/1/2019 | | | 989,767 |
| Total Value of U.S. Government Agency Obligations (cost $8,903,261) | | 8,730,086 |
| | | U.S. GOVERNMENT OBLIGATIONS—15.3% | | |
| 176M | | FDA Queens, LP, 6.99%, 6/15/2017 (b) | | | 185,745 |
| 650M | | U.S. Treasury Bonds, 3%, 11/15/2044 | | | 635,933 |
| | | U.S. Treasury Notes: | | | |
| 800M | | 1.375%, 3/31/2020 | | | 792,187 |
| 320M | | 1.5%, 5/31/2020 | | | 318,275 |
| 240M | | 2%, 2/15/2025 | | | 233,194 |
| 640M | | 2.125%, 12/31/2021 | | | 645,050 |
| 355M | | 2.25%, 7/31/2021 | | | 361,739 |
| 400M | | 2.25%, 11/15/2024 | | | 397,594 |
| 1,080M | | 2.375%, 8/15/2024 | | | 1,085,907 |
| Total Value of U.S. Government Obligations (cost $4,813,856) | | 4,655,624 |
| | | COMMERCIAL MORTGAGE-BACKED SECURITIES—4.8% |
| | | Fannie Mae—3.1% | | | |
| 398M | | 2.996%, 11/1/2022 | | | 413,198 |
| 500M | | 3.84%, 5/1/2018 | | | 533,513 |
| | | | | | 946,711 |
| | | Federal Home Loan Mortgage Corporation—1.7% | | |
| 500M | | Multi-Family Structured Pass-Through, 2.13%, 1/25/2019 | | 509,872 |
| Total Value of Commercial Mortgage-Backed Securities (cost $1,476,212) | | 1,456,583 |
| | | COLLATERALIZED MORTGAGE | | | |
| | | OBLIGATIONS—2.0% | | | |
| 555M | | Fannie Mae, 4%, 2/25/2025 (cost $598,387) | | | 606,685 |
| Total Value of Investments (cost $29,819,461) | 97.7 | % | 29,686,673 |
| Other Assets, Less Liabilities | 2.3 | | 708,355 |
| |
| Net Assets | | | 100.0 | % | $30,395,028 |
| |
| (a) | A portion or all of the security purchased on a when-issued or delayed delivery basis (see |
| Note 1G). |
| (b) | Security exempt from registration under Rule 144A of the Securities Act of 1933 (see Note 5). |
The Fund’s asset and liabilities are classified into the following three levels based on the inputs used to value the assets and liabilities:
Level 1 — Unadjusted quoted prices in active markets for identical securities that the Fund has the ability to access.
Level 2 — Observable inputs other than quoted prices included in Level 1 that are observable for the asset or liability, either directly or indirectly. These inputs may include quoted prices for the identical instrument on an inactive market, prices for similar instruments, interest rates, prepayment speeds, credit risk, yield curves, default rates and similar data.
Level 3 — Unobservable inputs for the asset or liability, to the extent relevant observable inputs are not available, representing the Fund’s own assumption about the assumptions a market participant would use in valuing the asset or liability, and would be based on the best information available.
The inputs methodology used for valuing securities are not necessarily an indication of the risk associated with investing in those securities. For example, U.S. Government securities are reflected as Level 2 because the inputs used to determine fair value may not always be quoted prices in an active market.
The following is a summary, by category of Level, of inputs used to value the Fund’s investments as of June 30, 2015:
| | | | | | | | | | | | |
| | | | Level 1 | | | Level 2 | | | Level 3 | | | Total |
| Residential Mortgage-Backed | | | | | | | | | | | | |
| Securities | | $ | — | | $ | 14,237,695 | | $ | — | | $ | 14,237,695 |
| U.S. Government Agency | | | | | | | | | | | | |
| Obligations | | | — | | | 8,730,086 | | | — | | | 8,730,086 |
| U.S. Government Obligations | | | — | | | 4,655,624 | | | — | | | 4,655,624 |
| Commercial Mortgage-Backed | | | | | | | | | | | | |
| Securities | | | — | | | 1,456,583 | | | — | | | 1,456,583 |
| Collateralized Mortgage | | | | | | | | | | | | |
| Obligations | | | — | | | 606,685 | | | — | | | 606,685 |
| Total Investments in Securities | | $ | — | | $ | 29,686,673 | | $ | — | | $ | 29,686,673 |
There were no transfers into or from Level 1 and Level 2 by the Fund for the period ended June 30, 2015. Transfers, if any, between Levels are recognized at the end of the reporting period.
| |
| See notes to financial statements | 35 |
Fund Expenses (unaudited)
GROWTH & INCOME FUND
The examples below show the ongoing costs (in dollars) of investing in your Fund and will help you in comparing these costs with costs of other mutual funds. Please refer to page 4 for a detailed explanation of the information presented in these examples.
| | | |
| | Beginning | Ending | |
| | Account | Account | Expenses Paid |
| | Value | Value | During Period |
| | (1/1/15) | (6/30/15) | (1/1/15–6/30/15)* |
| Expense Examples | | | |
| Actual | $1,000.00 | $1,024.54 | $3.92 |
| Hypothetical | | | |
| (5% annual return before expenses) | $1,000.00 | $1,020.92 | $3.91 |
* Expenses are equal to the annualized expense ratio of .78%, multiplied by the average account value over the period, multiplied by 181/365 (to reflect the one-half year period).
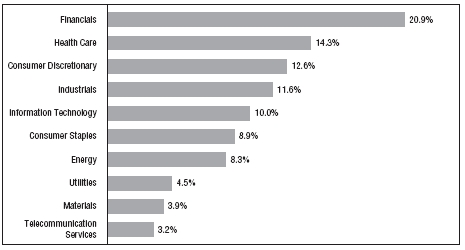
Portfolio Composition
BY SECTOR
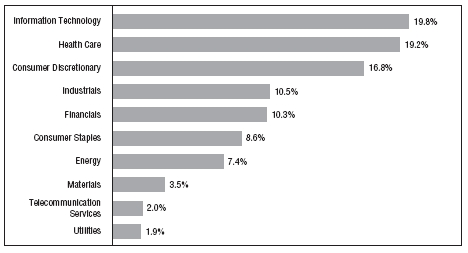
Portfolio holdings and allocations are subject to change. Percentages are as of June 30, 2015, and are based on the total value of investments.
Portfolio of Investments
GROWTH & INCOME FUND
June 30, 2015
| | | | |
| |
| | | | | |
| | | | | |
| Shares | | Security | | Value |
| | | COMMON STOCKS—99.8% | | |
| | | Consumer Discretionary—16.8% | | |
| 132,800 | | American Eagle Outfitters, Inc. | | $ 2,286,816 |
| 69,800 | | BorgWarner, Inc. | | 3,967,432 |
| 113,000 | | CBS Corporation – Class “B” | | 6,271,500 |
| 81,600 | | Delphi Automotive, PLC | | 6,943,344 |
| 69,400 | | Foot Locker, Inc. | | 4,650,494 |
| 159,900 | | Ford Motor Company | | 2,400,099 |
| 36,000 | | GNC Holdings, Inc. – Class “A” | | 1,601,280 |
| 66,400 | | Hanesbrands, Inc. | | 2,212,448 |
| 26,700 | | Harman International Industries, Inc. | | 3,175,698 |
| 48,200 | | Home Depot, Inc. | | 5,356,466 |
| 108,800 | * | Jarden Corporation | | 5,630,400 |
| 97,000 | | Johnson Controls, Inc. | | 4,804,410 |
| 53,200 | | L Brands, Inc. | | 4,560,836 |
| 52,000 | | Lear Corporation | | 5,837,520 |
| 39,600 | | Magna International, Inc. | | 2,221,164 |
| 86,400 | | Newell Rubbermaid, Inc. | | 3,551,904 |
| 47,600 | | Penske Automotive Group, Inc. | | 2,480,436 |
| 99,700 | | Stein Mart, Inc. | | 1,043,859 |
| 60,700 | | Tupperware Brands Corporation | | 3,917,578 |
| 42,800 | | Walt Disney Company | | 4,885,192 |
| 20,700 | | Whirlpool Corporation | | 3,582,135 |
| 14,800 | | Wyndham Worldwide Corporation | | 1,212,268 |
| | | | | 82,593,279 |
| | | Consumer Staples—8.6% | | |
| 120,300 | | Altria Group, Inc. | | 5,883,873 |
| 67,500 | | Avon Products, Inc. | | 422,550 |
| 96,178 | | Coca-Cola Company | | 3,773,063 |
| 72,100 | | CVS Health Corporation | | 7,561,848 |
| 46,100 | | Delhaize Group (ADR) | | 951,043 |
| 39,900 | | Koninklijke Ahold NV (ADR) | | 752,913 |
| 100,000 | | Nu Skin Enterprises, Inc. – Class “A” | | 4,713,000 |
| 44,400 | | PepsiCo, Inc. | | 4,144,296 |
| 78,700 | | Philip Morris International, Inc. | | 6,309,379 |
| 28,000 | | Procter & Gamble Company | | 2,190,720 |
| 60,700 | | Tyson Foods, Inc. – Class “A” | | 2,587,641 |
| 42,650 | | Wal-Mart Stores, Inc. | | 3,025,164 |
| | | | | 42,315,490 |
Portfolio of Investments (continued)
GROWTH & INCOME FUND
June 30, 2015
| | | | |
| |
| | | | | |
| | | | | |
| Shares | | Security | | Value |
| | | Energy—7.4% | | |
| 36,900 | | Anadarko Petroleum Corporation | | $ 2,880,414 |
| 9,300 | | Chevron Corporation | | 897,171 |
| 61,500 | | ConocoPhillips | | 3,776,715 |
| 65,700 | | Devon Energy Corporation | | 3,908,493 |
| 33,300 | | Ensco, PLC – Class “A” | | 741,591 |
| 53,500 | | ExxonMobil Corporation | | 4,451,200 |
| 26,700 | | Hess Corporation | | 1,785,696 |
| 80,222 | | Marathon Oil Corporation | | 2,129,092 |
| 102,022 | | Marathon Petroleum Corporation | | 5,336,771 |
| 42,750 | | National Oilwell Varco, Inc. | | 2,063,970 |
| 24,800 | | Noble Corporation, PLC | | 381,672 |
| 26,700 | | Occidental Petroleum Corporation | | 2,076,459 |
| 30,650 | | Phillips 66 | | 2,469,164 |
| 13,100 | | Schlumberger, Ltd. | | 1,129,089 |
| 93,607 | | Suncor Energy, Inc. | | 2,576,064 |
| | | | | 36,603,561 |
| | | Financials—10.3% | | |
| 67,306 | | American Express Company | | 5,231,022 |
| 37,700 | | Ameriprise Financial, Inc. | | 4,709,861 |
| 142,600 | | Brixmor Property Group, Inc. (REIT) | | 3,298,338 |
| 13,200 | | Citizens Financial Group, Inc. | | 360,492 |
| 53,643 | | Discover Financial Services | | 3,090,910 |
| 27,100 | | Financial Select Sector SPDR Fund (ETF) | | 660,698 |
| 16,000 | | iShares Core S&P Mid-Cap ETF (ETF) | | 2,399,680 |
| 31,800 | | iShares Russell 2000 ETF (ETF) | | 3,970,548 |
| 106,088 | | JPMorgan Chase & Company | | 7,188,523 |
| 15,200 | | Morgan Stanley | | 589,608 |
| 40,500 | | PNC Financial Services Group, Inc. | | 3,873,825 |
| 15,000 | | SPDR S&P 500 ETF Trust (ETF) | | 3,087,750 |
| 27,000 | | SPDR S&P Regional Banking (ETF) | | 1,192,320 |
| 105,808 | | Sunstone Hotel Investors, Inc. (REIT) | | 1,588,178 |
| 94,800 | | U.S. Bancorp | | 4,114,320 |
| 106,700 | | Urstadt Biddle Properties, Inc. – Class “A” (REIT) | | 1,993,156 |
| 63,267 | | Wells Fargo & Company | | 3,558,136 |
| | | | | 50,907,365 |
| | | | |
| |
| | | | | |
| | | | | |
| Shares | | Security | | Value |
| | | Health Care—19.1% | | |
| 106,700 | | Abbott Laboratories | | $ 5,236,836 |
| 89,400 | | AbbVie, Inc. | | 6,006,786 |
| 26,800 | * | Allergan, PLC | | 8,132,728 |
| 46,730 | | Baxter International, Inc. | | 3,267,829 |
| 21,200 | | Cardinal Health, Inc. | | 1,773,380 |
| 43,222 | * | Express Scripts Holding Company | | 3,844,165 |
| 111,800 | | Gilead Sciences, Inc. | | 13,089,544 |
| 39,900 | | Hill-Rom Holdings, Inc. | | 2,167,767 |
| 72,275 | | Johnson & Johnson | | 7,043,922 |
| 2,612 | * | Mallinckrodt, PLC | | 307,485 |
| 18,900 | | McKesson Corporation | | 4,248,909 |
| 45,112 | | Medtronic, PLC | | 3,342,799 |
| 86,743 | | Merck & Company, Inc. | | 4,938,279 |
| 93,100 | * | Mylan NV | | 6,317,766 |
| 31,900 | | Omnicare, Inc. | | 3,006,575 |
| 220,393 | | Pfizer, Inc. | | 7,389,777 |
| 55,500 | | Phibro Animal Health Corporation – Class “A” | | 2,161,170 |
| 69,543 | | Thermo Fisher Scientific, Inc. | | 9,023,900 |
| 65,200 | * | VWR Corporation | | 1,742,796 |
| 28,072 | | Zoetis, Inc. | | 1,353,632 |
| | | | | 94,396,045 |
| | | Industrials—10.4% | | |
| 37,694 | | 3M Company | | 5,816,184 |
| 73,100 | | Altra Industrial Motion Corporation | | 1,986,858 |
| 20,700 | | Caterpillar, Inc. | | 1,755,774 |
| 53,300 | * | Generac Holdings, Inc. | | 2,118,675 |
| 66,896 | | General Electric Company | | 1,777,427 |
| 80,400 | | Greenbrier Companies, Inc. | | 3,766,740 |
| 56,000 | | Honeywell International, Inc. | | 5,710,320 |
| 60,000 | | ITT Corporation | | 2,510,400 |
| 5,600 | | Lockheed Martin Corporation | | 1,041,040 |
| 23,800 | | Nielsen NV | | 1,065,526 |
| 49,400 | | Ryder System, Inc. | | 4,316,078 |
| 24,000 | | Snap-On, Inc. | | 3,822,000 |
| 33,500 | * | TAL International Group, Inc. | | 1,058,600 |
| 29,800 | | Textainer Group Holdings, Ltd. | | 775,098 |
| 94,400 | | Textron, Inc. | | 4,213,072 |
| 73,400 | | Tyco International, PLC | | 2,824,432 |
Portfolio of Investments (continued)
GROWTH & INCOME FUND
June 30, 2015
| | | | |
| |
| | | | | |
| | | | | |
| Shares | | Security | | Value |
| | | Industrials (continued) | | |
| 17,300 | * | United Rentals, Inc. | | $ 1,515,826 |
| 44,400 | | United Technologies Corporation | | 4,925,292 |
| 19,100 | * | Univar, Inc. | | 497,173 |
| | | | | 51,496,515 |
| | | Information Technology—19.8% | | |
| 79,000 | | Apple, Inc. | | 9,908,575 |
| 86,900 | * | ARRIS Group, Inc. | | 2,659,140 |
| 56,400 | | Avago Technologies, Ltd. | | 7,497,252 |
| 37,125 | | CDW Corporation | | 1,272,645 |
| 232,600 | | Cisco Systems, Inc. | | 6,387,196 |
| 26,900 | * | eBay, Inc. | | 1,620,456 |
| 226,900 | | EMC Corporation | | 5,987,891 |
| 127,000 | | Hewlett-Packard Company | | 3,811,270 |
| 155,200 | | Intel Corporation | | 4,720,408 |
| 40,300 | | International Business Machines Corporation | | 6,555,198 |
| 132,900 | | Juniper Networks, Inc. | | 3,451,413 |
| 167,100 | | Mentor Graphics Corporation | | 4,416,453 |
| 79,600 | | Methode Electronics, Inc. | | 2,185,020 |
| 166,100 | | Microsoft Corporation | | 7,333,315 |
| 42,800 | * | NXP Semiconductors NV | | 4,202,960 |
| 93,100 | | Oracle Corporation | | 3,751,930 |
| 54,000 | * | PTC, Inc. | | 2,215,080 |
| 57,700 | * | Qorvo, Inc. | | 4,631,579 |
| 66,688 | | QUALCOMM, Inc. | | 4,176,669 |
| 121,760 | | Symantec Corporation | | 2,830,920 |
| 50,200 | * | Synaptics, Inc. | | 4,354,097 |
| 46,800 | | TE Connectivity, Ltd. | | 3,009,240 |
| 20,000 | * | Yahoo!, Inc. | | 785,800 |
| | | | | 97,764,507 |
| | | Materials—3.5% | | |
| 66,400 | | Cytec Industries, Inc. | | 4,019,192 |
| 71,700 | | International Paper Company | | 3,412,203 |
| 94,300 | | MeadWestvaco Corporation | | 4,450,017 |
| 10,900 | | Praxair, Inc. | | 1,303,095 |
| 36,350 | | RPM International, Inc. | | 1,780,059 |
| 86,200 | * | Trinseo SA | | 2,313,608 |
| | | | | 17,278,174 |
| | | | | |
| |
| | | | | | |
| | | | | | |
| Shares | | Security | | | Value |
| | | Telecommunication Services—2.0% | | | |
| 127,000 | | AT&T, Inc. | | | $ 4,511,040 |
| 113,000 | | Verizon Communications, Inc. | | | 5,266,930 |
| | | | | | 9,777,970 |
| | | Utilities—1.9% | | | |
| 29,200 | | AGL Resources, Inc. | | | 1,359,552 |
| 120,500 | * | Dynegy, Inc. | | | 3,524,625 |
| 113,000 | | Exelon Corporation | | | 3,550,460 |
| 21,900 | | NiSource, Inc. | | | 998,421 |
| | | | | | 9,433,058 |
| Total Value of Common Stocks (cost $295,544,276) | 99.8 | % | 492,565,964 |
| Other Assets, Less Liabilities | .2 | | 747,302 |
| Net Assets | | | 100.0 | % | $493,313,266 |
| |
| * Non-income producing |
| |
| Summary of Abbreviations: |
| ADR | American Depositary Receipts |
| ETF | Exchange Traded Fund |
| REIT | Real Estate Investment Trust |
Portfolio of Investments (continued)
GROWTH & INCOME FUND
June 30, 2015
The Fund’s asset and liabilities are classified into the following three levels based on the inputs used to value the assets and liabilities:
Level 1 — Unadjusted quoted prices in active markets for identical securities that the Fund has the ability to access.
Level 2 — Observable inputs other than quoted prices included in Level 1 that are observable for the asset or liability, either directly or indirectly. These inputs may include quoted prices for the identical instrument on an inactive market, prices for similar instruments, interest rates, prepayment speeds, credit risk, yield curves, default rates and similar data.
Level 3 — Unobservable inputs for the asset or liability, to the extent relevant observable inputs are not available, representing the Fund’s own assumption about the assumptions a market participant would use in valuing the asset or liability, and would be based on the best information available.
The inputs methodology used for valuing securities are not necessarily an indication of the risk associated with investing in those securities. For example, U.S. Government securities are reflected as Level 2 because the inputs used to determine fair value may not always be quoted prices in an active market.
The following is a summary, by category of Level, of inputs used to value the Fund’s investments as of June 30, 2015:
| | | | | | | | | | | | |
| | | | Level 1 | | | Level 2 | | | Level 3 | | | Total |
| Common Stocks* | | $ | 492,565,964 | | $ | — | | $ | — | | $ | 492,565,964 |
* The Portfolio of Investments provides information on the industry categorization for common stocks.
There were no transfers into or from Level 1 and Level 2 by the Fund for the period ended June 30, 2015. Transfers, if any, between Levels are recognized at the end of the reporting period.
| |
| 42 | See notes to financial statements |
Fund Expenses (unaudited)
INTERNATIONAL FUND
The examples below show the ongoing costs (in dollars) of investing in your Fund and will help you in comparing these costs with costs of other mutual funds. Please refer to page 4 for a detailed explanation of the information presented in these examples.
| | | |
| | Beginning | Ending | |
| | Account | Account | Expenses Paid |
| | Value | Value | During Period |
| | (1/1/15) | (6/30/15) | (1/1/15–6/30/15)* |
| Expense Examples | | | |
| Actual | $1,000.00 | $1,027.20 | $4.47 |
| Hypothetical | | | |
| (5% annual return before expenses) | $1,000.00 | $1,020.38 | $4.46 |
* Expenses are equal to the annualized expense ratio of .89%, multiplied by the average account value over the period, multiplied by 181/365 (to reflect the one-half year period).
Portfolio Composition
BY SECTOR
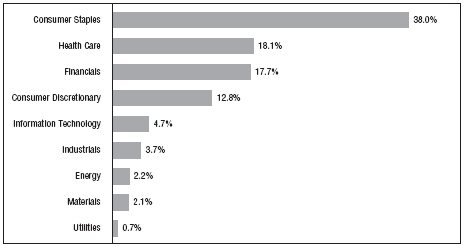
Portfolio holdings and allocations are subject to change. Percentages are as of June 30, 2015, and are based on the total value of investments.
Portfolio of Investments
INTERNATIONAL FUND
June 30, 2015
| | | | |
| |
| | | | | |
| | | | | |
| Shares | | Security | | Value |
| | | COMMON STOCKS—99.3% | | |
| | | United Kingdom—20.6% | | |
| 152,029 | | British American Tobacco, PLC | | $ 8,157,549 |
| 74,317 | | Diageo, PLC | | 2,149,733 |
| 131,659 | | Domino’s Pizza Group, PLC | | 1,607,363 |
| 53,409 | | Imperial Tobacco Group, PLC | | 2,573,776 |
| 1,316,248 | | Lloyds Banking Group, PLC | | 1,762,884 |
| 64,377 | * | Persimmon, PLC | | 1,997,746 |
| 62,717 | | Reckitt Benckiser Group, PLC | | 5,408,065 |
| 75,791 | | SABMiller, PLC | | 3,934,597 |
| | | | | 27,591,713 |
| | | Switzerland—15.6% | | |
| 411 | | Chocoladefabriken Lindt & Sprungli AG | | 2,173,361 |
| 24,737 | | Compagnie Financiere Richemont SA | | 2,012,139 |
| 14,065 | * | DKSH Holding, Ltd. | | 1,016,946 |
| 74,931 | | Nestle SA – Registered | | 5,409,747 |
| 21,656 | | Roche Holding AG – Genusscheine | | 6,068,637 |
| 851 | | SGS SA – Registered | | 1,552,817 |
| 126,948 | * | UBS Group AG | | 2,692,528 |
| | | | | 20,926,175 |
| | | India—12.0% | | |
| 340,735 | * | HDFC Bank, Ltd. | | 5,710,040 |
| 3,248 | | HDFC Bank, Ltd. (ADR) | | 196,601 |
| 353,738 | | Housing Development Finance Corporation, Ltd. | | 7,201,690 |
| 605,090 | | ITC, Ltd. | | 2,994,568 |
| | | | | 16,102,899 |
| | | France—8.6% | | |
| 14,605 | | Air Liquide SA | | 1,847,240 |
| 102,237 | | Bureau Veritas SA | | 2,354,809 |
| 20,166 | | Essilor International SA | | 2,405,585 |
| 4,622 | | Hermes International | | 1,724,142 |
| 11,069 | | L’Oreal SA | | 1,974,448 |
| 11,137 | | Pernod Ricard SA | | 1,286,309 |
| | | | | 11,592,533 |
| | | | |
| |
| | | | | |
| | | | | |
| Shares | | Security | | Value |
| | | United States—6.2% | | |
| 66,483 | | Philip Morris International, Inc. | | $ 5,329,942 |
| 2,561 | * | Priceline Group, Inc. | | 2,948,659 |
| | | | | 8,278,601 |
| | | Canada—6.0% | | |
| 48,185 | | Alimentation Couche-Tard – Class “B” | | 2,060,497 |
| 42,048 | | Bank of Nova Scotia | | 2,170,404 |
| 61,475 | | Enbridge, Inc. | | 2,874,904 |
| 56,698 | | Silver Wheaton Corporation | | 982,796 |
| | | | | 8,088,601 |
| | | China—4.9% | | |
| 22,380 | * | Alibaba Group Holding, Ltd. (ADR) | | 1,841,203 |
| 12,765 | * | Baidu, Inc. (ADR) | | 2,541,256 |
| 107,165 | | Tencent Holdings, Ltd. | | 2,138,724 |
| | | | | 6,521,183 |
| | | Netherlands—4.3% | | |
| 139,247 | | Unilever NV-CVA | | 5,798,983 |
| | | Denmark—4.2% | | |
| 12,039 | | Coloplast A/S – Series “B” | | 789,959 |
| 88,496 | | Novo Nordisk A/S – Series “B” | | 4,821,596 |
| | | | | 5,611,555 |
| | | Australia—3.8% | | |
| 40,471 | | CSL, Ltd. | | 2,700,065 |
| 52,014 | | Ramsay Health Care, Ltd. | | 2,466,882 |
| | | | | 5,166,947 |
| | | Spain—2.4% | | |
| 147,002 | | Banco Bilbao Vizcaya Argentaria SA | | 1,440,881 |
| 45,168 | | Grifols SA | | 1,819,349 |
| | | | | 3,260,230 |
Portfolio of Investments (continued)
INTERNATIONAL FUND
June 30, 2015
| | | | | |
| |
| | | | | | |
| | | | | | |
| Shares | | Security | | | Value |
| | | Hong Kong—2.4% | | | |
| 110,784 | | Cheung Kong Infrastructure Holdings, Ltd. | | | $ 860,369 |
| 175,985 | | Link REIT (REIT) | | | 1,030,725 |
| 388,991 | | Sands China, Ltd. | | | 1,309,759 |
| | | | | | 3,200,853 |
| | | Germany—2.2% | | | |
| 11,982 | | Bayer AG | | | 1,677,117 |
| 16,100 | | Fresenius Medical Care AG & Company | | | 1,328,953 |
| | | | | | 3,006,070 |
| | | Japan—1.7% | | | |
| 13,900 | | Daito Trust Construction Company, Ltd. | | | 1,440,144 |
| 37,400 | | Unicharm Corporation | | | 889,123 |
| | | | | | 2,329,267 |
| | | South Africa—1.7% | | | |
| 14,412 | | Naspers, Ltd. | | | 2,244,841 |
| | | Brazil—1.2% | | | |
| 112,708 | | Cielo SA | | | 1,593,232 |
| | | Ireland—1.1% | | | |
| 16,607 | | Paddy Power, PLC | | | 1,423,198 |
| | | South Korea—.4% | | | |
| 1,461 | | Amorepacific Corporation | | | 547,490 |
| Total Value of Common Stocks (cost $97,829,259) | 99.3 | % | 133,284,371 |
| Other Assets, Less Liabilities | .7 | | 889,871 |
| Net Assets | | | 100.0 | % | $ 134,174,242 |
| |
| * Non-income producing |
| |
| Summary of Abbreviations: |
| ADR | American Depositary Receipts |
| REIT | Real Estate Investment Trust |
The Fund’s asset and liabilities are classified into the following three levels based on the inputs used to value the assets and liabilities:
Level 1 — Unadjusted quoted prices in active markets for identical securities that the Fund has the ability to access.
Level 2 — Observable inputs other than quoted prices included in Level 1 that are observable for the asset or liability, either directly or indirectly. These inputs may include quoted prices for the identical instrument on an inactive market, prices for similar instruments, interest rates, prepayment speeds, credit risk, yield curves, default rates and similar data.
Level 3 — Unobservable inputs for the asset or liability, to the extent relevant observable inputs are not available, representing the Fund’s own assumption about the assumptions a market participant would use in valuing the asset or liability, and would be based on the best information available.
The inputs methodology used for valuing securities are not necessarily an indication of the risk associated with investing in those securities. For example, U.S. Government securities are reflected as Level 2 because the inputs used to determine fair value may not always be quoted prices in an active market.
The following is a summary, by category of Level, of inputs used to value the Fund’s investments as of June 30, 2015:
| | | | | | | | | | | | |
| | | | Level 1 | | | Level 2 | | | Level 3 | | | Total |
| Common Stocks | | | | | | | | | | | | |
| United Kingdom | | $ | 27,591,713 | | $ | — | | $ | — | | | 27,591,713 |
| Switzerland | | | 20,926,175 | | | — | | | — | | | 20,926,175 |
| India | | | 16,102,899 | | | — | | | — | | | 16,102,899 |
| France | | | 11,592,533 | | | — | | | — | | | 11,592,533 |
| United States | | | 8,278,601 | | | — | | | — | | | 8,278,601 |
| Canada | | | 8,088,601 | | | — | | | — | | | 8,088,601 |
| China | | | 6,521,183 | | | — | | | — | | | 6,521,183 |
| Netherlands | | | 5,798,983 | | | — | | | — | | | 5,798,983 |
| Denmark | | | 5,611,555 | | | — | | | — | | | 5,611,555 |
| Australia | | | 5,166,947 | | | — | | | — | | | 5,166,947 |
| Spain | | | 3,260,230 | | | — | | | — | | | 3,260,230 |
| Hong Kong | | | 3,200,853 | | | — | | | — | | | 3,200,853 |
| Germany | | | 3,006,070 | | | — | | | — | | | 3,006,070 |
| Japan | | | 2,329,267 | | | — | | | — | | | 2,329,267 |
| South Africa | | | 2,244,841 | | | — | | | — | | | 2,244,841 |
| Brazil | | | 1,593,232 | | | — | | | — | | | 1,593,232 |
| Ireland | | | 1,423,198 | | | — | | | — | | | 1,423,198 |
| South Korea | | | 547,490 | | | — | | | — | | | 547,490 |
| Total Investments in Securities | | $ | 133,284,371 | | $ | — | | $ | — | | $ | 133,284,371 |
Transfers between Level 1 and Level 2 securities as of June 30, 2015 resulted from securities priced previously with an official close price (Level 1 securities) or, securities fair valued by the Valuation Committee (Level 2 securities). Transfers from Level 2 to Level 1 as of June 30, 2015 were $101,102,474. Transfers, if any, between Levels are recognized at the end of the reporting period.
| |
| See notes to financial statements | 47 |
Fund Expenses (unaudited)
INVESTMENT GRADE FUND
The examples below show the ongoing costs (in dollars) of investing in your Fund and will help you in comparing these costs with costs of other mutual funds. Please refer to page 4 for a detailed explanation of the information presented in these examples.
| | | |
| | Beginning | Ending | |
| | Account | Account | Expenses Paid |
| | Value | Value | During Period |
| | (1/1/15) | (6/30/15) | (1/1/15–6/30/15)* |
| Expense Examples | | | |
| Actual | $1,000.00 | $998.35 | $3.42 |
| Hypothetical | | | |
| (5% annual return before expenses) | $1,000.00 | $1,021.37 | $3.46 |
* Expenses are equal to the annualized expense ratio of .69%, multiplied by the average account value over the period, multiplied by 181/365 (to reflect the one-half year period). Expenses paid during the period are net of expenses waived.
Portfolio Composition
TOP TEN SECTORS
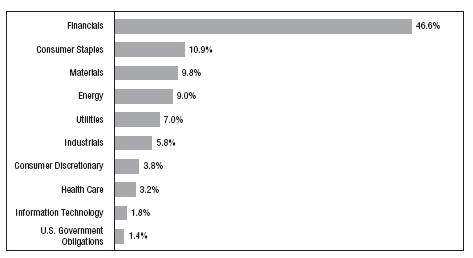
Portfolio holdings and allocations are subject to change. Percentages are as of June 30, 2015, and are based on the total value of investments.
Portfolio of Investments
INVESTMENT GRADE FUND
June 30, 2015
| | | | |
| |
| | | | | |
| | | | | |
| Principal | | | | |
| Amount | | Security | | Value |
| | | CORPORATE BONDS—95.7% | | |
| | | Agriculture—.7% | | |
| $ 400M | | Cargill, Inc., 6%, 11/27/2017 (a) | | $ 442,077 |
| | | Automotive—1.2% | | |
| 500M | | Johnson Controls, Inc., 5%, 3/30/2020 | | 549,460 |
| 200M | | Volkswagen Group of America Finance, LLC, 1.65%, 5/22/2018 (a) | | 200,162 |
| | | | | 749,622 |
| | | Chemicals—3.2% | | |
| 500M | | Agrium, Inc., 3.375%, 3/15/2025 | | 476,372 |
| 450M | | CF Industries, Inc., 3.45%, 6/1/2023 | | 436,435 |
| 500M | | Dow Chemical Co., 4.25%, 11/15/2020 | | 534,629 |
| 500M | | LyondellBasell Industries NV, 6%, 11/15/2021 | | 573,070 |
| | | | | 2,020,506 |
| | | Consumer Durables—1.3% | | |
| | | Newell Rubbermaid, Inc.: | | |
| 500M | | 2.875%, 12/1/2019 | | 505,857 |
| 265M | | 4.7%, 8/15/2020 | | 289,748 |
| | | | | 795,605 |
| | | Energy—8.7% | | |
| 575M | | Canadian Oil Sands, Ltd., 7.75%, 5/15/2019 (a) | | 625,920 |
| 500M | | Continental Resources, Inc., 5%, 9/15/2022 | | 490,940 |
| 400M | | DCP Midstream Operating, LP, 2.5%, 12/1/2017 | | 387,830 |
| 500M | | Enbridge Energy Partners, LP, 4.2%, 9/15/2021 | | 513,447 |
| 500M | | Kinder Morgan Energy Partners, LP, 3.45%, 2/15/2023 | | 471,675 |
| 200M | | Marathon Oil Corp., 3.85%, 6/1/2025 | | 196,417 |
| 500M | | Nabors Industries, Inc., 6.15%, 2/15/2018 | | 540,247 |
| 400M | | ONEOK Partners, LP, 3.375%, 10/1/2022 | | 368,564 |
| 400M | | Spectra Energy Capital, LLC, 6.2%, 4/15/2018 | | 437,270 |
| 400M | | Suncor Energy, Inc., 6.1%, 6/1/2018 | | 446,366 |
| 466M | | Valero Energy Corp., 9.375%, 3/15/2019 | | 573,961 |
| 400M | | Weatherford International, LLC, 6.35%, 6/15/2017 | | 428,572 |
| | | | | 5,481,209 |
| | | Financial Services—16.3% | | |
| | | American Express Co.: | | |
| 400M | | 7%, 3/19/2018 | | 453,925 |
| 200M | | 4.05%, 12/3/2042 | | 186,245 |
Portfolio of Investments (continued)
INVESTMENT GRADE FUND
June 30, 2015
| | | | |
| |
| | | | | |
| | | | | |
| Principal | | | | |
| Amount | | Security | | Value |
| | | Financial Services (continued) | | |
| | | American International Group, Inc.: | | |
| $ 300M | | 5.85%, 1/16/2018 | | $ 330,943 |
| 300M | | 6.4%, 12/15/2020 | | 357,072 |
| 500M | | Ameriprise Financial, Inc., 5.3%, 3/15/2020 | | 565,496 |
| 600M | | Assured Guaranty US Holding, Inc., 5%, 7/1/2024 | | 589,507 |
| 200M | | Barclays, PLC, 3.65%, 3/16/2025 | | 189,590 |
| 400M | | Berkshire Hathaway, Inc., 3.4%, 1/31/2022 | | 417,230 |
| 200M | | BlackRock, Inc., 5%, 12/10/2019 | | 223,454 |
| 400M | | CoBank ACB, 7.875%, 4/16/2018 (a) | | 461,790 |
| 300M | | Compass Bank, 6.4%, 10/1/2017 | | 326,621 |
| | | ERAC USA Finance, LLC: | | |
| 500M | | 4.5%, 8/16/2021 (a) | | 540,531 |
| 270M | | 3.3%, 10/15/2022 (a) | | 265,246 |
| 500M | | 7%, 10/15/2037 (a) | | 613,055 |
| 600M | | Ford Motor Credit Co., LLC, 8.125%, 1/15/2020 | | 733,423 |
| | | General Electric Capital Corp.: | | |
| 700M | | 4.65%, 10/17/2021 | | 767,589 |
| 900M | | 6.75%, 3/15/2032 | | 1,170,332 |
| 300M | | Harley-Davidson Financial Services, Inc., 2.4%, 9/15/2019 (a) | | 303,329 |
| 200M | | Harley-Davidson Funding Corp., 6.8%, 6/15/2018 (a) | | 228,394 |
| 400M | | Liberty Mutual Group, Inc., 4.95%, 5/1/2022 (a) | | 430,628 |
| 600M | | Protective Life Corp., 7.375%, 10/15/2019 | | 711,158 |
| 300M | | Prudential Financial, Inc., 7.375%, 6/15/2019 | | 356,010 |
| | | | | 10,221,568 |
| | | Financials—22.8% | | |
| | | Bank of America Corp.: | | |
| 350M | | 5.65%, 5/1/2018 | | 384,731 |
| 625M | | 5%, 5/13/2021 | | 686,981 |
| 475M | | 5.875%, 2/7/2042 | | 549,763 |
| | | Barclays Bank, PLC: | | |
| 400M | | 5.125%, 1/8/2020 | | 445,195 |
| 600M | | 3.75%, 5/15/2024 | | 603,289 |
| 300M | | Capital One Financial Corp., 3.2%, 2/5/2025 | | 284,344 |
| | | Citigroup, Inc.: | | |
| 1,250M | | 6.125%, 11/21/2017 | | 1,375,734 |
| 200M | | 8.5%, 5/22/2019 | | 244,147 |
| 200M | | 4.5%, 1/14/2022 | | 215,737 |
| 400M | | Deutsche Bank AG London, 3.7%, 5/30/2024 | | 395,757 |
| | | | |
| |
| | | | | |
| | | | | |
| Principal | | | | |
| Amount | | Security | | Value |
| | | Financials (continued) | | |
| | | Goldman Sachs Group, Inc.: | | |
| $ 200M | | 5.375%, 3/15/2020 | | $ 222,844 |
| 600M | | 5.75%, 1/24/2022 | | 683,048 |
| 300M | | 3.625%, 1/22/2023 | | 298,400 |
| 500M | | 6.125%, 2/15/2033 | | 597,485 |
| 200M | | 5.15%, 5/22/2045 | | 193,667 |
| | | JPMorgan Chase & Co.: | | |
| 900M | | 6%, 1/15/2018 | | 991,698 |
| 500M | | 4.5%, 1/24/2022 | | 536,294 |
| | | Morgan Stanley: | | |
| 500M | | 5.95%, 12/28/2017 | | 549,799 |
| 600M | | 6.625%, 4/1/2018 | | 673,490 |
| 850M | | 5.5%, 7/28/2021 | | 959,625 |
| 300M | | National City Corp., 6.875%, 5/15/2019 | | 348,218 |
| 200M | | Standard Chartered, PLC, 3.2% 4/17/2025 (a) | | 189,758 |
| 600M | | SunTrust Banks, Inc., 6%, 9/11/2017 | | 655,324 |
| 400M | | UBS AG, 4.875%, 8/4/2020 | | 442,684 |
| 500M | | U.S. Bancorp, 3.6%, 9/11/2024 | | 503,218 |
| | | Wells Fargo & Co.: | | |
| 300M | | 4.6%, 4/1/2021 | | 328,893 |
| 900M | | 3.45%, 2/13/2023 | | 896,017 |
| 100M | | 3.9%, 5/1/2045 | | 90,223 |
| | | | | 14,346,363 |
| | | Food/Beverage/Tobacco—5.7% | | |
| 300M | | Anheuser-Busch InBev SA/NV, 4.625%, 2/1/2044 | | 302,685 |
| 200M | | Anheuser-Busch InBev Worldwide, Inc., 6.875%, 11/15/2019 | | 238,913 |
| 550M | | Bunge Ltd. Finance Corp., 8.5%, 6/15/2019 | | 666,021 |
| 700M | | Dr. Pepper Snapple Group, Inc., 6.82%, 5/1/2018 | | 795,102 |
| 440M | | Ingredion, Inc., 4.625%, 11/1/2020 | | 471,949 |
| 250M | | PepsiCo, Inc., 5%, 6/1/2018 | | 274,304 |
| 400M | | Philip Morris International, Inc., 5.65%, 5/16/2018 | | 444,396 |
| 400M | | SABMiller Holdings, Inc., 3.75%, 1/15/2022 (a) | | 413,660 |
| | | | | 3,607,030 |
| | | Forest Products/Container—.9% | | |
| 500M | | Rock-Tenn Co., 4.9%, 3/1/2022 | | 539,157 |
Portfolio of Investments (continued)
INVESTMENT GRADE FUND
June 30, 2015
| | | | |
| |
| | | | | |
| | | | | |
| Principal | | | | |
| Amount | | Security | | Value |
| | | Health Care—3.1% | | |
| $ 400M | | Biogen, Inc., 6.875%, 3/1/2018 | | $ 452,890 |
| | | Express Scripts Holding Co.: | | |
| 450M | | 4.75%, 11/15/2021 | | 488,971 |
| 200M | | 3.5%, 6/15/2024 | | 195,983 |
| 400M | | Laboratory Corp. of America Holdings, 3.75%, 8/23/2022 | | 405,176 |
| 400M | | Mylan, Inc., 3.125%, 1/15/2023 (a) | | 382,306 |
| | | | | 1,925,326 |
| | | Information Technology—1.7% | | |
| 200M | | Apple, Inc., 2.5%, 2/9/2025 | | 187,777 |
| 250M | | Harris Corp., 4.4%, 12/15/2020 | | 268,279 |
| 200M | | Pitney Bowes, Inc., 5.75%, 9/15/2017 | | 216,066 |
| 400M | | Symantec Corp., 3.95%, 6/15/2022 | | 401,786 |
| | | | | 1,073,908 |
| | | Manufacturing—3.0% | | |
| 750M | | CRH America, Inc., 8.125%, 7/15/2018 | | 880,219 |
| 400M | | Ingersoll-Rand Global Holdings Co., Ltd., 6.875%, 8/15/2018 | | 455,086 |
| 500M | | Tyco Electronics Group SA, 6.55%, 10/1/2017 | | 555,083 |
| | | | | 1,890,388 |
| | | Media-Broadcasting—3.2% | | |
| 200M | | ABC, Inc., 8.75%, 8/15/2021 | | 262,222 |
| 400M | | British Sky Broadcasting Group, PLC, 9.5%, 11/15/2018 (a) | | 488,607 |
| 350M | | CBS Corp., 3.375%, 3/1/2022 | | 346,256 |
| 500M | | Comcast Corp., 4.25%, 1/15/2033 | | 489,200 |
| 400M | | DirecTV Holdings, LLC, 3.8%, 3/15/2022 | | 402,892 |
| | | | | 1,989,177 |
| | | Media-Diversified—1.7% | | |
| 620M | | McGraw-Hill Financial, Inc., 5.9%, 11/15/2017 | | 677,612 |
| 400M | | Time Warner, Inc., 3.6%, 7/15/2025 | | 389,882 |
| | | | | 1,067,494 |
| | | | |
| |
| | | | | |
| | | | | |
| Principal | | | | |
| Amount | | Security | | Value |
| | | Metals/Mining—4.8% | | |
| $ 500M | | Alcoa, Inc., 6.15%, 8/15/2020 | | $ 545,249 |
| 400M | | ArcelorMittal, 6.125%, 6/1/2018 | | 427,000 |
| 400M | | Glencore Finance Canada, Ltd., 4.95%, 11/15/2021 (a) | | 420,633 |
| 500M | | Newmont Mining Corp., 5.125%, 10/1/2019 | | 543,703 |
| 500M | | Rio Tinto Finance USA, Ltd., 3.75%, 9/20/2021 | | 518,877 |
| 500M | | Vale Overseas, Ltd., 5.625%, 9/15/2019 | | 542,020 |
| | | | | 2,997,482 |
| | | Real Estate Investment Trusts—6.1% | | |
| 400M | | Boston Properties, LP, 5.875%, 10/15/2019 | | 454,574 |
| | | Digital Realty Trust, LP: | | |
| 300M | | 5.25%, 3/15/2021 | | 328,715 |
| 500M | | 3.95%, 7/1/2022 | | 499,719 |
| 300M | | ERP Operating, LP, 3.375%, 6/1/2025 | | 294,369 |
| 400M | | HCP, Inc., 5.375%, 2/1/2021 | | 441,808 |
| 400M | | Health Care REIT, Inc., 4%, 6/1/2025 | | 395,585 |
| | | ProLogis, LP: | | |
| 300M | | 4.5%, 8/15/2017 | | 318,211 |
| 200M | | 3.35%, 2/1/2021 | | 204,543 |
| 500M | | Simon Property Group, LP, 3.375%, 10/1/2024 | | 497,371 |
| 400M | | Ventas Realty, LP, 4.75%, 6/1/2021 | | 433,965 |
| | | | | 3,868,860 |
| | | Retail-General Merchandise—1.2% | | |
| 400M | | Amazon.com, Inc., 4.8%, 12/5/2034 | | 398,562 |
| 100M | | GAP, Inc., 5.95%, 4/12/2021 | | 113,068 |
| 200M | | Home Depot, Inc., 5.875%, 12/16/2036 | | 241,194 |
| | | | | 752,824 |
| | | Telecommunications—.7% | | |
| 400M | | Verizon Communications, Inc., 5.15%, 9/15/2023 | | 438,674 |
| | | Transportation—2.6% | | |
| 400M | | Burlington North Santa Fe, LLC, 5.15%, 9/1/2043 | | 431,678 |
| 400M | | Con-way, Inc., 7.25%, 1/15/2018 | | 446,373 |
| 440M | | GATX Corp., 4.75%, 6/15/2022 | | 468,334 |
| 300M | | Penske Truck Leasing Co., LP, 4.875%, 7/11/2022 (a) | | 317,486 |
| | | | | 1,663,871 |
Portfolio of Investments (continued)
INVESTMENT GRADE FUND
June 30, 2015
| | | | | |
| |
| | | | | | |
| | | | | | |
| Principal | | | | | |
| Amount | | Security | | | Value |
| | | Utilities—6.8% | | | |
| $ 300M | | Duke Energy Progress, Inc., 4.15%, 12/1/2044 | | | $ 290,650 |
| 300M | | E.ON International Finance BV, 5.8%, 4/30/2018 (a) | | 332,306 |
| 300M | | Entergy Arkansas, Inc., 4.95%, 12/15/2044 | | | 301,375 |
| 400M | | Exelon Generation Co., LLC, 5.2%, 10/1/2019 | | 440,344 |
| | | Great River Energy Co.: | | | |
| 66M | | 5.829%, 7/1/2017 (a) | | | 69,068 |
| 280M | | 4.478%, 7/1/2030 (a) | | | 296,801 |
| 450M | | Ohio Power Co., 5.375%, 10/1/2021 | | | 513,767 |
| 450M | | Oklahoma Gas & Electric Co., 4%, 12/15/2044 | | 424,809 |
| 300M | | San Diego Gas & Electric Co., 1.914%, 2/1/2022 | | 301,392 |
| 604M | | Sempra Energy, 9.8%, 2/15/2019 | | | 759,206 |
| 500M | | South Carolina Electric & Gas Co., 5.45%, 2/1/2041 | | 566,039 |
| | | | | | 4,295,757 |
| Total Value of Corporate Bonds (cost $58,743,091) | | | 60,166,898 |
| | | U.S. GOVERNMENT OBLIGATIONS—1.3% | | |
| | | U.S. Treasury Bonds: | | | |
| 400M | | 3%, 11/15/2044 | | | 391,344 |
| 525M | | 2.5%, 2/15/2045 | | | 462,152 |
| Total Value of U.S. Government Obligations (cost $962,003) | | | 853,496 |
| Total Value of Investments (cost $59,705,094) | 97.0 | % | 61,020,394 |
| Other Assets, Less Liabilities | 3.0 | | 1,865,959 |
| Net Assets | | 100.0 | % | $ 62,886,353 |
(a) Security exempt from registration under Rule 144A of the Securities Act of 1933 (see Note 5).
The Fund’s asset and liabilities are classified into the following three levels based on the inputs used to value the assets and liabilities:
Level 1 — Unadjusted quoted prices in active markets for identical securities that the Fund has the ability to access.
Level 2 — Observable inputs other than quoted prices included in Level 1 that are observable for the asset or liability, either directly or indirectly. These inputs may include quoted prices for the identical instrument on an inactive market, prices for similar instruments, interest rates, prepayment speeds, credit risk, yield curves, default rates and similar data.
Level 3 — Unobservable inputs for the asset or liability, to the extent relevant observable inputs are not available, representing the Fund’s own assumption about the assumptions a market participant would use in valuing the asset or liability, and would be based on the best information available.
The inputs methodology used for valuing securities are not necessarily an indication of the risk associated with investing in those securities. For example, U.S. Government securities are reflected as Level 2 because the inputs used to determine fair value may not always be quoted prices in an active market.
The following is a summary, by category of Level, of inputs used to value the Fund’s investments as of June 30, 2015:
| | | | | | | | | | | | |
| | | | Level 1 | | | Level 2 | | | Level 3 | | | Total |
| Corporate Bonds* | | $ | — | | $ | 60,166,898 | | $ | — | | $ | 60,166,898 |
| U.S. Government Obligations | | | | | | 853,496 | | | | | | 853,496 |
| Total Investments in Securities | | $ | — | | $ | 61,020,394 | | $ | — | | $ | 61,020,394 |
* The Portfolio of Investments provides information on the industry categorization for corporate bonds.
There were no transfers into or from Level 1 and Level 2 by the Fund for the period ended June 30, 2015. Transfers, if any, between Levels are recognized at the end of the reporting period.
| |
| See notes to financial statements | 55 |
Fund Expenses (unaudited)
LIMITED DURATION HIGH QUALITY BOND FUND
The examples below show the ongoing costs (in dollars) of investing in your Fund and will help you in comparing these costs with costs of other mutual funds. Please refer to page 4 for a detailed explanation of the information presented in these examples.
| | | |
| | Beginning | Ending | |
| | Account | Account | Expenses Paid |
| | Value | Value | During Period |
| | (1/1/15) | (6/30/15) | (1/1/15–6/30/15)* |
| Expense Examples | | | |
| Actual | $1,000.00 | $996.92 | $8.42 |
| Hypothetical | | | |
| (5% annual return before expenses) | $1,000.00 | $1,016.36 | $8.50 |
* Expenses are equal to the annualized expense ratio of 1.70%, multiplied by the average account value over the period, multiplied by 181/365 (to reflect the one-half year period). Expenses paid during the period are net of expenses waived.
Portfolio Composition
BY SECTOR

Portfolio holdings and allocations are subject to change. Percentages are as of June 30, 2015, and are based on the total value of investments.
Portfolio of Investments
LIMITED DURATION HIGH QUALITY BOND FUND
June 30, 2015
| | | | |
| |
| | | | | |
| | | | | |
| Principal | | | | |
| Amount | | Security | | Value |
| | | CORPORATE BONDS—56.9% | | |
| | | Automotive—2.9% | | |
| $ 100M | | Toyota Motor Credit Corp., 2.125%, 7/18/2019 | | $ 100,379 |
| | | Energy—3.2% | | |
| 100M | | Suncor Energy, Inc., 6.1%, 6/1/2018 | | 111,592 |
| | | Financial Services—13.1% | | |
| 100M | | American Express Co., 7%, 3/19/2018 | | 113,481 |
| 100M | | American International Group, Inc., 5.85%, 1/16/2018 | | 110,314 |
| 100M | | BlackRock, Inc., 5%, 12/10/2019 | | 111,727 |
| 100M | | Harley-Davidson Funding Corp., 6.8%, 6/15/2018 (a) | | 114,197 |
| | | | | 449,719 |
| | | Financials—15.9% | | |
| 100M | | Bank of America Corp., 5.65%, 5/1/2018 | | 109,923 |
| 100M | | Barclays Bank, PLC, 6.75%, 5/22/2019 | | 116,025 |
| 100M | | Citigroup, Inc., 6.125%, 11/21/2017 | | 110,059 |
| 100M | | Goldman Sachs Group, Inc., 6.15%, 4/1/2018 | | 111,230 |
| 100M | | Royal Bank of Canada, 1%, 4/27/2017 | | 99,920 |
| | | | | 547,157 |
| | | Industrials—2.9% | | |
| 100M | | PACCAR Financial Corp., 1.45%, 3/9/2018 | | 99,971 |
| | | Information Technology—2.9% | | |
| 100M | | Apple, Inc., 2.1%, 5/6/2019 | | 101,062 |
| | | Manufacturing—3.2% | | |
| 100M | | Tyco Electronics Group SA, 6.55%, 10/1/2017 | | 111,017 |
| | | Real Estate Investment Trusts—3.3% | | |
| 100M | | Boston Properties, LP, 5.875%, 10/15/2019 | | 113,643 |
| | | Telecommunications—5.9% | | |
| 100M | | AT&T, Inc., 2.45%, 6/30/2020 | | 98,141 |
| 100M | | Verizon Communications, Inc., 3.65%, 9/14/2018 | | 105,258 |
| | | | | 203,399 |
| | | Utilities—3.6% | | |
| 100M | | Arizona Public Service Co., 8.75%, 3/1/2019 | | 122,660 |
| Total Value of Corporate Bonds (cost $1,970,356) | | 1,960,599 |
Portfolio of Investments (continued)
LIMITED DURATION HIGH QUALITY BOND FUND
June 30, 2015
| | | | |
| |
| | | | | |
| | | | | |
| Principal | | | | |
| Amount | | Security | | Value |
| | | ASSET BACKED SECURITIES—15.1% | | |
| | | Fixed Autos—11.6% | | |
| | | Ford Credit Auto Owners Trust: | | |
| $ 60M | | 1%, 9/15/2017 | | $ 60,104 |
| 45M | | 0.79%, 5/15/2018 | | 44,998 |
| 20M | | Ford Credit Floorplan Master Owner Trust, 1.42%, 1/15/2020 | | 20,009 |
| 15M | | Harley-Davidson Motorcycle Trust, 1.3%, 3/16/2020 | | 14,996 |
| 45M | | Honda Auto Receivables Owner Trust, 1.46%, 10/15/2020 | | 45,062 |
| 50M | | Hyundai Auto Receivables Trust, 1.48%, 6/15/2021 | | 49,786 |
| 67M | | Nissan Auto Receivables Owner Trust, 1%, 7/16/2018 | | 66,923 |
| 75M | | Nissan Master Owner Trust, 1.44%, 2/15/2020 | | 75,063 |
| 25M | | Toyota Auto Receivables Owner Trust, 1.52%, 6/15/2020 | | 24,955 |
| | | | | 401,896 |
| | | Fixed Financials—3.5% | | |
| 50M | | American Express Credit Account Master Trust, 1.26%, 1/15/2020 | | 50,087 |
| 40M | | Chase Issuance Trust, 1.3%, 2/18/2020 | | 39,975 |
| 30M | | Discover Card Execution Note Trust, 1.04%, 4/15/2019 | | 30,060 |
| | | | | 120,122 |
| Total Value of Asset Backed Securities (cost $522,063) | | 522,018 |
| | | RESIDENTIAL MORTGAGE-BACKED | | |
| | | SECURITIES—14.7% | | |
| | | Fannie Mae—11.7% | | |
| 220M | | 3%, 11/1/2021 – 9/1/2027 | | 228,557 |
| 125M | | 3.5%, 11/1/2025 – 1/1/2026 | | 132,034 |
| 40M | | 4%, 9/1/2024 | | 42,724 |
| | | | | 403,315 |
| | | Freddie Mac—3.0% | | |
| 74M | | 3.5%, 8/1/2026 (b) | | 78,571 |
| 23M | | 3%, 8/1/2027 | | 23,694 |
| | | | | 102,265 |
| Total Value of Residential Mortgage-Backed Securities (cost $505,530) | | 505,580 |
| | | | | |
| |
| | | | | | |
| | | | | | |
| Principal | | | | | |
| Amount | | Security | | | Value |
| | | U.S. GOVERNMENT OBLIGATIONS—4.9% | | |
| | | U.S. Treasury Notes: | | | |
| $ 40M | | 0.5%, 6/15/2016 | | | $ 40,078 |
| 35M | | 0.875%, 1/15/2018 | | | 35,014 |
| 20M | | 0.875%, 5/15/2017 | | | 20,095 |
| 60M | | 0.875%, 7/15/2017 | | | 60,253 |
| 15M | | 1.375%, 4/30/2020 | | | 14,837 |
| Total Value of U.S. Government Obligations (cost $170,074) | | | 170,277 |
| | | U.S. GOVERNMENT AGENCY | | | |
| | | OBLIGATIONS—4.8% | | | |
| 50M | | Fannie Mae, 1.125%, 7/20/2018 | | | 49,985 |
| 20M | | Federal Home Loan Bank, 0.875%, 5/24/2017 | | | 20,070 |
| 95M | | Freddie Mac, 1.75%, 5/30/2019 | | | 96,088 |
| Total Value of U.S. Government Agency Obligations (cost $165,371) | | 166,143 |
| Total Value of Investments (cost $3,333,394) | 96.4 | % | 3,324,617 |
| Other Assets, Less Liabilities | 3.6 | | 122,788 |
| Net Assets | | 100.0 | % | $3,447,405 |
| |
| (a) | Security exempt from registration under Rule 144A of the Securities Act of 1933 (see Note 5). |
| (b) | A portion or all of the security purchased on a when-issued or delayed delivery basis (see |
| Note 1G). |
Portfolio of Investments (continued)
LIMITED DURATION HIGH QUALITY BOND FUND
June 30, 2015
The Fund’s asset and liabilities are classified into the following three levels based on the inputs used to value the assets and liabilities:
Level 1 — Unadjusted quoted prices in active markets for identical securities that the Fund has the ability to access.
Level 2 — Observable inputs other than quoted prices included in Level 1 that are observable for the asset or liability, either directly or indirectly. These inputs may include quoted prices for the identical instrument on an inactive market, prices for similar instruments, interest rates, prepayment speeds, credit risk, yield curves, default rates and similar data.
Level 3 — Unobservable inputs for the asset or liability, to the extent relevant observable inputs are not available, representing the Fund’s own assumption about the assumptions a market participant would use in valuing the asset or liability, and would be based on the best information available.
The inputs methodology used for valuing securities are not necessarily an indication of the risk associated with investing in those securities.For example, U.S. Government securities are reflected as Level 2 because the inputs used to determine fair value may not always be quoted prices in an active market.
The following is a summary, by category of Level, of inputs used to value the Fund’s investments as of June 30, 2015:
| | | | | | | | | | | | |
| | | | Level 1 | | | Level 2 | | | Level 3 | | | Total |
| Corporate Bonds | | $ | — | | $ | 1,960,599 | | $ | — | | $ | 1,960,599 |
| Asset Backed Securities | | | — | | | 522,018 | | | — | | | 522,018 |
| Residential Mortgage Backed | | | | | | | | | | | | |
| Securities | | | — | | | 505,580 | | | — | | | 505,580 |
| U.S. Government Obligations | | | — | | | 170,277 | | | — | | | 170,277 |
| U.S. Government Agency | | | | | | | | | | | | |
| Obligations | | | — | | | 166,143 | | | — | | | 166,143 |
| Total Investments in Securities* | | $ | — | | $ | 3,324,617 | | $ | — | | $ | 3,324,617 |
* The Portfolio of Investments provides information on the industry categorization of corporate bonds and asset backed securities.
There were no transfers into or from Level 1 and Level 2 by the Fund for the period ended June 30, 2015. Transfers, if any, between Levels are recognized at the end of the reporting period.
| |
| 60 | See notes to financial statements |
Fund Expenses (unaudited)
OPPORTUNITY FUND
The examples below show the ongoing costs (in dollars) of investing in your Fund and will help you in comparing these costs with costs of other mutual funds. Please refer to page 4 for a detailed explanation of the information presented in these examples.
| | | |
| | Beginning | Ending | |
| | Account | Account | Expenses Paid |
| | Value | Value | During Period |
| | (1/1/15) | (6/30/15) | (1/1/15–6/30/15)* |
| Expense Examples | | | |
| Actual | $1,000.00 | $1,060.56 | $4.65 |
| Hypothetical | | | |
| (5% annual return before expenses) | $1,000.00 | $1,020.28 | $4.56 |
* Expenses are equal to the annualized expense ratio of .91%, multiplied by the average account value over the period, multiplied by 181/365 (to reflect the one-half year period).
Portfolio Composition
BY SECTOR
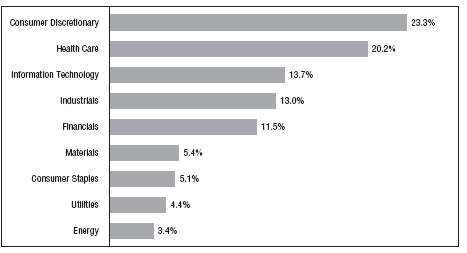
Portfolio holdings and allocations are subject to change. Percentages are as of June 30, 2015, and are based on the total value of investments.
Portfolio of Investments(continued)
OPPORTUNITY FUND
June 30, 2015
| | | | |
| |
| | | | | |
| | | | | |
| Shares | | Security | | Value |
| | | COMMON STOCKS—95.6% | | |
| | | Consumer Discretionary—22.3% | | |
| 18,500 | | American Eagle Outfitters, Inc. | | $ 318,570 |
| 6,400 | * | Belmond, Ltd. – Class “A” | | 79,936 |
| 100 | * | Bojangles’, Inc. | | 2,386 |
| 5,875 | | BorgWarner, Inc. | | 333,935 |
| 7,650 | | CST Brands, Inc. | | 298,809 |
| 8,700 | | Delphi Automotive, PLC | | 740,283 |
| 950 | * | El Pollo Loco Holdings, Inc. | | 19,675 |
| 5,000 | | Ethan Allen Interiors, Inc. | | 131,700 |
| 9,200 | | Finish Line, Inc. – Class “A’ | | 255,944 |
| 7,600 | | Foot Locker, Inc. | | 509,276 |
| 2,175 | | GNC Holdings, Inc. – Class “A” | | 96,744 |
| 8,600 | | Hanesbrands, Inc. | | 286,552 |
| 2,200 | | Harman International Industries, Inc. | | 261,668 |
| 2,000 | * | Helen of Troy, Ltd. | | 194,980 |
| 9,400 | * | Jarden Corporation | | 486,450 |
| 3,250 | | L Brands, Inc. | | 278,622 |
| 4,350 | | Lear Corporation | | 488,331 |
| 6,850 | | Newell Rubbermaid, Inc. | | 281,604 |
| 1,825 | | Nordstrom, Inc. | | 135,963 |
| 6,300 | | Penske Automotive Group, Inc. | | 328,293 |
| 900 | | Ralph Lauren Corporation | | 119,124 |
| 16,600 | | Ruth’s Hospitality Group, Inc. | | 267,592 |
| 9,600 | * | ServiceMaster Global Holdings, Inc. | | 347,232 |
| 9,600 | | Stein Mart, Inc. | | 100,512 |
| 14,400 | * | TRI Pointe Homes, Inc. | | 220,320 |
| 5,900 | | Tupperware Brands Corporation | | 380,786 |
| 2,200 | | Whirlpool Corporation | | 380,710 |
| 15,700 | * | William Lyon Homes – Class “A” | | 403,019 |
| 8,150 | | Winnebago Industries, Inc. | | 192,258 |
| 975 | | Wyndham Worldwide Corporation | | 79,862 |
| | | | | 8,021,136 |
| | | Consumer Staples—4.9% | | |
| 5,475 | | Avon Products, Inc. | | 34,273 |
| 3,800 | | Cal-Maine Foods, Inc. | | 198,360 |
| 3,600 | * | Coty, Inc. – Class “A” | | 115,092 |
| 9,200 | | Delhaize Group (ADR) | | 189,796 |
| 700 | | McCormick & Company, Inc. | | 56,665 |
| 8,700 | | Nu Skin Enterprises, Inc. – Class “A” | | 410,031 |
| | | | |
| |
| | | | | |
| | | | | |
| Shares | | Security | | Value |
| | | Consumer Staples (continued) | | |
| 8,000 | | Pinnacle Foods, Inc. | | $ 364,320 |
| 3,417 | | Tootsie Roll Industries, Inc. | | 110,403 |
| 6,800 | | Tyson Foods, Inc. | | 289,884 |
| | | | | 1,768,824 |
| | | Energy—3.3% | | |
| 1,025 | * | Dril-Quip, Inc. | | 77,131 |
| 3,075 | | Ensco, PLC – Class “A” | | 68,480 |
| 2,900 | | EOG Resources, Inc. | | 253,895 |
| 3,250 | | EQT Corporation | | 264,355 |
| 5,300 | * | Helix Energy Solutions Group, Inc. | | 66,939 |
| 3,100 | | Hess Corporation | | 207,328 |
| 5,100 | | National Oilwell Varco, Inc. | | 246,228 |
| | | | | 1,184,356 |
| | | Financials—11.0% | | |
| 2,175 | | Ameriprise Financial, Inc. | | 271,723 |
| 8,150 | | Berkshire Hills Bancorp, Inc. | | 232,112 |
| 11,450 | | Brixmor Property Group, Inc. (REIT) | | 264,838 |
| 3,200 | | Citizens Financial Group, Inc. | | 87,392 |
| 6,300 | | Discover Financial Services | | 363,006 |
| 5,475 | | Douglas Emmett, Inc. (REIT) | | 147,497 |
| 1,725 | | Federal Realty Investment Trust (REIT) | | 220,955 |
| 3,300 | | Financial Select Sector SPDR Fund (ETF) | | 80,454 |
| 4,200 | | First Republic Bank | | 264,726 |
| 3,000 | | iShares Core S&P Mid-Cap ETF (ETF) | | 449,940 |
| 4,250 | | iShares Russell 2000 ETF (ETF) | | 530,655 |
| 4,395 | | NASDAQ OMX Group, Inc. | | 214,520 |
| 5,500 | * | Realogy Holdings Corporation | | 256,960 |
| 3,400 | | SPDR S&P Regional Banking (ETF) | | 150,144 |
| 7,800 | | Sterling Bancorp | | 114,660 |
| 6,450 | | Waddell & Reed Financial, Inc. – Class “A” | | 305,150 |
| | | | | 3,954,732 |
| | | Health Care—19.2% | | |
| 3,850 | * | Allergan, PLC | | 1,168,321 |
| 2,950 | * | Centene Corporation | | 237,180 |
| 2,750 | | DENTSPLY International, Inc. | | 141,762 |
| 6,600 | | Gilead Sciences, Inc. | | 772,728 |
| 5,300 | | Hill-Rom Holdings, Inc. | | 287,949 |
Portfolio of Investments (continued)
OPPORTUNITY FUND
June 30, 2015
| | | | |
| |
| | | | | |
| | | | | |
| Shares | | Security | | Value |
| | | Health Care (continued) | | |
| 6,850 | * | Lannett Company, Inc. | | $ 407,164 |
| 2,875 | | McKesson Corporation | | 646,329 |
| 5,325 | | Omnicare, Inc. | | 501,881 |
| 3,450 | | Perrigo Company, PLC | | 637,664 |
| 9,200 | | Phibro Animal Health Corporation – Class “A” | | 358,248 |
| 15,800 | * | Prestige Brands Holdings, Inc. | | 730,592 |
| 4,625 | | Thermo Fisher Scientific, Inc. | | 600,140 |
| 15,700 | * | VWR Corporation | | 419,661 |
| | | | | 6,909,619 |
| | | Industrials—12.4% | | |
| 5,900 | | A.O. Smith Corporation | | 424,682 |
| 10,200 | | Advanced Drainage Systems, Inc. | | 299,166 |
| 8,450 | | Altra Industrial Motion Corporation | | 229,671 |
| 1,825 | | G&K Services, Inc. – Class “A” | | 126,181 |
| 4,950 | * | Generac Holdings, Inc. | | 196,763 |
| 7,900 | | Greenbrier Companies, Inc. | | 370,115 |
| 8,075 | | ITT Corporation | | 337,858 |
| 3,075 | | J.B. Hunt Transport Services, Inc. | | 252,427 |
| 3,100 | | Nielsen NV | | 138,787 |
| 5,350 | | Regal-Beloit Corporation | | 388,356 |
| 1,400 | | Roper Industries, Inc. | | 241,444 |
| 4,955 | | Ryder System, Inc. | | 432,918 |
| 2,800 | | Snap-On, Inc. | | 445,900 |
| 1,475 | * | TAL International Group, Inc. | | 46,610 |
| 2,175 | | Textainer Group Holdings, Ltd. | | 56,572 |
| 6,000 | | Textron, Inc. | | 267,780 |
| 1,600 | * | United Rentals, Inc. | | 140,192 |
| 2,500 | * | Univar, Inc. | | 65,075 |
| | | | | 4,460,497 |
| | | Information Technology—13.1% | | |
| 9,350 | * | ARRIS Group, Inc. | | 286,110 |
| 5,300 | | Avago Technologies, Ltd. | | 704,529 |
| 3,100 | | CDW Corporation | | 106,268 |
| 3,250 | * | Fiserv, Inc. | | 269,197 |
| 11,100 | | Juniper Networks, Inc. | | 288,267 |
| 1,100 | | Lam Research Corporation | | 89,485 |
| 14,800 | | Mentor Graphics Corporation | | 391,164 |
| 9,400 | | Methode Electronics, Inc. | | 258,030 |
| 10,500 | * | PTC, Inc. | | 430,710 |
| 5,900 | * | Qorvo, Inc. | | 473,593 |
| | | | | |
| |
| | | | | | |
| | | | | | |
| Shares | | Security | | | Value |
| | | Information Technology (continued) | | | |
| 10,200 | | Symantec Corporation | | | $ 237,150 |
| 5,250 | * | Synaptics, Inc. | | | 455,359 |
| 4,400 | | TE Connectivity, Ltd. | | | 282,920 |
| 10,200 | | Technology Select Sector SPDR Fund (ETF) | | | 422,280 |
| | | | | | 4,695,062 |
| | | Materials—5.1% | | | |
| 5,600 | | Cytec Industries, Inc. | | | 338,968 |
| 5,900 | | International Paper Company | | | 280,781 |
| 9,000 | | MeadWestvaco Corporation | | | 424,710 |
| 1,400 | | Praxair, Inc. | | | 167,370 |
| 1,975 | | Sigma-Aldrich Corporation | | | 275,216 |
| 13,300 | * | Trinseo SA | | | 356,972 |
| | | | | | 1,844,017 |
| | | Utilities—4.3% | | | |
| 5,700 | | AGL Resources, Inc. | | | 265,392 |
| 12,900 | * | Dynegy, Inc. | | | 377,325 |
| 2,625 | | NiSource, Inc. | | | 119,674 |
| 5,325 | | Portland General Electric Company | | | 176,577 |
| 4,925 | | SCANA Corporation | | | 249,451 |
| 7,400 | | WEC Energy Group, Inc. | | | 332,778 |
| | | | | | 1,521,197 |
| Total Value of Common Stocks (cost $30,022,892) | 95.6 | % | 34,359,440 |
| Other Assets, Less Liabilities | 4.4 | | 1,571,017 |
| Net Assets | | | 100.0 | % | $ 35,930,457 |
| |
| * Non-income producing |
| |
| Summary of Abbreviations: |
| ADR | American Depositary Receipts |
| ETF | Exchange Traded Fund |
| REIT | Real Estate Investment Trust |
Portfolio of Investments (continued)
OPPORTUNITY FUND
June 30, 2015
The Fund’s asset and liabilities are classified into the following three levels based on the inputs used to value the assets and liabilities:
Level 1 — Unadjusted quoted prices in active markets for identical securities that the Fund has the ability to access.
Level 2 — Observable inputs other than quoted prices included in Level 1 that are observable for the asset or liability, either directly or indirectly. These inputs may include quoted prices for the identical instrument on an inactive market, prices for similar instruments, interest rates, prepayment speeds, credit risk, yield curves, default rates and similar data.
Level 3 — Unobservable inputs for the asset or liability, to the extent relevant observable inputs are not available, representing the Fund’s own assumption about the assumptions a market participant would use in valuing the asset or liability, and would be based on the best information available.
The inputs methodology used for valuing securities are not necessarily an indication of the risk associated with investing in those securities. For example, U.S. Government securities are reflected as Level 2 because the inputs used to determine fair value may not always be quoted prices in an active market.
The following is a summary, by category of Level, of inputs used to value the Fund’s investments as of June 30, 2015:
| | | | | | | | | | | | |
| | | | Level 1 | | | Level 2 | | | Level 3 | | | Total |
| Common Stocks* | | $ | 34,359,440 | | $ | — | | $ | — | | $ | 34,359,440 |
* The Portfolio of Investments provides information on the industry categorization for common stocks.
There were no transfers into or from Level 1 and Level 2 by the Fund for the period ended June 30, 2015. Transfers, if any, between Levels are recognized at the end of the reporting period.
| |
| 66 | See notes to financial statements |
Fund Expenses (unaudited)
REAL ESTATE FUND
The examples below show the ongoing costs (in dollars) of investing in your Fund and will help you in comparing these costs with costs of other mutual funds. Please refer to page 4 for a detailed explanation of the information presented in these examples.
| | | |
| | Beginning | Ending | |
| | Account | Account | Expenses Paid |
| | Value | Value | During Period |
| | (5/1/15)* | (6/30/15) | (5/1/15–6/30/15)** |
| Expense Examples | | | |
| Actual | $1,000.00 | $939.00 | $4.07 |
| Hypothetical | | | |
| (5% annual return before expenses) | $1,000.00 | $1,004.17 | $4.20 |
* Commencement of operations.
** Actual expenses reflect only from the commencement of operations to the end of the period covered (May 1, 2015 through June 30, 2015). Therefore expenses shown are lower than would be expected for a six month period. Actual expenses for the six-month period will be reflected in future reports. Expenses are equal to the annualized expense ratio of 2.51%, multiplied by the average account value over the period, multiplied by 61/365 (to reflect the inception period), Expenses paid during the period are net of expenses waived and/or assumed.
Portfolio Composition
TOP TEN SECTORS
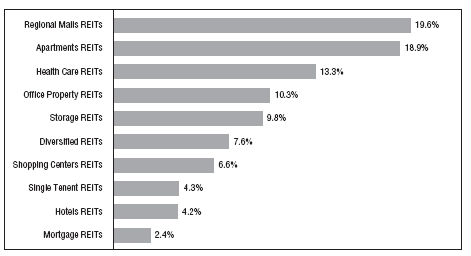
Portfolio holdings and allocations are subject to change. Percentages are as of June 30, 2015, and are based on the total value of investments.
Portfolio of Investments
REAL ESTATE FUND
June 30, 2015
| | | | |
| |
| | | | | |
| | | | | |
| Shares | | Security | | Value |
| | | COMMON STOCKS—92.9% | | |
| | | Apartments REITs—17.6% | | |
| 480 | | American Campus Communities, Inc. | | $ 18,091 |
| 944 | | Apartment Investment & Management Company – Class “A” | | 34,862 |
| 970 | | AvalonBay Communities, Inc. | | 155,074 |
| 357 | | Camden Property Trust | | 26,518 |
| 90 | | Education Realty Trust, Inc. | | 2,822 |
| 2,459 | | Equity Residential | | 172,548 |
| 133 | | Essex Property Trust, Inc. | | 28,263 |
| 947 | | Home Properties, Inc. | | 69,178 |
| 39 | | Mid-America Apartment Communities, Inc. | | 2,840 |
| 1,316 | | Post Properties, Inc. | | 71,551 |
| 91 | | UDR, Inc. | | 2,915 |
| | | | | 584,662 |
| | | Diversified REITs—7.0% | | |
| 860 | | CorEnergy Infrastructure Trust, Inc. | | 5,435 |
| 120 | | CoreSite Realty Corporation | | 5,453 |
| 2,231 | | Corrections Corporation of America | | 73,801 |
| 280 | | Digital Realty Trust, Inc. | | 18,670 |
| 1,000 | | Duke Realty Corporation | | 18,570 |
| 283 | | DuPont Fabros Technology, Inc. | | 8,334 |
| 1,540 | | Retail Properties of America, Inc. – Class “A” | | 21,452 |
| 840 | | Vornado Realty Trust | | 79,741 |
| 200 | | Whitestone REIT | | 2,604 |
| | | | | 234,060 |
| | | Health Care REITs—12.4% | | |
| 4,200 | | HCP, Inc. | | 153,174 |
| 1,420 | | Health Care REIT, Inc. | | 93,195 |
| 450 | | Healthcare Trust of America, Inc. | | 10,778 |
| 130 | | LTC Properties, Inc. | | 5,408 |
| 480 | | Omega Heathcare Investors, Inc. | | 16,478 |
| 2,160 | | Ventas, Inc. | | 134,114 |
| | | | | 413,147 |
| | | | |
| |
| | | | | |
| | | | | |
| Shares | | Security | | Value |
| | | Hotels REITs—3.9% | | |
| 1,165 | | Hospitality Properties Trust | | $ 33,575 |
| 4,571 | | Host Hotels & Resorts, Inc. | | 90,643 |
| 370 | | Sunstone Hotel Investors, Inc. | | 5,554 |
| | | | | 129,772 |
| | | Manufactured Homes REITs—.8% | | |
| 163 | | Equity LifeStyle Properties, Inc. | | 8,571 |
| 310 | | Sun Communities, Inc. | | 19,167 |
| | | | | 27,738 |
| | | Mortgage REITs—2.2% | | |
| 4,070 | | American Capital Agency Corporation | | 74,766 |
| | | Office Property REITs—9.6% | | |
| 440 | | Alexandria Real Estate Equities, Inc. | | 38,482 |
| 710 | | BioMed Realty Trust, Inc. | | 13,731 |
| 962 | | Boston Properties, Inc. | | 116,441 |
| 400 | | Brandywine Realty Trust | | 5,312 |
| 1,260 | | Corporate Office Properties Trust | | 29,660 |
| 520 | | Douglas Emmett, Inc. | | 14,009 |
| 1,730 | * | Equity Commonwealth | | 44,409 |
| 375 | | Franklin Street Properties Corporation | | 4,241 |
| 590 | | Mack-Cali Realty Corporation | | 10,874 |
| 900 | | New York REIT, Inc. | | 8,955 |
| 1,125 | | Paramount Group, Inc. | | 19,305 |
| 335 | | Piedmont Office Realty Trust, Inc. – Class “A” | | 5,893 |
| 76 | | SL Green Realty Corporation | | 8,352 |
| | | | | 319,664 |
| | | Regional Malls REITs—18.2% | | |
| 1,830 | | CBL & Associates Properties, Inc. | | 29,646 |
| 2,238 | | General Growth Properties, Inc. | | 57,427 |
| 510 | | Macerich Company | | 38,046 |
| 393 | | Pennsylvania Real Estate Investment Trust | | 8,387 |
| 1,910 | | Simon Property Group, Inc. | | 330,468 |
| 1,390 | | Tanger Factory Outlet Centers, Inc. | | 44,063 |
| 1,406 | | Taubman Centers, Inc. | | 97,717 |
| | | | | 605,754 |
Portfolio of Investments (continued)
REAL ESTATE FUND
June 30, 2015
| | | | | |
| |
| | | | | | |
| | | | | | |
| Shares | | Security | | | Value |
| | | Shopping Centers REITs—6.1% | | | |
| 140 | | Acadia Realty Trust | | | $ 4,075 |
| 420 | | Cedar Realty Trust, Inc. | | | 2,688 |
| 1,290 | | DDR Corporation | | | 19,943 |
| 990 | | Equity One, Inc. | | | 23,107 |
| 260 | | Federal Realty Investment Trust | | | 33,303 |
| 2,545 | | Kimco Realty Corporation | | | 57,364 |
| 440 | | Kite Realty Group Trust | | | 10,767 |
| 230 | | Ramco-Gershenson Properties Trust | | | 3,754 |
| 370 | | Regency Centers Corporation | | | 21,823 |
| 390 | | Weingarten Realty Investors | | | 12,749 |
| 1,020 | | WP Glimcher, Inc. | | | 13,801 |
| | | | | | 203,374 |
| | | Single Tenant REITs—4.0% | | | |
| 394 | | National Retail Properties, Inc. | | | 13,794 |
| 660 | | Realty Income Corporation | | | 29,297 |
| 3,900 | | Select Income REIT | | | 80,496 |
| 900 | | Spirit Realty Capital, Inc. | | | 8,703 |
| | | | | | 132,290 |
| | | Storage REITs—9.1% | | | |
| 835 | | CubeSmart | | | 19,339 |
| 90 | | Extra Space Storage, Inc. | | | 5,870 |
| 2,265 | | Iron Mountain, Inc. | | | 70,215 |
| 1,085 | | Public Storage | | | 200,041 |
| 100 | | Sovran Self Storage, Inc. | | | 8,691 |
| | | | | | 304,156 |
| | | Warehouse/Industrial REITs—2.0% | | | |
| 140 | | DCT Industrial Trust, Inc. | | | 4,402 |
| 220 | | EastGroup Properties, Inc. | | | 12,371 |
| 445 | | First Industrial Realty Trust, Inc. | | | 8,335 |
| 1,110 | | Prologis, Inc. | | | 41,181 |
| | | | | | 66,289 |
| Total Value of Common Stocks (cost $3,303,548) | 92.9 | % | 3,095,672 |
| Other Assets, Less Liabilities | 7.1 | | 235,568 |
| Net Assets | | | 100.0 | % | $3,331,240 |
|
| * Non-income producing |
| |
| Summary of Abbreviations: |
| REITs Real Estate Investment Trusts |
The Fund’s asset and liabilities are classified into the following three levels based on the inputs used to value the assets and liabilities:
Level 1 — Unadjusted quoted prices in active markets for identical securities that the Fund has the ability to access.
Level 2 — Observable inputs other than quoted prices included in Level 1 that are observable for the asset or liability, either directly or indirectly. These inputs may include quoted prices for the identical instrument on an inactive market, prices for similar instruments, interest rates, prepayment speeds, credit risk, yield curves, default rates and similar data.
Level 3 — Unobservable inputs for the asset or liability, to the extent relevant observable inputs are not available, representing the Fund’s own assumption about the assumptions a market participant would use in valuing the asset or liability, and would be based on the best information available.
The inputs methodology used for valuing securities are not necessarily an indication of the risk associated with investing in those securities. For example, U.S. Government securities are reflected as Level 2 because the inputs used to determine fair value may not always be quoted prices in an active market.
The following is a summary, by category of Level, of inputs used to value the Fund’s investments as of June 30, 2015:
| | | | | | | | | | | | |
| | | | Level 1 | | | Level 2 | | | Level 3 | | | Total |
| Common Stocks* | | $ | 3,095,672 | | $ | — | | $ | — | | $ | 3,095,672 |
* The Portfolio of Investments provides information on the industry categorization for common stocks.
There were no transfers into or from Level 1 and Level 2 by the Fund for the period ended June 30, 2015. Transfers, if any, between Levels are recognized at the end of the reporting period.
| |
| See notes to financial statements | 71 |
Fund Expenses (unaudited)
SELECT GROWTH FUND
The examples below show the ongoing costs (in dollars) of investing in your Fund and will help you in comparing these costs with costs of other mutual funds. Please refer to page 4 for a detailed explanation of the information presented in these examples.
| | | |
| | Beginning | Ending | |
| | Account | Account | Expenses Paid |
| | Value | Value | During Period |
| | (1/1/15) | (6/30/15) | (1/1/15–6/30/15)* |
| Expense Examples | | | |
| Actual | $1,000.00 | $1,049.07 | $4.22 |
| Hypothetical | | | |
| (5% annual return before expenses) | $1,000.00 | $1,020.67 | $4.16 |
* Expenses are equal to the annualized expense ratio of .83%, multiplied by the average account value over the period, multiplied by 181/365 (to reflect the one-half year period).
Portfolio Composition
BY SECTOR
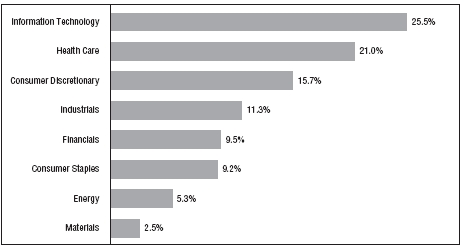
Portfolio holdings and allocations are subject to change. Percentages are as of June 30, 2015, and are based on the total value of investments.
Portfolio of Investments
SELECT GROWTH FUND
June 30, 2015
| | | | |
| |
| | | | | |
| | | | | |
| Shares | | Security | | Value |
| | | COMMON STOCKS—96.6% | | |
| | | Consumer Discretionary—15.2% | | |
| 27,000 | | Coach, Inc. | | $ 934,470 |
| 65,460 | | Gentex Corporation | | 1,074,853 |
| 14,725 | | Home Depot, Inc. | | 1,636,389 |
| 14,800 | | Kohl’s Corporation | | 926,628 |
| 28,040 | | Starbucks Corporation | | 1,503,365 |
| 13,100 | | Wyndham Worldwide Corporation | | 1,073,021 |
| | | | | 7,148,726 |
| | | Consumer Staples—8.9% | | |
| 10,200 | | Clorox Company | | 1,061,004 |
| 10,540 | | Kimberly-Clark Corporation | | 1,116,924 |
| 27,800 | | Kroger Company | | 2,015,778 |
| | | | | 4,193,706 |
| | | Energy—5.1% | | |
| 4,760 | | Chevron Corporation | | 459,197 |
| 5,080 | | ExxonMobil Corporation | | 422,656 |
| 7,820 | | Helmerich & Payne, Inc. | | 550,685 |
| 21,100 | | SM Energy Company | | 973,132 |
| | | | | 2,405,670 |
| | | Financials—9.2% | | |
| 12,400 | | Comerica, Inc. | | 636,368 |
| 13,790 | | Discover Financial Services | | 794,580 |
| 4,700 | | IntercontinentalExchange, Inc. | | 1,050,967 |
| 5,900 | | Travelers Companies, Inc. | | 570,294 |
| 27,400 | | Voya Financial, Inc. | | 1,273,278 |
| | | | | 4,325,487 |
| | | Health Care—20.3% | | |
| 7,220 | * | Allergan, PLC | | 2,190,981 |
| 4,900 | | C.R. Bard, Inc. | | 836,430 |
| 13,300 | | Gilead Sciences, Inc. | | 1,557,164 |
| 35,400 | * | Hologic, Inc. | | 1,347,324 |
| 6,190 | | Johnson & Johnson | | 603,278 |
| 7,520 | | McKesson Corporation | | 1,690,571 |
| 18,200 | * | Quintiles Transnational Holdings, Inc. | | 1,321,502 |
| | | | | 9,547,250 |
Portfolio of Investments (continued)
SELECT GROWTH FUND
June 30, 2015
| | | | | |
| |
| | | | | | |
| | | | | | |
| Shares | | Security | | | Value |
| | | Industrials—10.9% | | | |
| 23,160 | | Alaska Air Group, Inc. | | | $ 1,492,199 |
| 9,640 | | Boeing Company | | | 1,337,261 |
| 13,400 | | Cintas Corporation | | | 1,133,506 |
| 8,400 | | General Dynamics Corporation | | | 1,190,196 |
| | | | | | 5,153,162 |
| | | Information Technology—24.6% | | | |
| 15,700 | | Amdocs, Ltd. | | | 857,063 |
| 9,300 | * | ANSYS, Inc. | | | 848,532 |
| 21,050 | | Apple, Inc. | | | 2,640,196 |
| 36,000 | * | Aspen Technology, Inc. | | | 1,639,800 |
| 39,500 | | Cisco Systems, Inc. | | | 1,084,670 |
| 10,300 | | DST Systems, Inc. | | | 1,297,594 |
| 8,400 | * | F5 Networks, Inc. | | | 1,010,940 |
| 8,900 | | FactSet Research Systems, Inc. | | | 1,446,339 |
| 25,910 | | Hewlett-Packard Company | | | 777,559 |
| | | | | | 11,602,693 |
| | | Materials—2.4% | | | |
| 11,000 | | LyondellBasell Industries NV – Class “A” | | | 1,138,720 |
| Total Value of Common Stocks (cost $33,979,612) | 96.6 | % | 45,515,414 |
| Other Assets, Less Liabilities | 3.4 | | 1,616,534 |
| Net Assets | | | 100.0 | % | $47,131,948 |
* Non-income producing
The Fund’s asset and liabilities are classified into the following three levels based on the inputs used to value the assets and liabilities:
Level 1 — Unadjusted quoted prices in active markets for identical securities that the Fund has the ability to access.
Level 2 — Observable inputs other than quoted prices included in Level 1 that are observable for the asset or liability, either directly or indirectly. These inputs may include quoted prices for the identical instrument on an inactive market, prices for similar instruments, interest rates, prepayment speeds, credit risk, yield curves, default rates and similar data.
Level 3 — Unobservable inputs for the asset or liability, to the extent relevant observable inputs are not available, representing the Fund’s own assumption about the assumptions a market participant would use in valuing the asset or liability, and would be based on the best information available.
The inputs methodology used for valuing securities are not necessarily an indication of the risk associated with investing in those securities. For example, U.S. Government securities are reflected as Level 2 because the inputs used to determine fair value may not always be quoted prices in an active market.
The following is a summary, by category of Level, of inputs used to value the Fund’s investments as of June 30, 2015:
| | | | | | | | | | | | |
| | | | Level 1 | | | Level 2 | | | Level 3 | | | Total |
| Common Stocks* | | $ | 45,515,414 | | $ | — | | $ | — | | $ | 45,515,414 |
* The Portfolio of Investments provides information on the industry categorization for common stocks.
There were no transfers into or from Level 1 and Level 2 by the Fund for the period ended June 30, 2015. Transfers, if any, between Levels are recognized at the end of the reporting period.
| |
| See notes to financial statements | 75 |
Fund Expenses (unaudited)
SPECIAL SITUATIONS FUND
The examples below show the ongoing costs (in dollars) of investing in your Fund and will help you in comparing these costs with costs of other mutual funds. Please refer to page 4 for a detailed explanation of the information presented in these examples.
| | | |
| | Beginning | Ending | |
| | Account | Account | Expenses Paid |
| | Value | Value | During Period |
| | (1/1/15) | (6/30/15) | (1/1/15–6/30/15)* |
| Expense Examples | | | |
| Actual | $1,000.00 | $1,081.67 | $4.18 |
| Hypothetical | | | |
| (5% annual return before expenses) | $1,000.00 | $1,020.77 | $4.06 |
* Expenses are equal to the annualized expense ratio of .81%, multiplied by the average account value over the period, multiplied by 181/365 (to reflect the one-half year period).
Portfolio Composition
BY SECTOR
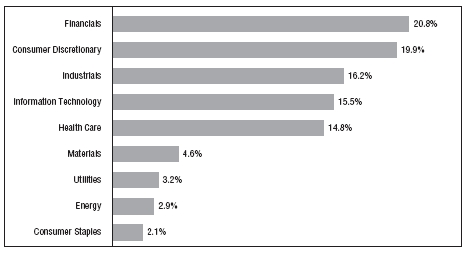
Portfolio holdings and allocations are subject to change. Percentages are as of June 30, 2015, and are based on the total value of investments.
Portfolio of Investments
SPECIAL SITUATIONS FUND
June 30, 2015
| | | | |
| |
| | | | | |
| | | | | |
| Shares | | Security | | Value |
| | | COMMON STOCKS—98.8% | | |
| | | Consumer Discretionary—19.6% | | |
| 60,000 | * | 1-800-FLOWERS.COM, Inc. – Class “A” | | $ 627,600 |
| 112,500 | | American Eagle Outfitters, Inc. | | 1,937,250 |
| 74,650 | * | Belmond, Ltd. – Class “A” | | 932,379 |
| 70,000 | * | Century Communities, Inc. | | 1,409,100 |
| 70,000 | | CST Brands, Inc. | | 2,734,200 |
| 25,000 | | Ethan Allen Interiors, Inc. | | 658,500 |
| 56,100 | | Finish Line, Inc. – Class “A” | | 1,560,702 |
| 111,050 | * | Fox Factory Holding Corporation | | 1,785,684 |
| 71,700 | | Hanesbrands, Inc. | | 2,389,044 |
| 15,500 | | Harman International Industries, Inc. | | 1,843,570 |
| 64,875 | * | Jarden Corporation | | 3,357,281 |
| 48,000 | * | Live Nation Entertainment, Inc. | | 1,319,520 |
| 25,250 | | Oxford Industries, Inc. | | 2,208,112 |
| 39,875 | | Penske Automotive Group, Inc. | | 2,077,886 |
| 44,400 | * | Performance Sports Group, Ltd. | | 799,200 |
| 102,250 | | Regal Entertainment Group – Class “A” | | 2,138,048 |
| 130,000 | | Ruth’s Hospitality Group, Inc. | | 2,095,600 |
| 73,250 | * | ServiceMaster Global Holdings, Inc. | | 2,649,452 |
| 29,250 | * | Starz – Class “A” | | 1,308,060 |
| 90,000 | * | TRI Pointe Homes, Inc. | | 1,377,000 |
| 32,000 | | Tupperware Brands Corporation | | 2,065,280 |
| 29,250 | * | Visteon Corporation | | 3,070,665 |
| 74,000 | * | William Lyon Homes – Class “A” | | 1,899,580 |
| 55,000 | | Winnebago Industries, Inc. | | 1,297,450 |
| | | | | 43,541,163 |
| | | Consumer Staples—2.0% | | |
| 19,800 | | Cal-Maine Foods, Inc. | | 1,033,560 |
| 6,975 | | Nu Skin Enterprises, Inc. – Class “A” | | 328,732 |
| 45,550 | | Pinnacle Foods, Inc. | | 2,074,347 |
| 33,000 | | Tootsie Roll Industries, Inc. | | 1,066,230 |
| | | | | 4,502,869 |
| | | Energy—2.9% | | |
| 11,900 | * | Black Stone Minerals, LP | | 204,918 |
| 14,750 | * | Dril-Quip, Inc. | | 1,109,936 |
| 50,000 | * | Helix Energy Solutions Group, Inc. | | 631,500 |
Portfolio of Investments (continued)
SPECIAL SITUATIONS FUND
June 30, 2015
| | | | |
| |
| | | | |
| | | | |
| Shares | | Security | | Value |
| | | Energy (continued) | | |
| 24,500 | | iShares U.S. Energy ETF (ETF) | | $ 1,038,310 |
| 57,375 | | Western Refining, Inc. | | 2,502,698 |
| 26,000 | * | Whiting Petroleum Corporation | | 873,600 |
| | | | | 6,360,962 |
| | | Financials—20.5% | | |
| 60,275 | | American Financial Group, Inc. | | 3,920,286 |
| 36,925 | | Aspen Insurance Holdings, Ltd. | | 1,768,707 |
| 41,200 | * | Atlas Financial Holdings, Inc. | | 816,996 |
| 80,000 | | Berkshire Hills Bancorp, Inc. | | 2,278,400 |
| 84,700 | | Brixmor Property Group, Inc. (REIT) | | 1,959,111 |
| 44,200 | | Brown & Brown, Inc. | | 1,452,412 |
| 67,050 | | Douglas Emmett, Inc. (REIT) | | 1,806,327 |
| 45,500 | * | FCB Financial Holdings, Inc. – Class “A” | | 1,446,900 |
| 17,625 | | Federal Realty Investment Trust (REIT) | | 2,257,586 |
| 60,000 | | FelCor Lodging Trust, Inc. | | 592,800 |
| 162,000 | | Financial Select Sector SPDR Fund (ETF) | | 3,949,560 |
| 58,000 | * | Green Bancorp, Inc. | | 890,880 |
| 26,000 | | iShares Russell 2000 ETF (ETF) | | 3,246,360 |
| 27,500 | | Montpelier Re Holdings, Ltd. | | 1,086,250 |
| 67,350 | | OceanFirst Financial Corporation | | 1,256,078 |
| 21,900 | | Prosperity Bancshares, Inc. | | 1,264,506 |
| 27,500 | | Simmons First National Corporation – Class “A” | | 1,283,700 |
| 96,000 | | SPDR S&P Regional Banking (ETF) | | 4,239,360 |
| 173,175 | | Sterling Bancorp | | 2,545,673 |
| 165,000 | * | Strategic Hotels & Resorts, Inc. (REIT) | | 1,999,800 |
| 61,300 | | Sunstone Hotel Investors, Inc. (REIT) | | 920,113 |
| 80,000 | | TCF Financial Corporation | | 1,328,800 |
| 54,000 | | Urstadt Biddle Properties, Inc. – Class “A” (REIT) | | 1,008,720 |
| 24,400 | | Waddell & Reed Financial, Inc. – Class “A” | | 1,154,364 |
| 76,000 | | WP Glimcher, Inc. (REIT) | | 1,028,280 |
| | | | | 45,501,969 |
| | | Health Care—14.7% | | |
| 29,250 | * | ANI Pharmaceuticals, Inc. | | 1,814,962 |
| 54,250 | * | Centene Corporation | | 4,361,700 |
| 106,000 | * | DepoMed, Inc. | | 2,274,760 |
| 63,275 | * | Exactech, Inc. | | 1,318,018 |
| 34,000 | | Hill-Rom Holdings, Inc. | | 1,847,220 |
| 117,750 | * | Horizon Pharma, PLC | | 4,090,635 |
| 26,000 | * | ICON, PLC | | 1,749,800 |
| | | | |
| |
| | | | | |
| | | | | |
| Shares | | Security | | Value |
| | | Health Care (continued) | | |
| 39,750 | * | Lannett Company, Inc. | | $ 2,362,740 |
| 47,475 | | Omnicare, Inc. | | 4,474,519 |
| 43,000 | | PerkinElmer, Inc. | | 2,263,520 |
| 63,200 | | Phibro Animal Health Corporation – Class “A” | | 2,461,008 |
| 32,500 | * | Surgical Care Affilates, Inc. | | 1,247,350 |
| 300 | * | Teladoc, Inc. | | 5,700 |
| 81,700 | * | VWR Corporation | | 2,183,841 |
| | | | | 32,455,773 |
| | | Industrials—16.1% | | |
| 42,800 | | A.O. Smith Corporation | | 3,080,744 |
| 62,500 | | Advanced Drainage Systems, Inc. | | 1,833,125 |
| 51,500 | | Altra Industrial Motion Corporation | | 1,399,770 |
| 15,200 | | G&K Services, Inc. – Class “A” | | 1,050,928 |
| 37,300 | * | Generac Holdings, Inc. | | 1,482,675 |
| 40,500 | | Greenbrier Companies, Inc. | | 1,897,425 |
| 20,000 | | Industrial Select Sector SPDR Fund (ETF) | | 1,081,200 |
| 65,000 | | ITT Corporation | | 2,719,600 |
| 73,425 | | Kforce, Inc. | | 1,679,230 |
| 140,975 | * | NCI Building Systems, Inc. | | 2,124,493 |
| 25,000 | | Orbital ATK, Inc. | | 1,834,000 |
| 36,000 | * | Patrick Industries, Inc. | | 1,369,800 |
| 3,500 | | Precision Castparts Corporation | | 699,545 |
| 33,950 | | Regal-Beloit Corporation | | 2,464,431 |
| 48,500 | | Ryder System, Inc. | | 4,237,445 |
| 20,050 | | Snap-On, Inc. | | 3,192,963 |
| 14,750 | | Standex International Corporation | | 1,178,968 |
| 9,400 | * | United Rentals, Inc. | | 823,628 |
| 55,000 | * | Univar, Inc. | | 1,431,650 |
| | | | | 35,581,620 |
| | | Information Technology—15.3% | | |
| 42,125 | * | Advanced Energy Industries, Inc. | | 1,158,016 |
| 64,500 | * | ARRIS Group, Inc. | | 1,973,700 |
| 29,925 | | Avnet, Inc. | | 1,230,217 |
| 61,000 | | CDW Corporation | | 2,091,080 |
| 61,625 | * | CommScope Holding Company, Inc. | | 1,880,179 |
| 16,750 | | IAC/InterActiveCorp | | 1,334,305 |
| 11,000 | | iShares U.S. Technology ETF (ETF) | | 1,151,370 |
| 78,000 | * | JDS Uniphase Corporation | | 903,240 |
| 102,225 | | Mentor Graphics Corporation | | 2,701,807 |
Portfolio of Investments (continued)
SPECIAL SITUATIONS FUND
June 30, 2015
| | | | | |
| |
| | | | | | |
| | | | | | |
| Shares | | Security | | | Value |
| | | Information Technology (continued) | | | |
| 71,475 | | Methode Electronics, Inc. | | | $ 1,961,989 |
| 53,025 | * | Microsemi Corporation | | | 1,853,224 |
| 33,000 | | MKS Instruments, Inc. | | | 1,252,020 |
| 62,500 | * | Newport Corporation | | | 1,185,000 |
| 93,000 | * | Orbotech, Ltd. | | | 1,934,400 |
| 32,000 | * | OSI Systems, Inc. | | | 2,265,280 |
| 67,000 | * | PTC, Inc. | | | 2,748,340 |
| 88,200 | * | QLogic Corporation | | | 1,251,558 |
| 15,000 | * | Qorvo, Inc. | | | 1,204,050 |
| 25,100 | * | Synaptics, Inc. | | | 2,177,048 |
| 28,500 | * | Verint Systems, Inc. | | | 1,731,232 |
| | | | | | 33,988,055 |
| | | Materials—4.5% | | | |
| 39,700 | | AptarGroup, Inc. | | | 2,531,669 |
| 130,000 | * | Ferro Corporation | | | 2,181,400 |
| 20,000 | | Huntsman Corporation | | | 441,400 |
| 22,500 | | MeadWestvaco Corporation | | | 1,061,775 |
| 16,000 | | Olin Corporation | | | 431,200 |
| 20,200 | | Sensient Technologies Corporation | | | 1,380,468 |
| 73,700 | * | Trinseo SA | | | 1,978,108 |
| | | | | | 10,006,020 |
| | | Utilities—3.2% | | | |
| 25,000 | | AGL Resources, Inc. | | | 1,164,000 |
| 70,000 | * | Dynegy, Inc. | | | 2,047,500 |
| 40,100 | | Portland General Electric Company | | | 1,329,716 |
| 25,000 | | SCANA Corporation | | | 1,266,250 |
| 29,000 | | WEC Energy Group, Inc. | | | 1,304,130 |
| | | | | | 7,111,596 |
| Total Value of Common Stocks (cost $172,680,381) | 98.8 | % | 219,050,027 |
| Other Assets, Less Liabilities | 1.2 | | 2,555,296 |
| Net Assets | | | 100.0 | % | $221,605,323 |
| |
| * Non-income producing |
| |
| Summary of Abbreviations: |
| ETF | Exchange Traded Fund |
| REIT | Real Estate Investment Trust |
The Fund’s asset and liabilities are classified into the following three levels based on the inputs used to value the assets and liabilities:
Level 1 — Unadjusted quoted prices in active markets for identical securities that the Fund has the ability to access.
Level 2 — Observable inputs other than quoted prices included in Level 1 that are observable for the asset or liability, either directly or indirectly. These inputs may include quoted prices for the identical instrument on an inactive market, prices for similar instruments, interest rates, prepayment speeds, credit risk, yield curves, default rates and similar data.
Level 3 — Unobservable inputs for the asset or liability, to the extent relevant observable inputs are not available, representing the Fund’s own assumption about the assumptions a market participant would use in valuing the asset or liability, and would be based on the best information available.
The inputs methodology used for valuing securities are not necessarily an indication of the risk associated with investing in those securities. For example, U.S. Government securities are reflected as Level 2 because the inputs used to determine fair value may not always be quoted prices in an active market.
The following is a summary, by category of Level, of inputs used to value the Fund’s investments as of June 30, 2015:
| | | | | | | | | | | | |
| | | | Level 1 | | | Level 2 | | | Level 3 | | | Total |
| Common Stocks* | | $ | 219,050,027 | | $ | — | | $ | — | | $ | 219,050,027 |
* The Portfolio of Investments provides information on the industry categorization for common stocks.
There were no transfers into or from Level 1 and Level 2 by the Fund for the period ended June 30, 2015. Transfers, if any, between Levels are recognized at the end of the reporting period.
| |
| See notes to financial statements | 81 |
Fund Expenses (unaudited)
TARGET MATURITY 2015 FUND
The examples below show the ongoing costs (in dollars) of investing in your Fund and will help you in comparing these costs with costs of other mutual funds. Please refer to page 4 for a detailed explanation of the information presented in these examples.
| | | |
| | Beginning | Ending | |
| | Account | Account | Expenses Paid |
| | Value | Value | During Period |
| | (1/1/15) | (6/30/15) | (1/1/15–6/30/15)* |
| Expense Examples | | | |
| Actual | $1,000.00 | $998.18 | $3.72 |
| Hypothetical | | | |
| (5% annual return before expenses) | $1,000.00 | $1,021.07 | $3.76 |
* Expenses are equal to the annualized expense ratio of .75%, multiplied by the average account value over the period, multiplied by 181/365 (to reflect the one-half year period). Expenses paid during the period are net of expenses waived.
Portfolio Composition
BY SECTOR
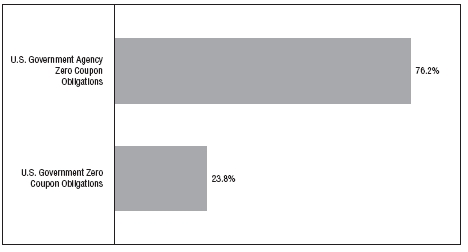
Portfolio holdings and allocations are subject to change. Percentages are as of June 30, 2015, and are based on the total value of investments.
Portfolio of Investments
TARGET MATURITY 2015 FUND
June 30, 2015
| | | | | | | |
| |
| | | | | | | | |
| | | | | | | | |
| Principal | | | | | Effective | | |
| Amount | | Security | | | Yield† | | Value |
| | | U.S. GOVERNMENT AGENCY ZERO COUPON | | | | |
| | | OBLIGATIONS—76.2% | | | | | |
| | | Agency For International Development – Israel: | | | | |
| $ 698M | | 9/15/2015 | | | 0.22 | % | $ 697,677 |
| 2,134M | | 11/15/2015 | | | 0.29 | | 2,131,650 |
| | | Fannie Mae: | | | | | |
| 243M | | 8/12/2015 | | | 0.18 | | 242,948 |
| 600M | | 9/23/2015 | | | (0.01 | ) | 600,019 |
| 2,208M | | 11/15/2015 | | | 0.29 | | 2,205,609 |
| | | Freddie Mac: | | | | | |
| 930M | | 9/15/2015 | | | 0.21 | | 929,594 |
| 830M | | 9/15/2015 | | | 0.22 | | 829,621 |
| 2,727M | | Resolution Funding Corporation, 10/15/2015 | | | 0.22 | | 2,725,285 |
| 2,000M | | Tennessee Valley Authority, 11/1/2015 | | | 0.32 | | 1,997,874 |
| Total Value of U.S. Government Agency Zero | | | | | |
| Coupon Obligations (cost $12,166,923) | | | | | 12,360,277 |
| | | U.S. GOVERNMENT ZERO COUPON | | | | | |
| | | OBLIGATIONS—23.8% | | | | | |
| 3,855M | | U.S. Treasury Strips, 11/15/2015 (cost $3,773,048) | | 0.07 | | 3,853,994 |
| Total Value of Investments (cost $15,939,971) | 100.0 | % | | | 16,214,271 |
| Other Assets, Less Liabilities | — | | | | 3,925 |
| Net Assets | | | 100.0 | % | | | $16,218,196 |
† The effective yields shown for the zero coupon obligations are the effective yields at June 30, 2015.
Portfolio of Investments (continued)
TARGET MATURITY 2015 FUND
June 30, 2015
The Fund’s asset and liabilities are classified into the following three levels based on the inputs used to value the assets and liabilities:
Level 1 — Unadjusted quoted prices in active markets for identical securities that the Fund has the ability to access.
Level 2 — Observable inputs other than quoted prices included in Level 1 that are observable for the asset or liability, either directly or indirectly. These inputs may include quoted prices for the identical instrument on an inactive market, prices for similar instruments, interest rates, prepayment speeds, credit risk, yield curves, default rates and similar data.
Level 3 — Unobservable inputs for the asset or liability, to the extent relevant observable inputs are not available, representing the Fund’s own assumption about the assumptions a market participant would use in valuing the asset or liability, and would be based on the best information available.
The inputs methodology used for valuing securities are not necessarily an indication of the risk associated with investing in those securities. For example, U.S. Government securities are reflected as Level 2 because the inputs used to determine fair value may not always be quoted prices in an active market.
The following is a summary, by category of Level, of inputs used to value the Fund’s investments as of June 30, 2015:
| | | | | | | | | | | | |
| | | | Level 1 | | | Level 2 | | | Level 3 | | | Total |
| U.S. Government Agency Zero | | | | | | | | | | | | |
| Coupon Obligations | | $ | — | | $ | 12,360,277 | | $ | — | | $ | 12,360,277 |
| U.S. Government Zero Coupon | | | | | | | | | | | | |
| Obligations | | | — | | | 3,853,994 | | | — | | | 3,853,994 |
| Total Investments in Securities | | $ | — | | $ | 16,214,271 | | $ | — | | $ | 16,214,271 |
There were no transfers into or from Level 1 and Level 2 by the Fund for the period ended June 30, 2015. Transfers, if any, between Levels are recognized at the end of the reporting period.
| |
| 84 | See notes to financial statements |
Fund Expenses (unaudited)
TOTAL RETURN FUND
The examples below show the ongoing costs (in dollars) of investing in your Fund and will help you in comparing these costs with costs of other mutual funds. Please refer to page 4 for a detailed explanation of the information presented in these examples.
| | | |
| | Beginning | Ending | |
| | Account | Account | Expenses Paid |
| | Value | Value | During Period |
| | (1/1/15) | (6/30/15) | (1/1/15–6/30/15)* |
| Expense Examples | | | |
| Actual | $1,000.00 | $1,012.63 | $4.64 |
| Hypothetical | | | |
| (5% annual return before expenses) | $1,000.00 | $1,020.18 | $4.66 |
* Expenses are equal to the annualized expense ratio of .93%, multiplied by the average account value over the period, multiplied by 181/365 (to reflect the one-half year period).
Portfolio Composition
TOP TEN SECTORS
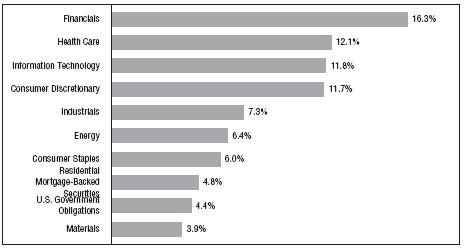
Portfolio holdings and allocations are subject to change. Percentages are as of June 30, 2015, and are based on the total value of investments.
Portfolio of Investments
TOTAL RETURN FUND
June 30, 2015
| | | | |
| |
| | | | | |
| | | | | |
| Shares | | Security | | Value |
| | | COMMON STOCKS—57.8% | | |
| | | Consumer Discretionary—9.7% | | |
| 5,250 | | American Eagle Outfitters, Inc. | | $ 90,405 |
| 2,700 | | BorgWarner, Inc. | | 153,468 |
| 4,400 | | CBS Corporation – Class “B” | | 244,200 |
| 3,150 | | Delphi Automotive, PLC | | 268,034 |
| 2,700 | | Foot Locker, Inc. | | 180,927 |
| 6,150 | | Ford Motor Company | | 92,311 |
| 1,350 | | GNC Holdings, Inc. – Class “A” | | 60,048 |
| 2,600 | | Hanesbrands, Inc. | | 86,632 |
| 1,000 | | Harman International Industries, Inc. | | 118,940 |
| 1,900 | | Home Depot, Inc. | | 211,147 |
| 4,200 | * | Jarden Corporation | | 217,350 |
| 3,750 | | Johnson Controls, Inc. | | 185,737 |
| 2,100 | | L Brands, Inc. | | 180,033 |
| 2,000 | | Lear Corporation | | 224,520 |
| 1,500 | | Magna International, Inc. | | 84,135 |
| 3,400 | | Newell Rubbermaid, Inc. | | 139,774 |
| 1,800 | | Penske Automotive Group, Inc. | | 93,798 |
| 3,900 | | Stein Mart, Inc. | | 40,833 |
| 2,300 | | Tupperware Brands Corporation | | 148,442 |
| 1,700 | | Walt Disney Company | | 194,038 |
| 900 | | Whirlpool Corporation | | 155,745 |
| 550 | | Wyndham Worldwide Corporation | | 45,051 |
| | | | | 3,215,568 |
| | | Consumer Staples—5.0% | | |
| 4,700 | | Altria Group, Inc. | | 229,877 |
| 2,400 | | Avon Products, Inc. | | 15,024 |
| 3,700 | | Coca-Cola Company | | 145,151 |
| 2,800 | | CVS Health Corporation | | 293,664 |
| 1,800 | | Delhaize Group (ADR) | | 37,134 |
| 1,500 | | Koninklijke Ahold NV (ADR) | | 28,305 |
| 3,900 | | Nu Skin Enterprises, Inc. – Class “A” | | 183,807 |
| 1,700 | | PepsiCo, Inc. | | 158,678 |
| 3,100 | | Philip Morris International, Inc. | | 248,527 |
| 1,050 | | Procter & Gamble Company | | 82,152 |
| 2,300 | | Tyson Foods, Inc. – Class “A” | | 98,049 |
| 1,700 | | Wal-Mart Stores, Inc. | | 120,581 |
| | | | | 1,640,949 |
| | | | |
| |
| | | | | |
| | | | | |
| Shares | | Security | | Value |
| | | Energy—4.1% | | |
| 1,400 | | Anadarko Petroleum Corporation | | $ 109,284 |
| 400 | | Chevron Corporation | | 38,588 |
| 2,300 | | ConocoPhillips | | 141,243 |
| 2,400 | | Devon Energy Corporation | | 142,776 |
| 1,000 | | Ensco, PLC – Class “A” | | 22,270 |
| 2,000 | | ExxonMobil Corporation | | 166,400 |
| 1,000 | | Hess Corporation | | 66,880 |
| 3,100 | | Marathon Oil Corporation | | 82,274 |
| 3,950 | | Marathon Petroleum Corporation | | 206,624 |
| 1,500 | | National Oilwell Varco, Inc. | | 72,420 |
| 700 | | Noble Corporation, PLC | | 10,773 |
| 950 | | Occidental Petroleum Corporation | | 73,882 |
| 1,200 | | Phillips 66 | | 96,672 |
| 500 | | Schlumberger, Ltd. | | 43,095 |
| 3,600 | | Suncor Energy, Inc. | | 99,072 |
| | | | | 1,372,253 |
| | | Financials—6.1% | | |
| 2,600 | | American Express Company | | 202,072 |
| 1,500 | | Ameriprise Financial, Inc. | | 187,395 |
| 5,500 | | Brixmor Property Group, Inc. (REIT) | | 127,215 |
| 500 | | Citizens Financial Group, Inc. | | 13,655 |
| 2,100 | | Discover Financial Services | | 121,002 |
| 900 | | Financial Select Sector SPDR Fund (ETF) | | 21,942 |
| 600 | | iShares Core S&P Mid-Cap ETF (ETF) | | 89,988 |
| 1,250 | | iShares Russell 2000 ETF (ETF) | | 156,075 |
| 4,150 | | JPMorgan Chase & Company | | 281,204 |
| 600 | | Morgan Stanley | | 23,274 |
| 1,550 | | PNC Financial Services Group, Inc. | | 148,258 |
| 900 | | SPDR S&P 500 ETF Trust (ETF) | | 185,265 |
| 900 | | SPDR S&P Regional Banking (ETF) | | 39,744 |
| 4,100 | | Sunstone Hotel Investors, Inc. (REIT) | | 61,541 |
| 3,650 | | U.S. Bancorp | | 158,410 |
| 4,200 | | Urstadt Biddle Properties, Inc. – Class “A” (REIT) | | 78,456 |
| 2,450 | | Wells Fargo & Company | | 137,788 |
| | | | | 2,033,284 |
Portfolio of Investments (continued)
TOTAL RETURN FUND
June 30, 2015
| | | | |
| | | | | |
| | | | | |
| Shares | | Security | | Value |
| | | Health Care—11.1% | | |
| 4,150 | | Abbott Laboratories | | $ 203,682 |
| 3,450 | | AbbVie, Inc. | | 231,805 |
| 1,100 | * | Allergan, PLC | | 333,806 |
| 1,800 | | Baxter International, Inc. | | 125,874 |
| 900 | | Cardinal Health, Inc. | | 75,285 |
| 1,700 | * | Express Scripts Holding Company | | 151,198 |
| 4,200 | | Gilead Sciences, Inc. | | 491,736 |
| 1,700 | | Hill-Rom Holdings, Inc. | | 92,361 |
| 2,800 | | Johnson & Johnson | | 272,888 |
| 118 | * | Mallinckrodt, PLC | | 13,891 |
| 700 | | McKesson Corporation | | 157,367 |
| 1,800 | | Medtronic, PLC | | 133,380 |
| 3,350 | | Merck & Company, Inc. | | 190,716 |
| 3,550 | * | Mylan NV | | 240,903 |
| 1,300 | | Omnicare, Inc. | | 122,525 |
| 8,650 | | Pfizer, Inc. | | 290,035 |
| 2,200 | | Phibro Animal Health Corporation – Class “A” | | 85,668 |
| 2,700 | | Thermo Fisher Scientific, Inc. | | 350,352 |
| 2,500 | * | VWR Corporation | | 66,825 |
| 1,100 | | Zoetis, Inc. | | 53,042 |
| | | | | 3,683,339 |
| | | Industrials—6.0% | | |
| 1,450 | | 3M Company | | 223,735 |
| 2,800 | | Altra Industrial Motion Corporation | | 76,104 |
| 750 | | Caterpillar, Inc. | | 63,615 |
| 2,050 | * | Generac Holdings, Inc. | | 81,487 |
| 2,400 | | General Electric Company | | 63,768 |
| 3,050 | | Greenbrier Companies, Inc. | | 142,892 |
| 2,200 | | Honeywell International, Inc. | | 224,334 |
| 2,350 | | ITT Corporation | | 98,324 |
| 250 | | Lockheed Martin Corporation | | 46,475 |
| 900 | | Nielsen NV | | 40,293 |
| 1,950 | | Ryder System, Inc. | | 170,372 |
| 900 | | Snap-On, Inc. | | 143,325 |
| 1,000 | * | TAL International Group, Inc. | | 31,600 |
| 1,100 | | Textainer Group Holdings, Ltd. | | 28,611 |
| 3,650 | | Textron, Inc. | | 162,900 |
| 2,850 | | Tyco International, PLC | | 109,668 |
| | | | |
| |
| | | | | |
| | | | | |
| Shares | | Security | | Value |
| | | Industrials (continued) | | |
| 700 | * | United Rentals, Inc. | | $ 61,334 |
| 1,750 | | United Technologies Corporation | | 194,128 |
| 700 | * | Univar, Inc. | | 18,221 |
| | | | | 1,981,186 |
| | | Information Technology—11.5% | | |
| 3,050 | | Apple, Inc. | | 382,546 |
| 3,350 | * | ARRIS Group, Inc. | | 102,510 |
| 2,200 | | Avago Technologies, Ltd. | | 292,446 |
| 1,300 | | CDW Corporation | | 44,564 |
| 9,100 | | Cisco Systems, Inc. | | 249,886 |
| 1,000 | * | eBay, Inc. | | 60,240 |
| 8,900 | | EMC Corporation | | 234,871 |
| 4,950 | | Hewlett-Packard Company | | 148,549 |
| 6,100 | | Intel Corporation | | 185,531 |
| 1,600 | | International Business Machines Corporation | | 260,256 |
| 5,150 | | Juniper Networks, Inc. | | 133,745 |
| 6,400 | | Mentor Graphics Corporation | | 169,152 |
| 3,000 | | Methode Electronics, Inc. | | 82,350 |
| 6,500 | | Microsoft Corporation | | 286,975 |
| 1,600 | * | NXP Semiconductors NV | | 157,120 |
| 3,600 | | Oracle Corporation | | 145,080 |
| 2,100 | * | PTC, Inc. | | 86,142 |
| 2,300 | * | Qorvo, Inc. | | 184,621 |
| 2,600 | | QUALCOMM, Inc. | | 162,838 |
| 4,800 | | Symantec Corporation | | 111,600 |
| 1,900 | * | Synaptics, Inc. | | 164,797 |
| 1,800 | | TE Connectivity, Ltd. | | 115,740 |
| 800 | * | Yahoo!, Inc. | | 31,432 |
| | | | | 3,792,991 |
| | | Materials—2.0% | | |
| 2,600 | | Cytec Industries, Inc. | | 157,378 |
| 2,800 | | International Paper Company | | 133,252 |
| 3,500 | | MeadWestvaco Corporation | | 165,165 |
| 400 | | Praxair, Inc. | | 47,820 |
| 1,400 | | RPM International, Inc. | | 68,558 |
| 3,300 | * | Trinseo SA | | 88,572 |
| | | | | 660,745 |
Portfolio of Investments (continued)
TOTAL RETURN FUND
June 30, 2015
| | | | |
| | | | |
| |
| | | | |
| Shares or | | | | |
| Principal | | | | |
| Amount | | Security | | Value |
| | | Telecommunication Services—1.2% | | |
| 4,900 | | AT&T, Inc. | | $ 174,048 |
| 4,500 | | Verizon Communications, Inc. | | 209,745 |
| | | | | 383,793 |
| | | Utilities—1.1% | | |
| 1,100 | | AGL Resources, Inc. | | 51,216 |
| 4,650 | * | Dynegy, Inc. | | 136,012 |
| 4,500 | | Exelon Corporation | | 141,390 |
| 850 | | NiSource, Inc. | | 38,752 |
| | | | | 367,370 |
| Total Value of Common Stocks (cost $17,101,861) | | 19,131,478 |
| | | CORPORATE BONDS—21.7% | | |
| | | Agriculture—.3% | | |
| $ 100M | | Cargill, Inc., 6%, 11/27/2017 (a) | | 110,519 |
| | | Automotive—.3% | | |
| 100M | | Johnson Controls, Inc., 5%, 3/30/2020 | | 109,892 |
| | | Chemicals—.9% | | |
| 100M | | Agrium, Inc., 3.375%, 3/15/2025 | | 95,274 |
| 100M | | CF Industries, Inc., 3.45%, 6/1/2023 | | 96,986 |
| 100M | | Dow Chemical Co., 4.25%, 11/15/2020 | | 106,926 |
| | | | | 299,186 |
| | | Energy—2.3% | | |
| 100M | | Canadian Oil Sands, Ltd., 7.75%, 5/15/2019 (a) | | 108,856 |
| 100M | | Continental Resources, Inc., 5%, 9/15/2022 | | 98,188 |
| 100M | | DCP Midstream Operating, LP, 2.5%, 12/1/2017 | | 96,958 |
| 100M | | Enbridge Energy Partners, LP, 4.2%, 9/15/2021 | | 102,689 |
| 100M | | Suncor Energy, Inc., 6.1%, 6/1/2018 | | 111,592 |
| 100M | | Valero Energy Corp., 9.375%, 3/15/2019 | | 123,168 |
| 100M | | Weatherford International, LLC, 6.35%, 6/15/2017 | | 107,143 |
| | | | | 748,594 |
| | | Financial Services—3.7% | | |
| 100M | | American Express Co., 7%, 3/19/2018 | | 113,481 |
| 100M | | American International Group, Inc., 6.4%, 12/15/2020 | | 119,024 |
| 100M | | Ameriprise Financial, Inc., 5.3%, 3/15/2020 | | 113,099 |
| 100M | | Assured Guaranty U.S. Holding, Inc., 5%, 7/1/2024 | | 98,251 |
| 100M | | BlackRock, Inc., 5%, 12/10/2019 | | 111,727 |
| | | | |
| |
| | | | | |
| | | | | |
| Principal | | | | |
| Amount | | Security | | Value |
| | | Financial Services (continued) | | |
| | | ERAC USA Finance, LLC: | | |
| $100M | | 4.5%, 8/16/2021 (a) | | $ 108,106 |
| 100M | | 3.3%, 10/15/2022 (a) | | 98,239 |
| 100M | | Ford Motor Credit Co., LLC, 8.125%, 1/15/2020 | | 122,237 |
| 100M | | General Electric Capital Corp., 5.625%, 9/15/2017 | | 108,927 |
| 100M | | Liberty Mutual Group, Inc., 4.95%, 5/1/2022 (a) | | 107,657 |
| 100M | | Prudential Financial, Inc., 7.375%, 6/15/2019 | | 118,670 |
| | | | | 1,219,418 |
| | | Financials—4.5% | | |
| | | Bank of America Corp.: | | |
| 100M | | 5.65%, 5/1/2018 | | 109,923 |
| 100M | | 5%, 5/13/2021 | | 109,917 |
| 100M | | Barclays Bank, PLC, 5.125%, 1/8/2020 | | 111,299 |
| 100M | | Citigroup, Inc., 6.125%, 11/21/2017 | | 110,059 |
| 100M | | Deutsche Bank AG London, 3.7%, 5/30/2024 | | 98,939 |
| 100M | | Fifth Third Bancorp, 3.5%, 3/15/2022 | | 101,859 |
| 200M | | Goldman Sachs Group, Inc., 3.625%, 1/22/2023 | | 198,934 |
| | | JPMorgan Chase & Co.: | | |
| 100M | | 6%, 1/15/2018 | | 110,189 |
| 100M | | 4.5%, 1/24/2022 | | 107,259 |
| 100M | | Morgan Stanley, 6.625%, 4/1/2018 | | 112,248 |
| 100M | | SunTrust Banks, Inc., 6%, 9/11/2017 | | 109,221 |
| 100M | | U.S. Bancorp, 3.6%, 9/11/2024 | | 100,644 |
| 100M | | Wells Fargo & Co., 4.6%, 4/1/2021 | | 109,631 |
| | | | | 1,490,122 |
| | | Food/Beverage/Tobacco—.7% | | |
| 100M | | Anheuser-Busch InBev SA/NV, 4.625%, 2/1/2044 | | 100,895 |
| 100M | | Anheuser-Busch InBev Worldwide, Inc., 6.875%, 11/15/2019 | | 119,457 |
| | | | | 220,352 |
| | | Forest Products/Containers—.3% | | |
| 100M | | Rock-Tenn Co., 4.9%, 3/1/2022 | | 107,831 |
| | | Health Care—1.0% | | |
| 100M | | Biogen, Inc., 6.875%, 3/1/2018 | | 113,222 |
| 100M | | Express Scripts Holding Co., 4.75%, 11/15/2021 | | 108,660 |
| 100M | | Laboratory Corp. of America Holdings, 3.2%, 2/1/2022 | | 98,734 |
| | | | | 320,616 |
Portfolio of Investments (continued)
TOTAL RETURN FUND
June 30, 2015
| | | | |
| |
| | | | | |
| | | | | |
| Principal | | | | |
| Amount | | Security | | Value |
| | | Information Technology—.3% | | |
| $ 100M | | Apple, Inc., 2.5%, 2/9/2025 | | $ 93,888 |
| | | Manufacturing—.3% | | |
| 100M | | Tyco Electronics Group SA, 6.55%, 10/1/2017 | | 111,017 |
| | | Media-Broadcasting—.9% | | |
| 100M | | CBS Corp., 3.375%, 3/1/2022 | | 98,930 |
| 100M | | Comcast Corp., 5.15%, 3/1/2020 | | 112,638 |
| 100M | | DirecTV Holdings, LLC, 3.8%, 3/15/2022 | | 100,723 |
| | | | | 312,291 |
| | | Metals/Mining—.3% | | |
| 100M | | Newmont Mining Corp., 5.125%, 10/1/2019 | | 108,741 |
| | | Real Estate Investment Trusts—2.0% | | |
| 100M | | Boston Properties, LP, 5.875%, 10/15/2019 | | 113,643 |
| 100M | | Digital Realty Trust, LP, 5.25%, 3/15/2021 | | 109,571 |
| 100M | | HCP, Inc., 5.375%, 2/1/2021 | | 110,452 |
| 100M | | ProLogis, LP, 3.35%, 2/1/2021 | | 102,272 |
| 100M | | Simon Property Group, LP, 3.375%, 10/1/2024 | | 99,474 |
| 100M | | Ventas Realty, LP, 4.75%, 6/1/2021 | | 108,491 |
| | | | | 643,903 |
| | | Retail-General Merchandise—1.0% | | |
| 100M | | Amazon.com, Inc., 4.8%, 12/5/2034 | | 99,641 |
| 100M | | GAP, Inc., 5.95%, 4/12/2021 | | 113,068 |
| 100M | | Home Depot, Inc., 5.875%, 12/16/2036 | | 120,597 |
| | | | | 333,306 |
| | | Telecommunications—.3% | | |
| 100M | | Verizon Communications, Inc., 5.15%, 9/15/2023 | | 109,669 |
| | | Transportation—1.0% | | |
| 100M | | Burlington North Santa Fe, LLC, 5.15%, 9/1/2043 | | 107,920 |
| 100M | | GATX Corp., 5.2%, 3/15/2044 | | 101,503 |
| 100M | | Penske Truck Leasing Co., LP, 4.875%, 7/11/2022 (a) | | 105,829 |
| | | | | 315,252 |
| | | | |
| |
| | | | | |
| | | | | |
| Principal | | | | |
| Amount | | Security | | Value |
| | | Utilities—1.6% | | |
| $ 100M | | Duke Energy Progress, Inc., 4.15%, 12/1/2044 | | $ 96,883 |
| 100M | | Ohio Power Co., 5.375%, 10/1/2021 | | 114,170 |
| 100M | | Oklahoma Gas & Electric Co., 4%, 12/15/2044 | | 94,402 |
| 100M | | Sempra Energy, 9.8%, 2/15/2019 | | 125,696 |
| 100M | | South Carolina Electric & Gas Co., 5.45%, 2/1/2041 | | 113,208 |
| | | | | 544,359 |
| Total Value of Corporate Bonds (cost $7,283,734) | | 7,198,956 |
| | | RESIDENTIAL MORTGAGE-BACKED | | |
| | | SECURITIES—4.8% | | |
| | | Fannie Mae—4.0% | | |
| 129M | | 3%, 1/1/2045 – 7/14/2045 (b) | | 128,118 |
| 582M | | 3.5%, 11/1/2028 – 7/14/2045 (b) | | 611,946 |
| 207M | | 4%, 7/1/2041 – 7/14/2045 (b) | | 219,163 |
| 159M | | 4.5%, 8/1/2041 | | 172,579 |
| 155M | | 5%, 3/1/2042 (b) | | 172,612 |
| | | | | 1,304,418 |
| | | Freddie Mac—.8% | | |
| 136M | | 3.5%, 11/1/2042 – 7/1/2044 | | 140,331 |
| 120M | | 4%, 7/1/2044 – 4/1/2045 | | 127,185 |
| | | | | 267,516 |
| Total Value of Residential Mortgage-Backed Securities (cost $1,569,727) | | 1,571,934 |
| | | U.S. GOVERNMENT OBLIGATIONS—4.4% | | |
| 100M | | U.S. Treasury Bonds, 3.125%, 8/15/2044 | | 100,180 |
| | | U.S. Treasury Notes: | | |
| 500M | | 0.06%, 1/31/2016 † | | 500,011 |
| 100M | | 0.089%, 4/30/2017 † | | 100,000 |
| 100M | | 0.099%, 1/31/2017 † | | 100,061 |
| 150M | | 2%, 2/15/2023 | | 148,371 |
| 500M | | 0.625%, 1/15/2024 (TIPS) | | 516,273 |
| |
| Total Value of U.S. Government Obligations (cost $1,483,841) | | 1,464,896 |
Portfolio of Investments (continued)
TOTAL RETURN FUND
June 30, 2015
| | | | | |
| |
| | | | | | |
| | | | | | |
| Principal | | | | | |
| Amount | | Security | | | Value |
| | | MUNICIPAL BONDS—2.0% | | | |
| $ 100M | | Crystal City, TX Indep. Sch. Dist. GO, 5%, 2/15/2034 (b) | | $ 113,917 |
| 200M | | Jackson, MS State Univ. Edl. Bldg. Corp. Rev., 5%, 3/1/2031 | | 224,944 |
| 100M | | New York City, NY Muni. Wtr. Fin. Auth. Wtr. & Swr. Sys. | | |
| | | Rev., 5%, 6/15/2039 | | | 112,028 |
| 100M | | Pennsylvania State GO, 5%, 8/15/2022 | | | 116,108 |
| 100M | | Yale University, CT, 2.086%, 4/15/2019 | | | 101,106 |
| Total Value of Municipal Bonds (cost $672,704) | | | 668,103 |
| | | U.S. GOVERNMENT AGENCY | | | |
| | | OBLIGATIONS—1.7% | | | |
| | | Fannie Mae: | | | |
| 300M | | 1.75%, 11/26/2019 | | | 301,767 |
| 250M | | 2.36%, 12/14/2022 | | | 246,129 |
| Total Value of U.S. Government Agency Obligations (cost $546,287) | | 547,896 |
| | | SHORT-TERM U.S. GOVERNMENT AGENCY | | |
| | | OBLIGATIONS—7.2% | | | |
| | | Federal Home Loan Bank: | | | |
| 500M | | 0.065%, 8/5/2015 | | | 499,986 |
| 1,600M | | 0.06%, 8/7/2015 | | | 1,599,950 |
| 300M | | 0.045%, 8/18/2015 | | | 299,988 |
| Total Value of Short-Term U.S. Government Agency Obligations (cost $2,399,852) | | 2,399,924 |
| Total Value of Investments (cost $31,058,006) | 99.6 | % | 32,983,187 |
| Other Assets, Less Liabilities | .4 | | 122,215 |
| Net Assets | | | 100.0 | % | $33,105,402 |
| |
| * | Non-income producing |
| |
| (a) | Security exempt from registration under Rule 144A of the Securities Act of 1933 (see Note 5). |
| (b) | A portion or all of the security purchased on a when-issued or delayed delivery basis (see |
| Note 1G). |
| † | Interest rates are determined and reset periodically. The interest rates above are the rates in effect |
| at June 30, 2015. |
| |
| Summary of Abbreviations: |
| ADR | American Depositary Receipts |
| ETF | Exchange Traded Fund |
| GO | General Obligation |
| REIT | Real Estate Investment Trust |
| TIPS | Treasury Inflation-Protected Securities |
The Fund’s asset and liabilities are classified into the following three levels based on the inputs used to value the assets and liabilities:
Level 1 — Unadjusted quoted prices in active markets for identical securities that the Fund has the ability to access.
Level 2 — Observable inputs other than quoted prices included in Level 1 that are observable for the asset or liability, either directly or indirectly. These inputs may include quoted prices for the identical instrument on an inactive market, prices for similar instruments, interest rates, prepayment speeds, credit risk, yield curves, default rates and similar data.
Level 3 — Unobservable inputs for the asset or liability, to the extent relevant observable inputs are not available, representing the Fund’s own assumption about the assumptions a market participant would use in valuing the asset or liability, and would be based on the best information available.
The inputs methodology used for valuing securities are not necessarily an indication of the risk associated with investing in those securities. For example, U.S. Government securities are reflected as Level 2 because the inputs used to determine fair value may not always be quoted prices in an active market.
The following is a summary, by category of Level, of inputs used to value the Fund’s investments as of June 30, 2015:
| | | | | | | | | | | | |
| | | | Level 1 | | | Level 2 | | | Level 3 | | | Total |
| Common Stocks | | $ | 19,131,478 | | $ | — | | $ | — | | | 19,131,478 |
| Corporate Bonds | | | — | | | 7,198,956 | | | — | | | 7,198,956 |
| Residential Mortgage-Backed | | | | | | | | | | | | |
| Securities | | | — | | | 1,571,934 | | | — | | | 1,571,934 |
| U.S. Government Obligations | | | — | | | 1,464,896 | | | — | | | 1,464,896 |
| Municipal Bonds | | | — | | | 668,103 | | | — | | | 668,103 |
| U.S. Government Agency | | | | | | | | | | | | |
| Obligations | | | — | | | 547,896 | | | — | | | 547,896 |
| Short-Term U.S. Government | | | | | | | | | | | | |
| Agency Obligations | | | — | | | 2,399,924 | | | — | | | 2,399,924 |
| Total Investments in Securities* | | $ | 19,131,478 | | $ | 13,851,709 | | $ | — | | $ | 32,983,187 |
* The Portfolio of Investments provides information on the industry categorization for common stocks and corporate bonds.
There were no transfers into or from Level 1 and Level 2 by the Fund for the period ended June 30, 2015. Transfers, if any, between Levels are recognized at the end of the reporting period.
| |
| See notes to financial statements | 95 |
Statements of Assets and Liabilities
FIRST INVESTORS LIFE SERIES FUNDS
June 30, 2015
| | | | | | | | | | | | | | | | | | | | | | | |
| | | | | | | | | | | | | | | | | | | | | | | |
| | | | | | | | | | | | | | | | | | | | | | | | |
| | | | | CASH | | | EQUITY | | | FUND FOR | | | | | | GROWTH & | | | | | | INVESTMENT | |
| | | | | MANAGEMENT | | | INCOME | | | INCOME | | | GOVERNMENT | | | INCOME | | | INTERNATIONAL | | | GRADE | |
| Assets | | | | | | | | | | | | | | | | | | | | | | | |
| Investments in securities: | | | | | | | | | | | | | | | | | | | | | | | |
| At identified cost | | | $ | 7,208,930 | | $ | 80,179,673 | | $ | 96,847,474 | | $ | 29,819,461 | | $ | 295,544,276 | | $ | 97,829,259 | | $ | 59,705,094 | |
| | | | | | | | | | | | | | | | | | | | | | | | |
| At value (Note 1A) | | | $ | 7,208,930 | | $ | 107,634,711 | | $ | 97,024,187 | | $ | 29,686,673 | | $ | 492,565,964 | | $ | 133,284,371 | | $ | 61,020,394 | |
| Cash | | | | 239,608 | | | 2,544,198 | | | 2,484,526 | | | 896,260 | | | 416,921 | | | 580,948 | | | 595,473 | |
| Receivables: | | | | | | | | | | | | | | | | | | | | | | | |
| Investment securities sold | | | | — | | | 92,154 | | | 908,582 | | | 911,067 | | | 752,886 | | | — | | | 667,764 | |
| Interest and dividends | | | | 61 | | | 182,943 | | | 1,355,780 | | | 114,522 | | | 569,567 | | | 446,018 | | | 759,334 | |
| Trust shares sold | | | | 150,792 | | | 102,353 | | | 6,415 | | | 5,304 | | | 64,192 | | | 94,562 | | | 23,127 | |
| Other assets | | | | 1,025 | | | 8,200 | | | 7,768 | | | 2,476 | | | 37,236 | | | 10,209 | | | 4,786 | |
| | | | | | | | | | | | | | | | | | | | | | | | |
| Total Assets | | | | 7,600,416 | | | 110,564,559 | | | 101,787,258 | | | 31,616,302 | | | 494,406,766 | | | 134,416,108 | | | 63,070,878 | |
| |
| Liabilities | | | | | | | | | | | | | | | | | | | | | | | |
| Payables: | | | | | | | | | | | | | | | | | | | | | | | |
| Investment securities purchased | | | | — | | | 415,881 | | | 1,171,508 | | | 1,166,141 | | | 437,385 | | | 59,086 | | | 99,867 | |
| Trust shares redeemed | | | | 713,477 | | | 27,315 | | | 93,264 | | | 27,272 | | | 288,360 | | | 43,193 | | | 38,233 | |
| Accrued advisory fees | | | | — | | | 73,744 | | | 66,570 | | | 15,955 | | | 327,501 | | | 89,472 | | | 33,091 | |
| Accrued expenses | | | | 8,658 | | | 17,030 | | | 20,698 | | | 11,906 | | | 40,254 | | | 50,115 | | | 13,334 | |
| Total Liabilities | | | | 722,135 | | | 533,970 | | | 1,352,040 | | | 1,221,274 | | | 1,093,500 | | | 241,866 | | | 184,525 | |
| Net Assets | | | $ | 6,878,281 | | $ | 110,030,589 | | $ | 100,435,218 | | $ | 30,395,028 | | $ | 493,313,266 | | $ | 134,174,242 | | $ | 62,886,353 | |
| Net Assets Consist of: | | | | | | | | | | | | | | | | | | | | | | | |
| Capital paid in | | | $ | 6,878,281 | | $ | 79,226,915 | | $ | 120,046,833 | | $ | 30,912,511 | | $ | 276,501,204 | | $ | 108,064,982 | | $ | 63,180,296 | |
| Undistributed net investment income (deficit) | | | | — | | | 1,034,576 | | | 1,731,358 | | | 259,266 | | | 3,260,933 | | | 1,157,498 | | | (95,192 | ) |
| Accumulated net realized gain (loss) on investments | | | | | | | | | | | �� | | | | | | | | | | | | |
| and foreign currency transactions | | | | — | | | 2,314,060 | | | (21,519,686 | ) | | (643,961 | ) | | 16,529,441 | | | (10,505,161 | ) | | (1,514,051 | ) |
| Net unrealized appreciation (depreciation) in value | | | | | | | | | | | | | | | | | | | | | | | |
| of investments and foreign currency transactions | | | | — | | | 27,455,038 | | | 176,713 | | | (132,788 | ) | | 197,021,688 | | | 35,456,923 | | | 1,315,300 | |
| Total | | | $ | 6,878,281 | | $ | 110,030,589 | | $ | 100,435,218 | | $ | 30,395,028 | | $ | 493,313,266 | | $ | 134,174,242 | | $ | 62,886,353 | |
| Shares of beneficial interest outstanding (Note 2) | | | | 6,878,281 | | | 5,410,155 | | | 15,823,993 | | | 3,133,241 | | | 10,820,589 | | | 6,323,127 | | | 5,866,684 | |
| | | | | | | | | | | | | | | | | | | | | | | | |
| Net asset value, offering and redemption price per share — | | | | | | | | | | | | | | | | | | | | | | | |
| (Net assets divided by shares outstanding) | | | $ | 1.00 | | $ | 20.34 | | $ | 6.35 | | $ | 9.70 | | $ | 45.59 | | $ | 21.22 | | $ | 10.72 | |
| | |
| 96 | See notes to financial statements | 97 |
Statements of Assets and Liabilities
FIRST INVESTORS LIFE SERIES FUNDS
June 30, 2015
| | | | | | | | | | | | | | | | | | | | | | | |
| | | | | | | | | | | | | | | | | | | | | | | |
| | | | | | | | | | | | | | | | | | | | | | | | |
| | | | | LIMITED | | | | | | | | | | | | | | | | | | | |
| | | | | DURATION | | | | | | | | | | | | | | | | | | | |
| | | | | HIGH QUALITY | | | | | | REAL | | | SELECT | | | SPECIAL | | | TARGET | | | TOTAL | |
| | | | | BOND | | | OPPORTUNITY | | | ESTATE | | | GROWTH | | | SITUATIONS | | | MATURITY 2015 | | | RETURN | |
| Assets | | | | | | | | | | | | | | | | | | | | | | | |
| Investments in securities: | | | | | | | | | | | | | | | | | | | | | | | |
| At identified cost | | | $ | 3,333,394 | | $ | 30,022,892 | | $ | 3,303,548 | | $ | 33,979,612 | | $ | 172,680,381 | | $ | 15,939,971 | | $ | 31,058,006 | |
| | |
| At value (Note 1A) | | | $ | 3,324,617 | | $ | 34,359,440 | | $ | 3,095,672 | | $ | 45,515,414 | | $ | 219,050,027 | | $ | 16,214,271 | | $ | 32,983,187 | |
| Cash | | | | 154,571 | | | 1,034,291 | | | 331,445 | | | 1,589,975 | | | 533,170 | | | 20,762 | | | 207,815 | |
| Receivables: | | | | | | | | | | | | | | | | | | | | | | | |
| Investment securities sold | | | | — | | | 536,438 | | | 35,866 | | | — | | | 2,719,741 | | | — | | | 124,210 | |
| Interest and dividends | | | | 20,982 | | | 21,184 | | | 10,443 | | | 26,709 | | | 153,222 | | | — | | | 122,244 | |
| Trust shares sold | | | | 70,969 | | | 183,282 | | | 11,795 | | | 84,337 | | | 88,077 | | | 659 | | | 342,337 | |
| Other assets | | | | 109 | | | 1,724 | | | — | | | 3,062 | | | 15,617 | | | 1,527 | | | 1,880 | |
| Total Assets | | | | 3,571,248 | | | 36,136,359 | | | 3,485,221 | | | 47,219,497 | | | 222,559,854 | | | 16,237,219 | | | 33,781,673 | |
| | |
| Liabilities | | | | | | | | | | | | | | | | | | | | | | | |
| Payables: | | | | | | | | | | | | | | | | | | | | | | | |
| Investment securities purchased | | | | 108,764 | | | 164,930 | | | 143,561 | | | — | | | 669,459 | | | — | | | 633,923 | |
| Trust shares redeemed | | | | 73 | | | 930 | | | — | | | 46,870 | | | 113,584 | | | 1,231 | | | 4,347 | |
| Accrued advisory fees | | | | 1,714 | | | 23,615 | | | 2,012 | | | 31,200 | | | 148,039 | | | 8,568 | | | 21,623 | |
| Accrued expenses | | | | 13,292 | | | 16,427 | | | 8,408 | | | 9,479 | | | 23,449 | | | 9,224 | | | 16,378 | |
| Total Liabilities | | | | 123,843 | | | 205,902 | | | 153,981 | | | 87,549 | | | 954,531 | | | 19,023 | | | 676,271 | |
| Net Assets | | | $ | 3,447,405 | | $ | 35,930,457 | | $ | 3,331,240 | | $ | 47,131,948 | | $ | 221,605,323 | | $ | 16,218,196 | | $ | 33,105,402 | |
| | |
| Net Assets Consist of: | | | | | | | | | | | | | | | | | | | | | | | |
| Capital paid in | | | $ | 3,464,532 | | $ | 31,297,720 | | $ | 3,527,844 | | $ | 32,452,200 | | $ | 162,457,736 | | $ | 15,542,505 | | $ | 30,982,882 | |
| Undistributed net investment income (deficit) | | | | (7,294 | ) | | 75,443 | | | 12,804 | | | 158,062 | | | 290,242 | | | 394,505 | | | 70,527 | |
| Accumulated net realized gain (loss) on investments | | | | (1,056 | ) | | 220,746 | | | (1,532 | ) | | 2,985,884 | | | 12,487,699 | | | 6,886 | | | 126,812 | |
| Net unrealized appreciation (depreciation) in value | | | | | | | | | | | | | | | | | | | | | | | |
| of investments | | | | (8,777 | ) | | 4,336,548 | | | (207,876 | ) | | 11,535,802 | | | 46,369,646 | | | 274,300 | | | 1,925,181 | |
| Total | | | $ | 3,447,405 | | $ | 35,930,457 | | $ | 3,331,240 | | $ | 47,131,948 | | $ | 221,605,323 | | $ | 16,218,196 | | $ | 33,105,402 | |
| | |
| Shares of beneficial interest outstanding (Note 2) | | | | 354,928 | | | 2,281,605 | | | 354,864 | | | 3,317,879 | | | 6,289,468 | | | 1,267,569 | | | 2,684,373 | |
| | | | | | | | | | | | | | | | | | | | | | | | |
| Net asset value, offering and redemption price per share — | | | | | | | | | | | | | | | | | | | | | | | |
| (Net assets divided by shares outstanding) | | | $ | 9.71 | | $ | 15.75 | | $ | 9.39 | | $ | 14.21 | | $ | 35.23 | | $ | 12.79 | | $ | 12.33 | |
| | |
| 98 | See notes to financial statements | 99 |
Statements of Operations
FIRST INVESTORS LIFE SERIES FUNDS
Six Months Ended June 30, 2015
| | | | | | | | | | | | | | | | | | | | | | | |
| | | | | | | | | | | | | | | | | | | | | | | |
| | | | | | | | | | | | | | | | | | | | | | | | |
| | | | | CASH | | | EQUITY | | | FUND FOR | | | | | | GROWTH & | | | | | | INVESTMENT | |
| | | | | MANAGEMENT | | | INCOME | | | INCOME | | | GOVERNMENT | | | INCOME | | | INTERNATIONAL | | | GRADE | |
| Investment Income | | | | | | | | | | | | | | | | | | | | | | | |
| Income: | | | | | | | | | | | | | | | | | | | | | | | |
| Interest | | | $ | 3,789 | | $ | 972 | | $ | 2,876,780 | | $ | 375,484 | | $ | 369 | | $ | 47 | | $ | 1,206,144 | |
| Dividends | | | | — | | | 1,485,967 | (a) | | — | | | — | | | 5,206,636 | (b) | | 1,757,030 | (c) | | — | |
| | | | | | | | | | | | | | | | | | | | | | | | |
| Total income | | | | 3,789 | | | 1,486,939 | | | 2,876,780 | | | 375,484 | | | 5,207,005 | | | 1,757,077 | | | 1,206,144 | |
| |
| Expenses (Notes 1 and 4): | | | | | | | | | | | | | | | | | | | | | | | |
| Advisory fees | | | | 28,745 | | | 414,612 | | | 374,754 | | | 113,951 | | | 1,829,877 | | | 504,506 | | | 236,292 | |
| Professional fees | | | | 9,724 | | | 13,098 | | | 12,303 | | | 9,424 | | | 37,948 | | | 15,971 | | | 9,345 | |
| Custodian fees and expenses | | | | 3,060 | | | 5,924 | | | 8,720 | | | 4,719 | | | 11,438 | | | 49,838 | | | 4,494 | |
| Reports and notices to shareholders | | | | 1,300 | | | 8,950 | | | 8,900 | | | 3,129 | | | 35,650 | | | 10,625 | | | 5,600 | |
| Registration fees | | | | 82 | | | 179 | | | 186 | | | 49 | | | 185 | | | 187 | | | 138 | |
| Trustees’ fees | | | | 227 | | | 3,001 | | | 2,714 | | | 833 | | | 13,504 | | | 3,656 | | | 1,724 | |
| Other expenses | | | | 716 | | | 6,977 | | | 21,877 | | | 6,924 | | | 19,302 | | | 14,823 | | | 5,593 | |
| | | | | | | | | | | | | | | | | | | | | | | | |
| Total expenses | | | | 43,854 | | | 452,741 | | | 429,454 | | | 139,029 | | | 1,947,904 | | | 599,606 | | | 263,186 | |
| Less: Expenses waived and/or assumed | | | | (40,065 | ) | | — | | | — | | | (22,790 | ) | | — | | | — | | | (47,258 | ) |
| Expenses paid indirectly | | | | — | | | (399 | ) | | (314 | ) | | (31 | ) | | (1,800 | ) | | — | | | (80 | ) |
| | | | | | | | | | | | | | | | | | | | | | | | |
| Net expenses | | | | 3,789 | | | 452,342 | | | 429,140 | | | 116,208 | | | 1,946,104 | | | 599,606 | | | 215,848 | |
| Net investment income | | | | — | | | 1,034,597 | | | 2,447,640 | | | 259,276 | | | 3,260,901 | | | 1,157,471 | | | 990,296 | |
| |
| Realized and Unrealized Gain (Loss) on Investments | | | | | | | | | | | | | | | | | | | | | | | |
| and Foreign Currency Transactions (Note 3): | | | | | | | | | | | | | | | | | | | | | | | |
| Net realized gain (loss) on: | | | | | | | | | | | | | | | | | | | | | | | |
| Investments | | | | — | | | 2,384,384 | | | (1,888,813 | ) | | (56,489 | ) | | 18,055,201 | | | 1,228,681 | | | 391,664 | |
| Foreign currency transactions | | | | — | | | — | | | — | | | — | | | — | | | 31,140 | | | — | |
| |
| Net realized gain (loss) on investments and | | | | | | | | | | | | | | | | | | | | | | | |
| foreign currency transactions | | | | — | | | 2,384,384 | | | (1,888,813 | ) | | (56,489 | ) | | 18,055,201 | | | 1,259,821 | | | 391,664 | |
| Net unrealized appreciation (depreciation) on investments | | | | — | | | (2,749,330 | ) | | 2,017,700 | | | (265,617 | ) | | (9,210,424 | ) | | 1,171,840 | | | (1,485,634 | ) |
| |
| Net gain (loss) on investments and foreign | | | | | | | | | | | | | | | | | | | | | | | |
| currency transactions | | | | — | | | (364,946 | ) | | 128,887 | | | (322,106 | ) | | 8,844,777 | | | 2,431,661 | | | (1,093,970 | ) |
| Net Increase (Decrease) in Net Assets Resulting | | | | | | | | | | | | | | | | | | | | | | | |
| from Operations | | | $ | — | | $ | 669,651 | | $ | 2,576,527 | | $ | (62,830 | ) | $ | 12,105,678 | | $ | 3,589,132 | | $ | (103,674 | ) |
|
| (a) Net of $4,120 foreign taxes withheld |
| (b) Net of $12,956 foreign taxes withheld |
| (c) Net of $204,613 foreign taxes withheld |
| | |
| 100 | See notes to financial statements | 101 |
Statements of Operations
FIRST INVESTORS LIFE SERIES FUNDS
Six Months Ended June 30, 2015
| | | | | | | | | | | | | | | | | | | | | | | |
| | | | | | | | | | | | | | | | | | | | | | | |
| | | | | | | | | | | | | | | | | | | | | | | | |
| | | | | LIMITED | | | | | | | | | | | | | | | | | | | |
| | | | | DURATION | | | | | | | | | | | | | | | | | | | |
| | | | | HIGH QUALITY | | | | | | REAL | | | SELECT | | | SPECIAL | | | TARGET | | | TOTAL | |
| | | | | BOND | | | OPPORTUNITY | | | ESTATE* | | | GROWTH | | | SITUATIONS | | | MATURITY 2015 | | | RETURN | |
| Investment Income | | | | | | | | | | | | | | | | | | | | | | | |
| Income: | | | | | | | | | | | | | | | | | | | | | | | |
| Interest | | | $ | 15,531 | | $ | — | | $ | — | | $ | 64 | | $ | 474 | | $ | 457,648 | | $ | 125,988 | |
| Dividends | | | | 4,316 | | | 219,141 | (d) | | 25,268 | | | 346,695 | | | 1,160,175 | | | — | | | 189,296 | (e) |
| | | | | | | | | | | | | | | | | | | | | | | | |
| Total income | | | | 19,847 | | | 219,141 | | | 25,268 | | | 346,759 | | | 1,160,649 | | | 457,648 | | | 315,284 | |
| |
| Expenses (Notes 1 and 4): | | | | | | | | | | | | | | | | | | | | | | | |
| Advisory fees | | | | 11,240 | | | 118,592 | | | 3,738 | | | 171,384 | | | 810,185 | | | 62,999 | | | 115,360 | |
| Professional fees | | | | 11,434 | | | 7,433 | | | 6,538 | | | 7,969 | | | 21,001 | | | 6,642 | | | 7,168 | |
| Custodian fees and expenses | | | | 2,263 | | | 10,590 | | | 1,000 | | | 1,454 | | | 6,888 | | | 2,118 | | | 11,453 | |
| Reports and notices to shareholders | | | | 500 | | | 3,100 | | | 50 | | | 4,000 | | | 16,050 | | | 1,650 | | | 3,800 | |
| Registration fees | | | | 64 | | | 179 | | | 210 | | | 188 | | | 183 | | | 78 | | | 180 | |
| Trustees’ fees | | | | 77 | | | 814 | | | 9 | | | 1,226 | | | 5,802 | | | 467 | | | 813 | |
| Other expenses | | | | 2,182 | | | 3,084 | | | 919 | | | 2,487 | | | 11,061 | | | 1,789 | | | 4,653 | |
| |
| Total expenses | | | | 27,760 | | | 143,792 | | | 12,464 | | | 188,708 | | | 871,170 | | | 75,743 | | | 143,427 | |
| Less: Expenses waived | | | | (2,248 | ) | | — | | | — | | | — | | | — | | | (12,600 | ) | | — | |
| Expenses paid indirectly | | | | (17 | ) | | (99 | ) | | — | | | — | | | (764 | ) | | (5 | ) | | (103 | ) |
| |
| Net expenses | | | | 25,495 | | | 143,693 | | | 12,464 | | | 188,708 | | | 870,406 | | | 63,138 | | | 143,324 | |
| |
| Net investment income (loss) | | | | (5,648 | ) | | 75,448 | | | 12,804 | | | 158,051 | | | 290,243 | | | 394,510 | | | 171,960 | |
| |
| Realized and Unrealized Gain (Loss) on Investments | | | | | | | | | | | | | | | | | | | | | | | |
| (Note 3): | | | | | | | | | | | | | | | | | | | | | | | |
| Net realized gain (loss) on investments | | | | (1,056 | ) | | 556,347 | | | (1,532 | ) | | 2,986,209 | | | 12,637,592 | | | 11,554 | | | 185,751 | |
| |
| Net unrealized appreciation (depreciation) on investments | | | | (2,369 | ) | | 1,072,070 | | | (207,876 | ) | | (1,004,205 | ) | | 4,028,218 | | | (428,136 | ) | | (18,191 | ) |
| |
| Net gain (loss) on investments | | | | (3,425 | ) | | 1,628,417 | | | (209,408 | ) | | 1,982,004 | | | 16,665,810 | | | (416,582 | ) | | 167,560 | |
| |
| Net Increase (Decrease) in Net Assets Resulting | | | | | | | | | | | | | | | | | | | | | | | |
| from Operations | | | $ | (9,073 | ) | $ | 1,703,865 | | $ | (196,604 | ) | $ | 2,140,055 | | $ | 16,956,053 | | $ | (22,072 | ) | $ | 339,520 | |
| |
| * | From May 1, 2015 (commencement of operations) to June 30, 2015. |
| (d) | Net of $126 foreign taxes withheld |
| (e) | Net of $479 foreign taxes withheld |
| | |
| 102 | See notes to financial statements | 103 |
Statements of Changes in Net Assets
FIRST INVESTORS LIFE SERIES FUNDS
| | | | | | | | | | | | | | | | | | | | | | | | | | |
| | | | | | | | | | | | | | |
| | | | | | | | | | | | | | | |
| | | | | CASH MANAGEMENT | | | EQUITY INCOME | | | FUND FOR INCOME | | | GOVERNMENT | |
| | | | | 1/1/15 to | | | 1/1/14 to | | | 1/1/15 to | | | 1/1/14 to | | | 1/1/15 to | | | 1/1/14 to | | | 1/1/15 to | | | 1/1/14 to | |
| | | | | 6/30/15 | | | 12/31/14 | | | 6/30/15 | | | 12/31/14 | | | 6/30/15 | | | 12/31/14 | | | 6/30/15 | | | 12/31/14 | |
| Increase (Decrease) in Net Assets From Operations | | | | | | | | | | | | | | | | | | | | | | | | | | |
| Net investment income | | | $ | — | | $ | — | | $ | 1,034,597 | | $ | 1,821,748 | | $ | 2,447,640 | | $ | 4,814,307 | | $ | 259,276 | | $ | 557,861 | |
| Net realized gain (loss) on investments | | | | — | | | — | | | 2,384,384 | | | 3,841,139 | | | (1,888,813 | ) | | 389,912 | | | (56,489 | ) | | 155,039 | |
| Net unrealized appreciation (depreciation) | | | | | | | | | | | | | | | | | | | | | | | | | | |
| of investments | | | | — | | | — | | | (2,749,330 | ) | | 2,582,413 | | | 2,017,700 | | | (4,402,351 | ) | | (265,617 | ) | | 210,134 | |
| | | | | | | | | | | | | | | | | | | | | | | | | | | |
| Net increase (decrease) in net assets resulting | | | | | | | | | | | | | | | | | | | | | | | | | | |
| from operations | | | | — | | | — | | | 669,651 | | | 8,245,300 | | | 2,576,527 | | | 801,868 | | | (62,830 | ) | | 923,034 | |
| |
| Distributions to Shareholders | | | | | | | | | | | | | | | | | | | | | | | | | | |
| Net investment income | | | | — | | | — | | | (1,821,769 | ) | | (1,692,596 | ) | | (5,371,141 | ) | | (5,169,204 | ) | | (691,893 | ) | | (784,013 | ) |
| Net realized gains | | | | — | | | — | | | (3,844,993 | ) | | (4,129,108 | ) | | — | | | — | | | — | | | — | |
| Total distributions | | | | — | | | — | | | (5,666,762 | ) | | (5,821,704 | ) | | (5,371,141 | ) | | (5,169,204 | ) | | (691,893 | ) | | (784,013 | ) |
| |
| Trust Share Transactions | | | | | | | | | | | | | | | | | | | | | | | | | | |
| Proceeds from shares sold | | | | 13,850,464 | | | 42,552,656 | | | 2,595,020 | | | 8,118,552 | | | 2,665,531 | | | 8,401,510 | | | 782,081 | | | 2,155,159 | |
| Reinvestment of distributions | | | | — | | | — | | | 5,666,762 | | | 5,821,704 | | | 5,371,141 | | | 5,169,204 | | | 691,893 | | | 784,013 | |
| Cost of shares redeemed | | | | (16,949,717 | ) | | (43,527,282 | ) | | (2,775,622 | ) | | (5,450,729 | ) | | (3,456,537 | ) | | (5,742,002 | ) | | (1,035,034 | ) | | (2,850,062 | ) |
| |
| Net increase (decrease) from trust share transactions | | | | (3,099,253 | ) | | (974,626 | ) | | 5,486,160 | | | 8,489,527 | | | 4,580,135 | | | 7,828,712 | | | 438,940 | | | 89,110 | |
| |
| Net increase (decrease) in net assets | | | | (3,099,253 | ) | | (974,626 | ) | | 489,049 | | | 10,913,123 | | | 1,785,521 | | | 3,461,376 | | | (315,783 | ) | | 228,131 | |
| |
| Net Assets | | | | | | | | | | | | | | | | | | | | | | | | | | |
| Beginning of period | | | | 9,977,534 | | | 10,952,160 | | | 109,541,540 | | | 98,628,417 | | | 98,649,697 | | | 95,188,321 | | | 30,710,811 | | | 30,482,680 | |
| |
| End of period † | | | $ | 6,878,281 | | $ | 9,977,534 | | $ | 110,030,589 | | $ | 109,541,540 | | $ | 100,435,218 | | $ | 98,649,697 | | $ | 30,395,028 | | $ | 30,710,811 | |
| | | | | | | | | | | | | | | | | | | | | | | | | | | |
| †Includes undistributed net investment income of | | | $ | — | | $ | — | | $ | 1,034,576 | | $ | 1,821,748 | | $ | 1,731,358 | | $ | 4,654,859 | | $ | 259,266 | | $ | 691,883 | |
| |
| Trust Shares Issued and Redeemed | | | | | | | | | | | | | | | | | | | | | | | | | | |
| Sold | | | | 13,850,464 | | | 42,552,656 | | | 124,468 | | | 393,394 | | | 413,650 | | | 1,253,054 | | | 79,743 | | | 218,414 | |
| Issued for distributions reinvested | | | | — | | | — | | | 273,229 | | | 296,119 | | | 844,519 | | | 780,847 | | | 70,673 | | | 80,247 | |
| Redeemed | | | | (16,949,717 | ) | | (43,527,282 | ) | | (132,910 | ) | | (264,808 | ) | | (538,192 | ) | | (855,036 | ) | | (105,028 | ) | | (288,676 | ) |
| | | | | | | | | | | | | | | | | | | | | | | | | | | |
| Net increase (decrease) in trust shares outstanding | | | | (3,099,253 | ) | | (974,626 | ) | | 264,787 | | | 424,705 | | | 719,977 | | | 1,178,865 | | | 45,388 | | | 9,985 | |
| | |
| 104 | See notes to financial statements | 105 |
Statements of Changes in Net Assets
FIRST INVESTORS LIFE SERIES FUNDS
| | | | | | | | | | | | | | | | | | | | | | | | | | |
| | | | | | | | | | | | | | | | | | | | | | | | |
| | | | | | | | | | | | | | | |
| | | | | | | | | | | | | LIMITED DURATION | |
| | | | | GROWTH & INCOME | | | INTERNATIONAL | | | INVESTMENT GRADE | | | HIGH QUALITY BOND | |
| | | | | 1/1/15 to | | | 1/1/14 to | | | 1/1/15 to | | | 1/1/14 to | | | 1/1/15 to | | | 1/1/14 to | | | 1/1/15 to | | | 7/1/14 to | |
| | | | | 6/30/15 | | | 12/31/14 | | | 6/30/15 | | | 12/31/14 | | | 6/30/15 | | | 12/31/14 | | | 6/30/15 | | | 12/31/14 | * |
| Increase (Decrease) in Net Assets From Operations | | | | | | | | | | | | | | | | | | | | | | | | | | |
| Net investment income (loss) | | | $ | 3,260,901 | | $ | 5,622,556 | | $ | 1,157,471 | | $ | 1,463,608 | | $ | 990,296 | | $ | 1,701,642 | | $ | (5,648 | ) | $ | (32,501 | ) |
| Net realized gain (loss) on investments and | | | | | | | | | | | | | | | | | | | | | | | | | | |
| foreign currency transactions | | | | 18,055,201 | | | 25,731,545 | | | 1,259,821 | | | 2,973,428 | | | 391,664 | | | 1,216,895 | | | (1,056 | ) | | 233 | |
| Net unrealized appreciation (depreciation) of investments | | | | | | | | | | | | | | | | | | | | | | | | | | |
| and foreign currency transactions | | | | (9,210,424 | ) | | 4,161,730 | | | 1,171,840 | | | (1,381,288 | ) | | (1,485,634 | ) | | 538,790 | | | (2,369 | ) | | (6,408 | ) |
| |
| Net increase (decrease) in net assets resulting | | | | | | | | | | | | | | | | | | | | | | | | | | |
| from operations | | | | 12,105,678 | | | 35,515,831 | | | 3,589,132 | | | 3,055,748 | | | (103,674 | ) | | 3,457,327 | | | (9,073 | ) | | (38,676 | ) |
| |
| Distributions to Shareholders | | | | | | | | | | | | | | | | | | | | | | | | | | |
| Net investment income | | | | (5,622,525 | ) | | (5,573,499 | ) | | (1,462,160 | ) | | (1,447,791 | ) | | (2,627,252 | ) | | (2,449,388 | ) | | — | | | — | |
| Net realized gains | | | | (25,760,338 | ) | | (3,093,486 | ) | | — | | | — | | | — | | | — | | | — | | | — | |
| |
| Total distributions | | | | (31,382,863 | ) | | (8,666,985 | ) | | (1,462,160 | ) | | (1,447,791 | ) | | (2,627,252 | ) | | (2,449,388 | ) | | — | | | — | |
| |
| Trust Share Transactions | | | | | | | | | | | | | | | | | | | | | | | | | | |
| Proceeds from shares sold | | | | 3,107,839 | | | 9,943,269 | | | 2,079,457 | | | 5,628,877 | | | 2,004,481 | | | 5,433,008 | | | 955,742 | | | 2,619,930 | |
| Reinvestment of distributions | | | | 31,382,863 | | | 8,666,985 | | | 1,462,160 | | | 1,447,791 | | | 2,627,252 | | | 2,449,388 | | | — | | | — | |
| Cost of shares redeemed | | | | (14,496,856 | ) | | (27,285,089 | ) | | (2,768,053 | ) | | (5,892,325 | ) | | (2,217,170 | ) | | (4,251,021 | ) | | (60,523 | ) | | (19,995 | ) |
| |
| Net increase (decrease) from trust share transactions | | | | 19,993,846 | | | (8,674,835 | ) | | 773,564 | | | 1,184,343 | | | 2,414,563 | | | 3,631,375 | | | 895,219 | | | 2,599,935 | |
| |
| Net increase (decrease) in net assets | | | | 716,661 | | | 18,174,011 | | | 2,900,536 | | | 2,792,300 | | | (316,363 | ) | | 4,639,314 | | | 886,146 | | | 2,561,259 | |
| |
| Net Assets | | | | | | | | | | | | | | | | | | | | | | | | | | |
| Beginning of period | | | | 492,596,605 | | | 474,422,594 | | | 131,273,706 | | | 128,481,406 | | | 63,202,716 | | | 58,563,402 | | | 2,561,259 | | | — | |
| | | | | | | | | | | | | | | | | | | | | | | | | | | |
| End of period † | | | $ | 493,313,266 | | $ | 492,596,605 | | $ | 134,174,242 | | $ | 131,273,706 | | $ | 62,886,353 | | $ | 63,202,716 | | $ | 3,447,405 | | $ | 2,561,259 | |
| |
| †Includes undistributed net investment income (deficit) of | | | $ | 3,260,933 | | $ | 5,622,557 | | $ | 1,157,498 | | $ | 1,462,187 | | $ | (95,192 | ) | $ | 1,541,764 | | $ | (7,294 | ) | $ | (1,646 | ) |
| |
| Trust Shares Issued and Redeemed | | | | | | | | | | | | | | | | | | | | | | | | | | |
| Sold | | | | 66,577 | | | 218,789 | | | 96,725 | | | 265,505 | | | 182,875 | | | 490,396 | | | 98,093 | | | 265,066 | |
| Issued for distributions reinvested | | | | 678,695 | | | 197,516 | | | 67,381 | | | 69,372 | | | 241,253 | | | 226,167 | | | — | | | — | |
| Redeemed | | | | (309,464 | ) | | (600,449 | ) | | (129,010 | ) | | (277,543 | ) | | (200,564 | ) | | (384,124 | ) | | (6,194 | ) | | (2,037 | ) |
| | | | | | | | | | | | | | | | | | | | | | | | | | | |
| Net increase (decrease) in trust shares outstanding | | | | 435,808 | | | (184,144 | ) | | 35,096 | | | 57,334 | | | 223,564 | | | 332,439 | | | 91,899 | | | 263,029 | |
*From July 1, 2014 (commencement of operations) to December 31, 2014.
| | |
| 106 | See notes to financial statements | 107 |
Statements of Changes in Net Assets
FIRST INVESTORS LIFE SERIES FUNDS
| | | | | | | | | | | | | | | | | | | | | | | |
| | | | | | | | | | | | | | |
| | | | | | | | | | | | | | | |
| | | | | OPPORTUNITY | | | REAL ESTATE | | | SELECT GROWTH | | | SPECIAL SITUATIONS | |
| | | | | 1/1/15 to | | | 1/1/14 to | | | 5/1/15 to | | | 1/1/15 to | | | 1/1/14 to | | | 1/1/15 to | | | 1/1/14 to | |
| | | | | 6/30/15 | | | 12/31/14 | | | 6/30/15 | * | | 6/30/15 | | | 12/31/14 | | | 6/30/15 | | | 12/31/14 | |
| Increase (Decrease) in Net Assets From Operations | | | | | | | | | | | | | | | | | | | | | | | |
| Net investment income | | | $ | 75,448 | | $ | 60,296 | | $ | 12,804 | | $ | 158,051 | | $ | 167,049 | | $ | 290,243 | | $ | 1,331,338 | |
| Net realized gain (loss) on investments | | | | 556,347 | | | (326,693 | ) | | (1,532 | ) | | 2,986,209 | | | 2,393,581 | | | 12,637,592 | | | 9,214,245 | |
| Net unrealized appreciation (depreciation) | | | | | | | | | | | | | | | | | | | | | | | |
| of investments | | | | 1,072,070 | | | 1,563,896 | | | (207,876 | ) | | (1,004,205 | ) | | 2,427,906 | | | 4,028,218 | | | 1,898,988 | |
| | | | | | | | | | | | | | | | | | | | | | | | |
| Net increase (decrease) in net assets resulting | | | | | | | | | | | | | | | | | | | | | | | |
| from operations | | | | 1,703,865 | | | 1,297,499 | | | (196,604 | ) | | 2,140,055 | | | 4,988,536 | | | 16,956,053 | | | 12,444,571 | |
| |
| Distributions to Shareholders | | | | | | | | | | | | | | | | | | | | | | | |
| Net investment income | | | | (60,301 | ) | | — | | | — | | | (167,038 | ) | | (125,761 | ) | | (1,331,340 | ) | | (948,767 | ) |
| Net realized gains | | | | — | | | (7,787 | ) | | — | | | (2,393,572 | ) | | (41,015 | ) | | (9,169,641 | ) | | (33,976,971 | ) |
| |
| Total distributions | | | | (60,301 | ) | | (7,787 | ) | | — | | | (2,560,610 | ) | | (166,776 | ) | | (10,500,981 | ) | | (34,925,738 | ) |
| |
| Trust Share Transactions | | | | | | | | | | | | | | | | | | | | | | | |
| Proceeds from shares sold | | | | 7,562,801 | | | 13,087,780 | | | 3,528,491 | | | 2,644,153 | | | 5,841,359 | | | 1,621,238 | | | 5,127,856 | |
| Reinvestment of distributions | | | | 60,301 | | | 7,787 | | | — | | | 2,560,610 | | | 166,776 | | | 10,500,981 | | | 34,925,738 | |
| Cost of shares redeemed | | | | (816,058 | ) | | (532,614 | ) | | (647 | ) | | (1,239,023 | ) | | (2,249,337 | ) | | (5,917,477 | ) | | (9,841,042 | ) |
| |
| Net increase from trust share transactions | | | | 6,807,044 | | | 12,562,953 | | | 3,527,844 | | | 3,965,740 | | | 3,758,798 | | | 6,204,742 | | | 30,212,552 | |
| |
| Net increase in net assets | | | | 8,450,608 | | | 13,852,665 | | | 3,331,240 | | | 3,545,185 | | | 8,580,558 | | | 12,659,814 | | | 7,731,385 | |
| |
| Net Assets | | | | | | | | | | | | | | | | | | | | | | | |
| Beginning of period | | | | 27,479,849 | | | 13,627,184 | | | — | | | 43,586,763 | | | 35,006,205 | | | 208,945,509 | | | 201,214,124 | |
| |
| End of period † | | | $ | 35,930,457 | | $ | 27,479,849 | | $ | 3,331,240 | | $ | 47,131,948 | | $ | 43,586,763 | | $ | 221,605,323 | | $ | 208,945,509 | |
| |
| †Includes undistributed net investment income of | | | $ | 75,443 | | $ | 60,296 | | $ | 12,804 | | $ | 158,062 | | $ | 167,049 | | $ | 290,242 | | $ | 1,331,339 | |
| |
| Trust Shares Issued and Redeemed | | | | | | | | | | | | | | | | | | | | | | | |
| Sold | | | | 482,936 | | | 915,743 | | | 354,929 | | | 184,648 | | | 437,045 | | | 46,719 | | | 151,084 | |
| Issued for distributions reinvested. | | | | 3,867 | | | 552 | | | — | | | 180,198 | | | 12,878 | | | 307,676 | | | 1,082,297 | |
| Redeemed | | | | (52,231 | ) | | (37,007 | ) | | (65 | ) | | (86,399 | ) | | (168,982 | ) | | (170,002 | ) | | (291,150 | ) |
| |
| Net increase in trust shares outstanding | | | | 434,572 | | | 879,288 | | | 354,864 | | | 278,447 | | | 280,941 | | | 184,393 | | | 942,231 | |
*From May 1, 2015 (commencement of operations) to June 30, 2015.
| | |
| 108 | See notes to financial statements | 109 |
Statements of Changes in Net Assets
FIRST INVESTORS LIFE SERIES FUNDS
| | | | | | | | | | | | | | | | | | | |
| | | | | | | | | | | | | |
| | | | | | | | | | | | | | |
| | | | | | | | | | TARGET MATURITY 2015 | | | TOTAL RETURN | |
| | | | | | | | | | 1/1/15 to | | | 1/1/14 to | | | 1/1/15 to | | | 1/1/14 to | |
| | | | | | | | | | 6/30/15 | | | 12/31/14 | | | 6/30/15 | | | 12/31/14 | |
| Increase (Decrease) in Net Assets From Operations | | | | | | | | | | | | | | | | | | | |
| Net investment income | | | | | | | | $ | 394,510 | | $ | 884,671 | | $ | 171,960 | | $ | 199,218 | |
| Net realized gain (loss) on investments | | | | | | | | | 11,554 | | | 212,133 | | | 185,751 | | | (39,546 | ) |
| Net unrealized appreciation (depreciation) | | | | | | | | | | | | | | | | | | | |
| of investments | | | | | | | | | (428,136 | ) | | (1,096,401 | ) | | (18,191 | ) | | 1,077,249 | |
| | | | | | | | | | | | | | | | | | | | |
| Net increase (decrease) in net assets resulting | | | | | | | | | | | | | | | | | | | |
| from operations | | | | | | | | | (22,072 | ) | | 403 | | | 339,520 | | | 1,236,921 | |
| |
| Distributions to Shareholders | | | | | | | | | | | | | | | | | | | |
| Net investment income | | | | | | | | | (884,676 | ) | | (961,279 | ) | | (305,447 | ) | | (17,034 | ) |
| Net realized gains | | | | | | | | | (212,132 | ) | | (383,900 | ) | | — | | | — | |
| |
| Total distributions | | | | | | | | | (1,096,808 | ) | | (1,345,179 | ) | | (305,447 | ) | | (17,034 | ) |
| |
| Trust Share Transactions | | | | | | | | | | | | | | | | | | | |
| Proceeds from shares sold | | | | | | | | | 200,628 | | | 724,447 | | | 4,943,257 | | | 14,856,310 | |
| Reinvestment of distributions. | | | | | | | | | 1,096,808 | | | 1,345,179 | | | 305,447 | | | 17,034 | |
| Cost of shares redeemed | | | | | | | | | (1,714,288 | ) | | (3,726,820 | ) | | (773,848 | ) | | (939,053 | ) |
| |
| Net increase (decrease) from trust share transactions | | | | | | | | | (416,852 | ) | | (1,657,194 | ) | | 4,474,856 | | | 13,934,291 | |
| |
| Net increase (decrease) in net assets | | | | | | | | | (1,535,732 | ) | | (3,001,970 | ) | | 4,508,929 | | | 15,154,178 | |
| |
| Net Assets | | | | | | | | | | | | | | | | | | | |
| Beginning of period | | | | | | | | | 17,753,928 | | | 20,755,898 | | | 28,596,473 | | | 13,442,295 | |
| |
| End of period † | | | | | | | | $ | 16,218,196 | | $ | 17,753,928 | | $ | 33,105,402 | | $ | 28,596,473 | |
| |
| †Includes undistributed net investment income of | | | | | | | | $ | 394,505 | | $ | 884,671 | | $ | 70,527 | | $ | 204,014 | |
| |
| Trust Shares Issued and Redeemed | | | | | | | | | | | | | | | | | | | |
| Sold | | | | | | | | | 15,013 | | | 52,786 | | | 396,261 | | | 1,245,483 | |
| Issued for distributions reinvested | | | | | | | | | 85,621 | | | 98,260 | | | 24,416 | | | 1,461 | |
| Redeemed | | | | | | | | | (131,957 | ) | | (267,514 | ) | | (62,100 | ) | | (78,453 | ) |
| |
| Net increase (decrease) in trust shares outstanding | | | | | | | | | (31,323 | ) | | (116,468 | ) | | 358,577 | | | 1,168,491 | |
| | |
| 110 | See notes to financial statements | 111 |
Notes to Financial Statements
FIRST INVESTORS LIFE SERIES FUNDS
June 30, 2015
1. Significant Accounting Policies—First Investors Life Series Funds, a Delaware statutory trust (“the Trust”), is registered under the Investment Company Act of 1940 (the “1940 Act”) as an open-end management investment company. The Trust operates as a series fund, issuing shares of beneficial interest in the Cash Management Fund, Equity Income Fund, Fund For Income, Government Fund, Growth & Income Fund, International Fund, Investment Grade Fund, Limited Duration High Quality Bond Fund, Opportunity Fund, Real Estate Fund, Select Growth Fund, Special Situations Fund, Target Maturity 2015 Fund and Total Return Fund (each a “Fund”, collectively, “the Funds”), and accounts separately for the assets, liabilities and operations of each Fund. Each Fund is diversified except for Real Estate Fund which is non-diversified. The objective of each Fund as of June 30, 2015 is as follows:
Cash Management Fund seeks to earn a high rate of current income consistent with the preservation of capital and maintenance of liquidity.
Equity Income Fund seeks total return.
Fund For Income seeks high current income.
Government Fund seeks to achieve a significant level of current income which is consistent with security and liquidity of principal.
Growth & Income Fund seeks long-term growth of capital and current income.
International Fund primarily seeks long-term capital growth.
Investment Grade Fund seeks to generate a maximum level of income consistent with investment in investment grade debt securities.
Limited Duration High Quality Bond Fund seeks current income consistent with low volatility of principal.
Opportunity Fund seeks long-term capital growth.
Real Estate Fund seeks total return.
Select Growth Fund seeks long-term growth of capital.
Special Situations Fund seeks long-term growth of capital.
Target Maturity 2015 Fund seeks a predictable compounded investment return for investors who hold their Fund shares until the Fund’s maturity, consistent with the preservation of capital.
Total Return Fund seeks high, long-term total investment return consistent with moderate investment risk.
A. Security Valuation—Except as provided below, a security listed or traded on an exchange or the Nasdaq Stock Market is valued at its last sale price on the exchange or market where the security is principally traded, and lacking any sales, the security is valued at the mean between the closing bid and asked prices. Securities traded in the over-the-counter (“OTC”) market (including securities listed on exchanges whose primary market is believed to be OTC) are valued at the mean between the last bid and asked prices based on quotes furnished by a market maker for such securities or an authorized pricing service. Fixed income securities, other than short-term debt securities held by the Cash Management Fund, are priced based upon valuations that are provided by a pricing service. Other securities may also be priced based upon valuations that are provided by pricing services approved by the Trust’s Board of Trustees (“the Board”). The pricing services consider security type, rating, market condition and yield data as well as market quotations, prices provided by market makers and other available information in determining value.
The Funds monitor for significant events occurring prior to the close of trading on the New York Stock Exchange that could have a material impact on the value of any securities that are held by the Funds. Examples of such events include trading halts, natural disasters, political events and issuer-specific developments. If the Valuation Committee of First Investors Management Company, Inc. (“FIMCO”) decides that such events warrant using fair value estimates, it will take such events into consideration in determining the fair values of such securities. If market quotations or prices are not readily available or determined to be unreliable, the securities will be valued at fair value as determined in good faith pursuant to procedures adopted by the Board. The Funds also use estimates from a pricing service to fair value foreign equity securities in the event that fluctuations in U.S. securities markets exceed a predetermined level or if a foreign market is closed. For valuation purposes, where applicable, quotations of foreign securities in foreign currencies are translated to U.S. dollar equivalents using the foreign exchange quotation in effect.
The Cash Management Fund values its portfolio securities in accordance with the amortized cost method of valuation under Rule 2a-7 under the 1940 Act. Amortized cost is an approximation of market value of an instrument, whereby the difference between its acquisition cost and market value at maturity is amortized on a straight-line basis over the remaining life of the instrument. The effect of changes in the market value of a security as a result of fluctuating interest rates is not taken into account and thus the amortized cost method of valuation may result in the value of a security being higher or lower than its actual market value.
In accordance with Accounting Standards Codification 820 “Fair Value Measurements and Disclosures” (“ASC 820”), investments held by the Funds are carried at “fair
Notes to Financial Statements (continued)
FIRST INVESTORS LIFE SERIES FUNDS
June 30, 2015
value”. As defined by ASC 820, fair value is the price that a fund would receive upon selling an investment in an orderly transaction to an independent buyer in the principal or most advantageous market for the investment under current market conditions. Various inputs are used in determining the value of the Funds’ investments.
In addition to defining fair value, ASC 820 established a three-tier hierarchy of inputs to establish a classification of fair value measurements for disclosure purposes. The three-tier hierarchy of inputs is summarized in the three broad Levels listed below:
Level 1 – Unadjusted quoted prices in active markets for identical securities that the Fund has the ability to access.
Level 2 – Observable inputs other than quoted prices included in Level 1 that are observable for the asset or liability, either directly or indirectly. These inputs may include quoted prices for the identical instrument on an inactive market, prices for similar instruments, interest rates, prepayment speeds, credit risk, yield curves, default rates and similar data.
Level 3 – Unobservable inputs for the asset or liability, to the extent relevant observable inputs are not available, representing the Fund’s own assumption about the assumptions a market participant would use in valuing the asset or liability, and would be based on the best information available.
Equity securities traded on an exchange or the Nasdaq Stock Market are categorized in Level 1 of the fair value hierarchy to the extent that they are actively traded and valuation adjustments are not applied. Foreign securities that are fair valued in the event that fluctuations in U.S. securities markets exceed a predetermined level or if a foreign market is closed are categorized in Level 2. Corporate and municipal bonds, asset backed, U.S. Government and U.S. Government Agency securities, pass-through certificates and loan participations are categorized in Level 2 to the extent that the inputs are observable and timely, otherwise they would be categorized in Level 3. Short-term notes that are valued at amortized cost by the Cash Management Fund are categorized in Level 2. Foreign exchange contracts that are considered derivative instruments and are valued at the net unrealized appreciation or depreciation on the instruments are categorized in Level 2. Restricted securities and securities that are fair valued by the Valuation Committee may be categorized in either Level 2 or Level 3 of the fair value hierarchy depending on the relative significance of the unobservable valuation inputs.
The aggregate value by input level, as of June 30, 2015, for each Fund’s investments is included following each Fund’s portfolio of investments.
B. Federal Income Tax—No provision has been made for federal income taxes on net income or capital gains since it is the policy of each Fund to continue to comply with
the special provisions of the Internal Revenue Code applicable to investment companies, and to make sufficient distributions of income and capital gains (in excess of any available capital loss carryovers), to relieve each Fund from all, or substantially all, federal income taxes. At December 31, 2014, capital loss carryovers were as follows:
| | | | | | | | | | | | | | |
| | | | | | | | | | | | | Not Subject |
| | | Year Capital Loss Carryovers Expire | | to Expiration |
| Fund | | | Total | | 2015 | | 2016 | | 2017 | | 2018 | | Long Term | | Short Term |
| Fund For Income | | $19,630,623 | | $433,726 | | $3,694,844 | | $15,502,053 | | $ — | | $ — | | $ — |
| Government | | 587,472 | | 37,942 | | — | | — | | — | | — | | 549,530 |
| International | | 11,232,146 | | — | | 1,810,164 | | 8,389,229 | | 1,032,753 | | — | | — |
| Investment Grade | | 1,905,026 | | — | | 759,925 | | 1,145,101 | | — | | — | | — |
| Opportunity | | 288,052 | | — | | — | | — | | — | | — | | 288,052 |
| Total Return | | 40,068 | | — | | — | | — | | — | | — | | 40,068 |
As a result of the passage of the Regulated Investment Company Modernization Act of 2010 (“the Modernization Act of 2010”), losses incurred in this fiscal year and beyond retain their character as short-term or long-term, have no expiration date and are utilized prior to capital loss carryovers occurring prior to the enactment of the Modernization Act of 2010.
The Funds recognize the tax benefits of uncertain tax positions only where the position is “more likely than not” to be sustained assuming examination by tax authorities. Management has analyzed the Funds’ tax positions, and has concluded that no liability for unrecognized tax benefits should be recorded related to uncertain tax positions taken on returns filed for open tax years 2012 – 2014, or expected to be taken in the Funds’ 2015 tax returns. The Funds identify their major tax jurisdictions as U.S. Federal, New York State, New York City and foreign jurisdictions where the Funds make significant investments; however, the Funds are not aware of any tax position for which it is reasonably possible that the total amounts of unrecognized tax benefits will change materially in the next twelve months.
C. Foreign Currency Translations and Transactions—The accounting records of the International Fund (the “Fund”) are maintained in U.S. dollars. Portfolio securities and other assets and liabilities denominated in foreign currencies are translated into U.S. dollars at the date of valuation. Purchases and sales of investment securities, dividend income and certain expenses are translated to U.S. dollars at the prevailing rates of exchange on the respective dates of such transactions.
The Fund does not isolate that portion of gains and losses on investments which is due to changes in foreign exchange rates from that which is due to changes in market prices of the investments. These changes are included with the net realized and unrealized gains and losses from investments.
Notes to Financial Statements (continued)
FIRST INVESTORS LIFE SERIES FUNDS
June 30, 2015
Net realized and unrealized gains and losses on foreign currency transactions include gains and losses from the sales of spot currency transactions and gains and losses on accrued foreign dividends and related withholding taxes.
D. Distributions to Shareholders—The Separate Accounts, which own the shares of the Funds, will receive all dividends and other distributions by them. All dividends and distributions are reinvested by the Separate Accounts in additional shares of the distributing Funds. Distributions to shareholders from net investment income and net realized capital gains are generally declared and paid annually on all Funds, except for the Cash Management Fund which declares dividends, if any, from the total of net investment income (plus or minus all realized short-term gains and losses on investments) daily and pays monthly. Dividends from net investment income and capital gain distributions are determined in accordance with income tax regulations which may differ from accounting principles generally accepted in the United States of America. These differences are primarily due to differing treatments for capital loss carryforwards, deferral of wash sale losses, late loss deferrals, post-October capital losses, net operating losses and foreign currency transactions.
E. Expense Allocation—Expenses directly charged or attributable to a Fund are paid from the assets of that Fund. General expenses of the Trust are allocated among and charged to the assets of each Fund on a fair and equitable basis, which may be based on the relative assets of each Fund or the nature of the services performed and relative applicability to each Fund.
F. Use of Estimates—The preparation of the financial statements in conformity with accounting principles generally accepted in the United States of America requires management to make estimates and assumptions that affect the reported amounts of assets and liabilities at the date of the financial statements and the reported amounts of revenue and expense during the reporting period. Actual results could differ from those estimates.
G. Other—Security transactions are generally accounted for on the first business day following the date the securities are purchased or sold, except for financial reporting purposes which is trade date. Investments in securities issued on a when-issued or delayed delivery basis are generally reflected in the assets of the Funds on the first business day following the date the securities are purchased and the Funds segregate assets for these transactions. Cost of securities is determined and gains and losses are based on the identified cost basis for securities for both financial statement and federal income tax purposes. Dividend income is recorded on the ex-dividend date or for certain foreign dividends, as soon as the Fund becomes aware of the dividends. Interest income and estimated expenses are accrued daily. Bond discounts and premiums are accreted or amortized using the interest method. Interest income on zero coupon
bonds and step bonds is accrued daily at the effective interest rate. Withholding taxes on foreign dividends have been provided in accordance with the Funds’ understanding of the applicable country’s tax rules and rates. The Bank of New York Mellon serves as custodian for the Funds and may provide credits against custodian charges based on uninvested cash balances of the Funds. For the six months ended June 30, 2015, the Funds received credits in the amount of $447. For the period January 1, 2015 through March 15, 2015, Brown Brothers Harriman & Co. served as custodian for the Equity Income, Growth & Income, International, Opportunity, Select Growth, Special Situations and Total Return Funds. As of March 16, 2015, the Bank of New York Mellon serves as custodian for all the Funds. Certain of the Funds reduced expenses through brokerage service arrangements. For the six months ended June 30, 2015, the Equity Income, Growth & Income, Opportunity, Special Situations and Total Return Funds’ expenses were reduced by a total of $3,165 under these arrangements.
2. Trust Shares—The Trust is authorized to issue an unlimited number of shares of beneficial interest without par value. The Trust consists of the Funds listed on the cover page, each of which is a separate and distinct series of the Trust. Shares in the Funds are acquired through the purchase of variable annuity or variable life insurance contracts for which a Fund is an investment option.
3. Security Transactions—For the six months ended June 30, 2015, purchases and sales of securities and long-term U.S. Government obligations (excluding U.S. Treasury bills, short-term securities and foreign currencies, were as follows:
| | | | | | | | |
| | | | | | | Long-Term U.S. |
| | | Securities | | Government Obligations |
| | | Cost of | | Proceeds | | Cost of | | Proceeds |
| Fund | | | Purchases | | of Sales | | Purchases | | of Sales |
| Equity Income | | $16,526,429 | | $12,676,674 | | $ — | | $ — |
| Fund For Income | | 30,666,933 | | 27,365,062 | | — | | — |
| Government | | 7,606,036 | | 10,067,681 | | 5,669,897 | | 2,866,709 |
| Growth & Income | | 58,655,735 | | 66,131,054 | | — | | — |
| International | | 14,444,266 | | 13,289,096 | | — | | — |
| Investment Grade | | 13,408,989 | | 13,146,158 | | 962,219 | | — |
| Limited Duration | | | | | | | | |
| High Quality Bond | | 3,349,071 | | 2,151,046 | | 220,064 | | 501,210 |
| Opportunity | | 12,471,972 | | 6,401,815 | | — | | — |
| Real Estate | | 3,512,688 | | 207,608 | | — | | — |
| Select Growth | | 13,727,856 | | 12,537,724 | | — | | — |
| Special Situations | | 47,325,022 | | 51,267,814 | | — | | — |
| Target Maturity 2015 | | 1,128,756 | | 2,723,682 | | — | | — |
| Total Return | | 8,768,122 | | 4,430,786 | | 351,803 | | 503,687 |
Notes to Financial Statements (continued)
FIRST INVESTORS LIFE SERIES FUNDS
June 30, 2015
At June 30, 2015, aggregate cost and net unrealized appreciation (depreciation) of securities for federal income tax purposes were as follows:
| | | | | | | | |
| | | | | | | | | Net |
| | | | | Gross | | Gross | | Unrealized |
| | | Aggregate | | Unrealized | | Unrealized | | Appreciation |
| Fund | | | Cost | | Appreciation | | Depreciation | | (Depreciation) |
| Equity Income | | $ 80,231,025 | | $ 29,237,353 | | $1,833,667 | | $ 27,403,686 |
| Fund For Income | | 97,537,614 | | 1,371,712 | | 1,885,139 | | (513,427) |
| Government | | 29,819,461 | | 367,088 | | 499,876 | | (132,788) |
| Growth & Income | | 297,014,868 | | 203,984,363 | | 8,433,267 | | 195,551,096 |
| International | | 98,253,754 | | 37,925,170 | | 2,894,553 | | 35,030,617 |
| Investment Grade | | 60,883,998 | | 1,103,748 | | 967,352 | | 136,396 |
| Limited Duration | | | | | | | | |
| High Quality Bond | | 3,347,748 | | 1,646 | | 24,777 | | (23,131) |
| Opportunity | | 30,064,837 | | 5,338,033 | | 1,043,430 | | 4,294,603 |
| Real Estate | | 3,303,548 | | 1,258 | | 209,134 | | (207,876) |
| Select Growth | | 33,979,824 | | 12,178,416 | | 642,826 | | 11,535,590 |
| Special Situations | | 172,829,281 | | 51,446,945 | | 5,226,199 | | 46,220,746 |
| Target Maturity 2015 | | 15,944,640 | | 269,631 | | — | | 269,631 |
| Total Return | | 31,224,505 | | 2,631,424 | | 872,742 | | 1,758,682 |
4. Advisory Fee and Other Transactions With Affiliates—Certain officers of the Trust are officers of the Trust’s investment adviser, FIMCO and its transfer agent, Administrative Data Management Corp. (“ADM”). Trustees of the Trust who are not officers or directors of FIMCO or its affiliates are remunerated by the Funds. For the six months ended June 30, 2015, total trustee fees accrued by the Funds amounted to $34,867.
The Investment Advisory Agreement provides as compensation to FIMCO for each Fund, an annual fee, payable monthly, at the rate of .75% on the first $250 million of each Fund’s average daily net assets, .72% on the next $250 million, .69% on the next $250 million, .66% on the next $500 million, declining by .02% on each $500 million thereafter, down to .60% on average daily net assets over $2.25 billion. For the six months ended June 30, 2015, FIMCO has voluntarily waived advisory fees in the amount of $22,790 on Government Fund, $47,258 on Investment Grade Fund, $2,248 on Limited Duration High Quality Bond Fund and $12,600 on Target Maturity 2015 Fund in order to limit the advisory fees on these Funds to .60% of their average daily net assets. During the six months ended June 30, 2015, FIMCO has voluntarily waived the Cash Management Fund’s entire advisory fee of $28,745 and assumed $11,320 of other Fund expenses to prevent a negative yield on the Fund’s shares. For the six months ended June 30, 2015, total advisory fees accrued to FIMCO were $4,796,235 of which $113,641 was voluntarily waived by FIMCO as noted above.
Muzinich & Co., Inc. serves as investment subadviser to Fund For Income, Vontobel Asset Management, Inc. serves as investment subadviser to International Fund and Smith Asset Management Group, L.P. serves as investment subadviser to Select Growth Fund. The subadvisers are paid by FIMCO and not by the Funds.
5. Restricted Securities—Certain restricted securities are exempt from the registration requirements under Rule 144A of the Securities Act of 1933 and may only be sold to qualified institutional investors. Unless otherwise noted, 144A securities are deemed to be liquid. At June 30, 2015, the Fund For Income held one hundred thirty-four 144A securities with an aggregate value of $37,921,664 representing 37.8% of the Fund’s net assets, the Government Fund held one 144A security with a value of $185,745 representing .6% of the Fund’s net assets, the Investment Grade Fund held nineteen 144A securities with an aggregate value of $7,021,757 representing 11.2% of the Fund’s net assets, the Limited Duration High Quality Bond Fund held one 144A security with a value of $114,197 representing 3.3% of the Fund’s net assets and the Total Return Fund held six 144A securities with an aggregate value of $639,206 representing 1.9% of the Fund’s net assets. Certain restricted securities are exempt from the registration requirements under Section 4(2) of the Securities Act of 1933 and may only be sold to qualified investors. Unless otherwise noted, these Section 4(2) securities are deemed to be liquid. At June 30, 2015, the Cash Management Fund held seven Section 4(2) securities with an aggregate value of $2,299,501 representing 33.4% of the Fund’s net assets. These securities are valued as set forth in Note 1A.
6. Derivatives—Some of the Funds may invest in derivatives such as futures contracts and options on futures contracts (“options”), to increase income, hedge against changes in interest rates or enhance potential return.
The Funds may enter into interest rate futures contracts on U.S. Treasury obligations and options thereon that are traded on a U.S. exchange. An interest rate futures contract provides for the future sale by one party and the purchase by another party of a specified amount of a particular financial instrument (debt security) at a specified price, date, time and place. Such investments may be used for, among other purposes, the purpose of hedging against changes in the value of a Fund’s portfolio securities due to anticipated changes in interest rates and market conditions. A public market exists for interest rate futures contracts covering a number of debt securities, including long-term U.S. Treasury Bonds, 10-year U.S. Treasury Notes and three-month U.S. Treasury Bills. No price is paid upon entering into futures contracts. Instead, upon entering into a futures contract, the Funds are required to deposit with their custodian in a segregated account in the name of the futures broker through which the transaction is effected an amount of cash or U.S. Government securities generally equal to 3%-5% or less of the contract value. This amount is known as “initial margin.”
Notes to Financial Statements (continued)
FIRST INVESTORS LIFE SERIES FUNDS
June 30, 2015
An option on an interest rate futures contract generally gives the purchaser the right, in return for the premium paid, to assume a position in a futures contract at a specified exercise price at any time prior to the expiration date of the option. The Funds may purchase put and call options on interest rate futures contracts on U.S. Treasury obligations which are traded on a U.S. exchange as a hedge against changes in interest rates, and may enter into closing transactions with respect to such options to terminate existing positions. There is no guarantee such closing transactions can be effected. When writing a call or put option on a futures contract, margin also must be deposited in accordance with applicable exchange rules. Initial margin on futures contracts is in the nature of a performance bond or good-faith deposit that is returned to a Fund upon termination of the transaction, assuming all obligations have been satisfied. Under certain circumstances, such as periods of high volatility, a Fund may be required by an exchange to increase the level of its initial margin payment. Subsequent payments, called “variation margin,” to and from the broker, are made on a daily basis as the value of the futures position varies, a process known as “marking to market.” Variation margin does not involve borrowing to finance the futures transactions, but rather represents a daily settlement of a Fund’s obligation to or from a clearing organization. A Fund is also obligated to make initial and variation margin payments when it writes options on futures contracts.
To the extent that a Fund participates in the futures or options markets, it will incur investment risks and transaction costs to which it would not be subject absent the use of these strategies. The use of these strategies involves certain special risks, including: (1) dependence on the ability of the Funds’ investment adviser, FIMCO to predict correctly movements in the direction of interest rates and securities prices; (2) imperfect correlation between the price of futures contracts and options thereon and movements in the prices of the securities or currencies being hedged; (3) the fact that skills needed to use these strategies are different from those needed to select portfolio securities; (4) the leverage (if any) that is created by investing in the option or futures contract; and (5) the possible absence of a liquid secondary market for any particular instrument at any time. If FIMCO’s prediction of movements in the direction of the securities and interest rate markets is inaccurate, the adverse consequences to that Fund may leave it in a worse position than if such strategies were not used. For the six months ended June 30, 2015, the Funds had no investments in interest rate futures contracts or options.
7. High Yield Credit Risk—The investments of Fund For Income in high yield securities, whether rated or unrated, may be considered speculative and subject to greater market fluctuations and risks of loss of income and principal than lower-yielding, higher-rated, fixed-income securities. The risk of loss due to default by the issuer may be significantly greater for the holders of high-yielding securities, because
such securities are generally unsecured and are often subordinated to other creditors of the issuer.
8. Litigation—The Blue Chip and Equity Income Funds have been named, and have received notice that they may be putative members of the proposed defendant class of shareholders, in a lawsuit filed in the United States Bankruptcy Court for the District of Delaware on November 1, 2010, by the Official Committee of Unsecured Creditors of Tribune Company (the “Committee”). The Committee is seeking to recover all payments made to beneficial owners of common stock in connection with a leveraged buyout of the Tribune Company (“LBO”), including payments made in connection with a 2007 tender offer into which the Blue Chip and Equity Income Funds tendered their shares of common stock of the Tribune Company. On December 9, 2011, the Blue Chip Fund was reorganized into the Growth & Income Fund pursuant to a Plan of Reorganization and Termination, whereby all of the assets of the Blue Chip Fund were transferred to the Growth & Income Fund, the Growth & Income Fund assumed all of the liabilities of the Blue Chip Fund, including any contingent liabilities with respect to pending or threatened litigation or actions, and shareholders of Blue Chip Fund became shareholders of Growth & Income Fund. The adversary proceeding brought by the Committee has been transferred to the Southern District of New York and administratively consolidated with other similar suits as discussed below. In addition, on June 2, 2011, the Blue Chip and Equity Income Funds were named as defendants in a lawsuit brought in connection with the Tribune Company’s LBO by Deutsche Bank Trust Company Americas, in its capacity as successor indenture trustee for a certain series of Senior Notes, Law Debenture Trust Company of New York, in its capacity as successor indenture trustee for a certain series of Senior Notes, and Wilmington Trust Company, in its capacity as successor indenture trustee for the PHONES Notes (together, the “Bondholder Plaintiffs”) in the Supreme Court of the State of New York. The Blue Chip and Equity Income Funds have also been named in a similar suit filed on behalf of participants in Tribune defined-compensation plans (the “Retiree Plaintiffs”). As with the Bondholder Plaintiffs and the Committee, the Retiree Plaintiffs seek to recover payments of the proceeds of the LBO. (All of these suits have been removed to the United States District Court for the Southern District of New York and administratively consolidated with other substantially similar suits against other former Tribune shareholders (the “MDL Proceeding”)). On September 23, 2013, the Judge in the MDL Proceeding dismissed various state law constructive fraudulent transfer suits, resulting in the Funds being dismissed from the Bondholder and Retiree Plaintiffs’ actions. On September 30, 2013, counsel for the plaintiffs in those suits appealed the MDL Judge’s dismissal ruling to the Second Circuit. The extent of the Funds’ potential liability in any such actions has not been determined. The Funds have been advised by counsel that the Funds could be held
Notes to Financial Statements (continued)
FIRST INVESTORS LIFE SERIES FUNDS
June 30, 2015
liable to return all or part of the proceeds received in any of these actions, as well as interest and court costs, even though the Funds had no knowledge of, or participation in, any misconduct. The Equity Income Fund received proceeds of $376,754 in connection with the LBO, representing 0.34% of its net assets as of June 30, 2015. The Blue Chip Fund received proceeds of $288,456 in connection with the LBO, representing 0.06% of the net assets of Growth & Income Fund as of June 30, 2015. The Equity Income and Growth & Income Funds cannot predict the outcomes of these proceedings, and thus have not accrued any of the amounts sought in the various actions in the accompanying financial statements.
9. Subsequent Events—Subsequent events occurring after June 30, 2015 have been evaluated for potential impact to this report through the date the financial statements were issued. There were no subsequent events to report that would have a material impact on the Funds’ financial statements.
|
| This page left intentionally blank. |
Financial Highlights
FIRST INVESTORS LIFE SERIES FUNDS
The following table sets forth the per share operating performance data for a trust share outstanding,
total return, ratios to average net assets and other supplemental data for each year ended December 31
except as otherwise indicated.
| | | | | | | | | | | | | | | | | | | | | | | | | | | | | | |
| | |
| | | | | | PER SHARE DATA | | | | | | | | | | RATIOS/SUPPLEMENTAL DATA | | | | | |
| | | | | | | | | | Less Distributions | | | | | | | | | | | | | | Ratio to Average Net | | | |
| | | | Investment Operations | | from | | | | | | | | | | Ratio to Average | | Assets Before Expenses | | | |
| | Net Asset | | | | Net Realized | | | | | | | | | | Net Asset | | | | | | Net Assets** | | Waived or Assumed | | | |
| | Value, | | Net | | and Unrealized | | Total from | | Net | | Net | | | | Value, | | | | Net Assets | | Expenses | | Net | | | | Net | | Portfolio | |
| | Beginning | | Investment | | Gain (Loss) on | | Investment | | Investment | | Realized | | Total | | End | | Total | | End of Period | | Before Fee | | Investment | | | | Investment | | Turnover | |
| | of Period | | Income | | Investments | | Operations | | Income | | Gains | | Distributions | | of Period | | Return | * | (in millions | ) | Credits | *** | Income | | Expenses | *** | Income (Loss | ) | Rate | |
| | |
| CASH MANAGEMENT FUND | | | | | | | | | | | | | | | | | | | | | | | | | |
| 2010 | $ 1.00 | | — | | — | | — | | — | | — | | — | | $ 1.00 | | .00 | % | $ 12 | | .23 | %(a) | .00 | % | 1.04 | % | (.81 | )% | N/A | |
| 2011 | 1.00 | | — | | — | | — | | — | | — | | — | | 1.00 | | .00 | | 12 | | .13 | (a) | .00 | | .99 | | (.86 | ) | N/A | |
| 2012 | 1.00 | | — | | — | | — | | — | | — | | — | | 1.00 | | .00 | | 12 | | .12 | (a) | .00 | | .99 | | (.87 | ) | N/A | |
| 2013 | 1.00 | | — | | — | | — | | — | | — | | — | | 1.00 | | .00 | | 11 | | .10 | (a) | .00 | | .99 | | (.89 | ) | N/A | |
| 2014 | 1.00 | | — | | — | | — | | — | | — | | — | | 1.00 | | .00 | | 10 | | .08 | (a) | .00 | | .99 | | (.91 | ) | N/A | |
| 2015(h) | 1.00 | | — | | — | | — | | — | | — | | — | | 1.00 | | .00 | †† | 7 | | .10 | (a)† | .00 | † | 1.14 | † | (1.04 | )† | N/A | |
| | |
| EQUITY INCOME FUND(b) | | | | | | | | | | | | | | | | | | | | | | | |
| 2010 | $13.46 | | $.31 | | $1.58 | | $ 1.89 | | $.29 | | $ — | | $ .29 | | $15.06 | | 14.32 | % | $ 71 | | .86 | % | 2.25 | % | N/A | | N/A | | 21 | % |
| 2011 | 15.06 | | .30 | | (.06 | ) | .24 | | .31 | | — | | .31 | | 14.99 | | 1.53 | | 69 | | .87 | | 1.94 | | N/A | | N/A | | 32 | |
| 2012 | 14.99 | | .38 | | 1.29 | | 1.67 | | .30 | | — | | .30 | | 16.36 | | 11.20 | | 74 | | .87 | | 2.37 | | N/A | | N/A | | 39 | |
| 2013 | 16.36 | | .36 | | 4.55 | | 4.91 | | .38 | | — | | .38 | | 20.89 | | 30.53 | | 99 | | .82 | | 1.97 | | N/A | | N/A | | 31 | |
| 2014 | 20.89 | | .35 | | 1.28 | | 1.63 | | .36 | | .87 | | 1.23 | | 21.29 | | 8.26 | | 110 | | .81 | | 1.76 | | N/A | | N/A | | 25 | |
| 2015(h) | 21.29 | | .19 | | (.04 | ) | .15 | | .35 | | .75 | | 1.10 | | 20.34 | | .60 | †† | 110 | | .82 | † | 1.87 | † | N/A | | N/A | | 12 | †† |
| | |
| FUND FOR INCOME(c) | | | | | | | | | | | | | | | | | | | | | | | | | |
| 2010 | $ 6.24 | | $.48 | | $ .31 | | $ .79 | | $.49 | | — | | $ .49 | | $ 6.54 | | 13.71 | % | $ 71 | | .87 | % | 7.43 | % | N/A | | N/A | | 71 | % |
| 2011 | 6.54 | | .43 | | (.07 | ) | .36 | | .48 | | — | | .48 | | 6.42 | | 5.66 | | 74 | | .88 | | 6.68 | | N/A | | N/A | | 63 | |
| 2012 | 6.42 | | .41 | | .42 | | .83 | | .44 | | — | | .44 | | 6.81 | | 13.51 | | 84 | | .88 | | 6.11 | | N/A | | N/A | | 61 | |
| 2013 | 6.81 | | .36 | | .09 | | .45 | | .42 | | — | | .42 | | 6.84 | | 6.88 | | 95 | | .88 | | 5.37 | | N/A | | N/A | | 56 | |
| 2014 | 6.84 | | .34 | | (.28 | ) | .06 | | .37 | | — | | .37 | | 6.53 | | .79 | | 99 | | .85 | | 4.88 | | N/A | | N/A | | 41 | |
| 2015(h) | 6.53 | | .15 | | .03 | | .18 | | .36 | | — | | .36 | | 6.35 | | 2.68 | †† | 100 | | .86 | † | 4.90 | † | N/A | | N/A | | 28 | †† |
| | |
| GOVERNMENT FUND | | | | | | | | | | | | | | | | | | | | | | | | | | | | | |
| 2010 | $10.29 | | $.32 | | $ .16 | | $ .48 | | $.42 | | — | | $ .42 | | $10.35 | | 4.82 | % | $ 28 | | .78 | % | 3.11 | % | .93 | % | 2.96 | % | 54 | % |
| 2011 | 10.35 | | .28 | | .26 | | .54 | | .36 | | — | | .36 | | 10.53 | | 5.41 | | 29 | | .81 | | 2.70 | | .96 | | 2.55 | | 33 | |
| 2012 | 10.53 | | .20 | | — | | .20 | | .31 | | — | | .31 | | 10.42 | | 1.95 | | 32 | | .75 | | 2.10 | | .90 | | 1.95 | | 46 | |
| 2013 | 10.42 | | .18 | | (.43 | ) | (.25 | ) | .27 | | — | | .27 | | 9.90 | | (2.47 | ) | 30 | | .76 | | 1.76 | | .91 | | 1.61 | | 118 | |
| 2014 | 9.90 | | .18 | | .13 | | .31 | | .26 | | — | | .26 | | 9.95 | | 3.14 | | 31 | | .74 | | 1.82 | | .89 | | 1.67 | | 103 | |
| 2015(h) | 9.95 | | .08 | | (.10 | ) | (.02 | ) | .23 | | — | | .23 | | 9.70 | | (.27 | )†† | 30 | | .77 | † | 1.71 | † | .92 | † | 1.56 | † | 43 | †† |
| | |
| GROWTH & INCOME FUND | | | | | | | | | | | | | | | | | | | | | | | | | |
| 2010 | $24.69 | | $.50 | | $3.45 | | $ 3.95 | | $.27 | | $ — | | $ .27 | | $28.37 | | 16.19 | % | $207 | | .82 | % | 1.91 | % | N/A | | N/A | | 27 | % |
| 2011 | 28.37 | | .44 | | .25 | | .69 | | .50 | | — | | .50 | | 28.56 | | 2.37 | | 321 | | .81 | | 1.51 | | N/A | | N/A | | 26 | |
| 2012 | 28.56 | | .61 | | 4.35 | | 4.96 | | .44 | | — | | .44 | | 33.08 | | 17.45 | | 357 | | .80 | | 1.87 | | N/A | | N/A | | 21 | |
| 2013 | 33.08 | | .53 | | 11.89 | | 12.42 | | .61 | | — | | .61 | | 44.89 | | 38.06 | | 474 | | .79 | | 1.34 | | N/A | | N/A | | 23 | |
| 2014 | 44.89 | | .54 | | 2.82 | | 3.36 | | .53 | | .29 | | .82 | | 47.43 | | 7.65 | | 493 | | .78 | | 1.18 | | N/A | | N/A | | 21 | |
| 2015(h) | 47.43 | | .31 | | .90 | | 1.21 | | .55 | | 2.50 | | 3.05 | | 45.59 | | 2.45 | †† | 493 | | .78 | † | 1.31 | † | N/A | | N/A | | 12 | †† |
Financial Highlights (continued)
FIRST INVESTORS LIFE SERIES FUNDS
| | | | | | | | | | | | | | | | | | | | | | | | | | | | | | |
| | |
| | | | | | PER SHARE DATA | | | | | | | | | | RATIOS/SUPPLEMENTAL DATA | | | | | |
| | | | | | | | | | Less Distributions | | | | | | | | | | | | | | Ratio to Average Net | | | |
| | | | Investment Operations | | from | | | | | | | | | | Ratio to Average | | Assets Before Expenses | | | |
| | | | | | | | | | | | | | | | | | | | | | Net Assets** | | Waived or Assumed | | | |
| | Net Asset | | Net | | Net Realized | | | | | | | | | | Net Asset | | | | | | | | | | | | Net | | | |
| | Value, | | Investment | | and Unrealized | | Total from | | Net | | Net | | | | Value, | | | | Net Assets | | Expenses | | Net | | | | Investment | | Portfolio | |
| | Beginning | | Income | | Gain (Loss) on | | Investment | | Investment | | Realized | | Total | | End | | Total | | End of Period | | Before Fee | | Investment | | | | Income | | Turnover | |
| | of Period | | (Loss | ) | Investments | | Operations | | Income | | Gains | | Distributions | | of Period | | Return | * | (in millions | ) | Credits | *** | Income (Loss | ) | Expenses | *** | (Loss | ) | Rate | |
| | |
| INTERNATIONAL FUND | | | | | | | | | | | | | | | | | | | | | | | | | | | |
| 2010 | $14.72 | | $ .34 | | $1.64 | | $1.98 | | $ — | | — | | $ — | | $16.70 | | 13.45 | % | $109 | | .99 | % | 2.15 | % | N/A | | N/A | | 35 | % |
| 2011 | 16.70 | | .39 | | (.29 | ) | .10 | | .36 | | — | | .36 | | 16.44 | | .64 | | 106 | | .96 | | 2.26 | | N/A | | N/A | | 32 | |
| 2012 | 16.44 | | .28 | | 3.12 | | 3.40 | | .27 | | — | | .27 | | 19.57 | | 20.85 | | 122 | | .94 | | 1.53 | | N/A | | N/A | | 41 | |
| 2013 | 19.57 | | .24 | | 1.08 | | 1.32 | | .27 | | — | | .27 | | 20.62 | | 6.77 | | 128 | | .92 | | 1.21 | | N/A | | N/A | | 35 | |
| 2014 | 20.62 | | .23 | | .26 | | .49 | | .23 | | — | | .23 | | 20.88 | | 2.39 | | 131 | | .92 | | 1.10 | | N/A | | N/A | | 28 | |
| 2015(h) | 20.88 | | .18 | | .39 | | .57 | | .23 | | — | | .23 | | 21.22 | | 2.72 | †† | 134 | | .89 | † | 1.72 | † | N/A | | N/A | | 10 | †† |
| | |
| INVESTMENT GRADE FUND | | | | | | | | | | | | | | | | | | | | | | | | | | | |
| 2010 | $10.35 | | $ .51 | | $ .41 | | $ .92 | | $.53 | | — | | $.53 | | $10.74 | | 9.26 | % | $ 43 | | .73 | % | 4.62 | % | .88 | % | 4.47 | % | 55 | % |
| 2011 | 10.74 | | .47 | | .17 | | .64 | | .52 | | — | | .52 | | 10.86 | | 6.23 | | 47 | | .71 | | 4.17 | | .86 | | 4.02 | | 29 | |
| 2012 | 10.86 | | .43 | | .76 | | 1.19 | | .48 | | — | | .48 | | 11.57 | | 11.23 | | 57 | | .70 | | 3.73 | | .85 | | 3.58 | | 28 | |
| 2013 | 11.57 | | .42 | | (.51 | ) | (.09 | ) | .45 | | — | | .45 | | 11.03 | | (.80 | ) | 59 | | .70 | | 3.49 | | .85 | | 3.34 | | 39 | |
| 2014 | 11.03 | | .42 | | .21 | | .63 | | .46 | | — | | .46 | | 11.20 | | 5.86 | | 63 | | .69 | | 2.78 | | .84 | | 2.63 | | 45 | |
| 2015(h) | 11.20 | | .18 | | (.19 | ) | (.01 | ) | .47 | | — | | .47 | | 10.72 | | (.17 | )†† | 63 | | .69 | † | 3.14 | † | .84 | † | 2.99 | † | 21 | †† |
| | |
| LIMITED DURATION HIGH QUALITY BOND FUND | | | | | | | | | | | | | | | | | |
| 2014(f) | $10.00 | | $(.13 | ) | $(.13 | ) | $(.26 | ) | — | | — | | — | | $ 9.74 | | (2.60 | )%†† | $ 3 | | 5.82 | %† | (4.25 | )%† | 5.97 | %† | (4.40 | )%† | 11 | %†† |
| 2015(h) | 9.74 | | (.01 | ) | (.02 | ) | (.03 | ) | — | | — | | — | | 9.71 | | (.31 | )†† | 3 | | 1.70 | † | (.37 | )† | 1.85 | † | (.52 | )† | 90 | †† |
| | |
| OPPORTUNITY FUND | | | | | | | | | | | | | | | | | | | | | | | | | | | | | |
| 2012(e) | $10.00 | | $(.05 | ) | $ .11 | | $ .06 | | $ — | | $ — | | $ — | | $10.06 | | .60 | %†† | $ 1 | | 16.84 | %† | (13.27 | )%† | N/A | | N/A | | 0 | %†† |
| 2013 | 10.06 | | (.04 | ) | 4.06 | | 4.02 | | — | | — | | — | | 14.08 | | 39.96 | | 14 | | 2.28 | | (.79 | ) | N/A | | N/A | | 32 | |
| 2014 | 14.08 | | .03 | | .78 | | .81 | | — | | .01 | | .01 | | 14.88 | | 5.73 | | 27 | | 1.01 | | .31 | | N/A | | N/A | | 31 | |
| 2015(h) | 14.88 | | .03 | | .87 | | .90 | | .03 | | — | | .03 | | 15.75 | | 6.06 | †† | 36 | | .91 | † | .48 | † | N/A | | N/A | | 21 | †† |
| | |
| REAL ESTATE FUND | | | | | | | | | | | | | | | | | | | | | | | | | | | | | |
| 2015(g) | $10.00 | | $ .04 | | $(.65 | ) | $(.61 | ) | — | | — | | — | | $ 9.39 | | (6.10 | )%†† | $ 3 | | 2.51 | %† | 2.58 | %† | N/A | | N/A | | 7 | %†† |
| | |
| SELECT GROWTH FUND | | | | | | | | | | | | | | | | | | | | | | | | | | | |
| 2010 | $ 6.66 | | $ .01 | | $1.39 | | $1.40 | | $.01 | | $ — | | $.01 | | $ 8.05 | | 21.10 | % | $ 14 | | .98 | % | .20 | % | N/A | | N/A | | 87 | % |
| 2011 | 8.05 | | .01 | | .41 | | .42 | | .01 | | — | | .01 | | 8.46 | | 5.25 | | 18 | | .90 | | .07 | | N/A | | N/A | | 61 | |
| 2012 | 8.46 | | .05 | | 1.08 | | 1.13 | | .01 | | — | | .01 | | 9.58 | | 13.30 | | 24 | | .87 | | .61 | | N/A | | N/A | | 52 | |
| 2013 | 9.58 | | .04 | | 3.12 | | 3.16 | | .05 | | — | | .05 | | 12.69 | | 33.15 | | 35 | | .85 | | .43 | | N/A | | N/A | | 64 | |
| 2014 | 12.69 | | .05 | | 1.66 | | 1.71 | | .05 | | .01 | | .06 | | 14.34 | | 13.53 | | 44 | | .83 | | .43 | | N/A | | N/A | | 37 | |
| 2015(h) | 14.34 | | .05 | | .65 | | .70 | | .05 | | .78 | | .83 | | 14.21 | | 4.91 | †† | 47 | | .83 | † | .69 | † | N/A | | N/A | | 28 | †† |
Financial Highlights (continued)
FIRST INVESTORS LIFE SERIES FUNDS
| | | | | | | | | | | | | | | | | | | | | | | | | | | | | | |
| |
| | | | | | PER SHARE DATA | | | | | | | | | | RATIOS/SUPPLEMENTAL DATA | | | | | |
| | | | | | | | | | Less Distributions | | | | | | | | | | | | | | Ratio to Average Net | | | |
| | | | Investment Operations | | from | | | | | | | | | | Ratio to Average | | Assets Before Expenses | | | |
| | | | | | | | | | | | | | | | | | | | | | Net Asset ** | | Waived or Assumed | | | |
| | Net Asset | | Net | | Net Realized | | | | | | | | | | Net Asset | | | | | | | | | | | | | | | |
| | Value, | | Investment | | and Unrealized | | Total from | | Net | | Net | | | | Value, | | | | Net Assets | | Expenses | | Net | | | | Net | | Portfolio | |
| | Beginning | | Income | | Gain (Loss) on | | Investment | | Investment | | Realized | | Total | | End | | Total | | End of Period | | Before Fee | | Investment | | | | Investment | | Turnover | |
| | of Period | | (Loss | ) | Investments | | Operations | | Income | | Gains | | Distributions | | of Period | | Return | * | (in millions | ) | Credits | *** | Income (Loss | ) | Expenses | *** | Income | | Rate | |
| | |
| SPECIAL SITUATIONS FUND(d) | | | | | | | | | | | | | | | | | | | | | | | |
| 2010 | $25.02 | | $ .16 | | $6.43 | | $6.59 | | $.22 | | $ — | | $ .22 | | $31.39 | | 26.57 | % | $152 | | .83 | % | .59 | % | N/A | | N/A | | 64 | % |
| 2011 | 31.39 | | .20 | | .51 | | .71 | | .16 | | — | | .16 | | 31.94 | | 2.24 | | 150 | | .81 | | .61 | | N/A | | N/A | | 59 | |
| 2012 | 31.94 | | .34 | | 2.88 | | 3.22 | | .20 | | 3.39 | | 3.59 | | 31.57 | | 10.01 | | 160 | | .81 | | 1.07 | | N/A | | N/A | | 61 | |
| 2013 | 31.57 | | .19 | | 9.11 | | 9.30 | | .34 | | 1.56 | | 1.90 | | 38.97 | | 30.88 | | 201 | | .82 | | .53 | | N/A | | N/A | | 108 | |
| 2014 | 38.97 | | .22 | | 1.82 | | 2.04 | | .18 | | 6.61 | | 6.79 | | 34.22 | | 6.30 | | 209 | | .80 | | .66 | | N/A | | N/A | | 41 | |
| 2015(h) | 34.22 | | .05 | | 2.69 | | 2.74 | | .22 | | 1.51 | | 1.73 | | 35.23 | | 8.17 | †† | 222 | | .81 | † | .27 | † | N/A | | N/A | | 22 | †† |
| | |
| TARGET MATURITY 2015 FUND | | | | | | | | | | | | | | | | | | | | | | | | | |
| 2010 | $15.45 | | $ .63 | | $ .66 | | $1.29 | | $.64 | | $ .08 | | $ .72 | | $16.02 | | 8.58 | % | $ 28 | | .71 | % | 3.87 | % | .86 | % | 3.72 | % | 4 | % |
| 2011 | 16.02 | | .65 | | .44 | | 1.09 | | .62 | | .22 | | .84 | | 16.27 | | 7.14 | | 26 | | .72 | | 3.87 | | .87 | | 3.72 | | 0 | |
| 2012 | 16.27 | | .66 | | (.53 | ) | .13 | | .66 | | .16 | | .82 | | 15.58 | | .84 | | 24 | | .73 | | 4.00 | | .88 | | 3.85 | | 0 | |
| 2013 | 15.58 | | .70 | | (.72 | ) | (.02 | ) | .68 | | .22 | | .90 | | 14.66 | | (.20 | ) | 21 | | .75 | | 4.28 | | .90 | | 4.13 | | 0 | |
| 2014 | 14.66 | | .71 | | (.71 | ) | — | | .71 | | .28 | | .99 | | 13.67 | | .03 | | 18 | | .74 | | 4.60 | | .89 | | 4.45 | | 0 | |
| 2015(h) | 13.67 | | .32 | | (.34 | ) | (.02 | ) | .69 | | .17 | | .86 | | 12.79 | | (.18 | )†† | 16 | | .75 | † | 4.70 | † | .90 | † | 4.55 | † | 7 | †† |
| | |
| TOTAL RETURN FUND | | | | | | | | | | | | | | | | | | | | | | | | | | | | | |
| 2012(e) | $10.00 | | $(.05 | ) | $ (.02 | ) | $ (.07 | ) | $ — | | — | | $ — | | $ 9.93 | | (.70 | )%†† | $ 1 | | 16.99 | %† | (14.84 | )%† | N/A | | N/A | | 64 | %†† |
| 2013 | 9.93 | | — | | 1.69 | | 1.69 | | — | | — | | — | | 11.62 | | 17.02 | | 13 | | 1.93 | | .16 | | N/A | | N/A | | 14 | |
| 2014 | 11.62 | | .09 | | .60 | | .69 | | .01 | | — | | .01 | | 12.30 | | 5.97 | | 29 | | .96 | | .96 | | N/A | | N/A | | 53 | |
| 2015(h) | 12.30 | | .07 | | .09 | | .16 | | .13 | | — | | .13 | | 12.33 | | 1.26 | †† | 33 | | .93 | † | 1.12 | † | N/A | | N/A | | 17 | †† |
| |
| * | The effect of fees and charges incurred at the separate account level are not reflected in these |
| | performance figures. |
| ** | Net of expenses waived or assumed by the investment adviser (Note 4). |
| *** | The ratios do not include a reduction of expenses from cash balances maintained with the Bank of |
| | New York Mellon or from brokerage service arrangements (Note 1G). |
| † | Annualized |
| †† | Not annualized |
| (a) | For each of the periods shown, FIMCO voluntarily waived advisory fees to limit the Fund’s overall |
| | expense ratio to .60% and waived additional advisory fees and assumed other expenses to prevent |
| | a negative yield on the Funds’ shares (Note 4). |
| (b) | Prior to September 4, 2012, known as Value Fund. |
| (c) | Prior to December 17, 2012, known as High Yield Fund. |
| (d) | Prior to December 17, 2012, known as Discovery Fund. |
| (e) | For the period December 17, 2012 (commencement of operations) to December 31, 2012. |
| (f) | For the period July 1, 2014 (commencement of operations) to December 31, 2014. |
| (g) | For the period May 1, 2015 (commencement of operations) to June 30, 2015. |
| (h) | For the period January 1, 2015 to June 30, 2015. |
| | |
| | See notes to financial statements | |
| 128 | | 129 |
Report of Independent Registered Public
Accounting Firm
To the Shareholders and Board of Trustees of
First Investors Life Series Funds
We have audited the accompanying statements of assets and liabilities, including the portfolios of investments, of the fourteen Funds comprising First Investors Life Series Funds, as of June 30, 2015, the related statements of operations, the statements of changes in net assets, and the financial highlights for each of the periods indicated thereon. These financial statements and financial highlights are the responsibility of the Life Series Funds’ management. Our responsibility is to express an opinion on these financial statements and financial highlights based on our audits.
We conducted our audits in accordance with the standards of the Public Company Accounting Oversight Board (United States). Those standards require that we plan and perform the audit to obtain reasonable assurance about whether the financial statements and financial highlights are free of material misstatement. The Funds are not required to have, nor were we engaged to perform, an audit of the Funds’ internal control over financial reporting. Our audits included consideration of internal control over financial reporting as a basis for designing audit procedures that are appropriate in the circumstances, but not for the purpose of expressing an opinion on the effectiveness of the Funds’ internal control over financial reporting. Accordingly, we express no such opinion. An audit includes examining, on a test basis, evidence supporting the amounts and disclosures in the financial statements. Our procedures included confirmation of securities owned as of June 30, 2015, by correspondence with the custodian and brokers. Where brokers have not replied to our confirmation requests, we have carried out other appropriate auditing procedures. An audit also includes assessing the accounting principles used and significant estimates made by management, as well as evaluating the overall financial statement presentation. We believe that our audits provide a reasonable basis for our opinion.
In our opinion, the financial statements and financial highlights referred to above present fairly, in all material respects, the financial position of each of the fourteen Funds comprising First Investors Life Series Funds, as of June 30, 2015, and the results of their operations, changes in their net assets, and their financial highlights for the periods presented, in conformity with accounting principles generally accepted in the United States of America.
Philadelphia, Pennsylvania
August 26, 2015
Board Considerations of Advisory Contracts and Fees
(unaudited)
FIRST INVESTORS LIFE SERIES FUNDS
Annual Consideration of the Investment Advisory Agreements and the Sub-Advisory Agreements with Muzinich & Co., Inc., Smith Group Asset Management, LP and Vontobel Asset Management, Inc.
The First Investors Life Series Funds’ (the “Trust”) investment advisory agreements with the Trust’s investment adviser and, as applicable, sub-advisers, on behalf of each of the Trust’s funds, can remain in effect after an initial term of no greater than two years only if they are renewed at least annually thereafter (i) by the vote of the Trustees or by a vote of the shareholders of each fund and (ii) by the vote of a majority of the Trustees who are not parties to the advisory agreement (or sub-advisory agreements, as applicable) or “interested persons” of any party thereto (the “Independent Trustees”), cast in person at a meeting called specifically for the purpose of voting on such approval.
The Board of Trustees (the “Board”) has four regularly scheduled and two informal meetings each year and takes into account throughout the year matters bearing on the approval of the advisory agreement (or sub-advisory agreements, as applicable). In particular, the Board and its standing committees also consider at each meeting at least certain of the factors that are relevant to the annual renewal of each fund’s advisory agreement (or sub-advisory agreements, as applicable), including investment performance, sub-adviser updates and reviews, reports with respect to brokerage and portfolio transactions, use of soft dollars for research products and services, portfolio turnover rates, compliance monitoring, and the services and support provided to each fund and its shareholders. In addition, the Board meets with representatives of each sub-adviser in person at least once per year.
On April 16, 2015 (the “April Meeting”), the Independent Trustees met in person with senior management personnel of First Investors Management Company, Inc. (“FIMCO”), the Trust’s investment adviser, Trust counsel, independent legal counsel to the Independent Trustees (“Independent Legal Counsel”) and others to give preliminary consideration to information bearing on the continuation of the advisory agreement (or sub-advisory agreement, as applicable) with respect to each fund. The primary purpose of the April Meeting was to ensure that the Independent Trustees had ample opportunity to consider matters they deemed relevant in determining whether to continue the advisory agreement (or sub-advisory agreements, as applicable), and to request any additional information they considered reasonably necessary to their deliberations. The Independent Trustees also met in executive session with Independent Legal Counsel to consider the continuation of the advisory agreement (or sub-advisory agreements, as applicable) outside the presence of management. As part of the April Meeting, the Independent Trustees asked FIMCO to respond to certain additional questions prior to the contract approval meeting of the Board to be held on May 21, 2015 (the “May Meeting”). In addition, Independent Legal Counsel, in conjunction with the Board,
Board Considerations of Advisory Contracts and Fees (continued)
(unaudited)
FIRST INVESTORS LIFE SERIES FUNDS
and personnel from FIMCO reviewed each sub-adviser’s response in connection with the request for information with respect to the applicable sub-advisory agreements and requested follow-up information or clarifications from each sub-adviser, as applicable, which was provided in time for the May Meeting.
At the May Meeting, the Board, including a majority of the Independent Trustees, approved the renewal of the investment advisory agreement (the “Advisory Agreement”) between FIMCO and each of the following funds (each a “Fund” and collectively the “Funds”): Growth & Income Fund, Special Situations Fund, International Fund, Equity Income Fund, Select Growth Fund, Opportunity Fund, Total Return Fund, Fund For Income, Investment Grade Fund, Government Fund, Limited Duration High Quality Bond Fund, Target Maturity 2015 Fund and Cash Management Fund. In addition, at the May Meeting, the Board, including a majority of the Independent Trustees, approved the renewal of the sub-advisory agreements (each a “Sub-Advisory Agreement” and collectively the “Sub-Advisory Agreements”) with: (1) Muzinich & Co., Inc. (“Muzinich”) with respect to the Fund For Income; (2) Smith Group Asset Management, LP (“Smith Group”) with respect to the Select Growth Fund; and (3) Vontobel Asset Management, Inc. (“Vontobel”) with respect to the International Fund. The Fund For Income, Select Growth Fund and International Fund are collectively referred to as the “Sub-Advised Funds.”
In reaching its decisions to approve the continuation of the Advisory Agreement for each Fund and the Sub-Advisory Agreements for the Sub-Advised Funds, the Board considered information furnished and discussed throughout the year at regularly scheduled Board and Committee meetings as well as a wide range of information provided specifically in relation to the renewal of the Advisory Agreement and Sub-Advisory Agreements for the April Meeting and May Meeting. Information furnished at Board and/or Committee meetings throughout the year included FIMCO’s analysis of each Fund’s investment performance and the performance of the sub-advisers to the respective Sub-Advised Funds, presentations given by representatives of FIMCO, Muzinich, Smith Group and Vontobel and various reports on compliance and other services provided by FIMCO. In preparation for the April Meeting and/or May Meeting, the Independent Trustees requested and received information compiled by Lipper, Inc. (“Lipper”), an independent provider of investment company data, that included, among other things, the investment performance over various time periods and the fees and expenses of each Fund as compared to a comparable group of funds as determined by Lipper (“Peer Group”). The Board also considered that FIMCO charges different fee rates to various mutual funds that have similar investment mandates and FIMCO’s explanation for these differences. Additionally, in response to specific requests from the Independent Trustees in connection with the April Meeting and/or May Meeting,
FIMCO furnished, and the Board considered, information concerning various aspects of its operations, including: (1) the nature, extent and quality of services provided by FIMCO to the Funds, including investment advisory and administrative services to the Funds including, as applicable, services in connection with selecting, overseeing and evaluating the sub-advisers; (2) the actual management fees paid by each Fund to FIMCO; (3) the costs of providing services to each Fund and the profitability of FIMCO from the relationship with each Fund; and (4) any “fall out” or ancillary benefits accruing to FIMCO as a result of the relationship with each Fund. FIMCO also provided, and the Board considered, an analysis of the overall profitability of the First Investors mutual fund business that included various entities affiliated with FIMCO as well as comparative profitability information based on analysis performed by FIMCO of the financial statements of certain publicly-traded mutual fund asset managers. The Board also considered FIMCO’s and each sub-adviser’s personnel and methods, including the education, experience of key personnel, and the number of their advisory and analytical personnel; general information regarding the compensation of FIMCO’s and each sub-adviser’s advisory personnel; FIMCO’s and each sub-adviser’s investment management process; FIMCO’s and each sub-adviser’s compliance program; the time and attention of FIMCO’s and each sub-adviser’s personnel devoted to the management of the Funds; FIMCO and each sub-adviser’s cybersecurity practices and related controls; and material pending, threatened or settled litigation involving FIMCO and each sub-adviser, and any ongoing or completed audits, investigations or examinations by the Securities and Exchange Commission. The Board also considered information provided by FIMCO on management’s initiatives for increasing Fund assets and new product development, enhanced sales and marketing efforts (including increasing the size of the sales force), continuing efforts as deemed practicable to reduce expenses and improve performance of the Funds, and improving the efficiency of back-office operations and services. In addition to evaluating, among other considerations, the written information provided by FIMCO, the Board also evaluated the answers to questions posed by the Board to representatives of FIMCO.
In addition, in response to specific requests from the Independent Trustees in connection with the April Meeting and/or May Meeting, Muzinich, Smith Group and Vontobel furnished, and the Board reviewed, information concerning various aspects of their respective operations, including: (1) the nature, extent and quality of services provided by Muzinich, Smith Group and Vontobel to the applicable Sub-Advised Funds; (2) the sub-advisory fee rates charged by Muzinich, Smith Group and Vontobel and a comparison of those fee rates to the fee rates of Muzinich, Smith Group and Vontobel for providing advisory services to other investment companies or accounts or compared to their standard fee schedule, as applicable, with an investment mandate similar to the applicable Sub-Advised Funds; (3) profitability and/or financial information provided
Board Considerations of Advisory Contracts and Fees (continued)
(unaudited)
FIRST INVESTORS LIFE SERIES FUNDS
by Muzinich, Smith Group and Vontobel; and (4) any “fall out” or ancillary benefits accruing to Muzinich, Smith Group and Vontobel as a result of the relationship with each applicable Sub-Advised Fund. The Board also considered FIMCO’s representations that it found the sub-adviser responses to the information request in connection with the renewal of the Sub-Advisory Agreements to be satisfactory and raising no issues of general concern.
In considering the information and materials described above, the Independent Trustees took into account management style, investment strategies and prevailing market conditions. Moreover, the Independent Trustees received assistance from and met separately with Independent Legal Counsel during both the April Meeting and May Meeting and were provided with a written description of their statutory responsibilities and the legal standards that are applicable to approvals of advisory agreements (and sub-advisory agreements, as applicable). Although the Advisory Agreement for all of the Funds and the Sub-Advisory Agreements for the Sub-Advised Funds were considered at the same Board meeting, the Independent Trustees addressed each Fund separately during the April Meeting and May Meeting.
Based on all of the information presented, the Board, including a majority of its Independent Trustees, determined on a Fund-by-Fund basis that the fees charged under the Advisory Agreement and each Sub-Advisory Agreement are reasonable in relation to the services that are provided under each Agreement. The Board did not identify any single factor as being of paramount importance in reaching its conclusions and determinations with respect to the continuance of the Advisory Agreement for each Fund and Sub-Advisory Agreements. Although not meant to be all-inclusive, the following describes some of the factors that were considered by the Board in deciding to approve the continuance of the Advisory Agreement for each Fund and Sub-Advisory Agreements with Muzinich, Smith Group and Vontobel.
Nature, Extent and Quality of Services
In examining the nature, extent and quality of the services provided by FIMCO, the Board recognized that FIMCO is dedicated to providing investment management services exclusively to the Funds and the other funds in the First Investors fund complex and that, unlike many other mutual fund managers, FIMCO is not in the business of providing management services to hedge funds, pension funds or private accounts. In this connection, the Board was advised that certain key FIMCO personnel provide separately managed account services to a FIMCO-affiliated investment adviser, but that these personnel spend most of their time serving their FIMCO clients. As a result, the Board considered that FIMCO’s personnel devote substantially all of their time to serving the funds in the First Investors fund complex.
The Board noted that FIMCO has undertaken extensive responsibilities as manager of the Funds, including: (1) the provision of investment advice to the Funds; (2) implementing policies and procedures designed to ensure compliance with each Fund’s investment objectives and policies; (3) the review of brokerage arrangements; (4) oversight of general portfolio compliance with applicable laws; (5) the provision of certain administrative services to the Funds, including fund accounting; (6) the implementation of Board directives as they relate to the Funds; and (7) evaluating and monitoring any sub-advisers on an ongoing basis, including, but not limited to, monitoring each sub-adviser’s investment performance, evaluating each sub-adviser’s compliance program on an annual basis and monitoring investments for compliance purposes, including monitoring each sub-adviser’s soft dollar practices, portfolio allocation and best execution. The Board also noted that FIMCO provided the same sorts of administrative and other services, except for direct management of the portfolio, for the Sub-Advised Funds as it does for the other funds. The Board noted that FIMCO provides not only advisory services, but historically also has provided certain administrative personnel and services that many other advisers do not provide without imposition of separate fees. The Board also noted the steps that FIMCO has taken to encourage strong performance, including providing significant incentives to portfolio managers and analysts based on Fund performance. In addition, the Board considered information regarding the overall financial strength of FIMCO and its affiliates and the resources and staffing in place with respect to the services provided to the Funds.
The Board considered the nature, extent and quality of the investment management services provided by Muzinich, Smith Group and Vontobel to the applicable Sub-Advised Funds. The Board considered Muzinich’s, Smith Group’s and Vontobel’s investment management process in managing the applicable Sub-Advised Funds and the experience and capability of their respective personnel responsible for the portfolio management of the applicable Sub-Advised Funds. The Board also considered information regarding the resources and staffing in place with respect to the services provided by each sub-adviser. Additionally, with respect to the Sub-Advised Funds, the Board considered the differences in fees paid by each applicable Fund to FIMCO and the fees paid by FIMCO to each sub-adviser, as well as representations by FIMCO that these fee differentials are warranted by its ongoing services and assumption of risks.
Based on the information considered, the Board concluded that the nature, extent and quality of the services provided to each Fund by FIMCO and the applicable Sub-Advised Funds by Muzinich, Smith Group and Vontobel were appropriate and consistent with the terms of the Advisory Agreement and Sub-Advisory Agreements, as applicable, and supported approval of the Advisory Agreement and each Sub-Advisory Agreement.
Board Considerations of Advisory Contracts and Fees (continued)
(unaudited)
FIRST INVESTORS LIFE SERIES FUNDS
Investment Performance
The Board placed significant emphasis on the investment performance of each of the Funds. While consideration was given to performance reports and discussions held at prior Board or Committee meetings, as applicable, particular attention was given to the performance information compiled by Lipper. In particular, the Board reviewed the performance of each Fund over the most recent calendar year (“1-year period”) and the annualized performance over the most recent three calendar year period (“3-year period”) and five calendar year period (“5-year period”). In addition, the Board considered the performance information provided by FIMCO for each Fund (other than the Target Maturity 2015 Fund) through April 30, 2015. The Board also reviewed the annual yield of the Government Fund, Investment Grade Fund, Fund For Income, Cash Management Fund and Target Maturity 2015 Fund over the past five years. With regard to the performance and yield information, the Board considered the performance and yield of each Fund on a percentile and quintile basis as compared to its Peer Group. For purposes of the performance data provided, the first quintile is defined as 20% of the funds in the applicable Peer Group with the highest performance or yield and the fifth quintile is defined as 20% of the funds in the applicable Peer Group with the lowest performance or yield. The Board also considered FIMCO’s representations that it imposes relatively stringent limits on the ability of portfolio managers to invest in risky asset classes or employ aggressive techniques.
On a Fund-by-Fund basis, the performance reports indicated, and the Board noted, that each Fund, except for the Equity Income Fund, Opportunity Fund and Government Fund, fell within one of the top three quintiles for at least one of the performance periods provided by Lipper. In particular, the Board noted that: (i) the Growth & Income Fund fell within the top three quintiles for each of the 1-year period, 3-year period and 5-year period; (ii) the International Fund fell within the first quintile for the 1-year period and 5-year period but outside of the top three quintiles for the 3-year period; (iii) the Select Growth Fund fell within the first quintile for the 1-year period and 5-year period but was in the fourth quintile for the 3-year period; (iv) the Fund For Income fell within the fourth quintile for the 1-year period and 3-year period but was in the third quintile for the 5-year period; (v) the Investment Grade Fund was in the second quintile for each of the 1-year period, 3-year period and 5-year period; (vi) the Target Maturity 2015 Fund fell within the first quintile for the 5-year period although performance for the other periods was outside of the top three quintiles; and (vii) the Cash Management fell within the third quintile for each of the 1-year period, 3-year period and 5-year period. The Board noted that Equity Income Fund’s performance was in the fourth quintile for the one-year period and the fifth quintile for the three- and five-year periods, respectively. With respect to the Equity Income Fund, the Board noted that FIMCO changed the portfolio manager for the Fund in November 2011 and that the changes
implemented by the new portfolio manager have led to improved performance during the one-year period. The Board noted that the Opportunity Fund’s and Total Return Fund’s performance was in the fifth quintile and second quintile, respectively, for the 1-year period, which was the only period reported due to the short operating history of each Fund. With respect to the Special Situations Fund, the Board noted that the Fund’s performance fell within the first quintile for the 1-year period, although performance for the 3-year period and 5-year period was not in the top three quintiles. However, the Board considered that FIMCO had recommended, and the Board had approved, the termination of the Special Situations Fund’s sub-adviser in September 2013 and that the Fund’s performance had improved since FIMCO began managing the Fund internally rather than using a sub-adviser. With respect to the Government Fund, the Board noted that the Fund’s performance fell outside of the top three quintiles for each of the 1-year period, 3-year period and 5-year period. However, the Board considered that FIMCO changed the portfolio manager on the Fund at the end of 2012. The Board also noted that the Limited Duration High Quality Bond Fund had not yet completed a full year of operating history and therefore no performance or yield information was provided by Lipper.
The Board also reviewed the yields of the Fund For Income, Investment Grade Fund, Government Fund, Target Maturity 2015 Fund and Cash Management Fund and noted that the yield for each such Fund fell within one of the top three quintiles for each of the past five calendar years, with the yield for the Target Maturity 2015 Fund falling within the top quintile for each of the past five calendar years and the yield for the Investment Grade and Government Funds falling within the top two quintiles for each of the past five calendar years. The Trustees also considered that, in the current market and interest-rate environment, comparative information regarding performance and fees of money market funds such as the Cash Management Fund is of relatively limited utility. Additionally, the Board considered FIMCO’s representation that it believes that the Funds use a more conservative investment style than many of their peers.
Based on the information considered, the Board concluded that the investment performance of each Fund was either (a) acceptable or better, or (b) subject to reasonable steps to monitor or address underperformance.
Fund Expenses, Costs of Services, Economies of Scale and Related Benefits
Management Fees and Expenses. The Board also gave substantial consideration to the fees payable under each Fund’s Advisory Agreement as well as under the Sub-Advisory Agreements for the Sub-Advised Funds.
The Board reviewed the information compiled by Lipper comparing each Fund’s contractual management fee rate (at common asset levels) and actual management
Board Considerations of Advisory Contracts and Fees (continued)
(unaudited)
FIRST INVESTORS LIFE SERIES FUNDS
fee rate (which included the effect of any fee waivers) as a percentage of average net assets to other funds in its Peer Group. In this regard, the Board considered the contractual and actual management fees of each Fund on a quintile basis as compared to its Peer Group and noted the relative position of each Fund within the Peer Group. The Board also considered that FIMCO provides not only advisory services but also certain administrative personnel to the Funds under each Fund’s Advisory Agreement and that many other advisers do not provide such administrative personnel under their advisory agreements and that FIMCO also provides certain administrative services without the imposition of a separate fee. The Board also considered that FIMCO informed the Board that it intends to: (i) extend, on a voluntary basis, the existing total expense cap limitation for the Cash Management Fund until May 31, 2016; and (ii) extend, on a voluntary basis, the existing management fee caps for the Government Fund, Investment Grade Fund, Limited Duration High Quality Bond Fund and Target Maturity 2015 Fund, respectively, until May 31, 2016. The Board also considered that, with respect to the Cash Management Fund, FIMCO was waiving all of its management fees and reimbursing a portion of other expenses to avoid a negative return for shareholders due to the historically low interest rate environment. In particular, the Board noted that: (i) the Growth & Income Fund’s contractual and actual management fees were in the fourth quintile of its Peer Group; (ii) the Special Situations Fund’s contractual and actual management fees were in the first and second quintiles, respectively, of its Peer Group; (iii) the International Fund’s contractual and actual management fees were in the first and third quintiles, respectively, of its Peer Group; (iv) the Equity Income Fund’s contractual and actual management fees were in the third quintile of its Peer Group; (v) the Select Growth Fund’s contractual and actual management fees were in the second and fourth quintiles, respectively, of its Peer Group; (vi) the Opportunity Fund’s contractual and actual management fees were in the second quintile of its Peer Group; (vii) the Total Return Fund’s contractual and actual management fees were in the third and fourth quintiles, respectively, of its Peer Group; (viii) the Fund For Income’s contractual and actual management fees were in the fourth quintile of its Peer Group; (ix) the Investment Grade Fund’s, Government Fund’s and Limited Duration High Quality Bond Fund’s contractual and actual management fees were in the fifth quintile of their respective Peer Groups; (x) the Target Maturity 2015 Fund’s contractual and actual management fees were in the fifth and fourth quintiles, respectively, of its Peer Group; and (xi) the Cash Management Fund’s contractual and actual management fees were in the fifth and first quintiles, respectively, of its Peer Group.
The Board also reviewed the information compiled by Lipper comparing each Fund’s total expense ratio, taking into account FIMCO’s expense waivers (as applicable), and the ratio of the sum of actual management and other non-management fees (i.e., fees other than management fees) to other funds in its Peer Group, including on a
quintile basis. In particular, the Board noted that: (i) the total expense ratio for each Fund except the Special Situations Fund, International Fund, Equity Income Fund and Cash Management Fund was not in the top three quintiles of their respective Peer Groups; and (ii) the ratio of the sum of actual management and other non-management fees for each Fund except the Special Situations Fund, International Fund, Equity Income and Cash Management Fund was not in the top three quintiles of their respective Peer Groups. In considering the level of the total expense ratio and the ratio of the sum of actual management and other non-management fees, the Board took into account management’s explanation that Lipper expense comparisons do not take into account the size of a fund complex, and as a result, in certain cases the First Investors funds are compared to funds in complexes that are much larger than First Investors. The Board also noted that Lipper’s customized expense groups tend to be fairly small in number and the funds included in the Peer Group generally change from year to year, thereby introducing an element of randomness that affects comparative results each year. While recognizing the limitations inherent in Lipper’s methodology, the Board believed that the data provided by Lipper was a generally appropriate measure of comparative expenses.
In considering the sub-advisory fee rates charged by and costs and profitability of Muzinich, Smith Group and Vontobel with regard to the respective Sub-Advised Funds, the Board noted that FIMCO pays Muzinich, Smith Group or Vontobel, as the case may be, a sub-advisory fee from its own advisory fee rather than each Fund paying Muzinich, Smith Group or Vontobel a fee directly. The Board also considered arrangements pursuant to which Muzinich, Smith Group and Vontobel (but not the Sub-Advised Funds) each pays a portion of its sub-advisory fee to a solicitor that introduced each such subadviser to FIMCO. Muzinich, Smith Group and Vontobel provided, and the Board reviewed, information comparing the fees charged by Muzinich, Smith Group and Vontobel for services to the respective Sub-Advised Funds versus the fee rates of Muzinich, Smith Group and Vontobel for providing advisory services to other comparable investment companies or accounts or compared to their standard fee schedule, as applicable. Based on a review of this information, the Board noted that the fees charged by Muzinich, Smith Group and Vontobel for services to each applicable Sub-Advised Fund appeared competitive to the fees Muzinich, Smith Group and Vontobel charge to their other comparable investment companies or accounts or compared to their standard fee schedule, as applicable.
The foregoing comparisons assisted the Trustees by providing them with a basis for evaluating each Fund’s management fee and expense ratio on a relative basis and the Board concluded that each Fund’s management fees appeared reasonable in relation to the services and benefits provided to each Fund.
Board Considerations of Advisory Contracts and Fees (continued)
(unaudited)
FIRST INVESTORS LIFE SERIES FUNDS
Profitability. The Board reviewed the materials it received from FIMCO regarding its revenues and costs in providing investment management and certain administrative services to the Funds. In particular, the Board considered the analysis of FIMCO’s profitability with respect to each Fund, calculated for the year ended December 31, 2014, as well as overall profitability information relating to the past five calendar years. The Board also considered the information provided by FIMCO comparing the profitability of certain publicly-traded mutual fund asset managers as analyzed by FIMCO based on publicly available financial statements and noted FIMCO’s analysis that its profit margin is significantly lower than the average of, and lower overall than any of, such publicly-traded managers. In reviewing the profitability information, the Board also considered the “fall-out” or ancillary benefits that may accrue to FIMCO as a result of its relationship with the Funds, which are discussed below. Based on the information provided, the Board also noted that FIMCO operates the Cash Management Fund at a loss. The Board acknowledged that, as a business matter, FIMCO was entitled to earn reasonable profits for its services to the Funds and concluded that the level of profitability to FIMCO of its contractual arrangements with each Fund did not appear so high as to call into question the appropriateness of the fees paid to FIMCO by any Fund or otherwise to preclude the proposed continuation of the Advisory Agreement for any of the Funds. The Board also considered the profitability and/or financial information provided by Muzinich, Smith Group and Vontobel.
Economies of Scale. With respect to whether economies of scale are realized by FIMCO and the extent to which any economies of scale are reflected in the level of management fee rates charged, the Board considered that the Advisory Agreement fee schedule for each Fund includes breakpoints to account for management economies of scale as each Fund’s assets increase.
“Fall Out” or Ancillary Benefits. The Board considered the “fall-out” or ancillary benefits that may accrue to FIMCO, Muzinich, Smith Group and Vontobel as a result of their relationship with the Funds. In that regard, the Board considered the fact that FIMCO, Smith Group and Vontobel may receive research from broker-dealers that execute brokerage transactions for the funds in the First Investors fund complex. However, the Board noted that FIMCO and these two sub-advisers must select brokers based on each Fund’s requirements for seeking best execution. The Board also considered the fact that Muzinich does not engage in any soft dollar arrangements.
In summary, based on all relevant information and factors, none of which was individually determinative of the outcome, the Board, including a majority of the Independent Trustees, approved the renewal of the Advisory Agreement and each Sub-Advisory Agreement.
FIRST INVESTORS LIFE SERIES FUNDS
Trustees and Officers
| |
| Trustees | | |
| | |
| Susan E. Artmann | |
| | |
| Mary J. Barneby | |
| | |
| Charles R. Barton, III | |
| | |
| Arthur M. Scutro, Jr. | |
| | |
| Mark R. Ward | |
| |
| Officers | | |
| | |
| William Lipkus | |
| President | |
| | |
| Marc S. Milgram | |
| Chief Compliance Officer | |
| | |
| Joseph I. Benedek | |
| Treasurer | |
| | |
| Mark S. Spencer | |
| Assistant Treasurer | |
| | |
| Mary C. Carty | |
| Secretary | |
| | |
| Carol Lerner Brown | |
| Assistant Secretary | |
FIRST INVESTORS LIFE SERIES FUNDS
| |
| Shareholder Information | | |
| |
| Investment Adviser | Custodian |
| First Investors Management | The Bank of New York Mellon |
| Company, Inc. | One Wall Street |
| 40 Wall Street | New York, NY 10286 |
| New York, NY 10005 | |
| |
| Subadviser | Transfer Agent |
| (Fund For Income) | Administrative Data Management Corp. |
| Muzinich & Co., Inc. | Raritan Plaza I – 8th Floor |
| 450 Park Avenue | Edison, NJ 08837-3620 |
| New York, NY 10022 | |
| |
| Subadviser | Independent Registered |
| (International Fund) | Public Accounting Firm |
| Vontobel Asset Management, Inc. | Tait, Weller & Baker LLP |
| 1540 Broadway | 1818 Market Street |
| New York, NY 10036 | Philadelphia, PA 19103 |
| |
| Subadviser | Legal Counsel |
| (Select Growth Fund) | K&L Gates LLP |
| Smith Asset Management Group, L.P. | 1601 K Street, N.W. |
| 100 Crescent Court | Washington, D.C. 20006 |
| Dallas, TX 75201 | |
A description of the policies and procedures that the Funds use to vote proxies relating to a portfolio’s securities is available, without charge, upon request by calling toll free 1-800-423-4026 or can be viewed online or downloaded from the EDGAR database on the U.S. Securities and Exchange Commission’s (“SEC”) internet website at http://www.sec.gov. In addition, information regarding how the Funds voted proxies relating to portfolio securities during the most recent 12-month period ended June 30, is available, without charge, upon request in writing or by calling 1-800-423-4026 and on the SEC’s internet website at http://www.sec.gov.
The Funds file their complete schedule of portfolio holdings with the SEC on Form N-Q for the first and third quarters of each fiscal year. The Funds’ Form N-Q is available on the SEC’s website at http://www.sec.gov; and may also be reviewed and copied at the SEC’s Public Reference Room in Washington D.C. Information on the operation of the Public Reference Room may be obtained by calling 1-800-SEC-0330. The schedule of portfolio holdings is available, without charge, upon request in writing or by calling 1-800-423-4026.
| |
| Item 2. | Code of Ethics |
| | |
| | Not applicable for semi-annual report |
| | |
| Item 3. | Audit Committee Financial Expert |
| | |
| | Not applicable for semi-annual report |
| | |
| Item 4. | Principal Accountant Fees and Services |
| | |
| | Not applicable for semi-annual report |
| | |
| Item 5. | Audit Committee of Listed Registrants |
| | |
| | Not applicable |
| | |
| Item 6. | Schedule of Investments |
| | |
| | (a) Schedule is included as part of the report to shareholders filed under Item 1 of |
| | this Form. |
| | |
| | (b) Not applicable |
| | |
| Item 7. | Disclosure of Proxy Voting Policies and Procedures for |
| Closed-End Management Investment Companies |
| | |
| | Not applicable |
| | |
| Item 8. | Portfolio Managers of Closed-End Management Investment Companies |
| | |
| | Not applicable |
| | |
| Item 9. | Purchases of Equity Securities by Closed-End Management |
| | Investment Companies and Affiliated Purchasers |
| | |
| | Not applicable |
| |
| Item 10. Submission of Matters to a Vote of Security Holders |
There were no material changes to the procedure by which shareholders may recommend nominees to the Registrant's Board of Trustees.
Item 11. Controls and Procedures
(a) The Registrant's Principal Executive Officer and Principal Financial Officer have concluded that the Registrant's disclosure controls and procedures (as defined in Rule 30a-3(c) under the Investment Company Act of 1940, as amended) are effective, based on their evaluation of these disclosure controls and procedures as of a date within 90 days of the filing date of this report.
(b) There were no changes in the Registrant's internal control over financial reporting (as defined in Rule 30a-3(d) under the Investment Company Act of 1940 as amended) that occurred during the second fiscal quarter of the period covered by this report that have materially affected, or are reasonably likely to materially affect, the Registrant's internal control over financial reporting.
Item 12. Exhibits
(a)(1) Code of Ethics - Not applicable for semi-annual report
(a)(2) Certifications pursuant to Section 302 of the Sarbanes-Oxley Act
of 2002 - Filed herewith
(b) Certifications pursuant to Section 906 of the Sarbanes-Oxley Act
of 2002 - Filed herewith
SIGNATURES
Pursuant to the requirements of the Securities Exchange Act of 1934 and the Investment Company Act of 1940, the Registrant has duly caused this report to be signed on its behalf by the undersigned, thereunto duly authorized.
| |
| First Investors Life Series Funds |
| |
| By | /S/ | WILLIAM LIPKUS |
| | William Lipkus |
| | President and Principal Executive Officer |
| |
| Date: | August 27, 2015 |
Pursuant to the requirements of the Securities Exchange Act of 1934 and the Investment Company Act of 1940, this report has been signed below by the following persons on behalf of the Registrant and in the capacities and on the dates indicated.
| |
| By | /S/ | WILLIAM LIPKUS |
| | William Lipkus |
| | President and Principal Executive Officer |
| |
| By | /S/ | JOSEPH I. BENEDEK |
| | Joseph I. Benedek |
| | Treasurer and Principal Financial Officer |
| |
| Date: | August 27, 2015 |