UNITED STATES
SECURITIES AND EXCHANGE COMMISSION
Washington, D.C. 20549
FORM N-CSR
CERTIFIED SHAREHOLDER REPORT OF REGISTERED
MANAGEMENT INVESTMENT COMPANIES
Investment Company Act file number 811-04347
GMO Trust
(Exact name of the registrant as specified in charter)
40 Rowes Wharf, Boston, MA 02110
(Address of principal executive offices) (Zip Code)
Sheppard N. Burnett, Chief Executive Officer,
40 Rowes Wharf, Boston, MA 02110
(Name and address of agent for services)
Registrant’s telephone number, including area code: 617-346-7646
Date of fiscal year end: 02/28/17
Date of reporting period: 02/28/17
Item 1. Reports to Stockholders.
The annual reports for each series of the registrant for the period ended February 28, 2017 are filed herewith.
GMO Trust
Annual Report
February 28, 2017
Asset Allocation Bond Fund
Core Plus Bond Fund
Currency Hedged International Bond Fund
Emerging Country Debt Fund
Opportunistic Income Fund (formerly Debt Opportunities Fund)
U.S. Treasury Fund
For a free copy of the Funds’ proxy voting guidelines, shareholders may call 1-617-346-7646 (collect) or visit the Securities and Exchange Commission’s website at www.sec.gov. Information regarding how the Funds voted proxies relating to portfolio securities during the most recent 12-month period ended June 30 is available on GMO’s website at www.gmo.com or on the Securities and Exchange Commission’s website at www.sec.gov.
The Funds file their complete schedule of portfolio holdings with the Securities and Exchange Commission for the first and third quarter of each fiscal year on Form N-Q, which is available on the Commission’s website at www.sec.gov. The Funds’ Form N-Q may be reviewed and copied at the Commission’s Public Reference Room in Washington, D.C. Information on the operation of the Public Reference Room may be obtained by calling 1-800-SEC-0330. The Funds have a policy with respect to disclosure of portfolio holdings under which they may also make a complete schedule of portfolio holdings available on GMO’s website at www.gmo.com.
This report is prepared for the general information of shareholders. It is authorized for distribution to prospective investors only when preceded or accompanied by a prospectus for the GMO Trust, which contains a complete discussion of the risks associated with an investment in these Funds and other important information. The GMO Trust prospectus can be obtained at www.gmo.com.
An investment in the Funds is subject to risk, including the possible loss of principal amount invested. There can be no assurance that the Funds will achieve their stated investment objectives. Please see the Funds’ prospectus regarding specific principal risks for each Fund. General risks may include: market risk-fixed income investments, management and operational risk, market risk-asset backed securities, credit risk and derivatives risk.
The Funds are distributed by Funds Distributor LLC. Funds Distributor LLC is not affiliated with GMO.
TABLE OF CONTENTS
GMO Asset Allocation Bond Fund
(A Series of GMO Trust)
Portfolio Management
Day-to-day management of the Fund’s portfolio is the responsibility of the Developed Fixed Income and Asset Allocation teams at Grantham, Mayo, Van Otterloo & Co. LLC.
Management Discussion and Analysis of Fund Performance
Class III shares of GMO Asset Allocation Bond Fund returned -0.05% (net) for the fiscal year ended February 28, 2017, as compared with +0.32% for the Citigroup 3-Month Treasury Bill Index.
The Fund underperformed the benchmark during the period by -0.36%. Developed markets interest-rate positioning detracted during the fiscal year. The Fund’s early year Eurozone steepener position drove losses, followed by losses from active positions in the U.K., Mexico, and New Zealand. These rates positions were implemented primarily using interest-rate swaps and options on interest-rate swaps. Gains from the Fund’s position in TIPS partly offset losses. In opportunistic strategies, cross-currency basis swap positions added value, as gains from yen cross-currency basis swap positions more than offset losses from euro cross-currency basis swap positions.
The Fund’s positions in developed market currencies added value, particularly its short positions in yen. These positions were implemented using both currency forwards and options.
The views expressed herein are exclusively those of Grantham, Mayo, Van Otterloo & Co. LLC as of the date of this report and are subject to change. GMO disclaims any responsibility to update such views. They are not meant as investment advice. References to specific securities are not recommendations of such securities and may not be representative of any GMO portfolio’s current or future investments.
2
GMO Asset Allocation Bond Fund
(A Series of GMO Trust)
Comparison of Change in Value of a $10,000,000 Investment in
GMO Asset Allocation Bond Fund Class III Shares and the Citigroup 3-Month Treasury Bill Index
As of February 28, 2017
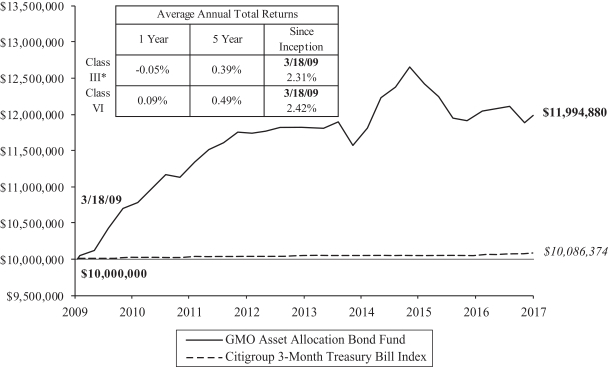
Performance data quoted represents past performance and is not indicative of future results. The investment return and principal value of an investment will fluctuate so that an investor’s shares, when redeemed, may be worth more or less than their original cost. Current performance data may be lower or higher than the performance data provided herein. To obtain performance information up to the most recent month-end, visit www.gmo.com. Performance shown is net of all fees after reimbursement from GMO. Returns would have been lower had certain expenses not been reimbursed during the periods shown and do not include the effect of taxes on distributions and redemptions. The performance information shown above only includes purchase premiums and/or redemption fees in effect as of February 28, 2017. All information is unaudited. Performance for classes may vary due to different fees.
| | * | For the period from March 18, 2009 to March 27, 2009, no Class III shares were outstanding. Performance for that period is that of Class VI, which has lower expenses. Therefore, the performance shown is higher than it would have been if Class III expenses had been applied throughout. |
3
GMO Asset Allocation Bond Fund
(A Series of GMO Trust)
Investment Concentration Summary
February 28, 2017 (Unaudited)
| | | | |
| Asset Class Summary& | | % of Total Net Assets | |
Debt Obligations | | | 90.0 | % |
Short-Term Investments | | | 9.6 | |
Options Purchased | | | 0.0 | ^ |
Forward Currency Contracts | | | (0.1 | ) |
Swap Contracts | | | (0.4 | ) |
Other | | | 0.9 | |
| | | | |
| | | 100.0 | % |
| | | | |
| & | In the table above, derivative financial instruments, if any, are based on market values or unrealized appreciation/depreciation rather than notional amounts. |
4
GMO Asset Allocation Bond Fund
(A Series of GMO Trust)
Schedule of Investments
(showing percentage of total net assets)
February 28, 2017
| | | | | | | | | | |
Par Value† /
Principal Amount | | | Description | | Value ($) | |
| | | | | | DEBT OBLIGATIONS — 90.0% | |
| | |
| | | | | | U.S. Government — 90.0% | |
| | | 211,246,935 | | | U.S. Treasury Inflation Indexed Bond, 0.25%, due 01/15/25 (a) | | | 210,648,683 | |
| | | 169,209,342 | | | U.S. Treasury Inflation Indexed Bond, 0.38%, due 07/15/25 (a) | | | 170,649,991 | |
| | | 94,073,247 | | | U.S. Treasury Inflation Indexed Bond, 0.63%, due 01/15/26 (a) | | | 96,385,192 | |
| | | 5,237,492 | | | U.S. Treasury Inflation Indexed Bond, 0.13%, due 07/15/26 (a) | | | 5,145,558 | |
| | | 65,158,392 | | | U.S. Treasury Inflation Indexed Bond, 1.75%, due 01/15/28 (a) | | | 74,270,012 | |
| | | 147,627,734 | | | U.S. Treasury Inflation Indexed Bond, 2.50%, due 01/15/29 (a) | | | 182,100,728 | |
| | | 12,189,463 | | | U.S. Treasury Inflation Indexed Bond, 3.88%, due 04/15/29 (a) | | | 17,020,610 | |
| | | 50,000,000 | | | U.S. Treasury Note, 1.00%, due 12/15/17 | | | 50,058,600 | |
| | | 80,000,000 | | | U.S. Treasury Note, 0.75%, due 02/28/18 | | | 79,837,520 | |
| | | 45,000,000 | | | U.S. Treasury Note, 0.75%, due 04/15/18 | | | 44,876,970 | |
| | | 20,000,000 | | | U.S. Treasury Note, 2.63%, due 04/30/18 | | | 20,372,660 | |
| | | 12,500,000 | | | U.S. Treasury Note, 1.00%, due 05/31/18 | | | 12,497,075 | |
| | | 12,500,000 | | | U.S. Treasury Note, 1.38%, due 07/31/18 | | | 12,553,713 | |
| | | 20,000,000 | | | U.S. Treasury Note, 1.38%, due 09/30/18 | | | 20,077,340 | |
| | | 40,000,000 | | | U.S. Treasury Note, 0.75%, due 10/31/18 | | | 39,729,680 | |
| | | 12,500,000 | | | U.S. Treasury Note, 1.00%, due 11/30/18 | | | 12,463,375 | |
| | | 25,000,000 | | | U.S. Treasury Note, 1.25%, due 12/31/18 | | | 25,020,500 | |
| | | 35,000,000 | | | U.S. Treasury Note, 1.13%, due 01/31/19 (b) | | | 34,934,375 | |
| | | 60,000,000 | | | U.S. Treasury Note, 1.50%, due 01/31/19 | | | 60,304,680 | |
| | | 20,000,000 | | | U.S. Treasury Note, 0.75%, due 02/15/19 | | | 19,811,720 | |
| | | 25,000,000 | | | U.S. Treasury Note, 1.13%, due 02/28/19 | | | 24,947,275 | |
| | | 20,000,000 | | | U.S. Treasury Note, 1.50%, due 02/28/19 | | | 20,098,440 | |
| | | 20,000,000 | | | U.S. Treasury Note, 3.13%, due 05/15/19 (c) | | | 20,784,380 | |
| | | 50,000,000 | | | U.S. Treasury Note, 3.63%, due 08/15/19 | | | 52,726,550 | |
| | | 35,000,000 | | | U.S. Treasury Note, USBM + 0.19%, 0.97%, due 04/30/18 | | | 35,059,990 | |
| | | | | | | | | | |
| | | | | | Total U.S. Government | | | 1,342,375,617 | |
| | | | | | | | | | |
| | | |
| | | | | | TOTAL DEBT OBLIGATIONS (COST $1,328,482,486) | | | 1,342,375,617 | |
| | | | | | | | | | |
| | |
| | | | | | OPTIONS PURCHASED — 0.0% | |
| | |
| | | | | | Currency Options — 0.0% | |
EUR | | | 17,893,000 | | | EUR Call/USD Put, Expires 03/06/17, Strike 1.15, (OTC) (CP-GS) | | | — | |
USD | | | 19,881,000 | | | USD Call/CHF Put, Expires 03/06/17, Strike 1.00, (OTC) (CP-GS) | | | 188,293 | |
EUR | | | 17,897,000 | | | EUR Call/USD Put, Expires 03/06/17, Strike 1.15, (OTC) (CP-GS) | | | — | |
USD | | | 19,886,000 | | | USD Call/CHF Put, Expires 03/06/17, Strike 1.00, (OTC) (CP-BCLY) | | | 188,340 | |
| | | | | | | | | | |
| | | | | | Total Currency Options | | | 376,633 | |
| | | | | | | | | | |
| | | |
| | | | | | TOTAL OPTIONS PURCHASED (COST $1,276,456) | | | 376,633 | |
| | | | | | | | | | |
| | | | | | | | | | |
Shares / Par Value† | | | Description | | Value ($) | |
| | | | | | SHORT-TERM INVESTMENTS — 9.6% | |
| | |
| | | | | | Money Market Funds — 0.3% | |
| | | 3,929,477 | | | State Street Institutional Treasury Money Market Fund-Premier Class, 0.42% (d) | | | 3,929,477 | |
| | | | | | | | | | |
| | |
| | | | | | Repurchase Agreements — 9.3% | |
| | | 138,689,018 | | | Nomura Securities International Inc. Repurchase Agreement, dated 02/28/17, maturing on 03/01/17 with a maturity value of $138,691,021 and an effective yield of 0.52%, collateralized by a U.S. Treasury Note with maturity date 8/15/24 and a market value of $141,263,220. | | | 138,689,018 | |
| | | | | | | | | | |
| | | |
| | | | | | TOTAL REPURCHASE AGREEMENTS (COST $138,689,018) | | | 138,689,018 | |
| | | | | | | | | | |
| | | |
| | | | | | TOTAL SHORT-TERM INVESTMENTS (COST $142,618,495) | | | 142,618,495 | |
| | | | | | | | | | |
| | | |
| | | | | | TOTAL INVESTMENTS — 99.6% (Cost $1,472,377,437) | | | 1,485,370,745 | |
| | | | | | Other Assets and Liabilities (net) — 0.4% | | | 6,622,847 | |
| | | | | | | | | | |
| | | |
| | | | | | TOTAL NET ASSETS — 100.0% | | | $1,491,993,592 | |
| | | | | | | | | | |
A summary of outstanding financial instruments at February 28, 2017 is as follows:
Forward Currency Contracts
| | | | | | | | | | | | | | | | | | | | | | |
Settlement
Date | | Counter
party | | Currency
Sold | | | Currency
Purchased | | | Net
Unrealized
Appreciation
(Depreciation) | |
| 03/09/2017 | | MSCI | | | CHF | | | | 21,590,746 | | | | USD | | | | 21,502,800 | | | $ | (1,499 | ) |
| 03/20/2017 | | MSCI | | | EUR | | | | 11,873,315 | | | | USD | | | | 12,672,864 | | | | 84,250 | |
| 11/07/2017 | | GS | | | EUR | | | | 238,995,000 | | | | USD | | | | 262,404,560 | | | | 5,921,451 | |
| 12/22/2017 | | JPM | | | EUR | | | | 62,184,000 | | | | USD | | | | 68,688,446 | | | | 1,771,868 | |
| 03/13/2017 | | BOA | | | JPY | | | | 1,651,106,537 | | | | USD | | | | 14,520,711 | | | | (181,147 | ) |
| 03/09/2017 | | BOA | | | USD | | | | 2,500,000 | | | | CHF | | | | 2,519,193 | | | | 9,106 | |
| 03/09/2017 | | GS | | | USD | | | | 6,422,063 | | | | CHF | | | | 6,400,000 | | | | (47,688 | ) |
| 03/09/2017 | | MSCI | | | USD | | | | 11,517,000 | | | | CHF | | | | 11,802,391 | | | | 238,135 | |
| 03/13/2017 | | JPM | | | USD | | | | 2,792,082 | | | | JPY | | | | 316,000,000 | | | | 21,660 | |
| 03/13/2017 | | MSCI | | | USD | | | | 1,000,000 | | | | JPY | | | | 114,823,600 | | | | 22,417 | |
| 03/13/2017 | | MSCI | | | USD | | | | 4,786,569 | | | | NZD | | | | 6,870,000 | | | | 160,142 | |
| 03/20/2017 | | BCLY | | | USD | | | | 2,756,164 | | | | EUR | | | | 2,580,000 | | | | (20,734 | ) |
| 11/07/2017 | | GS | | | USD | | | | 263,778,782 | | | | EUR | | | | 238,995,000 | | | | (7,295,672 | ) |
| 12/22/2017 | | JPM | | | USD | | | | 69,205,942 | | | | EUR | | | | 62,184,000 | | | | (2,289,363 | ) |
| | | | | | | | | | | | | | | | | | | | | | |
| | | | | | | | | | | | | | | | | | | | $ | (1,607,074 | ) |
| | | | | | | | | | | | | | | | | | | | | | |
| | | | |
| | See accompanying notes to the financial statements. | | 5 |
GMO Asset Allocation Bond Fund
(A Series of GMO Trust)
Schedule of Investments — (Continued)
February 28, 2017
Reverse Repurchase Agreements (e)
| | | | | | | | | | |
Face Value | | | Description | | Market
Value | |
| USD | | | 34,939,753 | | | Nomura Securities International Inc, (0.25%), dated 02/15/17 (collateral: U.S. Treasury Note, 1.13%, due 01/31/19), to be repurchased on demand at face value plus accrued interest. | | $ | (34,936,599 | ) |
| | | | | | | | | | |
| | | | | | Average balance outstanding | | $ | (34,973,109 | ) |
| | | | | | Average interest rate | | | (0.58 | )% |
| | | | | | Maximum balance outstanding | | $ | (76,916,001 | ) |
Average balance outstanding was calculated based on daily face value balances outstanding during the period that the Fund had entered into reverse repurchase agreements.
Swap Contracts
Interest Rate Swaps
| | | | | | | | | | | | | | | | | | | | |
| | | | | | |
Notional
Amount | | | Expiration
Date | | | Counterparty | | Receive
(Pay) # | | Fixed
Rate | | Variable Rate | | Net Unrealized
Appreciation/ (Depreciation) |
| | 54,130,000 | | | | MXN | | | | 1/22/2027 | | | JPMF (f) | | Receive | | 7.90% | | TIIE | | $14,753 |
| | 204,400,000 | | | | MXN | | | | 1/26/2027 | | | JPMF (f) | | Receive | | 7.87% | | TIIE | | 33,447 |
| | 191,400,000 | | | | MXN | | | | 1/26/2027 | | | JPMF (f) | | Receive | | 7.89% | | TIIE | | 45,279 |
| | 446,543,000 | | | | MXN | | | | 1/27/2027 | | | JPMF (f) | | Receive | | 7.91% | | TIIE | | 138,208 |
| | 32,618,000 | | | | CAD | | | | 3/17/2027 | | | JPMF (g) | | (Pay) | | 1.86% | | 3 Month CAD LIBOR | | 40,820 |
| | 6,007,000 | | | | CAD | | | | 3/17/2027 | | | JPMF (g) | | (Pay) | | 2.00% | | 3 Month CAD LIBOR | | (52,335) |
| | 15,757,000 | | | | CAD | | | | 3/17/2027 | | | JPMF (g) | | Receive | | 1.97% | | 3 Month CAD LIBOR | | 100,938 |
| | 18,053,000 | | | | CHF | | | | 3/17/2027 | | | JPMF (g) | | (Pay) | | 0.17% | | 6 Month CHF LIBOR | | (250,407) |
| | 20,835,000 | | | | EUR | | | | 3/17/2027 | | | JPMF (g) | | (Pay) | | 0.77% | | 6 Month EURIBOR | | (203,279) |
| | 15,126,000 | | | | GBP | | | | 3/17/2027 | | | JPMF (g) | | (Pay) | | 1.38% | | 6 Month GBP LIBOR | | (408,281) |
| | 10,407,000 | | | | GBP | | | | 3/17/2027 | | | JPMF (g) | | (Pay) | | 1.42% | | 6 Month GBP LIBOR | | (336,035) |
| | 9,597,000 | | | | GBP | | | | 3/17/2027 | | | JPMF (g) | | (Pay) | | 1.35% | | 6 Month GBP LIBOR | | (224,380) |
| | 42,912,000 | | | | GBP | | | | 3/17/2027 | | | JPMF (g) | | (Pay) | | 1.43% | | 6 Month GBP LIBOR | | (1,416,598) |
| | 10,140,000 | | | | GBP | | | | 3/17/2027 | | | JPMF (g) | | (Pay) | | 1.40% | | 6 Month GBP LIBOR | | (298,115) |
| | 47,079,000 | | | | NZD | | | | 3/17/2027 | | | JPMF (g) | | Receive | | 2.68% | | 3 Month NZD Bank Bill Rate | | (2,296,990) |
| | 3,974,000 | | | | NZD | | | | 3/17/2027 | | | JPMF (g) | | Receive | | 2.94% | | 3 Month NZD Bank Bill Rate | | (130,478) |
| | 16,672,000 | | | | NZD | | | | 3/17/2027 | | | JPMF (g) | | Receive | | 2.93% | | 3 Month NZD Bank Bill Rate | | (556,343) |
| | 8,746,000 | | | | NZD | | | | 3/17/2027 | | | JPMF (g) | | Receive | | 2.91% | | 3 Month NZD Bank Bill Rate | | (301,113) |
| | 9,047,000 | | | | NZD | | | | 3/17/2027 | | | JPMF (g) | | Receive | | 3.47% | | 3 Month NZD Bank Bill Rate | | (5,532) |
| | 8,113,000 | | | | NZD | | | | 3/17/2027 | | | JPMF (g) | | Receive | | 3.67% | | 3 Month NZD Bank Bill Rate | | 94,625 |
| | 27,827,000 | | | | SEK | | | | 3/17/2027 | | | JPMF (g) | | Receive | | 0.90% | | 3 Month SEK STIBOR | | (52,722) |
| | 86,550,000 | | | | SEK | | | | 3/17/2027 | | | JPMF (g) | | Receive | | 1.17% | | 3 Month SEK STIBOR | | 88,621 |
| | 98,458,000 | | | | SEK | | | | 3/17/2027 | | | JPMF (g) | | Receive | | 1.18% | | 3 Month SEK STIBOR | | 114,023 |
| | 100,519,000 | | | | SEK | | | | 3/17/2027 | | | JPMF (g) | | Receive | | 1.18% | | 3 Month SEK STIBOR | | 113,712 |
| | 174,020,000 | | | | SEK | | | | 3/17/2027 | | | JPMF (g) | | Receive | | 1.14% | | 3 Month SEK STIBOR | | 123,403 |
| | 73,434,000 | | | | SEK | | | | 3/17/2027 | | | JPMF (g) | | (Pay) | | 1.14% | | 3 Month SEK STIBOR | | (49,576) |
| | 64,704,000 | | | | SEK | | | | 3/17/2027 | | | JPMF (g) | | (Pay) | | 1.14% | | 3 Month SEK STIBOR | | (47,155) |
| | 24,515,000 | | | | USD | | | | 3/17/2027 | | | JPMF (g) | | Receive | | 2.22% | | 3 Month USD LIBOR | | (274,584) |
| | 12,092,000 | | | | USD | | | | 3/17/2027 | | | JPMF (g) | | (Pay) | | 2.26% | | 3 Month USD LIBOR | | 86,266 |
| | 17,078,000 | | | | USD | | | | 3/17/2027 | | | JPMF (g) | | Receive | | 2.49% | | 3 Month USD LIBOR | | 240,232 |
| | 19,579,000 | | | | USD | | | | 3/17/2027 | | | JPMF (g) | | (Pay) | | 2.35% | | 3 Month USD LIBOR | | (16,875) |
| | 4,985,000 | | | | USD | | | | 3/17/2027 | | | JPMF (g) | | (Pay) | | 2.32% | | 3 Month USD LIBOR | | 6,864 |
| | 13,819,000 | | | | USD | | | | 3/17/2027 | | | JPMF (g) | | (Pay) | | 2.29% | | 3 Month USD LIBOR | | 68,279 |
| | | | | | | | | | | | | | | | | | | | |
| | | | | | | | | | | | | | | | | | | | $(5,611,328) |
| | | | | | | | | | | | | | | | | | | | |
| | | | | | | | | | | | | | | | | | Premiums Paid (Received) | | $ (54,773) |
| | | | | | | | | | | | | | | | | | | | |
| # | Receive - Fund receives fixed rate and pays variable rate. |
| | (Pay) - Fund pays fixed rate and receives variable rate. |
| | | | |
| 6 | | See accompanying notes to the financial statements. | | |
GMO Asset Allocation Bond Fund
(A Series of GMO Trust)
Schedule of Investments — (Continued)
February 28, 2017
As of February 28, 2017, for the above contracts and/or agreements, the Fund had sufficient cash and/or securities to cover commitments or collateral requirements, if any, of the relevant broker or exchange.
Notes to Schedule of Investments:
| † | Denominated in U.S. Dollar, unless otherwise indicated. |
| (a) | Indexed security in which price and/or coupon is linked to the price of a specific instrument or financial statistic (Note 2). |
| (b) | All or a portion of this security has been pledged to cover collateral requirements on reverse repurchase agreements (Note 2). |
| (c) | All or a portion of this security has been pledged to cover margin requirements on futures and/or cleared swap contracts, collateral on OTC swap contracts, forward currency contracts, and/or written options, if any (Note 4). |
| (d) | The rate disclosed is the 7 day net yield as of February 28, 2017. |
| (e) | Reverse repurchase agreements have an open maturity date and can be closed by either party on demand. |
| (f) | Swap was cleared through the CME Group Inc. |
| (g) | Swap was cleared through the LCH.Clearnet Group Ltd. |
For a listing of definitions of acronyms, counterparty abbreviations and currency abbreviations used throughout the Schedule of Investments as well as the derivative tables, if any, please refer to page 52.
| | | | |
| | See accompanying notes to the financial statements. | | 7 |
GMO Core Plus Bond Fund
(A Series of GMO Trust)
Portfolio Management
Day-to-day management of the Fund’s portfolio is the responsibility of the Developed Fixed Income team at Grantham, Mayo, Van Otterloo & Co. LLC.
Management Discussion and Analysis of Fund Performance
Class III shares of GMO Core Plus Bond Fund returned +2.44% (net) for the fiscal year ended February 28, 2017, as compared with +1.42% for the Barclays U.S. Aggregate Index. The Fund outperformed its benchmark during the fiscal year by +1.02%.
The Fund’s investment exposure was achieved directly through bonds, swaps, and futures and indirectly through investment in underlying GMO Trust mutual funds, including GMO Opportunistic Income Fund (OIF), GMO Emerging Country Debt Fund (ECDF), and GMO U.S. Treasury Fund (USTF).
Exposure to asset-backed securities contributed positively to performance, given tighter spreads across structured products in general.
A small exposure to emerging debt added value during the fiscal year, thanks to spread tightening on the asset class and positive contributions from both country selection and security selection.
Developed markets interest-rate positioning contributed positively during the fiscal year. The Fund’s duration positions in the U.S., Australia, and Sweden added value, while losses from active duration positions in Mexico, the U.K., and New Zealand partly offset gains. In opportunistic strategies, swap spread strategies added value as long end swap spreads in the U.S. went less negative.
The currency strategy contributed positively during the fiscal year. The Fund’s active short positions in the yen and Swiss franc were successful during the year, while positions in euros detracted.
The views expressed herein are exclusively those of Grantham, Mayo, Van Otterloo & Co. LLC as of the date of this report and are subject to change. GMO disclaims any responsibility to update such views. They are not meant as investment advice. References to specific securities are not recommendations of such securities and may not be representative of any GMO portfolio’s current or future investments.
8
GMO Core Plus Bond Fund
(A Series of GMO Trust)
Comparison of Change in Value of a $10,000,000 Investment in
GMO Core Plus Bond Fund Class III Shares and the Barclays U.S. Aggregate Index
As of February 28, 2017
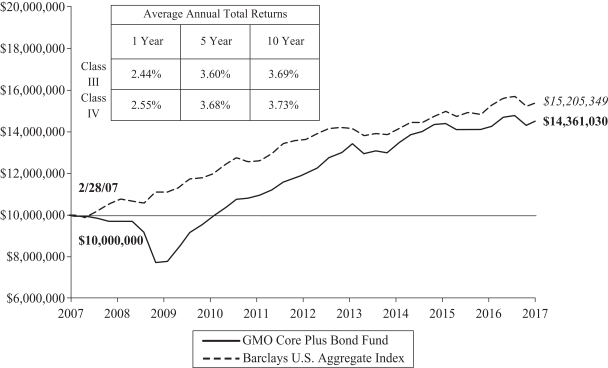
Performance data quoted represents past performance and is not indicative of future results. The investment return and principal value of an investment will fluctuate so that an investor’s shares, when redeemed, may be worth more or less than their original cost. Current performance data may be lower or higher than the performance data provided herein. To obtain performance information up to the most recent month-end, visit www.gmo.com. Performance shown is net of all fees after reimbursement from GMO. Returns would have been lower had certain expenses not been reimbursed during the periods shown and do not include the effect of taxes on distributions and redemptions. The performance information shown above only includes purchase premiums and/or redemption fees in effect as of February 28, 2017. All information is unaudited. Performance for classes may vary due to different fees.
9
GMO Core Plus Bond Fund
(A Series of GMO Trust)
Investment Concentration Summary
February 28, 2017 (Unaudited)
| | | | |
| Asset Class Summary† | | % of Total Net Assets | |
Debt Obligations | | | 81.9 | % |
Short-Term Investments | | | 16.4 | |
Mutual Funds | | | 15.1 | |
Swap Contracts | | | 0.1 | |
Loan Participations | | | 0.1 | �� |
Rights/Warrants | | | 0.1 | |
Futures Contracts | | | 0.1 | |
Options Purchased | | | 0.0 | ^ |
Loan Assignments | | | 0.0 | ^ |
Forward Currency Contracts | | | 0.0 | ^ |
Securities Sold Short | | | (0.0 | )^ |
Written Options/Credit Linked Options | | | (0.0 | )^ |
Reverse Repurchase Agreements | | | (0.0 | )^ |
Other | | | (13.8 | ) |
| | | | |
| | | 100.0 | % |
| | | | |
| | | | |
| Country/Region Summary‡ | | % of Investments | |
United States | | | 96.0 | % |
Other Emerging | | | 4.8 | ¥ |
New Zealand | | | 4.0 | |
Mexico | | | 3.0 | |
Sweden | | | 2.3 | |
Canada | | | (1.0 | ) |
Switzerland | | | (1.0 | ) |
Euro Region | | | (1.3 | )§ |
United Kingdom | | | (6.8 | ) |
| | | | |
| | | 100.0 | % |
| | | | |
| † | The table above incorporates aggregate indirect asset class exposure associated with investments in other funds of GMO Trust (“underlying funds”). Derivative financial instruments, if any, are based on market values or unrealized appreciation/depreciation rather than notional amounts. |
| ‡ | The table above incorporates aggregate indirect country exposure associated with investments in the underlying funds. The table is normalized to 100%, therefore the absolute exposure presented for each country may not be representative of the true exposure of the Fund. The table excludes short-term investments. The table includes exposure through the use of certain derivative financial instruments and excludes exposure through certain currency linked derivatives such as forward currency contracts and currency options. The table is based on duration adjusted net exposures (both investments and derivatives), taking into account the market value of securities and the notional amounts of swaps and other derivative financial instruments. For example, U.S. asset-backed securities may represent a relatively small percentage due to their short duration, even though they represent a large percentage of market value (direct and indirect). Duration is based on GMO’s models. The greater the duration of a bond, the greater its contribution to the concentration percentage. Credit default swap exposures are factored into the duration adjusted exposure using the reference security and applying the same methodology to that security. |
| ¥ | “Other Emerging” is associated with investments in GMO Emerging Country Debt Fund and is comprised of emerging countries that each represents between (1.0)% and 1.0% of Investments. |
| § | “Euro Region” is comprised of derivative financial instruments attributed to the Eurozone and not a particular country. |
10
GMO Core Plus Bond Fund
(A Series of GMO Trust)
Schedule of Investments
(showing percentage of total net assets)
February 28, 2017
| | | | | | | | | | |
Par Value† /
Shares | | | Description | | Value ($) | |
| | | | | | DEBT OBLIGATIONS — 58.9% | |
| | |
| | | | | | United States | |
| | | | | | U.S. Government — 44.3% | |
| | | 3,468,000 | | | U.S. Treasury Bond, 6.25%, due 05/15/30 | | | 4,937,159 | |
| | | 35,339,000 | | | U.S. Treasury Bond, 3.38%, due 05/15/44 (a) | | | 38,066,747 | |
| | | 79,956,000 | | | U.S. Treasury Note, 1.50%, due 02/28/19 | | | 80,349,543 | |
| | | 68,400,000 | | | U.S. Treasury Note, 2.00%, due 02/28/21 | | | 69,057,256 | |
| | | 39,004,000 | | | U.S. Treasury Note, 2.00%, due 02/15/23 | | | 38,848,608 | |
| | | 30,344,000 | | | U.S. Treasury Note, 2.00%, due 08/15/25 | | | 29,566,435 | |
| | | | | | | | | | |
| | | | | | | | | 260,825,748 | |
| | | | | | | | | | |
| | |
| | | | | | U.S. Government Agency — 14.6% | |
| | | 13,090,000 | | | Federal Home Loan Mortgage Corp., TBA, 3.50%, due 03/13/47 | | | 13,413,159 | |
| | | 22,550,000 | | | Federal National Mortgage Association, TBA, 2.50%, due 03/16/47 | | | 22,602,853 | |
| | | 8,830,000 | | | Federal National Mortgage Association, TBA, 3.00%, due 03/13/47 | | | 8,770,524 | |
| | | 18,830,000 | | | Federal National Mortgage Association, TBA, 4.00%, due 03/13/47 | | | 19,785,698 | |
| | | 20,690,000 | | | Government National Mortgage Association, TBA, 3.50%, due 03/21/47 | | | 21,505,478 | |
| | | | | | | | | | |
| | | | | | | | | 86,077,712 | |
| | | | | | | | | | |
| | | |
| | | | | | TOTAL DEBT OBLIGATIONS (COST $345,436,276) | | | 346,903,460 | |
| | | | | | | | | | |
| |
| | | MUTUAL FUNDS — 54.4% | |
| | |
| | | | | | United States — 39.3% | |
| | | | | | Affiliated Issuers — 39.3% | |
| | | 992,130 | | | GMO Emerging Country Debt Fund, Class IV | | | 28,722,150 | |
| | | 4,418,935 | | | GMO Opportunistic Income Fund, Class VI | | | 113,920,146 | |
| | | 3,545,790 | | | GMO U.S. Treasury Fund | | | 88,644,748 | |
| | | | | | | | | | |
| | | | | | | | | 231,287,044 | |
| | | | | | | | | | |
| | |
| | | | | | Exchange-Traded Funds — 15.1% | |
| | | 749,650 | | | iShares iBoxx $ Investment Grade Corporate Bond ETF | | | 88,893,497 | |
| | | | | | | | | | |
| | | |
| | | | | | TOTAL MUTUAL FUNDS (COST $318,860,603) | | | 320,180,541 | |
| | | | | | | | | | |
| | |
| | | | | | SHORT-TERM INVESTMENTS — 0.6% | |
| | |
| | | | | | Money Market Funds | |
| | | 3,598,275 | | | State Street Institutional Treasury Plus Money Market Fund-Premier Class, 0.41% (b) | | | 3,598,275 | |
| | | | | | | | | | |
| | | |
| | | | | | TOTAL SHORT-TERM INVESTMENTS (COST $3,598,275) | | | 3,598,275 | |
| | | | | | | | | | |
| | | |
| | | | | | TOTAL INVESTMENTS — 113.9%
(Cost $667,895,154) | | | 670,682,276 | |
| | | | | | Other Assets and Liabilities (net) — (13.9%) | | | (82,076,697 | ) |
| | | | | | | | | | |
| | | |
| | | | | | TOTAL NET ASSETS — 100.0% | | | $588,605,579 | |
| | | | | | | | | | |
A summary of outstanding financial instruments at February 28, 2017 is as follows:
Forward Currency Contracts
| | | | | | | | | | | | | | | | | | | | | | |
Settlement
Date | | Counter-
party | | Currency
Sold | | | Currency
Purchased | | | Net
Unrealized
Appreciation
(Depreciation) | |
| 03/09/2017 | | GS | | | CHF | | | | 5,000,000 | | | | USD | | | | 5,017,237 | | | $ | 37,256 | |
| 03/09/2017 | | MSCI | | | CHF | | | | 1,331,916 | | | | USD | | | | 1,326,491 | | | | (93 | ) |
| 03/20/2017 | | BCLY | | | EUR | | | | 3,210,000 | | | | USD | | | | 3,429,181 | | | | 25,797 | |
| 03/20/2017 | | MSCI | | | EUR | | | | 320,023 | | | | USD | | | | 341,573 | | | | 2,271 | |
| 11/07/2017 | | GS | | | EUR | | | | 4,716,000 | | | | USD | | | | 5,177,932 | | | | 116,846 | |
| 03/13/2017 | | BOA | | | JPY | | | | 52,851,246 | | | | USD | | | | 464,802 | | | | (5,798 | ) |
| 03/13/2017 | | JPM | | | JPY | | | | 428,000,000 | | | | USD | | | | 3,781,681 | | | | (29,336 | ) |
| 03/09/2017 | | MSCI | | | USD | | | | 661,477 | | | | CHF | | | | 661,906 | | | | (2,221 | ) |
| 03/13/2017 | | MSCI | | | USD | | | | 125,412 | | | | NZD | | | | 180,000 | | | | 4,196 | |
| 11/07/2017 | | GS | | | USD | | | | 5,205,049 | | | | EUR | | | | 4,716,000 | | | | (143,963 | ) |
| | | | | | | | | | | | | | | | | | | | | | |
| | | | | | | | | | | | | | | | | | | | $ | 4,955 | |
| | | | | | | | | | | | | | | | | | | | | | |
Futures Contracts
| | | | | | | | | | | | |
| | | | |
Number
of
Contracts + | | Type | | Expiration
Date | | Notional
Amount | | | Net
Unrealized
Appreciation
(Depreciation) | |
| Buys | | | | | | | | | | | | |
| 102 | | U.S. Long Bond (CBT) | | June 2017 | | $ | 15,468,937 | | | $ | 154,122 | |
| 349 | | U.S. Treasury Note 10 Yr. (CBT) | | June 2017 | | | 43,477,766 | | | | 122,168 | |
| 24 | | U.S. Treasury Note 2 Yr. (CBT) | | June 2017 | | | 5,193,750 | | | | 2,598 | |
| 39 | | U.S. Treasury Note 5 Yr. (CBT) | | June 2017 | | | 4,590,422 | | | | 5,126 | |
| | | | | | | | | | | | |
| | | | | | $ | 68,730,875 | | | $ | 284,014 | |
| | | | | | | | | | | | |
| + | Buys - Fund is long the futures contract. |
| | Sales - Fund is short the futures contract. |
| | | | |
| | See accompanying notes to the financial statements. | | 11 |
GMO Core Plus Bond Fund
(A Series of GMO Trust)
Schedule of Investments — (Continued)
February 28, 2017
Swap Contracts
Interest Rate Swaps
| | | | | | | | | | | | | | | | | | | | |
| | | | | | |
Notional
Amount | | | Expiration
Date | | Counterparty | | Receive
(Pay) # | | Fixed
Rate | | Variable Rate | | Net
Unrealized
Appreciation/
(Depreciation) | |
| | 330,867,000 | | | | MXN | | | 1/22/2027 | | CSS (c) | | Receive | | 7.90% | | TIIE | | $ | 90,164 | |
| | 430,000 | | | | CAD | | | 3/17/2027 | | CSS (d) | | Receive | | 1.97% | | 3 Month CAD LIBOR | | | 2,755 | |
| | 7,680,000 | | | | CAD | | | 3/17/2027 | | CSS (d) | | (Pay) | | 2.00% | | 3 Month CAD LIBOR | | | (66,911 | ) |
| | 962,000 | | | | CAD | | | 3/17/2027 | | CSS (d) | | (Pay) | | 1.86% | | 3 Month CAD LIBOR | | | 1,204 | |
| | 6,351,000 | | | | CHF | | | 3/17/2027 | | CSS (d) | | (Pay) | | 0.17% | | 6 Month CHF LIBOR | | | (88,093 | ) |
| | 7,311,000 | | | | EUR | | | 3/17/2027 | | CSS (d) | | (Pay) | | 0.77% | | 6 Month EURIBOR | | | (71,331 | ) |
| | 28,396,000 | | | | GBP | | | 3/17/2027 | | CSS (d) | | (Pay) | | 1.30% | | 6 Month GBP LIBOR | | | (499,806 | ) |
| | 1,335,000 | | | | GBP | | | 3/17/2027 | | CSS (d) | | (Pay) | | 1.40% | | 6 Month GBP LIBOR | | | (39,249 | ) |
| | 875,000 | | | | GBP | | | 3/17/2027 | | CSS (d) | | (Pay) | | 1.43% | | 6 Month GBP LIBOR | | | (28,885 | ) |
| | 445,000 | | | | GBP | | | 3/17/2027 | | CSS (d) | | (Pay) | | 1.38% | | 6 Month GBP LIBOR | | | (12,011 | ) |
| | 804,000 | | | | GBP | | | 3/17/2027 | | CSS (d) | | (Pay) | | 1.41% | | 6 Month GBP LIBOR | | | (24,702 | ) |
| | 29,223,000 | | | | NZD | | | 3/17/2027 | | CSS (d) | | Receive | | 3.67% | | 3 Month NZD Bank Bill Rate | | | 340,837 | |
| | 2,213,000 | | | | NZD | | | 3/17/2027 | | CSS (d) | | Receive | | 2.68% | | 3 Month NZD Bank Bill Rate | | | (107,973 | ) |
| | 987,000 | | | | NZD | | | 3/17/2027 | | CSS (d) | | Receive | | 2.94% | | 3 Month NZD Bank Bill Rate | | | (32,406 | ) |
| | 50,697,000 | | | | SEK | | | 3/17/2027 | | CSS (d) | | (Pay) | | 1.14% | | 3 Month SEK STIBOR | | | (34,226 | ) |
| | 173,460,000 | | | | SEK | | | 3/17/2027 | | CSS (d) | | Receive | | 1.17% | | 3 Month SEK STIBOR | | | 177,610 | |
| | 422,000 | | | | USD | | | 3/17/2027 | | CSS (d) | | (Pay) | | 2.29% | | 3 Month USD LIBOR | | | 2,085 | |
| | 9,544,000 | | | | USD | | | 3/17/2027 | | CSS (d) | | (Pay) | | 2.32% | | 3 Month USD LIBOR | | | 13,142 | |
| | 559,000 | | | | USD | | | 3/17/2027 | | CSS (d) | | (Pay) | | 2.35% | | 3 Month USD LIBOR | | | (482 | ) |
| | 6,964,000 | | | | USD | | | 3/17/2027 | | CSS (d) | | Receive | | 2.49% | | 3 Month USD LIBOR | | | 97,961 | |
| | 721,000 | | | | USD | | | 3/17/2027 | | CSS (d) | | Receive | | 2.22% | | 3 Month USD LIBOR | | | (8,076 | ) |
| | 368,000 | | | | USD | | | 3/17/2027 | | CSS (d) | | (Pay) | | 2.26% | | 3 Month USD LIBOR | | | 2,625 | |
| | | | | | | | | | | | | | | | | | | | |
| | | $ | (285,768 | ) |
| | | | | | | | | | | | | | | | | | | | |
| | | Premiums Paid (Received) | | $ | (191,458 | ) |
| | | | | | | | | | | | | | | | | | | | |
| # | Receive - Fund receives fixed rate and pays variable rate. |
| | (Pay) - Fund pays fixed rate and receives variable rate. |
As of February 28, 2017, for the above contracts and/or agreements, the Fund had sufficient cash and/or securities to cover commitments or collateral requirements, if any, of the relevant broker or exchange.
Notes to Schedule of Investments:
| † | Denominated in U.S. Dollar, unless otherwise indicated. |
| (a) | All or a portion of this security has been pledged to cover margin requirements on futures and/or cleared swap contracts, collateral on OTC swap contracts, forward currency contracts, and/or written options, if any (Note 4). |
| (b) | The rate disclosed is the 7 day net yield as of February 28, 2017. |
| (c) | Swap was cleared through the CME Group Inc. |
| (d) | Swap was cleared through the LCH.Clearnet Group Ltd. |
For a listing of definitions of acronyms, counterparty abbreviations and currency abbreviations used throughout the Schedule of Investments as well as the derivative tables, if any, please refer to page 52.
| | | | |
| 12 | | See accompanying notes to the financial statements. | | |
This page has been left blank intentionally.
GMO Currency Hedged International Bond Fund
(A Series of GMO Trust)
Portfolio Management
Day-to-day management of the Fund’s portfolio is the responsibility of the Developed Fixed Income team at Grantham, Mayo, Van Otterloo & Co. LLC.
Management Discussion and Analysis of Fund Performance
GMO Currency Hedged International Bond Fund returned +2.79% (net) for the fiscal year ended February 28, 2017, as compared with +1.77% for the J.P. Morgan GBI Global ex Japan ex-U.S. (Hedged). The Fund outperformed its benchmark during the fiscal year by +1.02%.
The Fund’s investment exposure was achieved directly through bonds, swaps, and futures and indirectly through investment in underlying GMO Trust mutual funds, including GMO Opportunistic Income Fund (OIF), GMO Emerging Country Debt Fund (ECDF), and GMO U.S. Treasury Fund (USTF).
A small exposure to emerging debt added value during the fiscal year, thanks to spread tightening on the asset class and positive contributions from both country selection and security selection.
Exposure to asset-backed securities also contributed positively to performance, given tighter spreads across structured products in general.
The currency strategy contributed positively during the fiscal year. The Fund’s active short positions in the yen and Swiss franc were successful during the year, while positions in euros detracted.
Developed markets interest-rate positioning detracted during the fiscal year. The Fund’s duration positions in Mexico, the U.K., and New Zealand, and an early year Eurozone steepener position detracted, while gains from duration positions in the U.S., Australia, and Sweden partly offset losses. In opportunistic strategies, cross-currency basis swap positions added value, as gains from yen cross-currency basis swap positions more than offset losses from euro cross-currency basis swap positions.
The views expressed herein are exclusively those of Grantham, Mayo, Van Otterloo & Co. LLC as of the date of this report and are subject to change. GMO disclaims any responsibility to update such views. They are not meant as investment advice. References to specific securities are not recommendations of such securities and may not be representative of any GMO portfolio’s current or future investments.
14
GMO Currency Hedged International Bond Fund
(A Series of GMO Trust)
Comparison of Change in Value of a $10,000,000 Investment in
GMO Currency Hedged International Bond Fund Class III Shares and the
J.P. Morgan GBI Global ex Japan ex U.S. (Hedged)
As of February 28, 2017
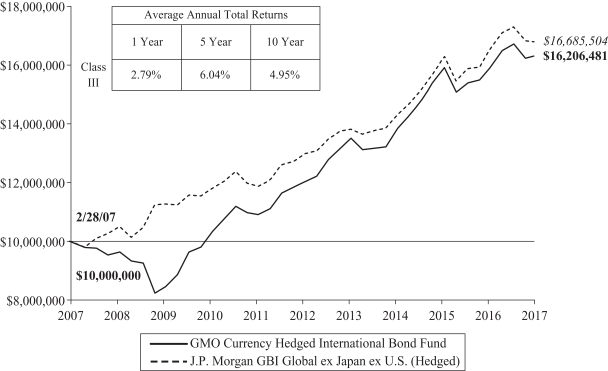
Performance data quoted represents past performance and is not indicative of future results. The investment return and principal value of an investment will fluctuate so that an investor’s shares, when redeemed, may be worth more or less than their original cost. Current performance data may be lower or higher than the performance data provided herein. To obtain performance information up to the most recent month-end, visit www.gmo.com. Performance shown is net of all fees after reimbursement from GMO. Returns would have been lower had certain expenses not been reimbursed during the periods shown and do not include the effect of taxes on distributions and redemptions. The performance information shown above only includes purchase premiums and/or redemption fees in effect as of February 28, 2017. All information is unaudited.
For J.P. Morgan disclaimers please visit http://www.gmo.com/America/_Disclaimers/_BenchmarkDisclaimers.htm.
15
GMO Currency Hedged International Bond Fund
(A Series of GMO Trust)
Investment Concentration Summary
February 28, 2017 (Unaudited)
| | | | |
| Asset Class Summary† | | % of Total Net Assets | |
Debt Obligations | | | 66.7 | % |
Short-Term Investments | | | 31.6 | |
Futures Contracts | | | 0.4 | |
Forward Currency Contracts | | | 0.4 | |
Loan Participations | | | 0.1 | |
Rights/Warrants | | | 0.1 | |
Loan Assignments | | | 0.0 | ^ |
Options Purchased | | | 0.0 | ^ |
Securities Sold Short | | | (0.0 | )^ |
Written Options/Credit Linked Options | | | (0.0 | )^ |
Reverse Repurchase Agreements | | | (0.0 | )^ |
Swap Contracts | | | (0.4 | ) |
Other | | | 1.1 | |
| | | | |
| | | 100.0 | % |
| | | | |
Country/Region Summary‡ | | % of Investments | |
Germany | | | 20.8 | % |
France | | | 15.2 | |
Italy | | | 13.0 | |
United Kingdom | | | 11.9 | |
Spain | | | 7.4 | |
New Zealand | | | 7.3 | |
Other Emerging | | | 5.9 | ¥ |
Belgium | | | 4.3 | |
Australia | | | 3.7 | |
Netherlands | | | 3.3 | |
Sweden | | | 3.3 | |
Mexico | | | 2.9 | |
Canada | | | 1.9 | |
Other Developed | | | 0.5 | ☐ |
Euro Region | | | 0.4 | § |
Switzerland | | | (1.8 | ) |
| | | | |
| | | 100.0 | % |
| | | | |
| † | The table above incorporates aggregate indirect asset class exposure associated with investments in other funds of GMO Trust (“underlying funds”). Derivative financial instruments, if any, are based on market values or unrealized appreciation/depreciation rather than notional amounts. |
| ‡ | The table above incorporates aggregate indirect country exposure associated with investments in the underlying funds. The table is normalized to 100%, therefore the absolute exposure presented for each country may not be representative of the true exposure of the Fund. The table excludes short-term investments. The table includes exposure through the use of certain derivative financial instruments and excludes exposure through certain currency linked derivatives such as forward currency contracts and currency options. The table is based on duration adjusted net exposures (both investments and derivatives), taking into account the market value of securities and the notional amounts of swaps and other derivative financial instruments. For example, U.S. asset-backed securities may represent a relatively small percentage due to their short duration, even though they represent a large percentage of market value (direct and indirect). Duration is based on GMO’s models. The greater the duration of a bond, the greater its contribution to the concentration percentage. Credit default swap exposures are factored into the duration adjusted exposure using the reference security and applying the same methodology to that security. |
| ¥ | “Other Emerging” is associated with investments in GMO Emerging Country Debt Fund and is comprised of emerging countries that each represent between (1.0)% and 1.0% of Investments. |
| ☐ | “Other Developed” is comprised of developed countries that each represent less than(1.0)% and 1.0% of Investments. |
| § | “Euro Region” is comprised of derivative financial instruments attributed to the Eurozone and not a particular country. |
16
GMO Currency Hedged International Bond Fund
(A Series of GMO Trust)
Schedule of Investments
(showing percentage of total net assets)
February 28, 2017
| | | | | | | | | | |
Par Value† | | | Description | | Value ($) | |
| | | DEBT OBLIGATIONS — 53.4% | |
| | | |
| | | | | | Belgium — 4.2% | | | | |
| | | | | | Foreign Government Obligations | | | | |
EUR | | | 1,130,000 | | | Belgium Government Bond, Reg S, 4.25%, due 09/28/21 | | | 1,455,209 | |
EUR | | | 590,000 | | | Belgium Government Bond, Reg S, 5.00%, due 03/28/35 | | | 1,019,757 | |
| | | | | | | | | | |
| | | | | | Total Belgium | | | 2,474,966 | |
| | | | | | | | | | |
| | | |
| | | | | | France — 3.4% | | | | |
| | | | | | Foreign Government Obligations | | | | |
EUR | | | 1,230,000 | | | France Government Bond OAT, Reg S, 4.50%, due 04/25/41 | | | 2,018,703 | |
| | | | | | | | | | |
| | | |
| | | | | | Germany — 4.5% | | | | |
| | | | | | Foreign Government Obligations | | | | |
EUR | | | 1,500,000 | | | Bundesrepublik Deutschland, Reg S, 4.75%, due 07/04/34 | | | 2,675,646 | |
| | | | | | | | | | |
| | | |
| | | | | | Italy — 15.3% | | | | |
| | | | | | Foreign Government Obligations | | | | |
EUR | | | 5,610,000 | | | Buoni Poliennali Del Tesoro, 3.75%, due 05/01/21 | | | 6,689,130 | |
EUR | | | 1,920,000 | | | Buoni Poliennali Del Tesoro, Reg S, 4.00%, due 02/01/37 | | | 2,389,281 | |
| | | | | | | | | | |
| | | | | | Total Italy | | | 9,078,411 | |
| | | | | | | | | | |
| | | |
| | | | | | Netherlands — 3.0% | | | | |
| | | | | | Foreign Government Obligations | | | | |
EUR | | | 1,050,000 | | | Netherlands Government Bond, 5.50%, due 01/15/28 | | | 1,711,139 | |
EUR | | | 70,000 | | | Netherlands Government Bond, Reg S, 4.00%, due 07/15/19 | | | 82,636 | |
| | | | | | | | | | |
| | | | | | Total Netherlands | | | 1,793,775 | |
| | | | | | | | | | |
| | | |
| | | | | | Spain — 9.6% | | | | |
| | | | | | Foreign Government Obligations | | | | |
EUR | | | 380,000 | | | Government of Spain, 2.10%, due 04/30/17 | | | 404,142 | |
EUR | | | 3,040,000 | | | Government of Spain, Reg S, 5.50%, due 04/30/21 | | | 3,929,693 | |
EUR | | | 1,010,000 | | | Government of Spain, Reg S, 4.20%, due 01/31/37 | | | 1,358,143 | |
| | | | | | | | | | |
| | | | | | Total Spain | | | 5,691,978 | |
| | | | | | | | | | |
| | | |
| | | | | | United Kingdom — 13.4% | | | | |
| | | | | | Foreign Government Obligations | | | | |
GBP | | | 510,000 | | | United Kingdom Gilt, Reg S, 1.25%, due 07/22/18 | | | 643,156 | |
GBP | | | 2,160,000 | | | United Kingdom Gilt, Reg S, 1.75%, due 07/22/19 | | | 2,786,447 | |
| | | | | | | | | | |
Par Value† / Shares | | | Description | | Value ($) | |
| | | | | | United Kingdom — continued | | | | |
| | | | | | Foreign Government Obligations — continued | |
GBP | | | 2,630,000 | | | United Kingdom Gilt, Reg S, 3.50%, due 01/22/45 | | | 4,481,396 | |
| | | | | | | | | | |
| | | | | | Total United Kingdom | | | 7,910,999 | |
| | | | | | | | | | |
| | | |
| | | | | | TOTAL DEBT OBLIGATIONS (COST $34,481,686) | | | 31,644,478 | |
| | | | | | | | | | |
| | | |
| | | | | | MUTUAL FUNDS — 43.6% | | | | |
| | | |
| | | | | | United States — 43.6% | | | | |
| | | | | | Affiliated Issuers — 43.6% | | | | |
| | | 127,032 | | | GMO Emerging Country Debt Fund, Class IV | | | 3,677,564 | |
| | | 111,902 | | | GMO Opportunistic Income Fund, Class VI | | | 2,884,836 | |
| | | 769,947 | | | GMO U.S. Treasury Fund | | | 19,248,680 | |
| | | | | | | | | | |
| | | |
| | | | | | TOTAL MUTUAL FUNDS
(COST $24,686,959) | | | 25,811,080 | |
| | | | | | | | | | |
| | | |
| | | | | | SHORT-TERM INVESTMENTS — 1.6% | | | | |
| | | |
| | | | | | Money Market Funds — 0.5% | | | | |
| | | 320,956 | | | State Street Institutional Treasury Plus Money Market Fund-Premier Class, 0.41% (a) | | | 320,956 | |
| | | | | | | | | | |
| | | |
| | | | | | U.S. Government — 1.1% | | | | |
| | | 650,000 | | | U.S. Treasury Bill, 0.55%, due 06/01/17 (b) (c) | | | 649,086 | |
| | | | | | | | | | |
| | | |
| | | | | | TOTAL SHORT-TERM INVESTMENTS (COST $969,990) | | | 970,042 | |
| | | | | | | | | | |
| | | |
| | | | | | TOTAL INVESTMENTS — 98.6%
(Cost $60,138,635) | | | 58,425,600 | |
| | | | | | Other Assets and Liabilities (net) — 1.4% | | | 807,023 | |
| | | | | | | | | | |
| | | |
| | | | | | TOTAL NET ASSETS — 100.0% | | | $59,232,623 | |
| | | | | | | | | | |
A summary of outstanding financial instruments at February 28, 2017 is as follows:
Forward Currency Contracts
| | | | | | | | | | | | | | | | | | |
Settlement
Date | | Counter-
party | | Currency
Sold | | | Currency
Purchased | | | Net
Unrealized
Appreciation
(Depreciation) | |
| 03/09/2017 | | MSCI | | CHF | | | 1,229,012 | | | USD | | | 1,224,006 | | | $ | (85 | ) |
| 03/20/2017 | | MSCI | | EUR | | | 22,673,748 | | | USD | | | 24,200,598 | | | | 160,887 | |
| 11/07/2017 | | GS | | EUR | | | 1,404,000 | | | USD | | | 1,541,522 | | | | 34,786 | |
| 03/20/2017 | | GS | | GBP | | | 6,303,000 | | | USD | | | 7,882,942 | | | | 58,520 | |
| 03/13/2017 | | BOA | | JPY | | | 48,835,500 | | | USD | | | 429,485 | | | | (5,358 | ) |
| 03/09/2017 | | MSCI | | USD | | | 649,506 | | | CHF | | | 649,535 | | | | (2,572 | ) |
| 03/13/2017 | | MSCI | | USD | | | 118,445 | | | NZD | | | 170,000 | | | | 3,963 | |
| 11/07/2017 | | GS | | USD | | | 1,549,595 | | | EUR | | | 1,404,000 | | | | (42,859 | ) |
| | | | | | | | | | | | | | | | | | |
| | | | | | | | | | | | | | | | $ | 207,282 | |
| | | | | | | | | | | | | | | | | | |
| | | | |
| | See accompanying notes to the financial statements. | | 17 |
GMO Currency Hedged International Bond Fund
(A Series of GMO Trust)
Schedule of Investments — (Continued)
February 28, 2017
Futures Contracts
| | | | | | | | | | | | |
| | | | |
Number
of
Contracts + | | Type | | Expiration
Date | |
Notional
Amount | | | Net
Unrealized
Appreciation
(Depreciation) | |
| Buys | | | | | | | | | | | | |
| 14 | | Australian Government Bond 10 Yr. | | March 2017 | | $ | 1,376,566 | | | $ | 11,563 | |
| 15 | | Australian Government Bond 3 Yr. | | March 2017 | | | 1,283,708 | | | | (1,092 | ) |
| 18 | | Canadian Government Bond 10 Yr. | | June 2017 | | | 1,861,391 | | | | 14,197 | |
| 31 | | Euro BOBL | | March 2017 | | | 4,424,720 | | | | 62,974 | |
| 11 | | Euro Bund | | March 2017 | | | 1,935,046 | | | | 54,761 | |
| 7 | | Euro BUXL Bond 30 Yr. | | March 2017 | | | 1,287,530 | | | | 26,712 | |
| 29 | | Euro OATs | | March 2017 | | | 4,606,852 | | | | 8,883 | |
| 4 | | Short-term
Euro-BTP | | March 2017 | | | 477,450 | | | | 3,683 | |
| 23 | | UK Gilt Long Bond | | June 2017 | | | 3,631,088 | | | | 45,072 | |
| | | | | | | | | | | | |
| | | | | | $ | 20,884,351 | | | $ | 226,753 | |
| | | | | | | | | | | | |
| + | Buys - Fund is long the futures contract. |
| | Sales - Fund is short the futures contract. |
Swap Contracts
Interest Rate Swaps
| | | | | | | | | | | | | | | | | | | | |
Notional
Amount | | | Expiration
Date | | Counterparty | | Receive
(Pay) # | | Fixed
Rate | | Variable Rate | | Net
Unrealized
Appreciation/
(Depreciation) | |
| | 10,113,000 | | | | EUR | | | 3/21/2018 | | CSS (d) | | Receive | | (0.22)% | | 3 Month EURIBOR | | $ | 9,008 | |
| | 665,000 | | | | USD | | | 12/16/2020 | | CSS (d) | | (Pay) | | 1.92% | | 3 Month USD LIBOR | | | (1,102 | ) |
| | 1,066,000 | | | | USD | | | 12/17/2025 | | CSS (d) | | (Pay) | | 2.43% | | 3 Month USD LIBOR | | | (11,705 | ) |
| | 33,320,000 | | | | MXN | | | 1/22/2027 | | CSS (d) | | Receive | | 7.90% | | TIIE | | | 9,082 | |
| | 883,000 | | | | CAD | | | 3/17/2027 | | CSS (e) | | (Pay) | | 1.86% | | 3 Month CAD LIBOR | | | 1,105 | |
| | 420,000 | | | | CAD | | | 3/17/2027 | | CSS (e) | | (Pay) | | 2.00% | | 3 Month CAD LIBOR | | | (3,659 | ) |
| | 430,000 | | | | CAD | | | 3/17/2027 | | CSS (e) | | Receive | | 1.97% | | 3 Month CAD LIBOR | | | 2,755 | |
| | 598,000 | | | | CHF | | | 3/17/2027 | | CSS (e) | | (Pay) | | 0.17% | | 6 Month CHF LIBOR | | | (8,295 | ) |
| | 848,000 | | | | EUR | | | 3/17/2027 | | CSS (e) | | (Pay) | | 0.77% | | 6 Month EURIBOR | | | (8,274 | ) |
| | 266,000 | | | | GBP | | | 3/17/2027 | | CSS (e) | | (Pay) | | 1.30% | | 6 Month GBP LIBOR | | | (4,682 | ) |
| | 805,000 | | | | GBP | | | 3/17/2027 | | CSS (e) | | (Pay) | | 1.43% | | 6 Month GBP LIBOR | | | (26,574 | ) |
| | 1,067,000 | | | | GBP | | | 3/17/2027 | | CSS (e) | | (Pay) | | 1.40% | | 6 Month GBP LIBOR | | | (31,370 | ) |
| | 412,000 | | | | GBP | | | 3/17/2027 | | CSS (e) | | (Pay) | | 1.38% | | 6 Month GBP LIBOR | | | (11,121 | ) |
| | 727,000 | | | | GBP | | | 3/17/2027 | | CSS (e) | | (Pay) | | 1.41% | | 6 Month GBP LIBOR | | | (22,337 | ) |
| | 2,067,000 | | | | NZD | | | 3/17/2027 | | CSS (e) | | Receive | | 2.68% | | 3 Month NZD Bank Bill Rate | | | (100,849 | ) |
| | 875,000 | | | | NZD | | | 3/17/2027 | | CSS (e) | | Receive | | 2.94% | | 3 Month NZD Bank Bill Rate | | | (28,729 | ) |
| | 870,000 | | | | NZD | | | 3/17/2027 | | CSS (e) | | Receive | | 3.67% | | 3 Month NZD Bank Bill Rate | | | 10,147 | |
| | | | |
| 18 | | See accompanying notes to the financial statements. | | |
GMO Currency Hedged International Bond Fund
(A Series of GMO Trust)
Schedule of Investments — (Continued)
February 28, 2017
Interest Rate Swaps — continued
| | | | | | | | | | | | | | | | | | | | |
Notional
Amount | | | Expiration
Date | | Counterparty | | Receive
(Pay) # | | Fixed
Rate | | Variable Rate | | Net
Unrealized
Appreciation/
(Depreciation) | |
| | 5,590,000 | | | | SEK | | | 3/17/2027 | | CSS (e) | | (Pay) | | 1.14% | | 3 Month SEK STIBOR | | $ | (3,774 | ) |
| | 18,050,000 | | | | SEK | | | 3/17/2027 | | CSS (e) | | Receive | | 1.17% | | 3 Month SEK STIBOR | | | 18,482 | |
| | 701,000 | | | | USD | | | 3/17/2027 | | CSS (e) | | Receive | | 2.49% | | 3 Month USD LIBOR | | | 9,861 | |
| | 513,000 | | | | USD | | | 3/17/2027 | | CSS (e) | | (Pay) | | 2.34% | | 3 Month USD LIBOR | | | (442 | ) |
| | 327,000 | | | | USD | | | 3/17/2027 | | CSS (e) | | (Pay) | | 2.32% | | 3 Month USD LIBOR | | | 450 | |
| | 353,000 | | | | USD | | | 3/17/2027 | | CSS (e) | | (Pay) | | 2.29% | | 3 Month USD LIBOR | | | 1,744 | |
| | 333,000 | | | | USD | | | 3/17/2027 | | CSS (e) | | (Pay) | | 2.26% | | 3 Month USD LIBOR | | | 2,376 | |
| | 668,000 | | | | USD | | | 3/17/2027 | | CSS (e) | | Receive | | 2.22% | | 3 Month USD LIBOR | | | (7,482 | ) |
| | 405,000 | | | | USD | | | 12/19/2035 | | CSS (d) | | (Pay) | | 2.72% | | 3 Month USD LIBOR | | | (8,649 | ) |
| | | | | | | | | | | | | | | | | | | | |
| | | | | | | | | | | | | | | | | | $ | (214,034 | ) |
| | | | | | | | | | | | | | | | | | | | |
| | | | | | | | | | | | | | Premiums Paid (Received) | | $ | (4,679 | ) |
| | | | | | | | | | | | | | | | | | | | |
| # | Receive - Fund receives fixed rate and pays variable rate. |
| | (Pay) - Fund pays fixed rate and receives variable rate. |
As of February 28, 2017, for the above contracts and/or agreements, the Fund had sufficient cash and/or securities to cover commitments or collateral requirements, if any, of the relevant broker or exchange.
Notes to Schedule of Investments:
| † | Denominated in U.S. Dollar, unless otherwise indicated. |
| (a) | The rate disclosed is the 7 day net yield as of February 28, 2017. |
| (b) | The rate shown represents yield-to-maturity. |
| (c) | All or a portion of this security has been pledged to cover margin requirements on futures and/or cleared swap contracts, collateral on OTC swap contracts, forward currency contracts, and/or written options, if any (Note 4). |
| (d) | Swap was cleared through the CME Group Inc. |
| (e) | Swap was cleared through the LCH.Clearnet Group Ltd. |
For a listing of definitions of acronyms, counterparty abbreviations and currency abbreviations used throughout the Schedule of Investments as well as the derivative tables, if any, please refer to page 52.
| | | | |
| | See accompanying notes to the financial statements. | | 19 |
GMO Emerging Country Debt Fund
(A Series of GMO Trust)
Portfolio Management
Day-to-day management of the Fund’s portfolio is the responsibility of the Emerging Country Debt team at Grantham, Mayo, Van Otterloo & Co. LLC.
Management Discussion and Analysis of Fund Performance
Class III shares of GMO Emerging Country Debt Fund returned +19.47% (net) for the fiscal year ended February 28, 2017, as compared with +12.06% for the J.P. Morgan EMBI Global (EMBIG). The Fund outperformed its benchmark during the fiscal year by +7.41%.
EMBIG spreads over U.S. Treasuries narrowed 149 basis points to 334 basis points, while the yield on the 10-year U.S. Treasury bond rose by 62 basis points to 2.36%.
The EMBIG index’s biggest gainers of the fiscal year were concentrated in low credit quality, commodity-reliant sovereigns, led by Venezuela (+75.2%), Zambia (+50.8%), and Ecuador (+49.3%). The worst performing countries featured two sovereigns in debt distress, namely Mozambique (-4.3%) and Belize (-3.0%). Slovak Republic, a high quality credit with very low yields, was the third worst performer on a total return basis.
Country selection added meaningfully to the Fund’s relative performance. Overweighting Venezuela had the largest positive impact, while overweight positions in Brazil, Angola, Iraq, Tunisia, and Pakistan also contributed. Underweight positions in China and the Philippines were also meaningful contributors to relative performance. A significant negative contribution from country selection came from overweighting Mexico.
Security selection also added to relative performance during the year. The Fund’s choice of holdings in Venezuela, Argentina, Colombia, Russia, and Brazil were meaningful contributors. These were partially offset by negative contributions from the Fund’s choice of holdings in Mexico and Tunisia.
The views expressed herein are exclusively those of Grantham, Mayo, Van Otterloo & Co. LLC as of the date of this report and are subject to change. GMO disclaims any responsibility to update such views. They are not meant as investment advice. References to specific securities are not recommendations of such securities and may not be representative of any GMO portfolio’s current or future investments.
20
GMO Emerging Country Debt Fund
(A Series of GMO Trust)
Comparison of Change in Value of a $10,000,000 Investment in
GMO Emerging Country Debt Fund Class III Shares and the J.P. Morgan EMBI Global
As of February 28, 2017
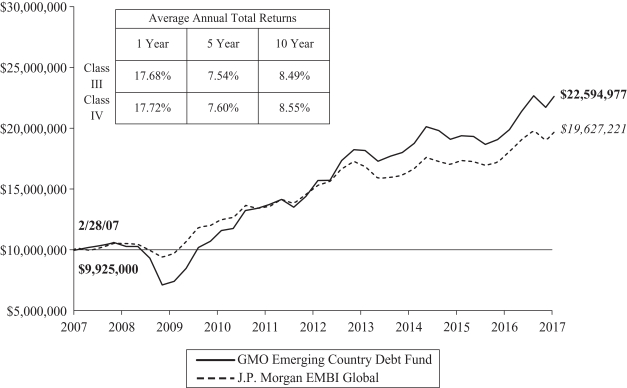
Performance data quoted represents past performance and is not indicative of future results. The investment return and principal value of an investment will fluctuate so that an investor’s shares, when redeemed, may be worth more or less than their original cost. Current performance data may be lower or higher than the performance data provided herein. To obtain performance information up to the most recent month-end, visit www.gmo.com. Performance shown is net of all fees after reimbursement from GMO. Each performance figure assumes a purchase at the beginning and redemption at the end of the stated period and reflects a transaction fee of 0.75% on the purchase and 0.75% on the redemption. Transaction fees are retained by the Fund to cover trading costs. Returns would have been lower had certain expenses not been reimbursed during the periods shown and do not include the effect of taxes on distributions and redemptions. All information is unaudited. Performance for classes may vary due to different fees.
For J.P. Morgan disclaimers please visit http://www.gmo.com/America/_Disclaimers/_BenchmarkDisclaimers.htm.
21
GMO Emerging Country Debt Fund
(A Series of GMO Trust)
Investment Concentration Summary
February 28, 2017 (Unaudited)
| | | | |
| Asset Class Summary† | | % of Total Net Assets | |
Debt Obligations | | | 89.8 | % |
Short-Term Investments | | | 7.2 | |
Loan Participations | | | 1.6 | |
Rights/Warrants | | | 1.1 | |
Loan Assignments | | | 0.1 | |
Forward Currency Contracts | | | 0.0 | ^ |
Options Purchased | | | 0.0 | ^ |
Securities Sold Short | | | (0.0 | )^ |
Written Options/Credit Linked Options | | | (0.1 | ) |
Reverse Repurchase Agreements | | | (0.8 | ) |
Swap Contracts | | | (0.9 | ) |
Other | | | 2.0 | |
| | | | |
| | | 100.0 | % |
| | | | |
| | | | |
| Country/Region Summary‡ | | % of Investments | |
Other Emerging | | | 14.6 | %• |
Mexico | | | 12.4 | |
Russia | | | 7.1 | |
Venezuela | | | 6.8 | |
Brazil | | | 6.5 | |
Turkey | | | 6.0 | |
Argentina | | | 5.1 | |
Indonesia | | | 4.9 | |
China | | | 3.5 | |
Philippines | | | 2.7 | |
Pakistan | | | 2.1 | |
Dominican Republic | | | 2.0 | |
Kazakhstan | | | 2.0 | |
Colombia | | | 1.9 | |
Tunisia | | | 1.9 | |
Malaysia | | | 1.8 | |
South Africa | | | 1.8 | |
Costa Rica | | | 1.6 | |
Peru | | | 1.6 | |
Sri Lanka | | | 1.6 | |
Israel | | | 1.5 | |
Ukraine | | | 1.4 | |
Uruguay | | | 1.4 | |
Bahrain | | | 1.3 | |
Panama | | | 1.1 | |
Angola | | | 1.0 | |
Chile | | | 1.0 | |
Congo | | | 1.0 | |
Morocco | | | 1.0 | |
Hungary | | | 0.8 | |
Other Developed | | | 0.6 | ☐ |
| | | | |
| | | 100.0 | % |
| | | | |
| † | The table above incorporates aggregate indirect asset class exposure associated with investments in other funds of GMO Trust ( “underlying funds”). Derivative financial instruments, if any, are based on market values or unrealized appreciation/depreciaton rather than notional amounts. |
| ‡ | The table above incorporates aggregate indirect country exposure associated with investments in the underlying funds. The table excludes short-term investments. The table includes exposure through the use of certain derivative financial instruments and excludes exposure through certain currency linked derivatives such as forward currency contracts and currency options. The table is based on duration adjusted net exposures (both investments and derivatives), taking into account the market value of securities and the notional amounts of swaps and other derivative financial instruments. For example, U.S. asset-backed securities may represent a relatively small percentage due to their short duration, even though they represent a large percentage of market value (direct and indirect). Duration is based on GMO’s models. The greater the duration of a bond, the greater its contribution to the concentration percentage. Credit default swap exposures are factored into the duration adjusted exposure using a reference security and applying the same methodology to that security. |
| • | “Other Emerging” is comprised of emerging countries that each represent between (1.0)% and 1.0% of Investments. |
| ☐ | “Other Developed” is comprised of developed countries that each represent between (1.0)% and 1.0% of Investments. |
22
GMO Emerging Country Debt Fund
(A Series of GMO Trust)
Schedule of Investments
(showing percentage of total net assets)
February 28, 2017
| | | | | | | | | | |
Par Value† | | | Description | | Value ($) | |
| | | | | | | | | | |
| | | DEBT OBLIGATIONS — 89.3% | |
| |
| | | Albania — 0.9% | |
| | | Foreign Government Obligations | |
| | | 49,649,849 | | | Republic of Albania Par Bond, Zero Coupon, due 08/31/25 (a) (b) | | | 36,318,756 | |
| | | | | | | | | | |
| |
| | | Angola — 0.6% | |
| | | Foreign Government Obligations | |
| | | 23,000,000 | | | Republic of Angola, Reg S, 9.50%, due 11/12/25 | | | 23,230,000 | |
| | | | | | | | | | |
| |
| | | Argentina — 4.4% | |
| | | Foreign Government Obligations | |
| | | 1,200,000 | | | Province of Buenos Aires, Reg S, Step Up, 4.00%, due 05/15/35 | | | 855,000 | |
| | | 11,100,000 | | | Republic of Argentina, Reg S, 7.63%, due 04/22/46 (c) | | | 11,155,500 | |
EUR | | | 8,008,646 | | | Republic of Argentina Discount Bond, 7.82%, due 12/31/33 | | | 8,717,675 | |
| | | 40,308,593 | | | Republic of Argentina Discount Bond, 8.28%, due 12/31/33 | | | 41,820,165 | |
| | | 10,786,557 | | | Republic of Argentina Discount Bond, 8.28%, due 12/31/33 | | | 11,390,604 | |
EUR | | | 67,050,000 | | | Republic of Argentina Par Bond, Step Up, 2.26%, due 12/31/38 | | | 43,152,386 | |
EUR | | | 96,430,000 | | | Republic of Argentina Par Bond, Step Up, 2.26%, due 12/31/38 | | | 61,294,734 | |
| | | | | | | | | | |
| | | Total Argentina | | | 178,386,064 | |
| | | | | | | | | | |
| |
| | | Armenia — 0.5% | |
| | | Foreign Government Obligations | |
| | | 21,300,000 | | | Republic of Armenia, Reg S, 7.15%, due 03/26/25 | | | 22,269,150 | |
| | | | | | | | | | |
| |
| | | Azerbaijan — 0.4% | |
| | | Foreign Government Agency — 0.3% | |
| | | 4,750,000 | | | Southern Gas Corridor CJSC, Reg S, 6.88%, due 03/24/26 | | | 5,230,938 | |
| | | 7,500,000 | | | State Oil Company of the Azerbaijan Republic, Reg S, 6.95%, due 03/18/30 | | | 8,043,750 | |
| | | | | | | | | | |
| | | 13,274,688 | |
| | | | | | | | | | |
| |
| | | Foreign Government Obligations — 0.1% | |
| | | 4,000,000 | | | Republic of Azerbaijan International Bond, Reg S, 4.75%, due 03/18/24 | | | 4,060,000 | |
| | | | | | | | | | |
| | | | | | Total Azerbaijan | | | 17,334,688 | |
| | | | | | | | | | |
| |
| | | Bahrain — 0.9% | |
| | | Foreign Government Obligations | |
| | | 40,750,000 | | | Bahrain Government International Bond, Reg S, 6.00%, due 09/19/44 | | | 35,248,750 | |
| | | | | | | | | | |
| | | | | | | | | | |
Par Value† | | | Description | | Value ($) | |
| | | Belize — 0.3% | |
| | | Foreign Government Obligations | |
| | | 32,486,300 | | | Republic of Belize, Reg S, Step Up, 4.94%, due 02/20/34 | | | 13,969,109 | |
| | | | | | | | | | |
| | | |
| | | | | | Bosnia & Herzegovina — 0.0% | | | | |
| | | Foreign Government Obligations | |
DEM | | | 2,694,160 | | | Bosnia & Herzegovina, Series A, Variable Rate, 0.56%, due 12/11/17 | | | 1,400,594 | |
| | | | | | | | | | |
| | | |
| | | | | | Brazil — 3.2% | | | | |
| | | Foreign Government Agency — 2.2% | |
GBP | | | 3,795,000 | | | Petrobras Global Finance BV, 6.25%, due 12/14/26 | | | 4,744,344 | |
GBP | | | 12,225,000 | | | Petrobras Global Finance BV, 6.63%, due 01/16/34 | | | 14,638,466 | |
| | | 81,900,000 | | | Petrobras Global Finance BV, 6.85%, due 06/05/2115 | | | 70,855,785 | |
| | | | | | | | | | |
| | | | | | | | | 90,238,595 | |
| | | | | | | | | | |
| |
| | | Foreign Government Obligations — 1.0% | |
| | | 4,435,000 | | | Republic of Brazil, 8.25%, due 01/20/34 | | | 5,421,788 | |
| | | 21,897,000 | | | Republic of Brazil, 7.13%, due 01/20/37 | | | 24,469,897 | |
| | | 10,000,000 | | | Republic of Brazil, 5.63%, due 02/21/47 | | | 9,525,000 | |
| | | | | | | | | | |
| | | | | | | | | 39,416,685 | |
| | | | | | | | | | |
| | | | | | Total Brazil | | | 129,655,280 | |
| | | | | | | | | | |
| | | |
| | | | | | Cameroon — 0.7% | | | | |
| | | Foreign Government Obligations | |
| | | 24,000,000 | | | Republic of Cameroon International Bond, Reg S, 9.50%, due 11/19/25 | | | 26,640,000 | |
| | | | | | | | | | |
| | | |
| | | | | | Chile — 0.9% | | | | |
| | | Corporate Debt — 0.5% | |
| | | 17,000,000 | | | Empresa Nacional de Electricidad SA, 8.13%, due 02/01/97 | | | 20,060,000 | |
| | | | | | | | | | |
| |
| | | Foreign Government Agency — 0.4% | |
| | | 16,500,000 | | | Corp Nacional del Cobre de Chile, Reg S, 4.50%, due 09/16/25 | | | 17,469,375 | |
| | | | | | | | | | |
| | | | | | Total Chile | | | 37,529,375 | |
| | | | | | | | | | |
| | | |
| | | | | | China — 0.8% | | | | |
| | | Foreign Government Agency | |
| | | 33,000,000 | | | Export-Import Bank of China via Avi Funding Co. Ltd. (The), Reg S, 3.80%, due 09/16/25 | | | 33,866,250 | |
| | | | | | | | | | |
| | | |
| | | | | | Colombia — 1.7% | | | | |
| | | Foreign Government Agency — 0.9% | |
| | | 36,500,000 | | | Ecopetrol SA, 7.38%, due 09/18/43 | | | 38,817,750 | |
| | | | | | | | | | |
| | | | |
| | See accompanying notes to the financial statements. | | 23 |
GMO Emerging Country Debt Fund
(A Series of GMO Trust)
Schedule of Investments — (Continued)
(showing percentage of total net assets)
February 28, 2017
| | | | | | | | | | |
Par Value† | | | Description | | Value ($) | |
| | | | | | Colombia — continued | | | | |
| | | Foreign Government Obligations — 0.8% | |
| | | 25,000,000 | | | Colombia Government International Bond, 5.63%, due 02/26/44 | | | 27,025,000 | |
| | | 3,800,000 | | | Republic of Colombia, 11.85%, due 03/09/28 (a) | | | 5,677,043 | |
| | | | | | | | | | |
| | | | | | | | | 32,702,043 | |
| | | | | | | | | | |
| | | | | | Total Colombia | | | 71,519,793 | |
| | | | | | | | | | |
| |
| | | Congo Republic (Brazzaville) — 1.5% | |
| | | Foreign Government Obligations | |
| | | 88,901,798 | | | Republic of Congo, Reg S, Step Up, 4.00%, due 06/30/29 | | | 60,008,714 | |
| | | | | | | | | | |
| |
| | | Costa Rica — 1.2% | |
| | | Foreign Government Agency — 0.3% | |
| | | 15,045,000 | | | Instituto Costarricense de Electricidad, Reg S, 6.38%, due 05/15/43 | | | 12,731,831 | |
| | | | | | | | | | |
| |
| | | Foreign Government Obligations — 0.9% | |
| | | 37,000,000 | | | Costa Rica Government International Bond, Reg S, 7.16%, due 03/12/45 | | | 36,815,000 | |
| | | | | | | | | | |
| | | | | | Total Costa Rica | | | 49,546,831 | |
| | | | | | | | | | |
| |
| | | Croatia — 0.6% | |
| | | Foreign Government Obligations | |
| | | 21,000,000 | | | Croatia Government International Bond, Reg S, 5.50%, due 04/04/23 | | | 22,554,000 | |
| | | | | | | | | | |
| |
| | | Dominican Republic — 3.0% | |
| | | Asset-Backed Securities — 0.5% | |
| | | 22,246,187 | | | Autopistas Del Nordeste Ltd., Reg S, 9.39%, due 04/15/24 (a) | | | 22,085,437 | |
| | | | | | | | | | |
| |
| | | Foreign Government Agency — 0.2% | |
| | | 7,370,000 | | | Banco de Reservas de la Republica Dominicana, Reg S, 7.00%, due 02/01/23 | | | 7,440,199 | |
| | | | | | | | | | |
| |
| | | Foreign Government Obligations — 2.3% | |
| | | 38,607,000 | | | Dominican Republic Discount Bond, Variable Rate, 2.13%, due 08/30/24 | | | 36,087,893 | |
| | | 15,200,000 | | | Dominican Republic International Bond, Reg S, 8.63%, due 04/20/27 | | | 17,784,000 | |
| | | 10,000,000 | | | Dominican Republic International Bond, Reg S, 7.45%, due 04/30/44 | | | 10,925,000 | |
| | | 28,000,000 | | | Dominican Republic International Bond, Reg S, 6.85%, due 01/27/45 | | | 28,910,000 | |
| | | | | | | | | | |
| | | | | | | | | 93,706,893 | |
| | | | | | | | | | |
| | | | | | Total Dominican Republic | | | 123,232,529 | |
| | | | | | | | | | |
| | | | | | | | | | |
Par Value† | | | Description | | Value ($) | |
| | | Ecuador — 0.6% | |
| | | Foreign Government Obligations | |
| | | 17,500,000 | | | Ecuador Government International Bond, Reg S, 7.95%, due 06/20/24 | | | 17,500,000 | |
| | | 7,000,000 | | | Ecuador Government International Bond, Reg S, 9.65%, due 12/13/26 | | | 7,595,000 | |
| | | | | | | | | | |
| | | | | | Total Ecuador | | | 25,095,000 | |
| | | | | | | | | | |
| |
| | | Egypt — 0.2% | |
| | | Foreign Government Obligations | |
| | | 7,100,000 | | | Egypt Government International Bond, Reg S, 8.50%, due 01/31/47 (c) | | | 7,696,400 | |
| | | | | | | | | | |
| |
| | | El Salvador — 0.6% | |
| | | Foreign Government Obligations | |
| | | 14,000,000 | | | El Salvador Government International Bond, Reg S, 7.65%, due 06/15/35 | | | 12,862,500 | |
| | | 13,203,000 | | | El Salvador Government International Bond, Reg S, 7.63%, due 02/01/41 | | | 11,981,722 | |
| | | | | | | | | | |
| | | | | | Total El Salvador | | | 24,844,222 | |
| | | | | | | | | | |
| |
| | | Ethiopia — 0.3% | |
| | | Foreign Government Obligations | |
| | | 14,000,000 | | | Federal Democratic Republic of Ethiopia, Reg S, 6.63%, due 12/11/24 | | | 13,212,500 | |
| | | | | | | | | | |
| |
| | | Gabon — 1.0% | |
| | | Foreign Government Obligations | |
| | | 37,500,000 | | | Gabonese Republic, Reg S, 6.38%, due 12/12/24 | | | 35,906,250 | |
| | | 4,500,000 | | | Gabonese Republic, Reg S, 6.95%, due 06/16/25 | | | 4,342,500 | |
| | | | | | | | | | |
| | | | | | Total Gabon | | | 40,248,750 | |
| | | | | | | | | | |
| |
| | | Ghana — 0.9% | |
| | | Foreign Government Agency — 0.4% | |
| | | 15,761,356 | | | Saderea, Ltd., Reg S, 12.50%, due 11/30/26 | | | 15,918,969 | |
| | | | | | | | | | |
| |
| | | Foreign Government Obligations — 0.5% | |
| | | 16,800,000 | | | Republic of Ghana, Reg S, 10.75%, due 10/14/30 | | | 19,698,000 | |
| | | | | | | | | | |
| | | | | | Total Ghana | | | 35,616,969 | |
| | | | | | | | | | |
| |
| | | Greece — 0.5% | |
| | | Foreign Government Obligations | |
EUR | | | 28,882,000 | | | Hellenic Republic Government Bond, Reg S, Step Up, 3.00%, due 02/24/36 | | | 19,257,747 | |
| | | | | | | | | | |
| | | | |
| 24 | | See accompanying notes to the financial statements. | | |
GMO Emerging Country Debt Fund
(A Series of GMO Trust)
Schedule of Investments — (Continued)
(showing percentage of total net assets)
February 28, 2017
| | | | | | | | | | |
Par Value† | | | Description | | Value ($) | |
| | | Grenada — 0.2% | |
| | | Foreign Government Obligations | |
| | | 12,043,610 | | | Grenada Government International Bond, Reg S, Step Up, 7.00%, due 05/12/30 | | | 6,486,267 | |
| | | | | | | | | | |
| |
| | | Guatemala — 0.5% | |
| | | Foreign Government Obligations | |
| | | 15,500,000 | | | Republic of Guatemala, Reg S, 8.13%, due 10/06/34 | | | 19,491,250 | |
| | | | | | | | | | |
| |
| | | Honduras — 0.6% | |
| | | Foreign Government Obligations | |
| | | 20,875,000 | | | Honduras Government International Bond, Reg S, 7.50%, due 03/15/24 | | | 22,962,500 | |
| | | 3,500,000 | | | Honduras Government International Bond, Reg S, 6.25%, due 01/19/27 | | | 3,539,375 | |
| | | | | | | | | | |
| | | | | | Total Honduras | | | 26,501,875 | |
| | | | | | | | | | |
| |
| | | Hungary — 0.4% | |
| | | Foreign Government Obligations | |
| | | 11,792,000 | | | Hungary Government International Bond, 7.63%, due 03/29/41 | | | 16,877,300 | |
| | | | | | | | | | |
| |
| | | Iceland — 0.2% | |
| | | Foreign Government Obligations | |
| | | 8,000,000 | | | Iceland Government International Bond, Reg S, 5.88%, due 05/11/22 | | | 9,055,552 | |
| | | | | | | | | | |
| |
| | | Indonesia — 3.5% | |
| | | Foreign Government Agency — 1.3% | |
| | | 28,200,000 | | | Majapahit Holding BV, Reg S, 7.88%, due 06/29/37 | | | 35,770,045 | |
| | | 14,400,000 | | | Pertamina Persero PT, Reg S, 6.50%, due 05/27/41 | | | 15,912,000 | |
| | | | | | | | | | |
| | | | | | | | | 51,682,045 | |
| | | | | | | | | | |
| |
| | | Foreign Government Obligations — 2.2% | |
| | | 43,091,000 | | | Indonesia Government International Bond, Reg S, 6.63%, due 02/17/37 | | | 53,109,657 | |
| | | 35,780,000 | | | Indonesia Government International Bond, Reg S, 5.25%, due 01/17/42 | | | 37,926,800 | |
| | | | | | | | | | |
| | | | | | | | | 91,036,457 | |
| | | | | | | | | | |
| | | | | | Total Indonesia | | | 142,718,502 | |
| | | | | | | | | | |
| |
| | | Iraq — 0.3% | |
| | | Foreign Government Obligations | |
| | | 15,000,000 | | | Republic of Iraq, Reg S, 5.80%, due 01/15/28 | | | 13,245,000 | |
| | | | | | | | | | |
| | | | | | | | | | |
Par Value† | | | Description | | Value ($) | |
| | | Israel — 1.1% | |
| | | Foreign Government Agency | |
| | | 7,243,000 | | | Israel Electric Corp., Ltd., Reg S, 7.88%, due 12/15/26 | | | 8,777,031 | |
JPY | | | 2,500,000,000 | | | Israel Electric Corp., Ltd., 4.10%, due 01/14/32 | | | 22,733,544 | |
| | | 12,143,000 | | | Israel Electric Corp., Ltd., Reg S, 8.10%, due 12/15/96 | | | 14,465,349 | |
| | | | | | | | | | |
| | | | | | Total Israel | | | 45,975,924 | |
| | | | | | | | | | |
| |
| | | Ivory Coast — 0.8% | |
| | | Foreign Government Obligations | |
| | | 32,599,700 | | | Ivory Coast Government International Bond, Reg S, Step Up, 5.75%, due 12/31/32 | | | 30,725,217 | |
| | | | | | | | | | |
| |
| | | Jamaica — 0.5% | |
| | | Foreign Government Agency — 0.1% | |
| | | 4,000,000 | | | National Road Operating & Construction Co., Ltd., Reg S, 9.38%, due 11/10/24 | | | 4,720,000 | |
| | | | | | | | | | |
| |
| | | Foreign Government Obligations — 0.4% | |
| | | 12,500,000 | | | Jamaica Government International Bond, 7.88%, due 07/28/45 | | | 14,312,500 | |
| | | | | | | | | | |
| | | | | | Total Jamaica | | | 19,032,500 | |
| | | | | | | | | | |
| |
| | | Jordan — 0.2% | |
| | | Foreign Government Obligations | |
| | | 10,000,000 | | | Jordan Government International Bond, Reg S, 5.75%, due 01/31/27 | | | 9,675,000 | |
| | | | | | | | | | |
| |
| | | Kazakhstan — 1.2% | |
| | | Foreign Government Obligations | |
| | | 43,400,000 | | | Kazakhstan Government International Bond, Reg S, 6.50%, due 07/21/45 | | | 50,886,500 | |
| | | | | | | | | | |
| |
| | | Kenya — 0.4% | |
| | | Foreign Government Obligations | |
| | | 17,000,000 | | | Kenya Government International Bond, Reg S, 6.88%, due 06/24/24 | | | 16,745,000 | |
| | | | | | | | | | |
| |
| | | Macedonia — 0.5% | |
| | | Foreign Government Obligations | |
EUR | | | 11,000,000 | | | FYR Macedonia, Reg S, 3.98%, due 07/24/21 | | | 11,842,762 | |
EUR | | | 8,600,000 | | | Macedonia Government International Bond, Reg S, 5.63%, due 07/26/23 | | | 9,608,697 | |
| | | | | | | | | | |
| | | | | | Total Macedonia | | | 21,451,459 | |
| | | | | | | | | | |
| | | | |
| | See accompanying notes to the financial statements. | | 25 |
GMO Emerging Country Debt Fund
(A Series of GMO Trust)
Schedule of Investments — (Continued)
(showing percentage of total net assets)
February 28, 2017
| | | | | | | | | | |
Par Value† | | | Description | | Value ($) | |
| | | Malaysia — 0.7% | |
| | | Foreign Government Agency | |
| | | 25,000,000 | | | Petronas Capital, Ltd., Reg S, 4.50%, due 03/18/45 | | | 26,766,400 | |
| | | | | | | | | | |
| |
| | | Mexico — 9.1% | |
| | | Foreign Government Agency — 3.2% | |
| | | 51,000,000 | | | Pemex Project Funding Master Trust, 6.63%, due 06/15/35 | | | 51,382,500 | |
| | | 9,000,000 | | | Petroleos Mexicanos, 6.50%, due 06/02/41 | | | 8,661,600 | |
| | | 10,500,000 | | | Petroleos Mexicanos, 6.38%, due 01/23/45 | | | 9,914,100 | |
| | | 46,900,000 | | | Petroleos Mexicanos, 5.63%, due 01/23/46 | | | 40,390,280 | |
| | | 21,000,000 | | | Petroleos Mexicanos, 6.75%, due 09/21/47 | | | 20,685,000 | |
| | | | | | | | | | |
| | | | | | | | | 131,033,480 | |
| | | | | | | | | | |
| | | Foreign Government Obligations — 5.9% | |
| | | 189,848,000 | | | United Mexican States, 5.75%, due 10/12/2110 | | | 183,488,092 | |
GBP | | | 46,503,000 | | | United Mexican States, 5.63%, due 03/19/2114 | | | 55,395,130 | |
| | | | | | | | | | |
| | | | | | | | | 238,883,222 | |
| | | | | | | | | | |
| | | | | | Total Mexico | | | 369,916,702 | |
| | | | | | | | | | |
| |
| | | Mongolia — 0.3% | |
| | | Foreign Government Obligations | |
| | | 14,100,000 | | | Mongolia Government International Bond, Reg S, 5.13%, due 12/05/22 | | | 13,095,375 | |
| | | | | | | | | | |
| |
| | | Morocco — 0.8% | |
| | | Foreign Government Agency | |
| | | 30,000,000 | | | Office Cherifien des Phosphates SA, Reg S, 6.88%, due 04/25/44 | | | 31,837,500 | |
| | | | | | | | | | |
| |
| | | Mozambique — 0.1% | |
| | | Foreign Government Obligations | |
| | | 4,500,000 | | | Mozambique International Bond, Reg S, 10.50%, due 01/18/23 (c) (d) | | | 2,958,750 | |
| | | | | | | | | | |
| |
| | | Nigeria — 0.1% | |
| | | Foreign Government Obligations | |
| | | 5,400,000 | | | Nigeria Government International Bond, Reg S, 6.38%, due 07/12/23 | | | 5,548,500 | |
| | | | | | | | | | |
| |
| | | Oman — 0.2% | |
| | | Foreign Government Obligations | |
| | | 10,000,000 | | | Oman Government International Bond, Reg S, 4.75%, due 06/15/26 | | | 9,800,000 | |
| | | | | | | | | | |
| | | | | | | | | | |
Par Value† | | | Description | | Value ($) | |
| | | Pakistan — 1.0% | |
| | | Foreign Government Obligations | |
| | | 40,500,000 | | | Islamic Republic of Pakistan, Reg S, 7.88%, due 03/31/36 | | | 40,950,283 | |
| | | | | | | | | | |
| |
| | | Panama — 1.0% | |
| | | Foreign Government Agency — 0.3% | |
| | | 13,600,000 | | | AES Panama SRL, Reg S, 6.00%, due 06/25/22 | | | 13,957,000 | |
| | | | | | | | | | |
| | | Foreign Government Obligations — 0.7% | |
| | | 7,295,000 | | | Panama Government International Bond, 8.13%, due 04/28/34 | | | 9,702,350 | |
| | | 18,908,000 | | | Panama Government International Bond, 4.30%, due 04/29/53 | | | 17,915,330 | |
| | | | | | | | | | |
| | | | | | | | | 27,617,680 | |
| | | | | | | | | | |
| | | | | | Total Panama | | | 41,574,680 | |
| | | | | | | | | | |
| |
| | | Paraguay — 0.2% | |
| | | Foreign Government Obligations | |
| | | 8,000,000 | | | Republic of Paraguay, Reg S, 6.10%, due 08/11/44 | | | 8,270,000 | |
| | | | | | | | | | |
| |
| | | Peru — 1.5% | |
| | | Foreign Government Agency — 0.2% | |
| | | 12,452,000 | | | Peru Enhanced Pass-Through Finance Ltd., Reg S, Zero Coupon, due 06/02/25 | | | 10,087,739 | |
| | | | | | | | | | |
| |
| | | Foreign Government Obligations — 1.3% | |
| | | 5,000,000 | | | Peru Par Bond, Series 30 Yr., Step Up, 4.00%, due 03/07/27 (a) | | | 4,950,000 | |
| | | 39,120,000 | | | Republic of Peru, 5.63%, due 11/18/50 | | | 46,112,700 | |
| | | | | | | | | | |
| | | | | | | | | 51,062,700 | |
| | | | | | | | | | |
| | | | | | Total Peru | | | 61,150,439 | |
| | | | | | | | | | |
| |
| | | Philippines — 3.2% | |
| | | Foreign Government Agency — 2.4% | |
| | | 25,651,000 | | | Central Bank of Philippines, Series A, 8.60%, due 06/15/27 | | | 35,861,894 | |
| | | 40,550,000 | | | National Power Corp., Global Bond, 9.63%, due 05/15/28 | | | 61,380,133 | |
| | | | | | | | | | |
| | | | | | | | | 97,242,027 | |
| | | | | | | | | | |
| |
| | | Foreign Government Obligations — 0.8% | |
| | | 27,354,000 | | | Republic of Philippines, 6.38%, due 01/15/32 | | | 35,560,200 | |
| | | | | | | | | | |
| | | | | | Total Philippines | | | 132,802,227 | |
| | | | | | | | | | |
| | | | |
| 26 | | See accompanying notes to the financial statements. | | |
GMO Emerging Country Debt Fund
(A Series of GMO Trust)
Schedule of Investments — (Continued)
(showing percentage of total net assets)
February 28, 2017
| | | | | | | | | | |
Par Value† | | | Description | | Value ($) | |
| | | Romania — 0.4% | |
| | | Foreign Government Obligations | |
| | | 13,594,000 | | | Romanian Government International Bond, Reg S, 6.13%, due 01/22/44 | | | 16,465,733 | |
| | | | | | | | | | |
| |
| | | Russia — 4.7% | |
| | | Foreign Government Agency — 2.4% | |
| | | 30,000,000 | | | Gazprom Neft OAO Via GPN Capital SA, Reg S, 4.38%, due 09/19/22 | | | 30,300,000 | |
| | | 38,800,000 | | | Gazprom OAO Via Gaz Capital SA, Reg S, 8.63%, due 04/28/34 | | | 50,556,400 | |
| | | 15,700,000 | | | Sberbank of Russia Via SB Capital SA, Reg S, 5.13%, due 10/29/22 | | | 16,072,875 | |
| | | | | | | | | | |
| | | | | | | | | 96,929,275 | |
| | | | | | | | | | |
| |
| | | Foreign Government Obligations — 2.3% | |
| | | 21,600,000 | | | Russian Foreign Bond, Reg S, 5.63%, due 04/04/42 | | | 23,544,000 | |
| | | 62,200,000 | | | Russian Foreign Bond, Reg S, 5.88%, due 09/16/43 | | | 70,286,000 | |
| | | | | | | | | | |
| | | | | | | | | 93,830,000 | |
| | | | | | | | | | |
| | | | | | Total Russia | | | 190,759,275 | |
| | | | | | | | | | |
| |
| | | Rwanda — 0.1% | |
| | | Foreign Government Obligations | |
| | | 5,000,000 | | | Rwanda International Government Bond, Reg S, 6.63%, due 05/02/23 | | | 5,037,500 | |
| | | | | | | | | | |
| |
| | | Serbia — 0.1% | |
| | | Foreign Government Obligations | |
| | | 2,718,803 | | | Republic of Serbia, Reg S, Step Up, 6.75%, due 11/01/24 | | | 2,746,603 | |
| | | | | | | | | | |
| |
| | | South Africa — 0.6% | |
| | | Foreign Government Agency | |
| | | 21,000,000 | | | Eskom Holdings SOC, Ltd., Reg S, 7.13%, due 02/11/25 | | | 21,735,000 | |
ZAR | | | 163,000,000 | | | Eskom Holdings SOC, Ltd., Zero Coupon, due 12/31/32 | | | 1,879,455 | |
ZAR | | | 20,000,000 | | | Transnet, Ltd., 13.50%, due 04/18/28 | | | 1,708,085 | |
| | | | | | | | | | |
| | | | | | Total South Africa | | | 25,322,540 | |
| | | | | | | | | | |
| | |
| | | | | | Sri Lanka — 1.2% | |
| | | | | | Foreign Government Obligations | |
| | | 19,000,000 | | | Sri Lanka Government International Bond, Reg S, 6.13%, due 06/03/25 | | | 19,190,000 | |
| | | 17,000,000 | | | Sri Lanka Government International Bond, Reg S, 6.85%, due 11/03/25 | | | 17,722,500 | |
| | | 13,500,000 | | | Sri Lanka Government International Bond, Reg S, 6.83%, due 07/18/26 | | | 14,056,875 | |
| | | | | | | | | | |
| | | | | | Total Sri Lanka | | | 50,969,375 | |
| | | | | | | | | | |
| | | | | | | | | | |
Par Value† | | | Description | | Value ($) | |
| | | | | | Suriname — 0.4% | |
| | | Foreign Government Obligations | |
| | | 15,496,000 | | | Republic of Suriname, 144A, 9.25%, due 10/26/26 | | | 15,399,150 | |
| | | | | | | | | | |
| |
| | | Thailand — 0.2% | |
| | | Foreign Government Agency | |
| | | 7,000,000 | | | PTT PCL, Reg S, 4.50%, due 10/25/42 | | | 6,746,250 | |
| | | | | | | | | | |
| |
| | | Trinidad And Tobago — 0.6% | |
| | | Foreign Government Agency — 0.3% | |
| | | 6,000,000 | | | Petroleum Company of Trinidad and Tobago Ltd., Reg S, 9.75%, due 08/14/19 | | | 6,442,500 | |
| | | 7,000,000 | | | Trinidad Generation UnLtd, 144A, 5.25%, due 11/04/27 | | | 6,956,250 | |
| | | | | | | | | | |
| | | | | | | | | 13,398,750 | |
| | | | | | | | | | |
| |
| | | Foreign Government Obligations — 0.3% | |
| | | 10,000,000 | | | Trinidad & Tobago Government International Bond, Reg S, 4.50%, due 08/04/26 | | | 10,075,000 | |
| | | | | | | | | | |
| | | | | | Total Trinidad And Tobago | | | 23,473,750 | |
| | | | | | | | | | |
| |
| | | Tunisia — 1.6% | |
| | | Foreign Government Agency | |
JPY | | | 7,000,000,000 | | | Banque Centrale de Tunisie SA, 4.30%, due 08/02/30 | | | 47,354,133 | |
JPY | | | 2,500,000,000 | | | Banque Centrale de Tunisie SA, 4.20%, due 03/17/31 | | | 16,689,661 | |
| | | | | | | | | | |
| | | | | | Total Tunisia | | | 64,043,794 | |
| | | | | | | | | | |
| |
| | | Turkey — 4.3% | |
| | | Foreign Government Agency — 0.3% | |
| | | 12,800,000 | | | Export Credit Bank of Turkey, 144A, 5.38%, due 10/24/23 | | | 12,528,000 | |
| | | | | | | | | | |
| | |
| | | | | | Foreign Government Obligations — 4.0% | |
| | | 69,302,000 | | | Republic of Turkey, 6.75%, due 05/30/40 | | | 72,767,100 | |
| | | 87,891,000 | | | Republic of Turkey, 6.00%, due 01/14/41 | | | 84,814,815 | |
| | | 3,700,000 | | | Turkey Government International Bond, 6.63%, due 02/17/45 | | | 3,861,875 | |
| | | | | | | | | | |
| | | | | | | | | 161,443,790 | |
| | | | | | | | | | |
| | | | | | Total Turkey | | | 173,971,790 | |
| | | | | | | | | | |
| |
| | | Ukraine — 1.3% | |
| | | Foreign Government Agency — 0.3% | |
| | | 7,900,000 | | | Oschadbank Via SSB #1 Plc, Reg S, Step Up, 9.63%, due 03/20/25 | | | 7,718,300 | |
| | | 3,700,000 | | | Ukreximbank Via Biz Finance Plc, Reg S, 9.75%, due 01/22/25 | | | 3,622,300 | |
| | | | | | | | | | |
| | | | | | | | | 11,340,600 | |
| | | | | | | | | | |
| | | | |
| | See accompanying notes to the financial statements. | | 27 |
GMO Emerging Country Debt Fund
(A Series of GMO Trust)
Schedule of Investments — (Continued)
(showing percentage of total net assets)
February 28, 2017
| | | | | | | | | | |
Par Value† | | | Description | | Value ($) | |
| | | | | | Ukraine — continued | | | | |
| | | | | | Foreign Government Obligations — 1.0% | |
| | | 2,957,000 | | | Ukraine Government International Bond, Reg S, 7.75%, due 09/01/19 | | | 2,971,785 | |
| | | 6,019,000 | | | Ukraine Government International Bond, Reg S, 7.75%, due 09/01/21 | | | 5,892,601 | |
| | | 6,019,000 | | | Ukraine Government International Bond, Reg S, 7.75%, due 09/01/22 | | | 5,820,373 | |
| | | 6,019,000 | | | Ukraine Government International Bond, Reg S, 7.75%, due 09/01/23 | | | 5,748,145 | |
| | | 6,019,000 | | | Ukraine Government International Bond, Reg S, 7.75%, due 09/01/24 | | | 5,666,888 | |
| | | 6,019,000 | | | Ukraine Government International Bond, Reg S, 7.75%, due 09/01/25 (c) | | | 5,612,718 | |
| | | 6,019,000 | | | Ukraine Government International Bond, Reg S, 7.75%, due 09/01/26 (c) | | | 5,579,613 | |
| | | 6,869,000 | | | Ukraine Government International Bond, Reg S, 7.75%, due 09/01/27 (c) | | | 6,340,087 | |
| | | | | | | | | | |
| | | | | | | | | 43,632,210 | |
| | | | | | | | | | |
| | | | | | Total Ukraine | | | 54,972,810 | |
| | | | | | | | | | |
| |
| | | United States — 9.2% | |
| | | Asset-Backed Securities — 0.6% | |
| | | 1,939,177 | | | Aircraft Finance Trust, Series 99-1A, Class A1, 144A, Variable Rate, 1 mo. LIBOR + .48%, 1.25%, due 05/15/24 | | | 378,140 | |
| | | 6,892,864 | | | Countrywide Home Equity Loan Trust, Series 05-F, Class 2A, AMBAC, Variable Rate, 1 mo. LIBOR + .24%, 1.01%, due 12/15/35 ◆ | | | 6,475,956 | |
| | | 3,395,875 | | | Countrywide Home Equity Loan Trust, Series 05-H, Class 2A, FGIC, Variable Rate, 1 mo. LIBOR + .24%, 1.01%, due 12/15/35 ◆ | | | 2,997,700 | |
| | | 2,791,856 | | | Countrywide Home Equity Loan Trust, Series 06-D, Class 2A, A, Variable Rate, 1 mo. LIBOR + .20%, 0.97%, due 05/15/36 ◆ | | | 2,420,706 | |
| | | 11,121,231 | | | Morgan Stanley IXIS Real Estate Capital Trust, Series 06-2, Class A3, Variable Rate, 1 mo. LIBOR + .15%, 0.92%, due 11/25/36 ◆ | | | 5,354,269 | |
| | | 11,269,514 | | | Morgan Stanley IXIS Real Estate Capital Trust, Series 06-2, Class A4, Variable Rate, 1 mo. LIBOR + .22%, 0.99%, due 11/25/36 ◆ | | | 5,474,134 | |
| | | 6,069,197 | | | Wamu Asset-Backed Certificates, Series 07-HE2, Class 2A4, Variable Rate, 1 mo. LIBOR + .36%, 1.13%, due 04/25/37 ◆ | | | 2,929,467 | |
| | | | | | | | | | |
| | | | | | | | | 26,030,372 | |
| | | | | | | | | | |
| |
| | | U.S. Government — 8.6% | |
| | | 74,668,300 | | | U.S. Treasury Inflation Indexed Note, 0.13%, due 01/15/22 (e) | | | 75,501,748 | |
| | | 30,000,000 | | | U.S. Treasury Note, 0.63%, due 06/30/17 | | | 29,998,830 | |
| | | | | | | | | | |
Par Value† | | | Description | | Value ($) | |
| | | United States — continued | |
| | | | | | U.S. Government — continued | |
| | | 17,000,000 | | | U.S. Treasury Note, 0.63%, due 11/30/17 | | | 16,973,446 | |
| | | 58,000,000 | | | U.S. Treasury Note, 1.00%, due 12/15/17 | | | 58,067,976 | |
| | | 170,000,000 | | | U.S. Treasury Note, 0.75%, due 02/28/18 (c) (f) | | | 169,654,730 | |
| | | | | | | | | | |
| | | | | | | | | 350,196,730 | |
| | | | | | | | | | |
| | | | | | Total United States | | | 376,227,102 | |
| | | | | | | | | | |
| |
| | | Uruguay — 1.2% | |
| | | Foreign Government Obligations | |
| | | 51,000,000 | | | Uruguay Government International Bond, 5.10%, due 06/18/50 | | | 48,067,500 | |
| | | | | | | | | | |
| |
| | | Venezuela — 7.8% | |
| | | Foreign Government Agency — 4.7% | |
| | | 131,893,000 | | | Electricidad de Caracas Finance BV, Reg S, 8.50%, due 04/10/18 | | | 100,403,546 | |
| | | 176,000,000 | | | Petroleos de Venezuela SA, Reg S, 6.00%, due 05/16/24 | | | 68,640,000 | |
| | | 54,000,000 | | | Petroleos de Venezuela SA, Reg S, 6.00%, due 11/15/26 | | | 20,166,300 | |
| | | | | | | | | | |
| | | | | | | | | 189,209,846 | |
| | | | | | | | | | |
| |
| | | Foreign Government Obligations — 3.1% | |
| | | 20,028,000 | | | Venezuela Government International Bond, Reg S, 7.75%, due 10/13/19 | | | 13,018,200 | |
| | | 63,611,000 | | | Venezuela Government International Bond, Reg S, 6.00%, due 12/09/20 | | | 35,145,078 | |
| | | 152,093,000 | | | Venezuela Government International Bond, Reg S, 9.00%, due 05/07/23 | | | 79,468,592 | |
| | | | | | | | | | |
| | | | | | | | | 127,631,870 | |
| | | | | | | | | | |
| | | | | | Total Venezuela | | | 316,841,716 | |
| | | | | | | | | | |
| |
| | | Vietnam — 0.4% | |
| | | Foreign Government Agency — 0.3% | |
| | | 23,804,000 | | | Debt and Asset Trading Corp., Reg S, 1.00%, due 10/10/25 | | | 13,842,026 | |
| | | | | | | | | | |
| |
| | | Foreign Government Obligations — 0.1% | |
| | | 5,000,000 | | | Socialist Republic of Vietnam, Series 30 Yr., Variable Rate, 2.06%, due 03/13/28 | | | 4,212,500 | |
| | | | | | | | | | |
| | | | | | Total Vietnam | | | 18,054,526 | |
| | | | | | | | | | |
| |
| | | Zambia — 0.9% | |
| | | Foreign Government Obligations | |
| | | 26,560,000 | | | Zambia Government International Bond, Reg S, 8.50%, due 04/14/24 | | | 27,622,400 | |
| | | 7,700,000 | | | Zambia Government International Bond, Reg S, 8.97%, due 07/30/27 | | | 8,085,000 | |
| | | | | | | | | | |
| | | | | | Total Zambia | | | 35,707,400 | |
| | | | | | | | | | |
| | | |
| | | | | | TOTAL DEBT OBLIGATIONS (COST $3,527,506,847) | | | 3,647,026,487 | |
| | | | | | | | | | |
| | | | |
| 28 | | See accompanying notes to the financial statements. | | |
GMO Emerging Country Debt Fund
(A Series of GMO Trust)
Schedule of Investments — (Continued)
(showing percentage of total net assets)
February 28, 2017
| | | | | | | | | | |
Par Value† | | | Description | | Value ($) | |
| | | LOAN ASSIGNMENTS — 0.1% | |
| |
| | | Indonesia | |
| | | 3,744,000 | | | Republic of Indonesia Loan Agreement, dated June 14, 1995, 6 mo. LIBOR + 0.88%, 1.19%, due 12/14/19 | | | 3,514,867 | |
| | | 816,140 | | | Republic of Indonesia Loan Agreement, dated September 14, 1994, 6 mo. LIBOR + 0.75%, 1.25%, due 12/16/19 | | | 746,769 | |
EUR | | | 758,538 | | | Republic of Indonesia, Indonesia Paris Club Debt, 4.00%, due 06/01/21 | | | 646,894 | |
| | | | | | | | | | |
| | | |
| | | | | | TOTAL LOAN ASSIGNMENTS (COST $4,947,129) | | | 4,908,530 | |
| | | | | | | | | | |
| |
| | | LOAN PARTICIPATIONS — 1.6% | |
| |
| | | Angola — 0.9% | |
| | | 24,325,000 | | | Republic of Angola Loan Agreement (Participation with Development Bank of Southern Africa), 6 mo. LIBOR + 6.25%, 6.60%, due 12/13/23 | | | 20,980,312 | |
| | | 15,750,000 | | | Republic of Angola Loan Agreement (Participation with Development Bank of Southern Africa), 6 mo. LIBOR + 6.25%, 6.60%, due 12/20/23 | | | 13,584,375 | |
| | | | | | | | | | |
| | | | | | Total Angola | | | 34,564,687 | |
| | | | | | | | | | |
| |
| | | Egypt — 0.0% | |
CHF | | | 101,538 | | | Paris Club Loan Agreement (Participation with Standard Chartered Bank), Zero Coupon, due 01/03/24 (a) | | | 88,657 | |
| | | | | | | | | | |
| |
| | | Indonesia — 0.1% | |
| | | 4,693,433 | | | Republic of Indonesia Loan Agreement (Participation with Deutsche Bank), 6 mo. LIBOR + .88%, 2.12%, due 09/29/19 | | | 4,294,491 | |
| | | | | | | | | | |
| |
| | | Iraq — 0.5% | |
JPY | | | 3,187,851,941 | | | Republic of Iraq Paris Club Loan Agreement (Participation with Deutsche Bank), Variable Rate, due 01/01/28 | | | 18,481,126 | |
JPY | | | 416,530,877 | | | Republic of Iraq Paris Club Loan Agreement (Participation with Deutsche Bank), Variable Rate, due 01/01/28 | | | 2,415,141 | |
| | | | | | | | | | |
| | | | | | Total Iraq | | | 20,896,267 | |
| | | | | | | | | | |
| |
| | | Russia — 0.0% | |
EUR | | | 57,042,402 | | | Russian Foreign Trade Obligations (Participation with GML International Ltd.) (d) | | | 2 | |
| | | | | | | | | | |
| | | | | | | | | | |
Par Value† /
Shares | | | Description | | Value ($) | |
| | | Vietnam — 0.1% | |
JPY | | | 532,049,391 | | | Socialist Republic of Vietnam Loan Agreement (Participation with Deutsche Bank), 6 mo. JPY LIBOR + .60%, 0.60%, due 09/01/17 | | | 4,351,302 | |
| | | | | | | | | | |
| | | |
| | | | | | TOTAL LOAN PARTICIPATIONS (COST $87,094,169) | | | 64,195,406 | |
| | | | | | | | | | |
| |
| | | MUTUAL FUNDS — 2.5% | |
| | |
| | | | | | United States — 2.5% | |
| | | | | | Affiliated Issuers — 2.5% | | | | |
| | | 568,012 | | | GMO Opportunistic Income Fund, Class VI | | | 14,643,342 | |
| | | 3,491,101 | | | GMO U.S. Treasury Fund | | | 87,277,534 | |
| | | | | | | | | | |
| | |
| | | TOTAL MUTUAL FUNDS (COST $99,161,727) | | | 101,920,876 | |
| | | | | | | | | | |
| |
| | | RIGHTS/WARRANTS — 1.1% | |
| |
| | | Argentina — 0.8% | |
EUR | | | 298,220,524 | | | Republic of Argentina GDP Linked, Expires 12/15/35 | | | 31,277,532 | |
| | | | | | | | | | |
| |
| | | Nigeria — 0.1% | |
| | | 27,000 | | | Central Bank of Nigeria Oil Warrants, Expires 11/15/20 | | | 2,076,250 | |
| | | | | | | | | | |
| |
| | | Ukraine — 0.1% | |
| | | 13,276,000 | | | Government of Ukraine GDP Linked, Expires 05/31/40 | | | 4,029,266 | |
| | | | | | | | | | |
| |
| | | Uruguay — 0.0% | |
| | | 4,000,000 | | | Banco Central Del Uruguay Value Recovery Rights, VRRB, Expires 01/02/21* (a) | | | — | |
| | | | | | | | | | |
| |
| | | Venezuela — 0.1% | |
| | | 959,065 | | | Republic of Venezuela Oil Warrants, Expires 04/15/20 | | | 5,994,156 | |
| | | | | | | | | | |
| | | |
| | | | | | TOTAL RIGHTS/WARRANTS (COST $50,169,932) | | | 43,377,204 | |
| | | | | | | | | | |
| | |
| | | | | | SHORT-TERM INVESTMENTS — 5.2% | |
| |
| | | Money Market Funds — 0.1% | |
| | | 4,113,742 | | | State Street Institutional Treasury Plus Money Market Fund-Premier Class, 0.41 (g) | | | 4,113,742 | |
| | | | | | | | | | |
| | | | |
| | See accompanying notes to the financial statements. | | 29 |
GMO Emerging Country Debt Fund
(A Series of GMO Trust)
Schedule of Investments — (Continued)
(showing percentage of total net assets)
February 28, 2017
| | | | | | | | | | |
Par Value† | | | Description | | Value ($) | |
| | | | | | U.S. Government — 5.1% | |
| | | 25,000,000 | | | U.S. Treasury Note, 1.00%, due 03/31/17 | | | 25,012,325 | |
| | | 30,000,000 | | | U.S. Treasury Note, 0.88%, due 05/15/17 | | | 30,023,820 | |
| | | 14,500,000 | | | U.S. Treasury Note, 0.63%, due 05/31/17 | | | 14,504,089 | |
| | | 10,000,000 | | | U.S. Treasury Note, 0.88%, due 07/15/17 | | | 10,007,810 | �� |
| | | 50,000,000 | | | U.S. Treasury Note, 1.88%, due 09/30/17 (f) | | | 50,328,100 | |
| | | 20,000,000 | | | U.S. Treasury Note, 0.88%, due 10/15/17 | | | 20,010,940 | |
| | | 10,000,000 | | | U.S. Treasury Note, 0.75%, due 10/31/17 | | | 9,996,880 | |
| | | 10,000,000 | | | U.S. Treasury Note, 2.25%, due 11/30/17 | | | 10,104,690 | |
| | | 40,000,000 | | | U.S. Treasury Note, 0.88%, due 01/15/18 | | | 39,992,200 | |
| | | | | | | | | | |
| | | | | | Total U.S. Government | | | 209,980,854 | |
| | | | | | | | | | |
| | | |
| | | | | | TOTAL SHORT-TERM INVESTMENTS (COST $214,136,869) | | | 214,094,596 | |
| | | | | | | | | | |
| | | |
| | | | | | TOTAL INVESTMENTS —99.8% (Cost $3,983,016,673) | | | 4,075,523,099 | |
| | | | | | Other Assets and Liabilities
(net) — 0.2% | | | 9,721,988 | |
| | | | | | | | | | |
| | | |
| | | | | | TOTAL NET ASSETS — 100.0% | | | $4,085,245,087 | |
| | | | | | | | | | |
A summary of outstanding financial instruments at February 28, 2017 is as follows:
Forward Currency Contracts
| | | | | | | | | | | | | | | | | | | | | | |
| | | | |
Settlement
Date | | Counter-
party | | Currency
Sold | | | Currency
Purchased | | | Net
Unrealized
Appreciation
(Depreciation) | |
| 03/20/2017 | | BOA | | | EUR | | | | 31,000,000 | | | | USD | | | | 33,069,033 | | | $ | 201,461 | |
Reverse Repurchase Agreements (h)
| | | | | | | | | | |
| | |
Face Value | | | Description | | Value ($) | |
| USD | | | 5,970,071 | | | JP Morgan Securities, Inc., 0.35%, dated 01/09/17, (collateral: Ukraine Government International Bond, Reg S, 7.75%, due 09/01/27), to be repurchased on demand at face value plus accrued interest. | | $ | (5,970,071 | ) |
| USD | | | 10,381,723 | | | JP Morgan Securities, Inc., 0.50%, dated 02/02/17, (collateral: Republic of Argentina, Reg S, 7.63%, due 04/22/46), to be repurchased on demand at face value plus accrued interest. | | | (10,381,723 | ) |
| USD | | | 2,725,977 | | | JP Morgan Securities, Inc., 0.25%, dated 01/04/17, (collateral: Mozambique International Bond, Reg S, 10.50%, due 01/18/23), to be repurchased on demand at face value plus accrued interest. | | | (2,725,977 | ) |
| USD | | | 5,879,903 | | | JP Morgan Securities, Inc., 0.25%, dated 01/24/17 (collateral Ukraine Government International Bond, Reg S, 7.75%, due 09/01/25), to be repurchased on demand at face value plus accrued interest. | | | (5,879,903 | ) |
| USD | | | 5,900,898 | | | JP Morgan Securities, Inc., 0.25%, dated 01/24/17 (collateral Ukraine Government International Bond, Reg S, 7.75%, due 09/01/26), to be repurchased on demand at face value plus accrued interest. | | | (5,900,898 | ) |
| USD | | | 1,734,064 | | | JP Morgan Securities, Inc., 0.25%, dated 01/27/17, (collateral: Egypt Government International Bond, Reg S, 8.50%, due 01/31/47), to be repurchased on demand at face value plus accrued interest. | | | (1,734,064 | ) |
| | | | | | | | | | |
| | | | | | | | $ | (32,592,636 | ) |
| | | | | | | | | | |
| | | | | | Average balance outstanding | | $ | (25,472,827 | ) |
| | | | | | Average interest rate | | | 0.32 | % |
| | | | | | Maximum balance outstanding | | $ | (48,171,581 | ) |
Average balance outstanding was calculated based on daily face value balances outstanding during the period that the Fund had entered into reverse repurchase agreements.
| | | | |
| 30 | | See accompanying notes to the financial statements. | | |
GMO Emerging Country Debt Fund
(A Series of GMO Trust)
Schedule of Investments — (Continued)
February 28, 2017
Credit Linked Options
| | | | | | | | | | | | | | | | | | | | |
| | | | |
Principal Amount | | | Expiration
Date | | | Description | | Premiums | | | Value ($) | |
| Put Sold | | USD | | | 62,000,000 | | | | 03/21/2017 | | | Lebanese Republic Credit Linked Put Option, Fund receives premium of 0.50% (OTC) (CP-DB) (a) | | $ | 1,258,083 | | | $ | 65,339 | |
| Put Sold | | USD | | | 70,000,000 | | | | 07/14/2017 | | | Turkiye Is Bankasi A.S. Credit Linked Put Option, Fund receives premium of 0.40% (OTC) (CP-DB) (a) | | | 1,147,222 | | | | 51,495 | |
| Put Sold | | USD | | | 70,000,000 | | | | 04/03/2018 | | | Turkiye Cumhuriyeti Ziraat Bankasi A.S. Credit Linked Put Option, Fund receives premium of 0.40% (OTC) (CP-DB) (a) | | | 1,136,333 | | | | 114,889 | |
| Put Sold | | USD | | | 45,000,000 | | | | 01/20/2021 | | | Republic of Philippines Credit Linked Put Option, Fund receives premium of 0.25% (OTC) (CP-DB) (a) | | | 302,188 | | | | 61,310 | |
| Put Sold | | USD | | | 43,000,000 | | | | 04/15/2024 | | | Banco do Brasil Credit Linked Put Option, Fund receives premium of 0.30% (OTC) (CP-DB) (a) | | | 450,784 | | | | (286,302 | ) |
| Put Sold | | USD | | | 100,000,000 | | | | 04/15/2024 | | | Banco do Brasil Credit Linked Put Option, Fund receives premium of 0.44% (OTC) (CP-DB) (a) | | | 1,932,333 | | | | (2,063,503 | ) |
| | | | | | | | | | | | | | | | | | | | |
| | | | | | | | | | | | | | $ | 6,226,943 | | | $ | (2,056,772 | ) |
| | | | | | | | | | | | | | | | | | | | |
Swap Contracts
Credit Default Swaps
| | | | | | | | | | | | | | | | | | | | | | | | | | | | |
| | | | | | | | |
Notional
Amount | | | Expiration
Date | | Counterparty | | Receive
(Pay) ^ | | Annual
Premium | | Implied
Credit
Spread (1) | | Reference Entity | | Maximum Potential
Amount of Future
Payments by the Fund
Under the Contract (2) | | | Net
Unrealized
Appreciation/
(Depreciation) | |
| | 19,500,000 | | | | USD | | | 3/20/2017 | | DB | | Receive | | 5.00% | | 36.47% | | Bolivarian Republic of Venezuela | | 19,500,000 | | | USD | | | $ | (338,966 | ) |
| | 2,500,000 | | | | USD | | | 5/20/2017 | | DB | | (Pay) | | 1.05% | | 0.29% | | Republic of Peru | | NA | | | | | | | (4,191 | ) |
| | 32,000,000 | | | | PEN | | | 5/20/2017 | | DB | | Receive | | 0.79% | | 0.12% | | Republic of Peru | | 32,000,000 | | | PEN | | | | 14,514 | |
| | 4,500,000 | | | | USD | | | 7/20/2017 | | JPM | | Receive | | 3.30% | | 2.24% | | Republic of Jamaica | | 4,500,000 | | | USD | | | | 18,079 | |
| | 5,400,000 | | | | EUR | | | 3/20/2018 | | DB | | Receive | | 1.00% | | 3.66% | | Republic of Macedonia | | 5,400,000 | | | EUR | | | | (159,188 | ) |
| | 50,000,000 | | | | USD | | | 6/20/2019 | | JPM | | (Pay) | | 1.00% | | 1.19% | | Republic of Brazil | | NA | | | | | | | 220,633 | |
| | 44,000,000 | | | | USD | | | 6/20/2019 | | JPM | | (Pay) | | 1.00% | | 1.00% | | Republic of Croatia | | NA | | | | | | | 746 | |
| | 6,000,000 | | | | USD | | | 6/20/2020 | | DB | | Receive | | 1.00% | | 2.19% | | Commonwealth of Bahamas | | 6,000,000 | | | USD | | | | (221,846 | ) |
| | 42,000,000 | | | | EUR | | | 12/20/2020 | | DB | | (Pay) | | 1.00% | | 2.09% | | Commonwealth of Bahamas | | NA | | | | | | | 1,788,964 | |
| | 57,000,000 | | | | USD | | | 12/20/2020 | | DB | | Receive | | 1.00% | | 2.39% | | Commonwealth of Bahamas | | 57,000,000 | | | USD | | | | (2,793,278 | ) |
| | 10,000,000 | | | | USD | | | 12/20/2022 | | JPM | | Receive | | 1.00% | | 1.27% | | Republic of Malaysia | | 10,000,000 | | | USD | | | | (142,237 | ) |
| | 15,000,000 | | | | USD | | | 12/20/2022 | | JPM | | Receive | | 1.00% | | 1.47% | | Indonesia | | 15,000,000 | | | USD | | | | (374,616 | ) |
| | 6,000,000 | | | | USD | | | 6/20/2023 | | DB | | Receive | | 1.00% | | 3.29% | | Commonwealth of Bahamas | | 6,000,000 | | | USD | | | | (723,971 | ) |
| | 200,000,000 | | | | USD | | | 6/20/2023 | | DB | | (Pay) | | 1.00% | | 2.17% | | Republic of Croatia | | NA | | | | | | | 13,241,501 | |
| | 160,000,000 | | | | EUR | | | 6/20/2023 | | DB | | Receive | | 1.00% | | 2.17% | | Republic of Croatia | | 160,000,000 | | | EUR | | | | (11,882,635 | ) |
| | 3,000,000 | | | | USD | | | 6/20/2023 | | DB | | Receive | | 1.00% | | 3.29% | | Commonwealth of Bahamas | | 3,000,000 | | | USD | | | | (361,986 | ) |
| | 40,000,000 | | | | USD | | | 6/20/2023 | | JPM | | Receive | | 1.00% | | 2.17% | | Republic of Croatia | | 40,000,000 | | | USD | | | | (2,648,300 | ) |
| | 20,000,000 | | | | USD | | | 3/20/2024 | | JPM | | Receive | | 1.00% | | 1.42% | | Republic of Malaysia | | 20,000,000 | | | USD | | | | (529,943 | ) |
| | 22,750,000 | | | | USD | | | 6/20/2024 | | JPM | | Receive | | 1.00% | | 2.84% | | Republic of Brazil | | 22,750,000 | | | USD | | | | (2,606,329 | ) |
| | 60,000,000 | | | | USD | | | 6/20/2024 | | JPM | | Receive | | 1.00% | | 1.23% | | Peoples Republic of China | | 60,000,000 | | | USD | | | | (931,526 | ) |
| | 27,250,000 | | | | USD | | | 6/20/2024 | | JPM | | Receive | | 1.00% | | 2.84% | | Republic of Brazil | | 27,250,000 | | | USD | | | | (3,121,867 | ) |
| | 25,000,000 | | | | USD | | | 3/20/2025 | | GS | | Receive | | 1.00% | | 1.29% | | Republic of China | | 25,000,000 | | | USD | | | | (517,545 | ) |
| | 91,000,000 | | | | USD | | | 6/20/2025 | | DB | | Receive | | 1.00% | | 5.94% | | Commonwealth of Bahamas | | 91,000,000 | | | USD | | | | (7,934,678 | ) |
| | 68,000,000 | | | | EUR | | | 6/20/2025 | | DB | | (Pay) | | 1.00% | | 5.56% | | Commonwealth of Bahamas | | NA | | | | | | | 5,832,673 | |
| | | | |
| | See accompanying notes to the financial statements. | | 31 |
GMO Emerging Country Debt Fund
(A Series of GMO Trust)
Schedule of Investments — (Continued)
February 28, 2017
Credit Default Swaps — Continued
| | | | | | | | | | | | | | | | | | | | | | | | | | | | |
| | | | | | | | |
Notional
Amount | | | Expiration
Date | | Counterparty | | Receive
(Pay) ^ | | Annual
Premium | | Implied
Credit
Spread (1) | | Reference Entity | | Maximum Potential
Amount of Future
Payments by the Fund
Under the Contract (2) | | | Net
Unrealized
Appreciation/
(Depreciation) | |
| | 10,000,000 | | | | USD | | | 6/20/2025 | | GS | | Receive | | 1.00% | | 1.73% | | Indonesia | | 10,000,000 | | | USD | | | $ | (519,831 | ) |
| | 25,000,000 | | | | USD | | | 6/20/2025 | | GS | | Receive | | 1.00% | | 1.73% | | Indonesia | | 25,000,000 | | | USD | | | | (1,299,577 | ) |
| | 20,000,000 | | | | USD | | | 6/20/2025 | | GS | | Receive | | 1.00% | | 1.31% | | Republic of China | | 20,000,000 | | | USD | | | | (449,043 | ) |
| | 21,000,000 | | | | USD | | | 6/20/2026 | | GS | | Receive | | 1.00% | | 2.71% | | Republic of South Africa | | 21,000,000 | | | USD | | | | (2,732,346 | ) |
| | 8,000,000 | | | | USD | | | 12/20/2026 | | GS | | Receive | | 1.00% | | 2.49% | | Republic of Russia | | 8,000,000 | | | USD | | | | (946,819 | ) |
| | 10,000,000 | | | | USD | | | 12/20/2026 | | JPM | | Receive | | 1.00% | | 2.76% | | Republic of South Africa | | 10,000,000 | | | USD | | | | (1,383,832 | ) |
| | 15,000,000 | | | | USD | | | 12/20/2026 | | JPM | | Receive | | 1.00% | | 2.76% | | Republic of South Africa | | 15,000,000 | | | USD | | | | (2,075,748 | ) |
| | 10,000,000 | | | | USD | | | 12/22/2026 | | GS | | Receive | | 1.00% | | 2.76% | | Republic of South Africa | | 10,000,000 | | | USD | | | | (1,383,832 | ) |
| | 40,000,000 | | | | USD | | | 3/20/2030 | | JPM | | Receive | | 1.00% | | 3.06% | | Republic of Brazil | | 40,000,000 | | | USD | | | | (7,580,654 | ) |
| | 20,000,000 | | | | USD | | | 9/20/2031 | | GS | | (Pay) | | 1.00% | | 2.17% | | United Mexican States | | NA | | | | | | | 2,469,151 | |
| | | | | | | | | | | | | | | | | | | | | | | | | | | | |
| | | | | | | | | | | | | | | | | | | | | | | | | | $ | (30,078,523 | ) |
| | | | | | | | | | | | | | | | | | | | | | | | | | | | |
| | | | | | | | | | | | | | | | | | Premiums Paid (Received) | | | | | | $ | 43,187,264 | |
| | | | | | | | | | | | | | | | | | | | | | | | | | | | |
| ^ | Receive - Fund receives a premium and sells credit protection. If a credit event occurs the Fund will, depending on the terms of the particular swap contract, either (i) pay to the buyer of protection an amount equal to the notional amount of the swap and take delivery of the referenced obligation or underlying securities comprising the referenced index or (ii) pay a net settlement amount in the form of cash or securities equal to the notional amount of the swap less the recovery value of the referenced obligation or underlying securities comprising the referenced index. |
| | (Pay) - Fund pays a premium and buys credit protection. If a credit event occurs the Fund will, depending on the terms of the particular swap contract, either (i) receive from the seller of protection an amount equal to the notional amount of the swap and deliver the referenced obligation or underlying securities comprising the referenced index or (ii) receive a net settlement amount in the form of cash or securities equal to the notional amount of the swap less the recovery value of the referenced obligation or underlying securities comprising the referenced index. |
| (1) | As of February 28, 2017, implied credit spreads in absolute terms, calculated using a model, and utilized in determining the market value of credit default swap contracts on the reference security, serve as an indicator of the current status of the payment/performance risk and reflect the likelihood or risk of default for the reference entity. The implied credit spread of a particular referenced entity reflects the cost of buying/selling protection. Wider (i.e., higher) credit spreads represent a deterioration of the referenced entity’s credit soundness and a greater likelihood or risk of default or other credit event occurring as defined under the terms of the contract. |
| (2) | The maximum potential amount the Fund could be required to pay as a seller of credit protection if a credit event occurs as defined under the terms of that particular swap contract. |
Cross-Currency Basis Swaps
| | | | | | | | | | | | | | | | | | |
| | | | | |
Notional
Amount | | | Expiration
Date | | Counterparty | | Fund Pays | | Fund Receives | | Net
Unrealized
Appreciation/
(Depreciation) | |
| | 120,000,000 | | | | EUR | | | 9/11/2020 | | JPM | | 3 Month EURIBOR plus a spread of (0.35)% | | 3 Month USD LIBOR | | $ | 2,157,337 | |
| | | | | | | | | | | | | | | | | | |
| | | | | | | | | | | | | | Premiums Paid (Received) | | $ | — | |
| | | | | | | | | | | | | | | | | | |
Cross-Currency Interest Rate Swaps
| | | | | | | | | | | | | | | | | | | | |
| | | | | | |
Notional
Amount | | | Expiration
Date | | Counterparty | | Receive
(Pay) # | | Fixed
Rate | | Variable Rate | | Net
Unrealized
Appreciation/
(Depreciation) | |
| | 14,000,000,000 | | | | JPY | | | 4/28/2025 | | GS | | (Pay) | | (0.22)% | | 3 Month USD LIBOR | | $ | (7,526,450 | ) |
| | 50,000,000 | | | | GBP | | | 3/10/2026 | | JPM | | (Pay) | | 1.17% | | 3 Month USD LIBOR | | | 43,291 | |
| | | | | | | | | | | | | | | | | | | | |
| | | | | | | | | | | | | | | | | | $ | (7,483,159 | ) |
| | | | | | | | | | | | | | | | | | | | |
| | | | | | | | | | | | | | | | Premiums Paid (Received) | | $ | — | |
| | | | | | | | | | | | | | | | | | | | |
| # | Receive - Fund receives fixed rate and pays variable rate. |
| | (Pay) - Fund pays fixed rate and receives variable rate. |
| | | | |
| 32 | | See accompanying notes to the financial statements. | | |
GMO Emerging Country Debt Fund
(A Series of GMO Trust)
Schedule of Investments — (Continued)
February 28, 2017
Interest Rate Swaps
| | | | | | | | | | | | | | | | | | | | |
| | | | | | |
Notional
Amount | | | Expiration
Date | | Counterparty | | Receive
(Pay) # | | Fixed
Rate | | Variable Rate | | Net
Unrealized
Appreciation/
(Depreciation) | |
| | 70,000,000 | | | | USD | | | 9/1/2045 | | JPMF (i) | | (Pay) | | 2.69% | | 3 Month USD LIBOR | | $ | (929,507 | ) |
| | | | | | | | | | | | | | | | | | | | |
| | | | | | | | | | | | | | | | | | $ | (929,507 | ) |
| | | | | | | | | | | | | | | | | | | | |
| | | | | | | | | | | | | | | | Premiums Paid (Received) | | $ | — | |
| | | | | | | | | | | | | | | | | | | | |
| # | Receive - Fund receives fixed rate and pays variable rate. |
| | (Pay) - Fund pays fixed rate and receives variable rate. |
As of February 28, 2017, for the above contracts and/or agreements, the Fund had sufficient cash and/or securities to cover commitments or collateral requirements, if any, of the relevant broker or exchange.
Notes to Schedule of Investments:
| † | Denominated in U.S. Dollar, unless otherwise indicated. |
| * | Non-income producing security. |
| ◆ | These securities are primarily backed by subprime mortgages. |
| (a) | Investment valued at fair value using methods determined in good faith by the Trustees of GMO Trust or persons acting at their direction pursuant to procedures approved by the Trustees (Note 2). |
| (b) | Security is backed by U.S. Treasury Bonds. |
| (c) | All or a portion of this security has been pledged to cover collateral requirements on reverse repurchase agreements (Note 2). |
| (d) | Security is in default. |
| (e) | Indexed security in which price and/or coupon is linked to the price of a specific instrument or financial statistic (Note 2). |
| (f) | All or a portion of this security has been pledged to cover margin requirements on futures and/or cleared swap contracts, collateral on OTC swap contracts, forward currency contracts, and/or written options, if any (Note 4). |
| (g) | The rate disclosed is the 7 day net yield as of February 28, 2017. |
| (h) | Reverse repurchase agreements have an open maturity date and can be closed by either party on demand. |
| (i) | Swap was cleared through the CME Group Inc. |
For a listing of definitions of acronyms, counterparty abbreviations and currency abbreviations used throughout the Schedule of Investments as well as the derivative tables, if any, please refer to page 52.
| | | | |
| | See accompanying notes to the financial statements. | | 33 |
GMO Opportunistic Income Fund (formerly GMO Debt Opportunities Fund)
(A Series of GMO Trust)
Portfolio Management
Day-to-day management of the Fund’s portfolio is the responsibility of the Developed Fixed Income team at Grantham, Mayo, Van Otterloo & Co. LLC.
Management Discussion and Analysis of Fund Performance
Although the Fund is not managed relative to any securities market index or benchmark, a discussion of the Fund’s performance relative to Barclays U.S. Securitized + Index is included for comparative purposes.
Class VI shares of GMO Opportunistic Income Fund returned +7.62% (net) for the fiscal year ended February 28, 2017, as compared with +1.43% for the Barclays U.S. Securitized + Index. The Fund outperformed its benchmark during the fiscal year by +6.19%, with allocation to longer duration mortgage-backed products contributing to outperformance.
More specifically outperformance was driven by sector allocation assets, such as residential and commercial mortgage-backed securities (RMBS & CMBS), which despite some market volatility, were top performers on the year. In asset-backed products, such as auto ABS, esoteric ABS, and student loan ABS deals, the Fund added additional performance in less volatile markets. Securitizations related to corporate debt markets, such as collateralized loan obligations (CLO), outperformed, adding additional alpha throughout the year. At fiscal year-end, approximately 26% of the portfolio was rated AAA (including cash and cash equivalents), 40% of the portfolio was rated single-A or better, and 51% of the portfolio was rated below BBB.
Effective January 1, 2017, the Fund’s investment objective changed from “positive total return” to “capital appreciation and current income” and, in conjunction with a change in the Fund’s name from “GMO Debt Opportunities Fund” to “GMO Opportunistic Income Fund,” the Fund eliminated its name policy that required the Fund to invest at least 80% of its assets in debt investments. Also effective January 1, 2017, the Fund’s investment management fee increased from 0.25% to 0.40% of the Fund’s average daily net assets. Performance of the Fund for periods prior to January 1, 2017 reflects the Fund’s annual operating expenses during those periods, and would have been lower if the current management fee were in effect. Effective January 1, 2017, the Fund changed its benchmark from the J.P. Morgan U.S. 3-Month Cash Index to the Barclays U.S. Securitized Index because GMO believes the Barclays U.S. Securitized Index is more representative of the Fund’s investment strategy.
*The Barclays U.S. Securitized + is an internally maintained benchmark computed by GMO, comprised of the J.P. Morgan U.S. 3 Month Cash index through 12/30/2016 and the Bloomberg Barclays U.S. Securitized: MBS, ABS, CMBS Index thereafter.
The views expressed herein are exclusively those of Grantham, Mayo, Van Otterloo & Co. LLC as of the date of this report and are subject to change. GMO disclaims any responsibility to update such views. They are not meant as investment advice. References to specific securities are not recommendations of such securities and may not be representative of any GMO portfolio’s current or future investments.
34
GMO Opportunistic Income Fund (Formerly GMO Debt Opportunities Fund)
(A Series of GMO Trust)
Comparison of Change in Value of a $300,000,000 Investment in GMO Opportunistic Income Fund (Formerly GMO Debt Opportunities Fund^) Class VI Shares and the Barclays U.S. Securitized + As of February 28, 2017
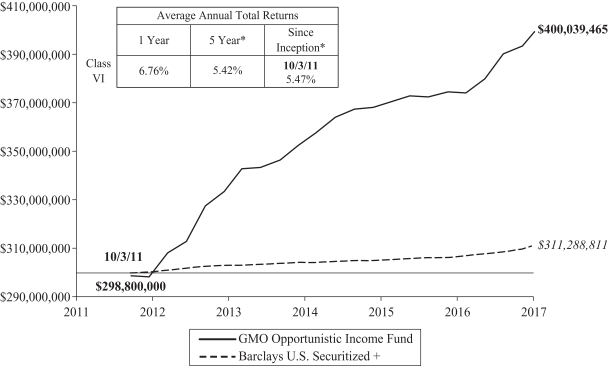
Performance data quoted represents past performance and is not indicative of future results. The investment return and principal value of an investment will fluctuate so that an investor’s shares, when redeemed, may be worth more or less than their original cost. Current performance data may be lower or higher than the performance data provided herein. To obtain performance information up to the most recent month-end, visit www.gmo.com. Performance shown is net of all fees after reimbursement from GMO. Each performance figure assumes a purchase at the beginning and redemption at the end of the stated period and reflects a transaction fee of .40% on the purchase and .40% on the redemption. Transaction fees are retained by the Fund to cover trading costs. Returns would have been lower had certain expenses not been reimbursed during the periods shown and do not include the effect of taxes on distributions and redemptions. All information is unaudited.
| | * | Beginning December 21, 2015 the pricing source for certain fixed income assets of the Fund changed, which may have had a material impact on the Fund’s performance for the period shown. |
| | ^ | Effective February 12, 2014, GMO Debt Opportunities Fund (the “Acquired Fund”) merged into GMO Short-Duration Collateral Fund (the “Acquiring Fund”) and the surviving entity was renamed GMO Debt Opportunities Fund. For accounting and financial reporting purposes, the Acquired Fund is the surviving entity, meaning that the combined entity adopted the historical financial reporting and performance history of the Acquired Fund. The information shown prior to February 12, 2014 is that of the Acquired Fund and reflects the Acquired Fund’s performance. |
35
GMO Opportunistic Income Fund (formerly GMO Debt Opportunities Fund)
(A Series of GMO Trust)
Investment Concentration Summary
February 28, 2017 (Unaudited)
| | | | |
| Asset Class Summary& | | % of Total Net Assets | |
Debt Obligations | | | 89.7 | % |
Short-Term Investments | | | 5.9 | |
Mutual Funds | | | 4.8 | |
Swap Contracts | | | 1.1 | |
Options Purchased | | | 0.1 | |
Forward Currency Contracts | | | 0.0 | ^ |
Written Options | | | (0.1 | ) |
Securities Sold Short | | | (2.3 | ) |
Other | | | 0.8 | |
| | | | |
| | | 100.0 | % |
| | | | |
| | | | |
| Industry Sector Summary | | % of Debt Obligations | |
Student Loans | | | 21.9 | % |
Collateralized Loan Obligations | | | 14.4 | |
Commercial Mortgage-Backed Securities | | | 13.4 | |
Small Balance Commercial Mortgages | | | 9.8 | |
U.S. Government Agency | | | 9.4 | |
Residential Mortgage-Backed Securities – Other | | | 9.3 | |
Auto Retail Subprime | | | 7.2 | |
Residential Mortgage-Backed Securities – Prime | | | 4.7 | |
Residential Mortgage-Backed Securities – Alt-A | | | 3.3 | |
Residential Mortgage-Backed Securities – Subprime | | | 1.9 | |
Collateralized Debt Obligations | | | 1.5 | |
Time Share | | | 1.2 | |
Auto Retail Prime | | | 1.0 | |
Business Equipment Loans | | | 0.8 | |
Other | | | 0.2 | |
| | | | |
| | | 100.0 | % |
| | | | |
| & | In the table above, derivative financial instruments, if any, are based on market values or unrealized appreciation/depreciation rather than notional amounts. |
36
GMO Opportunistic Income Fund (formerly GMO Debt Opportunities Fund)
(A Series of GMO Trust)
Schedule of Investments
(showing percentage of total net assets)
February 28, 2017
| | | | | | | | | | |
Par Value† | | | Description | | Value ($) | |
| | | | | | DEBT OBLIGATIONS — 89.7% | |
| | |
| | | | | | Asset-Backed Securities — 81.2% | |
| | | | | | Auto Retail Prime — 0.9% | |
| | | 13,120,000 | | | California Republic Auto Receivables Trust, Series 13-1, Class C, 144A, 3.25%, due 03/16/20 | | | 13,211,800 | |
| | | 985,600 | | | California Republic Auto Receivables Trust, Series 14-1, Class C, 3.40%, due 12/15/20 | | | 999,651 | |
| | | | | | | | | | |
| | | | | | Total Auto Retail Prime | | | 14,211,451 | |
| | | | | | | | | | |
| | |
| | | | | | Auto Retail Subprime — 6.5% | |
| | | 3,500,000 | | | AmeriCredit Automobile Receivables Trust, Series 13-1, Class E, 144A, 2.64%, due 07/08/20 | | | 3,516,647 | |
| | | 13,720,000 | | | AmeriCredit Automobile Receivables Trust, Series 14-2, Class E, 3.37%, due 11/08/21 | | | 13,899,143 | |
| | | 2,804,000 | | | CarFinance Capital Auto Trust, Series 13-1A, Class D, 144A, 4.68%, due 11/15/19 | | | 2,828,898 | |
| | | 2,651,300 | | | CarFinance Capital Auto Trust, Series 13-2A, Class D, 144A, 5.93%, due 08/15/19 | | | 2,691,139 | |
| | | 1,073,840 | | | CarFinance Capital Auto Trust, Series 13-2A, Class E, 144A, 7.86%, due 10/15/20 | | | 1,097,303 | |
| | | 2,592,000 | | | CarFinance Capital Auto Trust, Series 14-1A, Class C, 144A, 3.45%, due 04/15/20 | | | 2,632,871 | |
| | | 1,524,850 | | | CarFinance Capital Auto Trust, Series 14-1A, Class D, 144A, 4.90%, due 04/15/20 | | | 1,566,609 | |
| | | 4,130,000 | | | CFC LLC, Series 14-2A, Class E, 144A, 5.36%, due 11/15/21 | | | 4,154,150 | |
| | | 276,397 | | | CPS Auto Receivables Trust, Series 13-A, Class D, 144A, 4.41%, due 06/15/20 | | | 276,560 | |
| | | 52,931 | | | CPS Auto Receivables Trust, Series 13-A, Class E, 144A, 6.41%, due 06/15/20 | | | 53,088 | |
| | | 1,161,267 | | | CPS Auto Receivables Trust, Series 13-B, Class D, 144A, 4.66%, due 09/15/20 | | | 1,162,027 | |
| | | 51,150 | | | CPS Auto Receivables Trust, Series 13-B, Class E, 144A, 6.41%, due 09/15/20 | | | 51,224 | |
| | | 4,000,000 | | | CPS Auto Receivables Trust, Series 14-A, Class C, 144A, 3.29%, due 02/18/20 | | | 4,023,000 | |
| | | 1,500,000 | | | CPS Auto Receivables Trust, Series 14-A, Class D, 144A, 5.11%, due 02/18/20 | | | 1,518,639 | |
| | | 1,302,800 | | | CPS Auto Receivables Trust, Series 14-B, Class D, 144A, 4.62%, due 05/15/20 | | | 1,308,870 | |
| | | 1,049,647 | | | CPS Auto Receivables Trust, Series 15-C, Class D, 144A, 4.63%, due 08/16/21 | | | 1,057,519 | |
| | | 323,916 | | | CPS Auto Trust, Series 12-D, Class D, 144A, 4.82%, due 03/16/20 | | | 323,767 | |
| | | 3,606,187 | | | DT Auto Owner Trust, Series 13-1A, Class D, 144A, 3.74%, due 05/15/20 | | | 3,610,178 | |
| | | 4,309,088 | | | DT Auto Owner Trust, Series 13-2A, Class D, 144A, 4.18%, due 06/15/20 | | | 4,335,164 | |
| | | 4,390,500 | | | DT Auto Owner Trust, Series 14-2A, Class D, 144A, 3.68%, due 04/15/21 | | | 4,442,449 | |
| | | | | | | | | | |
Par Value† | | | Description | | Value ($) | |
| | | | | | Asset-Backed Securities — continued | |
| | | | | | Auto Retail Subprime — continued | |
| | | 5,847,188 | | | DT Auto Owner Trust, Series 15-2A, Class D, 144A, 4.25%, due 02/15/22 | | | 5,903,790 | |
| | | 6,000,000 | | | Exeter Automobile Receivables Trust, Series 13-2A, Class D, 144A, 6.81%, due 08/17/20 | | | 6,208,172 | |
| | | 6,000,000 | | | Exeter Automobile Receivables Trust, Series 14-1A, Class C, 144A, 3.57%, due 07/15/19 | | | 6,040,387 | |
| | | 6,000,000 | | | Exeter Automobile Receivables Trust, Series 14-1A, Class D, 144A, 5.53%, due 02/16/21 | | | 6,196,025 | |
| | | 5,000,000 | | | Exeter Automobile Receivables Trust, Series 14-2A, Class C, 144A, 3.26%, due 12/16/19 | | | 5,037,843 | |
| | | 4,875,000 | | | Exeter Automobile Receivables Trust, Series 14-2A, Class D, 144A, 4.93%, due 12/15/20 | | | 4,989,811 | |
| | | 1,938,500 | | | Flagship Credit Auto Trust, Series 13-1, Class D, 144A, 5.38%, due 07/15/20 | | | 1,951,779 | |
| | | 1,144,000 | | | Flagship Credit Auto Trust, Series 13-2, Class C, 144A, 4.42%, due 12/16/19 | | | 1,156,904 | |
| | | 3,000,000 | | | Flagship Credit Auto Trust, Series 14-1, Class C, 144A, 3.34%, due 04/15/20 | | | 3,007,774 | |
| | | 1,629,900 | | | Flagship Credit Auto Trust, Series 14-1, Class D, 144A, 4.83%, due 06/15/20 | | | 1,670,279 | |
| | | 1,400,000 | | | Flagship Credit Auto Trust, Series 14-1, Class E, 144A, 5.71%, due 08/16/21 | | | 1,441,624 | |
| | | | | | | | | | |
| | | | | | Total Auto Retail Subprime | | | 98,153,633 | |
| | | | | | | | | | |
| | |
| | | | | | Business Equipment Loans — 0.7% | |
| | | 127,390 | | | LEAF Receivables Funding 9 LLC, Series 13-1, Class B, 144A, 2.80%, due 09/15/21 | | | 127,422 | |
| | | 2,841,000 | | | LEAF Receivables Funding 9 LLC, Series 13-1, Class D, 144A, 5.11%, due 09/15/21 | | | 2,869,410 | |
| | | 5,700,000 | | | LEAF Receivables Funding 9 LLC, Series 13-1, Class E1, 144A, 6.00%, due 09/15/21 | | | 5,764,085 | |
| | | 2,282,000 | | | LEAF Receivables Funding 9 LLC, Series 13-1, Class E2, 144A, 6.00%, due 09/15/21 | | | 2,316,559 | |
| | | | | | | | | | |
| | | | | | Total Business Equipment Loans | | | 11,077,476 | |
| | | | | | | | | | |
| | |
| | | | | | Collateralized Debt Obligations — 1.3% | |
| | | 16,702,121 | | | GS Mortgage Securities Corp., Series 06-CC1, Class A, 144A, Variable Rate, 5.45%, due 03/21/46 | | | 12,777,123 | |
| | | 7,620,559 | | | Nomura CRE CDO, Series 07-2A, Class B, 144A, 3 mo. LIBOR + .33%, 1.38%, due 05/21/42 | | | 7,239,531 | |
| | | | | | | | | | |
| | | | | | Total Collateralized Debt Obligations | | | 20,016,654 | |
| | | | | | | | | | |
| | | | |
| | See accompanying notes to the financial statements. | | 37 |
GMO Opportunistic Income Fund (formerly GMO Debt Opportunities Fund)
(A Series of GMO Trust)
Schedule of Investments — (Continued)
(showing percentage of total net assets)
February 28, 2017
| | | | | | | | | | |
Par Value† | | | Description | | Value ($) | |
| | | | | | Asset-Backed Securities — continued | |
| | | | | | Collateralized Loan Obligations — 12.9% | |
| | | 1,043,954 | | | Acis CLO Ltd., Series 13-2A, Class C1, 144A, 3 mo. LIBOR + 2.82%, 3.84%, due 10/14/22 | | | 1,044,345 | |
| | | 7,000,000 | | | Ares IIIR/IVR CLO Ltd., Series 07-3RA, Class E, 144A, 3 mo. LIBOR + 3.50%, 4.52%, due 04/16/21 | | | 6,999,769 | |
| | | 1,368,000 | | | Ares IIIR/IVR CLO Ltd., Series 07-3RX, Class E, Reg S, 3 mo. LIBOR + 3.50%, 4.52%, due 04/16/21 | | | 1,367,955 | |
| | | 37,276,500 | | | Arrowpoint CLO Ltd., Series 15-4A, Class A, 144A, Variable Rate, 3 mo. LIBOR + 1.55%, 2.57%, due 04/18/27 | | | 37,377,072 | |
| | | 3,480,000 | | | Atrium XI, Series 11A, Class B, 144A, Variable Rate, 3 mo. LIBOR + 2.15%, 3.19%, due 10/23/25 | | | 3,482,707 | |
| | | 1,566,000 | | | Carlyle Daytona CLO Ltd., Series 07-1A, Class B1L, 144A, 3 mo. LIBOR + 1.35%, 2.39%, due 04/27/21 | | | 1,559,501 | |
| | | 5,603,000 | | | CIFC Funding Ltd., Series 13A-4A, Class C2R, 144A, 3 mo. LIBOR + 2.25%, due 11/27/24 | | | 5,603,000 | |
| | | 1,522,500 | | | CIFC Funding Ltd., Series 07-3X, Class C, Reg S, Variable Rate, 3 mo. LIBOR + 2.60%, 3.63%, due 07/26/21 | | | 1,523,983 | |
| | | 7,327,000 | | | CIFC Funding Ltd., Series 13A-4A, Class C1R, 144A, 3 mo. LIBOR + 2.25%, due 11/27/24 | | | 7,327,000 | |
| | | 3,750,000 | | | CIFC Funding Ltd., Series 15-5A, Class D, 144A, Variable Rate, 3 mo. LIBOR + 6.30%, 7.34%, due 10/25/27 | | | 3,721,710 | |
| | | 4,968,000 | | | Cumberland Park CLO Ltd., Series 15-2A, Class C, 144A, 3 mo. LIBOR + 2.85%, 3.88%, due 07/20/26 | | | 4,976,436 | |
| | | 4,350,000 | | | Dorchester Park CLO Ltd., Series 15-1A, Class E, 144A, Variable Rate, 3 mo. LIBOR + 5.25%, 6.28%, due 01/20/27 | | | 4,353,502 | |
| | | 5,418,252 | | | Franklin CLO VI Ltd., Series 6A, Class A,144A, Variable Rate, 3 mo. LIBOR + .23%, 1.27%, due 08/09/19 | | | 5,394,292 | |
| | | 3,520,000 | | | GoldenTree Loan Opportunities III Ltd., Series 07-3A, Class C, 144A, Variable Rate, 3 mo. LIBOR + 1.25%, 2.28%, due 05/01/22 | | | 3,522,612 | |
| | | 28,020,000 | | | Jamestown CLO VI Ltd., Series 15-6A, Class A1A, 144A, Variable Rate, 3 mo. LIBOR + 1.60%, 2.65%, due 02/20/27 | | | 28,028,546 | |
| | | 9,592,000 | | | Kingsland IV Ltd., Series 07-4X, Class B, Reg S, Variable Rate, 3 mo. LIBOR + .40%, 1.42%, due 04/16/21 | | | 9,488,282 | |
| | | 1,740,000 | | | Octagon Investment Partners XII Ltd., Series 12-1A, Class DR, 144A, 3 mo. LIBOR + 3.80%, 4.83%, due 05/05/23 | | | 1,741,375 | |
| | | 6,330,393 | | | Rockwall CDO II Ltd., Series 07-1A, Class A1LA, 144A, Variable Rate, 3 mo. LIBOR + .25%, 1.28%, due 08/01/24 | | | 6,320,087 | |
| | | | | | | | | | |
Par Value† | | | Description | | Value ($) | |
| | | | | | Asset-Backed Securities — continued | |
| | | | | | Collateralized Loan Obligations — continued | |
| | | 7,334,234 | | | San Gabriel CLO Ltd., Series 07-1A, Class B2L, 144A, 3 mo. LIBOR + 4.25%, 5.20%, due 09/10/21 | | | 7,354,411 | |
| | | 36,880,000 | | | West CLO Ltd., Series 15-2A, Class A1A, 144A, Variable Rate, 3 mo. LIBOR + 1.55%, 2.57%, due 01/16/27 | | | 36,884,204 | |
| | | 16,954,584 | | | Zais Investment Grade Ltd., Series 9A, Class B, 144A, Variable Rate, 3 mo. LIBOR +.85%, 1.89%, due 04/27/52 | | | 16,785,038 | |
| | | | | | | | | | |
| | | | | | Total Collateralized Loan Obligations | | | 194,855,827 | |
| | | | | | | | | | |
| | |
| | | | | | Commercial Mortgage-Backed Securities — 12.0% | |
| | | 4,406,000 | | | Bear Stearns Commercial Mortgage Securities Trust, Series 05-PWR9, Class E, Variable Rate, 5.14%, due 09/11/42 | | | 4,389,226 | |
| | | 3,074,400 | | | Citigroup Commercial Mortgage Trust, Series 04-C2, Class H, 144A, Variable Rate, 6.27%, due 10/15/41 | | | 2,710,084 | |
| | | 21,690,500 | | | Commercial Mortgage Trust, Series 07-GG9, Class AJ, Variable Rate, 5.51%, due 03/10/39 | | | 21,045,084 | |
| | | 23,260,500 | | | Core Industrial Trust, Series 15-WEST, Class E, 144A, Variable Rate, 4.23%, due 02/10/37 | | | 22,705,681 | |
| | | 1,473,491 | | | Credit Suisse First Boston Mortgage Securities Corp., Series 04-C1, Class G, 144A, Variable Rate, 5.31%, due 01/15/37 | | | 1,525,905 | |
| | | 4,769,114 | | | Credit Suisse First Boston Mortgage Securities Corp., Series 05-C2, Class AMFL, Variable Rate, 1 mo. LIBOR + .25%, 1.02%, due 04/15/37 | | | 4,054,152 | |
| | | 2,047,991 | | | Credit Suisse First Boston Mortgage Securities Corp., Series 05-C2, Class AMFX, 4.88%, due 04/15/37 | | | 1,904,822 | |
| | | 2,942,718 | | | Credit Suisse First Boston Mortgage Securities Corp., Series 05-C6, Class G, 144A, Variable Rate, 5.10%, due 12/15/40 | | | 2,941,441 | |
| | | 21,631,488 | | | Credit Suisse Mortgage Capital Certificates, Series 06-C4, Class AJ, Variable Rate, 5.54%, due 09/15/39 | | | 21,847,803 | |
| | | 8,715,587 | | | Credit Suisse Mortgage Capital Certificates, Series 14-USA, Class A2, 144A, 3.95%, due 09/15/37 | | | 8,943,256 | |
| | | 18,530,720 | | | CSMC Trust, Series 14-USA, Class E, 144A, 4.37%, due 09/15/37 | | | 16,004,129 | |
| | | 8,360,000 | | | GS Mortgage Securities Corp., Series 16-GS2, Class D, 144A, 2.75%, due 05/10/49 | | | 6,233,712 | |
| | | 11,025,000 | | | GS Mortgage Securities Corp., Series 16-RENT, Class E, 144A, Variable Rate, 4.07%, due 02/10/29 | | | 10,827,317 | |
| | | 8,801,500 | | | GS Mortgage Securities Trust, Series 11-GC3, Class D, 144A, Variable Rate, 5.63%, due 03/10/44 | | | 8,945,043 | |
| | | | |
| 38 | | See accompanying notes to the financial statements. | | |
GMO Opportunistic Income Fund (formerly GMO Debt Opportunities Fund)
(A Series of GMO Trust)
Schedule of Investments — (Continued)
(showing percentage of total net assets)
February 28, 2017
| | | | | | | | | | |
Par Value† | | | Description | | Value ($) | |
| | | | | | Asset-Backed Securities — continued | | | | |
| | | | | | Commercial Mortgage-Backed Securities — continued | |
| | | 9,793,333 | | | Hilton USA Trust, Series 16-SFP, Class E, 144A, 5.52%, due 11/05/35 | | | 9,674,394 | |
| | | 6,267,875 | | | Hyatt Hotel Portfolio Trust, Series 15-HYT, Class F, 144A, Variable Rate, 1 mo. LIBOR + 3.49%, 4.26%, due 11/15/29 | | | 6,142,182 | |
| | | 8,946,915 | | | JP Morgan Chase Commercial Mortgage Securities Corp., Series 05-CB13, Class AJ, Variable Rate, 5.50%, due 01/12/43 | | | 9,034,529 | |
| | | 3,000,000 | | | JP Morgan Chase Commercial Mortgage Securities Trust, Series 04-C3, Class H, 144A, Variable Rate, 5.50%, due 01/15/42 | | | 2,580,258 | |
| | | 2,797,935 | | | LB-UBS Commercial Mortgage Trust, Series 04-C1, Class A4, 4.57%, due 01/15/31 | | | 2,797,724 | |
| | | 838,416 | | | ML-CFC Commercial Mortgage Trust, Series 06-4, Class AJ, 5.24%, due 12/12/49 | | | 843,003 | |
| | | 6,888,920 | | | Motel 6 Trust, Series 15-MTL6, Class F, 144A, 5.00%, due 02/05/30 | | | 6,784,089 | |
| | | 9,436,663 | | | Wachovia Bank Commercial Mortgage Trust, Series 06-C29, Class AJ, Variable Rate, 5.37%, due 11/15/48 | | | 9,501,776 | |
| | | | | | | | | | |
| | | | | | Total Commercial Mortgage-Backed Securities | | | 181,435,610 | |
| | | | | | | | | | |
| | |
| | | | | | Other — 0.1% | |
| | | 10,423,078 | | | Aircraft Finance Trust, Series 99-1A, Class A1, 144A, Variable Rate,, 1 mo. LIBOR + .48%, 1.25%, due 05/15/24 | | | 2,032,500 | |
| | | | | | | | | | |
| | |
| | | | | | Residential Mortgage-Backed Securities — Other — 8.3% | |
| | | 1,701,544 | | | ACE Securities Corp. Home Equity Loan Trust, Series 06-ASL1, Class A, Variable Rate, 1 mo. LIBOR + .28%, 1.06%, due 02/25/36 ◆ | | | 1,009,438 | |
| | | 22,259,329 | | | American Home Mortgage Investment Trust, Series 06-2, Class 4A, 1 mo. LIBOR + .36%, 1.14%, due 02/25/36 | | | 5,337,366 | |
| | | 12,117,316 | | | American Home Mortgage Investment Trust, Series 06-3, Class 4A, Variable Rate, 1 mo. LIBOR + .38%, 1.16%, due 11/25/35 | | | 3,655,416 | |
| | | 2,346,974 | | | BCMSC Trust, Series 00-A, Class A4, Variable Rate, 8.29%, due 06/15/30 | | | 1,198,954 | |
| | | 3,072,800 | | | BCMSC Trust, Series 99-A, Class M1, Variable Rate, 6.79%, due 03/15/29 | | | 2,604,071 | |
| | | 7,484,389 | | | BCMSC Trust, Series 99-B, Class A4, Variable Rate, 7.30%, due 12/15/29 | | | 3,434,225 | |
| | | 1,037,444 | | | Bear Stearns Mortgage Funding Trust, Series 07-SL2, Class 1A, Variable Rate, 1 mo. LIBOR + .32%, 1.10%, due 02/25/37 | | | 1,826,842 | |
| | | 2,671,287 | | | Carrington Mortgage Loan Trust, Series 06-RFC1, Class A3, Variable Rate, 1 mo. LIBOR + .15%, 0.93%, due 05/25/36 | | | 2,634,504 | |
| | | | | | | | | | |
Par Value† | | | Description | | Value ($) | |
| | | | | | Asset-Backed Securities — continued | |
| | | | | | Residential Mortgage-Backed Securities — Other — continued | |
| | | 3,270,619 | | | Conseco Financial Corp., Series 98-6, Class M1, Variable Rate, 6.63%, due 06/01/30 | | | 2,991,225 | |
| | | 3,957,005 | | | Countrywide Home Equity Loan Trust, Series 07-E, Class A, FSA, Variable Rate, 1 mo. LIBOR + .15%, 0.92%, due 06/15/37 | | | 3,488,025 | |
| | | 1,253,442 | | | GMACM Home Equity Loan Trust, Series 04-HE3, Class A3, FSA, Variable Rate, 1 mo. LIBOR + .50%, 1.28%, due 10/25/34 ◆ | | | 1,171,972 | |
| | | 9,466,587 | | | Greenpoint Manufactured Housing, Series 98-1, Class 2A, Variable Rate, 1 mo. LIBOR + .57%, 1.34%, due 05/15/28 | | | 8,760,678 | |
| | | 33,343,965 | | | Home Equity Mortgage Loan Asset-Backed Trust, Series 06-A, Class A, Variable Rate, 1 mo. LIBOR + .26%, 1.04%, due 06/25/36 | | | 6,177,093 | |
| | | 4,665,938 | | | Master Second Lien Trust, Series 06-1, Class A, Variable Rate, 1 mo. LIBOR + .32%, 1.10%, due 03/25/36 | | | 1,200,713 | |
| | | 1,039,604 | | | Mellon Re-REMIC Pass-Through Trust, Series 04-TBC1, Class A, 144A, Variable Rate, 1 mo. LIBOR + .25%, 1.03%, due 02/26/34 | | | 932,120 | |
| | | 3,754,557 | | | Meritage Mortgage Loan Trust, Series 05-2, Class M2, Variable Rate, 1 mo. LIBOR + .75%, 1.53%, due 11/25/35 | | | 3,681,926 | |
| | | 4,691,778 | | | Merrill Lynch Mortgage Investors Trust, Series 05-SL2, Class M2, Variable Rate, 1 mo. LIBOR + 1.20%, 1.98%, due 12/25/35 | | | 4,734,653 | |
| | | 5,939,329 | | | Morgan Stanley Resecuritization Trust, Series 14-R8, Class 2A, 144A, Variable Rate, 1 mo. LIBOR + .16%, 0.93%, due 06/26/47 | | | 5,824,532 | |
| | | 8,428,463 | | | New Century Home Equity Loan Trust, Series 06-S1, Class A1, 1 mo. LIBOR + .34%, 1.12%, due 03/25/36 | | | 927,766 | |
| | | 14,775,878 | | | New Century Home Equity Loan Trust, Series 06-S1, Class A2A, 1 mo. LIBOR + .20%, 0.98%, due 03/25/36 | | | 1,626,517 | |
| | | 22,471,211 | | | New Century Home Equity Loan Trust, Series 06-S1, Class A2B, 1 mo. LIBOR + .40%, 1.18%, due 03/25/36 | | | 2,473,487 | |
| | | 9,748,202 | | | Oakwood Mortgage Investors, Inc., Series 00-D, Class A4, 7.40%, due 07/15/30 | | | 6,162,206 | |
| | | 2,885,060 | | | Oakwood Mortgage Investors, Inc., Series 98-D, Class M1, 144A, 7.42%, due 01/15/29 | | | 2,949,672 | |
| | | 10,864,079 | | | Oakwood Mortgage Investors, Inc., Series 99-C, Class A2, 7.48%, due 08/15/27 | | | 10,718,722 | |
| | | 6,534,742 | | | PHH Mortgage Trust, Series 07-1SL, Class M2, 144A, 7.00%, due 12/25/27 | | | 6,894,069 | |
| | | 2,302,812 | | | RBSSP Resecuritization Trust, Series 13-1, Class 1A2, 144A, 1 mo. LIBOR + .29%, 1.06%, due 01/26/37 | | | 2,257,548 | |
| | | | |
| | See accompanying notes to the financial statements. | | 39 |
GMO Opportunistic Income Fund (formerly GMO Debt Opportunities Fund)
(A Series of GMO Trust)
Schedule of Investments — (Continued)
(showing percentage of total net assets)
February 28, 2017
| | | | | | | | | | |
Par Value† | | | Description | | Value ($) | |
| | | | | | Asset-Backed Securities — continued | |
| | | | | | Residential Mortgage-Backed Securities — Other — continued | |
| | | 25,377,696 | | | Residential Funding Mortgage Securities II, Series 06-HI4, Class A4, 5.72%, due 09/25/36 | | | 21,095,324 | |
| | | 14,952,986 | | | Soundview Home Loan Trust, Series 06-A, Class A, Variable Rate, 1 mo. LIBOR + .38%, 1.16%, due 11/25/35 | | | 2,348,094 | |
| | | 26,188,662 | | | Terwin Mortgage Trust, Series 07-1SL, Class A1, 144A, Variable Rate, 1 mo. LIBOR + .11%, 0.68%, due 01/25/38 | | | 4,325,631 | |
| | | 2,896,835 | | | Wells Fargo Mortgage Backed Securities Trust, Series 05-AR14, Class A4, Variable Rate, 3.01%, due 08/25/35 | | | 2,895,440 | |
| | | | | | | | | | |
| | | | | | Total Residential Mortgage-Backed Securities — Other | | | 125,338,229 | |
| | | | | | | | | | |
| | | | | | Residential Mortgage-Backed Securities — Prime — 4.2% | |
| | | 9,385,130 | | | Adjustable Rate Mortgage Trust, Series 05-4, Class 6A1, Variable Rate, 3.30%, due 08/25/35 | | | 8,466,835 | |
| | | 5,720,484 | | | BCAP LLC Trust, Series 09-RR13, Class 16A2, 144A, Variable Rate, 3.42%, due 09/26/35 | | | 5,429,554 | |
| | | 2,632,645 | | | Chase Mortgage Finance Trust, Series 05-A1, Class 3A1, Variable Rate, 3.17%, due 12/25/35 | | | 2,520,665 | |
| | | 4,693,091 | | | Chase Mortgage Finance Trust, Series 07-A1, Class 11M1, Variable Rate, 3.07%, due 03/25/37 | | | 4,339,998 | |
| | | 10,825,789 | | | Citigroup Mortgage Loan Trust, Inc., Series 06-AR2, Class 1A2, Variable Rate, 3.44%, due 03/25/36 | | | 10,328,232 | |
| | | 4,353,391 | | | IndyMac INDA Mortgage Loan Trust, Series 06-AR3, Class 1A1, Variable Rate, 3.44%, due 12/25/36 | | | 3,954,044 | |
| | | 3,924,097 | | | IndyMac INDA Mortgage Loan Trust, Series 07-AR1, Class 1A1, Variable Rate, 3.48%, due 03/25/37 | | | 3,746,339 | |
| | | 5,266,829 | | | Merrill Lynch Mortgage Backed Securities Trust, Series 07-1, Class 1A1, Variable Rate, 3.38%, due 04/25/37 | | | 4,846,797 | |
| | | 5,983,397 | | | RBSSP Resecuritization Trust, Series 09-6, Class 3A2, 144A, Variable Rate, 1 mo. LIBOR + .17%, 2.94%, due 01/26/36 | | | 5,732,724 | |
| | | 3,511,515 | | | WaMu Mortgage Pass-Through Certificates, Series 05-AR10, Class 1A3, Variable Rate, 2.77%, due 09/25/35 | | | 3,414,974 | |
| | | 2,448,692 | | | WaMu Mortgage Pass-Through Certificates, Series 06-AR19, Class 2A, Variable Rate, 1.85%, due 01/25/47 | | | 2,288,050 | |
| | | 4,562,017 | | | WaMu Mortgage Pass-Through Certificates, Series 07-HY2, Class 2A1, Variable Rate, 2.98%, due 11/25/36 | | | 4,246,498 | |
| | | | | | | | | | |
Par Value† | | | Description | | Value ($) | |
| | | | | | Asset-Backed Securities — continued | |
| | | | | | Residential Mortgage-Backed Securities — Prime — continued | |
| | | 4,480,979 | | | Washington Mutual Mortgage Pass-Through Certificates WMALT, Series 07-5, Class A6, 6.00%, due 06/25/37 | | | 4,280,995 | |
| | | | | | | | | | |
| | | | | | Total Residential Mortgage-Backed Securities — Prime | | | 63,595,705 | |
| | | | | | | | | | |
| | |
| | | | | | Residential Mortgage-Backed Securities — Subprime — 1.7% | |
| | | 296,265 | | | Argent Securities Inc. Asset-Backed Pass-Through Certificates, Series 04-W8, Class A5, Variable Rate, 1 mo. LIBOR + 1.04%, 1.82%, due 05/25/34 | | | 295,875 | |
| | | 7,210,201 | | | Bear Stearns Asset-Backed Securities, Inc., Series 07-AQ1, Class A1, Variable Rate, 1 mo. LIBOR + .11%, 0.89%, due 04/25/31 | | | 7,588,832 | |
| | | 4,022,987 | | | Countrywide Asset-Backed Certificates, Series 06-BC3, Class 2A2, Variable Rate, 1 mo. LIBOR + .14%, 0.92%, due 02/25/37 | | | 3,981,409 | |
| | | 1,547,495 | | | First NLC Trust, Series 05-4, Class A3, Variable Rate, 1 mo. LIBOR + .27%, 1.05%, due 02/25/36 | | | 1,542,029 | |
| | | 953,060 | | | Home Equity Asset Trust, Series 07-3, Class 2A2, Variable Rate, 1 mo. LIBOR + .18%, 0.96%, due 08/25/37 | | | 951,043 | |
| | | 255,211 | | | JP Morgan Mortgage Acquisition Trust, Series 07-CH3, Class A3, Variable Rate, 1 mo. LIBOR + .15%, 0.93%, due 03/25/37 | | | 254,520 | |
| | | 2,120,746 | | | Nationstar Home Equity Loan Trust, Series 07-B, Class 2AV2, Variable Rate, 1 mo. LIBOR + .18%, 0.96%, due 04/25/37 | | | 2,116,217 | |
| | | 3,795,230 | | | Ownit Mortgage Loan Trust, Series 06-3, Class A2C, Variable Rate, 1 mo. LIBOR + .17%, 0.95%, due 03/25/37 | | | 3,735,405 | |
| | | 4,513,754 | | | RAMP Trust, Series 07-RZ1, Class A2, Variable Rate, 1 mo. LIBOR + .16%, 0.94%, due 02/25/37 | | | 4,425,468 | |
| | | 1,062,100 | | | Structured Asset Investment Loan Trust, Series 06-1, Class A3, Variable Rate, 1 mo. LIBOR + .20%, 0.98%, due 01/25/36 | | | 1,053,665 | |
| | | | | | | | | | |
| | | | | | Total Residential Mortgage-Backed Securities — Subprime | | | 25,944,463 | |
| | | | | | | | | | |
| | |
| | | | | | Residential Mortgage-Backed Securities — Alt-A — 3.0% | |
| | | 3,333,818 | | | Adjustable Rate Mortgage Trust, Series 05-1, Class 5M1, Variable Rate, 1 mo. LIBOR + 1.05%, 1.83%, due 05/25/35 | | | 3,170,345 | |
| | | 2,250,485 | | | Alternative Loan Trust, Series 03-18CB, Class 1A1, 5.25%, due 09/25/33 | | | 2,267,027 | |
| | | | |
| 40 | | See accompanying notes to the financial statements. | | |
GMO Opportunistic Income Fund (formerly GMO Debt Opportunities Fund)
(A Series of GMO Trust)
Schedule of Investments — (Continued)
(showing percentage of total net assets)
February 28, 2017
| | | | | | | | | | |
Par Value† | | | Description | | Value ($) | |
| | | | | | Asset-Backed Securities — continued | |
| | | | | | Residential Mortgage-Backed Securities — Alt-A — continued | |
| | | 3,080,116 | | | Alternative Loan Trust, Series 06-28CB, Class A1, Variable Rate, 1 mo. LIBOR + .70%, 1.48%, due 10/25/36 | | | 1,756,346 | |
| | | 3,103,445 | | | Alternative Loan Trust, Series 06-7CB, Class 1A1, Variable Rate, 1 mo. LIBOR + .70%, 1.48%, due 05/25/36 | | | 1,668,622 | |
| | | 4,574,149 | | | BCAP LLC Trust, Series 12-RR2, Class 1A2, 144A, Variable Rate, 1 mo. LIBOR + .17%, 0.94%, due 08/26/36 | | | 4,478,661 | |
| | | 2,292,981 | | | BCAP LLC Trust, Series 12-RR7, Class 1A2, 144A, Variable Rate, 1 mo. LIBOR + .17%, 0.94%, due 08/26/36 | | | 2,243,041 | |
| | | 7,175,294 | | | Bear Stearns Alt-A Trust, Series 05-7, Class 21A1, Variable Rate, 3.31%, due 09/25/35 | | | 6,662,486 | |
| | | 3,164,769 | | | Bear Stearns ARM Trust, Series 07-1, Class 2A1, Variable Rate, 3.37%, due 02/25/47 | | | 2,646,131 | |
| | | 9,823,107 | | | Citigroup Mortgage Loan Trust, Inc., Series 06-AR5, Class 2A2A, Variable Rate, 3.15%, due 07/25/36 | | | 7,032,183 | |
| | | 3,558,760 | | | Washington Mutual Mortgage Pass-Through Certificates WMALT, Series 05-7, Class 2CB1, 5.50%, due 08/25/35 | | | 3,528,129 | |
| | | 11,612,438 | | | Washington Mutual Mortgage Pass-Through Certificates WMALT, Series 06-AR10, Class A2A, Variable Rate, 1 mo. LIBOR + .17%, 0.95%, due 12/25/36 | | | 9,454,062 | |
| | | | | | | | | | |
| | | | | | Total Residential Mortgage-Backed Securities — Alt-A | | | 44,907,033 | |
| | | | | | | | | | |
| | |
| | | | | | Small Balance Commercial Mortgages — 8.8% | |
| | | 6,413,651 | | | Bayview Commercial Asset Trust, Series 04-1, Class A, 144A, Variable Rate, 1 mo. LIBOR + .54%, 1.14%, due 04/25/34 | | | 6,098,092 | |
| | | 901,229 | | | Bayview Commercial Asset Trust, Series 04-1, Class B, 144A, 1 mo. LIBOR + 2.85%, 2.68%, due 04/25/34 | | | 876,187 | |
| | | 929,985 | | | Bayview Commercial Asset Trust, Series 04-1, Class M1, 144A, Variable Rate, 1 mo. LIBOR + .84%, 1.34%, due 04/25/34 | | | 872,493 | |
| | | 517,183 | | | Bayview Commercial Asset Trust, Series 04-1, Class M2, 144A, Variable Rate, 1 mo. LIBOR + 1.80%, 1.98%, due 04/25/34 | | | 494,849 | |
| | | 4,467,345 | | | Bayview Commercial Asset Trust, Series 04-3, Class A1, 144A, 1 mo. LIBOR + .37%, 1.15%, due 01/25/35 | | | 4,283,940 | |
| | | 7,833,793 | | | Bayview Commercial Asset Trust, Series 05-2A, Class A1, 144A, Variable Rate, 1 mo. LIBOR + .31%, 1.09%, due 08/25/35 | | | 6,890,338 | |
| | | | | | | | | | |
Par Value† | | | Description | | Value ($) | |
| | | | | | Asset-Backed Securities — continued | |
| | | | | | Small Balance Commercial Mortgages — continued | |
| | | 9,735,714 | | | Bayview Commercial Asset Trust, Series 05-4A, Class A2, 144A, Variable Rate, 1 mo. LIBOR + .39%, 1.17%, due 01/25/36 | | | 8,496,869 | |
| | | 2,483,124 | | | Bayview Commercial Asset Trust, Series 06-1A, Class M1, 144A, 1 mo. LIBOR + .38%, 1.16%, due 04/25/36 | | | 2,118,398 | |
| | | 9,893,821 | | | Bayview Commercial Asset Trust, Series 06-2A, Class A2, 144A, Variable Rate, 1 mo. LIBOR + .28%, 1.06%, due 07/25/36 | | | 8,701,702 | |
| | | 2,334,834 | | | Bayview Commercial Asset Trust, Series 06-2A, Class M3, 144A, 1 mo. LIBOR + .35%, 1.13%, due 07/25/36 | | | 1,912,598 | |
| | | 3,863,922 | | | Bayview Commercial Asset Trust, Series 06-3A, Class A1, 144A, 1 mo. LIBOR + .25%, 1.03%, due 10/25/36 | | | 3,268,908 | |
| | | 1,148,268 | | | Bayview Commercial Asset Trust, Series 06-3A, Class A2, 144A, Variable Rate, 1 mo. LIBOR + .30%, 1.08%, due 10/25/36 | | | 973,886 | |
| | | 19,365,634 | | | Bayview Commercial Asset Trust, Series 07-2A, Class A1, 144A, Variable Rate, 1 mo. LIBOR + .27%, 1.04%, due 07/25/37 | | | 16,768,572 | |
| | | 6,139,143 | | | Bayview Commercial Asset Trust, Series 07-3, Class A1, 144A, Variable Rate, 1 mo. LIBOR + .24%, 1.01%, due 07/25/37 | | | 5,271,417 | |
| | | 7,235,259 | | | Bayview Commercial Asset Trust, Series 07-4A, Class A1, 144A, Variable Rate, 1 mo. LIBOR + .45%, 1.23%, due 09/25/37 | | | 6,313,571 | |
| | | 282,125 | | | Bayview Commercial Asset Trust, Series 07-6A, Class A2, 144A, Variable Rate, 1 mo. LIBOR + 1.30%, 2.08%, due 12/25/37 | | | 357,400 | |
| | | 4,771,231 | | | Bayview Financial Revolving Asset Trust, Series 04-B, Class A1, 144A, Variable Rate, 1 mo. LIBOR + .50%, 1.78%, due 05/28/39 | | | 3,278,556 | |
| | | 5,011,270 | | | Bayview Financial Revolving Asset Trust, Series 04-B, Class A2, 144A, Variable Rate, 1 mo. LIBOR + .65%, 2.08%, due 05/28/39 | | | 2,449,215 | |
| | | 9,900,589 | | | Bayview Financial Revolving Asset Trust, Series 05-A, Class A1, 144A, Variable Rate, 1 mo. LIBOR + .50%, 1.78%, due 02/28/40 | | | 8,283,746 | |
| | | 1,180,619 | | | GE Business Loan Trust, Series 05-2A, Class A, 144A, Variable Rate, 1 mo. LIBOR + .24%, 1.01%, due 11/15/33 | | | 1,129,684 | |
| | | 3,617,349 | | | GE Business Loan Trust, Series 06-2A, Class A, 144A, Variable Rate, 1 mo. LIBOR + .18%, 0.95%, due 11/15/34 | | | 3,429,516 | |
| | | 9,115,827 | | | GE Business Loan Trust, Series 07-1A, Class A, 144A, Variable Rate, 1 mo. LIBOR + .17%, 0.94%, due 04/16/35 | | | 8,529,261 | |
| | | 7,389,066 | | | GE Business Loan Trust, Series 07-1A, Class D, 144A, Variable Rate, 1 mo. LIBOR + 1.00%, 1.77%, due 04/16/35 | | | 6,431,329 | |
| | | 8,866,799 | | | Lehman Brothers Small Balance Commercial, Series 05-1A, Class A, 144A, Variable Rate, 1 mo. LIBOR + .25%, 1.03%, due 02/25/30 | | | 8,308,210 | |
| | | | |
| | See accompanying notes to the financial statements. | | 41 |
GMO Opportunistic Income Fund (formerly GMO Debt Opportunities Fund)
(A Series of GMO Trust)
Schedule of Investments — (Continued)
(showing percentage of total net assets)
February 28, 2017
| | | | | | | | | | |
Par Value† | | | Description | | Value ($) | |
| | | | | | Asset-Backed Securities — continued | |
| | | | | | Small Balance Commercial Mortgages — continued | |
| | | 984,606 | | | Lehman Brothers Small Balance Commercial, Series 05-2A, Class 1A, 144A, Variable Rate, 1 mo. LIBOR + .25%, 1.03%, due 09/25/30 | | | 938,006 | |
| | | 5,250,849 | | | Lehman Brothers Small Balance Commercial, Series 06-1A, Class M1, 144A, Variable Rate, 1 mo. LIBOR + .31%, 1.09%, due 04/25/31 | | | 4,911,078 | |
| | | 2,592,000 | | | Lehman Brothers Small Balance Commercial, Series 06-2A, Class M1, 144A, 1 mo. LIBOR + .29%, 1.07%, due 09/25/36 | | | 2,288,269 | |
| | | 6,789,882 | | | Lehman Brothers Small Balance Commercial, Series 06-3A, Class 1A, 144A, Variable Rate, 1 mo. LIBOR + .20%, 0.98%, due 12/25/36 | | | 6,173,413 | |
| | | 2,517,146 | | | Velocity Commercial Capital Loan Trust, Series 16-2, Class AFL, 1 mo. LIBOR + 1.80%, 2.58%, due 10/25/46 | | | 2,519,990 | |
| | | | | | | | | | |
| | | | | | Total Small Balance Commercial Mortgages | | | 132,369,493 | |
| | | | | | | | | | |
| | |
| | | | | | Student Loans — 19.7% | |
| | | 2,577,642 | | | Access Group, Inc., Series 05-A, Class A3, Variable Rate, 3 mo. LIBOR + .40%, 1.44%, due 07/25/34 | | | 2,397,437 | |
| | | 4,269,363 | | | Access Group, Inc., Series 03-A, Class A2, Variable Rate, 1.71%, due 07/01/38 | | | 4,277,410 | |
| | | 7,381,828 | | | Access Group, Inc., Series 05-A, Class B, Variable Rate, 3 mo. LIBOR + .80%, 1.84%, due 07/25/34 | | | 6,661,616 | |
| | | 6,603,567 | | | Collegiate Funding Services Education Loan Trust, Series 05-B, Class B, Variable Rate, 3 mo. LIBOR + .32%, 1.32%, due 03/28/35 | | | 5,885,429 | |
| | | 25,090,320 | | | KeyCorp Student Loan Trust, Series 06-A, Class 2B, Variable Rate, 3 mo. LIBOR + .48%, 1.48%, due 12/27/41 | | | 23,026,021 | |
| | | 5,622,500 | | | KeyCorp Student Loan Trust, Series 04-A, Class 2D, 3 mo. LIBOR + 1.25%, 2.29%, due 07/28/42 | | | 3,565,195 | |
| | | 18,250,000 | | | National Collegiate Commutation Trust, Series 07-3, Class A3R4, 144A, Variable Rate, 4.05%, due 03/31/38 | | | 7,756,250 | |
| | | 5,962,500 | | | National Collegiate II Commutation Trust, Series 07-4, Class A3R3, Variable Rate, due 03/25/38 | | | 2,698,031 | |
| | | 3,750,000 | | | National Collegiate II Commutation Trust, Series 07-3, Class A3R3, Variable Rate, 4.12%, due 03/25/38 | | | 1,696,875 | |
| | | 3,525,000 | | | National Collegiate Student Loan Trust, Series 06-4, Class A4, Variable Rate, 1 mo. LIBOR + .31%, 1.09%, due 05/25/32 | | | 2,871,501 | |
| | | 75,000 | | | National Collegiate Student Loan Trust, Series 07-4, Class A3A7, Variable Rate, 4.06%, due 03/25/38 | | | 58,875 | |
| | | 12,960,000 | | | National Collegiate Student Loan Trust, Series 06-1, Class A5, 1 mo. LIBOR + .35%, 1.13%, due 03/25/33 | | | 10,947,241 | |
| | | | | | | | | | |
Par Value† | | | Description | | Value ($) | |
| | | | | | Asset-Backed Securities — continued | |
| | | | | | Student Loans — continued | |
| | | 25,000 | | | National Collegiate Student Loan Trust, Series 07-3, Class A3A4, Variable Rate, due 03/25/38 | | | 19,625 | |
| | | 43,117,829 | | | National Collegiate Student Loan Trust, Series 07-1, Class A3, Variable Rate, 1 mo. LIBOR + .24%, 1.02%, due 07/25/30 | | | 42,291,338 | |
| | | 4,797,489 | | | National Collegiate Student Loan Trust, Series 06-2, Class A3, Variable Rate, 1 mo. LIBOR + .21%, 0.99%, due 11/25/27 | | | 4,693,829 | |
| | | 17,969,943 | | | National Collegiate Student Loan Trust, Series 06-1, Class A4, Variable Rate, 1 mo. LIBOR + .25%, 1.03%, due 03/27/28 | | | 17,805,419 | |
| | | 1,367,700 | | | National Collegiate Student Loan Trust, Series 05-3, Class A4, Variable Rate, 1 mo. LIBOR + .28%, 1.06%, due 04/25/29 | | | 1,364,346 | |
| | | 2,449,966 | | | National Collegiate Student Loan Trust, Series 06-3, Class A4, Variable Rate, 1 mo. LIBOR + .27%, 1.05%, due 03/26/29 | | | 2,408,438 | |
| | | 8,786,333 | | | National Collegiate Student Loan Trust, Series 05-2, Class A4, Variable Rate, 1 mo. LIBOR + .27%, 1.05%, due 09/25/29 | | | 8,683,004 | |
| | | 31,664,880 | | | SLC Private Student Loan Trust, Series 06-A, Class C, Variable Rate, 3 mo. LIBOR + .45%, 1.47%, due 07/15/36 | | | 28,431,183 | |
| | | 34,715,000 | | | SLM Private Credit Student Loan Trust, Series 06-A, Class A5, Variable Rate, 3 mo. LIBOR + .29%, 1.25%, due 06/15/39 | | | 32,101,488 | |
| | | 6,301,422 | | | SLM Private Credit Student Loan Trust, Series 05-A, Class B, Variable Rate, 3 mo. LIBOR + .28%, 1.24%, due 12/15/38 | | | 6,035,121 | |
| | | 6,688,054 | | | SLM Private Credit Student Loan Trust, Series 05-B, Class B, Variable Rate, 3 mo. LIBOR + .40%, 1.36%, due 06/15/39 | | | 6,347,095 | |
| | | 3,746,402 | | | SLM Private Credit Student Loan Trust, Series 03-C, Class C, 3 mo. LIBOR + 1.60%, 2.56%, due 09/15/32 | | | 1,085,789 | |
| | | 2,672,291 | | | SLM Private Credit Student Loan Trust, Series 06-C, Class C, 3 mo. LIBOR + .39%, 1.35%, due 12/15/39 | | | 1,973,424 | |
| | | 16,372,000 | | | SLM Private Credit Student Loan Trust, Series 05-B, Class A4, Variable Rate, 3 mo. LIBOR + .33%, 1.29%, due 06/15/39 | | | 15,163,391 | |
| | | 2,524,783 | | | SLM Private Credit Student Loan Trust, Series 04-A, Class B, Variable Rate, 3 mo. LIBOR + .58%, 1.54%, due 06/15/33 | | | 2,473,686 | |
| | | 10,289,600 | | | SLM Private Credit Student Loan Trust, Series 04-B, Class A3, Variable Rate, 3 mo. LIBOR + .33%, 1.29%, due 03/15/24 | | | 10,040,791 | |
| | | 9,000,000 | | | SLM Private Credit Student Loan Trust, Series 04-B, Class A4, Variable Rate, 3 mo. LIBOR + .43%, 1.39%, due 09/15/33 | | | 8,110,706 | |
| | | 2,892,922 | | | SLM Private Credit Student Loan Trust, Series 04-B, Class B, Variable Rate, 3 mo. LIBOR + .47%, 1.43%, due 09/15/33 | | | 2,806,003 | |
| | | | |
| 42 | | See accompanying notes to the financial statements. | | |
GMO Opportunistic Income Fund (formerly GMO Debt Opportunities Fund)
(A Series of GMO Trust)
Schedule of Investments — (Continued)
(showing percentage of total net assets)
February 28, 2017
| | | | | | | | | | |
Par Value† | | | Description | | Value ($) | |
| | | | | | Asset-Backed Securities — continued | |
| | | | | | Student Loans — continued | |
| | | 11,001,344 | | | SLM Private Credit Student Loan Trust, Series 05-A, Class A3, Variable Rate, 3 mo. LIBOR + .20%, 1.16%, due 06/15/23 | | | 10,709,920 | |
| | | 9,282,591 | | | SLM Private Education Loan Trust, Series 10-A, Class 2A, 144A, Variable Rate, 1 mo. LIBOR + 3.25%, 4.02%, due 05/16/44 | | | 9,651,470 | |
| | | 7,000,000 | | | SLM Private Education Loan Trust, Series 14-A, Class B, 144A, 3.50%, due 11/15/44 | | | 6,969,626 | |
| | | 6,000,000 | | | SLM Private Education Loan Trust, Series 11-B, Class A3, 144A, Variable Rate, 1 mo. LIBOR + 2.25%, 3.02%, due 06/16/42 | | | 6,258,865 | |
| | | | | | | | | | |
| | | | | | Total Student Loans | | | 297,266,438 | |
| | | | | | | | | | |
| | |
| | | | | | Time Share — 1.1% | |
| | | 325,652 | | | BXG Receivables Note Trust, Series 10-A, Class B, 144A, 7.50%, due 03/02/26 | | | 325,925 | |
| | | 2,948,557 | | | BXG Receivables Note Trust, Series 13-A, Class B, 144A, 4.00%, due 12/04/28 | | | 2,984,291 | |
| | | 1,256,863 | | | Diamond Resorts Owner Trust, Series 13-2, Class A, 144A, 2.27%, due 05/20/26 | | | 1,246,285 | |
| | | 1,039,168 | | | Diamond Resorts Owner Trust, Series 13-2, Class B, 144A, 2.62%, due 05/20/26 | | | 1,034,668 | |
| | | 2,183,426 | | | Marriott Vacation Club Owner Trust, Series 12-1A, Class B, 144A, 3.50%, due 05/20/30 | | | 2,208,374 | |
| | | 453,866 | | | Orange Lake Timeshare Trust, Series 12-AA, Class B, 144A, 4.87%, due 03/10/27 | | | 462,055 | |
| | | 522,002 | | | Sierra Timeshare Receivables Funding LLC, Series 12-3A, Class B, 144A, 2.66%, due 08/20/29 | | | 521,443 | |
| | | 1,976,655 | | | Sierra Timeshare Receivables Funding LLC, Series 13-2A, Class B, 144A, 2.92%, due 11/20/25 | | | 1,974,862 | |
| | | 418,175 | | | Sierra Timeshare Receivables Funding LLC, Series 13-2A, Class C, 144A, 4.75%, due 11/20/25 | | | 410,554 | |
| | | 1,640,663 | | | Silverleaf Finance XV LLC, Series 12-D, Class B, 144A, 4.45%, due 03/17/25 | | | 1,641,843 | |
| | | 2,312,521 | | | Silverleaf Finance XVII LLC, Series 13-A, Class B, 144A, 3.67%, due 03/16/26 | | | 2,307,278 | |
| | | 680,800 | | | Westgate Resorts LLC, Series 13-1A, Class B, 144A, 3.75%, due 08/20/25 | | | 679,355 | |
| | | | | | | | | | |
| | | | | | Total Time Share | | | 15,796,933 | |
| | | | | | | | | | |
| | | | | | Total Asset-Backed Securities | | | 1,227,001,445 | |
| | | | | | | | | | |
| | | |
| | | | | | U.S. Government Agency — 8.5% | | | | |
| | | 387,151 | | | Agency for International Development Floater (Support of Jamaica), Variable Rate, 3 mo. LIBOR + .30%, 1.35%, due 10/01/18 (a) | | | 384,103 | |
| | | | | | | | | | |
Par Value†
Shares /
Number of
Contracts | | | Description | | Value ($) | |
| | | | | | U.S. Government Agency — continued | |
| | | 7,900,000 | | | Agency for International Development Floater (Support of Morocco), Variable Rate, 6 mo. LIBOR - .02%, 1.35%, due 02/01/25 (a) | | | 7,600,652 | |
| | | 7,500,000 | | | Agency for International Development Floater (Support of Morocco), Variable Rate, 6 mo. LIBOR, 1.51%, due 10/29/26 (a) | | | 7,173,550 | |
| | | 4,582,500 | | | Agency for International Development Floater (Support of Tunisia), Variable Rate, 6 mo. LIBOR, 1.36%, due 07/01/23 (a) | | | 4,444,485 | |
| | | 16,000,000 | | | Federal Home Loan Bank Discount Notes, Variable Rate, 0.81%, due 02/01/19 | | | 15,999,888 | |
| | | 500,000 | | | Federal Home Loan Banks, Variable Rate, 0.79%, due 04/06/18 | | | 500,858 | |
| | | 35,000,000 | | | Federal Home Loan Banks, Variable Rate, 0.80%, due 08/15/18 | | | 34,986,910 | |
| | | 25,000,000 | | | Federal Home Loan Banks, Variable Rate, 0.73%, due 08/15/18 | | | 24,995,075 | |
| | | 33,250,000 | | | Federal National Mortgage Association, TBA, 2.50%, due 03/15/47 | | | 31,649,598 | |
| | | | | | | | | | |
| | | | | | Total U.S. Government Agency | | | 127,735,119 | |
| | | | | | | | | | |
| | | |
| | | | | | TOTAL DEBT OBLIGATIONS
(COST $1,338,810,329) | | | 1,354,736,564 | |
| | | | | | | | | | |
| | |
| | | | | | MUTUAL FUNDS — 4.8% | |
| | |
| | | | | | United States — 4.8% | |
| | | | | | Affiliated Issuers — 4.8% | | | | |
| | | 2,913,505 | | | GMO U.S. Treasury Fund | | | 72,837,633 | |
| | | | | | | | | | |
| | | |
| | | | | | TOTAL MUTUAL FUNDS
(COST $72,857,962) | | | 72,837,633 | |
| | | | | | | | | | |
| | |
| | | | | | OPTIONS PURCHASED — 0.1% | |
| | |
| | | | | | Equity Options — 0.0% | |
| | | 7,900 | | | iShares iBoxx $ High Yield Corporate Bond, Expires 06/16/17, Strike 84.00 | | | 560,900 | |
| | | | | | | | | | |
| | | | |
| | See accompanying notes to the financial statements. | | 43 |
GMO Opportunistic Income Fund (formerly GMO Debt Opportunities Fund)
(A Series of GMO Trust)
Schedule of Investments — (Continued)
(showing percentage of total net assets)
February 28, 2017
| | | | | | | | | | | | | | | | | | | | | | | | |
| | | | | | | |
Principal
Amount | | | Expiration
Date | | | Description | | Floating Rate
Index | | Pay/Receive
Floating Rate | | Exercise
Rate | | | Counterparty | | Value ($) | |
| | | | | | | | | | Options on Credit Default Swaps — 0.1% | | | | | | | | | | | | | | |
| USD | | | 34,480,000 | | | | 03/15/2017 | | | CDX.NA.HY.27.V1-5Y | | Fixed Spread | | Pay | | | 107.00% | | | BOA | | $ | 45,652 | |
| EUR | | | 86,200,000 | | | | 03/15/2017 | | | ITRAXX-EUROPES26V1-5Y | | Fixed Spread | | Pay | | | 72.50% | | | CITI | | | 111,747 | |
| USD | | | 17,240,000 | | | | 03/15/2017 | | | CDX.NA.HYS.27.V2-5Y | | Fixed Spread | | Pay | | | 107.00% | | | BOA | | | 22,826 | |
| EUR | | | 86,400,000 | | | | 04/19/2017 | | | ITRAXX-EUROPES26V1-5Y | | Fixed Spread | | Pay | | | 70.00% | | | BOA | | | 294,394 | |
| USD | | | 43,250,000 | | | | 06/21/2017 | | | CDX.NA.HYS.27.V1-5Y | | Fixed Spread | | Pay | | | 103.00% | | | JPM | | | 264,261 | |
| | | | | | | | | | | | | | | | | | | | | | | | |
| | | | | | | | | | | | | | | | | | | | | | | 738,880 | |
| | | | | | | | | | | | | | | | | | | | | | | | |
| | | | | | | | | | | | | | TOTAL OPTIONS PURCHASED (COST $2,813,864) | | $ | 1,299,780 | |
| | | | | | | | | | | | | | | | | | | | | | | | |
| | | | | | | | | | |
Shares /
Par Value† | | | Description | | Value ($) | |
| | | | | | SHORT-TERM INVESTMENTS — 5.9% | |
| | |
| | | | | | Money Market Funds — 0.6% | |
| | | 9,643,521 | | | State Street Institutional Treasury Plus Money Market Fund-Premier Class, 0.41% (b) | | | 9,643,521 | |
| | | | | | | | | | |
| | |
| | | | | | U.S. Government — 5.3% | |
| | | 20,000,000 | | | U.S. Treasury Note, 0.88%, due 08/15/17 | | | 20,012,500 | |
| | | 25,000,000 | | | U.S. Treasury Bill, 0.70%, due 08/24/17 (c) | | | 24,914,675 | |
| | | 10,000,000 | | | U.S. Treasury Note, 0.75%, due 10/31/17 | | | 9,996,880 | |
| | | 18,000,000 | | | U.S. Treasury Note, 1.00%, due 12/15/17 | | | 18,021,096 | |
| | | 7,000,000 | | | U.S. Treasury Note, 0.88%, due 01/15/18 (d) | | | 6,998,635 | |
| | | | | | | | | | |
| | | | | | Total U.S. Government | | | 79,943,786 | |
| | | | | | | | | | |
| | | |
| | | | | | TOTAL SHORT-TERM INVESTMENTS
(COST $89,606,170) | | | 89,587,307 | |
| | | | | | | | | | |
| | | |
| | | | | | TOTAL INVESTMENTS — 100.5% (Cost $1,504,088,325) | | | 1,518,461,284 | |
| | |
| | | | | | SECURITIES SOLD SHORT — (2.3)% | |
| | | |
| | | | | | Debt Obligations — (2.3)% | | | | |
| | | | | | U.S. Government Agency — (2.3)% | | | | |
| | | (35,000,000 | ) | | Federal National Mortgage Association, TBA, 3.00%, due 03/13/47 | | | (34,769,723 | ) |
| | | | | | | | | | |
| | | | | | Total U.S. Government Agency | | | (34,769,723 | ) |
| | | | | | | | | | |
| | | |
| | | | | | TOTAL DEBT OBLIGATIONS
(PROCEEDS $34,606,250) | | | (34,769,723 | ) |
| | | | | | | | | | |
| | | |
| | | | | | TOTAL SECURITIES SOLD SHORT
(PROCEEDS $34,606,250) | | | (34,769,723 | ) |
| | | | | | | | | | |
| | | | | | Other Assets and Liabilities (net) — 1.8% | | | 27,202,273 | |
| | | | | | | | | | |
| | | |
| | | | | | TOTAL NET ASSETS — 100.0% | | | $1,510,893,834 | |
| | | | | | | | | | |
A summary of outstanding financial instruments at February 28, 2017 is as follows:
Forward Currency Contracts
| | | | | | | | | | | | | | | | | | | | | | |
| | | | |
Settlement
Date | | Counter- party | | Currency
Sold | | | Currency
Purchased | | | Net
Unrealized
Appreciation
(Depreciation) | |
| 03/20/2017 | | MSCI | | | EUR | | | | 10,933,031 | | | | USD | | | | 11,669,261 | | | $ | 77,578 | |
| 03/20/2017 | | MSCI | | | USD | | | | 344,256 | | | | EUR | | | | 322,536 | | | | (2,289 | ) |
| | | | | | | | | | | | | | | | | | | | | | |
| | | $ | 75,289 | |
| | | | | | | | | | | | | | | | | | | | | | |
Written Options
Equity Options
| | | | | | | | | | | | | | | | |
| | | | |
Number
of
Contracts | | Expiration
Date | | | Description | | Premiums | | | Value ($) | |
| Put | | 7,900 | | | 06/16/2017 | | | iShares iBoxx
$ High Yield
Corporate Bond | | $ | 463,398 | | | $ | (237,000 | ) |
| | | | |
| 44 | | See accompanying notes to the financial statements. | | |
GMO Opportunistic Income Fund (formerly GMO Debt Opportunities Fund)
(A Series of GMO Trust)
Schedule of Investments — (Continued)
February 28, 2017
Written Options on Credit Default Swaps
| | | | | | | | | | | | | | | | | | | | | | | | | | | | |
| | | | | | | | |
Principal
Amount | | | Expiration
Date | | | Description | | Floating Rate
Index | | Pay/Receive
Floating Rate | | Exercise
Rate | | | Counterparty | | Premiums | | | Value ($) | |
| EUR | | | 86,200,000 | | | | 05/17/2017 | | | Put, ITRAXX-EUROPES26V1-5Y | | Fixed Spread | | Pay | | | 92.50% | | | CITI | | $ | 174,378 | | | $ | (147,882 | ) |
| EUR | | | 86,400,000 | | | | 06/21/2017 | | | Put, ITRAXX-EUROPES26V1-5Y | | Fixed Spread | | Pay | | | 105.00% | | | BOA | | | 144,524 | | | | (129,988 | ) |
| USD | | | 34,480,000 | | | | 05/17/2017 | | | Put, CDX.NA.HY.27.V1-5Y | | Fixed Spread | | Pay | | | 103.50% | | | BOA | | | 167,263 | | | | (94,197 | ) |
| USD | | | 17,240,000 | | | | 05/17/2017 | | | Put, CDX.NA.HYS.27.V2-5Y | | Fixed Spread | | Pay | | | 103.50% | | | BOA | | | 66,564 | | | | (47,098 | ) |
| USD | | | 43,250,000 | | | | 06/21/2017 | | | Put, CDX.NA.HYS.27V1-5Y | | Fixed Spread | | Pay | | | 98.00% | | | JPM | | | 324,375 | | | | (80,631 | ) |
| | | | | | | | | | | | | | | | | | | | | | | | | | | | |
| | | | | $ | 877,104 | | | $ | (499,796 | ) |
| | | | | | | | | | | | | | | | | | | | | | | | | | | | |
Swap Contracts
Credit Default Swaps
| | | | | | | | | | | | | | | | | | | | | | | | | | | | |
| | | | | | | | |
Notional
Amount | | | Expiration
Date | | Counterparty | | Receive
(Pay) ^ | | Annual
Premium | | Implied
Credit
Spread (1) | | Reference Entity | | Maximum Potential
Amount of Future
Payments by the Fund
Under the Contract (2) | | | Net
Unrealized
Appreciation/
(Depreciation) | |
| | 26,040,000 | | | | USD | | | 6/20/2017 | | GS | | (Pay) | | 5.00% | | 0.26% | | MBIA, Inc. | | NA | | | | | | $ | (378,716 | ) |
| | 21,650,000 | | | | USD | | | 12/20/2017 | | GS | | (Pay) | | 5.00% | | 0.35% | | MBIA, Inc. | | NA | | | | | | | (815,105 | ) |
| | 88,035,000 | | | | EUR | | | 12/20/2020 | | JPM | | Receive | | 1.00% | | 1.06% | | ITRAXX-EUROPE24V1-5Y | | 88,035,000 | | | EUR | | | | 2,619,155 | |
| | 4,400,000 | | | | USD | | | 12/22/2020 | | BOA | | (Pay) | | 5.00% | | 1.00% | | CDX.NA.HYS25.V1-5Y | | NA | | | | | | | (270,061 | ) |
| | 4,343,000 | | | | USD | | | 12/22/2020 | | JPM | | (Pay) | | 5.00% | | 1.00% | | CDX.NA.HYS25.V1-5Y | | NA | | | | | | | (266,563 | ) |
| | 17,300,000 | | | | USD | | | 12/22/2020 | | CITI | | Receive | | 5.00% | | 1.00% | | CDX.NA.HYS25.V2-5Y | | 17,300,000 | | | USD | | | | 2,418,075 | |
| | 4,400,000 | | | | USD | | | 12/22/2020 | | BOA | | (Pay) | | 1.00% | | 1.00% | | CDX.NA.IGS25.V1-5Y | | NA | | | | | | | 117,220 | |
| | 4,300,000 | | | | USD | | | 12/22/2020 | | CITI | | (Pay) | | 1.00% | | 1.00% | | CDX.NA.IGS25.V1-5Y | | NA | | | | | | | 114,556 | |
| | 17,550,000 | | | | EUR | | | 12/22/2020 | | BOA | | (Pay) | | 1.00% | | 1.06% | | ITRAXX-EUROPES24V1-5Y | | NA | | | | | | | (151,833 | ) |
| | 8,775,000 | | | | EUR | | | 12/22/2020 | | BOA | | (Pay) | | 1.00% | | 1.06% | | ITRAXX-EUROPES24V1-5Y | | NA | | | | | | | 433,224 | |
| | 28,672,500 | | | | EUR | | | 12/22/2020 | | BOA | | Receive | | 1.00% | | 1.06% | | ITRAXX-EUROPES24V1-5Y | | 28,672,500 | | | EUR | | | | 853,044 | |
| | 3,290,625 | | | | EUR | | | 12/22/2020 | | GS | | (Pay) | | 1.00% | | 1.06% | | ITRAXX-EUROPES24V1-5Y | | NA | | | | | | | 162,459 | |
| | 43,875,000 | | | | EUR | | | 12/22/2020 | | GS | | Receive | | 1.00% | | 1.06% | | ITRAXX-EUROPES24V1-5Y | | 43,875,000 | | | EUR | | | | 1,305,338 | |
| | 6,581,250 | | | | EUR | | | 12/22/2020 | | GS | | (Pay) | | 1.00% | | 1.06% | | ITRAXX-EUROPES24V1-5Y | | NA | | | | | | | (56,938 | ) |
| | 18,513,000 | | | | EUR | | | 6/20/2021 | | CSS (e) | | (Pay) | | 1.00% | | 0.73% | | ITRAXX-EUROPES25V1-5Y | | NA | | | | | | | (289,600 | ) |
| | 8,640,000 | | | | EUR | | | 12/20/2021 | | BOA | | Receive | | 1.00% | | 0.36% | | ITRAXX-EUROPES26V1-5Y | | 8,640,000 | | | EUR | | | | 277,424 | |
| | 16,270,650 | | | | USD | | | 12/20/2021 | | CSS (e) | | (Pay) | | 5.00% | | 3.90% | | CDX-NAHYS27V1-5Y | | NA | | | | | | | (1,256,631 | ) |
| | 17,433,000 | | | | USD | | | 12/20/2021 | | GS | | (Pay) | | 1.00% | | 1.00% | | CDX-NAIGS27V1-5Y | | NA | | | | | | | (241,845 | ) |
| | 8,814,564 | | | | USD | | | 12/20/2021 | | CSS (e) | | (Pay) | | 5.00% | | 3.92% | | CDX.NA.HYS27.V1-5Y | | NA | | | | | | | (680,775 | ) |
| | 22,155,000 | | | | USD | | | 12/20/2021 | | CSS (e) | | (Pay) | | 1.00% | | 0.67% | | CDX.NA.IGS27.V1-5Y | | NA | | | | | | | (380,446 | ) |
| | 25,980,000 | | | | USD | | | 12/21/2021 | | MSCS | | (Pay) | | 1.00% | | 1.00% | | CDX.NA.IGS27.V1-5Y | | NA | | | | | | | (360,416 | ) |
| | 173,400,000 | | | | EUR | | | 12/21/2021 | | BOA | | Receive | | 1.00% | | 1.06% | | ITRAXX-EUROPES26V1-5Y | | 173,400,000 | | | EUR | | | | 5,570,099 | |
| | 86,700,000 | | | | EUR | | | 12/20/2021 | | CSS (e) | | (Pay) | | 1.00% | | 0.8% | | ITRAXX-EUROPES26V1-5Y | | NA | | | | | | | (1,181,002 | ) |
| | 43,200,000 | | | | EUR | | | 12/21/2021 | | BOA | | Receive | | 1.00% | | 0.36% | | ITRAXX-EUROPES26V1-5Y | | 43,200,000 | | | EUR | | | | 1,387,087 | |
| | 4,400,000 | | | | USD | | | 1/17/2047 | | GS | | (Pay) | | 1.00% | | 1.00% | | CMBX.NA.AS.7 | | NA | | | | | | | 10,555 | |
| | 13,270,000 | | | | USD | | | 1/17/2047 | | MSCS | | (Pay) | | 1.00% | | 1.00% | | CMBX.NA.AS.7 | | NA | | | | | | | 31,832 | |
| | 4,505,000 | | | | USD | | | 1/17/2047 | | BOA | | (Pay) | | 1.00% | | 1.00% | | CMBX.NA.AS.7 | | NA | | | | | | | 10,807 | |
| | 21,462,000 | | | | USD | | | 1/17/2047 | | CSI | | (Pay) | | 1.65% | | 1.00% | | CMBX.NA.AS.7 | | NA | | | | | | | 51,483 | |
| | 26,609,000 | | | | USD | | | 1/17/2047 | | DB | | (Pay) | | 1.00% | | 1.00% | | CMBX.NA.AS.7 | | NA | | | | | | | 63,830 | |
| | 3,384,000 | | | | USD | | | 10/17/2057 | | MSCS | | (Pay) | | 1.00% | | 1.00% | | CMBX.NA.AS.8 | | NA | | | | | | | 22,775 | |
| | 8,650,000 | | | | USD | | | 10/17/2057 | | GS | | (Pay) | | 0.30% | | 0.3% | | CMBX.NA.BBB-8 | | NA | | | | | | | 1,318,987 | |
| | | | |
| | See accompanying notes to the financial statements. | | 45 |
GMO Opportunistic Income Fund (formerly GMO Debt Opportunities Fund)
(A Series of GMO Trust)
Schedule of Investments — (Continued)
February 28, 2017
Credit Default Swaps — Continued
| | | | | | | | | | | | | | | | | | | | | | | | | | | | |
| | | | | | | | |
Notional
Amount | | | Expiration
Date | | Counterparty | | Receive
(Pay) ^ | | Annual
Premium | | Implied
Credit
Spread (1) | | Reference Entity | | Maximum Potential
Amount of Future
Payments by the Fund
Under the Contract (2) | | | Net
Unrealized
Appreciation/
(Depreciation) | |
| | 874,200 | | | | USD | | | 9/17/2058 | | GS | | (Pay) | | 0.50% | | 0.50% | | CMBX.NA.AAA.9 | | NA | | | | | | $ | 21,537 | |
| | 4,400,000 | | | | USD | | | 9/17/2058 | | DB | | (Pay) | | 3.00% | | 3.00% | | CMBX.NA.BBB-.9 | | NA | | | | | | | 550,537 | |
| | 1,760,000 | | | | USD | | | 9/17/2058 | | GS | | (Pay) | | 3.00% | | 3.00% | | CMBX.NA.BBB-.9 | | NA | | | | | | | 220,215 | |
| | 4,325,000 | | | | USD | | | 5/11/2063 | | CSI | | (Pay) | | 3.00% | | 4.18% | | CMBX.NA.BBB-.6 | | NA | | | | | | | 560,214 | |
| | 8,715,000 | | | | USD | | | 5/11/2063 | | DB | | (Pay) | | 3.00% | | 3.00% | | CMBX.NA.BBB-.6 | | NA | | | | | | | 1,128,847 | |
| | 5,184,000 | | | | USD | | | 5/11/2063 | | CSI | | (Pay) | | 3.00% | | 1.00% | | CMBX.NA.BBB-.6 | | NA | | | | | | | 671,479 | |
| | | | | | | | | | | | | | | | | | | | | | | | | | | | |
| | | | | | | | | | | | | | | | | | | | | | | | | | $ | 13,590,848 | |
| | | | | | | | | | | | | | | | | | | | | | | | | | | | |
| | | | | | | | | | | | | | | | | | Premiums Paid (Received) | | | $ | (17,921,812 | ) |
| | | | | | | | | | | | | | | | | | | | | | | | | | | | |
| ^ | Receive - Fund receives a premium and sells credit protection. If a credit event occurs the Fund will, depending on the terms of the particular swap contract, either (i) pay to the buyer of protection an amount equal to the notional amount of the swap and take delivery of the referenced obligation or underlying securities comprising the referenced index or (ii) pay a net settlement amount in the form of cash or securities equal to the notional amount of the swap less the recovery value of the referenced obligation or underlying securities comprising the referenced index. |
| | (Pay) - Fund pays a premium and buys credit protection. If a credit event occurs the Fund will, depending on the terms of the particular swap contract, either (i) receive from the seller of protection an amount equal to the notional amount of the swap and deliver the referenced obligation or underlying securities comprising the referenced index or (ii) receive a net settlement amount in the form of cash or securities equal to the notional amount of the swap less the recovery value of the referenced obligation or underlying securities comprising the referenced index. |
| (1) | As of February 28, 2017, implied credit spreads in absolute terms, calculated using a model, and utilized in determining the market value of credit default swap contracts on the reference security, serve as an indicator of the current status of the payment/performance risk and reflect the likelihood or risk of default for the reference entity. The implied credit spread of a particular referenced entity reflects the cost of buying/selling protection. Wider (i.e., higher) credit spreads represent a deterioration of the referenced entity’s credit soundness and a greater likelihood or risk of default or other credit event occurring as defined under the terms of the contract. |
| (2) | The maximum potential amount the Fund could be required to pay as a seller of credit protection if a credit event occurs as defined under the terms of that particular swap contract. |
Interest Rate Swaps
| | | | | | | | | | | | | | | | | | | | |
| | | | | | |
Notional
Amount | | | Expiration
Date | | Counterparty | | Receive
(Pay) # | | Fixed
Rate | | Variable Rate | | Net
Unrealized
Appreciation/
(Depreciation) | |
| | 52,107,000 | | | | USD | | | 3/20/2019 | | CSS (f) | | Receive | | 1.56% | | 3 Month USD LIBOR | | $ | (34,741 | ) |
| | 34,756,000 | | | | USD | | | 3/20/2019 | | CSS (f) | | Receive | | 1.63% | | 3 Month USD LIBOR | | | 23,045 | |
| | 10,495,000 | | | | USD | | | 3/10/2021 | | CSS (g) | | (Pay) | | 1.27% | | 3 Month USD LIBOR | | | 259,549 | |
| | 7,392,000 | | | | USD | | | 3/16/2021 | | CSS (g) | | (Pay) | | 1.75% | | 3 Month USD LIBOR | | | 44,809 | |
| | 1,591,000 | | | | USD | | | 3/15/2022 | | CSS (f) | | (Pay) | | 1.50% | | 3 Month USD LIBOR | | | 38,784 | |
| | 21,503,000 | | | | USD | | | 3/16/2022 | | CSS (f) | | Receive | | 2.02% | | 3 Month USD LIBOR | | | 16,099 | |
| | 8,919,000 | | | | USD | | | 11/20/2023 | | CSS (f) | | (Pay) | | 1.90% | | 3 Month USD LIBOR | | | 138,707 | |
| | 19,668,000 | | | | USD | | | 4/16/2025 | | CSS (g) | | (Pay) | | 2.00% | | 3 Month USD LIBOR | | | 379,136 | |
| | 4,092,000 | | | | USD | | | 5/19/2026 | | CSS (g) | | (Pay) | | 1.65% | | 3 Month USD LIBOR | | | 232,401 | |
| | 1,069,000 | | | | USD | | | 6/10/2026 | | CSS (g) | | (Pay) | | 1.60% | | 3 Month USD LIBOR | | | 65,944 | |
| | 8,168,000 | | | | USD | | | 7/18/2026 | | CSS (g) | | (Pay) | | 1.42% | | 3 Month USD LIBOR | | | 638,057 | |
| | 13,794,000 | | | | USD | | | 8/15/2026 | | CSS (g) | | (Pay) | | 1.46% | | 3 Month USD LIBOR | | | 1,041,155 | |
| | 11,320,000 | | | | USD | | | 3/17/2027 | | CSS (f) | | Receive | | 2.38% | | 3 Month USD LIBOR | | | 37,170 | |
| | | | | | | | | | | | | | | | | | | | |
| | | | | | | | | | | | | | | | | | $ | 2,880,115 | |
| | | | | | | | | | | | | | | | | | | | |
| | | | | | | | | | | | | | | | Premiums Paid (Received) | | $ | (427,902 | ) |
| | | | | | | | | | | | | | | | | | | | |
| # | Receive - Fund receives fixed rate and pays variable rate. |
| | (Pay) - Fund pays fixed rate and receives variable rate. |
| | | | |
| 46 | | See accompanying notes to the financial statements. | | |
GMO Opportunistic Income Fund (formerly GMO Debt Opportunities Fund)
(A Series of GMO Trust)
Schedule of Investments — (Continued)
February 28, 2017
As of February 28, 2017, for the above contracts and/or agreements, the Fund had sufficient cash and/or securities to cover commitments or collateral requirements, if any, of the relevant broker or exchange.
Notes to Schedule of Investments:
| † | Denominated in U.S. Dollar, unless otherwise indicated. |
| ◆ | These securities are primarily backed by subprime mortgages. |
| (a) | Investment valued at fair value using methods determined in good faith by the Trustees of GMO Trust or persons acting at their direction pursuant to procedures approved by the Trustees (Note 2). |
| (b) | The rate disclosed is the 7 day net yield as of February 28, 2017. |
| (c) | The rate shown represents yield-to-maturity. |
| (d) | All or a portion of this security has been pledged to cover margin requirements on futures and/or cleared swap contracts, collateral on OTC swap contracts, forward currency contracts, and/or written options, if any (Note 4). |
| (e) | Swap was cleared through the Intercontinental Exchange, Inc. |
| (f) | Swap was cleared through the LCH.Clearnet Group Ltd. |
| (g) | Swap was cleared through the CME Group Inc. |
For a listing of definitions of acronyms, counterparty abbreviations and currency abbreviations used throughout the Schedule of Investments as well as the derivative tables, if any, please refer to page 52.
| | | | |
| | See accompanying notes to the financial statements. | | 47 |
GMO U.S. Treasury Fund
(A Series of GMO Trust)
Portfolio Management
Day-to-day management of the Fund’s portfolio is the responsibility of the Developed Fixed Income team at Grantham, Mayo, Van Otterloo & Co. LLC.
Management Discussion and Analysis of Fund Performance
GMO U.S. Treasury Fund returned +0.54% (net) for the fiscal year ended February 28, 2017, as compared with +0.32% for the Citigroup 3-Month Treasury Bill Index.
The Fund outperformed the benchmark during the fiscal year by +0.22%, with contributions coming from security selection in Treasury Bills.
The views expressed herein are exclusively those of Grantham, Mayo, Van Otterloo & Co. LLC as of the date of this report and are subject to change. GMO disclaims any responsibility to update such views. They are not meant as investment advice. References to specific securities are not recommendations of such securities and may not be representative of any GMO portfolio’s current or future investments.
48
GMO U.S. Treasury Fund
(A Series of GMO Trust)
Comparison of Change in Value of a $10,000,000 Investment in GMO U.S. Treasury Fund and the Citigroup 3-Month Treasury Bill Index As of February 28, 2017
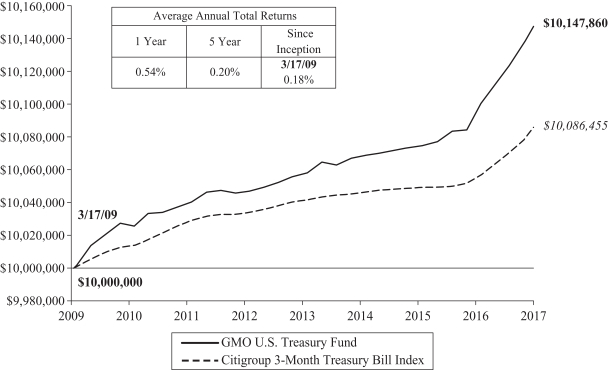
Performance data quoted represents past performance and is not indicative of future results. The investment return and principal value of an investment will fluctuate so that an investor’s shares, when redeemed, may be worth more or less than their original cost. Current performance data may be lower or higher than the performance data provided herein. To obtain performance information up to the most recent month-end, visit www.gmo.com. Performance shown is net of all fees after reimbursement from GMO. Returns would have been lower had certain expenses not been reimbursed during the periods shown and do not include the effect of taxes on distributions and redemptions. The performance information shown above only includes purchase premiums and/or redemption fees in effect as of February 28, 2017. All information is unaudited.
49
GMO U.S. Treasury Fund
(A Series of GMO Trust)
Investment Concentration Summary
February 28, 2017 (Unaudited)
| | | | |
| Asset Class Summary | | % of Total Net Assets | |
Short-Term Investments | | | 99.9 | % |
Other | | | 0.1 | |
| | | | |
| | | 100.0 | % |
| | | | |
50
GMO U.S. Treasury Fund
(A Series of GMO Trust)
Schedule of Investments
(showing percentage of total net assets)
February 28, 2017
| | | | | | | | | | |
Par Value† /
Shares | | | Description | | Value ($) | |
| | | | | | SHORT-TERM INVESTMENTS — 99.9% | |
| | |
| | | | | | U.S. Government — 99.7% | |
| | | 160,200,000 | | | U.S. Treasury Bill, 0.46%, due 03/09/17 (a) | | | 160,183,660 | |
| | | 75,000,000 | | | U.S. Treasury Bill, 0.41%, due 03/15/17 (a) | | | 74,988,150 | |
| | | 90,000,000 | | | U.S. Treasury Bill, 0.48%, due 04/13/17 (a) | | | 89,948,250 | |
| | | 100,000,000 | | | U.S. Treasury Bill, 0.52%, due 04/27/17 (a) | | | 99,918,700 | |
| | | 114,060,000 | | | U.S. Treasury Bill, 0.62%, due 07/13/17 (a) | | | 113,797,890 | |
| | | 41,000,000 | | | U.S. Treasury Bill, 0.63%, due 07/20/17 (a) | | | 40,899,509 | |
| | | 119,000,000 | | | U.S. Treasury Bill, 0.70%, due 08/24/17 (a) | | | 118,593,853 | |
| | | 45,000,000 | | | U.S. Treasury Bill, 0.82%, due 01/04/18 (a) | | | 44,687,115 | |
| | | 30,000,000 | | | U.S. Treasury Note, 0.75%, due 03/15/17 | | | 30,004,290 | |
| | | 50,000,000 | | | U.S. Treasury Note, 0.50%, due 03/31/17 | | | 50,004,100 | |
| | | 75,000,000 | | | U.S. Treasury Note, 1.00%, due 03/31/17 | | | 75,036,975 | |
| | | 115,000,000 | | | U.S. Treasury Note, 0.88%, due 05/15/17 | | | 115,091,310 | |
| | | 216,000,000 | | | U.S. Treasury Note, 0.63%, due 05/31/17 | | | 216,060,912 | |
| | | 50,000,000 | | | U.S. Treasury Note, 0.88%, due 06/15/17 | | | 50,042,900 | |
| | | 35,000,000 | | | U.S. Treasury Note, 0.75%, due 06/30/17 | | | 35,019,110 | |
| | | 55,000,000 | | | U.S. Treasury Note, 2.50%, due 06/30/17 | | | 55,347,985 | |
| | | 100,000,000 | | | U.S. Treasury Note, 0.50%, due 07/31/17 | | | 99,921,900 | |
| | | 120,000,000 | | | U.S. Treasury Note, 0.88%, due 08/15/17 | | | 120,075,000 | |
| | | 70,000,000 | | | U.S. Treasury Note, 4.75%, due 08/15/17 | | | 71,296,050 | |
| | | 9,000,000 | | | U.S. Treasury Note, 0.63%, due 08/31/17 | | | 8,993,673 | |
| | | 25,000,000 | | | U.S. Treasury Note, 1.88%, due 08/31/17 | | | 25,139,650 | |
| | | 82,000,000 | | | U.S. Treasury Note, 1.00%, due 09/15/17 | | | 82,108,896 | |
| | | 65,000,000 | | | U.S. Treasury Note, 0.63%, due 09/30/17 | | | 64,944,165 | |
| | | 50,000,000 | | | U.S. Treasury Note, 1.88%, due 09/30/17 | | | 50,328,100 | |
| | | 20,000,000 | | | U.S. Treasury Note, 0.88%, due 10/15/17 | | | 20,010,940 | |
| | | 144,000,000 | | | U.S. Treasury Note, 0.88%, due 11/15/17 | | | 144,067,536 | |
| | | 101,000,000 | | | U.S. Treasury Note, 0.88%, due 11/30/17 | | | 101,039,491 | |
| | | 90,000,000 | | | U.S. Treasury Note, 2.25%, due 11/30/17 | | | 90,942,210 | |
| | | 180,000,000 | | | U.S. Treasury Note, 1.00%, due 12/15/17 | | | 180,210,960 | |
| | | 65,000,000 | | | U.S. Treasury Note, 0.88%, due 01/15/18 | | | 64,987,325 | |
| | | 15,000,000 | | | U.S. Treasury Note, 1.00%, due 02/15/18 | | | 15,008,205 | |
| | | 20,000,000 | | | U.S. Treasury Note, 0.75%, due 02/28/18 | | | 19,959,380 | |
| | | 55,000,000 | | | U.S. Treasury Variable Rate Note, 0.68%, due 10/31/17 | | | 55,057,200 | |
| | | 75,000,000 | | | U.S. Treasury Variable Rate Note, 0.79%, due 01/31/18 | | | 75,175,575 | |
| | | | | | | | | | |
| | | | | | Total U.S. Government | | | 2,658,890,965 | |
| | | | | | | | | | |
| | | |
| | | | | | Money Market Funds — 0.2% | | | | |
| | | 3,888,540 | | | State Street Institutional Treasury Plus Money Market Fund-Premier Class, 0.41% (b) | | | 3,888,540 | |
| | | | | | | | | | |
| | | |
| | | | | | TOTAL SHORT-TERM INVESTMENTS (COST $2,662,846,947) | | | 2,662,779,505 | |
| | | | | | | | | | |
| | | |
| | | | | | TOTAL INVESTMENTS — 99.9%
(Cost $2,662,846,947) | | | 2,662,779,505 | |
| | | | | | Other Assets and Liabilities (net) — 0.1% | | | 3,917,634 | |
| | | | | | | | | | |
| | | |
| | | | | | TOTAL NET ASSETS — 100.0% | | | $2,666,697,139 | |
| | | | | | | | | | |
Notes to Schedule of Investments:
| † | Denominated in U.S. Dollar, unless otherwise indicated. |
| (a) | The rate shown represents yield-to-maturity. |
| (b) | The rate disclosed is the 7 day net yield as of February 28, 2017. |
For a listing of definitions of acronyms, counterparty abbreviations and currency abbreviations used throughout the Schedule of Investments as well as the derivative tables, if any, please refer to page 52.
| | | | |
| | See accompanying notes to the financial statements. | | 51 |
GMO Trust Funds
Schedule of Investments — (Continued)
February 28, 2017
Portfolio Abbreviations:
144A - Securities exempt from registration under Rule 144A of the Securities Act of 1933. These securities may be resold in transactions exempt from registration, normally to qualified institutional investors.
AMBAC - Insured as to the payment of principal and interest by AMBAC Assurance Corporation.
CAD LIBOR - London Interbank Offered Rate denominated in Canadian Dollar.
CDO - Collateralized Debt Obligation
CHF LIBOR - London Interbank Offered Rate denominated in Swiss Franc.
CJSC - Closed Joint-Stock Company
CLO - Collateralized Loan Obligation
CP - Counterparty
EURIBOR - Euro Interbank Offered Rate
FGIC - Insured as to the payment of principal and interest by Financial Guaranty Insurance Corporation.
FSA - Insured as to the payment of principal and interest by Financial Security Assurance.
GBP LIBOR - London Interbank Offered Rate denominated in British Pounds.
GDP - Gross Domestic Product
JPY LIBOR - London Interbank Offered Rate denominated in Japanese Yen
LIBOR - London Interbank Offered Rate
MBIA - Insured as to the payment of principal and interest by MBIA Insurance Corp.
OTC - Over-the-Counter
Reg S - Security exempt from registration under Regulation S of the Securities Act of 1933, which exempts from registration securities offered and sold outside the United States. Security may not be offered or sold in the United States except pursuant to an exemption from, or in a transaction not subject to, the registration requirements of the Securities Act of 1933.
SEK STIBOR - Stockholm Interbank Offered Rate denominated in Swedish Krona
TBA - To Be Announced-Delayed Delivery Security
TIIE - Tasa de Interes Interbacaria de Equilibrio - 28 - Day Interbank Equilibrium
Interest Rate - Mexico
USBM - U.S. Treasury 3 Month Bill Money Market Yield.
USD LIBOR - London Interbank Offered Rate denominated in United States Dollars.
VRRB - Variable Rate Reduction Bond
The rates shown on variable rate notes are the current interest rates at February 28, 2017, which are subject to change based on the terms of the security.
Counterparty Abbreviations:
BCLY - Barclays Bank plc
BOA - Bank of America, N.A.
CITI - Citibank N.A.
CSI - Credit Suisse International
CSS - Credit Suisse Securities
(USA) LLC
DB - Deutsche Bank AG
GS - Goldman Sachs International
JPMF - J.P. Morgan Securities LLC
JPM - JPMorgan Chase Bank, N.A.
MSCI - Morgan Stanley & Co.
International PLC
MSCS - Morgan Stanley Capital
Services LLC
Currency Abbreviations:
CAD - Canadian Dollar
CHF - Swiss Franc
DEM - Deutsche Mark
EUR - Euro
GBP - British Pound
JPY - Japanese Yen
MXN - Mexican Peso
NZD - New Zealand Dollar
PEN - Peruvian Sol
SEK - Swedish Krona
USD - United States Dollar
ZAR - South African Rand
| | | | |
| 52 | | See accompanying notes to the financial statements. | | |
GMO Trust Funds
Statements of Assets and Liabilities — February 28, 2017
| | | | | | | | | | | | | | | | |
| | | Asset Allocation
Bond Fund | | | Core Plus
Bond Fund | | | Currency
Hedged
International
Bond Fund | | | Emerging
Country Debt
Fund | |
Assets: | | | | | | | | | | | | | |
Investments in affiliated issuers, at value (Notes 2 and 10)(a) | | $ | — | | | $ | 231,287,044 | | | $ | 25,811,080 | | | $ | 101,920,876 | |
Investments in unaffiliated issuers, at value (Note 2)(b) | | | 1,485,370,745 | | | | 439,395,232 | | | | 32,614,520 | | | | 3,973,602,223 | |
Foreign currency, at value (Note 2)(c) | | | — | | | | 9 | | | | — | | | | 917,953 | |
Cash | | | 34,936,675 | | | | — | | | | — | | | | — | |
Receivable for investments sold | | | — | | | | — | | | | — | | | | 3,014,714 | |
Dividends and interest receivable | | | 2,136,289 | | | | 502,521 | | | | 425,021 | | | | 67,600,122 | |
Unrealized appreciation on open forward currency contracts (Note 4) | | | 8,229,029 | | | | 186,366 | | | | 258,156 | | | | 201,461 | |
Receivable for variation margin on open futures contracts (Note 4) | | | — | | | | 19,510 | | | | — | | | | — | |
Due from broker (Note 2) | | | 9,505,268 | | | | 3,458,135 | | | | 276,191 | | | | 6,058,380 | |
Receivable for open OTC swap contracts (Note 4) | | | — | | | | — | | | | — | | | | 25,786,889 | |
Interest receivable for open OTC swap contracts | | | — | | | | — | | | | — | | | | 2,192,756 | |
Receivable for expenses reimbursed and/or waived by GMO (Note 5) | | | — | | | | 41,539 | | | | 15,006 | | | | 5,093 | |
Miscellaneous receivable | | | — | | | | — | | | | — | | | | 2,815,563 | |
Receivable for options (Note 4)(d) | | | — | | | | — | | | | — | | | | 293,033 | |
| | | | | | | | | | | | | | | | |
Total assets | | | 1,540,178,006 | | | | 674,890,356 | | | | 59,399,974 | | | | 4,184,409,063 | |
| | | | | | | | | | | | | | | | |
Liabilities: | | | | | | | | | | | | | | | | |
Payable for investments purchased | | | 322 | | | | — | | | | — | | | | — | |
Payable for Fund shares repurchased | | | 2,143,635 | | | | — | | | | — | | | | 32,324 | |
Payable for purchases of delayed delivery securities | | | — | | | | 85,788,866 | | | | — | | | | — | |
Payable to affiliate for (Note 5): | | | | | | | | | | | | | | | | |
Management fee | | | 320,418 | | | | 55,422 | | | | 11,233 | | | | 1,092,771 | |
Shareholder service fee | | | 94,674 | | | | 22,659 | | | | 6,741 | | | | 349,188 | |
Payable for variation margin on open futures contracts (Note 4) | | | — | | | | — | | | | 744 | | | | — | |
Payable for variation margin on open cleared swap contracts (Note 4) | | | 372,356 | | | | 130,804 | | | | 13,477 | | | | 260,821 | |
Payable for swap premiums | | | 277,730 | | | | — | | | | — | | | | — | |
Unrealized depreciation on open forward currency contracts (Note 4) | | | 9,836,103 | | | | 181,411 | | | | 50,874 | | | | — | |
Interest payable for open swap contracts | | | — | | | | — | | | | — | | | | 856,750 | |
Payable for open OTC swap contracts (Note 4) | | | — | | | | — | | | | — | | | | 61,191,234 | |
Payable for reverse repurchase agreements (Note 2) | | | 34,936,599 | | | | — | | | | — | | | | 32,592,636 | |
Payable for options (Note 4)(d) | | | — | | | | — | | | | — | | | | 2,349,805 | |
Payable to agents unaffiliated with GMO | | | 252 | | | | — | | | | 28 | | | | 588 | |
Payable to Trustees and related expenses | | | 3,149 | | | | 100 | | | | 116 | | | | 6,598 | |
Accrued expenses | | | 199,176 | | | | 105,515 | | | | 84,138 | | | | 431,261 | |
| | | | | | | | | | | | | | | | |
Total liabilities | | | 48,184,414 | | | | 86,284,777 | | | | 167,351 | | | | 99,163,976 | |
| | | | | | | | | | | | | | | | |
Net assets | | $ | 1,491,993,592 | | | $ | 588,605,579 | | | $ | 59,232,623 | | | $ | 4,085,245,087 | |
| | | | | | | | | | | | | | | | |
(a) Cost of investments – affiliated issuers: | | $ | — | | | $ | 230,267,973 | | | $ | 24,686,959 | | | $ | 99,161,727 | |
(b) Cost of investments – unaffiliated issuers: | | $ | 1,472,377,437 | | | $ | 437,627,181 | | | $ | 35,451,676 | | | $ | 3,883,854,946 | |
(c) Cost of foreign currency: | | $ | — | | | $ | 9 | | | $ | — | | | $ | 916,918 | |
(d) Premiums on options: | | $ | — | | | $ | — | | | $ | — | | | $ | 6,226,943 | |
| | | | |
| | See accompanying notes to the financial statements. | | 53 |
GMO Trust Funds
Statements of Assets and Liabilities — February 28, 2017 — (Continued)
| | | | | | | | | | | | | | | | |
| | | Asset Allocation
Bond Fund | | | Core Plus
Bond Fund | | | Currency
Hedged
International
Bond Fund | | | Emerging
Country Debt
Fund | |
Net assets consist of: | | | | | | | | | | | | | | | | |
Paid-in capital | | $ | 1,549,492,325 | | | $ | 616,220,179 | | | $ | 67,536,983 | | | $ | 4,169,404,787 | |
Accumulated undistributed net investment income | | | 1,181,698 | | | | 1,128,597 | | | | 596,010 | | | | 34,037,148 | |
Accumulated net realized gain (loss) | | | (64,400,243 | ) | | | (31,342,063 | ) | | | (7,391,660 | ) | | | (221,705,644 | ) |
Net unrealized appreciation (depreciation) | | | 5,719,812 | | | | 2,598,866 | | | | (1,508,710 | ) | | | 103,508,796 | |
| | | | | | | | | | | | | | | | |
| | $ | 1,491,993,592 | | | $ | 588,605,579 | | | $ | 59,232,623 | | | $ | 4,085,245,087 | |
| | | | | | | | | | | | | | | | |
Net assets attributable to: | | | | | | | | | | | | | | | | |
Class III | | $ | 282,272,480 | | | $ | 22,172,253 | | | $ | 59,232,623 | | | $ | 1,067,086,401 | |
| | | | | | | | | | | | | | | | |
Class IV | | $ | — | | | $ | 566,433,326 | | | $ | — | | | $ | 3,018,158,686 | |
| | | | | | | | | | | | | | | | |
Class VI | | $ | 1,209,721,112 | | | $ | — | | | $ | — | | | $ | — | |
| | | | | | | | | | | | | | | | |
Shares outstanding: | | | | | | | | | | | | | | | | |
Class III | | | 12,741,416 | | | | 1,050,889 | | | | 2,235,062 | | | | 36,808,556 | |
| | | | | | | | | | | | | | | | |
Class IV | | | — | | | | 26,783,881 | | | | — | | | | 104,255,133 | |
| | | | | | | | | | | | | | | | |
Class VI | | | 54,423,599 | | | | — | | | | — | | | | — | |
| | | | | | | | | | | | | | | | |
Net asset value per share: | | | | | | | | | | | | | | | | |
Class III | | $ | 22.15 | | | $ | 21.10 | | | $ | 26.50 | | | $ | 28.99 | |
| | | | | | | | | | | | | | | | |
Class IV | | $ | — | | | $ | 21.15 | | | $ | — | | | $ | 28.95 | |
| | | | | | | | | | | | | | | | |
Class VI | | $ | 22.23 | | | $ | — | | | $ | — | | | $ | — | |
| | | | | | | | | | | | | | | | |
| | | | |
| 54 | | See accompanying notes to the financial statements. | | |
GMO Trust Funds
Statements of Assets and Liabilities — February 28, 2017 — (Continued)
| | | | | | | | |
| | | Opportunistic
Income Fund
(formerly Debt
Opportunities
Fund) | | | U.S. Treasury
Fund | |
Assets: | | | | | |
Investments in affiliated issuers, at value (Notes 2 and 10)(a) | | $ | 72,837,633 | | | $ | — | |
Investments in unaffiliated issuers, at value (Note 2)(b) | | | 1,445,623,651 | | | | 2,662,779,505 | |
Cash | | | 714,626 | | | | — | |
Receivable for investments sold | | | 582,177 | | | | — | |
Dividends and interest receivable | | | 3,445,104 | | | | 4,360,554 | |
Unrealized appreciation on open forward currency contracts (Note 4) | | | 77,578 | | | | — | |
Due from broker (Note 2) | | | 3,424,239 | | | | — | |
Receivable for open OTC swap contracts (Note 4) | | | 19,920,779 | | | | — | |
Receivable for purchases of delayed delivery securities | | | 34,606,250 | | | | — | |
Interest receivable for open OTC swap contracts | | | 979,159 | | | | — | |
Receivable for expenses reimbursed and/or waived by GMO (Note 5) | | | 54,941 | | | | 144,813 | |
| | | | | | | | |
Total assets | | | 1,582,266,137 | | | | 2,667,284,872 | |
| | | | | | | | |
Liabilities: | | | | | | | | |
Investments sold short, at value (Note 2)(c) | | | 34,769,723 | | | | — | |
Payable for investments purchased | | | 260,449 | | | | — | |
Payable for purchases of delayed securities | | | 31,514,766 | | | | — | |
Payable to affiliate for (Note 5): | | | | | | | | |
Management fee | | | 456,342 | | | | 157,555 | |
Shareholder service fee | | | 62,748 | | | | — | |
Payable for variation margin on open cleared swap contracts (Note 4) | | | 98,836 | | | | — | |
Dividend payable | | | — | | | | 266,278 | |
Unrealized depreciation on open forward currency contracts (Note 4) | | | 2,289 | | | | — | |
Interest payable for open swap contracts | | | 754,369 | | | | — | |
Payable for open OTC swap contracts (Note 4) | | | 2,541,477 | | | | — | |
Written options outstanding, at value (Note 4)(d) | | | 736,796 | | | | — | |
Payable to agents unaffiliated with GMO | | | 196 | | | | 394 | |
Payable to Trustees and related expenses | | | 2,430 | | | | 4,674 | |
Accrued expenses | | | 171,882 | | | | 158,832 | |
| | | | | | | | |
Total liabilities | | | 71,372,303 | | | | 587,733 | |
| | | | | | | | |
Net assets | | $ | 1,510,893,834 | | | $ | 2,666,697,139 | |
| | | | | | | | |
(a) Cost of investments – affiliated issuers: | | $ | 72,857,962 | | | $ | — | |
(b) Cost of investments – unaffiliated issuers: | | $ | 1,431,230,363 | | | $ | 2,662,846,947 | |
(c) Proceeds from securities sold short: | | $ | 34,606,250 | | | $ | — | |
(d) Premiums on written options: | | $ | 1,340,502 | | | $ | — | |
| | | | |
| | See accompanying notes to the financial statements. | | 55 |
GMO Trust Funds
Statements of Assets and Liabilities — February 28, 2017 — (Continued)
| | | | | | | | |
| | | Opportunistic
Income Fund
(formerly Debt
Opportunities
Fund) | | | U.S. Treasury
Fund | |
Net assets consist of: | | | | | | | | |
Paid-in capital | | $ | 1,616,785,775 | | | $ | 2,666,813,030 | |
Accumulated undistributed net investment income | | | 4,399,215 | | | | — | |
Accumulated net realized gain (loss) | | | (123,300,886 | ) | | | (48,449 | ) |
Net unrealized appreciation (depreciation) | | | 13,009,730 | | | | (67,442 | ) |
| | | | | | | | |
| | $ | 1,510,893,834 | | | $ | 2,666,697,139 | |
| | | | | | | | |
Net assets attributable to: | | | | | | | | |
Core Class | | $ | — | | | $ | 2,666,697,139 | |
| | | | | | | | |
Class VI | | $ | 1,510,893,834 | | | $ | — | |
| | | | | | | | |
Shares outstanding: | | | | | | | | |
Core Class | | | — | | | | 106,673,130 | |
| | | | | | | | |
Class VI | | | 58,611,319 | | | | — | |
| | | | | | | | |
Net asset value per share: | | | | | | | | |
Core Class | | $ | — | | | $ | 25.00 | |
| | | | | | | | |
Class VI | | $ | 25.78 | | | $ | — | |
| | | | | | | | |
| | | | |
| 56 | | See accompanying notes to the financial statements. | | |
GMO Trust Funds
Statements of Operations — Year Ended February 28, 2017
| | | | | | | | | | | | | | | | |
| | | Asset Allocation
Bond Fund | | | Core Plus
Bond Fund | | | Currency
Hedged
International
Bond Fund | | | Emerging
Country Debt
Fund | |
Investment Income: | | | | | | | | | | | | | |
Interest | | $ | 22,399,338 | | | $ | 613,434 | | | $ | 560,561 | | | $ | 298,724,904 | |
Dividends from unaffiliated issuers | | | 1,648,728 | | | | 186,970 | | | | 1,105 | | | | 1,244,977 | |
Dividends from affiliated issuers (Note 10) | | | 1,152,553 | | | | 746,111 | | | | 408,012 | | | | 818,783 | |
| | | | | | | | | | | | | | | | |
Total investment income | | | 25,200,619 | | | | 1,546,515 | | | | 969,678 | | | | 300,788,664 | |
| | | | | | | | | | | | | | | | |
Expenses: | | | | | | | | | | | | | |
Management fee (Note 5) | | | 5,063,894 | | | | 274,717 | | | | 154,826 | | | | 14,416,089 | |
Shareholder service fee – Class III (Note 5) | | | 560,767 | | | | 12,277 | | | | 92,896 | | | | 1,358,454 | |
Shareholder service fee – Class IV (Note 5) | | | — | | | | 101,702 | | | | — | | | | 3,213,247 | |
Shareholder service fee – Class VI (Note 5) | | | 908,442 | | | | — | | | | — | | | | — | |
Audit and tax fees | | | 105,090 | | | | 109,197 | | | | 99,920 | | | | 178,487 | |
Custodian, fund accounting agent and transfer agent fees | | | 279,661 | | | | 84,744 | | | | 51,497 | | | | 1,197,674 | |
Legal fees | | | 56,023 | | | | 21,672 | | | | 21,672 | | | | 104,539 | |
Registration fees | | | 5,235 | | | | 5,750 | | | | 3,025 | | | | 35,036 | |
Trustees’ fees and related expenses (Note 5) | | | 34,271 | | | | 1,516 | | | | 1,087 | | | | 70,885 | |
Interest expense (Note 2) | | | 64,190 | | | | 2,748 | | | | 1,791 | | | | — | |
Miscellaneous | | | 28,053 | | | | 5,901 | | | | 8,361 | | | | 79,078 | |
| | | | | | | | | | | | | | | | |
Total expenses | | | 7,105,626 | | | | 620,224 | | | | 435,075 | | | | 20,653,489 | |
Fees and expenses reimbursed and/or waived by GMO (Note 5) | | | (442,031 | ) | | | (207,766 | ) | | | (164,263 | ) | | | — | |
Indirectly incurred management fees waived or borne by GMO (Note 5) | | | — | | | | (68,562 | ) | | | (20,486 | ) | | | (39,365 | ) |
Indirectly incurred shareholder service fee waived or borne by GMO (Note 5) | | | — | | | | (14,626 | ) | | | (5,191 | ) | | | (7,887 | ) |
| | | | | | | | | | | | | | | | |
Net expenses | | | 6,663,595 | | | | 329,270 | | | | 245,135 | | | | 20,606,237 | |
| | | | | | | | | | | | | | | | |
Net investment income (loss) | | | 18,537,024 | | | | 1,217,245 | | | | 724,543 | | | | 280,182,427 | |
| | | | | | | | | | | | | | | | |
Realized and unrealized gain (loss): | | | | | | | | | | | | | |
Net realized gain (loss) on: | | | | | | | | | | | | | | | | |
Investments in unaffiliated issuers | | | (149,280,380 | ) | | | (235,319 | ) | | | (974,122 | ) | | | 99,035,329 | |
Investments in affiliated issuers | | | 235,105 | | | | 6,018,640 | | | | 1,543,855 | | | | 37,508 | |
Realized gain distributions from affiliated issuers (Note 10) | | | 13,727 | | | | 9,565 | | | | 10,811 | | | | 46,787 | |
Futures contracts | | | 6,339,183 | | | | (361,770 | ) | | | 273,643 | | | | — | |
Options | | | (31,823,476 | ) | | | (391,981 | ) | | | (120,552 | ) | | | — | |
Swap contracts | | | 108,482,529 | | | | (3,084,400 | ) | | | 499,118 | | | | 10,438,250 | |
Foreign currency, forward contracts and foreign currency related transactions | | | 29,219,763 | | | | 22,717 | | | | 1,945,157 | | | | 3,620,097 | |
| | | | | | | | | | | | | | | | |
Net realized gain (loss) | | | (36,813,549 | ) | | | 1,977,452 | | | | 3,177,910 | | | | 113,177,971 | |
| | | | | | | | | | | | | | | | |
Change in net unrealized appreciation (depreciation) on: | | | | | | | | | | | | | | | | |
Investments in unaffiliated issuers | | | 126,539,996 | | | | (94,674 | ) | | | (849,271 | ) | | | 279,657,824 | |
Investments in affiliated issuers | | | 63,423 | | | | (3,852,031 | ) | | | (934,518 | ) | | | 652,383 | |
Futures contracts | | | (12,973,233 | ) | | | 278,484 | | | | (188,355 | ) | | | — | |
Options | | | 39,392,236 | | | | 748,804 | | | | 222,199 | | | | 5,043,111 | |
Swap contracts | | | (120,857,680 | ) | | | 6,198,080 | | | | (688,308 | ) | | | 48,592,057 | |
Foreign currency, forward contracts and foreign currency related transactions | | | (14,067,309 | ) | | | (98,318 | ) | | | 232,293 | | | | (1,918,066 | ) |
| | | | | | | | | | | | | | | | |
Net change in unrealized appreciation (depreciation) | | | 18,097,433 | | | | 3,180,345 | | | | (2,205,960 | ) | | | 332,027,309 | |
| | | | | | | | | | | | | | | | |
Net realized and unrealized gain (loss) | | | (18,716,116 | ) | | | 5,157,797 | | | | 971,950 | | | | 445,205,280 | |
| | | | | | | | | | | | | | | | |
Net increase (decrease) in net assets resulting from operations | | $ | (179,092 | ) | | $ | 6,375,042 | | | $ | 1,696,493 | | | $ | 725,387,707 | |
| | | | | | | | | | | | | | | | |
| | | | |
| | See accompanying notes to the financial statements. | | 57 |
GMO Trust Funds
Statements of Operations — Year Ended February 28, 2017 — (Continued)
| | | | | | | | |
| | | Opportunistic
Income Fund
(formerly Debt
Opportunities
Fund) | | | U.S. Treasury
Fund | |
Investment Income: | | | | | |
Interest | | $ | 64,467,615 | | | $ | 15,442,193 | |
Dividends from affiliated issuers (Note 10) | | | 336,929 | | | | — | |
Dividends from unaffiliated issuers | | | 19,550 | | | | — | |
| | | | | | | | |
Total investment income | | | 64,824,094 | | | | 15,442,193 | |
| | | | | | | | |
Expenses: | | | | | |
Management fee (Note 5) | | | 4,264,569 | | | | 2,594,865 | |
Shareholder service fee – Class VI (Note 5) | | | 859,319 | | | | — | |
Audit and tax fees | | | 180,009 | | | | 50,558 | |
Custodian, fund accounting agent and transfer agent fees | | | 264,026 | | | | 373,934 | |
Legal fees | | | 83,116 | | | | 88,624 | |
Registration fees | | | 460 | | | | 515 | |
Trustees’ fees and related expenses (Note 5) | | | 26,711 | | | | 56,589 | |
Interest expense (Note 2) | | | 231 | | | | — | |
Miscellaneous | | | 57,350 | | | | 20,362 | |
| | | | | | | | |
Total expenses | | | 5,735,791 | | | | 3,185,447 | |
Fees and expenses reimbursed and/or waived by GMO (Note 5) | | | (555,010 | ) | | | (3,104,114 | ) |
| | | | | | | | |
Net expenses | | | 5,180,781 | | | | 81,333 | |
| | | | | | | | |
Net investment income (loss) | | | 59,643,313 | | | | 15,360,860 | |
| | | | | | | | |
Realized and unrealized gain (loss): | | | | | |
Net realized gain (loss) on: | | | | | | | | |
Investments in unaffiliated issuers | | | (1,375,019 | ) | | | 1,442,520 | |
Investments in affiliated issuers | | | 25,475 | | | | — | |
Investments in securities sold short | | | (34,180 | ) | | | — | |
Realized gain distributions from affiliated issuers (Note 10) | | | 33,490 | | | | — | |
Written options | | | 2,367,050 | | | | — | |
Swap contracts | | | (7,469,708 | ) | | | — | |
Foreign currency, forward contracts and foreign currency related transactions | | | 615,030 | | | | — | |
| | | | | | | | |
Net realized gain (loss) | | | (5,837,862 | ) | | | 1,442,520 | |
| | | | | | | | |
Change in net unrealized appreciation (depreciation) on: | | | | | | | | |
Investments in unaffiliated issuers | | | 59,839,383 | | | | 162,701 | |
Investments in affiliated issuers | | | (29,466 | ) | | | — | |
Investments in securities sold short | | | (163,473 | ) | | | — | |
Written options | | | 281,874 | | | | — | |
Swap contracts | | | (1,190,201 | ) | | | — | |
Foreign currency, forward contracts and foreign currency related transactions | | | 42,412 | | | | — | |
| | | | | | | | |
Net change in unrealized appreciation (depreciation) | | | 58,780,529 | | | | 162,701 | |
| | | | | | | | |
Net realized and unrealized gain (loss) | | | 52,942,667 | | | | 1,605,221 | |
| | | | | | | | |
Net increase (decrease) in net assets resulting from operations | | $ | 112,585,980 | | | $ | 16,966,081 | |
| | | | | | | | |
| | | | |
| 58 | | See accompanying notes to the financial statements. | | |
GMO Trust Funds
Statements of Changes in Net Assets
| | | | | | | | | | | | | | | | |
| | | Asset Allocation Bond Fund | | | Core Plus Bond Fund | |
| | | Year Ended
February 28/29, | | | Year Ended
February 28/29, | |
| | | 2017 | | | 2016 | | | 2017 | | | 2016 | |
Increase (decrease) in net assets: | | | | | | | | | | | | | | | | |
Operations: | | | | | | | | | | | | | | | | |
Net investment income (loss) | | $ | 18,537,024 | | | $ | 8,396,115 | | | $ | 1,217,245 | | | $ | 2,984,582 | |
Net realized gain (loss) | | | (36,813,549 | ) | | | (421,725,486 | ) | | | 1,977,452 | | | | (5,184,506 | ) |
Change in net unrealized appreciation (depreciation) | | | 18,097,433 | | | | (58,678,738 | ) | | | 3,180,345 | | | | (7,494,375 | ) |
| | | | | | | | | | | | | | | | |
| | | | |
Net increase (decrease) in net assets from operations | | | (179,092 | ) | | | (472,008,109 | ) | | | 6,375,042 | | | | (9,694,299 | ) |
| | | | | | | | | | | | | | | | |
Distributions to shareholders from: | | | | | | | | | | | | | | | | |
Net investment income | | | | | | | | | | | | | | | | |
Class III | | | — | | | | (26,485,630 | ) | | | (240,429 | ) | | | (2,771,556 | ) |
Class IV | | | — | | | | — | | | | (3,760,584 | ) | | | (9,179,274 | ) |
Class VI | | | — | | | | (286,205,734 | ) | | | — | | | | — | |
| | | | | | | | | | | | | | | | |
Total distributions from net investment income | | | — | | | | (312,691,364 | ) | | | (4,001,013 | ) | | | (11,950,830 | ) |
| | | | | | | | | | | | | | | | |
Net share transactions (Note 9): | | | | | | | | | | | | | | | | |
Class III | | | (70,279,130 | ) | | | (1,399,770 | ) | | | (30,050,465 | ) | | | 5,926,234 | |
Class IV | | | — | | | | — | | | | 349,034,173 | | | | 40,867,382 | |
Class VI | | | (678,881,916 | ) | | | (2,046,673,477 | ) | | | — | | | | — | |
| | | | | | | | | | | | | | | | |
Increase (decrease) in net assets resulting from net share transactions | | | (749,161,046 | ) | | | (2,048,073,247 | ) | | | 318,983,708 | | | | 46,793,616 | |
| | | | | | | | | | | | | | | | |
Total increase (decrease) in net assets | | | (749,340,138 | ) | | | (2,832,772,720 | ) | | | 321,357,737 | | | | 25,148,487 | |
| | |
| Net assets: | | | | | | | | | |
Beginning of period | | | 2,241,333,730 | | | | 5,074,106,450 | | | | 267,247,842 | | | | 242,099,355 | |
| | | | | | | | | | | | | | | | |
End of period | | $ | 1,491,993,592 | | | $ | 2,241,333,730 | | | $ | 588,605,579 | | | $ | 267,247,842 | |
| | | | | | | | | | | | | | | | |
Accumulated undistributed net investment income | | $ | 1,181,698 | | | $ | — | | | $ | 1,128,597 | | | $ | 341,183 | |
| | | | | | | | | | | | | | | | |
Distributions in excess of net investment income | | $ | — | | | $ | (49,400,874 | ) | | $ | — | | | $ | — | |
| | | | | | | | | | | | | | | | |
| | | | |
| | See accompanying notes to the financial statements. | | 59 |
GMO Trust Funds
Statements of Changes in Net Assets — (Continued)
| | | | | | | | | | | | | | | | |
| | | Currency Hedged
International Bond Fund | | | Emerging Country Debt Fund | |
| | | Year Ended
February 28/29, | | | Year Ended
February 28/29, | |
| | | 2017 | | | 2016 | | | 2017 | | | 2016 | |
Increase (decrease) in net assets: | | | | | | | | | | | | | | | | |
Operations: | | | | | | | | | | | | | | | | |
Net investment income (loss) | | $ | 724,543 | | | $ | 683,786 | | | $ | 280,182,427 | | | $ | 222,709,081 | |
Net realized gain (loss) | | | 3,177,910 | | | | 368,668 | | | | 113,177,971 | | | | (15,576,974 | ) |
Change in net unrealized appreciation (depreciation) | | | (2,205,960 | ) | | | (2,133,644 | ) | | | 332,027,309 | | | | (288,895,476 | ) |
| | | | | | | | | | | | | | | | |
| | | | |
Net increase (decrease) in net assets from operations | | | 1,696,493 | | | | (1,081,190 | ) | | | 725,387,707 | | | | (81,763,369 | ) |
| | | | | | | | | | | | | | | | |
Distributions to shareholders from: | | | | | | | | | | | | | | | | |
Net investment income | | | | | | | | | | | | | | | | |
Class III | | | (2,050,085 | ) | | | (6,260,770 | ) | | | (62,354,207 | ) | | | (60,444,445 | ) |
Class IV | | | — | | | | — | | | | (215,087,917 | ) | | | (216,009,314 | ) |
| | | | | | | | | | | | | | | | |
Total distributions from net investment income | | | (2,050,085 | ) | | | (6,260,770 | ) | | | (277,442,124 | ) | | | (276,453,759 | ) |
| | | | | | | | | | | | | | | | |
Net share transactions (Note 9): | | | | | | | | | | | | | | | | |
Class III | | | (1,932,534 | ) | | | (3,029,814 | ) | | | 142,444,973 | | | | 158,036,105 | |
Class IV | | | — | | | | — | | | | (438,892,230 | ) | | | 113,254,771 | |
| | | | | | | | | | | | | | | | |
Increase (decrease) in net assets resulting from net share transactions | | | (1,932,534 | ) | | | (3,029,814 | ) | | | (296,447,257 | ) | | | 271,290,876 | |
| | | | | | | | | | | | | | | | |
Purchase premiums and redemption fees (Notes 2 and 9): | | | | | | | | | | | | | | | | |
Class III | | | — | | | | — | | | | 1,373,509 | | | | 1,308,961 | |
Class IV | | | — | | | | — | | | | 4,896,963 | | | | 4,807,531 | |
| | | | | | | | | | | | | | | | |
Increase in net assets resulting from purchase premiums and redemption fees | | | — | | | | — | | | | 6,270,472 | | | | 6,116,492 | |
| | | | | | | | | | | | | | | | |
Total increase (decrease) in net assets resulting from net share transactions | | | (1,932,534 | ) | | | (3,029,814 | ) | | | (290,176,785 | ) | | | 277,407,368 | |
| | | | | | | | | | | | | | | | |
Total increase (decrease) in net assets | | | (2,286,126 | ) | | | (10,371,774 | ) | | | 157,768,798 | | | | (80,809,760 | ) |
| | |
| Net assets: | | | | | | | | | |
Beginning of period | | | 61,518,749 | | | | 71,890,523 | | | | 3,927,476,289 | | | | 4,008,286,049 | |
| | | | | | | | | | | | | | | | |
End of period | | $ | 59,232,623 | | | $ | 61,518,749 | | | $ | 4,085,245,087 | | | $ | 3,927,476,289 | |
| | | | | | | | | | | | | | | | |
Accumulated undistributed net investment income | | $ | 596,010 | | | $ | 274,607 | | | $ | 34,037,148 | | | $ | — | |
| | | | | | | | | | | | | | | | |
Distributions in excess of net investment income | | $ | — | | | $ | — | | | $ | — | | | $ | (11,084,718 | ) |
| | | | | | | | | | | | | | | | |
| | | | |
| 60 | | See accompanying notes to the financial statements. | | |
GMO Trust Funds
Statements of Changes in Net Assets — (Continued)
| | | | | | | | | | | | | | | | |
| | | Opportunistic Income Fund
(formerly Debt
Opportunities Fund) | | | U.S. Treasury Fund | |
| | | Year Ended
February 28/29, | | | Year Ended
February 28/29, | |
| | | 2017 | | | 2016 | | | 2017 | | | 2016 | |
Increase (decrease) in net assets: | | | | | | | | | | | | | | | | |
Operations: | | | | | | | | | | | | | | | | |
Net investment income (loss) | | $ | 59,643,313 | | | $ | 36,619,443 | | | $ | 15,360,860 | | | $ | 5,710,896 | |
Net realized gain (loss) | | | (5,837,862 | ) | | | (23,713,454 | ) | | | 1,442,520 | | | | 1,739,205 | |
Change in net unrealized appreciation (depreciation) | | | 58,780,529 | | | | (1,468,755 | ) | | | 162,701 | | | | (316,810 | ) |
| | | | | | | | | | | | | | | | |
| | | | |
Net increase (decrease) in net assets from operations | | | 112,585,980 | | | | 11,437,234 | | | | 16,966,081 | | | | 7,133,291 | |
| | | | | | | | | | | | | | | | |
Distributions to shareholders from: | | | | | | | | | | | | | | | | |
Net investment income | | | | | | | | | | | | | | | | |
Core Class | | | — | | | | — | | | | (15,360,860 | ) | | | (5,710,896 | ) |
Class VI | | | (37,550,318 | ) | | | (28,535,302 | ) | | | — | | | | — | |
| | | | | | | | | | | | | | | | |
Total distributions from net investment income | | | (37,550,318 | ) | | | (28,535,302 | ) | | | (15,360,860 | ) | | | (5,710,896 | ) |
| | | | | | | | | | | | | | | | |
Net realized gains | | | | | | | | | | | | | | | | |
Core Class | | | — | | | | — | | | | (1,586,333 | ) | | | (1,739,695 | ) |
| | | | | | | | | | | | | | | | |
Total distributions from net realized gains | | | — | | | | — | | | | (1,586,333 | ) | | | (1,739,695 | ) |
| | | | | | | | | | | | | | | | |
Net share transactions (Note 9): | | | | | | | | | | | | | | | | |
Core Class | | | — | | | | — | | | | (1,366,825,724 | ) | | | 1,789,890,628 | |
Class VI | | | (213,820,554 | ) | | | (128,174,824 | ) | | | — | | | | — | |
| | | | | | | | | | | | | | | | |
Increase (decrease) in net assets resulting from net share transactions | | | (213,820,554 | ) | | | (128,174,824 | ) | | | (1,366,825,724 | ) | | | 1,789,890,628 | |
| | | | | | | | | | | | | | | | |
Purchase premiums and redemption fees (Notes 2 and 9): | | | | | | | | | | | | | | | | |
Class VI | | | 1,659,519 | | | | 2,486,765 | | | | — | | | | — | |
| | | | | | | | | | | | | | | | |
Increase in net assets resulting from purchase premiums and redemption fees | | | 1,659,519 | | | | 2,486,765 | | | | — | | | | — | |
| | | | | | | | | | | | | | | | |
Total increase (decrease) in net assets resulting from net share transactions, purchase premiums and redemption fees | | | (212,161,035 | ) | | | (125,688,059 | ) | | | (1,366,825,724 | ) | | | — | |
| | | | | | | | | | | | | | | | |
Total increase (decrease) in net assets | | | (137,125,373 | ) | | | (142,786,127 | ) | | | (1,366,806,836 | ) | | | 1,789,573,328 | |
| | |
| Net assets: | | | | | | | | | |
Beginning of period | | | 1,648,019,207 | | | | 1,790,805,334 | | | | 4,033,503,975 | | | | 2,243,930,647 | |
| | | | | | | | | | | | | | | | |
End of period | | $ | 1,510,893,834 | | | $ | 1,648,019,207 | | | $ | 2,666,697,139 | | | $ | 4,033,503,975 | |
| | | | | | | | | | | | | | | | |
Accumulated undistributed net investment income | | $ | 4,399,215 | | | $ | 6,227,235 | | | $ | — | | | $ | — | |
| | | | | | | | | | | | | | | | |
| | | | |
| | See accompanying notes to the financial statements. | | 61 |
GMO Trust Funds
Financial Highlights
(For a share outstanding throughout the period)
ASSET ALLOCATION BOND FUND
| | | | | | | | | | | | | | | | | | | | | | | | | | | | | | | | | | | | | | | | | | | | | | | | | | |
| | | Class III Shares | | Class VI Shares |
| | | Year Ended February 28/29, | | Year Ended February 28/29, |
| | | 2017 | | 2016 | | 2015 | | 2014 | | 2013 | | 2017 | | 2016 | | 2015 | | 2014 | | 2013 |
Net asset value, beginning of period | | | $ | 22.16 | | | | $ | 26.36 | | | | $ | 24.57 | | | | $ | 24.43 | | | | $ | 24.60 | | | | $ | 22.21 | | | | $ | 26.40 | | | | $ | 24.60 | | | | $ | 24.46 | | | | $ | 24.61 | |
| | | | | | | | | | | | | | | | | | | | | | | | | | | | | | | | | | | | | | | | | | | | | | | | | | |
Income (loss) from investment operations: | | | | | | | | | | | | | | | | | | | | | | | | | | | | | | | | | | | | | | | | | | | | | | | | | | |
Net investment income (loss)†(a) | | | | 0.18 | | | | | 0.01 | | | | | 0.38 | | | | | 0.00 | (b) | | | | (0.02 | ) | | | | 0.21 | | | | | 0.06 | | | | | 0.22 | | | | | 0.03 | | | | | 0.01 | |
Net realized and unrealized gain (loss) | | | | (0.19 | ) | | | | (2.58 | ) | | | | 2.48 | | | | | 0.17 | | | | | 0.12 | | | | | (0.19 | ) | | | | (2.61 | ) | | | | 2.68 | | | | | 0.16 | | | | | 0.11 | |
| | | | | | | | | | | | | | | | | | | | | | | | | | | | | | | | | | | | | | | | | | | | | | | | | | |
Total from investment operations | | | | (0.01 | ) | | | | (2.57 | ) | | | | 2.86 | | | | | 0.17 | | | | | 0.10 | | | | | 0.02 | | | | | (2.55 | ) | | | | 2.90 | | | | | 0.19 | | | | | 0.12 | |
| | | | | | | | | | | | | | | | | | | | | | | | | | | | | | | | | | | | | | | | | | | | | | | | | | |
Less distributions to shareholders: | | | | | | | | | | | | | | | | | | | | | | | | | | | | | | | | | | | | | | | | | | | | | | | | | | |
From net investment income | | | | — | | | | | (1.63 | ) | | | | (0.67 | ) | | | | (0.03 | ) | | | | (0.01 | ) | | | | — | | | | | (1.64 | ) | | | | (0.70 | ) | | | | (0.05 | ) | | | | (0.01 | ) |
From net realized gains | | | | — | | | | | — | | | | | (0.40 | ) | | | | — | | | | | (0.26 | ) | | | | — | | | | | — | | | | | (0.40 | ) | | | | — | | | | | (0.26 | ) |
| | | | | | | | | | | | | | | | | | | | | | | | | | | | | | | | | | | | | | | | | | | | | | | | | | |
Total distributions | | | | — | | | | | (1.63 | ) | | | | (1.07 | ) | | | | (0.03 | ) | | | | (0.27 | ) | | | | — | | | | | (1.64 | ) | | | | (1.10 | ) | | | | (0.05 | ) | | | | (0.27 | ) |
| | | | | | | | | | | | | | | | | | | | | | | | | | | | | | | | | | | | | | | | | | | | | | | | | | |
Net asset value, end of period | | | $ | 22.15 | | | | $ | 22.16 | | | | $ | 26.36 | | | | $ | 24.57 | | | | $ | 24.43 | | | | $ | 22.23 | | | | $ | 22.21 | | | | $ | 26.40 | | | | $ | 24.60 | | | | $ | 24.46 | |
| | | | | | | | | | | | | | | | | | | | | | | | | | | | | | | | | | | | | | | | | | | | | | | | | | |
Total Return(c) | | | | (0.05 | )% | | | | (9.88 | )% | | | | 11.92 | % | | | | 0.72 | % | | | | 0.42 | % | | | | 0.09 | % | | | | (9.79 | )% | | | | 12.05 | % | | | | 0.79 | % | | | | 0.52 | % |
Ratios/Supplemental Data: | | | | | | | | | | | | | | | | | | | | | | | | | | | | | | | | | | | | | | | | | | | | | | | | | | |
Net assets, end of period (000’s) | | | $ | 282,272 | | | | $ | 352,828 | | | | $ | 421,910 | | | | $ | 260,775 | | | | $ | 91,186 | | | | $ | 1,209,721 | | | | $ | 1,888,505 | | | | $ | 4,652,197 | | | | $ | 2,849,433 | | | | $ | 88,029 | |
Net operating expenses to average daily net assets(e) | | | | 0.41 | % | | | | 0.40 | % | | | | 0.40 | % | | | | 0.40 | %(d) | | | | 0.40 | % | | | | 0.31 | % | | | | 0.31 | % | | | | 0.31 | % | | | | 0.31 | %(d) | | | | 0.31 | % |
Interest and/or dividend expenses to average daily net assets(f) | | | | 0.00 | %(g) | | | | 0.02 | % | | | | 0.01 | % | | | | 0.00 | %(g) | | | | 0.00 | % | | | | 0.00 | %(g) | | | | 0.02 | % | | | | 0.01 | % | | | | 0.00 | %(g) | | | | — | |
Total net expenses to average daily net assets(e) | | | | 0.41 | % | | | | 0.42 | % | | | | 0.41 | % | | | | 0.40 | % | | | | 0.40 | % | | | | 0.31 | % | | | | 0.33 | % | | | | 0.32 | % | | | | 0.31 | % | | | | 0.31 | % |
Net investment income (loss) to average daily net assets(a) | | | | 0.81 | % | | | | 0.03 | % | | | | 1.49 | % | | | | 0.01 | % | | | | (0.08 | )% | | | | 0.94 | % | | | | 0.27 | % | | | | 0.84 | % | | | | 0.13 | % | | | | 0.02 | % |
Portfolio turnover rate | | | | 130 | %(h) | | | | 177 | % | | | | 177 | % | | | | 32 | % | | | | 233 | % | | | | 130 | %(h) | | | | 177 | % | | | | 177 | % | | | | 32 | % | | | | 233 | % |
Fees and expenses reimbursed and/or waived by GMO to average daily net assets: | | | | 0.02 | % | | | | 0.03 | % | | | | 0.02 | % | | | | 0.02 | % | | | | 0.08 | % | | | | 0.02 | % | | | | 0.03 | % | | | | 0.02 | % | | | | 0.02 | % | | | | 0.07 | % |
| (a) | Net investment income is affected by the timing of the declaration of dividends by the underlying funds in which the Fund invests, if any. |
| (b) | Net investment income (loss) was less than $0.01 per share. |
| (c) | The total returns would have been lower had certain expenses not been reimbursed and/or waived during the periods shown, if applicable, and assumes the effect of reinvested distributions, if any. Calculation excludes purchase premiums and redemption fees which are borne by the shareholder purchasing or redeeming Fund shares, if any. |
| (d) | The net expense ratio does not include the effect of expense reductions (Note 2). |
| (e) | Net expenses exclude expenses incurred indirectly through investment in the underlying funds (Note 5). |
| (f) | Interest expense incurred as a result of entering into reverse repurchase agreements and/or margin on cleared swap contracts, if any, is included in the Fund’s net expenses. Income earned on investing proceeds from reverse repurchase agreements, if any, is included in interest income. |
| (g) | Ratio is less than 0.01%. |
| (h) | The portfolio turnover rate excludes investments in GMO U.S. Treasury Fund (“USTF”) which is used as a short-term investment vehicle for cash management. The Fund’s portfolio turnover rate during the year ended February 28, 2017, including transactions in USTF, was 126% of the average value of its portfolio. |
| † | Calculated using average shares outstanding throughout the period. |
| | | | |
| 62 | | See accompanying notes to the financial statements. | | |
GMO Trust Funds
Financial Highlights
(For a share outstanding throughout each period)
CORE PLUS BOND FUND
| | | | | | | | | | | | | | | | | | | | | | | | | | | | | | | | | | | | | | | | | | | | | | | | | | |
| | | Class III Shares | | Class IV Shares |
| | | Year Ended February 28/29, | | Year Ended February 28/29, |
| | | 2017(a) | | 2016(a) | | 2015(a) | | 2014(a) | | 2013(a) | | 2017(a) | | 2016(a) | | 2015(a) | | 2014(a) | | 2013(a) |
Net asset value, beginning of period | | | $ | 21.39 | | | | $ | 23.43 | | | | $ | 22.35 | | | | $ | 22.23 | | | | $ | 21.39 | | | | $ | 21.45 | | | | $ | 23.49 | | | | $ | 22.41 | | | | $ | 22.29 | | | | $ | 21.42 | |
| | | | | | | | | | | | | | | | | | | | | | | | | | | | | | | | | | | | | | | | | | | | | | | | | | |
Income (loss) from investment operations: | | | | | | | | | | | | | | | | | | | | | | | | | | | | | | | | | | | | | | | | | | | | | | | | | | |
Net investment income (loss)(b)† | | | | 0.26 | | | | | 0.24 | | | | | 0.21 | | | | | 0.21 | | | | | 0.21 | | | | | 0.24 | | | | | 0.27 | | | | | 0.21 | | | | | 0.21 | | | | | 0.24 | |
Net realized and unrealized gain (loss) | | | | 0.25 | | | | | (1.14 | ) | | | | 1.83 | | | | | 0.24 | | | | | 1.62 | | | | | 0.29 | | | | | (1.17 | ) | | | | 1.83 | | | | | 0.27 | | | | | 1.62 | |
| | | | | | | | | | | | | | | | | | | | | | | | | | | | | | | | | | | | | | | | | | | | | | | | | | |
Total from investment operations | | | | 0.51 | | | | | (0.90 | ) | | | | 2.04 | | | | | 0.45 | | | | | 1.83 | | | | | 0.53 | | | | | (0.90 | ) | | | | 2.04 | | | | | 0.48 | | | | | 1.86 | |
| | | | | | | | | | | | | | | | | | | | | | | | | | | | | | | | | | | | | | | | | | | | | | | | | | |
Less distributions to shareholders: | | | | | | | | | | | | | | | | | | | | | | | | | | | | | | | | | | | | | | | | | | | | | | | | | | |
From net investment income | | | | (0.80 | ) | | | | (1.14 | ) | | | | (0.96 | ) | | | | (0.33 | ) | | | | (0.99 | ) | | | | (0.83 | ) | | | | (1.14 | ) | | | | (0.96 | ) | | | | (0.36 | ) | | | | (0.99 | ) |
| | | | | | | | | | | | | | | | | | | | | | | | | | | | | | | | | | | | | | | | | | | | | | | | | | |
Total distributions | | | | (0.80 | ) | | | | (1.14 | ) | | | | (0.96 | ) | | | | (0.33 | ) | | | | (0.99 | ) | | | | (0.83 | ) | | | | (1.14 | ) | | | | (0.96 | ) | | | | (0.36 | ) | | | | (0.99 | ) |
| | | | | | | | | | | | | | | | | | | | | | | | | | | | | | | | | | | | | | | | | | | | | | | | | | |
Net asset value, end of period | | | $ | 21.10 | | | | $ | 21.39 | | | | $ | 23.43 | | | | $ | 22.35 | | | | $ | 22.23 | | | | $ | 21.15 | | | | $ | 21.45 | | | | $ | 23.49 | | | | $ | 22.41 | | | | $ | 22.29 | |
| | | | | | | | | | | | | | | | | | | | | | | | | | | | | | | | | | | | | | | | | | | | | | | | | | |
Total Return(c) | | | | 2.44 | % | | | | (3.93 | )% | | | | 9.25 | % | | | | 2.15 | % | | | | 8.67 | % | | | | 2.55 | % | | | | (3.91 | )% | | | | 9.32 | % | | | | 2.15 | % | | | | 8.85 | % |
Ratios/Supplemental Data: | | | | | | | | | | | | | | | | | | | | | | | | | | | | | | | | | | | | | | | | | | | | | | | | | | |
Net assets, end of period (000’s) | | | $ | 22,172 | | | | $ | 52,187 | | | | $ | 51,045 | | | | $ | 48,632 | | | | $ | 48,831 | | | | $ | 566,433 | | | | $ | 215,060 | | | | $ | 191,054 | | | | $ | 191,571 | | | | $ | 190,527 | |
Net operating expenses to average daily net assets(d) | | | | 0.35 | % | | | | 0.35 | % | | | | 0.37 | % | | | | 0.38 | % | | | | 0.38 | %(e) | | | | 0.30 | % | | | | 0.30 | % | | | | 0.32 | % | | | | 0.33 | % | | | | 0.33 | %(e) |
Interest and/or dividend expenses to average daily net assets(g) | | | | 0.00 | %(f) | | | | 0.01 | % | | | | 0.00 | %(f) | | | | 0.00 | %(f) | | | | — | | | | | 0.00 | %(f) | | | | 0.01 | % | | | | 0.00 | %(f) | | | | 0.00 | %(f) | | | | — | |
Total net expenses to average daily net assets(d) | | | | 0.35 | % | | | | 0.36 | % | | | | 0.37 | % | | | | 0.38 | % | | | | 0.38 | %(e) | | | | 0.30 | % | | | | 0.31 | % | | | | 0.32 | % | | | | 0.33 | % | | | | 0.33 | %(e) |
Net investment income (loss) to average daily net assets(b) | | | | 1.21 | % | | | | 1.14 | % | | | | 0.89 | % | | | | 0.95 | % | | | | 1.02 | % | | | | 1.10 | % | | | | 1.17 | % | | | | 0.94 | % | | | | 0.99 | % | | | | 1.07 | % |
Portfolio turnover rate | | | | 216 | %(h) | | | | 21 | % | | | | 128 | % | | | | 87 | % | | | | 135 | % | | | | 216 | %(h) | | | | 21 | % | | | | 128 | % | | | | 87 | % | | | | 135 | % |
Fees and expenses reimbursed and/or waived by GMO to average daily net assets:(i) | | | | 0.30 | % | | | | 0.21 | % | | | | 0.15 | % | | | | 0.12 | % | | | | 0.13 | % | | | | 0.26 | % | | | | 0.21 | % | | | | 0.15 | % | | | | 0.12 | % | | | | 0.13 | % |
| (a) | Per share amounts were adjusted to reflect a 1:3 reverse stock split effective July 15, 2016. |
| (b) | Net investment income is affected by the timing of the declaration of dividends by the underlying funds in which the Fund invests, if any. |
| (c) | The total returns would have been lower had certain expenses not been reimbursed and/or waived during the periods shown, if applicable, and assumes the effect of reinvested distributions, if any. Calculation excludes purchase premiums and redemption fees which are borne by the shareholder purchasing or redeeming Fund shares, if any. |
| (d) | Net expenses exclude expenses incurred indirectly through investment in the underlying funds (Note 5). |
| (e) | The net expense ratio does not include the effect of expense reductions (Note 2). |
| (f) | Ratio is less than 0.01%. |
| (g) | Interest expense incurred as a result of entering into reverse repurchase agreements and/or margin on cleared swap contracts, if any, is included in the Fund’s net expenses. Income earned on investing proceeds from reverse repurchase agreements, if any, is included in interest income. |
| (h) | The portfolio turnover rate excludes investments in GMO U.S. Treasury Fund (“USTF”) which is used as a short-term investment vehicle for cash management. The Fund’s portfolio turnover rate during the year ended February 28, 2017, including transactions in USTF, was 325% of the average value of its portfolio. |
| (i) | Ratios include indirect fees waived or borne by GMO. |
| † | Calculated using average shares outstanding throughout the period. |
| | | | |
| | See accompanying notes to the financial statements. | | 63 |
GMO Trust Funds
Financial Highlights
(For a share outstanding throughout each period)
CURRENCY HEDGED INTERNATIONAL BOND FUND
| | | | | | | | | | | | | | | | | | | | | | | | | |
| | | Class III Shares |
| | | Year Ended February 28/29, |
| | | 2017(a) | | 2016(a) | | 2015(a) | | 2014(a) | | 2013(a) |
Net asset value, beginning of period | | | $ | 26.67 | | | | $ | 29.70 | | | | $ | 26.70 | | | | $ | 26.28 | | | | $ | 25.05 | |
| | | | | | | | | | | | | | | | | | | | | | | | | |
Income (loss) from investment operations: | | | | | | | | | | | | | | | | | | | | | | | | | |
Net investment income (loss)†(b) | | | | 0.32 | | | | | 0.27 | | | | | 0.33 | | | | | 0.36 | | | | | 0.42 | |
Net realized and unrealized gain (loss) | | | | 0.42 | | | | | (0.72 | ) | | | | 4.14 | | | | | 0.42 | | | | | 1.92 | |
| | | | | | | | | | | | | | | | | | | | | | | | | |
Total from investment operations | | | | 0.74 | | | | | (0.45 | ) | | | | 4.47 | | | | | 0.78 | | | | | 2.34 | |
| | | | | | | | | | | | | | | | | | | | | | | | | |
Less distributions to shareholders: | | | | | | | | | | | | | | | | | | | | | | | | | |
From net investment income | | | | (0.91 | ) | | | | (2.58 | ) | | | | (1.47 | ) | | | | (0.33 | ) | | | | (1.11 | ) |
Return of capital | | | | — | | | | | — | | | | | — | | | | | (0.03 | ) | | | | — | |
| | | | | | | | | | | | | | | | | | | | | | | | | |
Total distributions | | | | (0.91 | ) | | | | (2.58 | ) | | | | (1.47 | ) | | | | (0.36 | ) | | | | (1.11 | ) |
| | | | | | | | | | | | | | | | | | | | | | | | | |
Net asset value, end of period | | | $ | 26.50 | | | | $ | 26.67 | | | | $ | 29.70 | | | | $ | 26.70 | | | | $ | 26.28 | |
| | | | | | | | | | | | | | | | | | | | | | | | | |
Total Return(c) | | | | 2.79 | % | | | | (1.17 | )% | | | | 17.02 | % | | | | 3.04 | % | | | | 9.43 | % |
Ratios/Supplemental Data: | | | | | | | | | | | | | | | | | | | | | | | | | |
Net assets, end of period (000’s) | | | $ | 59,233 | | | | $ | 61,519 | | | | $ | 71,891 | | | | $ | 71,837 | | | | $ | 69,527 | |
Net operating expenses to average daily net assets(d) | | | | 0.40 | % | | | | 0.38 | % | | | | 0.36 | % | | | | 0.39 | % | | | | 0.40 | % |
Interest and/or dividend expenses to average daily net assets(f) | | | | 0.00 | %(e) | | | | 0.01 | % | | | | 0.00 | %(e) | | | | 0.00 | %(e) | | | | — | |
Total net expenses to average daily net assets(d) | | | | 0.40 | % | | | | 0.39 | % | | | | 0.36 | % | | | | 0.39 | % | | | | 0.40 | % |
Net investment income (loss) to average daily net assets(b) | | | | 1.17 | % | | | | 1.03 | % | | | | 1.19 | % | | | | 1.41 | % | | | | 1.61 | % |
Portfolio turnover rate | | | | — | (g) | | | | 69 | % | | | | 117 | % | | | | 13 | % | | | | 34 | % |
Fees and expenses reimbursed and/or waived by GMO to average daily net assets:(h) | | | | 0.31 | % | | | | 0.58 | % | | | | 0.27 | % | | | | 0.24 | % | | | | 0.27 | % |
| (a) | Per share amounts were adjusted to reflect a 1:3 reverse stock split effective July 15, 2016. |
| (b) | Net investment income is affected by the timing of the declaration of dividends by the underlying funds in which the Fund invests, if any. |
| (c) | The total returns would have been lower had certain expenses not been reimbursed and/or waived during the periods shown, if applicable, and assumes the effect of reinvested distributions, if any. Calculation excludes purchase premiums and redemption fees which are borne by the shareholder purchasing or redeeming Fund shares, if any. |
| (d) | Net expenses exclude expenses incurred indirectly through investment in the underlying funds (Note 5). |
| (e) | Ratio is less than 0.01%. |
| (f) | Interest expense incurred as a result of entering into reverse repurchase agreements and/or margin on cleared swap contracts, if any, is included in the Fund’s net expenses. Income earned on investing proceeds from reverse repurchase agreements, if any, is included in interest income. |
| (g) | The portfolio turnover rate excludes investments in GMO U.S. Treasury Fund (“USTF”) which is used as a short-term investment vehicle for cash management. The Fund’s portfolio turnover rate during the year ended February 28, 2017, including transactions in USTF, was 21% of the average value of its portfolio. |
| (h) | Ratios include indirect fees waived or borne by GMO. |
| † | Calculated using average shares outstanding throughout the period. |
| | | | |
| 64 | | See accompanying notes to the financial statements. | | |
GMO Trust Funds
Financial Highlights
(For a share outstanding throughout each period)
EMERGING COUNTRY DEBT FUND
| | | | | | | | | | | | | | | | | | | | | | | | | | | | | | | | | | | | | | | | | | | | | | | | | | |
| | | Class III Shares | | Class IV Shares |
| | | Year Ended February 28/29, | | Year Ended February 28/29, |
| | | 2017(a) | | 2016(a) | | 2015(a) | | 2014(a) | | 2013(a) | | 2017(a) | | 2016(a) | | 2015(a) | | 2014(a) | | 2013(a) |
Net asset value, beginning of period | | | $ | 26.01 | | | | $ | 28.47 | | | | $ | 29.31 | | | | $ | 31.02 | | | | $ | 28.77 | | | | $ | 25.98 | | | | $ | 28.44 | | | | $ | 29.28 | | | | $ | 30.99 | | | | $ | 28.74 | |
| | | | | | | | | | | | | | | | | | | | | | | | | | | | | | | | | | | | | | | | | | | | | | | | | | |
Income (loss) from investment operations: | | | | | | | | | | | | | | | | | | | | | | | | | | | | | | | | | | | | | | | | | | | | | | | | | | |
Net investment income (loss)(b)† | | | | 1.94 | | | | | 1.53 | | | | | 1.77 | (c) | | | | 1.80 | | | | | 2.31 | | | | | 1.95 | | | | | 1.53 | | | | | 1.80 | (c) | | | | 1.80 | | | | | 2.37 | |
Net realized and unrealized gain (loss) | | | | 3.01 | (d) | | | | (2.04 | ) | | | | (0.03 | ) | | | | (1.77 | ) | | | | 2.46 | | | | | 3.01 | (d) | | | | (2.01 | ) | | | | (0.06 | ) | | | | (1.74 | ) | | | | 2.43 | |
| | | | | | | | | | | | | | | | | | | | | | | | | | | | | | | | | | | | | | | | | | | | | | | | | | |
Total from investment operations | | | | 4.95 | | | | | (0.51 | ) | | | | 1.74 | | | | | 0.03 | | | | | 4.77 | | | | | 4.96 | | | | | (0.48 | ) | | | | 1.74 | | | | | 0.06 | | | | | 4.80 | |
| | | | | | | | | | | | | | | | | | | | | | | | | | | | | | | | | | | | | | | | | | | | | | | | | | |
Less distributions to shareholders: | | | | | | | | | | | | | | | | | | | | | | | | | | | | | | | | | | | | | | | | | | | | | | | | | | |
From net investment income | | | | (1.97 | ) | | | | (1.95 | ) | | | | (2.58 | ) | | | | (1.74 | ) | | | | (2.52 | ) | | | | (1.99 | ) | | | | (1.98 | ) | | | | (2.58 | ) | | | | (1.77 | ) | | | | (2.55 | ) |
| | | | | | | | | | | | | | | | | | | | | | | | | | | | | | | | | | | | | | | | | | | | | | | | | | |
Total distributions | | | | (1.97 | ) | | | | (1.95 | ) | | | | (2.58 | ) | | | | (1.74 | ) | | | | (2.52 | ) | | | | (1.99 | ) | | | | (1.98 | ) | | | | (2.58 | ) | | | | (1.77 | ) | | | | (2.55 | ) |
| | | | | | | | | | | | | | | | | | | | | | | | | | | | | | | | | | | | | | | | | | | | | | | | | | |
Net asset value, end of period | | | $ | 28.99 | | | | $ | 26.01 | | | | $ | 28.47 | | | | $ | 29.31 | | | | $ | 31.02 | | | | $ | 28.95 | | | | $ | 25.98 | | | | $ | 28.44 | | | | $ | 29.28 | | | | $ | 30.99 | |
| | | | | | | | | | | | | | | | | | | | | | | | | | | | | | | | | | | | | | | | | | | | | | | | | | |
Total Return(e) | | | | 19.47 | % | | | | (1.77 | )% | | | | 6.03 | % | | | | 0.27 | % | | | | 17.04 | % | | | | 19.50 | % | | | | (1.73 | )% | | | | 6.07 | % | | | | 0.33 | % | | | | 17.14 | % |
Ratios/Supplemental Data: | | | | | | | | | | | | | | | | | | | | | | | | | | | | | | | | | | | | | | | | | | | | | | | | | | |
Net assets, end of period (000’s) | | | $ | 1,067,086 | | | | $ | 827,667 | | | | $ | 746,182 | | | | $ | 582,639 | | | | $ | 427,339 | | | | $ | 3,018,159 | | | | $ | 3,099,809 | | | | $ | 3,262,104 | | | | $ | 2,465,331 | | | | $ | 1,908,041 | |
Net operating expenses to average daily net assets(f) | | | | 0.54 | % | | | | 0.54 | % | | | | 0.56 | % | | | | 0.56 | %(g) | | | | 0.60 | %(g) | | | | 0.49 | % | | | | 0.49 | % | | | | 0.51 | % | | | | 0.51 | %(g) | | | | 0.55 | %(g) |
Interest and/or dividend expenses to average daily net assets(h) | | | | — | | | | | 0.00 | %(i) | | | | — | | | | | — | | | | | 0.02 | % | | | | — | | | | | 0.00 | %(i) | | | | — | | | | | — | | | | | 0.02 | % |
Total net expenses to average daily net assets(f) | | | | 0.54 | % | | | | 0.54 | %(h) | | | | 0.56 | % | | | | 0.56 | %(g) | | | | 0.62 | %(g) | | | | 0.49 | % | | | | 0.49 | %(f) | | | | 0.51 | % | | | | 0.51 | %(g) | | | | 0.57 | %(g) |
Net investment income (loss) to average daily net assets(b) | | | | 6.76 | % | | | | 5.58 | % | | | | 5.86 | %(j) | | | | 5.99 | % | | | | 7.75 | % | | | | 6.81 | % | | | | 5.60 | % | | | | 5.93 | %(j) | | | | 6.02 | % | | | | 7.84 | % |
Portfolio turnover rate | | | | 21 | %(k) | | | | 20 | % | | | | 18 | % | | | | 27 | % | | | | 36 | % | | | | 21 | %(k) | | | | 20 | % | | | | 18 | % | | | | 27 | % | | | | 36 | % |
Fees and expenses reimbursed and/or waived by GMO to average daily net assets:(l) | | | | 0.00 | %(i) | | | | 0.00 | %(i) | | | | 0.00 | %(i) | | | | — | | | | | 0.00 | %(i) | | | | 0.00 | %(i) | | | | 0.00 | %(i) | | | | 0.00 | %(i) | | | | — | | | | | 0.00 | %(i) |
Purchase premiums and redemption fees consisted of the following per share amounts (Note 2):† | | | $ | 0.04 | (a) | | | $ | 0.04 | (a) | | | $ | 0.06 | (a) | | | $ | 0.05 | (a) | | | $ | 0.08 | (a) | | | $ | 0.04 | (a) | | | $ | 0.04 | (a) | | | $ | 0.06 | (a) | | | $ | 0.05 | (a) | | | $ | 0.08 | (a) |
| (a) | Per share amounts were adjusted to reflect a 1:3 reverse stock split effective July 15, 2016. |
| (b) | Net investment income is affected by the timing of the declaration of dividends by the underlying funds in which the Fund invests, if any. |
| (c) | Includes income per share of $0.06 and $0.09, respectively, as a result of litigation on certain sovereign debt. Excluding this income, the Fund’s net investment income per share would have been $1.71 and $1.71, respectively. These per share amounts have been adjusted to reflect a 1:3 reverse stock split effective July 15, 2016. |
| (d) | Includes realized gain per share of $0.23 and $0.23, respectively, as a result of litigation on Argentinian sovereign debt. Excluding this income, the Fund’s realized gain per share would have been $2.78 and $2.78, respectively. |
| (e) | The total returns would have been lower had certain expenses not been reimbursed and/or waived during the periods shown, if applicable, and assumes the effect of reinvested distributions, if any. Calculation excludes purchase premiums and redemption fees which are borne by the shareholder purchasing or redeeming Fund shares, if any. |
| (f) | Net expenses exclude expenses incurred indirectly through investment in the underlying funds (Note 5). |
| (g) | The net expense ratio does not include the effect of expense reductions (Note 2). |
| (h) | Interest expense incurred as a result of entering into reverse repurchase agreements and/or margin on cleared swap contracts, if any, is included in the Fund’s net expenses. Income earned on investing proceeds from reverse repurchase agreements, if any, is included in interest income. |
| (i) | Ratio is less than 0.01%. |
| (j) | Includes income of $0.24 and $0.24, respectively, of average daily net assets as a result of litigation on certain sovereign debt. Excluding this income, the Fund’s net investment income to average daily net assets would have been 5.62% and 5.69%, respectively. |
| (k) | The portfolio turnover rate excludes investments in GMO U.S. Treasury Fund (“USTF”) which is used as a short-term investment vehicle for cash management. The Fund’s portfolio turnover rate during the year ended February 28, 2017, including transactions in USTF, was 23% of the average value of its portfolio. |
| (l) | Ratios include indirect fees waived or borne by GMO. |
| † | Calculated using average shares outstanding throughout the period. |
| | | | |
| | See accompanying notes to the financial statements. | | 65 |
GMO Trust Funds
Financial Highlights
(For a share outstanding throughout each period)
OPPORTUNISTIC INCOME FUND (FORMERLY DEBT OPPORTUNITIES FUND)
| | | | | | | | | | | | | | | | | | | | | | | | | |
| | | Class VI Shares |
| | | Year Ended February 28/29, |
| | | 2017 | | 2016 | | 2015(a) | | 2014(a)(b) | | 2013(a) |
Net asset value, beginning of period | | | $ | 24.57 | | | | $ | 24.80 | | | | $ | 24.22 | | | | $ | 24.22 | | | | $ | 22.54 | |
| | | | | | | | | | | | | | | | | | | | | | | | | |
Income (loss) from investment operations: | | | | | | | | | | | | | | | | | | | | | | | | | |
Net investment income (loss)(c)† | | | | 0.96 | | | | | 0.53 | | | | | 0.54 | | | | | 0.84 | | | | | 1.05 | |
Net realized and unrealized gain (loss) | | | | 0.89 | | | | | (0.34 | ) | | | | 0.42 | | | | | 0.14 | | | | | 1.54 | |
| | | | | | | | | | | | | | | | | | | | | | | | | |
Total from investment operations | | | | 1.85 | | | | | 0.19 | | | | | 0.96 | | | | | 0.98 | | | | | 2.59 | |
| | | | | | | | | | | | | | | | | | | | | | | | | |
Less distributions to shareholders: | | | | | | | | | | | | | | | | | | | | | | | | | |
From net investment income | | | | (0.64 | ) | | | | (0.42 | ) | | | | (0.38 | ) | | | | (0.56 | ) | | | | (0.35 | ) |
From net realized gains | | | | — | | | | | — | | | | | — | | | | | (0.42 | ) | | | | (0.56 | ) |
| | | | | | | | | | | | | | | | | | | | | | | | | |
Total distributions | | | | (0.64 | ) | | | | (0.42 | ) | | | | (0.38 | ) | | | | (0.98 | ) | | | | (0.91 | ) |
| | | | | | | | | | | | | | | | | | | | | | | | | |
Net asset value, end of period | | | $ | 25.78 | | | | $ | 24.57 | (d) | | | $ | 24.80 | | | | $ | 24.22 | | | | $ | 24.22 | |
| | | | | | | | | | | | | | | | | | | | | | | | | |
Total Return(e) | | | | 7.62 | % | | | | 0.77 | % | | | | 3.98 | % | | | | 4.27 | % | | | | 11.62 | % |
Ratios/Supplemental Data: | | | | | | | | | | | | | | | | | | | | | | | | | |
Net assets, end of period (000’s) | | | $ | 1,510,894 | | | | $ | 1,648,019 | | | | $ | 1,790,805 | | | | $ | 2,111,080 | | | | $ | 812,020 | |
Net expenses to average daily net assets(f) | | | | 0.33 | % | | | | 0.31 | % | | | | 0.31 | % | | | | 0.31 | %(g) | | | | 0.31 | %(g) |
Interest and/or dividend expenses to average daily net assets(i) | | | | 0.00 | %(h) | | | | 0.00 | %(h) | | | | 0.00 | %(h) | | | | — | | | | | — | |
Total net expenses to average daily net assets(f) | | | | 0.33 | % | | | | 0.31 | % | | | | 0.31 | % | | | | 0.31 | %(g) | | | | 0.31 | %(g) |
Net investment income (loss) to average daily net assets(c) | | | | 3.82 | % | | | | 2.13 | % | | | | 2.18 | % | | | | 3.51 | % | | | | 4.36 | % |
Portfolio turnover rate | | | | 66 | %(j) | | | | 66 | % | | | | 37 | % | | | | 30 | % | | | | 39 | % |
Fees and expenses reimbursed and/or waived by GMO to average daily net assets | | | | 0.04 | % | | | | 0.03 | % | | | | 0.03 | % | | | | 0.02 | % | | | | 0.04 | % |
Purchase premiums and redemption fees consisted of the following per share amounts (Note 2):† | | | $ | 0.03 | | | | $ | 0.04 | | | | $ | 0.03 | (a) | | | $ | 0.05 | (a) | | | $ | 0.11 | (a) |
| (a) | Per share amounts were adjusted to reflect a 1:7 reverse stock split effective May 15, 2014. |
| (b) | Effective February 12, 2014, GMO Debt Opportunities Fund (the “Acquired Fund”) merged into GMO Short-Duration Collateral Fund (the “Acquiring Fund”) and the surviving entity was renamed GMO Debt Opportunities Fund. For accounting and financial reporting purposes, the Acquired Fund is the surviving entity, meaning the combined entity adopted the historical financial reporting history of the Acquired Fund. Share and per share information have been adjusted to reflect the effects of the merger. |
| (c) | Net investment income is affected by the timing of the declaration of dividends by the underlying funds in which the Fund invests, if any. |
| (d) | Beginning December 21, 2015 the pricing source for certain fixed income assets of the Fund changed, which resulted in an increase in the December 21, 2015 net asset value of the Fund by $0.04 per share. |
| (e) | The total returns would have been lower had certain expenses not been reimbursed and/or waived during the periods shown, if applicable, and assumes the effect of reinvested distributions, if any. Calculation excludes purchase premiums and redemption fees which are borne by the shareholder purchasing or redeeming Fund shares, if any. |
| (f) | Net expenses exclude expenses incurred indirectly through investment in the underlying funds (Note 5). |
| (g) | The net expense ratio does not include the effect of expense reductions (Note 2). |
| (h) | Ratio is less than 0.01%. |
| (i) | Interest expense incurred as a result of entering into reverse repurchase agreements and/or margin on cleared swap contracts, if any, is included in the Fund’s net expenses. Income earned on investing proceeds from reverse repurchase agreements, if any, is included in interest income. |
| (j) | The portfolio turnover rate excludes investments in GMO U.S. Treasury Fund (“USTF”) which is used as a short-term investment vehicle for cash management. The Fund’s portfolio turnover rate during the year ended February 28, 2017, including transactions in USTF, was 75% of the average value of its portfolio. |
| † | Calculated using average shares outstanding throughout the period. |
| | | | |
| 66 | | See accompanying notes to the financial statements. | | |
GMO Trust Funds
Financial Highlights
(For a share outstanding throughout the period)
U.S. TREASURY FUND
| | | | | | | | | | | | | | | | | | | | | | | | | |
| | | Core Shares |
| | | Year Ended February 28/29, |
| | | 2017 | | 2016 | | 2015 | | 2014 | | 2013 |
Net asset value, beginning of period | | | $ | 25.00 | | | | $ | 25.00 | | | | $ | 25.00 | | | | $ | 25.00 | | | | $ | 25.00 | |
| | | | | | | | | | | | | | | | | | | | | | | | | |
Income (loss) from investment operations: | | | | | | | | | | | | | | | | | | | | | | | | | |
Net investment income (loss)† | | | | 0.12 | | | | | 0.04 | | | | | 0.01 | | | | | 0.02 | | | | | 0.03 | |
Net realized and unrealized gain (loss) | | | | 0.01 | | | | | 0.00 | | | | | 0.00 | (a) | | | | 0.01 | | | | | (0.00 | )(a) |
| | | | | | | | | | | | | | | | | | | | | | | | | |
Total from investment operations | | | | 0.13 | | | | | 0.04 | | | | | 0.01 | | | | | 0.03 | | | | | 0.03 | |
| | | | | | | | | | | | | | | | | | | | | | | | | |
Less distributions to shareholders: | | | | | | | | | | | | | | | | | | | | | | | | | |
From net investment income | | | | (0.12 | ) | | | | (0.03 | ) | | | | (0.01 | ) | | | | (0.02 | ) | | | | (0.03 | ) |
From net realized gains | | | | (0.01 | ) | | | | (0.01 | ) | | | | (0.00 | )(b) | | | | (0.01 | ) | | | | — | |
| | | | | | | | | | | | | | | | | | | | | | | | | |
Total distributions | | | | (0.13 | ) | | | | (0.04 | ) | | | | (0.01 | ) | | | | (0.03 | ) | | | | (0.03 | ) |
| | | | | | | | | | | | | | | | | | | | | | | | | |
Net asset value, end of period | | | $ | 25.00 | | | | $ | 25.00 | | | | $ | 25.00 | | | | $ | 25.00 | | | | $ | 25.00 | |
| | | | | | | | | | | | | | | | | | | | | | | | | |
Total Return(c) | | | | 0.54 | % | | | | 0.19 | % | | | | 0.06 | % | | | | 0.11 | % | | | | 0.11 | % |
Ratios/Supplemental Data: | | | | | | | | | | | | | | | | | | | | | | | | | |
Net assets, end of period (000’s) | | | $ | 2,666,697 | | | | $ | 4,033,504 | | | | $ | 2,243,931 | | | | $ | 1,909,864 | | | | $ | 2,912,203 | |
Net expenses to average daily net assets | | | | 0.00 | %(d) | | | | 0.00 | %(d) | | | | 0.00 | %(d) | | | | 0.00 | %(d)(e) | | | | 0.00 | %(d)(e) |
Net investment income (loss) to average daily net assets | | | | 0.47 | % | | | | 0.16 | % | | | | 0.05 | % | | | | 0.08 | % | | | | 0.10 | % |
Portfolio turnover rate(f) | | | | 0 | % | | | | 0 | % | | | | 0 | % | | | | 0 | % | | | | 0 | % |
Fees and expenses reimbursed and/or waived by GMO to average daily net assets: | | | | 0.10 | % | | | | 0.10 | % | | | | 0.10 | % | | | | 0.10 | % | | | | 0.10 | % |
| (a) | Net realized and unrealized gain (loss) was less than $0.01 per share. |
| (b) | Distributions from net realized gains were less than $0.01 per share. |
| (c) | The total returns would have been lower had certain expenses not been reimbursed and/or waived during the periods shown, if applicable, and assumes the effect of reinvested distributions, if any. Calculation excludes purchase premiums and redemption fees which are borne by the shareholder purchasing or redeeming Fund shares, if any. |
| (d) | Ratio is less than 0.01%. |
| (e) | The net expense ratio does not include the effect of expense reductions (Note 2). |
| (f) | Portfolio turnover rate calculation excludes short-term investments. |
| † | Calculated using average shares outstanding throughout the period. |
| | | | |
| | See accompanying notes to the financial statements. | | 67 |
GMO Trust Funds
Notes to Financial Statements
February 28, 2017
Each of Asset Allocation Bond Fund, Core Plus Bond Fund, Currency Hedged International Bond Fund, Emerging Country Debt Fund, Opportunistic Income Fund (formerly Debt Opportunities Fund) and U.S. Treasury Fund (each a “Fund” and collectively the “Funds”) is a series of GMO Trust (the “Trust”). The Trust is registered under the Investment Company Act of 1940, as amended (the “1940 Act”), as an open-end management investment company. The Trust was established as a Massachusetts business trust under the laws of The Commonwealth of Massachusetts on June 24, 1985. The Declaration of Trust permits the Trustees of the Trust (“Trustees”) to create an unlimited number of series of shares (Funds) and to subdivide Funds into classes. The Funds are advised and managed by Grantham, Mayo, Van Otterloo & Co. LLC (“GMO”).
The Funds may invest in GMO U.S. Treasury Fund and in money market funds unaffiliated with GMO.
Many of the Funds may invest without limitation in other GMO Funds (“underlying funds”). In particular, pursuant to an exemptive order granted by the Securities and Exchange Commission (“SEC”), some of the Funds may invest in Emerging Country Debt Fund, Opportunistic Income Fund and U.S. Treasury Fund. The financial statements of the underlying funds should be read in conjunction with the Funds’ financial statements.
The following table provides information about the Funds’ principal investment objectives and benchmarks (if any):
| | | | |
| | | |
| Fund Name | | Benchmark | | Investment Objective |
| Asset Allocation Bond Fund | | Citigroup 3-Month Treasury Bill Index | | Total return in excess of benchmark |
| Core Plus Bond Fund | | Barclays U.S. Aggregate Index | | Total return in excess of benchmark |
| Currency Hedged International Bond Fund | | J.P. Morgan GBI Global ex Japan ex U.S. (Hedged) | | Total return in excess of benchmark |
| Emerging Country Debt Fund | | J.P. Morgan EMBI Global | | Total return in excess of benchmark |
| Opportunistic Income Fund (formerly Debt Opportunities Fund) | | Not Applicable | | Capital appreciation and current income |
| U.S. Treasury Fund | | Not Applicable | | Liquidity and safety of principal with current income as a secondary objective |
Asset Allocation Bond Fund, Currency Hedged International Bond Fund and U.S. Treasury Fund currently limit subscriptions.
Emerging Country Debt Fund is currently distributed in Switzerland. The distribution of shares in Switzerland will be exclusively made to, and directed at, qualified investors as defined in the Swiss Collective Investment Schemes Act of 23 June 2006, as amended, and its implementing ordinance.
| 2. | Significant accounting policies |
The following is a summary of significant accounting policies followed by each Fund in the preparation of its financial statements. These policies are in conformity with accounting principles generally accepted in the United States of America (“U.S. GAAP”) and have been consistently followed by the Funds in preparing these financial statements. The preparation of financial statements in accordance with U.S. GAAP requires management to make estimates and assumptions that affect the reported amounts and disclosures in the financial statements. Actual results could differ from those estimates. The accounting records of the Funds are maintained in U.S. dollars.
Portfolio valuation
Typically, the Funds and the underlying funds value fixed income securities at the most recent price supplied by a specific relevant pricing source determined by GMO. Although GMO normally does not evaluate pricing sources on a day-to-day basis, it does evaluate pricing sources on an ongoing basis and may change a pricing source at any time. GMO monitors erratic or unusual movements (including unusual inactivity) in the prices supplied for a security and has discretion to override a price supplied by a source (e.g., by taking a price supplied by another) when it believes that the price supplied is not reliable. Alternative pricing sources are often but not always available for securities held by the Funds and the underlying funds. See the table below for information about securities for which no alternative pricing source was available.
Exchange-traded securities (other than exchange-traded options) for which market quotations are readily available are valued at (i) the last sale price or (ii) official closing price or (iii) most recent quoted price published by the exchange (if no reported last sale or official closing price) or (iv) the quoted price provided by a pricing source (in the event GMO deems the private market to be a more reliable indicator of market value than the exchange). Exchange-traded options are valued at the last sale price, provided that price is between the closing bid and ask prices. If the
68
GMO Trust Funds
Notes to Financial Statements — (Continued)
February 28, 2017
last sale price is not within this range, then they will be valued at the closing bid price for long positions and the closing ask price for short positions. Cleared derivatives are valued using the price quoted (which may be based on a model) by the relevant clearing house. If an updated quote for a cleared derivative is not available by the time that a Fund calculates its net asset value on any business day, then that derivative will generally be valued using an industry standard model, which may differ from the model used by the relevant clearing house. Over-the-counter (“OTC”) derivatives are generally valued at the price determined by an industry standard model. Unlisted securities for which market quotations are readily available are generally valued at the most recent quoted price. Shares of the underlying funds and other open-end registered investment companies are valued at their most recent net asset value. If quotations are not readily available or circumstances make an existing valuation methodology or procedure unreliable, derivatives and other securities are valued at fair value as determined in good faith by the Trustees or persons acting at their direction pursuant to procedures approved by the Trustees. Because of the uncertainty inherent in pricing, and in particular fair value pricing, the value determined for a particular security may be materially different from the value realized upon its sale. See the table below for information about securities and derivatives, if any, that were fair valued using methods determined in good faith by or at the direction of the Trustees. The Funds and/or the underlying funds classify such securities as Level 3 (levels defined below). For the year ended February 28, 2017, the Funds did not reduce the value of any of their OTC derivatives contracts, if any, based on the creditworthiness of their counterparties. See Note 4 “Derivative financial instruments” for a further discussion on valuation of derivatives.
The foregoing valuation methodologies are modified for equities that trade in non-U.S. securities markets which close prior to the close of the New York Stock Exchange (“NYSE”) due to time zone differences, including the value of equities that underlie futures, options and other derivatives (to the extent the market for those derivatives closes prior to the close of the NYSE). In those cases, the price will generally be adjusted, to the extent practicable and available, based on inputs from an independent pricing service approved by the Trustees that are intended to reflect valuation changes through the NYSE close. The table below shows the percentage of the net assets of the Funds, held either directly or through investments in the underlying funds, if any, that were valued using fair value inputs obtained from that independent pricing service as of February 28, 2017. These securities listed on foreign exchanges (including the value of equity securities that underlie futures, options and other derivatives (to the extent the market for such instruments closes prior to the close of the NYSE)) are classified as Level 2 (levels defined below) in the table below.
“Quoted price” typically means the bid price for securities held long and the ask price for securities sold short. If a market quotation for a security does not involve a bid or an ask, the “quoted price” may be the price provided by a market participant or other third-party pricing source in accordance with the market practice for that security. If an updated quoted price for a security is not available by the time that a Fund calculates its net asset value on any business day, the Fund will generally use the last quoted price so long as GMO believes that the last quoted price continues to represent that security’s fair value.
In the case of derivatives, prices determined by a model may reflect an estimate of the average of bid and ask prices, regardless of whether a Fund has a long position or a short position.
As discussed above, certain of the Funds and underlying funds invest in securities and/or derivatives which may have been fair valued using methods determined in good faith by or at the direction of the Trustees or valued using prices for which no alternative pricing source was available. The table below presents securities and/or derivatives on a net basis, based on market values or unrealized appreciation/(depreciation), which will tend to understate the Funds’ exposure. The net aggregate direct and indirect exposure to these valuation methodologies (based on each Fund’s net assets) as of February 28, 2017 is as follows:
Securities and derivatives
| | | | | | | | |
| | | |
| Fund Name | | Fair valued using
methods determined in
good faith by or at the
direction of the Trustees | | | Single source:
No alternative
pricing source
was available | |
Asset Allocation Bond Fund | | | — | | | | — | |
Core Plus Bond Fund | | | <1 | % | | | 2% | |
Currency Hedged International Bond Fund | | | <1 | % | | | 1% | |
Emerging Country Debt Fund | | | 2 | %† | | | 3% | |
Opportunistic Income Fund (formerly Debt Opportunities Fund) | | | 1 | %‡ | | | 7% | |
U.S. Treasury Fund | | | — | | | | — | |
| | † | Includes the Republic of Albania Par Bond, due 08/31/25 which represents 0.9% of the Fund’s total net assets and is valued by applying a 140 basis point spread to the yield of the U.S. Treasury Strip Principal, due 08/15/25. |
| | †† | Consists of four U.S. Agency for International Development Floater Bonds which were valued using current LIBOR yield and adjusted by 125 basis points for liquidity considerations. |
69
GMO Trust Funds
Notes to Financial Statements — (Continued)
February 28, 2017
U.S. GAAP requires the Funds to disclose the fair value of their investments in a three-level hierarchy (Levels 1, 2 and 3). The valuation hierarchy is based upon the relative observability of inputs to the valuation of the Funds’ investments. The inputs or methodologies used for valuing securities are not necessarily an indication of the risk associated with investing in those securities.
Changes in valuation techniques may result in transfers into or out of an investment’s assigned level within the fair value hierarchy. In addition, in periods of market dislocation, the observability of prices and inputs may be reduced for many instruments. This condition, as well as changes related to the liquidity of investments, could cause a security to be reclassified between levels.
U.S. GAAP requires additional disclosures about fair value measurements for material Level 3 securities and derivatives, if any (determined by each category of asset or liability as compared to a Fund’s total net assets separately identified in the table below). Other than Funds with investments valued using unadjusted prices supplied by a third-party pricing source (e.g., broker quotes) or as described in the footnotes to the Securities and derivatives table above, there were no other Funds with classes of investments or derivatives with direct material Level 3 holdings at February 28, 2017.
The three levels are defined as follows:
Level 1 – Valuations based on quoted prices for identical securities in active markets.
The types of assets and liabilities categorized in Level 1 generally include actively traded domestic and certain foreign equity securities; certain U.S. government obligations; derivatives actively traded on a national securities exchange (such as some futures and options); and shares of open-end mutual funds (even if their investments are valued using Level 2 or Level 3 inputs).
Level 2 – Valuations determined using other significant direct or indirect observable inputs.
The types of assets and liabilities categorized in Level 2 generally include certain U.S. government agency securities, mortgage-backed securities, asset-backed securities, certain sovereign debt obligations, and corporate bonds valued using vendor prices or broker quotes; cleared derivatives and certain OTC derivatives such as swaps, options, swaptions, and forward currency contracts valued using industry standard models; certain restricted securities valued at the most recent available market or quoted price and certain foreign equity securities that are adjusted based on inputs from an independent pricing service approved by the Trustees, including the value of equity securities that underlie futures, options and other derivatives (to the extent the market for such instruments closes prior to the close of the NYSE) to reflect estimated valuation changes through the NYSE close.
Level 3 – Valuations based primarily on inputs that are unobservable and significant.
The types of assets and liabilities categorized in Level 3 generally include, but are not limited to, certain debt securities (such as asset-backed, mortgage-backed, loans and sovereign debt) and derivatives even though they are valued using broker quotes; certain debt securities and derivatives adjusted by a specified discount for liquidity or other considerations; certain sovereign debt securities valued using comparable securities issued by the sovereign adjusted by a specified spread; securities whose trading has been suspended or that have been de-listed from their current primary trading exchange valued at the most recent available market or quoted price; securities in default or bankruptcy proceedings for which there is no current market quotation valued at the most recent available market or quoted price; potential litigation recoveries and interests related to bankruptcy proceedings; third-party investment funds where valuations are provided by fund sponsors and which are adjusted for liquidity considerations as well as the timing of the receipt of information; and certain derivatives for which GMO acts as intermediary between the third-party pricing vendor and the pricing agent.
The following is a summary of the respective levels assigned to the Funds’ direct securities and derivatives, if any, as of February 28, 2017:
| | | | | | | | | | | | | | | | |
| | | | | |
| Description | | Level 1 | | | Level 2 | | | Level 3 | | | Total | |
Asset Allocation Bond Fund | | | | | | | | | | | | | | | | |
Asset Valuation Inputs | | | | | | | | | | | | | | | | |
Debt Obligations | | | | | | | | | | | | | | | | |
U.S. Government | | $ | 586,154,843 | | | $ | 756,220,774 | | | $ | — | | | $ | 1,342,375,617 | |
| | | | | | | | | | | | | | | | | |
TOTAL DEBT OBLIGATIONS | | | 586,154,843 | | | | 756,220,774 | | | | — | | | | 1,342,375,617 | |
| | | | | | | | | | | | | | | | | |
Options Purchased | | | — | | | | 376,633 | | | | — | | | | 376,633 | |
Short-Term Investments | | | 3,929,477 | | | | 138,689,018 | | | | — | | | | 142,618,495 | |
| | | | | | | | | | | | | | | | | |
Total Investments | | $ | 590,084,320 | | | $ | 895,286,425 | | | $ | — | | | $ | 1,485,370,745 | |
| | | | | | | | | | | | | | | | | |
| | | | | | | | | | | | | | | | | |
70
GMO Trust Funds
Notes to Financial Statements — (Continued)
February 28, 2017
| | | | | | | | | | | | | | | | |
| | | | | |
| Description | | Level 1 | | | Level 2 | | | Level 3 | | | Total | |
Asset Allocation Bond Fund (continued) | | | | | | | | | | | | | | | | |
Asset Valuation Inputs (continued) | | | | | | | | | | | | | | | | |
Derivatives^ | | | | | | | | | | | | | | | | |
Forward Currency Contracts | | | | | | | | | | | | | | | | |
Foreign Currency Risk | | $ | — | | | $ | 8,229,029 | | | $ | — | | | $ | 8,229,029 | |
Swap Contracts | | | | | | | | | | | | | | | | |
Interest Rate Risk | | | — | | | | 1,309,470 | | | | — | | | | 1,309,470 | |
| | | | | | | | | | | | | | | | | |
Total | | $ | 590,084,320 | | | $ | 904,824,924 | | | $ | — | | | $ | 1,494,909,244 | |
| | | | | | | | | | | | | | | | | |
| | | | | | | | | | | | | | | | | |
Liability Valuation Inputs | | | | | | | | | | | | | | | | |
Derivatives^ | | | | | | | | | | | | | | | | |
Forward Currency Contracts | | | | | | | | | | | | | | | | |
Foreign Currency Risk | | $ | — | | | $ | (9,836,103 | ) | | $ | — | | | $ | (9,836,103 | ) |
Swap Contracts | | | | | | | | | | | | | | | | |
Interest Rate Risk | | | — | | | | (6,920,798 | ) | | | — | | | | (6,920,798 | ) |
| | | | | | | | | | | | | | | | | |
Total | | $ | — | | | $ | (16,756,901 | ) | | $ | — | | | $ | (16,756,901 | ) |
| | | | | | | | | | | | | | | | | |
| | | | | | | | | | | | | | | | | |
Core Plus Bond Fund | | | | | | | | | | | | | | | | |
Asset Valuation Inputs | | | | | | | | | | | | | | | | |
DEBT OBLIGATIONS | | | | | | | | | | | | | | | | |
U.S. Government | | $ | 260,825,748 | | | $ | — | | | $ | — | | | $ | 260,825,748 | |
U.S. Government Agency | | | — | | | | 86,077,712 | | | | — | | | | 86,077,712 | |
| | | | | | | | | | | | | | | | | |
TOTAL DEBT OBLIGATIONS | | | 260,825,748 | | | | 86,077,712 | | | | — | | | | 346,903,460 | |
| | | | | | | | | | | | | | | | | |
Mutual Funds | | | 320,180,541 | | | | — | | | | — | | | | 320,180,541 | |
Short-Term Investments | | | 3,598,275 | | | | — | | | | — | | | | 3,598,275 | |
| | | | | | | | | | | | | | | | | |
Total Investments | | | 584,604,564 | | | | 86,077,712 | | | | — | | | | 670,682,276 | |
| | | | | | | | | | | | | | | | | |
Derivatives^ | | | | | | | | | | | | | | | | |
Forward Currency Contracts | | | | | | | | | | | | | | | | |
Foreign Currency Risk | | | — | | | | 186,366 | | | | — | | | | 186,366 | |
Futures Contracts | | | | | | | | | | | | | | | | |
Interest Rate Risk | | | 284,014 | | | | — | | | | — | | | | 284,014 | |
Swap Contracts | | | | | | | | | | | | | | | | |
Interest Rate Risk | | | — | | | | 728,383 | | | | — | | | | 728,383 | |
| | | | | | | | | | | | | | | | | |
Total | | $ | 584,888,578 | | | $ | 86,992,461 | | | $ | — | | | $ | 671,881,039 | |
| | | | | | | | | | | | | | | | | |
Liability Valuation Inputs | | | | | | | | | | | | | | | | |
Derivatives^ | | | | | | | | | | | | | | | | |
Forward Currency Contracts | | | | | | | | | | | | | | | | |
Foreign Currency Risk | | $ | — | | | $ | (181,411 | ) | | $ | — | | | $ | (181,411 | ) |
Swap Contracts | | | | | | | | | | | | | | | | |
Interest Rate Risk | | | — | | | | (1,014,151 | ) | | | — | | | | (1,014,151 | ) |
| | | | | | | | | | | | | | | | | |
Total | | $ | — | | | $ | (1,195,562 | ) | | $ | — | | | $ | (1,195,562 | ) |
| | | | | | | | | | | | | | | | | |
| | | | | | | | | | | | | | | | | |
71
GMO Trust Funds
Notes to Financial Statements — (Continued)
February 28, 2017
| | | | | | | | | | | | | | | | |
| | | | | |
| Description | | Level 1 | | | Level 2 | | | Level 3 | | | Total | |
Currency Hedged International Bond Fund | | | | | | | | | | | | | | | | |
Asset Valuation Inputs | | | | | | | | | | | | | | | | |
Debt Obligations | | | | | | | | | | | | | | | | |
Foreign Government Obligations | | $ | — | | | $ | 31,644,478 | | | $ | — | | | $ | 31,644,478 | |
| | | | | | | | | | | | | | | | | |
TOTAL DEBT OBLIGATIONS | | | — | | | | 31,644,478 | | | | — | | | | 31,644,478 | |
| | | | | | | | | | | | | | | | | |
Mutual Funds | | | 25,811,080 | | | | — | | | | — | | | | 25,811,080 | |
Short-Term Investments | | | 970,042 | | | | — | | | | — | | | | 970,042 | |
| | | | | | | | | | | | | | | | | |
Total Investments | | | 26,781,122 | | | | 31,644,478 | | | | — | | | | 58,425,600 | |
| | | | | | | | | | | | | | | | | |
Derivatives^ | | | | | | | | | | | | | | | | |
Forward Currency Contracts | | | | | | | | | | | | | | | | |
Foreign Currency Risk | | | — | | | | 258,156 | | | | — | | | | 258,156 | |
Futures Contracts | | | | | | | | | | | | | | | | |
Interest Rate Risk | | | 227,845 | | | | — | | | | — | | | | 227,845 | |
Swap Contracts | | | | | | | | | | | | | | | | |
Interest Rate Risk | | | — | | | | 65,010 | | | | — | | | | 65,010 | |
| | | | | | | | | | | | | | | | | |
Total | | $ | 27,008,967 | | | $ | 31,967,644 | | | $ | — | | | $ | 58,976,611 | |
| | | | | | | | | | | | | | | | | |
| | | | | | | | | | | | | | | | | |
Liability Valuation Inputs | | | | | | | | | | | | | | | | |
Derivatives^ | | | | | | | | | | | | | | | | |
Forward Currency Contracts | | | | | | | | | | | | | | | | |
Foreign Currency Risk | | $ | — | | | $ | (50,874 | ) | | $ | — | | | $ | (50,874 | ) |
Futures Contracts | | | | | | | | | | | | | | | | |
Interest Rate Risk | | | (1,092 | ) | | | — | | | | — | | | | (1,092 | ) |
Swap Contracts | | | | | | | | | | | | | | | | |
Interest Rate Risk | | | — | | | | (279,044 | ) | | | — | | | | (279,044 | ) |
| | | | | | | | | | | | | | | | | |
Total | | $ | (1,092 | ) | | $ | (329,918 | ) | | $ | — | | | $ | (331,010 | ) |
| | | | | | | | | | | | | | | | | |
| | | | | | | | | | | | | | | | | |
Emerging Country Debt Fund | | | | | | | | | | | | | | | | |
Asset Valuation Inputs | | | | | | | | | | | | | | | | |
Debt Obligations | | | | | | | | | | | | | | | | |
Asset-Backed Securities | | $ | — | | | $ | 26,030,372 | | | $ | 22,085,437 | | | $ | 48,115,809 | |
Corporate Debt | | | — | | | | — | | | | 20,060,000 | | | | 20,060,000 | |
Foreign Government Agency | | | — | | | | 974,835,776 | | | | 101,585,077 | | | | 1,076,420,853 | |
Foreign Government Obligations | | | — | | | | 2,101,074,796 | | | | 51,158,299 | | | | 2,152,233,095 | |
U.S. Government | | | 274,694,982 | | | | 75,501,748 | | | | — | | | | 350,196,730 | |
| | | | | | | | | | | | | | | | | |
TOTAL DEBT OBLIGATIONS | | | 274,694,982 | | | | 3,177,442,692 | | | | 194,888,813 | | | | 3,647,026,487 | |
| | | | | | | | | | | | | | | | | |
Loan Assignments | | | — | | | | — | | | | 4,908,530 | | | | 4,908,530 | |
Loan Participations | | | — | | | | — | | | | 64,195,406 | | | | 64,195,406 | |
Mutual Funds | | | 101,920,876 | | | | — | | | | — | | | | 101,920,876 | |
Rights/Warrants | | | — | | | | 35,306,798 | | | | 8,070,406 | | | | 43,377,204 | |
Short-Term Investments | | | 214,094,596 | | | | — | | | | — | | | | 214,094,596 | |
| | | | | | | | | | | | | | | | | |
Total Investments | | | 590,710,454 | | | | 3,212,749,490 | | | | 272,063,155 | | | | 4,075,523,099 | |
| | | | | | | | | | | | | | | | | |
Derivatives^ | | | | | | | | | | | | | | | | |
Forward Currency Contracts | | | | | | | | | | | | | | | | |
Foreign Currency Risk | | | — | | | | 201,461 | | | | — | | | | 201,461 | |
Options | | | | | | | | | | | | | | | | |
Credit Risk | | | — | | | | — | | | | 293,033 | | | | 293,033 | |
Swap Contracts | | | | | | | | | | | | | | | | |
Credit Risk | | | — | | | | 23,586,261 | | | | — | | | | 23,586,261 | |
Interest Rate Risk | | | — | | | | 2,200,628 | | | | — | | | | 2,200,628 | |
| | | | | | | | | | | | | | | | | |
Total | | $ | 590,710,454 | | | $ | 3,238,737,840 | | | $ | 272,356,188 | | | $ | 4,101,804,482 | |
| | | | | | | | | | | | | | | | | |
| | | | | | | | | | | | | | | | | |
72
GMO Trust Funds
Notes to Financial Statements — (Continued)
February 28, 2017
| | | | | | | | | | | | | | | | |
| | | | | |
| Description | | Level 1 | | | Level 2 | | | Level 3 | | | Total | |
Emerging Country Debt Fund (continued) | | | | | | | | | | | | | | | | |
Liability Valuation Inputs | | | | | | | | | | | | | | | | |
Derivatives^ | | | | | | | | | | | | | | | | |
Options | | | | | | | | | | | | | | | | |
Credit Risk | | $ | — | | | $ | — | | | $ | (2,349,805 | ) | | $ | (2,349,805 | ) |
Swap Contracts | | | | | | | | | | | | | | | | |
Credit Risk | | | — | | | | (53,664,784 | ) | | | — | | | | (53,664,784 | ) |
Interest Rate Risk | | | — | | | | (8,455,957 | ) | | | — | | | | (8,455,957 | ) |
| | | | | | | | | | | | | | | | | |
Total | | $ | — | | | $ | (62,120,741 | ) | | $ | (2,349,805 | ) | | $ | (64,470,546 | ) |
| | | | | | | | | | | | | | | | | |
| | | | | | | | | | | | | | | | | |
Opportunistic Income Fund (formerly Debt Opportunities Fund) | | | | | | | | | | | | | | | | |
Asset Valuation Inputs | | | | | | | | | | | | | | | | |
Debt Obligations | | | | | | | | | | | | | | | | |
Asset-Backed Securities | | $ | — | | | $ | 1,173,501,244 | | | $ | 53,500,201 | | | $ | 1,227,001,445 | |
U.S. Government Agency | | | 76,482,731 | | | | 31,649,598 | | | | 19,602,790 | | | | 127,735,119 | |
| | | | | | | | | | | | | | | | | |
TOTAL DEBT OBLIGATIONS | | | 76,482,731 | | | | 1,205,150,842 | | | | 73,102,991 | | | | 1,354,736,564 | |
| | | | | | | | | | | | | | | | | |
Mutual Funds | | | 72,837,633 | | | | — | | | | — | | | | 72,837,633 | |
Options Purchased | | | 560,900 | | | | 738,880 | | | | — | | | | 1,299,780 | |
Short-Term Investments | | | 89,587,307 | | | | — | | | | — | | | | 89,587,307 | |
| | | | | | | | | | | | | | | | | |
Total Investments | | | 239,468,571 | | | | 1,205,889,722 | | | | 73,102,991 | | | | 1,518,461,284 | |
| | | | | | | | | | | | | | | | | |
Derivatives^ | | | | | | | | | | | | | | | | |
Forward Currency Contracts | | | | | | | | | | | | | | | | |
Foreign Currency Risk | | | — | | | | 77,578 | | | | — | | | | 77,578 | |
Swap Contracts | | | | | | | | | | | | | | | | |
Credit Risk | | | — | | | | 19,920,779 | | | | — | | | | 19,920,779 | |
Interest Rate Risk | | | — | | | | 2,914,856 | | | | — | | | | 2,914,856 | |
| | | | | | | | | | | | | | | | | |
Total | | $ | 239,468,571 | | | $ | 1,228,802,935 | | | $ | 73,102,991 | | | $ | 1,541,374,497 | |
| | | | | | | | | | | | | | | | | |
Liability Valuation Inputs | | | | | | | | | | | | | | | | |
Debt Obligations | | | | | | | | | | | | | | | | |
U.S. Government Agency | | $ | — | | | $ | (34,769,723 | ) | | $ | — | | | $ | (34,769,723 | ) |
Derivatives^ | | | | | | | | | | | | | | | | |
Forward Currency Contracts | | | | | | | | | | | | | | | | |
Foreign Currency Risk | | | — | | | | (2,289 | ) | | | — | | | | (2,289 | ) |
Written Options | | | | | | | | | | | | | | | | |
Credit Risk | | | — | | | | (499,796 | ) | | | — | | | | (499,796 | ) |
Interest Rate Risk | | | (237,000 | ) | | | — | | | | — | | | | (237,000 | ) |
Swap Contracts | | | | | | | | | | | | | | | | |
Credit Risk | | | — | | | | (6,329,931 | ) | | | — | | | | (6,329,931 | ) |
Interest Rate Risk | | | — | | | | (34,741 | ) | | | — | | | | (34,741 | ) |
| | | | | | | | | | | | | | | | | |
Total | | $ | (237,000 | ) | | $ | (41,636,480 | ) | | $ | — | | | $ | (41,873,480 | ) |
| | | | | | | | | | | | | | | | | |
| | | | | | | | | | | | | | | | | |
U.S. Treasury Fund | | | | | | | | | | | | | | | | |
Asset Valuation Inputs | | | | | | | | | | | | | | | | |
Short-Term Investments | | $ | 2,662,779,505 | | | $ | — | | | $ | — | | | $ | 2,662,779,505 | |
| | | | | | | | | | | | | | | | | |
Total Investments | | | 2,662,779,505 | | | | — | | | | — | | | | 2,662,779,505 | |
| | | | | | | | | | | | | | | | | |
Total | | $ | 2,622,779,505 | | | $ | — | | | $ | — | | | $ | 2,662,779,505 | |
| | | | | | | | | | | | | | | | | |
| | | | | | | | | | | | | | | | | |
The risks referenced in the tables above are not intended to be inclusive of all risks. Please see the “Investment and other risks” and “Derivative financial instruments” sections below for a further discussion of risks.
| | ^ | The tables above are based on market values or unrealized appreciation/(depreciation) rather than the notional amounts of derivatives. The uncertainties surrounding the valuation inputs for a derivative are likely to be more significant to the Funds’ net asset values than the uncertainties surrounding inputs for a non-derivative security with the same market value. Excludes purchased options, if any, which are included in investments. |
73
GMO Trust Funds
Notes to Financial Statements — (Continued)
February 28, 2017
The underlying funds held at year end are classified above as Level 1. For the summary of valuation inputs of the underlying funds, please refer to the underlying funds’ summary of levels above.
For all Funds for the year ended February 28, 2017, there were no significant transfers between Level 1 and Level 2.
The following is a reconciliation of securities and derivatives, if any, in which significant unobservable inputs (Level 3) were used in determining value:
| | | | | | | | | | | | | | | | | | | | | | | | | | | | | | | | | | | | | | | | |
| | | | | | | | | | | |
| | | Balances
as of
February
29, 2016 | | | Purchases | | | Sales | | | Accrued
Discounts/
Premiums | | | Total
Realized
Gain/(Loss) | | | Change in
Unrealized
Appreciation
(Depreciation) | | | Transfer
into
Level 3† | | | Transfer
out of
Level 3† | | | Balances
as of
February
28, 2017 | | | Net Change in
Unrealized
Appreciation
(Depreciation)
from Investments
Still Held as of
February 28,
2017 | |
Asset Allocation Bond Fund | | | | | | | | | | | | | | | | | | | | | | | | | |
Options purchased | | | | | | | | | | | | | | | | | | | | | | | | | |
Quanto options | | $ | 45,987,627 | | | $ | — | | | $ | (40,853,375 | ) | | $ | — | | | $ | (20,349,237 | ) | | $ | 15,214,985 | | | $ | — | | | $ | — | | | $ | — | | | $ | — | |
Derivatives | | | | | | | | | | | | | | | | | | | | | | | | | |
Swap Contracts | | | (11,702,625 | ) | | | — | | | | (5,433,680 | ) | | | — | | | | (5,433,680 | ) | | | 22,569,985 | | | | — | | | | — | | | | — | | | | — | |
| | | | | | | | | | | | | | | | | | | | | | | | | | | | | | | | | | | | | | | | | |
Total | | $ | 34,285,002 | | | $ | — | | | $ | (46,287,055 | ) | | $ | — | | | $ | (25,782,917 | ) | | $ | 37,784,970 | | | $ | — | | | $ | — | | | $ | — | | | $ | — | |
| | | | | | | | | | | | | | | | | | | | | | | | | | | | | | | | | | | | | | | | | |
| | | | | | | | | | | | | | | | | | | | | | | | | | | | | | | | | | | | | | | | | |
Core Plus Bond Fund | | | | | | | | | | | | | | | | | | | | | | | | | |
Derivatives | | | | | | | | | | | | | | | | | | | | | | | | | |
Swap Contracts | | $ | (45,734 | ) | | $ | — | | | $ | 53,455 | | | $ | — | | | $ | (53,455 | ) | | $ | 45,734 | | | $ | — | | | $ | — | | | $ | — | | | $ | — | |
| | | | | | | | | | | | | | | | | | | | | | | | | | | | | | | | | | | | | | | | | |
Total | | $ | (45,734 | ) | | $ | — | | | $ | 53,455 | | | $ | — | | | $ | (53,455 | ) | | $ | 45,734 | | | $ | — | | | $ | — | | | $ | — | | | $ | — | |
| | | | | | | | | | | | | | | | | | | | | | | | | | | | | | | | | | | | | | | | | |
| | | | | | | | | | | | | | | | | | | | | | | | | | | | | | | | | | | | | | | | | |
Currency Hedged International Bond Fund | | | | | | | | | | | | | | | | | | | | | | | | | |
Derivatives | | | | | | | | | | | | | | | | | | | | | | | | | |
Swap Contracts | | $ | (13,707 | ) | | $ | — | | | $ | 15,124 | | | $ | — | | | $ | (15,124 | ) | | $ | 13,707 | | | $ | — | | | $ | — | | | $ | — | | | $ | — | |
| | | | | | | | | | | | | | | | | | | | | | | | | | | | | | | | | | | | | | | | | |
Total | | $ | (13,707 | ) | | $ | — | | | $ | 15,124 | | | $ | — | | | $ | (15,124 | ) | | $ | 13,707 | | | $ | — | | | $ | — | | | $ | — | | | $ | — | |
| | | | | | | | | | | | | | | | | | | | | | | | | | | | | | | | | | | | | | | | | |
| | | | | | | | | | | | | | | | | | | | | | | | | | | | | | | | | | | | | | | | | |
Emerging Country Debt Fund | | | | | | | | | | | | | | | | | | | | | | | | | |
Debt Obligations | | | | | | | | | | | | | | | | | | | | | | | | | |
Asset-Backed Securities | | $ | 22,096,944 | | | $ | — | | | $ | (1,449,196 | ) | | $ | 96,395 | | | $ | — | | | $ | 1,341,294 | | | $ | — | | | $ | — | | | $ | 22,085,437 | | | $ | 1,341,294 | |
Corporate Debt | | | 21,661,400 | | | | — | | | | — | | | | (667 | ) | | | — | | | | (1,600,733 | ) | | | — | | | | — | | | | 20,060,000 | | | | (1,600,733 | ) |
Foreign Government Agency | | | 71,588,911 | | | | — | | | | — | | | | 683,299 | | | | — | | | | 2,535,467 | | | | 26,777,400 | ‡ | | | — | | | | 101,585,077 | | | | 2,535,467 | |
Foreign Government Obligations | | | 14,341,239 | | | | — | | | | — | | | | 171,929 | | | | — | | | | 326,375 | | | | 36,318,756 | ‡ | | | — | | | | 51,158,299 | | | | 326,375 | |
Judgments | | | 45,684,000 | | | | — | | | | (70,500,000 | ) | | | 163,871 | | | | 33,658,452 | | | | (9,006,323 | ) | | | — | | | | — | | | | — | | | | — | |
| | | | | | | | | | | | | | | | | | | | | | | | | | | | | | | | | | | | | | | | | |
Total Debt Obligations | | | 175,372,494 | | | | — | | | | (71,949,196 | ) | | | 1,114,827 | | | | 33,658,452 | | | | (6,403,920 | ) | | | 63,096,156 | | | | — | | | | 194,888,813 | | | | 2,602,403 | |
| | | | | | | | | | | | | | | | | | | | | | | | | | | | | | | | | | | | | | | | | |
Loan Assignments | | | 6,481,913 | | | | — | | | | (1,730,601 | ) | | | 394,760 | | | | — | | | | (237,542 | ) | | | — | | | | — | | | | 4,908,530 | | | | (237,542 | ) |
Loan Participations | | | 69,224,829 | | | | — | | | | (14,456,514 | ) | | | 2,377,919 | | | | — | | | | 7,049,172 | | | | — | | | | — | | | | 64,195,406 | | | | 7,049,172 | |
Rights/Warrants | | | 4,766,873 | | | | 169,500 | | | | — | | | | — | | | | — | | | | 3,134,033 | | | | — | | | | — | | | | 8,070,406 | | | | 3,134,033 | |
| | | | | | | | | | | | | | | | | | | | | | | | | | | | | | | | | | | | | | | | | |
Total Investments | | | 255,846,109 | | | | 169,500 | | | | (88,136,311 | ) | | | 3,887,506 | | | | 33,658,452 | | | | 3,541,743 | | | | 63,096,156 | | | | — | | | | 272,063,155 | | | | 12,548,066 | |
| | | | | | | | | | | | | | | | | | | | | | | | | | | | | | | | | | | | | | | | | |
Derivatives | | | | | | | | | | | | | | | | | | | | | | | | | |
Options | | | (5,519,531 | ) | | | — | | | | — | | | | — | | | | — | | | | 3,462,759 | | | | — | | | | — | | | | (2,056,772 | ) | | | 3,462,759 | |
| | | | | | | | | | | | | | | | | | | | | | | | | | | | | | | | | | | | | | | | | |
Total | | $ | 250,326,578 | | | $ | 169,500 | | | $ | (88,136,311 | )# | | $ | 3,887,506 | | | $ | 33,658,452 | | | $ | 7,004,502 | | | $ | 63,096,156 | | | $ | — | | | $ | 270,006,383 | | | $ | 16,010,825 | |
| | | | | | | | | | | | | | | | | | | | | | | | | | | | | | | | | | | | | | | | | |
| | | | | | | | | | | | | | | | | | | | | | | | | | | | | | | | | | | | | | | | | |
Opportunistic Income Fund (formerly Debt Opportunities Fund) | | | | | | | | | | | | | | | | | | | | | | | | | |
Debt Obligations | | | | | | | | | | | | | | | | | | | | | | | | | |
Asset-Backed Securities | | $ | 26,579,832 | | | $ | 55,601,982 | | | $ | (27,501,714 | ) | | $ | 921,776 | | | $ | (7,033,820 | ) | | $ | 8,872,061 | | | $ | — | | | $ | (3,939,916 | )‡ | | $ | 53,500,201 | | | $ | 189,603 | |
U.S. Government Agency | | | 22,266,906 | | | | — | | | | (2,841,092 | ) | | | (5,554 | ) | | | 26,109 | | | | 156,421 | | | | — | | | | — | | | | 19,602,790 | | | | 178,949 | |
| | | | | | | | | | | | | | | | | | | | | | | | | | | | | | | | | | | | | | | | | |
Total | | $ | 48,846,738 | | | $ | 55,601,982 | | | $ | (30,342,806 | )## | | $ | 916,222 | | | $ | (7,007,711 | ) | | $ | 9,028,482 | | | $ | — | | | $ | (3,939,916 | ) | | $ | 73,102,991 | | | $ | 368,552 | |
| | | | | | | | | | | | | | | | | | | | | | | | | | | | | | | | | | | | | | | | | |
| | | | | | | | | | | | | | | | | | | | | | | | | | | | | | | | | | | | | | | | | |
| | † | The Funds account for securities and derivatives, if any, transferred into and out of Level 3 at the value at the end of the year. |
74
GMO Trust Funds
Notes to Financial Statements — (Continued)
February 28, 2017
| | ‡ | Financial assets transferred between Level 2 and Level 3 were due to a change in observable and/or unobservable inputs. |
| | # | Includes $17,636,311 of proceeds received from principal payups and paydowns. |
| | ## | Includes $19,962,190 of received from principal paydowns. |
The net aggregate direct and indirect exposure to investments in securities and/or derivatives using Level 3 inputs and presented on a net basis, which will tend to understate the Funds’ exposure, (based on each Fund’s net assets) as of February 28, 2017 were as follows:
| | | | |
| | |
| Fund Name | | Level 3 securities
and derivatives | |
Asset Allocation Bond Fund | | | — | |
Core Plus Bond Fund | | | 1% | |
Currency Hedged International Bond Fund | | | 1% | |
Emerging Country Debt Fund | | | 7% | |
Opportunistic Income Fund (formerly Debt Opportunities Fund) | | | 5% | |
U.S. Treasury Fund | | | — | |
Cash
Cash and foreign currency, if any, on the Statements of Assets and Liabilities consist of cash balances held with the custodian.
Due to/from broker
Due to/from broker in the Statements of Assets and Liabilities includes collateral on swap contracts, futures contracts, option contracts and forward currency contracts, if any, and may include marked-to-market amounts related to foreign currency or cash owed.
Foreign currency translation
The market values of foreign securities, currency holdings and related assets and liabilities are typically translated into U.S. dollars at the close of regular trading on the NYSE, generally at 4:00 pm Eastern time. Income and expenses denominated in foreign currencies are typically translated into U.S. dollars at the close of regular trading on the NYSE. Fluctuations in the value of currency holdings and other assets and liabilities resulting from changes in exchange rates are recorded as unrealized foreign currency gains or losses. Realized gains or losses and unrealized appreciation or depreciation on investment securities and income and expenses are translated on the respective dates of such transactions. The effects of changes in foreign currency exchange rates on investments in securities are not separated on the Statements of Operations from the effects of changes in market prices of those securities, but are included with the net realized and unrealized gain or loss on investment securities.
Indexed investments
Each Fund may invest in various transactions and instruments that are designed to track the performance of an index (including, but not limited to, securities indices and credit default indices). Indexed securities are securities the redemption values and/or coupons of which are indexed to a specific instrument, group of instruments, index, or other statistic. Indexed securities typically, but not always, are debt securities or deposits whose value at maturity or coupon rate is determined by reference to other securities, securities or inflation indices, currencies, precious metals or other commodities, or other financial indicators. For example, the maturity value of gold-indexed securities depends on the price of gold and, therefore, their price tends to rise and fall with gold prices.
Loan assignments and participations
The Funds (except U.S. Treasury Fund) may invest in direct debt instruments, which are interests in amounts owed to lenders or lending syndicates, to suppliers of goods or services, or to other parties by corporate, governmental or other borrower. Such “loans” may include bank loans, promissory notes, and loan participations, or in the case of suppliers of goods or services, trade claims or other receivables. A loan is often administered by a bank or other financial institution that acts as agent for all holders. The agent administers the terms of the loan, as specified in the loan agreement. Unless, under the terms of the loan or other indebtedness a Fund has direct recourse against the borrower, it may have to rely on the agent to enforce its rights against the borrower. When investing in a loan participation, (i) a Fund has the right to receive payments of principal, interest and any fees to which it is entitled only from the party from whom the Fund has purchased the participation and only upon receipt by that party of payments from the borrower and (ii) a Fund generally has no right to enforce compliance by the borrower with the terms of the loan agreement or to vote on matters arising under the loan agreement. Thus, a Fund may be subject to credit risk both of the party from whom it purchased the loan participation and the borrower and that Fund may have minimal control over the terms of any loan modification. Loan assignments and participations outstanding at the end of the year, if any, are listed in each applicable Fund’s Schedule of Investments.
75
GMO Trust Funds
Notes to Financial Statements — (Continued)
February 28, 2017
Repurchase agreements
The Funds may enter into repurchase agreements with banks and brokers. Under a repurchase agreement a Fund acquires a security for a relatively short period for cash and obtains a simultaneous commitment from the seller to repurchase the security at an agreed upon price and date. The Fund, through its custodian, takes possession of securities it acquired under the repurchase agreement. The value of the securities acquired may be less than the amount owed to the Fund by the seller. If the seller in a repurchase agreement transaction defaults or enters into insolvency proceedings and the value of the securities subject to the repurchase agreement is insufficient, the Fund’s recovery of cash from the seller may be delayed and, even if the Fund is able to dispose of the securities, the Fund may incur a loss equal to the difference between the cash it paid and the value of the securities. As of February 28, 2017, the Funds listed below had entered into repurchase agreements. The value of related collateral for each broker listed below exceeds the value of the repurchase agreements at the year end.
| | | | | | | | | | | | | | | | |
| | | | | |
| Fund Name | | Counterparty | | | Gross Value | | | Net Value (with related collateral) | | | Weighted Average Maturity (days) | |
Asset Allocation Bond Fund | |
| Nomura Securities
International Inc. |
| | | $138,689,018 | | | | $141,263,220 | | | | 1.0 | |
Reverse repurchase agreements
The Funds may enter into reverse repurchase agreements with banks and brokers to enhance return. Under a reverse repurchase agreement a Fund sells portfolio assets subject to an agreement by that Fund to repurchase the same assets at an agreed upon price and date. A Fund can use the proceeds received from entering into a reverse repurchase agreement to make additional investments, which generally causes the Fund’s portfolio to behave as if it were leveraged. If the buyer in a reverse repurchase agreement files for bankruptcy or becomes insolvent, the Fund may be unable to recover the securities it sold and as a result may realize a loss on the transaction if the securities it sold are worth more than the purchase price it originally received from the buyer. As of February 28, 2017, the Funds listed below had entered into reverse repurchase agreements.
| | | | | | | | |
| | | |
| Fund Name | | Received from
reverse repurchase
agreements ($) | | | Market value of
securities plus
accrued interest ($) | |
Asset Allocation Bond Fund | | | 34,939,753 | | | | 34,936,599 | |
Emerging Country Debt Fund | | | 32,592,636 | | | | 32,369,346 | |
As of February 28, 2017, Asset Allocation Bond Fund and Emerging Country Debt Fund had investments in reverse repurchase agreements with Nomura Securities International Inc. and JP Morgan Securities, Inc. with a gross value of $34,939,753 and $32,592,636, respectively. The value of related collateral on reverse repurchase agreements was undercollateralized for Asset Allocation Bond Fund and exceeded the value on Emerging Country Debt Fund, respectively at year end. As of February 28, 2017, the reverse repurchase agreement held by Asset Allocation Bond Fund and Emerging Country Debt Fund had open maturity dates. Reverse repurchase agreements outstanding at the end of the period, if any, are listed in each applicable Fund’s Schedule of Investments.
The following is a summary of the gross value of reverse repurchase agreements categorized by class of collateral pledged and maturity date:
| | | | | | | | | | | | | | | | | | | | | | | | |
| | | |
| | | | | | February 28, 2017 | |
| | | |
| | | | | | Remaining Contractual Maturity of the Agreements | |
| | | | | | | |
| | | Overnight and
Continuous | | | Up to 30 days | | | Between
30-90 days | | | Greater Than
90 days | | | Demand | | | Total | |
Asset Allocation Bond Fund | | | | | | | | | | | | | | | | | | | | | | | | |
Reverse Repurchase Agreements | | | | | | | | | | | | | | | | | | | | | | | | |
Non-U.S.Government Debt Obligations | | $ | — | | | $ | — | | | $ | — | | | $ | — | | | $ | 34,939,753 | | | $ | 34,939,753 | |
| | | | | | | | | | | | | | | | | | | | | | | | | |
Total borrowings | | $ | — | | | $ | — | | | $ | — | | | $ | — | | | $ | 34,939,753 | | | $ | 34,939,753 | |
| | | | | | | | | | | | | | | | | | | | | | | | | |
Emerging Country Debt Fund | | | | | | | | | | | | | | | | | | | | | | | | |
Reverse Repurchase Agreements | | | | | | | | | | | | | | | | | | | | | | | | |
Non-U.S. Government Debt Obligations | | $ | — | | | $ | — | | | $ | — | | | $ | — | | | $ | 32,592,636 | | | $ | 32,592,636 | |
| | | | | | | | | | | | | | | | | | | | | | | | | |
Total borrowings | | $ | — | | | $ | — | | | $ | — | | | $ | — | | | $ | 32,592,636 | | | $ | 32,592,636 | |
| | | | | | | | | | | | | | | | | | | | | | | | | |
| | | | | | | | | | | | | | | | | | | | | | | | | |
76
GMO Trust Funds
Notes to Financial Statements — (Continued)
February 28, 2017
Inflation-indexed bonds
The Funds may invest in inflation-indexed bonds. Inflation-indexed bonds are fixed income securities whose principal value is adjusted periodically according to the rate of inflation/deflation. Two structures are common. The U.S. Treasury and some other issuers use a structure that accrues inflation/deflation into the principal value of the bond. Many other issuers adjust the coupon accruals for inflation related changes. Most other issuers pay out any inflation related accruals as part of a semiannual coupon.
The market price of inflation-indexed bonds normally changes when real interest rates change. Real interest rates, in turn, are tied to the relationship between nominal interest rates (i.e., stated interest rates) and the rate of inflation. Therefore, if the rate of inflation rises at a faster rate than nominal interest rates, real interest rates (i.e., nominal interest rate minus inflation) might decline, leading to an increase in value of inflation-indexed bonds. In contrast, if nominal interest rates increase at a faster rate than inflation, real interest rates might rise, leading to a decrease in value of inflation-indexed bonds. Coupon payments received by a Fund from inflation-indexed bonds are generally included in the Fund’s gross income for the period in which they accrue. In addition, any increase/decrease in the principal amount of an inflation-indexed bond is generally included in the Fund’s gross income even though principal is not paid until maturity. Inflation-indexed bonds outstanding at the end of the year, if any, are listed in each applicable Fund’s Schedule of Investments.
Delayed delivery commitments and when-issued securities
The Funds (except U.S. Treasury Fund) may purchase or sell securities on a when-issued or forward commitment basis. Payment and delivery may take place a month or more after the date of the transaction. The price of the underlying securities and the date when the securities will be delivered and paid for are fixed at the time the transaction is negotiated. The purchase of when-issued or delayed delivery securities can cause a Fund’s portfolio to be leveraged. Investments in when-issued securities also present the risk that the security will not be issued or delivered. Delayed delivery commitments outstanding at the end of the year, if any, are listed in each applicable Fund’s Schedule of Investments.
Short sales
Certain Funds may enter into short sales transactions. A short sale is a transaction in which a Fund sells securities it may not own in anticipation of a decline in the fair market value of the securities. Securities sold in short sale transactions and the interest payable on such securities, if any, are reflected as a liability on the Statements of Assets and Liabilities. A Fund is obligated to deliver securities at the trade price at the time the short position is closed. Possible losses from short sales may be unlimited, whereas losses from purchases cannot exceed the total amount invested. Short sales outstanding at the end of the year, if any, are listed in each applicable Fund’s Schedule of Investments.
Taxes and distributions
Each Fund has elected to be treated and intends to qualify each tax year as a regulated investment company under Subchapter M of the Internal Revenue Code of 1986, as amended (the “Code”). Each Fund intends to distribute its net investment income, if any, and its net realized short-term and long-term capital gains, if any, after giving effect to any available capital loss carryforwards for U.S. federal income tax purposes. Therefore, each Fund makes no provision for U.S. federal income or excise taxes.
With the exception of U.S. Treasury Fund, the policy of each Fund is to declare and pay dividends of its net investment income, if any, at least annually, although the Funds are permitted to, and will from time to time, declare and pay dividends of net investment income, if any, more frequently. The policy of U.S. Treasury Fund is to declare dividends daily, to the extent net investment income is available, and pay dividends on the first business day following the end of each month in which dividends were declared. Each Fund also intends to distribute net realized short-term and long-term capital gains, if any, at least annually. In addition, each Fund may, from time to time at their discretion, make unscheduled distributions in advance of large redemptions by shareholders or as otherwise deemed appropriate by a Fund. Typically all distributions are reinvested in additional shares of each Fund, at net asset value, unless GMO or its agents receive and process a shareholder election to receive cash distributions. Distributions to shareholders are recorded by each Fund on the ex-dividend date.
Taxes on foreign interest and dividend income are generally withheld in accordance with the applicable country’s tax treaty with the United States. The foreign withholding rates applicable to a Fund’s investments in certain jurisdictions may be higher if a significant portion of the Fund is held by non-U.S. shareholders. Each Fund may be subject to taxation on realized capital gains, repatriation proceeds and other transaction-based charges imposed by certain countries in which it invests. Taxes related to capital gains realized during the year ended February 28, 2017, if any, are reflected as part of Net realized gain (loss) in the Statements of Operations. Changes in tax liabilities related to capital gain taxes on unrealized investment gains, if any, are reflected as part of Change in net unrealized appreciation (depreciation) in the Statements of Operations. Transaction-based charges are generally calculated as a percentage of the transaction amount.
Income and capital gain distributions are determined in accordance with U.S. federal income tax regulations, which may differ from U.S. GAAP. Certain capital accounts in the financial statements are periodically adjusted for permanent differences in order to reflect their tax character. These adjustments have no impact on net assets or net asset value per share. Temporary differences that arise from recognizing certain items of income, expense, gain or loss in different periods for financial statement and tax purposes will likely reverse at some time in the future. Distributions in excess of net investment income or net realized gains are temporary over-distributions for financial statement purposes resulting from differences in the recognition or classification of income or distributions for financial statement and tax purposes.
77
GMO Trust Funds
Notes to Financial Statements — (Continued)
February 28, 2017
U.S. GAAP and tax accounting differences for each Fund primarily relate to reasons described in the following table:
| | | | | | | | | | | | |
| | | | | | | |
| Differences related to: | | Asset Allocation Bond Fund | | Core Plus Bond Fund | | Currency Hedged International Bond Fund | | Emerging Country Debt Fund | | Opportunistic Income Fund (formerly Debt Opportunities Fund) | | U.S. Treasury Fund |
| Interest, accretion and amortization | | | | | | | | X | | X | | |
| Capital loss carry forwards | | X | | X | | X | | X | | X | | |
| Defaulted bonds | | | | | | | | X | | | | |
| Derivative contract transactions | | X | | X | | X | | X | | X | | |
| Foreign currency transactions | | X | | X | | X | | X | | X | | |
| Late-year ordinary losses | | X | | | | | | | | | | |
| Litigation proceeds received | | | | | | X | | | | | | |
| Losses on wash sale transactions | | | | X | | X | | X | | | | |
| Losses related to debt obligations | | | | | | | | | | X | | |
| Net operating losses | | X | | | | | | | | | | |
| Partnership interest tax allocations | | | | X | | X | | | | | | |
| Post-October capital losses | | | | X | | | | X | | X | | |
| There are no significant differences | | | | | | | | | | | | X |
The tax character of distributions declared by each Fund to shareholders is as follows:
| | | | | | | | | | | | | | | | |
| | | |
| | | Tax year ended February 28, 2017 | | | Tax year ended February 29, 2016 | |
| | | | | |
| Fund Name | | Ordinary
Income
(including
any net short-term
capital gain) ($) | | | Total
Distributions ($) | | | Ordinary Income (including
any net short-term capital gain) ($) | | | Total Distributions ($) | |
| Asset Allocation Bond Fund | | | — | | | | — | | | | 312,691,364 | | | | 312,691,364 | |
| Core Plus Bond Fund | | | 4,001,013 | | | | 4,001,013 | | | | 11,950,830 | | | | 11,950,830 | |
| Currency Hedged International Bond Fund | | | 2,050,085 | | | | 2,050,085 | | | | 6,260,770 | | | | 6,260,770 | |
| Emerging Country Debt Fund | | | 277,442,124 | | | | 277,442,124 | | | | 276,453,759 | | | | 276,453,759 | |
| Opportunistic Income Fund (formerly Debt Opportunities Fund) | | | 37,550,318 | | | | 37,550,318 | | | | 28,535,302 | | | | 28,535,302 | |
| U.S. Treasury Fund | | | 16,947,193 | | | | 16,947,193 | | | | 7,450,591 | | | | 7,450,591 | |
78
GMO Trust Funds
Notes to Financial Statements — (Continued)
February 28, 2017
Distributions in excess of a Fund’s tax basis earnings and profits, if significant, are reported in the Funds’ financial statements as a return of capital.
As of February 28, 2017, the components of distributable earnings on a tax basis and certain tax attributes for the Funds consisted of the following:
| | | | | | | | | | | | | | | | |
| | | | | |
| Fund Name | | Undistributed
Ordinary
Income
(including any
net short-term
capital gain) ($) | | | Late-Year
Ordinary Loss
Deferral ($) | | | Capital Loss
Carryforwards ($) | | | Post-October
Capital Losses ($) | |
Asset Allocation Bond Fund | | | — | | | | (425,377) | | | | (64,261,592 | ) | | | — | |
Core Plus Bond Fund | | | 1,133,552 | | | | — | | | | (29,765,984 | ) | | | (1,288,064) | |
Currency Hedged International Bond Fund | | | 803,292 | | | | — | | | | (5,430,508 | ) | | | — | |
Emerging Country Debt Fund | | | 69,921,870 | | | | — | | | | (215,210,195 | ) | | | — | |
Opportunistic Income Fund (formerly Debt Opportunities Fund) | | | 4,715,281 | | | | — | | | | (118,674,464 | ) | | | — | |
U.S. Treasury Fund | | | — | | | | — | | | | — | | | | (48,449) | |
As of February 28, 2017, certain Funds had capital loss carryforwards available to offset future realized gains, if any, to the extent permitted by the Code. Net capital losses recognized in taxable years beginning on or after March 1, 2011 are carried forward without expiration and generally retain their short-term and/or long-term tax character, as applicable. In addition, such losses should be utilized prior to losses scheduled to expire on or before February 28, 2019. As a result of this ordering rule, losses that are subject to expiration may expire unused. Utilization of the capital loss carryforwards, post-October capital losses, late-year ordinary losses, and losses realized subsequent to February 28, 2017, if any, could be subject to further limitations imposed by the Code related to share ownership activity. The Funds’ capital loss carryforwards are as follows:
| | | | | | | | | | | | | | | | | | | | |
| | | | |
| | | Short-Term ($) | | | | | | Long-
Term ($) | |
| | | | | | |
| Fund Name | | Expiration
Date
2/28/2018 | | | Expiration
Date
2/28/2019 | | | No
Expiration
Date | | | Total
Short-
Term
($) | | | No
Expiration
Date | |
| GMO Asset Allocation Bond Fund | | | — | | | | — | | | | (23,385,098) | | | | (23,385,098) | | | | (40,876,494) | |
| GMO Core Plus Bond Fund | | | — | | | | — | | | | (291,118) | | | | (291,118) | | | | (29,474,866) | |
| GMO Currency Hedged International Bond Fund | | | (2,064,718) | | | | — | | | | — | | | | (2,064,718) | | | | (3,365,790) | |
| GMO Emerging Country Debt Fund | | | — | | | | (66,474,254) | | | | (58,028,833) | | | | (124,503,087) | | | | (90,707,108) | |
| GMO Opportunistic Income Fund (formerly Debt Opportunities Fund) | | | — | | | | — | | | | — | | | | — | | | | (118,674,464) | |
| U.S. Treasury Fund | | | — | | | | — | | | | — | | | | — | | | | — | |
79
GMO Trust Funds
Notes to Financial Statements — (Continued)
February 28, 2017
As of February 28, 2017, the approximate cost for U.S. federal income tax purposes and the aggregate investment-level gross and net unrealized appreciation (depreciation) in the value of investments were as follows:
| | | | | | | | | | | | | | | | |
| | | | | |
| Fund Name | | Aggregate
Cost ($) | | | Gross Unrealized
Appreciation ($) | | | Gross Unrealized
(Depreciation) ($) | | | Net Unrealized
Appreciation
(Depreciation) ($) | |
Asset Allocation Bond Fund | | | 1,472,516,091 | | | | 16,206,487 | | | | (3,351,833) | | | | 12,854,654 | |
Core Plus Bond Fund | | | 667,899,154 | | | | 2,783,122 | | | | — | | | | 2,783,122 | |
Currency Hedged International Bond Fund | | | 61,897,702 | | | | 1,635,116 | | | | (5,107,218) | | | | (3,472,102) | |
Emerging Country Debt Fund | | | 4,013,464,208 | | | | 196,619,770 | | | | (134,560,879) | | | | 62,058,891 | |
Opportunistic Income Fund (formerly Debt Opportunities Fund) | | | 1,504,768,382 | | | | 38,560,146 | | | | (24,867,244) | | | | 13,692,902 | |
U.S. Treasury Fund | | | 2,662,846,947 | | | | 215,274 | | | | (282,716) | | | | (67,442) | |
The Funds are subject to authoritative guidance related to the accounting and disclosure of uncertain tax positions under U.S. GAAP. This guidance sets forth a minimum threshold for the financial statement recognition of tax positions taken based on the technical merits of such positions. United States and non-U.S. tax rules (including the interpretation and application of tax laws) are subject to change. The Funds file tax returns and/or adopt certain tax positions in various jurisdictions. Non-U.S. taxes are provided for based on the Funds’ understanding of the prevailing tax rules of the non-U.S. markets in which they invest. Recently enacted tax rules, including interpretations of tax laws (e.g., guidance pertaining to the U.S. Foreign Account Tax Compliance Act) and tax legislation/initiatives currently under consideration in various jurisdictions, including the U.S., might affect the way the Funds and their investors are taxed prospectively and/or retroactively. Prior to the expiration of the relevant statutes of limitations, if any, the Funds are subject to examination by U.S. federal, state, local and non-U.S. jurisdictions with respect to the tax returns they have filed and the tax positions they have adopted. The Funds’ U.S. federal income tax returns are generally subject to examination by the Internal Revenue Service for a period of three years after they are filed. State, local and/or non-U.S. tax returns and/or other filings may be subject to examination for different periods, depending upon the tax rules of each applicable jurisdiction.
Security transactions and related investment income
Security transactions are accounted for in the financial statements on trade date. For purposes of daily net asset value calculations, the Funds’ policy is that security transactions are generally accounted for on the following business day. GMO may override that policy and a Fund may account for security transactions on trade date if it experiences significant purchases or redemptions or engages in significant portfolio transactions. Dividend income, net of applicable foreign withholding taxes, if any, is recorded on the ex-dividend date or, if later, when a Fund is informed of the ex-dividend date. Income dividends and capital gain distributions from the underlying funds are recorded on the ex-dividend date. Interest income is recorded on the accrual basis and is adjusted for the amortization of premiums and accretion of discounts. Principal on inflation-indexed securities is adjusted for inflation and any increase or decrease is recorded as interest income or investment loss. Coupon income is not recognized on securities for which collection is not expected. Paydown gains and losses on mortgage-related and other asset-backed securities, if any, are recorded as components of interest income in the Statements of Operations. Non-cash dividends, if any, are recorded at the fair market value of the asset received. In determining the net gain or loss on securities sold, the Funds use the identified cost basis.
Expenses and class allocations
Most of the expenses of the Trust are directly attributable to an individual Fund. Generally, common expenses are allocated among the Funds based on, among other things, the nature and type of expense and the relative size of the Funds. Investment income, common expenses, purchase premiums and redemption fees, if any, and realized and unrealized gains and losses are allocated among the classes of shares of the Funds, if applicable, based on the relative net assets of each class. Shareholder service fees, if any, which are directly attributable to a class of shares, are charged to that class’s operations. In addition, the Funds may incur fees and expenses indirectly as a shareholder in the underlying funds. Because the underlying funds have different expense and fee levels and the Funds may own different proportions of the underlying funds at different times, the amount of fees and expenses indirectly incurred by a Fund will vary (see Note 5).
State Street Bank and Trust Company (“State Street”) serves as the Funds’ custodian, fund accounting agent and transfer agent. Prior to December 31, 2013, State Street’s transfer agent fees may have been reduced by an earnings allowance calculated on the average daily cash balances each Fund maintained in a State Street transfer agent account. Effective January 1, 2014, any cash balances maintained at the transfer agent are held in a Demand Deposit Account and interest income earned, if any, is shown as interest income in the Statements of Operations. Prior to December 31, 2012, State Street’s custodian fees may have been reduced by an earnings allowance calculated on the average daily cash balance each Fund maintained in a State Street custodial account. Earnings allowances were reported as a reduction of expenses in the Statements of Operations. Effective January 1, 2013, any cash balances maintained at the custodian are held in a Demand Deposit Account and interest income earned, if any, is shown as interest income in the Statements of Operations.
80
GMO Trust Funds
Notes to Financial Statements — (Continued)
February 28, 2017
Purchases and redemptions of Fund shares
Purchase premiums and redemption fees (if applicable) are paid to and retained by a Fund to help offset estimated portfolio transaction costs and other related costs (e.g., bid to ask spreads, stamp duties and transfer fees) incurred by the Fund (directly or indirectly through investments in underlying funds) as a result of the purchase or redemption by allocating estimated transaction costs to the purchasing or redeeming shareholder. Such fees are recorded as a component of the Funds’ net share transactions. A Fund may impose a new purchase premium and/or redemption fee or modify an existing fee at any time.
Purchase premiums are not charged on reinvestments of dividends or other distributions. Redemption fees apply to all shares of a Fund regardless of how the shares were acquired (e.g., by direct purchase or by reinvestment of dividends or other distributions). If GMO determines that any portion of a cash purchase or redemption, as applicable, is offset by a corresponding cash redemption or purchase occurring on the same day, it ordinarily will waive or reduce the purchase premium or redemption fee with respect to that portion. GMO also may waive or reduce the purchase premium or redemption fee relating to a cash purchase or redemption of a Fund’s shares if the Fund will not incur transaction costs or will incur reduced transaction costs.
GMO will waive or reduce the purchase premium when securities are used to purchase a Fund’s shares except to the extent that the Fund incurs transaction costs (e.g., stamp duties or transfer fees) in connection with its acquisition of those securities. GMO may waive or reduce redemption fees when a Fund uses portfolio securities to redeem its shares. However, when a substantial portion of a Fund is being redeemed in-kind, the Fund may nonetheless charge a redemption fee equal to known or estimated costs.
Purchase premiums or redemption fees generally will not be waived for purchases and redemptions of Fund shares executed through brokers or agents, including, without limitation, intermediary platforms that are allowed pursuant to agreements with the Trust to transmit orders for purchases and redemptions the day after those orders are received.
As of February 28, 2017, the premium on cash purchases and the fee on cash redemptions were as follows:
| | | | | | | | | | | | |
| | | | | | | |
| | | Asset Allocation Bond Fund | | Core Plus Bond Fund | | Currency Hedged International Bond Fund | | Emerging Country Debt Fund(1) | | Opportunistic Income Fund (formerly Debt Opportunities Fund) | | U.S. Treasury Fund |
| Purchase Premium | | — | | — | | — | | 0.75% | | 0.40% | | — |
| Redemption Fee | | — | | — | | — | | 0.75% | | 0.40% | | — |
| | (1) | Prior to February 1, 2016, the premiums on purchases and the fee on redemptions were each 0.50% of the amount invested or redeemed. |
Recently-issued accounting guidance
In August 2016, Financial Accounting Standards Board (“FASB”) issued a new Accounting Standards Update No. 2016-15, “Statement of Cash Flows (Topic 230), Classification of Certain Cash Receipts and Cash Payments, a consensus of the FASB’s Emerging Issues Task Force” (“ASU 2016-15”). ASU 2016-15 is intended to reduce diversity in practice in how certain transactions are classified in the statement of cash flows. The issues addressed in ASU 2016-15 are: debt prepayment or debt extinguishment costs, settlement of zero-coupon debt instruments, contingent consideration payments made after a business combination, proceeds from the settlement of insurance claims, proceeds from the settlement of corporate-owned life insurance policies, including bank-owned life insurance policies, distributions received from equity method investments, beneficial interests in securitization transactions; and, separately identifiable cash flows and application of the predominance principle. ASU
81
GMO Trust Funds
Notes to Financial Statements — (Continued)
February 28, 2017
2016-15 is effective for interim and annual reporting periods beginning after December 15, 2017. GMO is currently evaluating the impact, if any, of this guidance on the Funds’ financial statements and disclosures.
| 3. | Investment and other risks |
The following chart identifies selected risks associated with each Fund. Risks not marked for a particular Fund may, however, still apply to some extent to that Fund at various times.
| | | | | | | | | | | | |
| | | | | | | |
| | | Asset Allocation Bond Fund | | Core Plus Bond Fund | | Currency Hedged International Bond Fund | | Emerging Country Debt Fund | | Opportunistic Income Fund (formerly Debt Opportunities Fund) | | U.S. Treasury Fund |
| Commodities Risk | | X | | | | | | | | | | |
| Counterparty Risk | | X | | X | | X | | X | | X | | |
| Credit Risk | | X | | X | | X | | X | | X | | X |
| Currency Risk | | X | | X | | X | | X | | X | | |
| Derivatives and Short Sales Risk | | X | | X | | X | | X | | X | | |
| Focused Investment Risk | | X | | X | | X | | X | | X | | X |
| Fund of Funds Risk | | X | | X | | X | | X | | X | | |
| Illiquidity Risk | | X | | X | | X | | X | | X | | |
| Large Shareholder Risk | | X | | X | | X | | X | | X | | X |
| Leveraging Risk | | X | | X | | X | | X | | X | | |
| Management and Operational Risk | | X | | X | | X | | X | | X | | X |
| Market Disruption and Geopolitical Risk | | X | | X | | X | | X | | X | | X |
| Market Risk – Asset-Backed Securities | | X | | X | | X | | X | | X | | |
| Market Risk – Equities | | X | | X | | X | | | | X | | |
| Market Risk – Fixed Income Investments | | X | | X | | X | | X | | X | | X |
| Non-Diversified Funds | | X | | X | | X | | X | | X | | |
| Non-U.S. Investment Risk | | X | | X | | X | | X | | X | | |
| Small Company Risk | | X | | X | | X | | | | X | | |
Investing in mutual funds involves many risks. The risks of investing in a particular Fund depend on the types of investments in its portfolio and the investment strategies GMO employs on its behalf. This section does not describe every potential risk of investing in the Funds. Funds could be subject to additional risks because of the types of investments they make and market conditions, which may change over time.
Each Fund that invests in other GMO Funds or other investment companies (collectively, “Underlying Funds”) is exposed to the risks to which the Underlying Funds in which it invests are exposed, as well as the risk that the Underlying Funds will not perform as expected. Therefore,
82
GMO Trust Funds
Notes to Financial Statements — (Continued)
February 28, 2017
unless otherwise noted, the selected risks summarized below include both direct and indirect risks, and references in this section to investments made by a Fund include those made both directly by the Fund and indirectly by the Fund through Underlying Funds.
An investment in a Fund is not a bank deposit and, therefore, is not insured or guaranteed by the Federal Deposit Insurance Corporation or any other government agency.
• COMMODITIES RISK. Commodity prices can be extremely volatile and are affected by many factors. Exposure to commodities can cause the net asset value of a Fund’s shares to decline or fluctuate in a rapid and unpredictable manner. The value of commodity-related derivatives or indirect investments in commodities may fluctuate more than the commodity, commodities or commodity index to which they relate. See “Derivatives and Short Sales Risk” for a discussion of specific risks of a Fund’s derivatives investments, including commodity-related derivatives.
• COUNTERPARTY RISK. Funds that enter into contracts with counterparties, such as repurchase or reverse repurchase agreements or OTC derivatives contracts, or that lend their securities run the risk that the counterparty will be unable or unwilling to make timely settlement payments or otherwise honor its obligations. If a counterparty fails to meet its contractual obligations, goes bankrupt, or otherwise experiences a business interruption, the Fund could miss investment opportunities or otherwise hold investments it would prefer to sell, resulting in losses for the Fund. In addition, a Fund may suffer losses if a counterparty fails to comply with applicable laws or other requirements. The Funds are not subject to any limits on their exposure to any one counterparty nor to a requirement that counterparties with whom they enter into contracts maintain a specific rating by a nationally recognized rating organization. Counterparty risk is pronounced during unusually adverse market conditions and is particularly acute in environments (like those of 2008) in which financial services firms are exposed to systemic risks of the type evidenced by the insolvency of Lehman Brothers and subsequent market disruptions.
Participants in OTC derivatives markets typically are not subject to the same level of credit evaluation and regulatory oversight as are members of exchange-based markets, and, therefore, OTC derivatives generally expose a Fund to greater counterparty risk than exchange-traded derivatives. A Fund is subject to the risk that a counterparty will not settle a derivative in accordance with its terms because of a dispute over the terms of the contract (whether or not bona fide) or because of a credit or liquidity problem. If a counterparty’s obligation to a Fund is not collateralized, then the Fund is essentially an unsecured creditor of the counterparty. If a counterparty defaults, the Fund will have contractual remedies (whether or not the obligation is collateralized), but the Fund may be unable to enforce them, thus causing the Fund to suffer a loss. Counterparty risk is greater for derivatives with longer maturities because of the longer time during which events may occur that prevent settlement. Counterparty risk also is greater when a Fund has entered into derivatives contracts with a single or small group of counterparties as it sometimes does as a result of its use of swaps and other OTC derivatives. Funds that use swap contracts are subject, in particular, to the creditworthiness of the counterparties because some types of swap contracts have terms longer than six months (and, in some cases, decades). The creditworthiness of a counterparty may be adversely affected by greater than average volatility in the markets, even if the counterparty’s net market exposure is small relative to its capital. Counterparty risk still exists even if a counterparty’s obligations are secured by collateral because the Fund’s interest in the collateral may not be perfected or additional collateral may not be promptly posted as required. GMO’s view with respect to a particular counterparty is subject to change. The fact, however, that it changes adversely (whether due to external events or otherwise) does not mean a Fund’s existing transactions with that counterparty will necessarily be terminated or modified. In addition, a Fund may enter into new transactions with a counterparty that GMO no longer considers a desirable counterparty if the transaction is primarily designed to reduce the Fund’s overall risk of potential exposure to that counterparty (for example, re-establishing the transaction with a lower notional amount or entering into a countervailing trade with the same counterparty).
The Funds also are subject to counterparty risk because they execute their securities transactions through brokers and dealers. If a broker or dealer fails to meet its contractual obligations, goes bankrupt, or otherwise experiences a business interruption, the Funds could miss investment opportunities or be unable to dispose of investments they would prefer to sell, resulting in losses for the Funds.
Counterparty risk with respect to derivatives has been and will continue to be affected by new rules and regulations relating to the derivatives market. As described under “Derivatives and Short Sales Risk,” some derivatives transactions are required to be centrally cleared, and a party to a cleared derivatives transaction is subject to the credit risk of the clearing house and the clearing member through which it holds its cleared position. Credit risk of market participants with respect to derivatives that are centrally cleared is concentrated in a few clearing houses, and it is not clear how an insolvency proceeding of a clearing house would be conducted and what impact an insolvency of a clearing house would have on the financial system. Also, in the event of a counterparty’s (or its affiliate’s) insolvency, the Funds’ ability to exercise remedies, such as the termination of transactions, netting of obligations and realization on collateral, could be stayed or eliminated under new special resolution regimes adopted in the United States, the European Union and various other jurisdictions. Such regimes provide governmental authorities with broad authority to intervene when a financial institution is experiencing financial difficulty. In particular, with respect to counterparties who are subject to such proceedings in the European Union, the liabilities of such counterparties to the Funds could be reduced, eliminated, or converted to equity in such counterparties (sometimes referred to as a “bail in”).
• CREDIT RISK. This is the risk that the issuer or guarantor of a fixed income investment or the obligor of an obligation underlying an asset-backed security will be unable or unwilling to satisfy its obligation to pay principal and interest or otherwise to honor its obligations in a timely
83
GMO Trust Funds
Notes to Financial Statements — (Continued)
February 28, 2017
manner. The market price of a fixed income investment will normally decline as a result of the issuer’s, guarantor’s, or obligor’s failure to meet its payment obligations, or in anticipation of such failure, or the downgrade of the credit rating of the investment. This risk is particularly acute in environments (like those of 2008) in which financial services firms are exposed to systemic risks of the type evidenced by the insolvency of Lehman Brothers and subsequent market disruptions.
All fixed income securities are subject to credit risk. Financial strength and solvency of an issuer are the primary factors influencing credit risk. The risk varies depending upon whether the issuer is a corporation, a government or government entity, whether the particular security has a priority over other obligations of the issuer in payment of principal and interest and whether it has any collateral backing or credit enhancement. Credit risk may change over the term of a fixed income security. U.S. government securities are subject to varying degrees of credit risk depending upon whether the securities are supported by the full faith and credit of the United States, supported by the ability to borrow from the U.S. Treasury, supported only by the credit of the issuing U.S. government agency, instrumentality, or corporation, or otherwise supported by the United States. For example, issuers of many types of U.S. government securities (e.g., the Federal Home Loan Mortgage Corporation (“Freddie Mac”), Federal National Mortgage Association (“Fannie Mae”), and Federal Home Loan Banks), although chartered or sponsored by Congress, are not funded by Congressional appropriations and their fixed income securities, including mortgage-backed and other asset-backed securities, are neither guaranteed nor insured by the U.S. government. These securities are subject to more credit risk than U.S. government securities that are supported by the full faith and credit of the United States (e.g., U.S. Treasury bonds). Investments in sovereign or quasi-sovereign debt involve the risk that the governmental entities responsible for repayment may be unable or unwilling to pay interest and repay principal when due. A governmental entity’s ability and willingness to pay interest and repay principal in a timely manner may be affected by a variety of factors, including its cash flow, the size of its reserves, its access to foreign exchange, the relative size of its debt service burden to its economy as a whole, and political constraints. Investments in quasi-sovereign issuers are subject to the additional risk that the issuer may default independently of its sovereign. Sovereign debt risk is greater for fixed income securities issued or guaranteed by emerging countries.
In many cases, the credit risk of a fixed income security is reflected in its credit ratings, and a Fund holding such a security is subject to the risk that the investment’s rating will be downgraded.
Securities issued by the U.S. government historically have presented minimal credit risk. However, events in 2011 led to a downgrade in the long-term credit rating of U.S. bonds by several major rating agencies and introduced greater uncertainty about the repayment by the United States of its obligations. A further credit rating downgrade could decrease, and a default in the payment of principal or interest on U.S. government securities would decrease, the value of a Fund’s investments and increase the volatility of a Fund’s portfolio.
As described under “Market Risk — Asset-Backed Securities,” asset-backed securities may be backed by many types of assets and their payment of interest and repayment of principal largely depend on the cash flows generated by the assets backing them. The credit risk of a particular asset-backed security depends on many factors, as described under “Market Risk — Asset-Backed Securities.”
The obligations of issuers also may be subject to bankruptcy, insolvency and other laws affecting the rights and remedies of creditors.
A Fund also is exposed to credit risk on a reference security to the extent it writes protection under credit default swaps. See “Derivatives and Short Sales Risk” for more information regarding risks associated with the use of credit default swaps. The extent to which the market price of a fixed income security changes in response to a credit event depends on many factors and can be difficult to predict. For example, even though the effective duration of a long-term floating rate security is very short, an adverse credit event or a change in the perceived creditworthiness of its issuer could cause its market price to decline much more than its effective duration would suggest.
Credit risk is particularly pronounced for below investment grade securities (commonly referred to as “junk bonds”). The sovereign debt of many non-U.S. governments, including their sub-divisions and instrumentalities, is below investment grade. Many asset-backed securities also are below investment grade. Below investment grade securities have speculative characteristics, often are less liquid than higher quality securities, present a greater risk of default and are more susceptible to real or perceived adverse industry conditions. Investments in distressed or defaulted or other low quality debt securities generally are considered speculative and may involve substantial risks not normally associated with investments in higher quality securities, including adverse business, financial or economic conditions that lead to payment defaults and insolvency proceedings on the part of their issuers. In particular, distressed or defaulted obligations might be repaid, if at all, only after lengthy workout or bankruptcy proceedings, during which the issuer might not make any interest or other payments, and a Fund may incur additional expenses to seek recovery. If GMO’s assessment of the eventual recovery value of a distressed or defaulted debt security proves incorrect, a Fund may lose a substantial portion or all of its investment or may be required to accept cash or instruments worth less than its original investment. In the event of default of sovereign debt, the Funds may be unable to pursue legal action against the issuer.
• CURRENCY RISK. Currency risk is the risk that fluctuations in exchange rates will adversely affect the market value of a Fund’s investments. Currency risk includes the risk that the currencies in which a Fund’s investments are traded, in which a Fund receives income, or in which a Fund has taken a position, will decline in value relative to the currency in which the Fund is denominated. Currency risk also includes the risk that the currency to which the Fund has obtained exposure through hedging declines in value relative to the currency being hedged, in which event the
84
GMO Trust Funds
Notes to Financial Statements — (Continued)
February 28, 2017
Fund may realize a loss on both the hedging instrument and the currency being hedged. Currency exchange rates can fluctuate significantly for many reasons. See “Market Disruption and Geopolitical Risk.”
Many of the Funds use derivatives to take currency positions that are under- or over-weighted (in some cases significantly) relative to the currency exposure of their portfolios and their benchmarks. If the exchange rates of the currencies involved do not move as expected, a Fund could lose money on both its holdings of a particular currency and the derivative. See also “Non-U.S. Investment Risk.”
Some currencies are illiquid (e.g., some emerging country currencies), and a Fund may not be able to convert them into U.S. dollars, in which case GMO may decide to purchase U.S. dollars in a parallel market with an unfavorable exchange rate. Exchange rates for many currencies (e.g., some emerging country currencies) are particularly affected by exchange control regulations.
Derivative transactions in foreign currencies (such as futures, forwards, options and swaps) may involve leveraging risk in addition to currency risk, as described under “Leveraging Risk.” In addition, the obligations of counterparties in currency derivative transactions are often not secured by collateral, which increases counterparty risk (see “Counterparty Risk”).
• DERIVATIVES AND SHORT SALES RISK. All of the Funds may invest in derivatives, which are financial contracts whose value depends on, or is derived from, the value of underlying assets, reference rates, or indices. Derivatives involve the risk that their value may not change as expected relative to changes in the value of the assets, rates, or indices they are designed to track. Derivatives include futures contracts, forward contracts, foreign currency contracts, swap contracts, contracts for differences, options on securities and indices, options on futures contracts, options on swap contracts, interest rate caps, floors and collars, reverse repurchase agreements, and other OTC contracts. Derivatives may relate to securities, commodities, currencies, currency exchange rates, interest rates, inflation rates, and indices.
The use of derivatives involves risks that are in addition to, and potentially greater than, the risks of investing directly in securities and other more traditional assets. In particular, a Fund’s use of OTC derivatives exposes it to the risk that the counterparties will be unable or unwilling to make timely settlement payments or otherwise honor their obligations. An OTC derivatives contract typically can be closed only with the consent of the other party to the contract. If the counterparty defaults, the Fund will still have contractual remedies but may not be able to enforce them. Because the contract for each OTC derivative is individually negotiated, the counterparty may interpret contractual terms (e.g., the definition of default) differently than the Fund, and if it does, the Fund may decide not to pursue its claims against the counterparty to avoid the cost and unpredictability of legal proceedings. The Fund, therefore, may be unable to obtain payments GMO believes are owed to it under OTC derivatives contracts, or those payments may be delayed or made only after the Fund has incurred the cost of litigation.
A Fund may invest in derivatives that (i) do not require the counterparty to post collateral (e.g., foreign currency forwards), (ii) require collateral but that do not provide for the Fund’s security interest in it to be perfected, (iii) require a significant upfront deposit by the Fund unrelated to the derivative’s fundamental fair (or intrinsic) value, or (iv) do not require that collateral be regularly marked-to-market. When a counterparty’s obligations are not fully secured by collateral, a Fund runs a greater risk of not being able to recover what it is owed if the counterparty defaults. Even when derivatives are required by contract to be collateralized, a Fund typically will not receive the collateral for one or more days after the collateral is required to be posted.
The Funds may invest in derivatives with a limited number of counterparties, and events affecting the creditworthiness of any of those counterparties may have a pronounced effect on the Funds. Derivatives risk is particularly acute in environments (like those of 2008) in which financial services firms are exposed to systemic risks of the type evidenced by the insolvency of Lehman Brothers and subsequent market disruptions. In addition, during those periods, a Fund may have a greater need for cash to provide collateral for large swings in its mark-to-market obligations under the derivatives in which it has invested.
Derivatives also present other risks described in this section, including market risk, illiquidity risk, currency risk, credit risk, and counterparty risk. Many derivatives, in particular OTC derivatives, are complex and their valuation often requires modeling and judgment, which increases the risk of mispricing or improper valuation. The pricing models used may not produce valuations that are consistent with the values a Fund realizes when it closes or sells an OTC derivative. Valuation risk is more pronounced when a Fund enters into OTC derivatives with specialized terms because the value of those derivatives in some cases is determined only by reference to similar derivatives with more standardized terms. As a result, incorrect valuations may result in increased cash payments to counterparties, undercollateralization and/or errors in the calculation of a Fund’s net asset value.
A Fund’s use of derivatives may not be effective or have the desired results. Moreover, suitable derivatives will not be available in all circumstances. For example, the economic costs of taking some derivative positions may be prohibitive, and if a counterparty or its affiliate is deemed to be an affiliate of a Fund, the Funds will not be permitted to trade with that counterparty. In addition, GMO may decide not to use derivatives to hedge or otherwise reduce a Fund’s risk exposures, potentially resulting in losses for the Fund.
85
GMO Trust Funds
Notes to Financial Statements — (Continued)
February 28, 2017
Swap contracts and other OTC derivatives are highly susceptible to illiquidity risk (see “Illiquidity Risk”) and counterparty risk (see “Counterparty Risk”). These derivatives are also subject to documentation risk, which is the risk that ambiguities, inconsistencies or errors in the documentation relating to a derivative transaction may lead to a dispute with the counterparty or unintended investment results. In addition, see “Commodities Risk” for a discussion of risks specific to commodity-related derivatives. Because many derivatives have a leverage component (i.e., a notional value in excess of the assets needed to establish and/or maintain the derivative position), adverse changes in the value or level of the underlying asset, rate or index may result in a loss substantially greater than the amount invested in the derivative itself. See “Leveraging Risk.”
A Fund’s use of derivatives may be subject to special tax rules and could generate additional taxable income for shareholders. In addition, the tax treatment of a Fund’s use of derivatives may be unclear because there is little case or other law interpreting the terms of most derivatives or determining their tax treatment. In addition, the SEC recently proposed a rule under the 1940 Act, regulating the use by registered investment companies of derivatives and many related instruments. That rule, if adopted as proposed, would, among other things, restrict a Fund’s ability to engage in derivatives transactions or so increase the cost of derivatives transactions that a Fund would be unable to implement its investment strategy.
Derivatives Regulation. The U.S. government has enacted legislation that provides for new regulation of the derivatives market, including clearing, margin, reporting, and registration requirements. The European Union (and some other countries) are implementing similar requirements, which will affect a Fund when it enters into a derivatives transaction with a counterparty organized in that country or otherwise subject to that country’s derivatives regulations. Because these requirements are new and evolving (and some of the rules are not yet final), their ultimate impact remains unclear.
Transactions in some types of swaps (including interest rate swaps and credit default swaps on North American and European indices) are required to be centrally cleared. In a transaction involving those swaps (“cleared derivatives”), a Fund’s counterparty is a clearing house, rather than a bank or broker. Since the Funds are not members of clearing houses and only members of a clearing house (“clearing members”) can participate directly in the clearing house, the Funds hold cleared derivatives through accounts at clearing members. In cleared derivatives positions, the Funds make payments (including margin payments) to and receive payments from a clearing house through their accounts at clearing members. Clearing members guarantee performance of their clients’ obligations to the clearing house.
In some ways, cleared derivative arrangements are less favorable to mutual funds than bilateral arrangements, for example, by requiring that funds provide more margin for their cleared derivatives positions. Also, as a general matter, in contrast to a bilateral derivatives position, following a period of notice to a Fund, a clearing member at any time can require termination of an existing cleared derivatives position or an increase in margin requirements above those required at the outset of a transaction. Clearing houses also have broad rights to increase margin requirements for existing positions or to terminate those positions at any time. Any increase in margin requirements or termination of existing cleared derivatives positions by the clearing member or the clearing house could interfere with the ability of a Fund to pursue its investment strategy. Further, any increase in margin requirements by a clearing member could expose a Fund to greater credit risk to its clearing member because margin for cleared derivatives positions in excess of a clearing house’s margin requirements typically is held by the clearing member (see “Counterparty Risk”). Also, a Fund is subject to risk if it enters into a derivatives transaction that is required to be cleared (or that GMO expects to be cleared), and no clearing member is willing or able to clear the transaction on the Fund’s behalf. While the documentation in place between the Funds and their clearing members generally provides that the clearing members will accept for clearing all cleared derivatives transactions that are within credit limits (specified in advance) for each Fund, the Funds are still subject to the risk that no clearing member will be willing or able to clear a transaction. In those cases, the position might have to be terminated, and the Fund could lose some or all of the benefit of the position, including loss of an increase in the value of the position and loss of hedging protection. In addition, the documentation governing the relationship between the Funds and clearing members is drafted by the clearing members and generally is less favorable to the Funds than typical bilateral derivatives documentation. For example, documentation relating to cleared derivatives generally includes a one-way indemnity by the Funds in favor of the clearing member for losses the clearing member incurs as the Funds’ clearing member. Also, such documentation typically does not provide the Funds any remedies if the clearing member defaults or becomes insolvent. While futures contracts entail similar risks, the risks may be more pronounced for cleared derivatives due to their more limited liquidity and market history.
Some types of cleared derivatives are required to be executed on an exchange or on a swap execution facility. A swap execution facility is a trading platform where multiple market participants can execute derivatives by accepting bids and offers made by multiple other participants in the platform. While this execution requirement is designed to increase transparency and liquidity in the cleared derivatives market, trading on a swap execution facility can create additional costs and risks for the Funds. For example, swap execution facilities typically charge fees, and if a Fund executes derivatives on a swap execution facility through a broker intermediary, the intermediary may impose fees as well. Also, a Fund may indemnify a swap execution facility, or a broker intermediary who executes cleared derivatives on a swap execution facility on the Fund’s behalf, against any losses or costs that may be incurred as a result of the Fund’s transactions on the swap execution facility.
If a Fund wishes to execute a package of transactions that include a swap that is required to be executed on a swap execution facility as well as other transactions (for example, a transaction that includes both a security and an interest rate swap that hedges interest rate exposure with respect
86
GMO Trust Funds
Notes to Financial Statements — (Continued)
February 28, 2017
to such security), the Fund may be unable to execute all components of the package on the swap execution facility. In that case, the Fund would need to trade some components of the package on the swap execution facility and other components in another manner, which could subject the Fund to the risk that some components would be executed successfully and others would not, or that the components would be executed at different times, leaving the Fund with an unhedged position for a period of time.
The U.S. government and the European Union have adopted mandatory minimum margin requirements for bilateral derivatives. GMO expects that the Funds’ transactions will become subject to variation margin requirements under such rules in 2017 and initial margin requirements under such rules in 2020. Such requirements could increase the amount of margin a Fund needs to provide in connection with its derivatives transactions and, therefore, make derivatives transactions more expensive.
These and other new rules and regulations could, among other things, further restrict a Fund’s ability to engage in, or increase the cost to the Fund of, derivatives transactions, for example, by making some types of derivatives no longer available to the Fund or otherwise limiting liquidity. The implementation of the clearing requirement has increased the costs of derivatives transactions for the Funds, since the Funds have to pay fees to their clearing members and are typically required to post more margin for cleared derivatives than they have historically posted for bilateral derivatives. The costs of derivatives transactions are expected to increase further as clearing members raise their fees to cover the costs of additional capital requirements and other regulatory changes applicable to the clearing members, which will take effect when rules imposing mandatory minimum margin requirements on bilateral swaps, as described above, become effective. These rules and regulations are new and evolving, so their potential impact on the Funds and the financial system are not yet known. While the new rules and regulations and central clearing of some derivatives transactions are designed to reduce systemic risk (i.e., the risk that the interdependence of large derivatives dealers could cause them to suffer liquidity, solvency or other challenges simultaneously), there is no assurance that they will achieve that result, and in the meantime, as noted above, central clearing and related requirements expose the Funds to new kinds of costs and risks.
Options. Some Funds are permitted to write options. The market price of an option is affected by many factors, including changes in the market prices or dividend rates of underlying securities (or in the case of indices, the securities in such indices); the time remaining before expiration; changes in interest rates or exchange rates; and changes in the actual or perceived volatility of the relevant stock market and underlying securities. The market price of an option also may be adversely affected if the market for the option becomes less liquid. In addition, since an American-style option allows the holder to exercise its rights any time before the option’s expiration, the writer of an American-style option has no control over when it will be required to fulfill its obligations as a writer of the option. (The writer of a European-style option is not subject to this risk because the holder may only exercise the option on its expiration date.) If a Fund writes a call option and does not hold the underlying security or instrument, the Fund’s potential loss is theoretically unlimited.
National securities exchanges generally have established limits on the maximum number of options an investor or group of investors acting in concert may write. A Fund, GMO, and other funds advised by GMO will likely constitute such a group. When applicable, these limits restrict a Fund’s ability to purchase or write options on a particular security.
Unlike exchange-traded options, which are standardized with respect to the underlying instrument, expiration date, contract size, and strike price, the terms of OTC options (i.e., options not traded on exchanges) generally are established through negotiation with the other party to the option contract. While a Fund has greater flexibility to tailor an OTC option, OTC options generally expose a Fund to greater credit risk than exchange-traded options, which are guaranteed by the clearing organization of the exchanges where they are traded. Purchasing and writing put and call options are highly specialized activities and entail greater than ordinary market risks.
Special tax rules apply to a Fund’s transactions in options, which could increase the taxes payable by shareholders. In particular, a Fund’s options transactions potentially could cause a substantial portion of the Fund’s distributions to consist of amounts taxable to shareholders subject to U.S. income tax at ordinary income tax rates. See the Funds’ Prospectus and Statement of Additional Information for more information.
Short Investment Exposure. Some Funds may sell securities or currencies short as part of their investment programs in an attempt to increase their returns or for hedging purposes. Short sales expose a Fund to the risk that it will be required to acquire, convert, or exchange a security or currency to replace the borrowed security or currency when the security or currency sold short has appreciated in value, thus resulting in a loss to the Fund. Purchasing a security or currency to close out a short position can itself cause the price of the security or currency to rise further, thereby exacerbating any losses. A Fund that sells short a security or currency it does not own also may have to pay borrowing fees to a broker and may be required to pay the broker any dividends or interest it receives on a borrowed security.
A Fund also may create short investment exposure by taking a derivative position in which the value of the derivative moves in the opposite direction from the price of an underlying investment, pool of investments, index or currency. Short sales of securities or currencies a Fund does not own and “short” derivative positions involve forms of investment leverage, and the amount of the Fund’s potential loss is theoretically unlimited. A Fund is subject to increased leveraging risk and other investment risks described in this “Investment and other risks” section to the extent it sells short securities or currencies it does not own or takes “short” derivative positions.
87
GMO Trust Funds
Notes to Financial Statements — (Continued)
February 28, 2017
• FOCUSED INVESTMENT RISK. Funds with investments that are focused in particular countries, regions, sectors, industries or issuers that are subject to the same or similar risk factors and funds with investments whose prices are closely correlated are subject to greater overall risk than funds with investments that are more diversified or whose prices are not as closely correlated.
A Fund that invests in the securities of a small number of issuers has greater exposure to adverse developments affecting those issuers and to a decline in the market price of particular securities than Funds investing in the securities of a larger number of issuers. Securities, sectors, or companies that share common characteristics are often subject to similar business risks and regulatory burdens, and often react similarly to specific economic, market, political or other developments.
Similarly, Funds having a significant portion of their assets in investments tied economically (or related) to a particular geographic region, country (e.g., Taiwan or Japan), or market (e.g., emerging markets), or to sectors within a region, country, or market (e.g., Russian oil) have more exposure to regional and country economic risks than funds making investments throughout the world. The political and economic prospects of one country or group of countries within the same geographic region may affect other countries in that region, and a recession, debt crisis or decline in the value of the currency of one country can spread to other countries. Furthermore, companies in a particular geographic region or country are vulnerable to events affecting other companies in that region or country because they often share common characteristics, are exposed to similar business risks and regulatory burdens, and react similarly to specific economic, market, political or other developments. See also “Non-U.S. Investment Risk”.
• FUND OF FUNDS RISK. Funds that invest in Underlying Funds (including underlying GMO Funds) are exposed to the risk that the Underlying Funds will not perform as expected. The Funds are also indirectly exposed to all of the risks to which the Underlying Funds are exposed.
Because a Fund bears the fees and expenses of an Underlying Fund in which it invests, absent reimbursement, the Fund will incur additional expenses when investing in an Underlying Fund. In addition, total Fund expenses will increase if a Fund makes a new or further investment in Underlying Funds with higher fees or expenses than the average fees and expenses of the Underlying Funds then in the Fund’s portfolio.
In addition, to the extent a Fund invests in shares of underlying GMO Funds, it is indirectly subject to Large Shareholder Risk because those underlying GMO Funds are more likely to have large shareholders (e.g., other GMO Funds). See “Large Shareholder Risk.”
Investments in ETFs involve the risk that an ETF’s performance may not track the performance of the index the ETF is designed to track. In addition, ETFs often use derivatives to track the performance of the relevant index, and, therefore, investments in those ETFs are subject to the same derivatives risks discussed in “Derivatives and Short Sales Risk”.
A Fund’s investments in one or more Underlying Funds could affect the amount, timing and character of its distributions and could cause the Fund to recognize taxable income in excess of the cash generated by such investments, requiring the Fund in turn to liquidate investments at disadvantageous times to generate cash needed to make required distributions.
• ILLIQUIDITY RISK. Illiquidity risk is the risk that low trading volume, lack of a market maker, large position size, or legal restrictions (including daily price fluctuation limits or “circuit breakers”) limits or prevents a Fund from selling particular securities or closing derivative positions at desirable prices. In addition to these risks, a Fund is exposed to illiquidity risk when it has an obligation to purchase particular securities (e.g., as a result of entering into reverse repurchase agreements, writing a put, or closing a short position). To the extent a Fund’s investments include asset-backed securities, distressed, defaulted or other low quality debt securities, emerging country debt securities, securities of companies with smaller market capitalizations or smaller total float adjusted market capitalizations, or emerging market securities, it is subject to increased illiquidity risk. These types of investments can be difficult to value, exposing a Fund to the risk that the price at which it sells them will be less than the price at which they were valued when held by the Fund. Illiquidity risk also may be greater in times of financial stress. For example, Inflation-Protected Securities issued by the U.S. Treasury (“TIPS”) have experienced periods of greatly reduced liquidity during disruptions in fixed income markets, such as the events surrounding the bankruptcy of Lehman Brothers in 2008. Less liquid securities are more susceptible than other securities to price declines when market prices decline generally.
A Fund may buy securities that are less liquid than those in its benchmark.
A Fund’s ability to use options as part of its investment program depends on the liquidity of the options market. In addition, that market may not be liquid when a Fund seeks to close out an option position. Also, the hours of trading for options on an exchange may not conform to the hours during which the securities held by a Fund are traded. To the extent that the options markets close before the markets for the underlying securities, significant price and rate movements can take place in the markets for underlying securities that are not immediately reflected in the options markets. If a Fund receives a redemption request and is unable to close out an option it has sold, the Fund may temporarily be leveraged in relation to its assets.
88
GMO Trust Funds
Notes to Financial Statements — (Continued)
February 28, 2017
• LARGE SHAREHOLDER RISK. To the extent a large number of shares of a Fund is held by a single shareholder (e.g., an institutional investor or another GMO Fund) or a group of shareholders with a common investment strategy (e.g., GMO asset allocation accounts), the Fund is subject to the risk that a redemption by those shareholders of all or a large portion of their Fund shares will adversely affect the Fund’s performance by forcing the Fund to sell portfolio securities, potentially at disadvantageous prices, to raise the cash needed to satisfy the redemption request. In addition, the Funds and other accounts over which GMO has investment discretion that invest in the Funds are not limited in how often they may purchase or sell Fund shares. The Asset Allocation Funds and separate accounts managed by GMO for its clients hold substantial percentages of the shares of many Funds, and asset allocation decisions by GMO may result in substantial redemptions from (or investments in) those Funds. These transactions may adversely affect the Fund’s performance to the extent that the Fund is required to sell investments (or invest cash) when it would not otherwise do so. Redemptions of a large number of shares also may increase transaction costs or, by necessitating a sale of portfolio securities, have adverse tax consequences for Fund shareholders. Additionally, redemptions and/or purchases of shares by a large shareholder and/or a group of shareholders over time potentially limit the use of any capital loss carryforwards to offset future realized capital gains (if any) and other losses that would otherwise reduce distributable net investment income. Large shareholders may limit or prevent a Fund’s use of tax equalization for U.S. federal tax purposes. In addition, to the extent a Fund invests in other GMO Funds subject to large shareholder risk, the Fund is indirectly subject to this risk.
• LEVERAGING RISK. The use of reverse repurchase agreements and other derivatives and securities lending creates leverage (i.e., a Fund’s investment exposures exceed its net asset value). Leverage increases a Fund’s losses when the value of its investments (including derivatives) declines. Because many derivatives have a leverage component (i.e., a notional value in excess of the assets needed to establish or maintain the derivative position), adverse changes in the value or level of the underlying asset, rate or index may result in a loss substantially greater than the amount invested in the derivative itself. In the case of swaps, the risk of loss generally is related to a notional principal amount, even if the parties have not made any initial investment. Some derivatives have the potential for unlimited loss, regardless of the size of the initial investment. A Fund’s portfolio also will be leveraged if it borrows money to meet redemption requests or settle investment transactions or if it exercises its right to delay payment on a redemption.
A Fund may manage some of its derivative positions by offsetting derivative positions against one another or against other assets. To the extent offsetting positions do not behave in relation to one another as expected, a Fund may perform as if it were leveraged.
• MANAGEMENT AND OPERATIONAL RISK. Each Fund is subject to management risk because it relies on GMO to achieve its investment objective. Each Fund runs the risk that GMO’s investment techniques will fail to produce desired results and cause the Fund to incur significant losses. GMO also may fail to use derivatives effectively, choosing to hedge or not to hedge positions at disadvantageous times.
For many Funds, GMO often uses quantitative models as part of its investment process. GMO’s models are not necessarily predictive of future market events and use simplifying assumptions that can limit their effectiveness. In addition, the data on which the models are based is subject to limitations (e.g. inaccuracies, staleness) that could adversely affect a Fund’s performance. The Funds also run the risk that GMO’s assessment of an investment (including a company’s fundamental fair (or intrinsic) value) may be wrong.
There can be no assurance that key GMO personnel will continue to be employed by GMO. The loss of their services could have an adverse impact on GMO’s ability to achieve the Funds’ investment objectives.
The Funds also are subject to the risk of loss as a result of other services provided by GMO and other service providers, including pricing, administrative, accounting, tax, legal, custody, transfer agency, and other services. Operational risk includes the possibility of loss caused by inadequate procedures and controls, human error, and system failures by a service provider. For example, trading delays or errors could prevent a Fund from benefiting from potential investment gains or avoiding losses. In addition, a service provider may be unable to provide a net asset value (“NAV”) for a Fund or share class on a timely basis. GMO is not contractually liable to the Funds for losses associated with operational risk absent its willful misfeasance, bad faith, gross negligence, or reckless disregard of its contractual obligations to provide services to the Funds. Other Fund service providers also have contractual limitations on their liability to the Funds for losses resulting from their errors.
The Funds and their service providers (including GMO) are susceptible to cyber-attacks and technological malfunctions that may have effects that are similar to those of a cyber-attack. Cyber-attacks include, among others, stealing or corrupting data maintained online or digitally, preventing legitimate users from accessing information or services on a website, releasing confidential information without authorization, and causing operational disruption. Successful cyber-attacks against, or security breakdowns of, a Fund, GMO, a sub-adviser, or a custodian, transfer agent, or other service provider may adversely affect the Fund or its shareholders. For instance, cyber-attacks may interfere with the processing of shareholder transactions, affect a Fund’s ability to calculate its net asset value, cause the release or misappropriation of private shareholder information or confidential Fund information, impede trading, cause reputational damage, and subject the Fund to regulatory fines, penalties or financial losses, reimbursement or other compensation costs, and additional compliance costs. While GMO has established business continuity plans and systems designed to prevent cyber-attacks, such plans and systems are subject to inherent limitations. Similar types of cyber security risks also are present for issuers of securities in which the Funds invest, which could result in material adverse consequences for such issuers, and may cause a Fund’s investment in such securities to lose value.
89
GMO Trust Funds
Notes to Financial Statements — (Continued)
February 28, 2017
• MARKET DISRUPTION AND GEOPOLITICAL RISK. The Funds are subject to the risk that geopolitical and other events (e.g., wars and terrorism) will disrupt securities markets and adversely affect global economies and markets, thereby decreasing the value of the Funds’ investments. Sudden or significant changes in the supply or prices of commodities or other economic inputs (e.g., the marked decline in oil prices that began in late 2014) may have material and unexpected effects on both global securities markets and individual countries, regions, sectors, companies, or industries, which could significantly reduce the value of a Fund’s investments. Terrorism in the United States and around the world has increased geopolitical risk. The terrorist attacks on September 11, 2001 resulted in the closure of some U.S. securities markets for four days, and similar attacks are possible in the future. Securities markets may be susceptible to market manipulation (e.g., the manipulation of the London Interbank Offered Rate (LIBOR)) or other fraudulent trading practices, which could disrupt the orderly functioning of markets or reduce the value of investments traded in them, including investments of the Funds. Instances of fraud and other deceptive practices committed by senior management of certain companies in which a Fund invests may undermine GMO’s due diligence efforts with respect to such companies, and if such fraud is discovered, negatively affect the value of the Fund’s investments. In addition, when discovered, financial fraud may contribute to overall market volatility, which can negatively impact a Fund’s investment program. Financial fraud also may impact the rates or indices underlying a Fund’s investments.
While the U.S. government has always honored its credit obligations, a default by the U.S. government (as has been threatened in recent years) would be highly disruptive to the U.S. and global securities markets and could significantly reduce the value of the Funds’ investments. Similarly, political events within the United States at times have resulted, and may in the future result, in a shutdown of government services, which could adversely affect the U.S. economy, decrease the value of many Fund investments, and increase uncertainty in or impair the operation of the U.S. or other securities markets. Uncertainty surrounding the sovereign debt of several European Union countries, as well as the continued existence of the European Union itself, has disrupted and may continue to disrupt markets in the United States and around the world. If a country changes its currency or leaves the European Union or if the European Union dissolves, the world’s securities markets likely will be significantly disrupted. Substantial government interventions (e.g., currency controls) also could adversely affect the Funds. War, terrorism, economic uncertainty, and related geopolitical events have led, and in the future may lead, to increased short-term market volatility and may have adverse long-term effects on U.S. and world economies and markets generally. Likewise, natural and environmental disasters, such as the earthquake and tsunami in Japan in early 2011, and systemic market dislocations of the kind surrounding the insolvency of Lehman Brothers in 2008, if repeated, would be highly disruptive to economies and markets, adversely affecting individual companies and industries, securities markets, interest rates, credit ratings, inflation, investor sentiment, and other factors affecting the value of the Funds’ investments. During such market disruptions, the Funds’ exposure to the risks described elsewhere in this “Investment and other risks” section will likely increase. Market disruptions, including sudden government interventions, can also prevent the Funds from implementing their investment programs and achieving their investment objectives. For example, a market disruption may adversely affect the orderly functioning of the securities markets and may cause the Funds’ derivatives counterparties to discontinue offering derivatives on some underlying commodities, securities, reference rates, or indices, or to offer them on a more limited basis. To the extent a Fund has focused its investments in the stock index of a particular region, adverse geopolitical and other events in that region could have a disproportionate impact on the Fund.
• MARKET RISK. All of the Funds are subject to market risk, which is the risk that the market value of their holdings will decline. Market risks include:
Asset-Backed Securities — Investments in asset-backed securities not only are subject to all of the market risks described under “Market Risk – Fixed Income Investments,” but to other market risks as well.
Asset-backed securities are often exposed to greater risk of severe credit downgrades, illiquidity, and defaults than many other types of fixed income investments. These risks are particularly acute during periods of adverse market conditions, such as those that occurred in 2008. Asset-backed securities may be backed by many types of assets, including pools of residential and commercial mortgages, automobile loans, educational loans, home equity loans, and credit-card receivables. They also may be backed by pools of corporate, sovereign or quasi-sovereign bonds, bank loans to corporations, or a combination of bonds and loans (commonly referred to as “collateralized debt obligations” or “collateralized loan obligations”) and by the fees payable to service providers.
As described under “Market Risk — Fixed Income Investments,” the market price of fixed income investments with complex structures, such as asset-backed securities, can decline due to a variety of factors, including market uncertainty about their credit quality and the reliability of their payment streams. Payment of interest on asset-backed securities and repayment of principal largely depend on the cash flow generated by the assets backing the securities, as well as the deal structure (e.g., the amount of underlying assets or other support available to produce the cash flows necessary to service interest and make principal payments), the quality of the underlying assets, the level of credit support and the credit quality of the credit-support provider, if any, and the reliability of various other service providers with access to the payment stream. A problem in any one of these factors can lead to a reduction in the payment stream GMO expected a Fund to receive at the time the Fund purchased the asset-backed security. Asset-backed securities involve risk of loss of principal if obligors of the underlying obligations default and the value of the defaulted obligations exceeds whatever credit support the securities may have. Asset-backed securities backed by sub-prime mortgage loans, in particular, may expose a Fund to significantly greater declines in value due to defaults because sub-prime mortgage loans are typically made to less creditworthy borrowers and thus have a higher risk of default than conventional mortgage loans. The obligations of issuers (and obligors of
90
GMO Trust Funds
Notes to Financial Statements — (Continued)
February 28, 2017
asset-backed securities) also are subject to bankruptcy, insolvency and other laws affecting the rights and remedies of creditors. As of the date of this report, many asset-backed securities owned by the Funds that were once rated investment grade are now rated below investment grade. See “Credit Risk” for more information about credit risk.
With the deterioration of worldwide economic and liquidity conditions that occurred and became acute in 2008, the markets for asset-backed securities became fractured, and uncertainty about the creditworthiness of those securities (and underlying assets) caused credit spreads (the difference between yields on asset-backed securities and U.S. Government securities) to widen dramatically. Concurrently, systemic risks of the type evidenced by the insolvency of Lehman Brothers and subsequent market disruptions reduced the ability of financial institutions to make markets in many fixed income securities. These events reduced liquidity and contributed to substantial declines in the market prices of asset-backed and other fixed income securities. These conditions may occur again. Also, government actions and proposals affecting the terms of underlying home and consumer loans, changes in demand for products (e.g., automobiles) financed by those loans, and the inability of borrowers to refinance existing loans (e.g., sub-prime mortgages) have had, and may continue to have, adverse valuation and liquidity effects on asset-backed securities.
The market price of an asset-backed security may depend on the servicing of its underlying assets and is, therefore, subject to risks associated with the negligence or defalcation of its servicer. In some circumstances, the mishandling of documentation for underlying assets also may affect the rights of holders of those underlying assets. The insolvency of an entity that generated the assets underlying an asset-backed security is likely to result in a decline in the market price of that security, as well as costs and delays. The obligations underlying asset-backed securities, in particular securities backed by pools of residential and commercial mortgages, also are subject to unscheduled prepayment, and a Fund may be unable to invest prepayments at as high a yield as was provided by the asset-backed security. When interest rates rise, these obligations also may be repaid more slowly than anticipated, and the market price of the Fund’s investment may decrease. In addition, the existence of insurance on an asset-backed security does not guarantee that the principal and interest will be paid because the insurer could default on its obligations.
The risk of investing in asset-backed securities has increased since the deterioration in worldwide economic and liquidity conditions referred to above because performance of the various sectors in which the assets underlying asset-backed securities are concentrated (e.g., auto loans, student loans, sub-prime mortgages, and credit card receivables) has become more highly correlated. See “Focused Investment Risk” for more information about risks of investing in correlated sectors. A single financial institution may serve as a trustee for many asset-backed securities. As a result, a disruption in that institution’s business may have a material impact on many investments. The risks associated with asset-backed securities are particularly pronounced for Opportunistic Income Fund, which has invested a substantial portion of its assets in asset-backed securities, and for each Fund that has invested a substantial portion of its assets in Opportunistic Income Fund.
Equities — Funds that invest in equities run the risk that the market price of an equity will decline. That decline may be attributable to factors affecting the issuer, such as poor performance by the company’s management or reduced demand for its goods or services, or to factors affecting a particular industry, such as a decline in demand, labor or raw material shortages, or increased production costs. A decline also may result from general market conditions not specifically related to a company or industry, such as real or perceived adverse economic conditions, changes in the general outlook for corporate earnings, changes in interest or currency rates, or adverse investor sentiment generally. Equities generally have significant price volatility, and their market prices can decline in a rapid or unpredictable manner. If a Fund purchases an equity for less than its fundamental fair (or intrinsic) value as determined by GMO, the Fund runs the risk that the market price of the equity will not appreciate or will decline due to GMO’s incorrect assessment of the equity’s fundamental fair (or intrinsic) value. The market prices of equities trading at high multiples of current earnings often are more sensitive to changes in future earnings expectations than the market prices of equities trading at lower multiples.
Fixed Income Investments — Funds that invest in fixed income securities (including bonds, notes, bills, synthetic debt instruments, and asset-backed securities) are subject to various market risks. The market price of a fixed income investment can decline due to market-related factors, including rising interest rates and widening credit spreads, or decreased liquidity stemming from the market’s uncertainty about the value of a fixed income investment (or class of fixed income investments). In addition, the market price of fixed income investments with complex structures, such as asset-backed securities, and sovereign and quasi-sovereign debt instruments, can decline due to uncertainty about their credit quality and the reliability of their payment streams. Some fixed income securities also are subject to unscheduled prepayment, and a Fund may be unable to invest prepayments at as high a yield as was provided by the fixed income security. When interest rates rise, these securities also may be repaid more slowly than anticipated, and the market price of the Fund’s investment may decrease. During periods of economic uncertainty and change, the market price of a Fund’s investments in below investment grade securities (commonly referred to as “junk bonds”) may be particularly volatile. Often below investment grade securities are subject to greater sensitivity to interest rate and economic changes than higher rated bonds and can be more difficult to value, exposing a Fund to the risk that the price at which it sells them will be less than the price at which they were valued when held by the Fund. See “Credit Risk” and “Illiquidity Risk” for more information about these risks.
A risk run by each Fund with a significant investment in fixed income securities is that an increase in prevailing interest rates will cause the market price of those securities to decline. The risk associated with increases in interest rates (also called “interest rate risk”) is generally greater for Funds investing in fixed income securities with longer durations. In addition, in managing some Funds, GMO may seek to evaluate potential
91
GMO Trust Funds
Notes to Financial Statements — (Continued)
February 28, 2017
investments in part by considering the volatility of interest rates. The value of a Fund’s investments may be significantly reduced if GMO’s assessment proves incorrect.
The extent to which a fixed income security’s price changes with changes in interest rates is referred to as interest rate duration, which can be measured mathematically or empirically. A longer-maturity investment generally has longer interest rate duration because the investment’s fixed rate is locked in for a longer period of time. Floating-rate or adjustable-rate securities, however, generally have shorter interest rate durations because their interest rates are not fixed but rather float up and down as interest rates change. Conversely, inverse floating-rate securities have durations that move in the opposite direction from short-term interest rates and thus tend to underperform fixed rate securities when interest rates rise but outperform them when interest rates decline. Fixed income securities paying no interest, such as zero coupon and principal-only securities, are subject to additional interest rate risk.
The market price of inflation-indexed bonds (including TIPS) typically declines during periods of rising real interest rates (i.e., nominal interest rate minus inflation) and increases during periods of declining real interest rates. In some interest rate environments, such as when real interest rates are rising faster than nominal interest rates, the market price of inflation-indexed bonds may decline more than the price of non-inflation-indexed (or nominal) fixed income bonds with similar maturities.
Generally, when interest rates on short term U.S. Treasury obligations equal or approach zero, a Fund that invests a substantial portion of its assets in U.S. Treasury obligations, such as U.S. Treasury Fund, will have a negative return unless GMO waives or reduces its management fees.
Fixed income securities denominated in foreign currencies also are subject to currency risk. See “Currency Risk”.
In response to government intervention, economic or market developments, or other factors, fixed income markets may experience periods of high volatility, reduced liquidity or both. During those periods, a Fund could have unusually high shareholder redemptions, requiring it to generate cash by selling securities when it would otherwise not do so, including at unfavorable prices. Fixed income investments may be difficult to value during such periods. In recent periods, central banks and governmental financial regulators, including the U.S. Federal Reserve, have maintained historically low interest rates by purchasing bonds. Steps to curtail or “taper” such activities and other actions by central banks or regulators (such as intervention in foreign currency markets or currency controls) could have a material adverse effect on the Funds.
• NON-DIVERSIFIED FUNDS. All of the Funds (except U.S. Treasury Fund) are not “diversified” investment companies within the meaning of the 1940 Act. This means they are allowed to invest in the securities of relatively few issuers. As a result, they may be subject to greater credit, market and other risks, and poor performance by a single issuer may have a greater impact on their performance, than if they were “diversified.”
In addition, each of the Funds (other than U.S. Treasury Fund) may invest in shares of one or more other GMO Funds that are not diversified investment companies under the 1940 Act.
• NON-U.S. INVESTMENT RISK. Funds that invest in non-U.S. securities are subject to more risks than Funds that invest only in U.S. securities. Non-U.S. securities markets often include securities of only a small number of companies in a limited number of industries. As a result, the market prices of many of the securities traded on those markets fluctuate more than those of U.S. securities. In addition, issuers of non-U.S. securities often are not subject to as much regulation as U.S. issuers, and the reporting, accounting, custody, and auditing standards to which those issuers are subject differ, in some cases significantly, from U.S. standards. Transactions in non-U.S. securities generally involve higher commission rates, transfer taxes and custodial costs. In addition, some jurisdictions may limit a Fund’s ability to profit from short-term trading (as defined in the relevant jurisdiction).
A Fund may be subject to non-U.S. taxation, including potentially on a retroactive basis, on (i) capital gains it realizes or dividends, interest, or other amounts it realizes or accrues in respect of non-U.S. investments; (ii) transactions in those investments; and (iii) repatriation of proceeds generated from the sale or other disposition of those investments. A Fund may seek a refund of taxes paid, but its efforts may not be successful, in which case the Fund will have incurred additional expenses for no economic benefit. A Fund’s decision to seek a refund is in its sole discretion, and, particularly in light of the cost involved, it may decide not to seek a refund, even if eligible. The outcome of a Fund’s efforts to obtain a refund may be unpredictable. Accordingly, a refund is not typically reflected in a Fund’s net asset value until it is received or until the Fund determines there is a high likelihood the refund will be received. In some cases, the amount of a refund could be material to a Fund’s net assets. Absent a determination that a refund is collectible and free from significant contingencies, such amount is not typically reflected in a Fund’s net assets.
Also, investing in non-U.S. securities exposes a Fund to the risk of nationalization, expropriation, or confiscatory taxation of assets of their issuers, other government involvement in the economy or in the affairs of specific companies or industries (including in the case of wholly or partially state-owned enterprises), adverse changes in investment regulations, capital requirements or exchange controls (which may include suspension of the ability to transfer currency from a country), and adverse political and diplomatic developments, including the imposition of economic sanctions.
92
GMO Trust Funds
Notes to Financial Statements — (Continued)
February 28, 2017
In some non-U.S. securities markets, custody arrangements for securities provide significantly less protection than custody arrangements in U.S. securities markets, and prevailing custody and trade settlement practices (e.g., the requirement to pay for securities prior to receipt) expose a Fund to credit and other risks it does not have in the United States with respect to brokers, custodians, clearing banks or other clearing agents, escrow agents, and issuers. Fluctuations in foreign currency exchange rates also affect the market value of a Fund’s non-U.S. investments (see “Currency Risk”).
The Funds need a license to invest directly in many non-U.S. securities markets. These licenses are often subject to limitations, including maximum investment amounts. Once a license is obtained, a Fund’s ability to continue to invest directly is subject to the risk that the license will be terminated or suspended. If a license to invest in a particular market is terminated or suspended, to obtain exposure to that market the Fund will be required to purchase American Depositary Receipts, Global Depositary Receipts, shares of other funds that are licensed to invest directly, or derivative instruments. The receipt of a non-U.S. license by one of GMO’s clients may preclude other clients, including a Fund, from obtaining a similar license, and this could limit the Fund’s investment opportunities. In addition, the activities of a GMO client could cause the suspension or revocation of a license and thereby limit the Funds’ investment opportunities.
Funds that invest a significant portion of their assets in securities of issuers tied economically to emerging countries (or investments related to emerging markets) are subject to greater non-U.S. investment risk than Funds investing primarily in more developed non-U.S. countries (or markets). The risks of investing in those securities include: greater fluctuations in currency exchange rates; increased risk of default (by both government and private issuers); greater social, economic, and political uncertainty and instability (including the risk of war or natural disaster); increased risk of nationalization, expropriation, or other confiscation of assets of issuers of securities in a Fund’s portfolio; greater governmental involvement in the economy or in the affairs of specific companies or industries (including in the case of wholly or partially state-owned enterprises); less governmental supervision and regulation of the securities markets and participants in those markets; controls on non-U.S. investment, capital controls and limitations on repatriation of invested capital, dividends, interest and other income and on a Fund’s ability to exchange local currencies for U.S. dollars; inability to purchase and sell investments or otherwise settle security or derivative transactions (i.e., a market freeze); unavailability of currency hedging techniques; differences in, or lack of, auditing and financial reporting standards and resulting unavailability of material information about issuers; slower clearance and settlement; difficulties in obtaining and enforcing legal judgments; and significantly smaller market capitalizations of issuers. In addition, the economies of emerging countries may be predominantly based on only a few industries or dependent on revenues from particular commodities.
• SMALL COMPANY RISK. Companies with smaller market capitalizations may have limited product lines, markets, or financial resources, may lack the competitive strength of larger companies, may have inexperienced managers or may depend on a smaller group of key employees as compared to larger companies. In addition, their securities often are less widely held and trade less frequently and in lesser quantities, and their market prices often fluctuate more, than the securities of companies with larger market capitalizations. Market risk and illiquidity risk are particularly pronounced for securities of these companies.
Temporary Defensive Positions. Temporary defensive positions are positions that are inconsistent with a Fund’s principal investment strategies and are taken in response to adverse market, economic, political or other conditions.
The Funds (other than Emerging Country Debt Fund and U.S. Treasury Fund) may take temporary defensive positions if deemed prudent by GMO. Many of the Funds have previously taken temporary defensive positions.
To the extent a Fund takes a temporary defensive position, or otherwise holds cash, cash equivalents, or high quality debt investments on a temporary basis, the Fund may not achieve its investment objective.
| 4. | Derivative financial instruments |
Derivatives are financial contracts whose value depends on, or is derived from, the value of underlying assets, reference rates, or indices that are used to increase, decrease or adjust elements of the investment exposures of a Fund’s portfolio. Derivatives may relate to securities, interest rates, currencies, currency exchange rates, inflation rates, commodities and indices, and include foreign currency contracts, swap contracts, reverse repurchase agreements, and other exchange-traded and OTC contracts.
The Funds may use derivatives to gain long investment exposure to securities or other assets. In particular, the Funds may use swaps or other derivatives on an index, a single security, or a basket of securities to gain investment exposures (e.g., by selling protection under a credit default swap). The Funds also may use currency derivatives (including forward currency contracts, futures contracts, swap contracts and options) to gain exposure to a given currency.
The Funds may use derivatives in an attempt to reduce their investment exposures (which may result in a reduction below zero). For example, a Fund may use credit default swaps to take a short position with respect to the likelihood of default by an issuer or may use a bond futures contract to short the bond market of a particular country. A Fund also may use currency derivatives in an attempt to reduce (which may result in a reduction below zero) some aspect of the currency exposure in its portfolio. For these purposes, the Fund may use an instrument denominated in a
93
GMO Trust Funds
Notes to Financial Statements — (Continued)
February 28, 2017
different currency that GMO believes is highly correlated with the relevant currency. The Funds may use derivatives in an attempt to adjust elements of their investment exposures to various securities, sectors, markets, indices, and currencies without actually having to sell existing investments or make new direct investments. For instance, GMO may alter the interest rate exposure of debt instruments by employing interest rate swaps. Such a strategy is designed to maintain the Fund’s exposure to the credit of an issuer through the debt instrument but adjust the Fund’s interest rate exposure through the swap. With these swaps, the Fund and its counterparties exchange interest rate exposure, such as fixed versus variable rates and shorter duration versus longer duration exposure. In adjusting its investment exposures, a Fund also may use currency derivatives in an attempt to adjust its currency exposure, seeking currency exposure that is different (in some cases, significantly different) from the currency exposure represented by its portfolio investments.
Each of the Funds is not limited in its use of derivatives or in the total notional value of its derivative positions. As a result of their derivative positions, the Funds will typically have (or may have, in the case of Opportunistic Income Fund and U.S. Treasury Fund) gross investment exposures in excess of their net assets (i.e., the Funds will be (or may be, in the case of Opportunistic Income Fund and U.S. Treasury Fund) leveraged) and therefore are subject to heightened risk of loss. Each Fund’s (other than Opportunistic Income Fund and U.S. Treasury Fund) performance can depend substantially, if not primarily, on the performance of assets or indices underlying its derivatives even though it does not own those assets or indices.
Certain derivatives transactions that may be used by the Funds, including certain interest rate swaps and certain credit default index swaps, are required to be transacted through a central clearing organization. The Funds hold cleared derivatives transactions, if any, through clearing members, who are members of derivatives clearing houses. Certain other derivatives, including futures and certain options, are transacted on exchanges. The Funds hold exchange-traded derivatives through clearing brokers that are typically members of the exchanges. In contrast to bilateral derivatives transactions, following a period of advance notice to the Fund, clearing brokers generally can require termination of existing cleared or exchange-traded derivatives transactions at any time and increases in margin above the margin that it required at the beginning of a transaction. Clearing houses and exchanges also have broad rights to increase margin requirements for existing transactions and to terminate transactions. Any such increase or termination could interfere with the ability of a Fund to pursue its investment strategy. Also, a Fund is subject to execution risk if it enters into a derivatives transaction that is required to be cleared (or that GMO expects to be cleared), and no clearing member is willing or able to clear the transaction on the Fund’s behalf. In that case, the transaction might have to be terminated, and the Fund could lose some or all of the benefit of any increase in the value of the transaction after the time of the transaction.
The use of derivatives involves risks that are in addition to, and potentially greater than, the risks associated with investing directly in securities and other more traditional assets. See “Investment and other risks” above for further information.
For Funds that held derivatives during the year ended February 28, 2017, the following table shows how the Fund used these derivatives (marked with an X):
| | | | | | | | | | | | | | | | | | | | |
| | | | | | |
| Type of Derivative and Objective for Use | | Asset
Allocation
Bond Fund | | | Core Plus
Bond Fund | | | Currency
Hedged
International
Bond Fund | | | Emerging
Country
Debt Fund | | | Opportunistic
Income Fund
(formerly Debt
Opportunities
Fund) | |
| Forward currency contracts | | | | | | | | | | | | | | | | | | | | |
Adjust currency exchange rate risk | | | X | | | | X | | | | X | | | | X | | | | X | |
Adjust exposure to foreign currencies | | | X | | | | X | | | | X | | | | X | | | | | |
| Futures contracts | | | | | | | | | | | | | | | | | | | | |
Adjust exposure to certain markets | | | X | | | | | | | | | | | | | | | | | |
Adjust interest rate exposure | | | | | | | X | | | | X | | | | | | | | | |
Maintain the diversity and liquidity of the portfolio | | | | | | | X | | | | X | | | | | | | | | |
| Options (Purchased) | | | | | | | | | | | | | | | | | | | | |
Adjust currency exchange rate risk | | | X | | | | X | | | | X | | | | | | | | | |
Adjust exposure to foreign currencies | | | X | | | | X | | | | X | | | | | | | | | |
Adjust interest rate exposure | | | X | | | | X | | | | X | | | | | | | | | |
Adjust exposure to a reference entity’s credit | | | | | | | | | | | | | | | | | | | X | |
Adjust exposure to equity markets | | | X | | | | | | | | | | | | | | | | X | |
Provide a measure of protection against default loss | | | | | | | | | | | | | | | | | | | X | |
94
GMO Trust Funds
Notes to Financial Statements — (Continued)
February 28, 2017
| | | | | | | | | | | | | | | | | | | | |
| | | | | | |
| Type of Derivative and Objective for Use | | Asset
Allocation
Bond Fund | | | Core Plus
Bond Fund | | | Currency
Hedged
International
Bond Fund | | | Emerging
Country
Debt Fund | | | Opportunistic
Income Fund
(formerly Debt
Opportunities
Fund) | |
| Options (Written) | | | | | | | | | | | | | | | | | | | | |
Adjust exposure to a reference entity’s credit | | | | | | | | | | | | | | | | | | | X | |
Adjust currency exchange rate risk | | | X | | | | X | | | | X | | | | | | | | | |
Adjust exposure to foreign currencies | | | X | | | | X | | | | X | | | | | | | | | |
Adjust interest rate exposure | | | X | | | | X | | | | X | | | | | | | | | |
Provide a measure of protection against default loss | | | | | | | | | | | | | | | | | | | X | |
| Options (Credit linked) | | | | | | | | | | | | | | | | | | | | |
Adjust exposure to a reference entity’s credit | | | | | | | | | | | | | | | X | | | | | |
| Swap contracts | | | | | | | | | | | | | | | | | | | | |
Adjust exposure to a reference entity’s credit | | | | | | | | | | | | | | | X | | | | X | |
Adjust exposure to certain markets | | | X | | | | | | | | | | | | | | | | | |
Adjust interest rate exposure | | | X | | | | X | | | | X | | | | X | | | | X | |
Provide a measure of protection against default loss | | | | | | | | | | | | | | | X | | | | X | |
Provide exposure to the Fund’s benchmark | | | | | | | X | | | | X | | | | | | | | | |
Adjust exposure to foreign currencies | | | | | | | | | | | | | | | X | | | | | |
| Rights and/or warrants | | | | | | | | | | | | | | | | | | | | |
Achieve exposure to a reference commodity/economic statistic | | | | | | | | | | | | | | | X | | | | | |
Forward currency contracts
The Funds (except U.S. Treasury Fund) may enter into forward currency contracts, including forward cross currency contracts. A forward currency contract is an agreement between two parties to buy and sell a currency at a set price on a future date (or to pay or receive the amount of the change in relative values of the two currencies). The market price of a forward currency contract fluctuates with changes in forward currency exchange rates. The value of each of the Fund’s forward currency contracts is marked-to-market daily using rates supplied by a quotation service and changes in value are recorded by each Fund as unrealized gains or losses. Realized gains or losses on the contracts are equal to the difference between the value of the contract at the time it was opened and the value at the time it was settled.
These contracts involve market risk in excess of the unrealized gain or loss. Forward currency contracts expose a Fund to the market risk of unfavorable movements in currency values and the risk that the counterparty will be unable or unwilling to meet the terms of the contracts. Most forward currency contracts are not collateralized. Forward currency contracts outstanding at the end of the year, if any, are listed in each applicable Fund’s Schedule of Investments.
Futures contracts
The Funds may purchase and sell futures contracts. A futures contract is a contract that obligates the holder to buy or sell an asset at a predetermined delivery price at a specified time in the future. Some futures contracts are net (cash) settled. Upon entering into a futures contract, a Fund is required to deposit cash, U.S. government and agency obligations or other liquid assets with the futures clearing broker in accordance with the initial margin requirements of the broker or exchange. Futures contracts are generally valued at the settlement price established at the close of business each day by the board of trade or exchange on which they are traded (and if the futures are traded outside the U.S. and the market for such futures is closed prior to the close of the NYSE due to time zone differences, the values will be adjusted, to the extent practicable and available, based on inputs from an independent pricing service approved by the Trustees to reflect estimated valuation changes through the NYSE close). The value of each of the Fund’s futures contracts is marked-to-market daily and an appropriate payable or receivable for the change in value (“variation margin”) is recorded by each Fund. The payable or receivable is settled on the following business day. Gains or losses are recognized but not accounted for as realized until the contracts expire or are closed. Futures contracts involve, to varying degrees, risk of loss in excess of the variation margin as recorded on the Statements of Assets and Liabilities. Under some circumstances, futures exchanges may establish daily limits on the amount that the price of a futures contract can vary from the previous day’s settlement price, thereby effectively preventing liquidation of unfavorable positions. Futures contracts expose the Funds to the risk that they may not be able to enter into a closing transaction due to an illiquid market. Futures contracts outstanding at the end of the year, if any, are listed in each applicable Fund’s Schedule of Investments.
95
GMO Trust Funds
Notes to Financial Statements — (Continued)
February 28, 2017
Options
The Funds may purchase call and put options. A call option gives the holder the right to buy an asset; a put option gives the holder the right to sell an asset. “Quanto” options are cash-settled options in which the underlying asset (often an index) is denominated in a currency other than the currency in which the option is settled. By purchasing options a Fund alters its exposure to the underlying asset by, in the case of a call option, entitling it to purchase the underlying asset at a set price from the writer of the option and, in the case of a put option, entitling it to sell the underlying asset at a set price to the writer of the option. A Fund pays a premium for a purchased option. That premium, if any, which is disclosed in the Schedule of Investments, is subsequently reflected in the marked-to-market value of the option. The potential loss associated with purchasing put and call options is limited to the premium paid. Purchased option contracts outstanding at the end of the year, if any, are listed in each applicable Fund’s Schedule of Investments.
The Funds may write (i.e., sell) call and put options on futures, swaps (“swaptions”), securities or currencies they own or in which they may invest. Writing options alters a Fund’s exposure to the underlying asset by, in the case of a call option, obligating that Fund to sell the underlying asset at a set price to the option-holder and, in the case of a put option, obligating that Fund to purchase the underlying asset at a set price from the option-holder. In some cases (e.g., index options), settlement will be in cash, based on a formula price. When a Fund writes a call or put option, an amount equal to the premium received is recorded as a liability and is subsequently included in the marked-to-market value of the option. As a writer of an option, a Fund has no control over whether it will be required to sell (call) or purchase (put) the underlying asset and as a result bears the risk of an unfavorable change in the price of the asset underlying the option. In the event that a Fund writes call options without an offsetting exposure (e.g., call options on an asset that the Fund does not own), it bears an unlimited risk of loss if the price of the underlying asset increases during the term of the option. OTC options expose a Fund to the risk the Fund may not be able to enter into a closing transaction because of an illiquid market. Written option contracts outstanding at the end of the year, if any, are listed in each applicable Fund’s Schedule of Investments.
When an option contract is closed, that Fund records a realized gain or loss equal to the difference between the value of the contract at the time it was opened and the value at the time it was closed. Realized gains and losses on purchased options are included in realized gains and losses on investment securities. If a written call option is exercised, the premium originally received is recorded as an addition to sales proceeds. If a written put option is exercised, the premium originally received is recorded as a reduction in the cost of investments purchased. Gains and losses from the
expiration or closing of written option contracts are separately disclosed in the Statements of Operations.
For the year ended February 28, 2017, investment activity in options contracts written by the Funds was as follows:
| | | | | | | | | | | | | | | | | | | | | | | | |
| | | Puts | | | Calls | |
| | | | | | | |
| | | Principal
Amount of
Contracts | | | Number of
Contracts | | | Premiums | | | Principal
Amount of
Contracts | | | Number of
Contracts | | | Premiums | |
Asset Allocation Bond Fund | | | | | | | | | | | | | | | | | | | | | | | | |
Outstanding, beginning of period | | | 74,764,000 | | | | — | | | $ | 4,092,476 | | | | 2,793,243,600 | | | | — | | | $ | 103,898,119 | |
Options written | | | — | | | | — | | | | — | | | | 407,298,000 | | | | — | | | | 15,212,569 | |
Options bought back | | | (37,382,000 | ) | | | — | | | | (2,395,187 | ) | | | (3,200,541,600 | ) | | | — | | | | (119,110,688 | ) |
Options expired | | | (37,382,000 | ) | | | — | | | | (1,697,289 | ) | | | — | | | | — | | | | — | |
Options exercised | | | — | | | | — | | | | — | | | | — | | | | — | | | | — | |
| | | | | | | | | | | | | | | | | | | | | | | | | |
Outstanding, end of period | | | — | | | | — | | | $ | — | | | | — | | | | — | | | $ | — | |
| | | | | | | | | | | | | | | | | | | | | | | | | |
| | | | | | | | | | | | | | | | | | | | | | | | | |
Core Plus Bond Fund | | | | | | | | | | | | | | | | | | | | | | | | |
Outstanding, beginning of period | | | — | | | | — | | | $ | — | | | | 40,895,000 | | | | — | | | $ | 1,721,643 | |
Options written | | | — | | | | — | | | | — | | | | — | | | | — | | | | — | |
Options bought back | | | — | | | | — | | | | — | | | | (40,895,000 | ) | | | — | | | | (1,721,643 | ) |
Options expired | | | — | | | | — | | | | — | | | | — | | | | — | | | | — | |
Options exercised | | | — | | | | — | | | | — | | | | — | | | | — | | | | — | |
| | | | | | | | | | | | | | | | | | | | | | | | | |
Outstanding, end of period | | | — | | | | — | | | $ | — | | | | — | | | | — | | | $ | — | |
| | | | | | | | | | | | | | | | | | | | | | | | | |
| | | | | | | | | | | | | | | | | | | | | | | | | |
96
GMO Trust Funds
Notes to Financial Statements — (Continued)
February 28, 2017
| | | | | | | | | | | | | | | | | | | | | | | | |
| | | Puts | | | Calls | |
| | | | | | | |
| | | Principal
Amount of
Contracts | | | Number of
Contracts | | | Premiums | | | Principal
Amount of
Contracts | | | Number of
Contracts | | | Premiums | |
Currency Hedged International Bond Fund | | | | | | | | | | | | | | | | | | | | | | | | |
Outstanding, beginning of period | | | — | | | | — | | | $ | — | | | | 12,158,000 | | | | — | | | $ | 510,173 | |
Options written | | | — | | | | — | | | | — | | | | — | | | | — | | | | — | |
Options bought back | | | — | | | | — | | | | — | | | | (12,158,000 | ) | | | — | | | | (510,173 | ) |
Options expired | | | — | | | | — | | | | — | | | | — | | | | — | | | | — | |
Options exercised | | | — | | | | — | | | | — | | | | — | | | | — | | | | — | |
| | | | | | | | | | | | | | | | | | | | | | | | | |
Outstanding, end of period | | | — | | | | — | | | $ | — | | | | — | | | | — | | | $ | — | |
| | | | | | | | | | | | | | | | | | | | | | | | | |
| | | | | | | | | | | | | | | | | | | | | | | | | |
Opportunistic Income Fund (formerly Debt Opportunities Fund) | | | | | | | | | | | | | | | | | |
Outstanding, beginning of period | | | 110,108,000 | | | | — | | | $ | 432,812 | | | | — | | | | — | | | $ | — | |
Options written | | | 1,353,158,000 | | | | 7,900 | | | | 4,377,004 | | | | 113,751,000 | | | | — | | | | 204,669 | |
Options bought back | | | (822,804,500 | ) | | | — | | | | (2,574,244 | ) | | | (113,751,000 | ) | | | — | | | | (204,669 | ) |
Options expired | | | (372,891,500 | ) | | | — | | | | (895,070 | ) | | | — | | | | — | | | | — | |
Options exercised | | | — | | | | — | | | | — | | | | — | | | | — | | | | — | |
| | | | | | | | | | | | | | | | | | | | | | | | | |
Outstanding, end of period | | | 267,570,000 | | | | 7,900 | | | $ | 1,340,502 | | | | — | | | | — | | | $ | — | |
| | | | | | | | | | | | | | | | | | | | | | | | | |
| | | | | | | | | | | | | | | | | | | | | | | | | |
In a credit linked option contract, one party makes payments to another party in exchange for the option to exercise a contract where the buyer has the right to receive a specified return if a credit event (e.g., default or similar event) occurs with respect to a reference entity or entities and a specified decrease in the value of the related collateral occurs. A writer of a credit linked option receives periodic payments in return for its obligation to pay an agreed-upon value to the other party if they exercise their option in the case of a credit event. If no credit event occurs, the seller has no payment obligation and will keep the premiums received.
Exchange-traded options are valued at the last sale price, provided that price is between the closing bid and ask prices. If the last sale price is not within this range, then they will be valued at the closing bid price for long positions and the closing ask price for short positions. The Funds value OTC options using industry models and inputs provided by primary pricing sources.
Swap contracts
The Funds may directly or indirectly use various swap contracts, including, without limitation, swaps on securities and securities indices, total return swaps, interest rate swaps, credit default swaps, variance swaps, commodity swaps, inflation swaps, municipal swaps, dividend swaps, volatility swaps, correlation swaps and other types of available swaps. A swap contract is an agreement to exchange the return generated by one asset for the return generated by another asset. Some swap contracts are net settled. When entering into a swap contract and during the term of the
transaction, a Fund and/or the swap counterparty may post or receive cash or securities as collateral.
Initial upfront payments received or made upon entering into a swap contract are included in the fair market value of the swap. The Funds do not amortize upfront payments. Net periodic payments made or received to compensate for differences between the stated terms of the swap contract and prevailing market conditions (credit spreads, currency exchange rates, interest rates, and other relevant factors) are recorded as realized gains or losses in the Statements of Operations. A liquidation payment received or made at the termination of the swap contract is recorded as realized
gain or loss in the Statements of Operations.
Interest rate swap contracts involve an exchange by the parties of their respective commitments to pay or rights to receive interest (e.g., an exchange of floating rate interest payments for fixed rate interest payments with respect to the notional amount of principal). Basis swaps are interest rate swaps that involve the exchange of two floating interest rate payments and may involve the exchange of two different currencies.
Inflation swaps involve the exchange of a floating rate linked to an index for a fixed rate interest payment with respect to a notional amount or principal.
Total return swap contracts involve a commitment by one party to pay interest to the other party in exchange for a payment to it from the other party based on the return of a reference asset (e.g., a security, basket of securities, or futures contract), both based on notional amounts. To the extent the return of the reference asset exceeds or falls short of the interest payments, one party is entitled to receive a payment from or obligated to make a payment to the other party.
97
GMO Trust Funds
Notes to Financial Statements — (Continued)
February 28, 2017
In a credit default swap contract, one party makes payments to another party in exchange for the right to receive a specified return (or to put a security) if a credit event (e.g., default or similar event) occurs with respect to a reference entity or entities. A seller of credit default protection receives periodic payments in return for its obligation to pay the principal amount of a debt security (or other agreed-upon value) to the other party upon the occurrence of a credit event. If no credit event occurs, the seller has no payment obligations so long as there is no early termination.
For credit default swap contracts on asset-backed securities, a credit event may be triggered by various occurrences, which may include an issuer’s failure to pay interest or principal on a reference security, a breach of a material representation or covenant, an agreement by the holders of an asset-backed security to a maturity extension, or a write-down on the collateral underlying the security. For credit default swap contracts on corporate or sovereign issuers, a credit event may be triggered by such occurrences as the issuer’s bankruptcy, failure to pay interest or principal, repudiation/moratorium and/or restructuring.
Correlation swaps involve receiving a stream of payments based on the actual average correlation between or among the price movements of two or more underlying variables over a period of time, in exchange for making a regular stream of payments based on a fixed “strike” correlation level (or vice versa), where both payment streams are based on a notional amount. The underlying variables may include, without limitation, commodity prices, exchange rates, interest rates and stock indices.
Variance swap contracts involve an agreement by two parties to exchange cash flows based on the measured variance (or square of volatility) of a specified underlying asset. One party agrees to exchange a “fixed rate” or strike price payment for the “floating rate” or realized price variance on the underlying asset with respect to the notional amount. At inception, the strike price chosen is generally fixed at a level such that the fair value of the swap is zero. As a result, no money changes hands at the initiation of the contract. At the expiration date, the amount payable by one party to the other is the difference between the realized price variance of the underlying asset and the strike price multiplied by the notional amount. A receiver of the realized price variance would be entitled to receive a payment when the realized price variance of the underlying asset is greater than the strike price and would be obligated to make a payment when that variance is less than the strike price. A payer of the realized price variance would be obligated to make a payment when the realized price variance of the underlying asset is greater than the strike price and would be entitled to receive a payment when that variance is less than the strike price. This type of agreement is essentially a forward contract on the future realized price variance of the underlying asset.
Generally, the Funds price their OTC swap contracts daily using industry standard models that may incorporate quotations from market makers or pricing vendors and record the change in value, if any, as unrealized gain or loss in the Statements of Operations. Gains or losses are realized upon the termination of the swap contracts or reset dates, as appropriate. Cleared swap contracts are valued using the quote (which may be based on a model) published by the relevant clearing house. If an updated quote for a cleared swap contract is not available by the time that a Fund calculates its net asset value on any business day, then that swap contract will generally be valued using an industry standard model, which may differ from the model used by the relevant clearing house.
The values assigned to swap contracts may differ significantly from the values realized upon termination, and the differences could be material. Entering into swap contracts involves counterparty credit, legal, and documentation risk that is generally not reflected in the value assigned to the swap contract. Such risks include the possibility that the counterparty defaults on its obligations to perform or disagrees as to the meaning of contractual terms, that a Fund has amounts on deposit in excess of amounts owed by that Fund, or that any collateral the other party posts is insufficient or not timely received by a Fund. Credit risk is particularly acute in economic environments in which financial services firms are exposed to systemic risks of the type evidenced by the insolvency of Lehman Brothers in 2008 and subsequent market disruptions. Swap contracts outstanding at the end of the year, if any, are listed in each applicable Fund’s Schedule of Investments.
Rights and warrants
The Funds may purchase or otherwise receive warrants or rights. Warrants and rights generally give the holder the right to receive, upon exercise, a security of the issuer at a set price. Funds typically use warrants and rights in a manner similar to their use of purchased options on securities, as described in the section entitled “Options” above. Risks associated with the use of warrants and rights are generally similar to risks associated with the use of purchased options. However, warrants and rights often do not have standardized terms, and may have longer maturities and may be less liquid than exchange-traded options. In addition, the terms of warrants or rights may limit a Fund’s ability to exercise the warrants or rights at such times and in such quantities as the Fund would otherwise wish. Rights and/or warrants outstanding at the end of the year, if any, are listed in each applicable Fund’s Schedule of Investments.
As provided by U.S. GAAP, the table below is based on market values or unrealized appreciation/(depreciation) rather than the notional amounts of derivatives. Changes to market values of reference asset(s) will tend to have a greater impact on the Funds (with correspondingly greater risk) the greater the notional amount. For further information on notional amounts, see the Schedule of Investments.
98
GMO Trust Funds
Notes to Financial Statements — (Continued)
February 28, 2017
The following is a summary of the valuations of derivative instruments categorized by risk exposure.
The Effect of Derivative Instruments on the Statements of Assets and Liabilities as of February 28, 2017 and the Statements of Operations for the year ended February 28, 2017^:
The risks referenced in the tables below are not intended to be inclusive of all risks. Please see the “Investment and other risks” and “Portfolio valuation” sections for a further discussion of risks.
| | | | | | | | | | | | | | | | | | | | | | | | | | | | |
| | | | | | | | |
| | | Credit
Contracts | | | Commodity
Contracts | | | Equity
Contracts | | | Foreign
Currency
Contracts | | | Interest
Rate
Contracts | | | Other
Contracts | | | Total | |
Asset Allocation Bond Fund | | | | | | | | | | | | | | | | | | | | | |
Asset Derivatives | | | | | | | | | | | | | | | | | | | | | | | | | | | | |
Investments, at value (purchased options) | | $ | — | | | $ | — | | | $ | — | | | $ | 376,633 | | | $ | — | | | $ | — | | | $ | 376,633 | |
Unrealized Appreciation on Forward Currency Contracts | | | — | | | | — | | | | — | | | | 8,229,029 | | | | — | | | | — | | | | 8,229,029 | |
Unrealized Appreciation on Swap Contracts¤ | | | — | | | | — | | | | — | | | | — | | | | 1,309,470 | | | | — | | | | 1,309,470 | |
| | | | | | | | | | | | | | | | | | | | | | | | | | | | | |
Total | | $ | | | | $ | | | | $ | | | | $ | 8,605,662 | | | $ | 1,309,470 | | | $ | | | | $ | 9,915,132 | |
| | | | | | | | | | | | | | | | | | | | | | | | | | | | | |
Derivatives not subject to Master Agreements | | $ | | | | $ | | | | $ | | | | $ | | | | $ | | | | $ | | | | $ | | |
| | | | | | | | | | | | | | | | | | | | | | | | | | | | | |
Total subject to Master Agreements | | $ | — | | | $ | — | | | $ | — | | | $ | 8,605,662 | | | $ | 1,309,470 | | | $ | — | | | $ | 9,915,132 | |
| | | | | | | | | | | | | | | | | | | | | | | | | | | | | |
Liability Derivatives | | | | | | | | | | | | | | | | | | | | | | | | | | | | |
Unrealized Depreciation on Forward Currency Contracts | | $ | — | | | $ | — | | | $ | — | | | $ | (9,836,103 | ) | | $ | — | | | $ | — | | | $ | (9,836,103 | ) |
Unrealized Depreciation on Swap Contracts¤ | | | — | | | | — | | | | — | | | | — | | | | (6,920,798 | ) | | | — | | | | (6,920,798 | ) |
| | | | | | | | | | | | | | | | | | | | | | | | | | | | | |
Total | | $ | | | | $ | | | | $ | | | | $ | (9,836,103 | ) | | $ | (6,920,798 | ) | | $ | | | | $ | (16,756,901 | ) |
| | | | | | | | | | | | | | | | | | | | | | | | | | | | | |
Derivatives not subject to Master Agreements | | $ | | | | $ | | | | $ | | | | $ | | | | $ | | | | $ | | | | $ | | |
| | | | | | | | | | | | | | | | | | | | | | | | | | | | | |
Total subject to Master Agreements | | $ | — | | | $ | — | | | $ | — | | | $ | (9,836,103 | ) | | $ | (6,920,798 | ) | | $ | — | | | $ | (16,756,901 | ) |
| | | | | | | | | | | | | | | | | | | | | | | | | | | | | |
Net Realized Gain (Loss) on | | | | | | | | | | | | | | | | | | | | | | | | | | | | |
Investments (purchased options) | | $ | — | | | $ | — | | | $ | (20,349,237 | ) | | $ | (47,609,826 | ) | | $ | (102,039,268 | ) | | $ | — | | | $ | (169,998,331 | ) |
Forward Currency Contracts | | | — | | | | — | | | | — | | | | 16,405,248 | | | | — | | | | — | | | | 16,405,248 | |
Futures Contracts | | | — | | | | — | | | | 6,339,183 | | | | — | | | | — | | | | — | | | | 6,339,183 | |
Written Options | | | — | | | | — | | | | — | | | | 2,242,588 | | | | (34,066,064 | ) | | | — | | | | (31,823,476 | ) |
Swap Contracts | | | — | | | | — | | | | — | | | | — | | | | 108,482,529 | | | | — | | | | 108,482,529 | |
| | | | | | | | | | | | | | | | | | | | | | | | | | | | | |
Total | | $ | — | | | $ | — | | | $ | (14,010,054 | ) | | $ | (28,961,990 | ) | | $ | (27,622,803 | ) | | $ | — | | | $ | (70,594,847 | ) |
| | | | | | | | | | | | | | | | | | | | | | | | | | | | | |
Change in Net Appreciation (Depreciation) on | | | | | | | | | | | | | | | | | | | | | | | | | | | | |
Investments (purchased options) | | $ | — | | | $ | — | | | $ | 15,214,985 | | | $ | 41,749,594 | | | $ | 80,393,894 | | | $ | — | | | $ | 137,358,473 | |
Forward Currency Contracts | | | — | | | | — | | | | — | | | | (7,803,500 | ) | | | — | | | | — | | | | (7,803,500 | ) |
Futures Contracts | | | — | | | | — | | | | (12,973,233 | ) | | | — | | | | — | | | | — | | | | (12,973,233 | ) |
Written Options | | | — | | | | — | | | | — | | | | (2,734,765 | ) | | | 42,127,001 | | | | — | | | | 39,392,236 | |
Swap Contracts | | | — | | | | — | | | | — | | | | — | | | | (120,857,680 | ) | | | — | | | | (120,857,680 | ) |
| | | | | | | | | | | | | | | | | | | | | | | | | | | | | |
Total | | $ | — | | | $ | — | | | $ | 2,241,752 | | | $ | 31,211,329 | | | $ | 1,663,215 | | | $ | — | | | $ | 35,116,296 | |
| | | | | | | | | | | | | | | | | | | | | | | | | | | | | |
| | | | | | | | | | | | | | | | | | | | | | | | | | | | | |
99
GMO Trust Funds
Notes to Financial Statements — (Continued)
February 28, 2017
| | | | | | | | | | | | | | | | | | | | | | | | | | | | |
| | | | | | | | |
| | | Credit
Contracts | | | Commodity
Contracts | | | Equity
Contracts | | | Foreign
Currency
Contracts | | | Interest
Rate
Contracts | | | Other
Contracts | | | Total | |
Core Plus Bond Fund | | | | | | | | | | | | | | | | | | | | | | | | | | | | |
Asset Derivatives | | | | | | | | | | | | | | | | | | | | | | | | | | | | |
Unrealized Appreciation on Forward Currency Contracts | | $ | — | | | $ | — | | | $ | — | | | $ | 186,366 | | | $ | — | | | $ | — | | | $ | 186,366 | |
Unrealized Appreciation on Futures Contracts¤ | | | — | | | | — | | | | — | | | | — | | | | 284,014 | | | | — | | | | 284,014 | |
Unrealized Appreciation on Swap Contracts¤ | | | — | | | | — | | | | — | | | | — | | | | 728,383 | | | | — | | | | 728,383 | |
| | | | | | | | | | | | | | | | | | | | | | | | | | | | | |
Total | | $ | | | | $ | | | | $ | | | | $ | 186,366 | | | $ | 1,012,397 | | | $ | | | | $ | 1,198,763 | |
| | | | | | | | | | | | | | | | | | | | | | | | | | | | | |
Derivatives not subject to Master Agreements | | $ | | | | $ | | | | $ | | | | $ | | | | $ | | | | $ | | | | $ | | |
| | | | | | | | | | | | | | | | | | | | | | | | | | | | | |
Total subject to Master Agreements | | $ | — | | | $ | — | | | $ | — | | | $ | 186,366 | | | $ | 1,012,397 | | | $ | — | | | $ | 1,198,763 | |
| | | | | | | | | | | | | | | | | | | | | | | | | | | | | |
Liability Derivatives | | | | | | | | | | | | | | | | | | | | | | | | | | | | |
Unrealized Depreciation on Forward Currency Contracts | | $ | — | | | $ | — | | | $ | — | | | $ | (181,411 | ) | | $ | — | | | $ | — | | | $ | (181,411 | ) |
Unrealized Depreciation on Swap Contracts¤ | | | — | | | | — | | | | — | | | | — | | | | (1,014,151 | ) | | | — | | | | (1,014,151 | ) |
| | | | | | | | | | | | | | | | | | | | | | | | | | | | | |
Total | | $ | | | | $ | | | | $ | | | | $ | (181,411 | ) | | $ | (1,014,151 | ) | | $ | | | | $ | (1,195,562 | ) |
| | | | | | | | | | | | | | | | | | | | | | | | | | | | | |
Derivatives not subject to Master Agreements | | $ | | | | $ | | | | $ | | | | $ | | | | $ | | | | $ | | | | $ | | |
| | | | | | | | | | | | | | | | | | | | | | | | | | | | | |
Total subject to Master Agreements | | $ | — | | | $ | — | | | $ | — | | | $ | (181,411 | ) | | $ | (1,014,151 | ) | | $ | — | | | $ | (1,195,562 | ) |
| | | | | | | | | | | | | | | | | | | | | | | | | | | | | |
Net Realized Gain (Loss) on | | | | | | | | | | | | | | | | | | | | | | | | | | | | |
Investments (purchased options) | | $ | — | | | $ | — | | | $ | — | | | $ | (1,001,647 | ) | | $ | (1,468,240 | ) | | $ | — | | | $ | (2,469,887 | ) |
Forward Currency Contracts | | | — | | | | — | | | | — | | | | (380,844 | ) | | | — | | | | — | | | | (380,844 | ) |
Futures Contracts | | | — | | | | — | | | | — | | | | — | | | | (361,770 | ) | | | — | | | | (361,770 | ) |
Written Options | | | — | | | | — | | | | — | | | | 61,707 | | | | (453,688 | ) | | | — | | | | (391,981 | ) |
Swap Contracts | | | — | | | | — | | | | — | | | | — | | | | (3,084,400 | ) | | | — | | | | (3,084,400 | ) |
| | | | | | | | | | | | | | | | | | | | | | | | | | | | | |
Total | | $ | — | | | $ | — | | | $ | — | | | $ | (1,320,784 | ) | | $ | (5,368,098 | ) | | $ | — | | | $ | (6,688,882 | ) |
| | | | | | | | | | | | | | | | | | | | | | | | | | | | | |
Change in Net Appreciation (Depreciation) on | | | | | | | | | | | | | | | | | | | | | | | | | | | | |
Investments (purchased options) | | $ | — | | | $ | — | | | $ | — | | | $ | 646,837 | | | $ | 1,950,839 | | | $ | — | | | $ | 2,597,676 | |
Forward Currency Contracts | | | — | | | | — | | | | — | | | | 20,845 | | | | — | | | | — | | | | 20,845 | |
Futures Contracts | | | — | | | | — | | | | — | | | | — | | | | 278,484 | | | | — | | | | 278,484 | |
Written Options | | | — | | | | — | | | | — | | | | (58,223 | ) | | | 807,027 | | | | — | | | | 748,804 | |
Swap Contracts | | | — | | | | — | | | | — | | | | — | | | | 6,198,080 | | | | — | | | | 6,198,080 | |
| | | | | | | | | | | | | | | | | | | | | | | | | | | | | |
Total | | $ | — | | | $ | — | | | $ | — | | | $ | 609,459 | | | $ | 9,234,430 | | | $ | — | | | $ | 9,843,889 | |
| | | | | | | | | | | | | | | | | | | | | | | | | | | | | |
| | | | | | | | | | | | | | | | | | | | | | | | | | | | | |
Currency Hedged International Bond Fund | | | | | | | | | | | | | | | | | |
Asset Derivatives | | | | | | | | | | | | | | | | | | | | | | | | | | | | |
Unrealized Appreciation on Forward Currency Contracts | | $ | — | | | $ | — | | | $ | — | | | $ | 258,156 | | | $ | — | | | $ | — | | | $ | 258,156 | |
Unrealized Appreciation on Futures Contracts¤ | | | — | | | | — | | | | — | | | | — | | | | 227,845 | | | | — | | | | 227,845 | |
Unrealized Appreciation on Swap Contracts¤ | | | — | | | | — | | | | — | | | | — | | | | 65,010 | | | | — | | | | 65,010 | |
| | | | | | | | | | | | | | | | | | | | | | | | | | | | | |
Total | | $ | | | | $ | | | | $ | | | | $ | 258,156 | | | $ | 292,855 | | | $ | | | | $ | 551,011 | |
| | | | | | | | | | | | | | | | | | | | | | | | | | | | | |
Derivatives not subject to Master Agreements | | $ | | | | $ | | | | $ | | | | $ | | | | $ | | | | $ | | | | $ | | |
| | | | | | | | | | | | | | | | | | | | | | | | | | | | | |
Total subject to Master Agreements | | $ | — | | | $ | — | | | $ | — | | | $ | 258,156 | | | $ | 292,855 | | | $ | — | | | $ | 551,011 | |
| | | | | | | | | | | | | | | | | | | | | | | | | | | | | |
Liability Derivatives | | | | | | | | | | | | | | | | | | | | | | | | | | | | |
Unrealized Depreciation on Forward Currency Contracts | | $ | — | | | $ | — | | | $ | — | | | $ | (50,874 | ) | | $ | — | | | $ | — | | | $ | (50,874 | ) |
Unrealized Depreciation on Futures Contracts¤ | | | — | | | | — | | | | — | | | | — | | | | (1,092 | ) | | | — | | | | (1,092 | ) |
Unrealized Depreciation on Swap Contracts¤ | | | — | | | | — | | | | — | | | | — | | | | (279,044 | ) | | | — | | | | (279,044 | ) |
| | | | | | | | | | | | | | | | | | | | | | | | | | | | | |
Total | | $ | | | | $ | | | | $ | | | | $ | (50,874 | ) | | $ | (280,136 | ) | | $ | | | | $ | (331,010 | ) |
| | | | | | | | | | | | | | | | | | | | | | | | | | | | | |
Derivatives not subject to Master Agreements | | $ | | | | $ | | | | $ | | | | $ | | | | $ | | | | $ | | | | $ | | |
| | | | | | | | | | | | | | | | | | | | | | | | | | | | | |
Total subject to Master Agreements | | $ | — | | | $ | — | | | $ | — | | | $ | (50,874 | ) | | $ | (280,136 | ) | | $ | — | | | $ | (331,010 | ) |
| | | | | | | | | | | | | | | | | | | | | | | | | | | | | |
| | | | | | | | | | | | | | | | | | | | | | | | | | | | | |
100
GMO Trust Funds
Notes to Financial Statements — (Continued)
February 28, 2017
| | | | | | | | | | | | | | | | | | | | | | | | |
| | | | | | | |
| | | Credit
Contracts | | | Equity
Contracts | | | Foreign
Currency
Contracts | | | Interest
Rate
Contracts | | | Other
Contracts | | | Total | |
Currency Hedged International Bond Fund (continued) | | | | | | | | | | | | | |
Net Realized Gain (Loss) on | | | | | | | | | | | | | | | | | | | | | | | | |
Investments (purchased options) | | $ | — | | | $ | — | | | $ | (198,159 | ) | | $ | (702,441 | ) | | $ | — | | | $ | (900,600 | ) |
Forward Currency Contracts | | | — | | | | — | | | | 1,793,655 | | | | — | | | | — | | | | 1,793,655 | |
Futures Contracts | | | — | | | | — | | | | — | | | | 273,643 | | | | — | | | | 273,643 | |
Written Options | | | — | | | | — | | | | 14,239 | | | | (134,791 | ) | | | — | | | | (120,552 | ) |
Swap Contracts | | | — | | | | — | | | | — | | | | 499,118 | | | | — | | | | 499,118 | |
| | | | | | | | | | | | | | | | | | | | | | | | | |
Total | | $ | — | | | $ | — | | | $ | 1,609,735 | | | $ | (64,471 | ) | | $ | — | | | $ | 1,545,264 | |
| | | | | | | | | | | | | | | | | | | | | | | | | |
Change in Net Appreciation (Depreciation) on | | | | | | | | | | | | | | | | | | | | | | | | |
Investments (purchased options) | | $ | — | | | $ | — | | | $ | 194,466 | | | $ | 579,037 | | | $ | — | | | $ | 773,503 | |
Forward Currency Contracts | | | — | | | | — | | | | 275,240 | | | | — | | | | — | | | | 275,240 | |
Futures Contracts | | | — | | | | — | | | | — | | | | (188,355 | ) | | | — | | | | (188,355 | ) |
Written Options | | | — | | | | — | | | | (17,313 | ) | | | 239,512 | | | | — | | | | 222,199 | |
Swap Contracts | | | — | | | | — | | | | — | | | | (688,308 | ) | | | — | | | | (688,308 | ) |
| | | | | | | | | | | | | | | | | | | | | | | | | |
Total | | $ | — | | | $ | — | | | $ | 452,393 | | | $ | (58,114 | ) | | $ | — | | | $ | 394,279 | |
| | | | | | | | | | | | | | | | | | | | | | | | | |
| | | | | | | | | | | | | | | | | | | | | | | | | |
Emerging Country Debt Fund | | | | | | | | | | | | | | | | | | | | | | | | |
Asset Derivatives | | | | | | | | | | | | | | | | | | | | | | | | |
Investments, at value (rights and/or warrants) | | $ | — | | | $ | — | | | $ | — | | | $ | — | | | $ | 43,377,204 | | | $ | 43,377,204 | |
Unrealized Appreciation on Forward Currency Contracts | | | — | | | | — | | | | 201,461 | | | | — | | | | — | | | | 201,461 | |
Options | | | 293,033 | | | | — | | | | — | | | | — | | | | — | | | | 293,033 | |
Unrealized Appreciation on Swap Contracts¤ | | | 23,586,261 | | | | — | | | | — | | | | 2,200,628 | | | | — | | | | 25,786,889 | |
| | | | | | | | | | | | | | | | | | | | | | | | | |
Total | | $ | 23,879,294 | | | $ | — | | | $ | 201,461 | | | $ | 2,200,628 | | | $ | 43,377,204 | | | $ | 69,658,587 | |
| | | | | | | | | | | | | | | | | | | | | | | | | |
Derivatives not subject to Master Agreements | | $ | — | | | $ | — | | | $ | — | | | $ | — | | | $ | 43,377,204 | | | $ | 43,377,204 | |
| | | | | | | | | | | | | | | | | | | | | | | | | |
Total subject to Master Agreements | | $ | 23,879,294 | | | $ | — | | | $ | 201,461 | | | $ | 2,200,628 | | | $ | — | | | $ | 26,281,383 | |
| | | | | | | | | | | | | | | | | | | | | | | | | |
Liability Derivatives | | | | | | | | | | | | | | | | | | | | | | | | |
Options | | $ | (2,349,805 | ) | | $ | — | | | $ | — | | | $ | — | | | $ | — | | | $ | (2,349,805 | ) |
Unrealized Depreciation on Swap Contracts¤ | | | (53,664,784 | ) | | | — | | | | — | | | | (8,455,957 | ) | | | — | | | | (62,120,741 | ) |
| | | | | | | | | | | | | | | | | | | | | | | | | |
Total | | $ | (56,014,589 | ) | | $ | — | | | $ | — | | | $ | (8,455,957 | ) | | $ | — | | | $ | (64,470,546 | ) |
| | | | | | | | | | | | | | | | | | | | | | | | | |
Derivatives not subject to Master Agreements | | $ | — | | | $ | — | | | $ | — | | | $ | — | | | $ | — | | | $ | — | |
| | | | | | | | | | | | | | | | | | | | | | | | | |
Total subject to Master Agreements | | $ | (56,014,589 | ) | | $ | — | | | $ | — | | | $ | (8,455,957 | ) | | $ | — | | | $ | (64,470,546 | ) |
| | | | | | | | | | | | | | | | | | | | | | | | | |
Net Realized Gain (Loss) on | | | | | | | | | | | | | | | | | | | | | | | | |
Forward Currency Contracts | | $ | — | | | $ | — | | | $ | 3,986,993 | | | $ | — | | | $ | — | | | $ | 3,986,993 | |
Swap Contracts | | | 3,941,709 | | | | — | | | | — | | | | 6,496,541 | | | | — | | | | 10,438,250 | |
| | | | | | | | | | | | | | | | | | | | | | | | | |
Total | | $ | 3,941,709 | | | $ | — | | | $ | 3,986,993 | | | $ | 6,496,541 | | | $ | — | | | $ | 14,425,243 | |
| | | | | | | | | | | | | | | | | | | | | | | | | |
Change in Net Appreciation (Depreciation) on | | | | | | | | | | | | | | | | | | | | | | | | |
Investments (rights and/or warrants) | | $ | — | | | $ | — | | | $ | — | | | $ | — | | | $ | (757,537 | ) | | $ | (757,537 | ) |
Forward Currency Contracts | | | — | | | | — | | | | (1,834,075 | ) | | | — | | | | — | | | | (1,834,075 | ) |
Options | | | 5,043,111 | | | | — | | | | — | | | | — | | | | — | | | | 5,043,111 | |
Swap Contracts | | | 31,820,023 | | | | — | | | | — | | | | 16,772,034 | | | | — | | | | 48,592,057 | |
| | | | | | | | | | | | | | | | | | | | | | | | | |
Total | | $ | 36,863,134 | | | $ | — | | | $ | (1,834,075 | ) | | $ | 16,772,034 | | | $ | (757,537 | ) | | $ | 51,043,556 | |
| | | | | | | | | | | | | | | | | | | | | | | | | |
| | | | | | | | | | | | | | | | | | | | | | | | | |
Opportunistic Income Fund (formerly Debt Opportunities Fund) | | | | | | | | | | | | | | | | | | | | | | | | |
Asset Derivatives | | | | | | | | | | | | | | | | | | | | | | | | |
Investments, at value (purchased options) | | $ | 738,880 | | | $ | — | | | $ | — | | | $ | 560,900 | | | $ | — | | | $ | 1,299,780 | |
Unrealized Appreciation on Forward Currency Contracts | | | — | | | | — | | | | 77,578 | | | | — | | | | — | | | | 77,578 | |
Unrealized Appreciation on Swap Contracts¤ | | | 19,920,779 | | | | — | | | | — | | | | 2,914,856 | | | | — | | | | 22,835,635 | |
| | | | | | | | | | | | | | | | | | | | | | | | | |
Total | | $ | 20,659,659 | | | $ | — | | | $ | 77,578 | | | $ | 3,475,756 | | | $ | — | | | $ | 24,212,993 | |
| | | | | | | | | | | | | | | | | | | | | | | | | |
Derivatives not subject to Master Agreements | | $ | — | | | $ | — | | | $ | — | | | $ | — | | | $ | — | | | $ | — | |
| | | | | | | | | | | | | | | | | | | | | | | | | |
Total subject to Master Agreements | | $ | 20,659,659 | | | $ | — | | | $ | 77,578 | | | $ | 3,475,756 | | | $ | — | | | $ | 24,212,993 | |
| | | | | | | | | | | | | | | | | | | | | | | | | |
| | | | | | | | | | | | | | | | | | | | | | | | | |
101
GMO Trust Funds
Notes to Financial Statements — (Continued)
February 28, 2017
| | | | | | | | | | | | | | | | | | | | | | | | |
| | | | | | | |
| | | Credit
Contracts | | | Equity
Contracts | | | Foreign
Currency
Contracts | | | Interest
Rate
Contracts | | | Other
Contracts | | | Total | |
Opportunistic Income Fund (formerly Debt Opportunities Fund) (continued) | | | | | | | | | | | | | | | | | | | | | | | | |
Liability Derivatives | | | | | | | | | | | | | | | | | | | | | | | | |
Unrealized Depreciation on Forward Currency Contracts | | $ | — | | | $ | — | | | $ | (2,289 | ) | | $ | — | | | $ | — | | | $ | (2,289 | ) |
Unrealized Depreciation on Swap Contracts¤ | | | (6,329,931 | ) | | | — | | | | — | | | | (34,741 | ) | | | — | | | | (6,364,672 | ) |
Written Options, at value | | $ | (499,796 | ) | | $ | — | | | $ | — | | | $ | (237,000 | ) | | $ | — | | | $ | (736,796 | ) |
| | | | | | | | | | | | | | | | | | | | | | | | | |
Total | | $ | (6,829,727 | ) | | $ | — | | | $ | (2,289 | ) | | $ | (271,741 | ) | | $ | | | | $ | (7,103,757 | ) |
| | | | | | | | | | | | | | | | | | | | | | | | | |
Derivatives not subject to Master Agreements | | $ | — | | | $ | — | | | $ | — | | | $ | — | | | $ | — | | | $ | — | |
| | | | | | | | | | | | | | | | | | | | | | | | | |
Total subject to Master Agreements | | $ | (6,829,727 | ) | | $ | — | | | $ | (2,289 | ) | | $ | (271,741 | ) | | $ | — | | | $ | (7,103,757 | ) |
| | | | | | | | | | | | | | | | | | | | | | | | | |
Net Realized Gain (Loss) on | | | | | | | | | | | | | | | | | | | | | | | | |
Investments (purchased options) | | $ | — | | | $ | (112,791 | ) | | $ | — | | | $ | (3,728,082 | ) | | $ | — | | | $ | (3,840,873 | ) |
Forward Currency Contracts | | | — | | | | — | | | | 597,792 | | | | — | | | | — | | | | 597,792 | |
Written Options | | | — | | | | — | | | | — | | | | 2,367,050 | | | | — | | | | 2,367,050 | |
Swap Contracts | | | (5,102,863 | ) | | | — | | | | — | | | | (2,366,845 | ) | | | — | | | | (7,469,708 | ) |
| | | | | | | | | | | | | | | | | | | | | | | | | |
Total | | $ | (5,102,863 | ) | | $ | (112,791 | ) | | $ | 597,792 | | | $ | (3,727,877 | ) | | $ | — | | | $ | (8,345,739 | ) |
| | | | | | | | | | | | | | | | | | | | | | | | | |
Change in Net Appreciation (Depreciation) on | | | | | | | | | | | | | | | | | | | | | | | | |
Investments (purchased options) | | $ | (792,492 | ) | | $ | 2,751 | | | $ | — | | | $ | (721,592 | ) | | $ | — | | | $ | (1,511,333 | ) |
Forward Currency Contracts | | | — | | | | — | | | | 42,412 | | | | — | | | | — | | | | 42,412 | |
Written Options | | | 55,476 | | | | — | | | | — | | | | 226,398 | | | | — | | | | 281,874 | |
Swap Contracts | | | (10,137,727 | ) | | | — | | | | — | | | | 8,947,526 | | | | — | | | | (1,190,201 | ) |
| | | | | | | | | | | | | | | | | | | | | | | | | |
Total | | $ | (10,874,743 | ) | | $ | 2,751 | | | $ | 42,412 | | | $ | 8,452,332 | | | $ | — | | | $ | (2,377,248 | ) |
| | | | | | | | | | | | | | | | | | | | | | | | | |
| | | | | | | | | | | | | | | | | | | | | | | | | |
| | ^ | Because the Funds recognize changes in value through the Statements of Operations, they do not qualify for hedge accounting under authoritative guidance for derivative instruments. The Funds’ investments in derivatives may represent an economic hedge; however, they are considered to be non-hedge transactions for the purpose of these tables. |
| | ¤ | The table includes cumulative unrealized appreciation/depreciation of futures and cleared swap contracts, if any, as reported in the Schedule of Investments. Year end variation margin on open futures and cleared swap contracts, if any, is reported within the Statements of Assets and Liabilities. |
Certain Funds are party to International Swaps and Derivatives Association, Inc. Master Agreements, Global Master Repurchase Agreements or other similar types of agreements (collectively, “Master Agreements”) that generally govern the terms of some OTC derivative transactions, repurchase agreements and reverse repurchase agreements. The Master Agreements may include collateral posting terms and netting provisions that apply in the event of a default and/or termination event. Upon the occurrence of such an event, including the bankruptcy or insolvency of the counterparty, the Master Agreements may permit the non-defaulting party to calculate a single net payment to close out applicable transactions. However, there is no guarantee that the terms of a Master Agreement will be enforceable; for example, when bankruptcy or insolvency laws impose restrictions on or prohibitions against the right of offset. Additionally, the netting and close out provisions of a Master Agreement may not extend to the obligations of the counterparty’s affiliates or across varying types of transactions. Because no such event has occurred, the Funds do not presently have a legally enforceable right of set-off and these amounts have not been offset in the Statements of Assets and Liabilities, but have been presented separately in the table below. Termination events may also include a decline in the net assets of a Fund below a certain level over a specified period of time and may entitle a counterparty to elect to terminate early with respect to some or all the transactions under the Master Agreement with that counterparty. Such an election by one or more of the counterparties could have a material adverse impact on a Fund’s operations. An estimate of the aggregate net payment, if any, that may need to be made by a Fund in such an event is represented by the unrealized amounts in the tables below. For more information about other uncertainties and risks, see “Investments and other risks” above.
For financial reporting purposes, on the Statements of Assets and Liabilities any cash collateral that has been pledged to cover obligations of the Funds is reported as Due from Broker and any cash collateral received from the counterparty is reported as Due to Broker. Any non-cash collateral pledged by the Funds is noted in the Schedules of Investments. The tables below show the potential effect of netting arrangements made available by the Master Agreements on the financial position of the Funds. For financial reporting purposes, the Funds’ Statements of Assets and Liabilities generally show derivative assets and derivative liabilities (regardless of whether they are subject to netting arrangements) on a gross basis, which reflects the full risks and exposures of the Fund prior to netting. See Note 2 for information on repurchase agreements and reverse repurchase agreements held by the Funds at February 28, 2017, if any.
102
GMO Trust Funds
Notes to Financial Statements — (Continued)
February 28, 2017
The tables above present the Funds’ derivative assets and liabilities by type of financial instrument. The following tables present the Funds’ OTC and/or exchange-traded derivative assets and liabilities by counterparty net of amounts that may be available for offset under the Master Agreements by the terms of the agreement and net of the related collateral received or pledged by the Funds as of February 28, 2017:
Asset Allocation Bond Fund
| | | | | | | | | | | | | | | | |
| | | | | |
| Counterparty | | Gross Derivative
Assets Subject to
Master Agreements | | | Collateral
Received | | | Derivative
Assets/(Liabilities)
Available for Offset | | | Net Amount
of Derivative
Assets | |
Bank of America, N.A. | | $ | 9,106 | | | $ | — | | | $ | 9,106 | | | $ | — | |
Barclays Bank plc | | | 188,340 | | | | (167,606 | ) | | | (20,734 | ) | | | — | * |
Goldman Sachs International | | | 6,109,744 | | | | — | | | | 6,109,744 | | | | — | |
JPMorgan Chase Bank, N.A. | | | 1,793,528 | | | | — | | | | 1,793,528 | | | | — | |
Morgan Stanley & Co. International PLC | | | 504,944 | | | | (503,445 | ) | | | (1,499 | ) | | | — | * |
| | | | | | | | | | | | | | | | | |
Total | | $ | 8,605,662 | | | $ | (671,051 | ) | | $ | 7,890,145 | | | $ | — | |
| | | | | | | | | | | | | | | | | |
| | | | | | | | | | | | | | | | | |
| | | | | |
| Counterparty | | Gross Derivative
Liabilities Subject to
Master Agreements | | | Collateral
Pledged | | | Derivative
(Assets)/Liabilities
Available for Offset | | | Net Amount
of Derivative
Liabilities | |
Bank of America, N.A. | | $ | 181,147 | | | $ | — | | | $ | (9,106 | ) | | $ | 172,041 | |
Barclays Bank plc | | | 20,734 | | | | — | | | | 20,734 | | | | — | |
Goldman Sachs International | | | 7,343,360 | | | | (1,233,616 | ) | | | (6,109,744 | ) | | | — | * |
JPMorgan Chase Bank, N.A. | | | 2,289,363 | | | | (495,835 | ) | | | (1,793,528 | ) | | | — | * |
Morgan Stanley & Co. International PLC | | | 1,499 | | | | — | | | | 1,499 | | | | — | |
| | | | | | | | | | | | | | | | | |
Total | | $ | 9,836,103 | | | $ | (1,729,451 | ) | | $ | (7,890,145 | ) | | $ | 172,041 | |
| | | | | | | | | | | | | | | | | |
| | | | | | | | | | | | | | | | | |
Core Plus Bond Fund
| | | | | | | | | | | | | | | | |
| | | | | |
| Counterparty | | Gross Derivative
Assets Subject to
Master Agreements | | | Collateral
Received | | | Derivative
Assets/(Liabilities)
Available for Offset | | | Net Amount
of Derivative
Assets | |
Barclays Bank plc | | $ | 25,797 | | | $ | — | | | $ | — | | | $ | 25,797 | |
Goldman Sachs International | | | 154,102 | | | | — | | | | (143,963 | ) | | | 10,139 | |
Morgan Stanley & Co. International PLC | | | 6,467 | | | | — | | | | (2,314 | ) | | | 4,153 | |
| | | | | | | | | | | | | | | | | |
Total | | $ | 186,366 | | | $ | — | | | $ | (146,277 | ) | | $ | 40,089 | |
| | | | | | | | | | | | | | | | | |
| | | | | | | | | | | | | | | | | |
| | | | | |
| Counterparty | | Gross Derivative
Liabilities Subject to
Master Agreements | | | Collateral
Pledged | | | Derivative
(Assets)/Liabilities
Available for Offset | | | Net Amount
of Derivative
Liabilities | |
Bank of America, N.A. | | $ | 5,798 | | | $ | — | | | $ | — | | | $ | 5,798 | |
Goldman Sachs International | | | 143,963 | | | | — | | | | 143,963 | | | | — | |
JPMorgan Chase Bank, N.A. | | | 29,336 | | | | — | | | | — | | | | 29,336 | |
Morgan Stanley & Co. International PLC | | | 2,314 | | | | — | | | | 2,314 | | | | — | |
| | | | | | | | | | | | | | | | | |
Total | | $ | 181,411 | | | $ | — | | | $ | 146,277 | | | $ | 35,134 | |
| | | | | | | | | | | | | | | | | |
| | | | | | | | | | | | | | | | | |
103
GMO Trust Funds
Notes to Financial Statements — (Continued)
February 28, 2017
Currency Hedged International Bond Fund
| | | | | | | | | | | | | | | | |
| | | | | |
| Counterparty | | Gross Derivative
Assets Subject to
Master Agreements | | | Collateral
Received | | | Derivative
Assets/(Liabilities)
Available for Offset | | | Net Amount
of Derivative
Assets | |
Goldman Sachs International | | $ | 93,306 | | | $ | — | | | $ | (42,859 | ) | | $ | 50,447 | |
Morgan Stanley & Co. International PLC | | | 164,850 | | | | (162,193 | ) | | | (2,657 | ) | | | — | * |
| | | | | | | | | | | | | | | | | |
Total | | $ | 258,156 | | | $ | (162,193 | ) | | $ | (45,516 | ) | | $ | 50,447 | |
| | | | | | | | | | | | | | | | | |
| | | | | | | | | | | | | | | | | |
| | | | | |
| Counterparty | | Gross Derivative
Liabilities Subject to
Master Agreements | | | Collateral
Pledged | | | Derivative
(Assets)/Liabilities
Available for Offset | | | Net Amount
of Derivative
Liabilities | |
Bank of America, N.A. | | $ | 5,358 | | | $ | — | | | $ | — | | | $ | 5,358 | |
Goldman Sachs International | | | 42,859 | | | | — | | | | 42,859 | | | | — | |
Morgan Stanley & Co. International PLC | | | 2,657 | | | | — | | | | 2,657 | | | | — | |
| | | | | | | | | | | | | | | | | |
Total | | $ | 50,874 | | | $ | — | | | $ | 45,516 | | | $ | 5,358 | |
| | | | | | | | | | | | | | | | | |
| | | | | | | | | | | | | | | | | |
Emerging Country Debt Fund
| | | | | | | | | | | | | | | | |
| | | | | |
| Counterparty | | Gross Derivative Assets Subject to Master Agreements | | | Collateral Received | | | Derivative Assets/(Liabilities) Available for Offset | | | Net Amount of Derivative Assets | |
Bank of America, N.A. | | $ | 201,461 | | | $ | — | | | $ | — | | | $ | 201,461 | |
Deutsche Bank AG | | | 21,170,685 | | | | — | | | | 21,170,685 | | | | — | |
Goldman Sachs International | | | 2,469,151 | | | | — | | | | 2,469,151 | | | | — | |
JPMorgan Chase Bank, N.A. | | | 2,863,948 | | | | — | | | | 2,863,948 | | | | — | |
| | | | | | | | | | | | | | | | | |
Total | | $ | 26,705,245 | | | $ | — | | | $ | 26,503,784 | | | $ | 201,461 | |
| | | | | | | | | | | | | | | | | |
| | | | | | | | | | | | | | | | | |
| | | | | |
| Counterparty | | Gross Derivative Liabilities Subject to Master Agreements | | | Collateral Pledged | | | Derivative (Assets)/Liabilities Available for Offset | | | Net Amount of Derivative Liabilities | |
Deutsche Bank AG | | $ | 26,770,544 | | | $ | (5,599,859 | ) | | $ | (21,170,685 | ) | | $ | — | * |
Goldman Sachs International | | | 15,251,352 | | | | (12,482,596 | ) | | | (2,469,151 | ) | | | 299,605 | |
JPMorgan Chase Bank, N.A. | | | 21,395,052 | | | | (18,531,104 | ) | | | (2,863,948 | ) | | | — | * |
| | | | | | | | | | | | | | | | | |
Total | | $ | 63,416,948 | | | $ | (36,613,559 | ) | | $ | (26,503,784 | ) | | $ | 299,605 | |
| | | | | | | | | | | | | | | | | |
| | | | | | | | | | | | | | | | | |
104
GMO Trust Funds
Notes to Financial Statements — (Continued)
February 28, 2017
Opportunistic Income Fund (formerly Debt Opportunities Fund)
| | | | | | | | | | | | | | | | |
| | | | | |
| Counterparty | | Gross Derivative
Assets Subject to
Master Agreements | | | Collateral
Received | | | Derivative
Assets/(Liabilities)
Available for Offset | | | Net Amount
of Derivative
Assets | |
Bank of America, N.A. | | $ | 9,011,777 | | | $ | (8,200,000 | ) | | $ | (693,177 | ) | | $ | 118,600 | |
Citibank N.A. | | | 2,644,378 | | | | (2,496,496 | ) | | | (147,882 | ) | | | — | * |
Credit Suisse International | | | 1,283,176 | | | | (1,182,466 | ) | | | — | | | | 100,710 | |
Deutsche Bank AG | | | 1,743,214 | | | | (1,560,000 | ) | | | — | | | | 183,214 | |
Goldman Sachs International | | | 3,039,091 | | | | (1,000,000 | ) | | | (1,492,604 | ) | | | 546,487 | |
JPMorgan Chase Bank, N.A. | | | 2,883,416 | | | | (2,536,222 | ) | | | (347,194 | ) | | | — | * |
Morgan Stanley & Co. International PLC | | | 77,578 | | | | — | | | | (2,289 | ) | | | 75,289 | |
Morgan Stanley & Co. LLC | | | 560,900 | | | | — | | | | (237,000 | ) | | | 323,900 | |
Morgan Stanley Capital Services LLC | | | 54,607 | | | | — | | | | 54,607 | | | | — | |
| | | | | | | | | | | | | | | | | |
Total | | $ | 21,298,137 | | | $ | (16,975,184 | ) | | $ | (2,865,539 | ) | | $ | 1,348,200 | |
| | | | | | | | | | | | | | | | | |
| | | | | | | | | | | | | | | | | |
| | | | | |
| Counterparty | | Gross Derivative
Liabilities Subject to
Master Agreements | | | Collateral
Pledged | | | Derivative
(Assets)/Liabilities
Available for Offset | | | Net Amount
of Derivative
Liabilities | |
Bank of America, N.A. | | $ | 693,177 | | | $ | — | | | $ | 693,177 | | | $ | — | |
Citibank N.A. | | | 147,882 | | | | — | | | | 147,882 | | | | — | |
Goldman Sachs International | | | 1,492,604 | | | | — | | | | 1,492,604 | | | | — | |
JPMorgan Chase Bank, N.A. | | | 347,194 | | | | — | | | | 347,194 | | | | — | |
Morgan Stanley & Co. International PLC | | | 2,289 | | | | — | | | | 2,289 | | | | — | * |
Morgan Stanley & Co. LLC | | | 237,000 | | | | — | | | | 237,000 | | | | — | |
Morgan Stanley Capital Services LLC | | | 360,416 | | | | (269,947 | ) | | | (54,607 | ) | | | 35,862 | |
| | | | | | | | | | | | | | | | | |
Total | | $ | 3,280,562 | | | $ | (269,947 | ) | | $ | 2,865,539 | | | $ | 35,862 | |
| | | | | | | | | | | | | | | | | |
| | | | | | | | | | | | | | | | | |
| | * | The actual collateral received and/or pledged is more than the amount shown. |
The average derivative activity of notional amounts (forward currency contracts, futures contracts and swap contracts), market values (rights and/or warrants), and principal amounts or number of contracts (options) outstanding, based on absolute values, at each month-end, was as follows for the year ended February 28, 2017:
| | | | | | | | | | | | | | | | | | | | | | | | |
| | | | | | | |
| Fund Name | | Forward
Currency
Contracts ($) | | | Futures
Contracts ($) | | | Swap
Contracts ($) | | | Options
(Principal) | | | Options
(Contracts) | | | Rights
and/or
Warrants ($) | |
Asset Allocation Bond Fund | | | 1,030,099,056 | | | | 14,620,654 | | | | 13,627,164,952 | | | | 1,100,710,639 | | | | 21,450 | | | | — | |
Core Plus Bond Fund | | | 27,613,729 | | | | 17,040,505 | | | | 121,100,831 | | | | 8,929,963 | | | | — | | | | — | |
Currency Hedged International Bond Fund | | | 44,232,413 | | | | 19,466,678 | | | | 101,094,631 | | | | 8,292,690 | | | | — | | | | — | |
Emerging Country Debt Fund | | | 84,672,454 | | | | — | | | | 1,627,467,828 | | | | 390,000,000 | | | | — | | | | 40,643,956 | |
Opportunistic Income Fund (formerly Debt Opportunities Fund) | | | 11,021,982 | | | | — | | | | 1,348,229,586 | | | | 347,487,086 | | | | 3,092 | | | | — | |
105
GMO Trust Funds
Notes to Financial Statements — (Continued)
February 28, 2017
| 5. | Fees and other transactions with affiliates |
GMO receives a management fee for the services it provides to each Fund. Management fees are paid monthly at the annual rate equal to the percentage of each Fund’s average daily net assets set forth in the table below:
| | | | | | | | | | | | |
| | | Asset Allocation Bond Fund | | Core Plus Bond Fund | | Currency Hedged International Bond Fund | | Emerging Country Debt Fund | | Opportunistic Income Fund (formerly Debt
Opportunities Fund) | | U.S. Treasury Fund |
| Management Fee | | 0.25% | | 0.25% | | 0.25% | | 0.35% | | 0.40%(a) | | 0.08%(b) |
| | (a) | Prior to January 1, 2017, the management fee was 0.25% |
| | (b) | GMO has voluntarily waived the Fund’s entire management fee. |
In addition for certain Funds, each class of shares pays GMO a shareholder service fee for providing client services and reporting, such as performance information, client account information, personal and electronic access to Fund information, access to analysis and explanations of Fund reports, and assistance in maintaining and correcting client-related information. Shareholder service fees are paid monthly equal to the percentage of each applicable Fund’s average daily net assets set forth in the table below:
| | | | | | | | | | | | |
| | | | |
| Fund Name | | Class III | | | Class IV | | | Class VI | |
Asset Allocation Bond Fund | | | 0.15% | | | | | | | | 0.055% | |
Core Plus Bond Fund | | | 0.15% | | | | 0.10% | | | | | |
Currency Hedged International Bond Fund | | | 0.15% | | | | | | | | | |
Emerging Country Debt Fund | | | 0.15% | | | | 0.10% | | | | | |
Opportunistic Income Fund (formerly Debt Opportunities Fund) | | | 0.15% | * | | | | | | | 0.055% | |
| | * | Class is offered but has no shareholders as of February 28, 2017. |
For each Fund other than Emerging Country Debt Fund, GMO has contractually agreed to reimburse each Fund for its “Specified Operating Expenses” (as defined below). Any such reimbursements are paid to a Fund concurrently with the Fund’s payment of management fees to GMO.
“Specified Operating Expenses” means: audit expenses, fund accounting expenses, pricing service expenses, expenses of non-investment related tax services, transfer agency expenses, expenses of non-investment related legal services provided to the Funds by or at the direction of GMO, federal securities law filing expenses, printing expenses, state and federal registration fees and custody expenses.
For each Fund that pays GMO a management fee, GMO has contractually agreed to waive or reduce that fee, but not below zero, to the extent necessary to offset the management fees paid to GMO that are directly or indirectly borne by the Fund as a result of the Fund’s direct or indirect investments in other GMO Funds.
For each Fund that charges a shareholder service fee, GMO has contractually agreed to waive or reduce the shareholder service fee charged to holders of each class of shares of the Fund, but not below zero, to the extent necessary to offset the shareholder service fees directly or indirectly borne by the class of shares of the Fund as a result of the Fund’s direct or indirect investments in other GMO Funds.
These contractual waivers and reimbursements will continue through at least June 30, 2017 for each Fund unless the Funds’ Board of Trustees authorizes their modification or termination, or reduces the fee rates paid to GMO under the Fund’s management contract or servicing and supplemental support agreement.
106
GMO Trust Funds
Notes to Financial Statements — (Continued)
February 28, 2017
In addition to the contractual waivers and reimbursements described above, GMO has voluntarily agreed to waive U.S. Treasury Fund’s entire management fee. GMO may change or terminate this waiver at any time.
The Funds’ portion of the gross fees paid by the Trust to the Trust’s independent Trustees and their legal counsel and any agents unaffiliated with GMO during the year ended February 28, 2017 is shown in the table below and is included in the Statements of Operations.
| | | | | | | | |
| | | |
| Fund Name | | Independent Trustees
and their legal counsel ($) | | | Agent
unaffiliated
with GMO ($) | |
Asset Allocation Bond Fund | | | 34,271 | | | | 3,593 | |
Core Plus Bond Fund | | | 1,516 | | | | 158 | |
Currency Hedged International Bond Fund | | | 1,087 | | | | 32 | |
Emerging Country Debt Fund | | | 70,885 | | | | 7,022 | |
Opportunistic Income Fund (formerly Debt Opportunities Fund) | | | 26,711 | | | | 2,617 | |
U.S. Treasury Fund | | | 56,589 | | | | 5,998 | |
Certain Funds incur fees and expenses indirectly as a shareholder in the underlying funds. For the year ended February 28, 2017 these indirect fees and expenses expressed as a percentage of each Fund’s average daily net assets were as follows:
| | | | | | | | | | | | | | | | |
| | | | | |
| Fund Name | | Indirect Net Expenses
(excluding shareholder
service fees) | | | Indirect Shareholder
Service Fees | | | Indirect Interest
Expense | | | Total Indirect
Expenses | |
Asset Allocation Bond Fund | | | < 0.001% | | | | 0.000% | | | | 0.000% | | | | < 0.001% | |
Core Plus Bond Fund | | | 0.061% | | | | 0.014% | | | | 0.000% | | | | 0.075% | |
Currency Hedged International Bond Fund | | | 0.035% | | | | 0.009% | | | | 0.000% | | | | 0.044% | |
Emerging Country Debt Fund | | | 0.001% | | | | < 0.001% | | | | 0.000% | | | | 0.001% | |
Opportunistic Income Fund (formerly Debt Opportunities Fund) | | | < 0.001% | | | | 0.000% | | | | 0.000% | | | | < 0.001% | |
U.S. Treasury Fund | | | 0.000% | | | | 0.000% | | | | 0.000% | | | | 0.000% | |
The Funds are permitted to purchase or sell securities from or to certain other GMO funds under specified conditions outlined in procedures adopted by the Trustees. The procedures have been designed to ensure that any purchase or sale of securities by a Fund from another fund or portfolio that is or could be considered an affiliate by virtue of having a common investment adviser (or affiliated investment advisers), common Trustees and/or common officers complies with Rule 17a-7 of the 1940 Act. Further, as defined under the procedures, each transaction is effectuated at the current market price. During the year ended February 28, 2017, the Funds did not engage in these transactions.
| 6. | Purchases and sales of securities |
Cost of purchases and proceeds from sales of securities, excluding short-term investments and including GMO U.S. Treasury Fund, for the year ended February 28, 2017 are noted in the table below:
| | | | | | | | | | | | | | | | |
| | | | | |
| | | Purchases ($) | | | Purchases ($) | | | Sales ($) | | | Sales ($) | |
| | | | | |
| Fund Name | | U.S. Government
Securities | | | Investments (Non-U.S.
Government Securities) | | | U.S. Government
Securities | | | Investments (Non-U.S.
Government Securities) | |
Asset Allocation Bond Fund | | | 1,823,088,803 | | | | 306,288,930 | | | | 1,790,271,726 | | | | 1,175,424,871 | |
Core Plus Bond Fund | | | 431,006,296 | | | | 451,573,629 | | | | 143,255,383 | | | | 329,352,674 | |
Currency Hedged International Bond Fund | | | — | | | | 13,400,000 | | | | — | | | | 12,619,083 | |
Emerging Country Debt Fund | | | 297,199,357 | | | | 591,278,111 | | | | 122,432,084 | | | | 937,107,710 | |
Opportunistic Income Fund (formerly Debt Opportunities Fund) | | | 139,552,211 | | | | 992,378,687 | | | | 31,805,219 | | | | 1,346,235,631 | |
107
GMO Trust Funds
Notes to Financial Statements — (Continued)
February 28, 2017
In the normal course of business the Funds enter into contracts with third-party service providers that contain a variety of representations and warranties and that provide general indemnifications. The Funds’ maximum exposure under these arrangements is unknown, as it involves possible future claims that may or may not be made against the Funds. Based on experience, GMO is of the view that the risk of loss to the Funds in connection with the Funds’ indemnification obligations is remote; however, there can be no assurance that such obligations will not result in material liabilities that adversely affect the Funds.
| 8. | Principal shareholders and related parties as of February 28, 2017 |
| | | | | | | | | | | | | | | | |
| | | | | |
| Fund Name | | Number of
shareholders that held
more than 10% of the
outstanding shares of
the Fund | | | Percentage of
outstanding shares of
the Fund held by those
shareholders owning
greater than 10% of the
outstanding shares of
the Fund | | | Percentage of the
shares of the Fund held
by senior management
of GMO and
GMO Trust officers | | | Percentage of the
Fund’s shares held by
accounts for which
GMO has
investment discretion | |
Asset Allocation Bond Fund | | | 2 | ‡ | | | 71.95% | | | | — | | | | 99.99% | |
Core Plus Bond Fund | | | 3 | ‡ | | | 62.62% | | | | < 0.01% | | | | 97.61% | |
Currency Hedged International Bond Fund | | | 1 | | | | 94.07% | | | | — | | | | 94.07% | |
Emerging Country Debt Fund | | | 1 | ‡ | | | 15.20% | | | | 0.04% | | | | 33.04% | |
Opportunistic Income Fund (formerly Debt Opportunities Fund) | | | 2 | # | | | 62.78% | | | | 0.44% | | | | 99.29% | |
U.S. Treasury Fund | | | 2 | # | | | 42.66% | | | | 0.13% | | | | 97.67% | |
| | ‡ | One of the shareholders is another fund of the Trust. |
| | # | Two of the shareholders are other funds of the Trust. |
The Declaration of Trust permits each Fund to issue an unlimited number of shares of beneficial interest (without par value). Transactions in the Funds’ shares were as follows:
| | | | | | | | | | | | | | | | |
| | | |
| | | Year Ended
February 28, 2017 | | | Year Ended
February 29, 2016 | |
| | | | | |
| | | Shares | | | Amount | | | Shares | | | Amount | |
Asset Allocation Bond Fund | | | | | | | | | | | | | | | | |
Class III: | | | | | | | | | | | | | | | | |
Shares sold | | | 2,214,990 | | | $ | 48,861,899 | | | | 3,486,285 | | | $ | 80,557,647 | |
Shares issued to shareholders in reinvestment of distributions | | | — | | | | — | | | | 1,170,894 | | | | 26,485,630 | |
Shares repurchased | | | (5,396,762 | ) | | | (119,141,029 | ) | | | (4,741,953 | ) | | | (108,443,047 | ) |
| | | | | | | | | | | | | | | | | |
Net increase (decrease) | | | (3,181,772 | ) | | $ | (70,279,130 | ) | | | (84,774 | ) | | $ | (1,399,770 | ) |
| | | | | | | | | | | | | | | | | |
Class VI: | | | | | | | | | | | | | | | | |
Shares sold | | | 1,080,206 | | | $ | 23,894,585 | | | | 13,228,053 | | | $ | 325,062,565 | |
Shares issued to shareholders in reinvestment of distributions | | | — | | | | — | | | | 12,325,878 | | | | 279,304,399 | |
Shares repurchased | | | (31,684,438 | ) | | | (702,776,501 | ) | | | (116,764,298 | ) | | | (2,651,040,441 | ) |
| | | | | | | | | | | | | | | | | |
Net increase (decrease) | | | (30,604,232 | ) | | $ | (678,881,916 | ) | | | (91,210,367 | ) | | $ | (2,046,673,477 | ) |
| | | | | | | | | | | | | | | | | |
| | | | | | | | | | | | | | | | | |
108
GMO Trust Funds
Notes to Financial Statements — (Continued)
February 28, 2017
| | | | | | | | | | | | | | | | |
| | | |
| | | Year Ended
February 28, 2017 | | | Year Ended
February 29, 2016 | |
| | | | | |
| | | Shares | | | Amount | | | Shares | | | Amount | |
Core Plus Bond Fund | | | | | | | | | | | | | | | | |
Class III:# | | | | | | | | | | | | | | | | |
Shares sold | | | 767,574 | | | $ | 16,125,848 | | | | 304,701 | | | $ | 6,869,966 | |
Shares issued to shareholders in reinvestment of distributions | | | 11,511 | | | | 240,429 | | | | 16,726 | | | | 359,773 | |
Shares repurchased | | | (2,168,606 | ) | | | (46,416,742 | ) | | | (60,416 | ) | | | (1,303,505 | ) |
| | | | | | | | | | | | | | | | | |
Net increase (decrease) | | | (1,389,521 | ) | | $ | (30,050,465 | ) | | | 261,011 | | | $ | 5,926,234 | |
| | | | | | | | | | | | | | | | | |
Class IV:# | | | | | | | | | | | | | | | | |
Shares sold | | | 23,983,698 | | | $ | 504,551,462 | | | | 1,683,291 | | | $ | 36,361,097 | |
Shares issued to shareholders in reinvestment of distributions | | | 177,829 | | | | 3,760,584 | | | | 425,557 | | | | 9,179,274 | |
Shares repurchased | | | (7,405,907 | ) | | | (159,277,873 | ) | | | (218,356 | ) | | | (4,672,989 | ) |
| | | | | | | | | | | | | | | | | |
Net increase (decrease) | | | 16,755,620 | | | $ | 349,034,173 | | | | 1,890,492 | | | $ | 40,867,382 | |
| | | | | | | | | | | | | | | | | |
| | | | | | | | | | | | | | | | | |
Currency Hedged International Bond Fund | | | | | | | | | | | | | | | | |
Class III:# | | | | | | | | | | | | | | | | |
Shares sold | | | — | | | $ | — | | | | 17,696 | | | $ | 489,111 | |
Shares issued to shareholders in reinvestment of distributions | | | 73,631 | | | | 1,933,541 | | | | 228,727 | | | | 5,839,409 | |
Shares repurchased | | | (144,981 | ) | | | (3,866,075 | ) | | | (360,750 | ) | | | (9,358,334 | ) |
| | | | | | | | | | | | | | | | | |
Net increase (decrease) | | | (71,350 | ) | | $ | (1,932,534 | ) | | | (114,327 | ) | | $ | (3,029,814 | ) |
| | | | | | | | | | | | | | | | | |
| | | | | | | | | | | | | | | | | |
Emerging Country Debt Fund | | | | | | | | | | | | | | | | |
Class III:# | | | | | | | | | | | | | | | | |
Shares sold | | | 8,275,889 | | | $ | 239,701,434 | | | | 8,465,858 | | | $ | 237,263,300 | |
Shares issued to shareholders in reinvestment of distributions | | | 1,985,567 | | | | 55,168,020 | | | | 2,045,947 | | | | 54,000,564 | |
Shares repurchased | | | (5,267,885 | ) | | | (152,424,481 | ) | | | (4,898,972 | ) | | | (133,227,759 | ) |
Purchase premiums | | | — | | | | 242,030 | | | | — | | | | 637,766 | |
Redemption fees | | | — | | | | 1,131,479 | | | | — | | | | 671,195 | |
| | | | | | | | | | | | | | | | | |
Net increase (decrease) | | | 4,993,571 | | | $ | 143,818,482 | | | | 5,612,833 | | | $ | 159,345,066 | |
| | | | | | | | | | | | | | | | | |
Class IV:# | | | | | | | | | | | | | | | | |
Shares sold | | | 5,763,893 | | | $ | 159,047,268 | | | | 17,150,361 | (a) | | $ | 456,814,315 | (a) |
Shares issued to shareholders in reinvestment of distributions | | | 6,895,496 | | | | 191,536,760 | | | | 7,111,245 | | | | 187,694,457 | |
Shares repurchased | | | (27,719,432 | ) | | | (789,476,258 | ) | | | (19,631,458 | )(b) | | | (531,254,001 | )(b) |
Purchase premiums | | | — | | | | 861,411 | | | | — | | | | 2,387,167 | |
Redemption fees | | | — | | | | 4,035,552 | | | | — | | | | 2,420,364 | |
| | | | | | | | | | | | | | | | | |
Net increase (decrease) | | | (15,060,043 | ) | | $ | (433,995,267 | ) | | | 4,630,148 | | | $ | 118,062,302 | |
| | | | | | | | | | | | | | | | | |
| | | | | | | | | | | | | | | | | |
Opportunistic Income Fund (formerly Debt Opportunities Fund) | | | | | | | | | | | | | | | | |
Class VI: | | | | | | | | | | | | | | | | |
Shares sold | | | 6,762,681 | | | $ | 171,348,377 | | | | 13,193,822 | (c) | | $ | 327,076,787 | (c) |
Shares issued to shareholders in reinvestment of distributions | | | 1,438,264 | | | | 36,271,611 | | | | 1,110,191 | | | | 27,443,611 | |
Shares repurchased | | | (16,653,463 | ) | | | (421,440,542 | ) | | | (19,452,966 | )(d) | | | (482,695,222 | )(d) |
Purchase premiums | | | — | | | | 330,391 | | | | — | | | | 934,339 | |
Redemption fees | | | — | | | | 1,329,128 | | | | — | | | | 1,552,426 | |
| | | | | | | | | | | | | | | | | |
Net increase (decrease) | | | (8,452,518 | ) | | $ | (212,161,035 | ) | | | (5,148,953 | ) | | $ | (125,688,059 | ) |
| | | | | | | | | | | | | | | | | |
| | | | | | | | | | | | | | | | | |
109
GMO Trust Funds
Notes to Financial Statements — (Continued)
February 28, 2017
| | | | | | | | | | | | | | | | |
| | | |
| | | Year Ended
February 28, 2017 | | | Year Ended
February 29, 2016 | |
| | | | | |
| | | Shares | | | Amount | | | Shares | | | Amount | |
U.S. Treasury Fund | | | | | | | | | | | | | | | | |
Core Class: | | | | | | | | | | | | | | | | |
Shares sold | | | 368,440,068 | | | $ | 9,213,633,291 | | | | 712,256,180 | | | $ | 17,806,570,597 | |
Shares issued to shareholders in reinvestment of distributions | | | 549,319 | | | | 13,735,786 | | | | 237,043 | | | | 5,925,398 | |
Shares repurchased | | | (423,663,112 | ) | | | (10,594,194,801 | ) | | | (640,904,840 | ) | | | (16,022,605,367 | ) |
| | | | | | | | | | | | | | | | | |
Net increase (decrease) | | | (54,673,725 | ) | | $ | (1,366,825,724 | ) | | | 71,588,383 | | | $ | 1,789,890,628 | |
| | | | | | | | | | | | | | | | | |
| | | | | | | | | | | | | | | | | |
| | (a) | 5,969,578 shares and $53,279,922 were purchased in-kind. |
| | (b) | 2,832,882 shares and $26,147,504 were redeemed in-kind. |
| | (c) | 907,139 shares and $22,542,400 were purchased in-kind. |
| | (d) | 907,139 shares and $22,542,400 were redeemed in-kind. |
| | # | Shares were adjusted to reflect a 1:3 reverse stock split effective July 15, 2016. |
| 10. | Investments in affiliated issuers |
A summary of the Funds’ transactions in the shares of other funds of GMO Trust during the year ended February 28, 2017 is set forth below:
| | | | | | | | | | | | | | | | | | | | | | | | |
| | | | | | | |
| Affiliate | | Value,
beginning of
period | | | Purchases | | | Sales
Proceeds | | | Dividend
Income | | | Distributions
of Realized
Gains | | | Value, end of
period | |
Asset Allocation Bond Fund | |
GMO U.S. Treasury Fund | | $ | 651,060,734 | | | $ | 289,659,556 | | | $ | 941,018,818 | | | $ | 1,152,553 | | | $ | 13,727 | | | $ | — | |
| | | | | | | | | | | | | | | | | | | | | | | | | |
| | | | | | | | | | | | | | | | | | | | | | | | | |
Core Plus Bond Fund | | | | | | | | | | | | | | | | | | | | | | | | |
GMO Emerging Country Debt Fund, Class IV | | $ | 13,799,995 | | | $ | 24,970,000 | | | $ | 11,132,000 | | | $ | 240,190 | | | $ | — | | | $ | 28,722,150 | |
GMO Opportunistic Income Fund (formerly GMO Debt Opportunities Fund), Class VI | | | 27,023,784 | | | | 106,811,000 | | | | 20,626,000 | | | | 310,357 | | | | — | | | | 113,920,146 | |
GMO U.S. Treasury Fund | | | 113,058,921 | | | | 231,200,000 | | | | 255,650,000 | | | | 195,564 | | | | 9,565 | | | | 88,644,748 | |
GMO World Opportunity Overlay Fund | | | 26,355,861 | | | | — | | | | 26,691,126 | | | | — | | | | — | | | | — | |
| | | | | | | | | | | | | | | | | | | | | | | | | |
Totals | | $ | 180,238,561 | | | $ | 362,981,000 | | | $ | 314,099,126 | | | $ | 746,111 | | | $ | 9,565 | | | $ | 231,287,044 | |
| | | | | | | | | | | | | | | | | | | | | | | | | |
| | | | | | | | | | | | | | | | | | | | | | | | | |
Currency Hedged International Bond Fund | | | | | | | | | | | | | | | | | | | | | | | | |
GMO Emerging Country Debt Fund, Class IV | | $ | 3,300,280 | | | $ | — | | | $ | — | | | $ | 252,285 | | | $ | — | | | $ | 3,677,564 | |
GMO Opportunistic Income Fund (formerly GMO Debt Opportunities Fund), Class VI | | | 2,749,434 | | | | — | | | | — | | | | 72,087 | | | | — | | | | 2,884,836 | |
GMO U.S. Treasury Fund | | | 11,851,979 | | | | 13,400,000 | | | | 6,000,000 | | | | 83,640 | | | | 10,811 | | | | 19,248,680 | |
GMO World Opportunity Overlay Fund | | | 6,312,879 | | | | — | | | | 6,412,829 | | | | — | | | | — | | | | — | |
| | | | | | | | | | | | | | | | | | | | | | | | | |
Totals | | $ | 24,214,572 | | | $ | 13,400,000 | | | $ | 12,412,829 | | | $ | 408,012 | | | $ | 10,811 | | | $ | 25,811,080 | |
| | | | | | | | | | | | | | | | | | | | | | | | | |
| | | | | | | | | | | | | | | | | | | | | | | | | |
Emerging Country Debt Fund | | | | | | | | | | | | | | | | | | | | | | | | |
GMO Opportunistic Income Fund (formerly Debt Opportunities Fund), Class VI | | $ | 13,956,048 | | | $ | — | | | $ | — | | | $ | 365,913 | | | $ | — | | | $ | 14,643,342 | |
GMO U.S. Treasury Fund | | | 84,774,937 | | | | 101,500,000 | | | | 99,000,000 | | | | 452,870 | | | | 46,787 | | | | 87,277,534 | |
| | | | | | | | | | | | | | | | | | | | | | | | | |
Totals | | $ | 98,730,985 | | | $ | 101,500,000 | | | $ | 99,000,000 | | | $ | 818,783 | | | $ | 46,787 | | | $ | 101,920,876 | |
| | | | | | | | | | | | | | | | | | | | | | | | | |
| | | | | | | | | | | | | | | | | | | | | | | | | |
Opportunistic Income Fund (formerly Debt Opportunities Fund) | | | | | | | | | | | | | | | | | | | | | | | | |
GMO U.S. Treasury Fund | | $ | 77,841,624 | | | $ | 189,500,000 | | | $ | 194,500,000 | | | $ | 336,929 | | | $ | 33,490 | | | $ | 72,837,633 | |
| | | | | | | | | | | | | | | | | | | | | | | | | |
| | | | | | | | | | | | | | | | | | | | | | | | | |
110
Report of Independent Registered Public Accounting Firm
To the Trustees of GMO Trust and Shareholders of GMO Asset Allocation Bond Fund, GMO Core Plus Bond Fund, GMO Currency Hedged International Bond Fund, GMO Emerging Country Debt Fund, GMO Opportunistic Income Fund (formerly GMO Debt Opportunities Fund) and GMO U.S. Treasury Fund:
In our opinion, the accompanying statements of assets and liabilities, including the schedules of investments, and the related statements of operations and of changes in net assets and the financial highlights present fairly, in all material respects, the financial position of the GMO Asset Allocation Bond Fund, GMO Core Plus Bond Fund, GMO Currency Hedged International Bond Fund, GMO Emerging Country Debt Fund, GMO Opportunistic Income Fund (formerly GMO Debt Opportunities Fund), and GMO U.S. Treasury Fund (the “Funds”) as of February 28, 2017, the results of each of their operations for the year then ended, the changes in each of their net assets for each of the two years in the period then ended and the financial highlights for each of the five years in the period then ended, in conformity with accounting principles generally accepted in the United States of America. These financial statements and financial highlights (hereafter referred to as “financial statements”) are the responsibility of the Fund’s management. Our responsibility is to express an opinion on these financial statements based on our audits. We conducted our audits of these financial statements in accordance with the standards of the Public Company Accounting Oversight Board (United States). Those standards require that we plan and perform the audit to obtain reasonable assurance about whether the financial statements are free of material misstatement. An audit includes examining, on a test basis, evidence supporting the amounts and disclosures in the financial statements, assessing the accounting principles used and significant estimates made by management, and evaluating the overall financial statement presentation. Our procedures included confirmation of securities owned as of February 28, 2017 by correspondence with the custodians and brokers; when replies were not received from brokers, we performed other auditing procedures. We believe that our audits provide a reasonable basis for our opinion.
PricewaterhouseCoopers LLP
Boston, Massachusetts
April 26, 2017
111
GMO Trust Funds
Board Review of Investment Management Agreement
February 28, 2017
GMO Opportunistic Income Fund (formerly known as GMO Debt Opportunities Fund)
Approval of new amended and restated management agreement for GMO Opportunistic Income Fund
At in-person meetings of the Board of Trustees (the “Board” or the “Trustees”) of GMO Trust (the “Trust”) held on September 30, 2016 and December 1, 2016, the Trustees who are not “interested persons” of the Trust (the “Independent Trustees”) considered the terms of a proposed new amended and restated management agreement between the Trust, on behalf of GMO Opportunistic Income Fund (the “Fund”), and Grantham, Mayo, Van Otterloo & Co. LLC (“GMO”) that will implement a new management fee for the Fund effective on or about January 1, 2017 (the “New Management Contract”), and at the December 1, 2016 meeting determined to recommend its approval to the full Board. Also at the December 1, 2016 meeting, the Board, including all of the Independent Trustees, approved the New Management Contract and recommended its approval to Fund shareholders. Holders of a majority of the Fund’s outstanding shares approved the New Management Contract at a special meeting of the Fund’s shareholders held on December 21, 2016.
In connection with its consideration of the New Management Contract, the Board met privately with its independent legal counsel. In addition to the information the Board took into account in June 2016 in connection with its renewal of the Fund’s then current management agreement for an additional twelve month period commencing June 30, 2016, as described in the Fund’s semi-annual report dated August 31, 2016, the Board also considered the following factors, among others:
| | • | | The Fund is not currently offered to external investors and its principal shareholders are other funds and separate account clients managed by GMO. GMO advised the Board that it is seeking to offer the Fund directly to external investors as a standalone investment option. |
| | • | | The Fund’s management fee and current estimated total expenses under the New Management Contract compared favorably with a group of mutual funds identified by GMO as having strategies similar to those of the Fund to be effective as of the effective date of the New Management Contract. |
| | • | | GMO advised the Board that, in connection with the Fund’s external offering, GMO believes that the then pending changes to the Fund’s investment objective and name and elimination of the name-related investment policy, combined with the management fee under the New Management Contract, would better position the Fund to compete for external investor allocations to a securitized credit strategy without affecting the Fund’s role as an asset allocation vehicle for its current shareholders. |
| | • | | Non-portfolio management-related services provided by GMO under the Current Management Contract (which would continue under the New Management Contract), including valuation, legal and compliance, board governance, accounting and operational services. |
| | • | | GMO advised the Board that GMO believes that the proposed fee is fair and reasonable in relation to the management services provided to the Fund. |
After reviewing these and other factors, the Trustees concluded, in the context of their overall review of the New Management Contract, that the fees charged to the Fund under the New Management Contract were within the range of fees that would be established through arm’slength bargaining.
In their deliberations, the Trustees considered all factors they deemed relevant, with each Trustee weighting individual factors as he thought appropriate. Following their deliberations, the Independent Trustees voting separately, and then all Trustees voting together, approved the New Management Contract for an initial period ending on the first anniversary of the agreement’s execution.
112
GMO Trust Funds
(A Series of GMO Trust)
Fund Expenses
February 28, 2017 (Unaudited)
Expense Examples: The following information is in relation to expenses for the six month period ended February 28, 2017.
As a shareholder of the Funds, you may incur two types of costs: (1) transaction costs, including purchase premium and redemption fees, if applicable; and (2) ongoing costs, including direct and/or indirect management fees, direct and/or indirect shareholder services fees, and other Fund expenses. This example is intended to help you understand your ongoing costs (in dollars) of investing in the Funds and to compare these costs with the ongoing costs of investing in other mutual funds.
These examples are based on an investment of $1,000 invested at the beginning of the period and held for the entire period, September 1, 2016 through February 28, 2017.
Actual Expenses
This section of the table for each class below provides information about actual account values and actual expenses. You may use the information in this section, together with the amount you invested, to estimate the expenses that you paid over the period. Simply divide your account value by $1,000 (for example, a $10,000,000 account value divided by $1,000 = 10,000), then multiply the result by the number under the heading entitled “Expenses Paid During the Period” to estimate the expenses you paid on your account during this period.
Hypothetical Example for Comparison Purposes
This section of the table for each class below provides information about hypothetical account values and hypothetical expenses based on the Funds’ actual expense ratio and an assumed rate of return of 5% per year before expenses, which is not the Funds’ actual return. The hypothetical account values and expenses may not be used to estimate the actual ending account balance or expenses you paid for the period. You may use this information to compare the ongoing costs of investing in the Funds with other funds. To do so, compare this 5% hypothetical example with the 5% hypothetical examples that appear in the shareholder reports of other funds.
Please note that the expenses shown in the table are meant to highlight your ongoing costs only and do not reflect any transactional costs, such as purchase premium and redemption fees. Therefore, this section of the table is useful in comparing ongoing costs only, and will not help you determine the relative total costs of owning different funds. In addition, if these transactional costs were included, your costs would have been higher.
| | | | | | | | | | | | | | | | | | | | | | | | | | | | |
| | | Actual | | | Hypothetical | | | | |
| | | Beginning
Account Value
September 1, 2016 | | | Ending
Account Value
February 28, 2017 | | | Expenses Paid
During the Period* | | | Beginning
Account Value
September 1, 2016 | | | Ending
Account Value
February 28, 2017 | | | Expenses Paid
During the Period* | | | Annualized
Expense Ratio | |
Asset Allocation Bond Fund | | | | | | | | | | | | | | | | | | | | | |
Class III | | | $1,000.00 | | | | $994.20 | | | | $1.98 | | | | $1,000.00 | | | | $1,022.81 | | | | $2.01 | | | | 0.40% | |
Class VI | | | $1,000.00 | | | | $994.60 | | | | $1.53 | | | | $1,000.00 | | | | $1,023.26 | | | | $1.56 | | | | 0.31% | |
Core Plus Bond Fund | | | | | | | | | | | | | | | | | | | | | |
Class III | | | $1,000.00 | | | | $982.00 | | | | $2.11 | | | | $1,000.00 | | | | $1,022.66 | | | | $2.16 | | | | 0.43% | |
Class IV | | | $1,000.00 | | | | $982.40 | | | | $1.82 | | | | $1,000.00 | | | | $1,022.96 | | | | $1.86 | | | | 0.37% | |
Currency Hedged International Bond Fund | | | | | | | | | | | | | |
Class III | | | $1,000.00 | | | | $972.10 | | | | $2.15 | | | | $1,000.00 | | | | $1,022.61 | | | | $2.21 | | | | 0.44% | |
Emerging Country Debt Fund | | | | | | | | | | | | | | | | | | | | | |
Class III | | | $1,000.00 | | | | $1,015.50 | | | | $2.70 | | | | $1,000.00 | | | | $1,022.12 | | | | $2.71 | | | | 0.54% | |
Class IV | | | $1,000.00 | | | | $1,015.80 | | | | $2.45 | | | | $1,000.00 | | | | $1,022.36 | | | | $2.46 | | | | 0.49% | |
Opportunistic Income Fund (formerly Debt Opportunities Fund) | | | | | | | | | | | | | |
Class VI | | | $1,000.00 | | | | $1,038.10 | | | | $1.82 | | | | $1,000.00 | | | | $1,023.01 | | | | $1.81 | | | | 0.36% | |
U.S. Treasury Fund | | | | | | | | | | | | | | | | | | | | | |
Core | | | $1,000.00 | | | | $1,002.80 | | | | $0.00 | | | | $1,000.00 | | | | $1,024.79 | | | | $0.00 | | | | 0.00% | |
| | * | Expenses are calculated using each class’s annualized net expense ratio (including indirect expenses incurred) for the six months ended February 28, 2017, multiplied by the average account value over the period, multiplied by 181 days in the period, divided by 365 days in the year. |
113
GMO Trust Funds
Tax Information for the Tax Year Ended February 28, 2017 (Unaudited)
The following information is being provided in order to meet reporting requirements set forth by the Code and/or to meet state-specific requirements. Shareholders should consult their tax advisors.
With respect to distributions paid, the Funds designate the following amounts (or, if subsequently determined to be different, the maximum amount allowable) for the fiscal year ended February 28, 2017:
| | | | | | | | | | | | |
| | | | |
| Fund Name | | U.S.
Government
Obligation
Income(a)(b) | | | Interest-
Related
Dividend
Income(c)
($) | | | Short-Term
Capital Gain
Dividends(c)
($) | |
Asset Allocation Bond Fund | | | — | | | | — | | | | — | |
Core Plus Bond Fund | | | 36.10% | | | | 609,328 | | | | — | |
Currency Hedged International Bond Fund | | | 20.27% | | | | — | | | | — | |
Emerging Country Debt Fund | | | 1.55% | | | | — | | | | — | |
Opportunistic Income Fund (formerly Debt Opportunities Fund) | | | 1.19% | | | | 32,229,139 | | | | — | |
U.S. Treasury Fund | | | 90.32% | | | | 15,360,860 | | | | 1,586,333 | |
| | (a) | Presented as a percentage of net investment income and short-term capital gain distributions paid, if any. |
| | (b) | All or a portion of these amounts may be exempt from taxation at the state level. |
| | (c) | These amounts are generally exempt from U.S. withholding taxes for non-U.S. shareholders, provided certain conditions are satisfied by both the Funds and the Funds’ shareholders. If applicable, interest related dividend amounts could include short-term capital gain dividends received from underlying funds. |
In early 2018, the Funds will notify applicable shareholders of amounts for use in preparing 2017 U.S. federal income tax forms.
114
Trustees and Officers (Unaudited)
The following tables present information regarding each Trustee and officer of the Trust as of February 28, 2017. Each Trustee’s and officer’s year of birth (“YOB”) is set forth after his or her name. Unless otherwise noted, (i) each Trustee and officer has engaged in the principal occupation(s) noted in the table for at least the most recent five years, although not necessarily in the same capacity, and (ii) the address of each Trustee and officer is c/o GMO Trust, 40 Rowes Wharf, Boston, MA 02110. Each Trustee serves in office until the earlier of (a) the election and qualification of a successor at the next meeting of shareholders called to elect Trustees or (b) the Trustee dies, resigns, or is removed as provided in the Trust’s governing documents. Each of the Trustees of the Trust, other than Mr. Kittredge, is not an “interested person” of the Trust, as such term is used in the 1940 Act (each, an “Independent Trustee”). Because the Funds do not hold annual meetings of shareholders, each Trustee will hold office for an indeterminate period. Each officer serves in office until his or her successor is elected and determined to be qualified to carry out the duties and responsibilities of the office, or until the officer resigns or is removed from office.
Management of the Trust
| | | | | | | | | | | | | |
Name and
Year of Birth | | Position(s)
Held with the Trust | | Length of Time Served | | Principal Occupation(s) During Past
5 Years | | Number of
Portfolios in
Fund Complex1
Overseen | | Other Directorships Held
in the Past
Five Years |
Donald W. Glazer YOB: 1944 | | Chairman of the Board of Trustees | | Chairman of the Board of Trustees since March 2005; Lead Independent Trustee (September 2004 – March 2005); Trustee since December 2000. | | Consultant – Law and Business2; Author of Legal Treatises. | | | | 36 | | | Director, BeiGene Ltd. (biotech research). |
| | | | | |
Peter Tufano YOB: 1957 | | Trustee | | Since December 2008. | | Peter Moores Dean and Professor of Finance, University of Oxford Saïd Business School (as of July 1, 2011); Sylvan C. Coleman Professor of Financial Management, Harvard Business School (1989 – 2011). | | | | 36 | | | Trustee of State Street Navigator Securities Lending Trust (5 Portfolios). |
| | | | | |
Paul Braverman YOB: 1949 | | Trustee | | Since March 2010. | | Director of Claren Road Asset Management, LLC (hedge fund) (January 2011 – present); Director of Leerink Swann Holdings, LLC (investment bank) (October 2013 – present); Director of Aesir Capital Management (investment advisor) (November 2012 – present); Director of Kieger (US) Ltd. (investment advisor) (January 2015 – present). | | | | 36 | | | Trustee of HIMCO Variable Insurance Trust (27 Portfolios). |
| | | | | | | | | | | | | |
| Interested Trustee and Officer | | | | |
| | | | | | | | | | | | | |
Name and Year of Birth | | Position(s) Held with the Trust | | Length of Time Served | | Principal Occupation(s) During Past
5 Years | | Number of
Portfolios in
Fund Complex1
Overseen | | Other Directorships Held
in the Past
Five Years |
Joseph B. Kittredge, Jr.3 YOB: 1954 | | Trustee; President of the Trust | | Trustee since March 2010; President since March 2009; Chief Executive Officer, March 2009 – June 2015. | | General Counsel, Grantham, Mayo, Van Otterloo & Co. LLC (October 2005 – present); Partner, Ropes & Gray, LLP (1988 – 2005). | | | | 48 | | | None. |
| 1 | The Fund Complex includes series of each of GMO Trust and GMO Series Trust. Mr. Kittredge also serves as a Trustee of GMO Series Trust. |
| 2 | As part of Mr. Glazer’s work as a consultant, he provides part-time consulting services to Goodwin Procter LLP (“Goodwin”). Goodwin has provided legal services to Renewable Resources, LLC, an affiliate of GMO; GMO, in connection with its relationship with Renewable Resources; and funds managed by Renewable Resources. Mr. Glazer has represented that he has no financial interest in, and is not involved in the provision of, such legal services. These entities did not pay any legal fees or disbursements to Goodwin during the calendar years ended December 31, 2015 and December 31, 2016. In correspondence with the staff of the SEC (the “Staff”) beginning in August 2006, the Independent Trustees’ legal counsel provided the Staff with information regarding Mr. Glazer’s relationship with Goodwin and his other business activities. On September 11, 2007, based on information that had been given to the Staff as of that date, the Staff provided oral no-action assurance consistent with the opinion of the Independent Trustees’ legal counsel that Mr. Glazer is not an “interested person” of the Trust. |
| 3 | Mr. Kittredge is an “interested person” of the Trust, as such term is used in the 1940 Act (an “Interested Trustee”), by virtue of his positions with the Trust and GMO indicated in the table above and his interest as a member of GMO. |
115
| | | | | | |
Officers | | | | | | |
Name and
Year of Birth | | Position(s)
Held with the Trust | | Length of
Time Served | | Principal Occupation(s) During Past 5 Years* |
Joseph B. Kittredge, Jr. YOB: 1954 | | Trustee and President | | Trustee since March 2010; President since March 2009; Chief Executive Officer, March 2009 – June 2015. | | General Counsel, Grantham, Mayo, Van Otterloo & Co. LLC (October 2005 – present); Partner, Ropes & Gray LLP (1988 – 2005). |
Sheppard N. Burnett YOB: 1968 | | Chief Executive Officer | | Chief Executive Officer since June 2015; Chief Financial Officer, March 2007 – June 2015; Treasurer, November 2006 – June 2015; Assistant Treasurer, September 2004 – November 2006. | | Head of Fund Treasury and Tax, Grantham, Mayo, Van Otterloo & Co. LLC (December 2006 – present). |
| | | |
Carly Cushman YOB: 1984 | | Treasurer, Chief Accounting Officer and Chief Financial Officer | | Treasurer and Chief Financial Officer since June 2015; Chief Accounting Officer since May 2014; Assistant Treasurer, September 2013 – June 2015. | | Fund Administrator, Grantham, Mayo, Van Otterloo & Co. LLC (December 2009 – present); Senior Accountant, Renaissance HealthCare (February 2009 – December 2009); Auditor/Senior Auditor, Deloitte & Touche (September 2006 – February 2009). |
| | | |
John L. Nasrah YOB: 1977 | | Assistant Treasurer and Chief Tax Officer | | Since March 2007. | | Fund Administrator, Grantham, Mayo, Van Otterloo & Co. LLC (September 2004 – present). |
| | | |
Betty Maganzini YOB: 1972 | | Assistant Treasurer | | Since September 2013. | | Fund Administrator, Grantham, Mayo, Van Otterloo & Co. LLC (July 2010 – present); Assistant Treasurer (June 2009 – July 2010), Manager, Fund Administration and Regulatory Affairs (2006 – 2009), Hambrecht & Quist Capital Management LLC. |
| | | |
Mahmoodur Rahman YOB: 1967 | | Assistant Treasurer | | Since September 2007. | | Fund Administrator, Grantham, Mayo, Van Otterloo & Co. LLC (April 2007 – present). |
| | | |
Cathy Tao YOB: 1974 | | Assistant Treasurer | | Since September 2016 | | Fund Administrator, Grantham, Mayo, Van Otterloo & Co. LLC (October 2007 – present) |
| | | |
Brian Kadehjian YOB: 1974 | | Assistant Treasurer and Treasury Officer | | Assistant Treasurer since February 2015; Treasury Officer since September 2013. | | Fund Administrator, Grantham, Mayo, Van Otterloo & Co. LLC (April 2002 – present). |
| | | |
Douglas Y. Charton YOB: 1982 | | Chief Legal Officer, Vice President and Clerk | | Since August 2015. | | Legal Counsel, Grantham, Mayo, Van Otterloo & Co. LLC (July 2015 – present); Associate, K&L Gates LLP (September 2007 – July 2015). |
| | | |
Megan Bunting YOB: 1978 | | Vice President and Assistant Clerk | | Since September 2013. | | Legal Counsel, Grantham, Mayo, Van Otterloo & Co. LLC (September 2006 – present). |
| | | |
Kevin O’Brien YOB: 1985 | | Vice President and Assistant Clerk | | Since March 2016. | | Legal Counsel, Grantham, Mayo, Van Otterloo & Co. LLC (February 2015 – present); Associate, Dechert LLP (October 2010 – February 2015). |
| | | |
Gregory L. Pottle YOB: 1971 | | Chief Compliance Officer | | Chief Compliance Officer since May 2015; Vice President and Assistant Clerk, November 2006 – November 2015. | | Chief Compliance Officer, Grantham, Mayo, Van Otterloo & Co. LLC (May 2015 – present); Legal Counsel, Grantham, Mayo, Van Otterloo & Co. LLC (March 2000 – May 2015). |
| | | |
Claire Wilkinson YOB: 1965 | | Anti-Money Laundering Officer | | Since February 2016. | | Compliance Associate, GMO UK Limited (April 2013 – present); General Counsel, MVision Private Equity Advisers Limited (November 2009 – January 2013). |
| * | Each officer of the Trust may also serve as an officer and/or director of certain pooled investment vehicles of which GMO or an affiliate of GMO serves as the investment adviser. With the exception of Mr. Kittredge, each officer listed in the table above also serves as an officer of GMO Series Trust. |
116
GMO Trust
Annual Report
February 28, 2017
Foreign Fund
Foreign Small Companies Fund
International Small Companies Fund
For a free copy of the Funds’ proxy voting guidelines, shareholders may call 1-617-346-7646 (collect) or visit the Securities and Exchange Commission’s website at www.sec.gov. Information regarding how the Funds voted proxies relating to portfolio securities during the most recent 12-month period ended June 30 is available on GMO’s website at www.gmo.com or on the Securities and Exchange Commission’s website at www.sec.gov.
The Funds file their complete schedule of portfolio holdings with the Securities and Exchange Commission for the first and third quarter of each fiscal year on Form N-Q, which is available on the Commission’s website at www.sec.gov. The Funds’ Form N-Q may be reviewed and copied at the Commission’s Public Reference Room in Washington, D.C. Information on the operation of the Public Reference Room may be obtained by calling 1-800-SEC-0330. The Funds have a policy with respect to disclosure of portfolio holdings under which they may also make a complete schedule of portfolio holdings available on GMO’s website at www.gmo.com.
This report is prepared for the general information of shareholders. It is authorized for distribution to prospective investors only when preceded or accompanied by a prospectus for the GMO Trust, which contains a complete discussion of the risks associated with an investment in these Funds and other important information. The GMO Trust prospectus can be obtained at www.gmo.com.
An investment in the Funds is subject to risk, including the possible loss of principal amount invested. There can be no assurance that the Funds will achieve their stated investment objectives. Please see the Funds’ prospectus regarding specific principal risks for each Fund. General risks may include: market risk-equities, management and operational risk, non-U.S. investment risk, small company risk and derivatives risk.
The Funds are distributed by Funds Distributor LLC. Funds Distributor LLC is not affiliated with GMO.
TABLE OF CONTENTS
GMO Foreign Fund
(A Series of GMO Trust)
Portfolio Managers
Day-to-day management of the Fund’s portfolio is the responsibility of the International Active team at Grantham, Mayo, Van Otterloo & Co. LLC.
Management Discussion and Analysis of Fund Performance
Class III shares of GMO Foreign Fund returned +15.81% (net) for the fiscal year ended February 28, 2017, as compared with +15.75% for the MSCI EAFE Index.
Stock selection added to relative performance. Holdings in Japan, France, and emerging markets contributed positively to relative returns. Positions in Melrose Industries in the United Kingdom, Takeuchi Manufacturing and NGK Spark in Japan, and Samsung Electronics in South Korea were the largest positive contributors to performance. On the negative side, Essentra and Imperial Brands in the United Kingdom detracted from returns.
Country allocation detracted from relative performance. An underweight position in the recovering Australian market hurt relative returns.
Because some of the securities and instruments held directly or indirectly by the Fund had positive fair value adjustments at the beginning or end of the fiscal year (and the performance of indices are not fair valued), the Fund’s absolute and relative performance is higher than it otherwise would have been in the absence of such fair value adjustments.
The views expressed herein are exclusively those of Grantham, Mayo, Van Otterloo & Co. LLC as of the date of this report and are subject to change. GMO disclaims any responsibility to update such views. They are not meant as investment advice. References to specific securities are not recommendations of such securities and may not be representative of any GMO portfolio’s current or future investments.
2
GMO Foreign Fund
(A Series of GMO Trust)
Comparison of Change in Value of a $35,000,000 Investment in
GMO Foreign Fund Class III Shares and the MSCI EAFE Index
As of February 28, 2017
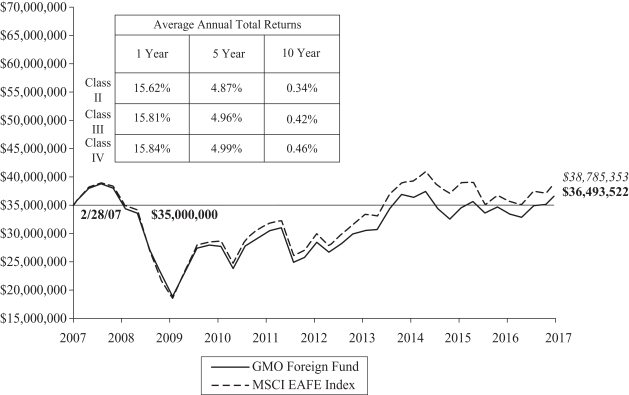
Performance data quoted represents past performance and is not indicative of future results. The investment return and principal value of an investment will fluctuate so that an investor’s shares, when redeemed, may be worth more or less than their original cost. Current performance data may be lower or higher than the performance data provided herein. To obtain performance information up to the most recent month-end, visit www.gmo.com. Performance shown is net of all fees after reimbursement from GMO. Returns would have been lower had certain expenses not been reimbursed during the periods shown and do not include the effect of taxes on distributions and redemptions. The performance information shown above only includes purchase premiums and/or redemption fees in effect as of February 28, 2017. All information is unaudited. Performance for classes may vary due to different fees.
MSCI data may not be reproduced or used for any other purpose. MSCI provides no warranties, has not prepared or approved this report, and has no liability hereunder.
3
GMO Foreign Fund
(A Series of GMO Trust)
Investment Concentration Summary
February 28, 2017 (Unaudited)
| | | | |
| Asset Class Summary& | | % of Total Net Assets | |
Common Stocks | | | 97.3 | % |
Mutual Funds | | | 0.0 | ^ |
Short-Term Investments | | | 2.5 | |
Forward Currency Contracts | | | 0.0 | ^ |
Other | | | 0.2 | |
| | | | |
| | | 100.0 | % |
| | | | |
| | | | |
| Country Summary¤ | | % of Investments | |
Japan | | | 29.9 | % |
United Kingdom | | | 23.0 | |
France | | | 13.0 | |
Hong Kong | | | 5.9 | |
Germany | | | 5.9 | |
Switzerland | | | 3.5 | |
South Korea | | | 2.8 | |
Taiwan | | | 2.6 | |
Australia | | | 2.6 | |
Netherlands | | | 2.1 | |
Sweden | | | 2.1 | |
Russia | | | 2.0 | |
Israel | | | 1.4 | |
Italy | | | 1.3 | |
Other Developed | | | 1.0 | ‡ |
Other Emerging | | | 0.9 | † |
| | | | |
| | | 100.0 | % |
| | | | |
| & | In the table above, derivative financial instruments, if any, are based on market values or unrealized appreciation/depreciation rather than notional amounts. |
| ¤ | The table above shows country exposure in the Fund. The table excludes short-term investments. The table excludes exposure through forward currency contracts and includes exposure through other derivative financial instruments, if any. The table takes into account the market value of securities and options and the notional amounts of swap contracts and other derivative financial instruments, if any. |
| ‡ | “Other Developed” is comprised of developed countries that each represent between (1.0)% and 1.0% of Investments. |
| † | “Other Emerging” is comprised of emerging countries that each represent between (1.0)% and 1.0% of Investments. |
| | | | |
| Industry Group Summary | | % of Equity Investments# | |
Banks | | | 15.8 | % |
Insurance | | | 12.0 | |
Automobiles & Components | | | 9.0 | |
Pharmaceuticals, Biotechnology & Life Sciences | | | 8.3 | |
Materials | | | 7.8 | |
Telecommunication Services | | | 6.7 | |
Capital Goods | | | 6.7 | |
Technology Hardware & Equipment | | | 5.3 | |
Food, Beverage & Tobacco | | | 4.7 | |
Diversified Financials | | | 4.1 | |
Real Estate | | | 3.7 | |
Media | | | 2.8 | |
Semiconductors & Semiconductor Equipment | | | 2.7 | |
Energy | | | 2.4 | |
Commercial & Professional Services | | | 1.9 | |
Utilities | | | 1.9 | |
Software & Services | | | 1.9 | |
Retailing | | | 1.2 | |
Transportation | | | 1.1 | |
| | | | |
| | | 100.0 | % |
| | | | |
| # | Equity investments may consist of common stocks and other stock-related securities, such as preferred stocks, if any. This table excludes exposure to derivative contracts, short-term investments, mutual funds and investment funds, if any. For a summary of these exposures, if any, see the Schedule of Investments. |
4
GMO Foreign Fund
(A Series of GMO Trust)
Schedule of Investments
(showing percentage of total net assets)
February 28, 2017
| | | | | | | | | | |
| | |
Shares | | | Description | | Value ($) | |
| | | | | | COMMON STOCKS — 97.3% | |
| | |
| | | | | | Australia — 2.6% | |
| | | 362,232 | | | Incitec Pivot Ltd | | | 1,018,441 | |
| | | 724,466 | | | Telstra Corp Ltd | | | 2,675,784 | |
| | | | | | | | | | |
| | | | | | Total Australia | | | 3,694,225 | |
| | | | | | | | | | |
| | |
| | | | | | France — 12.6% | |
| | | 11,557 | | | Arkema SA | | | 1,120,335 | |
| | | 111,262 | | | AXA SA | | | 2,627,788 | |
| | | 62,492 | | | BNP Paribas SA | | | 3,656,435 | |
| | | 16,277 | | | Capgemini SA | | | 1,394,159 | |
| | | 16,974 | | | Cie Generale des Etablissements Michelin | | | 1,911,175 | |
| | | 13,113 | | | Nexity SA * | | | 632,774 | |
| | | 62,421 | | | SCOR SE | | | 2,256,597 | |
| | | 36,235 | | | Societe Generale SA | | | 1,610,558 | |
| | | 65,620 | | | Technicolor SA (Registered) | | | 273,956 | |
| | | 24,422 | | | Teleperformance | | | 2,703,516 | |
| | | | | | | | | | |
| | | | | | Total France | | | 18,187,293 | |
| | | | | | | | | | |
| | |
| | | | | | Germany — 5.7% | |
| | | 17,926 | | | Allianz SE (Registered) | | | 3,122,123 | |
| | | 129,752 | | | Deutsche Telekom AG (Registered) | | | 2,240,471 | |
| | | 15,010 | | | Muenchener Rueckversicherungs-Gesellschaft AG in Muenchen (Registered) | | | 2,835,346 | |
| | | | | | | | | | |
| | | | | | Total Germany | | | 8,197,940 | |
| | | | | | | | | | |
| | |
| | | | | | Hong Kong — 5.7% | |
| | | 607,500 | | | BOC Hong Kong Holdings Ltd | | | 2,399,878 | |
| | | 438,000 | | | Cheung Kong Property Holding Ltd | | | 2,978,100 | |
| | | 146,488 | | | Power Assets Holdings Ltd | | | 1,314,159 | |
| | | 904,000 | | | Sino Land Co Ltd | | | 1,573,438 | |
| | | | | | | | | | |
| | | | | | Total Hong Kong | | | 8,265,575 | |
| | | | | | | | | | |
| | |
| | | | | | India — 0.6% | |
| | | 104,300 | | | ICICI Bank Ltd Sponsored ADR | | | 855,260 | |
| | | | | | | | | | |
| | |
| | | | | | Israel — 1.4% | |
| | | 321,102 | | | Bank Hapoalim BM | | | 1,979,302 | |
| | | | | | | | | | |
| | |
| | | | | | Italy — 1.2% | |
| | | 109,960 | | | Tenaris SA | | | 1,800,555 | |
| | | | | | | | | | |
| | |
| | | | | | Japan — 29.1% | |
| | | 432,915 | | | Aozora Bank Ltd | | | 1,623,723 | |
| | | 190,000 | | | Asahi Kasei Corp | | | 1,851,506 | |
| | | 99,400 | | | Astellas Pharma Inc | | | 1,338,951 | |
| | | 57,463 | | | Bridgestone Corp | | | 2,293,084 | |
| | | 77,783 | | | Brother Industries Ltd | | | 1,464,894 | |
| | | 107,000 | | | Fuji Heavy Industries Ltd | | | 4,003,656 | |
| | | 139,778 | | | Isuzu Motors Ltd | | | 1,868,066 | |
| | | 46,300 | | | Japan Airlines Co Ltd | | | 1,513,049 | |
| | | | | | | | | | |
| | |
Shares | | | Description | | Value ($) | |
| | | | | | Japan — continued | | | | |
| | | 97,380 | | | K’s Holdings Corp | | | 1,732,813 | |
| | | 242,600 | | | Mitsubishi Chemical Holdings Corp | | | 1,865,404 | |
| | | 110,700 | | | Mitsubishi Electric Corp | | | 1,622,961 | |
| | | 266,044 | | | Mitsubishi UFJ Financial Group Inc | | | 1,760,087 | |
| | | 29,600 | | | Mixi Inc | | | 1,284,739 | |
| | | 110,700 | | | NGK Spark Plug Co Ltd | | | 2,507,813 | |
| | | 102,200 | | | Nippon Steel & Sumitomo Metal Corp | | | 2,512,243 | |
| | | 73,249 | | | Nippon Telegraph & Telephone Corp | | | 3,098,383 | |
| | | 149,300 | | | NSK Ltd | | | 2,128,607 | |
| | | 59,400 | | | NTT DOCOMO Inc | | | 1,411,222 | |
| | | 88,500 | | | Seiko Epson Corp | | | 1,979,467 | |
| | | 167,100 | | | T&D Holdings Inc | | | 2,562,605 | |
| | | 33,138 | | | Tokio Marine Holdings Inc | | | 1,452,206 | |
| | | | | | | | | | |
| | | | | | Total Japan | | | 41,875,479 | |
| | | | | | | | | | |
| | |
| | | | | | Netherlands — 2.1% | |
| | | 214,801 | | | ING Groep NV | | | 2,959,226 | |
| | | | | | | | | | |
| | |
| | | | | | Russia — 1.9% | |
| | | 1,323,170 | | | Moscow Exchange MICEX-RTS PJSC | | | 2,796,903 | |
| | | | | | | | | | |
| | |
| | | | | | South Africa — 0.3% | |
| | | 18,909 | | | Anglo American Platinum Ltd * | | | 436,648 | |
| | | | | | | | | | |
| | |
| | | | | | South Korea — 2.7% | |
| | | 1,378 | | | Samsung Electronics Co Ltd | | | 2,341,819 | |
| | | 37,873 | | | SK Hynix Inc | | | 1,560,554 | |
| | | | | | | | | | |
| | | | | | Total South Korea | | | 3,902,373 | |
| | | | | | | | | | |
| | |
| | | | | | Spain — 1.0% | |
| | | 206,744 | | | Iberdrola SA | | | 1,372,734 | |
| | | | | | | | | | |
| | |
| | | | | | Sweden — 2.0% | |
| | | 35,941 | | | Investor AB – B Shares | | | 1,423,280 | |
| | | 59,003 | | | Swedbank AB – A Shares | | | 1,453,806 | |
| | | | | | | | | | |
| | | | | | Total Sweden | | | 2,877,086 | |
| | | | | | | | | | |
| | |
| | | | | | Switzerland — 3.4% | |
| | | 15,316 | | | Baloise Holding AG (Registered) | | | 1,993,348 | |
| | | 11,778 | | | Roche Holding AG | | | 2,866,818 | |
| | | | | | | | | | |
| | | | | | Total Switzerland | | | 4,860,166 | |
| | | | | | | | | | |
| | | |
| | | | | | Taiwan — 2.6% | | | | |
| | | 535,000 | | | Hon Hai Precision Industry Co Ltd | | | 1,556,831 | |
| | | 91,000 | | | MediaTek Inc | | | 663,152 | |
| | | 243,379 | | | Taiwan Semiconductor Manufacturing Co Ltd | | | 1,491,070 | |
| | | | | | | | | | |
| | | | | | Total Taiwan | | | 3,711,053 | |
| | | | | | | | | | |
| | |
| | | | | | United Kingdom — 22.4% | |
| | | 23,432 | | | AstraZeneca Plc | | | 1,350,387 | |
| | | 64,660 | | | BHP Billiton Plc | | | 1,042,186 | |
| | | | |
| | See accompanying notes to the financial statements. | | 5 |
GMO Foreign Fund
(A Series of GMO Trust)
Schedule of Investments — (Continued)
(showing percentage of total net assets)
February 28, 2017
| | | | | | | | | | |
Shares /
Par Value† | | | Description | | Value ($) | |
| | | | | | United Kingdom — continued | |
| | | 47,771 | | | British American Tobacco Plc | | | 3,017,433 | |
| | | 59,776 | | | Euromoney Institutional Investor Plc | | | 805,110 | |
| | | 164,670 | | | GlaxoSmithKline Plc | | | 3,369,629 | |
| | | 471,551 | | | HSBC Holdings Plc | | | 3,787,537 | |
| | | 108,564 | | | IMI Plc | | | 1,672,445 | |
| | | 76,557 | | | Imperial Brands Plc | | | 3,603,940 | |
| | | 167,864 | | | John Wood Group Plc | | | 1,575,486 | |
| | | 40,787 | | | Lonmin Plc * | | | 61,196 | |
| | | 1,143,232 | | | Melrose Industries Plc | | | 3,023,133 | |
| | | 23,415 | | | Rio Tinto Plc | | | 959,692 | |
| | | 55,886 | | | Schroders Plc (Non Voting) | | | 1,550,647 | |
| | | 43,649 | | | Shire Plc | | | 2,631,974 | |
| | | 276,485 | | | Tyman Plc | | | 948,325 | |
| | | 121,751 | | | WPP Plc | | | 2,864,364 | |
| | | | | | | | | | |
| | | | | | Total United Kingdom | | | 32,263,484 | |
| | | | | | | | | | |
| | | |
| | | | | | TOTAL COMMON STOCKS
(COST $131,439,796) | | | 140,035,302 | |
| | | | | | | | | | |
| | |
| | | | | | MUTUAL FUNDS — 0.0% | |
| | | |
| | | | | | United States — 0.0% | | | | |
| | | | | | Affiliated Issuers — 0.0% | | | | |
| | | 769 | | | GMO U.S. Treasury Fund | | | 19,226 | |
| | | | | | | | | | |
| | | |
| | | | | | TOTAL MUTUAL FUNDS
(COST $19,232) | | | 19,226 | |
| | | | | | | | | | |
| | |
| | | | | | SHORT-TERM INVESTMENTS — 2.5% | |
| | |
| | | | | | Time Deposits — 2.5% | |
| | | 720,591 | | | Australia and New Zealand Banking Group Ltd. (Melbourne) Time Deposit, 0.36%, due 03/01/17 | | | 720,591 | |
| | | 621,727 | | | BNP Paribas (Paris) Time Deposit, 0.36%, due 03/01/17 | | | 621,727 | |
HKD | | | 767,440 | | | BNP Paribas (Paris) Time Deposit, 0.01%, due 03/01/17 | | | 98,869 | |
| | | 720,591 | | | Citibank (New York) Time Deposit, 0.36%, due 03/01/17 | | | 720,591 | |
| | | | | | | | | | |
Par Value† | | | Description | | Value ($) | |
| | | | | | Time Deposits — continued | |
| | | 640,815 | | | DnB Nor Bank (Oslo) Time Deposit, 0.36%, due 03/01/17 | | | 640,815 | |
| | | 720,591 | | | Standard Chartered Bank (London) Time Deposit, 0.36%, due 03/01/17 | | | 720,591 | |
| | | | | | | | | | |
| | | | | | Total Time Deposits | | | 3,523,184 | |
| | | | | | | | | | |
| | | |
| | | | | | TOTAL SHORT-TERM INVESTMENTS (COST $3,523,184) | | | 3,523,184 | |
| | | | | | | | | | |
| | | |
| | | | | | TOTAL INVESTMENTS — 99.8%
(Cost $134,982,212) | | | 143,577,712 | |
| | | | | | Other Assets and Liabilities (net) — 0.2% | | | 343,591 | |
| | | | | | | | | | |
| | | |
| | | | | | TOTAL NET ASSETS — 100.0% | | | $143,921,303 | |
| | | | | | | | | | |
A summary of outstanding financial instruments at February 28, 2017 is as follows:
Forward Currency Contracts
| | | | | | | | | | | | | | | | | | | | | | |
Settlement
Date | | Counter- party | | Currency
Sold | | | Currency
Purchased | | | Net
Unrealized
Appreciation
(Depreciation) | |
| 03/13/2017 | | CITI | | | JPY | | | | 619,170,478 | | | | USD | | | | 5,453,517 | | | $ | (59,826 | ) |
| 03/13/2017 | | GS | | | USD | | | | 2,191,520 | | | | JPY | | | | 254,584,924 | | | | 75,407 | |
| | | | | | | | | | | | | | | | | | | | | | |
| | | | | | | | | | | | | | | | | | | | $ | 15,581 | |
| | | | | | | | | | | | | | | | | | | | | | |
As of February 28, 2017, for the above contracts and/or agreements, the Fund had sufficient cash and/or securities to cover commitments or collateral requirements, if any, of the relevant broker or exchange.
Notes to Schedule of Investments:
| * | Non-income producing security. |
| † | Denominated in U.S. Dollar, unless otherwise indicated. |
For a listing of definitions of acronyms, counterparty abbreviations and currency abbreviations used throughout the Schedule of Investments as well as the derivative tables, if any, please refer to page 20.
| | | | |
| 6 | | See accompanying notes to the financial statements. | | |
This page has been left blank intentionally.
GMO Foreign Small Companies Fund
(A Series of GMO Trust)
Portfolio Managers
Day-to-day management of the Fund’s portfolio is the responsibility of the International Active team at Grantham, Mayo, Van Otterloo & Co. LLC.
Management Discussion and Analysis of Fund Performance
Class III shares of GMO Foreign Small Companies Fund returned +14.25% (net) for the fiscal year ended February 28, 2017, as compared with +18.33% for the S&P Developed ex-U.S. Small Cap Index.
Stock selection detracted from relative performance. Holdings in the United Kingdom, Germany, and Canada detracted from relative returns. The largest negative impacts came from Howden Joinery Group, Essentra, and Travis Perkins in the United Kingdom, and Technicolor in France. Holdings that contributed positively to relative performance were Downer in Australia, Melrose in the United Kingdom, and Calsonic Kansei in Japan.
Because some of the securities and instruments held directly or indirectly by the Fund had positive fair value adjustments at the beginning or end of the fiscal year (and the performance of indices are not fair valued), the Fund’s absolute and relative performance is higher than it otherwise would have been in the absence of such fair value adjustments.
The views expressed herein are exclusively those of Grantham, Mayo, Van Otterloo & Co. LLC as of the date of this report and are subject to change. GMO disclaims any responsibility to update such views. They are not meant as investment advice. References to specific securities are not recommendations of such securities and may not be representative of any GMO portfolio’s current or future investments.
8
GMO Foreign Small Companies Fund
(A Series of GMO Trust)
Comparison of Change in Value of a $10,000,000 Investment in
GMO Foreign Small Companies Fund Class III Shares and the S&P Developed ex-U.S. Small Cap Index
As of February 28, 2017
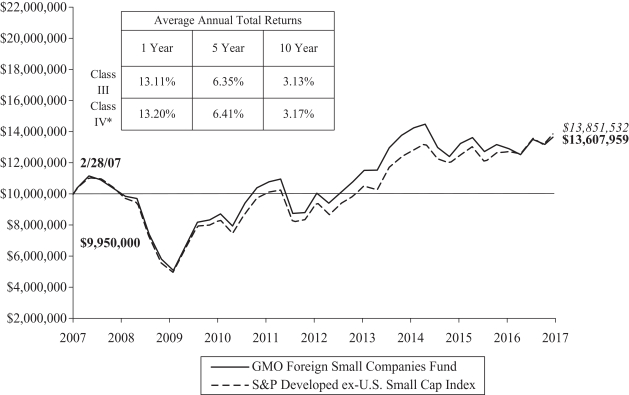
Performance data quoted represents past performance and is not indicative of future results. The investment return and principal value of an investment will fluctuate so that an investor’s shares, when redeemed, may be worth more or less than their original cost. Current performance data may be lower or higher than the performance data provided herein. To obtain performance information up to the most recent month-end, visit www.gmo.com. Performance shown is net of all fees after reimbursement from GMO. Each performance figure assumes a purchase at the beginning and redemption at the end of the stated period and reflects a transaction fee of .50% on the purchase and .50% on the redemption. Transaction fees are retained by the Fund to cover trading costs. Returns would have been lower had certain expenses not been reimbursed during the periods shown and do not include the effect of taxes on distributions and redemptions. All information is unaudited. Performance for classes may vary due to different fees.
| | * | For the period from March 16, 2009 to August 12, 2009, no Class IV shares were outstanding. Performance for that period is that of Class III shares, which have higher expenses. Therefore, the performance shown is lower than it would have been if Class IV expenses had been applied throughout. |
| | | For S&P disclaimers please visit http://www.gmo.com/America/_Disclaimers/_BenchmarkDisclaimers.htm. |
9
GMO Foreign Small Companies Fund
(A Series of GMO Trust)
Investment Concentration Summary
February 28, 2017 (Unaudited)
| | | | |
| Asset Class Summary& | | % of Total Net Assets | |
Common Stocks | | | 96.7 | % |
Short-Term Investments | | | 2.3 | |
Mutual Funds | | | 0.9 | |
Forward Currency Contracts | | | 0.0 | ^ |
Other | | | 0.1 | |
| | | | |
| | | 100.0 | % |
| | | | |
| | | | |
| Country Summary¤ | | % of Investments | |
Japan | | | 26.7 | % |
United Kingdom | | | 14.8 | |
France | | | 13.0 | |
Switzerland | | | 9.2 | |
Canada | | | 6.7 | |
Australia | | | 4.7 | |
Other Developed | | | 4.6 | ‡ |
Germany | | | 3.8 | |
Other Emerging | | | 3.5 | † |
Italy | | | 3.2 | |
Netherlands | | | 2.1 | |
Finland | | | 1.6 | |
Israel | | | 1.6 | |
Brazil | | | 1.6 | |
Taiwan | | | 1.5 | |
Russia | | | 1.4 | |
| | | | |
| | | 100.0 | % |
| | | | |
| | | | |
| Industry Group Summary | | % of Equity Investments# | |
Capital Goods | | | 14.7 | % |
Real Estate | | | 8.4 | |
Commercial & Professional Services | | | 8.1 | |
Materials | | | 7.8 | |
Diversified Financials | | | 7.6 | |
Banks | | | 6.9 | |
Software & Services | | | 6.6 | |
Automobiles & Components | | | 5.8 | |
Insurance | | | 5.3 | |
Retailing | | | 4.0 | |
Consumer Durables & Apparel | | | 3.6 | |
Health Care Equipment & Services | | | 3.4 | |
Utilities | | | 3.1 | |
Media | | | 2.6 | |
Energy | | | 2.0 | |
Consumer Services | | | 2.0 | |
Telecommunication Services | | | 1.6 | |
Semiconductors & Semiconductor Equipment | | | 1.6 | |
Transportation | | | 1.4 | |
Technology Hardware & Equipment | | | 1.3 | |
Food, Beverage & Tobacco | | | 1.2 | |
Pharmaceuticals, Biotechnology & Life Sciences | | | 1.0 | |
| | | | |
| | | 100.0 | % |
| | | | |
| & | In the table above, derivative financial instruments, if any, are based on market values or unrealized appreciation/depreciation rather than notional amounts. |
| ¤ | The table above shows country exposure in the Fund. The table excludes short-term investments. The table excludes exposure through forward currency contracts and includes exposure through other derivative financial instruments, if any. The table takes into account the market value of securities and options and the notional amounts of swap contracts and other derivative financial instruments, if any. |
| ‡ | “Other Developed” is comprised of developed countries that each represent between (1.0)% and 1.0% of Investments. |
| † | “Other Emerging” is comprised of emerging countries that each represent between (1.0)% and 1.0% of Investments. |
| # | Equity investments may consist of common stocks and other stock-related securities, such as preferred stocks, if any. This table excludes exposure to derivative contracts, short-term investments, mutual funds and investment funds, if any. For a summary of these exposures, if any, see the Schedule of Investments. |
10
GMO Foreign Small Companies Fund
(A Series of GMO Trust)
Schedule of Investments
(showing percentage of total net assets)
February 28, 2017
| | | | | | | | | | |
Shares | | | Description | | Value ($) | |
| | | | | | COMMON STOCKS — 96.7% | |
| | |
| | | | | | Argentina — 0.5% | |
| | | 281,729 | | | Grupo Supervielle SA Sponsored ADR * | | | 4,321,723 | |
| | | | | | | | | | |
| | |
| | | | | | Australia — 4.6% | |
| | | 185,012 | | | Ansell Ltd | | | 3,017,947 | |
| | | 2,433,495 | | | Downer EDI Ltd | | | 13,085,035 | |
| | | 2,062,201 | | | Incitec Pivot Ltd | | | 5,798,026 | |
| | | 8,826,145 | | | Spotless Group Holdings Ltd | | | 5,547,273 | |
| | | 1,067,806 | | | Tox Free Solutions Ltd | | | 1,817,879 | |
| | | 3,796,172 | | | Vicinity Centres (REIT) | | | 8,407,153 | |
| | | | | | | | | | |
| | | | | | Total Australia | | | 37,673,313 | |
| | | | | | | | | | |
| | |
| | | | | | Brazil — 1.6% | |
| | | 812,700 | | | FPC Par Corretora de Seguros SA | | | 4,099,425 | |
| | | 1,219,000 | | | Transmissora Alianca de Energia Eletrica SA | | | 8,616,732 | |
| | | | | | | | | | |
| | | | | | Total Brazil | | | 12,716,157 | |
| | | | | | | | | | |
| | |
| | | | | | Canada — 6.6% | |
| | | 626,500 | | | ATS Automation Tooling Systems Inc * | | | 6,367,829 | |
| | | 804,900 | | | Computer Modelling Group Ltd | | | 6,260,064 | |
| | | 1,239,450 | | | DHX Media Ltd (Variable Voting) | | | 5,365,786 | |
| | | 282,900 | | | Dorel Industries Inc – Class B | | | 7,452,696 | |
| | | 358,500 | | | Medical Facilities Corp | | | 4,904,340 | |
| | | 1,004,700 | | | Precision Drilling Corp * | | | 5,136,209 | |
| | | 73,500 | | | Stella-Jones Inc | | | 2,271,627 | |
| | | 886,600 | | | Superior Plus Corp | | | 8,223,846 | |
| | | 226,000 | | | Uni-Select Inc | | | 5,730,824 | |
| | | 1,060,600 | | | Western Energy Services Corp * | | | 2,124,075 | |
| | | | | | | | | | |
| | | | | | Total Canada | | | 53,837,296 | |
| | | | | | | | | | |
| | |
| | | | | | China — 0.4% | |
| | | 4,707,100 | | | Yuexiu Transport Infrastructure Ltd | | | 3,265,004 | |
| | | | | | | | | | |
| | |
| | | | | | Finland — 1.6% | |
| | | 230,628 | | | Tieto Oyj | | | 6,418,892 | |
| | | 330,830 | | | Tikkurila Oyj | | | 6,625,413 | |
| | | | | | | | | | |
| | | | | | Total Finland | | | 13,044,305 | |
| | | | | | | | | | |
| | |
| | | | | | France — 12.7% | |
| | | 94,198 | | | Alten SA | | | 6,514,974 | |
| | | 65,511 | | | Arkema SA | | | 6,350,635 | |
| | | 53,123 | | | BioMerieux | | | 8,169,271 | |
| | | 98,134 | | | Cie Generale des Etablissements Michelin | | | 11,049,326 | |
| | | 441,418 | | | Elior Group | | | 9,910,302 | |
| | | 99,936 | | | Euler Hermes Group | | | 8,813,097 | |
| | | 149,295 | | | Nexity SA * | | | 7,204,302 | |
| | | 208,265 | | | SCOR SE | | | 7,529,037 | |
| | | 62,628 | | | Sopra Steria Group | | | 7,912,625 | |
| | | 1,476,120 | | | Technicolor SA (Registered) | | | 6,162,631 | |
| | | | | | | | | | |
Shares | | | Description | | Value ($) | |
| | | | | | France — continued | |
| | | 141,856 | | | Teleperformance | | | 15,703,460 | |
| | | 131,365 | | | Vicat SA | | | 8,308,842 | |
| | | | | | | | | | |
| | | | | | Total France | | | 103,628,502 | |
| | | | | | | | | | |
| | |
| | | | | | Germany — 3.7% | |
| | | 99,998 | | | Gerresheimer AG | | | 7,836,199 | |
| | | 441,641 | | | Grand City Properties SA | | | 8,406,278 | |
| | | 89,405 | | | LEG Immobilien AG * | | | 7,362,759 | |
| | | 471,876 | | | TAG Immobilien AG | | | 6,442,972 | |
| | | | | | | | | | |
| | | | | | Total Germany | | | 30,048,208 | |
| | | | | | | | | | |
| | |
| | | | | | Hong Kong — 0.7% | |
| | | 4,394,910 | | | HKT Trust & HKT Ltd – Class SS | | | 5,862,615 | |
| | | | | | | | | | |
| | |
| | | | | | Ireland — 0.5% | |
| | | 55,421 | | | Kerry Group Plc – Class A | | | 4,255,244 | |
| | | | | | | | | | |
| | |
| | | | | | Israel — 1.6% | |
| | | 5,765,806 | | | Israel Discount Bank Ltd – Class A * | | | 12,761,786 | |
| | | | | | | | | | |
| | |
| | | | | | Italy — 3.1% | |
| | | 1,024,733 | | | Amplifon SPA | | | 10,967,085 | |
| | | 952,512 | | | Cerved Information Solutions SPA | | | 8,502,283 | |
| | | 755,216 | | | Enav SPA * | | | 2,693,669 | |
| | | 308,234 | | | ERG SPA | | | 3,587,204 | |
| | | | | | | | | | |
| | | | | | Total Italy | | | 25,750,241 | |
| | | | | | | | | | |
| | |
| | | | | | Japan — 26.0% | |
| | | 218,400 | | | Asahi Holdings Inc | | | 3,779,895 | |
| | | 324,100 | | | Chugoku Marine Paints Ltd | | | 2,441,545 | |
| | | 427,000 | | | COMSYS Holdings Corp | | | 7,572,849 | |
| | | 290,600 | | | Fuji Seal International Inc | | | 5,831,869 | |
| | | 299,600 | | | Fujitsu General Ltd | | | 5,864,852 | |
| | | 962,300 | | | Gunma Bank Ltd (The) | | | 5,583,557 | |
| | | 209,800 | | | HIS Co Ltd | | | 5,567,987 | |
| | | 318,500 | | | Hokuhoku Financial Group Inc | | | 5,585,780 | |
| | | 1,169,000 | | | Keiyo Bank Ltd (The) | | | 5,390,768 | |
| | | 1,252 | | | Kenedix Office Investment Corp (REIT) | | | 7,444,398 | |
| | | 538,900 | | | Kitz Corp | | | 3,675,096 | |
| | | 444,050 | | | Komori Corp | | | 5,913,396 | |
| | | 1,346,700 | | | Mitsubishi UFJ Lease & Finance Co Ltd | | | 7,445,595 | |
| | | 169,800 | | | Mixi Inc | | | 7,369,885 | |
| | | 123,000 | | | Musashino Bank Ltd (The) | | | 3,963,382 | |
| | | 758,000 | | | NHK Spring Co Ltd | | | 8,668,228 | |
| | | 352,200 | | | Nippon Seiki Co Ltd | | | 7,342,289 | |
| | | 99,100 | | | Nippon Shokubai Co Ltd | | | 6,560,170 | |
| | | 1,564,000 | | | Nippon Soda Co Ltd | | | 9,131,951 | |
| | | 424,300 | | | Nitto Kogyo Corp | | | 5,952,246 | |
| | | 3,909 | | | Nomura Real Estate Master Fund Inc (REIT) | | | 5,858,662 | |
| | | 1,361,800 | | | North Pacific Bank Ltd | | | 5,649,436 | |
| | | | |
| | See accompanying notes to the financial statements. | | 11 |
GMO Foreign Small Companies Fund
(A Series of GMO Trust)
Schedule of Investments — (Continued)
(showing percentage of total net assets)
February 28, 2017
| | | | | | | | | | |
Shares | | | Description | | Value ($) | |
| | | | | | Japan — continued | |
| | | 279,500 | | | OSG Corp | | | 5,866,344 | |
| | | 620,100 | | | San-In Godo Bank Ltd (The) | | | 5,555,193 | |
| | | 1,886,600 | | | Sanden Holdings Corp | | | 6,535,762 | |
| | | 843,200 | | | Sanwa Holdings Corp | | | 7,962,655 | |
| | | 392,500 | | | Sumitomo Rubber Industries Ltd | | | 6,473,942 | |
| | | 272,400 | | | Suruga Bank Ltd | | | 6,042,475 | |
| | | 474,000 | | | Tadano Ltd | | | 6,090,999 | |
| | | 999,700 | | | Takara Leben Co Ltd | | | 5,297,217 | |
| | | 218,700 | | | Tokyo Century Corp | | | 7,384,330 | |
| | | 228,500 | | | TS Tech Co Ltd | | | 5,976,055 | |
| | | 977,300 | | | Tsubakimoto Chain Co | | | 8,370,648 | |
| | | 270,700 | | | United Arrows Ltd | | | 8,531,845 | |
| | | | | | | | | | |
| | | | | | Total Japan | | | 212,681,301 | |
| | | | | | | | | | |
| | |
| | | | | | Mexico — 0.6% | |
| | | 2,764,929 | | | Grupo Herdez SAB de CV | | | 5,148,246 | |
| | | | | | | | | | |
| | |
| | | | | | Netherlands — 2.1% | |
| | | 306,909 | | | Aalberts Industries NV | | | 10,585,649 | |
| | | 132,527 | | | Flow Traders | | | 4,587,740 | |
| | | 438,404 | | | PostNL NV * | | | 1,914,564 | |
| | | | | | | | | | |
| | | | | | Total Netherlands | | | 17,087,953 | |
| | | | | | | | | | |
| | |
| | | | | | New Zealand — 0.5% | |
| | | 2,009,100 | | | Infratil Ltd | | | 4,172,760 | |
| | | | | | | | | | |
| | |
| | | | | | Russia — 1.3% | |
| | | 5,198,830 | | | Moscow Exchange MICEX-RTS PJSC | | | 10,989,232 | |
| | | | | | | | | | |
| | |
| | | | | | Singapore — 1.0% | |
| | | 9,245,024 | | | Keppel DC (REIT) | | | 7,782,003 | |
| | | | | | | | | | |
| | |
| | | | | | South Africa — 0.5% | |
| | | 915,864 | | | Northam Platinum Ltd * | | | 3,795,988 | |
| | | | | | | | | | |
| | |
| | | | | | South Korea — 0.5% | |
| | | 546,998 | | | Macquarie Korea Infrastructure Fund | | | 3,986,558 | |
| | | | | | | | | | |
| | |
| | | | | | Sweden — 0.9% | |
| | | 242,416 | | | Loomis AB – Class B | | | 7,516,571 | |
| | | | | | | | | | |
| | |
| | | | | | Switzerland — 8.9% | |
| | | 248,849 | | | Ascom Holding AG (Registered) | | | 4,324,177 | |
| | | 87,239 | | | Baloise Holding AG (Registered) | | | 11,353,988 | |
| | | 112,615 | | | Cembra Money Bank AG * | | | 9,134,175 | |
| | | 10,746 | | | dormakaba Holding AG * | | | 8,878,444 | |
| | | 99,786 | | | Dufry AG (Registered) * | | | 14,390,760 | |
| | | 17,420 | | | Flughafen Zuerich AG (Registered) | | | 3,517,125 | |
| | | 8,522 | | | Forbo Holdings AG (Registered) * | | | 11,621,705 | |
| | | 17,503 | | | Helvetia Holding AG (Registered) | | | 9,822,581 | |
| | | | | | | | | | |
| | | | | | Total Switzerland | | | 73,042,955 | |
| | | | | | | | | | |
| | | | | | | | | | |
Shares /
Par Value† | | | Description | | Value ($) | |
| | | | | | Taiwan — 1.5% | |
| | | 7,978,000 | | | Chipbond Technology Corp | | | 12,357,522 | |
| | | | | | | | | | |
| | |
| | | | | | Thailand — 0.9% | |
| | | 21,576,300 | | | Jasmine Broadband Internet Infrastructure Fund | | | 7,101,263 | |
| | | | | | | | | | |
| | |
| | | | | | United Kingdom — 14.4% | |
| | | 1,901,141 | | | Auto Trader Group Plc | | | 9,320,766 | |
| | | 398,396 | | | Bovis Homes Group Plc | | | 3,859,456 | |
| | | 645,955 | | | Euromoney Institutional Investor Plc | | | 8,700,230 | |
| | | 614,793 | | | IMI Plc | | | 9,470,980 | |
| | | 945,225 | | | John Wood Group Plc | | | 8,871,401 | |
| | | 1,585,148 | | | Jupiter Fund Management Plc | | | 8,247,532 | |
| | | 529,915 | | | Lonmin Plc * | | | 795,073 | |
| | | 7,584,664 | | | Melrose Industries Plc | | | 20,056,689 | |
| | | 313,725 | | | Micro Focus International Plc | | | 8,502,274 | |
| | | 199,598 | | | Savills Plc | | | 2,119,509 | |
| | | 2,205,677 | | | Spirent Communications Plc | | | 2,888,055 | |
| | | 1,580,094 | | | SThree Plc | | | 6,112,913 | |
| | | 2,838,091 | | | Topps Tiles Plc | | | 2,962,242 | |
| | | 2,731,156 | | | Tyman Plc | | | 9,367,684 | |
| | | 2,382,381 | | | Wilmington Plc | | | 7,945,758 | |
| | | 327,234 | | | WS Atkins Plc | | | 5,900,949 | |
| | | 605,158 | | | Xaar Plc | | | 2,758,351 | |
| | | | | | | | | | |
| | | | | | Total United Kingdom | | | 117,879,862 | |
| | | | | | | | | | |
| | | |
| | | | | | TOTAL COMMON STOCKS
(COST $723,458,770) | | | 790,706,608 | |
| | | | | | | | | | |
| | |
| | | | | | MUTUAL FUNDS — 0.9% | |
| | |
| | | | | | United States — 0.9% | |
| | | | | | Affiliated Issuers — 0.9% | | | | |
| | | 281,215 | | | GMO U.S. Treasury Fund | | | 7,030,375 | |
| | | | | | | | | | |
| | | |
| | | | | | TOTAL MUTUAL FUNDS
(COST $7,033,163) | | | 7,030,375 | |
| | | | | | | | | | |
| | |
| | | | | | SHORT-TERM INVESTMENTS — 2.3% | |
| | |
| | | | | | Time Deposits — 2.3% | |
| | | 4,092,266 | | | Australia and New Zealand Banking Group Ltd. (Melbourne) Time Deposit, 0.36%, due 03/01/17 | | | 4,092,266 | |
| | | 4,092,266 | | | BNP Paribas (Paris) Time Deposit, 0.36%, due 03/01/17 | | | 4,092,266 | |
SGD | | | 255,539 | | | HSBC Bank (Hong Kong) Time Deposit, 0.01%, due 03/01/17 | | | 182,345 | |
| | | 2,688,270 | | | National Australia Bank (Melbourne) Time Deposit, 0.36%, due 03/01/17 | | | 2,688,270 | |
| | | 4,092,266 | | | Standard Chartered Bank (London) Time Deposit, 0.36%, due 03/01/17 | | | 4,092,266 | |
| | | | |
| 12 | | See accompanying notes to the financial statements. | | |
GMO Foreign Small Companies Fund
(A Series of GMO Trust)
Schedule of Investments — (Continued)
(showing percentage of total net assets)
February 28, 2017
| | | | | | | | | | |
Par Value† | | | Description | | Value ($) | |
| | | | | | Time Deposits — continued | |
| | | 4,092,266 | | | Sumitomo (Tokyo) Time Deposit, 0.36%, due 03/01/17 | | | 4,092,266 | |
| | | | | | | | | | |
| | | | | | Total Time Deposits | | | 19,239,679 | |
| | | | | | | | | | |
| | | |
| | | | | | TOTAL SHORT-TERM INVESTMENTS
(COST $19,239,679) | | | 19,239,679 | |
| | | | | | | | | | |
| | | |
| | | | | | TOTAL INVESTMENTS — 99.9%
(Cost $749,731,612) | | | 816,976,662 | |
| | | | | | Other Assets and Liabilities (net) — 0.1% | | | 1,003,941 | |
| | | | | | | | | | |
| | | |
| | | | | | TOTAL NET ASSETS — 100.0% | | | $817,980,603 | |
| | | | | | | | | | |
A summary of outstanding financial instruments at February 28, 2017 is as follows:
Forward Currency Contracts
| | | | | | | | | | | | | | | | | | | | | | |
Settlement
Date | | Counter-
party | | Currency
Sold | | | Currency
Purchased | | | Net
Unrealized
Appreciation
(Depreciation) | |
| 03/13/2017 | | CITI | | | JPY | | | | 1,592,131,875 | | | | USD | | | | 14,023,146 | | | $ | (153,836 | ) |
| 03/13/2017 | | GS | | | JPY | | | | 558,048,207 | | | | USD | | | | 4,803,443 | | | | (165,642 | ) |
| 03/13/2017 | | MSCI | | | USD | | | | 2,235,488 | | | | JPY | | | | 253,012,258 | | | | 17,435 | |
| | | | | | | | | | | | | | | | | | | | | | |
| | | | | | | | | | | | | | | | | | | | $ | (302,043 | ) |
| | | | | | | | | | | | | | | | | | | | | | |
As of February 28, 2017, for the above contracts and/or agreements, the Fund had sufficient cash and/or securities to cover commitments or collateral requirements, if any, of the relevant broker or exchange.
Notes to Schedule of Investments:
| * | Non-income producing security. |
| † | Denominated in U.S. Dollar, unless otherwise indicated. |
For a listing of definitions of acronyms, counterparty abbreviations and currency abbreviations used throughout the Schedule of Investments as well as the derivative tables, if any, please refer to page 20.
| | | | |
| | See accompanying notes to the financial statements. | | 13 |
GMO International Small Companies Fund
(A Series of GMO Trust)
Portfolio Managers
Day-to-day management of the Fund’s portfolio was the responsibility of the Global Equity team and Asset Allocation team at Grantham, Mayo, Van Otterloo & Co. LLC until May 1, 2016, at which point the International Active team began managing the Fund.
Management Discussion and Analysis of Fund Performance
GMO International Small Companies Fund returned +14.35% (net) for the fiscal year ended February 28, 2017, as compared with +16.87% for the S&P Developed ex-U.S. Small Cap + Index.
Stock selection detracted from relative performance. Holdings in the United Kingdom, Germany, and Canada detracted from relative returns. The largest negative impacts came from Howden Joinery Group, Essentra, and Travis Perkins in the United Kingdom, and Technicolor in France. Alternatively, holdings that contributed positively to relative performance were Downer in Australia, Melrose in the United Kingdom, and Calsonic Kansei in Japan.
Because some of the securities and instruments held directly or indirectly by the Fund had positive fair value adjustments at the beginning or end of the fiscal year (and the performance of indices are not fair valued), the Fund’s absolute and relative performance is higher than it otherwise would have been in the absence of such fair value adjustments.
The views expressed herein are exclusively those of Grantham, Mayo, Van Otterloo & Co. LLC as of the date of this report and are subject to change. GMO disclaims any responsibility to update such views. They are not meant as investment advice. References to specific securities are not recommendations of such securities and may not be representative of any GMO portfolio’s current or future investments.
14
GMO International Small Companies Fund
(A Series of GMO Trust)
Comparison of Change in Value of a $10,000,000 Investment in
GMO International Small Companies Fund Class III Shares and the
S&P Developed ex-U.S. Small Cap + Index
As of February 28, 2017
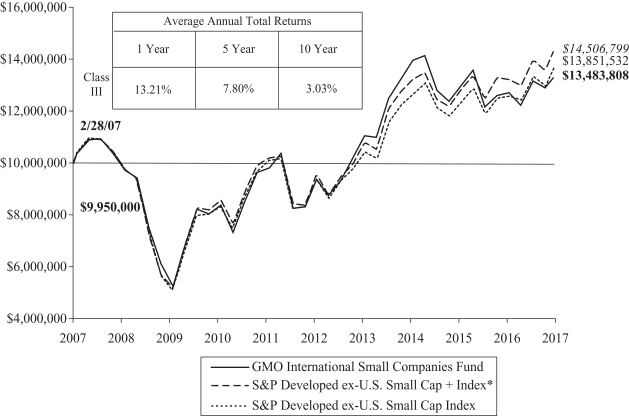
Performance data quoted represents past performance and is not indicative of future results. The investment return and principal value of an investment will fluctuate so that an investor’s shares, when redeemed, may be worth more or less than their original cost. Current performance data may be lower or higher than the performance data provided herein. To obtain performance information up to the most recent month-end, visit www.gmo.com. Performance shown is net of all fees after reimbursement from GMO. Each performance figure assumes a purchase at the beginning and redemption at the end of the stated period and reflects a transaction fee of .50% on the purchase and .50% on the redemption. Transaction fees are retained by the Fund to cover trading costs. Returns would have been lower had certain expenses not been reimbursed during the periods shown and do not include the effect of taxes on distributions and redemptions. All information is unaudited.
| | * | The S&P Developed ex-U.S. Small Cap + Index represents the S&P Developed ex-U.S. Small Cap Index prior to May 30, 2008, the MSCI EAFE Small Cap Index from May 31, 2008 to April 30, 2016, and the S&P Developed ex-U.S. Small Cap Index thereafter. |
| | | For S&P disclaimers please visit http://www.gmo.com/America/_Disclaimers/_BenchmarkDisclaimers.htm. |
15
GMO International Small Companies Fund
(A Series of GMO Trust)
Investment Concentration Summary
February 28, 2017 (Unaudited)
| | | | |
| Asset Class Summary& | | % of Total Net Assets | |
Common Stocks | | | 97.0 | % |
Short-Term Investments | | | 1.8 | |
Mutual Funds | | | 1.2 | |
Forward Currency Contracts | | | 0.0 | ^ |
Other | | | 0.0 | ^ |
| | | | |
| | | 100.0 | % |
| | | | |
| | | | |
| Country Summary¤ | | % of Investments | |
Japan | | | 26.5 | % |
United Kingdom | | | 14.8 | |
France | | | 13.0 | |
Switzerland | | | 9.1 | |
Canada | | | 6.7 | |
Australia | | | 4.7 | |
Germany | | | 3.8 | |
Other Developed | | | 3.7 | ‡ |
Other Emerging | | | 3.5 | † |
Italy | | | 3.2 | |
Netherlands | | | 2.1 | |
Finland | | | 1.6 | |
Brazil | | | 1.6 | |
Israel | | | 1.6 | |
Taiwan | | | 1.5 | |
Russia | | | 1.4 | |
United States | | | 1.2 | |
| | | | |
| | | 100.0 | % |
| | | | |
| & | In the table above, derivative financial instruments, if any, are based on market values or unrealized appreciation/depreciation rather than notional amounts. |
| ¤ | The table above shows country exposure in the Fund. The table excludes short-term investments. The table excludes exposure through forward currency contracts and includes exposure through other derivative financial instruments, if any. The table takes into account the market value of securities and options and the notional amounts of swap contracts and other derivative financial instruments, if any. |
| ‡ | “Other Developed” is comprised of developed countries that each represent between (1.0)% and 1.0% of Investments. |
| † | “Other Emerging” is comprised of emerging countries that each represent between (1.0)% and 1.0% of Investments. |
| | | | |
| Industry Group Summary | | % of Equity Investments# | |
Capital Goods | | | 14.7 | % |
Real Estate | | | 8.4 | |
Commercial & Professional Services | | | 8.1 | |
Materials | | | 7.8 | |
Diversified Financials | | | 7.6 | |
Banks | | | 6.9 | |
Software & Services | | | 6.6 | |
Automobiles & Components | | | 5.8 | |
Insurance | | | 5.3 | |
Retailing | | | 4.0 | |
Consumer Durables & Apparel | | | 3.6 | |
Health Care Equipment & Services | | | 3.4 | |
Utilities | | | 3.1 | |
Media | | | 2.6 | |
Energy | | | 2.0 | |
Consumer Services | | | 2.0 | |
Telecommunication Services | | | 1.6 | |
Semiconductors & Semiconductor Equipment | | | 1.6 | |
Transportation | | | 1.4 | |
Technology Hardware & Equipment | | | 1.3 | |
Food, Beverage & Tobacco | | | 1.2 | |
Pharmaceuticals, Biotechnology & Life Sciences | | | 1.0 | |
| | | | |
| | | 100.0 | % |
| | | | |
| # | Equity investments may consist of common stocks and other stock-related securities, such as preferred stocks, if any. This table excludes exposure to derivative contracts, short-term investments, mutual funds and investment funds, if any. For a summary of these exposures, if any, see the Schedule of Investments. |
16
GMO International Small Companies Fund
(A Series of GMO Trust)
Schedule of Investments
(showing percentage of total net assets)
February 28, 2017
| | | | | | | | | | |
| | | Shares | | | Description | | Value ($) | |
| | | | | | COMMON STOCKS — 97.0% | |
| | |
| | | | | | Argentina — 0.5% | |
| | | 43,969 | | | Grupo Supervielle SA Sponsored ADR * | | | 674,484 | |
| | | | | | | | | | |
| | |
| | | | | | Australia — 4.6% | |
| | | 28,889 | | | Ansell Ltd | | | 471,242 | |
| | | 379,840 | | | Downer EDI Ltd | | | 2,042,420 | |
| | | 322,267 | | | Incitec Pivot Ltd | | | 906,077 | |
| | | 1,377,665 | | | Spotless Group Holdings Ltd | | | 865,869 | |
| | | 168,060 | | | Tox Free Solutions Ltd | | | 286,113 | |
| | | 592,545 | | | Vicinity Centres (REIT) | | | 1,312,274 | |
| | | | | | | | | | |
| | | | | | Total Australia | | | 5,883,995 | |
| | | | | | | | | | |
| | |
| | | | | | Austria — 0.0% | |
| | | 1,761,602 | | | Immofinanz AG (Entitlement Shares) * (a) | | | — | |
| | | | | | | | | | |
| | |
| | | | | | Brazil — 1.6% | |
| | | 127,700 | | | FPC Par Corretora de Seguros SA | | | 644,145 | |
| | | 190,400 | | | Transmissora Alianca de Energia Eletrica SA | | | 1,345,878 | |
| | | | | | | | | | |
| | | | | | Total Brazil | | | 1,990,023 | |
| | | | | | | | | | |
| | |
| | | | | | Canada — 6.6% | |
| | | 97,700 | | | ATS Automation Tooling Systems Inc * | | | 993,036 | |
| | | 125,577 | | | Computer Modelling Group Ltd | | | 976,668 | |
| | | 193,400 | | | DHX Media Ltd (Variable Voting) | | | 837,261 | |
| | | 44,100 | | | Dorel Industries Inc – Class B | | | 1,161,767 | |
| | | 55,900 | | | Medical Facilities Corp | | | 764,721 | |
| | | 156,700 | | | Precision Drilling Corp * | | | 801,079 | |
| | | 11,500 | | | Stella-Jones Inc | | | 355,425 | |
| | | 138,300 | | | Superior Plus Corp | | | 1,282,831 | |
| | | 35,100 | | | Uni-Select Inc | | | 890,053 | |
| | | 165,500 | | | Western Energy Services Corp * | | | 331,448 | |
| | | | | | | | | | |
| | | | | | Total Canada | | | 8,394,289 | |
| | | | | | | | | | |
| | |
| | | | | | China — 0.4% | |
| | | 586,000 | | | China Shanshui Cement Group Ltd * (a) | | | — | |
| | | 736,000 | | | Yuexiu Transport Infrastructure Ltd | | | 510,515 | |
| | | | | | | | | | |
| | | | | | Total China | | | 510,515 | |
| | | | | | | | | | |
| | |
| | | | | | Finland — 1.6% | |
| | | 35,972 | | | Tieto Oyj | | | 1,001,181 | |
| | | 51,596 | | | Tikkurila Oyj | | | 1,033,295 | |
| | | | | | | | | | |
| | | | | | Total Finland | | | 2,034,476 | |
| | | | | | | | | | |
| | |
| | | | | | France — 12.7% | |
| | | 14,688 | | | Alten SA | | | 1,015,860 | |
| | | 10,218 | | | Arkema SA | | | 990,533 | |
| | | 8,510 | | | BioMerieux | | | 1,308,670 | |
| | | 15,305 | | | Cie Generale des Etablissements Michelin | | | 1,723,255 | |
| | | 68,853 | | | Elior Group | | | 1,545,823 | |
| | | 15,588 | | | Euler Hermes Group | | | 1,374,665 | |
| | | | | | | | | | |
| | | Shares | | | Description | | Value ($) | |
| | | | | | France — continued | |
| | | 23,292 | | | Nexity SA * | | | 1,123,967 | |
| | | 32,489 | | | SCOR SE | | | 1,174,517 | |
| | | 9,770 | | | Sopra Steria Group | | | 1,234,374 | |
| | | 230,236 | | | Technicolor SA (Registered) | | | 961,209 | |
| | | 22,075 | | | Teleperformance | | | 2,443,702 | |
| | | 20,477 | | | Vicat SA | | | 1,295,171 | |
| | | | | | | | | | |
| | | | | | Total France | | | 16,191,746 | |
| | | | | | | | | | |
| | |
| | | | | | Germany — 3.7% | |
| | | 15,598 | | | Gerresheimer AG | | | 1,222,315 | |
| | | 68,900 | | | Grand City Properties SA | | | 1,311,455 | |
| | | 13,946 | | | LEG Immobilien AG * | | | 1,148,493 | |
| | | 73,620 | | | TAG Immobilien AG | | | 1,005,204 | |
| | | | | | | | | | |
| | | | | | Total Germany | | | 4,687,467 | |
| | | | | | | | | | |
| | |
| | | | | | Hong Kong — 0.7% | |
| | | 687,000 | | | HKT Trust & HKT Ltd – Class SS | | | 916,428 | |
| | | | | | | | | | |
| | |
| | | | | | Indonesia — 0.0% | |
| | | 22,410,700 | | | Bakrie & Brothers Tbk PT * | | | 58,816 | |
| | | | | | | | | | |
| | |
| | | | | | Ireland — 0.5% | |
| | | 8,647 | | | Kerry Group Plc – Class A | | | 663,920 | |
| | | | | | | | | | |
| | |
| | | | | | Israel — 1.6% | |
| | | 896,369 | | | Israel Discount Bank Ltd – Class A * | | | 1,983,984 | |
| | | | | | | | | | |
| | |
| | | | | | Italy — 3.2% | |
| | | 159,836 | | | Amplifon SPA | | | 1,710,626 | |
| | | 148,574 | | | Cerved Information Solutions SPA | | | 1,326,196 | |
| | | 117,795 | | | Enav SPA * | | | 420,146 | |
| | | 48,082 | | | ERG SPA | | | 559,575 | |
| | | | | | | | | | |
| | | | | | Total Italy | | | 4,016,543 | |
| | | | | | | | | | |
| | |
| | | | | | Japan — 26.0% | |
| | | 34,000 | | | Asahi Holdings Inc | | | 588,445 | |
| | | 50,500 | | | Chugoku Marine Paints Ltd | | | 380,432 | |
| | | 66,100 | | | COMSYS Holdings Corp | | | 1,172,284 | |
| | | 44,900 | | | Fuji Seal International Inc | | | 901,070 | |
| | | 46,000 | | | Fujitsu General Ltd | | | 900,478 | |
| | | 150,200 | | | Gunma Bank Ltd (The) | | | 871,506 | |
| | | 32,800 | | | HIS Co Ltd | | | 870,496 | |
| | | 47,600 | | | Hokuhoku Financial Group Inc | | | 834,798 | |
| | | 182,000 | | | Keiyo Bank Ltd (The) | | | 839,281 | |
| | | 201 | | | Kenedix Office Investment Corp (REIT) | | | 1,195,147 | |
| | | 77,800 | | | Kitz Corp | | | 530,567 | |
| | | 69,400 | | | Komori Corp | | | 924,197 | |
| | | 210,700 | | | Mitsubishi UFJ Lease & Finance Co Ltd | | | 1,164,912 | |
| | | 26,500 | | | Mixi Inc | | | 1,150,188 | |
| | | 18,900 | | | Musashino Bank Ltd (The) | | | 609,008 | |
| | | 118,600 | | | NHK Spring Co Ltd | | | 1,356,269 | |
| | | | |
| | See accompanying notes to the financial statements. | | 17 |
GMO International Small Companies Fund
(A Series of GMO Trust)
Schedule of Investments — (Continued)
(showing percentage of total net assets)
February 28, 2017
| | | | | | | | | | |
| | | Shares | | | Description | | Value ($) | |
| | | | | | Japan — continued | |
| | | 55,000 | | | Nippon Seiki Co Ltd | | | 1,146,581 | |
| | | 15,500 | | | Nippon Shokubai Co Ltd | | | 1,026,061 | |
| | | 244,000 | | | Nippon Soda Co Ltd | | | 1,424,678 | |
| | | 66,300 | | | Nitto Kogyo Corp | | | 930,082 | |
| | | 607 | | | Nomura Real Estate Master Fund Inc (REIT) | | | 909,749 | |
| | | 203,500 | | | North Pacific Bank Ltd | | | 844,221 | |
| | | 43,700 | | | OSG Corp | | | 917,206 | |
| | | 97,100 | | | San-In Godo Bank Ltd (The) | | | 869,875 | |
| | | 295,000 | | | Sanden Holdings Corp | | | 1,021,971 | |
| | | 131,900 | | | Sanwa Holdings Corp | | | 1,245,581 | |
| | | 60,600 | | | Sumitomo Rubber Industries Ltd | | | 999,544 | |
| | | 42,600 | | | Suruga Bank Ltd | | | 944,969 | |
| | | 74,200 | | | Tadano Ltd | | | 953,485 | |
| | | 156,400 | | | Takara Leben Co Ltd | | | 828,733 | |
| | | 34,200 | | | Tokyo Century Corp | | | 1,154,751 | |
| | | 35,700 | | | TS Tech Co Ltd | | | 933,677 | |
| | | 152,000 | | | Tsubakimoto Chain Co | | | 1,301,891 | |
| | | 42,200 | | | United Arrows Ltd | | | 1,330,047 | |
| | | | | | | | | | |
| | | | | | Total Japan | | | 33,072,180 | |
| | | | | | | | | | |
| | |
| | | | | | Mexico — 0.6% | |
| | | 438,306 | | | Grupo Herdez SAB de CV | | | 816,118 | |
| | | | | | | | | | |
| | | |
| | | | | | Netherlands — 2.1% | | | | |
| | | 47,870 | | | Aalberts Industries NV | | | 1,651,092 | |
| | | 20,672 | | | Flow Traders | | | 715,611 | |
| | | 68,301 | | | PostNL NV * | | | 298,279 | |
| | | | | | | | | | |
| | | | | | Total Netherlands | | | 2,664,982 | |
| | | | | | | | | | |
| | |
| | | | | | New Zealand — 0.5% | |
| | | 312,650 | | | Infratil Ltd | | | 649,352 | |
| | | | | | | | | | |
| | |
| | | | | | Russia — 1.3% | |
| | | 813,880 | | | Moscow Exchange MICEX-RTS PJSC | | | 1,720,371 | |
| | | | | | | | | | |
| | |
| | | | | | Singapore — 1.0% | |
| | | 1,446,634 | | | Keppel DC (REIT) | | | 1,217,705 | |
| | | | | | | | | | |
| | |
| | | | | | South Africa — 0.5% | |
| | | 143,203 | | | Northam Platinum Ltd * | | | 593,534 | |
| | | | | | | | | | |
| | |
| | | | | | South Korea — 0.5% | |
| | | 85,612 | | | Macquarie Korea Infrastructure Fund | | | 623,946 | |
| | | | | | | | | | |
| | |
| | | | | | Sweden — 0.9% | |
| | | 37,877 | | | Loomis AB – Class B | | | 1,174,449 | |
| | | | | | | | | | |
| | |
| | | | | | Switzerland — 9.0% | |
| | | 38,916 | | | Ascom Holding AG (Registered) | | | 676,232 | |
| | | 13,637 | | | Baloise Holding AG (Registered) | | | 1,774,830 | |
| | | 17,605 | | | Cembra Money Bank AG | | | 1,427,937 | |
| | | | | | | | | | |
| | | Shares | | | Description | | Value ($) | |
| | | | | | Switzerland — continued | |
| | | 1,674 | | | dormakaba Holding AG * | | | 1,383,074 | |
| | | 15,600 | | | Dufry AG (Registered) * | | | 2,249,773 | |
| | | 2,720 | | | Flughafen Zuerich AG (Registered) | | | 549,172 | |
| | | 1,331 | | | Forbo Holdings AG (Registered) * | | | 1,815,125 | |
| | | 2,736 | | | Helvetia Holding AG (Registered) | | | 1,535,427 | |
| | | | | | | | | | |
| | | | | | Total Switzerland | | | 11,411,570 | |
| | | | | | | | | | |
| | |
| | | | | | Taiwan — 1.5% | |
| | | 1,249,000 | | | Chipbond Technology Corp | | | 1,934,638 | |
| | | 430,000 | | | ProMOS Technologies Inc * (a) (b) | | | — | |
| | | | | | | | | | |
| | | | | | Total Taiwan | | | 1,934,638 | |
| | | | | | | | | | |
| | |
| | | | | | Thailand — 0.9% | |
| | | 3,374,200 | | | Jasmine Broadband Internet Infrastructure Fund | | | 1,110,528 | |
| | | | | | | | | | |
| | | |
| | | | | | United Kingdom — 14.5% | | | | |
| | | 298,465 | | | Auto Trader Group Plc | | | 1,463,291 | |
| | | 62,327 | | | Bovis Homes Group Plc | | | 603,792 | |
| | | 102,392 | | | Euromoney Institutional Investor Plc | | | 1,379,096 | |
| | | 96,140 | | | IMI Plc | | | 1,481,051 | |
| | | 148,271 | | | John Wood Group Plc | | | 1,391,596 | |
| | | 248,689 | | | Jupiter Fund Management Plc | | | 1,293,930 | |
| | | 83,184 | | | Lonmin Plc * | | | 124,807 | |
| | | 1,190,721 | | | Melrose Industries Plc | | | 3,148,712 | |
| | | 49,245 | | | Micro Focus International Plc | | | 1,334,591 | |
| | | 30,889 | | | Savills Plc | | | 328,007 | |
| | | 346,262 | | | Spirent Communications Plc | | | 453,386 | |
| | | 248,064 | | | SThree Plc | | | 959,686 | |
| | | 445,556 | | | Topps Tiles Plc | | | 465,047 | |
| | | 428,768 | | | Tyman Plc | | | 1,470,646 | |
| | | 374,010 | | | Wilmington Plc | | | 1,247,405 | |
| | | 51,338 | | | WS Atkins Plc | | | 925,768 | |
| | | 95,007 | | | Xaar Plc | | | 433,048 | |
| | | | | | | | | | |
| | | | | | Total United Kingdom | | | 18,503,859 | |
| | | | | | | | | | |
| | | |
| | | | | | TOTAL COMMON STOCKS (COST $117,803,167) | | | 123,499,918 | |
| | | | | | | | | | |
| | |
| | | | | | MUTUAL FUNDS — 1.2% | |
| | | |
| | | | | | United States — 1.2% | | | | |
| | | | | | Affiliated Issuers — 1.2% | | | | |
| | | 62,003 | | | GMO U.S. Treasury Fund | | | 1,550,077 | |
| | | | | | | | | | |
| | | |
| | | | | | TOTAL MUTUAL FUNDS (COST $1,550,697) | | | 1,550,077 | |
| | | | | | | | | | |
| | | | |
| 18 | | See accompanying notes to the financial statements. | | |
GMO International Small Companies Fund
(A Series of GMO Trust)
Schedule of Investments — (Continued)
(showing percentage of total net assets)
February 28, 2017
| | | | | | | | | | |
| Par Value† | | | Description | | Value ($) | |
| | | | | | SHORT-TERM INVESTMENTS — 1.8% | |
| | |
| | | | | | Time Deposits — 1.8% | |
| | | 366,795 | | | Australia and New Zealand Banking Group Ltd. (Melbourne) Time Deposit, 0.36%, due 03/01/17 | | | 366,795 | |
| | | 637,313 | | | BNP Paribas (Paris) Time Deposit, 0.36%, due 03/01/17 | | | 637,313 | |
CAD | | | 11,508 | | | Brown Brothers Harriman (Grand Cayman) Time Deposit, 0.05%, due 03/01/17 | | | 8,664 | |
SGD | | | 38,235 | | | HSBC Bank (Hong Kong) Time Deposit, 0.01%, due 03/01/17 | | | 27,286 | |
| | | 637,313 | | | Standard Chartered Bank (London) Time Deposit, 0.36%, due 03/01/17 | | | 637,313 | |
| | | 637,313 | | | Sumitomo (Tokyo) Time Deposit, 0.36%, due 03/01/17 | | | 637,313 | |
| | | | | | | | | | |
| | | | | | Total Time Deposits | | | 2,314,684 | |
| | | | | | | | | | |
| | | |
| | | | | | TOTAL SHORT-TERM INVESTMENTS (COST $2,314,684) | | | 2,314,684 | |
| | | | | | | | | | |
| | | |
| | | | | | TOTAL INVESTMENTS — 100.0% (Cost $121,668,548) | | | 127,364,679 | |
| | | | | | Other Assets and Liabilities (net) — 0.0% | | | 35,976 | |
| | | | | | | | | | |
| | | |
| | | | | | TOTAL NET ASSETS — 100.0% | | | $127,400,655 | |
| | | | | | | | | | |
A summary of outstanding financial instruments at February 28, 2017 is as follows:
Forward Currency Contracts
| | | | | | | | | | | | | | | | | | | | | | |
Settlement
Date | | Counter-
party | | Currency
Sold | | | Currency
Purchased | | | Net
Unrealized
Appreciation
(Depreciation) | |
| 03/13/2017 | | CITI | | | JPY | | | | 212,573,620 | | | | USD | | | | 1,872,301 | | | $ | (20,539 | ) |
| 03/13/2017 | | GS | | | JPY | | | | 66,213,044 | | | | USD | | | | 569,934 | | | | (19,654 | ) |
| | | | | | | | | | | | | | | | | | | | | | |
| | | | | | | | | | | | | | | | | | | | $ | (40,193 | ) |
| | | | | | | | | | | | | | | | | | | | | | |
As of February 28, 2017, for the above contracts and/or agreements, the Fund had sufficient cash and/or securities to cover commitments or collateral requirements, if any, of the relevant broker or exchange.
Notes to Schedule of Investments:
| * | Non-income producing security. |
| † | Denominated in U.S. Dollar, unless otherwise indicated. |
| (a) | Investment valued at fair value using methods determined in good faith by the Trustees of GMO Trust or persons acting at their direction pursuant to procedures approved by the Trustees (Note 2). |
For a listing of definitions of acronyms, counterparty abbreviations and currency abbreviations used throughout the Schedule of Investments as well as the derivative tables, if any, please refer to page 20.
| | | | |
| | See accompanying notes to the financial statements. | | 19 |
GMO Trust Funds
Schedule of Investments — (Continued)
February 28, 2017
Portfolio Abbreviations:
ADR - American Depositary Receipt
PJSC - Private Joint-Stock Company
REIT - Real Estate Investment Trust
Counterparty Abbreviations:
CITI - Citibank N.A.
GS - Goldman Sachs International
MSCI - Morgan Stanley & Co. International PLC
Currency Abbreviations:
CAD - Canadian Dollar
HKD - Hong Kong Dollar
JPY - Japanese Yen
SGD - Singapore Dollar
USD - United States Dollar
| | | | |
| 20 | | See accompanying notes to the financial statements. | | |
GMO Trust Funds
Statements of Assets and Liabilities — February 28, 2017
| | | | | | | | | | | | |
| | | Foreign
Fund | | | Foreign Small
Companies
Fund | | | International
Small Companies
Fund | |
Assets: | | | | | | | | | | | | |
Investments in affiliated issuers, at value (Notes 2 and 10)(a) | | $ | 19,226 | | | $ | 7,030,375 | | | $ | 1,550,077 | |
Investments in unaffiliated issuers, at value (Note 2)(b) | | | 143,558,486 | | | | 809,946,287 | | | | 125,814,602 | |
Foreign currency, at value (Note 2)(c) | | | — | | | | 203,601 | | | | 26,546 | |
Receivable for investments sold | | | — | | | | 2,513,936 | | | | 351,488 | |
Dividends receivable | | | 394,129 | | | | 936,707 | | | | 136,005 | |
Dividend withholding tax receivable | | | 150,703 | | | | 537,432 | | | | 115,241 | |
Foreign capital gains tax refund receivable | | | 10,698 | | | | 3,263 | | | | 10,550 | |
Unrealized appreciation on open forward currency contracts (Note 4) | | | 75,407 | | | | 17,435 | | | | — | |
Receivable for foreign currency sold | | | — | | | | 301 | | | | — | |
Receivable for expenses reimbursed and/or waived by GMO (Note 5) | | | 35,924 | | | | 43,000 | | | | 20,888 | |
Miscellaneous receivable | | | 9 | | | | 3,397 | | | | 749 | |
| | | | | | | | | | | | |
Total assets | | | 144,244,582 | | | | 821,235,734 | | | | 128,026,146 | |
| | | | | | | | | | | | |
Liabilities: | | | | | | | | | | | | |
Foreign currency due to custodian(c) | | | 11 | | | | — | | | | — | |
Payable for investments purchased | | | 9 | | | | 2,037,760 | | | | 329,478 | |
Accrued foreign capital gains tax payable (Note 2) | | | — | | | | 199,807 | | | | 27,490 | |
Payable to affiliate for (Note 5): | | | | | | | | | | | | |
Management fee | | | 67,868 | | | | 447,918 | | | | 58,666 | |
Shareholder service fee | | | 20,423 | | | | 72,100 | | | | 14,666 | |
Payable for foreign currency purchased | | | — | | | | — | | | | 55 | |
Unrealized depreciation on open forward currency contracts (Note 4) | | | 59,826 | | | | 319,478 | | | | 40,193 | |
Payable to agents unaffiliated with GMO | | | — | | | | 140 | | | | 28 | |
Payable to Trustees and related expenses | | | 302 | | | | 1,977 | | | | 253 | |
Accrued expenses | | | 174,840 | | | | 175,951 | | | | 154,662 | |
| | | | | | | | | | | | |
Total liabilities | | | 323,279 | | | | 3,255,131 | | | | 625,491 | |
| | | | | | | | | | | | |
Net assets | | $ | 143,921,303 | | | $ | 817,980,603 | | | $ | 127,400,655 | |
| | | | | | | | | | | | |
(a) Cost of investments – affiliated issuers: | | $ | 19,232 | | | $ | 7,033,163 | | | $ | 1,550,697 | |
(b) Cost of investments – unaffiliated issuers: | | $ | 134,962,980 | | | $ | 742,698,449 | | | $ | 120,117,851 | |
(c) Cost of foreign currency: | | $ | (4 | ) | | $ | 204,033 | | | $ | 26,610 | |
| | | | |
| | See accompanying notes to the financial statements. | | 21 |
GMO Trust Funds
Statements of Assets and Liabilities — February 28, 2017 — (Continued)
| | | | | | | | | | | | |
| | | Foreign
Fund | | | Foreign Small
Companies
Fund | | | International
Small Companies
Fund | |
Net assets consist of: | | | | | | | | | | | | |
Paid-in capital | | $ | 167,385,333 | | | $ | 767,887,004 | | | $ | 141,620,005 | |
Accumulated undistributed net investment income | | | 480,737 | | | | — | | | | — | |
Distributions in excess of net investment income | | | — | | | | (7,947,837 | ) | | | (796,362 | ) |
Accumulated net realized gain (loss) | | | (32,496,952 | ) | | | (8,632,830 | ) | | | (19,012,891 | ) |
Net unrealized appreciation (depreciation) | | | 8,552,185 | | | | 66,674,266 | | | | 5,589,903 | |
| | | | | | | | | | | | |
| | $ | 143,921,303 | | | $ | 817,980,603 | | | $ | 127,400,655 | |
| | | | | | | | | | | | |
Net assets attributable to: | | | | | | | | | | | | |
Class II | | $ | 64,148,787 | | | $ | — | | | $ | — | |
| | | | | | | | | | | | |
Class III | | $ | 76,325,345 | | | $ | 246,851,750 | | | $ | 127,400,655 | |
| | | | | | | | | | | | |
Class IV | | $ | 3,447,171 | | | $ | 571,128,853 | | | $ | — | |
| | | | | | | | | | | | |
Shares outstanding: | | | | | | | | | | | | |
Class II | | | 5,453,762 | | | | — | | | | — | |
| | | | | | | | | | | | |
Class III | | | 6,443,189 | | | | 17,132,260 | | | | 5,917,258 | |
| | | | | | | | | | | | |
Class IV | | | 282,772 | | | | 39,725,471 | | | | — | |
| | | | | | | | | | | | |
Net asset value per share: | | | | | | | | | | | | |
Class II | | $ | 11.76 | | | $ | — | | | $ | — | |
| | | | | | | | | | | | |
Class III | | $ | 11.85 | | | $ | 14.41 | | | $ | 21.53 | |
| | | | | | | | | | | | |
Class IV | | $ | 12.19 | | | $ | 14.38 | | | $ | — | |
| | | | | | | | | | | | |
| | | | |
| 22 | | See accompanying notes to the financial statements. | | |
GMO Trust Funds
Statements of Operations — Year Ended February 28, 2017
| | | | | | | | | | | | |
| | | Foreign
Fund | | | Foreign Small
Companies
Fund | | | International
Small Companies
Fund | |
Investment Income: | | | | | | | | | | | | |
Dividends from unaffiliated issuers (Net of withholding tax)(a) | | $ | 4,675,323 | | | $ | 24,545,183 | | | $ | 5,566,267 | |
Dividends from affiliated issuers (Note 10) | | | 11,980 | | | | 114,815 | | | | 13,964 | |
Interest | | | 4,255 | | | | 22,041 | | | | 4,858 | |
| | | | | | | | | | | | |
Total investment income | | | 4,691,558 | | | | 24,682,039 | | | | 5,585,089 | |
| | | | | | | | | | | | |
Expenses: | | | | | | | | | | | | |
Management fee (Note 5) | | | 901,284 | | | | 6,532,926 | | | | 1,151,646 | |
Shareholder service fee – Class II (Note 5) | | | 150,098 | | | | — | | | | — | |
Shareholder service fee – Class III (Note 5) | | | 117,742 | | | | 477,579 | | | | 287,912 | |
Shareholder service fee – Class IV (Note 5) | | | 3,144 | | | | 614,889 | | | | — | |
Audit and tax fees | | | 118,092 | | | | 118,314 | | | | 132,541 | |
Custodian and fund accounting agent fees | | | 151,133 | | | | 475,577 | | | | 237,824 | |
Legal fees | | | 7,691 | | | | 28,629 | | | | 15,722 | |
Registration fees | | | 24,012 | | | | 3,588 | | | | 3,868 | |
Transfer agent fees | | | 58,399 | | | | 44,667 | | | | 29,752 | |
Trustees’ fees and related expenses (Note 5) | | | 2,476 | | | | 16,162 | | | | 3,187 | |
Miscellaneous | | | 10,500 | | | | 21,708 | | | | 32,078 | |
| | | | | | | | | | | | |
Total expenses | | | 1,544,571 | | | | 8,334,039 | | | | 1,894,530 | |
Fees and expenses reimbursed and/or waived by GMO (Note 5) | | | (344,906 | ) | | | (648,400 | ) | | | (403,143 | ) |
| | | | | | | | | | | | |
Net expenses | | | 1,199,665 | | | | 7,685,639 | | | | 1,491,387 | |
| | | | | | | | | | | | |
Net investment income (loss) | | | 3,491,893 | | | | 16,996,400 | | | | 4,093,702 | |
| | | | | | | | | | | | |
Realized and unrealized gain (loss): | | | | | | | | | | | | |
Net realized gain (loss) on: | | | | | | | | | | | | |
Investments in unaffiliated issuers (net of foreign capital gains tax) (Note 2)(b) | | | (5,793,764 | ) | | | 18,300,494 | | | | (11,284,015 | ) |
Investments in affiliated issuers | | | 2,591 | | | | 14,871 | | | | 60 | |
Realized gain distributions from affiliated issuers (Note 10) | | | 665 | | | | 12,350 | | | | 945 | |
Foreign currency, forward contracts and foreign currency related transactions (Note 2) | | | 176,084 | | | | 374,340 | | | | (184,868 | ) |
| | | | | | | | | | | | |
Net realized gain (loss) | | | (5,614,424 | ) | | | 18,702,055 | | | | (11,467,878 | ) |
| | | | | | | | | | | | |
Change in net unrealized appreciation (depreciation) on: | | | | | | | | | | | | |
Investments in unaffiliated issuers (net of foreign capital gains tax) (Note 2)(c) | | | 23,990,935 | | | | 88,374,307 | | | | 36,079,988 | |
Investments in affiliated issuers | | | (395 | ) | | | (7,301 | ) | | | (1,151 | ) |
Foreign currency, forward contracts and foreign currency related transactions | | | 16,286 | | | | (314,775 | ) | | | (55,508 | ) |
| | | | | | | | | | | | |
Net change in unrealized appreciation (depreciation) | | | 24,006,826 | | | | 88,052,231 | | | | 36,023,329 | |
| | | | | | | | | | | | |
Net realized and unrealized gain (loss) | | | 18,392,402 | | | | 106,754,286 | | | | 24,555,451 | |
| | | | | | | | | | | | |
Net increase (decrease) in net assets resulting from operations | | $ | 21,884,295 | | | $ | 123,750,686 | | | $ | 28,649,153 | |
| | | | | | | | | | | | |
(a) Withholding tax: | | $ | 458,269 | | | $ | 2,099,076 | | | $ | 465,482 | |
(b) Foreign capital gains tax on net realized gain (loss): | | $ | — | | | $ | 374,760 | | | $ | 10,367 | |
(c) Foreign capital gains tax on change in net unrealized appreciation (depreciation): | | $ | — | | | $ | 199,808 | | | $ | 27,492 | |
| | | | |
| | See accompanying notes to the financial statements. | | 23 |
GMO Trust Funds
Statements of Changes in Net Assets
| | | | | | | | | | | | | | | | |
| | | Foreign Fund | | | Foreign Small Companies Fund | |
| | | Year Ended
February 28/29, | | | Year Ended
February 28/29, | |
| | | 2017 | | | 2016 | | | 2017 | | | 2016 | |
Increase (decrease) in net assets: | | | | | | | | | | | | | | | | |
Operations: | | | | | | | | | | | | | | | | |
Net investment income (loss) | | $ | 3,491,893 | | | $ | 6,165,918 | | | $ | 16,996,400 | | | $ | 18,765,230 | |
Net realized gain (loss) | | | (5,614,424 | ) | | | (763,887 | ) | | | 18,702,055 | | | | 19,398,085 | |
Change in net unrealized appreciation (depreciation) | | | 24,006,826 | | | | (23,646,550 | ) | | | 88,052,231 | | | | (151,990,302 | ) |
| | | | | | | | | | | | | | | | |
| | | | |
Net increase (decrease) in net assets from operations | | | 21,884,295 | | | | (18,244,519 | ) | | | 123,750,686 | | | | (113,826,987 | ) |
| | | | | | | | | | | | | | | | |
Distributions to shareholders from: | | | | | | | | | | | | | | | | |
Net investment income | | | | | | | | | | | | | | | | |
Class II | | | (1,783,633 | ) | | | (3,078,855 | ) | | | — | | | | — | |
Class III | | | (2,090,462 | ) | | | (3,291,815 | ) | | | (8,085,286 | ) | | | (5,563,761 | ) |
Class IV | | | (96,361 | ) | | | (786,711 | ) | | | (15,561,235 | ) | | | (13,945,012 | ) |
| | | | | | | | | | | | | | | | |
Total distributions from net investment income | | | (3,970,456 | ) | | | (7,157,381 | ) | | | (23,646,521 | ) | | | (19,508,773 | ) |
| | | | | | | | | | | | | | | | |
Net realized gains | | | | | | | | | | | | | | | | |
Class II | | | — | | | | — | | | | — | | | | — | |
Class III | | | — | | | | — | | | | — | | | | (9,686,581 | ) |
Class IV | | | — | | | | — | | | | — | | | | (23,728,618 | ) |
| | | | | | | | | | | | | | | | |
Total distributions from net realized gains | | | — | | | | — | | | | — | | | | (33,415,199 | ) |
| | | | | | | | | | | | | | | | |
Net share transactions (Note 9): | | | | | | | | | | | | | | | | |
Class II | | | (15,015,496 | ) | | | (25,438,691 | ) | | | — | | | | — | |
Class III | | | (14,573,751 | ) | | | (59,807,577 | ) | | | (103,344,633 | ) | | | 11,586,510 | |
Class IV | | | 322,645 | | | | (19,372,725 | ) | | | (102,922,984 | ) | | | (36,885,233 | ) |
| | | | | | | | | | | | | | | | |
Increase (decrease) in net assets resulting from net share transactions | | | (29,266,602 | ) | | | (104,618,993 | ) | | | (206,267,617 | ) | | | (25,298,723 | ) |
| | | | | | | | | | | | | | | | |
Purchase premiums and redemption fees (Notes 2 and 9): | | | | | | | | | | | | | | | | |
Class III | | | — | | | | — | | | | 332,346 | | | | 115,825 | |
Class IV | | | — | | | | — | | | | 843,880 | | | | 273,609 | |
| | | | | | | | | | | | | | | | |
Increase in net assets resulting from purchase premiums and redemption fees | | | — | | | | — | | | | 1,176,226 | | | | 389,434 | |
| | | | | | | | | | | | | | | | |
Total increase (decrease) in net assets resulting from net share transactions, purchase premiums and redemption fees | | | (29,266,602 | ) | | | (104,618,993 | ) | | | (205,091,391 | ) | | | (24,909,289 | ) |
| | | | | | | | | | | | | | | | |
Total increase (decrease) in net assets | | | (11,352,763 | ) | | | (130,020,893 | ) | | | (104,987,226 | ) | | | (191,660,248 | ) |
| | | | |
| Net assets: | | | | | | | | | | | | | | | | |
Beginning of period | | | 155,274,066 | | | | 285,294,959 | | | | 922,967,829 | | | | 1,114,628,077 | |
| | | | | | | | | | | | | | | | |
End of period | | $ | 143,921,303 | | | $ | 155,274,066 | | | $ | 817,980,603 | | | $ | 922,967,829 | |
| | | | | | | | | | | | | | | | |
Accumulated undistributed net investment income | | $ | 480,737 | | | $ | 248,112 | | | $ | — | | | $ | — | |
| | | | | | | | | | | | | | | | |
Distributions in excess of net investment income | | $ | — | | | $ | — | | | $ | (7,947,837 | ) | | $ | (7,125,253 | ) |
| | | | | | | | | | | | | | | | |
| | | | |
| 24 | | See accompanying notes to the financial statements. | | |
GMO Trust Funds
Statements of Changes in Net Assets — (Continued)
| | | | | | | | |
| | | International Small Companies
Fund | |
| | | Year Ended
February 28/29, | |
| | | 2017 | | | 2016 | |
Increase (decrease) in net assets: | | | | | | | | |
Operations: | | | | | | | | |
Net investment income (loss) | | $ | 4,093,702 | | | $ | 5,596,802 | |
Net realized gain (loss) | | | (11,467,878 | ) | | | (1,482,496 | ) |
Change in net unrealized appreciation (depreciation) | | | 36,023,329 | | | | (37,006,716 | ) |
| | | | | | | | |
| | |
Net increase (decrease) in net assets from operations | | | 28,649,153 | | | | (32,892,410 | ) |
| | | | | | | | |
Distributions to shareholders from: | | | | | | | | |
Net investment income | | | | | | | | |
Class III | | | (5,876,532 | ) | | | (6,197,734 | ) |
| | | | | | | | |
Total distributions from net investment income | | | (5,876,532 | ) | | | (6,197,734 | ) |
| | | | | | | | |
Net share transactions (Note 9): | | | | | | | | |
Class III | | | (141,975,040 | ) | | | 1,195,773 | |
| | | | | | | | �� |
Increase (decrease) in net assets resulting from net share transactions | | | (141,975,040 | ) | | | 1,195,773 | |
| | | | | | | | |
Purchase premiums and redemption fees (Notes 2 and 9): | | | | | | | | |
Class III | | | 869,026 | | | | 182,910 | |
| | | | | | | | |
Increase in net assets resulting from purchase premiums and redemption fees | | | 869,026 | | | | 182,910 | |
| | | | | | | | |
Total increase (decrease) in net assets resulting from net share transactions, purchase premiums and redemption fees | | | (141,106,014 | ) | | | 1,378,683 | |
| | | | | | | | |
Total increase (decrease) in net assets | | | (118,333,393 | ) | | | (37,711,461 | ) |
| | |
| Net assets: | | | | | | | | |
Beginning of period | | | 245,734,048 | | | | 283,445,509 | |
| | | | | | | | |
End of period | | $ | 127,400,655 | | | $ | 245,734,048 | |
| | | | | | | | |
Distributions in excess of net investment income | | $ | (796,362 | ) | | $ | (457,014 | ) |
| | | | | | | | |
| | | | |
| | See accompanying notes to the financial statements. | | 25 |
GMO Trust Funds
Financial Highlights
(For a share outstanding throughout each period)
FOREIGN FUND
| | | | | | | | | | | | | | | | | | | | | | | | | | | | | | | | | | | | | | | | | | | | | | | | | | |
| | | Class II Shares | | Class III Shares |
| | | Year Ended February 28/29, | | Year Ended February 28/29, |
| | | 2017 | | 2016 | | 2015 | | 2014 | | 2013 | | 2017 | | 2016 | | 2015 | | 2014 | | 2013 |
Net asset value, beginning of period | | | $ | 10.45 | | | | $ | 12.12 | | | | $ | 13.58 | | | | $ | 11.57 | | | | $ | 11.21 | | | | $ | 10.52 | | | | $ | 12.20 | | | | $ | 13.66 | | | | $ | 11.64 | | | | $ | 11.27 | |
| | | | | | | | | | | | | | | | | | | | | | | | | | | | | | | | | | | | | | | | | | | | | | | | | | |
Income (loss) from investment operations: | | | | | | | | | | | | | | | | | | | | | | | | | | | | | | | | | | | | | | | | | | | | | | | | | | |
Net investment income (loss)(a)† | | | | 0.25 | | | | | 0.30 | | | | | 0.26 | | | | | 0.30 | | | | | 0.29 | | | | | 0.27 | | | | | 0.32 | | | | | 0.26 | | | | | 0.32 | | | | | 0.30 | |
Net realized and unrealized gain (loss) | | | | 1.37 | | | | | (1.51 | ) | | | | (0.93 | ) | | | | 2.04 | | | | | 0.43 | | | | | 1.37 | | | | | (1.53 | ) | | | | (0.92 | ) | | | | 2.04 | | | | | 0.44 | |
| | | | | | | | | | | | | | | | | | | | | | | | | | | | | | | | | | | | | | | | | | | | | | | | | | |
Total from investment operations | | | | 1.62 | | | | | (1.21 | ) | | | | (0.67 | ) | | | | 2.34 | | | | | 0.72 | | | | | 1.64 | | | | | (1.21 | ) | | | | (0.66 | ) | | | | 2.36 | | | | | 0.74 | |
| | | | | | | | | | | | | | | | | | | | | | | | | | | | | | | | | | | | | | | | | | | | | | | | | | |
Less distributions to shareholders: | | | | | | | | | | | | | | | | | | | | | | | | | | | | | | | | | | | | | | | | | | | | | | | | | | |
From net investment income | | | | (0.31 | ) | | | | (0.46 | ) | | | | (0.39 | ) | | | | (0.33 | ) | | | | (0.36 | ) | | | | (0.31 | ) | | | | (0.47 | ) | | | | (0.40 | ) | | | | (0.34 | ) | | | | (0.37 | ) |
From net realized gains | | | | — | | | | | — | | | | | (0.40 | ) | | | | — | | | | | — | | | | | — | | | | | — | | | | | (0.40 | ) | | | | — | | | | | — | |
| | | | | | | | | | | | | | | | | | | | | | | | | | | | | | | | | | | | | | | | | | | | | | | | | | |
Total distributions | | | | (0.31 | ) | | | | (0.46 | ) | | | | (0.79 | ) | | | | (0.33 | ) | | | | (0.36 | ) | | | | (0.31 | ) | | | | (0.47 | ) | | | | (0.80 | ) | | | | (0.34 | ) | | | | (0.37 | ) |
| | | | | | | | | | | | | | | | | | | | | | | | | | | | | | | | | | | | | | | | | | | | | | | | | | |
Net asset value, end of period | | | $ | 11.76 | | | | $ | 10.45 | | | | $ | 12.12 | | | | $ | 13.58 | | | | $ | 11.57 | | | | $ | 11.85 | | | | $ | 10.52 | | | | $ | 12.20 | | | | $ | 13.66 | | | | $ | 11.64 | |
| | | | | | | | | | | | | | | | | | | | | | | | | | | | | | | | | | | | | | | | | | | | | | | | | | |
Total Return(b) | | | | 15.62 | % | | | | (10.30 | )% | | | | (4.75 | )% | | | | 20.39 | % | | | | 6.65 | % | | | | 15.81 | % | | | | (10.29 | )% | | | | (4.64 | )% | | | | 20.42 | % | | | | 6.75 | % |
Ratios/Supplemental Data: | | | | | | | | | | | | | | | | | | | | | | | | | | | | | | | | | | | | | | | | | | | | | | | | | | |
Net assets, end of period (000’s) | | | $ | 64,149 | | | | $ | 70,865 | | | | $ | 108,343 | | | | $ | 165,028 | | | | $ | 217,052 | | | | $ | 76,325 | | | | $ | 81,645 | | | | $ | 152,047 | | | | $ | 197,489 | | | | $ | 222,262 | |
Net expenses to average daily net assets(c) | | | | 0.84 | % | | | | 0.83 | % | | | | 0.83 | % | | | | 0.83 | %(d) | | | | 0.84 | %(d) | | | | 0.77 | % | | | | 0.76 | % | | | | 0.76 | % | | | | 0.76 | %(d) | | | | 0.77 | %(d) |
Net investment income (loss) to average daily net assets(a) | | | | 2.25 | % | | | | 2.54 | % | | | | 2.04 | % | | | | 2.37 | % | | | | 2.65 | % | | | | 2.39 | % | | | | 2.61 | % | | | | 2.02 | % | | | | 2.53 | % | | | | 2.78 | % |
Portfolio turnover rate | | | | 77 | %(e) | | | | 113 | % | | | | 113 | % | | | | 98 | % | | | | 91 | % | | | | 77 | %(e) | | | | 113 | % | | | | 113 | % | | | | 98 | % | | | | 91 | % |
Fees and expenses reimbursed and/or waived by GMO to average daily net assets: | | | | 0.23 | % | | | | 0.18 | % | | | | 0.13 | % | | | | 0.11 | % | | | | 0.07 | % | | | | 0.23 | % | | | | 0.17 | % | | | | 0.13 | % | | | | 0.12 | % | | | | 0.07 | % |
| | | | | | | | | | | | | | | | | | | | | | | | | |
| | | Class IV Shares |
| | | Year Ended February 28/29, |
| | | 2017 | | 2016 | | 2015 | | 2014 | | 2013 |
Net asset value, beginning of period | | | $ | 10.81 | | | | $ | 12.53 | | | | $ | 14.00 | | | | $ | 11.92 | | | | $ | 11.55 | |
| | | | | | | | | | | | | | | | | | | | | | | | | |
Income (loss) from investment operations: | | | | | | | | | | | | | | | | | | | | | | | | | |
Net investment income (loss)(a)† | | | | 0.27 | | | | | 0.40 | | | | | 0.40 | | | | | 0.35 | | | | | 0.33 | |
Net realized and unrealized gain (loss) | | | | 1.43 | | | | | (1.64 | ) | | | | (1.07 | ) | | | | 2.08 | | | | | 0.42 | |
| | | | | | | | | | | | | | | | | | | | | | | | | |
Total from investment operations | | | | 1.70 | | | | | (1.24 | ) | | | | (0.67 | ) | | | | 2.43 | | | | | 0.75 | |
| | | | | | | | | | | | | | | | | | | | | | | | | |
Less distributions to shareholders: | | | | | | | | | | | | | | | | | | | | | | | | | |
From net investment income | | | | (0.32 | ) | | | | (0.48 | ) | | | | (0.40 | ) | | | | (0.35 | ) | | | | (0.38 | ) |
From net realized gains | | | | — | | | | | — | | | | | (0.40 | ) | | | | — | | | | | — | |
| | | | | | | | | | | | | | | | | | | | | | | | | |
Total distributions | | | | (0.32 | ) | | | | (0.48 | ) | | | | (0.80 | ) | | | | (0.35 | ) | | | | (0.38 | ) |
| | | | | | | | | | | | | | | | | | | | | | | | | |
Net asset value, end of period | | | $ | 12.19 | | | | $ | 10.81 | | | | $ | 12.53 | | | | $ | 14.00 | | | | $ | 11.92 | |
| | | | | | | | | | | | | | | | | | | | | | | | | |
Total Return(b) | | | | 15.84 | % | | | | (10.24 | )% | | | | (4.59 | )% | | | | 20.54 | % | | | | 6.68 | % |
Ratios/Supplemental Data: | | | | | | | | | | | | | | | | | | | | | | | | | |
Net assets, end of period (000’s) | | | $ | 3,447 | | | | $ | 2,763 | | | | $ | 24,905 | | | | $ | 67,628 | | | | $ | 88,992 | |
Net expenses to average daily net assets(c) | | | | 0.71 | % | | | | 0.70 | % | | | | 0.70 | % | | | | 0.70 | %(d) | | | | 0.70 | %(d) |
Net investment income (loss) to average daily net assets(a) | | | | 2.35 | % | | | | 3.25 | % | | | | 2.96 | % | | | | 2.71 | % | | | | 3.02 | % |
Portfolio turnover rate | | | | 77 | %(e) | | | | 113 | % | | | | 113 | % | | | | 98 | % | | | | 91 | % |
Fees and expenses reimbursed and/ or waived by GMO to average daily net assets: | | | | 0.23 | % | | | | 0.18 | % | | | | 0.13 | % | | | | 0.11 | % | | | | 0.07 | % |
| (a) | Net investment income is affected by the timing of the declaration of dividends by the underlying funds in which the Fund invests, if any. |
| (b) | The total returns would have been lower had certain expenses not been reimbursed and/or waived during the periods shown, if applicable, and assumes the effect of reinvested distributions, if any. Calculation excludes purchase premiums and redemption fees which are borne by the shareholder purchasing or redeeming Fund shares, if any. |
| (c) | Net expenses exclude expenses incurred indirectly through investment in the underlying funds (Note 5). |
| (d) | The net expense ratio does not include the effect of expense reductions (Note 2). |
| (e) | The portfolio turnover rate excludes investments in GMO U.S. Treasury Fund (“USTF”) which is used as a short-term investment vehicle for cash management. The Fund’s portfolio turnover rate during the year ended February 28, 2017, including transactions in USTF, was 81% of the average value of its portfolio. |
| † | Calculated using average shares outstanding throughout the period. |
| | | | |
| 26 | | See accompanying notes to the financial statements. | | |
GMO Trust Funds
Financial Highlights
(For a share outstanding throughout each period)
FOREIGN SMALL COMPANIES FUND
| | | | | | | | | | | | | | | | | | | | | | | | | | | | | | | | | | | | | | | | | | | | | | | | | | |
| | | Class III Shares | | Class IV Shares |
| | | Year Ended February 28/29, | | Year Ended February 28/29, |
| | | 2017 | | 2016 | | 2015 | | 2014 | | 2013 | | 2017 | | 2016 | | 2015 | | 2014 | | 2013 |
Net asset value, beginning of period | | | $ | 12.94 | | | | $ | 15.31 | | | | $ | 17.29 | | | | $ | 14.40 | | | | $ | 12.91 | | | | $ | 12.91 | | | | $ | 15.28 | | | | $ | 17.25 | | | | $ | 14.37 | | | | $ | 12.90 | |
| | | | | | | | | | | | | | | | | | | | | | | | | | | | | | | | | | | | | | | | | | | | | | | | | | |
Income (loss) from investment operations: | | | | | | | | | | | | | | | | | | | | | | | | | | | | | | | | | | | | | | | | | | | | | | | | | | |
Net investment income (loss)(a)† | | | | 0.26 | | | | | 0.26 | | | | | 0.20 | | | | | 0.27 | | | | | 0.23 | | | | | 0.25 | | | | | 0.27 | | | | | 0.21 | | | | | 0.25 | | | | | 0.12 | |
Net realized and unrealized gain (loss) | | | | 1.56 | | | | | (1.86 | ) | | | | (1.34 | ) | | | | 3.62 | | | | | 1.43 | | | | | 1.58 | | | | | (1.86 | ) | | | | (1.34 | ) | | | | 3.64 | | | | | 1.54 | |
| | | | | | | | | | | | | | | | | | | | | | | | | | | | | | | | | | | | | | | | | | | | | | | | | | |
Total from investment operations | | | | 1.82 | | | | | (1.60 | ) | | | | (1.14 | ) | | | | 3.89 | | | | | 1.66 | | | | | 1.83 | | | | | (1.59 | ) | | | | (1.13 | ) | | | | 3.89 | | | | | 1.66 | |
| | | | | | | | | | | | | | | | | | | | | | | | | | | | | | | | | | | | | | | | | | | | | | | | | | |
Less distributions to shareholders: | | | | | | | | | | | | | | | | | | | | | | | | | | | | | | | | | | | | | | | | | | | | | | | | | | |
From net investment income | | | | (0.35 | ) | | | | (0.28 | ) | | | | (0.23 | ) | | | | (0.48 | ) | | | | (0.17 | ) | | | | (0.36 | ) | | | | (0.29 | ) | | | | (0.23 | ) | | | | (0.49 | ) | | | | (0.19 | ) |
From net realized gains | | | | — | | | | | (0.49 | ) | | | | (0.61 | ) | | | | (0.52 | ) | | | | — | | | | | — | | | | | (0.49 | ) | | | | (0.61 | ) | | | | (0.52 | ) | | | | — | |
| | | | | | | | | | | | | | | | | | | | | | | | | | | | | | | | | | | | | | | | | | | | | | | | | | |
Total distributions | | | | (0.35 | ) | | | | (0.77 | ) | | | | (0.84 | ) | | | | (1.00 | ) | | | | (0.17 | ) | | | | (0.36 | ) | | | | (0.78 | ) | | | | (0.84 | ) | | | | (1.01 | ) | | | | (0.19 | ) |
| | | | | | | | | | | | | | | | | | | | | | | | | | | | | | | | | | | | | | | | | | | | | | | | | | |
Net asset value, end of period | | | $ | 14.41 | | | | $ | 12.94 | | | | $ | 15.31 | | | | $ | 17.29 | | | | $ | 14.40 | | | | $ | 14.38 | | | | $ | 12.91 | | | | $ | 15.28 | | | | $ | 17.25 | | | | $ | 14.37 | |
| | | | | | | | | | | | | | | | | | | | | | | | | | | | | | | | | | | | | | | | | | | | | | | | | | |
Total Return(b) | | | | 14.25 | % | | | | (10.82 | )% | | | | (6.34 | )% | | | | 27.54 | % | | | | 12.93 | % | | | | 14.34 | % | | | | (10.80 | )% | | | | (6.25 | )% | | | | 27.61 | % | | | | 12.96 | % |
Ratios/Supplemental Data: | | | | | | | | | | | | | | | | | | | | | | | | | | | | | | | | | | | | | | | | | | | | | | | | | | |
Net assets, end of period (000’s) | | | $ | 246,852 | | | | $ | 316,303 | | | | $ | 353,778 | | | | $ | 236,393 | | | | $ | 314,389 | | | | $ | 571,129 | | | | $ | 606,665 | | | | $ | 760,850 | | | | $ | 851,384 | | | | $ | 471,628 | |
Net expenses to average daily net assets(c) | | | | 0.86 | % | | | | 0.86 | % | | | | 0.85 | % | | | | 0.86 | %(d) | | | | 0.85 | %(d) | | | | 0.81 | % | | | | 0.81 | % | | | | 0.80 | % | | | | 0.81 | %(d) | | | | 0.80 | %(d) |
Net investment income (loss) to average daily net assets(a) | | | | 1.84 | % | | | | 1.73 | % | | | | 1.26 | % | | | | 1.73 | % | | | | 1.83 | % | | | | 1.81 | % | | | | 1.79 | % | | | | 1.32 | % | | | | 1.56 | % | | | | 0.90 | % |
Portfolio turnover rate | | | | 49 | %(e) | | | | 60 | % | | | | 58 | % | | | | 57 | % | | | | 56 | % | | | | 49 | %(e) | | | | 60 | % | | | | 58 | % | | | | 57 | % | | | | 56 | % |
Fees and expenses reimbursed and/or waived by GMO to average daily net assets: | | | | 0.07 | % | | | | 0.07 | % | | | | 0.07 | % | | | | 0.07 | % | | | | 0.09 | % | | | | 0.07 | % | | | | 0.07 | % | | | | 0.07 | % | | | | 0.07 | % | | | | 0.10 | % |
Purchase premiums and redemption fees consisted of the following per share amounts (Note 2):† | | | $ | 0.02 | | | | $ | 0.01 | | | | $ | 0.01 | | | | $ | 0.00 | (f) | | | $ | 0.02 | | | | $ | 0.02 | | | | $ | 0.01 | | | | $ | 0.01 | | | | $ | 0.00 | (f) | | | $ | 0.01 | |
| (a) | Net investment income is affected by the timing of the declaration of dividends by the underlying funds in which the Fund invests, if any. |
| (b) | The total returns would have been lower had certain expenses not been reimbursed and/or waived during the periods shown, if applicable, and assumes the effect of reinvested distributions, if any. Calculation excludes purchase premiums and redemption fees which are borne by the shareholder purchasing or redeeming Fund shares, if any. |
| (c) | Net expenses exclude expenses incurred indirectly through investment in the underlying funds (Note 5). |
| (d) | The net expense ratio does not include the effect of expense reductions (Note 2). |
| (e) | The portfolio turnover rate excludes investments in GMO U.S. Treasury Fund (“USTF”) which is used as a short-term investment vehicle for cash management. The Fund’s portfolio turnover rate during the year ended February 28, 2017, including transactions in USTF, was 51% of the average value of its portfolio. |
| (f) | Purchase premiums and redemption fees were less than $0.01 per share. |
| † | Calculated using average shares outstanding throughout the period. |
| | | | |
| | See accompanying notes to the financial statements. | | 27 |
GMO Trust Funds
Financial Highlights
(For a share outstanding throughout each period)
INTERNATIONAL SMALL COMPANIES FUND
| | | | | | | | | | | | | | | | | | | | | | | | | |
| | | Class III Shares |
| | | Year Ended February 28/29, |
| | | 2017(a) | | 2016(a) | | 2015(a) | | 2014(a) | | 2013(a) |
Net asset value, beginning of period | | | $ | 19.77 | | | | $ | 22.95 | | | | $ | 30.69 | | | | $ | 25.02 | | | | $ | 22.32 | |
| | | | | | | | | | | | | | | | | | | | | | | | | |
Income (loss) from investment operations: | | | | | | | | | | | | | | | | | | | | | | | | | |
Net investment income (loss)(b)† | | | | 0.45 | | | | | 0.45 | | | | | 0.57 | | | | | 0.45 | | | | | 0.54 | |
Net realized and unrealized gain (loss) | | | | 2.33 | | | | | (3.12 | ) | | | | (2.19 | ) | | | | 7.11 | | | | | 3.06 | |
| | | | | | | | | | | | | | | | | | | | | | | | | |
Total from investment operations | | | | 2.78 | | | | | (2.67 | ) | | | | (1.62 | ) | | | | 7.56 | | | | | 3.60 | |
| | | | | | | | | | | | | | | | | | | | | | | | | |
Less distributions to shareholders: | | | | | | | | | | | | | | | | | | | | | | | | | |
From net investment income | | | | (1.02 | ) | | | | (0.51 | ) | | | | (0.66 | ) | | | | (1.35 | ) | | | | (0.90 | ) |
From net realized gains | | | | — | | | | | — | | | | | (5.46 | ) | | | | (0.54 | ) | | | | — | |
| | | | | | | | | | | | | | | | | | | | | | | | | |
Total distributions | | | | (1.02 | ) | | | | (0.51 | ) | | | | (6.12 | ) | | | | (1.89 | ) | | | | (0.90 | ) |
| | | | | | | | | | | | | | | | | | | | | | | | | |
Net asset value, end of period | | | $ | 21.53 | | | | $ | 19.77 | | | | $ | 22.95 | | | | $ | 30.69 | | | | $ | 25.02 | |
| | | | | | | | | | | | | | | | | | | | | | | | | |
Total Return(c) | | | | 14.35 | % | | | | (11.83 | )% | | | | (4.87 | )% | | | | 31.30 | % | | | | 16.75 | % |
Ratios/Supplemental Data: | | | | | | | | | | | | | | | | | | | | | | | | | |
Net assets, end of period (000’s) | | | $ | 127,401 | | | | $ | 245,734 | | | | $ | 283,446 | | | | $ | 382,688 | | | | $ | 313,557 | |
Net expenses to average daily net assets(d) | | | | 0.78 | % | | | | 0.76 | % | | | | 0.77 | % | | | | 0.77 | %(e) | | | | 0.76 | %(e) |
Net investment income (loss) to average daily net assets(b) | | | | 2.13 | % | | | | 2.04 | % | | | | 2.15 | % | | | | 1.63 | % | | | | 2.50 | % |
Portfolio turnover rate | | | | 159 | %(f) | | | | 64 | % | | | | 83 | % | | | | 79 | % | | | | 76 | % |
Fees and expenses reimbursed and/or waived by GMO to average daily net assets: | | | | 0.21 | % | | | | 0.18 | % | | | | 0.17 | % | | | | 0.15 | % | | | | 0.17 | % |
Purchase premiums and redemption fees consisted of the following per share amounts (Note 2):† | | | $ | 0.10 | | | | $ | 0.01 | (a) | | | $ | 0.03 | (a) | | | $ | 0.02 | (a) | | | $ | 0.01 | (a) |
| (a) | Per share amounts were adjusted to reflect a 1:3 reverse stock split effective July 15, 2016. |
| (b) | Net investment income is affected by the timing of the declaration of dividends by the underlying funds in which the Fund invests, if any. |
| (c) | The total returns would have been lower had certain expenses not been reimbursed and/or waived during the periods shown, if applicable, and assumes the effect of reinvested distributions, if any. Calculation excludes purchase premiums and redemption fees which are borne by the shareholder purchasing or redeeming Fund shares, if any. |
| (d) | Net expenses exclude expenses incurred indirectly through investment in the underlying funds (Note 5). |
| (e) | The net expense ratio does not include the effect of expense reductions (Note 2). |
| (f) | The portfolio turnover rate excludes investments in GMO U.S. Treasury Fund (“USTF”) which is used as a short-term investment vehicle for cash management. The Fund’s portfolio turnover rate during the year ended February 28, 2017, including transactions in USTF, was 167% of the average value of its portfolio. |
| † | Calculated using average shares outstanding throughout the period. |
| | | | |
| 28 | | See accompanying notes to the financial statements. | | |
GMO Trust Funds
Notes to Financial Statements
February 28, 2017
Each of Foreign Fund, Foreign Small Companies Fund and International Small Companies Fund (each a “Fund” and collectively the “Funds”) is a series of GMO Trust (the “Trust”). The Trust is registered under the Investment Company Act of 1940, as amended (the “1940 Act”), as an open-end management investment company. The Trust was established as a Massachusetts business trust under the laws of The Commonwealth of Massachusetts on June 24, 1985. The Declaration of Trust permits the Trustees of the Trust (“Trustees”) to create an unlimited number of series of shares (Funds) and to subdivide Funds into classes. The Funds are advised and managed by Grantham, Mayo, Van Otterloo & Co. LLC (“GMO”).
The Funds may invest in GMO U.S. Treasury Fund and in money market funds unaffiliated with GMO.
The following table provides information about the Funds’ principal investment objectives and benchmarks (if any):
| | | | |
| | | |
| Fund Name | | Benchmark | | Investment Objective |
| Foreign Fund | | MSCI EAFE Index | | Total return in excess of benchmark |
| Foreign Small Companies Fund | | S&P Developed ex-U.S. Small Cap Index | | Total return in excess of benchmark |
| International Small Companies Fund | | S&P Developed ex-U.S. Small Cap Index | | Total return in excess of benchmark |
Foreign Small Companies Fund and International Small Companies Fund currently limit subscriptions.
| 2. | Significant accounting policies |
The following is a summary of significant accounting policies followed by each Fund in the preparation of its financial statements. These policies are in conformity with accounting principles generally accepted in the United States of America (“U.S. GAAP”) and have been consistently followed by the Funds in preparing these financial statements. The preparation of financial statements in accordance with U.S. GAAP requires management to make estimates and assumptions that affect the reported amounts and disclosures in the financial statements. Actual results could differ from those estimates. The accounting records of the Funds are maintained in U.S. dollars.
Portfolio valuation
Exchange-traded securities (other than exchange-traded options) for which market quotations are readily available are valued at (i) the last sale price or (ii) official closing price or (iii) most recent quoted price published by the exchange (if no reported last sale or official closing price) or (iv) the quoted price provided by a pricing source (in the event GMO deems the private market to be a more reliable indicator of market value than the exchange). Exchange-traded options are valued at the last sale price, provided that price is between the closing bid and ask prices. If the last sale price is not within this range, then they will be valued at the closing bid price for long positions and the closing ask price for short positions. Cleared derivatives are valued using the price quoted (which may be based on a model) by the relevant clearing house. If an updated quote for a cleared derivative is not available by the time that a Fund calculates its net asset value on any business day, then that derivative will generally be valued using an industry standard model, which may differ from the model used by the relevant clearing house. Over-the-counter (“OTC”) derivatives are generally valued at the price determined by an industry standard model. Unlisted securities for which market quotations are readily available are generally valued at the most recent quoted price. Shares of the underlying funds and other open-end registered investment companies are valued at their most recent net asset value. If quotations are not readily available or circumstances make an existing valuation methodology or procedure unreliable, derivatives and other securities are valued at fair value as determined in good faith by the Trustees or persons acting at their direction pursuant to procedures approved by the Trustees. Because of the uncertainty inherent in pricing, and in particular fair value pricing, the value determined for a particular security may be materially different from the value realized upon its sale. See the table below for information about securities and derivatives, if any, that were fair valued using methods determined in good faith by or at the direction of the Trustees. The Funds and/or the underlying funds classify such securities as Level 3 (levels defined below). For the year ended February 28, 2017, the Funds did not reduce the value of any of their OTC derivatives contracts, if any, based on the creditworthiness of their counterparties. See Note 4 “Derivative financial instruments” for a further discussion on valuation of derivatives.
The foregoing valuation methodologies are modified for equities that trade in non-U.S. securities markets which close prior to the close of the New York Stock Exchange (“NYSE”) due to time zone differences, including the value of equities that underlie futures, options and other derivatives (to the extent the market for those derivatives closes prior to the close of the NYSE). In those cases, the price will generally be adjusted, to the extent practicable and available, based on inputs from an independent pricing service approved by the Trustees that are intended to reflect valuation changes through the NYSE close. The table below shows the percentage of the net assets of the Funds, held either directly or through investments in the underlying funds, if any, that were valued using fair value inputs obtained from that independent pricing service as of February 28, 2017. These securities listed on foreign exchanges (including the value of equity securities that underlie futures, options and other derivatives (to the extent the market for such instruments closes prior to the close of the NYSE)) are classified as Level 2 (levels defined below) in the table below.
29
GMO Trust Funds
Notes to Financial Statements — (Continued)
February 28, 2017
“Quoted price” typically means the bid price for securities held long and the ask price for securities sold short. If a market quotation for a security does not involve a bid or an ask, the “quoted price” may be the price provided by a market participant or other third-party pricing source in accordance with the market practice for that security. If an updated quoted price for a security is not available by the time that a Fund calculates its net asset value on any business day, the Fund will generally use the last quoted price so long as GMO believes that the last quoted price continues to represent that security’s fair value.
In the case of derivatives, prices determined by a model may reflect an estimate of the average of bid and ask prices, regardless of whether a Fund has a long position or a short position.
As discussed above, certain of the Funds invest in securities and/or derivatives which may have been fair valued using methods determined in good faith by or at the direction of the Trustees or fair valued using inputs obtained from an independent pricing service. The table below presents securities and/or derivatives on a net basis, based on market values or unrealized appreciation/(depreciation), which will tend to understate the Funds’ exposure. The net aggregate direct and indirect exposure to these valuation methodologies (based on each Fund’s net assets) as of February 28, 2017 is as follows:
Securities and derivatives
| | | | |
| | | |
| Fund Name | | Fair valued using methods determined in
good faith by or at the direction of the Trustees | | Fair valued using
inputs obtained
from an
independent
pricing service (Net) |
| Foreign Fund | | — | | 97% |
| Foreign Small Companies Fund | | — | | 89% |
| International Small Companies Fund | | 0%§ | | 88% |
§ Represents the interest in securities that were determined to have a value of zero at February 28, 2017.
U.S. GAAP requires the Funds to disclose the fair value of their investments in a three-level hierarchy (Levels 1, 2 and 3). The valuation hierarchy is based upon the relative observability of inputs to the valuation of the Funds’ investments. The inputs or methodologies used for valuing securities are not necessarily an indication of the risk associated with investing in those securities.
Changes in valuation techniques may result in transfers into or out of an investment’s assigned level within the fair value hierarchy. In addition, in periods of market dislocation, the observability of prices and inputs may be reduced for many instruments. This condition, as well as changes related to the liquidity of investments, could cause a security to be reclassified between levels.
U.S. GAAP requires additional disclosures about fair value measurements for material Level 3 securities and derivatives, if any (determined by each category of asset or liability as compared to a Fund’s total net assets separately identified in the table below). At February 28, 2017, there were no direct material Level 3 classes of investments or derivatives with significant unobservable inputs subject to this additional disclosure.
The three levels are defined as follows:
Level 1 – Valuations based on quoted prices for identical securities in active markets.
The types of assets and liabilities categorized in Level 1 generally include actively traded domestic and certain foreign equity securities; certain U.S. government obligations; derivatives actively traded on a national securities exchange (such as some futures and options); and shares of open-end mutual funds (even if their investments are valued using Level 2 or Level 3 inputs).
Level 2 – Valuations determined using other significant direct or indirect observable inputs.
The types of assets and liabilities categorized in Level 2 generally include cleared derivatives and certain OTC derivatives such as swaps, options, swaptions, and forward currency contracts valued using industry standard models; certain restricted securities valued at the most recent available market or quoted price; certain securities that are valued at the local price and adjusted by applying a premium or discount when the holdings exceed foreign ownership limitations; and certain foreign equity securities that are adjusted based on inputs from an independent pricing service approved by the Trustees, including the value of equity securities that underlie futures, options and other derivatives (to the extent the market for such instruments closes prior to the close of the NYSE) to reflect estimated valuation changes through the NYSE close.
30
GMO Trust Funds
Notes to Financial Statements — (Continued)
February 28, 2017
Level 3 – Valuations based primarily on inputs that are unobservable and significant.
The types of assets and liabilities categorized in Level 3 generally include, but are not limited to, securities whose trading has been suspended or that have been de-listed from their current primary trading exchange valued at the most recent available market or quoted price; securities in default or bankruptcy proceedings for which there is no current market quotation valued at the most recent available market or quoted price; third-party investment funds where valuations are provided by fund sponsors and which are adjusted for liquidity considerations as well as the timing of the receipt of information; certain equity securities valued based on the last traded exchange price adjusted for the movement in a relevant index; and certain securities that are valued using a price from a comparable security related to the same issuer.
The following is a summary of the respective levels assigned to the Funds’ direct securities and derivatives, if any, as of February 28, 2017:
| | | | | | | | | | | | | | | | |
| | | | | |
| Description | | Level 1 | | | Level 2 | | | Level 3 | | | Total | |
Foreign Fund | | | | | | | | | | | | | | | | |
Asset Valuation Inputs | | | | | | | | | | | | | | | | |
Common Stocks | | | | | | | | | | | | | | | | |
Australia | | $ | — | | | $ | 3,694,225 | | | $ | — | | | $ | 3,694,225 | |
France | | | — | | | | 18,187,293 | | | | — | | | | 18,187,293 | |
Germany | | | — | | | | 8,197,940 | | | | — | | | | 8,197,940 | |
Hong Kong | | | — | | | | 8,265,575 | | | | — | | | | 8,265,575 | |
India | | | 855,260 | | | | — | | | | — | | | | 855,260 | |
Israel | | | — | | | | 1,979,302 | | | | — | | | | 1,979,302 | |
Italy | | | — | | | | 1,800,555 | | | | — | | | | 1,800,555 | |
Japan | | | — | | | | 41,875,479 | | | | — | | | | 41,875,479 | |
Netherlands | | | — | | | | 2,959,226 | | | | — | | | | 2,959,226 | |
Russia | | | — | | | | 2,796,903 | | | | — | | | | 2,796,903 | |
South Africa | | | — | | | | 436,648 | | | | — | | | | 436,648 | |
South Korea | | | — | | | | 3,902,373 | | | | — | | | | 3,902,373 | |
Spain | | | — | | | | 1,372,734 | | | | — | | | | 1,372,734 | |
Sweden | | | — | | | | 2,877,086 | | | | — | | | | 2,877,086 | |
Switzerland | | | — | | | | 4,860,166 | | | | — | | | | 4,860,166 | |
Taiwan | | | — | | | | 3,711,053 | | | | — | | | | 3,711,053 | |
United Kingdom | | | — | | | | 32,263,484 | | | | — | | | | 32,263,484 | |
| | | | | | | | | | | | | | | | | |
TOTAL COMMON STOCKS | | | 855,260 | | | | 139,180,042 | | | | — | | | | 140,035,302 | |
| | | | | | | | | | | | | | | | | |
Mutual Funds | | | | | | | | | | | | | | | | |
United States | | | 19,226 | | | | — | | | | — | | | | 19,226 | |
| | | | | | | | | | | | | | | | | |
TOTAL MUTUAL FUNDS | | | 19,226 | | | | — | | | | — | | | | 19,226 | |
| | | | | | | | | | | | | | | | | |
Short-Term Investments | | | 3,523,184 | | | | — | | | | — | | | | 3,523,184 | |
| | | | | | | | | | | | | | | | | |
Total Investments | | | 4,397,670 | | | | 139,180,042 | | | | — | | | | 143,577,712 | |
| | | | | | | | | | | | | | | | | |
Derivatives^ | | | | | | | | | | | | | | | | |
Forward Currency Contracts | | | | | | | | | | | | | | | | |
Foreign Currency Risk | | | — | | | | 75,407 | | | | — | | | | 75,407 | |
| | | | | | | | | | | | | | | | | |
Total | | $ | 4,397,670 | | | $ | 139,255,449 | | | $ | — | | | $ | 143,653,119 | |
| | | | | | | | | | | | | | | | | |
Liability Valuation Inputs | | | | | | | | | | | | | | | | |
Derivatives^ | | | | | | | | | | | | | | | | |
Forward Currency Contracts | | | | | | | | | | | | | | | | |
Foreign Currency Risk | | $ | — | | | $ | (59,826 | ) | | $ | — | | | $ | (59,826 | ) |
| | | | | | | | | | | | | | | | | |
| | | | | | | | | | | | | | | | | |
Foreign Small Companies Fund | | | | | | | | | | | | | | | | |
Asset Valuation Inputs | | | | | | | | | | | | | | | | |
Common Stocks | | | | | | | | | | | | | | | | |
Argentina | | $ | 4,321,723 | | | $ | — | | | $ | — | | | $ | 4,321,723 | |
Australia | | | — | | | | 37,673,313 | | | | — | | | | 37,673,313 | |
Brazil | | | — | | | | 12,716,157 | | | | — | | | | 12,716,157 | |
| | | | | | | | | | | | | | | | | |
31
GMO Trust Funds
Notes to Financial Statements — (Continued)
February 28, 2017
| | | | | | | | | | | | | | | | |
| | | | | |
| Description | | Level 1 | | | Level 2 | | | Level 3 | | | Total | |
Foreign Small Companies Fund (continued) | | | | | | | | | | | | | | | | |
Asset Valuation Inputs (continued) | | | | | | | | | | | | | | | | |
Canada | | $ | 53,837,296 | | | $ | — | | | $ | — | | | $ | 53,837,296 | |
China | | | — | | | | 3,265,004 | | | | — | | | | 3,265,004 | |
Finland | | | — | | | | 13,044,305 | | | | — | | | | 13,044,305 | |
France | | | — | | | | 103,628,502 | | | | — | | | | 103,628,502 | |
Germany | | | — | | | | 30,048,208 | | | | — | | | | 30,048,208 | |
Hong Kong | | | — | | | | 5,862,615 | | | | — | | | | 5,862,615 | |
Ireland | | | — | | | | 4,255,244 | | | | — | | | | 4,255,244 | |
Israel | | | — | | | | 12,761,786 | | | | — | | | | 12,761,786 | |
Italy | | | — | | | | 25,750,241 | | | | — | | | | 25,750,241 | |
Japan | | | — | | | | 212,681,301 | | | | — | | | | 212,681,301 | |
Mexico | | | 5,148,246 | | | | — | | | | — | | | | 5,148,246 | |
Netherlands | | | — | | | | 17,087,953 | | | | — | | | | 17,087,953 | |
New Zealand | | | — | | | | 4,172,760 | | | | — | | | | 4,172,760 | |
Russia | | | — | | | | 10,989,232 | | | | — | | | | 10,989,232 | |
Singapore | | | — | | | | 7,782,003 | | | | — | | | | 7,782,003 | |
South Africa | | | — | | | | 3,795,988 | | | | — | | | | 3,795,988 | |
South Korea | | | — | | | | 3,986,558 | | | | — | | | | 3,986,558 | |
Sweden | | | — | | | | 7,516,571 | | | | — | | | | 7,516,571 | |
Switzerland | | | — | | | | 73,042,955 | | | | — | | | | 73,042,955 | |
Taiwan | | | — | | | | 12,357,522 | | | | — | | | | 12,357,522 | |
Thailand | | | — | | | | 7,101,263 | | | | — | | | | 7,101,263 | |
United Kingdom | | | — | | | | 117,879,862 | | | | — | | | | 117,879,862 | |
| | | | | | | | | | | | | | | | | |
TOTAL COMMON STOCKS | | | 63,307,265 | | | | 727,399,343 | | | | — | | | | 790,706,608 | |
| | | | | | | | | | | | | | | | | |
Mutual Funds | | | | | | | | | | | | | | | | |
United States | | | 7,030,375 | | | | — | | | | — | | | | 7,030,375 | |
| | | | | | | | | | | | | | | | | |
TOTAL MUTUAL FUNDS | | | 7,030,375 | | | | — | | | | — | | | | 7,030,375 | |
| | | | | | | | | | | | | | | | | |
Short-Term Investments | | | 19,239,679 | | | | — | | | | — | | | | 19,239,679 | |
| | | | | | | | | | | | | | | | | |
Total Investments | | | 89,577,319 | | | | 727,399,343 | | | | — | | | | 816,976,662 | |
| | | | | | | | | | | | | | | | | |
Derivatives^ | | | | | | | | | | | | | | | | |
Forward Currency Contracts | | | | | | | | | | | | | | | | |
Foreign Currency Risk | | | — | | | | 17,435 | | | | — | | | | 17,435 | |
| | | | | | | | | | | | | | | | | |
Total | | $ | 89,577,319 | | | $ | 727,416,778 | | | $ | — | | | $ | 816,994,097 | |
| | | | | | | | | | | | | | | | | |
Liability Valuation Inputs | | | | | | | | | | | | | | | | |
Derivatives^ | | | | | | | | | | | | | | | | |
Forward Currency Contracts | | | | | | | | | | | | | | | | |
Foreign Currency Risk | | $ | — | | | $ | (319,478 | ) | | $ | — | | | $ | (319,478 | ) |
| | | | | | | | | | | | | | | | | |
| | | | | | | | | | | | | | | | | |
International Small Companies Fund | | | | | | | | | | | | | | | | |
Asset Valuation Inputs | | | | | | | | | | | | | | | | |
Common Stocks | | | | | | | | | | | | | | | | |
Argentina | | $ | 674,484 | | | $ | — | | | $ | — | | | $ | 674,484 | |
Australia | | | — | | | | 5,883,995 | | | | — | | | | 5,883,995 | |
Austria | | | — | | | | — | | | | 0 | § | | | 0 | § |
Brazil | | | — | | | | 1,990,023 | | | | — | | | | 1,990,023 | |
Canada | | | 8,394,289 | | | | — | | | | — | | | | 8,394,289 | |
China | | | — | | | | 510,515 | | | | 0 | § | | | 510,515 | |
Finland | | | — | | | | 2,034,476 | | | | — | | | | 2,034,476 | |
France | | | — | | | | 16,191,746 | | | | — | | | | 16,191,746 | |
Germany | | | — | | | | 4,687,467 | | | | — | | | | 4,687,467 | |
Hong Kong | | | — | | | | 916,428 | | | | — | | | | 916,428 | |
Indonesia | | | — | | | | 58,816 | | | | — | | | | 58,816 | |
| | | | | | | | | | | | | | | | | |
32
GMO Trust Funds
Notes to Financial Statements — (Continued)
February 28, 2017
| | | | | | | | | | | | | | | | |
| | | | | |
| Description | | Level 1 | | | Level 2 | | | Level 3 | | | Total | |
International Small Companies Fund (continued) | | | | | | | | | | | | | | | | |
Asset Valuation Inputs (continued) | | | | | | | | | | | | | | | | |
Ireland | | $ | — | | | $ | 663,920 | | | $ | — | | | $ | 663,920 | |
Israel | | | — | | | | 1,983,984 | | | | — | | | | 1,983,984 | |
Italy | | | — | | | | 4,016,543 | | | | — | | | | 4,016,543 | |
Japan | | | — | | | | 33,072,180 | | | | — | | | | 33,072,180 | |
Mexico | | | 816,118 | | | | — | | | | — | | | | 816,118 | |
Netherlands | | | — | | | | 2,664,982 | | | | — | | | | 2,664,982 | |
New Zealand | | | — | | | | 649,352 | | | | — | | | | 649,352 | |
Russia | | | — | | | | 1,720,371 | | | | — | | | | 1,720,371 | |
Singapore | | | — | | | | 1,217,705 | | | | — | | | | 1,217,705 | |
South Africa | | | — | | | | 593,534 | | | | — | | | | 593,534 | |
South Korea | | | — | | | | 623,946 | | | | — | | | | 623,946 | |
Sweden | | | — | | | | 1,174,449 | | | | — | | | | 1,174,449 | |
Switzerland | | | — | | | | 11,411,570 | | | | — | | | | 11,411,570 | |
Taiwan | | | — | | | | 1,934,638 | | | | 0 | § | | | 1,934,638 | |
Thailand | | | — | | | | 1,110,528 | | | | — | | | | 1,110,528 | |
United Kingdom | | | — | | | | 18,503,859 | | | | — | | | | 18,503,859 | |
| | | | | | | | | | | | | | | | | |
TOTAL COMMON STOCKS | | | 9,884,891 | | | | 113,615,027 | | | | 0 | § | | | 123,499,918 | |
| | | | | | | | | | | | | | | | | |
Mutual Funds | | | | | | | | | | | | | | | | |
United States | | | 1,550,077 | | | | — | | | | — | | | | 1,550,077 | |
| | | | | | | | | | | | | | | | | |
TOTAL MUTUAL FUNDS | | | 1,550,077 | | | | — | | | | — | | | | 1,550,077 | |
| | | | | | | | | | | | | | | | | |
Short-Term Investments | | | 2,314,684 | | | | — | | | | — | | | | 2,314,684 | |
| | | | | | | | | | | | | | | | | |
Total Investments | | | 13,749,652 | | | | 113,615,027 | | | | — | | | | 127,364,679 | |
| | | | | | | | | | | | | | | | | |
Total | | $ | 13,749,652 | | | $ | 113,615,027 | | | $ | 0 | § | | $ | 127,364,679 | |
| | | | | | | | | | | | | | | | | |
Liability Valuation Inputs | | | | | | | | | | | | | | | | |
Derivatives^ | | | | | | | | | | | | | | | | |
Forward Currency Contracts | | | | | | | | | | | | | | | | |
Foreign Currency Risk | | $ | — | | | $ | (40,193 | ) | | $ | — | | | $ | (40,193 | ) |
| | | | | | | | | | | | | | | | | |
| | | | | | | | | | | | | | | | | |
The risks referenced in the tables above are not intended to be inclusive of all risks. Please see the “Investment and other risks” and “Derivative financial instruments” sections below for a further discussion of risks.
| | ^ | The tables above are based on market values or unrealized appreciation/(depreciation) rather than the notional amounts of derivatives. The uncertainties surrounding the valuation inputs for a derivative are likely to be more significant to the Funds’ net asset values than the uncertainties surrounding inputs for a non-derivative security with the same market value. Excludes purchased options, if any, which are included in investments. |
| | § | Represents the interest in securities that were determined to have a value of zero at February 28, 2017. |
The underlying funds held at year end are classified above as Level 1. For the summary of valuation inputs of the underlying funds, please refer to the underlying funds’ Notes to Financial Statements.
For all Funds for the year ended February 28, 2017, there were no significant transfers between Level 1 and Level 2.
33
GMO Trust Funds
Notes to Financial Statements — (Continued)
February 28, 2017
The net aggregate direct and indirect exposure to investments in securities using Level 3 inputs (based on each Fund’s net assets) as of February 28, 2017 were as follows:
| | | | |
| | |
| Fund Name | | Level 3 securities
and derivatives | |
Foreign Fund | | | — | |
Foreign Small Companies Fund | | | — | |
International Small Companies Fund | | | 0%§ | |
| | § | Represents the interest in securities that were determined to have a value of zero at February 28, 2017. |
Cash
Cash and foreign currency, if any, on the Statements of Assets and Liabilities consist of cash balances held with the custodian.
Due to/from broker
Due to/from broker in the Statements of Assets and Liabilities includes collateral on swap contracts, futures contracts, option contracts and forward currency contracts, if any, and may include marked-to-market amounts related to foreign currency or cash owed.
Foreign currency translation
The market values of foreign securities, currency holdings and related assets and liabilities are typically translated into U.S. dollars at the close of regular trading on the NYSE, generally at 4:00 pm Eastern time. Income and expenses denominated in foreign currencies are typically translated into U.S. dollars at the close of regular trading on the NYSE. Fluctuations in the value of currency holdings and other assets and liabilities resulting from changes in exchange rates are recorded as unrealized foreign currency gains or losses. Realized gains or losses and unrealized appreciation or depreciation on investment securities and income and expenses are translated on the respective dates of such transactions. The effects of changes in foreign currency exchange rates on investments in securities are not separated on the Statements of Operations from the effects of changes in market prices of those securities, but are included with the net realized and unrealized gain or loss on investment securities.
Taxes and distributions
Each Fund has elected to be treated and intends to qualify each tax year as a regulated investment company under Subchapter M of the Internal Revenue Code of 1986, as amended (the “Code”). Each Fund intends to distribute its net investment income, if any, and its net realized short-term and long-term capital gains, if any, after giving effect to any available capital loss carryforwards for U.S. federal income tax purposes. Therefore, each Fund makes no provision for U.S. federal income or excise taxes.
The policy of each Fund is to declare and pay dividends of its net investment income, if any, at least annually, although the Funds are permitted to, and will from time to time, declare and pay dividends of net investment income, if any, more frequently. Each Fund also intends to distribute net realized short-term and long-term capital gains, if any, at least annually. In addition, each Fund may, from time to time at their discretion, make unscheduled distributions in advance of large redemptions by shareholders or as otherwise deemed appropriate by a Fund. Typically, all distributions are reinvested in additional shares of each Fund at net asset value, unless GMO or its agents receive and process a shareholder election to receive cash distributions. Distributions to shareholders are recorded by each Fund on the ex-dividend date.
Taxes on foreign interest and dividend income are generally withheld in accordance with the applicable country’s tax treaty with the United States. The foreign withholding rates applicable to a Fund’s investments in certain jurisdictions may be higher if a significant portion of the Fund is held by non-U.S. shareholders. Each Fund may be subject to taxation on realized capital gains, repatriation proceeds and other transaction-based charges imposed by certain countries in which it invests. Taxes related to capital gains realized during the year ended February 28, 2017, if any, are reflected as part of Net realized gain (loss) in the Statements of Operations. Changes in tax liabilities related to capital gain taxes on unrealized investment gains, if any, are reflected as part of Change in net unrealized appreciation (depreciation) in the Statements of Operations. Transaction-based charges are generally calculated as a percentage of the transaction amount.
Certain Funds have previously filed for and/or may file for additional tax refunds with respect to certain taxes withheld by certain countries. Generally, the amount of such refunds that a Fund reasonably determines are collectible and free from significant contingencies are reflected in a Fund’s net asset value and are reflected as Dividends from unaffiliated issuers in the Statements of Operations. In certain circumstances, a Fund’s receipt of such refunds may cause the Fund and/or its shareholders to be liable for U.S. federal income taxes and interest charges.
Foreign taxes paid by each Fund may be treated, to the extent permissible by the Code (and other applicable U.S. federal tax guidance) and if that Fund so elects, as if paid by U.S. shareholders of that Fund.
34
GMO Trust Funds
Notes to Financial Statements — (Continued)
February 28, 2017
Income and capital gain distributions are determined in accordance with U.S. federal income tax regulations, which may differ from U.S. GAAP. Certain capital accounts in the financial statements are periodically adjusted for permanent differences in order to reflect their tax character. These adjustments have no impact on net assets or net asset value per share. Temporary differences that arise from recognizing certain items of income, expense, gain or loss in different periods for financial statement and tax purposes will likely reverse at some time in the future. Distributions in excess of net investment income or net realized gains are temporary over-distributions for financial statement purposes resulting from differences in the recognition or classification of income or distributions for financial statement and tax purposes.
U.S. GAAP and tax accounting differences for each Fund primarily relate to reasons described in the following table:
| | | | | | |
| | | | |
| Differences related to: | | Foreign Fund | | Foreign Small Companies Fund | | International Small Companies Fund |
| Capital loss carryforwards | | X | | X | | X |
| Dividend income and withholding tax reclaim reserves | | X | | | | X |
| Dividends received from underlying investments | | X | | | | |
| Foreign currency transactions | | X | | | | X |
| Losses on wash sale transactions | | X | | X | | X |
| Passive foreign investment company transactions | | X | | X | | X |
| Post-October capital losses | | X | | X | | X |
The tax character of distributions declared by each Fund to shareholders is as follows:
| | | | | | | | | | | | | | | | | | | | |
| | | |
| | | Tax year ended February 28, 2017 | | | Tax year ended February 29, 2016 | |
| | | | | | |
| Fund Name | | Ordinary
Income
(including
any net
short-term
capital gain) ($) | | | Total
Distributions ($) | | | Ordinary
Income
(including
any net
short-term
capital gain) ($) | | | Net Long-
Term Capital
Gain ($) | | | Total
Distributions ($) | |
| Foreign Fund | | | 3,970,456 | | | | 3,970,456 | | | | 7,157,381 | | | | — | | | | 7,157,381 | |
| Foreign Small Companies Fund | | | 23,646,521 | | | | 23,646,521 | | | | 19,514,671 | | | | 33,409,301 | | | | 52,923,972 | |
International Small Companies Fund | | | 5,876,532 | | | | 5,876,532 | | | | 6,197,734 | | | | — | | | | 6,197,734 | |
Distributions in excess of a Fund’s tax basis earnings and profits, if significant, are reported in the Funds’ financial statements as a return of capital.
35
GMO Trust Funds
Notes to Financial Statements — (Continued)
February 28, 2017
As of February 28, 2017, the components of distributable earnings on a tax basis and certain tax attributes for the Funds consisted of the following:
| | | | | | | | | | | | | | | | |
| | | | | |
| Fund Name | | Undistributed
Ordinary
Income
(including any
net short-term
capital gain) ($) | | | Late-Year
Ordinary Loss
Deferral ($) | | | Capital Loss
Carryforwards ($) | | | Post- October
Capital Losses ($) | |
Foreign Fund | | | 960,437 | | | | — | | | | (31,279,532) | | | | (272,630) | |
Foreign Small Companies Fund | | | — | | | | (96,018) | | | | (7,421,251) | | | | — | |
International Small Companies Fund | | | 2,466 | | | | — | | | | (18,511,741) | | | | (36,711) | |
As of February 28, 2017, certain Funds had capital loss carryforwards available to offset future realized gains, if any, to the extent permitted by the Code. Net capital losses recognized in taxable years beginning on or after March 1, 2011 are carried forward without expiration and generally retain their short-term and/or long-term tax character, as applicable. In addition, such losses should be utilized prior to losses scheduled to expire on or before February 28, 2019. As a result of this ordering rule, losses that are subject to expiration may expire unused. Utilization of the capital loss carryforwards, post-October capital losses, late-year ordinary losses, and losses realized subsequent to February 28, 2017, if any, could be subject to further limitations imposed by the Code related to share ownership activity. The Funds’ capital loss carryforwards are as follows:
| | | | | | | | | | | | | | | | |
| | | | |
| | | Short-Term ($) | | | | | | Long-Term ($) | |
| | | | | |
| Fund Name | | Expiration
Date
2/28/2018 | | | No
Expiration
Date | | | Total Short-Term ($) | | | No
Expiration
Date | |
Foreign Fund | | | (12,719,749) | | | | (10,959,702) | | | | (23,679,451) | | | | (7,600,081) | |
Foreign Small Companies Fund | | | — | | | | (7,421,251) | | | | (7,421,251) | | | | — | |
International Small Companies Fund | | | — | | | | (12,770,746) | | | | (12,770,746) | | | | (5,740,995) | |
As of February 28, 2017, the approximate cost for U.S. federal income tax purposes and the aggregate investment-level gross and net unrealized appreciation (depreciation) in the value of investments were as follows:
| | | | | | | | | | | | | | | | |
| | | | | |
| Fund Name | | Aggregate
Cost ($) | | | Gross Unrealized
Appreciation ($) | | | Gross Unrealized
(Depreciation) ($) | | | Net Unrealized
Appreciation
(Depreciation) ($) | |
Foreign Fund | | | 136,084,655 | | | | 11,037,810 | | | | (3,544,753) | | | | 7,493,057 | |
Foreign Small Companies Fund | | | 758,690,849 | | | | 93,864,714 | | | | (35,578,901) | | | | 58,285,813 | |
International Small Companies Fund | | | 122,751,221 | | | | 9,476,825 | | | | (4,863,367) | | | | 4,613,458 | |
The Funds are subject to authoritative guidance related to the accounting and disclosure of uncertain tax positions under U.S. GAAP. This guidance sets forth a minimum threshold for the financial statement recognition of tax positions taken based on the technical merits of such positions. United States and non-U.S. tax rules (including the interpretation and application of tax laws) are subject to change. The Funds file tax returns and/or adopt certain tax positions in various jurisdictions. Non-U.S. taxes are provided for based on the Funds’ understanding of the prevailing tax rules of the non-U.S. markets in which they invest. Recently enacted tax rules, including interpretations of tax laws (e.g., guidance pertaining to the U.S. Foreign Account Tax Compliance Act) and tax legislation/initiatives currently under consideration in various jurisdictions, including the U.S., might affect the way the Funds and their investors are taxed prospectively and/or retroactively. Prior to the expiration of the relevant statutes of limitations, if any, the Funds are subject to examination by U.S. federal, state, local and non-U.S. jurisdictions with respect to the tax returns they have filed and the tax positions they have adopted. The Funds’ U.S. federal income tax returns are generally subject to examination by the Internal Revenue Service for a period of three years after they are filed. State, local and/or non-U.S. tax returns and/or other filings may be subject to examination for different periods, depending upon the tax rules of each applicable jurisdiction.
Security transactions and related investment income
Security transactions are accounted for in the financial statements on trade date. For purposes of daily net asset value calculations, the Funds’ policy is that security transactions are generally accounted for on the following business day. GMO may override that policy and a Fund may
36
GMO Trust Funds
Notes to Financial Statements — (Continued)
February 28, 2017
account for security transactions on trade date if it experiences significant purchases or redemptions or engages in significant portfolio transactions. Dividend income, net of applicable foreign withholding taxes, if any, is recorded on the ex-dividend date or, if later, when a Fund is informed of the ex-dividend date. Income dividends and capital gain distributions from the underlying funds are recorded on the ex-dividend date. Interest income is recorded on the accrual basis and is adjusted for the amortization of premiums and accretion of discounts. Principal on inflation-indexed securities is adjusted for inflation and any increase or decrease is recorded as interest income or investment loss. Coupon income is not recognized on securities for which collection is not expected. Paydown gains and losses on mortgage-related and other asset-backed securities, if any, are recorded as components of interest income in the Statements of Operations. Non-cash dividends, if any, are recorded at the fair market value of the asset received. In determining the net gain or loss on securities sold, the Funds use the identified cost basis.
Expenses and class allocations
Most of the expenses of the Trust are directly attributable to an individual Fund. Generally, common expenses are allocated among the Funds based on, among other things, the nature and type of expense and the relative size of the Funds. Investment income, common expenses, purchase premiums and redemption fees, if any, and realized and unrealized gains and losses are allocated among the classes of shares of the Funds, if applicable, based on the relative net assets of each class. Shareholder service fees, if any, which are directly attributable to a class of shares, are charged to that class’s operations. In addition, the Funds may incur fees and expenses indirectly as a shareholder in the underlying funds. Because the underlying funds have different expense and fee levels and the Funds may own different proportions of the underlying funds at different times, the amount of fees and expenses indirectly incurred by a Fund will vary (see Note 5).
Brown Brothers Harriman & Co. (“BBH”) serves as the Funds’ custodian and fund accounting agent. State Street Bank and Trust Company (“State Street”) serves as the Funds’ transfer agent. Prior to December 31, 2013, State Street’s transfer agent fees may have been reduced by an earnings allowance calculated on the average daily cash balances each Fund maintained in a State Street transfer agent account. Earnings allowances were reported as a reduction of expenses in the Statements of Operations. Effective January 1, 2014, any cash balances maintained at the transfer agent are held in a Demand Deposit Account and interest income earned, if any, is shown as interest income in the Statements of Operations.
Purchases and redemptions of Fund shares
Purchase premiums and redemption fees (if applicable) are paid to and retained by a Fund to help offset estimated portfolio transaction costs and other related costs (e.g., bid to ask spreads, stamp duties and transfer fees) incurred by the Fund (directly or indirectly through investments in underlying funds) as a result of the purchase or redemption by allocating estimated transaction costs to the purchasing or redeeming shareholder. Such fees are recorded as a component of the Funds’ net share transactions. A Fund may impose a new purchase premium and/or redemption fee
or modify an existing fee at any time.
Purchase premiums are not charged on reinvestments of dividends or other distributions. Redemption fees apply to all shares of a Fund regardless of how the shares were acquired (e.g., by direct purchase or by reinvestment of dividends or other distributions).
If GMO determines that any portion of a cash purchase or redemption, as applicable, is offset by a corresponding cash redemption or purchase occurring on the same day, it ordinarily will waive or reduce the purchase premium or redemption fee with respect to that portion. GMO also may waive or reduce the purchase premium or redemption fee relating to a cash purchase or redemption of a Fund’s shares if the Fund will not incur transaction costs or will incur reduced transaction costs.
GMO will waive or reduce the purchase premium when securities are used to purchase a Fund’s shares except to the extent that the Fund incurs transaction costs (e.g., stamp duties or transfer fees) in connection with its acquisition of those securities. GMO may waive or reduce redemption fees when a Fund uses portfolio securities to redeem its shares. However, when a substantial portion of a Fund is being redeemed in-kind, the Fund may nonetheless charge a redemption fee equal to known or estimated costs.
Purchase premiums or redemption fees generally will not be waived for purchases and redemptions of Fund shares executed through brokers or agents, including, without limitation, intermediary platforms that are allowed pursuant to agreements with the Trust to transmit orders for purchases and redemptions the day after those orders are received.
37
GMO Trust Funds
Notes to Financial Statements — (Continued)
February 28, 2017
As of February 28, 2017, the premium on cash purchases and the fee on cash redemptions were as follows:
| | | | | | | | | | |
| | | | |
| | | Foreign Fund | | Foreign Small Companies Fund | | | International Small Companies Fund | |
Purchase Premium | | — | | | 0.50% | | | | 0.50% | |
Redemption Fee | | — | | | 0.50% | | | | 0.50% | |
Recently-issued accounting guidance
In August 2016, Financial Accounting Standards Board (“FASB”) issued a new Accounting Standards Update No. 2016-15, “Statement of Cash Flows (Topic 230), Classification of Certain Cash Receipts and Cash Payments, a consensus of the FASB’s Emerging Issues Task Force” (“ASU 2016-15”). ASU 2016-15 is intended to reduce diversity in practice in how certain transactions are classified in the statement of cash flows. The issues addressed in ASU 2016-15 are: debt prepayment or debt extinguishment costs, settlement of zero-coupon debt instruments, contingent consideration payments made after a business combination, proceeds from the settlement of insurance claims, proceeds from the settlement of corporate-owned life insurance policies, including bank-owned life insurance policies, distributions received from equity method investments, beneficial interests in securitization transactions; and, separately identifiable cash flows and application of the predominance principle. ASU 2016-15 is effective for interim and annual reporting periods beginning after December 15, 2017. GMO is currently evaluating the impact, if any, of this guidance on the Funds’ financial statements and disclosures.
38
GMO Trust Funds
Notes to Financial Statements — (Continued)
February 28, 2017
| 3. | Investment and other risks |
The following chart identifies selected risks associated with each Fund. Risks not marked for a particular Fund may, however, still apply to some extent to that Fund at various times.
| | | | | | |
| | | | |
| | | Foreign Fund | | Foreign Small Companies Fund | | International Small Companies Fund |
| Counterparty Risk | | X | | X | | X |
| Currency Risk | | X | | X | | X |
| Derivatives and Short Sales Risk | | X | | X | | X |
| Focused Investment Risk | | X | | X | | X |
| Illiquidity Risk | | X | | X | | X |
| Large Shareholder Risk | | X | | X | | X |
| Leveraging Risk | | X | | X | | X |
| Management and Operational Risk | | X | | X | | X |
| Market Disruption and Geopolitical Risk | | X | | X | | X |
| Market Risk – Equities | | X | | X | | X |
| Non-Diversified Funds | | X | | | | |
| Non-U.S. Investment Risk | | X | | X | | X |
| Small Company Risk | | X | | X | | X |
Investing in mutual funds involves many risks. The risks of investing in a particular Fund depend on the types of investments in its portfolio and the investment strategies GMO employs on its behalf. This section does not describe every potential risk of investing in the Funds. Funds could be subject to additional risks because of the types of investments they make and market conditions, which may change over time.
Each Fund that invests in other GMO Funds or other investment companies (collectively, “Underlying Funds”) is exposed to the risks to which the Underlying Funds in which it invests are exposed, as well as the risk that the Underlying Funds will not perform as expected. Therefore, unless otherwise noted, the selected risks summarized below include both direct and indirect risks, and references in this section to investments made by a Fund include those made both directly by the Fund and indirectly by the Fund through Underlying Funds.
An investment in a Fund is not a bank deposit and, therefore, is not insured or guaranteed by the Federal Deposit Insurance Corporation or any other government agency.
• COUNTERPARTY RISK. Funds that enter into contracts with counterparties, such as repurchase or reverse repurchase agreements or OTC derivatives contracts, or that lend their securities run the risk that the counterparty will be unable or unwilling to make timely settlement payments or otherwise honor its obligations. If a counterparty fails to meet its contractual obligations, goes bankrupt, or otherwise experiences a business interruption, the Fund could miss investment opportunities or otherwise hold investments it would prefer to sell, resulting in losses for the Fund. In addition, a Fund may suffer losses if a counterparty fails to comply with applicable laws or other requirements. The Funds are not subject to any limits on their exposure to any one counterparty nor to a requirement that counterparties with whom they enter into contracts maintain a specific rating by a nationally recognized rating organization. Counterparty risk is pronounced during unusually adverse market conditions and is particularly acute in environments (like those of 2008) in which financial services firms are exposed to systemic risks of the type evidenced by the
insolvency of Lehman Brothers and subsequent market disruptions.
39
GMO Trust Funds
Notes to Financial Statements — (Continued)
February 28, 2017
Participants in OTC derivatives markets typically are not subject to the same level of credit evaluation and regulatory oversight as are members of exchange-based markets, and, therefore, OTC derivatives generally expose a Fund to greater counterparty risk than exchange-traded derivatives. A Fund is subject to the risk that a counterparty will not settle a derivative in accordance with its terms because of a dispute over the terms of the contract (whether or not bona fide) or because of a credit or liquidity problem. If a counterparty’s obligation to a Fund is not collateralized, then the Fund is essentially an unsecured creditor of the counterparty. If a counterparty defaults, the Fund will have contractual remedies (whether or not the obligation is collateralized), but the Fund may be unable to enforce them, thus causing the Fund to suffer a loss. Counterparty risk is greater for derivatives with longer maturities because of the longer time during which events may occur that prevent settlement. Counterparty risk also is greater when a Fund has entered into derivatives contracts with a single or small group of counterparties as it sometimes does as a result of its use of swaps and other OTC derivatives. Funds that use swap contracts are subject, in particular, to the creditworthiness of the counterparties because some types of swap contracts have terms longer than six months (and, in some cases, decades). The creditworthiness of a counterparty may be adversely affected by greater than average volatility in the markets, even if the counterparty’s net market exposure is small relative to its capital. Counterparty risk still exists even if a counterparty’s obligations are secured by collateral because the Fund’s interest in the collateral may not be perfected or additional collateral may not be promptly posted as required. GMO’s view with respect to a particular counterparty is subject to change. The fact, however, that it changes adversely (whether due to external events or otherwise) does not mean a Fund’s existing transactions with that counterparty will necessarily be terminated or modified. In addition, a Fund may enter into new transactions with a counterparty that GMO no longer considers a desirable counterparty if the transaction is primarily designed to reduce the Fund’s overall risk of potential exposure to that counterparty (for example, re-establishing the transaction with a lower notional amount or entering into a countervailing trade with the same counterparty).
The Funds also are subject to counterparty risk because they execute their securities transactions through brokers and dealers. If a broker or dealer fails to meet its contractual obligations, goes bankrupt, or otherwise experiences a business interruption, the Funds could miss investment opportunities or be unable to dispose of investments they would prefer to sell, resulting in losses for the Funds.
Counterparty risk with respect to derivatives has been and will continue to be affected by new rules and regulations relating to the derivatives market. As described under “Derivatives and Short Sales Risk,” some derivatives transactions are required to be centrally cleared, and a party to a cleared derivatives transaction is subject to the credit risk of the clearing house and the clearing member through which it holds its cleared position. Credit risk of market participants with respect to derivatives that are centrally cleared is concentrated in a few clearing houses, and it is not clear how an insolvency proceeding of a clearing house would be conducted and what impact an insolvency of a clearing house would have on the financial system. Also, in the event of a counterparty’s (or its affiliate’s) insolvency, the Funds’ ability to exercise remedies, such as the termination of transactions, netting of obligations and realization on collateral, could be stayed or eliminated under new special resolution regimes adopted in the United States, the European Union and various other jurisdictions. Such regimes provide governmental authorities with broad authority to intervene when a financial institution is experiencing financial difficulty. In particular, with respect to counterparties who are subject to such proceedings in the European Union, the liabilities of such counterparties to the Funds could be reduced, eliminated, or converted to equity in such counterparties (sometimes referred to as a “bail in”).
• CURRENCY RISK. Currency risk is the risk that fluctuations in exchange rates will adversely affect the market value of a Fund’s investments. Currency risk includes the risk that the currencies in which a Fund’s investments are traded, in which a Fund receives income, or in which a Fund has taken a position, will decline in value relative to the currency in which the Fund is denominated. Currency risk also includes the risk that the currency to which the Fund has obtained exposure through hedging declines in value relative to the currency being hedged, in which event the Fund may realize a loss on both the hedging instrument and the currency being hedged. Currency exchange rates can fluctuate significantly for many reasons. See “Market Disruption and Geopolitical Risk.”
Many of the Funds use derivatives to take currency positions that are under- or over-weighted (in some cases significantly) relative to the currency exposure of their portfolios and their benchmarks. If the exchange rates of the currencies involved do not move as expected, a Fund could lose money on both its holdings of a particular currency and the derivative. See also “Non-U.S. Investment Risk.”
Some currencies are illiquid (e.g., some emerging country currencies), and a Fund may not be able to convert them into U.S. dollars, in which case GMO may decide to purchase U.S. dollars in a parallel market with an unfavorable exchange rate. Exchange rates for many currencies (e.g., some emerging country currencies) are particularly affected by exchange control regulations.
Derivative transactions in foreign currencies (such as futures, forwards, options and swaps) may involve leveraging risk in addition to currency risk, as described under “Leveraging Risk.” In addition, the obligations of counterparties in currency derivative transactions are often not secured by collateral, which increases counterparty risk (see “Counterparty Risk”).
• DERIVATIVES AND SHORT SALES RISK. All of the Funds may invest in derivatives, which are financial contracts whose value depends on, or is derived from, the value of underlying assets, reference rates, or indices. Derivatives involve the risk that their value may not change as expected relative to changes in the value of the assets, rates, or indices they are designed to track. Derivatives include futures contracts, forward contracts, foreign currency contracts, swap contracts, contracts for differences, options on securities and indices, options on futures contracts,
40
GMO Trust Funds
Notes to Financial Statements — (Continued)
February 28, 2017
options on swap contracts, interest rate caps, floors and collars, reverse repurchase agreements, and other OTC contracts. Derivatives may relate to securities, commodities, currencies, currency exchange rates, interest rates, inflation rates, and indices.
The use of derivatives involves risks that are in addition to, and potentially greater than, the risks of investing directly in securities and other more traditional assets. In particular, a Fund’s use of OTC derivatives exposes it to the risk that the counterparties will be unable or unwilling to make timely settlement payments or otherwise honor their obligations. An OTC derivatives contract typically can be closed only with the consent of the other party to the contract. If the counterparty defaults, the Fund will still have contractual remedies but may not be able to enforce them. Because the contract for each OTC derivative is individually negotiated, the counterparty may interpret contractual terms (e.g., the definition of default) differently than the Fund, and if it does, the Fund may decide not to pursue its claims against the counterparty to avoid the cost and unpredictability of legal proceedings. The Fund, therefore, may be unable to obtain payments GMO believes are owed to it under OTC derivatives contracts, or those payments may be delayed or made only after the Fund has incurred the cost of litigation.
A Fund may invest in derivatives that (i) do not require the counterparty to post collateral (e.g., foreign currency forwards), (ii) require collateral but that do not provide for the Fund’s security interest in it to be perfected, (iii) require a significant upfront deposit by the Fund unrelated to the derivative’s fundamental fair (or intrinsic) value, or (iv) do not require that collateral be regularly marked-to-market. When a counterparty’s obligations are not fully secured by collateral, a Fund runs a greater risk of not being able to recover what it is owed if the counterparty defaults. Even when derivatives are required by contract to be collateralized, a Fund typically will not receive the collateral for one or more days after the collateral is required to be posted.
The Funds may invest in derivatives with a limited number of counterparties, and events affecting the creditworthiness of any of those counterparties may have a pronounced effect on the Funds. Derivatives risk is particularly acute in environments (like those of 2008) in which financial services firms are exposed to systemic risks of the type evidenced by the insolvency of Lehman Brothers and subsequent market disruptions. In addition, during those periods, a Fund may have a greater need for cash to provide collateral for large swings in its mark-to-market obligations under the derivatives in which it has invested.
Derivatives also present other risks described in this section, including market risk, illiquidity risk, currency risk, credit risk, and counterparty risk. Many derivatives, in particular OTC derivatives, are complex and their valuation often requires modeling and judgment, which increases the risk of mispricing or improper valuation. The pricing models used may not produce valuations that are consistent with the values a Fund realizes when it closes or sells an OTC derivative. Valuation risk is more pronounced when a Fund enters into OTC derivatives with specialized terms because the value of those derivatives in some cases is determined only by reference to similar derivatives with more standardized terms. As a result, incorrect valuations may result in increased cash payments to counterparties, undercollateralization and/or errors in the calculation of a Fund’s net asset value.
A Fund’s use of derivatives may not be effective or have the desired results. Moreover, suitable derivatives will not be available in all circumstances. For example, the economic costs of taking some derivative positions may be prohibitive, and if a counterparty or its affiliate is deemed to be an affiliate of a Fund, the Funds will not be permitted to trade with that counterparty. In addition, GMO may decide not to use derivatives to hedge or otherwise reduce a Fund’s risk exposures, potentially resulting in losses for the Fund.
Swap contracts and other OTC derivatives are highly susceptible to illiquidity risk (see “Illiquidity Risk”) and counterparty risk (see “Counterparty Risk”). These derivatives are also subject to documentation risk, which is the risk that ambiguities, inconsistencies or errors in the documentation relating to a derivative transaction may lead to a dispute with the counterparty or unintended investment results. Because many derivatives have a leverage component (i.e., a notional value in excess of the assets needed to establish and/or maintain the derivative position), adverse changes in the value or level of the underlying asset, rate or index may result in a loss substantially greater than the amount invested in the derivative itself. See “Leveraging Risk.”
A Fund’s use of derivatives may be subject to special tax rules and could generate additional taxable income for shareholders. In addition, the tax treatment of a Fund’s use of derivatives may be unclear because there is little case or other law interpreting the terms of most derivatives or determining their tax treatment. In addition, the Securities and Exchange Commission recently proposed a rule under the 1940 Act regulating the use by registered investment companies of derivatives and many related instruments. That rule, if adopted as proposed, would, among other things, restrict a Fund’s ability to engage in derivatives transactions or so increase the cost of derivatives transactions that a Fund would be unable to implement its investment strategy.
Derivatives Regulation. The U.S. government has enacted legislation that provides for new regulation of the derivatives market, including clearing, margin, reporting, and registration requirements. The European Union (and some other countries) are implementing similar requirements, which will affect a Fund when it enters into a derivatives transaction with a counterparty organized in that country or otherwise subject to that country’s derivatives regulations. Because these requirements are new and evolving (and some of the rules are not yet final), their ultimate impact remains unclear.
41
GMO Trust Funds
Notes to Financial Statements — (Continued)
February 28, 2017
Transactions in some types of swaps (including interest rate swaps and credit default swaps on North American and European indices) are required to be centrally cleared. In a transaction involving those swaps (“cleared derivatives”), a Fund’s counterparty is a clearing house, rather than a bank or broker. Since the Funds are not members of clearing houses and only members of a clearing house (“clearing members”) can participate directly in the clearing house, the Funds hold cleared derivatives through accounts at clearing members. In cleared derivatives positions, the Funds make payments (including margin payments) to and receive payments from a clearing house through their accounts at clearing members. Clearing members guarantee performance of their clients’ obligations to the clearing house.
In some ways, cleared derivative arrangements are less favorable to mutual funds than bilateral arrangements, for example, by requiring that funds provide more margin for their cleared derivatives positions. Also, as a general matter, in contrast to a bilateral derivatives position, following a period of notice to a Fund, a clearing member at any time can require termination of an existing cleared derivatives position or an increase in margin requirements above those required at the outset of a transaction. Clearing houses also have broad rights to increase margin requirements for existing positions or to terminate those positions at any time. Any increase in margin requirements or termination of existing cleared derivatives positions by the clearing member or the clearing house could interfere with the ability of a Fund to pursue its investment strategy. Further, any increase in margin requirements by a clearing member could expose a Fund to greater credit risk to its clearing member because margin for cleared derivatives positions in excess of a clearing house’s margin requirements typically is held by the clearing member (see “Counterparty Risk”). Also, a Fund is subject to risk if it enters into a derivatives transaction that is required to be cleared (or that GMO expects to be cleared), and no clearing member is willing or able to clear the transaction on the Fund’s behalf. While the documentation in place between the Funds and their clearing members generally provides that the clearing members will accept for clearing all cleared derivatives transactions that are within credit limits (specified in advance) for each Fund, the Funds are still subject to the risk that no clearing member will be willing or able to clear a transaction. In those cases, the position might have to be terminated, and the Fund could lose some or all of the benefit of the position, including loss of an increase in the value of the position and loss of hedging protection. In addition, the documentation governing the relationship between the Funds and clearing members is drafted by the clearing members and generally is less favorable to the Funds than typical bilateral derivatives documentation. For example, documentation relating to cleared derivatives generally includes a one-way indemnity by the Funds in favor of the clearing member for losses the clearing member incurs as the Funds’ clearing member. Also, such documentation typically does not provide the Funds any remedies if the clearing member defaults or becomes insolvent. While futures contracts entail similar risks, the risks may be more pronounced for cleared derivatives due to their more limited liquidity and market history.
Some types of cleared derivatives are required to be executed on an exchange or on a swap execution facility. A swap execution facility is a trading platform where multiple market participants can execute derivatives by accepting bids and offers made by multiple other participants in the platform. While this execution requirement is designed to increase transparency and liquidity in the cleared derivatives market, trading on a swap execution facility can create additional costs and risks for the Funds. For example, swap execution facilities typically charge fees, and if a Fund executes derivatives on a swap execution facility through a broker intermediary, the intermediary may impose fees as well. Also, a Fund may indemnify a swap execution facility, or a broker intermediary who executes cleared derivatives on a swap execution facility on the Fund’s behalf, against any losses or costs that may be incurred as a result of the Fund’s transactions on the swap execution facility.
If a Fund wishes to execute a package of transactions that include a swap that is required to be executed on a swap execution facility as well as other transactions (for example, a transaction that includes both a security and an interest rate swap that hedges interest rate exposure with respect to such security), the Fund may be unable to execute all components of the package on the swap execution facility. In that case, the Fund would need to trade some components of the package on the swap execution facility and other components in another manner, which could subject the Fund to the risk that some components would be executed successfully and others would not, or that the components would be executed at different times, leaving the Fund with an unhedged position for a period of time.
The U.S. government and the European Union have adopted mandatory minimum margin requirements for bilateral derivatives. GMO expects that the Funds’ transactions will become subject to variation margin requirements under such rules in 2017 and initial margin requirements under such rules in 2020. Such requirements could increase the amount of margin a Fund needs to provide in connection with its derivatives transactions and, therefore, make derivatives transactions more expensive.
These and other new rules and regulations could, among other things, further restrict a Fund’s ability to engage in, or increase the cost to the Fund of, derivatives transactions, for example, by making some types of derivatives no longer available to the Fund or otherwise limiting liquidity. The implementation of the clearing requirement has increased the costs of derivatives transactions for the Funds, since the Funds have to pay fees to their clearing members and are typically required to post more margin for cleared derivatives than they have historically posted for bilateral derivatives. The costs of derivatives transactions are expected to increase further as clearing members raise their fees to cover the costs of additional capital requirements and other regulatory changes applicable to the clearing members, which will take effect when rules imposing mandatory minimum margin requirements on bilateral swaps, as described above, become effective. These rules and regulations are new and evolving, so their potential impact on the Funds and the financial system are not yet known. While the new rules and regulations and central clearing of some derivatives transactions are designed to reduce systemic risk (i.e., the risk that the interdependence of large derivatives dealers could cause them to suffer liquidity, solvency or other challenges simultaneously), there is no assurance that they will achieve that result, and in the meantime, as noted above, central clearing and related requirements expose the Funds to new kinds of costs and risks.
42
GMO Trust Funds
Notes to Financial Statements — (Continued)
February 28, 2017
Options. The Funds are permitted to write options. The market price of an option is affected by many factors, including changes in the market prices or dividend rates of underlying securities (or in the case of indices, the securities in such indices); the time remaining before expiration; changes in interest rates or exchange rates; and changes in the actual or perceived volatility of the relevant stock market and underlying securities. The market price of an option also may be adversely affected if the market for the option becomes less liquid. In addition, since an American-style option allows the holder to exercise its rights any time before the option’s expiration, the writer of an American-style option has no control over when it will be required to fulfill its obligations as a writer of the option. (The writer of a European-style option is not subject to this risk because the holder may only exercise the option on its expiration date.) If a Fund writes a call option and does not hold the underlying security or instrument, the Fund’s potential loss is theoretically unlimited.
National securities exchanges generally have established limits on the maximum number of options an investor or group of investors acting in concert may write. A Fund, GMO, and other funds advised by GMO will likely constitute such a group. When applicable, these limits restrict a Fund’s ability to purchase or write options on a particular security.
Unlike exchange-traded options, which are standardized with respect to the underlying instrument, expiration date, contract size, and strike price, the terms of OTC options (i.e., options not traded on exchanges) generally are established through negotiation with the other party to the option contract. While a Fund has greater flexibility to tailor an OTC option, OTC options generally expose a Fund to greater credit risk than exchange-traded options, which are guaranteed by the clearing organization of the exchanges where they are traded. Purchasing and writing put and call options are highly specialized activities and entail greater than ordinary market risks.
Special tax rules apply to a Fund’s transactions in options, which could increase the taxes payable by shareholders. In particular, a Fund’s options transactions potentially could cause a substantial portion of the Fund’s distributions to consist of amounts taxable to shareholders subject to U.S. income tax at ordinary income tax rates. See the Funds’ Prospectus and Statement of Additional Information for more information.
Short Investment Exposure. Some Funds may sell securities or currencies short as part of their investment programs in an attempt to increase their returns or for hedging purposes. Short sales expose a Fund to the risk that it will be required to acquire, convert, or exchange a security or currency to replace the borrowed security or currency when the security or currency sold short has appreciated in value, thus resulting in a loss to the Fund. Purchasing a security or currency to close out a short position can itself cause the price of the security or currency to rise further, thereby exacerbating any losses. A Fund that sells short a security or currency it does not own also may have to pay borrowing fees to a broker and may be required to pay the broker any dividends or interest it receives on a borrowed security.
A Fund also may create short investment exposure by taking a derivative position in which the value of the derivative moves in the opposite direction from the price of an underlying investment, pool of investments, index or currency. Short sales of securities or currencies a Fund does not own and “short” derivative positions involve forms of investment leverage, and the amount of the Fund’s potential loss is theoretically unlimited. A Fund is subject to increased leveraging risk and other investment risks described in this “Investment and other risks” section to the extent it sells short securities or currencies it does not own or takes “short” derivative positions.
• FOCUSED INVESTMENT RISK. Funds with investments that are focused in particular countries, regions, sectors, industries or issuers that are subject to the same or similar risk factors and funds with investments whose prices are closely correlated are subject to greater overall risk than funds with investments that are more diversified or whose prices are not as closely correlated.
A Fund that invests in the securities of a small number of issuers has greater exposure to adverse developments affecting those issuers and to a decline in the market price of particular securities than Funds investing in the securities of a larger number of issuers. Securities, sectors, or companies that share common characteristics are often subject to similar business risks and regulatory burdens, and often react similarly to specific economic, market, political or other developments.
Similarly, Funds having a significant portion of their assets in investments tied economically (or related) to a particular geographic region, country (e.g., Taiwan or Japan), or market (e.g., emerging markets), or to sectors within a region, country, or market (e.g., Russian oil) have more exposure to regional and country economic risks than funds making investments throughout the world. The political and economic prospects of one country or group of countries within the same geographic region may affect other countries in that region, and a recession, debt crisis or decline in the value of the currency of one country can spread to other countries. Furthermore, companies in a particular geographic region or country are vulnerable to events affecting other companies in that region or country because they often share common characteristics, are exposed to similar business risks and regulatory burdens, and react similarly to specific economic, market, political or other developments. See also “Non-U.S. Investment Risk”.
• ILLIQUIDITY RISK. Illiquidity risk is the risk that low trading volume, lack of a market maker, large position size, or legal restrictions (including daily price fluctuation limits or “circuit breakers”) limits or prevents a Fund from selling particular securities or closing derivative positions at desirable prices. In addition to these risks, a Fund is exposed to illiquidity risk when it has an obligation to purchase particular securities (e.g., as a result of entering into reverse repurchase agreements, writing a put, or closing a short position). To the extent a Fund’s
43
GMO Trust Funds
Notes to Financial Statements — (Continued)
February 28, 2017
investments include asset-backed securities, distressed, defaulted or other low quality debt securities, emerging country debt securities, securities of companies with smaller market capitalizations or smaller total float adjusted market capitalizations, or emerging market securities, it is subject to increased illiquidity risk. These types of investments can be difficult to value, exposing a Fund to the risk that the price at which it sells them will be less than the price at which they were valued when held by the Fund. Illiquidity risk also may be greater in times of financial stress. For example, Inflation-Protected Securities issued by the U.S. Treasury (“TIPS”) have experienced periods of greatly reduced liquidity during disruptions in fixed income markets, such as the events surrounding the bankruptcy of Lehman Brothers in 2008. Less liquid securities are more susceptible than other securities to price declines when market prices decline generally.
A Fund may buy securities that are less liquid than those in its benchmark.
A Fund’s ability to use options as part of its investment program depends on the liquidity of the options market. In addition, that market may not be liquid when a Fund seeks to close out an option position. Also, the hours of trading for options on an exchange may not conform to the hours during which the securities held by a Fund are traded. To the extent that the options markets close before the markets for the underlying securities, significant price and rate movements can take place in the markets for underlying securities that are not immediately reflected in the options markets. If a Fund receives a redemption request and is unable to close out an option it has sold, the Fund may temporarily be leveraged in relation to its assets.
• LARGE SHAREHOLDER RISK. To the extent a large number of shares of a Fund is held by a single shareholder (e.g., an institutional investor or another GMO Fund) or a group of shareholders with a common investment strategy (e.g., GMO asset allocation accounts), the Fund is subject to the risk that a redemption by those shareholders of all or a large portion of their Fund shares will adversely affect the Fund’s performance by forcing the Fund to sell portfolio securities, potentially at disadvantageous prices, to raise the cash needed to satisfy the redemption request. In addition, the Funds and other accounts over which GMO has investment discretion that invest in the Funds are not limited in how often they may purchase or sell Fund shares. The Asset Allocation Funds and separate accounts managed by GMO for its clients hold substantial percentages of the shares of many Funds, and asset allocation decisions by GMO may result in substantial redemptions from (or investments in) those Funds. These transactions may adversely affect the Fund’s performance to the extent that the Fund is required to sell investments (or invest cash) when it would not otherwise do so. Redemptions of a large number of shares also may increase transaction costs or, by necessitating a sale of portfolio securities, have adverse tax consequences for Fund shareholders. Additionally, redemptions and/or purchases of shares by a large shareholder and/or a group of shareholders over time potentially limit the use of any capital loss carryforwards to offset future realized capital gains (if any) and other losses that would otherwise reduce distributable net investment income. Large shareholders may limit or prevent a Fund’s use of tax equalization for U.S. federal tax purposes. In addition, to the extent a Fund invests in other GMO Funds subject to large shareholder risk, the Fund is indirectly subject to this risk.
• LEVERAGING RISK. The use of reverse repurchase agreements and other derivatives and securities lending creates leverage (i.e., a Fund’s investment exposures exceed its net asset value). Leverage increases a Fund’s losses when the value of its investments (including derivatives) declines. Because many derivatives have a leverage component (i.e., a notional value in excess of the assets needed to establish or maintain the derivative position), adverse changes in the value or level of the underlying asset, rate or index may result in a loss substantially greater than the amount invested in the derivative itself. In the case of swaps, the risk of loss generally is related to a notional principal amount, even if the parties have not made any initial investment. Some derivatives have the potential for unlimited loss, regardless of the size of the initial investment. A Fund’s portfolio also will be leveraged if it borrows money to meet redemption requests or settle investment transactions or if it exercises its right to delay payment on a redemption.
A Fund may manage some of its derivative positions by offsetting derivative positions against one another or against other assets. To the extent offsetting positions do not behave in relation to one another as expected, a Fund may perform as if it were leveraged.
• MANAGEMENT AND OPERATIONAL RISK. Each Fund is subject to management risk because it relies on GMO to achieve its investment objective. Each Fund runs the risk that GMO’s investment techniques will fail to produce desired results and cause the Fund to incur significant losses. GMO also may fail to use derivatives effectively, choosing to hedge or not to hedge positions at disadvantageous times.
For many Funds, GMO often uses quantitative models as part of its investment process. GMO’s models are not necessarily predictive of future market events and use simplifying assumptions that can limit their effectiveness. In addition, the data on which the models are based is subject to limitations (e.g. inaccuracies, staleness) that could adversely affect a Fund’s performance. The Funds also run the risk that GMO’s assessment of an investment (including a company’s fundamental fair (or intrinsic) value) may be wrong.
There can be no assurance that key GMO personnel will continue to be employed by GMO. The loss of their services could have an adverse impact on GMO’s ability to achieve the Funds’ investment objectives.
The Funds also are subject to the risk of loss as a result of other services provided by GMO and other service providers, including pricing, administrative, accounting, tax, legal, custody, transfer agency, and other services. Operational risk includes the possibility of loss caused by inadequate procedures and controls, human error, and system failures by a service provider. For example, trading delays or errors could prevent a
44
GMO Trust Funds
Notes to Financial Statements — (Continued)
February 28, 2017
Fund from benefiting from potential investment gains or avoiding losses. In addition, a service provider may be unable to provide a net asset value (“NAV”) for a Fund or share class on a timely basis. GMO is not contractually liable to the Funds for losses associated with operational risk absent its willful misfeasance, bad faith, gross negligence, or reckless disregard of its contractual obligations to provide services to the Funds. Other Fund service providers also have contractual limitations on their liability to the Funds for losses resulting from their errors.
The Funds and their service providers (including GMO) are susceptible to cyber-attacks and technological malfunctions that may have effects that are similar to those of a cyber-attack. Cyber-attacks include, among others, stealing or corrupting data maintained online or digitally, preventing legitimate users from accessing information or services on a website, releasing confidential information without authorization, and causing operational disruption. Successful cyber-attacks against, or security breakdowns of, a Fund, GMO, a sub-adviser, or a custodian, transfer agent, or other service provider may adversely affect the Fund or its shareholders. For instance, cyber-attacks may interfere with the processing of shareholder transactions, affect a Fund’s ability to calculate its net asset value, cause the release or misappropriation of private shareholder information or confidential Fund information, impede trading, cause reputational damage, and subject the Fund to regulatory fines, penalties or financial losses, reimbursement or other compensation costs, and additional compliance costs. While GMO has established business continuity plans and systems designed to prevent cyber-attacks, such plans and systems are subject to inherent limitations. Similar types of cyber security risks also are present for issuers of securities in which the Funds invest, which could result in material adverse consequences for such issuers, and may cause a Fund’s investment in such securities to lose value.
• MARKET DISRUPTION AND GEOPOLITICAL RISK. The Funds are subject to the risk that geopolitical and other events (e.g., wars and terrorism) will disrupt securities markets and adversely affect global economies and markets, thereby decreasing the value of the Funds’ investments. Sudden or significant changes in the supply or prices of commodities or other economic inputs (e.g., the marked decline in oil prices that began in late 2014) may have material and unexpected effects on both global securities markets and individual countries, regions, sectors, companies, or industries, which could significantly reduce the value of a Fund’s investments. Terrorism in the United States and around the world has increased geopolitical risk. The terrorist attacks on September 11, 2001 resulted in the closure of some U.S. securities markets for four days, and similar attacks are possible in the future. Securities markets may be susceptible to market manipulation (e.g., the manipulation of the London Interbank Offered Rate (LIBOR)) or other fraudulent trading practices, which could disrupt the orderly functioning of markets or reduce the value of investments traded in them, including investments of the Funds. Instances of fraud and other deceptive practices committed by senior management of certain companies in which a Fund invests may undermine GMO’s due diligence efforts with respect to such companies, and if such fraud is discovered, negatively affect the value of the Fund’s investments. In addition, when discovered, financial fraud may contribute to overall market volatility, which can negatively impact a Fund’s investment program. Financial fraud also may impact the rates or indices underlying a Fund’s investments.
While the U.S. government has always honored its credit obligations, a default by the U.S. government (as has been threatened in recent years) would be highly disruptive to the U.S. and global securities markets and could significantly reduce the value of the Funds’ investments. Similarly, political events within the United States at times have resulted, and may in the future result, in a shutdown of government services, which could adversely affect the U.S. economy, decrease the value of many Fund investments, and increase uncertainty in or impair the operation of the U.S. or other securities markets. Uncertainty surrounding the sovereign debt of several European Union countries, as well as the continued existence of the European Union itself, has disrupted and may continue to disrupt markets in the United States and around the world. If a country changes its currency or leaves the European Union or if the European Union dissolves, the world’s securities markets likely will be significantly disrupted. Substantial government interventions (e.g., currency controls) also could adversely affect the Funds. War, terrorism, economic uncertainty, and related geopolitical events have led, and in the future may lead, to increased short-term market volatility and may have adverse long-term effects on U.S. and world economies and markets generally. Likewise, natural and environmental disasters, such as the earthquake and tsunami in Japan in early 2011, and systemic market dislocations of the kind surrounding the insolvency of Lehman Brothers in 2008, if repeated, would be highly disruptive to economies and markets, adversely affecting individual companies and industries, securities markets, interest rates, credit ratings, inflation, investor sentiment, and other factors affecting the value of the Funds’ investments. During such market disruptions, the Funds’ exposure to the risks described elsewhere in this “Investment and other risks” section will likely increase. Market disruptions, including sudden government interventions, can also prevent the Funds from implementing their investment programs and achieving their investment objectives. For example, a market disruption may adversely affect the orderly functioning of the securities markets and may cause the Funds’ derivatives counterparties to discontinue offering derivatives on some underlying commodities, securities, reference rates, or indices, or to offer them on a more limited basis. To the extent a Fund has focused its investments in the stock index of a particular region, adverse geopolitical and other events in that region could have a disproportionate impact on the Fund.
• MARKET RISK. All of the Funds are subject to market risk, which is the risk that the market value of their holdings will decline. Market risks include:
Equities — Funds that invest in equities run the risk that the market price of an equity will decline. That decline may be attributable to factors affecting the issuer, such as poor performance by the company’s management or reduced demand for its goods or services, or to factors affecting a particular industry, such as a decline in demand, labor or raw material shortages, or increased production costs. A decline also may result from general market conditions not specifically related to a company or industry, such as real or perceived adverse economic conditions, changes in the
45
GMO Trust Funds
Notes to Financial Statements — (Continued)
February 28, 2017
general outlook for corporate earnings, changes in interest or currency rates, or adverse investor sentiment generally. Equities generally have significant price volatility, and their market prices can decline in a rapid or unpredictable manner. If a Fund purchases an equity for less than its fundamental fair (or intrinsic) value as determined by GMO, the Fund runs the risk that the market price of the equity will not appreciate or will decline due to GMO’s incorrect assessment of the equity’s fundamental fair (or intrinsic) value. The market prices of equities trading at high multiples of current earnings often are more sensitive to changes in future earnings expectations than the market prices of equities trading at lower multiples.
• NON-DIVERSIFIED FUNDS. Some of the Funds are not “diversified” investment companies within the meaning of the 1940 Act. This means they are allowed to invest in the securities of relatively few issuers. As a result, they may be subject to greater credit, market and other risks, and poor performance by a single issuer may have a greater impact on their performance, than if they were “diversified.”
The following Fund is not a diversified investment company within the meaning of the 1940 Act:
• Foreign Fund
• NON-U.S. INVESTMENT RISK. Funds that invest in non-U.S. securities are subject to more risks than Funds that invest only in U.S. securities. Non-U.S. securities markets often include securities of only a small number of companies in a limited number of industries. As a result, the market prices of many of the securities traded on those markets fluctuate more than those of U.S. securities. In addition, issuers of non-U.S. securities often are not subject to as much regulation as U.S. issuers, and the reporting, accounting, custody, and auditing standards to which those issuers are subject differ, in some cases significantly, from U.S. standards. Transactions in non-U.S. securities generally involve higher commission rates, transfer taxes and custodial costs. In addition, some jurisdictions may limit a Fund’s ability to profit from short-term trading (as defined in the relevant jurisdiction).
A Fund may be subject to non-U.S. taxation, including potentially on a retroactive basis, on (i) capital gains it realizes or dividends, interest, or other amounts it realizes or accrues in respect of non-U.S. investments; (ii) transactions in those investments; and (iii) repatriation of proceeds generated from the sale or other disposition of those investments. A Fund may seek a refund of taxes paid, but its efforts may not be successful, in which case the Fund will have incurred additional expenses for no economic benefit. A Fund’s decision to seek a refund is in its sole discretion, and, particularly in light of the cost involved, it may decide not to seek a refund, even if eligible. The outcome of a Fund’s efforts to obtain a refund may be unpredictable. Accordingly, a refund is not typically reflected in a Fund’s net asset value until it is received or until the Fund determines there is a high likelihood the refund will be received. In some cases, the amount of a refund could be material to a Fund’s net assets. Absent a determination that a refund is collectible and free from significant contingencies, such amount is not typically reflected in a Fund’s net assets.
Also, investing in non-U.S. securities exposes a Fund to the risk of nationalization, expropriation, or confiscatory taxation of assets of their issuers, other government involvement in the economy or in the affairs of specific companies or industries (including in the case of wholly or partially state-owned enterprises), adverse changes in investment regulations, capital requirements or exchange controls (which may include suspension of the ability to transfer currency from a country), and adverse political and diplomatic developments, including the imposition of economic sanctions.
In some non-U.S. securities markets, custody arrangements for securities provide significantly less protection than custody arrangements in U.S. securities markets, and prevailing custody and trade settlement practices (e.g., the requirement to pay for securities prior to receipt) expose a Fund to credit and other risks it does not have in the United States with respect to brokers, custodians, clearing banks or other clearing agents, escrow agents, and issuers. Fluctuations in foreign currency exchange rates also affect the market value of a Fund’s non-U.S. investments (see “Currency Risk”).
The Funds need a license to invest directly in many non-U.S. securities markets. These licenses are often subject to limitations, including maximum investment amounts. Once a license is obtained, a Fund’s ability to continue to invest directly is subject to the risk that the license will be terminated or suspended. If a license to invest in a particular market is terminated or suspended, to obtain exposure to that market the Fund will be required to purchase American Depositary Receipts, Global Depositary Receipts, shares of other funds that are licensed to invest directly, or derivative instruments. The receipt of a non-U.S. license by one of GMO’s clients may preclude other clients, including a Fund, from obtaining a similar license, and this could limit the Fund’s investment opportunities. In addition, the activities of a GMO client could cause the suspension or revocation of a license and thereby limit the Funds’ investment opportunities.
Funds that invest a significant portion of their assets in securities of issuers tied economically to emerging countries (or investments related to emerging markets) are subject to greater non-U.S. investment risk than Funds investing primarily in more developed non-U.S. countries (or markets). The risks of investing in those securities include: greater fluctuations in currency exchange rates; increased risk of default (by both government and private issuers); greater social, economic, and political uncertainty and instability (including the risk of war or natural disaster); increased risk of nationalization, expropriation, or other confiscation of assets of issuers of securities in a Fund’s portfolio; greater governmental involvement in the economy or in the affairs of specific companies or industries (including in the case of wholly or partially state-owned enterprises); less governmental supervision and regulation of the securities markets and participants in those markets; controls on non-U.S.
46
GMO Trust Funds
Notes to Financial Statements — (Continued)
February 28, 2017
investment, capital controls and limitations on repatriation of invested capital, dividends, interest and other income and on a Fund’s ability to exchange local currencies for U.S. dollars; inability to purchase and sell investments or otherwise settle security or derivative transactions (i.e., a market freeze); unavailability of currency hedging techniques; differences in, or lack of, auditing and financial reporting standards and resulting unavailability of material information about issuers; slower clearance and settlement; difficulties in obtaining and enforcing legal judgments; and significantly smaller market capitalizations of issuers. In addition, the economies of emerging countries may be predominantly based on only a few industries or dependent on revenues from particular commodities.
• SMALL COMPANY RISK. Companies with smaller market capitalizations may have limited product lines, markets, or financial resources, may lack the competitive strength of larger companies, may have inexperienced managers or may depend on a smaller group of key employees as compared to larger companies. In addition, their securities often are less widely held and trade less frequently and in lesser quantities, and their market prices often fluctuate more, than the securities of companies with larger market capitalizations. Market risk and illiquidity risk are particularly pronounced for securities of these companies.
Temporary Defensive Positions. Temporary defensive positions are positions that are inconsistent with a Fund’s principal investment strategies and are taken in response to adverse market, economic, political, or other conditions. The Funds normally do not take temporary defensive positions. To the extent a Fund takes a temporary defensive position, or otherwise holds cash, cash equivalents, or high quality debt investments on a temporary basis, the Fund may not achieve its investment objective.
| 4. | Derivative financial instruments |
Derivatives are financial contracts whose value depends on, or is derived from, the value of underlying assets, reference rates, or indices that are used, to increase, decrease or adjust elements of the investment exposures of a Fund’s portfolio. Derivatives may relate to securities, interest rates, currencies, currency exchange rates, inflation rates, commodities and indices, and include foreign currency contracts, swap contracts, reverse repurchase agreements, and other exchange-traded and OTC contracts.
The Funds may use derivatives to gain long investment exposure to securities or other assets. For example, a Fund may use derivatives instead of investing directly in equity securities, including using equity derivatives to maintain equity exposure when it holds cash by “equitizing” its cash balances using futures contracts or other types of derivatives. The Funds also may use currency derivatives (including forward currency contracts, futures contracts, swap contracts and options) to gain exposure to a given currency.
The Funds may use derivatives in an attempt to reduce their investment exposures (which may result in a reduction below zero). A Fund also may use currency derivatives in an attempt to reduce some aspect of the currency exposure in its portfolio. For these purposes, the Fund may use an instrument denominated in a different currency that GMO believes is highly correlated with the relevant currency.
The Funds may use derivatives in an attempt to adjust elements of their investment exposures to various securities, sectors, markets, indices, and currencies without actually having to sell existing investments or make new direct investments. For example, if a Fund holds a large proportion of stocks of companies in a particular sector and GMO believes that stocks of companies in another sector will outperform those stocks, the Fund might use a short futures contract on an appropriate index (to synthetically “sell” a portion of the Fund’s portfolio) in combination with a long futures contract on another index (to synthetically “buy” exposure to that index). In adjusting its investment exposures, a Fund also may use currency derivatives in an attempt to adjust its currency exposure, seeking currency exposure that is different (in some cases, significantly different) from the currencies in which its equities are traded.
The Funds may use derivatives to effect transactions intended as substitutes for securities lending.
The Funds may have investment exposures in excess of their net assets (i.e., they may be leveraged). A Fund’s foreign currency exposure may differ significantly from the currencies in which its equities are traded.
Certain derivatives transactions that may be used by the Funds, including certain interest rate swaps and certain credit default index swaps, are required to be transacted through a central clearing organization. The Funds hold cleared derivatives transactions, if any, through clearing members, who are members of derivatives clearing houses. Certain other derivatives, including futures and certain options, are transacted on exchanges. The Funds hold exchange-traded derivatives, if any, through clearing brokers that are typically members of the exchanges. In contrast to bilateral derivatives transactions, following a period of advance notice to the Fund, clearing brokers generally can require termination of existing cleared or exchange-traded derivatives transactions at any time and increases in margin above the margin that it required at the beginning of a transaction. Clearing houses and exchanges also have broad rights to increase margin requirements for existing transactions and to terminate transactions. Any such increase or termination could interfere with the ability of a Fund to pursue its investment strategy. Also, a Fund is subject to execution risk if it enters into a derivatives transaction that is required to be cleared (or that GMO expects to be cleared), and no clearing member is willing or able to clear the transaction on the Fund’s behalf. In that case, the transaction might have to be terminated, and the Fund could lose some or all of the benefit of any increase in the value of the transaction after the time of the transaction.
47
GMO Trust Funds
Notes to Financial Statements — (Continued)
February 28, 2017
The use of derivatives involves risks that are in addition to, and potentially greater than, the risks associated with investing directly in securities and other more traditional assets. See “Investment and other risks” above for further information.
For Funds that held derivatives during the year ended February 28, 2017, the following table shows how the Fund used these derivatives (marked with an X):
| | | | | | | | | | | | |
| | | | |
| Type of Derivative and Objective for Use | | Foreign
Fund | | | Foreign Small
Companies Fund | | | International Small
Companies Fund | |
| Forward currency contracts | | | | | | | | | | | | |
Adjust exposure to foreign currencies | | | X | | | | X | | | | X | |
| Rights and/or warrants | | | | | | | | | | | | |
Received as a result of corporate actions | | | X | | | | X | | | | X | |
Forward currency contracts
The Funds may enter into forward currency contracts, including forward cross currency contracts. A forward currency contract is an agreement between two parties to buy and sell a currency at a set price on a future date (or to pay or receive the amount of the change in relative values of the two currencies). The market price of a forward currency contract fluctuates with changes in forward currency exchange rates. The value of each of the Fund’s forward currency contracts is marked-to-market daily using rates supplied by a quotation service and changes in value are recorded by each Fund as unrealized gains or losses. Realized gains or losses on the contracts are equal to the difference between the value of the contract at the time it was opened and the value at the time it was settled.
These contracts involve market risk in excess of the unrealized gain or loss. Forward currency contracts expose a Fund to the market risk of unfavorable movements in currency values and the risk that the counterparty will be unable or unwilling to meet the terms of the contracts. Most forward currency contracts are not collateralized. Forward currency contracts outstanding at the end of the year, if any, are listed in each applicable Fund’s Schedule of Investments.
Futures contracts
The Funds may purchase and sell futures contracts. A futures contract is a contract that obligates the holder to buy or sell an asset at a predetermined delivery price at a specified time in the future. Some futures contracts are net (cash) settled. Upon entering into a futures contract, a Fund is required to deposit cash, U.S. government and agency obligations or other liquid assets with the futures clearing broker in accordance with the initial margin requirements of the broker or exchange. Futures contracts are generally valued at the settlement price established at the close of business each day by the board of trade or exchange on which they are traded (and if the futures are traded outside the U.S. and the market for such futures is closed prior to the close of the NYSE due to time zone differences, the values will be adjusted, to the extent practicable and available, based on inputs from an independent pricing service approved by the Trustees to reflect estimated valuation changes through the NYSE close). The value of each of the Fund’s futures contracts is marked-to-market daily and an appropriate payable or receivable for the change in value (“variation margin”) is recorded by each Fund. The payable or receivable is settled on the following business day. Gains or losses are recognized but not accounted for as realized until the contracts expire or are closed. Futures contracts involve, to varying degrees, risk of loss in excess of the variation margin as recorded on the Statements of Assets and Liabilities. Under some circumstances, futures exchanges may establish daily limits on the amount that the price of a futures contract can vary from the previous day’s settlement price, thereby effectively preventing liquidation of unfavorable positions. Futures contracts expose the Funds to the risk that they may not be able to enter into a closing transaction due to an illiquid market. Futures contracts outstanding at the end of the year, if any, are listed in each applicable Fund’s Schedule of Investments.
Options
The Funds may purchase call and put options. A call option gives the holder the right to buy an asset; a put option gives the holder the right to sell an asset. “Quanto” options are cash-settled options in which the underlying asset (often an index) is denominated in a currency other than the currency in which the option is settled. By purchasing options a Fund alters its exposure to the underlying asset by, in the case of a call option, entitling it to purchase the underlying asset at a set price from the writer of the option and, in the case of a put option, entitling it to sell the underlying asset at a set price to the writer of the option. A Fund pays a premium for a purchased option. That premium, if any, which is disclosed in the Schedule of Investments, is subsequently reflected in the marked-to-market value of the option. The potential loss associated with purchasing put and call options is limited to the premium paid. Purchased option contracts outstanding at the end of the year, if any, are listed in each applicable Fund’s Schedule of Investments.
The Funds may write (i.e., sell) call and put options on futures, swaps (“swaptions”), securities or currencies they own or in which they may invest. Writing options alters a Fund’s exposure to the underlying asset by, in the case of a call option, obligating that Fund to sell the underlying asset at a set price to the option-holder and, in the case of a put option, obligating that Fund to purchase the underlying asset at a set price from the
48
GMO Trust Funds
Notes to Financial Statements — (Continued)
February 28, 2017
option-holder. In some cases (e.g., index options), settlement will be in cash, based on a formula price. When a Fund writes a call or put option, an amount equal to the premium received is recorded as a liability and is subsequently included in the marked-to-market value of the option. As a writer of an option, a Fund has no control over whether it will be required to sell (call) or purchase (put) the underlying asset and as a result bears the risk of an unfavorable change in the price of the asset underlying the option. In the event that a Fund writes call options without an offsetting exposure (e.g., call options on an asset that the Fund does not own), it bears an unlimited risk of loss if the price of the underlying asset increases during the term of the option. OTC options expose a Fund to the risk the Fund may not be able to enter into a closing transaction because of an illiquid market. Written option contracts outstanding at the end of the year, if any, are listed in each applicable Fund’s Schedule of Investments.
When an option contract is closed, that Fund records a realized gain or loss equal to the difference between the value of the contract at the time it was opened and the value at the time it was closed. Realized gains and losses on purchased options are included in realized gains and losses on investment securities. If a written call option is exercised, the premium originally received is recorded as an addition to sales proceeds. If a written put option is exercised, the premium originally received is recorded as a reduction in the cost of investments purchased. Gains and losses from the
expiration or closing of written option contracts are separately disclosed in the Statements of Operations.
Exchange-traded options are valued at the last sale price, provided that price is between the closing bid and ask prices. If the last sale price is not within this range, then they will be valued at the closing bid price for long positions and the closing ask price for short positions (and if the market of the underlying reference security closes or the official closing time of the underlying index occurs prior to the close of the NYSE due to time zone differences, the values will be adjusted, to the extent practicable and available, based on inputs from an independent pricing service approved by the Trustees to reflect estimated valuation changes through the NYSE close). The Funds value OTC options using industry models and inputs provided by primary pricing sources.
Swap contracts
The Funds may directly or indirectly use various swap contracts, including, without limitation, swaps on securities and securities indices, total return swaps, interest rate swaps, credit default swaps, variance swaps, commodity swaps, inflation swaps, municipal swaps, dividend swaps, volatility swaps, correlation swaps and other types of available swaps. A swap contract is an agreement to exchange the return generated by one asset for the return generated by another asset. Some swap contracts are net settled. When entering into a swap contract and during the term of the
transaction, a Fund and/or the swap counterparty may post or receive cash or securities as collateral.
Initial upfront payments received or made upon entering into a swap contract are included in the fair market value of the swap. The Funds do not amortize upfront payments. Net periodic payments made or received to compensate for differences between the stated terms of the swap contract and prevailing market conditions (credit spreads, currency exchange rates, interest rates, and other relevant factors) are recorded as realized gains or losses in the Statements of Operations. A liquidation payment received or made at the termination of the swap contract is recorded as realized
gain or loss in the Statements of Operations.
Interest rate swap contracts involve an exchange by the parties of their respective commitments to pay or rights to receive interest (e.g., an exchange of floating rate interest payments for fixed rate interest payments with respect to the notional amount of principal). Basis swaps are interest rate swaps that involve the exchange of two floating interest rate payments and may involve the exchange of two different currencies.
Total return swap contracts involve a commitment by one party to pay interest to the other party in exchange for a payment to it from the other party based on the return of a reference asset (e.g., a security, basket of securities, or futures contract), both based on notional amounts. To the extent the return of the reference asset exceeds or falls short of the interest payments, one party is entitled to receive a payment from or obligated to make a payment to the other party.
In a credit default swap contract, one party makes payments to another party in exchange for the right to receive a specified return (or to put a security) if a credit event (e.g., default or similar event) occurs with respect to a reference entity or entities. A seller of credit default protection receives periodic payments in return for its obligation to pay the principal amount of a debt security (or other agreed-upon value) to the other party upon the occurrence of a credit event. If no credit event occurs, the seller has no payment obligations so long as there is no early termination.
For credit default swap contracts on asset-backed securities, a credit event may be triggered by various occurrences, which may include an issuer’s failure to pay interest or principal on a reference security, a breach of a material representation or covenant, an agreement by the holders of an asset-backed security to a maturity extension, or a write-down on the collateral underlying the security. For credit default swap contracts on corporate or sovereign issuers, a credit event may be triggered by such occurrences as the issuer’s bankruptcy, failure to pay interest or principal, repudiation/moratorium and/or restructuring.
Variance swap contracts involve an agreement by two parties to exchange cash flows based on the measured variance (or square of volatility) of a specified underlying asset. One party agrees to exchange a “fixed rate” or strike price payment for the “floating rate” or realized price variance on the underlying asset with respect to the notional amount. At inception, the strike price chosen is generally fixed at a level such that the fair value of the swap is zero. As a result, no money changes hands at the initiation of the contract. At the expiration date, the amount payable by one party to the other is the difference between the realized price variance of the underlying asset and the strike price multiplied by the notional amount. A
49
GMO Trust Funds
Notes to Financial Statements — (Continued)
February 28, 2017
receiver of the realized price variance would be entitled to receive a payment when the realized price variance of the underlying asset is greater than the strike price and would be obligated to make a payment when that variance is less than the strike price. A payer of the realized price variance would be obligated to make a payment when the realized price variance of the underlying asset is greater than the strike price and would be entitled to receive a payment when that variance is less than the strike price. This type of agreement is essentially a forward contract on the future realized price variance of the underlying asset.
Generally, the Funds price their OTC swap contracts daily using industry standard models that may incorporate quotations from market makers or pricing vendors and record the change in value, if any, as unrealized gain or loss in the Statements of Operations. Gains or losses are realized upon the termination of the swap contracts or reset dates, as appropriate. Cleared swap contracts are valued using the quote (which may be based on a model) published by the relevant clearing house. If an updated quote for a cleared swap contract is not available by the time that a Fund calculates its net asset value on any business day, then that swap contract will generally be valued using an industry standard model, which may differ from the model used by the relevant clearing house.
The values assigned to swap contracts may differ significantly from the values realized upon termination, and the differences could be material. Entering into swap contracts involves counterparty credit, legal, and documentation risk that is generally not reflected in the value assigned to the swap contract. Such risks include the possibility that the counterparty defaults on its obligations to perform or disagrees as to the meaning of contractual terms, that a Fund has amounts on deposit in excess of amounts owed by that Fund, or that any collateral the other party posts is insufficient or not timely received by a Fund. Credit risk is particularly acute in economic environments in which financial services firms are exposed to systemic risks of the type evidenced by the insolvency of Lehman Brothers in 2008 and subsequent market disruptions. Swap contracts outstanding at the end of the year, if any, are listed in each applicable Fund’s Schedule of Investments.
Rights and warrants
The Funds may purchase or otherwise receive warrants or rights. Warrants and rights generally give the holder the right to receive, upon exercise, a security of the issuer at a set price. Funds typically use warrants and rights in a manner similar to their use of purchased options on securities, as described in the section entitled “Options” above. Risks associated with the use of warrants and rights are generally similar to risks associated with the use of purchased options. However, warrants and rights often do not have standardized terms, and may have longer maturities and may be less liquid than exchange-traded options. In addition, the terms of warrants or rights may limit a Fund’s ability to exercise the warrants or rights at such times and in such quantities as the Fund would otherwise wish. Rights and/or warrants outstanding at the end of the year, if any, are listed in each applicable Fund’s Schedule of Investments.
As provided by U.S. GAAP, the table below is based on market values or unrealized appreciation/(depreciation) rather than the notional amounts of derivatives. Changes to market values of reference asset(s) will tend to have a greater impact on the Funds (with correspondingly greater risk) the greater the notional amount. For further information on notional amounts, see the Schedule of Investments.
The following is a summary of the valuations of derivative instruments categorized by risk exposure.
The Effect of Derivative Instruments on the Statements of Assets and Liabilities as of February 28, 2017 and the Statements of Operations for the year ended February 28, 2017^:
The risks referenced in the tables below are not intended to be inclusive of all risks. Please see the “Investment and other risks” and “Portfolio valuation” sections for a further discussion of risks.
| | | | | | | | | | | | | | | | | | | | | | | | |
| | | | | | | |
| | | Credit
Contracts | | | Equity
Contracts | | | Foreign
Currency
Contracts | | | Interest
Rate
Contracts | | | Other
Contracts | | | Total | |
Foreign Fund | | | | | | | | | | | | | | | | | | | | | | | | |
Asset Derivatives | | | | | | | | | | | | | | | | | | | | | | | | |
Unrealized Appreciation on Forward Currency Contracts | | $ | — | | | $ | — | | | $ | 75,407 | | | $ | — | | | $ | — | | | $ | 75,407 | |
| | | | | | | | | | | | | | | | | | | | | | | | | |
Total | | $ | — | | | $ | — | | | $ | 75,407 | | | $ | — | | | $ | — | | | $ | 75,407 | |
| | | | | | | | | | | | | | | | | | | | | | | | | |
Derivatives not subject to Master Agreements | | $ | — | | | $ | — | | | $ | — | | | $ | — | | | $ | — | | | $ | — | |
| | | | | | | | | | | | | | | | | | | | | | | | | |
Total subject to Master Agreements | | $ | — | | | $ | — | | | $ | 75,407 | | | $ | — | | | $ | — | | | $ | 75,407 | |
| | | | | | | | | | | | | | | | | | | | | | | | | |
Liability Derivatives | | | | | | | | | | | | | | | | | | | | | | | | |
Unrealized Depreciation on Forward Currency Contracts | | $ | — | | | $ | — | | | $ | (59,826 | ) | | $ | — | | | $ | — | | | $ | (59,826 | ) |
| | | | | | | | | | | | | | | | | | | | | | | | | |
Total | | $ | — | | | $ | — | | | $ | (59,826 | ) | | $ | — | | | $ | — | | | $ | (59,826 | ) |
| | | | | | | | | | | | | | | | | | | | | | | | | |
Derivatives not subject to Master Agreements | | $ | — | | | $ | — | | | $ | — | | | $ | — | | | $ | — | | | $ | — | |
| | | | | | | | | | | | | | | | | | | | | | | | | |
Total subject to Master Agreements | | $ | — | | | $ | — | | | $ | (59,826 | ) | | $ | — | | | $ | — | | | $ | (59,826 | ) |
| | | | | | | | | | | | | | | | | | | | | | | | | |
| | | | | | | | | | | | | | | | | | | | | | | | | |
50
GMO Trust Funds
Notes to Financial Statements — (Continued)
February 28, 2017
| | | | | | | | | | | | | | | | | | | | | | | | |
| | | | | | | |
| | | Credit
Contracts | | | Equity
Contracts | | | Foreign
Currency
Contracts | | | Interest
Rate
Contracts | | | Other
Contracts | | | Total | |
Foreign Fund (continued) | | | | | | | | | | | | | | | | | | | | | | | | |
Net Realized Gain (Loss) on | | | | | | | | | | | | | | | | | | | | | | | | |
Forward Currency Contracts | | $ | — | | | $ | — | | | $ | 250,809 | | | $ | — | | | $ | — | | | $ | 250,809 | |
| | | | | | | | | | | | | | | | | | | | | | | | | |
Total | | $ | — | | | $ | — | | | $ | 250,809 | | | $ | — | | | $ | — | | | $ | 250,809 | |
| | | | | | | | | | | | | | | | | | | | | | | | | |
Change in Net Unrealized Appreciation (Depreciation) on | | | | | | | | | | | | | | | | | | | | | | | | |
Forward Currency Contracts | | $ | — | | | $ | — | | | $ | 15,581 | | | $ | — | | | $ | — | | | $ | 15,581 | |
| | | | | | | | | | | | | | | | | | | | | | | | | |
Total | | $ | — | | | $ | — | | | $ | 15,581 | | | $ | — | | | $ | — | | | $ | 15,581 | |
| | | | | | | | | | | | | | | | | | | | | | | | | |
| | | | | | | | | | | | | | | | | | | | | | | | | |
Foreign Small Companies Fund | | | | | | | | | | | | | | | | | | | | | | | | |
Asset Derivatives | | | | | | | | | | | | | | | | | | | | | | | | |
Forward Currency Contracts | | $ | — | | | $ | — | | | $ | 17,435 | | | $ | — | | | $ | — | | | $ | 17,435 | |
| | | | | | | | | | | | | | | | | | | | | | | | | |
Total | | $ | — | | | $ | — | | | $ | 17,435 | | | $ | — | | | $ | — | | | $ | 17,435 | |
| | | | | | | | | | | | | | | | | | | | | | | | | |
Derivatives not subject to Master Agreements | | $ | — | | | $ | — | | | $ | — | | | $ | — | | | $ | — | | | $ | — | |
| | | | | | | | | | | | | | | | | | | | | | | | | |
Total subject to Master Agreements | | $ | — | | | $ | — | | | $ | 17,435 | | | $ | — | | | $ | — | | | $ | 17,435 | |
| | | | | | | | | | | | | | | | | | | | | | | | | |
Liability Derivatives | | | | | | | | | | | | | | | | | | | | | | | | |
Unrealized Depreciation on Forward Currency Contracts | | $ | — | | | $ | — | | | $ | (319,478 | ) | | $ | — | | | $ | — | | | $ | (319,478 | ) |
| | | | | | | | | | | | | | | | | | | | | | | | | |
Total | | $ | — | | | $ | — | | | $ | (319,478 | ) | | $ | — | | | $ | — | | | $ | (319,478 | ) |
| | | | | | | | | | | | | | | | | | | | | | | | | |
Derivatives not subject to Master Agreements | | $ | — | | | $ | — | | | $ | — | | | $ | — | | | $ | — | | | $ | — | |
| | | | | | | | | | | | | | | | | | | | | | | | | |
Total subject to Master Agreements | | $ | — | | | $ | — | | | $ | (319,478 | ) | | $ | — | | | $ | — | | | $ | (319,478 | ) |
| | | | | | | | | | | | | | | | | | | | | | | | | |
Net Realized Gain (Loss) on | | | | | | | | | | | | | | | | | | | | | | | | |
Investments (rights and/or warrants) | | $ | — | | | $ | (125,063 | ) | | $ | — | | | $ | — | | | $ | — | | | $ | (125,063 | ) |
Forward Currency Contracts | | | — | | | | — | | | | 415,637 | | | | — | | | | — | | | | 415,637 | |
| | | | | | | | | | | | | | | | | | | | | | | | | |
Total | | $ | — | | | $ | (125,063 | ) | | $ | 415,637 | | | $ | — | | | $ | — | | | $ | 290,574 | |
| | | | | | | | | | | | | | | | | | | | | | | | | |
Change in Net Unrealized Appreciation (Depreciation) on | | | | | | | | | | | | | | | | | | | | | | | | |
Forward Currency Contracts | | $ | — | | | $ | — | | | $ | (302,043 | ) | | $ | — | | | $ | — | | | $ | (302,043 | ) |
| | | | | | | | | | | | | | | | | | | | | | | | | |
Total | | $ | — | | | $ | — | | | $ | (302,043 | ) | | $ | — | | | $ | — | | | $ | (302,043 | ) |
| | | | | | | | | | | | | | | | | | | | | | | | | |
| | | | | | | | | | | | | | | | | | | | | | | | | |
International Small Companies Fund | | | | | | | | | | | | | | | | | | | | | | | | |
Liability Derivatives | | | | | | | | | | | | | | | | | | | | | | | | |
Unrealized Depreciation on Forward Currency Contracts | | $ | — | | | $ | — | | | $ | (40,193 | ) | | $ | — | | | $ | — | | | $ | (40,193 | ) |
| | | | | | | | | | | | | | | | | | | | | | | | | |
Total | | $ | — | | | $ | — | | | $ | (40,193 | ) | | $ | — | | | $ | — | | | $ | (40,193 | ) |
| | | | | | | | | | | | | | | | | | | | | | | | | |
Derivatives not subject to Master Agreements | | $ | — | | | $ | — | | | $ | — | | | $ | — | | | $ | — | | | $ | — | |
| | | | | | | | | | | | | | | | | | | | | | | | | |
Total subject to Master Agreements | | $ | — | | | $ | — | | | $ | (40,193 | ) | | $ | — | | | $ | — | | | $ | (40,193 | ) |
| | | | | | | | | | | | | | | | | | | | | | | | | |
| | | | | | | | | | | | | | | | | | | | | | | | | |
Net Realized Gain (Loss) on | | | | | | | | | | | | | | | | | | | | | | | | |
Investments (rights and/or warrants) | | $ | — | | | $ | 25,952 | | | $ | — | | | $ | — | | | $ | — | | | $ | 25,952 | |
Forward Currency Contracts | | | — | | | | — | | | | 209,220 | | | | — | | | | — | | | | 209,220 | |
| | | | | | | | | | | | | | | | | | | | | | | | | |
Total | | $ | — | | | $ | 25,952 | | | $ | 209,220 | | | $ | — | | | $ | — | | | $ | 235,172 | |
| | | | | | | | | | | | | | | | | | | | | | | | | |
| | | | | | | | | | | | | | | | | | | | | | | | | |
51
GMO Trust Funds
Notes to Financial Statements — (Continued)
February 28, 2017
| | | | | | | | | | | | | | | | | | | | | | | | |
| | | | | | | |
| | | Credit
Contracts | | | Equity
Contracts | | | Foreign
Currency
Contracts | | | Interest
Rate
Contracts | | | Other
Contracts | | | Total | |
International Small Companies Fund (continued) | | | | | | | | | | | | | | | | | | | | | | | | |
Change in Net Unrealized Appreciation (Depreciation) on | | | | | | | | | | | | | | | | | | | | | | | | |
Investments (rights and/or warrants) | | $ | — | | | $ | (169 | ) | | $ | — | | | $ | — | | | $ | — | | | $ | (169 | ) |
Forward Currency Contracts | | | — | | | | — | | | | (40,193 | ) | | | — | | | | — | | | | (40,193 | ) |
| | | | | | | | | | | | | | | | | | | | | | | | | |
Total | | $ | — | | | $ | (169 | ) | | $ | (40,193 | ) | | $ | — | | | $ | — | | | $ | (40,362 | ) |
| | | | | | | | | | | | | | | | | | | | | | | | | |
| | | | | | | | | | | | | | | | | | | | | | | | | |
| | ^ | Because the Funds recognize changes in value through the Statements of Operations, they do not qualify for hedge accounting under authoritative guidance for derivative instruments. The Funds’ investments in derivatives may represent an economic hedge; however, they are considered to be non-hedge transactions for the purpose of these tables. |
Certain Funds are party to International Swaps and Derivatives Association, Inc. Master Agreements, Global Master Repurchase Agreements or other similar types of agreements (collectively, “Master Agreements”) that generally govern the terms of some OTC derivative transactions, repurchase agreements and reverse repurchase agreements. The Master Agreements may include collateral posting terms and netting provisions that apply in the event of a default and/or termination event. Upon the occurrence of such an event, including the bankruptcy or insolvency of the counterparty, the Master Agreements may permit the non-defaulting party to calculate a single net payment to close out applicable transactions. However, there is no guarantee that the terms of a Master Agreement will be enforceable; for example, when bankruptcy or insolvency laws impose restrictions on or prohibitions against the right of offset. Additionally, the netting and close out provisions of a Master Agreement may not extend to the obligations of the counterparty’s affiliates or across varying types of transactions. Because no such event has occurred, the Funds do not presently have a legally enforceable right of set-off, and these amounts have not been offset in the Statements of Assets and Liabilities, but have been presented separately in the table below. Termination events may also include a decline in the net assets of a Fund below a certain level over a specified period of time and may entitle a counterparty to elect to terminate early with respect to some or all the transactions under the Master Agreement with that counterparty. Such an election by one or more of the counterparties could have a material adverse impact on a Fund’s operations. An estimate of the aggregate net payment, if any, that may need to be made by a Fund in such an event is represented by the unrealized amounts in the tables below. For more information about other uncertainties and risks, see “Investments and other risks” above.
For financial reporting purposes, on the Statements of Assets and Liabilities any cash collateral that has been pledged to cover obligations of the Funds is reported as Due from Broker and any cash collateral received from the counterparty is reported as Due to Broker. Any non-cash collateral pledged by the Funds is noted in the Schedules of Investments. The tables below show the potential effect of netting arrangements made available by the Master Agreements on the financial position of the Funds. For financial reporting purposes, the Funds’ Statements of Assets and Liabilities generally show derivative assets and derivative liabilities (regardless of whether they are subject to netting arrangements) on a gross basis, which reflects the full risks and exposures of the Fund prior to netting. See Note 2 for information on repurchase agreements and reverse repurchase agreements held by the Funds at February 28, 2017, if any.
Foreign Fund
| | | | | | | | | | | | | | | | |
| | | | | |
| Counterparty | | Gross Derivative
Assets Subject to
Master Agreements | | | Collateral
Received | | | Derivative
Assets/(Liabilities)
Available for Offset | | | Net Amount
of Derivative
Assets | |
Goldman Sachs International | | $ | 75,407 | | | $ | — | | | $ | — | | | $ | 75,407 | |
| | | | | | | | | | | | | | | | | |
Total | | $ | 75,407 | | | $ | — | | | $ | — | | | $ | 75,407 | |
| | | | | | | | | | | | | | | | | |
| | | | | | | | | | | | | | | | | |
| | | | | |
| Counterparty | | Gross Derivative
Liabilities Subject to
Master Agreements | | | Collateral
Pledged | | | Derivative
(Assets)/Liabilities
Available for Offset | | | Net Amount
of Derivative
Liabilities | |
Citibank N.A. | | $ | 59,826 | | | $ | — | | | $ | — | | | $ | 59,826 | |
| | | | | | | | | | | | | | | | | |
Total | | $ | 59,826 | | | $ | — | | | $ | — | | | $ | 59,826 | |
| | | | | | | | | | | | | | | | | |
| | | | | | | | | | | | | | | | | |
52
GMO Trust Funds
Notes to Financial Statements — (Continued)
February 28, 2017
Foreign Small Companies Fund
| | | | | | | | | | | | | | | | |
| | | | | |
| Counterparty | | Gross Derivative
Assets Subject to
Master Agreements | | | Collateral
Received | | | Derivative
Assets/(Liabilities)
Available for Offset | | | Net Amount
of Derivative
Assets | |
Morgan Stanley & Co. International PLC | | $ | 17,435 | | | $ | — | | | $ | — | | | $ | 17,435 | |
| | | | | | | | | | | | | | | | | |
Total | | $ | 17,435 | | | $ | — | | | $ | — | | | $ | 17,435 | |
| | | | | | | | | | | | | | | | | |
| | | | | | | | | | | | | | | | | |
| | | | | |
| Counterparty | | Gross Derivative
Liabilities Subject to
Master Agreements | | | Collateral
Pledged | | | Derivative
(Assets)/Liabilities
Available for Offset | | | Net Amount
of Derivative
Liabilities | |
Citibank N.A. | | $ | 153,836 | | | $ | — | | | $ | — | | | $ | 153,836 | |
Goldman Sachs International | | | 165,642 | | | | — | | | | — | | | | 165,642 | |
| | | | | | | | | | | | | | | | | |
Total | | $ | 319,478 | | | $ | — | | | $ | — | | | $ | 319,478 | |
| | | | | | | | | | | | | | | | | |
| | | | | | | | | | | | | | | | | |
International Small Companies Fund
| | | | | | | | | | | | | | | | |
| | | | | |
| Counterparty | | Gross Derivative
Liabilities Subject to
Master Agreements | | | Collateral
Pledged | | | Derivative
(Assets)/Liabilities
Available for Offset | | | Net Amount
of Derivative
Liabilities | |
Citibank N.A. | | $ | 20,539 | | | $ | — | | | $ | — | | | $ | 20,539 | |
Goldman Sachs International | | | 19,654 | | | | — | | | | — | | | | 19,654 | |
| | | | | | | | | | | | | | | | | |
Total | | $ | 40,193 | | | $ | — | | | $ | — | | | $ | 40,193 | |
| | | | | | | | | | | | | | | | | |
| | | | | | | | | | | | | | | | | |
The average derivative activity of notional amounts (forward currency contracts) and market values (rights and/or warrants) outstanding, based on absolute values, at each month-end, was as follows for the year ended February 28, 2017:
| | | | | | | | |
| | | |
| Fund Name | | Forward
Currency
Contracts ($) | | | Rights and/or
Warrants ($) | |
Foreign Fund | | | 3,468,014 | | | | 23,924 | * |
Foreign Small Companies Fund | | | 9,483,976 | | | | 13,435 | |
International Small Companies Fund | | | 1,381,019 | | | | 41,386 | |
| | * | During the year ended February 28, 2017, the Fund did not hold this investment type at any month-end; therefore, the average amount outstanding was calculated using daily outstanding absolute values. |
| 5. | Fees and other transactions with affiliates |
GMO receives a management fee for the services it provides to each Fund. Management fees are paid monthly at the annual rate equal to the percentage of each Fund’s average daily net assets set forth in the table below:
| | | | | | | | | | | | |
| | | | |
| | | Foreign
Fund | | | Foreign Small
Companies Fund | | | International Small
Companies Fund | |
Management Fee | | | 0.60% | | | | 0.70% | | | | 0.60% | |
In addition, each class of shares of certain Funds pays GMO a shareholder service fee for providing client services and reporting, such as performance information, client account information, personal and electronic access to Fund information, access to analysis and explanations of
53
GMO Trust Funds
Notes to Financial Statements — (Continued)
February 28, 2017
Fund reports, and assistance in maintaining and correcting client-related information. Shareholder service fees are paid monthly equal to the percentage of each applicable Fund’s average daily net assets set forth in the table below:
| | | | | | | | | | | | |
| | | | |
| Fund Name | | Class II | | | Class III | | | Class IV | |
Foreign Fund | | | 0.22% | | | | 0.15% | | | | 0.09% | |
Foreign Small Companies Fund | | | | | | | 0.15% | | | | 0.10% | |
International Small Companies Fund | | | | | | | 0.15% | | | | | |
For each Fund, GMO has contractually agreed to reimburse the Fund for its “Specified Operating Expenses” (as defined below). Any such reimbursements are paid to a Fund concurrently with the Fund’s payment of management fees to GMO.
“Specified Operating Expenses” means: audit expenses, fund accounting expenses, pricing service expenses, expenses of non-investment related tax services, transfer agency expenses, expenses of non-investment related legal services provided to the Funds by or at the direction of GMO, federal securities law filing expenses, printing expenses, state and federal registration fees and custody expenses.
For each Fund that pays GMO a management fee, GMO has contractually agreed to waive or reduce that fee, but not below zero, to the extent necessary to offset the management fees paid to GMO that are directly or indirectly borne by the Fund as a result of the Fund’s direct or indirect investments in other GMO Funds.
For each Fund that charges a shareholder service fee, GMO has contractually agreed to waive or reduce the shareholder service fee charged to holders of each class of shares of the Fund, but not below zero, to the extent necessary to offset the shareholder service fees directly or indirectly borne by the class of shares of the Fund as a result of the Fund’s direct or indirect investments in other GMO Funds.
These contractual waivers and reimbursements will continue through at least June 30, 2017 for each Fund unless the Funds’ Board of Trustees authorizes their modification or termination, or reduces the fee rates paid to GMO under the Fund’s management contract or servicing and supplemental support agreement.
The Funds’ portion of the gross fees paid by the Trust to the Trust’s independent Trustees and their legal counsel and any agents unaffiliated with GMO during the year ended February 28, 2017 is shown in the table below and is included in the Statements of Operations.
| | | | | | | | |
| | | |
| Fund Name | | Independent Trustees
and their legal counsel ($) | | | Agent unaffiliated
with GMO ($) | |
Foreign Fund | | | 2,476 | | | | 337 | |
Foreign Small Companies Fund | | | 16,162 | | | | 1,550 | |
International Small Companies Fund | | | 3,187 | | | | 303 | |
Certain Funds incur fees and expenses indirectly as a shareholder in the underlying funds. For the year ended February 28, 2017 these indirect fees and expenses expressed as a percentage of each Fund’s average daily net assets were as follows:
| | | | | | | | | | | | |
| | | | |
| Fund Name | | Indirect Net Expenses
(excluding shareholder
service fees) | | | Indirect Shareholder
Service Fees | | | Total Indirect
Expenses | |
Foreign Fund | | | <0.001% | | | | 0.000% | | | | <0.001% | |
Foreign Small Companies Fund | | | <0.001% | | | | 0.000% | | | | <0.001% | |
International Small Companies Fund | | | <0.001% | | | | 0.000% | | | | <0.001% | |
The Funds are permitted to purchase or sell securities from or to certain other GMO funds under specified conditions outlined in procedures adopted by the Trustees. The procedures have been designed to ensure that any purchase or sale of securities by a Fund from another fund or portfolio that is or could be considered an affiliate by virtue of having a common investment adviser (or affiliated investment advisers), common Trustees and/or common officers complies with Rule 17a-7 of the 1940 Act. Further, as defined under the procedures, each transaction is effectuated at the current market price. During the year ended February 28, 2017, the Funds did not engage in these transactions.
54
GMO Trust Funds
Notes to Financial Statements — (Continued)
February 28, 2017
| 6. | Purchases and sales of securities |
Cost of purchases and proceeds from sales of securities, excluding short-term investments and including GMO U.S. Treasury Fund, for the year ended February 28, 2017 are noted in the table below:
| | | | | | | | | | | | | | | | |
| | | | | |
| | | Purchases ($) | | | Purchases ($) | | | Sales ($) | | | Sales ($) | |
| | | | | |
| Fund Name | | U.S. Government
Securities | | | Investments (Non-U.S.
Government Securities) | | | U.S. Government
Securities | | | Investments (Non-U.S.
Government Securities) | |
Foreign Fund | | | — | | | | 119,359,649 | | | | — | | | | 151,319,568 | |
Foreign Small Companies Fund | | | — | | | | 462,587,150 | | | | — | | | | 687,582,892 | |
International Small Companies Fund | | | — | | | | 315,371,817 | | | | — | | | | 462,261,586 | |
In the normal course of business the Funds enter into contracts with third-party service providers that contain a variety of representations and warranties and that provide general indemnifications. The Funds’ maximum exposure under these arrangements is unknown, as it involves possible future claims that may or may not be made against the Funds. Based on experience, GMO is of the view that the risk of loss to the Funds in connection with the Funds’ indemnification obligations is remote; however, there can be no assurance that such obligations will not result in material liabilities that adversely affect the Funds.
| 8. | Principal shareholders and related parties as of February 28, 2017 |
| | | | | | | | | | | | | | | | |
| | | | | |
| Fund Name | | Number of
shareholders that held
more than 10% of the
outstanding shares of
the Fund | | | Percentage of outstanding shares of
the Fund held by those
shareholders owning
greater than 10% of the
outstanding shares of
the Fund | | | Percentage of the
shares of the Fund held
by senior management
of GMO and
GMO Trust officers | | | Percentage of the
Fund’s shares held by
accounts for which
GMO has
investment discretion | |
Foreign Fund | | | 2 | | | | 66.25% | | | | 1.21% | | | | — | |
Foreign Small Companies Fund | | | 2 | | | | 69.60% | | | | <0.01% | | | | — | |
International Small Companies Fund | | | 2 | | | | 85.27% | | | | 0.09% | | | | — | |
The Declaration of Trust permits each Fund to issue an unlimited number of shares of beneficial interest (without par value). Transactions in the Funds’ shares were as follows:
| | | | | | | | | | | | | | | | |
| | | Year Ended
February 28, 2017 | | | Year Ended
February 29, 2016 | |
| | | | | |
| | | Shares | | | Amount | | | Shares | | | Amount | |
Foreign Fund | | | | | | | | | | | | | | | | |
| Class II: | | | | | | | | | | | | | | | | |
Shares sold | | | 374,261 | | | $ | 4,198,496 | | | | 67,258 | | | $ | 775,061 | |
Shares issued to shareholders in reinvestment of distributions | | | 158,890 | | | | 1,778,511 | | | | 266,995 | | | | 3,069,952 | |
Shares repurchased | | | (1,862,117 | ) | | | (20,992,503 | ) | | | (2,489,243 | ) | | | (29,283,704 | ) |
| | | | | | | | | | | | | | | | | |
Net increase (decrease) | | | (1,328,966 | ) | | $ | (15,015,496 | ) | | | (2,154,990 | ) | | $ | (25,438,691 | ) |
| | | | | | | | | | | | | | | | | |
Class III: | | | | | | | | | | | | | | | | |
Shares sold | | | — | | | $ | — | | | | 2,643,774 | | | $ | 29,943,507 | |
Shares issued to shareholders in reinvestment of distributions | | | 185,880 | | | | 2,088,090 | | | | 30,052 | | | | 358,824 | |
Shares repurchased | | | (1,501,867 | ) | | | (16,661,841 | ) | | | (7,377,328 | ) | | | (90,109,908 | ) |
| | | | | | | | | | | | | | | | | |
Net increase (decrease) | | | (1,315,987 | ) | | $ | (14,573,751 | ) | | | (4,703,502 | ) | | $ | (59,807,577 | ) |
| | | | | | | | | | | | | | | | | |
| | | | | | | | | | | | | | | | | |
55
GMO Trust Funds
Notes to Financial Statements — (Continued)
February 28, 2017
| | | | | | | | | | | | | | | | |
| | | Year Ended
February 28, 2017 | | | Year Ended
February 29, 2016 | |
| | | | | |
| | | Shares | | | Amount | | | Shares | | | Amount | |
Foreign Fund (continued) | | | | | | | | | | | | | | | | |
Class IV: | | | | | | | | | | | | | | | | |
Shares sold | | | 94,069 | | | $ | 1,100,024 | | | | 117,380 | | | $ | 1,442,285 | |
Shares issued to shareholders in reinvestment of distributions | | | 7,652 | | | | 88,611 | | | | 65,209 | | | | 775,219 | |
Shares repurchased | | | (74,523 | ) | | | (865,990 | ) | | | (1,914,868 | ) | | | (21,590,229 | ) |
| | | | | | | | | | | | | | | | | |
Net increase (decrease) | | | 27,198 | | | $ | 322,645 | | | | (1,732,279 | ) | | $ | (19,372,725 | ) |
| | | | | | | | | | | | | | | | | |
| | | | | | | | | | | | | | | | | |
Foreign Small Companies Fund | | | | | | | | | | | | | | | | |
Class III: | | | | | | | | | | | | | | | | |
Shares sold | | | 4,911,945 | | | $ | 70,841,467 | | | | 3,746,746 | | | $ | 48,707,693 | |
Shares issued to shareholders in reinvestment of distributions | | | 529,271 | | | | 7,195,678 | | | | 1,083,586 | | | | 15,250,342 | |
Shares repurchased | | | (12,753,958 | ) | | | (181,381,778 | ) | | | (3,493,135 | ) | | | (52,371,525 | ) |
Purchase premiums | | | — | | | | 4,090 | | | | — | | | | 538 | |
Redemption fees | | | — | | | | 328,256 | | | | — | | | | 115,287 | |
| | | | | | | | | | | | | | | | | |
Net increase (decrease) | | | (7,312,742 | ) | | $ | (103,012,287 | ) | | | 1,337,197 | | | $ | 11,702,335 | |
| | | | | | | | | | | | | | | | | |
Class IV: | | | | | | | | | | | | | | | | |
Shares sold | | | 8,926 | | | $ | 123,290 | | | | 29,565 | | | $ | 413,561 | |
Shares issued to shareholders in reinvestment of distributions | | | 1,147,196 | | | | 15,561,235 | | | | 2,608,099 | | | | 36,602,731 | |
Shares repurchased | | | (8,423,117 | ) | | | (118,607,509 | ) | | | (5,448,901 | ) | | | (73,901,525 | ) |
Purchase premiums | | | — | | | | 11,501 | | | | — | | | | 1,305 | |
Redemption fees | | | — | | | | 832,379 | | | | — | | | | 272,304 | |
| | | | | | | | | | | | | | | | | |
Net increase (decrease) | | | (7,266,995 | ) | | $ | (102,079,104 | ) | | | (2,811,237 | ) | | $ | (36,611,624 | ) |
| | | | | | | | | | | | | | | | | |
| | | | | | | | | | | | | | | | | |
International Small Companies Fund | | | | | | | | | | | | | | | | |
Class III:# | | | | | | | | | | | | | | | | |
Shares sold | | | 725,241 | | | $ | 15,784,750 | | | | 674,669 | | | $ | 15,897,693 | |
Shares issued to shareholders in reinvestment of distributions | | | 284,728 | | | | 5,807,368 | | | | 275,878 | | | | 5,902,470 | |
Shares repurchased | | | (7,515,899 | ) | | | (163,567,158 | ) | | | (872,262 | ) | | | (20,604,390 | ) |
Purchase premiums | | | — | | | | 65,250 | | | | — | | | | 79,888 | |
Redemption fees | | | — | | | | 803,776 | | | | — | | | | 103,022 | |
| | | | | | | | | | | | | | | | | |
Net increase (decrease) | | | (6,505,930 | ) | | $ | (141,106,014 | ) | | | 78,285 | | | $ | 1,378,683 | |
| | | | | | | | | | | | | | | | | |
| | | | | | | | | | | | | | | | | |
| | # | Shares were adjusted to reflect a 1:3 reverse stock split effective July 15, 2016. |
| 10. | Investments in affiliated issuers |
A summary of the Funds’ transactions in the shares of other funds of GMO Trust during the year ended February 28, 2017 is set forth below:
| | | | | | | | | | | | | | | | | | | | | | | | |
| | | | | | | |
| Affiliate | | Value,
beginning
of period | | | Purchases | | | Sales
Proceeds | | | Dividend
Income | | | Distributions
of Realized
Gains | | | Value, end of
period | |
Foreign Fund | | | | | | | | | | | | | | | | | | | | | | | | |
GMO U.S. Treasury Fund | | $ | 2,474,385 | | | $ | 7,512,646 | | | $ | 9,970,000 | | | $ | 11,980 | | | $ | 665 | | | $ | 19,226 | |
| | | | | | | | | | | | | | | | | | | | | | | | | |
Foreign Small Companies Fund | | | | | | | | | | | | | | | | | | | | | | | | |
GMO U.S. Treasury Fund | | $ | 28,295,639 | | | $ | 30,127,166 | | | $ | 51,400,000 | | | $ | 114,815 | | | $ | 12,350 | | | $ | 7,030,375 | |
| | | | | | | | | | | | | | | | | | | | | | | | | |
International Small Companies Fund | | | | | | | | | | | | | | | | | | | | | | | | |
GMO U.S. Treasury Fund | | $ | 3,326,167 | | | $ | 20,500,000 | | | $ | 22,275,000 | | | $ | 13,964 | | | $ | 945 | | | $ | 1,550,077 | |
| | | | | | | | | | | | | | | | | | | | | | | | | |
| | | | | | | | | | | | | | | | | | | | | | | | | |
56
Report of Independent Registered Public Accounting Firm
To the Trustees of GMO Trust and Shareholders of
GMO Foreign Fund, GMO Foreign Small Companies Fund, and GMO International Small Companies Fund:
In our opinion, the accompanying statements of assets and liabilities, including the schedules of investments, and the related statements of operations and of changes in net assets and the financial highlights present fairly, in all material respects, the financial position of the GMO Foreign Fund, GMO Foreign Small Companies Fund, and GMO International Small Companies Fund (the “Funds”) as of February 28, 2017, the results of each of their operations for the year then ended, the changes in each of their net assets for each of the two years in the period then ended and the financial highlights for each of the five years in the period then ended, in conformity with accounting principles generally accepted in the United States of America. These financial statements and financial highlights (hereafter referred to as “financial statements”) are the responsibility of the Fund’s management. Our responsibility is to express an opinion on these financial statements based on our audits. We conducted our audits of these financial statements in accordance with the standards of the Public Company Accounting Oversight Board (United States). Those standards require that we plan and perform the audit to obtain reasonable assurance about whether the financial statements are free of material misstatement. An audit includes examining, on a test basis, evidence supporting the amounts and disclosures in the financial statements, assessing the accounting principles used and significant estimates made by management, and evaluating the overall financial statement presentation. Our procedures included confirmation of securities owned as of February 28, 2017 by correspondence with the custodians and brokers; when replies were not received from brokers, we performed other auditing procedures. We believe that our audits provide a reasonable basis for our opinion.
PricewaterhouseCoopers LLP
Boston, Massachusetts
April 26, 2017
57
GMO Trust Funds
(A Series of GMO Trust)
Fund Expenses
February 28, 2017 (Unaudited)
Expense Examples: The following information is in relation to expenses for the six month period ended February 28, 2017.
As a shareholder of the Funds, you may incur two types of costs: (1) transaction costs, including purchase premium and redemption fees, if applicable; and (2) ongoing costs, including direct and/or indirect management fees, direct and/or indirect shareholder services fees, and other Fund expenses. This example is intended to help you understand your ongoing costs (in dollars) of investing in the Funds and to compare these costs with the ongoing costs of investing in other mutual funds.
These examples are based on an investment of $1,000 invested at the beginning of the period and held for the entire period, September 1, 2016 through February 28, 2017.
Actual Expenses
This section of the table for each class below provides information about actual account values and actual expenses. You may use the information in this section, together with the amount you invested, to estimate the expenses that you paid over the period. Simply divide your account value by $1,000 (for example, a $10,000,000 account value divided by $1,000 = 10,000), then multiply the result by the number under the heading entitled “Expenses Paid During the Period” to estimate the expenses you paid on your account during this period.
Hypothetical Example for Comparison Purposes
This section of the table for each class below provides information about hypothetical account values and hypothetical expenses based on the Funds’ actual expense ratio and an assumed rate of return of 5% per year before expenses, which is not the Funds’ actual return. The hypothetical account values and expenses may not be used to estimate the actual ending account balance or expenses you paid for the period. You may use this information to compare the ongoing costs of investing in the Funds with other funds. To do so, compare this 5% hypothetical example with the 5% hypothetical examples that appear in the shareholder reports of other funds.
Please note that the expenses shown in the table are meant to highlight your ongoing costs only and do not reflect any transactional costs, such as purchase premium and redemption fees. Therefore, this section of the table is useful in comparing ongoing costs only, and will not help you determine the relative total costs of owning different funds. In addition, if these transactional costs were included, your costs would have been higher.
| | | | | | | | | | | | | | | | | | | | | | | | | | | | |
| | | Actual | | | Hypothetical | | | | |
| | | Beginning
Account Value
September 1, 2016 | | | Ending
Account Value
February 28, 2017 | | | Expenses Paid
During the Period* | | | Beginning
Account Value
September 1, 2016 | | | Ending
Account Value
February 28, 2017 | | | Expenses Paid
During the Period* | | | Annualized
Expense Ratio | |
Foreign Fund | | | | | | | | | | | | | | | | | |
Class II | | $ | 1,000.00 | | | $ | 1,060.70 | | | $ | 4.24 | | | $ | 1,000.00 | | | $ | 1,020.68 | | | $ | 4.16 | | | | 0.83% | |
Class III | | $ | 1,000.00 | | | $ | 1,061.50 | | | $ | 3.88 | | | $ | 1,000.00 | | | $ | 1,021.03 | | | $ | 3.81 | | | | 0.76% | |
Class IV | | $ | 1,000.00 | | | $ | 1,061.90 | | | $ | 3.58 | | | $ | 1,000.00 | | | $ | 1,021.32 | | | $ | 3.51 | | | | 0.70% | |
Foreign Small Companies Fund | | | | | | | | | | | | | | | | | |
Class III | | $ | 1,000.00 | | | $ | 1,032.40 | | | $ | 4.33 | | | $ | 1,000.00 | | | $ | 1,020.53 | | | $ | 4.31 | | | | 0.86% | |
Class IV | | $ | 1,000.00 | | | $ | 1,032.80 | | | $ | 4.08 | | | $ | 1,000.00 | | | $ | 1,020.78 | | | $ | 4.06 | | | | 0.81% | |
International Small Companies Fund | | | | | | | | | | | | | | | | | |
Class III | | $ | 1,000.00 | | | $ | 1,037.00 | | | $ | 4.04 | | | $ | 1,000.00 | | | $ | 1,020.83 | | | $ | 4.01 | | | | 0.80% | |
| | * | Expenses are calculated using each class’s annualized net expense ratio (including indirect expenses incurred) for the six months ended February 28, 2017, multiplied by the average account value over the period, multiplied by 181 days in the period, divided by 365 days in the year. |
58
GMO Trust Funds
Tax Information for the Tax Year Ended February 28, 2017 (Unaudited)
The following information is being provided in order to meet reporting requirements set forth by the Code and/or to meet state-specific requirements. Shareholders should consult their tax advisors.
With respect to distributions paid, the Funds designate the following amounts (or, if subsequently determined to be different, the maximum amount allowable) for the fiscal year-ended February 28, 2017:
| | | | | | | | | | | | |
| | | | |
| Fund Name | | Qualified
Dividend
Income
(non-corporate
shareholders)(1) | | | Foreign
Taxes
Paid(2) ($) | | | Foreign
Source
Income(2) ($) | |
Foreign Fund | | | 100.00% | | | | — | | | | — | |
Foreign Small Companies Fund | | | 91.09% | | | | 2,355,398 | | | | 26,687,085 | |
International Small Companies Fund | | | 82.78% | | | | 431,283 | | | | 6,029,107 | |
| | (1) | Presented as a percentage of net investment income and short-term capital gain distributions paid, if any. |
| | (2) | The Funds expect to elect to treat foreign taxes attributed to foreign source income from certain of its investments, as if incurred directly by the Funds’ shareholders. |
In early 2018, the Funds will notify applicable shareholders of amounts for use in preparing 2017 U.S. federal income tax forms.
59
Trustees and Officers (Unaudited)
The following tables present information regarding each Trustee and officer of the Trust as of February 28, 2017. Each Trustee’s and officer’s year of birth (“YOB”) is set forth after his or her name. Unless otherwise noted, (i) each Trustee and officer has engaged in the principal occupation(s) noted in the table for at least the most recent five years, although not necessarily in the same capacity, and (ii) the address of each Trustee and officer is c/o GMO Trust, 40 Rowes Wharf, Boston, MA 02110. Each Trustee serves in office until the earlier of (a) the election and qualification of a successor at the next meeting of shareholders called to elect Trustees or (b) the Trustee dies, resigns, or is removed as provided in the Trust’s governing documents. Each of the Trustees of the Trust, other than Mr. Kittredge, is not an “interested person” of the Trust, as such term is used in the 1940 Act (each, an “Independent Trustee”). Because the Funds do not hold annual meetings of shareholders, each Trustee will hold office for an indeterminate period. Each officer serves in office until his or her successor is elected and determined to be qualified to carry out the duties and responsibilities of the office, or until the officer resigns or is removed from office.
Management of the Trust
| | | | | | | | | | | | | |
| Independent Trustees |
| | | | | | | | | | | | | |
Name and
Year of Birth | | Position(s) Held with the Trust | | Length of Time Served | | Principal Occupation(s) During Past
5 Years | | Number of
Portfolios in
Fund Complex1
Overseen | | Other Directorships Held
in the Past Five
Years |
Donald W. Glazer YOB: 1944 | | Chairman of the Board of Trustees | | Chairman of the Board of Trustees since March 2005; Lead Independent Trustee (September 2004 – March 2005); Trustee since December 2000. | | Consultant – Law and Business2; Author of Legal Treatises. | | | | 36 | | | Director, BeiGene Ltd. (biotech research). |
| | | | | |
Peter Tufano YOB: 1957 | | Trustee | | Since December 2008. | | Peter Moores Dean and Professor of Finance, University of Oxford Saïd Business School (as of July 1, 2011); Sylvan C. Coleman Professor of Financial Management, Harvard Business School (1989 – 2011). | | | | 36 | | | Trustee of State Street Navigator Securities Lending Trust (5 Portfolios). |
| | | | | |
Paul Braverman YOB: 1949 | | Trustee | | Since March 2010. | | Director of Claren Road Asset Management, LLC (hedge fund) (January 2011 – present); Director of Leerink Swann Holdings, LLC (investment bank) (October 2013 – present); Director of Aesir Capital Management (investment advisor) (November 2012 – present); Director of Kieger (US) Ltd. (investment advisor) (January 2015 – present). | | | | 36 | | | Trustee of HIMCO Variable Insurance Trust (27 Portfolios). |
| Interested Trustee and Officer | | | | |
| | | | | | | | | | | | | |
Joseph B. Kittredge, Jr.3 YOB: 1954 | | Trustee; President of the Trust | | Trustee since March 2010; President since March 2009; Chief Executive Officer, March 2009 –June 2015. | | General Counsel, Grantham, Mayo, Van Otterloo & Co. LLC (October 2005 – present); Partner, Ropes & Gray, LLP (1988 –2005). | | | | 48 | | | None. |
| 1 | The Fund Complex includes series of each of GMO Trust and GMO Series Trust. Mr. Kittredge also serves as a Trustee of GMO Series Trust. |
| 2 | As part of Mr. Glazer’s work as a consultant, he provides part-time consulting services to Goodwin Procter LLP (“Goodwin”). Goodwin has provided legal services to Renewable Resources, LLC, an affiliate of GMO; GMO, in connection with its relationship with Renewable Resources; and funds managed by Renewable Resources. Mr. Glazer has represented that he has no financial interest in, and is not involved in the provision of, such legal services. These entities did not pay any legal fees or disbursements to Goodwin during the calendar years ended December 31, 2015 and December 31, 2016. In correspondence with the staff of the SEC (the “Staff”) beginning in August 2006, the Independent Trustees’ legal counsel provided the Staff with information regarding Mr. Glazer’s relationship with Goodwin and his other business activities. On September 11, 2007, based on information that had been given to the Staff as of that date, the Staff provided oral no-action assurance consistent with the opinion of the Independent Trustees’ legal counsel that Mr. Glazer is not an “interested person” of the Trust. |
| 3 | Mr. Kittredge is an “interested person” of the Trust, as such term is used in the 1940 Act (an “Interested Trustee”), by virtue of his positions with the Trust and GMO indicated in the table above and his interest as a member of GMO. |
60
| | | | | | |
| Officers | | | | | | |
| | | | | | |
Name and Year of Birth | | Position(s)
Held with the Trust | | Length of
Time Served | | Principal Occupation(s)
During Past 5 Years* |
Joseph B. Kittredge, Jr. YOB: 1954 | | Trustee and President | | Trustee since March 2010; President since March 2009; Chief Executive Officer, March 2009 – June 2015. | | General Counsel, Grantham, Mayo, Van Otterloo & Co. LLC (October 2005 – present); Partner, Ropes & Gray LLP (1988 – 2005). |
| | | |
Sheppard N. Burnett
YOB: 1968 | | Chief Executive Officer | | Chief Executive Officer since June 2015; Chief Financial Officer, March 2007 – June 2015; Treasurer, November 2006-June 2015; Assistant Treasurer, September 2004 – November 2006. | | Head of Fund Treasury and Tax, Grantham, Mayo, Van Otterloo & Co. LLC (December 2006 – present). |
| | | |
Carly Cushman
YOB: 1984 | | Treasurer, Chief Accounting Officer and Chief Financial Officer | | Treasurer and Chief Financial Officer since June 2015; Chief Accounting Officer since May 2014; Assistant Treasurer, September 2013 – June 2015. | | Fund Administrator, Grantham, Mayo, Van Otterloo & Co. LLC (December 2009-present); Senior Accountant, Renaissance HealthCare (February 2009 – December 2009); Auditor/Senior Auditor, Deloitte & Touche (September 2006 – February 2009). |
| | | |
John L. Nasrah
YOB: 1977 | | Assistant Treasurer and Chief Tax Officer | | Since March 2007. | | Fund Administrator, Grantham, Mayo, Van Otterloo & Co. LLC (September 2004 – present). |
| | | |
Betty Maganzini
YOB: 1972 | | Assistant Treasurer | | Since September 2013. | | Fund Administrator, Grantham, Mayo, Van Otterloo & Co. LLC (July 2010-present); Assistant Treasurer (June 2009 – July 2010), Manager, Fund Administration and Regulatory Affairs (2006 – 2009), Hambrecht & Quist Capital Management LLC. |
| | | |
Mahmoodur Rahman
YOB: 1967 | | Assistant Treasurer | | Since September 2007. | | Fund Administrator, Grantham, Mayo, Van Otterloo & Co. LLC (April 2007 – present). |
| | | |
Cathy Tao
YOB: 1974 | | Assistant Treasurer | | Since September 2016 | | Fund Administrator, Grantham, Mayo, Van Otterloo & Co. LLC (October 2007 – present) |
| | | |
Brian Kadehjian
YOB: 1974 | | Assistant Treasurer and Treasury Officer | | Assistant Treasurer since February 2015; Treasury Officer since September 2013. | | Fund Administrator, Grantham, Mayo, Van Otterloo & Co. LLC (April 2002 – present). |
| | | |
Douglas Y. Charton
YOB: 1982 | | Chief Legal Officer, Vice President and Clerk | | Since August 2015. | | Legal Counsel, Grantham, Mayo, Van Otterloo & Co. LLC (July 2015 –present); Associate, K&L Gates LLP (September 2007 – July 2015). |
| | | |
Megan Bunting
YOB: 1978 | | Vice President and Assistant Clerk | | Since September 2013. | | Legal Counsel, Grantham, Mayo, Van Otterloo & Co. LLC (September 2006-present). |
| | | |
Kevin O’Brien
YOB: 1985 | | Vice President and Assistant Clerk | | Since March 2016. | | Legal Counsel, Grantham, Mayo, Van Otterloo & Co. LLC (February 2015 – present); Associate, Dechert LLP (October 2010 – February 2015). |
| | | |
Gregory L. Pottle
YOB: 1971 | | Chief Compliance Officer | | Chief Compliance Officer since May 2015; Vice President and Assistant Clerk, November 2006 –November 2015. | | Chief Compliance Officer, Grantham, Mayo, Van Otterloo & Co. LLC (May 2015 – present); Legal Counsel, Grantham, Mayo, Van Otterloo & Co. LLC (March 2000 – May 2015). |
| | | |
Claire Wilkinson
YOB: 1965 | | Anti-Money Laundering Officer | | Since February 2016. | | Compliance Associate, GMO UK Limited (April 2013 – present); General Counsel, MVision Private Equity Advisers Limited (November 2009 – January 2013). |
| * | Each officer of the Trust may also serve as an officer and/or director of certain pooled investment vehicles of which GMO or an affiliate of GMO serves as the investment adviser. With the exception of Mr. Kittredge, each officer listed in the table above also serves as an officer of GMO Series Trust. |
61
GMO Trust
Annual Report
February 28, 2017
International Equity Fund
International Large/Mid Cap Equity Fund
Quality Fund
Resources Fund
Risk Premium Fund
Tax-Managed International Equities Fund
U.S. Equity Allocation Fund
For a free copy of the Funds’ proxy voting guidelines, shareholders may call 1-617-346-7646 (collect) or visit the Securities and Exchange Commission’s website at www.sec.gov. Information regarding how the Funds voted proxies relating to portfolio securities during the most recent 12-month period ended June 30 is available on GMO’s website at www.gmo.com or on the Securities and Exchange Commission’s website at www.sec.gov.
The Funds file their complete schedule of portfolio holdings with the Securities and Exchange Commission for the first and third quarter of each fiscal year on Form N-Q, which is available on the Commission’s website at www.sec.gov. The Funds’ Form N-Q may be reviewed and copied at the Commission’s Public Reference Room in Washington, D.C. Information on the operation of the Public Reference Room may be obtained by calling 1-800-SEC-0330. The Funds have a policy with respect to disclosure of portfolio holdings under which they may also make a complete schedule of portfolio holdings available on GMO’s website at www.gmo.com.
This report is prepared for the general information of shareholders. It is authorized for distribution to prospective investors only when preceded or accompanied by a prospectus for the GMO Trust, which contains a complete discussion of the risks associated with an investment in these Funds and other important information. The GMO Trust prospectus can be obtained at www.gmo.com.
An investment in the Funds is subject to risk, including the possible loss of principal amount invested. There can be no assurance that the Funds will achieve their stated investment objectives. Please see the Funds’ prospectus regarding specific principal risks for each Fund. General risks may include: market risk-equities, management and operational risk, non-U.S. investment risk, small company risk and derivatives risk.
The Funds are distributed by Funds Distributor LLC. Funds Distributor LLC is not affiliated with GMO.
TABLE OF CONTENTS
GMO International Equity Fund
(A Series of GMO Trust)
Portfolio Management
Day-to-day management of the Fund’s portfolio is the responsibility of the Global Equity team at Grantham, Mayo, Van Otterloo & Co. LLC.
Management Discussion and Analysis of Fund Performance
Although the Fund is not managed relative to any securities market index or benchmark, a discussion of the Fund’s performance relative to the MSCI EAFE Index is included for comparative purposes.
Class III shares of GMO International Equity Fund returned +15.53% (net) for the fiscal year ended February 28, 2017, as compared with +15.75% for the MSCI EAFE Index.
The Fund’s country allocation produced modestly positive returns relative to the benchmark. An underweight position in Australia and an overweight position in Israel made the largest negative impacts on performance, but these were offset by underweight positions in Denmark and Switzerland. The Fund’s modest cash holdings were a drag on relative performance given the strong returns generated by equities.
Sector allocation proved modestly negative relative to the benchmark. The largest negative contribution was from being overweight Telecommunication Services. A positive contribution resulted from an underweight position in Health Care, but the majority of sectors had small losses. Underperformance in Information Technology and Consumer Discretionary was more than offset by good relative returns in other sectors, with Health Care of particular note.
Stock selection was a strong contributor to relative performance. Top stock contributors included overweight positions in Sumitomo Mitsui Financial Group and BASF, as well as having no exposure to Novo Nordisk (a Danish Pharmaceutical company). Top stock detractors included overweight positions in Nippon Telegraph and Telephone Corporation, KDDI Corporation (a Japanese telecoms company), and a lack of exposure to HSBC.
Because some of the securities and instruments held directly or indirectly by the Fund had positive fair value adjustments at the beginning or end of the fiscal year (and the performance of indices are not fair valued), the Fund’s absolute and relative performance is higher than it otherwise would have been in the absence of such fair value adjustments.
The views expressed herein are exclusively those of Grantham, Mayo, Van Otterloo & Co. LLC as of the date of this report and are subject to change. GMO disclaims any responsibility to update such views. They are not meant as investment advice. References to specific securities are not recommendations of such securities and may not be representative of any GMO portfolio’s current or future investments.
2
GMO International Equity Fund
(A Series of GMO Trust)
Comparison of Change in Value of a $35,000,000 Investment in
GMO International Equity Fund Class III Shares and the MSCI EAFE Index
As of February 28, 2017
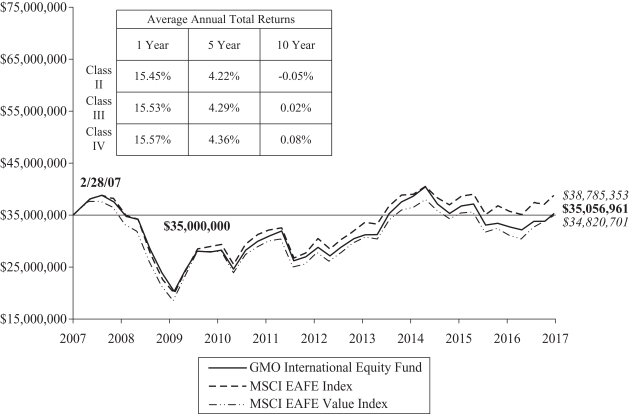
Performance data quoted represents past performance and is not indicative of future results. The investment return and principal value of an investment will fluctuate so that an investor’s shares, when redeemed, may be worth more or less than their original cost. Current performance data may be lower or higher than the performance data provided herein. To obtain performance information up to the most recent month-end, visit www.gmo.com. Performance shown is net of all fees after reimbursement from GMO. Returns would have been lower had certain expenses not been reimbursed during the periods shown and do not include the effect of taxes on distributions and redemptions. The performance information shown above only includes purchase premiums and/or redemption fees in effect as of February 28, 2017. All information is unaudited. Performance for classes may vary due to different fees.
MSCI data may not be reproduced or used for any other purpose. MSCI provides no warranties, has not prepared or approved this report, and has no liability hereunder.
3
GMO International Equity Fund
(A Series of GMO Trust)
Investment Concentration Summary
February 28, 2017 (Unaudited)
| | | | |
| Asset Class Summary& | | % of Total Net Assets | |
Common Stocks | | | 98.2 | % |
Preferred Stocks | | | 0.8 | |
Short-Term Investments | | | 0.5 | |
Mutual Funds | | | 0.4 | |
Other | | | 0.1 | |
| | | | |
| | | 100.0 | % |
| | | | |
| | | | |
| Country Summary* | | % of Investments | |
Japan | | | 27.5 | % |
United Kingdom | | | 16.6 | |
France | | | 9.6 | |
Germany | | | 9.3 | |
Australia | | | 6.6 | |
Switzerland | | | 5.6 | |
Hong Kong | | | 4.8 | |
Spain | | | 3.7 | |
Other Developed | | | 3.1 | ‡ |
Netherlands | | | 2.9 | |
Canada | | | 2.6 | |
Norway | | | 2.1 | |
Italy | | | 1.9 | |
Israel | | | 1.4 | |
Finland | | | 1.3 | |
Austria | | | 1.0 | |
| | | | |
| | | 100.0 | % |
| | | | |
| & | In the table above, derivative financial instruments, if any, are based on market values or unrealized appreciation/depreciation rather than notional amounts. |
| * | The table above shows country exposure in the Fund. The table excludes short-term investments. The table excludes exposure through forward currency contracts and includes exposure through other derivative financial instruments, if any. The table takes into account the market value of securities and options and the notional amounts of swap contracts and other derivative financial instruments, if any. |
| ‡ | “Other Developed” is comprised of developed countries that each represent between (1.0)% and 1.0% of Investments. |
| | | | |
| Industry Group Summary | | % of Equity Investments# | |
Insurance | | | 9.0 | % |
Banks | | | 8.6 | |
Energy | | | 8.0 | |
Capital Goods | | | 7.8 | |
Automobiles & Components | | | 7.3 | |
Telecommunication Services | | | 7.2 | |
Pharmaceuticals, Biotechnology & Life Sciences | | | 7.1 | |
Real Estate | | | 6.6 | |
Materials | | | 6.4 | |
Transportation | | | 5.1 | |
Food, Beverage & Tobacco | | | 4.4 | |
Consumer Durables & Apparel | | | 4.0 | |
Utilities | | | 3.1 | |
Retailing | | | 2.5 | |
Media | | | 2.4 | |
Food & Staples Retailing | | | 2.1 | |
Commercial & Professional Services | | | 1.9 | |
Household & Personal Products | | | 1.6 | |
Software & Services | | | 1.4 | |
Technology Hardware & Equipment | | | 1.3 | |
Health Care Equipment & Services | | | 0.9 | |
Diversified Financials | | | 0.8 | |
Consumer Services | | | 0.4 | |
Semiconductors & Semiconductor Equipment | | | 0.1 | |
| | | | |
| | | 100.0 | % |
| | | | |
| # | Equity investments may consist of common stocks and other stock-related securities, such as preferred stocks, if any. This table excludes exposure to derivative contracts, short-term investments, mutual funds and investment funds, if any. For a summary of these exposures, if any, see the Schedule of Investments. |
4
GMO International Equity Fund
(A Series of GMO Trust)
Schedule of Investments
(showing percentage of total net assets)
February 28, 2017
| | | | | | | | | | |
| Shares | | | Description | | Value ($) | |
| | | | | | COMMON STOCKS — 98.2% | |
| | |
| | | | | | Australia — 6.6% | |
| | | 321,081 | | | Abacus Property Group (REIT) | | | 762,733 | |
| | | 3,122,357 | | | Adelaide Brighton Ltd | | | 12,851,752 | |
| | | 340,848 | | | BHP Billiton Ltd | | | 6,451,603 | |
| | | 2,967,618 | | | BlueScope Steel Ltd | | | 27,754,878 | |
| | | 192,289 | | | BT Investment Management Ltd | | | 1,426,027 | |
| | | 128,589 | | | Credit Corp Group Ltd | | | 1,620,862 | |
| | | 4,078,560 | | | CSR Ltd | | | 13,061,021 | |
| | | 5,044,091 | | | Dexus Property Group (REIT) | | | 36,489,784 | |
| | | 3,879,911 | | | Downer EDI Ltd | | | 20,862,493 | |
| | | 125,824 | | | Elders Ltd * | | | 419,530 | |
| | | 8,607,991 | | | Fairfax Media Ltd | | | 6,229,012 | |
| | | 1,108,220 | | | Fortescue Metals Group Ltd | | | 5,610,446 | |
| | | 3,986,251 | | | GPT Group (The) (REIT) | | | 15,056,645 | |
| | | 1,643,877 | | | Investa Office Fund (REIT) | | | 5,885,490 | |
| | | 430,924 | | | LendLease Group | | | 5,027,725 | |
| | | 1,485,829 | | | Metcash Ltd * | | | 2,461,284 | |
| | | 19,191,567 | | | Mirvac Group (REIT) | | | 31,606,486 | |
| | | 1,518,586 | | | Nine Entertainment Co Holdings Ltd | | | 1,222,481 | |
| | | 3,293,937 | | | OZ Minerals Ltd | | | 23,437,395 | |
| | | 581,223 | | | Pact Group Holdings Ltd | | | 2,969,948 | |
| | | 1,976,373 | | | Primary Health Care Ltd | | | 4,996,865 | |
| | | 10,273,615 | | | Scentre Group (REIT) | | | 34,333,443 | |
| | | 1,176,271 | | | Shopping Centres Australasia Property Group (REIT) | | | 2,010,266 | |
| | | 394,187 | | | Sigma Pharmaceuticals Ltd | | | 355,020 | |
| | | 176,301 | | | Sonic Healthcare Ltd | | | 2,906,719 | |
| | | 288,481 | | | Southern Cross Media Group Ltd | | | 286,619 | |
| | | 241,293 | | | Star Entertainment Grp Ltd (The) | | | 901,701 | |
| | | 2,441,415 | | | Stockland (REIT) | | | 8,830,457 | |
| | | 75,035 | | | Tabcorp Holdings Ltd | | | 245,001 | |
| | | 364,680 | | | Tassal Group Ltd | | | 1,335,573 | |
| | | 26,566,007 | | | Telstra Corp Ltd | | | 98,120,395 | |
| | | 69,894 | | | Vicinity Centres (REIT) | | | 154,790 | |
| | | 19,738 | | | Virtus Health Ltd | | | 81,876 | |
| | | 30,282 | | | Woodside Petroleum Ltd | | | 726,373 | |
| | | 657,300 | | | WorleyParsons Ltd * | | | 5,352,566 | |
| | | | | | | | | | |
| | | | | | Total Australia | | | 381,845,259 | |
| | | | | | | | | | |
| | |
| | | | | | Austria — 1.0% | |
| | | 1,167,625 | | | Immofinanz AG (Entitlement Shares) * (a) | | | — | |
| | | 79,093 | | | Oesterreichische Post AG * | | | 2,875,902 | |
| | | 908,093 | | | OMV AG | | | 34,712,142 | |
| | | 493,211 | | | voestalpine AG | | | 20,722,944 | |
| | | | | | | | | | |
| | | | | | Total Austria | | | 58,310,988 | |
| | | | | | | | | | |
| | |
| | | | | | Belgium — 0.3% | |
| | | 615,191 | | | AGFA-Gevaert NV * | | | 2,513,481 | |
| | | 1,134 | | | Barco NV | | | 101,694 | |
| | | 499,600 | | | bpost SA | | | 12,406,088 | |
| | | | | | | | | | |
| Shares | | | Description | | Value ($) | |
| | | | | | Belgium — continued | |
| | | 46,444 | | | D’ieteren SA/NV | | | 2,071,354 | |
| | | 7,450 | | | Elia System Operator SA/NV | | | 381,928 | |
| | | 90,674 | | | Orange Belgium SA * | | | 2,057,683 | |
| | | | | | | | | | |
| | | | | | Total Belgium | | | 19,532,228 | |
| | | | | | | | | | |
| | |
| | | | | | Canada — 2.5% | |
| | | 66,000 | | | AGF Management Ltd – Class B | | | 300,632 | |
| | | 777,810 | | | Air Canada * | | | 7,835,490 | |
| | | 4,200 | | | BRP Inc * | | | 82,311 | |
| | | 95,500 | | | Canadian Imperial Bank of Commerce | | | 8,384,472 | |
| | | 227,700 | | | Canadian Tire Corp Ltd – Class A | | | 26,109,554 | |
| | | 115,500 | | | Cascades Inc | | | 1,152,217 | |
| | | 370,300 | | | Celestica Inc * | | | 4,892,911 | |
| | | 322,800 | | | CGI Group Inc – Class A * | | | 14,839,759 | |
| | | 60,400 | | | Chorus Aviation Inc | | | 325,147 | |
| | | 35,400 | | | CI Financial Corp | | | 721,753 | |
| | | 69,700 | | | Cogeco Communications Inc | | | 3,767,851 | |
| | | 195,500 | | | Corus Entertainment Inc – B Shares | | | 1,870,806 | |
| | | 1,825,200 | | | IAMGOLD Corp * | | | 7,200,759 | |
| | | 68,800 | | | Industrial Alliance Insurance & Financial Services Inc | | | 2,855,702 | |
| | | 22,300 | | | Linamar Corp | | | 990,253 | |
| | | 47,100 | | | Martinrea International Inc | | | 292,558 | |
| | | 9,300 | | | Medical Facilities Corp | | | 127,226 | |
| | | 1,673,200 | | | Metro Inc | | | 48,790,119 | |
| | | 98,577 | | | North West Co Inc (The) | | | 2,176,086 | |
| | | 6,000 | | | Open Text Corp | | | 197,771 | |
| | | 163,200 | | | Toromont Industries Ltd | | | 5,692,709 | |
| | | 484,700 | | | Transcontinental Inc – Class A | | | 7,382,534 | |
| | | 7,980 | | | Uranium Participation Corp * | | | 26,256 | |
| | | 139,300 | | | WestJet Airlines Ltd | | | 2,286,358 | |
| | | | | | | | | | |
| | | | | | Total Canada | | | 148,301,234 | |
| | | | | | | | | | |
| | |
| | | | | | Denmark — 0.4% | |
| | | 14,104 | | | AP Moeller – Maersk A/S – Class B | | | 22,933,345 | |
| | | 22,829 | | | Dfds A/S | | | 1,253,953 | |
| | | 12,564 | | | Per Aarsleff Holding A/S | | | 292,973 | |
| | | 8,571 | | | Schouw & Co AB | | | 672,728 | |
| | | | | | | | | | |
| | | | | | Total Denmark | | | 25,152,999 | |
| | | | | | | | | | |
| | |
| | | | | | Finland — 1.3% | |
| | | 24,585 | | | Kesko Oyj – B Shares | | | 1,127,204 | |
| | | 138,312 | | | Metso Oyj | | | 4,078,429 | |
| | | 595,750 | | | Neste Oyj | | | 20,736,153 | |
| | | 11,899 | | | Orion Oyj – Class B | | | 586,414 | |
| | | 233,537 | | | Sponda Oyj | | | 977,285 | |
| | | 27,313 | | | Tieto Oyj | | | 760,182 | |
| | | 1,894,505 | | | UPM-Kymmene Oyj | | | 44,931,370 | |
| | | | | | | | | | |
| | | | | | Total Finland | | | 73,197,037 | |
| | | | | | | | | | |
| | | | |
| | See accompanying notes to the financial statements. | | 5 |
GMO International Equity Fund
(A Series of GMO Trust)
Schedule of Investments — (Continued)
(showing percentage of total net assets)
February 28, 2017
| | | | | | | | | | |
| Shares | | | Description | | Value ($) | |
| | | | | | France — 9.6% | |
| | | 1,135,355 | | | Air France-KLM * | | | 8,001,200 | |
| | | 22,894 | | | APERAM SA | | | 1,163,798 | |
| | | 6,000,903 | | | AXA SA | | | 141,729,426 | |
| | | 723,081 | | | BNP Paribas SA | | | 42,307,796 | |
| | | 254,886 | | | Christian Dior SE | | | 54,040,992 | |
| | | 311,658 | | | Cie Generale des Etablissements Michelin | | | 35,090,904 | |
| | | 378,043 | | | CNP Assurances | | | 7,005,433 | |
| | | 12,889 | | | Ipsen SA | | | 1,145,028 | |
| | | 17,255 | | | IPSOS | | | 555,826 | |
| | | 4,612 | | | Legrand SA | | | 260,412 | |
| | | 238,372 | | | M6-Metropole Television SA | | | 5,050,158 | |
| | | 181,187 | | | Rexel SA | | | 2,931,530 | |
| | | 466,796 | | | SCOR SE | | | 16,875,253 | |
| | | 52,625 | | | Societe BIC SA | | | 6,512,653 | |
| | | 950,106 | | | Societe Generale SA | | | 42,229,914 | |
| | | 175,100 | | | STMicroelectronics NV – NY Shares | | | 2,672,026 | |
| | | 3,775,354 | | | TOTAL SA | | | 188,374,951 | |
| | | | | | | | | | |
| | | | | | Total France | | | 555,947,300 | |
| | | | | | | | | | |
| | |
| | | | | | Germany — 8.4% | |
| | | 284,910 | | | ADVA Optical Networking SE * | | | 2,995,843 | |
| | | 734,489 | | | Allianz SE (Registered) | | | 127,923,968 | |
| | | 960,180 | | | Bayerische Motoren Werke AG | | | 85,740,331 | |
| | | 46,024 | | | Bechtle AG | | | 4,793,813 | |
| | | 5,852 | | | Cewe Stiftung & Co KGAA | | | 493,762 | |
| | | 2,200,132 | | | Daimler AG (Registered) | | | 159,832,955 | |
| | | 2,659,587 | | | Deutsche Lufthansa AG (Registered) | | | 38,939,135 | |
| | | 9,759 | | | Diebold Nixdorf AG | | | 710,232 | |
| | | 5,773 | | | Duerr AG | | | 478,339 | |
| | | 20,395 | | | Evonik Industries AG | | | 654,057 | |
| | | 7,958 | | | Fraport AG Frankfurt Airport Services Worldwide | | | 497,864 | |
| | | 99,204 | | | Hannover Rueck SE | | | 11,191,755 | |
| | | 175,179 | | | HeidelbergCement AG | | | 16,355,255 | |
| | | 10,674 | | | Henkel AG & Co KGaA | | | 1,151,786 | |
| | | 6,881 | | | Indus Holding AG | | | 423,851 | |
| | | 57,696 | | | Jenoptik AG | | | 1,284,188 | |
| | | 2,151 | | | Koenig & Bauer AG * | | | 121,321 | |
| | | 21,181 | | | Muenchener Rueckversicherungs-Gesellschaft AG in Muenchen (Registered) | | | 4,001,030 | |
| | | 215,662 | | | RHOEN-KLINIKUM AG | | | 5,425,210 | |
| | | 1,293 | | | RTL Group SA | | | 99,410 | |
| | | 81,942 | | | RWE AG * | | | 1,166,962 | |
| | | 6,606 | | | Salzgitter AG | | | 241,050 | |
| | | 303,766 | | | Software AG | | | 11,260,874 | |
| | | 226,070 | | | STADA Arzneimittel AG | | | 13,671,317 | |
| | | 24,977 | | | Talanx AG | | | 892,332 | |
| | | | | | | | | | |
| | | | | | Total Germany | | | 490,346,640 | |
| | | | | | | | | | |
| | | | | | | | | | |
| Shares | | | Description | | Value ($) | |
| | | | | | Hong Kong — 4.7% | |
| | | 7,764,100 | | | BOC Hong Kong Holdings Ltd | | | 30,671,424 | |
| | | 2,881,600 | | | Champion (REIT) | | | 1,655,153 | |
| | | 2,361,100 | | | Dah Sing Banking Group Ltd | | | 4,594,551 | |
| | | 469,800 | | | Dah Sing Financial Holdings Ltd | | | 3,460,726 | |
| | | 5,255,990 | | | Esprit Holdings Ltd * | | | 4,976,742 | |
| | | 4,350,000 | | | Global Brands Group Holding Ltd * | | | 509,808 | |
| | | 1,431,530 | | | Henderson Land Development Co Ltd | | | 8,313,496 | |
| | | 5,727,000 | | | HKT Trust & HKT Ltd – Class SS | | | 7,639,564 | |
| | | 2,921,100 | | | Hongkong Land Holdings Ltd | | | 19,933,911 | |
| | | 2,478,900 | | | Hysan Development Co Ltd | | | 11,557,978 | |
| | | 4,375,700 | | | Kerry Properties Ltd | | | 13,409,073 | |
| | | 7,560,791 | | | Link (REIT) | | | 52,135,613 | |
| | | 917,200 | | | Luk Fook Holdings International Ltd | | | 2,663,218 | |
| | | 3,770,000 | | | Man Wah Holdings Ltd | | | 2,479,277 | |
| | | 1,621,000 | | | Pacific Textiles Holdings Ltd | | | 1,808,439 | |
| | | 3,106,700 | | | PCCW Ltd | | | 1,894,006 | |
| | | 17,447,100 | | | SJM Holdings Ltd | | | 14,315,461 | |
| | | 1,526,200 | | | SmarTone Telecommunications Holdings Ltd | | | 2,070,995 | |
| | | 404,000 | | | Swire Pacific Ltd – Class A | | | 4,158,635 | |
| | | 162,400 | | | Swire Properties Ltd | | | 488,333 | |
| | | 135,500 | | | Techtronic Industries Co Ltd | | | 484,862 | |
| | | 435,800 | | | Television Broadcasts Ltd | | | 1,905,938 | |
| | | 1,193,200 | | | Value Partners Group Ltd | | | 1,206,069 | |
| | | 2,029,000 | | | WH Group Ltd | | | 1,584,106 | |
| | | 5,719,900 | | | Wharf Holdings Ltd (The) | | | 45,315,438 | |
| | | 2,207,500 | | | Wheelock & Co Ltd | | | 14,337,217 | |
| | | 829,075 | | | Xinyi Automobile Glass Hong Kong Enterprises Ltd * | | | 157,944 | |
| | | 10,760,600 | | | Xinyi Glass Holdings Ltd | | | 9,756,178 | |
| | | 3,383,800 | | | Yue Yuen Industrial Holdings Ltd | | | 12,590,692 | |
| | | | | | | | | | |
| | | | | | Total Hong Kong | | | 276,074,847 | |
| | | | | | | | | | |
| | |
| | | | | | Ireland — 0.2% | |
| | | 384,710 | | | Smurfit Kappa Group Plc | | | 10,217,778 | |
| | | | | | | | | | |
| | |
| | | | | | Israel — 1.4% | |
| | | 3,778,947 | | | Bank Hapoalim BM | | | 23,293,776 | |
| | | 4,636,661 | | | Bank Leumi Le-Israel BM * | | | 20,329,156 | |
| | | 149,100 | | | Check Point Software Technologies Ltd * | | | 14,747,481 | |
| | | 274,626 | | | El Al Israel Airlines | | | 195,606 | |
| | | 8,104,575 | | | Israel Discount Bank Ltd – Class A * | | | 17,938,316 | |
| | | 116,840 | | | Mizrahi Tefahot Bank Ltd | | | 1,950,543 | |
| | | 10,496 | | | Teva Pharmaceutical Industries Ltd | | | 369,217 | |
| | | | | | | | | | |
| | | | | | Total Israel | | | 78,824,095 | |
| | | | | | | | | | |
| | |
| | | | | | Italy — 1.9% | |
| | | 474,840 | | | A2A SPA | | | 659,035 | |
| | | 324,423 | | | Amplifon SPA | | | 3,472,099 | |
| | | 1,800,866 | | | Banca Mediolanum SPA | | | 11,752,195 | |
| | | 78,636 | | | De’ Longhi SPA | | | 2,040,897 | |
| | | | |
| 6 | | See accompanying notes to the financial statements. | | |
GMO International Equity Fund
(A Series of GMO Trust)
Schedule of Investments — (Continued)
(showing percentage of total net assets)
February 28, 2017
| | | | | | | | | | |
| Shares | | | Description | | Value ($) | |
| | | | | | Italy — continued | |
| | | 6,787,484 | | | Enel SPA | | | 29,129,790 | |
| | | 1,655,969 | | | Eni SPA | | | 25,547,044 | |
| | | 14,389 | | | EXOR SPA | | | 681,468 | |
| | | 3,381,140 | | | Hera SPA | | | 8,374,131 | |
| | | 1,899,842 | | | Iren SPA | | | 3,267,753 | |
| | | 51,526 | | | La Doria SPA | | | 461,145 | |
| | | 711,078 | | | Recordati SPA | | | 22,565,451 | |
| | | 2,430 | | | Reply SPA | | | 323,681 | |
| | | 441,225 | | | Societa Cattolica di Assicurazioni SCRL | | | 2,764,591 | |
| | | 595,147 | | | Telecom Italia SPA * | | | 480,292 | |
| | | 1,378,987 | | | Telecom Italia SPA-RSP * | | | 914,214 | |
| | | | | | | | | | |
| | | | | | Total Italy | | | 112,433,786 | |
| | | | | | | | | | |
| | |
| | | | | | Japan — 27.3% | |
| | | 19,600 | | | ADEKA Corp | | | 274,516 | |
| | | 7,000 | | | Aichi Corp | | | 54,605 | |
| | | 47,800 | | | Ain Holdings Inc | | | 3,432,624 | |
| | | 236,800 | | | Alfresa Holdings Corp | | | 4,265,888 | |
| | | 140,800 | | | Alpine Electronics Inc | | | 2,041,047 | |
| | | 83,700 | | | AOKI Holdings Inc | | | 1,029,486 | |
| | | 268,400 | | | Aoyama Trading Co Ltd | | | 10,061,618 | |
| | | 136,113 | | | Asahi Glass Co Ltd | | | 1,111,035 | |
| | | 118,500 | | | Asatsu-DK Inc | | | 3,127,226 | |
| | | 127,800 | | | Autobacs Seven Co Ltd | | | 2,024,501 | |
| | | 154,900 | | | Brother Industries Ltd | | | 2,917,246 | |
| | | 1,691,900 | | | Calsonic Kansei Corp | | | 19,376,667 | |
| | | 52,100 | | | Cawachi Ltd | | | 1,395,115 | |
| | | 321,600 | | | Central Japan Railway Co | | | 52,645,833 | |
| | | 584,700 | | | Coca-Cola West Co Ltd | | | 17,377,633 | |
| | | 6,200 | | | Computer Engineering & Consulting Ltd | | | 99,563 | |
| | | 199,500 | | | Concordia Financial Group Ltd | | | 1,062,191 | |
| | | 439,600 | | | Cosmo Energy Holdings Co Ltd | | | 7,545,096 | |
| | | 21,200 | | | Credit Saison Co Ltd | | | 402,739 | |
| | | 295,800 | | | Daikyo Inc | | | 619,042 | |
| | | 263,500 | | | Daito Trust Construction Co Ltd | | | 36,863,148 | |
| | | 556,100 | | | Daiwa House Industry Co Ltd | | | 15,261,195 | |
| | | 711,000 | | | Daiwabo Holdings Co Ltd | | | 1,916,767 | |
| | | 809,700 | | | DCM Holdings Co Ltd | | | 7,201,399 | |
| | | 2,290,200 | | | Denka Co Ltd | | | 11,925,811 | |
| | | 144,700 | | | DIC Corp | | | 5,286,764 | |
| | | 70,600 | | | Doutor Nichires Holdings Co Ltd | | | 1,360,568 | |
| | | 17,300 | | | DTS Corp | | | 399,072 | |
| | | 7,500 | | | Ehime Bank Ltd (The) | | | 92,622 | |
| | | 116,000 | | | Fuji Electric Co Ltd | | | 640,706 | |
| | | 309,500 | | | Fuji Oil Holdings Inc | | | 6,981,616 | |
| | | 716,140 | | | FUJIFILM Holdings Corp | | | 27,702,052 | |
| | | 280,700 | | | Fujitsu General Ltd | | | 5,494,873 | |
| | | 34,400 | | | Fuyo General Lease Co Ltd | | | 1,644,457 | |
| | | 170,000 | | | Geo Holdings Corp | | | 2,051,980 | |
| | | 232,500 | | | Gunze Ltd | | | 853,831 | |
| | | | | | | | | | |
| Shares | | | Description | | Value ($) | |
| | | | | | Japan — continued | |
| | | 1,236,700 | | | Hanwa Co Ltd | | | 8,868,752 | |
| | | 332,900 | | | Haseko Corp | | | 3,939,480 | |
| | | 213,600 | | | Hiroshima Bank Ltd (The) | | | 1,009,256 | |
| | | 13,600 | | | Hitachi Capital Corp | | | 351,434 | |
| | | 279,400 | | | Hitachi Chemical Co Ltd | | | 7,883,832 | |
| | | 31,800 | | | Hitachi High-Technologies Corp | | | 1,324,616 | |
| | | 7,200 | | | Hitachi Transport System Ltd | | | 147,478 | |
| | | 2,300 | | | Hokuetsu Bank Ltd (The) | | | 55,479 | |
| | | 123,600 | | | Horiba Ltd | | | 6,848,261 | |
| | | 143,000 | | | Idemitsu Kosan Co Ltd | | | 4,607,685 | |
| | | 26,700 | | | Isuzu Motors Ltd | | | 356,833 | |
| | | 9,570,200 | | | ITOCHU Corp | | | 138,590,470 | |
| | | 28,500 | | | Jafco Co Ltd | | | 973,370 | |
| | | 1,140,200 | | | Japan Airlines Co Ltd | | | 37,260,862 | |
| | | 748,100 | | | K’s Holdings Corp | | | 13,311,951 | |
| | | 762,600 | | | Kaneka Corp | | | 5,965,330 | |
| | | 923,000 | | | Kanematsu Corp | | | 1,601,782 | |
| | | 5,293,900 | | | KDDI Corp | | | 138,342,959 | |
| | | 261,400 | | | Keihin Corp | | | 4,375,482 | |
| | | 135,600 | | | Kewpie Corp | | | 3,614,412 | |
| | | 61,200 | | | Kohnan Shoji Co Ltd | | | 1,166,302 | |
| | | 9,900 | | | Koito Manufacturing Co Ltd | | | 510,518 | |
| | | 68,100 | | | Kokuyo Co Ltd | | | 897,813 | |
| | | 48,900 | | | Kuraray Co Ltd | | | 742,923 | |
| | | 8,200 | | | Kyowa Exeo Corp | | | 113,736 | |
| | | 28,900 | | | Mandom Corp | | | 1,362,336 | |
| | | 5,707,800 | | | Marubeni Corp | | | 36,951,560 | |
| | | 2,400 | | | Maruwa Co Ltd | | | 78,034 | |
| | | 914,100 | | | Medipal Holdings Corp | | | 15,084,572 | |
| | | 2,749,500 | | | Mitsubishi Chemical Holdings Corp | | | 21,141,506 | |
| | | 341,800 | | | Mitsubishi Electric Corp | | | 7,715,850 | |
| | | 191,100 | | | Mitsubishi Tanabe Pharma Corp | | | 3,934,086 | |
| | | 14,611,000 | | | Mitsubishi UFJ Financial Group Inc | | | 96,663,047 | |
| | | 821,500 | | | Mitsubishi UFJ Lease & Finance Co Ltd | | | 4,541,885 | |
| | | 3,855,800 | | | Mitsui & Co Ltd | | | 59,022,807 | |
| | | 5,111,000 | | | Mitsui Engineering & Shipbuilding Co Ltd | | | 8,411,585 | |
| | | 3,600 | | | Mitsui Sugar Co Ltd | | | 86,947 | |
| | | 87,000 | | | Namura Shipbuilding Co Ltd | | | 581,301 | |
| | | 112,600 | | | NET One Systems Co Ltd | | | 862,179 | |
| | | 14,000 | | | Nichias Corp | | | 131,249 | |
| | | 5,400 | | | Nichiha Corp | | | 151,335 | |
| | | 9,900 | | | Nifco Inc | | | 506,418 | |
| | | 127,000 | | | Nippon Corp | | | 2,409,986 | |
| | | 136,781 | | | Nippon Electric Glass Co Ltd | | | 849,736 | |
| | | 1,021,200 | | | Nippon Light Metal Holdings Co Ltd | | | 2,509,681 | |
| | | 21,800 | | | Nippon Paper Industries Co Ltd | | | 396,190 | |
| | | 77,900 | | | Nippon Signal Co Ltd | | | 738,721 | |
| | | 3,103,200 | | | Nippon Telegraph & Telephone Corp | | | 131,263,259 | |
| | | 9,160 | | | Nippon Television Holdings Inc | | | 163,080 | |
| | | 81,013 | | | Nipro Corp | | | 1,047,793 | |
| | | | |
| | See accompanying notes to the financial statements. | | 7 |
GMO International Equity Fund
(A Series of GMO Trust)
Schedule of Investments — (Continued)
(showing percentage of total net assets)
February 28, 2017
| | | | | | | | | | |
| Shares | | | Description | | Value ($) | |
| | | | | | Japan — continued | |
| | | 119,300 | | | Nishi-Nippon Financial Holdings Inc * | | | 1,294,973 | |
| | | 2,768,200 | | | Nissan Motor Co Ltd | | | 27,237,468 | |
| | | 414,900 | | | Nisshinbo Holdings Inc | | | 4,233,056 | |
| | | 40,200 | | | Nissin Electric Co Ltd | | | 472,565 | |
| | | 88,500 | | | Nomura Holdings Inc | | | 571,942 | |
| | | 1,078,200 | | | NTT DOCOMO Inc | | | 25,615,819 | |
| | | 800 | | | NuFlare Technology Inc | | | 45,773 | |
| | | 10,500 | | | Okamura Corp | | | 95,476 | |
| | | 111,600 | | | Okinawa Electric Power Co (The) | | | 2,578,748 | |
| | | 205,800 | | | Onward Holdings Co Ltd | | | 1,524,389 | |
| | | 86,400 | | | Open House Co Ltd | | | 2,053,459 | |
| | | 452,200 | | | Orient Corp * | | | 837,546 | |
| | | 2,958,500 | | | Osaka Gas Co Ltd | | | 11,425,839 | |
| | | 12,000 | | | Osaki Electric Co Ltd | | | 116,279 | |
| | | 969,500 | | | Otsuka Holdings Co Ltd | | | 44,188,471 | |
| | | 124,500 | | | PanaHome Corp | | | 1,158,810 | |
| | | 72,000 | | | Pola Orbis Holdings Inc | | | 6,881,546 | |
| | | 108,200 | | | Press Kogyo Co Ltd | | | 549,242 | |
| | | 26,000 | | | Prima Meat Packers Ltd | | | 104,756 | |
| | | 3,200 | | | Relo Group Inc | | | 463,783 | |
| | | 297,500 | | | Rengo Co Ltd | | | 1,727,686 | |
| | | 43,300 | | | San-A Co Ltd | | | 1,984,540 | |
| | | 34,000 | | | Sankyu Inc | | | 217,468 | |
| | | 178,000 | | | Sanwa Holdings Corp | | | 1,680,921 | |
| | | 1,313,700 | | | Sekisui Chemical Co Ltd | | | 21,700,387 | |
| | | 1,508,100 | | | Sekisui House Ltd | | | 24,116,302 | |
| | | 89,000 | | | Showa Shell Sekiyu KK | | | 897,472 | |
| | | 19,100 | | | Softbank Technology Corp | | | 678,643 | |
| | | 14,496,700 | | | Sojitz Corp | | | 37,569,501 | |
| | | 85,700 | | | Sumitomo Dainippon Pharma Co Ltd | | | 1,513,848 | |
| | | 715,600 | | | Sumitomo Forestry Co Ltd | | | 10,424,001 | |
| | | 1,355,800 | | | Sumitomo Heavy Industries Ltd | | | 9,582,286 | |
| | | 3,789,800 | | | Sumitomo Mitsui Financial Group Inc | | | 147,640,001 | |
| | | 1,356,000 | | | Sumitomo Osaka Cement Co Ltd | | | 5,634,500 | |
| | | 1,044,000 | | | Sumitomo Rubber Industries Ltd | | | 17,219,861 | |
| | | 165,900 | | | Sundrug Co Ltd | | | 10,922,482 | |
| | | 152,300 | | | Suzuken Co Ltd | | | 5,155,549 | |
| | | 162,300 | | | T-Gaia Corp | | | 2,772,255 | |
| | | 531,000 | | | TIS Inc | | | 12,911,019 | |
| | | 244,000 | | | Toho Holdings Co Ltd | | | 5,276,799 | |
| | | 9,330 | | | Tokyo Electric Power Co Holdings Inc * | | | 35,832 | |
| | | 11,600 | | | Tokyo Seimitsu Co Ltd | | | 377,544 | |
| | | 56,000 | | | Toppan Printing Co Ltd | | | 564,550 | |
| | | 8,800 | | | Toshiba Plant Systems & Services Corp | | | 123,572 | |
| | | 3,458,000 | | | Tosoh Corp | | | 30,083,374 | |
| | | 55,500 | | | Towa Pharmaceutical Co Ltd | | | 2,646,420 | |
| | | 23,100 | | | Toyoda Gosei Co Ltd | | | 589,248 | |
| | | 962,400 | | | Toyota Tsusho Corp | | | 28,699,575 | |
| | | 31,900 | | | TPR Co Ltd | | | 1,085,428 | |
| | | 222,300 | | | TS Tech Co Ltd | | | 5,813,903 | |
| | | | | | | | | | |
| Shares | | | Description | | Value ($) | |
| | | | | | Japan — continued | |
| | | 87,400 | | | TSI Holdings Co Ltd | | | 607,688 | |
| | | 362,000 | | | Tsubakimoto Chain Co | | | 3,100,557 | |
| | | 17,000 | | | Tsumura & Co | | | 504,315 | |
| | | 31,900 | | | Tsuruha Holdings Inc | | | 2,951,401 | |
| | | 3,827,100 | | | Ube Industries Ltd | | | 9,570,490 | |
| | | 6,800 | | | UKC Holdings Corp | | | 132,228 | |
| | | 225,800 | | | Valor Holdings Co Ltd | | | 5,602,888 | |
| | | 26,600 | | | Warabeya Nichiyo Holdings Co Ltd | | | 596,681 | |
| | | 30,500 | | | Yahagi Construction Co Ltd | | | 275,936 | |
| | | 438,600 | | | Yamada Denki Co Ltd | | | 2,239,097 | |
| | | 147,600 | | | Yamaguchi Financial Group Inc | | | 1,703,182 | |
| | | 406,000 | | | Zeon Corp | | | 4,463,137 | |
| | | | | | | | | | |
| | | | | | Total Japan | | | 1,588,849,198 | |
| | | | | | | | | | |
| | |
| | | | | | Malta — 0.0% | |
| | | 15,984,486 | | | BGP Holdings Plc * (a) | | | 248,929 | |
| | | | | | | | | | |
| | |
| | | | | | Netherlands — 2.9% | |
| | | 115,769 | | | Aalberts Industries NV | | | 3,993,008 | |
| | | 102,900 | | | AerCap Holdings NV * | | | 4,661,370 | |
| | | 84,116 | | | AVG Technologies NV * | | | 2,077,665 | |
| | | 104,679 | | | BinckBank NV | | | 587,745 | |
| | | 56,536 | | | Corbion NV | | | 1,456,109 | |
| | | 210,719 | | | Heineken Holding NV | | | 16,014,157 | |
| | | 2,900,106 | | | ING Groep NV | | | 39,953,581 | |
| | | 926,284 | | | Koninklijke Ahold Delhaize NV | | | 19,717,906 | |
| | | 56,093 | | | Philips Lighting NV * | | | 1,553,388 | |
| | | 4,157,178 | | | PostNL NV * | | | 18,154,900 | |
| | | 1,509,213 | | | Wolters Kluwer NV | | | 61,857,325 | |
| | | | | | | | | | |
| | | | | | Total Netherlands | | | 170,027,154 | |
| | | | | | | | | | |
| | |
| | | | | | New Zealand — 0.5% | |
| | | 550,314 | | | Air New Zealand Ltd | | | 937,283 | |
| | | 237,499 | | | Chorus Ltd | | | 707,676 | |
| | | 878,078 | | | Fletcher Building Ltd | | | 6,100,262 | |
| | | 1,746,432 | | | Fletcher Building Ltd | | | 12,046,852 | |
| | | 1,281,609 | | | SKY Network Television Ltd | | | 3,505,916 | |
| | | 2,533,240 | | | Spark New Zealand Ltd | | | 6,546,696 | |
| | | | | | | | | | |
| | | | | | Total New Zealand | | | 29,844,685 | |
| | | | | | | | | | |
| | |
| | | | | | Norway — 2.1% | |
| | | 11,876 | | | Austevoll Seafood ASA | | | 104,845 | |
| | | 256,236 | | | Bakkafrost P/F | | | 9,535,805 | |
| | | 499,824 | | | BW LPG Ltd | | | 2,442,577 | |
| | | 614,388 | | | DNB ASA | | | 10,073,251 | |
| | | 3,267,275 | | | Orkla ASA | | | 28,722,017 | |
| | | 98,941 | | | Salmar ASA | | | 2,499,931 | |
| | | 12,295 | | | SpareBank 1 Nord Norge | | | 86,561 | |
| | | 2,334,239 | | | Statoil ASA | | | 41,155,438 | |
| | | 1,191,299 | | | Storebrand ASA * | | | 8,043,912 | |
| | | | |
| 8 | | See accompanying notes to the financial statements. | | |
GMO International Equity Fund
(A Series of GMO Trust)
Schedule of Investments — (Continued)
(showing percentage of total net assets)
February 28, 2017
| | | | | | | | | | |
| Shares | | | Description | | Value ($) | |
| | | | | | Norway — continued | |
| | | 1,136,300 | | | Subsea 7 SA * | | | 16,050,704 | |
| | | 45,524 | | | Telenor ASA | | | 742,287 | |
| | | 16,108 | | | Yara International ASA | | | 611,519 | |
| | | | | | | | | | |
| | | | | | Total Norway | | | 120,068,847 | |
| | | | | | | | | | |
| | |
| | | | | | Portugal — 0.2% | |
| | | 148,834 | | | Altri SGPS SA | | | 679,512 | |
| | | 1,104,709 | | | CTT-Correios de Portugal SA | | | 5,932,970 | |
| | | 1,016,279 | | | EDP – Energias de Portugal SA | | | 3,141,858 | |
| | | 178,954 | | | Navigator Co SA (The) | | | 676,847 | |
| | | 730,139 | | | REN-Redes Energeticas Nacionais SGPS SA | | | 2,032,437 | |
| | | | | | | | | | |
| | | | | | Total Portugal | | | 12,463,624 | |
| | | | | | | | | | |
| | |
| | | | | | Singapore — 0.7% | |
| | | 7,968,600 | | | CapitaLand Commercial Trust (REIT) | | | 8,862,955 | |
| | | 9,300 | | | CapitaLand Mall Trust (REIT) | | | 13,062 | |
| | | 333,000 | | | Fortune Real Estate Investment Trust | | | 373,567 | |
| | | 54,868,400 | | | Golden Agri-Resources Ltd | | | 14,851,506 | |
| | | 1,380,400 | | | Mapletree Greater China Commercial Trust (REIT) | | | 969,885 | |
| | | 706,500 | | | Mapletree Industrial Trust (REIT) | | | 839,161 | |
| | | 980,400 | | | Mapletree Logistics Trust (REIT) | | | 751,842 | |
| | | 170,600 | | | Venture Corp Ltd | | | 1,308,206 | |
| | | 17,437,600 | | | Yangzijiang Shipbuilding Holdings Ltd | | | 11,502,856 | |
| | | 93,000 | | | Yanlord Land Group Ltd | | | 96,540 | |
| | | | | | | | | | |
| | | | | | Total Singapore | | | 39,569,580 | |
| | | | | | | | | | |
| | |
| | | | | | Spain — 3.7% | |
| | | 734,404 | | | Ebro Foods SA | | | 14,906,487 | |
| | | 3,625,616 | | | Endesa SA | | | 77,114,515 | |
| | | 4,780,856 | | | Mapfre SA | | | 14,773,010 | |
| | | 7,134,416 | | | Repsol SA | | | 105,541,597 | |
| | | 11,674 | | | Viscofan SA | | | 610,551 | |
| | | | | | | | | | |
| | | | | | Total Spain | | | 212,946,160 | |
| | | | | | | | | | |
| | |
| | | | | | Sweden — 0.4% | |
| | | 484,951 | | | Axfood AB | | | 7,408,555 | |
| | | 18,290 | | | Bilia AB – A Shares | | | 408,883 | |
| | | 63,284 | | | Castellum AB | | | 856,657 | |
| | | 6,511 | | | Granges AB | | | 59,262 | |
| | | 32,183 | | | Industrivarden AB – C Shares | | | 636,256 | |
| | | 95,027 | | | Intrum Justitia AB | | | 3,435,588 | |
| | | 60,408 | | | Klovern AB – B Shares | | | 62,548 | |
| | | 146,125 | | | NCC AB – B Shares | | | 3,471,982 | |
| | | 262,331 | | | Sandvik AB | | | 3,560,995 | |
| | | 35,435 | | | Securitas AB – B Shares | | | 539,875 | |
| | | 13,261 | | | Skanska AB – B Shares | | | 315,627 | |
| | | 23,199 | | | Swedish Match AB | | | 721,744 | |
| | | 53,861 | | | Wihlborgs Fastigheter AB | | | 1,069,721 | |
| | | | | | | | | | |
| | | | | | Total Sweden | | | 22,547,693 | |
| | | | | | | | | | |
| | | | | | | | | | |
| Shares | | | Description | | Value ($) | |
| | | | | | Switzerland — 5.6% | |
| | | 82,222 | | | Adecco Group AG (Registered) | | | 5,912,306 | |
| | | 58,679 | | | Ascom Holding AG (Registered) | | | 1,019,648 | |
| | | 13,484 | | | Autoneum Holding AG | | | 3,587,699 | |
| | | 1,774 | | | Banque Cantonale Vaudoise (Registered) | | | 1,213,410 | |
| | | 5,696 | | | BKW AG | | | 290,026 | |
| | | 343 | | | Bobst Group SA (Registered) | | | 26,097 | |
| | | 40,951 | | | Cembra Money Bank AG | | | 3,321,526 | |
| | | 10,277 | | | dormakaba Holding AG * | | | 8,490,952 | |
| | | 3,408 | | | Emmi AG (Registered) * | | | 2,165,021 | |
| | | 28,015 | | | EMS-Chemie Holding AG (Registered) | | | 15,940,316 | |
| | | 14,817 | | | Flughafen Zuerich AG (Registered) | | | 2,991,576 | |
| | | 2,467 | | | Forbo Holdings AG (Registered) * | | | 3,364,321 | |
| | | 16,750 | | | Georg Fischer AG (Registered) | | | 14,517,987 | |
| | | 42 | | | Gurit Holding AG * | | | 35,368 | |
| | | 6,240 | | | Helvetia Holding AG (Registered) | | | 3,501,851 | |
| | | 12,324 | | | Implenia AG (Registered) | | | 920,366 | |
| | | 9,576 | | | Kardex AG (Registered) * | | | 966,198 | |
| | | 5,439 | | | Komax Holding AG (Registered) | | | 1,416,937 | |
| | | 279,667 | | | Kuehne & Nagel International AG (Registered) | | | 39,818,017 | |
| | | 403,528 | | | Logitech International SA (Registered) | | | 11,665,138 | |
| | | 10,546 | | | Mobilezone Holding AG (Registered) | | | 152,625 | |
| | | 4,840 | | | Sika AG | | | 27,238,239 | |
| | | 16,291 | | | Swatch Group AG (The) (Registered) | | | 1,055,475 | |
| | | 92,903 | | | Swiss Life Holding AG (Registered) * | | | 29,225,257 | |
| | | 1,596,286 | | | Swiss Re AG | | | 142,781,046 | |
| | | 1,640 | | | Valora Holding AG (Registered) | | | 545,634 | |
| | | 61,457 | | | Vontobel Holding AG (Registered) | | | 3,359,269 | |
| | | 5,161 | | | Zehnder Group AG – Class RG * | | | 180,351 | |
| | | | | | | | | | |
| | | | | | Total Switzerland | | | 325,702,656 | |
| | | | | | | | | | |
| | |
| | | | | | United Kingdom — 16.5% | |
| | | 2,714,919 | | | AstraZeneca Plc | | | 156,460,887 | |
| | | 3,785,540 | | | Balfour Beatty Plc | | | 12,972,808 | |
| | | 67,753 | | | Bellway Plc | | | 2,191,495 | |
| | | 874,079 | | | Berkeley Group Holdings Plc (The) | | | 31,945,661 | |
| | | 67,143 | | | Bovis Homes Group Plc | | | 650,447 | |
| | | 1,501,128 | | | British American Tobacco Plc | | | 94,818,067 | |
| | | 776,174 | | | Cairn Energy Plc * | | | 2,141,417 | |
| | | 2,311,119 | | | Carillion Plc | | | 6,281,005 | |
| | | 12,970,799 | | | Centrica Plc | | | 36,538,594 | |
| | | 434,180 | | | Compass Group Plc | | | 8,066,181 | |
| | | 587,425 | | | Crest Nicholson Holdings Plc | | | 3,944,355 | |
| | | 4,316,811 | | | Debenhams Plc | | | 2,874,156 | |
| | | 1,712,745 | | | Direct Line Insurance Group Plc | | | 7,299,852 | |
| | | 28,644 | | | Fenner Plc | | | 98,779 | |
| | | 7,495,818 | | | Firstgroup Plc * | | | 11,186,331 | |
| | | 277,549 | | | Galliford Try Plc | | | 5,225,790 | |
| | | 7,290,716 | | | GlaxoSmithKline Plc | | | 149,189,337 | |
| | | 133,725 | | | Halfords Group Plc | | | 563,531 | |
| | | | |
| | See accompanying notes to the financial statements. | | 9 |
GMO International Equity Fund
(A Series of GMO Trust)
Schedule of Investments — (Continued)
(showing percentage of total net assets)
February 28, 2017
| | | | | | | | | | |
| Shares | | | Description | | Value ($) | |
| | | | | | United Kingdom — continued | |
| | | 335,928 | | | Hunting Plc | | | 2,211,600 | |
| | | 229,089 | | | IG Group Holdings Plc | | | 1,520,863 | |
| | | 717,660 | | | Imperial Brands Plc | | | 33,784,025 | |
| | | 1,895,212 | | | Inchcape Plc | | | 17,652,100 | |
| | | 2,242,357 | | | Indivior Plc | | | 9,731,088 | |
| | | 567,034 | | | Intermediate Capital Group Plc | | | 4,989,504 | |
| | | 2,376,448 | | | J Sainsbury Plc | | | 7,888,603 | |
| | | 1,058,444 | | | Jupiter Fund Management Plc | | | 5,507,089 | |
| | | 8,660,720 | | | Kingfisher Plc | | | 35,326,089 | |
| | | 154,003 | | | Mitie Group Plc | | | 395,576 | |
| | | 406,874 | | | National Express Group Plc | | | 1,835,106 | |
| | | 30,089 | | | Pearson Plc | | | 251,353 | |
| | | 1,587,403 | | | Persimmon Plc | | | 40,592,658 | |
| | | 57,252 | | | Playtech Plc | | | 634,283 | |
| | | 915,297 | | | Reckitt Benckiser Group Plc | | | 83,108,649 | |
| | | 5,177,335 | | | Royal Mail Plc | | | 26,646,450 | |
| | | 1,856,569 | | | Sage Group Plc (The) | | | 14,878,933 | |
| | | 70,646 | | | Savills Plc | | | 750,182 | |
| | | 263,438 | | | Spectris Plc | | | 7,938,505 | |
| | | 99,119 | | | Victrex Plc | | | 2,350,679 | |
| | | 424,573 | | | WH Smith Plc | | | 8,914,375 | |
| | | 2,511,170 | | | WM Morrison Supermarkets Plc | | | 7,546,252 | |
| | | 4,735,789 | | | WPP Plc | | | 111,416,118 | |
| | | | | | | | | | |
| | | | | | Total United Kingdom | | | 958,318,773 | |
| | | | | | | | | | |
| | | |
| | | | | | TOTAL COMMON STOCKS
(COST $5,540,297,155) | | | 5,710,771,490 | |
| | | | | | | | | | |
| | |
| | | | | | PREFERRED STOCKS — 0.8% | |
| | |
| | | | | | Germany — 0.8% | |
| | | 164,043 | | | Jungheinrich AG | | | 4,961,804 | |
| | | 803,420 | | | Porsche Automobil Holding SE | | | 44,339,513 | |
| | | | | | | | | | |
| | | | | | Total Germany | | | 49,301,317 | |
| | | | | | | | | | |
| | | |
| | | | | | TOTAL PREFERRED STOCKS
(COST $79,162,336) | | | 49,301,317 | |
| | | | | | | | | | |
| | |
| | | | | | MUTUAL FUNDS — 0.4% | |
| | |
| | | | | | United States — 0.4% | |
| | | | | | Affiliated Issuers — 0.4% | | | | |
| | | 870,715 | | | GMO U.S. Treasury Fund | | | 21,767,868 | |
| | | | | | | | | | |
| | | |
| | | | | | TOTAL MUTUAL FUNDS
(COST $21,767,868) | | | 21,767,868 | |
| | | | | | | | | | |
| | | | | | | | | | |
| Par Value† | | | Description | | Value ($) | |
| | | | | | SHORT-TERM INVESTMENTS — 0.5% | |
| | |
| | | | | | Time Deposits — 0.5% | |
AUD | | | 4,567,469 | | | Australia and New Zealand Banking Group Ltd. (Melbourne) Time Deposit,
0.74%, due 03/01/17 | | | 3,501,878 | |
CAD | | | 15,734 | | | Brown Brothers Harriman (Grand Cayman) Time Deposit,
0.05%, due 03/01/17 | | | 11,846 | |
DKK | | | 34,345 | | | Brown Brothers Harriman (Grand Cayman) Time Deposit,
(0.45)%, due 03/01/17 | | | 4,895 | |
NZD | | | 30 | | | Brown Brothers Harriman (Grand Cayman) Time Deposit,
1.05%, due 03/01/17 | | | 21 | |
EUR | | | 1,501,132 | | | DnB Nor Bank (Oslo) Time Deposit,
(0.58)%, due 03/01/17 | | | 1,590,299 | |
SGD | | | 373,742 | | | HSBC Bank (Hong Kong) Time Deposit,
0.01%, due 03/01/17 | | | 266,692 | |
| | | 21,433,922 | | | Sumitomo (Tokyo) Time Deposit,
0.36%, due 03/01/17 | | | 21,433,922 | |
| | | | | | | | | | |
| | | | | | Total Time Deposits | | | 26,809,553 | |
| | | | | | | | | | |
| | | |
| | | | | | TOTAL SHORT-TERM INVESTMENTS
(COST $26,809,553) | | | 26,809,553 | |
| | | | | | | | | | |
| | | |
| | | | | | TOTAL INVESTMENTS — 99.9%
(Cost $5,668,036,912) | | | 5,808,650,228 | |
| | | | | | Other Assets and Liabilities (net) — 0.1% | | | 4,735,519 | |
| | | | | | | | | | |
| | | |
| | | | | | TOTAL NET ASSETS — 100.0% | | | $5,813,385,747 | |
| | | | | | | | | | |
Notes to Schedule of Investments:
| * | Non-income producing security. |
| † | Denominated in U.S. Dollar, unless otherwise indicated. |
| (a) | Investment valued at fair value using methods determined in good faith by the Trustees of GMO Trust or persons acting at their direction pursuant to procedures approved by the Trustees (Note 2). |
For a listing of definitions of acronyms, counterparty abbreviations and currency abbreviations used throughout the Schedule of Investments as well as the derivative tables, if any, please refer to page 54.
| | | | |
| 10 | | See accompanying notes to the financial statements. | | |
This page has been left blank intentionally.
GMO International Large/Mid Cap Equity Fund
(A Series of GMO Trust)
Portfolio Managers
Day-to-day management of the Fund’s portfolio is the responsibility of the Global Equity team at Grantham, Mayo, Van Otterloo & Co. LLC.
Management Discussion and Analysis of Fund Performance
Although the Fund is not managed relative to any securities market index or benchmark, a discussion of the Fund’s performance relative to the MSCI EAFE Index is included for comparative purposes.
Class III shares of GMO International Large/Mid Cap Equity Fund returned +14.70% (net) for the fiscal year ended February 28, 2017, as compared with +15.75% for the MSCI EAFE Index.
The Fund’s allocation among countries was broadly neutral for returns relative to the benchmark. An underweight position in Australia and an overweight position in Israel had the largest negative impact on performance, but these were offset by small gains in other areas of the portfolio. The Fund’s modest cash holdings were a drag on relative performance given the strong returns generated by equities.
Sector allocation proved negative relative to the benchmark. The largest negative contributions were from being overweight Telecommunication Services and an underweight position in Materials. Stock selection was a strong contributor to relative performance. Underperformance in Information Technology, Consumer Discretionary, and Industrials was more than offset by good relative returns in Financials, Health Care, and Telecommunication Services.
Top stock detractors included overweight positions in Royal Ahold (a Dutch retailer), Nippon Telegraph and Telephone Corporation, and Kingfisher Plc (a British multinational retailer). Top stock contributors included overweight positions in Mitsubishi UFJ Financial Group, Sumitomo Mitsui Financial Group, as well as having no exposure to Novo Nordisk (a Danish Pharmaceutical company).
Because some of the securities and instruments held directly or indirectly by the Fund had positive fair value adjustments at the beginning or end of the fiscal year (and the performance of indices are not fair valued), the Fund’s absolute and relative performance is higher than it otherwise would have been in the absence of such fair value adjustments.
The views expressed herein are exclusively those of Grantham, Mayo, Van Otterloo & Co. LLC as of the date of this report and are subject to change. GMO disclaims any responsibility to update such views. They are not meant as investment advice. References to specific securities are not recommendations of such securities and may not be representative of any GMO portfolio’s current or future investments.
12
GMO International Large/Mid Cap Equity Fund
(A Series of GMO Trust)
Comparison of Change in Value of a $10,000,000 Investment in
GMO International Large/Mid Cap Equity Fund Class III Shares and the MSCI EAFE Index
As of February 28, 2017
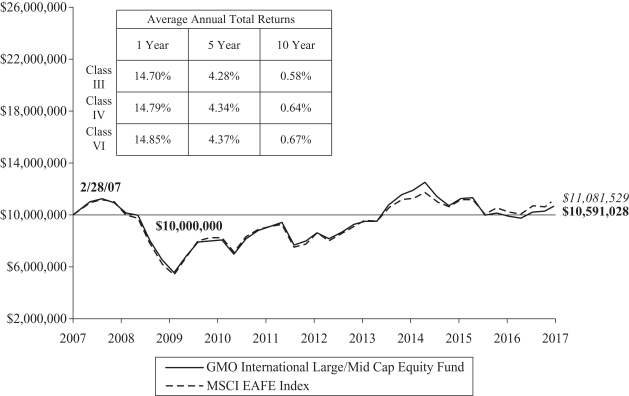
Performance data quoted represents past performance and is not indicative of future results. The investment return and principal value of an investment will fluctuate so that an investor’s shares, when redeemed, may be worth more or less than their original cost. Current performance data may be lower or higher than the performance data provided herein. To obtain performance information up to the most recent month-end, visit www.gmo.com. Performance shown is net of all fees after reimbursement from GMO. Returns would have been lower had certain expenses not been reimbursed during the periods shown and do not include the effect of taxes on distributions and redemptions. The performance information shown above only includes purchase premiums and/or redemption fees in effect as of February 28, 2017. All information is unaudited. Performance for classes may vary due to different fees.
MSCI data may not be reproduced or used for any other purpose. MSCI provides no warranties, has not prepared or approved this report, and has no liability hereunder.
13
GMO International Large/Mid Cap Equity Fund
(A Series of GMO Trust)
Investment Concentration Summary
February 28, 2017 (Unaudited)
| | | | |
| Asset Class Summary& | | % of Total Net Assets | |
Common Stocks | | | 96.2 | % |
Mutual Funds | | | 1.3 | |
Preferred Stocks | | | 1.2 | |
Short-Term Investments | | | 0.3 | |
Futures Contracts | | | 0.0 | ^ |
Other | | | 1.0 | |
| | | | |
| | | 100.0 | % |
| | | | |
| | | | |
| Country Summary* | | % of Investments | |
Japan | | | 27.3 | % |
United Kingdom | | | 18.6 | |
France | | | 10.3 | |
Germany | | | 9.0 | |
Switzerland | | | 5.7 | |
Hong Kong | | | 5.5 | |
Netherlands | | | 3.4 | |
Australia | | | 3.2 | |
Spain | | | 3.1 | |
Other Developed | | | 2.8 | ‡ |
United States | | | 2.4 | |
Israel | | | 2.2 | |
Norway | | | 1.8 | |
Canada | | | 1.7 | |
Austria | | | 1.5 | |
Finland | | | 1.5 | |
| | | | |
| | | 100.0 | % |
| | | | |
| & | In the table above, derivative financial instruments, if any, are based on market values or unrealized appreciation/depreciation rather than notional amounts. |
| * | The table above shows country exposure in the Fund. The table excludes short-term investments. The table excludes exposure through forward currency contracts and includes exposure through other derivative financial instruments, if any. The table takes into account the market value of securities and options and the notional amounts of swap contracts and other derivative financial instruments, if any. |
| ‡ | “Other Developed” is comprised of developed countries that each represent between (1.0)% and 1.0% of Investments. |
| | | | |
| Industry Group Summary | | % of Equity Investments# | |
Insurance | | | 9.1 | % |
Banks | | | 9.0 | |
Energy | | | 7.8 | |
Pharmaceuticals, Biotechnology & Life Sciences | | | 7.8 | |
Automobiles & Components | | | 7.7 | |
Capital Goods | | | 6.9 | |
Real Estate | | | 6.1 | |
Telecommunication Services | | | 6.0 | |
Materials | | | 5.8 | |
Transportation | | | 5.6 | |
Food, Beverage & Tobacco | | | 5.1 | |
Consumer Durables & Apparel | | | 4.7 | |
Food & Staples Retailing | | | 2.6 | |
Software & Services | | | 2.5 | |
Utilities | | | 2.4 | |
Media | | | 2.3 | |
Commercial & Professional Services | | | 2.2 | |
Retailing | | | 2.1 | |
Household & Personal Products | | | 1.9 | |
Technology Hardware & Equipment | | | 1.6 | |
Diversified Financials | | | 0.4 | |
Consumer Services | | | 0.3 | |
Health Care Equipment & Services | | | 0.1 | |
Semiconductors & Semiconductor Equipment | | | 0.0 | ^ |
| | | | |
| | | 100.0 | % |
| | | | |
| # | Equity investments may consist of common stocks and other stock-related securities, such as preferred stocks, if any. This table excludes exposure to derivative contracts, short-term investments, mutual funds and investment funds, if any. For a summary of these exposures, if any, see the Schedule of Investments. |
14
GMO International Large/Mid Cap Equity Fund
(A Series of GMO Trust)
Schedule of Investments
(showing percentage of total net assets)
February 28, 2017
| | | | | | | | | | |
| Shares | | | Description | | Value ($) | |
| | | | | | COMMON STOCKS — 96.2% | |
| | |
| | | | | | Australia — 3.2% | |
| | | 6,555 | | | Adelaide Brighton Ltd | | | 26,981 | |
| | | 1,652 | | | Australia & New Zealand Banking Group Ltd | | | 39,100 | |
| | | 27,208 | | | BHP Billiton Ltd | | | 514,996 | |
| | | 49,236 | | | BlueScope Steel Ltd | | | 460,484 | |
| | | 7,843 | | | CIMIC Group Ltd | | | 227,061 | |
| | | 54,050 | | | Dexus Property Group (REIT) | | | 391,007 | |
| | | 9,064 | | | Downer EDI Ltd | | | 48,738 | |
| | | 5,949 | | | Fairfax Media Ltd | | | 4,305 | |
| | | 68,181 | | | Fortescue Metals Group Ltd | | | 345,171 | |
| | | 66,306 | | | GPT Group (The) (REIT) | | | 250,447 | |
| | | 15,077 | | | LendLease Group | | | 175,908 | |
| | | 311 | | | Macquarie Group Ltd | | | 20,623 | |
| | | 51,854 | | | Mirvac Group (REIT) | | | 85,398 | |
| | | 867 | | | National Australia Bank Ltd | | | 21,266 | |
| | | 8,623 | | | OZ Minerals Ltd | | | 61,355 | |
| | | 408 | | | Rio Tinto Ltd | | | 19,343 | |
| | | 283,632 | | | Scentre Group (REIT) | | | 947,871 | |
| | | 1,299 | | | Shopping Centres Australasia Property Group (REIT) | | | 2,220 | |
| | | 2,537 | | | Sonic Healthcare Ltd | | | 41,828 | |
| | | 62,586 | | | Stockland (REIT) | | | 226,370 | |
| | | 8,572 | | | Suncorp Group Ltd | | | 87,090 | |
| | | 431,020 | | | Telstra Corp Ltd | | | 1,591,954 | |
| | | 2,642 | | | Wesfarmers Ltd | | | 86,475 | |
| | | 10,396 | | | Woodside Petroleum Ltd | | | 249,368 | |
| | | | | | | | | | |
| | | | | | Total Australia | | | 5,925,359 | |
| | | | | | | | | | |
| | |
| | | | | | Austria — 1.5% | |
| | | 1,376 | | | Oesterreichische Post AG * | | | 50,033 | |
| | | 46,497 | | | OMV AG | | | 1,777,362 | |
| | | 23,936 | | | voestalpine AG | | | 1,005,704 | |
| | | | | | | | | | |
| | | | | | Total Austria | | | 2,833,099 | |
| | | | | | | | | | |
| | |
| | | | | | Belgium — 0.2% | |
| | | 84 | | | Ageas | | | 3,193 | |
| | | 11,494 | | | bpost SA | | | 285,420 | |
| | | | | | | | | | |
| | | | | | Total Belgium | | | 288,613 | |
| | | | | | | | | | |
| | |
| | | | | | Canada — 1.7% | |
| | | 24,200 | | | Air Canada * | | | 243,786 | |
| | | 3,100 | | | Canadian Tire Corp Ltd – Class A | | | 355,466 | |
| | | 9,000 | | | CGI Group Inc – Class A * | | | 413,748 | |
| | | 8,700 | | | CI Financial Corp | | | 177,380 | |
| | | 1,200 | | | IGM Financial Inc | | | 36,781 | |
| | | 62,500 | | | Metro Inc | | | 1,822,485 | |
| | | 200 | | | Open Text Corp | | | 6,592 | |
| | | 1,700 | | | Saputo Inc | | | 58,377 | |
| | | | | | | | | | |
| Shares | | | Description | | Value ($) | |
| | | | | | Canada — continued | |
| | | 4,500 | | | Transcontinental Inc – Class A | | | 68,540 | |
| | | | | | | | | | |
| | | | | | Total Canada | | | 3,183,155 | |
| | | | | | | | | | |
| | |
| | | | | | Denmark — 0.8% | |
| | | 858 | | | AP Moeller – Maersk A/S – Class B | | | 1,395,123 | |
| | | | | | | | | | |
| | |
| | | | | | Finland — 1.5% | |
| | | 22,638 | | | Neste Oyj | | | 787,957 | |
| | | 84,430 | | | UPM – Kymmene Oyj | | | 2,002,399 | |
| | | | | | | | | | |
| | | | | | Total Finland | | | 2,790,356 | |
| | | | | | | | | | |
| | |
| | | | | | France — 10.3% | |
| | | 106 | | | Atos SE | | | 12,539 | |
| | | 197,503 | | | AXA SA | | | 4,664,629 | |
| | | 34,597 | | | BNP Paribas SA | | | 2,024,286 | |
| | | 11,522 | | | Christian Dior SE | | | 2,442,897 | |
| | | 8,688 | | | Cie Generale des Etablissements Michelin | | | 978,219 | |
| | | 1,081 | | | CNP Assurances | | | 20,032 | |
| | | 3,950 | | | Renault SA | | | 350,613 | |
| | | 1,667 | | | Rexel SA | | | 26,971 | |
| | | 18,560 | | | SCOR SE | | | 670,967 | |
| | | 365 | | | Societe BIC SA | | | 45,171 | |
| | | 41,034 | | | Societe Generale | | | 1,823,862 | |
| | | 121,341 | | | TOTAL SA | | | 6,054,427 | |
| | | 584 | | | Valeo SA | | | 35,965 | |
| | | | | | | | | | |
| | | | | | Total France | | | 19,150,578 | |
| | | | | | | | | | |
| | |
| | | | | | Germany — 7.8% | |
| | | 26,856 | | | Allianz SE (Registered) | | | 4,677,437 | |
| | | 5,977 | | | Aurubis AG | | | 344,507 | |
| | | 36,917 | | | Bayerische Motoren Werke AG | | | 3,296,544 | |
| | | 84 | | | Bechtle AG | | | 8,749 | |
| | | 483 | | | Covestro AG | | | 36,346 | |
| | | 65,491 | | | Daimler AG (Registered) | | | 4,757,724 | |
| | | 83,627 | | | Deutsche Lufthansa AG (Registered) | | | 1,224,387 | |
| | | 244 | | | Duerr AG | | | 20,217 | |
| | | 253 | | | Hannover Rueck SE | | | 28,542 | |
| | | 372 | | | HeidelbergCement AG | | | 34,731 | |
| | | 349 | | | Henkel AG & Co KGaA | | | 37,659 | |
| | | 1,863 | | | RWE AG * | | | 26,532 | |
| | | | | | | | | | |
| | | | | | Total Germany | | | 14,493,375 | |
| | | | | | | | | | |
| | |
| | | | | | Hong Kong — 5.5% | |
| | | 407,000 | | | BOC Hong Kong Holdings Ltd | | | 1,607,819 | |
| | | 34,500 | | | CK Hutchison Holdings Ltd | | | 426,131 | |
| | | 34,000 | | | Dah Sing Banking Group Ltd | | | 66,162 | |
| | | 47,000 | | | Henderson Land Development Co Ltd | | | 272,949 | |
| | | 74,000 | | | HKT Trust & HKT Ltd – Class SS | | | 98,713 | |
| | | 91,600 | | | Hongkong Land Holdings Ltd | | | 625,089 | |
| | | | |
| | See accompanying notes to the financial statements. | | 15 |
GMO International Large/Mid Cap Equity Fund
(A Series of GMO Trust)
Schedule of Investments — (Continued)
(showing percentage of total net assets)
February 28, 2017
| | | | | | | | | | |
| Shares | | | Description | | Value ($) | |
| | | | | | Hong Kong — continued | |
| | | 50,000 | | | Hysan Development Co Ltd | | | 233,127 | |
| | | 51,500 | | | Kerry Properties Ltd | | | 157,819 | |
| | | 309,500 | | | Link (REIT) | | | 2,134,165 | |
| | | 35,000 | | | Pacific Textiles Holdings Ltd | | | 39,047 | |
| | | 12,000 | | | Sino Land Co Ltd | | | 20,886 | |
| | | 678,000 | | | SJM Holdings Ltd | | | 556,303 | |
| | | 65,500 | | | Swire Pacific Ltd – Class A | | | 674,234 | |
| | | 2,500 | | | Techtronic Industries Co Ltd | | | 8,946 | |
| | | 14,000 | | | WH Group Ltd | | | 10,930 | |
| | | 230,000 | | | Wharf Holdings Ltd (The) | | | 1,822,156 | |
| | | 99,000 | | | Wheelock & Co Ltd | | | 642,983 | |
| | | 626,000 | | | Xinyi Glass Holdings Ltd | | | 567,568 | |
| | | 51,500 | | | Yue Yuen Industrial Holdings Ltd | | | 191,625 | |
| | | | | | | | | | |
| | | | | | Total Hong Kong | | | 10,156,652 | |
| | | | | | | | | | |
| | |
| | | | | | Ireland — 0.1% | |
| | | 8,302 | | | Smurfit Kappa Group Plc | | | 220,498 | |
| | | | | | | | | | |
| | |
| | | | | | Israel — 2.2% | |
| | | 133,737 | | | Bank Hapoalim BM | | | 824,367 | |
| | | 30,184 | | | Bank Leumi Le-Israel BM * | | | 132,340 | |
| | | 14,548 | | | Bezeq Israeli Telecommunication Corp Ltd | | | 25,982 | |
| | | 29,100 | | | Check Point Software Technologies Ltd * | | | 2,878,281 | |
| | | 29,401 | | | Israel Discount Bank Ltd – Class A * | | | 65,075 | |
| | | 3,665 | | | Teva Pharmaceutical Industries Ltd | | | 128,923 | |
| | | 400 | | | Teva Pharmaceutical Industries Ltd Sponsored ADR | | | 14,008 | |
| | | | | | | | | | |
| | | | | | Total Israel | | | 4,068,976 | |
| | | | | | | | | | |
| | |
| | | | | | Italy — 0.4% | |
| | | 34,779 | | | Banca Mediolanum SPA | | | 226,963 | |
| | | 477 | | | De’ Longhi SPA | | | 12,380 | |
| | | 12,035 | | | Enel SPA | | | 51,650 | |
| | | 27,021 | | | Eni SPA | | | 416,860 | |
| | | 787 | | | EXOR SPA | | | 37,273 | |
| | | 2,386 | | | Hera SPA | | | 5,909 | |
| | | 1,271 | | | Recordati SPA | | | 40,334 | |
| | | | | | | | | | |
| | | | | | Total Italy | | | 791,369 | |
| | | | | | | | | | |
| | |
| | | | | | Japan — 27.3% | |
| | | 100 | | | Aoyama Trading Co Ltd | | | 3,749 | |
| | | 5,000 | | | Asahi Glass Co Ltd | | | 40,813 | |
| | | 1,000 | | | Asahi Group Holdings Ltd | | | 35,352 | |
| | | 15,000 | | | Asahi Kasei Corp | | | 146,171 | |
| | | 1,300 | | | Bandai Namco Holdings Inc | | | 37,448 | |
| | | 7,000 | | | Calsonic Kansei Corp | | | 80,168 | |
| | | 16,300 | | | Central Japan Railway Co | | | 2,668,306 | |
| | | 23,000 | | | Chiba Bank Ltd (The) | | | 160,792 | |
| | | 2,200 | | | Coca-Cola West Co Ltd | | | 65,385 | |
| | | 4,700 | | | Daicel Corp | | | 57,054 | |
| | | | | | | | | | |
| Shares | | | Description | | Value ($) | |
| | | | | | Japan — continued | |
| | | 30,100 | | | Daiichi Sankyo Co Ltd | | | 686,374 | |
| | | 7,601 | | | Daito Trust Construction Co Ltd | | | 1,063,365 | |
| | | 38,300 | | | Daiwa House Industry Co Ltd | | | 1,051,077 | |
| | | 8,900 | | | DCM Holdings Co Ltd | | | 79,156 | |
| | | 2,200 | | | Fuji Heavy Industries Ltd | | | 82,318 | |
| | | 68,000 | | | FUJIFILM Holdings Corp | | | 2,630,407 | |
| | | 6,000 | | | Fujitsu Ltd | | | 34,847 | |
| | | 36,574 | | | Haseko Corp | | | 432,810 | |
| | | 340,500 | | | ITOCHU Corp | | | 4,930,937 | |
| | | 42,900 | | | Japan Airlines Co Ltd | | | 1,401,939 | |
| | | 28,240 | | | K’s Holdings Corp | | | 502,512 | |
| | | 5,000 | | | Kajima Corp | | | 32,588 | |
| | | 172,124 | | | KDDI Corp | | | 4,498,034 | |
| | | 20,700 | | | Konica Minolta Inc | | | 199,655 | |
| | | 238,400 | | | Marubeni Corp | | | 1,543,371 | |
| | | 164,100 | | | Mitsubishi Chemical Holdings Corp | | | 1,261,801 | |
| | | 5,200 | | | Mitsubishi Electric Corp | | | 117,386 | |
| | | 16,300 | | | Mitsubishi Tanabe Pharma Corp | | | 335,560 | |
| | | 637,400 | | | Mitsubishi UFJ Financial Group Inc | | | 4,216,893 | |
| | | 110,800 | | | Mitsui & Co Ltd | | | 1,696,075 | |
| | | 102,600 | | | Nippon Telegraph & Telephone Corp | | | 4,339,911 | |
| | | 10,208 | | | Nipro Corp | | | 132,027 | |
| | | 150,000 | | | Nissan Motor Co Ltd | | | 1,475,912 | |
| | | 3,800 | | | Obayashi Corp | | | 35,355 | |
| | | 153,000 | | | Osaka Gas Co Ltd | | | 590,892 | |
| | | 78,200 | | | Otsuka Holdings Co Ltd | | | 3,564,248 | |
| | | 1,200 | | | Resona Holdings Inc | | | 6,702 | |
| | | 59,600 | | | Sekisui Chemical Co Ltd | | | 984,504 | |
| | | 81,300 | | | Sekisui House Ltd | | | 1,300,083 | |
| | | 449,000 | | | Sojitz Corp | | | 1,163,624 | |
| | | 68,000 | | | Sumitomo Chemical Co Ltd | | | 379,336 | |
| | | 1,100 | | | Sumitomo Dainippon Pharma Co Ltd | | | 19,431 | |
| | | 132,200 | | | Sumitomo Mitsui Financial Group Inc | | | 5,150,142 | |
| | | 1,700 | | | Toho Holdings Co Ltd | | | 36,765 | |
| | | 200 | | | Tokyo Electron Ltd | | | 19,953 | |
| | | 46,400 | | | Toyota Tsusho Corp | | | 1,383,687 | |
| | | 2,400 | | | TS Tech Co Ltd | | | 62,768 | |
| | | | | | | | | | |
| | | | | | Total Japan | | | 50,737,683 | |
| | | | | | | | | | |
| | |
| | | | | | Malta — 0.1% | |
| | | 15,998,662 | | | BGP Holdings Plc * (a) | | | 249,150 | |
| | | | | | | | | | |
| | |
| | | | | | Netherlands — 3.4% | |
| | | 7,600 | | | AerCap Holdings NV * | | | 344,280 | |
| | | 9,793 | | | Heineken Holding NV | | | 744,245 | |
| | | 9,431 | | | ING Groep NV | | | 129,927 | |
| | | 99,714 | | | Koninklijke Ahold Delhaize NV | | | 2,122,623 | |
| | | 116,005 | | | PostNL NV * | | | 506,608 | |
| | | 2,196 | | | Randstad Holdings NV | | | 127,896 | |
| | | 57,450 | | | Wolters Kluwer NV | | | 2,354,673 | |
| | | | | | | | | | |
| | | | | | Total Netherlands | | | 6,330,252 | |
| | | | | | | | | | |
| | | | |
| 16 | | See accompanying notes to the financial statements. | | |
GMO International Large/Mid Cap Equity Fund
(A Series of GMO Trust)
Schedule of Investments — (Continued)
(showing percentage of total net assets)
February 28, 2017
| | | | | | | | | | |
| Shares | | | Description | | Value ($) | |
| | | | | | New Zealand — 0.6% | |
| | | 110,523 | | | Fletcher Building Ltd | | | 767,835 | |
| | | 151,515 | | | Spark New Zealand Ltd | | | 391,563 | |
| | | | | | | | | | |
| | | | | | Total New Zealand | | | 1,159,398 | |
| | | | | | | | | | |
| | |
| | | | | | Norway — 1.8% | |
| | | 1,913 | | | Bakkafrost P/F | | | 71,192 | |
| | | 117,163 | | | Orkla ASA | | | 1,029,958 | |
| | | 71,181 | | | Statoil ASA | | | 1,255,007 | |
| | | 27,060 | | | Yara International ASA | | | 1,027,297 | |
| | | | | | | | | | |
| | | | | | Total Norway | | | 3,383,454 | |
| | | | | | | | | | |
| | |
| | | | | | Portugal — 0.0% | |
| | | 5,802 | | | CTT-Correios de Portugal SA | | | 31,160 | |
| | | 12,569 | | | EDP – Energias de Portugal SA | | | 38,858 | |
| | | | | | | | | | |
| | | | | | Total Portugal | | | 70,018 | |
| | | | | | | | | | |
| | |
| | | | | | Singapore — 0.4% | |
| | | 2,533,400 | | | Golden Agri-Resources Ltd | | | 685,728 | |
| | | 135,800 | | | Yangzijiang Shipbuilding Holdings Ltd | | | 89,582 | |
| | | | | | | | | | |
| | | | | | Total Singapore | | | 775,310 | |
| | | | | | | | | | |
| | |
| | | | | | Spain — 3.1% | |
| | | 90,158 | | | Endesa SA | | | 1,917,603 | |
| | | 38,710 | | | Mapfre SA | | | 119,615 | |
| | | 246,232 | | | Repsol SA | | | 3,642,585 | |
| | | | | | | | | | |
| | | | | | Total Spain | | | 5,679,803 | |
| | | | | | | | | | |
| | |
| | | | | | Sweden — 0.1% | |
| | | 1,119 | | | Atlas Copco AB – A Shares | | | 36,554 | |
| | | 1,224 | | | Boliden AB | | | 37,272 | |
| | | 9,980 | | | Sandvik AB | | | 135,473 | |
| | | 580 | | | Swedish Match AB | | | 18,044 | |
| | | | | | | | | | |
| | | | | | Total Sweden | | | 227,343 | |
| | | | | | | | | | |
| | |
| | | | | | Switzerland — 5.7% | |
| | | 17,691 | | | Adecco Group AG (Registered) | | | 1,272,100 | |
| | | 1,138 | | | EMS-Chemie Holding AG (Registered) | | | 647,513 | |
| | | 68 | | | Forbo Holdings AG (Registered) * | | | 92,734 | |
| | | 9,484 | | | Kuehne & Nagel International AG (Registered) | | | 1,350,299 | |
| | | 174 | | | LafargeHolcim Ltd (Registered) * | | | 9,897 | |
| | | 175 | | | Sika AG | | | 984,854 | |
| | | 89 | | | Swatch Group AG (The) (Registered) | | | 5,766 | |
| | | 4,909 | | | Swiss Life Holding AG (Registered) * | | | 1,544,264 | |
| | | 51,614 | | | Swiss Re AG | | | 4,616,654 | |
| | | | | | | | | | |
| | | | | | Total Switzerland | | | 10,524,081 | |
| | | | | | | | | | |
| | |
| | | | | | United Kingdom — 18.5% | |
| | | 6,038 | | | 3i Group Plc | | | 51,593 | |
| | | 86,220 | | | AstraZeneca Plc | | | 4,968,862 | |
| | | | | | | | | | |
| Shares | | | Description | | Value ($) | |
| | | | | | United Kingdom — continued | |
| | | 4,928 | | | Bellway Plc | | | 159,398 | |
| | | 30,250 | | | Berkeley Group Holdings Plc (The) | | | 1,105,571 | |
| | | 6,072 | | | Bovis Homes Group Plc | | | 58,822 | |
| | | 84,807 | | | British American Tobacco Plc | | | 5,356,796 | |
| | | 26,900 | | | Carillion Plc | | | 73,107 | |
| | | 597,994 | | | Centrica Plc | | | 1,684,542 | |
| | | 8,056 | | | Crest Nicholson Holdings Plc | | | 54,093 | |
| | | 16,988 | | | Direct Line Insurance Group Plc | | | 72,404 | |
| | | 3,301 | | | Galliford Try Plc | | | 62,152 | |
| | | 210,649 | | | GlaxoSmithKline Plc | | | 4,310,494 | |
| | | 2,198 | | | Hammerson Plc (REIT) | | | 16,047 | |
| | | 30,983 | | | Henderson Group Plc | | | 85,835 | |
| | | 3,748 | | | IG Group Holdings Plc | | | 24,882 | |
| | | 23,748 | | | Imperial Brands Plc | | | 1,117,943 | |
| | | 29,206 | | | Inchcape Plc | | | 272,026 | |
| | | 25,363 | | | Indivior Plc | | | 110,067 | |
| | | 6,704 | | | Intermediate Capital Group Plc | | | 58,991 | |
| | | 155,213 | | | J Sainsbury Plc | | | 515,228 | |
| | | 870 | | | Johnson Matthey Plc | | | 33,082 | |
| | | 5,996 | | | Jupiter Fund Management Plc | | | 31,197 | |
| | | 538,442 | | | Kingfisher Plc | | | 2,196,244 | |
| | | 5,410 | | | Mondi Plc | | | 126,094 | |
| | | 61,318 | | | Persimmon Plc | | | 1,568,008 | |
| | | 36,848 | | | Reckitt Benckiser Group Plc | | | 3,345,786 | |
| | | 207,001 | | | Royal Mail Plc | | | 1,065,382 | |
| | | 133,847 | | | Sage Group Plc (The) | | | 1,072,678 | |
| | | 1,885 | | | Smiths Group Plc | | | 34,978 | |
| | | 22,567 | | | WH Smith Plc | | | 473,819 | |
| | | 54,110 | | | WM Morrison Supermarkets Plc | | | 162,605 | |
| | | 176,731 | | | WPP Plc | | | 4,157,846 | |
| | | | | | | | | | |
| | | | | | Total United Kingdom | | | 34,426,572 | |
| | | | | | | | | | |
| | | |
| | | | | | TOTAL COMMON STOCKS
(COST $170,485,486) | | | 178,860,217 | |
| | | | | | | | | | |
| | |
| | | | | | PREFERRED STOCKS — 1.2% | |
| | |
| | | | | | Germany — 1.2% | |
| | | 2,437 | | | Jungheinrich AG | | | 73,712 | |
| | | 39,437 | | | Porsche Automobil Holding SE | | | 2,176,467 | |
| | | | | | | | | | |
| | | | | | Total Germany | | | 2,250,179 | |
| | | | | | | | | | |
| | | |
| | | | | | TOTAL PREFERRED STOCKS
(COST $3,493,034) | | | 2,250,179 | |
| | | | | | | | | | |
| | |
| | | | | | MUTUAL FUNDS — 1.3% | |
| | |
| | | | | | United States — 1.3% | |
| | | | | | Affiliated Issuers — 1.3% | | | | |
| | | 96,320 | | | GMO U.S. Treasury Fund | | | 2,408,002 | |
| | | | | | | | | | |
| | | |
| | | | | | TOTAL MUTUAL FUNDS
(COST $2,407,998) | | | 2,408,002 | |
| | | | | | | | | | |
| | | | |
| | See accompanying notes to the financial statements. | | 17 |
GMO International Large/Mid Cap Equity Fund
(A Series of GMO Trust)
Schedule of Investments — (Continued)
(showing percentage of total net assets)
February 28, 2017
| | | | | | | | | | |
| Par Value† | | | Description | | Value ($) | |
| | | | | | SHORT-TERM INVESTMENTS — 0.3% | |
| | | |
| | | | | | Time Deposits — 0.3% | | | | |
AUD | | | 150,617 | | | Australia and New Zealand Banking Group Ltd. (Melbourne) Time Deposit,
0.74%, due 03/01/17 | | | 115,479 | |
CAD | | | 850 | | | Brown Brothers Harriman (Grand Cayman) Time Deposit, 0.05%, due 03/01/17 | | | 640 | |
| | | 363,862 | | | Sumitomo (Tokyo) Time Deposit,
0.36%, due 03/01/17 | | | 363,862 | |
| | | | | | | | | | |
| | | | | | Total Time Deposits | | | 479,981 | |
| | | | | | | | | | |
| | | |
| | | | | | TOTAL SHORT-TERM INVESTMENTS
(COST $479,981) | | | 479,981 | |
| | | | | | | | | | |
| | | |
| | | | | | TOTAL INVESTMENTS — 99.0%
(Cost $176,866,499) | | | 183,998,379 | |
| | | | | | Other Assets and Liabilities (net) — 1.0% | | | 1,851,849 | |
| | | | | | | | | | |
| | | |
| | | | | | TOTAL NET ASSETS — 100.0% | | | $185,850,228 | |
| | | | | | | | | | |
A summary of outstanding financial instruments at February 28, 2017 is as follows:
Futures Contracts
| | | | | | | | | | | | |
| | | | |
Number
of
Contracts + | | Type | | Expiration
Date | |
Notional
Amount | | | Net
Unrealized
Appreciation
(Depreciation) | |
| Buys | | | | | | | | | | | | |
| 23 | | Mini MSCI Emerging Markets | | March 2017 | | $ | 2,007,325 | | | $ | 18,330 | |
| | | | | | | | | | | | |
| + | Buys - Fund is long the futures contract. Sales - Fund is short the futures contract. |
As of February 28, 2017, for the above contracts and/or agreements, the Fund had sufficient cash and/or securities to cover commitments or collateral requirements, if any, of the relevant broker or exchange.
Notes to Schedule of Investments:
| * | Non-income producing security. |
| † | Denominated in U.S. Dollar, unless otherwise indicated. |
| (a) | Investment valued at fair value using methods determined in good faith by the Trustees of GMO Trust or persons acting at their direction pursuant to procedures approved by the Trustees (Note 2). |
For a listing of definitions of acronyms, counterparty abbreviations and currency abbreviations used throughout the Schedule of Investments as well as the derivative tables, if any, please refer to page 54.
| | | | |
| 18 | | See accompanying notes to the financial statements. | | |
This page has been left blank intentionally.
GMO Quality Fund
(A Series of GMO Trust)
Portfolio Management
Day-to-day management of the Fund’s portfolio is the responsibility of the Focused Equity team at Grantham, Mayo, Van Otterloo & Co. LLC.
Management Discussion and Analysis of Fund Performance
Although GMO does not manage the Fund to, or control the Fund’s risk relative to, any index or securities benchmark, a discussion of the Fund’s performance relative to the S&P 500 Index is included for comparative purposes. Please note that there are significant differences between the Fund’s portfolio holdings and those companies held in the S&P 500.
Class III shares of GMO Quality Fund returned +20.25% (net) for the fiscal year ended February 28, 2017, as compared with +24.98 for the S&P 500 Index.
Stock selection had a negative impact on returns relative to the S&P 500 Index. Stock selections in Information Technology and Consumer Discretionary were among the detractors, while selections in Health Care had a positive impact. Overweight positions in Coca-Cola and Nestle, as well as a lack of exposure to Bank of America and JP Morgan detracted from relative returns. Overweight positions in American Express and UnitedHealth, as well as not owning Exxon added to relative returns.
Sector selection detracted from returns relative to the S&P 500 Index. An underweight position in Financials and an overweight position in Consumer Staples had a negative impact on relative performance. Sector weightings adding to relative performance included an overweight position in Information Technology and an underweight position in Consumer Discretionary.
Because some of the securities and instruments held directly or indirectly by the Fund had positive fair value adjustments at the beginning or end of the fiscal year (and the performance of indices are not fair valued), the Fund’s absolute and relative performance is higher than it otherwise would have been in the absence of such fair value adjustments.
The views expressed herein are exclusively those of Grantham, Mayo, Van Otterloo & Co. LLC Management as of the date of this report and are subject to change. GMO disclaims any responsibility to update such views. They are not meant as investment advice. References to specific securities are not recommendations of such securities and may not be representative of any GMO portfolio’s current or future investments.
20
GMO Quality Fund
(A Series of GMO Trust)
Comparison of Change in Value of a $10,000,000 Investment in
GMO Quality Fund Class III Shares and the S&P 500 Index
As of February 28, 2017
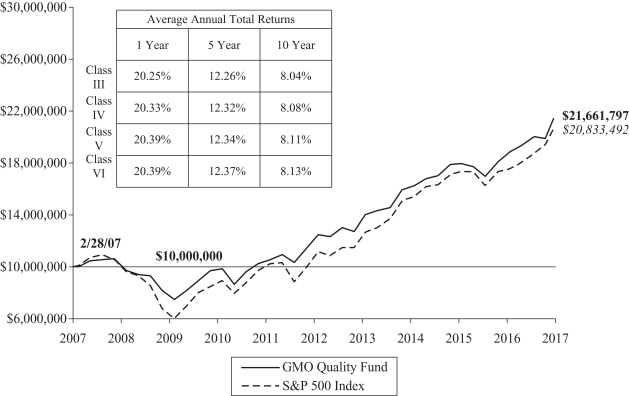
Performance data quoted represents past performance and is not indicative of future results. The investment return and principal value of an investment will fluctuate so that an investor’s shares, when redeemed, may be worth more or less than their original cost. Current performance data may be lower or higher than the performance data provided herein. To obtain performance information up to the most recent month-end, visit www.gmo.com. Performance shown is net of all fees after reimbursement from GMO. Returns would have been lower had certain expenses not been reimbursed during the periods shown and do not include the effect of taxes on distributions and redemptions. The performance information shown above only includes purchase premiums and/or redemption fees in effect as of February 28, 2017. All information is unaudited. Performance for classes may vary due to different fees.
For S&P disclaimers please visit http://www.gmo.com/America/_Disclaimers/_BenchmarkDisclaimers.htm.
21
GMO Quality Fund
(A Series of GMO Trust)
Investment Concentration Summary
February 28, 2017 (Unaudited)
| | | | |
| Asset Class Summary& | | % of Total Net Assets | |
Common Stocks | | | 97.5 | % |
Mutual Funds | | | 2.8 | |
Short-Term Investments | | | 0.2 | |
Other | | | (0.5 | ) |
| | | | |
| | | 100.0 | % |
| | | | |
| | | | |
| Country Summary* | | % of Investments | |
United States | | | 86.0 | % |
United Kingdom | | | 6.5 | |
Switzerland | | | 2.4 | |
Netherlands | | | 2.1 | |
Other Developed | | | 1.5 | ‡ |
Taiwan | | | 1.5 | |
| | | | |
| | | 100.0 | % |
| | | | |
| & | In the table above, derivative financial instruments, if any, are based on market values or unrealized appreciation/depreciation rather than notional amounts. |
| * | The table above shows country exposure in the Fund. The table excludes short-term investments. The table excludes exposure through forward currency contracts and includes exposure through other derivative financial instruments, if any. The table takes into account the market value of securities and options and the notional amounts of swap contracts and other derivative financial instruments, if any. |
| ‡ | “ Other Developed” is comprised of developed countries that each represent between (1.0)% and 1.0% of Investments. |
| | | | |
| Industry Group Summary | | % of Equity Investments# | |
Software & Services | | | 26.6 | % |
Health Care Equipment & Services | | | 13.7 | |
Food, Beverage & Tobacco | | | 9.9 | |
Capital Goods | | | 9.4 | |
Technology Hardware & Equipment | | | 8.5 | |
Pharmaceuticals, Biotechnology & Life Sciences | | | 6.3 | |
Household & Personal Products | | | 5.7 | |
Semiconductors & Semiconductor Equipment | | | 5.5 | |
Diversified Financials | | | 3.2 | |
Food & Staples Retailing | | | 2.6 | |
Consumer Durables & Apparel | | | 2.4 | |
Consumer Services | | | 2.3 | |
Materials | | | 1.8 | |
Energy | | | 1.2 | |
Retailing | | | 0.9 | |
| | | | |
| | | 100.0 | % |
| | | | |
| # | Equity investments may consist of common stocks and other stock-related securities, such as preferred stocks, if any. This table excludes exposure to derivative contracts, short-term investments, mutual funds and investment funds, if any. For a summary of these exposures, if any, see the Schedule of Investments. |
22
GMO Quality Fund
(A Series of GMO Trust)
Schedule of Investments
(showing percentage of total net assets)
February 28, 2017
| | | | | | | | | | |
Shares | | | Description | | Value ($) | |
| | | | | | COMMON STOCKS — 97.5% | | | | |
| | | |
| | | | | | Capital Goods — 9.2% | | | | |
| | | 1,419,439 | | | 3M Co. | | | 264,512,458 | |
| | | 1,845,525 | | | Emerson Electric Co. | | | 110,916,052 | |
| | | 528,619 | | | Honeywell International, Inc. | | | 65,813,066 | |
| | | 920,708 | | | Illinois Tool Works, Inc. | | | 121,542,663 | |
| | | 330,599 | | | Rockwell Automation, Inc. | | | 49,953,509 | |
| | | 1,324,293 | | | United Technologies Corp. | | | 149,049,177 | |
| | | 132,466 | | | WW Grainger, Inc. | | | 32,846,269 | |
| | | | | | | | | | |
| | | | | | Total Capital Goods | | | 794,633,194 | |
| | | | | | | | | | |
| | |
| | | | | | Consumer Durables & Apparel — 2.3% | |
| | | 414,192 | | | LVMH Moet Hennessy Louis Vuitton SE | | | 83,203,075 | |
| | | 1,270,628 | | | Nike, Inc. – Class B | | | 72,629,097 | |
| | | 859,911 | | | VF Corp. | | | 45,102,332 | |
| | | | | | | | | | |
| | | | | | Total Consumer Durables & Apparel | | | 200,934,504 | |
| | | | | | | | | | |
| | |
| | | | | | Consumer Services — 2.3% | |
| | | 4,298,708 | | | Compass Group Plc | | | 79,861,202 | |
| | | 905,036 | | | McDonald’s Corp. | | | 115,527,845 | |
| | | | | | | | | | |
| | | | | | Total Consumer Services | | | 195,389,047 | |
| | | | | | | | | | |
| | |
| | | | | | Diversified Financials — 3.1% | |
| | | 3,331,693 | | | American Express Co. | | | 266,735,342 | |
| | | | | | | | | | |
| | |
| | | | | | Energy — 1.2% | |
| | | 1,285,906 | | | Schlumberger Ltd. | | | 103,335,406 | |
| | | | | | | | | | |
| | |
| | | | | | Food & Staples Retailing — 2.5% | |
| | | 885,081 | | | Costco Wholesale Corp. | | | 156,818,652 | |
| | | 758,673 | | | CVS Health Corp. | | | 61,133,870 | |
| | | | | | | | | | |
| | | | | | Total Food & Staples Retailing | | | 217,952,522 | |
| | | | | | | | | | |
| | |
| | | | | | Food, Beverage & Tobacco — 9.6% | |
| | | 2,937,026 | | | British American Tobacco Plc | | | 185,515,901 | |
| | | 4,240,021 | | | Coca-Cola Co. (The) | | | 177,911,281 | |
| | | 2,202,373 | | | Nestle SA (Registered) | | | 162,531,051 | |
| | | 506,108 | | | PepsiCo, Inc. | | | 55,864,201 | |
| | | 2,270,530 | | | Philip Morris International, Inc. | | | 248,282,456 | |
| | | | | | | | | | |
| | | | | | Total Food, Beverage & Tobacco | | | 830,104,890 | |
| | | | | | | | | | |
| | |
| | | | | | Health Care Equipment & Services — 13.4% | |
| | | 3,516,455 | | | Abbott Laboratories | | | 158,521,791 | |
| | | 246,846 | | | Anthem, Inc. | | | 40,685,158 | |
| | | 392,999 | | | Becton Dickinson and Co. | | | 71,938,467 | |
| | | 865,650 | | | Cerner Corp. * | | | 47,645,376 | |
| | | 344,300 | | | Humana, Inc. | | | 72,733,375 | |
| | | 34,415 | | | Intuitive Surgical, Inc. * | | | 25,363,855 | |
| | | 2,881,435 | | | Medtronic Plc | | | 233,136,906 | |
| | | 814,245 | | | Stryker Corp. | | | 104,679,337 | |
| | | 2,107,896 | | | UnitedHealth Group, Inc. | | | 348,603,841 | |
| | | | | | | | | | |
| Shares | | | Description | | Value ($) | |
| | | | | | Health Care Equipment & Services — continued | |
| | | 456,267 | | | Zimmer Biomet Holdings, Inc. | | | 53,419,740 | |
| | | | | | | | | | |
| | | | | | Total Health Care Equipment & Services | | | 1,156,727,846 | |
| | | | | | | | | | |
| | |
| | | | | | Household & Personal Products — 5.6% | |
| | | 1,101,611 | | | Reckitt Benckiser Group Plc | | | 100,025,911 | |
| | | 3,895,234 | | | Unilever NV CVA | | | 184,392,914 | |
| | | 4,090,368 | | | Unilever Plc | | | 194,053,298 | |
| | | | | | | | | | |
| | | | | | Total Household & Personal Products | | | 478,472,123 | |
| | | | | | | | | | |
| | |
| | | | | | Materials — 1.8% | |
| | | 1,352,515 | | | Monsanto Co. | | | 153,956,782 | |
| | | | | | | | | | |
| | |
| | | | | | Pharmaceuticals, Biotechnology & Life Sciences — 6.1% | |
| | | 728,953 | | | Eli Lilly & Co. | | | 60,364,598 | |
| | | 2,928,340 | | | Johnson & Johnson | | | 357,872,432 | |
| | | 580,728 | | | Novartis AG (Registered) * | | | 45,350,150 | |
| | | 1,929,243 | | | Pfizer, Inc. | | | 65,825,771 | |
| | | | | | | | | | |
| | | | | | Total Pharmaceuticals, Biotechnology & Life Sciences | | | 529,412,951 | |
| | | | | | | | | | |
| | |
| | | | | | Retailing — 0.8% | |
| | | 295,462 | | | Genuine Parts Co. | | | 28,278,668 | |
| | | 556,449 | | | TJX Cos, Inc. (The) | | | 43,653,424 | |
| | | | | | | | | | |
| | | | | | Total Retailing | | | 71,932,092 | |
| | | | | | | | | | |
| | |
| | | | | | Semiconductors & Semiconductor Equipment — 5.3% | |
| | | 755,664 | | | Analog Devices, Inc. | | | 61,911,552 | |
| | | 3,729,349 | | | QUALCOMM, Inc. | | | 210,633,631 | |
| | | 20,700,577 | | | Taiwan Semiconductor Manufacturing Co., Ltd. | | | 126,822,745 | |
| | | 778,537 | | | Texas Instruments, Inc. | | | 59,651,505 | |
| | | | | | | | | | |
| | | | | | Total Semiconductors & Semiconductor Equipment | | | 459,019,433 | |
| | | | | | | | | | |
| | |
| | | | | | Software & Services — 26.0% | |
| | | 1,693,033 | | | Accenture Plc – Class A | | | 207,396,543 | |
| | | 418,365 | | | Alphabet, Inc. – Class A * | | | 353,489,140 | |
| | | 299,407 | | | Alphabet, Inc. – Class C * | | | 246,474,837 | |
| | | 205,400 | | | Automatic Data Processing, Inc. | | | 21,078,148 | |
| | | 2,815,779 | | | Cognizant Technology Solutions Corp. – Class A * | | | 166,891,221 | |
| | | 293,169 | | | Intuit, Inc. | | | 36,775,119 | |
| | | 708,807 | | | MasterCard, Inc. – Class A | | | 78,294,821 | |
| | | 9,317,787 | | | Microsoft Corp. | | | 596,152,012 | |
| | | 10,225,399 | | | Oracle Corp. | | | 435,499,743 | |
| | | 546,576 | | | SAP SE | | | 50,914,804 | |
| | | 1,544,500 | | | Teradata Corp. * | | | 48,033,950 | |
| | | | | | | | | | |
| | | | | | Total Software & Services | | | 2,241,000,338 | |
| | | | | | | | | | |
| | |
| | | | | | Technology Hardware & Equipment — 8.3% | |
| | | 542,979 | | | Amphenol Corp. – Class A | | | 37,579,577 | |
| | | 3,147,117 | | | Apple, Inc. | | | 431,123,558 | |
| | | | |
| | See accompanying notes to the financial statements. | | 23 |
GMO Quality Fund
(A Series of GMO Trust)
Schedule of Investments — (Continued)
(showing percentage of total net assets)
February 28, 2017
| | | | | | | | | | |
| Shares | | | Description | | Value ($) | |
| | | | | | Technology Hardware & Equipment — continued | |
| | | 7,259,296 | | | Cisco Systems, Inc. | | | 248,122,737 | |
| | | | | | | | | | |
| | | | | | Total Technology Hardware & Equipment | | | 716,825,872 | |
| | | | | | | | | | |
| | | |
| | | | | | TOTAL COMMON STOCKS
(COST $6,713,021,525) | | | 8,416,432,342 | |
| | | | | | | | | | |
| | |
| | | | | | MUTUAL FUNDS — 2.8% | |
| | |
| | | | | | Affiliated Issuers — 2.8% | |
| | | 9,617,981 | | | GMO U.S. Treasury Fund | | | 240,449,520 | |
| | | | | | | | | | |
| | | |
| | | | | | TOTAL MUTUAL FUNDS
(COST $240,432,540) | | | 240,449,520 | |
| | | | | | | | | | |
| | |
| | | | | | SHORT-TERM INVESTMENTS — 0.2% | |
| | |
| | | | | | Money Market Funds — 0.2% | |
| | | 18,256,935 | | | State Street Institutional Treasury Money Market Fund-Premier Class, 0.42% (a) | | | 18,256,935 | |
| | | | | | | | | | |
| | | |
| | | | | | TOTAL SHORT-TERM INVESTMENTS
(COST $18,256,935) | | | 18,256,935 | |
| | | | | | | | | | |
| | | |
| | | | | | TOTAL INVESTMENTS — 100.5%
(Cost $6,971,711,000) | | | 8,675,138,797 | |
| | | | | | Other Assets and Liabilities (net) — (0.5%) | | | (42,936,840 | ) |
| | | | | | | | | | |
| | | |
| | | | | | TOTAL NET ASSETS — 100.0% | | | $8,632,201,957 | |
| | | | | | | | | | |
Notes to Schedule of Investments:
| * | Non-income producing security. |
| (a) | The rate disclosed is the 7 day net yield as of February 28, 2017. |
For a listing of definitions of acronyms, counterparty abbreviations and currency abbreviations used throughout the Schedule of Investments as well as the derivative tables, if any, please refer to page 54.
| | | | |
| 24 | | See accompanying notes to the financial statements. | | |
This page has been left blank intentionally.
GMO Resources Fund
(A Series of GMO Trust)
Portfolio Managers
Day-to-day management of the Fund’s portfolio is the responsibility of the Focused Equity team at Grantham, Mayo, Van Otterloo & Co. LLC.
Management Discussion and Analysis of Fund Performance
Although the Fund is not managed relative to any securities market index or benchmark, a discussion of the Fund’s performance relative to the MSCI ACWI Commodity Producers Index is included for comparative purposes.
Class III shares of GMO Resources Fund returned +51.75% (net) for the period ended February 28, 2017, as compared with +32.75% for the MSCI ACWI Commodity Producers Index.
Sector allocation was positive for the period. Positive contributions from the Fund’s overweight position in Industrial Metals and underweight position in Energy more than offset the negative impact from an overweight position in Agriculture.
Country allocation had a positive impact on performance relative to the benchmark. The Fund’s overweight in Emerging Markets and underweight in the United States were among the top contributors to relative returns.
Stock selection also added to relative returns. Contributors include overweight positions in mining companies Anglo American and Teck Resources. Detractors from relative performance included overweight positions in agriculture companies Ros Agro and Adecoagro.
Because some of the securities and instruments held directly or indirectly by the Fund had positive fair value adjustments at the beginning or end of the fiscal year (and the performance of indices are not fair valued), the Fund’s absolute and relative performance is higher than it otherwise would have been in the absence of such fair value adjustments.
The views expressed herein are exclusively those of Grantham, Mayo, Van Otterloo & Co. LLC as of the date of this report and are subject to change. GMO disclaims any responsibility to update such views. They are not meant as investment advice. References to specific securities are not recommendations of such securities and may not be representative of any GMO portfolio’s current or future investments.
26
GMO Resources Fund
(A Series of GMO Trust)
Comparison of Change in Value of a $10,000,000 Investment in
GMO Resources Fund Class III Shares and the MSCI ACWI Commodity Producers
As of February 28, 2017
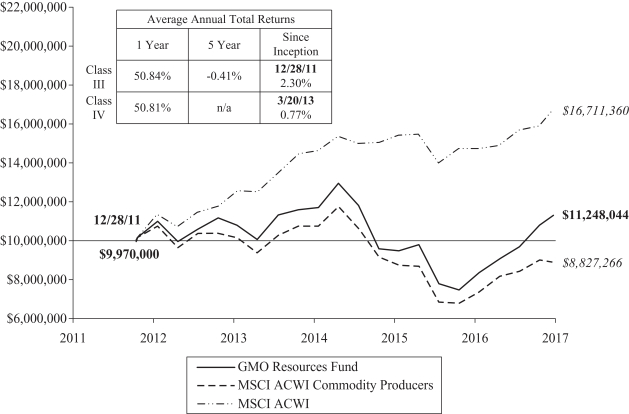
Performance data quoted represents past performance and is not indicative of future results. The investment return and principal value of an investment will fluctuate so that an investor’s shares, when redeemed, may be worth more or less than their original cost. Current performance data may be lower or higher than the performance data provided herein. To obtain performance information up to the most recent month-end, visit www.gmo.com. Performance shown is net of all fees after reimbursement from GMO. Each performance figure assumes a purchase at the beginning and redemption at the end of the stated period and reflects a transaction fee of .30% on the purchase and .30% on the redemption. Transaction fees are retained by the Fund to cover trading costs. Returns would have been lower had certain expenses not been reimbursed during the periods shown and do not include the effect of taxes on distributions and redemptions. All information is unaudited. Performance for classes may vary due to different fees.
MSCI data may not be reproduced or used for any other purpose. MSCI provides no warranties, has not prepared or approved this report, and has no liability hereunder.
27
GMO Resources Fund
(A Series of GMO Trust)
Investment Concentration Summary
February 28, 2017 (Unaudited)
| | | | |
| Asset Class Summary& | | % of Total Net Assets | |
Common Stocks | | | 86.1 | % |
Preferred Stocks | | | 10.5 | |
Mutual Funds | | | 2.9 | |
Short-Term Investments | | | 0.3 | |
Other | | | 0.2 | |
| | | | |
| | | 100.0 | % |
| | | | |
| | | | |
| Country Summary* | | % of Equity Investments | |
United Kingdom | | | 24.2 | % |
United States | | | 15.4 | |
Russia | | | 12.5 | |
Norway | | | 6.6 | |
Brazil | | | 4.9 | |
Chile | | | 4.7 | |
Other Emerging | | | 4.0 | † |
Canada | | | 3.9 | |
Japan | | | 2.9 | |
Poland | | | 2.1 | |
Other Developed | | | 2.0 | ‡ |
Spain | | | 1.9 | |
France | | | 1.8 | |
Australia | | | 1.8 | |
Argentina | | | 1.6 | |
Israel | | | 1.6 | |
South Africa | | | 1.5 | |
Thailand | | | 1.4 | |
Germany | | | 1.4 | |
Singapore | | | 1.4 | |
Italy | | | 1.2 | |
Ukraine | | | 1.2 | |
| | | | |
| | | 100.0 | % |
| | | | |
| & | In the table above, derivative financial instruments, if any, are based on market values or unrealized appreciation/depreciation rather than notional amounts. |
| * | The table above shows country exposure in the Fund. The table excludes short-term investments. The table excludes exposure through forward currency contracts and includes exposure through other derivative financial instruments, if any. The table takes into account the market value of securities and options and the notional amounts of swap contracts and other derivative financial instruments, if any. |
| † | “Other Emerging” is comprised of emerging countries that each represent between (1.0)% and 1.0% of Investments. |
| ‡ | “ Other Developed” is comprised of developed countries that each represent between (1.0)% and 1.0% of Investments. |
| | | | |
| Industry Group Summary | | % of Equity Investments# | |
Materials | | | 46.7 | % |
Energy | | | 37.5 | |
Food, Beverage & Tobacco | | | 8.6 | |
Utilities | | | 2.9 | |
Semiconductors & Semiconductor Equipment | | | 2.5 | |
Capital Goods | | | 1.8 | |
| | | | |
| | | 100.0 | % |
| | | | |
| # | Equity investments may consist of common stocks and other stock-related securities, such as preferred stocks, if any. This table excludes exposure to derivative contracts, short-term investments, mutual funds and investment funds, if any. For a summary of these exposures, if any, see the Schedule of Investments. |
28
GMO Resources Fund
(A Series of GMO Trust)
Schedule of Investments
(showing percentage of total net assets)
February 28, 2017
| | | | | | | | | | |
| Shares | | | Description | | Value ($) | |
| | | | | | COMMON STOCKS — 86.1% | |
| | |
| | | | | | Argentina — 1.6% | |
| | | 282,100 | | | Adecoagro SA * | | | 3,306,212 | |
| | | | | | | | | | |
| | |
| | | | | | Australia — 1.8% | |
| | | 633,685 | | | Beach Energy Ltd | | | 341,473 | |
| | | 153,655 | | | Sandfire Resources NL | | | 756,594 | |
| | | 186,798 | | | Santos Ltd * | | | 543,021 | |
| | | 31,863 | | | Woodside Petroleum Ltd | | | 764,297 | |
| | | 162,650 | | | WorleyParsons Ltd * | | | 1,324,501 | |
| | | | | | | | | | |
| | | | | | Total Australia | | | 3,729,886 | |
| | | | | | | | | | |
| | |
| | | | | | Austria — 1.0% | |
| | | 53,239 | | | OMV AG | | | 2,035,078 | |
| | | | | | | | | | |
| | |
| | | | | | Brazil — 0.7% | |
| | | 80,000 | | | Cosan SA Industria e Comercio | | | 1,022,635 | |
| | | 85,800 | | | Sao Martinho SA | | | 524,086 | |
| | | | | | | | | | |
| | | | | | Total Brazil | | | 1,546,721 | |
| | | | | | | | | | |
| | |
| | | | | | Canada — 3.8% | |
| | | 5,751 | | | Agrium Inc | | | 554,446 | |
| | | 35,400 | | | Ensign Energy Services Inc | | | 211,622 | |
| | | 244,834 | | | First Quantum Minerals Ltd | | | 2,547,512 | |
| | | 49,800 | | | Potash Corp of Saskatchewan Inc | | | 863,870 | |
| | | 198,998 | | | Teck Resources Ltd – Class B | | | 3,977,863 | |
| | | | | | | | | | |
| | | | | | Total Canada | | | 8,155,313 | |
| | | | | | | | | | |
| | |
| | | | | | China — 0.5% | |
| | | 3,550,000 | | | Century Sunshine Group Holdings Ltd | | | 155,255 | |
| | | 892,000 | | | China Oilfield Services Ltd – Class H | | | 888,460 | |
| | | | | | | | | | |
| | | | | | Total China | | | 1,043,715 | |
| | | | | | | | | | |
| | |
| | | | | | Colombia — 0.4% | |
| | | 2,045,784 | | | Ecopetrol SA * | | | 922,154 | |
| | | | | | | | | | |
| | |
| | | | | | Czech Republic — 0.9% | |
| | | 108,880 | | | CEZ AS | | | 1,921,592 | |
| | | | | | | | | | |
| | |
| | | | | | France — 1.8% | |
| | | 106,406 | | | Electricite de France SA | | | 1,043,203 | |
| | | 56,443 | | | TOTAL SA | | | 2,816,278 | |
| | | | | | | | | | |
| | | | | | Total France | | | 3,859,481 | |
| | | | | | | | | | |
| | |
| | | | | | Germany — 1.4% | |
| | | 6,636 | | | Aurubis AG * | | | 382,491 | |
| | | 106,723 | | | K+S AG (Registered) | | | 2,492,434 | |
| | | | | | | | | | |
| | | | | | Total Germany | | | 2,874,925 | |
| | | | | | | | | | |
| | |
| | | | | | Greece — 0.1% | |
| | | 34,741 | | | Mytilineos Holdings SA * | | | 260,744 | |
| | | | | | | | | | |
| | | | | | | | | | |
| Shares | | | Description | | Value ($) | |
| | | | | | Hungary — 0.6% | |
| | | 18,126 | | | MOL Hungarian Oil & Gas Plc | | | 1,242,706 | |
| | | | | | | | | | |
| | |
| | | | | | India — 0.7% | |
| | | 179,307 | | | Cairn India Ltd | | | 762,239 | |
| | | 268,072 | | | Oil & Natural Gas Corp Ltd | | | 776,810 | |
| | | | | | | | | | |
| | | | | | Total India | | | 1,539,049 | |
| | | | | | | | | | |
| | |
| | | | | | Indonesia — 0.0% | |
| | | 27,969,700 | | | Energi Mega Persada Tbk PT * | | | 104,846 | |
| | | | | | | | | | |
| | |
| | | | | | Israel — 1.6% | |
| | | 495,874 | | | Israel Chemicals Ltd | | | 2,112,887 | |
| | | 6,568 | | | Israel Corp Ltd (The) * | | | 1,188,592 | |
| | | | | | | | | | |
| | | | | | Total Israel | | | 3,301,479 | |
| | | | | | | | | | |
| | |
| | | | | | Italy — 1.3% | |
| | | 248,608 | | | CNH Industrial NV | | | 2,302,419 | |
| | | 945,797 | | | Saipem SPA * | | | 431,778 | |
| | | | | | | | | | |
| | | | | | Total Italy | | | 2,734,197 | |
| | | | | | | | | | |
| | |
| | | | | | Japan — 2.9% | |
| | | 22,400 | | | Asahi Holdings Inc | | | 387,682 | |
| | | 80,000 | | | Dowa Holdings Co Ltd | | | 647,219 | |
| | | 53,200 | | | Inpex Corp | | | 528,978 | |
| | | 18,700 | | | Japan Petroleum Exploration Co Ltd | | | 451,344 | |
| | | 65,300 | | | Mitsubishi Materials Corp | | | 2,168,011 | |
| | | 308,000 | | | Mitsui Mining & Smelting Co Ltd | | | 1,015,075 | |
| | | 900 | | | Nittetsu Mining Co Ltd | | | 46,361 | |
| | | 61,000 | | | Sumitomo Metal Mining Co Ltd | | | 847,439 | |
| | | | | | | | | | |
| | | | | | Total Japan | | | 6,092,109 | |
| | | | | | | | | | |
| | |
| | | | | | Kazakhstan — 0.0% | |
| | | 8,156 | | | KazMunaiGas Exploration Production JSC GDR (Registered Shares) * | | | 84,203 | |
| | | | | | | | | | |
| | |
| | | | | | Netherlands — 0.7% | |
| | | 28,099 | | | Fugro NV CVA * | | | 448,333 | |
| | | 65,361 | | | SBM Offshore NV | | | 1,006,061 | |
| | | | | | | | | | |
| | | | | | Total Netherlands | | | 1,454,394 | |
| | | | | | | | | | |
| | |
| | | | | | Norway — 6.5% | |
| | | 173,731 | | | Austevoll Seafood ASA | | | 1,533,753 | |
| | | 9,553 | | | Bakkafrost P/F | | | 355,514 | |
| | | 68,983 | | | Fred Olsen Energy ASA * | | | 188,218 | |
| | | 138,585 | | | Grieg Seafood ASA | | | 1,281,513 | |
| | | 8,577 | | | Leroy Seafood Group ASA | | | 452,885 | |
| | | 43,631 | | | Ocean Yield ASA | | | 312,162 | |
| | | 146,717 | | | Petroleum Geo-Services ASA * | | | 411,802 | |
| | | 7,209 | | | Prosafe SE * | | | 33,376 | |
| | | 24,942 | | | Salmar ASA | | | 630,207 | |
| | | | |
| | See accompanying notes to the financial statements. | | 29 |
GMO Resources Fund
(A Series of GMO Trust)
Schedule of Investments — (Continued)
(showing percentage of total net assets)
February 28, 2017
| | | | | | | | | | |
| Shares | | | Description | | Value ($) | |
| | | | | | Norway — continued | |
| | | 151,222 | | | Statoil ASA | | | 2,666,226 | |
| | | 112,133 | | | Subsea 7 SA * | | | 1,583,925 | |
| | | 53,311 | | | TGS Nopec Geophysical Co ASA | | | 1,169,539 | |
| | | 86,917 | | | Yara International ASA | | | 3,299,688 | |
| | | | | | | | | | |
| | | | | | Total Norway | | | 13,918,808 | |
| | | | | | | | | | |
| | |
| | | | | | Poland — 2.1% | |
| | | 140,406 | | | KGHM Polska Miedz SA | | | 4,445,383 | |
| | | | | | | | | | |
| | |
| | | | | | Russia — 10.7% | |
| | | 1,086,830 | | | Gazprom Neft PJSC | | | 4,260,893 | |
| | | 209,251 | | | Gazprom PJSC Sponsored ADR | | | 934,006 | |
| | | 95,638 | | | Lukoil PJSC Sponsored ADR | | | 5,071,127 | |
| | | 26,344 | | | Novatek PJSC Sponsored GDR (Registered) | | | 3,414,724 | |
| | | 55,325 | | | PhosAgro PJSC GDR (Registered) | | | 762,395 | |
| | | 302,262 | | | Ros Agro Plc GDR (Registered) | | | 4,230,303 | |
| | | 356,158 | | | Rosneft Oil Co PJSC GDR (Registered) | | | 2,020,687 | |
| | | 9 | | | Surgutneftegas OJSC | | | 4 | |
| | | 53,906 | | | Tatneft PJSC Sponsored ADR | | | 1,890,322 | |
| | | 55,853 | | | TMK PJSC GDR (Registered) | | | 290,250 | |
| | | | | | | | | | |
| | | | | | Total Russia | | | 22,874,711 | |
| | | | | | | | | | |
| | |
| | | | | | Singapore — 1.3% | |
| | | 956,800 | | | Ezion Holdings Ltd * | | | 252,091 | |
| | | 2,725,600 | | | Ezra Holdings Ltd * | | | 36,930 | |
| | | 428,200 | | | First Resources Ltd | | | 574,575 | |
| | | 6,613,600 | | | Golden Agri-Resources Ltd | | | 1,790,137 | |
| | | 569,600 | | | Indofood Agri Resources Ltd | | | 210,956 | |
| | | | | | | | | | |
| | | | | | Total Singapore | | | 2,864,689 | |
| | | | | | | | | | |
| | |
| | | | | | South Africa — 1.5% | |
| | | 117,091 | | | African Rainbow Minerals Ltd | | | 904,018 | |
| | | 69,060 | | | Sasol Ltd | | | 1,964,479 | |
| | | 39,531 | | | Tongaat Hulett Ltd | | | 381,744 | |
| | | | | | | | | | |
| | | | | | Total South Africa | | | 3,250,241 | |
| | | | | | | | | | |
| | |
| | | | | | South Korea — 0.3% | |
| | | 16,023 | | | Poongsan Corp | | | 579,724 | |
| | | 466 | | | Poongsan Holdings Corp | | | 20,010 | |
| | | | | | | | | | |
| | | | | | Total South Korea | | | 599,734 | |
| | | | | | | | | | |
| | |
| | | | | | Spain — 1.9% | |
| | | 102,385 | | | Endesa SA | | | 2,177,663 | |
| | | 120,482 | | | Iberdrola SA | | | 799,974 | |
| | | 66,188 | | | Repsol SA | | | 979,139 | |
| | | | | | | | | | |
| | | | | | Total Spain | | | 3,956,776 | |
| | | | | | | | | | |
| | |
| | | | | | Sweden — 0.3% | |
| | | 11,273 | | | Boliden AB | | | 343,272 | |
| | | | | | | | | | |
| Shares | | | Description | | Value ($) | |
| | | | | | Sweden — continued | |
| | | 42,212 | | | Tethys Oil AB | | | 331,377 | |
| | | | | | | | | | |
| | | | | | Total Sweden | | | 674,649 | |
| | | | | | | | | | |
| | |
| | | | | | Thailand — 1.5% | |
| | | 438,464 | | | PTT Exploration & Production Pcl (Foreign Registered) | | | 1,166,785 | |
| | | 174,494 | | | PTT Pcl (Foreign Registered) | | | 1,984,293 | |
| | | | | | | | | | |
| | | | | | Total Thailand | | | 3,151,078 | |
| | | | | | | | | | |
| | |
| | | | | | Turkey — 0.3% | |
| | | 295,694 | | | Gubre Fabrikalari TAS | | | 400,256 | |
| | | 544,724 | | | Koza Anadolu Metal Madencilik Isletmeleri AS * | | | 309,860 | |
| | | | | | | | | | |
| | | | | | Total Turkey | | | 710,116 | |
| | | | | | | | | | |
| | |
| | | | | | Ukraine — 1.2% | |
| | | 127,223 | | | Kernel Holding SA | | | 2,454,785 | |
| | | | | | | | | | |
| | |
| | | | | | United Arab Emirates — 0.1% | |
| | | 1,300,490 | | | Dana Gas PJSC * | | | 162,805 | |
| | | | | | | | | | |
| | |
| | | | | | United Kingdom — 24.1% | |
| | | 85,496 | | | Amec Foster Wheeler Plc | | | 467,386 | |
| | | 542,762 | | | Anglo American Plc * | | | 8,522,153 | |
| | | 454,583 | | | BHP Billiton Plc | | | 7,326,942 | |
| | | 348,817 | | | BP Plc | | | 1,966,864 | |
| | | 672,167 | | | EnQuest Plc * | | | 403,278 | |
| | | 2,446,711 | | | Glencore Plc * | | | 9,753,971 | |
| | | 35,690 | | | Hunting Plc | | | 234,967 | |
| | | 20,148 | | | John Wood Group Plc | | | 189,099 | |
| | | 75,585 | | | Petrofac Ltd | | | 837,264 | |
| | | 309,350 | | | Premier Oil Plc * | | | 267,270 | |
| | | 268,578 | | | Rio Tinto Plc | | | 11,007,988 | |
| | | 209,261 | | | Royal Dutch Shell Plc A Shares (London) | | | 5,415,210 | |
| | | 169,999 | | | Royal Dutch Shell Plc B Shares (London) | | | 4,601,634 | |
| | | 10,375 | | | TechnipFMC Plc * | | | 334,629 | |
| | | | | | | | | | |
| | | | | | Total United Kingdom | | | 51,328,655 | |
| | | | | | | | | | |
| | |
| | | | | | United States — 12.5% | |
| | | 8,932 | | | Apache Corp. | | | 469,734 | |
| | | 36,700 | | | Atwood Oceanics, Inc. * | | | 385,717 | |
| | | 133,047 | | | Chesapeake Energy Corp. * | | | 725,106 | |
| | | 5,409 | | | ConocoPhillips | | | 257,306 | |
| | | 236,808 | | | Denbury Resources, Inc. * | | | 641,750 | |
| | | 13,700 | | | Devon Energy Corp. | | | 594,032 | |
| | | 60,100 | | | Diamond Offshore Drilling, Inc. * | | | 1,012,084 | |
| | | 184,900 | | | Ensco Plc – Class A | | | 1,800,926 | |
| | | 30,300 | | | First Solar, Inc. * | | | 1,096,557 | |
| | | 363,944 | | | Freeport-McMoRan, Inc. * | | | 4,876,849 | |
| | | 42,000 | | | Joy Global, Inc. | | | 1,183,980 | |
| | | | |
| 30 | | See accompanying notes to the financial statements. | | |
GMO Resources Fund
(A Series of GMO Trust)
Schedule of Investments — (Continued)
(showing percentage of total net assets)
February 28, 2017
| | | | | | | | | | |
| Shares | | | Description | | Value ($) | |
| | | | | | United States — continued | |
| | | 87,204 | | | Mosaic Co. (The) | | | 2,719,893 | |
| | | 16,800 | | | Murphy Oil Corp. | | | 475,272 | |
| | | 45,700 | | | Nabors Industries Ltd. | | | 669,048 | |
| | | 29,200 | | | National Oilwell Varco, Inc. | | | 1,180,264 | |
| | | 208,600 | | | Noble Corp Plc | | | 1,393,448 | |
| | | 43,500 | | | Northern Oil and Gas, Inc. * | | | 130,500 | |
| | | 24,000 | | | Oasis Petroleum, Inc. * | | | 339,840 | |
| | | 71,800 | | | Rowan Cos., Plc – Class A * | | | 1,301,016 | |
| | | 24,258 | | | SM Energy Co. | | | 597,960 | |
| | | 276,455 | | | SolarEdge Technologies, Inc. * | | | 4,050,066 | |
| | | 14,600 | | | Southwestern Energy Co. * | | | 109,646 | |
| | | 28,400 | | | Tidewater, Inc. * | | | 38,624 | |
| | | 22,400 | | | Unit Corp. * | | | 607,936 | |
| | | | | | | | | | |
| | | | | | Total United States | | | 26,657,554 | |
| | | | | | | | | | |
| | | |
| | | | | | TOTAL COMMON STOCKS
(COST $146,200,779) | | | 183,258,788 | |
| | | | | | | | | | |
| | |
| | | | | | PREFERRED STOCKS — 10.5% | |
| | |
| | | | | | Brazil — 4.1% | |
| | | 1,170,300 | | | Bradespar SA | | | 8,778,656 | |
| | | | | | | | | | |
| | |
| | | | | | Chile — 4.7% | |
| | | 27,714 | | | Sociedad Quimica y Minera de Chile SA – Class B | | | 870,344 | |
| | | 287,378 | | | Sociedad Quimica y Minera de Chile SA Sponsored ADR | | | 9,052,407 | |
| | | | | | | | | | |
| | | | | | Total Chile | | | 9,922,751 | |
| | | | | | | | | | |
| | |
| | | | | | Russia — 1.7% | |
| | | 21,740 | | | Bashneft PJSC | | | 479,873 | |
| | | 4,491,384 | | | Surgutneftegas OJSC | | | 2,448,817 | |
| | | 201,481 | | | Tatneft PJSC | | | 731,515 | |
| | | | | | | | | | |
| | | | | | Total Russia | | | 3,660,205 | |
| | | | | | | | | | |
| | | |
| | | | | | TOTAL PREFERRED STOCKS
(COST $11,909,647) | | | 22,361,612 | |
| | | | | | | | | | |
| | |
| | | | | | MUTUAL FUNDS — 2.9% | |
| | |
| | | | | | United States — 2.9% | |
| | | | | | Affiliated Issuers — 2.9% | | | | |
| | | 246,003 | | | GMO U.S. Treasury Fund | | | 6,150,081 | |
| | | | | | | | | | |
| | | |
| | | | | | TOTAL MUTUAL FUNDS
(COST $6,149,300) | | | 6,150,081 | |
| | | | | | | | | | |
| | | | | | | | | | |
| Par Value† | | | Description | | Value ($) | |
| | | | | | SHORT-TERM INVESTMENTS — 0.3% | |
| | |
| | | | | | Time Deposits — 0.3% | |
| | | 546,928 | | | Barclays (London) Time Deposit,
0.36%, due 03/01/17 | | | 546,928 | |
CAD | | | 5,815 | | | Brown Brothers Harriman (Grand Cayman) Time Deposit, 0.05%, due 03/01/17 | | | 4,378 | |
NOK | | | 49,184 | | | Brown Brothers Harriman (Grand Cayman) Time Deposit, 0.05%, due 03/01/17 | | | 5,867 | |
| | | | | | | | | | |
| | | | | | Total Time Deposits | | | 557,173 | |
| | | | | | | | | | |
| | | |
| | | | | | TOTAL SHORT-TERM INVESTMENTS (COST $557,173) | | | 557,173 | |
| | | | | | | | | | |
| | | |
| | | | | | TOTAL INVESTMENTS — 99.8%
(Cost $164,816,899) | | | 212,327,654 | |
| | | | | | Other Assets and Liabilities (net) — 0.2% | | | 493,714 | |
| | | | | | | | | | |
| | | |
| | | | | | TOTAL NET ASSETS — 100.0% | | | $212,821,368 | |
| | | | | | | | | | |
Notes to Schedule of Investments:
| † | Denominated in U.S. Dollar, unless otherwise indicated. |
| * | Non-income producing security. |
For a listing of definitions of acronyms, counterparty abbreviations and currency abbreviations used throughout the Schedule of Investments as well as the derivative tables, if any, please refer to page 54.
| | | | |
| | See accompanying notes to the financial statements. | | 31 |
GMO Risk Premium Fund
(A Series of GMO Trust)
Portfolio Management
Day-to-day management of the Fund’s portfolio is the responsibility of the Global Equity team at Grantham, Mayo, Van Otterloo & Co. LLC.
Management Discussion and Analysis of Fund Performance
Although the Fund is not managed relative to any securities market index or benchmark, a discussion of the Fund’s performance relative to the MSCI World Index is included for comparative purposes.
Class III shares of GMO Risk Premium Fund returned +19.50% (net) for the fiscal year ended February 28, 2017, as compared with +21.26% for the MSCI World Index.
Because the Fund gains its investment exposure by writing (selling) options on equity indices, the Fund typically benefits (relative to equity markets) when there is depreciation, or modest growth, in equity markets. During periods when equity markets increase sharply, such as during the Fund’s fiscal period, the Fund may tend to underperform the equity markets. The Fund’s geographic exposure during the fiscal year was mainly in the U.S. and Europe, with positions in Europe making the largest positive contribution to performance.
Because some of the securities and instruments held directly or indirectly by the Fund had positive fair value adjustments at the beginning or end of the fiscal year (and the performance of indices are not fair valued), the Fund’s absolute and relative performance is higher than it otherwise would have been in the absence of such fair value adjustments.
The views expressed herein are exclusively those of Grantham, Mayo, Van Otterloo & Co. LLC as of the date of this report and are subject to change. GMO disclaims any responsibility to update such views. They are not meant as investment advice. References to specific securities are not recommendations of such securities and may not be representative of any GMO portfolio’s current or future investments.
32
GMO Risk Premium Fund
(A Series of GMO Trust)
Comparison of Change in Value of a $10,000,000 Investment in
GMO Risk Premium Fund Class III Shares and the MSCI World Index
As of February 28, 2017
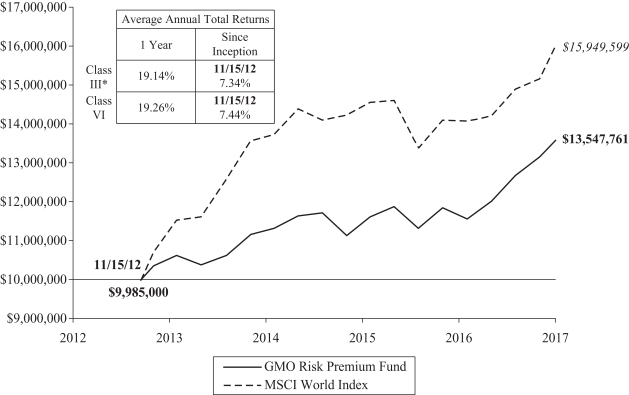
Performance data quoted represents past performance and is not indicative of future results. The investment return and principal value of an investment will fluctuate so that an investor’s shares, when redeemed, may be worth more or less than their original cost. Current performance data may be lower or higher than the performance data provided herein. To obtain performance information up to the most recent month-end, visit www.gmo.com. Performance shown is net of all fees after reimbursement from GMO. Each performance figure assumes a purchase at the beginning and redemption at the end of the stated period and reflects a transaction fee of .15% on the purchase and .15% on the redemption. Transaction fees are retained by the Fund to cover trading costs. Returns would have been lower had certain expenses not been reimbursed during the periods shown and do not include the effect of taxes on distributions and redemptions. All information is unaudited. Performance for classes may vary due to different fees.
| | * | For the period from November 15, 2012 to December 14, 2012, no Class III shares were outstanding. Performance for that period is that of Class VI, which has lower expenses. Therefore, the performance shown is higher than it would have been if Class III expenses had been applied throughout. |
| | | MSCI data may not be reproduced or used for any other purpose. MSCI provides no warranties, has not prepared or approved this report, and has no liability hereunder. |
33
GMO Risk Premium Fund
(A Series of GMO Trust)
Investment Concentration Summary
February 28, 2017 (Unaudited)
| | | | |
| Asset Class Summary& | | % of Total Net Assets | |
Short-Term Investments | | | 98.5 | % |
Written Options | | | (0.7 | ) |
Other | | | 2.2 | |
| | | | |
| | | 100.0 | % |
| | | | |
| & | In the table above, derivative financial instruments, if any, are based on market values or unrealized appreciation/depreciation rather than notional amounts. |
34
GMO Risk Premium Fund
(A Series of GMO Trust)
Schedule of Investments
(showing percentage of total net assets)
February 28, 2017
| | | | | | | | | | |
| Par Value† | | | Description | | Value ($) | |
| | | | | | SHORT-TERM INVESTMENTS — 98.5% | |
| | |
| | | | | | U.S. Government — 98.5% | |
| | | 45,800,000 | | | U.S. Treasury Bill, 0.40%, due 03/16/17 (a)(b) | | | 45,791,939 | |
| | | 10,400,000 | | | U.S. Treasury Bill, 0.41%, due 03/23/17 (a) | | | 10,397,338 | |
| | | 35,400,000 | | | U.S. Treasury Bill, 0.63%,
due 07/20/17 (a)(b) | | | 35,313,234 | |
| | | 7,000,000 | | | U.S. Treasury Bill, 0.71%, due 08/24/17 (a) | | | 6,976,109 | |
| | | 20,000,000 | | | U.S. Treasury Bill, 0.81%, due 12/07/17 (a)(b) | | | 19,875,780 | |
| | | 20,000,000 | | | U.S. Treasury Bill, 0.82%,
due 01/04/18 (a)(b) | | | 19,860,940 | |
| | | 20,000,000 | | | U.S. Treasury Bill, 0.82%,
due 02/01/18 (a)(b) | | | 19,848,820 | |
| | | | | | | | | | |
| | | | | | Total U.S. Government | | | 158,064,160 | |
| | | | | | | | | | |
| | | | | | | | | | |
| Shares | | | Description | | Value ($) | |
| | | | | | Money Market Funds — 0.0% | |
| | | 19,234 | | | State Street Institutional Treasury Money Market Fund-Premier Class, 0.42% (c) | | | 19,234 | |
| | | | | | | | | | |
| | | |
| | | | | | TOTAL SHORT-TERM INVESTMENTS
(COST $158,099,801) | | | 158,083,394 | |
| | | | | | | | | | |
| | | |
| | | | | | TOTAL INVESTMENTS — 98.5%
(Cost $158,099,801) | �� | | 158,083,394 | |
| | | | | | Other Assets and Liabilities (net) — 1.5% | | | 2,340,333 | |
| | | | | | | | | | |
| | | |
| | | | | | TOTAL NET ASSETS — 100.0% | | | $160,423,727 | |
| | | | | | | | | | |
A summary of outstanding financial instruments at February 28, 2017 is as follows:
Written Options
Index Options
| | | | | | | | | | | | | | | | |
| | | | |
Number of
Contracts | | | Expiration
Date | | Description | | Premiums | | | Value | |
| Put | | | 3,046 | | | 03/17/2017 | | Euro STOXX 50, Strike 3,275 | | $ | 1,290,100 | | | $ | (768,911 | ) |
| Put | | | 223 | | | 03/17/2017 | | S&P 500 Index, Strike 2,345 | | | 523,147 | | | | (343,420 | ) |
| | | | | | | | | | | | | | | | |
| | | | | | | | | | $ | 1,813,247 | | | $ | (1,112,331 | ) |
| | | | | | | | | | | | | | | | |
As of February 28, 2017, for the above contracts and/or agreements, the Fund had sufficient cash and/or securities to cover commitments or collateral requirements, if any, of the relevant broker or exchange.
Notes to Schedule of Investments:
| † | Denominated in U.S. Dollar, unless otherwise indicated. |
| (a) | The rate shown represents yield-to-maturity. |
| (b) | All or a portion of this security has been pledged to cover margin requirements on futures and/or cleared swap contracts, collateral on OTC swap contracts, forward currency contracts, and/or written options, if any (Note 4). |
| (c) | The rate disclosed is the 7 day net yield as of February 28, 2017. |
For a listing of definitions of acronyms, counterparty abbreviations and currency abbreviations used throughout the Schedule of Investments as well as the derivative tables, if any, please refer to page 54.
| | | | |
| | See accompanying notes to the financial statements. | | 35 |
GMO Tax-Managed International Equities Fund
(A Series of GMO Trust)
Portfolio Managers
Day-to-day management of the Fund’s portfolio is the responsibility of the Asset Allocation team and the Global Equity team at Grantham, Mayo, Van Otterloo & Co. LLC.
Management Discussion and Analysis of Fund Performance
Although the Fund is not managed relative to any securities market index or benchmark, a discussion of the Fund’s performance relative to the MSCI EAFE Index is included for comparative purposes.
GMO Tax-Managed International Equities Fund returned +15.05% (net) for the fiscal year ended February 28, 2017, as compared with +15.75% for the MSCI EAFE Index. The MSCI EAFE Index (after tax) returned +14.12% for the same period.
The Fund’s exposure to emerging markets was the largest positive contributor to performance relative to the benchmark. Among developed countries, an underweight position in Australia and an overweight position in Israel had the largest negative impacts on performance, but these were largely offset by underweight positions in Denmark and Switzerland. The Fund’s modest cash holdings were a drag on relative performance, given the strong returns generated by equities.
Allocation between sectors proved modestly positive relative to the benchmark, driven by a strong contribution from an underweight position in Health Care. Stock selection was also a modestly positive contributor to relative performance. Underperformance in Information Technology, Consumer Staples, and Consumer Discretionary was countered by strong relative returns in Financials and Materials.
Top stock detractors included overweight positions in KDDI Corporation (a Japanese telecom company), Teva Pharmaceutical Industries Ltd (an Israeli headquartered generics producer), and Next plc (a British multinational retailer). Top stock contributors included overweight positions in Tosoh Corporation (a Japanese chemical company) and Bluescope Steel limited (primarily located in Australasia), as well as having no exposure to BT Group plc (a British telecom company).
The views expressed herein are exclusively those of Grantham, Mayo, Van Otterloo & Co. LLC as of the date of this report and are subject to change. GMO disclaims any responsibility to update such views. They are not meant as investment advice. References to specific securities are not recommendations of such securities and may not be representative of any GMO portfolio’s current or future investments.
36
GMO Tax-Managed International Equities Fund
(A Series of GMO Trust)
Comparison of Change in Value of a $5,000,000 Investment in
GMO Tax-Managed International Equities Fund Class III Shares and the MSCI EAFE After Tax Index
As of February 28, 2017
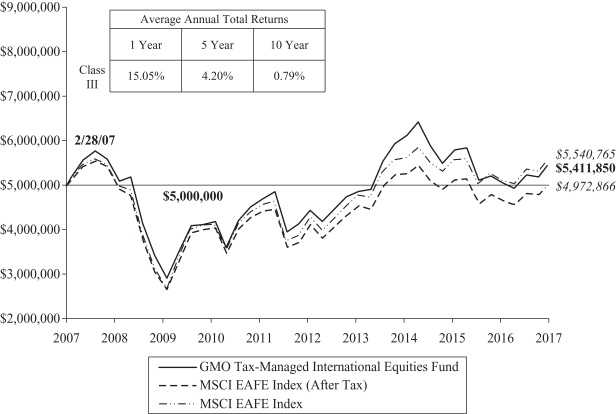
Performance data quoted represents past performance and is not indicative of future results. The investment return and principal value of an investment will fluctuate so that an investor’s shares, when redeemed, may be worth more or less than their original cost. Current performance data may be lower or higher than the performance data provided herein. To obtain performance information up to the most recent month-end, visit www.gmo.com. Performance shown is net of all fees after reimbursement from GMO. Returns would have been lower had certain expenses not been reimbursed during the periods shown and do not include the effect of taxes on distributions and redemptions. The performance information shown above only includes purchase premiums and/or redemption fees in effect as of February 28, 2017. All information is unaudited.
MSCI data may not be reproduced or used for any other purpose. MSCI provides no warranties, has not prepared or approved this report, and has no liability hereunder.
37
GMO Tax-Managed International Equities Fund
(A Series of GMO Trust)
Investment Concentration Summary
February 28, 2017 (Unaudited)
| | | | |
| Asset Class Summary& | | % of Total Net Assets | |
Common Stocks | | | 97.0 | % |
Preferred Stocks | | | 1.9 | |
Mutual Funds | | | 0.4 | |
Short-Term Investments | | | 0.2 | |
Rights/Warrants | | | 0.0 | ^ |
Futures Contracts | | | (0.0 | )^ |
Other | | | 0.5 | |
| | | | |
| | | 100.0 | % |
| | | | |
| | | | |
| Country Summary* | | % of Investments | |
Japan | | | 19.8 | % |
United Kingdom | | | 15.1 | |
Germany | | | 10.4 | |
France | | | 8.6 | |
Australia | | | 7.2 | |
Switzerland | | | 5.5 | |
Other Developed | | | 3.9 | ‡ |
Italy | | | 3.2 | |
Other Emerging | | | 3.0 | † |
Hong Kong | | �� | 2.8 | |
China | | | 2.8 | |
Netherlands | | | 2.7 | |
Canada | | | 1.9 | |
Spain | | | 1.9 | |
South Korea | | | 1.8 | |
Norway | | | 1.5 | |
Finland | | | 1.5 | |
Taiwan | | | 1.5 | |
Singapore | | | 1.4 | |
Israel | | | 1.2 | |
Sweden | | | 1.2 | |
Brazil | | | 1.1 | |
| | | | |
| | | 100.0 | % |
| | | | |
| & | In the table above, derivative financial instruments, if any, are based on market values or unrealized appreciation/depreciation rather than notional amounts. |
| * | The table above shows country exposure in the Fund. The table excludes short-term investments. The table excludes exposure through forward currency contracts and includes exposure through other derivative financial instruments, if any. The table takes into account the market value of securities and options and the notional amounts of swap contracts and other derivative financial instruments, if any. |
| ‡ | “Other Developed” is comprised of developed countries that each represent between (1.0)% and 1.0% of Investments. |
| † | “Other Emerging” is comprised of emerging countries that each represent between (1.0)% and 1.0% of Investments. |
| | | | |
| Industry Group Summary | | % of Equity Investments# | |
Materials | | | 10.7 | % |
Banks | | | 10.0 | |
Capital Goods | | | 9.3 | |
Automobiles & Components | | | 7.7 | |
Insurance | | | 6.9 | |
Real Estate | | | 6.1 | |
Energy | | | 6.0 | |
Pharmaceuticals, Biotechnology & Life Sciences | | | 5.8 | |
Telecommunication Services | | | 4.8 | |
Food, Beverage & Tobacco | | | 4.0 | |
Transportation | | | 3.5 | |
Diversified Financials | | | 2.9 | |
Software & Services | | | 2.8 | |
Utilities | | | 2.7 | |
Technology Hardware & Equipment | | | 2.6 | |
Consumer Durables & Apparel | | | 2.3 | |
Household & Personal Products | | | 2.0 | |
Food & Staples Retailing | | | 1.9 | |
Media | | | 1.8 | |
Retailing | | | 1.6 | |
Health Care Equipment & Services | | | 1.3 | |
Commercial & Professional Services | | | 1.3 | |
Consumer Services | | | 1.1 | |
Semiconductors & Semiconductor Equipment | | | 0.9 | |
| | | | |
| | | 100.0 | % |
| | | | |
| # | Equity investments may consist of common stocks and other stock-related securities, such as preferred stocks, if any. This table excludes exposure to derivative contracts, short-term investments, mutual funds and investment funds, if any. For a summary of these exposures, if any, see the Schedule of Investments. |
38
GMO Tax-Managed International Equities Fund
(A Series of GMO Trust)
Schedule of Investments
(showing percentage of total net assets)
February 28, 2017
| | | | | | | | | | |
Shares | | | Description | | Value ($) | |
| | | | | | COMMON STOCKS — 97.0% | |
| | |
| | | | | | Australia — 7.2% | |
| | | 20,206 | | | Adelaide Brighton Ltd | | | 83,169 | |
| | | 3,595 | | | ASX Ltd | | | 141,069 | |
| | | 8,317 | | | Australia & New Zealand Banking Group Ltd | | | 196,848 | |
| | | 43,210 | | | BHP Billiton Ltd | | | 817,883 | |
| | | 66,140 | | | BlueScope Steel Ltd | | | 618,580 | |
| | | 5,751 | | | BT Investment Management Ltd | | | 42,650 | |
| | | 14,851 | | | BWP Trust (REIT) | | | 32,439 | |
| | | 4,944 | | | Caltex Australia Ltd | | | 106,629 | |
| | | 12,692 | | | Challenger Ltd | | | 111,201 | |
| | | 6,452 | | | CIMIC Group Ltd | | | 186,791 | |
| | | 1,982 | | | CSL Ltd | | | 179,003 | |
| | | 34,056 | | | CSR Ltd | | | 109,060 | |
| | | 43,941 | | | Dexus Property Group (REIT) | | | 317,876 | |
| | | 25,601 | | | Fortescue Metals Group Ltd | | | 129,607 | |
| | | 21,637 | | | Genworth Mortgage Insurance Australia Ltd | | | 46,575 | |
| | | 77,239 | | | GPT Group (The) (REIT) | | | 291,743 | |
| | | 56,225 | | | Incitec Pivot Ltd | | | 158,081 | |
| | | 30,400 | | | Investa Office Fund (REIT) | | | 108,840 | |
| | | 19,962 | | | LendLease Group | | | 232,903 | |
| | | 3,180 | | | Macquarie Group Ltd | | | 210,870 | |
| | | 208,710 | | | Mirvac Group (REIT) | | | 343,723 | |
| | | 53,267 | | | Orora Ltd | | | 121,260 | |
| | | 29,645 | | | OZ Minerals Ltd | | | 210,933 | |
| | | 31,324 | | | Primary Health Care Ltd | | | 79,196 | |
| | | 9,739 | | | Rio Tinto Ltd | | | 461,731 | |
| | | 134,648 | | | Scentre Group (REIT) | | | 449,981 | |
| | | 20,186 | | | Sonic Healthcare Ltd | | | 332,812 | |
| | | 67,505 | | | South32 Ltd | | | 128,521 | |
| | | 64,473 | | | Spotless Group Holdings Ltd | | | 40,522 | |
| | | 21,251 | | | Star Entertainment Grp Ltd (The) | | | 79,414 | |
| | | 63,221 | | | Stockland (REIT) | | | 228,667 | |
| | | 108,218 | | | Telstra Corp Ltd | | | 399,698 | |
| | | 38,966 | | | Vicinity Centres (REIT) | | | 86,296 | |
| | | 17,067 | | | Wesfarmers Ltd | | | 558,621 | |
| | | 16,176 | | | Westfield Corp (REIT) | | | 109,088 | |
| | | 17,834 | | | Woodside Petroleum Ltd | | | 427,784 | |
| | | 14,510 | | | WorleyParsons Ltd * | | | 118,159 | |
| | | | | | | | | | |
| | | | | | Total Australia | | | 8,298,223 | |
| | | | | | | | | | |
| | |
| | | | | | Austria — 0.8% | |
| | | 88,088 | | | Immofinanz AG (Entitlement Shares) * (a) | | | — | |
| | | 7,133 | | | OMV AG | | | 272,661 | |
| | | 6,670 | | | Raiffeisen Bank International AG * | | | 147,926 | |
| | | 10,830 | | | voestalpine AG | | | 455,038 | |
| | | | | | | | | | |
| | | | | | Total Austria | | | 875,625 | |
| | | | | | | | | | |
| | |
| | | | | | Belgium — 0.4% | |
| | | 4,398 | | | Ageas | | | 167,199 | |
| | | | | | | | | | |
Shares | | | Description | | Value ($) | |
| | | | | | Belgium — continued | |
| | | 2,642 | | | Groupe Bruxelles Lambert SA | | | 223,883 | |
| | | 3,798 | | | Proximus SADP | | | 111,664 | |
| | | | | | | | | | |
| | | | | | Total Belgium | | | 502,746 | |
| | | | | | | | | | |
| | |
| | | | | | Brazil — 0.4% | |
| | | 7,100 | | | Ambev SA | | | 40,624 | |
| | | 7,400 | | | Banco do Brasil SA | | | 78,368 | |
| | | 4,000 | | | BB Seguridade Participacoes SA | | | 36,659 | |
| | | 12,200 | | | BM&FBovespa SA – Bolsa de Valores Mercadorias e Futuros | | | 74,327 | |
| | | 9,400 | | | JBS SA | | | 35,289 | |
| | | 9,100 | | | Kroton Educacional SA | | | 39,881 | |
| | | 10,400 | | | MRV Engenharia e Participacoes SA | | | 47,578 | |
| | | 6,200 | | | Transmissora Alianca de Energia Eletrica SA | | | 43,826 | |
| | | 2,400 | | | Vale SA | | | 25,073 | |
| | | | | | | | | | |
| | | | | | Total Brazil | | | 421,625 | |
| | | | | | | | | | |
| | |
| | | | | | Canada — 1.9% | |
| | | 4,300 | | | Alimentation Couche-Tard Inc – Class B | | | 191,205 | |
| | | 1,600 | | | Canadian Tire Corp Ltd – Class A | | | 183,466 | |
| | | 900 | | | CCL Industries Inc – Class B | | | 191,296 | |
| | | 7,400 | | | CGI Group Inc – Class A * | | | 340,193 | |
| | | 12,900 | | | CI Financial Corp | | | 263,011 | |
| | | 3,200 | | | Great-West Lifeco Inc | | | 87,312 | |
| | | 12,020 | | | Metro Inc | | | 350,500 | |
| | | 4,700 | | | Power Corp of Canada | | | 109,343 | |
| | | 2,900 | | | Russel Metals Inc | | | 57,926 | |
| | | 7,200 | | | Sun Life Financial Inc | | | 261,286 | |
| | | 2,200 | | | Toromont Industries Ltd | | | 76,740 | |
| | | 3,600 | | | Transcontinental Inc – Class A | | | 54,832 | |
| | | 2,500 | | | Westshore Terminals Investment Corp | | | 50,821 | |
| | | | | | | | | | |
| | | | | | Total Canada | | | 2,217,931 | |
| | | | | | | | | | |
| | |
| | | | | | China — 2.8% | |
| | | 4,500 | | | AAC Technologies Holdings Inc | | | 47,340 | |
| | | 18,500 | | | Anhui Conch Cement Co Ltd – Class H | | | 64,408 | |
| | | 13,000 | | | ANTA Sports Products Ltd | | | 39,331 | |
| | | 46,000 | | | Beijing Capital International Airport Co Ltd – Class H | | | 49,294 | |
| | | 107,000 | | | Belle International Holdings Ltd | | | 73,670 | |
| | | 31,000 | | | China Communications Construction Co Ltd – Class H | | | 40,000 | |
| | | 90,000 | | | China Communications Services Corp Ltd – Class H | | | 60,096 | |
| | | 9,000 | | | China Galaxy Securities Co Ltd – Class H | | | 8,818 | |
| | | 26,000 | | | China Mengniu Dairy Co Ltd | | | 51,118 | |
| | | 14,500 | | | China Mobile Ltd | | | 159,936 | |
| | | 88,000 | | | China National Building Material Co Ltd – Class H | | | 64,170 | |
| | | 8,000 | | | China Overseas Land & Investment Ltd | | | 24,604 | |
| | | | |
| | See accompanying notes to the financial statements. | | 39 |
GMO Tax-Managed International Equities Fund
(A Series of GMO Trust)
Schedule of Investments — (Continued)
(showing percentage of total net assets)
February 28, 2017
| | | | | | | | | | |
Shares | | | Description | | Value ($) | |
| | | | | | China — continued | |
| | | 262,000 | | | China Petroleum & Chemical Corp – Class H | | | 203,088 | |
| | | 15,000 | | | China Railway Construction Corp Ltd – Class H | | | 21,208 | |
| | | 13,000 | | | China Railway Group Ltd – Class H | | | 11,356 | |
| | | 90,000 | | | China Resources Cement Holdings Ltd | | | 46,799 | |
| | | 20,000 | | | China Resources Land Ltd | | | 54,566 | |
| | | 24,000 | | | China Resources Power Holdings Co Ltd | | | 43,435 | |
| | | 38,000 | | | China Shenhua Energy Co Ltd – Class H | | | 79,513 | |
| | | 48,000 | | | China Southern Airlines Co Ltd – Class H | | | 31,209 | |
| | | 184,000 | | | China Telecom Corp Ltd – Class H | | | 86,533 | |
| | | 118,000 | | | China Travel International Investment Hong Kong Ltd | | | 34,951 | |
| | | 98,000 | | | CNOOC Ltd | | | 115,933 | |
| | | 16,000 | | | Country Garden Holdings Co Ltd | | | 11,457 | |
| | | 122,000 | | | Datang International Power Generation Co Ltd – Class H | | | 35,680 | |
| | | 44,000 | | | Dongfeng Motor Group Co Ltd – Class H | | | 52,174 | |
| | | 85,000 | | | Geely Automobile Holdings Ltd | | | 115,543 | |
| | | 52,000 | | | Great Wall Motor Co Ltd – Class H | | | 63,858 | |
| | | 34,000 | | | Guangdong Investment Ltd | | | 46,320 | |
| | | 23,200 | | | Guangzhou R&F Properties Co Ltd – Class H | | | 32,032 | |
| | | 12,000 | | | Haitian International Holdings Ltd | | | 25,248 | |
| | | 39,000 | | | Huabao International Holdings Ltd * | | | 20,951 | |
| | | 58,000 | | | Huadian Power International Corp Ltd – Class H | | | 25,467 | |
| | | 32,000 | | | Huaneng Power International Inc – Class H | | | 21,833 | |
| | | 36,000 | | | Jiangsu Expressway Co Ltd – Class H | | | 47,490 | |
| | | 24,500 | | | Kingboard Chemical Holdings Ltd | | | 86,623 | |
| | | 32,000 | | | Kingboard Laminates Holdings Ltd | | | 35,844 | |
| | | 28,000 | | | Kunlun Energy Co Ltd | | | 24,326 | |
| | | 43,000 | | | Lee & Man Paper Manufacturing Ltd | | | 38,959 | |
| | | 16,000 | | | Lenovo Group Ltd | | | 9,596 | |
| | | 10,000 | | | Minth Group Ltd | | | 31,821 | |
| | | 400 | | | NetEase Inc ADR | | | 122,024 | |
| | | 70,000 | | | People’s Insurance Co Group of China Ltd (The) – Class H | | | 28,747 | |
| | | 17,000 | | | Ping An Insurance Group Co of China Ltd – Class H | | | 90,558 | |
| | | 13,000 | | | Shanghai Industrial Holdings Ltd | | | 36,277 | |
| | | 17,800 | | | Shanghai Pharmaceuticals Holding Co Ltd – Class H | | | 45,829 | |
| | | 36,000 | | | Shenzhen Expressway Co Ltd – Class H | | | 33,248 | |
| | | 30,000 | | | Shenzhen International Holdings Ltd | | | 43,013 | |
| | | 29,000 | | | Shimao Property Holdings Ltd | | | 41,624 | |
| | | 200 | | | SINA Corp * | | | 13,906 | |
| | | 25,000 | | | Sino Biopharmaceutical Ltd | | | 21,546 | |
| | | 43,500 | | | Sinopec Engineering Group Co Ltd – Class H | | | 39,544 | |
| | | 11,200 | | | Sinopharm Group Co Ltd – Class H | | | 51,793 | |
| | | 78,000 | | | Skyworth Digital Holdings Ltd | | | 50,605 | |
| | | 400 | | | Sohu.com Inc * | | | 15,932 | |
| | | 2,000 | | | Sunny Optical Technology Group Co Ltd | | | 12,880 | |
| | | | | | | | | | |
Shares | | | Description | | Value ($) | |
| | | | | | China — continued | |
| | | 12,300 | | | Tencent Holdings Ltd | | | 326,405 | |
| | | 34,000 | | | TravelSky Technology Ltd – Class H | | | 74,143 | |
| | | 48,000 | | | Zhejiang Expressway Co Ltd – Class H | | | 53,984 | |
| | | | | | | | | | |
| | | | | | Total China | | | 3,238,656 | |
| | | | | | | | | | |
| | |
| | | | | | Czech Republic — 0.1% | |
| | | 1,996 | | | CEZ AS | | | 35,227 | |
| | | 1,007 | | | Komercni Banka as | | | 36,199 | |
| | | | | | | | | | |
| | | | | | Total Czech Republic | | | 71,426 | |
| | | | | | | | | | |
| | |
| | | | | | Denmark — 0.7% | |
| | | 223 | | | AP Moeller – Maersk A/S – Class B | | | 362,602 | |
| | | 3,900 | | | Danske Bank A/S | | | 129,991 | |
| | | 7,996 | | | Novo Nordisk A/S – Class B | | | 283,114 | |
| | | | | | | | | | |
| | | | | | Total Denmark | | | 775,707 | |
| | | | | | | | | | |
| | |
| | | | | | Finland — 1.5% | |
| | | 2,834 | | | Amer Sports Oyj | | | 67,239 | |
| | | 11,148 | | | Fortum Oyj | | | 170,941 | |
| | | 6,666 | | | Neste Oyj | | | 232,022 | |
| | | 26,852 | | | Nokia Oyj | | | 137,481 | |
| | | 7,065 | | | Nokian Renkaat Oyj | | | 277,679 | |
| | | 3,416 | | | Sampo Oyj – A Shares | | | 155,499 | |
| | | 29,504 | | | UPM-Kymmene Oyj | | | 699,737 | |
| | | | | | | | | | |
| | | | | | Total Finland | | | 1,740,598 | |
| | | | | | | | | | |
| | |
| | | | | | France — 8.5% | |
| | | 55,739 | | | Air France-KLM * | | | 392,810 | |
| | | 3,891 | | | Atos SE | | | 460,284 | |
| | | 53,454 | | | AXA SA | | | 1,262,478 | |
| | | 9,845 | | | BNP Paribas SA | | | 576,035 | |
| | | 9,672 | | | Bouygues SA | | | 373,066 | |
| | | 3,431 | | | Capgemini SA | | | 293,872 | |
| | | 2,075 | | | Christian Dior SE | | | 439,942 | |
| | | 5,074 | | | Cie Generale des Etablissements Michelin | | | 571,303 | |
| | | 16,002 | | | GDF Suez Strip – VVPR * (a) | | | — | |
| | | 988 | | | Gecina SA (REIT) | | | 125,703 | |
| | | 1,013 | | | IPSOS | | | 32,631 | |
| | | 1,162 | | | L’Oreal SA | | | 216,334 | |
| | | 1,307 | | | Nexity SA | | | 63,070 | |
| | | 18,104 | | | Peugeot SA * | | | 345,075 | |
| | | 1,978 | | | Plastic Omnium SA | | | 66,814 | |
| | | 6,094 | | | Renault SA | | | 540,920 | |
| | | 2,326 | | | Sanofi | | | 200,636 | |
| | | 4,961 | | | Schneider Electric SE | | | 336,134 | |
| | | 477 | | | SEB SA | | | 62,925 | |
| | | 23,786 | | | Societe Generale SA | | | 1,057,230 | |
| | | 5,997 | | | STMicroelectronics NV | | | 91,460 | |
| | | 42,029 | | | TOTAL SA | | | 2,097,078 | |
| | | | |
| 40 | | See accompanying notes to the financial statements. | | |
GMO Tax-Managed International Equities Fund
(A Series of GMO Trust)
Schedule of Investments — (Continued)
(showing percentage of total net assets)
February 28, 2017
| | | | | | | | | | |
Shares | | | Description | | Value ($) | |
| | | | | | France — continued | |
| | | 3,079 | | | Valeo SA | | | 189,616 | |
| | | 5,325 | | | Veolia Environnement SA | | | 87,266 | |
| | | | | | | | | | |
| | | | | | Total France | | | 9,882,682 | |
| | | | | | | | | | |
| | | | | | Germany — 9.5% | |
| | | 9,847 | | | Allianz SE (Registered) | | | 1,715,026 | |
| | | 1,759 | | | Axel Springer SE | | | 91,926 | |
| | | 4,765 | | | BASF SE | | | 443,306 | |
| | | 4,667 | | | Bayer AG | | | 513,687 | |
| | | 11,111 | | | Bayerische Motoren Werke AG | | | 992,169 | |
| | | 1,465 | | | Continental AG | | | 296,931 | |
| | | 20,147 | | | Daimler AG (Registered) | | | 1,463,619 | |
| | | 21,417 | | | Deutsche Lufthansa AG (Registered) | | | 313,567 | |
| | | 6,303 | | | Deutsche Post AG (Registered) | | | 216,012 | |
| | | 13,216 | | | Deutsche Telekom AG (Registered) | | | 228,205 | |
| | | 4,913 | | | Duerr AG | | | 407,082 | |
| | | 689 | | | Fielmann AG | | | 51,001 | |
| | | 8,079 | | | Freenet AG | | | 240,810 | |
| | | 3,254 | | | Fresenius SE & Co KGaA | | | 258,346 | |
| | | 919 | | | Grammer AG | | | 54,845 | |
| | | 1,909 | | | Hannover Rueck SE | | | 215,365 | |
| | | 4,841 | | | HeidelbergCement AG | | | 451,971 | |
| | | 7,457 | | | K+S AG (Registered) | | | 174,153 | |
| | | 5,614 | | | Leoni AG | | | 225,105 | |
| | | 5,077 | | | METRO AG | | | 157,339 | |
| | | 3,573 | | | Muenchener Rueckversicherungs-Gesellschaft AG in Muenchen (Registered) | | | 674,929 | |
| | | 4,401 | | | ProSiebenSat.1 Media SE | | | 176,290 | |
| | | 1,776 | | | RTL Group SA | | | 136,545 | |
| | | 9,783 | | | Siemens AG (Registered) | | | 1,271,798 | |
| | | 1,476 | | | Volkswagen AG | | | 223,566 | |
| | | | | | | | | | |
| | | | | | Total Germany | | | 10,993,593 | |
| | | | | | | | | | |
| | |
| | | | | | Hong Kong — 2.8% | |
| | | 111,000 | | | BOC Hong Kong Holdings Ltd | | | 438,496 | |
| | | 31,000 | | | CK Hutchison Holdings Ltd | | | 382,901 | |
| | | 11,000 | | | CLP Holdings Ltd | | | 111,881 | |
| | | 21,600 | | | Dah Sing Banking Group Ltd | | | 42,032 | |
| | | 46,000 | | | First Pacific Co Ltd | | | 33,687 | |
| | | 25,600 | | | Henderson Land Development Co Ltd | | | 148,670 | |
| | | 33,500 | | | Hongkong Land Holdings Ltd | | | 228,608 | |
| | | 16,000 | | | Hysan Development Co Ltd | | | 74,601 | |
| | | 29,000 | | | Kerry Properties Ltd | | | 88,869 | |
| | | 91,500 | | | Link (REIT) | | | 630,940 | |
| | | 80,000 | | | Sino Land Co Ltd | | | 139,242 | |
| | | 24,500 | | | Swire Pacific Ltd – Class A | | | 252,195 | |
| | | 116,000 | | | WH Group Ltd | | | 90,565 | |
| | | 58,000 | | | Wharf Holdings Ltd (The) | | | 459,500 | |
| | | 25,000 | | | Wheelock & Co Ltd | | | 162,369 | |
| | | | | | | | | | |
| | | | | | Total Hong Kong | | | 3,284,556 | |
| | | | | | | | | | |
| | | | | | | | | | |
Shares | | | Description | | Value ($) | |
| | | | | | Hungary — 0.1% | |
| | | 684 | | | MOL Hungarian Oil & Gas Plc | | | 46,895 | |
| | | 1,732 | | | OTP Bank Plc | | | 50,283 | |
| | | 1,622 | | | Richter Gedeon Nyrt | | | 35,967 | |
| | | | | | | | | | |
| | | | | | Total Hungary | | | 133,145 | |
| | | | | | | | | | |
| | |
| | | | | | India — 0.6% | |
| | | 822 | | | Bharat Petroleum Corp Ltd | | | 8,239 | |
| | | 9,646 | | | Cairn India Ltd | | | 41,005 | |
| | | 6,091 | | | HCL Technologies Ltd | | | 76,592 | |
| | | 173 | | | Hero MotoCorp Ltd | | | 8,113 | |
| | | 7,074 | | | Hindalco Industries Ltd | | | 19,499 | |
| | | 1,057 | | | Hindustan Petroleum Corp Ltd | | | 8,526 | |
| | | 4,652 | | | Indiabulls Housing Finance Ltd | | | 60,559 | |
| | | 10,700 | | | Infosys Ltd Sponsored ADR | | | 161,998 | |
| | | 2,163 | | | ITC Ltd | | | 8,463 | |
| | | 124 | | | Maruti Suzuki India Ltd | | | 11,002 | |
| | | 2,846 | | | Oil & Natural Gas Corp Ltd | | | 8,247 | |
| | | 1,206 | | | Reliance Industries Ltd | | | 22,346 | |
| | | 3,141 | | | Tata Consultancy Services Ltd | | | 115,728 | |
| | | 8,879 | | | Tata Motors Ltd | | | 60,669 | |
| | | 3,623 | | | UPL Ltd | | | 38,833 | |
| | | 2,481 | | | Vedanta Ltd | | | 9,603 | |
| | | 4,536 | | | Wipro Ltd | | | 33,087 | |
| | | 723 | | | Yes Bank Ltd | | | 15,710 | |
| | | | | | | | | | |
| | | | | | Total India | | | 708,219 | |
| | | | | | | | | | |
| | |
| | | | | | Ireland — 0.3% | |
| | | 13,207 | | | Smurfit Kappa Group Plc | | | 350,774 | |
| | | | | | | | | | |
| | |
| | | | | | Israel — 1.2% | |
| | | 42,763 | | | Bank Hapoalim BM | | | 263,595 | |
| | | 55,586 | | | Bank Leumi Le-Israel BM * | | | 243,714 | |
| | | 74,084 | | | Bezeq The Israeli Telecommunication Corp Ltd | | | 132,311 | |
| | | 3,100 | | | Check Point Software Technologies Ltd * | | | 306,621 | |
| | | 959 | | | Frutarom Industries Ltd | | | 54,391 | |
| | | 11,928 | | | Teva Pharmaceutical Industries Ltd | | | 419,590 | |
| | | | | | | | | | |
| | | | | | Total Israel | | | 1,420,222 | |
| | | | | | | | | | |
| | |
| | | | | | Italy — 3.3% | |
| | | 289,745 | | | A2A SPA | | | 402,140 | |
| | | 13,107 | | | Azimut Holding SPA | | | 219,798 | |
| | | 37,018 | | | Banca Mediolanum SPA | | | 241,574 | |
| | | 1,351 | | | Brembo SPA | | | 90,783 | |
| | | 638 | | | Danieli & C Officine Meccaniche SPA – RSP | | | 10,553 | |
| | | 132,123 | | | Enel SPA | | | 567,031 | |
| | | 8,565 | | | Eni SPA | | | 132,134 | |
| | | 9,740 | | | EXOR SPA | | | 461,290 | |
| | | 4,099 | | | Ferrari NV | | | 267,357 | |
| | | 13,208 | | | Fiat Chrysler Automobiles NV * | | | 144,441 | |
| | | | |
| | See accompanying notes to the financial statements. | | 41 |
GMO Tax-Managed International Equities Fund
(A Series of GMO Trust)
Schedule of Investments — (Continued)
(showing percentage of total net assets)
February 28, 2017
| | | | | | | | | | |
Shares | | | Description | | Value ($) | |
| | | | | | Italy — continued | |
| | | 34,764 | | | Leonardo SPA * | | | 478,036 | |
| | | 87,850 | | | Mediaset SPA | | | 360,981 | |
| | | 369,578 | | | Telecom Italia SPA-RSP * | | | 245,016 | |
| | | 35,684 | | | Unipol Gruppo Finanziario SPA | | | 135,413 | |
| | | | | | | | | | |
| | | | | | Total Italy | | | 3,756,547 | |
| | | | | | | | | | |
| | |
| | | | | | Japan — 19.8% | |
| | | 21,100 | | | Acom Co Ltd * | | | 88,223 | |
| | | 46,900 | | | Aiful Corp * | | | 144,003 | |
| | | 9,500 | | | Asahi Group Holdings Ltd | | | 335,842 | |
| | | 2,700 | | | Asatsu-DK Inc | | | 71,253 | |
| | | 8,900 | | | Astellas Pharma Inc | | | 119,886 | |
| | | 7,700 | | | Bridgestone Corp | | | 307,272 | |
| | | 9,300 | | | Canon Inc | | | 271,239 | |
| | | 4,400 | | | Central Japan Railway Co | | | 720,279 | |
| | | 25,300 | | | Concordia Financial Group Ltd | | | 134,704 | |
| | | 13,100 | | | Daicel Corp | | | 159,022 | |
| | | 16,700 | | | Daiichi Sankyo Co Ltd | | | 380,812 | |
| | | 4,100 | | | Daito Trust Construction Co Ltd | | | 573,582 | |
| | | 12,700 | | | Daiwa House Industry Co Ltd | | | 348,529 | |
| | | 4,100 | | | East Japan Railway Co | | | 370,919 | |
| | | 11,200 | | | Fuji Heavy Industries Ltd | | | 419,074 | |
| | | 12,500 | | | FUJIFILM Holdings Corp | | | 483,531 | |
| | | 13,000 | | | Hanwa Co Ltd | | | 93,227 | |
| | | 35,800 | | | Haseko Corp | | | 423,651 | |
| | | 6,300 | | | Hoya Corp | | | 285,234 | |
| | | 4,400 | | | Idemitsu Kosan Co Ltd | | | 141,775 | |
| | | 97,500 | | | ITOCHU Corp | | | 1,411,942 | |
| | | 9,200 | | | Japan Airlines Co Ltd | | | 300,649 | |
| | | 10,700 | | | Japan Tobacco Inc | | | 357,971 | |
| | | 13,020 | | | K’s Holdings Corp | | | 231,682 | |
| | | 3,900 | | | Kao Corp | | | 201,454 | |
| | | 54,900 | | | KDDI Corp | | | 1,434,676 | |
| | | 27,800 | | | Kenedix Inc | | | 109,331 | |
| | | 17,100 | | | Konica Minolta Inc | | | 164,933 | |
| | | 12,700 | | | Kuraray Co Ltd | | | 192,947 | |
| | | 1,900 | | | Lawson Inc | | | 131,130 | |
| | | 50,700 | | | Leopalace21 Corp | | | 266,068 | |
| | | 77,200 | | | Marubeni Corp | | | 499,783 | |
| | | 9,800 | | | Medipal Holdings Corp | | | 161,721 | |
| | | 58,900 | | | Mitsubishi Chemical Holdings Corp | | | 452,895 | |
| | | 20,100 | | | Mitsubishi Electric Corp | | | 453,741 | |
| | | 35,000 | | | Mitsubishi Electric Corp | | | 513,131 | |
| | | 4,200 | | | Mitsubishi Materials Corp | | | 139,443 | |
| | | 40,600 | | | Mitsubishi UFJ Financial Group Inc | | | 268,600 | |
| | | 26,300 | | | Mitsui & Co Ltd | | | 402,588 | |
| | | 87,000 | | | Mitsui OSK Lines Ltd | | | 286,778 | |
| | | 178,300 | | | Mizuho Financial Group Inc | | | 332,730 | |
| | | 3,100 | | | Nagase & Co Ltd | | | 45,072 | |
| | | 6,100 | | | Nexon Co Ltd | | | 101,384 | |
| | | | | | | | | | |
Shares | | | Description | | Value ($) | |
| | | | | | Japan — continued | |
| | | 23,600 | | | Nippon Telegraph & Telephone Corp | | | 998,264 | |
| | | 5,100 | | | Nissan Chemical Industries Ltd | | | 164,463 | |
| | | 70,600 | | | Nissan Motor Co Ltd | | | 694,663 | |
| | | 5,300 | | | Nomura Real Estate Holdings Inc | | | 89,903 | |
| | | 24,800 | | | NTT DOCOMO Inc | | | 589,197 | |
| | | 14,800 | | | ORIX Corp | | | 230,289 | |
| | | 13,800 | | | Otsuka Holdings Co Ltd | | | 628,985 | |
| | | 75,300 | | | Resona Holdings Inc | | | 420,535 | |
| | | 19,700 | | | Sekisui House Ltd | | | 315,026 | |
| | | 1,000 | | | Shimamura Co Ltd | | | 129,484 | |
| | | 1,100 | | | Shin-Etsu Chemical Co Ltd | | | 93,167 | |
| | | 156,600 | | | Sojitz Corp | | | 405,843 | |
| | | 42,000 | | | Sumitomo Chemical Co Ltd | | | 234,296 | |
| | | 30,600 | | | Sumitomo Corp | | | 411,301 | |
| | | 23,800 | | | Sumitomo Mitsui Financial Group Inc | | | 927,181 | |
| | | 6,000 | | | Sumitomo Mitsui Trust Holdings Inc | | | 215,312 | |
| | | 5,820 | | | Suzuken Co Ltd | | | 197,014 | |
| | | 44,200 | | | Tokyo Electric Power Co Holdings Inc * | | | 169,751 | |
| | | 1,500 | | | Tokyo Electron Ltd | | | 149,647 | |
| | | 80,000 | | | Toshiba Corp * | | | 146,964 | |
| | | 78,000 | | | Tosoh Corp | | | 678,572 | |
| | | 15,500 | | | Toyota Tsusho Corp | | | 462,223 | |
| | | 13,560 | | | USS Co Ltd | | | 232,399 | |
| | | | | | | | | | |
| | | | | | Total Japan | | | 22,917,185 | |
| | | | | | | | | | |
| | |
| | | | | | Malta — 0.0% | |
| | | 1,718,063 | | | BGP Holdings Plc * (a) | | | 26,756 | |
| | | | | | | | | | |
| | |
| | | | | | Mexico — 0.3% | |
| | | 65,500 | | | America Movil SAB de CV – Class L | | | 41,664 | |
| | | 5,700 | | | Arca Continental SAB de CV | | | 31,987 | |
| | | 16,800 | | | Gentera SAB de CV | | | 22,217 | |
| | | 2,625 | | | Gruma SAB de CV – Class B | | | 34,482 | |
| | | 4,200 | | | Grupo Aeroportuario del Pacifico SAB de CV – Class B | | | 36,395 | |
| | | 2,330 | | | Grupo Aeroportuario del Sureste SAB de CV – Class B | | | 36,878 | |
| | | 7,900 | | | Grupo Financiero Banorte SAB de CV – Class O | | | 39,312 | |
| | | 20,200 | | | OHL Mexico SAB de CV | | | 21,194 | |
| | | 40,700 | | | Wal-Mart de Mexico SAB de CV | | | 79,206 | |
| | | | | | | | | | |
| | | | | | Total Mexico | | | 343,335 | |
| | | | | | | | | | |
| | |
| | | | | | Netherlands — 2.7% | |
| | | 3,070 | | | Heineken Holding NV | | | 253,543 | |
| | | 77,877 | | | ING Groep NV | | | 1,072,880 | |
| | | 15,331 | | | Koninklijke Ahold Delhaize NV | | | 326,353 | |
| | | 13,566 | | | RELX NV | | | 240,220 | |
| | | 10,191 | | | TomTom NV * | | | 88,536 | |
| | | 11,507 | | | Unilever NV CVA | | | 544,719 | |
| | | | |
| 42 | | See accompanying notes to the financial statements. | | |
GMO Tax-Managed International Equities Fund
(A Series of GMO Trust)
Schedule of Investments — (Continued)
(showing percentage of total net assets)
February 28, 2017
| | | | | | | | | | |
Shares | | | Description | | Value ($) | |
| | | | | | Netherlands — continued | |
| | | 14,998 | | | Wolters Kluwer NV | | | 614,715 | |
| | | | | | | | | | |
| | | | | | Total Netherlands | | | 3,140,966 | |
| | | | | | | | | | |
| | |
| | | | | | New Zealand — 0.5% | |
| | | 10,112 | | | Fisher & Paykel Healthcare Corp Ltd | | | 66,282 | |
| | | 42,712 | | | Fletcher Building Ltd | | | 296,733 | |
| | | 17,565 | | | SKYCITY Entertainment Group Ltd | | | 52,089 | |
| | | 81,592 | | | Spark New Zealand Ltd | | | 210,859 | |
| | | | | | | | | | |
| | | | | | Total New Zealand | | | 625,963 | |
| | | | | | | | | | |
| | |
| | | | | | Norway — 1.5% | |
| | | 14,800 | | | DNB ASA | | | 242,655 | |
| | | 62,932 | | | Seadrill Ltd * | | | 107,971 | |
| | | 25,510 | | | Statoil ASA | | | 449,772 | |
| | | 18,080 | | | Subsea 7 SA * | | | 255,387 | |
| | | 19,010 | | | Telenor ASA | | | 309,965 | |
| | | 10,327 | | | Yara International ASA | | | 392,051 | |
| | | | | | | | | | |
| | | | | | Total Norway | | | 1,757,801 | |
| | | | | | | | | | |
| | |
| | | | | | Peru — 0.0% | |
| | | 200 | | | Credicorp Ltd | | | 32,924 | |
| | | | | | | | | | |
| | |
| | | | | | Poland — 0.2% | |
| | | 1,935 | | | KGHM Polska Miedz SA | | | 61,264 | |
| | | 10,534 | | | PGE Polska Grupa Energetyczna SA | | | 30,740 | |
| | | 2,146 | | | Polski Koncern Naftowy ORLEN SA | | | 49,693 | |
| | | 23,236 | | | Polskie Gornictwo Naftowe i Gazownictwo SA | | | 35,697 | |
| | | 34,693 | | | Tauron Polska Energia SA * | | | 25,585 | |
| | | | | | | | | | |
| | | | | | Total Poland | | | 202,979 | |
| | | | | | | | | | |
| | |
| | | | | | Portugal — 0.3% | |
| | | 103,463 | | | EDP – Energias de Portugal SA | | | 319,859 | |
| | | | | | | | | | |
| | |
| | | | | | Russia — 0.3% | |
| | | 18,065 | | | Gazprom PJSC Sponsored ADR | | | 80,634 | |
| | | 2,428 | | | Lukoil PJSC Sponsored ADR | | | 128,743 | |
| | | 3,125 | | | MMC Norilsk Nickel PJSC ADR | | | 49,759 | |
| | | 2,666 | | | Tatneft PJSC Sponsored ADR | | | 93,489 | |
| | | | | | | | | | |
| | | | | | Total Russia | | | 352,625 | |
| | | | | | | | | | |
| | |
| | | | | | Singapore — 1.4% | |
| | | 107,000 | | | Ascendas Real Estate Investment Trust | | | 190,742 | |
| | | 61,900 | | | CapitaLand Commercial Trust (REIT) | | | 68,847 | |
| | | 55,600 | | | CapitaLand Ltd | | | 144,203 | |
| | | 66,000 | | | CapitaLand Mall Trust (REIT) | | | 92,698 | |
| | | 31,500 | | | DBS Group Holdings Ltd | | | 420,684 | |
| | | 77,400 | | | Global Logistic Properties Ltd | | | 146,756 | |
| | | 370,600 | | | Golden Agri-Resources Ltd | | | 100,312 | |
| | | 29,800 | | | Oversea-Chinese Banking Corp Ltd | | | 200,981 | |
| | | | | | | | | | |
Shares | | | Description | | Value ($) | |
| | | | | | Singapore — continued | |
| | | 11,100 | | | Singapore Exchange Ltd | | | 59,352 | |
| | | 11,643 | | | United Overseas Bank Ltd | | | 178,400 | |
| | | | | | | | | | |
| | | | | | Total Singapore | | | 1,602,975 | |
| | | | | | | | | | |
| | |
| | | | | | South Africa — 0.9% | |
| | | 6,241 | | | AVI Ltd | | | 45,285 | |
| | | 4,915 | | | Barclays Africa Group Ltd | | | 56,880 | |
| | | 4,867 | | | Barloworld Ltd | | | 42,997 | |
| | | 4,345 | | | Bidvest Group Ltd (The) | | | 51,332 | |
| | | 5,385 | | | Clicks Group Ltd | | | 52,707 | |
| | | 897 | | | EOH Holdings Ltd | | | 9,624 | |
| | | 7,272 | | | FirstRand Ltd | | | 27,505 | |
| | | 3,124 | | | Hyprop Investments Ltd (REIT) | | | 29,848 | |
| | | 3,269 | | | Imperial Holdings Ltd | | | 41,632 | |
| | | 3,144 | | | Liberty Holdings Ltd | | | 26,580 | |
| | | 26,440 | | | MMI Holdings Ltd | | | 49,539 | |
| | | 1,534 | | | Mondi Ltd | | | 35,193 | |
| | | 5,498 | | | MTN Group Ltd | | | 50,165 | |
| | | 3,153 | | | Nedbank Group Ltd | | | 58,791 | |
| | | 7,086 | | | Rand Merchant Investment Holdings Ltd | | | 21,701 | |
| | | 66,258 | | | Redefine Properties Ltd (REIT) | | | 54,887 | |
| | | 3,145 | | | Resilient REIT Ltd | | | 28,781 | |
| | | 10,186 | | | RMB Holdings Ltd | | | 49,189 | |
| | | 2,571 | | | Sanlam Ltd | | | 13,274 | |
| | | 3,430 | | | Sasol Ltd | | | 97,570 | |
| | | 1,201 | | | Shoprite Holdings Ltd | | | 17,331 | |
| | | 14,288 | | | Sibanye Gold Ltd | | | 29,274 | |
| | | 2,434 | | | SPAR Group Ltd (The) | | | 33,104 | |
| | | 8,140 | | | Standard Bank Group Ltd | | | 88,711 | |
| | | 6,567 | | | Super Group Ltd * | | | 17,448 | |
| | | | | | | | | | |
| | | | | | Total South Africa | | | 1,029,348 | |
| | | | | | | | | | |
| | |
| | | | | | South Korea — 1.5% | |
| | | 2,236 | | | BNK Financial Group Inc | | | 17,159 | |
| | | 357 | | | Coway Co Ltd | | | 28,225 | |
| | | 833 | | | Dongbu Insurance Co Ltd | | | 44,975 | |
| | | 135 | | | E-MART Inc | | | 24,810 | |
| | | 1,794 | | | Hana Financial Group Inc | | | 55,886 | |
| | | 952 | | | Hankook Tire Co Ltd | | | 50,285 | |
| | | 5,862 | | | Hanwha Life Insurance Co Ltd | | | 33,735 | |
| | | 303 | | | Hyundai Department Store Co Ltd | | | 26,634 | |
| | | 973 | | | Hyundai Marine & Fire Insurance Co Ltd | | | 27,881 | |
| | | 503 | | | Hyundai Mobis Co Ltd | | | 113,376 | |
| | | 716 | | | Hyundai Motor Co | | | 94,537 | |
| | | 3,479 | | | Industrial Bank of Korea | | | 37,978 | |
| | | 2,455 | | | KB Financial Group Inc | | | 101,342 | |
| | | 1,177 | | | KB Insurance Co Ltd | | | 27,421 | |
| | | 2,254 | | | Kia Motors Corp | | | 76,191 | |
| | | 298 | | | Korea Investment Holdings Co Ltd | | | 12,473 | |
| | | 1,362 | | | Korean Reinsurance Co | | | 13,489 | |
| | | | |
| | See accompanying notes to the financial statements. | | 43 |
GMO Tax-Managed International Equities Fund
(A Series of GMO Trust)
Schedule of Investments — (Continued)
(showing percentage of total net assets)
February 28, 2017
| | | | | | | | | | |
Shares | | | Description | | Value ($) | |
| | | | | | South Korea — continued | |
| | | 464 | | | KT&G Corp | | | 42,009 | |
| | | 2,509 | | | LG Display Co Ltd | | | 60,781 | |
| | | 154 | | | Lotte Shopping Co Ltd | | | 31,461 | |
| | | 783 | | | Meritz Fire & Marine Insurance Co Ltd | | | 10,662 | |
| | | 3,358 | | | Mirae Asset Daewoo Co Ltd | | | 26,477 | |
| | | 50 | | | NAVER Corp | | | 34,280 | |
| | | 97 | | | NCSoft Corp | | | 23,485 | |
| | | 238 | | | POSCO | | | 59,514 | |
| | | 429 | | | Samsung Card Co Ltd | | | 16,046 | |
| | | 192 | | | Samsung Electronics Co Ltd | | | 326,291 | |
| | | 246 | | | Samsung Life Insurance Co Ltd | | | 23,272 | |
| | | 2,470 | | | Shinhan Financial Group Co Ltd | | | 101,618 | |
| | | 213 | | | Shinsegae Inc | | | 37,571 | |
| | | 2,193 | | | SK Hynix Inc | | | 90,362 | |
| | | 4,761 | | | Woori Bank | | | 55,961 | |
| | | | | | | | | | |
| | | | | | Total South Korea | | | 1,726,187 | |
| | | | | | | | | | |
| | |
| | | | | | Spain — 1.9% | |
| | | 9,360 | | | ACS Actividades de Construccion y Servicios SA | | | 293,434 | |
| | | 7,027 | | | Amadeus IT Group SA | | | 326,340 | |
| | | 7,211 | | | Ferrovial SA | | | 136,607 | |
| | | 11,644 | | | Gas Natural SDG SA | | | 226,322 | |
| | | 9,768 | | | Grifols SA | | | 213,460 | |
| | | 59,312 | | | Iberdrola SA | | | 393,818 | |
| | | 28,805 | | | Repsol SA | | | 426,121 | |
| | | 15,924 | | | Telefonica SA | | | 162,106 | |
| | | | | | | | | | |
| | | | | | Total Spain | | | 2,178,208 | |
| | | | | | | | | | |
| | |
| | | | | | Sweden — 1.2% | |
| | | 3,329 | | | Atlas Copco AB – A Shares | | | 108,747 | |
| | | 3,360 | | | JM AB | | | 105,466 | |
| | | 2,808 | | | Modern Times Group MTG AB – B Shares | | | 90,791 | |
| | | 25,489 | | | Nordea Bank AB | | | 298,016 | |
| | | 6,322 | | | Sandvik AB | | | 85,818 | |
| | | 9,857 | | | Svenska Cellulosa AB SCA – Class B | | | 302,354 | |
| | | 56,073 | | | Telefonaktiebolaget LM Ericsson – B Shares | | | 363,821 | |
| | | | | | | | | | |
| | | | | | Total Sweden | | | 1,355,013 | |
| | | | | | | | | | |
| | |
| | | | | | Switzerland — 5.5% | |
| | | 15,133 | | | ABB Ltd (Registered) | | | 341,859 | |
| | | 632 | | | Actelion Ltd (Registered) * | | | 170,059 | |
| | | 5,114 | | | Adecco Group AG (Registered) | | | 367,730 | |
| | | 2,119 | | | Baloise Holding AG (Registered) | | | 275,784 | |
| | | 104 | | | dormakaba Holding AG * | | | 85,926 | |
| | | 228 | | | EMS-Chemie Holding AG (Registered) | | | 129,730 | |
| | | 190 | | | Georg Fischer AG (Registered) | | | 164,682 | |
| | | 158 | | | Givaudan SA (Registered) | | | 286,924 | |
| | | 212 | | | Helvetia Holding AG (Registered) | | | 118,973 | |
| | | 76 | | | Komax Holding AG (Registered) | | | 19,799 | |
| | | | | | | | | | |
Shares | | | Description | | Value ($) | |
| | | | | | Switzerland — continued | |
| | | 2,884 | | | Kuehne & Nagel International AG (Registered) | | | 410,614 | |
| | | 6,904 | | | Logitech International SA (Registered) | | | 199,580 | |
| | | 1,026 | | | Mobilezone Holding AG (Registered) | | | 14,849 | |
| | | 8,122 | | | Nestle SA (Registered) | | | 599,389 | |
| | | 1,277 | | | Pargesa Holding SA | | | 84,178 | |
| | | 868 | | | Roche Holding AG | | | 211,275 | |
| | | 455 | | | Schindler Holding AG | | | 87,990 | |
| | | 75 | | | SGS SA (Registered) | | | 159,349 | |
| | | 83 | | | Sika AG | | | 467,102 | |
| | | 1,040 | | | Swatch Group AG (The) (Registered) | | | 67,380 | |
| | | 1,804 | | | Swiss Life Holding AG (Registered) * | | | 567,499 | |
| | | 11,304 | | | Swiss Re AG | | | 1,011,095 | |
| | | 1,840 | | | Zurich Insurance Group AG * | | | 507,791 | |
| | | | | | | | | | |
| | | | | | Total Switzerland | | | 6,349,557 | |
| | | | | | | | | | |
| | |
| | | | | | Taiwan — 1.5% | |
| | | 38,000 | | | Advanced Semiconductor Engineering Inc | | | 47,410 | |
| | | 4,000 | | | Asustek Computer Inc | | | 36,092 | |
| | | 39,360 | | | Chang Hwa Commercial Bank Ltd | | | 23,509 | |
| | | 86,000 | | | China Development Financial Holding Corp | | | 22,655 | |
| | | 17,480 | | | China Life Insurance Co Ltd | | | 17,146 | |
| | | 8,000 | | | Chunghwa Telecom Co Ltd | | | 26,526 | |
| | | 71,000 | | | Compal Electronics Inc | | | 44,449 | |
| | | 48,800 | | | CTBC Financial Holding Co Ltd | | | 29,123 | |
| | | 69,635 | | | First Financial Holding Co Ltd | | | 41,106 | |
| | | 8,290 | | | Foxconn Technology Co Ltd | | | 24,748 | |
| | | 33,000 | | | Fubon Financial Holding Co Ltd | | | 53,477 | |
| | | 87,200 | | | Hon Hai Precision Industry Co Ltd | | | 253,749 | |
| | | 58,564 | | | Hua Nan Financial Holdings Co Ltd – Class C | | | 32,211 | |
| | | 62,000 | | | Inventec Corp | | | 46,052 | |
| | | 37,249 | | | Lite-On Technology Corp | | | 62,382 | |
| | | 65,000 | | | Mega Financial Holding Co Ltd | | | 50,592 | |
| | | 8,000 | | | Novatek Microelectronics Corp | | | 29,958 | |
| | | 8,000 | | | Pegatron Corp | | | 21,065 | |
| | | 32,000 | | | Pou Chen Corp | | | 43,427 | |
| | | 122,000 | | | Shin Kong Financial Holding Co Ltd * | | | 32,920 | |
| | | 21,000 | | | Siliconware Precision Industries Co Ltd | | | 33,082 | |
| | | 112,999 | | | Taishin Financial Holding Co Ltd | | | 44,690 | |
| | | 32,000 | | | Taiwan Cement Corp | | | 39,179 | |
| | | 15,600 | | | Taiwan Semiconductor Manufacturing Co Ltd Sponsored ADR | | | 490,932 | |
| | | 21,000 | | | Uni-President Enterprises Corp | | | 37,294 | |
| | | 154,000 | | | United Microelectronics Corp | | | 63,849 | |
| | | 86,000 | | | Yuanta Financial Holding Co Ltd | | | 36,380 | |
| | | | | | | | | | |
| | | | | | Total Taiwan | | | 1,684,003 | |
| | | | | | | | | | |
| | |
| | | | | | Thailand — 0.2% | |
| | | 6,500 | | | Kasikornbank Pcl (Foreign Registered) (b) | | | 35,200 | |
| | | 153,300 | | | Krung Thai Bank Pcl (Foreign Registered) | | | 85,981 | |
| | | | |
| 44 | | See accompanying notes to the financial statements. | | |
GMO Tax-Managed International Equities Fund
(A Series of GMO Trust)
Schedule of Investments — (Continued)
(showing percentage of total net assets)
February 28, 2017
| | | | | | | | | | |
Shares | | | Description | | Value ($) | |
| | | | | | Thailand — continued | |
| | | 8,100 | | | PTT Pcl (Foreign Registered) | | | 92,111 | |
| | | | | | | | | | |
| | | | | | Total Thailand | | | 213,292 | |
| | | | | | | | | | |
| | |
| | | | | | Turkey — 0.2% | |
| | | 11,009 | | | Akbank TAS | | | 26,229 | |
| | | 3,162 | | | Arcelik AS | | | 18,116 | |
| | | 28,711 | | | Eregli Demir ve Celik Fabrikalari TAS | | | 46,746 | |
| | | 9,799 | | | Haci Omer Sabanci Holding AS | | | 27,037 | |
| | | 10,322 | | | KOC Holding AS | | | 41,960 | |
| | | 995 | | | Tupras-Turkiye Petrol Rafineriler AS | | | 23,241 | |
| | | 11,485 | | | Turkcell Iletisim Hizmetleri AS * | | | 37,482 | |
| | | 20,383 | | | Turkiye Is Bankasi – Class C | | | 35,377 | |
| | | 20,914 | | | Turkiye Sise ve Cam Fabrikalari AS | | | 22,476 | |
| | | | | | | | | | |
| | | | | | Total Turkey | | | 278,664 | |
| | | | | | | | | | |
| | |
| | | | | | United Kingdom — 15.0% | |
| | | 30,536 | | | 3i Group Plc | | | 260,920 | |
| | | 14,557 | | | Anglo American Plc * | | | 228,566 | |
| | | 19,418 | | | AstraZeneca Plc | | | 1,119,060 | |
| | | 55,298 | | | Balfour Beatty Plc | | | 189,503 | |
| | | 10,342 | | | Berkeley Group Holdings Plc (The) | | | 377,977 | |
| | | 68,857 | | | BHP Billiton Plc | | | 1,109,833 | |
| | | 26,171 | | | BP Plc | | | 147,570 | |
| | | 28,023 | | | British American Tobacco Plc | | | 1,770,060 | |
| | | 12,422 | | | British Land Co Plc (The) (REIT) | | | 95,137 | |
| | | 10,193 | | | Bunzl Plc | | | 285,289 | |
| | | 93,366 | | | Cobham Plc | | | 138,882 | |
| | | 30,058 | | | Compass Group Plc | | | 558,416 | |
| | | 2,445 | | | CYBG Plc CDI * | | | 7,938 | |
| | | 7,663 | | | Diageo Plc | | | 216,057 | |
| | | 26,902 | | | Direct Line Insurance Group Plc | | | 114,658 | |
| | | 28,612 | | | DS Smith Plc | | | 158,208 | |
| | | 107,656 | | | GlaxoSmithKline Plc | | | 2,202,956 | |
| | | 14,276 | | | Halfords Group Plc | | | 60,161 | |
| | | 219,074 | | | HSBC Holdings Plc | | | 1,759,620 | |
| | | 12,591 | | | Imperial Brands Plc | | | 592,725 | |
| | | 31,597 | | | Inchcape Plc | | | 294,296 | |
| | | 86,813 | | | Kingfisher Plc | | | 354,100 | |
| | | 65,970 | | | Man Group Plc | | | 119,865 | |
| | | 11,280 | | | National Grid Plc | | | 137,034 | |
| | | 3,340 | | | Next Plc | | | 158,681 | |
| | | 16,923 | | | Persimmon Plc | | | 432,751 | |
| | | 6,917 | | | Reckitt Benckiser Group Plc | | | 628,061 | |
| | | 11,408 | | | Rio Tinto Plc | | | 467,570 | |
| | | 22,138 | | | Royal Dutch Shell Plc A Shares (London) | | | 572,882 | |
| | | 10,272 | | | Royal Dutch Shell Plc B Shares (London) | | | 278,049 | |
| | | 41,424 | | | Royal Mail Plc | | | 213,199 | |
| | | 41,207 | | | Sage Group Plc (The) | | | 330,242 | |
| | | 131,645 | | | Thomas Cook Group Plc * | | | 142,636 | |
| | | 13,516 | | | TUI AG | | | 190,821 | |
| | | | | | | | | | |
Shares | | | Description | | Value ($) | |
| | | | | | United Kingdom — continued | |
| | | 4,951 | | | Unilever Plc | | | 234,883 | |
| | | 41,227 | | | William Hill Plc | | | 134,988 | |
| | | 71,626 | | | WM Morrison Supermarkets Plc | | | 215,241 | |
| | | 47,012 | | | WPP Plc | | | 1,106,024 | |
| | | | | | | | | | |
| | | | | | Total United Kingdom | | | 17,404,859 | |
| | | | | | | | | | |
| | | |
| | | | | | TOTAL COMMON STOCKS
(COST $92,868,634) | | | 112,214,774 | |
| | | | | | | | | | |
| | | |
| | | | | | PREFERRED STOCKS — 1.9% | | | | |
| | | |
| | | | | | Brazil — 0.7% | | | | |
| | | 17,980 | | | Banco Bradesco SA | | | 192,265 | |
| | | 10,300 | | | Bradespar SA | | | 77,263 | |
| | | 8,000 | | | Centrais Eletricas Brasileiras SA – Class B * | | | 63,087 | |
| | | 7,000 | | | Cia Energetica de Sao Paulo – Class B | | | 40,110 | |
| | | 22,900 | | | Companhia Energetica de Minas Gerais | | | 78,298 | |
| | | 10,180 | | | Itau Unibanco Holding SA | | | 130,363 | |
| | | 44,240 | | | Itausa-Investimentos Itau SA | | | 142,243 | |
| | | 10,900 | | | Vale SA | | | 110,027 | |
| | | | | | | | | | |
| | | | | | Total Brazil | | | 833,656 | |
| | | | | | | | | | |
| | | |
| | | | | | Germany — 0.8% | | | | |
| | | 1,092 | | | Bayerische Motoren Werke AG | | | 81,373 | |
| | | 1,185 | | | Henkel AG & Co KGaA | | | 148,043 | |
| | | 9,790 | | | Porsche Automobil Holding SE | | | 540,295 | |
| | | 1,662 | | | Volkswagen AG | | | 245,638 | |
| | | | | | | | | | |
| | | | | | Total Germany | | | 1,015,349 | |
| | | | | | | | | | |
| | | |
| | | | | | Russia — 0.1% | | | | |
| | | 139,020 | | | Surgutneftegas OJSC | | | 75,797 | |
| | | | | | | | | | |
| | | |
| | | | | | South Korea — 0.3% | | | | |
| | | 322 | | | Hyundai Motor Co | | | 27,862 | |
| | | 534 | | | Hyundai Motor Co 2nd Preference | | | 48,125 | |
| | | 199 | | | Samsung Electronics Co Ltd | | | 263,395 | |
| | | | | | | | | | |
| | | | | | Total South Korea | | | 339,382 | |
| | | | | | | | | | |
| | | |
| | | | | | TOTAL PREFERRED STOCKS
(COST $1,571,653) | | | 2,264,184 | |
| | | | | | | | | | |
| | |
| | | | | | RIGHTS/WARRANTS — 0.0% | |
| | |
| | | | | | Brazil — 0.0% | |
| | | 782 | | | Itausa – Investimentos Itau SA Rights,
Expires 03/31/17* | | | 990 | |
| | | | | | | | | | |
| | | |
| | | | | | TOTAL RIGHTS/WARRANTS
(COST $0) | | | 990 | |
| | | | | | | | | | |
| | | | |
| | See accompanying notes to the financial statements. | | 45 |
GMO Tax-Managed International Equities Fund
(A Series of GMO Trust)
Schedule of Investments — (Continued)
(showing percentage of total net assets)
February 28, 2017
| | | | | | | | | | |
Shares /
Par Value† | | | Description | | Value ($) | |
| | | | | | MUTUAL FUNDS — 0.4% | |
| | |
| | | | | | United States — 0.4% | |
| | | | | | Affiliated Issuers — 0.4% | | | | |
| | | 17,103 | | | GMO U.S. Treasury Fund | | | 427,587 | |
| | | | | | | | | | |
| | | |
| | | | | | TOTAL MUTUAL FUNDS
(COST $427,584) | | | 427,587 | |
| | | | | | | | | | |
| | |
| | | | | | SHORT-TERM INVESTMENTS — 0.2% | |
| | | |
| | | | | | Time Deposits — 0.2% | | | | |
AUD | | | 56,882 | | | Australia and New Zealand Banking Group Ltd. (Melbourne) Time Deposit,
0.74%, due 03/01/17 | | | 43,611 | |
CAD | | | 3,428 | | | Brown Brothers Harriman (Grand Cayman) Time Deposit, 0.05%, due 03/01/17 | | | 2,581 | |
NZD | | | 840 | | | Brown Brothers Harriman (Grand Cayman) Time Deposit, 1.05%, due 03/01/17 | | | 605 | |
SGD | | | 14,989 | | | Brown Brothers Harriman (Grand Cayman) Time Deposit, 0.01%, due 03/01/17 | | | 10,696 | |
| | | 231,275 | | | Sumitomo (Tokyo) Time Deposit,
0.36%, due 03/01/17 | | | 231,275 | |
| | | | | | | | | | |
| | | | | | Total Time Deposits | | | 288,768 | |
| | | | | | | | | | |
| | | |
| | | | | | TOTAL SHORT-TERM INVESTMENTS
(COST $288,768) | | | 288,768 | |
| | | | | | | | | | |
| | | |
| | | | | | TOTAL INVESTMENTS — 99.5%
(Cost $95,156,639) | | | 115,196,303 | |
| | | | | | Other Assets and Liabilities (net) — 0.5% | | | 536,346 | |
| | | | | | | | | | |
| | | |
| | | | | | TOTAL NET ASSETS — 100.0% | | | $115,732,649 | |
| | | | | | | | | | |
A summary of outstanding financial instruments at February 28, 2017 is as follows:
Futures Contracts
| | | | | | | | | | | | |
| | | | |
Number
of
Contracts + | | Type | | Expiration
Date | |
Notional
Amount | | | Net
Unrealized
Appreciation
(Depreciation) | |
| Buys | | | | | | | | | | | | |
| 7 | | Mini MSCI Emerging Markets | | March 2017 | | $ | 610,925 | | | $ | (1,260 | ) |
| | | | | | | | | | | | |
| + | Buys - Fund is long the futures contract. Sales - Fund is short the futures contract. |
As of February 28, 2017, for the above contracts and/or agreements, the Fund had sufficient cash and/or securities to cover commitments or collateral requirements, if any, of the relevant broker or exchange.
Notes to Schedule of Investments:
| † | Denominated in U.S. Dollar, unless otherwise indicated. |
| * | Non-income producing security. |
| (a) | Investment valued at fair value using methods determined in good faith by the Trustees of GMO Trust or persons acting at their direction pursuant to procedures approved by the Trustees (Note 2). |
| (b) | Security valued at the local price and adjusted by applying a premium or discount since holding exceeds foreign ownership limits. |
For a listing of definitions of acronyms, counterparty abbreviations and currency abbreviations used throughout the Schedule of Investments as well as the derivative tables, if any, please refer to page 54.
| | | | |
| 46 | | See accompanying notes to the financial statements. | | |
This page has been left blank intentionally.
GMO U.S. Equity Allocation Fund
(A Series of GMO Trust)
Portfolio Management
Day-to-day management of the Fund’s portfolio is the responsibility of the Global Equity team at Grantham, Mayo, Van Otterloo & Co. LLC.
Management Discussion and Analysis of Fund Performance
Although the Fund is not managed relative to any securities market index or benchmark, a discussion of the Fund’s performance relative to the S&P 500 Index is included for comparative purposes.
Class III shares of GMO U.S. Equity Allocation Fund returned +23.59% (net) for the fiscal year ended February 28, 2017, as compared with +24.98% for the S&P 500 Index.
Allocation between sectors proved positive relative to the benchmark. The largest relative contributions were from being underweight Consumer Staples, Real Estate, and Utilities. Stock selection was positive in the majority of sectors, but the magnitude of the wins was small compared to the losses and, in aggregate, stock selection was a significant detractor from relative performance. In terms of stock selection, relative performance in Information Technology and Financials was particularly detrimental, with stock selection within the Health Care sector being the largest positive contributor.
Top stock detractors included having no exposure to the strongly performing Bank of America, an overweight position in Verizon Communications, and an underweight position in Apple Inc. Top stock contributors included overweight positions in JP Morgan Chase & Co, Assured Guaranty Ltd, and Delta Air Lines.
The views expressed herein are exclusively those of Grantham, Mayo, Van Otterloo & Co. LLC as of the date of this report and are subject to change. GMO disclaims any responsibility to update such views. They are not meant as investment advice. References to specific securities are not recommendations of such securities and may not be representative of any GMO portfolio’s current or future investments.
48
GMO U.S. Equity Allocation Fund
(A Series of GMO Trust)
Comparison of Change in Value of a $10,000,000 Investment in
GMO U.S. Equity Allocation Fund Class III Shares and the S&P 500 Index
As of February 28, 2017
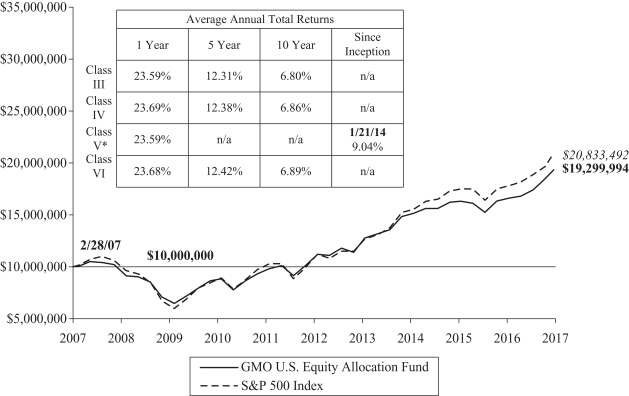
Performance data quoted represents past performance and is not indicative of future results. The investment return and principal value of an investment will fluctuate so that an investor’s shares, when redeemed, may be worth more or less than their original cost. Current performance data may be lower or higher than the performance data provided herein. To obtain performance information up to the most recent month-end, visit www.gmo.com. Performance shown is net of all fees after reimbursement from GMO. Returns would have been lower had certain expenses not been reimbursed during the periods shown and do not include the effect of taxes on distributions and redemptions. The performance information shown above only includes purchase premiums and/or redemption fees in effect as of February 28, 2017. All information is unaudited. Performance for classes may vary due to different fees.
| | * | For the period from July 31, 2014 to August 8, 2016, no Class V shares were outstanding. Performance for that period is that of Class IV shares, which have higher expenses. Therefore, the performance shown is lower than it would have been if Class V expenses had been applied throughout. |
| | | For S&P disclaimers please visit http://www.gmo.com/America/_Disclaimers/_BenchmarkDisclaimers.htm. |
49
GMO U.S. Equity Allocation Fund
(A Series of GMO Trust)
Investment Concentration Summary
February 28, 2017 (Unaudited)
| | | | |
| Asset Class Summary& | | % of Total Net Assets | |
Common Stocks | | | 99.2 | % |
Mutual Funds | | | 0.6 | |
Short-Term Investments | | | 0.2 | |
Other | | | 0.0 | ^ |
| | | | |
| | | 100.0 | % |
| | | | |
| | | | |
| Industry Group Summary | | % of Equity Investments# | |
Capital Goods | | | 10.0 | % |
Technology Hardware & Equipment | | | 8.8 | |
Software & Services | | | 8.5 | |
Pharmaceuticals, Biotechnology & Life Sciences | | | 8.2 | |
Insurance | | | 6.7 | |
Energy | | | 6.4 | |
Retailing | | | 6.2 | |
Health Care Equipment & Services | | | 5.8 | |
Semiconductors & Semiconductor Equipment | | | 5.8 | |
Diversified Financials | | | 5.0 | |
Materials | | | 4.8 | |
Food, Beverage & Tobacco | | | 4.6 | |
Banks | | | 4.4 | |
Automobiles & Components | | | 3.7 | |
Telecommunication Services | | | 2.7 | |
Food & Staples Retailing | | | 2.0 | |
Media | | | 1.6 | |
Commercial & Professional Services | | | 1.5 | |
Transportation | | | 1.1 | |
Consumer Durables & Apparel | | | 1.0 | |
Utilities | | | 0.6 | |
Real Estate | | | 0.3 | |
Consumer Services | | | 0.2 | |
Household & Personal Products | | | 0.1 | |
| | | | |
| | | 100.0 | % |
| | | | |
| & | In the table above, derivative financial instruments, if any, are based on market values or unrealized appreciation/depreciation rather than notional amounts. |
| # | Equity investments may consist of common stocks and other stock-related securities, such as preferred stocks, if any. This table excludes exposure to derivative contracts, short-term investments, mutual funds and investment funds, if any. For a summary of these exposures, if any, see the Schedule of Investments. |
50
GMO U.S. Equity Allocation Fund
(A Series of GMO Trust)
Schedule of Investments
(showing percentage of total net assets)
February 28, 2017
| | | | | | | | | | |
| Shares | | | Description | | Value ($) | |
| | | | | | COMMON STOCKS — 99.2% | |
| | |
| | | | | | Automobiles & Components — 3.7% | |
| | | 28,800 | | | Cooper-Standard Holding, Inc. * | | | 3,225,600 | |
| | | 1,600 | | | Dana, Inc. | | | 30,224 | |
| | | 444,500 | | | General Motors Co. | | | 16,375,380 | |
| | | 194,600 | | | Gentex Corp. | | | 4,092,438 | |
| | | 135,700 | | | Goodyear Tire & Rubber Co. (The) | | | 4,756,285 | |
| | | 42,321 | | | LCI Industries | | | 4,557,972 | |
| | | 120,680 | | | Lear Corp. | | | 17,135,353 | |
| | | 17,100 | | | Standard Motor Products, Inc. | | | 820,287 | |
| | | 27,284 | | | Superior Industries International, Inc. | | | 611,161 | |
| | | 107,185 | | | Thor Industries, Inc. | | | 11,878,242 | |
| | | 46,265 | | | Tower International, Inc. | | | 1,279,227 | |
| | | | | | | | | | |
| | | | | | Total Automobiles & Components | | | 64,762,169 | |
| | | | | | | | | | |
| | |
| | | | | | Banks — 4.4% | |
| | | 4,236 | | | American National Bankshares, Inc. | | | 154,826 | |
| | | 4,500 | | | CNB Financial Corp. | | | 108,135 | |
| | | 147,746 | | | Essent Group Ltd. * | | | 5,143,038 | |
| | | 11,400 | | | Federal Agricultural Mortgage Corp. – Class C | | | 656,412 | |
| | | 8,800 | | | Fifth Third Bancorp | | | 241,472 | |
| | | 3,200 | | | First Bancorp, Inc. | | | 86,752 | |
| | | 3,700 | | | German American Bancorp, Inc. | | | 175,565 | |
| | | 749,863 | | | JPMorgan Chase & Co. | | | 67,952,585 | |
| | | 29,750 | | | PennyMac Financial Services, Inc. – Class A * | | | 531,037 | |
| | | 4,900 | | | Territorial Bancorp, Inc. | | | 157,878 | |
| | | 48,041 | | | Walker & Dunlop, Inc. * | | | 1,952,867 | |
| | | | | | | | | | |
| | | | | | Total Banks | | | 77,160,567 | |
| | | | | | | | | | |
| | |
| | | | | | Capital Goods — 9.9% | |
| | | 239,520 | | | 3M Co. | | | 44,634,552 | |
| | | 42,344 | | | AGCO Corp. | | | 2,579,596 | |
| | | 24,100 | | | Carlisle Cos, Inc. | | | 2,489,530 | |
| | | 62,700 | | | Cummins, Inc. | | | 9,310,323 | |
| | | 17,551 | | | Douglas Dynamics, Inc. | | | 585,326 | |
| | | 56,600 | | | EMCOR Group, Inc. | | | 3,479,768 | |
| | | 697,671 | | | Emerson Electric Co. | | | 41,930,027 | |
| | | 52,100 | | | General Dynamics Corp. | | | 9,889,101 | |
| | | 309,400 | | | Honeywell International, Inc. | | | 38,520,300 | |
| | | 90,500 | | | Illinois Tool Works, Inc. | | | 11,946,905 | |
| | | 36,400 | | | Parker-Hannifin Corp. | | | 5,636,176 | |
| | | 115,500 | | | Wabash National Corp. | | | 2,442,825 | |
| | | 22,400 | | | WESCO International, Inc. * | | | 1,556,800 | |
| | | | | | | | | | |
| | | | | | Total Capital Goods | | | 175,001,229 | |
| | | | | | | | | | |
| | |
| | | | | | Commercial & Professional Services — 1.5% | |
| | | 265,429 | | | ACCO Brands Corp. * | | | 3,556,749 | |
| | | 94,308 | | | Cintas Corp. | | | 11,129,287 | |
| | | 86,242 | | | Deluxe Corp. | | | 6,346,549 | |
| | | | | | | | | | |
| Shares | | | Description | | Value ($) | |
| | | | | | Commercial & Professional Services — continued | |
| | | 6,700 | | | Heidrick & Struggles International, Inc. | | | 163,815 | |
| | | 21,400 | | | ICF International, Inc. * | | | 919,130 | |
| | | 39,880 | | | Korn/Ferry International | | | 1,232,691 | |
| | | 64,512 | | | Navigant Consulting, Inc. * | | | 1,503,130 | |
| | | 15,541 | | | TRC Cos., Inc. * | | | 159,295 | |
| | | 51,073 | | | TrueBlue, Inc. * | | | 1,325,344 | |
| | | 2,700 | | | Waste Management, Inc. | | | 197,964 | |
| | | | | | | | | | |
| | | | | | Total Commercial & Professional Services | | | 26,533,954 | |
| | | | | | | | | | |
| | |
| | | | | | Consumer Durables & Apparel — 1.0% | |
| | | 6,400 | | | Bassett Furniture Industries, Inc. | | | 175,040 | |
| | | 130,600 | | | Coach, Inc. | | | 4,974,554 | |
| | | 4,100 | | | CSS Industries, Inc. | | | 100,778 | |
| | | 6,700 | | | Culp, Inc. | | | 227,800 | |
| | | 4,295 | | | Flexsteel Industries, Inc. | | | 215,953 | |
| | | 34,473 | | | Helen of Troy Ltd. * | | | 3,368,012 | |
| | | 71,700 | | | Michael Kors Holdings Ltd * | | | 2,617,050 | |
| | | 28,727 | | | Tupperware Brands Corp. | | | 1,734,823 | |
| | | 20,800 | | | Whirlpool Corp. | | | 3,714,672 | |
| | | | | | | | | | |
| | | | | | Total Consumer Durables & Apparel | | | 17,128,682 | |
| | | | | | | | | | |
| | |
| | | | | | Consumer Services — 0.2% | |
| | | 12,300 | | | Bridgepoint Education, Inc. * | | | 114,759 | |
| | | 18,480 | | | Drive Shack, Inc. | | | 77,431 | |
| | | 32,750 | | | Wyndham Worldwide Corp. | | | 2,726,110 | |
| | | | | | | | | | |
| | | | | | Total Consumer Services | | | 2,918,300 | |
| | | | | | | | | | |
| | |
| | | | | | Diversified Financials — 5.0% | |
| | | 5,221 | | | Ares Commercial Real Estate Corp. REIT | | | 70,588 | |
| | | 150,088 | | | BlackRock Capital Investment Corp. | | | 1,163,182 | |
| | | 307,537 | | | Capital One Financial Corp. | | | 28,865,423 | |
| | | 204,751 | | | Chimera Investment Corp. REIT | | | 3,939,409 | |
| | | 193,100 | | | Discover Financial Services | | | 13,737,134 | |
| | | 4,104 | | | Encore Capital Group, Inc. * | | | 136,663 | |
| | | 38,459 | | | FirstCash, Inc. | | | 1,705,657 | |
| | | 65,600 | | | Franklin Resources, Inc. | | | 2,823,424 | |
| | | 216,900 | | | MFA Financial, Inc. REIT | | | 1,739,538 | |
| | | 89,866 | | | Nasdaq, Inc. | | | 6,390,371 | |
| | | 120,300 | | | New Residential Investment Corp. REIT | | | 2,029,461 | |
| | | 6,573 | | | OneMain Holdings, Inc. * | | | 184,176 | |
| | | 65,764 | | | PRA Group, Inc. * | | | 2,683,171 | |
| | | 43,900 | | | Raymond James Financial, Inc. | | | 3,448,784 | |
| | | 26,212 | | | Regional Management Corp. * | | | 550,190 | |
| | | 256,305 | | | T. Rowe Price Group, Inc. | | | 18,251,479 | |
| | | | | | | | | | |
| | | | | | Total Diversified Financials | | | 87,718,650 | |
| | | | | | | | | | |
| | |
| | | | | | Energy — 6.4% | |
| | | 249,793 | | | Chevron Corp. | | | 28,101,712 | |
| | | 332,776 | | | Denbury Resources, Inc. * | | | 901,823 | |
| | | 35,178 | | | Exterran Corp. * | | | 1,070,818 | |
| | | | |
| | See accompanying notes to the financial statements. | | 51 |
GMO U.S. Equity Allocation Fund
(A Series of GMO Trust)
Schedule of Investments — (Continued)
(showing percentage of total net assets)
February 28, 2017
| | | | | | | | | | |
| Shares | | | Description | | Value ($) | |
| | | | | | Energy — continued | |
| | | 9,571 | | | Marathon Petroleum Corp. | | | 474,722 | |
| | | 1,196,124 | | | Marathon Oil Corp. | | | 19,137,984 | |
| | | 210,450 | | | McDermott International, Inc. * | | | 1,548,912 | |
| | | 49,500 | | | Murphy Oil Corp. | | | 1,400,355 | |
| | | 166,305 | | | Tesoro Corp. | | | 14,167,523 | |
| | | 46,000 | | | Unit Corp. * | | | 1,248,440 | |
| | | 655,186 | | | Valero Energy Corp. | | | 44,519,889 | |
| | | | | | | | | | |
| | | | | | Total Energy | | | 112,572,178 | |
| | | | | | | | | | |
| | |
| | | | | | Food & Staples Retailing — 2.0% | |
| | | 496,200 | | | Wal-Mart Stores, Inc. | | | 35,195,466 | |
| | | | | | | | | | |
| | |
| | | | | | Food, Beverage & Tobacco — 4.6% | |
| | | 237,908 | | | Dr Pepper Snapple Group, Inc. | | | 22,230,124 | |
| | | 181,113 | | | Hormel Foods Corp. | | | 6,384,233 | |
| | | 117,045 | | | Ingredion, Inc. | | | 14,149,570 | |
| | | 9,700 | | | John B. Sanfilippo & Son, Inc. | | | 595,580 | |
| | | 13,200 | | | Omega Protein Corp. | | | 335,940 | |
| | | 333,300 | | | PepsiCo, Inc. | | | 36,789,654 | |
| | | | | | | | | | |
| | | | | | Total Food, Beverage & Tobacco | | | 80,485,101 | |
| | | | | | | | | | |
| | |
| | | | | | Health Care Equipment & Services — 5.8% | |
| | | 239,169 | | | Anthem, Inc. | | | 39,419,835 | |
| | | 2,900 | | | Baxter International, Inc. | | | 147,668 | |
| | | 27,777 | | | Chemed Corp. | | | 4,959,584 | |
| | | 8,821 | | | Exactech, Inc. * | | | 214,350 | |
| | | 71,300 | | | HCA Holdings, Inc. * | | | 6,220,212 | |
| | | 10,100 | | | Triple-S Management Corp. – Class B * | | | 188,567 | |
| | | 305,643 | | | UnitedHealth Group, Inc. | | | 50,547,239 | |
| | | | | | | | | | |
| | | | | | Total Health Care Equipment & Services | | | 101,697,455 | |
| | | | | | | | | | |
| | |
| | | | | | Household & Personal Products — 0.1% | |
| | | 25,200 | | | Central Garden & Pet Co. * | | | 850,500 | |
| | | 5,600 | | | Nutraceutical International Corp. | | | 188,720 | |
| | | | | | | | | | |
| | | | | | Total Household & Personal Products | | | 1,039,220 | |
| | | | | | | | | | |
| | |
| | | | | | Insurance — 6.6% | |
| | | 337,499 | | | Aflac, Inc. | | | 24,418,053 | |
| | | 11,992 | | | American Equity Investment Life Holding Co. | | | 322,705 | |
| | | 9,100 | | | American National Insurance Co. | | | 1,092,910 | |
| | | 254,476 | | | Assured Guaranty Ltd. | | | 10,461,508 | |
| | | 59,804 | | | Everest Re Group Ltd. | | | 14,062,313 | |
| | | 169,076 | | | First American Financial Corp. | | | 6,605,799 | |
| | | 57,989 | | | Hanover Insurance Group, Inc. (The) | | | 5,220,170 | |
| | | 4,128 | | | Lincoln National Corp. | | | 289,620 | |
| | | 241,166 | | | MBIA, Inc. * | | | 2,488,833 | |
| | | 43,414 | | | Navigators Group, Inc. (The) | | | 2,389,941 | |
| | | 182,900 | | | Principal Financial Group, Inc. | | | 11,438,566 | |
| | | 4,412 | | | Selective Insurance Group, Inc. | | | 195,452 | |
| | | | | | | | | | |
| Shares | | | Description | | Value ($) | |
| | | | | | Insurance — continued | |
| | | 305,472 | | | Travelers Cos., Inc. (The) | | | 37,340,897 | |
| | | 2,198 | | | Unum Group | | | 107,328 | |
| | | 2,372 | | | W.R. Berkley Corp. | | | 168,459 | |
| | | | | | | | | | |
| | | | | | Total Insurance | | | 116,602,554 | |
| | | | | | | | | | |
| | |
| | | | | | Materials — 4.8% | |
| | | 108,547 | | | Avery Dennison Corp. | | | 8,760,829 | |
| | | 230,100 | | | Dow Chemical Co. (The) | | | 14,326,026 | |
| | | 22,800 | | | Greif, Inc. – Class A | | | 1,300,284 | |
| | | 206,500 | | | International Paper Co. | | | 10,882,550 | |
| | | 23,600 | | | Koppers Holdings, Inc. * | | | 1,034,860 | |
| | | 409,080 | | | LyondellBasell Industries NV – Class A | | | 37,324,459 | |
| | | 2,700 | | | Nucor Corp. | | | 168,939 | |
| | | 49,000 | | | Packaging Corp. of America | | | 4,529,070 | |
| | | 42,000 | | | Reliance Steel & Aluminum Co. | | | 3,555,300 | |
| | | 43,100 | | | Sonoco Products Co. | | | 2,298,092 | |
| | | | | | | | | | |
| | | | | | Total Materials | | | 84,180,409 | |
| | | | | | | | | | |
| | |
| | | | | | Media — 1.6% | |
| | | 22,185 | | | Meredith Corp. | | | 1,391,000 | |
| | | 276,405 | | | Omnicom Group, Inc. | | | 23,522,065 | |
| | | 42,075 | | | Scripps Networks Interactive, Inc. – Class A | | | 3,398,398 | |
| | | | | | | | | | |
| | | | | | Total Media | | | 28,311,463 | |
| | | | | | | | | | |
| | |
| | | | | | Pharmaceuticals, Biotechnology & Life Sciences — 8.1% | |
| | | 440,818 | | | Gilead Sciences, Inc. | | | 31,068,853 | |
| | | 491,247 | | | Johnson & Johnson | | | 60,035,296 | |
| | | 206,837 | | | PDL BioPharma, Inc. | | | 442,631 | |
| | | 1,496,138 | | | Pfizer, Inc. | | | 51,048,228 | |
| | | | | | | | | | |
| | | | | | Total Pharmaceuticals, Biotechnology & Life Sciences | | | 142,595,008 | |
| | | | | | | | | | |
| | |
| | | | | | Real Estate — 0.2% | |
| | | 38,043 | | | Jones Lang LaSalle, Inc. | | | 4,363,532 | |
| | | | | | | | | | |
| | |
| | | | | | Retailing — 6.1% | |
| | | 93,800 | | | American Eagle Outfitters, Inc. | | | 1,486,730 | |
| | | 162,086 | | | Bed Bath & Beyond, Inc. | | | 6,548,275 | |
| | | 260,600 | | | Best Buy Co., Inc. | | | 11,500,278 | |
| | | 33,400 | | | Big Lots, Inc. | | | 1,714,756 | |
| | | 213,195 | | | Foot Locker, Inc. | | | 16,132,466 | |
| | | 30,800 | | | Genuine Parts Co. | | | 2,947,868 | |
| | | 75,202 | | | Guess?, Inc. | | | 955,065 | |
| | | 383,075 | | | Home Depot, Inc. (The) | | | 55,511,398 | |
| | | 209,700 | | | Macy’s, Inc. | | | 6,966,234 | |
| | | 62,469 | | | Murphy USA, Inc. * | | | 3,979,275 | |
| | | | | | | | | | |
| | | | | | Total Retailing | | | 107,742,345 | |
| | | | | | | | | | |
| | | | |
| 52 | | See accompanying notes to the financial statements. | | |
GMO U.S. Equity Allocation Fund
(A Series of GMO Trust)
Schedule of Investments — (Continued)
(showing percentage of total net assets)
February 28, 2017
| | | | | | | | | | |
| Shares | | | Description | | Value ($) | |
| | | | | | Semiconductors & Semiconductor Equipment — 5.7% | |
| | | 178,100 | | | Applied Materials, Inc. | | | 6,450,782 | |
| | | 1,272,816 | | | Intel Corp. | | | 46,075,939 | |
| | | 298,500 | | | Micron Technology, Inc. * | | | 6,996,840 | |
| | | 424,481 | | | QUALCOMM, Inc. | | | 23,974,687 | |
| | | 226,500 | | | Texas Instruments, Inc. | | | 17,354,430 | |
| | | | | | | | | | |
| | | | | | Total Semiconductors & Semiconductor Equipment | | | 100,852,678 | |
| | | | | | | | | | |
| | |
| | | | | | Software & Services — 8.4% | |
| | | 104,274 | | | Accenture Plc – Class A | | | 12,773,565 | |
| | | 112,873 | | | Activision Blizzard, Inc. | | | 5,093,958 | |
| | | 211,355 | | | Amdocs Ltd. | | | 12,818,681 | |
| | | 164,580 | | | CA, Inc. | | | 5,310,997 | |
| | | 3,000 | | | Citrix Systems, Inc. * | | | 236,850 | |
| | | 142,525 | | | Convergys Corp. | | | 3,118,447 | |
| | | 23,551 | | | CSG Systems International, Inc. | | | 928,145 | |
| | | 190,300 | | | eBay, Inc. * | | | 6,451,170 | |
| | | 202,264 | | | Fiserv, Inc. * | | | 23,341,266 | |
| | | 275,099 | | | International Business Machines Corp. | | | 49,468,302 | |
| | | 122,641 | | | Net 1 UEPS Technologies, Inc. * | | | 1,631,125 | |
| | | 368,758 | | | Paychex, Inc. | | | 22,649,116 | |
| | | 59,180 | | | Sykes Enterprises, Inc. * | | | 1,610,880 | |
| | | 30,000 | | | Synopsys, Inc. * | | | 2,143,200 | |
| | | 56,128 | | | Western Union Co. (The) | | | 1,102,354 | |
| | | | | | | | | | |
| | | | | | Total Software & Services | | | 148,678,056 | |
| | | | | | | | | | |
| | |
| | | | | | Technology Hardware & Equipment — 8.7% | |
| | | 143,065 | | | Apple, Inc. | | | 19,598,474 | |
| | | 125,207 | | | Arrow Electronics, Inc. * | | | 9,039,946 | |
| | | 119,564 | | | Avnet, Inc. | | | 5,509,509 | |
| | | 1,596,729 | | | Cisco Systems, Inc. | | | 54,576,197 | |
| | | 11,300 | | | Coherent, Inc. * | | | 2,063,154 | |
| | | 254,800 | | | Corning, Inc. | | | 7,035,028 | |
| | | 15,741 | | | ePlus, Inc. * | | | 1,998,320 | |
| | | 59,314 | | | F5 Networks, Inc. * | | | 8,497,917 | |
| | | 1,055,200 | | | HP, Inc. | | | 18,328,824 | |
| | | 26,402 | | | Insight Enterprises, Inc. * | | | 1,118,389 | |
| | | 26,800 | | | NETGEAR, Inc. * | | | 1,468,640 | |
| | | 146,193 | | | Sanmina Corp. * | | | 5,701,527 | |
| | | 127,300 | | | Seagate Technology Plc | | | 6,134,587 | |
| | | 58,738 | | | Tech Data Corp. * | | | 5,110,206 | |
| | | 91,700 | | | Western Digital Corp. | | | 7,049,896 | |
| | | | | | | | | | |
| | | | | | Total Technology Hardware & Equipment | | | 153,230,614 | |
| | | | | | | | | | |
| | |
| | | | | | Telecommunication Services — 2.7% | |
| | | 2,800 | | | FairPoint Communications, Inc. * | | | 44,380 | |
| | | 956,217 | | | Verizon Communications, Inc. | | | 47,457,050 | |
| | | 13,175 | | | Vonage Holdings Corp. * | | | 79,313 | |
| | | | | | | | | | |
| | | | | | Total Telecommunication Services | | | 47,580,743 | |
| | | | | | | | | | |
| | | | | | | | | | |
| Shares | | | Description | | Value ($) | |
| | | | | | Transportation — 1.1% | |
| | | 197,171 | | | Delta Air Lines, Inc. | | | 9,844,748 | |
| | | 21,366 | | | SkyWest, Inc. | | | 751,015 | |
| | | 87,700 | | | United Parcel Service, Inc. – Class B | | | 9,275,152 | |
| | | | | | | | | | |
| | | | | | Total Transportation | | | 19,870,915 | |
| | | | | | | | | | |
| | |
| | | | | | Utilities — 0.6% | |
| | | 17,765 | | | Avista Corp. | | | 708,290 | |
| | | 293,800 | | | CenterPoint Energy, Inc. | | | 8,026,616 | |
| | | 1,489 | | | DTE Energy Co. | | | 150,955 | |
| | | 16,200 | | | Pinnacle West Capital Corp. | | | 1,331,478 | |
| | | 900 | | | SCANA Corp. | | | 62,415 | |
| | | | | | | | | | |
| | | | | | Total Utilities | | | 10,279,754 | |
| | | | | | | | | | |
| | | |
| | | | | | TOTAL COMMON STOCKS
(COST $1,569,945,394) | | | 1,746,501,042 | |
| | | | | | | | | | |
| | |
| | | | | | MUTUAL FUNDS — 0.6% | |
| | |
| | | | | | Affiliated Issuers — 0.6% | |
| | | 447,204 | | | GMO U.S. Treasury Fund | | | 11,180,107 | |
| | | | | | | | | | |
| | | |
| | | | | | TOTAL MUTUAL FUNDS
(COST $11,180,107) | | | 11,180,107 | |
| | | | | | | | | | |
| | |
| | | | | | SHORT-TERM INVESTMENTS — 0.2% | |
| | |
| | | | | | Money Market Funds — 0.2% | |
| | | 3,560,695 | | | State Street Institutional Treasury Money Market Fund-Premier Class, 0.42% (a) | | | 3,560,695 | |
| | | | | | | | | | |
| | | |
| | | | | | TOTAL SHORT-TERM INVESTMENTS
(COST $3,560,695) | | | 3,560,695 | |
| | | | | | | | | | |
| | | |
| | | | | | TOTAL INVESTMENTS — 100.0%
(Cost $1,584,686,196) | | | 1,761,241,844 | |
| | | | | | Other Assets and Liabilities (net) — (0.0%) | | | (221,624 | ) |
| | | | | | | | | | |
| | | |
| | | | | | TOTAL NET ASSETS — 100.0% | | | $1,761,020,220 | |
| | | | | | | | | | |
Notes to Schedule of Investments:
| * | Non-income producing security. |
| (a) | The rate disclosed is the 7 day net yield as of February 28, 2017. |
For a listing of definitions of acronyms, counterparty abbreviations and currency abbreviations used throughout the Schedule of Investments as well as the derivative tables, if any, please refer to page 54.
| | | | |
| | See accompanying notes to the financial statements. | | 53 |
GMO Trust Funds
Schedule of Investments — (Continued)
February 28, 2017
Portfolio Abbreviations:
ADR - American Depositary Receipt
CDI - Certificado de Deposito Interbancario
CVA - Certificaaten van aandelen (Share Certificates)
Foreign Registered - Shares issued to foreign investors in markets that have foreign ownership limits.
GDR - Global Depository Receipt
JSC - Joint-Stock Company
OJSC - Open Joint-Stock Company
PJSC - Private Joint-Stock Company
REIT - Real Estate Investment Trust
Currency Abbreviations:
AUD - Australian Dollar
CAD - Canadian Dollar
DKK - Danish Krone
EUR - Euro
GBP - British Pound
HKD - Hong Kong Dollar
JPY - Japanese Yen
NOK - Norwegian Krone
NZD - New Zealand Dollar
SGD - Singapore Dollar
USD - United States Dollar
| | | | |
| 54 | | See accompanying notes to the financial statements. | | |
GMO Trust Funds
Statements of Assets and Liabilities — February 28, 2017
| | | | | | | | | | | | |
| | | International
Equity Fund | | | International
Large/Mid Cap
Equity Fund | | | Quality
Fund | |
Assets: | | | | | | | | | | | | |
Investments in affiliated issuers, at value (Notes 2 and 10)(a) | | $ | 21,767,868 | | | $ | 2,408,002 | | | $ | 240,449,520 | |
Investments in unaffiliated issuers, at value (Note 2)(b) | | | 5,786,882,360 | | | | 181,590,377 | | | | 8,434,689,277 | |
Foreign currency, at value (Note 2)(c) | | | 430 | | | | — | | | | 17 | |
Receivable for investments sold | | | 34,796,428 | | | | — | | | | — | |
Receivable for Fund shares sold | | | 147,615 | | | | 2,294 | | | | 1,201,175 | |
Dividends receivable | | | 19,163,856 | | | | 390,318 | | | | 14,198,309 | |
Dividend withholding tax receivable | | | 10,755,012 | | | | 1,625,451 | | | | 5,596,738 | |
Receivable for foreign currency sold | | | 41,353 | | | | — | | | | — | |
Due from broker (Note 2) | | | — | | | | 126,320 | | | | — | |
Receivable for expenses reimbursed and/or waived by GMO (Note 5) | | | 39,708 | | | | 25,044 | | | | 193,964 | |
Miscellaneous receivable | | | 17,819 | | | | 855 | | | | — | |
| | | | | | | | | | | | |
Total assets | | | 5,873,612,449 | | | | 186,168,661 | | | | 8,696,329,000 | |
| | | | | | | | | | | | |
Liabilities: | | | | | | | | | | | | |
Due to custodian | | | — | | | | 21,320 | | | | — | |
Payable for investments purchased | | | 2,040,148 | | | | — | | | | — | |
Payable for Fund shares repurchased | | | 54,757,772 | | | | — | | | | 60,793,768 | |
Payable to affiliate for (Note 5): | |
Management fee | | | 2,319,399 | | | | 54,154 | | | | 2,187,890 | |
Shareholder service fee | | | 452,531 | | | | 14,609 | | | | 671,896 | |
Payable for variation margin on open futures contracts (Note 4) | | | — | | | | 2,990 | | | | — | |
Payable to agents unaffiliated with GMO | | | 980 | | | | — | | | | 1,260 | |
Payable to Trustees and related expenses | | | 13,322 | | | | 1,386 | | | | 13,869 | |
Accrued expenses | | | 642,550 | | | | 223,974 | | | | 458,360 | |
| | | | | | | | | | | | |
Total liabilities | | | 60,226,702 | | | | 318,433 | | | | 64,127,043 | |
| | | | | | | | | | | | |
Net assets | | $ | 5,813,385,747 | | | $ | 185,850,228 | | | $ | 8,632,201,957 | |
| | | | | | | | | | | | |
(a) Cost of investments – affiliated issuers: | | $ | 21,767,868 | | | $ | 2,407,998 | | | $ | 240,432,540 | |
(b) Cost of investments – unaffiliated issuers: | | $ | 5,646,269,044 | | | $ | 174,458,501 | | | $ | 6,731,278,460 | |
(c) Cost of foreign currency: | | $ | 15,126 | | | $ | — | | | $ | 16 | |
| | | | |
| | See accompanying notes to the financial statements. | | 55 |
GMO Trust Funds
Statements of Assets and Liabilities — February 28, 2017 — (Continued)
| | | | | | | | | | | | |
| | | International
Equity Fund | | | International
Large/Mid
Cap Equity
Fund | | | Quality
Fund | |
Net assets consist of: | | | | | | | | | | | | |
Paid-in capital | | $ | 7,115,732,797 | | | $ | 182,841,219 | | | $ | 6,854,796,726 | |
Accumulated undistributed net investment income | | | — | | | | — | | | | 12,124,473 | |
Distributions in excess of net investment income | | | (1,659,043 | ) | | | (801,660 | ) | | | — | |
Accumulated net realized gain (loss) | | | (1,439,917,785 | ) | | | (3,037,402 | ) | | | 62,366,961 | |
Net unrealized appreciation (depreciation) | | | 139,229,778 | | | | 6,848,071 | | | | 1,702,913,797 | |
| | | | | | | | | | | | |
| | $ | 5,813,385,747 | | | $ | 185,850,228 | | | $ | 8,632,201,957 | |
| | | | | | | | | | | | |
Net assets attributable to: | | | | | | | | | | | | |
Class II | | $ | 10,301,983 | | | $ | — | | | $ | — | |
| | | | | | | | | | | | |
Class III | | $ | 731,059,802 | | | $ | 39,140,566 | | | $ | 3,587,626,506 | |
| | | | | | | | | | | | |
Class IV | | $ | 5,072,023,962 | | | $ | 146,112,404 | | | $ | 1,222,873,632 | |
| | | | | | | | | | | | |
Class V | | $ | — | | | $ | — | | | $ | 462,677,097 | |
| | | | | | | | | | | | |
Class VI | | $ | — | | | $ | 597,258 | | | $ | 3,359,024,722 | |
| | | | | | | | | | | | |
Shares outstanding: | | | | | | | | | | | | |
Class II | | | 510,582 | | | | — | | | | — | |
| | | | | | | | | | | | |
Class III | | | 35,813,992 | | | | 1,538,603 | | | | 162,719,961 | |
| | | | | | | | | | | | |
Class IV | | | 248,882,206 | | | | 5,752,610 | | | | 55,392,050 | |
| | | | | | | | | | | | |
Class V | | | — | | | | — | | | | 20,959,311 | |
| | | | | | | | | | | | |
Class VI | | | — | | | | 23,527 | | | | 152,346,830 | |
| | | | | | | | | | | | |
Net asset value per share: | | | | | | | | | | | | |
Class II | | $ | 20.18 | | | $ | — | | | $ | — | |
| | | | | | | | | | | | |
Class III | | $ | 20.41 | | | $ | 25.44 | | | $ | 22.05 | |
| | | | | | | | | | | | |
Class IV | | $ | 20.38 | | | $ | 25.40 | | | $ | 22.08 | |
| | | | | | | | | | | | |
Class V | | $ | — | | | $ | — | | | $ | 22.08 | |
| | | | | | | | | | | | |
Class VI | | $ | — | | | | 25.39 | | | | 22.05 | |
| | | | | | | | | | | | |
| | | | |
| 56 | | See accompanying notes to the financial statements. | | |
GMO Trust Funds
Statements of Assets and Liabilities — February 28, 2017 — (Continued)
| | | | | | | | | | | | | | | | |
| | | Resources
Fund | | | Risk Premium
Fund | | | Tax-Managed
International
Equities Fund | | | U.S. Equity
Allocation Fund | |
Assets: | | | | | | | | | | | | | | | | |
Investments in affiliated issuers, at value (Notes 2 and 10)(a) | | $ | 6,150,081 | | | $ | — | | | $ | 427,587 | | | $ | 11,180,107 | |
Investments in unaffiliated issuers, at value (Note 2)(b) | | | 206,177,573 | | | | 158,083,394 | | | | 114,768,716 | | | | 1,750,061,737 | |
Foreign currency, at value (Note 2)(c) | | | 81,391 | | | | — | | | | 27,693 | | | | — | |
Cash | | | — | | | | — | | | | 350 | | | | — | |
Receivable for investments sold | | | — | | | | — | | | | 2,629,611 | | | | — | |
Dividends receivable | | | 645,502 | | | | 233 | | | | 312,741 | | | | 4,330,762 | |
Dividend withholding tax receivable | | | 27,852 | | | | — | | | | 228,534 | | | | — | |
Receivable for foreign currency sold | | | — | | | | — | | | | 3,233 | | | | — | |
Due from broker (Note 2) | | | — | | | | 3,568,203 | | | | 39,650 | | | | — | |
Receivable for expenses reimbursed and/or waived by GMO (Note 5) | | | 994 | | | | 11,956 | | | | 15,052 | | | | 7,792 | |
Miscellaneous receivable | | | 2,210 | | | | — | | | | 398 | | | | — | |
| | | | | | | | | | | | | | | | |
Total assets | | | 213,085,603 | | | | 161,663,786 | | | | 118,453,565 | | | | 1,765,580,398 | |
| | | | | | | | | | | | | | | | |
Liabilities: | | | | | | | | | | | | | | | | |
Payable for Fund shares repurchased | | | 55,576 | | | | — | | | | 2,510,000 | | | | 3,890,735 | |
Payable to affiliate for (Note 5): | |
Management fee | | | 84,047 | | | | 55,762 | | | | 46,426 | | | | 413,096 | |
Shareholder service fee | | | 17,690 | | | | 7,290 | | | | 13,928 | | | | 85,398 | |
Payable for variation margin on open futures contracts (Note 4) | | | — | | | | — | | | | 910 | | | | — | |
Written options outstanding, at value (Note 4)(d) | | | — | | | | 1,112,331 | | | | — | | | | — | |
Payable to agents unaffiliated with GMO | | | 28 | | | | 28 | | | | 28 | | | | 280 | |
Payable to Trustees and related expenses | | | 439 | | | | 307 | | | | 259 | | | | 3,021 | |
Accrued expenses | | | 106,455 | | | | 64,341 | | | | 149,365 | | | | 167,648 | |
| | | | | | | | | | | | | | | | |
Total liabilities | | | 264,235 | | | | 1,240,059 | | | | 2,720,916 | | | | 4,560,178 | |
| | | | | | | | | | | | | | | | |
Net assets | | $ | 212,821,368 | | | $ | 160,423,727 | | | $ | 115,732,649 | | | $ | 1,761,020,220 | |
| | | | | | | | | | | | | | | | |
(a) Cost of investments – affiliated issuers: | | $ | 6,149,300 | | | $ | — | | | $ | 427,584 | | | $ | 11,180,107 | |
(b) Cost of investments – unaffiliated issuers: | | $ | 158,667,599 | | | $ | 158,099,801 | | | $ | 94,729,055 | | | $ | 1,573,506,089 | |
(c) Cost of foreign currency: | | $ | 80,654 | | | $ | — | | | $ | 27,833 | | | $ | — | |
(d) Premiums on written options: | | $ | — | | | $ | 1,813,247 | | | $ | — | | | $ | — | |
| | | | |
| | See accompanying notes to the financial statements. | | 57 |
GMO Trust Funds
Statements of Assets and Liabilities — February 28, 2017 — (Continued)
| | | | | | | | | | | | | | | | |
| | | Resources
Fund | | | Risk Premium
Fund | | | Tax-Managed
International
Equities Fund | | | U.S. Equity
Allocation Fund | |
Net assets consist of: | | | | | | | | | | | | | | | | |
Paid-in capital | | $ | 226,677,516 | | | $ | 148,743,772 | | | $ | 137,007,509 | | | $ | 1,549,428,126 | |
Accumulated undistributed net investment income | | | — | | | | — | | | | — | | | | 1,744,705 | |
Distributions in excess of net investment income | | | (1,125,547 | ) | | | (8,343 | ) | | | (375,725 | ) | | | — | |
Accumulated net realized gain (loss) | | | (60,234,652 | ) | | | 11,003,789 | | | | (40,892,988 | ) | | | 33,291,741 | |
Net unrealized appreciation (depreciation) | | | 47,504,051 | | | | 684,509 | | | | 19,993,853 | | | | 176,555,648 | |
| | | | | | | | | | | | | | | | |
| | $ | 212,821,368 | | | $ | 160,423,727 | | | $ | 115,732,649 | | | $ | 1,761,020,220 | |
| | | | | | | | | | | | | | | | |
Net assets attributable to: | | | | | | | | | | | | | | | | |
Class III | | $ | 22,561,741 | | | $ | 5,049,216 | | | $ | 115,732,649 | | | $ | 109,726,387 | |
| | | | | | | | | | | | | | | | |
Class IV | | $ | 190,259,627 | | | $ | — | | | $ | — | | | $ | 16,707,185 | |
| | | | | | | | | | | | | | | | |
Class V | | $ | — | | | $ | — | | | $ | — | | | $ | 164,651,512 | |
| | | | | | | | | | | | | | | | |
Class VI | | $ | — | | | $ | 155,374,511 | | | $ | — | | | $ | 1,469,935,136 | |
| | | | | | | | | | | | | | | | |
Shares outstanding: | | | | | | | | | | | | | | | | |
Class III | | | 1,303,659 | | | | 168,712 | | | | 8,102,468 | | | | 7,247,779 | |
| | | | | | | | | | | | | | | | |
Class IV | | | 11,027,754 | | | | — | | | | — | | | | 1,102,339 | |
| | | | | | | | | | | | | | | | |
Class V | | | — | | | | — | | | | — | | | | 10,910,819 | |
| | | | | | | | | | | | | | | | |
Class VI | | | — | | | | 5,167,795 | | | | — | | | | 97,631,890 | |
| | | | | | | | | | | | | | | | |
Net asset value per share: | | | | | | | | | | | | | | | | |
Class III | | $ | 17.31 | | | $ | 29.93 | | | $ | 14.28 | | | $ | 15.14 | |
| | | | | | | | | | | | | | | | |
Class IV | | $ | 17.25 | | | $ | — | | | $ | — | | | $ | 15.16 | |
| | | | | | | | | | | | | | | | |
Class V | | $ | — | | | $ | — | | | $ | — | | | $ | 15.09 | |
| | | | | | | | | | | | | | | | |
Class VI | | $ | — | | | $ | 30.07 | | | $ | — | | | $ | 15.06 | |
| | | | | | | | | | | | | | | | |
| | | | |
| 58 | | See accompanying notes to the financial statements. | | |
GMO Trust Funds
Statements of Operations — Year Ended February 28, 2017
| | | | | | | | | | | | |
| | | International
Equity Fund | | | International
Large/Mid Cap
Equity Fund | | | Quality
Fund | |
Investment Income: | | | | | | | | | | | | |
Dividends from unaffiliated issuers (Net of withholding tax) (Note 2)(a) | | $ | 278,220,664 | | | $ | 39,790,568 | | | $ | 180,176,572 | |
Dividends from affiliated issuers (Note 10) | | | 497,582 | | | | 73,394 | | | | 831,750 | |
Interest | | | — | | | | 3,444 | | | | — | |
| | | | | | | | | | | | |
Total investment income | | | 278,718,246 | | | | 39,867,406 | | | | 181,008,322 | |
| | | | | | | | | | | | |
Expenses: | | | | | | | | | | | | |
Management fee (Note 5) | | | 36,735,770 | | | | 3,434,658 | | | | 27,519,416 | |
Shareholder service fee – Class II (Note 5) | | | 119,281 | | | | — | | | | — | |
Shareholder service fee – Class III (Note 5) | | | 1,284,078 | | | | 430,138 | | | | 5,561,758 | |
Shareholder service fee – Class IV (Note 5) | | | 5,793,195 | | | | 352,030 | | | | 1,398,188 | |
Shareholder service fee – Class V (Note 5) | | | — | | | | — | | | | 334,093 | |
Shareholder service fee – Class VI (Note 5) | | | — | | | | 124,275 | | | | 1,598,695 | |
Audit and tax fees | | | 164,040 | | | | 160,123 | | | | 88,507 | |
Custodian and fund accounting agent fees | | | 2,578,429 | | | | 516,816 | | | | 1,108,072 | |
Legal fees | | | 140,526 | | | | 28,034 | | | | 171,867 | |
Registration fees | | | 14,622 | | | | 19,877 | | | | 25,278 | |
Transfer agent fees | | | 62,497 | | | | 58,301 | | | | — | |
Trustees’ fees and related expenses (Note 5) | | | 124,109 | | | | 15,759 | | | | 142,096 | |
Miscellaneous | | | 55,284 | | | | 18,639 | | | | 35,449 | |
| | | | | | | | | | | | |
Total expenses | | | 47,071,831 | | | | 5,158,650 | | | | 37,983,419 | |
Fees and expenses reimbursed and/or waived by GMO (Note 5) | | | (2,942,961 | ) | | | (734,449 | ) | | | (1,405,696 | ) |
| | | | | | | | | | | | |
Net expenses | | | 44,128,870 | | | | 4,424,201 | | | | 36,577,723 | |
| | | | | | | | | | | | |
Net investment income (loss) | | | 234,589,376 | | | | 35,443,205 | | | | 144,430,599 | |
| | | | | | | | | | | | |
Realized and unrealized gain (loss): | | | | | | | | | | | | |
Net realized gain (loss) on: | | | | | | | | | | | | |
Investments in unaffiliated issuers | | | (388,132,310 | )�� | | | (98,821,311 | ) | | | 124,346,476 | |
Investments in affiliated issuers | | | 144,978 | | | | 16,407 | | | | (91,835 | ) |
Realized gain distributions from affiliated issuers (Note 10) | | | 11,487 | | | | 5,414 | | | | 106,967 | |
Futures contracts | | | 16,527,985 | | | | 1,784,887 | | | | — | |
Foreign currency, forward contracts and foreign currency related transactions | | | 2,020,324 | | | | (850,406 | ) | | | (174,671 | ) |
| | | | | | | | | | | | |
Net realized gain (loss) | | | (369,427,536 | ) | | | (97,865,009 | ) | | | 124,186,937 | |
| | | | | | | | | | | | |
Change in net unrealized appreciation (depreciation) on: | | | | | | | | | | | | |
Investments in unaffiliated issuers | | | 1,247,904,645 | | | | 197,109,768 | | | | 1,215,439,021 | |
Investments in affiliated issuers | | | (75,879 | ) | | | 4 | | | | 16,980 | |
Futures contracts | | | (3,066,601 | ) | | | (31,335 | ) | | | — | |
Foreign currency, forward contracts and foreign currency related transactions | | | (541,051 | ) | | | (69,220 | ) | | | 51,371 | |
| | | | | | | | | | | | |
Net change in unrealized appreciation (depreciation) | | | 1,244,221,114 | | | | 197,009,217 | | | | 1,215,507,372 | |
| | | | | | | | | | | | |
Net realized and unrealized gain (loss) | | | 874,793,578 | | | | 99,144,208 | | | | 1,339,694,309 | |
| | | | | | | | | | | | |
Net increase (decrease) in net assets resulting from operations | | $ | 1,109,382,954 | | | $ | 134,587,413 | | | $ | 1,484,124,908 | |
| | | | | | | | | | | | |
(a) Withholding tax: | | $ | 30,645,686 | | | $ | 4,472,361 | | | $ | 1,988,425 | |
| | | | |
| | See accompanying notes to the financial statements. | | 59 |
GMO Trust Funds
Statements of Operations — Year Ended February 28, 2017 — (Continued)
| | | | | | | | | | | | | | | | |
| | | Resources
Fund | | | Risk
Premium
Fund | | | Tax-Managed
International
Equities Fund | | | U.S. Equity
Allocation Fund | |
Investment Income: | | | | | | | | | | | | | | | | |
Dividends from unaffiliated issuers (Net of withholding tax) (Note 2)(a) | | $ | 5,717,492 | | | $ | 2,856 | | | $ | 6,050,418 | | | $ | 64,526,560 | |
Dividends from affiliated issuers (Note 10) | | | 11,897 | | | | — | | | | 10,132 | | | | 174,881 | |
Interest | | | 3,024 | | | | 894,877 | | | | — | | | | 10,346 | |
| | | | | | | | | | | | | | | | |
Total investment income | | | 5,732,413 | | | | 897,733 | | | | 6,060,550 | | | | 64,711,787 | |
| | | | | | | | | | | | | | | | |
Expenses: | | | | | | | | | | | | | | | | |
Management fee (Note 5) | | | 967,286 | | | | 916,981 | | | | 835,283 | | | | 8,966,326 | |
Shareholder service fee – Class III (Note 5) | | | 24,524 | | | | 10,933 | | | | 250,585 | | | | 226,734 | |
Shareholder service fee – Class IV (Note 5) | | | 177,108 | | | | — | | | | — | | | | 170,734 | |
Shareholder service fee – Class V (Note 5) | | | — | | | | — | | | | — | | | | 74,626 | |
Shareholder service fee – Class VI (Note 5) | | | — | | | | 108,067 | | | | — | | | | 1,365,473 | |
Audit and tax fees | | | 91,031 | | | | 59,220 | | | | 122,709 | | | | 89,323 | |
Custodian and fund accounting agent fees | | | 253,188 | | | | 37,706 | | | | 251,895 | | | | 439,173 | |
Legal fees | | | 11,476 | | | | 13,633 | | | | 9,633 | | | | 51,289 | |
Registration fees | | | 3,953 | | | | 2,622 | | | | 2,830 | | | | 22,273 | |
Transfer agent fees | | | 44,703 | | | | — | | | | 31,203 | | | | — | |
Trustees’ fees and related expenses (Note 5) | | | 3,288 | | | | 3,483 | | | | 2,735 | | | | 48,880 | |
Miscellaneous | | | 10,495 | | | | 11,946 | | | | 7,477 | | | | 24,695 | |
| | | | | | | | | | | | | | | | |
Total expenses | | | 1,587,052 | | | | 1,164,591 | | | | 1,514,350 | | | | 11,479,526 | |
Fees and expenses reimbursed and/or waived by GMO (Note 5) | | | (190,668 | ) | | | (117,778 | ) | | | (383,695 | ) | | | (611,889 | ) |
| | | | | | | | | | | | | | | | |
Net expenses | | | 1,396,384 | | | | 1,046,813 | | | | 1,130,655 | | | | 10,867,637 | |
| | | | | | | | | | | | | | | | |
Net investment income (loss) | | | 4,336,029 | | | | (149,080 | ) | | | 4,929,895 | | | | 53,844,150 | |
| | | | | | | | | | | | | | | | |
Realized and unrealized gain (loss): | | | | | | | | | | | | | | | | |
Net realized gain (loss) on: | | | | | | | | | | | | | | | | |
Investments in unaffiliated issuers | | | (15,701,677 | ) | | | 14,479 | | | | 11,531,320 | | | | 303,526,923 | |
Investments in affiliated issuers | | | (700 | ) | | | — | | | | 2,178 | | | | 20,734 | |
Realized gain distributions from affiliated issuers (Note 10) | | | 997 | | | | — | | | | 1,041 | | | | 5,540 | |
Futures contracts | | | — | | | | 79,262 | | | | 1,016,633 | | | | 3,180,746 | |
Written options | | | — | | | | 38,536,036 | | | | — | | | | — | |
Swap contracts | | | — | | | | — | | | | — | | | | 2,130,834 | |
Foreign currency, forward contracts and foreign currency related transactions | | | 54,668 | | | | (5,975 | ) | | | (7,219 | ) | | | (43,458 | ) |
| | | | | | | | | | | | | | | | |
Net realized gain (loss) | | | (15,646,712 | ) | | | 38,623,802 | | | | 12,543,953 | | | | 308,821,319 | * |
| | | | | | | | | | | | | | | | |
Change in net unrealized appreciation (depreciation) on: | | | | | | | | | | | | | | | | |
Investments in unaffiliated issuers | | | 92,768,126 | | | | (10,319 | ) | | | 7,389,142 | | | | 274,241,286 | |
Investments in affiliated issuers | | | 781 | | | | — | | | | (640 | ) | | | — | |
Futures contracts | | | — | | | | — | | | | (26,590 | ) | | | 27,300 | |
Written options | | | — | | | | (1,966,096 | ) | | | — | | | | — | |
Swap contracts | | | — | | | | — | | | | — | | | | 137,535 | |
Foreign currency, forward contracts and foreign currency related transactions | | | (2,484 | ) | | | — | | | | (15,592 | ) | | | 73,685 | |
| | | | | | | | | | | | | | | | |
Net change in unrealized appreciation (depreciation) | | | 92,766,423 | | | | (1,976,415 | ) | | | 7,346,320 | | | | 274,479,806 | |
| | | | | | | | | | | | | | | | |
Net realized and unrealized gain (loss) | | | 77,119,711 | | | | 36,647,387 | | | | 19,890,273 | | | | 583,301,125 | |
| | | | | | | | | | | | | | | | |
Net increase (decrease) in net assets resulting from operations | | $ | 81,455,740 | | | $ | 36,498,307 | | | $ | 24,820,168 | | | $ | 637,145,275 | |
| | | | | | | | | | | | | | | | |
(a) Withholding tax: | | $ | 670,861 | | | $ | — | | | $ | 672,100 | | | $ | — | |
| * | For the details related to in-kind redemption realized gain (loss) please refer to Note 6. |
| | | | |
| 60 | | See accompanying notes to the financial statements. | | |
GMO Trust Funds
Statements of Changes in Net Assets
| | | | | | | | |
| | | International
Equity Fund | |
| | | Year Ended
February 28/29, | |
| | | 2017 | | | 2016 | |
Increase (decrease) in net assets: | | | | | | | | |
Operations: | | | | | | | | |
Net investment income (loss) | | $ | 234,589,376 | | | $ | 299,318,899 | |
Net realized gain (loss) | | | (369,427,536 | ) | | | (924,763,345 | ) |
Change in net unrealized appreciation (depreciation) | | | 1,244,221,114 | | | | (1,542,419,667 | ) |
| | | | | | | | |
| | |
Net increase (decrease) in net assets from operations | | | 1,109,382,954 | | | | (2,167,864,113 | ) |
| | | | | | | | |
Distributions to shareholders from: | | | | | | | | |
Net investment income | | | | | | | | |
Class II | | | (1,695,696 | ) | | | (2,783,157 | ) |
Class III | | | (29,374,478 | ) | | | (32,069,436 | ) |
Class IV | | | (231,403,335 | ) | | | (262,231,822 | ) |
| | | | | | | | |
Total distributions from net investment income | | | (262,473,509 | ) | | | (297,084,415 | ) |
| | | | | | | | |
Net share transactions (Note 9): | | | | | | | | |
Class II | | | (77,406,799 | ) | | | (14,840,408 | ) |
Class III | | | (418,557,020 | ) | | | (208,885,684 | ) |
Class IV | | | (2,713,470,910 | ) | | | (2,151,296,529 | ) |
| | | | | | | | |
Increase (decrease) in net assets resulting from net share transactions | | | (3,209,434,729 | ) | | | (2,375,022,621 | ) |
| | | | | | | | |
Total increase (decrease) in net assets | | | (2,362,525,284 | ) | | | (4,839,971,149 | ) |
| | |
Net assets: | | | | | | | | |
Beginning of period | | | 8,175,911,031 | | | | 13,015,882,180 | |
| | | | | | | | |
End of period | | $ | 5,813,385,747 | | | $ | 8,175,911,031 | |
| | | | | | | | |
Accumulated undistributed net investment income | | $ | — | | | $ | 8,828,912 | |
| | | | | | | | |
Distributions in excess of net investment income | | $ | (1,659,043 | ) | | $ | — | |
| | | | | | | | |
| | | | |
| | See accompanying notes to the financial statements. | | 61 |
GMO Trust Funds
Statements of Changes in Net Assets — (Continued)
| | | | | | | | | | | | | | | | |
| | | International Large/Mid Cap
Equity Fund | | | Quality Fund | |
| | | Year Ended
February 28/29, | | | Year Ended
February 28/29, | |
| | | 2017 | | | 2016 | | | 2017 | | | 2016 | |
Increase (decrease) in net assets: | | | | | | | | | | | | | | | | |
Operations: | | | | | | | | | | | | | | | | |
Net investment income (loss) | | $ | 35,443,205 | | | $ | 52,557,744 | | | $ | 144,430,599 | | | $ | 158,368,071 | |
Net realized gain (loss) | | | (97,865,009 | ) | | | (190,591,148 | ) | | | 124,186,937 | | | | 663,866,296 | |
Change in net unrealized appreciation (depreciation) | | | 197,009,217 | | | | (247,937,218 | ) | | | 1,215,507,372 | | | | (1,095,864,748 | ) |
| | | | | | | | | | | | | | | | |
| | | | |
Net increase (decrease) in net assets from operations | | | 134,587,413 | | | | (385,970,622 | ) | | | 1,484,124,908 | | | | (273,630,381 | ) |
| | | | | | | | | | | | | | | | |
Distributions to shareholders from: | | | | | | | | | | | | | | | | |
Net investment income | | | | | | | | | | | | | | | | |
Class III | | | (8,124,692 | ) | | | (15,313,801 | ) | | | (57,275,158 | ) | | | (79,292,453 | ) |
Class IV | | | (17,599,928 | ) | | | (29,419,761 | ) | | | (22,564,133 | ) | | | (35,006,780 | ) |
Class V | | | — | | | | — | | | | (7,845,378 | ) | | | (4,512,211 | ) |
Class VI | | | (14,995,054 | ) | | | (8,537,349 | ) | | | (60,728,903 | ) | | | (43,526,160 | ) |
| | | | | | | | | | | | | | | | |
Total distributions from net investment income | | | (40,719,674 | ) | | | (53,270,911 | ) | | | (148,413,572 | ) | | | (162,337,604 | ) |
| | | | | | | | | | | | | | | | |
Net realized gains | | | | | | | | | | | | | | | | |
Class III | | | — | | | | — | | | | (70,068,944 | ) | | | (566,483,770 | ) |
Class IV | | | — | | | | — | | | | (20,077,057 | ) | | | (243,748,776 | ) |
Class V | | | — | | | | — | | | | (7,430,364 | ) | | | (29,840,319 | ) |
Class VI | | | — | | | | — | | | | (57,344,795 | ) | | | (288,130,004 | ) |
| | | | | | | | | | | | | | | | |
Total distributions from net realized gains | | | — | | | | — | | | | (154,921,160 | ) | | | (1,128,202,869 | ) |
| | | | | | | | | | | | | | | | |
Net share transactions (Note 9): | | | | | | | | | | | | | | | | |
Class III | | | (454,115,817 | ) | | | (2,029,751 | ) | | | (947,621,009 | ) | | | (568,842,100 | ) |
Class IV | | | (549,754,619 | ) | | | (472,949,903 | ) | | | (265,229,455 | ) | | | (575,289,746 | ) |
Class V | | | — | | | | — | | | | 132,591,501 | | | | 50,179,833 | |
Class VI | | | (285,325,217 | ) | | | 355,695,906 | | | | 1,259,875,418 | | | | (372,760,331 | ) |
| | | | | | | | | | | | | | | | |
Increase (decrease) in net assets resulting from net share transactions | | | (1,289,195,653 | ) | | | (119,283,748 | ) | | | 179,616,455 | | | | (1,466,712,344 | ) |
| | | | | | | | | | | | | | | | |
Total increase (decrease) in net assets | | | (1,195,327,914 | ) | | | (558,525,281 | ) | | | 1,360,406,631 | | | | (3,030,883,198 | ) |
| | | | |
Net assets: | | | | | | | | | | | | | | | | |
Beginning of period | | | 1,381,178,142 | | | | 1,939,703,423 | | | | 7,271,795,326 | | | | 10,302,678,524 | |
| | | | | | | | | | | | | | | | |
End of period | | $ | 185,850,228 | | | $ | 1,381,178,142 | | | $ | 8,632,201,957 | | | $ | 7,271,795,326 | |
| | | | | | | | | | | | | | | | |
Accumulated undistributed net investment income | | $ | — | | | $ | 2,237,769 | | | $ | 12,124,473 | | | $ | 16,652,554 | |
| | | | | | | | | | | | | | | | |
Distributions in excess of net investment income | | $ | (801,660 | ) | | $ | — | | | $ | — | | | $ | — | |
| | | | | | | | | | | | | | | | |
| | | | |
| 62 | | See accompanying notes to the financial statements. | | |
GMO Trust Funds
Statements of Changes in Net Assets — (Continued)
| | | | | | | | | | | | | | | | |
| | | Resources Fund | | | Risk Premium Fund | |
| | | Year Ended
February 28/29, | | | Year Ended
February 28/29, | |
| | | 2017 | | | 2016 | | | 2017 | | | 2016 | |
Increase (decrease) in net assets: | | | | | | | | | | | | | | | | |
Operations: | | | | | | | | | | | | | | | | |
Net investment income (loss) | | $ | 4,336,029 | | | $ | 6,229,283 | | | $ | (149,080 | ) | | $ | (1,347,990 | ) |
Net realized gain (loss) | | | (15,646,712 | ) | | | (37,815,633 | ) | | | 38,623,802 | | | | 1,850,460 | |
Change in net unrealized appreciation (depreciation) | | | 92,766,423 | | | | (25,967,335 | ) | | | (1,976,415 | ) | | | (3,496,288 | ) |
| | | | | | | | | | | | | | | | |
| | | | |
Net increase (decrease) in net assets from operations | | | 81,455,740 | | | | (57,553,685 | ) | | | 36,498,307 | | | | (2,993,818 | ) |
| | | | | | | | | | | | | | | | |
Distributions to shareholders from: | | | | | | | | | | | | | | | | |
Net investment income | | | | | | | | | | | | | | | | |
Class III | | | (537,264 | ) | | | (450,778 | ) | | | — | | | | — | |
Class IV | | | (5,489,443 | ) | | | (5,429,594 | ) | | | — | | | | — | |
| | | | | | | | | | | | | | | | |
Total distributions from net investment income | | | (6,026,707 | ) | | | (5,880,372 | ) | | | — | | | | — | |
| | | | | | | | | | | | | | | | |
Net realized gains | | | | | | | | | | | | | | | | |
Class III | | | — | | | | — | | | | (544,070 | ) | | | (385,514 | ) |
Class IV† | | | — | | | | — | | | | — | | | | (477,401 | ) |
Class VI | | | — | | | | — | | | | (12,713,932 | ) | | | (27,007,381 | ) |
| | | | | | | | | | | | | | | | |
Total distributions from net realized gains | | | — | | | | — | | | | (13,258,002 | ) | | | (27,870,296 | ) |
| | | | | | | | | | | | | | | | |
Net share transactions (Note 9): | | | | | | | | | | | | | | | | |
Class III | | | 2,267,643 | | | | (4,873,918 | ) | | | (2,521,322 | ) | | | 2,420,526 | |
Class IV† | | | (49,883,908 | ) | | | 109,707,099 | | | | — | | | | (6,512,434 | ) |
Class VI | | | — | | | | — | | | | (91,116,939 | ) | | | (179,700,552 | ) |
| | | | | | | | | | | | | | | | |
Increase (decrease) in net assets resulting from net share transactions | | | (47,616,265 | ) | | | 104,833,181 | | | | (93,638,261 | ) | | | (183,792,460 | ) |
| | | | | | | | | | | | | | | | |
Purchase premiums and redemption fees (Notes 2 and 9): | | | | | | | | | | | | | | | | |
Class III | | | 19,745 | | | | 33,787 | | | | 6,093 | | | | 14,035 | |
Class IV† | | | 204,990 | | | | 308,729 | | | | — | | | | 16,478 | |
Class VI | | | — | | | | — | | | | 154,283 | | | | 897,087 | |
| | | | | | | | | | | | | | | | |
Increase in net assets resulting from purchase premiums and redemption fees | | | 224,735 | | | | 342,516 | | | | 160,376 | | | | 927,600 | |
| | | | | | | | | | | | | | | | |
Total increase (decrease) in net assets resulting from net share transactions, purchase premiums and redemption fees | | | (47,391,530 | ) | | | 105,175,697 | | | | (93,477,885 | ) | | | (182,864,860 | ) |
| | | | | | | | | | | | | | | | |
Total increase (decrease) in net assets | | | 28,037,503 | | | | 41,741,640 | | | | (70,237,580 | ) | | | (213,728,974 | ) |
| | | | |
Net assets: | | | | | | | | | | | | | | | | |
Beginning of period | | | 184,783,865 | | | | 143,042,225 | | | | 230,661,307 | | | | 444,390,281 | |
| | | | | | | | | | | | | | | | |
End of period | | $ | 212,821,368 | | | $ | 184,783,865 | | | $ | 160,423,727 | | | $ | 230,661,307 | |
| | | | | | | | | | | | | | | | |
Accumulated undistributed net investment income | | $ | — | | | $ | 323,736 | | | $ | — | | | $ | — | |
| | | | | | | | | | | | | | | | |
Distributions in excess of net investment income | | $ | (1,125,547 | ) | | $ | — | | | $ | (8,343 | ) | | $ | (100,672 | ) |
| | | | | | | | | | | | | | | | |
† Class IV of Risk Premium Fund liquidated on February 25, 2016. | | | | | | | | | | | | | | | | |
| | | | |
| | See accompanying notes to the financial statements. | | 63 |
GMO Trust Funds
Statements of Changes in Net Assets — (Continued)
| | | | | | | | | | | | | | | | |
| | | Tax-Managed International
Equities Fund | | | U.S. Equity Allocation Fund | |
| | | Year Ended
February 28/29, | | | Year Ended
February 28/29, | |
| | | 2017 | | | 2016 | | | 2017 | | | 2016 | |
Increase (decrease) in net assets: | | | | | | | | | | | | | | | | |
Operations: | | | | | | | | | | | | | | | | |
Net investment income (loss) | | $ | 4,929,895 | | | $ | 9,430,122 | | | $ | 53,844,150 | | | $ | 90,905,365 | |
Net realized gain (loss) | | | 12,543,953 | | | | (30,155,203 | ) | | | 308,821,319 | | | | 399,793,966 | |
Change in net unrealized appreciation (depreciation) | | | 7,346,320 | | | | (57,099,819 | ) | | | 274,479,806 | | | | (850,530,072 | ) |
| | | | | | | | | | | | | | | | |
| | | | |
Net increase (decrease) in net assets from operations | | | 24,820,168 | | | | (77,824,900 | ) | | | 637,145,275 | | | | (359,830,741 | ) |
| | | | | | | | | | | | | | | | |
Distributions to shareholders from: | | | | | | | | | | | | | | | | |
Net investment income | | | | | | | | | | | | | | | | |
Class III | | | (5,479,378 | ) | | | (10,648,298 | ) | | | (3,242,235 | ) | | | (2,736,725 | ) |
Class IV | | | — | | | | — | | | | (3,297,483 | ) | | | (6,908,903 | ) |
Class V | | | — | | | | — | | | | (2,051,735 | ) | | | — | |
Class VI | | | — | | | | — | | | | (54,438,157 | ) | | | (77,939,183 | ) |
| | | | | | | | | | | | | | | | |
Total distributions from net investment income | | | (5,479,378 | ) | | | (10,648,298 | ) | | | (63,029,610 | ) | | | (87,584,811 | ) |
| | | | | | | | | | | | | | | | |
Net realized gains | | | | | | | | | | | | | | | | |
Class III | | | — | | | | — | | | | (10,903,518 | ) | | | (18,059,938 | ) |
Class IV | | | — | | | | — | | | | (4,144,649 | ) | | | (40,178,877 | ) |
Class V | | | — | | | | — | | | | (14,444,911 | ) | | | — | |
Class VI | | | — | | | | — | | | | (169,453,338 | ) | | | (471,741,711 | ) |
| | | | | | | | | | | | | | | | |
Total distributions from net realized gains | | | — | | | | — | | | | (198,946,416 | ) | | | (529,980,526 | ) |
| | | | | | | | | | | | | | | | |
Net share transactions (Note 9): | | | | | | | | | | | | | | | | |
Class III | | | (119,585,524 | ) | | | (122,597,127 | ) | | | (102,529,429 | ) | | | (59,318,618 | ) |
Class IV | | | — | | | | — | | | | (534,602,197 | ) | | | 154,174,391 | |
Class V | | | — | | | | — | | | | 162,994,661 | | | | — | |
Class VI | | | — | | | | — | | | | (2,687,005,631 | ) | | | (1,320,602,585 | ) |
| | | | | | | | | | | | | | | | |
Increase (decrease) in net assets resulting from net share transactions | | | (119,585,524 | ) | | | (122,597,127 | ) | | | (3,161,142,596 | ) | | | (1,225,746,812 | ) |
| | | | | | | | | | | | | | | | |
Total increase (decrease) in net assets | | | (100,244,734 | ) | | | (211,070,325 | ) | | | (2,785,973,347 | ) | | | (2,203,142,890 | ) |
| | | | |
Net assets: | | | | | | | | | | | | | | | | |
Beginning of period | | | 215,977,383 | | | | 427,047,708 | | | | 4,546,993,567 | | | | 6,750,136,457 | |
| | | | | | | | | | | | | | | | |
End of period | | $ | 115,732,649 | | | $ | 215,977,383 | | | $ | 1,761,020,220 | | | $ | 4,546,993,567 | |
| | | | | | | | | | | | | | | | |
Accumulated undistributed net investment income | | $ | — | | | $ | — | | | $ | 1,744,705 | | | $ | 11,963,097 | |
| | | | | | | | | | | | | | | | |
Distributions in excess of net investment income | | $ | (375,725 | ) | | $ | (179,152 | ) | | $ | — | | | $ | — | |
| | | | | | | | | | | | | | | | |
| | | | |
| 64 | | See accompanying notes to the financial statements. | | |
GMO Trust Funds
Financial Highlights
(For a share outstanding throughout each period)
INTERNATIONAL EQUITY FUND
| | | | | | | | | | | | | | | | | | | | | | | | | | | | | | | | | | | | | | | | | | | | | | | | | | |
| | | Class II Shares | | Class III Shares |
| | | Year Ended February 28/29, | | Year Ended February 28/29, |
| | | 2017 | | 2016 | | 2015 | | 2014 | | 2013 | | 2017 | | 2016 | | 2015 | | 2014 | | 2013 |
Net asset value, beginning of period | | | $ | 18.17 | | | | $ | 23.43 | | | | $ | 26.16 | | | | $ | 20.94 | | | | $ | 20.18 | | | | $ | 18.38 | | | | $ | 23.70 | | | | $ | 26.44 | | | | $ | 21.16 | | | | $ | 20.39 | |
| | | | | | | | | | | | | | | | | | | | | | | | | | | | | | | | | | | | | | | | | | | | | | | | | | |
Income (loss) from investment operations: | | | | | | | | | | | | | | | | | | | | | | | | | | | | | | | | | | | | | | | | | | | | | | | | | | |
Net investment income (loss)†(a) | | | | 0.70 | | | | | 0.57 | | | | | 0.66 | | | | | 0.80 | | | | | 0.56 | | | | | 0.63 | | | | | 0.59 | | | | | 0.69 | | | | | 0.86 | | | | | 0.56 | |
Net realized and unrealized gain (loss) | | | | 2.07 | | | | | (5.19 | ) | | | | (1.42 | ) | | | | 4.88 | | | | | 0.85 | | | | | 2.19 | | | | | (5.25 | ) | | | | (1.45 | ) | | | | 4.90 | | | | | 0.88 | |
| | | | | | | | | | | | | | | | | | | | | | | | | | | | | | | | | | | | | | | | | | | | | | | | | | |
Total from investment operations | | | | 2.77 | | | | | (4.62 | ) | | | | (0.76 | ) | | | | 5.68 | | | | | 1.41 | | | | | 2.82 | | | | | (4.66 | ) | | | | (0.76 | ) | | | | 5.76 | | | | | 1.44 | |
| | | | | | | | | | | | | | | | | | | | | | | | | | | | | | | | | | | | | | | | | | | | | | | | | | |
Less distributions to shareholders: | | | | | | | | | | | | | | | | | | | | | | | | | | | | | | | | | | | | | | | | | | | | | | | | | | |
From net investment income | | | | (0.76 | ) | | | | (0.64 | ) | | | | (1.07 | ) | | | | (0.46 | ) | | | | (0.65 | ) | | | | (0.79 | ) | | | | (0.66 | ) | | | | (1.08 | ) | | | | (0.48 | ) | | | | (0.67 | ) |
From net realized gains | | | | — | | | | | — | | | | | (0.90 | ) | | | | — | | | | | — | | | | | — | | | | | — | | | | | (0.90 | ) | | | | — | | | | | — | |
| | | | | | | | | | | | | | | | | | | | | | | | | | | | | | | | | | | | | | | | | | | | | | | | | | |
Total distributions | | | | (0.76 | ) | | | | (0.64 | ) | | | | (1.97 | ) | | | | (0.46 | ) | | | | (0.65 | ) | | | | (0.79 | ) | | | | (0.66 | ) | | | | (1.98 | ) | | | | (0.48 | ) | | | | (0.67 | ) |
| | | | | | | | | | | | | | | | | | | | | | | | | | | | | | | | | | | | | | | | | | | | | | | | | | |
Net asset value, end of period | | | $ | 20.18 | | | | $ | 18.17 | | | | $ | 23.43 | | | | $ | 26.16 | | | | $ | 20.94 | | | | $ | 20.41 | | | | $ | 18.38 | | | | $ | 23.70 | | | | $ | 26.44 | | | | $ | 21.16 | |
| | | | | | | | | | | | | | | | | | | | | | | | | | | | | | | | | | | | | | | | | | | | | | | | | | |
Total Return(b) | | �� | | 15.45 | % | | | | (19.99 | )% | | | | (2.55 | )% | | | | 27.41 | % | | | | 7.23 | % | | | | 15.53 | % | | | | (19.95 | )% | | | | (2.50 | )% | | | | 27.53 | % | | | | 7.30 | % |
Ratios/Supplemental Data: | | | | | | | | | | | | | | | | | | | | | | | | | | | | | | | | | | | | | | | | | | | | | | | | | | |
Net assets, end of period (000’s) | | | $ | 10,302 | | | | $ | 81,206 | | | | $ | 118,737 | | | | $ | 139,401 | | | | $ | 169,056 | | | | $ | 731,060 | | | | $ | 1,043,305 | | | | $ | 1,523,128 | | | | $ | 1,555,509 | | | | $ | 1,540,203 | |
Net expenses to average daily net assets(c) | | | | 0.72 | % | | | | 0.72 | % | | | | 0.72 | % | | | | 0.72 | %(d) | | | | 0.72 | %(d) | | | | 0.65 | % | | | | 0.65 | % | | | | 0.65 | % | | | | 0.65 | %(d) | | | | 0.65 | %(d) |
Net investment income (loss) to average daily net assets(a) | | | | 3.62 | % | | | | 2.65 | % | | | | 2.63 | % | | | | 3.47 | % | | | | 2.87 | % | | | | 3.16 | % | | | | 2.70 | % | | | | 2.73 | % | | | | 3.62 | % | | | | 2.82 | % |
Portfolio turnover rate | | | | 27 | %(e) | | | | 75 | % | | | | 70 | % | | | | 48 | % | | | | 40 | % | | | | 27 | %(e) | | | | 75 | % | | | | 70 | % | | | | 48 | % | | | | 40 | % |
Fees and expenses reimbursed and/or waived by GMO to average daily net assets: | | | | 0.04 | % | | | | 0.04 | % | | | | 0.04 | % | | | | 0.04 | % | | | | 0.04 | % | | | | 0.04 | % | | | | 0.04 | % | | | | 0.04 | % | | | | 0.04 | % | | | | 0.04 | % |
| | | | | | | | | | | | | | | | | | | | |
| | | Class IV Shares | |
| | | Year Ended February 28/29, | |
| | | 2017 | | | 2016 | | | 2015 | | | 2014 | | | 2013 | |
Net asset value, beginning of period | | $ | 18.36 | | | $ | 23.66 | | | $ | 26.41 | | | $ | 21.14 | | | $ | 20.37 | |
| | | | | | | | | | | | | | | | | | | | |
Income (loss) from investment operations: | | | | | | | | | | | | | | | | | | | | |
Net investment income (loss)†(a) | | | 0.63 | | | | 0.62 | | | | 0.67 | | | | 0.89 | | | | 0.54 | |
Net realized and unrealized gain (loss) | | | 2.19 | | | | (5.25 | ) | | | (1.42 | ) | | | 4.88 | | | | 0.91 | |
| | | | | | | | | | | | | | | | | | | | |
Total from investment operations | | | 2.82 | | | | (4.63 | ) | | | (0.75 | ) | | | 5.77 | | | | 1.45 | |
| | | | | | | | | | | | | | | | | | | | |
Less distributions to shareholders: | | | | | | | | | | | | | | | | | | | | |
From net investment income | | | (0.80 | ) | | | (0.67 | ) | | | (1.10 | ) | | | (0.50 | ) | | | (0.68 | ) |
From net realized gains | | | — | | | | — | | | | (0.90 | ) | | | — | | | | — | |
| | | | | | | | | | | | | | | | | | | | |
Total distributions | | | (0.80 | ) | | | (0.67 | ) | | | (2.00 | ) | | | (0.50 | ) | | | (0.68 | ) |
| | | | | | | | | | | | | | | | | | | | |
Net asset value, end of period | | $ | 20.38 | | | $ | 18.36 | | | $ | 23.66 | | | $ | 26.41 | | | $ | 21.14 | |
| | | | | | | | | | | | | | | | | | | | |
Total Return(b) | | | 15.57 | % | | | (19.85 | )% | | | (2.47 | )% | | | 27.60 | % | | | 7.39 | % |
Ratios/Supplemental Data: | | | | | | | | | | | | | | | | | | | | |
Net assets, end of period (000’s) | | $ | 5,072,024 | | | $ | 7,051,400 | | | $ | 11,374,017 | | | $ | 11,926,293 | | | $ | 7,366,819 | |
Net expenses to average daily net assets(c) | | | 0.59 | % | | | 0.59 | % | | | 0.59 | % | | | 0.59 | %(d) | | | 0.59 | %(d) |
Net investment income (loss) to average daily net assets(a) | | | 3.19 | % | | | 2.80 | % | | | 2.66 | % | | | 3.74 | % | | | 2.70 | % |
Portfolio turnover rate | | | 27 | %(e) | | | 75 | % | | | 70 | % | | | 48 | % | | | 40 | % |
Fees and expenses reimbursed and/or waived by GMO to average daily net assets: | | | 0.04 | % | | | 0.04 | % | | | 0.04 | % | | | 0.04 | % | | | 0.04 | % |
| (a) | Net investment income is affected by the timing of the declaration of dividends by the underlying funds in which the Fund invests, if any. |
| (b) | The total returns would have been lower had certain expenses not been reimbursed and/or waived during the periods shown, if applicable, and assumes the effect of reinvested distributions, if any. Calculation excludes purchase premiums and redemption fees which are borne by the shareholder purchasing or redeeming Fund shares, if any. |
| (c) | Net expenses exclude expenses incurred indirectly through investment in the underlying funds (Note 5). |
| (d) | The net expense ratio does not include the effect of expense reductions (Note 2). |
| (e) | The portfolio turnover rate excludes investments in GMO U.S. Treasury Fund (“USTF”) which is used as a short-term investment vehicle for cash management. The Fund’s portfolio turnover rate during the year ended February 28, 2017, including transactions in USTF, was 50% of the average value of its portfolio. |
| † | Calculated using average shares outstanding throughout the period. |
| | | | |
| | See accompanying notes to the financial statements. | | 65 |
GMO Trust Funds
Financial Highlights
(For a share outstanding throughout each period)
INTERNATIONAL LARGE/MID CAP EQUITY FUND
| | | | | | | | | | | | | | | | | | | | | | | | | | | | | | | | | | | | | | | | | | | | | | | | | | |
| | | Class III Shares | | Class IV Shares |
| | | Year Ended February 28/29, | | Year Ended February 28/29, |
| | | 2017 | | 2016 | | 2015 | | 2014 | | 2013 | | 2017 | | 2016 | | 2015 | | 2014 | | 2013 |
Net asset value, beginning of period | | | $ | 23.46 | | | | $ | 30.16 | | | | $ | 35.20 | | | | $ | 28.96 | | | | $ | 27.50 | | | | $ | 23.44 | | | | $ | 30.14 | | | | $ | 35.18 | | | | $ | 28.94 | | | | $ | 27.48 | |
| | | | | | | | | | | | | | | | | | | | | | | | | | | | | | | | | | | | | | | | | | | | | | | | | | |
Income (loss) from investment operations: | | | | | | | | | | | | | | | | | | | | | | | | | | | | | | | | | | | | | | | | | | | | | | | | | | |
Net investment income (loss)†(a) | | | | 0.96 | | | | | 0.81 | | | | | 0.92 | | | | | 1.18 | | | | | 0.77 | | | | | 1.04 | | | | | 0.87 | | | | | 0.96 | | | | | 1.17 | | | | | 0.80 | |
Net realized and unrealized gain (loss) | | | | 2.40 | | | | | (6.71 | ) | | | | (2.19 | ) | | | | 6.56 | | | | | 1.62 | | | | | 2.34 | | | | | (6.75 | ) | | | | (2.21 | ) | | | | 6.60 | | | | | 1.60 | |
| | | | | | | | | | | | | | | | | | | | | | | | | | | | | | | | | | | | | | | | | | | | | | | | | | |
Total from investment operations | | | | 3.36 | | | | | (5.90 | ) | | | | (1.27 | ) | | | | 7.74 | | | | | 2.39 | | | | | 3.38 | | | | | (5.88 | ) | | | | (1.25 | ) | | | | 7.77 | | | | | 2.40 | |
| | | | | | | | | | | | | | | | | | | | | | | | | | | | | | | | | | | | | | | | | | | | | | | | | | |
Less distributions to shareholders: | | | | | | | | | | | | | | | | | | | | | | | | | | | | | | | | | | | | | | | | | | | | | | | | | | |
From net investment income | | | | (1.38 | ) | | | | (0.80 | ) | | | | (1.46 | ) | | | | (1.50 | ) | | | | (0.93 | ) | | | | (1.42 | ) | | | | (0.82 | ) | | | | (1.48 | ) | | | | (1.53 | ) | | | | (0.94 | ) |
From net realized gains | | | | — | | | | | — | | | | | (2.31 | ) | | | | — | | | | | — | | | | | — | | | | | — | | | | | (2.31 | ) | | | | — | | | | | — | |
| | | | | | | | | | | | | | | | | | | | | | | | | | | | | | | | | | | | | | | | | | | | | | | | | | |
Total distributions | | | | (1.38 | ) | | | | (0.80 | ) | | | | (3.77 | ) | | | | (1.50 | ) | | | | (0.93 | ) | | | | (1.42 | ) | | | | (0.82 | ) | | | | (3.79 | ) | | | | (1.53 | ) | | | | (0.94 | ) |
| | | | | | | | | | | | | | | | | | | | | | | | | | | | | | | | | | | | | | | | | | | | | | | | | | |
Net asset value, end of period | | | $ | 25.44 | | | | $ | 23.46 | | | | $ | 30.16 | | | | $ | 35.20 | | | | $ | 28.96 | | | | $ | 25.40 | | | | $ | 23.44 | | | | $ | 30.14 | | | | $ | 35.18 | | | | $ | 28.94 | |
| | | | | | | | | | | | | | | | | | | | | | | | | | | | | | | | | | | | | | | | | | | | | | | | | | |
Total Return(b) | | | | 14.70 | % | | | | (19.82 | )% | | | | (3.33 | )% | | | | 27.30 | % | | | | 8.93 | % | | | | 14.79 | % | | | | (19.78 | )% | | | | (3.28 | )% | | | | 27.40 | % | | | | 9.00 | % |
Ratios/Supplemental Data: | | | | | | | | | | | | | | | | | | | | | | | | | | | | | | | | | | | | | | | | | | | | | | | | | | |
Net assets, end of period (000’s) | | | $ | 39,141 | | | | $ | 459,614 | | | | $ | 592,365 | | | | $ | 598,840 | | | | $ | 621,870 | | | | $ | 146,112 | | | | $ | 641,750 | | | | $ | 1,346,483 | | | | $ | 1,262,615 | | | | $ | 1,394,919 | |
Net expenses to average daily net
assets(c) | | | | 0.54 | % | | | | 0.53 | % | | | | 0.53 | % | | | | 0.53 | %(d) | | | | 0.53 | %(d) | | | | 0.48 | % | | | | 0.47 | % | | | | 0.47 | % | | | | 0.47 | %(d) | | | | 0.47 | %(d) |
Net investment income (loss) to average daily net assets(a) | | | | 3.84 | % | | | | 2.90 | % | | | | 2.80 | % | | | | 3.70 | % | | | | 2.87 | % | | | | 4.14 | % | | | | 3.08 | % | | | | 2.91 | % | | | | 3.69 | % | | | | 2.93 | % |
Portfolio turnover rate | | | | 26 | %(e) | | | | 88 | % | | | | 82 | % | | | | 54 | % | | | | 47 | % | | | | 26 | %(e) | | | | 88 | % | | | | 82 | % | | | | 54 | % | | | | 47 | % |
Fees and expenses reimbursed and/or waived by GMO to average daily net assets: | | | | 0.08 | % | | | | 0.06 | % | | | | 0.07 | % | | | | 0.06 | % | | | | 0.05 | % | | | | 0.08 | % | | | | 0.06 | % | | | | 0.07 | % | | | | 0.06 | % | | | | 0.05 | % |
| | | | | | | | | | | | | | | | | | | | |
| | | Class VI Shares | |
| | | Year Ended February 28/29, | |
| | | 2017 | | | 2016 | | | 2015 | | | 2014 | | | 2013 | |
Net asset value, beginning of period | | $ | 23.44 | | | $ | 30.11 | | | $ | 35.15 | | | $ | 28.91 | | | $ | 27.46 | |
| | | | | | | | | | | | | | | | | | | | |
Income (loss) from investment operations: | | | | | | | | | | | | | | | | | | | | |
Net investment income (loss)†(a) | | | 0.92 | | | | 0.46 | | | | 0.94 | | | | 1.58 | | | | 0.79 | |
Net realized and unrealized gain (loss) | | | 2.47 | | | | (6.34 | ) | | | (2.17 | ) | | | 6.17 | | | | 1.61 | |
| | | | | | | | | | | | | | | | | | | | |
Total from investment operations | | | 3.39 | | | | (5.88 | ) | | | (1.23 | ) | | | 7.75 | | | | 2.40 | |
| | | | | | | | | | | | | | | | | | | | |
Less distributions to shareholders: | | | | | | | | | | | | | | | | | | | | |
From net investment income | | | (1.44 | ) | | | (0.79 | ) | | | (1.50 | ) | | | (1.51 | ) | | | (0.95 | ) |
From net realized gains | | | — | | | | — | | | | (2.31 | ) | | | — | | | | — | |
| | | | | | | | | | | | | | | | | | | | |
Total distributions | | | (1.44 | ) | | | (0.79 | ) | | | (3.81 | ) | | | (1.51 | ) | | | (0.95 | ) |
| | | | | | | | | | | | | | | | | | | | |
Net asset value, end of period | | $ | 25.39 | | | $ | 23.44 | | | $ | 30.11 | | | $ | 35.15 | | | $ | 28.91 | |
| | | | | | | | | | | | | | | | | | | | |
Total Return(b) | | | 14.85 | % | | | (19.76 | )% | | | (3.24 | )% | | | 27.39 | % | | | 9.01 | % |
Ratios/Supplemental Data: | | | | | | | | | | | | | | | | | | | | |
Net assets, end of period (000’s) | | $ | 597 | | | $ | 279,814 | | | $ | 855 | | | $ | 319,285 | | | $ | 2,481,773 | |
Net expenses to average daily net assets(c) | | | 0.44 | % | | | 0.44 | % | | | 0.44 | % | | | 0.44 | %(d) | | | 0.44 | %(d) |
Net investment income (loss) to average daily net assets(a) | | | 3.66 | % | | | 1.76 | % | | | 2.89 | % | | | 5.24 | % | | | 2.89 | % |
Portfolio turnover rate | | | 26 | %(e) | | | 88 | % | | | 82 | % | | | 54 | % | | | 47 | % |
Fees and expenses reimbursed and/or waived by GMO to average daily net assets: | | | 0.08 | % | | | 0.06 | % | | | 0.07 | % | | | 0.05 | % | | | 0.05 | % |
| (a) | Net investment income is affected by the timing of the declaration of dividends by the underlying funds in which the Fund invests, if any. |
| (b) | The total returns would have been lower had certain expenses not been reimbursed and/or waived during the periods shown, if applicable, and assumes the effect of reinvested distributions, if any. Calculation excludes purchase premiums and redemption fees which are borne by the shareholder purchasing or redeeming Fund shares, if any. |
| (c) | Net expenses exclude expenses incurred indirectly through investment in the underlying funds, if any (Note 5). |
| (d) | The net expense ratio does not include the effect of expense reductions (Note 2). |
| (e) | The portfolio turnover rate excludes investments in GMO U.S. Treasury Fund (“USTF”) which is used as a short-term investment vehicle for cash management. The Fund’s portfolio turnover rate during the year ended February 28, 2017, including transactions in USTF, was 51% of the average value of its portfolio. |
| † | Calculated using average shares outstanding throughout the period. |
| | | | |
| 66 | | See accompanying notes to the financial statements. | | |
GMO Trust Funds
Financial Highlights
(For a share outstanding throughout each period)
QUALITY FUND
| | | | | | | | | | | | | | | | | | | | | | | | | | | | | | | | | | | | | | | | | | | | | | | | | | |
| | | Class III Shares | | Class IV Shares |
| | | Year Ended February 28/29, | | Year Ended February 28/29, |
| | | 2017 | | 2016 | | 2015 | | 2014 | | 2013 | | 2017 | | 2016 | | 2015 | | 2014 | | 2013 |
Net asset value, beginning of period | | | $ | 18.99 | | | | $ | 22.98 | | | | $ | 25.08 | | | | $ | 23.81 | | | | $ | 23.41 | | | | $ | 19.01 | | | | $ | 23.01 | | | | $ | 25.10 | | | | $ | 23.83 | | | | $ | 23.42 | |
| | | | | | | | | | | | | | | | | | | | | | | | | | | | | | | | | | | | | | | | | | | | | | | | | | |
Income (loss) from investment operations: | | | | | | | | | | | | | | | | | | | | | | | | | | | | | | | | | | | | | | | | | | | | | | | | | | |
Net investment income (loss)†(a) | | | | 0.35 | | | | | 0.38 | | | | | 0.42 | | | | | 0.51 | | | | | 0.47 | | | | | 0.36 | | | | | 0.39 | | | | | 0.43 | | | | | 0.53 | | | | | 0.49 | |
Net realized and unrealized gain (loss) | | | | 3.44 | | | | | (1.04 | ) | | | | 2.91 | | | | | 3.70 | | | | | 2.24 | | | | | 3.45 | | | | | (1.05 | ) | | | | 2.92 | | | | | 3.70 | | | | | 2.24 | |
| | | | | | | | | | | | | | | | | | | | | | | | | | | | | | | | | | | | | | | | | | | | | | | | | | |
Total from investment operations | | | | 3.79 | | | | | (0.66 | ) | | | | 3.33 | | | | | 4.21 | | | | | 2.71 | | | | | 3.81 | | | | | (0.66 | ) | | | | 3.35 | | | | | 4.23 | | | | | 2.73 | |
| | | | | | | | | | | | | | | | | | | | | | | | | | | | | | | | | | | | | | | | | | | | | | | | | | |
Less distributions to shareholders: | | | | | | | | | | | | | | | | | | | | | | | | | | | | | | | | | | | | | | | | | | | | | | | | | | |
From net investment income | | | | (0.35 | ) | | | | (0.42 | ) | | | | (0.49 | ) | | | | (0.53 | ) | | | | (0.51 | ) | | | | (0.36 | ) | | | | (0.43 | ) | | | | (0.50 | ) | | | | (0.55 | ) | | | | (0.52 | ) |
From net realized gains | | | | (0.38 | ) | | | | (2.91 | ) | | | | (4.94 | ) | | | | (2.41 | ) | | | | (1.80 | ) | | | | (0.38 | ) | | | | (2.91 | ) | | | | (4.94 | ) | | | | (2.41 | ) | | | | (1.80 | ) |
| | | | | | | | | | | | | | | | | | | | | | | | | | | | | | | | | | | | | | | | | | | | | | | | | | |
Total distributions | | | | (0.73 | ) | | | | (3.33 | ) | | | | (5.43 | ) | | | | (2.94 | ) | | | | (2.31 | ) | | | | (0.74 | ) | | | | (3.34 | ) | | | | (5.44 | ) | | | | (2.96 | ) | | | | (2.32 | ) |
| | | | | | | | | | | | | | | | | | | | | | | | | | | | | | | | | | | | | | | | | | | | | | | | | | |
Net asset value, end of period | | | $ | 22.05 | | | | $ | 18.99 | | | | $ | 22.98 | | | | $ | 25.08 | | | | $ | 23.81 | | | | $ | 22.08 | | | | $ | 19.01 | | | | $ | 23.01 | | | | $ | 25.10 | | | | $ | 23.83 | |
| | | | | | | | | | | | | | | | | | | | | | | | | | | | | | | | | | | | | | | | | | | | | | | | | | |
Total Return(b) | | | | 20.25 | % | | | | (2.89 | )% | | | | 14.73 | % | | | | 18.38 | % | | | | 12.39 | % | | | | 20.33 | % | | | | (2.88 | )% | | | | 14.81 | % | | | | 18.43 | % | | | | 12.47 | % |
Ratios/Supplemental Data: | | | | | | | | | | | | | | | | | | | | | | | | | | | | | | | | | | | | | | | | | | | | | | | | | | |
Net assets, end of period (000’s) | | | $ | 3,587,627 | | | | $ | 3,968,156 | | | | $ | 5,336,063 | | | | $ | 5,747,512 | | | | $ | 6,682,281 | | | | $ | 1,222,874 | | | | $ | 1,294,033 | | | | $ | 2,201,876 | | | | $ | 2,134,444 | | | | $ | 2,079,055 | |
Net expenses to average daily net assets(c) | | | | 0.48 | % | | | | 0.48 | % | | | | 0.48 | % | | | | 0.48 | %(d) | | | | 0.48 | %(d) | | | | 0.44 | % | | | | 0.44 | % | | | | 0.44 | % | | | | 0.44 | %(d) | | | | 0.44 | %(d) |
Net investment income (loss) to average daily net assets(a) | | | | 1.72 | % | | | | 1.79 | % | | | | 1.71 | % | | | | 2.04 | % | | | | 2.02 | % | | | | 1.76 | % | | | | 1.83 | % | | | | 1.77 | % | | | | 2.07 | % | | | | 2.09 | % |
Portfolio turnover rate | | | | 29 | %(e) | | | | 37 | % | | | | 60 | % | | | | 48 | % | | | | 34 | % | | | | 29 | %(e) | | | | 37 | % | | | | 60 | % | | | | 48 | % | | | | 34 | % |
Fees and expenses reimbursed and/or waived by GMO to average daily net assets: | | | | 0.02 | % | | | | 0.02 | % | | | | 0.02 | % | | | | 0.01 | % | | | | 0.02 | % | | | | 0.02 | % | | | | 0.02 | % | | | | 0.02 | % | | | | 0.01 | % | | | | 0.02 | % |
| | | | | | | | | | | | | | | | | | | | | | | | | | | | | | | | | | | | | | | | | | | | | | | | | | |
| | | Class V Shares | | Class VI Shares |
| | | Year Ended February 28/29, | | Year Ended February 28/29, |
| | | 2017 | | 2016 | | 2015 | | 2014 | | 2013 | | 2017 | | 2016 | | 2015 | | 2014 | | 2013 |
Net asset value, beginning of period | | | $ | 19.01 | | | | $ | 23.01 | | | | $ | 25.10 | | | | $ | 23.82 | | | | $ | 23.42 | | | | $ | 18.99 | | | | $ | 22.99 | | | | $ | 25.09 | | | | $ | 23.82 | | | | $ | 23.41 | |
| | | | | | | | | | | | | | | | | | | | | | | | | | | | | | | | | | | | | | | | | | | | | | | | | | |
Income (loss) from investment operations: | | | | | | | | | | | | | | | | | | | | | | | | | | | | | | | | | | | | | | | | | | | | | | | | | | |
Net investment income (loss)†(a) | | | | 0.36 | | | | | 0.39 | | | | | 0.44 | | | | | 0.56 | | | | | 0.48 | | | | | 0.36 | | | | | 0.40 | | | | | 0.45 | | | | | 0.54 | | | | | 0.49 | |
Net realized and unrealized gain (loss) | | | | 3.46 | | | | | (1.05 | ) | | | | 2.92 | | | | | 3.68 | | | | | 2.25 | | | | | 3.46 | | | | | (1.04 | ) | | | | 2.90 | | | | | 3.70 | | | | | 2.25 | |
| | | | | | | | | | | | | | | | | | | | | | | | | | | | | | | | | | | | | | | | | | | | | | | | | | |
Total from investment operations | | | | 3.82 | | | | | (0.66 | ) | | | | 3.36 | | | | | 4.24 | | | | | 2.73 | | | | | 3.82 | | | | | (0.64 | ) | | | | 3.35 | | | | | 4.24 | | | | | 2.74 | |
| | | | | | | | | | | | | | | | | | | | | | | | | | | | | | | | | | | | | | | | | | | | | | | | | | |
Less distributions to shareholders: | | | | | | | | | | | | | | | | | | | | | | | | | | | | | | | | | | | | | | | | | | | | | | | | | | |
From net investment income | | | | (0.37 | ) | | | | (0.43 | ) | | | | (0.51 | ) | | | | (0.55 | ) | | | | (0.53 | ) | | | | (0.38 | ) | | | | (0.45 | ) | | | | (0.51 | ) | | | | (0.56 | ) | | | | (0.53 | ) |
From net realized gains | | | | (0.38 | ) | | | | (2.91 | ) | | | | (4.94 | ) | | | | (2.41 | ) | | | | (1.80 | ) | | | | (0.38 | ) | | | | (2.91 | ) | | | | (4.94 | ) | | | | (2.41 | ) | | | | (1.80 | ) |
| | | | | | | | | | | | | | | | | | | | | | | | | | | | | | | | | | | | | | | | | | | | | | | | | | |
Total distributions | | | | (0.75 | ) | | | | (3.34 | ) | | | | (5.45 | ) | | | | (2.96 | ) | | | | (2.33 | ) | | | | (0.76 | ) | | | | (3.36 | ) | | | | (5.45 | ) | | | | (2.97 | ) | | | | (2.33 | ) |
| | | | | | | | | | | | | | | | | | | | | | | | | | | | | | | | | | | | | | | | | | | | | | | | | | |
Net asset value, end of period | | | $ | 22.08 | | | | $ | 19.01 | | | | $ | 23.01 | | | | $ | 25.10 | | | | $ | 23.82 | | | | $ | 22.05 | | | | $ | 18.99 | | | | $ | 22.99 | | | | $ | 25.09 | | | | $ | 23.82 | |
| | | | | | | | | | | | | | | | | | | | | | | | | | | | | | | | | | | | | | | | | | | | | | | | | | |
Total Return(b) | | | | 20.39 | % | | | | (2.89 | )% | | | | 14.86 | % | | | | 18.49 | % | | | | 12.45 | % | | | | 20.39 | % | | | | (2.83 | )% | | | | 14.83 | % | | | | 18.50 | % | | | | 12.53 | % |
Ratios/Supplemental Data: | | | | | | | | | | | | | | | | | | | | | | | | | | | | | | | | | | | | | | | | | | | | | | | | | | |
Net assets, end of period (000’s) | | | $ | 462,677 | | | | $ | 277,186 | | | | $ | 267,809 | | | | $ | 653,307 | | | | $ | 455,097 | | | | $ | 3,359,025 | | | | $ | 1,732,420 | | | | $ | 2,496,930 | | | | $ | 3,675,950 | | | | $ | 4,140,416 | |
Net expenses to average daily net assets(c) | | | | 0.42 | % | | | | 0.42 | % | | | | 0.42 | % | | | | 0.42 | %(d) | | | | 0.41 | %(d) | | | | 0.39 | % | | | | 0.39 | % | | | | 0.39 | % | | | | 0.39 | %(d) | | | | 0.38 | %(d) |
Net investment income (loss) to average daily net assets(a) | | | | 1.72 | % | | | | 1.85 | % | | | | 1.81 | % | | | | 2.22 | % | | | | 2.05 | % | | | | 1.73 | % | | | | 1.88 | % | | | | 1.83 | % | | | | 2.13 | % | | | | 2.10 | % |
Portfolio turnover rate | | | | 29 | %(e) | | | | 37 | % | | | | 60 | % | | | | 48 | % | | | | 34 | % | | | | 29 | %(e) | | | | 37 | % | | | | 60 | % | | | | 48 | % | | | | 34 | % |
Fees and expenses reimbursed and/or waived by GMO to average daily net assets: | | | | 0.02 | % | | | | 0.02 | % | | | | 0.02 | % | | | | 0.01 | % | | | | 0.02 | % | | | | 0.02 | % | | | | 0.02 | % | | | | 0.02 | % | | | | 0.01 | % | | | | 0.02 | % |
| (a) | Net investment income is affected by the timing of the declaration of dividends by the underlying funds in which the Fund invests, if any. |
| (b) | The total returns would have been lower had certain expenses not been reimbursed and/or waived during the periods shown, if applicable, and assumes the effect of reinvested distributions, if any. Calculation excludes purchase premiums and redemption fees which are borne by the shareholder purchasing or redeeming Fund shares, if any. |
| (c) | Net expenses exclude expenses incurred indirectly through investment in the underlying funds, if any (Note 5). |
| (d) | The net expense ratio does not include the effect of expense reductions (Note 2). |
| (e) | The portfolio turnover rate excludes investments in GMO U.S. Treasury Fund (“USTF”) which is used as a short-term investment vehicle for cash management. The Fund’s portfolio turnover rate during the year ended February 28, 2017, including transactions in USTF, was 48% of the average value of its portfolio. |
| † | Calculated using average shares outstanding throughout the period. |
| | | | |
| | See accompanying notes to the financial statements. | | 67 |
GMO Trust Funds
Financial Highlights
(For a share outstanding throughout each period)
RESOURCES FUND
| | | | | | | | | | | | | | | | | | | | | | | | | | | | | | | | | | | | |
| | | Class III Shares | | | Class IV Shares | |
| | | Year Ended February 28/29, | | | Year Ended February 28/29, | |
| | | 2017 | | | 2016 | | | 2015 | | | 2014 | | | 2013 | | | 2017 | | | 2016 | | | 2015 | | | 2014(a) | |
Net asset value, beginning of period | | $ | 11.74 | | | $ | 16.33 | | | $ | 21.88 | | | $ | 21.59 | | | $ | 22.96 | | | $ | 11.71 | | | $ | 16.28 | | | $ | 21.86 | | | $ | 21.40 | |
| | | | | | | | | | | | | | | | | | | | | | | | | | | | | | | | | | | | |
Income (loss) from investment operations: | | | | | | | | | | | | | | | | | | | | | | | | | | | | | | | | | | | | |
Net investment income (loss)†(b) | | | 0.30 | | | | 0.47 | | | | 0.87 | | | | 0.51 | | | | 0.32 | | | | 0.34 | | | | 0.46 | | | | 0.75 | | | | 0.45 | |
Net realized and unrealized gain (loss) | | | 5.75 | | | | (4.67 | ) | | | (3.77 | ) | | | 0.45 | | | | (1.25 | )(c) | | | 5.68 | | | | (4.63 | ) | | | (3.65 | ) | | | 0.70 | |
| | | | | | | | | | | | | | | | | | | | | | | | | | | | | | | | | | | | |
Total from investment operations | | | 6.05 | | | | (4.20 | ) | | | (2.90 | ) | | | 0.96 | | | | (0.93 | ) | | | 6.02 | | | | (4.17 | ) | | | (2.90 | ) | | | 1.15 | |
| | | | | | | | | | | | | | | | | | | | | | | | | | | | | | | | | | | | |
Less distributions to shareholders: | | | | | | | | | | | | | | | | | | | | | | | | | | | | | | | | | | | | |
From net investment income | | | (0.48 | ) | | | (0.39 | ) | | | (1.03 | ) | | | (0.40 | ) | | | (0.20 | ) | | | (0.48 | ) | | | (0.40 | ) | | | (1.06 | ) | | | (0.42 | ) |
From net realized gains | | | — | | | | — | | | | (1.62 | ) | | | (0.27 | ) | | | (0.24 | ) | | | — | | | | — | | | | (1.62 | ) | | | (0.27 | ) |
| | | | | | | | | | | | | | | | | | | | | | | | | | | | | | | | | | | | |
Total distributions | | | (0.48 | ) | | | (0.39 | ) | | | (2.65 | ) | | | (0.67 | ) | | | (0.44 | ) | | | (0.48 | ) | | | (0.40 | ) | | | (2.68 | ) | | | (0.69 | ) |
| | | | | | | | | | | | | | | | | | | | | | | | | | | | | | | | | | | | |
Net asset value, end of period | | $ | 17.31 | | | $ | 11.74 | | | $ | 16.33 | | | $ | 21.88 | | | $ | 21.59 | | | $ | 17.25 | | | $ | 11.71 | | | $ | 16.28 | | | $ | 21.86 | |
| | | | | | | | | | | | | | | | | | | | | | | | | | | | | | | | | | | | |
Total Return(d) | | | 51.75 | % | | | (25.76 | )% | | | (12.81 | )% | | | 4.54 | % | | | (4.00 | )% | | | 51.72 | % | | | (25.68 | )% | | | (12.82 | )% | | | 5.48 | %** |
Ratios/Supplemental Data: | | | | | | | | | | | | | | | | | | | | | | | | | | | | | | | | | | | | |
Net assets, end of period (000’s) | | $ | 22,562 | | | $ | 13,864 | | | $ | 23,734 | | | $ | 81,646 | | | $ | 104,241 | | | $ | 190,260 | | | $ | 170,919 | | | $ | 119,308 | | | $ | 138,358 | |
Net expenses to average daily net assets(e) | | | 0.77 | % | | | 0.77 | % | | | 0.76 | % | | | 0.75 | %(f) | | | 0.77 | % | | | 0.72 | % | | | 0.72 | % | | | 0.71 | % | | | 0.70 | %(f) |
Net investment income (loss) to average daily net assets(b) | | | 1.99 | % | | | 3.36 | % | | | 4.01 | % | | | 2.36 | % | | | 1.48 | % | | | 2.26 | % | | | 3.31 | % | | | 3.58 | % | | | 2.23 | %* |
Portfolio turnover rate | | | 29 | %(g) | | | 130 | % | | | 126 | % | | | 40 | % | | | 51 | % | | | 29 | %(g) | | | 130 | % | | | 126 | % | | | 40 | % |
Fees and expenses reimbursed and/or waived by GMO to average daily net assets: | | | 0.10 | % | | | 0.10 | % | | | 0.08 | % | | | 0.10 | % | | | 0.73 | % | | | 0.10 | % | | | 0.11 | % | | | 0.09 | % | | | 0.11 | %* |
Purchase premiums and redemption fees consisted of the following per share amounts (Note 2):† | | $ | 0.02 | | | $ | 0.03 | | | $ | 0.07 | | | $ | 0.06 | | | $ | 0.22 | | | $ | 0.02 | | | $ | 0.02 | | | $ | 0.03 | | | $ | 0.03 | |
| (a) | Period from March 20, 2013 (commencement of operations) through February 28, 2014. |
| (b) | Net investment income is affected by the timing of the declaration of dividends by the underlying funds in which the Fund invests, if any. |
| (c) | The amount shown for a share outstanding does not correspond with the aggregate net realized and unrealized gain (loss) on investments due to the timing of purchases and redemptions of Fund shares in relation to fluctuating market values of the investments of the Fund. |
| (d) | The total returns would have been lower had certain expenses not been reimbursed and/or waived during the periods shown, if applicable, and assumes the effect of reinvested distributions, if any. Calculation excludes purchase premiums and redemption fees which are borne by the shareholder purchasing or redeeming Fund shares, if any. |
| (e) | Net expenses exclude expenses incurred indirectly through investment in the underlying funds (Note 5). |
| (f) | The net expense ratio does not include the effect of expense reductions (Note 2). |
| (g) | The portfolio turnover rate excludes investments in GMO U.S. Treasury Fund (“USTF”) which is used as a short-term investment vehicle for cash management. The Fund’s portfolio turnover rate during the year ended February 28, 2017, including transactions in USTF, was 40% of the average value of its portfolio. |
| † | Calculated using average shares outstanding throughout the period. |
| | | | |
| 68 | | See accompanying notes to the financial statements. | | |
GMO Trust Funds
Financial Highlights
(For a share outstanding throughout each period)
RISK PREMIUM FUND
| | | | | | | | | | | | | | | | | | | | | | | | | | | | | | | | | | | | | | | | | | | | | | | | | | |
| | | Class III Shares | | Class VI Shares |
| | | Year Ended February 28/29, | | Year Ended February 28/29, |
| | | 2017(a) | | 2016(a) | | 2015(a) | | 2014(a) | | 2013(a)(b) | | 2017(a) | | 2016(a) | | 2015(a) | | 2014(a) | | 2013(a)(c) |
Net asset value, beginning of period | | | $ | 26.91 | | | | $ | 29.73 | | | | $ | 31.74 | | | | $ | 31.59 | | | | $ | 30.81 | | | | $ | 27.00 | | | | $ | 29.82 | | | | $ | 31.80 | | | | $ | 31.59 | | | | $ | 30.00 | |
| | | | | | | | | | | | | | | | | | | | | | | | | | | | | | | | | | | | | | | | | | | | | | | | | | |
Income (loss) from investment operations: | | | | | | | | | | | | | | | | | | | | | | | | | | | | | | | | | | | | | | | | | | | | | | | | | | |
Net investment income (loss)(d)† | | | | (0.05 | ) | | | | (0.12 | ) | | | | (0.18 | ) | | | | (0.18 | ) | | | | (0.03 | ) | | | | (0.02 | ) | | | | (0.12 | ) | | | | (0.15 | ) | | | | (0.15 | ) | | | | (0.03 | ) |
Net realized and unrealized gain (loss) | | | | 5.22 | | | | | (0.30 | ) | | | | 1.02 | | | | | 2.13 | | | | | 0.81 | | | | | 5.24 | | | | | (0.30 | ) | | | | 1.02 | | | | | 2.16 | | | | | 1.62 | |
| | | | | | | | | | | | | | | | | | | | | | | | | | | | | | | | | | | | | | | | | | | | | | | | | | |
Total from investment operations | | | | 5.17 | | | | | (0.42 | ) | | | | 0.84 | | | | | 1.95 | | | | | 0.78 | | | | | 5.22 | | | | | (0.42 | ) | | | | 0.87 | | | | | 2.01 | | | | | 1.59 | |
| | | | | | | | | | | | | | | | | | | | | | | | | | | | | | | | | | | | | | | | | | | | | | | | | | |
Less distributions to shareholders: | | | | | | | | | | | | | | | | | | | | | | | | | | | | | | | | | | | | | | | | | | | | | | | | | | |
From net realized gains | | | | (2.15 | ) | | | | (2.40 | ) | | | | (2.85 | ) | | | | (1.80 | ) | | | | — | | | | | (2.15 | ) | | | | (2.40 | ) | | | | (2.85 | ) | | | | (1.80 | ) | | | | — | |
| | | | | | | | | | | | | | | | | | | | | | | | | | | | | | | | | | | | | | | | | | | | | | | | | | |
Total distributions | | | | (2.15 | ) | | | | (2.40 | ) | | | | (2.85 | ) | | | | (1.80 | ) | | | | — | | | | | (2.15 | ) | | | | (2.40 | ) | | | | (2.85 | ) | | | | (1.80 | ) | | | | — | |
| | | | | | | | | | | | | | | | | | | | | | | | | | | | | | | | | | | | | | | | | | | | | | | | | | |
Net asset value, end of period | | | $ | 29.93 | | | | $ | 26.91 | | | | $ | 29.73 | | | | $ | 31.74 | | | | $ | 31.59 | | | | $ | 30.07 | | | | $ | 27.00 | | | | $ | 29.82 | | | | $ | 31.80 | | | | $ | 31.59 | |
| | | | | | | | | | | | | | | | | | | | | | | | | | | | | | | | | | | | | | | | | | | | | | | | | | |
Total Return(e) | | | | 19.50 | % | | | | (1.66 | )% | | | | 3.19 | % | | | | 6.42 | % | | | | 2.53 | %** | | | | 19.62 | % | | | | (1.65 | )% | | | | 3.29 | % | | | | 6.61 | % | | | | 5.30 | %** |
Ratios/Supplemental Data: | | | | | | | | | | | | | | | | | | | | | | | | | | | | | | | | | | | | | | | | | | | | | | | | | | |
Net assets, end of period (000’s) | | | $ | 5,049 | | | | $ | 6,807 | | | | $ | 4,832 | | | | $ | 7,489 | | | | $ | 6,793 | | | | $ | 155,375 | | | | $ | 223,854 | | | | $ | 432,465 | | | | $ | 730,196 | | | | $ | 616,464 | |
Net expenses to average daily net assets | | | | 0.61 | % | | | | 0.60 | % | | | | 0.61 | %(f) | | | | 0.60 | %(f)(g) | | | | 0.60 | %(f)(g)* | | | | 0.51 | % | | | | 0.51 | % | | | | 0.51 | %(f) | | | | 0.51 | %(f)(g) | | | | 0.51 | %(f)(g)* |
Net investment income (loss) to average daily net assets(d) | | | | (0.16 | )% | | | | (0.45 | )% | | | | (0.58 | )% | | | | (0.57 | )% | | | | (0.56 | )%* | | | | (0.07 | )% | | | | (0.37 | )% | | | | (0.49 | )% | | | | (0.48 | )% | | | | (0.46 | )%* |
Portfolio turnover rate | | | | 0 | % | | | | 0 | % | | | | 112 | % | | | | 0 | % | | | | 0 | %** | | | | 0 | % | | | | 0 | % | | | | 112 | % | | | | 0 | % | | | | 0 | %** |
Fees and expenses reimbursed and/or waived by GMO to average daily net assets: | | | | 0.06 | % | | | | 0.05 | % | | | | 0.04 | % | | | | 0.05 | % | | | | 0.08 | %* | | | | 0.06 | % | | | | 0.05 | % | | | | 0.03 | % | | | | 0.05 | % | | | | 0.10 | %* |
Purchase premiums and redemption fees consisted of the following per share amounts (Note 2):† | | | $ | 0.02 | (a) | | | $ | 0.08 | (a) | | | $ | 0.14 | (a) | | | $ | 0.01 | (a) | | | $ | 0.02 | (a) | | | $ | 0.02 | (a) | | | $ | 0.07 | (a) | | | $ | 0.13 | (a) | | | $ | 0.01 | (a) | | | $ | 0.06 | (a) |
| (a) | Per share amounts were adjusted to reflect a 1:3 reverse stock split effective July 15, 2016. |
| (b) | Period from December 14, 2012 (commencement of operations) through February 28, 2013. |
| (c) | Period from November 15, 2012 (commencement of operations) through February 28, 2013. |
| (d) | Net investment income is affected by the timing of the declaration of dividends by the underlying funds in which the Fund invests, if any. |
| (e) | The total returns would have been lower had certain expenses not been reimbursed and/or waived during the periods shown, if applicable, and assumes the effect of reinvested distributions, if any. Calculation excludes purchase premiums and redemption fees which are borne by the shareholder purchasing or redeeming Fund shares, if any. |
| (f) | Net expenses exclude expenses incurred indirectly through investment in the underlying funds (Note 5). |
| (g) | The net expense ratio does not include the effect of expense reductions (Note 2). |
| † | Calculated using average shares outstanding throughout the period. |
| | | | |
| | See accompanying notes to the financial statements. | | 69 |
GMO Trust Funds
Financial Highlights
(For a share outstanding throughout each period)
TAX-MANAGED INTERNATIONAL EQUITIES FUND
| | | | | | | | | | | | | | | | | | | | | | | | | |
| | | Class III Shares |
| | | Year Ended February 28/29 |
| | | 2017 | | 2016 | | 2015 | | 2014 | | 2013 |
Net asset value, beginning of period | | | $ | 12.92 | | | | $ | 16.80 | | | | $ | 18.03 | | | | $ | 14.56 | | | | $ | 13.80 | |
| | | | | | | | | | | | | | | | | | | | | | | | | |
Income (loss) from investment operations: | | | | | | | | | | | | | | | | | | | | | | | | | |
Net investment income (loss)†(a) | | | | 0.41 | | | | | 0.40 | | | | | 0.47 | | | | | 0.57 | | | | | 0.39 | |
Net realized and unrealized gain (loss) | | | | 1.50 | | | | | (3.82 | ) | | | | (1.05 | ) | | | | 3.37 | | | | | 0.83 | |
| | | | | | | | | | | | | | | | | | | | | | | | | |
Total from investment operations | | | | 1.91 | | | | | (3.42 | ) | | | | (0.58 | ) | | | | 3.94 | | | | | 1.22 | |
| | | | | | | | | | | | | | | | | | | | | | | | | |
Less distributions to shareholders: | | | | | | | | | | | | | | | | | | | | | | | | | |
From net investment income | | | | (0.55 | ) | | | | (0.46 | ) | | | | (0.65 | ) | | | | (0.47 | ) | | | | (0.46 | ) |
| | | | | | | | | | | | | | | | | | | | | | | | | |
Total distributions | | | | (0.55 | ) | | | | (0.46 | ) | | | | (0.65 | ) | | | | (0.47 | ) | | | | (0.46 | ) |
| | | | | | | | | | | | | | | | | | | | | | | | | |
Net asset value, end of period | | | $ | 14.28 | | | | $ | 12.92 | | | | $ | 16.80 | | | | $ | 18.03 | | | | $ | 14.56 | |
| | | | | | | | | | | | | | | | | | | | | | | | | |
Total Return(b) | | | | 15.05 | % | | | | (20.63 | )% | | | | (3.10 | )% | | | | 27.37 | % | | | | 8.99 | % |
Ratios/Supplemental Data: | | | | | | | | | | | | | | | | | | | | | | | | | |
Net assets, end of period (000’s) | | | $ | 115,733 | | | | $ | 215,977 | | | | $ | 427,048 | | | | $ | 485,665 | | | | $ | 479,005 | |
Net expenses to average daily net assets(c) | | | | 0.68 | % | | | | 0.66 | % | | | | 0.66 | % | | | | 0.66 | % | | | | 0.67 | %(d) |
Net investment income (loss) to average daily net assets(a) | | | | 2.95 | % | | | | 2.59 | % | | | | 2.71 | % | | | | 3.54 | % | | | | 2.83 | % |
Portfolio turnover rate | | | | 47 | %(e) | | | | 79 | % | | | | 69 | % | | | | 49 | % | | | | 54 | % |
Fees and expenses reimbursed and/or waived by GMO to average daily net assets: | | | | 0.23 | % | | | | 0.14 | % | | | | 0.12 | % | | | | 0.10 | % | | | | 0.12 | % |
| (a) | Net investment income is affected by the timing of the declaration of dividends by the underlying funds in which the Fund invests, if any. |
| (b) | The total returns would have been lower had certain expenses not been reimbursed and/or waived during the periods shown, if applicable, and assumes the effect of reinvested distributions, if any. Calculation excludes purchase premiums and redemption fees which are borne by the shareholder purchasing or redeeming Fund shares, if any. |
| (c) | Net expenses exclude expenses incurred indirectly through investment in the underlying funds (Note 5). |
| (d) | The net expense ratio does not include the effect of expense reductions (Note 2). |
| (e) | The portfolio turnover rate excludes investments in GMO U.S. Treasury Fund (“USTF”) which is used as a short-term investment vehicle for cash management. The Fund’s portfolio turnover rate during the year ended February 28, 2017, including transactions in USTF, was 54% of the average value of its portfolio. |
| † | Calculated using average shares outstanding throughout the period. |
| | | | |
| 70 | | See accompanying notes to the financial statements. | | |
GMO Trust Funds
Financial Highlights
(For a share outstanding throughout each period)
U.S. EQUITY ALLOCATION FUND
| | | | | | | | | | | | | | | | | | | | | | | | | | | | | | | | | | | | | | | | | | | | | | | | | | |
| | | Class III Shares | | Class IV Shares |
| | | Year Ended February 28/29, | | Year Ended February 28/29, |
| | | 2017 | | 2016 | | 2015 | | 2014 | | 2013 | | 2017 | | 2016 | | 2015 | | 2014 | | 2013 |
Net asset value, beginning of period | | | $ | 13.79 | | | | $ | 16.61 | | | | $ | 17.27 | | | | $ | 14.51 | | | | $ | 13.06 | | | | $ | 13.76 | | | | $ | 16.58 | | | | $ | 17.24 | | | | $ | 14.48 | | | | $ | 13.04 | |
| | | | | | | | | | | | | | | | | | | | | | | | | | | | | | | | | | | | | | | | | | | | | | | | | | |
Income (loss) from investment operations: | | | | | | | | | | | | | | | | | | | | | | | | | | | | | | | | | | | | | | | | | | | | | | | | | | |
Net investment income (loss)(a)† | | | | 0.27 | | | | | 0.24 | | | | | 0.28 | | | | | 0.28 | | | | | 0.26 | | | | | 0.25 | | | | | 0.25 | | | | | 0.29 | | | | | 0.29 | | | | | 0.27 | |
Net realized and unrealized gain (loss) | | | | 2.89 | | | | | (1.20 | ) | | | | 1.66 | | | | | 2.77 | | | | | 1.47 | | | | | 2.92 | | | | | (1.20 | ) | | | | 1.66 | | | | | 2.77 | | | | | 1.46 | |
| | | | | | | | | | | | | | | | | | | | | | | | | | | | | | | | | | | | | | | | | | | | | | | | | | |
Total from investment operations | | | | 3.16 | | | | | (0.96 | ) | | | | 1.94 | | | | | 3.05 | | | | | 1.73 | | | | | 3.17 | | | | | (0.95 | ) | | | | 1.95 | | | | | 3.06 | | | | | 1.73 | |
| | | | | | | | | | | | | | | | | | | | | | | | | | | | | | | | | | | | | | | | | | | | | | | | | | |
Less distributions to shareholders: | | | | | | | | | | | | | | | | | | | | | | | | | | | | | | | | | | | | | | | | | | | | | | | | | | |
From net investment income | | | | (0.34 | ) | | | | (0.26 | ) | | | | (0.31 | ) | | | | (0.29 | ) | | | | (0.28 | ) | | | | (0.30 | ) | | | | (0.27 | ) | | | | (0.32 | ) | | | | (0.30 | ) | | | | (0.29 | ) |
From net realized gains | | | | (1.47 | ) | | | | (1.60 | ) | | | | (2.29 | ) | | | | — | | | | | — | | | | | (1.47 | ) | | | | (1.60 | ) | | | | (2.29 | ) | | | | — | | | | | — | |
| | | | | | | | | | | | | | | | | | | | | | | | | | | | | | | | | | | | | | | | | | | | | | | | | | |
Total distributions | | | | (1.81 | ) | | | | (1.86 | ) | | | | (2.60 | ) | | | | (0.29 | ) | | | | (0.28 | ) | | | | (1.77 | ) | | | | (1.87 | ) | | | | (2.61 | ) | | | | (0.30 | ) | | | | (0.29 | ) |
| | | | | | | | | | | | | | | | | | | | | | | | | | | | | | | | | | | | | | | | | | | | | | | | | | |
Net asset value, end of period | | | $ | 15.14 | | | | $ | 13.79 | | | | $ | 16.61 | | | | $ | 17.27 | | | | $ | 14.51 | | | | $ | 15.16 | | | | $ | 13.76 | | | | $ | 16.58 | | | | $ | 17.24 | | | | $ | 14.48 | |
| | | | | | | | | | | | | | | | | | | | | | | | | | | | | | | | | | | | | | | | | | | | | | | | | | |
Total Return(c) | | | | 23.59 | % | | | | (6.17 | )% | | | | 12.18 | % | | | | 21.11 | % | | | | 13.40 | % | | | | 23.69 | % | | | | (6.10 | )% | | | | 12.27 | % | | | | 21.21 | % | | | | 13.40 | % |
Ratios/Supplemental Data: | | | | | | | | | | | | | | | | | | | | | | | | | | | | | | | | | | | | | | | | | | | | | | | | | | |
Net assets, end of period (000’s) | | | $ | 109,726 | | | | $ | 194,615 | | | | $ | 286,934 | | | | $ | 488,982 | | | | $ | 188,363 | | | | $ | 16,707 | | | | $ | 513,751 | | | | $ | 431,841 | | | | $ | 288,782 | | | | $ | 44,849 | |
Net expenses to average daily net assets(e) | | | | 0.46 | % | | | | 0.46 | % | | | | 0.46 | % | | | | 0.46 | %(d) | | | | 0.46 | %(d) | | | | 0.41 | % | | | | 0.41 | % | | | | 0.41 | % | | | | 0.41 | %(d) | | | | 0.41 | %(d) |
Net investment income (loss) to average daily net assets(a) | | | | 1.80 | % | | | | 1.57 | % | | | | 1.59 | % | | | | 1.71 | % | | | | 1.95 | % | | | | 1.73 | % | | | | 1.65 | % | | | | 1.63 | % | | | | 1.75 | % | | | | 2.01 | % |
Portfolio turnover rate | | | | 66 | %(f) | | | | 89 | % | | | | 67 | % | | | | 74 | % | | | | 79 | % | | | | 66 | %(f) | | | | 89 | % | | | | 67 | % | | | | 74 | % | | | | 79 | % |
Fees and expenses reimbursed and/or waived by GMO to average daily net assets: | | | | 0.02 | % | | | | 0.02 | % | | | | 0.02 | % | | | | 0.02 | % | | | | 0.02 | % | | | | 0.02 | % | | | | 0.02 | % | | | | 0.02 | % | | | | 0.02 | % | | | | 0.02 | % |
| | | | | | | | | | | | | | | | | | | | | | | | | | | | | | | | |
| | | Class V Shares | | | Class VI Shares | |
| | | Period from
August 9, 2016
through
February 28,
2017 | | | Period from
March 1, 2014
through
July 30,
2014(b) | | | Period from
January 21, 2014
(commencement
of operations)
through
February 28,
2014 | | | Year Ended February 28/29, | |
| | | | | | 2017 | | | 2016 | | | 2015 | | | 2014 | | | 2013 | |
Net asset value, beginning of period | | $ | 14.95 | | | $ | 17.24 | | | $ | 17.17 | | | $ | 13.73 | | | $ | 16.54 | | | $ | 17.21 | | | $ | 14.47 | | | $ | 13.02 | |
| | | | | | | | | | | | | | | | | | | | | | | | | | | | | | | | |
Income (loss) from investment operations: | | | | | | | | | | | | | | | | | | | | | | | | | | | | | | | | |
Net investment income (loss)(a)† | | | 0.16 | | | | 0.12 | | | | 0.04 | | | | 0.27 | | | | 0.26 | | | | 0.30 | | | | 0.30 | | | | 0.28 | |
Net realized and unrealized gain (loss) | | | 1.50 | | | | 0.90 | | | | 0.03 | | | | 2.89 | | | | (1.19 | ) | | | 1.65 | | | | 2.74 | | | | 1.46 | |
| | | | | | | | | | | | | | | | | | | | | | | | | | | | | | | | |
Total from investment operations | | | 1.66 | | | | 1.02 | | | | 0.07 | | | | 3.16 | | | | (0.93 | ) | | | 1.95 | | | | 3.04 | | | | 1.74 | |
| | | | | | | | | | | | | | | | | | | | | | | | | | | | | | | | |
Less distributions to shareholders: | | | | | | | | | | | | | | | | | | | | | | | | | | | | | | | | |
From net investment income | | | (0.19 | ) | | | (0.04 | ) | | | — | | | | (0.36 | ) | | | (0.28 | ) | | | (0.33 | ) | | | (0.30 | ) | | | (0.29 | ) |
From net realized gains | | | (1.33 | ) | | | (0.43 | ) | | | — | | | | (1.47 | ) | | | (1.60 | ) | | | (2.29 | ) | | | — | | | | — | |
| | | | | | | | | | | | | | | | | | | | | | | | | | | | | | | | |
Total distributions | | | (1.52 | ) | | | (0.47 | ) | | | — | | | | (1.83 | ) | | | (1.88 | ) | | | (2.62 | ) | | | (0.30 | ) | | | (0.29 | ) |
| | | | | | | | | | | | | | | | | | | | | | | | | | | | | | | | |
Net asset value, end of period | | $ | 15.09 | | | $ | 17.79 | | | $ | 17.24 | | | $ | 15.06 | | | $ | 13.73 | | | $ | 16.54 | | | $ | 17.21 | | | $ | 14.47 | |
| | | | | | | | | | | | | | | | | | | | | | | | | | | | | | | | |
Total Return(c) | | | 11.37 | %** | | | 5.88 | %** | | | 0.39 | %** | | | 23.68 | % | | | (6.02 | )% | | | 12.28 | % | | | 21.14 | % | | | 13.56 | % |
Ratios/Supplemental Data: | | | | | | | | | | | | | | | | | | | | | | | | | | | | | | | | |
Net assets, end of period (000’s) | | $ | 164,652 | | | $ | 220,333 | | | $ | 259,581 | | | $ | 1,469,935 | | | $ | 3,838,628 | | | $ | 6,031,361 | | | $ | 7,082,304 | | | $ | 1,249,117 | |
Net expenses to average daily net assets(e) | | | 0.40 | %* | | | 0.40 | %* | | | 0.40 | %*(d) | | | 0.37 | % | | | 0.37 | % | | | 0.37 | % | | | 0.37 | %(d) | | | 0.37 | %(d) |
Net investment income (loss) to average daily net assets(a) | | | 1.93 | %* | | | 1.69 | %* | | | 1.97 | %* | | | 1.87 | % | | | 1.68 | % | | | 1.70 | % | | | 1.85 | % | | | 2.08 | % |
Portfolio turnover rate | | | 66 | %**(f) | | | 34 | %**(g) | | | 74 | %** | | | 66 | %(f) | | | 89 | % | | | 67 | % | | | 74 | % | | | 79 | % |
Fees and expenses reimbursed and/or waived by GMO to average daily net assets: | | | 0.02 | %* | | | 0.02 | %* | | | 0.01 | %* | | | 0.02 | % | | | 0.02 | % | | | 0.02 | % | | | 0.02 | % | | | 0.02 | % |
| (a) | Net investment income is affected by the timing of the declaration of dividends by the underlying funds in which the Fund invests. |
| (b) | The class was inactive from July 31, 2014 to August 8, 2016. |
| (c) | The total returns would have been lower had certain expenses not been reimbursed and/or waived during the periods shown, if applicable, and assumes the effect of reinvested distributions, if any. Calculation excludes purchase premiums and redemption fees which are borne by the shareholder purchasing or redeeming Fund shares, if any. |
| (d) | The net expense ratio does not include the effect of expense reductions (Note 2). |
| (e) | Net expenses exclude expenses incurred indirectly through investment in the underlying funds (Note 5). |
| (f) | The portfolio turnover rate excludes investments in GMO U.S. Treasury Fund (“USTF”) which is used as a short-term investment vehicle for cash management. The Fund’s portfolio turnover rate during the year ended February 28, 2017, including transactions in USTF, was 91% of the average value of its portfolio. |
| (g) | Calculation represents portfolio turnover of the Fund for the period ended July 30, 2014. |
| † | Calculated using average shares outstanding throughout the period. |
| | | | |
| | See accompanying notes to the financial statements. | | 71 |
GMO Trust Funds
Notes to Financial Statements
February 28, 2017
Each of International Equity Fund, International Large/Mid Cap Equity Fund, Quality Fund, Resources Fund, Risk Premium Fund, Tax-Managed International Equities Fund and U.S. Equity Allocation Fund (each a “Fund” and collectively the “Funds”) is a series of GMO Trust (the “Trust”). The Trust is registered under the Investment Company Act of 1940, as amended (the “1940 Act”), as an open-end management investment company. The Trust was established as a Massachusetts business trust under the laws of The Commonwealth of Massachusetts on June 24, 1985. The Declaration of Trust permits the Trustees of the Trust (“Trustees”) to create an unlimited number of series of shares (Funds) and to subdivide Funds into classes. The Funds are advised and managed by Grantham, Mayo, Van Otterloo & Co. LLC (“GMO”).
The Funds may invest in GMO U.S. Treasury Fund and in money market funds unaffiliated with GMO. The Funds may also invest in other GMO Funds (“underlying funds”).
The following table provides information about the Funds’ principal investment objectives and benchmarks (if any):
| | | | |
| | | |
| Fund Name | | Benchmark | | Investment Objective |
| International Equity Fund | | MSCI EAFE Index | | High total return |
| International Large/Mid Cap Equity Fund | | MSCI EAFE Index | | High total return |
| Quality Fund | | S&P 500 Index | | Total return |
| Resources Fund | | MSCI ACWI Commodity Producers Index | | Total return |
| Risk Premium Fund | | MSCI World Index | | Total return |
| Tax-Managed International Equities Fund | | MSCI EAFE Index (after tax) | | High after-tax total return |
| U.S. Equity Allocation Fund | | S&P 500 Index | | High total return |
International Large/Mid Cap Equity Fund and Risk Premium Fund currently limit subscriptions.
| 2. | Significant accounting policies |
The following is a summary of significant accounting policies followed by each Fund in the preparation of its financial statements. These policies are in conformity with accounting principles generally accepted in the United States of America (“U.S. GAAP”) and have been consistently followed by the Funds in preparing these financial statements. The preparation of financial statements in accordance with U.S. GAAP requires management to make estimates and assumptions that affect the reported amounts and disclosures in the financial statements. Actual results could differ from those estimates. The accounting records of the Funds are maintained in U.S. dollars.
Portfolio valuation
Exchange-traded securities (other than exchange-traded options) for which market quotations are readily available are valued at (i) the last sale price or (ii) official closing price or (iii) most recent quoted price published by the exchange (if no reported last sale or official closing price) or (iv) the quoted price provided by a pricing source (in the event GMO deems the private market to be a more reliable indicator of market value than the exchange). Exchange-traded options are valued at the last sale price, provided that price is between the closing bid and ask prices. If the last sale price is not within this range, then they will be valued at the closing bid price for long positions and the closing ask price for short positions. Cleared derivatives are valued using the price quoted (which may be based on a model) by the relevant clearing house. If an updated quote for a cleared derivative is not available by the time that a Fund calculates its net asset value on any business day, then that derivative will generally be valued using an industry standard model, which may differ from the model used by the relevant clearing house. Over-the-counter (“OTC”) derivatives are generally valued at the price determined by an industry standard model. Unlisted securities for which market quotations are readily available are generally valued at the most recent quoted price. Shares of the underlying funds and other open-end registered investment companies are valued at their most recent net asset value. If quotations are not readily available or circumstances make an existing valuation methodology or procedure unreliable, derivatives and other securities are valued at fair value as determined in good faith by the Trustees or persons acting at their direction pursuant to procedures approved by the Trustees. Because of the uncertainty inherent in pricing, and in particular fair value pricing, the value determined for a particular security may be materially different from the value realized upon its sale. See the table below for information about securities and derivatives, if any, that were fair valued using methods determined in good faith by or at the direction of the Trustees. The Funds and/or the underlying funds classify such securities as Level 3 (levels defined below). For the year ended February 28, 2017, the Funds did not reduce the value of any of their OTC derivatives contracts, if any, based on the creditworthiness of their counterparties. See Note 4 “Derivative financial instruments” for a further discussion on valuation of derivatives.
The foregoing valuation methodologies are modified for equities that trade in non-U.S. securities markets which close prior to the close of the New York Stock Exchange (“NYSE”) due to time zone differences, including the value of equities that underlie futures, options and other
72
GMO Trust Funds
Notes to Financial Statements — (Continued)
February 28, 2017
derivatives (to the extent the market for those derivatives closes prior to the close of the NYSE). In those cases, the price will generally be adjusted, to the extent practicable and available, based on inputs from an independent pricing service approved by the Trustees that are intended to reflect valuation changes through the NYSE close. The table below shows the percentage of the net assets of the Funds, held either directly or through investments in the underlying funds, if any, that were valued using fair value inputs obtained from that independent pricing service as of February 28, 2017. These securities listed on foreign exchanges (including the value of equity securities that underlie futures, options and other derivatives (to the extent the market for such instruments closes prior to the close of the NYSE)) are classified as Level 2 (levels defined below) in the table below.
“Quoted price” typically means the bid price for securities held long and the ask price for securities sold short. If a market quotation for a security does not involve a bid or an ask, the “quoted price” may be the price provided by a market participant or other third-party pricing source in accordance with the market practice for that security. If an updated quoted price for a security is not available by the time that a Fund calculates its net asset value on any business day, the Fund will generally use the last quoted price so long as GMO believes that the last quoted price continues to represent that security’s fair value.
In the case of derivatives, prices determined by a model may reflect an estimate of the average of bid and ask prices, regardless of whether a Fund has a long position or a short position.
As discussed above, certain of the Funds and underlying funds invest in securities and/or derivatives which may have been fair valued using methods determined in good faith by or at the direction of the Trustees or fair valued using inputs obtained from an independent pricing service. The table below presents securities and/or derivatives on a net basis, based on market values or unrealized appreciation/(depreciation), which will tend to understate the Funds’ exposure. The net aggregate direct and indirect exposure to these valuation methodologies (based on each Fund’s net assets) as of February 28, 2017 is as follows:
Securities and derivatives
| | | | | | | | |
| | | |
| Fund Name | | Fair valued using
methods determined in
good faith by or at the
direction of the Trustees | | | Fair valued using
inputs obtained
from an
independent
pricing service (Net) | |
International Equity Fund | | | <1 | % | | | 96 | % |
International Large/Mid Cap Equity Fund | | | <1 | % | | | 94 | % |
Quality Fund | | | — | | | | 14 | % |
Resources Fund | | | — | | | | 74 | % |
Risk Premium Fund | | | — | | | | (1 | )% |
Tax-Managed International Equities Fund | | | <1 | % | | | 96 | % |
U.S. Equity Allocation Fund | | | — | | | | — | |
U.S. GAAP requires the Funds to disclose the fair value of their investments in a three-level hierarchy (Levels 1, 2 and 3). The valuation hierarchy is based upon the relative observability of inputs to the valuation of the Funds’ investments. The inputs or methodologies used for valuing securities are not necessarily an indication of the risk associated with investing in those securities.
Changes in valuation techniques may result in transfers into or out of an investment’s assigned level within the fair value hierarchy. In addition, in periods of market dislocation, the observability of prices and inputs may be reduced for many instruments. This condition, as well as changes related to the liquidity of investments, could cause a security to be reclassified between levels.
U.S. GAAP requires additional disclosures about fair value measurements for material Level 3 securities and derivatives, if any (determined by each category of asset or liability as compared to a Fund’s total net assets separately identified in the table below). At February 28, 2017, there were no direct material Level 3 classes of investments or derivatives with significant unobservable inputs subject to this additional disclosure.
The three levels are defined as follows:
Level 1 – Valuations based on quoted prices for identical securities in active markets.
73
GMO Trust Funds
Notes to Financial Statements — (Continued)
February 28, 2017
The types of assets and liabilities categorized in Level 1 generally include actively traded domestic and certain foreign equity securities; certain U.S. government obligations; derivatives actively traded on a national securities exchange (such as some futures and options); and shares of open-end mutual funds (even if their investments are valued using Level 2 or Level 3 inputs).
Level 2 – Valuations determined using other significant direct or indirect observable inputs.
The types of assets and liabilities categorized in Level 2 generally include cleared derivatives and certain OTC derivatives such as swaps, options, swaptions, and forward currency contracts valued using industry standard models; certain restricted securities valued at the most recent available market or quoted price; certain securities that are valued at the local price and adjusted by applying a premium or discount when the holdings exceed foreign ownership limitations; and certain foreign equity securities that are adjusted based on inputs from an independent pricing service approved by the Trustees, including the value of equity securities that underlie futures, options and other derivatives (to the extent the market for such instruments closes prior to the close of the NYSE) to reflect estimated valuation changes through the NYSE close.
Level 3 – Valuations based primarily on inputs that are unobservable and significant.
The types of assets and liabilities categorized in Level 3 generally include, but are not limited to, securities whose trading has been suspended or that have been de-listed from their current primary trading exchange valued at the most recent available market or quoted price; securities in default or bankruptcy proceedings for which there is no current market quotation valued at the most recent available market or quoted price; third-party investment funds where valuations are provided by fund sponsors and which are adjusted for liquidity considerations as well as the timing of the receipt of information; certain equity securities valued based on the last traded exchange price adjusted for the movement in a relevant index and/or a security type conversion discount; and certain securities that are valued using a price from a comparable security related to the same issuer.
The following is a summary of the respective levels assigned to the Funds’ direct securities and derivatives, if any, as of February 28, 2017:
| | | | | | | | | | | | | | | | |
| | | | | |
| Description | | Level 1 | | | Level 2 | | | Level 3 | | | Total | |
International Equity Fund | | | | | | | | | | | | | | | | |
Asset Valuation Inputs | | | | | | | | | | | | | | | | |
Common Stocks | | | | | | | | | | | | | | | | |
Australia | | $ | — | | | $ | 381,845,259 | | | $ | — | | | $ | 381,845,259 | |
Austria | | | — | | | | 58,310,988 | | | | 0 | § | | | 58,310,988 | |
Belgium | | | — | | | | 19,532,228 | | | | — | | | | 19,532,228 | |
Canada | | | 148,301,234 | | | | — | | | | — | | | | 148,301,234 | |
Denmark | | | — | | | | 25,152,999 | | | | — | | | | 25,152,999 | |
Finland | | | — | | | | 73,197,037 | | | | — | | | | 73,197,037 | |
France | | | 2,672,026 | | | | 553,275,274 | | | | — | | | | 555,947,300 | |
Germany | | | — | | | | 490,346,640 | | | | — | | | | 490,346,640 | |
Hong Kong | | | — | | | | 276,074,847 | | | | — | | | | 276,074,847 | |
Ireland | | | — | | | | 10,217,778 | | | | — | | | | 10,217,778 | |
Israel | | | 14,747,481 | | | | 64,076,614 | | | | — | | | | 78,824,095 | |
Italy | | | — | | | | 112,433,786 | | | | — | | | | 112,433,786 | |
Japan | | | — | | | | 1,588,849,198 | | | | — | | | | 1,588,849,198 | |
Malta | | | — | | | | — | | | | 248,929 | | | | 248,929 | |
Netherlands | | | 6,739,035 | | | | 163,288,119 | | | | — | | | | 170,027,154 | |
New Zealand | | | — | | | | 29,844,685 | | | | — | | | | 29,844,685 | |
Norway | | | — | | | | 120,068,847 | | | | — | | | | 120,068,847 | |
Portugal | | | — | | | | 12,463,624 | | | | — | | | | 12,463,624 | |
Singapore | | | — | | | | 39,569,580 | | | | — | | | | 39,569,580 | |
Spain | | | — | | | | 212,946,160 | | | | — | | | | 212,946,160 | |
Sweden | | | — | | | | 22,547,693 | | | | — | | | | 22,547,693 | |
Switzerland | | | — | | | | 325,702,656 | | | | — | | | | 325,702,656 | |
United Kingdom | | | — | | | | 958,318,773 | | | | — | | | | 958,318,773 | |
| | | | | | | | | | | | | | | | | |
TOTAL COMMON STOCKS | | | 172,459,776 | | | | 5,538,062,785 | | | | 248,929 | | | | 5,710,771,490 | |
| | | | | | | | | | | | | | | | | |
Preferred Stocks | | | | | | | | | | | | | | | | |
Germany | | | — | | | | 49,301,317 | | | | — | | | | 49,301,317 | |
| | | | | | | | | | | | | | | | | |
TOTAL PREFERRED STOCKS | | | — | | | | 49,301,317 | | | | — | | | | 49,301,317 | |
| | | | | | | | | | | | | | | | | |
| | | | | | | | | | | | | | | | | |
74
GMO Trust Funds
Notes to Financial Statements — (Continued)
February 28, 2017
| | | | | | | | | | | | | | | | |
| | | | | |
| Description | | Level 1 | | | Level 2 | | | Level 3 | | | Total | |
International Equity Fund (continued) | | | | | | | | | | | | | | | | |
Asset Valuation Inputs (continued) | | | | | | | | | | | | | | | | |
Mutual Funds | | | | | | | | | | | | | | | | |
United States | | $ | 21,767,868 | | | $ | — | | | $ | — | | | $ | 21,767,868 | |
| | | | | | | | | | | | | | | | | |
TOTAL MUTUAL FUNDS | | | 21,767,868 | | | | — | | | | — | | | | 21,767,868 | |
| | | | | | | | | | | | | | | | | |
Short-Term Investments | | | 26,809,553 | | | | — | | | | — | | | | 26,809,553 | |
| | | | | | | | | | | | | | | | | |
Total Investments | | | 221,037,197 | | | | 5,587,364,102 | | | | 248,929 | | | | 5,808,650,228 | |
| | | | | | | | | | | | | | | | | |
Total | | $ | 221,037,197 | | | $ | 5,587,364,102 | | | $ | 248,929 | | | $ | 5,808,650,228 | |
| | | | | | | | | | | | | | | | | |
| | | | | | | | | | | | | | | | | |
International Large/Mid Cap Equity Fund | | | | | | | | | | | | | | | | |
Asset Valuation Inputs | | | | | | | | | | | | | | | | |
Common Stocks | | | | | | | | | | | | | | | | |
Australia | | $ | — | | | $ | 5,925,359 | | | $ | — | | | $ | 5,925,359 | |
Austria | | | — | | | | 2,833,099 | | | | — | | | | 2,833,099 | |
Belgium | | | — | | | | 288,613 | | | | — | | | | 288,613 | |
Canada | | | 3,183,155 | | | | — | | | | — | | | | 3,183,155 | |
Denmark | | | — | | | | 1,395,123 | | | | — | | | | 1,395,123 | |
Finland | | | — | | | | 2,790,356 | | | | — | | | | 2,790,356 | |
France | | | — | | | | 19,150,578 | | | | — | | | | 19,150,578 | |
Germany | | | — | | | | 14,493,375 | | | | — | | | | 14,493,375 | |
Hong Kong | | | — | | | | 10,156,652 | | | | — | | | | 10,156,652 | |
Ireland | | | — | | | | 220,498 | | | | — | | | | 220,498 | |
Israel | | | 2,892,289 | | | | 1,176,687 | | | | — | | | | 4,068,976 | |
Italy | | | — | | | | 791,369 | | | | — | | | | 791,369 | |
Japan | | | — | | | | 50,737,683 | | | | — | | | | 50,737,683 | |
Malta | | | — | | | | — | | | | 249,150 | | | | 249,150 | |
Netherlands | | | 344,280 | | | | 5,985,972 | | | | — | | | | 6,330,252 | |
New Zealand | | | — | | | | 1,159,398 | | | | — | | | | 1,159,398 | |
Norway | | | — | | | | 3,383,454 | | | | — | | | | 3,383,454 | |
Portugal | | | — | | | | 70,018 | | | | — | | | | 70,018 | |
Singapore | | | — | | | | 775,310 | | | | — | | | | 775,310 | |
Spain | | | — | | | | 5,679,803 | | | | — | | | | 5,679,803 | |
Sweden | | | — | | | | 227,343 | | | | — | | | | 227,343 | |
Switzerland | | | — | | | | 10,524,081 | | | | — | | | | 10,524,081 | |
United Kingdom | | | — | | | | 34,426,572 | | | | — | | | | 34,426,572 | |
| | | | | | | | | | | | | | | | | |
TOTAL COMMON STOCKS | | | 6,419,724 | | | | 172,191,343 | | | | 249,150 | | | | 178,860,217 | |
| | | | | | | | | | | | | | | | | |
Preferred Stocks | | | | | | | | | | | | |
Germany | | | — | | | | 2,250,179 | | | | — | | | | 2,250,179 | |
| | | | | | | | | | | | | | | | | |
TOTAL PREFERRED STOCKS | | | — | | | | 2,250,179 | | | | — | | | | 2,250,179 | |
| | | | | | | | | | | | | | | | | |
Mutual Funds | | | | | | | | | | | | |
United States | | | 2,408,002 | | | | — | | | | — | | | | 2,408,002 | |
| | | | | | | | | | | | | | | | | |
TOTAL MUTUAL FUNDS | | | 2,408,002 | | | | — | | | | — | | | | 2,408,002 | |
| | | | | | | | | | | | | | | | | |
Short-Term Investments | | | 479,981 | | | | — | | | | — | | | | 479,981 | |
| | | | | | | | | | | | | | | | | |
Total Investments | | | 9,307,707 | | | | 174,441,522 | | | | 249,150 | | | | 183,998,379 | |
| | | | | | | | | | | | | | | | | |
Derivatives^ | | | | | | | | | | | | |
Futures Contracts | | | | | | | | | | | | | | | | |
Equity Risk | | | 18,330 | | | | — | | | | — | | | | 18,330 | |
| | | | | | | | | | | | | | | | | |
Total | | $ | 9,326,037 | | | $ | 174,441,522 | | | $ | 249,150 | | | $ | 184,016,709 | |
| | | | | | | | | | | | | | | | | |
| | | | | | | | | | | | | | | | | |
75
GMO Trust Funds
Notes to Financial Statements — (Continued)
February 28, 2017
| | | | | | | | | | | | | | | | |
| | | | | |
| Description | | Level 1 | | | Level 2 | | | Level 3 | | | Total | |
Quality Fund | | | | | | | | | | | | | | | | |
Asset Valuation Inputs | | | | | | | | | | | | | | | | |
Common Stocks | | | | | | | | | | | | | | | | |
France | | $ | — | | | $ | 83,203,075 | | | $ | — | | | $ | 83,203,075 | |
Germany | | | — | | | | 50,914,804 | | | | — | | | | 50,914,804 | |
Netherlands | | | — | | | | 184,392,914 | | | | — | | | | 184,392,914 | |
Switzerland | | | — | | | | 207,881,201 | | | | — | | | | 207,881,201 | |
Taiwan | | | — | | | | 126,822,745 | | | | — | | | | 126,822,745 | |
United Kingdom | | | — | | | | 559,456,312 | | | | — | | | | 559,456,312 | |
United States | | | 7,203,761,291 | | | | — | | | | — | | | | 7,203,761,291 | |
| | | | | | | | | | | | | | | | | |
TOTAL COMMON STOCKS | | | 7,203,761,291 | | | | 1,212,671,051 | | | | — | | | | 8,416,432,342 | |
| | | | | | | | | | | | | | | | | |
Mutual Funds | | | | | | | | | | | | |
United States | | | 240,449,520 | | | | — | | | | — | | | | 240,449,520 | |
| | | | | | | | | | | | | | | | | |
TOTAL MUTUAL FUNDS | | | 240,449,520 | | | | — | | | | — | | | | 240,449,520 | |
| | | | | | | | | | | | | | | | | |
Short-Term Investments | | | 18,256,935 | | | | — | | | | — | | | | 18,256,935 | |
| | | | | | | | | | | | | | | | | |
Total Investments | | | 7,462,467,746 | | | | 1,212,671,051 | | | | — | | | | 8,675,138,797 | |
| | | | | | | | | | | | | | | | | |
Total | | $ | 7,462,467,746 | | | $ | 1,212,671,051 | | | $ | — | | | $ | 8,675,138,797 | |
| | | | | | | | | | | | | | | | | |
| | | | | | | | | | | | | | | | | |
Resources Fund | | | | | | | | | | | | | | | | |
Asset Valuation Inputs | | | | | | | | | | | | | | | | |
Common Stocks | | | | | | | | | | | | | | | | |
Argentina | | $ | 3,306,212 | | | $ | — | | | $ | — | | | $ | 3,306,212 | |
Australia | | | — | | | | 3,729,886 | | | | — | | | | 3,729,886 | |
Austria | | | — | | | | 2,035,078 | | | | — | | | | 2,035,078 | |
Brazil | | | — | | | | 1,546,721 | | | | — | | | | 1,546,721 | |
Canada | | | 8,155,313 | | | | — | | | | — | | | | 8,155,313 | |
China | | | — | | | | 1,043,715 | | | | — | | | | 1,043,715 | |
Colombia | | | 922,154 | | | | — | | | | — | | | | 922,154 | |
Czech Republic | | | — | | | | 1,921,592 | | | | — | | | | 1,921,592 | |
France | | | — | | | | 3,859,481 | | | | — | | | | 3,859,481 | |
Germany | | | — | | | | 2,874,925 | | | | — | | | | 2,874,925 | |
Greece | | | — | | | | 260,744 | | | | — | | | | 260,744 | |
Hungary | | | — | | | | 1,242,706 | | | | — | | | | 1,242,706 | |
India | | | — | | | | 1,539,049 | | | | — | | | | 1,539,049 | |
Indonesia | | | — | | | | 104,846 | | | | — | | | | 104,846 | |
Israel | | | — | | | | 3,301,479 | | | | — | | | | 3,301,479 | |
Italy | | | — | | | | 2,734,197 | | | | — | | | | 2,734,197 | |
Japan | | | — | | | | 6,092,109 | | | | — | | | | 6,092,109 | |
Kazakhstan | | | — | | | | 84,203 | | | | — | | | | 84,203 | |
Netherlands | | | — | | | | 1,454,394 | | | | — | | | | 1,454,394 | |
Norway | | | — | | | | 13,918,808 | | | | — | | | | 13,918,808 | |
Poland | | | — | | | | 4,445,383 | | | | — | | | | 4,445,383 | |
Russia | | | — | | | | 22,874,711 | | | | — | | | | 22,874,711 | |
Singapore | | | — | | | | 2,864,689 | | | | — | | | | 2,864,689 | |
South Africa | | | — | | | | 3,250,241 | | | | — | | | | 3,250,241 | |
South Korea | | | — | | | | 599,734 | | | | — | | | | 599,734 | |
Spain | | | — | | | | 3,956,776 | | | | — | | | | 3,956,776 | |
Sweden | | | — | | | | 674,649 | | | | — | | | | 674,649 | |
Thailand | | | — | | | | 3,151,078 | | | | — | | | | 3,151,078 | |
Turkey | | | — | | | | 710,116 | | | | — | | | | 710,116 | |
Ukraine | | | — | | | | 2,454,785 | | | | — | | | | 2,454,785 | |
United Arab Emirates | | | — | | | | 162,805 | | | | — | | | | 162,805 | |
United Kingdom | | | — | | | | 51,328,655 | | | | — | | | | 51,328,655 | |
United States | | | 26,657,554 | | | | — | | | | — | | | | 26,657,554 | |
| | | | | | | | | | | | | | | | | |
TOTAL COMMON STOCKS | | | 39,041,233 | | | | 144,217,555 | | | | — | | | | 183,258,788 | |
| | | | | | | | | | | | | | | | | |
| | | | | | | | | | | | | | | | | |
76
GMO Trust Funds
Notes to Financial Statements — (Continued)
February 28, 2017
| | | | | | | | | | | | | | | | |
| | | | | |
| Description | | Level 1 | | | Level 2 | | | Level 3 | | | Total | |
Resources Fund (continued) | | | | | | | | | | | | | | | | |
Asset Valuation Inputs (continued) | | | | | | | | | | | | | | | | |
Preferred Stocks | | | | | | | | | | | | | | | | |
Brazil | | $ | — | | | $ | 8,778,656 | | | $ | — | | | $ | 8,778,656 | |
Chile | | | 9,052,407 | | | | 870,344 | | | | — | | | | 9,922,751 | |
Russia | | | — | | | | 3,660,205 | | | | — | | | | 3,660,205 | |
| | | | | | | | | | | | | | | | | |
TOTAL PREFERRED STOCKS | | | 9,052,407 | | | | 13,309,205 | | | | — | | | | 22,361,612 | |
| | | | | | | | | | | | | | | | | |
Mutual Funds | | | | | | | | | | | | | | | | |
United States | | | 6,150,081 | | | | — | | | | — | | | | 6,150,081 | |
| | | | | | | | | | | | | | | | | |
TOTAL MUTUAL FUNDS | | | 6,150,081 | | | | — | | | | — | | | | 6,150,081 | |
| | | | | | | | | | | | | | | | | |
Short-Term Investments | | | 557,173 | | | | — | | | | — | | | | 557,173 | |
| | | | | | | | | | | | | | | | | |
Total Investments | | | 54,800,894 | | | | 157,526,760 | | | | — | | | | 212,327,654 | |
| | | | | | | | | | | | | | | | | |
Total | | $ | 54,800,894 | | | $ | 157,526,760 | | | $ | — | | | $ | 212,327,654 | |
| | | | | | | | | | | | | | | | | |
| | | | | | | | | | | | | | | | | |
Risk Premium Fund | | | | | | | | | | | | | | | | |
Asset Valuation Inputs | | | | | | | | | | | | | | | | |
Short-Term Investments | | $ | 158,083,394 | | | $ | — | | | $ | — | | | $ | 158,083,394 | |
| | | | | | | | | | | | | | | | | |
Total Investments | | | 158,083,394 | | | | — | | | | — | | | | 158,083,394 | |
| | | | | | | | | | | | | | | | | |
Total | | $ | 158,083,394 | | | $ | — | | | $ | — | | | $ | 158,083,394 | |
| | | | | | | | | | | | | | | | | |
| | | | | | | | | | | | | | | | | |
Liability Valuation Inputs | | | | | | | | | | | | | | | | |
Derivatives^ | | | | | | | | | | | | |
Written Options | | | | | | | | | | | | |
Equity Risk | | $ | (343,420 | ) | | $ | (768,911 | ) | | $ | — | | | $ | (1,112,331 | ) |
| | | | | | | | | | | | | | | | | |
| | | | | | | | | | | | | | | | | |
Tax-Managed International Equities Fund | | | | | | | | | | | | | | | | |
Asset Valuation Inputs | | | | | | | | | | | | | | | | |
Common Stocks | | | | | | | | | | | | | | | | |
Australia | | $ | — | | | $ | 8,298,223 | | | $ | — | | | $ | 8,298,223 | |
Austria | | | — | | | | 875,625 | | | | 0 | § | | | 875,625 | |
Belgium | | | — | | | | 502,746 | | | | — | | | | 502,746 | |
Brazil | | | — | | | | 421,625 | | | | — | | | | 421,625 | |
Canada | | | 2,217,931 | | | | — | | | | — | | | | 2,217,931 | |
China | | | 151,862 | | | | 3,086,794 | | | | — | | | | 3,238,656 | |
Czech Republic | | | — | | | | 71,426 | | | | — | | | | 71,426 | |
Denmark | | | — | | | | 775,707 | | | | — | | | | 775,707 | |
Finland | | | — | | | | 1,740,598 | | | | — | | | | 1,740,598 | |
France | | | — | | | | 9,882,682 | | | | 0 | § | | | 9,882,682 | |
Germany | | | — | | | | 10,993,593 | | | | — | | | | 10,993,593 | |
Hong Kong | | | — | | | | 3,284,556 | | | | — | | | | 3,284,556 | |
Hungary | | | — | | | | 133,145 | | | | — | | | | 133,145 | |
India | | | 161,998 | | | | 546,221 | | | | — | | | | 708,219 | |
Ireland | | | — | | | | 350,774 | | | | — | | | | 350,774 | |
Israel | | | 306,621 | | | | 1,113,601 | | | | — | | | | 1,420,222 | |
Italy | | | — | | | | 3,756,547 | | | | — | | | | 3,756,547 | |
Japan | | | — | | | | 22,917,185 | | | | — | | | | 22,917,185 | |
Malta | | | — | | | | — | | | | 26,756 | | | | 26,756 | |
Mexico | | | 343,335 | | | | — | | | | — | | | | 343,335 | |
Netherlands | | | — | | | | 3,140,966 | | | | — | | | | 3,140,966 | |
New Zealand | | | — | | | | 625,963 | | | | — | | | | 625,963 | |
Norway | | | — | | | | 1,757,801 | | | | — | | | | 1,757,801 | |
| | | | | | | | | | | | | | | | | |
77
GMO Trust Funds
Notes to Financial Statements — (Continued)
February 28, 2017
| | | | | | | | | | | | | | | | |
| | | | | |
| Description | | Level 1 | | | Level 2 | | | Level 3 | | | Total | |
Tax-Managed International Equities Fund (continued) | | | | | | | | | | | | | | | | |
Asset Valuation Inputs (continued) | | | | | | | | | | | | | | | | |
Peru | | $ | 32,924 | | | $ | — | | | $ | — | | | $ | 32,924 | |
Poland | | | — | | | | 202,979 | | | | — | | | | 202,979 | |
Portugal | | | — | | | | 319,859 | | | | — | | | | 319,859 | |
Russia | | | — | | | | 352,625 | | | | — | | | | 352,625 | |
Singapore | | | — | | | | 1,602,975 | | | | — | | | | 1,602,975 | |
South Africa | | | — | | | | 1,029,348 | | | | — | | | | 1,029,348 | |
South Korea | | | — | | | | 1,726,187 | | | | — | | | | 1,726,187 | |
Spain | | | — | | | | 2,178,208 | | | | — | | | | 2,178,208 | |
Sweden | | | — | | | | 1,355,013 | | | | — | | | | 1,355,013 | |
Switzerland | | | — | | | | 6,349,557 | | | | — | | | | 6,349,557 | |
Taiwan | | | 490,932 | | | | 1,193,071 | | | | — | | | | 1,684,003 | |
Thailand | | | — | | | | 213,292 | | | | — | | | | 213,292 | |
Turkey | | | — | | | | 278,664 | | | | — | | | | 278,664 | |
United Kingdom | | | — | | | | 17,404,859 | | | | — | | | | 17,404,859 | |
| | | | | | | | | | | | | | | | | |
TOTAL COMMON STOCKS | | | 3,705,603 | | | | 108,482,415 | | | | 26,756 | | | | 112,214,774 | |
| | | | | | | | | | | | | | | | | |
Preferred Stocks | | | | | | | | | | | | | | | | |
Brazil | | | — | | | | 833,656 | | | | — | | | | 833,656 | |
Germany | | | — | | | | 1,015,349 | | | | — | | | | 1,015,349 | |
Russia | | | — | | | | 75,797 | | | | — | | | | 75,797 | |
South Korea | | | — | | | | 339,382 | | | | — | | | | 339,382 | |
| | | | | | | | | | | | | | | | | |
TOTAL PREFERRED STOCKS | | | — | | | | 2,264,184 | | | | — | | | | 2,264,184 | |
| | | | | | | | | | | | | | | | | |
RIGHTS/WARRANTS | | | | | | | | | | | | | | | | |
Brazil | | | — | | | | — | | | | 990 | | | | 990 | |
| | | | | | | | | | | | | | | | | |
TOTAL RIGHTS/WARRANTS | | | — | | | | — | | | | 990 | | | | 990 | |
| | | | | | | | | | | | | | | | | |
Mutual Funds | | | | | | | | | | | | | | | | |
United States | | | 427,587 | | | | — | | | | — | | | | 427,587 | |
| | | | | | | | | | | | | | | | | |
TOTAL MUTUAL FUNDS | | | 427,587 | | | | — | | | | — | | | | 427,587 | |
| | | | | | | | | | | | | | | | | |
Short-Term Investments | | | 288,768 | | | | — | | | | — | | | | 288,768 | |
| | | | | | | | | | | | | | | | | |
Total Investments | | | 4,421,958 | | | | 110,746,599 | | | | 27,746 | | | | 115,196,303 | |
| | | | | | | | | | | | | | | | | |
Total | | $ | 4,421,958 | | | $ | 110,746,599 | | | | 27,746 | | | | 115,196,303 | |
| | | | | | | | | | | | | | | | | |
| | | | | | | | | | | | | | | | | |
Liability Valuation Inputs | | | | | | | | | | | | | | | | |
Derivatives^ | | | | | | | | | | | | |
Futures Contracts | | | | | | | | | | | | | | | | |
Equity Risk | | $ | (1,260 | ) | | $ | — | | | $ | — | | | $ | (1,260 | ) |
| | | | | | | | | | | | | | | | | |
Total | | $ | (1,260 | ) | | $ | — | | | $ | — | | | $ | (1,260 | ) |
| | | | | | | | | | | | | | | | | |
| | | | | | | | | | | | | | | | | |
U.S. Equity Allocation Fund | | | | | | | | | | | | | | | | |
Asset Valuation Inputs | | | | | | | | | | | | | | | | |
Common Stocks | | $ | 1,746,501,042 | | | $ | — | | | $ | — | | | $ | 1,746,501,042 | |
Mutual Funds | | | 11,180,107 | | | | — | | | | — | | | | 11,180,107 | |
Short-Term Investments | | | 3,560,695 | | | | — | | | | — | | | | 3,560,695 | |
| | | | | | | | | | | | | | | | | |
Total Investments | | | 1,761,241,844 | | | | — | | | | — | | | | 1,761,241,844 | |
| | | | | | | | | | | | | | | | | |
Total | | $ | 1,761,241,844 | | | $ | — | | | $ | — | | | $ | 1,761,241,844 | |
| | | | | | | | | | | | | | | | | |
| | | | | | | | | | | | | | | | | |
The risks referenced in the tables above are not intended to be inclusive of all risks. Please see the “Investment and other risks” and “Derivative financial instruments” sections below for a further discussion of risks.
| | ^ | The tables above are based on market values or unrealized appreciation/(depreciation) rather than the notional amounts of derivatives. The uncertainties surrounding the valuation inputs for a derivative are likely to be more significant to the Funds’ net asset values than the uncertainties |
78
GMO Trust Funds
Notes to Financial Statements — (Continued)
February 28, 2017
| | surrounding inputs for a non-derivative security with the same market value. Excludes purchased options, if any, which are included in investments. |
| | § | Represents the interest in securities that were determined to have a value of zero at February 28, 2017. |
The underlying funds held at year end are classified above as Level 1. For the summary of valuation inputs of the underlying funds, please refer to the underlying funds’ Notes to Financial Statements.
For all Funds for the year ended February 28, 2017, there were no significant transfers between Level 1 and Level 2.
The following is a reconciliation of securities and derivatives, if any, in which significant unobservable inputs (Level 3) were used in determining value:
| | | | | | | | | | | | | | | | | | | | | | | | | | | | | | | | | | | | | | | | |
| | | | | | | | | | | |
| | | Balances
as of
February 29,
2016 | | | Purchases | | | Sales | | | Accrued
Discounts/
Premiums | | | Total
Realized
Gain/
(Loss) | | | Change in
Unrealized
Appreciation
(Depreciation) | | | Transfer
into
Level 3† | | | Transfer
out of
Level 3† | | | Balances
as of
February 28,
2017 | | | Net Change in
Unrealized
Appreciation
(Depreciation)
from Investments
Still Held as of
February 28,
2017 | |
International Equity Fund | | | | | | | | | | | | | | | | | |
Common Stocks | | | | | | | | | | | | | | | | | | | | | | | | | | | | | | | | | | | | | | | | |
Malta | | $ | 0 | * | | $ | — | | | $ | — | | | $ | — | | | $ | — | | | $ | 248,929 | | | $ | — | | | $ | — | | | $ | 248,929 | | | $ | 248,929 | |
| | | | | | | | | | | | | | | | | | | | | | | | | | | | | | | | | | | | | | | | | |
Total | | $ | 0 | * | | $ | — | | | $ | — | | | $ | — | | | $ | — | | | $ | 248,929 | | | $ | — | | | $ | — | | | $ | 248,929 | | | $ | 248,929 | |
| | | | | | | | | | | | | | | | | | | | | | | | | | | | | | | | | | | | | | | | | |
| | | | | | | | | | | | | | | | | | | | | | | | | | | | | | | | | | | | | | | | | |
International Large/Mid Cap Equity Fund | | | | | | | | | | | | | | | | | |
Common Stocks | | | | | | | | | | | | | | | | | | | | | | | | | | | | | | | | | | | | | | | | |
Malta | | $ | 0 | * | | $ | — | | | $ | — | | | $ | — | | | $ | — | | | $ | 249,150 | | | $ | — | | | $ | — | | | $ | 249,150 | | | $ | 249,150 | |
| | | | | | | | | | | | | | | | | | | | | | | | | | | | | | | | | | | | | | | | | |
Total | | $ | 0 | * | | $ | — | | | $ | — | | | $ | — | | | $ | — | | | $ | 249,150 | | | $ | — | | | $ | — | | | $ | 249,150 | | | $ | 249,150 | |
| | | | | | | | | | | | | | | | | | | | | | | | | | | | | | | | | | | | | | | | | |
| | | | | | | | | | | | | | | | | | | | | | | | | | | | | | | | | | | | | | | | | |
Tax-Managed International Equities Fund | | | | | | | | | | | | | | | | | |
Common Stocks | | | | | | | | | | | | | | | | | | | | | | | | | | | | | | | | | | | | | | | | |
Malta | | $ | 0 | * | | $ | — | | | $ | — | | | $ | — | | | $ | — | | | $ | 26,756 | | | $ | — | | | $ | — | | | $ | 26,756 | | | $ | 26,756 | |
| | | | | | | | | | | | | | | | | | | | | | | | | | | | | | | | | | | | | | | | | |
Total Common Stocks | | $ | 0 | * | | $ | — | | | $ | — | | | $ | — | | | $ | — | | | $ | 26,756 | | | $ | — | | | $ | — | | | $ | 26,756 | | | $ | 26,756 | |
| | | | | | | | | | | | | | | | | | | | | | | | | | | | | | | | | | | | | | | | | |
Rights/Warrants | | | | | | | | | | | | | | | | | | | | | | | | | | | | | | | | | | | | | | | | |
Brazil | | $ | — | | | $ | 0 | | | $ | — | | | $ | — | | | $ | — | | | $ | 990 | | | $ | — | | | $ | — | | | $ | 990 | | | $ | 990 | |
| | | | | | | | | | | | | | | | | | | | | | | | | | | | | | | | | | | | | | | | | |
Total | | $ | 0 | * | | $ | 0 | | | $ | — | | | $ | — | | | $ | — | | | $ | 27,746 | | | $ | — | | | $ | — | | | $ | 27,746 | | | $ | 27,746 | |
| | | | | | | | | | | | | | | | | | | | | | | | | | | | | | | | | | | | | | | | | |
| | | | | | | | | | | | | | | | | | | | | | | | | | | | | | | | | | | | | | | | | |
| | † | The Funds account for securities and derivatives, if any, transferred into and out of Level 3 at the value at the end of the year. |
| | * | Represents the interest in securities that were determined to have a value of zero at February 29, 2016. |
The net aggregate direct and indirect exposure to investments in securities using Level 3 inputs (based on each Fund’s net assets) as of February 28, 2017 were as follows:
| | | | |
| | |
| Fund Name | | Level 3 securities
and derivatives | |
International Equity Fund | | | < 1% | |
International Large/Mid Cap Equity Fund | | | < 1% | |
Quality Fund | | | — | |
Resources Fund | | | — | |
Risk Premium Fund | | | — | |
Tax-Managed International Equities Fund | | | < 1% | |
U.S. Equity Allocation Fund | | | — | |
79
GMO Trust Funds
Notes to Financial Statements — (Continued)
February 28, 2017
Cash
Cash and foreign currency, if any, on the Statements of Assets and Liabilities consist of cash balances held with the custodian.
Due to/from broker
Due to/from broker in the Statements of Assets and Liabilities includes collateral on swap contracts, futures contracts, option contracts and forward currency contracts, if any, and may include marked-to-market amounts related to foreign currency or cash owed.
Foreign currency translation
The market values of foreign securities, currency holdings and related assets and liabilities are typically translated into U.S. dollars at the close of regular trading on the NYSE, generally at 4:00 pm Eastern time. Income and expenses denominated in foreign currencies are typically translated into U.S. dollars at the close of regular trading on the NYSE. Fluctuations in the value of currency holdings and other assets and liabilities resulting from changes in exchange rates are recorded as unrealized foreign currency gains or losses. Realized gains or losses and unrealized appreciation or depreciation on investment securities and income and expenses are translated on the respective dates of such transactions. The effects of changes in foreign currency exchange rates on investments in securities are not separated on the Statements of Operations from the effects of changes in market prices of those securities, but are included with the net realized and unrealized gain or loss on investment securities.
Taxes and distributions
Each Fund has elected to be treated and intends to qualify each tax year as a regulated investment company under Subchapter M of the Internal Revenue Code of 1986, as amended (the “Code”). Each Fund intends to distribute its net investment income, if any, and its net realized short-term and long-term capital gains, if any, after giving effect to any available capital loss carryforwards for U.S. federal income tax purposes. Therefore, each Fund makes no provision for U.S. federal income or excise taxes.
The policy of each Fund is to declare and pay dividends of its net investment income, if any, at least annually, although the Funds are permitted to, and will from time to time, declare and pay dividends of net investment income, if any, more frequently. Each Fund also intends to distribute net realized short-term and long-term capital gains, if any, at least annually. In addition, each Fund may, from time to time at their discretion, make unscheduled distributions in advance of large redemptions by shareholders or as otherwise deemed appropriate by a Fund. Typically, all distributions are reinvested in additional shares of each Fund at net asset value, unless GMO or its agents receive and process a shareholder election to receive cash distributions. Distributions to shareholders are recorded by each Fund on the ex-dividend date.
Taxes on foreign interest and dividend income are generally withheld in accordance with the applicable country’s tax treaty with the United States. The foreign withholding rates applicable to a Fund’s investments in certain jurisdictions may be higher if a significant portion of the Fund is held by non-U.S. shareholders. Each Fund may be subject to taxation on realized capital gains, repatriation proceeds and other transaction-based charges imposed by certain countries in which it invests. Taxes related to capital gains realized during the year ended February 28, 2017, if any, are reflected as part of Net realized gain (loss) in the Statements of Operations. Changes in tax liabilities related to capital gain taxes on unrealized investment gains, if any, are reflected as part of Change in net unrealized appreciation (depreciation) in the Statements of Operations. Transaction-based charges are generally calculated as a percentage of the transaction amount.
Certain Funds have previously filed for and/or may file for additional tax refunds with respect to certain taxes withheld by certain countries. Generally, the amount of such refunds that a Fund reasonably determines are collectible and free from significant contingencies are reflected in a Fund’s net asset value and are reflected as Dividends from unaffiliated issuers in the Statements of Operations. In certain circumstances, a Fund’s receipt of such refunds may cause the Fund and/or its shareholders to be liable for U.S. federal income taxes and interest charges.
Foreign taxes paid by each Fund may be treated, to the extent permissible by the Code (and other applicable U.S. federal tax guidance) and if that Fund so elects, as if paid by U.S. shareholders of that Fund.
Income and capital gain distributions are determined in accordance with U.S. federal income tax regulations, which may differ from U.S. GAAP. Certain capital accounts in the financial statements are periodically adjusted for permanent differences in order to reflect their tax character. These adjustments have no impact on net assets or net asset value per share. Temporary differences that arise from recognizing certain items of income, expense, gain or loss in different periods for financial statement and tax purposes will likely reverse at some time in the future. Distributions in excess of net investment income or net realized gains are temporary over-distributions for financial statement purposes resulting from differences in the recognition or classification of income or distributions for financial statement and tax purposes.
80
GMO Trust Funds
Notes to Financial Statements — (Continued)
February 28, 2017
U.S. GAAP and tax accounting differences for each Fund primarily relate to reasons described in the following table:
| | | | | | | | | | | | | | | | | | | | |
| | | | | | | | |
| Differences related to: | | International Equity Fund | | International Large/Mid Cap Equity Fund | | Quality Fund | | | Resources Fund | | Risk Premium Fund | | | Tax-Managed International Equities Fund | | U.S. Equity Allocation Fund | |
Capital loss carry forwards | | X | | X | | | | | | X | | | | | | X | | | X | |
Derivative contract transactions | | X | | | | | | | | | | | X | | | | | | | |
Dividend income and withholding tax reclaim reserves | | X | | X | | | | | | X | | | | | | X | | | | |
Dividends received from underlying investments | | X | | X | | | | | | | | | | | | X | | | | |
Foreign currency transactions | | | | X | | | | | | | | | | | | | | | | |
Late-year ordinary losses | | | | | | | | | | | | | X | | | | | | | |
Losses on wash sale transactions | | X | | X | | | X | | | X | | | | | | X | | | X | |
Net operating losses | | | | | | | | | | | | | X | | | | | | | |
Passive foreign investment company transactions | | X | | X | | | | | | X | | | | | | X | | | | |
Post-October capital losses | | X | | X | | | X | | | X | | | X | | | X | | | X | |
Redemption in-kind transactions | | | | | | | | | | | | | | | | | | | X | |
The tax character of distributions declared by each Fund to shareholders is as follows:
| | | | | | | | | | | | | | | | | | | | | | | | |
| | | |
| | | Tax year ended February 28, 2017 | | | Tax year ended February 29, 2016 | |
| | | | | | | |
| Fund Name | | Ordinary
Income
(including
any net
short-term
capital gain) ($) | | | Net Long-Term
Capital Gain ($) | | | Total
Distributions ($) | | | Ordinary
Income
(including
any net
short-term
capital gain) ($) | | | Net Long-Term
Capital Gain ($) | | | Total
Distributions ($) | |
| International Equity Fund | | | 262,473,509 | | | | — | | | | 262,473,509 | | | | 297,084,415 | | | | — | | | | 297,084,415 | |
International Large/Mid Cap Equity Fund | | | 40,719,674 | | | | — | | | | 40,719,674 | | | | 53,270,911 | | | | — | | | | 53,270,911 | |
| Quality Fund | | | 148,413,572 | | | | 154,921,160 | | | | 303,334,732 | | | | 231,512,893 | | | | 1,059,027,580 | | | | 1,290,540,473 | |
| Resources Fund | | | 6,026,707 | | | | — | | | | 6,026,707 | | | | 5,880,372 | | | | — | | | | 5,880,372 | |
| Risk Premium Fund | | | 5,207,663 | | | | 8,050,339 | | | | 13,258,002 | | | | 10,047,911 | | | | 17,822,385 | | | | 27,870,296 | |
Tax-Managed International Equities Fund | | | 5,479,378 | | | | — | | | | 5,479,378 | | | | 10,648,298 | | | | — | | | | 10,648,298 | |
| U.S. Equity Allocation Fund | | | 63,029,610 | | | | 198,946,416 | | | | 261,976,026 | | | | 95,609,558 | | | | 521,955,779 | | | | 617,565,337 | |
Distributions in excess of a Fund’s tax basis earnings and profits, if significant, are reported in the Funds’ financial statements as a return of capital.
81
GMO Trust Funds
Notes to Financial Statements — (Continued)
February 28, 2017
As of February 28, 2017, the components of distributable earnings on a tax basis and certain tax attributes for the Funds consisted of the following:
| | | | | | | | | | | | | | | | | | | | |
| | | | | | |
| Fund Name | | Undistributed
Ordinary
Income
(including any
net short-term
capital gain) ($) | | | Undistributed
Net Long-Term
Capital Gain ($) | | | Late-Year
Ordinary Loss
Deferral ($) | | | Capital Loss
Carryforwards ($) | | | Post-October
Capital Losses ($) | |
International Equity Fund | | | 15,987,870 | | | | — | | | | — | | | | (1,372,912,629) | | | | (32,350,802) | |
International Large/Mid Cap Equity Fund | | | 354,858 | | | | — | | | | — | | | | (208,414) | | | | — | |
Quality Fund | | | 15,904,720 | | | | 67,397,396 | | | | (207,477) | | | | — | | | | — | |
Resources Fund | | | 4,734,911 | | | | — | | | | — | | | | (57,749,153) | | | | — | |
Risk Premium Fund | | | 4,688,373 | | | | 7,016,332 | | | | (8,343) | | | | — | | | | — | |
Tax-Managed International Equities Fund | | | 367,020 | | | | — | | | | — | | | | (39,804,525) | | | | (474,875) | |
U.S. Equity Allocation Fund | | | 10,509,050 | | | | 64,380,593 | | | | — | | | | (36,676,027) | | | | — | |
As of February 28, 2017, certain Funds had capital loss carryforwards available to offset future realized gains, if any, to the extent permitted by the Code. Net capital losses recognized in taxable years beginning on or after March 1, 2011 are carried forward without expiration and generally retain their short-term and/or long-term tax character, as applicable. In addition, such losses should be utilized prior to losses scheduled to expire on or before February 28, 2019. As a result of this ordering rule, losses that are subject to expiration may expire unused. Utilization of the capital loss carryforwards, post-October capital losses, late-year ordinary losses, and losses realized subsequent to February 28, 2017, if any, could be subject to further limitations imposed by the Code related to share ownership activity. The Funds’ capital loss carryforwards are as follows:
| | | | | | | | | | | | | | | | |
| | | | |
| | | Short-Term ($) | | | Total
Short-
Term ($) | | | Long-
Term ($) | |
| Fund Name | | Expiration
Date
2/28/2018 | | | No
Expiration
Date | | | | No
Expiration
Date | |
| International Equity Fund | | | — | | | | (707,861,813) | | | | (707,861,813) | | | | (665,050,816) | |
| International Large/Mid Cap Equity Fund | | | — | | | | — | | | | — | | | | (208,414) | |
| Quality Fund | | | — | | | | — | | | | — | | | | — | |
| Resources Fund | | | — | | | | (24,234,257) | | | | (24,234,257) | | | | (33,514,896) | |
| Risk Premium Fund | | | — | | | | — | | | | — | | | | — | |
| Tax-Managed International Equities Fund | | | (10,176,681) | | | | (29,627,844) | | | | (39,804,525) | | | | — | |
| U.S. Equity Allocation Fund | | | (36,676,027) | | | | — | | | | (36,676,027) | | | | — | |
82
GMO Trust Funds
Notes to Financial Statements — (Continued)
February 28, 2017
As of February 28, 2017, the approximate cost for U.S. federal income tax purposes and the aggregate investment-level gross and net unrealized appreciation (depreciation) in the value of investments were as follows:
| | | | | | | | | | | | | | | | |
| | | | | |
| Fund Name | | Aggregate
Cost ($) | | | Gross Unrealized
Appreciation ($) | | | Gross Unrealized
(Depreciation) ($) | | | Net Unrealized
Appreciation
(Depreciation) ($) | |
International Equity Fund | | | 5,714,682,175 | | | | 435,624,034 | | | | (341,655,981) | | | | 93,968,053 | |
International Large/Mid Cap Equity Fund | | | 179,771,356 | | | | 11,941,890 | | | | (7,714,867) | | | | 4,227,023 | |
Quality Fund | | | 6,976,741,433 | | | | 1,801,284,915 | | | | (102,887,551) | | | | 1,698,397,364 | |
Resources Fund | | | 173,042,137 | | | | 48,640,220 | | | | (9,354,703) | | | | 39,285,517 | |
Risk Premium Fund | | | 158,099,801 | | | | 5,415 | | | | (21,822) | | | | (16,407) | |
Tax-Managed International Equities Fund | | | 96,283,220 | | | | 21,832,967 | | | | (2,919,884) | | | | 18,913,083 | |
U.S. Equity Allocation Fund | | | 1,587,863,366 | | | | 194,428,879 | | | | (21,050,401) | | | | 173,378,478 | |
The Funds are subject to authoritative guidance related to the accounting and disclosure of uncertain tax positions under U.S. GAAP. This guidance sets forth a minimum threshold for the financial statement recognition of tax positions taken based on the technical merits of such positions. United States and non-U.S. tax rules (including the interpretation and application of tax laws) are subject to change. The Funds file tax returns and/or adopt certain tax positions in various jurisdictions. Non-U.S. taxes are provided for based on the Funds’ understanding of the prevailing tax rules of the non-U.S. markets in which they invest. Recently enacted tax rules, including interpretations of tax laws (e.g., guidance pertaining to the U.S. Foreign Account Tax Compliance Act) and tax legislation/initiatives currently under consideration in various jurisdictions, including the U.S., might affect the way the Funds and their investors are taxed prospectively and/or retroactively. Prior to the expiration of the relevant statutes of limitations, if any, the Funds are subject to examination by U.S. federal, state, local and non-U.S. jurisdictions with respect to the tax returns they have filed and the tax positions they have adopted. The Funds’ U.S. federal income tax returns are generally subject to examination by the Internal Revenue Service for a period of three years after they are filed. State, local and/or non-U.S. tax returns and/or other filings may be subject to examination for different periods, depending upon the tax rules of each applicable jurisdiction.
Security transactions and related investment income
Security transactions are accounted for in the financial statements on trade date. For purposes of daily net asset value calculations, the Funds’ policy is that security transactions are generally accounted for on the following business day. GMO may override that policy and a Fund may account for security transactions on trade date if it experiences significant purchases or redemptions or engages in significant portfolio transactions. Dividend income, net of applicable foreign withholding taxes, if any, is recorded on the ex-dividend date or, if later, when a Fund is informed of the ex-dividend date. Income dividends and capital gain distributions from the underlying funds are recorded on the ex-dividend date. Interest income is recorded on the accrual basis and is adjusted for the amortization of premiums and accretion of discounts. Principal on inflation-indexed securities is adjusted for inflation and any increase or decrease is recorded as interest income or investment loss. Coupon income is not recognized on securities for which collection is not expected. Paydown gains and losses on mortgage-related and other asset-backed securities, if any, are recorded as components of interest income in the Statements of Operations. Non-cash dividends, if any, are recorded at the fair market value of the asset received. In determining the net gain or loss on securities sold, the Funds use the identified cost basis.
Expenses and class allocations
Most of the expenses of the Trust are directly attributable to an individual Fund. Generally, common expenses are allocated among the Funds based on, among other things, the nature and type of expense and the relative size of the Funds. Investment income, common expenses, purchase premiums and redemption fees, if any, and realized and unrealized gains and losses are allocated among the classes of shares of the Funds, if applicable, based on the relative net assets of each class. Shareholder service fees, if any, which are directly attributable to a class of shares, are charged to that class’s operations. In addition, the Funds may incur fees and expenses indirectly as a shareholder in the underlying funds. Because the underlying funds have different expense and fee levels and the Funds may own different proportions of the underlying funds at different times, the amount of fees and expenses indirectly incurred by a Fund will vary (see Note 5).
Brown Brothers Harriman & Co. (“BBH”) serves as the Funds’ custodian and fund accounting agent except for Quality Fund, U.S. Equity Allocation Fund and Risk Premium Fund. For Quality Fund, U.S. Equity Allocation Fund and Risk Premium Fund, State Street Bank and Trust Company (“State Street”) serves as the custodian and fund accounting agent. State Street serves as the transfer agent for all Funds. Prior to December 31, 2013, State Street’s transfer agent fees may have been reduced by an earnings allowance calculated on the average daily cash balances each Fund maintained in a State Street transfer agent account. Effective January 1, 2014, any cash balances maintained at the transfer agent are held in a Demand Deposit Account and interest income earned, if any, is shown as interest income in the Statements of Operations. Prior to December 31, 2012 for Quality Fund, U.S. Equity Allocation Fund and Risk Premium Fund, State Street’s custodian fees may have been reduced by an earnings allowance calculated on the average daily cash balance the Funds maintained in a State Street custodial account. Earnings
83
GMO Trust Funds
Notes to Financial Statements — (Continued)
February 28, 2017
allowances were reported as a reduction of expenses in the Statements of Operations. Effective January 1, 2013 for Quality Fund, U.S. Equity Allocation Fund and Risk Premium Fund, any cash balances maintained at the custodian are held in a Demand Deposit Account and interest income earned, if any, is shown as interest income in the Statements of Operations.
Purchases and redemptions of Fund shares
Purchase premiums and redemption fees (if applicable) are paid to and retained by a Fund to help offset estimated portfolio transaction costs and other related costs (e.g., bid to ask spreads, stamp duties and transfer fees) incurred by the Fund (directly or indirectly through investments in underlying funds) as a result of the purchase or redemption by allocating estimated transaction costs to the purchasing or redeeming shareholder. Such fees are recorded as a component of the Funds’ net share transactions. A Fund may impose a new purchase premium and/or redemption fee or modify an existing fee at any time.
Purchase premiums are not charged on reinvestments of dividends or other distributions. Redemption fees apply to all shares of a Fund regardless of how the shares were acquired (e.g., by direct purchase or by reinvestment of dividends or other distributions). If GMO determines that any portion of a cash purchase or redemption, as applicable, is offset by a corresponding cash redemption or purchase occurring on the same day, it ordinarily will waive or reduce the purchase premium or redemption fee with respect to that portion. GMO also may waive or reduce the purchase premium or redemption fee relating to a cash purchase or redemption of a Fund’s shares if the Fund will not incur transaction costs or will incur reduced transaction costs.
GMO will waive or reduce the purchase premium when securities are used to purchase a Fund’s shares except to the extent that the Fund incurs transaction costs (e.g., stamp duties or transfer fees) in connection with its acquisition of those securities. GMO may waive or reduce redemption fees when a Fund uses portfolio securities to redeem its shares. However, when a substantial portion of a Fund is being redeemed in-kind, the Fund may nonetheless charge a redemption fee equal to known or estimated costs.
Purchase premiums or redemption fees generally will not be waived for purchases and redemptions of Fund shares executed through brokers or agents, including, without limitation, intermediary platforms that are allowed pursuant to agreements with the Trust to transmit orders for purchases and redemptions the day after those orders are received.
As of February 28, 2017, the premium on cash purchases and the fee on cash redemptions were as follows:
| | | | | | | | | | | | | | | | | | | | | | | | | | | | |
| | | | | | | | |
| | | International Equity Fund | | | International Large/Mid Cap Equity Fund | | | Quality Fund | | | Resources Fund | | | Risk Premium Fund | | | Tax-Managed International Equities Fund | | | U.S. Equity Allocation Fund | |
Purchase Premium | | | — | | | | — | | | | — | | | | 0.30% | | | | 0.15% | | | | — | | | | — | |
Redemption Fee | | | — | | | | — | | | | — | | | | 0.30% | | | | 0.15% | | | | — | | | | — | |
Recently-issued accounting guidance
In August 2016, Financial Accounting Standards Board (“FASB”) issued a new Accounting Standards Update No. 2016-15, “Statement of Cash Flows (Topic 230), Classification of Certain Cash Receipts and Cash Payments, a consensus of the FASB’s Emerging Issues Task Force” (“ASU 2016-15”). ASU 2016-15 is intended to reduce diversity in practice in how certain transactions are classified in the statement of cash flows. The issues addressed in ASU 2016-15 are: debt prepayment or debt extinguishment costs, settlement of zero-coupon debt instruments, contingent consideration payments made after a business combination, proceeds from the settlement of insurance claims, proceeds from the settlement of corporate-owned life insurance policies, including bank-owned life insurance policies, distributions received from equity method investments, beneficial interests in securitization transactions; and, separately identifiable cash flows and application of the predominance principle. ASU 2016-15 is effective for interim and annual reporting periods beginning after December 15, 2017. GMO is currently evaluating the impact, if any, of this guidance on the Funds’ financial statements and disclosures.
84
GMO Trust Funds
Notes to Financial Statements — (Continued)
February 28, 2017
| 3. | Investment and other risks |
The following chart identifies selected risks associated with each Fund. Risks not marked for a particular Fund may, however, still apply to some extent to that Fund at various times.
| | | | | | | | | | | | | | |
| | | | | | | | |
| | | International Equity Fund | | International Large/Mid Cap Equity Fund | | Quality Fund | | Resources Fund | | Risk Premium Fund | | Tax-Managed International Equities Fund | | U.S. Equity Allocation Fund |
| Commodities Risk | | | | | | | | X | | | | | | |
| Counterparty Risk | | X | | X | | X | | X | | X | | X | | X |
| Credit Risk | | | | | | | | | | X | | | | |
| Currency Risk | | X | | X | | X | | X | | X | | X | | |
| Derivatives and Short Sales Risk | | X | | X | | X | | X | | X | | X | | X |
| Focused Investment Risk | | X | | X | | X | | X | | X | | X | | X |
| Illiquidity Risk | | X | | X | | X | | X | | X | | X | | X |
| Large Shareholder Risk | | X | | X | | X | | X | | X | | X | | X |
| Leveraging Risk | | X | | X | | X | | X | | | | X | | X |
| Management and Operational Risk | | X | | X | | X | | X | | X | | X | | X |
| Market Disruption and Geopolitical Risk | | X | | X | | X | | X | | X | | X | | X |
| Market Risk – Equities | | X | | X | | X | | X | | X | | X | | X |
| Market Risk – Fixed Income Investments | | | | | | | | | | X | | | | |
| Merger Arbitrage Risk | | | | | | | | X | | | | | | |
| Non-Diversified Funds | | | | | | X | | X | | X | | X | | |
| Non-U.S. Investment Risk | | X | | X | | X | | X | | X | | X | | |
| Small Company Risk | | X | | | | X | | X | | X | | X | | X |
Investing in mutual funds involves many risks. The risks of investing in a particular Fund depend on the types of investments in its portfolio and the investment strategies GMO employs on its behalf. This section does not describe every potential risk of investing in the Funds. Funds could be subject to additional risks because of the types of investments they make and market conditions, which may change over time.
Each Fund that invests in other GMO Funds or other investment companies (collectively, “Underlying Funds”) is exposed to the risks to which the Underlying Funds in which it invests are exposed, as well as the risk that the Underlying Funds will not perform as expected. Therefore, unless otherwise noted, the selected risks summarized below include both direct and indirect risks, and references in this section to investments made by a Fund include those made both directly by the Fund and indirectly by the Fund through Underlying Funds.
An investment in a Fund is not a bank deposit and, therefore, is not insured or guaranteed by the Federal Deposit Insurance Corporation or any other government agency.
• COMMODITIES RISK. Commodity prices can be extremely volatile and are affected by many factors. Exposure to commodities can cause the net asset value of a Fund’s shares to decline or fluctuate in a rapid and unpredictable manner. The value of commodity-related derivatives or
85
GMO Trust Funds
Notes to Financial Statements — (Continued)
February 28, 2017
indirect investments in commodities may fluctuate more than the commodity, commodities or commodity index to which they relate. See “Derivatives and Short Sales Risk” for a discussion of specific risks of a Fund’s derivatives investments, including commodity-related derivatives.
• COUNTERPARTY RISK. Funds that enter into contracts with counterparties, such as repurchase or reverse repurchase agreements or OTC derivatives contracts, or that lend their securities run the risk that the counterparty will be unable or unwilling to make timely settlement payments or otherwise honor its obligations. If a counterparty fails to meet its contractual obligations, goes bankrupt, or otherwise experiences a business interruption, the Fund could miss investment opportunities or otherwise hold investments it would prefer to sell, resulting in losses for the Fund. In addition, a Fund may suffer losses if a counterparty fails to comply with applicable laws or other requirements. The Funds are not subject to any limits on their exposure to any one counterparty nor to a requirement that counterparties with whom they enter into contracts maintain a specific rating by a nationally recognized rating organization. Counterparty risk is pronounced during unusually adverse market conditions and is particularly acute in environments (like those of 2008) in which financial services firms are exposed to systemic risks of the type evidenced by the insolvency of Lehman Brothers and subsequent market disruptions.
Participants in OTC derivatives markets typically are not subject to the same level of credit evaluation and regulatory oversight as are members of exchange-based markets, and, therefore, OTC derivatives generally expose a Fund to greater counterparty risk than exchange-traded derivatives. A Fund is subject to the risk that a counterparty will not settle a derivative in accordance with its terms because of a dispute over the terms of the contract (whether or not bona fide) or because of a credit or liquidity problem. If a counterparty’s obligation to a Fund is not collateralized, then the Fund is essentially an unsecured creditor of the counterparty. If a counterparty defaults, the Fund will have contractual remedies (whether or not the obligation is collateralized), but the Fund may be unable to enforce them, thus causing the Fund to suffer a loss. Counterparty risk is greater for derivatives with longer maturities because of the longer time during which events may occur that prevent settlement. Counterparty risk also is greater when a Fund has entered into derivatives contracts with a single or small group of counterparties as it sometimes does as a result of its use of swaps and other OTC derivatives. Funds that use swap contracts are subject, in particular, to the creditworthiness of the counterparties because some types of swap contracts have terms longer than six months (and, in some cases, decades). The creditworthiness of a counterparty may be adversely affected by greater than average volatility in the markets, even if the counterparty’s net market exposure is small relative to its capital. Counterparty risk still exists even if a counterparty’s obligations are secured by collateral because the Fund’s interest in the collateral may not be perfected or additional collateral may not be promptly posted as required. GMO’s view with respect to a particular counterparty is subject to change. The fact, however, that it changes adversely (whether due to external events or otherwise) does not mean a Fund’s existing transactions with that counterparty will necessarily be terminated or modified. In addition, a Fund may enter into new transactions with a counterparty that GMO no longer considers a desirable counterparty if the transaction is primarily designed to reduce the Fund’s overall risk of potential exposure to that counterparty (for example, re-establishing the transaction with a lower notional amount or entering into a countervailing trade with the same counterparty).
The Funds also are subject to counterparty risk because they execute their securities transactions through brokers and dealers. If a broker or dealer fails to meet its contractual obligations, goes bankrupt, or otherwise experiences a business interruption, the Funds could miss investment opportunities or be unable to dispose of investments they would prefer to sell, resulting in losses for the Funds.
Counterparty risk with respect to derivatives has been and will continue to be affected by new rules and regulations relating to the derivatives market. As described under “Derivatives and Short Sales Risk,” some derivatives transactions are required to be centrally cleared, and a party to a cleared derivatives transaction is subject to the credit risk of the clearing house and the clearing member through which it holds its cleared position. Credit risk of market participants with respect to derivatives that are centrally cleared is concentrated in a few clearing houses, and it is not clear how an insolvency proceeding of a clearing house would be conducted and what impact an insolvency of a clearing house would have on the financial system. Also, in the event of a counterparty’s (or its affiliate’s) insolvency, the Funds’ ability to exercise remedies, such as the termination of transactions, netting of obligations and realization on collateral, could be stayed or eliminated under new special resolution regimes adopted in the United States, the European Union and various other jurisdictions. Such regimes provide governmental authorities with broad authority to intervene when a financial institution is experiencing financial difficulty. In particular, with respect to counterparties who are subject to such proceedings in the European Union, the liabilities of such counterparties to the Funds could be reduced, eliminated, or converted to equity in such counterparties (sometimes referred to as a “bail in”).
• CREDIT RISK. This is the risk that the issuer or guarantor of a fixed income investment or the obligor of an obligation underlying an asset-backed security will be unable or unwilling to satisfy its obligation to pay principal and interest or otherwise to honor its obligations in a timely manner. The market price of a fixed income investment will normally decline as a result of the issuer’s, guarantor’s, or obligor’s failure to meet its payment obligations, or in anticipation of such failure, or the downgrade of the credit rating of the investment. This risk is particularly acute in environments (like those of 2008) in which financial services firms are exposed to systemic risks of the type evidenced by the insolvency of Lehman Brothers and subsequent market disruptions.
All fixed income securities are subject to credit risk. Financial strength and solvency of an issuer are the primary factors influencing credit risk. The risk varies depending upon whether the issuer is a corporation, a government or government entity, whether the particular security has a priority over other obligations of the issuer in payment of principal and interest and whether it has any collateral backing or credit enhancement.
86
GMO Trust Funds
Notes to Financial Statements — (Continued)
February 28, 2017
Credit risk may change over the term of a fixed income security. U.S. government securities are subject to varying degrees of credit risk depending upon whether the securities are supported by the full faith and credit of the United States, supported by the ability to borrow from the U.S. Treasury, supported only by the credit of the issuing U.S. government agency, instrumentality, or corporation, or otherwise supported by the United States. For example, issuers of many types of U.S. government securities (e.g., the Federal Home Loan Mortgage Corporation (“Freddie Mac”), Federal National Mortgage Association (“Fannie Mae”), and Federal Home Loan Banks), although chartered or sponsored by Congress, are not funded by Congressional appropriations and their fixed income securities, including mortgage-backed and other asset-backed securities, are neither guaranteed nor insured by the U.S. government. These securities are subject to more credit risk than U.S. government securities that are supported by the full faith and credit of the United States (e.g., U.S. Treasury bonds). Investments in sovereign or quasi-sovereign debt involve the risk that the governmental entities responsible for repayment may be unable or unwilling to pay interest and repay principal when due. A governmental entity’s ability and willingness to pay interest and repay principal in a timely manner may be affected by a variety of factors, including its cash flow, the size of its reserves, its access to foreign exchange, the relative size of its debt service burden to its economy as a whole, and political constraints. Investments in quasi-sovereign issuers are subject to the additional risk that the issuer may default independently of its sovereign. Sovereign debt risk is greater for fixed income securities issued or guaranteed by emerging countries.
In many cases, the credit risk of a fixed income security is reflected in its credit ratings, and a Fund holding such a security is subject to the risk that the investment’s rating will be downgraded.
Securities issued by the U.S. government historically have presented minimal credit risk. However, events in 2011 led to a downgrade in the long-term credit rating of U.S. bonds by several major rating agencies and introduced greater uncertainty about the repayment by the United States of its obligations. A further credit rating downgrade could decrease, and a default in the payment of principal or interest on U.S. government securities would decrease, the value of a Fund’s investments and increase the volatility of a Fund’s portfolio.
The obligations of issuers also may be subject to bankruptcy, insolvency and other laws affecting the rights and remedies of creditors.
A Fund also is exposed to credit risk on a reference security to the extent it writes protection under credit default swaps. See “Derivatives and Short Sales Risk” for more information regarding risks associated with the use of credit default swaps. The extent to which the market price of a fixed income security changes in response to a credit event depends on many factors and can be difficult to predict. For example, even though the effective duration of a long-term floating rate security is very short, an adverse credit event or a change in the perceived creditworthiness of its issuer could cause its market price to decline much more than its effective duration would suggest.
Credit risk is particularly pronounced for below investment grade securities (commonly referred to as “junk bonds”). The sovereign debt of many non-U.S. governments, including their sub-divisions and instrumentalities, is below investment grade. Many asset-backed securities also are below investment grade. Below investment grade securities have speculative characteristics, often are less liquid than higher quality securities, present a greater risk of default and are more susceptible to real or perceived adverse industry conditions. Investments in distressed or defaulted or other low quality debt securities generally are considered speculative and may involve substantial risks not normally associated with investments in higher quality securities, including adverse business, financial or economic conditions that lead to payment defaults and insolvency proceedings on the part of their issuers. In particular, distressed or defaulted obligations might be repaid, if at all, only after lengthy workout or bankruptcy proceedings, during which the issuer might not make any interest or other payments, and a Fund may incur additional expenses to seek recovery. If GMO’s assessment of the eventual recovery value of a distressed or defaulted debt security proves incorrect, a Fund may lose a substantial portion or all of its investment or may be required to accept cash or instruments worth less than its original investment. In the event of default of sovereign debt, the Funds may be unable to pursue legal action against the issuer.
• CURRENCY RISK. Currency risk is the risk that fluctuations in exchange rates will adversely affect the market value of a Fund’s investments. Currency risk includes the risk that the currencies in which a Fund’s investments are traded, in which a Fund receives income, or in which a Fund has taken a position, will decline in value relative to the currency in which the Fund is denominated. Currency risk also includes the risk that the currency to which the Fund has obtained exposure through hedging declines in value relative to the currency being hedged, in which event the Fund may realize a loss on both the hedging instrument and the currency being hedged. Currency exchange rates can fluctuate significantly for many reasons. See “Market Disruption and Geopolitical Risk.”
Many of the Funds use derivatives to take currency positions that are under- or over-weighted (in some cases significantly) relative to the currency exposure of their portfolios and their benchmarks. If the exchange rates of the currencies involved do not move as expected, a Fund could lose money on both its holdings of a particular currency and the derivative. See also “Non-U.S. Investment Risk.”
Some currencies are illiquid (e.g., some emerging country currencies), and a Fund may not be able to convert them into U.S. dollars, in which case GMO may decide to purchase U.S. dollars in a parallel market with an unfavorable exchange rate. Exchange rates for many currencies (e.g., some emerging country currencies) are particularly affected by exchange control regulations.
87
GMO Trust Funds
Notes to Financial Statements — (Continued)
February 28, 2017
Derivative transactions in foreign currencies (such as futures, forwards, options and swaps) may involve leveraging risk in addition to currency risk, as described under “Leveraging Risk.” In addition, the obligations of counterparties in currency derivative transactions are often not secured by collateral, which increases counterparty risk (see “Counterparty Risk”).
• DERIVATIVES AND SHORT SALES RISK. All of the Funds may invest in derivatives, which are financial contracts whose value depends on, or is derived from, the value of underlying assets, reference rates, or indices. Derivatives involve the risk that their value may not change as expected relative to changes in the value of the assets, rates, or indices they are designed to track. Derivatives include futures contracts, forward contracts, foreign currency contracts, swap contracts, contracts for differences, options on securities and indices, options on futures contracts, options on swap contracts, interest rate caps, floors and collars, reverse repurchase agreements, and other OTC contracts. Derivatives may relate to securities, commodities, currencies, currency exchange rates, interest rates, inflation rates, and indices.
The use of derivatives involves risks that are in addition to, and potentially greater than, the risks of investing directly in securities and other more traditional assets. In particular, a Fund’s use of OTC derivatives exposes it to the risk that the counterparties will be unable or unwilling to make timely settlement payments or otherwise honor their obligations. An OTC derivatives contract typically can be closed only with the consent of the other party to the contract. If the counterparty defaults, the Fund will still have contractual remedies but may not be able to enforce them. Because the contract for each OTC derivative is individually negotiated, the counterparty may interpret contractual terms (e.g., the definition of default) differently than the Fund, and if it does, the Fund may decide not to pursue its claims against the counterparty to avoid the cost and unpredictability of legal proceedings. The Fund, therefore, may be unable to obtain payments GMO believes are owed to it under OTC derivatives contracts, or those payments may be delayed or made only after the Fund has incurred the cost of litigation.
A Fund may invest in derivatives that (i) do not require the counterparty to post collateral (e.g., foreign currency forwards), (ii) require collateral but that do not provide for the Fund’s security interest in it to be perfected, (iii) require a significant upfront deposit by the Fund unrelated to the derivative’s fundamental fair (or intrinsic) value, or (iv) do not require that collateral be regularly marked-to-market. When a counterparty’s obligations are not fully secured by collateral, a Fund runs a greater risk of not being able to recover what it is owed if the counterparty defaults. Even when derivatives are required by contract to be collateralized, a Fund typically will not receive the collateral for one or more days after the collateral is required to be posted.
The Funds may invest in derivatives with a limited number of counterparties, and events affecting the creditworthiness of any of those counterparties may have a pronounced effect on the Funds. Derivatives risk is particularly acute in environments (like those of 2008) in which financial services firms are exposed to systemic risks of the type evidenced by the insolvency of Lehman Brothers and subsequent market disruptions. In addition, during those periods, a Fund may have a greater need for cash to provide collateral for large swings in its mark-to-market obligations under the derivatives in which it has invested.
Derivatives also present other risks described in this section, including market risk, illiquidity risk, currency risk, credit risk, and counterparty risk. Many derivatives, in particular OTC derivatives, are complex and their valuation often requires modeling and judgment, which increases the risk of mispricing or improper valuation. The pricing models used may not produce valuations that are consistent with the values a Fund realizes when it closes or sells an OTC derivative. Valuation risk is more pronounced when a Fund enters into OTC derivatives with specialized terms because the value of those derivatives in some cases is determined only by reference to similar derivatives with more standardized terms. As a result, incorrect valuations may result in increased cash payments to counterparties, undercollateralization and/or errors in the calculation of a Fund’s net asset value.
A Fund’s use of derivatives may not be effective or have the desired results. Moreover, suitable derivatives will not be available in all circumstances. For example, the economic costs of taking some derivative positions may be prohibitive, and if a counterparty or its affiliate is deemed to be an affiliate of a Fund, the Funds will not be permitted to trade with that counterparty. In addition, GMO may decide not to use derivatives to hedge or otherwise reduce a Fund’s risk exposures, potentially resulting in losses for the Fund.
Swap contracts and other OTC derivatives are highly susceptible to illiquidity risk (see “Illiquidity Risk”) and counterparty risk (see “Counterparty Risk”). These derivatives are also subject to documentation risk, which is the risk that ambiguities, inconsistencies or errors in the documentation relating to a derivative transaction may lead to a dispute with the counterparty or unintended investment results. In addition, see “Commodities Risk” for a discussion of risks specific to commodity-related derivatives. Because many derivatives have a leverage component (i.e., a notional value in excess of the assets needed to establish and/or maintain the derivative position), adverse changes in the value or level of the underlying asset, rate or index may result in a loss substantially greater than the amount invested in the derivative itself. See “Leveraging Risk.”
A Fund’s use of derivatives may be subject to special tax rules and could generate additional taxable income for shareholders. In addition, the tax treatment of a Fund’s use of derivatives may be unclear because there is little case or other law interpreting the terms of most derivatives or determining their tax treatment. In addition, the SEC recently proposed a rule under the 1940 Act, regulating the use by registered investment companies of derivatives and many related instruments. That rule, if adopted as proposed, would, among other things, restrict a Fund’s ability to engage in derivatives transactions or so increase the cost of derivatives transactions that a Fund would be unable to implement its investment strategy.
88
GMO Trust Funds
Notes to Financial Statements — (Continued)
February 28, 2017
Derivatives Regulation. The U.S. government has enacted legislation that provides for new regulation of the derivatives market, including clearing, margin, reporting, and registration requirements. The European Union (and some other countries) are implementing similar requirements, which will affect a Fund when it enters into a derivatives transaction with a counterparty organized in that country or otherwise subject to that country’s derivatives regulations. Because these requirements are new and evolving (and some of the rules are not yet final), their ultimate impact remains unclear.
Transactions in some types of swaps (including interest rate swaps and credit default swaps on North American and European indices) are required to be centrally cleared. In a transaction involving those swaps (“cleared derivatives”), a Fund’s counterparty is a clearing house, rather than a bank or broker. Since the Funds are not members of clearing houses and only members of a clearing house (“clearing members”) can participate directly in the clearing house, the Funds hold cleared derivatives through accounts at clearing members. In cleared derivatives positions, the Funds make payments (including margin payments) to and receive payments from a clearing house through their accounts at clearing members. Clearing members guarantee performance of their clients’ obligations to the clearing house.
In some ways, cleared derivative arrangements are less favorable to mutual funds than bilateral arrangements, for example, by requiring that funds provide more margin for their cleared derivatives positions. Also, as a general matter, in contrast to a bilateral derivatives position, following a period of notice to a Fund, a clearing member at any time can require termination of an existing cleared derivatives position or an increase in margin requirements above those required at the outset of a transaction. Clearing houses also have broad rights to increase margin requirements for existing positions or to terminate those positions at any time. Any increase in margin requirements or termination of existing cleared derivatives positions by the clearing member or the clearing house could interfere with the ability of a Fund to pursue its investment strategy. Further, any increase in margin requirements by a clearing member could expose a Fund to greater credit risk to its clearing member because margin for cleared derivatives positions in excess of a clearing house’s margin requirements typically is held by the clearing member (see “Counterparty Risk”). Also, a Fund is subject to risk if it enters into a derivatives transaction that is required to be cleared (or that GMO expects to be cleared), and no clearing member is willing or able to clear the transaction on the Fund’s behalf. While the documentation in place between the Funds and their clearing members generally provides that the clearing members will accept for clearing all cleared derivatives transactions that are within credit limits (specified in advance) for each Fund, the Funds are still subject to the risk that no clearing member will be willing or able to clear a transaction. In those cases, the position might have to be terminated, and the Fund could lose some or all of the benefit of the position, including loss of an increase in the value of the position and loss of hedging protection. In addition, the documentation governing the relationship between the Funds and clearing members is drafted by the clearing members and generally is less favorable to the Funds than typical bilateral derivatives documentation. For example, documentation relating to cleared derivatives generally includes a one-way indemnity by the Funds in favor of the clearing member for losses the clearing member incurs as the Funds’ clearing member. Also, such documentation typically does not provide the Funds any remedies if the clearing member defaults or becomes insolvent. While futures contracts entail similar risks, the risks may be more pronounced for cleared derivatives due to their more limited liquidity and market history.
Some types of cleared derivatives are required to be executed on an exchange or on a swap execution facility. A swap execution facility is a trading platform where multiple market participants can execute derivatives by accepting bids and offers made by multiple other participants in the platform. While this execution requirement is designed to increase transparency and liquidity in the cleared derivatives market, trading on a swap execution facility can create additional costs and risks for the Funds. For example, swap execution facilities typically charge fees, and if a Fund executes derivatives on a swap execution facility through a broker intermediary, the intermediary may impose fees as well. Also, a Fund may indemnify a swap execution facility, or a broker intermediary who executes cleared derivatives on a swap execution facility on the Fund’s behalf, against any losses or costs that may be incurred as a result of the Fund’s transactions on the swap execution facility.
If a Fund wishes to execute a package of transactions that include a swap that is required to be executed on a swap execution facility as well as other transactions (for example, a transaction that includes both a security and an interest rate swap that hedges interest rate exposure with respect to such security), the Fund may be unable to execute all components of the package on the swap execution facility. In that case, the Fund would need to trade some components of the package on the swap execution facility and other components in another manner, which could subject the Fund to the risk that some components would be executed successfully and others would not, or that the components would be executed at different times, leaving the Fund with an unhedged position for a period of time.
The U.S. government and the European Union have adopted mandatory minimum margin requirements for bilateral derivatives. GMO expects that the Funds’ transactions will become subject to variation margin requirements under such rules in 2017 and initial margin requirements under such rules in 2020. Such requirements could increase the amount of margin a Fund needs to provide in connection with its derivatives transactions and, therefore, make derivatives transactions more expensive.
These and other new rules and regulations could, among other things, further restrict a Fund’s ability to engage in, or increase the cost to the Fund of, derivatives transactions, for example, by making some types of derivatives no longer available to the Fund or otherwise limiting liquidity. The implementation of the clearing requirement has increased the costs of derivatives transactions for the Funds, since the Funds have to pay fees to their clearing members and are typically required to post more margin for cleared derivatives than they have historically posted for bilateral derivatives. The costs of derivatives transactions are expected to increase further as clearing members raise their fees to cover the costs of
89
GMO Trust Funds
Notes to Financial Statements — (Continued)
February 28, 2017
additional capital requirements and other regulatory changes applicable to the clearing members, which will take effect when rules imposing mandatory minimum margin requirements on bilateral swaps, as described above, become effective. These rules and regulations are new and evolving, so their potential impact on the Funds and the financial system are not yet known. While the new rules and regulations and central clearing of some derivatives transactions are designed to reduce systemic risk (i.e., the risk that the interdependence of large derivatives dealers could cause them to suffer liquidity, solvency or other challenges simultaneously), there is no assurance that they will achieve that result, and in the meantime, as noted above, central clearing and related requirements expose the Funds to new kinds of costs and risks.
Options. The Funds, particularly Risk Premium Fund, are permitted to write options. The market price of an option is affected by many factors, including changes in the market prices or dividend rates of underlying securities (or in the case of indices, the securities in such indices); the time remaining before expiration; changes in interest rates or exchange rates; and changes in the actual or perceived volatility of the relevant stock market and underlying securities. The market price of an option also may be adversely affected if the market for the option becomes less liquid. In addition, since an American-style option allows the holder to exercise its rights any time before the option’s expiration, the writer of an American-style option has no control over when it will be required to fulfill its obligations as a writer of the option. (The writer of a European-style option is not subject to this risk because the holder may only exercise the option on its expiration date.) If a Fund writes a call option and does not hold the underlying security or instrument, the Fund’s potential loss is theoretically unlimited.
National securities exchanges generally have established limits on the maximum number of options an investor or group of investors acting in concert may write. A Fund, GMO, and other funds advised by GMO will likely constitute such a group. When applicable, these limits restrict a Fund’s ability to purchase or write options on a particular security.
Unlike exchange-traded options, which are standardized with respect to the underlying instrument, expiration date, contract size, and strike price, the terms of OTC options (i.e., options not traded on exchanges) generally are established through negotiation with the other party to the option contract. While a Fund has greater flexibility to tailor an OTC option, OTC options generally expose a Fund to greater credit risk than exchange-traded options, which are guaranteed by the clearing organization of the exchanges where they are traded. Purchasing and writing put and call options are highly specialized activities and entail greater than ordinary market risks.
Special tax rules apply to a Fund’s transactions in options, which could increase the taxes payable by shareholders. In particular, a Fund’s options transactions potentially could cause a substantial portion of the Fund’s distributions to consist of amounts taxable to shareholders subject to U.S. income tax at ordinary income tax rates. See the Funds’ Prospectus and Statement of Additional Information for more information.
Short Investment Exposure. Some Funds may sell securities or currencies short as part of their investment programs in an attempt to increase their returns or for hedging purposes. Short sales expose a Fund to the risk that it will be required to acquire, convert, or exchange a security or currency to replace the borrowed security or currency when the security or currency sold short has appreciated in value, thus resulting in a loss to the Fund. Purchasing a security or currency to close out a short position can itself cause the price of the security or currency to rise further, thereby exacerbating any losses. A Fund that sells short a security or currency it does not own also may have to pay borrowing fees to a broker and may be required to pay the broker any dividends or interest it receives on a borrowed security.
A Fund also may create short investment exposure by taking a derivative position in which the value of the derivative moves in the opposite direction from the price of an underlying investment, pool of investments, index or currency. Short sales of securities or currencies a Fund does not own and “short” derivative positions involve forms of investment leverage, and the amount of the Fund’s potential loss is theoretically unlimited. A Fund is subject to increased leveraging risk and other investment risks described in this “Investment and other risks” section to the extent it sells short securities or currencies it does not own or takes “short” derivative positions.
• FOCUSED INVESTMENT RISK. Funds with investments that are focused in particular countries, regions, sectors, industries or issuers that are subject to the same or similar risk factors and funds with investments whose prices are closely correlated are subject to greater overall risk than funds with investments that are more diversified or whose prices are not as closely correlated.
A Fund that invests in the securities of a small number of issuers has greater exposure to adverse developments affecting those issuers and to a decline in the market price of particular securities than Funds investing in the securities of a larger number of issuers. Securities, sectors, or companies that share common characteristics are often subject to similar business risks and regulatory burdens, and often react similarly to specific economic, market, political or other developments.
Similarly, Funds having a significant portion of their assets in investments tied economically (or related) to a particular geographic region, country (e.g., Taiwan or Japan), or market (e.g., emerging markets), or to sectors within a region, country, or market (e.g., Russian oil) have more exposure to regional and country economic risks than funds making investments throughout the world. The political and economic prospects of one country or group of countries within the same geographic region may affect other countries in that region, and a recession, debt crisis or decline in the value of the currency of one country can spread to other countries. Furthermore, companies in a particular geographic region or country are vulnerable to events affecting other companies in that region or country because they often share common characteristics, are exposed
90
GMO Trust Funds
Notes to Financial Statements — (Continued)
February 28, 2017
to similar business risks and regulatory burdens, and react similarly to specific economic, market, political or other developments. See also “Non-U.S. Investment Risk”.
Because Resources Fund concentrates its investments in the natural resources sector, it is particularly exposed to adverse developments, including adverse price movements, affecting issuers in the natural resources sector and is subject to greater risks than a fund that invests in a wider range of industries. In addition, the market prices of securities of companies in the natural resources sector are often more volatile than those of securities of companies in other industries. Some of the commodities used as raw materials or produced by these companies are subject to broad price fluctuations as a result of industry-wide supply and demand factors. Companies in the natural resources sector often have limited pricing power over the supplies they purchase and the products they sell, which can affect their profitability, and are often capital-intensive and use significant amounts of leverage. Projects in the natural resources sector may have long setup times and companies cannot ensure that the market will be favorable at the time the project begins production. Companies in the natural resources sector may also be subject to special risks associated with natural or man-made disasters. In addition, the natural resources sector can be especially affected by political and economic developments, government regulations including changes in tax law or interpretations of law, energy conservation, and the success of exploration projects. Specifically, the natural resource sector can be significantly affected by import controls, worldwide competition and cartels, changes in consumer sentiment and spending, and can be subject to liability for, among other things, environmental damage, depletion of resources, and mandated expenditures for safety and pollution control. Resources Fund’s concentration in the securities of natural resources companies exposes it to the price movements of natural resources to a greater extent than if it were more broadly diversified. Because Resources Fund invests primarily in the natural resources sector, it runs the risk of performing poorly during an economic downturn or decline in demand for natural resources.
Because Risk Premium Fund can have substantial exposure through a limited number of options contracts and because the Fund’s exposures may relate to relatively few stock indices, the Fund is subject to focused investment risk.
• ILLIQUIDITY RISK. Illiquidity risk is the risk that low trading volume, lack of a market maker, large position size, or legal restrictions (including daily price fluctuation limits or “circuit breakers”) limits or prevents a Fund from selling particular securities or closing derivative positions at desirable prices. In addition to these risks, a Fund is exposed to illiquidity risk when it has an obligation to purchase particular securities (e.g., as a result of entering into reverse repurchase agreements, writing a put, or closing a short position). To the extent a Fund’s investments include asset-backed securities, distressed, defaulted or other low quality debt securities, emerging country debt securities, securities of companies with smaller market capitalizations or smaller total float adjusted market capitalizations, or emerging market securities, it is subject to increased illiquidity risk. These types of investments can be difficult to value, exposing a Fund to the risk that the price at which it sells them will be less than the price at which they were valued when held by the Fund. Illiquidity risk also may be greater in times of financial stress. For example, Inflation-Protected Securities issued by the U.S. Treasury (“TIPS”) have experienced periods of greatly reduced liquidity during disruptions in fixed income markets, such as the events surrounding the bankruptcy of Lehman Brothers in 2008. Less liquid securities are more susceptible than other securities to price declines when market prices decline generally.
A Fund may buy securities that are less liquid than those in its benchmark.
A Fund’s, and particularly Risk Premium Fund’s, ability to use options as part of its investment program depends on the liquidity of the options market. In addition, that market may not be liquid when a Fund seeks to close out an option position. Also, the hours of trading for options on an exchange may not conform to the hours during which the securities held by a Fund are traded. To the extent that the options markets close before the markets for the underlying securities, significant price and rate movements can take place in the markets for underlying securities that are not immediately reflected in the options markets. If a Fund receives a redemption request and is unable to close out an option it has sold, the Fund may temporarily be leveraged in relation to its assets.
• LARGE SHAREHOLDER RISK. To the extent a large number of shares of a Fund is held by a single shareholder (e.g., an institutional investor or another GMO Fund) or a group of shareholders with a common investment strategy (e.g., GMO asset allocation accounts), the Fund is subject to the risk that a redemption by those shareholders of all or a large portion of their Fund shares will adversely affect the Fund’s performance by forcing the Fund to sell portfolio securities, potentially at disadvantageous prices, to raise the cash needed to satisfy the redemption request. In addition, the Funds and other accounts over which GMO has investment discretion that invest in the Funds are not limited in how often they may purchase or sell Fund shares. The Asset Allocation Funds and separate accounts managed by GMO for its clients hold substantial percentages of the shares of many Funds, and asset allocation decisions by GMO may result in substantial redemptions from (or investments in) those Funds. These transactions may adversely affect the Fund’s performance to the extent that the Fund is required to sell investments (or invest cash) when it would not otherwise do so. Redemptions of a large number of shares also may increase transaction costs or, by necessitating a sale of portfolio securities, have adverse tax consequences for Fund shareholders. Additionally, redemptions and/or purchases of shares by a large shareholder and/or a group of shareholders over time potentially limit the use of any capital loss carryforwards to offset future realized capital gains (if any) and other losses that would otherwise reduce distributable net investment income. Large shareholders may limit or prevent a Fund’s use of tax equalization for U.S. Federal tax purposes. In addition, to the extent a Fund invests in other GMO Funds subject to large shareholder risk, the Fund is indirectly subject to this risk.
91
GMO Trust Funds
Notes to Financial Statements — (Continued)
February 28, 2017
• LEVERAGING RISK. The use of reverse repurchase agreements and other derivatives and securities lending creates leverage (i.e., a Fund’s investment exposures exceed its net asset value). Leverage increases a Fund’s losses when the value of its investments (including derivatives) declines. Because many derivatives have a leverage component (i.e., a notional value in excess of the assets needed to establish or maintain the derivative position), adverse changes in the value or level of the underlying asset, rate or index may result in a loss substantially greater than the amount invested in the derivative itself. In the case of swaps, the risk of loss generally is related to a notional principal amount, even if the parties have not made any initial investment. Some derivatives have the potential for unlimited loss, regardless of the size of the initial investment. A Fund’s portfolio also will be leveraged if it borrows money to meet redemption requests or settle investment transactions or if it exercises its right to delay payment on a redemption.
A Fund may manage some of its derivative positions by offsetting derivative positions against one another or against other assets. To the extent offsetting positions do not behave in relation to one another as expected, a Fund may perform as if it were leveraged.
• MANAGEMENT AND OPERATIONAL RISK. Each Fund is subject to management risk because it relies on GMO to achieve its investment objective. Each Fund runs the risk that GMO’s investment techniques will fail to produce desired results and cause the Fund to incur significant losses. GMO also may fail to use derivatives effectively, choosing to hedge or not to hedge positions at disadvantageous times. In the case of Tax- Managed International Equities Fund, GMO’s tax-management strategies may be ineffective or limited by market conditions, the timing of cash flows into and out of the Fund, and current or future developments in tax legislation and regulation.
For many Funds, GMO often uses quantitative models as part of its investment process. GMO’s models are not necessarily predictive of future market events and use simplifying assumptions that can limit their effectiveness. In addition, the data on which the models are based is subject to limitations (e.g., inaccuracies, staleness) that could adversely affect a Fund’s performance. The Funds also run the risk that GMO’s assessment of an investment (including a company’s fundamental fair (or intrinsic) value) may be wrong.
There can be no assurance that key GMO personnel will continue to be employed by GMO. The loss of their services could have an adverse impact on GMO’s ability to achieve the Funds’ investment objectives.
The Funds also are subject to the risk of loss as a result of other services provided by GMO and other service providers, including pricing, administrative, accounting, tax, legal, custody, transfer agency, and other services. Operational risk includes the possibility of loss caused by inadequate procedures and controls, human error, and system failures by a service provider. For example, trading delays or errors could prevent a Fund from benefiting from potential investment gains or avoiding losses. In addition, a service provider may be unable to provide a net asset value (“NAV”) for a Fund or share class on a timely basis. GMO is not contractually liable to the Funds for losses associated with operational risk absent its willful misfeasance, bad faith, gross negligence, or reckless disregard of its contractual obligations to provide services to the Funds. Other Fund service providers also have contractual limitations on their liability to the Funds for losses resulting from their errors.
The Funds and their service providers (including GMO) are susceptible to cyber-attacks and technological malfunctions that may have effects that are similar to those of a cyber-attack. Cyber-attacks include, among others, stealing or corrupting data maintained online or digitally, preventing legitimate users from accessing information or services on a website, releasing confidential information without authorization, and causing operational disruption. Successful cyber-attacks against, or security breakdowns of, a Fund, GMO, a sub-adviser, or a custodian, transfer agent, or other service provider may adversely affect the Fund or its shareholders. For instance, cyber-attacks may interfere with the processing of shareholder transactions, affect a Fund’s ability to calculate its net asset value, cause the release or misappropriation of private shareholder information or confidential Fund information, impede trading, cause reputational damage, and subject the Fund to regulatory fines, penalties or financial losses, reimbursement or other compensation costs, and additional compliance costs. While GMO has established business continuity plans and systems designed to prevent cyber-attacks, such plans and systems are subject to inherent limitations. Similar types of cyber security risks also are present for issuers of securities in which the Funds invest, which could result in material adverse consequences for such issuers, and may cause a Fund’s investment in such securities to lose value.
• MARKET DISRUPTION AND GEOPOLITICAL RISK. The Funds are subject to the risk that geopolitical and other events (e.g., wars and terrorism) will disrupt securities markets and adversely affect global economies and markets, thereby decreasing the value of the Funds’ investments. Sudden or significant changes in the supply or prices of commodities or other economic inputs (e.g., the marked decline in oil prices that began in late 2014) may have material and unexpected effects on both global securities markets and individual countries, regions, sectors, companies, or industries, which could significantly reduce the value of a Fund’s investments. Terrorism in the United States and around the world has increased geopolitical risk. The terrorist attacks on September 11, 2001 resulted in the closure of some U.S. securities markets for four days, and similar attacks are possible in the future. Securities markets may be susceptible to market manipulation (e.g., the manipulation of the London Interbank Offered Rate (LIBOR)) or other fraudulent trading practices, which could disrupt the orderly functioning of markets or reduce the value of investments traded in them, including investments of the Funds. Instances of fraud and other deceptive practices committed by senior management of certain companies in which a Fund invests may undermine GMO’s due diligence efforts with respect to such companies, and if such fraud is discovered, negatively affect the value of the Fund’s investments. In addition, when discovered, financial fraud may contribute to overall market volatility, which can negatively impact a Fund’s investment program. Financial fraud also may impact the rates or indices underlying a Fund’s investments.
92
GMO Trust Funds
Notes to Financial Statements — (Continued)
February 28, 2017
While the U.S. government has always honored its credit obligations, a default by the U.S. government (as has been threatened in recent years) would be highly disruptive to the U.S. and global securities markets and could significantly reduce the value of the Funds’ investments. Similarly, political events within the United States at times have resulted, and may in the future result, in a shutdown of government services, which could adversely affect the U.S. economy, decrease the value of many Fund investments, and increase uncertainty in or impair the operation of the U.S. or other securities markets. Uncertainty surrounding the sovereign debt of several European Union countries, as well as the continued existence of the European Union itself, has disrupted and may continue to disrupt markets in the United States and around the world. If a country changes its currency or leaves the European Union or if the European Union dissolves, the world’s securities markets likely will be significantly disrupted. Substantial government interventions (e.g., currency controls) also could adversely affect the Funds. War, terrorism, economic uncertainty, and related geopolitical events have led, and in the future may lead, to increased short-term market volatility and may have adverse long-term effects on U.S. and world economies and markets generally. Likewise, natural and environmental disasters, such as the earthquake and tsunami in Japan in early 2011, and systemic market dislocations of the kind surrounding the insolvency of Lehman Brothers in 2008, if repeated, would be highly disruptive to economies and markets, adversely affecting individual companies and industries, securities markets, interest rates, credit ratings, inflation, investor sentiment, and other factors affecting the value of the Funds’ investments. During such market disruptions, the Funds’ exposure to the risks described elsewhere in this “Investment and other risks” section will likely increase. Market disruptions, including sudden government interventions, can also prevent the Funds from implementing their investment programs and achieving their investment objectives. For example, a market disruption may adversely affect the orderly functioning of the securities markets and may cause the Funds’ derivatives counterparties to discontinue offering derivatives on some underlying commodities, securities, reference rates, or indices, or to offer them on a more limited basis. To the extent a Fund has focused its investments in the stock index of a particular region, adverse geopolitical and other events in that region could have a disproportionate impact on the Fund.
• MARKET RISK. All of the Funds are subject to market risk, which is the risk that the market value of their holdings will decline. Market risks include:
Equities — Funds that invest in equities run the risk that the market price of an equity will decline. That decline may be attributable to factors affecting the issuer, such as poor performance by the company’s management or reduced demand for its goods or services, or to factors affecting a particular industry, such as a decline in demand, labor or raw material shortages, or increased production costs. A decline also may result from general market conditions not specifically related to a company or industry, such as real or perceived adverse economic conditions, changes in the general outlook for corporate earnings, changes in interest or currency rates, or adverse investor sentiment generally. Equities generally have significant price volatility, and their market prices can decline in a rapid or unpredictable manner. If a Fund purchases an equity for less than its fundamental fair (or intrinsic) value as determined by GMO, the Fund runs the risk that the market price of the equity will not appreciate or will decline due to GMO’s incorrect assessment of the equity’s fundamental fair (or intrinsic) value. The market prices of equities trading at high multiples of current earnings often are more sensitive to changes in future earnings expectations than the market prices of equities trading at lower multiples.
Because of Risk Premium Fund’s emphasis on selling put options on stock indices, GMO expects its net asset value to decline when those indices decline in value. Also, Risk Premium Fund’s investment strategy of writing put options on stock indices can be expected to cause the Fund to underperform relative to those indices when those markets rise sharply because of the Fund’s lack of exposure to the upside of those markets.
Fixed Income Investments — Funds that invest in fixed income securities (including bonds, notes, bills, synthetic debt instruments, and asset-backed securities) are subject to various market risks. The market price of a fixed income investment can decline due to market-related factors, including rising interest rates and widening credit spreads, or decreased liquidity stemming from the market’s uncertainty about the value of a fixed income investment (or class of fixed income investments). In addition, the market price of fixed income investments with complex structures, such as asset-backed securities, and sovereign and quasi-sovereign debt instruments, can decline due to uncertainty about their credit quality and the reliability of their payment streams. Some fixed income securities also are subject to unscheduled prepayment, and a Fund may be unable to invest prepayments at as high a yield as was provided by the fixed income security. When interest rates rise, these securities also may be repaid more slowly than anticipated, and the market price of the Fund’s investment may decrease. During periods of economic uncertainty and change, the market price of a Fund’s investments in below investment grade securities (commonly referred to as “junk bonds”) may be particularly volatile. Often below investment grade securities are subject to greater sensitivity to interest rate and economic changes than higher rated bonds and can be more difficult to value, exposing a Fund to the risk that the price at which it sells them will be less than the price at which they were valued when held by the Fund. See “Credit Risk” and “Illiquidity Risk” for more information about these risks.
A risk run by each Fund with a significant investment in fixed income securities is that an increase in prevailing interest rates will cause the market price of those securities to decline. The risk associated with increases in interest rates (also called “interest rate risk”) is generally greater for Funds investing in fixed income securities with longer durations. In addition, in managing some Funds, GMO may seek to evaluate potential investments in part by considering the volatility of interest rates. The value of a Fund’s investments may be significantly reduced if GMO’s assessment proves incorrect.
93
GMO Trust Funds
Notes to Financial Statements — (Continued)
February 28, 2017
The extent to which a fixed income security’s price changes with changes in interest rates is referred to as interest rate duration, which can be measured mathematically or empirically. A longer-maturity investment generally has longer interest rate duration because the investment’s fixed rate is locked in for a longer period of time. Floating-rate or adjustable-rate securities, however, generally have shorter interest rate durations because their interest rates are not fixed but rather float up and down as interest rates change. Conversely, inverse floating-rate securities have durations that move in the opposite direction from short-term interest rates and thus tend to underperform fixed rate securities when interest rates rise but outperform them when interest rates decline. Fixed income securities paying no interest, such as zero coupon and principal-only securities, are subject to additional interest rate risk.
The market price of inflation-indexed bonds (including TIPS) typically declines during periods of rising real interest rates (i.e., nominal interest rate minus inflation) and increases during periods of declining real interest rates. In some interest rate environments, such as when real interest rates are rising faster than nominal interest rates, the market price of inflation-indexed bonds may decline more than the price of non-inflation-indexed (or nominal) fixed income bonds with similar maturities.
Generally, when interest rates on short term U.S. Treasury obligations equal or approach zero, a Fund that invests a substantial portion of its assets in U.S. Treasury obligations, such as U.S. Treasury Fund, will have a negative return unless GMO waives or reduces its management fees.
Fixed income securities denominated in foreign currencies also are subject to currency risk. See “Currency Risk”.
In response to government intervention, economic or market developments, or other factors, fixed income markets may experience periods of high volatility, reduced liquidity or both. During those periods, a Fund could have unusually high shareholder redemptions, requiring it to generate cash by selling securities when it would otherwise not do so, including at unfavorable prices. Fixed income investments may be difficult to value during such periods. In recent periods, central banks and governmental financial regulators, including the U.S. Federal Reserve, have maintained historically low interest rates by purchasing bonds. Steps to curtail or “taper” such activities and other actions by central banks or regulators (such as intervention in foreign currency markets or currency controls) could have a material adverse effect on the Funds.
• MERGER ARBITRAGE RISK. Some Funds may engage in transactions in which a Fund purchases securities at prices below the value of the consideration GMO expects to be paid for them upon consummation of a proposed merger, exchange offer, tender offer, or other similar transaction (“merger arbitrage transactions”). The purchase price paid by the Fund may substantially exceed the market price of the securities before the announcement of the transaction.
If a Fund engages in a merger arbitrage transaction and that transaction later appears unlikely to be consummated or, in fact, is not consummated or is delayed, the market prices of the securities purchased by the Fund may decline sharply, resulting in losses to the Fund. The risk/reward payout of merger arbitrage strategies typically is asymmetric, as the losses in failed transactions often far exceed the gains in successful transactions. A merger arbitrage transaction can fail for many reasons, including regulatory and antitrust restrictions, political motivations, industry weakness, stock specific events, failed financings, and general market declines.
Merger arbitrage strategies depend for success on the overall volume of merger activity, which has historically been cyclical. When merger activity is low, GMO may be unable to identify enough opportunities to provide sufficient diversification.
Merger arbitrage strategies are subject to the risk of overall market movements, and a Fund may experience losses even if a transaction is consummated. A Fund’s investments in derivatives or short sales of securities to hedge or otherwise adjust long or short investment exposure in connection with a merger arbitrage transaction may not perform as GMO expected or may otherwise reduce the Fund’s gains or increase its losses. Also, a Fund may be unable to hedge against market fluctuations or other risks. In addition, a Fund that sells securities short that GMO expects it to receive upon consummation of a transaction but it does not actually receive (and thus has an unintended “naked” short position) may be required to cover its short position at a time when the securities sold short have appreciated in value, thus resulting in a loss.
• NON-DIVERSIFIED FUNDS. Some of the Funds are not “diversified” investment companies within the meaning of the 1940 Act. This means they are allowed to invest in the securities of relatively few issuers. As a result, they may be subject to greater credit, market and other risks, and poor performance by a single issuer may have a greater impact on their performance, than if they were “diversified.”
The following Funds are not diversified investment companies within the meaning of the 1940 Act:
| | • | | Tax-Managed International Equities Fund |
94
GMO Trust Funds
Notes to Financial Statements — (Continued)
February 28, 2017
• NON-U.S. INVESTMENT RISK. Funds that invest in non-U.S. securities are subject to more risks than Funds that invest only in U.S. securities. Non-U.S. securities markets often include securities of only a small number of companies in a limited number of industries. As a result, the market prices of many of the securities traded on those markets fluctuate more than those of U.S. securities. In addition, issuers of non-U.S. securities often are not subject to as much regulation as U.S. issuers, and the reporting, accounting, custody, and auditing standards to which those issuers are subject differ, in some cases significantly, from U.S. standards. Transactions in non-U.S. securities generally involve higher commission rates, transfer taxes and custodial costs. In addition, some jurisdictions may limit a Fund’s ability to profit from short-term trading (as defined in the relevant jurisdiction).
A Fund may be subject to non-U.S. taxation, including potentially on a retroactive basis, on (i) capital gains it realizes or dividends, interest, or other amounts it realizes or accrues in respect of non-U.S. investments; (ii) transactions in those investments; and (iii) repatriation of proceeds generated from the sale or other disposition of those investments. A Fund may seek a refund of taxes paid, but its efforts may not be successful, in which case the Fund will have incurred additional expenses for no economic benefit. A Fund’s decision to seek a refund is in its sole discretion, and, particularly in light of the cost involved, it may decide not to seek a refund, even if eligible. The outcome of a Fund’s efforts to obtain a refund may be unpredictable. Accordingly, a refund is not typically reflected in a Fund’s net asset value until it is received or until the Fund determines there is a high likelihood the refund will be received. In some cases, the amount of a refund could be material to a Fund’s net assets. Absent a determination that a refund is collectible and free from significant contingencies, such amount is not typically reflected in a Fund’s net assets.
Also, investing in non-U.S. securities exposes a Fund to the risk of nationalization, expropriation, or confiscatory taxation of assets of their issuers, other government involvement in the economy or in the affairs of specific companies or industries (including in the case of wholly or partially state-owned enterprises), adverse changes in investment regulations, capital requirements or exchange controls (which may include suspension of the ability to transfer currency from a country), and adverse political and diplomatic developments, including the imposition of economic sanctions.
In some non-U.S. securities markets, custody arrangements for securities provide significantly less protection than custody arrangements in U.S. securities markets, and prevailing custody and trade settlement practices (e.g., the requirement to pay for securities prior to receipt) expose a Fund to credit and other risks it does not have in the United States with respect to brokers, custodians, clearing banks or other clearing agents, escrow agents, and issuers. Fluctuations in foreign currency exchange rates also affect the market value of a Fund’s non-U.S. investments (see “Currency Risk”).
The Funds need a license to invest directly in many non-U.S. securities markets. These licenses are often subject to limitations, including maximum investment amounts. Once a license is obtained, a Fund’s ability to continue to invest directly is subject to the risk that the license will be terminated or suspended. If a license to invest in a particular market is terminated or suspended, to obtain exposure to that market the Fund will be required to purchase American Depositary Receipts, Global Depositary Receipts, shares of other funds that are licensed to invest directly, or derivative instruments. The receipt of a non-U.S. license by one of GMO’s clients may preclude other clients, including a Fund, from obtaining a similar license, and this could limit the Fund’s investment opportunities. In addition, the activities of a GMO client could cause the suspension or revocation of a license and thereby limit the Funds’ investment opportunities.
Funds that invest a significant portion of their assets in securities of issuers tied economically to emerging countries (or investments related to emerging markets) are subject to greater non-U.S. investment risk than Funds investing primarily in more developed non-U.S. countries (or markets). The risks of investing in those securities include: greater fluctuations in currency exchange rates; increased risk of default (by both government and private issuers); greater social, economic, and political uncertainty and instability (including the risk of war or natural disaster); increased risk of nationalization, expropriation, or other confiscation of assets of issuers of securities in a Fund’s portfolio; greater governmental involvement in the economy or in the affairs of specific companies or industries (including in the case of wholly or partially state-owned enterprises); less governmental supervision and regulation of the securities markets and participants in those markets; controls on non-U.S. investment, capital controls and limitations on repatriation of invested capital, dividends, interest and other income and on a Fund’s ability to exchange local currencies for U.S. dollars; inability to purchase and sell investments or otherwise settle security or derivative transactions (i.e., a market freeze); unavailability of currency hedging techniques; differences in, or lack of, auditing and financial reporting standards and resulting unavailability of material information about issuers; slower clearance and settlement; difficulties in obtaining and enforcing legal judgments; and significantly smaller market capitalizations of issuers. In addition, the economies of emerging countries may be predominantly based on only a few industries or dependent on revenues from particular commodities.
• SMALL COMPANY RISK. Companies with smaller market capitalizations may have limited product lines, markets, or financial resources, may lack the competitive strength of larger companies, may have inexperienced managers or may depend on a smaller group of key employees as compared to larger companies. In addition, their securities often are less widely held and trade less frequently and in lesser quantities, and their market prices often fluctuate more, than the securities of companies with larger market capitalizations. Market risk and illiquidity risk are particularly pronounced for securities of these companies.
95
GMO Trust Funds
Notes to Financial Statements — (Continued)
February 28, 2017
Temporary Defensive Positions. Temporary defensive positions are positions that are inconsistent with a Fund’s principal investment strategies and are taken in response to adverse market, economic, political or other conditions. The Funds normally do not take temporary defensive positions. To the extent a Fund takes a temporary defensive position, or otherwise holds cash, cash equivalents, or high quality debt investments on a temporary basis, the Fund may not achieve its investment objective.
| 4. | Derivative financial instruments |
Derivatives are financial contracts whose value depends on, or is derived from, the value of underlying assets, reference rates, or indices that are used, to increase, decrease or adjust elements of the investment exposures of a Fund’s portfolio. Derivatives may relate to securities, interest rates, currencies, currency exchange rates, inflation rates, commodities and indices, and include foreign currency contracts, swap contracts, reverse repurchase agreements, and other exchange-traded and OTC contracts.
The Funds may use derivatives to gain long investment exposure to securities or other assets. For example, a Fund may use derivatives instead of investing directly in equity securities, including using equity derivatives to maintain equity exposure when it holds cash by “equitizing” its cash balances using futures contracts or other types of derivatives. The Funds also may use currency derivatives (including forward currency contracts, futures contracts, swap contracts and options) to gain exposure to a given currency.
The Funds may use derivatives in an attempt to reduce their investment exposures (which may result in a reduction below zero). A Fund also may use currency derivatives in an attempt to reduce some aspect of the currency exposure in its portfolio. For these purposes, the Fund may use an instrument denominated in a different currency that GMO believes is highly correlated with the relevant currency.
The Funds may use derivatives in an attempt to adjust elements of their investment exposures to various securities, sectors, markets, indices, and currencies without actually having to sell existing investments or make new direct investments. For example, if a Fund holds a large proportion of stocks of companies in a particular sector and GMO believes that stocks of companies in another sector will outperform those stocks, the Fund might use a short futures contract on an appropriate index (to synthetically “sell” a portion of the Fund’s portfolio) in combination with a long futures contract on another index (to synthetically “buy” exposure to that index). In adjusting its investment exposures, a Fund also may use currency derivatives in an attempt to adjust its currency exposure, seeking currency exposure that is different (in some cases, significantly different) from the currencies in which its equities are traded.
The Funds may use derivatives to effect transactions intended as substitutes for securities lending.
The Funds may have investment exposures in excess of their net assets (i.e., they may be leveraged). While GMO expects that Risk Premium Fund’s option positions typically will be fully collateralized at the time when the Fund is selling them, from time to time the Fund may have investment exposures in excess of its net assets (i.e., it may be leveraged). For example, if Risk Premium Fund receives a redemption request and is unable to close out an option it had sold, the Fund may temporarily have gross investment exposures in excess of its net assets (i.e., the Fund will be leveraged) and therefore is subject to heightened risk of loss. Risk Premium Fund’s performance can depend substantially, if not primarily, on the performance of assets or indices underlying its derivatives even though it does not own those assets or indices.
A Fund’s foreign currency exposure may differ significantly from the currencies in which its equities are traded.
Certain derivatives transactions that may be used by the Funds, including certain interest rate swaps and certain credit default index swaps, are required to be transacted through a central clearing organization. The Funds hold cleared derivatives transactions, if any, through clearing members, who are members of derivatives clearing houses. Certain other derivatives, including futures and certain options, are transacted on exchanges. The Funds hold exchange-traded derivatives through clearing brokers that are typically members of the exchanges. In contrast to bilateral derivatives transactions, following a period of advance notice to the Fund, clearing brokers generally can require termination of existing cleared or exchange-traded derivatives transactions at any time and increases in margin above the margin that it required at the beginning of a transaction. Clearing houses and exchanges also have broad rights to increase margin requirements for existing transactions and to terminate transactions. Any such increase or termination could interfere with the ability of a Fund to pursue its investment strategy. Also, a Fund is subject to execution risk if it enters into a derivatives transaction that is required to be cleared (or that GMO expects to be cleared), and no clearing member is willing or able to clear the transaction on the Fund’s behalf. In that case, the transaction might have to be terminated, and the Fund could lose some or all of the benefit of any increase in the value of the transaction after the time of the transaction.
The use of derivatives involves risks that are in addition to, and potentially greater than, the risks associated with investing directly in securities and other more traditional assets. See “Investment and other risks” above for further information.
96
GMO Trust Funds
Notes to Financial Statements — (Continued)
February 28, 2017
For Funds that held derivatives during the year ended February 28, 2017, the following table shows how the Fund used these derivatives (marked with an X):
| | | | | | | | | | | | | | | | | | | | | | | | |
| | | | | | | |
| Type of Derivative and Objective for Use | | International
Equity Fund | | | International
Large/Mid
Cap Equity
Fund | | | Resources
Fund | | | Risk
Premium
Fund | | | Tax-Managed
International
Equities Fund | | | U.S.
Equity
Allocation | |
| Futures contracts | | | | | | | | | | | | | | | | | | | | | | | | |
Adjust exposure to certain securities markets | | | X | | | | X | | | | | | | | X | | | | X | | | | X | |
Maintain the diversity and liquidity of
the portfolio | | | X | | | | X | | | | | | | | X | | | | X | | | | X | |
| Options (Written) | | | | | | | | | | | | | | | | | | | | | | | | |
Substitute for direct equity investment | | | | | | | | | | | | | | | X | | | | | | | | | |
| Swap contracts | | | | | | | | | | | | | | | | | | | | | | | | |
Substitute for direct investments in securities | | | | | | | | | | | | | | | | | | | | | | | X | |
| Rights and/or warrants | | | | | | | | | | | | | | | | | | | | | | | | |
Received as a result of corporate actions | | | X | | | | X | | | | X | | | | | | | | X | | | | | |
Forward currency contracts
The Funds may enter into forward currency contracts, including forward cross currency contracts. A forward currency contract is an agreement between two parties to buy and sell a currency at a set price on a future date (or to pay or receive the amount of the change in relative values of the two currencies). The market price of a forward currency contract fluctuates with changes in forward currency exchange rates. The value of each of the Fund’s forward currency contracts is marked-to-market daily using rates supplied by a quotation service and changes in value are recorded by each Fund as unrealized gains or losses. Realized gains or losses on the contracts are equal to the difference between the value of the contract at the time it was opened and the value at the time it was settled.
These contracts involve market risk in excess of the unrealized gain or loss. Forward currency contracts expose a Fund to the market risk of unfavorable movements in currency values and the risk that the counterparty will be unable or unwilling to meet the terms of the contracts. Most forward currency contracts are not collateralized. Forward currency contracts outstanding at the end of the year, if any, are listed in each applicable Fund’s Schedule of Investments.
Futures contracts
The Funds may purchase and sell futures contracts. A futures contract is a contract that obligates the holder to buy or sell an asset at a predetermined delivery price at a specified time in the future. Some futures contracts are net (cash) settled. Upon entering into a futures contract, a Fund is required to deposit cash, U.S. government and agency obligations or other liquid assets with the futures clearing broker in accordance with the initial margin requirements of the broker or exchange. Futures contracts are generally valued at the settlement price established at the close of business each day by the board of trade or exchange on which they are traded (and if the futures are traded outside the U.S. and the market for such futures is closed prior to the close of the NYSE due to time zone differences, the values will be adjusted, to the extent practicable and available, based on inputs from an independent pricing service approved by the Trustees to reflect estimated valuation changes through the NYSE close). The value of each of the Fund’s futures contracts is marked-to-market daily and an appropriate payable or receivable for the change in value (“variation margin”) is recorded by each Fund. The payable or receivable is settled on the following business day. Gains or losses are recognized but not accounted for as realized until the contracts expire or are closed. Futures contracts involve, to varying degrees, risk of loss in excess of the variation margin as recorded on the Statements of Assets and Liabilities. Under some circumstances, futures exchanges may establish daily limits on the amount that the price of a futures contract can vary from the previous day’s settlement price, thereby effectively preventing liquidation of unfavorable positions. Futures contracts expose the Funds to the risk that they may not be able to enter into a closing transaction due to an illiquid market. Futures contracts outstanding at the end of the year, if any, are listed in each applicable Fund’s Schedule of Investments.
Options
The Funds may purchase call and put options. A call option gives the holder the right to buy an asset; a put option gives the holder the right to sell an asset. “Quanto” options are cash-settled options in which the underlying asset (often an index) is denominated in a currency other than the currency in which the option is settled. By purchasing options a Fund alters its exposure to the underlying asset by, in the case of a call option, entitling it to purchase the underlying asset at a set price from the writer of the option and, in the case of a put option, entitling it to sell the underlying asset at a set price to the writer of the option. A Fund pays a premium for a purchased option. That premium, if any, which is disclosed in the Schedule of Investments, is subsequently reflected in the marked-to-market value of the option. The potential loss associated with purchasing put and call options is limited to the premium paid. Purchased option contracts outstanding at the end of the year, if any, are listed in each applicable Fund’s Schedule of Investments.
97
GMO Trust Funds
Notes to Financial Statements — (Continued)
February 28, 2017
The Funds may write (i.e., sell) call and put options on futures, swaps (“swaptions”), securities or currencies they own or in which they may invest. Writing options alters a Fund’s exposure to the underlying asset by, in the case of a call option, obligating that Fund to sell the underlying asset at a set price to the option-holder and, in the case of a put option, obligating that Fund to purchase the underlying asset at a set price from the option-holder. In some cases (e.g., index options), settlement will be in cash, based on a formula price. When a Fund writes a call or put option, an amount equal to the premium received is recorded as a liability and is subsequently included in the marked-to-market value of the option. As a writer of an option, a Fund has no control over whether it will be required to sell (call) or purchase (put) the underlying asset and as a result bears the risk of an unfavorable change in the price of the asset underlying the option. In the event that a Fund writes call options without an offsetting exposure (e.g., call options on an asset that the Fund does not own), it bears an unlimited risk of loss if the price of the underlying asset increases during the term of the option. OTC options expose a Fund to the risk the Fund may not be able to enter into a closing transaction because of an illiquid market. Written option contracts outstanding at the end of the year, if any, are listed in each applicable Fund’s Schedule of Investments.
When an option contract is closed, that Fund records a realized gain or loss equal to the difference between the value of the contract at the time it was opened and the value at the time it was closed. Realized gains and losses on purchased options are included in realized gains and losses on investment securities. If a written call option is exercised, the premium originally received is recorded as an addition to sales proceeds. If a written put option is exercised, the premium originally received is recorded as a reduction in the cost of investments purchased. Gains and losses from the expiration or closing of written option contracts are separately disclosed in the Statements of Operations.
For the year ended February 28, 2017, investment activity in options contracts written by the Funds was as follows:
| | | | | | | | | | | | | | | | | | | | | | | | |
| | Puts | | | Calls | |
| | | Principal
Amount of
Contracts | | | Number of
Contracts | | | Premiums | | | Principal
Amount of
Contracts | | | Number of
Contracts | | | Premiums | |
Risk Premium Fund | | | | | | | | | | | | | | | | | | | | | | | | |
Outstanding, beginning of period | | | — | | | | 4,274 | | | | $6,771,097 | | | | — | | | | — | | | | $ — | |
Options written | | | — | | | | 50,872 | | | | 49,333,838 | | | | — | | | | — | | | | — | |
Options bought back | | | — | | | | (14,543) | | | | (13,943,140) | | | | — | | | | — | | | | — | |
Options expired | | | — | | | | (32,809) | | | | (36,413,618) | | | | — | | | | — | | | | — | |
Options exercised | | | — | | | | (4,525) | | | | (3,934,930) | | | | — | | | | — | | | | — | |
| | | | | | | | | | | | | | | | | | | | | | | | | |
Outstanding, end of period | | | — | | | | 3,269 | | | | $1,813,247 | | | | — | | | | — | | | | $ — | |
| | | | | | | | | | | | | | | | | | | | | | | | | |
| | | | | | | | | | | | | | | | | | | | | | | | | |
Exchange-traded options are valued at the last sale price, provided that price is between the closing bid and ask prices. If the last sale price is not within this range, then they will be valued at the closing bid price for long positions and the closing ask price for short positions (and if the market of the underlying reference security closes or the official closing time of the underlying index occurs prior to the close of the NYSE due to time zone differences, the values will be adjusted, to the extent practicable and available, based on inputs from an independent pricing service approved by the Trustees to reflect estimated valuation changes through the NYSE close). The Funds value OTC options using industry models and inputs provided by primary pricing sources.
Swap contracts
The Funds may directly or indirectly use various swap contracts, including, without limitation, swaps on securities and securities indices, total return swaps, interest rate swaps, credit default swaps, variance swaps, commodity swaps, inflation swaps, municipal swaps, dividend swaps, volatility swaps, correlation swaps and other types of available swaps. A swap contract is an agreement to exchange the return generated by one asset for the return generated by another asset. Some swap contracts are net settled. When entering into a swap contract and during the term of the transaction, a Fund and/or the swap counterparty may post or receive cash or securities as collateral.
Initial upfront payments received or made upon entering into a swap contract are included in the fair market value of the swap. The Funds do not amortize upfront payments. Net periodic payments made or received to compensate for differences between the stated terms of the swap contract and prevailing market conditions (credit spreads, currency exchange rates, interest rates, and other relevant factors) are recorded as realized gains or losses in the Statements of Operations. A liquidation payment received or made at the termination of the swap contract is recorded as realized gain or loss in the Statements of Operations.
Interest rate swap contracts involve an exchange by the parties of their respective commitments to pay or rights to receive interest (e.g., an exchange of floating rate interest payments for fixed rate interest payments with respect to the notional amount of principal). Basis swaps are interest rate swaps that involve the exchange of two floating interest rate payments and may involve the exchange of two different currencies.
98
GMO Trust Funds
Notes to Financial Statements — (Continued)
February 28, 2017
Total return swap contracts involve a commitment by one party to pay interest to the other party in exchange for a payment to it from the other party based on the return of a reference asset (e.g., a security, basket of securities, or futures contract), both based on notional amounts. To the extent the return of the reference asset exceeds or falls short of the interest payments, one party is entitled to receive a payment from or obligated to make a payment to the other party.
In a credit default swap contract, one party makes payments to another party in exchange for the right to receive a specified return (or to put a security) if a credit event (e.g., default or similar event) occurs with respect to a reference entity or entities. A seller of credit default protection receives periodic payments in return for its obligation to pay the principal amount of a debt security (or other agreed-upon value) to the other party upon the occurrence of a credit event. If no credit event occurs, the seller has no payment obligations so long as there is no early termination.
For credit default swap contracts on asset-backed securities, a credit event may be triggered by various occurrences, which may include an issuer’s failure to pay interest or principal on a reference security, a breach of a material representation or covenant, an agreement by the holders of an asset-backed security to a maturity extension, or a write-down on the collateral underlying the security. For credit default swap contracts on corporate or sovereign issuers, a credit event may be triggered by such occurrences as the issuer’s bankruptcy, failure to pay interest or principal, repudiation/moratorium and/or restructuring.
Variance swap contracts involve an agreement by two parties to exchange cash flows based on the measured variance (or square of volatility) of a specified underlying asset. One party agrees to exchange a “fixed rate” or strike price payment for the “floating rate” or realized price variance on the underlying asset with respect to the notional amount. At inception, the strike price chosen is generally fixed at a level such that the fair value of the swap is zero. As a result, no money changes hands at the initiation of the contract. At the expiration date, the amount payable by one party to the other is the difference between the realized price variance of the underlying asset and the strike price multiplied by the notional amount. A receiver of the realized price variance would be entitled to receive a payment when the realized price variance of the underlying asset is greater than the strike price and would be obligated to make a payment when that variance is less than the strike price. A payer of the realized price variance would be obligated to make a payment when the realized price variance of the underlying asset is greater than the strike price and would be entitled to receive a payment when that variance is less than the strike price. This type of agreement is essentially a forward contract on the future realized price variance of the underlying asset.
Generally, the Funds price their OTC swap contracts daily using industry standard models that may incorporate quotations from market makers or pricing vendors and record the change in value, if any, as unrealized gain or loss in the Statements of Operations. Gains or losses are realized upon the termination of the swap contracts or reset dates, as appropriate. Cleared swap contracts are valued using the quote (which may be based on a model) published by the relevant clearing house. If an updated quote for a cleared swap contract is not available by the time that a Fund calculates its net asset value on any business day, then that swap contract will generally be valued using an industry standard model, which may differ from the model used by the relevant clearing house.
The values assigned to swap contracts may differ significantly from the values realized upon termination, and the differences could be material. Entering into swap contracts involves counterparty credit, legal, and documentation risk that is generally not reflected in the value assigned to the swap contract. Such risks include the possibility that the counterparty defaults on its obligations to perform or disagrees as to the meaning of contractual terms, that a Fund has amounts on deposit in excess of amounts owed by that Fund, or that any collateral the other party posts is insufficient or not timely received by a Fund. Credit risk is particularly acute in economic environments in which financial services firms are exposed to systemic risks of the type evidenced by the insolvency of Lehman Brothers in 2008 and subsequent market disruptions. Swap contracts outstanding at the end of the year, if any, are listed in each applicable Fund’s Schedule of Investments.
Rights and warrants
The Funds may purchase or otherwise receive warrants or rights. Warrants and rights generally give the holder the right to receive, upon exercise, a security of the issuer at a set price. Funds typically use warrants and rights in a manner similar to their use of purchased options on securities, as described in the section entitled “Options” above. Risks associated with the use of warrants and rights are generally similar to risks associated with the use of purchased options. However, warrants and rights often do not have standardized terms, and may have longer maturities and may be less liquid than exchange-traded options. In addition, the terms of warrants or rights may limit a Fund’s ability to exercise the warrants or rights at such times and in such quantities as the Fund would otherwise wish. Rights and/or warrants outstanding at the end of the year, if any, are listed in each applicable Fund’s Schedule of Investments.
As provided by U.S. GAAP, the table below is based on market values or unrealized appreciation/(depreciation) rather than the notional amounts of derivatives. Changes to market values of reference asset(s) will tend to have a greater impact on the Funds (with correspondingly greater risk) the greater the notional amount. For further information on notional amounts, see the Schedule of Investments.
99
GMO Trust Funds
Notes to Financial Statements — (Continued)
February 28, 2017
The following is a summary of the valuations of derivative instruments categorized by risk exposure.
The Effect of Derivative Instruments on the Statements of Assets and Liabilities as of February 28, 2017 and the Statements of Operations for the year ended February 28, 2017^:
The risks referenced in the tables below are not intended to be inclusive of all risks. Please see the “Investment and other risks” and “Portfolio valuation” sections for a further discussion of risks.
| | | | | | | | | | | | | | | | | | | | | | | | |
| | | | | | | |
| | | Credit
Contracts | | | Equity
Contracts | | | Foreign
Currency
Contracts | | | Interest
Rate
Contracts | | | Other
Contracts | | | Total | |
International Equity Fund | | | | | | | | | | | | | | | | | | | | | | | | |
Net Realized Gain (Loss) on | | | | | | | | | | | | | | | | | | | | | | | | |
Investments (rights and/or warrants) | | $ | — | | | $ | 5,705 | | | $ | — | | | $ | — | | | $ | — | | | $ | 5,705 | |
Futures Contracts | | | — | | | | 16,527,985 | | | | — | | | | — | | | | — | | | $ | 16,527,985 | |
| | | | | | | | | | | | | | | | | | | | | | | | | |
Total | | $ | — | | | $ | 16,533,690 | | | $ | — | | | $ | — | | | $ | — | | | $ | 16,533,690 | |
| | | | | | | | | | | | | | | | | | | | | | | | | |
Change in Net Unrealized Appreciation (Depreciation) on | | | | | | | | | | | | | | | | | | | | | | | | |
Futures Contracts | | $ | — | | | $ | (3,066,601 | ) | | $ | — | | | $ | — | | | $ | — | | | $ | (3,066,601 | ) |
| | | | | | | | | | | | | | | | | | | | | | | | | |
Total | | $ | — | | | $ | (3,066,601 | ) | | $ | — | | | $ | — | | | $ | — | | | $ | (3,066,601 | ) |
| | | | | | | | | | | | | | | | | | | | | | | | | |
| | | | | | | | | | | | | | | | | | | | | | | | | |
International Large/Mid Cap Equity Fund | | | | | | | | | | | | | | | | | | | | | | | | |
Asset Derivatives | | | | | | | | | | | | | | | | | | | | | | | | |
Unrealized Appreciation on Futures Contracts* | | $ | — | | | $ | 18,330 | | | $ | — | | | $ | — | | | $ | — | | | $ | 18,330 | |
| | | | | | | | | | | | | | | | | | | | | | | | | |
Total | | $ | — | | | $ | 18,330 | | | $ | — | | | $ | — | | | $ | — | | | $ | 18,330 | |
| | | | | | | | | | | | | | | | | | | | | | | | | |
Derivatives not subject to Master Agreements | | $ | — | | | $ | — | | | $ | — | | | $ | — | | | $ | — | | | $ | — | |
| | | | | | | | | | | | | | | | | | | | | | | | | |
Total subject to Master Agreements | | $ | — | | | $ | 18,330 | | | $ | — | | | $ | — | | | $ | — | | | $ | 18,330 | |
| | | | | | | | | | | | | | | | | | | | | | | | | |
Net Realized Gain (Loss) on | | | | | | | | | | | | | | | | | | | | | | | | |
Investments (rights and/or warrants) | | $ | — | | | $ | (2 | ) | | $ | — | | | $ | — | | | $ | — | | | $ | (2 | ) |
Futures Contracts | | | — | | | | 1,784,887 | | | | — | | | | — | | | | — | | | | 1,784,887 | |
| | | | | | | | | | | | | | | | | | | | | | | | | |
Total | | $ | — | | | $ | 1,784,885 | | | $ | — | | | $ | — | | | $ | — | | | $ | 1,784,885 | |
| | | | | | | | | | | | | | | | | | | | | | | | | |
Change in Net Unrealized Appreciation (Depreciation) on | | | | | | | | | | | | | | | | | | | | | | | | |
Futures Contracts | | $ | — | | | $ | (31,335 | ) | | $ | — | | | $ | — | | | $ | — | | | $ | (31,335 | ) |
| | | | | | | | | | | | | | | | | | | | | | | | | |
Total | | $ | — | | | $ | (31,335 | ) | | $ | — | | | $ | — | | | $ | — | | | $ | (31,335 | ) |
| | | | | | | | | | | | | | | | | | | | | | | | | |
| | | | | | | | | | | | | | | | | | | | | | | | | |
Resources Fund | | | | | | | | | | | | | | | | | | | | | | | | |
Net Realized Gain (Loss) on | | | | | | | | | | | | | | | | | | | | | | | | |
Investments (rights and/or warrants) | | $ | — | | | $ | (44,665 | ) | | $ | — | | | $ | — | | | $ | — | | | $ | (44,665 | ) |
| | | | | | | | | | | | | | | | | | | | | | | | | |
Total | | $ | — | | | $ | (44,665 | ) | | $ | — | | | $ | — | | | $ | — | | | $ | (44,665 | ) |
| | | | | | | | | | | | | | | | | | | | | | | | | |
| | | | | | | | | | | | | | | | | | | | | | | | | |
Risk Premium Fund | | | | | | | | | | | | | | | | | | | | | | | | |
Liability Derivatives | | | | | | | | | | | | | | | | | | | | | | | | |
Written Options, at value | | $ | — | | | $ | (1,112,331 | ) | | $ | — | | | $ | — | | | $ | — | | | $ | (1,112,331 | ) |
| | | | | | | | | | | | | | | | | | | | | | | | | |
Total | | $ | — | | | $ | (1,112,331 | ) | | $ | — | | | $ | — | | | $ | — | | | $ | (1,112,331 | ) |
| | | | | | | | | | | | | | | | | | | | | | | | | |
Derivatives not subject to Master Agreements | | $ | — | | | $ | — | | | $ | — | | | $ | — | | | $ | — | | | $ | — | |
| | | | | | | | | | | | | | | | | | | | | | | | | |
Total subject to Master Agreements | | $ | — | | | $ | (1,112,331 | ) | | $ | — | | | $ | — | | | $ | — | | | $ | (1,112,331 | ) |
| | | | | | | | | | | | | | | | | | | | | | | | | |
Net Realized Gain (Loss) on | | | | | | | | | | | | | | | | | | | | | | | | |
Futures Contracts | | $ | — | | | $ | 79,262 | | | $ | — | | | $ | — | | | $ | — | | | $ | 79,262 | |
Written Options | | | — | | | | 38,536,036 | | | | — | | | | — | | | | — | | | | 38,536,036 | |
| | | | | | | | | | | | | | | | | | | | | | | | | |
Total | | $ | — | | | $ | 38,615,298 | | | $ | — | | | $ | — | | | $ | — | | | $ | 38,615,298 | |
| | | | | | | | | | | | | | | | | | | | | | | | | |
Change in Net Unrealized Appreciation (Depreciation) on | | | | | | | | | | | | | | | | | | | | | | | | |
Written Options | | $ | — | | | $ | (1,966,096 | ) | | $ | — | | | $ | — | | | $ | — | | | $ | (1,966,096 | ) |
| | | | | | | | | | | | | | | | | | | | | | | | | |
Total | | $ | — | | | $ | (1,966,096 | ) | | $ | — | | | $ | — | | | $ | — | | | $ | (1,966,096 | ) |
| | | | | | | | | | | | | | | | | | | | | | | | | |
| | | | | | | | | | | | | | | | | | | | | | | | | |
100
GMO Trust Funds
Notes to Financial Statements — (Continued)
February 28, 2017
| | | | | | | | | | | | | | | | | | | | | | | | |
| | | | | | | |
| | | Credit
Contracts | | | Equity
Contracts | | | Foreign
Currency
Contracts | | | Interest
Rate
Contracts | | | Other
Contracts | | | Total | |
Tax-Managed International Equities Fund | | | | | | | | | | | | | | | | | | | | | | | | |
Asset Derivatives | | | | | | | | | | | | | | | | | | | | | | | | |
Investments, at value (rights and/or warrants) | | $ | — | | | $ | 990 | | | $ | — | | | $ | — | | | $ | — | | | $ | 990 | |
| | | | | | | | | | | | | | | | | | | | | | | | | |
Total | | $ | — | | | $ | 990 | | | $ | — | | | $ | — | | | $ | — | | | $ | 990 | |
| | | | | | | | | | | | | | | | | | | | | | | | | |
Derivatives not subject to Master Agreements | | $ | — | | | $ | 990 | | | $ | — | | | $ | — | | | $ | — | | | $ | 990 | |
| | | | | | | | | | | | | | | | | | | | | | | | | |
Total subject to Master Agreements | | $ | — | | | $ | — | | | $ | — | | | $ | — | | | $ | — | | | $ | — | |
| | | | | | | | | | | | | | | | | | | | | | | | | |
Liability Derivatives | | | | | | | | | | | | | | | | | | | | | | | | |
Unrealized Depreciation on Futures Contracts* | | $ | — | | | $ | (1,260 | ) | | $ | — | | | $ | — | | | $ | — | | | $ | (1,260 | ) |
| | | | | | | | | | | | | | | | | | | | | | | | | |
Total | | $ | — | | | $ | (1,260 | ) | | $ | — | | | $ | — | | | $ | — | | | $ | (1,260 | ) |
| | | | | | | | | | | | | | | | | | | | | | | | | |
Derivatives not subject to Master Agreements | | $ | — | | | $ | — | | | $ | — | | | $ | — | | | $ | — | | | $ | — | |
| | | | | | | | | | | | | | | | | | | | | | | | | |
Total subject to Master Agreements | | $ | — | | | $ | (1,260 | ) | | $ | — | | | $ | — | | | $ | — | | | $ | (1,260 | ) |
| | | | | | | | | | | | | | | | | | | | | | | | | |
Net Realized Gain (Loss) on | | | | | | | | | | | | | | | | | | | | | | | | |
Investments (rights and/or warrants) | | $ | — | | | $ | (3,471 | ) | | $ | — | | | $ | — | | | $ | — | | | $ | (3,471 | ) |
Futures Contracts | | | — | | | | 1,016,633 | | | | — | | | | — | | | | — | | | | 1,016,633 | |
| | | | | | | | | | | | | | | | | | | | | | | | | |
Total | | $ | — | | | $ | 1,013,162 | | | $ | — | | | $ | — | | | $ | — | | | $ | 1,013,162 | |
| | | | | | | | | | | | | | | | | | | | | | | | | |
Change in Net Unrealized Appreciation (Depreciation) on | | | | | | | | | | | | | | | | | | | | | | | | |
Investments (rights and/or warrants) | | $ | — | | | $ | 990 | | | $ | — | | | $ | — | | | $ | — | | | $ | 990 | |
Futures Contracts | | | — | | | | (26,590 | ) | | | — | | | | — | | | | — | | | | (26,590 | ) |
| | | | | | | | | | | | | | | | | | | | | | | | | |
Total | | $ | — | | | $ | (25,600 | ) | | $ | — | | | $ | — | | | $ | — | | | $ | (25,600 | ) |
| | | | | | | | | | | | | | | | | | | | | | | | | |
| | | | | | | | | | | | | | | | | | | | | | | | | |
U.S. Equity Allocation Fund | | | | | | | | | | | | | | | | | | | | | | | | |
Net Realized Gain (Loss) on | | | | | | | | | | | | | | | | | | | | | | | | |
Futures Contracts | | $ | — | | | $ | 3,180,746 | | | $ | — | | | $ | — | | | $ | — | | | $ | 3,180,746 | |
Swap Contracts | | | — | | | | 2,130,834 | | | | — | | | | — | | | | — | | | | 2,130,834 | |
| | | | | | | | | | | | | | | | | | | | | | | | | |
Total | | $ | — | | | $ | 5,311,580 | | | $ | — | | | $ | — | | | $ | — | | | $ | 5,311,580 | |
| | | | | | | | | | | | | | | | | | | | | | | | | |
Change in Net Unrealized Appreciation (Depreciation) on | | | | | | | | | | | | | | | | | | | | | | | | |
Futures Contracts | | $ | — | | | $ | 27,300 | | | $ | — | | | $ | — | | | $ | — | | | $ | 27,300 | |
Swap Contracts | | | — | | | | 137,535 | | | | — | | | | — | | | | — | | | | 137,535 | |
| | | | | | | | | | | | | | | | | | | | | | | | | |
Total | | $ | — | | | $ | 164,835 | | | $ | — | | | $ | — | | | $ | — | | | $ | 164,835 | |
| | | | | | | | | | | | | | | | | | | | | | | | | |
| | | | | | | | | | | | | | | | | | | | | | | | | |
| | ^ | Because the Funds recognize changes in value through the Statements of Operations, they do not qualify for hedge accounting under authoritative guidance for derivative instruments. The Funds’ investments in derivatives may represent an economic hedge; however, they are considered to be non-hedge transactions for the purpose of these tables. |
| | * | The table includes cumulative unrealized appreciation/depreciation of futures and cleared swap contracts, if any, as reported in the Schedule of Investments. Year end variation margin on open futures and cleared swap contracts, if any, is reported within the Statements of Assets and Liabilities. |
Certain Funds are party to International Swaps and Derivatives Association, Inc. Master Agreements, Global Master Repurchase Agreements or other similar types of agreements (collectively, “Master Agreements”) that generally govern the terms of some OTC derivative transactions, repurchase agreements and reverse repurchase agreements. The Master Agreements may include collateral posting terms and netting provisions that apply in the event of a default and/or termination event. Upon the occurrence of such an event, including the bankruptcy or insolvency of the counterparty, the Master Agreements may permit the non-defaulting party to calculate a single net payment to close out applicable transactions. However, there is no guarantee that the terms of a Master Agreement will be enforceable; for example, when bankruptcy or insolvency laws impose restrictions on or prohibitions against the right of offset. Additionally, the netting and close out provisions of a Master Agreement may not extend to the obligations of the counterparty’s affiliates or across varying types of transactions. Because no such event has occurred, the Funds do not presently have a legally enforceable right of set-off and these amounts have not been offset in the Statements of Assets and Liabilities, but have been presented separately in the table below. Termination events may also include a decline in the net assets of a Fund below a certain level over a specified period of time and may entitle a counterparty to elect to terminate early with respect to some or all the transactions under the Master Agreement with that counterparty. Such an election by one or more of the counterparties could have a material adverse impact on a Fund’s
101
GMO Trust Funds
Notes to Financial Statements — (Continued)
February 28, 2017
operations. An estimate of the aggregate net payment, if any, that may need to be made by a Fund in such an event is represented by the unrealized amounts in the tables below. For more information about other uncertainties and risks, see “Investments and other risks” above.
For financial reporting purposes, on the Statements of Assets and Liabilities any cash collateral that has been pledged to cover obligations of the Funds is reported as Due from Broker and any cash collateral received from the counterparty is reported as Due to Broker. Any non-cash collateral pledged by the Funds is noted in the Schedules of Investments. The tables below show the potential effect of netting arrangements made available by the Master Agreements on the financial position of the Funds. For financial reporting purposes, the Funds’ Statements of Assets and Liabilities generally show derivative assets and derivative liabilities (regardless of whether they are subject to netting arrangements) on a gross basis, which reflects the full risks and exposures of the Fund prior to netting. See Note 2 for information on repurchase agreements and reverse repurchase agreements held by the Funds at February 28, 2017, if any.
The tables above present the Funds’ derivative assets and liabilities by type of financial instrument. The following tables present the Funds’ OTC and/or exchange-traded derivative assets and liabilities by counterparty net of amounts that may be available for offset under the Master Agreements by the terms of the agreement and net of the related collateral received or pledged by the Funds as of February 28, 2017:
Risk Premium Fund
| | | | | | | | | | | | | | | | |
| | | | | |
| Counterparty | | Gross Derivative
Liabilities Subject to
Master Agreements | | | Collateral
Pledged | | | Derivative
(Assets)/Liabilities
Available for Offset | | | Net Amount
of Derivative
Liabilities | |
Morgan Stanley & Co. LLC | | $ | 1,112,331 | | | $ | 1,112,331 | * | | $ | — | | | $ | — | |
| | | | | | | | | | | | | | | | | |
Total | | $ | 1,112,331 | | | $ | 1,112,331 | | | $ | — | | | $ | — | |
| | | | | | | | | | | | | | | | | |
| | | | | | | | | | | | | | | | | |
| | * | The actual collateral received and/or pledged is more than the amount shown. |
The average derivative activity of notional amounts (futures contracts and swap contracts), market values (rights and/ or warrants) or number of contracts (options) outstanding, based on absolute values, at each month-end, was as follows for the year ended February 28, 2017:
| | | | | | | | | | | | | | | | |
| | | | | |
| Fund Name | | Futures
Contracts ($) | | | Swap
Contracts ($) | | | Options
(Contracts) | | | Rights and/or
Warrants ($) | |
International Equity Fund | | | 12,805,197 | | | | — | | | | — | | | | 95,629 | |
International Large/Mid Cap Equity Fund | | | 3,941,693 | | | | — | | | | — | | | | 24,458 | |
Resources Fund | | | — | | | | — | | | | — | | | | 5,341 | |
Risk Premium Fund | | | 99,493* | | | | — | | | | 4,206 | | | | — | |
Tax-Managed International Equities Fund | | | 704,765 | | | | — | | | | — | | | | 4,034 | |
U.S. Equity Allocation Fund | | | 7,891,945* | | | | 2,338,655 | | | | — | | | | — | |
| | * | During the year ended February 28, 2017, the Fund did not hold this investment type at any month-end; therefore, the average amount outstanding was calculated using daily outstanding absolute values. |
| 5. | Fees and other transactions with affiliates |
GMO receives a management fee for the services it provides to each Fund. Management fees are paid monthly at the annual rate equal to the percentage of each Fund’s average daily net assets set forth in the table below:
| | | | | | | | | | | | | | | | | | | | | | | | | | | | |
| | | | | | | | |
| | | International
Equity Fund | | | International
Large/Mid
Cap Equity
Fund | | | Quality
Fund | | | Resources
Fund | | | Risk
Premium
Fund | | | Tax-Managed
International
Equities
Fund | | | U.S. Equity
Allocation
Fund | |
Management Fee | | | 0.50% | | | | 0.38% | | | | 0.33% | | | | 0.50% | | | | 0.45% | | | | 0.50% | | | | 0.31% | |
In addition, each class of shares of certain Funds pays GMO a shareholder service fee for providing client services and reporting, such as performance information, client account information, personal and electronic access to Fund information, access to analysis and explanations of
102
GMO Trust Funds
Notes to Financial Statements — (Continued)
February 28, 2017
Fund reports, and assistance in maintaining and correcting client-related information. Shareholder service fees are paid monthly equal to the percentage of each applicable Fund’s average daily net assets set forth in the table below:
| | | | | | | | | | | | | | | | | | | | |
| | | | | | |
| Fund Name | | Class II | | | Class III | | | Class IV | | | Class V | | | Class VI | |
International Equity Fund | | | 0.22% | | | | 0.15% | | | | 0.09% | | | | | | | | | |
International Large/Mid Cap Equity Fund | | | | | | | 0.15% | | | | 0.09% | | | | | | | | 0.055% | |
Quality Fund | | | | | | | 0.15% | | | | 0.105% | | | | 0.085% | | | | 0.055% | |
Resources Fund | | | | | | | 0.15% | | | | 0.10% | | | | 0.085% | * | | | 0.055% | * |
Risk Premium Fund | | | | | | | 0.15% | | | | 0.10% | * | | | 0.085% | * | | | 0.055% | |
Tax-Managed International Equities Fund | | | | | | | 0.15% | | | | | | | | | | | | | |
U.S. Equity Allocation Fund | | | | | | | 0.15% | | | | 0.10% | | | | 0.085% | | | | 0.055% | |
| | * | Class is offered but has no shareholders as of February 28, 2017. |
For each Fund other than Resources Fund, GMO has contractually agreed to reimburse the Fund for its “Specified Operating Expenses” (as defined below). Any such reimbursements are paid to a Fund concurrently with the Fund’s payment of management fees to GMO. For Resources Fund, GMO has contractually agreed to reimburse the Fund for the portion of its “Specified Operating Expenses” (as defined below) that exceeds 0.10% of the Fund’s average daily net assets.
“Specified Operating Expenses” means: audit expenses, fund accounting expenses, pricing service expenses, expenses of non-investment related tax services, transfer agency expenses, expenses of non-investment related legal services provided to the Funds by or at the direction of GMO, federal securities law filing expenses, printing expenses, state and federal registration fees and custody expenses.
For each Fund that pays GMO a management fee, GMO has contractually agreed to waive or reduce that fee, but not below zero, to the extent necessary to offset the management fees paid to GMO that are directly or indirectly borne by the Fund as a result of the Fund’s direct or indirect investments in other GMO Funds.
For each Fund that charges a shareholder service fee, GMO has contractually agreed to waive or reduce the shareholder service fee charged to holders of each class of shares of the Fund, but not below zero, to the extent necessary to offset the shareholder service fees directly or indirectly borne by the class of shares of the Fund as a result of the Fund’s direct or indirect investments in other GMO Funds.
These contractual waivers and reimbursements will continue through at least June 30, 2017 for each Fund unless the Funds’ Board of Trustees authorizes their modification or termination, or reduces the fee rates paid to GMO under the Fund’s management contract or servicing and supplemental support agreement.
The Funds’ portion of the fees paid by the Trust to the Trust’s independent Trustees and their legal counsel and any agents unaffiliated with GMO during the year ended February 28, 2017 is shown in the table below and is included in the Statements of Operations.
| | | | | | | | |
| | | |
| Fund Name | | Independent Trustees
and their legal counsel ($) | | | Agent unaffiliated
with GMO ($) | |
International Equity Fund | | | 124,109 | | | | 12,895 | |
International Large/Mid Cap Equity Fund | | | 15,759 | | | | 1,870 | |
Quality Fund | | | 142,096 | | | | 14,096 | |
Resources Fund | | | 3,288 | | | | 365 | |
Risk Premium Fund | | | 3,483 | | | | 365 | |
Tax-Managed International Equities Fund | | | 2,735 | | | | 303 | |
U.S. Equity Allocation Fund | | | 48,880 | | | | 5,427 | |
103
GMO Trust Funds
Notes to Financial Statements — (Continued)
February 28, 2017
Certain Funds incur fees and expenses indirectly as a shareholder in the underlying funds. For the year ended February 28, 2017 these indirect fees and expenses expressed as a percentage of each Fund’s average daily net assets were as follows:
| | | | | | | | | | | | |
| | | | |
| Fund Name | | Indirect Net Expenses
(excluding shareholder
service fees) | | | Indirect Shareholder
Service Fees | | | Total Indirect Expenses | |
International Equity Fund | | | < 0.001% | | | | 0.000% | | | | < 0.001% | |
International Large/Mid Cap Equity Fund | | | < 0.001% | | | | 0.000% | | | | < 0.001% | |
Quality Fund | | | < 0.001% | | | | 0.000% | | | | < 0.001% | |
Resources Fund | | | < 0.001% | | | | 0.000% | | | | < 0.001% | |
Risk Premium Fund | | | 0.000% | | | | 0.000% | | | | 0.000% | |
Tax-Managed International Equities Fund | | | < 0.001% | | | | 0.000% | | | | < 0.001% | |
U.S. Equity Allocation Fund | | | < 0.001% | | | | 0.000% | | | | < 0.001% | |
The Funds are permitted to purchase or sell securities from or to certain other GMO funds under specified conditions outlined in procedures adopted by the Trustees. The procedures have been designed to ensure that any purchase or sale of securities by a Fund from another fund or portfolio that is or could be considered an affiliate by virtue of having a common investment adviser (or affiliated investment advisers), common Trustees and/or common officers complies with Rule 17a-7 of the 1940 Act. Further, as defined under the procedures, each transaction is effectuated at the current market price. During the year ended February 28, 2017, the Funds did not engage in these transactions.
| 6. | Purchases and sales of securities |
Cost of purchases and proceeds from sales of securities, excluding short-term investments and including GMO U.S. Treasury Fund, for the year ended February 28, 2017 are noted in the table below:
| | | | | | | | | | | | | | | | |
| | | | | |
| | | Purchases ($) | | | Purchases ($) | | | Sales ($) | | | Sales ($) | |
| | | | | |
| Fund Name | | U.S. Government
Securities | | | Investments (Non-U.S.
Government Securities) | | | U.S. Government
Securities | | | Investments (Non-U.S.
Government Securities) | |
International Equity Fund | | | — | | | | 3,597,976,507 | | | | — | | | | 6,811,440,540 | |
International Large/Mid Cap Equity Fund | | | — | | | | 449,556,842 | | | | — | | | | 1,745,487,665 | |
Quality Fund | | | — | | | | 4,132,684,538 | | | | — | | | | 3,944,437,731 | |
Resources Fund | | | — | | | | 77,720,690 | | | | — | | | | 125,994,664 | |
Risk Premium Fund | | | — | | | | — | | | | — | | | | — | |
Tax-Managed International Equities Fund | | | — | | | | 88,681,948 | | | | — | | | | 206,693,695 | |
U.S. Equity Allocation Fund | | | — | | | | 2,656,561,912 | | | | — | | | | 6,010,434,969 | |
Cost of purchases and proceeds from sales of securities for in-kind transactions, excluding short-term investments, in accordance with U.S. GAAP for the year ended February 28, 2017 are noted in the table below:
| | | | | | | | |
| | | |
| Fund Name | | Purchases ($) | | | Sales ($) | |
U.S. Equity Allocation Fund | | | — | | | | 153,780,220 | |
For the year ended February 28, 2017, the Funds had the following net realized gains/(losses) attributed to redemption in-kind transactions:
| | | | |
| | |
| Fund Name | | Net realized gains/(losses)
attributed to redemption
in-kind transactions ($) | |
U.S. Equity Allocation Fund | | | 21,941,191 | |
104
GMO Trust Funds
Notes to Financial Statements — (Continued)
February 28, 2017
In the normal course of business the Funds enter into contracts with third-party service providers that contain a variety of representations and warranties and that provide general indemnifications. The Funds’ maximum exposure under these arrangements is unknown, as it involves possible future claims that may or may not be made against the Funds. Based on experience, GMO is of the view that the risk of loss to the Funds in connection with the Funds’ indemnification obligations is remote; however, there can be no assurance that such obligations will not result in material liabilities that adversely affect the Funds.
| 8. | Principal shareholders and related parties as of February 28, 2017 |
| | | | | | | | | | | | | | | | |
| | | | | |
| Fund Name | | Number of
shareholders that held
more than 10% of the
outstanding shares of
the Fund | | | Percentage of
outstanding shares of
the Fund held by those
shareholders owning
greater than 10% of the
outstanding shares of
the Fund | | | Percentage of the
shares of the Fund held
by senior management
of GMO and
GMO Trust officers | | | Percentage of the
Fund’s shares held by
accounts for which
GMO has
investment discretion | |
International Equity Fund | | | 3 | # | | | 40.49 | % | | | 0.13 | % | | | 90.58 | % |
International Large/Mid Cap Equity Fund | | | 2 | | | | 98.09 | % | | | — | | | | — | |
Quality Fund | | | — | | | | — | | | | 0.12 | % | | | 19.62 | % |
Resources Fund | | | 1 | | | | 70.78 | % | | | 12.03 | % | | | 5.95 | % |
Risk Premium Fund | | | 2 | ‡ | | | 96.20 | % | | | 0.07 | % | | | 99.66 | % |
Tax-Managed International Equities Fund | | | 2 | | | | 29.72 | % | | | 0.45 | % | | | — | |
U.S. Equity Allocation Fund | | | 5 | § | | | 75.65 | % | | | 0.02 | % | | | 98.70 | % |
| | ‡ | One of the shareholders is another fund of the Trust. |
| | # | Two of the shareholders are other funds of the Trust. |
| | § | Four of the shareholders are other funds of the Trust and one shareholder is another fund managed by GMO. |
The Declaration of Trust permits each Fund to issue an unlimited number of shares of beneficial interest (without par value). Transactions in the Funds’ shares were as follows:
| | | | | | | | | | | | | | | | |
| | | |
| | | Year Ended
February 28, 2017 | | | Year Ended
February 29, 2016 | |
| | | | | |
| | | Shares | | | Amount | | | Shares | | | Amount | |
International Equity Fund | | | | | | | | | | | | | | | | |
| Class II: | | | | | | | | | | | | | | | | |
Shares sold | | | 394,169 | | | $ | 7,758,214 | | | | 40,871 | | | $ | 879,894 | |
Shares issued to shareholders in reinvestment of distributions | | | 53,704 | | | | 1,036,907 | | | | 122,349 | | | | 2,473,073 | |
Shares repurchased | | | (4,406,766 | ) | | | (86,201,920 | ) | | | (762,281 | ) | | | (18,193,375 | ) |
| | | | | | | | | | | | | | | | | |
Net increase (decrease) | | | (3,958,893 | ) | | $ | (77,406,799 | ) | | | (599,061 | ) | | $ | (14,840,408 | ) |
| | | | | | | | | | | | | | | | | |
| Class III: | | | | | | | | | | | | | | | | |
Shares sold | | | 3,202,195 | | | $ | 63,057,431 | | | | 11,099,737 | | | $ | 212,113,201 | |
Shares issued to shareholders in reinvestment of distributions | | | 1,458,230 | | | | 28,472,050 | | | | 1,420,943 | | | | 29,100,091 | |
Shares repurchased | | | (25,597,340 | ) | | | (510,086,501 | ) | | | (20,046,562 | ) | | | (450,098,976 | ) |
| | | | | | | | | | | | | | | | | |
Net increase (decrease) | | | (20,936,915 | ) | | $ | (418,557,020 | ) | | | (7,525,882 | ) | | $ | (208,885,684 | ) |
| | | | | | | | | | | | | | | | | |
| | | | | | | | | | | | | | | | | |
105
GMO Trust Funds
Notes to Financial Statements — (Continued)
February 28, 2017
| | | | | | | | | | | | | | | | |
| | | |
| | | Year Ended
February 28, 2017 | | | Year Ended
February 29, 2016 | |
| | | | | |
| | | Shares | | | Amount | | | Shares | | | Amount | |
International Equity Fund (continued) | | | | | | | | | | | | | | | | |
| Class IV: | | | | | | | | | | | | | | | | |
Shares sold | | | 11,139,274 | | | $ | 215,725,536 | | | | 24,271,645 | (a) | | $ | 515,469,914 | (a) |
Shares issued to shareholders in reinvestment of distributions | | | 11,785,933 | | | | 229,782,109 | | | | 12,723,714 | | | | 260,908,804 | |
Shares repurchased | | | (158,196,157 | ) | | | (3,158,978,555 | ) | | | (133,552,246 | ) | | | (2,927,675,247 | ) |
| | | | | | | | | | | | | | | | | |
Net increase (decrease) | | | (135,270,950 | ) | | $ | (2,713,470,910 | ) | | | (96,556,887 | ) | | $ | (2,151,296,529 | ) |
| | | | | | | | | | | | | | | | | |
| | | | | | | | | | | | | | | | | |
International Large/Mid Cap Equity Fund | | | | | | | | | | | | | | | | |
Class III: | | | | | | | | | | | | | | | | |
Shares sold | | | 411,984 | | | $ | 10,495,496 | | | | 605,372 | | | $ | 16,698,856 | |
Shares issued to shareholders in reinvestment of distributions | | | 253,763 | | | | 6,161,168 | | | | 477,071 | | | | 12,391,865 | |
Shares repurchased | | | (18,719,775 | ) | | | (470,772,481 | ) | | | (1,128,246 | ) | | | (31,120,472 | ) |
| | | | | | | | | | | | | | | | | |
Net increase (decrease) | | | (18,054,028 | ) | | $ | (454,115,817 | ) | | | (45,803 | ) | | $ | (2,029,751 | ) |
| | | | | | | | | | | | | | | | | |
Class IV: | | | | | | | | | | | | | | | | |
Shares sold | | | 1,317,734 | | | $ | 33,127,702 | | | | 4,154,261 | | | $ | 120,506,310 | |
Shares issued to shareholders in reinvestment of distributions | | | 728,389 | | | | 17,599,928 | | | | 1,128,998 | | | | 29,419,761 | |
Shares repurchased | | | (23,672,201 | ) | | | (600,482,249 | ) | | | (22,578,254 | ) | | | (622,875,974 | ) |
| | | | | | | | | | | | | | | | | |
Net increase (decrease) | | | (21,626,078 | ) | | $ | (549,754,619 | ) | | | (17,294,995 | ) | | $ | (472,949,903 | ) |
| | | | | | | | | | | | | | | | | |
Class VI: | | | | | | | | | | | | | | | | |
Shares sold | | | — | | | $ | — | | | | 11,580,744 | | | $ | 347,306,281 | |
Shares issued to shareholders in reinvestment of distributions | | | 623,703 | | | | 14,995,054 | | | | 332,833 | | | | 8,537,330 | |
Shares repurchased | | | (12,536,597 | ) | | | (300,320,271 | ) | | | (5,562 | ) | | | (147,705 | ) |
| | | | | | | | | | | | | | | | | |
Net increase (decrease) | | | (11,912,894 | ) | | $ | (285,325,217 | ) | | | 11,908,015 | | | $ | 355,695,906 | |
| | | | | | | | | | | | | | | | | |
| | | | | | | | | | | | | | | | | |
Quality Fund | | | | | | | | | | | | | | | | |
Class III: | | | | | | | | | | | | | | | | |
Shares sold | | | 27,204,984 | | | $ | 577,084,371 | | | | 37,113,339 | | | $ | 737,344,467 | |
Shares issued to shareholders in reinvestment of distributions | | | 5,427,657 | | | | 111,954,229 | | | | 30,774,221 | | | | 612,057,442 | |
Shares repurchased | | | (78,926,958 | ) | | | (1,636,659,609 | ) | | | (91,043,451 | ) | | | (1,918,244,009 | ) |
| | | | | | | | | | | | | | | | | |
Net increase (decrease) | | | (46,294,317 | ) | | $ | (947,621,009 | ) | | | (23,155,891 | ) | | $ | (568,842,100 | ) |
| | | | | | | | | | | | | | | | | |
Class IV: | | | | | | | | | | | | | | | | |
Shares sold | | | 23,563,655 | | | $ | 498,378,900 | | | | 12,972,554 | | | $ | 257,812,501 | |
Shares issued to shareholders in reinvestment of distributions | | | 2,065,342 | | | | 42,641,190 | | | | 13,099,210 | | | | 260,671,560 | |
Shares repurchased | | | (38,313,485 | ) | | | (806,249,545 | ) | | | (53,695,896 | ) | | | (1,093,773,807 | ) |
| | | | | | | | | | | | | | | | | |
Net increase (decrease) | | | (12,684,488 | ) | | $ | (265,229,455 | ) | | | (27,624,132 | ) | | $ | (575,289,746 | ) |
| | | | | | | | | | | | | | | | | |
Class V: | | | | | | | | | | | | | | | | |
Shares sold | | | 9,463,322 | | | $ | 197,196,406 | | | | 14,581,336 | | | $ | 281,324,249 | |
Shares issued to shareholders in reinvestment of distributions | | | 717,958 | | | | 14,824,416 | | | | 1,727,690 | | | | 34,265,400 | |
Shares repurchased | | | (3,801,010 | ) | | | (79,429,321 | ) | | | (13,369,451 | ) | | | (265,409,816 | ) |
| | | | | | | | | | | | | | | | | |
Net increase (decrease) | | | 6,380,270 | | | $ | 132,591,501 | | | | 2,939,575 | | | $ | 50,179,833 | |
| | | | | | | | | | | | | | | | | |
Class VI: | | | | | | | | | | | | | | | | |
Shares sold | | | 91,893,911 | | | $ | 1,913,611,617 | | | | 4,668,807 | | | $ | 94,787,369 | |
Shares issued to shareholders in reinvestment of distributions | | | 5,665,767 | | | | 116,815,260 | | | | 16,573,784 | | | | 329,071,123 | |
Shares repurchased | | | (36,449,428 | ) | | | (770,551,459 | ) | | | (38,615,013 | ) | | | (796,618,823 | ) |
| | | | | | | | | | | | | | | | | |
Net increase (decrease) | | | 61,110,250 | | | $ | 1,259,875,418 | | | | (17,372,422 | ) | | $ | (372,760,331 | ) |
| | | | | | | | | | | | | | | | | |
| | | | | | | | | | | | | | | | | |
106
GMO Trust Funds
Notes to Financial Statements — (Continued)
February 28, 2017
| | | | | | | | | | | | | | | | |
| | | Year Ended
February 28, 2017 | | | Year Ended
February 29, 2016 | |
| | | | | |
| | | Shares | | | Amount | | | Shares | | | Amount | |
Resources Fund | | | | | | | | | | | | | | | | |
Class III: | | | | | | | | | | | | | | | | |
Shares sold | | | 570,839 | | | $ | 8,566,354 | | | | 80,942 | | | $ | 1,025,701 | |
Shares issued to shareholders in reinvestment of distributions | | | 32,759 | | | | 537,264 | | | | 23,071 | | | | 276,260 | |
Shares repurchased | | | (480,753 | ) | | | (6,835,975 | ) | | | (376,930 | ) | | | (6,175,879 | ) |
Purchase premiums | | | — | | | | 2,754 | | | | — | | | | 31,664 | |
Redemption fees | | | — | | | | 16,991 | | | | — | | | | 2,123 | |
| | | | | | | | | | | | | | | | | |
Net increase (decrease) | | | 122,845 | | | $ | 2,287,388 | | | | (272,917 | ) | | $ | (4,840,131 | ) |
| | | | | | | | | | | | | | | | | |
Class IV: | | | | | | | | | | | | | | | | |
Shares sold | | | 169,620 | | | $ | 2,585,614 | | | | 6,912,543 | | | $ | 105,688,092 | |
Shares issued to shareholders in reinvestment of distributions | | | 315,651 | | | | 5,118,000 | | | | 426,392 | | | | 5,037,059 | |
Shares repurchased | | | (4,055,808 | ) | | | (57,587,522 | ) | | | (68,102 | ) | | | (1,018,052 | ) |
Purchase premiums | | | — | | | | 29,756 | | | | — | | | | 289,355 | |
Redemption fees | | | — | | | | 175,234 | | | | — | | | | 19,374 | |
| | | | | | | | | | | | | | | | | |
Net increase (decrease) | | | (3,570,537 | ) | | $ | (49,678,918 | ) | | | 7,270,833 | | | $ | 110,015,828 | |
| | | | | | | | | | | | | | | | | |
| | | | | | | | | | | | | | | | | |
Risk Premium Fund | | | | | | | | | | | | | | | | |
Class III:# | | | | | | | | | | | | | | | | |
Shares sold | | | 2,862 | | | $ | 85,653 | | | | 144,920 | | | $ | 3,932,767 | |
Shares issued to shareholders in reinvestment of distributions | | | 18,814 | | | | 544,069 | | | | 13,688 | | | | 385,514 | |
Shares repurchased | | | (105,987 | ) | | | (3,151,044 | ) | | | (68,020 | ) | | | (1,897,755 | ) |
Purchase premiums | | | — | | | | — | | | | — | | | | 3,273 | |
Redemption fees | | | — | | | | 6,093 | | | | — | | | | 10,762 | |
| | | | | | | | | | | | | | | | | |
Net increase (decrease) | | | (84,311 | ) | | $ | (2,515,229 | ) | | | 90,588 | | | $ | 2,434,561 | |
| | | | | | | | | | | | | | | | | |
Class IV:‡# | | | | | | | | | | | | | | | | |
Shares sold | | | — | | | $ | — | | | | — | | | $ | — | |
Shares issued to shareholders in reinvestment of distributions | | | — | | | | — | | | | 50,801 | | | | 477,401 | |
Shares repurchased | | | — | | | | — | | | | (764,691 | ) | | | (6,989,835 | ) |
Purchase premiums | | | — | | | | — | | | | — | | | | 2,962 | |
Redemption fees | | | — | | | | — | | | | — | | | | 13,516 | |
| | | | | | | | | | | | | | | | | |
Net increase (decrease) | | | — | | | $ | — | | | | (713,890 | ) | | $ | (6,495,956 | ) |
| | | | | | | | | | | | | | | | | |
Class VI:# | | | | | | | | | | | | | | | | |
Shares sold | | | 390 | | | $ | 10,630 | | | | 7,288,864 | | | $ | 201,620,443 | |
Shares issued to shareholders in reinvestment of distributions | | | 437,685 | | | | 12,713,932 | | | | 948,606 | | | | 27,005,743 | |
Shares repurchased | | | (3,562,411 | ) | | | (103,841,501 | ) | | | (14,450,027 | ) | | | (408,326,738 | ) |
Purchase premiums | | | — | | | | 16 | | | | — | | | | 299,048 | |
Redemption fees | | | — | | | | 154,267 | | | | — | | | | 598,039 | |
| | | | | | | | | | | | | | | | | |
Net increase (decrease) | | | (3,124,336 | ) | | $ | (90,962,656 | ) | | | (6,212,557 | ) | | $ | (178,803,465 | ) |
| | | | | | | | | | | | | | | | | |
| | | | | | | | | | | | | | | | | |
Tax-Managed International Equities Fund | | | | | | | | | | | | | | | | |
Class III: | | | | | | | | | | | | | | | | |
Shares sold | | | 51,654 | | | $ | 709,686 | | | | 213,044 | | | $ | 3,126,326 | |
Shares issued to shareholders in reinvestment of distributions | | | 226,091 | | | | 3,089,352 | | | | 326,791 | | | | 4,756,977 | |
Shares repurchased | | | (8,885,564 | ) | | | (123,384,562 | ) | | | (9,254,256 | ) | | | (130,480,430 | ) |
| | | | | | | | | | | | | | | | | |
Net increase (decrease) | | | (8,607,819 | ) | | $ | (119,585,524 | ) | | | (8,714,421 | ) | | $ | (122,597,127 | ) |
| | | | | | | | | | | | | | | | | |
| | | | | | | | | | | | | | | | | |
107
GMO Trust Funds
Notes to Financial Statements — (Continued)
February 28, 2017
| | | | | | | | | | | | | | | | |
| | | Year Ended
February 28, 2017 | | | Year Ended
February 29, 2016 | |
| | | | | |
| | | Shares | | | Amount | | | Shares | | | Amount | |
U.S. Equity Allocation Fund | | | | | | | | | | | | | | | | |
Class III: | | | | | | | | | | | | | | | | |
Shares sold | | | 254,123 | | | $ | 3,737,099 | | | | 3,690,778 | | | $ | 52,394,646 | |
Shares issued to shareholders in reinvestment of distributions | | | 964,254 | | | | 14,133,772 | | | | 1,411,262 | | | | 20,777,207 | |
Shares repurchased | | | (8,083,310 | ) | | | (120,400,300 | ) | | | (8,265,441 | ) | | | (132,490,471 | ) |
| | | | | | | | | | | | | | | | | |
Net increase (decrease) | | | (6,864,933 | ) | | $ | (102,529,429 | ) | | | (3,163,401 | ) | | $ | (59,318,618 | ) |
| | | | | | | | | | | | | | | | | |
Class IV: | | | | | | | | | | | | | | | | |
Shares sold | | | 353,391 | | | $ | 5,084,358 | | | | 15,005,109 | | | $ | 210,258,173 | |
Shares issued to shareholders in reinvestment of distributions | | | 482,865 | | | | 7,017,672 | | | | 3,184,478 | | | | 46,544,031 | |
Shares repurchased | | | (37,081,635 | )(b) | | | (546,704,227 | )(b) | | | (6,893,844 | ) | | | (102,627,813 | ) |
| | | | | | | | | | | | | | | | | |
Net increase (decrease) | | | (36,245,379 | ) | | $ | (534,602,197 | ) | | | 11,295,743 | | | $ | 154,174,391 | |
| | | | | | | | | | | | | | | | | |
Class V:* | | | | | | | | | | | | | | | | |
Shares sold | | | 11,302,431 | | | $ | 168,755,254 | | | | — | | | $ | — | |
Shares issued to shareholders in reinvestment of distributions | | | 1,125,283 | | | | 16,496,645 | | | | — | | | | — | |
Shares repurchased | | | (1,516,895 | ) | | | (22,257,238 | ) | | | — | | | | — | |
| | | | | | | | | | | | | | | | | |
Net increase (decrease) | | | 10,910,819 | | | $ | 162,994,661 | | | | — | | | $ | — | |
| | | | | | | | | | | | | | | | | |
Class VI: | | | | | | | | | | | | | | | | |
Shares sold | | | 1,279,791 | | | $ | 19,202,615 | | | | 23,204,175 | | | $ | 356,309,707 | |
Shares issued to shareholders in reinvestment of distributions | | | 15,359,314 | | | | 223,790,989 | | | | 37,541,140 | | | | 549,608,080 | |
Shares repurchased | | | (198,687,826 | ) | | | (2,929,999,235 | ) | | | (145,656,187 | )(c) | | | (2,226,520,372 | )(c) |
| | | | | | | | | | | | | | | | | |
Net increase (decrease) | | | (182,048,721 | ) | | $ | (2,687,005,631 | ) | | | (84,910,872 | ) | | $ | (1,320,602,585 | ) |
| | | | | | | | | | | | | | | | | |
| | | | | | | | | | | | | | | | | |
| | (a) | 42,664,021 shares and $928,795,727 were redeemed in-kind. |
| | (b) | 10,797,603 shares and $153,780,220 were redeemed in-kind. |
| | (c) | 42,205,856 shares and $640,262,842 were redeemed in-kind. |
| | # | Shares were adjusted to reflect a 1:3 reverse stock split effective July 15, 2016. |
| | ‡ | Class IV liquidated on February 25, 2016. |
| | * | The class was inactive from July 31, 2014 to August 8, 2016. |
| 10. | Investments in affiliated issuers |
A summary of the Funds’ transactions in the shares of other funds of GMO Trust during the year ended February 28, 2017 is set forth below:
| | | | | | | | | | | | | | | | | | | | | | | | |
| | | | | | | |
| Affiliate | | Value,
beginning of
period | | | Purchases | | | Sales
Proceeds | | | Dividend
Income | | | Distributions
of Realized
Gains | | | Value, end of
period | |
International Equity Fund | | | | | | | | | | | | | | | | | | | | | | | | |
GMO U.S. Treasury Fund | | $ | 296,198,769 | | | $ | 1,663,000,000 | | | $ | 1,937,499,999 | | | $ | 497,582 | | | $ | 11,487 | | | $ | 21,767,868 | |
| | | | | | | | | | | | | | | | | | | | | | | | | |
| | | | | | | | | | | | | | | | | | | | | | | | | |
International Large/Mid Cap Equity Fund | | | | | | | | | | | | | | | | | | | | | | | | |
GMO U.S. Treasury Fund | | $ | 50,481,592 | | | $ | 221,480,000 | | | $ | 269,570,000 | | | $ | 73,394 | | | $ | 5,414 | | | $ | 2,408,002 | |
| | | | | | | | | | | | | | | | | | | | | | | | | |
| | | | | | | | | | | | | | | | | | | | | | | | | |
Quality Fund | | | | | | | | | | | | | | | | | | | | | | | | |
GMO U.S. Treasury Fund | | $ | 117,824,375 | | | $ | 1,740,700,000 | | | $ | 1,618,000,000 | | | $ | 831,750 | | | $ | 106,967 | | | $ | 240,449,520 | |
| | | | | | | | | | | | | | | | | | | | | | | | | |
| | | | | | | | | | | | | | | | | | | | | | | | | |
Resources Fund | | | | | | | | | | | | | | | | | | | | | | | | |
GMO U.S. Treasury Fund | | $ | 2,000,000 | | | $ | 23,200,000 | | | $ | 19,050,000 | | | $ | 11,897 | | | $ | 997 | | | $ | 6,150,081 | |
| | | | | | | | | | | | | | | | | | | | | | | | | |
| | | | | | | | | | | | | | | | | | | | | | | | | |
Tax-Managed International Equities Fund | | | | | | | | | | | | | | | | | | | | | | | | |
GMO U.S. Treasury Fund | | $ | 14,106,048 | | | $ | 12,650,000 | | | $ | 26,330,000 | | | $ | 10,132 | | | $ | 1,041 | | | $ | 427,587 | |
| | | | | | | | | | | | | | | | | | | | | | | | | |
| | | | | | | | | | | | | | | | | | | | | | | | | |
U.S. Equity Allocation Fund | | | | | | | | | | | | | | | | | | | | | | | | |
GMO U.S. Treasury Fund | | $ | 159,329,373 | | | $ | 755,170,000 | | | $ | 903,340,000 | | | $ | 174,881 | | | $ | 5,540 | | | $ | 11,180,107 | |
| | | | | | | | | | | | | | | | | | | | | | | | | |
| | | | | | | | | | | | | | | | | | | | | | | | | |
Subsequent to February 28, 2017, GMO International Large/Mid Cap Equity Fund received redemption requests in the amount of $51,327,010.
108
Report of Independent Registered Public Accounting Firm
To the Trustees of GMO Trust and Shareholders of
GMO International Equity Fund, GMO International Large/Mid Cap Equity Fund, GMO Quality Fund, GMO Resources Fund, GMO Risk Premium Fund, GMO Tax-Managed International Equities Fund, and GMO U.S. Equity Allocation Fund
In our opinion, the accompanying statements of assets and liabilities, including the schedules of investments, and the related statements of operations and of changes in net assets and the financial highlights present fairly, in all material respects, the financial position of the GMO International Equity Fund, GMO International Large/Mid Cap Equity Fund, GMO Quality Fund, GMO Resources Fund, GMO Risk Premium Fund, GMO Tax-Managed International Equities Fund, and GMO U.S. Equity Allocation Fund (the “Funds”) as of February 28, 2017, the results of each of their operations for the year then ended, the changes in each of their net assets for each of the two years in the period then ended and the financial highlights for each of the periods indicated, in conformity with accounting principles generally accepted in the United States of America. These financial statements and financial highlights (hereafter referred to as “financial statements”) are the responsibility of the Fund’s management. Our responsibility is to express an opinion on these financial statements based on our audits. We conducted our audits of these financial statements in accordance with the standards of the Public Company Accounting Oversight Board (United States). Those standards require that we plan and perform the audit to obtain reasonable assurance about whether the financial statements are free of material misstatement. An audit includes examining, on a test basis, evidence supporting the amounts and disclosures in the financial statements, assessing the accounting principles used and significant estimates made by management, and evaluating the overall financial statement presentation. Our procedures included confirmation of securities owned as of February 28, 2017 by correspondence with the custodians and brokers; when replies were not received from brokers, we performed other auditing procedures. We believe that our audits provide a reasonable basis for our opinion.
PricewaterhouseCoopers LLP
Boston, Massachusetts
April 26, 2017
109
GMO Trust Funds
(A Series of GMO Trust)
Fund Expenses
February 28, 2017 (Unaudited)
Expense Examples: The following information is in relation to expenses for the six month period ended February 28, 2017.
As a shareholder of the Funds, you may incur two types of costs: (1) transaction costs, including purchase premium and redemption fees, if applicable; and (2) ongoing costs, including direct and/or indirect management fees, direct and/or indirect shareholder services fees, and other Fund expenses. This example is intended to help you understand your ongoing costs (in dollars) of investing in the Funds and to compare these costs with the ongoing costs of investing in other mutual funds.
These examples are based on an investment of $1,000 invested at the beginning of the period and held for the entire period, September 1, 2016 through February 28, 2017.
Actual Expenses
This section of the table for each class below provides information about actual account values and actual expenses. You may use the information in this section, together with the amount you invested, to estimate the expenses that you paid over the period. Simply divide your account value by $1,000 (for example, a $10,000,000 account value divided by $1,000 = 10,000), then multiply the result by the number under the heading entitled “Expenses Paid During the Period” to estimate the expenses you paid on your account during this period.
Hypothetical Example for Comparison Purposes
This section of the table for each class below provides information about hypothetical account values and hypothetical expenses based on the Funds’ actual expense ratio and an assumed rate of return of 5% per year before expenses, which is not the Funds’ actual return. The hypothetical account values and expenses may not be used to estimate the actual ending account balance or expenses you paid for the period. You may use this information to compare the ongoing costs of investing in the Funds with other funds. To do so, compare this 5% hypothetical example with the 5% hypothetical examples that appear in the shareholder reports of other funds.
Please note that the expenses shown in the table are meant to highlight your ongoing costs only and do not reflect any transactional costs, such as purchase premium and redemption fees. Therefore, this section of the table is useful in comparing ongoing costs only, and will not help you determine the relative total costs of owning different funds. In addition, if these transactional costs were included, your costs would have been higher.
| | | | | | | | | | | | | | | | | | | | | | | | | | | | |
| | | Actual | | | Hypothetical | | | | |
| | | Beginning
Account Value
September 1, 2016 | | | Ending
Account Value
February 28, 2017 | | | Expenses Paid
During the Period* | | | Beginning
Account Value
September 1, 2016 | | | Ending
Account Value
February 28, 2017 | | | Expenses Paid
During the Period* | | | Annualized
Expense Ratio | |
International Equity Fund | | | | | | | | | | | | | | | | | | | | | |
Class II | | | $1,000.00 | | | | $1,055.70 | | | | $3.67 | | | | $1,000.00 | | | | $1,021.22 | | | | $3.61 | | | | 0.72% | |
Class III | | | $1,000.00 | | | | $1,055.60 | | | | $3.31 | | | | $1,000.00 | | | | $1,021.57 | | | | $3.26 | | | | 0.65% | |
Class IV | | | $1,000.00 | | | | $1,056.10 | | | | $3.01 | | | | $1,000.00 | | | | $1,021.87 | | | | $2.96 | | | | 0.59% | |
International Large/Mid Cap Equity Fund | | | | | | | | | | | | | | | | | | | | | |
Class III | | | $1,000.00 | | | | $1,047.80 | | | | $2.74 | | | | $1,000.00 | | | | $1,022.12 | | | | $2.71 | | | | 0.54% | |
Class IV | | | $1,000.00 | | | | $1,047.90 | | | | $2.49 | | | | $1,000.00 | | | | $1,022.36 | | | | $2.46 | | | | 0.49% | |
Class VI | | | $1,000.00 | | | | $1,048.20 | | | | $2.23 | | | | $1,000.00 | | | | $1,022.61 | | | | $2.21 | | | | 0.44% | |
Quality Fund | | | | | | | | | | | | | | | | | | | | | |
Class III | | | $1,000.00 | | | | $1,068.60 | | | | $2.46 | | | | $1,000.00 | | | | $1,022.41 | | | | $2.41 | | | | 0.48% | |
Class IV | | | $1,000.00 | | | | $1,068.90 | | | | $2.26 | | | | $1,000.00 | | | | $1,022.61 | | | | $2.21 | | | | 0.44% | |
Class V | | | $1,000.00 | | | | $1,069.00 | | | | $2.15 | | | | $1,000.00 | | | | $1,022.71 | | | | $2.11 | | | | 0.42% | |
Class VI | | | $1,000.00 | | | | $1,068.80 | | | | $2.00 | | | | $1,000.00 | | | | $1,022.86 | | | | $1.96 | | | | 0.39% | |
Resources Fund | | | | | | | | | | | | | | | | | | | | | |
Class III | | | $1,000.00 | | | | $1,227.30 | | | | $4.20 | | | | $1,000.00 | | | | $1,021.03 | | | | $3.81 | | | | 0.76% | |
Class IV | | | $1,000.00 | | | | $1,226.70 | | | | $3.92 | | | | $1,000.00 | | | | $1,021.27 | | | | $3.56 | | | | 0.71% | |
Risk Premium Fund | | | | | | | | | | | | | | | | | | | | | |
Class III | | | $1,000.00 | | | | $1,083.30 | | | | $3.15 | | | | $1,000.00 | | | | $1,021.77 | | | | $3.06 | | | | 0.61% | |
Class VI | | | $1,000.00 | | | | $1,083.70 | | | | $2.63 | | | | $1,000.00 | | | | $1,022.27 | | | | $2.56 | | | | 0.51% | |
Tax-Managed International Equities Fund | | | | | | | | | | | | | | | | | | | | | |
Class III | | | $1,000.00 | | | | $1,051.00 | | | | $3.56 | | | | $1,000.00 | | | | $1,021.32 | | | | $3.51 | | | | 0.70% | |
110
GMO Trust Funds
Fund Expenses — (Continued)
February 28, 2017 (Unaudited)
| | | | | | | | | | | | | | | | | | | | | | | | | | | | |
| | | Actual | | | Hypothetical | | | | |
| | | Beginning
Account Value
September 1, 2016 | | | Ending
Account Value
February 28, 2017 | | | Expenses Paid
During the Period* | | | Beginning
Account Value
September 1, 2016 | | | Ending
Account Value
February 28, 2017 | | | Expenses Paid
During the Period* | | | Annualized
Expense Ratio | |
U.S. Equity Allocation Fund | | | | | | | | | | | | | | | | | | | | | |
Class III | | | $1,000.00 | | | | $1,105.00 | | | | $2.40 | | | | $1,000.00 | | | | $1,022.51 | | | | $2.31 | | | | 0.46% | |
Class IV | | | $1,000.00 | | | | $1,104.90 | | | | $2.14 | | | | $1,000.00 | | | | $1,022.76 | | | | $2.06 | | | | 0.41% | |
Class V | | | $1,000.00 | | | | $1,105.50 | | | | $2.09 | | | | $1,000.00 | | | | $1,022.81 | | | | $2.01 | | | | 0.40% | |
Class VI | | | $1,000.00 | | | | $1,105.70 | | | | $1.93 | | | | $1,000.00 | | | | $1,022.96 | | | | $1.86 | | | | 0.37% | |
| | * | Expenses are calculated using each class’s annualized net expense ratio (including indirect expenses incurred) for the six months ended February 28, 2017, multiplied by the average account value over the period, multiplied by 181 days in the period, divided by 365 days in the year. |
111
GMO Trust Funds
Tax Information for the Tax Year Ended February 28, 2017 (Unaudited)
The following information is being provided in order to meet reporting requirements set forth by the Code and/or to meet state-specific requirements. Shareholders should consult their tax advisors.
With respect to distributions paid, the Funds designate the following amounts (or, if subsequently determined to be different, the maximum amount allowable) for the fiscal year-ended February 28, 2017:
| | | | | | | | | | | | | | | | | | | | | | | | |
| | | | | | | |
| Fund Name | | Dividend
Received
Deduction
(corporate
shareholders)(1) | | | Qualified
Dividend
Income
(non-corporate
shareholders)(1) | | | Short-
Term
Capital
Gain
Dividends(2)
($) | | | Long-Term
Capital Gain
Distributions
($) | | | Foreign
Taxes
Paid(3) ($) | | | Foreign
Source
Income(3)
($) | |
International Equity Fund | | | — | | | | 100.00% | | | | — | | | | — | | | | 29,404,392 | | | | 308,950,774 | |
International Large/Mid Cap Equity Fund | | | — | | | | 100.00% | | | | — | | | | — | | | | 4,280,484 | | | | 44,263,566 | |
Quality Fund | | | 93.63% | | | | 100.00% | | | | — | | | | 154,921,160 | | | | — | | | | — | |
Resources Fund | | | 3.72% | | | | 94.98% | | | | — | | | | — | | | | 563,361 | | | | 6,212,745 | |
Risk Premium Fund | | | — | | | | — | | | | 5,207,663 | | | | 8,050,339 | | | | — | | | | — | |
Tax-Managed International Equities Fund | | | — | | | | 100.00% | | | | — | | | | — | | | | 637,330 | | | | 6,725,935 | |
U.S. Equity Allocation Fund | | | 100% | | | | 100.00% | | | | — | | | | 198,946,416 | | | | — | | | | — | |
| | (1) | Presented as a percentage of net investment income and short-term capital gain distributions paid, if any. |
| | (2) | These amounts are generally exempt from U.S. withholding taxes for non-U.S. shareholders, provided certain conditions are satisfied by both the Funds and the Funds’ shareholders. |
| | (3) | The Funds expect to elect to treat foreign taxes attributed to foreign source income from certain of its investments, as if incurred directly by the Funds’ shareholders. |
In early 2018, the Funds will notify applicable shareholders of amounts for use in preparing 2017 U.S. federal income tax forms.
112
Trustees and Officers (Unaudited)
The following tables present information regarding each Trustee and officer of the Trust as of February 28, 2017. Each Trustee’s and officer’s year of birth (“YOB”) is set forth after his or her name. Unless otherwise noted, (i) each Trustee and officer has engaged in the principal occupation(s) noted in the table for at least the most recent five years, although not necessarily in the same capacity, and (ii) the address of each Trustee and officer is c/o GMO Trust, 40 Rowes Wharf, Boston, MA 02110. Each Trustee serves in office until the earlier of (a) the election and qualification of a successor at the next meeting of shareholders called to elect Trustees or (b) the Trustee dies, resigns, or is removed as provided in the Trust’s governing documents. Each of the Trustees of the Trust, other than Mr. Kittredge, is not an “interested person” of the Trust, as such term is used in the 1940 Act (each, an “Independent Trustee”). Because the Funds do not hold annual meetings of shareholders, each Trustee will hold office for an indeterminate period. Each officer serves in office until his or her successor is elected and determined to be qualified to carry out the duties and responsibilities of the office, or until the officer resigns or is removed from office.
| | | | | | | | | | | | | |
| Management of the Trust |
| Independent Trustees | | | | |
| | | | | | | | | | | | | |
Name and Year of Birth | | Position(s) Held with the Trust | | Length of Time Served | | Principal Occupation(s) During Past 5 Years | | Number of
Portfolios in
Fund Complex1
Overseen | | Other Directorships
Held in the
Past Five
Years |
Donald W. Glazer YOB: 1944 | | Chairman of the Board of Trustees | | Chairman of the Board of Trustees since March 2005; Lead Independent Trustee (September 2004 – March 2005); Trustee since December 2000. | | Consultant – Law and Business2; Author of Legal Treatises. | | | | 36 | | | Director, BeiGene Ltd. (biotech research). |
| | | | | |
Peter Tufano YOB: 1957 | | Trustee | | Since December 2008. | | Peter Moores Dean and Professor of Finance, University of Oxford Saïd Business School (as of July 1, 2011); Sylvan C. Coleman Professor of Financial Management, Harvard Business School (1989 – 2011). | | | | 36 | | | Trustee of State Street Navigator Securities Lending Trust (5 Portfolios). |
| | | | | |
Paul Braverman YOB: 1949 | | Trustee | | Since March 2010. | | Director of Claren Road Asset Management, LLC (hedge fund) (January 2011 – present); Director of Leerink Swann Holdings, LLC (investment bank) (October 2013 – present); Director of Aesir Capital Management (investment advisor) (November 2012 – present); Director of Kieger (US) Ltd. (investment advisor) (January 2015 – present). | | | | 36 | | | Trustee of HIMCO Variable Insurance Trust (27 Portfolios). |
|
| Interested Trustee and Officer |
Joseph B. Kittredge, Jr.3 YOB: 1954 | | Trustee; President of the Trust | | Trustee since March 2010; President since March 2009; Chief Executive Officer, March 2009 – June 2015. | | General Counsel, Grantham, Mayo, Van Otterloo & Co. LLC (October 2005 – present); Partner, Ropes & Gray, LLP (1988 – 2005). | | | | 48 | | | None. |
| 1 | The Fund Complex includes series of each of GMO Trust and GMO Series Trust. Mr. Kittredge also serves as a Trustee of GMO Series Trust. |
| 2 | As part of Mr. Glazer’s work as a consultant, he provides part-time consulting services to Goodwin Procter LLP (“Goodwin”). Goodwin has provided legal services to Renewable Resources, LLC, an affiliate of GMO; GMO, in connection with its relationship with Renewable Resources; and funds managed by Renewable Resources. Mr. Glazer has represented that he has no financial interest in, and is not involved in the provision of, such legal services. These entities did not pay any legal fees or disbursements to Goodwin during the Calendar years ended December 31, 2015 and December 31, 2016. In correspondence with the staff of the SEC (the “Staff”) beginning in August 2006, the Independent Trustees’ legal counsel provided the Staff with information regarding Mr. Glazer’s relationship with Goodwin and his other business activities. On September 11, 2007, based on information that had been given to the Staff as of that date, the Staff provided oral no-action assurance consistent with the opinion of the Independent Trustees’ legal counsel that Mr. Glazer is not an “interested person” of the Trust. |
| 3 | Mr. Kittredge is an “interested person” of the Trust, as such term is used in the 1940 Act (an “Interested Trustee”), by virtue of his positions with the Trust and GMO indicated in the table above and his interest as a member of GMO. |
113
| | | | | | |
| Officers | | | | | | |
| | | | | | |
Name and Year of Birth | | Position(s) Held with the Trust | | Length of Time Served | | Principal Occupation(s) During Past 5 Years* |
Joseph B. Kittredge, Jr. YOB: 1954 | | Trustee and President | | Trustee since March 2010; President since March 2009; Chief Executive Officer, March 2009 – June 2015. | | General Counsel, Grantham, Mayo, Van Otterloo & Co. LLC (October 2005 – present); Partner, Ropes & Gray LLP (1988 – 2005). |
| | | |
Sheppard N. Burnett YOB: 1968 | | Chief Executive Officer | | Chief Executive Officer since June 2015; Chief Financial Officer, March 2007 – June 2015; Treasurer, November 2006 – June 2015; Assistant Treasurer, September 2004 – November 2006. | | Head of Fund Treasury and Tax, Grantham, Mayo, Van Otterloo & Co. LLC (December 2006 – present). |
| | | |
Carly Cushman YOB: 1984 | | Treasurer, Chief Accounting Officer and Chief Financial Officer | | Treasurer and Chief Financial Officer since June 2015; Chief Accounting Officer since May 2014; Assistant Treasurer, September 2013 – June 2015. | | Fund Administrator, Grantham, Mayo, Van Otterloo & Co. LLC (December 2009 – present); Senior Accountant, Renaissance HealthCare (February 2009 – December 2009); Auditor/Senior Auditor, Deloitte & Touche (September 2006 – February 2009). |
| | | |
John L. Nasrah YOB: 1977 | | Assistant Treasurer and Chief Tax Officer | | Since March 2007. | | Fund Administrator, Grantham, Mayo, Van Otterloo & Co. LLC (September 2004 – present). |
| | | |
Betty Maganzini YOB: 1972 | | Assistant Treasurer | | Since September 2013. | | Fund Administrator, Grantham, Mayo, Van Otterloo & Co. LLC (July 2010 – present); Assistant Treasurer (June 2009 – July 2010), Manager, Fund Administration and Regulatory Affairs (2006 – 2009), Hambrecht & Quist Capital Management LLC. |
| | | |
Mahmoodur Rahman YOB: 1967 | | Assistant Treasurer | | Since September 2007. | | Fund Administrator, Grantham, Mayo, Van Otterloo & Co. LLC (April 2007 – present). |
| | | |
Cathy Tao YOB: 1974 | | Assistant Treasurer | | Since September 2016 | | Fund Administrator, Grantham, Mayo, Van Otterloo & Co. LLC (October 2007 – present) |
| | | |
Brian Kadehjian YOB: 1974 | | Assistant Treasurer and Treasury Officer | | Assistant Treasurer since February 2015; Treasury Officer since September 2013. | | Fund Administrator, Grantham, Mayo, Van Otterloo & Co. LLC (April 2002 – present). |
| | | |
Douglas Y. Charton YOB: 1982 | | Chief Legal Officer, Vice President and Clerk | | Since August 2015. | | Legal Counsel, Grantham, Mayo, Van Otterloo & Co. LLC (July 2015 – present); Associate, K&L Gates LLP (September 2007 – July 2015). |
| | | |
Megan Bunting YOB: 1978 | | Vice President and Assistant Clerk | | Since September 2013. | | Legal Counsel, Grantham, Mayo, Van Otterloo & Co. LLC (September 2006 – present). |
| | | |
Kevin O’Brien YOB: 1985 | | Vice President and Assistant Clerk | | Since March 2016. | | Legal Counsel, Grantham, Mayo, Van Otterloo & Co. LLC (February 2015 – present); Associate, Dechert LLP (October 2010 – February 2015). |
| | | |
Gregory L. Pottle YOB: 1971 | | Chief Compliance Officer | | Chief Compliance Officer since May 2015; Vice President and Assistant Clerk, November 2006 – November 2015. | | Chief Compliance Officer, Grantham, Mayo, Van Otterloo & Co. LLC (May 2015 – present); Legal Counsel, Grantham, Mayo, Van Otterloo & Co. LLC (March 2000 – May 2015). |
| | | |
Claire Wilkinson YOB: 1965 | | Anti-Money Laundering Officer | | Since February 2016. | | Compliance Associate, GMO UK Limited (April 2013 – present); General Counsel, MVision Private Equity Advisers Limited (November 2009 – January 2013). |
| * | Each officer of the Trust may also serve as an officer and/or director of certain pooled investment vehicles of which GMO or an affiliate of GMO serves as the investment adviser. With the exception of Mr. Kittredge, each officer listed in the table above also serves as an officer of GMO Series Trust. |
114
GMO Trust
Annual Report
February 28, 2017
Emerging Countries Fund
Emerging Domestic Opportunities Fund
Emerging Markets Fund
Taiwan Fund
For a free copy of the Funds’ proxy voting guidelines, shareholders may call 1-617-346-7646 (collect) or visit the Securities and Exchange Commission’s website at www.sec.gov. Information regarding how the Funds voted proxies relating to portfolio securities during the most recent 12-month period ended June 30 is available on GMO’s website at www.gmo.com or on the Securities and Exchange Commission’s website at www.sec.gov.
The Funds file their complete schedule of portfolio holdings with the Securities and Exchange Commission for the first and third quarter of each fiscal year on Form N-Q, which is available on the Commission’s website at www.sec.gov. The Funds’ Form N-Q may be reviewed and copied at the Commission’s Public Reference Room in Washington, D.C. Information on the operation of the Public Reference Room may be obtained by calling 1-800-SEC-0330. The Funds have a policy with respect to disclosure of portfolio holdings under which they may also make a complete schedule of portfolio holdings available on GMO’s website at www.gmo.com.
This report is prepared for the general information of shareholders. It is authorized for distribution to prospective investors only when preceded or accompanied by a prospectus for the GMO Trust, which contains a complete discussion of the risks associated with an investment in these Funds and other important information. The GMO Trust prospectus can be obtained at www.gmo.com.
An investment in the Funds is subject to risk, including the possible loss of principal amount invested. There can be no assurance that the Funds will achieve their stated investment objectives. Please see the Funds’ prospectus regarding specific principal risks for each Fund. General risks may include: market risk-equities, management and operational risk, non-U.S. investment risk, small company risk and derivatives risk.
The Funds are distributed by Funds Distributor LLC. Funds Distributor LLC is not affiliated with GMO.
TABLE OF CONTENTS
GMO Emerging Countries Fund
(A Series of GMO Trust)
Portfolio Management
Day-to-day management of the Fund’s portfolio is the responsibility of the Emerging Markets Equity team at Grantham, Mayo, Van Otterloo & Co. LLC.
Management Discussion and Analysis of Fund Performance
Class III shares of GMO Emerging Countries Fund returned +36.00% (net) for the fiscal year ended February 28, 2017, as compared with +30.27% for the S&P/IFCI Composite Index.
Country-sector allocation contributed to the Fund’s relative returns for the fiscal year. The Fund’s overweight in Russia Financials and India Financials added to relative performance. The Fund’s overweight in Korean Consumer Discretionary and Turkey Telecommunications detracted from relative performance.
Stock selection was additive during the fiscal year. The Fund’s stock selections in Korean Information Technology and Brazil Financials helped relative performance, while the stock selections in Russia Energy and India Materials hurt relative performance.
Because some of the securities and instruments held directly or indirectly by the Fund had positive fair value adjustments at the beginning or end of the fiscal year (and the performance of indices are not fair valued), the Fund’s absolute and relative performance is higher than it otherwise would have been in the absence of such fair value adjustments.
The views expressed herein are exclusively those of Grantham, Mayo, Van Otterloo & Co. LLC as of the date of this report and are subject to change. GMO disclaims any responsibility to update such views. They are not meant as investment advice. References to specific securities are not recommendations of such securities and may not be representative of any GMO portfolio’s current or future investments.
2
GMO Emerging Countries Fund
(A Series of GMO Trust)
Comparison of Change in Value of a $10,000,000 Investment in
GMO Emerging Countries Fund Class III Shares and the S&P/IFCI Composite Index
As of February 28, 2017
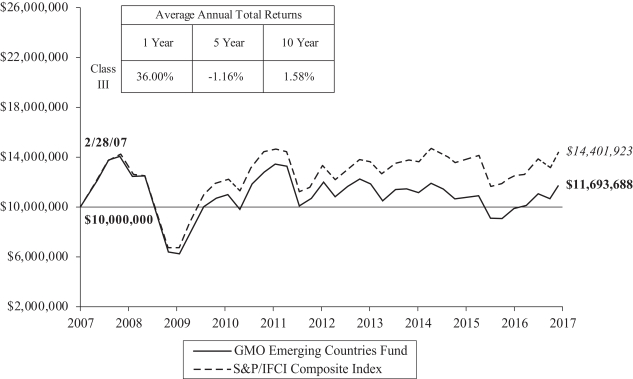
Performance data quoted represents past performance and is not indicative of future results. The investment return and principal value of an investment will fluctuate so that an investor’s shares, when redeemed, may be worth more or less than their original cost. Current performance data may be lower or higher than the performance data provided herein. To obtain performance information up to the most recent month-end, visit www.gmo.com. Performance shown is net of all fees after reimbursement from GMO. Returns would have been lower had certain expenses not been reimbursed during the periods shown and do not include the effect of taxes on distributions and redemptions. The performance information shown above only includes purchase premiums and/or redemption fees in effect as of February 28, 2017. All information is unaudited.
For S&P disclaimers please visit http://www.gmo.com/America/_Disclaimers/_BenchmarkDisclaimers.htm.
3
GMO Emerging Countries Fund
(A Series of GMO Trust)
Investment Concentration Summary
February 28, 2017 (Unaudited)
| | | | |
| Asset Class Summary& | | % of Total Net Assets | |
Common Stocks | | | 90.5 | % |
Preferred Stocks | | | 4.8 | |
Investment Funds | | | 3.1 | |
Short-Term Investments | | | 0.2 | |
Rights/Warrants | | | 0.0 | ^ |
Futures Contracts | | | (0.0 | )^ |
Other | | | 1.4 | |
| | | | |
| | | 100.0 | % |
| | | | |
| | | | |
| Country Summary¤ | | % of Investments | |
Taiwan | | | 22.6 | % |
China | | | 21.1 | |
South Korea | | | 17.1 | |
India | | | 10.9 | |
Russia | | | 7.4 | |
Turkey | | | 6.3 | |
United States | | | 3.6 | * |
Brazil | | | 2.9 | |
Thailand | | | 2.3 | |
Mexico | | | 1.4 | |
Indonesia | | | 0.7 | |
Greece | | | 0.7 | |
United Kingdom | | | 0.6 | * |
Philippines | | | 0.6 | |
South Africa | | | 0.5 | |
Qatar | | | 0.2 | |
Malaysia | | | 0.2 | |
United Arab Emirates | | | 0.2 | |
Vietnam | | | 0.2 | |
Egypt | | | 0.2 | |
Chile | | | 0.1 | |
Belgium | | | 0.1 | * |
Czech Republic | | | 0.1 | |
Poland | | | 0.0 | ^ |
| | | | |
| | | 100.0 | % |
| | | | |
| | | | |
| Industry Group Summary | | % of Equity Investments# | |
Banks | | | 24.5 | % |
Technology Hardware & Equipment | | | 16.8 | |
Telecommunication Services | | | 14.1 | |
Automobiles & Components | | | 7.7 | |
Materials | | | 6.8 | |
Software & Services | | | 6.0 | |
Semiconductors & Semiconductor Equipment | | | 5.1 | |
Energy | | | 4.4 | |
Diversified Financials | | | 2.8 | |
Food, Beverage & Tobacco | | | 2.4 | |
Insurance | | | 2.4 | |
Real Estate | | | 1.3 | |
Transportation | | | 0.9 | |
Consumer Services | | | 0.8 | |
Utilities | | | 0.7 | |
Food & Staples Retailing | | | 0.7 | |
Consumer Durables & Apparel | | | 0.6 | |
Capital Goods | | | 0.5 | |
Household & Personal Products | | | 0.5 | |
Health Care Equipment & Services | | | 0.3 | |
Media | | | 0.3 | |
Pharmaceuticals, Biotechnology & Life Sciences | | | 0.3 | |
Retailing | | | 0.1 | |
| | | | |
| | | 100.0 | % |
| | | | |
| & | In the table above, derivative financial instruments, if any, are based on market values or unrealized appreciation/depreciation rather than notional amounts. |
| ¤ | The table above shows country exposure in the Fund. The table excludes short-term investments. The table excludes exposure through forward currency contracts and includes exposure through other derivative financial instruments, if any. The table takes into account the market value of securities and options and the notional amounts of swap contracts and other derivative financial instruments, if any. |
| * | Includes companies that derive more than 50% of their revenues or profits from emerging markets. |
| # | Equity investments may consist of common stocks and other stock-related securities, such as preferred stocks, if any. This table excludes exposure to derivative contracts, short-term investments, mutual funds and investment funds, if any. For a summary of these exposures, if any, see the Schedule of Investments. |
4
GMO Emerging Countries Fund
(A Series of GMO Trust)
Schedule of Investments
(showing percentage of total net assets)
February 28, 2017
| | | | | | | | | | |
Shares | | | Description | | Value ($) | |
| | | | | | COMMON STOCKS — 90.5% | |
| | |
| | | | | | Belgium — 0.1% | |
| | | 200 | | | Anheuser-Busch InBev SA/NV Sponsored ADR | | | 21,898 | |
| | | | | | | | | | |
| | |
| | | | | | Brazil — 1.4% | |
| | | 8,800 | | | Ambev SA ADR | | | 50,072 | |
| | | 1,600 | | | BR Malls Participacoes SA * | | | 7,648 | |
| | | 12,700 | | | CCR SA | | | 73,549 | |
| | | 1,500 | | | Equatorial Energia SA | | | 28,622 | |
| | | 5,100 | | | Kroton Educacional SA | | | 22,351 | |
| | | 1,955 | | | Localiza Rent a Car SA | | | 24,180 | |
| | | 5,000 | | | LPS Brasil Consultoria de Imoveis SA * | | | 8,829 | |
| | | 2,200 | | | Marisa Lojas SA * | | | 4,899 | |
| | | 2,000 | | | Multiplus SA | | | 22,941 | |
| | | 525 | | | Raia Drogasil SA | | | 10,009 | |
| | | 11,100 | | | Rumo Logistica Operadora Multimodal SA * | | | 30,475 | |
| | | 8,900 | | | Tim Participacoes SA | | | 27,866 | |
| | | 4,600 | | | Tim Participacoes SA ADR | | | 71,346 | |
| | | | | | | | | | |
| | | | | | Total Brazil | | | 382,787 | |
| | | | | | | | | | |
| | |
| | | | | | Chile — 0.1% | |
| | | 3,500 | | | Enel Americas SA ADR | | | 34,125 | |
| | | 344,016 | | | Itau CorpBanca | | | 2,772 | |
| | | | | | | | | | |
| | | | | | Total Chile | | | 36,897 | |
| | | | | | | | | | |
| | |
| | | | | | China — 20.9% | |
| | | 627,002 | | | Agricultural Bank of China Ltd – Class H | | | 288,993 | |
| | | 3,726 | | | Alibaba Group Holding Ltd Sponsored ADR * | | | 383,405 | |
| | | 12,500 | | | Anhui Conch Cement Co Ltd – Class H | | | 43,519 | |
| | | 700 | | | Baidu Inc Sponsored ADR * | | | 121,891 | |
| | | 849,500 | | | Bank of China Ltd – Class H | | | 429,822 | |
| | | 125,000 | | | Belle International Holdings Ltd | | | 86,063 | |
| | | 113,000 | | | China Cinda Asset Management Co Ltd – Class H | | | 44,539 | |
| | | 397,160 | | | China Communications Services Corp Ltd – Class H | | | 265,196 | |
| | | 896,320 | | | China Construction Bank Corp – Class H | | | 737,977 | |
| | | 16,000 | | | China Life Insurance Co Ltd – Class H | | | 48,751 | |
| | | 300 | | | China Lodging Group Ltd Sponsored ADR * | | | 17,391 | |
| | | 1,000 | | | China Machinery Engineering Corp – Class H | | | 695 | |
| | | 97,810 | | | China Mobile Ltd | | | 1,078,852 | |
| | | 3,000 | | | China Mobile Ltd Sponsored ADR | | | 165,780 | |
| | | 11,200 | | | China Overseas Property Holdings Ltd | | | 2,018 | |
| | | 30,000 | | | China Telecom Corp Ltd – Class H | | | 14,109 | |
| | | 123,000 | | | Country Garden Holdings Co Ltd | | | 88,073 | |
| | | 90,000 | | | Geely Automobile Holdings Ltd | | | 122,339 | |
| | | 3,500 | | | Hengan International Group Co Ltd | | | 29,873 | |
| | | 811,847 | | | Industrial & Commercial Bank of China Ltd – Class H | | | 531,969 | |
| | | 1,000 | | | New Oriental Education & Technology Group Inc Sponsored ADR * | | | 48,410 | |
| | | | | | | | | | |
Shares | | | Description | | Value ($) | |
| | | | | | China — continued | |
| | | 1,400 | | | People’s Insurance Co Group of China Ltd (The) – Class H | | | 575 | |
| | | 108,000 | | | PICC Property & Casualty Co Ltd – Class H | | | 164,916 | |
| | | 17,181 | | | Ping An Insurance Group Co of China Ltd – Class H | | | 91,523 | |
| | | 8,400 | | | Qingdao Haier Co Ltd – Class A | | | 13,363 | |
| | | 1,000 | | | Shenzhou International Group Holdings Ltd | | | 5,971 | |
| | | 15,200 | | | Sinopharm Group Co Ltd Class H | | | 70,291 | |
| | | 22,000 | | | Sunac China Holdings Ltd | | | 22,878 | |
| | | 1,039 | | | TAL Education Group ADR * | | | 89,842 | |
| | | 18,194 | | | Tencent Holdings Ltd | | | 482,814 | |
| | | 14,000 | | | Tong Ren Tang Technologies Co Ltd – Class H | | | 25,668 | |
| | | 170,000 | | | Want Want China Holdings Ltd | | | 109,363 | |
| | | 15,251 | | | WH Group Ltd 144A | | | 11,907 | |
| | | 38,000 | | | Xinyi Glass Holdings Ltd | | | 34,453 | |
| | | 165,000 | | | Yangzijiang Shipbuilding Holdings Ltd | | | 108,844 | |
| | | 12,000 | | | Zhejiang Expressway Co Ltd – Class H | | | 13,496 | |
| | | | | | | | | | |
| | | | | | Total China | | | 5,795,569 | |
| | | | | | | | | | |
| | |
| | | | | | Czech Republic — 0.1% | |
| | | 1,186 | | | CEZ AS | | | 20,931 | |
| | | | | | | | | | |
| | |
| | | | | | Egypt — 0.2% | |
| | | 4,601 | | | Alexandria Mineral Oils Co | | | 27,935 | |
| | | 23,615 | | | Telecom Egypt Co | | | 16,168 | |
| | | | | | | | | | |
| | | | | | Total Egypt | | | 44,103 | |
| | | | | | | | | | |
| | |
| | | | | | Greece — 0.7% | |
| | | 46,588 | | | Alpha Bank AE * | | | 84,068 | |
| | | 46,032 | | | Eurobank Ergasias SA * | | | 30,611 | |
| | | 157,572 | | | National Bank of Greece SA * | | | 39,972 | |
| | | 159,022 | | | Piraeus Bank SA * | | | 30,744 | |
| | | | | | | | | | |
| | | | | | Total Greece | | | 185,395 | |
| | | | | | | | | | |
| | |
| | | | | | India — 10.9% | |
| | | 15,086 | | | Asian Paints Ltd | | | 232,017 | |
| | | 4,547 | | | Aurobindo Pharma Ltd | | | 46,173 | |
| | | 2,810 | | | Berger Paints India Ltd | | | 9,702 | |
| | | 3,042 | | | Bharat Financial Inclusion Ltd * | | | 38,311 | |
| | | 1,495 | | | CCL Products India Ltd | | | 7,693 | |
| | | 2,077 | | | Fortis Healthcare Ltd * | | | 6,007 | |
| | | 39,495 | | | HDFC Bank Ltd (a) | | | 851,822 | |
| | | 8,558 | | | Hero MotoCorp Ltd | | | 401,324 | |
| | | 9,803 | | | Indian Oil Corp Ltd | | | 56,504 | |
| | | 452 | | | Indraprastha Gas Ltd | | | 7,044 | |
| | | 2,632 | | | IndusInd Bank Ltd | | | 51,734 | |
| | | 6,967 | | | Infosys Ltd | | | 105,559 | |
| | | 23,400 | | | Infosys Ltd Sponsored ADR | | | 354,276 | |
| | | 21 | | | Kajaria Ceramics Ltd | | | 185 | |
| | | | |
| | See accompanying notes to the financial statements. | | 5 |
GMO Emerging Countries Fund
(A Series of GMO Trust)
Schedule of Investments — (Continued)
(showing percentage of total net assets)
February 28, 2017
| | | | | | | | | | |
Shares | | | Description | | Value ($) | |
| | | | | | India — continued | |
| | | 1,582 | | | LIC Housing Finance Ltd | | | 13,267 | |
| | | 1,985 | | | Mphasis Ltd | | | 17,745 | |
| | | 3,668 | | | Muthoot Finance Ltd | | | 19,547 | |
| | | 9,893 | | | Petronet LNG Ltd | | | 60,149 | |
| | | 4,805 | | | Sun TV Network Ltd | | | 51,255 | |
| | | 3,083 | | | Tata Consultancy Services Ltd | | | 113,591 | |
| | | 5,535 | | | UltraTech Cement Ltd | | | 311,955 | |
| | | 11,763 | | | Yes Bank Ltd | | | 255,591 | |
| | | | | | | | | | |
| | | | | | Total India | | | 3,011,451 | |
| | | | | | | | | | |
| | |
| | | | | | Indonesia — 0.7% | |
| | | 35,700 | | | Bank Central Asia Tbk PT | | | 41,288 | |
| | | 114,000 | | | Indosat Tbk PT * | | | 60,680 | |
| | | 179,400 | | | Telekomunikasi Indonesia Persero Tbk PT | | | 51,508 | |
| | | 1,500 | | | Telekomunikasi Indonesia Persero Tbk PT Sponsored ADR | | | 42,750 | |
| | | | | | | | | | |
| | | | | | Total Indonesia | | | 196,226 | |
| | | | | | | | | | |
| | |
| | | | | | Malaysia — 0.2% | |
| | | 1,260 | | | Genting Malaysia Berhad | | | 1,489 | |
| | | 4,922 | | | Hong Leong Bank Berhad | | | 15,039 | |
| | | 3,234 | | | Media Prima Berhad | | | 749 | |
| | | 12,400 | | | Petronas Chemicals Group Berhad | | | 20,246 | |
| | | 5,400 | | | Public Bank Berhad | | | 24,271 | |
| | | | | | | | | | |
| | | | | | Total Malaysia | | | 61,794 | |
| | | | | | | | | | |
| | |
| | | | | | Mexico — 1.4% | |
| | | 38,376 | | | Cemex SAB de CV CPO * | | | 32,395 | |
| | | 35,664 | | | Cemex SAB de CV Sponsored ADR * | | | 301,717 | |
| | | 20,600 | | | Wal-Mart de Mexico SAB de CV | | | 40,090 | |
| | | | | | | | | | |
| | | | | | Total Mexico | | | 374,202 | |
| | | | | | | | | | |
| | |
| | | | | | Philippines — 0.6% | |
| | | 18,302 | | | BDO Unibank Inc | | | 42,045 | |
| | | 1,455 | | | GT Capital Holdings Inc | | | 34,975 | |
| | | 19,100 | | | Manila Water Co Inc | | | 11,610 | |
| | | 16,500 | | | Puregold Price Club Inc | | | 15,112 | |
| | | 12,840 | | | Robinsons Retail Holdings Inc | | | 20,733 | |
| | | 3,120 | | | San Miguel Corp | | | 6,675 | |
| | | 8,600 | | | Semirara Mining & Power Corp | | | 24,358 | |
| | | | | | | | | | |
| | | | | | Total Philippines | | | 155,508 | |
| | | | | | | | | | |
| | |
| | | | | | Poland — 0.0% | |
| | | 1,010 | | | Powszechny Zaklad Ubezpieczen SA | | | 8,954 | |
| | | | | | | | | | |
| | |
| | | | | | Qatar — 0.2% | |
| | | 9,797 | | | Qatar Gas Transport Co Ltd Nakilat | | | 63,349 | |
| | | | | | | | | | |
| | | | | | | | | | |
Shares | | | Description | | Value ($) | |
| | | | | | Russia — 7.2% | |
| | | 44,716 | | | Gazprom Neft PJSC | | | 175,308 | |
| | | 4,168 | | | Lenta Ltd 144A GDR * | | | 27,675 | |
| | | 789 | | | LUKOIL PJSC Sponsored ADR | | | 41,836 | |
| | | 282 | | | Mail.Ru Group Ltd GDR (Registered Shares) * | | | 6,207 | |
| | | 2,201 | | | MegaFon PJSC GDR (Registered Shares) | | | 25,413 | |
| | | 69,467 | | | Mobile TeleSystems PJSC Sponsored ADR | | | 713,426 | |
| | | 36,039 | | | Moscow Exchange MICEX-RTS PJSC | | | 76,179 | |
| | | 22,599 | | | Sberbank of Russia PJSC Sponsored ADR | | | 246,404 | |
| | | 1,448 | | | Sistema PJSC FC Sponsored GDR (Registered Shares) | | | 12,912 | |
| | | 53,452 | | | Surgutneftegas OJSC Sponsored ADR | | | 269,716 | |
| | | 10,404 | | | Tatneft PAO Sponsored ADR | | | 364,837 | |
| | | 429 | | | VimpelCom Ltd Sponsored ADR | | | 1,763 | |
| | | 694 | | | X5 Retail Group NV GDR (Registered) * | | | 21,032 | |
| | | | | | | | | | |
| | | | | | Total Russia | | | 1,982,708 | |
| | | | | | | | | | |
| | |
| | | | | | South Africa — 0.5% | |
| | | 1,951 | | | Bidvest Group Ltd (The) | | | 23,049 | |
| | | 516 | | | Capitec Bank Holdings Ltd | | | 28,485 | |
| | | 15,933 | | | FirstRand Ltd | | | 60,263 | |
| | | 867 | | | MTN Group Ltd | | | 7,911 | |
| | | 2,457 | | | Truworths International Ltd | | | 16,310 | |
| | | | | | | | | | |
| | | | | | Total South Africa | | | 136,018 | |
| | | | | | | | | | |
| | |
| | | | | | South Korea — 13.9% | |
| | | 81 | | | Amorepacific Corp | | | 21,551 | |
| | | 4,048 | | | BNK Financial Group Inc | | | 31,063 | |
| | | 16 | | | CJ O Shopping Co Ltd | | | 2,742 | |
| | | 3 | | | DGB Financial Group Inc | | | 28 | |
| | | 1,015 | | | Dongbu Insurance Co Ltd | | | 54,801 | |
| | | 18 | | | GS Home Shopping Inc | | | 3,431 | |
| | | 6,363 | | | Hana Financial Group Inc | | | 198,218 | |
| | | 920 | | | Hankook Tire Co Ltd | | | 48,595 | |
| | | 313 | | | Hyundai Marine & Fire Insurance Co Ltd | | | 8,969 | |
| | | 3,094 | | | Hyundai Mobis Co Ltd | | | 697,386 | |
| | | 1,128 | | | Hyundai Motor Co | | | 148,936 | |
| | | 66 | | | Hyundai Wia Corp | | | 3,902 | |
| | | 6,707 | | | Industrial Bank of Korea | | | 73,215 | |
| | | 1,025 | | | Kangwon Land Inc | | | 32,015 | |
| | | 2,421 | | | KB Financial Group Inc | | | 99,939 | |
| | | 325 | | | KB Insurance Co Ltd | | | 7,572 | |
| | | 9,521 | | | Kia Motors Corp | | | 321,836 | |
| | | 72 | | | Korea Zinc Co Ltd | | | 26,478 | |
| | | 2,020 | | | KT&G Corp | | | 182,884 | |
| | | 3 | | | Kwangju Bank | | | 28 | |
| | | 540 | | | LG Chem Ltd | | | 135,018 | |
| | | 29 | | | LG Household & Health Care Ltd | | | 22,506 | |
| | | 89 | | | Lotte Chemical Corp | | | 28,675 | |
| | | 436 | | | Samsung Electronics Co Ltd | | | 740,953 | |
| | | 196 | | | Samsung Electronics Co Ltd GDR | | | 165,999 | |
| | | | |
| 6 | | See accompanying notes to the financial statements. | | |
GMO Emerging Countries Fund
(A Series of GMO Trust)
Schedule of Investments — (Continued)
(showing percentage of total net assets)
February 28, 2017
| | | | | | | | | | |
Shares | | | Description | | Value ($) | |
| | | | | | South Korea — continued | |
| | | 2,584 | | | Shinhan Financial Group Co Ltd | | | 106,308 | |
| | | 5,690 | | | SK Hynix Inc | | | 234,456 | |
| | | 414 | | | SK Telecom Co Ltd | | | 84,634 | |
| | | 1,800 | | | SK Telecom Co Ltd Sponsored ADR | | | 40,680 | |
| | | 27,773 | | | Woori Bank | | | 326,445 | |
| | | | | | | | | | |
| | | | | | Total South Korea | | | 3,849,263 | |
| | | | | | | | | | |
| | |
| | | | | | Taiwan — 22.5% | |
| | | 10,000 | | | Advanced Semiconductor Engineering Inc | | | 12,476 | |
| | | 4,200 | | | Advanced Semiconductor Engineering Inc ADR | | | 25,956 | |
| | | 5,894 | | | Advantech Co Ltd | | | 50,218 | |
| | | 59,000 | | | Asustek Computer Inc | | | 532,350 | |
| | | 47,000 | | | Catcher Technology Co Ltd | | | 392,170 | |
| | | 155,500 | | | Cathay Financial Holding Co Ltd | | | 244,080 | |
| | | 23,000 | | | Cheng Shin Rubber Industry Co Ltd | | | 48,887 | |
| | | 136,748 | | | Chunghwa Telecom Co Ltd | | | 453,414 | |
| | | 700 | | | Chunghwa Telecom Co Ltd Sponsored ADR | | | 23,009 | |
| | | 828,577 | | | Compal Electronics Inc | | | 518,729 | |
| | | 330,480 | | | CTBC Financial Holding Co Ltd | | | 197,225 | |
| | | 9,210 | | | Delta Electronics Inc | | | 51,238 | |
| | | 97,463 | | | E.Sun Financial Holding Co Ltd | | | 59,165 | |
| | | 39,914 | | | Far EasTone Telecommunications Co Ltd | | | 96,007 | |
| | | 42,845 | | | First Financial Holding Co Ltd | | | 25,292 | |
| | | 19,000 | | | Formosa Chemicals & Fibre Corp | | | 60,077 | |
| | | 8,000 | | | Formosa Petrochemical Corp | | | 27,830 | |
| | | 35,000 | | | Formosa Plastics Corp | | | 105,421 | |
| | | 31,762 | | | Foxconn Technology Co Ltd | | | 94,819 | |
| | | 242,811 | | | Fubon Financial Holding Co Ltd | | | 393,481 | |
| | | 268,975 | | | Hon Hai Precision Industry Co Ltd | | | 782,708 | |
| | | 92,366 | | | Lite-On Technology Corp | | | 154,687 | |
| | | 28,176 | | | MediaTek Inc | | | 205,329 | |
| | | 99,000 | | | Mega Financial Holding Co Ltd | | | 77,056 | |
| | | 22,000 | | | Nan Ya Plastics Corp | | | 53,392 | |
| | | 34,000 | | | Pegatron Corp | | | 89,527 | |
| | | 37,000 | | | Pou Chen Corp | | | 50,213 | |
| | | 466 | | | President Chain Store Corp | | | 3,420 | |
| | | 830,200 | | | ProMOS Technologies Inc * (b) (c) | | | — | |
| | | 104,715 | | | Quanta Computer Inc | | | 216,770 | |
| | | 260,437 | | | Taishin Financial Holding Co Ltd | | | 103,001 | |
| | | 26,401 | | | Taiwan Mobile Co Ltd | | | 92,705 | |
| | | 60,000 | | | Taiwan Semiconductor Manufacturing Co Ltd | | | 367,592 | |
| | | 16,000 | | | Taiwan Semiconductor Manufacturing Co Ltd Sponsored ADR | | | 503,520 | |
| | | 49,000 | | | Uni-President Enterprises Corp | | | 87,019 | |
| | | 1,000 | | | Wowprime Corp | | | 4,643 | |
| | | 22,577 | | | Yuanta Financial Holding Co Ltd | | | 9,551 | |
| | | | | | | | | | |
| | | | | | Total Taiwan | | | 6,212,977 | |
| | | | | | | | | | |
| | |
| | | | | | Thailand — 1.7% | |
| | | 11,900 | | | Advanced Info Service Pcl NVDR | | | 56,874 | |
| | | | | | | | | | |
Shares | | | Description | | Value ($) | |
| | | | | | Thailand — continued | |
| | | 6,000 | | | Airports of Thailand Pcl (Foreign Registered) | | | 6,661 | |
| | | 119,860 | | | Chularat Hospital Pcl (Foreign Registered) | | | 8,783 | |
| | | 21,100 | | | CP ALL Pcl (Foreign Registered) | | | 36,243 | |
| | | 28,100 | | | Intouch Holdings Pcl (Foreign Registered) | | | 42,610 | |
| | | 111,700 | | | Jasmine International Pcl NVDR | | | 28,161 | |
| | | 2,300 | | | Kasikornbank Pcl (Foreign Registered) (a) | | | 12,455 | |
| | | 46,200 | | | PTT Global Chemical Pcl (Foreign Registered) | | | 94,213 | |
| | | 117,433 | | | Quality Houses Pcl (Foreign Registered) | | | 8,807 | |
| | | 312,533 | | | Sansiri Pcl (Foreign Registered) | | | 17,365 | |
| | | 9,500 | | | Siam Cement Pcl (The) (Foreign Registered) | | | 140,302 | |
| | | 12,000 | | | Tisco Financial Group Pcl (Foreign Registered) | | | 23,520 | |
| | | | | | | | | | |
| | | | | | Total Thailand | | | 475,994 | |
| | | | | | | | | | |
| | |
| | | | | | Turkey — 6.2% | |
| | | 33,359 | | | Akbank TAS | | | 79,478 | |
| | | 576 | | | Arcelik AS | | | 3,300 | |
| | | 214,348 | | | Emlak Konut Gayrimenkul Yatirim Ortakligi AS REIT | | | 183,905 | |
| | | 98,526 | | | Eregli Demir ve Celik Fabrikalari TAS | | | 160,417 | |
| | | 20,443 | | | Haci Omer Sabanci Holding AS | | | 56,405 | |
| | | 2,353 | | | Koza Altin Isletmeleri AS * | | | 12,151 | |
| | | 55,780 | | | Turk Hava Yollari AO * | | | 83,489 | |
| | | 34,892 | | | Turk Telekomunikasyon AS | | | 55,104 | |
| | | 52,133 | | | Turkcell Iletisim Hizmetleri AS * | | | 170,140 | |
| | | 2,300 | | | Turkcell Iletisim Hizmetleri AS ADR * | | | 18,975 | |
| | | 190,784 | | | Turkiye Garanti Bankasi AS | | | 450,363 | |
| | | 58,131 | | | Turkiye Halk Bankasi AS | | | 179,590 | |
| | | 58,704 | | | Turkiye Is Bankasi – Class C | | | 101,888 | |
| | | 69,402 | | | Turkiye Vakiflar Bankasi TAO – Class D | | | 100,766 | |
| | | 60,291 | | | Yapi ve Kredi Bankasi AS * | | | 63,577 | |
| | | | | | | | | | |
| | | | | | Total Turkey | | | 1,719,548 | |
| | | | | | | | | | |
| | |
| | | | | | United Arab Emirates — 0.2% | |
| | | 5,163 | | | Abu Dhabi Commercial Bank PJSC | | | 9,954 | |
| | | 3,186 | | | Emaar Properties PJSC | | | 6,457 | |
| | | 11,965 | | | First Gulf Bank PJSC | | | 44,461 | |
| | | | | | | | | | |
| | | | | | Total United Arab Emirates | | | 60,872 | |
| | | | | | | | | | |
| | |
| | | | | | United Kingdom — 0.6% | |
| | | 1,728 | | | British American Tobacco Plc | | | 109,149 | |
| | | 1,348 | | | Unilever Plc | | | 63,951 | |
| | | | | | | | | | |
| | | | | | Total United Kingdom | | | 173,100 | |
| | | | | | | | | | |
| | |
| | | | | | Vietnam — 0.2% | |
| | | 9,660 | | | Vietnam Dairy Products JSC | | | 55,669 | |
| | | | | | | | | | |
| | | |
| | | | | | TOTAL COMMON STOCKS
(COST $23,834,337) | | | 25,025,213 | |
| | | | | | | | | | |
| | | | |
| | See accompanying notes to the financial statements. | | 7 |
GMO Emerging Countries Fund
(A Series of GMO Trust)
Schedule of Investments — (Continued)
(showing percentage of total net assets)
February 28, 2017
| | | | | | | | | | |
Shares | | | Description | | Value ($) | |
| | | | | | PREFERRED STOCKS — 4.8% | |
| | |
| | | | | | Brazil — 1.5% | |
| | | 800 | | | Banco Bradesco SA | | | 8,555 | |
| | | 25,745 | | | Cia Energetica de Minas Gerais Sponsored ADR | | | 84,958 | |
| | | 2,860 | | | Itau Unibanco Holding SA | | | 36,625 | |
| | | 6,060 | | | Itau Unibanco Holding SA Sponsored ADR | | | 77,507 | |
| | | 64,811 | | | Itausa-Investimentos Itau SA | | | 208,384 | |
| | | | | | | | | | |
| | | | | | Total Brazil | | | 416,029 | |
| | | | | | | | | | |
| | |
| | | | | | Russia — 0.2% | |
| | | 22 | | | Sberbank of Russia PJSC | | | 45 | |
| | | 62,100 | | | Surgutneftegas OJSC | | | 33,858 | |
| | | 8 | | | Transneft PJSC | | | 25,346 | |
| | | | | | | | | | |
| | | | | | Total Russia | | | 59,249 | |
| | | | | | | | | | |
| | |
| | | | | | South Korea — 3.1% | |
| | | 2,345 | | | Hyundai Motor Co 2nd Preference | | | 211,336 | |
| | | 482 | | | Samsung Electronics Co Ltd | | | 637,971 | |
| | | 7 | | | Samsung Electronics Co Ltd GDR (Registered Shares) | | | 4,629 | |
| | | | | | | | | | |
| | | | | | Total South Korea | | | 853,936 | |
| | | | | | | | | | |
| | | |
| | | | | | TOTAL PREFERRED STOCKS
(COST $1,033,852) | | | 1,329,214 | |
| | | | | | | | | | |
| | |
| | | | | | INVESTMENT FUNDS — 3.1% | |
| | |
| | | | | | Thailand — 0.5% | |
| | | 201,000 | | | BTS Rail Mass Transit Growth Infrastructure Fund | | | 65,645 | |
| | | 208,400 | | | Digital Telecommunications Infrastructure Fund (Foreign Registered) | | | 84,721 | |
| | | | | | | | | | |
| | | | | | Total Thailand | | | 150,366 | |
| | | | | | | | | | |
| | |
| | | | | | United States — 2.6% | |
| | | 18,899 | | | iShares MSCI Emerging Markets ETF | | | 717,973 | |
| | | | | | | | | | |
| | | |
| | | | | | TOTAL INVESTMENT FUNDS
(COST $849,790) | | | 868,339 | |
| | | | | | | | | | |
| | | | | | | | | | |
Shares
Par Value† | | | Description | | Value ($) | |
| | | | | | RIGHTS/WARRANTS — 0.0% | |
| | |
| | | | | | Brazil — 0.0% | |
| | | 1,062 | | | Itausa – Investimentos Itau SA Rights, Expires 03/31/17 * | | | 1,345 | |
| | | | | | | | | | |
| | |
| | | | | | Thailand — 0.0% | |
| | | 78,133 | | | Sansiri PCL Warrants, Expires 11/24/17 * | | | 201 | |
| | | | | | | | | | |
| | | |
| | | | | | TOTAL RIGHTS/WARRANTS
(COST $0) | | | 1,546 | |
| | | | | | | | | | |
| | | | | | SHORT-TERM INVESTMENTS — 0.2% | |
| | |
| | | | | | Time Deposits — 0.2% | |
| | SGD | 145 | | | Brown Brothers Harriman (Grand Cayman) Time Deposit, 0.01%, due 03/01/17 | | | 104 | |
| | | 7,250 | | | Brown Brothers Harriman (Grand Cayman) Time Deposit, 0.36%, due 03/01/17 | | | 7,250 | |
| | | 55,602 | | | Sumitomo (Tokyo) Time Deposit, 0.36%, due 03/01/17 | | | 55,602 | |
| | | | | | | | | | |
| | | | | | Total Time Deposits | | | 62,956 | |
| | | | | | | | | | |
| | | |
| | | | | | TOTAL SHORT-TERM INVESTMENTS
(COST $62,956) | | | 62,956 | |
| | | | | | | | | | |
| | | |
| | | | | | TOTAL INVESTMENTS — 98.6%
(Cost $25,780,935) | | | 27,287,268 | |
| | | | | | Other Assets and Liabilities (net) — 1.4% | | | 375,772 | |
| | | | | | | | | | |
| | | |
| | | | | | TOTAL NET ASSETS — 100.0% | | | $27,663,040 | |
| | | | | | | | | | |
A summary of outstanding financial instruments at February 28, 2017 is as follows:
Futures Contracts
| | | | | | | | | | | | |
| | | | |
Number
of
Contracts + | | Type | | Expiration
Date | | Notional
Amount | | | Net
Unrealized
Appreciation
(Depreciation) | |
| Buys | | | | | | | | | | | | |
| 6 | | Mini MSCI Emerging Markets | | March 2017 | | $ | 279,240 | | | $ | (696 | ) |
| | | | | | | | | | | | |
| + | Buys - Fund is long the futures contract. Sales - Fund is short the futures contract. |
As of February 28, 2017, for the above contracts and/or agreements, the Fund had sufficient cash and/or securities to cover commitments or collateral requirements, if any, of the relevant broker or exchange.
Notes to Schedule of Investments:
| † | Denominated in U.S. Dollar, unless otherwise indicated. |
| * | Non-income producing security. |
| (a) | Security valued at the local price and adjusted by applying a premium or discount since holding exceeds foreign ownership limits. |
| (b) | Investment valued at fair value using methods determined in good faith by the Trustees of GMO Trust or persons acting at their direction pursuant to procedures approved by the Trustees (Note 2). |
For a listing of definitions of acronyms, counterparty abbreviations and currency abbreviations used throughout the Schedule of Investments as well as the derivative tables, if any, please refer to page 35.
| | | | |
| 8 | | See accompanying notes to the financial statements. | | |
This page has been left blank intentionally.
GMO Emerging Domestic Opportunities Fund
(A Series of GMO Trust)
Portfolio Management
Day-to-day management of the Fund’s portfolio is the responsibility of the Emerging Markets Equity team at Grantham, Mayo, Van Otterloo & Co. LLC and GMO Singapore Pte. Limited.
Management Discussion and Analysis of Fund Performance
Although GMO does not manage the Fund to, or control the Fund’s risk relative to, any index or benchmark, a discussion of the Fund’s performance relative to the MSCI Emerging Markets Index is included for comparative purposes. Please note that, in GMO’s view, only approximately half of the stocks in the MSCI Emerging Markets Index are stocks that GMO considers to be suitable investments for the Fund.
Class III shares of GMO Emerging Domestic Opportunities Fund returned +20.73% (net) for the fiscal year ended February 28, 2017, as compared with +29.46% for the MSCI Emerging Markets Index.
Country-sector allocation detracted from the Fund’s relative returns for the fiscal year. The Fund’s holdings in Philippines Consumer Staples and Thailand Telecommunications hurt relative performance.
Stock selection overall had a marginally positive impact on relative returns for the fiscal year. In particular, the Fund’s stock selections in India Financials and India Energy added to relative performance.
Because some of the securities and instruments held directly or indirectly by the Fund had positive fair value adjustments at the beginning or end of the fiscal year (and the performance of indices are not fair valued), the Fund’s absolute and relative performance is higher than it otherwise would have been in the absence of such fair value adjustments.
The views expressed herein are exclusively those of Grantham, Mayo, Van Otterloo & Co. LLC as of the date of this report and are subject to change. GMO disclaims any responsibility to update such views. They are not meant as investment advice. References to specific securities are not recommendations of such securities and may not be representative of any GMO portfolio’s current or future investments.
10
GMO Emerging Domestic Opportunities Fund
(A Series of GMO Trust)
Comparison of Change in Value of a $10,000,000 Investment in
GMO Emerging Domestic Opportunities Class II Shares and the MSCI Emerging Markets Index
As of February 28, 2017
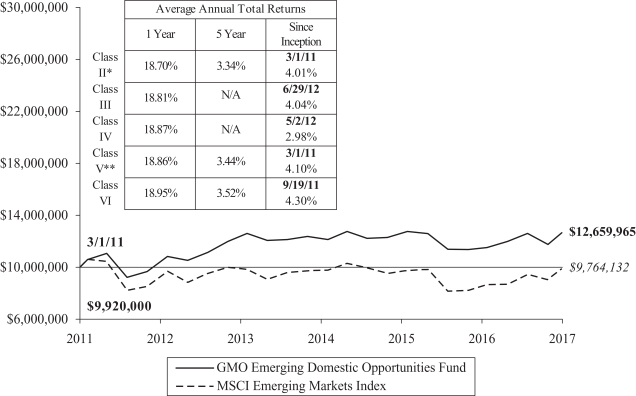
Performance data quoted represents past performance and is not indicative of future results. The investment return and principal value of an investment will fluctuate so that an investor’s shares, when redeemed, may be worth more or less than their original cost. Current performance data may be lower or higher than the performance data provided herein. To obtain performance information up to the most recent month-end, visit www.gmo.com. Performance shown is net of all fees after reimbursement from GMO. Each performance figure assumes a purchase at the beginning and redemption at the end of the stated period and reflects a transaction fee of .80% on the purchase and .80% on the redemption. Transaction fees are retained by the Fund to cover trading costs. Returns would have been lower had certain expenses not been reimbursed during the periods shown and do not include the effect of taxes on distributions and redemptions. All information is unaudited. Performance for classes may vary due to different fees.
| | * | For the period from March 1, 2011 to March 24, 2011, no Class II shares were outstanding. Performance for that period is that of Class V, which has lower expenses. Therefore, the performance shown is higher than it would have been if Class II expenses had been applied throughout. |
| | ** | For the period from October 27, 2011 to November 29, 2013, no Class V shares were outstanding. Performance for that period is that of Class II, which has higher expenses. Therefore, the performance shown is lower than it would have been if Class V expenses had been applied throughout. |
| | | MSCI data may not be reproduced or used for any other purpose. MSCI provides no warranties, has not prepared or approved this report, and has no liability hereunder. |
11
GMO Emerging Domestic Opportunities Fund
(A Series of GMO Trust)
Investment Concentration Summary
February 28, 2017 (Unaudited)
| | | | |
| Asset Class Summary& | | % of Total Net Assets | |
Common Stocks | | | 70.7 | % |
Investment Funds | | | 19.5 | |
Mutual Funds | | | 3.3 | |
Preferred Stocks | | | 2.5 | |
Fully Funded Total Return Swaps | | | 2.3 | |
Short-Term Investments | | | 0.9 | |
Rights/Warrants | | | 0.5 | |
Futures Contracts | | | 0.3 | |
Swap Contracts | | | 0.0 | ^ |
Forward Currency Contracts | | | 0.0 | ^ |
| | | | |
| | | 100.0 | % |
| | | | |
| | | | |
| Country Summary¤ | | % of Investments | |
China | | | 20.8 | % |
United States | | | 17.0 | |
India | | | 13.0 | |
Philippines | | | 9.3 | |
Taiwan | | | 9.2 | |
Thailand | | | 6.6 | |
Brazil | | | 6.5 | |
United Kingdom | | | 5.0 | * |
Russia | | | 4.0 | |
Indonesia | | | 1.6 | |
United Arab Emirates | | | 1.6 | |
South Africa | | | 1.5 | |
Vietnam | | | 1.4 | |
South Korea | | | 1.4 | |
Qatar | | | 1.4 | |
Mexico | | | 1.3 | |
Turkey | | | 0.4 | |
Belgium | | | 0.4 | * |
Malaysia | | | 0.3 | |
Singapore | | | (2.7 | ) |
| | | | |
| | | 100.0 | % |
| | | | |
| | | | |
| Industry Group Summary | | % of Equity Investments# | |
Banks | | | 24.7 | % |
Food, Beverage & Tobacco | | | 11.3 | |
Energy | | | 7.5 | |
Diversified Financials | | | 6.7 | |
Software & Services | | | 6.0 | |
Insurance | | | 5.0 | |
Food & Staples Retailing | | | 4.8 | |
Consumer Services | | | 4.3 | |
Materials | | | 4.1 | |
Telecommunication Services | | | 4.0 | |
Capital Goods | | | 3.9 | |
Real Estate | | | 3.7 | |
Household & Personal Products | | | 3.6 | |
Transportation | | | 2.5 | |
Media | | | 2.0 | |
Consumer Durables & Apparel | | | 1.8 | |
Utilities | | | 1.2 | |
Health Care Equipment & Services | | | 1.2 | |
Pharmaceuticals, Biotechnology & Life Sciences | | | 0.9 | |
Automobiles & Components | | | 0.5 | |
Retailing | | | 0.3 | |
| | | | |
| | | 100.0 | % |
| | | | |
| & | In the table above, derivative financial instruments, if any, are based on market values or unrealized appreciation/depreciation rather than notional amounts. |
| ¤ | The table above shows country exposure in the Fund. The table excludes short-term investments. The table excludes exposure through forward currency contracts and includes exposure through other derivative financial instruments, if any. The table takes into account the market value of securities and options and the notional amounts of swap contracts and other derivative financial instruments, if any. |
| * | Includes companies that derive more than 50% of their revenues or profits from emerging markets. |
| # | Equity investments may consist of common stocks and other stock-related securities, such as preferred stocks, if any. This table excludes exposure to derivative contracts, short-term investments, mutual funds and investment funds, if any. For a summary of these exposures, if any, see the Schedule of Investments. |
12
GMO Emerging Domestic Opportunities Fund
(A Series of GMO Trust)
Schedule of Investments
(showing percentage of total net assets)
February 28, 2017
| | | | | | | | | | |
Shares | | | Description | | Value ($) | |
| | | | | | COMMON STOCKS — 70.7% | |
| | |
| | | | | | Belgium — 0.4% | |
| | | 75,000 | | | Anheuser-Busch InBev SA/NV Sponsored ADR | | | 8,211,751 | |
| | | | | | | | | | |
| | | |
| | | | | | Brazil — 2.7% | | | | |
| | | 1,215,200 | | | BR Malls Participacoes SA * | | | 5,808,686 | |
| | | 1,108,900 | | | BTG Pactual Group | | | 6,688,743 | |
| | | 639,800 | | | Light SA | | | 4,578,694 | |
| | | 5,332,821 | | | LPS Brasil Consultoria de Imoveis SA * | | | 9,416,806 | |
| | | 2,036,000 | | | Marisa Lojas SA * | | | 4,533,544 | |
| | | 67,200 | | | Ouro Fino Saude Animal Participacoes SA | | | 560,330 | |
| | | 427,800 | | | Raia Drogasil SA | | | 8,155,680 | |
| | | 5,651,400 | | | Rumo Logistica Operadora Multimodal SA * | | | 15,515,816 | |
| | | | | | | | | | |
| | | | | | Total Brazil | | | 55,258,299 | |
| | | | | | | | | | |
| | | |
| | | | | | China — 17.1% | | | | |
| | | 462,300 | | | Alibaba Group Holding Ltd Sponsored ADR * | | | 47,570,670 | |
| | | 1,832,000 | | | Anhui Conch Cement Co Ltd – Class H | | | 6,378,137 | |
| | | 6,617,000 | | | China Life Insurance Co Ltd – Class H | | | 20,161,560 | |
| | | 244,342 | | | China Lodging Group Ltd Sponsored ADR * | | | 14,164,506 | |
| | | 1,168,043 | | | China Mobile Ltd | | | 12,883,613 | |
| | | 524,650 | | | Hangzhou Robam Appliances Co Ltd – Class A | | | 3,236,118 | |
| | | 77,736,000 | | | Industrial & Commercial Bank of China Ltd – Class H | | | 50,937,153 | |
| | | 472,139 | | | Kweichow Moutai Co Ltd – Class A | | | 24,403,525 | |
| | | 1,711,803 | | | Midea Group Co Ltd – Class A | | | 7,956,357 | |
| | | 8,503,500 | | | Ping An Insurance Group Co of China Ltd – Class H | | | 45,297,837 | |
| | | 4,765,000 | | | Qingdao Haier Co Ltd – Class A | | | 7,580,470 | |
| | | 522,431 | | | TAL Education Group ADR * | | | 45,174,609 | |
| | | 1,372,700 | | | Tencent Holdings Ltd | | | 36,427,293 | |
| | | 7,183,440 | | | Tong Ren Tang Technologies Co Ltd – Class H | | | 13,170,584 | |
| | | 14,302,500 | | | WH Group Ltd | | | 11,166,428 | |
| | | | | | | | | | |
| | | | | | Total China | | | 346,508,860 | |
| | | | | | | | | | |
| | | |
| | | | | | India — 13.9% | | | | |
| | | 678,823 | | | Amara Raja Batteries Ltd | | | 8,715,710 | |
| | | 978,524 | | | Asian Paints Ltd | | | 15,049,310 | |
| | | 2,502,156 | | | Berger Paints India Ltd | | | 8,639,210 | |
| | | 1,255,833 | | | Bharat Financial Inclusion Ltd * | | | 15,815,915 | |
| | | 862,935 | | | CCL Products India Ltd | | | 4,440,493 | |
| | | 1,178,365 | | | CMI Ltd * (a) | | | 3,202,269 | |
| | | 1,849,092 | | | Fortis Healthcare Ltd * | | | 5,347,521 | |
| | | 2,103,160 | | | Gateway Distriparks Ltd | | | 7,742,174 | |
| | | | | | | | | | |
Shares | | | Description | | Value ($) | |
| | | | | | India — continued | | | | |
| | | 10,683,040 | | | Gayatri Projects Ltd (a) | | | 22,225,368 | |
| | | 711,359 | | | HDFC Bank Ltd (b) | | | 15,342,477 | |
| | | 4,605,167 | | | Indian Oil Corp Ltd | | | 26,543,914 | |
| | | 634,418 | | | Indraprastha Gas Ltd | | | 9,886,883 | |
| | | 1,196,613 | | | IndusInd Bank Ltd | | | 23,520,405 | |
| | | 1,102,560 | | | LIC Housing Finance Ltd | | | 9,246,258 | |
| | | 3,432,919 | | | Muthoot Finance Ltd | | | 18,294,112 | |
| | | 1,161,699 | | | Narayana Hrudayalaya Ltd * | | | 5,687,052 | |
| | | 4,633,032 | | | Petronet LNG Ltd | | | 28,168,554 | |
| | | 1,607,271 | | | Sangam India Ltd | | | 6,502,100 | |
| | | 1,993,257 | | | Sun TV Network Ltd | | | 21,262,306 | |
| | | 288,971 | | | Supreme Industries Ltd | | | 4,377,640 | |
| | | 2,670,564 | | | Techno Electric & Engineering Co Ltd | | | 15,010,787 | |
| | | 1,315,960 | | | Vakrangee Ltd | | | 6,249,906 | |
| | | | | | | | | | |
| | | | | | Total India | | | 281,270,364 | |
| | | | | | | | | | |
| | | |
| | | | | | Indonesia — 1.7% | | | | |
| | | 15,003,900 | | | Bank Central Asia Tbk PT | | | 17,352,520 | |
| | | 57,133,700 | | | Malindo Feedmill Tbk PT * | | | 5,306,442 | |
| | | 44,263,800 | | | Telekomunikasi Indonesia Persero Tbk PT | | | 12,708,594 | |
| | | | | | | | | | |
| | | | | | Total Indonesia | | | 35,367,556 | |
| | | | | | | | | | |
| | | |
| | | | | | Malaysia — 0.3% | | | | |
| | | 4,386,600 | | | Genting Malaysia Berhad | | | 5,185,520 | |
| | | 1,896,116 | | | Media Prima Berhad | | | 439,199 | |
| | | | | | | | | | |
| | | | | | Total Malaysia | | | 5,624,719 | |
| | | | | | | | | | |
| | | |
| | | | | | Mexico — 1.4% | | | | |
| | | 32,370,404 | | | Cemex SAB de CV CPO * | | | 27,325,090 | |
| | | | | | | | | | |
| | | |
| | | | | | Philippines — 5.9% | | | | |
| | | 7,947,222 | | | BDO Unibank Inc | | | 18,257,189 | |
| | | 4,887,370 | | | Cebu Air Inc | | | 8,951,896 | |
| | | 21,104,800 | | | Century Pacific Food Inc | | | 6,851,127 | |
| | | 7,304,434 | | | Concepcion Industrial Corp | | | 8,582,707 | |
| | | 537,299 | | | GT Capital Holdings Inc | | | 12,915,521 | |
| | | 3,105,480 | | | Philippine Seven Corp | | | 8,537,829 | |
| | | 12,478,300 | | | Puregold Price Club Inc | | | 11,428,860 | |
| | | 10,546,070 | | | Robinsons Retail Holdings Inc | | | 17,029,151 | |
| | | 9,300,802 | | | Semirara Mining & Power Corp | | | 26,342,300 | |
| | | | | | | | | | |
| | | | | | Total Philippines | | | 118,896,580 | |
| | | | | | | | | | |
| | |
| | | | | | Qatar — 1.5% | |
| | | 4,767,973 | | | Qatar Gas Transport Co Ltd Nakilat | | | 30,830,345 | |
| | | | | | | | | | |
| | |
| | | | | | Russia — 4.2% | |
| | | 1,644,906 | | | LSR Group PJSC GDR (Registered) | | | 5,918,237 | |
| | | 820,000 | | | Mobile TeleSystems PJSC Sponsored ADR | | | 8,421,400 | |
| | | 4,629,480 | | | Sberbank of Russia PJSC Sponsored ADR | | | 50,476,595 | |
| | | | |
| | See accompanying notes to the financial statements. | | 13 |
GMO Emerging Domestic Opportunities Fund
(A Series of GMO Trust)
Schedule of Investments — (Continued)
(showing percentage of total net assets)
February 28, 2017
| | | | | | | | | | |
Shares | | | Description | | Value ($) | |
| | | | | | Russia — continued | | | | |
| | | 781,639 | | | Sollers PJSC * | | | 7,845,837 | |
| | | 412,901 | | | X5 Retail Group NV GDR (Registered) * | | | 12,513,383 | |
| | | | | | | | | | |
| | | | | | Total Russia | | | 85,175,452 | |
| | | | | | | | | | |
| | |
| | | | | | South Africa — 1.5% | |
| | | 441,483 | | | Capitec Bank Holdings Ltd | | | 24,371,277 | |
| | | 745,697 | | | MTN Group Ltd | | | 6,803,843 | |
| | | | | | | | | | |
| | | | | | Total South Africa | | | 31,175,120 | |
| | | | | | | | | | |
| | |
| | | | | | South Korea — 1.5% | |
| | | 183,077 | | | KT&G Corp | | | 16,575,215 | |
| | | 347,198 | | | Shinhan Financial Group Co Ltd | | | 14,284,090 | |
| | | | | | | | | | |
| | | | | | Total South Korea | | | 30,859,305 | |
| | | | | | | | | | |
| | |
| | | | | | Taiwan — 4.6% | |
| | | 5,746,000 | | | Cathay Financial Holding Co Ltd | | | 9,019,204 | |
| | | 64,302,267 | | | E.Sun Financial Holding Co Ltd | | | 39,034,479 | |
| | | 28,256,946 | | | Fubon Financial Holding Co Ltd | | | 45,791,058 | |
| | | | | | | | | | |
| | | | | | Total Taiwan | | | 93,844,741 | |
| | | | | | | | | | |
| | |
| | | | | | Thailand — 5.1% | |
| | | 5,308,000 | | | Airports of Thailand Pcl (Foreign Registered) | | | 5,892,624 | |
| | | 88,550,540 | | | Chularat Hospital Pcl (Foreign Registered) | | | 6,488,991 | |
| | | 7,832,800 | | | CP ALL Pcl (Foreign Registered) | | | 13,454,132 | |
| | | 7,582,900 | | | CPN Retail Growth Leasehold Property Fund | | | 4,212,609 | |
| | | 12,541,128 | | | Hemraj Leasehold REIT (Foreign Registered) * | | | 3,592,880 | |
| | | 9,872,700 | | | Intouch Holdings Pcl (Foreign Registered) | | | 14,970,456 | |
| | | 14,179,675 | | | LPN Development Pcl (Foreign Registered) | | | 4,708,147 | |
| | | 8,188,800 | | | Major Cineplex Group Pcl (Foreign Registered) | | | 7,968,743 | |
| | | 126,138,100 | | | Quality Houses Pcl (Foreign Registered) | | | 9,460,233 | |
| | | 5,381,700 | | | Taokaenoi Food & Marketing Pcl (Foreign Registered) | | | 4,317,016 | |
| | | 9,667,100 | | | Tisco Financial Group Pcl (Foreign Registered) | | | 18,947,537 | |
| | | 3,413,900 | | | Total Access Communication Pcl (Foreign Registered) | | | 4,255,258 | |
| | | 20,730,409 | | | WHA Premium Growth Freehold & Leasehold Real Estate Investment Trust (Foreign Registered) | | | 5,820,229 | |
| | | | | | | | | | |
| | | | | | Total Thailand | | | 104,088,855 | |
| | | | | | | | | | |
| | |
| | | | | | Turkey — 0.4% | |
| | | 3,538,546 | | | Turkiye Garanti Bankasi AS | | | 8,353,061 | |
| | | | | | | | | | |
| | | | | | | | | | |
Shares | | | Description | | Value ($) | |
| | | | | | United Arab Emirates — 1.7% | |
| | | 4,790,051 | | | Abu Dhabi Commercial Bank PJSC | | | 9,234,828 | |
| | | 2,956,915 | | | Emaar Properties PJSC | | | 5,992,211 | |
| | | 5,214,410 | | | First Gulf Bank PJSC | | | 19,376,510 | |
| | | | | | | | | | |
| | | | | | Total United Arab Emirates | | | 34,603,549 | |
| | | | | | | | | | |
| | |
| | | | | | United Kingdom — 5.3% | |
| | | 870,975 | | | British American Tobacco Plc | | | 55,014,740 | |
| | | 1,123,459 | | | Unilever Plc | | | 53,298,632 | |
| | | | | | | | | | |
| | | | | | Total United Kingdom | | | 108,313,372 | |
| | | | | | | | | | |
| | |
| | | | | | Vietnam — 1.5% | |
| | | 3,095,955 | | | Bank for Foreign Trade of Vietnam JSC | | | 5,090,381 | |
| | | 590,927 | | | Phu Nhuan Jewelry JSC | | | 1,945,277 | |
| | | 4,159,711 | | | Vietnam Dairy Products JSC | | | 23,971,905 | |
| | | 8 | | | Vingroup JSC * | | | 16 | |
| | | | | | | | | | |
| | | | | | Total Vietnam | | | 31,007,579 | |
| | | | | | | | | | |
| | | |
| | | | | | TOTAL COMMON STOCKS (COST $1,325,846,021) | | | 1,436,714,598 | |
| | | | | | | | | | |
| | |
| | | | | | PREFERRED STOCKS — 2.5% | |
| | |
| | | | | | Brazil — 2.5% | |
| | | 780,000 | | | Banco Bradesco SA | | | 8,340,730 | |
| | | 1,020,500 | | | Eletropaulo Metropolitana Eletricidade de Sao Paulo SA | | | 4,100,133 | |
| | | 2,921,600 | | | Itau Unibanco Holding SA | | | 37,413,434 | |
| | | | | | | | | | |
| | | | | | Total Brazil | | | 49,854,297 | |
| | | | | | | | | | |
| | | |
| | | | | | TOTAL PREFERRED STOCKS (COST $36,625,942) | | | 49,854,297 | |
| | | | | | | | | | |
| | |
| | | | | | INVESTMENT FUNDS — 19.5% | |
| | |
| | | | | | Brazil — 1.8% | |
| | | 955,600 | | | iShares MSCI Brazil Capped ETF | | | 36,054,788 | |
| | | | | | | | | | |
| | |
| | | | | | China — 2.3% | |
| | | 1,233,300 | | | iShares China Large-Cap ETF | | | 47,112,060 | |
| | | | | | | | | | |
| | |
| | | | | | Taiwan — 5.1% | |
| | | 3,211,400 | | | iShares MSCI Taiwan Capped ETF | | | 104,017,246 | |
| | | | | | | | | | |
| | |
| | | | | | Thailand — 3.9% | |
| | | 56,672,100 | | | Jasmine Broadband Internet Infrastructure Fund | | | 18,652,110 | |
| | | 51,564,800 | | | TICON Industrial Growth Leasehold Property Fund (a) | | | 16,408,121 | |
| | | 108,857,492 | | | Digital Telecommunication Infrastructure Fund | | | 44,253,977 | |
| | | | | | | | | | |
| | | | | | Total Thailand | | | 79,314,208 | |
| | | | | | | | | | |
| | | | |
| 14 | | See accompanying notes to the financial statements. | | |
GMO Emerging Domestic Opportunities Fund
(A Series of GMO Trust)
Schedule of Investments — (Continued)
(showing percentage of total net assets)
February 28, 2017
| | | | | | | | | | |
Shares | | | Description | | Value ($) | |
| | | | | | United States — 6.4% | |
| | | 3,409,431 | | | iShares MSCI Emerging Markets ETF | | | 129,524,284 | |
| | | | | | | | | | |
| | | |
| | | | | | TOTAL INVESTMENT FUNDS
(COST $368,382,251) | | | 396,022,586 | |
| | | | | | | | | | |
| | |
| | | | | | RIGHTS/WARRANTS — 0.5% | |
| | |
| | | | | | China — 0.5% | |
| | | 767,900 | | | Jiangsu Yanghe Brewery Joint Stock Co Ltd Warrants, Expires 05/14/18 * | | | 9,059,896 | |
| | | | | | | | | | |
| | | |
| | | | | | TOTAL RIGHTS/WARRANTS
(COST $7,979,009) | | | 9,059,896 | |
| | | | | | | | | | |
| | |
| | | | | | MUTUAL FUNDS — 3.3% | |
| | |
| | | | | | United States — 3.3% | |
| | | | | | Affiliated Issuers — 3.3% | | | | |
| | | 2,670,905 | | | GMO U.S. Treasury Fund | | | 66,772,614 | |
| | | | | | | | | | |
| | | |
| | | | | | TOTAL MUTUAL FUNDS (COST $66,772,614) | | | 66,772,614 | |
| | | | | | | | | | |
| | |
| | | | | | FULLY FUNDED TOTAL RETURN
SWAPS — 2.3% | |
| | |
| | | | | | China — 2.3% | |
| | | 8,414,783 | | | Total Return on Hangzhou Robam Appliances, Expires 7/14/2017, (OTC) (CP-GS) | | | 8,570,219 | |
| | | 3,708,807 | | | Total Return on Jiangsu Yanghe Brewery, Expires 7/12/2017, (OTC) (CP-GS) | | | 3,750,655 | |
| | | 12,170,791 | | | Total Return on Wuliangye Yibin Co Ltd, Expires 4/5/2017, (OTC) (CP-GS) | | | 16,179,907 | |
| | | 1,847,880 | | | Total Return on Zhejiang Supor Cookware Co, Expires 10/19/2017, (OTC) (CP-GS) | | | 1,766,083 | |
| | | 498,763 | | | Total Return on Zhejiang Supor Cookware Co, Expires 10/19/2017, (OTC) (CP-GS) | | | 482,209 | |
| | | 358,754 | | | Total Return on Zhejiang Supor Cookware Co, Expires 11/14/2017, (OTC) (CP-GS) | | | 380,320 | |
| | | 1,299,140 | | | Total Return on Zhejiang Supor Cookware Co, Expires 11/14/2017, (OTC) (CP-GS) | | | 1,354,027 | |
| | | 346,799 | | | Total Return on Zhejiang Supor Cookware Co, Expires 11/14/2017, (OTC) (CP-GS) | | | 353,860 | |
| | | 1,534,862 | | | Total Return on Zhejiang Supor Cookware Co, Expires 11/27/2017, (OTC) (CP-GS) | | | 1,594,918 | |
| | | 770,474 | | | Total Return on Zhejiang Supor Cookware Co, Expires 11/27/2017, (OTC) (CP-GS) | | | 793,114 | |
| | | | | | | | | | |
Shares /
Par Value† | | | Description | | Value ($) | |
| | | | | | China — continued | |
| | | 1,610,563 | | | Total Return on Zhejiang Supor Cookware Co, Expires 11/27/2017, (OTC) (CP-GS) | | | 1,616,196 | |
| | | 10,878,519 | | | Total Return on Zhejiang Supor Cookware Co, Expires 7/19/2017, (OTC) (CP-GS) | | | 10,008,891 | |
| | | | | | | | | | |
| | | | | | Total China | | | 46,850,399 | |
| | | | | | | | | | |
| | | |
| | | | | | TOTAL FULLY FUNDED TOTAL RETURN SWAPS
(COST $43,440,133) | | | 46,850,399 | |
| | | | | | | | | | |
| | |
| | | | | | SHORT-TERM INVESTMENTS — 0.9% | |
| | |
| | | | | | Time Deposits — 0.3% | |
ZAR | | | 27,260,670 | | | Brown Brothers Harriman (Grand Cayman) Time Deposit, 5.70%, due 03/01/17 | | | 2,078,191 | |
| | | 795,504 | | | Standard Chartered Bank (London) Time Deposit, 0.36%, due 03/01/17 | | | 795,504 | |
| | | 4,095,162 | | | Sumitomo (Tokyo) Time Deposit, 0.36%, due 03/01/17 | | | 4,095,162 | |
| | | | | | | | | | |
| | | | | | Total Time Deposits | | | 6,968,857 | |
| | | | | | | | | | |
| | | |
| | | | | | U.S. Government — 0.6% | | | | |
| | | 1,500,000 | | | U.S. Treasury Bill, 0.48%, due 04/13/17 (c) (d) | | | 1,499,138 | |
| | | 5,000,000 | | | U.S. Treasury Bill, 0.53%, due 06/08/17 (c) (d) | | | 4,992,685 | |
| | | 5,500,000 | | | U.S. Treasury Bill, 0.58%, due 07/06/17 (c) (d) | | | 5,488,752 | |
| | | | | | | | | | |
| | | | | | Total U.S. Government | | | 11,980,575 | |
| | | | | | | | | | |
| | | |
| | | | | | TOTAL SHORT-TERM INVESTMENTS
(COST $18,947,837) | | | 18,949,432 | |
| | | | | | | | | | |
| | | |
| | | | | | TOTAL INVESTMENTS — 99.7%
(Cost $1,867,993,807) | | | 2,024,223,822 | |
| | | | | | Other Assets and Liabilities (net) — 0.3% | | | 6,893,267 | |
| | | | | | | | | | |
| | | |
| | | | | | TOTAL NET ASSETS — 100.0% | | | $2,031,117,089 | |
| | | | | | | | | | |
| | | | |
| | See accompanying notes to the financial statements. | | 15 |
GMO Emerging Domestic Opportunities Fund
(A Series of GMO Trust)
Schedule of Investments — (Continued)
February 28, 2017
A summary of outstanding financial instruments at February 28, 2017 is as follows:
Forward Currency Contracts
| | | | | | | | | | | | | | | | | | | | | | |
| | | | |
Settlement
Date | | Counter-
party | | Currency
Sold | | | Currency
Purchased | | | Net
Unrealized
Appreciation
(Depreciation) | |
| 06/30/2017 | | BCLY | | | GBP | | | | 68,332,500 | | | | USD | | | | 90,520,969 | | | $ | 5,470,634 | |
| 04/12/2017 | | MSCI | | | PHP | | | | 2,071,369,000 | | | | USD | | | | 41,769,893 | | | | 729,117 | |
| 06/13/2017 | | MSCI | | | PHP | | | | 1,979,635,372 | | | | USD | | | | 39,014,897 | | | | 29,069 | |
| 06/30/2017 | | BCLY | | | USD | | | | 90,790,236 | | | | GBP | | | | 68,332,500 | | | | (5,739,901 | ) |
| | | | | | | | | | | | | | | | | | | | | | |
| | | | | | | | | | | | | | | | | | | | $ | 488,919 | |
| | | | | | | | | | | | | | | | | | | | | | |
Futures Contracts
| | | | | | | | | | | | |
| | | | |
Number
of
Contracts + | | Type | | Expiration
Date | | Notional
Amount | | | Net
Unrealized
Appreciation
(Depreciation) | |
| Buys | | | | | | | | | | | | |
| 3,655 | | Mini MSCI Emerging Markets | | March 2017 | | $ | 170,103,700 | | | $ | 5,192,414 | |
| | | | | | | | | | | | |
| Sales | | | | | | | | | | | | |
| 7,316 | | SET 50 | | March 2017 | | $ | 40,993,555 | | | $ | 195,933 | |
| 3,233 | | SGX CNX Nifty Index 50 | | March 2017 | | | 57,544,292 | | | | 179,621 | |
| | | | | | | | | | | | |
| | $ | 98,537,847 | | | $ | 375,554 | |
| | | | | | | | | | | | |
| + | Buys - Fund is long the futures contract. |
| | Sales - Fund is short the futures contract. |
Swap Contracts
Total Return Swaps
| | | | | | | | | | | | | | | | | | |
| | | | | |
Notional
Amount | | | Expiration
Date | | Counterparty | | Fund Pays | | Fund Receives | | Net
Unrealized
Appreciation/
(Depreciation) | |
| | 10,285,641 | | | | USD | | | 11/3/2017 | | JPM | | Total return on MSCI Daily TR Net Emerging Markets Philippines USD | | 1 Month LIBOR minus 1.0% | | $ | 105,974 | |
| | 10,382,130 | | | | USD | | | 11/21/2017 | | GS | | Total return on MSCI Daily TR Net Emerging Markets Philippines USD | | 3 Month LIBOR minus 0.5% | | | 93,045 | |
| | 9,391,109 | | | | USD | | | 11/21/2017 | | GS | | Total return on MSCI Daily TR Net Emerging Markets Philippines USD | | 3 Month LIBOR minus 0.5% | | | 84,164 | |
| | 10,245,275 | | | | USD | | | 12/11/2017 | | GS | | Total return on MSCI Daily TR Net Emerging Markets Philippines USD | | 3 Month LIBOR minus 0.5% | | | 91,819 | |
| | 10,264,151 | | | | USD | | | 12/11/2017 | | GS | | Total return on MSCI Daily TR Net Emerging Markets Philippines USD | | 3 Month LIBOR minus 0.8% | | | 91,561 | |
| | 13,072,046 | | | | USD | | | 12/19/2017 | | UBSA | | Total return on MSCI Daily TR Net Emerging Markets Philippines USD | | 1 Month LIBOR minus 1.3% | | | 114,922 | |
| | 18,130,974 | | | | USD | | | 12/19/2017 | | UBSA | | Total return on MSCI Daily TR Net Emerging Markets Philippines USD | | 1 Month LIBOR minus 1.3% | | | 159,397 | |
| | | | | | | | | | | | | | | | | | |
| | | | | | | | | | | | | | | | $ | 740,882 | |
| | | | | | | | | | | | | | | | | | |
| | | | | | | | | | | | Premiums Paid (Received) | | $ | — | |
| | | | | | | | | | | | | | | | | | |
As of February 28, 2017, for the above contracts and/or agreements, the Fund had sufficient cash and/or securities to cover commitments or collateral requirements, if any, of the relevant broker or exchange.
| | | | |
| 16 | | See accompanying notes to the financial statements. | | |
GMO Emerging Domestic Opportunities Fund
(A Series of GMO Trust)
Schedule of Investments — (Continued)
February 28, 2017
Notes to Schedule of Investments:
| † | Denominated in U.S. Dollar, unless otherwise indicated. |
| * | Non-income producing security. |
| (a) | Affiliated company (Note 10). |
| (b) | Security valued at the local price and adjusted by applying a premium or discount since holding exceeds foreign ownership limits. |
| (c) | The rate shown represents yield-to-maturity. |
| (d) | All or a portion of this security has been pledged to cover margin requirements on futures and/or cleared swap contracts, collateral on OTC swap contracts, forward currency contracts, and/or written options, if any (Note 4). |
For a listing of definitions of acronyms, counterparty abbreviations and currency abbreviations used throughout the Schedule of Investments as well as the derivative tables, if any, please refer to page 35.
| | | | |
| | See accompanying notes to the financial statements. | | 17 |
GMO Emerging Markets Fund
(A Series of GMO Trust)
Portfolio Management
Day-to-day management of the Fund’s portfolio is the responsibility of the Emerging Markets Equity team at Grantham, Mayo, Van Otterloo & Co. LLC.
Management Discussion and Analysis of Fund Performance
Class III shares of GMO Emerging Markets Fund returned +34.67% (net) for the fiscal year ended February 28, 2017, as compared with +30.27% for the S&P/IFCI Composite Index.
Country-sector allocation contributed to the Fund’s relative returns for the fiscal year. The Fund’s overweight in Brazil Utilities and Russia Financials added to relative performance. The Fund’s overweight in Korean Consumer Discretionary and Turkey Telecommunications detracted from relative performance.
Stock selection was additive during the fiscal year. The Fund’s stock selections in India Financials and Brazil Financials helped relative performance, while the stock selections in Russia Energy and India Materials hurt relative performance.
Because some of the securities and instruments held directly or indirectly by the Fund had positive fair value adjustments at the beginning or end of the fiscal year (and the performance of indices are not fair valued), the Fund’s absolute and relative performance is higher than it otherwise would have been in the absence of such fair value adjustments.
The views expressed herein are exclusively those of Grantham, Mayo, Van Otterloo & Co. LLC as of the date of this report and are subject to change. GMO disclaims any responsibility to update such views. They are not meant as investment advice. References to specific securities are not recommendations of such securities and may not be representative of any GMO portfolio’s current or future investments.
18
GMO Emerging Markets Fund
(A Series of GMO Trust)
Comparison of Change in Value of a $50,000,000 Investment in
GMO Emerging Markets Fund Class III Shares and the S&P/IFCI Composite Index
As of February 28, 2017
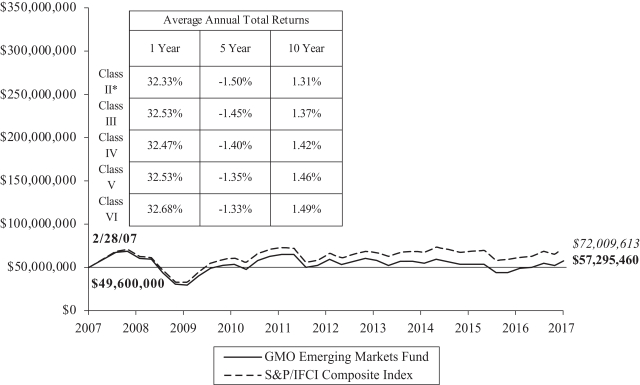
Performance data quoted represents past performance and is not indicative of future results. The investment return and principal value of an investment will fluctuate so that an investor’s shares, when redeemed, may be worth more or less than their original cost. Current performance data may be lower or higher than the performance data provided herein. To obtain performance information up to the most recent month-end, visit www.gmo.com. Performance shown is net of all fees after reimbursement from GMO. Each performance figure assumes a purchase at the beginning and redemption at the end of the stated period and reflects a transaction fee of .80% on the purchase and .80% on the redemption. Transaction fees are retained by the Fund to cover trading costs. Returns would have been lower had certain expenses not been reimbursed during the periods shown and do not include the effect of taxes on distributions and redemptions. All information is unaudited. Performance for classes may vary due to different fees.
| | * | For the period from January 9, 1998 to August 12, 2009, no Class II shares were outstanding. Performance for that period is that of Class III shares, which have been adjusted downward to reflect Class II’s higher gross expenses (Class II’s expenses during these periods were calculated by adjusting Class III’s gross expenses during such periods upward by the current differential between the gross shareholder service fees for Class II and Class III shares). |
| | | For S&P disclaimers please visit http://www.gmo.com/America/_Disclaimers/_BenchmarkDisclaimers.htm. |
19
GMO Emerging Markets Fund
(A Series of GMO Trust)
Investment Concentration Summary
February 28, 2017 (Unaudited)
| | | | |
| Asset Class Summary& | | % of Total Net Assets | |
Common Stocks | | | 93.6 | % |
Preferred Stocks | | | 4.1 | |
Mutual Funds | | | 1.8 | |
Investment Funds | | | 0.7 | |
Short-Term Investments | | | 0.3 | |
Swap Contracts | | | 0.0 | ^ |
Fully Funded Total Return Swaps | | | 0.0 | ^ |
Rights/Warrants | | | 0.0 | ^ |
Futures Contracts | | | 0.0 | ^ |
Other | | | (0.5 | ) |
| | | | |
| | | 100.0 | % |
| | | | |
Country Summary¤ | | % of Investments | |
Taiwan | | | 24.8 | % |
China | | | 20.3 | |
South Korea | | | 16.1 | |
India | | | 12.2 | |
Russia | | | 6.3 | |
Turkey | | | 4.9 | |
Brazil | | | 3.1 | |
United States | | | 2.5 | |
Thailand | | | 2.5 | |
Mexico | | | 1.1 | |
South Africa | | | 0.9 | |
Greece | | | 0.8 | |
Philippines | | | 0.8 | |
Indonesia | | | 0.7 | |
United Arab Emirates | | | 0.7 | |
United Kingdom | | | 0.6 | |
Chile | | | 0.5 | |
Qatar | | | 0.3 | |
Vietnam | | | 0.2 | |
Poland | | | 0.2 | |
Malaysia | | | 0.2 | |
Egypt | | | 0.2 | |
Czech Republic | | | 0.1 | |
Belgium | | | 0.0 | ^* |
Sri Lanka | | | 0.0 | ^ |
| | | | |
| | | 100.0 | % |
| | | | |
| | | | |
| Industry Group Summary | | % of Equity Investments# | |
Banks | | | 22.7 | % |
Technology Hardware & Equipment | | | 16.4 | |
Telecommunication Services | | | 11.3 | |
Automobiles & Components | | | 7.0 | |
Materials | | | 6.0 | |
Capital Goods | | | 4.4 | |
Software & Services | | | 4.0 | |
Semiconductors & Semiconductor Equipment | | | 4.0 | |
Energy | | | 3.3 | |
Real Estate | | | 3.1 | |
Diversified Financials | | | 3.0 | |
Utilities | | | 2.6 | |
Consumer Durables & Apparel | | | 2.6 | |
Insurance | | | 2.5 | |
Food, Beverage & Tobacco | | | 2.3 | |
Consumer Services | | | 1.0 | |
Retailing | | | 0.9 | |
Transportation | | | 0.7 | |
Food & Staples Retailing | | | 0.6 | |
Media | | | 0.4 | |
Household & Personal Products | | | 0.4 | |
Pharmaceuticals, Biotechnology & Life Sciences | | | 0.4 | |
Health Care Equipment & Services | | | 0.4 | |
Commercial & Professional Services | | | 0.0 | ^ |
| | | | |
| | | 100.0 | % |
| | | | |
| & | In the table above, derivative financial instruments, if any, are based on market values or unrealized appreciation/depreciation rather than notional amounts. |
| ¤ | The table above shows country exposure in the Fund. The table excludes short-term investments. The table excludes exposure through forward currency contracts and includes exposure through other derivative financial instruments, if any. The table takes into account the market value of securities and options and the notional amounts of swap contracts and other derivative financial instruments, if any. |
| # | Equity investments may consist of common stocks and other stock-related securities, such as preferred stocks, if any. This table excludes exposure to derivative contracts, short-term investments, mutual funds and investment funds, if any. For a summary of these exposures, if any, see the Schedule of Investments. |
| * | Includes companies that derive more than 50% of their revenues or profits from emerging markets. |
20
GMO Emerging Markets Fund
(A Series of GMO Trust)
Schedule of Investments
(showing percentage of total net assets)
February 28, 2017
| | | | | | | | | | |
| | | Shares | | | Description | | Value ($) | |
| | | | | | COMMON STOCKS — 93.6% | |
| | |
| | | | | | Belgium — 0.0% | |
| | | 17,600 | | | Anheuser-Busch InBev SA Sponsored ADR | | | 1,927,024 | |
| | | | | | | | | | |
| | |
| | | | | | Brazil — 2.4% | |
| | | 4,090,073 | | | AES Tiete Energia SA | | | 21,096,159 | |
| | | 103,600 | | | Banco Bradesco SA | | | 1,081,271 | |
| | | 359,600 | | | BR Malls Participacoes SA * | | | 1,718,897 | |
| | | 1,741,176 | | | BTG Pactual Group | | | 10,502,550 | |
| | | 1,396,500 | | | Cia Hering | | | 7,799,640 | |
| | | 1,615,023 | | | EDP-Energias do Brasil SA | | | 7,105,319 | |
| | | 1,881,500 | | | Engie Brasil Energia SA | | | 22,297,118 | |
| | | 384,600 | | | Equatorial Energia SA | | | 7,338,663 | |
| | | 523,671 | | | Grendene SA | | | 3,361,559 | |
| | | 206,100 | | | Light SA | | | 1,474,944 | |
| | | 1,197,700 | | | LPS Brasil Consultoria de Imoveis SA * | | | 2,114,923 | |
| | | 386,300 | | | Marisa Lojas SA * | | | 860,171 | |
| | | 743,300 | | | Multiplus SA | | | 8,526,150 | |
| | | 15,000 | | | Ouro Fino Saude Animal Participacoes SA | | | 125,074 | |
| | | 99,600 | | | Raia Drogasil SA | | | 1,898,798 | |
| | | 1,810,400 | | | Rumo Logistica Operadora Multimodal SA * | | | 4,970,420 | |
| | | 2,048,651 | | | Transmissora Alianca de Energia Eletrica SA | | | 14,481,277 | |
| | | 910,000 | | | Via Varejo SA | | | 3,442,363 | |
| | | | | | | | | | |
| | | | | | Total Brazil | | | 120,195,296 | |
| | | | | | | | | | |
| | |
| | | | | | Chile — 0.5% | |
| | | 24,922,544 | | | Enel Americas SA | | | 4,849,416 | |
| | | 1,201,100 | | | Enel Americas SA ADR | | | 11,710,725 | |
| | | 15,711,140 | | | Enel Chile SA | | | 1,616,641 | |
| | | 1,434,047 | | | Inversiones Aguas Metropolitanas SA | | | 2,139,122 | |
| | | 167,554 | | | Inversiones La Construccion SA | | | 2,216,550 | |
| | | 991,966 | | | SONDA SA | | | 1,617,164 | |
| | | 1,048,936 | | | Vina Concha y Toro SA | | | 1,774,225 | |
| | | | | | | | | | |
| | | | | | Total Chile | | | 25,923,843 | |
| | | | | | | | | | |
| | |
| | | | | | China — 20.4% | |
| | | 195,000 | | | AAC Technologies Holdings Inc | | | 2,051,400 | |
| | | 134,060,290 | | | Agricultural Bank of China Ltd – Class H | | | 61,790,018 | |
| | | 3,034,705 | | | Aier Eye Hospital Group Co Ltd – Class A | | | 14,025,688 | |
| | | 299,255 | | | Alibaba Group Holding Ltd Sponsored ADR * | | | 30,793,339 | |
| | | 608,500 | | | Anhui Conch Cement Co Ltd – Class H | | | 2,118,502 | |
| | | 57,400 | | | Baidu Inc Sponsored ADR * | | | 9,995,062 | |
| | | 152,909,682 | | | Bank of China Ltd – Class H | | | 77,367,721 | |
| | | 29,414,000 | | | Belle International Holdings Ltd | | | 20,251,571 | |
| | | 452,300 | | | Changyou.com Ltd ADR * | | | 12,492,526 | |
| | | 56,136,200 | | | China Communications Services Corp Ltd – Class H | | | 37,483,903 | |
| | | 156,117,106 | | | China Construction Bank Corp – Class H | | | 128,537,637 | |
| | | 1,397,734 | | | China International Travel Service Corp Ltd – Class A | | | 10,000,130 | |
| | | | | | | | | | |
| | | Shares | | | Description | | Value ($) | |
| | | | | | China — continued | |
| | | 4,863,000 | | | China Lesso Group Holdings Ltd | | | 3,647,953 | |
| | | 2,192,000 | | | China Life Insurance Co Ltd – Class H | | | 6,678,878 | |
| | | 79,600 | | | China Lodging Group Ltd Sponsored ADR * | | | 4,614,412 | |
| | | 22,571,000 | | | China Machinery Engineering Corp – Class H | | | 15,699,061 | |
| | | 13,894,962 | | | China Mobile Ltd | | | 153,262,600 | |
| | | 636,200 | | | China Mobile Ltd Sponsored ADR | | | 35,156,412 | |
| | | 99,000 | | | Chlitina Holding Ltd | | | 526,294 | |
| | | 1,180,864 | | | CKH Food & Health Ltd * | | | 1,795,563 | |
| | | 1,745,600 | | | Dongfang Electric Corp Ltd – Class H | | | 1,824,711 | |
| | | 8,983,000 | | | FIH Mobile Ltd | | | 3,480,233 | |
| | | 458,000 | | | Haier Electronics Group Co Ltd | | | 842,477 | |
| | | 586,000 | | | Haitian International Holdings Ltd | | | 1,232,948 | |
| | | 114,200 | | | Hangzhou Robam Appliances Co Ltd – Class A | | | 704,402 | |
| | | 950,490 | | | Hangzhou Robam Appliances Co Ltd – Class A | | | 5,850,685 | |
| | | 14,416,000 | | | Harbin Electric Co Ltd – Class H | | | 7,094,574 | |
| | | 209,000 | | | Hengan International Group Co Ltd | | | 1,783,859 | |
| | | 10,248,000 | | | Hua Han Health Industry Holdings Ltd * | | | 686,465 | |
| | | 15,038,000 | | | Huabao International Holdings Ltd * | | | 8,078,571 | |
| | | 140,386,391 | | | Industrial & Commercial Bank of China Ltd – Class H | | | 91,989,336 | |
| | | 972,000 | | | Jiangsu Expressway Co Ltd – Class H | | | 1,282,235 | |
| | | 226,800 | | | Jiangsu Yanghe Brewery Joint-Stock Co Ltd – Class A | | | 2,674,282 | |
| | | 33,049 | | | Jiangsu Yanghe Brewery Joint-Stock Co Ltd – Class A | | | 390,497 | |
| | | 179,603 | | | Kweichow Moutai Co Ltd – Class A | | | 9,264,046 | |
| | | 92,931 | | | Kweichow Moutai Co Ltd – Class A | | | 4,803,340 | |
| | | 1,534,955 | | | Midea Group Co Ltd – Class A | | | 7,115,166 | |
| | | 402,400 | | | Midea Group Co Ltd – Class A | | | 1,870,331 | |
| | | 23,460,000 | | | PICC Property & Casualty Co Ltd – Class H | | | 35,823,322 | |
| | | 2,780,061 | | | Ping An Insurance Group Co of China Ltd – Class H | | | 14,809,285 | |
| | | 1,728,942 | | | Qingdao Haier Co Ltd – Class A | | | 2,750,513 | |
| | | 2,927,665 | | | SAIC Motor Corp Ltd – Class A | | | 10,982,003 | |
| | | 686,000 | | | Shenzhen Expressway Co Ltd – Class H | | | 633,569 | |
| | | 669,500 | | | Shenzhen International Holdings Ltd | | | 959,909 | |
| | | 14,040,500 | | | Sinopec Engineering Group Co Ltd – Class H | | | 12,763,610 | |
| | | 61,000 | | | Sohu.com Inc * | | | 2,429,630 | |
| | | 171,006 | | | TAL Education Group ADR * | | | 14,786,889 | |
| | | 2,431,565 | | | Tencent Holdings Ltd | | | 64,526,358 | |
| | | 1,881,880 | | | Tong Ren Tang Technologies Co Ltd – Class H | | | 3,450,361 | |
| | | 171,000 | | | TravelSky Technology Ltd – Class H | | | 372,894 | |
| | | 33,949,000 | | | Want Want China Holdings Ltd | | | 21,839,805 | |
| | | 4,615,268 | | | WH Group Ltd | | | 3,603,290 | |
| | | 672,729 | | | Wuliangye Yibin Co Ltd – Class A | | | 3,878,376 | |
| | | 2,826,000 | | | Xinyi Glass Holdings Ltd | | | 2,562,214 | |
| | | 6,065,500 | | | Xtep International Holdings Ltd | | | 2,764,164 | |
| | | 43,674,080 | | | Yangzijiang Shipbuilding Holdings Ltd | | | 28,809,965 | |
| | | 8,260,000 | | | Zhejiang Expressway Co Ltd – Class H | | | 9,289,770 | |
| | | 1,224,573 | | | Zhejiang Supor Cookware Co Ltd – Class A | | | 6,633,445 | |
| | | | | | | | | | |
| | | | | | Total China | | | 1,022,926,200 | |
| | | | | | | | | | |
| | | | |
| | See accompanying notes to the financial statements. | | 21 |
GMO Emerging Markets Fund
(A Series of GMO Trust)
Schedule of Investments — (Continued)
(showing percentage of total net assets)
February 28, 2017
| | | | | | | | | | |
| | | Shares | | | Description | | Value ($) | |
| | | | | | Czech Republic — 0.2% | |
| | | 1,055,964 | | | Moneta Money Bank AS * | | | 3,530,371 | |
| | | 8,158 | | | Philip Morris CR AS | | | 4,254,636 | |
| | | | | | | | | | |
| | | | | | Total Czech Republic | | | 7,785,007 | |
| | | | | | | | | | |
| | |
| | | | | | Egypt — 0.2% | |
| | | 11,625,874 | | | Telecom Egypt Co | | | 7,959,744 | |
| | | | | | | | | | |
| | |
| | | | | | Greece — 0.8% | |
| | | 10,466,666 | | | Alpha Bank AE * | | | 18,887,036 | |
| | | 10,341,896 | | | Eurobank Ergasias SA * | | | 6,877,275 | |
| | | 35,399,812 | | | National Bank of Greece SA * | | | 8,980,101 | |
| | | 35,717,726 | | | Piraeus Bank SA * | | | 6,905,456 | |
| | | | | | | | | | |
| | | | | | Total Greece | | | 41,649,868 | |
| | | | | | | | | | |
| | |
| | | | | | India — 12.1% | |
| | | 222,078 | | | Amara Raja Batteries Ltd | | | 2,851,358 | |
| | | 2,912,970 | | | Asian Paints Ltd | | | 44,800,320 | |
| | | 1,422,392 | | | Aurobindo Pharma Ltd | | | 14,443,910 | |
| | | 832,372 | | | Berger Paints India Ltd | | | 2,873,936 | |
| | | 390,443 | | | Bharat Financial Inclusion Ltd * | | | 4,917,225 | |
| | | 177,449 | | | CCL Products India Ltd | | | 913,118 | |
| | | 293,346 | | | CMI Ltd * | | | 797,183 | |
| | | 629,862 | | | Fortis Healthcare Ltd * | | | 1,821,543 | |
| | | 475,623 | | | Gateway Distriparks Ltd | | | 1,750,868 | |
| | | 16,900,000 | | | Gayatri Projects Ltd (a) | | | 35,159,348 | |
| | | 7,988,747 | | | HDFC Bank Ltd (b) | | | 172,300,018 | |
| | | 35,300 | | | HDFC Bank Ltd ADR | | | 2,530,657 | |
| | | 1,855,762 | | | Hero MotoCorp Ltd | | | 87,025,131 | |
| | | 3,509,023 | | | IFCI Ltd * | | | 1,533,179 | |
| | | 1,424,808 | | | Indian Oil Corp Ltd | | | 8,212,510 | |
| | | 210,960 | | | Indraprastha Gas Ltd | | | 3,287,638 | |
| | | 391,011 | | | IndusInd Bank Ltd | | | 7,685,640 | |
| | | 843,332 | | | Infosys Ltd | | | 12,777,525 | |
| | | 1,743,200 | | | Infosys Ltd Sponsored ADR | | | 26,392,048 | |
| | | 3,022,460 | | | Jai Balaji Industries Ltd * | | | 596,373 | |
| | | 1,754,682 | | | Kiri Industries Ltd * (a) | | | 7,867,156 | |
| | | 811,005 | | | KPIT Technologies Ltd | | | 1,674,111 | |
| | | 275,755 | | | LIC Housing Finance Ltd | | | 2,312,529 | |
| | | 328,532 | | | Mphasis Ltd | | | 2,937,021 | |
| | | 816,306 | | | Muthoot Finance Ltd | | | 4,350,115 | |
| | | 121,808 | | | Narayana Hrudayalaya Ltd * | | | 596,306 | |
| | | 1,920,616 | | | NMDC Ltd | | | 4,334,026 | |
| | | 1,449,808 | | | Petronet LNG Ltd | | | 8,814,745 | |
| | | 532,104 | | | Sangam India Ltd | | | 2,152,589 | |
| | | 673,730 | | | Sun TV Network Ltd | | | 7,186,757 | |
| | | 77,996 | | | Supreme Industries Ltd | | | 1,181,566 | |
| | | 151,145 | | | Tata Consultancy Services Ltd | | | 5,568,856 | |
| | | 201,544 | | | Tech Mahindra Ltd | | | 1,482,145 | |
| | | 889,071 | | | Techno Electric & Engineering Co Ltd | | | 4,997,317 | |
| | | 1,178,296 | | | UltraTech Cement Ltd | | | 66,409,324 | |
| | | | | | | | | | |
| | | Shares | | | Description | | Value ($) | |
| | | | | | India — continued | |
| | | 309,349 | | | Vakrangee Ltd | | | 1,469,195 | |
| | | 105,963 | | | Wipro Ltd | | | 772,936 | |
| | | 2,413,396 | | | Yes Bank Ltd | | | 52,439,318 | |
| | | | | | | | | | |
| | | | | | Total India | | | 609,215,540 | |
| | | | | | | | | | |
| | | |
| | | | | | Indonesia — 0.7% | | | | |
| | | 52,639,500 | | | Bakrie Telecom Tbk PT * | | | 134,204 | |
| | | 4,972,100 | | | Bank Central Asia Tbk PT | | | 5,750,403 | |
| | | 11,847,400 | | | Bank Pembangunan Daerah Jawa Timur Tbk PT | | | 505,266 | |
| | | 9,335,669 | | | Gajah Tunggal Tbk PT * | | | 884,555 | |
| | | 10,404,891 | | | Indo Tambangraya Megah Tbk PT | | | 13,701,058 | |
| | | 12,104,500 | | | Malindo Feedmill Tbk PT * | | | 1,124,237 | |
| | | 337,585,800 | | | Panin Financial Tbk PT * | | | 5,247,785 | |
| | | 20,145,100 | | | Telekomunikasi Indonesia Persero Tbk PT | | | 5,783,866 | |
| | | 63,700 | | | Telekomunikasi Indonesia Persero Tbk PT Sponsored ADR | | | 1,815,450 | |
| | | | | | | | | | |
| | | | | | Total Indonesia | | | 34,946,824 | |
| | | | | | | | | | |
| | | |
| | | | | | Malaysia — 0.2% | | | | |
| | | 2,851,800 | | | DiGi.Com Berhad | | | 3,237,003 | |
| | | 1,483,046 | | | Genting Malaysia Berhad | | | 1,753,149 | |
| | | 3,882,888 | | | KSL Holdings Berhad * | | | 1,014,012 | |
| | | 724,887 | | | Media Prima Berhad | | | 167,906 | |
| | | 1,115,500 | | | Petronas Chemicals Group Berhad | | | 1,821,331 | |
| | | 163,900 | | | Petronas Gas Berhad | | | 738,921 | |
| | | 1,587,767 | | | UOA Development Berhad | | | 894,117 | |
| | | | | | | | | | |
| | | | | | Total Malaysia | | | 9,626,439 | |
| | | | | | | | | | |
| | | |
| | | | | | Mexico — 1.1% | | | | |
| | | 6,970,504 | | | Cemex SAB de CV CPO * | | | 5,884,068 | |
| | | 5,392,192 | | | Cemex SAB de CV Sponsored ADR * | | | 45,617,944 | |
| | | 38,619 | | | Industrias Bachoco SAB de CV – Series B | | | 153,869 | |
| | | 1,287,400 | | | Wal-Mart de Mexico SAB de CV | | | 2,505,405 | |
| | | | | | | | | | |
| | | | | | Total Mexico | | | 54,161,286 | |
| | | | | | | | | | |
| | | |
| | | | | | Philippines — 0.8% | | | | |
| | | 2,562,524 | | | BDO Unibank Inc | | | 5,886,898 | |
| | | 7,199,300 | | | Century Pacific Food Inc | | | 2,337,066 | |
| | | 2,491,740 | | | Concepcion Industrial Corp | | | 2,927,794 | |
| | | 3,484,677 | | | First Gen Corp | | | 1,463,364 | |
| | | 178,758 | | | GT Capital Holdings Inc | | | 4,296,961 | |
| | | 9,514,450 | | | Lopez Holding Corp | | | 1,495,633 | |
| | | 129,000 | | | Manila Electric Co | | | 749,820 | |
| | | 5,424,500 | | | Manila Water Co Inc | | | 3,297,306 | |
| | | 743,420 | | | Philippine Seven Corp | | | 2,043,869 | |
| | | 4,131,088 | | | Puregold Price Club Inc | | | 3,783,658 | |
| | | 3,433,860 | | | Robinsons Retail Holdings Inc | | | 5,544,788 | |
| | | 2,658,225 | | | Semirara Mining & Power Corp | | | 7,528,787 | |
| | | | | | | | | | |
| | | | | | Total Philippines | | | 41,355,944 | |
| | | | | | | | | | |
| | | | |
| 22 | | See accompanying notes to the financial statements. | | |
GMO Emerging Markets Fund
(A Series of GMO Trust)
Schedule of Investments — (Continued)
(showing percentage of total net assets)
February 28, 2017
| | | | | | | | | | |
| | | Shares | | | Description | | Value ($) | |
| | | | | | Poland — 0.2% | | | | |
| | | 2,268,826 | | | Energa SA | | | 6,088,277 | |
| | | 15,767 | | | KRUK SA | | | 950,211 | |
| | | 2,154,806 | | | Synthos SA | | | 3,116,868 | |
| | | | | | | | | | |
| | | | | | Total Poland | | | 10,155,356 | |
| | | | | | | | | | |
| | | |
| | | | | | Qatar — 0.3% | | | | |
| | | 138,635 | | | Doha Bank QSC | | | 1,478,352 | |
| | | 54,002 | | | Industries Qatar QSC * | | | 1,747,843 | |
| | | 22,805 | | | Qatar Electricity & Water Co QSC * | | | 1,409,273 | |
| | | 1,466,410 | | | Qatar Gas Transport Co Ltd Nakilat | | | 9,482,001 | |
| | | 48,501 | | | Qatar Navigation QSC | | | 1,162,894 | |
| | | | | | | | | | |
| | | | | | Total Qatar | | | 15,280,363 | |
| | | | | | | | | | |
| | | |
| | | | | | Russia — 5.4% | | | | |
| | | 474,795 | | | Globaltrans Investment Plc Sponsored GDR (Registered) | | | 2,840,694 | |
| | | 561,265 | | | LSR Group PJSC GDR (Registered) | | | 2,019,385 | |
| | | 256,179 | | | Lukoil PJSC Sponsored ADR | | | 13,583,684 | |
| | | 268,717 | | | M.Video PJSC | | | 1,722,449 | |
| | | 1,689,755 | | | MegaFon PJSC GDR (Registered) | | | 19,510,031 | |
| | | 10,052,915 | | | Mobile TeleSystems PJSC Sponsored ADR | | | 103,243,437 | |
| | | 1,660,997 | | | Moscow Exchange MICEX-RTS PJSC | | | 3,510,998 | |
| | | 180,000 | | | QIWI Plc Sponsored ADR | | | 2,512,800 | |
| | | 6,782,985 | | | Rostelecom PJSC | | | 9,070,022 | |
| | | 12,897 | | | Rostelecom PJSC Sponsored ADR | | | 104,212 | |
| | | 2,392,732 | | | Sberbank of Russia PJSC Sponsored ADR | | | 26,088,668 | |
| | | 3,290,258 | | | Sistema PJSC Sponsored GDR (Registered) | | | 29,339,280 | |
| | | 164,082 | | | Sollers PJSC * | | | 1,647,002 | |
| | | 9,062,893 | | | Surgutneftegas OJSC Sponsored ADR | | | 45,730,860 | |
| | | 221,643 | | | Tatneft PJSC Sponsored ADR | | | 7,772,356 | |
| | | 123,647 | | | X5 Retail Group NV GDR (Registered) * | | | 3,747,247 | |
| | | | | | | | | | |
| | | | | | Total Russia | | | 272,443,125 | |
| | | | | | | | | | |
| | | |
| | | | | | South Africa — 0.9% | | | | |
| | | 1,259,432 | | | Barloworld Ltd | | | 11,126,257 | |
| | | 128,627 | | | Capitec Bank Holdings Ltd | | | 7,100,623 | |
| | | 650,928 | | | Lewis Group Ltd | | | 2,083,988 | |
| | | 139,290 | | | MTN Group Ltd | | | 1,270,901 | |
| | | 4,990,890 | | | Murray & Roberts Holdings Ltd | | | 5,807,968 | |
| | | 366,296 | | | Reunert Ltd | | | 1,960,898 | |
| | | 69,279 | | | Vodacom Group Ltd | | | 782,411 | |
| | | 1,245,031 | | | Wilson Bayly Holmes-Ovcon Ltd | | | 13,786,941 | |
| | | | | | | | | | |
| | | | | | Total South Africa | | | 43,919,987 | |
| | | | | | | | | | |
| | | |
| | | | | | South Korea — 13.7% | | | | |
| | | 11,699 | | | Amorepacific Group | | | 1,344,607 | |
| | | 1,759,774 | | | BNK Financial Group Inc | | | 13,504,097 | |
| | | 32,833 | | | Cheil Worldwide Inc | | | 549,948 | |
| | | 11,570 | | | CJ O Shopping Co Ltd | | | 1,983,026 | |
| | | 3,979 | | | Com2uSCorp | | | 385,262 | |
| | | | | | | | | | |
| | | Shares | | | Description | | Value ($) | |
| | | | | | South Korea — continued | | | | |
| | | 7,600 | | | Coway Co Ltd | | | 600,869 | |
| | | 115,475 | | | Daishin Securities Co Ltd | | | 1,168,036 | |
| | | 944,277 | | | Daou Data Corp | | | 9,093,172 | |
| | | 1,134,433 | | | Daou Technology Inc | | | 18,440,183 | |
| | | 1,533,626 | | | DGB Financial Group Inc | | | 14,098,712 | |
| | | 180,650 | | | Dongbu Insurance Co Ltd | | | 9,753,517 | |
| | | 388,194 | | | Grand Korea Leisure Co Ltd | | | 7,326,716 | |
| | | 59,585 | | | GS Home Shopping Inc | | | 11,356,273 | |
| | | 892,786 | | | Hana Financial Group Inc | | | 27,811,752 | |
| | | 168,721 | | | Hankook Tire Co Ltd | | | 8,911,944 | |
| | | 964,509 | | | Hankook Tire Worldwide Co Ltd | | | 17,473,495 | |
| | | 315,678 | | | Hanon Systems | | | 2,554,394 | |
| | | 235,293 | | | Hanwha Life Insurance Co Ltd | | | 1,354,084 | |
| | | 132 | | | Huons Global Co Ltd | | | 3,383 | |
| | | 8,120 | | | Hyundai Glovis Co Ltd | | | 1,101,389 | |
| | | 124,310 | | | Hyundai Home Shopping Network Corp | | | 12,579,935 | |
| | | 283,787 | | | Hyundai Marine & Fire Insurance Co Ltd | | | 8,131,863 | |
| | | 523,645 | | | Hyundai Mobis Co Ltd | | | 118,029,274 | |
| | | 24,442 | | | Hyundai Motor Co | | | 3,227,204 | |
| | | 71,901 | | | Hyundai Wia Corp | | | 4,250,759 | |
| | | 865,150 | | | Industrial Bank of Korea | | | 9,444,193 | |
| | | 38,833 | | | Innocean Worldwide Inc | | | 2,094,153 | |
| | | 177,013 | | | JB Financial Group Co Ltd | | | 888,885 | |
| | | 274,850 | | | Kangwon Land Inc | | | 8,584,797 | |
| | | 350,852 | | | KB Financial Group Inc | | | 14,483,142 | |
| | | 321,743 | | | KB Insurance Co Ltd | | | 7,495,742 | |
| | | 1,700,414 | | | Kia Motors Corp | | | 57,478,613 | |
| | | 11,716 | | | KIWOOM Securities Co Ltd | | | 797,892 | |
| | | 66,540 | | | KONA I Co Ltd * | | | 623,138 | |
| | | 184,571 | | | Korea Real Estate Investment & Trust Co Ltd | | | 516,341 | |
| | | 7,570 | | | Korea Zinc Co Ltd | | | 2,783,907 | |
| | | 84,494 | | | Korean Reinsurance Co | | | 836,833 | |
| | | 28,049 | | | KT Skylife Co Ltd | | | 415,204 | |
| | | 207,884 | | | KT&G Corp | | | 18,821,162 | |
| | | 28,264 | | | Kwangju Bank | | | 260,038 | |
| | | 45,121 | | | Kyobo Securities Co Ltd | | | 352,578 | |
| | | 93,194 | | | LF Corp | | | 1,737,681 | |
| | | 27,742 | | | LG Chem Ltd | | | 6,936,433 | |
| | | 1,388 | | | LG Household & Health Care Ltd | | | 1,077,161 | |
| | | 23,221 | | | LOTTE Himart Co Ltd | | | 991,556 | |
| | | 505,819 | | | Meritz Financial Group Inc | | | 5,253,601 | |
| | | 66,600 | | | Meritz Fire & Marine Insurance Co Ltd | | | 906,843 | |
| | | 738,039 | | | Meritz Securities Co Ltd | | | 2,381,949 | |
| | | 449,404 | | | Mirae Asset Life Insurance Co Ltd | | | 2,448,627 | |
| | | 8,475 | | | NS Shopping Co Ltd | | | 1,236,948 | |
| | | 314,422 | | | Partron Co Ltd | | | 3,084,436 | |
| | | 36,313 | | | S&T Motiv Co Ltd | | | 1,540,874 | |
| | | 54,705 | | | Samsung Card Co Ltd | | | 2,046,155 | |
| | | 65,409 | | | Samsung Electronics Co Ltd | | | 111,158,257 | |
| | | 21,237 | | | Samsung Electronics Co Ltd GDR | | | 17,986,346 | |
| | | | |
| | See accompanying notes to the financial statements. | | 23 |
GMO Emerging Markets Fund
(A Series of GMO Trust)
Schedule of Investments — (Continued)
(showing percentage of total net assets)
February 28, 2017
| | | | | | | | | | |
| | | Shares | | | Description | | Value ($) | |
| | | | | | South Korea — continued | | | | |
| | | 2,014 | | | Samsung Fire & Marine Insurance Co Ltd | | | 453,865 | |
| | | 6,730 | | | Samsung SDS Co Ltd | | | 773,482 | |
| | | 247,339 | | | Seoyon E-Hwa Co Ltd | | | 3,410,426 | |
| | | 609,657 | | | Shinhan Financial Group Co Ltd | | | 25,081,929 | |
| | | 109,168 | | | Silicon Works Co Ltd | | | 2,974,360 | |
| | | 70,206 | | | SK Hynix Inc | | | 2,892,832 | |
| | | 42,784 | | | SK Telecom Co Ltd | | | 8,746,384 | |
| | | 194,100 | | | SK Telecom Co Ltd Sponsored ADR | | | 4,386,660 | |
| | | 16,406 | | | Spigen Korea Co Ltd | | | 777,962 | |
| | | 188,765 | | | Tongyang Life Insurance Co Ltd | | | 1,762,407 | |
| | | 4,964,482 | | | Woori Bank | | | 58,352,782 | |
| | | 18,643 | | | Youngone Corp | | | 529,314 | |
| | | | | | | | | | |
| | | | | | Total South Korea | | | 689,839,782 | |
| | | | | | | | | | |
| | |
| | | | | | Sri Lanka — 0.0% | |
| | | 103,983,101 | | | Anilana Hotels & Properties Ltd * (a) | | | 1,028,843 | |
| | | | | | | | | | |
| | | |
| | | | | | Taiwan — 25.0% | | | | |
| | | 14,914,000 | | | AcBel Polytech Inc | | | 11,860,142 | |
| | | 424,000 | | | Actron Technology Corp | | | 1,504,734 | |
| | | 1,047,522 | | | Advantech Co Ltd | | | 8,925,092 | |
| | | 19,233,940 | | | AmTRAN Technology Co Ltd | | | 14,478,570 | |
| | | 695,000 | | | Asia Vital Components Co Ltd | | | 595,236 | |
| | | 6,691,120 | | | Asustek Computer Inc | | | 60,373,191 | |
| | | 94,000 | | | Aurora Corp | | | 169,988 | |
| | | 335,000 | | | Basso Industry Corp | | | 965,046 | |
| | | 542,067 | | | Bizlink Holding Inc | | | 3,328,489 | |
| | | 2,795,300 | | | Casetek Holdings Ltd | | | 9,450,471 | |
| | | 3,762,000 | | | Catcher Technology Co Ltd | | | 31,390,257 | |
| | | 14,887,000 | | | Cathay Financial Holding Co Ltd | | | 23,367,368 | |
| | | 7,046,000 | | | Chailease Holding Co Ltd | | | 15,111,000 | |
| | | 1,901,180 | | | Chang Hwa Commercial Bank Ltd | | | 1,135,544 | |
| | | 6,874,000 | | | Cheng Shin Rubber Industry Co Ltd | | | 14,610,768 | |
| | | 560,000 | | | Chicony Electronics Co Ltd | | | 1,318,794 | |
| | | 831,000 | | | Chicony Power Technology Co Ltd | | | 1,311,071 | |
| | | 2,614,000 | | | Chin-Poon Industrial Co Ltd | | | 5,225,426 | |
| | | 2,058,000 | | | China Development Financial Holding Corp | | | 542,135 | |
| | | 3,495,120 | | | China Life Insurance Co Ltd | | | 3,428,366 | |
| | | 4,033,919 | | | Chong Hong Construction Co Ltd | | | 9,240,412 | |
| | | 325,000 | | | Chroma ATE Inc | | | 992,614 | |
| | | 13,245,659 | | | Chunghwa Telecom Co Ltd | | | 43,918,500 | |
| | | 171,721 | | | Chunghwa Telecom Co Ltd Sponsored ADR | | | 5,644,469 | |
| | | 110,000 | | | Cleanaway Co Ltd | | | 607,044 | |
| | | 59,249,711 | | | Compal Electronics Inc | | | 37,093,198 | |
| | | 4,992,400 | | | Coretronic Corp | | | 7,049,093 | |
| | | 59,253,720 | | | CTBC Financial Holding Co Ltd | | | 35,361,571 | |
| | | 2,972,000 | | | CTCI Corp | | | 4,919,045 | |
| | | 1,697,000 | | | Dynapack International Technology Corp | | | 2,214,614 | |
| | | 298,000 | | | E Ink Holdings Inc | | | 245,503 | |
| | | 19,138,862 | | | E.Sun Financial Holding Co Ltd | | | 11,618,183 | |
| | | | | | | | | | |
| | | Shares | | | Description | | Value ($) | |
| | | | | | Taiwan — continued | | | | |
| | | 528,000 | | | Eclat Textile Co Ltd | | | 5,281,888 | |
| | | 131,000 | | | Elan Microelectronics Corp | | | 160,856 | |
| | | 287,000 | | | Elitegroup Computer Systems Co Ltd | | | 211,968 | |
| | | 106,000 | | | eMemory Technology Inc | | | 1,517,569 | |
| | | 41,000 | | | Everlight Electronics Co Ltd | | | 65,909 | |
| | | 1,238,000 | | | Far Eastern New Century Corp | | | 1,104,990 | |
| | | 7,079,084 | | | Far EasTone Telecommunications Co Ltd | | | 17,027,711 | |
| | | 82,000 | | | Faraday Technology Corp | | | 96,154 | |
| | | 3,748,000 | | | Farglory Land Development Co Ltd | | | 4,748,564 | |
| | | 329,000 | | | Feng TAY Enterprise Co Ltd | | | 1,395,525 | |
| | | 1,100,001 | | | FLEXium Interconnect Inc | | | 3,381,565 | |
| | | 4,211,000 | | | Formosa Chemicals & Fibre Corp | | | 13,314,985 | |
| | | 6,210,000 | | | Formosa Plastics Corp | | | 18,704,774 | |
| | | 3,168,002 | | | Formosan Rubber Group Inc | | | 1,757,909 | |
| | | 20,322,475 | | | Foxconn Technology Co Ltd | | | 60,668,883 | |
| | | 33,852,293 | | | Fubon Financial Holding Co Ltd | | | 54,858,452 | |
| | | 415,000 | | | Getac Technology Corp | | | 581,600 | |
| | | 208,000 | | | Giant Manufacturing Co Ltd | | | 1,282,798 | |
| | | 9,317,200 | | | Gigabyte Technology Co Ltd | | | 12,987,458 | |
| | | 196,000 | | | Global Unichip Corp | | | 649,845 | |
| | | 2,578,000 | | | Grand Pacific Petrochemical | | | 1,864,117 | |
| | | 289,000 | | | Grape King Bio Ltd | | | 1,923,613 | |
| | | 344,000 | | | Green Seal Holding Ltd | | | 1,826,890 | |
| | | 25,869,754 | | | Highwealth Construction Corp | | | 42,072,708 | |
| | | 58,000 | | | Hiroca Holdings Ltd | | | 181,671 | |
| | | 63,000 | | | Holtek Semiconductor Inc | | | 109,765 | |
| | | 31,218,250 | | | Hon Hai Precision Industry Co Ltd | | | 90,843,985 | |
| | | 7,000 | | | Hotai Motor Co Ltd | | | 79,992 | |
| | | 33,000 | | | Hu Lane Associate Inc | | | 163,764 | |
| | | 2,168,000 | | | Hua Nan Financial Holdings Co Ltd – Class C | | | 1,192,412 | |
| | | 2,472,000 | | | Huaku Development Co Ltd | | | 5,412,048 | |
| | | 2,329,500 | | | IEI Integration Corp | | | 3,581,537 | |
| | | 28,621,600 | | | Inventec Corp | | | 21,259,557 | |
| | | 174,000 | | | Iron Force Industrial Co Ltd | | | 1,017,363 | |
| | | 433,000 | | | ITEQ Corp | | | 590,347 | |
| | | 4,225,000 | | | KEE TAI Properties Co Ltd | | | 1,456,451 | |
| | | 169,000 | | | Kenda Rubber Industrial Co Ltd | | | 272,768 | |
| | | 44,000 | | | King Slide Works Co Ltd | | | 608,305 | |
| | | 2,155,000 | | | King’s Town Bank Co Ltd | | | 2,004,823 | |
| | | 242,000 | | | Kinik Co | | | 615,679 | |
| | | 2,493,000 | | | Kinsus Interconnect Technology Corp | | | 6,903,621 | |
| | | 109,000 | | | Kung Long Batteries Industrial Co Ltd | | | 539,360 | |
| | | 33,649,141 | | | Lite-On Technology Corp | | | 56,352,769 | |
| | | 1,707,000 | | | Lotes Co Ltd | | | 5,835,388 | |
| | | 479,000 | | | Lung Yen Life Service Corp | | | 902,890 | |
| | | 24,000 | | | Macauto Industrial Co Ltd | | | 143,221 | |
| | | 1,403,785 | | | Makalot Industrial Co Ltd | | | 5,688,766 | |
| | | 9,414,000 | | | Mega Financial Holding Co Ltd | | | 7,327,283 | |
| | | 2,594,695 | | | Mercuries Life Insurance Co Ltd * | | | 1,396,511 | |
| | | 554,000 | | | Merida Industry Co Ltd | | | 2,823,016 | |
| | | | |
| 24 | | See accompanying notes to the financial statements. | | |
GMO Emerging Markets Fund
(A Series of GMO Trust)
Schedule of Investments — (Continued)
(showing percentage of total net assets)
February 28, 2017
| | | | | | | | | | |
| | | Shares | | | Description | | Value ($) | |
| | | | | | Taiwan — continued | | | | |
| | | 1,066,000 | | | MIN AIK Technology Co Ltd | | | 1,310,673 | |
| | | 316,000 | | | Mitac Holdings Corp | | | 337,673 | |
| | | 832,000 | | | Nan Ya Plastics Corp | | | 2,019,206 | |
| | | 380,000 | | | Nien Made Enterprise Co Ltd | | | 3,712,660 | |
| | | 2,486,810 | | | Novatek Microelectronics Corp | | | 9,312,417 | |
| | | 986,000 | | | OptoTech Corp | | | 552,242 | |
| | | 8,873,470 | | | Pegatron Corp | | | 23,365,176 | |
| | | 8,580 | | | Phison Electronics Corp | | | 75,376 | |
| | | 9,457,000 | | | Pou Chen Corp | | | 12,834,162 | |
| | | 231,000 | | | President Chain Store Corp | | | 1,695,073 | |
| | | 146,500 | | | Primax Electronics Ltd | | | 224,283 | |
| | | 26,050,550 | | | Quanta Computer Inc | | | 53,926,990 | |
| | | 12,305,870 | | | Radiant Opto-Electronics Corp | | | 25,452,903 | |
| | | 8,221,720 | | | Realtek Semiconductor Corp | | | 30,582,432 | |
| | | 1,909,000 | | | Rechi Precision Co Ltd | | | 2,108,687 | |
| | | 12,120,626 | | | Ruentex Development Co Ltd * | | | 15,245,785 | |
| | | 10,604,000 | | | Ruentex Industries Ltd | | | 20,095,359 | |
| | | 462,000 | | | Sercomm Corp | | | 1,248,392 | |
| | | 1,267,000 | | | Shin Zu Shing Co Ltd | | | 3,549,060 | |
| | | 616,000 | | | ShunSin Technology Holding Ltd | | | 2,350,610 | |
| | | 87,000 | | | Sigurd Microelectronics Corp | | | 77,769 | |
| | | 5,002,780 | | | Simplo Technology Co Ltd | | | 16,286,110 | |
| | | 440,000 | | | Sinbon Electronics Co Ltd | | | 1,050,241 | |
| | | 1,211,000 | | | Sitronix Technology Corp | | | 3,915,086 | |
| | | 40,000 | | | St Shine Optical Co Ltd | | | 682,858 | |
| | | 1,080,000 | | | Syncmold Enterprise Corp | | | 2,174,871 | |
| | | 9,000 | | | Systex Corp | | | 18,154 | |
| | | 485,000 | | | Taiflex Scientific Co Ltd | | | 612,187 | |
| | | 2,151,585 | | | Taishin Financial Holding Co Ltd | | | 850,939 | |
| | | 520,000 | | | Taiwan Cement Corp | | | 636,655 | |
| | | 1,497,000 | | | Taiwan Mobile Co Ltd | | | 5,256,591 | |
| | | 213,000 | | | Taiwan Paiho Ltd | | | 638,947 | |
| | | 314,000 | | | Taiwan PCB Techvest Co Ltd | | | 323,523 | |
| | | 357,000 | | | Taiwan Semiconductor Co Ltd | | | 447,447 | |
| | | 8,185,000 | | | Taiwan Semiconductor Manufacturing Co Ltd | | | 50,145,699 | |
| | | 1,505,020 | | | Taiwan Semiconductor Manufacturing Co Ltd Sponsored ADR | | | 47,362,979 | |
| | | 5,223,269 | | | Taiwan Surface Mounting Technology Corp | | | 4,881,091 | |
| | | 3,900,000 | | | Teco Electric and Machinery Co Ltd | | | 3,512,433 | |
| | | 820,000 | | | Test Research Inc | | | 1,132,773 | |
| | | 2,365,000 | | | Tong Hsing Electronic Industries Ltd | | | 10,633,788 | |
| | | 1,031,000 | | | Tong Yang Industry Co Ltd | | | 2,046,687 | |
| | | 465,000 | | | Topco Scientific Co Ltd | | | 1,540,677 | |
| | | 104,000 | | | Toung Loong Textile Manufacturing | | | 263,345 | |
| | | 256,000 | | | Transcend Information Inc | | | 719,487 | |
| | | 5,934,160 | | | Tripod Technology Corp | | | 15,485,671 | |
| | | 58,000 | | | TrueLight Corp | | | 115,525 | |
| | | 40,000 | | | Tung Thih Electronic Co Ltd | | | 414,909 | |
| | | 410,000 | | | TXC Corp | | | 611,274 | |
| | | 4,609,000 | | | Uni-President Enterprises Corp | | | 8,185,129 | |
| | | | | | | | | | |
| | | Shares | | | Description | | Value ($) | |
| | | | | | Taiwan — continued | | | | |
| | | 4,317,000 | | | United Integrated Services Co Ltd | | | 8,356,269 | |
| | | 169,000 | | | Visual Photonics Epitaxy Co Ltd | | | 328,608 | |
| | | 4,871,000 | | | Wan Hai Lines Ltd | | | 2,986,959 | |
| | | 5,580,000 | | | Winbond Electronics Corp | | | 2,025,962 | |
| | | 772,000 | | | Xxentria Technology Materials Corp | | | 1,916,997 | |
| | | 1,608,000 | | | Yageo Corp | | | 3,955,616 | |
| | | 188,000 | | | Yeong Guan Energy Technology Group Co Ltd | | | 728,142 | |
| | | 7,979,000 | | | Yuanta Financial Holding Co Ltd | | | 3,375,289 | |
| | | 3,457,670 | | | Yungtay Engineering Co Ltd | | | 5,583,542 | |
| | | 81,000 | | | Zeng Hsing Industrial Co Ltd | | | 418,422 | |
| | | | | | | | | | |
| | | | | | Total Taiwan | | | 1,252,483,767 | |
| | | | | | | | | | |
| | | |
| | | | | | Thailand — 2.2% | | | | |
| | | 1,214,100 | | | Advanced Info Service Pcl (Foreign Registered) | | | 5,802,544 | |
| | | 312,000 | | | Advanced Info Service Pcl NVDR | | | 1,491,141 | |
| | | 1,777,900 | | | Airports of Thailand Pcl (Foreign Registered) | | | 1,973,718 | |
| | | 1,046,000 | | | Central Pattana Pcl (Foreign Registered) | | | 1,648,164 | |
| | | 20,849,700 | | | Chularat Hospital Pcl (Foreign Registered) | | | 1,527,868 | |
| | | 2,598,100 | | | CP ALL Pcl (Foreign Registered) | | | 4,462,667 | |
| | | 1,702,500 | | | CPN Retail Growth Leasehold Property Fund | | | 945,808 | |
| | �� | 697,800 | | | Eastern Polymer Group Pcl (Foreign Registered) | | | 255,886 | |
| | | 1,322,450 | | | Eastern Polymer Group Pcl NVDR | | | 484,506 | |
| | | 1,061,101 | | | Glow Energy Pcl (Foreign Registered) | | | 2,367,408 | |
| | | 144,900 | | | Glow Energy Pcl NVDR | | | 323,284 | |
| | | 4,211,300 | | | Hana Microelectronics Pcl (Foreign Registered) | | | 5,127,566 | |
| | | 776,200 | | | Hana Microelectronics Pcl NVDR | | | 945,528 | |
| | | 2,622,268 | | | Hemraj Leasehold REIT (Foreign Registered) * | | | 751,248 | |
| | | 3,897,501 | | | Intouch Holdings Pcl (Foreign Registered) | | | 5,909,971 | |
| | | 1,159,650 | | | Intouch Holdings Pcl NVDR | | | 1,760,796 | |
| | | 5,291,000 | | | Jasmine International Pcl (Foreign Registered) | | | 1,333,910 | |
| | | 3,587,600 | | | Jasmine International Pcl NVDR | | | 904,467 | |
| | | 1,400 | | | Kasikornbank Pcl (Foreign Registered) (b) | | | 7,581 | |
| | | 140,100 | | | KCE Electronics Pcl (Foreign Registered) | | | 394,345 | |
| | | 953,100 | | | Kiatnakin Bank Pcl (Foreign Registered) | | | 1,795,314 | |
| | | 12,217,100 | | | Land & Houses Pcl NVDR | | | 3,425,866 | |
| | | 15,493,950 | | | LPN Development Pcl (Foreign Registered) | | | 5,144,532 | |
| | | 3,850,100 | | | LPN Development Pcl NVDR | | | 1,278,367 | |
| | | 1,841,350 | | | Major Cineplex Group Pcl (Foreign Registered) | | | 1,791,868 | |
| | | 798,700 | | | Major Cineplex Group Pcl NVDR | | | 777,237 | |
| | | 4,615,300 | | | PTT Global Chemical Pcl (Foreign Registered) | | | 9,411,728 | |
| | | 41,468,600 | | | Quality Houses Pcl (Foreign Registered) | | | 3,110,104 | |
| | | 4,233,302 | | | Ratchaburi Electricity Generating Holding Pcl (Foreign Registered) | | | 6,306,640 | |
| | | 60,199,423 | | | Sansiri Pcl (Foreign Registered) | | | 3,344,884 | |
| | | 6,744,000 | | | Sansiri Pcl NVDR | | | 374,720 | |
| | | 695,400 | | | Siam Cement Pcl (The) (Foreign Registered) | | | 10,270,115 | |
| | | 1,050,719 | | | STP & I Pcl (Foreign Registered) | | | 282,957 | |
| | | 3,595,300 | | | STP & I Pcl NVDR | | | 967,141 | |
| | | 286,400 | | | Taokaenoi Food & Marketing Pcl NVDR | | | 229,182 | |
| | | 1,684,200 | | | Taokaenoi Food & Marketing Pcl (Foreign Registered) | | | 1,351,008 | |
| | | | |
| | See accompanying notes to the financial statements. | | 25 |
GMO Emerging Markets Fund
(A Series of GMO Trust)
Schedule of Investments — (Continued)
(showing percentage of total net assets)
February 28, 2017
| | | | | | | | | | |
| | | Shares | | | Description | | Value ($) | |
| | | | | | Thailand — continued | | | | |
| | | 2,714,400 | | | Thanachart Capital Pcl (Foreign Registered) | | | 3,771,566 | |
| | | 4,563,600 | | | Tisco Financial Group Pcl (Foreign Registered) | | | 8,944,666 | |
| | | 1,735,700 | | | Total Access Communication Pcl (Foreign Registered) | | | 2,163,465 | |
| | | 804,300 | | | Total Access Communication Pcl NVDR | | | 1,002,520 | |
| | | 20,649,450 | | | TTW Pcl (Foreign Registered) | | | 6,497,517 | |
| | | 4,334,593 | | | WHA Premium Growth Freehold & Leasehold Real Estate Investment Trust (Foreign Registered) | | | 1,216,972 | |
| | | | | | | | | | |
| | | | | | Total Thailand | | | 111,876,775 | |
| | | | | | | | | | |
| | | |
| | | | | | Turkey — 5.0% | | | | |
| | | 1,511,649 | | | Akbank TAS | | | 3,601,526 | |
| | | 2,016,605 | | | Albaraka Turk Katilim Bankas AS | | | 680,028 | |
| | | 97,809 | | | Arcelik AS | | | 560,360 | |
| | | 122,805 | | | BIM Birlesik Magazalar AS | | | 1,765,420 | |
| | | 5,870 | | | EGE Endustri VE Ticaret AS | | | 425,326 | |
| | | 27,604,962 | | | Emlak Konut Gayrimenkul Yatirim Ortakligi AS REIT | | | 23,684,353 | |
| | | 3,634,182 | | | Enka Insaat ve Sanayi AS | | | 5,622,338 | |
| | | 7,568,112 | | | Eregli Demir ve Celik Fabrikalari TAS | | | 12,322,166 | |
| | | 42,263 | | | Ford Otomotiv Sanayi AS | | | 424,777 | |
| | | 2,064,900 | | | Goodyear Lastikleri TAS | | | 2,079,937 | |
| | | 1,629,462 | | | Gubre Fabrikalari TAS | | | 2,205,663 | |
| | | 437,200 | | | Haci Omer Sabanci Holding AS | | | 1,206,285 | |
| | | 401,133 | | | KOC Holding AS | | | 1,630,631 | |
| | | 4,147 | | | Konya Cimento Sanayii AS | | | 331,739 | |
| | | 431,256 | | | Koza Altin Isletmeleri AS * | | | 2,226,970 | |
| | | 36,635 | | | Otokar Otomotiv Ve Savunma Sanayi AS | | | 1,387,379 | |
| | | 6,833,500 | | | Soda Sanayii AS | | | 10,437,653 | |
| | | 386,325 | | | TAV Havalimanlari Holding AS | | | 1,606,949 | |
| | | 1,664,502 | | | Tekfen Holding AS | | | 3,603,537 | |
| | | 2,500,934 | | | Turk Hava Yollari AO * | | | 3,743,305 | |
| | | 1,089,305 | | | Turk Telekomunikasyon AS | | | 1,720,315 | |
| | | 10,237,219 | | | Turkcell Iletisim Hizmetleri AS * | | | 33,409,868 | |
| | | 213,200 | | | Turkcell Iletisim Hizmetleri AS ADR * | | | 1,758,900 | |
| | | 24,902,210 | | | Turkiye Garanti Bankasi AS | | | 58,783,942 | |
| | | 10,128,059 | | | Turkiye Halk Bankasi AS | | | 31,289,699 | |
| | | 6,708,180 | | | Turkiye Is Bankasi – Class C | | | 11,642,874 | |
| | | 4,266,900 | | | Turkiye Sinai Kalkinma Bankasi AS | | | 1,731,278 | |
| | | 13,593,053 | | | Turkiye Vakiflar Bankasi TAO – Class D | | | 19,735,883 | |
| | | 9,009,938 | | | Yapi ve Kredi Bankasi AS * | | | 9,501,027 | |
| | | | | | | | | | |
| | | | | | Total Turkey | | | 249,120,128 | |
| | | | | | | | | | |
| | | |
| | | | | | United Arab Emirates — 0.7% | | | | |
| | | 1,584,591 | | | Abu Dhabi Commercial Bank PJSC | | | 3,054,962 | |
| | | 3,303,249 | | | Aldar Properties PJSC | | | 2,157,031 | |
| | | 10,290,835 | | | DAMAC Properties Dubai Co PJSC | | | 8,230,056 | |
| | | 607,142 | | | Dubai Islamic Bank PJSC | | | 1,032,439 | |
| | | 3,041,497 | | | Emaar Properties PJSC | | | 6,163,617 | |
| | | 312,220 | | | Emirates Telecommunications Group Co PJSC | | | 1,495,853 | |
| | | | | | | | | | |
| | | Shares | | | Description | | Value ($) | |
| | | | | | United Arab Emirates — continued | | | | |
| | | 2,095,408 | | | First Gulf Bank PJSC | | | 7,786,441 | |
| | | 2,858,886 | | | RAK Properties PJSC | | | 598,783 | |
| | | 9,802,743 | | | Union Properties PJSC * | | | 2,747,216 | |
| | | | | | | | | | |
| | | | | | Total United Arab Emirates | | | 33,266,398 | |
| | | | | | | | | | |
| | | |
| | | | | | United Kingdom — 0.6% | | | | |
| | | 281,657 | | | British American Tobacco Plc | | | 17,790,736 | |
| | | 234,663 | | | Unilever Plc | | | 11,132,776 | |
| | | | | | | | | | |
| | | | | | Total United Kingdom | | | 28,923,512 | |
| | | | | | | | | | |
| | | |
| | | | | | Vietnam — 0.2% | | | | |
| | | 1,082,186 | | | Bank for Foreign Trade of Vietnam JSC | | | 1,779,334 | |
| | | 117,050 | | | Phu Nhuan Jewelry JSC | | | 385,318 | |
| | | 1,390,402 | | | Vietnam Dairy Products JSC | | | 8,012,716 | |
| | | 6 | | | Vingroup JSC * | | | 12 | |
| | | | | | | | | | |
| | | | | | Total Vietnam | | | 10,177,380 | |
| | | | | | | | | | |
| | | |
| | | | | | TOTAL COMMON STOCKS (COST $4,307,473,110) | | | 4,696,188,431 | |
| | | | | | | | | | |
| | | |
| | | | | | PREFERRED STOCKS — 4.1% | | | | |
| | | |
| | | | | | Brazil — 0.7% | | | | |
| | | 154,000 | | | Banco Bradesco SA | | | 1,646,760 | |
| | | 3,564,600 | | | Banco do Estado do Rio Grande do Sul SA – Class B | | | 18,995,734 | |
| | | 354,500 | | | Eletropaulo Metropolitana Eletricidade de Sao Paulo SA | | | 1,424,299 | |
| | | 517,000 | | | Itau Unibanco Holding SA | | | 6,620,600 | |
| | | 461,650 | | | Itau Unibanco Holding SA Sponsored ADR | | | 5,904,503 | |
| | | | | | | | | | |
| | | | | | Total Brazil | | | 34,591,896 | |
| | | | | | | | | | |
| | | |
| | | | | | Russia — 0.9% | | | | |
| | | 81,205,323 | | | Surgutneftegas OJSC | | | 44,275,202 | |
| | | 12,100 | | | Surgutneftegaz OJSC Sponsored ADR | | | 66,429 | |
| | | | | | | | | | |
| | | | | | Total Russia | | | 44,341,631 | |
| | | | | | | | | | |
| | | |
| | | | | | South Korea — 2.5% | | | | |
| | | 197,906 | | | Hyundai Motor Co 2nd Preference | | | 17,835,609 | |
| | | 80,843 | | | Samsung Electronics Co Ltd (Non-Voting) | | | 107,003,116 | |
| | | | | | | | | | |
| | | | | | Total South Korea | | | 124,838,725 | |
| | | | | | | | | | |
| | | |
| | | | | | TOTAL PREFERRED STOCKS (COST $181,228,716) | | | 203,772,252 | |
| | | | | | | | | | |
| | | |
| | | | | | INVESTMENT FUNDS — 0.7% | | | | |
| | | |
| | | | | | India — 0.1% | | | | |
| | | 10,189 | | | Fire Capital Mauritius Private Fund * (c) (d) | | | 5,728,545 | |
| | | 1,371,900 | | | TDA India Technology Fund II LP * (c) (d) | | | 114,022 | |
| | | | | | | | | | |
| | | | | | Total India | | | 5,842,567 | |
| | | | | | | | | | |
| | | | |
| 26 | | See accompanying notes to the financial statements. | | |
GMO Emerging Markets Fund
(A Series of GMO Trust)
Schedule of Investments — (Continued)
(showing percentage of total net assets)
February 28, 2017
| | | | | | | | | | |
| | | Shares | | | Description | | Value ($) | |
| | | | | | Russia — 0.1% | | | | |
| | | 5,452,004 | | | NCH Eagle Fund LP * (c) (d) | | | 2,083,527 | |
| | | | | | | | | | |
| | | |
| | | | | | Thailand — 0.3% | | | | |
| | | 22,249,200 | | | Digital Telecommunication Infrastructure Fund | | | 9,044,996 | |
| | | 13,343,800 | | | Jasmine Broadband Internet Infrastructure Fund | | | 4,391,756 | |
| | | 10,457,700 | | | TICON Industrial Growth Leasehold Property Fund | | | 3,327,681 | |
| | | | | | | | | | |
| | | | | | Total Thailand | | | 16,764,433 | |
| | | | | | | | | | |
| | | |
| | | | | | United States — 0.2% | | | | |
| | | 251,908 | | | iShares MSCI Emerging Markets ETF | | | 9,569,985 | |
| | | | | | | | | | |
| | | |
| | | | | | TOTAL INVESTMENT FUNDS (COST $39,837,912) | | | 34,260,512 | |
| | | | | | | | | | |
| | | |
| | | | | | RIGHTS/WARRANTS — 0.0% | | | | |
| | | |
| | | | | | India — 0.0% | | | | |
| | | 228,191 | | | South Indian Bank Ltd (The) Rights, Expires 12/31/49 * (b) | | | 23,428 | |
| | | | | | | | | | |
| | | |
| | | | | | Thailand — 0.0% | | | | |
| | | 42,563,506 | | | Sansiri Pcl Warrants, Expires 11/24/17 * | | | 109,746 | |
| | | | | | | | | | |
| | | |
| | | | | | TOTAL RIGHTS/WARRANTS
(COST $0) | | | 133,174 | |
| | | | | | | | | | |
| | |
| | | | | | MUTUAL FUNDS — 1.8% | |
| | |
| | | | | | United States — 1.8% | |
| | | | | | Affiliated Issuers — 1.8% | | | | |
| | | 3,595,027 | | | GMO U.S. Treasury Fund | | | 89,875,673 | |
| | | | | | | | | | |
| | | |
| | | | | | TOTAL MUTUAL FUNDS (COST $89,875,673) | | | 89,875,673 | |
| | | | | | | | | | |
| | | | | | | | | | |
| | | Shares /
Par Value† | | | Description | | Value ($) | |
| | | | | | FULLY FUNDED TOTAL RETURN SWAPS — 0.0% | |
| | | |
| | | | | | China — 0.0% | | | | |
| | | 354,789 | | | Total Return on Zhejiang Supor Cookware Co, Expires 11/27/2017, (OTC) (CP-GS) | | | 368,672 | |
| | | 178,099 | | | Total Return on Zhejiang Supor Cookware Co, Expires 11/27/2017, (OTC) (CP-GS) | | | 183,332 | |
| | | 372,347 | | | Total Return on Zhejiang Supor Cookware Co, Expires 11/27/2017, (OTC) (CP-GS) | | | 373,649 | |
| | | | | | | | | | |
| | | | | | Total China | | | 925,653 | |
| | | | | | | | | | |
| | | |
| | | | | | TOTAL FULLY FUNDED TOTAL RETURN SWAPS
(COST $905,235) | | | 925,653 | |
| | | | | | | | | | |
| | |
| | | | | | SHORT-TERM INVESTMENTS — 0.3% | |
| | |
| | | | | | Time Deposits — 0.3% | |
| | | 4,765,542 | | | Standard Chartered Bank (London) Time Deposit, 0.36%, due 03/01/17 | | | 4,765,542 | |
| | | 10,236,176 | | | Sumitomo (Tokyo) Time Deposit, 0.36%, due 03/01/17 | | | 10,236,176 | |
| | | | | | | | | | |
| | | | | | Total Time Deposits | | | 15,001,718 | |
| | | | | | | | | | |
| | | |
| | | | | | TOTAL SHORT-TERM INVESTMENTS (COST $15,001,718) | | | 15,001,718 | |
| | | | | | | | | | |
| | | |
| | | | | | TOTAL INVESTMENTS — 100.5% (Cost $4,634,322,364) | | | 5,040,157,413 | |
| | | | | | Other Assets and Liabilities (net) — (0.5%) | | | (23,217,921 | ) |
| | | | | | | | | | |
| | | |
| | | | | | TOTAL NET ASSETS — 100.0% | | | $5,016,939,492 | |
| | | | | | | | | | |
Additional information on each restricted security is as follows:
| | | | | | | | | | | | |
Issuer Description | | Acquisition Date | | Acquisition
Cost | | | Value as a
Percentage
of Fund’s
Net Assets | | Value as of
February 28, 2017 | |
| Fire Capital Mauritius Private Fund | | 12/12/06-10/26/09 | | | 10,189,080 | | | 0.11% | | $ | 5,728,545 | |
| NCH Eagle Fund LP | | 4/6/09 | | | 5,452,004 | | | 0.04% | | | 2,083,527 | |
| TDA India Technology Fund II LP | | 2/23/00-3/23/04 | | | — | | | 0.00% | | | 114,022 | |
| | | | | | | | | | | | |
| | | | | | | | | | $ | 7,926,094 | |
| | | | | | | | | | | | |
| | | | |
| | See accompanying notes to the financial statements. | | 27 |
GMO Emerging Markets Fund
(A Series of GMO Trust)
Schedule of Investments — (Continued)
February 28, 2017
A summary of outstanding financial instruments at February 28, 2017 is as follows:
Futures Contracts
| | | | | | | | | | | | | | |
Number of
Contracts + | | Type | | Expiration
Date | | | Notional
Amount | | | Net
Unrealized
Appreciation
(Depreciation) | |
| Buys | | | | | | | | | | | | | | |
| 1,070 | | Mini MSCI
Emerging
Markets | | | March 2017 | | | $ | 49,797,800 | | | $ | (133,506 | ) |
| | | | | | | | | | | | | | |
| + | Buys - Fund is long the futures contract. |
| | Sales - Fund is short the futures contract. |
Swap Contracts
Total Return Swaps
| | | | | | | | | | | | | | | | | | |
Notional
Amount | | | Expiration
Date | | Counterparty | | Fund Pays | | Fund Receives | | Net
Unrealized
Appreciation/
(Depreciation) | |
| | 22,923,153 | | | | USD | | | 3/2/2017 | | MSCI | | Depreciation of Total Return on Asustek Computer, Inc. + (Daily Fed Funds Rate minus 0.25%) | | Appreciation of Total Return on Asustek Computer, Inc. | | | $1,035,331 | |
| | | | | | | | | | | | | | | | | | |
| | | Premiums Paid/(Received) | | $ | — | |
| | | | | | | | | | | | | | | | | | |
As of February 28, 2017, for the above contracts and/or agreements, the Fund had sufficient cash and/or securities to cover commitments or collateral requirements, if any, of the relevant broker or exchange.
Notes to Schedule of Investments:
| † | Denominated in U.S. Dollar, unless otherwise indicated. |
| * | Non-income producing security. |
| (a) | Affiliated company (Note 10). |
| (b) | Security valued at the local price and adjusted by applying a premium or discount since holding exceeds foreign ownership limits. |
| (c) | Investment valued at fair value using methods determined in good faith by the Trustees of GMO Trust or persons acting at their direction pursuant to procedures approved by the Trustees (Note 2). |
| (d) | Private placement securities are restricted as to resale. |
For a listing of definitions of acronyms, counterparty abbreviations and currency abbreviations used throughout the Schedule of Investments as well as the derivative tables, if any, please refer to page 35.
| | | | |
| 28 | | See accompanying notes to the financial statements. | | |
This page has been left blank intentionally.
GMO Taiwan Fund
(A Series of GMO Trust)
Portfolio Management
Day-to-day management of the Fund’s portfolio is the responsibility of the Emerging Markets Equity team at Grantham, Mayo, Van Otterloo & Co. LLC.
Management Discussion and Analysis of Fund Performance
GMO Taiwan Fund returned +27.53% (net) for the fiscal year ended February 28, 2017, as compared with +31.10% for the MSCI Taiwan Index.
Sector allocation detracted from relative performance. The Fund’s overweight in Industrials hurt relative performance, while the Fund’s underweight in Consumer Staples helped relative performance.
Stock selection detracted from relative performance, particularly in the Information Technology sector. The biggest detractor from relative returns was an underweight in Taiwan Semiconductor Manufacturing Co., Ltd.
Because some of the securities and instruments held directly or indirectly by the Fund had positive fair value adjustments at the beginning or end of the fiscal year (and the performance of indices are not fair valued), the Fund’s absolute and relative performance is higher than it otherwise would have been in the absence of such fair value adjustments.
The views expressed herein are exclusively those of Grantham, Mayo, Van Otterloo & Co. LLC as of the date of this report and are subject to change. GMO disclaims any responsibility to update such views. They are not meant as investment advice. References to specific securities are not recommendations of such securities and may not be representative of any GMO portfolio’s current or future investments.
30
GMO Taiwan Fund
(A Series of GMO Trust)
Comparison of Change in Value of a $10,000,000 Investment in
GMO Taiwan Fund Class III Shares and the MSCI Taiwan Index
As of February 28, 2017
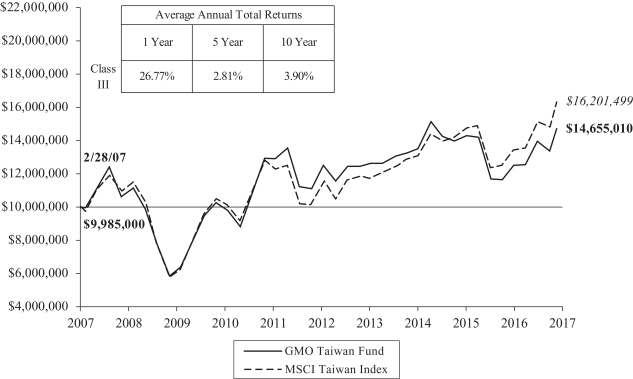
Performance data quoted represents past performance and is not indicative of future results. The investment return and principal value of an investment will fluctuate so that an investor’s shares, when redeemed, may be worth more or less than their original cost. Current performance data may be lower or higher than the performance data provided herein. To obtain performance information up to the most recent month-end, please call (617) 330-7500. Performance shown is net of all fees after reimbursement from GMO. Each performance figure assumes a purchase at the beginning and redemption at the end of the stated period and reflects a transaction fee of .15% on the purchase and .45% on the redemption. Transaction fees are retained by the Fund to cover trading costs. Returns would have been lower had certain expenses not been reimbursed during the periods shown and do not include the effect of taxes on distributions and redemptions. All information is unaudited.
MSCI data may not be reproduced or used for any other purpose. MSCI provides no warranties, has not prepared or approved this report, and has no liability hereunder.
31
GMO Taiwan Fund
(A Series of GMO Trust)
Investment Concentration Summary
February 28, 2017 (Unaudited)
| | | | |
| Asset Class Summary& | | % of Total Net Assets | |
Common Stocks | | | 95.0 | % |
Investment Funds | | | 3.9 | |
Mutual Funds | | | 1.5 | |
Other | | | (0.4 | ) |
| | | | |
| | | 100.0 | % |
| | | | |
| | | | |
| Industry Sector Summary | | % of Equity Investments# | |
Technology Hardware, Storage & Peripherals | | | 23.6 | % |
Semiconductors & Semiconductor Equipment | | | 15.3 | |
Electronic Equipment, Instruments & Components | | | 14.0 | |
Diversified Financial Services | | | 7.2 | |
Commercial Banks | | | 6.7 | |
Real Estate Management & Development | | | 6.4 | |
Textiles, Apparel & Luxury Goods | | | 3.9 | |
Diversified Telecommunication Services | | | 3.7 | |
Chemicals | | | 3.5 | |
Insurance Premiums | | | 2.6 | |
Auto Components | | | 2.0 | |
Wireless Telecommunication Services | | | 1.7 | |
Electrical Equipment | | | 1.7 | |
Household Durables | | | 1.7 | |
Machinery | | | 1.5 | |
Construction & Engineering | | | 1.2 | |
Food Products | | | 0.7 | |
Leisure Products | | | 0.4 | |
Personal Products | | | 0.3 | |
Capital Markets | | | 0.3 | |
Marine | | | 0.3 | |
Food & Staples Retailing | | | 0.2 | |
Building Products | | | 0.2 | |
Communications Equipment | | | 0.2 | |
Commercial Services & Supplies | | | 0.1 | |
Health Care Equipment & Supplies | | | 0.1 | |
Metals & Mining | | | 0.1 | |
Construction Materials | | | 0.1 | |
Industrial Conglomerates | | | 0.1 | |
Automobiles | | | 0.1 | |
Diversified Consumer Services | | | 0.1 | |
| | | | |
| | | 100.0 | % |
| | | | |
| & | In the table above, derivative financial instruments, if any, are based on market values or unrealized appreciation/depreciation rather than notional amounts. |
| # | Equity investments may consist of common stocks and other stock-related securities, such as preferred stocks, if any. This table excludes exposure to derivative contracts, short-term investments, mutual funds and investment funds, if any. For a summary of these exposures, if any, see the Schedule of Investments. |
32
GMO Taiwan Fund
(A Series of GMO Trust)
Schedule of Investments
(showing percentage of total net assets)
February 28, 2017
| | | | | | | | | | |
| | | Shares | | | Description | | Value ($) | |
| | | | | | COMMON STOCKS — 95.0% | |
| | |
| | | | | | Taiwan — 95.0% | |
| | | 1,296,000 | | | AcBel Polytech Inc | | | 1,032,029 | |
| | | 49,000 | | | Actron Technology Corp | | | 174,077 | |
| | | 14,000 | | | Advantech Co Ltd | | | 119,386 | |
| | | 1,965,850 | | | AmTRAN Technology Co Ltd | | | 1,481,688 | |
| | | 50,000 | | | Asia Vital Components Co Ltd | | | 42,843 | |
| | | 730,323 | | | Asustek Computer Inc | | | 6,599,034 | |
| | | 36,000 | | | Basso Industry Corp | | | 103,783 | |
| | | 59,849 | | | Bizlink Holding Inc | | | 368,869 | |
| | | 245,000 | | | Catcher Technology Co Ltd | | | 2,049,194 | |
| | | 1,580,000 | | | Cathay Financial Holding Co Ltd | | | 2,484,353 | |
| | | 643,000 | | | Chailease Holding Co Ltd | | | 1,380,686 | |
| | | 203,860 | | | Chang Hwa Commercial Bank Ltd | | | 121,826 | |
| | | 16,000 | | | Chaun-Choung Technology Corp | | | 75,510 | |
| | | 741,000 | | | Cheng Shin Rubber Industry Co Ltd | | | 1,577,222 | |
| | | 23,000 | | | Chicony Electronics Co Ltd | | | 54,253 | |
| | | 88,000 | | | Chicony Power Technology Co Ltd | | | 139,032 | |
| | | 119,000 | | | Chimei Materials Technology Corp | | | 52,203 | |
| | | 289,000 | | | Chin-Poon Industrial Co Ltd | | | 579,121 | |
| | | 465,000 | | | China Development Financial Holding Corp | | | 122,645 | |
| | | 377,160 | | | China Life Insurance Co Ltd | | | 370,264 | |
| | | 113,000 | | | China Motor Corp | | | 105,981 | |
| | | 21,000 | | | China Steel Chemical Corp | | | 87,542 | |
| | | 223,000 | | | ChipMOS TECHNOLOGIES Inc | | | 179,960 | |
| | | 23,000 | | | Chlitina Holding Ltd | | | 122,426 | |
| | | 408,989 | | | Chong Hong Construction Co Ltd | | | 937,394 | |
| | | 35,000 | | | Chroma ATE Inc | | | 107,080 | |
| | | 1,198,379 | | | Chunghwa Telecom Co Ltd | | | 3,980,928 | |
| | | 11,305 | | | Chunghwa Telecom Co Ltd Sponsored ADR | | | 371,595 | |
| | | 19,000 | | | Cleanaway Co Ltd | | | 104,947 | |
| | | 4,156,486 | | | Compal Electronics Inc | | | 2,605,533 | |
| | | 514,600 | | | Coretronic Corp | | | 727,426 | |
| | | 5,229,680 | | | CTBC Financial Holding Co Ltd | | | 3,126,547 | |
| | | 302,000 | | | CTCI Corp | | | 500,196 | |
| | | 14,000 | | | Delta Electronics Inc | | | 78,143 | |
| | | 207,000 | | | Dynapack International Technology Corp | | | 270,630 | |
| | | 194,000 | | | E Ink Holdings Inc | | | 159,821 | |
| | | 5,278,863 | | | E.Sun Financial Holding Co Ltd | | | 3,206,989 | |
| | | 63,000 | | | Eclat Textile Co Ltd | | | 633,421 | |
| | | 122,000 | | | Elan Microelectronics Corp | | | 150,046 | |
| | | 15,000 | | | eMemory Technology Inc | | | 214,807 | |
| | | 37,000 | | | Everlight Electronics Co Ltd | | | 59,552 | |
| | | 133,000 | | | Far Eastern New Century Corp | | | 119,033 | |
| | | 641,767 | | | Far EasTone Telecommunications Co Ltd | | | 1,546,756 | |
| | | 398,000 | | | Farglory Land Development Co Ltd | | | 504,869 | |
| | | 45,000 | | | Feng TAY Enterprise Co Ltd | | | 191,026 | |
| | | 128,880 | | | First Financial Holding Co Ltd | | | 76,195 | |
| | | 24,530 | | | FLEXium Interconnect Inc | | | 75,558 | |
| | | 386,000 | | | Formosa Chemicals & Fibre Corp | | | 1,223,153 | |
| | | 560,000 | | | Formosa Plastics Corp | | | 1,690,615 | |
| | | | | | | | | | |
| | | Shares | | | Description | | Value ($) | |
| | | | | | Taiwan — continued | |
| | | 363,500 | | | Formosan Rubber Group Inc | | | 201,888 | |
| | | 1,508,473 | | | Foxconn Technology Co Ltd | | | 4,514,601 | |
| | | 4,412,940 | | | Fubon Financial Holding Co Ltd | | | 7,157,928 | |
| | | 22,000 | | | Giant Manufacturing Co Ltd | | | 136,048 | |
| | | 995,000 | | | Gigabyte Technology Co Ltd | | | 1,387,373 | |
| | | 22,000 | | | Global Unichip Corp | | | 73,043 | |
| | | 422,000 | | | Grand Pacific Petrochemical | | | 305,364 | |
| | | 37,000 | | | Grape King Bio Ltd | | | 246,609 | |
| | | 71,000 | | | Green Seal Holding Ltd | | | 376,990 | |
| | | 2,211,622 | | | Highwealth Construction Corp | | | 3,599,131 | |
| | | 7,000 | | | Hiroca Holdings Ltd | | | 21,934 | |
| | | 2,714,159 | | | Hon Hai Precision Industry Co Ltd | | | 7,921,930 | |
| | | 232,000 | | | Hua Nan Financial Holdings Co Ltd – Class C | | | 127,697 | |
| | | 252,000 | | | Huaku Development Co Ltd | | | 552,006 | |
| | | 213,000 | | | IEI Integration Corp | | | 328,034 | |
| | | 1,376,000 | | | Inventec Corp | | | 1,023,351 | |
| | | 28,000 | | | Iron Force Industrial Co Ltd | | | 163,784 | |
| | | 237,000 | | | ITEQ Corp | | | 323,540 | |
| | | 468,000 | | | KEE TAI Properties Co Ltd | | | 161,417 | |
| | | 16,000 | | | Kenda Rubber Industrial Co Ltd | | | 25,832 | |
| | | 3,000 | | | King Slide Works Co Ltd | | | 41,447 | |
| | | 226,000 | | | King’s Town Bank Co Ltd | | | 210,523 | |
| | | 81,000 | | | Kinik Co | | | 205,997 | |
| | | 90,000 | | | Kinsus Interconnect Technology Corp | | | 249,647 | |
| | | 28,000 | | | Kung Long Batteries Industrial Co Ltd | | | 138,634 | |
| | | 7,000 | | | Land Mark Optoelectronics Corp | | | 73,303 | |
| | | 105,000 | | | Lite-On Semiconductor Corp | | | 100,122 | |
| | | 2,375,834 | | | Lite-On Technology Corp | | | 3,987,539 | |
| | | 194,000 | | | Lotes Co Ltd | | | 663,116 | |
| | | 54,000 | | | Lung Yen Life Service Corp | | | 101,824 | |
| | | 1,000 | | | Macauto Industrial Co Ltd | | | 5,977 | |
| | | 139,657 | | | Makalot Industrial Co Ltd | | | 566,941 | |
| | | 10,596 | | | MediaTek Inc | | | 77,421 | |
| | | 907,000 | | | Mega Financial Holding Co Ltd | | | 706,028 | |
| | | 321,910 | | | Mercuries Life Insurance Co Ltd * | | | 173,420 | |
| | | 58,000 | | | Merida Industry Co Ltd | | | 296,527 | |
| | | 16,000 | | | Merry Electronics Co Ltd | | | 75,380 | |
| | | 76,000 | | | MIN AIK Technology Co Ltd | | | 93,446 | |
| | | 103,000 | | | Nan Ya Plastics Corp | | | 250,572 | |
| | | 40,000 | | | Nien Made Enterprise Co Ltd | | | 391,794 | |
| | | 233,995 | | | Novatek Microelectronics Corp | | | 877,648 | |
| | | 186,000 | | | OptoTech Corp | | | 104,333 | |
| | | 511,000 | | | Pegatron Corp | | | 1,348,309 | |
| | | 11,000 | | | Phison Electronics Corp | | | 96,669 | |
| | | 871,000 | | | Pou Chen Corp | | | 1,183,795 | |
| | | 30,000 | | | President Chain Store Corp | | | 220,236 | |
| | | 1,827,856 | | | Quanta Computer Inc | | | 3,793,072 | |
| | | 1,097,670 | | | Radiant Opto-Electronics Corp | | | 2,273,907 | |
| | | 691,870 | | | Realtek Semiconductor Corp | | | 2,579,476 | |
| | | 210,000 | | | Rechi Precision Co Ltd | | | 232,035 | |
| | | 1,438,036 | | | Ruentex Development Co Ltd * | | | 1,811,641 | |
| | | | |
| | See accompanying notes to the financial statements. | | 33 |
GMO Taiwan Fund
(A Series of GMO Trust)
Schedule of Investments — (Continued)
(showing percentage of total net assets)
February 28, 2017
| | | | | | | | | | |
| | | Shares | | | Description | | Value ($) | |
| | | | | | Taiwan — continued | |
| | | 1,009,600 | | | Ruentex Industries Ltd | | | 1,917,920 | |
| | | 69,000 | | | Sercomm Corp | | | 186,595 | |
| | | 282,000 | | | Shin Kong Financial Holding Co Ltd * | | | 76,166 | |
| | | 151,000 | | | Shin Zu Shing Co Ltd | | | 423,953 | |
| | | 120,000 | | | ShunSin Technology Holding Ltd | | | 458,839 | |
| | | 140,000 | | | Sigurd Microelectronics Corp | | | 125,195 | |
| | | 497,000 | | | Simplo Technology Co Ltd | | | 1,619,831 | |
| | | 47,000 | | | Sinbon Electronics Co Ltd | | | 112,266 | |
| | | 245,400 | | | SinoPac Financial Holdings Co Ltd | | | 74,741 | |
| | | 217,000 | | | Sitronix Technology Corp | | | 702,015 | |
| | | 8,000 | | | St Shine Optical Co Ltd | | | 136,743 | |
| | | 19,000 | | | Sunny Friend Environmental Technology Co Ltd | | | 79,075 | |
| | | 3,000 | | | Sunspring Metal Corp | | | 4,075 | |
| | | 161,000 | | | Syncmold Enterprise Corp | | | 324,469 | |
| | | 4,500 | | | Synnex Technology International Corp | | | 4,948 | |
| | | 54,000 | | | Taiflex Scientific Co Ltd | | | 68,246 | |
| | | 376,004 | | | Taishin Financial Holding Co Ltd | | | 148,802 | |
| | | 107,550 | | | Taiwan Cement Corp | | | 132,013 | |
| | | 150,000 | | | Taiwan Mobile Co Ltd | | | 527,645 | |
| | | 43,000 | | | Taiwan Paiho Ltd | | | 129,360 | |
| | | 77,000 | | | Taiwan PCB Techvest Co Ltd | | | 79,517 | |
| | | 209,000 | | | Taiwan Semiconductor Manufacturing Co Ltd | | | 1,281,370 | |
| | | 226,580 | | | Taiwan Semiconductor Manufacturing Co Ltd Sponsored ADR | | | 7,130,473 | |
| | | 553,022 | | | Taiwan Surface Mounting Technology Corp | | | 516,902 | |
| | | 403,000 | | | Teco Electric and Machinery Co Ltd | | | 363,698 | |
| | | 81,000 | | | Test Research Inc | | | 112,008 | |
| | | 242,000 | | | Tong Hsing Electronic Industries Ltd | | | 1,089,195 | |
| | | 131,000 | | | Tong Yang Industry Co Ltd | | | 260,874 | |
| | | 93,000 | | | Topco Scientific Co Ltd | | | 308,908 | |
| | | 5,000 | | | Toung Loong Textile Manufacturing | | | 12,676 | |
| | | 658,000 | | | Tripod Technology Corp | | | 1,718,394 | |
| | | 10,000 | | | Tung Thih Electronic Co Ltd | | | 104,080 | |
| | | 440,000 | | | Uni-President Enterprises Corp | | | 782,937 | |
| | | 487,000 | | | United Integrated Services Co Ltd | | | 943,489 | |
| | | 38,000 | | | Vanguard International Semiconductor Corp | | | 75,271 | |
| | | 88,000 | | | Visual Photonics Epitaxy Co Ltd | | | 171,328 | |
| | | 506,000 | | | Wan Hai Lines Ltd | | | 310,477 | |
| | | 585,000 | | | Winbond Electronics Corp | | | 212,694 | |
| | | 165,000 | | | WPG Holdings Ltd | | | 209,607 | |
| | | 81,000 | | | Xxentria Technology Materials Corp | | | 201,234 | |
| | | 166,000 | | | Yageo Corp | | | 408,469 | |
| | | 35,000 | | | Yeong Guan Energy Technology Group Co Ltd | | | 135,663 | |
| | | 865,000 | | | Yuanta Financial Holding Co Ltd | | | 366,248 | |
| | | 368,152 | | | Yungtay Engineering Co Ltd | | | 594,977 | |
| | | 10,000 | | | Zeng Hsing Industrial Co Ltd | | | 51,613 | |
| | | | | | | | | | |
| | | | | | Total Taiwan | | | 118,360,465 | |
| | | | | | | | | | |
| | | |
| | | | | | TOTAL COMMON STOCKS
(COST $109,316,856) | | | 118,360,465 | |
| | | | | | | | | | |
| | | | | | | | | | |
| | | Shares | | | Description | | Value ($) | |
| | | | | | INVESTMENT FUNDS — 3.9% | |
| | |
| | | | | | Taiwan — 3.9% | |
| | | 149,173 | | | iShares MSCI Taiwan Capped ETF | | | 4,831,714 | |
| | | | | | | | | | |
| | | |
| | | | | | TOTAL INVESTMENT FUNDS
(COST $4,793,871) | | | 4,831,714 | |
| | | | | | | | | | |
| | |
| | | | | | MUTUAL FUNDS — 1.5% | |
| | |
| | | | | | United States — 1.5% | |
| | | | | | Affiliated Issuers — 1.5% | |
| | | 76,003 | | | GMO U.S. Treasury Fund | | | 1,900,066 | |
| | | | | | | | | | |
| | | |
| | | | | | TOTAL MUTUAL FUNDS
(COST $1,900,066) | | | 1,900,066 | |
| | | | | | | | | | |
| | | |
| | | | | | TOTAL INVESTMENTS — 100.4%
(Cost $116,010,793) | | | 125,092,245 | |
| | | | | | Other Assets and Liabilities (net) — (0.4%) | | | (453,097 | ) |
| | | | | | | | | | |
| | | |
| | | | | | TOTAL NET ASSETS — 100.0% | | | $124,639,148 | |
| | | | | | | | | | |
Notes to Schedule of Investments:
| * | Non-income producing security. |
For a listing of definitions of acronyms, counterparty abbreviations and currency abbreviations used throughout the Schedule of Investments as well as the derivative tables, if any, please refer to page 35.
| | | | |
| 34 | | See accompanying notes to the financial statements. | | |
GMO Trust Funds
Schedule of Investments — (Continued)
February 28, 2017
Portfolio Abbreviations:
144A - Securities exempt from registration under Rule 144A of the Securities Act of 1933. These securities may be resold in transactions exempt from registration, normally to qualified institutional investors.
ADR - American Depositary Receipt
CP - Counterparty
CPO - Ordinary Participation Certificate (Certificado de Participacion Ordinares), representing a bundle of shares of the multiple series of one issuer that trade together as a unit.
ETF - Exchange-Traded Fund
Foreign Registered - Shares issued to foreign investors in markets that have foreign ownership limits.
GDR - Global Depository Receipt
JSC - Joint-Stock Company
LIBOR - London Interbank Offered Rate
NVDR - Non-Voting Depository Receipt
OJSC - Open Joint-Stock Company
OTC - Over-the-Counter
PJSC - Private Joint-Stock Company
Counterparty Abbreviations:
BCLY - Barclays Bank plc
GS - Goldman Sachs International
MSCI - Morgan Stanley & Co. International PLC
UBSA - UBS AG
Currency Abbreviations:
GBP - British Pound
PHP - Philippine Peso
SGD - Singapore Dollar
USD - United States Dollar
ZAR - South African Rand
| | | | |
| | See accompanying notes to the financial statements. | | 35 |
GMO Trust Funds
Statements of Assets and Liabilities — February 28, 2017
| | | | | | | | | | | | | | | | |
| | | Emerging
Countries
Fund | | | Emerging
Domestic
Opportunities
Fund | | | Emerging
Markets Fund | | | Taiwan Fund | |
Assets: | | | | | | | | | | | | | |
Investments in affiliated issuers, at value (Notes 2 and 10)(a) | | $ | — | | | $ | 108,608,372 | | | $ | 133,931,020 | | | $ | 1,900,066 | |
Investments in unaffiliated issuers, at value (Note 2)(b) | | | 27,287,268 | | | | 1,915,615,450 | | | | 4,906,226,393 | | | | 123,192,179 | |
Foreign currency, at value (Note 2)(c) | | | 528,272 | | | | 6,870,937 | | | | 47,966,320 | | | | 7,230,008 | |
Cash | | | — | | | | — | | | | 444 | | | | — | |
Receivable for investments sold | | | 376,099 | | | | 15,748,212 | | | | 67,090,487 | | | | 7,460,252 | |
Receivable for Fund shares sold | | | — | | | | — | | | | 55,576 | | | | — | |
Dividends receivable | | | 70,983 | | | | 2,676,022 | | | | 11,523,678 | | | | — | |
Dividend withholding tax receivable | | | — | | | | 411,249 | | | | — | | | | — | |
Foreign capital gains tax refund receivable | | | 234,856 | | | | 1,036,076 | | | | 3,140,853 | | | | — | |
Unrealized appreciation on open forward currency contracts (Note 4) | | | — | | | | 6,228,820 | | | | — | | | | — | |
Receivable for foreign currency sold | | | 9,944 | | | | 11,547 | | | | 8,581,135 | | | | 7,996 | |
Receivable for variation margin on open futures contracts (Note 4) | | | — | | | | 5,567,968 | | | | — | | | | — | |
Receivable for open OTC swap contracts (Note 4) | | | — | | | | 740,882 | | | | 1,035,331 | | | | — | |
Due from broker (Note 2) | | | — | | | | 2,349,633 | | | | — | | | | — | |
Receivable for expenses reimbursed and/or waived by GMO (Note 5) | | | 9,191 | | | | 13,770 | | | | 516,206 | | | | — | |
Miscellaneous receivable | | | 34 | | | | 25,440 | | | | 114,157 | | | | 433 | |
| | | | | | | | | | | | | | | | |
Total assets | | | 28,516,647 | | | | 2,065,904,378 | | | | 5,180,181,600 | | | | 139,790,934 | |
| | | | | | | | | | | | | | | | |
Liabilities: | | | | | | | | | | | | | | | | |
Due to custodian | | | — | | | | 7,157,533 | | | | — | | | | 43,219 | |
Foreign taxes payable | | | 1,285 | | | | — | | | | 110,541 | | | | — | |
Payable for investments purchased | | | 723,867 | | | | 13,683,832 | | | | 148,153,888 | | | | 14,910,399 | |
Payable for Fund shares repurchased | | | — | | | | 4,000,000 | | | | 6,859,601 | | | | — | |
Accrued foreign capital gains tax payable (Note 2) | | | — | | | | 2,238,963 | | | | 2,589,053 | | | | — | |
Payable to affiliate for (Note 5): | | | | | | | | | | | | | | | | |
Management fee | | | 13,769 | | | | 1,167,425 | | | | 2,778,750 | | | | 90,231 | |
Shareholder service fee | | | 3,180 | | | | 203,259 | | | | 307,281 | | | | 16,710 | |
Payable for variation margin on open futures contracts (Note 4) | | | — | | | | — | | | | 133,506 | | | | — | |
Unrealized depreciation on open forward currency contracts (Note 4) | | | — | | | | 5,739,901 | | | | — | | | | — | |
Due to broker (Note 2) | | | 696 | | | | — | | | | — | | | | — | |
Miscellaneous payable | | | — | | | | — | | | | 984,731 | | | | — | |
Payable to agents unaffiliated with GMO | | | — | | | | 224 | | | | 672 | | | | 28 | |
Payable to Trustees and related expenses | | | 61 | | | | 3,952 | | | | 9,620 | | | | 258 | |
Accrued expenses | | | 110,749 | | | | 592,200 | | | | 1,314,465 | | | | 90,941 | |
| | | | | | | | | | | | | | | | |
Total liabilities | | | 853,607 | | | | 34,787,289 | | | | 163,242,108 | | | | 15,151,786 | |
| | | | | | | | | | | | | | | | |
Net assets | | $ | 27,663,040 | | | $ | 2,031,117,089 | | | $ | 5,016,939,492 | | | $ | 124,639,148 | |
| | | | | | | | | | | | | | | | |
(a) Cost of investments – affiliated issuers: | | $ | — | | | $ | 93,650,542 | | | $ | 108,962,130 | | | $ | 1,900,066 | |
(b) Cost of investments – unaffiliated issuers: | | $ | 25,780,935 | | | $ | 1,774,343,265 | | | $ | 4,525,360,234 | | | $ | 114,110,727 | |
(c) Cost of foreign currency: | | $ | 527,841 | | | $ | 6,885,838 | | | $ | 47,954,296 | | | $ | 7,229,511 | |
| | | | |
| 36 | | See accompanying notes to the financial statements. | | |
GMO Trust Funds
Statements of Assets and Liabilities — February 28, 2017 — (Continued)
| | | | | | | | | | | | | | | | |
| | | Emerging
Countries
Fund | | | Emerging
Domestic
Opportunities
Fund | | | Emerging
Markets Fund | | | Taiwan Fund | |
Net assets consist of: | | | | | | | | | | | | | | | | |
Paid-in capital | | $ | 52,984,283 | | | $ | 2,093,694,688 | | | $ | 6,742,110,909 | | | $ | 127,393,107 | |
Distributions in excess of net investment income | | | (151,286 | ) | | | (26,884,070 | ) | | | (33,369,509 | ) | | | (454,704 | ) |
Accumulated net realized gain (loss) | | | (26,679,662 | ) | | | (194,369,514 | ) | | | (2,097,140,987 | ) | | | (11,387,894 | ) |
Net unrealized appreciation (depreciation) | | | 1,509,705 | | | | 158,675,985 | | | | 405,339,079 | | | | 9,088,639 | |
| | | | | | | | | | | | | | | | |
| | $ | 27,663,040 | | | $ | 2,031,117,089 | | | $ | 5,016,939,492 | | | $ | 124,639,148 | |
| | | | | | | | | | | | | | | | |
Net assets attributable to: | | | | | | | | | | | | | | | | |
Class II | | $ | — | | | $ | 603,564,638 | | | $ | 498,563,510 | | | $ | — | |
| | | | | | | | | | | | | | | | |
Class III | | $ | 27,663,040 | | | $ | 129,067,505 | | | $ | 301,786,070 | | | $ | 124,639,148 | |
| | | | | | | | | | | | | | | | |
Class IV | | $ | — | | | $ | 335,224,822 | | | $ | 582,310,790 | | | $ | — | |
| | | | | | | | | | | | | | | | |
Class V | | $ | — | | | $ | 948,051,988 | | | $ | 110,257,204 | | | $ | — | |
| | | | | | | | | | | | | | | | |
Class VI | | $ | — | | | $ | 15,208,136 | | | $ | 3,524,021,918 | | | $ | — | |
| | | | | | | | | | | | | | | | |
Shares outstanding: | | | | | | | | | | | | | | | | |
Class II | | | — | | | | 26,658,058 | | | | 16,629,844 | | | | — | |
| | | | | | | | | | | | | | | | |
Class III | | | 1,022,431 | | | | 5,701,131 | | | | 10,041,863 | | | | 5,932,342 | |
| | | | | | | | | | | | | | | | |
Class IV | | | — | | | | 14,801,407 | | | | 19,555,277 | | | | — | |
| | | | | | | | | | | | | | | | |
Class V | | | — | | | | 41,905,739 | | | | 3,712,592 | | | | — | |
| | | | | | | | | | | | | | | | |
Class VI | | | — | | | | 668,265 | | | | 118,360,704 | | | | — | |
| | | | | | | | | | | | | | | | |
Net asset value per share: | | | | | | | | | | | | | | | | |
Class II | | $ | — | | | $ | 22.64 | | | $ | 29.98 | | | $ | — | |
| | | | | | | | | | | | | | | | |
Class III | | $ | 27.06 | | | $ | 22.64 | | | $ | 30.05 | | | $ | 21.01 | |
| | | | | | | | | | | | | | | | |
Class IV | | $ | — | | | $ | 22.65 | | | $ | 29.78 | | | $ | — | |
| | | | | | | | | | | | | | | | |
Class V | | $ | — | | | $ | 22.62 | | | $ | 29.70 | | | $ | — | |
| | | | | | | | | | | | | | | | |
Class VI | | $ | — | | | $ | 22.76 | | | $ | 29.77 | | | $ | — | |
| | | | | | | | | | | | | | | | |
| | | | |
| | See accompanying notes to the financial statements. | | 37 |
GMO Trust Funds
Statements of Operations — Year Ended February 28, 2017
| | | | | | | | | | | | | | | | |
| | | Emerging
Countries
Fund | | | Emerging
Domestic
Opportunities
Fund | | | Emerging
Markets Fund | | | Taiwan Fund | |
Investment Income: | | | | | | | | | | | | | |
Dividends from unaffiliated issuers (Net of withholding tax)(a) | | $ | 707,533 | | | $ | 40,341,205 | | | $ | 158,026,649 | | | $ | 4,007,648 | |
Interest | | | 12,939 | | | | 2,336,466 | | | | 16,385 | | | | 688 | |
Dividends from affiliated issuers (Note 10) | | | 473 | | | | 1,624,435 | | | | 367,080 | | | | 4,010 | |
| | | | | | | | | | | | | | | | |
Total investment income | | | 720,945 | | | | 44,302,106 | | | | 158,410,114 | | | | 4,012,346 | |
| | | | | | | | | | | | | | | | |
Expenses: | | | | | | | | | | | | | |
Management fee (Note 5) | | | 160,371 | | | | 15,358,529 | | | | 37,436,850 | | | | 832,838 | |
Shareholder service fee – Class II (Note 5) | | | — | | | | 1,327,066 | | | | 1,082,015 | | | | — | |
Shareholder service fee – Class III (Note 5) | | | 37,009 | | | | 268,836 | | | | 345,474 | | | | 154,229 | |
Shareholder service fee – Class IV (Note 5) | | | — | | | | 736,164 | | | | 293,697 | | | | — | |
Shareholder service fee – Class V (Note 5) | | | — | | | | 470,152 | | | | 323,397 | | | | — | |
Shareholder service fee – Class VI (Note 5) | | | — | | | | 6,127 | | | | 1,985,093 | | | | — | |
Audit and tax fees | | | 83,434 | | | | 98,207 | | | | 245,968 | | | | 84,361 | |
Custodian and fund accounting agent fees | | | 143,227 | | | | 2,517,196 | | | | 6,414,091 | | | | 244,654 | |
Legal fees | | | 10,306 | | | | 53,264 | | | | 123,673 | | | | 9,899 | |
Registration fees | | | 6,401 | | | | 6,435 | | | | 34,741 | | | | 368 | |
Transfer agent fees | | | 29,091 | | | | 89,868 | | | | 97,527 | | | | 28,723 | |
Trustees’ fees and related expenses (Note 5) | | | 425 | | | | 34,659 | | | | 84,583 | | | | 1,717 | |
Miscellaneous | | | 14,324 | | | | 30,086 | | | | 45,664 | | | | 4,894 | |
| | | | | | | | | | | | | | | | |
Total expenses | | | 484,588 | | | | 20,996,589 | | | | 48,512,773 | | | | 1,361,683 | |
Fees and expenses reimbursed and/or waived by GMO (Note 5) | | | (185,530 | ) | | | (917,960 | ) | | | (2,740,698 | ) | | | — | |
| | | | | | | | | | | | | | | | |
Net expenses | | | 299,058 | | | | 20,078,629 | | | | 45,772,075 | | | | 1,361,683 | |
| | | | | | | | | | | | | | | | |
Net investment income (loss) | | | 421,887 | | | | 24,223,477 | | | | 112,638,039 | | | | 2,650,663 | |
| | | | | | | | | | | | | | | | |
Realized and unrealized gain (loss): | | | | | | | | | | | | | |
Net realized gain (loss) on: | | | | | | | | | | | | | | | | |
Investments in unaffiliated issuers (net of foreign capital gains tax) (Note 2)(b) | | | (2,081,317 | ) | | | 100,867,276 | | | | (351,110,421 | ) | | | (1,916,954 | ) |
Investments in affiliated issuers | | | 166 | | | | (1,525,524 | ) | | | (10,250 | ) | | | 685 | |
Realized gain distributions from affiliated issuers (Note 10) | | | 49 | | | | 57,690 | | | | 35,383 | | | | 688 | |
Futures contracts | | | (12 | ) | | | (20,424,305 | ) | | | (2,097 | ) | | | — | |
Written options | | | (415 | ) | | | 220,020 | | | | 53,298 | | | | — | |
Swap contracts | | | — | | | | (4,734,695 | ) | | | (3,644,256 | ) | | | — | |
Foreign currency, forward contracts and foreign currency related transactions | | | (62,423 | ) | | | (10,677,384 | ) | | | (15,884,937 | ) | | | (105,570 | ) |
| | | | | | | | | | | | | | | | |
Net realized gain (loss) | | | (2,143,952 | ) | | | 63,783,078 | | | | (370,563,280 | ) | | | (2,021,151 | ) |
| | | | | | | | | | | | | | | | |
Change in net unrealized appreciation (depreciation) on: | | | | | | | | | | | | | | | | |
Investments in unaffiliated issuers (net of foreign capital gains tax) (Note 2)(c) | | | 9,019,366 | | | | 280,796,204 | | | | 1,743,068,346 | | | | 23,668,850 | |
Investments in affiliated issuers | | | — | | | | 1,710,488 | | | | 11,752,546 | | | | — | |
Futures contracts | | | (696 | ) | | | 2,793,678 | | | | (133,506 | ) | | | — | |
Written options | | | (1,260 | ) | | | (1,716,561 | ) | | | (363,121 | ) | | | — | |
Swap contracts | | | — | | | | 607,160 | | | | 869,885 | | | | — | |
Foreign currency, forward contracts and foreign currency related transactions | | | 9,251 | | | | 2,533,525 | | | | 1,465,131 | | | | 7,136 | |
| | | | | | | | | | | | | | | | |
Net change in unrealized appreciation (depreciation) | | | 9,026,661 | | | | 286,724,494 | | | | 1,756,659,281 | | | | 23,675,986 | |
| | | | | | | | | | | | | | | | |
Net realized and unrealized gain (loss) | | | 6,882,709 | | | | 350,507,572 | | | | 1,386,096,001 | | | | 21,654,835 | |
| | | | | | | | | | | | | | | | |
Net increase (decrease) in net assets resulting from operations | | $ | 7,304,596 | | | $ | 374,731,049 | | | $ | 1,498,734,040 | | | $ | 24,305,498 | |
| | | | | | | | | | | | | | | | |
(a) Withholding tax: | | $ | 122,133 | | | $ | 3,450,703 | | | $ | 24,610,746 | | | $ | 1,025,651 | |
(b) Foreign capital gains tax on net realized gain (loss): | | $ | (2,634 | ) | | $ | 2,373,459 | | | $ | (43,841 | ) | | $ | — | |
(c) Foreign capital gains tax on change in net unrealized appreciation (depreciation): | | $ | — | | | $ | 4,283,236 | | | $ | 2,589,202 | | | $ | — | |
| | | | |
| 38 | | See accompanying notes to the financial statements. | | |
GMO Trust Funds
Statements of Changes in Net Assets
| | | | | | | | | | | | | | | | |
| | | Emerging Countries Fund | | | Emerging Domestic
Opportunities Fund | |
| | | Year Ended
February 28/29, | | | Year Ended
February 28/29, | |
| | | 2017 | | | 2016 | | | 2017 | | | 2016 | |
Increase (decrease) in net assets: | | | | | | | | | | | | | | | | |
Operations: | | | | | | | | | | | | | | | | |
Net investment income (loss) | | $ | 421,887 | | | $ | 669,599 | | | $ | 24,223,477 | | | $ | 37,658,910 | |
Net realized gain (loss) | | | (2,143,952 | ) | | | (4,392,663 | ) | | | 63,783,078 | | | | (201,193,676 | ) |
Change in net unrealized appreciation (depreciation) | | | 9,026,661 | | | | (4,195,093 | ) | | | 286,724,494 | | | | (284,441,903 | ) |
| | | | | | | | | | | | | | | | |
| | | | |
Net increase (decrease) in net assets from operations | | | 7,304,596 | | | | (7,918,157 | ) | | | 374,731,049 | | | | (447,976,669 | ) |
| | | | | | | | | | | | | | | | |
Distributions to shareholders from: | | | | | | | | | | | | | | | | |
Net investment income | | | | | | | | | | | | | | | | |
Class II | | | — | | | | — | | | | (16,074,541 | ) | | | (10,957,179 | ) |
Class III | | | (325,047 | ) | | | (645,110 | ) | | | (4,625,740 | ) | | | (5,170,992 | ) |
Class IV | | | — | | | | — | | | | (16,393,890 | ) | | | (10,726,064 | ) |
Class V | | | — | | | | — | | | | (22,714,666 | ) | | | (5,385,781 | ) |
Class VI | | | — | | | | — | | | | (301,900 | ) | | | (8,108,215 | ) |
| | | | | | | | | | | | | | | | |
Total distributions from net investment income | | | (325,047 | ) | | | (645,110 | ) | | | (60,110,737 | ) | | | (40,348,231 | ) |
| | | | | | | | | | | | | | | | |
Net realized gains | | | | | | | | | | | | | | | | |
Class III | | | — | | | | (346,793 | ) | | | — | | | | — | |
| | | | | | | | | | | | | | | | |
Total distributions from net realized gains | | | — | | | | (346,793 | ) | | | — | | | | — | |
| | | | | | | | | | | | | | | | |
Return of capital | | | | | | | | | | | | | | | | |
Class III | | | — | | | | (36,830 | ) | | | — | | | | — | |
| | | | | | | | | | | | | | | | |
Total distributions from return of capital | | | — | | | | (36,830 | ) | | | — | | | | — | |
| | | | | | | | | | | | | | | | |
Net share transactions (Note 9): | | | | | | | | | | | | | | | | |
Class II | | | — | | | | — | | | | (49,674,608 | ) | | | (46,500,485 | ) |
Class III | | | (146,465 | ) | | | (8,725,604 | ) | | | (148,973,139 | ) | | | (31,379,384 | ) |
Class IV | | | — | | | | — | | | | (551,680,333 | ) | | | 183,384,511 | |
Class V | | | — | | | | — | | | | 584,300,107 | | | | 130,232,888 | |
Class VI | | | — | | | | — | | | | 4,115,333 | | | | (496,894,808 | ) |
| | | | | | | | | | | | | | | | |
Increase (decrease) in net assets resulting from net share transactions | | | (146,465 | ) | | | (8,725,604 | ) | | | (161,912,640 | ) | | | (261,157,278 | ) |
| | | | | | | | | | | | | | | | |
Purchase premiums and redemption fees (Notes 2 and 9): | | | | | | | | | | | | | | | | |
Class II | | | — | | | | — | | | | 666,973 | | | | 1,063,973 | |
Class III | | | — | | | | — | | | | 189,178 | | | | 475,127 | |
Class IV | | | — | | | | — | | | | 789,104 | | | | 986,392 | |
Class V | | | — | | | | — | | | | 627,488 | | | | 472,320 | |
Class VI | | | — | | | | — | | | | 12,335 | | | | 648,745 | |
| | | | | | | | | | | | | | | | |
Increase in net assets resulting from purchase premiums and redemption fees | | | — | | | | — | | | | 2,285,078 | | | | 3,646,557 | |
| | | | | | | | | | | | | | | | |
Total increase (decrease) in net assets resulting from net share transactions, purchase premiums and redemption fees | | | (146,465 | ) | | | (8,725,604 | ) | | | (159,627,562 | ) | | | (257,510,721 | ) |
| | | | | | | | | | | | | | | | |
Total increase (decrease) in net assets | | | 6,833,084 | | | | (17,672,494 | ) | | | 154,992,750 | | | | (745,835,621 | ) |
| | |
| Net assets: | | | | | | | | | |
Beginning of period | | | 20,829,956 | | | | 38,502,450 | | | | 1,876,124,339 | | | | 2,621,959,960 | |
| | | | | | | | | | | | | | | | |
End of period | | $ | 27,663,040 | | | $ | 20,829,956 | | | $ | 2,031,117,089 | | | $ | 1,876,124,339 | |
| | | | | | | | | | | | | | | | |
Accumulated undistributed net investment income | | $ | — | | | $ | — | | | $ | — | | | $ | 911,204 | |
| | | | | | | | | | | | | | | | |
Distributions in excess of net investment income | | $ | (151,286 | ) | | $ | (229,547 | ) | | $ | (26,884,070 | ) | | $ | — | |
| | | | | | | | | | | | | | | | |
| | | | |
| | See accompanying notes to the financial statements. | | 39 |
GMO Trust Funds
Statements of Changes in Net Assets — (Continued)
| | | | | | | | | | | | | | | | |
| | | Emerging Markets Fund | | | Taiwan Fund | |
| | | Year Ended
February 28/29, | | | Year Ended
February 28/29, | |
| | | 2017 | | | 2016 | | | 2017 | | | 2016 | |
Increase (decrease) in net assets: | | | | | | | | | | | | | | | | |
Operations: | | | | | | | | | | | | | | | | |
Net investment income (loss) | | $ | 112,638,039 | | | $ | 166,310,707 | | | $ | 2,650,663 | | | $ | 2,939,946 | |
Net realized gain (loss) | | | (370,563,280 | ) | | | (855,974,919 | ) | | | (2,021,151 | ) | | | (6,384,991 | ) |
Change in net unrealized appreciation (depreciation) | | | 1,756,659,281 | | | | (882,990,000 | ) | | | 23,675,986 | | | | (19,892,086 | ) |
| | | | | | | | | | | | | | | | |
| | | | |
Net increase (decrease) in net assets from operations | | | 1,498,734,040 | | | | (1,572,654,212 | ) | | | 24,305,498 | | | | (23,337,131 | ) |
| | | | | | | | | | | | | | | | |
Distributions to shareholders from: | | | | | | | | | | | | | | | | |
Net investment income | | | | | | | | | | | | | | | | |
Class II | | | (9,908,272 | ) | | | (14,843,763 | ) | | | — | | | | — | |
Class III | | | (5,175,773 | ) | | | (9,750,759 | ) | | | (3,287,415 | ) | | | (2,538,791 | ) |
Class IV | | | (6,690,386 | ) | | | (15,521,572 | ) | | | — | | | | — | |
Class V | | | (9,258,670 | ) | | | (9,715,352 | ) | | | — | | | | — | |
Class VI | | | (78,005,121 | ) | | | (139,438,918 | ) | | | — | | | | — | |
| | | | | | | | | | | | | | | | |
Total distributions from net investment income | | | (109,038,222 | ) | | | (189,270,364 | ) | | | (3,287,415 | ) | | | (2,538,791 | ) |
| | | | | | | | | | | | | | | | |
Net realized gains | | | | | | | | | | | | | | | | |
Class III | | | — | | | | — | | | | — | | | | (4,888,939 | ) |
| | | | | | | | | | | | | | | | |
Total distributions from net realized gains | | | — | | | | — | | | | — | | | | (4,888,939 | ) |
| | | | | | | | | | | | | | | | |
Net share transactions (Note 9): | | | | | | | | | | | | | | | | |
Class II | | | (177,168,152 | ) | | | (305,210,826 | ) | | | — | | | | — | |
Class III | | | 52,256,879 | | | | (2,035,123 | ) | | | 11,814,153 | | | | 4,424,325 | |
Class IV | | | 241,413,390 | | | | (429,527,732 | ) | | | — | | | | — | |
Class V | | | (258,808,154 | ) | | | 199,756,734 | | | | — | | | | — | |
Class VI | | | (1,166,985,719 | ) | | | (289,122,093 | ) | | | — | | | | — | |
| | | | | | | | | | | | | | | | |
Increase (decrease) in net assets resulting from net share transactions | | | (1,309,291,756 | ) | | | (826,139,040 | ) | | | 11,814,153 | | | | 4,424,325 | |
| | | | | | | | | | | | | | | | |
Purchase premiums and redemption fees (Notes 2 and 9): | | | | | | | | | | | | | | | | |
Class II | | | 1,529,910 | | | | 2,353,882 | | | | — | | | | — | |
Class III | | | 719,593 | | | | 1,067,882 | | | | 258,811 | | | | 143,473 | |
Class IV | | | 922,716 | | | | 2,040,543 | | | | — | | | | — | |
Class V | | | 1,099,805 | | | | 1,030,442 | | | | — | | | | — | |
Class VI | | | 11,065,007 | | | | 16,113,225 | | | | — | | | | — | |
| | | | | | | | | | | | | | | | |
Increase in net assets resulting from purchase premiums and redemption fees | | | 15,337,031 | | | | 22,605,974 | | | | 258,811 | | | | 143,473 | |
| | | | | | | | | | | | | | | | |
Total increase (decrease) in net assets resulting from net share transactions, purchase premiums and redemption fees | | | (1,293,954,725 | ) | | | (803,533,066 | ) | | | 12,072,964 | | | | 4,567,798 | |
| | | | | | | | | | | | | | | | |
Total increase (decrease) in net assets | | | 95,741,093 | | | | (2,565,457,642 | ) | | | 33,091,047 | | | | (26,197,063 | ) |
| | |
| Net assets: | | | | | | | | | |
Beginning of period | | | 4,921,198,399 | | | | 7,486,656,041 | | | | 91,548,101 | | | | 117,745,164 | |
| | | | | | | | | | | | | | | | |
End of period | | $ | 5,016,939,492 | | | $ | 4,921,198,399 | | | $ | 124,639,148 | | | $ | 91,548,101 | |
| | | | | | | | | | | | | | | | |
Distributions in excess of net investment income | | $ | (33,369,509 | ) | | $ | (45,634,300 | ) | | $ | (454,704 | ) | | $ | (10,688 | ) |
| | | | | | | | | | | | | | | | |
| | | | |
| 40 | | See accompanying notes to the financial statements. | | |
GMO Trust Funds
Financial Highlights
(For a share outstanding throughout each period)
EMERGING COUNTRIES FUND
| | | | | | | | | | | | | | | | | | | | | | | | | |
| | | Class III Shares |
| | | Year Ended February 28/29, |
| | | 2017(a) | | 2016(a) | | 2015(a) | | 2014(a) | | 2013(a) |
Net asset value, beginning of period | | | $ | 20.16 | | | | $ | 27.39 | | | | $ | 27.63 | | | | $ | 31.83 | | | | $ | 33.09 | |
| | | | | | | | | | | | | | | | | | | | | | | | | |
Income (loss) from investment operations: | | | | | | | | | | | | | | | | | | | | | | | | | |
Net investment income (loss)(b)† | | | | 0.42 | | | | | 0.57 | | | | | 0.66 | | | | | 0.78 | | | | | 0.60 | |
Net realized and unrealized gain (loss) | | | | 6.80 | | | | | (6.84 | ) | | | | 0.15 | | | | | (4.14 | ) | | | | (1.29 | ) |
| | | | | | | | | | | | | | | | | | | | | | | | | |
Total from investment operations | | | | 7.22 | | | | | (6.27 | ) | | | | 0.81 | | | | | (3.36 | ) | | | | (0.69 | ) |
| | | | | | | | | | | | | | | | | | | | | | | | | |
Less distributions to shareholders: | | | | | | | | | | | | | | | | | | | | | | | | | |
From net investment income | | | | (0.32 | ) | | | | (0.60 | ) | | | | (1.05 | ) | | | | (0.84 | ) | | | | (0.57 | ) |
From net realized gains | | | | — | | | | | (0.33 | ) | | | | — | | | | | — | | | | | — | |
Return of capital | | | | — | | | | | (0.03 | ) | | | | — | | | | | — | | | | | — | |
| | | | | | | | | | | | | | | | | | | | | | | | | |
Total distributions | | | | (0.32 | ) | | | | (0.96 | ) | | | | (1.05 | ) | | | | (0.84 | ) | | | | (0.57 | ) |
| | | | | | | | | | | | | | | | | | | | | | | | | |
Net asset value, end of period | | | $ | 27.06 | | | | $ | 20.16 | | | | $ | 27.39 | | | | $ | 27.63 | | | | $ | 31.83 | |
| | | | | | | | | | | | | | | | | | | | | | | | | |
Total Return(c) | | | | 36.00 | % | | | | (23.10 | )% | | | | 3.02 | % | | | | (10.61 | )% | | | | (2.05 | )% |
Ratios/Supplemental Data: | | | | | | | | | | | | | | | | | | | | | | | | | |
Net assets, end of period (000’s) | | | $ | 27,663 | | | | $ | 20,830 | | | | $ | 38,502 | | | | $ | 46,055 | | | | $ | 134,535 | |
Net expenses to average daily net assets(d) | | | | 1.21 | % | | | | 1.31 | % | | | | 1.23 | % | | | | 1.24 | %(e) | | | | 1.18 | %(e) |
Net investment income (loss) to average daily net assets(b) | | | | 1.71 | % | | | | 2.27 | % | | | | 2.27 | % | | | | 2.66 | % | | | | 1.94 | % |
Portfolio turnover rate | | | | 80 | %(f) | | | | 59 | % | | | | 74 | % | | | | 122 | % | | | | 108 | % |
Fees and expenses reimbursed and/or waived by GMO to average daily net assets: | | | | 0.75 | % | | | | 0.77 | % | | | | 0.28 | % | | | | 0.43 | % | | | | 0.21 | % |
| (a) | Per share amounts were adjusted to reflect a 1:3 reverse stock split effective July 15, 2016. |
| (b) | Net investment income is affected by the timing of the declaration of dividends by the underlying funds in which the Fund invests, if any. |
| (c) | The total returns would have been lower had certain expenses not been reimbursed and/or waived during the periods shown, if applicable, and assumes the effect of reinvested distributions, if any. Calculation excludes purchase premiums and redemption fees which are borne by the shareholder purchasing or redeeming Fund shares, if any. |
| (d) | Net expenses exclude expenses incurred indirectly through investment in the underlying funds (Note 5). |
| (e) | The net expense ratio does not include the effect of expense reductions (Note 2). |
| (f) | The portfolio turnover rate excludes investments in GMO U.S. Treasury Fund (“USTF”) which is used as a short-term investment vehicle for cash management. The Fund’s portfolio turnover rate during the year ended February 28, 2017, including transactions in USTF, was 86% of the average value of its portfolio. |
| † | Calculated using average shares outstanding throughout the period. |
| | | | |
| | See accompanying notes to the financial statements. | | 41 |
GMO Trust Funds
Financial Highlights
(For a share outstanding throughout each period)
EMERGING DOMESTIC OPPORTUNITIES FUND
| | | | | | | | | | | | | | | | | | | | | | | | | | | | | | | | | | | | | | | | | | | | | | | | | | |
| | | Class II Shares | | Class III Shares |
| | | Year Ended February 28/29, | | Year Ended February 28/29, | | Period from
June 29, 2012
(commencement
of operations)
through
February 28,
2013 |
| | | 2017 | | 2016 | | 2015 | | 2014 | | 2013 | | 2017 | | 2016 | | 2015 | | 2014 | |
Net asset value, beginning of period | | | $ | 19.36 | | | | $ | 23.99 | | | | $ | 22.55 | | | | $ | 24.60 | | | | $ | 21.39 | | | | $ | 19.35 | | | | $ | 23.98 | | | | $ | 22.54 | | | | $ | 24.59 | | | | $ | 21.02 | |
| | | | | | | | | | | | | | | | | | | | | | | | | | | | | | | | | | | | | | | | | | | | | | | | | | |
Income (loss) from investment operations: | | | | | | | | | | | | | | | | | | | | | | | | | | | | | | | | | | | | | | | | | | | | | | | | | | |
Net investment income (loss)(a)† | | | | 0.25 | | | | | 0.34 | | | | | 0.28 | | | | | 0.26 | | | | | 0.24 | | | | | 0.27 | | | | | 0.36 | | | | | 0.29 | | | | | 0.30 | | | | | 0.05 | |
Net realized and unrealized gain (loss) | | | | 3.68 | | | | | (4.60 | ) | | | | 1.55 | | | | | (1.22 | ) | | | | 3.27 | | | | | 3.68 | | | | | (4.60 | ) | | | | 1.55 | | | | | (1.24 | ) | | | | 3.84 | |
| | | | | | | | | | | | | | | | | | | | | | | | | | | | | | | | | | | | | | | | | | | | | | | | | | |
Total from investment operations | | | | 3.93 | | | | | (4.26 | ) | | | | 1.83 | | | | | (0.96 | ) | | | | 3.51 | | | | | 3.95 | | | | | (4.24 | ) | | | | 1.84 | | | | | (0.94 | ) | | | | 3.89 | |
| | | | | | | | | | | | | | | | | | | | | | | | | | | | | | | | | | | | | | | | | | | | | | | | | | |
Less distributions to shareholders: | | | | | | | | | | | | | | | | | | | | | | | | | | | | | | | | | | | | | | | | | | | | | | | | | | |
From net investment income | | | | (0.65 | ) | | | | (0.37 | ) | | | | (0.23 | ) | | | | (0.30 | ) | | | | (0.15 | ) | | | | (0.66 | ) | | | | (0.39 | ) | | | | (0.24 | ) | | | | (0.32 | ) | | | | (0.17 | ) |
From net realized gains | | | | — | | | | | — | | | | | (0.16 | ) | | | | (0.79 | ) | | | | (0.15 | ) | | | | — | | | | | — | | | | | (0.16 | ) | | | | (0.79 | ) | | | | (0.15 | ) |
| | | | | | | | | | | | | | | | | | | | | | | | | | | | | | | | | | | | | | | | | | | | | | | | | | |
Total distributions | | | | (0.65 | ) | | | | (0.37 | ) | | | | (0.39 | ) | | | | (1.09 | ) | | | | (0.30 | ) | | | | (0.66 | ) | | | | (0.39 | ) | | | | (0.40 | ) | | | | (1.11 | ) | | | | (0.32 | ) |
| | | | | | | | | | | | | | | | | | | | | | | | | | | | | | | | | | | | | | | | | | | | | | | | | | |
Net asset value, end of period | | | $ | 22.64 | | | | $ | 19.36 | | | | $ | 23.99 | | | | $ | 22.55 | | | | $ | 24.60 | | | | $ | 22.64 | | | | $ | 19.35 | | | | $ | 23.98 | | | | $ | 22.54 | | | | $ | 24.59 | |
| | | | | | | | | | | | | | | | | | | | | | | | | | | | | | | | | | | | | | | | | | | | | | | | | | |
Total Return(b) | | | | 20.62 | % | | | | (17.91 | )% | | | | 8.18 | % | | | | (4.01 | )% | | | | 16.47 | % | | | | 20.73 | % | | | | (17.86 | )% | | | | 8.23 | % | | | | (3.95 | )% | | | | 18.57 | %** |
Ratios/Supplemental Data: | | | | | | | | | | | | | | | | | | | | | | | | | | | | | | | | | | | | | | | | | | | | | | | | | | |
Net assets, end of period (000’s) | | | $ | 603,565 | | | | $ | 556,539 | | | | $ | 738,035 | | | | $ | 621,278 | | | | $ | 352,479 | | | | $ | 129,068 | | | | $ | 242,740 | | | | $ | 336,488 | | | | $ | 384,757 | | | | $ | 104,740 | |
Net expenses to average daily net assets(c) | | | | 1.06 | % | | | | 1.07 | % | | | | 1.07 | % | | | | 1.07 | %(d) | | | | 1.07 | %(d) | | | | 0.99 | % | | | | 1.00 | % | | | | 1.00 | % | | | | 1.00 | %(d) | | | | 1.00 | %*(d) |
Net investment income (loss) to average daily net assets(a) | | | | 1.12 | % | | | | 1.51 | % | | | | 1.21 | % | | | | 1.09 | % | | | | 1.05 | % | | | | 1.26 | % | | | | 1.61 | % | | | | 1.26 | % | | | | 1.23 | % | | | | 0.31 | %* |
Portfolio turnover rate | | | | 227 | %(e) | | | | 250 | % | | | | 204 | % | | | | 274 | % | | | | 247 | % | | | | 227 | %(e) | | | | 250 | % | | | | 204 | % | | | | 274 | % | | | | 247 | %**††† |
Fees and expenses reimbursed and/or waived by GMO to average daily net assets: | | | | 0.04 | % | | | | 0.04 | % | | | | 0.03 | % | | | | 0.03 | % | | | | 0.03 | % | | | | 0.05 | % | | | | 0.04 | % | | | | 0.03 | % | | | | 0.03 | % | | | | 0.04 | %* |
Purchase premiums and redemption fees consisted of the following per share amounts (Note 2):† | | | $ | 0.02 | | | | $ | 0.04 | | | | $ | 0.03 | | | | $ | 0.10 | | | | $ | 0.24 | | | | $ | 0.02 | | | | $ | 0.03 | | | | $ | 0.03 | | | | $ | 0.09 | | | | $ | 0.31 | |
| | | | | | | | | | | | | | | | | | | | | | | | | | | | | | | | | | | | | | | | | | | | | |
| | | Class IV Shares | | Class V Shares |
| | | Year Ended February 28/29, | | Period from
May 2, 2012
(commencement
of operations)
through
February 28,
2013 | | Year Ended February 28/29, | | Period from
November 29, 2013
(commencement
of operations)
through
February 28,
2014 |
| | | 2017 | | 2016 | | 2015 | | 2014 | | | 2017 | | 2016 | | 2015 | |
Net asset value, beginning of period | | | $ | 19.36 | | | | $ | 24.00 | | | | $ | 22.56 | | | | $ | 24.60 | | | | $ | 22.00 | | | | $ | 19.35 | | | | $ | 23.98 | | | | $ | 22.54 | | | | $ | 24.52 | |
| | | | | | | | | | | | | | | | | | | | | | | | | | | | | | | | | | | | | | | | | | | | | |
Income (loss) from investment operations: | | | | | | | | | | | | | | | | | | | | | | | | | | | | | | | | | | | | | | | | | | | | | |
Net investment income (loss)(a)† | | | | 0.29 | | | | | 0.36 | | | | | 0.30 | | | | | 0.31 | | | | | 0.14 | | | | | 0.23 | | | | | 0.37 | | | | | 0.31 | | | | | 0.01 | |
Net realized and unrealized gain (loss) | | | | 3.67 | | | | | (4.60 | ) | | | | 1.56 | | | | | (1.23 | ) | | | | 2.78 | | | | | 3.73 | | | | | (4.59 | ) | | | | 1.55 | | | | | (1.20 | ) |
| | | | | | | | | | | | | | | | | | | | | | | | | | | | | | | | | | | | | | | | | | | | | |
Total from investment operations | | | | 3.96 | | | | | (4.24 | ) | | | | 1.86 | | | | | (0.92 | ) | | | | 2.92 | | | | | 3.96 | | | | | (4.22 | ) | | | | 1.86 | | | | | (1.19 | ) |
| | | | | | | | | | | | | | | | | | | | | | | | | | | | | | | | | | | | | | | | | | | | | |
Less distributions to shareholders: | | | | | | | | | | | | | | | | | | | | | | | | | | | | | | | | | | | | | | | | | | | | | |
From net investment income | | | | (0.67 | ) | | | | (0.40 | ) | | | | (0.26 | ) | | | | (0.33 | ) | | | | (0.17 | ) | | | | (0.69 | ) | | | | (0.41 | ) | | | | (0.26 | ) | | | | (0.34 | ) |
From net realized gains | | | | — | | | | | — | | | | | (0.16 | ) | | | | (0.79 | ) | | | | (0.15 | ) | | | | — | | | | | — | | | | | (0.16 | ) | | | | (0.45 | ) |
| | | | | | | | | | | | | | | | | | | | | | | | | | | | | | | | | | | | | | | | | | | | | |
Total distributions | | | | (0.67 | ) | | | | (0.40 | ) | | | | (0.42 | ) | | | | (1.12 | ) | | | | (0.32 | ) | | | | (0.69 | ) | | | | (0.41 | ) | | | | (0.42 | ) | | | | (0.79 | ) |
| | | | | | | | | | | | | | | | | | | | | | | | | | | | | | | | | | | | | | | | | | | | | |
Net asset value, end of period | | | $ | 22.65 | | | | $ | 19.36 | | | | $ | 24.00 | | | | $ | 22.56 | | | | $ | 24.60 | | | | $ | 22.62 | | | | $ | 19.35 | | | | $ | 23.98 | | | | $ | 22.54 | |
| | | | | | | | | | | | | | | | | | | | | | | | | | | | | | | | | | | | | | | | | | | | | |
Total Return(b) | | | | 20.80 | % | | | | (17.84 | )% | | | | 8.29 | % | | | | (3.88 | )% | | | | 13.34 | %** | | | | 20.78 | % | | | | (17.79 | )% | | | | 8.32 | % | | | | (4.95 | )%** |
Ratios/Supplemental Data: | | | | | | | | | | | | | | | | | | | | | | | | | | | | | | | | | | | | | | | | | | | | | |
Net assets, end of period (000’s) | | | $ | 335,225 | | | | $ | 745,300 | | | | $ | 686,589 | | | | $ | 659,592 | | | | $ | 518,430 | | | | $ | 948,052 | | | | $ | 322,379 | | | | $ | 255,379 | | | | $ | 235,753 | |
Net expenses to average daily net assets(c) | | | | 0.95 | % | | | | 0.96 | % | | | | 0.95 | % | | | | 0.95 | %(d) | | | | 0.95 | %*(d) | | | | 0.93 | % | | | | 0.94 | % | | | | 0.93 | % | | | | 0.94 | %*(d) |
Net investment income (loss) to average daily net assets(a) | | | | 1.34 | % | | | | 1.61 | % | | | | 1.29 | % | | | | 1.29 | % | | | | 0.71 | %* | | | | 1.04 | % | | | | 1.65 | % | | | | 1.32 | % | | | | 0.09 | % |
Portfolio turnover rate | | | | 227 | %(e) | | | | 250 | % | | | | 204 | % | | | | 274 | % | | | | 247 | %**††† | | | | 227 | %(e) | | | | 250 | % | | | | 204 | % | | | | 274 | %**†††† |
Fees and expenses reimbursed and/ or waived by GMO to average daily net assets: | | | | 0.04 | % | | | | 0.04 | % | | | | 0.03 | % | | | | 0.03 | % | | | | 0.04 | %* | | | | 0.05 | % | | | | 0.04 | % | | | | 0.03 | % | | | | 0.06 | %* |
Purchase premiums and redemption fees consisted of the following per share amounts (Note 2):† | | | $ | 0.03 | | | | $ | 0.03 | | | | $ | 0.03 | | | | $ | 0.10 | | | | $ | 0.28 | | | | $ | 0.03 | | | | $ | 0.04 | | | | $ | 0.03 | | | | $ | 0.02 | |
| | | | |
| 42 | | See accompanying notes to the financial statements. | | |
GMO Trust Funds
Financial Highlights
(For a share outstanding throughout the period)
EMERGING DOMESTIC OPPORTUNITIES FUND (continued)
| | | | | | | | | | | | | | | | | | | | | | | | | |
| | | Class VI Shares |
| | | Year Ended February 28/29, |
| | | 2017 | | 2016 | | 2015 | | 2014 | | 2013 |
Net asset value, beginning of period | | | $ | 19.41 | | | | $ | 24.06 | | | | $ | 22.61 | | | | $ | 24.65 | | | | $ | 21.41 | |
| | | | | | | | | | | | | | | | | | | | | | | | | |
Income (loss) from investment operations: | | | | | | | | | | | | | | | | | | | | | | | | | |
Net investment income (loss)(a)† | | | | 0.27 | | | | | 0.40 | | | | | 0.31 | | | | | 0.36 | | | | | 0.34 | |
Net realized and unrealized gain (loss) | | | | 3.72 | | | | | (4.64 | ) | | | | 1.57 | | | | | (1.28 | ) | | | | 3.22 | |
| | | | | | | | | | | | | | | | | | | | | | | | | |
Total from investment operations | | | | 3.99 | | | | | (4.24 | ) | | | | 1.88 | | | | | (0.92 | ) | | | | 3.56 | |
| | | | | | | | | | | | | | | | | | | | | | | | | |
Less distributions to shareholders: | | | | | | | | | | | | | | | | | | | | | | | | | |
From net investment income | | | | (0.64 | ) | | | | (0.41 | ) | | | | (0.27 | ) | | | | (0.33 | ) | | | | (0.17 | ) |
From net realized gains | | | | — | | | | | — | | | | | (0.16 | ) | | | | (0.79 | ) | | | | (0.15 | ) |
| | | | | | | | | | | | | | | | | | | | | | | | | |
Total distributions | | | | (0.64 | ) | | | | (0.41 | ) | | | | (0.43 | ) | | | | (1.12 | ) | | | | (0.32 | ) |
| | | | | | | | | | | | | | | | | | | | | | | | | |
Net asset value, end of period | | | $ | 22.76 | | | | $ | 19.41 | | | | $ | 24.06 | | | | $ | 22.61 | | | | $ | 24.65 | |
| | | | | | | | | | | | | | | | | | | | | | | | | |
Total Return(b) | | | | 20.88 | % | | | | (17.81 | )% | | | | 8.37 | % | | | | (3.84 | )% | | | | 16.69 | % |
Ratios/Supplemental Data: | | | | | | | | | | | | | | | | | | | | | | | | | |
Net assets, end of period (000’s) | | | $ | 15,208 | | | | $ | 9,167 | | | | $ | 605,469 | | | | $ | 546,120 | | | | $ | 654,063 | |
Net expenses to average daily net assets(c) | | | | 0.90 | % | | | | 0.91 | % | | | | 0.90 | % | | | | 0.90 | %(d) | | | | 0.90 | %(d) |
Net investment income (loss) to average daily net assets(a) | | | | 1.20 | % | | | | 1.79 | % | | | | 1.34 | % | | | | 1.47 | % | | | | 1.50 | % |
Portfolio turnover rate | | | | 227 | %(e) | | | | 250 | % | | | | 204 | % | | | | 274 | % | | | | 247 | % |
Fees and expenses reimbursed and/or waived by GMO to average daily net assets: | | | | 0.05 | % | | | | 0.04 | % | | | | 0.03 | % | | | | 0.03 | % | | | | 0.03 | % |
Purchase premiums and redemption fees consisted of the following per share amounts (Note 2):† | | | $ | 0.02 | | | | $ | 0.03 | | | | $ | 0.03 | | | | $ | 0.11 | | | | $ | 0.07 | |
| (a) | Net investment income is affected by the timing of the declaration of dividends by the underlying funds in which the Fund invests, if any. |
| (b) | The total returns would have been lower had certain expenses not been reimbursed and/or waived during the periods shown, if applicable, and assumes the effect of reinvested distributions, if any. Calculation excludes purchase premiums and redemption fees which are borne by the shareholder purchasing or redeeming Fund shares, if any. |
| (c) | Net expenses exclude expenses incurred indirectly through investment in the underlying funds (Note 5). |
| (d) | The net expense ratio does not include the effect of expense reductions (Note 2). |
| (e) | The portfolio turnover rate excludes investments in GMO U.S. Treasury Fund (“USTF”) which is used as a short-term investment vehicle for cash management. The Fund’s portfolio turnover rate during the year ended February 28, 2017, including transactions in USTF, was 271% of the average value of its portfolio. |
| † | Calculated using average shares outstanding throughout the period. |
| ††† | Calculation represents portfolio turnover of the Fund for the year ended February 28, 2013. |
| †††† | Calculation represents portfolio turnover of the Fund for the year ended February 28, 2014. |
| | | | |
| | See accompanying notes to the financial statements. | | 43 |
GMO Trust Funds
Financial Highlights
(For a share outstanding throughout each period)
EMERGING MARKETS FUND
| | | | | | | | | | | | | | | | | | | | | | | | | | | | | | | | | | | | | | | | | | | | | | | | | | |
| | | Class II Shares | | Class III Shares |
| | | Year Ended February 28/29, | | Year Ended February 28/29, |
| | | 2017(a) | | 2016(a) | | 2015(a) | | 2014(a) | | 2013(a) | | 2017(a) | | 2016(a) | | 2015(a) | | 2014(a) | | 2013(a) |
Net asset value, beginning of period | | | $ | 22.80 | | | | $ | 30.48 | | | | $ | 30.60 | | | | $ | 35.22 | | | | $ | 36.30 | | | | $ | 22.83 | | | | $ | 30.57 | | | | $ | 30.69 | | | | $ | 35.31 | | | | $ | 36.39 | |
| | | | | | | | | | | | | | | | | | | | | | | | | | | | | | | | | | | | | | | | | | | | | | | | | | |
Income (loss) from investment operations: | | | | | | | | | | | | | | | | | | | | | | | | | | | | | | | | | | | | | | | | | | | | | | | | | | |
Net investment income (loss)(b)† | | | | 0.57 | | | | | 0.72 | | | | | 0.84 | | | | | 0.75 | | | | | 0.66 | | | | | 0.57 | | | | | 0.66 | | | | | 0.81 | | | | | 0.81 | | | | | 0.72 | |
Net realized and unrealized gain (loss) | | | | 7.22 | | | | | (7.59 | ) | | | | 0.00 | (c) | | | | (4.56 | ) | | | | (1.05 | ) | | | | 7.27 | | | | | (7.56 | ) | | | | 0.06 | | | | | (4.62 | ) | | | | (1.08 | ) |
| | | | | | | | | | | | | | | | | | | | | | | | | | | | | | | | | | | | | | | | | | | | | | | | | | |
Total from investment operations | | | | 7.79 | | | | | (6.87 | ) | | | | 0.84 | | | | | (3.81 | ) | | | | (0.39 | ) | | | | 7.84 | | | | | (6.90 | ) | | | | 0.87 | | | | | (3.81 | ) | | | | (0.36 | ) |
| | | | | | | | | | | | | | | | | | | | | | | | | | | | | | | | | | | | | | | | | | | | | | | | | | |
Less distributions to shareholders: | | | | | | | | | | | | | | | | | | | | | | | | | | | | | | | | | | | | | | | | | | | | | | | | | | |
From net investment income | | | | (0.61 | ) | | | | (0.81 | ) | | | | (0.96 | ) | | | | (0.81 | ) | | | | (0.69 | ) | | | | (0.62 | ) | | | | (0.84 | ) | | | | (0.99 | ) | | | | (0.81 | ) | | | | (0.72 | ) |
From net realized gains | | | | — | | | | | — | | | | | — | | | | | — | | | | | — | | | | | — | | | | | — | | | | | — | | | | | — | | | | | — | |
| | | | | | | | | | | | | | | | | | | | | | | | | | | | | | | | | | | | | | | | | | | | | | | | | | |
Total distributions | | | | (0.61 | ) | | | | (0.81 | ) | | | | (0.96 | ) | | | | (0.81 | ) | | | | (0.69 | ) | | | | (0.62 | ) | | | | (0.84 | ) | | | | (0.99 | ) | | | | (0.81 | ) | | | | (0.72 | ) |
| | | | | | | | | | | | | | | | | | | | | | | | | | | | | | | | | | | | | | | | | | | | | | | | | | |
Net asset value, end of period | | | $ | 29.98 | | | | $ | 22.80 | | | | $ | 30.48 | | | | $ | 30.60 | | | | $ | 35.22 | | | | $ | 30.05 | | | | $ | 22.83 | | | | $ | 30.57 | | | | $ | 30.69 | | | | $ | 35.31 | |
| | | | | | | | | | | | | | | | | | | | | | | | | | | | | | | | | | | | | | | | | | | | | | | | | | |
Total Return(d) | | | | 34.47 | % | | | | (22.76 | )% | | | | 2.84 | % | | | | (10.92 | )% | | | | (1.00 | )% | | | | 34.67 | % | | | | (22.80 | )% | | | | 2.91 | % | | | | (10.87 | )% | | | | (0.96 | )% |
Ratios/Supplemental Data: | | | | | | | | | | | | | | | | | | | | | | | | | | | | | | | | | | | | | | | | | | | | | | | | | | |
Net assets, end of period (000’s) | | | $ | 498,564 | | | | $ | 532,366 | | | | $ | 1,000,299 | | | | $ | 1,308,100 | | | | $ | 2,004,694 | | | | $ | 301,786 | | | | $ | 189,907 | | | | $ | 283,712 | | | | $ | 447,963 | | | | $ | 970,102 | |
Net expenses to average daily net assets(e) | | | | 1.07 | % | | | | 1.09 | % | | | | 1.07 | % | | | | 1.06 | %(f) | | | | 1.06 | %(f) | | | | 1.01 | % | | | | 1.04 | % | | | | 1.02 | % | | | | 1.01 | %(f) | | | | 1.01 | %(f) |
Net investment income (loss) to average daily net assets(b) | | | | 2.08 | % | | | | 2.57 | % | | | | 2.66 | % | | | | 2.33 | % | | | | 1.97 | % | | | | 2.07 | % | | | | 2.45 | % | | | | 2.55 | % | | | | 2.45 | % | | | | 2.12 | % |
Portfolio turnover rate | | | | 62 | %(g) | | | | 104 | % | | | | 94 | % | | | | 98 | % | | | | 119 | % | | | | 62 | %(g) | | | | 104 | % | | | | 94 | % | | | | 98 | % | | | | 119 | % |
Fees and expenses reimbursed and/or waived by GMO to average daily net assets: | | | | 0.04 | % | | | | 0.03 | % | | | | 0.03 | % | | | | 0.03 | % | | | | 0.03 | % | | | | 0.03 | % | | | | 0.01 | % | | | | 0.01 | % | | | | 0.01 | % | | | | 0.01 | % |
Purchase premiums and redemption fees consisted of the following per share amounts (Note 2):† | | | $ | 0.09 | (a) | | | $ | 0.10 | (a) | | | $ | 0.11 | (a) | | | $ | 0.10 | (a) | | | $ | 0.07 | (a) | | | $ | 0.09 | (a) | | | $ | 0.10 | (a) | | | $ | 0.11 | (a) | | | $ | 0.11 | (a) | | | $ | 0.09 | (a) |
| | | | | | | | | | | | | | | | | | | | | | | | | | | | | | | | | | | | | | | | | | | | | | | | | | |
| | | Class IV Shares | | Class V Shares |
| | | Year Ended February 28/29, | | Year Ended February 28/29, |
| | | 2017(a) | | 2016(a) | | 2015(a) | | 2014(a) | | 2013(a) | | 2017(a) | | 2016(a) | | 2015(a) | | 2014(a) | | 2013(a) |
Net asset value, beginning of period | | | $ | 22.65 | | | | $ | 30.30 | | | | $ | 30.45 | | | | $ | 35.04 | | | | $ | 36.09 | | | | $ | 22.59 | | | | $ | 30.24 | | | | $ | 30.39 | | | | $ | 34.98 | | | | $ | 36.03 | |
| | | | | | | | | | | | | | | | | | | | | | | | | | | | | | | | | | | | | | | | | | | | | | | | | | |
Income (loss) from investment operations: | | | | | | | | | | | | | | | | | | | | | | | | | | | | | | | | | | | | | | | | | | | | | | | | | | |
Net investment income (loss)(b)† | | | | 0.53 | | | | | 0.69 | | | | | 0.84 | | | | | 0.84 | | | | | 0.66 | | | | | 0.61 | | | | | 0.72 | | | | | 0.87 | | | | | 0.78 | | | | | 0.75 | |
Net realized and unrealized gain (loss) | | | | 7.24 | | | | | (7.50 | ) | | | | 0.00 | (c) | | | | (4.59 | ) | | | | (0.96 | ) | | | | 7.15 | | | | | (7.50 | ) | | | | 0.00 | (c) | | | | (4.50 | ) | | | | (1.05 | ) |
| | | | | | | | | | | | | | | | | | | | | | | | | | | | | | | | | | | | | | | | | | | | | | | | | | |
Total from investment operations | | | | 7.77 | | | | | (6.81 | ) | | | | 0.84 | | | | | (3.75 | ) | | | | (0.30 | ) | | | | 7.76 | | | | | (6.78 | ) | | | | 0.87 | | | | | (3.72 | ) | | | | (0.30 | ) |
| | | | | | | | | | | | | | | | | | | | | | | | | | | | | | | | | | | | | | | | | | | | | | | | | | |
Less distributions to shareholders: | | | | | | | | | | | | | | | | | | | | | | | | | | | | | | | | | | | | | | | | | | | | | | | | | | |
From net investment income | | | | (0.64 | ) | | | | (0.84 | ) | | | | (0.99 | ) | | | | (0.84 | ) | | | | (0.75 | ) | | | | (0.65 | ) | | | | (0.87 | ) | | | | (1.02 | ) | | | | (0.87 | ) | | | | (0.75 | ) |
From net realized gains | | | | — | | | | | — | | | | | — | | | | | — | | | | | — | | | | | — | | | | | — | | | | | — | | | | | — | | | | | — | |
| | | | | | | | | | | | | | | | | | | | | | | | | | | | | | | | | | | | | | | | | | | | | | | | | | |
Total distributions | | | | (0.64 | ) | | | | (0.84 | ) | | | | (0.99 | ) | | | | (0.84 | ) | | | | (0.75 | ) | | | | (0.65 | ) | | | | (0.87 | ) | | | | (1.02 | ) | | | | (0.87 | ) | | | | (0.75 | ) |
| | | | | | | | | | | | | | | | | | | | | | | | | | | | | | | | | | | | | | | | | | | | | | | | | | |
Net asset value, end of period | | | $ | 29.78 | | | | $ | 22.65 | | | | $ | 30.30 | | | | $ | 30.45 | | | | $ | 35.04 | | | | $ | 29.70 | | | | $ | 22.59 | | | | $ | 30.24 | | | | $ | 30.39 | | | | $ | 34.98 | |
| | | | | | | | | | | | | | | | | | | | | | | | | | | | | | | | | | | | | | | | | | | | | | | | | | |
Total Return(d) | | | | 34.61 | % | | | | (22.69 | )% | | | | 2.88 | % | | | | (10.81 | )% | | | | (0.81 | )% | | | | 34.67 | % | | | | (22.67 | )% | | | | 2.93 | % | | | | (10.74 | )% | | | | (0.78 | )% |
Ratios/Supplemental Data: | | | | | | | | | | | | | | | | | | | | | | | | | | | | | | | | | | | | | | | | | | | | | | | | | | |
Net assets, end of period (000’s) | | | $ | 582,311 | | | | $ | 268,085 | | | | $ | 837,963 | | | | $ | 748,429 | | | | $ | 1,481,411 | | | | $ | 110,257 | | | | $ | 269,570 | | | | $ | 170,125 | | | | $ | 406,384 | | | | $ | 677,796 | |
Net expenses to average daily net assets(e) | | | | 0.96 | % | | | | 0.99 | % | | | | 0.97 | % | | | | 0.96 | %(f) | | | | 0.96 | %(f) | | | | 0.91 | % | | | | 0.94 | % | | | | 0.92 | % | | | | 0.91 | %(f) | | | | 0.91 | %(f) |
Net investment income (loss) to average daily net assets(b) | | | | 1.92 | % | | | | 2.55 | % | | | | 2.64 | % | | | | 2.57 | % | | | | 1.99 | % | | | | 2.24 | % | | | | 2.69 | % | | | | 2.77 | % | | | | 2.39 | % | | | | 2.25 | % |
Portfolio turnover rate | | | | 62 | %(g) | | | | 104 | % | | | | 94 | % | | | | 98 | % | | | | 119 | % | | | | 62 | %(g) | | | | 104 | % | | | | 94 | % | | | | 98 | % | | | | 119 | % |
Fees and expenses reimbursed and/ or waived by GMO to average daily net assets: | | | | 0.03 | % | | | | 0.01 | % | | | | 0.01 | % | | | | 0.01 | % | | | | 0.01 | % | | | | 0.06 | % | | | | 0.04 | % | | | | 0.04 | % | | | | 0.04 | % | | | | 0.04 | % |
Purchase premiums and redemption fees consisted of the following per share amounts (Note 2):† | | | $ | 0.09 | (a) | | | $ | 0.10 | (a) | | | $ | 0.11 | (a) | | | $ | 0.10 | (a) | | | $ | 0.07 | (a) | | | $ | 0.08 | (a) | | | $ | 0.10 | (a) | | | $ | 0.10 | (a) | | | $ | 0.10 | (a) | | | $ | 0.01 | (a) |
| | | | |
| 44 | | See accompanying notes to the financial statements. | | |
GMO Trust Funds
Financial Highlights
(For a share outstanding throughout each period)
EMERGING MARKETS FUND (continued)
| | | | | | | | | | | | | | | | | | | | | | | | | |
| | | Class VI Shares |
| | | Year Ended February 28/29, |
| | | 2017(a) | | 2016(a) | | 2015(a) | | 2014(a) | | 2013(a) |
Net asset value, beginning of period | | | $ | 22.62 | | | | $ | 30.30 | | | | $ | 30.45 | | | | $ | 35.04 | | | | $ | 36.12 | |
| | | | | | | | | | | | | | | | | | | | | | | | | |
Income (loss) from investment operations: | | | | | | | | | | | | | | | | | | | | | | | | | |
Net investment income (loss)(b)† | | | | 0.63 | | | | | 0.69 | | | | | 0.90 | | | | | 0.78 | | | | | 0.72 | |
Net realized and unrealized gain (loss) | | | | 7.17 | | | | | (7.50 | ) | | | | (0.03 | )(h) | | | | (4.47 | ) | | | | (1.02 | ) |
| | | | | | | | | | | | | | | | | | | | | | | | | |
Total from investment operations | | | | 7.80 | | | | | (6.81 | ) | | | | 0.87 | | | | | (3.69 | ) | | | | (0.30 | ) |
| | | | | | | | | | | | | | | | | | | | | | | | | |
Less distributions to shareholders: | | | | | | | | | | | | | | | | | | | | | | | | | |
From net investment income | | | | (0.65 | ) | | | | (0.87 | ) | | | | (1.02 | ) | | | | (0.90 | ) | | | | (0.78 | ) |
From net realized gains | | | | — | | | | | — | | | | | — | | | | | — | | | | | — | |
| | | | | | | | | | | | | | | | | | | | | | | | | |
Total distributions | | | | (0.65 | ) | | | | (0.87 | ) | | | | (1.02 | ) | | | | (0.90 | ) | | | | (0.78 | ) |
| | | | | | | | | | | | | | | | | | | | | | | | | |
Net asset value, end of period | | | $ | 29.77 | | | | $ | 22.62 | | | | $ | 30.30 | | | | $ | 30.45 | | | | $ | 35.04 | |
| | | | | | | | | | | | | | | | | | | | | | | | | |
Total Return(d) | | | | 34.83 | % | | | | (22.71 | )% | | | | 2.96 | % | | | | (10.69 | )% | | | | (0.82 | )% |
Ratios/Supplemental Data: | | | | | | | | | | | | | | | | | | | | | | | | | |
Net assets, end of period (000’s) | | | $ | 3,524,022 | | | | $ | 3,661,271 | | | | $ | 5,194,557 | | | | $ | 5,220,293 | | | | $ | 5,673,002 | |
Net expenses to average daily net assets(e) | | | | 0.89 | % | | | | 0.91 | % | | | | 0.89 | % | | | | 0.88 | %(f) | | | | 0.88 | %(f) |
Net investment income (loss) to average daily net assets(b) | | | | 2.32 | % | | | | 2.61 | % | | | | 2.79 | % | | | | 2.43 | % | | | | 2.12 | % |
Portfolio turnover rate | | | | 62 | %(g) | | | | 104 | % | | | | 94 | % | | | | 98 | % | | | | 119 | % |
Fees and expenses reimbursed and/or waived by GMO to average daily net assets: | | | | 0.06 | % | | | | 0.04 | % | | | | 0.04 | % | | | | 0.04 | % | | | | 0.04 | % |
Purchase premiums and redemption fees consisted of the following per share amounts (Note 2):† | | | $ | 0.08 | (a) | | | $ | 0.09 | (a) | | | $ | 0.11 | (a) | | | $ | 0.10 | (a) | | | $ | 0.07 | (a) |
| (a) | Per share amounts were adjusted to reflect a 1:3 reverse stock split effective July 15, 2016. |
| (b) | Net investment income is affected by the timing of the declaration of dividends by the underlying funds in which the Fund invests, if any. |
| (c) | Net realized and unrealized gain (loss) was less than $0.01 per share. |
| (d) | The total returns would have been lower had certain expenses not been reimbursed and/or waived during the periods shown, if applicable, and assumes the effect of reinvested distributions, if any. Calculation excludes purchase premiums and redemption fees which are borne by the shareholder purchasing or redeeming Fund shares, if any. |
| (e) | Net expenses exclude expenses incurred indirectly through investment in the underlying funds (Note 5). |
| (f) | The net expense ratio does not include the effect of expense reductions (Note 2). |
| (g) | The portfolio turnover rate excludes investments in GMO U.S. Treasury Fund (“USTF”) which is used as a short-term investment vehicle for cash management. The Fund’s portfolio turnover rate during the year ended February 28, 2017, including transactions in USTF, was 80% of the average value of its portfolio. |
| (h) | The amount shown for a share outstanding does not correspond with the aggregate net realized and unrealized gain (loss) on investments due to the timing of purchases and redemptions of Fund shares in relation to fluctuating market values of the investments of the Fund. |
| † | Calculated using average shares outstanding throughout the period. |
| | | | |
| | See accompanying notes to the financial statements. | | 45 |
GMO Trust Funds
Financial Highlights
(For a share outstanding throughout each period)
TAIWAN FUND
| | | | | | | | | | | | | | | | | | | | | | | | | |
| | | Class III Shares |
| | | Year Ended February 28/29, |
| | | 2017 | | 2016 | | 2015 | | 2014 | | 2013 |
Net asset value, beginning of period | | | $ | 16.97 | | | | $ | 22.52 | | | | $ | 21.30 | | | | $ | 20.43 | | | | $ | 21.60 | |
| | | | | | | | | | | | | | | | | | | | | | | | | |
Income (loss) from investment operations: | | | | | | | | | | | | | | | | | | | | | | | | | |
Net investment income (loss)(a)† | | | | 0.49 | | | | | 0.56 | | | | | 0.46 | | | | | 0.17 | | | | | 0.34 | |
Net realized and unrealized gain (loss) | | | | 4.11 | | | | | (4.70 | ) | | | | 1.38 | | | | | 0.90 | | | | | (0.87 | )(b) |
| | | | | | | | | | | | | | | | | | | | | | | | | |
Total from investment operations | | | | 4.60 | | | | | (4.14 | ) | | | | 1.84 | | | | | 1.07 | | | | | (0.53 | ) |
| | | | | | | | | | | | | | | | | | | | | | | | | |
Less distributions to shareholders: | | | | | | | | | | | | | | | | | | | | | | | | | |
From net investment income | | | | (0.56 | ) | | | | (0.48 | ) | | | | (0.51 | ) | | | | (0.20 | ) | | | | (0.23 | ) |
From net realized gains | | | | — | | | | | (0.93 | ) | | | | (0.11 | ) | | | | — | | | | | (0.41 | ) |
| | | | | | | | | | | | | | | | | | | | | | | | | |
Total distributions | | | | (0.56 | ) | | | | (1.41 | ) | | | | (0.62 | ) | | | | (0.20 | ) | | | | (0.64 | ) |
| | | | | | | | | | | | | | | | | | | | | | | | | |
Net asset value, end of period | | | $ | 21.01 | | | | $ | 16.97 | | | | $ | 22.52 | | | | $ | 21.30 | | | | $ | 20.43 | |
| | | | | | | | | | | | | | | | | | | | | | | | | |
Total Return(c) | | | | 27.53 | % | | | | (19.02 | )% | | | | 8.75 | % | | | | 5.26 | % | | | | (2.25 | )% |
Ratios/Supplemental Data: | | | | | | | | | | | | | | | | | | | | | | | | | |
Net assets, end of period (000’s) | | | $ | 124,639 | | | | $ | 91,548 | | | | $ | 117,745 | | | | $ | 151,393 | | | | $ | 56,283 | |
Net expenses to average daily net assets(d) | | | | 1.33 | % | | | | 1.33 | % | | | | 1.27 | % | | | | 1.35 | %(e) | | | | 1.38 | %(e) |
Net investment income (loss) to average daily net assets(a) | | | | 2.58 | % | | | | 2.88 | % | | | | 2.01 | % | | | | 0.82 | % | | | | 1.71 | % |
Portfolio turnover rate | | | | 97 | %(f) | | | | 90 | % | | | | 134 | % | | | | 201 | % | | | | 156 | % |
Fees and expenses reimbursed and/or waived by GMO to average daily net assets: | | | | — | | | | | — | | | | | — | | | | | — | | | | | 0.00 | %(g) |
Purchase premiums and redemption fees consisted of the following per share amounts (Note 2):† | | | $ | 0.05 | | | | $ | 0.03 | | | | $ | 0.06 | | | | $ | 0.03 | | | | $ | 0.04 | |
| (a) | Net investment income is affected by the timing of the declaration of dividends by the underlying funds in which the Fund invests, if any. |
| (b) | The amount shown for a share outstanding does not correspond with the aggregate net realized and unrealized gain (loss) on investments due to the timing of purchases and redemptions of Fund shares in relation to fluctuating market values of the investments of the Fund. |
| (c) | The total return would have been lower had certain expenses not been reimbursed and/or waived during the periods shown, if applicable, and assumes the effect of reinvested distributions, if any. Calculation excludes purchase premiums and redemption fees which are borne by the shareholder purchasing or redeeming Fund shares, if any. |
| (d) | Net expenses exclude expenses incurred indirectly through investment in the underlying funds (Note 5). |
| (e) | The net expense ratio does not include the effect of expense reductions (Note 2). |
| (f) | The portfolio turnover rate excludes investments in GMO U.S. Treasury Fund (“USTF”) which is used as a short-term investment vehicle for cash management. The Fund’s portfolio turnover rate during the year ended February 28, 2017, including transactions in USTF, was 109% of the average value of its portfolio. |
| (g) | Ratio is less than 0.01%. |
| † | Calculated using average shares outstanding throughout the period. |
| | | | |
| 46 | | See accompanying notes to the financial statements. | | |
GMO Trust Funds
Notes to Financial Statements
February 28, 2017
Each of Emerging Countries Fund, Emerging Domestic Opportunities Fund, Emerging Markets Fund and Taiwan Fund (each a “Fund” and collectively the “Funds”) is a series of GMO Trust (the “Trust”). The Trust is registered under the Investment Company Act of 1940, as amended (the “1940 Act”), as an open-end management investment company. The Trust was established as a Massachusetts business trust under the laws of The Commonwealth of Massachusetts on June 24, 1985. The Declaration of Trust permits the Trustees of the Trust (“Trustees”) to create an unlimited number of series of shares (Funds) and to subdivide Funds into classes. The Funds are advised and managed by Grantham, Mayo, Van Otterloo & Co. LLC (“GMO”).
The Funds may invest in GMO U.S. Treasury Fund and in money market funds unaffiliated with GMO.
The following table provides information about the Funds’ principal investment objectives and benchmarks (if any):
| | | | |
| | | |
| Fund Name | | Benchmark | | Investment Objective |
| Emerging Countries Fund | | S&P/IFCI Composite Index | | Total return in excess of benchmark |
| Emerging Domestic Opportunities Fund | | Not Applicable | | Total Return |
| Emerging Markets Fund | | S&P/IFCI Composite Index | | Total return in excess of benchmark |
| Taiwan Fund | | MSCI Taiwan Index | | Total return in excess of benchmark |
Taiwan Fund currently limits subscriptions.
| 2. | Significant accounting policies |
The following is a summary of significant accounting policies followed by each Fund in the preparation of its financial statements. These policies are in conformity with accounting principles generally accepted in the United States of America (“U.S. GAAP”) and have been consistently followed by the Funds in preparing these financial statements. The preparation of financial statements in accordance with U.S. GAAP requires management to make estimates and assumptions that affect the reported amounts and disclosures in the financial statements. Actual results could differ from those estimates. The accounting records of the Funds are maintained in U.S. dollars.
Portfolio valuation
Exchange-traded securities (other than exchange-traded options) for which market quotations are readily available are valued at (i) the last sale price or (ii) official closing price or (iii) most recent quoted price published by the exchange (if no reported last sale or official closing price) or (iv) the quoted price provided by a pricing source (in the event GMO deems the private market to be a more reliable indicator of market value than the exchange). Exchange-traded options are valued at the last sale price, provided that price is between the closing bid and ask prices. If the last sale price is not within this range, then they will be valued at the closing bid price for long positions and the closing ask price for short positions. Cleared derivatives are valued using the price quoted (which may be based on a model) by the relevant clearing house. If an updated quote for a cleared derivative is not available by the time that a Fund calculates its net asset value on any business day, then that derivative will generally be valued using an industry standard model, which may differ from the model used by the relevant clearing house. Over-the-counter (“OTC”) derivatives are generally valued at the price determined by an industry standard model. Unlisted securities for which market quotations are readily available are generally valued at the most recent quoted price. Shares of the underlying funds and other open-end registered investment companies are valued at their most recent net asset value. If quotations are not readily available or circumstances make an existing valuation methodology or procedure unreliable, derivatives and other securities are valued at fair value as determined in good faith by the Trustees or persons acting at their direction pursuant to procedures approved by the Trustees. Because of the uncertainty inherent in pricing, and in particular fair value pricing, the value determined for a particular security may be materially different from the value realized upon its sale. See the table below for information about securities and derivatives, if any, that were fair valued using methods determined in good faith by or at the direction of the Trustees. The Funds and/or the underlying funds classify such securities as Level 3 (levels defined below). For the year ended February 28, 2017, the Funds did not reduce the value of any of their OTC derivatives contracts, if any, based on the creditworthiness of their counterparties. See Note 4 “Derivative financial instruments” for a further discussion on valuation of derivatives.
The foregoing valuation methodologies are modified for equities that trade in non-U.S. securities markets which close prior to the close of the New York Stock Exchange (“NYSE”) due to time zone differences, including the value of equities that underlie futures, options and other derivatives (to the extent the market for those derivatives closes prior to the close of the NYSE). In those cases, the price will generally be adjusted, to the extent practicable and available, based on inputs from an independent pricing service approved by the Trustees that are intended to reflect valuation changes through the NYSE close. The table below shows the percentage of the net assets of the Funds, held either directly or through investments in the underlying funds, if any, that were valued using fair value inputs obtained from that independent pricing service as of February 28, 2017. These securities listed on foreign exchanges (including the value of equity securities that underlie futures, options and other
47
GMO Trust Funds
Notes to Financial Statements — (Continued)
February 28, 2017
derivatives (to the extent the market for such instruments closes prior to the close of the NYSE)) are classified as Level 2 (levels defined below) in the table below.
“Quoted price” typically means the bid price for securities held long and the ask price for securities sold short. If a market quotation for a security does not involve a bid or an ask, the “quoted price” may be the price provided by a market participant or other third-party pricing source in accordance with the market practice for that security. If an updated quoted price for a security is not available by the time that a Fund calculates its net asset value on any business day, the Fund will generally use the last quoted price so long as GMO believes that the last quoted price continues to represent that security’s fair value.
In the case of derivatives, prices determined by a model may reflect an estimate of the average of bid and ask prices, regardless of whether a Fund has a long position or a short position.
As discussed above, certain of the Funds and underlying funds invest in securities and/or derivatives which may have been fair valued using methods determined in good faith by or at the direction of the Trustees or fair valued using inputs obtained from an independent pricing service. The table below presents securities and/or derivatives on a net basis, based on market values or unrealized appreciation/(depreciation), which will tend to understate the Funds’ exposure. The net aggregate direct and indirect exposure to these valuation methodologies (based on each Fund’s net assets) as of February 28, 2017 is as follows:
Securities and derivatives
| | | | | | | | |
| | | |
| Fund Name | | Fair valued using
methods determined in
good faith by or at the
direction of the Trustees | | | Fair valued using
inputs obtained
from an
independent
pricing service (Net) | |
Emerging Countries Fund | | | <1% | | | | 84% | |
Emerging Domestic Opportunities Fund | | | — | | | | 72% | |
Emerging Markets Fund | | | <1% | | | | 90% | |
Taiwan Fund | | | — | | | | 89% | |
U.S. GAAP requires the Funds to disclose the fair value of their investments in a three-level hierarchy (Levels 1, 2 and 3). The valuation hierarchy is based upon the relative observability of inputs to the valuation of the Funds’ investments. The inputs or methodologies used for valuing securities are not necessarily an indication of the risk associated with investing in those securities.
Changes in valuation techniques may result in transfers into or out of an investment’s assigned level within the fair value hierarchy. In addition, in periods of market dislocation, the observability of prices and inputs may be reduced for many instruments. This condition, as well as changes related to the liquidity of investments, could cause a security to be reclassified between levels.
U.S. GAAP requires additional disclosures about fair value measurements for material Level 3 securities and derivatives, if any (determined by each category of asset or liability as compared to a Fund’s total net assets separately identified in the table below). At February 28, 2017, there were no direct material Level 3 classes of investments or derivatives with significant unobservable inputs subject to this additional disclosure.
The three levels are defined as follows:
Level 1 – Valuations based on quoted prices for identical securities in active markets.
The types of assets and liabilities categorized in Level 1 generally include actively traded domestic and certain foreign equity securities; certain U.S. government obligations; derivatives actively traded on a national securities exchange (such as some futures and options); and shares of open-end mutual funds (even if their investments are valued using Level 2 or Level 3 inputs).
Level 2 – Valuations determined using other significant direct or indirect observable inputs.
The types of assets and liabilities categorized in Level 2 generally include cleared derivatives and certain OTC derivatives such as swaps, options, swaptions, and forward currency contracts valued using industry standard models; certain restricted securities valued at the most recent available market or quoted price; certain securities that are valued at the local price and adjusted by applying a premium or discount when the holdings exceed foreign ownership limitations; and certain foreign equity securities that are adjusted based on inputs from an independent pricing service
48
GMO Trust Funds
Notes to Financial Statements — (Continued)
February 28, 2017
approved by the Trustees, including the value of equity securities that underlie futures, options and other derivatives (to the extent the market for such instruments closes prior to the close of the NYSE) to reflect estimated valuation changes through the NYSE close.
Level 3 – Valuations based primarily on inputs that are unobservable and significant.
The types of assets and liabilities categorized in Level 3 generally include, but are not limited to, securities whose trading has been suspended or that have been de-listed from their current primary trading exchange valued at the most recent available market or quoted price; securities in default or bankruptcy proceedings for which there is no current market quotation valued at the most recent available market or quoted price; third-party investment funds where valuations are provided by fund sponsors and which are adjusted for liquidity considerations as well as the timing of the receipt of information; certain equity securities valued based on the last traded exchange price adjusted for the movement in a relevant index; certain securities that are valued using a price from a comparable security related to the same issuer; and certain recently acquired equity securities that have yet to begin trading that are valued at cost.
The following is a summary of the respective levels assigned to the Funds’ direct securities and derivatives, if any, as of February 28, 2017:
| | | | | | | | | | | | | | | | |
| | | | | |
| Description | | Level 1 | | | Level 2 | | | Level 3 | | | Total | |
Emerging Countries Fund | | | | | | | | | | | | | | | | |
Asset Valuation Inputs | | | | | | | | | | | | | | | | |
Common Stocks | | | | | | | | | | | | | | | | |
Belgium | | $ | 21,898 | | | $ | — | | | $ | — | | | $ | 21,898 | |
Brazil | | | 121,418 | | | | 261,369 | | | | — | | | | 382,787 | |
Chile | | | 34,125 | | | | 2,772 | | | | — | | | | 36,897 | |
China | | | 826,719 | | | | 4,968,850 | | | | — | | | | 5,795,569 | |
Czech Republic | | | — | | | | 20,931 | | | | — | | | | 20,931 | |
Egypt | | | — | | | | 44,103 | | | | — | | | | 44,103 | |
Greece | | | — | | | | 185,395 | | | | — | | | | 185,395 | |
India | | | 354,276 | | | | 2,657,175 | | | | — | | | | 3,011,451 | |
Indonesia | | | 42,750 | | | | 153,476 | | | | — | | | | 196,226 | |
Malaysia | | | — | | | | 61,794 | | | | — | | | | 61,794 | |
Mexico | | | 374,202 | | | | — | | | | — | | | | 374,202 | |
Philippines | | | — | | | | 155,508 | | | | — | | | | 155,508 | |
Poland | | | — | | | | 8,954 | | | | — | | | | 8,954 | |
Qatar | | | — | | | | 63,349 | | | | — | | | | 63,349 | |
Russia | | | 715,189 | | | | 1,267,519 | | | | — | | | | 1,982,708 | |
South Africa | | | — | | | | 136,018 | | | | — | | | | 136,018 | |
South Korea | | | 40,680 | | | | 3,808,583 | | | | — | | | | 3,849,263 | |
Taiwan | | | 552,485 | | | | 5,660,492 | | | | 0 | § | | | 6,212,977 | |
Thailand | | | — | | | | 475,994 | | | | — | | | | 475,994 | |
Turkey | | | 18,975 | | | | 1,700,573 | | | | — | | | | 1,719,548 | |
United Arab Emirates | | | — | | | | 60,872 | | | | — | | | | 60,872 | |
United Kingdom | | | — | | | | 173,100 | | | | — | | | | 173,100 | |
Vietnam | | | — | | | | 55,669 | | | | — | | | | 55,669 | |
| | | | | | | | | | | | | | | | | |
TOTAL COMMON STOCKS | | | 3,102,717 | | | | 21,922,496 | | | | 0 | § | | | 25,025,213 | |
| | | | | | | | | | | | | | | | | |
Preferred Stocks | | | | | | | | | | | | | | | | |
Brazil | | | 162,465 | | | | 253,564 | | | | — | | | | 416,029 | |
Russia | | | — | | | | 59,249 | | | | — | | | | 59,249 | |
South Korea | | | — | | | | 853,936 | | | | — | | | | 853,936 | |
| | | | | | | | | | | | | | | | | |
TOTAL PREFERRED STOCKS | | | 162,465 | | | | 1,166,749 | | | | — | | | | 1,329,214 | |
| | | | | | | | | | | | | | | | | |
Investment Funds | | | | | | | | | | | | | | | | |
Thailand | | | — | | | | 150,366 | | | | — | | | | 150,366 | |
United States | | | 717,973 | | | | — | | | | — | | | | 717,973 | |
| | | | | | | | | | | | | | | | | |
TOTAL INVESTMENT FUNDS | | | 717,973 | | | | 150,366 | | | | — | | | | 868,339 | |
| | | | | | | | | | | | | | | | | |
| | | | | | | | | | | | | | | | | |
49
GMO Trust Funds
Notes to Financial Statements — (Continued)
February 28, 2017
| | | | | | | | | | | | | | | | |
| | | | | |
| Description | | Level 1 | | | Level 2 | | | Level 3 | | | Total | |
Emerging Countries Fund (continued) | | | | | | | | | | | | | | | | |
Asset Valuation Inputs (continued) | | | | | | | | | | | | | | | | |
Rights/Warrants | | | | | | | | | | | | | | | | |
Brazil | | $ | — | | | $ | — | | | $ | 1,345 | | | $ | 1,345 | |
Thailand | | | 201 | | | | — | | | | — | | | | 201 | |
| | | | | | | | | | | | | | | | | |
TOTAL RIGHTS/WARRANTS | | | 201 | | | | — | | | | 1,345 | | | | 1,546 | |
| | | | | | | | | | | | | | | | | |
Short-Term Investments | | | 62,956 | | | | — | | | | — | | | | 62,956 | |
| | | | | | | | | | | | | | | | | |
Total Investments | | | 4,046,312 | | | | 23,239,611 | | | | 1,345 | | | | 27,287,268 | |
| | | | | | | | | | | | | | | | | |
Total | | $ | 4,046,312 | | | $ | 23,239,611 | | | $ | 1,345 | | | $ | 27,287,268 | |
| | | | | | | | | | | | | | | | | |
Liability Valuation Inputs | | | | | | | | | | | | | | | | |
Derivatives^ | | | | | | | | | | | | | | | | |
Futures Contracts | | | | | | | | | | | | | | | | |
Equity Risk | | $ | (696 | ) | | $ | — | | | $ | — | | | $ | (696 | ) |
| | | | | | | | | | | | | | | | | |
Total | | $ | (696 | ) | | $ | — | | | $ | — | | | $ | (696 | ) |
| | | | | | | | | | | | | | | | | |
| | | | | | | | | | | | | | | | | |
Emerging Domestic Opportunities Fund | | | | | | | | | | | | | | | | |
Asset Valuation Inputs | | | | | | | | | | | | | | | | |
Common Stocks | | | | | | | | | | | | | | | | |
Belgium | | $ | 8,211,751 | | | $ | — | | | $ | — | | | $ | 8,211,751 | |
Brazil | | | — | | | | 55,258,299 | | | | — | | | | 55,258,299 | |
China | | | 106,909,785 | | | | 239,599,075 | | | | — | | | | 346,508,860 | |
India | | | — | | | | 281,270,364 | | | | — | | | | 281,270,364 | |
Indonesia | | | — | | | | 35,367,556 | | | | — | | | | 35,367,556 | |
Malaysia | | | — | | | | 5,624,719 | | | | — | | | | 5,624,719 | |
Mexico | | | 27,325,090 | | | | — | | | | — | | | | 27,325,090 | |
Philippines | | | — | | | | 118,896,580 | | | | — | | | | 118,896,580 | |
Qatar | | | — | | | | 30,830,345 | | | | — | | | | 30,830,345 | |
Russia | | | 8,421,400 | | | | 76,754,052 | | | | — | | | | 85,175,452 | |
South Africa | | | — | | | | 31,175,120 | | | | — | | | | 31,175,120 | |
South Korea | | | — | | | | 30,859,305 | | | | — | | | | 30,859,305 | |
Taiwan | | | — | | | | 93,844,741 | | | | — | | | | 93,844,741 | |
Thailand | | | — | | | | 104,088,855 | | | | — | | | | 104,088,855 | |
Turkey | | | — | | | | 8,353,061 | | | | — | | | | 8,353,061 | |
United Arab Emirates | | | — | | | | 34,603,549 | | | | — | | | | 34,603,549 | |
United Kingdom | | | — | | | | 108,313,372 | | | | — | | | | 108,313,372 | |
Vietnam | | | — | | | | 31,007,579 | | | | — | | | | 31,007,579 | |
| | | | | | | | | | | | | | | | | |
TOTAL COMMON STOCKS | | | 150,868,026 | | | | 1,285,846,572 | | | | — | | | | 1,436,714,598 | |
| | | | | | | | | | | | | | | | | |
Preferred Stocks | | | | | | | | | | | | | | | | |
Brazil | | | — | | | | 49,854,297 | | | | — | | | | 49,854,297 | |
| | | | | | | | | | | | | | | | | |
TOTAL PREFERRED STOCKS | | | — | | | | 49,854,297 | | | | — | | | | 49,854,297 | |
| | | | | | | | | | | | | | | | | |
Investment Funds | | | | | | | | | | | | | | | | |
Brazil | | | 36,054,788 | | | | — | | | | — | | | | 36,054,788 | |
China | | | 47,112,060 | | | | — | | | | — | | | | 47,112,060 | |
Taiwan | | | 104,017,246 | | | | — | | | | — | | | | 104,017,246 | |
Thailand | | | — | | | | 79,314,208 | | | | — | | | | 79,314,208 | |
United States | | | 129,524,284 | | | | — | | | | — | | | | 129,524,284 | |
| | | | | | | | | | | | | | | | | |
TOTAL INVESTMENT FUNDS | | | 316,708,378 | | | | 79,314,208 | | | | — | | | | 396,022,586 | |
| | | | | | | | | | | | | | | | | |
Rights/Warrants | | | | | | | | | | | | | | | | |
China | | | — | | | | 9,059,896 | | | | — | | | | 9,059,896 | |
| | | | | | | | | | | | | | | | | |
TOTAL RIGHTS/WARRANTS | | | — | | | | 9,059,896 | | | | — | | | | 9,059,896 | |
| | | | | | | | | | | | | | | | | |
| | | | | | | | | | | | | | | | | |
50
GMO Trust Funds
Notes to Financial Statements — (Continued)
February 28, 2017
| | | | | | | | | | | | | | | | |
| | | | | |
| Description | | Level 1 | | | Level 2 | | | Level 3 | | | Total | |
Emerging Domestic Opportunities Fund (continued) | | | | | | | | | | | | | | | | |
Asset Valuation Inputs (continued) | | | | | | | | | | | | | | | | |
Mutual Funds | | | | | | | | | | | | | | | | |
United States | | $ | 66,772,614 | | | $ | — | | | $ | — | | | $ | 66,772,614 | |
| | | | | | | | | | | | | | | | | |
TOTAL MUTUAL FUNDS | | | 66,772,614 | | | | — | | | | — | | | | 66,772,614 | |
| | | | | | | | | | | | | | | | | |
Fully Funded Total Return Swaps | | | — | | | | 46,850,399 | | | | — | | | | 46,850,399 | |
| | | | | | | | | | | | | | | | | |
Short-Term Investments | | | 18,949,432 | | | | — | | | | — | | | | 18,949,432 | |
| | | | | | | | | | | | | | | | | |
Total Investments | | | 553,298,450 | | | | 1,470,925,372 | | | | — | | | | 2,024,223,822 | |
| | | | | | | | | | | | | | | | | |
Derivatives^ | | | | | | | | | | | | | | | | |
Forward Currency Contracts | | | | | | | | | | | | | | | | |
Foreign Currency Risk | | | — | | | | 6,228,820 | | | | — | | | | 6,228,820 | |
Futures Contracts | | | | | | | | | | | | | | | | |
Equity Risk | | | 5,192,414 | | | | 375,554 | | | | — | | | | 5,567,968 | |
Swap Contracts | | | | | | | | | | | | | | | | |
Equity Risk | | | — | | | | 740,882 | | | | — | | | | 740,882 | |
| | | | | | | | | | | | | | | | | |
Total | | $ | 558,490,864 | | | $ | 1,478,270,628 | | | $ | — | | | $ | 2,036,761,492 | |
| | | | | | | | | | | | | | | | | |
Liability Valuation Inputs | | | | | | | | | | | | | | | | |
Derivatives^ | | | | | | | | | | | | | | | | |
Forward Currency Contracts | | | | | | | | | | | | | | | | |
Foreign Currency Risk | | $ | — | | | $ | (5,739,901 | ) | | $ | — | | | $ | (5,739,901 | ) |
| | | | | | | | | | | | | | | | | |
| | | $ | — | | | $ | (5,739,901 | ) | | $ | — | | | $ | (5,739,901 | ) |
| | | | | | | | | | | | | | | | | |
| | | | | | | | | | | | | | | | | |
Emerging Markets Fund | | | | | | | | | | | | | | | | |
Asset Valuation Inputs | | | | | | | | | | | | | | | | |
Common Stocks | | | | | | | | | | | | | | | | |
Belgium | | $ | 1,927,024 | | | $ | — | | | $ | — | | | $ | 1,927,024 | |
Brazil | | | — | | | | 120,195,296 | | | | — | | | | 120,195,296 | |
Chile | | | 11,710,725 | | | | 14,213,118 | | | | — | | | | 25,923,843 | |
China | | | 110,268,270 | | | | 911,971,465 | | | | 686,465 | | | | 1,022,926,200 | |
Czech Republic | | | — | | | | 7,785,007 | | | | — | | | | 7,785,007 | |
Egypt | | | — | | | | 7,959,744 | | | | — | | | | 7,959,744 | |
Greece | | | — | | | | 41,649,868 | | | | — | | | | 41,649,868 | |
India | | | 28,922,705 | | | | 580,292,835 | | | | — | | | | 609,215,540 | |
Indonesia | | | 1,815,450 | | | | 33,131,374 | | | | — | | | | 34,946,824 | |
Malaysia | | | — | | | | 9,626,439 | | | | — | | | | 9,626,439 | |
Mexico | | | 54,161,286 | | | | — | | | | — | | | | 54,161,286 | |
Philippines | | | — | | | | 41,355,944 | | | | — | | | | 41,355,944 | |
Poland | | | — | | | | 10,155,356 | | | | — | | | | 10,155,356 | |
Qatar | | | — | | | | 15,280,363 | | | | — | | | | 15,280,363 | |
Russia | | | 105,756,237 | | | | 166,686,888 | | | | — | | | | 272,443,125 | |
South Africa | | | — | | | | 43,919,987 | | | | — | | | | 43,919,987 | |
South Korea | | | 4,386,660 | | | | 685,453,122 | | | | — | | | | 689,839,782 | |
Sri Lanka | | | — | | | | 1,028,843 | | | | — | | | | 1,028,843 | |
Taiwan | | | 53,007,448 | | | | 1,199,476,319 | | | | — | | | | 1,252,483,767 | |
Thailand | | | — | | | | 111,876,775 | | | | — | | | | 111,876,775 | |
Turkey | | | 1,758,900 | | | | 247,361,228 | | | | — | | | | 249,120,128 | |
United Arab Emirates | | | — | | | | 33,266,398 | | | | — | | | | 33,266,398 | |
United Kingdom | | | — | | | | 28,923,512 | | | | — | | | | 28,923,512 | |
Vietnam | | | — | | | | 10,177,380 | | | | — | | | | 10,177,380 | |
| | | | | | | | | | | | | | | | | |
TOTAL COMMON STOCKS | | | 373,714,705 | | | | 4,321,787,261 | | | | 686,465 | | | | 4,696,188,431 | |
| | | | | | | | | | | | | | | | | |
| | | | | | | | | | | | | | | | | |
51
GMO Trust Funds
Notes to Financial Statements — (Continued)
February 28, 2017
| | | | | | | | | | | | | | | | |
| | | | | |
| Description | | Level 1 | | | Level 2 | | | Level 3 | | | Total | |
Emerging Markets Fund (continued) | | | | | | | | | | | | | | | | |
Asset Valuation Inputs (continued) | | | | | | | | | | | | | | | | |
Preferred Stocks | | | | | | | | | | | | | | | | |
Brazil | | $ | 5,904,503 | | | $ | 28,687,393 | | | $ | — | | | $ | 34,591,896 | |
Russia | | | 66,429 | | | | 44,275,202 | | | | — | | | | 44,341,631 | |
South Korea | | | — | | | | 124,838,725 | | | | — | | | | 124,838,725 | |
| | | | | | | | | | | | | | | | | |
TOTAL PREFERRED STOCKS | | | 5,970,932 | | | | 197,801,320 | | | | — | | | | 203,772,252 | |
| | | | | | | | | | | | | | | | | |
Investment Funds | | | | | | | | | | | | | | | | |
India | | | — | | | | — | | | | 5,842,567 | | | | 5,842,567 | |
Russia | | | — | | | | — | | | | 2,083,527 | | | | 2,083,527 | |
Thailand | | | — | | | | 16,764,433 | | | | — | | | | 16,764,433 | |
United States | | | 9,569,985 | | | | — | | | | — | | | | 9,569,985 | |
| | | | | | | | | | | | | | | | | |
TOTAL INVESTMENT FUNDS | | | 9,569,985 | | | | 16,764,433 | | | | 7,926,094 | | | | 34,260,512 | |
| | | | | | | | | | | | | | | | | |
Rights/Warrants | | | | | | | | | | | | | | | | |
India | | | — | | | | — | | | | 23,428 | | | | 23,428 | |
Thailand | | | 109,746 | | | | — | | | | — | | | | 109,746 | |
| | | | | | | | | | | | | | | | | |
TOTAL RIGHTS/WARRANTS | | | 109,746 | | | | — | | | | 23,428 | | | | 133,174 | |
| | | | | | | | | | | | | | | | | |
Mutual Funds | | | | | | | | | | | | | | | | |
United States | | | 89,875,673 | | | | — | | | | — | | | | 89,875,673 | |
| | | | | | | | | | | | | | | | | |
TOTAL MUTUAL FUNDS | | | 89,875,673 | | | | — | | | | — | | | | 89,875,673 | |
| | | | | | | | | | | | | | | | | |
Fully Funded Total Return Swaps | | | — | | | | 925,653 | | | | — | | | | 925,653 | |
| | | | | | | | | | | | | | | | | |
Short-Term Investments | | | 15,001,718 | | | | — | | | | — | | | | 15,001,718 | |
| | | | | | | | | | | | | | | | | |
Total Investments | | | 494,242,759 | | | | 4,537,278,667 | | | | 8,635,987 | | | | 5,040,157,413 | |
| | | | | | | | | | | | | | | | | |
Derivatives^ | | | | | | | | | | | | | | | | |
Swap Contracts | | | | | | | | | | | | | | | | |
Equity Risk | | | — | | | | 1,035,331 | | | | — | | | | 1,035,331 | |
| | | | | | | | | | | | | | | | | |
Total | | $ | 494,242,759 | | | $ | 4,538,313,998 | | | $ | 8,635,987 | | | $ | 5,041,192,744 | |
| | | | | | | | | | | | | | | | | |
Liability Valuation Inputs | | | | | | | | | | | | | | | | |
Derivatives^ | | | | | | | | | | | | | | | | |
Futures Contracts | | | | | | | | | | | | | | | | |
Equity Risk | | $ | (133,506 | ) | | $ | — | | | $ | — | | | $ | (133,506 | ) |
| | | | | | | | | | | | | | | | | |
| | | $ | (133,506 | ) | | $ | — | | | $ | — | | | $ | (133,506 | ) |
| | | | | | | | | | | | | | | | | |
| | | | | | | | | | | | | | | | | |
Taiwan Fund | | | | | | | | | | | | | | | | |
Asset Valuation Inputs | | | | | | | | | | | | | | | | |
Common Stocks | | | | | | | | | | | | | | | | |
Taiwan | | $ | 7,502,068 | | | $ | 110,858,397 | | | $ | — | | | $ | 118,360,465 | |
| | | | | | | | | | | | | | | | | |
TOTAL COMMON STOCKS | | | 7,502,068 | | | | 110,858,397 | | | | — | | | | 118,360,465 | |
| | | | | | | | | | | | | | | | | |
Investment Funds | | | | | | | | | | | | | | | | |
Taiwan | | | 4,831,714 | | | | — | | | | — | | | | 4,831,714 | |
| | | | | | | | | | | | | | | | | |
TOTAL INVESTMENT FUNDS | | | 4,831,714 | | | | — | | | | — | | | | 4,831,714 | |
| | | | | | | | | | | | | | | | | |
Mutual Funds | | | | | | | | | | | | | | | | |
United States | | | 1,900,066 | | | | — | | | | — | | | | 1,900,066 | |
| | | | | | | | | | | | | | | | | |
TOTAL MUTUAL FUNDS | | | 1,900,066 | | | | — | | | | — | | | | 1,900,066 | |
| | | | | | | | | | | | | | | | | |
Total Investments | | | 14,233,848 | | | | 110,858,397 | | | | — | | | | 125,092,245 | |
| | | | | | | | | | | | | | | | | |
Total | | $ | 14,233,848 | | | $ | 110,858,397 | | | $ | — | | | $ | 125,092,245 | |
| | | | | | | | | | | | | | | | | |
| | | | | | | | | | | | | | | | | |
52
GMO Trust Funds
Notes to Financial Statements — (Continued)
February 28, 2017
The risks referenced in the tables above are not intended to be inclusive of all risks. Please see the “Investment and other risks” and “Derivative financial instruments” sections below for a further discussion of risks.
| | § | Represents the interest in securities that were determined to have a value of zero at February 28, 2017. |
| | ^ | The tables above are based on market values or unrealized appreciation/(depreciation) rather than the notional amounts of derivatives. The uncertainties surrounding the valuation inputs for a derivative are likely to be more significant to the Funds’ net asset values than the uncertainties surrounding inputs for a non-derivative security with the same market value. Excludes purchased options and fully funded total return swaps, if any, which are included in investments. |
Investments in other GMO Funds (“underlying funds”) held at year end are classified above as Level 1. For the summary of valuation inputs of the underlying funds, please refer to the underlying funds’ Notes to Financial Statements.
For all Funds for the year ended February 28, 2017, there were no significant transfers between Level 1 and Level 2.
The following is a reconciliation of securities and derivatives, if any, in which significant unobservable inputs (Level 3) were used in determining value:
| | | | | | | | | | | | | | | | | | | | | | | | | | | | | | | | | | | | | | | | |
| | | | | | | | | | | |
| | | Balances
as of
February 29,
2016 | | | Purchases | | | Sales | | | Accrued
Discounts/
Premiums | | | Total
Realized
Gain
(Loss) | | | Change in
Unrealized
Appreciation
(Depreciation) | | | Transfer
into
Level 3† | | | Transfer out
of Level 3† | | | Balances
as of
February 28, 2017 | | | Net Change in
Unrealized
Appreciation
(Depreciation)
from Investments
Still Held as of
February 28,
2017 | |
Emerging Countries Fund | | | | | | | | | | | | | | | | | | | | | | | | | | | | | | | | | | | | | | | | |
Common Stocks | | | | | | | | | | | | | | | | | | | | | | | | | | | | | | | | | | | | | | | | |
South Africa | | $ | 10 | | | $ | — | | | $ | (10 | ) | | $ | — | | | $ | — | | | $ | — | | | $ | — | | | $ | — | | | $ | — | | | $ | — | |
Right/Warrants | | | | | | | | | | | | | | | | | | | | | | | | | | | | | | | | | | | | | | | | |
Brazil | | | — | | | | 0 | | | | — | | | | — | | | | — | | | | 1,345 | | | | — | | | | — | | | | 1,345 | | | | 1,345 | |
| | | | | | | | | | | | | | | | | | | | | | | | | | | | | | | | | | | | | | | | | |
Total | | $ | 10 | | | $ | 0 | | | $ | (10 | ) | | $ | — | | | $ | — | | | $ | 1,345 | | | $ | — | | | $ | — | | | $ | 1,345 | | | $ | 1,345 | |
| | | | | | | | | | | | | | | | | | | | | | | | | | | | | | | | | | | | | | | | | |
| | | | | | | | | | | | | | | | | | | | | | | | | | | | | | | | | | | | | | | | | |
Emerging Markets Fund | | | | | | | | | | | | | | | | | | | | | | | | | | | | | | | | | | | | | |
Common Stocks | | | | | | | | | | | | | | | | | | | | | | | | | | | | | | | | | | | | | | | | |
China | | $ | — | | | $ | — | | | $ | — | | | $ | — | | | $ | — | | | $ | — | | | $ | 686,465 | ‡ | | $ | — | | | $ | 686,465 | | | $ | — | |
India | | | 27,968,473 | | | | — | | | | — | | | | — | | | | — | | | | 7,190,875 | | | | — | | | | (35,159,348 | )‡ | | | — | | | | — | |
Indonesia | | | 39,366 | | | | — | | | | — | | | | — | | | | — | | | | 94,838 | | | | — | | | | (134,204 | )‡ | | | — | | | | — | |
South Africa | | | 590 | | | | — | | | | (590 | ) | | | — | | | | — | | | | — | | | | — | | | | — | | | | — | | | | — | |
| | | | | | | | | | | | | | | | | | | | | | | | | | | | | | | | | | | | | | | | | |
Total Common Stocks | | $ | 28,008,429 | | | $ | — | | | $ | (590 | ) | | $ | — | | | $ | — | | | $ | 7,285,713 | | | $ | 686,465 | | | $ | (35,293,552 | ) | | $ | 686,465 | | | $ | — | |
| | | | | | | | | | | | | | | | | | | | | | | | | | | | | | | | | | | | | | | | | |
Investment Funds | | | | | | | | | | | | | | | | | | | | | | | | | | | | | | | | | | | | | | | | |
China | | $ | 369,539 | | | $ | — | | | $ | (381,966 | ) | | $ | — | | | $ | (37,678 | ) | | $ | 50,105 | | | $ | — | | | $ | — | | | $ | — | | | $ | — | |
India | | | 7,348,647 | | | | — | | | | — | | | | — | | | | — | | | | (1,506,080 | ) | | | — | | | | — | | | | 5,842,567 | | | | (1,506,080 | ) |
Poland | | | 185,987 | | | | — | | | | (189,544 | ) | | | — | | | | (282,176 | ) | | | 285,733 | | | | — | | | | — | | | | — | | | | — | |
Russia | | | 3,053,171 | | | | — | | | | — | | | | — | | | | — | | | | (969,644 | ) | | | — | | | | — | | | | 2,083,527 | | | | (969,644 | ) |
| | | | | | | | | | | | | | | | | | | | | | | | | | | | | | | | | | | | | | | | | |
Total Investment Funds | | $ | 10,957,344 | | | $ | — | | | $ | (571,510 | ) | | $ | — | | | $ | (319,854 | ) | | $ | (2,139,886 | ) | | $ | — | | | $ | — | | | $ | 7,926,094 | | | $ | (2,475,724 | ) |
| | | | | | | | | | | | | | | | | | | | | | | | | | | | | | | | | | | | | | | | | |
Total | | $ | 38,965,773 | | | $ | — | | | $ | (572,100 | ) | | $ | — | | | $ | (319,854 | ) | | $ | 5,145,827 | | | $ | 686,465 | | | $ | (35,293,552 | ) | | $ | 8,612,559 | | | $ | (2,475,724 | ) |
| | | | | | | | | | | | | | | | | | | | | | | | | | | | | | | | | | | | | | | | | |
Rights/Warrants | | | | | | | | | | | | | | | | | | | | | | | | | | | | | | | | | | | | | | | | |
India | | $ | — | | | $ | 0 | | | $ | — | | | $ | — | | | $ | — | | | $ | 23,428 | | | $ | — | | | $ | — | | | $ | 23,428 | | | $ | 23,428 | |
| | | | | | | | | | | | | | | | | | | | | | | | | | | | | | | | | | | | | | | | | |
Total | | $ | 38,965,773 | | | $ | 0 | | | $ | (572,100 | ) | | $ | — | | | $ | (319,854 | ) | | $ | 5,169,255 | | | $ | 686,465 | | | $ | (35,293,552 | ) | | $ | 8,635,987 | | | $ | (2,452,296 | ) |
| | | | | | | | | | | | | | | | | | | | | | | | | | | | | | | | | | | | | | | | | |
| | | | | | | | | | | | | | | | | | | | | | | | | | | | | | | | | | | | | | | | | |
| | † | The Funds account for securities and derivatives, if any, transferred into and out of Level 3 at the value at the end of the year. |
| | ‡ | Financial assets transferred between Level 2 and Level 3 were due to a change in observable and/or unobservable inputs. |
53
GMO Trust Funds
Notes to Financial Statements — (Continued)
February 28, 2017
The net aggregate direct and indirect exposure to investments in securities and/or derivatives using Level 3 inputs and presented on a net basis, which will tend to understate the Funds’ exposure, (based on each Fund’s net assets) as of February 28, 2017 were as follows:
| | | | |
| | |
| Fund Name | | Level 3 securities
and derivatives | |
Emerging Countries Fund | | | < 1% | |
Emerging Domestic Opportunities Fund | | | — | |
Emerging Markets Fund | | | < 1% | |
Taiwan Fund | | | — | |
Cash
Cash, foreign currency, and due to custodian, if any, on the Statements of Assets and Liabilities consist of cash balances held with the custodian or cash owed.
Due to/from broker
Due to/from broker in the Statements of Assets and Liabilities includes collateral on swap contracts, futures contracts, option contracts and forward currency contracts, if any, and may include marked-to-market amounts related to foreign currency or cash owed.
Foreign currency translation
The market values of foreign securities, currency holdings and related assets and liabilities are typically translated into U.S. dollars at the close of regular trading on the NYSE, generally at 4:00 pm Eastern time. Income and expenses denominated in foreign currencies are typically translated into U.S. dollars at the close of regular trading on the NYSE. Fluctuations in the value of currency holdings and other assets and liabilities resulting from changes in exchange rates are recorded as unrealized foreign currency gains or losses. Realized gains or losses and unrealized appreciation or depreciation on investment securities and income and expenses are translated on the respective dates of such transactions. The effects of changes in foreign currency exchange rates on investments in securities are not separated on the Statements of Operations from the effects of changes in market prices of those securities, but are included with the net realized and unrealized gain or loss on investment securities.
Taxes and distributions
Each Fund has elected to be treated and intends to qualify each tax year as a regulated investment company under Subchapter M of the Internal Revenue Code of 1986, as amended (the “Code”). Each Fund intends to distribute its net investment income, if any, and its net realized short-term and long-term capital gains, if any, after giving effect to any available capital loss carryforwards for U.S. federal income tax purposes. Therefore, each Fund makes no provision for U.S. federal income or excise taxes.
The policy of each Fund is to declare and pay dividends of its net investment income, if any, at least annually, although the Funds are permitted to, and will from time to time, declare and pay dividends of net investment income, if any, more frequently. Each Fund also intends to distribute net realized short-term and long-term capital gains, if any, at least annually. In addition, each Fund may, from time to time at their discretion, make unscheduled distributions in advance of large redemptions by shareholders or as otherwise deemed appropriate by a Fund. Typically, all distributions are reinvested in additional shares of each Fund at net asset value, unless GMO or its agents receive and process a shareholder election to receive cash distributions. Distributions to shareholders are recorded by each Fund on the ex-dividend date.
Taxes on foreign interest and dividend income are generally withheld in accordance with the applicable country’s tax treaty with the United States. The foreign withholding rates applicable to a Fund’s investments in certain jurisdictions may be higher if a significant portion of the Fund is held by non-U.S. shareholders. Each Fund may be subject to taxation on realized capital gains, repatriation proceeds and other transaction-based charges imposed by certain countries in which it invests. Taxes related to capital gains realized during the year ended February 28, 2017, if any, are reflected as part of Net realized gain (loss) in the Statements of Operations. Changes in tax liabilities related to capital gain taxes on unrealized investment gains, if any, are reflected as part of Change in net unrealized appreciation (depreciation) in the Statements of Operations. Transaction-based charges are generally calculated as a percentage of the transaction amount.
Certain Funds have previously filed for and/or may file for additional tax refunds with respect to certain taxes withheld by certain countries. Generally, the amount of such refunds that a Fund reasonably determines are collectible and free from significant contingencies are reflected in a Fund’s net asset value and are reflected as Dividends from unaffiliated issuers in the Statements of Operations. In certain circumstances, a Fund’s receipt of such refunds may cause the Fund and/or its shareholders to be liable for U.S. federal income taxes and interest charges.
Foreign taxes paid by each Fund may be treated, to the extent permissible by the Code (and other applicable U.S. federal tax guidance) and if that Fund so elects, as if paid by U.S. shareholders of that Fund.
54
GMO Trust Funds
Notes to Financial Statements — (Continued)
February 28, 2017
Income and capital gain distributions are determined in accordance with U.S. federal income tax regulations, which may differ from U.S. GAAP. Certain capital accounts in the financial statements are periodically adjusted for permanent differences in order to reflect their tax character. These adjustments have no impact on net assets or net asset value per share. Temporary differences that arise from recognizing certain items of income, expense, gain or loss in different periods for financial statement and tax purposes will likely reverse at some time in the future. Distributions in excess of net investment income or net realized gains are temporary over-distributions for financial statement purposes resulting from differences in the recognition or classification of income or distributions for financial statement and tax purposes.
U.S. GAAP and tax accounting differences for each Fund primarily relate to reasons described in the following table:
| | | | | | | | |
| | | | | |
| Differences related to: | | Emerging Countries Fund | | Emerging Domestic Opportunities Fund | | Emerging Markets Fund | | Taiwan Fund |
| Capital loss carry forwards | | X | | X | | X | | X |
| Derivative contract transactions | | | | X | | X | | |
| Dividends received from underlying investments | | X | | | | | | |
| Foreign capital gains taxes | | | | X | | | | |
| Foreign currency transactions | | X | | X | | X | | X |
| Late-year ordinary losses | | X | | X | | X | | X |
| Losses on wash sale transactions | | X | | X | | X | | X |
| Partnership interest tax allocations | | | | | | X | | |
| Passive foreign investment company transactions | | X | | X | | X | | X |
| Post-October capital losses | | X | | X | | X | | X |
The tax character of distributions declared by each Fund to shareholders is as follows:
| | | | | | | | | | | | | | | | | | | | | | | | |
| | | |
| | | Tax year ended February 28, 2017 | | | Tax year ended February 29, 2016 | |
| | | | | | | |
| Fund Name | | Ordinary
Income
(including
any net
short-term
capital gain) ($) | | | Total
Distributions ($) | | | Ordinary
Income
(including
any net
short-term
capital gain) ($) | | | Net Long-
Term Capital
Gain ($) | | | Return of
Capital ($) | | | Total
Distributions ($) | |
| Emerging Countries Fund | | | 325,047 | | | | 325,047 | | | | 645,110 | | | | 346,793 | | | | 36,830 | | | | 1,028,733 | |
| Emerging Domestic Opportunities Fund | | | 60,110,737 | | | | 60,110,737 | | | | 40,348,231 | | | | — | | | | — | | | | 40,348,231 | |
| Emerging Markets Fund | | | 109,038,222 | | | | 109,038,222 | | | | 189,270,364 | | | | — | | | | — | | | | 189,270,364 | |
| Taiwan Fund | | | 3,287,415 | | | | 3,287,415 | | | | 3,438,210 | | | | 3,989,520 | | | | — | | | | 7,427,730 | |
Distributions in excess of a Fund’s tax basis earnings and profits, if significant, are reported in the Funds’ financial statements as a return of capital.
55
GMO Trust Funds
Notes to Financial Statements — (Continued)
February 28, 2017
As of February 28, 2017, the components of distributable earnings on a tax basis and certain tax attributes for the Funds consisted of the following:
| | | | | | | | | | | | | | | | |
| | | | | |
| Fund Name | | Undistributed
Ordinary
Income
(including any
net short-term
capital gain) ($) | | | Late-Year
Ordinary Loss
Deferral ($) | | | Capital Loss
Carryforwards ($) | | | Post- October
Capital
Losses ($) | |
Emerging Countries Fund | | | — | | | | (58,514) | | | | (26,294,111) | | | | (88,590) | |
Emerging Domestic Opportunities Fund | | | — | | | | (2,997,678) | | | | (155,974,240) | | | | (29,338,211) | |
Emerging Markets Fund | | | — | | | | (5,873,663) | | | | (2,055,231,423) | | | | — | |
Taiwan Fund | | | 339,237 | | | | (248,729) | | | | (6,778,160) | | | | (770,197) | |
As of February 28, 2017, certain Funds had capital loss carryforwards available to offset future realized gains, if any, to the extent permitted by the Code. Net capital losses recognized in taxable years beginning on or after March 1, 2011 are carried forward without expiration and generally retain their short-term and/or long-term tax character, as applicable. Utilization of the capital loss carryforwards, post-October capital losses, late-year ordinary losses and losses realized subsequent to February 28, 2017, if any, could be subject to further limitations imposed by the Code related to share ownership activity. The Funds’ capital loss carryforwards are as follows:
| | | | | | | | |
| | | |
| | | Short-
Term ($) | | | Long- Term ($) | |
| | | |
| Fund Name | | No Expiration
Date | | | No Expiration Date | |
Emerging Countries Fund | | | (6,104,190) | | | | (20,189,921) | |
Emerging Domestic Opportunities Fund | | | (116,712,916) | | | | (39,261,324) | |
Emerging Markets Fund | | | (353,404,858) | | | | (1,701,826,565) | |
Taiwan Fund | | | (564,457) | | | | (6,213,703) | |
As of February 28, 2017, the approximate cost for U.S. federal income tax purposes and the aggregate investment-level gross and net unrealized appreciation (depreciation) in the value of investments were as follows:
| | | | | | | | | | | | | | | | |
| | | | | |
| Fund Name | | Aggregate
Cost ($) | | | Gross Unrealized
Appreciation ($) | | | Gross Unrealized
(Depreciation) ($) | | | Net Unrealized
Appreciation
(Depreciation) ($) | |
Emerging Countries Fund | | | 26,161,413 | | | | 2,878,049 | | | | (1,752,194) | | | | 1,125,855 | |
Emerging Domestic Opportunities Fund | | | 1,895,223,861 | | | | 172,064,893 | | | | (43,064,932) | | | | 128,999,961 | |
Emerging Markets Fund | | | 4,700,594,061 | | | | 551,962,594 | | | | (212,399,242) | | | | 339,563,352 | |
Taiwan Fund | | | 120,395,546 | | | | 7,556,189 | | | | (2,859,490) | | | | 4,696,699 | |
The Funds are subject to authoritative guidance related to the accounting and disclosure of uncertain tax positions under U.S. GAAP. This guidance sets forth a minimum threshold for the financial statement recognition of tax positions taken based on the technical merits of such positions. United States and non-U.S. tax rules (including the interpretation and application of tax laws) are subject to change. The Funds file tax returns and/or adopt certain tax positions in various jurisdictions. Non-U.S. taxes are provided for based on the Funds’ understanding of the prevailing tax rules of the non-U.S. markets in which they invest. Recently enacted tax rules, including interpretations of tax laws (e.g., guidance pertaining to the U.S. Foreign Account Tax Compliance Act) and tax legislation/initiatives currently under consideration in various jurisdictions, including the U.S., might affect the way the Funds and their investors are taxed prospectively and/or retroactively. Prior to the expiration of the relevant statutes of limitations, if any, the Funds are subject to examination by U.S. federal, state, local and non-U.S. jurisdictions with respect to the tax returns they have filed and the tax positions they have adopted. The Funds’ U.S. federal income tax returns are generally subject to examination by the Internal Revenue Service for a period of three years after they are filed. State, local and/or non-U.S. tax returns and/or other filings may be subject to examination for different periods, depending upon the tax rules of each applicable jurisdiction.
56
GMO Trust Funds
Notes to Financial Statements — (Continued)
February 28, 2017
Security transactions and related investment income
Security transactions are accounted for in the financial statements on trade date. For purposes of daily net asset value calculations, the Funds’ policy is that security transactions are generally accounted for on the following business day. GMO may override that policy and a Fund may account for security transactions on trade date if it experiences significant purchases or redemptions or engages in significant portfolio transactions. Dividend income, net of applicable foreign withholding taxes, if any, is recorded on the ex-dividend date or, if later, when a Fund is informed of the ex-dividend date. Income dividends and capital gain distributions from the underlying funds are recorded on the ex-dividend date. Interest income is recorded on the accrual basis and is adjusted for the amortization of premiums and accretion of discounts. Principal on inflation-indexed securities is adjusted for inflation and any increase or decrease is recorded as interest income or investment loss. Coupon income is not recognized on securities for which collection is not expected. Paydown gains and losses on mortgage-related and other asset-backed securities, if any, are recorded as components of interest income in the Statements of Operations. Non-cash dividends, if any, are recorded at the fair market value of the asset received. In determining the net gain or loss on securities sold, the Funds use the identified cost basis.
Expenses and class allocations
Most of the expenses of the Trust are directly attributable to an individual Fund. Generally, common expenses are allocated among the Funds based on, among other things, the nature and type of expense and the relative size of the Funds. Investment income, common expenses, purchase premiums and redemption fees, if any, and realized and unrealized gains and losses are allocated among the classes of shares of the Funds, if applicable, based on the relative net assets of each class. Shareholder service fees, if any, which are directly attributable to a class of shares, are charged to that class’s operations. In addition, the Funds may incur fees and expenses indirectly as a shareholder in the underlying funds (see Note 5).
Brown Brothers Harriman & Co. (“BBH”) serves as the Funds’ custodian and fund accounting agent. State Street Bank and Trust Company (“State Street”) serves as the Funds’ transfer agent. Prior to December 31, 2013, State Street’s transfer agent fees may have been reduced by an earnings allowance calculated on the average daily cash balances each Fund maintained in a State Street transfer agent account. Earnings allowances were reported as a reduction of expenses in the Statements of Operations. Effective January 1, 2014, any cash balances maintained at the transfer agent are held in a Demand Deposit Account and interest income earned, if any, is shown as interest income in the Statements of Operations.
Purchases and redemptions of Fund shares
Purchase premiums and redemption fees (if applicable) are paid to and retained by a Fund to help offset estimated portfolio transaction costs and other related costs (e.g., bid to ask spreads, stamp duties and transfer fees) incurred by the Fund (directly or indirectly through investments in underlying funds) as a result of the purchase or redemption by allocating estimated transaction costs to the purchasing or redeeming shareholder. Such fees are recorded as a component of the Funds’ net share transactions. A Fund may impose a new purchase premium and/or redemption fee or modify an existing fee at any time.
Purchase premiums are not charged on reinvestments of dividends or other distributions. Redemption fees apply to all shares of a Fund regardless of how the shares were acquired (e.g., by direct purchase or by reinvestment of dividends or other distributions).
If GMO determines that any portion of a cash purchase or redemption, as applicable, is offset by a corresponding cash redemption or purchase occurring on the same day, it ordinarily will waive or reduce the purchase premium or redemption fee with respect to that portion. GMO also may waive or reduce the purchase premium or redemption fee relating to a cash purchase or redemption of a Fund’s shares if the Fund will not incur transaction costs or will incur reduced transaction costs.
GMO will waive or reduce the purchase premium when securities are used to purchase a Fund’s shares except to the extent that the Fund incurs transaction costs (e.g., stamp duties or transfer fees) in connection with its acquisition of those securities. GMO may waive or reduce redemption fees when a Fund uses portfolio securities to redeem its shares. However, when a substantial portion of a Fund is being redeemed in-kind, the Fund may nonetheless charge a redemption fee equal to known or estimated costs.
Purchase premiums or redemption fees generally will not be waived for purchases and redemptions of Fund shares executed through brokers or agents, including, without limitation, intermediary platforms that are allowed pursuant to agreements with the Trust to transmit orders for purchases and redemptions the day after those orders are received.
57
GMO Trust Funds
Notes to Financial Statements — (Continued)
February 28, 2017
As of February 28, 2017, the premium on cash purchases and the fee on cash redemptions were as follows:
| | | | | | | | |
| | | | | |
| | | Emerging Countries Fund | | Emerging Domestic Opportunities Fund | | Emerging Markets Fund | | Taiwan Fund |
| Purchase Premium | | — | | 0.80% | | 0.80% | | 0.15% |
| Redemption Fee | | — | | 0.80% | | 0.80% | | 0.45% |
Recently-issued accounting guidance
In August 2016, Financial Accounting Standards Board (“FASB”) issued a new Accounting Standards Update No. 2016-15, “Statement of Cash Flows (Topic 230), Classification of Certain Cash Receipts and Cash Payments, a consensus of the FASB’s Emerging Issues Task Force” (“ASU 2016-15”). ASU 2016-15 is intended to reduce diversity in practice in how certain transactions are classified in the statement of cash flows. The issues addressed in ASU 2016-15 are: debt prepayment or debt extinguishment costs, settlement of zero-coupon debt instruments, contingent consideration payments made after a business combination, proceeds from the settlement of insurance claims, proceeds from the settlement of corporate-owned life insurance policies, including bank-owned life insurance policies, distributions received from equity method investments, beneficial interests in securitization transactions; and, separately identifiable cash flows and application of the predominance principle. ASU 2016-15 is effective for interim and annual reporting periods beginning after December 15, 2017. GMO is currently evaluating the impact, if any, of this guidance on the Funds’ financial statements and disclosures.
Other matters
Emerging Markets Fund (“EMF”)
Indian regulators alleged in 2002 that EMF violated some conditions under which it was granted permission to operate in India and have restricted some of EMF’s locally held assets pending resolution of the dispute. Although these locally held assets remain the property of EMF, a portion of the assets are not permitted to be withdrawn from EMF’s local custodial account located in India. The amount of restricted assets is small relative to the size of EMF, representing approximately 0.08% of the Fund’s total net assets as of February 28, 2017 and is included within miscellaneous payable within the Statements of Assets and Liabilities. The effect of this claim on the value of the restricted assets, and all matters relating to EMF’s response to these allegations, are subject to the supervision and control of GMO Trust’s Board of Trustees. Any costs in respect of this matter will be borne by EMF.
58
GMO Trust Funds
Notes to Financial Statements — (Continued)
February 28, 2017
| 3. | Investment and other risks |
The following chart identifies selected risks associated with each Fund. Risks not marked for a particular Fund may, however, still apply to some extent to that Fund at various times.
| | | | | | | | |
| | | Emerging Countries Fund | | Emerging Domestic Opportunities Fund | | Emerging Markets Fund | | Taiwan Fund |
| Counterparty Risk | | X | | X | | X | | X |
| Credit Risk | | | | X | | | | |
| Currency Risk | | X | | X | | X | | X |
| Derivatives and Short Sales Risk | | X | | X | | X | | X |
| Focused Investment Risk | | X | | X | | X | | X |
| Fund of Funds Risk | | X | | X | | X | | X |
| Illiquidity Risk | | X | | X | | X | | X |
| Large Shareholder Risk | | X | | X | | X | | X |
| Leveraging Risk | | X | | X | | X | | X |
| Management and Operational Risk | | X | | X | | X | | X |
| Market Disruption and Geopolitical Risk | | X | | X | | X | | X |
| Market Risk – Equities | | X | | X | | X | | X |
| Market Risk – Fixed Income Investments | | | | X | | | | |
| Non-Diversified Funds | | X | | X | | X | | X |
| Non-U.S. Investment Risk | | X | | X | | X | | X |
| Small Company Risk | | X | | X | | X | | X |
Investing in mutual funds involves many risks. The risks of investing in a particular Fund depend on the types of investments in its portfolio and the investment strategies GMO employs on its behalf. This section does not describe every potential risk of investing in the Funds. Funds could be subject to additional risks because of the types of investments they make and market conditions, which may change over time.
Each Fund that invests in other GMO Funds or other investment companies (collectively, “Underlying Funds”) is exposed to the risks to which the Underlying Funds in which it invests are exposed, as well as the risk that the Underlying Funds will not perform as expected. Therefore, unless otherwise noted, the selected risks summarized below include both direct and indirect risks, and references in this section to investments made by a Fund include those made both directly by the Fund and indirectly by the Fund through Underlying Funds.
An investment in a Fund is not a bank deposit and, therefore, is not insured or guaranteed by the Federal Deposit Insurance Corporation or any other government agency.
• COUNTERPARTY RISK. Funds that enter into contracts with counterparties, such as repurchase or reverse repurchase agreements or OTC derivatives contracts, or that lend their securities run the risk that the counterparty will be unable or unwilling to make timely settlement payments or otherwise honor its obligations. If a counterparty fails to meet its contractual obligations, goes bankrupt, or otherwise experiences a business interruption, the Fund could miss investment opportunities or otherwise hold investments it would prefer to sell, resulting in losses for the Fund.
59
GMO Trust Funds
Notes to Financial Statements — (Continued)
February 28, 2017
In addition, a Fund may suffer losses if a counterparty fails to comply with applicable laws or other requirements. The Funds are not subject to any limits on their exposure to any one counterparty nor to a requirement that counterparties with whom they enter into contracts maintain a specific rating by a nationally recognized rating organization. Counterparty risk is pronounced during unusually adverse market conditions and is particularly acute in environments (like those of 2008) in which financial services firms are exposed to systemic risks of the type evidenced by the insolvency of Lehman Brothers and subsequent market disruptions.
Participants in OTC derivatives markets typically are not subject to the same level of credit evaluation and regulatory oversight as are members of exchange-based markets, and, therefore, OTC derivatives generally expose a Fund to greater counterparty risk than exchange-traded derivatives. A Fund is subject to the risk that a counterparty will not settle a derivative in accordance with its terms because of a dispute over the terms of the contract (whether or not bona fide) or because of a credit or liquidity problem. If a counterparty’s obligation to a Fund is not collateralized, then the Fund is essentially an unsecured creditor of the counterparty. If a counterparty defaults, the Fund will have contractual remedies (whether or not the obligation is collateralized), but the Fund may be unable to enforce them, thus causing the Fund to suffer a loss. Counterparty risk is greater for derivatives with longer maturities because of the longer time during which events may occur that prevent settlement. Counterparty risk also is greater when a Fund has entered into derivatives contracts with a single or small group of counterparties as it sometimes does as a result of its use of swaps and other OTC derivatives. Funds that use swap contracts are subject, in particular, to the creditworthiness of the counterparties because some types of swap contracts have terms longer than six months (and, in some cases, decades). The creditworthiness of a counterparty may be adversely affected by greater than average volatility in the markets, even if the counterparty’s net market exposure is small relative to its capital. Counterparty risk still exists even if a counterparty’s obligations are secured by collateral because the Fund’s interest in the collateral may not be perfected or additional collateral may not be promptly posted as required. GMO’s view with respect to a particular counterparty is subject to change. The fact, however, that it changes adversely (whether due to external events or otherwise) does not mean a Fund’s existing transactions with that counterparty will necessarily be terminated or modified. In addition, a Fund may enter into new transactions with a counterparty that GMO no longer considers a desirable counterparty if the transaction is primarily designed to reduce the Fund’s overall risk of potential exposure to that counterparty (for example, re-establishing the transaction with a lower notional amount or entering into a countervailing trade with the same counterparty).
The Funds also are subject to counterparty risk because they execute their securities transactions through brokers and dealers. If a broker or dealer fails to meet its contractual obligations, goes bankrupt, or otherwise experiences a business interruption, the Funds could miss investment opportunities or be unable to dispose of investments they would prefer to sell, resulting in losses for the Funds.
Counterparty risk with respect to derivatives has been and will continue to be affected by new rules and regulations relating to the derivatives market. As described under “Derivatives and Short Sales Risk,” some derivatives transactions are required to be centrally cleared, and a party to a cleared derivatives transaction is subject to the credit risk of the clearing house and the clearing member through which it holds its cleared position. Credit risk of market participants with respect to derivatives that are centrally cleared is concentrated in a few clearing houses, and it is not clear how an insolvency proceeding of a clearing house would be conducted and what impact an insolvency of a clearing house would have on the financial system. Also, in the event of a counterparty’s (or its affiliate’s) insolvency, the Funds’ ability to exercise remedies, such as the termination of transactions, netting of obligations and realization on collateral, could be stayed or eliminated under new special resolution regimes adopted in the United States, the European Union and various other jurisdictions. Such regimes provide governmental authorities with broad authority to intervene when a financial institution is experiencing financial difficulty. In particular, with respect to counterparties who are subject to such proceedings in the European Union, the liabilities of such counterparties to the Funds could be reduced, eliminated, or converted to equity in such counterparties (sometimes referred to as a “bail in”).
• CREDIT RISK. This is the risk that the issuer or guarantor of a fixed income investment or the obligor of an obligation underlying an asset-backed security will be unable or unwilling to satisfy its obligation to pay principal and interest or otherwise to honor its obligations in a timely manner. The market price of a fixed income investment will normally decline as a result of the issuer’s, guarantor’s, or obligor’s failure to meet its payment obligations, or in anticipation of such failure, or the downgrade of the credit rating of the investment. This risk is particularly acute in environments (like those of 2008) in which financial services firms are exposed to systemic risks of the type evidenced by the insolvency of Lehman Brothers and subsequent market disruptions.
All fixed income securities are subject to credit risk. Financial strength and solvency of an issuer are the primary factors influencing credit risk. The risk varies depending upon whether the issuer is a corporation, a government or government entity, whether the particular security has a priority over other obligations of the issuer in payment of principal and interest and whether it has any collateral backing or credit enhancement. Credit risk may change over the term of a fixed income security. U.S. government securities are subject to varying degrees of credit risk depending upon whether the securities are supported by the full faith and credit of the United States, supported by the ability to borrow from the U.S. Treasury, supported only by the credit of the issuing U.S. government agency, instrumentality, or corporation, or otherwise supported by the United States. For example, issuers of many types of U.S. government securities (e.g., the Federal Home Loan Mortgage Corporation (“Freddie Mac”), Federal National Mortgage Association (“Fannie Mae”), and Federal Home Loan Banks), although chartered or sponsored by Congress, are not funded by Congressional appropriations and their fixed income securities, including mortgage-backed and other asset-backed securities, are neither guaranteed nor insured by the U.S. government. These securities are subject to more credit risk than U.S. government securities that
60
GMO Trust Funds
Notes to Financial Statements — (Continued)
February 28, 2017
are supported by the full faith and credit of the United States (e.g., U.S. Treasury bonds). Investments in sovereign or quasi-sovereign debt involve the risk that the governmental entities responsible for repayment may be unable or unwilling to pay interest and repay principal when due. A governmental entity’s ability and willingness to pay interest and repay principal in a timely manner may be affected by a variety of factors, including its cash flow, the size of its reserves, its access to foreign exchange, the relative size of its debt service burden to its economy as a whole, and political constraints. Investments in quasi-sovereign issuers are subject to the additional risk that the issuer may default independently of its sovereign. Sovereign debt risk is greater for fixed income securities issued or guaranteed by emerging countries.
In many cases, the credit risk of a fixed income security is reflected in its credit ratings, and a Fund holding such a security is subject to the risk that the investment’s rating will be downgraded.
Securities issued by the U.S. government historically have presented minimal credit risk. However, events in 2011 led to a downgrade in the long-term credit rating of U.S. bonds by several major rating agencies and introduced greater uncertainty about the repayment by the United States of its obligations. A further credit rating downgrade could decrease, and a default in the payment of principal or interest on U.S. government securities would decrease, the value of a Fund’s investments and increase the volatility of a Fund’s portfolio.
The obligations of issuers also may be subject to bankruptcy, insolvency and other laws affecting the rights and remedies of creditors.
A Fund also is exposed to credit risk on a reference security to the extent it writes protection under credit default swaps. See “Derivatives and Short Sales Risk” for more information regarding risks associated with the use of credit default swaps. The extent to which the market price of a fixed income security changes in response to a credit event depends on many factors and can be difficult to predict. For example, even though the effective duration of a long-term floating rate security is very short, an adverse credit event or a change in the perceived creditworthiness of its issuer could cause its market price to decline much more than its effective duration would suggest.
Credit risk is particularly pronounced for below investment grade securities (commonly referred to as “junk bonds”). The sovereign debt of many non-U.S. governments, including their sub-divisions and instrumentalities, is below investment grade. Many asset-backed securities also are below investment grade. Below investment grade securities have speculative characteristics, often are less liquid than higher quality securities, present a greater risk of default and are more susceptible to real or perceived adverse industry conditions. Investments in distressed or defaulted or other low quality debt securities generally are considered speculative and may involve substantial risks not normally associated with investments in higher quality securities, including adverse business, financial or economic conditions that lead to payment defaults and insolvency proceedings on the part of their issuers. In particular, distressed or defaulted obligations might be repaid, if at all, only after lengthy workout or bankruptcy proceedings, during which the issuer might not make any interest or other payments, and a Fund may incur additional expenses to seek recovery. If GMO’s assessment of the eventual recovery value of a distressed or defaulted debt security proves incorrect, a Fund may lose a substantial portion or all of its investment or may be required to accept cash or instruments worth less than its original investment. In the event of default of sovereign debt, the Funds may be unable to pursue legal action against the issuer.
• CURRENCY RISK. Currency risk is the risk that fluctuations in exchange rates will adversely affect the market value of a Fund’s investments. Currency risk includes the risk that the currencies in which a Fund’s investments are traded, in which a Fund receives income, or in which a Fund has taken a position, will decline in value relative to the currency in which the Fund is denominated. Currency risk also includes the risk that the currency to which the Fund has obtained exposure through hedging declines in value relative to the currency being hedged, in which event the Fund may realize a loss on both the hedging instrument and the currency being hedged. Currency exchange rates can fluctuate significantly for many reasons. See “Market Disruption and Geopolitical Risk.”
Many of the Funds use derivatives to take currency positions that are under- or over-weighted (in some cases significantly) relative to the currency exposure of their portfolios and their benchmarks. If the exchange rates of the currencies involved do not move as expected, a Fund could lose money on both its holdings of a particular currency and the derivative. See also “Non-U.S. Investment Risk.”
Some currencies are illiquid (e.g., some emerging country currencies), and a Fund may not be able to convert them into U.S. dollars, in which case GMO may decide to purchase U.S. dollars in a parallel market with an unfavorable exchange rate. Exchange rates for many currencies (e.g., some emerging country currencies) are particularly affected by exchange control regulations.
Derivative transactions in foreign currencies (such as futures, forwards, options and swaps) may involve leveraging risk in addition to currency risk, as described under “Leveraging Risk.” In addition, the obligations of counterparties in currency derivative transactions are often not secured by collateral, which increases counterparty risk (see “Counterparty Risk”).
• DERIVATIVES AND SHORT SALES RISK. All of the Funds may invest in derivatives, which are financial contracts whose value depends on, or is derived from, the value of underlying assets, reference rates, or indices. Derivatives involve the risk that their value may not change as expected relative to changes in the value of the assets, rates, or indices they are designed to track. Derivatives include futures contracts, forward contracts, foreign currency contracts, swap contracts, contracts for differences, options on securities and indices, options on futures contracts,
61
GMO Trust Funds
Notes to Financial Statements — (Continued)
February 28, 2017
options on swap contracts, interest rate caps, floors and collars, reverse repurchase agreements, and other OTC contracts. Derivatives may relate to securities, commodities, currencies, currency exchange rates, interest rates, inflation rates, and indices.
The use of derivatives involves risks that are in addition to, and potentially greater than, the risks of investing directly in securities and other more traditional assets. In particular, a Fund’s use of OTC derivatives exposes it to the risk that the counterparties will be unable or unwilling to make timely settlement payments or otherwise honor their obligations. An OTC derivatives contract typically can be closed only with the consent of the other party to the contract. If the counterparty defaults, the Fund will still have contractual remedies but may not be able to enforce them. Because the contract for each OTC derivative is individually negotiated, the counterparty may interpret contractual terms (e.g., the definition of default) differently than the Fund, and if it does, the Fund may decide not to pursue its claims against the counterparty to avoid the cost and unpredictability of legal proceedings. The Fund, therefore, may be unable to obtain payments GMO believes are owed to it under OTC derivatives contracts, or those payments may be delayed or made only after the Fund has incurred the cost of litigation.
A Fund may invest in derivatives that (i) do not require the counterparty to post collateral (e.g., foreign currency forwards), (ii) require collateral but that do not provide for the Fund’s security interest in it to be perfected, (iii) require a significant upfront deposit by the Fund unrelated to the derivative’s fundamental fair (or intrinsic) value, or (iv) do not require that collateral be regularly marked-to-market. When a counterparty’s obligations are not fully secured by collateral, a Fund runs a greater risk of not being able to recover what it is owed if the counterparty defaults. Even when derivatives are required by contract to be collateralized, a Fund typically will not receive the collateral for one or more days after the collateral is required to be posted.
The Funds may invest in derivatives with a limited number of counterparties, and events affecting the creditworthiness of any of those counterparties may have a pronounced effect on the Funds. Derivatives risk is particularly acute in environments (like those of 2008) in which financial services firms are exposed to systemic risks of the type evidenced by the insolvency of Lehman Brothers and subsequent market disruptions. In addition, during those periods, a Fund may have a greater need for cash to provide collateral for large swings in its mark-to-market obligations under the derivatives in which it has invested.
Derivatives also present other risks described in this section, including market risk, illiquidity risk, currency risk, credit risk, and counterparty risk. Many derivatives, in particular OTC derivatives, are complex and their valuation often requires modeling and judgment, which increases the risk of mispricing or improper valuation. The pricing models used may not produce valuations that are consistent with the values a Fund realizes when it closes or sells an OTC derivative. Valuation risk is more pronounced when a Fund enters into OTC derivatives with specialized terms because the value of those derivatives in some cases is determined only by reference to similar derivatives with more standardized terms. As a result, incorrect valuations may result in increased cash payments to counterparties, undercollateralization and/or errors in the calculation of a Fund’s net asset value.
A Fund’s use of derivatives may not be effective or have the desired results. Moreover, suitable derivatives will not be available in all circumstances. For example, the economic costs of taking some derivative positions may be prohibitive, and if a counterparty or its affiliate is deemed to be an affiliate of a Fund, the Funds will not be permitted to trade with that counterparty. In addition, GMO may decide not to use derivatives to hedge or otherwise reduce a Fund’s risk exposures, potentially resulting in losses for the Fund.
Swap contracts and other OTC derivatives are highly susceptible to illiquidity risk (see “Illiquidity Risk”) and counterparty risk (see “Counterparty Risk”). These derivatives are also subject to documentation risk, which is the risk that ambiguities, inconsistencies or errors in the documentation relating to a derivative transaction may lead to a dispute with the counterparty or unintended investment results. Because many derivatives have a leverage component (i.e., a notional value in excess of the assets needed to establish and/or maintain the derivative position), adverse changes in the value or level of the underlying asset, rate or index may result in a loss substantially greater than the amount invested in the derivative itself. See “Leveraging Risk.”
A Fund’s use of derivatives may be subject to special tax rules and could generate additional taxable income for shareholders. In addition, the tax treatment of a Fund’s use of derivatives may be unclear because there is little case or other law interpreting the terms of most derivatives or determining their tax treatment. In addition, the Securities and Exchange Commission recently proposed a rule under the 1940 Act regulating the use by registered investment companies of derivatives and many related instruments. That rule, if adopted as proposed, would, among other things, restrict a Fund’s ability to engage in derivatives transactions or so increase the cost of derivatives transactions that a Fund would be unable to implement its investment strategy.
Derivatives Regulation. The U.S. government has enacted legislation that provides for new regulation of the derivatives market, including clearing, margin, reporting, and registration requirements. The European Union (and some other countries) are implementing similar requirements, which will affect a Fund when it enters into a derivatives transaction with a counterparty organized in that country or otherwise subject to that country’s derivatives regulations. Because these requirements are new and evolving (and some of the rules are not yet final), their ultimate impact remains unclear.
62
GMO Trust Funds
Notes to Financial Statements — (Continued)
February 28, 2017
Transactions in some types of swaps (including interest rate swaps and credit default swaps on North American and European indices) are required to be centrally cleared. In a transaction involving those swaps (“cleared derivatives”), a Fund’s counterparty is a clearing house, rather than a bank or broker. Since the Funds are not members of clearing houses and only members of a clearing house (“clearing members”) can participate directly in the clearing house, the Funds hold cleared derivatives through accounts at clearing members. In cleared derivatives positions, the Funds make payments (including margin payments) to and receive payments from a clearing house through their accounts at clearing members. Clearing members guarantee performance of their clients’ obligations to the clearing house.
In some ways, cleared derivative arrangements are less favorable to mutual funds than bilateral arrangements, for example, by requiring that funds provide more margin for their cleared derivatives positions. Also, as a general matter, in contrast to a bilateral derivatives position, following a period of notice to a Fund, a clearing member at any time can require termination of an existing cleared derivatives position or an increase in margin requirements above those required at the outset of a transaction. Clearing houses also have broad rights to increase margin requirements for existing positions or to terminate those positions at any time. Any increase in margin requirements or termination of existing cleared derivatives positions by the clearing member or the clearing house could interfere with the ability of a Fund to pursue its investment strategy. Further, any increase in margin requirements by a clearing member could expose a Fund to greater credit risk to its clearing member because margin for cleared derivatives positions in excess of a clearing house’s margin requirements typically is held by the clearing member (see “Counterparty Risk”). Also, a Fund is subject to risk if it enters into a derivatives transaction that is required to be cleared (or that GMO expects to be cleared), and no clearing member is willing or able to clear the transaction on the Fund’s behalf. While the documentation in place between the Funds and their clearing members generally provides that the clearing members will accept for clearing all cleared derivatives transactions that are within credit limits (specified in advance) for each Fund, the Funds are still subject to the risk that no clearing member will be willing or able to clear a transaction. In those cases, the position might have to be terminated, and the Fund could lose some or all of the benefit of the position, including loss of an increase in the value of the position and loss of hedging protection. In addition, the documentation governing the relationship between the Funds and clearing members is drafted by the clearing members and generally is less favorable to the Funds than typical bilateral derivatives documentation. For example, documentation relating to cleared derivatives generally includes a one-way indemnity by the Funds in favor of the clearing member for losses the clearing member incurs as the Funds’ clearing member. Also, such documentation typically does not provide the Funds any remedies if the clearing member defaults or becomes insolvent. While futures contracts entail similar risks, the risks may be more pronounced for cleared derivatives due to their more limited liquidity and market history.
Some types of cleared derivatives are required to be executed on an exchange or on a swap execution facility. A swap execution facility is a trading platform where multiple market participants can execute derivatives by accepting bids and offers made by multiple other participants in the platform. While this execution requirement is designed to increase transparency and liquidity in the cleared derivatives market, trading on a swap execution facility can create additional costs and risks for the Funds. For example, swap execution facilities typically charge fees, and if a Fund executes derivatives on a swap execution facility through a broker intermediary, the intermediary may impose fees as well. Also, a Fund may indemnify a swap execution facility, or a broker intermediary who executes cleared derivatives on a swap execution facility on the Fund’s behalf, against any losses or costs that may be incurred as a result of the Fund’s transactions on the swap execution facility.
If a Fund wishes to execute a package of transactions that include a swap that is required to be executed on a swap execution facility as well as other transactions (for example, a transaction that includes both a security and an interest rate swap that hedges interest rate exposure with respect to such security), the Fund may be unable to execute all components of the package on the swap execution facility. In that case, the Fund would need to trade some components of the package on the swap execution facility and other components in another manner, which could subject the Fund to the risk that some components would be executed successfully and others would not, or that the components would be executed at different times, leaving the Fund with an unhedged position for a period of time.
The U.S. government and the European Union have adopted mandatory minimum margin requirements for bilateral derivatives. GMO expects that the Funds’ transactions will become subject to variation margin requirements under such rules in 2017 and initial margin requirements under such rules in 2020. Such requirements could increase the amount of margin a Fund needs to provide in connection with its derivatives transactions and, therefore, make derivatives transactions more expensive.
These and other new rules and regulations could, among other things, further restrict a Fund’s ability to engage in, or increase the cost to the Fund of, derivatives transactions, for example, by making some types of derivatives no longer available to the Fund or otherwise limiting liquidity. The implementation of the clearing requirement has increased the costs of derivatives transactions for the Funds, since the Funds have to pay fees to their clearing members and are typically required to post more margin for cleared derivatives than they have historically posted for bilateral derivatives. The costs of derivatives transactions are expected to increase further as clearing members raise their fees to cover the costs of additional capital requirements and other regulatory changes applicable to the clearing members, which will take effect when rules imposing mandatory minimum margin requirements on bilateral swaps, as described above, become effective. These rules and regulations are new and evolving, so their potential impact on the Funds and the financial system are not yet known. While the new rules and regulations and central clearing of some derivatives transactions are designed to reduce systemic risk (i.e., the risk that the interdependence of large derivatives dealers could cause them to suffer liquidity, solvency or other challenges simultaneously), there is no assurance that they will achieve that result, and in the meantime, as noted above, central clearing and related requirements expose the Funds to new kinds of costs and risks.
63
GMO Trust Funds
Notes to Financial Statements — (Continued)
February 28, 2017
Options. The Funds are permitted to write options. The market price of an option is affected by many factors, including changes in the market prices or dividend rates of underlying securities (or in the case of indices, the securities in such indices); the time remaining before expiration; changes in interest rates or exchange rates; and changes in the actual or perceived volatility of the relevant stock market and underlying securities. The market price of an option also may be adversely affected if the market for the option becomes less liquid. In addition, since an American-style option allows the holder to exercise its rights any time before the option’s expiration, the writer of an American-style option has no control over when it will be required to fulfill its obligations as a writer of the option. (The writer of a European-style option is not subject to this risk because the holder may only exercise the option on its expiration date.) If a Fund writes a call option and does not hold the underlying security or instrument, the Fund’s potential loss is theoretically unlimited.
National securities exchanges generally have established limits on the maximum number of options an investor or group of investors acting in concert may write. A Fund, GMO, and other funds advised by GMO will likely constitute such a group. When applicable, these limits restrict a Fund’s ability to purchase or write options on a particular security.
Unlike exchange-traded options, which are standardized with respect to the underlying instrument, expiration date, contract size, and strike price, the terms of OTC options (i.e., options not traded on exchanges) generally are established through negotiation with the other party to the option contract. While a Fund has greater flexibility to tailor an OTC option, OTC options generally expose a Fund to greater credit risk than exchange-traded options, which are guaranteed by the clearing organization of the exchanges where they are traded. Purchasing and writing put and call options are highly specialized activities and entail greater than ordinary market risks.
Special tax rules apply to a Fund’s transactions in options, which could increase the taxes payable by shareholders. In particular, a Fund’s options transactions potentially could cause a substantial portion of the Fund’s distributions to consist of amounts taxable to shareholders subject to U.S. income tax at ordinary income tax rates. See the Funds’ Prospectus and Statement of Additional Information for more information.
Short Investment Exposure. Some Funds may sell securities or currencies short as part of their investment programs in an attempt to increase their returns or for hedging purposes. Short sales expose a Fund to the risk that it will be required to acquire, convert, or exchange a security or currency to replace the borrowed security or currency when the security or currency sold short has appreciated in value, thus resulting in a loss to the Fund. Purchasing a security or currency to close out a short position can itself cause the price of the security or currency to rise further, thereby exacerbating any losses. A Fund that sells short a security or currency it does not own also may have to pay borrowing fees to a broker and may be required to pay the broker any dividends or interest it receives on a borrowed security.
A Fund also may create short investment exposure by taking a derivative position in which the value of the derivative moves in the opposite direction from the price of an underlying investment, pool of investments, index or currency. Short sales of securities or currencies a Fund does not own and “short” derivative positions involve forms of investment leverage, and the amount of the Fund’s potential loss is theoretically unlimited. A Fund is subject to increased leveraging risk and other investment risks described in this “Investment and other risks” section to the extent it sells short securities or currencies it does not own or takes “short” derivative positions.
• FOCUSED INVESTMENT RISK. Funds with investments that are focused in particular countries, regions, sectors, industries or issuers that are subject to the same or similar risk factors and funds with investments whose prices are closely correlated are subject to greater overall risk than funds with investments that are more diversified or whose prices are not as closely correlated.
A Fund that invests in the securities of a small number of issuers has greater exposure to adverse developments affecting those issuers and to a decline in the market price of particular securities than Funds investing in the securities of a larger number of issuers. Securities, sectors, or companies that share common characteristics are often subject to similar business risks and regulatory burdens, and often react similarly to specific economic, market, political or other developments.
Similarly, Funds having a significant portion of their assets in investments tied economically (or related) to a particular geographic region, country (e.g., Taiwan or Japan), or market (e.g., emerging markets), or to sectors within a region, country, or market (e.g., Russian oil) have more exposure to regional and country economic risks than funds making investments throughout the world. The political and economic prospects of one country or group of countries within the same geographic region may affect other countries in that region, and a recession, debt crisis or decline in the value of the currency of one country can spread to other countries. Furthermore, companies in a particular geographic region or country are vulnerable to events affecting other companies in that region or country because they often share common characteristics, are exposed to similar business risks and regulatory burdens, and react similarly to specific economic, market, political or other developments. See also “Non-U.S. Investment Risk”.
• FUND OF FUNDS RISK. Funds that invest in Underlying Funds (including underlying GMO Funds) are exposed to the risk that the Underlying Funds will not perform as expected. The Funds are also indirectly exposed to all of the risks to which the Underlying Funds are exposed.
64
GMO Trust Funds
Notes to Financial Statements — (Continued)
February 28, 2017
Because a Fund bears the fees and expenses of an Underlying Fund in which it invests, absent reimbursement, the Fund will incur additional expenses when investing in an Underlying Fund. In addition, total Fund expenses will increase if a Fund makes a new or further investment in Underlying Funds with higher fees or expenses than the average fees and expenses of the Underlying Funds then in the Fund’s portfolio.
In addition, to the extent a Fund invests in shares of underlying GMO Funds, it is indirectly subject to Large Shareholder Risk because those underlying GMO Funds are more likely to have large shareholders (e.g., other GMO Funds). See “Large Shareholder Risk.”
Investments in ETFs involve the risk that an ETF’s performance may not track the performance of the index the ETF is designed to track. In addition, ETFs often use derivatives to track the performance of the relevant index, and, therefore, investments in those ETFs are subject to the same derivatives risks discussed in “Derivatives and Short Sales Risk”.
A Fund’s investments in one or more Underlying Funds could affect the amount, timing and character of its distributions and could cause the Fund to recognize taxable income in excess of the cash generated by such investments, requiring the Fund in turn to liquidate investments at disadvantageous times to generate cash needed to make required distributions.
• ILLIQUIDITY RISK. Illiquidity risk is the risk that low trading volume, lack of a market maker, large position size, or legal restrictions (including daily price fluctuation limits or “circuit breakers”) limits or prevents a Fund from selling particular securities or closing derivative positions at desirable prices. In addition to these risks, a Fund is exposed to illiquidity risk when it has an obligation to purchase particular securities (e.g., as a result of entering into reverse repurchase agreements, writing a put, or closing a short position). To the extent a Fund’s investments include asset-backed securities, distressed, defaulted or other low quality debt securities, emerging country debt securities, securities of companies with smaller market capitalizations or smaller total float adjusted market capitalizations, or emerging market securities, it is subject to increased illiquidity risk. These types of investments can be difficult to value, exposing a Fund to the risk that the price at which it sells them will be less than the price at which they were valued when held by the Fund. Illiquidity risk also may be greater in times of financial stress. For example, Inflation-Protected Securities issued by the U.S. Treasury (“TIPS”) have experienced periods of greatly reduced liquidity during disruptions in fixed income markets, such as the events surrounding the bankruptcy of Lehman Brothers in 2008. Less liquid securities are more susceptible than other securities to price declines when market prices decline generally.
A Fund may buy securities that are less liquid than those in its benchmark.
A Fund’s ability to use options as part of its investment program depends on the liquidity of the options market. In addition, that market may not be liquid when a Fund seeks to close out an option position. Also, the hours of trading for options on an exchange may not conform to the hours during which the securities held by a Fund are traded. To the extent that the options markets close before the markets for the underlying securities, significant price and rate movements can take place in the markets for underlying securities that are not immediately reflected in the options markets. If a Fund receives a redemption request and is unable to close out an option it has sold, the Fund may temporarily be leveraged in relation to its assets.
• LARGE SHAREHOLDER RISK. To the extent a large number of shares of a Fund is held by a single shareholder (e.g., an institutional investor or another GMO Fund) or a group of shareholders with a common investment strategy (e.g., GMO asset allocation accounts), the Fund is subject to the risk that a redemption by those shareholders of all or a large portion of their Fund shares will adversely affect the Fund’s performance by forcing the Fund to sell portfolio securities, potentially at disadvantageous prices, to raise the cash needed to satisfy the redemption request. In addition, the Funds and other accounts over which GMO has investment discretion that invest in the Funds are not limited in how often they may purchase or sell Fund shares. The Asset Allocation Funds and separate accounts managed by GMO for its clients hold substantial percentages of the shares of many Funds, and asset allocation decisions by GMO may result in substantial redemptions from (or investments in) those Funds. These transactions may adversely affect the Fund’s performance to the extent that the Fund is required to sell investments (or invest cash) when it would not otherwise do so. Redemptions of a large number of shares also may increase transaction costs or, by necessitating a sale of portfolio securities, have adverse tax consequences for Fund shareholders. Additionally, redemptions and/or purchases of shares by a large shareholder and/or a group of shareholders over time potentially limit the use of any capital loss carryforwards to offset future realized capital gains (if any) and other losses that would otherwise reduce distributable net investment income. Large shareholders may limit or prevent a Fund’s use of tax equalization for U.S. federal tax purposes. In addition, to the extent a Fund invests in other GMO Funds subject to large shareholder risk, the Fund is indirectly subject to this risk.
• LEVERAGING RISK. The use of reverse repurchase agreements and other derivatives and securities lending creates leverage (i.e., a Fund’s investment exposures exceed its net asset value). Leverage increases a Fund’s losses when the value of its investments (including derivatives) declines. Because many derivatives have a leverage component (i.e., a notional value in excess of the assets needed to establish or maintain the derivative position), adverse changes in the value or level of the underlying asset, rate or index may result in a loss substantially greater than the amount invested in the derivative itself. In the case of swaps, the risk of loss generally is related to a notional principal amount, even if the parties have not made any initial investment. Some derivatives have the potential for unlimited loss, regardless of the size of the initial investment. A Fund’s portfolio also will be leveraged if it borrows money to meet redemption requests or settle investment transactions or if it exercises its right to delay payment on a redemption.
65
GMO Trust Funds
Notes to Financial Statements — (Continued)
February 28, 2017
A Fund may manage some of its derivative positions by offsetting derivative positions against one another or against other assets. To the extent offsetting positions do not behave in relation to one another as expected, a Fund may perform as if it were leveraged.
• MANAGEMENT AND OPERATIONAL RISK. Each Fund is subject to management risk because it relies on GMO to achieve its investment objective. Each Fund runs the risk that GMO’s investment techniques will fail to produce desired results and cause the Fund to incur significant losses. GMO also may fail to use derivatives effectively, choosing to hedge or not to hedge positions at disadvantageous times.
For many Funds, GMO often uses quantitative models as part of its investment process. GMO’s models are not necessarily predictive of future market events and use simplifying assumptions that can limit their effectiveness. In addition, the data on which the models are based is subject to limitations (e.g. inaccuracies, staleness) that could adversely affect a Fund’s performance. The Funds also run the risk that GMO’s assessment of an investment (including a company’s fundamental fair (or intrinsic) value) may be wrong.
There can be no assurance that key GMO personnel will continue to be employed by GMO. The loss of their services could have an adverse impact on GMO’s ability to achieve the Funds’ investment objectives.
The Funds also are subject to the risk of loss as a result of other services provided by GMO and other service providers, including pricing, administrative, accounting, tax, legal, custody, transfer agency, and other services. Operational risk includes the possibility of loss caused by inadequate procedures and controls, human error, and system failures by a service provider. For example, trading delays or errors could prevent a Fund from benefiting from potential investment gains or avoiding losses. In addition, a service provider may be unable to provide a net asset value (“NAV”) for a Fund or share class on a timely basis. GMO is not contractually liable to the Funds for losses associated with operational risk absent its willful misfeasance, bad faith, gross negligence, or reckless disregard of its contractual obligations to provide services to the Funds. Other Fund service providers also have contractual limitations on their liability to the Funds for losses resulting from their errors.
The Funds and their service providers (including GMO) are susceptible to cyber-attacks and technological malfunctions that may have effects that are similar to those of a cyber-attack. Cyber-attacks include, among others, stealing or corrupting data maintained online or digitally, preventing legitimate users from accessing information or services on a website, releasing confidential information without authorization, and causing operational disruption. Successful cyber-attacks against, or security breakdowns of, a Fund, GMO, a sub-adviser, or a custodian, transfer agent, or other service provider may adversely affect the Fund or its shareholders. For instance, cyber-attacks may interfere with the processing of shareholder transactions, affect a Fund’s ability to calculate its net asset value, cause the release or misappropriation of private shareholder information or confidential Fund information, impede trading, cause reputational damage, and subject the Fund to regulatory fines, penalties or financial losses, reimbursement or other compensation costs, and additional compliance costs. While GMO has established business continuity plans and systems designed to prevent cyber-attacks, such plans and systems are subject to inherent limitations. Similar types of cyber security risks also are present for issuers of securities in which the Funds invest, which could result in material adverse consequences for such issuers, and may cause a Fund’s investment in such securities to lose value.
• MARKET DISRUPTION AND GEOPOLITICAL RISK. The Funds are subject to the risk that geopolitical and other events (e.g., wars and terrorism) will disrupt securities markets and adversely affect global economies and markets, thereby decreasing the value of the Funds’ investments. Sudden or significant changes in the supply or prices of commodities or other economic inputs (e.g., the marked decline in oil prices that began in late 2014) may have material and unexpected effects on both global securities markets and individual countries, regions, sectors, companies, or industries, which could significantly reduce the value of a Fund’s investments. Terrorism in the United States and around the world has increased geopolitical risk. The terrorist attacks on September 11, 2001 resulted in the closure of some U.S. securities markets for four days, and similar attacks are possible in the future. Securities markets may be susceptible to market manipulation (e.g., the manipulation of the London Interbank Offered Rate (LIBOR)) or other fraudulent trading practices, which could disrupt the orderly functioning of markets or reduce the value of investments traded in them, including investments of the Funds. Instances of fraud and other deceptive practices committed by senior management of certain companies in which a Fund invests may undermine GMO’s due diligence efforts with respect to such companies, and if such fraud is discovered, negatively affect the value of the Fund’s investments. In addition, when discovered, financial fraud may contribute to overall market volatility, which can negatively impact a Fund’s investment program. Financial fraud also may impact the rates or indices underlying a Fund’s investments.
While the U.S. government has always honored its credit obligations, a default by the U.S. government (as has been threatened in recent years) would be highly disruptive to the U.S. and global securities markets and could significantly reduce the value of the Funds’ investments. Similarly, political events within the United States at times have resulted, and may in the future result, in a shutdown of government services, which could adversely affect the U.S. economy, decrease the value of many Fund investments, and increase uncertainty in or impair the operation of the U.S. or other securities markets. Uncertainty surrounding the sovereign debt of several European Union countries, as well as the continued existence of the European Union itself, has disrupted and may continue to disrupt markets in the United States and around the world. If a country changes its currency or leaves the European Union or if the European Union dissolves, the world’s securities markets likely will be significantly disrupted. Substantial government interventions (e.g., currency controls) also could adversely affect the Funds. War, terrorism, economic uncertainty, and related geopolitical events have led, and in the future may lead, to increased short-term market volatility and may have adverse long-term effects
66
GMO Trust Funds
Notes to Financial Statements — (Continued)
February 28, 2017
on U.S. and world economies and markets generally. Likewise, natural and environmental disasters, such as the earthquake and tsunami in Japan in early 2011, and systemic market dislocations of the kind surrounding the insolvency of Lehman Brothers in 2008, if repeated, would be highly disruptive to economies and markets, adversely affecting individual companies and industries, securities markets, interest rates, credit ratings, inflation, investor sentiment, and other factors affecting the value of the Funds’ investments. During such market disruptions, the Funds’ exposure to the risks described elsewhere in this “Investment and other risks” section will likely increase. Market disruptions, including sudden government interventions, can also prevent the Funds from implementing their investment programs and achieving their investment objectives. For example, a market disruption may adversely affect the orderly functioning of the securities markets and may cause the Funds’ derivatives counterparties to discontinue offering derivatives on some underlying commodities, securities, reference rates, or indices, or to offer them on a more limited basis. To the extent a Fund has focused its investments in the stock index of a particular region, adverse geopolitical and other events in that region could have a disproportionate impact on the Fund.
• MARKET RISK. All of the Funds are subject to market risk, which is the risk that the market value of their holdings will decline. Market risks include:
Equities — Funds that invest in equities run the risk that the market price of an equity will decline. That decline may be attributable to factors affecting the issuer, such as poor performance by the company’s management or reduced demand for its goods or services, or to factors affecting a particular industry, such as a decline in demand, labor or raw material shortages, or increased production costs. A decline also may result from general market conditions not specifically related to a company or industry, such as real or perceived adverse economic conditions, changes in the general outlook for corporate earnings, changes in interest or currency rates, or adverse investor sentiment generally. Equities generally have significant price volatility, and their market prices can decline in a rapid or unpredictable manner. If a Fund purchases an equity for less than its fundamental fair (or intrinsic) value as determined by GMO, the Fund runs the risk that the market price of the equity will not appreciate or will decline due to GMO’s incorrect assessment of the equity’s fundamental fair (or intrinsic) value. The market prices of equities trading at high multiples of current earnings often are more sensitive to changes in future earnings expectations than the market prices of equities trading at lower multiples.
Fixed Income Investments — Funds that invest in fixed income securities (including bonds, notes, bills, synthetic debt instruments, and asset-backed securities) are subject to various market risks. The market price of a fixed income investment can decline due to market-related factors, including rising interest rates and widening credit spreads, or decreased liquidity stemming from the market’s uncertainty about the value of a fixed income investment (or class of fixed income investments). In addition, the market price of fixed income investments with complex structures, such as asset-backed securities, and sovereign and quasi-sovereign debt instruments, can decline due to uncertainty about their credit quality and the reliability of their payment streams. Some fixed income securities also are subject to unscheduled prepayment, and a Fund may be unable to invest prepayments at as high a yield as was provided by the fixed income security. When interest rates rise, these securities also may be repaid more slowly than anticipated, and the market price of the Fund’s investment may decrease. During periods of economic uncertainty and change, the market price of a Fund’s investments in below investment grade securities (commonly referred to as “junk bonds”) may be particularly volatile. Often below investment grade securities are subject to greater sensitivity to interest rate and economic changes than higher rated bonds and can be more difficult to value, exposing a Fund to the risk that the price at which it sells them will be less than the price at which they were valued when held by the Fund. See “Credit Risk” and “Illiquidity Risk” for more information about these risks.
A risk run by each Fund with a significant investment in fixed income securities is that an increase in prevailing interest rates will cause the market price of those securities to decline. The risk associated with increases in interest rates (also called “interest rate risk”) is generally greater for Funds investing in fixed income securities with longer durations. In addition, in managing some Funds, GMO may seek to evaluate potential investments in part by considering the volatility of interest rates. The value of a Fund’s investments may be significantly reduced if GMO’s assessment proves incorrect.
The extent to which a fixed income security’s price changes with changes in interest rates is referred to as interest rate duration, which can be measured mathematically or empirically. A longer-maturity investment generally has longer interest rate duration because the investment’s fixed rate is locked in for a longer period of time. Floating-rate or adjustable-rate securities, however, generally have shorter interest rate durations because their interest rates are not fixed but rather float up and down as interest rates change. Conversely, inverse floating-rate securities have durations that move in the opposite direction from short-term interest rates and thus tend to underperform fixed rate securities when interest rates rise but outperform them when interest rates decline. Fixed income securities paying no interest, such as zero coupon and principal-only securities, are subject to additional interest rate risk.
The market price of inflation-indexed bonds (including TIPS) typically declines during periods of rising real interest rates (i.e., nominal interest rate minus inflation) and increases during periods of declining real interest rates. In some interest rate environments, such as when real interest rates are rising faster than nominal interest rates, the market price of inflation-indexed bonds may decline more than the price of non-inflation-indexed (or nominal) fixed income bonds with similar maturities.
67
GMO Trust Funds
Notes to Financial Statements — (Continued)
February 28, 2017
Generally, when interest rates on short term U.S. Treasury obligations equal or approach zero, a Fund that invests a substantial portion of its assets in U.S. Treasury obligations, such as U.S. Treasury Fund, will have a negative return unless GMO waives or reduces its management fees.
Fixed income securities denominated in foreign currencies also are subject to currency risk. See “Currency Risk”.
In response to government intervention, economic or market developments, or other factors, fixed income markets may experience periods of high volatility, reduced liquidity or both. During those periods, a Fund could have unusually high shareholder redemptions, requiring it to generate cash by selling securities when it would otherwise not do so, including at unfavorable prices. Fixed income investments may be difficult to value during such periods. In recent periods, central banks and governmental financial regulators, including the U.S. Federal Reserve, have maintained historically low interest rates by purchasing bonds. Steps to curtail or “taper” such activities and other actions by central banks or regulators (such as intervention in foreign currency markets or currency controls) could have a material adverse effect on the Funds.
• NON-DIVERSIFIED FUNDS. All of the Funds are not “diversified” investment companies within the meaning of the 1940 Act. This means they are allowed to invest in the securities of relatively few issuers and/or foreign currencies. As a result, they may be subject to greater credit, market and other risks, and poor performance by a single issuer may have a greater impact on their performance, than if they were “diversified.”
• NON-U.S. INVESTMENT RISK. Funds that invest in non-U.S. securities are subject to more risks than Funds that invest only in U.S. securities. Non-U.S. securities markets often include securities of only a small number of companies in a limited number of industries. As a result, the market prices of many of the securities traded on those markets fluctuate more than those of U.S. securities. In addition, issuers of non-U.S. securities often are not subject to as much regulation as U.S. issuers, and the reporting, accounting, custody, and auditing standards to which those issuers are subject differ, in some cases significantly, from U.S. standards. Transactions in non-U.S. securities generally involve higher commission rates, transfer taxes and custodial costs. In addition, some jurisdictions may limit a Fund’s ability to profit from short-term trading (as defined in the relevant jurisdiction).
A Fund may be subject to non-U.S. taxation, including potentially on a retroactive basis, on (i) capital gains it realizes or dividends, interest, or other amounts it realizes or accrues in respect of non-U.S. investments; (ii) transactions in those investments; and (iii) repatriation of proceeds generated from the sale or other disposition of those investments. A Fund may seek a refund of taxes paid, but its efforts may not be successful, in which case the Fund will have incurred additional expenses for no economic benefit. A Fund’s decision to seek a refund is in its sole discretion, and, particularly in light of the cost involved, it may decide not to seek a refund, even if eligible. The outcome of a Fund’s efforts to obtain a refund may be unpredictable. Accordingly, a refund is not typically reflected in a Fund’s net asset value until it is received or until the Fund determines there is a high likelihood the refund will be received. In some cases, the amount of a refund could be material to a Fund’s net assets. Absent a determination that a refund is collectible and free from significant contingencies, such amount is not typically reflected in a Fund’s net assets. For information on possible special Singapore tax consequences of an investment in the Funds, see the Funds’ Prospectus and Statement of Additional Information for more information.
Also, investing in non-U.S. securities exposes a Fund to the risk of nationalization, expropriation, or confiscatory taxation of assets of their issuers, other government involvement in the economy or in the affairs of specific companies or industries (including in the case of wholly or partially state-owned enterprises), adverse changes in investment regulations, capital requirements or exchange controls (which may include suspension of the ability to transfer currency from a country), and adverse political and diplomatic developments, including the imposition of economic sanctions.
In some non-U.S. securities markets, custody arrangements for securities provide significantly less protection than custody arrangements in U.S. securities markets, and prevailing custody and trade settlement practices (e.g., the requirement to pay for securities prior to receipt) expose a Fund to credit and other risks it does not have in the United States with respect to brokers, custodians, clearing banks or other clearing agents, escrow agents, and issuers. Fluctuations in foreign currency exchange rates also affect the market value of a Fund’s non-U.S. investments (see “Currency Risk”).
The Funds need a license to invest directly in many non-U.S. securities markets. These licenses are often subject to limitations, including maximum investment amounts. Once a license is obtained, a Fund’s ability to continue to invest directly is subject to the risk that the license will be terminated or suspended. If a license to invest in a particular market is terminated or suspended, to obtain exposure to that market the Fund will be required to purchase American Depositary Receipts, Global Depositary Receipts, shares of other funds that are licensed to invest directly, or derivative instruments. The receipt of a non-U.S. license by one of GMO’s clients may preclude other clients, including a Fund, from obtaining a similar license, and this could limit the Fund’s investment opportunities. In addition, the activities of a GMO client could cause the suspension or revocation of a license and thereby limit the Funds’ investment opportunities.
Funds that invest a significant portion of their assets in securities of issuers tied economically to emerging countries (or investments related to emerging markets) are subject to greater non-U.S. investment risk than Funds investing primarily in more developed non-U.S. countries (or markets). The risks of investing in those securities include: greater fluctuations in currency exchange rates; increased risk of default (by both government and private issuers); greater social, economic, and political uncertainty and instability (including the risk of war or natural disaster); increased risk of nationalization, expropriation, or other confiscation of assets of issuers of securities in a Fund’s portfolio; greater governmental involvement in the economy or in the affairs of specific companies or industries (including in the case of wholly or partially state-owned
68
GMO Trust Funds
Notes to Financial Statements — (Continued)
February 28, 2017
enterprises); less governmental supervision and regulation of the securities markets and participants in those markets; controls on non-U.S. investment, capital controls and limitations on repatriation of invested capital, dividends, interest and other income and on a Fund’s ability to exchange local currencies for U.S. dollars; inability to purchase and sell investments or otherwise settle security or derivative transactions (i.e., a market freeze); unavailability of currency hedging techniques; differences in, or lack of, auditing and financial reporting standards and resulting unavailability of material information about issuers; slower clearance and settlement; difficulties in obtaining and enforcing legal judgments; and significantly smaller market capitalizations of issuers. In addition, the economies of emerging countries may be predominantly based on only a few industries or dependent on revenues from particular commodities.
• SMALL COMPANY RISK. Companies with smaller market capitalizations may have limited product lines, markets, or financial resources, may lack the competitive strength of larger companies, may have inexperienced managers or may depend on a smaller group of key employees as compared to larger companies. In addition, their securities often are less widely held and trade less frequently and in lesser quantities, and their market prices often fluctuate more, than the securities of companies with larger market capitalizations. Market risk and illiquidity risk are particularly pronounced for securities of these companies.
Temporary Defensive Positions.
Temporary defensive positions are positions that are inconsistent with a Fund’s principal investment strategies and are taken in response to adverse market, economic, political or other conditions. The Funds normally do not take temporary defensive positions. To the extent a Fund takes a temporary defensive position, or otherwise holds cash, cash equivalents, or high quality debt investments on a temporary basis, the Fund may not achieve its investment objective.
| 4. | Derivative financial instruments |
Derivatives are financial contracts whose value depends on, or is derived from, the value of underlying assets, reference rates, or indices that are used, to increase, decrease or adjust elements of the investment exposures of a Fund’s portfolio. Derivatives may relate to securities, interest rates, currencies, currency exchange rates, inflation rates, commodities and indices, and include foreign currency contracts, swap contracts, reverse repurchase agreements, and other exchange-traded and OTC contracts.
The Funds may use derivatives to gain long investment exposure to securities or other assets. For example, a Fund may use derivatives instead of investing directly in equity securities, including using equity derivatives to maintain equity exposure when it holds cash by “equitizing” its cash balances using futures contracts or other types of derivatives. The Funds also may use currency derivatives (including forward currency contracts, futures contracts, swap contracts and options) to gain exposure to a given currency.
The Funds may use derivatives in an attempt to reduce their investment exposures (which may result in a reduction below zero). A Fund also may use currency derivatives in an attempt to reduce some aspect of the currency exposure in its portfolio. For these purposes, the Fund may use an instrument denominated in a different currency that GMO believes is highly correlated with the relevant currency.
The Funds may use derivatives in an attempt to adjust elements of their investment exposures to various securities, sectors, markets, indices, and currencies without actually having to sell existing investments or make new direct investments. For example, if a Fund holds a large proportion of stocks of companies in a particular sector and GMO believes that stocks of companies in another sector will outperform those stocks, the Fund might use a short futures contract on an appropriate index (to synthetically “sell” a portion of the Fund’s portfolio) in combination with a long futures contract on another index (to synthetically “buy” exposure to that index). In adjusting its investment exposures, a Fund also may use currency derivatives in an attempt to adjust its currency exposure, seeking currency exposure that is different (in some cases, significantly different) from the currencies in which its equities are traded.
The Funds may use derivatives to effect transactions intended as substitutes for securities lending.
The Funds may have investment exposures in excess of their net assets (i.e., they may be leveraged). A Fund’s foreign currency exposure may differ significantly from the currencies in which its equities are traded.
Certain derivatives transactions that may be used by the Funds, including certain interest rate swaps and certain credit default index swaps, are required to be transacted through a central clearing organization. The Funds hold cleared derivatives transactions, if any, through clearing members, who are members of derivatives clearing houses. Certain other derivatives, including futures and certain options, are transacted on exchanges. The Funds hold exchange-traded derivatives through clearing brokers that are typically members of the exchanges. In contrast to bilateral derivatives transactions, following a period of advance notice to the Fund, clearing brokers generally can require termination of existing cleared or exchange-traded derivatives transactions at any time and increases in margin above the margin that it required at the beginning of a transaction. Clearing houses and exchanges also have broad rights to increase margin requirements for existing transactions and to terminate transactions. Any such increase or termination could interfere with the ability of a Fund to pursue its investment strategy. Also, a Fund is subject to execution risk if it enters into a derivatives transaction that is required to be cleared (or that GMO expects to be cleared), and no clearing
69
GMO Trust Funds
Notes to Financial Statements — (Continued)
February 28, 2017
member is willing or able to clear the transaction on the Fund’s behalf. In that case, the transaction might have to be terminated, and the Fund could lose some or all of the benefit of any increase in the value of the transaction after the time of the transaction.
The use of derivatives involves risks that are in addition to, and potentially greater than, the risks associated with investing directly in securities and other more traditional assets. See “Investment and other risks” above for further information.
For Funds that held derivatives during the year ended February 28, 2017, the following table shows how the Fund used these derivatives (marked with an X):
| | | | | | | | | | | | |
| | | | |
| Type of Derivative and Objective for Use | | Emerging Countries Fund | | | Emerging Domestic Opportunities Fund | | | Emerging Markets Fund | |
| Forward currency contracts | | | | | | | | | | | | |
Hedge foreign currency exposure in the underlying funds’ investments relative to the U.S. dollar | | | X | | | | X | | | | X | |
| Futures contracts | | | | | | | | | | | | |
Adjust exposure to certain securities markets | | | X | | | | X | | | | X | |
| Options (Written) | | | | | | | | | | | | |
Substitute for direct equity investment | | | X | | | | X | | | | X | |
Income enhancement on securities held in the portfolio | | | | | | | X | | | | | |
| Swap contracts | | | | | | | | | | | | |
Substitute for direct equity investment | | | | | | | X | | | | X | |
Achieve returns comparable to holding and lending a direct equity position | | | | | | | X | | | | X | |
| Rights and/or warrants | | | | | | | | | | | | |
Received as a result of corporate actions | | | X | | | | X | | | | X | |
Forward currency contracts
The Funds may enter into forward currency contracts, including forward cross currency contracts. A forward currency contract is an agreement between two parties to buy and sell a currency at a set price on a future date (or to pay or receive the amount of the change in relative values of the two currencies). The market price of a forward currency contract fluctuates with changes in forward currency exchange rates. The value of each of the Fund’s forward currency contracts is marked-to-market daily using rates supplied by a quotation service and changes in value are recorded by each Fund as unrealized gains or losses. Realized gains or losses on the contracts are equal to the difference between the value of the contract at the time it was opened and the value at the time it was settled.
These contracts involve market risk in excess of the unrealized gain or loss. Forward currency contracts expose a Fund to the market risk of unfavorable movements in currency values and the risk that the counterparty will be unable or unwilling to meet the terms of the contracts. Most forward currency contracts are not collateralized. Forward currency contracts outstanding at the end of the year, if any, are listed in each applicable Fund’s Schedule of Investments.
Futures contracts
The Funds may purchase and sell futures contracts. A futures contract is a contract that obligates the holder to buy or sell an asset at a predetermined delivery price at a specified time in the future. Some futures contracts are net (cash) settled. Upon entering into a futures contract, a Fund is required to deposit cash, U.S. government and agency obligations or other liquid assets with the futures clearing broker in accordance with the initial margin requirements of the broker or exchange. Futures contracts are generally valued at the settlement price established at the close of business each day by the board of trade or exchange on which they are traded (and if the futures are traded outside the U.S. and the market for such futures is closed prior to the close of the NYSE due to time zone differences, the values will be adjusted, to the extent practicable and available, based on inputs from an independent pricing service approved by the Trustees to reflect estimated valuation changes through the NYSE close). The value of each of the Fund’s futures contracts is marked-to-market daily and an appropriate payable or receivable for the change in value (“variation margin”) is recorded by each Fund. The payable or receivable is settled on the following business day. Gains or losses are recognized but not accounted for as realized until the contracts expire or are closed. Futures contracts involve, to varying degrees, risk of loss in excess of the variation margin as recorded on the Statements of Assets and Liabilities. Under some circumstances, futures exchanges may establish daily limits on the amount that the price of a futures contract can vary from the previous day’s settlement price, thereby effectively preventing liquidation of unfavorable positions. Futures contracts expose the Funds to the risk that they may not be able to enter into a closing
70
GMO Trust Funds
Notes to Financial Statements — (Continued)
February 28, 2017
transaction due to an illiquid market. Futures contracts outstanding at the end of the year, if any, are listed in each applicable Fund’s Schedule of Investments.
Options
The Funds may purchase call and put options. A call option gives the holder the right to buy an asset; a put option gives the holder the right to sell an asset. “Quanto” options are cash-settled options in which the underlying asset (often an index) is denominated in a currency other than the currency in which the option is settled. By purchasing options a Fund alters its exposure to the underlying asset by, in the case of a call option, entitling it to purchase the underlying asset at a set price from the writer of the option and, in the case of a put option, entitling it to sell the underlying asset at a set price to the writer of the option. A Fund pays a premium for a purchased option. That premium, if any, which is disclosed in the Schedule of Investments, is subsequently reflected in the marked-to-market value of the option. The potential loss associated with purchasing put and call options is limited to the premium paid. Purchased option contracts outstanding at the end of the year, if any, are listed in each applicable Fund’s Schedule of Investments.
The Funds may write (i.e., sell) call and put options on futures, swaps (“swaptions”), securities or currencies they own or in which they may invest. Writing options alters a Fund’s exposure to the underlying asset by, in the case of a call option, obligating that Fund to sell the underlying asset at a set price to the option-holder and, in the case of a put option, obligating that Fund to purchase the underlying asset at a set price from the option-holder. In some cases (e.g., index options), settlement will be in cash, based on a formula price. When a Fund writes a call or put option, an amount equal to the premium received is recorded as a liability and is subsequently included in the marked-to-market value of the option. As a writer of an option, a Fund has no control over whether it will be required to sell (call) or purchase (put) the underlying asset and as a result bears the risk of an unfavorable change in the price of the asset underlying the option. In the event that a Fund writes call options without an offsetting exposure (e.g., call options on an asset that the Fund does not own), it bears an unlimited risk of loss if the price of the underlying asset increases during the term of the option. OTC options expose a Fund to the risk the Fund may not be able to enter into a closing transaction because of an illiquid market. Written option contracts outstanding at the end of the year, if any, are listed in each applicable Fund’s Schedule of Investments.
When an option contract is closed, that Fund records a realized gain or loss equal to the difference between the value of the contract at the time it was opened and the value at the time it was closed. Realized gains and losses on purchased options are included in realized gains and losses on investment securities. If a written call option is exercised, the premium originally received is recorded as an addition to sales proceeds. If a written put option is exercised, the premium originally received is recorded as a reduction in the cost of investments purchased. Gains and losses from the expiration or closing of written option contracts are separately disclosed in the Statements of Operations.
For the year ended February 28, 2017, investment activity in options contracts written by the Funds was as follows:
| | | | | | | | | | | | | | | | | | | | | | | | |
| | | Puts | | | Calls | |
| | | | | | | |
| | | Principal
Amount of
Contracts | | | Number of
Contracts | | | Premiums | | | Principal
Amount of
Contracts | | | Number of
Contracts | | | Premiums | |
Emerging Countries Fund | |
Outstanding, beginning of year | | | — | | | | — | | | $ | — | | | | — | | | | 8 | | | $ | 3,828 | |
Options written | | | — | | | | — | | | | — | | | | — | | | | 22 | | | | 17,772 | |
Options bought back | | | — | | | | — | | | | — | | | | — | | | | (30 | ) | | | (21,600 | ) |
Options expired | | | — | | | | — | | | | — | | | | — | | | | — | | | | — | |
Options exercised | | | — | | | | — | | | | — | | | | — | | | | — | | | | — | |
| | | | | | | | | | | | | | | | | | | | | | | | | |
Outstanding, end of year | | | — | | | | — | | | $ | — | | | | — | | | | — | | | $ | — | |
| | | | | | | | | | | | | | | | | | | | | | | | | |
| | | | | | | | | | | | | | | | | | | | | | | | | |
Emerging Domestic Opportunities Fund | | | | | | | | | | | | | | | | | | | | | | | | |
Outstanding, beginning of year | | | — | | | | — | | | $ | — | | | | — | | | | 9,647 | | | $ | 4,967,831 | |
Options written | | | — | | | | — | | | | — | | | | — | | | | 16,582 | | | | 12,785,715 | |
Options bought back | | | — | | | | — | | | | — | | | | — | | | | (26,229 | ) | | | (17,753,546 | ) |
Options expired | | | — | | | | — | | | | — | | | | — | | | | — | | | | — | |
Options exercised | | | — | | | | — | | | | — | | | | — | | | | — | | | | — | |
| | | | | | | | | | | | | | | | | | | | | | | | | |
Outstanding, end of year | | | — | | | | — | | | $ | — | | | | — | | | | — | | | $ | — | |
| | | | | | | | | | | | | | | | | | | | | | | | | |
| | | | | | | | | | | | | | | | | | | | | | | | | |
71
GMO Trust Funds
Notes to Financial Statements — (Continued)
February 28, 2017
| | | | | | | | | | | | | | | | | | | | | | | | |
| | | Puts | | | Calls | |
| | | | | | | |
| | | Principal
Amount of
Contracts | | | Number of
Contracts | | | Premiums | | | Principal
Amount of
Contracts | | | Number of
Contracts | | | Premiums | |
Emerging Markets Fund | | | | | | | | | | | | | | | | | | | | | | | | |
Outstanding, beginning of year | | | — | | | | — | | | $ | — | | | | — | | | | 1,732 | | | $ | 989,969 | |
Options written | | | — | | | | — | | | | — | | | | — | | | | 5,695 | | | | 4,257,657 | |
Options bought back | | | — | | | | — | | | | — | | | | — | | | | (7,427 | ) | | | (5,247,626 | ) |
Options expired | | | — | | | | — | | | | — | | | | — | | | | — | | | | — | |
Options exercised | | | — | | | | — | | | | — | | | | — | | | | — | | | | — | |
| | | | | | | | | | | | | | | | | | | | | | | | | |
Outstanding, end of year | | | — | | | | — | | | $ | — | | | | — | | | | — | | | $ | — | |
| | | | | | | | | | | | | | | | | | | | | | | | | |
| | | | | | | | | | | | | | | | | | | | | | | | | |
Exchange-traded options are valued at the last sale price, provided that price is between the closing bid and ask prices. If the last sale price is not within this range, then they will be valued at the closing bid price for long positions and the closing ask price for short positions (and if the market of the underlying reference security closes or the official closing time of the underlying index occurs prior to the close of the NYSE due to time zone differences, the values will be adjusted, to the extent practicable and available, based on inputs from an independent pricing service approved by the Trustees to reflect estimated valuation changes through the NYSE close). The Funds value OTC options using industry models and inputs provided by primary pricing sources.
Swap contracts
The Funds may directly or indirectly use various swap contracts, including, without limitation, swaps on securities and securities indices, total return swaps, interest rate swaps, credit default swaps, variance swaps, commodity swaps, inflation swaps, municipal swaps, dividend swaps, volatility swaps, correlation swaps and other types of available swaps. A swap contract is an agreement to exchange the return generated by one asset for the return generated by another asset. Some swap contracts are net settled. When entering into a swap contract and during the term of the transaction, a Fund and/or the swap counterparty may post or receive cash or securities as collateral.
Initial upfront payments received or made upon entering into a swap contract are included in the fair market value of the swap. The Funds do not amortize upfront payments. Net periodic payments made or received to compensate for differences between the stated terms of the swap contract and prevailing market conditions (credit spreads, currency exchange rates, interest rates, and other relevant factors) are recorded as realized gains or losses in the Statements of Operations. A liquidation payment received or made at the termination of the swap contract is recorded as realized gain or loss in the Statements of Operations.
Interest rate swap contracts involve an exchange by the parties of their respective commitments to pay or rights to receive interest (e.g., an exchange of floating rate interest payments for fixed rate interest payments with respect to the notional amount of principal). Basis swaps are interest rate swaps that involve the exchange of two floating interest rate payments and may involve the exchange of two different currencies.
Total return swap contracts involve a commitment by one party to pay interest to the other party in exchange for a payment to it from the other party based on the return of a reference asset (e.g., a security, basket of securities, or futures contract), both based on notional amounts. To the extent the return of the reference asset exceeds or falls short of the interest payments, one party is entitled to receive a payment from or obligated to make a payment to the other party.
In a credit default swap contract, one party makes payments to another party in exchange for the right to receive a specified return (or to put a security) if a credit event (e.g., default or similar event) occurs with respect to a reference entity or entities. A seller of credit default protection receives periodic payments in return for its obligation to pay the principal amount of a debt security (or other agreed-upon value) to the other party upon the occurrence of a credit event. If no credit event occurs, the seller has no payment obligations so long as there is no early termination.
For credit default swap contracts on asset-backed securities, a credit event may be triggered by various occurrences, which may include an issuer’s failure to pay interest or principal on a reference security, a breach of a material representation or covenant, an agreement by the holders of an asset-backed security to a maturity extension, or a write-down on the collateral underlying the security. For credit default swap contracts on corporate or sovereign issuers, a credit event may be triggered by such occurrences as the issuer’s bankruptcy, failure to pay interest or principal, repudiation/moratorium and/or restructuring.
Variance swap contracts involve an agreement by two parties to exchange cash flows based on the measured variance (or square of volatility) of a specified underlying asset. One party agrees to exchange a “fixed rate” or strike price payment for the “floating rate” or realized price variance on the underlying asset with respect to the notional amount. At inception, the strike price chosen is generally fixed at a level such that the fair value
72
GMO Trust Funds
Notes to Financial Statements — (Continued)
February 28, 2017
of the swap is zero. As a result, no money changes hands at the initiation of the contract. At the expiration date, the amount payable by one party to the other is the difference between the realized price variance of the underlying asset and the strike price multiplied by the notional amount. A receiver of the realized price variance would be entitled to receive a payment when the realized price variance of the underlying asset is greater than the strike price and would be obligated to make a payment when that variance is less than the strike price. A payer of the realized price variance would be obligated to make a payment when the realized price variance of the underlying asset is greater than the strike price and would be entitled to receive a payment when that variance is less than the strike price. This type of agreement is essentially a forward contract on the future realized price variance of the underlying asset.
Generally, the Funds price their OTC swap contracts daily using industry standard models that may incorporate quotations from market makers or pricing vendors and record the change in value, if any, as unrealized gain or loss in the Statements of Operations. Gains or losses are realized upon the termination of the swap contracts or reset dates, as appropriate. Cleared swap contracts are valued using the quote (which may be based on a model) published by the relevant clearing house. If an updated quote for a cleared swap contract is not available by the time that a Fund calculates its net asset value on any business day, then that swap contract will generally be valued using an industry standard model, which may differ from the model used by the relevant clearing house.
The values assigned to swap contracts may differ significantly from the values realized upon termination, and the differences could be material. Entering into swap contracts involves counterparty credit, legal, and documentation risk that is generally not reflected in the value assigned to the swap contract. Such risks include the possibility that the counterparty defaults on its obligations to perform or disagrees as to the meaning of contractual terms, that a Fund has amounts on deposit in excess of amounts owed by that Fund, or that any collateral the other party posts is insufficient or not timely received by a Fund. Credit risk is particularly acute in economic environments in which financial services firms are exposed to systemic risks of the type evidenced by the insolvency of Lehman Brothers in 2008 and subsequent market disruptions. Swap contracts outstanding at the end of the year, if any, are listed in each applicable Fund’s Schedule of Investments.
Rights and warrants
The Funds may purchase or otherwise receive warrants or rights. Warrants and rights generally give the holder the right to receive, upon exercise, a security of the issuer at a set price. Funds typically use warrants and rights in a manner similar to their use of purchased options on securities, as described in the section entitled “Options” above. Risks associated with the use of warrants and rights are generally similar to risks associated with the use of purchased options. However, warrants and rights often do not have standardized terms, and may have longer maturities and may be less liquid than exchange-traded options. In addition, the terms of warrants or rights may limit a Fund’s ability to exercise the warrants or rights at such times and in such quantities as the Fund would otherwise wish. Rights and/or warrants outstanding at the end of the year, if any, are listed in each applicable Fund’s Schedule of Investments.
As provided by U.S. GAAP, the table below is based on market values or unrealized appreciation/(depreciation) rather than the notional amounts of derivatives. Changes to market values of reference asset(s) will tend to have a greater impact on the Funds (with correspondingly greater risk) the greater the notional amount. For further information on notional amounts, see the Schedule of Investments.
The following is a summary of the valuations of derivative instruments categorized by risk exposure.
The Effect of Derivative Instruments on the Statements of Assets and Liabilities as of February 28, 2017 and the Statements of Operations for the year ended February 28, 2017^:
The risks referenced in the tables below are not intended to be inclusive of all risks. Please see the “Investment and other risks” and “Portfolio valuation” sections for a further discussion of risks.
| | | | | | | | | | | | | | | | | | | | | | | | |
| | | | | | | |
| | | Credit
Contracts | | | Equity
Contracts | | | Foreign
Currency
Contracts | | | Interest
Rate
Contracts | | | Other
Contracts | | | Total | |
Emerging Countries Fund | | | | | | | | | | | | | | | | | | | | | | | | |
Asset Derivatives | | | | | | | | | | | | | | | | | | | | | | | | |
Investments (rights and/or warrants) | | $ | — | | | $ | 1,546 | | | $ | — | | | $ | — | | | $ | — | | | $ | 1,546 | |
| | | | | | | | | | | | | | | | | | | | | | | | | |
Total | | $ | — | | | $ | 1,546 | | | $ | — | | | $ | — | | | $ | — | | | $ | 1,546 | |
| | | | | | | | | | | | | | | | | | | | | | | | | |
Derivatives not subject to Master Agreements | | $ | — | | | $ | 1,546 | | | $ | — | | | $ | — | | | $ | — | | | $ | 1,546 | |
| | | | | | | | | | | | | | | | | | | | | | | | | |
Total subject to Master Agreements | | $ | — | | | $ | — | | | $ | — | | | $ | — | | | $ | — | | | $ | — | |
| | | | | | | | | | | | | | | | | | | | | | | | | |
| | | | | | | | | | | | | | | | | | | | | | | | | |
73
GMO Trust Funds
Notes to Financial Statements — (Continued)
February 28, 2017
| | | | | | | | | | | | | | | | | | | | | | | | |
| | | | | | | |
| | | Credit
Contracts | | | Equity Contracts | | | Foreign
Currency
Contracts | | | Interest
Rate
Contracts | | | Other
Contracts | | | Total | |
Emerging Countries Fund (continued) | | | | | | | | | | | | | | | | | | | | | | | | |
Liability Derivatives | | | | | | | | | | | | | | | | | | | | | | | | |
Unrealized Depreciation on Futures Contracts* | | $ | — | | | $ | (696 | ) | | $ | — | | | $ | — | | | $ | — | | | $ | (696 | ) |
| | | | | | | | | | | | | | | | | | | | | | | | | |
Total | | $ | — | | | $ | (696 | ) | | $ | — | | | $ | — | | | $ | — | | | $ | (696 | ) |
| | | | | | | | | | | | | | | | | | | | | | | | | |
Derivatives not subject to Master Agreements | | $ | — | | | $ | — | | | $ | — | | | $ | — | | | $ | — | | | $ | — | |
| | | | | | | | | | | | | | | | | | | | | | | | | |
Total subject to Master Agreements | | $ | — | | | $ | (696 | ) | | $ | — | | | $ | — | | | $ | — | | | $ | (696 | ) |
| | | | | | | | | | | | | | | | | | | | | | | | | |
Net Realized Gain (Loss) on | | | | | | | | | | | | | | | | | | | | | | | | |
Investments (rights and/or warrants) | | $ | — | | | $ | (198 | ) | | $ | — | | | $ | — | | | $ | — | | | $ | (198 | ) |
Futures Contracts | | | — | | | | (12 | ) | | | — | | | | — | | | | — | | | | (12 | ) |
Written Options | | | — | | | | (415 | ) | | | — | | | | — | | | | — | | | | (415 | ) |
Forward Currency Contracts | | | — | | | | — | | | | (59,817 | ) | | | — | | | | — | | | | (59,817 | ) |
| | | | | | | | | | | | | | | | | | | | | | | | | |
Total | | $ | — | | | $ | (625 | ) | | $ | (59,817 | ) | | $ | — | | | $ | — | | | $ | (60,442 | ) |
| | | | | | | | | | | | | | | | | | | | | | | | | |
Change in Net Unrealized Appreciation (Depreciation) on | | | | | | | | | | | | | | | | | | | | | | | | |
Investments (rights and/or warrants) | | $ | — | | | $ | 1,994 | | | $ | — | | | $ | — | | | $ | — | | | $ | 1,994 | |
Futures Contracts | | | — | | | | (696 | ) | | | — | | | | — | | | | — | | | | (696 | ) |
Written Options | | | — | | | | (1,260 | ) | | | — | | | | — | | | | — | | | | (1,260 | ) |
| | | | | | | | | | | | | | | | | | | | | | | | | |
Total | | $ | — | | | $ | 38 | | | $ | — | | | $ | — | | | $ | — | | | $ | 38 | |
| | | | | | | | | | | | | | | | | | | | | | | | | |
| | | | | | | | | | | | | | | | | | | | | | | | | |
Emerging Domestic Opportunities Fund | | | | | | | | | | | | | | | | | | | | | | | | |
Asset Derivatives | | | | | | | | | | | | | | | | | | | | | | | | |
Investments, at value (rights and/or warrants) | | $ | — | | | $ | 9,059,896 | | | $ | — | | | $ | — | | | $ | — | | | $ | 9,059,896 | |
Investments, at value (Fully Funded total return swaps) | | | — | | | | 46,850,399 | | | | — | | | | — | | | | — | | | | 46,850,399 | |
Unrealized Appreciation on Forward Currency Contracts | | | — | | | | — | | | | 6,228,820 | | | | — | | | | — | | | | 6,228,820 | |
Unrealized Appreciation on Futures Contracts | | | — | | | | 5,567,968 | | | | — | | | | — | | | | — | | | | 5,567,968 | |
Unrealized Appreciation Swap Contracts | | | — | | | | 740,882 | | | | — | | | | — | | | | — | | | | 740,882 | |
| | | | | | | | | | | | | | | | | | | | | | | | | |
Total | | $ | — | | | $ | 62,219,145 | | | $ | 6,228,820 | | | $ | — | | | $ | — | | | $ | 68,447,965 | |
| | | | | | | | | | | | | | | | | | | | | | | | | |
Derivatives not subject to Master Agreements | | $ | — | | | $ | 9,059,896 | | | $ | — | | | $ | — | | | $ | — | | | $ | 9,059,896 | |
| | | | | | | | | | | | | | | | | | | | | | | | | |
Total subject to Master Agreements | | $ | — | | | $ | 53,159,249 | | | $ | 6,228,820 | | | $ | — | | | $ | — | | | $ | 59,388,069 | |
| | | | | | | | | | | | | | | | | | | | | | | | | |
Liability Derivatives | | | | | | | | | | | | | | | | | | | | | | | | |
Unrealized Depreciation on Forward Currency Contracts | | $ | — | | | $ | — | | | $ | (5,739,901 | ) | | $ | — | | | $ | — | | | $ | (5,739,901 | ) |
| | | | | | | | | | | | | | | | | | | | | | | | | |
Total | | $ | — | | | $ | — | | | $ | (5,739,901 | ) | | $ | — | | | $ | — | | | $ | (5,739,901 | ) |
| | | | | | | | | | | | | | | | | | | | | | | | | |
Derivatives not subject to Master Agreements | | $ | — | | | $ | — | | | $ | — | | | $ | — | | | $ | — | | | $ | — | |
| | | | | | | | | | | | | | | | | | | | | | | | | |
Total subject to Master Agreements | | $ | — | | | $ | — | | | $ | (5,739,901 | ) | | $ | — | | | $ | — | | | $ | (5,739,901 | ) |
| | | | | | | | | | | | | | | | | | | | | | | | | |
Net Realized Gain (Loss) on | | | | | | | | | | | | | | | | | | | | | | | | |
Investments (rights and/or warrants) | | $ | — | | | $ | (148,619 | ) | | $ | — | | | $ | — | | | $ | — | | | $ | (148,619 | ) |
Swap Contracts | | | — | | | | (4,734,695 | ) | | | — | | | | — | | | | — | | | | (4,734,695 | ) |
Futures Contracts | | | — | | | | (20,424,305 | ) | | | — | | | | — | | | | — | | | | (20,424,305 | ) |
Written Options | | | — | | | | 220,020 | | | | — | | | | — | | | | — | | | | 220,020 | |
Forward Currency Contracts | | | — | | | | — | | | | (7,467,329 | ) | | | — | | | | — | | | | (7,467,329 | ) |
| | | | | | | | | | | | | | | | | | | | | | | | | |
Total | | $ | — | | | $ | (25,087,599 | ) | | $ | (7,467,329 | ) | | $ | — | | | $ | — | | | $ | (32,554,928 | ) |
| | | | | | | | | | | | | | | | | | | | | | | | | |
| | | | | | | | | | | | | | | | | | | | | | | | | |
74
GMO Trust Funds
Notes to Financial Statements — (Continued)
February 28, 2017
| | | | | | | | | | | | | | | | | | | | | | | | |
| | | | | | | |
| | | Credit
Contracts | | | Equity
Contracts | | | Foreign
Currency
Contracts | | | Interest
Rate
Contracts | | | Other
Contracts | | | Total | |
Emerging Domestic Opportunities Fund (continued) | | | | | | | | | | | | | | | | | | | | | | | | |
Change in Net Unrealized Appreciation (Depreciation) on | | | | | | | | | | | | | | | | | | | | | | | | |
Investments (rights and/or warrants) | | $ | — | | | $ | 1,080,887 | | | $ | — | | | $ | — | | | $ | — | | | $ | 1,080,887 | |
Investments (Fully Funded total return swaps) | | | — | | | | 3,410,266 | | | | — | | | | — | | | | — | | | | 3,410,266 | |
Futures Contracts | | | — | | | | 2,793,678 | | | | — | | | | — | | | | — | | | | 2,793,678 | |
Written Options | | | — | | | | (1,716,561 | ) | | | — | | | | — | | | | — | | | | (1,716,561 | ) |
Swap Contracts | | | — | | | | 607,160 | | | | — | | | | — | | | | — | | | | 607,160 | |
Forward Currency Contracts | | | — | | | | — | | | | 2,520,267 | | | | — | | | | — | | | | 2,520,267 | |
| | | | | | | | | | | | | | | | | | | | | | | | | |
Total | | $ | — | | | $ | 6,175,430 | | | $ | 2,520,267 | | | $ | — | | | $ | — | | | $ | 8,695,697 | |
| | | | | | | | | | | | | | | | | | | | | | | | | |
| | | | | | | | | | | | | | | | | | | | | | | | | |
Emerging Markets Fund | | | | | | | | | | | | | | | | | | | | | | | | |
Asset Derivatives | | | | | | | | | | | | | | | | | | | | | | | | |
Investments (rights and/or warrants) | | $ | — | | | $ | 133,174 | | | $ | — | | | $ | — | | | $ | — | | | $ | 133,174 | |
Investments, at value (Fully Funded total return swaps) | | | — | | | | 925,653 | | | | — | | | | — | | | | — | | | | 925,653 | |
Unrealized Appreciation on Swap Contracts* | | | — | | | | 1,035,331 | | | | — | | | | — | | | | — | | | | 1,035,331 | |
| | | | | | | | | | | | | | | | | | | | | | | | | |
Total | | $ | — | | | $ | 2,094,158 | | | $ | — | | | $ | — | | | $ | — | | | $ | 2,094,158 | |
| | | | | | | | | | | | | | | | | | | | | | | | | |
Derivatives not subject to Master Agreements | | $ | — | | | $ | 133,174 | | | $ | — | | | $ | — | | | $ | — | | | $ | 133,174 | |
| | | | | | | | | | | | | | | | | | | | | | | | | |
Total subject to Master Agreements | | $ | — | | | $ | 1,960,984 | | | $ | — | | | $ | — | | | $ | — | | | $ | 1,960,984 | |
| | | | | | | | | | | | | | | | | | | | | | | | | |
Liability Derivatives | | | | | | | | | | | | | | | | | | | | | | | | |
Unrealized Depreciation on Futures Contracts* | | $ | — | | | $ | (133,506 | ) | | $ | — | | | $ | — | | | $ | — | | | $ | (133,506 | ) |
| | | | | | | | | | | | | | | | | | | | | | | | | |
Total | | $ | — | | | $ | (133,506 | ) | | $ | — | | | $ | — | | | $ | — | | | $ | (133,506 | ) |
| | | | | | | | | | | | | | | | | | | | | | | | | |
Derivatives not subject to Master Agreements | | $ | — | | | $ | — | | | $ | — | | | $ | — | | | $ | — | | | $ | — | |
| | | | | | | | | | | | | | | | | | | | | | | | | |
Total subject to Master Agreements | | $ | — | | | $ | (133,506 | ) | | $ | — | | | $ | — | | | $ | — | | | $ | (133,506 | ) |
| | | | | | | | | | | | | | | | | | | | | | | | | |
Net Realized Gain (Loss) on | | | | | | | | | | | | | | | | | | | | | | | | |
Investments (rights and/or warrants) | | $ | — | | | $ | (121,684 | ) | | $ | — | | | $ | — | | | $ | — | | | $ | (121,684 | ) |
Futures Contracts | | | — | | | | (2,097 | ) | | | — | | | | — | | | | — | | | | (2,097 | ) |
Written Options | | | — | | | | 53,298 | | | | — | | | | — | | | | — | | | | 53,298 | |
Swap Contracts | | | — | | | | (3,644,256 | ) | | | — | | | | — | | | | — | | | | (3,644,256 | ) |
Forward Currency Contracts | | | — | | | | — | | | | (11,856,453 | ) | | | — | | | | — | | | | (11,856,453 | ) |
| | | | | | | | | | | | | | | | | | | | | | | | | |
Total | | $ | — | | | $ | (3,714,739 | ) | | $ | (11,856,453 | ) | | $ | — | | | $ | — | | | $ | (15,571,192 | ) |
| | | | | | | | | | | | | | | | | | | | | | | | | |
Change in Net Unrealized Appreciation (Depreciation) on | | | | | | | | | | | | | | | | | | | | | | | | |
Investments (rights and/or warrants) | | $ | — | | | $ | 33,374 | | | $ | — | | | $ | — | | | $ | — | | | $ | 33,374 | |
Investments (Fully Funded total return swaps) | | | — | | | | 20,418 | | | | — | | | | — | | | | — | | | | 20,418 | |
Futures Contracts | | | — | | | | (133,506 | ) | | | — | | | | — | | | | — | | | | (133,506 | ) |
Written Options | | | — | | | | (363,121 | ) | | | — | | | | — | | | | — | | | | (363,121 | ) |
Swap Contracts | | | — | | | | 869,885 | | | | — | | | | — | | | | — | | | | 869,885 | |
| | | | | | | | | | | | | | | | | | | | | | | | | |
Total | | $ | — | | | $ | 427,050 | | | $ | — | | | $ | — | | | $ | — | | | $ | 427,050 | |
| | | | | | | | | | | | | | | | | | | | | | | | | |
| | | | | | | | | | | | | | | | | | | | | | | | | |
| | ^ | Because the Funds recognize changes in value through the Statements of Operations, they do not qualify for hedge accounting under authoritative guidance for derivative instruments. The Funds’ investments in derivatives may represent an economic hedge; however, they are considered to be non-hedge transactions for the purpose of these tables. |
| | * | The table includes cumulative unrealized appreciation/depreciation of futures and cleared swap contracts, if any, as reported in the Schedule of Investments. Year end variation margin on open futures and cleared swap contracts, if any, is reported within the Statements of Assets and Liabilities. |
Certain Funds are party to International Swaps and Derivatives Association, Inc. Master Agreements, Global Master Repurchase Agreements or other similar types of agreements (collectively, “Master Agreements”) that generally govern the terms of some OTC derivative transactions, repurchase agreements and reverse repurchase agreements. The Master Agreements may include collateral posting terms and netting provisions that apply in the event of a default and/or termination event. Upon the occurrence of such an event, including the bankruptcy or insolvency of the counterparty, the Master Agreements may permit the non-defaulting party to calculate a single net payment to close out applicable transactions.
75
GMO Trust Funds
Notes to Financial Statements — (Continued)
February 28, 2017
However, there is no guarantee that the terms of a Master Agreement will be enforceable; for example, when bankruptcy or insolvency laws impose restrictions on or prohibitions against the right of offset. Additionally, the netting and close out provisions of a Master Agreement may not extend to the obligations of the counterparty’s affiliates and across varying types of transactions. Because no such event has occurred, the Funds do not presently have a legally enforceable right of set-off and these amounts have not been offset in the Statements of Assets and Liabilities, but have been presented separately in the table below. Termination events may also include a decline in the net assets of a Fund below a certain level over a specified period of time and may entitle a counterparty to elect to terminate early with respect to some or all the transactions under the Master Agreement with that counterparty. Such an election by one or more of the counterparties could have a material adverse impact on a Fund’s operations. An estimate of the aggregate net payment, if any, that may need to be made by a Fund in such an event is represented by the unrealized amounts in the tables below. For more information about other uncertainties and risks, see “Investments and other risks” above.
For financial reporting purposes, on the Statements of Assets and Liabilities any cash collateral that has been pledged to cover obligations of the Funds is reported as Due from Broker and any cash collateral received from the counterparty is reported as Due to Broker. Any non-cash collateral pledged by the Funds is noted in the Schedules of Investments. The tables below show the potential effect of netting arrangements made available by the Master Agreements on the financial position of the Funds. For financial reporting purposes, the Funds’ Statements of Assets and Liabilities generally show derivative assets and derivative liabilities (regardless of whether they are subject to netting arrangements) on a gross basis, which reflects the full risks and exposures of the Fund prior to netting. See Note 2 for information on repurchase agreements and reverse repurchase agreements held by the Funds at February 28, 2017, if any.
The tables above present the Funds’ derivative assets and liabilities by type of financial instrument. The following tables present the Funds’ OTC and/or exchange-traded derivative assets and liabilities by counterparty net of amounts that may be available for offset under the Master Agreements by the terms of the agreement and net of the related collateral received or pledged by the Funds as of February 28, 2017:
Emerging Domestic Opportunities Fund
| | | | | | | | | | | | | | | | |
| | | | | |
| Counterparty | | Gross Derivative
Assets Subject to
Master Agreements | | | Collateral
Received | | | Derivative
Assets/(Liabilities)
Available for Offset | | | Net Amount
of Derivative
Assets | |
Barclays Bank plc | | $ | 5,470,634 | | | $ | — | | | $ | 5,470,634 | | | $ | — | |
Goldman Sachs International | | | 47,210,988 | | | | — | | | | — | | | | 47,210,988 | |
JP Morgan Chase Bank, N.A. | | | 105,974 | | | | — | | | | — | | | | 105,974 | |
Morgan Stanley & Co. International PLC | | | 758,186 | | | | (720,000 | ) | | | — | | | | 38,186 | |
UBS AG | | | 274,319 | | | | — | | | | — | | | | 274,319 | |
| | | | | | | | | | | | | | | | | |
Total | | $ | 53,820,101 | | | $ | (720,000 | ) | | $ | 5,470,634 | | | $ | 47,629,467 | |
| | | | | | | | | | | | | | | | | |
| | | | | | | | | | | | | | | | | |
| | | | | |
| Counterparty | | Gross Derivative
Liabilities Subject to
Master Agreements | | | Collateral
Pledged | | | Derivative
(Assets)/Liabilities
Available for Offset | | | Net Amount
of Derivative
Liabilities | |
Barclays Bank plc | | $ | 5,739,901 | | | $ | (269,267 | ) | | $ | (5,470,634 | ) | | $ | — | * |
| | | | | | | | | | | | | | | | | |
Total | | $ | 5,739,901 | | | $ | (269,267 | ) | | $ | (5,470,634 | ) | | $ | — | |
| | | | | | | | | | | | | | | | | |
| | | | | | | | | | | | | | | | | |
Emerging Markets Fund
| | | | | | | | | | | | | | | | |
| | | | | |
| Counterparty | | Gross Derivative
Assets Subject to
Master Agreements | | | Collateral
Received | | | Derivative
Assets/(Liabilities)
Available for Offset | | | Net Amount
of Derivative
Assets | |
Goldman Sachs International | | $ | 925,653 | | | $ | — | | | $ | — | | | $ | 925,653 | |
Morgan Stanley & Co. International PLC | | | 1,035,331 | | | | (1,035,331 | ) | | | — | | | | — | * |
| | | | | | | | | | | | | | | | | |
Total | | $ | 1,960,984 | | | $ | (1,035,331 | ) | | $ | — | | | $ | 925,653 | |
| | | | | | | | | | | | | | | | | |
| | | | | | | | | | | | | | | | | |
| | * | The actual collateral received and/or pledged is more than the amount shown. |
76
GMO Trust Funds
Notes to Financial Statements — (Continued)
February 28, 2017
The average derivative activity of notional amounts (forward currency contracts, futures contracts and swap contracts), market values (rights and/or warrants), and number of contracts (options) outstanding, based on absolute values, at each month-end, was as follows for the year ended February 28, 2017:
| | | | | | | | | | | | | | | | | | | | |
| | | | | | |
| Fund Name | | Forward
Currency
Contracts ($) | | | Futures
Contracts ($) | | | Swap
Contracts ($) | | | Options
(Contracts) | | | Rights and/or
Warrants ($) | |
Emerging Countries Fund | | | 118,764 | | | | 23,270 | | | | — | | | | 1 | | | | 415 | |
Emerging Domestic Opportunities Fund | | | 649,913,587 | | | | 244,397,615 | | | | 40,395,082 | * | | | 1,569 | | | | 6,747,028 | |
Emerging Markets Fund | | | 23,752,784 | | | | 4,149,817 | | | | 25,163,081 | * | | | 353 | | | | 209,202 | |
| | * | Includes fully funded total return swap average derivative activity for the period ended February 28, 2017. |
| 5. | Fees and other transactions with affiliates |
GMO receives a management fee for the services it provides to each Fund. Management fees are paid monthly at the annual rate equal to the percentage of each Fund’s average daily net assets set forth in the table below:
| | | | | | | | | | | | | | | | |
| | | | | |
| | | Emerging
Countries
Fund | | | Emerging
Domestic
Opportunities
Fund | | | Emerging
Markets
Fund | | | Taiwan
Fund | |
Management Fee | | | 0.65% | | | | 0.75% | | | | 0.75%(1) | | | | 0.81% | |
| | (1) | Effective January 1, 2017, GMO has contractually agreed to waive the management fee charged to each class of shares of the Fund by 0.10%, from 0.75% to 0.65%. The management fee waiver will continue through at least January 1, 2018. |
In addition, each class of shares of the Funds pays GMO directly or indirectly a shareholder service fee for providing client services and reporting, such as performance information, client account information, personal and electronic access to Fund information, access to analysis and explanations of Fund reports, and assistance in maintaining and correcting client-related information. Shareholder service fees are paid monthly equal to the percentage of each applicable Fund’s average daily net assets set forth in the table below:
| | | | | | | | | | | | | | | | | | | | |
| | | | | | |
| Fund Name | | Class II | | | Class III | | | Class IV | | | Class V | | | Class VI | |
Emerging Countries Fund | | | | | | | 0.15% | | | | | | | | | | | | | |
Emerging Domestic Opportunities Fund | | | 0.22% | | | | 0.15% | | | | 0.105% | | | | 0.085% | | | | 0.055% | |
Emerging Markets Fund | | | 0.22% | | | | 0.15% | | | | 0.105% | | | | 0.085% | | | | 0.055% | |
Taiwan Fund | | | | | | | 0.15% | | | | | | | | | | | | | |
For each Fund, other than Emerging Countries Fund and Taiwan Fund, GMO has contractually agreed to reimburse each Fund for its “Specified Operating Expenses” (as defined below). Any such reimbursements are paid to a Fund concurrently with the Fund’s payment of management fees to GMO. For Emerging Countries Fund, GMO has contractually agreed to reimburse the Fund for the portion of its “Specified Operating Expenses” (as defined below) that exceeds 0.35% of the Fund’s average daily net assets.
Subject to the exclusions noted below, “Specified Operating Expenses” means: audit expenses, fund accounting expenses, pricing service expenses, expenses of non-investment related tax services, transfer agency expenses, expenses of non-investment related legal services provided to the Funds by or at the direction of GMO, federal securities law filing expenses, printing expenses, state and federal registration fees and custody expenses; provided, however, that in the case of Emerging Markets Fund, “Specified Operating Expenses” does not include custody expenses, and in the case of Emerging Domestic Opportunities Fund, “Specified Operating Expenses” only includes custody expenses to the extent that they exceed 0.10% of the Fund’s average daily net assets.
77
GMO Trust Funds
Notes to Financial Statements — (Continued)
February 28, 2017
For each Fund that pays GMO a management fee, GMO has contractually agreed to waive or reduce that fee, but not below zero, to the extent necessary to offset the management fees paid to GMO that are directly or indirectly borne by the Fund as a result of the Fund’s direct or indirect investments in other GMO Funds.
For each Fund that charges a shareholder service fee, GMO has contractually agreed to waive or reduce the shareholder service fee charged to holders of each class of shares of the Fund, but not below zero, to the extent necessary to offset the shareholder service fees directly or indirectly borne by the class of shares of the Fund as a result of the Fund’s direct or indirect investments in other GMO Funds.
In addition, for Emerging Markets Fund only, GMO has contractually agreed to waive the shareholder service fees charged to holders of each class of shares of the Fund to the extent necessary to prevent the shareholder service fees borne by each class of shares of the Fund from exceeding the percentage of the class’s average daily net assets as follows: 0.20% for Class II shares, 0.15% for Class III shares, 0.10% of Class IV shares, 0.05% for Class V shares, and 0.02% for Class VI shares.
These contractual waivers and reimbursements will continue through at least June 30, 2017 for each Fund unless the Funds’ Board of Trustees authorizes their modification or termination, or reduces the fee rates paid to GMO under the Fund’s management contract or servicing and supplemental support agreement.
The Funds’ portion of the gross fees paid by the Trust to the Trust’s independent Trustees and their legal counsel and any agents unaffiliated with GMO during the year ended February 28, 2017 is shown in the table below and is included in the Statements of Operations.
| | | | | | | | |
| | | |
| Fund Name | | Independent Trustees and
their legal counsel ($) | | | Agent unaffiliated
with GMO ($) | |
Emerging Countries Fund | | | 425 | | | | 2 | |
Emerging Domestic Opportunities Fund | | | 34,659 | | | | 3,380 | |
Emerging Markets Fund | | | 84,583 | | | | 8,575 | |
Taiwan Fund | | | 1,717 | | | | 124 | |
Certain Funds incur fees and expenses indirectly as a shareholder in the underlying funds. For the year ended February 28, 2017 these indirect fees and expenses expressed as a percentage of each Fund’s average daily net assets were as follows:
| | | | | | | | | | | | |
| | | | |
| Fund Name | | Indirect Net Expenses
(excluding shareholder
service fees) | | | Indirect Shareholder
Service Fees | | | Total Indirect Expenses | |
Emerging Countries Fund | | | < 0.001% | | | | 0.000% | | | | < 0.001% | |
Emerging Domestic Opportunities Fund | | | < 0.001% | | | | 0.000% | | | | < 0.001% | |
Emerging Markets Fund | | | < 0.001% | | | | 0.000% | | | | < 0.001% | |
Taiwan Fund | | | < 0.001% | | | | 0.000% | | | | < 0.001% | |
The Funds are permitted to purchase or sell securities from or to certain other GMO funds under specified conditions outlined in procedures adopted by the Trustees. The procedures have been designed to ensure that any purchase or sale of securities by a Fund from another fund or portfolio that is or could be considered an affiliate by virtue of having a common investment adviser (or affiliated investment advisers), common Trustees and/or common officers complies with Rule 17a-7 of the 1940 Act. Further, as defined under the procedures, each transaction is effectuated at the current market price. During the year ended February 28, 2017, the Funds did not engage in these transactions.
78
GMO Trust Funds
Notes to Financial Statements — (Continued)
February 28, 2017
| 6. | Purchases and sales of securities |
Cost of purchases and proceeds from sales of securities, excluding short-term investments and including GMO U.S. Treasury Fund, for the year ended February 28, 2017 are noted in the table below:
| | | | | | | | | | | | | | | | |
| | | | | |
| | | Purchases ($) | | | Purchases ($) | | | Sales ($) | | | Sales ($) | |
| | | | | |
| Fund Name | | U.S. Government
Securities | | | Investments (Non-U.S.
Government Securities) | | | U.S. Government
Securities | | | Investments (Non-U.S.
Government Securities) | |
Emerging Countries Fund | | | $ — | | | $ | 20,976,572 | | | | $ — | | | $ | 20,921,968 | |
Emerging Domestic Opportunities Fund | | | — | | | | 5,313,689,581 | | | | — | | | | 5,550,192,012 | |
Emerging Markets Fund | | | — | | | | 3,971,789,671 | | | | — | | | | 5,213,643,060 | |
Taiwan Fund | | | — | | | | 124,867,746 | | | | — | | | | 112,221,420 | |
In the normal course of business the Funds enter into contracts with third-party service providers that contain a variety of representations and warranties and that provide general indemnifications. The Funds’ maximum exposure under these arrangements is unknown, as it involves possible future claims that may or may not be made against the Funds. Based on experience, GMO is of the view that the risk of loss to the Funds in connection with the Funds’ indemnification obligations is remote; however, there can be no assurance that such obligations will not result in material liabilities that adversely affect the Funds.
| 8. | Principal shareholders and related parties as of February 28, 2017 |
| | | | | | | | | | | | | | | | |
| | | | | |
| Fund Name* | | Number of
shareholders that held
more than 10% of the
outstanding shares of
the Fund | | | Percentage of
outstanding shares of
the Fund held by those
shareholders owning
greater than 10% of the
outstanding shares of
the Fund | | | Percentage of the
shares of the Fund held
by senior management
of GMO and GMO
Trust officers | | | Percentage of the
Fund’s shares held by accounts for which
GMO has investment discretion | |
Emerging Countries Fund | | | 4 | † | | | 90.97% | | | | 0.35 | % | | | 45.64 | % |
Emerging Domestic Opportunities Fund | | | 3 | | | | 35.92% | | | | 0.53 | % | | | — | |
Emerging Markets Fund | | | 3 | ‡ | | | 31.39% | | | | 0.60 | % | | | 68.43 | % |
Taiwan Fund | | | 1 | | | | 100.00% | | | | — | | | | 100.00 | % |
| | * | With the exception of Taiwan Fund, each Fund’s outstanding shares were owned by more than 10 shareholders as of February 28, 2017. |
| | † | One of the shareholders is another fund managed by GMO. |
| | ‡ | Two of the shareholders are other funds of the Trust. |
79
GMO Trust Funds
Notes to Financial Statements — (Continued)
February 28, 2017
The Declaration of Trust permits each Fund to issue an unlimited number of shares of beneficial interest (without par value). Transactions in the Funds’ shares were as follows:
| | | | | | | | | | | | | | | | |
| | | |
| | | Year Ended
February 28, 2017 | | | Year Ended
February 29, 2016 | |
| | | | | |
| | | Shares | | | Amount | | | Shares | | | Amount | |
Emerging Countries Fund | | | | | | | | | | | | | | | | |
Class III:# | | | | | | | | | | | | | | | | |
Shares sold | | | 59,348 | | | $ | 1,519,166 | | | | 60,670 | | | $ | 1,588,367 | |
Shares issued to shareholders in reinvestment of distributions | | | 13,360 | | | | 325,047 | | | | 47,190 | | | | 1,028,733 | |
Shares repurchased | | | (83,312 | ) | | | (1,990,678 | ) | | | (480,602 | ) | | | (11,342,704 | ) |
| | | | | | | | | | | | | | | | | |
Net increase (decrease) | | | (10,604 | ) | | $ | (146,465 | ) | | | (372,742 | ) | | $ | (8,725,604 | ) |
| | | | | | | | | | | | | | | | | |
| | | | | | | | | | | | | | | | | |
Emerging Domestic Opportunities Fund | | | | | | | | | | | | | | | | |
Class II: | | | | | | | | | | | | | | | | |
Shares sold | | | 7,485,284 | | | $ | 160,982,074 | | | | 4,409,709 | | | $ | 89,770,584 | |
Shares issued to shareholders in reinvestment of distributions | | | 697,230 | | | | 14,510,206 | | | | 453,085 | | | | 9,906,715 | |
Shares repurchased | | | (10,275,533 | ) | | | (225,166,888 | ) | | | (6,874,283 | ) | | | (146,177,784 | ) |
Purchase premiums | | | — | | | | 78,467 | | | | — | | | | 155,838 | |
Redemption fees | | | — | | | | 588,506 | | | | — | | | | 908,135 | |
| | | | | | | | | | | | | | | | | |
Net increase (decrease) | | | (2,093,019 | ) | | $ | (49,007,635 | ) | | | (2,011,489 | ) | | $ | (45,436,512 | ) |
| | | | | | | | | | | | | | | | | |
Class III: | | | | | | | | | | | | | | | | |
Shares sold | | | 2,933,935 | | | $ | 62,998,906 | | | | 1,908,289 | | | $ | 37,860,727 | |
Shares issued to shareholders in reinvestment of distributions | | | 222,746 | | | | 4,625,740 | | | | 237,017 | | | | 5,170,993 | |
Shares repurchased | | | (10,000,083 | ) | | | (216,597,785 | ) | | | (3,630,072 | ) | | | (74,411,104 | ) |
Purchase premiums | | | — | | | | 24,572 | | | | — | | | | 74,988 | |
Redemption fees | | | — | | | | 164,606 | | | | — | | | | 400,139 | |
| | | | | | | | | | | | | | | | | |
Net increase (decrease) | | | (6,843,402 | ) | | $ | (148,783,961 | ) | | | (1,484,766 | ) | | $ | (30,904,257 | ) |
| | | | | | | | | | | | | | | | | |
Class IV: | | | | | | | | | | | | | | | | |
Shares sold | | | 6,037,293 | | | $ | 129,016,957 | | | | 11,894,352 | | | $ | 234,416,398 | |
Shares issued to shareholders in reinvestment of distributions | | | 782,540 | | | | 16,393,889 | | | | 492,028 | | | | 10,726,065 | |
Shares repurchased | | | (30,511,626 | ) | | | (697,091,179 | ) | | | (2,501,335 | ) | | | (61,757,952 | ) |
Purchase premiums | | | — | | | | 104,701 | | | | — | | | | 147,157 | |
Redemption fees | | | — | | | | 684,403 | | | | — | | | | 839,235 | |
| | | | | | | | | | | | | | | | | |
Net increase (decrease) | | | (23,691,793 | ) | | $ | (550,891,229 | ) | | | 9,885,045 | | | $ | 184,370,903 | |
| | | | | | | | | | | | | | | | | |
Class V: | | | | | | | | | | | | | | | | |
Shares sold | | | 26,717,121 | | | $ | 614,385,969 | | | | 16,616,084 | | | $ | 334,463,505 | |
Shares issued to shareholders in reinvestment of distributions | | | 1,075,943 | | | | 22,220,013 | | | | 247,046 | | | | 5,385,781 | |
Shares repurchased | | | (2,550,388 | ) | | | (52,305,875 | ) | | | (10,847,820 | ) | | | (209,616,398 | ) |
Purchase premiums | | | — | | | | 58,196 | | | | — | | | | 71,574 | |
Redemption fees | | | — | | | | 569,292 | | | | — | | | | 400,746 | |
| | | | | | | | | | | | | | | | | |
Net increase (decrease) | | | 25,242,676 | | | $ | 584,927,595 | | | | 6,015,310 | | | $ | 130,705,208 | |
| | | | | | | | | | | | | | | | | |
| | | | | | | | | | | | | | | | | |
80
GMO Trust Funds
Notes to Financial Statements — (Continued)
February 28, 2017
| | | | | | | | | | | | | | | | |
| | | |
| | | Year Ended
February 28, 2017 | | | Year Ended
February 29, 2016 | |
| | | | | |
| | | Shares | | | Amount | | | Shares | | | Amount | |
Emerging Domestic Opportunities Fund (continued) | | | | | | | | | | | | | | | | |
Class VI: | | | | | | | | | | | | | | | | |
Shares sold | | | 205,646 | | | $ | 4,338,151 | | | | 14,135 | | | $ | 305,152 | |
Shares issued to shareholders in reinvestment of distributions | | | 13,943 | | | | 290,287 | | | | 344,877 | | | | 7,625,003 | |
Shares repurchased | | | (23,501 | ) | | | (513,105 | ) | | | (25,054,992 | ) | | | (504,824,963 | ) |
Purchase premiums | | | — | | | | 1,413 | | | | — | | | | 105,213 | |
Redemption fees | | | — | | | | 10,922 | | | | — | | | | 543,532 | |
| | | | | | | | | | | | | | | | | |
Net increase (decrease) | | | 196,088 | | | $ | 4,127,668 | | | | (24,695,980 | ) | | $ | (496,246,063 | ) |
| | | | | | | | | | | | | | | | | |
| | | | | | | | | | | | | | | | | |
Emerging Markets Fund | | | | | | | | | | | | | | | | |
Class II:# | | | | | | | | | | | | | | | | |
Shares sold | | | 823,187 | | | $ | 23,902,466 | | | | 8,660,478 | | | $ | 208,458,170 | |
Shares issued to shareholders in reinvestment of distributions | | | 317,627 | | | | 8,547,393 | | | | 430,140 | | | | 10,635,137 | |
Shares repurchased | | | (7,873,707 | ) | | | (209,618,011 | ) | | | (18,541,178 | ) | | | (524,304,133 | ) |
Purchase premiums | | | — | | | | 206,220 | | | | — | | | | 829,154 | |
Redemption fees | | | — | | | | 1,323,690 | | | | — | | | | 1,524,728 | |
| | | | | | | | | | | | | | | | | |
Net increase (decrease) | | | (6,732,893 | ) | | $ | (175,638,242 | ) | | | (9,450,560 | ) | | $ | (302,856,944 | ) |
| | | | | | | | | | | | | | | | | |
Class III:# | | | | | | | | | | | | | | | | |
Shares sold | | | 1,646,735 | | | $ | 50,110,147 | | | | 2,521,243 | | | $ | 77,353,683 | |
Shares issued to shareholders in reinvestment of distributions | | | 101,508 | | | | 2,737,447 | | | | 207,018 | | | | 5,115,848 | |
Shares repurchased | | | (20,839 | ) | | | (590,715 | ) | | | (3,695,910 | ) | | | (84,504,654 | ) |
Purchase premiums | | | — | | | | 115,197 | | | | — | | | | 330,713 | |
Redemption fees | | | — | | | | 604,396 | | | | — | | | | 737,169 | |
| | | | | | | | | | | | | | | | | |
Net increase (decrease) | | | 1,727,404 | | | $ | 52,976,472 | | | | (967,649 | ) | | $ | (967,241 | ) |
| | | | | | | | | | | | | | | | | |
Class IV:# | | | | | | | | | | | | | | | | |
Shares sold | | | 12,277,358 | | | $ | 367,988,726 | | | | 4,020,625 | | | $ | 115,714,945 | |
Shares issued to shareholders in reinvestment of distributions | | | 106,683 | | | | 2,851,160 | | | | 377,883 | | | | 9,288,060 | |
Shares repurchased | | | (4,671,454 | ) | | | (129,426,496 | ) | | | (20,209,744 | ) | | | (554,530,737 | ) |
Purchase premiums | | | — | | | | 188,279 | | | | — | | | | 711,055 | |
Redemption fees | | | — | | | | 734,437 | | | | — | | | | 1,329,488 | |
| | | | | | | | | | | | | | | | | |
Net increase (decrease) | | | 7,712,587 | | | $ | 242,336,106 | | | | (15,811,236 | ) | | $ | (427,487,189 | ) |
| | | | | | | | | | | | | | | | | |
Class V:# | | | | | | | | | | | | | | | | |
Shares sold | | | 3,283,522 | | | $ | 87,142,351 | | | | 7,056,847 | | | $ | 218,105,434 | |
Shares issued to shareholders in reinvestment of distributions | | | 326,859 | | | | 8,709,058 | | | | 349,642 | | | | 8,560,034 | |
Shares repurchased | | | (11,837,332 | ) | | | (354,659,563 | ) | | | (1,092,476 | ) | | | (26,908,734 | ) |
Purchase premiums | | | — | | | | 107,715 | | | | — | | | | 300,601 | |
Redemption fees | | | — | | | | 992,090 | | | | — | | | | 729,841 | |
| | | | | | | | | | | | | | | | | |
Net increase (decrease) | | | (8,226,951 | ) | | $ | (257,708,349 | ) | | | 6,314,013 | | | $ | 200,787,176 | |
| | | | | | | | | | | | | | | | | |
Class VI:# | | | | | | | | | | | | | | | | |
Shares sold | | | 9,646,816 | | | $ | 286,707,394 | | | | 34,257,356 | | | $ | 929,371,388 | |
Shares issued to shareholders in reinvestment of distributions | | | 2,878,228 | | | | 76,876,100 | | | | 5,625,667 | | | | 138,033,181 | |
Shares repurchased | | | (55,955,886 | ) | | | (1,530,569,213 | ) | | | (49,515,650 | ) | | | (1,356,526,662 | ) |
Purchase premiums | | | — | | | | 1,452,890 | | | | — | | | | 5,336,294 | |
Redemption fees | | | — | | | | 9,612,117 | | | | — | | | | 10,776,931 | |
| | | | | | | | | | | | | | | | | |
Net increase (decrease) | | | (43,430,842 | ) | | $ | (1,155,920,712 | ) | | | (9,632,627 | ) | | $ | (273,008,868 | ) |
| | | | | | | | | | | | | | | | | |
| | | | | | | | | | | | | | | | | |
81
GMO Trust Funds
Notes to Financial Statements — (Continued)
February 28, 2017
| | | | | | | | | | | | | | | | |
| | | |
| | | Year Ended
February 28, 2017 | | | Year Ended
February 29, 2016 | |
| | | | | |
| | | Shares | | | Amount | | | Shares | | | Amount | |
Taiwan Fund | | | | | | | | | | | | | | | | |
Class III: | | | | | | | | | | | | | | | | |
Shares sold | | | 2,602,196 | | | $ | 49,511,671 | | | | 983,694 | | | $ | 21,651,474 | |
Shares issued to shareholders in reinvestment of distributions | | | 174,377 | | | | 3,287,415 | | | | 386,535 | | | | 7,427,731 | |
Shares repurchased | | | (2,239,688 | ) | | | (40,984,933 | ) | | | (1,202,843 | ) | | | (24,654,880 | ) |
Purchase premiums | | | — | | | | 74,379 | | | | — | | | | 32,526 | |
Redemption fees | | | — | | | | 184,432 | | | | — | | | | 110,947 | |
| | | | | | | | | | | | | | | | | |
Net increase (decrease) | | | 536,885 | | | $ | 12,072,964 | | | | 167,386 | | | $ | 4,567,798 | |
| | | | | | | | | | | | | | | | | |
| | | | | | | | | | | | | | | | | |
| | # | Shares were adjusted to reflect a 1:3 reverse stock split effective July 15, 2016. |
| 10. | Investments in affiliated companies and other Funds of the Trust |
An affiliated company for the purposes of this disclosure is a company in which a Fund has or had direct ownership of at least 5% of the issuer’s voting securities. A summary of the Fund’s transactions involving companies that are or were affiliates during the year ended February 28, 2017 is set forth below:
| | | | | | | | | | | | | | | | | | | | |
| | | | | | |
| Affiliate | | Value,
beginning
of period | | | Purchases | | | Sales
Proceeds | | | Dividend
Income | | | Value, end of
period | |
Emerging Domestic Opportunities Fund | | | | | | | | | | | | | | | | | | | | |
CMI Ltd. | | $ | 5,234,567 | | | $ | — | | | $ | — | | | $ | — | | | $ | 3,202,269 | |
Gayatri Projects Ltd. | | | 17,467,627 | | | | — | | | | — | | | | 63,000 | | | | 22,225,368 | |
TICON Industrial Growth Leasehold Property Fund | | | 15,379,869 | | | | 1,794,633 | | | | — | | | | 1,187,389 | | | | 16,408,121 | |
iShares MSCI Philippines ETF | | | — | * | | | 53,248,659 | | | | 54,750,079 | | | | 194,999 | | | | — | # |
| | | | | | | | | | | | | | | | | | | | | |
Totals | | $ | 38,082,063 | | | $ | 55,043,292 | | | $ | 54,750,079 | | | $ | 1,445,388 | | | $ | 41,835,758 | |
| | | | | | | | | | | | | | | | | | | | | |
Emerging Markets Fund | | | | | | | | | | | | | | | | | | | | |
Anilana Hotels & Properties Ltd | | $ | 1,882,313 | | | $ | 342,799 | | | $ | — | | | $ | — | | | $ | 1,028,843 | |
Gayatri Projects Ltd | | | 27,968,473 | | | | — | | | | — | | | | 100,873 | | | | 35,159,348 | |
Kiri Industries Ltd | | | 1,878,798 | | | | 230,419 | | | | — | | | | — | | | | 7,867,156 | |
| | | | | | | | | | | | | | | | | | | | | |
Totals | | $ | 31,729,584 | | | $ | 573,218 | | | $ | — | | | $ | 100,873 | | | $ | 44,055,347 | |
| | | | | | | | | | | | | | | | | | | | | |
| | | | | | | | | | | | | | | | | | | | | |
| | * | Security not an affiliate at the beginning of the period. |
| | # | No longer an affiliate as of February 28, 2017. |
A summary of the Funds’ transactions in the shares of other funds of GMO Trust during the year ended February 28, 2017 is set forth below:
| | | | | | | | | | | | | | | | | | | | | | | | |
| | | | | | | |
| Affiliate | | Value,
beginning
of period | | | Purchases | | | Sales
Proceeds | | | Dividend
Income | | | Distributions
of Realized
Gains | | | Value, end of
period | |
Emerging Countries Fund | | | | | | | | | | | | | | | | | | | | | | | | |
GMO U.S. Treasury Fund | | $ | 5,506 | | | $ | 1,625,475 | | | $ | 1,631,147 | | | $ | 473 | | | $ | 49 | | | $ | — | |
| | | | | | | | | | | | | | | | | | | | | | | | | |
Emerging Domestic Opportunities Fund | | | | | | | | | | | | | | | | | | | | | | | | |
GMO U.S. Treasury Fund | | $ | 35,814,390 | | | $ | 927,236,688 | | | $ | 896,210,000 | | | $ | 179,047 | | | $ | 57,690 | | | $ | 66,772,614 | |
| | | | | | | | | | | | | | | | | | | | | | | | | |
Emerging Markets Fund | | | | | | | | | | | | | | | | | | | | | | | | |
GMO U.S. Treasury Fund | | $ | 64,084,435 | | | $ | 950,801,488 | | | $ | 925,000,000 | | | $ | 266,207 | | | $ | 35,383 | | | $ | 89,875,673 | |
| | | | | | | | | | | | | | | | | | | | | | | | | |
Taiwan Fund | | | | | | | | | | | | | | | | | | | | | | | | |
GMO U.S. Treasury Fund | | $ | 20,834 | | | $ | 15,354,354 | | | $ | 13,475,807 | | | $ | 4,010 | | | $ | 688 | | | $ | 1,900,066 | |
| | | | | | | | | | | | | | | | | | | | | | | | | |
| | | | | | | | | | | | | | | | | | | | | | | | | |
82
Report of Independent Registered Public Accounting Firm
To the Trustees of GMO Trust and Shareholders of
GMO Emerging Countries Fund, GMO Emerging Domestic Opportunities Fund, GMO Emerging Markets Fund, and GMO Taiwan Fund:
In our opinion, the accompanying statements of assets and liabilities, including the schedules of investments and the related statements of operations and of changes in net assets and the financial highlights present fairly, in all material respects, the financial position of the GMO Emerging Countries Fund, GMO Emerging Domestic Opportunities Fund, GMO Emerging Markets Fund, and GMO Taiwan Fund (the “Funds”) as of February 28, 2017, the results of each of their operations for the year then ended, the changes in each of their net assets for each of the two years in the period then ended and the financial highlights for each of the periods indicated, in conformity with accounting principles generally accepted in the United States of America. These financial statements and financial highlights (hereafter referred to as “financial statements”) are the responsibility of the Fund’s management. Our responsibility is to express an opinion on these financial statements based on our audits. We conducted our audits of these financial statements in accordance with the standards of the Public Company Accounting Oversight Board (United States). Those standards require that we plan and perform the audit to obtain reasonable assurance about whether the financial statements are free of material misstatement. An audit includes examining, on a test basis, evidence supporting the amounts and disclosures in the financial statements, assessing the accounting principles used and significant estimates made by management, and evaluating the overall financial statement presentation. Our procedures included confirmation of securities owned as of February 28, 2017 by correspondence with the custodians and brokers; when replies were not received from brokers, we performed other auditing procedures. We believe that our audits provide a reasonable basis for our opinion.
PricewaterhouseCoopers LLP
Boston, Massachusetts
April 26, 2017
83
GMO Trust Funds
(A Series of GMO Trust)
Fund Expenses
February 28, 2017 (Unaudited)
Expense Examples: The following information is in relation to expenses for the six month period ended February 28, 2017.
As a shareholder of the Funds, you may incur two types of costs: (1) transaction costs, including purchase premium and redemption fees, if applicable; and (2) ongoing costs, including direct and/or indirect management fees, direct and/or indirect shareholder services fees, and distribution (12b-1) and/or administration fees for Funds with Class M shares, if applicable, and other Fund expenses. This example is intended to help you understand your ongoing costs (in dollars) of investing in the Funds and to compare these costs with the ongoing costs of investing in other mutual funds.
These examples are based on an investment of $1,000 invested at the beginning of the period and held for the entire period, September 1, 2016 through February 28, 2017.
Actual Expenses
This section of the table for each class below provides information about actual account values and actual expenses. You may use the information in this section, together with the amount you invested, to estimate the expenses that you paid over the period. Simply divide your account value by $1,000 (for example, a $10,000,000 account value divided by $1,000 = 10,000), then multiply the result by the number under the heading entitled “Expenses Paid During the Period” to estimate the expenses you paid on your account during this period.
Hypothetical Example for Comparison Purposes
This section of the table for each class below provides information about hypothetical account values and hypothetical expenses based on the Funds’ actual expense ratio and an assumed rate of return of 5% per year before expenses, which is not the Funds’ actual return. The hypothetical account values and expenses may not be used to estimate the actual ending account balance or expenses you paid for the period. You may use this information to compare the ongoing costs of investing in the Funds with other funds. To do so, compare this 5% hypothetical example with the 5% hypothetical examples that appear in the shareholder reports of other funds.
Please note that the expenses shown in the table are meant to highlight your ongoing costs only and do not reflect any transactional costs, such as purchase premium and redemption fees. Therefore, this section of the table is useful in comparing ongoing costs only, and will not help you determine the relative total costs of owning different funds. In addition, if these transactional costs were included, your costs would have been higher.
| | | | | | | | | | | | | | | | | | | | | | | | | | | | |
| | | Actual | | | Hypothetical | | | | |
| | | Beginning
Account Value
September 1, 2016 | | | Ending
Account Value
February 28, 2017 | | | Expenses Paid
During the Period* | | | Beginning
Account Value
September 1, 2016 | | | Ending
Account Value
February 28, 2017 | | | Expenses Paid
During the Period* | | | Annualized
Expense Ratio | |
Emerging Countries Fund | | | | | | | | | | | | | | | | | |
Class III | | | $1,000.00 | | | | $1,072.30 | | | | $6.06 | | | | $1,000.00 | | | | $1,018.94 | | | | $5.91 | | | | 1.18% | |
Emerging Domestic Opportunities Fund | | | | | | | | | | | | | | | | | |
Class II | | | $1,000.00 | | | | $1,003.20 | | | | $5.31 | | | | $1,000.00 | | | | $1,019.49 | | | | $5.36 | | | | 1.07% | |
Class III | | | $1,000.00 | | | | $1,003.40 | | | | $4.92 | | | | $1,000.00 | | | | $1,019.89 | | | | $4.96 | | | | 0.99% | |
Class IV | | | $1,000.00 | | | | $1,003.70 | | | | $4.72 | | | | $1,000.00 | | | | $1,020.08 | | | | $4.76 | | | | 0.95% | |
Class V | | | $1,000.00 | | | | $1,003.50 | | | | $4.62 | | | | $1,000.00 | | | | $1,020.18 | | | | $4.66 | | | | 0.93% | |
Class VI | | | $1,000.00 | | | | $1,004.00 | | | | $4.47 | | | | $1,000.00 | | | | $1,020.33 | | | | $4.51 | | | | 0.90% | |
Emerging Markets Fund | | | | | | | | | | | | | | | | | |
Class II | | | $1,000.00 | | | | $1,060.50 | | | | $5.31 | | | | $1,000.00 | | | | $1,019.64 | | | | $5.21 | | | | 1.04% | |
Class III | | | $1,000.00 | | | | $1,060.80 | | | | $5.06 | | | | $1,000.00 | | | | $1,019.89 | | | | $4.96 | | | | 0.99% | |
Class IV | | | $1,000.00 | | | | $1,061.00 | | | | $4.75 | | | | $1,000.00 | | | | $1,020.18 | | | | $4.66 | | | | 0.93% | |
Class V | | | $1,000.00 | | | | $1,061.10 | | | | $4.55 | | | | $1,000.00 | | | | $1,020.38 | | | | $4.46 | | | | 0.89% | |
Class VI | | | $1,000.00 | | | | $1,061.10 | | | | $4.39 | | | | $1,000.00 | | | | $1,020.53 | | | | $4.31 | | | | 0.86% | |
Taiwan Fund | | | | | | | | | | | | | | | | | |
Class III | | | $1,000.00 | | | | $1,090.20 | | | | $6.89 | | | | $1,000.00 | | | | $1,018.20 | | | | $6.66 | | | | 1.33% | |
| | * | Expenses are calculated using each class’s annualized net expense ratio (including indirect expenses incurred) for the six months ended February 28, 2017, multiplied by the average account value over the period, multiplied by 181 days in the period, divided by 365 days in the year. |
84
GMO Trust Funds
Tax Information for the Tax Year Ended February 28, 2017 (Unaudited)
The following information is being provided in order to meet reporting requirements set forth by the Code and/or to meet state-specific requirements. Shareholders should consult their tax advisors.
With respect to distributions paid, the Funds designate the following amounts (or, if subsequently determined to be different, the maximum amount allowable) for the fiscal year-ended February 28, 2017:
| | | | | | | | | | | | |
| | | | |
| Fund Name | | Qualified
Dividend
Income (non-corporate
shareholders)(1) | | | Foreign
Taxes
Paid(2)
($) | | | Foreign
Source
Income(2)
($) | |
Emerging Countries Fund | | | 100.00% | | | | 116,824 | | | | 832,430 | |
Emerging Domestic Opportunities Fund | | | 52.52% | | | | 7,694,201 | | | | 46,190,383 | |
Emerging Markets Fund | | | 79.06% | | | | 21,432,380 | | | | 181,358,583 | |
Taiwan Fund | | | 0.00% | | | | 1,030,300 | | | | 5,037,379 | |
| | (1) | Presented as a percentage of net investment income and short-term capital gain distributions paid, if any. |
| | (2) | The Funds expect to elect to treat foreign taxes attributed to foreign source income from certain of its investments, as if incurred directly by the Funds’ shareholders. |
In early 2018, the Funds will notify applicable shareholders of amounts for use in preparing 2017 U.S. federal income tax forms.
85
Trustees and Officers (Unaudited)
The following tables present information regarding each Trustee and officer of the Trust as of February 28, 2017. Each Trustee’s and officer’s year of birth (“YOB”) is set forth after his or her name. Unless otherwise noted, (i) each Trustee and officer has engaged in the principal occupation(s) noted in the table for at least the most recent five years, although not necessarily in the same capacity, and (ii) the address of each Trustee and officer is c/o GMO Trust, 40 Rowes Wharf, Boston, MA 02110. Each Trustee serves in office until the earlier of (a) the election and qualification of a successor at the next meeting of shareholders called to elect Trustees or (b) the Trustee dies, resigns, or is removed as provided in the Trust’s governing documents. Each of the Trustees of the Trust, other than Mr. Kittredge, is not an “interested person” of the Trust, as such term is used in the 1940 Act (each, an “Independent Trustee”). Because the Funds do not hold annual meetings of shareholders, each Trustee will hold office for an indeterminate period. Each officer serves in office until his or her successor is elected and determined to be qualified to carry out the duties and responsibilities of the office, or until the officer resigns or is removed from office.
Management of the Trust
| | | | | | | | | | | | | |
| Independent Trustees |
| |
Name and
Year of Birth | | Position(s) Held with the Trust | | Length of Time Served | | Principal Occupation(s) During Past
5 Years | | Number of
Portfolios in
Fund Complex1
Overseen | | Other Directorships Held
in the Past Five
Years |
Donald W. Glazer YOB: 1944 | | Chairman of the Board of Trustees | | Chairman of the Board of Trustees since March 2005; Lead Independent Trustee (September 2004 – March 2005); Trustee since December 2000. | | Consultant – Law and Business2; Author of Legal Treatises. | | | | 36 | | | Director, BeiGene Ltd. (biotech research). |
| | | | | |
Peter Tufano YOB: 1957 | | Trustee | | Since December 2008. | | Peter Moores Dean and Professor of Finance, University of Oxford Saïd Business School (as of July 1, 2011); Sylvan C. Coleman Professor of Financial Management, Harvard Business School (1989 – 2011). | | | | 36 | | | Trustee of State Street Navigator Securities Lending Trust (5 Portfolios). |
| | | | | |
Paul Braverman YOB: 1949 | | Trustee | | Since March 2010. | | Director of Claren Road Asset Management, LLC (hedge fund) (January 2011 – present); Director of Leerink Swann Holdings, LLC (investment bank) (October 2013 – present); Director of Aesir Capital Management (investment advisor) (November 2012 – present); Director of Kieger (US) Ltd. (investment advisor) (January 2015 – present). | | | | 36 | | | Trustee of HIMCO Variable Insurance Trust (27 Portfolios). |
| | | | | | | | | | | | | |
| Interested Trustee and Officer | | | | |
| |
Name and
Year of Birth | | Position(s) Held with the Trust | | Length of Time Served | | Principal Occupation(s) During Past
5 Years | | Number of
Portfolios in
Fund Complex1
Overseen | | Other Directorships Held
in the Past Five
Years |
Joseph B. Kittredge, Jr.3 YOB: 1954 | | Trustee; President of the Trust | | Trustee since March 2010; President since March 2009; Chief Executive Officer, March 2009 – June 2015. | | General Counsel, Grantham, Mayo, Van Otterloo & Co. LLC (October 2005 – present); Partner, Ropes & Gray, LLP (1988 – 2005). | | | | 48 | | | None. |
| 1 | The Fund Complex includes series of each of GMO Trust and GMO Series Trust. Mr. Kittredge also serves as a Trustee of GMO Series Trust. |
| 2 | As part of Mr. Glazer’s work as a consultant, he provides part-time consulting services to Goodwin Procter LLP (“Goodwin”). Goodwin has provided legal services to Renewable Resources, LLC, an affiliate of GMO; GMO, in connection with its relationship with Renewable Resources; and funds managed by Renewable Resources. Mr. Glazer has represented that he has no financial interest in, and is not involved in the provision of, such legal services. These entities did not pay any legal fees or disbursements to Goodwin during the calendar years ended December 31, 2015 and December 31, 2016. In correspondence with the staff of the SEC (the “Staff”) beginning in August 2006, the Independent Trustees’ legal counsel provided the Staff with information regarding Mr. Glazer’s relationship with Goodwin and his other business activities. On September 11, 2007, based on information that had been given to the Staff as of that date, the Staff provided oral no-action assurance consistent with the opinion of the Independent Trustees’ legal counsel that Mr. Glazer is not an “interested person” of the Trust. |
| 3 | Mr. Kittredge is an “interested person” of the Trust, as such term is used in the 1940 Act (an “Interested Trustee”), by virtue of his positions with the Trust and GMO indicated in the table above and his interest as a member of GMO. |
86
| | | | | | |
| Officers |
| |
Name and
Year of Birth | | Position(s) Held with the Trust | | Length of
Time Served | | Principal Occupation(s)
During Past 5 Years* |
Joseph B. Kittredge, Jr. YOB: 1954 | | Trustee and President | | Trustee since March 2010; President since March 2009; Chief Executive Officer, March 2009 – June 2015. | | General Counsel, Grantham, Mayo, Van Otterloo & Co. LLC (October 2005 – present); Partner, Ropes & Gray LLP (1988 – 2005). |
| | | |
Sheppard N. Burnett YOB: 1968 | | Chief Executive Officer | | Chief Executive Officer since June 2015; Chief Financial Officer, March 2007 – June 2015; Treasurer, November 2006 – June 2015; Assistant Treasurer, September 2004 –November 2006. | | Head of Fund Treasury and Tax, Grantham, Mayo, Van Otterloo & Co. LLC (December 2006 – present). |
| | | |
Carly Cushman YOB: 1984 | | Treasurer, Chief Accounting Officer and Chief Financial Officer | | Treasurer and Chief Financial Officer since June 2015; Chief Accounting Officer since May 2014; Assistant Treasurer, September 2013 – June 2015. | | Fund Administrator, Grantham, Mayo, Van Otterloo & Co. LLC (December 2009 – present); Senior Accountant, Renaissance HealthCare (February 2009 – December 2009); Auditor/Senior Auditor, Deloitte & Touche (September 2006 – February 2009). |
| | | |
John L. Nasrah YOB: 1977 | | Assistant Treasurer and Chief Tax Officer | | Since March 2007. | | Fund Administrator, Grantham, Mayo, Van Otterloo & Co. LLC (September 2004 – present). |
| | | |
Betty Maganzini YOB: 1972 | | Assistant Treasurer | | Since September 2013. | | Fund Administrator, Grantham, Mayo, Van Otterloo & Co. LLC (July 2010 – present); Assistant Treasurer (June 2009 – July 2010), Manager, Fund Administration and Regulatory Affairs (2006 – 2009), Hambrecht & Quist Capital Management LLC. |
| | | |
Mahmoodur Rahman YOB: 1967 | | Assistant Treasurer | | Since September 2007. | | Fund Administrator, Grantham, Mayo, Van Otterloo & Co. LLC (April 2007 – present). |
| | | |
Cathy Tao YOB: 1974 | | Assistant Treasurer | | Since September 2016. | | Fund Administrator, Grantham, Mayo, Van Otterloo & Co. LLC (October 2007 – present) |
| | | |
Brian Kadehjian YOB: 1974 | | Assistant Treasurer and Treasury Officer | | Assistant Treasurer since February 2015; Treasury Officer since September 2013. | | Fund Administrator, Grantham, Mayo, Van Otterloo & Co. LLC (April 2002 – present). |
| | | |
Douglas Y. Charton YOB: 1982 | | Chief Legal Officer, Vice President and Clerk | | Since August 2015. | | Legal Counsel, Grantham, Mayo, Van Otterloo & Co. LLC (July 2015 – present); Associate, K&L Gates LLP (September 2007 – July 2015). |
| | | |
Megan Bunting YOB: 1978 | | Vice President and Assistant Clerk | | Since September 2013. | | Legal Counsel, Grantham, Mayo, Van Otterloo & Co. LLC (September 2006 – present). |
| | | |
Kevin O’Brien YOB: 1985 | | Vice President and Assistant Clerk | | Since March 2016. | | Legal Counsel, Grantham, Mayo, Van Otterloo & Co. LLC (February 2015 – present); Associate, Dechert LLP (October 2010 – February 2015). |
| | | |
Gregory L. Pottle YOB: 1971 | | Chief Compliance Officer | | Chief Compliance Officer since May 2015; Vice President and Assistant Clerk, November 2006 – November 2015. | | Chief Compliance Officer, Grantham, Mayo, Van Otterloo & Co. LLC (May 2015 – present); Legal Counsel, Grantham, Mayo, Van Otterloo & Co. LLC (March 2000 – May 2015). |
| | | |
Claire Wilkinson YOB: 1965 | | Anti-Money Laundering Officer | | Since February 2016. | | Compliance Associate, GMO UK Limited (April 2013-present); General Counsel, MVision Private Equity Advisers Limited (November 2009 – January 2013). |
| * | Each officer of the Trust may also serve as an officer and/or director of certain pooled investment vehicles of which GMO or an affiliate of GMO serves as the investment adviser. With the exception of Mr. Kittredge, each officer listed in the table above also serves as an officer of GMO Series Trust. |
87
GMO Trust
Annual Report
February 28, 2017
Alpha Only Fund
Benchmark-Free Allocation Fund
Benchmark-Free Fund
Global Asset Allocation Fund
Global Developed Equity Allocation Fund
Global Equity Allocation Fund
Implementation Fund
International Developed Equity Allocation Fund
International Equity Allocation Fund
SGM Major Markets Fund
Special Opportunities Fund
Strategic Opportunities Allocation Fund
For a free copy of the Funds’ proxy voting guidelines, shareholders may call 1-617-346-7646 (collect) or visit the Securities and Exchange Commission’s website at www.sec.gov. Information regarding how the Funds voted proxies relating to portfolio securities during the most recent 12-month period ended June 30 is available on GMO’s website at www.gmo.com or on the Securities and Exchange Commission’s website at www.sec.gov.
The Funds file their complete schedule of portfolio holdings with the Securities and Exchange Commission for the first and third quarter of each fiscal year on Form N-Q, which is available on the Commission’s website at www.sec.gov. The Funds’ Form N-Q may be reviewed and copied at the Commission’s Public Reference Room in Washington, D.C. Information on the operation of the Public Reference Room may be obtained by calling 1-800-SEC-0330. The Funds have a policy with respect to disclosure of portfolio holdings under which they may also make a complete schedule of portfolio holdings available on GMO’s website at www.gmo.com.
This report is prepared for the general information of shareholders. It is authorized for distribution to prospective investors only when preceded or accompanied by a prospectus for the GMO Trust, which contains a complete discussion of the risks associated with an investment in these Funds and other important information. The GMO Trust prospectus can be obtained at www.gmo.com.
An investment in the Funds is subject to risk, including the possible loss of principal amount invested. There can be no assurance that the Funds will achieve their stated investment objectives. Please see the Funds’ prospectus regarding specific principal risks for each Fund. General risks may include: market risk-equities, management and operational risk, non-U.S. investment risk, small company risk and derivatives risk.
The Funds are distributed by Funds Distributor LLC. Funds Distributor LLC is not affiliated with GMO.
TABLE OF CONTENTS
GMO Alpha Only Fund
(A Series of GMO Trust)
Portfolio Management
Day-to-day management of the Fund’s portfolio is the responsibility of the Asset Allocation team at Grantham, Mayo, Van Otterloo & Co. LLC.
Management Discussion and Analysis of Fund Performance
Class III shares of GMO Alpha Only Fund returned -2.02% (net) for the fiscal year ended February 28, 2017, as compared with +0.32% for the Citigroup 3 Month Treasury Bill Index.
Although the Fund’s emerging value portfolio had strong performance, non-US developed stocks had a relatively lackluster year. Exacerbating this, the Russell 2000 enjoyed particularly good returns and so, in aggregate, the international and emerging value positions that were we held long underperformed the U.S. equities (Russell 2000 and S&P 500) that were correspondingly held short. The Fund’s long positions in US quality stocks relative to its short position in the S&P 500 also detracted from performance, as quality underperformed.
Because some of the securities and instruments held directly or indirectly by the Fund had positive fair value adjustments at the beginning or end of the fiscal year (and the performance of indices are not fair valued), the Fund’s absolute and relative performance is higher than it otherwise would have been in the absence of such fair value adjustments.
The views expressed herein are exclusively those of Grantham, Mayo, Van Otterloo & Co. LLC as of the date of this report and are subject to change. GMO disclaims any responsibility to update such views. They are not meant as investment advice. References to specific securities are not recommendations of such securities and may not be representative of any GMO portfolio’s current or future investments.
2
GMO Alpha Only Fund
(A Series of GMO Trust)
Comparison of Change in Value of a $10,000,000 Investment in
GMO Alpha Only Fund Class III Shares and the Citigroup 3-Month Treasury Bill Index
As of February 28, 2017
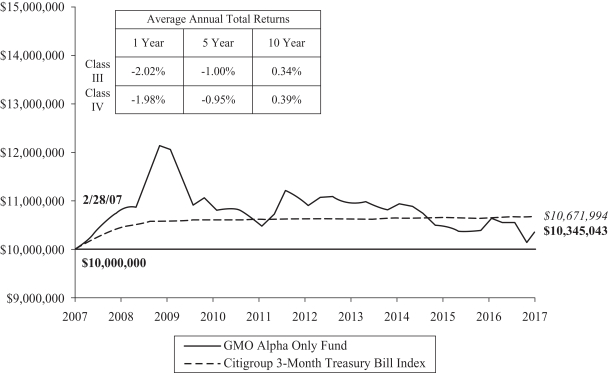
Performance data quoted represents past performance and is not indicative of future results. The investment return and principal value of an investment will fluctuate so that an investor’s shares, when redeemed, may be worth more or less than their original cost. Current performance data may be lower or higher than the performance data provided herein. To obtain performance information up to the most recent month-end, visit www.gmo.com. Performance shown is net of all fees after reimbursement from GMO. Returns would have been lower had certain expenses not been reimbursed during the periods shown and do not include the effect of taxes on distributions and redemptions. The performance information shown above only includes purchase premiums and/or redemption fees in effect as of February 28, 2017. All information is unaudited. Performance for classes may vary due to different fees.
3
GMO Alpha Only Fund
(A Series of GMO Trust)
Investment Concentration Summary
February 28, 2017 (Unaudited)
| | | | |
| Asset Class Summary& | | % of Total Net Assets | |
Common Stocks | | | 88.1 | % |
Short-Term Investments | | | 5.8 | |
Mutual Funds | | | 4.5 | |
Preferred Stocks | | | 1.0 | |
Rights/Warrants | | | 0.0 | ^ |
Futures Contracts | | | (3.6 | ) |
Other | | | 4.2 | |
| | | | |
| | | 100.0 | % |
| | | | |
| & | In the table above, derivative financial instruments, if any, are based on market values or unrealized appreciation/depreciation rather than notional amounts. The Fund’s investment program involves having both long and short investment exposures. The additional short exposures that the Fund has to futures contracts based on notional amounts are (83.1)% of net assets. |
4
GMO Alpha Only Fund
(A Series of GMO Trust)
Schedule of Investments
(showing percentage of total net assets)
February 28, 2017
| | | | | | | | | | |
Shares | | | Description | | Value ($) | |
| | | | | | COMMON STOCKS — 88.1% | |
| | |
| | | | | | Australia — 1.1% | |
| | | 2,174 | | | Amcor Ltd | | | 23,399 | |
| | | 15,053 | | | AMP Ltd | | | 56,266 | |
| | | 9,534 | | | AusNet Services | | | 11,836 | |
| | | 14,897 | | | Australia & New Zealand Banking Group Ltd | | | 352,585 | |
| | | 2,039 | | | Bank of Queensland Ltd | | | 18,504 | |
| | | 2,469 | | | Bendigo & Adelaide Bank Ltd | | | 23,111 | |
| | | 490 | | | Caltex Australia Ltd | | | 10,568 | |
| | | 340 | | | CIMIC Group Ltd | | | 9,843 | |
| | | 1,531 | | | Coca Cola Amatil Ltd | | | 12,021 | |
| | | 8,729 | | | Commonwealth Bank of Australia | | | 550,440 | |
| | | 1,954 | | | Crown Resorts Ltd | | | 18,958 | |
| | | 5,180 | | | Dexus Property Group (REIT) | | | 37,473 | |
| | | 13,053 | | | DUET Group | | | 27,498 | |
| | | 8,352 | | | Fortescue Metals Group Ltd | | | 42,283 | |
| | | 9,640 | | | GPT Group (The) (REIT) | | | 36,412 | |
| | | 2,243 | | | Harvey Norman Holdings Ltd | | | 8,856 | |
| | | 9,026 | | | Incitec Pivot Ltd | | | 25,377 | |
| | | 2,964 | | | LendLease Group | | | 34,582 | |
| | | 12,837 | | | Mirvac Group (REIT) | | | 21,141 | |
| | | 13,522 | | | National Australia Bank Ltd | | | 331,668 | |
| | | 2,006 | | | Orica Ltd | | | 28,103 | |
| | | 4,658 | | | Origin Energy Ltd * | | | 23,319 | |
| | | 6,979 | | | QBE Insurance Group Ltd | | | 65,831 | |
| | | 2,159 | | | Rio Tinto Ltd | | | 102,359 | |
| | | 18,445 | | | South32 Ltd | | | 35,117 | |
| | | 12,239 | | | Stockland (REIT) | | | 44,268 | |
| | | 6,548 | | | Suncorp Group Ltd | | | 66,527 | |
| | | 2,901 | | | Tabcorp Holdings Ltd | | | 9,472 | |
| | | 5,075 | | | Tatts Group Ltd | | | 15,785 | |
| | | 18,004 | | | Vicinity Centres (REIT) | | | 39,872 | |
| | | 1,408 | | | Vocus Group Ltd | | | 4,723 | |
| | | 17,029 | | | Westpac Banking Corp | | | 439,785 | |
| | | 2,364 | | | Woolworths Ltd | | | 46,657 | |
| | | | | | | | | | |
| | | | | | Total Australia | | | 2,574,639 | |
| | | | | | | | | | |
| | |
| | | | | | Austria — 0.0% | |
| | | 1,531 | | | Erste Group Bank AG * | | | 44,528 | |
| | | 788 | | | OMV AG | | | 30,122 | |
| | | 311 | | | Raiffeisen Bank International AG * | | | 6,897 | |
| | | 608 | | | voestalpine AG | | | 25,546 | |
| | | | | | | | | | |
| | | | | | Total Austria | | | 107,093 | |
| | | | | | | | | | |
| | |
| | | | | | Belgium — 0.1% | |
| | | 992 | | | Ageas | | | 37,713 | |
| | | 432 | | | Groupe Bruxelles Lambert SA | | | 36,608 | |
| | | 1,277 | | | KBC Groep NV | | | 78,150 | |
| | | 814 | | | Proximus SADP | | | 23,932 | |
| | | 377 | | | Solvay SA | | | 43,871 | |
| | | | | | | | | | |
Shares | | | Description | | Value ($) | |
| | | | | | Belgium — continued | |
| | | 177 | | | Umicore SA | | | 9,318 | |
| | | | | | | | | | |
| | | | | | Total Belgium | | | 229,592 | |
| | | | | | | | | | |
| | |
| | | | | | Brazil — 0.5% | |
| | | 3,200 | | | AES Tiete Energia SA | | | 16,505 | |
| | | 12,950 | | | Banco Bradesco SA | | | 135,159 | |
| | | 13,400 | | | Banco do Brasil SA | | | 141,910 | |
| | | 6,500 | | | Banco Santander Brasil SA | | | 71,501 | |
| | | 10,900 | | | BB Seguridade Participacoes SA | | | 99,897 | |
| | | 9,000 | | | BR Malls Participacoes SA * | | | 43,020 | |
| | | 3,600 | | | Centrais Eletricas Brasileiras SA * | | | 24,807 | |
| | | 6,500 | | | Cia Siderurgica Nacional SA * | | | 24,946 | |
| | | 5,100 | | | EDP-Energias do Brasil SA | | | 22,438 | |
| | | 2,700 | | | Fibria Celulose SA | | | 23,092 | |
| | | 46,400 | | | Petroleo Brasileiro SA * | | | 236,942 | |
| | | 1,900 | | | Porto Seguro SA | | | 17,629 | |
| | | 2,900 | | | Sul America SA | | | 18,070 | |
| | | 13,200 | | | Tim Participacoes SA | | | 41,329 | |
| | | 20,100 | | | Vale SA | | | 209,982 | |
| | | | | | | | | | |
| | | | | | Total Brazil | | | 1,127,227 | |
| | | | | | | | | | |
| | |
| | | | | | Chile — 0.2% | |
| | | 50,170 | | | AES Gener SA | | | 19,117 | |
| | | 369 | | | Banco de Credito e Inversiones | | | 19,963 | |
| | | 1,027,871 | | | Banco Santander Chile | | | 56,366 | |
| | | 1,237 | | | Cia Cervecerias Unidas SA | | | 14,637 | |
| | | 46,218 | | | Colbun SA | | | 9,097 | |
| | | 19,480 | | | Empresas CMPC SA | | | 43,489 | |
| | | 7,091 | | | Empresas COPEC SA | | | 73,767 | |
| | | 448,369 | | | Enel Americas SA | | | 87,243 | |
| | | 306,029 | | | Enel Chile SA | | | 31,490 | |
| | | 2,564,954 | | | Itau CorpBanca | | | 20,665 | |
| | | 4,777 | | | Latam Airlines Group SA * | | | 48,610 | |
| | | | | | | | | | |
| | | | | | Total Chile | | | 424,444 | |
| | | | | | | | | | |
| | |
| | | | | | China — 3.9% | |
| | | 383,000 | | | Agricultural Bank of China Ltd – Class H | | | 176,529 | |
| | | 54,000 | | | Alibaba Health Information Technology Ltd * | | | 23,713 | |
| | | 120,000 | | | Alibaba Pictures Group Ltd * | | | 20,088 | |
| | | 19,000 | | | Anhui Conch Cement Co Ltd – Class H | | | 66,149 | |
| | | 8,000 | | | ANTA Sports Products Ltd | | | 24,204 | |
| | | 1,238,000 | | | Bank of China Ltd – Class H | | | 626,391 | |
| | | 136,000 | | | Bank of Communications Co Ltd – Class H | | | 108,398 | |
| | | 24,000 | | | Beijing Capital International Airport Co Ltd – Class H | | | 25,719 | |
| | | 8,000 | | | Beijing Enterprises Holdings Ltd | | | 41,843 | |
| | | 99,000 | | | Belle International Holdings Ltd | | | 68,162 | |
| | | 137,000 | | | China Cinda Asset Management Co Ltd – Class H | | | 53,999 | |
| | | 139,000 | | | China CITIC Bank Corp Ltd – Class H | | | 95,423 | |
| | | | |
| | See accompanying notes to the financial statements. | | 5 |
GMO Alpha Only Fund
(A Series of GMO Trust)
Schedule of Investments — (Continued)
(showing percentage of total net assets)
February 28, 2017
| | | | | | | | | | |
Shares | | | Description | | Value ($) | |
| | | | | | China — continued | |
| | | 34,000 | | | China Coal Energy Co Ltd – Class H * | | | 17,981 | |
| | | 69,000 | | | China Communications Construction Co Ltd – Class H | | | 89,032 | |
| | | 40,000 | | | China Communications Services Corp Ltd – Class H | | | 26,709 | |
| | | 21,000 | | | China Conch Venture Holdings Ltd | | | 41,616 | |
| | | 1,311,000 | | | China Construction Bank Corp – Class H | | | 1,079,400 | |
| | | 52,000 | | | China Everbright Bank Co Ltd – Class H | | | 26,327 | |
| | | 14,000 | | | China Everbright Ltd | | | 27,769 | |
| | | 64,000 | | | China Evergrande Group | | | 48,037 | |
| | | 46,000 | | | China Galaxy Securities Co Ltd – Class H | | | 45,071 | |
| | | 78,000 | | | China Huarong Asset Management Co Ltd – Class H * | | | 30,612 | |
| | | 62,000 | | | China Jinmao Holdings Group Ltd | | | 19,250 | |
| | | 116,000 | | | China Life Insurance Co Ltd – Class H | | | 353,444 | |
| | | 21,000 | | | China Mengniu Dairy Co Ltd | | | 41,287 | |
| | | 61,000 | | | China Merchants Bank Co Ltd – Class H | | | 162,208 | |
| | | 20,000 | | | China Merchants Holdings Co Ltd – Class H | | | 55,766 | |
| | | 92,000 | | | China Minsheng Banking Corp Ltd – Class H | | | 104,920 | |
| | | 95,500 | | | China Mobile Ltd | | | 1,053,373 | |
| | | 48,000 | | | China National Building Material Co Ltd – Class H | | | 35,002 | |
| | | 30,000 | | | China Oilfield Services Ltd – Class H | | | 29,881 | |
| | | 60,000 | | | China Overseas Land & Investment Ltd | | | 184,527 | |
| | | 41,000 | | | China Pacific Insurance Group Co Ltd – Class H | | | 150,103 | |
| | | 398,000 | | | China Petroleum & Chemical Corp – Class H | | | 308,508 | |
| | | 55,000 | | | China Power International Development Ltd | | | 21,318 | |
| | | 30,500 | | | China Railway Construction Corp Ltd – Class H | | | 43,123 | |
| | | 62,000 | | | China Railway Group Ltd – Class H | | | 54,157 | |
| | | 44,000 | | | China Resources Land Ltd | | | 120,045 | |
| | | 29,079 | | | China Resources Power Holdings Co Ltd | | | 52,627 | |
| | | 53,000 | | | China Shenhua Energy Co Ltd – Class H | | | 110,900 | |
| | | 30,000 | | | China Southern Airlines Co Ltd – Class H | | | 19,505 | |
| | | 25,200 | | | China Taiping Insurance Holdings Co Ltd * | | | 58,963 | |
| | | 216,000 | | | China Telecom Corp Ltd – Class H | | | 101,582 | |
| | | 94,000 | | | China Unicom Hong Kong Ltd | | | 114,292 | |
| | | 20,500 | | | China Vanke Co Ltd – Class H | | | 51,457 | |
| | | 42,000 | | | Chongqing Rural Commercial Bank Co Ltd – Class H | | | 29,483 | |
| | | 68,000 | | | CITIC Ltd | | | 97,686 | |
| | | 33,500 | | | CITIC Securities Co Ltd – Class H | | | 71,593 | |
| | | 278,000 | | | CNOOC Ltd | | | 328,872 | |
| | | 26,000 | | | COSCO SHIPPING Ports Ltd | | | 28,957 | |
| | | 87,000 | | | Country Garden Holdings Co Ltd | | | 62,295 | |
| | | 65,000 | | | CRRC Corp Ltd – Class H | | | 62,335 | |
| | | 42,000 | | | Dongfeng Motor Group Co Ltd – Class H | | | 49,803 | |
| | | 31,000 | | | Far East Horizon Ltd | | | 29,824 | |
| | | 40,500 | | | Fosun International Ltd | | | 63,643 | |
| | | 8,000 | | | Fuyao Glass Industry Group Co Ltd – Class H | | | 24,911 | |
| | | | | | | | | | |
Shares | | | Description | | Value ($) | |
| | | | | | China — continued | |
| | | 217,000 | | | GCL-Poly Energy Holdings Ltd * | | | 29,621 | |
| | | 21,200 | | | GF Securities Co Ltd – Class H | | | 46,680 | |
| | | 202,000 | | | GOME Electrical Appliances Holding Ltd | | | 28,098 | |
| | | 48,500 | | | Great Wall Motor Co Ltd – Class H | | | 59,560 | |
| | | 44,000 | | | Guangdong Investment Ltd | | | 59,943 | |
| | | 16,000 | | | Guangzhou Automobile Group Co Ltd – Class H | | | 26,833 | |
| | | 16,000 | | | Guangzhou R&F Properties Co Ltd – Class H | | | 22,091 | |
| | | 20,000 | | | Haier Electronics Group Co Ltd | | | 36,789 | |
| | | 10,000 | | | Haitian International Holdings Ltd | | | 21,040 | |
| | | 48,000 | | | Haitong Securities Co Ltd – Class H | | | 87,855 | |
| | | 11,500 | | | Hengan International Group Co Ltd | | | 98,155 | |
| | | 368,000 | | | HengTen Networks Group Ltd * | | | 9,057 | |
| | | 66,000 | | | Huaneng Power International Inc – Class H | | | 45,030 | |
| | | 15,800 | | | Huatai Securities Co Ltd – Class H | | | 32,223 | |
| | | 1,150,000 | | | Industrial & Commercial Bank of China Ltd – Class H | | | 753,547 | |
| | | 20,000 | | | Jiangsu Expressway Co Ltd – Class H | | | 26,383 | |
| | | 19,000 | | | Jiangxi Copper Co Ltd – Class H | | | 31,999 | |
| | | 50,000 | | | Kunlun Energy Co Ltd | | | 43,439 | |
| | | 112,000 | | | Lenovo Group Ltd | | | 67,175 | |
| | | 22,500 | | | Longfor Properties Co Ltd | | | 35,993 | |
| | | 12,100 | | | New China Life Insurance Co Ltd – Class H | | | 59,550 | |
| | | 109,000 | | | People’s Insurance Co Group of China Ltd (The) – Class H | | | 44,764 | |
| | | 72,000 | | | PICC Property & Casualty Co Ltd – Class H | | | 109,944 | |
| | | 32,000 | | | Shandong Weigao Group Medical Polymer Co Ltd – Class H | | | 19,250 | |
| | | 48,000 | | | Shanghai Electric Group Co Ltd – Class H * | | | 24,837 | |
| | | 8,000 | | | Shanghai Industrial Holdings Ltd | | | 22,325 | |
| | | 20,000 | | | Shimao Property Holdings Ltd | | | 28,706 | |
| | | 50,000 | | | Sino-Ocean Land Holdings Ltd | | | 24,836 | |
| | | 20,500 | | | Sinopec Engineering Group Co Ltd – Class H | | | 18,636 | |
| | | 54,000 | | | Sinopec Shanghai Petrochemical Co Ltd – Class H | | | 32,689 | |
| | | 34,000 | | | Sinotrans Ltd – Class H | | | 15,371 | |
| | | 34,500 | | | SOHO China Ltd | | | 17,861 | |
| | | 37,000 | | | Sun Art Retail Group Ltd | | | 35,669 | |
| | | 32,000 | | | Sunac China Holdings Ltd | | | 33,277 | |
| | | 32,000 | | | Tingyi Cayman Islands Holding Corp | | | 35,872 | |
| | | 4,000 | | | Tsingtao Brewery Co Ltd – Class H | | | 18,386 | |
| | | 89,000 | | | Want Want China Holdings Ltd | | | 57,255 | |
| | | 16,000 | | | Weichai Power Co Ltd – Class H | | | 28,172 | |
| | | 24,000 | | | Zhejiang Expressway Co Ltd – Class H | | | 26,992 | |
| | | 34,000 | | | Zijin Mining Group Co Ltd – Class H | | | 12,845 | |
| | | 12,600 | | | ZTE Corp – Class H | | | 20,520 | |
| | | | | | | | | | |
| | | | | | Total China | | | 9,108,080 | |
| | | | | | | | | | |
| | |
| | | | | | Colombia — 0.0% | |
| | | 76,893 | | | Ecopetrol SA * | | | 34,660 | |
| | | | |
| 6 | | See accompanying notes to the financial statements. | | |
GMO Alpha Only Fund
(A Series of GMO Trust)
Schedule of Investments — (Continued)
(showing percentage of total net assets)
February 28, 2017
| | | | | | | | | | |
Shares | | | Description | | Value ($) | |
| | | | | | Colombia — continued | |
| | | 3,655 | | | Grupo de Inversiones Suramericana SA | | | 45,656 | |
| | | | | | | | | | |
| | | | | | Total Colombia | | | 80,316 | |
| | | | | | | | | | |
| | |
| | | | | | Czech Republic — 0.0% | |
| | | 2,515 | | | CEZ AS | | | 44,387 | |
| | | 4,446 | | | Moneta Money Bank AS * | | | 14,864 | |
| | | | | | | | | | |
| | | | | | Total Czech Republic | | | 59,251 | |
| | | | | | | | | | |
| | |
| | | | | | Denmark — 0.1% | |
| | | 20 | | | AP Moeller – Maersk A/S – Class A | | | 30,996 | |
| | | 18 | | | AP Moeller – Maersk A/S – Class B | | | 29,268 | |
| | | 281 | | | Carlsberg A/S – Class B | | | 24,664 | |
| | | 3,504 | | | Danske Bank A/S | | | 116,793 | |
| | | 451 | | | DONG Energy A/S * | | | 16,578 | |
| | | 4,344 | | | TDC A/S * | | | 23,342 | |
| | | 604 | | | Tryg A/S | | | 11,222 | |
| | | | | | | | | | |
| | | | | | Total Denmark | | | 252,863 | |
| | | | | | | | | | |
| | |
| | | | | | Egypt — 0.0% | |
| | | 10,519 | | | Commercial International Bank Egypt SAE | | | 47,704 | |
| | | 15,874 | | | Talaat Moustafa Group | | | 7,786 | |
| | | | | | | | | | |
| | | | | | Total Egypt | | | 55,490 | |
| | | | | | | | | | |
| | |
| | | | | | Finland — 0.2% | |
| | | 338 | | | Elisa Oyj | | | 11,261 | |
| | | 2,377 | | | Fortum Oyj | | | 36,448 | |
| | | 603 | | | Metso Oyj | | | 17,781 | |
| | | 444 | | | Neste Oyj | | | 15,454 | |
| | | 29,697 | | | Nokia Oyj | | | 152,048 | |
| | | 618 | | | Nokian Renkaat Oyj | | | 24,289 | |
| | | 222 | | | Orion Oyj – Class B | | | 10,941 | |
| | | 2,275 | | | Sampo Oyj – A Shares | | | 103,560 | |
| | | 2,948 | | | Stora Enso Oyj – R Shares | | | 31,615 | |
| | | 2,716 | | | UPM-Kymmene Oyj | | | 64,415 | |
| | | | | | | | | | |
| | | | | | Total Finland | | | 467,812 | |
| | | | | | | | | | |
| | |
| | | | | | France — 2.1% | |
| | | 321 | | | Accor SA | | | 12,687 | |
| | | 9,361 | | | ArcelorMittal * | | | 82,370 | |
| | | 9,870 | | | AXA SA | | | 233,110 | |
| | | 5,392 | | | BNP Paribas SA | | | 315,488 | |
| | | 4,677 | | | Bollore SA | | | 18,143 | |
| | | 551 | | | Bouygues SA | | | 21,253 | |
| | | 2,886 | | | Carrefour SA | | | 68,943 | |
| | | 300 | | | Casino Guichard-Perrachon SA | | | 15,868 | |
| | | 2,541 | | | Cie de Saint-Gobain | | | 121,860 | |
| | | 927 | | | Cie Generale des Etablissements Michelin | | | 104,375 | |
| | | 917 | | | CNP Assurances | | | 16,993 | |
| | | 5,718 | | | Credit Agricole SA | | | 69,166 | |
| | | | | | | | | | |
Shares | | | Description | | Value ($) | |
| | | | | | France — continued | |
| | | 1,400 | | | Electricite de France SA | | | 13,726 | |
| | | 7,819 | | | Engie SA | | | 95,668 | |
| | | 212 | | | Eurazeo SA | | | 13,092 | |
| | | 934 | | | Eutelsat Communications SA | | | 18,379 | |
| | | 169 | | | Fonciere Des Regions (REIT) | | | 13,916 | |
| | | 215 | | | Gecina SA (REIT) | | | 27,355 | |
| | | 189 | | | ICADE (REIT) | | | 13,477 | |
| | | 192 | | | Imerys SA | | | 15,500 | |
| | | 1,119 | | | Klepierre (REIT) | | | 41,561 | |
| | | 631 | | | Lagardere SCA | | | 15,868 | |
| | | 6,594 | | | LVMH Moet Hennessy Louis Vuitton SE | | | 1,324,607 | |
| | | 5,036 | | | Natixis SA | | | 27,495 | |
| | | 10,153 | | | Orange SA | | | 152,980 | |
| | | 1,689 | | | Peugeot SA * | | | 32,194 | |
| | | 976 | | | Publicis Groupe SA | | | 65,848 | |
| | | 978 | | | Renault SA | | | 86,810 | |
| | | 1,617 | | | Rexel SA | | | 26,162 | |
| | | 5,903 | | | Sanofi | | | 509,181 | |
| | | 2,861 | | | Schneider Electric SE | | | 193,848 | |
| | | 873 | | | SCOR SE | | | 31,560 | |
| | | 1,855 | | | SES SA | | | 37,880 | |
| | | 3,905 | | | Societe Generale SA | | | 173,568 | |
| | | 1,664 | | | Suez | | | 24,951 | |
| | | 11,466 | | | TOTAL SA | | | 572,107 | |
| | | 505 | | | Unibail-Rodamco SE (REIT) | | | 115,072 | |
| | | 2,576 | | | Vinci SA | | | 185,716 | |
| | | 2,619 | | | Vivendi SA | | | 46,114 | |
| | | 75 | | | Wendel SA | | | 8,300 | |
| | | | | | | | | | |
| | | | | | Total France | | | 4,963,191 | |
| | | | | | | | | | |
| | |
| | | | | | Germany — 1.6% | |
| | | 2,326 | | | Allianz SE (Registered) | | | 405,113 | |
| | | 231 | | | Axel Springer SE | | | 12,072 | |
| | | 4,674 | | | BASF SE | | | 434,840 | |
| | | 1,685 | | | Bayerische Motoren Werke AG | | | 150,464 | |
| | | 5,417 | | | Commerzbank AG | | | 41,294 | |
| | | 4,900 | | | Daimler AG (Registered) | | | 355,970 | |
| | | 16,661 | | | Deutsche Bank AG (Registered) | | | 287,691 | |
| | | 7,019 | | | Deutsche Bank AG (Registered) * | | | 138,300 | |
| | | 1,250 | | | Deutsche Lufthansa AG (Registered) | | | 18,301 | |
| | | 10,183 | | | E.ON SE | | | 78,985 | |
| | | 865 | | | Evonik Industries AG | | | 27,740 | |
| | | 223 | | | Fraport AG Frankfurt Airport Services Worldwide | | | 13,951 | |
| | | 323 | | | Hannover Rueck SE | | | 36,440 | |
| | | 359 | | | HUGO BOSS AG | | | 24,688 | |
| | | 1,024 | | | K+S AG (Registered) | | | 23,915 | |
| | | 819 | | | Muenchener Rueckversicherungs-Gesellschaft AG in Muenchen (Registered) | | | 154,707 | |
| | | 1,186 | | | ProSiebenSat.1 Media SE | | | 47,507 | |
| | | | |
| | See accompanying notes to the financial statements. | | 7 |
GMO Alpha Only Fund
(A Series of GMO Trust)
Schedule of Investments — (Continued)
(showing percentage of total net assets)
February 28, 2017
| | | | | | | | | | |
Shares | | | Description | | Value ($) | |
| | | | | | Germany — continued | |
| | | 207 | | | RTL Group SA | | | 15,915 | |
| | | 1,696 | | | RWE AG * | | | 24,153 | |
| | | 8,751 | | | SAP AG | | | 815,176 | |
| | | 3,894 | | | Siemens AG (Registered) | | | 506,223 | |
| | | 3,978 | | | Telefonica Deutschland Holding AG | | | 17,443 | |
| | | 86 | | | Volkswagen AG | | | 13,026 | |
| | | 2,372 | | | Vonovia SE | | | 82,574 | |
| | | | | | | | | | |
| | | | | | Total Germany | | | 3,726,488 | |
| | | | | | | | | | |
| | |
| | | | | | Greece — 0.1% | |
| | | 20,075 | | | Eurobank Ergasias SA * | | | 13,350 | |
| | | 558 | | | FF Group * | | | 10,915 | |
| | | 2,050 | | | Hellenic Telecommunications Organization SA | | | 18,388 | |
| | | 91,585 | | | National Bank of Greece SA * | | | 23,233 | |
| | | 3,480 | | | OPAP SA | | | 31,272 | |
| | | 109,298 | | | Piraeus Bank SA * | | | 21,131 | |
| | | | | | | | | | |
| | | | | | Total Greece | | | 118,289 | |
| | | | | | | | | | |
| | |
| | | | | | Hong Kong — 0.5% | |
| | | 19,000 | | | BOC Hong Kong Holdings Ltd | | | 75,058 | |
| | | 6,000 | | | Cathay Pacific Airways Ltd | | | 8,807 | |
| | | 13,699 | | | Cheung Kong Property Holding Ltd | | | 93,144 | |
| | | 14,000 | | | CK Hutchison Holdings Ltd | | | 172,923 | |
| | | 12,000 | | | First Pacific Co Ltd | | | 8,788 | |
| | | 5,000 | | | Hang Lung Group Ltd | | | 20,759 | |
| | | 12,000 | | | Hang Lung Properties Ltd | | | 30,286 | |
| | | 3,900 | | | Hang Seng Bank Ltd | | | 79,919 | |
| | | 6,000 | | | Henderson Land Development Co Ltd | | | 34,844 | |
| | | 14,000 | | | HK Electric Investments & HK Electric Investments Ltd | | | 12,266 | |
| | | 7,000 | | | HKT Trust & HKT Ltd | | | 9,338 | |
| | | 6,000 | | | Hongkong Land Holdings Ltd | | | 40,945 | |
| | | 3,000 | | | Hysan Development Co Ltd | | | 13,988 | |
| | | 1,300 | | | Jardine Matheson Holdings Ltd | | | 80,670 | |
| | | 3,500 | | | Kerry Properties Ltd | | | 10,726 | |
| | | 32,000 | | | Li & Fung Ltd | | | 14,256 | |
| | | 3,000 | | | MTR Corp Ltd | | | 15,859 | |
| | | 30,000 | | | New World Development Co Ltd | | | 39,268 | |
| | | 8,000 | | | NWS Holdings Ltd | | | 14,571 | |
| | | 23,000 | | | PCCW Ltd | | | 14,022 | |
| | | 7,000 | | | Power Assets Holdings Ltd | | | 62,798 | |
| | | 16,000 | | | Sino Land Co Ltd | | | 27,848 | |
| | | 12,000 | | | SJM Holdings Ltd | | | 9,846 | |
| | | 7,000 | | | Sun Hung Kai Properties Ltd | | | 102,271 | |
| | | 3,000 | | | Swire Pacific Ltd – Class A | | | 30,881 | |
| | | 6,200 | | | Swire Properties Ltd | | | 18,643 | |
| | | 7,000 | | | Wharf Holdings Ltd (The) | | | 55,457 | |
| | | 4,000 | | | Wheelock & Co Ltd | | | 25,979 | |
| | | 4,000 | | | Yue Yuen Industrial Holdings Ltd | | | 14,883 | |
| | | | | | | | | | |
| | | | | | Total Hong Kong | | | 1,139,043 | |
| | | | | | | | | | |
| | | | | | | | | | |
Shares | | | Description | | Value ($) | |
| | | | | | Hungary — 0.0% | |
| | | 558 | | | MOL Hungarian Oil & Gas Plc | | | 38,256 | |
| | | 1,854 | | | OTP Bank Plc | | | 53,826 | |
| | | | | | | | | | |
| | | | | | Total Hungary | | | 92,082 | |
| | | | | | | | | | |
| | |
| | | | | | India — 1.2% | |
| | | 754 | | | ACC Ltd | | | 15,917 | |
| | | 9,898 | | | Ambuja Cements Ltd | | | 33,857 | |
| | | 26,056 | | | Axis Bank Ltd | | | 197,275 | |
| | | 9,806 | | | Bharat Heavy Electricals Ltd | | | 23,794 | |
| | | 7,896 | | | Bharat Petroleum Corp Ltd | | | 79,146 | |
| | | 15,571 | | | Bharti Airtel Ltd | | | 85,947 | |
| | | 8,846 | | | Bharti Infratel Ltd | | | 37,618 | |
| | | 7,002 | | | Cairn India Ltd | | | 29,766 | |
| | | 10,625 | | | Coal India Ltd | | | 51,187 | |
| | | 510 | | | Container Corp Of India Ltd | | | 9,295 | |
| | | 4,948 | | | GAIL India Ltd | | | 38,298 | |
| | | 4,390 | | | HCL Technologies Ltd | | | 55,203 | |
| | | 17,345 | | | Hindalco Industries Ltd | | | 47,810 | |
| | | 3,394 | | | Hindustan Petroleum Corp Ltd | | | 27,377 | |
| | | 8,187 | | | Housing Development Finance Corp Ltd | | | 167,971 | |
| | | 8,600 | | | ICICI Bank Ltd Sponsored ADR | | | 70,520 | |
| | | 21,163 | | | Idea Cellular Ltd | | | 36,420 | |
| | | 14,749 | | | IDFC Bank Ltd | | | 13,797 | |
| | | 4,616 | | | Indiabulls Housing Finance Ltd | | | 60,090 | |
| | | 28,400 | | | Infosys Ltd Sponsored ADR | | | 429,976 | |
| | | 26,400 | | | ITC Ltd | | | 103,297 | |
| | | 4,942 | | | Larsen & Toubro Ltd | | | 108,667 | |
| | | 4,683 | | | Mahindra & Mahindra Financial Services Ltd | | | 20,401 | |
| | | 5,814 | | | Mahindra & Mahindra Ltd | | | 113,927 | |
| | | 25,693 | | | NTPC Ltd | | | 62,751 | |
| | | 20,033 | | | Oil & Natural Gas Corp Ltd | | | 58,051 | |
| | | 10,460 | | | Power Finance Corp | | | 21,297 | |
| | | 20,168 | | | Reliance Industries Ltd | | | 373,699 | |
| | | 418 | | | Siemens Ltd | | | 7,568 | |
| | | 24,134 | | | State Bank of India | | | 97,100 | |
| | | 24,607 | | | Tata Motors Ltd | | | 168,135 | |
| | | 6,360 | | | Tata Motors Ltd – Class A DVR | | | 26,245 | |
| | | 18,504 | | | Tata Power Co Ltd | | | 22,884 | |
| | | 4,690 | | | Tata Steel Ltd | | | 33,887 | |
| | | 3,914 | | | Tech Mahindra Ltd | | | 28,783 | |
| | | 16,178 | | | Vedanta Ltd | | | 62,619 | |
| | | 9,453 | | | Wipro Ltd | | | 68,954 | |
| | | | | | | | | | |
| | | | | | Total India | | | 2,889,529 | |
| | | | | | | | | | |
| | |
| | | | | | Indonesia — 0.4% | |
| | | 224,300 | | | Adaro Energy Tbk PT | | | 28,433 | |
| | | 315,500 | | | Astra International Tbk PT | | | 193,436 | |
| | | 52,300 | | | Bank Danamon Indonesia Tbk PT | | | 19,387 | |
| | | 145,500 | | | Bank Mandiri Persero Tbk PT | | | 122,818 | |
| | | | |
| 8 | | See accompanying notes to the financial statements. | | |
GMO Alpha Only Fund
(A Series of GMO Trust)
Schedule of Investments — (Continued)
(showing percentage of total net assets)
February 28, 2017
| | | | | | | | | | |
Shares | | | Description | | Value ($) | |
| | | | | | Indonesia — continued | |
| | | 116,200 | | | Bank Negara Indonesia Persero Tbk PT | | | 54,320 | |
| | | 173,000 | | | Bank Rakyat Indonesia Persero Tbk PT | | | 154,675 | |
| | | 7,500 | | | Gudang Garam Tbk PT | | | 36,970 | |
| | | 101,100 | | | Hanjaya Mandala Sampoerna Tbk PT | | | 29,287 | |
| | | 24,600 | | | Indocement Tunggal Prakarsa Tbk PT | | | 27,883 | |
| | | 68,400 | | | Indofood Sukses Makmur Tbk PT | | | 41,514 | |
| | | 83,600 | | | Media Nusantara Citra Tbk PT | | | 10,392 | |
| | | 170,000 | | | Perusahaan Gas Negara Persero Tbk PT | | | 35,962 | |
| | | 46,200 | | | Semen Indonesia Persero Tbk PT | | | 33,273 | |
| | | 26,200 | | | United Tractors Tbk PT | | | 48,387 | |
| | | 62,600 | | | XL Axiata Tbk PT * | | | 14,015 | |
| | | | | | | | | | |
| | | | | | Total Indonesia | | | 850,752 | |
| | | | | | | | | | |
| | |
| | | | | | Ireland — 0.0% | |
| | | 95,825 | | | Bank of Ireland * | | | 22,716 | |
| | | | | | | | | | |
| | |
| | | | | | Israel — 0.1% | |
| | | 80 | | | Azrieli Group Ltd | | | 3,979 | |
| | | 5,701 | | | Bank Hapoalim BM | | | 35,141 | |
| | | 7,744 | | | Bank Leumi Le-Israel BM * | | | 33,953 | |
| | | 10,565 | | | Bezeq The Israeli Telecommunication Corp Ltd | | | 18,869 | |
| | | 2,729 | | | Israel Chemicals Ltd | | | 11,628 | |
| | | 2,638 | | | Teva Pharmaceutical Industries Ltd | | | 92,797 | |
| | | 400 | | | Teva Pharmaceutical Industries Ltd Sponsored ADR | | | 14,008 | |
| | | | | | | | | | |
| | | | | | Total Israel | | | 210,375 | |
| | | | | | | | | | |
| | |
| | | | | | Italy — 0.5% | |
| | | 5,953 | | | Assicurazioni Generali SPA | | | 85,150 | |
| | | 2,101 | | | Atlantia SPA | | | 49,193 | |
| | | 2,739 | | | CNH Industrial NV | | | 25,367 | |
| | | 38,804 | | | Enel SPA | | | 166,535 | |
| | | 12,946 | | | Eni SPA | | | 199,721 | |
| | | 582 | | | EXOR NV | | | 27,564 | |
| | | 2,420 | | | Fiat Chrysler Automobiles NV * | | | 26,465 | |
| | | 64,570 | | | Intesa Sanpaolo SPA | | | 150,344 | |
| | | 4,986 | | | Intesa Sanpaolo SPA – RSP | | | 11,083 | |
| | | 3,030 | | | Mediobanca SPA | | | 24,285 | |
| | | 2,800 | | | Poste Italiane SPA | | | 17,985 | |
| | | 32,449 | | | Saipem SPA * | | | 14,814 | |
| | | 12,469 | | | Snam SPA | | | 49,653 | |
| | | 51,528 | | | Telecom Italia SPA * | | | 41,584 | |
| | | 32,254 | | | Telecom Italia SPA – RSP * | | | 21,383 | |
| | | 8,067 | | | Terna Rete Elettrica Nazionale SPA | | | 37,350 | |
| | | 9,614 | | | UniCredit SPA | | | 128,955 | |
| | | 5,769 | | | UnipolSai SPA | | | 12,243 | |
| | | | | | | | | | |
| | | | | | Total Italy | | | 1,089,674 | |
| | | | | | | | | | |
| | | | | | | | | | |
Shares | | | Description | | Value ($) | |
| | | | | | Japan — 3.5% | |
| | | 600 | | | AEON Financial Service Co Ltd | | | 11,611 | |
| | | 400 | | | Aeon Mall Co Ltd | | | 6,145 | |
| | | 1,000 | | | Aisin Seiki Co Ltd | | | 49,685 | |
| | | 400 | | | Alfresa Holdings Corp | | | 7,206 | |
| | | 900 | | | Amada Holdings Co Ltd | | | 10,168 | |
| | | 6,000 | | | ANA Holdings Inc | | | 17,938 | |
| | | 6,000 | | | Aozora Bank Ltd | | | 22,504 | |
| | | 5,000 | | | Asahi Glass Co Ltd | | | 40,813 | |
| | | 6,000 | | | Asahi Kasei Corp | | | 58,469 | |
| | | 2,000 | | | Bank of Kyoto Ltd (The) | | | 16,293 | |
| | | 200 | | | Benesse Holdings Inc | | | 6,146 | |
| | | 3,300 | | | Bridgestone Corp | | | 131,688 | |
| | | 5,400 | | | Canon Inc | | | 157,494 | |
| | | 700 | | | Central Japan Railway Co | | | 114,590 | |
| | | 4,000 | | | Chiba Bank Ltd (The) | | | 27,964 | |
| | | 2,200 | | | Chubu Electric Power Co Inc | | | 29,018 | |
| | | 900 | | | Chugoku Bank Ltd (The) | | | 14,369 | |
| | | 1,500 | | | Chugoku Electric Power Co Inc (The) | | | 16,540 | |
| | | 6,300 | | | Concordia Financial Group Ltd | | | 33,543 | |
| | | 800 | | | Credit Saison Co Ltd | | | 15,198 | |
| | | 3,000 | | | Dai Nippon Printing Co Ltd | | | 32,660 | |
| | | 5,500 | | | Dai-ichi Life Insurance Co Ltd (The) | | | 103,421 | |
| | | 3,100 | | | Daiichi Sankyo Co Ltd | | | 70,690 | |
| | | 1,000 | | | Daiwa House Industry Co Ltd | | | 27,443 | |
| | | 7 | | | Daiwa House REIT Investment Corp | | | 18,203 | |
| | | 8,000 | | | Daiwa Securities Group Inc | | | 50,715 | |
| | | 200 | | | DeNA Co Ltd | | | 4,503 | |
| | | 800 | | | Eisai Co Ltd | | | 44,910 | |
| | | 800 | | | Electric Power Development Co Ltd | | | 18,813 | |
| | | 600 | | | FANUC Corp | | | 117,837 | |
| | | 3,000 | | | Fuji Electric Co Ltd | | | 16,570 | |
| | | 2,000 | | | Fuji Heavy Industries Ltd | | | 74,835 | |
| | | 2,200 | | | FUJIFILM Holdings Corp | | | 85,101 | |
| | | 4,000 | | | Fukuoka Financial Group Inc | | | 18,668 | |
| | | 2,100 | | | Hachijuni Bank Ltd (The) | | | 13,260 | |
| | | 400 | | | Hakuhodo DY Holdings Inc | | | 4,924 | |
| | | 600 | | | Hankyu Hanshin Holdings Inc | | | 20,102 | |
| | | 1,400 | | | Hino Motors Ltd | | | 16,238 | |
| | | 100 | | | Hirose Electric Co Ltd | | | 13,418 | |
| | | 3,000 | | | Hiroshima Bank Ltd (The) | | | 14,175 | |
| | | 100 | | | Hisamitsu Pharmaceutical Co Inc | | | 5,379 | |
| | | 200 | | | Hitachi Chemical Co Ltd | | | 5,643 | |
| | | 200 | | | Hitachi Construction Machinery Co Ltd | | | 4,647 | |
| | | 25,000 | | | Hitachi Ltd | | | 137,621 | |
| | | 900 | | | Hokuriku Electric Power Co | | | 8,903 | |
| | | 5,400 | | | Honda Motor Co Ltd | | | 167,278 | |
| | | 500 | | | Idemitsu Kosan Co Ltd | | | 16,111 | |
| | | 4,000 | | | IHI Corp * | | | 12,437 | |
| | | 400 | | | Iida Group Holdings Co Ltd | | | 6,770 | |
| | | 1,800 | | | Inpex Corp | | | 17,898 | |
| | | | |
| | See accompanying notes to the financial statements. | | 9 |
GMO Alpha Only Fund
(A Series of GMO Trust)
Schedule of Investments — (Continued)
(showing percentage of total net assets)
February 28, 2017
| | | | | | | | | | |
Shares | | | Description | | Value ($) | |
| | | | | | Japan — continued | |
| | | 1,800 | | | Isetan Mitsukoshi Holdings Ltd | | | 23,052 | |
| | | 3,000 | | | Isuzu Motors Ltd | | | 40,093 | |
| | | 7,600 | | | ITOCHU Corp | | | 110,059 | |
| | | 1,300 | | | J Front Retailing Co Ltd | | | 19,976 | |
| | | 600 | | | Japan Airlines Co Ltd | | | 19,607 | |
| | | 2,200 | | | Japan Post Bank Co Ltd | | | 27,565 | |
| | | 2,400 | | | Japan Post Holdings Co Ltd | | | 30,784 | |
| | | 4 | | | Japan Prime Realty Investment Corp (REIT) | | | 15,889 | |
| | | 7 | | | Japan Real Estate Investment Corp (REIT) | | | 38,582 | |
| | | 13 | | | Japan Retail Fund Investment Corp (REIT) | | | 26,149 | |
| | | 1,100 | | | JGC Corp | | | 19,722 | |
| | | 1,000 | | | JSR Corp | | | 17,104 | |
| | | 1,200 | | | JTEKT Corp | | | 20,368 | |
| | | 10,800 | | | JX Holdings Inc | | | 51,485 | |
| | | 1,000 | | | Kamigumi Co Ltd | | | 9,383 | |
| | | 1,000 | | | Kaneka Corp | | | 7,822 | |
| | | 3,600 | | | Kansai Electric Power Co Inc (The) * | | | 39,924 | |
| | | 7,000 | | | Kawasaki Heavy Industries Ltd | | | 21,936 | |
| | | 9,300 | | | KDDI Corp | | | 243,032 | |
| | | 1,500 | | | Kirin Holdings Co Ltd | | | 25,877 | |
| | | 4,700 | | | Komatsu Ltd | | | 112,982 | |
| | | 2,400 | | | Konica Minolta Inc | | | 23,148 | |
| | | 700 | | | Kuraray Co Ltd | | | 10,635 | |
| | | 500 | | | Kurita Water Industries Ltd | | | 11,932 | |
| | | 1,600 | | | Kyocera Corp | | | 87,970 | |
| | | 500 | | | Kyowa Hakko Kirin Co Ltd | | | 7,493 | |
| | | 900 | | | Kyushu Financial Group Inc | | | 6,159 | |
| | | 200 | | | Lawson Inc | | | 13,803 | |
| | | 8,400 | | | Marubeni Corp | | | 54,380 | |
| | | 1,100 | | | Marui Group Co Ltd | | | 15,197 | |
| | | 300 | | | Maruichi Steel Tube Ltd | | | 9,502 | |
| | | 3,000 | | | Mazda Motor Corp | | | 41,949 | |
| | | 4,680 | | | Mebuki Financial Group Inc | | | 20,610 | |
| | | 900 | | | Medipal Holdings Corp | | | 14,852 | |
| | | 2,500 | | | Mitsubishi Chemical Holdings Corp | | | 19,223 | |
| | | 7,700 | | | Mitsubishi Electric Corp | | | 173,821 | |
| | | 9,800 | | | Mitsubishi Electric Corp | | | 143,677 | |
| | | 1,000 | | | Mitsubishi Gas Chemical Co Inc | | | 21,081 | |
| | | 16,000 | | | Mitsubishi Heavy Industries Ltd | | | 63,152 | |
| | | 600 | | | Mitsubishi Materials Corp | | | 19,920 | |
| | | 3,600 | | | Mitsubishi Motors Corp | | | 23,265 | |
| | | 1,200 | | | Mitsubishi Tanabe Pharma Corp | | | 24,704 | |
| | | 64,900 | | | Mitsubishi UFJ Financial Group Inc | | | 429,364 | |
| | | 2,400 | | | Mitsubishi UFJ Lease & Finance Co Ltd | | | 13,269 | |
| | | 8,700 | | | Mitsui & Co Ltd | | | 133,175 | |
| | | 3,000 | | | Mitsui Fudosan Co Ltd | | | 67,881 | |
| | | 6,000 | | | Mitsui OSK Lines Ltd | | | 19,778 | |
| | | 200 | | | Mixi Inc | | | 8,681 | |
| | | 122,700 | | | Mizuho Financial Group Inc | | | 228,974 | |
| | | 2,600 | | | MS&AD Insurance Group Holdings Inc | | | 88,054 | |
| | | | | | | | | | |
Shares | | | Description | | Value ($) | |
| | | | | | Japan — continued | |
| | | 9,000 | | | NEC Corp | | | 22,432 | |
| | | 600 | | | Nikon Corp | | | 9,173 | |
| | | 7 | | | Nippon Building Fund Inc (REIT) | | | 39,160 | |
| | | 2,000 | | | Nippon Electric Glass Co Ltd | | | 12,425 | |
| | | 4,000 | | | Nippon Express Co Ltd | | | 20,639 | |
| | | 4,100 | | | Nippon Steel & Sumitomo Metal Corp | | | 100,785 | |
| | | 3,500 | | | Nippon Telegraph & Telephone Corp | | | 148,048 | |
| | | 9,000 | | | Nippon Yusen KK | | | 19,838 | |
| | | 12,260 | | | Nissan Motor Co Ltd | | | 120,631 | |
| | | 500 | | | Nisshin Seifun Group Inc | | | 7,531 | |
| | | 100 | | | Nissin Foods Holdings Co Ltd | | | 5,602 | |
| | | 500 | | | NOK Corp | | | 11,439 | |
| | | 18,500 | | | Nomura Holdings Inc | | | 119,559 | |
| | | 700 | | | Nomura Real Estate Holdings Inc | | | 11,874 | |
| | | 14 | | | Nomura Real Estate Master Fund Inc (REIT) | | | 20,983 | |
| | | 440 | | | Nomura Research Institute Ltd | | | 15,202 | |
| | | 2,400 | | | NSK Ltd | | | 34,217 | |
| | | 2,000 | | | OJI Holdings Corp | | | 9,580 | |
| | | 6,700 | | | ORIX Corp | | | 104,252 | |
| | | 10,000 | | | Osaka Gas Co Ltd | | | 38,620 | |
| | | 4,100 | | | Panasonic Corp | | | 44,990 | |
| | | 11,200 | | | Resona Holdings Inc | | | 62,550 | |
| | | 3,600 | | | Ricoh Co Ltd | | | 31,404 | |
| | | 300 | | | Rohm Co Ltd | | | 19,377 | |
| | | 200 | | | Sankyo Co Ltd | | | 7,079 | |
| | | 1,100 | | | SBI Holdings Inc | | | 15,390 | |
| | | 1,000 | | | Sega Sammy Holdings Inc | | | 14,718 | |
| | | 1,500 | | | Seiko Epson Corp | | | 33,550 | |
| | | 2,100 | | | Sekisui Chemical Co Ltd | | | 34,689 | |
| | | 3,100 | | | Sekisui House Ltd | | | 49,573 | |
| | | 10,000 | | | Shinsei Bank Ltd | | | 18,245 | |
| | | 3,000 | | | Shizuoka Bank Ltd (The) | | | 26,345 | |
| | | 1,000 | | | Showa Shell Sekiyu KK | | | 10,084 | |
| | | 1,800 | | | Sompo Japan Nipponkoa Holdings Inc | | | 67,288 | |
| | | 900 | | | Sony Financial Holdings Inc | | | 15,814 | |
| | | 8,000 | | | Sumitomo Chemical Co Ltd | | | 44,628 | |
| | | 6,000 | | | Sumitomo Corp | | | 80,647 | |
| | | 2,000 | | | Sumitomo Electric Industries Ltd | | | 32,580 | |
| | | 3,000 | | | Sumitomo Heavy Industries Ltd | | | 21,203 | |
| | | 2,000 | | | Sumitomo Metal Mining Co Ltd | | | 27,785 | |
| | | 6,800 | | | Sumitomo Mitsui Financial Group Inc | | | 264,909 | |
| | | 1,700 | | | Sumitomo Mitsui Trust Holdings Inc | | | 61,005 | |
| | | 900 | | | Sumitomo Rubber Industries Ltd | | | 14,845 | |
| | | 250 | | | Suzuken Co Ltd | | | 8,463 | |
| | | 2,900 | | | T&D Holdings Inc | | | 44,474 | |
| | | 6,000 | | | Taiheiyo Cement Corp | | | 21,068 | |
| | | 5,000 | | | Taisei Corp | | | 35,084 | |
| | | 100 | | | Taisho Pharmaceutical Holdings Co Ltd | | | 8,150 | |
| | | 2,000 | | | Takashimaya Co Ltd | | | 17,996 | |
| | | 1,800 | | | Takeda Pharmaceutical Co Ltd | | | 83,709 | |
| | | | |
| 10 | | See accompanying notes to the financial statements. | | |
GMO Alpha Only Fund
(A Series of GMO Trust)
Schedule of Investments — (Continued)
(showing percentage of total net assets)
February 28, 2017
| | | | | | | | | | |
Shares | | | Description | | Value ($) | |
| | | | | | Japan — continued | |
| | | 600 | | | Teijin Ltd | | | 11,482 | |
| | | 600 | | | THK Co Ltd | | | 15,469 | |
| | | 2,000 | | | Tobu Railway Co Ltd | | | 10,242 | |
| | | 1,200 | | | Tohoku Electric Power Co Inc | | | 15,423 | |
| | | 3,500 | | | Tokio Marine Holdings Inc | | | 153,380 | |
| | | 3,900 | | | Tokyo Electric Power Co Holdings Inc * | | | 14,978 | |
| | | 800 | | | Tokyo Electron Ltd | | | 79,811 | |
| | | 10,000 | | | Tokyo Gas Co Ltd | | | 45,516 | |
| | | 3,000 | | | Tokyu Corp | | | 22,241 | |
| | | 2,700 | | | Tokyu Fudosan Holdings Corp | | | 15,395 | |
| | | 1,000 | | | TonenGeneral Sekiyu KK | | | 11,987 | |
| | | 3,000 | | | Toppan Printing Co Ltd | | | 30,244 | |
| | | 400 | | | Toyoda Gosei Co Ltd | | | 10,203 | |
| | | 800 | | | Toyota Industries Corp | | | 39,015 | |
| | | 13,638 | | | Toyota Motor Corp | | | 771,540 | |
| | | 1,100 | | | Toyota Tsusho Corp | | | 32,803 | |
| | | 200 | | | Trend Micro Inc | | | 8,762 | |
| | | 16 | | | United Urban Investment Corp (REIT) | | | 24,863 | |
| | | 600 | | | USS Co Ltd | | | 10,283 | |
| | | 800 | | | West Japan Railway Co | | | 52,983 | |
| | | 3,400 | | | Yamada Denki Co Ltd | | | 17,357 | |
| | | 1,000 | | | Yamaguchi Financial Group Inc | | | 11,539 | |
| | | 1,000 | | | Yamaha Motor Co Ltd | | | 23,104 | |
| | | 600 | | | Yokogawa Electric Corp | | | 9,342 | |
| | | 600 | | | Yokohama Rubber Co Ltd (The) | | | 11,924 | |
| | | | | | | | | | |
| | | | | | Total Japan | | | 8,193,113 | |
| | | | | | | | | | |
| | |
| | | | | | Malaysia — 0.4% | |
| | | 13,500 | | | AirAsia Berhad | | | 8,205 | |
| | | 16,800 | | | Alliance Financial Group Berhad | | | 14,410 | |
| | | 30,200 | | | AMMB Holdings Berhad | | | 31,471 | |
| | | 4,000 | | | Berjaya Sports Toto Berhad | | | 2,631 | |
| | | 2,400 | | | British American Tobacco Malaysia Berhad | | | 26,214 | |
| | | 47,635 | | | CIMB Group Holdings Berhad | | | 53,281 | |
| | | 27,300 | | | DiGi.Com Berhad | | | 30,988 | |
| | | 26,400 | | | Gamuda Berhad | | | 29,185 | |
| | | 35,100 | | | Genting Berhad | | | 73,103 | |
| | | 10,100 | | | Hong Leong Bank Berhad | | | 30,860 | |
| | | 3,800 | | | Hong Leong Financial Group Berhad | | | 12,881 | |
| | | 44,900 | | | IJM Corp Berhad | | | 33,874 | |
| | | 25,900 | | | IOI Properties Group Berhad | | | 12,306 | |
| | | 54,600 | | | Malayan Banking Berhad | | | 105,694 | |
| | | 20,300 | | | Maxis Berhad | | | 28,826 | |
| | | 17,400 | | | MISC Berhad | | | 29,018 | |
| | | 14,100 | | | Petronas Chemicals Group Berhad | | | 23,022 | |
| | | 1,200 | | | Petronas Dagangan Berhad | | | 6,613 | |
| | | 13,341 | | | RHB Bank Berhad | | | 14,533 | |
| | | 12,300 | | | RHB Capital Berhad * | | | — | |
| | | 65,300 | | | SapuraKencana Petroleum Berhad * | | | 27,906 | |
| | | 36,200 | | | Sime Darby Berhad | | | 73,043 | |
| | | | | | | | | | |
Shares | | | Description | | Value ($) | |
| | | | | | Malaysia — continued | |
| | | 34,300 | | | Tenaga Nasional Berhad | | | 104,523 | |
| | | 7,800 | | | UMW Holdings Berhad | | | 9,728 | |
| | | 8,600 | | | Westports Holdings Berhad | | | 7,762 | |
| | | 72,000 | | | YTL Corp Berhad | | | 25,133 | |
| | | 33,800 | | | YTL Power International Berhad | | | 11,336 | |
| | | | | | | | | | |
| | | | | | Total Malaysia | | | 826,546 | |
| | | | | | | | | | |
| | |
| | | | | | Mexico — 0.5% | |
| | | 43,900 | | | Alfa SAB de CV – Class A | | | 55,980 | |
| | | 517,264 | | | America Movil SAB de CV – Series L | | | 329,026 | |
| | | 6,500 | | | Arca Continental SAB de CV | | | 36,477 | |
| | | 7,700 | | | Coca-Cola Femsa SAB de CV – Series L | | | 50,585 | |
| | | 40,200 | | | Fibra Uno Administracion SA de CV
(REIT) | | | 58,205 | |
| | | 3,300 | | | Grupo Carso SAB de CV – Series A1 | | | 13,973 | |
| | | 38,900 | | | Grupo Financiero Banorte SAB de CV – Class O | | | 193,575 | |
| | | 28,500 | | | Grupo Financiero Santander Mexico SAB de CV – Class B | | | 42,711 | |
| | | 59,400 | | | Grupo Mexico SAB de CV – Series B | | | 179,960 | |
| | | 1,165 | | | Industrias Penoles SAB de CV | | | 27,601 | |
| | | 8,400 | | | Infraestructura Energetica Nova
SAB de CV | | | 35,980 | |
| | | 23,800 | | | Kimberly-Clark de Mexico SAB de CV – Class A | | | 44,955 | |
| | | 13,000 | | | OHL Mexico SAB de CV | | | 13,640 | |
| | | 53,100 | | | Wal-Mart de Mexico SAB de CV | | | 103,338 | |
| | | | | | | | | | |
| | | | | | Total Mexico | | | 1,186,006 | |
| | | | | | | | | | |
| | |
| | | | | | Netherlands — 0.3% | |
| | | 1,493 | | | ABN AMRO Group NV | | | 34,209 | |
| | | 9,327 | | | Aegon NV | | | 49,489 | |
| | | 300 | | | AerCap Holdings NV * | | | 13,590 | |
| | | 1,261 | | | Akzo Nobel NV | | | 84,545 | |
| | | 487 | | | Boskalis Westminster | | | 17,769 | |
| | | 19,735 | | | ING Groep NV | | | 271,881 | |
| | | 629 | | | Koninklijke DSM NV | | | 41,347 | |
| | | 11,887 | | | Koninklijke KPN NV | | | 33,592 | |
| | | 1,604 | | | NN Group NV | | | 49,914 | |
| | | 636 | | | Randstad Holdings NV | | | 37,041 | |
| | | 248 | | | Unilever NV CVA | | | 11,740 | |
| | | | | | | | | | |
| | | | | | Total Netherlands | | | 645,117 | |
| | | | | | | | | | |
| | |
| | | | | | New Zealand — 0.0% | |
| | | 3,835 | | | Contact Energy Ltd | | | 13,500 | |
| | | 1,280 | | | Fletcher Building Ltd | | | 8,892 | |
| | | 6,852 | | | Meridian Energy Ltd | | | 13,328 | |
| | | 9,817 | | | Spark New Zealand Ltd | | | 25,370 | |
| | | | | | | | | | |
| | | | | | Total New Zealand | | | 61,090 | |
| | | | | | | | | | |
| | | | |
| | See accompanying notes to the financial statements. | | 11 |
GMO Alpha Only Fund
(A Series of GMO Trust)
Schedule of Investments — (Continued)
(showing percentage of total net assets)
February 28, 2017
| | | | | | | | | | |
Shares | | | Description | | Value ($) | |
| | | | | | Norway — 0.1% | |
| | | 4,973 | | | DNB ASA | | | 81,535 | |
| | | 1,069 | | | Gjensidige Forsikring ASA | | | 16,714 | |
| | | 7,196 | | | Norsk Hydro ASA | | | 40,741 | |
| | | 4,362 | | | Orkla ASA | | | 38,346 | |
| | | 2,074 | | | Statoil ASA | | | 36,567 | |
| | | 950 | | | Yara International ASA | | | 36,065 | |
| | | | | | | | | | |
| | | | | | Total Norway | | | 249,968 | |
| | | | | | | | | | |
| | |
| | | | | | Peru — 0.1% | |
| | | 3,000 | | | Cia de Minas Buenaventura SAA ADR | | | 36,900 | |
| | | 500 | | | Credicorp Ltd | | | 82,310 | |
| | | | | | | | | | |
| | | | | | Total Peru | | | 119,210 | |
| | | | | | | | | | |
| | |
| | | | | | Philippines — 0.2% | |
| | | 30,730 | | | Aboitiz Equity Ventures Inc | | | 44,929 | |
| | | 24,600 | | | Aboitiz Power Corp | | | 21,015 | |
| | | 32,100 | | | Alliance Global Group Inc | | | 8,111 | |
| | | 11,790 | | | Bank of the Philippine Islands | | | 22,053 | |
| | | 30,605 | | | BDO Unibank Inc | | | 70,309 | |
| | | 66,600 | | | DMCI Holdings Inc | | | 16,791 | |
| | | 156,600 | | | Energy Development Corp | | | 18,372 | |
| | | 555 | | | Globe Telecom Inc | | | 20,196 | |
| | | 8,480 | | | International Container Terminal Services Inc | | | 12,799 | |
| | | 16,780 | | | JG Summit Holdings Inc | | | 25,889 | |
| | | 188,000 | | | Megaworld Corp | | | 13,600 | |
| | | 218,900 | | | Metro Pacific Investments Corp | | | 29,610 | |
| | | 10,610 | | | Metropolitan Bank & Trust Co | | | 17,104 | |
| | | 1,515 | | | PLDT Inc | | | 43,991 | |
| | | 27,300 | | | Robinsons Land Corp | | | 12,854 | |
| | | 1,840 | | | Security Bank Corp | | | 7,322 | |
| | | 2,000 | | | SM Investments Corp | | | 26,376 | |
| | | | | | | | | | |
| | | | | | Total Philippines | | | 411,321 | |
| | | | | | | | | | |
| | |
| | | | | | Poland — 0.2% | |
| | | 510 | | | Bank Handlowy w Warszawie SA | | | 9,886 | |
| | | 1,595 | | | Bank Pekao SA | | | 54,853 | |
| | | 747 | | | Grupa Azoty SA | | | 12,737 | |
| | | 1,546 | | | Grupa Lotos SA * | | | 18,481 | |
| | | 310 | | | Jastrzebska Spolka Weglowa SA * | | | 5,311 | |
| | | 2,182 | | | KGHM Polska Miedz SA | | | 69,084 | |
| | | 10,943 | | | Orange Polska SA | | | 12,723 | |
| | | 13,112 | | | PGE Polska Grupa Energetyczna SA | | | 38,263 | |
| | | 4,999 | | | Polski Koncern Naftowy ORLEN SA | | | 115,757 | |
| | | 8,748 | | | Powszechny Zaklad Ubezpieczen SA | | | 77,557 | |
| | | 17,547 | | | Tauron Polska Energia SA * | | | 12,941 | |
| | | | | | | | | | |
| | | | | | Total Poland | | | 427,593 | |
| | | | | | | | | | |
| | |
| | | | | | Portugal — 0.0% | |
| | | 12,391 | | | EDP-Energias de Portugal SA | | | 38,307 | |
| | | | | | | | | | |
Shares | | | Description | | Value ($) | |
| | | | | | Portugal — continued | |
| | | 1,344 | | | Galp Energia SGPS SA | | | 19,782 | |
| | | | | | | | | | |
| | | | | | Total Portugal | | | 58,089 | |
| | | | | | | | | | |
| | |
| | | | | | Qatar — 0.1% | |
| | | 1,626 | | | Barwa Real Estate Co | | | 17,785 | |
| | | 2,948 | | | Commercial Bank QSC (The) | | | 25,080 | |
| | | 2,113 | | | Doha Bank QSC | | | 22,532 | |
| | | 1,532 | | | Industries Qatar QSC * | | | 49,585 | |
| | | 5,727 | | | Masraf Al Rayan QSC * | | | 63,052 | |
| | | 1,248 | | | Ooredoo QSC | | | 36,315 | |
| | | 299 | | | Qatar Electricity & Water Co QSC * | | | 18,477 | |
| | | 4,230 | | | Qatar Gas Transport Co Ltd | | | 27,352 | |
| | | 921 | | | Qatar Islamic Bank SAQ | | | 25,797 | |
| | | | | | | | | | |
| | | | | | Total Qatar | | | 285,975 | |
| | | | | | | | | | |
| | |
| | | | | | Russia — 0.5% | |
| | | 92,874 | | | Gazprom PAO Sponsored ADR | | | 414,550 | |
| | | 488,000 | | | Inter RAO UES PJSC | | | 33,649 | |
| | | 6,639 | | | Lukoil PJSC Sponsored ADR | | | 352,028 | |
| | | 7,800 | | | Mobile TeleSystems PJSC Sponsored ADR | | | 80,106 | |
| | | 1,626 | | | PhosAgro PJSC GDR (Registered) | | | 22,407 | |
| | | 9,110 | | | Rosneft Oil Co PJSC GDR (Registered) | | | 51,686 | |
| | | 15,140 | | | Rostelecom PJSC | | | 20,245 | |
| | | 1,806,000 | | | RusHydro PJSC | | | 29,011 | |
| | | 3,270 | | | Severstal PJSC GDR (Registered) | | | 46,577 | |
| | | 2,826 | | | Sistema PJSC Sponsored GDR (Registered) | | | 25,199 | |
| | | 110,800 | | | Surgutneftegas OJSC | | | 55,790 | |
| | | 1,842 | | | Tatneft PJSC Sponsored ADR | | | 64,593 | |
| | | | | | | | | | |
| | | | | | Total Russia | | | 1,195,841 | |
| | | | | | | | | | |
| | |
| | | | | | Singapore — 0.2% | |
| | | 11,100 | | | CapitaLand Commercial Trust (REIT) | | | 12,346 | |
| | | 800 | | | City Developments Ltd | | | 5,400 | |
| | | 9,000 | | | DBS Group Holdings Ltd | | | 120,195 | |
| | | 18,700 | | | Golden Agri-Resources Ltd | | | 5,062 | |
| | | 27,900 | | | Hutchison Port Holdings Trust – Class U | | | 10,596 | |
| | | 7,800 | | | Keppel Corp Ltd | | | 37,853 | |
| | | 16,000 | | | Oversea-Chinese Banking Corp Ltd | | | 107,909 | |
| | | 5,600 | | | Singapore Press Holdings Ltd | | | 13,975 | |
| | | 12,900 | | | Suntec Real Estate Investment Trust | | | 15,914 | |
| | | 6,555 | | | United Overseas Bank Ltd | | | 100,439 | |
| | | 2,600 | | | UOL Group Ltd | | | 12,214 | |
| | | 13,000 | | | Yangzijiang Shipbuilding Holdings Ltd | | | 8,575 | |
| | | | | | | | | | |
| | | | | | Total Singapore | | | 450,478 | |
| | | | | | | | | | |
| | |
| | | | | | South Africa — 1.0% | |
| | | 587 | | | Anglo American Platinum Ltd * | | | 13,555 | |
| | | 6,361 | | | AngloGold Ashanti Ltd * | | | 70,134 | |
| | | 6,606 | | | Barclays Africa Group Ltd | | | 76,450 | |
| | | | |
| 12 | | See accompanying notes to the financial statements. | | |
GMO Alpha Only Fund
(A Series of GMO Trust)
Schedule of Investments — (Continued)
(showing percentage of total net assets)
February 28, 2017
| | | | | | | | | | |
Shares | | | Description | | Value ($) | |
| | | | | | South Africa — continued | |
| | | 4,966 | | | Bidvest Group Ltd (The) | | | 58,668 | |
| | | 5,278 | | | Brait SE * | | | 29,619 | |
| | | 3,794 | | | Coronation Fund Managers Ltd | | | 19,460 | |
| | | 2,390 | | | Exxaro Resources Ltd | | | 19,642 | |
| | | 52,452 | | | FirstRand Ltd | | | 198,389 | |
| | | 15,882 | | | Fortress Income Fund Ltd – Class A (REIT) | | | 21,061 | |
| | | 11,854 | | | Fortress Income Fund Ltd (REIT) | | | 31,491 | |
| | | 3,249 | | | Foschini Group Ltd (The) | | | 40,180 | |
| | | 12,803 | | | Gold Fields Ltd | | | 39,025 | |
| | | 32,564 | | | Growthpoint Properties Ltd (REIT) | | | 65,670 | |
| | | 3,872 | | | Hyprop Investments Ltd (REIT) | | | 36,995 | |
| | | 9,733 | | | Impala Platinum Holdings Ltd * | | | 32,588 | |
| | | 2,433 | | | Imperial Holdings Ltd | | | 30,986 | |
| | | 1,911 | | | Liberty Holdings Ltd | | | 16,156 | |
| | | 7,643 | | | Life Healthcare Group Holdings Ltd | | | 19,509 | |
| | | 15,942 | | | MMI Holdings Ltd | | | 29,870 | |
| | | 25,864 | | | MTN Group Ltd | | | 235,987 | |
| | | 3,091 | | | Nedbank Group Ltd | | | 57,635 | |
| | | 745 | | | Pioneer Foods Group Ltd | | | 9,305 | |
| | | 76,041 | | | Redefine Properties Ltd (REIT) | | | 62,991 | |
| | | 5,361 | | | Remgro Ltd | | | 91,244 | |
| | | 11,000 | | | RMB Holdings Ltd | | | 53,119 | |
| | | 5,485 | | | Sappi Ltd * | | | 34,173 | |
| | | 8,629 | | | Sasol Ltd | | | 245,460 | |
| | | 12,334 | | | Sibanye Gold Ltd | | | 25,271 | |
| | | 20,174 | | | Standard Bank Group Ltd | | | 219,859 | |
| | | 46,402 | | | Steinhoff International Holdings NV | | | 247,107 | |
| | | 4,109 | | | Telkom SA SOC Ltd | | | 21,344 | |
| | | 948 | | | Tiger Brands Ltd | | | 30,186 | |
| | | 6,970 | | | Truworths International Ltd | | | 46,269 | |
| | | 6,128 | | | Tsogo Sun Holdings Ltd | | | 12,894 | |
| | | 5,797 | | | Vodacom Group Ltd | | | 65,469 | |
| | | | | | | | | | |
| | | | | | Total South Africa | | | 2,307,761 | |
| | | | | | | | | | |
| | |
| | | | | | South Korea — 2.0% | |
| | | 4,063 | | | BNK Financial Group Inc | | | 31,179 | |
| | | 434 | | | Daelim Industrial Co Ltd | | | 32,055 | |
| | | 2,821 | | | DGB Financial Group Inc | | | 25,934 | |
| | | 773 | | | Dongbu Insurance Co Ltd | | | 41,735 | |
| | | 203 | | | Dongsuh Cos Inc | | | 4,573 | |
| | | 798 | | | Doosan Heavy Industries & Construction Co | | | 17,296 | |
| | | 304 | | | E-MART Inc | | | 55,868 | |
| | | 829 | | | GS Engineering & Construction Corp * | | | 21,818 | |
| | | 797 | | | GS Holdings Corp | | | 39,059 | |
| | | 4,613 | | | Hana Financial Group Inc | | | 143,703 | |
| | | 579 | | | Hankook Tire Co Ltd | | | 30,583 | |
| | | 752 | | | Hanwha Corp | | | 24,171 | |
| | | 3,623 | | | Hanwha Life Insurance Co Ltd | | | 20,850 | |
| | | 312 | | | Hanwha Techwin Co Ltd * | | | 12,115 | |
| | | 228 | | | Hyosung Corp | | | 26,471 | |
| | | | | | | | | | |
Shares | | | Description | | Value ($) | |
| | | | | | South Korea — continued | |
| | | 127 | | | Hyundai Department Store Co Ltd | | | 11,163 | |
| | | 423 | | | Hyundai Heavy Industries Co Ltd * | | | 61,406 | |
| | | 364 | | | Hyundai Marine & Fire Insurance Co Ltd | | | 10,430 | |
| | | 1,062 | | | Hyundai Mobis Co Ltd | | | 239,374 | |
| | | 2,403 | | | Hyundai Motor Co | | | 317,281 | |
| | | 1,248 | | | Hyundai Steel Co | | | 68,865 | |
| | | 273 | | | Hyundai Wia Corp | | | 16,140 | |
| | | 3,927 | | | Industrial Bank of Korea | | | 42,868 | |
| | | 6,190 | | | KB Financial Group Inc | | | 255,523 | |
| | | 97 | | | KCC Corp | | | 29,689 | |
| | | 4,106 | | | Kia Motors Corp | | | 138,794 | |
| | | 4,002 | | | Korea Electric Power Corp | | | 153,984 | |
| | | 462 | | | Korea Gas Corp * | | | 19,970 | |
| | | 652 | | | Korea Investment Holdings Co Ltd | | | 27,289 | |
| | | 132 | | | Korea Zinc Co Ltd | | | 48,544 | |
| | | 87 | | | KT Corp | | | 2,342 | |
| | | 1,818 | | | KT&G Corp | | | 164,596 | |
| | | 142 | | | Kumho Petrochemical Co Ltd | | | 9,625 | |
| | | 716 | | | LG Chem Ltd | | | 179,024 | |
| | | 1,479 | | | LG Corp | | | 82,060 | |
| | | 3,625 | | | LG Display Co Ltd | | | 87,816 | |
| | | 240 | | | Lotte Chemical Corp | | | 77,326 | |
| | | 5 | | | Lotte Chilsung Beverage Co Ltd | | | 6,669 | |
| | | 40 | | | Lotte Confectionery Co Ltd | | | 6,903 | |
| | | 63 | | | Lotte Shopping Co Ltd | | | 12,870 | |
| | | 5,718 | | | Mirae Asset Daewoo Co Ltd | | | 45,085 | |
| | | 2,348 | | | NH Investment & Securities Co Ltd | | | 24,060 | |
| | | 279 | | | OCI Co Ltd | | | 21,949 | |
| | | 751 | | | POSCO | | | 187,794 | |
| | | 760 | | | Posco Daewoo Corp | | | 16,483 | |
| | | 580 | | | Samsung Card Co Ltd | | | 21,694 | |
| | | 540 | | | Samsung Electronics Co Ltd | | | 917,694 | |
| | | 1,424 | | | Samsung Heavy Industries Co Ltd * | | | 14,074 | |
| | | 1,091 | | | Samsung Life Insurance Co Ltd | | | 103,212 | |
| | | 957 | | | Samsung Securities Co Ltd | | | 28,011 | |
| | | 6,651 | | | Shinhan Financial Group Co Ltd | | | 273,629 | |
| | | 123 | | | Shinsegae Inc | | | 21,696 | |
| | | 463 | | | SK Holdings Co Ltd | | | 89,219 | |
| | | 1,009 | | | SK Innovation Co Ltd | | | 137,630 | |
| | | 2,205 | | | SK Networks Co Ltd | | | 14,438 | |
| | | 314 | | | SK Telecom Co Ltd | | | 64,191 | |
| | | 702 | | | S-Oil Corp | | | 53,588 | |
| | | 4,741 | | | Woori Bank * | | | 55,726 | |
| | | | | | | | | | |
| | | | | | Total South Korea | | | 4,688,134 | |
| | | | | | | | | | |
| | |
| | | | | | Spain — 0.7% | |
| | | 3,276 | | | Abertis Infraestructuras SA | | | 47,996 | |
| | | 1,024 | | | ACS Actividades de Construccion y Servicios SA | | | 32,102 | |
| | | 33,479 | | | Banco Bilbao Vizcaya Argentaria SA | | | 218,115 | |
| | | | |
| | See accompanying notes to the financial statements. | | 13 |
GMO Alpha Only Fund
(A Series of GMO Trust)
Schedule of Investments — (Continued)
(showing percentage of total net assets)
February 28, 2017
| | | | | | | | | | |
Shares | | | Description | | Value ($) | |
| | | | | | Spain — continued | |
| | | 28,349 | | | Banco de Sabadell SA | | | 41,614 | |
| | | 74,303 | | | Banco Santander SA | | | 404,103 | |
| | | 24,650 | | | Bankia SA | | | 24,300 | |
| | | 3,617 | | | Bankinter SA | | | 27,868 | |
| | | 11,475 | | | CaixaBank SA | | | 39,988 | |
| | | 1,214 | | | Enagas SA | | | 29,784 | |
| | | 1,699 | | | Endesa SA | | | 36,137 | |
| | | 1,709 | | | Ferrovial SA | | | 32,376 | |
| | | 1,874 | | | Gas Natural SDG SA | | | 36,424 | |
| | | 28,768 | | | Iberdrola SA | | | 191,013 | |
| | | 1,593 | | | International Consolidated Airlines Group SA | | | 10,583 | |
| | | 5,763 | | | Mapfre SA | | | 17,808 | |
| | | 2,203 | | | Red Electrica Corp SA | | | 39,768 | |
| | | 5,741 | | | Repsol SA | | | 84,928 | |
| | | 23,699 | | | Telefonica SA | | | 241,255 | |
| | | 584 | | | Zardoya Otis SA | | | 4,654 | |
| | | | | | | | | | |
| | | | | | Total Spain | | | 1,560,816 | |
| | | | | | | | | | |
| | |
| | | | | | Sweden — 0.5% | |
| | | 1,017 | | | Alfa Laval AB | | | 18,371 | |
| | | 1,291 | | | Electrolux AB | | | 34,185 | |
| | | 431 | | | ICA Gruppen AB | | | 13,984 | |
| | | 877 | | | Industrivarden AB – C Shares | | | 17,338 | |
| | | 2,318 | | | Investor AB – B Shares | | | 91,794 | |
| | | 1,257 | | | Kinnevik AB – Class B | | | 33,933 | |
| | | 15,457 | | | Nordea Bank AB | | | 180,722 | |
| | | 1,991 | | | Sandvik AB | | | 27,027 | |
| | | 7,730 | | | Skandinaviska Enskilda Banken AB – Class A | | | 88,326 | |
| | | 1,731 | | | Skanska AB – B Shares | | | 41,200 | |
| | | 2,130 | | | SKF AB – B Shares | | | 40,474 | |
| | | 7,747 | | | Svenska Handelsbanken AB – A Shares | | | 107,564 | |
| | | 4,609 | | | Swedbank AB – A Shares | | | 113,564 | |
| | | 1,935 | | | Tele2 AB – B Shares | | | 17,278 | |
| | | 15,621 | | | Telefonaktiebolaget LM Ericsson – B Shares | | | 101,354 | |
| | | 13,222 | | | Telia Co AB | | | 53,087 | |
| | | 7,846 | | | Volvo AB – B Shares | | | 102,231 | |
| | | | | | | | | | |
| | | | | | Total Sweden | | | 1,082,432 | |
| | | | | | | | | | |
| | |
| | | | | | Switzerland — 2.1% | |
| | | 4,790 | | | ABB Ltd (Registered) * | | | 108,207 | |
| | | 827 | | | Adecco Group AG (Registered) | | | 59,467 | |
| | | 467 | | | Aryzta AG * | | | 15,106 | |
| | | 173 | | | Baloise Holding AG (Registered) | | | 22,516 | |
| | | 1,329 | | | Cie Financiere Richemont SA (Registered) | | | 97,893 | |
| | | 3,537 | | | Credit Suisse Group AG (Registered) * | | | 53,363 | |
| | | 1,139 | | | Julius Baer Group Ltd * | | | 55,706 | |
| | | 35,181 | | | Nestle SA (Registered) | | | 2,596,294 | |
| | | 13,298 | | | Novartis AG (Registered) * | | | 1,038,466 | |
| | | 92 | | | Pargesa Holding SA | | | 6,065 | |
| | | 82 | | | Swatch Group AG (The) | | | 27,275 | |
| | | 266 | | | Swatch Group AG (The) (Registered) | | | 17,234 | |
| | | | | | | | | | |
Shares | | | Description | | Value ($) | |
| | | | | | Switzerland — continued | |
| | | 163 | | | Swiss Life Holding AG (Registered) * | | | 51,276 | |
| | | 383 | | | Swiss Prime Site AG (Registered) * | | | 33,261 | |
| | | 1,650 | | | Swiss Re AG | | | 147,586 | |
| | | 132 | | | Swisscom AG (Registered) | | | 58,104 | |
| | | 235 | | | Syngenta AG (Registered) | | | 101,289 | |
| | | 18,615 | | | UBS Group AG (Registered) | | | 286,966 | |
| | | 766 | | | Zurich Insurance Group AG * | | | 211,395 | |
| | | | | | | | | | |
| | | | | | Total Switzerland | | | 4,987,469 | |
| | | | | | | | | | |
| | |
| | | | | | Taiwan — 2.8% | |
| | | 49,000 | | | Acer Inc * | | | 23,531 | |
| | | 69,000 | | | Advanced Semiconductor Engineering Inc | | | 86,087 | |
| | | 39,000 | | | Asia Cement Corp | | | 38,569 | |
| | | 38,000 | | | Asia Pacific Telecom Co Ltd * | | | 12,729 | |
| | | 12,000 | | | Asustek Computer Inc | | | 108,275 | |
| | | 2,000 | | | Casetek Holdings Ltd | | | 6,762 | |
| | | 11,000 | | | Catcher Technology Co Ltd | | | 91,784 | |
| | | 136,000 | | | Cathay Financial Holding Co Ltd | | | 213,472 | |
| | | 17,000 | | | Chailease Holding Co Ltd | | | 36,459 | |
| | | 82,520 | | | Chang Hwa Commercial Bank Ltd | | | 49,288 | |
| | | 22,000 | | | Cheng Shin Rubber Industry Co Ltd | | | 46,761 | |
| | | 44,000 | | | China Airlines Ltd | | | 14,465 | |
| | | 225,000 | | | China Development Financial Holding Corp | | | 59,271 | |
| | | 57,520 | | | China Life Insurance Co Ltd | | | 56,421 | |
| | | 64,000 | | | Chunghwa Telecom Co Ltd | | | 212,204 | |
| | | 70,000 | | | Compal Electronics Inc | | | 43,823 | |
| | | 293,320 | | | CTBC Financial Holding Co Ltd | | | 175,048 | |
| | | 34,250 | | | Eva Airways Corp | | | 17,027 | |
| | | 15,000 | | | Evergreen Marine Corp Taiwan Ltd * | | | 7,088 | |
| | | 54,000 | | | Far Eastern New Century Corp | | | 48,198 | |
| | | 27,000 | | | Far EasTone Telecommunications Co Ltd | | | 64,945 | |
| | | 160,190 | | | First Financial Holding Co Ltd | | | 94,562 | |
| | | 54,000 | | | Formosa Chemicals & Fibre Co | | | 170,746 | |
| | | 10,000 | | | Formosa Petrochemical Corp | | | 34,788 | |
| | | 69,000 | | | Formosa Plastics Corp | | | 207,831 | |
| | | 13,000 | | | Formosa Taffeta Co Ltd | | | 13,186 | |
| | | 15,361 | | | Foxconn Technology Co Ltd | | | 45,857 | |
| | | 111,000 | | | Fubon Financial Holding Co Ltd | | | 179,878 | |
| | | 14,000 | | | Highwealth Construction Corp | | | 22,769 | |
| | | 258,525 | | | Hon Hai Precision Industry Co Ltd | | | 752,298 | |
| | | 6,000 | | | HTC Corp * | | | 15,368 | |
| | | 122,936 | | | Hua Nan Financial Holdings Co Ltd – Class C | | | 67,616 | |
| | | 97,000 | | | Innolux Corp | | | 39,523 | |
| | | 42,000 | | | Inventec Corp | | | 31,197 | |
| | | 35,435 | | | Lite-On Technology Corp | | | 59,344 | |
| | | 25,000 | | | MediaTek Inc | | | 182,185 | |
| | | 182,000 | | | Mega Financial Holding Co Ltd | | | 141,658 | |
| | | 2,000 | | | Merida Industry Co Ltd | | | 10,191 | |
| | | 79,000 | | | Nan Ya Plastics Corp | | | 191,728 | |
| | | 11,000 | | | Nanya Technology Corp | | | 16,367 | |
| | | | |
| 14 | | See accompanying notes to the financial statements. | | |
GMO Alpha Only Fund
(A Series of GMO Trust)
Schedule of Investments — (Continued)
(showing percentage of total net assets)
February 28, 2017
| | | | | | | | | | |
Shares | | | Description | | Value ($) | |
| | | | | | Taiwan — continued | |
| | | 10,000 | | | Novatek Microelectronics Corp | | | 37,447 | |
| | | 1,000 | | | OBI Pharma Inc * | | | 11,418 | |
| | | 32,000 | | | Pegatron Corp | | | 84,261 | |
| | | 2,000 | | | Phison Electronics Corp | | | 17,570 | |
| | | 45,000 | | | Quanta Computer Inc | | | 93,154 | |
| | | 14,000 | | | Ruentex Development Co Ltd * | | | 17,610 | |
| | | 10,000 | | | Ruentex Industries Ltd | | | 18,951 | |
| | | 137,000 | | | Shin Kong Financial Holding Co Ltd * | | | 36,967 | |
| | | 36,000 | | | Siliconware Precision Industries Co Ltd | | | 56,712 | |
| | | 169,550 | | | SinoPac Financial Holdings Co Ltd | | | 51,586 | |
| | | 23,350 | | | Synnex Technology International Corp | | | 25,649 | |
| | | 142,577 | | | Taishin Financial Holding Co Ltd | | | 56,388 | |
| | | 32,100 | | | Taiwan Business Bank | | | 8,785 | |
| | | 12,000 | | | Taiwan Fertilizer Co Ltd | | | 16,594 | |
| | | 27,000 | | | Taiwan Mobile Co Ltd | | | 94,808 | |
| | | 63,931 | | | Taiwan Semiconductor Manufacturing Co Ltd Sponsored ADR | | | 2,011,909 | |
| | | 32,000 | | | Teco Electric and Machinery Co Ltd | | | 28,820 | |
| | | 3,000 | | | Transcend Information Inc | | | 8,432 | |
| | | 200,000 | | | United Microelectronics Corp | | | 82,921 | |
| | | 26,393 | | | Wistron Corp | | | 22,109 | |
| | | 25,000 | | | WPG Holdings Ltd | | | 31,716 | |
| | | 160,000 | | | Yuanta Financial Holding Co Ltd | | | 67,683 | |
| | | 14,000 | | | Yulon Motor Co Ltd | | | 13,031 | |
| | | 7,000 | | | Zhen Ding Technology Holding Ltd | | | 17,427 | |
| | | | | | | | | | |
| | | | | | Total Taiwan | | | 6,601,247 | |
| | | | | | | | | | |
| | |
| | | | | | Thailand — 0.1% | |
| | | 6,000 | | | Advanced Info Service Pcl (Foreign Registered) | | | 28,676 | |
| | | 4,200 | | | Bangkok Bank Pcl NVDR | | | 21,317 | |
| | | 9,200 | | | Banpu Pcl (Foreign Registered) | | | 5,161 | |
| | | 6,900 | | | BEC World Pcl (Foreign Registered) | | | 3,102 | |
| | | 32,700 | | | BTS Group Holdings Pcl (Foreign Registered) | | | 7,671 | |
| | | 2,800 | | | Glow Energy Pcl (Foreign Registered) | | | 6,247 | |
| | | 8,100 | | | Indorama Ventures Pcl (Foreign Registered) | | | 8,232 | |
| | | 53,900 | | | IRPC Pcl (Foreign Registered) | | | 7,646 | |
| | | 3,800 | | | Kasikornbank Pcl (Foreign Registered) (a) | | | 20,578 | |
| | | 4,900 | | | Kasikornbank Pcl NVDR | | | 26,815 | |
| | | 21,000 | | | Krung Thai Bank Pcl (Foreign Registered) | | | 11,778 | |
| | | 8,700 | | | PTT Exploration & Production Pcl (Foreign Registered) | | | 23,151 | |
| | | 11,800 | | | PTT Global Chemical Pcl (Foreign Registered) | | | 24,063 | |
| | | 7,000 | | | PTT Pcl (Foreign Registered) | | | 79,602 | |
| | | 9,900 | | | Siam Commercial Bank Pcl (The) (Foreign Registered) | | | 43,569 | |
| | | 4,600 | | | Thai Oil Pcl (Foreign Registered) | | | 9,903 | |
| | | 50,300 | | | TMB Bank Pcl (Foreign Registered) | | | 3,516 | |
| | | | | | | | | | |
| | | | | | Total Thailand | | | 331,027 | |
| | | | | | | | | | |
| | | | | | | | | | |
Shares | | | Description | | Value ($) | |
| | | | | | Turkey — 0.2% | |
| | | 31,705 | | | Emlak Konut Gayrimenkul Yatirim Ortakligi AS (REIT) | | | 27,202 | |
| | | 21,818 | | | Eregli Demir ve Celik Fabrikalari TAS | | | 35,523 | |
| | | 14,309 | | | Haci Omer Sabanci Holding AS | | | 39,480 | |
| | | 5,279 | | | KOC Holding AS | | | 21,459 | |
| | | 3,935 | | | Petkim Petrokimya Holding AS | | | 4,661 | |
| | | 1,778 | | | TAV Havalimanlari Holding AS | | | 7,396 | |
| | | 1,951 | | | Tupras-Turkiye Petrol Rafineriler AS | | | 45,571 | |
| | | 9,008 | | | Turk Telekomunikasyon AS | | | 14,226 | |
| | | 7,289 | | | Turkcell Iletisim Hizmetleri AS * | | | 23,788 | |
| | | 18,000 | | | Turkiye Garanti Bankasi AS | | | 42,491 | |
| | | 10,429 | | | Turkiye Halk Bankasi AS | | | 32,219 | |
| | | 24,545 | | | Turkiye Is Bankasi – Class C | | | 42,601 | |
| | | 12,007 | | | Turkiye Sise ve Cam Fabrikalari AS | | | 12,904 | |
| | | 12,516 | | | Turkiye Vakiflar Bankasi TAO – Class D | | | 18,172 | |
| | | 902 | | | Ulker Biskuvi Sanayi AS | | | 4,568 | |
| | | 7,201 | | | Yapi ve Kredi Bankasi AS * | | | 7,594 | |
| | | | | | | | | | |
| | | | | | Total Turkey | | | 379,855 | |
| | | | | | | | | | |
| | |
| | | | | | United Arab Emirates — 0.1% | |
| | | 30,521 | | | Abu Dhabi Commercial Bank PJSC | | | 58,842 | |
| | | 49,013 | | | Aldar Properties PJSC | | | 32,006 | |
| | | 19,255 | | | Dubai Islamic Bank PJSC | | | 32,743 | |
| | | 32,668 | | | Emaar Malls PJSC | | | 23,290 | |
| | | 27,336 | | | Emaar Properties PJSC | | | 55,397 | |
| | | 14,026 | | | First Gulf Bank PJSC | | | 52,120 | |
| | | 10,645 | | | National Bank of Abu Dhabi PJSC | | | 30,428 | |
| | | | | | | | | | |
| | | | | | Total United Arab Emirates | | | 284,826 | |
| | | | | | | | | | |
| | |
| | | | | | United Kingdom — 7.7% | |
| | | 4,950 | | | 3i Group Plc | | | 42,296 | |
| | | 4,936 | | | Aberdeen Asset Management Plc | | | 16,952 | |
| | | 1,132 | | | Admiral Group Plc | | | 25,675 | |
| | | 734 | | | Antofagasta Plc | | | 7,376 | |
| | | 6,436 | | | AstraZeneca Plc | | | 370,907 | |
| | | 20,653 | | | Aviva Plc | | | 127,489 | |
| | | 1,356 | | | Babcock International Group Plc | | | 15,942 | |
| | | 16,154 | | | BAE Systems Plc | | | 126,462 | |
| | | 86,083 | | | Barclays Plc | | | 241,952 | |
| | | 5,381 | | | Barratt Developments Plc | | | 34,172 | |
| | | 454 | | | Berkeley Group Holdings Plc (The) | | | 16,593 | |
| | | 5,374 | | | BHP Billiton Plc | | | 86,618 | |
| | | 95,593 | | | BP Plc | | | 539,017 | |
| | | 39,589 | | | British American Tobacco Plc | | | 2,500,621 | |
| | | 5,234 | | | British Land Co Plc (The) (REIT) | | | 40,086 | |
| | | 42,945 | | | BT Group Plc | | | 173,543 | |
| | | 2,326 | | | Capita Plc | | | 16,256 | |
| | | 27,824 | | | Centrica Plc | | | 78,380 | |
| | | 9,151 | | | Cobham Plc | | | 13,612 | |
| | | 69,489 | | | Compass Group Plc | | | 1,290,964 | |
| | | | |
| | See accompanying notes to the financial statements. | | 15 |
GMO Alpha Only Fund
(A Series of GMO Trust)
Schedule of Investments — (Continued)
(showing percentage of total net assets)
February 28, 2017
| | | | | | | | | | |
Shares | | | Description | | Value ($) | |
| | | | | | United Kingdom — continued | |
| | | 7,357 | | | Direct Line Insurance Group Plc | | | 31,356 | |
| | | 5,236 | | | Dixons Carphone Plc | | | 19,692 | |
| | | 852 | | | easyJet Plc | | | 10,052 | |
| | | 8,302 | | | G4S Plc | | | 27,014 | |
| | | 9,197 | | | GKN Plc | | | 41,091 | |
| | | 40,472 | | | Glencore Plc * | | | 161,344 | |
| | | 4,237 | | | Hammerson Plc (REIT) | | | 30,933 | |
| | | 101,234 | | | HSBC Holdings Plc | | | 813,120 | |
| | | 503 | | | IMI Plc | | | 7,749 | |
| | | 2,420 | | | Inmarsat Plc | | | 21,383 | |
| | | 5,037 | | | Intu Properties Plc (REIT) | | | 17,917 | |
| | | 1,662 | | | Investec Plc | | | 11,716 | |
| | | 1,346 | | | Investec Plc | | | 9,652 | |
| | | 18,437 | | | ITV Plc | | | 46,334 | |
| | | 8,335 | | | J Sainsbury Plc | | | 27,668 | |
| | | 11,451 | | | Kingfisher Plc | | | 46,707 | |
| | | 4,024 | | | Land Securities Group Plc (REIT) | | | 53,217 | |
| | | 30,292 | | | Legal & General Group Plc | | | 93,373 | |
| | | 326,905 | | | Lloyds Banking Group Plc | | | 278,691 | |
| | | 8,693 | | | Marks & Spencer Group Plc | | | 36,088 | |
| | | 4,149 | | | Meggitt Plc | | | 24,252 | |
| | | 1,869 | | | Mondi Plc | | | 43,562 | |
| | | 19,159 | | | National Grid Plc | | | 232,751 | |
| | | 25,087 | | | Old Mutual Plc | | | 67,907 | |
| | | 4,398 | | | Pearson Plc | | | 36,739 | |
| | | 1,652 | | | Persimmon Plc | | | 42,245 | |
| | | 1,392 | | | Petrofac Ltd | | | 15,419 | |
| | | 17,598 | | | Reckitt Benckiser Group Plc | | | 1,597,892 | |
| | | 6,296 | | | Rio Tinto Plc | | | 258,049 | |
| | | 3,433 | | | Rolls-Royce Holdings Plc * | | | 33,529 | |
| | | 17,947 | | | Royal Bank of Scotland Group Plc * | | | 52,821 | |
| | | 22,021 | | | Royal Dutch Shell Plc A Shares (London) | | | 569,855 | |
| | | 19,061 | | | Royal Dutch Shell Plc B Shares (London) | | | 515,955 | |
| | | 4,816 | | | Royal Mail Plc | | | 24,787 | |
| | | 5,453 | | | RSA Insurance Group Plc | | | 40,558 | |
| | | 725 | | | Schroders Plc | | | 27,627 | |
| | | 4,219 | | | Segro Plc (REIT) | | | 25,839 | |
| | | 439 | | | Severn Trent Plc | | | 12,740 | |
| | | 5,249 | | | Sky Plc | | | 64,980 | |
| | | 730 | | | Smiths Group Plc | | | 13,546 | |
| | | 5,128 | | | SSE Plc | | | 97,977 | |
| | | 10,053 | | | Standard Life Plc | | | 46,074 | |
| | | 16,708 | | | Standard Chartered Plc * | | | 149,764 | |
| | | 863 | | | Tate & Lyle Plc | | | 7,971 | |
| | | 17,516 | | | Taylor Wimpey Plc | | | 39,108 | |
| | | 1,341 | | | Travis Perkins Plc | | | 25,356 | |
| | | 2,674 | | | TUI AG | | | 37,752 | |
| | | 134,160 | | | Unilever Plc | | | 6,364,758 | |
| | | 2,362 | | | United Utilities Group Plc | | | 28,703 | |
| | | 4,651 | | | William Hill Plc | | | 15,229 | |
| | | | | | | | | | |
Shares | | | Description | | Value ($) | |
| | | | | | United Kingdom — continued | |
| | | 11,871 | | | WM Morrison Supermarkets Plc | | | 35,673 | |
| | | | | | | | | | |
| | | | | | Total United Kingdom | | | 18,099,428 | |
| | | | | | | | | | |
| | |
| | | | | | United States — 52.2% | |
| | | 22,918 | | | 3M Co. | | | 4,270,769 | |
| | | 47,900 | | | Abbott Laboratories | | | 2,159,332 | |
| | | 33,500 | | | Accenture Plc – Class A | | | 4,103,750 | |
| | | 6,910 | | | Alphabet, Inc. – Class A * | | | 5,838,466 | |
| | | 4,695 | | | Alphabet, Inc. – Class C * | | | 3,864,971 | |
| | | 57,805 | | | American Express Co. | | | 4,627,868 | |
| | | 8,200 | | | Amphenol Corp. – Class A | | | 567,522 | |
| | | 8,159 | | | Analog Devices, Inc. | | | 668,467 | |
| | | 3,800 | | | Anthem, Inc. | | | 626,316 | |
| | | 53,800 | | | Apple, Inc. | | | 7,370,062 | |
| | | 3,300 | | | Automatic Data Processing, Inc. | | | 338,646 | |
| | | 8,179 | | | Becton Dickinson and Co. | | | 1,497,166 | |
| | | 14,050 | | | Cerner Corp. * | | | 773,312 | |
| | | 160,051 | | | Cisco Systems, Inc. | | | 5,470,543 | |
| | | 67,698 | | | Coca-Cola Co. (The) | | | 2,840,608 | |
| | | 55,966 | | | Cognizant Technology Solutions Corp. – Class A * | | | 3,317,105 | |
| | | 8,109 | | | Colgate-Palmolive Co. | | | 591,795 | |
| | | 14,181 | | | Costco Wholesale Corp. | | | 2,512,590 | |
| | | 1,062 | | | CR Bard, Inc. | | | 260,445 | |
| | | 12,300 | | | CVS Health Corp. | | | 991,134 | |
| | | 11,700 | | | Eli Lilly & Co. | | | 968,877 | |
| | | 29,848 | | | Emerson Electric Co. | | | 1,793,865 | |
| | | 3,400 | | | Genuine Parts Co. | | | 325,414 | |
| | | 8,500 | | | Honeywell International, Inc. | | | 1,058,250 | |
| | | 5,291 | | | Humana, Inc. | | | 1,117,724 | |
| | | 14,567 | | | Illinois Tool Works, Inc. | | | 1,922,990 | |
| | | 7,331 | | | Intuit, Inc. | | | 919,601 | |
| | | 588 | | | Intuitive Surgical, Inc. * | | | 433,356 | |
| | | 46,800 | | | Johnson & Johnson | | | 5,719,428 | |
| | | 11,363 | | | MasterCard, Inc. – Class A | | | 1,255,157 | |
| | | 14,024 | | | McDonald’s Corp. | | | 1,790,164 | |
| | | 46,067 | | | Medtronic Plc | | | 3,727,281 | |
| | | 148,000 | | | Microsoft Corp. | | | 9,469,040 | |
| | | 20,937 | | | Monsanto Co. | | | 2,383,259 | |
| | | 20,094 | | | NIKE Inc – Class B | | | 1,148,573 | |
| | | 163,382 | | | Oracle Corp. | | | 6,958,439 | |
| | | 8,066 | | | PepsiCo, Inc. | | | 890,325 | |
| | | 31,100 | | | Pfizer, Inc. | | | 1,061,132 | |
| | | 47,389 | | | Philip Morris International, Inc. | | | 5,181,987 | |
| | | 67,909 | | | QUALCOMM, Inc. | | | 3,835,500 | |
| | | 4,865 | | | Rockwell Automation, Inc. | | | 735,101 | |
| | | 20,794 | | | Schlumberger Ltd. | | | 1,671,006 | |
| | | 15,726 | | | Stryker Corp. | | | 2,021,734 | |
| | | 24,300 | | | Teradata Corp. * | | | 755,730 | |
| | | 16,938 | | | Texas Instruments, Inc. | | | 1,297,790 | |
| | | 8,016 | | | TJX Cos., Inc. (The) | | | 628,855 | |
| | | | |
| 16 | | See accompanying notes to the financial statements. | | |
GMO Alpha Only Fund
(A Series of GMO Trust)
Schedule of Investments — (Continued)
(showing percentage of total net assets)
February 28, 2017
| | | | | | | | | | |
Shares | | | Description | | Value ($) | |
| | | | | | United States — continued | |
| | | 21,142 | | | United Technologies Corp. | | | 2,379,532 | |
| | | 34,892 | | | UnitedHealth Group, Inc. | | | 5,770,439 | |
| | | 13,912 | | | VF Corp. | | | 729,684 | |
| | | 2,100 | | | WW Grainger, Inc. | | | 520,716 | |
| | | 7,328 | | | Zimmer Biomet Holdings, Inc. | | | 857,962 | |
| | | | | | | | | | |
| | | | | | Total United States | | | 122,019,778 | |
| | | | | | | | | | |
| | | |
| | | | | | TOTAL COMMON STOCKS
(COST $181,806,196) | | | 206,042,066 | |
| | | | | | | | | | |
| | |
| | | | | | PREFERRED STOCKS — 1.0% | |
| | |
| | | | | | Brazil — 0.8% | |
| | | 43,280 | | | Banco Bradesco SA | | | 462,804 | |
| | | 2,600 | | | Braskem SA – Class A | | | 26,943 | |
| | | 2,300 | | | Centrais Eletricas Brasileiras SA – Class B * | | | 18,138 | |
| | | 11,800 | | | Cia Energetica de Minas Gerais | | | 40,346 | |
| | | 1,700 | | | Cia Paranaense de Energia – Class B | | | 18,348 | |
| | | 14,300 | | | Gerdau SA | | | 59,347 | |
| | | 17,640 | | | Itau Unibanco Holding SA | | | 225,894 | |
| | | 60,710 | | | Itausa-Investimentos Itau SA | | | 195,198 | |
| | | 61,100 | | | Petroleo Brasileiro SA * | | | 296,715 | |
| | | 6,300 | | | Suzano Papel e Celulose SA – Class A | | | 27,252 | |
| | | 7,000 | | | Telefonica Brasil SA | | | 102,921 | |
| | | 30,000 | | | Vale SA | | | 302,827 | |
| | | | | | | | | | |
| | | | | | Total Brazil | | | 1,776,733 | |
| | | | | | | | | | |
| | |
| | | | | | Chile — 0.0% | |
| | | 2,167 | | | Embotelladora Andina SA – Class B | | | 8,232 | |
| | | | | | | | | | |
| | |
| | | | | | Colombia — 0.0% | |
| | | 2,648 | | | Bancolombia SA | | | 24,686 | |
| | | 37,891 | | | Grupo Aval Acciones y Valores SA | | | 14,686 | |
| | | 1,687 | | | Grupo de Inversiones Suramericana SA | | | 20,451 | |
| | | | | | | | | | |
| | | | | | Total Colombia | | | 59,823 | |
| | | | | | | | | | |
| | |
| | | | | | Germany — 0.1% | |
| | | 294 | | | Bayerische Motoren Werke AG | | | 21,908 | |
| | | 779 | | | Porsche Automobil Holding SE | | | 42,991 | |
| | | 944 | | | Volkswagen AG | | | 139,520 | |
| | | | | | | | | | |
| | | | | | Total Germany | | | 204,419 | |
| | | | | | | | | | |
| | |
| | | | | | Russia — 0.0% | |
| | | 107,645 | | | Surgutneftegas OJSC | | | 58,691 | |
| | | | | | | | | | |
| | |
| | | | | | South Korea — 0.1% | |
| | | 352 | | | Hyundai Motor Co 2nd Preference | | | 30,458 | |
| | | 586 | | | Hyundai Motor Co | | | 52,811 | |
| | | 127 | | | LG Chem Ltd | | | 19,928 | |
| | | 96 | | | Samsung Electronics Co Ltd | | | 127,065 | |
| | | | | | | | | | |
| | | | | | Total South Korea | | | 230,262 | |
| | | | | | | | | | |
| | | |
| | | | | | TOTAL PREFERRED STOCKS
(COST $1,426,821) | | | 2,338,160 | |
| | | | | | | | | | |
| | | | | | | | | | |
Shares/
Par Value† | | | Description | | Value ($) | |
| | | | | | RIGHTS/WARRANTS — 0.0% | |
| | |
| | | | | | Brazil — 0.0% | |
| | | 994 | | | Itausa – Investimentos Itau SA, Expires 03/31/17 * | | | 1,259 | |
| | | | | | | | | | |
| | |
| | | | | | Malaysia — 0.0% | |
| | | 6,475 | | | IOI Properties Group Berhad, Expires 03/17/17 * | | | 1,065 | |
| | | | | | | | | | |
| | |
| | | | | | South Korea — 0.0% | |
| | | 128 | | | Samsung Securities Co Ltd, Expires 03/16/17 * | | | 850 | |
| | | | | | | | | | |
| | | |
| | | | | | TOTAL RIGHTS/WARRANTS
(COST $0) | | | 3,174 | |
| | | | | | | | | | |
| | | |
| | | | | | MUTUAL FUNDS — 4.5% | | | | |
| | | |
| | | | | | United States — 4.5% | | | | |
| | | | | | Affiliated Issuers | | | | |
| | | 423,815 | | | GMO U.S. Treasury Fund | | | 10,595,373 | |
| | | | | | | | | | |
| | | |
| | | | | | TOTAL MUTUAL FUNDS
(COST $10,595,373) | | | 10,595,373 | |
| | | | | | | | | | |
| | |
| | | | | | SHORT-TERM INVESTMENTS — 5.8% | |
| | | |
| | | | | | Time Deposits — 0.2% | | | | |
| | | 486,693 | | | Barclays (London) Time Deposit, 0.36%, due 03/01/17 | | | 486,693 | |
AUD | | | 5,064 | | | Brown Brothers Harriman (Grand Cayman) Time Deposit, 0.74%, due 03/01/17 | | | 3,882 | |
EUR | | | 23 | | | Brown Brothers Harriman (Grand Cayman) Time Deposit, (0.58)%, due 03/01/17 | | | 25 | |
HKD | | | 36,447 | | | Brown Brothers Harriman (Grand Cayman) Time Deposit, 0.01%, due 03/01/17 | | | 4,695 | |
JPY | | | 171,888 | | | Brown Brothers Harriman (Grand Cayman) Time Deposit, (0.10)%, due 03/01/17 | | | 1,532 | |
SGD | | | 779 | | | Brown Brothers Harriman (Grand Cayman) Time Deposit, 0.01%, due 03/01/17 | | | 556 | |
ZAR | | | 1,674 | | | Brown Brothers Harriman (Grand Cayman) Time Deposit, 5.70%, due 03/01/17 | | | 128 | |
| | | | | | | | | | |
| | | | | | Total Time Deposits | | | 497,511 | |
| | | | | | | | | | |
| | | |
| | | | | | U.S. Government — 5.6% | | | | |
| | | 2,000,000 | | | U.S. Treasury Bill, 0.55%, due 06/15/17 (b) (c) | | | 1,996,770 | |
| | | 6,000,000 | | | U.S. Treasury Bill, 0.64%, due 07/27/17 (b) (c) | | | 5,984,376 | |
| | | | |
| | See accompanying notes to the financial statements. | | 17 |
GMO Alpha Only Fund
(A Series of GMO Trust)
Schedule of Investments — (Continued)
(showing percentage of total net assets)
February 28, 2017
| | | | | | | | | | |
Par Value† | | | Description | | Value ($) | |
| | | | | | U.S. Government — continued | | | | |
| | | 5,000,000 | | | U.S. Treasury Bill, 0.65%, due 08/03/17 (b) (c) | | | 4,986,130 | |
| | | | | | | | | | |
| | | | | | Total U.S. Government | | | 12,967,276 | |
| | | | | | | | | | |
| | | |
| | | | | | TOTAL SHORT-TERM INVESTMENTS
(COST $13,465,434) | | | 13,464,787 | |
| | | | | | | | | | |
| | | |
| | | | | | TOTAL INVESTMENTS — 99.4%
(Cost $207,293,824) | | | 232,443,560 | |
| | | | | | Other Assets and Liabilities (net) — 0.6% | | | 1,389,852 | |
| | | | | | | | | | |
| | | |
| | | | | | TOTAL NET ASSETS — 100.0% | | | $233,833,412 | |
| | | | | | | | | | |
A summary of outstanding financial instruments at February 28, 2017 is as follows:
Futures Contracts
| | | | | | | | | | | | |
| | | | |
Number
of
Contracts + | | Type | | Expiration
Date | | Notional
Amount | | | Net
Unrealized
Appreciation
(Depreciation) | |
| Sales | | | | | | | | | | | | |
| 248 | | Russell 2000 Mini | | March 2017 | | $ | 17,174,000 | | | $ | 24,455 | |
| 1,499 | | S&P 500 E-Mini | | March 2017 | | | 177,091,860 | | | | (8,407,599 | ) |
| | | | | | | | | | | | |
| | | | | | $ | 194,265,860 | | | $ | (8,383,144 | ) |
| | | | | | | | | | | | |
| + | Buys - Fund is long the futures contract. Sales - Fund is short the futures contract. |
As of February 28, 2017, for the above contracts and/or agreements, the Fund had sufficient cash and/or securities to cover commitments or collateral requirements, if any, of the relevant broker or exchange.
Notes to Schedule of Investments:
| † | Denominated in U.S. Dollar, unless otherwise indicated. |
| * | Non-income producing security. |
| (a) | Security valued at the local price and adjusted by applying a premium or discount since holding exceeds foreign ownership limits. |
| (b) | The rate shown represents yield-to-maturity. |
| (c) | All or a portion of this security has been pledged to cover margin requirements on futures and/or cleared swap contracts, collateral on OTC swap contracts, forward currency contracts, and/or written options, if any (Note 4). |
For a listing of definitions of acronyms, counterparty abbreviations and currency abbreviations used throughout the Schedule of Investments as well as the derivative tables, if any, please refer to page 96.
| | | | |
| 18 | | See accompanying notes to the financial statements. | | |
This page has been left blank intentionally.
GMO Benchmark-Free Allocation Fund
(A Series of GMO Trust)
Portfolio Management
Day-to-day management of the Fund’s portfolio is the responsibility of the Asset Allocation team at Grantham, Mayo, Van Otterloo & Co. LLC.
Management Discussion and Analysis of Fund Performance
Although GMO does not manage the Fund to, or control the Fund’s risk relative to, any securities index or securities benchmark, a discussion of the Fund’s performance relative to the Consumer Price Index (“CPI”) is included for comparative purposes only.
Class III shares of GMO Benchmark-Free Allocation Fund returned +11.66% (net) for the fiscal year ended February 28, 2017, as compared with +2.84% for the CPI.
The Fund’s exposure to equities, particularly in emerging markets, was the primary driver of the strong performance. The Funds exposure to fixed income also contributed, as all of the strategies enjoyed positive performance with emerging debt and distressed debt being most noteworthy. Alternative strategies also added value in aggregate, although one of the strategies in this grouping, relative value interest rates & FX, did post modest negative returns. Cash and short duration bond holdings had a negative impact on performance, largely due to the considerable increase in yields in the US in the fourth quarter of 2016.
Because some of the securities and instruments held directly or indirectly by the Fund had positive fair value adjustments at the beginning or end of the fiscal year (and the performance of indices are not fair valued), the Fund’s absolute and relative performance is higher than it otherwise would have been in the absence of such fair value adjustments.
The views expressed herein are exclusively those of Grantham, Mayo, Van Otterloo & Co. LLC as of the date of this report and are subject to change. GMO disclaims any responsibility to update such views. They are not meant as investment advice. References to specific securities are not recommendations of such securities and may not be representative of any GMO portfolio’s current or future investments.
20
GMO Benchmark-Free Allocation Fund
(A Series of GMO Trust)
Comparison of Change in Value of a $10,000,000 Investment in
GMO Benchmark-Free Allocation Fund Class III Shares and the Consumer Price Index
As of February 28, 2017
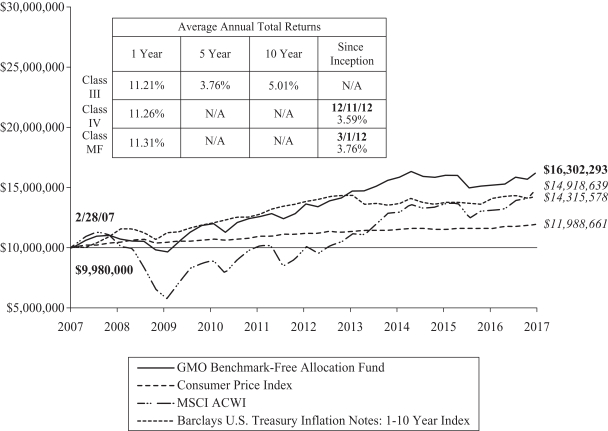
Performance data quoted represents past performance and is not indicative of future results. The investment return and principal value of an investment will fluctuate so that an investor’s shares, when redeemed, may be worth more or less than their original cost. Current performance data may be lower or higher than the performance data provided herein. To obtain performance information up to the most recent month-end, visit www.gmo.com. Performance shown is net of all fees after reimbursement from GMO. Each performance figure assumes a purchase at the beginning and redemption at the end of the stated period and reflects a transaction fee of .20% on the purchase and .20% on the redemption. Transaction fees are retained by the Fund to cover trading costs. Returns would have been lower had certain expenses not been reimbursed during the periods shown and do not include the effect of taxes on distributions and redemptions. All information is unaudited. Performance for classes may vary due to different fees.
Prior to January 1, 2012, the Fund served as a principal component of a broader GMO real return strategy that also included a pooled investment vehicle with a cash-like benchmark. The returns shown for periods prior to January 1, 2012 are for Class III shares of the Fund under the Fund’s prior fee arrangement. Under the Fund’s current fee arrangement, the returns for periods prior to January 1, 2012 would have been lower.
MSCI data may not be reproduced or used for any other purpose. MSCI provides no warranties, has not prepared or approved this report, and has no liability hereunder.
21
GMO Benchmark-Free Allocation Fund
(A Series of GMO Trust)
Investment Concentration Summary
February 28, 2017 (Unaudited)
| | | | |
Asset Class Summary& | | % of Total Net Assets | |
Common Stocks | | | 43.5 | % |
Debt Obligations | | | 41.2 | |
Short-Term Investments | | | 13.5 | |
Preferred Stocks | | | 2.0 | |
Futures Contracts | | | 0.1 | |
Options Purchased | | | 0.1 | |
Loan Participations | | | 0.1 | |
Rights/Warrants | | | 0.1 | |
Forward Currency Contracts | | | 0.0 | ^ |
Loan Assignments | | | 0.0 | ^ |
Swap Contracts | | | (0.0 | )^ |
Reverse Repurchase Agreements | | | (0.0 | )^ |
Written Options/Credit Linked Options | | | (0.1 | ) |
Securities Sold Short | | | (1.3 | ) |
Other | | | 0.8 | |
| | | | |
| | | 100.0 | % |
| | | | |
| | | | |
| Country/Region Summary¤ | | Debt Obligations as a
% of Total Net Assets | |
United States | | | 11.9 | % |
Other Emerging | | | 2.4 | † |
Mexico | | | 1.3 | |
Other Developed | | | 0.8 | ‡ |
Euro Region | | | (0.1 | )± |
Japan | | | (1.4 | ) |
United Kingdom | | | (2.0 | ) |
| | | | |
| | | 12.9 | % |
| | | | |
| | | | |
| Country/Region Summary¤ | | Equity Investments as a
% of Total Net Assets | |
United States | | | 10.3 | % |
China | | | 5.9 | |
Other Emerging | | | 4.2 | † |
South Korea | | | 3.1 | |
Other Developed | | | 3.1 | ‡ |
Japan | | | 2.9 | |
Taiwan | | | 2.7 | |
Brazil | | | 2.3 | |
United Kingdom | | | 2.1 | |
Germany | | | 1.6 | |
South Africa | | | 1.4 | |
India | | | 1.3 | |
France | | | 1.2 | |
Netherlands | | | 1.2 | |
Switzerland | | | 1.1 | |
| | | | |
| | | 44.4 | % |
| | | | |
| & | The table above incorporates aggregate indirect asset class exposure associated with investments in other funds of GMO Trust (“underlying funds”). Derivative financial instruments, if any, are based on market values or unrealized appreciation/depreciation rather than notional amounts. |
| ¤ | The table above incorporates aggregate indirect country exposure associated with investments in the underlying funds. The table excludes short-term investments. The table includes exposure through the use of certain |
| | derivative financial instruments and excludes exposure through certain currency linked derivatives such as forward currency contracts and currency options. The table is based on duration adjusted net exposures (both investments and derivatives), taking into account the market value of securities and the notional amounts of swaps and other derivative financial instruments. For example, U.S. asset-backed securities may represent a relatively small percentage due to their short duration, even though they represent a large percentage of market value (direct and indirect). Duration is based on GMO’s models. The greater the duration of a bond, the greater its contribution to the concentration percentage. Credit default swap exposures are factored into the duration adjusted exposure using the reference security and applying the same methodology to that security. The tables are not normalized, thus, due to the exclusions listed above and negative exposures, which may be attributable to derivatives or short sales, if any, the tables may not total to 100%. |
| † | “Other Emerging” is comprised of emerging countries that each represent between (1.0)% and 1.0% of Total Net Assets. |
| ‡ | “Other Developed” is comprised of developed countries that each represent between (1.0)% and 1.0% of Total Net Assets. |
| ± | “Euro Region” is comprised of derivative financial instruments attributed to the Eurozone and not a particular country. |
22
GMO Benchmark-Free Allocation Fund
(A Series of GMO Trust)
Schedule of Investments
(showing percentage of total net assets)
February 28, 2017
| | | | | | | | | | |
| Shares | | | Description | | Value ($) | |
| | | | | | MUTUAL FUNDS — 99.9% | |
| | |
| | | | | | Affiliated Issuers — 99.9% | |
| | | 21,455,507 | | | GMO Emerging Country Debt Fund, Class IV | | | 621,136,921 | |
| | | 823,998,941 | | | GMO Implementation Fund | | | 10,761,426,169 | |
| | | 26,485,600 | | | GMO Opportunistic Income Fund, Class VI | | | 682,798,759 | |
| | | 31,629,522 | | | GMO SGM Major Markets Fund, Class VI | | | 1,030,173,520 | |
| | | 33,077,370 | | | GMO Special Opportunities Fund, Class VI | | | 674,447,572 | |
| | | | | | | | | | |
| | | |
| | | | | | TOTAL MUTUAL FUNDS
(COST $13,655,207,127) | | | 13,769,982,941 | |
| | | | | | | | | | |
| | |
| | | | | | SHORT-TERM INVESTMENTS — 0.1% | |
| | |
| | | | | | Money Market Funds — 0.1% | |
| | | 7,055,247 | | | State Street Institutional Treasury Money Market Fund-Premier Class, 0.42% (a) | | | 7,055,247 | |
| | | | | | | | | | |
| | | |
| | | | | | TOTAL SHORT-TERM INVESTMENTS
(COST $7,055,247) | | | 7,055,247 | |
| | | | | | | | | | |
| | | |
| | | | | | TOTAL INVESTMENTS — 100.0%
(Cost $13,662,262,374) | | | 13,777,038,188 | |
| | | | | | Other Assets and Liabilities (net) — (0.0%) | | | (6,580,554 | ) |
| | | | | | | | | | |
| | | |
| | | | | | TOTAL NET ASSETS — 100.0% | | | $13,770,457,634 | |
| | | | | | | | | | |
Notes to Schedule of Investments:
| (a) | The rate disclosed is the 7 day net yield as of February 28, 2017. |
For a listing of definitions of acronyms, counterparty abbreviations and currency abbreviations used throughout the Schedule of Investments as well as the derivative tables, if any, please refer to page 96.
| | | | |
| | See accompanying notes to the financial statements. | | 23 |
GMO Benchmark-Free Fund
(A Series of GMO Trust)
Portfolio Management
Day-to-day management of the Fund’s portfolio is the responsibility of the Asset Allocation team at Grantham, Mayo, Van Otterloo & Co. LLC.
Management Discussion and Analysis of Fund Performance
Although GMO does not manage the Fund to, or control the Fund’s risk relative to, any index or benchmark, a discussion of the Fund’s performance relative to the Consumer Price Index (“CPI”) is included for comparative purposes only.
GMO Benchmark-Free Fund returned +14.52% (net) for the fiscal year ended February 28, 2017, as compared with +2.84% for the CPI.
The Fund’s exposure to equities, particularly in emerging markets, was the primary driver of the strong performance. The Fund’s exposure to alternative strategies and fixed income also contributed, as all of the strategies enjoyed positive performance with emerging debt being most noteworthy. Cash and short duration bond holdings had a negative impact on performance, largely due to the considerable increase in yields in the US in the fourth quarter of 2016.
Because some of the securities and instruments held directly or indirectly by the Fund had positive fair value adjustments at the beginning or end of the fiscal year (and the performance of indices are not fair valued), the Fund’s absolute and relative performance is higher than it otherwise would have been in the absence of such fair value adjustments.
The views expressed herein are exclusively those of Grantham, Mayo, Van Otterloo & Co. LLC as of the date of this report and are subject to change. GMO disclaims any responsibility to update such views. They are not meant as investment advice. References to specific securities are not recommendations of such securities and may not be representative of any GMO portfolio’s current or future investments.
24
GMO Benchmark-Free Fund
(A Series of GMO Trust)
Comparison of Change in Value of a $10,000,000 Investment in
GMO Benchmark-Free Fund Class III Shares and the Consumer Price Index
As of February 28, 2017
��
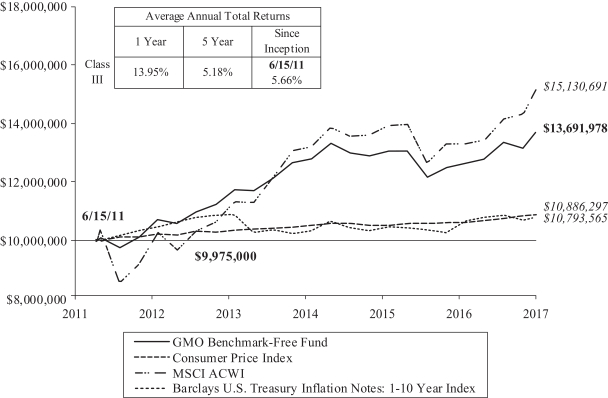
Performance data quoted represents past performance and is not indicative of future results. The investment return and principal value of an investment will fluctuate so that an investor’s shares, when redeemed, may be worth more or less than their original cost. Current performance data may be lower or higher than the performance data provided herein. To obtain performance information up to the most recent month-end, visit www.gmo.com. Performance shown is net of all fees after reimbursement from GMO. Each performance figure assumes a purchase at the beginning and redemption at the end of the stated period and reflects a transaction fee of .25% on the purchase and .25% on the redemption. Transaction fees are retained by the Fund to cover trading costs. Returns would have been lower had certain expenses not been reimbursed during the periods shown and do not include the effect of taxes on distributions and redemptions. All information is unaudited.
MSCI data may not be reproduced or used for any other purpose. MSCI provides no warranties, has not prepared or approved this report, and has no liability hereunder.
25
GMO Benchmark-Free Fund
(A Series of GMO Trust)
Investment Concentration Summary
February 28, 2017 (Unaudited)
| | | | |
| Asset Class Summary& | | % of Total Net Assets | |
Common Stocks | | | 47.7 | % |
Debt Obligations | | | 35.6 | |
Short-Term Investments | | | 14.7 | |
Preferred Stocks | | | 1.9 | |
Loan Participations | | | 0.1 | |
Investment Funds | | | 0.1 | |
Futures Contracts | | | 0.1 | |
Rights/Warrants | | | 0.1 | |
Swap Contracts | | | 0.0 | ^ |
Forward Currency Contracts | | | 0.0 | ^ |
Loan Assignments | | | 0.0 | ^ |
Options Purchased | | | 0.0 | ^ |
Written/Credit Linked Options | | | (0.0 | )^ |
Reverse Repurchase Agreements | | | (0.0 | )^ |
Securities Sold Short | | | (0.0 | )^ |
Other | | | (0.3 | ) |
| | | | |
| | | 100.0 | % |
| | | | |
| | | | |
| Country/Region Summary¤ | | Debt Obligations as a
% of Total Net Assets | |
United States | | | 12.0 | % |
Other Emerging | | | 3.4 | † |
Euro Region | | | (0.1 | )# |
Other Developed | | | (0.8 | )‡ |
| | | | |
| | | 14.5 | % |
| | | | |
| | | | |
| Country/Region Summary¤ | | Equity Investments as a
% of Total Net Assets | |
United States | | | 9.2 | % |
China | | | 5.9 | |
Other Developed | | | 5.4 | ‡ |
Taiwan | | | 4.8 | |
South Korea | | | 4.1 | |
Japan | | | 3.6 | |
United Kingdom | | | 2.8 | |
India | | | 2.3 | |
Other Emerging | | | 1.9 | † |
Germany | | | 1.8 | |
Brazil | | | 1.8 | |
France | | | 1.4 | |
Russia | | | 1.3 | |
South Africa | | | 1.3 | |
Turkey | | | 1.1 | |
Australia | | | 1.0 | |
| | | | |
| | | 49.7 | % |
| | | | |
| & | The table above incorporates aggregate indirect asset class exposure associated with investments in other funds of GMO Trust (“underlying funds”). Derivative financial instruments, if any, are based on market values or unrealized appreciation/depreciation rather than notional amounts. |
| ¤ | The table above incorporates aggregate indirect country exposure associated with investments in the underlying funds. The table excludes short-term investments. The table includes exposure through the use of certain derivative financial instruments and excludes exposure through the use of certain currency linked derivatives such as forward currency contracts and |
| | currency options. The table is based on duration adjusted net exposures (both investments and derivatives), taking into account the market value of securities and the notional amounts of swaps and other derivative financial instruments. For example, U.S. asset-backed securities may represent a relatively small percentage due to their short duration, even though they represent a large percentage of market value (direct and indirect). Duration is based on GMO’s models. The greater the duration of a bond, the greater its contribution to the concentration percentage. Credit default swap exposures are factored into the duration adjusted exposure using the reference security and applying the same methodology to that security. The tables are not normalized, thus, due to the exclusions listed above and negative exposures, which may be attributable to derivatives or short sales, if any, the tables may not total to 100%. |
| † | “Other Emerging” is comprised of emerging countries that each represent between (1.0)% and 1.0% of Total Net Assets. |
| # | “Euro Region” is comprised of derivative financial instruments attributed to the Eurozone and not a particular country. |
| ‡ | “Other Developed” is comprised of developed countries that each represent between (1.0)% and 1.0% of Total Net Assets. |
26
GMO Benchmark-Free Fund
(A Series of GMO Trust)
Schedule of Investments
(showing percentage of total net assets)
February 28, 2017
| | | | | | | | | | |
| | |
Shares | | | Description | | Value ($) | |
| | | | | | COMMON STOCKS — 31.4% | |
| | |
| | | | | | Australia — 1.0% | |
| | | 61,664 | | | Abacus Property Group (REIT) | | | 146,484 | |
| | | 436,040 | | | Adelaide Brighton Ltd | | | 1,794,757 | |
| | | 1,434 | | | ASX Ltd | | | 56,271 | |
| | | 40,505 | | | BHP Billiton Ltd | | | 766,682 | |
| | | 193,771 | | | BlueScope Steel Ltd | | | 1,812,258 | |
| | | 49,603 | | | Credit Corp Group Ltd | | | 625,245 | |
| | | 430,340 | | | CSR Ltd | | | 1,378,104 | |
| | | 508,639 | | | Dexus Property Group (REIT) | | | 3,679,576 | |
| | | 533,451 | | | Downer EDI Ltd | | | 2,868,394 | |
| | | 338,143 | | | Fairfax Media Ltd | | | 244,691 | |
| | | 6,185 | | | Fortescue Metals Group Ltd | | | 31,312 | |
| | | 319,833 | | | Genworth Mortgage Insurance Australia Ltd | | | 688,467 | |
| | | 312,237 | | | GPT Group (The) (REIT) | | | 1,179,364 | |
| | | 258,408 | | | Investa Office Fund (REIT) | | | 925,165 | |
| | | 15,140 | | | LendLease Group | | | 176,643 | |
| | | 379,812 | | | Metcash Ltd * | | | 629,160 | |
| | | 2,217,550 | | | Mirvac Group (REIT) | | | 3,652,068 | |
| | | 551,018 | | | Myer Holdings Ltd | | | 531,898 | |
| | | 3,444 | | | Navitas Ltd | | | 13,011 | |
| | | 194,561 | | | Nine Entertainment Co Holdings Ltd | | | 156,624 | |
| | | 356,314 | | | OZ Minerals Ltd | | | 2,535,284 | |
| | | 191,637 | | | Pact Group Holdings Ltd | | | 979,231 | |
| | | 27,413 | | | Resolute Mining Ltd | | | 33,712 | |
| | | 1,061,675 | | | Scentre Group (REIT) | | | 3,548,015 | |
| | | 261,400 | | | Shopping Centres Australasia Property Group (REIT) | | | 446,736 | |
| | | 75,159 | | | Sigma Pharmaceuticals Ltd | | | 67,691 | |
| | | 84,092 | | | Sonic Healthcare Ltd | | | 1,386,445 | |
| | | 177,931 | | | Star Entertainment Grp Ltd (The) | | | 664,920 | |
| | | 341,015 | | | Stockland (REIT) | | | 1,233,431 | |
| | | 2,671,160 | | | Telstra Corp Ltd | | | 9,865,807 | |
| | | 3,762 | | | Virtus Health Ltd | | | 15,605 | |
| | | 59,093 | | | Wesfarmers Ltd | | | 1,934,174 | |
| | | 102,819 | | | WorleyParsons Ltd * | | | 837,282 | |
| | | 34,707 | | | WPP AUNZ Ltd | | | 29,339 | |
| | | | | | | | | | |
| | | | | | Total Australia | | | 44,933,846 | |
| | | | | | | | | | |
| | |
| | | | | | Austria — 0.1% | |
| | | 10,381 | | | Oesterreichische Post AG | | | 377,464 | |
| | | 94,528 | | | OMV AG | | | 3,613,360 | |
| | | 4,039 | | | Raiffeisen Bank International AG * | | | 89,576 | |
| | | 43,033 | | | voestalpine AG | | | 1,808,089 | |
| | | | | | | | | | |
| | | | | | Total Austria | | | 5,888,489 | |
| | | | | | | | | | |
| | |
| | | | | | Belgium — 0.0% | |
| | | 718 | | | Barco NV | | | 64,388 | |
| | | 55,635 | | | bpost SA | | | 1,381,529 | |
| | | 8,807 | | | D’Ieteren SA NV | | | 392,783 | |
| | | | | | | | | | |
| | |
Shares | | | Description | | Value ($) | |
| | | | | | Belgium — continued | |
| | | 420 | | | Orange Belgium SA * | | | 9,531 | |
| | | | | | | | | | |
| | | | | | Total Belgium | | | 1,848,231 | |
| | | | | | | | | | |
| | |
| | | | | | Brazil — 0.4% | |
| | | 361,300 | | | Ambev SA | | | 2,067,257 | |
| | | 90,500 | | | Banco Bradesco SA | | | 944,546 | |
| | | 200,000 | | | Banco do Brasil SA | | | 2,118,051 | |
| | | 218,900 | | | BB Seguridade Participacoes SA | | | 2,006,190 | |
| | | 788,150 | | | BM&FBovespa SA – Bolsa de Valores Mercadorias e Futuros | | | 4,801,738 | |
| | | 184,100 | | | Centrais Eletricas Brasileiras SA * | | | 1,268,614 | |
| | | 31,100 | | | Companhia de Saneamento Basico do Estado de Sao Paulo | | | 327,614 | |
| | | 34,800 | | | EcoRodovias Infraestrutura e Logistica SA | | | 102,525 | |
| | | 2,507 | | | FII BTG Pactual Corporate Office Fund (REIT) | | | 86,180 | |
| | | 7,500 | | | M Dias Branco SA | | | 332,780 | |
| | | 277,000 | | | MRV Engenharia e Participacoes SA | | | 1,267,232 | |
| | | 33,200 | | | Qualicorp SA | | | 209,852 | |
| | | 4,933 | | | Smiles SA | | | 97,826 | |
| | | 287,100 | | | Transmissora Alianca de Energia Eletrica SA | | | 2,029,419 | |
| | | | | | | | | | |
| | | | | | Total Brazil | | | 17,659,824 | |
| | | | | | | | | | |
| | |
| | | | | | Canada — 0.9% | |
| | | 15,900 | | | AGF Management Ltd – Class B | | | 72,425 | |
| | | 86,700 | | | Air Canada * | | | 873,397 | |
| | | 27,300 | | | Bank of Montreal | | | 2,071,651 | |
| | | 3,700 | | | BCE Inc | | | 161,405 | |
| | | 11,300 | | | Canadian Imperial Bank of Commerce | | | 992,089 | |
| | | 43,700 | | | Canadian Tire Corp Ltd – Class A | | | 5,010,925 | |
| | | 23,100 | | | Cascades Inc | | | 230,444 | |
| | | 2,600 | | | Celestica Inc * | | | 34,355 | |
| | | 67,200 | | | CGI Group Inc – Class A * | | | 3,089,318 | |
| | | 39,000 | | | Chorus Aviation Inc | | | 209,946 | |
| | | 184,700 | | | CI Financial Corp | | | 3,765,755 | |
| | | 700 | | | Cominar Real Estate Investment Trust | | | 7,816 | |
| | | 2,700 | | | Corus Entertainment Inc – B Shares | | | 25,837 | |
| | | 8,300 | | | Dream Global Real Estate Investment Trust | | | 61,678 | |
| | | 5,040 | | | Dream Industrial Real Estate Investment Trust | | | 32,216 | |
| | | 12,700 | | | Gluskin Sheff + Associates Inc | | | 172,591 | |
| | | 355,200 | | | IAMGOLD Corp (CAD) * | | | 1,401,331 | |
| | | 6,300 | | | Industrial Alliance Insurance & Financial Services Inc | | | 261,496 | |
| | | 900 | | | Laurentian Bank of Canada | | | 38,895 | |
| | | 30,900 | | | Medical Facilities Corp | | | 422,717 | |
| | | 262,400 | | | Metro Inc | | | 7,651,522 | |
| | | 17,600 | | | North West Co Inc (The) | | | 388,520 | |
| | | 47,400 | | | Open Text Corp | | | 1,562,394 | |
| | | 9,200 | | | Open Text Corp | | | 303,416 | |
| | | 95,400 | | | Pure Industrial Real Estate Trust (REIT) | | | 429,523 | |
| | | | |
| | See accompanying notes to the financial statements. | | 27 |
GMO Benchmark-Free Fund
(A Series of GMO Trust)
Schedule of Investments — (Continued)
(showing percentage of total net assets)
February 28, 2017
| | | | | | | | | | |
| | |
Shares | | | Description | | Value ($) | |
| | | | | | Canada — continued | |
| | | 37,800 | | | Rogers Sugar Inc | | | 181,003 | |
| | | 30,600 | | | Russel Metals Inc | | | 611,217 | |
| | | 15,700 | | | Saputo Inc | | | 539,133 | |
| | | 92,100 | | | Sun Life Financial Inc | | | 3,342,283 | |
| | | 4,100 | | | TFI International Inc | | | 102,238 | |
| | | 34,700 | | | Toromont Industries Ltd | | | 1,210,398 | |
| | | 71,400 | | | Transcontinental Inc – Class A | | | 1,087,503 | |
| | | 10,500 | | | Valener Inc | | | 164,433 | |
| | | 37,630 | | | WestJet Airlines Ltd | | | 617,628 | |
| | | 2,900 | | | Westshore Terminals Investment Corp | | | 58,952 | |
| | | 16,700 | | | ZCL Composites Inc | | | 153,018 | |
| | | | | | | | | | |
| | | | | | Total Canada | | | 37,339,468 | |
| | | | | | | | | | |
| | |
| | | | | | China — 3.5% | |
| | | 550,000 | | | Agile Group Holdings Ltd | | | 362,802 | |
| | | 1,399,500 | | | Anhui Conch Cement Co Ltd – Class H | | | 4,872,381 | |
| | | 554,000 | | | ANTA Sports Products Ltd | | | 1,676,095 | |
| | | 438,500 | | | BAIC Motor Corp Ltd – Class H | | | 493,004 | |
| | | 1,414,000 | | | Beijing Capital International Airport Co Ltd – Class H | | | 1,515,266 | |
| | | 948,000 | | | Beijing Capital Land Ltd – Class H | | | 406,430 | |
| | | 19,500 | | | Beijing Enterprises Holdings Ltd | | | 101,992 | |
| | | 7,103,000 | | | Belle International Holdings Ltd | | | 4,890,420 | |
| | | 43,275 | | | Changyou.com Ltd ADR* | | | 1,195,256 | |
| | | 60,000 | | | Chaowei Power Holdings Ltd. | | | 47,318 | |
| | | 2,166,000 | | | China BlueChemical Ltd – Class H | | | 752,537 | |
| | | 717,000 | | | China Cinda Asset Management Co Ltd – Class H | | | 282,608 | |
| | | 63,000 | | | China Communications Construction Co Ltd – Class H | | | 81,290 | |
| | | 3,374,000 | | | China Communications Services Corp Ltd – Class H | | | 2,252,924 | |
| | | 1,614,000 | | | China Everbright Ltd | | | 3,201,319 | |
| | | 721,000 | | | China Greenfresh Group Co Ltd | | | 352,994 | |
| | | 3,982,000 | | | China Jinmao Holdings Group Ltd | | | 1,236,350 | |
| | | 1,838,000 | | | China Lesso Group Holdings Ltd | | | 1,378,765 | |
| | | 1,768,000 | | | China Machinery Engineering Corp – Class H | | | 1,229,717 | |
| | | 57,100 | | | China Mobile Ltd Sponsored ADR | | | 3,155,346 | |
| | | 8,134,000 | | | China National Building Material Co Ltd – Class H | | | 5,931,367 | |
| | | 1,063,000 | | | China National Materials Co Ltd – Class H | | | 363,646 | |
| | | 12,620,000 | | | China Petroleum & Chemical Corp – Class H | | | 9,782,313 | |
| | | 1,787,500 | | | China Railway Construction Corp Ltd – Class H | | | 2,527,292 | |
| | | 464,000 | | | China Resources Cement Holdings Ltd | | | 241,273 | |
| | | 828,000 | | | China Resources Land Ltd | | | 2,259,021 | |
| | | 2,466,000 | | | China Resources Power Holdings Co Ltd | | | 4,462,928 | |
| | | 1,444,500 | | | China Shenhua Energy Co Ltd – Class H | | | 3,022,558 | |
| | | 14,304,000 | | | China Telecom Corp Ltd – Class H | | | 6,726,993 | |
| | | 1,152,000 | | | China Travel International Investment Hong Kong Ltd | | | 341,214 | |
| | | | | | | | | | |
| | |
Shares | | | Description | | Value ($) | |
| | | | | | China — continued | |
| | | 1,181,500 | | | China ZhengTong Auto Services Holdings Ltd | | | 494,445 | |
| | | 3,136,000 | | | CIFI Holdings Group Co Ltd | | | 1,049,824 | |
| | | 3,988,000 | | | CNOOC Ltd | | | 4,717,769 | |
| | | 6,131,000 | | | Country Garden Holdings Co Ltd | | | 4,390,025 | |
| | | 3,488,000 | | | Datang International Power Generation Co Ltd – Class H | | | 1,020,091 | |
| | | 3,202,000 | | | Dongfeng Motor Group Co Ltd – Class H | | | 3,796,882 | |
| | | 221,000 | | | Far East Horizon Ltd | | | 212,615 | |
| | | 248,000 | | | Future Land Development Holdings Ltd | | | 63,790 | |
| | | 3,072,000 | | | Great Wall Motor Co Ltd – Class H | | | 3,772,542 | |
| | | 1,549,000 | | | Greentown China Holdings Ltd * | | | 1,415,179 | |
| | | 2,340,000 | | | Guangdong Investment Ltd | | | 3,187,896 | |
| | | 244,000 | | | Guangshen Railway Co Ltd – Class H | | | 152,424 | |
| | | 3,506,800 | | | Guangzhou R&F Properties Co Ltd – Class H | | | 4,841,841 | |
| | | 60,000 | | | Haier Electronics Group Co Ltd | | | 110,368 | |
| | | 513,000 | | | Hi Sun Technology China Ltd * | | | 81,936 | |
| | | 47,000 | | | Hua Hong Semiconductor Ltd | | | 56,186 | |
| | | 3,323,000 | | | Huabao International Holdings Ltd * | | | 1,785,149 | |
| | | 2,356,000 | | | Huadian Power International Corp Ltd – Class H | | | 1,034,474 | |
| | | 150,000 | | | IGG, Inc. | | | 105,993 | |
| | | 1,656,000 | | | Jiangsu Expressway Co Ltd – Class H | | | 2,184,547 | |
| | | 1,079,500 | | | Kingboard Chemical Holdings Ltd | | | 3,816,719 | |
| | | 829,000 | | | Kingboard Laminates Holdings Ltd | | | 928,571 | |
| | | 314,000 | | | Kunlun Energy Co Ltd | | | 272,797 | |
| | | 2,733,000 | | | KWG Property Holding Ltd | | | 1,724,508 | |
| | | 2,737,000 | | | Lee & Man Paper Manufacturing Ltd | | | 2,479,781 | |
| | | 1,324,000 | | | Longfor Properties Co Ltd | | | 2,117,967 | |
| | | 214,000 | | | Lonking Holdings Ltd | | | 57,821 | |
| | | 260,000 | | | Minth Group Ltd | | | 827,352 | |
| | | 420,000 | | | Nexteer Automotive Group Ltd | | | 542,222 | |
| | | 391,000 | | | Nine Dragons Paper Holdings Ltd | | | 496,167 | |
| | | 1,871,000 | | | People’s Insurance Co Group of China Ltd (The) – Class H | | | 768,377 | |
| | | 1,278,000 | | | PICC Property & Casualty Co Ltd – Class H | | | 1,951,501 | |
| | | 2,295,000 | | | Poly Property Group Co Ltd * | | | 962,628 | |
| | | 230,000 | | | Q Technology Group Co. Ltd. * | | | 168,902 | |
| | | 46,500 | | | Shandong Chenming Paper Holdings Ltd – Class H | | | 60,452 | |
| | | 588,000 | | | Shanghai Industrial Holdings Ltd | | | 1,640,859 | |
| | | 641,900 | | | Shanghai Pharmaceuticals Holding Co Ltd – Class H | | | 1,652,664 | |
| | | 1,300,000 | | | Shenzhen Expressway Co Ltd – Class H | | | 1,200,641 | |
| | | 984,500 | | | Shenzhen International Holdings Ltd | | | 1,411,546 | |
| | | 2,283,500 | | | Shimao Property Holdings Ltd | | | 3,277,555 | |
| | | 311,000 | | | Shui On Land Ltd | | | 69,699 | |
| | | 553,000 | | | Sino Biopharmaceutical Ltd | | | 476,603 | |
| | | 3,336,500 | | | Sino-Ocean Group Holding Ltd | | | 1,657,270 | |
| | | 1,831,500 | | | Sinopec Engineering Group Co Ltd – Class H | | | 1,664,937 | |
| | | 88,800 | | | Sinopharm Group Co Ltd – Class H | | | 410,648 | |
| | | 331,000 | | | Sinotrans Ltd – Class H | | | 149,644 | |
| | | | |
| 28 | | See accompanying notes to the financial statements. | | |
GMO Benchmark-Free Fund
(A Series of GMO Trust)
Schedule of Investments — (Continued)
(showing percentage of total net assets)
February 28, 2017
| | | | | | | | | | |
| | |
Shares | | | Description | | Value ($) | |
| | | | | | China — continued | |
| | | 722,000 | | | Sinotruk Hong Kong Ltd | | | 599,048 | |
| | | 4,400,000 | | | Skyworth Digital Holdings Ltd | | | 2,854,630 | |
| | | 2,229,000 | | | SOHO China Ltd | | | 1,153,974 | |
| | | 92,976 | | | Sohu.com Inc * | | | 3,703,234 | |
| | | 56,000 | | | Sun Art Retail Group Ltd | | | 53,985 | |
| | | 114,000 | | | Texhong Textile Group Ltd | | | 167,038 | |
| | | 706,000 | | | Tianjin Port Development Holdings Ltd | | | 119,000 | |
| | | 958,000 | | | Tianneng Power International Ltd | | | 845,433 | |
| | | 1,788,000 | | | TravelSky Technology Ltd – Class H | | | 3,899,027 | |
| | | 204,000 | | | Weichai Power Co Ltd – Class H | | | 359,194 | |
| | | 937,000 | | | Xinhua Winshare Publishing and Media Co Ltd – Class H | | | 854,313 | |
| | | 1,574,000 | | | XTEP International Holdings Ltd | | | 717,301 | |
| | | 5,344,000 | | | Yuexiu Property Co Ltd | | | 866,761 | |
| | | 1,447,000 | | | Yuexiu Real Estate Investment Trust | | | 861,067 | |
| | | 496,000 | | | Yuexiu Transport Infrastructure Ltd | | | 344,042 | |
| | | 1,746,000 | | | Yuzhou Properties Co Ltd | | | 606,993 | |
| | | 1,986,000 | | | Zhejiang Expressway Co Ltd – Class H | | | 2,233,592 | |
| | | 201,000 | | | Zhongsheng Group Holdings Ltd. | | | 291,412 | |
| | | | | | | | | | |
| | | | | | Total China | | | 150,935,270 | |
| | | | | | | | | | |
| | |
| | | | | | Czech Republic — 0.0% | |
| | | 103,385 | | | CEZ AS | | | 1,824,612 | |
| | | 306 | | | Philip Morris CR AS | | | 159,588 | |
| | | | | | | | | | |
| | | | | | Total Czech Republic | | | 1,984,200 | |
| | | | | | | | | | |
| | |
| | | | | | Denmark — 0.0% | |
| | | 12 | | | AP Moeller – Maersk A/S – Class B | | | 19,512 | |
| | | 1,010 | | | Dfds A/S | | | 55,478 | |
| | | 3,561 | | | Schouw & Co AB | | | 279,499 | |
| | | | | | | | | | |
| | | | | | Total Denmark | | | 354,489 | |
| | | | | | | | | | |
| | |
| | | | | | Finland — 0.2% | |
| | | 11,015 | | | Cramo Oyj | | | 238,371 | |
| | | 1,901 | | | Kesko Oyj – B Shares | | | 87,159 | |
| | | 83,241 | | | Neste Oyj | | | 2,897,349 | |
| | | 14,155 | | | Sponda Oyj | | | 59,235 | |
| | | 3,556 | | | Tieto Oyj | | | 98,971 | |
| | | 264,308 | | | UPM-Kymmene Oyj | | | 6,268,503 | |
| | | | | | | | | | |
| | | | | | Total Finland | | | 9,649,588 | |
| | | | | | | | | | |
| | |
| | | | | | France — 1.4% | |
| | | 168,508 | | | Air France-KLM* | | | 1,187,527 | |
| | | 8,227 | | | Alten SA | | | 568,999 | |
| | | 7,796 | | | APERAM SA | | | 396,303 | |
| | | 615,196 | | | AXA SA | | | 14,529,699 | |
| | | 114,368 | | | BNP Paribas SA | | | 6,691,718 | |
| | | 176 | | | Capgemini SA | | | 15,075 | |
| | | 21,535 | | | Christian Dior SE | | | 4,565,851 | |
| | | | | | | | | | |
| | |
Shares | | | Description | | Value ($) | |
| | | | | | France — continued | |
| | | 10,047 | | | Cie Generale des Etablissements Michelin | | | 1,131,233 | |
| | | 103,139 | | | CNP Assurances | | | 1,911,245 | |
| | | 2,010 | | | Groupe Fnac SA * | | | 120,184 | |
| | | 17,261 | | | IPSOS | | | 556,019 | |
| | | 12,876 | | | LVMH Moet Hennessy Louis Vuitton SE | | | 2,586,537 | |
| | | 71,682 | | | SCOR SE | | | 2,591,389 | |
| | | 119,995 | | | Societe Generale SA | | | 5,333,485 | |
| | | 349,049 | | | TOTAL SA | | | 17,416,126 | |
| | | 19,061 | | | Valeo SA | | | 1,173,845 | |
| | | | | | | | | | |
| | | | | | Total France | | | 60,775,235 | |
| | | | | | | | | | |
| | |
| | | | | | Germany — 1.5% | |
| | | 30,060 | | | ADVA Optical Networking SE * | | | 316,082 | |
| | | 92,923 | | | Allianz SE (Registered) | | | 16,184,137 | |
| | | 63,338 | | | BASF SE | | | 5,892,573 | |
| | | 94,027 | | | Bayerische Motoren Werke AG | | | 8,396,234 | |
| | | 3,499 | | | Bechtle AG | | | 364,452 | |
| | | 4,253 | | | Cewe Stiftung & Co KGAA | | | 358,846 | |
| | | 211,092 | | | Daimler AG (Registered Shares) | | | 15,335,187 | |
| | | 292,698 | | | Deutsche Lufthansa AG (Registered) | | | 4,285,401 | |
| | | 5,438 | | | Diebold Nixdorf AG | | | 395,762 | |
| | | 161 | | | Duerr AG | | | 13,340 | |
| | | 12,902 | | | Hannover Rueck SE | | | 1,455,545 | |
| | | 30,109 | | | HeidelbergCement AG | | | 2,811,067 | |
| | | 1,552 | | | Henkel AG & Co KGaA | | | 167,470 | |
| | | 16,003 | | | RHOEN-KLINIKUM AG | | | 402,572 | |
| | | 9,031 | | | RTL Group SA | | | 694,332 | |
| | | 127,940 | | | RWE AG * | | | 1,822,033 | |
| | | 17,089 | | | SAP AG | | | 1,591,879 | |
| | | 35,320 | | | Software AG | | | 1,309,342 | |
| | | 28,645 | | | STADA Arzneimittel AG | | | 1,732,271 | |
| | | 17,026 | | | Talanx AG | | | 608,273 | |
| | | 1,002 | | | Washtec AG | | | 62,404 | |
| | | | | | | | | | |
| | | | | | Total Germany | | | 64,199,202 | |
| | | | | | | | | | |
| | |
| | | | | | Greece — 0.0% | |
| | | 12,055 | | | FF Group * | | | 235,809 | |
| | | | | | | | | | |
| | |
| | | | | | Hong Kong — 0.7% | |
| | | 900,400 | | | BOC Hong Kong Holdings Ltd | | | 3,556,952 | |
| | | 1,014,400 | | | Champion (REIT) | | | 582,657 | |
| | | 120,900 | | | Dah Sing Banking Group Ltd | | | 235,264 | |
| | | 4,000 | | | Dah Sing Financial Holdings Ltd | | | 29,466 | |
| | | 206,170 | | | Henderson Land Development Co Ltd | | | 1,197,316 | |
| | | 40,000 | | | HKT Trust & HKT Ltd – Class SS | | | 53,358 | |
| | | 331,000 | | | Hongkong Land Holdings Ltd | | | 2,258,779 | |
| | | 184,100 | | | Hysan Development Co Ltd | | | 858,373 | |
| | | 312,800 | | | Kerry Properties Ltd | | | 958,557 | |
| | | 904,400 | | | Link (REIT) | | | 6,236,307 | |
| | | | |
| | See accompanying notes to the financial statements. | | 29 |
GMO Benchmark-Free Fund
(A Series of GMO Trust)
Schedule of Investments — (Continued)
(showing percentage of total net assets)
February 28, 2017
| | | | | | | | | | |
| | |
Shares | | | Description | | Value ($) | |
| | | | | | Hong Kong — continued | |
| | | 89,800 | | | Luk Fook Holdings International Ltd | | | 260,747 | |
| | | 629,200 | | | Man Wah Holdings Ltd | | | 413,782 | |
| | | 29,700 | | | New World Development Co Ltd | | | 38,875 | |
| | | 2,298,900 | | | SJM Holdings Ltd | | | 1,886,262 | |
| | | 14,300 | | | SmarTone Telecommunications Holdings Ltd | | | 19,405 | |
| | | 59,800 | | | Sun Hung Kai Properties Ltd | | | 873,683 | |
| | | 21,500 | | | Swire Pacific Ltd – Class A | | | 221,313 | |
| | | 1,400 | | | Television Broadcasts Ltd | | | 6,123 | |
| | | 8,000 | | | Truly International Holdings Ltd | | | 3,440 | |
| | | 1,124,500 | | | WH Group Ltd | | | 877,934 | |
| | | 750,100 | | | Wharf Holdings Ltd (The) | | | 5,942,600 | |
| | | 365,500 | | | Wheelock & Co Ltd | | | 2,373,839 | |
| | | 55,425 | | | Xinyi Automobile Glass Hong Kong Enterprises Ltd * | | | 10,559 | |
| | | 1,209,400 | | | Xinyi Glass Holdings Ltd | | | 1,096,511 | |
| | | 12,900 | | | Yue Yuen Industrial Holdings Ltd | | | 47,999 | |
| | | | | | | | | | |
| | | | | | Total Hong Kong | | | 30,040,101 | |
| | | | | | | | | | |
| | |
| | | | | | Hungary — 0.0% | |
| | | 437,577 | | | Magyar Telekom Telecommunications Plc | | | 736,885 | |
| | | 9,013 | | | MOL Hungarian Oil & Gas Plc | | | 617,925 | |
| | | | | | | | | | |
| | | | | | Total Hungary | | | 1,354,810 | |
| | | | | | | | | | |
| | |
| | | | | | India — 0.8% | |
| | | 155,007 | | | Bharat Petroleum Corp Ltd | | | 1,553,729 | |
| | | 311,647 | | | Canara Bank * | | | 1,379,645 | |
| | | 15,701 | | | Claris Lifesciences Ltd | | | 74,925 | |
| | | 373,759 | | | Firstsource Solutions Ltd * | | | 247,830 | |
| | | 123,886 | | | HCL Technologies Ltd | | | 1,557,817 | |
| | | 45,388 | | | Hexaware Technologies Ltd | | | 152,241 | |
| | | 261,804 | | | Hindustan Zinc Ltd | | | 1,202,806 | |
| | | 872,500 | | | Housing Development & Infrastructure Ltd * | | | 900,877 | |
| | | 105,410 | | | Indiabulls Housing Finance Ltd | | | 1,372,203 | |
| | | 73,895 | | | Indian Bank | | | 318,768 | |
| | | 746,624 | | | Infosys Ltd Sponsored ADR | | | 11,303,887 | |
| | | 95,014 | | | Karnataka Bank Ltd (The) | | | 196,121 | |
| | | 35,621 | | | KPIT Technologies Ltd | | | 73,530 | |
| | | 10,031 | | | Mphasis Ltd | | | 89,676 | |
| | | 61,236 | | | NIIT Technologies Ltd | | | 383,077 | |
| | | 298,885 | | | NMDC Ltd | | | 674,458 | |
| | | 2,083 | | | Oracle Financial Services Software Ltd | | | 116,933 | |
| | | 1,414,978 | | | Power Finance Corp | | | 2,880,999 | |
| | | 1,652,270 | | | Rural Electrification Corp Ltd | | | 3,783,839 | |
| | | 112,759 | | | Sonata Software Ltd | | | 325,644 | |
| | | 389,600 | | | Syndicate Bank * | | | 405,302 | |
| | | 140,906 | | | Tata Consultancy Services Ltd | | | 5,191,606 | |
| | | 37,383 | | | Time Technoplast Ltd | | | 54,234 | |
| | | 65,155 | | | Wipro Ltd | | | 475,266 | |
| | | | | | | | | | |
| | | | | | Total India | | | 34,715,413 | |
| | | | | | | | | | |
| | | | | | | | | | |
| | |
Shares | | | Description | | Value ($) | |
| | | | | | Indonesia — 0.0% | |
| | | 1,239,700 | | | Bank Pembangunan Daerah Jawa Barat Dan Banten Tbk PT | | | 213,345 | |
| | | 409,700 | | | Barito Pacific Tbk PT * | | | 68,138 | |
| | | 57,900 | | | Indo Tambangraya Megah Tbk PT | | | 76,242 | |
| | | | | | | | | | |
| | | | | | Total Indonesia | | | 357,725 | |
| | | | | | | | | | |
| | |
| | | | | | Ireland — 0.0% | |
| | | 26,943 | | | Smurfit Kappa Group Plc | | | 715,597 | |
| | | | | | | | | | |
| | |
| | | | | | Israel — 0.4% | |
| | | 2,522 | | | B Communications Ltd | | | 49,853 | |
| | | 594,600 | | | Bank Hapoalim BM | | | 3,665,167 | |
| | | 397,983 | | | Bank Leumi Le-Israel BM * | | | 1,744,931 | |
| | | 72,100 | | | Check Point Software Technologies Ltd * | | | 7,131,411 | |
| | | 297,620 | | | El Al Israel Airlines | | | 211,984 | |
| | | 343,136 | | | Israel Discount Bank Ltd – Class A * | | | 759,482 | |
| | | 44,830 | | | Mizrahi Tefahot Bank Ltd | | | 748,398 | |
| | | 35,391 | | | Teva Pharmaceutical Industries Ltd | | | 1,244,946 | |
| | | | | | | | | | |
| | | | | | Total Israel | | | 15,556,172 | |
| | | | | | | | | | |
| | |
| | | | | | Italy — 0.1% | |
| | | 34,038 | | | A2A SPA | | | 47,242 | |
| | | 38,149 | | | ACEA SPA | | | 484,429 | |
| | | 6,949 | | | ASTM SPA | | | 89,858 | |
| | | 112,984 | | | Banca Mediolanum SPA | | | 737,316 | |
| | | 3,475 | | | Eni SPA | | | 53,610 | |
| | | 930 | | | EXOR SPA | | | 44,045 | |
| | | 230,934 | | | Hera SPA | | | 571,958 | |
| | | 302,992 | | | Iren SPA | | | 521,150 | |
| | | 15,426 | | | MARR SPA | | | 312,723 | |
| | | 87,047 | | | Recordati SPA | | | 2,762,358 | |
| | | 780 | | | Reply SPA | | | 103,898 | |
| | | 87,828 | | | Societa Cattolica di Assicurazioni SCRL | | | 550,305 | |
| | | 19,207 | | | Societa Iniziative Autostradali e Servizi SPA | | | 168,363 | |
| | | | | | | | | | |
| | | | | | Total Italy | | | 6,447,255 | |
| | | | | | | | | | |
| | |
| | | | | | Japan — 3.6% | |
| | | 14,600 | | | Alfresa Holdings Corp | | | 263,015 | |
| | | 23,000 | | | AOKI Holdings Inc | | | 282,893 | |
| | | 2,700 | | | Aoyama Trading Co Ltd | | | 101,216 | |
| | | 3,700 | | | Arcs Co Ltd | | | 83,351 | |
| | | 33,100 | | | Asahi Kasei Corp | | | 322,552 | |
| | | 2,000 | | | Autobacs Seven Co Ltd | | | 31,682 | |
| | | 3,800 | | | BML Inc | | | 82,967 | |
| | | 3,400 | | | Brother Industries Ltd | | | 64,032 | |
| | | 99,100 | | | Calsonic Kansei Corp | | | 1,134,953 | |
| | | 13,700 | | | Cawachi Ltd | | | 366,853 | |
| | | 53,600 | | | Central Japan Railway Co | | | 8,774,305 | |
| | | 30,500 | | | Coca-Cola West Co Ltd | | | 906,477 | |
| | | 28,100 | | | Cosmo Energy Holdings Co Ltd | | | 482,295 | |
| | | | |
| 30 | | See accompanying notes to the financial statements. | | |
GMO Benchmark-Free Fund
(A Series of GMO Trust)
Schedule of Investments — (Continued)
(showing percentage of total net assets)
February 28, 2017
| | | | | | | | | | |
| | |
Shares | | | Description | | Value ($) | |
| | | | | | Japan — continued | |
| | | 400 | | | Daiichi Sankyo Co Ltd | | | 9,121 | |
| | | 22,600 | | | Daito Trust Construction Co Ltd | | | 3,161,695 | |
| | | 21,400 | | | Daiwa House Industry Co Ltd | | | 587,286 | |
| | | 35,000 | | | Daiwabo Holdings Co Ltd | | | 94,356 | |
| | | 125,200 | | | DCM Holdings Co Ltd | | | 1,113,517 | |
| | | 140,800 | | | Denka Co Ltd | | | 733,191 | |
| | | 14,500 | | | Descente Ltd | | | 169,031 | |
| | | 17,900 | | | DIC Corp | | | 653,994 | |
| | | 17,900 | | | Doutor Nichires Holdings Co Ltd | | | 344,960 | |
| | | 10,500 | | | DTS Corp | | | 242,211 | |
| | | 8,200 | | | Ehime Bank Ltd (The) | | | 101,266 | |
| | | 14,600 | | | Elecom Co Ltd | | | 271,278 | |
| | | 7,800 | | | Exedy Corp | | | 222,888 | |
| | | 9,100 | | | Fujicco Co Ltd | | | 197,163 | |
| | | 54,200 | | | FujiFilm Holdings Corp | | | 2,096,588 | |
| | | 53,300 | | | Fujitsu General Ltd | | | 1,043,380 | |
| | | 6,900 | | | Fuyo General Lease Co Ltd | | | 329,847 | |
| | | 15,500 | | | Gunze Ltd | | | 56,922 | |
| | | 154,300 | | | Hanwa Co Ltd | | | 1,106,532 | |
| | | 37,100 | | | Haseko Corp | | | 439,035 | |
| | | 16,000 | | | Hitachi Chemical Co Ltd | | | 451,472 | |
| | | 3,600 | | | Hitachi Transport System Ltd | | | 73,739 | |
| | | 5,300 | | | Idemitsu Kosan Co Ltd | | | 170,774 | |
| | | 985,200 | | | ITOCHU Corp | | | 14,267,134 | |
| | | 6,000 | | | Itochu Techno-Solutions Corp | | | 162,940 | |
| | | 124,600 | | | Japan Airlines Co Ltd | | | 4,071,832 | |
| | | 38,300 | | | K’s Holdings Corp | | | 681,523 | |
| | | 45,400 | | | Kaneka Corp | | | 355,135 | |
| | | 456,000 | | | Kanematsu Corp | | | 791,346 | |
| | | 1,400 | | | Kasai Kogyo Co Ltd | | | 18,227 | |
| | | 11,100 | | | Kawasaki Kisen Kaisha Ltd | | | 29,920 | |
| | | 564,500 | | | KDDI Corp | | | 14,751,809 | |
| | | 2,100 | | | Keihin Corp | | | 35,151 | |
| | | 1,400 | | | Kokuyo Co Ltd | | | 18,457 | |
| | | 400 | | | Kuroda Electric Co Ltd | | | 8,311 | |
| | | 11,300 | | | Kyowa Exeo Corp | | | 156,734 | |
| | | 800 | | | Kyudenko Corp | | | 20,189 | |
| | | 162,000 | | | Marubeni Corp | | | 1,048,766 | |
| | | 17,400 | | | MCJ Co Ltd | | | 191,560 | |
| | | 63,100 | | | Medipal Holdings Corp | | | 1,041,282 | |
| | | 350,700 | | | Mitsubishi Chemical Holdings Corp | | | 2,696,608 | |
| | | 2,700 | | | Mitsubishi Electric Corp | | | 60,950 | |
| | | 201,900 | | | Mitsubishi Electric Corp | | | 2,960,035 | |
| | | 64,600 | | | Mitsubishi Tanabe Pharma Corp | | | 1,329,889 | |
| | | 1,599,500 | | | Mitsubishi UFJ Financial Group Inc | | | 10,581,919 | |
| | | 72,500 | | | Mitsubishi UFJ Lease & Finance Co Ltd | | | 400,835 | |
| | | 201,000 | | | Mitsui & Co Ltd | | | 3,076,815 | |
| | | 10,000 | | | Mitsui Chemicals Inc | | | 50,887 | |
| | | 108,000 | | | Mitsui Engineering & Shipbuilding Co Ltd | | | 177,744 | |
| | | 6,000 | | | Mitsui Sugar Co Ltd | | | 144,911 | |
| | | | | | | | | | |
| | |
Shares | | | Description | | Value ($) | |
| | | | | | Japan — continued | |
| | | 1,645,700 | | | Mizuho Financial Group Inc | | | 3,071,083 | |
| | | 1,200 | | | NHK Spring Co Ltd | | | 13,723 | |
| | | 22,200 | | | Nichiha Corp | | | 622,155 | |
| | | 46,000 | | | Nippon Corp | | | 872,908 | |
| | | 69,900 | | | Nippon Light Metal Holdings Co Ltd | | | 171,785 | |
| | | 336,700 | | | Nippon Telegraph & Telephone Corp | | | 14,242,179 | |
| | | 2,500 | | | Nippon Signal Co Ltd | | | 23,707 | |
| | | 4,700 | | | Nishi-Nippon Financial Holdings Inc * | | | 51,017 | |
| | | 355,800 | | | Nissan Motor Co Ltd | | | 3,500,861 | |
| | | 51,500 | | | Nissin Electric Co Ltd | | | 605,399 | |
| | | 19,800 | | | Noritsu Koki Co Ltd | | | 168,855 | |
| | | 2,600 | | | Okamura Corp | | | 23,642 | |
| | | 18,100 | | | Open House Co Ltd | | | 430,180 | |
| | | 3,800 | | | ORIX Corp | | | 59,128 | |
| | | 265,500 | | | Osaka Gas Co Ltd | | | 1,025,371 | |
| | | 8,000 | | | Osaki Electric Co Ltd | | | 77,519 | |
| | | 138,500 | | | Otsuka Holdings Co Ltd | | | 6,312,635 | |
| | | 73,500 | | | PanaHome Corp | | | 684,116 | |
| | | 15,100 | | | Pola Orbis Holdings Inc | | | 1,443,213 | |
| | | 2,200 | | | Press Kogyo Co Ltd | | | 11,168 | |
| | | 50,000 | | | Prima Meat Packers Ltd | | | 201,453 | |
| | | 17,500 | | | Rengo Co Ltd | | | 101,629 | |
| | | 171,500 | | | Resona Holdings Inc | | | 957,791 | |
| | | 900 | | | Rock Field Co Ltd | | | 13,851 | |
| | | 4,100 | | | Roland DG Corp | | | 126,201 | |
| | | 1,800 | | | San-A Co Ltd | | | 82,498 | |
| | | 139,300 | | | Sekisui Chemical Co Ltd | | | 2,301,030 | |
| | | 94,700 | | | Sekisui House Ltd | | | 1,514,364 | |
| | | 1,348,100 | | | Sojitz Corp | | | 3,493,719 | |
| | | 67,800 | | | Sumitomo Forestry Co Ltd | | | 987,628 | |
| | | 83,200 | | | Sumitomo Heavy Industries Ltd | | | 588,026 | |
| | | 381,200 | | | Sumitomo Mitsui Financial Group Inc | | | 14,850,481 | |
| | | 126,000 | | | Sumitomo Osaka Cement Co Ltd | | | 523,559 | |
| | | 80,200 | | | Sumitomo Rubber Industries Ltd | | | 1,322,827 | |
| | | 13,800 | | | Sundrug Co Ltd | | | 908,561 | |
| | | 14,000 | | | Suzuken Co Ltd | | | 473,918 | |
| | | 28,600 | | | T-Gaia Corp | | | 488,518 | |
| | | 26,400 | | | TIS Inc | | | 641,904 | |
| | | 44,600 | | | Toho Holdings Co Ltd | | | 964,529 | |
| | | 4,500 | | | Tokyo Century Corp | | | 151,941 | |
| | | 200 | | | Tokyo Electron Ltd | | | 19,953 | |
| | | 6,000 | | | Toshiba Plant Systems & Services Corp | | | 84,254 | |
| | | 362,000 | | | Tosoh Corp | | | 3,149,271 | |
| | | 1,900 | | | Toyoda Gosei Co Ltd | | | 48,466 | |
| | | 58,700 | | | Toyota Tsusho Corp | | | 1,750,483 | |
| | | 10,000 | | | TPR Co Ltd | | | 340,259 | |
| | | 20,200 | | | TS Tech Co Ltd | | | 528,299 | |
| | | 7,200 | | | TSI Holdings Co Ltd | | | 50,061 | |
| | | 1,700 | | | Tsuruha Holdings Inc | | | 157,285 | |
| | | 3,000 | | | TV Asahi Holdings Corp | | | 61,164 | |
| | | | |
| | See accompanying notes to the financial statements. | | 31 |
GMO Benchmark-Free Fund
(A Series of GMO Trust)
Schedule of Investments — (Continued)
(showing percentage of total net assets)
February 28, 2017
| | | | | | | | | | |
| | |
Shares | | | Description | | Value ($) | |
| | | | | | Japan — continued | |
| | | 11,800 | | | UKC Holdings Corp | | | 229,455 | |
| | | 25,000 | | | Wacoal Holdings Corp | | | 313,887 | |
| | | 700 | | | Yellow Hat Ltd | | | 17,815 | |
| | | 12,300 | | | Yuasa Trading Co Ltd | | | 354,080 | |
| | | | | | | | | | |
| | | | | | Total Japan | | | 156,907,550 | |
| | | | | | | | | | |
| | |
| | | | | | Mexico — 0.3% | |
| | | 671,678 | | | Alpek SA de CV | | | 710,742 | |
| | | 331,100 | | | Arca Continental SAB de CV | | | 1,858,076 | |
| | | 587,529 | | | Bolsa Mexicana de Valores SAB de CV | | | 846,575 | |
| | | 108,586 | | | Gruma SAB de CV – Class B | | | 1,426,375 | |
| | | 99,800 | | | Grupo Aeroportuario del Centro Norte SAB de CV | | | 478,051 | |
| | | 161,600 | | | Grupo Aeroportuario del Pacifico SAB de CV – Class B | | | 1,400,322 | |
| | | 55,900 | | | Grupo Aeroportuario del Sureste SAB de CV – Class B | | | 884,762 | |
| | | 88,800 | | | Grupo Financiero Interacciones SA de CV – Class O | | | 395,570 | |
| | | 171,042 | | | Grupo Herdez SAB de CV | | | 318,477 | |
| | | 1,100 | | | Industrias Bachoco SAB de CV Sponsored ADR | | | 52,646 | |
| | | 473,300 | | | OHL Mexico SAB de CV | | | 496,586 | |
| | | 36,100 | | | Prologis Property Mexico SA de CV (REIT) | | | 53,400 | |
| | | 2,459,938 | | | Wal-Mart de Mexico SAB de CV | | | 4,787,277 | |
| | | | | | | | | | |
| | | | | | Total Mexico | | | 13,708,859 | |
| | | | | | | | | | |
| | |
| | | | | | Netherlands — 0.6% | |
| | | 20,500 | | | AerCap Holdings NV * | | | 928,650 | |
| | | 60,600 | | | AVG Technologies NV * | | | 1,496,820 | |
| | | 364 | | | BinckBank NV | | | 2,044 | |
| | | 24,507 | | | Heineken Holding NV | | | 1,862,474 | |
| | | 372,292 | | | ING Groep NV | | | 5,128,912 | |
| | | 69,807 | | | Koninklijke Ahold Delhaize NV | | | 1,485,988 | |
| | | 22,905 | | | Philips Lighting NV * | | | 634,309 | |
| | | 528,276 | | | PostNL NV * | | | 2,307,044 | |
| | | 129,149 | | | Unilever NV CVA | | | 6,113,666 | |
| | | 201,612 | | | Wolters Kluwer NV | | | 8,263,354 | |
| | | | | | | | | | |
| | | | | | Total Netherlands | | | 28,223,261 | |
| | | | | | | | | | |
| | |
| | | | | | New Zealand — 0.1% | |
| | | 675,095 | | | Air New Zealand Ltd | | | 1,149,806 | |
| | | 269,340 | | | Fletcher Building Ltd | | | 1,857,901 | |
| | | 124,623 | | | Fletcher Building Ltd | | | 865,792 | |
| | | 105,492 | | | SKY Network Television Ltd | | | 288,579 | |
| | | | | | | | | | |
| | | | | | Total New Zealand | | | 4,162,078 | |
| | | | | | | | | | |
| | |
| | | | | | Norway — 0.3% | |
| | | 8,812 | | | Austevoll Seafood ASA | | | 77,795 | |
| | | 31,623 | | | Bakkafrost P/F | | | 1,176,847 | |
| | | | | | | | | | |
| | |
Shares | | | Description | | Value ($) | |
| | | | | | Norway — continued | |
| | | 89,108 | | | BW LPG Ltd | | | 435,459 | |
| | | 147,524 | | | DNB ASA | | | 2,418,741 | |
| | | 360,524 | | | Orkla ASA | | | 3,169,299 | |
| | | 11,320 | | | Salmar ASA | | | 286,021 | |
| | | 19,206 | | | SpareBank 1 Nord Norge | | | 135,217 | |
| | | 47,489 | | | Statoil ASA | | | 837,288 | |
| | | 68,656 | | | Storebrand ASA * | | | 463,580 | |
| | | 177,439 | | | Subsea 7 SA * | | | 2,506,398 | |
| | | | | | | | | | |
| | | | | | Total Norway | | | 11,506,645 | |
| | | | | | | | | | |
| | |
| | | | | | Poland — 0.2% | |
| | | 62,043 | | | Asseco Poland SA | | | 853,989 | |
| | | 197,873 | | | Bank Millennium SA * | | | 331,916 | |
| | | 271,661 | | | Enea SA * | | | 712,662 | |
| | | 123,347 | | | KGHM Polska Miedz SA | | | 3,905,277 | |
| | | 20,505 | | | PGE Polska Grupa Energetyczna SA | | | 59,837 | |
| | | 2,460,762 | | | Tauron Polska Energia SA * | | | 1,814,752 | |
| | | | | | | | | | |
| | | | | | Total Poland | | | 7,678,433 | |
| | | | | | | | | | |
| | |
| | | | | | Portugal — 0.0% | |
| | | 123,026 | | | CTT-Correios de Portugal SA | | | 660,725 | |
| | | | | | | | | | |
| | |
| | | | | | Russia — 0.5% | |
| | | 210,800 | | | Aeroflot PJSC * | | | 600,906 | |
| | | 12,930 | | | Gazprom Neft PJSC | | | 50,692 | |
| | | 2,454,942 | | | Gazprom PJSC Sponsored ADR | | | 10,957,801 | |
| | | 82,218 | | | Lukoil PJSC Sponsored ADR | | | 4,359,541 | |
| | | 223,980 | | | Novolipetsk Steel PJSC | | | 432,901 | |
| | | 46,581 | | | Novolipetsk Steel PJSC GDR | | | 892,758 | |
| | | 224,824 | | | Rosneft Oil Co PJSC GDR (Registered) | | | 1,275,554 | |
| | | 18,211,000 | | | RusHydro PJSC | | | 300,021 | |
| | | 415,490 | | | Tatneft PJSC | | | 2,423,889 | |
| | | 15,101 | | | Tatneft PJSC Sponsored ADR | | | 529,546 | |
| | | | | | | | | | |
| | | | | | Total Russia | | | 21,823,609 | |
| | | | | | | | | | |
| | |
| | | | | | Singapore — 0.2% | |
| | | 946,900 | | | CapitaLand Commercial Trust (REIT) | | | 1,053,174 | |
| | | 497,000 | | | Fortune Real Estate Investment Trust | | | 557,545 | |
| | | 199,800 | | | Frasers Centrepoint Trust (REIT) | | | 285,237 | |
| | | 4,050,800 | | | Golden Agri-Resources Ltd | | | 1,096,448 | |
| | | 716,300 | | | Mapletree Greater China Commercial Trust (REIT) | | | 503,280 | |
| | | 424,600 | | | Mapletree Industrial Trust (REIT) | | | 504,328 | |
| | | 58,100 | | | Mapletree Logistics Trust (REIT) | | | 44,555 | |
| | | 107,400 | | | Parkway Life Real Estate Investment Trust | | | 186,136 | |
| | | 119,800 | | | SATS Ltd | | | 427,393 | |
| | | 93,700 | | | Venture Corp Ltd | | | 718,516 | |
| | | 1,568,000 | | | Yangzijiang Shipbuilding Holdings Ltd | | | 1,034,344 | |
| | | 60,600 | | | Yanlord Land Group Ltd | | | 62,906 | |
| | | | | | | | | | |
| | | | | | Total Singapore | | | 6,473,862 | |
| | | | | | | | | | |
| | | | |
| 32 | | See accompanying notes to the financial statements. | | |
GMO Benchmark-Free Fund
(A Series of GMO Trust)
Schedule of Investments — (Continued)
(showing percentage of total net assets)
February 28, 2017
| | | | | | | | | | |
| | |
Shares | | | Description | | Value ($) | |
| | | | | | South Africa — 1.2% | |
| | | 43,859 | | | AECI Ltd | | | 366,531 | |
| | | 95,436 | | | African Rainbow Minerals Ltd | | | 736,827 | |
| | | 18,875 | | | Astral Foods Ltd | | | 212,677 | |
| | | 329,833 | | | AVI Ltd | | | 2,393,299 | |
| | | 295,273 | | | Barclays Africa Group Ltd | | | 3,417,119 | |
| | | 314,823 | | | Barloworld Ltd | | | 2,781,253 | |
| | | 190,093 | | | Bidvest Group Ltd (The) | | | 2,245,762 | |
| | | 68,811 | | | Blue Label Telecoms Ltd | | | 97,481 | |
| | | 187,862 | | | Clicks Group Ltd | | | 1,838,729 | |
| | | 254,239 | | | Emira Property Fund Ltd (REIT) | | | 285,087 | |
| | | 46,082 | | | Hyprop Investments Ltd (REIT) | | | 440,291 | |
| | | 263,479 | | | KAP Industrial Holdings Ltd | | | 188,200 | |
| | | 34,624 | | | Kumba Iron Ore Ltd* | | | 565,467 | |
| | | 273,479 | | | Liberty Holdings Ltd | | | 2,312,009 | |
| | | 585,126 | | | MMI Holdings Ltd | | | 1,096,316 | |
| | | 146,748 | | | Mondi Ltd | | | 3,366,649 | |
| | | 92,221 | | | MTN Group Ltd | | | 841,436 | |
| | | 373,431 | | | Nedbank Group Ltd | | | 6,963,064 | |
| | | 192,222 | | | Reunert Ltd | | | 1,029,024 | |
| | | 241,769 | | | RMB Holdings Ltd | | | 1,167,511 | |
| | | 1,304,693 | | | SA Corporate Real Estate Fund Nominees Pty Ltd | | | 558,472 | |
| | | 22,259 | | | Santam Ltd | | | 411,227 | |
| | | 171,811 | | | Sasol Ltd | | | 4,887,329 | |
| | | 55,476 | | | Shoprite Holdings Ltd | | | 800,567 | |
| | | 837,175 | | | Sibanye Gold Ltd | | | 1,715,250 | |
| | | 4,324 | | | Standard Bank Group Ltd | | | 47,123 | |
| | | 176,711 | | | Super Group Ltd * | | | 469,518 | |
| | | 352,758 | | | Telkom SA SOC Ltd | | | 1,832,355 | |
| | | 222,241 | | | Truworths International Ltd | | | 1,475,297 | |
| | | 368,034 | | | Tsogo Sun Holdings Ltd | | | 774,372 | |
| | | 427,409 | | | Vodacom Group Ltd | | | 4,826,994 | |
| | | 27,168 | | | Wilson Bayly Holmes-Ovcon Ltd | | | 300,847 | |
| | | | | | | | | | |
| | | | | | Total South Africa | | | 50,444,083 | |
| | | | | | | | | | |
| | |
| | | | | | South Korea — 1.8% | |
| | | 143,941 | | | BNK Financial Group Inc | | | 1,104,569 | |
| | | 7,990 | | | Daekyo Co Ltd | | | 57,536 | |
| | | 29,859 | | | Daishin Securities Co Ltd | | | 302,025 | |
| | | 93,574 | | | Daou Technology Inc | | | 1,521,043 | |
| | | 124,354 | | | DGB Financial Group Inc | | | 1,143,193 | |
| | | 22,507 | | | Dongbu Insurance Co Ltd | | | 1,215,180 | |
| | | 14,005 | | | Dongwon Development Co Ltd | | | 53,601 | |
| | | 12,295 | | | DuzonBizon Co Ltd | | | 249,852 | |
| | | 6,731 | | | E-MART Inc | | | 1,236,991 | |
| | | 8,373 | | | GS Holdings Corp | | | 410,337 | |
| | | 58,348 | | | Hana Financial Group Inc | | | 1,817,635 | |
| | | 19,788 | | | Hankook Tire Co Ltd | | | 1,045,214 | |
| | | 15,111 | | | Hanwha Corp | | | 485,699 | |
| | | 303,764 | | | Hanwha Life Insurance Co Ltd | | | 1,748,125 | |
| | | | | | | | | | |
| | |
Shares | | | Description | | Value ($) | |
| | | | | | South Korea — continued | |
| | | 2,699 | | | Hyundai Corp | | | 49,881 | |
| | | 6,966 | | | Hyundai Department Store Co Ltd | | | 612,315 | |
| | | 548 | | | Hyundai Home Shopping Network Corp | | | 55,457 | |
| | | 41,617 | | | Hyundai Marine & Fire Insurance Co Ltd | | | 1,192,527 | |
| | | 9,282 | | | Hyundai Mobis Co Ltd | | | 2,092,156 | |
| | | 80,064 | | | Hyundai Motor Co | | | 10,571,264 | |
| | | 270,474 | | | Industrial Bank of Korea | | | 2,952,560 | |
| | | 115,953 | | | JB Financial Group Co Ltd | | | 582,268 | |
| | | 159,454 | | | KB Financial Group Inc | | | 6,582,242 | |
| | | 264,501 | | | Kia Motors Corp | | | 8,940,852 | |
| | | 9,620 | | | Kolon Industries Inc | | | 605,521 | |
| | | 3,295 | | | Korea Petrochemical Ind Co Ltd | | | 774,721 | |
| | | 64,558 | | | Korean Reinsurance Co | | | 639,386 | |
| | | 8,335 | | | KT Hitel Co Ltd * | | | 54,125 | |
| | | 8,657 | | | KT&G Corp | | | 783,778 | |
| | | 14,392 | | | Kwangju Bank | | | 132,411 | |
| | | 110,902 | | | LG Display Co Ltd | | | 2,686,597 | |
| | | 16,942 | | | LG International Corp | | | 488,249 | |
| | | 4,739 | | | Lotte Shopping Co Ltd | | | 968,147 | |
| | | 949 | | | LS Corp | | | 56,833 | |
| | | 42,303 | | | Meritz Fire & Marine Insurance Co Ltd | | | 576,008 | |
| | | 10,944 | | | NCSoft Corp | | | 2,649,666 | |
| | | 17,203 | | | NHN Entertainment Corp * | | | 889,681 | |
| | | 2,127 | | | Posco Daewoo Corp | | | 46,130 | |
| | | 2,181 | | | Samjin Pharmaceutical Co Ltd | | | 64,511 | |
| | | 51,041 | | | Samsung Card Co Ltd | | | 1,909,108 | |
| | | 4,630 | | | Samsung Electronics Co Ltd | | | 7,868,371 | |
| | | 2,108 | | | Samsung Electronics Co Ltd GDR | | | 1,785,337 | |
| | | 22,115 | | | Seah Besteel Corp | | | 509,007 | |
| | | 51,645 | | | Shinhan Financial Group Co Ltd | | | 2,124,728 | |
| | | 7,382 | | | Shinsegae Inc | | | 1,302,096 | |
| | | 500 | | | SK Gas Co Ltd | | | 46,640 | |
| | | 17,852 | | | SK Innovation Co Ltd | | | 2,435,051 | |
| | | 26,121 | | | SKC Co Ltd | | | 726,006 | |
| | | 3,586 | | | SL Corp | | | 78,610 | |
| | | 4,799 | | | Ssangyong Cement Industrial Co Ltd | | | 60,663 | |
| | | 1,342 | | | Ssangyong Information & Communication * | | | 2,571 | |
| | | 39,258 | | | Tongyang Life Insurance Co Ltd | | | 366,533 | |
| | | 1,333 | | | Unid Co Ltd | | | 52,080 | |
| | | 377,424 | | | Woori Bank | | | 4,436,260 | |
| | | | | | | | | | |
| | | | | | Total South Korea | | | 81,141,347 | |
| | | | | | | | | | |
| | |
| | | | | | Spain — 0.5% | |
| | | 55,062 | | | Ebro Foods SA | | | 1,117,614 | |
| | | 398,878 | | | Endesa SA | | | 8,483,873 | |
| | | 70,774 | | | Mapfre SA | | | 218,694 | |
| | | 911,545 | | | Repsol SA | | | 13,484,756 | |
| | | | | | | | | | |
| | | | | | Total Spain | | | 23,304,937 | |
| | | | | | | | | | |
| | | | |
| | See accompanying notes to the financial statements. | | 33 |
GMO Benchmark-Free Fund
(A Series of GMO Trust)
Schedule of Investments — (Continued)
(showing percentage of total net assets)
February 28, 2017
| | | | | | | | | | |
| | |
Shares | | | Description | | Value ($) | |
| | | | | | Sweden — 0.1% | |
| | | 16,930 | | | Acando AB | | | 60,706 | |
| | | 33,404 | | | Axfood AB | | | 510,310 | |
| | | 11,963 | | | Bilia AB – A Shares | | | 267,440 | |
| | | 8,934 | | | Granges AB | | | 81,316 | |
| | | 35,500 | | | Intrum Justitia AB | | | 1,283,460 | |
| | | 16,482 | | | NCC AB – B Shares | | | 391,618 | |
| | | 15,107 | | | Nobina AB | | | 92,476 | |
| | | 7,609 | | | Ratos AB – B Shares | | | 35,346 | |
| | | 177,588 | | | Sandvik AB | | | 2,410,656 | |
| | | 1,216 | | | Securitas AB – B Shares | | | 18,526 | |
| | | 7,491 | | | Wihlborgs Fastigheter AB | | | 148,777 | |
| | | | | | | | | | |
| | | | | | Total Sweden | | | 5,300,631 | |
| | | | | | | | | | |
| | |
| | | | | | Switzerland — 0.8% | |
| | | 3,104 | | | ALSO Holding AG (Registered) * | | | 347,206 | |
| | | 1,123 | | | Autoneum Holding AG | | | 298,797 | |
| | | 5,381 | | | BKW AG | | | 273,987 | |
| | | 1,177 | | | Burkhalter Holding AG | | | 172,810 | |
| | | 44 | | | Emmi AG (Registered) | | | 27,952 | |
| | | 2,908 | | | EMS-Chemie Holding AG (Registered) | | | 1,654,628 | |
| | | 1,763 | | | Georg Fischer AG (Registered) | | | 1,528,072 | |
| | | 108 | | | Gurit Holding AG * | | | 90,947 | |
| | | 484 | | | Inficon Holding AG * | | | 211,264 | |
| | | 23 | | | Intershop Holding AG | | | 11,470 | |
| | | 3,348 | | | Kardex AG (Registered) * | | | 337,806 | |
| | | 832 | | | Komax Holding AG (Registered) | | | 216,748 | |
| | | 29,284 | | | Kuehne & Nagel International AG (Registered) | | | 4,169,354 | |
| | | 1,774 | | | Logitech International SA (Registered) | | | 51,283 | |
| | | 68,747 | | | Nestle SA (Registered) | | | 5,073,401 | |
| | | 18,159 | | | Novartis AG (Registered) * | | | 1,418,071 | |
| | | 2,116 | | | Orior AG * | | | 169,449 | |
| | | 79 | | | Schweiter Technologies AG | | | 88,847 | |
| | | 445 | | | Sika AG | | | 2,504,340 | |
| | | 8,852 | | | Swiss Life Holding AG (Registered) * | | | 2,784,646 | |
| | | 149,863 | | | Swiss Re AG | | | 13,404,609 | |
| | | | | | | | | | |
| | | | | | Total Switzerland | | | 34,835,687 | |
| | | | | | | | | | |
| | |
| | | | | | Taiwan — 1.8% | |
| | | 194,000 | | | Catcher Technology Co Ltd | | | 1,618,742 | |
| | | 50,000 | | | Channel Well Technology Co Ltd | | | 50,223 | |
| | | 138,000 | | | China Motor Corp | | | 129,398 | |
| | | 54,000 | | | China Synthetic Rubber Corp | | | 53,093 | |
| | | 597,000 | | | Compeq Manufacturing Co Ltd | | | 389,303 | |
| | | 1,314,000 | | | CTBC Financial Holding Co Ltd | | | 784,171 | |
| | | 67,000 | | | Cyberlink Corp | | | 147,006 | |
| | | 34,000 | | | Elite Material Co Ltd | | | 124,476 | |
| | | 588,490 | | | Foxconn Technology Co Ltd | | | 1,756,825 | |
| | | 5,184,000 | | | Fubon Financial Holding Co Ltd | | | 8,400,795 | |
| | | 213,000 | | | Gigabyte Technology Co Ltd | | | 296,905 | |
| | | | | | | | | | |
| | |
Shares | | | Description | | Value ($) | |
| | | | | | Taiwan — continued | |
| | | 46,000 | | | Greatek Electronics Inc | | | 62,473 | |
| | | 6,389,300 | | | Hon Hai Precision Industry Co Ltd | | | 18,592,624 | |
| | | 2,847,000 | | | Inventec Corp | | | 2,114,694 | |
| | | 225,000 | | | Lite-On Technology Corp | | | 376,811 | |
| | | 780,150 | | | Mercuries Life Insurance Co Ltd * | | | 419,890 | |
| | | 43,000 | | | Micro-Star International Co Ltd | | | 99,732 | |
| | | 35,000 | | | Novatek Microelectronics Corp | | | 131,065 | |
| | | 3,348,000 | | | Pegatron Corp | | | 8,815,785 | |
| | | 45,000 | | | Sheng Yu Steel Co Ltd | | | 61,987 | |
| | | 1,502,000 | | | Shin Kong Financial Holding Co Ltd * | | | 405,289 | |
| | | 60,000 | | | Shinkong Insurance Co Ltd | | | 52,184 | |
| | | 11,000 | | | Sinmag Equipment Corp | | | 48,430 | |
| | | 51,000 | | | Syncmold Enterprise Corp | | | 102,702 | |
| | | 14,000 | | | TaiDoc Technology Corp | | | 50,354 | |
| | | 266,000 | | | Taiwan Business Bank | | | 72,801 | |
| | | 151,000 | | | Taiwan Semiconductor Co Ltd | | | 189,256 | |
| | | 1,455,000 | | | Taiwan Semiconductor Manufacturing Co Ltd | | | 8,914,104 | |
| | | 622,524 | | | Taiwan Semiconductor Manufacturing Co Ltd Sponsored ADR | | | 19,590,830 | |
| | | 15,000 | | | TOPBI International Holdings Ltd. | | | 53,163 | |
| | | 108,000 | | | Topco Scientific Co Ltd | | | 357,835 | |
| | | 175,000 | | | Transcend Information Inc | | | 491,837 | |
| | | 213,000 | | | Tripod Technology Corp | | | 555,841 | |
| | | 1,081,000 | | | United Microelectronics Corp | | | 448,188 | |
| | | 823,000 | | | WPG Holdings Ltd | | | 1,044,095 | |
| | | 80,000 | | | YC INOX Co Ltd | | | 70,117 | |
| | | | | | | | | | |
| | | | | | Total Taiwan | | | 76,873,024 | |
| | | | | | | | | | |
| | |
| | | | | | Thailand — 0.1% | |
| | | 241,100 | | | AP Thailand PCL | | | 49,323 | |
| | | 165,100 | | | Bangkok Bank Pcl (Foreign Registered) (a) | | | 911,148 | |
| | | 2,049,100 | | | Bangkok Expressway & Metro Pcl | | | 413,446 | |
| | | 84,800 | | | Kiatnakin Bank Pcl (Foreign Registered) | | | 159,553 | |
| | | 194,000 | | | Supalai Pcl (Foreign Registered) | | | 138,237 | |
| | | 1,422,500 | | | Thai Beverage Pcl | | | 963,704 | |
| | | 216,500 | | | Thai Oil Pcl (Foreign Registered) | | | 466,097 | |
| | | 43,500 | | | Thai Vegetable Oil PCL (Foreign Registered) | | | 47,991 | |
| | | 606,600 | | | Thanachart Capital PCL (Foreign Registered) | | | 842,593 | |
| | | | | | | | | | |
| | | | | | Total Thailand | | | 3,992,092 | |
| | | | | | | | | | |
| | |
| | | | | | Turkey — 0.5% | |
| | | 17,956 | | | Akbank TAS | | | 42,780 | |
| | | 53,907 | | | Arcelik AS | | | 308,840 | |
| | | 2,790,265 | | | Eregli Demir ve Celik Fabrikalari TAS | | | 4,543,020 | |
| | | 268,693 | | | KOC Holding AS | | | 1,092,253 | |
| | | 90,907 | | | Selcuk Ecza Deposu Ticaret ve Sanayi AS | | | 83,643 | |
| | | 148,680 | | | Turk Telekomunikasyon AS | | | 234,807 | |
| | | 1,766,488 | | | Turkiye Halk Bankasi AS | | | 5,457,399 | |
| | | 4,596,843 | | | Turkiye IS Bankasi – Class C | | | 7,978,386 | |
| | | 667,616 | | | Turkiye Sise ve Cam Fabrikalari AS | | | 717,487 | |
| | | | |
| 34 | | See accompanying notes to the financial statements. | | |
GMO Benchmark-Free Fund
(A Series of GMO Trust)
Schedule of Investments — (Continued)
(showing percentage of total net assets)
February 28, 2017
| | | | | | | | | | |
| | |
Shares | | | Description | | Value ($) | |
| | | | | | Turkey — continued | |
| | | 2,375,365 | | | Turkiye Vakiflar Bankasi TAO – Class D | | | 3,448,811 | |
| | | | | | | | | | |
| | | | | | Total Turkey | | | 23,907,426 | |
| | | | | | | | | | |
| | |
| | | | | | United Kingdom — 2.3% | |
| | | 55,823 | | | 3i Group Plc | | | 476,988 | |
| | | 277,126 | | | AstraZeneca Plc | | | 15,970,783 | |
| | | 91,613 | | | Berkeley Group Holdings Plc (The) | | | 3,348,254 | |
| | | 6,606 | | | Bovis Homes Group Plc | | | 63,996 | |
| | | 1,473,971 | | | BP Plc | | | 8,311,228 | |
| | | 219,821 | | | British American Tobacco Plc | | | 13,884,893 | |
| | | 6,312 | | | Carillion Plc | | | 17,154 | |
| | | 29,410 | | | Centrica Plc | | | 82,848 | |
| | | 135,427 | | | Compass Group Plc | | | 2,515,957 | |
| | | 31,985 | | | Computacenter Plc | | | 310,834 | |
| | | 77,763 | | | Crest Nicholson Holdings Plc | | | 522,151 | |
| | | 55,287 | | | Direct Line Insurance Group Plc | | | 235,637 | |
| | | 98,140 | | | Ferrexpo Plc * | | | 194,312 | |
| | | 292,500 | | | Firstgroup Plc * | | | 436,510 | |
| | | 18,613 | | | Galliford Try Plc | | | 350,452 | |
| | | 191,701 | | | GlaxoSmithKline Plc | | | 3,922,761 | |
| | | 141,000 | | | GlaxoSmithKline Plc Sponsored ADR | | | 5,848,680 | |
| | | 747 | | | HSBC Holdings Plc | | | 6,000 | |
| | | 32,072 | | | Hunting Plc | | | 211,148 | |
| | | 99,031 | | | IG Group Holdings Plc | | | 657,441 | |
| | | 70,434 | | | Imperial Brands Plc | | | 3,315,697 | |
| | | 128,018 | | | Inchcape Plc | | | 1,192,366 | |
| | | 333,862 | | | Indivior Plc | | | 1,448,851 | |
| | | 51,175 | | | Intermediate Capital Group Plc | | | 450,304 | |
| | | 62,672 | | | Jupiter Fund Management Plc | | | 326,083 | |
| | | 775,982 | | | Kingfisher Plc | | | 3,165,142 | |
| | | 6,529 | | | Legal & General Group Plc | | | 20,125 | |
| | | 70,194 | | | Lookers Plc | | | 107,507 | |
| | | 13,100 | | | Mitie Group Plc | | | 33,649 | |
| | | 9,674 | | | Mondi Plc | | | 225,478 | |
| | | 48,369 | | | National Express Group Plc | | | 218,157 | |
| | | 142,861 | | | Persimmon Plc | | | 3,653,202 | |
| | | 58,343 | | | Reckitt Benckiser Group Plc | | | 5,297,525 | |
| | | 398,849 | | | Royal Mail Plc | | | 2,052,777 | |
| | | 343,348 | | | Sage Group Plc (The) | | | 2,751,663 | |
| | | 126,759 | | | Unilever Plc | | | 6,013,640 | |
| | | 32,342 | | | WH Smith Plc | | | 679,055 | |
| | | 592,401 | | | WPP Plc | | | 13,937,066 | |
| | | | | | | | | | |
| | | | | | Total United Kingdom | | | 102,256,314 | |
| | | | | | | | | | |
| | |
| | | | | | United States — 5.5% | |
| | | 44,215 | | | 3M Co. | | | 8,239,465 | |
| | | 93,574 | | | Abbott Laboratories | | | 4,218,316 | |
| | | 65,182 | | | Accenture Plc – Class A | | | 7,984,795 | |
| | | 23,175 | | | Alphabet, Inc. – Class C * | | | 19,077,892 | |
| | | 112,548 | | | American Express Co. | | | 9,010,593 | |
| | | | | | | | | | |
| | |
Shares | | | Description | | Value ($) | |
| | | | | | United States — continued | |
| | | 15,904 | | | Amphenol Corp. – Class A | | | 1,100,716 | |
| | | 17,781 | | | Analog Devices, Inc. | | | 1,456,797 | |
| | | 7,392 | | | Anthem, Inc. | | | 1,218,349 | |
| | | 104,898 | | | Apple, Inc. | | | 14,369,977 | |
| | | 6,400 | | | Automatic Data Processing, Inc. | | | 656,768 | |
| | | 15,934 | | | Becton Dickinson and Co. | | | 2,916,719 | |
| | | 27,270 | | | Cerner Corp. * | | | 1,500,941 | |
| | | 313,884 | | | Cisco Systems, Inc. | | | 10,728,555 | |
| | | 132,313 | | | Coca-Cola Co. (The) | | | 5,551,853 | |
| | | 113,617 | | | Cognizant Technology Solutions Corp. – Class A * | | | 6,734,080 | |
| | | 15,772 | | | Colgate-Palmolive Co. | | | 1,151,041 | |
| | | 27,567 | | | Costco Wholesale Corp. | | | 4,884,321 | |
| | | 2,028 | | | CR Bard, Inc. | | | 497,347 | |
| | | 23,895 | | | CVS Health Corp. | | | 1,925,459 | |
| | | 22,785 | | | Eli Lilly & Co. | | | 1,886,826 | |
| | | 58,072 | | | Emerson Electric Co. | | | 3,490,127 | |
| | | 6,700 | | | Genuine Parts Co. | | | 641,257 | |
| | | 16,610 | | | Honeywell International, Inc. | | | 2,067,945 | |
| | | 10,338 | | | Humana, Inc. | | | 2,183,903 | |
| | | 28,516 | | | Illinois Tool Works, Inc. | | | 3,764,397 | |
| | | 14,271 | | | Intuit, Inc. | | | 1,790,154 | |
| | | 1,056 | | | Intuitive Surgical, Inc. * | | | 778,272 | |
| | | 91,426 | | | Johnson & Johnson | | | 11,173,171 | |
| | | 22,223 | | | MasterCard, Inc. – Class A | | | 2,454,753 | |
| | | 27,597 | | | McDonald’s Corp. | | | 3,522,757 | |
| | | 89,911 | | | Medtronic Plc | | | 7,274,699 | |
| | | 286,116 | | | Microsoft Corp. | | | 18,305,702 | |
| | | 41,142 | | | Monsanto Co. | | | 4,683,194 | |
| | | 39,377 | | | Nike, Inc. – Class B | | | 2,250,789 | |
| | | 318,959 | | | Oracle Corp. | | | 13,584,464 | |
| | | 15,837 | | | PepsiCo, Inc. | | | 1,748,088 | |
| | | 60,660 | | | Pfizer, Inc. | | | 2,069,719 | |
| | | 117,046 | | | Philip Morris International, Inc. | | | 12,798,980 | |
| | | 133,684 | | | QUALCOMM, Inc. | | | 7,550,472 | |
| | | 9,550 | | | Rockwell Automation, Inc. | | | 1,443,005 | |
| | | 40,484 | | | Schlumberger Ltd. | | | 3,253,294 | |
| | | 30,670 | | | Stryker Corp. | | | 3,942,935 | |
| | | 47,636 | | | Teradata Corp. * | | | 1,481,480 | |
| | | 31,082 | | | Texas Instruments, Inc. | | | 2,381,503 | |
| | | 15,574 | | �� | TJX Cos., Inc. (The) | | | 1,221,780 | |
| | | 41,306 | | | United Technologies Corp. | | | 4,648,990 | |
| | | 68,480 | | | UnitedHealth Group, Inc. | | | 11,325,222 | |
| | | 27,073 | | | VF Corp. | | | 1,419,979 | |
| | | 4,061 | | | WW Grainger, Inc. | | | 1,006,966 | |
| | | 14,273 | | | Zimmer Biomet Holdings, Inc. | | | 1,671,083 | |
| | | | | | | | | | |
| | | | | | Total United States | | | 241,039,890 | |
| | | | | | | | | | |
| | | |
| | | | | | TOTAL COMMON STOCKS (COST $1,261,559,241) | | | 1,379,231,177 | |
| | | | | | | | | | |
| | | | |
| | See accompanying notes to the financial statements. | | 35 |
GMO Benchmark-Free Fund
(A Series of GMO Trust)
Schedule of Investments — (Continued)
(showing percentage of total net assets)
February 28, 2017
| | | | | | | | | | |
| | | Par Value† /
Shares | | | Description | | Value ($) | |
| | | | | | DEBT OBLIGATIONS — 23.5% | |
| | |
| | | | | | U.S. Government — 23.5% | |
| | | 125,679,098 | | | U.S. Treasury Inflation Indexed Bond, 0.25%, due 01/15/25 (b) | | | 125,323,175 | |
| | | 85,021,062 | | | U.S. Treasury Inflation Indexed Bond, 0.38%, due 07/15/25 (b) | | | 85,744,931 | |
| | | 84,825,588 | | | U.S. Treasury Inflation Indexed Bond, 0.63%, due 01/15/26 (b) | | | 86,910,262 | |
| | | 79,670,311 | | | U.S. Treasury Inflation Indexed Bond, 0.13%, due 07/15/26 (b) | | | 78,271,858 | |
| | | 5,000,000 | | | U.S. Treasury Note, 2.75%, due 05/31/17 | | | 5,027,920 | |
| | | 15,000,000 | | | U.S. Treasury Note, 1.00%, due 09/15/17 | | | 15,019,920 | |
| | | 12,000,000 | | | U.S. Treasury Note, 0.75%, due 10/31/17 | | | 11,996,256 | |
| | | 12,500,000 | | | U.S. Treasury Note, 0.88%, due 11/15/17 | | | 12,505,863 | |
| | | 10,000,000 | | | U.S. Treasury Note, 0.63%, due 11/30/17 | | | 9,984,380 | |
| | | 40,000,000 | | | U.S. Treasury Note, 0.88%, due 01/31/18 | | | 39,978,120 | |
| | | 85,000,000 | | | U.S. Treasury Note, 0.75%, due 02/28/18 | | | 84,827,365 | |
| | | 35,000,000 | | | U.S. Treasury Note, USBM + 0.19%, 0.97%, due 04/30/18 | | | 35,059,990 | |
| | | 20,000,000 | | | U.S. Treasury Note, 2.63%, due 04/30/18 | | | 20,372,660 | |
| | | 12,500,000 | | | U.S. Treasury Note, 1.00%, due 05/31/18 | | | 12,497,075 | |
| | | 12,500,000 | | | U.S. Treasury Note, 1.38%, due 07/31/18 | | | 12,553,712 | |
| | | 20,000,000 | | | U.S. Treasury Note, 1.38%, due 09/30/18 | | | 20,077,340 | |
| | | 30,000,000 | | | U.S. Treasury Note, 0.75%, due 10/31/18 | | | 29,797,260 | |
| | | 15,000,000 | | | U.S. Treasury Note, 1.00%, due 11/30/18 | | | 14,956,050 | |
| | | 25,000,000 | | | U.S. Treasury Note, 1.25%, due 12/31/18 | | | 25,020,500 | |
| | | 35,000,000 | | | U.S. Treasury Note, 1.13%, due 01/31/19 (d) | | | 34,934,375 | |
| | | 25,000,000 | | | U.S. Treasury Note, 1.50%, due 01/31/19 | | | 25,126,950 | |
| | | 25,000,000 | | | U.S. Treasury Note, 0.75%, due 02/15/19 | | | 24,764,650 | |
| | | 20,000,000 | | | U.S. Treasury Note, 1.13%, due 02/28/19 | | | 19,957,820 | |
| | | 12,500,000 | | | U.S. Treasury Note, 1.38%, due 02/28/19 | | | 12,534,662 | |
| | | 20,000,000 | | | U.S. Treasury Note, 1.50%, due 03/31/19 | | | 20,089,840 | |
| | | 12,500,000 | | | U.S. Treasury Note, 0.88%, due 04/15/19 | | | 12,395,513 | |
| | | 20,000,000 | | | U.S. Treasury Note, 3.13%, due 05/15/19 | | | 20,784,380 | |
| | | 35,000,000 | | | U.S. Treasury Note, 0.88%, due 06/15/19 | | | 34,645,905 | |
| | | 25,000,000 | | | U.S. Treasury Note, 1.63%, due 06/30/19 | | | 25,164,050 | |
| | | 40,000,000 | | | U.S. Treasury Note, 3.63%, due 08/15/19 | | | 42,181,240 | |
| | | 35,000,000 | | | U.S. Treasury Note, 1.75%, due 09/30/19 | | | 35,314,440 | |
| | | | | | | | | | |
| | | | | | Total U.S. Government | | | 1,033,818,462 | |
| | | | | | | | | | |
| | | |
| | | | | | TOTAL DEBT OBLIGATIONS (COST $1,032,842,273) | | | 1,033,818,462 | |
| | | | | | | | | | |
| | |
| | | | | | PREFERRED STOCKS — 1.4% | |
| | |
| | | | | | Brazil — 1.0% | |
| | | 115,800 | | | Banco Bradesco SA | | | 1,238,277 | |
| | | 17,700 | | | Banco Bradesco SA ADR | | | 187,089 | |
| | | 13,300 | | | Banco do Estado do Rio Grande do Sul SA – Class B | | | 70,876 | |
| | | 48,100 | | | Bradespar SA | | | 360,808 | |
| | | 313,500 | | | Centrais Eletricas Brasileiras SA – Class B * | | | 2,472,232 | |
| | | | | | | | | | |
| | |
Shares | | | Description | | Value ($) | |
| | | | | | Brazil — continued | |
| | | 14,200 | | | Cia de Saneamento do Parana | | | 65,639 | |
| | | 2,062,500 | | | Cia Energetica de Minas Gerais | | | 7,051,963 | |
| | | 247,400 | | | Cia Energetica de Sao Paulo – Class B | | | 1,417,598 | |
| | | 374,660 | | | Itau Unibanco Holding SA | | | 4,797,818 | |
| | | 179,680 | | | Itau Unibanco Holding SA Sponsored ADR | | | 2,298,107 | |
| | | 4,157,410 | | | Itausa – Investimentos Itau SA | | | 13,367,150 | |
| | | 201,000 | | | Metalurgica Gerdau SA * | | | 377,766 | |
| | | 972,100 | | | Vale SA | | | 9,812,601 | |
| | | | | | | | | | |
| | | | | | Total Brazil | | | 43,517,924 | |
| | | | | | | | | | |
| | |
| | | | | | Chile — 0.0% | |
| | | 7,082 | | | Sociedad Quimica y Minera de Chile SA – Class B | | | 222,406 | |
| | | | | | | | | | |
| | |
| | | | | | Germany — 0.1% | |
| | | 13,184 | | | Bayerische Motoren Werke AG | | | 982,435 | |
| | | 1,680 | | | Jungheinrich AG | | | 50,815 | |
| | | 65,832 | | | Porsche Automobil Holding SE | | | 3,633,163 | |
| | | | | | | | | | |
| | | | | | Total Germany | | | 4,666,413 | |
| | | | | | | | | | |
| | |
| | | | | | Russia — 0.1% | |
| | | 2,740,200 | | | Surgutneftegas OJSC | | | 1,497,314 | |
| | | 469 | | | Transneft PJSC | | | 1,458,573 | |
| | | | | | | | | | |
| | | | | | Total Russia | | | 2,955,887 | |
| | | | | | | | | | |
| | |
| | | | | | South Korea — 0.2% | |
| | | 4,546 | | | Hyundai Motor Co | | | 393,356 | |
| | | 29,404 | | | Hyundai Motor Co 2nd Preference | | | 2,649,934 | |
| | | 5,538 | | | Samsung Electronics Co Ltd | | | 7,330,048 | |
| | | 627 | | | Samsung Electronics Co Ltd GDR (Registered) | | | 414,635 | |
| | | | | | | | | | |
| | | | | | Total South Korea | | | 10,787,973 | |
| | | | | | | | | | |
| | | |
| | | | | | TOTAL PREFERRED STOCKS (COST $37,172,232) | | | 62,150,603 | |
| | | | | | | | | | |
| |
| | | RIGHTS/WARRANTS — 0.0% | |
| | |
| | | | | | Brazil — 0.0% | |
| | | 68,123 | | | Itausa – Investimentos Itau SA Rights, Expires 03/31/17* | | | 86,276 | |
| | | | | | | | | | |
| | |
| | | | | | India — 0.0% | |
| | | 31,164 | | | Canara Bank Rights, Expires 02/17/17 * | | | 41,572 | |
| | | | | | | | | | |
| | |
| | | TOTAL RIGHTS/WARRANTS
(COST $0) | | | 127,848 | |
| | | | | | | | | | |
| | | | |
| 36 | | See accompanying notes to the financial statements. | | |
GMO Benchmark-Free Fund
(A Series of GMO Trust)
Schedule of Investments — (Continued)
(showing percentage of total net assets)
February 28, 2017
| | | | | | | | | | |
| | | Shares /
Par Value† | | | Description | | Value ($) | |
| | | MUTUAL FUNDS — 35.9% | |
| | |
| | | | | | United States — 35.9% | |
| | | | | | Affiliated Issuers — 35.9% | |
| | | 8,785,166 | | | GMO Emerging Country Debt Fund, Class IV | | | 254,330,557 | |
| | | 18,277,424 | | | GMO Emerging Markets Fund, Class VI | | | 544,118,916 | |
| | | 10,309,695 | | | GMO Opportunistic Income Fund, Class VI | | | 265,783,934 | |
| | | 5,844,708 | | | GMO SGM Major Markets Fund, Class VI | | | 190,362,136 | |
| | | 13,957,737 | | | GMO Special Opportunities Fund, Class VI | | | 284,598,267 | |
| | | 1,460,115 | | | GMO U.S. Treasury Fund | | | 36,502,880 | |
| | | | | | | | | | |
| | |
| | | TOTAL MUTUAL FUNDS
(COST $1,513,700,009) | | | 1,575,696,690 | |
| | | | | | | | | | |
| | |
| | | | | | SHORT-TERM INVESTMENTS — 7.2% | |
| | |
| | | | | | Money Market Funds — 0.2% | |
| | | 10,867,034 | | | State Street Institutional Treasury Money Market Fund-Premier Class, 0.42% (c) | | | 10,867,034 | |
| | | | | | | | | | |
| | |
| | | | | | Repurchase Agreements — 5.6% | |
| | | 244,200,958 | | | Daiwa Capital Markets America Inc. Repurchase Agreement, dated 02/28/17, maturing on 03/01/17 with a maturity value of $244,204,485 and an effective yield of 0.52%, collateralized by a U.S. Treasury Note with maturity date 04/30/22 and a market value of $248,950,276. | | | 244,200,958 | |
| | | | | | | | | | |
| | | | | | | | | | |
| | | Shares /
Par Value† | | | Description | | Value ($) | |
| | |
| | | | | | U.S. Government — 1.4% | |
| | | 20,000,000 | | | U.S. Treasury Note, 1.88%, due 08/31/17 | | | 20,111,720 | |
| | | 40,000,000 | | | U.S. Treasury Note, 1.00%, due 12/15/17 | | | 40,046,880 | |
| | | | | | | | | | |
| | | Total U.S. Government | | | 60,158,600 | |
| | | | | | | | | | |
| | |
| | | TOTAL SHORT-TERM INVESTMENTS (COST $315,237,072) | | | 315,226,592 | |
| | | | | | | | | | |
| | |
| | | TOTAL INVESTMENTS — 99.4% (Cost $4,160,510,827) | | | 4,366,251,372 | |
| | | Other Assets and Liabilities (net) — 0.6% | | | 28,008,162 | |
| | | | | | | | | | |
| | |
| | | TOTAL NET ASSETS — 100.0% | | | $4,394,259,534 | |
| | | | | | | | | | |
A summary of outstanding financial instruments at February 28, 2017 is as follows:
Reverse Repurchase Agreements (e)
| | | | | | | | | | |
Face Value | | | Description | | Market
Value | |
| USD | | | 34,939,753 | | | Nomura Securities International Inc, (0.25%), dated 02/15/17 (collateral: U.S.Treasury Note, 1.13%, due 01/31/19), to be repurchased on demand at face value plus accrued interest. | | $ | (34,936,599 | ) |
| | | | | | | | | | |
Reverse Repurchase Agreements
| | | | |
| Average balance outstanding | | $ | (36,481,684 | ) |
| Average interest rate | | | (0.01 | )% |
| Maximum balance outstanding | | $ | (86,930,825 | ) |
Average balance outstanding was calculated based on daily face value balances outstanding during the period that the Fund had entered into reverse repurchase agreements.
As of February 28, 2017, for the above contracts and/or agreements, the Fund had sufficient cash and/or securities to cover commitments or collateral requirements, if any, of the relevant broker or exchange.
Notes to Schedule of Investments:
| † | Denominated in U.S. Dollar, unless otherwise indicated. |
| * | Non-income producing security. |
| (a) | Security valued at the local price and adjusted by applying a premium or discount since holding exceeds foreign ownership limits. |
| (b) | Indexed security in which price and/or coupon is linked to the price of a specific instrument or financial statistic (Note 2). |
| (c) | The rate disclosed is the 7 day net yield as of February 28, 2017. |
| (d) | All or a portion of this security has been pledged to cover collateral requirements on reverse repurchase agreements (Note 2). |
| (e) | Reverse repurchase agreements have an open maturity date and can be closed by either party on demand. |
For a listing of definitions of acronyms, counterparty abbreviations and currency abbreviations used throughout the Schedule of Investments as well as the derivative tables, if any, please refer to page 96.
| | | | |
| | See accompanying notes to the financial statements. | | 37 |
GMO Global Asset Allocation Fund
(A Series of GMO Trust)
Portfolio Management
Day-to-day management of the Fund’s portfolio is the responsibility of the Asset Allocation team at Grantham, Mayo, Van Otterloo & Co. LLC.
Management Discussion and Analysis of Fund Performance
GMO Global Asset Allocation Fund returned +13.21% (net) for the fiscal year ended February 28, 2017, as compared with +14.51% for the Fund’s benchmark, the GMO Global Asset Allocation Index (65% MSCI ACWI and 35% Barclays U.S. Aggregate Index).
The Fund’s underweight in equities compared to the benchmark detracted from relative performance. Within equities, the overweighting to emerging markets was helpful, but the overweighting to developed ex-US stocks and the underweighting to the US hurt relative performance. The Fund’s exposure to alternative strategies detracted from relative performance, as they significantly underperformed the very strong returns generated by equity markets. The underweighting to fixed income was beneficial to performance, and the Fund also enjoyed strong performance within fixed income, driven primarily by emerging market debt. Our exposure to cash/cash plus detracted from relative performance.
Because some of the securities and instruments held directly or indirectly by the Fund had positive fair value adjustments at the beginning or end of the fiscal year (and the performance of indices are not fair valued), the Fund’s absolute and relative performance is higher than it otherwise would have been in the absence of such fair value adjustments.
The views expressed herein are exclusively those of Grantham, Mayo, Van Otterloo & Co. LLC as of the date of this report and are subject to change. GMO disclaims any responsibility to update such views. They are not meant as investment advice. References to specific securities are not recommendations of such securities and may not be representative of any GMO portfolio’s current or future investments.
38
GMO Global Asset Allocation Fund
(A Series of GMO Trust)
Comparison of Change in Value of a $10,000,000 Investment in
GMO Global Asset Allocation Fund Class III Shares and the GMO Global Asset Allocation Index
As of February 28, 2017
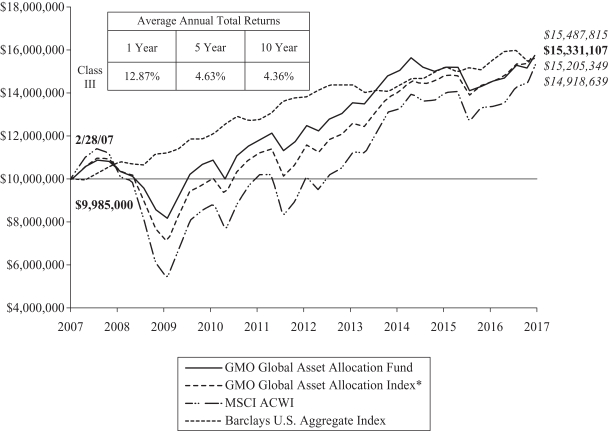
Performance data quoted represents past performance and is not indicative of future results. The investment return and principal value of an investment will fluctuate so that an investor’s shares, when redeemed, may be worth more or less than their original cost. Current performance data may be lower or higher than the performance data provided herein. To obtain performance information up to the most recent month-end, visit www.gmo.com. Performance shown is net of all fees after reimbursement from GMO. Each performance figure assumes a purchase at the beginning and redemption at the end of the stated period and reflects a transaction fee of .15% on the purchase and .15% on the redemption. Transaction fees are retained by the Fund to cover trading costs. Returns would have been lower had certain expenses not been reimbursed during the periods shown and do not include the effect of taxes on distributions and redemptions. All information is unaudited.
| | * | The GMO Global Asset Allocation Index is comprised of 48.75% S&P 500 Index, 16.25% MSCI ACWI ex USA and 35% Barclays U.S. Aggregate Index through 3/31/2007, and 65% MSCI ACWI (All Country World Index) and 35% Barclays U.S. Aggregate Index thereafter. |
| | | MSCI data may not be reproduced or used for any other purpose. MSCI provides no warranties, has not prepared or approved this report, and has no liability hereunder. |
| | | For S&P disclaimers please visit http://www.gmo.com/America/_Disclaimers/_BenchmarkDisclaimers.htm. |
39
GMO Global Asset Allocation Fund
(A Series of GMO Trust)
Investment Concentration Summary
February 28, 2017 (Unaudited)
| | | | |
| Asset Class Summary& | | % of Total Net Assets | |
Common Stocks | | | 52.6 | % |
Debt Obligations | | | 25.2 | |
Short-Term Investments | | | 16.5 | |
Mutual Funds | | | 5.2 | |
Preferred Stocks | | | 0.8 | |
Investment Funds | | | 0.1 | |
Loan Participations | | | 0.1 | |
Futures Contracts | | | 0.1 | |
Rights/Warrants | | | 0.0 | ^ |
Options Purchased | | | 0.0 | ^ |
Loan Assignments | | | 0.0 | ^ |
Forward Currency Contracts | | | (0.0 | )^ |
Written/Credit Linked Options | | | (0.0 | )^ |
Reverse Repurchase Agreements | | | (0.0 | )^ |
Swap Contracts | | | (0.1 | ) |
Securities Sold Short | | | (0.1 | ) |
Other | | | (0.4 | ) |
| | | | |
| | | 100.0 | % |
| | | | |
| | | | |
| Country/Region Summary¤ | | Debt Obligations as a
% of Total Net Assets | |
United States | | | 15.0 | % |
Other Emerging | | | 2.0 | † |
Mexico | | | 1.2 | |
Euro Region | | | (0.1 | )# |
Other Developed | | | (0.3 | )‡ |
United Kingdom | | | (1.5 | ) |
| | | | |
| | | 16.3 | % |
| | | | |
| | | | |
| Country/Region Summary¤ | | Equity Investments as a
% of Total Net Assets | |
United States | | | 16.8 | % |
Japan | | | 5.9 | |
Other Developed | | | 4.5 | ‡ |
United Kingdom | | | 4.3 | |
Taiwan | | | 4.0 | |
Other Emerging | | | 3.7 | † |
China | | | 3.1 | |
South Korea | | | 2.5 | |
France | | | 2.1 | |
Germany | | | 2.0 | |
India | | | 1.9 | |
Switzerland | | | 1.4 | |
Australia | | | 1.4 | |
Hong Kong | | | 1.0 | |
Euro Region | | | (0.0 | )#^ |
| | | | |
| | | 54.6 | % |
| | | | |
| & | The table above incorporates aggregate indirect asset class exposure associated with investments in other funds of GMO Trust (“underlying funds”), except for GMO Alpha Only Fund. Derivative financial instruments, if any, are based on market values or unrealized appreciation/depreciation rather than notional amounts. |
| ¤ | The table above incorporates aggregate indirect country exposure associated with investments in the underlying funds. The table excludes short-term |
| | investments. The table includes exposure through the use of certain derivative financial instruments and excludes exposure through certain currency linked derivatives such as forward currency contracts and currency options. The table is based on duration adjusted net exposures (both investments and derivatives), taking into account the market value of securities and the notional amounts of swaps and other derivative financial instruments. For example, U.S. asset-backed securities may represent a relatively small percentage due to their short duration, even though they represent a large percentage of market value (direct and indirect). Duration is based on GMO’s models. The greater the duration of a bond, the greater its contribution to the concentration percentage. Credit default swap exposures are factored into the duration adjusted exposure using the reference security and applying the same methodology to that security. The tables are not normalized, thus, due to the exclusions listed above and negative exposures, which may be attributable to derivatives or short sales, if any, the tables may not total to 100%. |
| † | “Other Emerging” is comprised of emerging countries that each represent between (1.0)% and 1.0% of Investments. |
| # | “Euro Region” is comprised of derivative financial instruments attributed to the Eurozone and not a particular country. |
| ‡ | “Other Developed” is comprised of developed countries that each represent between (1.0)% and 1.0% of Investments. |
40
GMO Global Asset Allocation Fund
(A Series of GMO Trust)
Schedule of Investments
(showing percentage of total net assets)
February 28, 2017
| | | | | | | | | | |
Shares /
Par Value† | | | Description | | Value ($) | |
| | | | | | MUTUAL FUNDS — 100.0% | |
| | |
| | | | | | Affiliated Issuers — 100.0% | |
| | | 3,500,804 | | | GMO Alpha Only Fund, Class IV | | | 73,411,864 | |
| | | 19,646,163 | | | GMO Asset Allocation Bond Fund, Class VI | | | 436,734,200 | |
| | | 5,788,131 | | | GMO Core Plus Bond Fund, Class IV | | | 122,418,980 | |
| | | 3,412,967 | | | GMO Emerging Country Debt Fund, Class IV | | | 98,805,388 | |
| | | 12,210,106 | | | GMO Emerging Markets Fund, Class VI | | | 363,494,869 | |
| | | 24,906,477 | | | GMO International Equity Fund, Class IV | | | 507,593,996 | |
| | | 3,790,828 | | | GMO Opportunistic Income Fund, Class VI | | | 97,727,559 | |
| | | 9,161,597 | | | GMO Quality Fund, Class VI | | | 202,013,212 | |
| | | 2,132,991 | | | GMO Risk Premium Fund, Class VI | | | 64,139,050 | |
| | | 2,241,399 | | | GMO SGM Major Markets Fund, Class VI | | | 73,002,358 | |
| | | 13,364,208 | | | GMO U.S. Equity Allocation Fund, Class VI | | | 201,264,975 | |
| | | 7,323,473 | | | GMO U.S. Treasury Fund | | | 183,086,818 | |
| | | | | | | | | | |
| | | |
| | | | | | TOTAL MUTUAL FUNDS
(COST $2,521,013,959) | | | 2,423,693,269 | |
| | | | | | | | | | |
| | |
| | | | | | DEBT OBLIGATIONS — 0.0% | |
| | | |
| | | | | | Asset-Backed Securities — 0.0% | | | | |
| | | 38,755 | | | ACE Securities Corp., Series 06-ASL1, Class A, Variable Rate, 1 mo. LIBOR + .28%, 1.06%, due 02/25/36 ◆ | | | 22,991 | |
| | | 180,046 | | | Bayview Financial Acquisition Trust, Series 04-B, Class A2, 144A, Variable Rate, 1 mo. LIBOR + .65%, 2.08%, due 05/28/39 | | | 87,996 | |
| | | 41,781 | | | GMAC Mortgage Corp. Loan Trust, Series 04-HE3, Class A3, FSA, Variable Rate, 1 mo. LIBOR + .50%, 1.28%, due 10/25/34 ◆ | | | 39,066 | |
| | | 27,649 | | | Mellon Residential Funding Corp., Series 04-TBC1, Class A, 144A, Variable Rate, 1 mo. LIBOR + .25%, 1.03%, due 02/26/34 | | | 24,790 | |
| | | | | | | | | | |
| | | | | | Total Asset-Backed Securities | | | 174,843 | |
| | | | | | | | | | |
| | | |
| | | | | | TOTAL DEBT OBLIGATIONS
(COST $225,903) | | | 174,843 | |
| | | | | | | | | | |
| | |
| | | | | | SHORT-TERM INVESTMENTS — 0.0% | |
| | |
| | | | | | Money Market Funds — 0.0% | |
| | | 288,832 | | | State Street Institutional Treasury Money Market Fund-Premier Class, 0.42% (a) | | | 288,832 | |
| | | | | | | | | | |
| | | |
| | | | | | TOTAL SHORT-TERM INVESTMENTS
(COST $288,832) | | | 288,832 | |
| | | | | | | | | | |
| | | |
| | | | | | TOTAL INVESTMENTS — 100.0%
(Cost $2,521,528,694) | | | 2,424,156,944 | |
| | | | | | Other Assets and Liabilities (net) — (0.0%) | | | (211,912 | ) |
| | | | | | | | | | |
| | | |
| | | | | | TOTAL NET ASSETS — 100.0% | | | $2,423,945,032 | |
| | | | | | | | | | |
Notes to Schedule of Investments:
| † | Denominated in U.S. Dollar, unless otherwise indicated. |
| ◆ | These securities are primarily backed by subprime mortgages. |
| (a) | The rate disclosed is the 7 day net yield as of February 28, 2017. |
For a listing of definitions of acronyms, counterparty abbreviations and currency abbreviations used throughout the Schedule of Investments as well as the derivative tables, if any, please refer to page 96.
| | | | |
| | See accompanying notes to the financial statements. | | 41 |
GMO Global Developed Equity Allocation Fund
(A Series of GMO Trust)
Portfolio Management
Day-to-day management of the Fund’s portfolio is the responsibility of the Asset Allocation team at Grantham, Mayo, Van Otterloo & Co. LLC.
Management Discussion and Analysis of Fund Performance
GMO Global Developed Equity Allocation Fund returned +20.03% (net) for the fiscal year ended February 28, 2017, as compared with +21.26% for the Fund’s benchmark, the MSCI World Index.
The Fund’s exposure to emerging markets was the largest positive contributor to performance relative to the benchmark and broadly compensated for the negative relative contributions from the underweight to the US and the overweight to Europe. The Fund’s modest cash holdings were a drag on relative performance given the strong returns generated by equities.
Allocation between sectors proved neutral and, in stock selection, poor relative performance in Information Technology was offset by good relative returns in Utilities and Healthcare. Top stock detractors included having no exposure to the strongly performing Bank of America, as well as overweight positions in Valero Energy Corporation and Nippon Telegraph and Telephone Corporation. Top stock contributors included overweight positions in Samsung Electronics Co., BASF, and United Health Group.
Because some of the securities and instruments held directly or indirectly by the Fund had positive fair value adjustments at the beginning or end of the fiscal year (and the performance of indices are not fair valued), the Fund’s absolute and relative performance is higher than it otherwise would have been in the absence of such fair value adjustments.
The views expressed herein are exclusively those of Grantham, Mayo, Van Otterloo & Co. LLC as of the date of this report and are subject to change. GMO disclaims any responsibility to update such views. They are not meant as investment advice. References to specific securities are not recommendations of such securities and may not be representative of any GMO portfolio’s current or future investments.
42
GMO Global Developed Equity Allocation Fund
(A Series of GMO Trust)
Comparison of Change in Value of a $10,000,000 Investment in
GMO Global Developed Equity Allocation Fund Class III Shares and the MSCI World Index
As of February 28, 2017
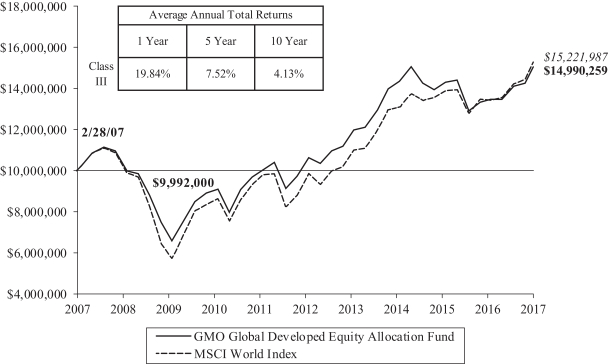
Performance data quoted represents past performance and is not indicative of future results. The investment return and principal value of an investment will fluctuate so that an investor’s shares, when redeemed, may be worth more or less than their original cost. Current performance data may be lower or higher than the performance data provided herein. To obtain performance information up to the most recent month-end, visit www.gmo.com. Performance shown is net of all fees after reimbursement from GMO. Each performance figure assumes a purchase at the beginning and redemption at the end of the stated period and reflects a transaction fee of .08% on the purchase and .08% on the redemption. Transaction fees are retained by the Fund to cover trading costs. Returns would have been lower had certain expenses not been reimbursed during the periods shown and do not include the effect of taxes on distributions and redemptions. All information is unaudited.
MSCI data may not be reproduced or used for any other purpose. MSCI provides no warranties, has not prepared or approved this report, and has no liability hereunder.
43
GMO Global Developed Equity Allocation Fund
(A Series of GMO Trust)
Investment Concentration Summary
February 28, 2017 (Unaudited)
| | | | |
| Asset Class Summary& | | % of Total Net Assets | |
Common Stocks | | | 97.8 | % |
Short-Term Investments | | | 1.5 | |
Preferred Stocks | | | 0.8 | |
Investment Funds | | | 0.1 | |
Swap Contracts | | | 0.0 | ^ |
Rights/Warrants | | | 0.0 | ^ |
Futures Contracts | | | (0.0 | )^ |
Other | | | (0.2 | ) |
| | | | |
| | | 100.0 | % |
| | | | |
| | | | |
| Country/Region Summary¤ | | % of Investments | |
United States | | | 40.6 | % |
Japan | | | 12.7 | |
United Kingdom | | | 9.2 | |
France | | | 4.7 | |
Germany | | | 4.5 | |
Other Developed | | | 3.9 | ‡ |
Other Emerging | | | 3.4 | † |
Switzerland | | | 3.2 | |
Australia | | | 3.1 | |
Taiwan | | | 2.9 | |
Hong Kong | | | 2.2 | |
China | | | 2.0 | |
Netherlands | | | 1.8 | |
Spain | | | 1.7 | |
South Korea | | | 1.7 | |
India | | | 1.2 | |
Canada | | | 1.2 | |
| | | | |
| | | 100.0 | % |
| | | | |
| & | The table above incorporates aggregate indirect asset class exposure associated with investments in other funds of GMO Trust (“underlying funds”). Derivative financial instruments, if any, are based on market values or unrealized appreciation/depreciation rather than notional amounts. |
| ¤ | The table above incorporates aggregate indirect country exposure associated with investments in the underlying funds. The table excludes short-term investments and includes exposure through the use of derivative financial instruments, if any. The table excludes exposure through forward currency contracts, if any. |
| ‡ | “Other Developed” is comprised of developed countries that each represent between (1.0)% and 1.0% of Investments. |
| † | “Other Emerging” is comprised of emerging countries that each represent between (1.0)% and 1.0% of Investments. |
44
GMO Global Developed Equity Allocation Fund
(A Series of GMO Trust)
Schedule of Investments
(showing percentage of total net assets)
February 28, 2017
| | | | | | | | | | |
Shares /
Par Value† | | | Description | | Value ($) | |
| | | | | | MUTUAL FUNDS — 100.0% | |
| | |
| | | | | | Affiliated Issuers — 100.0% | |
| | | 3,310,105 | | | GMO Emerging Markets Fund, Class VI | | | 98,541,837 | |
| | | 22,398,238 | | | GMO International Equity Fund, Class IV | | | 456,476,089 | |
| | | 9,936,690 | | | GMO Quality Fund, Class VI | | | 219,104,022 | |
| | | 14,465,096 | | | GMO U.S. Equity Allocation Fund, Class VI | | | 217,844,350 | |
| | | | | | | | | | |
| | | |
| | | | | | TOTAL MUTUAL FUNDS (COST $1,064,014,178) | | | 991,966,298 | |
| | | | | | | | | | |
| | |
| | | | | | SHORT-TERM INVESTMENTS — 0.0% | |
| | |
| | | | | | Time Deposits — 0.0% | |
| | | 338,803 | | | State Street Eurodollar Time Deposit, 0.07%, due 03/01/17 | | | 338,803 | |
| | | | | | | | | | |
| | | |
| | | | | | TOTAL SHORT-TERM INVESTMENTS (COST $338,803) | | | 338,803 | |
| | | | | | | | | | |
| | | |
| | | | | | TOTAL INVESTMENTS — 100.0% (Cost $1,064,352,981) | | | 992,305,101 | |
| | | | | | Other Assets and Liabilities (net) — (0.0%) | | | (45,488 | ) |
| | | | | | | | | | |
| | | |
| | | | | | TOTAL NET ASSETS — 100.0% | | | $992,259,613 | |
| | | | | | | | | | |
Notes to Schedule of Investments:
| † | Denominated in U.S. Dollar, unless otherwise indicated. |
For a listing of definitions of acronyms, counterparty abbreviations and currency abbreviations used throughout the Schedule of Investments as well as the derivative tables, if any, please refer to page 96.
| | | | |
| | See accompanying notes to the financial statements. | | 45 |
GMO Global Equity Allocation Fund
(A Series of GMO Trust)
Portfolio Management
Day-to-day management of the Fund’s portfolio is the responsibility of the Asset Allocation team at Grantham, Mayo, Van Otterloo & Co. LLC.
Management Discussion and Analysis of Fund Performance
GMO Global Equity Allocation Fund returned +21.93% (net) for the fiscal year ended February 28, 2017, as compared with +22.07 for the Fund’s benchmark, the MSCI All Country World Index (“ACWI”).
The Fund’s exposure to emerging markets was the largest positive contributor to performance relative to the benchmark and more than compensated for the negative relative contributions from the underweight to the US and the overweight to Europe. The Fund’s modest cash holdings were a drag on relative performance given the strong returns generated by equities.
Allocation between sectors proved neutral, as a positive contribution from an underweight position in Healthcare offset a negative contribution from being overweight in Telecommunication Services. Stock selection was beneficial in Utilities, Health Care, and Telecommunication Services, which outweighed negative selection from Information Technology and Energy.
Top stock detractors included having no exposure to the strongly performing Bank of America, as well as overweight positions in Nippon Telegraph and Telephone Corporation and Valero Energy Corporation. Top stock contributors included overweight positions in Sberbank Russia, Samsung Electronics Co., and Yes Bank Limited (India’s fifth largest private sector bank).
The views expressed herein are exclusively those of Grantham, Mayo, Van Otterloo & Co. LLC as of the date of this report and are subject to change. GMO disclaims any responsibility to update such views. They are not meant as investment advice. References to specific securities are not recommendations of such securities and may not be representative of any GMO portfolio’s current or future investments.
46
GMO Global Equity Allocation Fund
(A Series of GMO Trust)
Comparison of Change in Value of a $10,000,000 Investment in
GMO Global Equity Allocation Fund Class III Shares and the MSCI ACWI +
As of February 28, 2017
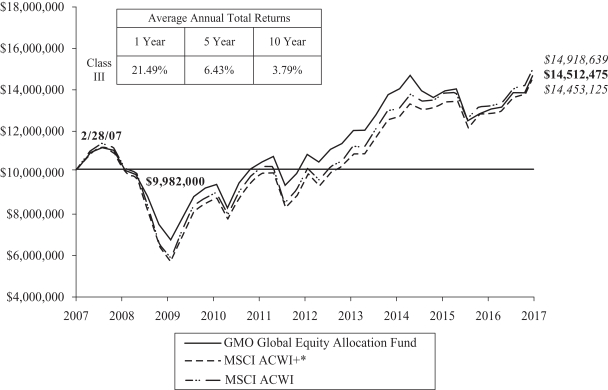
Performance data quoted represents past performance and is not indicative of future results. The investment return and principal value of an investment will fluctuate so that an investor’s shares, when redeemed, may be worth more or less than their original cost. Current performance data may be lower or higher than the performance data provided herein. To obtain performance information up to the most recent month-end, visit www.gmo.com. Performance shown is net of all fees after reimbursement from GMO. Each performance figure assumes a purchase at the beginning and redemption at the end of the stated period and reflects a transaction fee of .18% on the purchase and .18% on the redemption. Transaction fees are retained by the Fund to cover trading costs. Returns would have been lower had certain expenses not been reimbursed during the periods shown and do not include the effect of taxes on distributions and redemptions. All information is unaudited.
| | * | The MSCI ACWI + represents 75% S&P 500 Index and 25% MSCI ACWI ex-USA prior to May 30, 2008 and MSCI ACWI thereafter. |
| | | MSCI data may not be reproduced or used for any other purpose. MSCI provides no warranties, has not prepared or approved this report, and has no liability hereunder. |
| | | For S&P disclaimers please visit http://www.gmo.com/America/_Disclaimers/_BenchmarkDisclaimers.htm. |
47
GMO Global Equity Allocation Fund
(A Series of GMO Trust)
Investment Concentration Summary
February 28, 2017 (Unaudited)
| | | | |
| Asset Class Summary& | | % of Total Net Assets | |
Common Stocks | | | 97.2 | % |
Short-Term Investments | | | 1.5 | |
Preferred Stocks | | | 1.3 | |
Investment Funds | | | 0.2 | |
Swap Contracts | | | 0.0 | ^ |
Rights/Warrants | | | 0.0 | ^ |
Futures Contracts | | | (0.0 | )^ |
Other | | | (0.2 | ) |
| | | | |
| | | 100.0 | % |
| | | | |
| | | | |
| Country/Region Summary¤ | | % of Investments | |
United States | | | 34.1 | % |
Japan | | | 11.0 | |
United Kingdom | | | 7.9 | |
Taiwan | | | 6.2 | |
China | | | 4.6 | |
France | | | 4.1 | |
Germany | | | 3.9 | |
Other Emerging | | | 3.9 | † |
South Korea | | | 3.8 | |
Other Developed | | | 3.4 | ‡ |
India | | | 2.9 | |
Switzerland | | | 2.7 | |
Australia | | | 2.7 | |
Hong Kong | | | 2.0 | |
Netherlands | | | 1.6 | |
Spain | | | 1.5 | |
Russia | | | 1.5 | |
Turkey | | | 1.2 | |
Canada | | | 1.0 | |
| | | | |
| | | 100.0 | % |
| | | | |
| & | The table above incorporates aggregate indirect asset class exposure associated with investments in other funds of GMO Trust (“underlying funds”). Derivative financial instruments, if any, are based on market values or unrealized appreciation/depreciation rather than notional amounts. |
| ¤ | The table above incorporates aggregate indirect country exposure associated with investments in the underlying funds. The table excludes short-term investments and includes exposure through the use of derivative financial instruments, if any. The table excludes exposure through forward currency contracts, if any. |
| † | “Other Emerging” is comprised of emerging countries that each represent between (1.0)% and 1.0% of Investments. |
| ‡ | “Other Developed” is comprised of developed countries that each represent between (1.0)% and 1.0% of Investments. |
48
GMO Global Equity Allocation Fund
(A Series of GMO Trust)
Schedule of Investments
(showing percentage of total net assets)
February 28, 2017
| | | | | | | | | | |
| | | Shares / Par Value† | | | Description | | Value ($) | |
| | | | | | MUTUAL FUNDS — 100.0% | |
| | |
| | | | | | Affiliated Issuers — 100.0% | |
| | | 16,947,060 | | | GMO Emerging Markets Fund, Class VI | | | 504,513,964 | |
| | | 43,439,004 | | | GMO International Equity Fund, Class IV | | | 885,286,898 | |
| | | 18,127,410 | | | GMO Quality Fund, Class VI | | | 399,709,400 | |
| | | 27,665,758 | | | GMO U.S. Equity Allocation Fund, Class VI | | | 416,646,309 | |
| | | | | | | | | | |
| | | |
| | | | | | TOTAL MUTUAL FUNDS
(COST $2,358,486,029) | | | 2,206,156,571 | |
| | | | | | | | | | |
| | |
| | | | | | SHORT-TERM INVESTMENTS — 0.0% | |
| | |
| | | | | | Time Deposits — 0.0% | |
| | | 745,313 | | | State Street Eurodollar Time Deposit, 0.07%, due 03/01/2017 | | | 745,313 | |
| | | | | | | | | | |
| | | |
| | | | | | TOTAL SHORT-TERM INVESTMENTS (COST $745,313) | | | 745,313 | |
| | | | | | | | | | |
| | | |
| | | | | | TOTAL INVESTMENTS — 100.0%
(Cost $2,359,231,342) | | | 2,206,901,884 | |
| | | | | | Other Assets and Liabilities (net) — (0.0%) | | | (83,666 | ) |
| | | | | | | | | | |
| | | |
| | | | | | TOTAL NET ASSETS — 100.0% | | | $2,206,818,218 | |
| | | | | | | | | | |
Notes to Schedule of Investments:
| † | Denominated in U.S. Dollar, unless otherwise indicated. |
For a listing of definitions of acronyms, counterparty abbreviations and currency abbreviations used throughout the Schedule of Investments as well as the derivative tables, if any, please refer to page 96.
| | | | |
| | See accompanying notes to the financial statements. | | 49 |
GMO Implementation Fund
(A Series of GMO Trust)
Portfolio Management
Day-to-day management of the Fund’s portfolio is the responsibility of the Asset Allocation team at Grantham, Mayo, Van Otterloo & Co. LLC. Allocations among asset classes are made by the Asset Allocation team and specific security selection is primarily handled by other GMO investment teams in collaboration with the Asset Allocation team. For example, the Global Equity team selects equity securities within GMO Implementation Fund.
Management Discussion and Analysis of Fund Performance
Although GMO does not manage the Fund to, or control the Fund’s risk relative to, any securities index or securities benchmark, a discussion of the Fund’s performance relative to the Consumer Price Index (“CPI”) is included for comparative purposes only.
GMO Implementation Fund returned +12.88% (net) for the fiscal year ended February 28, 2017, as compared with +2.84% for the CPI.
The Fund’s exposure to equities, particularly in emerging markets, was the primary driver of the strong performance. The Fund’s exposure to fixed income also contributed, with distressed debt being most noteworthy. Alternative strategies had a minimal impact on performance, while cash and short duration bond holdings detracted, largely due to the considerable increase in yields in the US in the fourth quarter of 2016.
Because some of the securities and instruments held directly or indirectly by the Fund had positive fair value adjustments at the beginning or end of the fiscal year (and the performance of indices are not fair valued), the Fund’s absolute and relative performance is higher than it otherwise would have been in the absence of such fair value adjustments.
The views expressed herein are exclusively those of Grantham, Mayo, Van Otterloo & Co. LLC as of the date of this report and are subject to change. GMO disclaims any responsibility to update such views. They are not meant as investment advice. References to specific securities are not recommendations of such securities and may not be representative of any GMO portfolio’s current or future investments.
50
GMO Implementation Fund
(A Series of GMO Trust)
Comparison of Change in Value of a $10,000,000 Investment in
GMO Implementation Fund and the Consumer Price Index
As of February 28, 2017
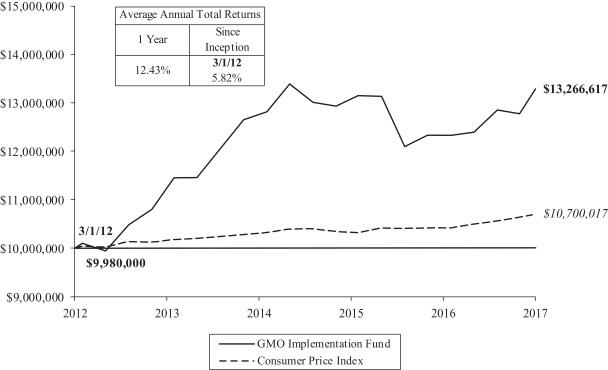
Performance data quoted represents past performance and is not indicative of future results. The investment return and principal value of an investment will fluctuate so that an investor’s shares, when redeemed, may be worth more or less than their original cost. Current performance data may be lower or higher than the performance data provided herein. To obtain performance information up to the most recent month-end, please call (617) 330-7500. Performance shown is net of all fees after reimbursement from GMO. Each performance figure assumes a purchase at the beginning and redemption at the end of the stated period and reflects a transaction fee of .20% on the purchase and .20% on the redemption. Transaction fees are retained by the Fund to cover trading costs. Returns would have been lower had certain expenses not been reimbursed during the periods shown and do not include the effect of taxes on distributions and redemptions. All information is unaudited.
51
GMO Implementation Fund
(A Series of GMO Trust)
Consolidated Investment Concentration Summary (a)
February 28, 2017 (Unaudited)
| | | | |
| Asset Class Summary& | | % of Total Net Assets | |
Common Stocks | | | 51.0 | % |
Debt Obligations | | | 38.1 | |
Short-Term Investments | | | 6.8 | |
Preferred Stocks | | | 2.5 | |
Options Purchased | | | 0.1 | |
Rights/Warrants | | | 0.1 | |
Futures Contracts | | | 0.0 | ^ |
Forward Currency Contracts | | | 0.0 | ^ |
Reverse Repurchase Agreements | | | 0.0 | ^ |
Swap Contracts | | | 0.0 | ^ |
Written Options | | | (0.1 | ) |
Securities Sold Short | | | (1.5 | ) |
Other | | | 3.0 | |
| | | | |
| | | 100.0 | % |
| | | | |
| | | | |
| Country/Region Summary¤ | | Debt Obligations as a
% of Total Net Assets | |
United States | | | 13.7 | % |
Other Developed | | | 0.7 | ‡ |
Other Emerging | | | 0.0 | ^† |
Euro Region | | | 0.0 | ^§ |
United Kingdom | | | (1.9 | ) |
| | | | |
| | | 12.5 | % |
| | | | |
| | | | |
| Country/Region Summary¤ | | Equity Investments as a % of Total Net Assets | |
United States | | | 9.6 | % |
China | | | 7.5 | |
Other Developed | | | 4.3 | ‡ |
South Korea | | | 4.0 | |
Japan | | | 3.7 | |
Taiwan | | | 3.4 | |
Brazil | | | 3.1 | |
Other Emerging | | | 2.7 | † |
United Kingdom | | | 2.3 | |
South Africa | | | 1.8 | |
Germany | | | 1.8 | |
India | | | 1.7 | |
France | | | 1.5 | |
Switzerland | | | 1.3 | |
Netherlands | | | 1.3 | |
Turkey | | | 1.1 | |
Australia | | | 1.1 | |
| | | | |
| | | 52.2 | % |
| | | | |
| | | | |
| Industry Group Summary | | % of Equity Investments# | |
Banks | | | 9.9 | % |
Materials | | | 8.0 | |
Software & Services | | | 7.3 | |
Capital Goods | | | 6.8 | |
Energy | | | 6.7 | |
Technology Hardware & Equipment | | | 6.7 | |
Food, Beverage & Tobacco | | | 5.4 | |
Utilities | | | 5.0 | |
Insurance | | | 4.9 | |
Automobiles & Components | | | 4.8 | |
| | | | |
| Industry Group Summary | | % of Equity Investments# | |
Telecommunication Services | | | 4.5 | % |
Real Estate | | | 4.4 | |
Semiconductors & Semiconductor Equipment | | | 4.0 | |
Consumer Durables & Apparel | | | 3.2 | |
Pharmaceuticals, Biotechnology & Life Sciences | | | 2.9 | |
Diversified Financials | | | 2.9 | |
Transportation | | | 2.5 | |
Health Care Equipment & Services | | | 2.3 | |
Media | | | 2.3 | |
Food & Staples Retailing | | | 1.7 | |
Retailing | | | 1.7 | |
Household & Personal Products | | | 1.1 | |
Commercial & Professional Services | | | 0.6 | |
Consumer Services | | | 0.4 | |
| | | | |
| | | 100.0 | % |
| | | | |
| (a) | GMO Implementation SPC Ltd. is a 100% owned subsidiary of GMO Implementation Fund. As such, the holdings of GMO Implementation SPC Ltd. have been included with GMO Implementation Fund. |
| & | In the table above, derivative financial instruments, if any, are based on market values or unrealized appreciation/depreciation rather than notional amounts. |
| ¤ | The table above incorporates aggregate indirect country exposure associated with investments in the underlying funds. The table excludes short-term investments. The table includes exposure through the use of certain derivative financial instruments and excludes exposure through certain currency linked derivatives such as forward currency contracts and currency options. The table is based on duration adjusted net exposures (both investments and derivatives), taking into account the market value of securities and the notional amounts of swaps and other derivative financial instruments. For example, U.S. asset-backed securities may represent a relatively small percentage due to their short duration, even though they represent a large percentage of market value (direct and indirect). Duration is based on GMO’s models. The greater the duration of a bond, the greater its contribution to the concentration percentage. Credit default swap exposures are factored into the duration adjusted exposure using the reference security and applying the same methodology to that security. The table is not normalized, thus, due to the exclusions listed above and negative exposures, which may be attributable to derivatives or short sales, if any, the table may not total to 100%. |
| ‡ | “Other Developed” is comprised of developed countries that each represent between (1.0)% and 1.0% of Total Net Assets. |
| † | “Other Emerging” is comprised of emerging countries that each represent between (1.0)% and 1.0% of Total Net Assets. |
| § | “Euro Region” is comprised of derivative financial instruments attributed to the Eurozone and not a particular country. |
| # | Equity investments may consist of common stocks and other stock-related securities, such as preferred stocks, if any. This table excludes exposure to derivative contracts, short-term investments, mutual funds and investment funds, if any. For a summary of these exposures, if any, see the Schedule of Investments. |
52
GMO Implementation Fund
(A Series of GMO Trust)
Consolidated Schedule of Investments
(showing percentage of total net assets)
February 28, 2017
| | | | | | | | | | |
Shares | | | Description | | Value ($) | |
| | | | | | COMMON STOCKS — 51.0% | |
| | |
| | | | | | Australia — 1.1% | |
| | | 1,007,808 | | | Adelaide Brighton Ltd | | | 4,148,177 | |
| | | 111,645 | | | BHP Billiton Ltd | | | 2,113,226 | |
| | | 182,128 | | | BlueScope Steel Ltd | | | 1,703,366 | |
| | | 51,024 | | | BWP Trust (REIT) | | | 111,453 | |
| | | 70,364 | | | CIMIC Group Ltd | | | 2,037,094 | |
| | | 119,389 | | | Credit Corp Group Ltd | | | 1,504,896 | |
| | | 315,120 | | | CSR Ltd | | | 1,009,128 | |
| | | 1,662,142 | | | Dexus Property Group (REIT) | | | 12,024,200 | |
| | | 1,393,905 | | | Downer EDI Ltd | | | 7,495,099 | |
| | | 6,099,249 | | | DUET Group | | | 12,849,031 | |
| | | 890,813 | | | Fairfax Media Ltd | | | 644,620 | |
| | | 203,735 | | | Fortescue Metals Group Ltd | | | 1,031,423 | |
| | | 786,896 | | | Genworth Mortgage Insurance Australia Ltd | | | 1,693,859 | |
| | | 1,714,830 | | | GPT Group (The) (REIT) | | | 6,477,159 | |
| | | 512,680 | | | Investa Office Fund (REIT) | | | 1,835,522 | |
| | | 145,312 | | | LendLease Group | | | 1,695,401 | |
| | | 408,287 | | | Metcash Ltd * | | | 676,329 | |
| | | 4,534,983 | | | Mirvac Group (REIT) | | | 7,468,633 | |
| | | 454,359 | | | Nine Entertainment Co Holdings Ltd | | | 365,764 | |
| | | 938,277 | | | OZ Minerals Ltd | | | 6,676,130 | |
| | | 567,394 | | | Pact Group Holdings Ltd | | | 2,899,283 | |
| | | 2,869,741 | | | Scentre Group (REIT) | | | 9,590,396 | |
| | | 388,390 | | | Shopping Centres Australasia Property Group (REIT) | | | 663,764 | |
| | | 252,745 | | | Sonic Healthcare Ltd | | | 4,167,068 | |
| | | 554,867 | | | Star Entertainment Grp Ltd (The) | | | 2,073,512 | |
| | | 997,718 | | | Stockland (REIT) | | | 3,608,688 | |
| | | 385,198 | | | Tassal Group Ltd | | | 1,410,715 | |
| | | 5,293,262 | | | Telstra Corp Ltd | | | 19,550,420 | |
| | | 129,137 | | | Virtus Health Ltd | | | 535,681 | |
| | | 136,126 | | | Wesfarmers Ltd | | | 4,455,543 | |
| | | 85,898 | | | Woodside Petroleum Ltd | | | 2,060,431 | |
| | | | | | | | | | |
| | | | | | Total Australia | | | 124,576,011 | |
| | | | | | | | | | |
| | |
| | | | | | Austria — 0.2% | |
| | | 18,165 | | | Oesterreichische Post AG * | | | 660,497 | |
| | | 306,283 | | | OMV AG | | | 11,707,755 | |
| | | 137,646 | | | voestalpine AG | | | 5,783,382 | |
| | | | | | | | | | |
| | | | | | Total Austria | | | 18,151,634 | |
| | | | | | | | | | |
| | |
| | | | | | Belgium — 0.0% | |
| | | 231,456 | | | AGFA-Gevaert NV * | | | 945,657 | |
| | | 1,891 | | | Barco NV | | | 169,579 | |
| | | 146,355 | | | bpost SA | | | 3,634,289 | |
| | | 385 | | | Groupe Bruxelles Lambert SA | | | 32,625 | |
| | | | | | | | | | |
| | | | | | Total Belgium | | | 4,782,150 | |
| | | | | | | | | | |
| | | | | | | | | | |
Shares | | | Description | | Value ($) | |
| | | | | | Brazil — 1.0% | |
| | | 563,330 | | | Banco Bradesco SA | | | 5,879,461 | |
| | | 1,135,500 | | | Banco do Brasil SA | | | 12,025,234 | |
| | | 6,728,800 | | | BM&FBovespa SA – Bolsa de Valores Mercadorias e Futuros | | | 40,994,648 | |
| | | 2,279,100 | | | Centrais Eletricas Brasileiras SA * | | | 15,705,047 | |
| | | 162,873 | | | Cia de Saneamento de Minas Gerais-COPASA | | | 2,694,107 | |
| | | 231,100 | | | Companhia de Saneamento Basico do Estado de Sao Paulo | | | 2,434,458 | |
| | | 118,800 | | | Grendene SA | | | 762,603 | |
| | | 1,884,200 | | | JBS SA | | | 7,073,464 | |
| | | 23,900 | | | M Dias Branco SA | | | 1,060,457 | |
| | | 3,503,100 | | | MRV Engenharia e Participacoes SA | | | 16,026,144 | |
| | | 1,699,670 | | | Transmissora Alianca de Energia Eletrica SA | | | 12,014,430 | |
| | | | | | | | | | |
| | | | | | Total Brazil | | | 116,670,053 | |
| | | | | | | | | | |
| | |
| | | | | | Canada — 0.9% | |
| | | 42,700 | | | AGF Management Ltd – Class B | | | 194,500 | |
| | | 228,300 | | | Air Canada * | | | 2,299,845 | |
| | | 50,700 | | | Alimentation Couche-Tard Inc – Class B | | | 2,254,436 | |
| | | 87,700 | | | Bank of Montreal | | | 6,655,084 | |
| | | 97,100 | | | Bird Construction Inc | | | 648,454 | |
| | | 31,300 | | | Canadian Imperial Bank of Commerce | | | 2,747,999 | |
| | | 107,000 | | | Canadian Tire Corp Ltd – Class A | | | 12,269,312 | |
| | | 23,400 | | | Celestica Inc * | | | 309,193 | |
| | | 202,500 | | | CGI Group Inc – Class A * | | | 9,309,328 | |
| | | 68,100 | | | Chorus Aviation Inc | | | 366,598 | |
| | | 386,200 | | | CI Financial Corp | | | 7,874,037 | |
| | | 895,500 | | | IAMGOLD Corp (CAD) * | | | 3,532,917 | |
| | | 207,000 | | | IAMGOLD Corp (USD) * | | | 815,580 | |
| | | 17,000 | | | Industrial Alliance Insurance & Financial Services Inc | | | 705,624 | |
| | | 75,800 | | | Medical Facilities Corp | | | 1,036,957 | |
| | | 707,400 | | | Metro Inc | | | 20,627,618 | |
| | | 104,400 | | | Open Text Corp | | | 3,441,223 | |
| | | 99,500 | | | Rogers Sugar Inc | | | 476,449 | |
| | | 25,300 | | | Saputo Inc | | | 868,795 | |
| | | 332,000 | | | Sun Life Financial Inc | | | 12,048,185 | |
| | | 12,100 | | | TFI International Inc | | | 301,726 | |
| | | 8,800 | | | TMX Group Ltd | | | 464,978 | |
| | | 103,400 | | | Toromont Industries Ltd | | | 3,606,778 | |
| | | 198,920 | | | Transcontinental Inc – Class A | | | 3,029,778 | |
| | | 99,060 | | | WestJet Airlines Ltd | | | 1,625,891 | |
| | | 7,600 | | | Westshore Terminals Investment Corp | | | 154,495 | |
| | | 25,700 | | | ZCL Composites Inc – Class C | | | 235,483 | |
| | | | | | | | | | |
| | | | | | Total Canada | | | 97,901,263 | |
| | | | | | | | | | |
| | | | |
| | See accompanying notes to the financial statements. | | 53 |
GMO Implementation Fund
(A Series of GMO Trust)
Consolidated Schedule of Investments — (Continued)
(showing percentage of total net assets)
February 28, 2017
| | | | | | | | | | |
Shares | | | Description | | Value ($) | |
| | | | | | Chile — 0.0% | |
| | | 166,269 | | | Empresa Nacional de Telecomunicaciones SA * | | | 1,827,833 | |
| | | 130,558 | | | Enel Americas SA | | | 25,404 | |
| | | 130,558 | | | Enel Chile SA | | | 13,434 | |
| | | | | | | | | | |
| | | | | | Total Chile | | | 1,866,671 | |
| | | | | | | | | | |
| | |
| | | | | | China — 7.5% | |
| | | 2,500,000 | | | 361 Degrees International Ltd | | | 945,964 | |
| | | 7,206,000 | | | Agile Property Holdings Ltd | | | 4,753,367 | |
| | | 10,921,000 | | | Anhui Conch Cement Co Ltd – Class H | | | 38,021,628 | |
| | | 3,931,000 | | | ANTA Sports Products Ltd | | | 11,893,013 | |
| | | 2,990,000 | | | BAIC Motor Corp Ltd – Class H | | | 3,361,646 | |
| | | 6,344,000 | | | Beijing Capital International Airport Co Ltd – Class H | | | 6,798,335 | |
| | | 33,930,000 | | | Belle International Holdings Ltd | | | 23,360,828 | |
| | | 92,420 | | | Changyou.com Ltd ADR * | | | 2,552,640 | |
| | | 13,359,000 | | | China Communications Construction Co Ltd – Class H | | | 17,237,312 | |
| | | 20,164,000 | | | China Communications Services Corp Ltd – Class H | | | 13,464,125 | |
| | | 6,898,000 | | | China Everbright Ltd | | | 13,681,971 | |
| | | 2,904,000 | | | China Foods Ltd | | | 1,292,915 | |
| | | 5,086,000 | | | China Greenfresh Group Co Ltd | | | 2,490,049 | |
| | | 3,976,000 | | | China High Speed Transmission Equipment Group Co Ltd | | | 4,849,241 | |
| | | 14,572,000 | | | China Jinmao Holdings Group Ltd | | | 4,524,384 | |
| | | 9,241,000 | | | China Lesso Group Holdings Ltd | | | 6,932,083 | |
| | | 6,062,000 | | | China Machinery Engineering Corp – Class H | | | 4,216,370 | |
| | | 4,980,000 | | | China Mengniu Dairy Co Ltd | | | 9,791,011 | |
| | | 3,501,500 | | | China Mobile Ltd | | | 38,621,832 | |
| | | 51,406,000 | | | China National Building Material Co Ltd – Class H | | | 37,485,595 | |
| | | 63,654,000 | | | China Petroleum & Chemical Corp – Class H | | | 49,340,997 | |
| | | 17,318,500 | | | China Railway Construction Corp Ltd – Class H | | | 24,486,100 | |
| | | 12,120,000 | | | China Resources Cement Holdings Ltd | | | 6,302,210 | |
| | | 8,880,963 | | | China Resources Power Holdings Co Ltd | | | 16,072,626 | |
| | | 2,947,000 | | | China SCE Property Holdings Ltd | | | 1,070,034 | |
| | | 4,824,000 | | | China Shanshui Cement Group Ltd * (a) | | | — | |
| | | 5,628,000 | | | China Shenhua Energy Co Ltd – Class H | | | 11,776,364 | |
| | | 324,000 | | | China Shineway Pharmaceutical Group Ltd | | | 349,349 | |
| | | 4,632,000 | | | China Southern Airlines Co Ltd – Class H | | | 3,011,628 | |
| | | 111,094,000 | | | China Telecom Corp Ltd – Class H | | | 52,246,122 | |
| | | 3,007,000 | | | China ZhengTong Auto Services Holdings Ltd | | | 1,258,396 | |
| | | 10,414,000 | | | CIFI Holdings Group Co Ltd | | | 3,486,245 | |
| | | 743,877 | | | CKH Food & Health Ltd * | | | 1,131,102 | |
| | | 22,005,000 | | | CNOOC Ltd | | | 26,031,720 | |
| | | | | | | | | | |
Shares | | | Description | | Value ($) | |
| | | | | | China — continued | |
| | | 28,567,000 | | | Country Garden Holdings Co Ltd | | | 20,455,038 | |
| | | 694,000 | | | Dah Chong Hong Holdings Ltd | | | 272,577 | |
| | | 3,064,000 | | | Datang International Power Generation Co Ltd – Class H | | | 896,089 | |
| | | 1,787,000 | | | Digital China Holdings Ltd | | | 1,593,490 | |
| | | 13,946,000 | | | Dongfeng Motor Group Co Ltd – Class H | | | 16,536,952 | |
| | | 2,898,000 | | | Future Land Development Holdings Ltd | | | 745,417 | |
| | | 5,120,000 | | | Geely Automobile Holdings Ltd | | | 6,959,742 | |
| | | 6,777,500 | | | Great Wall Motor Co Ltd – Class H | | | 8,323,048 | |
| | | 8,294,500 | | | Greentown China Holdings Ltd * | | | 7,577,921 | |
| | | 9,198,000 | | | Guangdong Investment Ltd | | | 12,530,885 | |
| | | 1,298,000 | | | Guangshen Railway Co Ltd – Class H | | | 810,847 | |
| | | 18,624,400 | | | Guangzhou R&F Properties Co Ltd – Class H | | | 25,714,721 | |
| | | 2,375,000 | | | Haitian International Holdings Ltd | | | 4,997,014 | |
| | | 2,458,000 | | | Harbin Electric Co Ltd – Class H | | | 1,209,660 | |
| | | 1,635,000 | | | Hi Sun Technology China Ltd. * | | | 261,142 | |
| | | 630,000 | | | Hopson Development Holdings Ltd | | | 570,537 | |
| | | 18,770,000 | | | Huabao International Holdings Ltd * | | | 10,083,433 | |
| | | 2,104,000 | | | Huadian Power International Corp Ltd – Class H | | | 923,826 | |
| | | 5,771,036 | | | Intime Retail Group Co Ltd | | | 7,170,428 | |
| | | 8,804,000 | | | Jiangsu Expressway Co Ltd – Class H | | | 11,613,982 | |
| | | 1,482,000 | | | Ju Teng International Holdings Ltd | | | 556,570 | |
| | | 4,804,000 | | | Kingboard Chemical Holdings Ltd | | | 16,985,195 | |
| | | 4,047,000 | | | Kingboard Laminates Holdings Ltd | | | 4,533,085 | |
| | | 13,866,500 | | | KWG Property Holding Ltd | | | 8,749,687 | |
| | | 14,176,000 | | | Lee & Man Paper Manufacturing Ltd | | | 12,843,760 | |
| | | 8,977,000 | | | Longfor Properties Co Ltd | | | 14,360,262 | |
| | | 28,200 | | | NetEase Inc ADR | | | 8,602,692 | |
| | | 1,959,000 | | | Nine Dragons Paper Holdings Ltd | | | 2,485,912 | |
| | | 24,863,000 | | | People’s Insurance Co Group of China Ltd (The) – Class H | | | 10,210,670 | |
| | | 4,896,000 | | | PICC Property & Casualty Co Ltd – Class H | | | 7,476,171 | |
| | | 12,421,000 | | | Poly Property Group Co Ltd * | | | 5,209,938 | |
| | | 3,131,000 | | | Pou Sheng International Holdings Ltd | | | 762,248 | |
| | | 1,119,000 | | | Q Technology Group Co Ltd * | | | 821,746 | |
| | | 3,772,000 | | | Shanghai Industrial Holdings Ltd | | | 10,526,055 | |
| | | 4,363,100 | | | Shanghai Pharmaceuticals Holding Co Ltd – Class H | | | 11,233,427 | |
| | | 6,798,000 | | | Shenzhen Expressway Co Ltd – Class H | | | 6,278,431 | |
| | | 5,973,500 | | | Shenzhen International Holdings Ltd | | | 8,564,621 | |
| | | 11,547,000 | | | Shimao Property Holdings Ltd | | | 16,573,647 | |
| | | 7,170,000 | | | Shui On Land Ltd | | | 1,606,877 | |
| | | 578,000 | | | Sinofert Holdings Ltd | | | 92,289 | |
| | | 15,687,500 | | | Sino-Ocean Land Holdings Ltd | | | 7,792,126 | |
| | | 7,616,000 | | | Sinopec Engineering Group Co Ltd – Class H | | | 6,923,376 | |
| | | 1,198,500 | | | Sinotruk Hong Kong Ltd | | | 994,404 | |
| | | | |
| 54 | | See accompanying notes to the financial statements. | | |
GMO Implementation Fund
(A Series of GMO Trust)
Consolidated Schedule of Investments — (Continued)
(showing percentage of total net assets)
February 28, 2017
| | | | | | | | | | |
Shares | | | Description | | Value ($) | |
| | | | | | China — continued | |
| | | 22,143,532 | | | Skyworth Digital Holdings Ltd | | | 14,366,271 | |
| | | 8,507,500 | | | SOHO China Ltd | | | 4,404,412 | |
| | | 498,250 | | | Sohu.com Inc * | | | 19,845,298 | |
| | | 1,897,000 | | | Texhong Textile Group Ltd | | | 2,779,572 | |
| | | 1,180,000 | | | Tianjin Development Holdings Ltd | | | 619,276 | |
| | | 1,650,000 | | | Tianjin Port Development Holdings Ltd | | | 278,116 | |
| | | 3,052,000 | | | Tianneng Power International Ltd | | | 2,693,385 | |
| | | 9,680,000 | | | TravelSky Technology Ltd – Class H | | | 21,108,828 | |
| | | 2,339,000 | | | Weichai Power Co Ltd – Class H | | | 4,118,406 | |
| | | 1,509,000 | | | Xinhua Winshare Publishing and Media Co Ltd – Class H | | | 1,375,835 | |
| | | 5,563,000 | | | XTEP International Holdings Ltd | | | 2,535,163 | |
| | | 2,356,000 | | | Yingde Gases Group Co Ltd | | | 1,615,114 | |
| | | 16,806,000 | | | Yuexiu Property Co Ltd | | | 2,725,822 | |
| | | 6,257,000 | | | Yuexiu Real Estate Investment Trust | | | 3,723,356 | |
| | | 6,006,000 | | | Yuzhou Properties Co Ltd | | | 2,087,973 | |
| | | 10,874,000 | | | Zhejiang Expressway Co Ltd – Class H | | | 12,229,645 | |
| | | 1,157,000 | | | Zhongsheng Group Holdings Ltd | | | 1,677,433 | |
| | | | | | | | | | |
| | | | | | Total China | | | 844,451,045 | |
| | | | | | | | | | |
| | |
| | | | | | Czech Republic — 0.2% | |
| | | 1,000,813 | | | CEZ AS | | | 17,663,064 | |
| | | 80,000 | | | O2 Czech Republic AS | | | 856,665 | |
| | | | | | | | | | |
| | | | | | Total Czech Republic | | | 18,519,729 | |
| | | | | | | | | | |
| | |
| | | | | | Denmark — 0.0% | |
| | | 2,459 | | | AP Moeller – Maersk A/S – Class B | | | 3,998,374 | |
| | | | | | | | | | |
| | |
| | | | | | Finland — 0.2% | |
| | | 7,303 | | | Cramo Oyj | | | 158,041 | |
| | | 8,730 | | | Kesko Oyj – B Shares | | | 400,263 | |
| | | 227,134 | | | Neste Oyj | | | 7,905,798 | |
| | | 4,331 | | | Orion Oyj – Class B | | | 213,443 | |
| | | 83,477 | | | Sponda Oyj | | | 349,327 | |
| | | 667,170 | | | UPM-Kymmene Oyj | | | 15,823,043 | |
| | | | | | | | | | |
| | | | | | Total Finland | | | 24,849,915 | |
| | | | | | | | | | |
| | |
| | | | | | France — 1.5% | |
| | | 424,572 | | | Air France-KLM * | | | 2,992,087 | |
| | | 5,926 | | | Aubay | | | 163,732 | |
| | | 1,619,989 | | | AXA SA | | | 38,260,900 | |
| | | 376,854 | | | BNP Paribas SA | | | 22,049,880 | |
| | | 66,170 | | | Christian Dior SE | | | 14,029,366 | |
| | | 15,610 | | | Cie Generale des Etablissements Michelin | | | 1,757,594 | |
| | | 202,803 | | | CNP Assurances | | | 3,758,095 | |
| | | 35,001 | | | IPSOS | | | 1,127,467 | |
| | | 35,555 | | | LVMH Moet Hennessy Louis Vuitton SE | | | 7,142,304 | |
| | | 26,321 | | | Renault SA | | | 2,336,320 | |
| | | 5,647 | | | Rexel SA | | | 91,366 | |
| | | | | | | | | | |
Shares | | | Description | | Value ($) | |
| | | | | | France — continued | |
| | | 167,585 | | | SCOR SE | | | 6,058,397 | |
| | | 474,087 | | | Societe Generale SA | | | 21,072,011 | |
| | | 49,100 | | | STMicroelectronics NV | | | 749,266 | |
| | | 934,288 | | | TOTAL SA | | | 46,617,173 | |
| | | 148,151 | | | Vivendi SA | | | 2,608,534 | |
| | | | | | | | | | |
| | | | | | Total France | | | 170,814,492 | |
| | | | | | | | | | |
| | |
| | | | | | Germany — 1.6% | |
| | | 100,526 | | | ADVA Optical Networking SE * | | | 1,057,035 | |
| | | 257,659 | | | Allianz SE (Registered) | | | 44,875,742 | |
| | | 242,185 | | | BASF SE | | | 22,531,384 | |
| | | 194,762 | | | Bayerische Motoren Werke AG | | | 17,391,466 | |
| | | 6,123 | | | Bechtle AG | | | 637,765 | |
| | | 2,053 | | | Cewe Stiftung & Co KGAA | | | 173,221 | |
| | | 560,650 | | | Daimler AG (Registered Shares) | | | 40,729,504 | |
| | | 770,758 | | | Deutsche Lufthansa AG (Registered) | | | 11,284,693 | |
| | | 14,095 | | | Diebold Nixdorf AG | | | 1,025,793 | |
| | | 40,080 | | | Hannover Rueck SE | | | 4,521,643 | |
| | | 12,781 | | | HeidelbergCement AG | | | 1,193,272 | |
| | | 4,169 | | | Henkel AG & Co KGaA | | | 449,859 | |
| | | 87,163 | | | Linde AG | | | 14,153,750 | |
| | | 3,476 | | | ProSiebenSat.1 Media SE | | | 139,237 | |
| | | 51,812 | | | RHOEN-KLINIKUM AG | | | 1,303,386 | |
| | | 139,374 | | | RWE AG * | | | 1,984,868 | |
| | | 47,183 | | | SAP SE | | | 4,395,204 | |
| | | 94,251 | | | Software AG | | | 3,493,963 | |
| | | 117,621 | | | STADA Arzneimittel AG | | | 7,112,987 | |
| | | 38,542 | | | Talanx AG | | | 1,376,956 | |
| | | 2,109 | | | Washtec AG | | | 131,348 | |
| | | | | | | | | | |
| | | | | | Total Germany | | | 179,963,076 | |
| | | | | | | | | | |
| | |
| | | | | | Hong Kong — 0.8% | |
| | | 2,513,000 | | | BOC Hong Kong Holdings Ltd | | | 9,927,387 | |
| | | 202,500 | | | CK Hutchison Holdings Ltd | | | 2,501,205 | |
| | | 694,800 | | | Dah Sing Banking Group Ltd | | | 1,352,036 | |
| | | 344,400 | | | Dah Sing Financial Holdings Ltd | | | 2,536,980 | |
| | | 1,716,000 | | | HKT Trust & HKT Ltd – Class SS | | | 2,289,067 | |
| | | 1,025,600 | | | Hongkong Land Holdings Ltd | | | 6,998,802 | |
| | | 468,000 | | | Hysan Development Co Ltd | | | 2,182,068 | |
| | | 1,051,000 | | | Kerry Properties Ltd | | | 3,220,725 | |
| | | 2,582,500 | | | Link (REIT) | | | 17,807,677 | |
| | | 216,000 | | | Luk Fook Holdings International Ltd | | | 627,186 | |
| | | 1,758,800 | | | Man Wah Holdings Ltd | | | 1,156,644 | |
| | | 738,000 | | | Pacific Textiles Holdings Ltd | | | 823,335 | |
| | | 6,222,000 | | | SJM Holdings Ltd | | | 5,105,191 | |
| | | 3,000 | | | Sun Hung Kai Properties Ltd | | | 43,830 | |
| | | 207,500 | | | Swire Pacific Ltd – Class A | | | 2,135,931 | |
| | | 278,500 | | | WH Group Ltd | | | 217,434 | |
| | | 2,084,000 | | | Wharf Holdings Ltd (The) | | | 16,510,304 | |
| | | | |
| | See accompanying notes to the financial statements. | | 55 |
GMO Implementation Fund
(A Series of GMO Trust)
Consolidated Schedule of Investments — (Continued)
(showing percentage of total net assets)
February 28, 2017
| | | | | | | | | | |
Shares | | | Description | | Value ($) | |
| | | | | | Hong Kong — continued | |
| | | 1,015,000 | | | Wheelock & Co Ltd | | | 6,592,194 | |
| | | 232,500 | | | Xinyi Automobile Glass Hong Kong Enterprises Ltd * | | | 44,293 | |
| | | 4,048,000 | | | Xinyi Glass Holdings Ltd | | | 3,670,148 | |
| | | | | | | | | | |
| | | | | | Total Hong Kong | | | 85,742,437 | |
| | | | | | | | | | |
| | |
| | | | | | Hungary — 0.2% | |
| | | 3,053,976 | | | Magyar Telekom Telecommunications Plc | | | 5,142,937 | |
| | | 155,249 | | | MOL Hungarian Oil & Gas Plc | | | 10,643,761 | |
| | | 91,928 | | | OTP Bank Plc | | | 2,668,860 | |
| | | | | | | | | | |
| | | | | | Total Hungary | | | 18,455,558 | |
| | | | | | | | | | |
| | |
| | | | | | India — 1.7% | |
| | | 984,775 | | | Allahabad Bank * | | | 1,082,978 | |
| | | 1,100,843 | | | Andhra Bank | | | 927,467 | |
| | | 1,205,813 | | | Cairn India Ltd | | | 5,125,942 | |
| | | 1,977,915 | | | Canara Bank * | | | 8,756,124 | |
| | | 3,028,310 | | | Firstsource Solutions Ltd * | | | 2,007,992 | |
| | | 1,013,075 | | | HCL Technologies Ltd | | | 12,739,017 | |
| | | 1,423,114 | | | Hexaware Technologies Ltd | | | 4,773,434 | |
| | | 1,865,278 | | | Hindustan Zinc Ltd | | | 8,569,648 | |
| | | 75,917 | | | IDBI Bank Ltd * | | | 90,880 | |
| | | 110,425 | | | IFCI Ltd * | | | 48,247 | |
| | | 909,310 | | | Indiabulls Housing Finance Ltd | | | 11,837,187 | |
| | | 3,334,514 | | | Infosys Ltd Sponsored ADR | | | 50,484,542 | |
| | | 2,158,776 | | | Jaypee Infratech Ltd * | | | 359,804 | |
| | | 639,117 | | | KPIT Technologies Ltd | | | 1,319,292 | |
| | | 76,815 | | | MOIL Ltd | | | 407,063 | |
| | | 220,756 | | | Mphasis Ltd | | | 1,973,521 | |
| | | 247,991 | | | NIIT Ltd * | | | 277,636 | |
| | | 539,915 | | | NIIT Technologies Ltd | | | 3,377,569 | |
| | | 1,257,940 | | | NMDC Ltd | | | 2,838,641 | |
| | | 1,841,865 | | | Oil & Natural Gas Corp Ltd | | | 5,337,294 | |
| | | 1,116,074 | | | Oriental Bank of Commerce | | | 2,120,803 | |
| | | 6,263,090 | | | Power Finance Corp | | | 12,752,112 | |
| | | 8,379,387 | | | Rural Electrification Corp Ltd | | | 19,189,509 | |
| | | 426,182 | | | Sonata Software Ltd | | | 1,230,798 | |
| | | 2,440,614 | | | Syndicate Bank * | | | 2,538,978 | |
| | | 539,619 | | | Tata Consultancy Services Ltd | | | 19,881,972 | |
| | | 2,287,714 | | | Union Bank of India | | | 5,022,963 | |
| | | 973,166 | | | Wipro Ltd | | | 7,098,659 | |
| | | 38,046 | | | Zensar Technologies Ltd | | | 523,622 | |
| | | | | | | | | | |
| | | | | | Total India | | | 192,693,694 | |
| | | | | | | | | | |
| | |
| | | | | | Indonesia — 0.0% | |
| | | 5,370,300 | | | Bank Pembangunan Daerah Jawa Barat Dan Banten Tbk PT | | | 924,197 | |
| | | 7,882,400 | | | Bank Tabungan Negara Persero Tbk PT | | | 1,262,325 | |
| | | | | | | | | | |
Shares | | | Description | | Value ($) | |
| | | | | | Indonesia — continued | |
| | | 4,575,600 | | | Gajah Tunggal Tbk PT * | | | 433,538 | |
| | | 670,400 | | | Indo Tambangraya Megah Tbk PT | | | 882,775 | |
| | | | | | | | | | |
| | | | | | Total Indonesia | | | 3,502,835 | |
| | | | | | | | | | |
| | | | | | Ireland — 0.0% | |
| | | 40,321 | | | Smurfit Kappa Group Plc | | | 1,070,912 | |
| | | | | | | | | | |
| | |
| | | | | | Israel — 0.4% | |
| | | 1,525,602 | | | Bank Hapoalim BM | | | 9,403,945 | |
| | | 1,176,098 | | | Bank Leumi Le-Israel BM * | | | 5,156,527 | |
| | | 200,100 | | | Check Point Software Technologies Ltd * | | | 19,791,891 | |
| | | 733,482 | | | El Al Israel Airlines | | | 522,432 | |
| | | 460,436 | | | Israel Discount Bank Ltd – Class A * | | | 1,019,109 | |
| | | 86,404 | | | Mizrahi Tefahot Bank Ltd | | | 1,442,440 | |
| | | 200 | | | Orbotech Ltd * | | | 6,030 | |
| | | 9,100 | | | SodaStream International Ltd * | | | 443,534 | |
| | | 114,808 | | | Teva Pharmaceutical Industries Ltd | | | 4,038,590 | |
| | | | | | | | | | |
| | | | | | Total Israel | | | 41,824,498 | |
| | | | | | | | | | |
| | |
| | | | | | Italy — 0.4% | |
| | | 15,205 | | | Amplifon SPA | | | 162,730 | |
| | | 650,170 | | | Banca Mediolanum SPA | | | 4,242,910 | |
| | | 2,580,864 | | | Enel SPA | | | 11,076,257 | |
| | | 853,781 | | | Eni SPA | | | 13,171,473 | |
| | | 523,944 | | | Hera SPA | | | 1,297,660 | |
| | | 811,241 | | | Iren SPA | | | 1,395,344 | |
| | | 3,824 | | | La Doria SPA | | | 34,224 | |
| | | 152,296 | | | Recordati SPA | | | 4,832,977 | |
| | | 1,201 | | | Reply SPA | | | 159,976 | |
| | | 776,834 | | | Saras SPA | | | 1,414,299 | |
| | | 162,096 | | | Societa Cattolica di Assicurazioni SCRL | | | 1,015,647 | |
| | | | | | | | | | |
| | | | | | Total Italy | | | 38,803,497 | |
| | | | | | | | | | |
| | |
| | | | | | Japan — 3.7% | |
| | | 65,000 | | | AOKI Holdings Inc | | | 799,481 | |
| | | 13,700 | | | Aoyama Trading Co Ltd | | | 513,577 | |
| | | 10,600 | | | Arcs Co Ltd | | | 238,788 | |
| | | 7,100 | | | Autobacs Seven Co Ltd | | | 112,472 | |
| | | 10,100 | | | BML Inc | | | 220,516 | |
| | | 38,000 | | | Brother Industries Ltd | | | 715,657 | |
| | | 307,000 | | | Calsonic Kansei Corp | | | 3,515,949 | |
| | | 99,400 | | | Central Japan Railway Co | | | 16,271,751 | |
| | | 16,000 | | | Chiba Bank Ltd (The) | | | 111,855 | |
| | | 90,400 | | | Coca-Cola West Co Ltd | | | 2,686,740 | |
| | | 54,800 | | | Daicel Corp | | | 665,219 | |
| | | 72,100 | | | Daiichi Sanyko Co Ltd | | | 1,644,105 | |
| | | 32,500 | | | Daito Trust Construction Co Ltd | | | 4,546,685 | |
| | | 201,400 | | | Daiwa House Industry Co Ltd | | | 5,527,070 | |
| | | 306,200 | | | DCM Holdings Co Ltd | | | 2,723,314 | |
| | | | |
| 56 | | See accompanying notes to the financial statements. | | |
GMO Implementation Fund
(A Series of GMO Trust)
Consolidated Schedule of Investments — (Continued)
(showing percentage of total net assets)
February 28, 2017
| | | | | | | | | | |
Shares | | | Description | | Value ($) | |
| | | | | | Japan — continued | |
| | | 367,000 | | | Denka Co Ltd | | | 1,911,086 | |
| | | 193,122 | | | FUJIFILM Holdings Corp | | | 7,470,428 | |
| | | 5,000 | | | Fujitsu General Ltd | | | 97,878 | |
| | | 30,000 | | | Hanwa Co Ltd | | | 215,139 | |
| | | 178,400 | | | Haseko Corp | | | 2,111,154 | |
| | | 16,200 | | | Hitachi High-Technologies Corp | | | 674,804 | |
| | | 8,000 | | | Hitachi Transport System Ltd | | | 163,865 | |
| | | 38,500 | | | Idemitsu Kosan Co Ltd | | | 1,240,530 | |
| | | 144,092 | | | Inpex Corp | | | 1,432,735 | |
| | | 2,597,000 | | | ITOCHU Corp | | | 37,608,352 | |
| | | 14,700 | | | Itochu Techno-Solutions Corp | | | 399,203 | |
| | | 341,000 | | | Japan Airlines Co Ltd | | | 11,143,618 | |
| | | 154,000 | | | Kaneka Corp | | | 1,204,642 | |
| | | 1,173,000 | | | Kanematsu Corp | | | 2,035,633 | |
| | | 1,486,600 | | | KDDI Corp | | | 38,848,608 | |
| | | 67,300 | | | Keihin Corp | | | 1,126,510 | |
| | | 110,500 | | | Konica Minolta Inc | | | 1,065,793 | |
| | | 64,500 | | | K’s Holdings Corp | | | 1,147,735 | |
| | | 11,700 | | | Kyowa Exeo Corp | | | 162,282 | |
| | | 1,789,500 | | | Marubeni Corp | | | 11,584,985 | |
| | | 25,500 | | | MCJ Co Ltd | | | 280,735 | |
| | | 188,704 | | | Medipal Holdings Corp | | | 3,114,012 | |
| | | 864,000 | | | Mitsubishi Chemical Holdings Corp | | | 6,643,481 | |
| | | 88,300 | | | Mitsubishi Electric Corp | | | 1,993,298 | |
| | | 386,000 | | | Mitsubishi Electric Corp | | | 5,659,105 | |
| | | 196,200 | | | Mitsubishi Tanabe Pharma Corp | | | 4,039,076 | |
| | | 4,549,300 | | | Mitsubishi UFJ Financial Group Inc | | | 30,097,108 | |
| | | 796,474 | | | Mitsui & Co Ltd | | | 12,192,056 | |
| | | 6,181,700 | | | Mizuho Financial Group Inc | | | 11,535,829 | |
| | | 7,900 | | | Nichiha Corp | | | 221,398 | |
| | | 107,000 | | | Nippon Corp | | | 2,030,459 | |
| | | 4,000 | | | Nippon Paper Industries Co Ltd | | | 72,695 | |
| | | 889,100 | | | Nippon Telegraph & Telephone Corp | | | 37,608,320 | |
| | | 983,736 | | | Nissan Motor Co Ltd | | | 9,679,380 | |
| | | 366,029 | | | NTT DOCOMO Inc | | | 8,696,094 | |
| | | 144,000 | | | Onward Holdings Co Ltd | | | 1,066,628 | |
| | | 429,000 | | | Osaka Gas Co Ltd | | | 1,656,814 | |
| | | 17,000 | | | Osaki Electric Co Ltd | | | 164,728 | |
| | | 347,600 | | | Otsuka Holdings Co Ltd | | | 15,843,119 | |
| | | 146,000 | | | PanaHome Corp | | | 1,358,925 | |
| | | 17,000 | | | Sanyo Special Steel Co Ltd | | | 92,435 | |
| | | 413,500 | | | Sekisui Chemical Co Ltd | | | 6,830,409 | |
| | | 299,500 | | | Sekisui House Ltd | | | 4,789,358 | |
| | | 900 | | | Shimamura Co Ltd | | | 116,535 | |
| | | 4,090,100 | | | Sojitz Corp | | | 10,599,852 | |
| | | 1,700 | | | Sugi Holdings Co Ltd | | | 78,322 | |
| | | 53,400 | | | Sumitomo Corp | | | 717,760 | |
| | | 19,700 | | | Sumitomo Dainippon Pharma Co Ltd | | | 347,990 | |
| | | 171,700 | | | Sumitomo Forestry Co Ltd | | | 2,501,118 | |
| | | | | | | | | | |
Shares | | | Description | | Value ($) | |
| | | | | | Japan — continued | |
| | | 993,700 | | | Sumitomo Mitsui Financial Group Inc | | | 38,711,759 | |
| | | 199,300 | | | Sumitomo Rubber Industries Ltd | | | 3,287,275 | |
| | | 61,300 | | | Suzuken Co Ltd | | | 2,075,083 | |
| | | 45,737 | | | TIS Inc | | | 1,112,074 | |
| | | 130,600 | | | Toho Holdings Co Ltd | | | 2,824,383 | |
| | | 17,200 | | | Tokai Rika Co Ltd | | | 346,859 | |
| | | 12,000 | | | Token Corp | | | 861,893 | |
| | | 18,500 | | | Tokyo Century Corp | | | 624,646 | |
| | | 7,200 | | | Tokyo Electron Ltd | | | 718,304 | |
| | | 737,000 | | | Tosoh Corp | | | 6,411,638 | |
| | | 178,000 | | | Toyota Tsusho Corp | | | 5,308,108 | |
| | | 68,700 | | | TS Tech Co Ltd | | | 1,796,739 | |
| | | 140,000 | | | Tsubakimoto Chain Co | | | 1,199,110 | |
| | | 74,500 | | | Valor Holdings Co Ltd | | | 1,848,605 | |
| | | 86,000 | | | Wacoal Holdings Corp | | | 1,079,771 | |
| | | 29,700 | | | Warabeya Nichiyo Holdings Co Ltd | | | 666,219 | |
| | | 62,000 | | | Yamaguchi Financial Group Inc | | | 715,429 | |
| | | 6,400 | | | Yokohama Rubber Co Ltd (The) | | | 127,189 | |
| | | | | | | | | | |
| | | | | | Total Japan | | | 411,680,282 | |
| | | | | | | | | | |
| | |
| | | | | | Malaysia — 0.0% | |
| | | 593,000 | | | Ta Ann Holdings Berhad | | | 518,081 | |
| | | | | | | | | | |
| | |
| | | | | | Mexico — 0.4% | |
| | | 3,291,203 | | | Alpek SA de CV | | | 3,482,616 | |
| | | 1,162,205 | | | Arca Continental SAB de CV | | | 6,522,092 | |
| | | 3,888,246 | | | Bolsa Mexicana de Valores SAB de CV | | | 5,602,604 | |
| | | 899,793 | | | Gentera SAB de CV | | | 1,189,931 | |
| | | 801,445 | | | Gruma SAB de CV – Class B | | | 10,527,704 | |
| | | 432,400 | | | Grupo Aeroportuario del Pacifico SAB de CV – Class B | | | 3,746,900 | |
| | | 116,475 | | | Grupo Aeroportuario del Sureste SAB de CV – Class B | | | 1,843,518 | |
| | | 290,091 | | | Grupo Financiero Interacciones SA de CV – Class O | | | 1,292,245 | |
| | | 447,013 | | | Grupo Herdez SAB de CV | | | 832,330 | |
| | | 339,816 | | | La Comer SAB de CV * | | | 225,456 | |
| | | 1,352,300 | | | Macquarie Mexico Real Estate Management SA de CV (REIT) * | | | 1,397,295 | |
| | | 3,002,100 | | | OHL Mexico SAB de CV | | | 3,149,803 | |
| | | 3,956,200 | | | Wal-Mart de Mexico SAB de CV | | | 7,699,148 | |
| | | | | | | | | | |
| | | | | | Total Mexico | | | 47,511,642 | |
| | | | | | | | | | |
| | |
| | | | | | Netherlands — 1.3% | |
| | | 95,400 | | | AerCap Holdings NV * | | | 4,321,620 | |
| | | 276,647 | | | ASR Nederland NV * | | | 7,391,369 | |
| | | 64,282 | | | Heineken Holding NV | | | 4,885,280 | |
| | | 731,600 | | | NXP Semiconductors NV * | | | 75,215,796 | |
| | | 1,391,103 | | | PostNL NV * | | | 6,075,111 | |
| | | | |
| | See accompanying notes to the financial statements. | | 57 |
GMO Implementation Fund
(A Series of GMO Trust)
Consolidated Schedule of Investments — (Continued)
(showing percentage of total net assets)
February 28, 2017
| | | | | | | | | | |
Shares | | | Description | | Value ($) | |
| | | | | | Netherlands — continued | |
| | | 82,133 | | | Unilever NV | | | 3,887,355 | |
| | | 364,684 | | | Unilever NV CVA | | | 17,263,442 | |
| | | 553,593 | | | Wolters Kluwer NV | | | 22,689,795 | |
| | | | | | | | | | |
| | | | | | Total Netherlands | | | 141,729,768 | |
| | | | | | | | | | |
| | |
| | | | | | New Zealand — 0.1% | |
| | | 1,108,332 | | | Air New Zealand Ltd | | | 1,887,686 | |
| | | 734,899 | | | Fletcher Building Ltd | | | 5,069,315 | |
| | | 193,730 | | | Fletcher Building Ltd | | | 1,345,898 | |
| | | 400,650 | | | SKY Network Television Ltd | | | 1,096,001 | |
| | | | | | | | | | |
| | | | | | Total New Zealand | | | 9,398,900 | |
| | | | | | | | | | |
| | |
| | | | | | Norway — 0.2% | |
| | | 86,934 | | | Bakkafrost P/F | | | 3,235,240 | |
| | | 234,648 | | | BW LPG Ltd | | | 1,146,694 | |
| | | 43,698 | | | DNB ASA | | | 716,454 | |
| | | 855,410 | | | Orkla ASA | | | 7,519,750 | |
| | | 295 | | | Salmar ASA | | | 7,454 | |
| | | 499,003 | | | Statoil ASA | | | 8,798,021 | |
| | | 268,300 | | | Storebrand ASA * | | | 1,811,619 | |
| | | 190,330 | | | Subsea 7 SA * | | | 2,688,489 | |
| | | 42,321 | | | Yara International ASA | | | 1,606,659 | |
| | | | | | | | | | |
| | | | | | Total Norway | | | 27,530,380 | |
| | | | | | | | | | |
| | |
| | | | | | Poland — 0.6% | |
| | | 369,344 | | | Asseco Poland SA | | | 5,083,825 | |
| | | 115,994 | | | Bank Millennium SA * | | | 194,571 | |
| | | 1,501,466 | | | Enea SA * | | | 3,938,871 | |
| | | 1,093,339 | | | KGHM Polska Miedz SA | | | 34,616,096 | |
| | | 2,122 | | | mBank SA * | | | 206,793 | |
| | | 2,647,204 | | | PGE Polska Grupa Energetyczna SA | | | 7,725,020 | |
| | | 112,975 | | | Polski Koncern Naftowy ORLEN SA | | | 2,616,050 | |
| | | 13,437,848 | | | Tauron Polska Energia SA * | | | 9,910,083 | |
| | | | | | | | | | |
| | | | | | Total Poland | | | 64,291,309 | |
| | | | | | | | | | |
| | |
| | | | | | Portugal — 0.0% | |
| | | 406,670 | | | CTT – Correios de Portugal SA | | | 2,184,068 | |
| | | 144,789 | | | REN-Redes Energeticas Nacionais SGPS SA | | | 403,038 | |
| | | | | | | | | | |
| | | | | | Total Portugal | | | 2,587,106 | |
| | | | | | | | | | |
| | |
| | | | | | Russia — 1.0% | |
| | | 2,003,400 | | | Aeroflot PJSC * | | | 5,710,889 | |
| | | 8,132,361 | | | Gazprom PAO Sponsored ADR | | | 36,299,347 | |
| | | 571,802 | | | Lukoil PJSC Sponsored ADR | | | 30,319,325 | |
| | | 2,137,800 | | | Magnitogorsk Iron & Steel OJSC | | | 1,354,977 | |
| | | 355,220 | | | Novolipetsk Steel PJSC | | | 686,558 | |
| | | 2,039,447 | | | Rosneft Oil Co PJSC GDR (Registered) | | | 11,570,937 | |
| | | | | | | | | | |
Shares | | | Description | | Value ($) | |
| | | | | | Russia — continued | |
| | | 389,969,311 | | | RusHydro PJSC | | | 6,424,634 | |
| | | 509,872 | | | Tatneft PJSC Sponsored ADR | | | 17,879,674 | |
| | | | | | | | | | |
| | | | | | Total Russia | | | 110,246,341 | |
| | | | | | | | | | |
| | |
| | | | | | Singapore — 0.1% | |
| | | 3,778,800 | | | CapitaLand Commercial Trust (REIT) | | | 4,202,908 | |
| | | 146,300 | | | DBS Group Holdings Ltd | | | 1,953,842 | |
| | | 1,550,000 | | | Fortune Real Estate Investment Trust | | | 1,738,823 | |
| | | 910,800 | | | SATS Ltd | | | 3,249,328 | |
| | | 605,200 | | | Sino Grandness Food Industry Group Ltd | | | 114,235 | |
| | | 23,300 | | | Venture Corp Ltd | | | 178,671 | |
| | | 4,348,200 | | | Yangzijiang Shipbuilding Holdings Ltd | | | 2,868,326 | |
| | | 298,200 | | | Yanlord Land Group Ltd | | | 309,549 | |
| | | | | | | | | | |
| | | | | | Total Singapore | | | 14,615,682 | |
| | | | | | | | | | |
| | |
| | | | | | South Africa — 1.9% | |
| | | 222,925 | | | AECI Ltd | | | 1,862,992 | |
| | | 2,691,606 | | | African Phoenix Investments Ltd * | | | 119,011 | |
| | | 346,469 | | | African Rainbow Minerals Ltd | | | 2,674,962 | |
| | | 193,072 | | | Astral Foods Ltd | | | 2,175,465 | |
| | | 1,797,726 | | | AVI Ltd | | | 13,044,467 | |
| | | 1,968,337 | | | Barclays Africa Group Ltd | | | 22,779,064 | |
| | | 1,406,085 | | | Barloworld Ltd | | | 12,421,832 | |
| | | 1,144,332 | | | Bidvest Group Ltd (The) | | | 13,519,160 | |
| | | 772,756 | | | Clicks Group Ltd | | | 7,563,472 | |
| | | 218,409 | | | DataTec Ltd | | | 907,969 | |
| | | 3,261 | | | Distell Group Ltd | | | 35,548 | |
| | | 1,912,051 | | | Emira Property Fund Ltd (REIT) | | | 2,144,046 | |
| | | 197,608 | | | Hyprop Investments Ltd (REIT) | | | 1,888,046 | |
| | | 970,937 | | | Imperial Holdings Ltd | | | 12,365,391 | |
| | | 13,823 | | | JSE Ltd | | | 171,506 | |
| | | 368,085 | | | Kumba Iron Ore Ltd * | | | 6,011,434 | |
| | | 325,555 | | | Lewis Group Ltd | | | 1,042,286 | |
| | | 826,993 | | | Liberty Holdings Ltd | | | 6,991,452 | |
| | | 2,806,340 | | | MMI Holdings Ltd | | | 5,258,075 | |
| | | 241,366 | | | Mondi Ltd | | | 5,537,348 | |
| | | 1,517,316 | | | Nedbank Group Ltd | | | 28,292,156 | |
| | | 193,563 | | | Omnia Holdings Ltd | | | 2,556,778 | |
| | | 1,989,525 | | | RMB Holdings Ltd | | | 9,607,487 | |
| | | 1,828,684 | | | SA Corporate Real Estate Ltd (REIT) | | | 782,765 | |
| | | 6,876 | | | Sanlam Ltd | | | 35,501 | |
| | | 70,539 | | | Santam Ltd | | | 1,303,182 | |
| | | 285,607 | | | Shoprite Holdings Ltd | | | 4,121,557 | |
| | | 1,652,934 | | | Sibanye Gold Ltd | | | 3,386,621 | |
| | | 404,122 | | | SPAR Group Ltd (The) | | | 5,496,342 | |
| | | 645,142 | | | Standard Bank Group Ltd | | | 7,030,828 | |
| | | 731,420 | | | Super Group Ltd * | | | 1,943,372 | |
| | | 1,253,945 | | | Telkom SA SOC Ltd | | | 6,513,454 | |
| | | | |
| 58 | | See accompanying notes to the financial statements. | | |
GMO Implementation Fund
(A Series of GMO Trust)
Consolidated Schedule of Investments — (Continued)
(showing percentage of total net assets)
February 28, 2017
| | | | | | | | | | |
Shares | | | Description | | Value ($) | |
| | | | | | South Africa — continued | |
| | | 961,167 | | | Truworths International Ltd | | | 6,380,490 | |
| | | 1,122,029 | | | Tsogo Sun Holdings Ltd | | | 2,360,837 | |
| | | 703,057 | | | Vodacom Group Ltd | | | 7,940,057 | |
| | | 27,890 | | | Vukile Property Fund Ltd (REIT) | | | 39,948 | |
| | | 230,181 | | | Wilson Bayly Holmes-Ovcon Ltd | | | 2,548,925 | |
| | | | | | | | | | |
| | | | | | Total South Africa | | | 208,853,826 | |
| | | | | | | | | | |
| | |
| | | | | | South Korea — 3.7% | |
| | | 374,151 | | | BNK Financial Group Inc | | | 2,871,147 | |
| | | 5,655 | | | Crown Confectionery Co Ltd (a) | | | 165,612 | |
| | | 628 | | | Dae Han Flour Mills Co Ltd | | | 102,183 | |
| | | 79,198 | | | Daelim Industrial Co Ltd | | | 5,849,526 | |
| | | 75,037 | | | Daishin Securities Co Ltd | | | 759,003 | |
| | | 504,062 | | | Daou Technology Inc | | | 8,193,515 | |
| | | 209,663 | | | DGB Financial Group Inc | | | 1,927,444 | |
| | | 106,464 | | | Dongbu Insurance Co Ltd | | | 5,748,121 | |
| | | 12,648 | | | DuzonBizon Co Ltd | | | 257,025 | |
| | | 45,727 | | | E-MART Inc | | | 8,403,491 | |
| | | 4,199 | | | GOLFZON Co Ltd | | | 250,703 | |
| | | 266,512 | | | Hana Financial Group Inc | | | 8,302,280 | |
| | | 216,444 | | | Hankook Tire Co Ltd | | | 11,432,696 | |
| | | 10,666 | | | Hansol Paper Co Ltd | | | 194,638 | |
| | | 89,391 | | | Hanwha Corp | | | 2,873,214 | |
| | | 42,039 | | | Hanwha General Insurance Co Ltd | | | 250,900 | |
| | | 977,999 | | | Hanwha Life Insurance Co Ltd | | | 5,628,267 | |
| | | 58,900 | | | Harim Holdings Co Ltd | | | 217,257 | |
| | | 54,928 | | | Hyundai Department Store Co Ltd | | | 4,828,201 | |
| | | 21,107 | | | Hyundai Home Shopping Network Corp | | | 2,135,987 | |
| | | 179,909 | | | Hyundai Marine & Fire Insurance Co Ltd | | | 5,155,258 | |
| | | 154,863 | | | Hyundai Mobis Co Ltd | | | 34,906,004 | |
| | | 397,781 | | | Hyundai Motor Co | | | 52,521,084 | |
| | | 892,069 | | | Industrial Bank of Korea | | | 9,738,041 | |
| | | 594,405 | | | JB Financial Group Co Ltd | | | 2,984,853 | |
| | | 3,630 | | | Kangnam Jevisco Co Ltd | | | 116,857 | |
| | | 848,732 | | | KB Financial Group Inc | | | 35,035,556 | |
| | | 1,108,779 | | | Kia Motors Corp | | | 37,479,742 | |
| | | 7,955 | | | Korea Petrochemical Ind Co Ltd | | | 1,870,381 | |
| | | 240,515 | | | Korean Reinsurance Co | | | 2,382,072 | |
| | | 186,524 | | | KT Hitel Co Ltd * | | | 1,211,229 | |
| | | 193,674 | | | KT&G Corp | | | 17,534,633 | |
| | | 6,150 | | | Kukdo Chemical Co Ltd | | | 278,840 | |
| | | 12,141 | | | Kyobo Securities Co Ltd | | | 94,871 | |
| | | 3,301 | | | LF Corp | | | 61,550 | |
| | | 753,492 | | | LG Display Co Ltd | | | 18,253,320 | |
| | | 89,488 | | | LG International Corp | | | 2,578,942 | |
| | | 59,196 | | | LOTTE Himart Co Ltd | | | 2,527,716 | |
| | | 56,917 | | | Lotte Shopping Co Ltd | | | 11,627,772 | |
| | | 185,834 | | | Meritz Fire & Marine Insurance Co Ltd | | | 2,530,363 | |
| | | 43,789 | | | NCSoft Corp | | | 10,601,813 | |
| | | | | | | | | | |
Shares | | | Description | | Value ($) | |
| | | | | | South Korea — continued | |
| | | 91,790 | | | NHN Entertainment Corp * | | | 4,747,070 | |
| | | 51,964 | | | Poongsan Corp | | | 1,880,093 | |
| | | 40,794 | | | Samjin Pharmaceutical Co Ltd | | | 1,206,628 | |
| | | 201,697 | | | Samsung Card Co Ltd | | | 7,544,160 | |
| | | 20,698 | | | Samsung Electronics Co Ltd | | | 35,174,847 | |
| | | 8 | | | Samsung Electronics Co Ltd GDR | | | 6,775 | |
| | | 75,147 | | | Seah Besteel Corp | | | 1,729,612 | |
| | | 4,998 | | | SeAH Steel Corp | | | 494,572 | |
| | | 115,032 | | | Seoul Securities Co Ltd * | | | 273,870 | |
| | | 31,817 | | | Shinsegae Inc | | | 5,612,137 | |
| | | 102,350 | | | SK Innovation Co Ltd | | | 13,960,760 | |
| | | 39,875 | | | Soulbrain Co Ltd | | | 1,693,176 | |
| | | 148,308 | | | Tongyang Life Insurance Co Ltd | | | 1,384,679 | |
| | | 4,408 | | | Unid Co Ltd | | | 172,218 | |
| | | 1,225,697 | | | Woori Bank | | | 14,406,901 | |
| | | | | | | | | | |
| | | | | | Total South Korea | | | 410,169,605 | |
| | | | | | | | | | |
| | |
| | | | | | Spain — 0.7% | |
| | | 1,274,911 | | | Atlantica Yield Plc | | | 27,742,064 | |
| | | 109,113 | | | Ebro Foods SA | | | 2,214,706 | |
| | | 843,595 | | | Endesa SA | | | 17,942,712 | |
| | | 2,400,362 | | | Repsol SA | | | 35,509,269 | |
| | | | | | | | | | |
| | | | | | Total Spain | | | 83,408,751 | |
| | | | | | | | | | |
| | |
| | | | | | Sweden — 0.2% | |
| | | 95,019 | | | Axfood AB | | | 1,451,597 | |
| | | 5,321 | | | Fastighets AB Balder – B Shares * | | | 116,246 | |
| | | 78,055 | | | Intrum Justitia AB | | | 2,821,985 | |
| | | 103 | | | JM AB | | | 3,233 | |
| | | 889,005 | | | Meda AB – A Shares | | | 15,364,011 | |
| | | 30,606 | | | NCC AB – B Shares | | | 727,209 | |
| | | 304,393 | | | Sandvik AB | | | 4,131,961 | |
| | | 23,685 | | | Wihlborgs Fastigheter AB | | | 470,403 | |
| | | | | | | | | | |
| | | | | | Total Sweden | | | 25,086,645 | |
| | | | | | | | | | |
| | |
| | | | | | Switzerland — 1.3% | |
| | | 52,719 | | | Actelion Ltd (Registered) * | | | 14,185,673 | |
| | | 14,424 | | | Adecco Group AG (Registered) | | | 1,037,180 | |
| | | 2,647 | | | ALSO Holding AG (Registered) * | | | 296,087 | |
| | | 16,442 | | | Ascom Holding AG (Registered) | | | 285,708 | |
| | | 9,299 | | | BKW AG | | | 473,482 | |
| | | 2,143 | | | Bobst Group SA (Registered) | | | 163,046 | |
| | | 954 | | | Bossard Holding AG * | | | 164,220 | |
| | | 2,206 | | | Emmi AG (Registered) * | | | 1,401,418 | |
| | | 9,127 | | | EMS-Chemie Holding AG (Registered) | | | 5,193,187 | |
| | | 6,064 | | | Georg Fischer AG (Registered) | | | 5,255,944 | |
| | | 196 | | | Gurit Holding AG * | | | 165,052 | |
| | | 9,168 | | | Kardex AG (Registered) * | | | 925,032 | |
| | | | |
| | See accompanying notes to the financial statements. | | 59 |
GMO Implementation Fund
(A Series of GMO Trust)
Consolidated Schedule of Investments — (Continued)
(showing percentage of total net assets)
February 28, 2017
| | | | | | | | | | |
Shares | | | Description | | Value ($) | |
| | | | | | Switzerland — continued | |
| | | 3,304 | | | Komax Holding AG (Registered) | | | 860,739 | |
| | | 87,716 | | | Kuehne & Nagel International AG (Registered) | | | 12,488,698 | |
| | | 189,689 | | | Nestle SA (Registered) | | | 13,998,697 | |
| | | 50,252 | | | Novartis AG (Registered) * | | | 3,924,274 | |
| | | 3,189 | | | Orior AG * | | | 255,374 | |
| | | 1,633 | | | Sika AG | | | 9,190,085 | |
| | | 13,140 | | | Swiss Life Holding AG (Registered) * | | | 4,133,557 | |
| | | 395,779 | | | Swiss Re AG | | | 35,400,751 | |
| | | 470,100 | | | Syngenta AG ADR | | | 40,593,135 | |
| | | 9,109 | | | UBS Group AG (Registered) | | | 140,423 | |
| | | | | | | | | | |
| | | | | | Total Switzerland | | | 150,531,762 | |
| | | | | | | | | | |
| | |
| | | | | | Taiwan — 3.4% | |
| | | 49,539 | | | Addcn Technology Co Ltd | | | 314,720 | |
| | | 2,374,000 | | | Asustek Computer Inc | | | 21,420,317 | |
| | | 1,094,000 | | | BES Engineering Corp | | | 244,088 | |
| | | 3,180,440 | | | Chang Hwa Commercial Bank Ltd | | | 1,899,625 | |
| | | 1,470,200 | | | China Life Insurance Co Ltd | | | 1,442,120 | |
| | | 1,470 | | | Chunghwa Telecom Co Ltd | | | 4,874 | |
| | | 10,032,000 | | | Compal Electronics Inc | | | 6,280,514 | |
| | | 91,000 | | | Cyberlink Corp | | | 199,664 | |
| | | 4,737,582 | | | Foxconn Technology Co Ltd | | | 14,143,150 | |
| | | 12,575,000 | | | Fubon Financial Holding Co Ltd | | | 20,378,085 | |
| | | 1,128,000 | | | Gigabyte Technology Co Ltd | | | 1,572,344 | |
| | | 36,000 | | | Grape King Bio Ltd | | | 239,619 | |
| | | 32,661,663 | | | Hon Hai Precision Industry Co Ltd | | | 95,044,217 | |
| | | 3,509,854 | | | Hua Nan Financial Holdings Co Ltd – Class C | | | 1,930,439 | |
| | | 18,867,000 | | | Innolux Corp | | | 7,687,365 | |
| | | 10,312,000 | | | Inventec Corp | | | 7,659,545 | |
| | | 202,000 | | | Kinik Co | | | 513,913 | |
| | | 7,359,475 | | | Lite-On Technology Corp | | | 12,325,030 | |
| | | 2,889,600 | | | Mercuries Life Insurance Co Ltd * | | | 1,555,232 | |
| | | 1,413,000 | | | Novatek Microelectronics Corp | | | 5,291,291 | |
| | | 13,430,000 | | | Pegatron Corp | | | 35,363,199 | |
| | | 528,000 | | | Phison Electronics Corp | | | 4,638,516 | |
| | | 10,094,000 | | | Pou Chen Corp | | | 13,698,639 | |
| | | 3,869,808 | | | Powertech Technology Inc | | | 11,226,519 | |
| | | 124,020 | | | Radiant Opto-Electronics Corp | | | 256,517 | |
| | | 204,000 | | | Sheng Yu Steel Co Ltd | | | 281,007 | |
| | | 2,854,000 | | | Siliconware Precision Industries Co Ltd | | | 4,496,011 | |
| | | 440,223 | | | Taishin Financial Holding Co Ltd | | | 174,105 | |
| | | 5,672,400 | | | Taiwan Business Bank | | | 1,552,468 | |
| | | 3,323,000 | | | Taiwan Cement Corp | | | 4,068,469 | |
| | | 352,030 | | | Taiwan Cooperative Financial Holding Co Ltd | | | 167,832 | |
| | | 1,060,000 | | | Taiwan Semiconductor Co Ltd | | | 1,328,554 | |
| | | | | | | | | | |
Shares | | | Description | | Value ($) | |
| | | | | | Taiwan — continued | |
| | | 2,508,973 | | | Taiwan Semiconductor Manufacturing Co Ltd Sponsored ADR | | | 78,957,380 | |
| | | 216,000 | | | Teco Electric and Machinery Co Ltd | | | 194,535 | |
| | | 401,060 | | | Topco Scientific Co Ltd | | | 1,328,826 | |
| | | 33,000 | | | Transcend Information Inc | | | 92,746 | |
| | | 755,000 | | | Tripod Technology Corp | | | 1,970,234 | |
| | | 1,005,000 | | | United Integrated Services Co Ltd | | | 1,945,342 | |
| | | 28,791,000 | | | United Microelectronics Corp | | | 11,936,904 | |
| | | 7,161,859 | | | Wistron Corp | | | 5,999,368 | |
| | | 4,844,000 | | | WPG Holdings Ltd | | | 6,145,318 | |
| | | | | | | | | | |
| | | | | | Total Taiwan | | | 385,968,641 | |
| | | | | | | | | | |
| | |
| | | | | | Thailand — 0.3% | |
| | | 1,862,400 | | | AP Thailand Pcl NVDR | | | 381,000 | |
| | | 1,029,700 | | | Kiatnakin Bank Pcl NVDR | | | 1,937,400 | |
| | | 8,944,000 | | | Krung Thai Bank Pcl (Foreign Registered) | | | 5,016,402 | |
| | | 721,500 | | | Mega Lifesciences Pcl NVDR | | | 521,294 | |
| | | 661,600 | | | PTT Pcl (Foreign Registered) | | | 7,523,514 | |
| | | 44,700 | | | Ratchaburi Electricity Generating Holding Pcl (Foreign Registered) | | | 66,593 | |
| | | 5,650,400 | | | SC Asset Corp Pcl NVDR | | | 601,571 | |
| | | 1,854,200 | | | Supalai Pcl NVDR | | | 1,321,227 | |
| | | 960,300 | | | Supalai Pcl | | | 684,271 | |
| | | 7,216,900 | | | Thai Beverage Pcl | | | 4,889,246 | |
| | | 934,200 | | | Thanachart Capital Pcl NVDR | | | 1,297,149 | |
| | | 5,926,300 | | | Thanachart Capital Pcl (Foreign Registered) | | | 8,231,877 | |
| | | | | | | | | | |
| | | | | | Total Thailand | | | 32,471,544 | |
| | | | | | | | | | |
| | |
| | | | | | Turkey — 1.1% | |
| | | 68,220 | | | Aksa Akrilik Kimya Sanayii AS | | | 196,093 | |
| | | 258,479 | | | Arcelik AS | | | 1,480,859 | |
| | | 9,341,711 | | | Eregli Demir ve Celik Fabrikalari TAS | | | 15,209,874 | |
| | | 2,122,749 | | | KOC Holding AS | | | 8,629,103 | |
| | | 78,117 | | | Turk Telekomunikasyon AS | | | 123,368 | |
| | | 906,018 | | | Turkcell Iletisim Hizmetleri AS * | | | 2,956,851 | |
| | | 8,770,354 | | | Turkiye Halk Bankasi AS | | | 27,095,186 | |
| | | 27,342,092 | | | Turkiye Is Bankasi – Class C | | | 47,455,559 | |
| | | 4,032,300 | | | Turkiye Sise ve Cam Fabrikalari AS | | | 4,333,512 | |
| | | 13,016,509 | | | Turkiye Vakiflar Bankasi TAO – Class D | | | 18,898,772 | |
| | | | | | | | | | |
| | | | | | Total Turkey | | | 126,379,177 | |
| | | | | | | | | | |
| | |
| | | | | | United Kingdom — 2.6% | |
| | | 166,005 | | | 3i Group Plc | | | 1,418,455 | |
| | | 731,583 | | | AstraZeneca Plc | | | 42,161,159 | |
| | | 286,142 | | | Berkeley Group Holdings Plc (The) | | | 10,457,861 | |
| | | 486,855 | | | British American Tobacco Plc | | | 30,751,973 | |
| | | 10,900 | | | British American Tobacco Plc Sponsored ADR | | | 695,856 | |
| | | 302,404 | | | Carillion Plc | | | 821,852 | |
| | | | |
| 60 | | See accompanying notes to the financial statements. | | |
GMO Implementation Fund
(A Series of GMO Trust)
Consolidated Schedule of Investments — (Continued)
(showing percentage of total net assets)
February 28, 2017
| | | | | | | | | | |
Shares | | | Description | | Value ($) | |
| | | | | | United Kingdom — continued | |
| | | 3,794,274 | | | Centrica Plc | | | 10,688,421 | |
| | | 83,699 | | | Cobham Plc | | | 124,502 | |
| | | 374,672 | | | Compass Group Plc | | | 6,960,639 | |
| | | 124,534 | | | Crest Nicholson Holdings Plc | | | 836,202 | |
| | | 758,278 | | | Debenhams Plc | | | 504,865 | |
| | | 17,714 | | | Galliford Try Plc | | | 333,525 | |
| | | 6,619 | | | GlaxoSmithKline Plc | | | 135,444 | |
| | | 362,600 | | | GlaxoSmithKline Plc Sponsored ADR | | | 15,040,648 | |
| | | 45,718 | | | IG Group Holdings Plc | | | 303,510 | |
| | | 272,696 | | | Imperial Brands Plc | | | 12,837,230 | |
| | | 573,766 | | | Inchcape Plc | | | 5,344,086 | |
| | | 105,112 | | | Indivior Plc | | | 456,151 | |
| | | 53,447 | | | Intermediate Capital Group Plc | | | 470,297 | |
| | | 1,117,558 | | | J Sainsbury Plc | | | 3,709,724 | |
| | | 23,959 | | | Jupiter Fund Management Plc | | | 124,659 | |
| | | 2,318,606 | | | Kingfisher Plc | | | 9,457,329 | |
| | | 555 | | | Land Securities Group Plc (REIT) | | | 7,340 | |
| | | 64,637 | | | Mondi Plc | | | 1,506,537 | |
| | | 464,819 | | | Persimmon Plc | | | 11,886,223 | |
| | | 28,194 | | | Plus500 Ltd | | | 161,642 | |
| | | 314,558 | | | Reckitt Benckiser Group Plc | | | 28,561,761 | |
| | | 1,409,454 | | | Royal Mail Plc | | | 7,254,110 | |
| | | 972,689 | | | Sage Group Plc (The) | | | 7,795,333 | |
| | | 1,695,235 | | | Sky Plc | | | 20,986,034 | |
| | | 77,065 | | | Spectris Plc | | | 2,322,295 | |
| | | 19,353 | | | Tate & Lyle Plc | | | 178,753 | |
| | | 357,834 | | | Unilever Plc | | | 16,976,191 | |
| | | 50,002 | | | WH Smith Plc | | | 1,049,846 | |
| | | 750,979 | | | WM Morrison Supermarkets Plc | | | 2,256,747 | |
| | | 1,472,650 | | | WPP Plc | | | 34,646,162 | |
| | | | | | | | | | |
| | | | | | Total United Kingdom | | | 289,223,362 | |
| | | | | | | | | | |
| | |
| | | | | | United States — 10.7% | |
| | | 123,757 | | | 3M Co. | | | 23,062,117 | |
| | | 258,297 | | | Abbott Laboratories | | | 11,644,029 | |
| | | 184,055 | | | Accenture Plc – Class A | | | 22,546,738 | |
| | | 296,751 | | | Alere, Inc. * | | | 11,365,563 | |
| | | 132,250 | | | Allied World Assurance Co Holdings AG | | | 6,985,445 | |
| | | 60,773 | | | Alphabet, Inc. – Class C * | | | 50,028,941 | |
| | | 270,873 | | | American Express Co. | | | 21,686,092 | |
| | | 920,193 | | | American International Group, Inc. | | | 58,818,737 | |
| | | 44,077 | | | Amphenol Corp. – Class A | | | 3,050,569 | |
| | | 49,131 | | | Analog Devices, Inc. | | | 4,025,303 | |
| | | 20,460 | | | Anthem, Inc. | | | 3,372,217 | |
| | | 238,600 | | | Apple, Inc. | | | 32,685,814 | |
| | | 17,800 | | | Automatic Data Processing, Inc. | | | 1,826,636 | |
| | | 784,500 | | | B/E Aerospace, Inc. | | | 49,894,200 | |
| | | 36,181 | | | Becton Dickinson and Co. | | | 6,622,932 | |
| | | 850,500 | | | Brocade Communications Systems, Inc. | | | 10,469,655 | |
| | | | | | | | | | |
Shares | | | Description | | Value ($) | |
| | | | | | United States — continued | |
| | | 41,975 | | | CDK Global, Inc. | | | 2,788,399 | |
| | | 75,503 | | | Cerner Corp. * | | | 4,155,685 | |
| | | 535,934 | | | Cisco Systems, Inc. | | | 18,318,224 | |
| | | 365,203 | | | Coca-Cola Co. (The) | | | 15,323,918 | |
| | | 320,531 | | | Cognizant Technology Solutions Corp. – Class A * | | | 18,997,872 | |
| | | 76,222 | | | Costco Wholesale Corp. | | | 13,505,014 | |
| | | 66,052 | | | CVS Health Corp. | | | 5,322,470 | |
| | | 138,676 | | | Cypress Semiconductor Corp. | | | 1,840,231 | |
| | | 175,931 | | | Depomed, Inc. * | | | 2,883,509 | |
| | | 16,588 | | | DISH Network Corp. – Class A * | | | 1,028,456 | |
| | | 1,150 | | | Donnelley Financial Solutions, Inc. * | | | 26,577 | |
| | | 31,179 | | | EI du Pont de Nemours & Co. | | | 2,448,799 | |
| | | 63,136 | | | Eli Lilly & Co. | | | 5,228,292 | |
| | | 160,700 | | | Emerson Electric Co. | | | 9,658,070 | |
| | | 83,400 | | | Endurance Specialty Holdings Ltd. | | | 7,750,362 | |
| | | 329,216 | | | EnPro Industries, Inc. | | | 21,491,220 | |
| | | 184 | | | Envision Healthcare Corp. * | | | 12,880 | |
| | | 171,725 | | | Exxon Mobil Corp. | | | 13,964,677 | |
| | | 10,628 | | | F5 Networks, Inc. * | | | 1,522,674 | |
| | | 18,500 | | | Genuine Parts Co. | | | 1,770,635 | |
| | | 312,397 | | | Headwaters, Inc. * | | | 7,185,131 | |
| | | 45,898 | | | Honeywell International, Inc. | | | 5,714,301 | |
| | | 28,572 | | | Humana, Inc. | | | 6,035,835 | |
| | | 78,389 | | | Illinois Tool Works, Inc. | | | 10,348,132 | |
| | | 2,953 | | | Intuitive Surgical, Inc. * | | | 2,176,361 | |
| | | 252,235 | | | Johnson & Johnson | | | 30,825,639 | |
| | | 147,813 | | | Joy Global, Inc. | | | 4,166,848 | |
| | | 549,941 | | | Level 3 Communications, Inc. * | | | 31,484,122 | |
| | | 992,510 | | | Liberty Media Corp-Liberty SiriusXM – Class C * | | | 38,638,414 | |
| | | 172,600 | | | Linear Technology Corp. | | | 11,146,508 | |
| | | 1,150 | | | LSC Communications, Inc. | | | 32,683 | |
| | | 61,324 | | | MasterCard, Inc. – Class A | | | 6,773,849 | |
| | | 75,524 | | | McDonald’s Corp. | | | 9,640,639 | |
| | | 222,984 | | | Mead Johnson Nutrition Co. | | | 19,575,765 | |
| | | 248,173 | | | Medtronic Plc | | | 20,079,677 | |
| | | 781,088 | | | Microsoft Corp. | | | 49,974,010 | |
| | | 392,155 | | | Monsanto Co. | | | 44,639,004 | |
| | | 24 | | | Nexstar Media Group, Inc. | | | 1,655 | |
| | | 108,320 | | | NIKE, Inc. – Class B | | | 6,191,571 | |
| | | 839,703 | | | Oracle Corp. | | | 35,762,951 | |
| | | 168,751 | | | Pandora Media, Inc. * | | | 2,089,137 | |
| | | 43,610 | | | PepsiCo, Inc. | | | 4,813,672 | |
| | | 167,644 | | | Pfizer, Inc. | | | 5,720,013 | |
| | | 325,773 | | | Philip Morris International, Inc. | | | 35,623,278 | |
| | | 316,387 | | | QUALCOMM, Inc. | | | 17,869,538 | |
| | | 1,013,500 | | | Reynolds American, Inc. | | | 62,401,195 | |
| | | 1,990,200 | | | Rite Aid Corp. * | | | 11,941,200 | |
| | | | |
| | See accompanying notes to the financial statements. | | 61 |
GMO Implementation Fund
(A Series of GMO Trust)
Consolidated Schedule of Investments — (Continued)
(showing percentage of total net assets)
February 28, 2017
| | | | | | | | | | |
Shares | | | Description | | Value ($) | |
| | | | | | United States — continued | |
| | | 26,300 | | | Rockwell Automation, Inc. | | | 3,973,930 | |
| | | 111,907 | | | Schlumberger Ltd. | | | 8,992,847 | |
| | | 627,200 | | | Stillwater Mining Co. * | | | 10,700,032 | |
| | | 73,723 | | | Stryker Corp. | | | 9,477,829 | |
| | | 130,942 | | | Teradata Corp. * | | | 4,072,296 | |
| | | 85,986 | | | Texas Instruments, Inc. | | | 6,588,247 | |
| | | 43,105 | | | TJX Cos., Inc. (The) | | | 3,381,587 | |
| | | 71 | | | T-Mobile US, Inc. * | | | 4,440 | |
| | | 639,416 | | | TopBuild Corp. * | | | 26,842,684 | |
| | | 158,987 | | | Twitter, Inc. * | | | 2,507,225 | |
| | | 114,065 | | | United Technologies Corp. | | | 12,838,016 | |
| | | 188,202 | | | UnitedHealth Group, Inc. | | | 31,124,847 | |
| | | 74,802 | | | VF Corp. | | | 3,923,365 | |
| | | 750,000 | | | Viacom, Inc. – Class B | | | 32,587,500 | |
| | | 593,968 | | | Westar Energy, Inc. | | | 32,062,393 | |
| | | 370,100 | | | Western Refining, Inc. | | | 13,516,052 | |
| | | 88,849 | | | WGL Holdings, Inc. | | | 7,418,003 | |
| | | 483,400 | | | WhiteWave Foods Co. (The) * | | | 26,625,672 | |
| | | 110,221 | | | Williams Cos., Inc. (The) | | | 3,123,663 | |
| | | 11,296 | | | WW Grainger, Inc. | | | 2,800,956 | |
| | | 89,702 | | | Yahoo!, Inc. * | | | 4,095,793 | |
| | | 39,275 | | | Zimmer Biomet Holdings, Inc. | | | 4,598,317 | |
| | | | | | | | | | |
| | | | | | Total United States | | | 1,198,229,774 | |
| | | | | | | | | | |
| | | |
| | | | | | TOTAL COMMON STOCKS (COST $5,356,702,225) | | | 5,729,070,422 | |
| | | | | | | | | | |
| | |
| | | | | | PREFERRED STOCKS — 2.5% | |
| | |
| | | | | | Brazil — 2.0% | |
| | | 3,260,020 | | | Banco Bradesco SA | | | 34,860,176 | |
| | | 933,700 | | | Banco do Estado do Rio Grande do Sul SA – Class B | | | 4,975,681 | |
| | | 2,822,850 | | | Bradespar SA | | | 21,174,750 | |
| | | 2,687,175 | | | Centrais Eletricas Brasileiras SA – Class B * | | | 21,190,818 | |
| | | 994,339 | | | Cia Energetica de Minas Gerais Sponsored ADR | | | 3,281,319 | |
| | | 1,460,200 | | | Cia Energetica de Sao Paulo – Class B | | | 8,366,925 | |
| | | 9,920,427 | | | Companhia Energetica de Minas Gerais | | | 33,919,263 | |
| | | 2,220,860 | | | Itau Unibanco Holding SA | | | 28,439,869 | |
| | | 16,301,080 | | | Itausa-Investimentos Itau SA | | | 52,412,196 | |
| | | 928,600 | | | Metalurgica Gerdau SA * | | | 1,745,241 | |
| | | 1,387,700 | | | Vale SA | | | 14,007,763 | |
| | | | | | | | | | |
| | | | | | Total Brazil | | | 224,374,001 | |
| | | | | | | | | | |
| | |
| | | | | | Germany — 0.1% | |
| | | 34,296 | | | Bayerische Motoren Werke AG | | | 2,555,642 | |
| | | 19,989 | | | Jungheinrich AG | | | 604,606 | |
| | | 228,724 | | | Porsche Automobil Holding SE | | | 12,622,912 | |
| | | | | | | | | | |
| | | | | | Total Germany | | | 15,783,160 | |
| | | | | | | | | | |
| | | | | | | | | | |
Shares /
Par Value | | | Description | | Value ($) | |
| | | | | | South Korea — 0.4% | |
| | | 64,989 | | | Hyundai Motor Co | | | 5,623,358 | |
| | | 101,800 | | | Hyundai Motor Co 2nd Preference | | | 9,174,373 | |
| | | 18,438 | | | Samsung Electronics Co Ltd | | | 24,404,375 | |
| | | 3,201 | | | Samsung Electronics Co Ltd GDR (Registered) | | | 2,116,822 | |
| | | | | | | | | | |
| | | | | | Total South Korea | | | 41,318,928 | |
| | | | | | | | | | |
| | | |
| | | | | | TOTAL PREFERRED STOCKS (COST $185,973,144) | | | 281,476,089 | |
| | | | | | | | | | |
| | |
| | | | | | RIGHTS/WARRANTS — 0.1% | |
| | |
| | | | | | Brazil — 0.0% | |
| | | 239,195 | | | Itausa – Investimentos Itau SA Rights, Expires 03/31/17 * | | | 302,934 | |
| | | | | | | | | | |
| | |
| | | | | | India — 0.0% | |
| | | 174,239 | | | Canara Bank, Expires 03/16/17 * | | | 232,428 | |
| | | | | | | | | | |
| | |
| | | | | | Singapore — 0.0% | |
| | | 630,200 | | | Interoil Corporate Escrow* | | | 2,520,800 | |
| | | | | | | | | | |
| | |
| | | | | | United States — 0.1% | |
| | | 2,616,810 | | | Media General, Inc. * | | | 3,925,215 | |
| | | 2,279,800 | | | Safeway Casa Ley CVR * | | | 638,344 | |
| | | 2,279,800 | | | Safeway PDC, LLC CVR * | | | 45,596 | |
| | | | | | | | | | |
| | | | | | Total United States | | | 4,609,155 | |
| | | | | | | | | | |
| | | |
| | | | | | TOTAL RIGHTS/WARRANTS (COST $4,895,407) | | | 7,665,317 | |
| | | | | | | | | | |
| |
| | | DEBT OBLIGATIONS — 38.1% † | |
| |
| | | Canada — 0.4% | |
| | | Corporate Debt — 0.4% | |
| | | 500,000 | | | Canbriam Energy Inc, 144A, 9.75%, due 11/15/19 | | | 525,000 | |
| | | 1,750,000 | | | Cenovus Energy Inc, 5.70%, due 10/15/19 | | | 1,882,258 | |
| | | 250,000 | | | First Quantum Minerals Ltd, 144A, 7.25%, due 10/15/19 | | | 258,125 | |
| | | 18,352,800 | | | Nortel Networks Ltd, due 07/15/11 (b) | | | 18,215,154 | |
| | | 26,379,600 | | | Nortel Networks Ltd, 10.13%, due 07/15/13 (b) | | | 26,874,217 | |
| | | 2,500,000 | | | Teck Resources Ltd, 6.13%, due 10/01/35 | | | 2,587,500 | |
| | | | | | | | | | |
| | | | | | Total Corporate Debt | | | 50,342,254 | |
| | | | | | | | | | |
| | | | | | Total Canada | | | 50,342,254 | |
| | | | | | | | | | |
| |
| | | Denmark — 0.3% | |
| | | Bank Loans — 0.3% | |
| | | 6,965,283 | | | O.W. Bunker & Trading A/S, Ancillary Revolver, 0.00% (b) | | | 6,895,537 | |
| | | | |
| 62 | | See accompanying notes to the financial statements. | | |
GMO Implementation Fund
(A Series of GMO Trust)
Consolidated Schedule of Investments — (Continued)
(showing percentage of total net assets)
February 28, 2017
| | | | | | | | | | |
Par Value† | | | Description | | Value ($) | |
| | | Denmark — continued | |
| | | Bank Loans — continued | |
| | | 6,393,489 | | | O.W. Bunker & Trading A/S, Term Loan A, 1.75% (b) | | | 6,329,554 | |
| | | 15,849,007 | | | O.W. Bunker & Trading A/S, Term Loan B, 2.25% (b) | | | 15,690,517 | |
| | | | | | | | | | |
| | | | | | Total Bank Loans | | | 28,915,608 | |
| | | | | | | | | | |
| | | Total Denmark | | | 28,915,608 | |
| | | | | | | | | | |
| |
| | | France — 0.0% | |
| | | Corporate Debt — 0.0% | |
| | | 1,250,000 | | | Credit Agricole SA, 144A, Variable Rate, 8.38%, due 10/29/49 | | | 1,381,250 | |
| | | | | | | | | | |
| |
| | | Italy — 0.0% | |
| | | Corporate Debt — 0.0% | |
| | | 2,000,000 | | | Intesa Sanpaolo SPA, 144A, 5.02%, due 06/26/24 | | | 1,881,420 | |
| | | 1,000,000 | | | Meccanica Holdings USA, Inc, 144A 6.25% due 07/15/19 | | | 1,076,000 | |
| | | | | | | | | | |
| | | | | | Total Italy | | | 2,957,420 | |
| | | | | | | | | | |
| |
| | | Japan — 0.2% | |
| | | Corporate Debt — 0.0% | |
| | | 3,000,000 | | | SoftBank Group Corp, 144A, 4.50%, due 04/15/20 | | | 3,101,250 | |
| | | | | | | | | | |
| | |
| | | | | | Foreign Government Obligations — 0.2% | |
JPY | | | 1,700,000,000 | | | Japan Treasury Discount Bill, Zero coupon, due 05/22/17 | | | 15,139,526 | |
| | | | | | | | | | |
| | | | | | Total Japan | | | 18,240,776 | |
| | | | | | | | | | |
| |
| | | Luxembourg — 0.0% | |
| | | Corporate Debt — 0.0% | |
| | | 500,000 | | | ArcelorMittal, 10.60%, due 06/01/19 | | | 586,250 | |
| | | 250,000 | | | Intelsat Jackson Holdings SA, 7.25%, due 04/01/19 | | | 239,375 | |
| | | 500,000 | | | INEOS Group Holdings SA, 144A, 5.88%, due 02/15/19 | | | 507,345 | |
| | | | | | | | | | |
| | | | | | Total Corporate Debt | | | 1,332,970 | |
| | | | | | | | | | |
| | | | | | Total Luxembourg | | | 1,332,970 | |
| | | | | | | | | | |
| |
| | | Puerto Rico — 0.3% | |
| | | Municipal Obligations — 0.3% | |
| | | 3,012,000 | | | Puerto Rico Commonwealth Aqueduct & Sewer Authority, (Senior Lien), 6.00%, due 07/01/38 | | | 2,334,300 | |
| | | 1,410,000 | | | Puerto Rico Commonwealth Aqueduct & Sewer Authority, (Senior Lien), 5.25%, due 07/01/42 | | | 1,071,600 | |
| | | | | | | | | | |
Par Value† | | | Description | | Value ($) | |
| | | Puerto Rico — continued | |
| | | Municipal Obligations — continued | |
| | | 16,687,000 | | | Puerto Rico Commonwealth Aqueduct & Sewer Authority, (Senior Lien), 6.00%, due 07/01/44 | | | 12,932,425 | |
| | | 26,571,000 | | | Puerto Rico Commonwealth Aqueduct & Sewer Authority, (Senior Lien), 6.00%, due 07/01/47 | | | 20,592,525 | |
| | | | | | | | | | |
| | | | | | Total Municipal Obligations | | | 36,930,850 | |
| | | | | | | | | | |
| | | | | | Total Puerto Rico | | | 36,930,850 | |
| | | | | | | | | | |
| |
| | | United Kingdom — 0.3% | |
| | | Corporate Debt — 0.3% | |
| | | 250,000 | | | Algeco Scotsman Global Finance Plc, 144A, 8.50%, due 10/15/18 | | | 243,125 | |
| | | 2,750,000 | | | Anglo American Capital Plc, 144A, 4.88%, due 05/14/25 | | | 2,853,125 | |
| | | 1,000,000 | | | Globe Luxembourg, SCA, 144A, 9.63%, due 05/01/18 | | | 1,025,000 | |
GBP | | | 22,680,335 | | | TWRFIN, Reg S, 8.75%, due 04/02/20 | | | 26,876,469 | |
| | | | | | | | | | |
| | | | | | Total Corporate Debt | | | 30,997,719 | |
| | | | | | | | | | |
| | | | | | Total United Kingdom | | | 30,997,719 | |
| | | | | | | | | | |
| |
| | | United States — 36.6% | |
| | | Bank Loans — 0.5% | |
| | | 55,513,311 | | | Sears Roebuck Acceptance Corp., Term Loan, 4.50%, due 06/30/18 | | | 54,888,786 | |
| | | | | | | | | | |
| |
| | | Corporate Debt — 0.5% | |
| | | 1,500,000 | | | Allegheny Technologies, Inc., 5.95%, due 01/15/21 | | | 1,506,615 | |
| | | 1,000,000 | | | APX Group, Inc., 6.38%, due 12/01/19 | | | 1,028,750 | |
| | | 1,250,000 | | | Arconic, Inc., 6.15%, due 08/15/20 | | | 1,368,750 | |
| | | 2,000,000 | | | Avon Products, Inc., 7.00%, due 03/15/23 | | | 1,870,000 | |
| | | 1,000,000 | | | Bill Barrett Corp., 7.63%, due 10/01/19 | | | 995,000 | |
| | | 500,000 | | | Boxer Parent Co., Inc., 144A, 9.00%, due 10/15/19 | | | 501,875 | |
| | | 1,000,000 | | | Brinker International, Inc., 2.60%, due 05/15/18 | | | 1,000,000 | |
| | | 1,500,000 | | | CenturyLink, Inc., 5.80%, due 03/15/22 | | | 1,548,750 | |
| | | 1,000,000 | | | Cenveo Corp., 144A, 6.00%, due 08/01/19 | | | 850,000 | |
| | | 1,250,000 | | | CF Industries, Inc., 6.88%, due 05/01/18 | | | 1,311,562 | |
| | | 1,000,000 | | | CHS/Community Health Systems, Inc., 8.00%, due 11/15/19 (c) | | | 977,500 | |
| | | 500,000 | | | Cleaver-Brooks, Inc., 144A, 8.75%, due 12/15/19 | | | 521,875 | |
| | | 750,000 | | | Continental Resources, Inc., 5.00%, due 09/15/22 | | | 765,000 | |
| | | 500,000 | | | CSC Holdings LLC, 8.63%, due 02/15/19 | | | 552,815 | |
| | | | |
| | See accompanying notes to the financial statements. | | 63 |
GMO Implementation Fund
(A Series of GMO Trust)
Consolidated Schedule of Investments — (Continued)
(showing percentage of total net assets)
February 28, 2017
| | | | | | | | | | |
Par Value† | | | Description | | Value ($) | |
| | | Corporate Debt — continued | |
| | | 1,500,000 | | | DCP Midstream Operating LP, 144A, 6.75%, due 09/15/37 | | | 1,590,000 | |
| | | 1,250,000 | | | Downstream Development Authority of the Quapaw Tribe of Oklahoma, 144A, 10.50%, due 07/01/19 | | | 1,240,625 | |
| | | 250,000 | | | Dynegy, Inc., 6.75%, due 11/01/19 | | | 257,500 | |
| | | 2,750,000 | | | EMC Corp., 3.38%, due 06/01/23 | | | 2,628,607 | |
| | | 1,250,000 | | | Ensco Plc 5.20% due | | | 1,106,250 | |
| | | 2,500,000 | | | Ensco Plc 5.75% due | | | 1,950,000 | |
| | | 2,000,000 | | | Freeport-McMoRan, Inc., 2.38%, due 03/15/18 | | | 1,990,000 | |
| | | 1,250,000 | | | Genworth Holdings, Inc., 7.70%, due 06/15/20 | | | 1,245,312 | |
| | | 750,000 | | | Gibson Brands, Inc., 144A, 8.88%, due 08/01/18 | | | 676,875 | |
| | | 1,250,000 | | | Hertz Corp. (The), 6.75%, due 04/15/19 | | | 1,254,687 | |
| | | 250,000 | | | iHeartCommunications, Inc., 9.00%, due 12/15/19 | | | 218,468 | |
| | | 8,861,500 | | | iHeartCommunications, Inc., 9.00%, due 03/01/21 | | | 7,177,815 | |
| | | 4,430,800 | | | iHeartCommunications, Inc., 9.00%, due 09/15/22 | | | 3,566,794 | |
| | | 750,000 | | | Laureate Education, Inc., 144A, 9.25%, due 09/01/19 | | | 784,688 | |
| | | 1,000,000 | | | Lexmark International, Inc., 6.13%, due 03/15/20 | | | 1,039,617 | |
| | | 1,250,000 | | | Transocean, Inc., 6.80%, due 03/15/38 | | | 1,006,250 | |
| | | 750,000 | | | Mallinckrodt International Finance SA, 3.50% due 04/15/18 | | | 751,875 | |
| | | 750,000 | | | McClatchy Co. (The), 6.88%, due 03/15/29 | | | 644,063 | |
| | | 250,000 | | | MHGE Parent LLC/MHGE Parent Finance, Inc., 144A, 8.50%, due 08/01/19 (c) | | | 247,500 | |
| | | 500,000 | | | Michael Baker International LLC/CDL Acquisition Co., Inc., 144A, 8.25%, due 10/15/18 | | | 505,000 | |
| | | 1,000,000 | | | Murphy Oil Corp., 4.70%, due 12/01/22 | | | 982,500 | |
| | | 1,250,000 | | | Navient Corp., 5.50%, due 01/25/23 | | | 1,200,000 | |
| | | 1,000,000 | | | Springleaf Finance Corp., 5.25%, due 12/15/19 | | | 1,006,250 | |
| | | 750,000 | | | Sprint Capital Corp., 6.90%, due 05/01/19 | | | 798,990 | |
| | | 2,250,000 | | | Sprint Capital Corp., 8.75%, due 03/15/32 | | | 2,700,000 | |
| | | 500,000 | | | Syniverse Holdings, Inc., 9.13%, due 01/15/19 | | | 460,000 | |
| | | 1,500,000 | | | Talen Energy Supply LLC, 4.60%, due 12/15/21 | | | 1,235,250 | |
| | | 500,000 | | | Tenet Healthcare Corp., 5.50%, due 03/01/19 | | | 505,805 | |
| | | 500,000 | | | Valeant Pharmaceuticals International Inc, 144A, 6.75% due 08/15/18 (c) | | | 492,500 | |
| | | 750,000 | | | Vander Intermediate Holding II Corp., 144A, 9.75%, due 02/01/19 | | | 753,750 | |
| | | | | | | | | | |
Par Value† | | | Description | | Value ($) | |
| | | Corporate Debt — continued | |
| | | 250,000 | | | Wave Holdco LLC/Wave Holdco Corp., 144A, 8.25%, due 07/15/19 | | | 255,000 | |
| | | 2,000,000 | | | Williams Cos, Inc. (The), 8.75%, due 03/15/32 | | | 2,567,500 | |
| | | 1,500,000 | | | Yum! Brands, Inc., 5.35%, due 11/01/43 | | | 1,290,000 | |
| | | | | | | | | | |
| | | | | | Total Corporate Debt | | | 58,927,963 | |
| | | | | | | | | | |
| | | |
| | | | | | U.S. Government — 34.7% | | | | |
| | | 345,242,664 | | | U.S. Treasury Inflation Indexed Bond, 0.25%, due 01/15/25 (d) | | | 344,264,937 | |
| | | 233,111,560 | | | U.S. Treasury Inflation Indexed Bond, 0.38%, due 07/15/25 (d) | | | 235,096,272 | |
| | | 232,704,416 | | | U.S. Treasury Inflation Indexed Bond, 0.63%, due 01/15/26 (d) | | | 238,423,359 | |
| | | 215,341,498 | | | U.S. Treasury Inflation Indexed Bond, 0.13%, due 07/15/26 (d) | | | 211,561,609 | |
| | | 41,000,000 | | | U.S. Treasury Note, 1.88%, due 08/31/17 | | | 41,229,026 | |
| | | 75,000,000 | | | U.S. Treasury Note, 0.63%, due 09/30/17 | | | 74,935,575 | |
| | | 175,000,000 | | | U.S. Treasury Note, 0.88%, due 11/30/17 | | | 175,068,425 | |
| | | 30,000,000 | | | U.S. Treasury Note, 2.25%, due 11/30/17 | | | 30,314,070 | |
| | | 320,000,000 | | | U.S. Treasury Note, 1.00%, due 12/15/17 | | | 320,375,040 | |
| | | 125,000,000 | | | U.S. Treasury Note, 0.88%, due 01/15/18 | | | 124,975,625 | |
| | | 82,500,000 | | | U.S. Treasury Note, 0.88%, due 01/31/18 | | | 82,454,873 | |
| | | 355,000,000 | | | U.S. Treasury Note, 0.75%, due 02/28/18 (e) | | | 354,278,995 | |
| | | 10,000,000 | | | U.S. Treasury Note, 0.75%, due 04/15/18 | | | 9,972,660 | |
| | | 55,000,000 | | | U.S. Treasury Note, USBM + 0.19%, 0.71%, due 04/30/18 | | | 55,094,270 | |
| | | 10,000,000 | | | U.S. Treasury Note, 2.63%, due 04/30/18 | | | 10,186,330 | |
| | | 55,000,000 | | | U.S. Treasury Note, 1.00%, due 05/31/18 | | | 54,987,130 | |
| | | 55,000,000 | | | U.S. Treasury Note, 1.38%, due 07/31/18 | | | 55,236,335 | |
| | | 165,000,000 | | | U.S. Treasury Note, 0.75%, due 10/31/18 | | | 163,884,930 | |
| | | 50,000,000 | | | U.S. Treasury Note, 1.00%, due 11/30/18 | | | 49,853,500 | |
| | | 100,000,000 | | | U.S. Treasury Note, 1.25%, due 12/31/18 | | | 100,082,000 | |
| | | 150,000,000 | | | U.S. Treasury Note, 1.13%, due 01/31/19 | | | 149,718,750 | |
| | | 40,000,000 | | | U.S. Treasury Note, 1.50%, due 01/31/19 | | | 40,203,120 | |
| | | 110,000,000 | | | U.S. Treasury Note, 0.75%, due 02/15/19 | | | 108,964,460 | |
| | | | |
| 64 | | See accompanying notes to the financial statements. | | |
GMO Implementation Fund
(A Series of GMO Trust)
Consolidated Schedule of Investments — (Continued)
(showing percentage of total net assets)
February 28, 2017
| | | | | | | | | | |
Par Value† /
Number
of Contracts | | | Description | | Value ($) | |
| | | | | | U.S. Government — continued | | | | |
| | | 50,000,000 | | | U.S. Treasury Note, 1.38%, due 02/28/19 | | | 50,138,650 | |
| | | 20,000,000 | | | U.S. Treasury Note, 1.50%, due 02/28/19 | | | 20,098,440 | |
| | | 150,000,000 | | | U.S. Treasury Note, 1.13%, due 02/28/19 | | | 149,683,650 | |
| | | 50,000,000 | | | U.S. Treasury Note, 0.88%, due 04/15/19 | | | 49,582,050 | |
| | | 75,000,000 | | | U.S. Treasury Note, 3.13%, due 05/15/19 | | | 77,941,425 | |
| | | 25,000,000 | | | U.S. Treasury Note, 1.63%, due 06/30/19 | | | 25,164,050 | |
| | | 290,000,000 | | | U.S. Treasury Note, 3.63%, due 08/15/19 | | | 305,813,990 | |
| | | 25,000,000 | | | U.S. Treasury Note, 1.75%, due 09/30/19 | | | 25,224,600 | |
| | | 105,000,000 | | | U.S. Treasury Note, 1.25%, due 10/31/19 | | | 104,540,625 | |
| | | 52,500,000 | | | U.S. Treasury Note, 1.50%, due 10/31/19 | | | 52,600,485 | |
| | | | | | | | | | |
| | | | | | Total U.S. Government | | | 3,891,949,256 | |
| | | | | | | | | | |
| | |
| | | | | | U.S. Government Agency — 0.9% | |
| | | 20,000,000 | | | Federal Home Loan Bank Discount Notes, due 03/08/17 | | | 19,998,440 | |
| | | 20,000,000 | | | Federal Home Loan Bank Discount Notes, Variable Rate, 0.56%, due 07/27/17 | | | 20,001,620 | |
| | | 64,000,000 | | | Federal Home Loan Bank Discount Notes, Variable Rate, 0.81%, due 02/01/19 | | | 63,999,552 | |
| | | | | | | | | | |
| | | | | | Total U.S. Government Agency | | | 103,999,612 | |
| | | | | | | | | | |
| | | | | | Total United States | | | 4,109,765,617 | |
| | | | | | | | | | |
| | | |
| | | | | | TOTAL DEBT OBLIGATIONS (COST $4,281,554,785) | | | 4,280,864,464 | |
| | | | | | | | | | |
| |
| | | OPTIONS PURCHASED — 0.1% | |
| |
| | | Currency Options — 0.0% | |
EUR | | | 31,901,000 | | | EUR Call/USD Put, Expires 03/06/17, Strike 1.15, (OTC) (CP-GS) | | | — | |
EUR | | | 31,901,000 | | | EUR Call/USD Put, Expires 03/06/17, Strike 1.15, (OTC) (CP-GS) | | | — | |
USD | | | 35,446,000 | | | USD Call/CHF Put, Expires 03/06/17, Strike 1.00, (OTC) (CP-GS) | | | 335,709 | |
USD | | | 35,445,000 | | | USD Call/CHF Put, Expires 03/06/17, Strike 1.00, (OTC) (CP-BCLY) | | | 335,699 | |
| | | | | | | | | | |
| | | | | | Total Currency Options | | | 671,408 | |
| | | | | | | | | | |
| |
| | | Equity Options — 0.1% | |
| | | 1,100 | | | CDK Global, Inc., Put, Expires 05/19/17, Strike 65 | | | 225,500 | |
| | | | | | | | | | |
Par Value† /
Number
of Contracts | | | Description | | Value ($) | |
| | | Equity Options — continued | |
| | | 5,500 | | | Cypress Semiconductor Corp., Put, Expires 06/16/17, Strike 12 | | | 291,500 | |
| | | 2,000 | | | Depomed, Inc., Put, Expires 03/17/17, Strike 19 | | | 538,000 | |
| | | 1,000 | | | DISH Network Corp., Put, Expires 06/16/17, Strike 53 | | | 125,000 | |
| | | 900 | | | EI du Pont de Nemours & Co., Put, Expires 07/21/17, Strike 75 | | | 206,100 | |
| | | 1,724 | | | Exxon Mobil Corp., Put, Expires 06/16/17, Strike 80 | | | 444,792 | |
| | | 400 | | | F5 Networks, Inc., Put, Expires 04/21/17, Strike 135 | | | 89,200 | |
| | | 2,800 | | | Pandora Media, Inc., Put, Expires 06/16/17, Strike 13 | | | 400,400 | |
| | | 3,301 | | | Sears Holdings Corp., Put, Expires 01/19/18, Strike 10 | | | 1,693,413 | |
| | | 7,078 | | | Sears Holdings Corp., Put, Expires 01/19/18, Strike 8 | | | 2,583,470 | |
| | | 6,052 | | | Sears Holdings Corp., Put, Expires 06/15/18, Strike 8 | | | 1,997,160 | |
| | | 1,964 | | | Sears Holdings Corp., Put, Expires 06/15/18, Strike 10 | | | 1,040,920 | |
| | | 1,000 | | | T-Mobile US, Inc., Put, Expires 05/19/17, Strike 50 | | | 58,000 | |
| | | 2,000 | | | Twitter, Inc., Put, Expires 04/21/17, Strike 18 | | | 490,000 | |
| | | 2,300 | | | Unilever NV, Put, Expires 08/18/17, Strike 45 | | | 414,000 | |
| | | 7,500 | | | Viacom, Inc., Put, Expires 03/17/17, Strike 33 | | | 15,000 | |
| | | 2,500 | | | Williams Cos , Inc. (The), Put, Expires 05/19/17, Strike 28 | | | 392,500 | |
| | | 2,400 | | | Yahoo!, Inc., Put, Expires 07/21/17, Strike 44 | | | 441,600 | |
| | | | | | | | | | |
| | | | | | Total Equity Options | | | 11,446,555 | |
| | | | | | | | | | |
| | | |
| | | | | | TOTAL OPTIONS PURCHASED (COST $13,665,839) | | | 12,117,963 | |
| | | | | | | | | | |
| | |
| | | | | | SHORT-TERM INVESTMENTS — 6.8% | |
| | |
| | | | | | Money Market Funds — 0.2% | |
| | | 24,979,063 | | | State Street Institutional Treasury Money Market Fund-Premier Class, 0.42% (f) (g) | | | 24,979,063 | |
| | | | | | | | | | |
| | |
| | | | | | Repurchase Agreements — 6.1% | |
| | | 278,849,254 | | | Daiwa Capital Markets America Inc. Repurchase Agreement, dated 02/28/17, maturing on 03/01/17 with a maturity value of $278,853,282 and an effective yield of 0.52%, collateralized by a U.S. Treasury Note with maturity date 07/31/23 and a market value of $284,364,255. | | | 278,849,254 | |
| | | | |
| | See accompanying notes to the financial statements. | | 65 |
GMO Implementation Fund
(A Series of GMO Trust)
Consolidated Schedule of Investments — (Continued)
(showing percentage of total net assets)
February 28, 2017
| | | | | | | | | | |
Par Value† | | | Description | | Value ($) | |
| | | | | | Repurchase Agreements — continued | |
| | | 110,092,416 | | | Mizuho Securities USA Inc. Repurchase Agreement, dated 02/28/17, maturing on 03/01/17 with a maturity value of $110,094,037 and an effective yield of 0.53%, collateralized by a U.S. Treasury Note with maturity date 09/30/20 and a market value of $ 112,231,757. | | | 110,092,416 | |
| | | 297,190,753 | | | Nomura Securities International Inc. Repurchase Agreement, dated 02/28/17, maturing on 03/01/17 with a maturity value of $297,195,046 and an effective yield of 0.52%, collateralized by a U.S. Treasury Note with maturity date 08/15/24 and a market value of $302,962,770. | | | 297,190,753 | |
| | | | | | | | | | |
| | | | | | TOTAL REPURCHASE AGREEMENTS
(COST $686,132,423) | | | 686,132,423 | |
| | | | | | | | | | |
| | |
| | | | | | U.S. Government — 0.5% | |
| | | 25,000,000 | | | U.S. Treasury Bill,
0.50%, due 04/20/17 (g) (h) | | | 24,982,450 | |
| | | 25,000,000 | | | U.S. Treasury Bill,
0.63%, due 07/20/17 (g) (h) | | | 24,938,725 | |
| | | | | | | | | | |
| | | | | | Total U.S. Government | | | 49,921,175 | |
| | | | | | | | | | |
| | | |
| | | | | | TOTAL SHORT-TERM INVESTMENTS
(COST $761,035,926) | | | 761,032,661 | |
| | | | | | | | | | |
| | | |
| | | | | | TOTAL INVESTMENTS — 98.6% (Cost $10,603,827,326) | | | 11,072,226,916 | |
| | | | | | | | | | |
| | | | | | | | | | |
Shares | | | Description | | Value ($) | |
| | | | | | SECURITIES SOLD SHORT — (1.5)% | |
| | |
| | | | | | Common Stocks — (1.4)% | |
| | | | | | Canada — 0.0% | |
| | | (6,634 | ) | | Fairfax Financial Holdings Ltd | | | (2,986,848 | ) |
| | | | | | | | | | |
| | |
| | | | | | United Kingdom — (0.3)% | |
| | | (533,102 | ) | | British American Tobacco Plc Sponsored ADR | | | (34,033,232 | ) |
| | | | | | | | | | |
| | |
| | | | | | United States — (1.1)% | |
| | | (40,084 | ) | | Analog Devices, Inc. | | | (3,284,082 | ) |
| | | (785,461 | ) | | CenturyLink, Inc. | | | (19,055,284 | ) |
| | | (82,554 | ) | | Great Plains Energy, Inc. | | | (2,399,019 | ) |
| | | (119,414 | ) | | Praxair, Inc. | | | (14,175,636 | ) |
| | | (212,836 | ) | | Rockwell Collins, Inc. | | | (20,344,993 | ) |
| | | (9,296,281 | ) | | Sirius XM Holdings, Inc. | | | (47,318,070 | ) |
| | | (144,525 | ) | | Tesoro Corp. | | | (12,312,085 | ) |
| | | | | | | | | | |
| | | | | | Total United States | | | (118,889,169 | ) |
| | | | | | | | | | |
| | | |
| | | | | | TOTAL COMMON STOCKS (PROCEEDS $140,407,228) | | | (155,909,249 | ) |
| | | | | | | | | | |
| | | |
| | | | | | Exchange-Traded Fund — (0.1)% | | | | |
| | | (90,500 | ) | | Vanguard Industrials ETF (Proceeds $11,116,917) | | | (11,313,405 | ) |
| | | | | | | | | | |
| | | | | | | | | (11,313,405 | ) |
| | | | | | | | | | |
| | | |
| | | | | | TOTAL SECURITIES SOLD SHORT (PROCEEDS $151,524,145) | | | (167,222,654 | ) |
| | | | | | | | | | |
| | | | | | Other Assets and Liabilities (net) — 2.9% | | | 321,679,591 | |
| | | | | | | | | | |
| | | |
| | | | | | TOTAL NET ASSETS — 100.0% | | | $11,226,683,853 | |
| | | | | | | | | | |
A summary of outstanding financial instruments at February 28, 2017 is as follows:
Reverse Repurchase Agreements(1)
| | | | | | | | | | |
Face Value | | | Description | | Market
Value | |
| USD | | | 412,425 | | | Barclays Bank plc, (0.75%), dated 02/13/17, (collateral: Valeant Pharmaceuticals International, 144A 6.75%, due 08/15/18), to be repurchased on demand at face value plus accrued interest. | | $ | (412,297 | ) |
| USD | | | 183,857 | | | Barclays Bank plc, (1.00%), dated 02/13/17, (collateral: MHGE Parent LLC/MHGE Parent Finance, Inc., 144A, 8.50%, due 08/01/19), to be repurchased on demand at face value plus accrued interest. | | | (183,780 | ) |
| USD | | | 730,178 | | | Citigroup, Inc., (0.75%), dated 02/15/17, (collateral: CHS/Community Health Systems, Inc. 8.00%, due 11/15/19), to be repurchased on demand at face value plus accrued interest. | | $ | (729,980 | ) |
| | | | | | | | | | |
| | | | | | | | $ | (1,326,057 | ) |
| | | | | | | | | | |
| | | | | | Average balance outstanding | | $ | (140,735,846 | ) |
| | | | | | Average interest rate | | | (0.22 | )% |
| | | | | | Maximum balance outstanding | | $ | (290,656,351 | ) |
Average balance outstanding was calculated based on daily face value balances outstanding during the period that the Fund had entered into reverse repurchase agreements.
| | | | |
| 66 | | See accompanying notes to the financial statements. | | |
GMO Implementation Fund
(A Series of GMO Trust)
Consolidated Schedule of Investments — (Continued)
February 28, 2017
Forward Currency Contracts
| | | | | | | | | | | | | | | | | | | | | | |
Settlement
Date | | Counter-
party | | Currency
Sold | | | Currency
Purchased | | | Net
Unrealized
Appreciation
(Depreciation) | |
| 03/13/2017 | | BOA | | | AUD | | | | 2,850,645 | | | | USD | | | | 2,152,371 | | | $ | (32,647 | ) |
| 03/13/2017 | | GS | | | AUD | | | | 9,658,743 | | | | USD | | | | 7,290,635 | | | | (112,788 | ) |
| 03/13/2017 | | MSCI | | | AUD | | | | 5,971,336 | | | | USD | | | | 4,518,186 | | | | (58,841 | ) |
| 03/09/2017 | | MSCI | | | CHF | | | | 39,051,699 | | | | USD | | | | 38,892,628 | | | | (2,712 | ) |
| 03/20/2017 | | MSCI | | | EUR | | | | 34,092,851 | | | | USD | | | | 36,388,664 | | | | 241,914 | |
| 11/07/2017 | | GS | | | EUR | | | | 193,938,000 | | | | USD | | | | 212,934,227 | | | | 4,805,098 | |
| 12/22/2017 | | JPM | | | EUR | | | | 55,095,000 | | | | USD | | | | 60,857,937 | | | | 1,569,874 | |
| 03/20/2017 | | GS | | | GBP | | | | 40,466,887 | | | | USD | | | | 50,610,519 | | | | 375,714 | |
| 03/13/2017 | | BCLY | | | HKD | | | | 57,710,360 | | | | USD | | | | 7,446,079 | | | | 10,799 | |
| 03/13/2017 | | BOA | | | JPY | | | | 3,027,116,116 | | | | USD | | | | 26,622,074 | | | | (332,112 | ) |
| 05/22/2017 | | BOA | | | JPY | | | | 1,700,000,000 | | | | USD | | | | 15,206,813 | | | | 22,566 | |
| 03/09/2017 | | MSCI | | | SEK | | | | 146,685,825 | | | | USD | | | | 16,143,448 | | | | (111,630 | ) |
| 03/09/2017 | | MSCI | | | USD | | | | 20,645,000 | | | | CHF | | | | 21,156,583 | | | | 426,874 | |
| 03/13/2017 | | MSCI | | | USD | | | | 8,402,624 | | | | NZD | | | | 12,060,000 | | | | 281,123 | |
| 03/20/2017 | | BCLY | | | USD | | | | 1,968,121 | | | | EUR | | | | 1,859,942 | | | | 3,872 | |
| 03/20/2017 | | BOA | | | USD | | | | 1,553,918 | | | | EUR | | | | 1,463,735 | | | | (2,001 | ) |
| 03/20/2017 | | GS | | | USD | | | | 67,000 | | | | GBP | | | | 53,404 | | | | (705 | ) |
| 03/20/2017 | | JPM | | | USD | | | | 216,000 | | | | EUR | | | | 204,120 | | | | 418 | |
| 11/07/2017 | | GS | | | USD | | | | 214,049,371 | | | | EUR | | | | 193,938,000 | | | | (5,920,241 | ) |
| 12/22/2017 | | JPM | | | USD | | | | 61,316,438 | | | | EUR | | | | 55,095,000 | | | | (2,028,375 | ) |
| | | | | | | | | | | | | | | | | | | | | | |
| | | | | | | | | | | | | | | | | | | | $ | (863,800 | ) |
| | | | | | | | | | | | | | | | | | | | | | |
Futures Contracts
| | | | | | | | | | | | |
Number
of
Contracts + | | Type | | Expiration
Date | |
Notional
Amount | | | Net
Unrealized
Appreciation
(Depreciation) | |
| Buys | | | | | | | | | | | | |
| 292 | | U.S. Treasury Note 10 Yr. (CBT) | | June 2017 | | $ | 36,376,812 | | | $ | 102,215 | |
| 66 | | U.S. Treasury Note 2 Yr. (CBT) | | June 2017 | | | 14,282,813 | | | | 7,145 | |
| 190 | | U.S. Treasury Note 5 Yr. (CBT) | | June 2017 | | | 22,363,594 | | | | 24,972 | |
| | | | | | | | | | | | |
| | | | | | $ | 73,023,219 | | | $ | 134,332 | |
| | | | | | | | | | | | |
| Sales | | | | | | | | | | | | |
| 51 | | U.S. Long Bond (CBT) | | June 2017 | | $ | 7,734,469 | | | $ | (77,397 | ) |
| | | | | | | | | | | | |
| + | Buys - Fund is long the futures contract. |
| | Sales - Fund is short the futures contract. |
Written Options
Equity Options
| | | | | | | | | | | | | | | | | | |
| | | | |
Number of
Contracts | | | Expiration
Date | | Description | | Premiums | | | Value | |
| Call | | USD | | | 1,470 | | | 04/21/2017 | | Monsanto Co., Strike 105.00 | | $ | 975,525 | | | $ | (1,345,050 | ) |
| Call | | USD | | | 1,325 | | | 10/20/2017 | | Monsanto Co., Strike 110.00 | | | 783,931 | | | | (1,164,675 | ) |
| Call | | USD | | | 10,000 | | | 08/18/2017 | | Rite Aid Corp. Strike 6.00 | | | 436,567 | | | | (500,000 | ) |
| Call | | USD | | | 9,951 | | | 04/21/2017 | | Rite Aid Corp. Strike 7.00 | | | 931,983 | | | | (19,902 | ) |
| Call | | USD | | | 2,684 | | | 04/21/2017 | | Rite Aid Corp. Strike 8.00 | | | 121,998 | | | | (5,368 | ) |
| Call | | USD | | | 3,750 | | | 03/17/2017 | | Viacom, Inc. Strike 37.50 | | | 1,337,443 | | | | (2,475,000 | ) |
| Call | | USD | | | 3,750 | | | 03/17/2017 | | Viacom, Inc. Strike 40.00 | | | 629,311 | | | | (1,323,750 | ) |
| | | | | | | | | | | | | | | | | | |
| | | | | | | | | | | | $ | 5,216,758 | | | $ | (6,833,745 | ) |
| | | | | | | | | | | | | | | | | | |
Swap Contracts
Credit Default Swaps
| | | | | | | | | | | | | | | | | | | | | | | | |
| | | | | | | | |
Notional
Amount | | | Expiration
Date | | Counterparty | | Receive
(Pay) ^ | | Annual
Premium | | Implied
Credit
Spread (1) | | Reference
Entity | | Maximum Potential
Amount of Future
Payments by the Fund
Under the Contract (2) | | Net
Unrealized
Appreciation/
(Depreciation) | |
| | 3,000,000 | | | | USD | | | 3/20/2017 | | MSCI | | (Pay) | | 5.00% | | 28.13% | | Sears Roebuck Acceptance Corp. | | NA | | $ | 38,523 | |
| | 3,000,000 | | | | USD | | | 3/20/2017 | | GS | | (Pay) | | 5.00% | | 28.13% | | Sears Roebuck Acceptance Corp. | | NA | | | 38,523 | |
| | 3,000,000 | | | | USD | | | 3/20/2017 | | GS | | (Pay) | | 5.00% | | 28.13% | | Sears Roebuck Acceptance Corp. | | NA | | | 38,523 | |
| | 17,458,000 | | | | USD | | | 12/20/2018 | | GS | | (Pay) | | 5.00% | | 33.05% | | Sears Roebuck Acceptance Corp. | | NA | | | 5,892,076 | |
| | 6,000,000 | | | | USD | | | 12/20/2018 | | GS | | (Pay) | | 0.00% | | 1.00% | | Sears Roebuck Acceptance Corp. | | NA | | | (341,025 | ) |
| | | | |
| | See accompanying notes to the financial statements. | | 67 |
GMO Implementation Fund
(A Series of GMO Trust)
Consolidated Schedule of Investments — (Continued)
February 28, 2017
| | | | | | | | | | | | | | | | | | | | | | | | |
| | | | | | | | |
Notional
Amount | | | Expiration
Date | | Counterparty | | Receive
(Pay) ^ | | Annual
Premium | | Implied
Credit
Spread (1) | | Reference
Entity | | Maximum Potential
Amount of Future
Payments by the Fund
Under the Contract (2) | | Net
Unrealized
Appreciation/
(Depreciation) | |
| | 3,000,000 | | | | USD | | | 6/20/2021 | | MSCI | | (Pay) | | 0.00% | | 1.00% | | Sears Roebuck Acceptance Corp. | | NA | | $ | (241,621 | ) |
| | 3,000,000 | | | | USD | | | 12/20/2021 | | MSCI | | (Pay) | | 0.00% | | 1.00% | | Sears Roebuck Acceptance Corp. | | NA | | | (247,137 | ) |
| | 8,702,000 | | | | EUR | | | 12/20/2021 | | BCLY | | (Pay) | | 1.00% | | 1.3% | | Assicurazioni Generali SpA | | NA | | | 128,988 | |
| | 15,135,000 | | | | USD | | | 12/20/2021 | | JPM | | (Pay) | | 1.00% | | 0.77% | | MetLife, Inc. | | NA | | | (158,495 | ) |
| | 3,814,000 | | | | USD | | | 12/20/2021 | | JPM | | (Pay) | | 1.00% | | 0.65% | | Prudential Financial | | NA | | | (60,613 | ) |
| | 27,255,000 | | | | USD | | | 12/20/2021 | | JPM | | (Pay) | | 1.00% | | 0.77% | | MetLife, Inc. | | NA | | | (285,416 | ) |
| | 10,660,000 | | | | USD | | | 12/20/2021 | | JPM | | (Pay) | | 1.00% | | 0.65% | | Prudential Financial | | NA | | | (169,410 | ) |
| | 79,900,000 | | | | USD | | | 12/20/2021 | | CSS(i) | | (Pay) | | 5.00% | | 3.28% | | CDX.NA.HYS27.V1-5Y | | NA | | | 6,109,208 | |
| | 11,590,000 | | | | EUR | | | 12/20/2021 | | JPM | | (Pay) | | 1.00% | | 1.3% | | Assicurazioni Generali SpA | | NA | | | 171,796 | |
| | 2,298,000 | | | | USD | | | 12/20/2021 | | BOA | | (Pay) | | 1.00% | | 0.77% | | MetLife, Inc. | | NA | | | (24,065 | ) |
| | 15,229,000 | | | | USD | | | 12/20/2021 | | BCLY | | (Pay) | | 1.00% | | 0.65% | | Prudential Financial | | NA | | | (242,022 | ) |
| | 6,472,000 | | | | USD | | | 12/20/2021 | | CSI | | (Pay) | | 1.00% | | 0.77% | | MetLife, Inc. | | NA | | | (67,775 | ) |
| | 8,803,000 | | | | USD | | | 12/20/2021 | | GS | | (Pay) | | 1.00% | | 0.77% | | MetLife, Inc. | | NA | | | (92,186 | ) |
| | 30,260,000 | | | | USD | | | 12/20/2021 | | MSCI | | (Pay) | | 1.00% | | 0.65% | | Prudential Financial | | NA | | | (480,897 | ) |
| | 13,087,000 | | | | EUR | | | 12/20/2021 | | BCLY | | (Pay) | | 1.00% | | 1.30% | | Assicurazioni Generali SpA | | NA | | | 97,341 | |
| | | | | | | | | | | | | | | | | | | | | | | | |
| | | | | | | | | | | | | | | | | | | | | | $ | 10,104,316 | |
| | | | | | | | | | | | | | | | | | | | | | | | |
| | | | | | | | | | | | | | | | | | Premiums Paid/(Received) | | $ | (11,894,351 | ) |
| | | | | | | | | | | | | | | | | | | | | | | | |
| ^ | Receive - Fund receives a premium and sells credit protection. If a credit event occurs the Fund will, depending on the terms of the particular swap contract, either (i) pay to the buyer of protection an amount equal to the notional amount of the swap and take delivery of the referenced obligation or underlying securities comprising the referenced index or (ii) pay a net settlement amount in the form of cash or securities equal to the notional amount of the swap less the recovery value of the referenced obligation or underlying securities comprising the referenced index. (Pay) - Fund pays a premium and buys credit protection. If a credit event occurs the Fund will, depending on the terms of the particular swap contract, either (i) receive from the seller of protection an amount equal to the notional amount of the swap and deliver the referenced obligation or underlying securities comprising the referenced index or (ii) receive a net settlement amount in the form of cash or securities equal to the notional amount of the swap less the recovery value of the referenced obligation or underlying securities comprising the referenced index. |
| (1) | As of February 28, 2017, implied credit spreads in absolute terms, calculated using a model, and utilized in determining the market value of credit default swap contracts on the reference security, serve as an indicator of the current status of the payment/performance risk and reflect the likelihood or risk of default for the reference entity. The implied credit spread of a particular referenced entity reflects the cost of buying/selling protection. Wider (i.e., higher) credit spreads represent a deterioration of the referenced entity’s credit soundness and a greater likelihood or risk of default or other credit event occurring as defined under the terms of the contract. |
| (2) | The maximum potential amount the Fund could be required to pay as a seller of credit protection if a credit event occurs as defined under the terms of that particular swap contract. |
Interest Rate Swaps
| | | | | | | | | | | | | | | | | | | | |
| | | | | | |
Notional
Amount | | | Expiration
Date | | Counterparty | | Receive
(Pay) # | | Fixed
Rate | | Variable Rate | | Net
Unrealized
Appreciation/
(Depreciation) | |
| | 576,500,000 | | | | MXN | | | 1/22/2027 | | JPMF (j) | | Receive | | 7.90% | | TIIE | | $ | 156,873 | |
| | 313,700,000 | | | | MXN | | | 1/26/2027 | | JPMF (j) | | Receive | | 7.89% | | TIIE | | | 74,015 | |
| | 342,300,000 | | | | MXN | | | 1/26/2027 | | JPMF (j) | | Receive | | 7.87% | | TIIE | | | 55,801 | |
| | 1,132,092,000 | | | | MXN | | | 1/27/2027 | | JPMF (j) | | Receive | | 7.91% | | TIIE | | | 349,761 | |
| | 58,468,000 | | | | CAD | | | 3/17/2027 | | JPMF (k) | | (Pay) | | 1.86% | | 3 Month CAD LIBOR | | | 73,171 | |
| | 28,648,000 | | | | CAD | | | 3/17/2027 | | JPMF (k) | | Receive | | 1.97% | | 3 Month CAD LIBOR | | | 183,517 | |
| | 27,897,000 | | | | CAD | | | 3/17/2027 | | JPMF (k) | | (Pay) | | 2.00% | | 3 Month CAD LIBOR | | | (243,049 | ) |
| | 39,590,000 | | | | CHF | | | 3/17/2027 | | JPMF (k) | | (Pay) | | 0.17% | | 6 Month CHF LIBOR | | | (549,139 | ) |
| | 54,160,000 | | | | EUR | | | 3/17/2027 | | JPMF (k) | | (Pay) | | 0.77% | | 6 Month EURIBOR | | | (528,417 | ) |
| | 17,232,000 | | | | GBP | | | 3/17/2027 | | JPMF (k) | | (Pay) | | 1.35% | | 6 Month GBP LIBOR | | | (402,887 | ) |
| | 74,119,000 | | | | GBP | | | 3/17/2027 | | JPMF (k) | | (Pay) | | 1.43% | | 6 Month GBP LIBOR | | | (2,446,795 | ) |
| | | | |
| 68 | | See accompanying notes to the financial statements. | | |
GMO Implementation Fund
(A Series of GMO Trust)
Consolidated Schedule of Investments — (Continued)
February 28, 2017
| | | | | | | | | | | | | | | | | | | | |
| | | | | | |
Notional
Amount | | | Expiration
Date | | Counterparty | | Receive
(Pay) # | | Fixed
Rate | | Variable Rate | | Net
Unrealized
Appreciation/
(Depreciation) | |
| | 17,093,000 | | | | GBP | | | 3/17/2027 | | JPMF (k) | | (Pay) | | 1.43% | | 6 Month GBP LIBOR | | $ | (559,124 | ) |
| | 17,440,000 | | | | GBP | | | 3/17/2027 | | JPMF (k) | | (Pay) | | 1.40% | | 6 Month GBP LIBOR | | | (512,734 | ) |
| | 19,709,000 | | | | GBP | | | 3/17/2027 | | JPMF (k) | | (Pay) | | 1.30% | | 6 Month GBP LIBOR | | | (346,904 | ) |
| | 44,051,000 | | | | GBP | | | 3/17/2027 | | JPMF (k) | | (Pay) | | 1.38% | | 6 Month GBP LIBOR | | | (1,189,025 | ) |
| | 15,188,000 | | | | GBP | | | 3/17/2027 | | JPMF (k) | | (Pay) | | 1.41% | | 6 Month GBP LIBOR | | | (466,640 | ) |
| | 18,794,000 | | | | GBP | | | 3/17/2027 | | JPMF (k) | | (Pay) | | 1.42% | | 6 Month GBP LIBOR | | | (606,846 | ) |
| | 16,527,000 | | | �� | NZD | | | 3/17/2027 | | JPMF (k) | | Receive | | 3.47% | | 3 Month NZD Bank Bill Rate | | | (10,106 | ) |
| | 14,689,000 | | | | NZD | | | 3/17/2027 | | JPMF (k) | | Receive | | 3.67% | | 3 Month NZD Bank Bill Rate | | | 171,322 | |
| | 136,948,000 | | | | NZD | | | 3/17/2027 | | JPMF (k) | | Receive | | 2.68% | | 3 Month NZD Bank Bill Rate | | | (6,681,710 | ) |
| | 17,175,000 | | | | NZD | | | 3/17/2027 | | JPMF (k) | | (Pay) | | 2.94% | | 3 Month NZD Bank Bill Rate | | | (563,905 | ) |
| | 29,836,000 | | | | NZD | | | 3/17/2027 | | JPMF (k) | | Receive | | 2.93% | | 3 Month NZD Bank Bill Rate | | | (995,624 | ) |
| | 15,653,000 | | | | NZD | | | 3/17/2027 | | JPMF (k) | | Receive | | 2.91% | | 3 Month NZD Bank Bill Rate | | | (538,911 | ) |
| | 198,210,000 | | | | SEK | | | 3/17/2027 | | JPMF (k) | | (Pay) | | 1.14% | | 3 Month SEK STIBOR | | | (144,450 | ) |
| | 180,162,000 | | | | SEK | | | 3/17/2027 | | JPMF (k) | | (Pay) | | 1.14% | | 3 Month SEK STIBOR | | | (121,629 | ) |
| | 229,610,000 | | | | SEK | | | 3/17/2027 | | JPMF (k) | | (Pay) | | 0.90% | | 3 Month SEK STIBOR | | | (435,027 | ) |
| | 155,150,000 | | | | SEK | | | 3/17/2027 | | JPMF (k) | | Receive | | 1.17% | | 3 Month SEK STIBOR | | | 158,862 | |
| | 176,432,000 | | | | SEK | | | 3/17/2027 | | JPMF (k) | | Receive | | 1.18% | | 3 Month SEK STIBOR | | | 204,323 | |
| | 180,124,000 | | | | SEK | | | 3/17/2027 | | JPMF (k) | | Receive | | 1.18% | | 3 Month SEK STIBOR | | | 203,766 | |
| | 493,670,000 | | | | SEK | | | 3/17/2027 | | JPMF (k) | | Receive | | 1.14% | | 3 Month SEK STIBOR | | | 350,078 | |
| | 44,030,000 | | | | USD | | | 3/17/2027 | | JPMF (k) | | (Pay) | | 2.22% | | 3 Month USD LIBOR | | | (493,165 | ) |
| | 45,635,000 | | | | USD | | | 3/17/2027 | | JPMF (k) | | Receive | | 2.49% | | 3 Month USD LIBOR | | | 641,937 | |
| | 38,925,000 | | | | USD | | | 3/17/2027 | | JPMF (k) | | (Pay) | | 2.35% | | 3 Month USD LIBOR | | | (33,550 | ) |
| | 21,816,000 | | | | USD | | | 3/17/2027 | | JPMF (k) | | (Pay) | | 2.32% | | 3 Month USD LIBOR | | | 30,040 | |
| | 29,281,000 | | | | USD | | | 3/17/2027 | | JPMF (k) | | (Pay) | | 2.29% | | 3 Month USD LIBOR | | | 144,675 | |
| | 21,698,000 | | | | USD | | | 3/17/2027 | | JPMF (k) | | (Pay) | | 2.26% | | 3 Month USD LIBOR | | | 154,796 | |
| | | | | | | | | | | | | | | | | | | | |
| | | | | | | | | | | | | | | | | | $ | (14,916,700 | ) |
| | | | | | | | | | | | | | | | | | | | |
| | | | | | | | | | | | | | Premiums Paid/(Received) | | $ | (160,430 | ) |
| | | | | | | | | | | | | | | | | | | | |
| # | Receive - Fund receives fixed rate and pays variable rate. |
| | (Pay) - Fund pays fixed rate and receives variable rate. |
Total Return Swaps
| | | | | | | | | | | | | | | | | | |
Notional
Amount | | | Expiration
Date | | Counterparty | | Fund Pays | | Fund Receives | | Net
Unrealized
Appreciation/
(Depreciation) | |
| | 50,022,931 | | | | USD | | | 3/1/2017 | | GS | | Depreciation of Total Return on IBOXX High Yield + (1 month USD LIBOR rate minus 0.70%) | | Appreciation of Total Return on IBOXX High Yield | | $ | 573,066 | |
| | | | | | | | | | | | | | | | | | |
As of February 28, 2017, for the above contracts and/or agreements, the Fund had sufficient cash and/or securities to cover commitments or collateral requirements, if any, of the relevant broker or exchange.
| | | | |
| | See accompanying notes to the financial statements. | | 69 |
GMO Implementation Fund
(A Series of GMO Trust)
Consolidated Schedule of Investments — (Continued)
February 28, 2017
Notes to Schedule of Investments:
| † | Denominated in U.S. Dollar, unless otherwise indicated. |
| * | Non-income producing security. |
| (a) | Investment valued at fair value using methods determined in good faith by the Trustees of GMO Trust or persons acting at their direction pursuant to procedures approved by the Trustees (Note 2). |
| (b) | Security is in default. |
| (c) | All or a portion of this security has been pledged to cover collateral requirements on reverse repurchase agreements (Note 2). |
| (d) | Indexed security in which price and/or coupon is linked to the price of a specific instrument or financial statistic (Note 2). |
| (e) | All or a portion of this security has been pledged to cover margin requirements on futures and/or cleared swap contracts, collateral on OTC swap contracts, forward currency contracts, and/or written options, if any (Note 4). |
| (f) | The rate disclosed is the 7 day net yield as of February 28, 2017. |
| (g) | All or a portion of this security or derivative is owned by GMO Implementation SPC Ltd., which is a 100% owned subsidiary of GMO Implementation Fund. |
| (h) | The rate shown represents yield-to-maturity. |
| (i) | Swap was cleared through the Intercontinental Exchange, Inc. |
| (j) | Swap was cleared through the CME Group Inc. |
| (k) | Swap was cleared through the LCH.Clearnet Group Ltd. |
| (l) | Reverse repurchase agreements have an open maturity date and can be closed by either party on demand. |
For a listing of definitions of acronyms, counterparty abbreviations and currency abbreviations used throughout the Schedule of Investments as well as the derivative tables, if any, please refer to page 96.
| | | | |
| 70 | | See accompanying notes to the financial statements. | | |
This page has been left blank intentionally.
GMO International Developed Equity Allocation Fund
(A Series of GMO Trust)
Portfolio Management
Day-to-day management of the Fund’s portfolio is the responsibility of the Asset Allocation team at Grantham, Mayo, Van Otterloo & Co. LLC.
Management Discussion and Analysis of Fund Performance
GMO International Developed Equity Allocation Fund returned +17.37% (net) for the fiscal year ended February 28, 2017, as compared with +15.75% for the Fund’s benchmark, the MSCI EAFE Index.
The Fund’s exposure to emerging markets was the largest positive contributor to performance relative to the benchmark. The Fund’s modest cash holdings were a drag on relative performance given the strong returns generated by equities.
Allocation between sectors proved neutral, as a positive contribution from an underweight position in Healthcare offset a negative contribution from being overweight in Telecommunication Services. Apart from very modest underperformance in Information Technology, stock selection was beneficial in all sectors with Financials, Health Care, Utilities, and Telecommunication Services of particular note.
Top stock detractors included having no exposure to the strongly performing HSBC and overweight positions in Nippon Telegraph and Telephone Corporation and KDDI Corporation (a Japanese telecoms company). Top stock contributors included overweight positions in Sumitomo Mitsui Financial Group and BASF, as well as having no exposure to Novo Nordisk (a Danish Pharmaceutical company).
Because some of the securities and instruments held directly or indirectly by the Fund had positive fair value adjustments at the beginning or end of the fiscal year (and the performance of indices are not fair valued), the Fund’s absolute and relative performance is higher than it otherwise would have been in the absence of such fair value adjustments.
The views expressed herein are exclusively those of Grantham, Mayo, Van Otterloo & Co. LLC as of the date of this report and are subject to change. GMO disclaims any responsibility to update such views. They are not meant as investment advice. References to specific securities are not recommendations of such securities and may not be representative of any GMO portfolio’s current or future investments.
72
GMO International Developed Equity Allocation Fund
(A Series of GMO Trust)
Comparison of Change in Value of a $10,000,000 Investment in
GMO International Developed Equity Allocation Fund Class III Shares and the MSCI EAFE Index
As of February 28, 2017
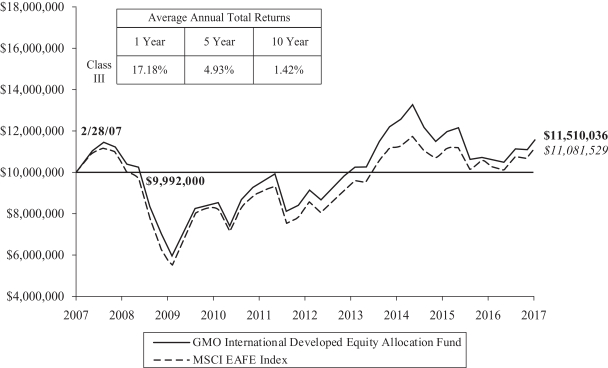
Performance data quoted represents past performance and is not indicative of future results. The investment return and principal value of an investment will fluctuate so that an investor’s shares, when redeemed, may be worth more or less than their original cost. Current performance data may be lower or higher than the performance data provided herein. To obtain performance information up to the most recent month-end, visit www.gmo.com. Performance shown is net of all fees after reimbursement from GMO. Each performance figure assumes a purchase at the beginning and redemption at the end of the stated period and reflects a transaction fee of .08% on the purchase and .08% on the redemption. Transaction fees are retained by the Fund to cover trading costs. Returns would have been lower had certain expenses not been reimbursed during the periods shown and do not include the effect of taxes on distributions and redemptions. All information is unaudited.
MSCI data may not be reproduced or used for any other purpose. MSCI provides no warranties, has not prepared or approved this report, and has no liability hereunder.
73
GMO International Developed Equity Allocation Fund
(A Series of GMO Trust)
Investment Concentration Summary
February 28, 2017 (Unaudited)
| | | | |
| Asset Class Summary& | | % of Total Net Assets | |
Common Stocks | | | 97.8 | % |
Preferred Stocks | | | 1.2 | |
Short-Term Investments | | | 1.0 | |
Investment Funds | | | 0.1 | |
Swap Contracts | | | 0.0 | ^ |
Rights/Warrants | | | 0.0 | ^ |
Futures Contracts | | | (0.0 | )^ |
Other | | | (0.1 | ) |
| | | | |
| | | 100.0 | % |
| | | | |
| | | | |
| Country/Region Summary¤ | | % of Investments | |
Japan | | | 24.9 | % |
United Kingdom | | | 15.0 | |
France | | | 8.7 | |
Germany | | | 8.4 | |
Australia | | | 6.0 | |
Switzerland | | | 5.1 | |
Hong Kong | | | 4.3 | |
Spain | | | 3.3 | |
Other Emerging | | | 3.1 | † |
Other Developed | | | 2.8 | ‡ |
Netherlands | | | 2.7 | |
Taiwan | | | 2.6 | |
Canada | | | 2.3 | |
China | | | 2.0 | |
Norway | | | 1.9 | |
Italy | | | 1.8 | |
South Korea | | | 1.6 | |
India | | | 1.2 | |
Israel | | | 1.2 | |
Finland | | | 1.1 | |
| | | | |
| | | 100.0 | % |
| | | | |
| & | The table above incorporates aggregate indirect asset class exposure associated with investments in other funds of GMO Trust (“underlying funds”). Derivative financial instruments, if any, are based on market values or unrealized appreciation/depreciation rather than notional amounts. |
| ¤ | The table above incorporates aggregate indirect country exposure associated with investments in the underlying funds. The table excludes short-term investments and includes exposure through the use of derivative financial instruments, if any. The table excludes exposure through forward currency contracts, if any. |
| † | "Other Emerging" is comprised of emerging countries that each represent between (1.0)% and 1.0% of Investments. |
| ‡ | "Other Developed" is comprised of developed countries that each represent between (1.0)% and 1.0% of Investments. |
74
GMO International Developed Equity Allocation Fund
(A Series of GMO Trust)
Schedule of Investments
(showing percentage of total net assets)
February 28, 2017
| | | | | | | | | | |
Shares /
Par Value† | | | Description | | Value ($) | |
| | | | | | MUTUAL FUNDS — 100.0% | |
| | |
| | | | | | Affiliated Issuers — 100.0% | |
| | | 2,007,664 | | | GMO Emerging Markets Fund, Class VI | | | 59,768,161 | |
| | | 26,588,637 | | | GMO International Equity Fund, Class IV | | | 541,876,427 | |
| | | | | | | | | | |
| | |
| | | TOTAL MUTUAL FUNDS
(COST $675,602,270) | | | 601,644,588 | |
| | | | | | | | | | |
| | |
| | | | | | SHORT-TERM INVESTMENTS — 0.0% | |
| | |
| | | | | | Time Deposits — 0.0% | |
| | | 200,023 | | | State Street Eurodollar Time Deposit, 0.07%, due 03/01/17 | | | 200,023 | |
| | | | | | | | | | |
| | | |
| | | | | | TOTAL SHORT-TERM INVESTMENTS
(COST $200,023) | | | 200,023 | |
| | | | | | | | | | |
| | | |
| | | | | | TOTAL INVESTMENTS — 100.0%
(Cost $675,802,293) | | | 601,844,611 | |
| | | Other Assets and Liabilities (net) — (0.0%) | | | (52,379 | ) |
| | | | | | | | | | |
| | | |
| | | | | | TOTAL NET ASSETS — 100.0% | | | $601,792,232 | |
| | | | | | | | | | |
Notes to Schedule of Investments:
| † | Denominated in U.S. Dollar, unless otherwise indicated. |
For a listing of definitions of acronyms, counterparty abbreviations and currency abbreviations used throughout the Schedule of Investments as well as the derivative tables, if any, please refer to page 96.
| | | | |
| | See accompanying notes to the financial statements. | | 75 |
GMO International Equity Allocation Fund
(A Series of GMO Trust)
Portfolio Management
Day-to-day management of the Fund’s portfolio is the responsibility of the Asset Allocation team at Grantham, Mayo, Van Otterloo & Co. LLC.
Management Discussion and Analysis of Fund Performance
GMO International Equity Allocation Fund returned +21.57% (net) for the fiscal year ended February 28, 2017, as compared with +19.31% for the MSCI ACWI (All Country World Index) ex USA.
The Fund’s exposure to emerging markets was the largest positive contributor to performance relative to the benchmark. The Fund’s modest cash holdings were a drag on relative performance given the strong returns generated by equities.
Allocation between sectors proved neutral, as a positive contribution from an underweight position in Healthcare offset a negative contribution from being overweight in Telecommunication Services. Apart from modest underperformance in Energy and Information Technology, stock selection was beneficial in all sectors with Financials, Utilities, Telecommunication Services, and Health Care of particular note.
Top stock detractors included overweight positions in Nippon Telegraph and Telephone Corporation, KDDI Corporation (a Japanese telecoms company), and Swiss Re. Top stock contributors included overweight positions in Sberbank Russia and Samsung Electronics Co., as well as having no exposure to Novo Nordisk (a Danish Pharmaceutical company).
The views expressed herein are exclusively those of Grantham, Mayo, Van Otterloo & Co. LLC as of the date of this report and are subject to change. GMO disclaims any responsibility to update such views. They are not meant as investment advice. References to specific securities are not recommendations of such securities and may not be representative of any GMO portfolio’s current or future investments.
76
GMO International Equity Allocation Fund
(A Series of GMO Trust)
Comparison of Change in Value of a $10,000,000 Investment in
GMO International Equity Allocation Fund Class III Shares and the MSCI ACWI ex USA
As of February 28, 2017
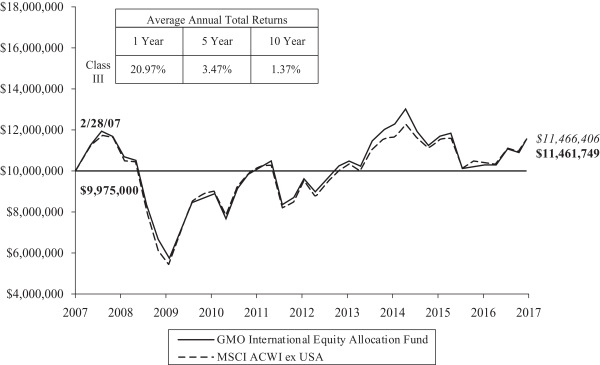
Performance data quoted represents past performance and is not indicative of future results. The investment return and principal value of an investment will fluctuate so that an investor’s shares, when redeemed, may be worth more or less than their original cost. Current performance data may be lower or higher than the performance data provided herein. To obtain performance information up to the most recent month-end, visit www.gmo.com. Performance shown is net of all fees after reimbursement from GMO. Each performance figure assumes a purchase at the beginning and redemption at the end of the stated period and reflects a transaction fee of .25% on the purchase and .25% on the redemption. Transaction fees are retained by the Fund to cover trading costs. Returns would have been lower had certain expenses not been reimbursed during the periods shown and do not include the effect of taxes on distributions and redemptions. All information is unaudited.
MSCI data may not be reproduced or used for any other purpose. MSCI provides no warranties, has not prepared or approved this report, and has no liability hereunder.
77
GMO International Equity Allocation Fund
(A Series of GMO Trust)
Investment Concentration Summary
February 28, 2017 (Unaudited)
| | | | |
| Asset Class Summary& | | % of Total Net Assets | |
Common Stocks | | | 96.7 | % |
Preferred Stocks | | | 1.9 | |
Short-Term Investments | | | 1.3 | |
Investment Funds | | | 0.2 | |
Swap Contracts | | | 0.0 | ^ |
Rights/Warrants | | | 0.0 | ^ |
Futures Contracts | | | (0.0 | )^ |
Other | | | (0.1 | ) |
| | | | |
| | | 100.0 | % |
| | | | |
| | | | |
| Country/Region Summary¤ | | % of Investments | |
Japan | | | 18.4 | % |
United Kingdom | | | 11.2 | |
Taiwan | | | 8.4 | |
China | | | 6.6 | |
France | | | 6.5 | |
Germany | | | 6.3 | |
South Korea | | | 5.4 | |
Australia | | | 4.5 | |
India | | | 4.1 | |
Other Emerging | | | 4.1 | † |
Switzerland | | | 3.8 | |
Other Developed | | | 3.6 | ‡ |
Hong Kong | | | 3.3 | |
Spain | | | 2.5 | |
Russia | | | 2.1 | |
Netherlands | | | 2.0 | |
Canada | | | 1.7 | |
Turkey | | | 1.7 | |
Norway | | | 1.4 | |
Italy | | | 1.3 | |
Brazil | | | 1.1 | |
| | | | |
| | | 100.0 | % |
| | | | |
| & | The table above incorporates aggregate indirect asset class exposure associated with investments in other funds of GMO Trust (“underlying funds”). Derivative financial instruments, if any, are based on market values or unrealized appreciation/depreciation rather than notional amounts. |
| ¤ | The table above incorporates aggregate indirect country exposure associated with investments in the underlying funds. The table excludes short-term investments and includes exposure through the use of derivative financial instruments, if any. The table excludes exposure through forward currency contracts, if any. |
| † | “Other Emerging” is comprised of emerging countries that each represent between (1.0)% and 1.0% of Investments. |
| ‡ | “Other Developed” is comprised of developed countries that each represent between (1.0)% and 1.0% of Investments. |
78
GMO International Equity Allocation Fund
(A Series of GMO Trust)
Schedule of Investments
(showing percentage of total net assets)
February 28, 2017
| | | | | | | | | | |
| | | Shares /
Par Value† | | | Description | | Value ($) | |
| | | | | | MUTUAL FUNDS — 100.0% | |
| | |
| | | | | | Affiliated Issuers — 100.0% | |
| | | 11,972,873 | | | GMO Emerging Markets Fund, Class VI | | | 356,432,437 | |
| | | 35,776,490 | | | GMO International Equity Fund, Class IV | | | 729,124,865 | |
| | | | | | | | | | |
| | | |
| | | | | | TOTAL MUTUAL FUNDS
(COST $1,187,462,443) | | | 1,085,557,302 | |
| | | | | | | | | | |
| | |
| | | | | | SHORT-TERM INVESTMENTS — 0.0% | |
| | |
| | | | | | Time Deposits — 0.0% | |
| | | 289,908 | | | State Street Eurodollar Time Deposit, 0.07%, due 03/01/2017 | | | 289,908 | |
| | | | | | | | | | |
| | | |
| | | | | | TOTAL SHORT-TERM INVESTMENTS (COST $289,908) | | | 289,908 | |
| | | | | | | | | | |
| | | |
| | | | | | TOTAL INVESTMENTS — 100.0%
(Cost $1,187,752,351) | | | 1,085,847,210 | |
| | | | | | Other Assets and Liabilities (net) — (0.0%) | | | (44,026 | ) |
| | | | | | | | | | |
| | | |
| | | | | | TOTAL NET ASSETS — 100.0% | | $ | 1,085,803,184 | |
| | | | | | | | | | |
Notes to Schedule of Investments:
| † | Denominated in U.S. Dollar, unless otherwise indicated. |
For a listing of definitions of acronyms, counterparty abbreviations and currency abbreviations used throughout the Schedule of Investments as well as the derivative tables, if any, please refer to page 96.
| | | | |
| | See accompanying notes to the financial statements. | | 79 |
GMO SGM Major Markets Fund
(A Series of GMO Trust)
Portfolio Management
Day-to-day management of the Fund’s portfolio is the responsibility of the Systematic Global Macro team at Grantham, Mayo, Van Otterloo & Co. LLC. Prior to March 9, 2016, both Grantham, Mayo, Van Otterloo & Co. LLC and GMO Singapore Pte. Limited were responsible for day-to-day management of the Fund’s portfolio.
Management Discussion and Analysis of Fund Performance
Although GMO does not manage the Fund to, or control the Fund’s risk relative to, any index or benchmark, a discussion of the Fund’s performance relative to the Citigroup 3 Month Treasury Bill Index is included for comparative purposes.
Class III shares of GMO SGM Major Markets Fund returned +5.12% (net) for the fiscal year ended February 28, 2017, as compared with +0.32% for the Citigroup 3-Month Treasury Bill Index.
The Fund added value from equity market positions and currency management. The Fund gradually increased beta exposure throughout the year based on strengthening momentum, and global equities were up over 20%. Another highlight was our exposure to UK markets, both a long in (hedged) equities, and a short in the GBP. These positions performed well when the British delivered a surprise referendum result in June to leave the European Union. A long position in U.S. Treasuries detracted some value after the U.S. election, as inflation expectations jumped up with the talk of tax cuts and infrastructure spending. Short positions in commodity markets also lost value over the year.
Because some of the securities and instruments held directly or indirectly by the Fund had positive fair value adjustments at the beginning or end of the fiscal year (and the performance of indices are not fair valued), the Fund’s absolute and relative performance is higher than it otherwise would have been in the absence of such fair value adjustments.
The views expressed herein are exclusively those of Grantham, Mayo, Van Otterloo & Co. LLC Management as of the date of this report and are subject to change. GMO disclaims any responsibility to update such views. They are not meant as investment advice. References to specific securities are not recommendations of such securities and may not be representative of any GMO portfolio’s current or future investments.
80
GMO SGM Major Markets Fund
(A Series of GMO Trust)
Comparison of Change in Value of a $10,000,000 Investment in
GMO SGM Major Markets Fund Class III Shares and the Citigroup 3-Month Treasury Bill +++ Index
As of February 28, 2017
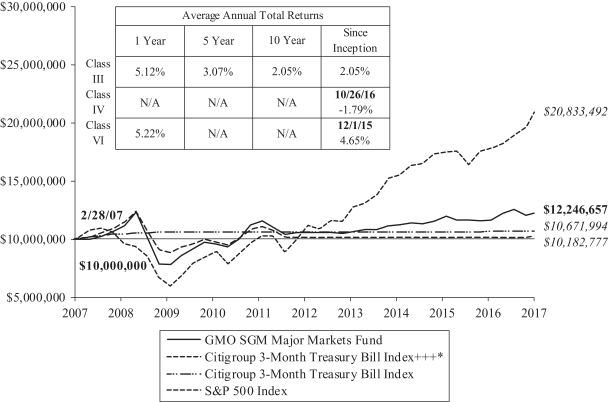
Performance data quoted represents past performance and is not indicative of future results. The investment return and principal value of an investment will fluctuate so that an investor’s shares, when redeemed, may be worth more or less than their original cost. Current performance data may be lower or higher than the performance data provided herein. To obtain performance information up to the most recent month-end, visit www.gmo.com. Performance shown is net of all fees after reimbursement from GMO. Returns would have been lower had certain expenses not been reimbursed during the periods shown and do not include the effect of taxes on distributions and redemptions. The performance information shown above only includes purchase premiums and/or redemption fees in effect as of February 28, 2017. All information is unaudited.
| | * | The Citigroup 3-Month Treasury Bill +++ Index is a composite benchmark computed by GMO and comprised of 50% Bloomberg Commodity Total Return Index (formerly the Dow Jones-UBS Commodity Index) and 50% J.P. Morgan U.S. 3 Month Cash Index through October 3, 2011 and the Citigroup 3-Month Treasury Bill Index thereafter. |
| | | For S&P disclaimers please visit http://www.gmo.com/America/_Disclaimers/_BenchmarkDisclaimers.htm. |
81
GMO SGM Major Markets Fund
(A Series of GMO Trust)
Consolidated Investment Concentration Summary (a)
February 28, 2017 (Unaudited)
| | | | |
| Asset Class Summary& | | % of Total Net Assets | |
Short-Term Investments | | | 61.4 | % |
Debt Obligations | | | 38.3 | |
Futures Contracts | | | 1.7 | + |
Forward Currency Contracts | | | 0.2 | |
Other | | | (1.6 | ) |
| | | | |
| | | 100.0 | % |
| | | | |
| (a) | GMO Alternative Asset SPC Ltd. is a 100% owned subsidiary of GMO SGM Major Markets Fund. As such, the holdings of GMO Alternative Asset SPC Ltd. have been included with GMO SGM Major Markets Fund. |
| & | The table above incorporates aggregate indirect asset class exposure associated with investments in other funds of GMO Trust (“underlying funds”). Derivative financial instruments, if any, are based on market values or unrealized appreciation/depreciation rather than notional amounts. The exposure the Fund has to futures contracts based on notional amounts is 12.5% of net assets. |
| + | Some or all is comprised of commodity exposure. See Consolidated Schedule of Investments. |
82
GMO SGM Major Markets Fund
(A Series of GMO Trust)
Consolidated Schedule of Investments
(showing percentage of total net assets)
February 28, 2017
| | | | | | | | | | |
Par Value† /
Shares | | | Description | | Value ($) | |
| | | | | | DEBT OBLIGATIONS — 20.9% | |
| | |
| | | | | | U.S. Government — 20.3% | |
| | | 6,500,000 | | | U.S. Treasury Note, 0.63%, due 05/31/17 | | | 6,501,833 | |
| | | 6,500,000 | | | U.S. Treasury Note, 0.75%, due 06/30/17 | | | 6,503,549 | |
| | | 70,000,000 | | | U.S. Treasury Note, 0.63%, due 09/30/17 (a) | | | 69,939,870 | |
| | | 100,000,000 | | | U.S. Treasury Note, 1.00%, due 02/15/18 (b) | | | 100,054,700 | |
| | | 20,000,000 | | | U.S. Treasury Note, 0.75%, due 02/28/18 (b) | | | 19,959,380 | |
| | | 12,700,000 | | | U.S. Treasury Note, 0.88%, due 03/31/18 (b) | | | 12,684,125 | |
| | | 14,000,000 | | | U.S. Treasury Note, 2.88%, due 03/31/18 (b) | | | 14,283,276 | |
| | | 62,000,000 | | | U.S. Treasury Note, USBM + 0.17%, 0.95%, due 10/31/18 (a) | | | 62,061,008 | |
| | | 13,500,000 | | | U.S. Treasury Note, USBM + 0.19%, 0.97%, due 04/30/18 | | | 13,523,139 | |
| | | | | | | | | | |
| | | | | | Total U.S. Government | | | 305,510,880 | |
| | | | | | | | | | |
| | |
| | | | | | U.S. Government Agency — 0.6% | |
| | | 9,000,000 | | | Federal Home Loan Banks, 0.80%, 3 mo. LIBOR + 0.23%, due 02/13/19 | | | 8,996,634 | |
| | | | | | | | | | |
| | | |
| | | | | | TOTAL DEBT OBLIGATIONS
(COST $314,569,309) | | | 314,507,514 | |
| | | | | | | | | | |
| | |
| | | | | | MUTUAL FUNDS — 55.4% | |
| | |
| | | | | | Affiliated Issuers — 55.4% | |
| | | 33,388,654 | | | GMO U.S. Treasury Fund | | | 834,716,360 | |
| | | | | | | | | | |
| | | |
| | | | | | TOTAL MUTUAL FUNDS
(COST $834,981,269) | | | 834,716,360 | |
| | | | | | | | | | |
| | |
| | | | | | SHORT-TERM INVESTMENTS — 23.5% | |
| | |
| | | | | | Money Market Funds — 1.3% | |
| | | 3,289,392 | | | SSgA USD Liquidity Fund-Class S2 Shares (b) | | | 3,289,392 | |
| | | | | | | | | | |
Par Value† /
Shares | | | Description | | Value ($) | |
| | | | | | Money Market Funds — continued | |
| | | 16,986,577 | | | State Street Institutional Treasury Plus Money Market Fund-Premier Class, 0.41% (c) | | | 16,986,577 | |
| | | | | | | | | | |
| | | | | | Total Money Market Funds | | | 20,275,969 | |
| | | | | | | | | | |
| | |
| | | | | | U.S. Government — 20.3% | |
| | | 25,000,000 | | | U.S. Treasury Bill, 0.40%, due 03/16/17 (b) (d) | | | 24,995,600 | |
| | | 30,000,000 | | | U.S. Treasury Bill, 0.41%, due 03/23/17 (b) (d) | | | 29,992,320 | |
| | | 25,000,000 | | | U.S. Treasury Bill, 0.44%, due 04/06/17 (b) (d) | | | 24,988,800 | |
| | | 55,000,000 | | | U.S. Treasury Bill, 0.48%, due 04/13/17 (b) (d) | | | 54,968,375 | |
| | | 13,000,000 | | | U.S. Treasury Note, 0.63%, due 06/30/17 | | | 12,999,493 | |
| | | 20,000,000 | | | U.S. Treasury Note, 0.50%, due 07/31/17 | | | 19,984,380 | |
| | | 40,000,000 | | | U.S. Treasury Note, 0.88%, due 08/15/17 (b) | | | 40,025,000 | |
| | | 25,000,000 | | | U.S. Treasury Note, 1.88%, due 08/31/17 (a) | | | 25,139,650 | |
| | | 40,000,000 | | | U.S. Treasury Note, 1.00%, due 09/15/17 (b) | | | 40,053,120 | |
| | | 33,000,000 | | | U.S. Treasury Note, 1.00%, due 12/15/17 | | | 33,038,676 | |
| | | | | | | | | | |
| | | | | | Total U.S. Government | | | 306,185,414 | |
| | | | | | | | | | |
| | |
| | | | | | U.S. Government Agency — 1.9% | |
| | | 22,000,000 | | | Federal Home Loan Bank Discount Notes, due 03/30/17 | | | 21,992,916 | |
| | | 7,000,000 | | | Federal Home Loan Bank Discount Notes, due 04/21/17 | | | 6,995,240 | |
| | | | | | | | | | |
| | | | | | Total U.S. Government Agency | | | 28,988,156 | |
| | | | | | | | | | |
| | | |
| | | | | | TOTAL SHORT-TERM INVESTMENTS
(COST $355,467,923) | | | 355,449,539 | |
| | | | | | | | | | |
| | | |
| | | | | | TOTAL INVESTMENTS — 99.8%
(Cost $1,505,018,501) | | | 1,504,673,413 | |
| | | | | | Other Assets and Liabilities (net) — 0.2% | | | 2,713,568 | |
| | | | | | | | | | |
| | | |
| | | | | | TOTAL NET ASSETS — 100.0% | | | $1,507,386,981 | |
| | | | | | | | | | |
A summary of outstanding financial instruments at February 28, 2017 is as follows:
Forward Currency Contracts
| | | | | | | | | | | | | | | | | | | | | | |
| | | | |
Settlement
Date | | Counter-
party | | Currency
Sold | | | Currency
Purchased | | | Net
Unrealized
Appreciation
(Depreciation) | |
| 04/10/2017 | | SSB | | | AUD | | | | 52,923,742 | | | | USD | | | | 40,424,477 | | | $ | (115,858 | ) |
| 04/18/2017 | | UBS | | | CHF | | | | 110,040,511 | | | | USD | | | | 110,106,575 | | | | 240,410 | |
| 04/03/2017 | | JPM | | | EUR | | | | 6,264,667 | | | | USD | | | | 6,650,706 | | | | 3,960 | |
| 04/03/2017 | | MSCI | | | EUR | | | | 2,308,219 | | | | USD | | | | 2,440,445 | | | | (8,551 | ) |
| 04/03/2017 | | SSB | | | EUR | | | | 17,665,161 | | | | USD | | | | 18,925,338 | | | | 182,788 | |
| 03/24/2017 | | JPM | | | GBP | | | | 54,149,626 | | | | USD | | | | 66,331,397 | | | | (896,778 | ) |
| 03/24/2017 | | MSCI | | | GBP | | | | 586,360 | | | | USD | | | | 729,754 | | | | 1,773 | |
| 03/24/2017 | | UBS | | | GBP | | | | 54,149,625 | | | | USD | | | | 66,879,660 | | | | (348,513 | ) |
| 04/24/2017 | | MSCI | | | GBP | | | | 59,776,494 | | | | USD | | | | 74,387,065 | | | | 117,893 | |
| 05/23/2017 | | JPM | | | GBP | | | | 60,000,000 | | | | USD | | | | 74,731,800 | | | | 136,830 | |
| 05/23/2017 | | SSB | | | GBP | | | | 25,698 | | | | USD | | | | 32,065 | | | | 116 | |
| 04/07/2017 | | SSB | | | JPY | | | | 340,000,000 | | | | USD | | | | 3,030,412 | | | | (720 | ) |
| 03/09/2017 | | JPM | | | USD | | | | 89,677,816 | | | | NZD | | | | 126,285,795 | | | | 1,264,401 | |
| 03/09/2017 | | SSB | | | USD | | | | 2,441,707 | | | | NZD | | | | 3,393,948 | | | | 2,377 | |
| 03/17/2017 | | JPM | | | USD | | | | 34,958,624 | | | | NZD | | | | 48,914,045 | | | | 257,559 | |
| 03/17/2017 | | MSCI | | | USD | | | | 23,439,551 | | | | NZD | | | | 33,017,638 | | | | 331,845 | |
| | | | | | | | | | | | | | | | | | | | | | |
| | | | |
Settlement
Date | | Counter-
party | | Currency
Sold | | | Currency
Purchased | | | Net
Unrealized
Appreciation
(Depreciation) | |
| 03/17/2017 | | SSB | | | USD | | | | 4,929,944 | | | | NZD | | | | 6,869,833 | | | $ | 16,065 | |
| 03/17/2017 | | UBS | | | USD | | | | 7,067,363 | | | | NZD | | | | 9,716,942 | | | | (71,548 | ) |
| 04/03/2017 | | MSCI | | | USD | | | | 8,635,020 | | | | EUR | | | | 8,065,000 | | | | (78,140 | ) |
| 04/03/2017 | | SSB | | | USD | | | | 3,429,880 | | | | EUR | | | | 3,200,000 | | | | (34,714 | ) |
| 04/07/2017 | | MSCI | | | USD | | | | 87,017,809 | | | | JPY | | | | 9,849,101,395 | | | | 787,870 | |
| 04/07/2017 | | UBS | | | USD | | | | 85,774,735 | | | | JPY | | | | 9,721,116,667 | | | | 889,947 | |
| 04/10/2017 | | JPM | | | USD | | | | 6,376,343 | | | | AUD | | | | 8,310,029 | | | | (10,744 | ) |
| 04/10/2017 | | MSCI | | | USD | | | | 9,530,645 | | | | AUD | | | | 12,452,939 | | | | 8,482 | |
| 04/10/2017 | | UBS | | | USD | | | | 5,273,476 | | | | AUD | | | | 6,931,215 | | | | 35,932 | |
| 04/18/2017 | | JPM | | | USD | | | | 44,225,894 | | | | NZD | | | | 61,742,672 | | | | 184,338 | |
| 04/18/2017 | | SSB | | | USD | | | | 1,625,552 | | | | CHF | | | | 1,630,000 | | | | 1,865 | |
| 04/18/2017 | | SSB | | | USD | | | | 394,358 | | | | NZD | | | | 546,923 | | | | (967 | ) |
| 04/28/2017 | | JPM | | | USD | | | | 28,855,890 | | | | JPY | | | | 3,244,054,197 | | | | 89,754 | |
| | | | | | | | | | | | | | | | | | | | | | |
| | | | | | | | | | | | | | | | | | | | $ | 2,987,672 | |
| | | | | | | | | | | | | | | | | | | | | | |
| | | | |
| | See accompanying notes to the financial statements. | | 83 |
GMO SGM Major Markets Fund
(A Series of GMO Trust)
Consolidated Schedule of Investments — (Continued)
February 28, 2017
Futures Contracts
| | | | | | | | | | | | |
| | | | |
Number
of
Contracts + | | Type | | Expiration
Date | | Notional
Amount | | | Net
Unrealized
Appreciation
(Depreciation) | |
| Buys | | | | | | | | | | | | |
| 7,364 | | Euro STOXX 50 | | March 2017 | | $ | 260,087,332 | | | $ | 7,083,641 | |
| 4,171 | | FTSE 100 Index | | March 2017 | | | 377,355,456 | | | | 19,858,200 | |
| 169 | | Hang Seng Index | | March 2017 | | | 25,830,391 | | | | (398,927 | ) |
| 3,238 | | Mini MSCI Emerging Markets | | March 2017 | | | 150,696,520 | | | | 8,732,332 | |
| 415 | | MSCI Singapore | | March 2017 | | | 10,207,725 | | | | (83,904 | ) |
| 864 | | MSCI Taiwan Index | | March 2017 | | | 30,979,622 | | | | (295,018 | ) |
| 463 | | S&P TSX 60 Index | | March 2017 | | | 63,350,712 | | | | 657,026 | |
| 54 | | Silver (b) | | May 2017 | | | 4,986,630 | | | | 187,798 | |
| 1,139 | | Soybean (b) | | May 2017 | | | 58,985,962 | | | | (877,227 | ) |
| 621 | | SPI 200 | | March 2017 | | | 67,738,553 | | | | 1,809,830 | |
| 1,078 | | U.S. Treasury Note 10 Yr. (CBT) | | June 2017 | | | 134,295,219 | | | | 377,356 | |
| | | | | | | | | | | | |
| | | | | | $ | 1,184,514,122 | | | $ | 37,051,107 | |
| | | | | | | | | | | | |
| | | | | | | | | | | | |
| | | | |
Number
of
Contracts + | | Type | | Expiration
Date | | Notional
Amount | | | Net
Unrealized
Appreciation
(Depreciation) | |
| Sales | | | | | | | | | | | | |
| 5 | | Australian Government Bond 10 Yr. | | March 2017 | | $ | 493,009 | | | $ | (8 | ) |
| 209 | | Canadian Government Bond 10 Yr. | | June 2017 | | | 21,674,013 | | | | (166,069 | ) |
| 3,859 | | Corn (b) | | May 2017 | | | 72,115,062 | | | | 309,346 | |
| 509 | | Crude Oil (b) | | March 2017 | | | 27,491,090 | | | | (298,585 | ) |
| 1,325 | | Euro Bund | | March 2017 | | | 233,789,267 | | | | (3,547,737 | ) |
| 2,445 | | FTSE/JSE TOP 40 | | March 2017 | | | 82,413,249 | | | | 1,164,443 | |
| 397 | | Gold 100 OZ (b) | | April 2017 | | | 49,779,830 | | | | (2,769,088 | ) |
| 224 | | Japanese Government Bond 10 Yr. (OSE) | | March 2017 | | | 301,467,906 | | | | (999,396 | ) |
| 639 | | Nikkei 225 | | March 2017 | | | 109,261,659 | | | | (4,147,919 | ) |
| 616 | | UK Gilt Long Bond | | June 2017 | | | 97,528,207 | | | | (1,190,495 | ) |
| | | | | | | | | | | | |
| | | | | | $ | 996,013,292 | | | $ | (11,645,508 | ) |
| | | | | | | | | | | | |
| + | Buys - Fund is long the futures contract. |
| | Sales - Fund is short the futures contract. |
As of February 28, 2017, for the above contracts and/or agreements, the Fund had sufficient cash and/or securities to cover commitments or collateral requirements, if any, of the relevant broker or exchange.
Notes to Schedule of Investments:
| † | Denominated in U.S. Dollar, unless otherwise indicated. |
| (a) | All or a portion of this security has been pledged to cover margin requirements on futures and/or cleared swap contracts, collateral on OTC swap contracts, forward currency contracts, and/or written options, if any (Note 4). |
| (b) | All or a portion of this security or derivative is owned by GMO Alternative Asset SPC Ltd., which is a 100% owned subsidiary of GMO SGM Major Markets Fund. |
| (c) | The rate disclosed is the 7 day net yield as of February 28, 2017. |
| (d) | The rate shown represents yield-to-maturity. |
For a listing of definitions of acronyms, counterparty abbreviations and currency abbreviations used throughout the Schedule of Investments as well as the derivative tables, if any, please refer to page 96.
| | | | |
| 84 | | See accompanying notes to the financial statements. | | |
This page has been left blank intentionally.
GMO Special Opportunities Fund
(A Series of GMO Trust)
Portfolio Management
Day-to-day management of the Fund’s portfolio is the responsibility of the Asset Allocation team at Grantham, Mayo, Van Otterloo & Co. LLC.
Management Discussion and Analysis of Fund Performance
Although GMO does not manage the Fund to, or control the Fund’s risk relative to, any securities index or securities benchmark, a discussion of the Fund’s performance relative to the Consumer Price Index (“CPI”) is included for comparative purposes only.
Class VI shares of GMO Special Opportunities Fund returned +13.21% (net) for the fiscal year ended February 28, 2017, as compared with +2.84% for the CPI.
The Fund’s exposure to equities (which is predominantly in the US) was the key driver of performance.
The views expressed herein are exclusively those of Grantham, Mayo, Van Otterloo & Co. LLC as of the date of this report and are subject to change. GMO disclaims any responsibility to update such views. They are not meant as investment advice. References to specific securities are not recommendations of such securities and may not be representative of any GMO portfolio’s current or future investments.
86
GMO Special Opportunities Fund
(A Series of GMO Trust)
Comparison of Change in Value of a $300,000,000 Investment in
GMO Special Opportunities Fund Class VI Shares and the Consumer Price Index
As of February 28, 2017
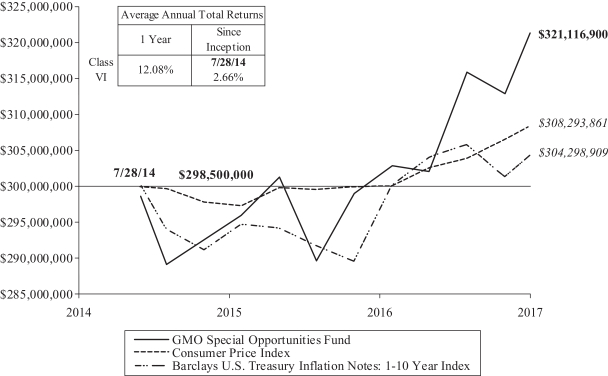
Performance data quoted represents past performance and is not indicative of future results. The investment return and principal value of an investment will fluctuate so that an investor’s shares, when redeemed, may be worth more or less than their original cost. Current performance data may be lower or higher than the performance data provided herein. To obtain performance information up to the most recent month-end, visit www.gmo.com. Performance shown is net of all fees after reimbursement from GMO. Each performance figure assumes a purchase at the beginning and redemption at the end of the stated period and reflects a transaction fee of .50% on the purchase and .50% on the redemption. Transaction fees are retained by the Fund to cover trading costs. Returns would have been lower had certain expenses not been reimbursed during the periods shown and do not include the effect of taxes on distributions and redemptions. All information is unaudited.
87
GMO Special Opportunities Fund
(A Series of GMO Trust)
Consolidated Investment Concentration Summary (a)
February 28, 2017 (Unaudited)
| | | | |
| Asset Class Summary& | | % of Total Net Assets | |
Common Stocks | | | 72.8 | % |
Short-Term Investments | | | 25.6 | |
Debt Obligations | | | 2.1 | |
Forward Currency Contracts | | | 0.0 | ^ |
Written Options | | | (0.2 | ) |
Futures Contracts | | | (0.3 | )+ |
Other | | | 0.0 | ^ |
| | | | |
| | | 100.0 | % |
| | | | |
| | | | |
| Country/Region Summary¤ | | Debt Obligations as a
% of Total Net Assets | |
Other Developed | | | 0.9 | %‡ |
Other Emerging | | | 0.6 | † |
| | | | |
| | | 1.5 | % |
| | | | |
| | | | |
| Country/Region Summary¤ | | Equity Investments as a
% of Total Net Assets | |
United States | | | 56.3 | % |
United Kingdom | | | 5.9 | |
Netherlands | | | 3.8 | |
Germany | | | 3.7 | |
Romania | | | 2.4 | |
Other Developed | | | 0.5 | ‡ |
| | | | |
| | | 72.6 | % |
| | | | |
| | | | |
| Industry Group Summary | | % of Equity Investments# | |
Diversified Financials | | | 26.8 | % |
Software & Services | | | 23.9 | |
Retailing | | | 11.2 | |
Media | | | 9.0 | |
Banks | | | 8.1 | |
Capital Goods | | | 7.2 | |
Automobiles & Components | | | 6.6 | |
Utilities | | | 3.3 | |
Insurance | | | 1.8 | |
Food, Beverage & Tobacco | | | 1.4 | |
Transportation | | | 0.7 | |
Energy | | | 0.0 | ^ |
| | | | |
| | | 100.0 | % |
| | | | |
| (a) | GMO Special Opportunities SPC Ltd. is a 100% owned subsidiary of GMO Special Opportunities Fund. As such, the holdings of GMO Special Opportunities SPC Ltd. have been included with GMO Special Opportunities Fund. |
| & | In the table above, derivative financial instruments, if any, are based on market values and unrealized appreciation/depreciation rather than notional amounts. |
| + | Some or all is comprised of commodity exposure. See Consolidated Schedule of Investments. |
| ¤ | The table excludes short-term investments. The table includes exposure through the use of certain derivative financial instruments and excludes exposure through certain currency linked derivatives such as forward currency contracts and currency options. The table is based on duration adjusted net exposures (both investments and derivatives), taking into account the market value of securities and the notional amounts of swaps and |
| | other derivative financial instruments. For example, U.S. asset-backed securities may represent a relatively small percentage due to their short duration, even though they represent a large percentage of market value (direct and indirect). Duration is based on GMO’s models. The greater the duration of a bond, the greater its contribution to the concentration percentage. Credit default swap exposures are factored into the duration adjusted exposure using the reference security and applying the same methodology to that security. The tables are not normalized, thus, due to the exclusions listed above and negative exposures, which may be attributable to derivatives or short sales, if any, the tables may not total to 100%. |
| ‡ | “Other Developed” is comprised of developed countries that each represent between (1.0)% and 1.0% of Total Net Assets. |
| † | “Other Emerging” is comprised of emerging countries that each represent between (1.0)% and 1.0% of Total Net Assets. |
| # | Equity investments may consist of common stocks and other stock-related securities, such as preferred stocks, if any. This table excludes exposure to derivative contracts, short-term investments, mutual funds and investment funds, if any. For a summary of these exposures, if any, see the Schedule of Investments. |
88
GMO Special Opportunities Fund
(A Series of GMO Trust)
Consolidated Schedule of Investments
(showing percentage of total net assets)
February 28, 2017
| | | | | | | | | | |
Shares /
Par Value† | | | Description | | Value ($) | |
| | | | | | COMMON STOCKS — 72.8% | |
| | |
| | | | | | Canada — 0.0% | |
| | | 6,000,000 | | | Jagercor Energy Corp * (a) | | | 90,348 | |
| | | | | | | | | | |
| | |
| | | | | | Germany — 3.7% | |
| | | 635,000 | | | Brenntag AG | | | 36,389,148 | |
| | | | | | | | | | |
| | |
| | | | | | Ireland — 0.5% | |
| | | 60,000 | | | Ryanair Holdings Plc Sponsored ADR * | | | 4,905,000 | |
| | | | | | | | | | |
| | |
| | | | | | Netherlands — 3.8% | |
| | | 970,000 | | | InterXion Holding NV * | | | 37,733,000 | |
| | | | | | | | | | |
| | |
| | | | | | Romania — 2.4% | |
| | | 7,200,000 | | | Societatea Energetica Electrica SA | | | 23,927,036 | |
| | | | | | | | | | |
| | |
| | | | | | United Kingdom — 5.9% | |
| | | 1,380,000 | | | Metro Bank Plc * | | | 58,503,026 | |
| | | | | | | | | | |
| | |
| | | | | | United States — 56.5% | |
| | | 2,630,000 | | | Ally Financial, Inc. | | | 59,148,700 | |
| | | 275,000 | | | Berkshire Hathaway, Inc. – Class B * | | | 47,140,500 | |
| | | 1,260,000 | | | Cimpress NV * | | | 101,064,600 | |
| | | 670,000 | | | CommerceHub, Inc. – Series A * | | | 11,055,000 | |
| | | 1,410,000 | | | CommerceHub, Inc. – Series C * | | | 23,053,500 | |
| | | 142,681 | | | Credit Acceptance Corp. * | | | 28,601,833 | |
| | | 1,300,000 | | | General Motors Co. | | | 47,892,000 | |
| | | 1,597,544 | | | Interactive Brokers Group, Inc. – Class A | | | 58,645,840 | |
| | | 925,000 | | | Liberty Global Plc LiLAC – Class A * | | | 22,616,250 | |
| | | 1,725,000 | | | Liberty Global Plc LiLAC – Class C * | | | 42,417,750 | |
| | | 170,224 | | | National Beverage Corp. | | | 9,942,784 | |
| | | 75,000 | | | Roper Industries, Inc. | | | 15,690,000 | |
| | | 836,570 | | | Trupanion, Inc. * | | | 13,008,664 | |
| | | 2,150,000 | | | Wayfair, Inc. – Class A * | | | 81,291,500 | |
| | | | | | | | | | |
| | | Total United States | | | 561,568,921 | |
| | | | | | | | | | |
| | |
| | | TOTAL COMMON STOCKS
(COST $671,198,377) | | | 723,116,479 | |
| | | | | | | | | | |
| | |
| | | | | | DEBT OBLIGATIONS — 2.1% | |
| | | |
| | | | | | Corporate Debt — 2.1% | | | | |
| | | | | | Jamaica — 1.3% | | | | |
| | | 1,220,000 | | | Digicel Group Ltd, 144A, 8.25%, due 09/30/20 | | | 1,079,700 | |
| | | 14,500,000 | | | Digicel Group Ltd, 144A, 7.13%, due 04/01/22 | | | 11,763,125 | |
| | | | | | | | | | |
| | | Total Jamaica | | | 12,842,825 | |
| | | | | | | | | | |
| | | | | | | | | | |
Shares /
Par Value† | | | Description | | Value ($) | |
| | | | | | Corporate Debt — continued | | | | |
| | | | | | United States — 0.8% | |
| | | 7,500,000 | | | Pacific Drilling SA, 144A, 5.38%, due 06/01/20 | | | 3,468,750 | |
| | | 7,500,000 | | | Pacific Drilling V Ltd., 144A, 7.25%, due 12/01/17 | | | 4,087,500 | |
| | | | | | | | | | |
| | | Total United States | | | 7,556,250 | |
| | | | | | | | | | |
| | | | | | Total Corporate Debt | | | 20,399,075 | |
| | | | | | | | | | |
| | | | | | TOTAL DEBT OBLIGATIONS
(COST $21,250,171) | | | 20,399,075 | |
| | | | | | | | | | |
| | |
| | | | | | SHORT-TERM INVESTMENTS — 25.6% | |
| | |
| | | | | | Money Market Funds — 0.3% | |
| | | 3,509,386 | | | State Street Institutional Treasury Money Market Fund-Premier Class, 0.42% (b) (c) | | | 3,509,386 | |
| | | | | | | | | | |
| | | |
| | | | | | U.S. Government — 25.3% | | | | |
| | | 25,000,000 | | | U.S. Treasury Bill, 0.40%, due 03/16/17 (d) | | | 24,995,600 | |
| | | 22,000,000 | | | U.S. Treasury Bill, 0.41%, due 03/23/17 (d) | | | 21,994,368 | |
| | | 35,000,000 | | | U.S. Treasury Bill, 0.44%, due 04/06/17 (d) | | | 34,984,320 | |
| | | 35,000,000 | | | U.S. Treasury Bill, 0.48%, due 04/13/17 (d) | | | 34,979,875 | |
| | | 30,000,000 | | | U.S. Treasury Bill, 0.54%, due 05/18/17 (d) (e) | | | 29,964,720 | |
| | | 4,400,000 | | | U.S. Treasury Bill, 0.55%, due 06/15/17 (c) (d) (e) | | | 4,392,894 | |
| | | 25,000,000 | | | U.S. Treasury Bill, 0.65%, due 08/03/17 (d) | | | 24,930,650 | |
| | | 65,000,000 | | | U.S. Treasury Bill, 0.70%, due 08/24/17 (d) | | | 64,778,155 | |
| | | 10,000,000 | | | U.S. Treasury Note, 1.00%, due 12/15/17 (e) | | | 10,011,720 | |
| | | | | | | | | | |
| | | | | | Total U.S. Government | | | 251,032,302 | |
| | | | | | | | | | |
| | | |
| | | | | | TOTAL SHORT-TERM INVESTMENTS
(COST $254,555,056) | | | 254,541,688 | |
| | | | | | | | | | |
| | | |
| | | | | | TOTAL INVESTMENTS — 100.5%
(Cost $947,003,604) | | | 998,057,242 | |
| | | | | | Other Assets and Liabilities (net) — (0.5%) | | | (5,238,304 | ) |
| | | | | | | | | | |
| | | |
| | | | | | TOTAL NET ASSETS — 100.0% | | | $992,818,938 | |
| | | | | | | | | | |
A summary of outstanding financial instruments at February 28, 2017 is as follows:
Forward Currency Contracts
| | | | | | | | | | | | | | | | | | | | | | |
Settlement
Date | | Counter-
party | | Currency
Sold | | | Currency
Purchased | | | Net
Unrealized
Appreciation
(Depreciation) | |
| 03/09/2017 | | GS | | | CAD | | | | 2,100,000 | | | | USD | | | | 1,580,774 | | | $ | (384 | ) |
| 03/27/2017 | | MSCI | | | RON | | | | 88,600,000 | | | | USD | | | | 20,737,759 | | | | (11,390 | ) |
| 03/09/2017 | | MSCI | | | USD | | | | 1,578,627 | | | | CAD | | | | 2,100,000 | | | | 2,531 | |
| | | | | | | | | | | | | | | | | | | | | | |
| | | | | | | | | | | | | | | | | | | | $ | (9,243 | ) |
| | | | | | | | | | | | | | | | | | | | | | |
| | | | |
| | See accompanying notes to the financial statements. | | 89 |
GMO Special Opportunities Fund
(A Series of GMO Trust)
Consolidated Schedule of Investments — (Continued)
(showing percentage of total net assets)
February 28, 2017
Futures Contracts (c)
| | | | | | | | | | | | | | |
| | Number
of
Contracts + | | Type | | Expiration
Date | |
Notional
Amount | | | Net
Unrealized
Appreciation
(Depreciation) | |
| | Buys | | | | | | | | | | | | |
| | 25 | | Natural Gas | | December 2019 | | $ | 192,125 | | | $ | (68,812 | ) |
| | 25 | | Natural Gas | | January 2020 | | | 190,312 | | | | (70,625 | ) |
| | 25 | | Natural Gas | | February 2020 | | | 186,688 | | | | (74,250 | ) |
| | 25 | | Natural Gas | | March 2020 | | | 167,313 | | | | (93,625 | ) |
| | 25 | | Natural Gas | | April 2020 | | | 166,813 | | | | (94,125 | ) |
| | 25 | | Natural Gas | | May 2020 | | | 168,875 | | | | (92,063 | ) |
| | 25 | | Natural Gas | | June 2020 | | | 171,063 | | | | (89,875 | ) |
| | 25 | | Natural Gas | | July 2020 | | | 172,750 | | | | (88,188 | ) |
| | 25 | | Natural Gas | | August 2020 | | | 172,875 | | | | (88,063 | ) |
| | | | | | | | | | | | | | |
| | Number
of
Contracts + | | Type | | Expiration
Date | |
Notional
Amount | | | Net
Unrealized
Appreciation
(Depreciation) | |
| | 25 | | Natural Gas | | September 2020 | | $ | 174,750 | | | $ | (86,188 | ) |
| | 25 | | Natural Gas | | October 2020 | | | 178,750 | | | | (82,187 | ) |
| | 25 | | Natural Gas | | November 2020 | | | 187,375 | | | | (73,562 | ) |
| | 133 | | Uranium Futures | | February 2017 | | | 739,812 | | | | (426,192 | ) |
| | 133 | | Uranium Futures | | March 2017 | | | 764,750 | | | | (401,254 | ) |
| | 133 | | Uranium Futures | | April 2017 | | | 764,750 | | | | (401,254 | ) |
| | 133 | | Uranium Futures | | May 2017 | | | 766,412 | | | | (399,592 | ) |
| | 133 | | Uranium Futures | | June 2017 | | | 766,412 | | | | (399,592 | ) |
| | | | | | | | | | | | | | |
| | | | | | | | $ | 5,931,825 | | | $ | (3,029,447 | ) |
| | | | | | | | | | | | | | |
| + | Buys - Fund is long the futures contract. |
| | Sales - Fund is short the futures contract. |
Written Options
Equity Options
| | | | | | | | | | | | | | | | | | |
| | | | |
Number of Contracts | | | Expiration
Date | | Description | | | Premiums | | | | Value | |
| Put | | | | | 500 | | | 07/21/2017 | | Cimpress NV, Strike 85.00 | | $ | 348,322 | | | $ | (460,000 | ) |
| Put | | | | | 250 | | | 04/21/2017 | | Credit Acceptance Corp., Strike 165.00 | | | 461,655 | | | | (77,500 | ) |
| Put | | | | | 1,000 | | | 07/21/2017 | | National Beverage Corp., Strike 48.50 | | | 506,648 | | | | (200,000 | ) |
| Put | | | | | 600 | | | 06/16/2017 | | National Beverage Corp., Strike 48.50 | | | 387,987 | | | | (61,200 | ) |
| Put | | | | | 1,000 | | | 10/20/2017 | | National Beverage Corp., Strike 60.00 | | | 710,642 | | | | (780,000 | ) |
| Put | | | | | 1,000 | | | 05/19/2017 | | Wayfair, Inc., Strike 35.00 | | | 593,912 | | | | (217,000 | ) |
| | | | | | | | | | | | | | | | | | |
| | | | | | | | | | | | $ | 3,009,166 | | | $ | (1,795,700 | ) |
| | | | | | | | | | | | | | | | | | |
As of February 28, 2017, for the above contracts and/or agreements, the Fund had sufficient cash and/or securities to cover commitments or collateral requirements, if any, of the relevant broker or exchange.
Notes to Schedule of Investments:
| † | Denominated in U.S. Dollar, unless otherwise indicated. |
| * | Non-income producing security. |
| (a) | Affiliated company (Note 10). |
| (b) | The rate disclosed is the 7 day net yield as of February 28, 2017. |
| (c) | All or a portion of this security or derivative is owned by GMO Special Opportunities SPC Ltd., which is a 100% owned subsidiary of GMO Special Opportunities Fund. |
| (d) | The rate shown represents yield-to-maturity. |
| (e) | All or a portion of this security has been pledged to cover margin requirements on futures and/or cleared swap contracts, collateral on OTC swap contracts, forward currency contracts, and/or written options, if any (Note 4). |
For a listing of definitions of acronyms, counterparty abbreviations and currency abbreviations used throughout the Schedule of Investments as well as the derivative tables, if any, please refer to page 96.
| | | | |
| 90 | | See accompanying notes to the financial statements. | | |
This page has been left blank intentionally.
GMO Strategic Opportunities Allocation Fund
(A Series of GMO Trust)
Portfolio Management
Day-to-day management of the Fund’s portfolio is the responsibility of the Asset Allocation team at Grantham, Mayo, Van Otterloo & Co. LLC.
Management Discussion and Analysis of Fund Performance
GMO Strategic Opportunities Allocation Fund returned +16.60% (net) for the fiscal year ended February 28, 2017, as compared with +16.06% for the GMO Strategic Opportunities Allocation Index (75% MSCI World Index (MSCI Standard Index Series) and 25% Barclays U.S. Aggregate Index).
The Fund’s underweight in equities compared to the benchmark weight detracted from relative performance. Within equities, the overweighting to emerging markets was helpful, but the overweighting to developed ex-US stocks and the underweighting to the US hurt relative performance. The Fund’s underweighting to fixed income was beneficial to performance, and the Fund also enjoyed strong performance within fixed income driven primarily by emerging market debt. Our exposure to cash/cash plus detracted from relative performance.
Because some of the securities and instruments held directly or indirectly by the Fund had positive fair value adjustments at the beginning or end of the fiscal year (and the performance of indices are not fair valued), the Fund’s absolute and relative performance is higher than it otherwise would have been in the absence of such fair value adjustments.
The views expressed herein are exclusively those of Grantham, Mayo, Van Otterloo & Co. LLC as of the date of this report and are subject to change. GMO disclaims any responsibility to update such views. They are not meant as investment advice. References to specific securities are not recommendations of such securities and may not be representative of any GMO portfolio’s current or future investments.
92
GMO Strategic Opportunities Allocation Fund
(A Series of GMO Trust)
Comparison of Change in Value of a $10,000,000 Investment in
GMO Strategic Opportunities Allocation Fund Class III Shares and the
GMO Strategic Opportunities Allocation Index
As of February 28, 2017
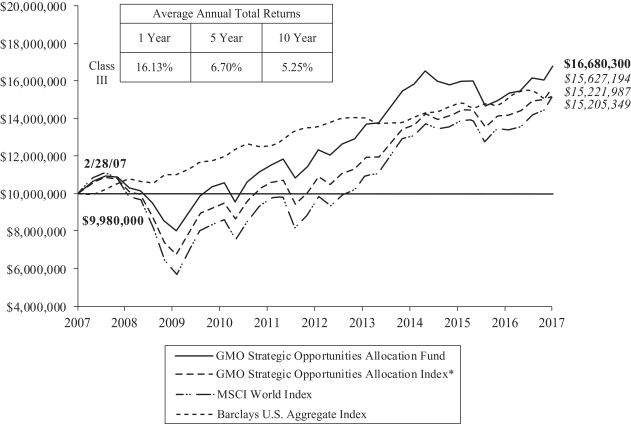
Performance data quoted represents past performance and is not indicative of future results. The investment return and principal value of an investment will fluctuate so that an investor’s shares, when redeemed, may be worth more or less than their original cost. Current performance data may be lower or higher than the performance data provided herein. To obtain performance information up to the most recent month-end, visit www.gmo.com. Performance shown is net of all fees after reimbursement from GMO. Each performance figure assumes a purchase at the beginning and redemption at the end of the stated period and reflects a transaction fee of .20% on the purchase and .20% on the redemption. Transaction fees are retained by the Fund to cover trading costs. Returns would have been lower had certain expenses not been reimbursed during the periods shown and do not include the effect of taxes on distributions and redemptions. All information is unaudited.
| | * | The GMO Strategic Opportunities Allocation Index is a composite benchmark computed by GMO and comprised of 75% MSCI World Index and 25% Barclays U.S. Aggregate Index. |
| | | MSCI data may not be reproduced or used for any other purpose. MSCI provides no warranties, has not prepared or approved this report, and has no liability hereunder. |
93
GMO Strategic Opportunities Allocation Fund
(A Series of GMO Trust)
Investment Concentration Summary
February 28, 2017 (Unaudited)
| | | | |
| Asset Class Summary& | | % of Total Net Assets | |
Common Stocks | | | 66.1 | % |
Short-Term Investments | | | 17.0 | |
Debt Obligations | | | 12.8 | |
Mutual Funds | | | 2.8 | |
Preferred Stocks | | | 1.0 | |
Investment Funds | | | 0.1 | |
Loan Participations | | | 0.1 | |
Rights/Warrants | | | 0.0 | ^ |
Swap Contracts | | | 0.0 | ^ |
Loan Assignments | | | 0.0 | ^ |
Options Purchased | | | 0.0 | ^ |
Forward Currency Contracts | | | 0.0 | ^ |
Futures Contracts | | | (0.0 | )^ |
Written Options/Credit Linked Options | | | (0.0 | )^ |
Reverse Repurchase Agreements | | | (0.0 | )^ |
Securities Sold Short | | | (0.0 | )^ |
Other | | | 0.1 | |
| | | | |
| | | 100.0 | % |
| | | | |
| | | | |
| Country/Region Summary¤ | | Debt Obligations as a
% of Total Net Assets | |
United States | | | 8.7 | % |
Other Emerging | | | 2.7 | † |
Other Developed | | | 0.1 | ‡ |
Euro Region | | | (0.1 | )# |
| | | | |
| | | 11.4 | % |
| | | | |
| | | | |
| Country/Region Summary¤ | | Equity Investments as a
% of Total Net Assets | |
United States | | | 18.7 | % |
Japan | | | 7.8 | |
United Kingdom | | | 5.4 | |
Taiwan | | | 5.0 | |
Other Developed | | | 3.8 | ‡ |
China | | | 3.8 | |
Other Emerging | | | 3.4 | † |
South Korea | | | 3.1 | |
France | | | 2.8 | |
Germany | | | 2.7 | |
India | | | 2.3 | |
Australia | | | 1.9 | |
Switzerland | | | 1.9 | |
Hong Kong | | | 1.4 | |
Russia | | | 1.2 | |
Netherlands | | | 1.1 | |
Spain | | | 1.1 | |
| | | | |
| | | 67.4 | % |
| | | | |
| & | The table above incorporates aggregate indirect asset class exposure associated with investments in other funds of GMO Trust (“underlying funds”). Derivative financial instruments, if any, are based on market values or unrealized appreciation/depreciation rather than notional amounts. |
| ¤ | The table above incorporates aggregate indirect country exposure associated with investments in the underlying funds. The table excludes short-term investments. The table includes exposure through the use of certain |
| | derivative financial instruments and excludes exposure through certain currency linked derivatives such as forward currency contracts and currency options. The table is based on duration adjusted net exposures (both investments and derivatives), taking into account the market value of securities and the notional amounts of swaps and other derivative financial instruments. For example, U.S. asset-backed securities may represent a relatively small percentage due to their short duration, even though they represent a large percentage of market value (direct and indirect). Duration is based on GMO’s models. The greater the duration of a bond, the greater its contribution to the concentration percentage. Credit default swap exposures are factored into the duration-adjusted exposure using the reference security and applying the same methodology to that security. The tables are not normalized, thus, due to the exclusions listed above and negative exposures, which may be attributable to derivatives or short sales, if any, the tables may not total to 100%. |
| † | “Other Emerging” is comprised of emerging countries that each represent between (1.0)% and 1.0% of Total Net Assets. |
| ‡ | “Other Developed” is comprised of developed countries that each represent between (1.0)% and 1.0% of Total Net Assets. |
| # | “Euro Region” is comprised of derivative financial instruments attributed to the Eurozone and not a particular country. |
94
GMO Strategic Opportunities Allocation Fund
(A Series of GMO Trust)
Schedule of Investments
(showing percentage of total net assets)
February 28, 2017
| | | | | | | | |
Shares /
Par Value† | | Description | | Value ($) | |
| | | | MUTUAL FUNDS — 94.4% | | | | |
| | |
| | | | Affiliated Issuers — 94.4% | |
| | 2,666,698 | | GMO Core Plus Bond Fund, Class IV | | | 56,400,656 | |
| | 2,933,769 | | GMO Emerging Country Debt Fund, Class IV | | | 84,932,626 | |
| | 13,119,558 | | GMO Emerging Markets Fund, Class VI | | | 390,569,250 | |
| | 28,135,373 | | GMO International Equity Fund, Class IV | | | 573,398,898 | |
| | 3,252,296 | | GMO Opportunistic Income Fund, Class VI | | | 83,844,202 | |
| | 9,417,020 | | GMO Quality Fund, Class VI | | | 207,645,291 | |
| | 13,585,549 | | GMO U.S. Equity Allocation Fund, Class VI | | | 204,598,363 | |
| | 12,122,043 | | GMO U.S. Treasury Fund | | | 303,051,065 | |
| | | | | | | | |
| | | |
| | | | TOTAL MUTUAL FUNDS
(COST $1,946,415,208) | | | 1,904,440,351 | |
| | | | | | | | |
| | | | DEBT OBLIGATIONS — 5.6% | |
| | | |
| | | | Asset-Backed Securities — 0.0% | | | | |
| | 480,122 | | Bayview Financial Revolving Asset Trust, Series 04-B, Class A2, 144A, 1 mo. LIBOR + .65%, 2.08%, due 05/28/39 | | | 234,656 | |
| | | | | | | | |
| | |
| | | | U.S. Government — 5.6% | |
| | 25,806,124 | | U.S. Treasury Inflation Indexed Bond, 0.25%, due 01/15/25 (a) | | | 25,733,042 | |
| | 17,432,413 | | U.S. Treasury Inflation Indexed Bond, 0.38%, due 07/15/25 (a) | | | 17,580,832 | |
| | 1,122,757 | | U.S. Treasury Inflation Indexed Bond, 0.63%, due 01/15/26 (a) | | | 1,150,350 | |
| | | | | | | | |
Par Value† /
Shares | | Description | | Value ($) | |
| | | | U.S. Government — continued | |
| | 24,860,220 | | U.S. Treasury Inflation Indexed Bond, 1.75%, due 01/15/28 (a) | | | 28,336,623 | |
| | 22,689,037 | | U.S. Treasury Inflation Indexed Bond, 2.50%, due 01/15/29 (a) | | | 27,987,222 | |
| | 7,929,025 | | U.S. Treasury Inflation Indexed Bond, 3.88%, due 04/15/29 (a) | | | 11,071,599 | |
| | | | | | | | |
| | | | Total U.S. Government | | | 111,859,668 | |
| | | | | | | | |
| | | |
| | | | TOTAL DEBT OBLIGATIONS
(COST $109,593,992) | | | 112,094,324 | |
| | | | | | | | |
| | |
| | | | SHORT-TERM INVESTMENTS — 0.0% | |
| | |
| | | | Money Market Funds — 0.0% | |
| | 274,119 | | State Street Institutional Treasury Money Market Fund-Premier Class, 0.42% (b) | | | 274,119 | |
| | | | | | | | |
| | | |
| | | | TOTAL SHORT-TERM INVESTMENTS (COST $274,119) | | | 274,119 | |
| | | | | | | | |
| | | |
| | | | TOTAL INVESTMENTS — 100.0%
(Cost $2,056,283,319) | | | 2,016,808,794 | |
| | | | Other Assets and Liabilities (net) — 0.00% | | | 190,702 | |
| | | | | | | | |
| | | |
| | | | TOTAL NET ASSETS — 100.0% | | | $2,016,999,496 | |
| | | | | | | | |
Notes to Schedule of Investments:
| † | Denominated in U.S. Dollar, unless otherwise indicated. |
| (a) | Indexed security in which price and/or coupon is linked to the price of a specific instrument or financial statistic (Note 2). |
| (b) | The rate disclosed is the 7 day net yield as of February 28, 2017. |
For a listing of definitions of acronyms, counterparty abbreviations and currency abbreviations used throughout the Schedule of Investments as well as the derivative tables, if any, please refer to page 96.
| | | | |
| | See accompanying notes to the financial statements. | | 95 |
GMO Trust Funds
Schedule of Investments — (Continued)
February 28, 2017
Portfolio Abbreviations:
144A - Securities exempt from registration under Rule 144A of the Securities Act of 1933. These securities may be resold in transactions exempt from registration, normally to qualified institutional investors.
ADR - American Depositary Receipt
CHF LIBOR – London Interbank Offered Rate denominated in Swiss Franc.
CP - Counterparty
ETF - Exchange-Traded Fund
EURIBOR - Euro Interbank Offered Rate
Foreign Registered - Shares issued to foreign investors in markets that have foreign ownership limits.
FSA - Insured as to the payment of principal and interest by Financial Security Assurance.
GBP LIBOR - London Interbank Offered Rate denominated in British Pounds.
GDR - Global Depository Receipt
LIBOR - London Interbank Offered Rate
MSCI - Morgan Stanley Capital International
OJSC - Open Joint-Stock Company
OTC - Over-the-Counter
REIT - Real Estate Investment Trust
TIIE - Tasa de Interes Interbacaria de Equilibrio - 28 - Day Interbank Equilibrium Interest Rate - Mexico
USD LIBOR - London Interbank Offered Rate denominated in United States Dollars.
XL - Insured as to the payment of principal and interest by XL Capital Assurance.
The rates shown on variable rate notes are the current interest rates at February 28, 2017, which are subject to change based on the terms of the security.
Counterparty Abbreviations:
BCLY - Barclays Bank PLC
BOA - Bank of America, N.A.
CSI - Credit Suisse International
CSS - Credit Suisse Securities (USA) LLC
GS - Goldman Sachs International
JPM - JPMorgan Chase Bank, N.A.
JPMF - J.P. Morgan Securities, LLC
MSCI - Morgan Stanley & Co. International PLC
Currency Abbreviations:
AUD - Australian Dollar
CAD - Canadian Dollar
CHF - Swiss Franc
EUR - Euro
GBP - British Pound
HKD - Hong Kong Dollar
JPY - Japanese Yen
MXN - Mexican Peso
NZD - New Zealand Dollar
RON - Romanian Leu
SEK - Swedish Krona
USD - United States Dollar
| | | | |
| 96 | | See accompanying notes to the financial statements. | | |
GMO Trust Funds
Statements of Assets and Liabilities — February 28, 2017
| | | | | | | | | | | | | | | | |
| | | Alpha Only
Fund | | | Benchmark-Free
Allocation Fund | | | Benchmark-
Free Fund | | | Global Asset
Allocation Fund | |
Assets: | | | | | | | | | | | | | |
Investments in affiliated issuers, at value (Notes 2 and 10)(a) | | $ | 10,595,373 | | | $ | 13,769,982,941 | | | $ | 1,575,696,690 | | | $ | 2,423,693,269 | |
Investments in unaffiliated issuers, at value (Note 2)(b) | | | 221,848,187 | | | | 7,055,247 | | | | 2,790,554,682 | | | | 463,675 | |
Foreign currency, at value (Note 2)(c) | | | 35,244 | | | | — | | | | 1,046,696 | | | | — | |
Cash | | | 9,059,933 | | | | — | | | | 34,936,599 | | | | — | |
Receivable for investments sold | | | — | | | | — | | | | 29,989,071 | | | | 1,980 | |
Receivable for Fund shares sold | | | — | | | | 78,379,362 | | | | — | | | | — | |
Dividends receivable | | | 522,613 | | | | 1,971 | | | | 6,949,387 | | | | 103,615 | |
Dividend withholding tax receivable | | | 349,932 | | | | — | | | | 581,553 | | | | — | |
Receivable for variation margin on open futures contracts (Note 4) | | | 676,345 | | | | — | | | | — | | | | — | |
Receivable for expenses reimbursed and/or waived by GMO (Note 5) | | | 89,161 | | | | 1,699,748 | | | | 88,139 | | | | — | |
Miscellaneous receivable | | | 3,552 | | | | 129,241 | | | | 24,045 | | | | 135 | |
| | | | | | | | | | | | | | | | |
Total assets | | | 243,180,340 | | | | 13,857,248,510 | | | | 4,439,866,862 | | | | 2,424,262,674 | |
| | | | | | | | | | | | | | | | |
Liabilities: | | | | | | | | | | | | | | | | |
Payable for investments purchased | | | 3,552 | | | | 64,417,171 | | | | 40,259 | | | | 103,164 | |
Payable for Fund shares repurchased | | | — | | | | 13,891,604 | | | | 9,617,917 | | | | 90,135 | |
Accrued foreign capital gains tax payable (Note 2) | | | 4,949 | | | | — | | | | 551,073 | | | | — | |
Payable to affiliate for (Note 5): | | | | | | | | | | | | | | | | |
Management fee | | | 89,496 | | | | 6,869,903 | | | | — | | | | — | |
Supplemental support fee – Class MF | | | — | | | | 454,134 | | | | — | | | | — | |
Shareholder service fee | | | 18,199 | | | | 801,873 | | | | — | | | | — | |
Due to broker (Note 2) | | | 9,059,489 | | | | — | | | | — | | | | — | |
Payable for reverse repurchase agreements (Note 2) | | | — | | | | — | | | | 34,936,599 | | | | — | |
Payable to agents unaffiliated with GMO | | | — | | | | 1,932 | | | | 672 | | | | 336 | |
Payable to Trustees and related expenses | | | 975 | | | | 22,421 | | | | 6,925 | | | | 4,095 | |
Accrued expenses | | | 170,268 | | | | 331,838 | | | | 453,883 | | | | 119,912 | |
| | | | | | | | | | | | | | | | |
Total liabilities | | | 9,346,928 | | | | 86,790,876 | | | | 45,607,328 | | | | 317,642 | |
| | | | | | | | | | | | | | | | |
Net assets | | $ | 233,833,412 | | | $ | 13,770,457,634 | | | $ | 4,394,259,534 | | | $ | 2,423,945,032 | |
| | | | | | | | | | | | | | | | |
(a) Cost of investments – affiliated issuers: | | $ | 10,595,373 | | | $ | 13,655,207,127 | | | $ | 1,513,700,009 | | | $ | 2,521,013,959 | |
(b) Cost of investments – unaffiliated issuers: | | $ | 196,698,451 | | | $ | 7,055,247 | | | $ | 2,646,810,818 | | | $ | 514,735 | |
(c) Cost of foreign currency: | | $ | 34,262 | | | $ | — | | | $ | 1,044,988 | | | $ | — | |
| | | | |
| | See accompanying notes to the financial statements. | | 97 |
GMO Trust Funds
Statements of Assets and Liabilities — February 28, 2017 — (Continued)
| | | | | | | | | | | | | | | | |
| | | Alpha Only
Fund | | | Benchmark-Free
Allocation Fund | | | Benchmark-
Free Fund | | | Global Asset
Allocation Fund | |
Net assets consist of: | | | | | | | | | | | | | | | | |
Paid-in capital | | $ | 605,289,331 | | | $ | 14,232,736,432 | | | $ | 4,770,884,426 | | | $ | 2,804,045,872 | |
Accumulated undistributed net investment income | | | 67,491 | | | | 4,355,144 | | | | 12,141,708 | | | | 1,907,347 | |
Accumulated net realized gain (loss) | | | (388,224,195 | ) | | | (581,409,756 | ) | | | (594,063,616 | ) | | | (284,636,437 | ) |
Net unrealized appreciation (depreciation) | | | 16,700,785 | | | | 114,775,814 | | | | 205,297,016 | | | | (97,371,750 | ) |
| | | | | | | | | | | | | | | | |
| | $ | 233,833,412 | | | $ | 13,770,457,634 | | | $ | 4,394,259,534 | | | $ | 2,423,945,032 | |
| | | | | | | | | | | | | | | | |
Net assets attributable to: | | | | | | | | | | | | | | | | |
Class III | | $ | 7,851,903 | | | $ | 5,248,862,817 | | | $ | 4,394,259,534 | | | $ | 2,423,945,032 | |
| | | | | | | | | | | | | | | | |
Class IV | | $ | 225,981,509 | | | $ | 2,663,418,308 | | | $ | — | | | $ | — | |
| | | | | | | | | | | | | | | | |
Class MF | | $ | — | | | $ | 5,858,176,509 | | | $ | — | | | $ | — | |
| | | | | | | | | | | | | | | | |
Shares outstanding: | | | | | | | | | | | | | | | | |
Class III | | | 374,693 | | | | 203,607,521 | | | | 231,862,951 | | | | 79,521,888 | |
| | | | | | | | | | | | | | | | |
Class IV | | | 10,778,114 | | | | 103,316,990 | | | | — | | | | — | |
| | | | | | | | | | | | | | | | |
Class MF | | | — | | | | 227,089,922 | | | | — | | | | — | |
| | | | | | | | | | | | | | | | |
Net asset value per share: | | | | | | | | | | | | | | | | |
Class III | | $ | 20.96 | | | $ | 25.78 | | | $ | 18.95 | | | $ | 30.48 | |
| | | | | | | | | | | | | | | | |
Class IV | | $ | 20.97 | | | $ | 25.78 | | | $ | — | | | $ | — | |
| | | | | | | | | | | | | | | | |
Class MF | | $ | — | | | $ | 25.80 | | | $ | — | | | $ | — | |
| | | | | | | | | | | | | | | | |
| | | | |
| 98 | | See accompanying notes to the financial statements. | | |
GMO Trust Funds
Statements of Assets and Liabilities — February 28, 2017 — (Continued)
| | | | | | | | | | | | | | | | |
| | | Global
Developed Equity
Allocation Fund | | | Global Equity
Allocation Fund | | | Consolidated
Implementation
Fund | | | International
Developed Equity
Allocation Fund | |
Assets: | | | | | | | | | | | | | |
Investments in affiliated issuers, at value (Notes 2 and 10)(a) | | $ | 991,966,298 | | | $ | 2,206,156,571 | | | $ | — | | | $ | 601,644,588 | |
Investments in unaffiliated issuers, at value (Note 2)(b) | | | 338,803 | | | | 745,313 | | | | 11,072,226,916 | | | | 200,023 | |
Foreign currency, at value (Note 2)(c) | | | — | | | | — | | | | 20,961,432 | | | | — | |
Cash | | | — | | | | — | | | | 204,813 | | | | — | |
Receivable for investments sold | | | — | | | | — | | | | 142,191,094 | | | | 61,501,360 | |
Receivable for Fund shares sold | | | — | | | | — | | | | 64,288,337 | | | | 5,226 | |
Dividends and interest receivable | | | — | | | | — | | | | 22,357,975 | | | | — | |
Dividend withholding tax receivable | | | — | | | | — | | | | 11,086,809 | | | | — | |
Receivable for variation margin on open cleared swap contracts | | | — | | | | — | | | | 35,813 | | | | — | |
Unrealized appreciation on open forward currency contracts (Note 4) | | | — | | | | — | | | | 7,738,252 | | | | — | |
Due from broker (Note 2) | | | — | | | | — | | | | 207,508,165 | | | | — | |
Receivable for open OTC swap contracts (Note 4) | | | — | | | | — | | | | 6,978,836 | | | | — | |
Receivable for closed swap contracts (Note 4) | | | — | | | | — | | | | 83,130 | | | | — | |
Receivable for expenses reimbursed and/or waived by GMO (Note 5) | | | 5,584 | | | | — | | | | 68,651 | | | | 5,752 | |
Miscellaneous receivable | | | — | | | | — | | | | 133,956 | | | | 49,258 | |
| | | | | | | | | | | | | | | | |
Total assets | | | 992,310,685 | | | | 2,206,901,884 | | | | 11,555,864,179 | | | | 663,406,207 | |
| | | | | | | | | | | | | | | | |
Liabilities: | | | | | | | | | | | | | | | | |
Investments sold short, at value (Note 2)(d) | | | — | | | | — | | | | 167,222,654 | | | | — | |
Payable for investments purchased | | | — | | | | — | | | | 138,105,964 | | | | — | |
Payable for Fund shares repurchased | | | — | | | | — | | | | — | | | | 61,571,555 | |
Payable for closed swap contracts (Note 4) | | | — | | | | — | | | | 231,862 | | | | — | |
Accrued foreign capital gains tax payable (Note 2) | | | — | | | | — | | | | 1,341,361 | | | | — | |
Payable for variation margin on open futures contracts (Note 4) | | | — | | | | — | | | | 77,701 | | | | — | |
Payable for variation margin on open cleared swap contracts (Note 4) | | | — | | | | — | | | | 864,013 | | | | — | |
Unrealized depreciation on open forward currency contracts (Note 4) | | | — | | | | — | | | | 8,602,052 | | | | — | |
Interest payable for open OTC swap contracts | | | — | | | | — | | | | 567,274 | | | | — | |
Interest and dividend payable for short sales | | | — | | | | — | | | | 170,494 | | | | — | |
Payable for open OTC swap contracts (Note 4) | | | — | | | | — | | | | 2,410,662 | | | | — | |
Payable for reverse repurchase agreements (Note 2) | | | — | | | | — | | | | 1,326,057 | | | | — | |
Written options outstanding, at value (Note 4)(e) | | | — | | | | — | | | | 6,833,745 | | | | — | |
Payable to agents unaffiliated with GMO | | | 168 | | | | 336 | | | | 1,596 | | | | 168 | |
Payable to Trustees and related expenses | | | 1,701 | | | | 3,456 | | | | 18,234 | | | | 1,149 | |
Accrued expenses | | | 49,203 | | | | 79,874 | | | | 1,406,657 | | | | 41,103 | |
| | | | | | | | | | | | | | | | |
Total liabilities | | | 51,072 | | | | 83,666 | | | | 329,180,326 | | | | 61,613,975 | |
| | | | | | | | | | | | | | | | |
Net assets | | $ | 992,259,613 | | | $ | 2,206,818,218 | | | $ | 11,226,683,853 | | | $ | 601,792,232 | |
| | | | | | | | | | | | | | | | |
(a) Cost of investments – affiliated issuers: | | $ | 1,064,014,178 | | | $ | 2,358,486,029 | | | $ | — | | | $ | 675,602,270 | |
(b) Cost of investments – unaffiliated issuers: | | $ | 338,803 | | | $ | 745,313 | | | $ | 10,603,827,326 | | | $ | 200,023 | |
(c) Cost of foreign currency: | | $ | — | | | $ | — | | | $ | 20,940,808 | | | $ | — | |
(d) Proceeds from securities sold short: | | $ | — | | | $ | — | | | $ | 151,524,145 | | | $ | — | |
(e) Premiums on written options: | | $ | — | | | $ | — | | | $ | 5,216,758 | | | $ | — | |
| | | | |
| | See accompanying notes to the financial statements. | | 99 |
GMO Trust Funds
Statements of Assets and Liabilities — February 28, 2017 — (Continued)
| | | | | | | | | | | | | | | | |
| | | Global
Developed Equity
Allocation Fund | | | Global Equity
Allocation Fund | | | Consolidated
Implementation
Fund | | | International
Developed Equity
Allocation Fund | |
Net assets consist of: | | | | | | | | | | | | | | | | |
Paid-in capital | | $ | 1,145,168,246 | | | $ | 2,682,980,969 | | | $ | 12,085,768,139 | | | $ | 841,364,059 | |
Accumulated undistributed net investment income | | | 4,106,980 | | | | 3,028,905 | | | | 13,863,806 | | | | 54,847 | |
Accumulated net realized gain (loss) | | | (84,967,733 | ) | | | (326,862,198 | ) | | | (1,305,041,517 | ) | | | (165,668,992 | ) |
Net unrealized appreciation (depreciation) | | | (72,047,880 | ) | | | (152,329,458 | ) | | | 432,093,425 | | | | (73,957,682 | ) |
| | | | | | | | | | | | | | | | |
| | $ | 992,259,613 | | | $ | 2,206,818,218 | | | $ | 11,226,683,853 | | | $ | 601,792,232 | |
| | | | | | | | | | | | | | | | |
Net assets attributable to: | | | | | | | | | | | | | | | | |
Core Class | | $ | — | | | $ | — | | | $ | 11,226,683,853 | | | $ | — | |
| | | | | | | | | | | | | | | | |
Class III | | $ | 992,259,613 | | | $ | 2,206,818,218 | | | $ | — | | | $ | 601,792,232 | |
| | | | | | | | | | | | | | | | |
Shares outstanding: | | | | | | | | | | | | | | | | |
Core Class | | | — | | | | — | | | | 859,742,652 | | | | — | |
| | | | | | | | | | | | | | | | |
Class III | | | 50,618,815 | | | | 96,611,088 | | | | — | | | | 40,873,522 | |
| | | | | | | | | | | | | | | | |
Net asset value per share: | | | | | | | | | | | | | | | | |
Core Class | | $ | — | | | $ | — | | | $ | 13.06 | | | $ | — | |
| | | | | | | | | | | | | | | | |
Class III | | $ | 19.60 | | | $ | 22.84 | | | $ | — | | | $ | 14.72 | |
| | | | | | | | | | | | | | | | |
| | | | |
| 100 | | See accompanying notes to the financial statements. | | |
GMO Trust Funds
Statements of Assets and Liabilities — February 28, 2017 — (Continued)
| | | | | | | | | | | | | | | | |
| | | International
Equity
Allocation Fund | | | Consolidated
SGM Major
Markets Fund | | | Consolidated
Special
Opportunities
Fund | | | Strategic
Opportunities
Allocation Fund | |
Assets: | | | | | | | | | | | | | |
Investments in affiliated issuers, at value (Notes 2 and 10)(a) | | $ | 1,085,557,302 | | | $ | 834,716,360 | | | $ | 90,348 | | | $ | 1,904,440,351 | |
Investments in unaffiliated issuers, at value (Note 2)(b) | | | 289,908 | | | | 669,957,053 | | | | 997,966,894 | | | | 112,368,443 | |
Foreign currency, at value (Note 2)(c) | | | — | | | | 38 | | | | 22 | | | | — | |
Cash | | | — | | | | 160,782 | | | | — | | | | — | |
Receivable for investments sold | | | — | | | | 14,040,763 | | | | 3,694,297 | | | | 3,711,365 | |
Receivable for Fund shares sold | | | — | | | | — | | | | — | | | | 717,563 | |
Dividends and interest receivable | | | 1 | | | | 1,037,210 | | | | 960,612 | | | | 398,649 | |
Dividend withholding tax receivable | | | — | | | | — | | | | 21,089 | | | | — | |
Unrealized appreciation on open forward currency contracts (Note 4) | | | — | | | | 4,554,205 | | | | 2,531 | | | | — | |
Receivable for variation margin on open futures contracts (Note 4) | | | — | | | | 1,656,751 | | | | 64,938 | | | | — | |
Due from broker (Note 2) | | | — | | | | 112,289 | | | | 293 | | | | — | |
Receivable for expenses reimbursed and/or waived by GMO (Note 5) | | | 5,416 | | | | 57,075 | | | | — | | | | 4,588 | |
Miscellaneous receivable | | | — | | | | — | | | | — | | | | 7,425 | |
| | | | | | | | | | | | | | | | |
Total assets | | | 1,085,852,627 | | | | 1,526,292,526 | | | | 1,002,801,024 | | | | 2,021,648,384 | |
| | | | | | | | | | | | | | | | |
Liabilities: | | | | | | | | | | | | | | | | |
Payable for investments purchased | | | — | | | | 14,860,368 | | | | 6,276,479 | | | | 140,440 | |
Payable for Fund shares repurchased | | | — | | | | — | | | | — | | | | 4,431,446 | |
Accrued foreign capital gains tax payable (Note 2) | | | — | | | | — | | | | 801,696 | | | | — | |
Payable to affiliate for (Note 5): | | | | | | | | | | | | | | | | |
Management fee | | | — | | | | 985,185 | | | | 854,710 | | | | — | |
Shareholder service fee | | | — | | | | 66,068 | | | | 42,736 | | | | — | |
Unrealized depreciation on open forward currency contracts (Note 4) | | | — | | | | 1,566,533 | | | | 11,774 | | | | — | |
Payable for variation margin on open futures contracts (Note 4) | | | — | | | | 1,289,371 | | | | — | | | | — | |
Written options outstanding, at value (Note 4)(d) | | | — | | | | — | | | | 1,795,700 | | | | — | |
Payable to agents unaffiliated with GMO | | | 168 | | | | 196 | | | | 140 | | | | 280 | |
Payable to Trustees and related expenses | | | 1,692 | | | | 2,509 | | | | 1,603 | | | | 3,294 | |
Accrued expenses | | | 47,583 | | | | 135,315 | | | | 197,248 | | | | 73,428 | |
| | | | | | | | | | | | | | | | |
Total liabilities | | | 49,443 | | | | 18,905,545 | | | | 9,982,086 | | | | 4,648,888 | |
| | | | | | | | | | | | | | | | |
Net assets | | $ | 1,085,803,184 | | | $ | 1,507,386,981 | | | $ | 992,818,938 | | | $ | 2,016,999,496 | |
| | | | | | | | | | | | | | | | |
(a) Cost of investments – affiliated issuers: | | $ | 1,187,462,443 | | | $ | 834,981,269 | | | $ | 317,181 | | | $ | 1,946,415,208 | |
(b) Cost of investments – unaffiliated issuers: | | $ | 289,908 | | | $ | 670,037,232 | | | $ | 946,686,423 | | | $ | 109,868,111 | |
(c) Cost of foreign currency: | | $ | — | | | $ | 3,846 | | | $ | 22 | | | $ | — | |
(d) Premiums on written options: | | $ | — | | | $ | — | | | $ | 3,009,166 | | | $ | — | |
| | | | |
| | See accompanying notes to the financial statements. | | 101 |
GMO Trust Funds
Statements of Assets and Liabilities — February 28, 2017 — (Continued)
| | | | | | | | | | | | | | | | |
| | | International
Equity
Allocation Fund | | | Consolidated
SGM Major
Markets Fund | | | Consolidated
Special
Opportunities
Fund | | | Strategic
Opportunities
Allocation Fund | |
Net assets consist of: | | | | | | | | | | | | | | | | |
Paid-in capital | | $ | 1,290,927,780 | | | $ | 1,539,369,761 | | | $ | 937,335,544 | | | $ | 2,090,683,891 | |
Accumulated undistributed net investment income | | | 1,964,006 | | | | — | | | | — | | | | 1,595,492 | |
Distributions in excess of net investment income | | | — | | | | (30,076,100 | ) | | | (1,169,260 | ) | | | — | |
Accumulated net realized gain (loss) | | | (105,183,461 | ) | | | (29,954,117 | ) | | | 7,425,918 | | | | (35,805,362 | ) |
Net unrealized appreciation (depreciation) | | | (101,905,141 | ) | | | 28,047,437 | | | | 49,226,736 | | | | (39,474,525 | ) |
| | | | | | | | | | | | | | | | |
| | $ | 1,085,803,184 | | | $ | 1,507,386,981 | | | $ | 992,818,938 | | | $ | 2,016,999,496 | |
| | | | | | | | | | | | | | | | |
Net assets attributable to: | | | | | | | | | | | | | | | | |
Class III | | $ | 1,085,803,184 | | | $ | 6,116,721 | | | $ | — | | | $ | 2,016,999,496 | |
| | | | | | | | | | | | | | | | |
Class IV | | $ | — | | | $ | 54,825,177 | | | $ | — | | | $ | — | |
| | | | | | | | | | | | | | | | |
Class VI | | $ | — | | | $ | 1,446,445,083 | | | $ | 992,818,938 | | | $ | — | |
| | | | | | | | | | | | | | | | |
Shares outstanding: | | | | | | | | | | | | | | | | |
Class III | | | 39,499,339 | | | | 187,144 | | | | — | | | | 102,066,638 | |
| | | | | | | | | | | | | | | | |
Class IV | | | — | | | | 1,683,989 | | | | — | | | | — | |
| | | | | | | | | | | | | | | | |
Class VI | | | — | | | | 44,406,834 | | | | 48,683,961 | | | | — | |
| | | | | | | | | | | | | | | | |
Net asset value per share: | | | | | | | | | | | | | | | | |
Class III | | $ | 27.49 | | | $ | 32.68 | | | $ | — | | | $ | 19.76 | |
| | | | | | | | | | | | | | | | |
Class IV | | $ | — | | | $ | 32.56 | | | $ | — | | | $ | — | |
| | | | | | | | | | | | | | | | |
Class VI | | $ | — | | | $ | 32.57 | | | $ | 20.39 | | | $ | — | |
| | | | | | | | | | | | | | | | |
| | | | |
| 102 | | See accompanying notes to the financial statements. | | |
GMO Trust Funds
Statements of Operations — Year Ended February 28, 2017
| | | | | | | | | | | | | | | | |
| | | Alpha Only
Fund | | | Benchmark-Free
Allocation Fund | | | Benchmark-
Free Fund | | | Global Asset
Allocation Fund | |
Investment Income: | | | | | | | | | | | | | |
Dividends from affiliated issuers (Note 10) | | $ | 69,116 | | | $ | 314,196,781 | | | $ | 45,392,762 | | | $ | 58,310,298 | |
Dividends from unaffiliated issuers (Net of withholding tax)(a) | | | 6,084,099 | | | | 16,437 | | | | 52,183,052 | | | | 1,069 | |
Interest | | | 60,348 | | | | 171 | | | | 8,114,542 | | | | 23,306 | |
| | | | | | | | | | | | | | | | |
Total investment income | | | 6,213,563 | | | | 314,213,389 | | | | 105,690,356 | | | | 58,334,673 | |
| | | | | | | | | | | | | | | | |
Expenses: | | | | | | | | | | | | | |
Management fee (Note 5) | | | 1,341,940 | | | | 98,652,500 | | | | — | | | | — | |
Shareholder service fee – Class III (Note 5) | | | 11,539 | | | | 8,172,743 | | | | — | | | | — | |
Shareholder service fee – Class IV (Note 5) | | | 260,695 | | | | 2,652,265 | | | | — | | | | — | |
Supplemental support fee – Class MF (Note 5) | | | — | | | | 7,076,548 | | | | — | | | | — | |
Audit and tax fees | | | 141,675 | | | | 59,026 | | | | 147,194 | | | | 76,711 | |
Custodian and fund accounting agent fees | | | 291,992 | | | | 136,631 | | | | 2,000,299 | | | | 71,114 | |
Legal fees | | | 34,181 | | | | 345,786 | | | | 96,190 | | | | 62,037 | |
Registration fees | | | 6,678 | | | | 15,126 | | | | — | | | | 5,352 | |
Transfer agent fees | | | 43,757 | | | | — | | | | — | | | | — | |
Trustees’ fees and related expenses (Note 5) | | | 2,534 | | | | 259,237 | | | | 75,978 | | | | 47,831 | |
Interest expense (Note 2) | | | — | | | | — | | | | 1,269 | | | | — | |
Miscellaneous | | | 76,121 | | | | 105,339 | | | | 92,697 | | | | 15,964 | |
| | | | | | | | | | | | | | | | |
Total expenses | | | 2,211,112 | | | | 117,475,201 | | | | 2,413,627 | | | | 279,009 | |
Fees and expenses reimbursed and/or waived by GMO (Note 5) | | | (530,143 | ) | | | (631,786 | ) | | | (1,773,255 | ) | | | (226,122 | ) |
Indirectly incurred management fees waived or borne by GMO (Note 5) | | | — | | | | (20,435,518 | ) | | | — | | | | — | |
Supplemental support fee waived – Class MF (Note 5) | | | — | | | | (592,129 | ) | | | — | | | | — | |
Indirectly incurred shareholder service fee waived or borne by GMO (Note 5) | | | — | | | | (2,004,226 | ) | | | — | | | | — | |
| | | | | | | | | | | | | | | | |
Net expenses | | | 1,680,969 | | | | 93,811,542 | | | | 640,372 | | | | 52,887 | |
| | | | | | | | | | | | | | | | |
Net investment income (loss) | | | 4,532,594 | | | | 220,401,847 | | | | 105,049,984 | | | | 58,281,786 | |
| | | | | | | | | | | | | | | | |
Realized and unrealized gain (loss): | | | | | | | | | | | | | |
Net realized gain (loss) on: | | | | | | | | | | | | | | | | |
Investments in unaffiliated issuers (net of foreign capital gains tax) (Note 2)(b) | | | 6,463,609 | | | | — | | | | 30,049,748 | | | | (14,377 | ) |
Investments in affiliated issuers | | | — | | | | 101,516,026 | | | | (9,349,595 | ) | | | (194,468,169 | ) |
Realized gain distributions from affiliated issuers (Note 10) | | | 2,697 | | | | 51,904,439 | | | | 12,268,174 | | | | 31,457,746 | |
Futures contracts | | | (45,393,896 | ) | | | — | | | | 6,495,210 | | | | — | |
Swap contracts | | | — | | | | — | | | | 299,633 | | | | — | |
Foreign currency, forward contracts and foreign currency related transactions | | | (93,567 | ) | | | — | | | | 5,404,472 | | | | — | |
| | | | | | | | | | | | | | | | |
Net realized gain (loss) | | | (39,021,157 | ) | | | 153,420,465 | | | | 45,167,642 | | | | (163,024,800 | ) |
| | | | | | | | | | | | | | | | |
Change in net unrealized appreciation (depreciation) on: | | | | | | | | | | | | | | | | |
Investments in unaffiliated issuers (net of foreign capital gains tax) (Note 2)(c) | | | 36,815,360 | | | | — | | | | 260,763,137 | | | | 1,947 | |
Investments in affiliated issuers | | | — | | | | 1,325,782,244 | | | | 198,449,864 | | | | 468,276,265 | |
Futures contracts | | | (7,921,154 | ) | | | — | | | | (197,030 | ) | | | — | |
Swap contracts | | | — | | | | — | | | | 19,340 | | | | — | |
Foreign currency, forward contracts and foreign currency related transactions | | | 125,032 | | | | — | | | | (7,114,514 | ) | | | — | |
| | | | | | | | | | | | | | | | |
Net change in unrealized appreciation (depreciation) | | | 29,019,238 | | | | 1,325,782,244 | | | | 451,920,797 | | | | 468,278,212 | |
| | | | | | | | | | | | | | | | |
Net realized and unrealized gain (loss) | | | (10,001,919 | ) | | | 1,479,202,709 | | | | 497,088,439 | | | | 305,253,412 | |
| | | | | | | | | | | | | | | | |
Net increase (decrease) in net assets resulting from operations | | $ | (5,469,325 | ) | | $ | 1,699,604,556 | | | $ | 602,138,423 | | | $ | 363,535,198 | |
| | | | | | | | | | | | | | | | |
(a) Withholding tax: | | $ | 294,433 | | | $ | — | | | $ | 4,937,036 | | | $ | — | |
(b) Foreign capital gains tax on net realized gain (loss): | | $ | 5,370 | | | $ | — | | | $ | 17,838 | | | $ | — | |
(c) Foreign capital gains tax on change in net unrealized appreciation (depreciation): | | $ | 5,487 | | | $ | — | | | $ | 551,073 | | | $ | — | |
| | | | |
| | See accompanying notes to the financial statements. | | 103 |
GMO Trust Funds
Statements of Operations — Year Ended February 28, 2017 — (Continued)
| | | | | | | | | | | | | | | | |
| | | Global
Developed Equity
Allocation Fund | | | Global Equity
Allocation Fund | | | Consolidated
Implementation
Fund | | | International
Developed Equity
Allocation Fund | |
Investment Income: | | | | | | | | | | | | | |
Dividends from unaffiliated issuers (Net of withholding tax)(a) | | $ | — | | | $ | — | | | $ | 217,164,966 | | | $ | — | |
Dividends from affiliated issuers (Note 10) | | | 33,392,018 | | | | 69,331,442 | | | | — | | | | 27,696,794 | |
Interest | | | 71 | | | | 178 | | | | 53,823,324 | | | | 98 | |
| | | | | | | | | | | | | | | | |
Total investment income | | | 33,392,089 | | | | 69,331,620 | | | | 270,988,290 | | | | 27,696,892 | |
| | | | | | | | | | | | | | | | |
Expenses: | | | | | | | | | | | | | |
Audit and tax fees | | | 15,328 | | | | 15,478 | | | | 265,070 | | | | 15,055 | |
Custodian, fund accounting agent and transfer agent fees | | | 56,452 | | | | 63,509 | | | | 5,652,744 | | | | 59,341 | |
Dividend expense on short sales | | | — | | | | — | | | | 5,733,725 | | | | — | |
Legal fees | | | 23,375 | | | | 53,554 | | | | 448,818 | | | | 17,542 | |
Registration fees | | | 1,309 | | | | 4,377 | | | | — | | | | 976 | |
Trustees’ fees and related expenses (Note 5) | | | 20,408 | | | | 44,703 | | | | 214,514 | | | | 15,154 | |
Interest expense (Note 2) | | | — | | | | — | | | | 100,181 | | | | — | |
Miscellaneous | | | 8,000 | | | | 17,922 | | | | 214,956 | | | | 6,438 | |
| | | | | | | | | | | | | | | | |
Total expenses | | | 124,872 | | | | 199,543 | | | | 12,630,008 | | | | 114,506 | |
Fees and expenses reimbursed and/or waived by GMO (Note 5) | | | (102,335 | ) | | | (150,219 | ) | | | (6,211,290 | ) | | | (97,133 | ) |
| | | | | | | | | | | | | | | | |
Net expenses | | | 22,537 | | | | 49,324 | | | | 6,418,718 | | | | 17,373 | |
| | | | | | | | | | | | | | | | |
Net investment income (loss) | | | 33,369,552 | | | | 69,282,296 | | | | 264,569,572 | | | | 27,679,519 | |
| | | | | | | | | | | | | | | | |
Realized and unrealized gain (loss): | | | | | | | | | | | | | |
Net realized gain (loss) on: | | | | | | | | | | | | | | | | |
Investments in unaffiliated issuers (net of foreign capital gains tax) (Note 2)(b) | | | — | | | | — | | | | (101,566,826 | ) | | | — | |
Investments in affiliated issuers | | | (85,112,303 | ) | | | (323,061,248 | ) | | | — | | | | (23,893,115 | ) |
Investments in securities sold short | | | — | | | | — | | | | (51,670,595 | ) | | | — | |
Realized gain distributions from affiliated issuers (Note 10) | | | 27,122,992 | | | | 48,181,241 | | | | — | | | | — | |
Futures contracts | | | — | | | | — | | | | (1,780,766 | ) | | | — | |
Written options | | | — | | | | — | | | | (21,056,748 | ) | | | — | |
Swap contracts | | | — | | | | — | | | | 90,658,897 | | | | — | |
Foreign currency, forward contracts and foreign currency related transactions | | | — | | | | — | | | | 42,626,914 | | | | — | |
| | | | | | | | | | | | | | | | |
Net realized gain (loss) | | | (57,989,311 | ) | | | (274,880,007 | ) | | | (42,789,124 | ) | | | (23,893,115 | ) |
| | | | | | | | | | | | | | | | |
Change in net unrealized appreciation (depreciation) on: | | | | | | | | | | | | | | | | |
Investments in unaffiliated issuers (net of foreign capital gains tax) (Note 2)(c) | | | — | | | | — | | | | 1,439,709,540 | | | | — | |
Investments in affiliated issuers | | | 255,753,023 | | | | 729,023,158 | | | | — | | | | 142,706,231 | |
Investments in securities sold short | | | — | | | | — | | | | (17,719,646 | ) | | | — | |
Futures contracts | | | — | | | | — | | | | 52,234 | | | | — | |
Written options | | | — | | | | — | | | | 33,109,386 | | | | — | |
Swap contracts | | | — | | | | — | | | | (114,819,306 | ) | | | — | |
Foreign currency, forward contracts and foreign currency related transactions | | | — | | | | — | | | | (25,535,201 | ) | | | — | |
| | | | | | | | | | | | | | | | |
Net change in unrealized appreciation (depreciation) | | | 255,753,023 | | | | 729,023,158 | | | | 1,314,797,007 | | | | 142,706,231 | |
| | | | | | | | | | | | | | | | |
Net realized and unrealized gain (loss) | | | 197,763,712 | | | | 454,143,151 | | | | 1,272,007,883 | | | | 118,813,116 | |
| | | | | | | | | | | | | | | | |
Net increase (decrease) in net assets resulting from operations | | $ | 231,133,264 | | | $ | 523,425,447 | | | $ | 1,536,577,455 | | | $ | 146,492,635 | |
| | | | | | | | | | | | | | | | |
(a) Withholding tax: | | $ | — | | | $ | — | | | $ | 21,366,835 | | | $ | — | |
(b) Foreign capital gains tax on net realized gain (loss): | | $ | — | | | $ | — | | | $ | (37 | ) | | $ | — | |
(c) Foreign capital gains tax on change in net unrealized appreciation (depreciation): | | $ | — | | �� | $ | — | | | $ | 1,341,361 | | | $ | — | |
| | | | |
| 104 | | See accompanying notes to the financial statements. | | |
GMO Trust Funds
Statements of Operations — Year Ended February 28, 2017 — (Continued)
| | | | | | | | | | | | | | | | |
| | | International
Equity
Allocation Fund | | | Consolidated
SGM Major
Markets Fund | | | Consolidated
Special
Opportunities
Fund | | | Strategic
Opportunities
Allocation Fund | |
Investment Income: | | | | | | | | | | | | | |
Dividends from affiliated issuers (Note 10) | | $ | 36,356,912 | | | $ | 4,516,688 | | | $ | — | | | $ | 52,762,693 | |
Dividends from unaffiliated issuers (Net of withholding tax)(a) | | | — | | | | 98,076 | | | | 9,985,730 | | | | 278,371 | |
Interest | | | 83 | | | | 1,579,705 | | | | 14,477,632 | | | | 1,980,897 | |
| | | | | | | | | | | | | | | | |
Total investment income | | | 36,356,995 | | | | 6,194,469 | | | | 24,463,362 | | | | 55,021,961 | |
| | | | | | | | | | | | | | | | |
Expenses: | | | | | | | | | | | | | |
Management fee (Note 5) | | | — | | | | 11,953,213 | | | | 11,836,075 | | | | — | |
Shareholder service fee – Class III (Note 5) | | | — | | | | 33,527 | | | | — | | | | — | |
Shareholder service fee – Class IV (Note 5) | | | — | | | | 18,513 | | | | — | | | | — | |
Shareholder service fee – Class VI (Note 5) | | | — | | | | 750,968 | | | | 591,804 | | | | — | |
Audit and tax fees | | | 15,471 | | | | 133,165 | | | | 137,875 | | | | 63,273 | |
Custodian, fund accounting agent and transfer agent fees | | | 56,410 | | | | 267,305 | | | | 392,325 | | | | 55,178 | |
Legal fees | | | 26,206 | | | | 110,918 | | | | 200,728 | | | | 41,018 | |
Registration fees | | | 5,956 | | | | — | | | | 276 | | | | 1,981 | |
Trustees’ fees and related expenses (Note 5) | | | 19,141 | | | | 23,201 | | | | 18,680 | | | | 35,953 | |
Miscellaneous | | | 8,647 | | | | 45,110 | | | | 33,549 | | | | 14,411 | |
| | | | | | | | | | | | | | | | |
Total expenses | | | 131,831 | | | | 13,335,920 | | | | 13,211,312 | | | | 211,814 | |
Fees and expenses reimbursed and/or waived by GMO (Note 5) | | | (110,746 | ) | | | (530,271 | ) | | | — | | | | (172,424 | ) |
| | | | | | | | | | | | | | | | |
Net expenses | | | 21,085 | | | | 12,805,649 | | | | 13,211,312 | | | | 39,390 | |
| | | | | | | | | | | | | | | | |
Net investment income (loss) | | | 36,335,910 | | | | (6,611,180 | ) | | | 11,252,050 | | | | 54,982,571 | |
| | | | | | | | | | | | | | | | |
Realized and unrealized gain (loss): | | | | | | | | | | | | | |
Net realized gain (loss) on: | | | | | | | | | | | | | | | | |
Investments in unaffiliated issuers | | | — | | | | 62,750 | | | | 11,576,782 | | | | 9,483,965 | |
Investments in affiliated issuers | | | (37,280,749 | ) | | | 112,252 | | | | 1,281,975 | | | | (54,806,386 | ) |
Realized gain distributions from affiliated issuers (Note 10) | | | — | | | | 544,018 | | | | — | | | | 23,599,593 | |
Futures contracts | | | — | | | | 12,525,853 | | | | (351,959 | ) | | | — | |
Written options | | | — | | | | — | | | | 4,618,825 | | | | — | |
Swap contracts | | | — | | | | — | | | | 135,530 | | | | — | |
Foreign currency, forward contracts and foreign currency related transactions | | | — | | | | 35,549,835 | | | | (1,504,072 | ) | | | — | |
| | | | | | | | | | | | | | | | |
Net realized gain (loss) | | | (37,280,749 | ) | | | 48,794,708 | | | | 15,757,081 | | | | (21,722,828 | ) |
| | | | | | | | | | | | | | | | |
Change in net unrealized appreciation (depreciation) on: | | | | | | | | | | | | | | | | |
Investments in unaffiliated issuers | | | — | | | | (29,460 | ) | | | 111,325,503 | | | | (3,098,454 | ) |
Investments in affiliated issuers | | | 226,072,718 | | | | (313,011 | ) | | | (64,863 | ) | | | 280,472,910 | |
Futures contracts | | | — | | | | 26,568,559 | | | | (1,749,496 | ) | | | — | |
Written options | | | — | | | | — | | | | 832,961 | | | | — | |
Swap contracts | | | — | | | | — | | | | (899,007 | ) | | | — | |
Foreign currency, forward contracts and foreign currency related transactions | | | — | | | | (12,239,975 | ) | | | 798,234 | | | | — | |
| | | | | | | | | | | | | | | | |
Net change in unrealized appreciation (depreciation) | | | 226,072,718 | | | | 13,986,113 | | | | 110,243,332 | | | | 277,374,456 | |
| | | | | | | | | | | | | | | | |
Net realized and unrealized gain (loss) | | | 188,791,969 | | | | 62,780,821 | | | | 126,000,413 | | | | 255,651,628 | |
| | | | | | | | | | | | | | | | |
Net increase (decrease) in net assets resulting from operations | | $ | 225,127,879 | | | $ | 56,169,641 | | | $ | 137,252,463 | | | $ | 310,634,199 | |
| | | | | | | | | | | | | | | | |
(a) Withholding tax: | | $ | — | | | $ | — | | | $ | 261,327 | | | $ | — | |
| | | | |
| | See accompanying notes to the financial statements. | | 105 |
GMO Trust Funds
Statements of Changes in Net Assets
| | | | | | | | | | | | | | | | |
| | | Alpha Only Fund | | | Benchmark-Free
Allocation Fund | |
| | | Year Ended
February 28/29, | | | Year Ended
February 28/29, | |
| | | 2017 | | | 2016 | | | 2017 | | | 2016* | |
Increase (decrease) in net assets: | | | | | | | | | | | | | | | | |
Operations: | | | | | | | | | | | | | | | | |
Net investment income (loss) | | $ | 4,532,594 | | | $ | 29,576,303 | | | $ | 220,401,847 | | | $ | 154,045,787 | |
Net realized gain (loss) | | | (39,021,157 | ) | | | 2,134,877 | | | | 153,420,465 | | | | (56,381,264 | ) |
Change in net unrealized appreciation (depreciation) | | | 29,019,238 | | | | (70,370,476 | ) | | | 1,325,782,244 | | | | (1,488,947,168 | ) |
Accumulated deconsolidation impact (Note 2) | | | — | | | | — | | | | — | | | | (1,054,490,449 | ) |
| | | | | | | | | | | | | | | | |
| | | | |
Net increase (decrease) in net assets from operations | | | (5,469,325 | ) | | | (38,659,296 | ) | | | 1,699,604,556 | | | | (2,445,773,094 | ) |
| | | | | | | | | | | | | | | | |
Distributions to shareholders from: | | | | | | | | | | | | | | | | |
Net investment income | | | | | | | | | | | | | | | | |
Class III | | | (226,478 | ) | | | (615,633 | ) | | | (80,269,673 | ) | | | (85,487,336 | ) |
Class IV | | | (7,404,091 | ) | | | (61,976,715 | ) | | | (42,073,207 | ) | | | (48,744,018 | ) |
Class MF | | | — | | | | — | | | | (99,711,857 | ) | | | (157,879,410 | ) |
| | | | | | | | | | | | | | | | |
Total distributions from net investment income | | | (7,630,569 | ) | | | (62,592,348 | ) | | | (222,054,737 | ) | | | (292,110,764 | ) |
| | | | | | | | | | | | | | | | |
Net realized gains | | | | | | | | | | | | | | | | |
Class III | | | — | | | | — | | | | — | | | | (44,107,021 | ) |
Class IV | | | — | | | | — | | | | — | | | | (24,797,845 | ) |
Class MF | | | — | | | | — | | | | — | | | | (79,692,381 | ) |
| | | | | | | | | | | | | | | | |
Total distributions from net realized gains | | | — | | | | — | | | | — | | | | (148,597,247 | ) |
| | | | | | | | | | | | | | | | |
Net share transactions (Note 9): | | | | | | | | | | | | | | | | |
Class III | | | 517,480 | | | | (18,040,112 | ) | | | (1,155,147,216 | ) | | | 724,704,303 | |
Class IV | | | (47,601,802 | ) | | | (2,946,773,242 | ) | | | (94,499,738 | ) | | | (396,090,776 | ) |
Class MF | | | — | | | | — | | | | (2,872,966,238 | ) | | | (2,706,440,865 | ) |
| | | | | | | | | | | | | | | | |
Increase (decrease) in net assets resulting from net share transactions | | | (47,084,322 | ) | | | (2,964,813,354 | ) | | | (4,122,613,192 | ) | | | (2,377,827,338 | ) |
| | | | | | | | | | | | | | | | |
Purchase premiums and redemption fees (Notes 2 and 9): | | | | | | | | | | | | | | | | |
Class III | | | — | | | | — | | | | 3,463,441 | | | | 3,249,006 | |
Class IV | | | — | | | | — | | | | 1,691,330 | | | | 1,652,987 | |
Class MF | | | — | | | | — | | | | 4,522,945 | | | | 5,469,002 | |
| | | | | | | | | | | | | | | | |
Increase in net assets resulting from purchase premiums and redemption fees | | | — | | | | — | | | | 9,677,716 | | | | 10,370,995 | |
| | | | | | | | | | | | | | | | |
Total increase (decrease) in net assets resulting from net share transactions, purchase premiums and redemption fees | | | (47,084,322 | ) | | | (2,964,813,354 | ) | | | (4,112,935,476 | ) | | | (2,367,456,343 | ) |
| | | | | | | | | | | | | | | | |
Total increase (decrease) in net assets | | | (60,184,216 | ) | | | (3,066,064,998 | ) | | | (2,635,385,657 | ) | | | (5,253,937,448 | ) |
| | |
| Net assets: | | | | | | | | | |
Beginning of period | | | 294,017,628 | | | | 3,360,082,626 | | | | 16,405,843,291 | | | | 21,659,780,739 | |
| | | | | | | | | | | | | | | | |
End of period | | $ | 233,833,412 | | | $ | 294,017,628 | | | $ | 13,770,457,634 | | | $ | 16,405,843,291 | |
| | | | | | | | | | | | | | | | |
Accumulated undistributed net investment income | | $ | 67,491 | | | $ | 3,453,807 | | | $ | 4,355,144 | | | $ | — | |
| | | | | | | | | | | | | | | | |
Distributions in excess of net investment income | | $ | — | | | $ | — | | | $ | — | | | $ | (16,296,369 | ) |
| | | | | | | | | | | | | | | | |
| * | Amounts are consolidated through July 31, 2015 (Note 2 – Basis of presentation and principles of consolidation). |
| | | | |
| 106 | | See accompanying notes to the financial statements. | | |
GMO Trust Funds
Statements of Changes in Net Assets — (Continued)
| | | | | | | | | | | | | | | | |
| | | Benchmark-Free Fund | | | Global Asset
Allocation Fund | |
| | | Year Ended
February 28/29, | | | Year Ended
February 28/29, | |
| | | 2017 | | | 2016 | | | 2017 | | | 2016 | |
Increase (decrease) in net assets: | | | | | | | | | | | | | | | | |
Operations: | | | | | | | | | | | | | | | | |
Net investment income (loss) | | $ | 105,049,984 | | | $ | 144,244,953 | | | $ | 58,281,786 | | | $ | 132,943,879 | |
Net realized gain (loss) | | | 45,167,642 | | | | (598,780,463 | ) | | | (163,024,800 | ) | | | (26,556,395 | ) |
Change in net unrealized appreciation (depreciation) | | | 451,920,797 | | | | (88,185,945 | ) | | | 468,278,212 | | | | (564,399,527 | ) |
| | | | | | | | | | | | | | | | |
| | | | |
Net increase (decrease) in net assets from operations | | | 602,138,423 | | | | (542,721,455 | ) | | | 363,535,198 | | | | (458,012,043 | ) |
| | | | | | | | | | | | | | | | |
Distributions to shareholders from: | | | | | | | | | | | | | | | | |
Net investment income | | | | | | | | | | | | | | | | |
Class III | | | (116,700,824 | ) | | | (147,265,835 | ) | | | (62,220,291 | ) | | | (137,881,813 | ) |
| | | | | | | | | | | | | | | | |
Total distributions from net investment income | | | (116,700,824 | ) | | | (147,265,835 | ) | | | (62,220,291 | ) | | | (137,881,813 | ) |
| | | | | | | | | | | | | | | | |
Net realized gains | | | | | | | | | | | | | | | | |
Class III | | | — | | | | (143,010,501 | ) | | | — | | | | (193,655,005 | ) |
| | | | | | | | | | | | | | | | |
Total distributions from net realized gains | | | — | | | | (143,010,501 | ) | | | — | | | | (193,655,005 | ) |
| | | | | | | | | | | | | | | | |
Net share transactions (Note 9): | | | | | | | | | | | | | | | | |
Class III | | | (397,485,238 | ) | | | 84,996,794 | | | | (1,197,015,061 | ) | | | (763,046,770 | ) |
| | | | | | | | | | | | | | | | |
Increase (decrease) in net assets resulting from net share transactions | | | (397,485,238 | ) | | | 84,996,794 | | | | (1,197,015,061 | ) | | | (763,046,770 | ) |
| | | | | | | | | | | | | | | | |
Purchase premiums and redemption fees (Notes 2 and 9): | | | | | | | | | | | | | | | | |
Class III | | | 1,188,794 | | | | 757,147 | | | | 1,853,433 | | | | 1,464,987 | |
| | | | | | | | | | | | | | | | |
Increase in net assets resulting from purchase premiums and redemption fees | | | 1,188,794 | | | | 757,147 | | | | 1,853,433 | | | | 1,464,987 | |
| | | | | | | | | | | | | | | | |
Total increase (decrease) in net assets resulting from net share transactions, purchase premiums and redemption fees | | | (396,296,444 | ) | | | 85,753,941 | | | | (1,195,161,628 | ) | | | (761,581,783 | ) |
| | | | | | | | | | | | | | | | |
Total increase (decrease) in net assets | | | 89,141,155 | | | | (747,243,850 | ) | | | (893,846,721 | ) | | | (1,551,130,644 | ) |
| | |
| Net assets: | | | | | | | | | |
Beginning of period | | | 4,305,118,379 | | | | 5,052,362,229 | | | | 3,317,791,753 | | | | 4,868,922,397 | |
| | | | | | | | | | | | | | | | |
End of period | | $ | 4,394,259,534 | | | $ | 4,305,118,379 | | | $ | 2,423,945,032 | | | $ | 3,317,791,753 | |
| | | | | | | | | | | | | | | | |
Accumulated undistributed net investment income | | $ | 12,141,708 | | | $ | 10,334,251 | | | $ | 1,907,347 | | | $ | 3,068,850 | |
| | | | | | | | | | | | | | | | |
| | | | |
| | See accompanying notes to the financial statements. | | 107 |
GMO Trust Funds
Statements of Changes in Net Assets — (Continued)
| | | | | | | | | | | | | | | | |
| | | Global Developed Equity
Allocation Fund | | | Global Equity
Allocation Fund | |
| | | Year Ended
February 28/29, | | | Year Ended
February 28/29, | |
| | | 2017 | | | 2016 | | | 2017 | | | 2016 | |
Increase (decrease) in net assets: | | | | | | | | | | | | | | | | |
Operations: | | | | | | | | | | | | | | | | |
Net investment income (loss) | | $ | 33,369,552 | | | $ | 40,484,945 | | | $ | 69,282,296 | | | $ | 86,029,002 | |
Net realized gain (loss) | | | (57,989,311 | ) | | | 82,146,162 | | | | (274,880,007 | ) | | | 66,387,365 | |
Change in net unrealized appreciation (depreciation) | | | 255,753,023 | | | | (373,116,972 | ) | | | 729,023,158 | | | | (712,669,060 | ) |
| | | | | | | | | | | | | | | | |
| | | | |
Net increase (decrease) in net assets from operations | | | 231,133,264 | | | | (250,485,865 | ) | | | 523,425,447 | | | | (560,252,693 | ) |
| | | | | | | | | | | | | | | | |
Distributions to shareholders from: | | | | | | | | | | | | | | | | |
Net investment income | | | | | | | | | | | | | | | | |
Class III | | | (30,222,114 | ) | | | (40,963,522 | ) | | | (68,744,144 | ) | | | (87,088,321 | ) |
| | | | | | | | | | | | | | | | |
Total distributions from net investment income | | | (30,222,114 | ) | | | (40,963,522 | ) | | | (68,744,144 | ) | | | (87,088,321 | ) |
| | | | | | | | | | | | | | | | |
Net realized gains | | | | | | | | | | | | | | | | |
Class III | | | (39,709,256 | ) | | | (137,293,847 | ) | | | (55,809,080 | ) | | | (278,611,210 | ) |
| | | | | | | | | | | | | | | | |
Total distributions from net realized gains | | | (39,709,256 | ) | | | (137,293,847 | ) | | | (55,809,080 | ) | | | (278,611,210 | ) |
| | | | | | | | | | | | | | | | |
Net share transactions (Note 9): | | | | | | | | | | | | | | | | |
Class III | | | (602,267,298 | ) | | | 90,912,790 | | | | (1,073,431,102 | ) | | | 4,118,970 | |
| | | | | | | | | | | | | | | | |
Increase (decrease) in net assets resulting from net share transactions | | | (602,267,298 | ) | | | 90,912,790 | | | | (1,073,431,102 | ) | | | 4,118,970 | |
| | | | | | | | | | | | | | | | |
Purchase premiums and redemption fees (Notes 2 and 9): | | | | | | | | | | | | | | | | |
Class III | | | 549,011 | | | | 151,021 | | | | 2,209,585 | | | | 744,974 | |
| | | | | | | | | | | | | | | | |
Increase in net assets resulting from purchase premiums and redemption fees | | | 549,011 | | | | 151,021 | | | | 2,209,585 | | | | 744,974 | |
| | | | | | | | | | | | | | | | |
Total increase (decrease) in net assets resulting from net share transactions, purchase premiums and redemption fees | | | (601,718,287 | ) | | | 91,063,811 | | | | (1,071,221,517 | ) | | | 4,863,944 | |
| | | | | | | | | | | | | | | | |
Total increase (decrease) in net assets | | | (440,516,393 | ) | | | (337,679,423 | ) | | | (672,349,294 | ) | | | (921,088,280 | ) |
| | |
| Net assets: | | | | | | | | | |
Beginning of period | | | 1,432,776,006 | | | | 1,770,455,429 | | | | 2,879,167,512 | | | | 3,800,255,792 | |
| | | | | | | | | | | | | | | | |
End of period | | $ | 992,259,613 | | | $ | 1,432,776,006 | | | $ | 2,206,818,218 | | | $ | 2,879,167,512 | |
| | | | | | | | | | | | | | | | |
Accumulated undistributed net investment income | | $ | 4,106,980 | | | $ | 960,039 | | | $ | 3,028,905 | | | $ | 2,499,838 | |
| | | | | | | | | | | | | | | | |
| | | | |
| 108 | | See accompanying notes to the financial statements. | | |
GMO Trust Funds
Statements of Changes in Net Assets — (Continued)
| | | | | | | | | | | | | | | | |
| | | Consolidated Implementation
Fund | | | International Developed
Equity Allocation Fund | |
| | | Year Ended
February 28/29, | | | Year Ended
February 28/29, | |
| | | 2017 | | | 2016 | | | 2017 | | | 2016 | |
Increase (decrease) in net assets: | | | | | | | | | | | | | | | | |
Operations: | | | | | | | | | | | | | | | | |
Net investment income (loss) | | $ | 264,569,572 | | | $ | 259,945,732 | | | $ | 27,679,519 | | | $ | 34,048,299 | |
Net realized gain (loss) | | | (42,789,124 | ) | | | (1,363,176,491 | ) | | | (23,893,115 | ) | | | 2,634,243 | |
Change in net unrealized appreciation (depreciation) | | | 1,314,797,007 | | | | (1,181,832,408 | ) | | | 142,706,231 | | | | (276,145,346 | ) |
| | | | | | | | | | | | | | | | |
| | | | |
Net increase (decrease) in net assets from operations | | | 1,536,577,455 | | | | (2,285,063,167 | ) | | | 146,492,635 | | | | (239,462,804 | ) |
| | | | | | | | | | | | | | | | |
Distributions to shareholders from: | | | | | | | | | | | | | | | | |
Net investment income | | | | | | | | | | | | | | | | |
Core Class | | | (218,046,347 | ) | | | — | | | | — | | | | — | |
Class III | | | — | | | | — | | | | (27,805,230 | ) | | | (34,075,093 | ) |
| | | | | | | | | | | | | | | | |
Total distributions from net investment income | | | (218,046,347 | ) | | | — | | | | (27,805,230 | ) | | | (34,075,093 | ) |
| | | | | | | | | | | | | | | | |
Net share transactions (Note 9): | | | | | | | | | | | | | | | | |
Core Class | | | (3,756,011,512 | ) | | | 13,998,781 | | | | — | | | | — | |
Class III | | | — | | | | — | | | | (460,198,898 | ) | | | 35,666,797 | |
| | | | | | | | | | | | | | | | |
Increase (decrease) in net assets resulting from net share transactions | | | (3,756,011,512 | ) | | | 13,998,781 | | | | (460,198,898 | ) | | | 35,666,797 | |
| | | | | | | | | | | | | | | | |
Purchase premiums and redemption fees (Notes 2 and 9): | | | | | | | | | | | | | | | | |
Core Class | | | 8,960,910 | | | | 10,401,407 | | | | — | | | | — | |
Class III | | | — | | | | — | | | | 480,788 | | | | 200,552 | |
| | | | | | | | | | | | | | | | |
Increase in net assets resulting from purchase premiums and redemption fees | | | 8,960,910 | | | | 10,401,407 | | | | 480,788 | | | | 200,552 | |
| | | | | | | | | | | | | | | | |
Total increase (decrease) in net assets resulting from net share transactions, purchase premiums and redemption fees | | | (3,747,050,602 | ) | | | 24,400,188 | | | | (459,718,110 | ) | | | 35,867,349 | |
| | | | | | | | | | | | | | | | |
Total increase (decrease) in net assets | | | (2,428,519,494 | ) | | | (2,260,662,979 | ) | | | (341,030,705 | ) | | | (237,670,548 | ) |
| | |
| Net assets: | | | | | | | | | |
Beginning of period | | | 13,655,203,347 | | | | 15,915,866,326 | | | | 942,822,937 | | | | 1,180,493,485 | |
| | | | | | | | | | | | | | | | |
End of period | | $ | 11,226,683,853 | | | $ | 13,655,203,347 | | | $ | 601,792,232 | | | $ | 942,822,937 | |
| | | | | | | | | | | | | | | | |
Accumulated undistributed net investment income | | $ | 13,863,806 | | | $ | — | | | $ | 54,847 | | | $ | 180,558 | |
| | | | | | | | | | | | | | | | |
Distributions in excess of net investment income | | $ | — | | | $ | (28,509,981 | ) | | $ | — | | | $ | — | |
| | | | | | | | | | | | | | | | |
| | | | |
| | See accompanying notes to the financial statements. | | 109 |
GMO Trust Funds
Statements of Changes in Net Assets — (Continued)
| | | | | | | | | | | | | | | | |
| | | International Equity
Allocation Fund | | | Consolidated SGM Major
Markets Fund | |
| | | Year Ended
February 28/29, | | | Year Ended
February 28/29, | |
| | | 2017 | | | 2016 | | | 2017 | | | 2016 | |
Increase (decrease) in net assets: | | | | | | | | | | | | | | | | |
Operations: | | | | | | | | | | | | | | | | |
Net investment income (loss) | | $ | 36,335,910 | | | $ | 41,758,274 | | | $ | (6,611,180 | ) | | $ | (10,628,660 | ) |
Net realized gain (loss) | | | (37,280,749 | ) | | | (8,872,666 | ) | | | 48,794,708 | | | | (6,534,870 | ) |
Change in net unrealized appreciation (depreciation) | | | 226,072,718 | | | | (351,588,187 | ) | | | 13,986,113 | | | | (7,724,502 | ) |
| | | | | | | | | | | | | | | | |
| | | | |
Net increase (decrease) in net assets from operations | | | 225,127,879 | | | | (318,702,579 | ) | | | 56,169,641 | | | | (24,888,032 | ) |
| | | | | | | | | | | | | | | | |
Distributions to shareholders from: | | | | | | | | | | | | | | | | |
Net investment income | | | | | | | | | | | | | | | | |
Class III | | | (35,103,258 | ) | | | (41,811,574 | ) | | | (338,003 | ) | | | — | |
Class IV | | | — | | | | — | | | | (1,340,200 | ) | | | — | |
Class VI | | | — | | | | — | | | | (47,180,108 | ) | | | — | |
| | | | | | | | | | | | | | | | |
Total distributions from net investment income | | | (35,103,258 | ) | | | (41,811,574 | ) | | | (48,858,311 | ) | | | — | |
| | | | | | | | | | | | | | | | |
Net realized gains | | | | | | | | | | | | | | | | |
Class III | | | — | | | | (58,512,714 | ) | | | (214,673 | ) | | | — | |
Class IV | | | — | | | | — | | | | (1,979,745 | ) | | | — | |
Class VI | | | — | | | | — | | | | (52,825,200 | ) | | | — | |
| | | | | | | | | | | | | | | | |
Total distributions from net realized gains | | | — | | | | (58,512,714 | ) | | | (55,019,618 | ) | | | — | |
| | | | | | | | | | | | | | | | |
Net share transactions (Note 9): | | | | | | | | | | | | | | | | |
Class III | | | (239,862,091 | ) | | | (41,855,340 | ) | | | (18,796,751 | ) | | | (1,442,809,396 | ) |
Class IV | | | — | | | | — | | | | 58,957,014 | | | | — | |
Class VI | | | — | | | | — | | | | 193,889,925 | | | | 1,289,299,894 | |
| | | | | | | | | | | | | | | | |
Increase (decrease) in net assets resulting from net share transactions | | | (239,862,091 | ) | | | (41,855,340 | ) | | | 234,050,188 | | | | (153,509,502 | ) |
| | | | | | | | | | | | | | | | |
Purchase premiums and redemption fees (Notes 2 and 9): | | | | | | | | | | | | | | | | |
Class III | | | 841,053 | | | | 642,512 | | | | — | | | | — | |
| | | | | | | | | | | | | | | | |
Increase in net assets resulting from purchase premiums and redemption fees | | | 841,053 | | | | 642,512 | | | | — | | | | — | |
| | | | | | | | | | | | | | | | |
Total increase (decrease) in net assets resulting from net share transactions, purchase premiums and redemption fees | | | (239,021,038 | ) | | | (41,212,828 | ) | | | 234,050,188 | | | | (153,509,502 | ) |
| | | | | | | | | | | | | | | | |
Total increase (decrease) in net assets | | | (48,996,417 | ) | | | (460,239,695 | ) | | | 186,341,900 | | | | (178,397,534 | ) |
| | |
| Net assets: | | | | | | | | | |
Beginning of period | | | 1,134,799,601 | | | | 1,595,039,296 | | | | 1,321,045,081 | | | | 1,499,442,615 | |
| | | | | | | | | | | | | | | | |
End of period | | $ | 1,085,803,184 | | | $ | 1,134,799,601 | | | $ | 1,507,386,981 | | | $ | 1,321,045,081 | |
| | | | | | | | | | | | | | | | |
Accumulated undistributed net investment income | | $ | 1,964,006 | | | $ | 731,354 | | | $ | — | | | $ | — | |
| | | | | | | | | | | | | | | | |
Distributions in excess of net investment income | | $ | — | | | $ | — | | | $ | (30,076,100 | ) | | $ | (4,096,311 | ) |
| | | | | | | | | | | | | | | | |
| | | | |
| 110 | | See accompanying notes to the financial statements. | | |
GMO Trust Funds
Statements of Changes in Net Assets — (Continued)
| | | | | | | | | | | | | | | | |
| | | Consolidated Special
Opportunities Fund | | | Strategic Opportunities
Allocation Fund | |
| | | Year Ended
February 28/29, | | | Year Ended
February 28/29, | |
| | | 2017 | | | 2016 | | | 2017 | | | 2016 | |
Increase (decrease) in net assets: | | | | | | | | | | | | | | | | |
Operations: | | | | | | | | | | | | | | | | |
Net investment income (loss) | | $ | 11,252,050 | | | $ | 6,735,991 | | | $ | 54,982,571 | | | $ | 85,266,872 | |
Net realized gain (loss) | | | 15,757,081 | | | | 40,207,442 | | | | (21,722,828 | ) | | | 1,485,381 | |
Change in net unrealized appreciation (depreciation) | | | 110,243,332 | | | | (72,176,731 | ) | | | 277,374,456 | | | | (394,050,705 | ) |
| | | | | | | | | | | | | | | | |
| | | | |
Net increase (decrease) in net assets from operations | | | 137,252,463 | | | | (25,233,298 | ) | | | 310,634,199 | | | | (307,298,452 | ) |
| | | | | | | | | | | | | | | | |
Distributions to shareholders from: | | | | | | | | | | | | | | | | |
Net investment income | | | | | | | | | | | | | | | | |
Class III | | | — | | | | — | | | | (54,767,504 | ) | | | (86,263,190 | ) |
Class VI | | | (16,240,542 | ) | | | (8,063,110 | ) | | | — | | | | — | |
| | | | | | | | | | | | | | | | |
Total distributions from net investment income | | | (16,240,542 | ) | | | (8,063,110 | ) | | | (54,767,504 | ) | | | (86,263,190 | ) |
| | | | | | | | | | | | | | | | |
Net realized gains | | | | | | | | | | | | | | | | |
Class III | | | — | | | | — | | | | (1,162,716 | ) | | | (106,172,024 | ) |
Class VI | | | (20,678,991 | ) | | | (9,220,808 | ) | | | — | | | | — | |
| | | | | | | | | | | | | | | | |
Total distributions from net realized gains | | | (20,678,991 | ) | | | (9,220,808 | ) | | | (1,162,716 | ) | | | (106,172,024 | ) |
| | | | | | | | | | | | | | | | |
Net share transactions (Note 9): | | | | | | | | | | | | | | | | |
Class III | | | — | | | | — | | | | (206,111,527 | ) | | | 17,977,573 | |
Class VI | | | (247,683,492 | ) | | | 334,243,331 | | | | — | | | | — | |
| | | | | | | | | | | | | | | | |
Increase (decrease) in net assets resulting from net share transactions | | | (247,683,492 | ) | | | 334,243,331 | | | | (206,111,527 | ) | | | 17,977,573 | |
| | | | | | | | | | | | | | | | |
Purchase premiums and redemption fees (Notes 2 and 9): | | | | | | | | | | | | | | | | |
Class III | | | — | | | | — | | | | 491,456 | | | | 478,138 | |
Class VI | | | 1,434,047 | | | | 3,145,391 | | | | — | | | | — | |
| | | | | | | | | | | | | | | | |
Increase in net assets resulting from purchase premiums and redemption fees | | | 1,434,047 | | | | 3,145,391 | | | | 491,456 | | | | 478,138 | |
| | | | | | | | | | | | | | | | |
Total increase (decrease) in net assets resulting from net share transactions, purchase premiums and redemption fees | | | (246,249,445 | ) | | | 337,388,722 | | | | (205,620,071 | ) | | | 18,455,711 | |
| | | | | | | | | | | | | | | | |
Total increase (decrease) in net assets | | | (145,916,515 | ) | | | 294,871,506 | | | | 49,083,908 | | | | (481,277,955 | ) |
| | |
| Net assets: | | | | | | | | | |
Beginning of period | | | 1,138,735,453 | | | | 843,863,947 | | | | 1,967,915,588 | | | | 2,449,193,543 | |
| | | | | | | | | | | | | | | | |
End of period | | $ | 992,818,938 | | | $ | 1,138,735,453 | | | $ | 2,016,999,496 | | | $ | 1,967,915,588 | |
| | | | | | | | | | | | | | | | |
Accumulated undistributed net investment income | | $ | — | | | $ | 1,905,575 | | | $ | 1,595,492 | | | $ | 1,238,648 | |
| | | | | | | | | | | | | | | | |
Distributions in excess of net investment income | | $ | (1,169,260 | ) | | $ | — | | | $ | — | | | $ | — | |
| | | | | | | | | | | | | | | | |
| | | | |
| | See accompanying notes to the financial statements. | | 111 |
GMO Trust Funds
Financial Highlights
(For a share outstanding throughout each period)
ALPHA ONLY FUND
| | | | | | | | | | | | | | | | | | | | | | | | | | | | | | | | | | | | | | | | | | | | | | | | | | |
| | | Class III Shares | | Class IV Shares |
| | | Year Ended February 28/29, | | Year Ended February 28/29, |
| | | 2017 | | 2016 | | 2015 | | 2014 | | 2013 | | 2017 | | 2016 | | 2015 | | 2014 | | 2013 |
Net asset value, beginning of period | | | $ | 22.04 | | | | $ | 22.93 | | | | $ | 23.98 | | | | $ | 24.22 | | | | $ | 24.13 | | | | $ | 22.05 | | | | $ | 22.95 | | | | $ | 23.99 | | | | $ | 24.24 | | | | $ | 24.14 | |
| | | | | | | | | | | | | | | | | | | | | | | | | | | | | | | | | | | | | | | | | | | | | | | | | | |
Income (loss) from investment operations: | | | | | | | | | | | | | | | | | | | | | | | | | | | | | | | | | | | | | | | | | | | | | | | | | | |
Net investment income (loss)† | | | | 0.35 | | | | | 0.37 | | | | | 0.34 | | | | | 0.53 | (a) | | | | 0.51 | (a) | | | | 0.37 | | | | | 0.39 | | | | | 0.35 | | | | | 0.58 | (a) | | | | 0.60 | (a) |
Net realized and unrealized gain (loss) | | | | (0.80 | ) | | | | (0.40 | ) | | | | (0.96 | ) | | | | (0.76 | ) | | | | (0.35 | ) | | | | (0.81 | ) | | | | (0.41 | ) | | | | (0.95 | ) | | | | (0.80 | ) | | | | (0.42 | ) |
| | | | | | | | | | | | | | | | | | | | | | | | | | | | | | | | | | | | | | | | | | | | | | | | | | |
Total from investment operations | | | | (0.45 | ) | | | | (0.03 | ) | | | | (0.62 | ) | | | | (0.23 | ) | | | | 0.16 | | | | | (0.44 | ) | | | | (0.02 | ) | | | | (0.60 | ) | | | | (0.22 | ) | | | | 0.18 | |
| | | | | | | | | | | | | | | | | | | | | | | | | | | | | | | | | | | | | | | | | | | | | | | | | | |
Less distributions to shareholders: | | | | | | | | | | | | | | | | | | | | | | | | | | | | | | | | | | | | | | | | | | | | | | | | | | |
From net investment income | | | | (0.63 | ) | | | | (0.86 | ) | | | | (0.43 | ) | | | | (0.01 | ) | | | | (0.07 | ) | | | | (0.64 | ) | | | | (0.88 | ) | | | | (0.44 | ) | | | | (0.03 | ) | | | | (0.08 | ) |
| | | | | | | | | | | | | | | | | | | | | | | | | | | | | | | | | | | | | | | | | | | | | | | | | | |
Total distributions | | | | (0.63 | ) | | | | (0.86 | ) | | | | (0.43 | ) | | | | (0.01 | ) | | | | (0.07 | ) | | | | (0.64 | ) | | | | (0.88 | ) | | | | (0.44 | ) | | | | (0.03 | ) | | | | (0.08 | ) |
| | | | | | | | | | | | | | | | | | | | | | | | | | | | | | | | | | | | | | | | | | | | | | | | | | |
Net asset value, end of period | | | $ | 20.96 | | | | $ | 22.04 | | | | $ | 22.93 | | | | $ | 23.98 | | | | $ | 24.22 | | | | $ | 20.97 | | | | $ | 22.05 | | | | $ | 22.95 | | | | $ | 23.99 | | | | $ | 24.24 | |
| | | | | | | | | | | | | | | | | | | | | | | | | | | | | | | | | | | | | | | | | | | | | | | | | | |
Total Return(b) | | | | (2.02 | )% | | | | (0.06 | )% | | | | (2.60 | )% | | | | (0.94 | )% | | | | 0.67 | % | | | | (1.98 | )% | | | | (0.03 | )% | | | | (2.51 | )% | | | | (0.93 | )% | | | | 0.73 | % |
Ratios/Supplemental Data: | | | | | | | | | | | | | | | | | | | | | | | | | | | | | | | | | | | | | | | | | | | | | | | | | | |
Net assets, end of period (000’s) | | | $ | 7,852 | | | | $ | 7,712 | | | | $ | 26,695 | | | | $ | 35,392 | | | | $ | 51,886 | | | | $ | 225,982 | | | | $ | 286,305 | | | | $ | 3,333,388 | | | | $ | 3,523,518 | | | | $ | 3,389,131 | |
Net expenses to average daily net assets | | | | 0.68 | %(c) | | | | 0.66 | %(c) | | | | 0.65 | % | | | | 0.30 | %(c)(d) | | | | 0.23 | %(c)(d) | | | | 0.62 | %(c) | | | | 0.60 | %(c) | | | | 0.60 | % | | | | 0.26 | %(c)(d) | | | | 0.18 | %(c)(d) |
Net investment income (loss) to average daily net assets | | | | 1.62 | %(a) | | | | 1.66 | %(a) | | | | 1.44 | % | | | | 2.19 | %(a) | | | | 2.10 | %(a) | | | | 1.69 | %(a) | | | | 1.76 | %(a) | | | | 1.46 | % | | | | 2.42 | %(a) | | | | 2.47 | %(a) |
Portfolio turnover rate | | | | 22 | %(e) | | | | 85 | % | | | | 123 | % | | | | 66 | % | | | | 104 | % | | | | 22 | %(e) | | | | 85 | % | | | | 123 | % | | | | 66 | % | | | | 104 | % |
Fees and expenses reimbursed and/or waived by GMO to average daily net assets: | | | | 0.20 | % | | | | 0.06 | % | | | | 0.04 | % | | | | 0.37 | %(f) | | | | 0.44 | %(f) | | | | 0.20 | % | | | | 0.05 | % | | | | 0.04 | % | | | | 0.36 | %(f) | | | | 0.44 | %(f) |
| (a) | Net investment income is affected by the timing of the declaration of dividends by the underlying funds in which the Fund invests, if any. |
| (b) | The total returns would have been lower had certain expenses not been reimbursed and/or waived during the periods shown, if applicable, and assumes the effect of reinvested distributions, if any. Calculation excludes purchase premiums and redemption fees which are borne by the shareholder purchasing or redeeming Fund shares, if any. |
| (c) | Net expenses exclude expenses incurred indirectly through investment in the underlying funds (Note 5). |
| (d) | The net expense ratio does not include the effect of expense reductions (Note 2). |
| (e) | The portfolio turnover rate excludes investments in GMO U.S. Treasury Fund (“USTF”) which is used as a short-term investment vehicle for cash management. The Fund’s portfolio turnover rate during the year ended February 28, 2017, including transactions in USTF, was 80% of the average value of its portfolio. |
| (f) | Ratios include indirect fees waived or borne by the Fund. |
| † | Calculated using average shares outstanding throughout the period. |
| | | | |
| 112 | | See accompanying notes to the financial statements. | | |
GMO Trust Funds
Financial Highlights
(For a share outstanding throughout each period)
BENCHMARK-FREE ALLOCATION FUND
| | | | | | | | | | | | | | | | | | | | | | | | | | | | | | | | | | | | | | | | | | | | | | | | | | |
| | | Class III Shares | | Class IV Shares |
| | | Year Ended February 28/29, | | Year Ended February 28/29, |
| | | 2017 | | 2016(a) | | 2015(b) | | 2014(b) | | 2013(b) | | 2017 | | 2016(a) | | 2015(b) | | 2014(b) | | 2013(b)(c) |
Net asset value, beginning of period | | | $ | 23.46 | | | | $ | 27.04 | | | | $ | 27.07 | | | | $ | 25.77 | | | | $ | 24.03 | | | | $ | 23.46 | | | | $ | 27.03 | | | | $ | 27.06 | | | | $ | 25.75 | | | | $ | 24.91 | |
| | | | | | | | | | | | | | | | | | | | | | | | | | | | | | | | | | | | | | | | | | | | | | | | | | |
Income (loss) from investment operations: | | | | | | | | | | | | | | | | | | | | | | | | | | | | | | | | | | | | | | | | | | | | | | | | | | |
Net investment income (loss)(e)† | | | | 0.37 | | | | | 0.19 | | | | | 0.38 | | | | | 0.48 | | | | | 0.30 | | | | | 0.40 | | | | | 0.20 | | | | | 0.36 | | | | | 0.46 | | | | | 0.03 | |
Net realized and unrealized gain (loss) | | | | 2.35 | | | | | (3.26 | ) | | | | 0.86 | | | | | 1.57 | | | | | 1.62 | | | | | 2.33 | | | | | (3.26 | ) | | | | 0.89 | | | | | 1.61 | | | | | 0.96 | |
| | | | | | | | | | | | | | | | | | | | | | | | | | | | | | | | | | | | | | | | | | | | | | | | | | |
Total from investment operations | | | | 2.72 | | | | | (3.07 | ) | | | | 1.24 | | | | | 2.05 | | | | | 1.92 | | | | | 2.73 | | | | | (3.06 | ) | | | | 1.25 | | | | | 2.07 | | | | | 0.99 | |
| | | | | | | | | | | | | | | | | | | | | | | | | | | | | | | | | | | | | | | | | | | | | | | | | | |
Less distributions to shareholders: | | | | | | | | | | | | | | | | | | | | | | | | | | | | | | | | | | | | | | | | | | | | | | | | | | |
From net investment income | | | | (0.40 | ) | | | | (0.34 | ) | | | | (0.52 | ) | | | | (0.39 | ) | | | | (0.18 | ) | | | | (0.41 | ) | | | | (0.34 | ) | | | | (0.53 | ) | | | | (0.40 | ) | | | | (0.15 | ) |
From net realized gains | | | | — | | | | | (0.17 | ) | | | | (0.75 | ) | | | | (0.36 | ) | | | | — | | | | | — | | | | | (0.17 | ) | | | | (0.75 | ) | | | | (0.36 | ) | | | | — | |
| | | | | | | | | | | | | | | | | | | | | | | | | | | | | | | | | | | | | | | | | | | | | | | | | | |
Total distributions | | | | (0.40 | ) | | | | (0.51 | ) | | | | (1.27 | ) | | | | (0.75 | ) | | | | (0.18 | ) | | | | (0.41 | ) | | | | (0.51 | ) | | | | (1.28 | ) | | | | (0.76 | ) | | | | (0.15 | ) |
| | | | | | | | | | | | | | | | | | | | | | | | | | | | | | | | | | | | | | | | | | | | | | | | | | |
Net asset value, end of period | | | $ | 25.78 | | | | $ | 23.46 | | | | $ | 27.04 | | | | $ | 27.07 | | | | $ | 25.77 | | | | $ | 25.78 | | | | $ | 23.46 | | | | $ | 27.03 | | | | $ | 27.06 | | | | $ | 25.75 | |
| | | | | | | | | | | | | | | | | | | | | | | | | | | | | | | | | | | | | | | | | | | | | | | | | | |
Total Return(f) | | | | 11.66 | % | | | | (11.51 | )% | | | | 4.71 | % | | | | 8.03 | % | | | | 8.03 | % | | | | 11.71 | % | | | | (11.46 | )% | | | | 4.75 | % | | | | 8.12 | % | | | | 3.99 | %** |
Ratios/Supplemental Data: | | | | | | | | | | | | | | | | | | | | | | | | | | | | | | | | | | | | | | | | | | | | | | | | | | |
Net assets, end of period (000’s) | | | $ | 5,248,863 | | | | $ | 5,872,663 | | | | $ | 6,040,891 | | | | $ | 3,109,509 | | | | $ | 970,749 | | | | $ | 2,663,418 | | | | $ | 2,508,115 | | | | $ | 3,363,711 | | | | $ | 2,511,906 | | | | $ | 705,982 | |
Net operating expenses to average daily net assets(g) | | | | 0.65 | % | | | | 0.66 | % | | | | 0.64 | % | | | | 0.59 | %(i) | | | | 0.54 | %(i) | | | | 0.60 | % | | | | 0.61 | % | | | | 0.59 | % | | | | 0.54 | %(i) | | | | 0.48 | %(i)* |
Interest and/or dividend expenses to average daily net assets(j) | | | | — | | | | | 0.02 | % | | | | 0.05 | % | | | | — | | | | | — | | | | | — | | | | | 0.02 | % | | | | 0.05 | % | | | | — | | | | | — | |
Total net expenses to average daily net assets(g) | | | | 0.65 | % | | | | 0.68 | % | | | | 0.69 | % | | | | 0.59 | % | | | | 0.54 | % | | | | 0.60 | % | | | | 0.63 | % | | | | 0.64 | % | | | | 0.54 | % | | | | 0.48 | %* |
Net investment income (loss) to average daily net assets(e) | | | | 1.46 | % | | | | 0.73 | % | | | | 1.41 | % | | | | 1.79 | % | | | | 1.23 | % | | | | 1.61 | % | | | | 0.80 | % | | | | 1.32 | % | | | | 1.73 | % | | | | 0.60 | %* |
Portfolio turnover rate | | | | 7 | % | | | | 53 | %(k) | | | | 84 | % | | | | 52 | % | | | | 42 | % | | | | 7 | % | | | | 53 | %(k) | | | | 84 | % | | | | 52 | % | | | | 42 | %** |
Fees and expenses reimbursed and/or waived by GMO to average daily net assets:(l) | | | | 0.15 | % | | | | 0.16 | % | | | | 0.20 | % | | | | 0.27 | % | | | | 0.41 | % | | | | 0.15 | % | | | | 0.16 | % | | | | 0.20 | % | | | | 0.27 | % | | | | 0.40 | %* |
Purchase premiums and redemption fees consisted of the following per share amounts (Note 2):† | | | $ | 0.02 | | | | $ | 0.01 | | | | $ | 0.01 | | | | $ | 0.03 | | | | $ | 0.07 | | | | $ | 0.02 | | | | $ | 0.01 | | | | $ | 0.01 | | | | $ | 0.03 | | | | $ | 0.01 | |
| | | | | | | | | | | | | | | | | | | | |
| | | Class MF Shares | |
| | | Year Ended February 28/29, | |
| | | 2017 | | | 2016(a) | | | 2015(b) | | | 2014(b) | | | 2013(b)(d) | |
Net asset value, beginning of period | | $ | 23.47 | | | $ | 27.04 | | | $ | 27.07 | | | $ | 25.76 | | | $ | 24.10 | |
| | | | | | | | | | | | | | | | | | | | |
Income (loss) from investment operations: | | | | | | | | | | | | | | | | | | | | |
Net investment income (loss)(e)† | | | 0.35 | | | | 0.19 | | | | 0.37 | | | | 0.49 | | | | 0.33 | |
Net realized and unrealized gain (loss) | | | 2.39 | | | | (3.24 | ) | | | 0.88 | | | | 1.58 | | | | 1.52 | |
| | | | | | | | | | | | | | | | | | | | |
Total from investment operations | | | 2.74 | | | | (3.05 | ) | | | 1.25 | | | | 2.07 | | | | 1.85 | |
| | | | | | | | | | | | | | | | | | | | |
Less distributions to shareholders: | | | | | | | | | | | | | | | | | | | | |
From net investment income | | | (0.41 | ) | | | (0.35 | ) | | | (0.53 | ) | | | (0.40 | ) | | | (0.19 | ) |
From net realized gains | | | — | | | | (0.17 | ) | | | (0.75 | ) | | | (0.36 | ) | | | — | |
| | | | | | | | | | | | | | | | | | | | |
Total distributions | | | (0.41 | ) | | | (0.52 | ) | | | (1.28 | ) | | | (0.76 | ) | | | (0.19 | ) |
| | | | | | | | | | | | | | | | | | | | |
Net asset value, end of period | | $ | 25.80 | | | $ | 23.47 | | | $ | 27.04 | | | $ | 27.07 | | | $ | 25.76 | |
| | | | | | | | | | | | | | | | | | | | |
Total Return(f) | | | 11.76 | % | | | (11.45 | )% | | | 4.78 | % | | | 8.11 | % | | | 7.71 | % |
Ratios/Supplemental Data: | | | | | | | | | | | | | | | | | | | | |
Net assets, end of period (000’s) | | $ | 5,858,177 | | | $ | 8,025,066 | | | $ | 12,255,179 | | | $ | 9,103,523 | | | $ | 2,947,886 | |
Net operating expenses to average daily net assets(g) | | | 0.60 | %(h) | | | 0.58 | %(h) | | | 0.55 | %(h) | | | 0.53 | %(i) | | | 0.49 | %(i) |
Interest and/or dividend expenses to average daily net assets(j) | | | — | | | | 0.02 | % | | | 0.05 | % | | | — | | | | — | |
Total net expenses to average daily net assets(g) | | | 0.60 | %(h) | | | 0.60 | %(h) | | | 0.60 | %(h) | | | 0.53 | % | | | 0.49 | % |
Net investment income (loss) to average daily net assets(e) | | | 1.38 | % | | | 0.77 | % | | | 1.37 | % | | | 1.83 | % | | | 1.34 | % |
Portfolio turnover rate | | | 7 | % | | | 53 | %(k) | | | 84 | % | | | 52 | % | | | 42 | % |
Fees and expenses reimbursed and/or waived by GMO to average daily net assets:(l) | | | 0.16 | % | | | 0.19 | % | | | 0.23 | % | | | 0.27 | % | | | 0.41 | % |
Purchase premiums and redemption fees consisted of the following per share amounts (Note 2):† | | $ | 0.02 | | | $ | 0.01 | | | $ | 0.01 | | | $ | 0.03 | | | $ | 0.06 | |
| (a) | The amounts shown, where applicable, are consolidated through the period ended July 31, 2015 (Note 2 – Basis of presentation and principles of consolidation). |
| (b) | Consolidated financial highlights (Note 2 – Basis of presentation and principles of consolidation). |
| (c) | Period from December 11, 2012 (commencement of operations) through February 28, 2013. |
| (d) | Period from March 1, 2012 (commencement of operations) through February 28, 2013. |
| (e) | Net investment income is affected by the timing of the declaration of dividends by the underlying funds in which the Fund invests, if any. |
| (f) | The total returns would have been lower had certain expenses not been reimbursed and/or waived during the periods shown, if applicable, and assumes the effect of reinvested distributions, if any. Calculation excludes purchase premiums and redemption fees which are borne by the shareholder purchasing or redeeming Fund shares, if any. |
| (g) | Net expenses exclude expenses incurred indirectly through investment in the underlying funds (Note 5). |
| (h) | Class MF net expenses include a supplemental support fee reduction (Note 5). |
| (i) | The net expense ratio does not include the effect of expense reductions (Note 2). |
| (j) | Interest and dividend expense incurred as a result of entering into reverse repurchase agreements, securities sold short and/or cleared swap contracts, if any, is included in the Fund’s net expenses. |
| (k) | Had the Fund not been consolidated for the year ended February 29, 2016, the portfolio turnover would have been 23%. |
| (l) | Ratios include indirect fees waived or borne by GMO. |
| † | Calculated using average shares outstanding throughout the period. |
| | | | |
| | See accompanying notes to the financial statements. | | 113 |
GMO Trust Funds
Financial Highlights
(For a share outstanding throughout the period)
BENCHMARK-FREE FUND
| | | | | | | | | | | | | | | | | | | | | | | | | |
| | | Class III Shares |
| | | Year Ended February 28/29, |
| | | 2017 | | 2016 | | 2015 | | 2014 | | 2013 |
Net asset value, beginning of period | | | $ | 17.00 | | | | $ | 20.30 | | | | $ | 22.09 | | | | $ | 21.33 | | | | $ | 20.76 | |
| | | | | | | | | | | | | | | | | | | | | | | | | |
Income (loss) from investment operations: | | | | | | | | | | | | | | | | | | | | | | | | | |
Net investment income (loss)(a)† | | | | 0.43 | | | | | 0.58 | | | | | 0.61 | | | | | 0.59 | | | | | 0.52 | |
Net realized and unrealized gain (loss) | | | | 2.01 | | | | | (2.70 | ) | | | | 0.61 | | | | | 1.45 | | | | | 1.34 | |
| | | | | | | | | | | | | | | | | | | | | | | | | |
Total from investment operations | | | | 2.44 | | | | | (2.12 | ) | | | | 1.22 | | | | | 2.04 | | | | | 1.86 | |
| | | | | | | | | | | | | | | | | | | | | | | | | |
Less distributions to shareholders: | | | | | | | | | | | | | | | | | | | | | | | | | |
From net investment income | | | | (0.49 | ) | | | | (0.60 | ) | | | | (0.79 | ) | | | | (0.74 | ) | | | | (0.68 | ) |
From net realized gains | | | | — | | | | | (0.58 | ) | | | | (2.22 | ) | | | | (0.54 | ) | | | | (0.61 | ) |
| | | | | | | | | | | | | | | | | | | | | | | | | |
Total distributions | | | | (0.49 | ) | | | | (1.18 | ) | | | | (3.01 | ) | | | | (1.28 | ) | | | | (1.29 | ) |
| | | | | | | | | | | | | | | | | | | | | | | | | |
Net asset value, end of period | | | $ | 18.95 | | | | $ | 17.00 | | | | $ | 20.30 | | | | $ | 22.09 | | | | $ | 21.33 | |
| | | | | | | | | | | | | | | | | | | | | | | | | |
Total Return(b) | | | | 14.52 | % | | | | (10.82 | )% | | | | 5.76 | % | | | | 9.66 | % | | | | 9.25 | % |
Ratios/Supplemental Data: | | | | | | | | | | | | | | | | | | | | | | | | | |
Net assets, end of period (000’s) | | | $ | 4,394,260 | | | | $ | 4,305,118 | | | | $ | 5,052,362 | | | | $ | 4,367,658 | | | | $ | 3,941,582 | |
Net expenses to average daily net assets(c) | | | | 0.01 | % | | | | 0.00 | %(d) | | | | 0.00 | %(d) | | | | 0.00 | %(d)(e) | | | | 0.00 | %(d)(e) |
Interest and/or dividend expenses to average daily net assets(f) | | | | 0.00 | %(g) | | | | — | | | | | — | | | | | — | | | | | — | |
Total net expenses to average net assets(c) | | | | 0.01 | % | | | | 0.00 | %(d) | | | | 0.00 | %(d) | | | | 0.00 | %(d) | | | | 0.00 | %(d) |
Net investment income (loss) to average daily net assets(a) | | | | 2.37 | % | | | | 3.09 | % | | | | 2.90 | % | | | | 2.67 | % | | | | 2.51 | % |
Portfolio turnover rate | | | | 83 | %(h) | | | | 101 | % | | | | 60 | % | | | | 51 | % | | | | 31 | % |
Fees and expenses reimbursed and/or waived by GMO to average daily net assets: | | | | 0.04 | % | | | | 0.01 | % | | | | 0.00 | %(i) | | | | 0.00 | %(i) | | | | 0.01 | % |
Purchase premiums and redemption fees consisted of the following per share amounts (Note 2):† | | | $ | 0.00 | (j) | | | $ | 0.00 | (j) | | | $ | 0.00 | (j) | | | $ | 0.00 | (j) | | | $ | 0.00 | (i) |
| (a) | Net investment income is affected by the timing of the declaration of dividends by the underlying funds in which the Fund invests, if any. |
| (b) | The total returns would have been lower had certain expenses not been reimbursed and/or waived during the periods shown, if applicable, and assumes the effect of reinvested distributions, if any. Calculation excludes purchase premiums and redemption fees which are borne by the shareholder purchasing or redeeming Fund shares, if any. |
| (c) | Net expenses exclude expenses incurred indirectly through investment in the underlying funds (Note 5). |
| (d) | Net expenses to average daily net assets were less than 0.01%. |
| (e) | The net expense ratio does not include the effect of expense reductions (Note 2). |
| (f) | Interest and dividend expense incurred as a result of entering into reverse repurchase agreements, securities sold short and/or cleared swap contracts, if any, is included in the Fund’s net expenses. |
| (g) | Ratio is less than 0.01%. |
| (h) | The portfolio turnover rate excludes investments in GMO U.S. Treasury Fund (“USTF”) which is used as a short-term investment vehicle for cash management. The Fund’s portfolio turnover rate during the year ended February 28, 2017, including transactions in USTF, was 86% of the average value of its portfolio. |
| (i) | Fees and expenses reimbursed by GMO were less than 0.01%. |
| (j) | Purchase premiums and redemption fees were less than $0.01 per share. |
| † | Calculated using average shares outstanding throughout the period. |
| | | | |
| 114 | | See accompanying notes to the financial statements. | | |
GMO Trust Funds
Financial Highlights
(For a share outstanding throughout each period)
GLOBAL ASSET ALLOCATION FUND
| | | | | | | | | | | | | | | | | | | | | | | | | |
| | | Class III Shares |
| | | Year Ended February 28/29, |
| | | 2017(a) | | 2016(a) | | 2015(a) | | 2014(a) | | 2013(a) |
Net asset value, beginning of period | | | $ | 27.60 | | | | $ | 33.81 | | | | $ | 35.40 | | | | $ | 32.70 | | | | $ | 31.20 | |
| | | | | | | | | | | | | | | | | | | | | | | | | |
Income (loss) from investment operations: | | | | | | | | | | | | | | | | | | | | | | | | | |
Net investment income (loss)(b)† | | | | 0.61 | | | | | 1.02 | | | | | 0.96 | | | | | 0.81 | | | | | 0.87 | |
Net realized and unrealized gain (loss) | | | | 3.00 | | | | | (4.53 | ) | | | | 0.60 | | | | | 2.73 | | | | | 1.50 | |
| | | | | | | | | | | | | | | | | | | | | | | | | |
Total from investment operations | | | | 3.61 | | | | | (3.51 | ) | | | | 1.56 | | | | | 3.54 | | | | | 2.37 | |
| | | | | | | | | | | | | | | | | | | | | | | | | |
Less distributions to shareholders: | | | | | | | | | | | | | | | | | | | | | | | | | |
From net investment income | | | | (0.73 | ) | | | | (1.14 | ) | | | | (1.29 | ) | | | | (0.84 | ) | | | | (0.87 | ) |
From net realized gains | | | | — | | | | | (1.56 | ) | | | | (1.86 | ) | | | | — | | | | | — | |
| | | | | | | | | | | | | | | | | | | | | | | | | |
Total distributions | | | | (0.73 | ) | | | | (2.70 | ) | | | | (3.15 | ) | | | | (0.84 | ) | | | | (0.87 | ) |
| | | | | | | | | | | | | | | | | | | | | | | | | |
Net asset value, end of period | | | $ | 30.48 | | | | $ | 27.60 | | | | $ | 33.81 | | | | $ | 35.40 | | | | $ | 32.70 | |
| | | | | | | | | | | | | | | | | | | | | | | | | |
Total Return(c) | | | | 13.21 | % | | | | (10.98 | )% | | | | 4.55 | % | | | | 10.88 | % | | | | 7.65 | % |
Ratios/Supplemental Data: | | | | | | | | | | | | | | | | | | | | | | | | | |
Net assets, end of period (000’s) | | | $ | 2,423,945 | | | | $ | 3,317,792 | | | | $ | 4,868,922 | | | | $ | 5,362,913 | | | | $ | 4,764,133 | |
Net expenses to average daily net assets(d)(e) | | | | 0.00 | % | | | | 0.00 | % | | | | 0.00 | % | | | | 0.00 | %(f) | | | | 0.00 | %(f) |
Net investment income (loss) to average daily net assets(b) | | | | 2.06 | % | | | | 3.33 | % | | | | 2.75 | % | | | | 2.33 | % | | | | 2.70 | % |
Portfolio turnover rate | | | | 19 | %(g) | | | | 20 | % | | | | 38 | % | | | | 46 | % | | | | 29 | % |
Fees and expenses reimbursed and/or waived by GMO to average daily net assets: | | | | 0.01 | % | | | | 0.01 | % | | | | 0.01 | % | | | | 0.01 | % | | | | 0.01 | % |
Purchase premiums and redemption fees consisted of the following per share amounts (Note 2):† | | | $ | 0.02 | | | | $ | 0.01 | | | | $ | 0.01 | | | | $ | 0.01 | | | | $ | 0.01 | |
| (a) | Per share amounts were adjusted to reflect a 1:3 reverse stock split effective July 15, 2016. |
| (b) | Net investment income is affected by the timing of the declaration of dividends by the underlying funds in which the Fund invests, if any. |
| (c) | The total returns would have been lower had certain expenses not been reimbursed and/or waived during the periods shown, if applicable, and assumes the effect of reinvested distributions, if any. Calculation excludes purchase premiums and redemption fees which are borne by the shareholder purchasing or redeeming Fund shares, if any. |
| (d) | Net expenses exclude expenses incurred indirectly through investment in the underlying funds (Note 5). |
| (e) | Net expenses to average daily net assets were less than 0.01%. |
| (f) | The net expense ratio does not include the effect of expense reductions (Note 2). |
| (g) | The portfolio turnover rate excludes investments in GMO U.S. Treasury Fund (“USTF”) which is used as a short-term investment vehicle for cash management. The Fund’s portfolio turnover rate during the year ended February 28, 2017, including transactions in USTF, was 18% of the average value of its portfolio. |
| † | Calculated using average shares outstanding throughout the period. |
| | | | |
| | See accompanying notes to the financial statements. | | 115 |
GMO Trust Funds
Financial Highlights
(For a share outstanding throughout each period)
GLOBAL DEVELOPED EQUITY ALLOCATION FUND
| | | | | | | | | | | | | | | | | | | | | | | | | |
| | | Class III Shares |
| | | Year Ended February 28/29, |
| | | 2017 | | 2016 | | 2015 | | 2014 | | 2013 |
Net asset value, beginning of period | | | $ | 17.40 | | | | $ | 22.84 | | | | $ | 25.00 | | | | $ | 21.13 | | | | $ | 19.49 | |
| | | | | | | | | | | | | | | | | | | | | | | | | |
Income (loss) from investment operations: | | | | | | | | | | | | | | | | | | | | | | | | | |
Net investment income (loss)(a)† | | | | 0.52 | | | | | 0.51 | | | | | 0.80 | | | | | 0.61 | | | | | 0.57 | |
Net realized and unrealized gain (loss) | | | | 2.87 | | | | | (3.64 | ) | | | | 0.02 | (b) | | | | 3.96 | | | | | 1.73 | |
| | | | | | | | | | | | | | | | | | | | | | | | | |
Total from investment operations | | | | 3.39 | | | | | (3.13 | ) | | | | 0.82 | | | | | 4.57 | | | | | 2.30 | |
| | | | | | | | | | | | | | | | | | | | | | | | | |
Less distributions to shareholders: | | | | | | | | | | | | | | | | | | | | | | | | | |
From net investment income | | | | (0.55 | ) | | | | (0.52 | ) | | | | (0.82 | ) | | | | (0.70 | ) | | | | (0.66 | ) |
From net realized gains | | | | (0.64 | ) | | | | (1.79 | ) | | | | (2.16 | ) | | | | — | | | | | — | |
| | | | | | | | | | | | | | | | | | | | | | | | | |
Total distributions | | | | (1.19 | ) | | | | (2.31 | ) | | | | (2.98 | ) | | | | (0.70 | ) | | | | (0.66 | ) |
| | | | | | | | | | | | | | | | | | | | | | | | | |
Net asset value, end of period | | | $ | 19.60 | | | | $ | 17.40 | | | | $ | 22.84 | | | | $ | 25.00 | | | | $ | 21.13 | |
| | | | | | | | | | | | | | | | | | | | | | | | | |
Total Return(c) | | | | 20.03 | % | | | | (14.81 | )% | | | | 3.32 | % | | | | 21.68 | % | | | | 11.95 | % |
Ratios/Supplemental Data: | | | | | | | | | | | | | | | | | | | | | | | | | |
Net assets, end of period (000’s) | | | $ | 992,260 | | | | $ | 1,432,776 | | | | $ | 1,770,455 | | | | $ | 1,591,060 | | | | $ | 1,531,772 | |
Net expenses to average daily net assets(d)(e) | | | | 0.00 | % | | | | 0.00 | % | | | | 0.00 | % | | | | 0.00 | %(f) | | | | 0.00 | %(f) |
Net investment income (loss) to average daily net assets(a) | | | | 2.78 | % | | | | 2.49 | % | | | | 3.34 | % | | | | 2.62 | % | | | | 2.86 | % |
Portfolio turnover rate | | | | 29 | % | | | | 14 | % | | | | 16 | % | | | | 36 | % | | | | 31 | % |
Fees and expenses reimbursed and/or waived by GMO to average daily net assets: | | | | 0.01 | % | | | | 0.01 | % | | | | 0.01 | % | | | | 0.01 | % | | | | 0.01 | % |
Purchase premiums and redemption fees consisted of the following per share amounts (Note 2):† | | | $ | 0.01 | | | | $ | 0.00 | (g) | | | $ | 0.00 | (g) | | | | — | | | | | — | |
| (a) | Net investment income is affected by the timing of the declaration of dividends by the underlying funds in which the Fund invests, if any. |
| (b) | The amount shown for a share outstanding does not correspond with the aggregate net realized and unrealized gain (loss) on investments due to the timing of purchases and redemptions of Fund shares in relation to fluctuating market values of the investments of the Fund. |
| (c) | The total returns would have been lower had certain expenses not been reimbursed and/or waived during the periods shown, if applicable, and assumes the effect of reinvested distributions, if any. Calculation excludes purchase premiums and redemption fees which are borne by the shareholder purchasing or redeeming Fund shares, if any. |
| (d) | Net expenses exclude expenses incurred indirectly through investment in the underlying funds (Note 5). |
| (e) | Net expenses to average daily net assets were less than 0.01%. |
| (f) | The net expense ratio does not include the effect of expense reductions (Note 2). |
| (g) | Purchase premiums and redemption fees were less than $0.01 per share. |
| † | Calculated using average shares outstanding throughout the period. |
| | | | |
| 116 | | See accompanying notes to the financial statements. | | |
GMO Trust Funds
Financial Highlights
(For a share outstanding throughout each period)
GLOBAL EQUITY ALLOCATION FUND
| | | | | | | | | | | | | | | | | | | | | | | | | |
| | | Class III Shares |
| | | Year Ended February 28/29, |
| | | 2017(a) | | 2016(a) | | 2015(a) | | 2014(a) | | 2013(a) |
Net asset value, beginning of period | | | $ | 19.71 | | | | $ | 26.22 | | | | $ | 28.29 | | | | $ | 25.80 | | | | $ | 25.47 | |
| | | | | | | | | | | | | | | | | | | | | | | | | |
Income (loss) from investment operations: | | | | | | | | | | | | | | | | | | | | | | | | | |
Net investment income (loss)(b)† | | | | 0.57 | | | | | 0.60 | | | | | 0.96 | | | | | 0.84 | | | | | 0.75 | |
Net realized and unrealized gain (loss) | | | | 3.67 | | | | | (4.47 | ) | | | | (0.03 | )(c) | | | | 3.63 | | | | | 1.71 | |
| | | | | | | | | | | | | | | | | | | | | | | | | |
Total from investment operations | | | | 4.24 | | | | | (3.87 | ) | | | | 0.93 | | | | | 4.47 | | | | | 2.46 | |
| | | | | | | | | | | | | | | | | | | | | | | | | |
Less distributions to shareholders: | | | | | | | | | | | | | | | | | | | | | | | | | |
From net investment income | | | | (0.70 | ) | | | | (0.60 | ) | | | | (0.90 | ) | | | | (0.87 | ) | | | | (0.78 | ) |
From net realized gains | | | | (0.41 | ) | | | | (2.04 | ) | | | | (2.10 | ) | | | | (1.11 | ) | | | | (1.35 | ) |
| | | | | | | | | | | | | | | | | | | | | | | | | |
Total distributions | | | | (1.11 | ) | | | | (2.64 | ) | | | | (3.00 | ) | | | | (1.98 | ) | | | | (2.13 | ) |
| | | | | | | | | | | | | | | | | | | | | | | | | |
Net asset value, end of period | | | $ | 22.84 | | | | $ | 19.71 | | | | $ | 26.22 | | | | $ | 28.29 | | | | $ | 25.80 | |
| | | | | | | | | | | | | | | | | | | | | | | | | |
Total Return(d) | | | | 21.93 | % | | | | (15.96 | )% | | | | 3.37 | % | | | | 17.60 | % | | | | 10.01 | % |
Ratios/Supplemental Data: | | | | | | | | | | | | | | | | | | | | | | | | | |
Net assets, end of period (000’s) | | | $ | 2,206,818 | | | | $ | 2,879,168 | | | | $ | 3,800,256 | | | | $ | 2,948,319 | | | | $ | 2,220,674 | |
Net expenses to average daily net assets(f)(g) | | | | 0.00 | % | | | | 0.00 | % | | | | 0.00 | % | | | | 0.00 | %(e) | | | | 0.00 | %(e) |
Net investment income (loss) to average daily net assets(b) | | | | 2.63 | % | | | | 2.58 | % | | | | 3.54 | % | | | | 3.02 | % | | | | 2.90 | % |
Portfolio turnover rate | | | | 27 | % | | | | 15 | % | | | | 21 | % | | | | 51 | % | | | | 24 | % |
Fees and expenses reimbursed and/or waived by GMO to average daily net assets: | | | | 0.01 | % | | | | 0.01 | % | | | | 0.01 | % | | | | 0.01 | % | | | | 0.01 | % |
Purchase premiums and redemption fees consisted of the following per share amounts (Note 2):† | | | $ | 0.02 | | | | $ | 0.01 | | | | $ | 0.01 | | | | $ | 0.01 | | | | $ | 0.01 | |
| (a) | Per share amounts were adjusted to reflect a 1:3 reverse stock split effective July 15, 2016. |
| (b) | Net investment income is affected by the timing of the declaration of dividends by the underlying funds in which the Fund invests, if any. |
| (c) | The amount shown for a share outstanding does not correspond with the aggregate net realized and unrealized gain (loss) on investments due to the timing of purchases and redemptions of Fund shares in relation to fluctuating market values of the investments of the Fund. |
| (d) | The total returns would have been lower had certain expenses not been reimbursed and/or waived during the periods shown, if applicable, and assumes the effect of reinvested distributions, if any. Calculation excludes purchase premiums and redemption fees which are borne by the shareholder purchasing or redeeming Fund shares, if any. |
| (e) | The net expense ratio does not include the effect of expense reductions (Note 2). |
| (f) | Net expenses exclude expenses incurred indirectly through investment in the underlying funds (Note 5). |
| (g) | Net expenses to average daily net assets were less than 0.01%. |
| † | Calculated using average shares outstanding throughout the period. |
| | | | |
| | See accompanying notes to the financial statements. | | 117 |
GMO Trust Funds
Financial Highlights
(For a share outstanding throughout each period)
CONSOLIDATED IMPLEMENTATION FUND
| | | | | | | | | | | | | | | | | | | | | | | | | |
| | | Core Shares |
| | | Year Ended February 28/29, | | Period from
March 1, 2012
(commencement
of operations)
through
February 28,
2013 |
| | | 2017 | | 2016 | | 2015 | | 2014 | |
Net asset value, beginning of period | | | $ | 11.80 | | | | $ | 13.59 | | | | $ | 12.71 | | | | $ | 11.30 | | | | $ | 10.00 | |
| | | | | | | | | | | | | | | | | | | | | | | | | |
Income (loss) from investment operations: | | | | | | | | | | | | | | | | | | | | | | | | | |
Net investment income (loss)† | | | | 0.27 | | | | | 0.21 | | | | | 0.25 | | | | | 0.32 | | | | | 0.24 | |
Net realized and unrealized gain (loss) | | | | 1.24 | | | | | (2.00 | ) | | | | 0.63 | | | | | 1.09 | | | | | 1.06 | |
| | | | | | | | | | | | | | | | | | | | | | | | | |
Total from investment operations | | | | 1.51 | | | | | (1.79 | ) | | | | 0.88 | | | | | 1.41 | | | | | 1.30 | |
| | | | | | | | | | | | | | | | | | | | | | | | | |
Less distributions to shareholders: | | | | | | | | | | | | | | | | | | | | | | | | | |
From net investment income | | | | (0.25 | ) | | | | — | | | | | — | | | | | — | | | | | — | |
| | | | | | | | | | | | | | | | | | | | | | | | | |
Total distributions | | | | (0.25 | ) | | | | — | | | | | — | | | | | — | | | | | — | |
| | | | | | | | | | | | | | | | | | | | | | | | | |
Net asset value, end of period | | | $ | 13.06 | | | | $ | 11.80 | | | | $ | 13.59 | | | | $ | 12.71 | | | | $ | 11.30 | |
| | | | | | | | | | | | | | | | | | | | | | | | | |
Total Return(a) | | | | 12.88 | % | | | | (13.17 | )% | | | | 6.92 | % | | | | 12.48 | % | | | | 13.00 | % |
Ratios/Supplemental Data: | | | | | | | | | | | | | | | | | | | | | | | | | |
Net assets, end of period (000’s) | | | $ | 11,226,684 | | | | $ | 13,655,203 | | | | $ | 15,915,866 | | | | $ | 10,160,905 | | | | $ | 2,471,328 | |
Net operating expenses to average daily net assets(b) | | | | 0.00 | % | | | | 0.00 | % | | | | 0.00 | % | | | | 0.00 | %(c) | | | | 0.00 | % |
Interest and/or dividend expenses to average daily net assets(d) | | | | 0.05 | % | | | | 0.07 | % | | | | 0.07 | % | | | | — | | | | | — | |
Total net expenses to average daily net assets | | | | 0.05 | % | | | | 0.07 | % | | | | 0.07 | % | | | | 0.00 | % | | | | 0.00 | % |
Net investment income (loss) to average daily net assets | | | | 2.11 | % | | | | 1.62 | % | | | | 1.89 | % | | | | 2.61 | % | | | | 2.21 | % |
Portfolio turnover rate | | | | 142 | % | | | | 127 | % | | | | 115 | % | | | | 65 | % | | | | 66 | % |
Fees and expenses reimbursed and/or waived by GMO to average daily net assets: | | | | 0.05 | % | | | | 0.05 | % | | | | 0.04 | % | | | | 0.08 | % | | | | 0.23 | % |
Purchase premiums and redemption fees consisted of the following per share amounts (Note 2):† | | | $ | 0.01 | | | | $ | 0.01 | | | | | — | | | | | — | | | | | — | |
| (a) | The total returns would have been lower had certain expenses not been reimbursed and/or waived during the periods shown, if applicable, and assumes the effect of reinvested distributions, if any. Calculation excludes purchase premiums and redemption fees which are borne by the shareholder purchasing or redeeming Fund shares, if any. |
| (b) | Ratio is less than 0.01%. |
| (c) | The net expense ratio does not include the effect of expense reductions (Note 2). |
| (d) | Interest expense and dividend expense incurred as a result of entering into repurchase agreements, securities sold short and/or margin on cleared swap contracts, if any, is included in the Fund’s net expenses. Income earned on investing proceeds from reverse repurchase agreements, if any, is included in interest income. |
| † | Calculated using average shares outstanding throughout the period. |
| | | | |
| 118 | | See accompanying notes to the financial statements. | | |
GMO Trust Funds
Financial Highlights
(For a share outstanding throughout each period)
INTERNATIONAL DEVELOPED EQUITY ALLOCATION FUND
| | | | | | | | | | | | | | | | | | | | | | | | | |
| | | Class III Shares |
| | | Year Ended February 28/29, |
| | | 2017 | | 2016 | | 2015 | | 2014 | | 2013 |
Net asset value, beginning of period | | | $ | 13.05 | | | | $ | 16.88 | | | | $ | 17.99 | | | | $ | 14.86 | | | | $ | 13.87 | |
| | | | | | | | | | | | | | | | | | | | | | | | | |
Income (loss) from investment operations: | | | | | | | | | | | | | | | | | | | | | | | | | |
Net investment income (loss)(a)† | | | | 0.45 | | | | | 0.48 | | | | | 0.74 | | | | | 0.54 | | | | | 0.50 | |
Net realized and unrealized gain (loss) | | | | 1.79 | | | | | (3.83 | ) | | | | (1.11 | ) | | | | 3.16 | | | | | 0.97 | |
| | | | | | | | | | | | | | | | | | | | | | | | | |
Total from investment operations | | | | 2.24 | | | | | (3.35 | ) | | | | (0.37 | ) | | | | 3.70 | | | | | 1.47 | |
| | | | | | | | | | | | | | | | | | | | | | | | | |
Less distributions to shareholders: | | | | | | | | | | | | | | | | | | | | | | | | | |
From net investment income | | | | (0.57 | ) | | | | (0.48 | ) | | | | (0.74 | ) | | | | (0.57 | ) | | | | (0.48 | ) |
| | | | | | | | | | | | | | | | | | | | | | | | | |
Total distributions | | | | (0.57 | ) | | | | (0.48 | ) | | | | (0.74 | ) | | | | (0.57 | ) | | | | (0.48 | ) |
| | | | | | | | | | | | | | | | | | | | | | | | | |
Net asset value, end of period | | | $ | 14.72 | | | | $ | 13.05 | | | | $ | 16.88 | | | | $ | 17.99 | | | | $ | 14.86 | |
| | | | | | | | | | | | | | | | | | | | | | | | | |
Total Return(b) | | | | 17.37 | % | | | | (20.09 | )% | | | | (1.86 | )% | | | | 25.02 | % | | | | 10.71 | % |
Ratios/Supplemental Data: | | | | | | | | | | | | | | | | | | | | | | | | | |
Net assets, end of period (000’s) | | | $ | 601,792 | | | | $ | 942,823 | | | | $ | 1,180,493 | | | | $ | 1,150,492 | | | | $ | 966,794 | |
Net expenses to average daily net assets(c)(d) | | | | 0.00 | % | | | | 0.00 | % | | | | 0.00 | % | | | | 0.00 | %(e) | | | | 0.00 | %(e) |
Net investment income (loss) to average daily net assets(a) | | | | 3.14 | % | | | | 3.07 | % | | | | 4.24 | % | | | | 3.28 | % | | | | 3.59 | % |
Portfolio turnover rate | | | | 10 | % | | | | 14 | % | | | | 7 | % | | | | 52 | % | | | | 17 | % |
Fees and expenses reimbursed and/or waived by GMO to average daily net assets: | | | | 0.01 | % | | | | 0.01 | % | | | | 0.01 | % | | | | 0.01 | % | | | | 0.01 | % |
Purchase premiums and redemption fees consisted of the following per share amounts (Note 2):† | | | $ | 0.01 | | | | $ | 0.00 | (f) | | | $ | 0.00 | (f) | | | | — | | | | | — | |
| (a) | Net investment income is affected by the timing of the declaration of dividends by the underlying funds in which the Fund invests, if any. |
| (b) | The total returns would have been lower had certain expenses not been reimbursed and/or waived during the periods shown, if applicable, and assumes the effect of reinvested distributions, if any. Calculation excludes purchase premiums and redemption fees which are borne by the shareholder purchasing or redeeming Fund shares, if any. |
| (c) | Net expenses exclude expenses incurred indirectly through investment in the underlying funds (Note 5). |
| (d) | Net expenses to average daily net assets were less than 0.01%. |
| (e) | The net expense ratio does not include the effect of expense reductions (Note 2). |
| (f) | Purchase premiums and redemption fees were less than $0.01 per share. |
| † | Calculated using average shares outstanding throughout the period. |
| | | | |
| | See accompanying notes to the financial statements. | | 119 |
GMO Trust Funds
Financial Highlights
(For a share outstanding throughout each period)
INTERNATIONAL EQUITY ALLOCATION FUND
| | | | | | | | | | | | | | | | | | | | | | | | | |
| | | Class III Shares |
| | | Year Ended February 28/29, |
| | | 2017(a) | | 2016(a) | | 2015(a) | | 2014(a) | | 2013(a) |
Net asset value, beginning of period | | | $ | 23.40 | | | | $ | 31.71 | | | | $ | 34.11 | | | | $ | 31.29 | | | | $ | 29.94 | |
| | | | | | | | | | | | | | | | | | | | | | | | | |
Income (loss) from investment operations: | | | | | | | | | | | | | | | | | | | | | | | | | |
Net investment income (loss)(b)† | | | | 0.84 | | | | | 0.84 | | | | | 1.32 | | | | | 1.05 | | | | | 0.96 | |
Net realized and unrealized gain (loss) | | | | 4.15 | | | | | (7.11 | ) | | | | (1.83 | ) | | | | 3.96 | | | | | 1.35 | |
| | | | | | | | | | | | | | | | | | | | | | | | | |
Total from investment operations | | | | 4.99 | | | | | (6.27 | ) | | | | (0.51 | ) | | | | 5.01 | | | | | 2.31 | |
| | | | | | | | | | | | | | | | | | | | | | | | | |
Less distributions to shareholders: | | | | | | | | | | | | | | | | | | | | | | | | | |
From net investment income | | | | (0.90 | ) | | | | (0.87 | ) | | | | (1.35 | ) | | | | (1.02 | ) | | | | (0.96 | ) |
From net realized gains | | | | — | | | | | (1.17 | ) | | | | (0.54 | ) | | | | (1.17 | ) | | | | — | |
| | | | | | | | | | | | | | | | | | | | | | | | | |
Total distributions | | | | (0.90 | ) | | | | (2.04 | ) | | | | (1.89 | ) | | | | (2.19 | ) | | | | (0.96 | ) |
| | | | | | | | | | | | | | | | | | | | | | | | | |
Net asset value, end of period | | | $ | 27.49 | | | | $ | 23.40 | | | | $ | 31.71 | | | | $ | 34.11 | | | | $ | 31.29 | |
| | | | | | | | | | | | | | | | | | | | | | | | | |
Total Return(c) | | | | 21.57 | % | | | | (20.70 | )% | | | | (1.30 | )% | | | | 16.22 | % | | | | 7.79 | % |
Ratios/Supplemental Data: | | | | | | | | | | | | | | | | | | | | | | | | | |
Net assets, end of period (000’s) | | | $ | 1,085,803 | | | | $ | 1,134,800 | | | | $ | 1,595,039 | | | | $ | 1,790,318 | | | | $ | 1,385,150 | |
Net expenses to average daily net assets(d)(e) | | | | 0.00 | % | | | | 0.00 | % | | | | 0.00 | % | | | | 0.00 | %(f) | | | | 0.00 | %(f) |
Net investment income (loss) to average daily net assets(b) | | | | 3.20 | % | | | | 2.92 | % | | | | 3.94 | % | | | | 3.15 | % | | | | 3.26 | % |
Portfolio turnover rate | | | | 7 | % | | | | 14 | % | | | | 18 | % | | | | 40 | % | | | | 21 | % |
Fees and expenses reimbursed and/or waived by GMO to average daily net assets: | | | | 0.01 | % | | | | 0.01 | % | | | | 0.01 | % | | | | 0.01 | % | | | | 0.01 | % |
Purchase premiums and redemption fees consisted of the following per share amounts (Note 2):† | | | $ | 0.02 | | | | $ | 0.01 | | | | $ | 0.01 | | | | $ | 0.02 | | | | $ | 0.02 | |
| (a) | Per share amounts were adjusted to reflect a 1:3 reverse stock split effective July 15, 2016. |
| (b) | Net investment income is affected by the timing of the declaration of dividends by the underlying funds in which the Fund invests, if any. |
| (c) | The total returns would have been lower had certain expenses not been reimbursed and/or waived during the periods shown, if applicable, and assumes the effect of reinvested distributions, if any. Calculation excludes purchase premiums and redemption fees which are borne by the shareholder purchasing or redeeming Fund shares, if any. |
| (d) | Net expenses exclude expenses incurred indirectly through investment in the underlying funds (Note 5). |
| (e) | Net expenses to average daily net assets were less than 0.01%. |
| (f) | The net expense ratio does not include the effect of expense reductions (Note 2). |
| † | Calculated using average shares outstanding throughout the period. |
| | | | |
| 120 | | See accompanying notes to the financial statements. | | |
GMO Trust Funds
Financial Highlights
(For a share outstanding throughout each period)
CONSOLIDATED SGM MAJOR MARKETS FUND
| | | | | | | | | | | | | | | | | | | | | | | | | | | | | | |
| | | Class III Shares | | Class IV Shares |
| | | Year Ended February 28/29, | | Period from
October 26, 2016
(commencement
of operations)
through
February 28, 2017 |
| | | 2017 | | 2016 | | 2015 | | 2014 | | 2013 | |
Net asset value, beginning of period | | | $ | 33.25 | | | | $ | 33.80 | | | | $ | 32.18 | | | | $ | 30.47 | | | | $ | 30.05 | | | | $ | 35.27 | |
| | | | | | | | | | | | | | | | | | | | | | | | | | | | | | |
Income (loss) from investment operations: | | | | | | | | | | | | | | | | | | | | | | | | | | | | | | |
Net investment income (loss)(a)† | | | | (0.21 | ) | | | | (0.26 | ) | | | | (0.25 | ) | | | | (0.22 | ) | | | | (0.18 | ) | | | | (0.05 | ) |
Net realized and unrealized gain (loss) | | | | 1.87 | | | | | (0.29 | ) | | | | 1.87 | (b) | | | | 1.93 | | | | | 0.60 | | | | | (0.62 | ) |
| | | | | | | | | | | | | | | | | | | | | | | | | | | | | | |
Total from investment operations | | | | 1.66 | | | | | (0.55 | ) | | | | 1.62 | | | | | 1.71 | | | | | 0.42 | | | | | (0.67 | ) |
| | | | | | | | | | | | | | | | | | | | | | | | | | | | | | |
Less distributions to shareholders: | | | | | | | | | | | | | | | | | | | | | | | | | | | | | | |
From net investment income | | | | (1.01 | ) | | | | — | | | | | — | | | | | — | | | | | — | | | | | (0.82 | ) |
From net realized gains | | | | (1.22 | ) | | | | — | | | | | — | | | | | — | | | | | — | | | | | (1.22 | ) |
| | | | | | | | | | | | | | | | | | | | | | | | | | | | | | |
Total distributions | | | | (2.23 | ) | | | | — | | | | | — | | | | | — | | | | | — | | | | | (2.04 | ) |
| | | | | | | | | | | | | | | | | | | | | | | | | | | | | | |
Net asset value, end of period | | | $ | 32.68 | | | | $ | 33.25 | | | | $ | 33.80 | | | | $ | 32.18 | | | | $ | 30.47 | | | | $ | 32.56 | |
| | | | | | | | | | | | | | | | | | | | | | | | | | | | | | |
Total Return(c) | | | | 5.12 | % | | | | (1.63 | )% | | | | 5.03 | % | | | | 5.61 | % | | | | 1.40 | % | | | | (1.79 | )%** |
Ratios/Supplemental Data: | | | | | | | | | | | | | | | | | | | | | | | | | | | | | | |
Net assets, end of period (000’s) | | | $ | 6,117 | | | | $ | 24,020 | | | | $ | 1,499,443 | | | | $ | 1,662,189 | | | | $ | 959,752 | | | | $ | 54,825 | |
Net expenses to average daily net assets(d) | | | | 1.00 | % | | | | 0.85 | % | | | | 0.80 | % | | | | 0.75 | % | | | | 0.75 | %(e) | | | | 0.95 | %* |
Net investment income (loss) to average daily net assets(a) | | | | (0.61 | )% | | | | (0.79 | )% | | | | (0.76 | )% | | | | (0.70 | )% | | | | (0.61 | )% | | | | (0.41 | )%* |
Portfolio turnover rate | | | | 15 | %(f) | | | | 29 | % | | | | 45 | % | | | | 97 | % | | | | 17 | % | | | | 15 | %(f)** |
Fees and expenses reimbursed and/or waived by GMO to average daily net assets: | | | | 0.04 | % | | | | 0.03 | % | | | | 0.08 | % | | | | 0.13 | % | | | | 0.17 | % | | | | 0.05 | %* |
| | | | | | | | | | |
| | | Class VI Shares |
| | | Year Ended
February 28, 2017 | | Period from
December 1, 2015
(commencement
of operations)
through
February 29, 2016 |
| | | |
Net asset value, beginning of period | | | $ | 33.26 | | | | $ | 33.07 | |
| | | | | | | | | | |
Income (loss) from investment operations: | | | | | | | | | | |
Net investment income (loss)(a)† | | | | (0.16 | ) | | | | (0.05 | ) |
Net realized and unrealized gain (loss) | | | | 1.85 | | | | | 0.24 | |
| | | | | | | | | | |
Total from investment operations | | | | 1.69 | | | | | 0.19 | |
| | | | | | | | | | |
Less distributions to shareholders: | | | | | | | | | | |
From net investment income | | | | (1.16 | ) | | | | — | |
From net realized gains | | | | (1.22 | ) | | | | — | |
| | | | | | | | | | |
Total distributions | | | | (2.38 | ) | | | | — | |
| | | | | | | | | | |
Net asset value, end of period | | | $ | 32.57 | | | | $ | 33.26 | |
| | | | | | | | | | |
Total Return(c) | | | | 5.22 | % | | | | 0.57 | %** |
Ratios/Supplemental Data: | | | | | | | | | | |
Net assets, end of period (000’s) | | | $ | 1,446,445 | | | | $ | 1,297,025 | |
Net expenses to average daily net assets(d) | | | | 0.91 | % | | | | 0.91 | %* |
Net investment income (loss) to average daily net assets(a) | | | | (0.47 | )% | | | | (0.59 | )%* |
Portfolio turnover rate | | | | 15 | %(f) | | | | 29 | %** |
Fees and expenses reimbursed and/or waived by GMO to average daily net assets: | | | | 0.04 | % | | | | 0.13 | % |
| (a) | Net investment income is affected by the timing of the declaration of dividends by the underlying funds in which the Fund invests, if any. |
| (b) | The amount shown for a share outstanding does not correspond with the aggregate net realized and unrealized gain (loss) on investments due to the timing of purchases and redemptions of Fund shares in relation to fluctuating market values of the investments of the Fund. |
| (c) | The total returns would have been lower had certain expenses not been reimbursed and/or waived during the periods shown, if applicable, and assumes the effect of reinvested distributions, if any. Calculation excludes purchase premiums and redemption fees which are borne by the shareholder purchasing or redeeming Fund shares, if any. |
| (d) | Net expenses exclude expenses incurred indirectly through investment in the underlying funds (Note 5). |
| (e) | The net expense ratio does not include the effect of expense reductions (Note 2). |
| (f) | The portfolio turnover rate excludes investments in GMO U.S. Treasury Fund (“USTF”) which is used as a short-term investment vehicle for cash management. The Fund’s portfolio turnover rate during the year ended February 28, 2017, including transactions in USTF, was 47% of the average value of its portfolio. |
| † | Calculated using average shares outstanding throughout the period. |
| | | | |
| | See accompanying notes to the financial statements. | | 121 |
GMO Trust Funds
Consolidated Financial Highlights
(For a share outstanding throughout each period)
CONSOLIDATED SPECIAL OPPORTUNITIES FUND
| | | | | | | | | | | | | | | |
| | | Class VI Shares |
| | | Year Ended
February 28/29, | | Period from
July 28, 2014
(commencement
of operations)
through
February 28, 2015 |
| | | 2017 | | 2016 | |
Net asset value, beginning of period | | | $ | 18.65 | | | | $ | 19.81 | | | | $ | 20.00 | |
| | | | | | | | | | | | | | | |
Income (loss) from investment operations: | | | | | | | | | | | | | | | |
Net investment income (loss)† | | | | 0.21 | | | | | 0.16 | | | | | (0.03 | ) |
Net realized and unrealized gain (loss) | | | | 2.23 | | | | | (0.85 | ) | | | | (0.15 | )(a) |
| | | | | | | | | | | | | | | |
Total from investment operations | | | | 2.44 | | | | | (0.69 | ) | | | | (0.18 | ) |
| | | | | | | | | | | | | | | |
Less distributions to shareholders: | | | | | | | | | | | | | | | |
From net investment income | | | | (0.32 | ) | | | | (0.21 | ) | | | | (0.01 | ) |
From net realized gains | | | | (0.38 | ) | | | | (0.26 | ) | | | | — | |
| | | | | | | | | | | | | | | |
Total distributions | | | | (0.70 | ) | | | | (0.47 | ) | | | | (0.01 | ) |
| | | | | | | | | | | | | | | |
Net asset value, end of period | | | $ | 20.39 | | | | $ | 18.65 | | | | $ | 19.81 | |
| | | | | | | | | | | | | | | |
Total Return(b) | | | | 13.21 | % | | | | (3.64 | )% | | | | (0.89 | )%** |
Ratios/Supplemental Data: | | | | | | | | | | | | | | | |
Net assets, end of period (000’s) | | | $ | 992,819 | | | | $ | 1,138,735 | | | | $ | 843,864 | |
Net expenses to average daily net assets | | | | 1.23 | % | | | | 1.29 | % | | | | 1.36 | %* |
Net investment income (loss) to average daily net assets | | | | 1.05 | % | | | | 0.80 | % | | | | (0.25 | )%* |
Portfolio turnover rate | | | | 87 | % | | | | 69 | % | | | | 64 | %** |
Fees and expenses reimbursed and/or waived by GMO to average daily net assets: | | | | — | | | | | — | | | | | 0.02 | %* |
Purchase premiums and redemption fees consisted of the following per share amounts (Note 2):† | | | $ | 0.03 | | | | $ | 0.07 | | | | $ | 0.13 | |
| (a) | The amount shown for a share outstanding does not correspond with the aggregate net realized and unrealized gain (loss) on investments due to the timing of purchases and redemptions of Fund shares in relation to fluctuating market values of the investments of the Fund. |
| (b) | The total returns would have been lower had certain expenses not been reimbursed and/or waived during the periods shown, if applicable, and assumes the effect of reinvested distributions, if any. Calculation excludes purchase premiums and redemption fees which are borne by the shareholder purchasing or redeeming Fund shares, if any. |
| † | Calculated using average shares outstanding throughout the period. |
| | | | |
| 122 | | See accompanying notes to the financial statements. | | |
GMO Trust Funds
Financial Highlights
(For a share outstanding throughout each period)
STRATEGIC OPPORTUNITIES ALLOCATION FUND
| | | | | | | | | | | | | | | | | | | | | | | | | |
| | | Class III Shares |
| | | Year Ended February 28/29, |
| | | 2017 | | 2016 | | 2015 | | 2014 | | 2013 |
Net asset value, beginning of period | | | $ | 17.43 | | | | $ | 21.89 | | | | $ | 23.43 | | | | $ | 21.47 | | | | $ | 21.26 | |
| | | | | | | | | | | | | | | | | | | | | | | | | |
Income (loss) from investment operations: | | | | | | | | | | | | | | | | | | | | | | | | | |
Net investment income (loss)(a)† | | | | 0.51 | | | | | 0.75 | | | | | 0.76 | | | | | 0.68 | | | | | 0.65 | |
Net realized and unrealized gain (loss) | | | | 2.36 | | | | | (3.47 | ) | | | | 0.44 | | | | | 2.96 | | | | | 1.57 | |
| | | | | | | | | | | | | | | | | | | | | | | | | |
Total from investment operations | | | | 2.87 | | | | | (2.72 | ) | | | | 1.20 | | | | | 3.64 | | | | | 2.22 | |
| | | | | | | | | | | | | | | | | | | | | | | | | |
Less distributions to shareholders: | | | | | | | | | | | | | | | | | | | | | | | | | |
From net investment income | | | | (0.53 | ) | | | | (0.80 | ) | | | | (0.87 | ) | | | | (0.78 | ) | | | | (0.75 | ) |
From net realized gains | | | | (0.01 | ) | | | | (0.94 | ) | | | | (1.87 | ) | | | | (0.90 | ) | | | | (1.26 | ) |
| | | | | | | | | | | | | | | | | | | | | | | | | |
Total distributions | | | | (0.54 | ) | | | | (1.74 | ) | | | | (2.74 | ) | | | | (1.68 | ) | | | | (2.01 | ) |
| | | | | | | | | | | | | | | | | | | | | | | | | |
Net asset value, end of period | | | $ | 19.76 | | | | $ | 17.43 | | | | $ | 21.89 | | | | $ | 23.43 | | | | $ | 21.47 | |
| | | | | | | | | | | | | | | | | | | | | | | | | |
Total Return(b) | | | | 16.60 | % | | | | (13.00 | )% | | | | 5.36 | % | | | | 17.24 | % | | | | 10.81 | % |
Ratios/Supplemental Data: | | | | | | | | | | | | | | | | | | | | | | | | | |
Net assets, end of period (000’s) | | | $ | 2,016,999 | | | | $ | 1,967,916 | | | | $ | 2,449,194 | | | | $ | 2,455,863 | | | | $ | 2,168,928 | |
Net expenses to average daily net assets(c)(d) | | | | 0.00 | % | | | | 0.00 | % | | | | 0.00 | % | | | | 0.00 | %(e) | | | | 0.00 | %(e) |
Net investment income (loss) to average daily net assets(a) | | | | 2.69 | % | | | | 3.80 | % | | | | 3.31 | % | | | | 2.99 | % | | | | 3.01 | % |
Portfolio turnover rate | | | | 28 | %(f) | | | | 65 | % | | | | 30 | % | | | | 53 | % | | | | 34 | % |
Fees and expenses reimbursed and/or waived by GMO to average daily net assets: | | | | 0.01 | % | | | | 0.01 | % | | | | 0.01 | % | | | | 0.01 | % | | | | 0.01 | % |
Purchase premiums and redemption fees consisted of the following per share amounts (Note 2):† | | | $ | 0.00 | (g) | | | $ | 0.00 | (g) | | | $ | 0.00 | (g) | | | $ | 0.00 | (g) | | | $ | 0.00 | (g) |
| (a) | Net investment income is affected by the timing of the declaration of dividends by the underlying funds in which the Fund invests, if any. |
| (b) | The total returns would have been lower had certain expenses not been reimbursed and/or waived during the periods shown, if applicable, and assumes the effect of reinvested distributions, if any. Calculation excludes purchase premiums and redemption fees which are borne by the shareholder purchasing or redeeming Fund shares, if any. |
| (c) | Net expenses exclude expenses incurred indirectly through investment in the underlying funds (Note 5). |
| (d) | Net expenses to average daily net assets were less than 0.01%. |
| (e) | The net expense ratio does not include the effect of expense reductions (Note 2). |
| (f) | The portfolio turnover rate excludes investments in GMO U.S. Treasury Fund (“USTF”) which is used as a short-term investment vehicle for cash management. The Fund’s portfolio turnover rate during the year ended February 28, 2017, including transactions in USTF, was 39% of the average value of its portfolio. |
| (g) | Purchase premiums and redemption fees were less than $0.01 per share. |
| † | Calculated using average shares outstanding throughout the period. |
| | | | |
| | See accompanying notes to the financial statements. | | 123 |
GMO Trust Funds
Notes to Financial Statements
February 28, 2017
Each of Alpha Only Fund, Benchmark-Free Allocation Fund, Benchmark-Free Fund, Global Asset Allocation Fund, Global Developed Equity Allocation Fund, Global Equity Allocation Fund, Implementation Fund, International Developed Equity Allocation Fund, International Equity Allocation Fund, SGM Major Markets Fund, Special Opportunities Fund and Strategic Opportunities Allocation Fund, (each a “Fund” and collectively the “Funds”) is a series of GMO Trust (the “Trust”). The Trust is registered under the Investment Company Act of 1940, as amended (the “1940 Act”), as an open-end management investment company. The Trust was established as a Massachusetts business trust under the laws of The Commonwealth of Massachusetts on June 24, 1985. The Declaration of Trust permits the Trustees of the Trust (“Trustees”) to create an unlimited number of series of shares (Funds) and to subdivide Funds into classes. The Funds are advised and managed by Grantham, Mayo, Van Otterloo & Co. LLC (“GMO”).
The Funds may invest in GMO U.S. Treasury Fund and in money market funds unaffiliated with GMO.
Many of the Funds may invest primarily in other GMO Funds and Implementation Fund, Special Opportunities Fund, and SGM Major Markets Fund may also invest in their wholly-owned subsidiaries, GMO Implementation SPC Ltd., GMO Special Opportunities SPC Ltd. and GMO Alternative Asset SPC Ltd., respectively. These GMO Funds and wholly-owned subsidiaries are referenced herein as “underlying funds.” As a result, the Funds are exposed to all of the risks of the underlying funds in which they invest. Several of the underlying funds themselves invest a substantial portion of their assets in other GMO Funds. The financial statements of the underlying funds should be read in conjunction with the Funds’ financial statements.
The following table provides information about the Funds’ principal investment objectives and benchmarks (if any):
| | | | |
| | | |
| Fund Name | | Benchmark | | Investment Objective |
| Alpha Only Fund | | Citigroup 3-Month Treasury Bill Index | | Total return greater than benchmark |
| Benchmark-Free Allocation Fund | | Not Applicable | | Positive total return, not “relative” return |
| Benchmark-Free Fund | | Not Applicable | | Positive total return |
| Global Asset Allocation Fund | | GMO Global Asset Allocation Index (65% MSCI ACWI, 35% Barclays U.S. Aggregate Index) | | Total return greater than benchmark |
| Global Developed Equity Allocation Fund | | MSCI World Index | | Total return greater than benchmark |
| Global Equity Allocation Fund | | MSCI ACWI | | Total return greater than benchmark |
| Implementation Fund | | Not Applicable | | Positive total return, not “relative” return |
| International Developed Equity Allocation Fund | | MSCI EAFE Index | | Total return greater than benchmark |
| International Equity Allocation Fund | | MSCI ACWI ex USA | | Total return greater than benchmark |
| SGM Major Markets Fund | | Citigroup 3-Month Treasury Bill Index | | Long-term total return |
| Special Opportunities Fund | | Not Applicable | | Positive total return |
| Strategic Opportunities Allocation Fund | | GMO Strategic Opportunities Allocation Index (75% MSCI World Index (MSCI Standard Index Series), 25% Barclays U.S. Aggregate Index) | | Total return greater than benchmark |
Alpha Only Fund, Benchmark-Free Fund, Implementation Fund, Special Opportunities Fund and Strategic Opportunities Allocation Fund currently limit subscriptions.
Global Developed Equity Allocation Fund is currently distributed in Switzerland. The distribution of shares in Switzerland will be exclusively made to, and directed at, qualified investors as defined in the Swiss Collective Investment Schemes Act of 23 June 2006, as amended, and its implementing ordinance.
| 2. | Significant accounting policies |
The following is a summary of significant accounting policies followed by each Fund in the preparation of its financial statements. These policies are in conformity with accounting principles generally accepted in the United States of America (“U.S. GAAP”) and have been consistently followed by the Funds in preparing these financial statements. The preparation of financial statements in accordance with U.S. GAAP requires
124
GMO Trust Funds
Notes to Financial Statements — (Continued)
February 28, 2017
management to make estimates and assumptions that affect the reported amounts and disclosures in the financial statements. Actual results could differ from those estimates. The accounting records of the Funds are maintained in U.S. dollars.
Basis of presentation and principles of consolidation: Benchmark-Free Allocation Fund, Implementation Fund, Special Opportunities Fund and SGM Major Markets Fund
Implementation Fund, Special Opportunities Fund and SGM Major Markets Fund include the accounts of their wholly-owned subsidiaries Implementation SPC Ltd., Special Opportunities SPC Ltd. and Alternative Asset SPC Ltd. (each a “wholly-owned subsidiary”), respectively, and the accompanying financial statements have been consolidated for those accounts. The consolidated financial statements include all of the assets and liabilities of each wholly-owned subsidiary. Prior to August 1, 2015, Benchmark-Free Allocation Fund (“BFAF”) included the accounts of its wholly-owned subsidiary, Implementation Fund. Effective August 1, 2015, BFAF was no longer the sole shareholder of Implementation Fund, thus consolidation was no longer required. The accompanying financial statements for BFAF include the accounts of Implementation Fund through July 31, 2015. Accumulated deconsolidation impact shown in BFAF’s Statement of Changes resulted from income and gain/loss related to the deconsolidation of Implementation Fund. All interfund accounts and transactions have been eliminated in consolidation.
Portfolio valuation
Shares of the underlying funds and other open-end registered investment companies are valued at their most recent net asset value. Direct investments held by the Funds and underlying funds are valued as follows: Exchange-traded securities (other than exchange-traded options) for which market quotations are readily available are valued at (i) the last sale price or (ii) official closing price or (iii) most recent quoted price published by the exchange (if no reported last sale or official closing price) or (iv) the quoted price provided by a pricing source (in the event GMO deems the private market to be a more reliable indicator of market value than the exchange). Exchange-traded options are valued at the last sale price, provided that price is between the closing bid and ask prices. If the last sale price is not within this range, then they will be valued at the closing bid price for long positions and the closing ask price for short positions. Cleared derivatives are valued using the price quoted (which may be based on a model) by the relevant clearing house. If an updated quote for a cleared derivative is not available by the time that a Fund calculates its net asset value on any business day, then that derivative will generally be valued using an industry standard model, which may differ from the model used by the relevant clearing house. Over-the-counter (“OTC”) derivatives are generally valued at the price determined by an industry standard model. Unlisted securities for which market quotations are readily available are generally valued at the most recent quoted price. If quotations are not readily available or circumstances make an existing valuation methodology or procedure unreliable, derivatives and other securities are valued at fair value as determined in good faith by the Trustees or persons acting at their direction pursuant to procedures approved by the Trustees. Because of the uncertainty inherent in pricing, and in particular fair value pricing, the value determined for a particular security may be materially different from the value realized upon its sale. See the table below for information about securities and derivatives, if any, that were fair valued using methods determined in good faith by or at the direction of the Trustees. The Funds and/or the underlying funds classify such securities as Level 3 (levels defined below). For the year ended February 28, 2017, the Funds did not reduce the value of any of their OTC derivatives contracts, if any, based on the creditworthiness of their counterparties. See Note 4 “Derivative financial instruments” for a further discussion on valuation of derivatives.
The foregoing valuation methodologies are modified for equities that trade in non-U.S. securities markets which close prior to the close of the New York Stock Exchange (“NYSE”) due to time zone differences, including the value of equities that underlie futures, options and other derivatives (to the extent the market for those derivatives closes prior to the close of the NYSE). In those cases, the price will generally be adjusted, to the extent practicable and available, based on inputs from an independent pricing service approved by the Trustees that are intended to reflect valuation changes through the NYSE close. The table below shows the percentage of the net assets of the Funds, held either directly or through investments in the underlying funds, if any, that were valued using fair value inputs obtained from that independent pricing service as of February 28, 2017. These securities listed on foreign exchanges (including the value of equity securities that underlie futures, options and other derivatives (to the extent the market for such instruments closes prior to the close of the NYSE)) are classified as Level 2 (levels defined below) in the table below and are described in the disclosures of the underlying funds.
Typically, the Funds and the underlying funds value fixed income securities at the most recent price supplied by a specific relevant pricing source determined by GMO. Although GMO normally does not evaluate pricing sources on a day-to-day basis, it does evaluate pricing sources on an ongoing basis and may change a pricing source at any time. GMO monitors erratic or unusual movements (including unusual inactivity) in the prices supplied for a security and has discretion to override a price supplied by a source (e.g., by taking a price supplied by another) when it believes that the price supplied is not reliable. Alternative pricing sources are often but not always available for securities held by the Funds and the underlying funds. See the table below for information about securities for which no alternative pricing source was available.
“Quoted price” typically means the bid price for securities held long and the ask price for securities sold short. If a market quotation for a security does not involve a bid or an ask, the “quoted price” may be the price provided by a market participant or other third-party pricing source in accordance with the market practice for that security. If an updated quoted price for a security is not available by the time that a Fund calculates its net asset value on any business day, the Fund will generally use the last quoted price so long as GMO believes that the last quoted price continues to represent that security’s fair value.
125
GMO Trust Funds
Notes to Financial Statements — (Continued)
February 28, 2017
In the case of derivatives, prices determined by a model may reflect an estimate of the average of bid and ask prices, regardless of whether a Fund has a long position or a short position.
As discussed above, certain of the Funds and underlying funds invest in securities and/or derivatives which may have been fair valued using methods determined in good faith by or at the direction of the Trustees, fair valued using inputs obtained from an independent pricing service, or valued using prices for which no alternative pricing source was available. The table below presents securities and/or derivatives on a net basis, based on market values or unrealized appreciation/(depreciation), which will tend to understate the Funds’ exposure. The net aggregate direct and indirect exposure to these valuation methodologies (based on each Fund’s net assets) as of February 28, 2017 is as follows:
Securities and derivatives
| | | | | | | | | | | | |
| | | | |
| Fund Name | | Fair valued using
methods determined in good faith by or at the
direction of the Trustees | | | Fair valued using
inputs obtained
from an
independent
pricing service (Net) | | | Single source;
No alternative
pricing source
was available | |
Alpha Only Fund | | | — | | | | 35% | | | | — | |
Benchmark-Free Allocation Fund | | | < 1% | | | | 30% | | | | 2% | |
Benchmark-Free Fund | | | < 1% | | | | 37% | | | | < 1% | |
Global Asset Allocation Fund | | | < 1% | | | | 36% | | | | < 1% | |
Global Developed Equity Allocation Fund | | | < 1% | | | | 56% | | | | — | |
Global Equity Allocation Fund | | | < 1% | | | | 62% | | | | — | |
Consolidated Implementation Fund | | | < 1% | | | | 38% | | | | 1% | |
International Developed Equity Allocation Fund | | | < 1% | | | | 96% | | | | — | |
International Equity Allocation Fund | | | < 1% | | | | 94% | | | | — | |
Consolidated SGM Major Markets Fund | | | — | | | | 2% | | | | — | |
Consolidated Special Opportunities Fund | | | — | | | | 12% | | | | — | |
Strategic Opportunities Allocation Fund | | | < 1% | | | | 46% | | | | < 1% | |
U.S. GAAP requires the Funds to disclose the fair value of their investments in a three-level hierarchy (Levels 1, 2 and 3). The valuation hierarchy is based upon the relative observability of inputs to the valuation of the Funds’ investments. The inputs or methodologies used for valuing securities are not necessarily an indication of the risk associated with investing in those securities.
Changes in valuation techniques may result in transfers into or out of an investment’s assigned level within the fair value hierarchy. In addition, in periods of market dislocation, the observability of prices and inputs may be reduced for many instruments. This condition, as well as changes related to the liquidity of investments, could cause a security to be reclassified between levels.
U.S. GAAP requires additional disclosures about fair value measurements for material Level 3 securities and derivatives, if any (determined by each category of asset or liability as compared to a Fund’s total net assets separately identified in the table below). Other than Funds with investments valued using unadjusted prices supplied by a third-party pricing source (e.g., broker quotes) or as disclosed in the Asset and Liability Valuation Inputs table below, there were no other Funds with classes of investments or derivatives with direct material Level 3 holdings at February 28, 2017.
The three levels are defined as follows:
Level 1 – Valuations based on quoted prices for identical securities in active markets.
The types of assets and liabilities categorized in Level 1 generally include actively traded domestic and certain foreign equity securities; certain U.S. government obligations; derivatives actively traded on a national securities exchange (such as some futures and options); and shares of open-end mutual funds (even if their investments are valued using Level 2 or Level 3 inputs).
126
GMO Trust Funds
Notes to Financial Statements — (Continued)
February 28, 2017
Level 2 – Valuations determined using other significant direct or indirect observable inputs.
The types of assets and liabilities categorized in Level 2 generally include certain U.S. government agency securities, mortgage-backed securities, asset-backed securities, certain sovereign debt obligations, and corporate bonds valued using vendor prices or broker quotes; cleared derivatives and certain OTC derivatives such as swaps, options, swaptions, and forward currency contracts valued using industry standard models; certain restricted securities valued at the most recent available market or quoted price; certain securities that are valued at the local price and adjusted by applying a premium or discount when the holdings exceed foreign ownership limitations; and certain foreign equity securities that are adjusted based on inputs from an independent pricing service approved by the Trustees, including the value of equity securities that underlie futures, options and other derivatives (to the extent the market for such instruments closes prior to the close of the NYSE) to reflect estimated valuation changes through the NYSE close.
Level 3 – Valuations based primarily on inputs that are unobservable and significant.
The types of assets and liabilities categorized in Level 3 generally include, but are not limited to, certain debt securities (such as asset-backed, mortgage-backed, loans and sovereign debt) and derivatives even though they are valued using broker quotes; certain debt securities and derivatives adjusted by a specified discount for liquidity or other considerations; securities whose trading has been suspended or that have been de-listed from their current primary trading exchange valued at the most recent available market or quoted price; securities in default or bankruptcy proceedings for which there is no current market quotation valued at the most recent available market or quoted price; potential litigation recoveries and interests related to bankruptcy proceedings; third-party investment funds where valuations are provided by fund sponsors and which are adjusted for liquidity considerations as well as the timing of the receipt of information; certain equity securities valued based on the last traded exchange price adjusted for the movement in a relevant index; certain securities that are valued using a price from a comparable security related to the same issuer; and certain recently acquired equity securities that have yet to begin trading that are valued at cost.
The following is a summary of the respective levels assigned to the Funds’ direct securities and derivatives, if any, as of February 28, 2017:
| | | | | | | | | | | | | | | | |
| | | | | |
| Description | | Level 1 | | | Level 2 | | | Level 3 | | | Total | |
Alpha Only Fund | | | | | | | | | | | | | | | | |
Asset Valuation Inputs | | | | | | | | | | | | | | | | |
Common Stocks | | | | | | | | | | | | | | | | |
Australia | | $ | — | | | $ | 2,574,639 | | | $ | — | | | $ | 2,574,639 | |
Austria | | | — | | | | 107,093 | | | | — | | | | 107,093 | |
Belgium | | | — | | | | 229,592 | | | | — | | | | 229,592 | |
Brazil | | | — | | | | 1,127,227 | | | | — | | | | 1,127,227 | |
Chile | | | — | | | | 424,444 | | | | — | | | | 424,444 | |
China | | | — | | | | 9,108,080 | | | | — | | | | 9,108,080 | |
Colombia | | | 80,316 | | | | — | | | | — | | | | 80,316 | |
Czech Republic | | | — | | | | 59,251 | | | | — | | | | 59,251 | |
Denmark | | | — | | | | 252,863 | | | | — | | | | 252,863 | |
Egypt | | | — | | | | 55,490 | | | | — | | | | 55,490 | |
Finland | | | — | | | | 467,812 | | | | — | | | | 467,812 | |
France | | | — | | | | 4,963,191 | | | | — | | | | 4,963,191 | |
Germany | | | — | | | | 3,726,488 | | | | — | | | | 3,726,488 | |
Greece | | | — | | | | 118,289 | | | | — | | | | 118,289 | |
Hong Kong | | | — | | | | 1,139,043 | | | | — | | | | 1,139,043 | |
Hungary | | | — | | | | 92,082 | | | | — | | | | 92,082 | |
India | | | 500,496 | | | | 2,389,033 | | | | — | | | | 2,889,529 | |
Indonesia | | | — | | | | 850,752 | | | | — | | | | 850,752 | |
Ireland | | | — | | | | 22,716 | | | | — | | | | 22,716 | |
Israel | | | 14,008 | | | | 196,367 | | | | — | | | | 210,375 | |
Italy | | | — | | | | 1,089,674 | | | | — | | | | 1,089,674 | |
Japan | | | — | | | | 8,193,113 | | | | — | | | | 8,193,113 | |
Malaysia | | | — | | | | 826,546 | | | | 0 | § | | | 826,546 | |
Mexico | | | 1,186,006 | | | | — | | | | — | | | | 1,186,006 | |
Netherlands | | | 13,590 | | | | 631,527 | | | | — | | | | 645,117 | |
New Zealand | | | — | | | | 61,090 | | | | — | | | | 61,090 | |
Norway | | | — | | | | 249,968 | | | | — | | | | 249,968 | |
| | | | | | | | | | | | | | | | | |
127
GMO Trust Funds
Notes to Financial Statements — (Continued)
February 28, 2017
| | | | | | | | | | | | | | | | |
| | | | | |
| Description | | Level 1 | | | Level 2 | | | Level 3 | | | Total | |
Alpha Only Fund (continued) | | | | | | | | | | | | | | | | |
Asset Valuation Inputs (continued) | | | | | | | | | | | | | | | | |
Common Stocks (continued) | | | | | | | | | | | | | | | | |
Peru | | $ | 119,210 | | | $ | — | | | $ | — | | | $ | 119,210 | |
Philippines | | | — | | | | 411,321 | | | | — | | | | 411,321 | |
Poland | | | — | | | | 427,593 | | | | — | | | | 427,593 | |
Portugal | | | — | | | | 58,089 | | | | — | | | | 58,089 | |
Qatar | | | — | | | | 285,975 | | | | — | | | | 285,975 | |
Russia | | | 80,106 | | | | 1,115,735 | | | | — | | | | 1,195,841 | |
Singapore | | | — | | | | 450,478 | | | | — | | | | 450,478 | |
South Africa | | | — | | | | 2,307,761 | | | | — | | | | 2,307,761 | |
South Korea | | | — | | | | 4,688,134 | | | | — | | | | 4,688,134 | |
Spain | | | — | | | | 1,560,816 | | | | — | | | | 1,560,816 | |
Sweden | | | — | | | | 1,082,432 | | | | — | | | | 1,082,432 | |
Switzerland | | | — | | | | 4,987,469 | | | | — | | | | 4,987,469 | |
Taiwan | | | 2,011,909 | | | | 4,589,338 | | | | — | | | | 6,601,247 | |
Thailand | | | — | | | | 331,027 | | | | — | | | | 331,027 | |
Turkey | | | — | | | | 379,855 | | | | — | | | | 379,855 | |
United Arab Emirates | | | — | | | | 284,826 | | | | — | | | | 284,826 | |
United Kingdom | | | — | | | | 18,099,428 | | | | — | | | | 18,099,428 | |
United States | | | 122,019,778 | | | | — | | | | — | | | | 122,019,778 | |
| | | | | | | | | | | | | | | | | |
TOTAL COMMON STOCKS | | | 126,025,419 | | | | 80,016,647 | | | | 0 | § | | | 206,042,066 | |
| | | | | | | | | | | | | | | | | |
Preferred Stocks | | | | | | | | | | | | | | | | |
Brazil | | | — | | | | 1,776,733 | | | | — | | | | 1,776,733 | |
Chile | | | — | | | | 8,232 | | | | — | | | | 8,232 | |
Colombia | | | 59,823 | | | | — | | | | — | | | | 59,823 | |
Germany | | | — | | | | 204,419 | | | | — | | | | 204,419 | |
Russia | | | — | | | | 58,691 | | | | — | | | | 58,691 | |
South Korea | | | — | | | | 230,262 | | | | — | | | | 230,262 | |
| | | | | | | | | | | | | | | | | |
TOTAL PREFERRED STOCKS | | | 59,823 | | | | 2,278,337 | | | | — | | | | 2,338,160 | |
| | | | | | | | | | | | | | | | | |
Rights/Warrants | | | | | | | | | | | | | | | | |
Brazil | | | — | | | | — | | | | 1,259 | | | | 1,259 | |
Malaysia | | | — | | | | — | | | | 1,065 | | | | 1,065 | |
South Korea | | | 850 | | | | — | | | | — | | | | 850 | |
| | | | | | | | | | | | | | | | | |
TOTAL RIGHTS/WARRANTS | | | 850 | | | | — | | | | 2,324 | | | | 3,174 | |
| | | | | | | | | | | | | | | | | |
Mutual Funds | | | | | | | | | | | | | | | | |
United States | | | 10,595,373 | | | | — | | | | — | | | | 10,595,373 | |
| | | | | | | | | | | | | | | | | |
TOTAL MUTUAL FUNDS | | | 10,595,373 | | | | — | | | | — | | | | 10,595,373 | |
| | | | | | | | | | | | | | | | | |
Short-Term Investments | | | 13,464,787 | | | | — | | | | — | | | | 13,464,787 | |
| | | | | | | | | | | | | | | | | |
Total Investments | | | 150,146,252 | | | | 82,294,984 | | | | 2,324 | | | | 232,443,560 | |
| | | | | | | | | | | | | | | | | |
Derivatives^ | | | | | | | | | | | | | | | | |
Futures Contracts | | | | | | | | | | | | | | | | |
Equity Risk | | | 24,455 | | | | — | | |
| —
|
| | | 24,455 | |
| | | | | | | | | | | | | | | | | |
Total | | $ | 150,170,707 | | | $ | 82,294,984 | | | $ | 2,324 | | | $ | 232,468,015 | |
| | | | | | | | | | | | | | | | | |
| | | | | | | | | | | | | | | | | |
Liability Valuation Inputs | | | | | | | | | | | | | | | | |
Derivatives^ | | | | | | | | | | | | | | | | |
Futures Contracts | | | | | | | | | | | | | | | | |
Equity Risk | | $ | (8,407,599 | ) | | $ | — | | | $ | — | | | $ | (8,407,599 | ) |
| | | | | | | | | | | | | | | | | |
Total Futures Contracts | | $ | (8,407,599 | ) | | $ | — | | | $ | — | | | $ | (8,407,599 | ) |
| | | | | | | | | | | | | | | | | |
| | | | | | | | | | | | | | | | | |
128
GMO Trust Funds
Notes to Financial Statements — (Continued)
February 28, 2017
| | | | | | | | | | | | | | | | |
| | | | | |
| Description | | Level 1 | | | Level 2 | | | Level 3 | | | Total | |
Benchmark-Free Allocation Fund | | | | | | | | | | | | | | | | |
Asset Valuation Inputs | | | | | | | | | | | | | | | | |
Mutual Funds | | $ | 13,769,982,941 | | | $ | — | | | $ | — | | | $ | 13,769,982,941 | |
Short-Term Investments | | | 7,055,247 | | | | — | | | | — | | | | 7,055,247 | |
| | | | | | | | | | | | | | | | | |
Total Investments | | | 13,777,038,188 | | | | — | | | | — | | | | 13,777,038,188 | |
| | | | | | | | | | | | | | | | | |
Total | | $ | 13,777,038,188 | | | $ | — | | | $ | — | | | $ | 13,777,038,188 | |
| | | | | | | | | | | | | | | | | |
| | | | | | | | | | | | | | | | | |
Benchmark-Free Fund | |
Asset Valuation Inputs | | | | | | | | | | | | | | | | |
Common Stocks | | | | | | | | | | | | | | | | |
Australia | | | — | | | | 44,933,846 | | | | — | | | | 44,933,846 | |
Austria | | | — | | | | 5,888,489 | | | | — | | | | 5,888,489 | |
Belgium | | | — | | | | 1,848,231 | | | | — | | | | 1,848,231 | |
Brazil | | | — | | | | 17,659,824 | | | | — | | | | 17,659,824 | |
Canada | | | 37,339,468 | | | | — | | | | — | | | | 37,339,468 | |
China | | | 8,053,836 | | | | 142,881,434 | | | | — | | | | 150,935,270 | |
Czech Republic | | | — | | | | 1,984,200 | | | | — | | | | 1,984,200 | |
Denmark | | | — | | | | 354,489 | | | | — | | | | 354,489 | |
Finland | | | — | | | | 9,649,588 | | | | — | | | | 9,649,588 | |
France | | | — | | | | 60,775,235 | | | | — | | | | 60,775,235 | |
Germany | | | — | | | | 64,199,202 | | | | — | | | | 64,199,202 | |
Greece | | | — | | | | 235,809 | | | | — | | | | 235,809 | |
Hong Kong | | | — | | | | 30,040,101 | | | | — | | | | 30,040,101 | |
Hungary | | | — | | | | 1,354,810 | | | | — | | | | 1,354,810 | |
India | | | 11,303,887 | | | | 23,411,526 | | | | — | | | | 34,715,413 | |
Indonesia | | | — | | | | 357,725 | | | | — | | | | 357,725 | |
Ireland | | | — | | | | 715,597 | | | | — | | | | 715,597 | |
Israel | | | 7,131,411 | | | | 8,424,761 | | | | — | | | | 15,556,172 | |
Italy | | | — | | | | 6,447,255 | | | | — | | | | 6,447,255 | |
Japan | | | — | | | | 156,907,550 | | | | — | | | | 156,907,550 | |
Mexico | | | 13,708,859 | | | | — | | | | — | | | | 13,708,859 | |
Netherlands | | | 2,425,470 | | | | 25,797,791 | | | | — | | | | 28,223,261 | |
New Zealand | | | — | | | | 4,162,078 | | | | — | | | | 4,162,078 | |
Norway | | | — | | | | 11,506,645 | | | | — | | | | 11,506,645 | |
Poland | | | — | | | | 7,678,433 | | | | — | | | | 7,678,433 | |
Portugal | | | — | | | | 660,725 | | | | — | | | | 660,725 | |
Russia | | | — | | | | 21,823,609 | | | | — | | | | 21,823,609 | |
Singapore | | | — | | | | 6,473,862 | | | | — | | | | 6,473,862 | |
South Africa | | | — | | | | 50,444,083 | | | | — | | | | 50,444,083 | |
South Korea | | | — | | | | 81,141,347 | | | | — | | | | 81,141,347 | |
Spain | | | — | | | | 23,304,937 | | | | — | | | | 23,304,937 | |
Sweden | | | — | | | | 5,300,631 | | | | — | | | | 5,300,631 | |
Switzerland | | | — | | | | 34,835,687 | | | | — | | | | 34,835,687 | |
Taiwan | | | 19,590,830 | | | | 57,282,194 | | | | — | | | | 76,873,024 | |
Thailand | | | — | | | | 3,992,092 | | | | — | | | | 3,992,092 | |
Turkey | | | — | | | | 23,907,426 | | | | — | | | | 23,907,426 | |
United Kingdom | | | 5,848,680 | | | | 96,407,634 | | | | — | | | | 102,256,314 | |
United States | | | 241,039,890 | | | | — | | | | — | | | | 241,039,890 | |
| | | | | | | | | | | | | | | | | |
TOTAL COMMON STOCKS | | | 346,442,331 | | | | 1,032,788,846 | | | | — | | | | 1,379,231,177 | |
| | | | | | | | | | | | | | | | | |
Mutual Funds | | | | | | | | | | | | | | | | |
United States | | | 1,575,696,690 | | | | — | | | | — | | | | 1,575,696,690 | |
| | | | | | | | | | | | | | | | | |
TOTAL MUTUAL FUNDS | | | 1,575,696,690 | | | | — | | | | — | | | | 1,575,696,690 | |
| | | | | | | | | | | | | | | | | |
| | | | | | | | | | | | | | | | | |
129
GMO Trust Funds
Notes to Financial Statements — (Continued)
February 28, 2017
| | | | | | | | | | | | | | | | |
| | | | | |
| Description | | Level 1 | | | Level 2 | | | Level 3 | | | Total | |
Benchmark-Free Fund (continued) | |
Asset Valuation Inputs (continued) | | | | | | | | | | | | | | | | |
Preferred Stocks | | | | | | | | | | | | | | | | |
Brazil | | $ | 2,485,196 | | | $ | 41,032,728 | | | $ | — | | | $ | 43,517,924 | |
Chile | | | — | | | | 222,406 | | | | — | | | | 222,406 | |
Germany | | | — | | | | 4,666,413 | | | | — | | | | 4,666,413 | |
Russia | | | — | | | | 2,955,887 | | | | — | | | | 2,955,887 | |
South Korea | | | — | | | | 10,787,973 | | | | — | | | | 10,787,973 | |
| | | | | | | | | | | | | | | | | |
TOTAL PREFERRED STOCKS | | | 2,485,196 | | | | 59,665,407 | | | | — | | | | 62,150,603 | |
| | | | | | | | | | | | | | | | | |
Rights/Warrants | | | | | | | | | | | | | | | | |
Brazil | | | — | | | | — | | | | 86,276 | | | | 86,276 | |
India | | | — | | | | — | | | | 41,572 | | | | 41,572 | |
| | | | | | | | | | | | | | | | | |
TOTAL RIGHTS/WARRANTS | | | — | | | | — | | | | 127,848 | | | | 127,848 | |
| | | | | | | | | | | | | | | | | |
Debt Obligations | | | | | | | | | | | | | | | | |
United States | | | 657,568,236 | | | | 376,250,226 | | | | — | | | | 1,033,818,462 | |
| | | | | | | | | | | | | | | | | |
TOTAL DEBT OBLIGATIONS | | | 657,568,236 | | | | 376,250,226 | | | | — | | | | 1,033,818,462 | |
| | | | | | | | | | | | | | | | | |
Short-Term Investments | | | 71,025,634 | | | | 244,200,958 | | | | — | | | | 315,226,592 | |
| | | | | | | | | | | | | | | | | |
Total Investments | | | 2,653,218,087 | | | | 1,712,905,437 | | | | 127,848 | | | | 4,366,251,372 | |
| | | | | | | | | | | | | | | | | |
Total | | $ | 2,653,218,087 | | | $ | 1,712,905,437 | | | $ | 127,848 | | | $ | 4,366,251,372 | |
| | | | | | | | | | | | | | | | | |
| | | | | | | | | | | | | | | | | |
Global Asset Allocation Fund | |
Asset Valuation Inputs | | | | | | | | | | | | | | | | |
Mutual Fund | | $ | 2,423,693,269 | | | $ | — | | | $ | — | | | $ | 2,423,693,269 | |
Debt Obligations | | | | | | | | | | | | | | | | |
Asset-Backed Securities | | | — | | | | 174,843 | | | | — | | | | 174,843 | |
| | | | | | | | | | | | | | | | | |
TOTAL DEBT OBLIGATIONS | | | — | | | | 174,843 | | | | — | | | | 174,843 | |
| | | | | | | | | | | | | | | | | |
Short-Term Investments | | | 288,832 | | | | — | | | | — | | | | 288,832 | |
| | | | | | | | | | | | | | | | | |
Total Investments | | | 2,423,982,101 | | | | 174,843 | | | | — | | | | 2,424,156,944 | |
| | | | | | | | | | | | | | | | | |
Total | | $ | 2,423,982,101 | | | $ | 174,843 | | | $ | — | | | $ | 2,424,156,944 | |
| | | | | | | | | | | | | | | | | |
| | | | | | | | | | | | | | | | | |
Global Developed Equity Allocation Fund | |
Asset Valuation Inputs | | | | | | | | | | | | | | | | |
Mutual Funds | | $ | 991,966,298 | | | $ | — | | | $ | — | | | $ | 991,966,298 | |
Short-Term Investments | | | 338,803 | | | | — | | | | — | | | | 338,803 | |
| | | | | | | | | | | | | | | | | |
Total Investments | | | 992,305,101 | | | | — | | | | — | | | | 992,305,101 | |
| | | | | | | | | | | | | | | | | |
Total | | $ | 992,305,101 | | | $ | — | | | $ | — | | | $ | 992,305,101 | |
| | | | | | | | | | | | | | | | | |
| | | | | | | | | | | | | | | | | |
Global Equity Allocation Fund | |
Asset Valuation Inputs | | | | | | | | | | | | | | | | |
Mutual Funds | | $ | 2,206,156,571 | | | $ | — | | | $ | — | | | $ | 2,206,156,571 | |
Short-Term Investments | | | 745,313 | | | | — | | | | — | | | | 745,313 | |
| | | | | | | | | | | | | | | | | |
Total Investments | | | 2,206,901,884 | | | | — | | | | — | | | | 2,206,901,884 | |
| | | | | | | | | | | | | | | | | |
Total | | $ | 2,206,901,884 | | �� | $ | — | | | $ | — | | | $ | 2,206,901,884 | |
| | | | | | | | | | | | | | | | | |
| | | | | | | | | | | | | | | | | |
130
GMO Trust Funds
Notes to Financial Statements — (Continued)
February 28, 2017
| | | | | | | | | | | | | | | | |
| | | | | |
| Description | | Level 1 | | | Level 2 | | | Level 3 | | | Total | |
Implementation Fund | |
Asset Valuation Inputs | | | | | | | | | | | | | | | | |
Common Stocks | | | | | | | | | | | | | | | | |
Australia | | $ | — | | | $ | 124,576,011 | | | $ | — | | | $ | 124,576,011 | |
Austria | | | — | | | | 18,151,634 | | | | — | | | | 18,151,634 | |
Belgium | | | — | | | | 4,782,150 | | | | — | | | | 4,782,150 | |
Brazil | | | — | | | | 116,670,053 | | | | — | | | | 116,670,053 | |
Canada | | | 97,901,263 | | | | — | | | | — | | | | 97,901,263 | |
Chile | | | — | | | | 1,866,671 | | | | — | | | | 1,866,671 | |
China | | | 31,000,630 | | | | 813,450,415 | | | | 0 | § | | | 844,451,045 | |
Czech Republic | | | — | | | | 18,519,729 | | | | — | | | | 18,519,729 | |
Denmark | | | — | | | | 3,998,374 | | | | — | | | | 3,998,374 | |
Finland | | | — | | | | 24,849,915 | | | | — | | | | 24,849,915 | |
France | | | 749,266 | | | | 170,065,226 | | | | — | | | | 170,814,492 | |
Germany | | | — | | | | 179,963,076 | | | | — | | | | 179,963,076 | |
Hong Kong | | | — | | | | 85,742,437 | | | | — | | | | 85,742,437 | |
Hungary | | | — | | | | 18,455,558 | | | | — | | | | 18,455,558 | |
India | | | 50,484,542 | | | | 142,209,152 | | | | — | | | | 192,693,694 | |
Indonesia | | | — | | | | 3,502,835 | | | | — | | | | 3,502,835 | |
Ireland | | | — | | | | 1,070,912 | | | | — | | | | 1,070,912 | |
Israel | | | 20,241,455 | | | | 21,583,043 | | | | — | | | | 41,824,498 | |
Italy | | | — | | | | 38,803,497 | | | | — | | | | 38,803,497 | |
Japan | | | — | | | | 411,680,282 | | | | — | | | | 411,680,282 | |
Malaysia | | | — | | | | 518,081 | | | | — | | | | 518,081 | |
Mexico | | | 47,511,642 | | | | — | | | | — | | | | 47,511,642 | |
Netherlands | | | 83,424,771 | | | | 58,304,997 | | | | — | | | | 141,729,768 | |
New Zealand | | | — | | | | 9,398,900 | | | | — | | | | 9,398,900 | |
Norway | | | — | | | | 27,530,380 | | | | — | | | | 27,530,380 | |
Poland | | | — | | | | 64,291,309 | | | | — | | | | 64,291,309 | |
Portugal | | | — | | | | 2,587,106 | | | | — | | | | 2,587,106 | |
Russia | | | — | | | | 110,246,341 | | | | — | | | | 110,246,341 | |
Singapore | | | — | | | | 14,615,682 | | | | — | | | | 14,615,682 | |
South Africa | | | — | | | | 208,853,826 | | | | — | | | | 208,853,826 | |
South Korea | | | — | | | | 410,003,993 | | | | 165,612 | | | | 410,169,605 | |
Spain | | | 27,742,064 | | | | 55,666,687 | | | | — | | | | 83,408,751 | |
Sweden | | | — | | | | 9,722,634 | | | | 15,364,011 | | | | 25,086,645 | |
Switzerland | | | 40,593,135 | | | | 109,938,627 | | | | — | | | | 150,531,762 | |
Taiwan | | | 78,957,380 | | | | 307,011,261 | | | | — | | | | 385,968,641 | |
Thailand | | | — | | | | 32,471,544 | | | | — | | | | 32,471,544 | |
Turkey | | | — | | | | 126,379,177 | | | | — | | | | 126,379,177 | |
United Kingdom | | | 15,736,504 | | | | 273,486,858 | | | | — | | | | 289,223,362 | |
United States | | | 1,198,229,774 | | | | — | | | | — | | | | 1,198,229,774 | |
| | | | | | | | | | | | | | | | | |
TOTAL COMMON STOCKS | | | 1,692,572,426 | | | | 4,020,968,373 | | | | 15,529,623 | | | | 5,729,070,422 | |
| | | | | | | | | | | | | | | | | |
Preferred Stocks | | | | | | | | | | | | | | | | |
Brazil | | | 3,281,319 | | | | 221,092,682 | | | | — | | | | 224,374,001 | |
Germany | | | — | | | | 15,783,160 | | | | — | | | | 15,783,160 | |
South Korea | | | — | | | | 41,318,928 | | | | — | | | | 41,318,928 | |
| | | | | | | | | | | | | | | | | |
TOTAL PREFERRED STOCKS | | | 3,281,319 | | | | 278,194,770 | | | | — | | | | 281,476,089 | |
| | | | | | | | | | | | | | | | | |
Rights/Warrants | | | | | | | | | | | | | | | | |
Brazil | | | — | | | | — | | | | 302,934 | | | | 302,934 | |
India | | | — | | | | — | | | | 232,428 | | | | 232,428 | |
Singapore | | | — | | | | — | | | | 2,520,800 | | | | 2,520,800 | |
United States | | | — | | | | — | | | | 4,609,155 | | | | 4,609,155 | |
| | | | | | | | | | | | | | | | | |
TOTAL RIGHTS/WARRANTS | | | — | | | | — | | | | 7,665,317 | | | | 7,665,317 | |
| | | | | | | | | | | | | | | | | |
| | | | | | | | | | | | | | | | | |
131
GMO Trust Funds
Notes to Financial Statements — (Continued)
February 28, 2017
| | | | | | | | | | | | | | | | |
| | | | | |
| Description | | Level 1 | | | Level 2 | | | Level 3 | | | Total | |
Consolidated Implementation Fund (continued) | |
Asset Valuation Inputs (continued) | | | | | | | | | | | | | | | | |
Debt Obligations | | | | | | | | | | | | | | | | |
Canada | | $ | — | | | $ | 50,342,254 | | | $ | — | | | $ | 50,342,254 | |
Denmark | | | — | | | | — | | | | 28,915,608 | | | | 28,915,608 | |
France | | | — | | | | 1,381,250 | | | | — | | | | 1,381,250 | |
Italy | | | — | | | | 2,957,420 | | | | — | | | | 2,957,420 | |
Japan | | | — | | | | 18,240,776 | | | | — | | | | 18,240,776 | |
Luxembourg | | | — | | | | 1,332,970 | | | | — | | | | 1,332,970 | |
Puerto Rico | | | — | | | | 36,930,850 | | | | — | | | | 36,930,850 | |
United Kingdom | | | — | | | | 30,997,719 | | | | — | | | | 30,997,719 | |
United States | | | 2,966,602,691 | | | | 1,088,274,140 | | | | 54,888,786 | | | | 4,109,765,617 | |
| | | | | | | | | | | | | | | | | |
TOTAL DEBT OBLIGATIONS | | | 2,966,602,691 | | | | 1,230,457,379 | | | | 83,804,394 | | | | 4,280,864,464 | |
| | | | | | | | | | | | | | | | | |
Options Purchased | | | 11,446,555 | | | | 671,408 | | | | — | | | | 12,117,963 | |
Short-Term Investments | | | 74,900,238 | | | | 686,132,423 | | | | — | | | | 761,032,661 | |
| | | | | | | | | | | | | | | | | |
Total Investments | | | 4,748,803,229 | | | | 6,216,424,353 | | | | 106,999,334 | | | | 11,072,226,916 | |
| | | | | | | | | | | | | | | | | |
Derivatives^ | | | | | | | | | | | | | | | | |
Forward Currency Contracts | | | | | | | | | | | | | | | | |
Foreign Currency Risk | | | — | | | | 7,738,252 | | | | — | | | | 7,738,252 | |
Futures Contracts | | | | | | | | | | | | | | | | |
Interest Rate Risk | | | 134,332 | | | | — | | | | — | | | | 134,332 | |
Swap Contracts | | | | | | | | | | | | | | | | |
Credit Risk | | | — | | | | 12,514,978 | | | | — | | | | 12,514,978 | |
Equity Risk | | | — | | | | 573,066 | | | | — | | | | 573,066 | |
Interest Rate Risk | | | — | | | | 2,952,937 | | | | — | | | | 2,952,937 | |
| | | | | | | | | | | | | | | | | |
Total | | $ | 4,748,937,561 | | | $ | 6,240,203,586 | | | $ | 106,999,334 | | | $ | 11,096,140,481 | |
| | | | | | | | | | | | | | | | | |
| | | | | | | | | | | | | | | | | |
Liability Valuation Inputs | | | | | | | | | | | | | | | | |
Common Stocks | | | | | | | | | | | | | | | | |
Canada | | $ | (2,986,848 | ) | | $ | — | | | $ | — | | | $ | (2,986,848 | ) |
United Kingdom | | | (34,033,232 | ) | | | — | | | | — | | | | (34,033,232 | ) |
United States | | | (118,889,169 | ) | | | — | | | | — | | | | (118,889,169 | ) |
| | | | | | | | | | | | | | | | | |
Total Common Stocks | | | (155,909,249 | ) | | | — | | | | — | | | | (155,909,249 | ) |
| | | | | | | | | | | | | | | | | |
Exchange-Traded Fund | | | (11,313,405 | ) | | | — | | | | — | | | | (11,313,405 | ) |
Derivatives^ | | | | | | | | | | | | | | | | |
Forward Currency Contracts | | | | | | | | | | | | | | | | |
Foreign Currency Risk | | | — | | | | (8,602,052 | ) | | | — | | | | (8,602,052 | ) |
Futures Contracts | | | | | | | | | | | | | | | | |
Interest Rate Risk | | | (77,397 | ) | | | — | | | | — | | | | (77,397 | ) |
Written Options | | | | | | | | | | | | | | | | |
Equity Risk | | | (6,833,745 | ) | | | — | | | | — | | | | (6,833,745 | ) |
Swap Contracts | | | | | | | | | | | | | | | | |
Credit Risk | | | — | | | | (2,410,662 | ) | | | — | | | | (2,410,662 | ) |
Interest Rate Risk | | | — | | | | (17,869,637 | ) | | | — | | | | (17,869,637 | ) |
| | | | | | | | | | | | | | | | | |
Total | | $ | (174,133,796 | ) | | $ | (28,882,351 | ) | | $ | — | | | $ | (203,016,147 | ) |
| | | | | | | | | | | | | | | | | |
| | | | | | | | | | | | | | | | | |
International Developed Equity Allocation Fund | |
Asset Valuation Inputs | | | | | | | | | | | | | | | | |
Mutual Funds | | $ | 601,644,588 | | | $ | — | | | $ | — | | | $ | 601,644,588 | |
Short-Term Investments | | | 200,023 | | | | — | | | | — | | | | 200,023 | |
| | | | | | | | | | | | | | | | | |
Total Investments | | | 601,844,611 | | | | — | | | | — | | | | 601,844,611 | |
| | | | | | | | | | | | | | | | | |
Total | | $ | 601,844,611 | | | $ | — | | | $ | — | | | $ | 601,844,611 | |
| | | | | | | | | | | | | | | | | |
| | | | | | | | | | | | | | | | | |
132
GMO Trust Funds
Notes to Financial Statements — (Continued)
February 28, 2017
| | | | | | | | | | | | | | | | |
| | | | | |
| Description | | Level 1 | | | Level 2 | | | Level 3 | | | Total | |
International Equity Allocation Fund | | | | | | | | | | | | | | | | |
Asset Valuation Inputs | | | | | | | | | | | | | | | | |
Mutual Funds | | $ | 1,085,557,302 | | | $ | — | | | $ | — | | | $ | 1,085,557,302 | |
Short-Term Investments | | | 289,908 | | | | — | | | | — | | | | 289,908 | |
| | | | | | | | | | | | | | | | | |
Total Investments | | | 1,085,847,210 | | | | — | | | | — | | | | 1,085,847,210 | |
| | | | | | | | | | | | | | | | | |
Total | | $ | 1,085,847,210 | | | $ | — | | | $ | — | | | $ | 1,085,847,210 | |
| | | | | | | | | | | | | | | | | |
| | | | | | | | | | | | | | | | | |
Consolidated SGM Major Markets Fund | | | | | | | | | | | | | | | | |
Asset Valuation Inputs | | | | | | | | | | | | | | | | |
Debt Obligations | | | | | | | | | | | | | | | | |
U.S. Government | | $ | 305,510,880 | | | $ | — | | | $ | — | | | $ | 305,510,880 | |
U.S. Government Agency | | | 8,996,634 | | | | — | | | | — | | | | 8,996,634 | |
| | | | | | | | | | | | | | | | | |
TOTAL DEBT OBLIGATIONS | | | 314,507,514 | | | | — | | | | — | | | | 314,507,514 | |
| | | | | | | | | | | | | | | | | |
Mutual Funds | | | 834,716,360 | | | | — | | | | — | | | | 834,716,360 | |
Short-Term Investments | | | 355,449,539 | | | | — | | | | — | | | | 355,449,539 | |
| | | | | | | | | | | | | | | | | |
Total Investments | | | 1,504,673,413 | | | | — | | | | — | | | | 1,504,673,413 | |
| | | | | | | | | | | | | | | | | |
Derivatives^ | | | | | | | | | | | | | | | | |
Forward Currency Contracts | | | | | | | | | | | | | | | | |
Foreign Currency Risk | | | — | | | | 4,554,205 | | | | — | | | | 4,554,205 | |
Futures Contracts | | | | | | | | | | | | | | | | |
Equity Risk | | | 10,553,801 | | | | 28,751,671 | | | | — | | | | 39,305,472 | |
Physical Commodity Contract Risk | | | 497,144 | | | | — | | | | — | | | | 497,144 | |
Interest Rate Risk | | | 377,356 | | | | — | | | | — | | | | 377,356 | |
| | | | | | | | | | | | | | | | | |
Total | | $ | 1,516,101,714 | | | $ | 33,305,876 | | | $ | — | | | $ | 1,549,407,590 | |
| | | | | | | | | | | | | | | | | |
| | | | | | | | | | | | | | | | | |
Liability Valuation Inputs | | | | | | | | | | | | | | | | |
Derivatives^ | | | | | | | | | | | | | | | | |
Forward Currency Contracts | | | | | | | | | | | | | | | | |
Foreign Currency Risk | | $ | — | | | $ | (1,566,533 | ) | | $ | — | | | $ | (1,566,533 | ) |
Futures Contracts | | | | | | | | | | | | | | | | |
Equity Risk | | | (4,147,919 | ) | | | (777,849 | ) | | | — | | | | (4,925,768 | ) |
Physical Commodity Contract Risk | | | (3,944,900 | ) | | | — | | | | — | | | | (3,944,900 | ) |
Interest Rate Risk | | | (5,903,705 | ) | | | — | | | | — | | | | (5,903,705 | ) |
| | | | | | | | | | | | | | | | | |
Total | | $ | (13,996,524 | ) | | $ | (2,344,382 | ) | | $ | — | | | $ | (16,340,906 | ) |
| | | | | | | | | | | | | | | | | |
| | | | | | | | | | | | | | | | | |
Consolidated Special Opportunities Fund | | | | | | | | | | | | | | | | |
Asset Valuation Inputs | | | | | | | | | | | | | | | | |
Common Stocks | | | | | | | | | | | | | | | | |
Canada | | $ | 90,348 | | | $ | — | | | $ | — | | | $ | 90,348 | |
Germany | | | — | | | | 36,389,148 | | | | — | | | | 36,389,148 | |
Ireland | | | 4,905,000 | | | | — | | | | — | | | | 4,905,000 | |
Netherlands | | | 37,733,000 | | | | — | | | | — | | | | 37,733,000 | |
Romania | | | — | | | | 23,927,036 | | | | — | | | | 23,927,036 | |
United Kingdom | | | — | | | | 58,503,026 | | | | — | | | | 58,503,026 | |
United States | | | 561,568,921 | | | | — | | | | — | | | | 561,568,921 | |
| | | | | | | | | | | | | | | | | |
TOTAL COMMON STOCKS | | | 604,297,269 | | | | 118,819,210 | | | | — | | | | 723,116,479 | |
| | | | | | | | | | | | | | | | | |
Debt Obligations | | | | | | | | | | | | | | | | |
Jamaica | | | — | | | | 12,842,825 | | | | — | | | | 12,842,825 | |
United States | | | — | | | | 7,556,250 | | | | — | | | | 7,556,250 | |
| | | | | | | | | | | | | | | | | |
TOTAL DEBT OBLIGATIONS | | | — | | | | 20,399,075 | | | | — | | | | 20,399,075 | |
| | | | | | | | | | | | | | | | | |
Short-Term Investments | | | 254,541,688 | | | | — | | | | — | | | | 254,541,688 | |
| | | | | | | | | | | | | | | | | |
Total Investments | | | 858,838,957 | | | | 139,218,285 | | | | — | | | | 998,057,242 | |
| | | | | | | | | | | | | | | | | |
| | | | | | | | | | | | | | | | | |
133
GMO Trust Funds
Notes to Financial Statements — (Continued)
February 28, 2017
| | | | | | | | | | | | | | | | |
| | | | | |
| Description | | Level 1 | | | Level 2 | | | Level 3 | | | Total | |
Consolidated Special Opportunities Fund (continued) | | | | | | | | | | | | | | | | |
Asset Valuation Inputs (continued) | | | | | | | | | | | | | | | | |
Derivatives^ | | | | | | | | | | | | | | | | |
Forward Currency Contracts | | | | | | | | | | | | | | | | |
Foreign Currency Risk | | $ | — | | | $ | 2,531 | | | $ | — | | | $ | 2,531 | |
| | | | | | | | | | | | | | | | | |
Total | | $ | 858,838,957 | | | $ | 139,220,816 | | | $ | — | | | $ | 998,059,773 | |
| | | | | | | | | | | | | | | | | |
| | | | | | | | | | | | | | | | | |
Liability Valuation Inputs | | | | | | | | | | | | | | | | |
Derivatives^ | | | | | | | | | | | | | | | | |
Forward Currency Contracts | | | | | | | | | | | | | | | | |
Foreign Currency Risk | | $ | — | | | $ | (11,774 | ) | | $ | — | | | $ | (11,774 | ) |
Futures Contracts | | | | | | | | | | | | | | | | |
Physical Commodity Contract Risk | | | (3,029,447 | ) | | | — | | | | — | | | | (3,029,447 | ) |
Written Options | | | | | | | | | | | | | | | | |
Equity Risk | | | (355,700 | ) | | | (1,440,000 | ) | | | — | | | | (1,795,700 | ) |
| | | | | | | | | | | | | | | | | |
Total | | $ | (3,385,147 | ) | | $ | (1,451,774 | ) | | $ | — | | | $ | (4,836,921 | ) |
| | | | | | | | | | | | | | | | | |
| | | | | | | | | | | | | | | | | |
Strategic Opportunities Allocation Fund | | | | | | | | | | | | | | | | |
Asset Valuation Inputs | | | | | | | | | | | | | | | | |
Mutual Funds | | $ | 1,904,440,351 | | | $ | — | | | $ | — | | | $ | 1,904,440,351 | |
Debt Obligations | | | | | | | | | | | | | | | | |
Asset-Backed Securities | | | — | | | | 234,656 | | | | — | | | | 234,656 | |
U.S. Government | | | — | | | | 111,859,668 | | | | — | | | | 111,859,668 | |
| | | | | | | | | | | | | | | | | |
Total Debt Obligations | | | — | | | | 112,094,324 | | | | — | | | | 112,094,324 | |
| | | | | | | | | | | | | | | | | |
Short-Term Investments | | | 274,119 | | | | — | | | | — | | | | 274,119 | |
| | | | | | | | | | | | | | | | | |
Total Investments | | | 1,904,714,470 | | | | 112,094,324 | | | | — | | | | 2,016,808,794 | |
| | | | | | | | | | | | | | | | | |
Total | | $ | 1,904,714,470 | | | $ | 112,094,324 | | | $ | — | | | $ | 2,016,808,794 | |
| | | | | | | | | | | | | | | | | |
| | | | | | | | | | | | | | | | | |
The risks referenced in the tables above are not intended to be inclusive of all risks. Please see the “Investment and other risks” and “Derivative financial instruments” sections below for a further discussion of risks.
| | ^ | The tables above are based on market values or unrealized appreciation/(depreciation) rather than the notional amounts of derivatives. The uncertainties surrounding the valuation inputs for a derivative are likely to be more significant to the Funds’ net asset values than the uncertainties surrounding inputs for a non-derivative security with the same market value. Excludes purchased options, if any, which are included in investments. |
| | § | Represents the interest in securities that were determined to have a value of zero at February 28, 2017. |
The underlying funds held at year end are classified above as Level 1. For the summary of valuation inputs of the underlying funds, please refer to the underlying funds’ Notes to Financial Statements.
For all Funds for the year ended February 28, 2017, there were no significant transfers between Level 1 and Level 2.
134
GMO Trust Funds
Notes to Financial Statements — (Continued)
February 28, 2017
The following is a reconciliation of securities and derivatives, if any, in which significant unobservable inputs (Level 3) were used in determining value:
| | | | | | | | | | | | | | | | | | | | | | | | | | | | | | | | | | | | | | | | |
| | | | | | | | | | | |
| | | Balances
as of
February 29,
2016 | | | Purchases | | | Sales | | | Accrued
Discounts/
Premiums | | | Total Realized Gain/ (Loss) | | | Change in
Unrealized
Appreciation
(Depreciation) | | | Transfer into Level 3† | | | Transfer out of
Level 3† | | | Balances
as of
February 28,
2017 | | | Net Change in
Unrealized Appreciation
(Depreciation)
from Investments
Still Held as of
February 28,
2017 | |
Alpha Only Fund | | | | | | | | | | | | | | | | | | | | | | | | | | | | | | | | | | | | | | | | |
Common Stocks | | | | | | | | | | | | | | | | | | | | | | | | | | | | | | | | | | | | | | | | |
China | | $ | 13,765 | | | $ | — | | | $ | (12,564 | ) | | $ | — | | | $ | (3,663 | ) | | $ | 2,462 | | | $ | — | | | $ | — | | | $ | 0 | | | $ | — | |
Rights/Warrants | | | | | | | | | | | | | | | | | | | | | | | | | | | | | | | | | | | | | | | | |
Brazil | | | — | | | | 0 | | | | — | | | | — | | | | — | | | | 1,259 | | | | — | | | | — | | | | 1,259 | | | | 1,259 | |
Malaysia | | | — | | | | 0 | | | | — | | | | — | | | | — | | | | 1,065 | | | | — | | | | — | | | | 1,065 | | | | 1,065 | |
| | | | | | | | | | | | | | | | | | | | | | | | | | | | | | | | | | | | | | | | | |
Total | | $ | 13,765 | | | $ | 0 | | | $ | (12,564 | ) | | $ | — | | | $ | (3,663 | ) | | $ | 4,786 | | | $ | — | | | $ | — | | | $ | 2,324 | | | $ | 2,324 | |
| | | | | | | | | | | | | | | | | | | | | | | | | | | | | | | | | | | | | | | | | |
| | | | | | | | | | | | | | | | | | | | | | | | | | | | | | | | | | | | | | | | | |
Benchmark-Free Fund | | | | | | | | | | | | | | | | | | | | | | | | | | | | | | | | | | | | | | | | |
Rights/Warrants | | | | | | | | | | | | | | | | | | | | | | | | | | | | | | | | | | | | | | | | |
Brazil | | $ | — | | | $ | 0 | | | $ | — | | | $ | — | | | $ | — | | | $ | 86,276 | | | $ | — | | | $ | — | | | $ | 86,276 | | | $ | 86,276 | |
India | | | — | | | | 0 | | | | — | | | | — | | | | — | | | | 41,572 | | | | — | | | | — | | | | 41,572 | | | | 41,572 | |
| | | | | | | | | | | | | | | | | | | | | | | | | | | | | | | | | | | | | | | | | |
Total | | $ | — | | | $ | 0 | | | $ | — | | | $ | — | | | $ | — | | | $ | 127,848 | | | $ | — | | | $ | — | | | $ | 127,848 | | | $ | 127,848 | |
| | | | | | | | | | | | | | | | | | | | | | | | | | | | | | | | | | | | | | | | | |
| | | | | | | | | | | | | | | | | | | | | | | | | | | | | | | | | | | | | | | | | |
Global Asset Allocation Fund | | | | | | | | | | | | | | | | | | | | | | | | | | | | | | | | | | | | | | | | |
Debt Obligations | | | | | | | | | | | | | | | | | | | | | | | | | | | | | | | | | | | | | | | | |
Asset-Backed Securities | | $ | 500 | | | $ | — | | | $ | — | | | $ | 1,681 | | | $ | (55,127 | ) | | $ | 52,946 | | | $ | — | | | $ | — | | | $ | — | | | $ | — | |
| | | | | | | | | | | | | | | | | | | | | | | | | | | | | | | | | | | | | | | | | |
Total | | $ | 500 | | | $ | — | | | $ | — | | | $ | 1,681 | | | $ | (55,127 | ) | | $ | 52,946 | | | $ | — | | | $ | — | | | $ | — | | | $ | — | |
| | | | | | | | | | | | | | | | | | | | | | | | | | | | | | | | | | | | | | | | | |
| | | | | | | | | | | | | | | | | | | | | | | | | | | | | | | | | | | | | | | | | |
Consolidated Implementation Fund | | | | | | | | | | | | | | | | | | | | | | | | | | | | | | | | | | | | | | | | |
Common Stocks | | | | | | | | | | | | | | | | | | | | | | | | | | | | | | | | | | | | | | | | |
China | | $ | 0 | * | | $ | — | | | $ | — | | | $ | — | | | $ | — | | | $ | — | | | $ | — | | | $ | — | | | $ | 0 | * | | $ | — | |
South Africa | | | 170 | | | | — | | | | (170 | ) | | | — | | | | — | | | | — | | | | — | | | | — | | | | — | | | | — | |
South Korea | | | — | | | | — | | | | — | | | | — | | | | — | | | | — | | | | 165,612 | ‡ | | | — | | | | 165,612 | | | | — | |
Sweden | | | — | | | | — | | | | — | | | | — | | | | — | | | | — | | | | 15,364,011 | ‡ | | | — | | | | 15,364,011 | | |
| —
|
|
United Kingdom | | | 7,478,801 | | | | — | | | | (7,996,799 | ) | | | — | | | | (2,189,612 | ) | | | 2,707,610 | | | | — | | | | — | | | | — | | | | — | |
Rights/Warrants | | | | | | | | | | | | | | | | | | | | | | | | | | | | | | | | | | | | | | | | |
Brazil | | | — | | | | — | | | | — | | | | — | | | | — | | | | 302,934 | | | | — | | | | — | | | | 302,934 | | | | 302,934 | |
India | | | — | | | | — | | | | — | | | | — | | | | — | | | | 232,428 | | | | — | | | | — | | | | 232,428 | | | | 232,428 | |
Singapore | | | — | | | | 2,470,384 | | | | — | | | | — | | | | — | | | | 50,416 | | | | — | | | | — | | | | 2,520,800 | | | | 50,416 | |
United States | | | 911,920 | | | | — | | | | — | | | | — | | | | — | | | | 3,697,235 | | | | — | | | | — | | | | 4,609,155 | | | | 3,697,235 | |
Debt Obligations | | | | | | | | | | | | | | | | | | | | | | | | | | | | | | | | | | | | | | | | |
Asset-Backed Securities | | | | | | | | | | | | | | | | | | | | | | | | | | | | | | | | | | | | | | | | |
United States | | | 1,599 | | | | — | | | | — | | | | 562 | | | | (171,213 | ) | | | 169,052 | | | | — | | | | — | | | | — | | | | — | |
Bank Loans | | | | | | | | | | | | | | | | | | | | | | | | | | | | | | | | | | | | | | | | |
Denmark | | | 27,420,461 | | | | 2,919,530 | | | | (5,027,493 | ) | | | 3,114,863 | | | | (48,213 | ) | | | 536,460 | | | | — | | | | — | | | | 28,915,608 | | | | 536,460 | |
United States | | | 52,371,322 | | | | — | | | | (573,781 | ) | | | 169,506 | | | | 11,099 | | | | 2,910,640 | | | | — | | | | — | | | | 54,888,786 | | | | 2,910,640 | |
Purchased Options | | | | | | | | | | | | | | | | | | | | | | | | | | | | | | | | | | | | | | | | |
United States | | | 32,065,424 | | | | — | | | | (26,567,491 | ) | | | — | | | | (16,106,763 | ) | | | 10,608,830 | | | | — | | | | — | | | | — | | | | — | |
| | | | | | | | | | | | | | | | | | | | | | | | | | | | | | | | | | | | | | | | | |
Total Investments | | $ | 120,249,697 | | | $ | 5,389,914 | | | $ | (40,165,734 | ) | | $ | 3,284,931 | | | $ | (18,504,702 | ) | | $ | 21,215,605 | | | $ | 15,529,623 | | | $ | — | | | $ | 106,999,334 | | | $ | 7,730,113 | |
| | | | | | | | | | | | | | | | | | | | | | | | | | | | | | | | | | | | | | | | | |
Derivatives | | | | | | | | | | | | | | | | | | | | | | | | | | | | | | | | | | | | | | | | |
Swap Contracts | | $ | (8,456,355 | ) | | $ | — | | | $ | 1,006,043 | | | $ | — | | | $ | (1,006,043 | ) | | $ | 8,456,355 | | | $ | — | | | $ | — | | | $ | — | | | $ | — | |
| | | | | | | | | | | | | | | | | | | | | | | | | | | | | | | | | | | | | | | | | |
Total | | $ | 111,793,342 | | | $ | 5,389,914 | | | $ | (39,159,691 | ) | | $ | 3,284,931 | | | $ | (19,510,745 | ) | | $ | 29,671,960 | | | $ | 15,529,623 | | | $ | — | | | $ | 106,999,334 | | | $ | 7,730,113 | |
| | | | | | | | | | | | | | | | | | | | | | | | | | | | | | | | | | | | | | | | | |
| | | | | | | | | | | | | | | | | | | | | | | | | | | | | | | | | | | | | | | | | |
| | † | The Funds account for securities and derivatives, if any, transferred into and out of Level 3 at the value at the end of the year. |
| | ‡ | Financial assets transferred between Level 2 and Level 3 were due to a change in observable and/or unobservable inputs. |
| | * | Represents the interest in securities that were determined to have a value of zero at February 29, 2016 and February 28, 2017, respectively. |
135
GMO Trust Funds
Notes to Financial Statements — (Continued)
February 28, 2017
The net aggregate direct and indirect exposure to investments in securities and/or derivatives using Level 3 inputs and presented on a net basis, which will tend to understate the Funds’ exposure, (based on each Fund’s net assets) as of February 28, 2017 were as follows:
| | | | |
| | |
| Fund Name | | Level 3
securities
and derivatives | |
Alpha Only Fund | | | < 1% | |
Benchmark-Free Allocation Fund | | | 1% | |
Benchmark-Free Fund | | | < 1% | |
Global Asset Allocation Fund | | | 1% | |
Global Developed Equity Allocation Fund | | | < 1% | |
Global Equity Allocation Fund | | | < 1% | |
Consolidated Implementation Fund | | | < 1% | |
International Developed Equity Allocation Fund | | | < 1% | |
International Equity Allocation Fund | | | < 1% | |
Consolidated SGM Major Markets Fund | | | — | |
Consolidated Special Opportunities Fund | | | — | |
Strategic Opportunities Allocation Fund | | | < 1% | |
Cash
Cash and foreign currency, if any, on the Statements of Assets and Liabilities consist of cash balances held with the custodian.
Due to/from broker
Due to/from broker in the Statements of Assets and Liabilities includes collateral on swap contracts, futures contracts, option contracts and forward currency contracts, if any, and may include marked-to-market amounts related to foreign currency or cash owed.
Foreign currency translation
The market values of foreign securities, currency holdings and related assets and liabilities are typically translated into U.S. dollars at the close of regular trading on the NYSE, generally at 4:00 pm Eastern time. Income and expenses denominated in foreign currencies are typically translated into U.S. dollars at the close of regular trading on the NYSE. Fluctuations in the value of currency holdings and other assets and liabilities resulting from changes in exchange rates are recorded as unrealized foreign currency gains or losses. Realized gains or losses and unrealized appreciation or depreciation on investment securities and income and expenses are translated on the respective dates of such transactions. The effects of changes in foreign currency exchange rates on investments in securities are not separated on the Statements of Operations from the effects of changes in market prices of those securities, but are included with the net realized and unrealized gain or loss on investment securities.
Loan assignments and participations
Certain Funds may invest in direct debt instruments, which are interests in amounts owed to lenders or lending syndicates, to suppliers of goods or services, or to other parties by corporate, governmental or other borrower. Such “loans” may include bank loans, promissory notes, and loan participations, or in the case of suppliers of goods or services, trade claims or other receivables. A loan is often administered by a bank or other financial institution that acts as agent for all holders. The agent administers the terms of the loan, as specified in the loan agreement. Unless, under the terms of the loan or other indebtedness a Fund has direct recourse against the borrower, it may have to rely on the agent to enforce its rights against the borrower. When investing in a loan participation, (i) a Fund has the right to receive payments of principal, interest and any fees to which it is entitled only from the party from whom the Fund has purchased the participation and only upon receipt by that party of payments from the borrower and (ii) a Fund generally has no right to enforce compliance by the borrower with the terms of the loan agreement or to vote on matters arising under the loan agreement. Thus, a Fund may be subject to credit risk both of the party from whom it purchased the loan participation and the borrower and that Fund may have minimal control over the terms of any loan modification. Loan assignments and participations outstanding at the end of the year, if any, are listed in each applicable Fund’s Schedule of Investments.
Repurchase agreements
The Funds may enter into repurchase agreements with banks and brokers. Under a repurchase agreement a Fund acquires a security for a relatively short period for cash and obtains a simultaneous commitment from the seller to repurchase the security at an agreed upon price and date. The Fund, through its custodian, takes possession of securities it acquired under the repurchase agreement. The value of the securities acquired may be less than the amount owed to the Fund by the seller. If the seller in a repurchase agreement transaction defaults or enters into insolvency proceedings and the value of the securities subject to the repurchase agreement is insufficient, the Fund’s recovery of cash from the seller may be delayed and, even if the Fund is able to dispose of the securities, the Fund may incur a loss equal to the difference between the cash it paid and the
136
GMO Trust Funds
Notes to Financial Statements — (Continued)
February 28, 2017
value of the securities. As of February 28, 2017, the Funds listed below had entered into repurchase agreements. The value of related collateral for each broker listed below exceeds the value of the repurchase agreements at period end.
| | | | | | | | | | |
| | | | |
| Fund Name | | Counterparty | | Gross Value | | | Weighted Average
Maturity (days) | |
Benchmark-Free Fund | | Daiwa Capital Markets America Inc. | | | 244,200,958 | | | | 1.0 | |
Implementation Fund | | Daiwa Capital Markets America Inc. | | | 278,849,254 | | | | 0.4 | |
| | | Mizuho Securities USA Inc. | | | 110,092,416 | | | | 0.2 | |
| | | Nomura Securities International Inc. | | | 297,190,753 | | | | 0.4 | |
Reverse repurchase agreements
The Funds may enter into reverse repurchase agreements with banks and brokers to enhance return. Under a reverse repurchase agreement a Fund sells portfolio assets subject to an agreement by that Fund to repurchase the same assets at an agreed upon price and date. A Fund can use the proceeds received from entering into a reverse repurchase agreement to make additional investments, which generally causes the Fund’s portfolio to behave as if it were leveraged. If the buyer in a reverse repurchase agreement files for bankruptcy or becomes insolvent, the Fund may be unable to recover the securities it sold and as a result may realize a loss on the transaction if the securities it sold are worth more than the purchase price it originally received from the buyer. Reverse repurchase agreements outstanding at the end of the year, if any, are listed in each applicable Fund’s Schedule of Investments.
| | | | | | | | |
| | | |
| Fund Name | | Received from
reverse repurchase
agreements ($) | | | Market value of
securities plus
accrued interest ($) | |
Benchmark-Free Fund | | | 34,939,753 | | | | 34,936,599 | |
Implementation Fund | | | 1,326,460 | | | | 1,326,057 | |
As of February 28, 2017, Benchmark-Free Fund and Implementation Fund had investments in reverse repurchase agreements with Nomura Securities International Inc., Barclays Bank plc and Citigroup Inc. with a gross value of $34,939,753, 596,282 and 730,178, respectively. The value of related collateral on Benchmark-Free Fund was undercollateralized of the reverse repurchase agreement and exceeded the value on Implementation Fund, respectively at year end. As of February 28, 2017, the reverse repurchase agreement held by Benchmark-Free Fund and Implementation Fund had open maturity dates. Reverse repurchase agreements outstanding at the end of the period, if any, are listed in each applicable Fund’s Schedule of Investments.
The following is a summary of the gross value of reverse repurchase agreements categorized by class of collateral pledged and maturity date:
| | | | | | | | | | | | | | | | | | | | | | | | |
| | |
| | | February 28, 2017 | |
| | |
| | | Remaining Contractual Maturity of the Agreements | |
| | | | | | | |
| | | Overnight
and
Continuous | | | Up to
30 days | | | Between
30-90 days | | | Greater Than
90 days | | | Demand | | | Total | |
Benchmark-Free Fund | | | | | | | | | | | | | | | | | | | | | | | | |
Reverse Repurchase Agreements | | | | | | | | | | | | | | | | | | | | | | | | |
Non-U.S.Government Debt Obligations | | | $— | | | | $— | | | | $— | | | | $— | | | | $34,939,753 | | | | $34,939,753 | |
| | | | | | | | | | | | | | | | | | | | | | | | | |
Total borrowings | | | $— | | | | $— | | | | $— | | | | $— | | | | $34,939,753 | | | | $34,939,753 | |
| | | | | | | | | | | | | | | | | | | | | | | | | |
| | | | | | | |
Implementation Fund | | | | | | | | | | | | | | | | | | | | | | | | |
Reverse Repurchase Agreements | | | | | | | | | | | | | | | | | | | | | | | | |
Non-U.S. Government Debt Obligations | | | $— | | | | $— | | | | $— | | | | $— | | | | $1,326,460 | | | | $1,326,460 | |
| | | | | | | | | | | | | | | | | | | | | | | | | |
Total Borrowings | | | $— | | | | $— | | | | $— | | | | $— | | | | $1,326,460 | | | | $1,326,460 | |
| | | | | | | | | | | | | | | | | | | | | | | | | |
| | | | | | | | | | | | | | | | | | | | | | | | | |
137
GMO Trust Funds
Notes to Financial Statements — (Continued)
February 28, 2017
Inflation-indexed bonds
Certain Funds may invest in inflation-indexed bonds. Inflation-indexed bonds are fixed income securities whose principal value is adjusted periodically according to the rate of inflation/deflation. Two structures are common. The U.S. Treasury and some other issuers use a structure that accrues inflation/deflation into the principal value of the bond. Many other issuers adjust the coupon accruals for inflation related changes. Most other issuers pay out any inflation related accruals as part of a semiannual coupon.
The market price of inflation-indexed bonds normally changes when real interest rates change. Real interest rates, in turn, are tied to the relationship between nominal interest rates (i.e., stated interest rates) and the rate of inflation. Therefore, if the rate of inflation rises at a faster rate than nominal interest rates, real interest rates (i.e., nominal interest rate minus inflation) might decline, leading to an increase in value of inflation-indexed bonds. In contrast, if nominal interest rates increase at a faster rate than inflation, real interest rates might rise, leading to a decrease in value of inflation-indexed bonds. Coupon payments received by a Fund from inflation-indexed bonds are generally included in the Fund’s gross income for the period in which they accrue. In addition, any increase/decrease in the principal amount of an inflation-indexed bond is generally included in the Fund’s gross income even though principal is not paid until maturity. Inflation-indexed bonds outstanding at the end of the year, if any, are listed in each applicable Fund’s Schedule of Investments.
Short sales
Certain Funds may enter into short sales transactions. A short sale is a transaction in which a Fund sells securities it may not own in anticipation of a decline in the fair market value of the securities. Securities sold in short sale transactions and the interest payable on such securities, if any, are reflected as a liability on the Statements of Assets and Liabilities. A Fund is obligated to deliver securities at the trade price at the time the short position is closed. Possible losses from short sales may be unlimited, whereas losses from purchases cannot exceed the total amount invested. Short sales outstanding at the end of the year, if any, are listed in each applicable Fund’s Schedule of Investments.
Municipal obligations
Municipal obligations are issued by or on behalf of states, territories and possessions of the United States and their political subdivisions, agencies and instrumentalities and the District of Columbia to obtain funds for various public purposes. Municipal notes are generally used to provide for short-term capital needs, such as to finance working capital needs of municipalities or to provide various interim or construction financing, and generally have maturities of one year or less. Municipal bonds, which meet longer-term capital needs and generally have maturities of more than one year when issued, have two principal classifications: “general obligation” bonds and “revenue” bonds. Issuers of general obligation bonds include states, counties, cities, towns and regional districts. The basic security behind general obligation bonds is the issuer’s pledge of its full faith, credit, and taxing power for the payment of principal and interest. Revenue bonds have been issued to fund a wide variety of capital projects. The principal security for a revenue bond is generally the net revenues derived from a particular facility or group of facilities or, in some cases, from the proceeds of a special excise or other specific revenue source. Although the principal security behind these bonds varies widely, many provide additional security in the form of a debt service reserve fund whose monies also may be used to make principal and interest payments on the issuer’s obligations. Municipal obligations at the end of the year, if any, are listed in each applicable Fund’s Schedule of Investments.
Trade claims
Certain Funds may purchase trade claims against companies, including companies in bankruptcy or reorganization proceedings. Trade claims generally include claims of suppliers for goods delivered and not paid, claims for unpaid services rendered, claims for contract rejection damages and claims related to litigation. Trade claims are illiquid instruments which generally do not pay interest and there can be no guarantee that the debtor will ever be able to satisfy the obligation on the trade claim. Such claims are typically unsecured and may be subordinated to other unsecured obligations of a debtor, and generally are subject to defenses of the debtor with respect to the underlying transaction giving rise to the trade claim. Trade claims outstanding at the end of the year, if any, are listed in each applicable Fund’s Schedule of Investments.
Taxes and distributions
Each Fund has elected to be treated and intends to qualify each tax year as a regulated investment company under Subchapter M of the Internal Revenue Code of 1986, as amended (the “Code”). Each Fund intends to distribute its net investment income, if any, and its net realized short-term and long-term capital gains, if any, after giving effect to any available capital loss carryforwards for U.S. federal income tax purposes. Therefore, each Fund makes no provision for U.S. federal income or excise taxes.
Alternative Asset SPC Ltd., Implementation SPC Ltd. and Special Opportunities SPC Ltd. are wholly-owned subsidiaries of SGM Major Markets Fund, Implementation Fund and Special Opportunities Fund, respectively, and each has elected to be treated as a (non-U.S.) corporation for U.S. federal income tax purposes.
The policy of each Fund is to declare and pay dividends of its net investment income, if any, at least annually, although the Funds are permitted to, and will from time to time, declare and pay dividends of net investment income, if any, more frequently. Each Fund also intends to distribute net realized short-term and long-term capital gains, if any, at least annually. In addition, each Fund may, from time to time at their discretion, make unscheduled distributions in advance of large redemptions by shareholders or as otherwise deemed appropriate by a Fund. Typically all distributions are reinvested in additional shares of each Fund, at net asset value, unless GMO or its agents receive and process a shareholder election to receive cash distributions. Distributions to shareholders are recorded by each Fund on the ex-dividend date.
138
GMO Trust Funds
Notes to Financial Statements — (Continued)
February 28, 2017
Taxes on foreign interest and dividend income are generally withheld in accordance with the applicable country’s tax treaty with the United States. The foreign withholding rates applicable to a Fund’s investments in certain jurisdictions may be higher if a significant portion of the Fund is held by non-U.S. shareholders and/or if certain investments are made by a Fund’s wholly-owned subsidiary. Each Fund may be subject to taxation on realized capital gains, repatriation proceeds and other transaction-based charges imposed by certain countries in which it invests. Taxes related to capital gains realized during the year ended February 28, 2017, if any, are reflected as part of Net realized gain (loss) in the Statements of Operations. Changes in tax liabilities related to capital gain taxes on unrealized investment gains, if any, are reflected as part of Change in net unrealized appreciation (depreciation) in the Statements of Operations. Transaction-based charges are generally calculated as a percentage of the transaction amount.
Certain Funds have previously filed for and/or may file for additional tax refunds with respect to certain taxes withheld by certain countries. Generally, the amount of such refunds that a Fund reasonably determines are collectible and free from significant contingencies are reflected in a Fund’s net asset value and are reflected as Dividends from unaffiliated issuers in the Statements of Operations. In certain circumstances, a Fund’s receipt of such refunds may cause the Fund and/or its shareholders to be liable for U.S. federal income taxes and interest charges.
Foreign taxes paid by each Fund may be treated, to the extent permissible by the Code (and other applicable U.S. federal tax guidance) and if that Fund so elects, as if paid by U.S. shareholders of that Fund.
Income and capital gain distributions are determined in accordance with U.S. federal income tax regulations, which may differ from U.S. GAAP. Certain capital accounts in the financial statements are periodically adjusted for permanent differences in order to reflect their tax character. These adjustments have no impact on net assets or net asset value per share. Temporary differences that arise from recognizing certain items of income, expense, gain or loss in different periods for financial statement and tax purposes will likely reverse at some time in the future. Distributions in excess of net investment income or net realized gains are temporary over-distributions for financial statement purposes resulting from differences in the recognition or classification of income or distributions for financial statement and tax purposes.
U.S. GAAP and tax accounting differences for each Fund primarily relate to reasons described in the following table:
| | | | | | | | | | | | | | | | | | | | | | | | |
| | | | | | | | | | | | | |
| Differences related to: | | Alpha Only Fund | | Benchmark-Free Allocation Fund | | Benchmark-Free Fund | | Global Asset Allocation Fund | | Global Developed Equity Allocation Fund | | Global Equity Alloca-
tion Fund | | Consolidated Implementa-
tion Fund | | Interna-
tional Developed Equity Allocation Fund | | Interna-
tional Equity Allocation Fund | | Consoli-
dated SGM
Major Markets Fund | | Consoli-
dated Special Oppor-
tunities Fund | | Strategic Oppor-
tunities Allocation Fund |
| Accretion and amortization | | | | | | | | | | | | | | | | | | | | | | X | | |
| Capital loss carry forwards | | X | | X | | X | | X | | X | | X | | X | | X | | X | | | | | | X |
| Controlled foreign corporation transactions | | | | | | | | | | | | | | | | | | | | X | | X | | |
| Derivative contract transactions | | X | | | | X | | | | | | | | X | | | | | | X | | X | | |
| Dividend income and withholding tax reclaim reserves | | X | | | | | | | | | | | | | | | | | | | | | | |
| Dividends received from underlying investments | | X | | | | | | | | | | | | X | | | | | | | | X | | |
| Foreign capital gains taxes | | | | | | | | | | | | | | | | | | | | | | X | | |
| Foreign currency transactions | | | | | | X | | | | | | | | X | | | | | | X | | X | | |
| Late year ordinary losses | | | | X | | | | | | | | | | | | | | | | X | | | | |
| Losses on wash sale transactions | | X | | X | | X | | X | | X | | X | | X | | X | | X | | | | X | | X |
| Mutual fund distributions received | | | | X | | X | | X | | X | | | | | | | | | | | | | | |
| Passive foreign investment company transactions | | X | | | | X | | | | | | | | X | | | | | | | | | | |
139
GMO Trust Funds
Notes to Financial Statements — (Continued)
February 28, 2017
| | | | | | | | | | | | | | | | | | | | | | | | |
| | | | | | | | | | | | | |
| Differences related to: | | Alpha Only Fund | | Benchmark-Free Allocation Fund | | Benchmark-Free Fund | | Global Asset Allocation Fund | | Global Developed Equity Allocation Fund | | Global Equity Alloca-
tion Fund | | Consolidated Implementa-
tion Fund | | Interna-
tional Developed Equity Allocation Fund | | Interna-
tional Equity Allocation Fund | | Consoli-
dated SGM
Major Markets Fund | | Consoli-
dated Special Oppor-
tunities Fund | | Strategic Oppor-
tunities Allocation Fund |
| Post-October capital losses | | X | | | | X | | X | | | | | | | | X | | X | | | | X | | |
| Gains/losses on underlying fund shares | | | | X | | X | | X | | | | | | | | | | | | | | | | |
The tax character of distributions declared by each Fund to shareholders is as follows:
| | | | | | | | | | | | | | | | | | | | | | | | |
| | | |
| | | Tax year ended February 28, 2017 | | | Tax year ended February 29, 2016 | |
| | | | | | | |
| Fund Name | | Ordinary
Income
(including
any net
short-term
capital gain) ($) | | | Net Long-Term
Capital Gain ($) | | | Total
Distributions ($) | | | Ordinary
Income
(including
any net
short-term
capital gain) ($) | | | Net Long-Term
Capital Gain ($) | | | Total
Distributions ($) | |
| Alpha Only Fund | | | 7,630,569 | | | | — | | | | 7,630,569 | | | | 62,592,348 | | | | — | | | | 62,592,348 | |
| Benchmark-Free Allocation Fund | | | 222,054,737 | | | | — | | | | 222,054,737 | | | | 309,142,891 | | | | 131,565,120 | | | | 440,708,011 | |
| Benchmark-Free Fund | | | 116,700,824 | | | | — | | | | 116,700,824 | | | | 157,864,255 | | | | 132,412,081 | | | | 290,276,336 | |
| Global Asset Allocation Fund | | | 62,220,291 | | | | — | | | | 62,220,291 | | | | 139,248,090 | | | | 192,288,728 | | | | 331,536,818 | |
| Global Developed Equity Allocation Fund | | | 30,222,611 | | | | 39,708,759 | | | | 69,931,370 | | | | 40,963,522 | | | | 137,293,847 | | | | 178,257,369 | |
| Global Equity Allocation Fund | | | 68,753,269 | | | | 55,799,955 | | | | 124,553,224 | | | | 87,088,321 | | | | 278,611,210 | | | | 365,699,531 | |
| Consolidated Implementation Fund | | | 218,046,347 | | | | — | | | | 218,046,347 | | | | — | | | | — | | | | — | |
| International Developed Equity Allocation Fund | | | 27,805,230 | | | | — | | | | 27,805,230 | | | | 34,075,093 | | | | — | | | | 34,075,093 | |
| International Equity Allocation Fund | | | 35,103,258 | | | | — | | | | 35,103,258 | | | | 41,812,547 | | | | 58,511,741 | | | | 100,324,288 | |
| Consolidated SGM Major Markets Fund | | | 68,935,774 | | | | 34,942,155 | | | | 103,877,929 | | | | — | | | | — | | | | — | |
| Consolidated Special Opportunities Fund | | | 30,825,271 | | | | 6,094,262 | | | | 36,919,533 | | | | 13,915,124 | | | | 3,368,794 | | | | 17,283,918 | |
| Strategic Opportunities Allocation Fund | | | 54,767,596 | | | | 1,162,624 | | | | 55,930,220 | | | | 87,128,479 | | | | 105,306,735 | | | | 192,435,214 | |
Distributions in excess of a Fund’s tax basis earnings and profits, if significant, are reported in the Funds’ financial statements as a return of capital.
140
GMO Trust Funds
Notes to Financial Statements — (Continued)
February 28, 2017
As of February 28, 2017, the components of distributable earnings on a tax basis and certain tax attributes for the Funds consisted of the following:
| | | | | | | | | | | | | | | | | | | | |
| | | | | | |
| Fund Name | | Undistributed
Ordinary
Income
(including any
net short-term
capital gain) ($) | | | Undistributed
Net Long-Term
Capital Gain ($) | | | Late-Year
Ordinary Loss
Deferral ($) | | | Capital Loss
Carryforwards ($) | | | Post-October
Capital Losses ($) | |
Alpha Only Fund | | | 643,085 | | | | — | | | | (6,466) | | | | (370,398,163) | | | | (21,761,001) | |
Benchmark-Free Allocation Fund | | | 17,766,561 | | | | — | | | | (13,411,417) | | | | (416,250,767) | | | | — | |
Benchmark-Free Fund | | | 16,278,515 | | | | — | | | | — | | | | (569,031,568) | | | | (2,214,773) | |
Global Asset Allocation Fund | | | 1,935,903 | | | | — | | | | — | | | | (210,741,572) | | | | (13,133,698) | |
Global Developed Equity Allocation Fund | | | 4,110,832 | | | | — | | | | (3,852) | | | | (62,444,314) | | | | — | |
Global Equity Allocation Fund | | | 3,036,437 | | | | — | | �� | | (7,532) | | | | (258,545,432) | | | | — | |
Consolidated Implementation Fund | | | 51,131,312 | | | | — | | | | — | | | | (1,269,460,115) | | | | — | |
International Developed Equity Allocation Fund | | | 57,626 | | | | — | | | | (2,779) | | | | (74,898,434) | | | | (25,050,614) | |
International Equity Allocation Fund | | | 1,968,137 | | | | — | | | | (4,131) | | | | (50,815,115) | | | | (1,063,745) | |
Consolidated SGM Major Markets Fund | | | 847,508 | | | | 11,234,351 | | | | (27,088,428) | | | | — | | | | — | |
Consolidated Special Opportunities Fund | | | 21,443,930 | | | | — | | | | (239,136) | | | | — | | | | (6,744,894) | |
Strategic Opportunities Allocation Fund | | | 1,595,492 | | | | — | | | | — | | | | (16,043,549) | | | | — | |
As of February 28, 2017, certain Funds had capital loss carryforwards available to offset future realized gains, if any, to the extent permitted by the Code. Net capital losses recognized in taxable years beginning on or after March 1, 2011 are carried forward without expiration and generally retain their short-term and/or long-term tax character, as applicable. In addition, such losses should be utilized prior to losses scheduled to expire on or before February 28, 2019. As a result of this ordering rule, losses that are subject to expiration may expire unused. Utilization of the capital loss carryforwards, post-October capital losses, late-year ordinary losses, and losses realized subsequent to February 28, 2017, if any, could be subject to further limitations imposed by the Code related to share ownership activity. The Funds’ capital loss carryforwards are as follows:
| | | | | | | | | | | | | | | | | | | | |
| | | | |
| | | Short-Term ($) | | | | | | Long-
Term ($) | |
| | | | | | |
| Fund Name | | Expiration
Date
2/28/2018 | | | Expiration
Date
2/28/2019 | | | No
Expiration
Date | | | Total
Short-
Term ($) | | | No
Expiration
Date | |
| Alpha Only Fund | | | — | | | | — | | | | (210,317,423) | | | | (210,317,423) | | | | (160,080,740) | |
| Benchmark-Free Allocation Fund | | | (22,052,464) | | | | (7,441,107) | | | | (20,273,725) | | | | (49,767,296) | | | | (366,483,471) | |
| Benchmark-Free Fund | | | — | | | | — | | | | (56,983,052) | | | | (56,983,052) | | | | (512,048,516) | |
| Global Asset Allocation Fund | | | — | | | | — | | | | (1,075,470) | | | | (1,075,470) | | | | (209,666,102) | |
| Global Developed Equity Allocation Fund | | | — | | | | — | | | | — | | | | — | | | | (62,444,314) | |
| Global Equity Allocation Fund | | | — | | | | — | | | | — | | | | — | | | | (258,545,432) | |
| Consolidated Implementation Fund | | | — | | | | — | | | | (996,843,618) | | | | (996,843,618) | | | | (272,616,497) | |
| International Developed Equity Allocation Fund | | | (14,472,130) | | | | (22,515,333) | | | | — | | | | (36,987,463) | | | | (37,910,971) | |
| International Equity Allocation Fund | | | — | | | | — | | | | — | | | | — | | | | (50,815,115) | |
| Consolidated SGM Major Markets Fund | | | — | | | | — | | | | — | | | | — | | | | — | |
| Consolidated Special Opportunities Fund | | | — | | | | — | | | | — | | | | — | | | | — | |
| Strategic Opportunities Allocation Fund | | | — | | | | — | | | | — | | | | — | | | | (16,043,549) | |
141
GMO Trust Funds
Notes to Financial Statements — (Continued)
February 28, 2017
As of February 28, 2017, the approximate cost for U.S. federal income tax purposes and the aggregate investment-level gross and net unrealized appreciation (depreciation) in the value of investments were as follows:
| | | | | | | | | | | | | | | | |
| | | | | |
| Fund Name | | Aggregate
Cost ($) | | | Gross Unrealized
Appreciation ($) | | | Gross Unrealized
(Depreciation) ($) | | | Net Unrealized
Appreciation
(Depreciation) ($) | |
Alpha Only Fund | | | 211,943,073 | | | | 25,261,953 | | | | (4,761,466) | | | | 20,500,487 | |
Benchmark-Free Allocation Fund | | | 13,841,037,202 | | | | 149,942,876 | | | | (213,941,890) | | | | (63,999,014) | |
Benchmark-Free Fund | | | 4,187,360,335 | | | | 207,504,104 | | | | (28,613,067) | | | | 178,891,037 | |
Global Asset Allocation Fund | | | 2,582,236,017 | | | | 36,694,997 | | | | (194,779,070) | | | | (158,079,073) | |
Global Developed Equity Allocation Fund | | | 1,086,876,398 | | | | 13,924,629 | | | | (108,495,926) | | | | (94,571,297) | |
Global Equity Allocation Fund | | | 2,427,548,108 | | | | 35,960,017 | | | | (256,606,241) | | | | (220,646,224) | |
Consolidated Implementation Fund | | | 10,670,038,947 | | | | 600,852,917 | | | | (198,664,948) | | | | 402,187,969 | |
International Developed Equity Allocation Fund | | | 741,522,239 | | | | 3,004,088 | | | | (142,681,716) | | | | (139,677,628) | |
International Equity Allocation Fund | | | 1,241,056,950 | | | | 2,833,962 | | | | (158,043,702) | | | | (155,209,740) | |
Consolidated SGM Major Markets Fund | | | 1,515,538,175 | | | | 50,666,387 | | | | (61,531,149) | | | | (10,864,762) | |
Consolidated Special Opportunities Fund | | | 954,403,003 | | | | 80,955,503 | | | | (37,301,264) | | | | 43,654,239 | |
Strategic Opportunities Allocation Fund | | | 2,076,045,132 | | | | 31,138,957 | | | | (90,375,295) | | | | (59,236,338) | |
The Funds are subject to authoritative guidance related to the accounting and disclosure of uncertain tax positions under U.S. GAAP. This guidance sets forth a minimum threshold for the financial statement recognition of tax positions taken based on the technical merits of such positions. United States and non-U.S. tax rules (including the interpretation and application of tax laws) are subject to change. The Funds file tax returns and/or adopt certain tax positions in various jurisdictions. Non-U.S. taxes are provided for based on the Funds’ understanding of the prevailing tax rules of the non-U.S. markets in which they invest. Recently enacted tax rules, including interpretations of tax laws (e.g., guidance pertaining to the U.S. Foreign Account Tax Compliance Act) and tax legislation/initiatives currently under consideration in various jurisdictions, including the U.S., might affect the way the Funds and their investors are taxed prospectively and/or retroactively. Prior to the expiration of the relevant statutes of limitations, if any, the Funds are subject to examination by U.S. federal, state, local and non-U.S. jurisdictions with respect to the tax returns they have filed and the tax positions they have adopted. The Funds’ U.S. federal income tax returns are generally subject to examination by the Internal Revenue Service for a period of three years after they are filed. State, local and/or non-U.S. tax returns and/or other filings may be subject to examination for different periods, depending upon the tax rules of each applicable jurisdiction.
Security transactions and related investment income
Security transactions are accounted for in the financial statements on trade date. For purposes of daily net asset value calculations, the Funds’ policy is that security transactions are generally accounted for on the following business day. GMO may override that policy and a Fund may account for security transactions on trade date if it experiences significant purchases or redemptions or engages in significant portfolio transactions. Dividend income, net of applicable foreign withholding taxes, if any, is recorded on the ex-dividend date or, if later, when a Fund is informed of the ex-dividend date. Income dividends and capital gain distributions from the underlying funds are recorded on the ex-dividend date. Interest income is recorded on the accrual basis and is adjusted for the amortization of premiums and accretion of discounts. Principal on inflation-indexed securities is adjusted for inflation and any increase or decrease is recorded as interest income or investment loss. Coupon income is not recognized on securities for which collection is not expected. Paydown gains and losses on mortgage-related and other asset-backed securities, if any, are recorded as components of interest income in the Statements of Operations. Non-cash dividends, if any, are recorded at the fair market value of the asset received. In determining the net gain or loss on securities sold, the Funds use the identified cost basis.
Expenses and class allocations
Most of the expenses of the Trust are directly attributable to an individual Fund. Generally, common expenses are allocated among the Funds based on, among other things, the nature and type of expense and the relative size of the Funds. Investment income, common expenses, purchase premiums and redemption fees, if any, and realized and unrealized gains and losses are allocated among the classes of shares of the Funds, if applicable, based on the relative net assets of each class. Shareholder service fees and supplemental support fees, if any, which are directly attributable to a class of shares, are charged to that class’s operations. In addition, the Funds may incur fees and expenses indirectly as a shareholder in the underlying funds. Because the underlying funds have different expense and fee levels and the Funds may own different proportions of the underlying funds at different times, the amount of fees and expenses indirectly incurred by a Fund will vary (see Note 5).
142
GMO Trust Funds
Notes to Financial Statements — (Continued)
February 28, 2017
State Street Bank and Trust Company (“State Street”) serves as the Funds’ custodian, fund accounting agent and transfer agent for all Funds except Alpha Only Fund. For Alpha Only Fund, Brown Brothers Harriman & Co. (“BBH”) serves as the custodian and fund accounting agent and State Street serves as the transfer agent. Prior to December 31, 2013, State Street’s transfer agent fees may have been reduced by an earnings allowance calculated on the average daily cash balances each Fund maintained in a State Street transfer agent account. Effective January 1, 2014, any cash balances maintained at the transfer agent are held in a Demand Deposit Account and interest income earned, if any, is shown as interest income in the Statements of Operations. Prior to December 31, 2012, State Street’s custodian fees may have been reduced by an earnings allowance calculated on the average daily cash balance each Fund maintained in a State Street custodial account. Earnings allowances were reported as a reduction of expenses in the Statements of Operations. Effective January 1, 2013, any cash balances maintained at the custodian are held in a Demand Deposit Account and interest income earned, if any, is shown as interest income in the Statements of Operations.
Purchases and redemptions of Fund shares
Purchase premiums and redemption fees (if applicable) are paid to and retained by a Fund to help offset estimated portfolio transaction costs and other related costs (e.g., bid to ask spreads, stamp duties, and transfer fees) incurred by the Fund (directly or indirectly through investments in underlying funds or a wholly-owned subsidiary) as a result of the purchase or redemption by allocating estimated transaction costs to the purchasing or redeeming shareholder. Such fees are recorded as a component of the Funds’ net share transactions. A Fund may impose a new purchase premium and/or redemption fee or modify an existing fee at any time.
Each of the Funds may charge purchase premiums and redemption fees. Purchase premiums and redemption fees for the Funds are typically reassessed periodically by GMO.
Purchase premiums are not charged on reinvestments of dividends or other distributions. Redemption fees apply to all shares of a Fund regardless of how the shares were acquired (e.g., by direct purchase or by reinvestment of dividends or other distributions). If GMO determines that any portion of a cash purchase or redemption, as applicable, is offset by a corresponding cash redemption or purchase occurring on the same day, it ordinarily will waive or reduce the purchase premium or redemption fee with respect to that portion. GMO also may waive or reduce the purchase premium or redemption fee relating to a cash purchase or redemption of a Fund’s shares if the Fund will not incur transaction costs or will incur reduced transaction costs.
GMO will waive or reduce the purchase premium when securities are used to purchase a Fund’s shares except to the extent that the Fund incurs transaction costs (e.g., stamp duties or transfer fees) in connection with its acquisition of those securities. GMO may waive or reduce redemption fees when a Fund uses portfolio securities to redeem its shares. However, when a substantial portion of a Fund is being redeemed in-kind, the Fund may nonetheless charge a redemption fee equal to known or estimated costs.
Purchase premiums or redemption fees generally will not be waived for purchases and redemptions of Fund shares executed through brokers or agents, including, without limitation, intermediary platforms that are allowed pursuant to agreements with the Trust to transmit orders for purchases and redemptions the day after those orders are received.
GMO may consider known cash flows out of or into underlying funds when placing orders for the cash purchase or redemption of underlying fund shares by accounts over which it has investment discretion, including the Funds and other pooled investment vehicles. Consequently, participants in those accounts will tend to benefit more from waivers of the underlying funds’ purchase premiums and redemption fees than other underlying fund shareholders.
143
GMO Trust Funds
Notes to Financial Statements — (Continued)
February 28, 2017
As of February 28, 2017, the premium on cash purchases and the fee on cash redemptions were as follows:
| | | | | | | | | | | | | | | | | | | | | | | | |
| | | | | | | | | | | | | |
| | | Alpha Only Fund | | Benchmark-Free Allocation Fund(a) | | Benchmark-Free Fund(b) | | Global Asset Allocation Fund(c) | | Global Developed Equity Allocation Fund(d) | | Global Equity Allocation Fund(e) | | Implementation Fund(f) | | International Developed Equity Allocation Fund(g) | | International Equity Allocation Fund(h) | | SGM Major Markets Fund | | Special Opportunities Fund | | Strategic Opportunities Allocation Fund(i) |
| Purchase Premium | | — | | 0.20% | | 0.25% | | 0.15% | | 0.08% | | 0.18% | | 0.20% | | 0.08% | | 0.25% | | — | | 0.50% | | 0.20% |
| Redemption Fee | | — | | 0.20% | | 0.25% | | 0.15% | | 0.08% | | 0.18% | | 0.20% | | 0.08% | | 0.25% | | — | | 0.50% | | 0.20% |
| | (a) | For the periods from June 30, 2015 to June 30, 2016, June 30, 2014 to June 30, 2015 and June 30, 2013 to June 30, 2014, the premium on cash purchases and the fee on cash redemptions were each 0.18%, 0.13% and 0.11%, respectively, of the amount invested or redeemed. Prior to June 30, 2013, these same fees were each 0.12% of the amount invested or redeemed. |
| | (b) | For the periods from June 30, 2015 to June 30, 2016, June 30, 2014 to June 30, 2015 and June 30, 2013 to June 30, 2014, the premium on cash purchases and the fee on cash redemptions were each 0.18%, 0.13% and 0.14%, respectively, of the amount invested or redeemed. Prior to June 30, 2013, these same fees were each 0.13% of the amount invested or redeemed. |
| | (c) | For the period from June 30, 2015 to June 30, 2016 and June 30, 2013 to June 30, 2015, the premium on cash purchases and the fee on cash redemptions were each 0.14% and 0.11%, respectively, of the amount invested or redeemed. Prior to June 30, 2013, these same fees were each 0.10% of the amount invested or redeemed. |
| | (d) | Prior to March 10, 2014, there was no premium on cash purchases or fee on cash redemptions. |
| | (e) | For the period from June 30, 2015 to June 30, 2016, and June 30, 2013 to June 30, 2015, the premium on cash purchases and the fee on cash redemptions were each 0.19% and 0.11%, respectively, of the amount invested or redeemed. Prior to June 30, 2013, these same fees were each 0.12% of the amount invested or redeemed. |
| | (f) | Prior to June 30, 2015, there was no premium on cash purchases or fee on cash redemptions. |
| | (g) | Prior to March 10, 2014, there was no premium on cash purchases or fees on cash redemptions. |
| | (h) | For the period from June 30, 2015 to June 30, 2016 and June 30, 2013 to June 30, 2015, the premium on cash purchases and the fee on cash redemptions were each 0.27% and 0.20%, respectively, of the amount invested or redeemed. Prior to June 20, 2013, the same fees were each 0.21% of the amount invested or redeemed. |
| | (i) | For the period from June 30, 2015 to June 30, 2016 and June 30, 2013 to June 30, 2015, the premium on cash purchases and the fee on cash redemptions were each 0.14% and 0.06% of the amount invested or redeemed. Prior to June 30, 2013, these same fees were each 0.07% of the amount invested or redeemed. |
Recently-issued accounting guidance
In August 2016, Financial Accounting Standards Board (“FASB”) issued a new Accounting Standards Update No. 2016-15, “Statement of Cash Flows (Topic 230), Classification of Certain Cash Receipts and Cash Payments, a consensus of the FASB’s Emerging Issues Task Force” (“ASU 2016-15”). ASU 2016-15 is intended to reduce diversity in practice in how certain transactions are classified in the statement of cash flows. The issues addressed in ASU 2016-15 are: debt prepayment or debt extinguishment costs, settlement of zero-coupon debt instruments, contingent consideration payments made after a business combination, proceeds from the settlement of insurance claims, proceeds from the settlement of corporate-owned life insurance policies, including bank-owned life insurance policies, distributions received from equity method investments, beneficial interests in securitization transactions; and, separately identifiable cash flows and application of the predominance principle. ASU 2016-15 is effective for interim and annual reporting periods beginning after December 15, 2017. GMO is currently evaluating the impact, if any, of this guidance on the Funds’ financial statements and disclosures.
144
GMO Trust Funds
Notes to Financial Statements — (Continued)
February 28, 2017
| 3. | Investment and other risks |
The following chart identifies selected risks associated with each Fund. Risks not marked for a particular Fund may, however, still apply to some extent to that Fund at various times.
| | | | | | | | | | | | | | | | | | | | | | | | |
| | | | | | | | | | | | | |
| | | Alpha Only Fund | | Benchmark-Free Allocation Fund | | Benchmark-Free Fund | | Global Asset Allocation Fund | | Global Developed Equity Allocation Fund | | Global Equity Allocation Fund | | Implemen-
tation Fund | | International Developed Equity Allocation Fund | | International Equity Allocation Fund | | SGM Major Markets Fund | | Special Opportu-
nities Fund | | Strategic Opportu-
nities Allocation Fund |
| Commodities Risk | | | | X | | X | | X | | | | | | X | | | | | | X | | X | | X |
| Counterparty Risk | | X | | X | | X | | X | | X | | X | | X | | X | | X | | X | | X | | X |
| Credit Risk | | X | | X | | X | | X | | X | | X | | X | | X | | X | | X | | X | | X |
| Currency Risk | | X | | X | | X | | X | | X | | X | | X | | X | | X | | X | | X | | X |
| Derivatives and Short Sales Risk | | X | | X | | X | | X | | X | | X | | X | | X | | X | | X | | X | | X |
| Focused Investment Risk | | X | | X | | X | | X | | X | | X | | X | | X | | X | | X | | X | | X |
| Fund of Funds Risk | | X | | X | | X | | X | | X | | X | | X | | X | | X | | X | | X | | X |
| Futures Contracts Risk | | | | X | | X | | X | | | | | | | | | | | | X | | | | X |
| Illiquidity Risk | | X | | X | | X | | X | | X | | X | | X | | X | | X | | X | | X | | X |
| Large Shareholder Risk | | X | | X | | X | | X | | X | | X | | X | | X | | X | | X | | X | | X |
| Leveraging Risk | | X | | X | | X | | X | | X | | X | | X | | X | | X | | X | | X | | X |
| Management and Operational Risk | | X | | X | | X | | X | | X | | X | | X | | X | | X | | X | | X | | X |
| Market Disruption and Geopolitical Risk | | X | | X | | X | | X | | X | | X | | X | | X | | X | | X | | X | | X |
| Market Risk – Asset-Backed Securities | | | | X | | X | | X | | | | | | X | | | | | | X | | X | | X |
| Market Risk – Equities | | X | | X | | X | | X | | X | | X | | X | | X | | X | | X | | X | | X |
| Market Risk – Fixed Income Investments | | X | | X | | X | | X | | X | | X | | X | | X | | X | | X | | X | | X |
| Merger Arbitrage Risk | | | | X | | X | | X | | | | | | X | | | | | | | | X | | X |
| Non-Diversified Funds | | X | | X | | X | | X | | X | | X | | X | | X | | X | | X | | X | | X |
| Non-U.S. Investment Risk | | X | | X | | X | | X | | X | | X | | X | | X | | X | | X | | X | | X |
| Small Company Risk | | X | | X | | X | | X | | X | | X | | X | | X | | X | | | | X | | X |
Investing in mutual funds involves many risks. The risks of investing in a particular Fund depend on the types of investments in its portfolio and the investment strategies GMO employs on its behalf. This section does not describe every potential risk of investing in the Funds. Funds could be subject to additional risks because of the types of investments they make and market conditions, which may change over time.
Each Fund that invests in other GMO Funds, other investment companies or in a wholly-owned subsidiary (collectively, “Underlying Funds”) is exposed to the risks to which the Underlying Funds in which it invests are exposed as well as the risk that the Underlying Funds will not perform as expected. Therefore, unless otherwise noted, the selected risks summarized below include both direct and indirect risks, and references in this section to investments made by a Fund include those made both directly by the Fund and indirectly by the Fund through Underlying Funds.
145
GMO Trust Funds
Notes to Financial Statements — (Continued)
February 28, 2017
An investment in a Fund is not a bank deposit and, therefore, is not insured or guaranteed by the Federal Deposit Insurance Corporation or any other government agency.
• COMMODITIES RISK. Commodity prices can be extremely volatile and are affected by many factors. Exposure to commodities can cause the net asset value of a Fund’s shares to decline or fluctuate in a rapid and unpredictable manner. The value of commodity-related derivatives or indirect investments in commodities may fluctuate more than the commodity, commodities or commodity index to which they relate. See “Derivatives and Short Sales Risk” for a discussion of specific risks of a Fund’s derivatives investments, including commodity-related derivatives.
• COUNTERPARTY RISK. Funds that enter into contracts with counterparties, such as repurchase or reverse repurchase agreements or OTC derivatives contracts, or that lend their securities run the risk that the counterparty will be unable or unwilling to make timely settlement payments or otherwise honor its obligations. If a counterparty fails to meet its contractual obligations, goes bankrupt, or otherwise experiences a business interruption, the Fund could miss investment opportunities or otherwise hold investments it would prefer to sell, resulting in losses for the Fund. In addition, a Fund may suffer losses if a counterparty fails to comply with applicable laws or other requirements. The Funds are not subject to any limits on their exposure to any one counterparty nor to a requirement that counterparties with whom they enter into contracts maintain a specific rating by a nationally recognized rating organization. Counterparty risk is pronounced during unusually adverse market conditions and is particularly acute in environments (like those of 2008) in which financial services firms are exposed to systemic risks of the type evidenced by the insolvency of Lehman Brothers and subsequent market disruptions.
Participants in OTC derivatives markets typically are not subject to the same level of credit evaluation and regulatory oversight as are members of exchange-based markets, and, therefore, OTC derivatives generally expose a Fund to greater counterparty risk than exchange-traded derivatives. A Fund is subject to the risk that a counterparty will not settle a derivative in accordance with its terms because of a dispute over the terms of the contract (whether or not bona fide) or because of a credit or liquidity problem. If a counterparty’s obligation to a Fund is not collateralized, then the Fund is essentially an unsecured creditor of the counterparty. If a counterparty defaults, the Fund will have contractual remedies (whether or not the obligation is collateralized), but the Fund may be unable to enforce them, thus causing the Fund to suffer a loss. Counterparty risk is greater for derivatives with longer maturities because of the longer time during which events may occur that prevent settlement. Counterparty risk also is greater when a Fund has entered into derivatives contracts with a single or small group of counterparties as it sometimes does as a result of its use of swaps and other OTC derivatives. Funds that use swap contracts are subject, in particular, to the creditworthiness of the counterparties because some types of swap contracts have terms longer than six months (and, in some cases, decades). The creditworthiness of a counterparty may be adversely affected by greater than average volatility in the markets, even if the counterparty’s net market exposure is small relative to its capital. Counterparty risk still exists even if a counterparty’s obligations are secured by collateral because the Fund’s interest in the collateral may not be perfected or additional collateral may not be promptly posted as required. GMO’s view with respect to a particular counterparty is subject to change. The fact, however, that it changes adversely (whether due to external events or otherwise) does not mean a Fund’s existing transactions with that counterparty will necessarily be terminated or modified. In addition, a Fund may enter into new transactions with a counterparty that GMO no longer considers a desirable counterparty if the transaction is primarily designed to reduce the Fund’s overall risk of potential exposure to that counterparty (for example, re-establishing the transaction with a lower notional amount or entering into a countervailing trade with the same counterparty).
The Funds also are subject to counterparty risk because they execute their securities transactions through brokers and dealers. If a broker or dealer fails to meet its contractual obligations, goes bankrupt, or otherwise experiences a business interruption, the Funds could miss investment opportunities or be unable to dispose of investments they would prefer to sell, resulting in losses for the Funds.
Counterparty risk with respect to derivatives has been and will continue to be affected by new rules and regulations relating to the derivatives market. As described under “Derivatives and Short Sales Risk,” some derivatives transactions are required to be centrally cleared, and a party to a cleared derivatives transaction is subject to the credit risk of the clearing house and the clearing member through which it holds its cleared position. Credit risk of market participants with respect to derivatives that are centrally cleared is concentrated in a few clearing houses, and it is not clear how an insolvency proceeding of a clearing house would be conducted and what impact an insolvency of a clearing house would have on the financial system. Also, in the event of a counterparty’s (or its affiliate’s) insolvency, the Funds’ ability to exercise remedies, such as the termination of transactions, netting of obligations and realization on collateral, could be stayed or eliminated under new special resolution regimes adopted in the United States, the European Union and various other jurisdictions. Such regimes provide governmental authorities with broad authority to intervene when a financial institution is experiencing financial difficulty. In particular, with respect to counterparties who are subject to such proceedings in the European Union, the liabilities of such counterparties to the Funds could be reduced, eliminated, or converted to equity in such counterparties (sometimes referred to as a “bail in”).
• CREDIT RISK. This is the risk that the issuer or guarantor of a fixed income investment or the obligor of an obligation underlying an asset-backed security will be unable or unwilling to satisfy its obligation to pay principal and interest or otherwise to honor its obligations in a timely manner. The market price of a fixed income investment will normally decline as a result of the issuer’s, guarantor’s, or obligor’s failure to meet its payment obligations, or in anticipation of such failure, or the downgrade of the credit rating of the investment. This risk is particularly acute in
146
GMO Trust Funds
Notes to Financial Statements — (Continued)
February 28, 2017
environments (like those of 2008) in which financial services firms are exposed to systemic risks of the type evidenced by the insolvency of Lehman Brothers and subsequent market disruptions.
All fixed income securities are subject to credit risk. Financial strength and solvency of an issuer are the primary factors influencing credit risk. The risk varies depending upon whether the issuer is a corporation, a government or government entity, whether the particular security has a priority over other obligations of the issuer in payment of principal and interest and whether it has any collateral backing or credit enhancement. Credit risk may change over the term of a fixed income security. U.S. government securities are subject to varying degrees of credit risk depending upon whether the securities are supported by the full faith and credit of the United States, supported by the ability to borrow from the U.S. Treasury, supported only by the credit of the issuing U.S. government agency, instrumentality, or corporation, or otherwise supported by the United States. For example, issuers of many types of U.S. government securities (e.g., the Federal Home Loan Mortgage Corporation (“Freddie Mac”), Federal National Mortgage Association (“Fannie Mae”), and Federal Home Loan Banks), although chartered or sponsored by Congress, are not funded by Congressional appropriations and their fixed income securities, including mortgage-backed and other asset-backed securities, are neither guaranteed nor insured by the U.S. government. These securities are subject to more credit risk than U.S. government securities that are supported by the full faith and credit of the United States (e.g., U.S. Treasury bonds). Investments in sovereign or quasi-sovereign debt involve the risk that the governmental entities responsible for repayment may be unable or unwilling to pay interest and repay principal when due. A governmental entity’s ability and willingness to pay interest and repay principal in a timely manner may be affected by a variety of factors, including its cash flow, the size of its reserves, its access to foreign exchange, the relative size of its debt service burden to its economy as a whole, and political constraints. Investments in quasi-sovereign issuers are subject to the additional risk that the issuer may default independently of its sovereign. Sovereign debt risk is greater for fixed income securities issued or guaranteed by emerging countries.
In many cases, the credit risk of a fixed income security is reflected in its credit ratings, and a Fund holding such a security is subject to the risk that the investment’s rating will be downgraded.
Securities issued by the U.S. government historically have presented minimal credit risk. However, events in 2011 led to a downgrade in the long-term credit rating of U.S. bonds by several major rating agencies and introduced greater uncertainty about the repayment by the United States of its obligations. A further credit rating downgrade could decrease, and a default in the payment of principal or interest on U.S. government securities would decrease, the value of a Fund’s investments and increase the volatility of a Fund’s portfolio.
As described under “Market Risk — Asset-Backed Securities,” asset-backed securities may be backed by many types of assets and their payment of interest and repayment of principal largely depend on the cash flows generated by the assets backing them. The credit risk of a particular asset-backed security depends on many factors, as described under “Market Risk — Asset-Backed Securities.”
The obligations of issuers also may be subject to bankruptcy, insolvency and other laws affecting the rights and remedies of creditors.
A Fund also is exposed to credit risk on a reference security to the extent it writes protection under credit default swaps. See “Derivatives and Short Sales Risk” for more information regarding risks associated with the use of credit default swaps. The extent to which the market price of a fixed income security changes in response to a credit event depends on many factors and can be difficult to predict. For example, even though the effective duration of a long-term floating rate security is very short, an adverse credit event or a change in the perceived creditworthiness of its issuer could cause its market price to decline much more than its effective duration would suggest.
Credit risk is particularly pronounced for below investment grade securities (commonly referred to as “junk bonds”). The sovereign debt of many non-U.S. governments, including their sub-divisions and instrumentalities, is below investment grade. Many asset-backed securities also are below investment grade. Below investment grade securities have speculative characteristics, often are less liquid than higher quality securities, present a greater risk of default and are more susceptible to real or perceived adverse industry conditions. Investments in distressed or defaulted or other low quality debt securities generally are considered speculative and may involve substantial risks not normally associated with investments in higher quality securities, including adverse business, financial or economic conditions that lead to payment defaults and insolvency proceedings on the part of their issuers. In particular, distressed or defaulted obligations might be repaid, if at all, only after lengthy workout or bankruptcy proceedings, during which the issuer might not make any interest or other payments, and a Fund may incur additional expenses to seek recovery. If GMO’s assessment of the eventual recovery value of a distressed or defaulted debt security proves incorrect, a Fund may lose a substantial portion or all of its investment or may be required to accept cash or instruments worth less than its original investment. In the event of default of sovereign debt, the Funds may be unable to pursue legal action against the issuer.
• CURRENCY RISK. Currency risk is the risk that fluctuations in exchange rates will adversely affect the market value of a Fund’s investments. Currency risk includes the risk that the currencies in which a Fund’s investments are traded, in which a Fund receives income, or in which a Fund has taken a position, will decline in value relative to the currency in which the Fund is denominated. Currency risk also includes the risk that the currency to which the Fund has obtained exposure through hedging declines in value relative to the currency being hedged, in which event the Fund may realize a loss on both the hedging instrument and the currency being hedged. Currency exchange rates can fluctuate significantly for many reasons. See “Market Disruption and Geopolitical Risk.”
147
GMO Trust Funds
Notes to Financial Statements — (Continued)
February 28, 2017
Many of the Funds use derivatives to take currency positions that are under- or over-weighted (in some cases significantly) relative to the currency exposure of their portfolios and their benchmarks. If the exchange rates of the currencies involved do not move as expected, a Fund could lose money on both its holdings of a particular currency and the derivative. See also “Non-U.S. Investment Risk.”
Some currencies are illiquid (e.g., some emerging country currencies), and a Fund may not be able to convert them into U.S. dollars, in which case GMO may decide to purchase U.S. dollars in a parallel market with an unfavorable exchange rate. Exchange rates for many currencies (e.g., some emerging country currencies) are particularly affected by exchange control regulations.
Derivative transactions in foreign currencies (such as futures, forwards, options and swaps) may involve leveraging risk in addition to currency risk, as described under “Leveraging Risk.” In addition, the obligations of counterparties in currency derivative transactions are often not secured by collateral, which increases counterparty risk (see “Counterparty Risk”).
• DERIVATIVES AND SHORT SALES RISK. All of the Funds may invest in derivatives, which are financial contracts whose value depends on, or is derived from, the value of underlying assets, reference rates, or indices. Derivatives involve the risk that their value may not change as expected relative to changes in the value of the assets, rates, or indices they are designed to track. Derivatives include futures contracts, forward contracts, foreign currency contracts, swap contracts, contracts for differences, options on securities and indices, options on futures contracts, options on swap contracts, interest rate caps, floors and collars, reverse repurchase agreements, and other OTC contracts. Derivatives may relate to securities, commodities, currencies, currency exchange rates, interest rates, inflation rates, and indices.
The use of derivatives involves risks that are in addition to, and potentially greater than, the risks of investing directly in securities and other more traditional assets. In particular, a Fund’s use of OTC derivatives exposes it to the risk that the counterparties will be unable or unwilling to make timely settlement payments or otherwise honor their obligations. An OTC derivatives contract typically can be closed only with the consent of the other party to the contract. If the counterparty defaults, the Fund will still have contractual remedies but may not be able to enforce them. Because the contract for each OTC derivative is individually negotiated, the counterparty may interpret contractual terms (e.g., the definition of default) differently than the Fund, and if it does, the Fund may decide not to pursue its claims against the counterparty to avoid the cost and unpredictability of legal proceedings. The Fund, therefore, may be unable to obtain payments GMO believes are owed to it under OTC derivatives contracts, or those payments may be delayed or made only after the Fund has incurred the cost of litigation.
A Fund may invest in derivatives that (i) do not require the counterparty to post collateral (e.g., foreign currency forwards), (ii) require collateral but that do not provide for the Fund’s security interest in it to be perfected, (iii) require a significant upfront deposit by the Fund unrelated to the derivative’s fundamental fair (or intrinsic) value, or (iv) do not require that collateral be regularly marked-to-market. When a counterparty’s obligations are not fully secured by collateral, a Fund runs a greater risk of not being able to recover what it is owed if the counterparty defaults. Even when derivatives are required by contract to be collateralized, a Fund typically will not receive the collateral for one or more days after the collateral is required to be posted.
The Funds may invest in derivatives with a limited number of counterparties, and events affecting the creditworthiness of any of those counterparties may have a pronounced effect on the Funds. Derivatives risk is particularly acute in environments (like those of 2008) in which financial services firms are exposed to systemic risks of the type evidenced by the insolvency of Lehman Brothers and subsequent market disruptions. In addition, during those periods, a Fund may have a greater need for cash to provide collateral for large swings in its mark-to-market obligations under the derivatives in which it has invested.
Derivatives also present other risks described in this section, including market risk, illiquidity risk, currency risk, credit risk, and counterparty risk. Many derivatives, in particular OTC derivatives, are complex and their valuation often requires modeling and judgment, which increases the risk of mispricing or improper valuation. The pricing models used may not produce valuations that are consistent with the values a Fund realizes when it closes or sells an OTC derivative. Valuation risk is more pronounced when a Fund enters into OTC derivatives with specialized terms because the value of those derivatives in some cases is determined only by reference to similar derivatives with more standardized terms. As a result, incorrect valuations may result in increased cash payments to counterparties, undercollateralization and/or errors in the calculation of a Fund’s net asset value.
A Fund’s use of derivatives may not be effective or have the desired results. Moreover, suitable derivatives will not be available in all circumstances. For example, the economic costs of taking some derivative positions may be prohibitive, and if a counterparty or its affiliate is deemed to be an affiliate of a Fund, the Funds will not be permitted to trade with that counterparty. In addition, GMO may decide not to use derivatives to hedge or otherwise reduce a Fund’s risk exposures, potentially resulting in losses for the Fund.
Swap contracts and other OTC derivatives are highly susceptible to illiquidity risk (see “Illiquidity Risk”) and counterparty risk (see “Counterparty Risk”). These derivatives are also subject to documentation risk, which is the risk that ambiguities, inconsistencies or errors in the documentation relating to a derivative transaction may lead to a dispute with the counterparty or unintended investment results. In addition, see “Commodities Risk” for a discussion of risks specific to commodity-related derivatives. Because many derivatives have a leverage component
148
GMO Trust Funds
Notes to Financial Statements — (Continued)
February 28, 2017
(i.e., a notional value in excess of the assets needed to establish and/or maintain the derivative position), adverse changes in the value or level of the underlying asset, rate or index may result in a loss substantially greater than the amount invested in the derivative itself. See “Leveraging Risk.”
A Fund’s use of derivatives may be subject to special tax rules and could generate additional taxable income for shareholders. In addition, the tax treatment of a Fund’s use of derivatives may be unclear because there is little case or other law interpreting the terms of most derivatives or determining their tax treatment. In addition, the SEC recently proposed a rule under the 1940 Act, regulating the use by registered investment companies of derivatives and many related instruments. That rule, if adopted as proposed, would, among other things, restrict a Fund’s ability to engage in derivatives transactions or so increase the cost of derivatives transactions that a Fund would be unable to implement its investment strategy.
Derivatives Regulation. The U.S. government has enacted legislation that provides for new regulation of the derivatives market, including clearing, margin, reporting, and registration requirements. The European Union (and some other countries) are implementing similar requirements, which will affect a Fund when it enters into a derivatives transaction with a counterparty organized in that country or otherwise subject to that country’s derivatives regulations. Because these requirements are new and evolving (and some of the rules are not yet final), their ultimate impact remains unclear.
Transactions in some types of swaps (including interest rate swaps and credit default swaps on North American and European indices) are required to be centrally cleared. In a transaction involving those swaps (“cleared derivatives”), a Fund’s counterparty is a clearing house, rather than a bank or broker. Since the Funds are not members of clearing houses and only members of a clearing house (“clearing members”) can participate directly in the clearing house, the Funds hold cleared derivatives through accounts at clearing members. In cleared derivatives positions, the Funds make payments (including margin payments) to and receive payments from a clearing house through their accounts at clearing members. Clearing members guarantee performance of their clients’ obligations to the clearing house.
In some ways, cleared derivative arrangements are less favorable to mutual funds than bilateral arrangements, for example, by requiring that funds provide more margin for their cleared derivatives positions. Also, as a general matter, in contrast to a bilateral derivatives position, following a period of notice to a Fund, a clearing member at any time can require termination of an existing cleared derivatives position or an increase in margin requirements above those required at the outset of a transaction. Clearing houses also have broad rights to increase margin requirements for existing positions or to terminate those positions at any time. Any increase in margin requirements or termination of existing cleared derivatives positions by the clearing member or the clearing house could interfere with the ability of a Fund to pursue its investment strategy. Further, any increase in margin requirements by a clearing member could expose a Fund to greater credit risk to its clearing member because margin for cleared derivatives positions in excess of a clearing house’s margin requirements typically is held by the clearing member (see “Counterparty Risk”). Also, a Fund is subject to risk if it enters into a derivatives transaction that is required to be cleared (or that GMO expects to be cleared), and no clearing member is willing or able to clear the transaction on the Fund’s behalf. While the documentation in place between the Funds and their clearing members generally provides that the clearing members will accept for clearing all cleared derivatives transactions that are within credit limits (specified in advance) for each Fund, the Funds are still subject to the risk that no clearing member will be willing or able to clear a transaction. In those cases, the position might have to be terminated, and the Fund could lose some or all of the benefit of the position, including loss of an increase in the value of the position and loss of hedging protection. In addition, the documentation governing the relationship between the Funds and clearing members is drafted by the clearing members and generally is less favorable to the Funds than typical bilateral derivatives documentation. For example, documentation relating to cleared derivatives generally includes a one-way indemnity by the Funds in favor of the clearing member for losses the clearing member incurs as the Funds’ clearing member. Also, such documentation typically does not provide the Funds any remedies if the clearing member defaults or becomes insolvent. While futures contracts entail similar risks, the risks may be more pronounced for cleared derivatives due to their more limited liquidity and market history.
Some types of cleared derivatives are required to be executed on an exchange or on a swap execution facility. A swap execution facility is a trading platform where multiple market participants can execute derivatives by accepting bids and offers made by multiple other participants in the platform. While this execution requirement is designed to increase transparency and liquidity in the cleared derivatives market, trading on a swap execution facility can create additional costs and risks for the Funds. For example, swap execution facilities typically charge fees, and if a Fund executes derivatives on a swap execution facility through a broker intermediary, the intermediary may impose fees as well. Also, a Fund may indemnify a swap execution facility, or a broker intermediary who executes cleared derivatives on a swap execution facility on the Fund’s behalf, against any losses or costs that may be incurred as a result of the Fund’s transactions on the swap execution facility.
If a Fund wishes to execute a package of transactions that include a swap that is required to be executed on a swap execution facility as well as other transactions (for example, a transaction that includes both a security and an interest rate swap that hedges interest rate exposure with respect to such security), the Fund may be unable to execute all components of the package on the swap execution facility. In that case, the Fund would need to trade some components of the package on the swap execution facility and other components in another manner, which could subject the Fund to the risk that some components would be executed successfully and others would not, or that the components would be executed at different times, leaving the Fund with an unhedged position for a period of time.
149
GMO Trust Funds
Notes to Financial Statements — (Continued)
February 28, 2017
The U.S. government and the European Union have adopted mandatory minimum margin requirements for bilateral derivatives. GMO expects that the Funds’ transactions will become subject to variation margin requirements under such rules in 2017 and initial margin requirements under such rules in 2020. Such requirements could increase the amount of margin a Fund needs to provide in connection with its derivatives transactions and, therefore, make derivatives transactions more expensive.
These and other new rules and regulations could, among other things, further restrict a Fund’s ability to engage in, or increase the cost to the Fund of, derivatives transactions, for example, by making some types of derivatives no longer available to the Fund or otherwise limiting liquidity. The implementation of the clearing requirement has increased the costs of derivatives transactions for the Funds, since the Funds have to pay fees to their clearing members and are typically required to post more margin for cleared derivatives than they have historically posted for bilateral derivatives. The costs of derivatives transactions are expected to increase further as clearing members raise their fees to cover the costs of additional capital requirements and other regulatory changes applicable to the clearing members, which will take effect when rules imposing mandatory minimum margin requirements on bilateral swaps, as described above, become effective. These rules and regulations are new and evolving, so their potential impact on the Funds and the financial system are not yet known. While the new rules and regulations and central clearing of some derivatives transactions are designed to reduce systemic risk (i.e., the risk that the interdependence of large derivatives dealers could cause them to suffer liquidity, solvency or other challenges simultaneously), there is no assurance that they will achieve that result, and in the meantime, as noted above, central clearing and related requirements expose the Funds to new kinds of costs and risks.
Options. Some Funds are permitted to write options. The market price of an option is affected by many factors, including changes in the market prices or dividend rates of underlying securities (or in the case of indices, the securities in such indices); the time remaining before expiration; changes in interest rates or exchange rates; and changes in the actual or perceived volatility of the relevant stock market and underlying securities. The market price of an option also may be adversely affected if the market for the option becomes less liquid. In addition, since an American-style option allows the holder to exercise its rights any time before the option’s expiration, the writer of an American-style option has no control over when it will be required to fulfill its obligations as a writer of the option. (The writer of a European-style option is not subject to this risk because the holder may only exercise the option on its expiration date.) If a Fund writes a call option and does not hold the underlying security or instrument, the Fund’s potential loss is theoretically unlimited.
National securities exchanges generally have established limits on the maximum number of options an investor or group of investors acting in concert may write. A Fund, GMO, and other funds advised by GMO will likely constitute such a group. When applicable, these limits restrict a Fund’s ability to purchase or write options on a particular security.
Unlike exchange-traded options, which are standardized with respect to the underlying instrument, expiration date, contract size, and strike price, the terms of OTC options (i.e., options not traded on exchanges) generally are established through negotiation with the other party to the option contract. While a Fund has greater flexibility to tailor an OTC option, OTC options generally expose a Fund to greater credit risk than exchange-traded options, which are guaranteed by the clearing organization of the exchanges where they are traded. Purchasing and writing put and call options are highly specialized activities and entail greater than ordinary market risks.
Special tax rules apply to a Fund’s transactions in options, which could increase the taxes payable by shareholders. In particular, a Fund’s options transactions potentially could cause a substantial portion of the Fund’s distributions to consist of amounts taxable to shareholders subject to U.S. income tax at ordinary income tax rates. See the Funds’ Prospectus and Statement of Additional Information for more information.
Short Investment Exposure. Some Funds may sell securities or currencies short as part of their investment programs in an attempt to increase their returns or for hedging purposes. Short sales expose a Fund to the risk that it will be required to acquire, convert, or exchange a security or currency to replace the borrowed security or currency when the security or currency sold short has appreciated in value, thus resulting in a loss to the Fund. Purchasing a security or currency to close out a short position can itself cause the price of the security or currency to rise further, thereby exacerbating any losses. A Fund that sells short a security or currency it does not own also may have to pay borrowing fees to a broker and may be required to pay the broker any dividends or interest it receives on a borrowed security.
A Fund also may create short investment exposure by taking a derivative position in which the value of the derivative moves in the opposite direction from the price of an underlying investment, pool of investments, index or currency. Short sales of securities or currencies a Fund does not own and “short” derivative positions involve forms of investment leverage, and the amount of the Fund’s potential loss is theoretically unlimited. A Fund is subject to increased leveraging risk and other investment risks described in this “Investment and other risks” section to the extent it sells short securities or currencies it does not own or takes “short” derivative positions.
• FOCUSED INVESTMENT RISK. Funds with investments that are focused in particular countries, regions, sectors, industries or issuers that are subject to the same or similar risk factors and funds with investments whose prices are closely correlated are subject to greater overall risk than funds with investments that are more diversified or whose prices are not as closely correlated.
150
GMO Trust Funds
Notes to Financial Statements — (Continued)
February 28, 2017
A Fund that invests in the securities of a small number of issuers has greater exposure to adverse developments affecting those issuers and to a decline in the market price of particular securities than Funds investing in the securities of a larger number of issuers. Securities, sectors, or companies that share common characteristics are often subject to similar business risks and regulatory burdens, and often react similarly to specific economic, market, political or other developments.
Similarly, Funds having a significant portion of their assets in investments tied economically (or related) to a particular geographic region, country (e.g., Taiwan or Japan), or market (e.g., emerging markets), or to sectors within a region, country, or market (e.g., Russian oil) have more exposure to regional and country economic risks than funds making investments throughout the world. The political and economic prospects of one country or group of countries within the same geographic region may affect other countries in that region, and a recession, debt crisis or decline in the value of the currency of one country can spread to other countries. Furthermore, companies in a particular geographic region or country are vulnerable to events affecting other companies in that region or country because they often share common characteristics, are exposed to similar business risks and regulatory burdens, and react similarly to specific economic, market, political or other developments. See also “Non-U.S. Investment Risk”.
• FUND OF FUNDS RISK. Funds that invest in Underlying Funds (including underlying GMO Funds) are exposed to the risk that the Underlying Funds will not perform as expected. The Funds are also indirectly exposed to all of the risks to which the Underlying Funds are exposed.
Because a Fund bears the fees and expenses of an Underlying Fund in which it invests, absent reimbursement, the Fund will incur additional expenses when investing in an Underlying Fund. In addition, total Fund expenses will increase if a Fund makes a new or further investment in Underlying Funds with higher fees or expenses than the average fees and expenses of the Underlying Funds then in the Fund’s portfolio. Because some underlying GMO Funds invest a substantial portion of their assets in other GMO Funds (pursuant to an exemptive order obtained from the SEC), the Asset Allocation Funds have more tiers of investments than funds in many other groups of investment companies and therefore may be subject to greater fund of funds risk. In addition, to the extent a Fund invests in shares of underlying GMO Funds, it is indirectly subject to Large Shareholder Risk because those underlying GMO Funds are more likely to have large shareholders (e.g., other GMO Funds). See “Large Shareholder Risk.”
Investments in ETFs involve the risk that an ETF’s performance may not track the performance of the index the ETF is designed to track. In addition, ETFs often use derivatives to track the performance of the relevant index, and, therefore, investments in those ETFs are subject to the same derivatives risks discussed in “Derivatives and Short Sales Risk.”
A Fund’s investments in one or more Underlying Funds could affect the amount, timing and character of its distributions and could cause the Fund to recognize taxable income in excess of the cash generated by such investments, requiring the Fund in turn to liquidate investments at disadvantageous times to generate cash needed to make required distributions.
• FUTURES CONTRACTS RISK. The risk of loss to a Fund resulting from its use of futures contracts is potentially unlimited. Futures markets are highly volatile and the use of futures contracts may increase the volatility of the Fund’s net asset value. A Fund’s ability to establish and close out positions in futures contracts is subject to the development and maintenance of a liquid secondary market. A liquid secondary market may not exist for any particular futures contract at any particular time and a Fund might be unable to effect closing transactions to terminate its exposure to the contract. In using futures contracts, a Fund is reliant on GMO’s ability to predict market and price movements correctly. The skills needed to use futures contracts successfully are different from those needed for traditional portfolio management. If a Fund uses futures contracts for hedging purposes, it runs the risk of imperfect correlation between changes in the prices of the contracts and changes in the securities, index, or other asset underlying the contracts or movements in the prices of the Fund’s investments that are the subject of the hedge.
A Fund typically will be required to post margin with its futures commission merchant in connection with its transactions in futures contracts. If the Fund has insufficient cash to meet margin requirements, the Fund may need to sell other investments at disadvantageous times. A Fund may be delayed or prevented from recovering margin or other amounts deposited with a futures commission merchant or futures clearinghouse. For example, in the event of an insolvency of the futures commission merchant, a Fund may not be able to recover all (or any) of the margin it has posted with the futures commission merchant or realize the value of any increase in the price of its positions.
The Commodity Futures Trading Commission (the “CFTC”) and the various exchanges have established limits referred to as “speculative position limits” on the maximum net long or net short positions that any person and certain affiliated entities may hold or control in a particular futures contract. In addition an exchange may impose trading limits on the number of contracts that any person may trade on a particular day. An exchange may order the liquidation of positions found to be in violation of these limits, and it may impose sanctions or restrictions. In addition, the Dodd-Frank Wall Street Reform and Consumer Protection Act requires the CFTC to establish speculative position limits on listed futures and economically equivalent OTC derivatives which may adversely affect the market liquidity of the futures contracts, options and economically equivalent derivatives in which a Fund invests. As a result of such limits, positions held by other GMO clients or by GMO or its affiliates may prevent GMO from taking positions on behalf of a Fund in a particular futures contract or OTC derivative.
151
GMO Trust Funds
Notes to Financial Statements — (Continued)
February 28, 2017
Futures contracts traded on markets outside the United States generally are not subject to regulation by the CFTC or other U.S. regulators. U.S. regulators neither regulate the activities of a foreign exchange, nor have the power to compel enforcement of the rules of the foreign exchange or the laws of the country in which the exchange is located. Margin and other payments made by a Fund in foreign countries may not have the same protections as payments in the United States. In addition, foreign futures contracts may be less liquid and more volatile than U.S. contracts.
• ILLIQUIDITY RISK. Illiquidity risk is the risk that low trading volume, lack of a market maker, large position size, or legal restrictions (including daily price fluctuation limits or “circuit breakers”) limits or prevents a Fund from selling particular securities or closing derivative positions at desirable prices. In addition to these risks, a Fund is exposed to illiquidity risk when it has an obligation to purchase particular securities (e.g., as a result of entering into reverse repurchase agreements, writing a put, or closing a short position). To the extent a Fund’s investments include asset-backed securities, distressed, defaulted or other low quality debt securities, emerging country debt securities, securities of companies with smaller market capitalizations or smaller total float adjusted market capitalizations, or emerging market securities, it is subject to increased illiquidity risk. These types of investments can be difficult to value, exposing a Fund to the risk that the price at which it sells them will be less than the price at which they were valued when held by the Fund. Illiquidity risk also may be greater in times of financial stress. For example, Inflation-Protected Securities issued by the U.S. Treasury (“TIPS”) have experienced periods of greatly reduced liquidity during disruptions in fixed income markets, such as the events surrounding the bankruptcy of Lehman Brothers in 2008. Less liquid securities are more susceptible than other securities to price declines when market prices decline generally.
A Fund may buy securities that are less liquid than those in its benchmark.
A Fund’s, and particularly Risk Premium Fund’s, ability to use options as part of its investment program depends on the liquidity of the options market. In addition, that market may not be liquid when a Fund seeks to close out an option position. Also, the hours of trading for options on an exchange may not conform to the hours during which the securities held by a Fund are traded. To the extent that the options markets close before the markets for the underlying securities, significant price and rate movements can take place in the markets for underlying securities that are not immediately reflected in the options markets. If a Fund receives a redemption request and is unable to close out an option it has sold, the Fund may temporarily be leveraged in relation to its assets.
• LARGE SHAREHOLDER RISK. To the extent a large number of shares of a Fund is held by a single shareholder (e.g., an institutional investor or another GMO Fund) or a group of shareholders with a common investment strategy (e.g., GMO asset allocation accounts), the Fund is subject to the risk that a redemption by those shareholders of all or a large portion of their Fund shares will adversely affect the Fund’s performance by forcing the Fund to sell portfolio securities, potentially at disadvantageous prices, to raise the cash needed to satisfy the redemption request. In addition, the Funds and other accounts over which GMO has investment discretion that invest in the Funds are not limited in how often they may purchase or sell Fund shares. The Asset Allocation Funds and separate accounts managed by GMO for its clients hold substantial percentages of the shares of many Funds, and asset allocation decisions by GMO may result in substantial redemptions from (or investments in) those Funds. These transactions may adversely affect the Fund’s performance to the extent that the Fund is required to sell investments (or invest cash) when it would not otherwise do so. Redemptions of a large number of shares also may increase transaction costs or, by necessitating a sale of portfolio securities, have adverse tax consequences for Fund shareholders. Additionally, redemptions and/or purchases of shares by a large shareholder and/or a group of shareholders over time potentially limit the use of any capital loss carryforwards to offset future realized capital gains (if any) and other losses that would otherwise reduce distributable net investment income. Large Shareholders may limit or prevent a Fund’s use of tax equalization for U.S. federal tax purposes. In addition, to the extent a Fund invests in other GMO Funds subject to large shareholder risk, the Fund is indirectly subject to this risk.
• LEVERAGING RISK. The use of reverse repurchase agreements and other derivatives and securities lending creates leverage (i.e., a Fund’s investment exposures exceed its net asset value). Leverage increases a Fund’s losses when the value of its investments (including derivatives) declines. Because many derivatives have a leverage component (i.e., a notional value in excess of the assets needed to establish or maintain the derivative position), adverse changes in the value or level of the underlying asset, rate or index may result in a loss substantially greater than the amount invested in the derivative itself. In the case of swaps, the risk of loss generally is related to a notional principal amount, even if the parties have not made any initial investment. Some derivatives have the potential for unlimited loss, regardless of the size of the initial investment. A Fund’s portfolio also will be leveraged if it borrows money to meet redemption requests or settle investment transactions or if it exercises its right to delay payment on a redemption.
A Fund may manage some of its derivative positions by offsetting derivative positions against one another or against other assets. To the extent offsetting positions do not behave in relation to one another as expected, a Fund may perform as if it were leveraged.
• MANAGEMENT AND OPERATIONAL RISK. Each Fund is subject to management risk because it relies on GMO to achieve its investment objective. Each Fund runs the risk that GMO’s investment techniques will fail to produce desired results and cause the Fund to incur significant losses. GMO also may fail to use derivatives effectively, choosing to hedge or not to hedge positions at disadvantageous times.
152
GMO Trust Funds
Notes to Financial Statements — (Continued)
February 28, 2017
For many Funds, GMO often uses quantitative models as part of its investment process. GMO’s models are not necessarily predictive of future market events and use simplifying assumptions that can limit their effectiveness. In addition, the data on which the models are based is subject to limitations (e.g. inaccuracies, staleness) that could adversely affect a Fund’s performance. The Funds also run the risk that GMO’s assessment of an investment (including a company’s fundamental fair (or intrinsic) value) may be wrong.
GMO relies heavily on quantitative models in making investment decisions for GMO SGM Major Markets Fund. The usefulness of GMO’s models may be diminished by the faulty incorporation of mathematical models into computer code, by reliance on proprietary and third-party technology that may include errors, omissions, bugs or viruses, and by the retrieval of limited or imperfect data for processing by the model. These risks are present in the ordinary course of business and are more likely to occur when GMO is making changes to its models. Any of these aspects could adversely affect a Fund’s performance.
There can be no assurance that key GMO personnel will continue to be employed by GMO. The loss of their services could have an adverse impact on GMO’s ability to achieve the Funds’ investment objectives.
The Funds also are subject to the risk of loss as a result of other services provided by GMO and other service providers, including pricing, administrative, accounting, tax, legal, custody, transfer agency, and other services. Operational risk includes the possibility of loss caused by inadequate procedures and controls, human error, and system failures by a service provider. For example, trading delays or errors could prevent a Fund from benefiting from potential investment gains or avoiding losses. In addition, a service provider may be unable to provide a net asset value (“NAV”) for a Fund or share class on a timely basis. GMO is not contractually liable to the Funds for losses associated with operational risk absent its willful misfeasance, bad faith, gross negligence, or reckless disregard of its contractual obligations to provide services to the Funds. Other Fund service providers also have contractual limitations on their liability to the Funds for losses resulting from their errors.
The Funds and their service providers (including GMO) are susceptible to cyber-attacks and technological malfunctions that may have effects that are similar to those of a cyber-attack. Cyber-attacks include, among others, stealing or corrupting data maintained online or digitally, preventing legitimate users from accessing information or services on a website, releasing confidential information without authorization, and causing operational disruption. Successful cyber-attacks against, or security breakdowns of, a Fund, GMO, a sub-adviser, or a custodian, transfer agent, or other service provider may adversely affect the Fund or its shareholders. For instance, cyber-attacks may interfere with the processing of shareholder transactions, affect a Fund’s ability to calculate its net asset value, cause the release or misappropriation of private shareholder information or confidential Fund information, impede trading, cause reputational damage, and subject the Fund to regulatory fines, penalties or financial losses, reimbursement or other compensation costs, and additional compliance costs. While GMO has established business continuity plans and systems designed to prevent cyber-attacks, such plans and systems are subject to inherent limitations. Similar types of cyber security risks also are present for issuers of securities in which the Funds invest, which could result in material adverse consequences for such issuers, and may cause a Fund’s investment in such securities to lose value.
• MARKET DISRUPTION AND GEOPOLITICAL RISK. The Funds are subject to the risk that geopolitical and other events (e.g., wars and terrorism) will disrupt securities markets and adversely affect global economies and markets, thereby decreasing the value of the Funds’ investments. Sudden or significant changes in the supply or prices of commodities or other economic inputs (e.g., the marked decline in oil prices that began in late 2014) may have material and unexpected effects on both global securities markets and individual countries, regions, sectors, companies, or industries, which could significantly reduce the value of a Fund’s investments. Terrorism in the United States and around the world has increased geopolitical risk. The terrorist attacks on September 11, 2001 resulted in the closure of some U.S. securities markets for four days, and similar attacks are possible in the future. Securities markets may be susceptible to market manipulation (e.g., the manipulation of the London Interbank Offered Rate (LIBOR)) or other fraudulent trading practices, which could disrupt the orderly functioning of markets or reduce the value of investments traded in them, including investments of the Funds. Instances of fraud and other deceptive practices committed by senior management of certain companies in which a Fund invests may undermine GMO’s due diligence efforts with respect to such companies, and if such fraud is discovered, negatively affect the value of the Fund’s investments. In addition, when discovered, financial fraud may contribute to overall market volatility, which can negatively impact a Fund’s investment program. Financial fraud also may impact the rates or indices underlying a Fund’s investments.
While the U.S. government has always honored its credit obligations, a default by the U.S. government (as has been threatened in recent years) would be highly disruptive to the U.S. and global securities markets and could significantly reduce the value of the Funds’ investments. Similarly, political events within the United States at times have resulted, and may in the future result, in a shutdown of government services, which could adversely affect the U.S. economy, decrease the value of many Fund investments, and increase uncertainty in or impair the operation of the U.S. or other securities markets. Uncertainty surrounding the sovereign debt of several European Union countries, as well as the continued existence of the European Union itself, has disrupted and may continue to disrupt markets in the United States and around the world. If a country changes its currency or leaves the European Union or if the European Union dissolves, the world’s securities markets likely will be significantly disrupted. Substantial government interventions (e.g., currency controls) also could adversely affect the Funds. War, terrorism, economic uncertainty, and related geopolitical events have led, and in the future may lead, to increased short-term market volatility and may have adverse long-term effects on U.S. and world economies and markets generally. Likewise, natural and environmental disasters, such as the earthquake and tsunami in Japan
153
GMO Trust Funds
Notes to Financial Statements — (Continued)
February 28, 2017
in early 2011, and systemic market dislocations of the kind surrounding the insolvency of Lehman Brothers in 2008, if repeated, would be highly disruptive to economies and markets, adversely affecting individual companies and industries, securities markets, interest rates, credit ratings, inflation, investor sentiment, and other factors affecting the value of the Funds’ investments. During such market disruptions, the Funds’ exposure to the risks described elsewhere in this “Investment and other risks” section will likely increase. Market disruptions, including sudden government interventions, can also prevent the Funds from implementing their investment programs and achieving their investment objectives. For example, a market disruption may adversely affect the orderly functioning of the securities markets and may cause the Funds’ derivatives counterparties to discontinue offering derivatives on some underlying commodities, securities, reference rates, or indices, or to offer them on a more limited basis. To the extent a Fund has focused its investments in the stock index of a particular region, adverse geopolitical and other events in that region could have a disproportionate impact on the Fund.
• MARKET RISK. All of the Funds are subject to market risk, which is the risk that the market value of their holdings will decline. Market risks include:
Asset-Backed Securities — Investments in asset-backed securities not only are subject to all of the market risks described under “Market Risk – Fixed Income Investments,” but to other market risks as well.
Asset-backed securities are often exposed to greater risk of severe credit downgrades, illiquidity, and defaults than many other types of fixed income investments. These risks are particularly acute during periods of adverse market conditions, such as those that occurred in 2008. Asset-backed securities may be backed by many types of assets, including pools of residential and commercial mortgages, automobile loans, educational loans, home equity loans, and credit-card receivables. They also may be backed by pools of corporate, sovereign or quasi-sovereign bonds, bank loans to corporations, or a combination of bonds and loans (commonly referred to as “collateralized debt obligations” or “collateralized loan obligations”) and by the fees payable to service providers.
As described under “Market Risk — Fixed Income Investments,” the market price of fixed income investments with complex structures, such as asset-backed securities, can decline due to a variety of factors, including market uncertainty about their credit quality and the reliability of their payment streams. Payment of interest on asset-backed securities and repayment of principal largely depend on the cash flow generated by the assets backing the securities, as well as the deal structure (e.g., the amount of underlying assets or other support available to produce the cash flows necessary to service interest and make principal payments), the quality of the underlying assets, the level of credit support and the credit quality of the credit-support provider, if any, and the reliability of various other service providers with access to the payment stream. A problem in any one of these factors can lead to a reduction in the payment stream GMO expected a Fund to receive at the time the Fund purchased the asset-backed security. Asset-backed securities involve risk of loss of principal if obligors of the underlying obligations default and the value of the defaulted obligations exceeds whatever credit support the securities may have. Asset-backed securities backed by sub-prime mortgage loans, in particular, may expose a Fund to significantly greater declines in value due to defaults because sub-prime mortgage loans are typically made to less creditworthy borrowers and thus have a higher risk of default than conventional mortgage loans. The obligations of issuers (and obligors of asset-backed securities) also are subject to bankruptcy, insolvency and other laws affecting the rights and remedies of creditors. As of the date of this report, many asset-backed securities owned by the Funds that were once rated investment grade are now rated below investment grade. See “Credit Risk” for more information about credit risk.
With the deterioration of worldwide economic and liquidity conditions that occurred and became acute in 2008, the markets for asset-backed securities became fractured, and uncertainty about the creditworthiness of those securities (and underlying assets) caused credit spreads (the difference between yields on asset-backed securities and U.S. Government securities) to widen dramatically. Concurrently, systemic risks of the type evidenced by the insolvency of Lehman Brothers and subsequent market disruptions reduced the ability of financial institutions to make markets in many fixed income securities. These events reduced liquidity and contributed to substantial declines in the market prices of asset-backed and other fixed income securities. These conditions may occur again. Also, government actions and proposals affecting the terms of underlying home and consumer loans, changes in demand for products (e.g., automobiles) financed by those loans, and the inability of borrowers to refinance existing loans (e.g., sub-prime mortgages) have had, and may continue to have, adverse valuation and liquidity effects on asset-backed securities.
The market price of an asset-backed security may depend on the servicing of its underlying assets and is, therefore, subject to risks associated with the negligence or defalcation of its servicer. In some circumstances, the mishandling of documentation for underlying assets also may affect the rights of holders of those underlying assets. The insolvency of an entity that generated the assets underlying an asset-backed security is likely to result in a decline in the market price of that security, as well as costs and delays. The obligations underlying asset-backed securities, in particular securities backed by pools of residential and commercial mortgages, also are subject to unscheduled prepayment, and a Fund may be unable to invest prepayments at as high a yield as was provided by the asset-backed security. When interest rates rise, these obligations also may be repaid more slowly than anticipated, and the market price of the Fund’s investment may decrease. In addition, the existence of insurance on an asset-backed security does not guarantee that the principal and interest will be paid because the insurer could default on its obligations.
154
GMO Trust Funds
Notes to Financial Statements — (Continued)
February 28, 2017
The risk of investing in asset-backed securities has increased since the deterioration in worldwide economic and liquidity conditions referred to above because performance of the various sectors in which the assets underlying asset-backed securities are concentrated (e.g., auto loans, student loans, sub-prime mortgages, and credit card receivables) has become more highly correlated. See “Focused Investment Risk” for more information about risks of investing in correlated sectors. A single financial institution may serve as a trustee for many asset-backed securities. As a result, a disruption in that institution’s business may have a material impact on many investments.
Equities — Funds that invest in equities run the risk that the market price of an equity will decline. That decline may be attributable to factors affecting the issuer, such as poor performance by the company’s management or reduced demand for its goods or services, or to factors affecting a particular industry, such as a decline in demand, labor or raw material shortages, or increased production costs. A decline also may result from general market conditions not specifically related to a company or industry, such as real or perceived adverse economic conditions, changes in the general outlook for corporate earnings, changes in interest or currency rates, or adverse investor sentiment generally. Equities generally have significant price volatility, and their market prices can decline in a rapid or unpredictable manner. If a Fund purchases an equity for less than its fundamental fair (or intrinsic) value as determined by GMO, the Fund runs the risk that the market price of the equity will not appreciate or will decline due to GMO’s incorrect assessment of the equity’s fundamental fair (or intrinsic) value. The market prices of equities trading at high multiples of current earnings often are more sensitive to changes in future earnings expectations than the market prices of equities trading at lower multiples.
To the extent a Fund invests in GMO Risk Premium Fund (“Risk Premium Fund”), the Fund is exposed to Risk Premium Fund’s market risk with respect to equities. Because of Risk Premium Fund’s emphasis on selling put options on stock indices, GMO expects its net asset value to decline when those indices decline in value. Also, Risk Premium Fund’s investment strategy of writing put options on stock indices can be expected to cause the Fund to underperform relative to those indices when those markets rise sharply because of the Fund’s lack of exposure to the upside of those markets.
Fixed Income Investments — Funds that invest in fixed income securities (including bonds, notes, bills, synthetic debt instruments, and asset-backed securities) are subject to various market risks. The market price of a fixed income investment can decline due to market-related factors, including rising interest rates and widening credit spreads, or decreased liquidity stemming from the market’s uncertainty about the value of a fixed income investment (or class of fixed income investments). In addition, the market price of fixed income investments with complex structures, such as asset-backed securities, and sovereign and quasi-sovereign debt instruments, can decline due to uncertainty about their credit quality and the reliability of their payment streams. Some fixed income securities also are subject to unscheduled prepayment, and a Fund may be unable to invest prepayments at as high a yield as was provided by the fixed income security. When interest rates rise, these securities also may be repaid more slowly than anticipated, and the market price of the Fund’s investment may decrease. During periods of economic uncertainty and change, the market price of a Fund’s investments in below investment grade securities (commonly referred to as “junk bonds”) may be particularly volatile. Often below investment grade securities are subject to greater sensitivity to interest rate and economic changes than higher rated bonds and can be more difficult to value, exposing a Fund to the risk that the price at which it sells them will be less than the price at which they were valued when held by the Fund. See “Credit Risk” and “Illiquidity Risk” for more information about these risks.
A risk run by each Fund with a significant investment in fixed income securities is that an increase in prevailing interest rates will cause the market price of those securities to decline. The risk associated with increases in interest rates (also called “interest rate risk”) is generally greater for Funds investing in fixed income securities with longer durations. In addition, in managing some Funds, GMO may seek to evaluate potential investments in part by considering the volatility of interest rates. The value of a Fund’s investments may be significantly reduced if GMO’s assessment proves incorrect.
The extent to which a fixed income security’s price changes with changes in interest rates is referred to as interest rate duration, which can be measured mathematically or empirically. A longer-maturity investment generally has longer interest rate duration because the investment’s fixed rate is locked in for a longer period of time. Floating-rate or adjustable-rate securities, however, generally have shorter interest rate durations because their interest rates are not fixed but rather float up and down as interest rates change. Conversely, inverse floating-rate securities have durations that move in the opposite direction from short-term interest rates and thus tend to underperform fixed rate securities when interest rates rise but outperform them when interest rates decline. Fixed income securities paying no interest, such as zero coupon and principal-only securities, are subject to additional interest rate risk.
The market price of inflation-indexed bonds (including TIPS) typically declines during periods of rising real interest rates (i.e., nominal interest rate minus inflation) and increases during periods of declining real interest rates. In some interest rate environments, such as when real interest rates are rising faster than nominal interest rates, the market price of inflation-indexed bonds may decline more than the price of non-inflation-indexed (or nominal) fixed income bonds with similar maturities.
Generally, when interest rates on short term U.S. Treasury obligations equal or approach zero, a Fund that invests a substantial portion of its assets in U.S. Treasury obligations, such as U.S. Treasury Fund, will have a negative return unless GMO waives or reduces its management fees.
155
GMO Trust Funds
Notes to Financial Statements — (Continued)
February 28, 2017
Fixed income securities denominated in foreign currencies also are subject to currency risk. See “Currency Risk”.
In response to government intervention, economic or market developments, or other factors, fixed income markets may experience periods of high volatility, reduced liquidity or both. During those periods, a Fund could have unusually high shareholder redemptions, requiring it to generate cash by selling securities when it would otherwise not do so, including at unfavorable prices. Fixed income investments may be difficult to value during such periods. In recent periods, central banks and governmental financial regulators, including the U.S. Federal Reserve, have maintained historically low interest rates by purchasing bonds. Steps to curtail or “taper” such activities and other actions by central banks or regulators (such as intervention in foreign currency markets or currency controls) could have a material adverse effect on the Funds.
• MERGER ARBITRAGE RISK. Some Funds may engage in transactions in which a Fund purchases securities at prices below the value of the consideration GMO expects to be paid for them upon consummation of a proposed merger, exchange offer, tender offer, or other similar transaction (“merger arbitrage transactions”). The purchase price paid by the Fund may substantially exceed the market price of the securities before the announcement of the transaction.
If a Fund engages in a merger arbitrage transaction and that transaction later appears unlikely to be consummated or, in fact, is not consummated or is delayed, the market prices of the securities purchased by the Fund may decline sharply, resulting in losses to the Fund. The risk/reward payout of merger arbitrage strategies typically is asymmetric, as the losses in failed transactions often far exceed the gains in successful transactions. A merger arbitrage transaction can fail for many reasons, including regulatory and antitrust restrictions, political motivations, industry weakness, stock specific events, failed financings, and general market declines.
Merger arbitrage strategies depend for success on the overall volume of merger activity, which has historically been cyclical. When merger activity is low, GMO may be unable to identify enough opportunities to provide sufficient diversification.
Merger arbitrage strategies are subject to the risk of overall market movements, and a Fund may experience losses even if a transaction is consummated. A Fund’s investments in derivatives or short sales of securities to hedge or otherwise adjust long or short investment exposure in connection with a merger arbitrage transaction may not perform as GMO expected or may otherwise reduce the Fund’s gains or increase its losses. Also, a Fund may be unable to hedge against market fluctuations or other risks. In addition, a Fund that sells securities short that GMO expects it to receive upon consummation of a transaction but it does not actually receive (and thus has an unintended “naked” short position) may be required to cover its short position at a time when the securities sold short have appreciated in value, thus resulting in a loss.
• NON-DIVERSIFIED FUNDS. All of the Funds are not “diversified” investment companies within the meaning of the 1940 Act. This means they are allowed to invest in the securities of relatively few issuers. As a result, they may be subject to greater credit, market and other risks, and poor performance by a single issuer may have a greater impact on their performance, than if they were “diversified.”
In addition, each of the Funds may invest a portion of its assets in shares of one or more other GMO Funds that are not diversified investment companies under the 1940 Act. Each of the Funds may invest without limitation in other GMO Funds that are not diversified.
• NON-U.S. INVESTMENT RISK. Funds that invest in non-U.S. securities are subject to more risks than Funds that invest only in U.S. securities. Non-U.S. securities markets often include securities of only a small number of companies in a limited number of industries. As a result, the market prices of many of the securities traded on those markets fluctuate more than those of U.S. securities. In addition, issuers of non-U.S. securities often are not subject to as much regulation as U.S. issuers, and the reporting, accounting, custody, and auditing standards to which those issuers are subject differ, in some cases significantly, from U.S. standards. Transactions in non-U.S. securities generally involve higher commission rates, transfer taxes and custodial costs. In addition, some jurisdictions may limit a Fund’s ability to profit from short-term trading (as defined in the relevant jurisdiction).
A Fund may be subject to non-U.S. taxation, including potentially on a retroactive basis, on (i) capital gains it realizes or dividends, interest, or other amounts it realizes or accrues in respect of non-U.S. investments; (ii) transactions in those investments; and (iii) repatriation of proceeds generated from the sale or other disposition of those investments. A Fund may seek a refund of taxes paid, but its efforts may not be successful, in which case the Fund will have incurred additional expenses for no economic benefit. A Fund’s decision to seek a refund is in its sole discretion, and, particularly in light of the cost involved, it may decide not to seek a refund, even if eligible. The outcome of a Fund’s efforts to obtain a refund may be unpredictable. Accordingly, a refund is not typically reflected in a Fund’s net asset value until it is received or until the Fund determines there is a high likelihood the refund will be received. In some cases, the amount of a refund could be material to a Fund’s net assets. Absent a determination that a refund is collectible and free from significant contingencies, such amount is not typically reflected in a Fund’s net assets. For information on possible special Australian tax consequences of an investment in the Funds, see the Funds’ Prospectus and Statement of Additional Information for more information.
Also, investing in non-U.S. securities exposes a Fund to the risk of nationalization, expropriation, or confiscatory taxation of assets of their issuers, other government involvement in the economy or in the affairs of specific companies or industries (including in the case of wholly or partially state-owned enterprises), adverse changes in investment regulations, capital requirements or exchange controls (which may include suspension of the ability to transfer currency from a country), and adverse political and diplomatic developments, including the imposition of economic sanctions.
156
GMO Trust Funds
Notes to Financial Statements — (Continued)
February 28, 2017
In some non-U.S. securities markets, custody arrangements for securities provide significantly less protection than custody arrangements in U.S. securities markets, and prevailing custody and trade settlement practices (e.g., the requirement to pay for securities prior to receipt) expose a Fund to credit and other risks it does not have in the United States with respect to brokers, custodians, clearing banks or other clearing agents, escrow agents, and issuers. Fluctuations in foreign currency exchange rates also affect the market value of a Fund’s non-U.S. investments (see “Currency Risk”).
The Funds need a license to invest directly in many non-U.S. securities markets. These licenses are often subject to limitations, including maximum investment amounts. Once a license is obtained, a Fund’s ability to continue to invest directly is subject to the risk that the license will be terminated or suspended. If a license to invest in a particular market is terminated or suspended, to obtain exposure to that market the Fund will be required to purchase American Depositary Receipts, Global Depositary Receipts, shares of other funds that are licensed to invest directly, or derivative instruments. The receipt of a non-U.S. license by one of GMO’s clients may preclude other clients, including a Fund, from obtaining a similar license, and this could limit the Fund’s investment opportunities. In addition, the activities of a GMO client could cause the suspension or revocation of a license and thereby limit the Funds’ investment opportunities.
Funds that invest a significant portion of their assets in securities of issuers tied economically to emerging countries (or investments related to emerging markets) are subject to greater non-U.S. investment risk than Funds investing primarily in more developed non-U.S. countries (or markets). The risks of investing in those securities include: greater fluctuations in currency exchange rates; increased risk of default (by both government and private issuers); greater social, economic, and political uncertainty and instability (including the risk of war or natural disaster); increased risk of nationalization, expropriation, or other confiscation of assets of issuers of securities in a Fund’s portfolio; greater governmental involvement in the economy or in the affairs of specific companies or industries (including in the case of wholly or partially state-owned enterprises); less governmental supervision and regulation of the securities markets and participants in those markets; controls on non-U.S. investment, capital controls and limitations on repatriation of invested capital, dividends, interest and other income and on a Fund’s ability to exchange local currencies for U.S. dollars; inability to purchase and sell investments or otherwise settle security or derivative transactions (i.e., a market freeze); unavailability of currency hedging techniques; differences in, or lack of, auditing and financial reporting standards and resulting unavailability of material information about issuers; slower clearance and settlement; difficulties in obtaining and enforcing legal judgments; and significantly smaller market capitalizations of issuers. In addition, the economies of emerging countries may be predominantly based on only a few industries or dependent on revenues from particular commodities.
• SMALL COMPANY RISK. Companies with smaller market capitalizations may have limited product lines, markets, or financial resources, may lack the competitive strength of larger companies, may have inexperienced managers or may depend on a smaller group of key employees as compared to larger companies. In addition, their securities often are less widely held and trade less frequently and in lesser quantities, and their market prices often fluctuate more, than the securities of companies with larger market capitalizations. Market risk and illiquidity risk are particularly pronounced for securities of these companies.
Temporary Defensive Positions. Temporary defensive positions are positions that are inconsistent with a Fund’s principal investment strategies and are taken in response to adverse market, economic, political, or other conditions.
Benchmark-Free Allocation Fund, Benchmark-Free Fund and Implementation Fund may take temporary defensive positions if deemed prudent by GMO.
To the extent a Fund takes a temporary defensive position, or otherwise holds cash, cash equivalents, or high quality debt investments on a temporary basis, the Fund may not achieve its investment objective.
| 4. | Derivative financial instruments |
At February 28, 2017, only Alpha Only Fund, Implementation Fund, SGM Major Markets Fund and Special Opportunities Fund held derivative financial instruments directly. For a listing of derivative financial instruments held by the underlying funds, if any, please refer to the underlying funds’ Schedule of Investments. The derivative information provided below only pertains to direct investments made by Alpha Only Fund, Benchmark-Free Fund, Implementation Fund, SGM Major Markets Fund and Special Opportunities Fund (or their wholly-owned subsidiary).
Derivatives are financial contracts whose value depends on, or is derived from, the value of underlying assets, reference rates, or indices, that are used to increase, decrease or adjust elements of the investment exposures of a Fund’s portfolio. Derivatives may relate to securities, interest rates, currencies, currency exchange rates, inflation rates, commodities and indices, and include foreign currency contracts, swap contracts, reverse repurchase agreements, and other exchange-traded and OTC contracts.
157
GMO Trust Funds
Notes to Financial Statements — (Continued)
February 28, 2017
Use of Derivatives by Alpha Only Fund and Special Opportunities Fund
Alpha Only Fund’s investment program involves having both long and short investment exposures. Alpha Only Fund seeks to construct a portfolio in which it has long investment exposure to asset classes and sub-asset classes that GMO expects will outperform relative to the asset classes and sub-asset classes to which it has short investment exposure.
The Funds may use derivatives to gain long investment exposure to securities or other assets. For example, a Fund may use derivatives instead of investing directly in equity securities, including using equity derivatives to maintain equity exposure when it holds cash by “equitizing” its cash balances using futures contracts or other types of derivatives. The Funds also may use currency derivatives (including forward currency contracts, futures contracts, swap contracts, and options) to gain exposure to a given currency. In addition, Special Opportunities Fund may use derivatives to gain investment exposure to commodities, including the use of exchange-traded futures and foreign exchange contracts to gain exposure to a range of global equity, bond, currency, and commodity markets.
The Funds may use derivatives in an attempt to reduce their investment exposures (which may result in a reduction below zero). A Fund also may use currency derivatives in an attempt to reduce some aspect of the currency exposure in its portfolio. For these purposes, the Fund may use an instrument denominated in a different currency that GMO believes is highly correlated with the relevant currency.
The Funds may use derivatives in an attempt to adjust elements of their investment exposures to various securities, sectors, markets, indices, and currencies (and in the case of Special Opportunities Fund, commodities) without actually having to sell existing investments or make new direct investments. For example, if a Fund holds a large proportion of stocks of companies in a particular sector and GMO believes that stocks of companies in another sector will outperform those stocks, the Fund might use a short futures contract on an appropriate index (to synthetically “sell” a portion of the Fund’s portfolio) in combination with a long futures contract on another index (to synthetically “buy” exposure to that index). In adjusting its investment exposures, a Fund also may use currency derivatives in an attempt to adjust its currency exposure, seeking currency exposure that is different (in some cases, significantly different) from the currencies in which its equities are traded.
The Funds may use derivatives to effect transactions intended as substitutes for securities lending.
Special Opportunities Fund may have investment exposures in excess of its net assets (i.e., it may be leveraged). Alpha Only Fund is not limited in its use of derivatives or in the total notional value of its derivative positions. As a result of its derivative positions, Alpha Only Fund will typically have gross investment exposures in excess of its net assets (i.e., the Fund will be leveraged) and therefore is subject to heightened risk of loss. Alpha Only Fund’s performance can depend substantially, if not primarily, on the performance of assets or indices underlying its derivatives even though it does not own those assets or indices.
A Fund’s foreign currency exposure may differ significantly from the currencies in which its equities are traded
Use of Derivatives by Benchmark-Free Fund and Implementation Fund
The Funds may use derivatives to gain long investment exposure to securities, commodities or other assets. For example, a Fund may use derivatives instead of investing directly in equity securities, including using equity derivatives to maintain equity exposure when it holds cash by “equitizing” its cash balances using futures contracts or other types of derivatives. The Funds also may use exchange-traded futures and forward foreign exchange contracts to gain exposure to a range of global equity, bond, currency, and commodity markets and may use currency derivatives (including forward currency contracts, futures contracts, swap contracts and options) to gain exposure to a given currency.
The Funds may use derivatives such as futures, related options, and swap contracts, in an attempt to reduce their investment exposures (which may result in a reduction below zero). For example, a Fund may use credit default swaps to take a short position with respect to the likelihood of default by an issuer or may use a bond futures contract to short the bond market of a particular country. A Fund also may use currency derivatives in an attempt to reduce (which may result in a reduction below zero) some aspect of the currency exposure in its portfolio. For these purposes, the Fund may use an instrument denominated in a different currency that GMO believes is highly correlated with the relevant currency. Implementation Fund uses exchange-traded futures and forward contracts as an integral part of its investment program.
The Funds may use derivatives in an attempt to adjust elements of their investment exposures to individual commodities, various securities, sectors, markets, indices and currencies without actually having to sell existing investments or make new direct investments. For example, if a Fund holds a large proportion of a certain type of security or commodity and GMO believes that another security or commodity will outperform such security or commodity, the Fund might use a short futures contract on an appropriate index (to synthetically “sell” a portion of those stocks) in combination with a long futures contract on another index (to synthetically “buy” exposure to that index). Long and short swap contracts and contracts for differences also may be used for these purposes. Derivatives used to effect synthetic sales and purchases will generally be unwound as actual portfolio securities are sold and purchased. In adjusting investment exposures, each Fund also may use currency derivatives, seeking currency exposure that is different (in some cases, significantly different) from the currency exposure represented by its portfolio. Each Fund’s foreign currency exposure may differ significantly from the currency exposure represented by its investments.
158
GMO Trust Funds
Notes to Financial Statements — (Continued)
February 28, 2017
The Funds may use derivatives to effect transactions intended as substitutes for securities lending.
Each of the Funds is not limited in its use of derivatives or in the total notional value of its derivative positions. As a result of their derivative positions, the Funds may have gross investment exposures in excess of their net assets (i.e., the Funds may be leveraged) and therefore are subject to heightened risk of loss. Each Fund’s performance can depend substantially, if not primarily, on the performance of assets or indices underlying its derivatives even though it does not own those assets or indices.
Use of Derivatives by SGM Major Markets Fund
The Fund invests in a range of global equity, bond, currency, and commodity markets using exchange traded futures and forward non-U.S. exchange contracts as well as making other investments.
The Fund may use derivatives to gain long and/or short investment exposure to global equities, bonds, currencies, commodities, or other assets. In particular, the Fund may use exchange traded futures and forward foreign exchange contracts to gain exposure to a range of global equity, bond, currency, and commodity markets. The Fund also may use currency derivatives (including forward currency contracts, futures contracts, swap contracts and options) to gain exposure to a given currency.
The Fund may use derivatives in an attempt to adjust its investment exposures. For example, the Fund may use credit default swaps to take a short position with respect to the likelihood of default by an issuer. The Fund also may use currency derivatives in an attempt to reduce (which may result in a reduction below zero) some aspect of the currency exposure in its portfolio. For these purposes, the Fund may use an instrument denominated in a different currency that GMO believes is highly correlated with the relevant currency.
The Fund may use derivatives, such as futures, related options, and swap contracts, in an attempt to adjust elements of its investment exposures to individual commodities, various securities, sectors, markets, indices and currencies without actually having to sell existing investments or make new direct investments. For example, if the Fund holds a large proportion of a certain type of security or commodity and GMO believes that another security or commodity will outperform such security or commodity, the Fund might use a short futures contract on an appropriate index (to synthetically “sell” a portion of the Fund’s portfolio) in combination with a long futures contract on another index (to synthetically “buy” exposure to that index). Long and short swap contracts and contracts for differences also may be used for these purposes. Derivatives used to effect synthetic sales and purchases will generally be unwound as actual portfolio securities are sold and purchased. In addition, the Fund may alter the interest rate exposure of debt instruments by employing interest rate swaps. Such a strategy is designed to maintain the Fund’s exposure to the credit of an issuer through the debt instrument but adjust the Fund’s interest rate exposure through the swap. With these swaps, the Fund and its counterparties exchange interest rate exposure, such as fixed versus variable rates and shorter duration versus longer duration exposure. In adjusting its investment exposure, the Fund also may use currency derivatives in an attempt to adjust its currency exposure, seeking currency exposure that is different (in some cases, significantly different) from the currencies in which its equities are traded.
The Fund is not limited in its use of derivatives or in the total notional value of its derivative positions. As a result of its derivative positions, the Fund will typically have gross investment exposures in excess of its net assets (i.e., the Fund will be leveraged) and therefore is subject to heightened risk of loss. The Fund’s performance can depend substantially, if not primarily, on the performance of assets or indices underlying its derivatives even though it does not own those assets or indices.
* * *
Certain derivatives transactions that may be used by the Funds, including certain interest rate swaps and certain credit default index swaps, are required to be transacted through a central clearing organization. The Funds hold cleared derivatives transactions, if any, through clearing members, who are members of derivatives clearing houses. Certain other derivatives, including futures and certain options, are transacted on exchanges. The Funds hold exchange-traded derivatives through clearing brokers that are typically members of the exchanges. In contrast to bilateral derivatives transactions, following a period of advance notice to the Fund, clearing brokers generally can require termination of existing cleared or exchange-traded derivatives transactions at any time and increases in margin above the margin that it required at the beginning of a transaction. Clearing houses and exchanges also have broad rights to increase margin requirements for existing transactions and to terminate transactions. Any such increase or termination could interfere with the ability of a Fund to pursue its investment strategy. Also, a Fund is subject to execution risk if it enters into a derivatives transaction that is required to be cleared (or that GMO expects to be cleared), and no clearing member is willing or able to clear the transaction on the Fund’s behalf. In that case, the transaction might have to be terminated, and the Fund could lose some or all of the benefit of any increase in the value of the transaction after the time of the transaction.
The use of derivatives involves risks that are in addition to, and potentially greater than, the risks associated with investing directly in securities and other more traditional assets. See “Investment and other risks” above for further information.
159
GMO Trust Funds
Notes to Financial Statements — (Continued)
February 28, 2017
For Funds that held derivatives during the year ended February 28, 2017, the following table shows how the Fund used these derivatives (marked with an X):
| | | | | | | | | | | | | | | | | | | | |
| | | | | | |
| Type of Derivative and Objective for Use | | Alpha Only Fund | | | Benchmark-
Free Fund | | | Consolidated
Implementation
Fund* | | | Consolidated
Special
Opportunities
Fund‡ | | | Consolidated
SGM Major
Markets
Fund¤ | |
| Forward currency contracts | | | | | | | | | | | | | | | | | | | | |
Adjust currency exchange rate risk | | | | | | | | | | | | | | | | | | | X | |
Adjust exposure to foreign currencies | | | X | | | | X | | | | X | | | | X | | | | X | |
Manage against anticipated currency exchange rate changes | | | | | | | | | | | X | | | | | | | | | |
| Futures contracts | | | | | | | | | | | | | | | | | | | | |
Adjust exposure to certain securities markets | | | | | | | X | | | | X | | | | | | | | X | |
Substitute for direct investment | | | | | | | | | | | | | | | X | | | | X | |
Maintain the diversity and liquidity of the portfolio | | | | | | | X | | | | X | | | | | | | | X | |
Hedge some or all of the broad market exposure of the underlying funds and/or assets in which the Fund invests | | | X | | | | | | | | | | | | | | | | | |
Adjust interest rate exposure | | | | | | | | | | | X | | | | | | | | X | |
| Options (Purchased) | | | | | | | | | | | | | | | | | | | | |
Substitute for direct equity investment | | | | | | | | | | | X | | | | | | | | | |
Adjust currency exchange rate risk | | | | | | | | | | | X | | | | | | | | | |
Adjust exposure to foreign currencies | | | | | | | | | | | X | | | | | | | | | |
Adjust interest rate exposure | | | | | | | | | | | X | | | | | | | | | |
| Options (Written) | | | | | | | | | | | | | | | | | | | | |
Substitute for direct equity investment | | | | | | | | | | | X | | | | X | | | | | |
Adjust currency exchange rate risk | | | | | | | | | | | X | | | | | | | | | |
Adjust exposure to foreign currencies | | | | | | | | | | | X | | | | | | | | | |
Adjust interest rate exposure | | | | | | | | | | | X | | | | | | | | | |
| Swap contracts | | | | | | | | | | | | | | | | | | | | |
Adjust interest rate exposure | | | | | | | | | | | X | | | | | | | | | |
Adjust exposure to foreign currencies | | | | | | | | | | | X | | | | | | | | | |
Substitute for direct investment in securities | | | | | | | X | | | | X | | | | | | | | | |
Achieve exposure to a reference entity’s credit | | | | | | | | | | | X | | | | X | | | | | |
| Rights and/or warrants | | | | | | | | | | | | | | | | | | | | |
Received as a result of corporate actions | | | X | | | | X | | | | X | | | | X | | | | | |
| | * | Certain derivatives are held by Implementation Fund’s wholly-owned subsidiary. |
| | ‡ | Certain derivatives are held by Special Opportunities Fund’s wholly-owned subsidiary. |
| | ¤ | Certain derivatives are held by SGM Major Markets Fund’s wholly-owned subsidiary. |
Forward currency contracts
The Funds may enter into forward currency contracts, including forward cross currency contracts. A forward currency contract is an agreement between two parties to buy and sell a currency at a set price on a future date (or to pay or receive the amount of the change in relative values of the two currencies). The market price of a forward currency contract fluctuates with changes in forward currency exchange rates. The value of each of the Fund’s forward currency contracts is marked-to-market daily using rates supplied by a quotation service and changes in value are recorded by
160
GMO Trust Funds
Notes to Financial Statements — (Continued)
February 28, 2017
each Fund as unrealized gains or losses. Realized gains or losses on the contracts are equal to the difference between the value of the contract at the time it was opened and the value at the time it was settled.
These contracts involve market risk in excess of the unrealized gain or loss. Forward currency contracts expose a Fund to the market risk of unfavorable movements in currency values and the risk that the counterparty will be unable or unwilling to meet the terms of the contracts. Most forward currency contracts are not collateralized. Forward currency contracts outstanding at the end of the year, if any, are listed in each applicable Fund’s Schedule of Investments.
Futures contracts
The Funds may purchase and sell futures contracts. A futures contract is a contract that obligates the holder to buy or sell an asset at a predetermined delivery price at a specified time in the future. Some futures contracts are net (cash) settled. Upon entering into a futures contract, a Fund is required to deposit cash, U.S. government and agency obligations or other liquid assets with the futures clearing broker in accordance with the initial margin requirements of the broker or exchange. Futures contracts are generally valued at the settlement price established at the close of business each day by the board of trade or exchange on which they are traded (and if the futures are traded outside the U.S. and the market for such futures is closed prior to the close of the NYSE due to time zone differences, the values will be adjusted, to the extent practicable and available, based on inputs from an independent pricing service approved by the Trustees to reflect estimated valuation changes through the NYSE close). The value of each of the Fund’s futures contracts is marked-to-market daily and an appropriate payable or receivable for the change in value (“variation margin”) is recorded by each Fund. The payable or receivable is settled on the following business day. Gains or losses are recognized but not accounted for as realized until the contracts expire or are closed. Futures contracts involve, to varying degrees, risk of loss in excess of the variation margin as recorded on the Statements of Assets and Liabilities. Under some circumstances, futures exchanges may establish daily limits on the amount that the price of a futures contract can vary from the previous day’s settlement price, thereby effectively preventing liquidation of unfavorable positions. Futures contracts expose the Funds to the risk that they may not be able to enter into a closing transaction due to an illiquid market. Futures contracts outstanding at the end of the year, if any, are listed in each applicable Fund’s Schedule of Investments.
Options
The Funds may purchase call and put options. A call option gives the holder the right to buy an asset; a put option gives the holder the right to sell an asset. “Quanto” options are cash-settled options in which the underlying asset (often an index) is denominated in a currency other than the currency in which the option is settled. By purchasing options a Fund alters its exposure to the underlying asset by, in the case of a call option, entitling it to purchase the underlying asset at a set price from the writer of the option and, in the case of a put option, entitling it to sell the underlying asset at a set price to the writer of the option. A Fund pays a premium for a purchased option. That premium, if any, which is disclosed in the Schedule of Investments, is subsequently reflected in the marked-to-market value of the option. The potential loss associated with purchasing put and call options is limited to the premium paid. Purchased option contracts outstanding at the end of the year, if any, are listed in each applicable Fund’s Schedule of Investments.
The Funds may write (i.e., sell) call and put options on futures, swaps (“swaptions”), securities or currencies they own or in which they may invest. Writing options alters a Fund’s exposure to the underlying asset by, in the case of a call option, obligating that Fund to sell the underlying asset at a set price to the option-holder and, in the case of a put option, obligating that Fund to purchase the underlying asset at a set price from the option-holder. In some cases (e.g., index options), settlement will be in cash, based on a formula price. When a Fund writes a call or put option, an amount equal to the premium received is recorded as a liability and is subsequently included in the marked-to-market value of the option. As a writer of an option, a Fund has no control over whether it will be required to sell (call) or purchase (put) the underlying asset and as a result bears the risk of an unfavorable change in the price of the asset underlying the option. In the event that a Fund writes call options without an offsetting exposure (e.g., call options on an asset that the Fund does not own), it bears an unlimited risk of loss if the price of the underlying asset increases during the term of the option. OTC options expose a Fund to the risk the Fund may not be able to enter into a closing transaction because of an illiquid market. Written option contracts outstanding at the end of the year, if any, are listed in each applicable Fund’s Schedule of Investments.
When an option contract is closed, that Fund records a realized gain or loss equal to the difference between the value of the contract at the time it was opened and the value at the time it was closed. Realized gains and losses on purchased options are included in realized gains and losses on investment securities. If a written call option is exercised, the premium originally received is recorded as an addition to sales proceeds. If a written put option is exercised, the premium originally received is recorded as a reduction in the cost of investments purchased. Gains and losses from the expiration or closing of written option contracts are separately disclosed in the Statements of Operations.
161
GMO Trust Funds
Notes to Financial Statements — (Continued)
February 28, 2017
For the year ended February 28, 2017, investment activity in options contracts written by the Funds was as follows:
| | | | | | | | | | | | | | | | | | | | | | | | |
| | | Puts | | | Calls | |
| | | | | | | |
| | | Principal
Amount of
Contracts | | | Number of
Contracts | | | Premiums | | | Principal
Amount of
Contracts | | | Number of
Contracts | | | Premiums | |
Consolidated Implementation Fund | | | | | | | | | | | | | | | | | | | | | | | | |
Outstanding, beginning of period | | | 66,117,704 | | | | 4,296 | | | $ | 3,619,425 | | | | 2,530,576,425 | | | | 7,337 | | | $ | 97,090,157 | |
Options written | | | — | | | | 25,216 | | | | 4,845,584 | | | | 364,398,000 | | | | 80,263 | | | | 28,346,793 | |
Options bought back | | | (33,061,000 | ) | | | (25,216 | ) | | | (6,963,911 | ) | | | (2,894,979,000 | ) | | | (7,842 | ) | | | (113,716,686 | ) |
Options expired | | | (33,056,704 | ) | | | (4,296 | ) | | | (1,501,098 | ) | | | 4,575 | | | | (44,091 | ) | | | (4,828,466 | ) |
Options exercised | | | — | | | | — | | | | — | | | | — | | | | (2,737 | ) | | | (1,675,040 | ) |
| | | | | | | | | | | | | | | | | | | | | | | | | |
Outstanding, end of period | | | — | | | | — | | | $ | — | | | | — | | | | 32,930 | | | $ | 5,216,758 | |
| | | | | | | | | | | | | | | | | | | | | | | | | |
| | | | | | | | | | | | | | | | | | | | | | | | | |
Consolidated Special Opportunities Fund | | | | | | | | | | | | | | | | | | | | | | | | |
Outstanding, beginning of period | | | — | | | | 430 | | | $ | 419,205 | | | | — | | | | — | | | $ | — | |
Options written | | | — | | | | 8,120 | | | | 7,208,786 | | | | — | | | | — | | | | — | |
Options bought back | | | — | | | | — | | | | — | | | | — | | | | — | | | | — | |
Options expired | | | — | | | | (4,200 | ) | | | (4,618,825 | ) | | | — | | | | — | | | | — | |
Options exercised | | | — | | | | — | | | | — | | | | — | | | | — | | | | — | |
| | | | | | | | | | | | | | | | | | | | | | | | | |
Outstanding, end of period | | | — | | | | 4,350 | | | $ | 3,009,166 | | | | — | | | | — | | | $ | — | |
| | | | | | | | | | | | | | | | | | | | | | | | | |
| | | | | | | | | | | | | | | | | | | | | | | | | |
In a credit linked option contract, one party makes payments to another party in exchange for the option to exercise a contract where the buyer has the right to receive a specified return if a credit event (e.g., default or similar event) occurs with respect to a reference entity or entities and a specified decrease in the value of the related collateral occurs. A writer of a credit linked option receives periodic payments in return for its obligation to pay an agreed-upon value to the other party if they exercise their option in the case of a credit event. If no credit event occurs, the seller has no payment obligation and will keep the premiums received.
Exchange-traded options are valued at the last sale price, provided that price is between the closing bid and ask prices. If the last sale price is not within this range, then they will be valued at the closing bid price for long positions and the closing ask price for short positions (and if the market of the underlying reference security closes or the official closing time of the underlying index occurs prior to the close of the NYSE due to time zone differences, the values will be adjusted, to the extent practicable and available, based on inputs from an independent pricing service approved by the Trustees to reflect estimated valuation changes through the NYSE close). The Funds value OTC options using industry models and inputs provided by primary pricing sources.
Swap contracts
The Funds may directly or indirectly use various swap contracts, including, without limitation, swaps on securities and securities indices, total return swaps, interest rate swaps, credit default swaps, variance swaps, commodity swaps, inflation swaps, municipal swaps, dividend swaps, volatility swaps, correlation swaps and other types of available swaps. A swap contract is an agreement to exchange the return generated by one asset for the return generated by another asset. Some swap contracts are net settled. When entering into a swap contract and during the term of the transaction, a Fund and/or the swap counterparty may post or receive cash or securities as collateral.
Initial upfront payments received or made upon entering into a swap contract are included in the fair market value of the swap. The Funds do not amortize upfront payments. Net periodic payments made or received to compensate for differences between the stated terms of the swap contract and prevailing market conditions (credit spreads, currency exchange rates, interest rates, and other relevant factors) are recorded as realized gains or losses in the Statements of Operations. A liquidation payment received or made at the termination of the swap contract is recorded as realized gain or loss in the Statements of Operations.
Interest rate swap contracts involve an exchange by the parties of their respective commitments to pay or rights to receive interest (e.g., an exchange of floating rate interest payments for fixed rate interest payments with respect to the notional amount of principal). Basis swaps are interest rate swaps that involve the exchange of two floating interest rate payments and may involve the exchange of two different currencies.
Inflation swaps involve the exchange of a floating rate linked to an index for a fixed rate interest payment with respect to a notional amount or principal.
162
GMO Trust Funds
Notes to Financial Statements — (Continued)
February 28, 2017
Total return swap contracts involve a commitment by one party to pay interest to the other party in exchange for a payment to it from the other party based on the return of a reference asset (e.g., a security, basket of securities, or futures contract), both based on notional amounts. To the extent the return of the reference asset exceeds or falls short of the interest payments, one party is entitled to receive a payment from or obligated to make a payment to the other party.
In a credit default swap contract, one party makes payments to another party in exchange for the right to receive a specified return (or to put a security) if a credit event (e.g., default or similar event) occurs with respect to a reference entity or entities. A seller of credit default protection receives periodic payments in return for its obligation to pay the principal amount of a debt security (or other agreed-upon value) to the other party upon the occurrence of a credit event. If no credit event occurs, the seller has no payment obligations so long as there is no early termination.
For credit default swap contracts on asset-backed securities, a credit event may be triggered by various occurrences, which may include an issuer’s failure to pay interest or principal on a reference security, a breach of a material representation or covenant, an agreement by the holders of an asset-backed security to a maturity extension, or a write-down on the collateral underlying the security. For credit default swap contracts on corporate or sovereign issuers, a credit event may be triggered by such occurrences as the issuer’s bankruptcy, failure to pay interest or principal, repudiation/moratorium and/or restructuring.
Correlation swaps involve receiving a stream of payments based on the actual average correlation between or among the price movements of two or more underlying variables over a period of time, in exchange for making a regular stream of payments based on a fixed “strike” correlation level (or vice versa), where both payment streams are based on a notional amount. The underlying variables may include, without limitation, commodity prices, exchange rates, interest rates and stock indices.
Variance swap contracts involve an agreement by two parties to exchange cash flows based on the measured variance (or square of volatility) of a specified underlying asset. One party agrees to exchange a “fixed rate” or strike price payment for the “floating rate” or realized price variance on the underlying asset with respect to the notional amount. At inception, the strike price chosen is generally fixed at a level such that the fair value of the swap is zero. As a result, no money changes hands at the initiation of the contract. At the expiration date, the amount payable by one party to the other is the difference between the realized price variance of the underlying asset and the strike price multiplied by the notional amount. A receiver of the realized price variance would be entitled to receive a payment when the realized price variance of the underlying asset is greater than the strike price and would be obligated to make a payment when that variance is less than the strike price. A payer of the realized price variance would be obligated to make a payment when the realized price variance of the underlying asset is greater than the strike price and would be entitled to receive a payment when that variance is less than the strike price. This type of agreement is essentially a forward contract on the future realized price variance of the underlying asset.
Forward starting dividend swap contracts involve an exchange by the parties of their respective commitments to pay or rights to receive the changes in a dividend index point. A Fund gains exposure by either paying or receiving an amount in respect of an increase or decrease in the change of the relevant dividend index point based on a notional amount. For example, if a Fund took a long position on a dividend index swap, the Fund would receive payments if the relevant index point increased in value and would be obligated to pay if that index point decreased in value.
Future swap contracts involve an exchange by the parties of their respective commitments to pay or rights to receive the changes in an index. The Fund gains exposure by either paying or receiving an amount in respect of an increase or decrease in the change of the index based on a notional amount. For example, if the Fund took a long position on a future swap, the Fund would receive payments if the relevant index increased in value and would be obligated to pay if that index decreased in value.
Generally, the Funds price their OTC swap contracts daily using industry standard models that may incorporate quotations from market makers or pricing vendors and record the change in value, if any, as unrealized gain or loss in the Statements of Operations. Gains or losses are realized upon the termination of the swap contracts or reset dates, as appropriate. Cleared swap contracts are valued using the quote (which may be based on a model) published by the relevant clearing house. If an updated quote for a cleared swap contract is not available by the time that a Fund calculates its net asset value on any business day, then that swap contract will generally be valued using an industry standard model, which may differ from the model used by the relevant clearing house.
The values assigned to swap contracts may differ significantly from the values realized upon termination, and the differences could be material. Entering into swap contracts involves counterparty credit, legal, and documentation risk that is generally not reflected in the value assigned to the swap contract. Such risks include the possibility that the counterparty defaults on its obligations to perform or disagrees as to the meaning of contractual terms, that a Fund has amounts on deposit in excess of amounts owed by that Fund, or that any collateral the other party posts is insufficient or not timely received by a Fund. Credit risk is particularly acute in economic environments in which financial services firms are exposed to systemic risks of the type evidenced by the insolvency of Lehman Brothers in 2008 and subsequent market disruptions. Swap contracts outstanding at the end of the year, if any, are listed in each applicable Fund’s Schedule of Investments.
163
GMO Trust Funds
Notes to Financial Statements — (Continued)
February 28, 2017
Rights and warrants
The Funds may purchase or otherwise receive warrants or rights. Warrants and rights generally give the holder the right to receive, upon exercise, a security of the issuer at a set price. Funds typically use warrants and rights in a manner similar to their use of purchased options on securities, as described in the section entitled “Options” above. Risks associated with the use of warrants and rights are generally similar to risks associated with the use of purchased options. However, warrants and rights often do not have standardized terms, and may have longer maturities and may be less liquid than exchange-traded options. In addition, the terms of warrants or rights may limit a Fund’s ability to exercise the warrants or rights at such times and in such quantities as the Fund would otherwise wish. Rights and/or warrants outstanding at the end of the year, if any, are listed in each applicable Fund’s Schedule of Investments.
As provided by U.S. GAAP, the table below is based on market values or unrealized appreciation/(depreciation) rather than the notional amounts of derivatives. Changes to market values of reference asset(s) will tend to have a greater impact on the Funds (with correspondingly greater risk) the greater the notional amount. For further information on notional amounts, see the Schedule of Investments.
The following is a summary of the valuations of derivative instruments categorized by risk exposure.
The Effect of Derivative Instruments on the Statements of Assets and Liabilities as of February 28, 2017 and the Statements of Operations for the year ended February 28, 2017^:
The risks referenced in the tables below are not intended to be inclusive of all risks. Please see the “Investment and other risks” and “Portfolio valuation” sections for a further discussion of risks.
| | | | | | | | | | | | | | | | | | | | | | | | | | | | | | | | |
| | | | | | | | | |
| | | Credit Contracts | | | Commodity
Contracts | | | Equity Contracts | | | Foreign
Currency
Contracts | | | Inflation
Contracts | | | Interest
Rate
Contracts | | | Other Contracts | | | Total | |
Alpha Only Fund | | | | | | | | | | | | | | | | | |
Asset Derivatives | | | | | | | | | | | | | | | | | | | | | | | | | | | | | | | | |
Investments, at value (rights and/or warrants) | | $ | — | | | $ | — | | | $ | 3,174 | | | $ | — | | | $ | — | | | $ | — | | | $ | — | | | $ | 3,174 | |
Unrealized Appreciation on Futures Contracts¤ | | | — | | | | — | | | | 24,455 | | | | — | | | | — | | | | — | | | | — | | | | 24,455 | |
| | | | | | | | | | | | | | | | | | | | | | | | | | | | | | | | | |
Total | | $ | — | | | $ | — | | | $ | 27,629 | | | $ | — | | | $ | — | | | $ | — | | | $ | — | | | $ | 27,629 | |
| | | | | | | | | | | | | | | | | | | | | | | | | | | | | | | | | |
Derivatives not subject to Master Agreements | | $ | — | | | $ | — | | | $ | 3,174 | | | $ | — | | | $ | — | | | $ | — | | | $ | — | | | $ | 3,174 | |
| | | | | | | | | | | | | | | | | | | | | | | | | | | | | | | | | |
Total subject to Master Agreements | | $ | — | | | $ | — | | | $ | 24,455 | | | $ | — | | | $ | — | | | $ | — | | | $ | — | | | $ | 24,455 | |
| | | | | | | | | | | | | | | | | | | | | | | | | | | | | | | | | |
Liability Derivatives | | | | | | | | | | | | | | | | | | | | | | | | | | | | | | | | |
Unrealized Depreciation on Futures Contracts¤ | | $ | — | | | $ | — | | | $ | (8,407,599 | ) | | $ | — | | | $ | — | | | $ | — | | | $ | — | | | $ | (8,407,599 | ) |
| | | | | | | | | | | | | | | | | | | | | | | | | | | | | | | | | |
Total | | $ | — | | | $ | — | | | $ | (8,407,599 | ) | | $ | — | | | $ | — | | | $ | — | | | $ | — | | | $ | (8,407,599 | ) |
| | | | | | | | | | | | | | | | | | | | | | | | | | | | | | | | | |
Derivatives not subject to Master Agreements | | $ | — | | | $ | — | | | $ | — | | | $ | — | | | $ | — | | | $ | — | | | $ | — | | | $ | — | |
| | | | | | | | | | | | | | | | | | | | | | | | | | | | | | | | | |
Total subject to Master Agreements | | $ | — | | | $ | — | | | $ | (8,407,599 | ) | | $ | — | | | $ | — | | | $ | — | | | $ | — | | | $ | (8,407,599 | ) |
| | | | | | | | | | | | | | | | | | | | | | | | | | | | | | | | | |
Net Realized Gain (Loss) on | | | | | | | | | | | | | | | | | | | | | | | | | | | | | | | | |
Forward Currency Contracts | | $ | — | | | $ | — | | | $ | — | | | $ | 108,902 | | | $ | — | | | $ | — | | | $ | — | | | | 108,902 | |
Futures Contracts | | | — | | | | — | | | | (45,393,896 | ) | | | — | | | | — | | | | — | | | | — | | | | (45,393,896 | ) |
| | | | | | | | | | | | | | | | | | | | | | | | | | | | | | | | | |
Total | | $ | — | | | $ | — | | | $ | (45,393,896 | ) | | $ | 108,902 | | | $ | — | | | $ | — | | | $ | — | | | $ | (45,284,994 | ) |
| | | | | | | | | | | | | | | | | | | | | | | | | | | | | | | | | |
Change in Net Unrealized Appreciation (Depreciation) on | | | | | | | | | | | | | | | | | | | | | | | | | | | | | | | | |
Investments (rights and/or warrants) | | $ | — | | | $ | — | | | $ | 3,198 | | | $ | — | | | $ | — | | | $ | — | | | $ | — | | | $ | 3,198 | |
Forward Currency Contracts | | | — | | | | — | | | | — | | | | 108,542 | | | | — | | | | — | | | | — | | | | 108,542 | |
Futures Contracts | | | — | | | | — | | | | (7,921,154 | ) | | | — | | | | — | | | | — | | | | — | | | | (7,921,154 | ) |
| | | | | | | | | | | | | | | | | | | | | | | | | | | | | | | | | |
Total | | $ | — | | | $ | — | | | $ | (7,917,956 | ) | | $ | 108,542 | | | $ | — | | | $ | — | | | $ | — | | | $ | (7,809,414 | ) |
| | | | | | | | | | | | | | | | | | | | | | | | | | | | | | | | | |
| | | | | | | | | | | | | | | | | | | | | | | | | | | | | | | | | |
164
GMO Trust Funds
Notes to Financial Statements — (Continued)
February 28, 2017
| | | | | | | | | | | | | | | | | | | | | | | | | | | | | | | | |
| | | | | | | | | |
| | | Credit Contracts | | | Commodity
Contracts | | | Equity Contracts | | | Foreign
Currency
Contracts | | | Inflation
Contracts | | | Interest
Rate
Contracts | | | Other Contracts | | | Total | |
Benchmark-Free Fund | | | | | | | | | | | | | | | | | | | | | | | | | | | | | | | | |
Asset Derivatives | | | | | | | | | | | | | | | | | | | | | | | | | | | | | | | | |
Investments, at value (rights and/or warrants) | | $ | — | | | $ | — | | | $ | 127,848 | | | $ | — | | | $ | — | | | $ | — | | | $ | — | | | $ | 127,848 | |
| | | | | | | | | | | | | | | | | | | | | | | | | | | | | | | | | |
Total | | $ | — | | | $ | — | | | $ | 127,848 | | | $ | — | | | $ | — | | | $ | — | | | $ | — | | | $ | 127,848 | |
| | | | | | | | | | | | | | | | | | | | | | | | | | | | | | | | | |
Derivatives not subject to Master Agreements | | $ | — | | | $ | — | | | $ | 127,848 | | | $ | — | | | $ | — | | | $ | — | | | $ | — | | | $ | 127,848 | |
| | | | | | | | | | | | | | | | | | | | | | | | | | | | | | | | | |
Total subject to Master Agreements | | $ | — | | | $ | — | | | $ | — | | | $ | — | | | $ | — | | | $ | — | | | $ | — | | | $ | — | |
| | | | | | | | | | | | | | | | | | | | | | | | | | | | | | | | | |
Net Realized Gain (Loss) on | | | | | | | | | | | | | | | | | | | | | | | | | | | | | | | | |
Investments (rights and/or warrants) | | $ | — | | | $ | — | | | $ | 30 | | | $ | — | | | $ | — | | | $ | — | | | $ | — | | | $ | 30 | |
Forward Currency Contracts | | | — | | | | — | | | | — | | | | 5,196,244 | | | | — | | | | — | | | | — | | | | 5,196,244 | |
Futures Contracts | | | — | | | | — | | | | 6,495,210 | | | | — | | | | — | | | | — | | | | — | | | | 6,495,210 | |
Swap Contracts | | | — | | | | — | | | | 299,633 | | | | — | | | | — | | | | — | | | | — | | | | 299,633 | |
| | | | | | | | | | | | | | | | | | | | | | | | | | | | | | | | | |
Total | | $ | — | | | $ | — | | | $ | 6,794,873 | | | $ | 5,196,244 | | | $ | — | | | $ | — | | | $ | — | | | $ | 11,991,117 | |
| | | | | | | | | | | | | | | | | | | | | | | | | | | | | | | | | |
Change in Net Unrealized Appreciation (Depreciation) on | | | | | | | | | | | | | | | | | | | | | | | | | | | | | | | | |
Investments (rights and/or warrants) | | $ | — | | | $ | — | | | $ | 127,848 | | | $ | — | | | $ | — | | | $ | — | | | $ | — | | | $ | 127,848 | |
Forward Currency Contracts | | | — | | | | — | | | | — | | | | (7,251,480 | ) | | | — | | | | — | | | | — | | | | (7,251,480 | ) |
Futures Contracts | | | — | | | | — | | | | (197,030 | ) | | | — | | | | — | | | | — | | | | — | | | | (197,030 | ) |
Swap Contracts | | | — | | | | — | | | | 19,340 | | | | — | | | | — | | | | — | | | | — | | | | 19,340 | |
| | | | | | | | | | | | | | | | | | | | | | | | | | | | | | | | | |
Total | | $ | — | | | $ | — | | | $ | (49,842 | ) | | $ | (7,251,480 | ) | | $ | — | | | $ | — | | | $ | — | | | $ | (7,301,322 | ) |
| | | | | | | | | | | | | | | | | | | | | | | | | | | | | | | | | |
| | | | | | | | | | | | | | | | | | | | | | | | | | | | | | | | | |
Consolidated Implementation Fund | | | | | | | | | | | | | | | | | | | | | | | | | | | | | | | | |
Asset Derivatives | | | | | | | | | | | | | | | | | | | | | | | | | | | | | | | | |
Investments, at value (purchased options) | | $ | — | | | $ | — | | | $ | 11,446,555 | | | $ | 671,408 | | | $ | — | | | $ | — | | | $ | — | | | $ | 12,117,963 | |
Investments, at value (rights and/or warrants) | | | — | | | | — | | | | 7,665,317 | | | | — | | | | — | | | | — | | | | — | | | | 7,665,317 | |
Unrealized Appreciation on Forward Currency Contracts | | | — | | | | — | | | | — | | | | 7,738,252 | | | | — | | | | — | | | | — | | | | 7,738,252 | |
Unrealized Appreciation on Futures Contracts¤ | | | — | | | | — | | | | — | | | | — | | | | — | | | | 134,332 | | | | — | | | | 134,332 | |
Unrealized Appreciation on Swap Contracts¤ | | | 12,514,978 | | | | — | | | | 573,066 | | | | — | | | | — | | | | 2,952,937 | | | | — | | | | 16,040,981 | |
| | | | | | | | | | | | | | | | | | | | | | | | | | | | | | | | | |
Total | | $ | 12,514,978 | | | $ | — | | | $ | 19,684,938 | | | $ | 8,409,660 | | | $ | — | | | $ | 3,087,269 | | | $ | — | | | $ | 43,696,845 | |
| | | | | | | | | | | | | | | | | | | | | | | | | | | | | | | | | |
Derivatives not subject to Master Agreements | | $ | — | | | $ | — | | | $ | 7,665,317 | | | $ | — | | | $ | — | | | $ | — | | | $ | — | | | $ | 7,665,317 | |
| | | | | | | | | | | | | | | | | | | | | | | | | | | | | | | | | |
Total subject to Master Agreements | | $ | 12,514,978 | | | $ | — | | | $ | 12,019,621 | | | $ | 8,409,660 | | | $ | — | | | $ | 3,087,269 | | | $ | — | | | $ | 36,031,528 | |
| | | | | | | | | | | | | | | | | | | | | | | | | | | | | | | | | |
Liability Derivatives | | | | | | | | | | | | | | | | | | | | | | | | | | | | | | | | |
Unrealized Depreciation on Forward Currency Contracts | | $ | — | | | $ | — | | | $ | — | | | $ | (8,602,052 | ) | | $ | — | | | $ | — | | | $ | — | | | $ | (8,602,052 | ) |
Unrealized Depreciation on Futures Contracts¤ | | | — | | | | — | | | | — | | | | — | | | | — | | | | (77,397 | ) | | | — | | | | (77,397 | ) |
Written Options, at value | | | — | | | | — | | | | (6,833,745 | ) | | | — | | | | — | | | | — | | | | — | | | | (6,833,745 | ) |
Unrealized Depreciation on Swap Contracts¤ | | | (2,410,662 | ) | | | — | | | | — | | | | — | | | | — | | | | (17,869,637 | ) | | | — | | | | (20,280,299 | ) |
| | | | | | | | | | | | | | | | | | | | | | | | | | | | | | | | | |
Total | | $ | (2,410,662 | ) | | $ | — | | | $ | (6,833,745 | ) | | $ | (8,602,052 | ) | | $ | — | | | $ | (17,947,034 | ) | | $ | — | | | $ | (35,793,493 | ) |
| | | | | | | | | | | | | | | | | | | | | | | | | | | | | | | | | |
Derivatives not subject to Master Agreements | | $ | — | | | $ | — | | | $ | — | | | $ | — | | | $ | — | | | $ | — | | | $ | — | | | $ | — | |
| | | | | | | | | | | | | | | | | | | | | | | | | | | | | | | | | |
Total subject to Master Agreements | | $ | (2,410,662 | ) | | $ | — | | | $ | (6,833,745 | ) | | $ | (8,602,052 | ) | | $ | — | | | $ | (17,947,034 | ) | | $ | — | | | $ | (35,793,493 | ) |
| | | | | | | | | | | | | | | | | | | | | | | | | | | | | | | | | |
| | | | | | | | | | | | | | | | | | | | | | | | | | | | | | | | | |
165
GMO Trust Funds
Notes to Financial Statements — (Continued)
February 28, 2017
| | | | | | | | | | | | | | | | | | | | | | | | | | | | | | | | |
| | | | | | | | | |
| | | Credit Contracts | | | Commodity
Contracts | | | Equity Contracts | | | Foreign
Currency
Contracts | | | Inflation
Contracts | | | Interest
Rate
Contracts | | | Other Contracts | | | Total | |
Consolidated Implementation Fund (continued) | | | | | | | | | | | | | | | | | | | | | | | | | |
Net Realized Gain (Loss) on | | | | | | | | | | | | | | | | | | | | | | | | | | | | | | | | |
Investments (purchased options) | | $ | — | | | $ | — | | | $ | (29,814,733 | ) | | $ | (43,281,107 | ) | | $ | — | | | $ | (114,882,740 | ) | | $ | — | | | $ | (187,978,580 | ) |
Investments (rights and/or warrants) | | | — | | | | — | | | | 229,668 | | | | — | | | | — | | | | — | | | | — | | | | 229,668 | |
Forward Currency Contracts | | | — | | | | — | | | | — | | | | 28,499,131 | | | | — | | | | — | | | | — | | | | 28,499,131 | |
Futures Contracts | | | — | | | | — | | | | — | | | | — | | | | — | | | | (1,780,766 | ) | | | — | | | | (1,780,766 | ) |
Written Options | | | — | | | | — | | | | 7,184,423 | | | | 3,433,332 | | | | — | | | | (31,674,503 | ) | | | — | | | | (21,056,748 | ) |
Swap Contracts | | | (3,316,600 | ) | | | — | | | | (1,683,964 | ) | | | — | | | | — | | | | 95,659,461 | | | | — | | | | 90,658,897 | |
| | | | | | | | | | | | | | | | | | | | | | | | | | | | | | | | | |
Total | | $ | (3,316,600 | ) | | $ | — | | | $ | (24,084,606 | ) | | $ | (11,348,644 | ) | | $ | — | | | $ | (52,678,548 | ) | | $ | — | | | $ | (91,428,398 | ) |
| | | | | | | | | | | | | | | | | | | | | | | | | | | | | | | | | |
Change in Net Unrealized Appreciation (Depreciation) on | | | | | | | | | | | | | | | | | | | | | | | | | | | | | | | | |
Investments (purchased options) | | $ | — | | | $ | — | | | $ | 12,416,432 | | | $ | 35,969,161 | | | $ | — | | | $ | 92,576,564 | | | $ | — | | | $ | 140,962,157 | |
Investments (rights and/or warrants) | | | — | | | | — | | | | 4,283,013 | | | | — | | | | — | | | | — | | | | — | | | | 4,283,013 | |
Forward Currency Contracts | | | — | | | | — | | | | — | | | | (15,335,650 | ) | | | — | | | | — | | | | — | | | | (15,335,650 | ) |
Futures Contracts | | | — | | | | — | | | | — | | | | — | | | | — | | | | 52,234 | | | | — | | | | 52,234 | |
Written Options | | | — | | | | — | | | �� | (1,947,044 | ) | | | (4,178,872 | ) | | | — | | | | 39,235,302 | | | | — | | | | 33,109,386 | |
Swap Contracts | | | (9,436,595 | ) | | | — | | | | 7,022,530 | | | | — | | | | — | | | | (112,405,241 | ) | | | — | | | | (114,819,306 | ) |
| | | | | | | | | | | | | | | | | | | | | | | | | | | | | | | | | |
Total | | $ | (9,436,595 | ) | | $ | — | | | $ | 21,774,931 | | | $ | 16,454,639 | | | $ | — | | | $ | 19,458,859 | | | $ | — | | | $ | 48,251,834 | |
| | | | | | | | | | | | | | | | | | | | | | | | | | | | | | | | | |
| | | | | | | | | | | | | | | | | | | | | | | | | | | | | | | | | |
Consolidated SGM Major Markets Fund | | | | | | | | | | | | | | | | | | | | | | | | | | | | | |
Asset Derivatives | | | | | | | | | | | | | | | | | | | | | | | | | | | | | | | | |
Unrealized Appreciation on Forward Currency Contracts | | $ | — | | | $ | — | | | $ | — | | | $ | 4,554,205 | | | $ | — | | | $ | — | | | $ | — | | | $ | 4,554,205 | |
Unrealized Appreciation on Futures Contracts¤ | | | — | | | | 497,144 | | | | 39,305,472 | | | | — | | | | — | | | | 377,356 | | | | — | | | | 40,179,972 | |
| | | | | | | | | | | | | | | | | | | | | | | | | | | | | | | | | |
Total | | $ | — | | | $ | 497,144 | | | $ | 39,305,472 | | | $ | 4,554,205 | | | $ | — | | | $ | 377,356 | | | $ | — | | | $ | 44,734,177 | |
| | | | | | | | | | | | | | | | | | | | | | | | | | | | | | | | | |
Derivatives not subject to Master Agreements | | $ | — | | | $ | — | | | $ | — | | | $ | — | | | $ | — | | | $ | — | | | $ | — | | | $ | — | |
| | | | | | | | | | | | | | | | | | | | | | | | | | | | | | | | | |
Total subject to Master Agreements | | $ | — | | | $ | 497,144 | | | $ | 39,305,472 | | | $ | 4,554,205 | | | $ | — | | | $ | 377,356 | | | $ | — | | | $ | 44,734,177 | |
| | | | | | | | | | | | | | | | | | | | | | | | | | | | | | | | | |
Liability Derivatives | | | | | | | | | | | | | | | | | | | | | | | | | | | | | | | | |
Unrealized Depreciation on Forward Currency Contracts | | $ | — | | | $ | — | | | $ | — | | | $ | (1,566,533 | ) | | $ | — | | | $ | — | | | $ | — | | | $ | (1,566,533 | ) |
Unrealized Depreciation on Futures Contracts¤ | | | — | | | | (3,944,900 | ) | | | (4,925,768 | ) | | | — | | | | — | | | | (5,903,705 | ) | | | — | | | | (14,774,373 | ) |
| | | | | | | | | | | | | | | | | | | | | | | | | | | | | | | | | |
Total | | $ | — | | | $ | (3,944,900 | ) | | $ | (4,925,768 | ) | | $ | (1,566,533 | ) | | $ | — | | | $ | (5,903,705 | ) | | $ | — | | | $ | (16,340,906 | ) |
| | | | | | | | | | | | | | | | | | | | | | | | | | | | | | | | | |
Derivatives not subject to Master Agreements | | $ | — | | | $ | — | | | $ | — | | | $ | — | | | $ | — | | | $ | — | | | $ | — | | | $ | — | |
| | | | | | | | | | | | | | | | | | | | | | | | | | | | | | | | | |
Total subject to Master Agreements | | $ | — | | | $ | (3,944,900 | ) | | $ | (4,925,768 | ) | | $ | (1,566,533 | ) | | $ | — | | | $ | (5,903,705 | ) | | $ | — | | | $ | (16,340,906 | ) |
| | | | | | | | | | | | | | | | | | | | | | | | | | | | | | | | | |
Net Realized Gain (Loss) on | | | | | | | | | | | | | | | | | | | | | | | | | | | | | | | | |
Forward Currency Contracts | | $ | — | | | $ | — | | | $ | — | | | $ | 37,499,519 | | | $ | — | | | $ | — | | | $ | — | | | $ | 37,499,519 | |
Futures Contracts | | | — | | | | (17,012,067 | ) | | | 52,424,332 | | | | — | | | | — | | | | (22,886,412 | ) | | | — | | | | 12,525,853 | |
| | | | | | | | | | | | | | | | | | | | | | | | | | | | | | | | | |
Total | | $ | — | | | $ | (17,012,067 | ) | | $ | 52,424,332 | | | $ | 37,499,519 | | | $ | — | | | $ | (22,886,412 | ) | | $ | — | | | $ | 50,025,372 | |
| | | | | | | | | | | | | | | | | | | | | | | | | | | | | | | | | |
Change in Net Unrealized Appreciation (Depreciation) on | | | | | | | | | | | | | | | | | | | | | | | | | | | | | | | | |
Forward Currency Contracts | | $ | — | | | $ | — | | | $ | — | | | $ | (12,239,229 | ) | | $ | — | | | $ | — | | | $ | — | | | $ | (12,239,229 | ) |
Futures Contracts | | | — | | | | (2,604,567 | ) | | | 22,690,233 | | | | — | | | | — | | | | 6,482,893 | | | | — | | | | 26,568,559 | |
| | | | | | | | | | | | | | | | | | | | | | | | | | | | | | | | | |
Total | | $ | — | | | $ | (2,604,567 | ) | | $ | 22,690,233 | | | $ | (12,239,229 | ) | | $ | — | | | $ | 6,482,893 | | | $ | — | | | $ | 14,329,330 | |
| | | | | | | | | | | | | | | | | | | | | | | | | | | | | | | | | |
| | | | | | | | | | | | | | | | | | | | | | | | | | | | | | | | | |
166
GMO Trust Funds
Notes to Financial Statements — (Continued)
February 28, 2017
| | | | | | | | | | | | | | | | | | | | | | | | | | | | | | | | |
| | | | | | | | | |
| | | Credit Contracts | | | Commodity
Contracts | | | Equity Contracts | | | Foreign
Currency
Contracts | | | Inflation
Contracts | | | Interest
Rate
Contracts | | | Other Contracts | | | Total | |
Consolidated Special Opportunities Fund | | | | | | | | | | | | | | | | | | | | | | | | | |
Asset Derivatives | | | | | | | | | | | | | | | | | | | | | | | | | | | | | | | | |
Unrealized Appreciation on Forward Currency Contracts | | $ | — | | | $ | — | | | $ | — | | | $ | 2,531 | | | $ | — | | | $ | — | | | $ | — | | | $ | 2,531 | |
| | | | | | | | | | | | | | | | | | | | | | | | | | | | | | | | | |
Total | | $ | — | | | $ | — | | | $ | — | | | $ | 2,531 | | | $ | — | | | $ | — | | | $ | — | | | $ | 2,531 | |
| | | | | | | | | | | | | | | | | | | | | | | | | | | | | | | | | |
Derivatives not subject to Master Agreements | | $ | — | | | $ | — | | | $ | — | | | $ | — | | | $ | — | | | $ | — | | | $ | — | | | $ | — | |
| | | | | | | | | | | | | | | | | | | | | | | | | | | | | | | | | |
Total subject to Master Agreements | | $ | — | | | $ | — | | | $ | — | | | $ | 2,531 | | | $ | — | | | $ | — | | | $ | — | | | $ | 2,531 | |
| | | | | | | | | | | | | | | | | | | | | | | | | | | | | | | | | |
Liability Derivatives | | | | | | | | | | | | | | | | | | | | | | | | | | | | | | | | |
Unrealized Depreciation on Forward Currency Contracts | | $ | — | | | $ | — | | | $ | — | | | $ | (11,774 | ) | | $ | — | | | $ | — | | | $ | — | | | $ | (11,774 | ) |
Unrealized Depreciation on Futures Contracts¤ | | | — | | | | (3,029,447 | ) | | | — | | | | — | | | | — | | | | — | | | | — | | | | (3,029,447 | ) |
Written Options, at value | | | — | | | | — | | | | (1,795,700 | ) | | | — | | | | — | | | | — | | | | — | | | | (1,795,700 | ) |
| | | | | | | | | | | | | | | | | | | | | | | | | | | | | | | | | |
Total | | $ | — | | | $ | (3,029,447 | ) | | $ | (1,795,700 | ) | | $ | (11,774 | ) | | $ | — | | | $ | — | | | $ | — | | | $ | (4,836,921 | ) |
| | | | | | | | | | | | | | | | | | | | | | | | | | | | | | | | | |
Derivatives not subject to Master Agreements | | $ | — | | | $ | — | | | $ | — | | | $ | — | | | $ | — | | | $ | — | | | $ | — | | | $ | — | |
| | | | | | | | | | | | | | | | | | | | | | | | | | | | | | | | | |
Total subject to Master Agreements | | $ | — | | | $ | (3,029,447 | ) | | $ | (1,795,700 | ) | | $ | (11,774 | ) | | $ | — | | | $ | — | | | $ | — | | | $ | (4,836,921 | ) |
| | | | | | | | | | | | | | | | | | | | | | | | | | | | | | | | | |
Net Realized Gain (Loss) on | | | | | | | | | | | | | | | | | | | | | | | | | | | | | | | | |
Investments (rights and/or warrants) | | $ | — | | | $ | — | | | $ | (1,909,116 | ) | | $ | — | | | $ | — | | | $ | — | | | $ | — | | | $ | (1,909,116 | ) |
Forward Currency Contracts | | | — | | | | — | | | | — | | | | (1,019,528 | ) | | | — | | | | — | | | | — | | | | (1,019,528 | ) |
Futures Contracts | | | — | | | | (351,959 | ) | | | — | | | | — | | | | — | | | | — | | | | — | | | | (351,959 | ) |
Written Options | | | — | | | | — | | | | 4,618,825 | | | | — | | | | — | | | | — | | | | — | | | | 4,618,825 | |
Swap Contracts | | | 135,530 | | | | — | | | | — | | | | — | | | | — | | | | — | | | | — | | | | 135,530 | |
| | | | | | | | | | | | | | | | | | | | | | | | | | | | | | | | | |
Total | | $ | 135,530 | | | $ | (351,959 | ) | | $ | 2,709,709 | | | $ | (1,019,528 | ) | | $ | — | | | $ | — | | | $ | — | | | $ | 1,473,752 | |
| | | | | | | | | | | | | | | | | | | | | | | | | | | | | | | | | |
Change in Net Unrealized Appreciation (Depreciation) on | | | | | | | | | | | | | | | | | | | | | | | | | | | | | | | | |
Investments (rights and/or warrants) | | $ | — | | | $ | — | | | $ | 2,076,605 | | | $ | — | | | $ | — | | | $ | — | | | $ | — | | | $ | 2,076,605 | |
Forward Currency Contracts | | | — | | | | — | | | | — | | | | 797,777 | | | | — | | | | — | | | | — | | | | 797,777 | |
Futures Contracts | | | — | | | | (1,749,496 | ) | | | — | | | | — | | | | — | | | | — | | | | — | | | | (1,749,496 | ) |
Written Options | | | — | | | | — | | | | 832,961 | | | | — | | | | — | | | | — | | | | — | | | | 832,961 | |
Swap Contracts | | | (899,007 | ) | | | — | | | | — | | | | — | | | | — | | | | — | | | | — | | | | (899,007 | ) |
| | | | | | | | | | | | | | | | | | | | | | | | | | | | | | | | | |
Total | | $ | (899,007 | ) | | $ | (1,749,496 | ) | | $ | 2,909,566 | | | $ | 797,777 | | | $ | — | | | $ | — | | | $ | — | | | $ | 1,058,840 | |
| | | | | | | | | | | | | | | | | | | | | | | | | | | | | | | | | |
| | | | | | | | | | | | | | | | | | | | | | | | | | | | | | | | | |
| | ^ | Because the Funds recognize changes in value through the Statements of Operations, they do not qualify for hedge accounting under authoritative guidance for derivative instruments. The Funds’ investments in derivatives may represent an economic hedge; however, they are considered to be non-hedge transactions for the purpose of these tables. |
| | ¤ | The table includes cumulative unrealized appreciation/depreciation of futures and cleared swap contracts, if any, as reported in the Schedule of Investments. Year end variation margin on open futures and cleared swap contracts, if any, is reported within the Statements of Assets and Liabilities. |
Certain Funds are party to International Swaps and Derivatives Association, Inc. Master Agreements, Global Master Repurchase Agreements or other similar types of agreements (collectively, “Master Agreements”) that generally govern the terms of some OTC derivative transactions, repurchase agreements and reverse repurchase agreements. The Master Agreements may include collateral posting terms and netting provisions that apply in the event of a default and/or termination event. Upon the occurrence of such an event, including the bankruptcy or insolvency of the counterparty, the Master Agreements may permit the non-defaulting party to calculate a single net payment to close out applicable transactions. However, there is no guarantee that the terms of a Master Agreement will be enforceable; for example, when bankruptcy or insolvency laws impose restrictions on or prohibitions against the right of offset. Additionally, the netting and close out provisions of a Master Agreement may not extend to the obligations of the counterparty’s affiliates or across varying types of transactions. Because no such event has occurred, the Funds do not presently have a legally enforceable right of set-off and these amounts have not been offset in the Statements of Assets and Liabilities, but have been presented separately in the table below. Termination events may also include a decline in the net assets of a Fund below a certain level over a specified period of time and may entitle a counterparty to elect to terminate early with respect to some or all the transactions under the
167
GMO Trust Funds
Notes to Financial Statements — (Continued)
February 28, 2017
Master Agreement with that counterparty. Such an election by one or more of the counterparties could have a material adverse impact on a Fund’s operations. An estimate of the aggregate net payment, if any, that may need to be made by a Fund in such an event is represented by the unrealized amounts in the tables below. For more information about other uncertainties and risks, see “Investments and other risks” above.
For financial reporting purposes, on the Statements of Assets and Liabilities any cash collateral that has been pledged to cover obligations of the Funds is reported as Due from Broker and any cash collateral received from the counterparty is reported as Due to Broker. Any non-cash collateral pledged by the Funds is noted in the Schedules of Investments. The tables below show the potential effect of netting arrangements made available by the Master Agreements on the financial position of the Funds. For financial reporting purposes, the Funds’ Statements of Assets and Liabilities generally show derivative assets and derivative liabilities (regardless of whether they are subject to netting arrangements) on a gross basis, which reflects the full risks and exposures of the Fund prior to netting. See Note 2 for information on repurchase agreements and reverse repurchase agreements held by the Funds at February 28, 2017, if any.
The tables above present the Funds’ derivative assets and liabilities by type of financial instrument. The following tables present the Funds’ OTC and/or exchange-traded derivative assets and liabilities by counterparty net of amounts that may be available for offset under the Master Agreements by the terms of the agreement and net of the related collateral received or pledged by the Funds as of February 28, 2017:
Consolidated Implementation Fund
| | | | | | | | | | | | | | | | |
| | | | | |
| Counterparty | | Gross Derivative
Assets Subject to
Master Agreements | | | Collateral
Received | | | Derivative
Assets/(Liabilities)
Available for Offset | | | Net Amount
of Derivative
Assets | |
Bank of America, N.A. | | $ | 22,566 | | | $ | — | | | $ | 22,566 | | | $ | — | |
Barclays Bank plc | | | 576,699 | | | | (334,677 | ) | | | (242,022 | ) | | | — | * |
Goldman Sachs International | | | 12,058,709 | | | | (4,682,191 | ) | | | (6,466,945 | ) | | | 909,573 | |
JPMorgan Chase Bank, N.A. | | | 1,742,088 | | | | — | | | | 1,742,088 | | | | — | |
Morgan Stanley & Co. International PLC | | | 988,434 | | | | — | | | | 988,434 | | | | — | |
Morgan Stanley & Co. LLC | | | 11,446,555 | | | | — | | | | (6,833,745 | ) | | | 4,612,810 | |
| | | | | | | | | | | | | | | | | |
Total | | $ | 26,835,051 | | | $ | (5,016,868 | ) | | $ | (10,789,624 | ) | | $ | 5,522,383 | |
| | | | | | | | | | | | | | | | | |
| | | | | | | | | | | | | | | | | |
| | | | | |
| Counterparty | | Gross Derivative
Liabilities Subject to
Master Agreements | | | Collateral
Pledged | | | Derivative
(Assets)/Liabilities
Available for Offset | | | Net Amount
of Derivative
Liabilities | |
Bank of America, N.A. | | $ | 390,825 | | | $ | — | | | $ | (22,566 | ) | | $ | 368,259 | |
Barclays Bank plc | | | 242,022 | | | | — | | | | 242,022 | | | | — | |
Credit Suisse International | | | 67,775 | | | | — | | | | — | | | | 67,775 | |
Goldman Sachs International | | | 6,466,945 | | | | — | | | | 6,466,945 | | | | — | |
JPMorgan Chase Bank, N.A. | | | 2,702,309 | | | | (960,221 | ) | | | (1,742,088 | ) | | | — | * |
Morgan Stanley & Co. International PLC | | | 1,142,838 | | | | (19,959 | ) | | | (988,434 | ) | | | 134,445 | |
Morgan Stanley & Co. LLC | | | 6,833,745 | | | | — | | | | 6,833,745 | | | | — | * |
| | | | | | | | | | | | | | | | | |
Total | | $ | 17,846,459 | | | $ | (980,180 | ) | | $ | 10,789,624 | | | $ | 570,479 | |
| | | | | | | | | | | | | | | | | |
| | | | | | | | | | | | | | | | | |
168
GMO Trust Funds
Notes to Financial Statements — (Continued)
February 28, 2017
Consolidated SGM Major Markets Fund
| | | | | | | | | | | | | | | | |
| | | | | |
| Counterparty | | Gross Derivative
Assets Subject to
Master Agreements | | | Collateral
Received | | | Derivative
Assets/(Liabilities)
Available for Offset | | | Net Amount
of Derivative
Assets | |
JPMorgan Chase Bank, N.A. | | $ | 1,936,842 | | | $ | — | | | $ | (907,522 | ) | | $ | 1,029,320 | |
Morgan Stanley & Co. International PLC | | | 1,247,863 | | | | (236,000 | ) | | | (86,691 | ) | | | 925,172 | |
State Street Bank and Trust Company | | | 203,211 | | | | — | | | | (152,259 | ) | | | 50,952 | |
UBS AG | | | 1,166,289 | | | | (539,895 | ) | | | (420,061 | ) | | | 206,333 | |
| | | | | | | | | | | | | | | | | |
Total | | $ | 4,554,205 | | | $ | (775,895 | ) | | $ | (1,566,533 | ) | | $ | 2,211,777 | |
| | | | | | | | | | | | | | | | | |
| | | | | | | | | | | | | | | | | |
| | | | | |
| Counterparty | | Gross Derivative
Liabilities Subject to
Master Agreements | | | Collateral
Pledged | | | Derivative
(Assets)/Liabilities
Available for Offset | | | Net Amount
of Derivative
Liabilities | |
JPMorgan Chase Bank, N.A. | | $ | 907,522 | | | $ | — | | | $ | 907,522 | | | $ | — | * |
Morgan Stanley & Co. International PLC | | | 86,691 | | | | — | | | | 86,691 | | | | — | |
State Street Bank and Trust Company | | | 152,259 | | | | — | | | | 152,259 | | | | — | |
UBS AG | | | 420,061 | | | | — | | | | 420,061 | | | | — | |
| | | | | | | | | | | | | | | | | |
Total | | $ | 1,566,533 | | | $ | — | | | $ | 1,566,533 | | | $ | — | |
| | | | | | | | | | | | | | | | | |
| | | | | | | | | | | | | | | | | |
Consolidated Special Opportunities Fund
| | | | | | | | | | | | | | | | |
| | | | | |
| Counterparty | | Gross Derivative
Assets Subject to
Master Agreements | | | Collateral
Received | | | Derivative
Assets/(Liabilities)
Available for Offset | | | Net Amount
of Derivative
Assets | |
Morgan Stanley & Co. International PLC | | $ | 2,531 | | | $ | — | | | $ | 2,531 | | | $ | — | * |
| | | | | | | | | | | | | | | | | |
Total | | $ | 2,531 | | | $ | — | | | $ | 2,531 | | | $ | — | |
| | | | | | | | | | | | | | | | | |
| | | | | | | | | | | | | | | | | |
| | | | | |
| Counterparty | | Gross Derivative
Liabilities Subject to
Master Agreements | | | Collateral
Pledged | | | Derivative
(Assets)/Liabilities
Available for Offset | | | Net Amount
of Derivative
Liabilities | |
Goldman Sachs International | | $ | 384 | | | $ | — | | | $ | — | | | $ | 384 | |
Morgan Stanley & Co. International PLC | | | 11,390 | | | | — | | | | (2,531 | ) | | | 8,859 | |
Morgan Stanley & Co. LLC | | | 1,795,700 | | | | (1,795,700 | ) | | | — | | | | — | * |
| | | | | | | | | | | | | | | | | |
Total | | $ | 1,807,474 | | | $ | (1,795,700 | ) | | $ | (2,531 | ) | | $ | 9,243 | |
| | | | | | | | | | | | | | | | | |
| | | | | | | | | | | | | | | | | |
| | * | The actual collateral received and/or pledged is more than the amount shown. |
The average derivative activity of notional amounts (forward currency contracts, futures contracts and swap contracts), market values (rights and/or warrants), and principal amounts or number of contracts (options) outstanding, based on absolute values, at each month-end, was as follows for the year ended February 28, 2017:
| | | | | | | | | | | | | | | | | | | | | | | | |
| | | | | | | |
| Fund Name | | Forward
Currency
Contracts ($) | | | Futures
Contracts ($) | | | Swap
Contracts ($) | | | Options
(Principal) | | | Options
(Contracts) | | | Rights and/
or
Warrants ($) | |
Alpha Only Fund | | | 5,451,944 | | | | 218,166,259 | | | | — | | | | — | | | | — | | | | 2,149 | |
Benchmark-Free Fund | | | 82,198,988 | | | | 840,930* | | | | 328,856 | | | | — | | | | — | | | | 48,500 | |
Implementation Fund | | | 1,705,479,629 | | | | 17,338,259 | | | | 13,229,211,976 | | | | 1,148,723,597 | | | | 72,468 | | | | 1,508,229 | |
Consolidated Consolidated SGM Major Markets Fund | | | 1,135,360,118 | | | | 1,896,828,838 | | | | — | | | | — | | | | — | | | | — | |
Consolidated Special Opportunities Fund | | | 62,722,547 | | | | 7,025,897 | | | | 19,520,354 | | | | — | | | | 3,368 | | | | 3,716,262 | |
| | * | During the year ended February 28, 2017, the Fund did not hold this investment type at any month-end; therefore, the average amount outstanding was calculated using daily outstanding absolute values. |
169
GMO Trust Funds
Notes to Financial Statements — (Continued)
February 28, 2017
| 5. | Fees and other transactions with affiliates |
GMO receives a management fee for the services it provides to certain Funds. Management fees are paid monthly at the annual rate equal to the percentage of each Fund’s average daily net assets set forth in the table below:
| | | | | | | | | | | | | | | | | | | | | | | | |
| | | | | | | | | | | | | |
| | | Alpha
Only
Fund | | Benchmark-
Free
Allocation
Fund | | Benchmark-Free Fund | | Global Asset Allocation Fund | | Global Developed Equity Allocation Fund | | Global Equity Allocation Fund | | Implemen-
tation Fund | | International Developed Equity Allocation Fund | | International Equity Allocation Fund | | SGM Major Markets Fund | | Special Opportunities Fund | | Strategic Opportunities Allocation Fund |
Management Fee | | 0.50% | | 0.65% | | — | | — | | — | | — | | — | | — | | — | | 0.85% | | 1.10% | | — |
For certain Funds above, GMO does not charge the Fund a management fee or shareholder service fee, but it receives management and/or shareholder service fees from the underlying funds in which the Fund invests. Because those fees vary from fund to fund, the levels of indirect net expenses set forth below are affected by GMO’s asset allocation decisions.
In addition, each class of shares of certain Funds pays GMO directly or indirectly a shareholder service or supplemental support fee. Shareholder service fees are paid to GMO for providing client services and reporting, such as performance information, client account information, personal and electronic access to Fund information, access to analysis and explanations of Fund reports, and assistance in maintaining and correcting client-related information. Class MF shares of Benchmark-Free Allocation Fund are subject to a supplemental support fee payable to GMO for providing supplemental support services to Class MF shareholders and their investment advisers. These supplemental support services include without limitation, (1) provision and presentation of educational and explanatory information about the Fund and its asset allocation strategy as requested or directed by an investor or its investment adviser, (2) provision and presentation of similar educational and explanatory information about the strategies of the GMO Funds in which the Fund invests, (3) provision and presentation of information for inclusion in the quarterly or other periodic reports of the investor, (4) provision of responses to information requests relating to oversight functions of the investor’s board of directors in areas including pricing, compliance, and taxation, (5) access to and meetings with GMO’s Chief Investment Strategist and Heads of GMO’s Asset Allocation Team and other investment professionals of GMO, (6) assistance with services provided by an investor’s investment adviser, and (7) such other assistance as may be requested from time to time by an investor or its agent, provided that such assistance is not primarily intended to result in the sale of Fund shares.
Shareholder service and/or supplemental support fees are paid monthly equal to the percentage of each applicable Fund’s average daily net assets set forth in the table below
| | | | | | | | | | | | | | | | | | | | |
| | | | | | |
| Fund Name | | Class III | | | Class IV | | | Class V | | | Class VI | | | Class MF | |
Alpha Only Fund | | | 0.15% | | | | 0.10% | | | | | | | | | | | | | |
Benchmark-Free Allocation Fund | | | 0.15% | | | | 0.10% | | | | | | | | | | | | 0.10% | |
SGM Major Markets Fund | | | 0.15% | | | | 0.10% | | | | | | | | 0.055% | | | | | |
Special Opportunities Fund | | | 0.15% | * | | | 0.10% | * | | | 0.085%* | | | | 0.055% | | | | | |
| | * | Class is offered but has no shareholders as of February 28, 2017. |
For each Fund, other than Special Opportunities Fund, GMO has contractually agreed to reimburse the Fund for its “Specified Operating Expenses” (as defined below). Any such reimbursements are paid to a Fund concurrently with the Fund’s payment of management fees to GMO. For Special Opportunities Fund, GMO has contractually agreed to reimburse the Fund for the portion of its “Specified Operating Expenses” (as defined below) that exceeds 0.10% of the Fund’s average daily net assets.
170
GMO Trust Funds
Notes to Financial Statements — (Continued)
February 28, 2017
“Specified Operating Expenses” means: audit expenses, fund accounting expenses, pricing service expenses, expenses of non-investment related tax services, transfer agency expenses, expenses of non-investment related legal services provided to the Funds by or at the direction of GMO, federal securities law filing expenses, printing expenses, state and federal registration fees and custody expenses. In the case of Benchmark-Free Fund, “Specified Operating Expenses” does not include the Fund’s direct custody expenses attributable to its holdings of emerging market securities.
For each Fund, other than Benchmark-Free Allocation Fund, that pays GMO a management fee, GMO has contractually agreed to waive or reduce that fee, but not below zero, to the extent necessary to offset the management fees paid to GMO that are directly or indirectly borne by the Fund as a result of the Fund’s direct or indirect investments in other GMO Funds.
For each Fund, other than Benchmark-Free Allocation Fund, that charges a shareholder service fee, GMO has contractually agreed to waive or reduce the shareholder service fee charged to holders of each class of shares of the Fund, but not below zero, to the extent necessary to offset the shareholder service fees directly or indirectly borne by the class of shares of the Fund as a result of the Fund’s direct or indirect investments in other GMO Funds.
These contractual waivers and reimbursements will continue through at least June 30, 2017 for each Fund unless the Funds’ Board of Trustees authorizes their modification or termination, or reduces the fee rates paid to GMO under the Fund’s management contract or servicing and supplemental support agreement.
For Benchmark-Free Allocation Fund only, the fees payable to GMO under its management contract and servicing and supplemental support agreement are reduced by amounts equal to the management fees and shareholder service fees, respectively, that GMO receives as a result of the Fund’s investment in underlying GMO Funds. In addition, effective March 1, 2014, GMO has contractually agreed to reduce the rate of the supplemental support fees charged to the Fund’s Class MF shares to a rate to be charged in any month (starting on the first business day of the month) based on the net assets attributable to Class MF shares as of the last business day of the preceding month based on the following schedule: 0.10% on the first $6 billion of net assets, 0.05% on the next $2 billion, 0.03% on the next $2 billion, and 0.01% thereafter; provided, however, that the effective rate charged at any time will not be reduced to less than 0.06% of Class MF’s average daily net assets. The rate will be calculated before giving effect to any reduction or waiver described above, and any applicable reduction or waiver will serve to further reduce the supplemental support fee paid to GMO. This reduction will continue through at least June 30, 2017, and may not be terminated prior to this date without the action or consent of the Fund’s Board of Trustees.
The Funds’ portion of the fees paid by the Trust to the Trust’s independent Trustees and their legal counsel and any agents unaffiliated with GMO during the year ended February 28, 2017 is shown in the table below and is included in the Statements of Operations.
| | | | | | | | |
| | | |
| Fund Name | | Independent Trustees
and their legal counsel ($) | | | Agent unaffiliated
with GMO ($) | |
Alpha Only Fund | | | 2,534 | | | | 400 | |
Benchmark-Free Allocation Fund | | | 259,237 | | | | 27,059 | |
Benchmark-Free Fund | | | 75,978 | | | | 7,564 | |
Global Asset Allocation Fund | | | 47,831 | | | | 5,056 | |
Global Developed Equity Allocation Fund | | | 20,408 | | | | 2,129 | |
Global Equity Allocation Fund | | | 44,703 | | | | 4,621 | |
Consolidated Implementation Fund | | | 214,514 | | | | 22,400 | |
International Developed Equity Allocation Fund | | | 15,154 | | | | 1,575 | |
International Equity Allocation Fund | | | 19,141 | | | | 1,944 | |
Consolidated SGM Major Markets Fund | | | 23,201 | | | | 2,404 | |
Consolidated Special Opportunities Fund | | | 18,680 | | | | 1,733 | |
Strategic Opportunities Allocation Fund | | | 35,953 | | | | 3,437 | |
171
GMO Trust Funds
Notes to Financial Statements — (Continued)
February 28, 2017
Certain Funds incur fees and expenses indirectly as a shareholder in the underlying funds. For the year ended February 28, 2017 these indirect fees and expenses expressed as a percentage of each Fund’s average daily net assets were as follows:
| | | | | | | | | | | | | | | | |
| | | | | |
| Fund Name | | Indirect Net Expenses
(excluding shareholder
service fees) | | | Indirect Shareholder
Service Fees | | | Indirect Interest
Expense | | | Total Indirect Expenses | |
Alpha Only Fund | | | < 0.001% | | | | 0.000% | | | | 0.000% | | | | < 0.001% | |
Benchmark-Free Allocation Fund | | | 0.144% | | | | 0.013% | | |
| 0.037%
| *
| | | 0.194% | |
Benchmark-Free Fund | | | 0.240% | | | | 0.021% | | | | < 0.001% | | | | 0.261% | |
Global Asset Allocation Fund | | | 0.414% | | | | 0.061% | | | | 0.001% | | | | 0.476% | |
Global Developed Equity Allocation Fund | | | 0.456% | | | | 0.071% | | | | 0.000% | | | | 0.527% | |
Global Equity Allocation Fund | | | 0.508% | | | | 0.070% | | | | 0.000% | | | | 0.578% | |
Consolidated Implementation Fund | | | 0.000% | | | | 0.000% | | | | 0.000% | | | | 0.000% | |
International Developed Equity Allocation Fund | | | 0.536% | | | | 0.086% | | | | 0.000% | | | | 0.622% | |
International Equity Allocation Fund | | | 0.609% | | | | 0.079% | | | | 0.000% | | | | 0.688% | |
Consolidated SGM Major Markets Fund | | | 0.002% | | | | 0.000% | | | | 0.000% | | | | 0.002% | |
Consolidated Special Opportunities Fund | | | 0.000% | | | | 0.000% | | | | 0.000% | | | | 0.000% | |
Strategic Opportunities Allocation Fund | | | 0.397% | | | | 0.056% | | | | < 0.001% | | | | 0.453% | |
| | * | Includes indirect dividend expense. |
The Funds are permitted to purchase or sell securities from or to certain other GMO funds under specified conditions outlined in procedures adopted by the Trustees. The procedures have been designed to ensure that any purchase or sale of securities by a Fund from another fund or portfolio that is or could be considered an affiliate by virtue of having a common investment adviser (or affiliated investment advisers), common Trustees and/or common officers complies with Rule 17a-7 of the 1940 Act. Further, as defined under the procedures, each transaction is effectuated at the current market price. During the year ended February 28, 2017, the Funds did not engage in these transactions.
| 6. | Purchases and sales of securities |
Cost of purchases and proceeds from sales of securities, excluding short-term investments and including GMO U.S. Treasury Fund, for the year ended February 28, 2017 are noted in the table below:
| | | | | | | | | | | | | | | | |
| | | | | |
| | | Purchases ($) | | | Purchases ($) | | | Sales ($) | | | Sales ($) | |
| | | | | |
| Fund Name | | U.S. Government
Securities | | | Investments (Non-U.S.
Government Securities) | | | U.S. Government
Securities | | | Investments (Non-U.S.
Government Securities) | |
Alpha Only Fund | | | — | | | | 200,479,372 | | | | — | | | | 286,939,367 | |
Benchmark-Free Allocation Fund | | | — | | | | 1,075,375,262 | | | | — | | | | 5,137,993,142 | |
Benchmark-Free Fund | | | 1,586,044,116 | | | | 1,792,371,586 | | | | 1,126,612,609 | | | | 2,528,964,284 | |
Global Asset Allocation Fund | | | — | | | | 520,386,930 | | | | — | | | | 1,687,210,868 | |
Global Developed Equity Allocation Fund | | | — | | | | 342,488,484 | | | | — | | | | 953,511,567 | |
Global Equity Allocation Fund | | | — | | | | 715,092,575 | | | | — | | | | 1,793,198,540 | |
Consolidated Implementation Fund | | | 6,248,628,577 | | | | 7,700,580,229 | | | | 5,455,185,738 | | | | 10,186,330,740 | |
International Developed Equity Allocation Fund | | | — | | | | 89,099,065 | | | | — | | | | 548,942,425 | |
International Equity Allocation Fund | | | — | | | | 80,565,244 | | | | — | | | | 318,233,307 | |
Consolidated SGM Major Markets Fund | | | 341,670,521 | | | | 365,060,705 | | | | 13,989,609 | | | | 470,000,000 | |
Consolidated Special Opportunities Fund | | | — | | | | 699,131,522 | | | | — | | | | 899,053,187 | |
Strategic Opportunities Allocation Fund | | | 86,314,981 | | | | 701,751,602 | | | | 276,019,730 | | | | 694,682,436 | |
172
GMO Trust Funds
Notes to Financial Statements — (Continued)
February 28, 2017
In the normal course of business the Funds enter into contracts with third-party service providers that contain a variety of representations and warranties and that provide general indemnifications. The Funds’ maximum exposure under these arrangements is unknown, as it involves possible future claims that may or may not be made against the Funds. Based on experience, GMO is of the view that the risk of loss to the Funds in connection with the Funds’ indemnification obligations is remote; however, there can be no assurance that such obligations will not result in material liabilities that adversely affect the Funds.
| 8. | Principal shareholders and related parties as of February 28, 2017 |
| | | | | | | | | | | | | | | | |
| | | | | |
| Fund Name | | Number of
shareholders that held
more than 10% of the
outstanding shares of
the Fund | | | Percentage of
outstanding shares of
the Fund held by those
shareholders owning
greater than 10% of the
outstanding shares of
the Fund | | | Percentage of the
shares of the Fund held
by senior management
of GMO and
GMO Trust officers | | | Percentage of the
Fund’s shares held by
accounts for which
GMO has
investment discretion | |
Alpha Only Fund | | | 3 | ‡ | | | 87.85% | | | | 0.09% | | | | 99.38% | |
Benchmark-Free Allocation Fund | | | 1 | | | | 42.54% | | | | 0.93% | | | | 2.13% | |
Benchmark-Free Fund | | | — | | | | — | | | | — | | | | 100.00% | |
Global Asset Allocation Fund | | | — | | | | — | | | | 0.19% | | | | 7.35% | |
Global Developed Equity Allocation Fund | | | 4 | | | | 56.59% | | | | — | | | | — | |
Global Equity Allocation Fund | | | 1 | | | | 15.73% | | | | 0.01% | | | | 0.67% | |
Implementation Fund | | | 1 | ‡ | | | 95.84% | | | | — | | | | 100.00% | |
International Developed Equity Allocation Fund | | | 5 | | | | 74.27% | | | | < 0.01% | | | | 1.73% | |
International Equity Allocation Fund | | | 3 | † | | | 53.06% | | | | 0.01% | | | | 20.52% | |
SGM Major Markets Fund± | | | 2 | # | | | 80.98% | | | | 0.10% | | | | 97.34% | |
Special Opportunities Fund | | | 2 | # | | | 96.61% | | | | 0.07% | | | | 99.59% | |
Strategic Opportunities Allocation Fund | | | 1 | | | | 27.04% | | | | < 0.01% | | | | 99.96% | |
| | ± | The Fund’s outstanding shares were owned by more than 10 shareholders as of February 28, 2017. |
| | † | One of the shareholders is another fund managed by GMO. |
| | ‡ | One of the shareholders is another fund of the Trust. |
| | # | Two of the shareholders are other funds of the Trust. |
173
GMO Trust Funds
Notes to Financial Statements — (Continued)
February 28, 2017
The Declaration of Trust permits each Fund to issue an unlimited number of shares of beneficial interest (without par value). Transactions in the Funds’ shares were as follows:
| | | | | | | | | | | | | | | | |
| | | |
| | | Year Ended
February 28, 2017 | | | Year Ended
February 29, 2016 | |
| | | | | |
| | | Shares | | | Amount | | | Shares | | | Amount | |
Alpha Only Fund | | | | | | | | | | | | | | | | |
Class III: | | | | | | | | | | | | | | | | |
Shares sold | | | 23,049 | | | $ | 485,000 | | | | 34,813 | | | $ | 787,161 | |
Shares issued to shareholders in reinvestment of distributions | | | 10,799 | | | | 226,478 | | | | 28,004 | | | | 615,633 | |
Shares repurchased | | | (9,062 | ) | | | (193,998 | ) | | | (877,135 | ) | | | (19,442,906 | ) |
| | | | | | | | | | | | | | | | | |
Net increase (decrease) | | | 24,786 | | | $ | 517,480 | | | | (814,318 | ) | | $ | (18,040,112 | ) |
| | | | | | | | | | | | | | | | | |
Class IV: | | | | | | | | | | | | | | | | |
Shares sold | | | 290,332 | | | $ | 6,216,866 | | | | 6,213,891 | (a) | | $ | 141,103,403 | (a) |
Shares issued to shareholders in reinvestment of distributions | | | 323,934 | | | | 6,805,653 | | | | 2,800,200 | | | | 61,485,182 | |
Shares repurchased | | | (2,820,045 | ) | | | (60,624,321 | ) | | | (141,301,153 | )(a) | | | (3,149,361,827 | )(a) |
| | | | | | | | | | | | | | | | | |
Net increase (decrease) | | | (2,205,779 | ) | | $ | (47,601,802 | ) | | | (132,287,062 | ) | | $ | (2,946,773,242 | ) |
| | | | | | | | | | | | | | | | | |
| | | | | | | | | | | | | | | | | |
Benchmark-Free Allocation Fund | | | | | | | | | | | | | | | | |
Class III: | |
Shares sold | | | 11,196,580 | | | $ | 282,349,518 | | | | 72,331,281 | | | $ | 1,847,742,291 | |
Shares issued to shareholders in reinvestment of distributions | | | 2,999,733 | | | | 74,370,066 | | | | 4,651,398 | | | | 120,052,586 | |
Shares repurchased | | | (60,921,352 | ) | | | (1,511,866,800 | ) | | | (50,094,065 | ) | | | (1,243,090,574 | ) |
Purchase premiums | | | — | | | | 239,291 | | | | — | | | | 846,534 | |
Redemption fees | | | — | | | | 3,224,150 | | | | — | | | | 2,402,472 | |
| | | | | | | | | | | | | | | | | |
Net increase (decrease) | | | (46,725,039 | ) | | $ | (1,151,683,775 | ) | | | 26,888,614 | | | $ | 727,953,309 | |
| | | | | | | | | | | | | | | | | |
Class IV: | | | | | | | | | | | | | | | | |
Shares sold | | | 10,289,818 | | | $ | 256,114,599 | | | | 23,359,719 | | | $ | 620,703,712 | |
Shares issued to shareholders in reinvestment of distributions | | | 1,600,299 | | | | 39,678,337 | | | | 2,795,335 | | | | 72,119,639 | |
Shares repurchased | | | (15,488,463 | ) | | | (390,292,674 | ) | | | (43,693,869 | ) | | | (1,088,914,127 | ) |
Purchase premiums | | | — | | | | 112,306 | | | | — | | | | 465,686 | |
Redemption fees | | | — | | | | 1,579,024 | | | | — | | | | 1,187,301 | |
| | | | | | | | | | | | | | | | | |
Net increase (decrease) | | | (3,598,346 | ) | | $ | (92,808,408 | ) | | | (17,538,815 | ) | | $ | (394,437,789 | ) |
| | | | | | | | | | | | | | | | | |
Class MF: | | | | | | | | | | | | | | | | |
Shares sold | | | 9,091,977 | | | $ | 219,971,887 | | | | 24,241,374 | | | $ | 613,440,726 | |
Shares issued to shareholders in reinvestment of distributions | | | 4,019,603 | | | | 99,711,857 | | | | 9,204,641 | | | | 237,571,791 | |
Shares repurchased | | | (127,883,060 | ) | | | (3,192,649,982 | ) | | | (144,801,570 | ) | | | (3,557,453,382 | ) |
Purchase premiums | | | — | | | | 309,201 | | | | — | | | | 1,550,889 | |
Redemption fees | | | — | | | | 4,213,744 | | | | — | | | | 3,918,113 | |
| | | | | | | | | | | | | | | | | |
Net increase (decrease) | | | (114,771,480 | ) | | $ | (2,868,443,293 | ) | | | (111,355,555 | ) | | $ | (2,700,971,863 | ) |
| | | | | | | | | | | | | | | | | |
| | | | | | | | | | | | | | | | | |
174
GMO Trust Funds
Notes to Financial Statements — (Continued)
February 28, 2017
| | | | | | | | | | | | | | | | |
| | | |
| | | Year Ended
February 28, 2017 | | | Year Ended
February 29, 2016 | |
| | | | | |
| | | Shares | | | Amount | | | Shares | | | Amount | |
Benchmark-Free Fund | |
Class III: | |
Shares sold | | | 2,964,651 | | | $ | 53,692,431 | | | | 13,827,563 | | | $ | 255,015,278 | |
Shares issued to shareholders in reinvestment of distributions | | | 6,315,267 | | | | 114,708,600 | | | | 15,533,367 | | | | 287,039,750 | |
Shares repurchased | | | (30,712,702 | ) | | | (565,886,269 | ) | | | (24,900,259 | ) | | | (457,058,234 | ) |
Purchase premiums | | | — | | | | 2,491 | | | | — | | | | 199,764 | |
Redemption fees | | | — | | | | 1,186,303 | | | | — | | | | 557,383 | |
| | | | | | | | | | | | | | | | | |
Net increase (decrease) | | | (21,432,784 | ) | | $ | (396,296,444 | ) | | | 4,460,671 | | | $ | 85,753,941 | |
| | | | | | | | | | | | | | | | | |
| | | | | | | | | | | | | | | | | |
Global Asset Allocation Fund | |
Class III:# | |
Shares sold | | | 617,412 | | | $ | 18,044,077 | | | | 4,489,709 | | | $ | 137,972,354 | |
Shares issued to shareholders in reinvestment of distributions | | | 1,753,044 | | | | 51,432,938 | | | | 10,223,198 | | | | 309,983,152 | |
Shares repurchased | | | (43,110,243 | ) | | | (1,266,492,076 | ) | | | (38,477,873 | ) | | | (1,211,002,276 | ) |
Purchase premiums | | | — | | | | 19,792 | | | | — | | | | 106,404 | |
Redemption fees | | | — | | | | 1,833,641 | | | | — | | | | 1,358,583 | |
| | | | | | | | | | | | | | | | | |
Net increase (decrease) | | | (40,739,787 | ) | | $ | (1,195,161,628 | ) | | | (23,764,966 | ) | | $ | (761,581,783 | ) |
| | | | | | | | | | | | | | | | | |
| | | | | | | | | | | | | | | | | |
Global Developed Equity Allocation Fund | |
Class III: | |
Shares sold | | | 378,886 | | | $ | 7,197,962 | | | | 2,634,197 | | | $ | 55,440,868 | |
Shares issued to shareholders in reinvestment of distributions | | | 3,760,099 | | | | 69,595,229 | | | | 8,853,244 | | | | 177,958,581 | |
Shares repurchased | | | (35,852,275 | ) | | | (679,060,489 | ) | | | (6,683,069 | ) | | | (142,486,659 | ) |
Purchase premiums | | | — | | | | 5,763 | | | | — | | | | 40,703 | |
Redemption fees | | | — | | | | 543,248 | | | | — | | | | 110,318 | |
| | | | | | | | | | | | | | | | | |
Net increase (decrease) | | | (31,713,290 | ) | | $ | (601,718,287 | ) | | | 4,804,372 | | | $ | 91,063,811 | |
| | | | | | | | | | | | | | | | | |
| | | | | | | | | | | | | | | | | |
Global Equity Allocation Fund | |
Class III: | |
Shares sold | | | 896,100 | | | $ | 19,538,574 | | | | 3,982,610 | | | $ | 89,859,760 | |
Shares issued to shareholders in reinvestment of distributions | | | 5,519,865 | | | | 118,776,536 | | | | 15,556,920 | | | | 358,248,969 | |
Shares repurchased | | | (55,808,897 | ) | | | (1,211,746,212 | ) | | | (18,545,772 | ) | | | (443,989,759 | ) |
Purchase premiums | | | — | | | | 22,447 | | | | — | | | | 121,845 | |
Redemption fees | | | — | | | | 2,187,138 | | | | — | | | | 623,129 | |
| | | | | | | | | | | | | | | | | |
Net increase (decrease) | | | (49,392,932 | ) | | $ | (1,071,221,517 | ) | | | 993,758 | | | $ | 4,863,944 | |
| | | | | | | | | | | | | | | | | |
| | | | | | | | | | | | | | | | | |
Consolidated Implementation Fund | |
Core Class: | |
Shares sold | | | 20,213,611 | | | $ | 252,945,091 | | | | 325,222,206 | (b) | | $ | 4,218,767,955 | (b) |
Shares issued to shareholders in reinvestment of distributions | | | 17,429,764 | | | | 218,046,347 | | | | — | | | | — | |
Shares repurchased | | | (335,030,566 | ) | | | (4,227,002,950 | ) | | | (338,943,875 | )(b) | | | (4,204,769,174 | )(b) |
Purchase premiums | | | — | | | | 506,904 | | | | — | | | | 3,506,474 | |
Redemption fees | | | — | | | | 8,454,006 | | | | — | | | | 6,894,933 | |
| | | | | | | | | | | | | | | | | |
Net increase (decrease) | | | (297,387,191 | ) | | $ | (3,747,050,602 | ) | | | (13,721,669 | ) | | $ | 24,400,188 | |
| | | | | | | | | | | | | | | | | |
| | | | | | | | | | | | | | | | | |
175
GMO Trust Funds
Notes to Financial Statements — (Continued)
February 28, 2017
| | | | | | | | | | | | | | | | |
| | | |
| | | Year Ended
February 28, 2017 | | | Year Ended
February 29, 2016 | |
| | | | | |
| | | Shares | | | Amount | | | Shares | | | Amount | |
International Developed Equity Allocation Fund | |
Class III: | |
Shares sold | | | 4,384,487 | | | $ | 61,744,274 | | | | 9,393,220 | | | $ | 150,906,997 | |
Shares issued to shareholders in reinvestment of distributions | | | 1,722,551 | | | | 24,243,085 | | | | 2,148,270 | | | | 30,814,431 | |
Shares repurchased | | | (37,498,662 | ) | | | (546,186,257 | ) | | | (9,223,733 | ) | | | (146,054,631 | ) |
Purchase premiums | | | — | | | | 46,639 | | | | — | | | | 86,862 | |
Redemption fees | | | — | | | | 434,149 | | | | — | | | | 113,690 | |
| | | | | | | | | | | | | | | | | |
Net increase (decrease) | | | (31,391,624 | ) | | $ | (459,718,110 | ) | | | 2,317,757 | | | $ | 35,867,349 | |
| | | | | | | | | | | | | | | | | |
| | | | | | | | | | | | | | | | | |
International Equity Allocation Fund | | | | | | | | | | | | | | | | |
Class III:# | | | | | | | | | | | | | | | | |
Shares sold | | | 1,015,102 | | | $ | 25,738,591 | | | | 3,028,332 | | | $ | 83,159,704 | |
Shares issued to shareholders in reinvestment of distributions | | | 1,345,263 | | | | 34,818,517 | | | | 3,562,958 | | | | 99,615,186 | |
Shares repurchased | | | (11,358,185 | ) | | | (300,419,199 | ) | | | (8,404,489 | ) | | | (224,630,230 | ) |
Purchase premiums | | | — | | | | 68,619 | | | | — | | | | 159,656 | |
Redemption fees | | | — | | | | 772,434 | | | | — | | | | 482,856 | |
| | | | | | | | | | | | | | | | | |
Net increase (decrease) | | | (8,997,820 | ) | | $ | (239,021,038 | ) | | | (1,813,199 | ) | | $ | (41,212,828 | ) |
| | | | | | | | | | | | | | | | | |
| | | | | | | | | | | | | | | | | |
Consolidated SGM Major Markets Fund | |
Class III: | |
Shares sold | | | 920,661 | | | $ | 32,602,984 | | | | 3,469,486 | | | $ | 116,950,581 | |
Shares issued to shareholders in reinvestment of distributions | | | 16,710 | | | | 552,675 | | | | — | | | | — | |
Shares repurchased | | | (1,472,573 | ) | | | (51,952,410 | ) | | | (47,109,602 | ) | | | (1,559,759,977 | ) |
| | | | | | | | | | | | | | | | | |
Net increase (decrease) | | | (535,202 | ) | | $ | (18,796,751 | ) | | | (43,640,116 | ) | | $ | (1,442,809,396 | ) |
| | | | | | | | | | | | | | | | | |
Class IV: | | | | | | | | | | | | | | | | |
Shares sold | | | 1,633,992 | | | $ | 57,413,784 | | | | — | | | $ | — | |
Shares issued to shareholders in reinvestment of distributions | | | 104,598 | | | | 3,319,945 | | | | — | | | | — | |
Shares repurchased | | | (54,601 | ) | | | (1,776,715 | ) | | | — | | | | — | |
| | | | | | | | | | | | | | | | | |
Net increase (decrease) | | | 1,683,989 | | | $ | 58,957,014 | | | | — | | | $ | — | |
| | | | | | | | | | | | | | | | | |
Class VI: | | | | | | | | | | | | | | | | |
Shares sold | | | 11,918,840 | | | $ | 421,919,797 | | | | 44,028,379 | | | $ | 1,455,150,686 | |
Shares issued to shareholders in reinvestment of distributions | | | 3,113,453 | | | | 99,975,150 | | | | — | | | | — | |
Shares repurchased | | | (9,620,986 | ) | | | (328,005,022 | ) | | | (5,032,852 | ) | | | (165,850,792 | ) |
| | | | | | | | | | | | | | | | | |
Net increase (decrease) | | | 5,411,307 | | | $ | 193,889,925 | | | | 38,995,527 | | | $ | 1,289,299,894 | |
| | | | | | | | | | | | | | | | | |
| | | | | | | | | | | | | | | | | |
Consolidated Special Opportunities Fund | |
Class VI: | |
Shares sold | | | 157,444 | | | $ | 3,101,282 | | | | 26,243,967 | (c) | | $ | 489,248,559 | (c) |
Shares issued to shareholders in reinvestment of distributions | | | 1,855,789 | | | | 36,919,533 | | | | 876,930 | | | | 17,283,918 | |
Shares repurchased | | | (14,372,910 | ) | | | (287,704,307 | ) | | | (8,675,912 | )(c) | | | (172,289,146 | )(c) |
Purchase premiums | | | — | | | | 5,534 | | | | — | | | | 2,371,022 | |
Redemption fees | | | — | | | | 1,428,513 | | | | — | | | | 774,369 | |
| | | | | | | | | | | | | | | | | |
Net increase (decrease) | | | (12,359,677 | ) | | $ | (246,249,445 | ) | | | 18,444,985 | | | $ | 337,388,722 | |
| | | | | | | | | | | | | | | | | |
| | | | | | | | | | | | | | | | | |
176
GMO Trust Funds
Notes to Financial Statements — (Continued)
February 28, 2017
| | | | | | | | | | | | | | | | |
| | | |
| | | Year Ended
February 28, 2017 | | | Year Ended
February 29, 2016 | |
| | | | | |
| | | Shares | | | Amount | | | Shares | | | Amount | |
Strategic Opportunities Allocation Fund | |
Class III: | |
Shares sold | | | 893,443 | | | $ | 16,967,331 | | | | 7,092,841 | | | $ | 137,972,294 | |
Shares issued to shareholders in reinvestment of distributions | | | 2,841,743 | | | | 53,702,273 | | | | 9,863,675 | | | | 190,867,800 | |
Shares repurchased | | | (14,553,101 | ) | | | (276,781,131 | ) | | | (15,958,945 | ) | | | (310,862,521 | ) |
Purchase premiums | | | — | | | | 7,878 | | | | — | | | | 108,910 | |
Redemption fees | | | — | | | | 483,578 | | | | — | | | | 369,228 | |
| | | | | | | | | | | | | | | | | |
Net increase (decrease) | | | (10,817,915 | ) | | $ | (205,620,071 | ) | | | 997,571 | | | $ | 18,455,711 | |
| | | | | | | | | | | | | | | | | |
| | | | | | | | | | | | | | | | | |
| | (a) | 1,532,411 shares and $34,065,494 were purchased in-kind and redeemed in-kind. |
| | (b) | 34,102,823 shares and $444,018,756 were purchased in-kind and redeemed in-kind |
| | (c) | 864,281 shares and $17,415,262, were purchased in-kind and redeemed in-kind |
| | # | Shares were adjusted to reflect a 1:3 reverse stock split effective July 15, 2016. |
| 10. | Investments in affiliated companies and other Funds of the Trust |
An affiliated company for the purposes of this disclosure is a company in which a Fund has or had direct ownership of at least 5% of the issuer’s voting securities. A summary of the Fund’s transactions involving companies that are or were affiliates during the year ended February 28, 2017 is set forth below:
| | | | | | | | | | | | | | | | | | | | |
| | | | | | |
| Affiliate | | Value,
beginning of
period | | | Purchases | | | Sales
Proceeds | | | Dividend Income | | | Value, end of
period | |
Consolidated Special Opportunities Fund | | | | | | | | | | | | | | | | | | | | |
Jagercor Energy Corp | | $ | 155,211 | | | $ | — | | | $ | — | | | $ | — | | | $ | 90,348 | |
Newalta Corp | | | — | * | | | 4,671,298 | | | | 10,356,076 | | | | — | | | | — | # |
| | | | | | | | | | | | | | | | | | | | | |
Totals | | $ | 155,211 | | | $ | 4,671,298 | | | $ | 10,356,076 | | | $ | — | | | $ | 90,348 | |
| | | | | | | | | | | | | | | | | | | | | |
| | | | | | | | | | | | | | | | | | | | | |
| | * | Security not an affiliate at the beginning of the period. |
| | # | No longer an affiliate as of February 28, 2017. |
177
GMO Trust Funds
Notes to Financial Statements — (Continued)
February 28, 2017
A summary of the Funds’ transactions in the shares of other funds of GMO Trust during the year ended February 28, 2017 is set forth below:
| | | | | | | | | | | | | | | | | | | | | | | | | | | | |
| | | | | | | | |
| Affiliate | | Value,
beginning of
period | | | Purchases | | | Sales
Proceeds | | | Dividend
Income | | | Distributions
of Realized
Gains | | | Return of
Capital | | | Value, end of
period | |
GMO Alpha Only Fund | | | | | | | | | | | | | | | | | | | | | | | | | | | | |
GMO U.S. Treasury Fund | | $ | 3,011,692 | | | $ | 148,801,818 | | | $ | 141,219,999 | | | $ | 69,116 | | | $ | 2,697 | | | $ | — | | | $ | 10,595,373 | |
| | | | | | | | | | | | | | | | | | | | | | | | | | | | | |
| | | | | | | | | | | | | | | | | | | | | | | | | | | | | |
Benchmark-Free Allocation Fund | | | | | | | | | | | | | | | | | | | | | | | | | | | | |
GMO Emerging Country Debt Fund, Class IV | | $ | 748,622,535 | | | $ | 47,635,076 | | | $ | 256,866,642 | | | $ | 44,111,665 | | | $ | — | | | $ | — | | | $ | 621,136,921 | |
GMO Implementation Fund | | | 13,227,455,053 | | | | 462,775,287 | | | | 4,204,268,866 | | | | 209,323,292 | | | | — | | | | — | | | | 10,761,426,169 | |
GMO Opportunistic Income Fund, Class VI | | | 775,552,374 | | | | 68,561,137 | | | | 197,264,144 | | | | 17,233,707 | | | | — | | | | — | | | | 682,798,759 | |
GMO SGM Major Markets Fund, Class VI | | | 814,182,754 | | | | 470,547,987 | | | | 216,183,696 | | | | 32,293,301 | | | | 37,283,480 | | | | — | | | | 1,030,173,520 | |
GMO Special Opportunities Fund, Class VI | | | 839,489,834 | | | | 25,855,775 | | | | 263,409,794 | | | | 11,234,816 | | | | 14,620,959 | | | | — | | | | 674,447,572 | |
| | | | | | | | | | | | | | | | | | | | | | | | | | | | | |
Totals | | $ | 16,405,302,550 | | | $ | 1,075,375,262 | | | $ | 5,137,993,142 | | | $ | 314,196,781 | | | $ | 51,904,439 | | | $ | — | | | $ | 13,769,982,941 | |
| | | | | | | | | | | | | | | | | | | | | | | | | | | | | |
| | | | | | | | | | | | | | | | | | | | | | | | | | | | | |
Benchmark-Free Fund | | | | | | | | | | | | | | | | | | | | | | | | | | | | |
GMO Emerging Country Debt Fund, Class IV | | $ | 242,720,374 | | | $ | 17,020,615 | | | $ | 35,340,000 | | | $ | 17,020,615 | | | $ | — | | | $ | — | | | $ | 254,330,557 | |
GMO Emerging Markets Fund, Class VI | | | 411,052,988 | | | | 120,435,283 | | | | 111,177,960 | | | | 10,435,283 | | | | — | | | | — | | | | 544,118,916 | |
GMO Opportunistic Income Fund, Class VI | | | 246,974,456 | | | | 6,503,529 | | | | — | | | | 6,503,529 | | | | — | | | | — | | | | 265,783,934 | |
GMO SGM Major Markets Fund, Class VI | | | 200,160,790 | | | | 13,235,015 | | | | 20,726,000 | | | | 6,509,405 | | | | 6,725,610 | | | | — | | | | 190,362,136 | |
GMO Special Opportunities Fund, Class VI | | | 272,146,747 | | | | 10,009,740 | | | | 22,866,000 | | | | 4,495,303 | | | | 5,514,437 | | | | — | | | | 284,598,267 | |
GMO U.S. Treasury Fund | | | 204,990,090 | | | | 192,456,754 | | | | 361,000,000 | | | | 428,627 | | | | 28,127 | | | | — | | | | 36,502,880 | |
| | | | | | | | | | | | | | | | | | | | | | | | | | | | | |
Totals | | $ | 1,578,045,445 | | | $ | 359,660,936 | | | $ | 551,109,960 | | | $ | 45,392,762 | | | $ | 12,268,174 | | | $ | — | | | $ | 1,575,696,690 | |
| | | | | | | | | | | | | | | | | | | | | | | | | | | | | |
| | | | | | | | | | | | | | | | | | | | | | | | | | | | | |
Global Asset Allocation Fund | | | | | | | | | | | | | | | | | | | | | | | | | | | | |
GMO Alpha Only Fund, Class IV | | $ | 99,903,387 | | | $ | 2,282,390 | | | $ | 24,940,441 | | | $ | 2,282,390 | | | $ | — | | | $ | — | | | $ | 73,411,864 | |
GMO Asset Allocation Bond Fund, Class VI | | | 666,921,092 | | | | 6,392,504 | | | | 237,443,404 | | | | — | | | | — | | | | — | | | | 436,734,200 | |
GMO Core Plus Bond Fund, Class IV | | | — | | | | 122,446,468 | | | | 664,814 | | | | — | | | | — | | | | — | | | | 122,418,980 | |
GMO Emerging Country Debt Fund, Class IV | �� | | 150,074,191 | | | | 7,794,462 | | | | 75,254,430 | | | | 7,794,462 | | | | — | | | | — | | | | 98,805,388 | |
GMO Emerging Markets Fund, Class VI | | | 433,780,941 | | | | 45,382,674 | | | | 226,201,660 | | | | 7,738,245 | | | | — | | | | — | | | | 363,494,869 | |
GMO International Equity Fund, Class IV | | | 760,145,595 | | | | 24,274,286 | | | | 354,039,245 | | | | 23,423,908 | | | | — | | | | — | | | | 507,593,996 | |
GMO Opportunistic Income Fund, Class VI | | | 155,335,123 | | | | 3,031,794 | | | | 67,144,555 | | | | 3,031,794 | | | | — | | | | — | | | | 97,727,559 | |
GMO Quality Fund, Class VI | | | — | | | | 226,985,614 | | | | 36,635,418 | | | | 3,585,189 | | | | 2,941,680 | | | | — | | | | 202,013,212 | |
GMO Risk Premium Fund, Class VI | | | 85,983,383 | | | | 4,413,462 | | | | 35,025,116 | | | | — | | | | 4,413,462 | | | | — | | | | 64,139,050 | |
GMO SGM Major Markets Fund, Class VI | | | 99,883,924 | | | | 5,252,168 | | | | 31,611,937 | | | | 2,570,080 | | | | 2,682,088 | | | | — | | | | 73,002,358 | |
GMO U.S. Equity Allocation Fund, Class VI | | | 544,247,275 | | | | 27,921,704 | | | | 416,676,473 | | | | 6,627,192 | | | | 21,294,512 | | | | — | | | | 201,264,975 | |
GMO U.S. Treasury Fund | | | 320,035,653 | | | | 44,209,405 | | | | 181,174,825 | | | | 1,257,038 | | | | 126,004 | | | | — | | | | 183,086,818 | |
| | | | | | | | | | | | | | | | | | | | | | | | | | | | | |
Totals | | $ | 3,316,310,564 | | | $ | 520,386,931 | | | $ | 1,686,812,318 | | | $ | 58,310,298 | | | $ | 31,457,746 | | | $ | — | | | $ | 2,423,693,269 | |
| | | | | | | | | | | | | | | | | | | | | | | | | | | | | |
| | | | | | | | | | | | | | | | | | | | | | | | | | | | | |
Global Developed Equity Allocation Fund | | | | | | | | | | | | | | | | | | | | | | | | | | | | |
GMO Emerging Markets Fund, Class VI | | $ | 146,525,557 | | | $ | 7,905,769 | | | $ | 92,766,529 | | | $ | 2,465,166 | | | $ | — | | | $ | — | | | $ | 98,541,837 | |
GMO International Equity Fund, Class IV | | | 648,877,447 | | | | 32,868,844 | | | | 294,357,001 | | | | 19,398,520 | | | | — | | | | — | | | | 456,476,089 | |
GMO Quality Fund, Class VI | | | — | | | | 266,781,931 | | | | 60,322,704 | | | | 3,877,931 | | | | 3,302,802 | | | | — | | | | 219,104,022 | |
GMO U.S. Equity Allocation Fund, Class VI | | | 636,945,658 | | | | 34,931,940 | | | | 506,065,333 | | | | 7,650,401 | | | | 23,820,190 | | | | — | | | | 217,844,350 | |
| | | | | | | | | | | | | | | | | | | | | | | | | | | | | |
Totals | | $ | 1,432,348,662 | | | $ | 342,488,484 | | | $ | 953,511,567 | | | $ | 33,392,018 | | | $ | 27,122,992 | | | $ | — | | | $ | 991,966,298 | |
| | | | | | | | | | | | | | | | | | | | | | | | | | | | | |
| | | | | | | | | | | | | | | | | | | | | | | | | | | | | |
Global Equity Allocation Fund | | | | | | | | | | | | | | | | | | | | | | | | | | | | |
GMO Emerging Markets Fund, Class VI | | $ | 643,097,271 | | | $ | 23,849,418 | | | $ | 335,480,483 | | | $ | 11,182,122 | | | $ | — | | | $ | — | | | $ | 504,513,964 | |
GMO International Equity Fund, Class IV | | | 1,159,489,783 | | | | 72,454,667 | | | | 467,795,849 | | | | 36,243,812 | | | | — | | | | — | | | | 885,286,898 | |
GMO Quality Fund, Class VI | | | — | | | | 546,821,555 | | | | 169,684,300 | | | | 6,888,363 | | | | 6,661,212 | | | | — | | | | 399,709,400 | |
GMO U.S. Equity Allocation Fund, Class VI | | | 1,075,713,572 | | | | 71,966,935 | | | | 820,237,908 | | | | 15,017,145 | | | | 41,520,029 | | | | — | | | | 416,646,309 | |
| | | | | | | | | | | | | | | | | | | | | | | | | | | | | |
Totals | | $ | 2,878,300,626 | | | $ | 715,092,575 | | | $ | 1,793,198,540 | | | $ | 69,331,442 | | | $ | 48,181,241 | | | $ | — | | | $ | 2,206,156,571 | |
| | | | | | | | | | | | | | | | | | | | | | | | | | | | | |
| | | | | | | | | | | | | | | | | | | | | | | | | | | | | |
178
GMO Trust Funds
Notes to Financial Statements — (Continued)
February 28, 2017
| | | | | | | | | | | | | | | | | | | | | | | | | | | | |
| | | | | | | | |
| Affiliate | | Value,
beginning of
period | | | Purchases | | | Sales
Proceeds | | | Dividend
Income | | | Distributions
of Realized
Gains | | | Return of
Capital | | | Value, end of
period | |
International Developed Equity Allocation Fund | | | | | | | | | | | | | | | | | | | | | | | | | | | | |
GMO Emerging Markets Fund, Class VI | | $ | 94,700,211 | | | $ | 5,432,948 | | | $ | 67,506,310 | | | $ | 1,645,271 | | | $ | — | | | $ | — | | | $ | 59,768,161 | |
GMO International Equity Fund, Class IV | | | 847,974,621 | | | | 83,666,117 | | | | 481,436,115 | | | | 26,051,523 | | | | — | | | | — | | | | 541,876,427 | |
| | | | | | | | | | | | | | | | | | | | | | | | | | | | | |
Totals | | $ | 942,674,832 | | | $ | 89,099,065 | | | $ | 548,942,425 | | | $ | 27,696,794 | | | $ | — | | | $ | — | | | $ | 601,644,588 | |
| | | | | | | | | | | | | | | | | | | | | | | | | | | | | |
| | | | | | | | | | | | | | | | | | | | | | | | | | | | | |
International Equity Allocation Fund | | | | | | | | | | | | | | | | | | | | | | | | | | | | |
GMO Emerging Markets Fund, Class VI | | $ | 369,371,327 | | | $ | 17,498,662 | | | $ | 134,726,621 | | | $ | 7,732,703 | | | $ | — | | | $ | — | | | $ | 356,432,437 | |
GMO International Equity Fund, Class IV | | | 765,062,070 | | | | 63,066,582 | | | | 183,506,686 | | | | 28,624,209 | | | | — | | | | — | | | | 729,124,865 | |
| | | | | | | | | | | | | | | | | | | | | | | | | | | | | |
Totals | | $ | 1,134,433,397 | | | $ | 80,565,244 | | | $ | 318,233,307 | | | $ | 36,356,912 | | | $ | — | | | $ | — | | | $ | 1,085,557,302 | |
| | | | | | | | | | | | | | | | | | | | | | | | | | | | | |
| | | | | | | | | | | | | | | | | | | | | | | | | | | | | |
Consolidated SGM Major Markets Fund | | | | | | | | | | | | | | | | | | | | | | | | | | | | |
GMO U.S. Treasury Fund | | $ | 939,856,415 | | | $ | 365,060,705 | | | $ | 470,000,000 | | | $ | 4,516,688 | | | $ | 544,018 | | | | — | | | $ | 834,716,360 | |
| | | | | | | | | | | | | | | | | | | | | | | | | | | | | |
| | | | | | | | | | | | | | | | | | | | | | | | | | | | | |
Strategic Opportunities Allocation Fund | | | | | | | | | | | | | | | | | | | | | | | | | | | | |
GMO Core Plus Bond Fund, Class IV | | $ | — | | | $ | 56,107,319 | | | $ | — | | | $ | — | | | $ | — | | | $ | — | | | $ | 56,400,656 | |
GMO Emerging Country Debt Fund, Class IV | | | 98,375,017 | | | | 6,633,655 | | | | 31,343,220 | | | | 6,633,656 | | | | — | | | | — | | | | 84,932,626 | |
GMO Emerging Markets Fund, Class VI | | | 361,131,996 | | | | 44,585,406 | | | | 116,201,736 | | | | 8,140,406 | | | | — | | | | — | | | | 390,569,250 | |
GMO International Equity Fund, Class IV | | | 558,786,340 | | | | 43,325,872 | | | | 91,334,145 | | | | 24,560,619 | | | | — | | | | — | | | | 573,398,898 | |
GMO Opportunistic Income Fund, Class VI | | | 86,283,231 | | | | 2,117,058 | | | | 8,698,035 | | | | 2,117,058 | | | | — | | | | — | | | | 83,844,202 | |
GMO Quality Fund, Class VI | | | — | | | | 207,744,773 | | | | 11,638,195 | | | | 3,429,963 | | | | 2,719,250 | | | | — | | | | 207,645,291 | |
GMO U.S. Equity Allocation Fund, Class VI | | | 402,543,560 | | | | 27,077,515 | | | | 259,870,078 | | | | 6,354,402 | | | | 20,723,113 | | | | — | | | | 204,598,363 | |
GMO U.S. Treasury Fund | | | 143,377,530 | | | | 314,160,004 | | | | 154,390,036 | | | | 1,526,589 | | | | 157,230 | | | | — | | | | 303,051,065 | |
| | | | | | | | | | | | | | | | | | | | | | | | | | | | | |
Totals | | $ | 1,650,497,674 | | | $ | 701,751,602 | | | $ | 673,475,445 | | | $ | 52,762,693 | | | $ | 23,599,593 | | | $ | — | | | $ | 1,904,440,351 | |
| | | | | | | | | | | | | | | | | | | | | | | | | | | | | |
| | | | | | | | | | | | | | | | | | | | | | | | | | | | | |
179
Report of Independent Registered Public Accounting Firm
To the Trustees of GMO Trust and Shareholders of GMO Alpha Only Fund, GMO Benchmark-Free Allocation Fund, GMO Benchmark-Free Fund, GMO Global Asset Allocation Fund, GMO Global Developed Equity Allocation Fund, GMO Global Equity Allocation Fund, GMO Implementation Fund, GMO International Developed Equity Allocation Fund, GMO International Equity Allocation Fund, GMO SGM Major Markets Fund, GMO Special Opportunities Fund, and GMO Strategic Opportunities Allocation Fund
In our opinion, the accompanying statements of assets and liabilities (consolidated statements of assets and liabilities for GMO Implementation Fund, GMO SGM Major Markets Fund and GMO Special Opportunities Fund), including the schedules of investments (consolidated schedules of investments for GMO Implementation Fund, GMO SGM Major Markets Fund and GMO Special Opportunities Fund), and the related statements of operations (consolidated statements of operations for GMO Implementation Fund, GMO SGM Major Markets Fund and GMO Special Opportunities Fund) and of changes in net assets (consolidated changes in net assets for GMO Implementation Fund, GMO SGM Major Markets Fund and GMO Special Opportunities Fund) and the financial highlights (consolidated financial highlights for GMO Implementation Fund, GMO SGM Major Markets Fund and GMO Special Opportunities Fund) present fairly, in all material respects, the financial position of the GMO Alpha Only Fund, GMO Benchmark-Free Allocation Fund, GMO Benchmark-Free Fund, GMO Global Asset Allocation Fund, GMO Global Developed Equity Allocation Fund, GMO Global Equity Allocation Fund, GMO Implementation Fund, GMO International Developed Equity Allocation Fund, GMO International Equity Allocation Fund, GMO SGM Major Markets Fund, GMO Special Opportunities Fund, and GMO Strategic Opportunities Allocation Fund (the “Funds”) as of February 28, 2017, the results of each of their operations for the year then ended, the changes in each of their net assets for each of the two years in the period then ended and the financial highlights for each of the periods indicated, in conformity with accounting principles generally accepted in the United States of America. These financial statements and financial highlights (hereafter referred to as “financial statements”) are the responsibility of the Fund’s management. Our responsibility is to express an opinion on these financial statements based on our audits. We conducted our audits of these financial statements in accordance with the standards of the Public Company Accounting Oversight Board (United States). Those standards require that we plan and perform the audit to obtain reasonable assurance about whether the financial statements are free of material misstatement. An audit includes examining, on a test basis, evidence supporting the amounts and disclosures in the financial statements, assessing the accounting principles used and significant estimates made by management, and evaluating the overall financial statement presentation. Our procedures included confirmation of securities owned as of February 28, 2017 by correspondence with the custodians and brokers; when replies were not received from brokers, we performed other auditing procedures. We believe that our audits provide a reasonable basis for our opinion.
PricewaterhouseCoopers LLP
Boston, Massachusetts
April 26, 2017
180
GMO Trust Funds
(A Series of GMO Trust)
Fund Expenses
February 28, 2017 (Unaudited)
Expense Examples: The following information is in relation to expenses for the six month period ended February 28, 2017.
As a shareholder of the Funds, you may incur two types of costs: (1) transaction costs, including purchase premium and redemption fees, if applicable; and (2) ongoing costs, including direct and /or indirect management fees, direct and/or indirect shareholder services fees, and distribution (12b-1) and/or administration fees for Funds with Class M shares, if applicable, and other Fund expenses. This example is intended to help you understand your ongoing costs (in dollars) of investing in the Funds and to compare these costs with the ongoing costs of investing in other mutual funds.
These examples are based on an investment of $1,000 invested at the beginning of the period and held for the entire period, September 1, 2016 through February 28, 2017.
Actual Expenses
This section of the table for each class below provides information about actual account values and actual expenses. You may use the information in this section, together with the amount you invested, to estimate the expenses that you paid over the period. Simply divide your account value by $1,000 (for example, a $10,000,000 account value divided by $1,000 = 10,000), then multiply the result by the number under the heading entitled “Expenses Paid During the Period” to estimate the expenses you paid on your account during this period.
Hypothetical Example for Comparison Purposes
This section of the table for each class below provides information about hypothetical account values and hypothetical expenses based on the Funds’ actual expense ratio and an assumed rate of return of 5% per year before expenses, which is not the Funds’ actual return. The hypothetical account values and expenses may not be used to estimate the actual ending account balance or expenses you paid for the period. You may use this information to compare the ongoing costs of investing in the Funds with other funds. To do so, compare this 5% hypothetical example with the 5% hypothetical examples that appear in the shareholder reports of other funds.
Please note that the expenses shown in the table are meant to highlight your ongoing costs only and do not reflect any transactional costs, such as purchase premium and redemption fees. Therefore, this section of the table is useful in comparing ongoing costs only, and will not help you determine the relative total costs of owning different funds. In addition, if these transactional costs were included, your costs would have been higher.
| | | | | | | | | | | | | | | | | | | | | | | | | | | | |
| | | Actual | | | Hypothetical | | | | |
| | | Beginning
Account Value
September 1, 2016 | | | Ending
Account Value
February 28, 2017 | | | Expenses Paid
During the Period* | | | Beginning
Account Value
September 1, 2016 | | | Ending
Account Value
February 28, 2017 | | | Expenses Paid
During the Period* | | | Annualized
Expense Ratio | |
Alpha Only Fund | | | | | | | | | | | | | | | | | |
Class III | | | $1,000.00 | | | | $982.10 | | | | $3.34 | | | | $1,000.00 | | | | $1,021.42 | | | | $3.41 | | | | 0.68% | |
Class IV | | | $1,000.00 | | | | $982.30 | | | | $3.10 | | | | $1,000.00 | | | | $1,021.67 | | | | $3.16 | | | | 0.63% | |
Benchmark-Free Allocation Fund | | | | | | | | | | | | | | | | | |
Class III | | | $1,000.00 | | | | $1,033.50 | | | | $4.24 | | | | $1,000.00 | | | | $1,020.63 | | | | $4.21 | | | | 0.84% | |
Class IV | | | $1,000.00 | | | | $1,033.90 | | | | $3.98 | | | | $1,000.00 | | | | $1,020.88 | | | | $3.96 | | | | 0.79% | |
Class MF | | | $1,000.00 | | | | $1,033.80 | | | | $3.98 | | | | $1,000.00 | | | | $1,020.88 | | | | $3.96 | | | | 0.79% | |
Benchmark-Free Fund | | | | | | | | | | | | | | | | | |
Class III | | | $1,000.00 | | | | $1,037.40 | | | | $1.31 | | | | $1,000.00 | | | | $1,023.51 | | | | $1.30 | | | | 0.26% | |
Global Asset Allocation Fund | | | | | | | | | | | | | | | | | |
Class III | | | $1,000.00 | | | | $1,038.30 | | | | $2.38 | | | | $1,000.00 | | | | $1,022.46 | | | | $2.36 | | | | 0.47% | |
Global Developed Equity Allocation Fund | | | | | | | | | | | | | | | | | |
Class III | | | $1,000.00 | | | | $1,071.20 | | | | $2.72 | | | | $1,000.00 | | | | $1,022.17 | | | | $2.66 | | | | 0.53% | |
Global Equity Allocation Fund | | | | | | | | | | | | | | | | | |
Class III | | | $1,000.00 | | | | $1,069.70 | | | | $2.93 | | | | $1,000.00 | | | | $1,021.97 | | | | $2.86 | | | | 0.57% | |
Implementation Fund | | | | | | | | | | | | | | | | | |
Core | | | $1,000.00 | | | | $1,043.90 | | | | $0.20 | | | | $1,000.00 | | | | $1,024.60 | | | | $0.20 | | | | 0.04% | |
International Developed Equity Allocation Fund | | | | | | | | | | | | | | | | | |
Class III | | | $1,000.00 | | | | $1,056.30 | | | | $3.16 | | | | $1,000.00 | | | | $1,021.72 | | | | $3.11 | | | | 0.62% | |
International Equity Allocation Fund | | | | | | | | | | | | | | | | | |
Class III | | | $1,000.00 | | | | $1,057.90 | | | | $3.47 | | | | $1,000.00 | | | | $1,021.42 | | | | $3.41 | | | | 0.68% | |
181
GMO Trust Funds
(A Series of GMO Trust)
Fund Expenses — (Continued)
February 28, 2017 (Unaudited)
| | | | | | | | | | | | | | | | | | | | | | | | | | | | |
| | | Actual | | | Hypothetical | | | | |
| | | Beginning
Account Value
September 1, 2016 | | | Ending
Account Value
February 28, 2017 | | | Expenses Paid
During the Period* | | | Beginning
Account Value
September 1, 2016 | | | Ending
Account Value
February 28, 2017 | | | Expenses Paid
During the Period* | | | Annualized
Expense Ratio | |
SGM Major Markets Fund | | | | | | | | | | | | | | | | | |
Class III | | | $1,000.00 | | | | $984.90 | | | | $4.92 | | | | $1,000.00 | | | | $1,019.84 | | | | $5.01 | | | | 1.00% | |
Class IV | | | $1,000.00 | | | | $982.10 | | | | $3.22 | (a) | | | $1,000.00 | | | | $1,013.87 | | | | $3.28 | | | | 0.95% | |
Class VI | | | $1,000.00 | | | | $985.50 | | | | $4.48 | | | | $1,000.00 | | | | $1,020.28 | | | | $4.56 | | | | 0.91% | |
Special Opportunities Fund | | | | | | | | | | | | | | | | | |
Class VI | | | $1,000.00 | | | | $1,024.80 | | | | $6.18 | | | | $1,000.00 | | | | $1,018.70 | | | | $6.16 | | | | 1.23% | |
Strategic Opportunities Allocation Fund | | | | | | | | | | | | | | | | | |
Class III | | | $1,000.00 | | | | $1,047.80 | | | | $2.28 | | | | $1,000.00 | | | | $1,022.56 | | | | $2.26 | | | | 0.45% | |
| | (a) | For the period October 27, 2016 (commencement of operations) through February 28, 2017, expenses were calculated using the class’s annualized net expense ratio (including indirect expenses incurred) for the period ended February 28, 2017, multiplied by the average account value over the period, multiplied by 125 days in the period, divided by 365 days in the year. |
| | * | Expenses are calculated using each class’s annualized net expense ratio (including indirect expenses incurred) for the six months ended February 28, 2017, multiplied by the average account value over the period, multiplied by 181 days in the period, divided by 365 days in the year. |
182
GMO Trust Funds
(A Series of GMO Trust)
Tax Information for the Tax Year Ended February 28, 2017 (Unaudited)
The following information is being provided in order to meet reporting requirements set forth by the Code and/or to meet state-specific requirements. Shareholders should consult their tax advisors.
With respect to distributions paid, the Funds designate the following amounts (or, if subsequently determined to be different, the maximum amount allowable) for the fiscal year-ended February 28, 2017:
| | | | | | | | | | | | | | | | | | | | | | | | | | | | | | | | |
| | | | | | | | | |
| Fund Name | | Dividend
Received
Deduction
(corporate
shareholders)(1) | | | Qualified
Dividend
Income
(non-corporate
shareholders)(1) | | | U.S.
Government
Obligation
Income(1,2) | | | Interest-
Related
Dividend
Income
($)(3) | | | Short-
Term
Capital
Gain
Dividends
($)(3) | | | Long-Term
Capital Gain
Distributions
($) | | | Foreign
Taxes
Paid
($)(4) | | | Foreign
Source
Income
($)(4) | |
Alpha Only Fund | | | 39.16% | | | | 80.64% | | | | — | | | | — | | | | — | | | | — | | | | — | | | | — | |
Benchmark-Free Allocation Fund | | | 14.93% | | | | 75.82% | | | | 13.19% | | | | 29,921,930 | | | | — | | | | — | | | | — | | | | — | |
Benchmark-Free Fund | | | 8.67% | | | | 47.10% | | | | 4.85% | | | | 17,234,559 | | | | — | | | | — | | | | — | | | | — | |
Global Asset Allocation Fund | | | 17.48% | | | | 66.85% | | | | 2.48% | | | | 5,805,707 | | | | — | | | | — | | | | 4,164,661 | | | | 35,322,614 | |
Global Developed Equity Allocation Fund | | | 37.33% | | | | 100.00% | | | | — | | | | — | | | | — | | | | 39,709,256 | | | | 2,625,567 | | | | 24,491,339 | |
Global Equity Allocation Fund | | | 31.23% | | | | 97.42% | | | | — | | | | — | | | | — | | | | 55,809,080 | | | | 6,259,743 | | | | 53,699,307 | |
Consolidated Implementation Fund | | | 14.14% | | | | 77.65% | | | | 11.75% | | | | 28,296,091 | | | | — | | | | — | | | | — | | | | — | |
International Developed Equity Allocation Fund | | | — | | | | 98.37% | | | | — | | | | — | | | | — | | | | — | | | | 3,181,727 | | | | 30,880,244 | |
International Equity Allocation Fund | | | — | | | | 100.00% | | | | — | | | | — | | | | — | | | | — | | | | 4,721,687 | | | | 41,083,575 | |
Consolidated SGM Major Markets Fund | | | — | | | | — | | | | 6.84% | | | | — | | | | 20,077,463 | | | | 34,942,155 | | | | — | | | | — | |
Consolidated Special Opportunities Fund | | | 16.62% | | | | 27.27% | | | | 3.13% | | | | 1,931,927 | | | | 14,583,094 | | | | 6,094,262 | | | | — | | | | — | |
Strategic Opportunities Allocation Fund | | | 17.47% | | | | 77.84% | | | | 3.62% | | | | 6,479,739 | | | | — | | | | 1,162,716 | | | | 4,366,794 | | | | 37,068,908 | |
| | (1) | Presented as a percentage of net investment income and short-term capital gain distributions paid, if any. |
| | (2) | All or a portion of these amounts may be exempt from taxation at the state level. |
| | (3) | These amounts are generally exempt from U.S. withholding taxes for non-U.S. shareholders, provided certain conditions are satisfied by both the Funds and the Funds’ shareholders. If applicable, interest related dividend amounts could include short-term capital gain dividends received from underlying funds. |
| | (4) | The Funds expect to elect to treat foreign taxes attributed to foreign source income from certain of its investments, as if incurred directly by the Funds’ shareholders. |
In early 2018, the Funds will notify applicable shareholders of amounts for use in preparing 2017 U.S. federal income tax forms.
183
Trustees and Officers (Unaudited)
The following tables present information regarding each Trustee and officer of the Trust as of February 28, 2017. Each Trustee’s and officer’s year of birth (“YOB”) is set forth after his or her name. Unless otherwise noted, (i) each Trustee and officer has engaged in the principal occupation(s) noted in the table for at least the most recent five years, although not necessarily in the same capacity, and (ii) the address of each Trustee and officer is c/o GMO Trust, 40 Rowes Wharf, Boston, MA 02110. Each Trustee serves in office until the earlier of (a) the election and qualification of a successor at the next meeting of shareholders called to elect Trustees or (b) the Trustee dies, resigns, or is removed as provided in the Trust’s governing documents. Each of the Trustees of the Trust, other than Mr. Kittredge, is not an “interested person” of the Trust, as such term is used in the 1940 Act (each, an “Independent Trustee”). Because the Funds do not hold annual meetings of shareholders, each Trustee will hold office for an indeterminate period. Each officer serves in office until his or her successor is elected and determined to be qualified to carry out the duties and responsibilities of the office, or until the officer resigns or is removed from office.
Management of the Trust
| | | | | | | | | | | | | |
| Independent Trustees |
| | | | | | | | | | | | | |
Name and
Year of Birth | | Position(s)
Held with the Trust | | Length of
Time Served | | Principal Occupation(s) During Past
5 Years | | Number of
Portfolios in
Fund Complex1
Overseen | | Other
Directorships
Held in the
Past Five
Years |
Donald W. Glazer YOB: 1944 | | Chairman of the Board of Trustees | | Chairman of the Board of Trustees since March 2005; Lead Independent Trustee (September 2004 – March 2005); Trustee since December 2000. | | Consultant – Law and Business2; Author of Legal Treatises. | | | | 36 | | | Director, BeiGene Ltd. (biotech research). |
| | | | | |
Peter Tufano YOB: 1957 | | Trustee | | Since December 2008. | | Peter Moores Dean and Professor of Finance, University of Oxford Saïd Business School (as of July 1, 2011); Sylvan C. Coleman Professor of Financial Management, Harvard Business School (1989 – 2011). | | | | 36 | | | Trustee of State Street Navigator Securities Lending Trust (5 Portfolios). |
| | | | | |
Paul Braverman YOB: 1949 | | Trustee | | Since March 2010. | | Director of Claren Road Asset Management, LLC (hedge fund) (January 2011 – present); Director of Leerink Swann Holdings, LLC (investment bank) (October 2013 – present); Director of Aesir Capital Management (investment advisor) (November 2012 – present); Director of Kieger (US) Ltd. (investment advisor) (January 2015 – present). | | | | 36 | | | Trustee of HIMCO Variable Insurance Trust (27 Portfolios). |
| Interested Trustee and Officer | | | | |
| | | | | | | | | | | | | |
Joseph B. Kittredge, Jr.3 YOB: 1954 | | Trustee; President of the Trust | | Trustee since March 2010; President since March 2009; Chief Executive Officer, March 2009 – June 2015. | | General Counsel, Grantham, Mayo, Van Otterloo & Co. LLC (October 2005 – present); Partner, Ropes & Gray, LLP (1988 – 2005). | | | | 48 | | | None. |
| 1 | The Fund Complex includes series of each of GMO Trust and GMO Series Trust. Mr. Kittredge also serves as a Trustee of GMO Series Trust. |
| 2 | As part of Mr. Glazer’s work as a consultant, he provides part-time consulting services to Goodwin Procter LLP (“Goodwin”). Goodwin has provided legal services to Renewable Resources, LLC, an affiliate of GMO; GMO, in connection with its relationship with Renewable Resources; and funds managed by Renewable Resources. Mr. Glazer has represented that he has no financial interest in, and is not involved in the provision of, such legal services. These entities did not pay any legal fees or disbursements to Goodwin during the calendar years ended December 31, 2015 and December 31, 2016. In correspondence with the staff of the SEC (the “Staff”) beginning in August 2006, the Independent Trustees’ legal counsel provided the Staff with information regarding Mr. Glazer’s relationship with Goodwin and his other business activities. On September 11, 2007, based on information that had been given to the Staff as of that date, the Staff provided oral no-action assurance consistent with the opinion of the Independent Trustees’ legal counsel that Mr. Glazer is not an “interested person” of the Trust. |
| 3 | Mr. Kittredge is an “interested person” of the Trust, as such term is used in the 1940 Act (an “Interested Trustee”), by virtue of his positions with the Trust and GMO indicated in the table above and his interest as a member of GMO. |
184
| | | | | | |
| Officers | | | | | | |
| | | | | | |
Name and
Year of Birth | | Position(s)
Held with the Trust | | Length of
Time Served | | Principal Occupation(s)
During Past 5 Years* |
Joseph B. Kittredge, Jr. YOB: 1954 | | Trustee and President | | Trustee since March 2010; President since March 2009; Chief Executive Officer, March 2009 – June 2015. | | General Counsel, Grantham, Mayo, Van Otterloo & Co. LLC (October 2005 – present); Partner, Ropes & Gray LLP (1988 – 2005). |
| | | |
Sheppard N. Burnett YOB: 1968 | | Chief Executive Officer | | Chief Executive Officer since June 2015; Chief Financial Officer, March 2007 – June 2015; Treasurer, November 2006 – June 2015; Assistant Treasurer, September 2004 – November 2006. | | Head of Fund Treasury and Tax, Grantham, Mayo, Van Otterloo & Co. LLC (December 2006 – present). |
| | | |
Carly Cushman YOB: 1984 | | Treasurer, Chief Accounting Officer and Chief Financial Officer | | Treasurer and Chief Financial Officer since June 2015; Chief Accounting Officer since May 2014; Assistant Treasurer, September 2013 – June 2015. | | Fund Administrator, Grantham, Mayo, Van Otterloo & Co. LLC (December 2009 – present); Senior Accountant, Renaissance HealthCare (February 2009 – December 2009); Auditor/Senior Auditor, Deloitte & Touche (September 2006 – February 2009). |
| | | |
John L. Nasrah YOB: 1977 | | Assistant Treasurer and Chief Tax Officer | | Since March 2007. | | Fund Administrator, Grantham, Mayo, Van Otterloo & Co. LLC (September 2004 – present). |
| | | |
Betty Maganzini YOB: 1972 | | Assistant Treasurer | | Since September 2013. | | Fund Administrator, Grantham, Mayo, Van Otterloo & Co. LLC (July 2010 – present); Assistant Treasurer (June 2009 – July 2010), Manager, Fund Administration and Regulatory Affairs (2006 – 2009), Hambrecht & Quist Capital Management LLC. |
| | | |
Mahmoodur Rahman YOB: 1967 | | Assistant Treasurer | | Since September 2007. | | Fund Administrator, Grantham, Mayo, Van Otterloo & Co. LLC (April 2007 – present). |
| | | |
Cathy Tao YOB: 1974 | | Assistant Treasurer | | Since September 2016 | | Fund Administrator, Grantham, Mayo, Van Otterloo & Co. LLC (October 2007 – present) |
| | | |
Brian Kadehjian YOB: 1974 | | Assistant Treasurer and Treasury Officer | | Assistant Treasurer since February 2015; Treasury Officer since September 2013. | | Fund Administrator, Grantham, Mayo, Van Otterloo & Co. LLC (April 2002 – present). |
| | | |
Douglas Y. Charton YOB: 1982 | | Chief Legal Officer, Vice President and Clerk | | Since August 2015. | | Legal Counsel, Grantham, Mayo, Van Otterloo & Co. LLC (July 2015 – present); Associate, K&L Gates LLP (September 2007 – July 2015). |
| | | |
Megan Bunting YOB: 1978 | | Vice President and Assistant Clerk | | Since September 2013. | | Legal Counsel, Grantham, Mayo, Van Otterloo & Co. LLC (September 2006 – present). |
| | | |
Kevin O’Brien YOB: 1985 | | Vice President and Assistant Clerk | | Since March 2016. | | Legal Counsel, Grantham, Mayo, Van Otterloo & Co. LLC (February 2015 – present); Associate, Dechert LLP (October 2010 – February 2015). |
Gregory L. Pottle YOB: 1971 | | Chief Compliance Officer | | Chief Compliance Officer since May 2015; Vice President and Assistant Clerk, November 2006 – November 2015. | | Chief Compliance Officer, Grantham, Mayo, Van Otterloo & Co. LLC (May 2015 – present); Legal Counsel, Grantham, Mayo, Van Otterloo & Co. LLC (March 2000 – May 2015). |
| | | |
Claire Wilkinson YOB: 1965 | | Anti-Money Laundering Officer | | Since February 2016. | | Compliance Associate, GMO UK Limited (April 2013 – present); General Counsel, MVision Private Equity Advisers Limited (November 2009 – January 2013). |
| * | Each officer of the Trust may also serve as an officer and/or director of certain pooled investment vehicles of which GMO or an affiliate of GMO serves as the investment adviser. With the exception of Mr. Kittredge, each officer listed in the table above also serves as an officer of GMO Series Trust. |
185
Item 2. Code of Ethics.
As of February 28, 2017, the registrant has adopted a Code of Ethics that applies to the Principal Executive Officer and Principal Financial Officer pursuant to the Sarbanes-Oxley Act of 2002 (the “Code of Ethics”). During the year ended February 28, 2017 there were no substantive amendments to a provision of the Code of Ethics nor were there any waivers granted from a provision of the Code of Ethics. A copy of the Code of Ethics is filed with this Form N-CSR under item 12 (a).
Item 3. Audit Committee Financial Expert.
The registrant’s Board of Trustees has determined that the registrant does not have an “audit committee financial expert” (as such term has been defined in Form N-CSR) serving on its audit committee. The registrant’s Board believes that, although none of its members individually meets all required elements of the definition of an “audit committee financial expert”, the members of the registrant’s audit committee collectively possess the knowledge and experience necessary to execute all of the audit committee’s functions, duties and powers.
Item 4. Principal Accountant Fees and Services. *
| | (a) | AUDIT FEES: The aggregate fees billed to the registrant for professional services rendered by its independent auditors, PricewaterhouseCoopers LLP for the audit of the registrant’s annual financial statements for 2017 and 2016 were $2,021,951 and $2,446,609, respectively. |
| | (b) | AUDIT-RELATED FEES: The aggregate fees billed to the registrant in 2017 and 2016 for engagements for audit-related services rendered by PricewaterhouseCoopers LLP that related directly to the operations and financial reporting of the Funds were $122,935 and $42,000, respectively. The aggregate fees billed in 2017 and 2016 to the registrant’s Investment Advisor, and any entity controlling, controlled, or under common control with the Advisor that provides ongoing services to the Funds (each, a “Service Affiliate”) for engagements for audit-related services rendered by PricewaterhouseCoopers LLP that related directly to the operations and financial reporting of the Funds were $514,334 and $504,899, respectively. |
| | (c) | TAX FEES: The aggregate fees billed to the registrant in 2017 and 2016 for professional services rendered by PricewaterhouseCoopers LLP for tax compliance, tax advice, and tax planning, including the preparation of Form 1120 RIC, Form 8613 and review of excise tax distribution calculations, were $902,160 and $779,369, respectively. The aggregate fees billed in 2017 and 2016 to the registrant’s Service Affiliates for engagements for tax services rendered by PricewaterhouseCoopers LLP that related directly to the operations and financial reporting of the Funds were $0 and $0, respectively. |
| | (d) | ALL OTHER FEES: No such fees were billed by PricewaterhouseCoopers LLP to the registrant or to the registrant’s Service Affiliates that related directly to the operations and financial reporting of the Funds in 2017 or 2016. |
| | (e) | (1) The Audit Committee has adopted an Audit and Non-Audit Services Pre-Approval Policy (the “Policy”), which sets forth the procedures and the conditions pursuant to which services to be performed by the independent auditor are to be preapproved. Under the Policy, the Audit Committee pre-approves, on an annual basis, the following services: (1) the engagement, scope and terms of the annual audit; (2) certain audit-related services; (3) certain tax services that the Committee believes would not impair, and are consistent with the SEC’s rules on auditor independence; and (4) certain permissible non-audit services that the Committee believes are routine and recurring services and that would not impair, and are consistent with the SEC’s rules on auditor independence, subject to certain limitations on the projected fees associated with each service. All other types of services not included on the schedule to the policy, or for which the projected fees exceed those provided in the schedule, require the specific pre-approval by the Audit Committee or the Chairperson of the Committee (if timing necessitates that preapproval is required before the Committee’s next regularly scheduled meeting) if they are to be provided by the independent auditor. |
| | (g) | NON-AUDIT FEES: The aggregate fees billed by PricewaterhouseCoopers LLP in 2017 and 2016 for non-audit services rendered to the registrant and the registrant’s Service Affiliates were $1,574,429 and $1,361,268, respectively. For the fiscal year ended February 28, 2017, this amount reflects the amounts disclosed above in Item 4(b),(c),(d), plus $35,000 in fees billed to the Funds’ Service Affiliates for non-audit services that did not relate directly to the operations and financial reporting of the Funds. For the fiscal year ended February 29, 2016, this amount reflects the amounts disclosed above in Item 4(b),(c),(d), plus $35,000 in fees billed to the Funds’ Service Affiliates for non-audit services that did not relate directly to the operations and financial reporting of the Funds. |
| | (h) | The registrant’s Audit Committee has considered whether the provision of non-audit services by the registrant’s independent registered public accounting firm to the registrant’s Investment Advisor, and any entity controlling, controlled, or under common control with the Advisor that provided ongoing services to the registrant that were not pre-approved by the Committee (because such services did not relate directly to the operations and financial reporting of the registrant) was compatible with maintaining the independence of the independent registered public accounting firm. |
*Includes information regarding all series of GMO Trust.
Item 5. Audit Committee of Listed Registrants.
Not applicable to this registrant.
Item 6. Schedule of Investments.
The complete schedule of investments for each series of the registrant is included as part of the annual reports to shareholders filed under Item 1 of this Form N-CSR.
Item 7. Disclosure of Proxy Voting Policies and Procedures for Closed-End Management Investment Companies.
Not applicable to this registrant.
Item 8. Portfolio Managers of Closed-End Management Investment Companies.
Not applicable to this registrant.
Item 9. Purchases of Equity Securities by Closed-End Management Investment Company and Affiliated Purchasers.
Not applicable to this registrant.
Item 10. Submission of Matters to a Vote of Security Holders.
There were no material changes to the procedures by which shareholders may recommend nominees to the registrant’s Board of Trustees.
Item 11. Controls and Procedures.
| | (a) | The registrant’s Principal Executive Officer and Principal Financial Officer have concluded as of a date within 90 days of the filing of this report, based on their evaluation of the registrant’s disclosure controls and procedures (as defined in Rule 30a-3(c) under the Investment Company Act of 1940) that the design and operation of such procedures are effective to provide reasonable assurance that information required to be disclosed by the registrant on Form N-CSR is recorded, processed, summarized, and reported within the time periods specified in the Commission’s rules and forms. |
| | (b) | There were no changes in the registrant’s internal control over financial reporting (as defined in Rule 30a-3(d) under the Investment Company Act of 1940) that occurred during the second fiscal quarter of the period covered by this report that has materially affected, or is reasonably likely to materially affect, the registrant’s internal control over financial reporting. |
Item 12. Exhibits.
(a)(1) Code of Ethics described in Item 2 is attached hereto as EX-99.CODEETH.
(a)(2) Certifications by the Principal Executive Officer and Principal Financial Officer of the registrant as required by Rule 30a-2(a) under the Investment Company Act of 1940 are attached hereto as EX-99.CERT.
(a)(3) Not applicable to this registrant.
| | (b) | Certifications by the Principal Executive Officer and Principal Financial Officer of the registrant pursuant to Section 906 of the Sarbanes-Oxley Act of 2002 and required by Rule 30a-2(b) under the Investment Company Act of 1940 are attached hereto as EX-99.906CERT. |
SIGNATURES
Pursuant to the requirements of the Securities Exchange Act of 1934 and the Investment Company Act of 1940, the registrant has duly caused this report to be signed on its behalf by the undersigned, thereunto duly authorized.
| | |
| (Registrant) | | GMO Trust |
| |
| By (Signature and Title): | | /s/ Sheppard N. Burnett |
| | Sheppard N. Burnett, Chief Executive Officer |
| |
| | Date: May 3, 2017 |
Pursuant to the requirements of the Securities Exchange Act of 1934 and the Investment Company Act of 1940, this report has been signed below by the following persons on behalf of the registrant and in the capacities and on the dates indicated.
| | |
| By (Signature and Title): | | /s/ Sheppard N. Burnett |
| | Sheppard N. Burnett, Chief Executive Officer |
| |
| | Date: May 3, 2017 |
| | |
| By (Signature and Title): | | /s/ Carly Cushman |
| | Carly Cushman, Principal Financial Officer |
| |
| | Date: May 3, 2017 |