UNITED STATES
SECURITIES AND EXCHANGE COMMISSION
Washington, D.C. 20549
FORM N-CSR
CERTIFIED SHAREHOLDER REPORT OF REGISTERED MANAGEMENT INVESTMENT COMPANIES
Investment Company Act file number 811-04356
Franklin California Tax-Free Trust
(Exact name of registrant as specified in charter)
One Franklin Parkway, San Mateo, CA 94403-1906
(Address of principal executive offices) (Zip code)
Craig S. Tyle, One Franklin Parkway, San Mateo, CA 94403-1906
(Name and address of agent for service)
Registrant's telephone number, including area code:__ 650 312-2000
Date of fiscal year end: 6/30
Date of reporting period:_6/30/10
Item 1. Reports to Stockholders.
Franklin California Tax-Free Trust’s annual report goes into greater detail about municipal bond market conditions during the period. In addition, you will find performance data, financial information and a discussion from the portfolio managers. Please remember that all securities markets fluctuate, as do mutual fund share prices. Municipal bonds can provide tax-free income and diversification from equities. Despite periods of volatility, municipal bonds have a solid long-term record of performance, driven mostly by their income component.
Please check our website at franklintempleton.com for special portfolio manager commentary. Although market conditions are constantly changing, we remain committed to our disciplined strategy as we manage the Funds, keeping in mind the trust you have placed in us. We appreciate your confidence and encourage you to contact us when you have questions about your Franklin Templeton tax-free investment.
Sincerely,

Charles B. Johnson
Chairman
Franklin California Tax-Free Trust

Rafael R. Costas Jr.
Senior Vice Presidents and Co-Directors Franklin Municipal Bond Department
This letter reflects our analysis and opinions as of June 30, 2010. The information is not a complete analysis of every aspect of any market, country, industry, security or fund. Statements of fact are from sources considered reliable.
Not part of the annual report | 3
Annual Report
State Update and Municipal Bond Market Overview
California’s large, diverse and wealthy economy — the eighth largest in the world — has a gross state product of $1.8 trillion and is responsible for 13% of U.S. gross domestic product.1 However, during the year under review, the state’s economy remained weak and was not expected to experience an economic rebound sooner than the nation as a whole. The state unemployment rate rose sharply from 11.6% in June 2009 to 12.3% by June 2010, well above the 9.5% national rate.2 Some positive trends that may bode well for California’s growth prospects are its well-edu cated workforce, capacity to attract venture capital, prominence in the growing biotechnology and alternative energy industries, and stabilizing real estate market. In addition, the state experienced a significant rebound in manufacturing activity in 2010’s first quarter, while construction activity picked up but did not return to prerecession levels.
Limited fiscal flexibility, a difficult political environment and weak revenue collections made the state financially vulnerable during the recent downturn. Approval by two-thirds of the legislature is required to pass a budget and the governor needs legislative consent to raise revenues or order spending cuts. Additionally, voter approval is required to issue general obligation or deficit bonds. In July 2009, Governor Schwarzenegger signed an amended budget passed by the California Senate and General Assembly. Since that time, the projected current-year budget gap increased. In response, the governor declared a state fiscal emergency and called the legislature into special sessions to address the gaps.
Despite a positive trend of higher-than-anticipated tax revenues from December 2009 through March 2010, revenues fell short of expectations again in April. As the budget moved further out of balance, by mid-May the governor sought to eliminate a revised, $19.1 billion budget gap for the 2010-11 fiscal year.3 Under a fresh round of austerity measures, he proposed elimination of the state’s welfare-to-work program (CalWORKS), slashing by 60% all mental health programs at the county level, the appropriation of $880 million from state transportation projects, and imposition of an across-the-board 10% wage cut for
1. Source: Moody’s Investors Service, “New Issue: Moody’s Assigns Baa1 to up to $2B State of California General Obligation Bonds; Outlook is Stable,” 2/24/10.
2. Source: Bureau of Labor Statistics.
3. Source: California State Controllers Office, www.sco.ca.gov.
4 | Annual Report
all state workers.4 State parks and K-12 education spending would be spared, and tax increases would not be implemented to bolster California’s finances under the new plan.
The Democrats in the Senate and Assembly countered with two competing plans that blocked the governor’s proposed elimination of CalWORKS and a wage cut for state workers. The Senate plan proposed higher income and alcohol taxes and an extended tax hike on vehicles. The Assembly plan proposed the sale of bonds to provide funding for education, local governments and business incentives. State lawmakers were unable to reconcile the three plans and missed the June 15, 2010, budget deadline. On June 28, lawmakers left Sacramento for a month-long summer recess without passing a budget for the upcoming fiscal year. They continued to work from their home districts during the recess and were expected to return to the capital if a budget agreement were reached.
California’s tax-supported debt increased substantially during the fiscal year and was seventh-highest among the 50 states at $2,362 per capita or 5.6% of personal income, compared with the $936 and 2.5% national medians.5 Moreover, with California implementing a long-term strategic plan including voter-authorized projects necessary to support ongoing economic growth, its debt burden is likely to rise in the next few years.
Although there were signs California’s recession was lifting, the negative impact on municipal credit continued in tandem with the state’s persistent revenue deterioration, increased spending pressures and depletion of reserve funds. During the period, independent credit rating agency Moody’s Investors Service assigned California’s general obligation bonds an A1 rating with a stable outlook.6 Although Moody’s judges obligations rated A1 as “upper-medium grade” and subject to “low credit risk,” it was nonetheless among the worst ratings assigned to any U.S. state, suggesting a susceptibility to credit impairment over the long term.6 The rating and outlook reflected the budgetary shortfalls the state faced, as well as possible liquidity strains resulting from such shortfalls, particularly if the legislature fails to enact timely solutions. In addition, Moody’s expects state legislators will address any further challenges to its budgetary balance and liquidity without another major cash crisis.
4. Source: The San Francisco Chronicle, “California’s Painful Budget Revision,” 5/15/10.
5. Source: Moody’s Investors Service, “Special Comment: 2010 State Debt Medians Report,” May 2010.
6. This does not indicate Moody’s rating of the Fund.
Annual Report | 5
During the 12 months ended June 30, 2010, the municipal bond market delivered solid returns to investors, as the Barclay’s Capital (BC) Municipal Bond Index posted a total return of +9.61%.7 The U.S. Treasury market trailed the tax-exempt market during this reporting period with a +6.67% total return as measured by the BC U.S. Treasury Index.8
Despite municipal bonds’ relative strength, many tax-free bonds retained their pre-tax yield advantage over Treasuries. As of June 30, 2010, the +5.00% yield of the BC Municipal Bond Index: Long Component exceeded the +3.68% yield of the BC U.S. Treasury Index: Long Component.9 Investors continued to purchase municipal bond mutual fund shares even though budgetary pressures at state and local levels and concerns regarding some issuers’ abilities to repay debt were well publicized. Many municipal bonds were re-rated during the period due to a changing economic landscape, rating downgrades of bond insurers, and reconciliation between corporate and municipal rating scales. Moody’s Investors Service and Fitch recalibrated ratings for many state and local government issuers to bring them in line with corporate and sovereign ratings. In some cases, these changes resulted in as much as a three-notch rating increase. Investor interest also increased for lower investment-grade and speculative-grade issues during the reporting period, which drove up the BC Baa Municipal Bond Index 15.34% and the BC Municipal Bond High Yield Index 21.90%, compared with the BC Aaa Municipal Bond Index’s +6.61% total return.10
7. Source: © 2010 Morningstar. All Rights Reserved. The information contained herein: (1) is proprietary to Morningstar and/or its content providers; (2) may not be copied or distributed; and (3) is not warranted to be accurate, complete or timely. Neither Morningstar nor its content providers are responsible for any damages or losses arising from any use of this information. Past performance is no guarantee of future results. The BC Municipal Bond Index is a market value-weighted index engineered for the long-term tax-exempt bond market. To be included in the index, bonds must be fixed rate, have at least one year to final maturity and be rated investment grade (Baa3/BBB- or higher) by at least two of the following agencies: Moody’s, Standard & Poor’s and Fitch.
8. Source: © 2010 Morningstar. The BC U.S. Treasury Index is the U.S. Treasury component of the U.S. Government Index and covers public obligations of the U.S. Treasury with a remaining maturity of one year or more.
9. Source: © 2010 Morningstar. The BC Municipal Bond Index: Long Component is the long (22+ years) component of the BC Municipal Bond Index. The BC U.S. Treasury Index: Long Component is the long component of the BC U.S. Treasury Index and covers public obligations of the U.S. Treasury with remaining maturity of 10 years or more.
10. Source: © 2010 Morningstar. The BC Baa Municipal Bond Index is the Baa credit quality component of the BC Municipal Bond Index. The BC Municipal Bond High Yield Index consists of bonds that are nonrated or rated Ba1 or below. They must have an outstanding par value of at least $3 million and be issued as part of a transaction of at least $20 million. The bonds must be dated after 12/31/90 and must be at least one year from their maturity date. The BC Aaa Municipal Bond Index is the Aaa credit quality component of the BC Municipal Bond Index.
6 | Annual Report
The American Recovery and Reinvestment Act of February 2009 allowed municipalities to issue taxable bonds and receive a 35% federal government subsidy for all coupon payments distributed to investors for the life of the bonds. This subsidy enabled municipalities to borrow significantly below their after-tax cost in the traditional tax-exempt municipal bond market. In May 2010, the House of Representatives modified and approved certain provisions of the Act. If these modifications become law, municipalities would continue to receive a subsidy for their taxable borrowing at 32% starting in 2011 and 30% in 2012. Municipal bond new-issue supply rose 3.9% in the first half of 2010 compared with the first half of 2009.11 Notably, issuance of taxable municipals surge d 157.8% while tax-free issuance fell 19.8% for the same period.11 This comparative shortage of tax-free supply, at a time when many observers believed taxes are likely to rise in the future, supported the municipal bond market’s performance. We continued to believe these new, subsidized, taxable municipal bonds, known as Build America Bonds, may suppress future supply of tax-exempt municipal bonds as long as the government permits their use.
Given the various ratings changes, the relatively steep yield curve, and the reduced tax-exempt supply during the reporting period, we looked for opportunities to keep the portfolio fully invested in longer term bonds.
The foregoing information reflects our analysis and opinions as of June 30, 2010, the end of the reporting period. The information is not a complete analysis of every aspect of any market, country, industry, security or fund. Statements of fact are from sources considered reliable.
11. Source: Thomson Reuters.
Annual Report | 7
Franklin California Insured Tax-Free Income Fund
Your Fund’s Goal and Main Investments: Franklin California Insured Tax-Free Income Fund seeks to provide as high a level of income exempt from federal and California personal income taxes as is consistent with prudent investment management and the preservation of capital by investing at least 80% of its net assets in insured municipal securities that pay interest free from such taxes.1, 2
Credit Quality Breakdown*
Franklin California Insured Tax-Free Income Fund
Based on Total Long-Term Investments as of 6/30/10**
| | |
| AAA | 46.1 | % |
| AA | 10.1 | % |
| A | 35.5 | % |
| BBB | 2.8 | % |
| Not Rated by S&P | 5.5 | % |
*Standard & Poor’s (S&P) is the primary independent rating agency; Moody’s is the secondary rating agency. Securities not rated by an independent rating agency are assigned comparable internal ratings. Ratings for securities not rated by S&P are in the table below. The letter ratings are provided to indicate the creditworthiness of the Fund’s bond holdings and generally can range from AAA or Aaa (highest) to Below Investment Grade (lowest).
**Does not include short-term investments and other net assets.
| | | | |
| Ratings | Moody’s | | Internal | |
| AAA or Aaa | 0.1 | % | 0.3 | % |
| AA or Aa | 1.6 | % | 0.1 | % |
| A | 0.7 | % | 2.3 | % |
| BBB or Baa | — | | 0.4 | % |
| Total | 2.4 | % | 3.1 | % |
We are pleased to bring you Franklin California Insured Tax-Free Income Fund’s annual report for the fiscal year ended June 30, 2010.
1. For investors subject to alternative minimum tax, a small portion of Fund dividends may be taxable. Distributions of capital gains are generally taxable. To avoid imposition of 28% backup withholding on all Fund distributions and redemption proceeds, U.S. investors must be properly certified on Form W-9 and non-U.S. investors on Form W-8BEN.
2. Fund shares are not insured by any U.S. or other government agency. They are subject to market risks and will fluctuate in value.
The dollar value, number of shares or principal amount, and names of all portfolio holdings are listed in the Fund’s Statement of Investments (SOI). The SOI begins on page 36.
8 | Annual Report
| | | | |
| Dividend Distributions* | | | | |
| Franklin California Insured Tax-Free In come Fund | | |
| | | Dividend per Share | |
| Month | Class A | Class B | Class C | Advisor Class |
| July 2009 | 4.60 cents | 4.08 cents | 4.06 cents | 4.69 cents |
| August 2009 | 4.60 cents | 4.08 cents | 4.06 cents | 4.69 cents |
| September 2009 | 4.60 cents | 4.07 cents | 4.06 cents | 4.69 cents |
| October 2009 | 4.60 cents | 4.07 cents | 4.06 cents | 4.69 cents |
| November 2009 | 4.60 cents | 4.07 cents | 4.06 cents | 4.69 cents |
| December 2009 | 4.50 cents | 3.94 cents | 3.93 cents | 4.60 cents |
| January 2010 | 4.50 cents | 3.94 cents | 3.93 cents | 4.60 cents |
| February 2010 | 4.50 cents | 3.94 cents | 3.93 cents | 4.60 cents |
| March 2010 | 4.54 cents | 3.98 cents | 3.96 cents | 4.64 cents |
| April 2010 | 4.54 cents | 3.98 cents | 3.96 cents | 4.64 cents |
| May 2010 | 4.54 cents | 3.98 cents | 3.96 cents | 4.64 cents |
| June 2010 | 4.59 cents | 4.06 cents | 4.04 cents | 4.70 cents |
*Assumes shares were purchased and held for the entire accrual period, which differs from the calendar month. Since dividends accrue daily, your actual distributions will vary depending on the date you purchased your shares and any account activity. All Fund distributions will vary depending upon current market conditions, and past distributions are not indicative of future trends.
Performance Overview
The Fund’s Class A share price, as measured by net asset value, increased from $11.45 on June 30, 2009, to $12.07 on June 30, 2010. The Fund’s Class A shares paid dividends totaling 54.50 cents per share for the same period.3 The Performance Summary beginning on page 11 shows that at the end of this reporting period the Fund’s Class A shares’ distribution rate was 4.37%, based on an annualization of the current 4.59 cent per share dividend and the maximum offering price of $12.61 on June 30, 2010. An investor in the 2010 maximum combined effective federal and California personal income tax bracket of 41.21% would need to earn a distribution rate of 7.43% from a taxable investment to match the Fund’s Class A tax-free distrib ution rate. For the Fund’s Class B, C and Advisor shares’ performance, please see the Performance Summary. During the year under review, renewed investor interest in municipal bonds and limited new-issue supply tended to reduce the Fund’s income, which caused dividends to decline slightly.
3. All Fund distributions will vary depending upon current market conditions, and past distributions are not indicative of future trends.
Performance data represent past performance, which does not guarantee future results. Investment return and principal value will fluctuate, and you may have a gain or loss when you sell your shares. Current performance may differ from figures shown. Please visit franklintempleton.com or call (800) 342-5236 for most recent month-end performance.
Annual Report | 9
|
| Portfolio Breakdown |
| Franklin California Insured |
| Tax-Free Income Fund |
| 6/30/10 |
| |
| % of Total |
| Long-Term Investments* |
| | |
| General Obligation | 23.8 | % |
| Hospital & Health Care | 14.7 | % |
| Subject to Government Appropriations | 13.4 | % |
| Prerefunded | 12.6 | % |
| Transportation | 12.3 | % |
| Utilities | 8.7 | % |
| Tax-Supported | 6.9 | % |
| Higher Education | 3.1 | % |
| Other Revenue | 2.9 | % |
| Housing | 1.6 | % |
*Does not include short-term investments and other net assets.
Investment Strategy
We use a consistent, disciplined strategy in an effort to maximize tax-exempt income for our shareholders by seeking to maintain exposure to higher coupon securities. We generally employ a buy-and-hold approach and invest in securities that we believe should provide the most relative value in the market. As we invest during different interest rate environments, our portfolio becomes progressively more diversified with a broad range of securities. This broad diversification may help mitigate interest rate risk. We do not use leverage or exotic derivatives, nor do we use hedging techniques that could add volatility and contribute to underperformance in adverse markets. We generally stay fully invested to help maximize income distribution.
Manager’s Discussion
Consistent with our strategy, we sought to remain fully invested in bonds that maintain an average weighted maturity of 15 to 30 years with good call features. The combination of our value-oriented philosophy of investing primarily for income and a positive sloping municipal yield curve favored the use of longer term bonds. We also maintained our conservative, buy-and-hold investment strategy as we attempted to provide shareholders with high, current, tax-free income.
Thank you for your participation in Franklin California Insured Tax-Free Income Fund. We look forward to serving your future investment needs.
The foregoing information reflects our analysis, opinions and portfolio holdings as of June 30, 2010, the end of the reporting period. The way we implement our main investment strategies and the resulting portfolio holdings may change depending on factors such as market and economic conditions. These opinions may not be relied upon as investment advice or an offer for a particular security. The information is not a complete analysis of every aspect of any market, state, industry, security or the Fund. Statements of fact are from sources considered reliable, but the investment manager makes no representation or warranty as to their completeness or accuracy. Although historical performance is no guarantee of future results, these insights may help you understand our investment management philosophy.
10 | Annual Report
Performance Summary as of 6/30/10
Franklin California Insured Tax-Free Income Fund
Your dividend income will vary depending on dividends or interest paid by securities in the Fund’s portfolio, adjusted for operating expenses of each class. Capital gain distributions are net profits realized from the sale of portfolio securities. The performance table and graphs do not reflect any taxes that a shareholder would pay on Fund dividends, capital gain distributions, if any, or any realized gains on the sale of Fund shares. Total return reflects reinvestment of the Fund’s dividends and capital gain distributions, if any, and any unrealized gains or losses.
| | | | | | | | |
| Price and Distribution Information | | | | | | |
| Class A (Symbol: FRCIX) | | | | Change | | 6/30/10 | | 6/30/09 |
| Net Asset Value (NAV) | | | +$ | 0.62 | $ | 12.07 | $ | 11.45 |
| Distributions (7/1/09–6/30/10) | | | | | | | | |
| Dividend Income | $ | 0.5450 | | | | | | |
| Class B (Symbol: FRCBX) | | | | Change | | 6/30/10 | | 6/30/09 |
| Net Asset Value (NAV) | | | +$ | 0.63 | $ | 12.14 | $ | 11.51 |
| Distributions (7/1/09–6/30/10) | | | | | | | | |
| Dividend Income | $ | 0.4800 | | | | | | |
| Class C (Symbol: FRCAX) | | | | Change | | 6/30/10 | | 6/30/09 |
| Net Asset Value (NAV) | | | +$ | 0.64 | $ | 12.21 | $ | 11.57 |
| Distributions (7/1/09–6/30/10) | | | | | | | | |
| Dividend Income | $ | 0.4782 | | | | | | |
| Advisor Class (Symbol: n/a) | | | | Change | | 6/30/10 | | 6/30/09 |
| Net Asset Value (NAV) | | | +$ | 0.63 | $ | 12.08 | $ | 11.45 |
| Distributions (7/1/09–6/30/10) | | | | | | | | |
| Dividend Income | $ | 0.5566 | | | | | | |
Annual Report | 11
Performance Summary (continued)
Performance
Cumulative total return excludes sales charges. Average annual total return includes maximum sales charges. Class A: 4.25% maximum initial sales charge; Class B: contingent deferred sales charge (CDSC) declining from 4% to 1% over six years, and eliminated thereafter; Class C: 1% CDSC in first year only; Advisor Class: no sales charges.
| | | | | | | | | | | |
| Class A | | | | 1-Year | | | 5-Year | | | 10-Year | |
| Cumulative Total Return1 | | | + | 10.33 | % | + | 17.19 | % | + | 61.33 | % |
| Average Annual Total Return2 | | | + | 5.62 | % | + | 2.33 | % | + | 4.45 | % |
| Distribution Rate3 | 4.37 | % | | | | | | | | | |
| Taxable Equivalent Distribution Rate4 | 7.43 | % | | | | | | | | | |
| 30-Day Standardized Yield5 | 3.78 | % | | | | | | | | | |
| Taxable Equivalent Yield4 | 6.43 | % | | | | | | | | | |
| Total Annual Operating Expenses6 | 0.61 | % | | | | | | | | | |
| Class B | | | | 1-Year | | | 5-Year | | | 10-Year | |
| Cumulative Total Return1 | | | + | 9.77 | % | + | 14.06 | % | + | 54.81 | % |
| Average Annual Total Return2 | | | + | 5.77 | % | + | 2.33 | % | + | 4.47 | % |
| Distribution Rate3 | 4.01 | % | | | | | | | | | |
| Taxable Equivalent Distribution Rate4 | 6.82 | % | | | | | | | | | |
| 30-Day Standardized Yield5 | 3.40 | % | | | | | | | | | |
| Taxable Equivalent Yield4 | 5.78 | % | | | | | | | | | |
| Total Annual Operating Expenses6 | 1.16 | % | | | | | | | | | |
| Class C | | | | 1-Year | | | 5-Year | | | 10-Year | |
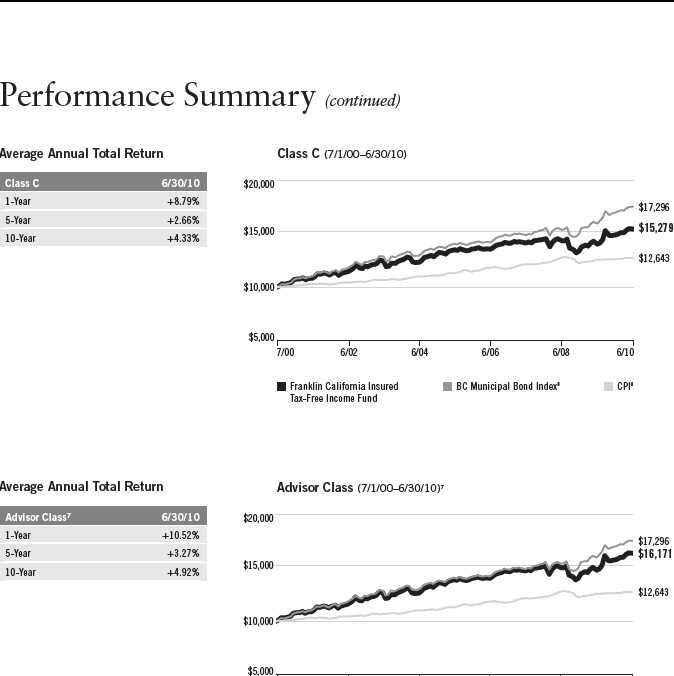
| Cumulative Total Return1 | | | + | 9.79 | % | + | 14.02 | % | + | 52.79 | % |
| Average Annual Total Return2 | | | + | 8.79 | % | + | 2.66 | % | + | 4.33 | % |
| Distribution Rate3 | 3.97 | % | | | | | | | | | |
| Taxable Equivalent Distribution Rate4 | 6.75 | % | | | | | | | | | |
| 30-Day Standardized Yield5 | 3.43 | % | | | | | | | | | |
| Taxable Equivalent Yield4 | 5.83 | % | | | | | | | | | |
| Total Annual Operating Expenses6 | 1.16 | % | | | | | | | | | |
| Advisor Class7 | | | | 1-Year | | | 5-Year | | | 10-Year | |
| Cumulative Total Return1 | | | + | 10.52 | % | + | 17.47 | % | + | 61.71 | % |
| Average Annual Total Return2 | | | + | 10.52 | % | + | 3.27 | % | + | 4.92 | % |
| Distribution Rate3 | 4.67 | % | | | | | | | | | |
| Taxable Equivalent Distribution Rate4 | 7.94 | % | | | | | | | | | |
| 30-Day Standardized Yield5 | 4.06 | % | | | | | | | | | |
| Taxable Equivalent Yield4 | 6.91 | % | | | | | | | | | |
| Total Annual Operating Expenses6 | 0.51 | % | | | | | | | | | |
Performance data represent past performance, which does not guarantee future results. Investment return and principal value will fluctuate, and you may have a gain or loss when you sell your shares. Current performance may differ f rom figures shown. For most recent month-end performance, go to franklintempleton.com or call (800) 342-5236.
12 | Annual Report
Performance Summary (continued)
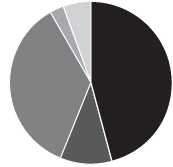
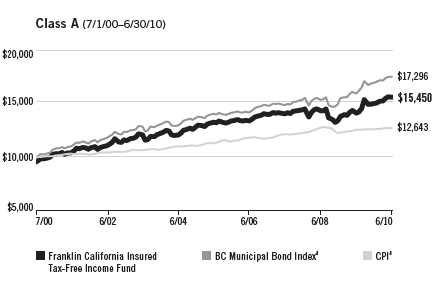
Total Return 10,000 Investment
Total return over the periods shown. It includes any current, account fees and reinvested distributions. income or distributions. It differs from the Fund in composition and does not pay management fees or expenses. One cannot invest directly in an index.
| | | |
| Average Annual Total Return | |
| |
| Class A | | 6/30/10 | |
| 1-Year | + | 5.62 | % |
| 5-Year | + | 2.33 | % |
| 10-Year | + | 4.45 | % |
| | | |
| Average Annual Total Return | |
| |
| Class B | | 6/30/10 | |
| 1-Year | + | 5.77 | % |
| 5-Year | + | 2.33 | % |
| 10-Year | + | 4.47 | % |
| | | | | |
| 7/00 | 6/02 | 6/04 | 6/06 | 6/08 | 6/10 |
| |
| |
| Franklin California Insured | | BC Municipal Bond Index8 | CPI8 |
| Tax-Free Income Fund | | | | |
14 | Annual Report
Performance Summary (continued)
Endnotes
Because municipal bonds are sensitive to interest rate movements, the Fund’s yield and share price will fluctuate with market conditions. Bond prices generally move in the opposite direction of interest rates. Thus, as prices of bonds in the Fund adjust to a rise in interest rates, the Fund’s share price may decline. Since the Fund concentrates its investments in a single state, it is subject to greater risk of adverse economic and regulatory changes in that state than a geographically diversified fund. The Fund’s prospectus also includes a description of the main investment risks.
| |
Class B: Class C: | These shares have higher annual fees and expenses than Class A shares. Prior to 1/1/04, these shares were offered with an initial sales charge; thus actual total returns would have differed. These shares have higher annual fees and expenses than Class A shares. |
Advisor Class: | Shares are available to certain eligible investors as described in the prospectus. |
1. Cumulative total return represents the change in value of an investment over the periods indicated.
2. Average annual total return represents the average annual change in value of an investment over the periods indicated.
3. Distribution rate is based on an annualization of the respective class’s current monthly dividend and the maximum offering price (NAV for Classes B, C and Advisor) per share on 6/30/10.
4. Taxable equivalent distribution rate and yield assume the published rates as of 6/28/10 for the maximum combined effective federal and California personal income tax rate of 41.21%, based on the federal income tax rate of 35.00%.
5. The 30-day standardized yield for the 30 days ended 6/30/10 reflects an estimated yield to maturity (assuming all portfolio securities are held to maturity). It should be regarded as an estimate of the Fund’s rate of investment income, and it may not equal the Fund’s actual income distribution rate (which reflects the Fund’s past dividends paid to shareholders) or the income reported in the Fund’s financial statements.
6. Figures are as stated in the Fund’s prospectus current as of the date of this report. In periods of market volatility, assets may decline significantly, causing total annual Fund operating expenses to become higher than the figures shown.
7. Effective 10/31/08, the Fund began offering Advisor Class shares, which do not have sales charges or a Rule 12b-1 plan. Performance quotations for this class reflect the following methods of calculation: (a) For periods prior to 10/31/08, a restated figure is used based upon the Fund’s Class A performance, excluding the effect of Class A’s maximum initial sales charge, but reflecting the effect of the Class A Rule 12b-1 fees; and (b) for periods after 10/30/08, actual Advisor Class performance is used reflecting all charges and fees applicable to that class. Since 10/31/08 (commencement of sales), the cumulative and average annual total returns of Advisor Class shares were +15.35% and +8.97%.
8. Source: © 2010 Morningstar. The BC Municipal Bond Index is a market value-weighted index engineered for the long-term tax-exempt bond market. To be included in the index, bonds must be fixed rate, have at least one year to final maturity and be rated investment grade (Baa3/BBB- or higher) by at least two of the following agencies: Moody’s, Standard & Poor’s and Fitch. The Consumer Price Index (CPI), calculated by the U.S. Bureau of Labor Statistics, is a commonly used measure of the inflation rate.
Annual Report | 15
Your Fund’s Expenses
Franklin California Insured Tax-Free Income Fund
As a Fund shareholder, you can incur two types of costs:
- Transaction costs, including sales charges (loads) on Fund purchases; and
- Ongoing Fund costs, including management fees, distribution and service (12b-1) fees, and other Fund expenses. All mutual funds have ongoing costs, sometimes referred to as operating expenses.
The following table shows ongoing costs of investing in the Fund and can help you understand these costs and compare them with those of other mutual funds. The table assumes a $1,000 investment held for the six months indicated.
Actual Fund Expenses
The first line (Actual) for each share class listed in the table provides actual account values and expenses. The “Ending Account Value” is derived from the Fund’s actual return, which includes the effect of Fund expenses.
You can estimate the expenses you paid during the period by following these steps. Of course, your account value and expenses will differ from those in this illustration:
| 1. | Divide your account value by $1,000. |
| | If an account had an $8,600 value, then $8,600 ÷ $1,000 = 8.6. |
| 2. | Multiply the result by the number under the heading “Expenses Paid During Period.” |
| | If Expenses Paid During Period were $7.50, then 8.6 x $7.50 = $64.50. |
In this illustration, the estimated expenses paid this period are $64.50.
Hypothetical Example for Comparison with Other Funds
Information in the second line (Hypothetical) for each class in the table can help you compare ongoing costs of investing in the Fund with those of other mutual funds. This information may not be used to estimate the actual ending account balance or expenses you paid during the period. The hypothetical “Ending Account Value” is based on the actual expense ratio for each class and an assumed 5% annual rate of return before expenses, which does not represent the Fund’s actual return. The figure under the heading “Expenses Paid During Period” shows the hypothetical expenses your account would have incurred under this scenario. You can compare this figure with the 5% hypothetical examples that appear in shareholder reports of other funds.
16 | Annual Report
Your Fund’s Expenses (continued)
Please note that expenses shown in the table are meant to highlight ongoing costs and do not reflect any transaction costs, such as sales charges. Therefore, the second line for each class is useful in comparing ongoing costs only, and will not help you compare total costs of owning different funds. In addition, if transaction costs were included, your total costs would have been higher. Please refer to the Fund prospectus for additional information on operating expenses.
| | | | | | |
| | | Beginning Account | | Ending Account | | Expenses Paid During |
| Class A | | Value 1/1/10 | | Value 6/30/10 | | Period* 1/1/10–6/30/10 |
| Actual | $ | 1,000 | $ | 1,039.20 | $ | 3.08 |
| Hypothetical (5% return before expenses) | $ | 1,000 | $ | 1,021.77 | $ | 3.06 |
| Class B | | | | | | |
| Actual | $ | 1,000 | $ | 1,037.00 | $ | 5.86 |
| Hypothetical (5% return before expenses) | $ | 1,000 | $ | 1,019.04 | $ | 5.81 |
| Class C | | | | | | |
| Actual | $ | 1,000 | $ | 1,036.70 | $ | 5.86 |
| Hypothetical (5% return before expenses) | $ | 1,000 | $ | 1,019.04 | $ | 5.81 |
| Advisor Class | | | | | | |
| Actual | $ | 1,000 | $ | 1,039.60 | $ | 2.58 |
| Hypothetical (5% return before expenses) | $ | 1,000 | $ | 1,022.27 | $ | 2.56 |
*Expenses are calculated using the most recent six-month expense ratio, annualized for each class (A: 0.61%; B: 1.16%; C: 1.16%; and Advisor: 0.51%), multiplied by the average account value over the period, multiplied by 181/365 to reflect the one-half year period.
Annual Report | 17
Franklin California Intermediate-Term Tax-Free Income Fund
Your Fund’s Goal and Main Investments: Franklin California Intermediate-Term Tax-Free Income Fund seeks to provide as high a level of income exempt from federal and California personal income taxes as is consistent with prudent investment management and the preservation of capital by investing at least 80% of its total assets in securities that pay interest free from such taxes.1 The Fund maintains a dollar-weighted average portfolio maturity (the time at which the debt must be repaid) of 3 to 10 years.
| | |
| Credit Quality Breakdown* | | |
| Franklin California Intermediate-Term Tax-Free Income Fund | | |
| 6/30/10 | | |
| | % of Total | |
| Ratings | Long-Term Investments** | |
| AAA | 12.0 | % |
| AA | 29.0 | % |
| A | 36.2 | % |
| BBB | 13.8 | % |
| Below Investment Grade | 0.4 | % |
| Not Rated by S&P | 8.6 | % |
*Standard & Poor’s (S&P) is the primary independent rating agency; Moody’s is the secondary rating agency. Securities not rated by an independent rating agency are assigned comparable internal ratings. Ratings for securities not rated by S&P are in the table below. The letter ratings are provided to indicate the creditworthiness of the Fund’s bond holdings and generally can range from AAA or Aaa (highest) to Below Investment Grade (lowest).
**Does not include short-term investments and other net assets.
| | | | |
| Ratings | Moody’s | | Internal | |
| AAA or Aaa | — | | 0.9 | % |
| A | 1.3 | % | 2.3 | % |
| BBB or Baa | 1.9 | % | 2.2 | % |
| Total | 3.2 | % | 5.4 | % |
We are pleased to bring you Franklin California Intermediate-Term Tax-Free Income Fund’s annual report for the fiscal year ended June 30, 2010.
1. For investors subject to alternative minimum tax, a small portion of Fund dividends may be taxable. Distributions of capital gains are generally taxable. To avoid imposition of 28% backup withholding on all Fund distributions and redemption proceeds, U.S. investors must be properly certified on Form W-9 and non-U.S. investors on Form W-8BEN.
The dollar value, number of shares or principal amount, and names of all portfolio holdings are listed in the Fund’s Statement of Investments (SOI). The SOI begins on page 51.
18 | Annual Report
| | | |
| Dividend Distributions* | | | |
| Franklin California Intermediate-Term Tax-Free Income Fund | |
| | | Dividend per Share |
| Month | Class A | Class C | Advisor Class |
| July 2009 | 3.77 cents | 3.26 cents | 3.86 cents |
| August 2009 | 3.77 cents | 3.26 cents | 3.86 cents |
| September 2009 | 3.82 cents | 3.31 cents | 3.91 cents |
| October 2009 | 3.82 cents | 3.31 cents | 3.91 cents |
| November 2009 | 3.82 cents | 3.31 cents | 3.91 cents |
| December 2009 | 3.82 cents | 3.28 cents | 3.91 cents |
| January 2010 | 3.82 cents | 3.28 cents | 3.91 cents |
| February 2010 | 3.82 cents | 3.28 cents | 3.91 cents |
| March 2010 | 3.82 cents | 3.29 cents | 3.91 cents |
| April 2010 | 3.82 cents | 3.29 cents | 3.91 cents |
| May 2010 | 3.82 cents | 3.29 cents | 3.91 cents |
| June 2010 | 3.72 cents | 3.19 cents | 3.81 cents |
*Assumes shares were purchased and held for the entire accrual period, which differs from the calendar month. Since dividends accrue daily, your actual distributions will vary depending on the date you purchased your shares and any account activity. All Fund distributions will vary depending upon current market conditions, and past distributions are not indicative of future trends.
Performance Overview
The Fund’s Class A share price, as measured by net asset value, increased from $10.87 on June 30, 2009, to $11.42 on June 30, 2010. The Fund’s Class A shares paid dividends totaling 45.46 cents per share for the same period.2 The Performance Summary beginning on page 21 shows that at the end of this reporting period the Fund’s Class A shares’ distribution rate was 3.82%, based on an annualization of the current 3.72 cent per share dividend and the maximum offering price of $11.68 on June 30, 2010. An investor in the 2010 maximum combined effective federal and California personal income tax bracket of 41.21% would need to earn a distribution rate of 6.50% from a taxable investment to match the Fund’s Class A tax-free distrib ution rate. For the Fund’s Class C and Advisor shares’ performance, please see the Performance Summary. During the year under review, renewed investor interest in municipal bonds and limited new-issue supply tended to reduce the Fund’s income, which caused dividends to decline slightly.
2. All Fund distributions will vary depending upon current market conditions, and past distributions are not indicative of future trends.
Performance data represent past performance, which does not guarantee future results. Investment return and principal value will fluctuate, and you may have a gain or loss when you sell your shares. Current performance may differ from figures shown. Please visit franklintempleton.com or call (800) 342-5236 for most recent month-end performance.
Annual Report | 19
Portfolio Breakdown
Franklin California Intermediate-Term Tax-Free Income Fund 6/30/10
|
| % of Total |
| Long-Term Investments* |
| | |
| Subject to Government Appropriations | 20.8 | % |
| Tax-Supported | 16.3 | % |
| Hospital & Health Care | 15.8 | % |
| General Obligation | 15.1 | % |
| Utilities | 12.5 | % |
| Transportation | 6.1 | % |
| Other Revenue | 4.1 | % |
| Prerefunded | 3.7 | % |
| Housing | 3.4 | % |
| Higher Education | 2.2 | % |
*Does not include short-term investments and other net assets.
Investment Strategy
We use a consistent, disciplined strategy in an effort to maximize tax-exempt income for our shareholders by seeking to maintain exposure to higher coupon securities. We generally employ a buy-and-hold approach and invest in securities that we believe should provide the most relative value in the market. As we invest during different interest rate environments, our portfolio becomes progressively more diversified with a broad range of securities. This broad diversification may help mitigate interest rate risk. We do not use leverage or exotic derivatives, nor do we use hedging techniques that could add volatility and contribute to underperformance in adverse markets. We generally stay fully invested to help maximize income distribution.
Manager’s Discussion
Consistent with our strategy, we sought to remain fully invested in a portfolio of bonds that maintain an average weighted maturity of 3 to 10 years. We also maintained our conservative, buy-and-hold investment strategy as we attempted to provide shareholders with high, current, tax-free income.
Thank you for your participation in Franklin California Intermediate-Term Tax-Free Income Fund. We look forward to serving your future investment needs.
The foregoing information reflects our analysis, opinions and portfolio holdings as of June 30, 2010, the end of the reporting period. The way we implement our main investment strategies and the resulting portfolio holdings may change depending on factors such as market and economic conditions. These opinions may not be relied upon as investment advice or an offer for a particular security. The information is not a complete analysis of every aspect of any market, state, industry, security or the Fund. Statements of fact are from sources considered reliable, but the investment manager makes no representation or warranty as to their completeness or accuracy. Although historical performance is no guarantee of future results, these insights may help you understand our investment management philosophy.
20 | Annual Report
Performance Summary as of 6/30/10
Franklin California Intermediate-Term Tax-Free Income Fund
Your dividend income will vary depending on dividends or interest paid by securities in the Fund’s portfolio, adjusted for operating expenses of each class. Capital gain distributions are net profits realized from the sale of portfolio securities. The performance table and graphs do not reflect any taxes that a shareholder would pay on Fund dividends, capital gain distributions, if any, or any realized gains on the sale of Fund shares. Total return reflects reinvestment of the Fund’s dividends and capital gain distributions, if any, and any unrealized gains or losses.
| | | | | | | | |
| Price and Distribution Information | | | | | | |
| Class A (Symbol: FKCIX) | | | | Change | | 6/30/10 | | 6/30/09 |
| Net Asset Value (NAV) | | | $ | 0.55 | $ | 11.42 | $ | 10.87 |
| Distributions (7/1/09–6/30/10) | | | | | | | | |
| Dividend Income | $ | 0.4546 | | | | | | |
| Class C (Symbol: FCCIX) | | | | Change | | 6/30/10 | | 6/30/09 |
| Net Asset Value (NAV) | | | $ | 0.56 | $ | 11.45 | $ | 10.89 |
| Distributions (7/1/09–6/30/10) | | | | | | | | |
| Dividend Income | $ | 0.3918 | | | | | | |
| Advisor Class (Symbol: FRCZX) | | | | Change | | 6/30/10 | | 6/30/09 |
| Net Asset Value (NAV) | | | $ | 0.57 | $ | 11.44 | $ | 10.87 |
| Distributions (7/1/09–6/30/10) | | | | | | | | |
| Dividend Income | $ | 0.4653 | | | | | | |
Annual Report | 21
Performance Summary (continued)
Performance
Cumulative total return excludes sales charges. Average annual total return includes maximum sales charges. Class A: 2.25% maximum initial sales charge; Class C: 1% contingent deferred sales charge in first year only; Advisor Class: no sales charges.
| | | | | | | | | | | |
| Class A | | | | 1-Year | | | 5-Year | | | 10-Year | |
| Cumulative Total Return1 | | | + | 9.36 | % | + | 18.67 | % | + | 55.21 | % |
| Average Annual Total Return2 | | | + | 6.90 | % | + | 3.01 | % | + | 4.26 | % |
| Distribution Rate3 | 3.82 | % | | | | | | | | | |
| Taxable Equivalent Distribution Rate4 | 6.50 | % | | | | | | | | | |
| 30-Day Standardized Yield5 | 3.26 | % | | | | | | | | | |
| Taxable Equivalent Yield4 | 5.54 | % | | | | | | | | | |
| Total Annual Operating Expenses6 | 0.66 | % | | | | | | | | | |
| Class C | | | | 1-Year | | | 5-Year | | | Inception (7/1/03) | |
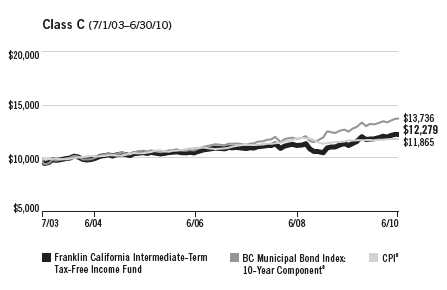
| Cumulative Total Return1 | | | + | 8.83 | % | + | 15.54 | % | + | 22.79 | % |
| Average Annual Total Return2 | | | + | 7.83 | % | + | 2.93 | % | + | 2.98 | % |
| Distribution Rate3 | 3.34 | % | | | | | | | | | |
| Taxable Equivalent Distribution Rate4 | 5.68 | % | | | | | | | | | |
| 30-Day Standardized Yield5 | 2.80 | % | | | | | | | | | |
| Taxable Equivalent Yield4 | 4.76 | % | | | | | | | | | |
| Total Annual Operating Expenses6 | 1.21 | % | | | | | | | | | |
| Advisor Class7 | | | | 1-Year | | | 5-Year | | | 10-Year | |
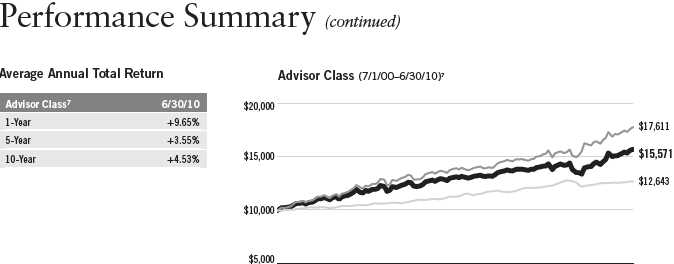
| Cumulative Total Return1 | | | + | 9.65 | % | + | 19.05 | % | + | 55.71 | % |
| Average Annual Total Return2 | | | + | 9.65 | % | + | 3.55 | % | + | 4.53 | % |
| Distribution Rate3 | 4.00 | % | | | | | | | | | |
| Taxable Equivalent Distribution Rate4 | 6.80 | % | | | | | | | | | |
| 30-Day Standardized Yield5 | 3.45 | % | | | | | | | | | |
| Taxable Equivalent Yield4 | 5.87 | % | | | | | | | | | |
| Total Annual Operating Expenses6 | 0.56 | % | | | | | | | | | |
Performance data represent past performance, which does not guarantee future results. Investment return and principal value will fluctuate, and you may have a gain or loss when you sell your shares. Current performance may differ f rom figures shown. For most recent month-end performance, go to franklintempleton.com or call (800) 342-5236.
22 | Annual Report
Performance (continued)
Total Return 10,000 Investment
Total return over the periods shown. It includes any current, applicable, maximum sales charge, Fund expenses, account fees and reinvested distributions. The unmanaged index includes reinvestment of any income or distributions. It differs from the Fund in composition and does not pay management fees or expenses. One cannot invest directly in an index.

| | | |
| Average Annual Total Return | |
| |
| Class A | | 6/30/10 | |
| 1-Year | + | 6.90 | % |
| 5-Year | + | 3.01 | % |
| 10-Year | + | 4.26 | % |
| | | |
| Average Annual Total Return | |
| |
| Class C | | 6/30/10 | |
| 1-Year | + | 7.83 | % |
| 5-Year | + | 2.93 | % |
| Since Inception (7/1/03) | + | 2.98 | % |
| | | | | |
| 7/00 | 6/02 | 6/04 | 6/06 | 6/08 | 6/10 |
| |
| |
| Franklin California Intermediate-Term | BC Municipal Bond Index: | CPI8 |
| Tax-Free Income Fund | | 10-Year Component8 | |
24 | Annual Report
Performance Summary (continued)
Endnotes
Because municipal bonds are sensitive to interest rate movements, the Fund’s yield and share price will fluctuate with market conditions. Bond prices generally move in the opposite direction of interest rates. Thus, as prices of bonds in the Fund adjust to a rise in interest rates, the Fund’s share price may decline. Since the Fund concentrates its investments in a single state, it is subject to greater risk of adverse economic and regulatory changes in that state than a geographically diversified fund. The Fund’s prospectus also includes a description of the main investment risks.
| |
Class C: | Prior to 1/1/04, these shares were offered with an initial sales charge; thus actual total returns would have differed. These shares have higher annual fees and expenses than Class A shares. |
| |
Advisor Class: | Shares are available to certain eligible investors as described in the prospectus. |
1. Cumulative total return represents the change in value of an investment over the periods indicated.
2. Average annual total return represents the average annual change in value of an investment over the periods indicated.
3. Distribution rate is based on an annualization of the respective class’s current monthly dividend and the maximum offering price (NAV for Classes C and Advisor) per share on 6/30/10.
4. Taxable equivalent distribution rate and yield assume the published rates as of 6/28/10 for the maximum combined effective federal and California personal income tax rate of 41.21%, based on the federal income tax rate of 35.00%.
5. The 30-day standardized yield for the 30 days ended 6/30/10 reflects an estimated yield to maturity (assuming all portfolio securities are held to maturity). It should be regarded as an estimate of the Fund’s rate of investment income, and it may not equal the Fund’s actual income distribution rate (which reflects the Fund’s past dividends paid to shareholders) or the income reported in the Fund’s financial statements.
6. Figures are as stated in the Fund’s prospectus current as of the date of this report. In periods of market volatility, assets may decline significantly, causing total annual Fund operating expenses to become higher than the figures shown.
7. Effective 10/31/08, the Fund began offering Advisor Class shares, which do not have sales charges or a Rule 12b-1 plan. Performance quotations for this class reflect the following methods of calculation: (a) For periods prior to 10/31/08, a restated figure is used based upon the Fund’s Class A performance, excluding the effect of Class A’s maximum initial sales charge, but reflecting the effect of the Class A Rule 12b-1 fees; and (b) for periods after 10/30/08, actual Advisor Class performance is used reflecting all charges and fees applicable to that class. Since 10/31/08 (commencement of sales), the cumulative and average annual total returns of Advisor Class shares were +15.68% and +9.15%.
8. Source: © 2010 Morningstar. The BC Municipal Bond Index: 10-Year Component is the 10-year (8-12) component of the BC Municipal Bond Index, which is a market value-weighted index engineered for the long-term tax-exempt bond market. To be included in the index, bonds must be fixed rate, have at least one year to final maturity and be rated investment grade (Baa3/BBB- or higher) by at least two of the following agencies: Moody’s, Standard & Poor’s and Fitch. The Consumer Price Index (CPI), calculated by the U.S. Bureau of Labor Statistics, is a commonly used measure of the inflation rate.
Annual Report | 25
Your Fund’s Expenses
Franklin California Intermediate-Term Tax-Free Income Fund
As a Fund shareholder, you can incur two types of costs:
- Transaction costs, including sales charges (loads) on Fund purchases; and
- Ongoing Fund costs, including management fees, distribution and service (12b-1) fees, and other Fund expenses. All mutual funds have ongoing costs, sometimes referred to as operating expenses.
The following table shows ongoing costs of investing in the Fund and can help you understand these costs and compare them with those of other mutual funds. The table assumes a $1,000 investment held for the six months indicated.
Actual Fund Expenses
The first line (Actual) for each share class listed in the table provides actual account values and expenses. The “Ending Account Value” is derived from the Fund’s actual return, which includes the effect of Fund expenses.
You can estimate the expenses you paid during the period by following these steps. Of course, your account value and expenses will differ from those in this illustration:
| 1. | Divide your account value by $1,000. |
| | If an account had an $8,600 value, then $8,600 ÷ $1,000 = 8.6. |
| 2. | Multiply the result by the number under the heading “Expenses Paid During Period.” |
| | If Expenses Paid During Period were $7.50, then 8.6 x $7.50 = $64.50. |
In this illustration, the estimated expenses paid this period are $64.50.
Hypothetical Example for Comparison with Other Funds
Information in the second line (Hypothetical) for each class in the table can help you compare ongoing costs of investing in the Fund with those of other mutual funds. This information may not be used to estimate the actual ending account balance or expenses you paid during the period. The hypothetical “Ending Account Value” is based on the actual expense ratio for each class and an assumed 5% annual rate of return before expenses, which does not represent the Fund’s actual return. The figure under the heading “Expenses Paid During Period” shows the hypothetical expenses your account would have incurred under this scenario. You can compare this figure with the 5% hypothetical examples that appear in shareholder reports of other funds.
26 | Annual Report
Your Fund’s Expenses (continued)
Please note that expenses shown in the table are meant to highlight ongoing costs and do not reflect any transaction costs, such as sales charges. Therefore, the second line for each class is useful in comparing ongoing costs only, and will not help you compare total costs of owning different funds. In addition, if transaction costs were included, your total costs would have been higher. Please refer to the Fund prospectus for additional information on operating expenses.
| | | | | | |
| | | Beginning Account | | Ending Account | | Expenses Paid During |
| Class A | | Value 1/1/10 | | Value 6/30/10 | | Period* 1/1/10–6/30/10 |
| Actual | $ | 1,000 | $ | 1,036.50 | $ | 3.28 |
| Hypothetical (5% return before expenses) | $ | 1,000 | $ | 1,021.57 | $ | 3.26 |
| Class C | | | | | | |
| Actual | $ | 1,000 | $ | 1,033.50 | $ | 6.00 |
| Hypothetical (5% return before expenses) | $ | 1,000 | $ | 1,018.89 | $ | 5.96 |
| Advisor Class | | | | | | |
| Actual | $ | 1,000 | $ | 1,037.80 | $ | 2.78 |
| Hypothetical (5% return before expenses) | $ | 1,000 | $ | 1,022.07 | $ | 2.76 |
*Expenses are calculated using the most recent six-month expense ratio, annualized for each class (A: 0.65%; C: 1.19%; and Advisor: 0.55%), multiplied by the average account value over the period, multiplied by 181/365 to reflect the one-half year period.
Annual Report | 27
Franklin California Tax-Exempt Money Fund
Your Fund’s Goal and Main Investments: Franklin California Tax-Exempt Money Fund seeks to provide as high a level of income exempt from federal and California personal income taxes as is consistent with prudent investment management and the preservation of capital and liquidity.1 The Fund’s portfolio invests at least 80% of its total assets in securities that pay interest free from such taxes. The Fund tries to maintain a stable $1.00 share price.
Performance data represent past performance, which does not guarantee future results. Investment return will fluctuate. Current performance may differ from figures shown. Please visit franklintempleton.com or call (800) 342-5236 for most recent month-end performance.
An investment in the Fund is not guaranteed by the Federal Deposit Insurance Corporation (FDIC) or any other government agency. Although the Fund seeks to preserve the value of your investment at $1.00 per share, it is possible to lose money by investing in the Fund.
This annual report for Franklin California Tax-Exempt Money Fund covers the fiscal year ended June 30, 2010.
Performance Overview
In an effort to promote continued economic recovery, the Federal Reserve Board held short-term interest rates at a historically low level during the 12-month period under review, which affected money market portfolio yields. As a result, Franklin California Tax-Exempt Money Fund’s seven-day effective yield was unchanged at 0.00% from June 30, 2009, to June 30, 2010.
Investment Strategy
We invest at least 80% of the Fund’s total assets in high-quality, short-term municipal securities whose interest is free from federal and California state personal income taxes. Although the Fund tries to invest all of its assets in tax-free securities, it is possible, although not anticipated, that up to 20% of its assets may be in securities that pay taxable interest, including interest that may be subject to federal alternative minimum tax. We have maintained a dollar-weighted average portfolio maturity of 90 days or less (effective June 30, 2010, the Fund is required to maintain a dollar-weighted average portfolio maturity of no greater than 60 days).
1. For investors subject to alternative minimum tax, a small portion of Fund dividends may be taxable. Distributions of capital gains are generally taxable. To avoid imposition of 28% backup withholding on all Fund distributions and redemption proceeds, U.S. investors must be properly certified on Form W-9 and non-U.S. investors on Form W-8BEN.
The dollar value, number of shares or principal amount, and names of all portfolio holdings are listed in the Fund’s Statement of Investments (SOI). The SOI begins on page 61.
28 | Annual Report
Manager’s Discussion
During the year under review, short-term municipal bond yields remained relatively low. The Securities Industry and Financial Markets Association (SIFMA) Municipal Swap Index, a benchmark for variable rate securities, which make up a large portion of Franklin California Tax-Exempt Money Fund, also stayed at low levels. The rate ranged from a high of 0.43% in the middle of August 2009 to a low of 0.15% in the beginning of January 2010, and reached 0.25% at period-end.2 During the reporting period, issuance of variable rate demand notes (VRDNs) was extremely low compared to recent years, and demand for well-structured VRDNs supported low rates. Franklin California Tax-Exempt Money Fund continued to be very selective in purchasing high-quality securities. In this environment, the Fund’s yield remained at 0.00% for the reporting period. During the period under review, the Fund participated in several issues including Roseville Joint Union High School District tax and revenue anticipation notes (TRANs), Los Angeles Unified School District TRANs and VRDNs for California Education Facilities Authority Revenue for Stanford University and Metropolitan Water District of Southern California Waterworks Revenue.
Thank you for your continued participation in Franklin California Tax-Exempt Money Fund. We look forward to serving your future investment needs.
The foregoing information reflects our analysis, opinions and portfolio holdings as of June 30, 2010, the end of the reporting period. The way we implement our main investment strategies and the resulting portfolio holdings may change depending on factors such as market and economic conditions. These opinions may not be relied upon as investment advice or an offer for a particular security. The information is not a complete analysis of every aspect of any market, state, industry, security or the Fund. Statements of fact are from sources considered reliable, but the investment manager makes no representation or warranty as to their completeness or accuracy. Although historical performance is no guarantee of future results, these insights may help you understand our investment management philosophy.
2. Source: Thomson Financial. The SIFMA Municipal Swap Index is a weekly high-grade market index composed of seven-day tax-exempt variable rate demand notes produced by the Municipal Market Data Group. Actual issues are selected from Municipal Market Data’s database of more than 10,000 active issues based on several specific criteria.
|
| Portfolio Breakdown |
| Franklin California Tax-Exempt Money Fund |
| 6/30/10 |
| | |
| | % of Total | |
| | Investments | |
| Variable Rate Notes | 91.7 | % |
| Notes & Bonds | 8.3 | % |
Performance Summary
Franklin California Tax-Exempt Money Fund
| | |
| Symbol: FCLXX | | |
| 6/30/10 | | |
| |
| Seven-day effective yield1 | 0.00 | % |
| Seven-day annualized yield | 0.00 | % |
| Taxable equivalent yield 2 | 0.00 | % |
| Total annual operating expenses 3 | 0.57 | % |
1. Seven-day effective yield assumes the compounding of daily dividends, if any.
2. Taxable equivalent yield assumes the published rates as of 6/28/10 for the maximum combined effective federal and California personal income tax rate of 41.21%, based on the federal income tax rate of 35.00%.
3. Figures are as stated in the Fund’s prospectus current as of the date of this report. In periods of market volatility, assets may decline significantly, causing total annual Fund operating expenses to become higher than the figures shown. To avoid a negative yield, the Fund administrator, investment manager and/or transfer agent have voluntarily agreed to waive or limit their respective fees, assume as their own expense certain expenses otherwise payable by the Fund, and if necessary, make a capital infusion into the Fund. These waivers, expense reimbursements and capital infusions, which are not reflected in the table above, are voluntary and may be modified or discontinued by the Fund administrator, investment manager and/or transfer agent at any time. There is no guarantee the Fund will be able to avoid a negative yield.
Annualized and effective yields are for the seven-day period ended 6/30/10. The Fund’s average weighted maturity was 19 days. Yield reflects Fund expenses and fluctuations in interest rates on portfolio investments.
Performance data represent past performance, which does not guarantee future results. Investment return will fluctuate. Current performance may differ from figures shown. Please visit franklintempleton.com or call (800) 342-5236 for most recent month-end performance.
Annual Report | 29
Your Fund’s Expenses
Franklin California Tax-Exempt Money Fund
As a Fund shareholder, you can incur two types of costs:
- Transaction costs, including sales charges (loads) on Fund purchases; and
- Ongoing Fund costs, including management fees, distribution and service (12b-1) fees, and other Fund expenses. All mutual funds have ongoing costs, sometimes referred to as operating expenses.
The following table shows ongoing costs of investing in the Fund and can help you understand these costs and compare them with those of other mutual funds. The table assumes a $1,000 investment held for the six months indicated.
Actual Fund Expenses
The first line (Actual) of the table provides actual account values and expenses. The “Ending Account Value” is derived from the Fund’s actual return which includes the effect of Fund expenses.
You can estimate the expenses you paid during the period by following these steps. Of course, your account value and expenses will differ from those in this illustration:
| 1. | Divide your account value by $1,000. |
| | If an account had an $8,600 value, then $8,600 ÷ $1,000 = 8.6. |
| 2. | Multiply the result by the number under the heading “Expenses Paid During Period.” |
| | If Expenses Paid During Period were $7.50, then 8.6 x $7.50 = $64.50. |
In this illustration, the estimated expenses paid this period are $64.50.
Hypothetical Example for Comparison with Other Funds
Information in the second line (Hypothetical) of the table can help you compare ongoing costs of investing in the Fund with those of other mutual funds. This information may not be used to estimate the actual ending account balance or expenses you paid during the period. The hypothetical “Ending Account Value” is based on the Fund’s actual expense ratio and an assumed 5% annual rate of return before expenses, which does not represent the Fund’s actual return. The figure under the heading “Expenses Paid During Period” shows the hypothetical expenses your account would have incurred under this scenario. You can compare this figure with the 5% hypothetical examples that appear in shareholder reports of other funds.
30 | Annual Report
Your Fund’s Expenses (continued)
Please note that expenses shown in the table are meant to highlight ongoing costs and do not reflect any transaction costs, such as sales charges. Therefore, the second line of the table is useful in comparing ongoing costs only, and will not help you compare total costs of owning different funds. In addition, if transaction costs were included, your total costs would have been higher. Please refer to the Fund prospectus for additional information on operating expenses.
| | | | | | |
| | | Beginning Account | | Ending Account | | Expenses Paid During |
| | | Value 1/1/10 | | Value 6/30/10 | | Period* 1/1/10–6/30/10 |
| Actual | $ | 1,000 | $ | 1,000.00 | $ | 1.19 |
| Hypothetical (5% return before expenses) | $ | 1,000 | $ | 1,023.60 | $ | 1.20 |
*Expenses are calculated using the most recent six-month annualized expense ratio, net of voluntary expense waivers, of 0.24%, multiplied by the average account value over the period, multiplied by 181/365 to reflect the one-half year period.
Annual Report | 31
| | | | | | | | | | | | | | | |
| Franklin California Tax-Free Trust | | | | | | | |
| Financial Highlights | | | | | | | | | | | | | | | |
| |
| Franklin California Insured Tax-Free Income Fund | | | | | | | | | | | | | | | |
| | | | | | Year Ended June 30, | | | | |
| Class A | | 2010 | | | 2009 | | | 2008 | | | 2007 | | | 2006 | |
| Per share operating performance | | | | | | | | | | | | | | | |
| (for a share outstanding throughout the year) | | | | | | | | | | | | | | | |
| Net asset value, beginning of year | $ | 11.45 | | $ | 12.19 | | $ | 12.48 | | $ | 12.43 | | $ | 12.85 | |
| Income from investment operationsa: | | | | | | | | | | | | | | | |
| Net investment incomeb | | 0.55 | | | 0.55 | | | 0.54 | | | 0.54 | | | 0.55 | |
| Net realized and unrealized gains (losses) | | 0.62 | | | (0.75 | ) | | (0.29 | ) | | 0.05 | | | (0.43 | ) |
| Total from investment operations | | 1.17 | | | (0.20 | ) | | 0.25 | | | 0.59 | | | 0.12 | |
| Less distributions from net investment income | | (0.55 | ) | | (0.54 | ) | | (0.54 | ) | | (0.54 | ) | | (0.54 | ) |
| Redemption feesc | | — | | | —d | | | —d | | | —d | | | —d | |
| Net asset value, end of year | $ | 12.07 | | $ | 11.45 | | $ | 12.19 | | $ | 12.48 | | $ | 12.43 | |
| |
| Total returne | | 10.33 | % | | (1.54 | )% | | 1.98 | % | | 4.79 | % | | 0.96 | % |
| |
| Ratios to average net assets | | | | | | | | | | | | | | | |
| Expenses | | 0.61 | % | | 0.61 | % | | 0.61 | % | | 0.61 | % | | 0.61 | % |
| Net investment income | | 4.60 | % | | 4.74 | % | | 4.33 | % | | 4.29 | % | | 4.34 | % |
| |
| Supplemental data | | | | | | | | | | | | | | | |
| Net assets, end of year (000’s) | $ | 1,899,692 | | $ | 1,780,448 | | $ | 1,875,898 | | $ | 1,810,358 | | $ | 1,751,279 | |
| Portfolio turnover rate | | 14.19 | % | | 13.04 | % | | 13.14 | % | | 6.77 | % | | 5.75 | % |
aThe amount shown for a share outstanding throughout the period may not correlate with the Statement of Operations for the period due to the timing of sales and repurchases of the Fund shares in relation to income earned and/or fluctuating market value of the investments of the Fund. bBased on average daily shares outstanding. cEffective September 1, 2008, the redemption fee was eliminated. dAmount rounds to less than $0.01 per share. eTotal return does not reflect sales commissions or contingent deferred sales charges, if applicable.
32 | The accompanying notes are an integral part of these financial statements. | Annual Report
| | | | | | | | | | | | | | | |
| Franklin California Tax-Free Trust | | | | | | | | | | |
| Financial Highlights (continued) | | | | | | | | | | | | | | | |
| |
| Franklin California Insured Tax-Free Income Fund | | | | | | | | | | | | | | | |
| | | | | | Year Ended June 30, | | | | |
| Class B | | 2010 | | | 2009 | | | 2008 | | | 2007 | | | 2006 | |
| Per share operating performance | | | | | | | | | | | | | | | |
| (for a share outstanding throughout the year) | | | | | | | | | | | | | | | |
| Net asset value, beginning of year | $ | 11.51 | | $ | 12.26 | | $ | 12.54 | | $ | 12.49 | | $ | 12.91 | |
| Income from investment operationsa: | | | | | | | | | | | | | | | |
| Net investment incomeb | | 0.49 | | | 0.49 | | | 0.47 | | | 0.48 | | | 0.48 | |
| Net realized and unrealized gains (losses) | | 0.62 | | | (0.76 | ) | | (0.28 | ) | | 0.04 | | | (0.43 | ) |
| Total from investment operations | | 1.11 | | | (0.27 | ) | | 0.19 | | | 0.52 | | | 0.05 | |
| Less distributions from net investment income | | (0.48 | ) | | (0.48 | ) | | (0.47 | ) | | (0.47 | ) | | (0.47 | ) |
| Redemption feesc | | — | | | —d | | | —d | | | —d | | | —d | |
| Net asset value, end of year | $ | 12.14 | | $ | 11.51 | | $ | 12.26 | | $ | 12.54 | | $ | 12.49 | |
| |
| Total returne | | 9.77 | % | | (2.14 | )% | | 1.49 | % | | 4.20 | % | | 0.41 | % |
| |
| Ratios to average net assets | | | | | | | | | | | | | | | |
| Expenses | | 1.15 | % | | 1.15 | % | | 1.16 | % | | 1.16 | % | | 1.16 | % |
| Net investment income | | 4.06 | % | | 4.20 | % | | 3.78 | % | | 3.74 | % | | 3.79 | % |
| |
| Supplemental data | | | | | | | | | | | | | | | |
| Net assets, end of year (000’s) | $ | 18,898 | | $ | 31,963 | | $ | 48,875 | | $ | 59,127 | | $ | 68,922 | |
| Portfolio turnover rate | | 14.19 | % | | 13.04 | % | | 13.14 | % | | 6.77 | % | | 5.75 | % |
aThe amount shown for a share outstanding throughout the period may not correlate with the Statement of Operations for the period due to the timing of sales and repurchases of the Fund shares in relation to income earned and/or fluctuating market value of the investments of the Fund. bBased on average daily shares outstanding. cEffective September 1, 2008, the redemption fee was eliminated. dAmount rounds to less than $0.01 per share. eTotal return does not reflect sales commissions or contingent deferred sales charges, if applicable.
Annual Report | The accompanying notes are an integral part of these financial statements. | 33
| | | | | | | | | | | | | | | |
| Franklin California Tax-Free Trust | | | | | | | | | | |
| Financial Highlights (continued) | | | | | | | | | | | | | | | |
| |
| Franklin California Insured Tax-Free Income Fund | | | | | | | | | | | | | | | |
| | | | | | Year Ended June 30, | | | | |
| Class C | | 2010 | | | 2009 | | | 2008 | | | 2007 | | | 2006 | |
| Per share operating performance | | | | | | | | | | | | | | | |
| (for a share outstanding throughout the year) | | | | | | | | | | | | | | | |
| Net asset value, beginning of year | $ | 11.57 | | $ | 12.32 | | $ | 12.60 | | $ | 12.55 | | $ | 12.97 | |
| Income from investment operationsa: | | | | | | | | | | | | | | | |
| Net investment incomeb | | 0.49 | | | 0.49 | | | 0.47 | | | 0.48 | | | 0.48 | |
| Net realized and unrealized gains (losses) | | 0.63 | | | (0.76 | ) | | (0.28 | ) | | 0.04 | | | (0.43 | ) |
| Total from investment operations | | 1.12 | | | (0.27 | ) | | 0.19 | | | 0.52 | | | 0.05 | |
| Less distributions from net investment income | | (0.48 | ) | | (0.48 | ) | | (0.47 | ) | | (0.47 | ) | | (0.47 | ) |
| Redemption feesc | | — | | | —d | | | —d | | | —d | | | —d | |
| Net asset value, end of year | $ | 12.21 | | $ | 11.57 | | $ | 12.32 | | $ | 12.60 | | $ | 12.55 | |
| |
| Total returne | | 9.79 | % | | (2.15 | )% | | 1.48 | % | | 4.17 | % | | 0.40 | % |
| |
| Ratios to average net assets | | | | | | | | | | | | | | | |
| Expenses | | 1.16 | % | | 1.16 | % | | 1.16 | % | | 1.16 | % | | 1.16 | % |
| Net investment income | | 4.05 | % | | 4.19 | % | | 3.78 | % | | 3.74 | % | | 3.79 | % |
| |
| Supplemental data | | | | | | | | | | | | | | | |
| Net assets, end of year (000’s) | $ | 252,630 | | $ | 186,238 | | $ | 163,407 | | $ | 139,476 | | $ | 133,560 | |
| Portfolio turnover rate | | 14.19 | % | | 13.04 | % | | 13.14 | % | | 6.77 | % | | 5.75 | % |
aThe amount shown for a share outstanding throughout the period may not correlate with the Statement of Operations for the period due to the timing of sales and repurchases of the Fund shares in relation to income earned and/or fluctuating market value of the investments of the Fund. bBased on average daily shares outstanding. cEffective September 1, 2008, the redemption fee was eliminated. dAmount rounds to less than $0.01 per share. eTotal return does not reflect sales commissions or contingent deferred sales charges, if applicable.
34 | The accompanying notes are an integral part of these financial statements. | Annual Report
| | | | | | |
| Franklin California Tax-Free Trust | | | | | | |
| Financial Highlights (continued) | | | | | | |
| |
| Franklin California Insured Tax-Free Income Fund | | | | | | |
| | | Year Ended | |
| | | June 30, | |
| Advisor Class | | 2010 | | | 2009 | a |
| Per share operating performance | | | | | | |
| (for a share outstanding throughout the year) | | | | | | |
| Net asset value, beginning of year | $ | 11.45 | | $ | 11.33 | |
| Income from investment operationsb: | | | | | | |
| Net investment incomec | | 0.56 | | | 0.37 | |
| Net realized and unrealized gains (losses) | | 0.63 | | | 0.12 | |
| Total from investment operations | | 1.19 | | | 0.49 | |
| Less distributions from net investment income | | (0.56 | ) | | (0.37 | ) |
| Net asset value, end of year | $ | 12.08 | | $ | 11.45 | |
| |
| Total returnd | | 10.52 | % | | 4.37 | % |
| |
| Ratios to average net assetse | | | | | | |
| Expenses | | 0.51 | % | | 0.51 | % |
| Net investment income | | 4.70 | % | | 4.84 | % |
| |
| Supplemental data | | | | | | |
| Net assets, end of year (000’s) | $ | 10,960 | | $ | 2,100 | |
| Portfolio turnover rate | | 14.19 | % | | 13.04 | % |
aFor the period October 31, 2008 (effective date) to June 30, 2009. bThe amount shown for a share outstanding throughout the period may not correlate with the Statement of Operations for the period due to the timing of sales and repurchases of the Fund shares in relation to income earned and/or fluctuating market value of the investments of the Fund. cBased on average daily shares outstanding. dTotal return is not annualized for periods less than one year. eRatios are annualized for periods less than one year.
Annual Report | The accompanying notes are an integral part of these financial statements. | 35
| | | | |
| Franklin California Tax-Free Trust | | | | |
| |
| Statement of Investments, June 30, 2010 | | | | |
| |
| |
| Franklin California Insured Tax-Free Income Fund | | Principal Amount | | Value |
| Municipal Bonds 98.7% | | | | |
| California 98.7% | | | | |
| ABAG Finance Authority for Nonprofit Corps. California Health Facilities Revenue, Institute on | | | | |
| Aging, California Mortgage Insured, 5.65%, 8/15/38 | $ | 9,000,000 | $ | 8,668,530 |
| ABAG Finance Authority for Nonprofit Corps. COP, | | | | |
| Lincoln Child Center Inc., California Mortgage Insured, 6.125%, 11/01/24 | | 1,950,000 | | 1,956,630 |
| Lytton Gardens Inc., Refunding, California Mortgage Insured, 6.00%, 2/15/30 | | 3,005,000 | | 3,005,180 |
| Odd Fellows Home, California Mortgage Insured, 6.00%, 8/15/24 | | 5,000,000 | | 5,046,600 |
| ABAG Finance Authority for Nonprofit Corps. Revenue, | | | | |
| Casa De Las Campanas, California Mortgage Insured, 6.00%, 9/01/37 | | 8,000,000 | | 8,109,120 |
| Poway Retirement Housing Foundation Hou sing Inc. Project, Series A, California Mortgage | | | | |
| Insured, 5.375%, 11/15/25 | | 5,145,000 | | 5,149,476 |
| Sansum-Santa Barbara, Refunding, Series A, California Mortgage Insured, 5.60%, | | | | |
| 4/01/26 | | 2,750,000 | | 2,768,700 |
| Acalanes UHSD, GO, Capital Appreciation, Election of 2002, Series A, FGIC Insured, zero | | | | |
| cpn., 8/01/25 | | 9,045,000 | | 4,348,022 |
| Alameda Corridor Transportation Authority Revenue, Capital Appreciation, sub. lien, Refunding, | | | | |
| Series A, AMBAC Insured, zero cpn. to 10/01/12, | | | | |
| 5.25% thereafter, 10/01/21 | | 64,660,000 | | 54,869,183 |
| 5.45% thereafter, 10/01/25 | | 25,000,000 | | 20,345,500 |
| Alameda Power and Telecommunication Electric System Revenue COP, Refunding, Series A, | | | | |
| NATL Insured, 5.75%, 7/01/30 | | 3,305,000 | | 3,355,831 |
| Alhambra City Elementary School District GO, Capital Appreciation, Election of 1999, Series | | | | |
| B, NATL RE, FGIC Insured, zero cpn., 9/01/27 | | 3,035,000 | | 1,045,982 |
| Alisal USD, GO, Capital Appreciation, Election of 2006, Series B, Assured Guaranty, zero cpn., | | | | |
| 8/01/32 | | 3,355,000 | | 831,805 |
| 8/01/33 | | 3,610,000 | | 830,914 |
| 2/01/34 | | 3,345,000 | | 742,389 |
| Alum Rock Union Elementary School District GO, Election of 2008, Series A, Assured Guaranty, | | | | |
| 5.00%, 8/01/33 | | 12,595,000 | | 12,769,819 |
| Alvord USD, GO, Election of 2007, Series A, AGMC Insured, 5.00%, 8/01/32 | | 9,070,000 | | 9,165,688 |
| Anaheim PFAR, Distribution System, second lien, NATL Insured, 5.00%, 10/01/29 | | 5,000,000 | | 5,085,450 |
| Antelope Valley UHSD, GO, Series A, NATL Insured, 5.00%, 2/01/27 | | 5,000,000 | | 5,069,350 |
| Antioch USD, GO, Election of 2008, School Facilities Improvement No. 1-B, Assured Guaranty, | | | | |
| 5.375%, 8/01/36 | | 3,130,000 | | 3,226,122 |
| Arcadia USD, GO, Capital Appreciation, Election of 2006, Series A, AGMC Insured, zero cpn., | | | | |
| 8/01/46 | | 27,665,000 | | 2,559,012 |
| Atascadero CDA Tax Allocation, Redevelopment Project, XLCA Insured, 5.00%, 9/01/34 | | 4,315,000 | | 3,842,766 |
| Auburn PFA Wastewater Revenue, Assured Guaranty, 5.50%, 6/01/39 | | 1,880,000 | | 1,970,184 |
| Auburn USD, COP, Refinancing Project, Assured Guaranty, 5.00%, 6/01/38 | | 10,000,000 | | 10,040,100 |
| Bakersfield City School District GO, Series A, AGMC Insured, 5.00%, | | | | |
| 11/01/27 | | 2,415,000 | | 2,512,421 |
| 11/01/28 | | 2,535,000 | | 2,626,640 |
| Bakersfield Wastewater Revenue, Series A, AGMC Insured, 5.00%, 9/15/32 | | 10,430,000 | | 10,624,728 |
| Baldwin Park RDA Tax Allocation, Refunding, AGMC Insured, 5.70%, 9/01/25 | | 4,000,000 | | 4,087,520 |
| Baldwin Park USD, GO, | | | | |
| Capital Appreciation, Election of 2006, AGMC Insured, zero cpn., 8/01/28 | | 5,810,000 | | 1,996,432 |
| Election of 2006, AGMC Insured, 5.00%, 8/01/31 | | 5,440,000 | | 5,507,619 |
36 | Annual Report
| | | | |
| Franklin California Tax-Free Trust | | | | |
| |
| Statement of Investments, June 30, 2010 (continued) | | | | |
| |
| |
| Franklin California Insured Tax-Free Income Fund | | Principal Amount | | Value |
| Municipal Bonds (continued) | | | | |
| California (continued) | | | | |
| Brea and Olinda USD, GO, Series A, NATL RE, FGIC Insured, Pre-Refunded, 5.60%, | | | | |
| 8/01/20 | $ | 1,000,000 | $ | 1,013,690 |
| Brentwood Infrastructure Financing Authority Infrastructure Revenue, Refunding, Series A, | | | | |
| AGMC Insured, 5.00%, 9/02/32 | | 3,790,000 | | 3,933,679 |
| Buckeye USD, GO, Election of 2006, AGMC Insured, 5.00%, 8/01/32 | | 10,705,000 | | 10,949,716 |
| Cabrillo Community College District GO, Capital Appreciation, Election of 2004, Series B, NATL | | | | |
| Insured, zero cpn., 8/01/39 | | 12,570,000 | | 1,868,279 |
| California Community College Financing Authority Lease Revenue, | | | | |
| Grossmont Palomar and Shasta, Series A, NATL Insured, 5.125%, 4/01/31 | | 3,030,000 | | 3,024,001 |
| Sequoias and Kern, AGMC Insured, 5.00%, 6/01/30 | | 2,330,000 | | 2,295,236 |
| Sequoias and Kern, AGMC Insured, 5.125%, 6/01/35 | | 1,250,000 | | 1,233,488 |
| California Educational Facilities Authority Revenue, Stanford University, Refunding, Series O, | | | | |
| 5.125%, 1/01/31 | | 24,705,000 | | 24,721,058 |
| California Health Facilities Financing Authority Revenue, | | | | |
| Asian Community Center, Series A, California Mortgage Insured, 5.00%, 4/01/37 | | 10,550,000 | | 9,513,990 |
| Catholic Healthcare West, Refunding, ACA Insured, 5.00%, 7/01/28 | | 8,765,000 | | 8,713,549 |
| Catholic Healthcare West, Refunding, Series A, 5.00%, 7/01/28 | | 12,995,000 | | 12,918,719 |
| Children’s Hospital Los Angeles, Refunding, Series A, AGMC Insured, 5.25%, 7/01/38 | | 7,000,000 | | 6,929,020 |
| Community Health Facilities, Series A, California Mortgage Insured, 5.80%, 8/01/25 | | 1,020,000 | | 1,020,959 |
| Kaiser Permanente, Series A, ETM, 5.40%, 5/01/28 | | 15,400,000 | | 15,412,474 |
| Marshall Hospital, Refunding, Series A, California Mortgage Insured, 5.30%, 11/01/28 | | 3,005,000 | | 3,013,564 |
| Northern California Presbyterian, Refunding, 5.40%, 7/01/28 | | 5,000,000 | | 4,730,400 |
| Senior Living, Aldersly, Series A, California Mortgage Insured, 5.25%, 3/01/32 | | 2,000,000 | | 1,879,240 |
| Sutter Health, Refunding, Series A, NATL Insured, 5.00%, 8/15/19 | | 1,585,000 | | 1,600,581 |
| Sutter Health, Refunding, Series A, NATL Insured, 5.00%, 8/15/38 | | 3,735,000 | | 3,593,070 |
| Sutter Health, Series A, BHAC Insured, 5.00%, 11/15/42 | | 15,000,000 | | 15,072,000 |
| The Help Group, Refunding, California Mortgage Insured, 5.40%, 8/01/22 | | 4,755,000 | | 4,757,710 |
| True to Life Children’s Services, Series A, California Mortgage Insured, 5.625%, 9/01/25 | | 1,250,000 | | 1,251,113 |
| California HFAR, Home Mortgage, Series N, AMBAC Insured, 6.30%, 8/01/31 | | 240,000 | | 240,547 |
| California Infrastructure and Economic Development Bank Revenue, Bay Area Toll Bridges, first | | | | |
| lien, Series A, AMBAC Insured, Pre-Refunded, 5.00%, 7/01/33 | | 8,460,000 | | 9,950,737 |
| California Municipal Finance Authority Senior Living Revenue, Pilgrim Place in Claremont, | | | | |
| California Mortgage Insured, | | | | |
| Series A, 5.875%, 5/15/29 | | 2,895,000 | | 2,959,906 |
| Series A, 6.125%, 5/15/39 | | 5,830,000 | | 5,983,679 |
| California PCFA, PCR, Southern California Edison Co., Refunding, Series C, NATL Insured, | | | | |
| 5.55%, 9/01/31 | | 4,800,000 | | 4,734,960 |
| California Public School District Financing Au thority Lease Revenue, Southern Kern USD, | | | | |
| Series B, AGMC Insured, ETM, 5.90%, 9/01/26 | | 1,615,000 | | 1,997,884 |
| California School Facilities Financing Authority Revenue, Azusa USD, Series A, AGMC Insured, | | | | |
| 5.00%, 8/01/32 | | 10,000,000 | | 10,079,400 |
| California State Department of Water Resources Water Revenue, | | | | |
| AGMC Insured, Pre-Refunded, 5.125%, 12/01/29 | | 115,000 | | 122,627 |
| Central Valley Project, Series AC, NATL Insured, Pre-Refunded, 5.00%, 12/01/26 | | 40,000 | | 46,462 |
| Central Valley Project, Series AD, AGMC Insured, Pre-Refunded, 5.00%, 12/01/26 | | 25,000 | | 29,134 |
| Refunding, AGMC Insured, 5.125%, 12/01/29 | | 4,885,000 | | 5,036,630 |
Annual Report | 37
| | | | |
| Franklin California Tax-Free Trust | | | | |
| |
| Statement of Investments, June 30, 2010 (continued) | | | | |
| |
| |
| Franklin California Insured Tax-Free Income Fund | | Principal Amount | | Value |
| Municipal Bonds (continued) | | | | |
| California (continued) | | | | |
| California State GO, | | | | |
| FGIC Insured, 5.375%, 6/01/26 | $ | 1,350,000 | $ | 1,356,818 |
| NATL Insured, 6.00%, 8/01/16 | | 210,000 | | 210,611 |
| NATL Insured, 6.00%, 10/01/21 | | 65,000 | | 65,499 |
| Pre-Refunded, 5.125%, 6/01/31 | | 24,705,000 | | 25,785,597 |
| Refunding, 5.125%, 6/01/31 | | 295,000 | | 294,997 |
| Refunding, NATL Insured, 5.00%, 8/01/29 | | 730,000 | | 728,197 |
| Various Purpose, 5.00%, 11/01/32 | | 20,000,000 | | 19,448,200 |
| California State Local Government Finance Authority Revenue, Marin Valley Mobile, Senior | | | | |
| Series A, AGMC Insured, 5.80%, 10/01/20 | | 3,770,000 | | 3,782,780 |
| California State Public Works Board Lease Revenue, Department of Mental Health Hospital, | | | | |
| Series A, AMBAC Insured, 5.00%, | | | | |
| 12/01/21 | | 4,100,000 | | 4,165,149 |
| 12/01/26 | | 5,675,000 | | 5,532,160 |
| California State University Foundation Revenue, Monterey Bay, NATL Insured, Pre-Refunded, | | | | |
| 5.35%, 6/01/31 | | 2,000,000 | | 2,091,540 |
| California State University of Los Angeles Auxiliary Services Inc. Revenue, NATL Insured, | | | | |
| Pre-Refunded, 5.125%, 6/01/33 | | 3,200,000 | | 3,338,496 |
| California State University Revenue, Systemwide, | | | | |
| Refunding, Series A, AMBAC Insured, 5.00%, 11/01/33 | | 22,000,000 | | 22,146,740 |
| Series A, AGMC Insured, 5.00%, 11/01/33 | | 10,000,000 | | 10,134,900 |
| California Statewide CDA, | | | | |
| COP, Children’s Hospital, Los Angeles, 5.25%, 8/15/29 | | 12,250,000 | | 11,225,777 |
| COP, NATL Insured, 5.00%, 4/01/18 | | 3,000,000 | | 2,812,680 |
| COP, Refunding, AGMC Insured, 5.50%, 8/15/31 | | 7,000,000 | | 7,005,740 |
| COP, Refunding, California Mortgage Insured, 5.75%, 8/01/21 | | 5,895,000 | | 5,895,000 |
| MFHR, 740 Olive Street, Series L, GNMA Secured, 4.90%, 7/20/39 | | 13,475,000 | | 13,289,719 |
| MFHR, 740 Olive Street, Series L, GNMA Secured, 5.10%, 7/20/50 | | 10,000,000 | | 9,932,100 |
| MFHR, Silver Ridge Apartments, Mandatory Put 8/01/21, Series H, FNMA Insured, 5.80%, | | | | |
| 8/01/33 | | 2,785,000 | | 2,849,640 |
| California Statewide CDA Revenue, | | | | |
| Adventist, Series B, Assured Guaranty, 5.00%, 3/01/37 | | 17,000,000 | | 17,041,820 |
| Catholic Healthcare West, Series K, Assured Guaranty, 5.50%, 7/01/41 | | 17,000,000 | | 17,505,920 |
| Community Hospital of the Monterey Peninsula, Series B, AGMC Insured, 5.25%, | | | | |
| 6/01/23 | | 2,000,000 | | 2,093,480 |
| COP, John Muir/Mt. Diablo Health System, NATL Insured, 5.125%, 8/15/22 | | 5,000,000 | | 5,013,800 |
| Enloe Medical Center, California Mortgage Insured, 6.25%, 8/15/28 | | 17,215,000 | | 18,420,911 |
| Henry Mayo Newhall Memorial, Series B, AMBAC Insured, 5.05%, 10/01/28 | | 7,825,000 | | 7,570,766 |
| Lodi Memorial Hospital, Series A, California Mortgage Insured, 5.00%, 12/01/27 | | 15,000,000 | | 14,558,100 |
| Methodist Hospital of Southern California Project, FHA Insured, 6.75%, 2/01/38 | | 20,000,000 | | 22,792,400 |
| Refunding, California Mortgage Insured, 5.00%, 8/01/21 | | 2,035,000 | | 2,062,635 |
| St. Ignatius College Preparatory, AMBAC Insured, 5.00%, 6/01/37 | | 7,215,000 | | 6,505,405 |
| St. Joseph Health System, Series E, AGMC Insured, 5.25%, 7/01/47 | | 20,000,000 | | 20,142,400 |
| Sutter Health, Series C, AGMC Insured, 5.05%, 8/15/38 | | 15,000,000 | | 15,228,600 |
| California Statewide CDA Water and Wastewater Revenue, Pooled Financing Program, Refunding, | | | | |
| Series A, AGMC Insured, 5.00%, 10/01/32 | | 9,320,000 | | 9,478,906 |
| Series B, AGMC Insured, 5.75%, 10/01/29 | | 1,465,000 | | 1,468,355 |
38 | Annual Report
| | | | |
| Franklin California Tax-Free Trust | | | | |
| |
| Statement of Investments, June 30, 2010 (continued) | | | | |
| |
| |
| Franklin California Insured Tax-Free Income Fund | | Principal Amount | | Value |
| Municipal Bonds (continued) | | | | |
| California (continued) | | | | |
| Carlsbad USD, COP, Series A, Assured Guaranty, 5.00%, | | | | |
| 10/01/34 | $ | 14,000,000 | $ | 13,959,960 |
| 10/01/41 | | 3,880,000 | | 3,825,370 |
| Castaic Lake Water Agency Revenue COP, Series A, NATL Insured, Pre-Refunded, 5.00%, | | | | |
| 8/01/29 | | 8,000,000 | | 8,292,640 |
| Castaic USD, COP, Refunding, AGMC Insured, 5.125%, 9/01/33 | | 1,000,000 | | 1,006,620 |
| Central USD, GO, Election of 2008, Series A, Assured Guaranty, | | | | |
| 5.50%, 8/01/29 | | 3,000,000 | | 3,209,760 |
| 5.625%, 8/01/33 | | 3,500,000 | | 3,699,640 |
| Chabot-Las Positas Community College District GO, Capital Appreciation Bonds, Series C, | | | | |
| AMBAC Insured, zero cpn., | | | | |
| 8/01/35 | | 10,000,000 | | 2,006,800 |
| 8/01/36 | | 10,000,000 | | 1,872,800 |
| 8/01/37 | | 15,045,000 | | 2,656,195 |
| Chaffey Community College District GO, | | | | |
| Refunding, Series A, AGMC Insured, 5.00%, 7/01/27 | | 270,000 | | 278,856 |
| Series A, AGMC Insured, Pre-Refunded, 5.00%, 7/01/27 | | 5,480,000 | | 6,030,247 |
| Chico PFAR, Merged Redevelopment Project Area, NATL Insured, 5.125%, 4/01/24 | | 2,790,000 | | 2,792,288 |
| Chino Basin Regional Financing Authority Revenue, Municipal Water District, Sewer System | | | | |
| Project, Refunding, AMBAC Insured, 6.00%, 8/01/16 | | 2,000,000 | | 2,006,740 |
| Chula Vista Elementary School District GO, Election of 1998, Series F, NATL Insured, 5.00%, | | | | |
| 8/01/28 | | 2,685,000 | | 2,741,331 |
| Clovis PFAR, 2001 Corp. Yard Project, AMBAC Insured, 5.00%, 3/01/27 | | 3,265,000 | | 3,292,589 |
| Coachella Valley USD, GO, Capital Appreciation, Election of 2005, Series C, AGMC Insured, | | | | |
| zero cpn., | | | | |
| 8/01/36 | | 8,000,000 | | 1,424,560 |
| 8/01/37 | | 8,000,000 | | 1,329,840 |
| 8/01/40 | | 7,500,000 | | 1,012,950 |
| 8/01/43 | | 10,000,000 | | 1,095,500 |
| College of the Sequoias Tulare Area ID No. 3 GO, Election of 2008, Series A, Assured Guaranty, | | | | |
| 5.50%, 8/01/33 | | 5,000,000 | | 5,266,000 |
| College of the Sequoias Visalia Area ID No. 2 GO, Election of 2008, | | | | |
| Series A, Assured Guaranty, 5.50%, 8/01/33 | | 5,750,000 | | 6,055,900 |
| Series B, AGMC Insured, 5.00%, 8/01/39 | | 3,000,000 | | 2,941,290 |
| Colton Joint USD, GO, Election of 2008, Series A, Assured Guaranty, 5.375%, 8/01/34 | | 10,665,000 | | 10,859,956 |
| Compton USD, GO, Election of 2002, Series B, NATL Insured, Pre-Refunded, 5.00%, | | | | |
| 6/01/29 | | 2,000,000 | | 2,296,320 |
| Corona-Norco USD, | | | | |
| COP, Refunding, AGMC Insured, 5.125%, 4/15/25 | | 5,355,000 | | 5,360,837 |
| COP, Refunding, AGMC Insured, 5.125%, 4/15/29 | | 2,540,000 | | 2,542,134 |
| GO, Capital Appreciation, Refunding, Series B, AGMC Insured, zero cpn., 3/01/25 | | 1,400,000 | | 616,182 |
| GO, Capital Appreciation, Series B, AGMC Insured, zero cpn., 9/01/23 | | 2,320,000 | | 1,145,245 |
| GO, Capital Appreciation, Series B, AGMC Insured, zero cpn., 9/01/24 | | 2,620,000 | | 1,202,344 |
| GO, Capital Appreciation, Series C, NATL RE, FGIC Insured, zero cpn., 9/01/25 | | 4,655,000 | | 1,980,516 |
| GO, Capital Appreciation, Series C, NATL RE, FGIC Insured, zero cpn., 9/01/26 | | 6,080,000 | | 2,410,659 |
| GO, Election of 2006, Series B, Assured Guaranty, 5.375%, 2/01/34 | | 12,000,000 | | 12,279,360 |
| GO, Election of 2006, Series C, AGMC Insured, 5.50%, 8/01/39 | | 7,500,000 | | 7,726,350 |
Annual Report | 39
| | | | |
| Franklin California Tax-Free Trust | | | | |
| |
| Statement of Investments, June 30, 2010 (continued) | | | | |
| |
| |
| Franklin California Insured Tax-Free Income Fund | | Principal Amount | | Value |
| Municipal Bonds (continued) | | | | |
| California (continued) | | | | |
| Coronado CDA Tax Allocation, Community Development Project, NATL Insured, 5.375%, | | | | |
| 9/01/26 | $ | 2,700,000 | $ | 2,710,152 |
| Covina PFA Wastewater Revenue, Assured Guaranty, 5.375%, 10/01/29 | | 6,550,000 | | 6,902,783 |
| Cucamonga County Water District COP, NATL RE, FGIC Insured, 5.00%, 9/01/29 | | 5,070,000 | | 5,095,350 |
| Delano USD, COP, Refinancing Project, NATL Ins ured, 5.125%, 1/01/22 | | 1,620,000 | | 1,721,995 |
| Desert Sands USD, COP, Financing Project, AGMC Insured, 5.75%, 3/01/24 | | 10,000,000 | | 10,807,800 |
| East Bay MUD Water System Revenue, Refunding, NATL Insured, Pre-Refunded, 5.00%, | | | | |
| 6/01/26 | | 14,000,000 | | 14,590,100 |
| East Side UHSD Santa Clara County GO, | | | | |
| Election of 2008, Series A, Assured Guaranty, 5.00%, 8/01/38 | | 4,255,000 | | 4,277,296 |
| Series F, AGMC Insured, 5.00%, 8/01/35 | | 19,000,000 | | 19,107,920 |
| El Centro Financing Authority Wastewater Reven ue, Series A, AGMC Insured, 5.25%, | | | | |
| 10/01/35 | | 6,200,000 | | 6,285,002 |
| El Monte UHSD, GO, Election of 2008, Series A, Assured Guaranty, 5.50%, 6/01/34 | | 11,355,000 | | 11,950,002 |
| El Monte Water Authority Revenue, Water System Project, AMBAC Insured, Pre-Refunded, | | | | |
| 5.60%, 9/01/34 | | 1,800,000 | | 1,850,022 |
| Elsinore Valley Municipal Water District COP, Refunding, Series A, BHAC Insured, 5.00%, | | | | |
| 7/01/29 | | 7,245,000 | | 7,634,781 |
| Escondido Joint Powers Financing Authority Lease Revenue, AMBAC Insured, 5.125%, | | | | |
| 9/01/30 | | 3,770,000 | | 3,656,862 |
| Eureka USD, GO, AGMC Insured, 5.00%, 8/01/25 | | 4,145,000 | | 4,319,256 |
| Fairfield Suisun USD, GO, | | | | |
| Election of 2002, NATL Insured, 5.00%, 8/01/25 | | 4,185,000 | | 4,334,237 |
| NATL Insured, 5.00%, 8/01/27 | | 12,000,000 | | 12,269,880 |
| Florin Resource Conservation District COP, Elk Grove Water Service, Refunding, Series A, NATL | | | | |
| Insured, 5.00%, 3/01/33 | | 5,000,000 | | 4,715,100 |
| Folsom COP, Central Business District Fire Station, NATL Insured, 5.125%, 10/01/26 | | 2,030,000 | | 2,038,546 |
| Foothill/Eastern Corridor Agency Toll Road Revenue, | | | | |
| Capital Appreciation, Refunding, NATL Insured, zero cpn., 1/15/17 | | 20,000,000 | | 13,547,400 |
| Capital Appreciation, Refunding, NATL Insured, zero cpn., 1/15/18 | | 25,000,000 | | 15,733,000 |
| Capital Appreciation, Refunding, NATL Insured, zero cpn., 1/15/19 | | 5,970,000 | | 3,483,495 |
| senior lien, Refunding, Series A, NATL Insured, 5.00%, 1/01/35 | | 66,735,000 | | 60,690,144 |
| Fowler USD, GO, | | | | |
| Capital Appreciation, Election of 2004, Series C, AGMC Insured, zero cpn., 8/01/41 | | 3,095,000 | | 401,824 |
| Capital Appreciation, Election of 2004, Series C, AGMC Insured, zero cpn., 8/01/42 | | 3,005,000 | | 364,206 |
| Election of 2004, Series C, AGMC Insured, 5.25%, 8/01/39 | | 3,555,000 | | 3,658,522 |
| Franklin-McKinley School District GO, Election of 2004, Series A, FGIC Insured, Pre-Refunded, | | | | |
| 5.00%, 8/01/29 | | 5,280,000 | | 6,167,568 |
| Fresno USD, GO, Refunding, Series C, NATL Insured, 5.90%, | | | | |
| 2/01/20 | | 2,065,000 | | 2,315,010 |
| 8/01/22 | | 3,000,000 | | 3,389,040 |
| Fullerton School District GO, Capital Appreciation, Series A, NATL RE, FGIC Insured, zero cpn., | | | | |
| 8/01/23 | | 3,030,000 | | 1,498,608 |
| Fullerton University Foundation Auxiliary Organization Revenue, Series A, NATL Insured, | | | | |
| Pre-Refunded, | | | | |
| 5.75%, 7/01/25 | | 1,250,000 | | 1,262,500 |
| 5.75%, 7/01/30 | | 1,000,000 | | 1,010,000 |
40 | Annual Report
| | | | |
| Franklin California Tax-Free Trust | | | | |
| |
| Statement of Investments, June 30, 2010 (continued) | | | | |
| |
| |
| Franklin California Insured Tax-Free Income Fund | | Principal Amount | | Value |
| Municipal Bonds (continued) | | | | |
| California (continued) | | | | |
| Glendora PFAR Tax Allocation, Project No. 1, Refunding, Series A, NATL Insured, 5.00%, | | | | |
| 9/01/24 | $ | 5,000,000 | $ | 4,924,950 |
| Grossmont UHSD, GO, | | | | |
| AGMC Insured, 5.00%, 8/01/33 | | 1,440,000 | | 1,472,616 |
| AGMC Insured, 5.25%, 8/01/33 | | 5,510,000 | | 5,735,634 |
| Capital Appreciation, Election of 2004, AGMC Insured, zero cpn., 8/01/24 | | 5,110,000 | | 2,342,935 |
| Hawthorne School District GO, | | | | |
| Capital Appreciation, Election of 2004, Series C, Assured Guaranty, zero cpn., 8/01/38 | | 10,000,000 | | 1,638,000 |
| Hawthorne School District, Assured Guaranty, 5.00%, 8/01/34 | | 1,000,000 | | 970,010 |
| Hollister RDA Tax Allocation, Community Development Project, Refunding, AMBAC Insured, | | | | |
| 5.125%, 10/01/32 | | 19,815,000 | | 17,438,785 |
| Huntington Beach UHSD, COP, Adult Education Project, AGMC Insured, 5.25%, 9/01/39 | | 2,000,000 | | 2,026,580 |
| Indian Wells Valley Water District COP, | | | | |
| Assured Guaranty, 5.25%, 10/01/39 | | 7,590,000 | | 7,881,987 |
| Refunding, Assured Guaranty, 5.125%, 10/01/32 | | 1,690,000 | | 1,744,469 |
| Jefferson San Mateo County UHSD, GO, Refunding, Series A, NATL Insured, 6.45%, | | | | |
| 8/01/25 | | 3,045,000 | | 3,492,371 |
| 8/01/29 | | 3,075,000 | | 3,519,799 |
| Jurupa Community Services District Special Tax, CFD No. 2, Series A, NATL Insured, 5.00%, | | | | |
| 9/01/32 | | 7,000,000 | | 6,075,860 |
| Jurupa USD, COP, AGMC Insured, 5.625%, 9/01/24 | | 1,600,000 | | 1,635,072 |
| Kern High School District GO, AGMC Insured, ETM, 6.625%, | | | | |
| 8/01/14 | | 1,535,000 | | 1,864,073 |
| 8/01/15 | | 1,400,000 | | 1,741,992 |
| La Habra COP, Refunding, Series A, AGMC Insured, 5.25%, 9/01/40 | | 7,900,000 | | 7,936,498 |
| La Mirada RDA Tax Allocation, Merged Project Area, Refunding, Series A, AGMC Insured, | | | | |
| 5.00%, 8/15/28 | | 1,855,000 | | 1,872,493 |
| Lake Elsinore USD, COP, School Facilities Project Funding Program, AGMC Insured, 5.00%, | | | | |
| 6/01/42 | | 10,000,000 | | 9,842,800 |
| Lake Tahoe USD, GO, Election of 2008, AGMC Insured, 5.375%, 8/01/29 | | 10,000,000 | | 10,531,200 |
| Lancaster Financing Authority Tax Allocation Revenue, Subordinated, Redevelopment Projects | | | | |
| No. 5 and 6, Series B, NATL RE, FGIC Insured, 5.00%, 2/01/35 | | 5,775,000 | | 5,087,544 |
| Lancaster School District GO, Capital Appreciation, Election of 1999, NATL Insured, zero cpn., | | | | |
| 8/01/25 | | 5,495,000 | | 2,212,122 |
| 7/01/26 | | 5,965,000 | | 2,244,033 |
| Lawndale RDA Tax Allocation, Economic Revitalization Project, Assured Guaranty, 5.50%, | | | | |
| 8/01/44 | | 6,085,000 | | 6,167,087 |
| Lemon Grove School District GO, Election of 2008, Series A, Assured Guaranty, 5.125%, | | | | |
| 8/01/33 | | 2,100,000 | | 2,108,232 |
| Live Oak School District COP, Assured Guaranty, | | | | |
| 5.50%, 8/01/29 | | 1,245,000 | | 1,308,433 |
| 5.875%, 8/01/34 | | 2,270,000 | | 2,401,456 |
| 5.875%, 8/01/39 | | 2,750,000 | | 2,896,987 |
| Lodi Electric System Revenue COP, Series A, Assured Guaranty, 5.00%, 7/01/32 | | 18,960,000 | | 19,096,322 |
| Lodi USD, GO, NATL Insured, 5.00%, 8/01/23 | | 2,150,000 | | 2,206,739 |
| Lodi USD School Facilities ID No. 1 GO, Election of 2006, AGMC Insured, 5.00%, | | | | |
| 8/01/30 | | 6,450,000 | | 6,615,700 |
| 8/01/32 | | 8,220,000 | | 8,346,835 |
Annual Report | 41
| | | | |
| Franklin California Tax-Free Trust | | | | |
| |
| Statement of Investments, June 30, 2010 (continued) | | | | |
| |
| |
| Franklin California Insured Tax-Free Income Fund | | Principal Amount | | Value |
| Municipal Bonds (continued) | | | | |
| California (continued) | | | | |
| Long Beach Bond Finance Authority Lease Revenu e, | | | | |
| Aquarium of the Pacific Project, Refunding, AMBAC Insured, 5.00%, 11/01/19 | $ | 4,000,000 | $ | 4,011,000 |
| Public Safety Facilities Projects, AMBAC Insured, 5.00%, 11/01/26 | | 6,780,000 | | 6,381,133 |
| Public Safety Facilities Projects, AMBAC Insured, 5.00%, 11/01/31 | | 10,500,000 | | 9,324,840 |
| Long Beach Bond Finance Authority Tax Allocation Revenue, North Long Beach Redevelopment | | | | |
| Projects, Series A, AMBAC Insured, | | | | |
| 5.00%, 8/01/25 | | 7,015,000 | | 6,377,056 |
| 5.00%, 8/01/31 | | 3,135,000 | | 2,640,516 |
| Pre-Refunded, 5.00%, 8/01/25 | | 6,535,000 | | 7,122,627 |
| Pre-Refunded, 5.00%, 8/01/31 | | 8,865,000 | | 9,662,141 |
| Long Beach USD, GO, Election of 1999, Series C, NATL Insured, 5.125%, 8/01/31 | | 13,870,000 | | 13,874,161 |
| Los Angeles Community College District GO, | | | | |
| Series A, NATL Insured, Pre-Refunded, 5.00%, 6/01/26 | | 4,000,000 | | 4,199,680 |
| Series B, AGMC Insured, 5.00%, 8/01/27 | | 4,000,000 | | 4,119,000 |
| Los Angeles COP, | | | | |
| Municipal Improvement Corp. of Los Angeles, Program AW Certificates, AMBAC Insured, | | | | |
| 5.00%, 6/01/27 | | 5,895,000 | | 5,948,586 |
| Real Property Program, NATL Insured, 5.00%, 2/01/27 | | 9,890,000 | | 9,910,373 |
| Los Angeles County Public Works Financing Authority Lease Revenue, Master Refunding | | | | |
| Project, Refunding, Series B, NATL RE, FGIC Insured, 5.00%, 9/01/31 | | 7,600,000 | | 7,274,264 |
| Los Angeles Department of Water and Power Revenue, Power System, | | | | |
| Series A, Sub Series A-1, AGMC Insured, 5.00%, 7/01/35 | | 5,000,000 | | 5,124,000 |
| Series B, AGMC Insured, 5.00%, 7/01/35 | | 5,000,000 | | 5,112,550 |
| Los Angeles Department of Water and Power Waterworks Revenue, System, Series A, Sub | | | | |
| Series A-2, AMBAC Insured, 5.00%, 7/01/44 | | 10,000,000 | | 10,248,600 |
| Los Angeles Mortgage Revenue, Refunding, Series I, NATL Insured, 6.50%, 7/01/22 | | 675,000 | | 675,250 |
| Los Angeles USD, GO, | | | | |
| Election of 2004, Series H, AGMC Insured, 5.00%, 7/01/27 | | 5,000,000 | | 5,160,500 |
| Election of 2004, Series H, AGMC Insured, 5.00%, 7/01/28 | | 5,000,000 | | 5,139,350 |
| Election of 2005, Series E, AGMC Insured, 5.00%, 7/01/27 | | 5,800,000 | | 5,986,180 |
| Los Angeles Wastewater System Revenue, Refunding, Series A, NATL Insured, 5.00%, | | | | |
| 6/01/26 | | 10,000,000 | | 10,387,900 |
| Lynwood PFA Tax Allocation, Project Area A, Refunding, Series A, AGMC Insured, 5.85%, | | | | |
| 9/01/18 | | 1,765,000 | | 1,779,967 |
| Marin Municipal Water District COP, Financing Project, AMBAC Insured, 5.00%, 7/01/29 | | 1,200,000 | | 1,105,608 |
| Mendocino County COP, Public Facilities Corp., NATL Insured, 5.25%, 6/01/30 | | 2,680,000 | | 2,682,010 |
| Merced Irrigation District Electricity System Revenue, Refunding, XLCA Insured, 5.00%, | | | | |
| 9/01/26 | | 10,000,000 | | 8,944,700 |
| Millbrae COP, Police Department Expansion, AMBAC Insured, 5.875%, 3/01/24 | | 1,025,000 | | 1,034,092 |
| Modesto Irrigation District COP, Capital Improvements, Series A, AGMC Insured, 5.00%, | | | | |
| 7/01/26 | | 5,000,000 | | 5,076,450 |
| 7/01/31 | | 8,285,000 | | 8,327,253 |
| Montebello COP, Capital Improvement Project, Refunding, AGMC Insured, 5.375%, | | | | |
| 11/01/26 | | 8,715,000 | | 8,924,421 |
| Montebello CRDA Tax Allocation, Montebello Hills Redevelopment Project, Refunding, NATL | | | | |
| Insured, 5.60%, 3/01/19 | | 2,460,000 | | 2,460,049 |
| Montebello USD, GO, Election of 2004, AGMC Insured, 5.00%, 8/01/33 | | 2,700,000 | | 2,746,521 |
42 | Annual Report
| | | | |
| Franklin California Tax-Free Trust | | | | |
| |
| Statement of Investments, June 30, 2010 (continued) | | | | |
| |
| |
| Franklin California Insured Tax-Free Income Fund | | Principal Amount | | Value |
| Municipal Bonds (continued) | | | | |
| California (continued) | | | | |
| Moorpark USD, | | | | |
| COP, Refunding, Assured Guaranty, 5.625%, 11/01/28 | $ | 2,180,000 | $ | 2,263,886 |
| GO, Election of 2008, Capital Appreciation Bonds, Series A, Assured Guaranty, zero cpn., | | | | |
| 8/01/32 | | 5,870,000 | | 1,471,022 |
| Moreno Valley USD, GO, Election of 2004, Series A, AGMC Insured, Pre-Refunded, 5.00%, | | | | |
| 8/01/26 | | 4,000,000 | | 4,617,400 |
| Morgan Hill USD, GO, FGIC Insured, Pre-Refunded, 5.50%, 8/01/25 | | 3,840,000 | | 3,892,301 |
| Mount Diablo USD, GO, Election of 2002, NATL RE, FGIC Insured, 5.00%, 7/01/25 | | 6,025,000 | | 6,152,127 |
| Murrieta Valley USD, COP, NATL Insured, 5.00%, 8/01/27 | | 2,380,000 | | 2,430,099 |
| Natomas USD, GO, AGMC Insured, 5.00%, 9/01/26 | | 2,535,000 | | 2,576,929 |
| Nevada Joint UHSD, GO, Series A, AGMC Insured, 5.00%, 8/01/26 | | 1,295,000 | | 1,328,722 |
| Newark USD, GO, Capital Appreciation, Series C, AGMC Insured, zero cpn., | | | | |
| 8/01/22 | | 2,165,000 | | 1,149,788 |
| 8/01/23 | | 2,465,000 | | 1,227,397 |
| 8/01/24 | | 2,560,000 | | 1,201,536 |
| 8/01/25 | | 2,705,000 | | 1,196,719 |
| Northern California Public Power Agency Revenue, AMBAC Insured, Pre-Refunded, 7.50%, | | | | |
| 7/01/23 | | 3,200,000 | | 4,381,824 |
| Oak View USD, GO, AGMC Insured, 5.00%, 8/01/49 | | 1,895,000 | | 1,853,537 |
| Oceanside COP, AMBAC Insured, 5.20%, 4/01/23 | | 2,500,000 | | 2,538,600 |
| Oceanside USD, GO, Refunding, Series A, Assured Guaranty, 5.25%, 8/01/33 | | 5,000,000 | | 5,101,950 |
| Orange County Sanitation Districts COP, NATL RE, FGIC Insured, 5.00%, 2/01/33 | | 8,000,000 | | 8,126,960 |
| Pacifica COP, AMBAC Insured, 5.375%, 1/01/37 | | 6,600,000 | | 6,790,278 |
| Palm Springs Financing Authority Lease Revenue, Convention Center Project, Refunding, | | | | |
| Series A, NATL Insured, 5.00%, 11/01/25 | | 2,295,000 | | 2,261,057 |
| Pasadena Area Community College District GO, Election of 2002, Series A, FGIC Insured, | | | | |
| Pre-Refunded, 5.00%, 6/01/28 | | 4,000,000 | | 4,482,280 |
| Patterson Joint USD, GO, Capital Appreciation, | | | | |
| Series A, NATL RE, FGIC Insured, zero cpn., 8/01/22 | | 1,900,000 | | 954,047 |
| Series A, NATL RE, FGIC Insured, zero cpn., 8/01/24 | | 2,075,000 | | 900,758 |
| Series A, NATL RE, FGIC Insured, zero cpn., 8/01/25 | | 2,170,000 | | 866,828 |
| Series A, NATL RE, FGIC Insured, zero cpn., 8/01/26 | | 2,265,000 | | 833,565 |
| Series C, NATL RE, FGIC Insured, zero cpn., 8/01/23 | | 1,985,000 | | 927,194 |
| Peralta Community College District GO, | | | | |
| Election of 2000, Series B, NATL Insured, 5.25%, 8/01/32 | | 8,450,000 | | 8,550,301 |
| Election of 2006, Series B, AGMC Insured, 5.00%, 8/01/24 | | 6,000,000 | | 6,408,000 |
| Perris CFD No. 93-1 Special Tax, Series A, AMBAC Insured, 5.125%, 8/15/23 | | 3,885,000 | | 3,810,330 |
| Pleasanton USD, COP, Refunding, AGMC Insured, 5.00%, 8/01/29 | | 4,000,000 | | 3,999,840 |
| Plumas County COP, Capital Improvement Program, Series A, AMBAC Insured, 5.00%, | | | | |
| 6/01/33 | | 3,280,000 | | 3,077,460 |
| Pomona USD, GO, Election of 2008, Series A, Assured Guaranty, 5.25%, 8/01/33 | | 5,675,000 | | 5,823,004 |
| Porterville COP, Sewer System Refinancing Project, Refunding, AMBAC Insured, 5.25%, | | | | |
| 10/01/23 | | 3,000,000 | | 2,999,490 |
| Poway RDA Tax Allocation, | | | | |
| NATL Insured, Pre-Refunded, 5.75%, 6/15/33 | | 9,250,000 | | 9,645,992 |
| Paguay Redevelopment Project, AMBAC Insured, 5.00%, 12/15/25 | | 9,195,000 | | 8,972,481 |
| Refunding, NATL Insured, 5.75%, 6/15/33 | | 2,225,000 | | 2,227,915 |
Annual Report | 43
| | | | |
| Franklin California Tax-Free Trust | | | | |
| |
| Statement of Investments, June 30, 2010 (continued) | | | | |
| |
| |
| Franklin California Insured Tax-Free Income Fund | | Principal Amount | | Value |
| Municipal Bonds (continued) | | | | |
| California (continued) | | | | |
| Rancho Cucamonga RDA Tax Allocation, Rancho Redevelopment Project, Refunding, AGMC | | | | |
| Insured, 5.25%, 9/01/20 | $ | 2,500,000 | $ | 2,508,375 |
| Redwood City School District GO, NATL RE, FGIC Insured, 5.00%, 7/15/27 | | 3,000,000 | | 3,025,230 |
| Richmond Joint Powers Financing Authority Revenue, Lease, Civic Center Project, Refunding, | | | | |
| Assured Guaranty, 5.875%, 8/01/37 | | 24,000,000 | | 25,587,360 |
| Ripon RDA Tax Allocation, Community Redevelopment Project, NATL Insured, Pre-Refunded, | | | | |
| 5.85%, 11/01/30 | | 3,975,000 | | 4,125,334 |
| Riverside Electric Revenue, Issue D, AGMC Insured, 5.00%, 10/01/38 | | 5,310,000 | | 5,428,307 |
| Rohnert Park Community Development Commission Tax Allocation, Redevelopment Project, | | | | |
| Series R, NATL RE, FGIC Insured, 5.00%, 8/01/37 | | 5,000,000 | | 4,407,350 |
| Roseville Financing Authority Revenue, senior lien, Series A, AMBAC Insured, 5.00%, | | | | |
| 9/01/25 | | 5,675,000 | | 5,204,883 |
| Sacramento Area Flood Control Agency Special Assessment, | | | | |
| Consolidated, Capital AD, Refunding, Series A, Assured Guaranty, 5.00%, 10/01/32 | | 5,000,000 | | 5,048,000 |
| Subordinated, Capital AD No. 2, FGIC Insured, 5.80%, 11/01/16 | | 900,000 | | 901,395 |
| Sacramento City Financing Authority Revenue, | | | | |
| Capital Improvement, Series A, AMBAC Insured, Pre-Refunded, 5.00%, 12/01/26 | | 8,395,000 | | 8,748,849 |
| Capital Improvement, Series A, AMBAC Insured, Pre-Refunded, 5.00%, 12/01/32 | | 21,500,000 | | 22,406,225 |
| City Hall and Redevelopment Projects, Series A, AGMC Insured, Pre-Refunded, 5.00%, | | | | |
| 12/01/28 | | 10,000,000 | | 11,048,000 |
| Sacramento County Airport System Revenue, Senior Series B, Assured Guaranty, 5.50%, | | | | |
| 7/01/34 | | 16,320,000 | | 17,382,106 |
| Salida Area Public Facilities Financing Agency CFD No. 1988-1 Special Tax, AGMC Insured, | | | | |
| 5.75%, 9/01/30 | | 3,435,000 | | 3,449,118 |
| San Bernardino City USD, GO, Election of 2004, Series B, AGMC Insured, 5.00%, 8/01/28 | | 10,000,000 | | 10,256,000 |
| San Bernardino County COP, 1997 Public Improvement Financing Project, NATL Insured, | | | | |
| 5.25%, 10/01/25 | | 5,450,000 | | 5,398,824 |
| San Bernardino County SFMR, Capital Appreciation, Series A, GNMA Secured, ETM, zero cpn., | | | | |
| 5/01/22 | | 28,405,000 | | 15,842,037 |
| San Francisco BART District Sales Tax Revenue, AMBAC Insured, 5.00%, 7/01/28 | | 2,795,000 | | 2,795,000 |
| San Francisco City and County Airports Commission International Airport Revenue, Refunding, | | | | |
| Second Series 28A, NATL Insured, 5.125%, | | | | |
| 5/01/24 | | 9,745,000 | | 9,825,883 |
| 5/01/27 | | 16,575,000 | | 16,417,206 |
| San Francisco City and County Public Utilities Commission Water Revenue, Refunding, Series A, | | | | |
| AGMC Insured, 5.00%, 11/01/31 | | 3,885,000 | | 3,947,238 |
| San Francisco Community College District GO, Series A, NATL RE, FGIC Insured, 5.00%, | | | | |
| 6/15/26 | | 6,000,000 | | 6,124,620 |
| San Gabriel USD, GO, Capital Appreciation, | | | | |
| Election of 2002, Series C, AGMC Insured, zero cpn., 8/01/31 | | 5,870,000 | | 1,566,233 |
| Election of 2002, Series C, AGMC Insured, zero cpn., 7/01/32 | | 6,115,000 | | 1,524,103 |
| Series A, AGMC Insured, zero cpn., 8/01/26 | | 3,530,000 | | 1,363,074 |
| Series A, AGMC Insured, zero cpn., 2/01/27 | | 1,850,000 | | 684,667 |
| San Jacinto USD, COP, Refunding, AGMC Insured, 5.125%, 9/01/30 | | 4,375,000 | | 4,445,700 |
| San Joaquin Delta Community College District GO, Election of 2004, | | | | |
| Capital Appreciation, Series B, AGMC Insured, zero cpn., 8/01/31 | | 10,475,000 | | 2,881,882 |
| Capital Appreciation, Series B, AGMC Insured, zero cpn., 8/01/32 | | 15,185,000 | | 3,912,719 |
| Series A, AGMC Insured, 5.00%, 8/01/29 | | 520,000 | | 538,803 |
| Series A, AGMC Insured, Pre-Refunded, 5.00%, 8/01/29 | | 4,530,000 | | 5,303,543 |
| |
| 44 | Annual Report | | | | |
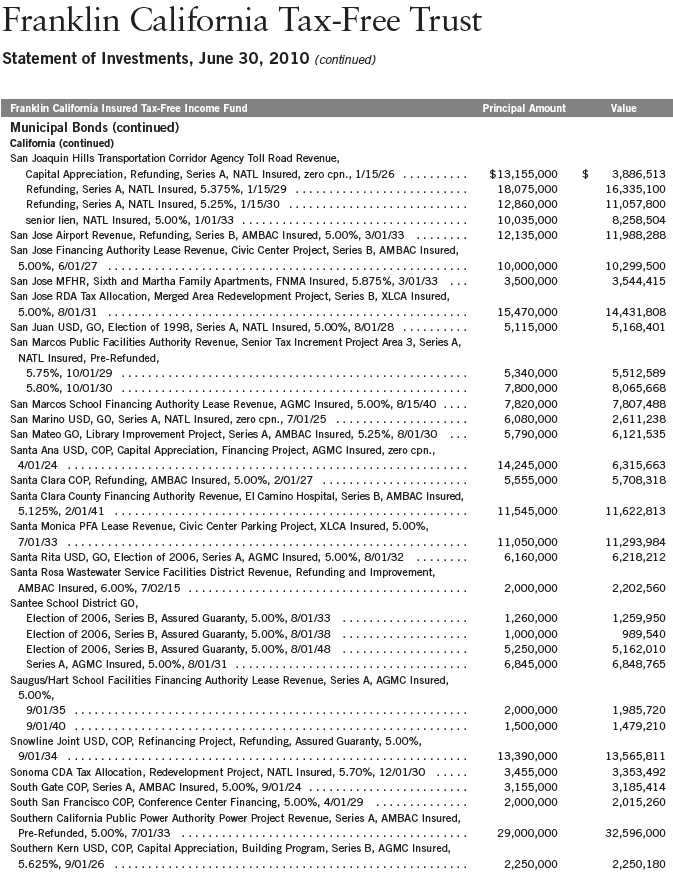
Annual Report | 45
| | | | |
| Franklin California Tax-Free Trust | | | | |
| |
| Statement of Investments, June 30, 2010 (continued) | | | | |
| |
| |
| Franklin California Insured Tax-Free Income Fund | | Principal Amount | | Value |
| Municipal Bonds (continued) | | | | |
| California (continued) | | | | |
| Southern Mono Health Care District GO, Series A, NATL Insured, 5.00%, 8/01/24 | $ | 3,005,000 | $ | 3,020,115 |
| Southern Mono Health Care District Revenue, Capital Appreciation, Series A, NATL Insured, | | | | |
| zero cpn., | | | | |
| 8/01/28 | | 2,340,000 | | 690,417 |
| 8/01/29 | | 2,440,000 | | 661,679 |
| 8/01/30 | | 2,550,000 | | 646,731 |
| 8/01/31 | | 2,660,000 | | 635,740 |
| Stanislaus County Board of Education COP, AGMC Insured, Pre-Refunded, 5.70%, 9/01/24 | | 2,000,000 | | 2,009,520 |
| Stanislaus USD, GO, Election of 2008, Series A, Assured Guaranty, 5.625%, 8/01/33 | | 4,140,000 | | 4,351,306 |
| Stockton Revenue COP, Wastewater System Project, Refunding, Series A, NATL Insured, 5.00%, | | | | |
| 9/01/23 | | 6,500,000 | | 6,509,295 |
| Susanville PFAR, NATL Insured, 5.70%, 6/01/30 | | 3,000,000 | | 3,017,520 |
| Sweetwater UHSD, GO, Election of 2006, Series A, BHAC Insured, 5.00%, 8/01/38 | | 14,980,000 | | 15,258,179 |
| Truckee PFA Tax Allocation Revenue, Truckee Redevelopment Project Loan, Series A, AGMC | | | | |
| Insured, | | | | |
| 5.00%, 9/01/30 | | 1,255,000 | | 1,257,887 |
| 5.375%, 9/01/37 | | 5,000,000 | | 5,085,750 |
| Turlock PFA Sewer Revenue, NATL RE, FGIC Insured, 5.50%, 9/15/29 | | 6,855,000 | | 6,869,807 |
| Tustin CRDA Tax Allocation, Housing, AGMC Insured, | | | | |
| 5.00%, 9/01/30 | | 2,125,000 | | 2,122,174 |
| 5.25%, 9/01/39 | | 3,250,000 | | 3,265,015 |
| Union Elementary School District GO, Capital Appreciation, | | | | |
| Series A, NATL RE, FGIC Insured, zero cpn., 9/01/24 | | 2,000,000 | | 980,600 |
| Series B, NATL RE, FGIC Insured, zero cpn., 9/01/25 | | 5,500,000 | | 2,508,000 |
| Series B, NATL RE, FGIC Insured, zero cpn., 9/01/26 | | 5,850,000 | | 2,497,248 |
| University of California Revenues, Limited Project, Series D, NATL RE, FGIC Insured, 5.00%, | | | | |
| 5/15/37 | | 6,460,000 | | 6,587,327 |
| Vacaville PFA Tax Allocation Revenue, Vacaville Redevelopment Projects, AGMC Insured, 5.00%, | | | | |
| 9/01/31 | | 5,095,000 | | 5,035,694 |
| Val Verde USD, | | | | |
| COP, Refunding, Series A, Assured Guaranty, 5.00%, 3/01/29 | | 10,000,000 | | 10,175,100 |
| COP, Refunding, Series A, Assured Guaranty, 5.125%, 3/01/36 | | 7,020,000 | | 7,056,083 |
| GO, Election of 2008, Refunding, Series B, AGMC Insured, zero cpn., 8/01/34 | | 1,000,000 | | 497,320 |
| Vista USD, GO, | | | | |
| Capital Appreciation, Series A, AGMC Insured, zero cpn., 8/01/26 | | 7,150,000 | | 2,870,796 |
| Capital Appreciation, Series A, AGMC Insured, zero cpn., 2/01/27 | | 4,795,000 | | 1,847,418 |
| Series A, AGMC Insured, 5.25%, 8/01/25 | | 5,000,000 | | 5,188,300 |
| Washington Township Health Care District Revenue, Refunding, | | | | |
| 5.00%, 7/01/18 | | 2,000,000 | | 2,010,680 |
| 5.125%, 7/01/23 | | 450,000 | | 450,275 |
| Washington USD, GO, Yolo County, Election of 1999, Series A, NATL RE, FGIC Insured, | | | | |
| 5.375%, 8/01/25 | | 2,045,000 | | 2,104,775 |
| Weaver USD, GO, Election of 2006, Series C, AMBAC Insured, zero cpn., 8/01/47 | | 18,685,000 | | 1,511,430 |
| West Basin Municipal Water District Revenue COP, Refunding, Series A, NATL Insured, 5.00%, | | | | |
| 8/01/24 | | 2,500,000 | | 2,605,225 |
| West Contra Costa USD, GO, | | | | |
| Refunding, Assured Guaranty, 5.25%, 8/01/29 | | 2,500,000 | | 2,563,350 |
| Series A, AGMC Insured, 5.00%, 8/01/35 | | 20,000,000 | | 20,052,600 |
46 | Annual Report
| | | | |
| Franklin California Tax-Free Trust | | | | |
| |
| Statement of Investments, June 30, 2010 (continued) | | | | |
| |
| |
| Franklin California Insured Tax-Free Income Fund | | Principal Amount | | Value |
| Municipal Bonds (continued) | | | | |
| California (continued) | | | | |
| West Kern Community College District COP, AMBAC Insured, 5.375%, 11/01/28 | $ | 5,615,000 | $ | 5,960,435 |
| Western Placer USD Financing Corp. COP, AGMC Insured, Pre-Refunded, 5.55%, 11/01/30 | | 6,930,000 | | 7,538,939 |
| Western Riverside County Water and Wastewater Finance Authority Revenue, Western Municipal | | | | |
| Water District Improvement, Assured Guaranty, | | | | |
| 5.50%, 9/01/34 | | 1,750,000 | | 1,838,428 |
| 5.625%, 9/01/39 | | 2,500,000 | | 2,645,450 |
| Westlands Water District Revenue COP, | | | | |
| NATL Insured, 5.00%, 9/01/29 | | 11,775,000 | | 12,147,679 |
| Series A, NATL Insured, 5.00%, 9/01/37 | | 4,340,000 | | 4,301,504 |
| Woodland Finance Authority Lease Revenue, Capital Projects, Refunding, XLCA Insured, 5.00%, | | | | |
| 3/01/32 | | 6,340,000 | | 6,447,400 |
| Woodland Finance Authority Wastewater Revenue, second senior lien, NATL Insured, 5.00%, | | | | |
| 3/01/33 | | 1,370,000 | | 1,362,561 |
| 3/01/35 | | 2,590,000 | | 2,557,288 |
| Woodside Elementary School District GO, Election of 2005, NATL Insured, Pre-Refunded, | | | | |
| 5.00%, 10/01/29 | | 4,435,000 | | 5,242,658 |
| Yosemite Community College District GO, Election of 2004, Series C, AGMC Insured, 5.00%, | | | | |
| 8/01/32 | | 5,000,000 | | 5,153,800 |
| Total Municipal Bonds before Short Term Investments | | | | |
| (Cost $2,116,756,459) | | | | 2,152,328,553 |
| Short Term Investments 0.0%a | | | | |
| Municipal Bonds 0.0%a | | | | |
| California 0.0%a | | | | |
| bCalifornia Infrastructure and Economic Development Bank Revenue, Pacific Gas and Electric Co., | | | | |
| Refunding, Series B, Daily VRDN and Put, 0.10%, 12/01/16 | | 300,000 | | 300,000 |
| bCalifornia PCFA, PCR, Pacific Gas and Electric Co., Refunding, Series F, Daily VRDN and Put, | | | | |
| 0.10%, 11/01/26 | | 200,000 | | 200,000 |
| Total Short Term Investments (Cost $500,000) | | | | 500,000 |
| Total Investments (Cost $2,117,256,459) 98.7% | | | | 2,152,828,553 |
| Other Assets, less Liabilities 1.3% | | | | 29,352,589 |
| Net Assets 100.0% | | | $ | 2,182,181,142 |
See Abbreviations on page 79.
aRounds to less than 0.1% of net assets.
bVariable rate demand notes (VRDNs) are tax-exempt obligations which contain a floating or variable interest rate adjustment formula and an unconditional right of demand to receive payment of the principal balance plus accrued interest at specified dates. The coupon rate shown represents the rate at period end.
Annual Report | The accompanying notes are an integral part of these financial statements. | 47
| | | | | | | | | | | | | | | |
| Franklin California Tax-Free Trust | | | | | | | | | | |
| Financial Highlights | | | | | | | | | | | | | | | |
| |
| Franklin California Intermediate-Term Tax-Free Income Fund | | | | | | | | | | | | | | | |
| | | | | | Year Ended June 30, | | | | |
| Class A | | 2010 | | | 2009 | | | 2008 | | | 2007 | | | 2006 | |
| Per share operating performance | | | | | | | | | | | | | | | |
| (for a share outstanding throughout the year) | | | | | | | | | | | | | | | |
| Net asset value, beginning of year | $ | 10.87 | | $ | 11.27 | | $ | 11.33 | | $ | 11.30 | | $ | 11.68 | |
| Income from investment operationsa: | | | | | | | | | | | | | | | |
| Net investment incomeb | | 0.45 | | | 0.45 | | | 0.44 | | | 0.43 | | | 0.43 | |
| Net realized and unrealized gains (losses) | | 0.55 | | | (0.40 | ) | | (0.07 | ) | | 0.04 | | | (0.39 | ) |
| Total from investment operations | | 1.00 | | | 0.05 | | | 0.37 | | | 0.47 | | | 0.04 | |
| Less distributions from net investment income | | (0.45 | ) | | (0.45 | ) | | (0.43 | ) | | (0.44 | ) | | (0.42 | ) |
| Redemption feesc | | — | | | —d | | | —d | | | —d | | | —d | |
| Net asset value, end of year | $ | 11.42 | | $ | 10.87 | | $ | 11.27 | | $ | 11.33 | | $ | 11.30 | |
| |
| Total returne | | 9.36 | % | | 0.51 | % | | 3.29 | % | | 4.13 | % | | 0.37 | % |
| |
| Ratios to average net assets | | | | | | | | | | | | | | | |
| Expenses | | 0.66 | % | | 0.66 | % | | 0.66 | % | | 0.67 | % | | 0.66 | % |
| Net investment income | | 3.95 | % | | 4.17 | % | | 3.85 | % | | 3.76 | % | | 3.74 | % |
| |
| Supplemental data | | | | | | | | | | | | | | | |
| Net assets, end of year (000’s) | $ | 669,838 | | $ | 517,829 | | $ | 517,443 | | $ | 458,146 | | $ | 463,545 | |
| Portfolio turnover rate | | 12.40 | % | | 20.01 | % | | 22.97 | % | | 11.25 | % | | 13.28 | % |
aThe amount shown for a share outstanding throughout the period may not correlate with the Statement of Operations for the period due to the timing of sales and repurchases of the Fund shares in relation to income earned and/or fluctuating market value of the investments of the Fund. bBased on average daily shares outstanding. cEffective September 1, 2008, the redemption fee was eliminated. dAmount rounds to less than $0.01 per share. eTotal return does not reflect sales commissions or contingent deferred sales charges, if applicable.
48 | The accompanying notes are an integral part of these financial statements. | Annual Report
| | | | | | | | | | | | | | | |
| Franklin California Tax-Free Trust | | | | | | | | | | |
| Financial Highlights (continued) | | | | | | | | | | | | | | | |
| |
| Franklin California Intermediate-Term Tax-Free Income Fund | | | | | | | | | | | | | | | |
| | | | | | Year Ended June 30, | | | | |
| Class C | | 2010 | | | 2009 | | | 2008 | | | 2007 | | | 2006 | |
| Per share operating performance | | | | | | | | | | | | | | | |
| (for a share outstanding throughout the year) | | | | | | | | | | | | | | | |
| Net asset value, beginning of year | $ | 10.89 | | $ | 11.29 | | $ | 11.36 | | $ | 11.32 | | $ | 11.70 | |
| Income from investment operationsa: | | | | | | | | | | | | | | | |
| Net investment incomeb | | 0.38 | | | 0.40 | | | 0.38 | | | 0.37 | | | 0.37 | |
| Net realized and unrealized gains (losses) | | 0.57 | | | (0.41 | ) | | (0.08 | ) | | 0.05 | | | (0.39 | ) |
| Total from investment operations | | 0.95 | | | (0.01 | ) | | 0.30 | | | 0.42 | | | (0.02 | ) |
| Less distributions from net investment income | | (0.39 | ) | | (0.39 | ) | | (0.37 | ) | | (0.38 | ) | | (0.36 | ) |
| Redemption feesc | | — | | | —d | | | —d | | | —d | | | —d | |
| Net asset value, end of year | $ | 11.45 | | $ | 10.89 | | $ | 11.29 | | $ | 11.36 | | $ | 11.32 | |
| |
| Total returne | | 8.83 | % | | (0.05 | )% | | 2.63 | % | | 3.68 | % | | (0.18 | )% |
| |
| Ratios to average net assets | | | | | | | | | | | | | | | |
| Expenses | | 1.21 | % | | 1.21 | % | | 1.21 | % | | 1.20 | % | | 1.20 | % |
| Net investment income | | 3.40 | % | | 3.62 | % | | 3.30 | % | | 3.23 | % | | 3.20 | % |
| |
| Supplemental data | | | | | | | | | | | | | | | |
| Net assets, end of year (000’s) | $ | 111,795 | | $ | 59,205 | | $ | 36,842 | | $ | 27,025 | | $ | 25,173 | |
| Portfolio turnover rate | | 12.40 | % | | 20.01 | % | | 22.97 | % | | 11.25 | % | | 13.28 | % |
aThe amount shown for a share outstanding throughout the period may not correlate with the Statement of Operations for the period due to the timing of sales and repurchases of the Fund shares in relation to income earned and/or fluctuating market value of the investments of the Fund. bBased on average daily shares outstanding. cEffective September 1, 2008, the redemption fee was eliminated. dAmount rounds to less than $0.01 per share. eTotal return does not reflect sales commissions or contingent deferred sales charges, if applicable.
Annual Report | The accompanying notes are an integral part of these financial statements. | 49
| | | | | | |
| Franklin California Tax-Free Trust | | | | | | |
| Financial Highlights (continued) | | | | | | |
| |
| Franklin California Intermediate-Term Tax-Free Income Fund | | | | | | |
| | | Year Ended | |
| | | June 30, | |
| Advisor Class | | 2010 | | | 2009 | a |
| Per share operating performance | | | | | | |
| (for a share outstanding throughout the year) | | | | | | |
| Net asset value, beginning of year | $ | 10.87 | | $ | 10.60 | |
| Income from investment operationsb: | | | | | | |
| Net investment incomec | | 0.46 | | | 0.31 | |
| Net realized and unrealized gains (losses) | | 0.58 | | | 0.27 | |
| Total from investment operations | | 1.04 | | | 0.58 | |
| Less distributions from net investment income | | (0.47 | ) | | (0.31 | ) |
| Net asset value, end of year | $ | 11.44 | | $ | 10.87 | |
| |
| Total returnd | | 9.65 | % | | 5.49 | % |
| |
| Ratios to average net assetse | | | | | | |
| Expenses | | 0.56 | % | | 0.56 | % |
| Net investment income | | 4.05 | % | | 4.27 | % |
| |
| Supplemental data | | | | | | |
| Net assets, end of year (000’s) | $ | 36,322 | | $ | 156 | |
| Portfolio turnover rate | | 12.40 | % | | 20.01 | % |
aFor the period October 31, 2008 (effective date) to June 30, 2009. bThe amount shown for a share outstanding throughout the period may not correlate with the Statement of Operations for the period due to the timing of sales and repurchases of the Fund shares in relation to income earned and/or fluctuating market value of the investments of the Fund. cBased on average daily shares outstanding. dTotal return is not annualized for periods less than one year. eRatios are annualized for periods less than one year.
50 | The accompanying notes are an integral part of these financial statements. | Annual Report
| | | | |
| Franklin California Tax-Free Trust | | | | |
| |
| Statement of Investments, June 30, 2010 | | | | |
| |
| |
| Franklin California Intermediate-Term Tax-Free Income Fund | | Principal Amount | | Value |
| Municipal Bonds 96.7% | | | | |
| California 91.3% | | | | |
| ABAG Finance Authority for Nonprofit Corps. COP, Rhoda Haas Goldman Plaza, California | | | | |
| Mortgage Insured, 5.125%, 5/15/15 | $ | 2,200,000 | $ | 2,201,716 |
| ABAG Finance Authority for Nonprofit Corps. Revenue, San Diego Hospital Assn., Series C, | | | | |
| 5.125%, 3/01/18 | | 2,490,000 | | 2,522,893 |
| 5.25%, 3/01/19 | | 2,315,000 | | 2,352,480 |
| ABAG Revenue, Refunding, Series A-E, 5.40%, 9/15/14 | | 1,320,000 | | 1,348,657 |
| ABAG Water and Wastewater Revenue, Pooled Financing Program, Refunding, Series A, AGMC | | | | |
| Insured, 5.00%, 10/01/10 | | 670,000 | | 674,040 |
| Alameda Corridor Transportation Authority Revenue, Capital Appreciation, sub. lien, Refunding, | | | | |
| Series A, AMBAC Insured, zero cpn., 10/01/17 | | 10,000,000 | | 6,858,400 |
| Alameda-Contra Costa Transit District COP, Refunding, AMBAC Insured, 4.375%, 8/01/14 | | 1,330,000 | | 1,355,709 |
| Antelope Valley UHSD, GO, Series A, NATL Insured, | | | | |
| 4.50%, 8/01/13 | | 1,230,000 | | 1,314,993 |
| 4.625%, 8/01/14 | | 1,250,000 | | 1,330,013 |
| Arcadia USD, GO, Capital Appreciation, Election of 2006, Series A, AGMC Insured, zero cpn., | | | | |
| 8/01/22 | | 4,065,000 | | 2,038,191 |
| Bakersfield Hospital Revenue, Adventist Health System, Refunding, NATL Insured, 5.50%, | | | | |
| 3/01/19 | | 11,210,000 | | 11,238,137 |
| Baldwin Park USD, GO, Capital Appreciation, Election of 2006, AGMC Insured, zero cpn., | | | | |
| 8/01/24 | | 5,265,000 | | 2,408,843 |
| Banning Utility Authority Water Enterprise Revenue, Refunding and Improvement Projects, | | | | |
| NATL RE, FGIC Insured, 5.00%, 11/01/21 | | 1,080,000 | | 1,123,200 |
| Bay Area Toll Authority Toll Bridge Revenue, San Francisco Bay Area, Refunding, Series F, | | | | |
| 5.00%, 4/01/24 | | 3,000,000 | | 3,201,330 |
| Burbank Electric Revenue, NATL Insured, 4.00%, | | | | |
| 6/01/11 | | 1,000,000 | | 1,028,540 |
| 6/01/12 | | 1,000,000 | | 1,056,400 |
| Burbank USD, GO, Capital Appreciation, Election of 1997, Series C, NATL RE, FGIC Insured, | | | | |
| 4.00%, 8/01/12 | | 2,500,000 | | 2,605,675 |
| zero cpn., 8/01/15 | | 4,600,000 | | 3,875,408 |
| zero cpn., 8/01/16 | | 4,670,000 | | 3,683,089 |
| Burbank Water and Power Electric Revenue, Refunding, NATL Insured, 4.00%, 6/01/11 | | 2,080,000 | | 2,083,973 |
| California Educational Facilities Authority Revenue, Stanford University, Refunding, Series R, | | | | |
| 4.00%, 11/01/11 | | 1,000,000 | | 1,044,200 |
| California Health Facilities Financing Authority Revenue, | | | | |
| Catholic Healthcare West, Series K, 5.125%, 7/01/22 | | 20,000,000 | | 20,642,800 |
| Cedars-Sinai Medical Center, Refunding, 5.00%, 11/15/19 | | 2,000,000 | | 2,086,680 |
| Paradise Valley Estates, Refunding, California Mortgage Insured, 5.00%, 1/01/11 | | 1,480,000 | | 1,497,686 |
| Paradise Valley Estates, Refunding, California Mortgage Insured, 4.375%, 1/01/12 | | 1,000,000 | | 1,028,510 |
| Paradise Valley Estates, Refunding, California Mortgage Insured, 5.00%, 1/01/13 | | 1,815,000 | | 1,927,312 |
| Paradise Valley Estates, Refunding, California Mortgage Insured, 5.00%, 1/01/14 | | 1,635,000 | | 1,723,617 |
| Providence Health and Services, Series C, 5.75%, 10/01/19 | | 1,440,000 | | 1,624,939 |
| Providence Health and Services, Series C, 6.00%, 10/01/20 | | 1,500,000 | | 1,701,885 |
| Scripps Health, Series A, 5.00%, 10/01/22 | | 4,600,000 | | 4,778,986 |
| The Episcopal Home, California Mortgage Insured, 4.625%, 2/01/12 | | 1,350,000 | | 1,397,237 |
| The Episcopal Home, California Mortgage Insured, 4.75%, 2/01/13 | | 1,200,000 | | 1,242,780 |
Annual Report | 51
| | | | |
| Franklin California Tax-Free Trust | | | | |
| |
| Statement of Investments, June 30, 2010 (continued) | | | | |
| |
| |
| Franklin California Intermediate-Term Tax-Free Income Fund | | Principal Amount | | Value |
| Municipal Bonds (continued) | | | | |
| California (continued) | | | | |
| California Municipal Finance Authority COP, Community Hospitals of Central California, | | | | |
| 5.00%, 2/01/18 | $ | 4,390,000 | $ | 4,376,171 |
| 5.00%, 2/01/19 | | 3,860,000 | | 3,796,542 |
| 5.00%, 2/01/20 | | 1,600,000 | | 1,571,328 |
| 5.00%, 2/01/21 | | 1,600,000 | | 1,556,432 |
| Refunding, 5.00%, 2/01/14 | | 1,765,000 | | 1,817,191 |
| Refunding, 5.00%, 2/01/17 | | 4,025,000 | | 4,058,488 |
| Refunding, 5.00%, 2/01/19 | | 2,590,000 | | 2,547,420 |
| California Municipal Finance Authority Revenue, | | | | |
| Kern Regional Center Project, Series A, 6.00%, 5/01/19 | | 1,500,000 | | 1,656,450 |
| Kern Regional Center Project, Series A, 6.875%, 5/01/25 | | 1,500,000 | | 1,628,265 |
| Loma Linda University, 5.00%, 4/01/24 | | 1,180,000 | | 1,214,562 |
| California State Department of Water Resources Power Supply Revenue, | | | | |
| Power Supply, Refunding, Series H, 5.00%, 5/01/22 | | 7,400,000 | | 8,037,140 |
| Power Supply, Refunding, Series H, AGMC Insured, 5.00%, 5/01/22 | | 5,000,000 | | 5,466,000 |
| Power Supply, Series H, AGMC Insured, 5.00%, 5/01/17 | | 10,420,000 | | 11,847,540 |
| Refunding, Series L, 5.00%, 5/01/22 | | 10,000,000 | | 11,087,800 |
| Series A, 5.50%, 5/01/12 | | 2,000,000 | | 2,174,380 |
| Series A, Pre-Refunded, 5.125%, 5/01/18 | | 2,500,000 | | 2,738,725 |
| California State Department of Water Resources Water Revenue, Central Valley Project, | | | | |
| Refunding, Series AE, 5.00%, 12/01/26 | | 5,000,000 | | 5,395,500 |
| California State Economic Recovery GO, Series A, | | | | |
| 5.00%, 7/01/15 | | 6,115,000 | | 6,762,517 |
| Pre-Refunded, 5.00%, 7/01/15 | | 4,555,000 | | 5,244,035 |
| California State GO, | | | | |
| 5.25%, 6/01/16 | | 515,000 | | 521,855 |
| Pre-Refunded, 5.00%, 11/01/12 | | 1,320,000 | | 1,399,279 |
| Refunding, 5.00%, 11/01/12 | | 590,000 | | 620,851 |
| Refunding, NATL Insured, 5.00%, 2/01/18 | | 5,000 | | 5,014 |
| California State Public Works Board Lease Revenue, | | | | |
| California State University Projects, Series B-1, 5.375%, 3/01/25 | | 2,500,000 | | 2,547,900 |
| Department of Corrections and Rehabilitation, Refunding, Series J, 5.00%, 1/01/21 | | 3,000,000 | | 3,044,520 |
| Department of Forestry and Fire Protection, Series A, 4.875%, 10/01/18 | | 1,325,000 | | 1,327,266 |
| Department of General Services, Buildings 8 and 9, Series A, 5.75%, 4/01/23 | | 4,000,000 | | 4,236,040 |
| Department of General Services, Buildings 8 and 9, Series A, 6.00%, 4/01/24 | | 6,605,000 | | 7,062,462 |
| Trustees of California State University, Series J, 5.50%, 11/01/25 | | 4,725,000 | | 4,874,074 |
| Trustees of California State University, Series J, 5.50%, 11/01/26 | | 1,000,000 | | 1,023,340 |
| Various Capital Projects, Series A, Sub Series A-1, 5.25%, 3/01/22 | | 7,475,000 | | 7,650,737 |
| Various Capital Projects, Series G, Sub Series G-1, 5.25%, 10/01/18 | | 5,605,000 | | 6,018,873 |
| Various Capital Projects, Series G, Sub Series G-1, 5.00%, 10/01/20 | | 6,405,000 | | 6,590,745 |
| Various Capital Projects, Series G, Sub Series G-1, 5.125%, 10/01/22 | | 14,555,000 | | 14,751,638 |
| California Statewide CDA, | | | | |
| COP, St. Joseph Health System Obligation Group, 5.25%, 7/01/11 | | 1,005,000 | | 1,007,372 |
| MFHR, 740 Olive Street, Series L, GNMA Secured, 4.25%, 7/20/24 | | 3,540,000 | | 3,637,421 |
| MFHR, 740 Olive Street, Series L, GNMA Secured, 4.55%, 7/20/29 | | 3,110,000 | | 3,094,263 |
52 | Annual Report
| | | | |
| Franklin California Tax-Free Trust | | | | |
| |
| Statement of Investments, June 30, 2010 (continued) | | | | |
| |
| |
| Franklin California Intermediate-Term Tax-Free Income Fund | | Principal Amount | | Value |
| Municipal Bonds (continued) | | | | |
| California (continued) | | | | |
| California Statewide CDA Revenue, | | | | |
| CHF-Irvine LLC, UCI East Campus Apartments, Phase II, 6.00%, 5/15/23 | $ | 10,000,000 | $ | 10,900,100 |
| Daughters of Charity Health, Refunding, Series A, 5.25%, 7/01/24 | | 3,670,000 | | 3,478,389 |
| Daughters of Charity Health, Refunding, Series G, 5.25%, 7/01/13 | | 1,000,000 | | 1,047,470 |
| Enloe Medical Center, Series A, California Mortgage Insured, 5.50%, 8/15/23 | | 3,000,000 | | 3,110,970 |
| Health Facility, Los Angeles Jewish Home for the Aging, California Mortgage Insured, | | | | |
| 5.00%, 11/15/18 | | 3,000,000 | | 3,081,870 |
| Lodi Memorial Hospital, Series A, California Mortgage Insured, 5.00%, 12/01/22 | | 8,000,000 | | 8,063,600 |
| Methodist Hospital of Southern California Project, FHA Insured, 5.50%, 8/01/18 | | 3,260,000 | | 3,741,991 |
| Methodist Hospital of Southern California Project, FHA Insured, 5.50%, 2/01/19 | | 3,405,000 | | 3,883,709 |
| Methodist Hospital of Southern California Project, FHA Insured, 5.50%, 8/01/19 | | 3,450,000 | | 3,959,048 |
| Mission Community, California Mortgage Insured, 4.40%, 11/01/10 | | 1,100,000 | | 1,106,699 |
| Mission Community, California Mortgage Insured, 4.50%, 11/01/11 | | 1,145,000 | | 1,170,499 |
| Viewpoint School, Refunding, ACA Insured, 4.50%, 10/01/17 | | 460,000 | | 465,635 |
| Viewpoint School, Refunding, ACA Insured, 4.75%, 10/01/18 | | 480,000 | | 486,398 |
| Castaic Lake Water Agency Revenue COP, Water System Improvement Project, Capital | | | | |
| Appreciation, AMBAC Insured, zero cpn., 8/01/22 | | 10,445,000 | | 5,471,195 |
| Cathedral City 1915 Act Special Assessment, Limited Obligation, Cove ID No. 04-02, 5.00%, | | | | |
| 9/02/24 | | 975,000 | | 920,995 |
| Cerritos PFAR Tax Allocation, Redevelopment Project, Refunding, Series A, AMBAC Insured, | | | | |
| 3.00%, 11/01/11 | | 2,585,000 | | 2,600,613 |
| Clovis MFR, Mandatory Put 11/01/10, Refunding, FNMA Insured, 5.10%, 11/01/30 | | 4,105,000 | | 4,139,359 |
| Clovis USD, GO, Capital Appreciation, Election of 2004, Series A, NATL RE, FGIC Insured, zero | | | | |
| cpn., 8/01/17 | | 5,235,000 | | 3,904,839 |
| Compton CRDA Tax Allocation, Redevelopment Project, second lien, Series A, 5.00%, | | | | |
| 8/01/25 | | 8,275,000 | | 7,985,954 |
| Compton Public Finance Authority Lease Revenue, Various Capital Projects, Refunding, AMBAC | | | | |
| Insured, 5.00%, 9/01/22 | | 15,190,000 | | 15,525,699 |
| Conejo Valley USD, GO, Election of 1998, | | | | |
| Series C, AGMC Insured, zero cpn., 8/01/17 | | 2,500,000 | | 1,869,950 |
| Series D, NATL RE, FGIC Insured, 4.50%, 8/01/19 | | 4,000,000 | | 4,132,000 |
| Contra Costa Community College District GO, Election of 2002, NATL RE, FGIC Insured, | | | | |
| 4.75%, 8/01/18 | | 2,450,000 | | 2,556,918 |
| Corona-Norco USD, PFA Special Tax Revenue, Series A, 5.25%, 9/01/25 | | 2,235,000 | | 2,162,273 |
| Cupertino USD, GO, Refunding, 5.00%, | | | | |
| 8/01/22 | | 1,690,000 | | 1,892,868 |
| 8/01/23 | | 2,000,000 | | 2,209,780 |
| Desert Sands USD, | | | | |
| COP, Financing Project, AGMC insured, 5.00%, 3/01/19 | | 2,090,000 | | 2,223,676 |
| GO, Election of 2001, 5.25%, 8/01/21 | | 2,015,000 | | 2,242,997 |
| Eden Township Healthcare District COP, 5.00%, 6/01/18 | | 1,505,000 | | 1,504,925 |
| Fairfax School District GO, Election of 2000, Series A, NATL RE, FGIC Insured, 5.00%, | | | | |
| 11/01/17 | | 760,000 | | 829,213 |
| Folsom PFA Lease Revenue, City Hall and Community Center, Refunding, AGMC Insured, | | | | |
| 5.00%, 10/01/17 | | 1,275,000 | | 1,342,588 |
Annual Report | 53
| | | | |
| Franklin California Tax-Free Trust | | | | |
| |
| Statement of Investments, June 30, 2010 (continued) | | | | |
| |
| |
| Franklin California Intermediate-Term Tax-Free Income Fund | | Principal Amount | | Value |
| Municipal Bonds (continued) | | | | |
| California (continued) | | | | |
| a Folsom PFA Special Tax Revenue, Refunding, Series A, 5.00%, | | | | |
| 9/01/19 | $ | 1,000,000 | $ | 1,016,830 |
| 9/01/20 | | 1,270,000 | | 1,279,982 |
| 9/01/21 | | 1,335,000 | | 1,330,394 |
| 9/01/22 | | 1,400,000 | | 1,382,346 |
| Foothill/Eastern Corridor Agency Toll Road Revenue, Refunding, NATL Insured, 5.00%, | | | | |
| 1/15/16 | | 1,000,000 | | 1,012,140 |
| Fresno Joint Powers Financing Authority Lease Revenue, Master Lease Projects, Series A, | | | | |
| 5.25%, 4/01/22 | | 1,055,000 | | 1,094,573 |
| 5.50%, 4/01/23 | | 1,070,000 | | 1,119,744 |
| 5.625%, 4/01/24 | | 1,110,000 | | 1,163,324 |
| 5.75%, 4/01/25 | | 1,125,000 | | 1,180,789 |
| Galt Capital Improvements Authority Lease Revenue, Culture and Recreation Improvement | | | | |
| Project, 5.00%, 4/01/12 | | 1,025,000 | | 1,032,852 |
| Galt Middle School Joint Powers Authority Special Tax, CFD No. 1, Refunding, 5.40%, | | | | |
| 9/01/12 | | 1,235,000 | | 1,246,164 |
| Garden Grove Agency Community Development Tax Allocation, Garden Grove Community | | | | |
| Project, Refunding, AMBAC Insured, 4.25%, 10/01/13 | | 2,025,000 | | 2,094,194 |
| Golden State Tobacco Securitization Corp. Tobacco Settlement Revenue, Asset-Backed, ETM, | | | | |
| 5.00%, 6/01/12 | | 1,500,000 | | 1,619,610 |
| Hayward USD, GO, Election of 2008, 5.00%, 8/01/26 | | 4,770,000 | | 4,849,659 |
| Huntington Beach PFAR, Lease Capital Improvement Refinancing Project, Refunding, Series B, | | | | |
| AMBAC Insured, | | | | |
| 4.125%, 8/01/14 | | 2,140,000 | | 2,232,555 |
| 4.25%, 8/01/15 | | 2,080,000 | | 2,162,950 |
| Inland Empire Solid Waste Financing Authority Revenue, Landfill Improvement Financing | | | | |
| Project, Series B, AGMC Insured, ETM, 6.25%, 8/01/11 | | 300,000 | | 309,153 |
| Irvine 1915 Act Special Assessment, Limited Obligation, | | | | |
| AD No. 00-18, Group 2, 4.375%, 9/02/10 | | 885,000 | | 887,478 |
| AD No. 00-18, Group 2, 4.70%, 9/02/12 | | 1,475,000 | | 1,508,866 |
| AD No. 00-18, Group 2, 4.80%, 9/02/13 | | 1,175,000 | | 1,202,507 |
| AD No. 00-18, Group 2, 5.125%, 9/02/17 | | 1,705,000 | | 1,714,719 |
| AD No. 00-18, Group 3, 4.75%, 9/02/15 | | 1,000,000 | | 1,017,820 |
| AD No. 00-18, Group 3, 5.00%, 9/02/17 | | 1,000,000 | | 1,004,570 |
| AD No. 03-19, Group 2, Refunding, 4.875%, 9/02/16 | | 1,000,000 | | 1,012,120 |
| AD No. 03-19, Group 2, Refunding, 5.00%, 9/02/18 | | 1,000,000 | | 999,930 |
| AD No. 03-19, Group 2, Refunding, 5.125%, 9/02/19 | | 1,000,000 | | 995,960 |
| Irvine USD Financing Authority Special Tax, Series A, | | | | |
| 4.70%, 9/01/15 | | 1,040,000 | | 1,066,728 |
| 4.80%, 9/01/17 | | 1,325,000 | | 1,328,419 |
| 4.875%, 9/01/18 | | 1,490,000 | | 1,484,457 |
| 5.00%, 9/01/20 | | 1,095,000 | | 1,075,279 |
| Lake Elsinore School Financing Authority Reven ue, Refunding, 6.00%, 9/01/11 | | 530,000 | | 530,827 |
| Lancaster RDA Tax Allocation, Combine Redevelopment Project Areas, 6.00%, 8/01/24 | | 1,300,000 | | 1,385,033 |
| Loma Linda Hospital Revenue, Loma Linda University Medical Center, Series A, 5.00%, | | | | |
| 12/01/19 | | 5,000,000 | | 4,948,050 |
54 | Annual Report
| | | | |
| Franklin California Tax-Free Trust | | | | |
| |
| Statement of Investments, June 30, 2010 (continued) | | | | |
| |
| |
| Franklin California Intermediate-Term Tax-Free Income Fund | | Principal Amount | | Value |
| Municipal Bonds (continued) | | | | |
| California (continued) | | | | |
| Long Beach Bond Finance Authority Natural Gas Purchase Revenue, Series A, 5.00%, | | | | |
| 11/15/17 | $ | 3,950,000 | $ | 4,087,342 |
| Long Beach Harbor Revenue, Series A, 5.00%, 5/15/23 | | 8,000,000 | | 8,824,400 |
| Los Angeles Convention and Exhibition Center Authority Lease Revenue, Refunding, Series A, | | | | |
| 5.00%, 8/15/20 | | 20,000,000 | | 21,315,400 |
| AMBAC Insured, 3.00%, 8/15/12 | | 4,525,000 | | 4,655,772 |
| Los Angeles County MTA Sales Tax Revenue, Proposition C, Senior, Refunding, Series A, 5.25%, | | | | |
| 7/01/23 | | 15,000,000 | | 17,074,050 |
| Los Angeles Department of Airports Airport Revenue, Senior, Los Angeles International Airport, | | | | |
| Refunding, Series A, 5.00%, 5/15/25 | | 10,000,000 | | 10,689,800 |
| Los Angeles GO, Judgment Obligation, Series A, 5.00%, 6/01/18 | | 5,650,000 | | 6,181,552 |
| Los Angeles USD, GO, | | | | |
| Election of 2004, Series F, FGIC Insured, 5.00%, 7/01/21 | | 5,975,000 | | 6,398,568 |
| Refunding, NATL Insured, 5.25%, 7/01/13 | | 3,500,000 | | 3,890,565 |
| Refunding, Series A-1, FGIC Insured, 5.00%, 7/01/25 | | 6,265,000 | | 6,462,723 |
| Refunding, Series A-2, FGIC Insured, 5.00%, 7/01/22 | | 5,000,000 | | 5,369,150 |
| Series I, 5.00%, 7/01/18 | | 5,000,000 | | 5,585,000 |
| M-S-R Public Power Agency San Juan Project Revenue, Refunding, Series I, NATL Insured, | | | | |
| 4.25%, 7/01/11 | | 5,055,000 | | 5,220,349 |
| 5.00%, 7/01/18 | | 1,000,000 | | 1,021,540 |
| Marina Joint Powers Financing Authority MFHR, Abrams B Apartments Financing, Mandatory | | | | |
| Put 11/15/16, FNMA Insured, | | | | |
| 3.90%, 11/15/36 | | 3,440,000 | | 3,557,407 |
| 3.95%, 11/15/36 | | 1,390,000 | | 1,427,891 |
| Montebello USD, GO, Capital Appreciation, NATL RE, FGIC Insured, zero cpn., | | | | |
| 8/01/18 | | 1,455,000 | | 996,195 |
| 8/01/19 | | 1,480,000 | | 942,331 |
| Moreno Valley USD, GO, | | | | |
| Capital Appreciation, Refunding, NATL Insured, zero cpn., 8/01/24 | | 7,500,000 | | 3,258,675 |
| Election of 2004, Series A, AGMC Insured, Pre-Refunded, 5.00%, 8/01/17 | | 2,000,000 | | 2,308,700 |
| Election of 2004, Series A, AGMC Insured, Pre-Refunded, 5.00%, 8/01/18 | | 2,300,000 | | 2,655,005 |
| Nevada County COP, Refunding, NATL Insured, 4.125%, 10/01/12 | | 1,040,000 | | 1,051,523 |
| Northern California Power Agency Revenue, Geothermal Project No. 3, Series A, | | | | |
| 5.00%, 7/01/23 | | 2,000,000 | | 2,120,260 |
| 5.25%, 7/01/24 | | 2,000,000 | | 2,141,920 |
| Oakland USD Alameda County GO, 6.50%, 8/01/23 | | 2,200,000 | | 2,474,032 |
| Oceanside USD, GO, Refunding, AGMC Insured, 5.00%, | | | | |
| 8/01/23 | | 1,130,000 | | 1,214,140 |
| 8/01/24 | | 1,245,000 | | 1,326,062 |
| Orange County CFD No. 2002-1 Special Tax, Ladera Ranch, Series A, | | | | |
| 4.60%, 8/15/14 | | 1,000,000 | | 1,010,360 |
| 4.75%, 8/15/15 | | 1,000,000 | | 1,009,140 |
| 4.90%, 8/15/16 | | 1,285,000 | | 1,287,480 |
| Orange County CFD No. 2003-1 Special Tax, Ladera Ranch, Series A, | | | | |
| 4.90%, 8/15/17 | | 1,000,000 | | 1,000,810 |
| 5.10%, 8/15/18 | | 1,000,000 | | 999,290 |
Annual Report | 55
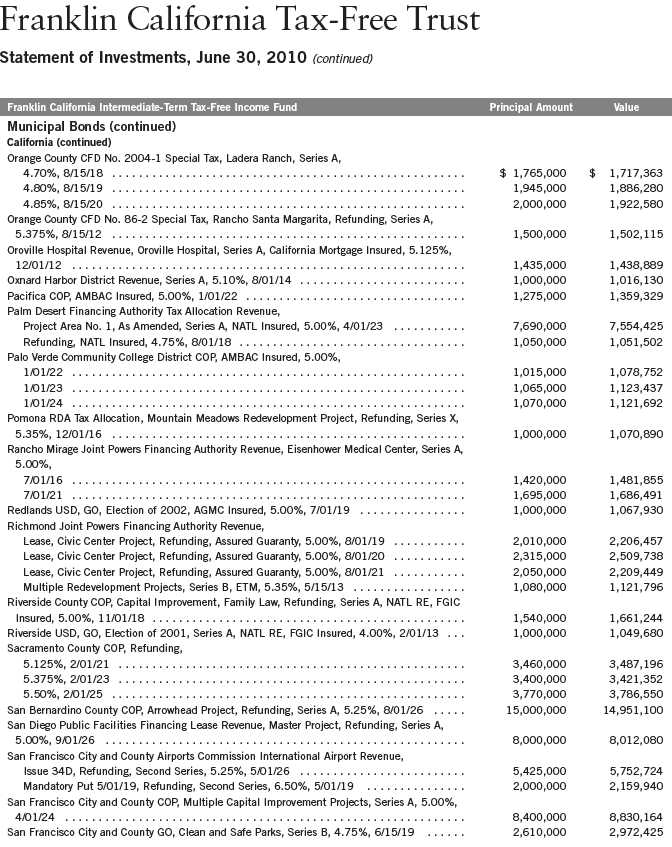
56 | Annual Report
| | | | |
| Franklin California Tax-Free Trust | | | | |
| |
| Statement of Investments, June 30, 2010 (continued) | | | | |
| |
| |
| Franklin California Intermediate-Term Tax-Free Income Fund | | Principal Amount | | Value |
| Municipal Bonds (continued) | | | | |
| California (continued) | | | | |
| San Francisco City and County Redevelopment Fi nancing Authority Tax Allocation Revenue, | | | | |
| Mission Bay North Redevelopment, Series C, 5.875%, 8/01/25 | $ | 1,000,000 | $ | 1,059,400 |
| Mission Bay South Redevelopment, Series D, 5.50%, 8/01/19 | | 1,030,000 | | 1,084,796 |
| Mission Bay South Redevelopment, Series D, 6.25%, 8/01/21 | | 1,000,000 | | 1,075,860 |
| Mission Bay South Redevelopment, Series D, 6.25%, 8/01/23 | | 1,000,000 | | 1,084,900 |
| Mission Bay South Redevelopment, Series D, 6.00%, 8/01/25 | | 1,465,000 | | 1,560,826 |
| Mission Bay South Redevelopment, Series D, 6.125%, 8/01/26 | | 1,550,000 | | 1,642,210 |
| San Joaquin County COP, | | | | |
| General Hospital Project, Refunding, NATL Insured, 5.00%, 9/01/17 | | 1,000,000 | | 1,007,390 |
| Solid Waste System Facilities Projects, NATL Insured, 5.00%, 4/01/17 | | 1,340,000 | | 1,382,036 |
| San Joaquin Hills Transportation Corridor Agen cy Toll Road Revenue, Capital Appreciation, | | | | |
| Refunding, Series A, | | | | |
| 5.60%, 1/15/16 | | 3,000,000 | | 3,031,140 |
| NATL Insured, zero cpn., 1/15/26 | | 19,000,000 | | 5,613,360 |
| San Jose RDA Tax Allocation, Merged Area Redevelopment Project, | | | | |
| Refunding, Series D, AMBAC Insured, 5.00%, 8/01/23 | | 13,000,000 | | 12,815,660 |
| Series B, XLCA Insured, 5.00%, 8/01/26 | | 8,000,000 | | 7,831,120 |
| San Marcos Public Facilities Authority Revenue, Senior Tax Increment Project Area 3, Series A, | | | | |
| NATL Insured, Pre-Refunded, 5.30%, 10/01/11 | | 350,000 | | 360,941 |
| Sanger USD, GO, Election of 2006, Series A, AGMC Insured, 5.00%, | | | | |
| 8/01/19 | | 1,325,000 | | 1,426,270 |
| 8/01/20 | | 1,510,000 | | 1,619,445 |
| Santa Ana USD, GO, | | | | |
| Election of 1999, Series B, NATL RE, FGIC Insured, zero cpn., 8/01/14 | | 3,125,000 | | 2,782,844 |
| Election of 2008, Series A, 5.25%, 8/01/25 | | 2,000,000 | | 2,150,920 |
| Santa Clara 1915 Act, Reassessment District 187, Refunding, Series 1, 5.25%, 9/02/11 | | 740,000 | | 749,176 |
| Santa Monica-Malibu USD, COP, Series C, NATL Insured, | | | | |
| 4.00%, 5/01/12 | | 525,000 | | 537,380 |
| 4.25%, 5/01/14 | | 840,000 | | 856,439 |
| 4.25%, 5/01/15 | | 875,000 | | 888,676 |
| 4.25%, 11/01/15 | | 670,000 | | 680,197 |
| South Bayside Waste Management Authority Solid Waste Enterprise Revenue, Shoreway | | | | |
| Environmental Center, Series A, 5.25%, 9/01/24 | | 3,500,000 | | 3,617,950 |
| South County Regional Wastewater Authority Revenue, Regional Wastewater Facilities Project, | | | | |
| Refunding, AGMC Insured, 3.25%, 8/01/11 | | 1,000,000 | | 1,023,330 |
| South Gate PFA Tax Allocation Revenue, South Gate Redevelopment Project No. 1, XLCA | | | | |
| Insured, 5.00%, 9/01/16 | | 1,490,000 | | 1,511,650 |
| Southern California Public Power Authority Nat ural Gas Project Revenue, Project No. 1, Series | | | | |
| A, 5.25%, 11/01/19 | | 1,500,000 | | 1,537,665 |
| Southern Public Power Authority Power Project Revenue, Canyon Power, Refunding, Series A, | | | | |
| 5.00%, 7/01/19 | | 1,500,000 | | 1,719,495 |
| Stockton Revenue, O’Connor Woods Housing Corp., Series A, 5.375%, 11/01/11 | | 440,000 | | 449,438 |
| Tobacco Securitization Authority Northern California Tobacco Settlement Revenue, Asset-Backed | | | | |
| Bonds, Series B, | | | | |
| ETM, 4.50%, 6/01/11 | | 1,540,000 | | 1,597,257 |
| Pre-Refunded, 4.60%, 6/01/12 | | 1,760,000 | | 1,827,038 |
| Pre-Refunded, 4.70%, 6/01/13 | | 1,500,000 | | 1,558,485 |
| Pre-Refunded, 4.80%, 6/01/14 | | 725,000 | | 753,921 |
Annual Report | 57
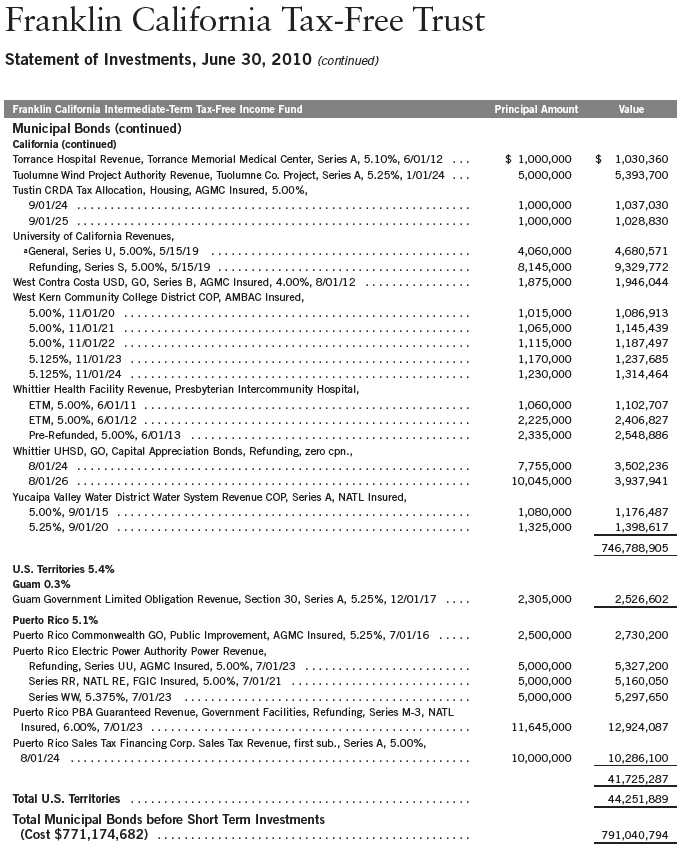
58 | Annual Report
| | | | |
| Franklin California Tax-Free Trust | | | | |
| |
| Statement of Investments, June 30, 2010 (continued) | | | | |
| |
| |
| Franklin California Intermediate-Term Tax-Free Income Fund | | Principal Amount | | Value |
| Short Term Investments 2.8% | | | | |
| Municipal Bonds 2.8% | | | | |
| California 2.7% | | | | |
| bCalifornia Health Facilities Financing Authority Revenue, Children’s Hospital Los Angeles, | | | | |
| Series B, Daily VRDN and Put, 0.16%, 7/01/42 | $ | 800,000 | $ | 800,000 |
| bCalifornia Infrastructure and Economic Development Bank Revenue, | | | | |
| Contemporary Jewish Museum, Daily VRDN and Put, 0.17%, 12/01/36 | | 1,100,000 | | 1,100,000 |
| Pacific Gas and Electric Co., Refunding, Series A, Daily VRDN and Put, 0.12%, | | | | |
| 11/01/26 | | 3,000,000 | | 3,000,000 |
| bCalifornia PCFA, PCR, Pacific Gas and Electric Co., Refunding, Series F, Daily VRDN and Put, | | | | |
| 0.10%, 11/01/26 | | 2,000,000 | | 2,000,000 |
| bCalifornia State Economic Recovery GO, Series C-4, Daily VRDN and Put, 0.10%, 7/01/23 | | 2,500,000 | | 2,500,000 |
| bCalifornia Statewide CDA Revenue, Los Angeles County Museum Art Project, Refunding, | | | | |
| Series D, Daily VRDN and Put, 0.12%, 12/01/34 | | 1,900,000 | | 1,900,000 |
| bIrvine 1915 Act Special Assessment, Limited Obligation, AD No. 93-14, Daily VRDN and Put, | | | | |
| 0.16%, 9/02/25 | | 2,700,000 | | 2,700,000 |
| bLos Angeles Department of Water and Power Revenue, Refunding, Series B-3, Daily VRDN and | | | | |
| Put, 0.14%, 7/01/34 | | 2,900,000 | | 2,900,000 |
| bSacramento County Sanitation District Financing Authority Revenue, sub. lien, Sanitation | | | | |
| District, Refunding, Series C, Daily VRDN and Put, 0.17%, 12/01/38 | | 3,750,000 | | 3,750,000 |
| bSanta Clara Electric Revenue, sub. bond, Refunding, Series A, Daily VRDN and Put, 0.17%, | | | | |
| 7/01/34 | | 1,700,000 | | 1,700,000 |
| bSouthern California Public Power Authority Power Project Revenue, Mead-Adelanto Project, | | | | |
| Refunding, Series A, Daily VRDN and Put, 0.12%, 7/01/20 | | 100,000 | | 100,000 |
| | | | | 22,450,000 |
| U.S. Territories 0.1% | | | | |
| Puerto Rico 0.1% | | | | |
| bPuerto Rico Commonwealth GO, Public Improvement, Refunding, Series B, Daily VRDN and | | | | |
| Put, 0.10%, 7/01/32 | | 700,000 | | 700,000 |
| Total Short Term Investments (Cost $23,150,000) | | | | 23,150,000 |
| Total Investments (Cost $794,324,682) 99.5% | | | | 814,190,794 |
| Other Assets, less Liabilities 0.5% | | | | 3,764,632 |
| Net Assets 100.0% | | | $ | 817,955,426 |
See Abbreviations on page 79.
aSecurity purchased on a when-issued basis. See Note 1(b).
bVariable rate demand notes (VRDNs) are tax-exempt obligations which contain a floating or variable interest rate adjustment formula and an unconditional right of demand to receive payment of the principal balance plus accrued interest at specified dates. The coupon rate shown represents the rate at period end.
Annual Report | The accompanying notes are an integral part of these financial statements. | 59
| | | | | | | | | | | | | | | |
| Franklin California Tax-Free Trust | | | | | | | | | | |
| |
| Financial Highlights | | | | | | | | | | | | | | | |
| |
| Franklin California Tax-Exempt Money Fund | | | | | | | | | | | | | | | |
| | | | | | Year Ended June 30, | | | | |
| Class A | | 2010 | | | 2009 | | | 2008 | | | 2007 | | | 2006 | |
| Per share operating performance | | | | | | | | | | | | | | | |
| (for a share outstanding throughout the year) | | | | | | | | | | | | | | | |
| Net asset value, beginning of year | $ | 1.00 | | $ | 1.00 | | $ | 1.00 | | $ | 1.00 | | $ | 1.00 | |
| Income from investment operations - net investment income (loss) | | (—)a | | | 0.006 | | | 0.024 | | | 0.029 | | | 0.023 | |
| Less distributions from net investment income | | — | | | (0.006 | ) | | (0.024 | ) | | (0.029 | ) | | (0.023 | ) |
| Net asset value, end of year | $ | 1.00 | | $ | 1.00 | | $ | 1.00 | | $ | 1.00 | | $ | 1.00 | |
| |
| Total returnb | | —% | | | 0.57 | % | | 2.43 | % | | 2.97 | % | | 2.33 | % |
| |
| Ratios to average net assets | | | | | | | | | | | | | | | |
| Expenses before waiver and payments by affiliates | | 0.54 | % | | 0.57 | % | | 0.54 | % | | 0.55 | % | | 0.55 | % |
| Expenses net of waiver and payments by affiliates | | 0.24 | % | | 0.46 | % | | 0.54 | % | | 0.55 | % | | 0.55 | % |
| Net investment income (loss) | | (—)%c | | | 0.61 | % | | 2.37 | % | | 2.94 | % | | 2.30 | % |
| |
| Supplemental data | | | | | | | | | | | | | | | |
| Net assets, end of year (000’s) | $ | 630,453 | | $ | 570,026 | | $ | 709,264 | | $ | 658,903 | | $ | 610,593 | |
| |
| |
| aAmount rounds to less than $0.001 per share. | | | | | | | | | | | | | | | |
| bTotal return does not reflect sales commissions or contingent deferred sales charges, if applicable. | | | | | | | | | | | | | |
| cRounds to less than 0.01%. | | | | | | | | | | | | | | | |
60 | The accompanying notes are an integral part of these financial statements. | Annual Report
| | | | |
| Franklin California Tax-Free Trust | | | | |
| |
| Statement of Investments, June 30, 2010 | | | | |
| |
| |
| Franklin California Tax-Exempt Money Fund | | Principal Amount | | Value |
| Investments 102.8% | | | | |
| Municipal Bonds 102.8% | | | | |
| California 102.8% | | | | |
| aCalifornia Education Notes Program Note Participations Revenue, Series A, 2.00%, | | | | |
| 7/01/11 | $ | 10,000,000 | $ | 10,140,800 |
| bCalifornia Educational Facilities Authority Revenue, Stanford University, Refunding, | | | | |
| Series L, Weekly VRDN and Put, 0.10%, 10/01/22 | | 3,300,000 | | 3,300,000 |
| Series L-2, Weekly VRDN and Put, 0.10%, 10/01/14 | | 5,800,000 | | 5,800,000 |
| Series L-3, Weekly VRDN and Put, 0.10%, 10/01/15 | | 5,040,000 | | 5,040,000 |
| Series L-4, Weekly VRDN and Put, 0.10%, 10/01/16 | | 1,175,000 | | 1,175,000 |
| Series L-5, Weekly VRDN and Put, 0.10%, 10/01/17 | | 8,900,000 | | 8,900,000 |
| bCalifornia Health Facilities Financing Authority Revenue, Adventist Health System West, | | | | |
| Series A, Weekly VRDN and Put, 0.25%, 8/01/21 | | 7,200,000 | | 7,200,000 |
| bCalifornia HFAR, | | | | |
| MF, Montecito Village, Series B, FHLMC Insured, Weekly VRDN and Put, 0.29%, | | | | |
| 4/01/43 | | 6,325,000 | | 6,325,000 |
| MFH, Refunding, Series B, Weekly VRDN and Put, 0.32%, 2/01/35 | | 2,600,000 | | 2,600,000 |
| MFH, Series B, Weekly VRDN and Put, 0.32%, 2/01/31 | | 1,900,000 | | 1,900,000 |
| MFH III, Refunding, Series F, Weekly VRDN and Put, 0.19%, 2/01/32 | | 4,140,000 | | 4,140,000 |
| MFH III, Series D, Weekly VRDN and Put, 0.32%, 2/01/31 | | 9,300,000 | | 9,300,000 |
| bCalifornia Infrastructure and Economic Development Bank Revenue, | | | | |
| American National Red Cross, Refunding, Weekly VRDN and Put, 0.17%, 9/01/34 | | 5,000,000 | | 5,000,000 |
| California Academy of Sciences, Refunding, Series A, Daily VRDN and Put, 0.12%, | | | | |
| 9/01/38 | | 13,100,000 | | 13,100,000 |
| Contemporary Jewish Museum, Daily VRDN and Put, 0.17%, 12/01/36 | | 1,200,000 | | 1,200,000 |
| J. Paul Getty Trust, Refunding, Series B, Daily VRDN and Put, 0.08%, 10/01/23 | | 8,200,000 | | 8,200,000 |
| J. Paul Getty Trust, Refunding, Series D, Daily VRDN and Put, 0.08%, 4/01/33 | | 16,925,000 | | 16,925,000 |
| Los Angeles County Museum, Refunding, Series B, Daily VRDN and Put, 0.12%, | | | | |
| 9/01/37 | | 6,800,000 | | 6,800,000 |
| Orange County Performing Arts Center, Series B, Weekly VRDN and Put, 0.25%, | | | | |
| 7/01/34 | | 9,700,000 | | 9,700,000 |
| bCalifornia Municipal Finance Autho rity Revenue, Westmont College, Series A, Weekly VRDN | | | | |
| and Put, 0.27%, 1/01/40 | | 5,000,000 | | 5,000,000 |
| bCalifornia PCFA, PCR, Pacific Gas and Electric Co., Refunding, Series C, Daily VRDN and Put, | | | | |
| 0.13%, 11/01/26 | | 20,304,000 | | 20,304,000 |
| California School Cash Reserve Program Authority COP, Series A, 2.50%, 7/01/10 | | 10,500,000 | | 10,500,000 |
| bCalifornia State Department of Water Resources Power Supply Revenue, | | | | |
| Refunding, Series G, Sub Series G-3, AGMC Insured, Weekly VRDN and Put, 0.35%, | | | | |
| 5/01/16 | | 6,255,000 | | 6,255,000 |
| Series B, Sub Series B-1, Daily VRDN and Put, 0.10%, 5/01/22 | | 1,130,000 | | 1,130,000 |
| bCalifornia State Economic Recovery GO, | | | | |
| Series C-2, Daily VRDN and Put, 0.16%, 7/01/23 | | 1,200,000 | | 1,200,000 |
| Series C-4, Daily VRDN and Put, 0.10%, 7/01/23 | | 2,000,000 | | 2,000,000 |
| Series C-11, Weekly VRDN and Put, 0.18%, 7/01/23 | | 13,000,000 | | 13,000,000 |
| bCalifornia State Educational Facilities Authority Revenue, California Institute of Technology, | | | | |
| Series B, Weekly VRDN and Put, 0.19%, 10/01/36 | | 22,600,000 | | 22,600,000 |
| bCalifornia State GO, | | | | |
| Kindergarten, Series A3, Daily VRDN and Put, 0.18%, 5/01/34 | | 17,200,000 | | 17,200,000 |
| Kindergarten, Series B1, Daily VRDN and Put, 0.13%, 5/01/34 | | 6,300,000 | | 6,300,000 |
| Series B-3, Weekly VRDN and Put, 0.20%, 5/01/33 | | 20,000,000 | | 20,000,000 |
| bCalifornia Statewide CDA Revenue, | | | | |
| John Muir Health, Refunding, Series C, Daily VRDN and Put, 0.12%, 8/15/27 | | 9,600,000 | | 9,600,000 |
| |
| | | Annual Report | 61 |
Franklin California Tax-Free Trust
Statement of Investments, June 30, 2010 (continued)
| | | | |
| Franklin California Tax-Exempt Money Fund | | Principal Amount | | Value |
| Investments (continued) | | | | |
| Municipal Bonds (continued) | | | | |
| California (continued) | | | | |
| bCalifornia Statewide CDA Revenue, (continued) | | | | |
| Los Angeles County Museum Art Project, Refundi ng, Series C, Weekly VRDN and Put, | | | | |
| 0.19%, 12/01/34 | $ | 5,000,000 | $ | 5,000,000 |
| Los Angeles County Museum Art Project, Refundi ng, Series D, Daily VRDN and Put, | | | | |
| 0.12%, 12/01/34 | | 1,200,000 | | 1,200,000 |
| Motion Picture and Television Fund, Series A, Weekly VRDN and Put, 0.25%, 3/01/31 | | 2,300,000 | | 2,300,000 |
| Touro University Project, Refunding, Weekly VRDN and Put, 0.26%, 9/01/29 | | 4,570,000 | | 4,570,000 |
| bCalleguas-Las Virgenes PFAR, Municipal Water District Project, Refunding, Series A, | | | | |
| Weekly VRDN and Put, 0.25%, 7/01/37 | | 8,825,000 | | 8,825,000 |
| bEast Bay MUD Wastewater System Revenue, Refunding, Series A, Weekly VRDN and Put, | | | | |
| 0.25%, 6/01/33 | | 3,000,000 | | 3,000,000 |
| bFremont PFA, COP, Weekly VRDN and Put, 0.28%, 8/01/30 | | 7,600,000 | | 7,600,000 |
| bHillsborough COP, Refunding, Series A, Weekly VRDN and Put, 0.30%, 6/01/30 | | 1,800,000 | | 1,800,000 |
| bIrvine 1915 Act Special Assessment, Limited Obligation, | | | | |
| AD No. 00-18, Series A, Daily VRDN and Put, 0.16%, 9/02/26 | | 1,056,000 | | 1,056,000 |
| AD No. 03-19, Series A, Daily VRDN and Put, 0.16%, 9/02/29 | | 5,279,000 | | 5,279,000 |
| AD No. 03-19, Series B, Daily VRDN and Put, 0.16%, 9/02/29 | | 9,829,000 | | 9,829,000 |
| AD No. 05-21, Series A, Daily VRDN and Put, 0.15%, 9/02/31 | | 7,100,000 | | 7,100,000 |
| AD No. 94-13, Daily VRDN and Put, 0.16%, 9/02/22 | | 1,450,000 | | 1,450,000 |
| AD No. 94-15, Refunding, Daily VRDN and Put, 0.16%, 9/02/20 | | 2,773,000 | | 2,773,000 |
| AD No. 97-13, Daily VRDN and Put, 0.16%, 9/02/23 | | 8,700,000 | | 8,700,000 |
| AD No. 97-16, Daily VRDN and Put, 0.16%, 9/02/22 | | 10,100,000 | | 10,100,000 |
| bIrvine Ranch Water District GO, District Nos. 105 140 240 and 250, Daily VRDN and Put, | | | | |
| 0.15%, 1/01/21 | | 14,900,000 | | 14,900,000 |
| bLos Angeles County Housing Authori ty MFHR, Malibu Meadows Project, Refunding, Series B, | | | | |
| FNMA Insured, Weekly VRDN and Put, 0.24%, 4/15/28 | | 11,425,000 | | 11,425,000 |
| bLos Angeles County MFMR, | | | | |
| Housing, Valencia Housing Project, Series C, Weekly VRDN and Put, 0.20%, 4/01/31 | | 11,575,000 | | 11,575,000 |
| Series A, FHLMC Insured, Weekly VRDN and Put, 0.20%, 7/01/14 | | 4,500,000 | | 4,500,000 |
| bLos Angeles Department of Water and Power Revenue, Refunding, Series B-1, Weekly VRDN | | | | |
| and Put, 0.24%, 7/01/34 | | 5,450,000 | | 5,450,000 |
| bLos Angeles Department of Water and Power Waterworks Revenue, | | | | |
| Refunding, Series B, Sub Series B-4, Weekly VRDN and Put, 0.24%, 7/01/35 | | 8,750,000 | | 8,750,000 |
| Series B, Sub Series B-2, Daily VRDN and Put, 0.13%, 7/01/35 | | 9,000,000 | | 9,000,000 |
| Los Angeles USD, GO, TRAN, | | | | |
| 2.00%, 8/12/10 | | 10,000,000 | | 10,015,773 |
| aSeries A, 2.00%, 6/30/11 | | 8,000,000 | | 8,105,360 |
| bLos Angeles Wastewater System Revenue, Refunding, | | | | |
| Series B, Weekly VRDN and Put, 0.27%, 6/01/28 | | 7,200,000 | | 7,200,000 |
| Sub Series A, Weekly VRDN and Put, 0.26%, 6/01/28 | | 12,000,000 | | 12,000,000 |
| bMetropolitan Water District of Southern California Revenue, Special, Refunding, Series A, | | | | |
| Weekly VRDN and Put, 0.24%, 10/01/29 | | 15,000,000 | | 15,000,000 |
| bMetropolitan Water District of Southern California Waterworks Revenue, | | | | |
| Series C, Weekly VRDN and Put, 0.24%, 7/01/28 | | 13,200,000 | | 13,200,000 |
| Series C-2, Daily VRDN and Put, 0.14%, 7/01/36 | | 1,300,000 | | 1,300,000 |
| bOceanside MFHR, Shadow Way Apartments Project, Weekly VRDN and Put, 0.26%, | | | | |
| 3/01/49 | | 5,350,000 | | 5,350,000 |
| bOrange County Apartment Development Revenue, | | | | |
| Harbor Pointe, Issue D, Refunding, FHLMC Insured, Weekly VRDN and Put, 0.25%, | | | | |
| 12/01/22 | | 4,160,000 | | 4,160,000 |
| 62 | Annual Report | | | | |
Franklin California Tax-Free Trust
Statement of Investments, June 30, 2010 (continued)
| | | | | |
| Franklin California Tax-Exempt Money Fund | | Principal Amount | | Value | |
| Investments (continued) | | | | | |
| Municipal Bonds (continued) | | | | | |
| California (continued) | | | | | |
| bOrange County Apartment Development Revenue, (continued) | | | | | |
| Park Ridge Villas, Issue 1, Refunding, FNMA Insured, Weekly VRDN and Put, 0.25%, | | | | | |
| 11/15/28 | $ | 5,100,000 | $ | 5,100,000 | |
| Trabuco Woods, Refunding, Series J, FNMA Insured, Weekly VRDN and Put, 0.28%, | | | | | |
| 11/15/28 | | 2,670,000 | | 2,670,000 | |
| bOrange County Housing Authority MF Apartment Development Revenue, Lantern Pines Project, | | | | | |
| Series CC, FNMA Insured, Weekly VRDN and Put, 0.24%, 12/01/27 | | 2,595,000 | | 2,595,000 | |
| Roseville Joint UHSD, GO, TRAN, 3.00%, 9/08/10 | | 10,000,000 | | 10,027,922 | |
| bSacramento County Sanitation District Financing Authority Revenue, sub. lien, Sanitation | | | | | |
| District, Refunding, | | | | | |
| Series C, Daily VRDN and Put, 0.17%, 12/01/38 | | 12,600,000 | | 12,600,000 | |
| Series E, Weekly VRDN and Put, 0.20%, 12/01/40 | | 3,000,000 | | 3,000,000 | |
| bSan Bernardino County MFHR, Housing Mortgage, Parkview, Refunding, Series A, | | | | | |
| FNMA Insured, Weekly VRDN and Put, 0.26%, 2/15/27 | | 1,200,000 | | 1,200,000 | |
| bSan Diego County COP, San Diego Foundation, Weekly VRDN and Put, 0.25%, 8/01/36 | | 4,535,000 | | 4,535,000 | |
| bSan Jose Financing Authority Lease Revenue, | | | | | |
| Civic Center Project, Refunding, Series A, Weekly VRDN and Put, 0.24%, 6/01/39 | | 24,220,000 | | 24,220,000 | |
| Hayes Mansion, Refunding, Series C, Weekly VRDN and Put, 0.16%, 6/01/27 | | 8,915,000 | | 8,915,000 | |
| bSan Jose RDAR, Merged Area Redevelopment Project, Series B, Weekly VRDN and Put, | | | | | |
| 0.15%, 7/01/26 | | 19,320,000 | | 19,320,000 | |
| San Mateo UHSD, GO, BAN, 2.00%, 2/28/11 | | 5,000,000 | | 5,046,791 | |
| bSanta Ana Housing Authority MFHR, Harbor Pointe Apartments, Refunding, Series A, | | | | | |
| FNMA Insured, Weekly VRDN and Put, 0.35%, 12/15/22 | | 1,200,000 | | 1,200,000 | |
| bSanta Clara County Financing Authority Lease Revenue, Valley Medical Center Facilities | | | | | |
| Replacement Project, Series B, Weekly VRDN and Put, 0.21%, 11/15/25 | | 4,900,000 | | 4,900,000 | |
| bSanta Clara County Housing Authori ty MFHR, Benton Park Central Apartments, Refunding, | | | | | |
| Series A, FNMA Insured, Weekly VRDN and Put, 0.24%, 12/15/25 | | 5,000,000 | | 5,000,000 | |
| bSimi Valley MFHR, Refunding, Series A, Weekly VRDN and Put, 0.24%, 7/01/23 | | 1,275,000 | | 1,275,000 | |
| bSouthern California Public Power Authority Power Project Revenue, | | | | | |
| Mead-Adelanto Project, Refunding, Series A, Daily VRDN and Put, 0.12%, 7/01/20 | | 18,105,000 | | 18,105,000 | |
| Mead-Phoenix Project, Refunding, Series A, Daily VRDN and Put, 0.12%, 7/01/20 | | 11,900,000 | | 11,900,000 | |
| bTustin 1915 Act Special Assessment, Reassessment District No. 95-2, Series A, Daily VRDN | | | | | |
| and Put, 0.17%, 9/02/13 | | 8,776,000 | | 8,776,000 | |
| bUnion City MFR, Housing Mission Si erra, Refunding, Series A, FNMA Insured, Weekly VRDN | | | | | |
| and Put, 0.25%, 7/15/29 | | 9,400,000 | | 9,400,000 | |
| bWalnut Creek MFHR, Creekside Drive, FHLMC Insured, Weekly VRDN and Put, 0.25%, | | | | | |
| 4/01/27 | | 3,730,000 | | 3,730,000 | |
| Total Investments (Cost $647,863,646) | | | | 647,863,646 | |
| Other Assets, less Liabilities (2.8)% | | | | (17,410,448 | ) |
| Net Assets 100.0% | | | $ | 630,453,198 | |
See Abbreviations on page 79.
aSecurity purchased on a when-issued basis. See Note 1(b).
bVariable rate demand notes (VRDNs) are tax-exempt obligations which contain a floating or variable interest rate adjustment formula and an unconditional right of demand to receive payment of the principal balance plus accrued interest at specified dates. The coupon rate shown represents the rate at period end.
Annual Report | The accompanying notes are an integral part of these financial statements. | 63
| | | | | | | | | |
| Franklin California Tax-Free Trust | | | | | | | |
| |
| Financial Statements | | | | | | | | | |
| |
| |
| Statements of Assets and Liabilities | | | | | | | | | |
| June 30, 2010 | | | | | | | | | |
| |
| | | Franklin | | | Franklin California | | | Franklin | |
| | | California | | | Intermediate-Term | | | California | |
| | | Insured Tax-Free | | | Tax-Free | | | Tax-Exempt | |
| | | Income Fund | | | Income Fund | | | Money Fund | |
| Assets: | | | | | | | | | |
| Investments in securities: | | | | | | | | | |
| Cost | $ | 2,117,256,459 | | $ | 794,324,682 | | $ | 647,863,646 | |
| Value | $ | 2,152,828,553 | | $ | 814,190,794 | | $ | 647,863,646 | |
| Cash | | 60,215 | | | 46,262 | | | 99,237 | |
| Receivables: | | | | | | | | | |
| Capital shares sold | | 4,864,068 | | | 5,047,288 | | | 755,830 | |
| Interest | | 33,056,545 | | | 11,135,000 | | | 825,187 | |
| Other assets | | 3,676 | | | 1,177 | | | — | |
| Total assets | | 2,190,813,057 | | | 830,420,521 | | | 649,543,900 | |
| Liabilities: | | | | | | | | | |
| Payables: | | | | | | | | | |
| Investment securities purchased | | — | | | 9,618,441 | | | 18,246,160 | |
| Capital shares redeemed | | 4,474,448 | | | 1,401,838 | | | 660,148 | |
| Affiliates | | 1,470,913 | | | 555,292 | | | 130,380 | |
| Distributions to shareholders | | 2,532,853 | | | 804,196 | | | — | |
| Accrued expenses and other liabilities | | 153,701 | | | 85,328 | | | 54,014 | |
| Total liabilities | | 8,631,915 | | | 12,465,095 | | | 19,090,702 | |
| Net assets, at value | $ | 2,182,181,142 | | $ | 817,955,426 | | $ | 630,453,198 | |
| Net assets consist of: | | | | | | | | | |
| Paid-in capital | $ | 2,150,140,431 | | $ | 809,225,054 | | $ | 630,455,744 | |
| Undistributed net investment income | | 864,000 | | | 100,101 | | | — | |
| Net unrealized appreciation (depreciation) | | 35,572,094 | | | 19,866,112 | | | — | |
| Accumulated net realized gain (loss) | | (4,395,383 | ) | | (11,235,841 | ) | | (2,546 | ) |
| Net assets, at value | $ | 2,182,181,142 | | $ | 817,955,426 | | $ | 630,453,198 | |
64 | The accompanying notes are an integral part of these financial statements. | Annual Report
| | | | | | | | |
| Franklin California Tax-Free Trust | | | | |
| |
| Financial Statements (continued) | | | | | | | | |
| |
| |
| Statements of Assets and Liabilities (continued) | | | | | | | | |
| June 30, 2010 | | | | | | | | |
| |
| | | | | Franklin | | Franklin California | | Franklin |
| | | | | California | | Intermediate-Term | | California |
| | | Insured Tax-Free | | Tax-Free | | Tax-Exempt |
| | | | | Income Fund | | Income Fund | | Money Fund |
| Class A: | | | | | | | | |
| Net assets, at value | $ | 1,899,692,172 | $ | 669,838,230 | $ | 630,453,198 |
| Shares outstanding | | | | 157,348,979 | | 58,655,741 | | 630,417,142 |
| Net asset value per sharea | | | $ | 12.07 | $ | 11.42 | $ | 1.00 |
| Maximum offering price per share (net asset value per share ÷ 95.75%, | | | | | | | | |
| 97.75% and 100%, respectively) | | | $ | 12.61 | $ | 11.68 | $ | 1.00 |
| Class B: | | | | | | | | |
| Net assets, at value | | $ | | 18,898,405 | | | | |
| Shares outstanding | | | | 1,557,032 | | | | |
| Net asset value and maximum offering price per sharea | | | $ | 12.14 | | | | |
| Class C: | | | | | | | | |
| Net assets, at value | | $ | | 252,630,305 | $ | 111,795,132 | | |
| Shares outstanding | | | | 20,683,223 | | 9,761,837 | | |
| Net asset value and maximum offering price per sharea | | | $ | 12.21 | $ | 11.45 | | |
| Advisor Class: | | | | | | | | |
| Net assets, at value | | $ | | 10,960,260 | $ | 36,322,064 | | |
| Shares outstanding | | | | 906,970 | | 3,176,298 | | |
| Net asset value and maximum offering price per share | | | $ | 12.08 | $ | 11.44 | | |
| |
| |
| aRedemption price is equal to net asset value less contingent deferred sales charges, if applicable. | | | | | | | | |
Annual Report | The accompanying notes are an integral part of these financial statements. | 65
| | | | | | | | | |
| Franklin California Tax-Free Trust | | | | | | | |
| |
| Financial Statements (continued) | | | | | | | | | |
| |
| |
| Statements of Operations | | | | | | | | | |
| for the year ended June 30, 2010 | | | | | | | | | |
| |
| | | Franklin | | | Franklin California | | | Franklin | |
| | | California | | | Intermediate-Term | | | California | |
| | | Insured Tax-Free | | | Tax-Free | | | Tax-Exempt | |
| | | Income Fund | | | Income Fund | | | Money Fund | |
| Investment income: | | | | | | | | | |
| Interest | $ | 110,452,927 | | $ | 31,697,425 | | $ | 1,518,815 | |
| Expenses: | | | | | | | | | |
| Management fees (Note 3a) | | 9,818,034 | | | 3,394,188 | | | 3,059,898 | |
| Distribution fees: (Note 3c) | | | | | | | | | |
| Class A | | 1,861,790 | | | 578,111 | | | — | |
| Class B | | 165,156 | | | — | | | — | |
| Class C | | 1,455,675 | | | 552,565 | | | — | |
| Transfer agent fees (Note 3e) | | 554,988 | | | 249,559 | | | 200,728 | |
| Custodian fees | | 29,480 | | | 9,691 | | | 8,467 | |
| Reports to shareholders | | 78,065 | | | 33,622 | | | 23,584 | |
| Registration and filing fees | | 16,424 | | | 13,736 | | | 5,246 | |
| Professional fees | | 60,413 | | | 37,031 | | | 30,817 | |
| Trustees’ fees and expenses | | 62,940 | | | 19,282 | | | 18,149 | |
| Other | | 138,329 | | | 78,249 | | | 43,519 | |
| Total expenses | | 14,241,294 | | | 4,966,034 | | | 3,390,408 | |
| Expenses waived/paid by affiliates (Note 3f) | | — | | | — | | | (1,870,837 | ) |
| Net expenses | | 14,241,294 | | | 4,966,034 | | | 1,519,571 | |
| Net investment income (loss) | | 96,211,633 | | | 26,731,391 | | | (756 | ) |
| Realized and unrealized gains (losses): | | | | | | | | | |
| Net realized gain (loss) from investments | | (1,728,533 | ) | | (2,500,808 | ) | | — | |
| Net change in unrealized appreciation (depreciation) on investments | | 111,155,290 | | | 34,202,965 | | | — | |
| Net realized and unrealized gain (loss) | | 109,426,757 | | | 31,702,157 | | | — | |
| Net increase (decrease) in net assets resulting from operations | $ | 205,638,390 | | $ | 58,433,548 | | $ | (756 | ) |
66 | The accompanying notes are an integral part of these financial statements. | Annual Report
| | | | | | | | | | | | |
| Franklin California Tax-Free Trust | | | | | | | |
| |
| Financial Statements (continued) | | | | | | | | | | | | |
| |
| |
| Statements of Changes in Net Assets | | | | | | | | | | | | |
| |
| |
| | | | | | | | | Franklin California | |
| | | Franklin California Insured | | | Intermediate-Term | |
| | | Tax-Free Income Fund | | | Tax-Free Income Fund | |
| | | Year Ended June 30, | | | Year Ended June 30, | |
| | | 2010 | | | 2009 | | | 2010 | | | 2009 | |
| Increase (decrease) in net assets: | | | | | | | | | | | | |
| Operations: | | | | | | | | | | | | |
| Net investment income | $ | 96,211,633 | | $ | 94,527,407 | | $ | 26,731,391 | | $ | 23,261,745 | |
| Net realized gain (loss) from investments | | (1,728,533 | ) | | (2,844,035 | ) | | (2,500,808 | ) | | (5,684,875 | ) |
| Net change in unrealized appreciation | | | | | | | | | | | | |
| (depreciation) on investments | | 111,155,290 | | | (130,270,547 | ) | | 34,202,965 | | | (16,143,756 | ) |
| Net increase (decrease) in net assets | | | | | | | | | | | | |
| resulting from operations | | 205,638,390 | | | (38,587,175 | ) | | 58,433,548 | | | 1,433,114 | |
| Distributions to shareholders from: | | | | | | | | | | | | |
| Net investment income: | | | | | | | | | | | | |
| Class A | | (85,130,860 | ) | | (85,101,308 | ) | | (23,433,993 | ) | | (21,317,414 | ) |
| Class B | | (1,030,689 | ) | | (1,662,730 | ) | | — | | | — | |
| Class C | | (8,854,634 | ) | | (6,927,938 | ) | | (2,924,111 | ) | | (1,642,458 | ) |
| Advisor Class | | (381,759 | ) | | (50,507 | ) | | (833,140 | ) | | (2,135 | ) |
| Total distributions to shareholders | | (95,397,942 | ) | | (93,742,483 | ) | | (27,191,244 | ) | | (22,962,007 | ) |
| Capital share transactions: (Note 2) | | | | | | | | | | | | |
| Class A | | 22,070,962 | | | 23,467,087 | | | 125,092,403 | | | 20,503,056 | |
| Class B | | (14,616,826 | ) | | (13,987,116 | ) | | — | | | — | |
| Class C | | 55,294,464 | | | 33,302,435 | | | 49,009,626 | | | 23,776,300 | |
| Advisor Class | | 8,443,157 | | | 2,115,249 | | | 35,421,789 | | | 153,009 | |
| Total capital share transactions | | 71,191,757 | | | 44,897,655 | | | 209,523,818 | | | 44,432,365 | |
| Redemption fees | | — | | | 624 | | | — | | | 990 | |
| Net increase (decrease) in net | | | | | | | | | | | | |
| assets | | 181,432,205 | | | (87,431,379 | ) | | 240,766,122 | | | 22,904,462 | |
| Net assets: | | | | | | | | | | | | |
| Beginning of year | | 2,000,748,937 | | | 2,088,180,316 | | | 577,189,304 | | | 554,284,842 | |
| End of year | $ | 2,182,181,142 | | $ | 2,000,748,937 | | $ | 817,955,426 | | $ | 577,189,304 | |
| Undistributed net investment income | | | | | | | | | | | | |
| included in net assets: | | | | | | | | | | | | |
| End of year | $ | 864,000 | | $ | 279,845 | | $ | 100,101 | | $ | 582,763 | |
Annual Report | The accompanying notes are an integral part of these financial statements. | 67
| | | | | | |
| Franklin California Tax-Free Trust | | | | | | |
| |
| Financial Statements (continued) | | | | | | |
| |
| |
| Statements of Changes in Net Assets (continued) | | | | | | |
| |
| |
| | | Franklin California | |
| | | Tax-Exempt Money Fund | |
| | | Year Ended June 30, | |
| | | 2010 | | | 2009 | |
| Increase (decrease) in net assets: | | | | | | |
| Operations: | | | | | | |
| Net investment income (loss) | $ | (756 | ) | $ | 4,088,586 | |
| Net realized gain (loss) from investments | | — | | | 28,688 | |
| Net increase (decrease) in net assets resulting from operations | | (756 | ) | | 4,117,274 | |
| Distributions to shareholders from net investment income | | — | | | (4,088,586 | ) |
| Capital share transactions (Note 2) | | 60,428,298 | | | (139,267,200 | ) |
| Net increase (decrease) in net assets | | 60,427,542 | | | (139,238,512 | ) |
| Net assets (there is no undistributed net investment income at beginning or end of year): | | | | | | |
| Beginning of year | | 570,025,656 | | | 709,264,168 | |
| End of year | $ | 630,453,198 | | $ | 570,025,656 | |
68 | The accompanying notes are an integral part of these financial statements. | Annual Report
Franklin California Tax-Free Trust
Notes to Financial Statements
1. ORGANIZATION AND SIGNIFICANT ACCOUNTING POLICIES
Franklin California Tax-Free Trust (Trust) is registered under the Investment Company Act of 1940, as amended, (1940 Act) as an open-end investment company, consisting of three funds (Funds). The classes of shares offered within each of the Funds are indicated below. Each class of shares differs by its initial sales load, contingent deferred sales charges, distribution fees, voting rights on matters affecting a single class and its exchange privilege.
| | |
| | | Class A, Class B, Class C |
| Class A | Class A, Class C & Advisor Class | & Advisor Class |
| Franklin California Tax-Exempt | Franklin California Intermediate-Term | Franklin California Insured Tax-Free |
| Money Fund | Tax-Free Income Fund | Income Fund |
The following summarizes the Funds’ significant accounting policies.
a. Financial Instrument Valuation
The Funds value their investments in securities and other assets and liabilities carried at fair value daily. Fair value is the price that would be received to sell an asset or paid to transfer a liability in an orderly transaction between market participants on the measurement date. Under procedures approved by the Funds’ Board of Trustees, the Funds may utilize independent pricing services, quotations from securities and financial instrument dealers, and other market sources to determine fair value.
Debt securities generally trade in the over-the-counter market rather than on a securities exchange. The Funds’ pricing services use multiple valuation techniques to determine fair value. In instances where sufficient market activity exists, the pricing services may utilize a market-based approach through which quotes from market makers are used to determine fair value. In instances where sufficient market activity may not exist or is limited, the pricing services also utilize proprietary valuation models which may consider market characteristics such as benchmark yield curves, option-adjusted spreads, credit spreads, estimated default rates, coupon rates, anticipated timing of principal repayments, underlying collateral, and other unique security features in order to estimate the relevant cash flows, which are then discounted to calculate the fair value.
Securities in the Franklin California Tax-Exempt Money Fund are valued at amortized cost, which approximates market value. Amortized cost is an income-based approach which involves valuing an instrument at its cost and thereafter assuming a constant amortization to maturity of any discount or premium.
The Funds have procedures to determine the fair value of securities and other financial instruments for which market prices are not readily available or which may not be reliably priced. Under these procedures, the Funds primarily employ a market-based approach which may use related or comparable assets or liabilities, recent transactions, market multiples, book values, and other relevant information for the investment to determine the fair value of the investment. The Funds may also use an income-based valuation approach in which the anticipated future cash flows of
Annual Report | 69
Franklin California Tax-Free Trust
Notes to Financial Statements (continued)
| 1. | ORGANIZATION AND SIGNIFICANT ACCOUNTING POLICIES (continued) |
| a. | Financial Instrument Valuation (continued) |
the investment are discounted to calculate fair value. Discounts may also be applied due to the nature or duration of any restrictions on the disposition of the investments. Due to the inherent uncertainty of valuations of such investments, the fair values may differ significantly from the values that would have been used had an active market existed.
b. Securities Purchased on a When-Issued Basis
The Funds may purchase securities on a when-issued basis, with payment and delivery scheduled for a future date. These transactions are subject to market fluctuations and are subject to the risk that the value at delivery may be more or less than the trade date purchase price. Although the Funds will generally purchase these securities with the intention of holding the securities, they may sell the securities before the settlement date. Sufficient assets have been segregated for these securities.
c. Income Taxes
It is each Fund’s policy to qualify as a regulated investment company under the Internal Revenue Code and to distribute to shareholders substantially all of its income and net realized gains. As a result, no provision for federal income taxes is required. The Funds file U.S. income tax returns as well as tax returns in certain other jurisdictions. As of June 30, 2010, and for all open tax years, the Funds have determined that no provision for income tax is required in the Funds’ financial statements. Open tax years are those that remain subject to examination by such taxing authorities, which in the case of the U.S. is three years after the filing of a fund’s tax return.
d. Security Transactions, Investment Income, Expenses and Distributions
Security transactions are accounted for on trade date. Realized gains and losses on security transactions are determined on a specific identification basis. Interest income and estimated expenses are accrued daily. Amortization of premium and accretion of discount on debt securities are included in interest income. Dividends from net investment income are normally declared daily; these dividends may be reinvested or paid monthly to shareholders. Distributions to shareholders are determined according to income tax regulations (tax basis). Distributable earnings determined on a tax basis may differ from earnings recorded in accordance with accounting principles generally accepted in the United States of America. These differences may be permanent or temporary. Permanent differences are reclassified among capital accounts to reflect their tax character. These reclassifications have no impact on net assets or the results of operations. T emporary differences are not reclassified, as they may reverse in subsequent periods.
Common expenses incurred by the Trust are allocated among the Funds based on the ratio of net assets of each fund to the combined net assets of the Trust. Fund specific expenses are charged directly to the fund that incurred the expense.
70 | Annual Report
Franklin California Tax-Free Trust
Notes to Financial Statements (continued)
| 1. | ORGANIZATION AND SIGNIFICANT ACCOUNTING POLICIES (continued) |
| d. | Security Transactions, Investment Income, Expenses and Distributions (continued) |
Realized and unrealized gains and losses and net investment income, not including class specific expenses, are allocated daily to each class of shares based upon the relative proportion of net assets of each class. Differences in per share distributions, by class, are generally due to differences in class specific expenses.
e. Insurance
The scheduled payments of interest and principal for each insured municipal security in the Trust are insured by either a new issue insurance policy or a secondary insurance policy. Some municipal securities in the Funds are secured by collateral guaranteed by an agency of the U.S. government. Insurance companies typically insure municipal bonds that tend to be of very high quality, with the majority of underlying municipal bonds rated A or better. However, there is a risk that in the event of an issuer default, the insurer may not be able to fulfill its obligations under the terms of the policy.
Depending on the type of coverage, premiums for insurance are either added to the cost basis of the security or paid by a third party.
f. Accounting Estimates
The preparation of financial statements in accordance with accounting principles generally accepted in the United States of America requires management to make estimates and assumptions that affect the reported amounts of assets and liabilities at the date of the financial statements and the amounts of income and expenses during the reporting period. Actual results could differ from those estimates.
| g. | Redemption Fees |
| A | short term trading redemption fee was imposed, with some exceptions, on any Fund shares |
that were redeemed or exchanged within seven calendar days following their purchase date. The redemption fee was 2% of the amount redeemed. Such fees were retained by the funds and accounted for as an addition to paid-in capital. Effective September 1, 2008, the redemption fee was eliminated.
h. Guarantees and Indemnifications
Under the Trust’s organizational documents, its officers and trustees are indemnified by the Trust against certain liabilities arising out of the performance of their duties to the Trust. Additionally, in the normal course of business, the Trust, on behalf of the Funds, enters into contracts with service providers that contain general indemnification clauses. The Trust’s maximum exposure under these arrangements is unknown as this would involve future claims that may be made against the Trust that have not yet occurred. Currently, the Trust expects the risk of loss to be remote.
Annual Report | 71
Franklin California Tax-Free Trust
Notes to Financial Statements (continued)
2. SHARES OF BENEFICIAL INTEREST
At June 30, 2010, there were an unlimited number of shares authorized (without par value). Transactions in the Franklin California Tax-Exempt Money Fund’s shares were at $1.00 per share. Transactions in the Funds’ shares were as follows:
| | | | | | | | | | | | |
| | Franklin California | | Franklin California | |
| | Insured | | Intermediate-Term | |
| | Tax-Free Income Fund | | Tax-Free Income Fund | |
| | Shares | | | | Amount | | Shares | | | | Amount | |
| Class A Shares: | | | | | | | | | | | | |
| Year ended June 30, 2010 | | | | | | | | | | | | |
| Shares sold | 22,027,906 | | $ | 263,003,879 | | 21,886,852 | | $ | 247,268,174 | |
| Shares issued in reinvestment of | | | | | | | | | | | | |
| distributions | 4,471,892 | | | | 53,341,183 | | 1,441,412 | | | | 16,286,584 | |
| Shares redeemed | (24,703,502 | ) | | | (294,274,100 | ) | (12,331,343 | ) | | | (138,462,355 | ) |
| Net increase (decrease) | 1,796,296 | | | $ | 22,070,962 | | 10,996,921 | | $ | 125,092,403 | |
| Year ended June 30, 2009 | | | | | | | | | | | | |
| Shares sold | 29,167,937 | | $ | 337,405,080 | | 19,328,396 | | $ | 210,337,015 | |
| Shares issued in reinvestment of | | | | | | | | | | | | |
| distributions | 4,296,933 | | | | 49,692,892 | | 1,236,042 | | | | 13,446,918 | |
| Shares redeemed | (31,748,010 | ) | | | (363,630,885 | ) | (18,836,592 | ) | | | (203,280,877 | ) |
| Net increase (decrease) | 1,716,860 | | | $ | 23,467,087 | | 1,727,846 | | | $ | 20,503,056 | |
| Class B Shares: | | | | | | | | | | | | |
| Year ended June 30, 2010 | | | | | | | | | | | | |
| Shares sold | 17,575 | | | $ | 210,119 | | | | | | | |
| Shares issued in reinvestment of | | | | | | | | | | | | |
| distributions | 60,301 | | | | 721,991 | | | | | | | |
| Shares redeemed | (1,298,661 | ) | | | (15,548,936 | ) | | | | | | |
| Net increase (decrease) | (1,220,785 | ) | | $ | (14,616,826 | ) | | | | | | |
| Year ended June 30, 2009 | | | | | | | | | | | | |
| Shares sold | 73,578 | | | $ | 832,721 | | | | | | | |
| Shares issued in reinvestment of | | | | | | | | | | | | |
| distributions | 90,842 | | | | 1,056,458 | | | | | | | |
| Shares redeemed | (1,374,300 | ) | | | (15,876,295 | ) | | | | | | |
| Net increase (decrease) | (1,209,880 | ) | | $ | (13,987,116 | ) | | | | | | |
| Class C Shares: | | | | | | | | | | | | |
| Year ended June 30, 2010 | | | | | | | | | | | | |
| Shares sold | 7,020,068 | | | $ | 84,645,671 | | 5,246,321 | | | $ | 59,419,554 | |
| Shares issued in reinvestment of | | | | | | | | | | | | |
| distributions | 485,889 | | | | 5,865,745 | | 158,867 | | | | 1,801,773 | |
| Shares redeemed | (2,916,731 | ) | | | (35,216,952 | ) | (1,078,520 | ) | | | (12,211,701 | ) |
| Net increase (decrease) | 4,589,226 | | | $ | 55,294,464 | | 4,326,668 | | | $ | 49,009,626 | |
| Year ended June 30, 2009 | | | | | | | | | | | | |
| Shares sold | 6,066,207 | | | $ | 70,773,138 | | 3,372,119 | | | $ | 36,707,062 | |
| Shares issued in reinvestment of | | | | | | | | | | | | |
| distributions | 366,507 | | | | 4,283,092 | | 85,595 | | | | 932,866 | |
| Shares redeemed | (3,601,441 | ) | | | (41,753,795 | ) | (1,285,439 | ) | | | (13,863,628 | ) |
| Net increase (decrease) | 2,831,273 | | | $ | 33,302,435 | | 2,172,275 | | | $ | 23,776,300 | |
72 | Annual Report
Franklin California Tax-Free Trust
Notes to Financial Statements (continued)
| | | | | | | | | | | |
| 2. SHARES OF BENEFICIAL INTEREST (continued) | | | | | | | | | | |
| |
| | Franklin California | | Franklin California | |
| | Insured | | | Intermediate-Term | |
| | Tax-Free Income Fund | | Tax-Free Income Fund | |
| | Shares | | | Amount | | Shares | | | | Amount | |
| Advisor Class Shares: | | | | | | | | | | | |
| Year ended June 30, 2010 | | | | | | | | | | | |
| Shares sold | 951,829 | | $ | 11,183,290 | | 3,611,536 | | | $ | 40,527,620 | |
| Shares issued in reinvestment of | | | | | | | | | | | |
| distributions | 9,044 | | | 108,110 | | 5,872 | | | | 66,817 | |
| Shares redeemed | (237,341 | ) | | (2,848,243 | ) | (455,461 | ) | | | (5,172,648 | ) |
| Net increase (decrease) | 723,532 | | $ | 8,443,157 | | 3,161,947 | | | $ | 35,421,789 | |
| Year ended June 30, 2009a | | | | | | | | | | | |
| Shares sold | 252,413 | | $ | 2,901,997 | | 16,051 | | | $ | 171,296 | |
| Shares issued in reinvestment of | | | | | | | | | | | |
| distributions | 3,639 | | | 42,024 | | 157 | | | | 1,713 | |
| Shares redeemed | (72,614 | ) | | (828,772 | ) | (1,857 | ) | | | (20,000 | ) |
| Net increase (decrease) | 183,438 | | $ | 2,115,249 | | 14,351 | | | $ | 153,009 | |
| |
| aFor the period October 31, 2008 (effective date) to June 30, 2009. | | | | | | | | | | |
| | | | | | | | | | Franklin California | |
| | | | | | | | | | Tax-Exempt | |
| | | | | | | | | | Money Fund | |
| | | | | | | | | | | Amount | |
| Class A Shares: | | | | | | | | | | | |
| Year ended June 30, 2010 | | | | | | | | | | | |
| Shares sold | | | | | | | | $ | 535,881,464 | |
| Shares redeemed | | | | | | | | | | (475,453,166 | ) |
| Net increase (decrease) | | | | | | | | | $ | 60,428,298 | |
| Year ended June 30, 2009 | | | | | | | | | | | |
| Shares sold | | | | | | | | $ | 567,744,452 | |
| Shares issued in reinvestment of distributions | | | | | | | | | 3,885,276 | |
| Shares redeemed | | | | | | | | | | (710,896,928 | ) |
| Net increase (decrease) | | | | | | | | $ | (139,267,200 | ) |
3. TRANSACTIONS WITH AFFILIATES
Franklin Resources, Inc. is the holding company for various subsidiaries that together are referred to as Franklin Templeton Investments. Certain officers and trustees of the Funds are also officers and/or directors of the following subsidiaries:
| |
Subsidiary Franklin Advisers, Inc. (Advisers) Franklin Templeton Services, LLC (FT Services) Franklin Templeton Distributors, Inc. (Distributors) Franklin Templeton Investor Services, LLC (Investor Services) | Affiliation Investment manager Administrative manager Principal underwriter Transfer agent |
Annual Report | 73
Franklin California Tax-Free Trust
Notes to Financial Statements (continued)
| 3. | TRANSACTIONS WITH AFFILIATES (continued) |
| a. | Management Fees |
The Franklin California Insured Tax-Free Income Fund and Franklin California Intermediate-Term Tax-Free Income Fund pay an investment management fee to Advisers based on the month-end net assets of each of the funds and the Franklin California Tax-Exempt Money Fund pays an investment management fee to Advisers based on the average daily net assets of the fund as follows:
| | |
| Annualized Fee Rate | | Net Assets |
| 0.625 | % | Up to and including $100 million |
| 0.500 | % | Over $100 million, up to and including $250 million |
| 0.450 | % | Over $250 million, up to and including $7.5 billion |
| 0.440 | % | Over $7.5 billion, up to and including $10 billion |
| 0.430 | % | Over $10 billion, up to and including $12.5 billion |
| 0.420 | % | Over $12.5 billion, up to and including $15 billion |
| 0.400 | % | Over $15 billion, up to and including $17.5 billion |
| 0.380 | % | Over $17.5 billion, up to and including $20 billion |
b. Administrative Fees
Under an agreement with Advisers, FT Services provides administrative services to the Funds. The fee is paid by Advisers based on average daily net assets, and is not an additional expense of the Funds.
c. Distribution Fees
The Funds’ Board of Trustees has adopted distribution plans for each share class of the Franklin California Insured Tax-Free Income Fund and Franklin California Intermediate-Term Tax-Free Income Fund, with the exception of Advisor Class shares, pursuant to Rule 12b-1 under the 1940 Act. Under the funds’ Class A reimbursement distribution plans, the funds reimburse Distributors for costs incurred in connection with the servicing, sale and distribution of each fund’s shares up to the maximum annual plan rate for each class. Under the Class A reimbursement distribution plans, costs exceeding the maximum for the current plan year cannot be reimbursed in subsequent periods.
In addition, under the funds’ Class B and C compensation distribution plans, the funds pay Distributors for costs incurred in connection with the servicing, sale and distribution of each fund’s shares up to the maximum annual plan rate for each class.
74 | Annual Report
Franklin California Tax-Free Trust
Notes to Financial Statements (continued)
| 3. | TRANSACTIONS WITH AFFILIATES (continued) |
| c. | Distribution Fees (continued) |
The maximum annual plan rates, based on the average daily net assets, for each class, are as follows:
| | | | |
| | Franklin California | | Franklin California | |
| | Insured | | Intermediate-Term | |
| | Tax-Free Income Fund | | Tax-Free Income Fund | |
| Reimbursement Plans: | | | | |
| Class A | 0.10 | % | 0.10 | % |
| Compensation Plans: | | | | |
| Class B | 0.65 | % | — | |
| Class C | 0.65 | % | 0.65 | % |
d. Sales Charges/Underwriting Agreements
Distributors has advised the Funds of the following commission transactions related to the sales and redemptions of the Funds’ shares for the year:
| | | | | | |
| | | Franklin California | | Franklin California | | Franklin California |
| | | Insured Tax-Free | | Intermediate-Term | | Tax-Exempt |
| | | Income Fund | | Tax-Free Income Fund | | Money Fund |
| Sales charges retained net of commissions | | | | | | |
| paid to unaffiliated broker/dealers | $ | 574,371 | $ | 141,087 | $ | — |
| Contingent deferred sales charges | | | | | | |
| retained | $ | 62,678 | $ | 32,958 | $ | 20,429 |
e. Transfer Agent Fees
For the year ended June 30, 2010, the Funds paid transfer agent fees as noted in the Statements of Operations of which the following amounts were retained by Investor Services:
| | | | | | |
| | | Franklin California | | Franklin California | | Franklin California |
| | | Insured Tax-Free | | Intermediate-Term | | Tax-Exempt |
| | | Income Fund | | Tax-Free Income Fund | | Money Fund |
| Transfer agent fees | $ | 312,757 | $ | 119,734 | $ | 142,161 |
| |
| f. Waiver and Expense Reimbursements | | | | | | |
In efforts to prevent a negative yield for the Franklin California Tax-Exempt Money Fund, Advisers has voluntarily agreed to waive or limit its fees, assume as its own expense certain expenses otherwise payable by the fund and if necessary, make a capital infusion into the fund. These waivers, expense reimbursements and capital infusions are voluntary and may be modified or discontinued by Advisers at any time, and without further notice. There is no guarantee that the fund will be able to avoid a negative yield.
Annual Report | 75
Franklin California Tax-Free Trust
Notes to Financial Statements (continued)
4. INCOME TAXES
For tax purposes, capital losses may be carried over to offset future capital gains, if any. At June 30, 2010, the capital loss carryforwards were as follows:
| | | | | | |
| | | Franklin California | | Franklin California | | Franklin California |
| | | Insured Tax-Free | | Intermediate-Term | | Tax-Exempt |
| | | Income Fund | | Tax-Free Income Fund | | Money Fund |
| Capital loss carryforwards expiring in: | | | | | | |
| 2011 | $ | — | $ | 145,149 | $ | — |
| 2012 | | — | | 865,726 | | — |
| 2013 | | — | | 421,949 | | — |
| 2015 | | — | | 1,083,972 | | — |
| 2016 | | — | | 154,257 | | 2,546 |
| 2017 | | 1,446,203 | | 5,166,158 | | — |
| 2018 | | — | | 1,396,013 | | — |
| | $ | 1,446,203 | $ | 9,233,224 | $ | 2,546 |
During the year ended June 30, 2010, the Franklin California Insured Tax-Free Income Fund utilized $71,114 of capital loss carryforwards.
On June 30, 2010, the Franklin California Intermediate-Term Tax-Free Income Fund had expired capital loss carryforwards of $112,465, which were reclassified to paid-in capital.
For tax purposes, realized capital losses occurring subsequent to October 31, may be deferred and treated as occurring on the first day of the following fiscal year. At June 30, 2010, the Franklin California Insured Tax-Free Income Fund and Franklin California Intermediate-Term Tax-Free Income Fund deferred realized capital losses of $2,896,238 and $2,002,618, respectively.
The tax character of distributions paid during the years ended June 30, 2010 and 2009, was as follows:
| | | | | | | | |
| | | Franklin California | | Franklin California |
| | | Insured | | Intermediate-Term |
| | | Tax-Free Income Fund | | Tax-Free Income Fund |
| | | 2010 | | 2009 | | 2010 | | 2009 |
| Distributions paid from: | | | | | | | | |
| Tax exempt income | $ | 95,397,942 | $ | 93,742,483 | $ | 27,191,244 | $ | 22,962,007 |
| |
| Franklin California |
|
| Tax-Exempt |
|
| Money Fund |
| | | 2010 | | 2009 | | | | |
| Distributions paid from: | | | | | | | | |
| Tax exempt income | $ | — | $ | 4,088,586 | | | | |
76 | Annual Report
Franklin California Tax-Free Trust
Notes to Financial Statements (continued)
4. INCOME TAXES (continued)
At June 30, 2010, the cost of investments, net unrealized appreciation (depreciation), and undistributed tax exempt income for income tax purposes were as follows:
| | | | | | | | | |
| | | Franklin California | | | Franklin California | | | Franklin California |
| | | Insured Tax-Free | | | Intermediate-Term | | | Tax-Exempt | |
| | | Income Fund | | | Tax-Free Income Fund | | | Money Fund | |
| Cost of investments | $ | 2,116,566,908 | | $ | 794,200,065 | | $ | 647,863,646 |
| |
| Unrealized appreciation | $ | 74,314,934 | | $ | 24,911,104 | | | $ | — |
| Unrealized depreciation | | (38,053,289 | ) | | (4,920,375 | ) | | | — |
| Net unrealized appreciation | | | | | | | | | |
| (depreciation) | $ | 36,261,645 | | $ | 19,990,729 | | | $ | — |
| |
| Distributable earnings – undistributed | | | | | | | | | |
| tax exempt income | $ | 2,654,361 | | $ | 779,679 | | | $ | — |
Net investment income differs for financial statement and tax purposes primarily due to differing treatments of bond discounts and non-deductible expenses.
Net realized gains (losses) differ for financial statement and tax purposes primarily due to differing treatments of wash sales and bond discounts.
5. INVESTMENT TRANSACTIONS
Purchases and sales of investments (excluding short term securities) for the year ended June 30, 2010, were as follows:
| | | | |
| | | Franklin California | | Franklin California |
| | | Insured Tax-Free | | Intermediate-Term |
| | | Income Fund | | Tax-Free Income Fund |
| Purchases | $ | 348,460,468 | $ | 276,161,612 |
| Sales | $ | 296,799,243 | $ | 82,197,449 |
6. CONCENTRATION OF RISK
Each of the Funds invests a large percentage of its total assets in obligations of issuers within California and U.S. territories. Such concentration may subject the Funds to risks associated with industrial or regional matters, and economic, political or legal developments occurring within California and U.S. territories. In addition, investments in these securities are sensitive to interest rate changes and credit risk of the issuer and may subject the Funds to increased market volatility. The market for these investments may be limited, which may make them difficult to buy or sell.
Annual Report | 77
Franklin California Tax-Free Trust
Notes to Financial Statements (continued)
7. CREDIT FACILITY
The Franklin California Insured Tax-Free Income Fund and Franklin California Intermediate-Term Tax-Free Income Fund, together with other U.S. registered and foreign investment funds (collectively “Borrowers”), managed by Franklin Templeton Investments, are borrowers in a joint syndicated senior unsecured credit facility totaling $750 million (Global Credit Facility) which matures on January 21, 2011. This Global Credit Facility provides a source of funds to the Borrowers for temporary and emergency purposes, including the ability to meet future unanticipated or unusually large redemption requests.
Under the terms of the Global Credit Facility, the funds shall, in addition to interest charged on any borrowings made by the funds and other costs incurred by the funds, pay their share of fees and expenses incurred in connection with the implementation and maintenance of the Global Credit Facility, based upon its relative share of the aggregate net assets of all of the Borrowers, including an annual commitment fee of 0.10% based upon the unused portion of the Global Credit Facility, which is reflected in other expenses on the Statements of Operations. During the year ended June 30, 2010, the funds did not use the Global Credit Facility.
8. FAIR VALUE MEASUREMENTS
The Funds follow a fair value hierarchy that distinguishes between market data obtained from independent sources (observable inputs) and the Funds’ own market assumptions (unobservable inputs). These inputs are used in determining the value of the Funds’ investments and are summarized in the following fair value hierarchy:
- Level 1 – quoted prices in active markets for identical securities
- Level 2 – other significant observable inputs (including quoted prices for similar securities, interest rates, prepayment speed, credit risk, etc.)
- Level 3 – significant unobservable inputs (including the Funds’ own assumptions in determining the fair value of investments)
The inputs or methodology used for valuing securities are not an indication of the risk associated with investing in those securities. Money market securities may be valued using amortized cost, in accordance with the 1940 Act. Generally, amortized cost reflects the current fair value of a security, but since the value is not obtained from a quoted price in an active market, such securities are reflected as a Level 2.
For movements between the levels within the fair value hierarchy, the Funds have adopted a policy of recognizing the transfers as of the date of the underlying event which caused the movement.
At June 30, 2010, all of the Funds’ investments in securities carried at fair value were in Level 2 inputs.
78 | Annual Report
Franklin California Tax-Free Trust
Notes to Financial Statements (continued)
9. SUBSEQUENT EVENTS
The Funds have evaluated subsequent events through the issuance of the financial statements and determined that no events have occurred that require disclosure.
| | | |
| ABBREVIATIONS | |
| |
| Selected Portfolio | |
| |
| 1915 Act | - | Improvement Bond Act of 1915 | MF |
| ABAG | - | The Association of Bay Area Governments | MFH |
| ACA | - | American Capital Access Holdings Inc. | MFHR |
| AD | - | Assessment District | MFMR |
| AGMC | - | Assured Guaranty Municipal Corp. | MFR |
| AMBAC | - | American Municipal Bond Assurance Corp. | MTA |
| BAN | - | BondAnticipation Note | MUD |
| BART | - | Bay Area Rapid Transit | NATL |
| BHAC | - | Berkshire Hathaway Assurance Corp. | NATL RE |
| CDA | - | Community Development Authority/Agency | |
| CFD | - | Community Facilities District | PBA |
| COP | - | Certificate of Participation | PCFA |
| CRDA | - | Community Redevelopment | PCR |
| | | Authority/Agency | PFA |
| ETM | - | Escrow to Maturity | PFAR |
| FGIC | - | FinancialGuaranty Insurance Co. | RDA |
| FHA | - | Federal Housing Authority/Agency | RDAR |
| FHLMC | - | Federal Home Loan Mortgage Corp. | SFMR |
| FNMA | - | Federal National Mortgage Association | TRAN |
| GNMA | - | Government National Mortgage Association | UHSD |
| GO | - | GeneralObligation | USD |
| HFAR | - | HousingFinance Authority Revenue | XLCA |
| ID | - | Improvement District | |
- Multi-Family
- Multi-FamilyHousing
- Multi-FamilyHousing Revenue
- Multi-FamilyMortgage Revenue
- Multi-FamilyRevenue
- Metropolitan Transit Authority
- MunicipalUtility District
- National Public Financial Guarantee Corp.
- National Public Financial Guarantee Corp. Reinsured
- PublicBuilding Authority
- Pollution Control Financing Authority
- Pollution Control Revenue
- PublicFinancing Authority
- PublicFinancing Authority Revenue
- Redevelopment Agency/Authority
- Redevelopment Agency Revenue
- SingleFamily Mortgage Revenue
- Tax and Revenue Anticipation Note
- Unified/UnionHigh School District
- Unified/UnionSchool District
- XL Capital Assurance
Annual Report | 79
Franklin California Tax-Free Trust
Report of Independent Registered Public Accounting Firm
To the Board of Trustees and Shareholders of Franklin California Tax-Free Trust
In our opinion, the accompanying statements of assets and liabilities, including the statements of investments, and the related statements of operations and of changes in net assets and the financial highlights present fairly, in all material respects, the financial position of Franklin California Insured Tax-Free Income Fund, Franklin California Intermediate-Term Tax-Free Income Fund and Franklin California Tax-Exempt Money Fund (separate portfolios of Franklin California Tax-Free Trust, hereafter referred to as the “Funds”) at June 30, 2010, the results of each of their operations for the year then ended, the changes in each of their net assets for each of the two years in the period then ended and the financial highlights for each of the periods presented, in conformity with accounting principles generally accepted in the United States of America. These financial statements and financial highlights (hereafter referred to as “financial statements”) are the responsibility of the Funds’ management. Our responsibility is to express an opinion on these financial statements based on our audits. We conducted our audits of these financial statements in accordance with the standards of the Public Company Accounting Oversight Board (United States). Those standards require that we plan and perform the audit to obtain reasonable assurance about whether the financial statements are free of material misstatement. An audit includes examining, on a test basis, evidence supporting the amounts and disclosures in the financial statements, assessing the accounting principles used and significant estimates made by management, and evaluating the overall financial statement presentation.
We believe that our audits, which included confirmation of securities at June 30, 2010 by correspondence with the custodian and brokers, provide a reasonable basis for our opinion.
PricewaterhouseCoopers LLP
San Francisco, California
August 16, 2010
80 | Annual Report
Franklin California Tax-Free Trust
Tax Designation (unaudited)
Under Section 852(b)(5)(A) of the Internal Revenue Code, the Funds designate 100% of the distributions paid from net investment income as exempt-interest dividends for the fiscal year ended June 30, 2010. A portion of the Funds’ exempt-interest dividends may be subject to the federal alternative minimum tax. In January 2011, shareholders will be notified of amounts for use in preparing their 2010 income tax returns.
Annual Report | 81
Franklin California Tax-Free Trust
Board Members and Officers
The name, year of birth and address of the officers and board members, as well as their affiliations, positions held with the Trust, principal occupations during the past five years and number of portfolios overseen in the Franklin Templeton Investments fund complex are shown below. Generally, each board member serves until that person’s successor is elected and qualified.
| | | | |
| Independent Board Members | | | |
| |
| | | | Number of Portfolios in | |
| Name, Year of Birth | | Length of | Fund Complex Overseen | |
| and Address | Position | Time Served | by Board Member* | Other Directorships Held |
| Harris J. Ashton (1932) | Trustee | Since 1985 | 130 | Bar-S Foods (meat packing company). |
| One Franklin Parkway | | | | |
| San Mateo, CA 94403-1906 | | | | |
Principal Occupation During Past 5 Years:
Director of various companies; and formerly, Director, RBC Holdings, Inc. (bank holding company) (until 2002); and President, Chief Executive Officer and Chairman of the Board, General Host Corporation (nursery and craft centers) (until 1998).
| | | | |
| Sam Ginn (1937) | Trustee | Since 2007 | 107 | ICO Global Communications |
| One Franklin Parkway | | | | (Holdings) Limited (satellite company). |
| San Mateo, CA 94403-1906 | | | | |
Principal Occupation During Past 5 Years:
Private investor; and formerly, Chairman of the Board, Vodafone AirTouch, PLC (wireless company); Chairman of the Board and Chief Executive Officer, AirTouch Communications (cellular communications) (1993-1998) and Pacific Telesis Group (telephone holding company) (1988-1994).
| | | | |
| Edith E. Holiday (1952) | Trustee | Since 2006 | 130 | Hess Corporation (exploration and |
| One Franklin Parkway | | | | refining of oil and gas), H.J. Heinz |
| San Mateo, CA 94403-1906 | | | | Company (processed foods and allied |
| | | | | products), RTI International Metals, |
| | | | | Inc. (manufacture and distribution of |
| | | | | titanium), Canadian National Railway |
| | | | | (railroad) and White Mountains |
| | | | | Insurance Group, Ltd. (holding |
| | | | | company). |
Principal Occupation During Past 5 Years:
Director or Trustee of various companies and trusts; and formerly, Assistant to the President of the United States and Secretary of the Cabinet (1990-1993); General Counsel to the United States Treasury Department (1989-1990); and Counselor to the Secretary and Assistant Secretary for Public Affairs and Public Liaison – United States Treasury Department (1988-1989).
| | | | |
| J. Michael Luttig (1954) | Trustee | Since | 130 | Boeing Capital Corporation (aircraft |
| One Franklin Parkway | | December 2009 | | financing). |
| San Mateo, CA 94403-1906 | | | | |
Principal Occupation During Past 5 Years:
Executive Vice President, General Counsel and member of Executive Council, The Boeing Company; and formerly, Federal Appeals Court Judge, U.S. Court of Appeals for the Fourth Circuit (1991-2006).
82 | Annual Report
| | | | |
| | | | Number of Portfolios in | |
| Name, Year of Birth | | Length of | Fund Complex Overseen | |
| and Address | Position | Time Served | by Board Member* | Other Directorships Held |
| Frank A. Olson (1932) | Trustee | Since 2007 | 130 | Hess Corporation (exploration and |
| One Franklin Parkway | | | | refining of oil and gas). |
| San Mateo, CA 94403-1906 | | | | |
Principal Occupation During Past 5 Years:
Chairman Emeritus, The Hertz Corporation (car rental) (since 2000) (Chairman of the Board (1980-2000) and Chief Executive Officer (1977-1999)); and formerly, Chairman of the Board, President and Chief Executive Officer, UAL Corporation (airlines).
| | | | |
| Larry D. Thompson (1945) | Trustee | Since 2007 | 138 | Cbeyond, Inc. (business |
| One Franklin Parkway | | | | communications provider) and The |
| San Mateo, CA 94403-1906 | | | | Southern Company (energy company). |
Principal Occupation During Past 5 Years:
Senior Vice President – Government Affairs, General Counsel and Secretary, PepsiCo, Inc. (consumer products); and formerly, Director, Delta Airlines (aviation) (2003-2005) and Providian Financial Corp. (credit card provider) (1997-2001); Senior Fellow of The Brookings Institution (2003-2004); Visiting Professor, University of Georgia School of Law (2004); and Deputy Attorney General, U.S. Department of Justice (2001-2003).
| | | | |
| John B. Wilson (1959) | Lead | Trustee since | 107 | None |
| One Franklin Parkway | Independent | 2006 and Lead | | |
| San Mateo, CA 94403-1906 | Trustee | Independent | | |
| Trustee |
| | | since 2008 | | |
Principal Occupation During Past 5 Years:
President and Founder, Hyannis Port Capital, Inc. (real estate and private equity investing); serves on private and non-profit boards; and formerly, Chief Operating Officer and Executive Vice President, Gap, Inc. (retail) (1996-2000); Chief Financial Officer and Executive Vice President – Finance and Strategy, Staples, Inc. (office supplies) (1992-1996); Senior Vice President – Corporate Planning, Northwest Airlines, Inc. (airlines) (1990-1992); and Vice President and Partner, Bain & Company (consulting firm) (1986-1990).
| | | | | |
| Interested Board Members and Officers | | | |
| |
| | | | | Number of Portfolios in | |
| Name, Year of Birth | | Length of | | Fund Complex Overseen | |
| and Address | Position | Time Served | | by Board Member* | Other Directorships Held |
| **Charles B. Johnson (1933) | Trustee and | Trustee since | | 130 | None |
| One Franklin Parkway | Chairman of | 1985 | and | | |
| San Mateo, CA 94403-1906 | the Board | Chairman of the | | | |
| | | Board since 1993 | | | |
Principal Occupation During Past 5 Years:
Chairman of the Board, Member – Office of the Chairman and Director, Franklin Resources, Inc.; and officer and/or director or trustee, as the case may be, of some of the other subsidiaries of Franklin Resources, Inc. and of 41 of the investment companies in Franklin Templeton Investments.
| | | | |
| **Gregory E. Johnson (1961) | Trustee | Since 2007 | 87 | None |
| One Franklin Parkway | | | | |
| San Mateo, CA 94403-1906 | | | | |
Principal Occupation During Past 5 Years:
Director, President and Chief Executive Officer, Franklin Resources, Inc.; and officer and/or director or trustee, as the case may be, of some of the other subsidiaries of Franklin Resources, Inc. and of 33 of the investment companies in Franklin Templeton Investments.
Annual Report | 83
| | | | |
| | | | Number of Portfolios in | |
| Name, Year of Birth | | Length of | Fund Complex Overseen | |
| and Address | Position | Time Served | by Board Member* | Other Directorships Held |
| Sheila Amoroso (1959) | Vice President | Since 1999 | Not Applicable | Not Applicable |
| One Franklin Parkway | | | | |
| San Mateo, CA 94403-1906 | | | | |
Principal Occupation During Past 5 Years:
Senior Vice President, Franklin Advisers, Inc.; and officer of eight of the investment companies in Franklin Templeton Investments.
| | | | |
| Rafael R. Costas, Jr. (1965) | Vice President | Since 1999 | Not Applicable | Not Applicable |
| One Franklin Parkway | | | | |
| San Mateo, CA 94403-1906 | | | | |
Principal Occupation During Past 5 Years:
Senior Vice President, Franklin Advisers, Inc.; and officer of eight of the investment companies in Franklin Templeton Investments.
| | | | |
| James M. Davis (1952) | Chief | Chief Compliance | Not Applicable | Not Applicable |
| One Franklin Parkway | Compliance | Officer since | | |
| San Mateo, CA 94403-1906 | Officer and | 2004 and Vice | | |
| | Vice President | President – AML | | |
| | – AML | Compliance | | |
| | Compliance | since 2006 | | |
Principal Occupation During Past 5 Years:
Director, Global Compliance, Franklin Resources, Inc.; officer of some of the other subsidiaries of Franklin Resources, Inc. and of 45 of the investment companies in Franklin Templeton Investments; and formerly, Director of Compliance, Franklin Resources, Inc. (1994-2001).
| | | | |
| Laura F. Fergerson (1962) | Chief | Since 2009 | Not Applicable | Not Applicable |
| One Franklin Parkway | Executive | | | |
| San Mateo, CA 94403-1906 | Officer – | | | |
| | Finance and | | | |
| | Administration | | | |
Principal Occupation During Past 5 Years:
Senior Vice President, Franklin Templeton Services, LLC; officer of 45 of the investment companies in Franklin Templeton Investments; and formerly, Director and member of Audit and Valuation Committees, Runkel Funds, Inc. (2003-2004); Assistant Treasurer of most of the investment companies in Franklin Templeton Investments (1997-2003); and Vice President, Franklin Templeton Services, LLC (1997-2003).
| | | | |
| Gaston Gardey (1967) | Treasurer, | Since 2009 | Not Applicable | Not Applicable |
| One Franklin Parkway | Chief Financial | | | |
| San Mateo, CA 94403-1906 | Officer and | | | |
| | Chief | | | |
| | Accounting | | | |
| | Officer | | | |
Principal Occupation During Past 5 Years:
Director, Fund Accounting, Franklin Templeton Investments; and officer of 27 of the investment companies in Franklin Templeton Investments.
| | | | |
| Aliya S. Gordon (1973) | Vice President | Since 2009 | Not Applicable | Not Applicable |
| One Franklin Parkway | | | | |
| San Mateo, CA 94403-1906 | | | | |
Principal Occupation During Past 5 Years:
Associate General Counsel, Franklin Templeton Investments; officer of 45 of the investment companies in Franklin Templeton Investments; and formerly, Litigation Associate, Steefel, Levitt & Weiss, LLP (2000-2004).
84 | Annual Report
| | | | |
| | | | Number of Portfolios in | |
| Name, Year of Birth | | Length of | Fund Complex Overseen | |
| and Address | Position | Time Served | by Board Member* | Other Directorships Held |
| David P. Goss (1947) | Vice President | Since 2000 | Not Applicable | Not Applicable |
| One Franklin Parkway | | | | |
| San Mateo, CA 94403-1906 | | | | |
Principal Occupation During Past 5 Years:
Senior Associate General Counsel, Franklin Templeton Investments; officer and/or director, as the case may be, of some of the other subsidiaries of Franklin Resources, Inc. and of 45 of the investment companies in Franklin Templeton Investments.
| | | | |
| Steven J. Gray (1955) | Vice President | Since | Not Applicable | Not Applicable |
| One Franklin Parkway | | August 2009 | | |
| San Mateo, CA 94403-1906 | | | | |
Principal Occupation During Past 5 Years:
Senior Associate General Counsel, Franklin Templeton Investments; Vice President, Franklin Templeton Distributors, Inc.; and officer of 45 of the investment companies in Franklin Templeton Investments.
| | | | | |
| Christopher J. Molumphy | | President | Since April 2010 | Not Applicable | Not Applicable |
| (1962 | ) | and Chief | | | |
| One Franklin Parkway | | Executive | | | |
| San Mateo, CA 94403-1906 | | Officer – | | | |
| | | Investment | | | |
| | | Management | | | |
Principal Occupation During Past 5 Years:
Director and Executive Vice President, Franklin Advisers, Inc.; Executive Vice President, Franklin Templeton Institutional, LLC; and officer of some of the other subsidiaries of Franklin Resources, Inc. and of 22 of the investment companies in Franklin Templeton Investments.
| | | | |
| Robert C. Rosselot (1960) | Vice President | Since | Not Applicable | Not Applicable |
| 500 East Broward Blvd. | | August 2009 | | |
| Suite 2100 | | | | |
| Fort Lauderdale, FL 33394-3091 | | | | |
Principal Occupation During Past 5 Years:
Senior Associate General Counsel, Franklin Templeton Investments; Assistant Secretary, Franklin Resources, Inc.; Vice President and Secretary, Templeton Investment Counsel, LLC; Vice President, Secretary and Trust Officer, Fiduciary Trust International of the South; and officer of 45 of the investment companies in Franklin Templeton Investments.
| | | | |
| Karen L. Skidmore (1952) | Vice President | Since 2006 | Not Applicable | Not Applicable |
| One Franklin Parkway | and Secretary | | | |
| San Mateo, CA 94403-1906 | | | | |
Principal Occupation During Past 5 Years:
Senior Associate General Counsel, Franklin Templeton Investments; and officer of 45 of the investment companies in Franklin Templeton Investments.
| | | | |
| Craig S. Tyle (1960) | Vice President | Since 2005 | Not Applicable | Not Applicable |
| One Franklin Parkway | | | | |
| San Mateo, CA 94403-1906 | | | | |
Principal Occupation During Past 5 Years:
General Counsel and Executive Vice President, Franklin Resources, Inc.; officer of some of the other subsidiaries of Franklin Resources, Inc. and of 45 of the investment companies in Franklin Templeton Investments; and formerly, Partner, Shearman & Sterling, LLP (2004-2005); and General Counsel, Investment Company Institute (ICI) (1997-2004).
Annual Report | 85
| | | | |
| | | | Number of Portfolios in | |
| Name, Year of Birth | | Length of | Fund Complex Overseen | |
| and Address | Position | Time Served | by Board Member* | Other Directorships Held |
| Thomas Walsh (1961) | Vice President | Since 1999 | Not Applicable | Not Applicable |
| One Franklin Parkway | | | | |
| San Mateo, CA 94403-1906 | | | | |
Principal Occupation During Past 5 Years:
Senior Vice President, Franklin Advisers, Inc.; and officer of eight of the investment companies in Franklin Templeton Investments
*We base the number of portfolios on each separate series of the U.S. registered investment companies within the Franklin Templeton Investments fund complex. These portfolios have a common investment manager or affiliated investment managers.
**Charles B. Johnson is considered to be an interested person of the Trust under the federal securities laws due to his position as officer and director and major shareholder of Franklin Resources, Inc. (Resources), which is the parent company of the Fund’s investment manager and distributor. Gregory E. Johnson is considered to be an interested person of the Trust under the federal securities laws due to his position as an officer and director of Resources.
Note 1: Charles B. Johnson is the father of Gregory E. Johnson.
Note 2: Officer information is current as of the date of this report. It is possible that after this date, information about officers may change. Note 3: Prior to June 30, 2010, Robert F. Carlson and Frank W.T. LaHaye each ceased to be a trustee of the Trust.
The Sarbanes-Oxley Act of 2002 and Rules adopted by the Securities and Exchange Commission require the Fund to disclose whether the Fund’s Audit Committee includes at least one member who is an audit committee financial expert within the meaning of such Act and Rules. The Fund’s Board has determined that there is at least one such financial expert on the Audit Committee and has designated John B. Wilson as its audit committee financial expert. The Board believes that Mr. Wilson qualifies as such an expert in view of his extensive business background and experience, including service as chief financial officer of Staples, Inc. from 1992 to 1996. Mr. Wilson has been a Member and Chairman of the Fund’s Audit Committee since 2006. As a result of such background and experience, the Board believes that Mr. Wilson has acquired an understanding of generally accepted accounting principles and financial statemen ts, the general application of such principles in connection with the accounting estimates, accruals and reserves, and analyzing and evaluating financial statements that present a breadth and level of complexity of accounting issues generally comparable to those of the Fund, as well as an understanding of internal controls and procedures for financial reporting and an understanding of audit committee functions. Mr. Wilson is an independent Board member as that term is defined under the relevant Securities and Exchange Commission Rules and Releases.
The Statement of Additional Information (SAI) includes additional information about the board members and is available, without charge, upon request. Shareholders may call (800) DIAL BEN/(800) 342-5236 to request the SAI.
86 | Annual Report
Franklin California Tax-Free Trust
Shareholder Information
Board Review of Investment Management Agreement
At a meeting held February 23, 2010, the Board of Trustees (Board), including a majority of non-interested or independent Trustees, approved renewal of the investment management agreement for each of the separate tax-exempt funds within the Trust (Fund(s)). In reaching this decision, the Board took into account information furnished throughout the year at regular Board meetings, as well as information prepared specifically in connection with the annual renewal review process. Information furnished and discussed throughout the year included investment performance reports and related financial information for each Fund, as well as periodic reports on shareholder services, legal, compliance, pricing and other services provided by the Investment Manager (Manager) and its affiliates. Information furnished specifically in connection with the renewal process included a report for each Fund prepared by Lipper, Inc. (Lipper), an independent o rganization, as well as additional material, including a Fund profitability analysis report prepared by management. The Lipper reports compared each Fund’s investment performance and expenses with those of other mutual funds deemed comparable to the Fund as selected by Lipper. The Fund profitability analysis report discussed the profitability to Franklin Templeton Investments from its overall U.S. fund operations, as well as on an individual fund-by-fund basis. Included with such profitability analysis report was information on a fund-by-fund basis listing portfolio managers and other accounts they manage, as well as information on management fees charged by the Manager and its affiliates to U.S. mutual funds and other accounts, including management’s explanation of differences where relevant and a three-year expense analysis with an explanation for any increase in expense ratios. Additional material accompanying such report was a memorandum prepared by management describing project initiatives and capital investments relating to the services provided to the Funds by the Franklin Templeton Investments organization, as well as a memorandum relating to economies of scale and a comparative analysis concerning transfer agent fees charged each Fund.
In considering such materials, the independent Trustees received assistance and advice from and met separately with independent counsel. While the investment management agreements for all Funds were considered at the same Board meeting, the Board dealt with each Fund separately. In approving continuance of the investment management agreement for each Fund, the Board, including a majority of independent Trustees, determined that the existing management fee structure was fair and reasonable and that continuance of the investment management agreement was in the best interests of each Fund and its shareholders. While attention was given to all information furnished, the following discusses some primary factors relevant to the Board’s decision.
NATURE, EXTENT AND QUALITY OF SERVICE. The Board was satisfied with the nature and quality of the overall services provided by the Manager and its affiliates to the Funds and their shareholders. In addition to investment performance and expenses discussed later, the Board’s opinion was based, in part, upon periodic reports furnished it showing that the investment policies and restrictions for each Fund were consistently complied with as well as other reports periodically furnished the Board covering matters such as the compliance of portfolio managers and other management personnel with the code of ethics adopted throughout the Franklin Templeton fund complex, the adherence to fair value pricing procedures established by the Board, and the accuracy of net asset
Annual Report | 87
Franklin California Tax-Free Trust
Shareholder Information (continued)
Board Review of Investment Management Agreement (continued)
value calculations. The Board also noted the extent of benefits provided Fund shareholders from being part of the Franklin Templeton family of funds, including the right to exchange investments between the same class of funds without a sales charge, the ability to reinvest Fund dividends into other funds and the right to combine holdings in other funds to obtain a reduced sales charge. Favorable consideration was given to management’s continuous efforts and expenditures in establishing back-up systems and recovery procedures to function in the event of a natural disaster, it being noted that such systems and procedures had functioned smoothly during the Florida hurricanes and blackouts experienced in recent years. Consideration was also given to the experience of each Fund’s portfolio management team, the number of accounts managed and general method of compensation. In this latter respect, the Board noted that a primary fa ctor in management’s determination of a portfolio manager’s bonus compensation was the relative investment performance of the funds he or she managed and that a portion of such bonus was required to be invested in a predesignated list of funds within such person’s fund management area so as to be aligned with the interests of Fund shareholders. The Board also took into account the quality of transfer agent and shareholder services provided Fund shareholders by an affiliate of the Manager, noting continuing expenditures by management to increase and improve the scope of such services, periodic favorable reports on such service conducted by third parties, and the continuous enhancements to and high industry ranking given the Franklin Templeton website. Particular attention was given to management’s conservative approach and diligent risk management procedures, including continuous monitoring of counterparty credit risk and attention given to derivatives and other complex instruments. The Bo ard also took into account, among other things, management’s efforts in establishing a global credit facility for the benefit of the Funds and other accounts managed by Franklin Templeton Investments to provide a source of cash for temporary and emergency purposes or to meet unusual redemption requests as well as the strong financial position of the Manager’s parent company and its commitment to the mutual fund business as evidenced by its subsidization of money market funds. The Board also noted management’s efforts to minimize any negative impact on the nature and quality of services provided the Funds arising from Franklin Templeton Investments’ implementation of a hiring freeze and employee reductions in response to market conditions during the latter part of 2008 and early 2009.
INVESTMENT PERFORMANCE. The Board placed significant emphasis on the investment performance of each Fund in view of its importance to shareholders. While consideration was given to performance reports and discussions with portfolio managers at Board meetings during the year, particular attention in assessing performance was given to the Lipper reports furnished for the agreement renewals. The Lipper reports prepared for each individual Fund showed its investment performance in comparison with a performance universe selected by Lipper. The following summarizes the performance results for each of the Funds.
Franklin California Insured Tax-Free Income Fund – The Lipper report for this Fund showed the investment performance of its Class A shares during 2009 and the previous 10 years ended December 31, 2009, in comparison with a performance universe consisting of all retail and
88 | Annual Report
Franklin California Tax-Free Trust
Shareholder Information (continued)
Board Review of Investment Management Agreement (continued)
institutional single-state insured municipal debt funds as selected by Lipper. The Lipper report showed that the Fund’s income return during 2009 and for the previous three-, five- and 10-year periods on an annualized basis was in the highest quintile of its performance universe. The Lipper report also showed that the Fund’s total return during 2009 was in the middle quintile of its performance universe, and for the previous three-, five- and 10-year periods on an annualized basis was in the lowest, middle and second-highest quintiles of such universe, respectively. The Board was satisfied with such performance, noting the Fund’s objective of maximizing tax-free income.
Franklin California Intermediate-Term Tax-Free Income Fund – The Lipper report for this Fund showed the investment performance of its Class A shares during 2009 and the previous 10 years ended December 31, 2009, in comparison with a performance universe consisting of all retail and institutional California intermediate municipal debt funds as selected by Lipper. Such Lipper report comparison showed that the Fund’s income return in 2009 and during each of the previous three-, five- and 10-year periods on an annualized basis was in the highest quintile of its performance universe. The Lipper report also showed that the Fund’s total return during 2009 was in the second-highest quintile of its performance universe, and on an annualized basis was in the middle quintile of such universe for each of the previous three- and five-year perio ds, and in the second-highest quintile of such universe for the previous 10-year period. The Board was satisfied with such performance, noting the Fund’s objective of maximizing tax-free income.
Franklin California Tax-Exempt Money Fund – The Lipper report for this Fund showed its investment performance during 2009 and the 10-year period ended December 31, 2009, in comparison to a performance universe consisting of all retail and institutional California tax-exempt money market funds as selected by Lipper. The Lipper report showed the Fund’s total return to be in the lowest quintile of its performance universe during 2009, and to be in the second-lowest quintile of such universe in each of the previous three-, five- and 10-year periods on an annualized basis. In discussing such performance, management explained that it reflected the Fund’s conservative approach, noting that it had no derivative holdings or investments in non-rated or Tier 2 securities. The Board found such performance acceptable in view of such factors, no ting that the Fund’s total return was within 10 basis points of its Lipper performance universe medians in 2009 and in each of the previous three-, five- and 10-year annualized periods.
COMPARATIVE EXPENSES. Consideration was given to a comparative analysis of the management fees and total expense ratio of each Fund compared with those of a group of other funds selected by Lipper as constituting its appropriate Lipper expense group. Lipper expense data is based upon information taken from each fund’s most recent annual report, which reflects historical asset levels that may be quite different from those currently existing, particularly in a period of market volatility. While recognizing such inherent limitation and the fact that expense ratios generally increase as assets decline and decrease as assets grow, the Board believed the independent analysis conducted by Lipper to be an appropriate measure of comparative expenses. In reviewing comparative costs, Lipper provides information on each Fund’s contractual investmen t management fee in
Annual Report | 89
Franklin California Tax-Free Trust
Shareholder Information (continued)
Board Review of Investment Management Agreement (continued)
comparison with the contractual investment management fee rate that would have been charged by other funds within its Lipper expense group assuming they were similar in size to the Fund, as well as the actual total expense ratio of the Fund in comparison with those of such group. The Lipper contractual investment management fee analysis includes administrative fees as being part of management fees and total expenses for comparative consistency were shown by Lipper for Fund Class A shares in the case of Franklin California Insured Tax-Free Income Fund and Franklin California Intermediate-Term Tax-Free Income Fund. The Lipper report for Franklin California Insured Tax-Free Income Fund showed that its contractual investment fee rate was at the median of its Lipper expense group, while its actual total expense ratio was the least expensive within such group. The Lipper report for Franklin California Intermediate-Term Tax-Free Income Fund showed that its contractual investment fee rate was below the median of its Lipper expense group, while its actual total expense ratio was in the least expensive quintile of such group including 12b-1 fees, and the second most expensive quintile of such group excluding 12b-1 fees. The Board was satisfied with the management fee and total expenses of these two Funds in comparison to their Lipper expense groups. The Lipper expense comparison for Franklin California Tax-Exempt Money Fund showed its contractual investment management fee to be within three basis points above its Lipper expense group median, while its actual total expenses were in the least expensive quintile of such expense group. The Board was satisfied with the comparative expenses of this Fund as shown in the Lipper report and noted that the Fund’s expenses were subsidized by management fee waivers.
MANAGEMENT PROFITABILITY. The Board also considered the level of profits realized by the Manager and its affiliates in connection with the operation of each Fund. In this respect, the Board reviewed the Fund profitability analysis that addresses the overall profitability of Franklin Templeton’s U.S. fund business, as well as its profits in providing management and other services to each of the individual Funds during the 12-month period ended September 30, 2009, being the most recent fiscal year-end for Franklin Resources, Inc., the Manager’s parent. In reviewing the analysis, attention was given to the methodology followed in allocating costs to each Fund, it being recognized that allocation methodologies are inherently subjective and various allocation methodologies may each be reasonable while producing different results. In this res pect, the Board noted that, while being continuously refined and reflecting changes in the Manager’s own cost accounting, the allocation methodology was consistent with that followed in profitability report presentations for the Funds made in prior years and that the Funds’ independent registered public accounting firm had been engaged by the Manager to review the reasonableness of the allocation methodologies solely for use by the Funds’ Board in reference to the profitability analysis. In reviewing and discussing such analysis, management discussed with the Board its belief that costs incurred in establishing the infrastructure necessary for the type of mutual fund operations conducted by the Manager and its affiliates may not be fully reflected in the expenses allocated to each Fund in determining its profitability, as well as the fact that the level of profits, to a certain extent, reflected operational
90 | Annual Report
Franklin California Tax-Free Trust
Shareholder Information (continued)
Board Review of Investment Management Agreement (continued)
cost savings and efficiencies initiated by management. The Board also took into account management’s expenditures in improving shareholder services provided the Funds, as well as the need to meet additional regulatory and compliance requirements resulting from the Sarbanes-Oxley Act and recent SEC and other regulatory requirements. In addition, the Board considered a third-party study comparing the profitability of the Manager’s parent on an overall basis to other publicly held managers broken down to show profitability from management operations exclusive of distribution expenses, as well as profitability including distribution expenses. The Board also considered the extent to which the Manager and its affiliates might derive ancillary benefits from fund operations, including its interest in a joint venture entity that financed up-front commissions paid to brokers/dealers who sold fund Class B shares prior to February 2005 when the offering of such shares was discontinued. Based upon its consideration of all these factors, the Board determined that the level of profits realized by the Manager and its affiliates from providing services to each Fund was not excessive in view of the nature, quality and extent of services provided, also noting with respect to Franklin California Tax-Exempt Money Fund, that expenses were being subsidized through fee waivers.
ECONOMIES OF SCALE. The Board also considered whether economies of scale are realized by the Manager as the Funds grow larger and the extent to which this is reflected in the level of management fees charged. While recognizing any precise determination is inherently subjective, the Board noted that based upon the Fund profitability analysis, it appeared as some funds get larger, at some point economies of scale do result in the Manager realizing a larger profit margin on management services provided such fund. The Board also noted that any economies of scale are shared with each of these Funds and their shareholders through management fee breakpoints existing in each of the Fund’s investment management agreements so that as a Fund grows in size, its effective management fee rate declines. The management fee structure, including administrativ e expenses for each Fund provides for a fee of 0.625% on the first $100 million of net assets; 0.50% on the next $150 million of net assets; 0.45% on net assets in excess of $250 million; with additional breakpoints thereafter beginning at the $7.5 billion net asset level. At December 31, 2009, the net assets of Franklin California Insured Tax-Free Income Fund stood at approximately $2.1 billion, and those of Franklin California Intermediate-Term Tax-Free Income Fund and Franklin California Tax-Exempt Money Fund were approximately $680 million and $557 million, respectively. In discussing these fee levels, management’s position was that the existing fee rate reaches a low level quickly, which anticipates economies of scale as assets grow, and in support of such position pointed out the generally favorable effective management fee rate and low total actual expense comparisons for these Funds within their Lipper expense groups as previously discussed under “Comparative Exp enses.” The Board believed that to the extent economies of scale may be realized by the Manager and its affiliates, the schedule of fees under the investment management agreement for these three Funds provides a sharing of benefits with each Fund and its shareholders. The Board also noted the fact that management was subsidizing the expenses of Franklin California Tax-Exempt Money Fund through fee waivers.
Annual Report | 91
Franklin California Tax-Free Trust
Shareholder Information (continued)
Proxy Voting Policies and Procedures
The Trust’s investment manager has established Proxy Voting Policies and Procedures (Policies) that the Trust uses to determine how to vote proxies relating to portfolio securities. Shareholders may view the Trust’s complete Policies online at franklintempleton.com. Alternatively, shareholders may request copies of the Policies free of charge by calling the Proxy Group collect at (954) 527-7678 or by sending a written request to: Franklin Templeton Companies, LLC, 500 East Broward Boulevard, Suite 1500, Fort Lauderdale, FL 33394, Attention: Proxy Group. Copies of the Trust’s proxy voting records are also made available online at franklintempleton.com and posted on the U.S. Securities and Exchange Commission’s website at sec.gov and reflect the most recent 12-month period ended June 30.
Quarterly Statement of Investments
The Trust files a complete statement of investments with the U.S. Securities and Exchange Commission for the first and third quarters for each fiscal year on Form N-Q. Shareholders may view the filed Form N-Q by visiting the Commission’s website at sec.gov. The filed form may also be viewed and copied at the Commission’s Public Reference Room in Washington, DC. Information regarding the operations of the Public Reference Room may be obtained by calling (800) SEC-0330.
Householding of Reports and Prospectuses
You will receive the Fund’s financial reports every six months as well as an annual updated summary prospectus (prospectus available upon request). To reduce Fund expenses, we try to identify related shareholders in a household and send only one copy of the financial reports and summary prospectus. This process, called “householding,” will continue indefinitely unless you instruct us otherwise. If you prefer not to have these documents householded, please call us at (800) 632-2301. At any time you may view current prospectuses/summary prospectuses and financial reports on our website. If you choose, you may receive these documents through electronic delivery.
92 | Annual Report

Sign up for electronic delivery
on franklintempleton. com
Annual Report and Shareholder Letter
FRANKLIN CALIFORNIA TAX-FREE TRUST
Investment Manager
Franklin Advisers, Inc.
Distributor
Franklin Templeton Distributors, Inc.
(800) DIAL BEN®
franklintempleton. com
Shareholder Services
(800) 632-2301
Authorized for distribution only when accompanied or preceded by a summary prospectus and/or prospectus. Investors should carefully consider a fund’s investment goals, risks, charges and expenses before investing. A prospectus contains this and other information; please read it carefully before investing.
To ensure the highest quality of service, telephone calls to or from our service departments may be monitored, recorded and accessed. These calls can be identified by the presence of a regular beeping tone.
© 2010 Franklin Templeton Investments. All rights reserved.
CAT A 08/10
Item 2. Code of Ethics.
(a) The Registrant has adopted a code of ethics that applies to its principal executive officers and principal financial and accounting officer.
(c) N/A
(d) N/A
(f) Pursuant to Item 12(a)(1), the Registrant is attaching as an exhibit a copy of its code of ethics that applies to its principal executive officers and principal financial and accounting officer.
Item 3. Audit Committee Financial Expert.
(a)(1) The Registrant has an audit committee financial expert serving on its audit committee.
(2) The audit committee financial expert is John B. Wilson and he is "independent" as defined under the relevant Securities and Exchange Commission Rules and Releases.
Item 4. Principal Accountant Fees and Services.
(a) Audit Fees
The aggregate fees paid to the principal accountant for professional services rendered by the principal accountant for the audit of the registrant’s annual financial statements or for services that are normally provided by the principal accountant in connection with statutory and regulatory filings or engagements were $92,755 for the fiscal year ended June 30, 2010 and $99,409 for the fiscal year ended June 30, 2009.
(b) Audit-Related Fees
There were no fees paid to the principal accountant for assurance and related services rendered by the principal accountant to the registrant that are reasonably related to the performance of the audit of the registrant's financial statements and are not reported under paragraph (a) of Item 4.
There were no fees paid to the principal accountant for assurance and related services rendered by the principal accountant to the registrant's investment adviser and any entity controlling, controlled by or under common control with the investment adviser that provides ongoing services to the registrant that are reasonably related to the performance of the audit of their financial statements.
(c) Tax Fees
There were no fees paid to the principal accountant for professional services rendered by the principal accountant to the registrant for tax compliance, tax advice and tax planning.
The aggregate fees paid to the principal accountant for professional services rendered by the principal accountant to the registrant’s investment adviser and any entity controlling, controlled by or under common control with the investment adviser that provides ongoing services to the registrant for tax compliance, tax advice and tax planning were $762 for the fiscal year ended June 30, 2010 and $6,000 for the fiscal year ended June 30, 2009. The services for which these fees were paid included tax compliance and advice.
(d) All Other Fees
There were no fees paid to the principal accountant for products and services rendered by the principal accountant to the registrant, other than the services reported in paragraphs (a)-(c) of Item 4.
There were no fees paid to the principal accountant for products and services rendered by the principal accountant to the registrant’s investment adviser and any entity controlling, controlled by or under common control with the investment adviser that provides ongoing services to the registrant, other than the services reported in paragraphs (a)-(c) of Item 4.
(e) (1) The registrant’s audit committee is directly responsible for approving the services to be provided by the auditors, including:
(i) pre-approval of all audit and audit related services;
(ii) pre-approval of all non-audit related services to be provided to the Fund by the auditors;
(iii) pre-approval of all non-audit related services to be provided to the registrant by the auditors to the registrant’s investment adviser or to any entity that controls, is controlled by or is under common control with the registrant’s investment adviser and that provides ongoing services to the registrant where the non-audit services relate directly to the operations or financial reporting of the registrant; and
(iv) establishment by the audit committee, if deemed necessary or appropriate, as an alternative to committee pre-approval of services to be provided by the auditors, as required by paragraphs (ii) and (iii) above, of policies and procedures to permit such services to be pre-approved by other means, such as through establishment of guidelines or by action of a designated member or members of the committee; provided the policies and procedures are detailed as to the particular service and the committee is informed of each service and such policies and procedures do not include delegation of audit committee responsibilities, as contemplated under the Securities Exchange Act of 1934, to management; subject, in the case of (ii) through (iv), to any waivers, exceptions or exemptions that may be available under applicable law or rules.
(e) (2) None of the services provided to the registrant described in paragraphs (b)-(d) of Item 4 were approved by the audit committee pursuant to paragraph (c)(7)(i)(C) of Rule 2-01 of regulation S-X.
(f) No disclosures are required by this Item 4(f).
(g) The aggregate non-audit fees paid to the principal accountant for services rendered by the principal accountant to the registrant and the registrant’s investment adviser and any entity controlling, controlled by or under common control with the investment adviser that provides ongoing services to the registrant were $762 for the fiscal year ended June 30, 2010 and $6,000 for the fiscal year ended June 30, 2009.
(h) The registrant’s audit committee of the board has considered whether the provision of non-audit services that were rendered to the registrant’s investment adviser (not including any sub-adviser whose role is primarily portfolio management and is subcontracted with or overseen by another investment adviser), and any entity controlling, controlled by, or under common control with the investment adviser that provides ongoing services to the registrant that were not pre-approved pursuant to paragraph (c)(7)(ii) of Rule 2-01 of Regulation S-X is compatible with maintaining the principal accountant’s independence.
Item 5. Audit Committee of Listed Registrants. N/A
Item 6. Schedule of Investments. N/A
Item 7. Disclosure of Proxy Voting Policies and Procedures for Closed-End Management Investment Companies. N/A
Item 8. Portfolio Managers of Closed-End Management Investment Companies. N/A
Item 9. Purchases of Equity Securities by Closed-End Management Investment Company and Affiliated Purchasers. N/A
Item 10. Submission of Matters to a Vote of Security Holders.
There have been no changes to the procedures by which shareholders may recommend nominees to the Registrant's Board of Trustees that would require disclosure herein.
Item 11. Controls and Procedures.
(a) Evaluation of Disclosure Controls and Procedures. The Registrant maintains disclosure controls and procedures that are designed to ensure that information required to be disclosed in the Registrant’s filings under the Securities Exchange Act of 1934 and the Investment Company Act of 1940 is recorded, processed, summarized and reported within the periods specified in the rules and forms of the Securities and Exchange Commission. Such information is accumulated and communicated to the Registrant’s management, including its principal executive officer and principal financial officer, as appropriate, to allow timely decisions regarding required disclosure. The Registrant’s management, including the principal executive officer and the principal financial officer, recognizes that any set of controls and procedures, no matter how well designed and operated, can provide only reasonable assurance of achieving the desired control objectives.
Within 90 days prior to the filing date of this Shareholder Report on Form N-CSR, the Registrant had carried out an evaluation, under the supervision and with the participation of the Registrant’s management, including the Registrant’s principal executive officer and the Registrant’s principal financial officer, of the effectiveness of the design and operation of the Registrant’s disclosure controls and procedures. Based on such evaluation, the Registrant’s principal executive officer and principal financial officer concluded that the Registrant’s disclosure controls and procedures are effective.
(b) Changes in Internal Controls. There have been no significant changes in the Registrant’s internal controls or in other factors that could significantly affect the internal controls subsequent to the date of their evaluation in connection with the preparation of this Shareholder Report on Form N-CSR.
Item 12. Exhibits.
(a)(1) Code of Ethics
(a)(2) Certifications pursuant to Section 302 of the Sarbanes-Oxley Act of 2002 of Laura F. Fergerson, Chief Executive Officer - Finance and Administration, and Gaston Gardey, Chief Financial Officer and Chief Accounting Officer
(b) Certifications pursuant to Section 906 of the Sarbanes-Oxley Act of 2002 of Laura F. Fergerson, Chief Executive Officer - Finance and Administration, and Gaston Gardey, Chief Financial Officer and Chief Accounting Officer
SIGNATURES
Pursuant to the requirements of the Securities Exchange Act of 1934 and the Investment Company Act of 1940, the registrant has duly caused this report to be signed on its behalf by the undersigned, thereunto duly authorized.
FRANKLIN CALIFORNIA TAX-FREE TRUST
By /s/LAURA F. FERGERSON
Laura F. Fergerson
Chief Executive Officer - Finance and Administration
Date August 26, 2010
Pursuant to the requirements of the Securities Exchange Act of 1934 and the Investment Company Act of 1940, this report has been signed below by the following persons on behalf of the registrant and in the capacities and on the dates indicated.
By /s/LAURA F. FERGERSON
Laura F. Fergerson
Chief Executive Officer - Finance and Administration
Date August 26, 2010
By /s/GASTON GARDEY
Gaston Gardey
Chief Financial Officer and Chief Accounting Officer
Date August 26, 2010