Shareholder Letter
Dear Shareholder:
The 12-month period ended June 30, 2011, was typical of transitions between recessions and recoveries as the year under review endured swings in economic growth and investor sentiment. Although a 2.9% gross domestic product growth rate for 2010 reflected overall economic expansion, the road to that ultimate performance was, to say the least, bumpy and filled with anxiety.
Not all indicators moved in the same direction and at the same speed. While optimism among investors, economists and business leaders in the U.S. was beginning to firm up, a crisis of confidence in the eurozone erupted and undermined global equity markets throughout the summer of 2010. Investors worried about sovereign debt defaults and their potential effects on global economic growth. By the end of 2010, those fears had diminished, but the eurozone’s economic situation remained fragile. In March 2011, Portugal officially sought a bailout from the European Union and International Monetary Fund. Furthermore, Greece appeared to be at risk of defaulting on its debt. Near the end of the reporting period, global equity markets again declined amid increasing concerns about the ability of Greece to avoid a default without a large bailout package and concessions.
In the U.S., the nascent economic recovery lacked momentum, so the Federal Reserve Board (Fed) embarked on a second round of economic stimulus using quantitative easing, or QE2, which comprised mostly more aggressive purchases of U.S. Treasury long-dated bonds. The Fed’s goal was to spur economic growth that would ultimately lead to greater employment and help the country avoid a deflationary period. QE2 ended on June 30, 2011, leaving some uncertainty about what effect that might have. Many economists lowered their growth expectations for the U.S. economy after taking into consideration continued sluggishness in the housing market, persistently high unemployment, lower
NOT FDIC INSURED | MAY LOSE VALUE | NO BANK GUARANTEE
Not part of the annual report | 1
Annual Report
State Update and Municipal Bond Market Overview
California’s diverse and wealthy economy, the largest contributor to the nation’s gross domestic product, recovered modestly from the Great Recession at a slower pace than the national average. Weak real estate markets, a high foreclosure rate and low homebuilding activity hindered a strong recovery. California’s unemployment rate reached a historical high of 12.5% in December 2010, but declined to 11.8% by period-end, which was significantly higher than the 9.2% national rate.1 The state gained jobs in all sectors except other services, mining and logging, and financial activities. The information, education and health services, and professional and business services sectors posted the strongest annual growth rates. In the economic forecast included with the governor’s fiscal year 2012 budget proposal, the state projected slim job growth of 1.2% in 2011, a pace that would lag working-age population growth.2 However, the state projected job growth to accelerate in 2012 and 2013, with nonfarm jobs lost during the Great Recession to be recovered fully by the third quarter of 2016.
California enacted its fiscal year 2011 budget three months late, in October 2010. To close a significant budget gap, state officials relied on optimistic revenue forecasts, higher federal aid assumptions, spending cuts, and various nonrecur-ring measures that included payment deferrals, loans and fund shifts. However, federal funds and spending cuts that failed to materialize added to the state’s fiscal year 2012 budget deficit. In November 2010, voters passed propositions that allowed for timelier budgets and further limited the state’s budgetary flexibility and ability to raise revenues. In early 2011, Governor Brown submitted to the legislature his fiscal year 2012 budget, which included spending cuts, revenue enhancements and inter-fund borrowing to address the budget deficit. In late March, Governor Brown halted negotiations with Republican legislators due to disagreements regarding tax measures that would help close the remaining budget gap without deeper cuts to schools and public safety. Late in the period, a projected jump in tax revenues allowed the governor to revise his fiscal year 2012 budget to include fewer extensions of temporary fees and taxes than set forth in the original proposal. At period-end, the governor signed the budget, which was balanced and included cuts to cities and counties, transit projects, and deferred education payments.
1. Source: Bureau of Labor Statistics.
2. Source: Edmund G. Brown, Jr., Governor, State of California, “2011-12 Governor’s Budget Summary,” 1/10/11.
4 | Annual Report
The state’s net tax-supported debt was $2,542 per capita and 6.0% of personal income, compared with the $1,066 and 2.8% national medians.3 Although California’s debt levels ranked among the nation’s highest, they were moderate given the state’s large budget. However, with unused voter authorizations for significant additional general obligation (GO) bond issuance, the state likely faces higher debt levels in coming years. Independent credit rating agency Moody’s Investors Service assigned California’s GO bonds a rating of A1 with a stable outlook.4 The rating reflected the state’s diverse, wealthy economy and relatively well funded pension obligation. The outlook reflected Moody’s expectation the state will address any further budgetary and liquidity challenges without a significant cash crisis.
For the 12 months ended June 30, 2011, the municipal bond market posted a gain of 3.48% as measured by the Barclays Capital (BC) Municipal Bond Index, which tracks investment-grade municipal securities.5 The gain was noteworthy considering the same index endured a record five consecutive months of negative total returns from September 2010 through January 2011. In comparison during the same period, Treasuries rose 2.24%, according to the BC U.S. Treasury Index, which tracks various U.S. Treasury securities.5
For the first two months of the reporting period, municipal bond performance was solid, supported by strong investor demand and generally low interest rates resulting in part from the Federal Reserve Board’s (Fed’s) accommodative stance. The market also benefited from lower-than-normal tax-exempt issuance due to the Build America Bonds (BAB) program. The BAB program allowed municipal issuers to sell their bonds in the taxable market and take advantage of a 35% federal government subsidy for all coupon payments made on those municipal bonds. Such taxable bonds, however, are not part of the Funds’ tax-free portfolios. This subsidy enabled municipalities to borrow at significantly lower net yields than they could otherwise obtain in the traditional tax-exempt municipal bond market, which dramatically reduced the supply of new tax-exempt bonds. Of the $433 billion in issuance for the year 2010, $275 billion, or 64%, was in the form of tax-exempt municipal bonds.6 For the year 2008 (prior to the BAB program), municipal issuance totaled $390 billion, with $341 billion, or 88%, in the form of tax-exempt municipal bonds.6
3. Source: Moody’s Investors Service, “Special Comment: 2011 State Debt Medians Report,” 5/25/11. 4. This does not indicate Moody’s rating of the Fund.
5. Source: © 2011 Morningstar. All Rights Reserved. The information contained herein: (1) is proprietary to Morningstar and/or its content providers; (2) may not be copied or distributed; and (3) is not warranted to be accurate, complete or timely. Neither Morningstar nor its content providers are responsible for any damages or losses arising from any use of this information. Past performance is no guarantee of future results.
6. Source: Thomson Reuters.
Annual Report | 5
November, December and January were particularly challenging months for many fixed income markets as they pulled back sharply after the Fed announced its intention to implement a second round of quantitative easing (QE2) with a $600 billion bond buying program. During the three-month period the BC Municipal Bond Index: Long Component, which consists of 22-year and longer maturity municipal securities, fell 8.58%, while the BC U.S. Treasury Index: Long Component, which tracks Treasuries with 10-year or longer maturities, dipped 7.07%.5
Several factors contributed to municipal bond market weakness:
- The market seemed dissatisfied that the Fed indicated it would target bonds with maturities of 10 years or less, which contributed to a sell-off in bonds with maturities longer than 10 years.
- Some observers felt QE2 was unnecessary and might even ignite inflation, which contributed to weakness in shorter term bonds. The municipal bond market pulled back as yields generally rose. This was exacerbated as market concerns led to investor redemptions, forcing further sell-offs.
According to the Investment Company Institute, cash flows into munici- pal bond mutual funds during the reporting period first turned negative the week of November 10 and worsened in following weeks. - For most of calendar year 2010, market participants had expected the BAB program to be extended beyond 2010, and they began to anticipate a larger-than-normal supply of municipal bonds going into year-end.
This belief waned, however, as Republicans took over the majority of the House of Representatives and did not propose legislation that would continue the program. - Market participants feared municipalities would concentrate their borrowing needs in tax-free bonds during 2011 as they no longer had the option of using BABs. However, tax-exempt new-issue supply in the municipal bond market was lower than expected.
- In December, Congress enacted an extension of tax cuts for all Americans, which likely further reduced the appeal of tax-exempt municipal bonds.
- Some observers raised concerns about the ability of municipal market borrowers to meet their debt obligations. High-profile and repetitive media coverage of such comments created panic among some investors. However, counterarguments citing the historically low level of municipal defaults alleviated these fears somewhat.
6 | Annual Report
Since February, reduced supply has helped drive bond prices higher, and the market turned positive. So far, year-to-date supply through June 2011 is down a dramatic 43% compared with the same period for 2010.6
On August 2, 2011, the U.S. raised its debt ceiling and avoided defaulting on its debt obligations. Independent credit rating agency, Standard & Poor’s (S&P) lowered the country’s long-term rating to AA+ from AAA, citing political risks and a rising debt burden.7 At the same time, however, S&P affirmed the highest short-term rating, A-1+, of the U.S. A few days later, S&P similarly lowered the long-term ratings of government-sponsored enterprises (GSEs) such as Fannie Mae and Freddie Mac while affirming their A-1+ short-term ratings. Short-term debt obligations are those that generally have a maturity of one year or less. In addition, municipal bonds backed by the U.S. government or GSEs were downgraded along with the country’s rating.
Although the municipal bond market experienced recent, short-term volatility, we maintained a long-term perspective. In our view, the rise in yields at times during the reporting period provided us opportunities to buy high-quality, essential use revenue and general obligation bonds at levels that may enhance the Fund’s income-earning potential.
The foregoing information reflects our analysis and opinions as of June 30, 2011, the end of the reporting period. The information is not a complete analysis of every aspect of any market, country, industry, security or fund. Statements of fact are from sources considered reliable.
7. These do not indicate ratings of the Funds. STANDARD & POOR’s®, S&P® and S&P 500® are registered trademarks of Standard & Poor’s Financial Services LLC. Standard & Poor’s does not sponsor, endorse, sell or promote any S&P index-based product.
Annual Report | 7
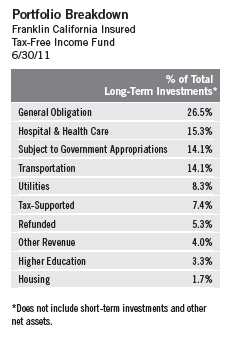
Franklin California Insured Tax-Free Income Fund
Your Fund’s Goal and Main Investments: Franklin California Insured Tax-Free Income Fund seeks to provide as high a level of income exempt from federal and California personal income taxes as is consistent with prudent investment management and preservation of capital by investing at least 80% of its net assets in insured municipal securities that pay interest free from such taxes.1, 2

8 | Annual Report
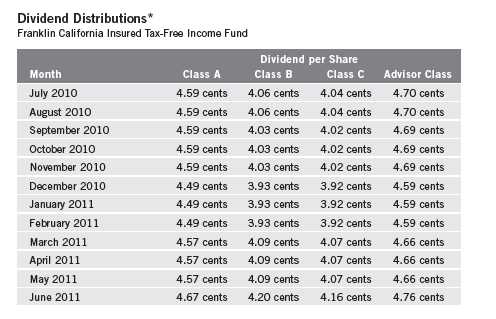
*Assumes shares were purchased and held for the entire accrual period, which differs from the calendar month. Since dividends accrue daily, your actual distributions will vary depending on the date you purchased your shares and any account activity. All Fund distributions will vary depending upon current market conditions, and past distributions are not indicative of future trends.
Performance Overview
The Fund’s Class A share price, as measured by net asset value, decreased from $12.07 on June 30, 2010, to $11.76 on June 30, 2011. The Fund’s Class A shares paid dividends totaling 54.93 cents per share for the same period.3 The Performance Summary beginning on page 11 shows that at the end of this reporting period the Fund’s Class A shares’ distribution rate was 4.56%, based on an annualization of the current 4.67 cent per share dividend and the maximum offering price of $12.28 on June 30, 2011. An investor in the 2011 maximum combined effective federal and California personal income tax bracket of 41.21% would need to earn a distribution rate of 7.76% from a taxable investment to match the Fund’s Class A tax-free distribution rate. For the Fund’s Class B, C and Advisor shares’ performance, please see the Performance Summary.
Investment Strategy
We use a consistent, disciplined strategy in an effort to maximize tax-exempt income for our shareholders by seeking to maintain exposure to higher coupon
3. All Fund distributions will vary depending upon current market conditions, and past distributions are not indicative of future trends.
Performance data represent past performance, which does not guarantee future results. Investment return and principal value will fluctuate, and you may have a gain or loss when you sell your shares. Current performance may differ from figures shown. Please visit franklintempleton.com or call (800) 342-5236 for most recent month-end performance.
Annual Report | 9
securities while balancing risk and return within the Fund’s range of allowable investments. We generally employ a buy-and-hold approach and invest in securities we believe should provide the most relative value in the market. As we invest during different interest rate environments, our portfolio remains diversified with a broad range of securities. This broad diversification may help mitigate interest rate risk. We do not use leverage or exotic derivatives, nor do we use hedging techniques that could add volatility and contribute to underperformance in adverse markets. We generally stay fully invested to help maximize income distribution.
Manager’s Discussion
The combination of our value-oriented philosophy of investing primarily for income and a positive-sloping municipal yield curve favored the use of longer term bonds. Consistent with our strategy, we sought to purchase bonds that ranged from 15 to 30 years in maturity with good call features. We believe our conservative, buy-and-hold investment strategy can help us achieve high, current, tax-free income for shareholders.
Thank you for your participation in Franklin California Insured Tax-Free Income Fund. We look forward to serving your future investment needs.
The foregoing information reflects our analysis, opinions and portfolio holdings as of June 30, 2011, the end of the reporting period. The way we implement our main investment strategies and the resulting portfolio holdings may change depending on factors such as market and economic conditions. These opinions may not be relied upon as investment advice or an offer for a particular security. The information is not a complete analysis of every aspect of any market, state, industry, security or the Fund. Statements of fact are from sources considered reliable, but the investment manager makes no representation or warranty as to their completeness or accuracy. Although historical performance is no guarantee of future results, these insights may help you understand our investment management philosophy.
10 | Annual Report
Performance Summary as of 6/30/11
Franklin California Insured Tax-Free Income Fund
Your dividend income will vary depending on dividends or interest paid by securities in the Fund’s portfolio, adjusted for operating expenses of each class. Capital gain distributions are net profits realized from the sale of portfolio securities. The performance table and graphs do not reflect any taxes that a shareholder would pay on Fund dividends, capital gain distributions, if any, or any realized gains on the sale of Fund shares. Total return reflects reinvestment of the Fund’s dividends and capital gain distributions, if any, and any unrealized gains or losses.

Annual Report | 11
Performance Summary (continued)
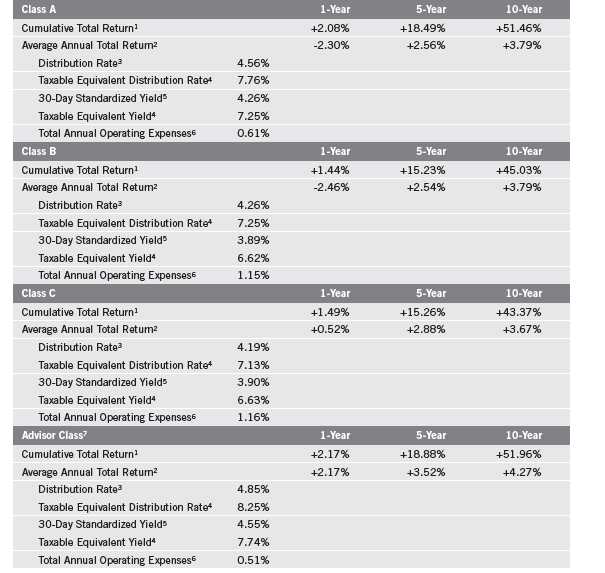
Performance
Cumulative total return excludes sales charges. Average annual total return includes maximum sales charges. Class A: 4.25% maximum initial sales charge; Class B: contingent deferred sales charge (CDSC) declining from 4% to 1% over six years, and eliminated thereafter; Class C: 1% CDSC in first year only; Advisor Class: no sales charges.
Performance data represent past performance, which does not guarantee future results. Investment return and principal value will fluctuate, and you may have a gain or loss when you sell your shares. Current performance may differ from figures shown. For most recent month-end performance, go to franklintempleton.com or call (800) 342-5236.
12 | Annual Report
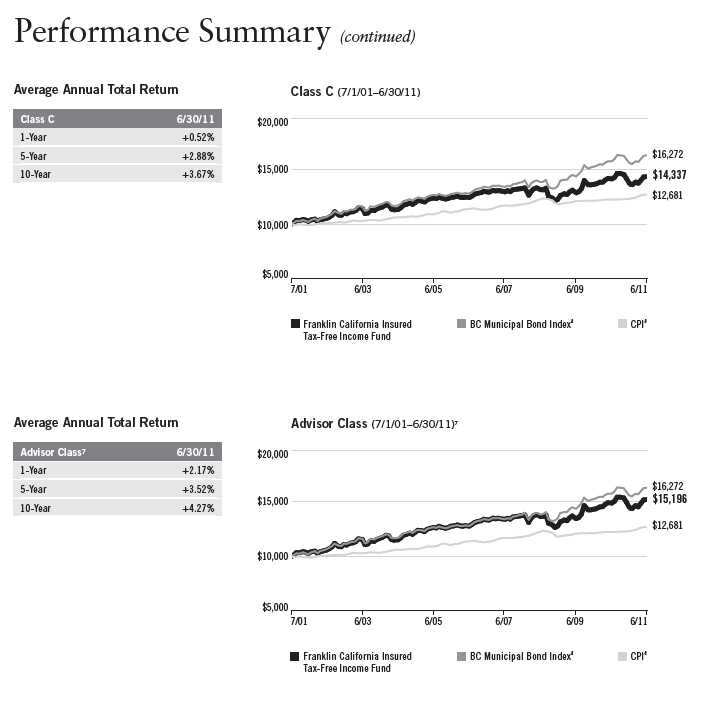
Performance Summary (continued)
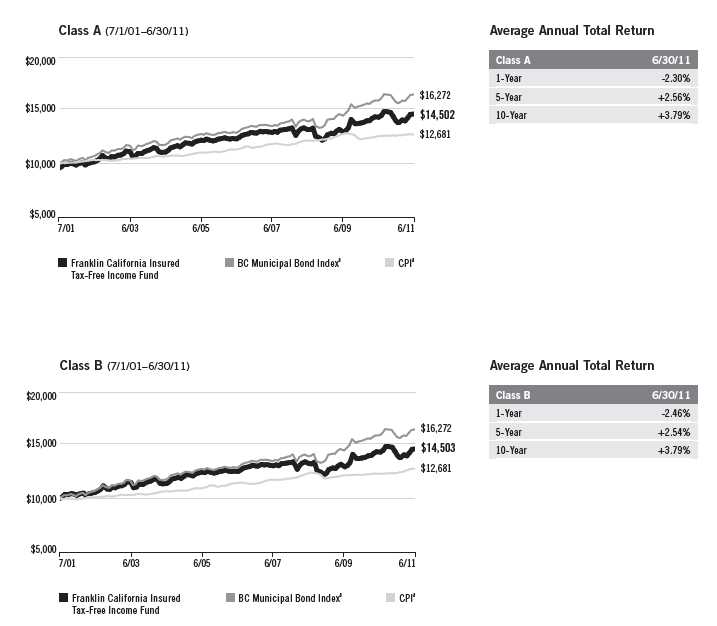
Total Return Index Comparison for a Hypothetical $10,000 Investment
Total return represents the change in value of an investment over the periods shown. It includes any current, applicable, maximum sales charge, Fund expenses, account fees and reinvested distributions. The unmanaged index includes reinvestment of any income or distributions. It differs from the Fund in composition and does not pay management fees or expenses. One cannot invest directly in an index.
Annual Report | 13
14 | Annual Report
Performance Summary (continued)
Endnotes
Because municipal bonds are sensitive to interest rate movements, the Fund’s yield and share price will fluctuate with market conditions. Bond prices generally move in the opposite direction of interest rates. Thus, as prices of bonds in the Fund adjust to a rise in interest rates, the Fund’s share price may decline. Since the Fund concentrates its investments in a single state, it is subject to greater risk of adverse economic and regulatory changes in that state than a geographically diversified fund. The manager applies various techniques and analyses in making investment decisions for the Fund, but there can be no guarantee that these decisions will produce the desired results. The Fund’s prospectus also includes a description of the main investment risks.
Class B: These shares have higher annual fees and expenses than Class A shares.
Class C: Prior to 1/1/04, these shares were offered with an initial sales charge; thus actual total returns would have differed. These shares have higher annual fees and expenses than Class A shares.
Advisor Class: Shares are available to certain eligible investors as described in the prospectus.
1. Cumulative total return represents the change in value of an investment over the periods indicated.
2. Average annual total return represents the average annual change in value of an investment over the periods indicated.
3. Distribution rate is based on an annualization of the respective class’s current monthly dividend and the maximum offering price (NAV for Classes B, C and Advisor) per share on 6/30/11.
4. Taxable equivalent distribution rate and yield assume the published rates as of 6/29/11 for the maximum combined effective federal and California personal income tax rate of 41.21%, based on the federal income tax rate of 35.00%.
5. The 30-day standardized yield for the 30 days ended 6/30/11 reflects an estimated yield to maturity (assuming all portfolio securities are held to maturity). It should be regarded as an estimate of the Fund’s rate of investment income, and it may not equal the Fund’s actual income distribution rate (which reflects the Fund’s past dividends paid to shareholders) or the income reported in the Fund’s financial statements.
6. Figures are as stated in the Fund’s prospectus current as of the date of this report. In periods of market volatility, assets may decline significantly, causing total annual Fund operating expenses to become higher than the figures shown.
7. Effective 10/31/08, the Fund began offering Advisor Class shares, which do not have sales charges or a Rule 12b-1 plan. Performance quotations for this class reflect the following methods of calculation: (a) For periods prior to 10/31/08, a restated figure is used based upon the Fund’s Class A performance, excluding the effect of Class A’s maximum initial sales charge, but reflecting the effect of the Class A Rule 12b-1 fees; and (b) for periods after 10/31/08, actual Advisor Class performance is used reflecting all charges and fees applicable to that class. Since 10/31/08 (commencement of sales), the cumulative and average annual total returns of Advisor Class shares were +17.86% and +6.36%.
8. Source: © 2011 Morningstar. The BC Municipal Bond Index is a market value-weighted index engineered for the long-term tax-exempt bond market. To be included in the index, bonds must be fixed rate, have at least one year to final maturity and be rated investment grade (Baa3/BBB- or higher) by at least two of the following agencies: Moody’s, Standard & Poor’s and Fitch. The Consumer Price Index (CPI), calculated by the U.S. Bureau of Labor Statistics, is a commonly used measure of the inflation rate.
Annual Report | 15
Your Fund’s Expenses
Franklin California Insured Tax-Free Income Fund
As a Fund shareholder, you can incur two types of costs:
- Transaction costs, including sales charges (loads) on Fund purchases; and
- Ongoing Fund costs, including management fees, distribution and service (12b-1) fees, and other Fund expenses. All mutual funds have ongoing costs, sometimes referred to as operating expenses.
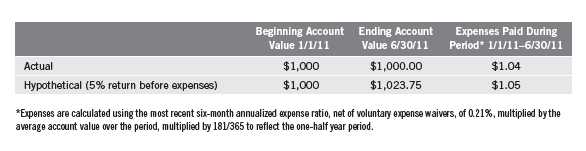
The following table shows ongoing costs of investing in the Fund and can help you understand these costs and compare them with those of other mutual funds. The table assumes a $1,000 investment held for the six months indicated.
Actual Fund Expenses
The first line (Actual) for each share class listed in the table provides actual account values and expenses. The “Ending Account Value” is derived from the Fund’s actual return, which includes the effect of Fund expenses.
You can estimate the expenses you paid during the period by following these steps. Of course, your account value and expenses will differ from those in this illustration:
| 1. | Divide your account value by $1,000. |
| | If an account had an $8,600 value, then $8,600 ÷ $1,000 = 8.6. |
| 2. | Multiply the result by the number under the heading “Expenses Paid During Period.” |
| | If Expenses Paid During Period were $7.50, then 8.6 x $7.50 = $64.50. |
In this illustration, the estimated expenses paid this period are $64.50.
Hypothetical Example for Comparison with Other Funds
Information in the second line (Hypothetical) for each class in the table can help you compare ongoing costs of investing in the Fund with those of other mutual funds. This information may not be used to estimate the actual ending account balance or expenses you paid during the period. The hypothetical “Ending Account Value” is based on the actual expense ratio for each class and an assumed 5% annual rate of return before expenses, which does not represent the Fund’s actual return. The figure under the heading “Expenses Paid During Period” shows the hypothetical expenses your account would have incurred under this scenario. You can compare this figure with the 5% hypothetical examples that appear in shareholder reports of other funds.
16 | Annual Report
Your Fund’s Expenses (continued)
Please note that expenses shown in the table are meant to highlight ongoing costs and do not reflect any transaction costs, such as sales charges. Therefore, the second line for each class is useful in comparing ongoing costs only, and will not help you compare total costs of owning different funds. In addition, if transaction costs were included, your total costs would have been higher. Please refer to the Fund prospectus for additional information on operating expenses.

*Expenses are calculated using the most recent six-month expense ratio, annualized for each class (A: 0.61%; B: 1.15%; C: 1.16%; and Advisor: 0.51%), multiplied by the average account value over the period, multiplied by 181/365 to reflect the one-half year period.
Annual Report | 17
Franklin California Intermediate-Term Tax-Free Income Fund
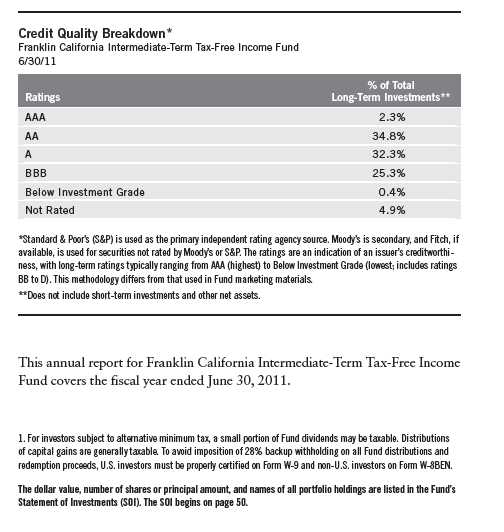
Your Fund’s Goal and Main Investments: Franklin California Intermediate-Term Tax-Free Income Fund seeks to provide as high a level of income exempt from federal and California personal income taxes as is consistent with prudent investment management and preservation of capital by investing at least 80% of its total assets in securities that pay interest free from such taxes.1 The Fund maintains a dollar-weighted average portfolio maturity (the time at which the debt must be repaid) of 3 to 10 years.
18 | Annual Report
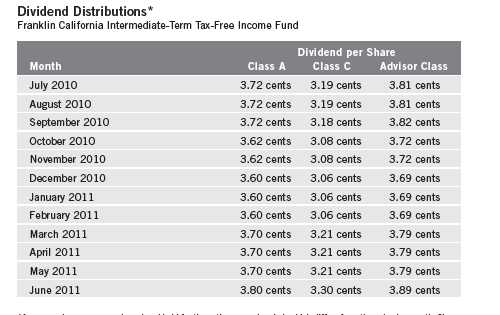
*Assumes shares were purchased and held for the entire accrual period, which differs from the calendar month. Since dividends accrue daily, your actual distributions will vary depending on the date you purchased your shares and any account activity. All Fund distributions will vary depending upon current market conditions, and past distributions are not indicative of future trends.
Performance Overview
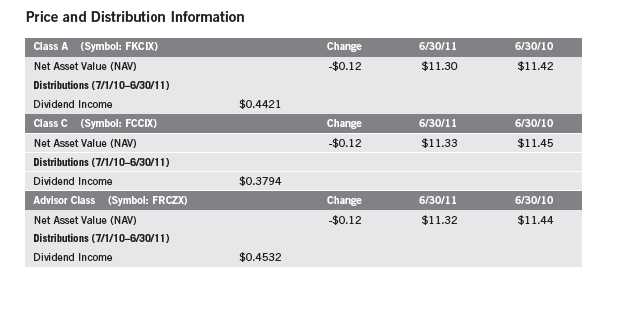
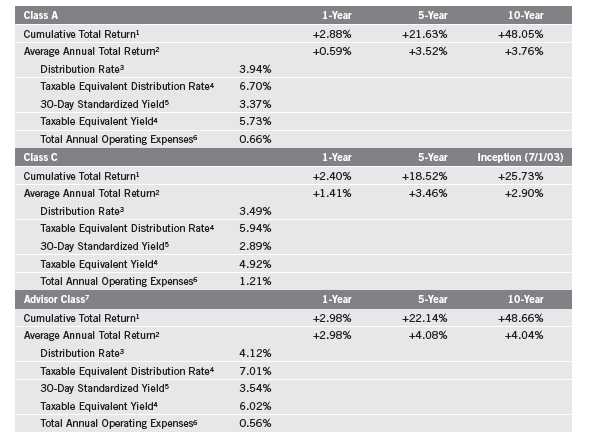
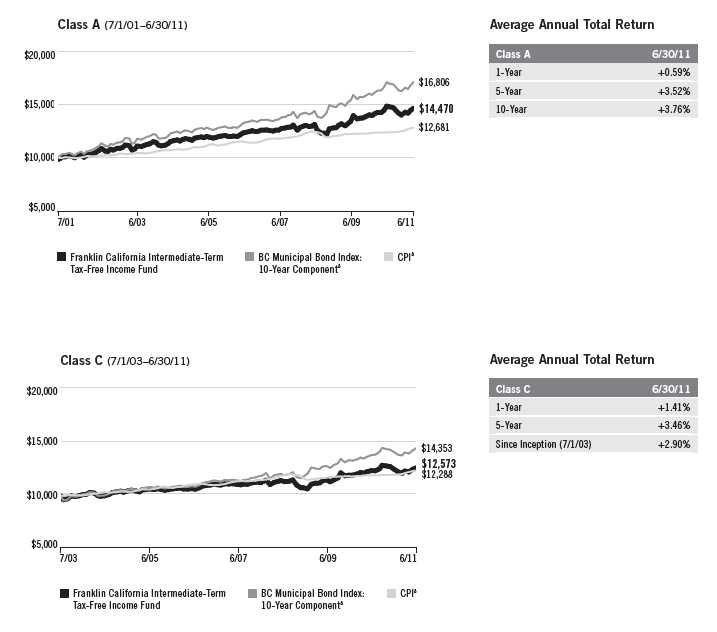
The Fund’s Class A share price, as measured by net asset value, decreased from $11.42 on June 30, 2010, to $11.30 on June 30, 2011. The Fund’s Class A shares paid dividends totaling 44.21 cents per share for the same period.2 The Performance Summary beginning on page 21 shows that at the end of this reporting period the Fund’s Class A shares’ distribution rate was 3.94%, based on an annualization of the current 3.80 cent per share dividend and the maximum offering price of $11.56 on June 30, 2011. An investor in the 2011 maximum combined effective federal and California personal income tax bracket of 41.21% would need to earn a distribution rate of 6.70% from a taxable investment to match the Fund’s Class A tax-free distribution rate. For the Fund’s Class C and Advisor shares’ performance, please see the Performance Summary.
2. All Fund distributions will vary depending upon current market conditions, and past distributions are not indicative of future trends.
Performance data represent past performance, which does not guarantee future results. Investment return and principal value will fluctuate, and you may have a gain or loss when you sell your shares. Current performance may differ from figures shown. Please visit franklintempleton.com or call (800) 342-5236 for most recent month-end performance.
Annual Report | 19

Investment Strategy
We use a consistent, disciplined strategy in an effort to maximize tax-exempt income for our shareholders by seeking to maintain exposure to higher coupon securities while balancing risk and return within the Fund’s range of allowable investments. We generally employ a buy-and-hold approach and invest in securities we believe should provide the most relative value in the market. As we invest during different interest rate environments, our portfolio remains diversified with a broad range of securities. This broad diversification may help mitigate interest rate risk. We do not use leverage or exotic derivatives, nor do we use hedging techniques that could add volatility and contribute to underperformance in adverse markets. We generally stay fully invested to help maximize income distribution.
Manager’s Discussion
Consistent with our strategy, we sought to remain fully invested in bonds that maintain an average weighted maturity of 3 to 10 years. We believe our conservative, buy-and-hold investment strategy can help us achieve high, current, tax-free income for shareholders.
Thank you for your participation in Franklin California Intermediate-Term Tax-Free Income Fund. We look forward to serving your future investment needs.
The foregoing information reflects our analysis, opinions and portfolio holdings as of June 30, 2011, the end of the reporting period. The way we implement our main investment strategies and the resulting portfolio holdings may change depending on factors such as market and economic conditions. These opinions may not be relied upon as investment advice or an offer for a particular security. The information is not a complete analysis of every aspect of any market, state, industry, security or the Fund. Statements of fact are from sources considered reliable, but the investment manager makes no representation or warranty as to their completeness or accuracy. Although historical performance is no guarantee of future results, these insights may help you understand our investment management philosophy.
20 | Annual Report
Performance Summary as of 6/30/11
Franklin California Intermediate-Term Tax-Free Income Fund
Your dividend income will vary depending on dividends or interest paid by securities in the Fund’s portfolio, adjusted for operating expenses of each class. Capital gain distributions are net profits realized from the sale of portfolio securities. The performance table and graphs do not reflect any taxes that a shareholder would pay on Fund dividends, capital gain distributions, if any, or any realized gains on the sale of Fund shares. Total return reflects reinvestment of the Fund’s dividends and capital gain distributions, if any, and any unrealized gains or losses.
Annual Report | 21
Performance Summary (continued)
Performance
Cumulative total return excludes sales charges. Average annual total return includes maximum sales charges. Class A: 2.25% maximum initial sales charge; Class C: 1% contingent deferred sales charge in first year only; Advisor Class: no sales charges.
Performance data represent past performance, which does not guarantee future results. Investment return and principal value will fluctuate, and you may have a gain or loss when you sell your shares. Current performance may differ from figures shown. For most recent month-end performance, go to franklintempleton.com or call (800) 342-5236.
22 | Annual Report
Performance Summary (continued)
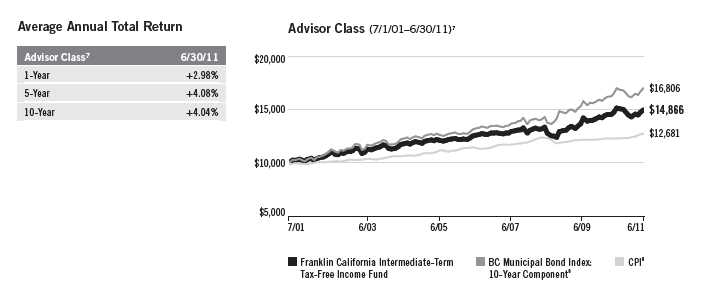
Total Return Index Comparison for a Hypothetical $10,000 Investment
Total return represents the change in value of an investment over the periods shown. It includes any current, applicable, maximum sales charge, Fund expenses, account fees and reinvested distributions. The unmanaged index includes reinvestment of any income or distributions. It differs from the Fund in composition and does not pay management fees or expenses. One cannot invest directly in an index.
Annual Report | 23
Performance Summary (continued)
Endnotes
Because municipal bonds are sensitive to interest rate movements, the Fund’s yield and share price will fluctuate
with market conditions. Bond prices generally move in the opposite direction of interest rates. Thus, as prices
of bonds in the Fund adjust to a rise in interest rates, the Fund’s share price may decline. Since the Fund con-
centrates its investments in a single state, it is subject to greater risk of adverse economic and regulatory changes
in that state than a geographically diversified fund. The manager applies various techniques and analyses in
making investment decisions for the Fund, but there can be no guarantee that these decisions will produce the
desired results. The Fund’s prospectus also includes a description of the main investment risks.
Class C: Prior to 1/1/04, these shares were offered with an initial sales charge; thus actual total returns would
have differed. These shares have higher annual fees and expenses than Class A shares.
Advisor Class: Shares are available to certain eligible investors as described in the prospectus.
1. Cumulative total return represents the change in value of an investment over the periods indicated.
2. Average annual total return represents the average annual change in value of an investment over the periods indicated.
3. Distribution rate is based on an annualization of the respective class’s current monthly dividend and the maximum
offering price (NAV for Classes C and Advisor) per share on 6/30/11.
4. Taxable equivalent distribution rate and yield assume the published rates as of 6/29/11 for the maximum combined
effective federal and California personal income tax rate of 41.21%, based on the federal income tax rate of 35.00%.
5. The 30-day standardized yield for the 30 days ended 6/30/11 reflects an estimated yield to maturity (assuming all
portfolio securities are held to maturity). It should be regarded as an estimate of the Fund’s rate of investment
income, and it may not equal the Fund’s actual income distribution rate (which reflects the Fund’s past dividends
paid to shareholders) or the income reported in the Fund’s financial statements.
6. Figures are as stated in the Fund’s prospectus current as of the date of this report. In periods of market volatility, assets
may decline significantly, causing total annual Fund operating expenses to become higher than the figures shown.
7. Effective 10/31/08, the Fund began offering Advisor Class shares, which do not have sales charges or a Rule 12b-1
plan. Performance quotations for this class reflect the following methods of calculation: (a) For periods prior to 10/31/08,
a restated figure is used based upon the Fund’s Class A performance, excluding the effect of Class A’s maximum initial
sales charge, but reflecting the effect of the Class A Rule 12b-1 fees; and (b) for periods after 10/31/08, actual
Advisor Class performance is used reflecting all charges and fees applicable to that class. Since 10/31/08 (commence-
ment of sales), the cumulative and average annual total returns of Advisor Class shares were +19.12% and +6.79%.
8. Source: © 2011 Morningstar. The BC Municipal Bond Index: 10-Year Component is the 10-year (8-12) component
of the BC Municipal Bond Index, which is a market value-weighted index engineered for the long-term tax-exempt
bond market. To be included in the index, bonds must be fixed rate, have at least one year to final maturity and be
rated investment grade (Baa3/BBB- or higher) by at least two of the following agencies: Moody’s, Standard & Poor’s
and Fitch. The Consumer Price Index (CPI), calculated by the U.S. Bureau of Labor Statistics, is a commonly used
measure of the inflation rate.
24 | Annual Report
Your Fund’s Expenses
Franklin California Intermediate-Term Tax-Free Income Fund
As a Fund shareholder, you can incur two types of costs:
- Transaction costs, including sales charges (loads) on Fund purchases; and
- Ongoing Fund costs, including management fees, distribution and service (12b-1) fees, and other Fund expenses. All mutual funds have ongoing costs, sometimes referred to as operating expenses.
The following table shows ongoing costs of investing in the Fund and can help you understand these costs and compare them with those of other mutual funds. The table assumes a $1,000 investment held for the six months indicated.
Actual Fund Expenses
The first line (Actual) for each share class listed in the table provides actual account values and expenses. The “Ending Account Value” is derived from the Fund’s actual return, which includes the effect of Fund expenses.
You can estimate the expenses you paid during the period by following these steps. Of course, your account value and expenses will differ from those in this illustration:
| 1. | Divide your account value by $1,000. |
| | If an account had an $8,600 value, then $8,600 ÷ $1,000 = 8.6. |
| 2. | Multiply the result by the number under the heading “Expenses Paid During Period.” |
| | If Expenses Paid During Period were $7.50, then 8.6 x $7.50 = $64.50. |
In this illustration, the estimated expenses paid this period are $64.50.
Hypothetical Example for Comparison with Other Funds
Information in the second line (Hypothetical) for each class in the table can help you compare ongoing costs of investing in the Fund with those of other mutual funds. This information may not be used to estimate the actual ending account balance or expenses you paid during the period. The hypothetical “Ending Account Value” is based on the actual expense ratio for each class and an assumed 5% annual rate of return before expenses, which does not represent the Fund’s actual return. The figure under the heading “Expenses Paid During Period” shows the hypothetical expenses your account would have incurred under this scenario. You can compare this figure with the 5% hypothetical examples that appear in shareholder reports of other funds.
Annual Report | 25
Your Fund’s Expenses (continued)
Please note that expenses shown in the table are meant to highlight ongoing costs and do not reflect any transaction costs, such as sales charges. Therefore, the second line for each class is useful in comparing ongoing costs only, and will not help you compare total costs of owning different funds. In addition, if transaction costs were included, your total costs would have been higher. Please refer to the Fund prospectus for additional information on operating expenses.
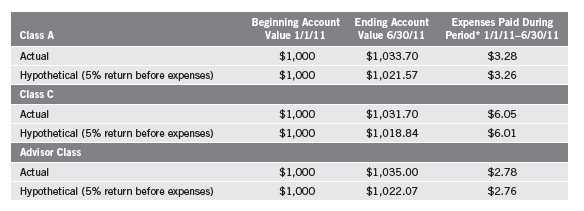
*Expenses are calculated using the most recent six-month expense ratio, annualized for each class (A: 0.65%; C: 1.20%; and Advisor: 0.55%), multiplied by the average account value over the period, multiplied by 181/365 to reflect the one-half year period.
26 | Annual Report
Franklin California Tax-Exempt Money Fund
Your Fund’s Goal and Main Investments: Franklin California Tax-Exempt Money Fund seeks to provide as high a level of income exempt from federal and California personal income taxes as is consistent with prudent investment management and preservation of capital and liquidity.1 The Fund’s portfolio invests at least 80% of its total assets in securities that pay interest free from such taxes. The Fund tries to maintain a stable $1.00 share price.
Performance data represent past performance, which does not guarantee future results. Investment return will fluctuate. Current performance may differ from figures shown. Please visit franklintempleton.com or call (800) 342-5236 for most recent month-end performance.
An investment in the Fund is not guaranteed by the Federal Deposit Insurance Corporation (FDIC) or any other government agency. Although the Fund seeks to preserve the value of your investment at $1.00 per share, it is possible to lose money by investing in the Fund.
This annual report for Franklin California Tax-Exempt Money Fund covers the fiscal year ended June 30, 2011.
Performance Overview
In an effort to promote continued economic recovery, the Federal Reserve Board held short-term interest rates at a historically low level during the 12-month period under review, which affected money market portfolio yields. As a result, Franklin California Tax-Exempt Money Fund’s seven-day effective yield was unchanged at 0.00% from June 30, 2010, to June 30, 2011.
Investment Strategy
We invest at least 80% of the Fund’s total assets in high-quality, short-term municipal securities whose interest is free from federal and California state personal income taxes. Although the Fund tries to invest all of its assets in tax-free securities, it is possible, although not anticipated, that up to 20% of its assets may be in securities that pay taxable interest, including interest that may be subject to federal alternative minimum tax. We maintain a dollar-weighted average portfolio maturity of 60 days or less.
Manager’s Discussion
During the year under review, short-term municipal bond yields remained relatively low as the Federal Open Market Committee kept the federal funds
1. For investors subject to alternative minimum tax, a small portion of Fund dividends may be taxable. Distributions of capital gains are generally taxable. To avoid imposition of 28% backup withholding on all Fund distributions and redemption proceeds, U.S. investors must be properly certified on Form W-9 and non-U.S. investors on Form W-8BEN.
The dollar value, number of shares or principal amount, and names of all portfolio holdings are listed in the Fund’s Statement of Investments (SOI). The SOI begins on page 60.
Annual Report | 27
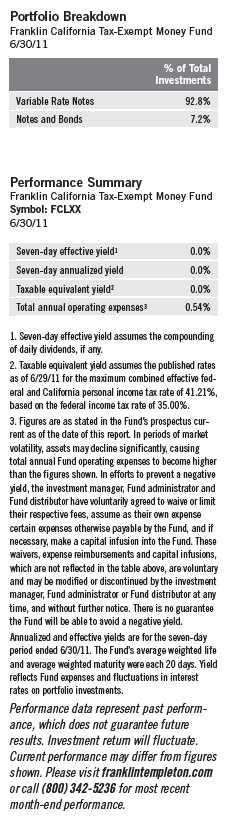
target rate in a range of 0% to 0.25% and the discount rate at 0.75%. In addition, the Securities Industry and Financial Markets Association (SIFMA) Municipal Swap Index, a weekly index of variable rate securities, which make up a large portion of Franklin California Tax-Exempt Money Fund, also stayed relatively low. The SIFMA rate ranged from a high during the reporting period of 0.34% near the end of December 2010 to 0.09% at period-end, which was an all-time low.2
During the Fund’s fiscal year, variable rate demand note (VRDN) issuance was extremely low compared to recent years, and demand for well-structured VRDNs supported low rates. Franklin California Tax-Exempt Money Fund continued to be very selective in purchasing high-quality securities. In this environment, the Fund’s yield remained at 0.00% for the fiscal year.
During the review period, the Fund participated in several issues including California Education Facilities Authority Revenue for Stanford University and Metropolitan Water District of Southern California Water revenue VRDNs, and Roseville Joint Union High School District tax and revenue anticipation notes.
Thank you for your continued participation in Franklin California Tax-Exempt Money Fund. We look forward to serving your future investment needs.
The foregoing information reflects our analysis, opinions and portfolio holdings as of June 30, 2011, the end of the reporting period. The way we implement our main investment strategies and the resulting portfolio holdings may change depending on factors such as market and economic conditions. These opinions may not be relied upon as investment advice or an offer for a particular security. The information is not a complete analysis of every aspect of any market, state, industry, security or the Fund. Statements of fact are from sources considered reliable, but the investment manager makes no representation or warranty as to their completeness or accuracy. Although historical performance is no guarantee of future results, these insights may help you understand our investment management philosophy.
2. Source: Thomson Financial.
28 | Annual Report
Your Fund’s Expenses
Franklin California Tax-Exempt Money Fund
As a Fund shareholder, you can incur two types of costs:
- Transaction costs, including sales charges (loads) on Fund purchases; and
- Ongoing Fund costs, including management fees, distribution and service (12b-1) fees, and other Fund expenses. All mutual funds have ongoing costs, sometimes referred to as operating expenses.
The following table shows ongoing costs of investing in the Fund and can help you understand these costs and compare them with those of other mutual funds. The table assumes a $1,000 investment held for the six months indicated.
Actual Fund Expenses
The first line (Actual) of the table provides actual account values and expenses. The “Ending Account Value” is derived from the Fund’s actual return which includes the effect of Fund expenses.
You can estimate the expenses you paid during the period by following these steps. Of course, your account value and expenses will differ from those in this illustration:
| 1. | Divide your account value by $1,000. |
| | If an account had an $8,600 value, then $8,600 ÷ $1,000 = 8.6. |
| 2. | Multiply the result by the number under the heading “Expenses Paid During Period.” |
| | If Expenses Paid During Period were $7.50, then 8.6 x $7.50 = $64.50. |
In this illustration, the estimated expenses paid this period are $64.50.
Hypothetical Example for Comparison with Other Funds
Information in the second line (Hypothetical) of the table can help you compare ongoing costs of investing in the Fund with those of other mutual funds. This information may not be used to estimate the actual ending account balance or expenses you paid during the period. The hypothetical “Ending Account Value” is based on the Fund’s actual expense ratio and an assumed 5% annual rate of return before expenses, which does not represent the Fund’s actual return. The figure under the heading “Expenses Paid During Period” shows the hypothetical expenses your account would have incurred under this scenario. You can compare this figure with the 5% hypothetical examples that appear in shareholder reports of other funds.
Annual Report | 29
Your Fund’s Expenses (continued)
Please note that expenses shown in the table are meant to highlight ongoing costs and do not reflect any transaction costs, such as sales charges. Therefore, the second line of the table is useful in comparing ongoing costs only, and will not help you compare total costs of owning different funds. In addition, if transaction costs were included, your total costs would have been higher. Please refer to the Fund prospectus for additional information on operating expenses.
30 | Annual Report
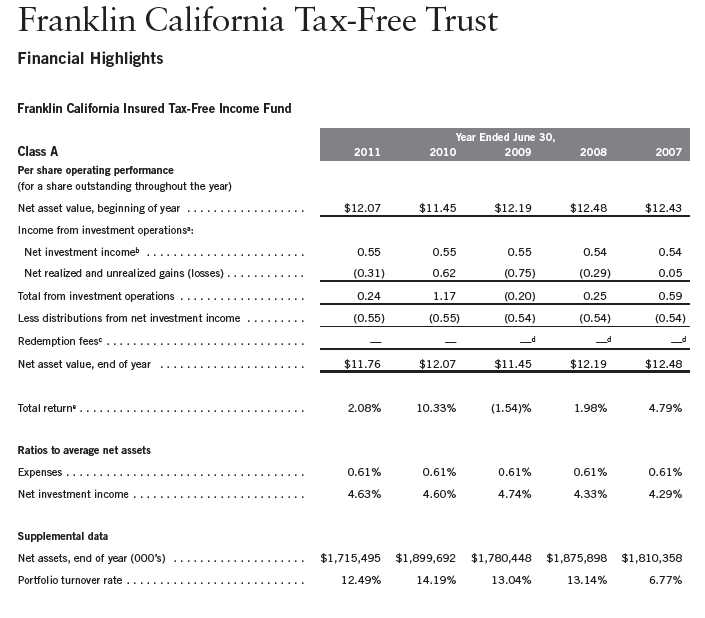
aThe amount shown for a share outstanding throughout the period may not correlate with the Statement of Operations for the period due to the timing of sales and repurchases of
the Fund shares in relation to income earned and/or fluctuating market value of the investments of the Fund.
bBased on average daily shares outstanding.
cEffective September 1, 2008, the redemption fee was eliminated.
dAmount rounds to less than $0.01 per share.
eTotal return does not reflect sales commissions or contingent deferred sales charges, if applicable.
Annual Report | The accompanying notes are an integral part of these financial statements. | 31
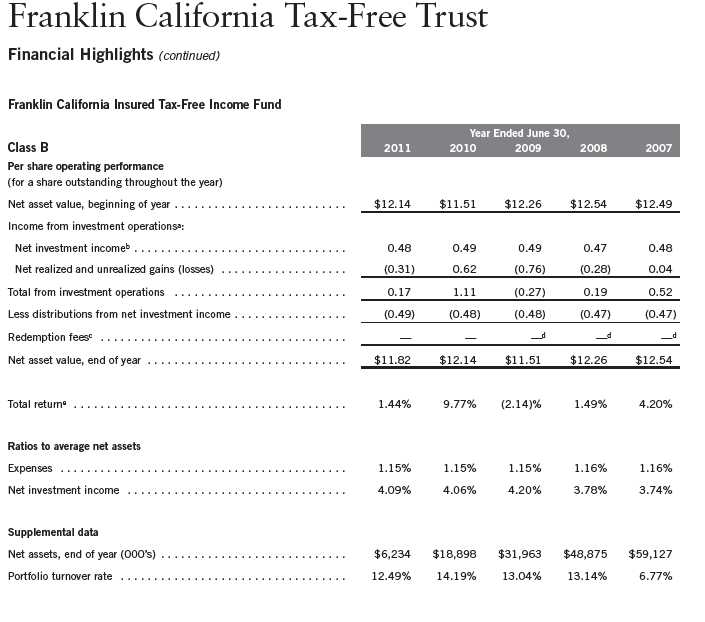
aThe amount shown for a share outstanding throughout the period may not correlate with the Statement of Operations for the period due to the timing of sales and repurchases of
the Fund shares in relation to income earned and/or fluctuating market value of the investments of the Fund.
bBased on average daily shares outstanding.
cEffective September 1, 2008, the redemption fee was eliminated.
dAmount rounds to less than $0.01 per share.
eTotal return does not reflect sales commissions or contingent deferred sales charges, if applicable.
32 | The accompanying notes are an integral part of these financial statements. | Annual Report

aThe amount shown for a share outstanding throughout the period may not correlate with the Statement of Operations for the period due to the timing of sales and repurchases of
the Fund shares in relation to income earned and/or fluctuating market value of the investments of the Fund.
bBased on average daily shares outstanding.
cEffective September 1, 2008, the redemption fee was eliminated.
dAmount rounds to less than $0.01 per share.
eTotal return does not reflect sales commissions or contingent deferred sales charges, if applicable.
Annual Report | The accompanying notes are an integral part of these financial statements. | 33

aFor the period October 31, 2008 (effective date) to June 30, 2009.
bThe amount shown for a share outstanding throughout the period may not correlate with the Statement of Operations for the period due to the timing of sales and repurchases of
the Fund shares in relation to income earned and/or fluctuating market value of the investments of the Fund.
cBased on average daily shares outstanding.
dTotal return is not annualized for periods less than one year.
eRatios are annualized for periods less than one year.
34 | The accompanying notes are an integral part of these financial statements. | Annual Report
| | | | |
| Franklin California Tax-Free Trust | | | | |
| |
| Statement of Investments, June 30, 2011 | | | | |
| |
| |
| Franklin California Insured Tax-Free Income Fund | | Principal Amount | | Value |
| Municipal Bonds 97.5% | | | | |
| California 97.5% | | | | |
| ABAG Finance Authority for Nonprofit Corps. California Health Facilities Revenue, Institute on | | | | |
| Aging, California Mortgage Insured, 5.65%, 8/15/38 | $ | 9,000,000 | $ | 8,649,900 |
| ABAG Finance Authority for Nonprofit Corps. COP, | | | | |
| Lincoln Child Center Inc., California Mortgage Insured, 6.125%, 11/01/24 | | 1,950,000 | | 1,956,572 |
| Odd Fellows Home, California Mortgage Insured, 6.00%, 8/15/24 | | 5,000,000 | | 5,013,750 |
| ABAG Finance Authority for Nonprofit Corps. Revenue, | | | | |
| Casa De Las Campanas, California Mortgage Insured, 6.00%, 9/01/37 | | 11,000,000 | | 11,200,420 |
| Channing House, California Mortgage Insured, 6.00%, 5/15/30 | | 8,495,000 | | 8,663,711 |
| Poway Retirement Housing Foundation Housing Inc. Project, Series A, California Mortgage | | | | |
| Insured, 5.375%, 11/15/25 | | 5,145,000 | | 5,147,109 |
| Sansum-Santa Barbara, Refunding, Series A, California Mortgage Insured, 5.60%, | | | | |
| 4/01/26 | | 2,750,000 | | 2,770,845 |
| Acalanes UHSD, GO, Capital Appreciation, Election of 2002, Series A, FGIC Insured, | | | | |
| zero cpn., 8/01/25 | | 9,045,000 | | 4,474,019 |
| Alameda Corridor Transportation Authority Revenue, Capital Appreciation, sub. lien, | | | | |
| Refunding, Series A, AMBAC Insured, | | | | |
| zero cpn. to 10/01/12, 5.25% thereafter, 10/01/21 | | 64,660,000 | | 55,254,556 |
| zero cpn. to 10/01/12, 5.45% thereafter, 10/01/25 | | 25,000,000 | | 19,895,750 |
| Alhambra City Elementary School District GO, Capital Appreciation, Election of 1999, Series B, | | | | |
| NATL RE, FGIC Insured, zero cpn., 9/01/27 | | 3,035,000 | | 1,114,998 |
| Alisal USD, GO, Capital Appreciation, Election of 2006, Series B, Assured Guaranty, | | | | |
| zero cpn., | | | | |
| 8/01/32 | | 3,355,000 | | 880,654 |
| 8/01/33 | | 3,610,000 | | 870,515 |
| 2/01/34 | | 3,345,000 | | 767,510 |
| Alvord USD, GO, Election of 2007, Series A, AGMC Insured, 5.00%, 8/01/32 | | 9,070,000 | | 8,816,493 |
| Anaheim City School District GO, AGMC Insured, 6.25%, 8/01/40 | | 7,500,000 | | 8,019,900 |
| Anaheim PFAR, Distribution System, second lien, NATL Insured, 5.00%, 10/01/29 | | 5,000,000 | | 5,021,850 |
| Antelope Valley UHSD, GO, Series A, NATL Insured, 5.00%, 2/01/27 | | 5,000,000 | | 5,077,350 |
| Antioch USD, GO, Election of 2008, School Facilities Improvement No. 1-B, Assured | | | | |
| Guaranty, 5.375%, 8/01/36 | | 3,130,000 | | 3,163,554 |
| Atascadero CDA Tax Allocation, Redevelopment Project, XLCA Insured, 5.00%, 9/01/34 | | 4,315,000 | | 3,622,227 |
| Atascadero USD, GO, Election of 2010, Series A, AGMC Inured, 5.00%, 8/01/40 | | 6,235,000 | | 5,958,977 |
| Atwater PFA Wastewater Revenue, AGMC Insured, 6.125%, 5/01/45 | | 4,620,000 | | 4,668,741 |
| Auburn PFA Wastewater Revenue, Assured Guaranty, 5.50%, 6/01/39 | | 1,880,000 | | 1,928,316 |
| Auburn USD, COP, Refinancing Project, Assured Guaranty, 5.00%, 6/01/38 | | 10,000,000 | | 9,940,900 |
| Bakersfield Wastewater Revenue, Series A, AGMC Insured, 5.00%, 9/15/32 | | 10,430,000 | | 10,528,772 |
| Baldwin Park RDA Tax Allocation, Refunding, AGMC Insured, 5.70%, 9/01/25 | | 4,000,000 | | 4,056,680 |
| Baldwin Park USD, GO, | | | | |
| Capital Appreciation, Election of 2006, AGMC Insured, zero cpn., 8/01/28 | | 5,810,000 | | 2,022,054 |
| Election of 2006, AGMC Insured, 5.00%, 8/01/31 | | 5,440,000 | | 5,479,440 |
| Beaumout USD, GO, Election of 2008, Series C, AGMC Insured, | | | | |
| 5.75%, 8/01/36 | | 6,200,000 | | 6,308,748 |
| zero cpn., 8/01/40 | | 11,000,000 | | 1,459,590 |
| Berkeley USD, GO, Election of 2010, Series B, AGMC Insured, 5.375%, 8/01/35 | | 5,090,000 | | 5,102,470 |
| Brentwood Infrastructure Financing Authority Infrastructure Revenue, Refunding, Series A, | | | | |
| AGMC Insured, 5.00%, 9/02/32 | | 3,790,000 | | 3,830,629 |
| Buckeye USD, GO, Election of 2006, AGMC Insured, 5.00%, 8/01/32 | | 10,705,000 | | 10,973,695 |
Annual Report | 35
| | | | |
| Franklin California Tax-Free Trust | | | | |
| |
| Statement of Investments, June 30, 2011 (continued) | | | | |
| |
| |
| Franklin California Insured Tax-Free Income Fund | | Principal Amount | | Value |
| Municipal Bonds (continued) | | | | |
| California (continued) | | | | |
| California Community College Financing Authority Lease Revenue, | | | | |
| Grossmont Palomar and Shasta, Series A, NATL Insured, 5.125%, 4/01/31 | $ | 3,030,000 | $ | 2,838,504 |
| Sequoias and Kern, AGMC Insured, 5.00%, 6/01/30 | | 2,330,000 | | 2,312,991 |
| Sequoias and Kern, AGMC Insured, 5.125%, 6/01/35 | | 1,250,000 | | 1,197,613 |
| California Educational Facilities Authority Revenue, Stanford University, Refunding, Series O, | | | | |
| 5.125%, 1/01/31 | | 24,705,000 | | 24,722,293 |
| California Health Facilities Financing Authority Revenue, | | | | |
| Catholic Healthcare West, Refunding, ACA Insured, 5.00%, 7/01/28 | | 8,765,000 | | 8,463,309 |
| Catholic Healthcare West, Refunding, Series A, 5.00%, 7/01/28 | | 12,995,000 | | 12,547,712 |
| Children’s Hospital Los Angeles, Refunding, Series A, AGMC Insured, 5.25%, 7/01/38 | | 7,000,000 | | 6,442,310 |
| Community Development Program for Persons with Developmental Disabilities, Series A, | | | | |
| California Mortgage Insured, 6.25%, 2/01/26 | | 5,000,000 | | 5,383,800 |
| Community Health Facilities, Series A, California Mortgage Insured, 5.80%, 8/01/25 | | 980,000 | | 980,892 |
| Kaiser Permanente, Series A, ETM, 5.40%, 5/01/28 | | 15,400,000 | | 15,412,320 |
| Marshall Hospital, Refunding, Series A, California Mortgage Insured, 5.30%, 11/01/28 | | 2,970,000 | | 2,969,881 |
| Northern California Presbyterian, Refunding, 5.40%, 7/01/28 | | 5,000,000 | | 4,598,250 |
| Senior Living, Aldersly, Series A, California Mortgage Insured, 5.25%, 3/01/32 | | 2,000,000 | | 1,921,900 |
| Sutter Health, Refunding, Series A, NATL Insured, 5.00%, 8/15/19 | | 1,585,000 | | 1,587,552 |
| Sutter Health, Refunding, Series A, NATL Insured, 5.00%, 8/15/38 | | 3,735,000 | | 3,503,206 |
| Sutter Health, Series A, BHAC Insured, 5.00%, 11/15/42 | | 15,000,000 | | 14,336,700 |
| The Help Group, Refunding, California Mortgage Insured, 5.40%, 8/01/22 | | 4,480,000 | | 4,482,285 |
| True to Life Children’s Services, Series A, California Mortgage Insured, 5.625%, 9/01/25 | | 1,250,000 | | 1,251,038 |
| California HFAR, Home Mortgage, Series N, AMBAC Insured, 6.30%, 8/01/31 | | 195,000 | | 195,449 |
| California Infrastructure and Economic Development Bank Revenue, Bay Area Toll Bridges, | | | | |
| first lien, Series A, AMBAC Insured, Pre-Refunded, 5.00%, 7/01/33 | | 8,460,000 | | 9,922,988 |
| California Municipal Finance Authority Senior Living Revenue, Pilgrim Place in Claremont, | | | | |
| Series A, California Mortgage Insured, | | | | |
| 5.875%, 5/15/29 | | 2,895,000 | | 2,895,666 |
| 6.125%, 5/15/39 | | 5,830,000 | | 5,849,239 |
| California PCFA, PCR, Southern California Edison Co., Refunding, Series C, NATL Insured, | | | | |
| 5.55%, 9/01/31 | | 4,800,000 | | 4,765,104 |
| California Public School District Financing Authority Lease Revenue, Southern Kern USD, | | | | |
| Series B, AGMC Insured, ETM, 5.90%, 9/01/26 | | 1,615,000 | | 2,011,305 |
| California School Facilities Financing Authority Revenue, Azusa USD, Series A, AGMC Insured, | | | | |
| 5.00%, 8/01/32 | | 10,000,000 | | 9,948,100 |
| California State Department of Water Resources Water System Revenue, | | | | |
| AGMC Insured, Pre-Refunded, 5.125%, 12/01/29 | | 815,000 | | 831,153 |
| Central Valley Project, Refunding, Series W, AGMC Insured, 5.125%, 12/01/29 | | 4,070,000 | | 4,150,667 |
| Central Valley Project, Series AC, NATL Insured, Pre-Refunded, 5.00%, 12/01/26 | | 40,000 | | 45,802 |
| Central Valley Project, Series AD, AGMC Insured, Pre-Refunded, 5.00%, 12/01/26 | | 25,000 | | 28,922 |
| Central Valley Project, Series W, AGMC Insured, Pre-Refunded, 5.125%, 12/01/29 | | 115,000 | | 117,279 |
| California State GO, | | | | |
| FGIC Insured, 5.375%, 6/01/26 | | 1,350,000 | | 1,354,658 |
| NATL Insured, 6.00%, 8/01/16 | | 210,000 | | 210,821 |
| NATL Insured, 6.00%, 10/01/21 | | 65,000 | | 65,600 |
| Refunding, 5.125%, 6/01/31 | | 295,000 | | 295,024 |
| Refunding, NATL Insured, 5.00%, 8/01/29 | | 730,000 | | 730,058 |
36 | Annual Report
| | | | |
| Franklin California Tax-Free Trust | | | | |
| |
| Statement of Investments, June 30, 2011 (continued) | | | | |
| |
| |
| Franklin California Insured Tax-Free Income Fund | | Principal Amount | | Value |
| Municipal Bonds (continued) | | | | |
| California (continued) | | | | |
| California State Local Government Finance Authority Revenue, Marin Valley Mobile Country | | | | |
| Club Park Acquisition Project, Senior, Series A, AGMC Insured, 5.80%, 10/01/20 | $ | 3,770,000 | $ | 3,780,217 |
| California State Public Works Board Lease Revenue, Department of Mental Health Hospital, | | | | |
| Series A, AMBAC Insured, 5.00%, | | | | |
| 12/01/21 | | 4,100,000 | | 4,151,619 |
| 12/01/26 | | 5,675,000 | | 5,584,938 |
| California State University Revenue, Systemwide, | | | | |
| Refunding, Series A, AMBAC Insured, 5.00%, 11/01/33 | | 22,000,000 | | 21,794,080 |
| Series A, AGMC Insured, 5.00%, 11/01/33 | | 5,000,000 | | 4,849,200 |
| California Statewide CDA, | | | | |
| COP, Children’s Hospital Los Angeles, 5.25%, 8/15/29 | | 12,250,000 | | 10,823,242 |
| COP, NATL Insured, 5.00%, 4/01/18 | | 3,000,000 | | 2,972,730 |
| COP, Refunding, AGMC Insured, 5.50%, 8/15/31 | | 7,000,000 | | 7,000,980 |
| COP, Refunding, California Mortgage Insured, 5.75%, 8/01/21 | | 5,895,000 | | 5,902,487 |
| MFHR, 740 Olive Street, Series L, GNMA Secured, 4.90%, 7/20/39 | | 13,475,000 | | 12,538,218 |
| MFHR, 740 Olive Street, Series L, GNMA Secured, 5.10%, 7/20/50 | | 10,000,000 | | 9,197,000 |
| MFHR, Silver Ridge Apartments, Mandatory Put 8/01/21, Series H, FNMA Insured, 5.80%, | | | | |
| 8/01/33 | | 2,785,000 | | 2,819,618 |
| California Statewide CDA Revenue, | | | | |
| Adventist, Series B, Assured Guaranty, 5.00%, 3/01/37 | | 17,000,000 | | 16,450,050 |
| California Endowment, 5.00%, 7/01/33 | | 18,460,000 | | 18,615,987 |
| Catholic Healthcare West, Series K, Assured Guaranty, 5.50%, 7/01/41 | | 17,000,000 | | 17,068,510 |
| COP, John Muir/Mt. Diablo Health System, NATL Insured, 5.125%, 8/15/22 | | 5,000,000 | | 5,001,300 |
| Enloe Medical Center, California Mortgage Insured, 6.25%, 8/15/28 | | 17,215,000 | | 18,182,483 |
| Henry Mayo Newhall Memorial, Series B, AMBAC Insured, 5.05%, 10/01/28 | | 7,825,000 | | 7,648,311 |
| Methodist Hospital of Southern California Project, FHA Insured, 6.75%, 2/01/38 | | 20,000,000 | | 22,568,800 |
| Refunding, California Mortgage Insured, 5.00%, 8/01/21 | | 2,035,000 | | 2,064,060 |
| St. Joseph Health System, Series E, AGMC Insured, 5.25%, 7/01/47 | | 20,000,000 | | 19,371,800 |
| Sutter Health, Series C, AGMC Insured, 5.05%, 8/15/38 | | 15,000,000 | | 13,929,600 |
| California Statewide CDA Water and Wastewater Revenue, Pooled Financing Program, | | | | |
| Refunding, | | | | |
| Series A, AGMC Insured, 5.00%, 10/01/32 | | 9,320,000 | | 9,428,485 |
| Series B, AGMC Insured, 5.75%, 10/01/29 | | 1,465,000 | | 1,465,894 |
| Carlsbad USD, COP, Series A, Assured Guaranty, 5.00%, | | | | |
| 10/01/34 | | 14,000,000 | | 13,642,160 |
| 10/01/41 | | 3,880,000 | | 3,677,270 |
| Castaic USD, COP, Refunding, AGMC Insured, 5.125%, 9/01/33 | | 1,000,000 | | 996,650 |
| Central USD, GO, Election of 2008, Series A, Assured Guaranty, | | | | |
| 5.50%, 8/01/29 | | 3,000,000 | | 3,094,470 |
| 5.625%, 8/01/33 | | 3,500,000 | | 3,562,265 |
| Chaffey Community College District GO, Refunding, Series A, AGMC Insured, 5.00%, | | | | |
| 7/01/27 | | 270,000 | | 273,969 |
| Chico PFAR, Merged Redevelopment Project Area, NATL Insured, 5.125%, 4/01/24 | | 2,790,000 | | 2,622,209 |
| Chula Vista Elementary School District GO, Election of 1998, Series F, NATL Insured, 5.00%, | | | | |
| 8/01/28 | | 2,685,000 | | 2,727,611 |
| Clovis PFAR, 2001 Corp. Yard Project, AMBAC Insured, 5.00%, 3/01/27 | | 3,265,000 | | 3,280,215 |
Annual Report | 37
| | | | |
| Franklin California Tax-Free Trust | | | | |
| |
| Statement of Investments, June 30, 2011 (continued) | | | | |
| |
| |
| Franklin California Insured Tax-Free Income Fund | | Principal Amount | | Value |
| Municipal Bonds (continued) | | | | |
| California (continued) | | | | |
| Coachella Valley USD, GO, Capital Appreciation, Election of 2005, Series C, AGMC Insured, | | | | |
| zero cpn., | | | | |
| 8/01/36 | $ | 8,000,000 | $ | 1,432,560 |
| 8/01/37 | | 8,000,000 | | 1,330,800 |
| 8/01/40 | | 7,500,000 | | 1,006,425 |
| 8/01/43 | | 10,000,000 | | 1,084,000 |
| College of the Sequoias Tulare Area ID No. 3 GO, Election of 2008, Series A, Assured | | | | |
| Guaranty, 5.50%, 8/01/33 | | 5,000,000 | | 5,214,700 |
| College of the Sequoias Visalia Area ID No. 2 GO, Election of 2008, | | | | |
| Series A, Assured Guaranty, 5.50%, 8/01/33 | | 5,750,000 | | 6,016,455 |
| Series B, AGMC Insured, 5.00%, 8/01/39 | | 3,000,000 | | 2,827,470 |
| Colton Joint USD, GO, | | | | |
| Capital Appreciation Bonds, Election of 2008, Series B, AGMC Insured, zero cpn., | | | | |
| 8/01/42 | | 16,365,000 | | 2,024,841 |
| Election of 2008, Series A, Assured Guaranty, 5.375%, 8/01/34 | | 10,665,000 | | 10,667,986 |
| Compton USD, GO, Election of 2002, Series B, NATL Insured, Pre-Refunded, 5.00%, | | | | |
| 6/01/29 | | 2,000,000 | | 2,246,680 |
| Corona-Norco USD, GO, | | | | |
| Capital Appreciation, Refunding, Series B, AGMC Insured, zero cpn., 3/01/25 | | 1,400,000 | | 629,580 |
| Capital Appreciation, Series B, AGMC Insured, zero cpn., 9/01/23 | | 2,320,000 | | 1,177,354 |
| Capital Appreciation, Series B, AGMC Insured, zero cpn., 9/01/24 | | 2,620,000 | | 1,233,548 |
| Capital Appreciation, Series C, NATL RE, FGIC Insured, zero cpn., 9/01/25 | | 4,655,000 | | 2,061,141 |
| Capital Appreciation, Series C, NATL RE, FGIC Insured, zero cpn., 9/01/26 | | 6,080,000 | | 2,500,704 |
| Election of 2006, Series B, Assured Guaranty, 5.375%, 2/01/34 | | 12,000,000 | | 12,164,880 |
| Election of 2006, Series C, AGMC Insured, 5.50%, 8/01/39 | | 7,500,000 | | 7,621,725 |
| Coronado CDA Tax Allocation, Community Development Project, NATL Insured, 5.375%, | | | | |
| 9/01/26 | | 2,700,000 | | 2,730,186 |
| Covina PFA Wastewater Revenue, Assured Guaranty, 5.375%, 10/01/29 | | 6,550,000 | | 6,862,238 |
| Covina PFA Water Revenue, AGMC Insured, 5.50%, 10/01/40 | | 3,500,000 | | 3,575,950 |
| Cucamonga County Water District COP, NATL RE, FGIC Insured, 5.00%, 9/01/29 | | 5,070,000 | | 5,091,091 |
| Delano USD, COP, Refinancing Project, NATL Insured, 5.125%, 1/01/22 | | 1,620,000 | | 1,544,735 |
| Desert Sands USD, COP, Financing Project, AGMC Insured, 5.75%, 3/01/24 | | 10,000,000 | | 10,788,600 |
| El Monte UHSD, GO, Election of 2008, Series A, Assured Guaranty, 5.50%, 6/01/34 | | 11,355,000 | | 11,654,204 |
| Elsinore Valley Municipal Water District COP, Refunding, Series A, BHAC Insured, 5.00%, | | | | |
| 7/01/29 | | 7,245,000 | | 7,579,357 |
| Escondido Joint Powers Financing Authority Lease Revenue, AMBAC Insured, 5.125%, | | | | |
| 9/01/30 | | 3,770,000 | | 3,483,141 |
| Escondido UHSD, COP, AGMC Insured, 5.00%, | | | | |
| 6/01/33 | | 3,500,000 | | 3,351,600 |
| 6/01/37 | | 2,500,000 | | 2,308,900 |
| Eureka USD, GO, AGMC Insured, 5.00%, 8/01/25 | | 4,145,000 | | 4,255,298 |
| Fairfax Elementary School District GO, Election of 2010, AGMC Insured, 5.75%, 11/01/40 | | 2,250,000 | | 2,318,670 |
| Fairfield Suisun USD, GO, | | | | |
| Election of 2002, NATL Insured, 5.00%, 8/01/25 | | 4,185,000 | | 4,331,559 |
| NATL Insured, 5.00%, 8/01/27 | | 12,000,000 | | 12,339,720 |
| Florin Resource Conservation District COP, Elk Grove Water Service, Refunding, Series A, NATL | | | | |
| Insured, 5.00%, 3/01/33 | | 5,000,000 | | 4,083,950 |
| Folsom COP, Central Business District Fire Station, NATL Insured, 5.125%, 10/01/26 | | 2,030,000 | | 2,042,403 |
38 | Annual Report
| | | | |
| Franklin California Tax-Free Trust | | | | |
| |
| Statement of Investments, June 30, 2011 (continued) | | | | |
| |
| |
| Franklin California Insured Tax-Free Income Fund | | Principal Amount | | Value |
| Municipal Bonds (continued) | | | | |
| California (continued) | | | | |
| Fontana USD, GO, | | | | |
| Refunding, Series A, AGMC Insured, 5.25%, 8/01/28 | $ | 7,000,000 | $ | 7,070,770 |
| Series A, AGMC Insured, 5.25%, 8/01/27 | | 6,700,000 | | 6,782,946 |
| Foothill/Eastern Corridor Agency Toll Road Revenue, | | | | |
| Capital Appreciation, Refunding, NATL Insured, zero cpn., 1/15/17 | | 20,000,000 | | 14,738,400 |
| Capital Appreciation, Refunding, NATL Insured, zero cpn., 1/15/18 | | 25,000,000 | | 17,389,750 |
| Capital Appreciation, Refunding, NATL Insured, zero cpn., 1/15/19 | | 5,970,000 | | 3,885,455 |
| senior lien, Refunding, Series A, NATL Insured, 5.00%, 1/01/35 | | 66,735,000 | | 53,670,956 |
| Fowler USD, GO, | | | | |
| Capital Appreciation, Election of 2004, Series C, AGMC Insured, zero cpn., 8/01/41 | | 3,095,000 | | 374,309 |
| Capital Appreciation, Election of 2004, Series C, AGMC Insured, zero cpn., 8/01/42 | | 3,005,000 | | 337,762 |
| Election of 2004, Series C, AGMC Insured, 5.25%, 8/01/39 | | 3,555,000 | | 3,593,181 |
| Franklin-McKinley School District GO, Election of 2004, Series A, FGIC Insured, Pre-Refunded, | | | | |
| 5.00%, 8/01/29 | | 5,280,000 | | 6,131,558 |
| Fresno USD, GO, Refunding, Series C, NATL Insured, 5.90%, | | | | |
| 2/01/20 | | 2,065,000 | | 2,296,548 |
| 8/01/22 | | 3,000,000 | | 3,299,370 |
| Fullerton School District GO, Capital Appreciation, Series A, NATL RE, FGIC Insured, zero cpn., | | | | |
| 8/01/23 | | 3,030,000 | | 1,575,994 |
| Glendora PFAR Tax Allocation, Project No. 1, Refunding, Series A, NATL Insured, 5.00%, | | | | |
| 9/01/24 | | 5,000,000 | | 4,568,100 |
| Grossmont UHSD, GO, | | | | |
| AGMC Insured, 5.00%, 8/01/33 | | 1,440,000 | | 1,430,438 |
| AGMC Insured, 5.25%, 8/01/33 | | 7,510,000 | | 7,633,164 |
| Capital Appreciation, Election of 2004, AGMC Insured, zero cpn., 8/01/24 | | 5,110,000 | | 2,408,190 |
| Hawthorne School District GO, Election of 2008, Series A, Assured Guaranty, 5.00%, | | | | |
| 8/01/34 | | 1,000,000 | | 987,830 |
| Hayward USD, GO, Capital Appreciation, Election of 2008, Series A, AGMC Insured, zero cpn., | | | | |
| 8/01/38 | | 9,875,000 | | 1,439,084 |
| Hercules PFA Wastewater Revenue, AGMC Insured, 5.00%, 8/01/40 | | 5,690,000 | | 5,318,386 |
| Hollister RDA Tax Allocation, Community Development Project, Refunding, AMBAC Insured, | | | | |
| 5.125%, 10/01/32 | | 19,815,000 | | 17,359,129 |
| Huntington Beach UHSD, COP, Adult Education Project, AGMC Insured, 5.25%, 9/01/39 | | 2,000,000 | | 1,942,600 |
| Indian Wells Valley Water District COP, | | | | |
| Assured Guaranty, 5.25%, 10/01/39 | | 7,590,000 | | 7,716,222 |
| Refunding, Assured Guaranty, 5.125%, 10/01/32 | | 1,690,000 | | 1,730,340 |
| Jefferson UHSD San Mateo County GO, Refunding, Series A, NATL Insured, 6.45%, | | | | |
| 8/01/25 | | 3,045,000 | | 3,399,773 |
| 8/01/29 | | 3,075,000 | | 3,369,646 |
| Jurupa Community Services District Special Tax, CFD No. 2, Series A, NATL Insured, 5.00%, | | | | |
| 9/01/32 | | 7,000,000 | | 5,985,000 |
| Jurupa PFAR, superior lien, Refunding, Series A, AGMC Insured, 5.00%, 9/01/30 | | 4,000,000 | | 3,927,200 |
| Jurupa USD, COP, AGMC Insured, 5.625%, 9/01/24 | | 1,600,000 | | 1,607,024 |
| Kern High School District GO, AGMC Insured, ETM, 6.625%, | | | | |
| 8/01/14 | | 1,535,000 | | 1,810,701 |
| 8/01/15 | | 1,400,000 | | 1,713,250 |
| La Habra COP, Refunding, Series A, AGMC Insured, 5.25%, 9/01/40 | | 7,900,000 | | 7,669,952 |
Annual Report | 39
| | | | |
| Franklin California Tax-Free Trust | | | | |
| |
| Statement of Investments, June 30, 2011 (continued) | | | | |
| |
| |
| Franklin California Insured Tax-Free Income Fund | | Principal Amount | | Value |
| Municipal Bonds (continued) | | | | |
| California (continued) | | | | |
| La Mirada RDA Tax Allocation, Merged Project Area, Refunding, Series A, AGMC Insured, | | | | |
| 5.00%, 8/15/28 | $ | 1,855,000 | $ | 1,867,039 |
| Lake Elsinore USD, COP, School Facilities Project Funding Program, AGMC Insured, 5.00%, | | | | |
| 6/01/42 | | 10,000,000 | | 9,358,800 |
| Lake Tahoe USD, GO, Election of 2008, AGMC Insured, 5.375%, 8/01/29 | | 10,000,000 | | 10,469,100 |
| Lakeside USD San Diego County GO, Capital Appreciation, Election of 2008, Series B, zero | | | | |
| cpn., 8/01/45 | | 11,540,000 | | 1,182,504 |
| Lancaster School District GO, Capital Appreciation, Election of 1999, NATL Insured, zero cpn., | | | | |
| 8/01/25 | | 5,495,000 | | 2,375,598 |
| 7/01/26 | | 5,965,000 | | 2,420,478 |
| Lawndale RDA Tax Allocation, Economic Revitalization Project, Assured Guaranty, 5.50%, | | | | |
| 8/01/44 | | 6,085,000 | | 6,116,216 |
| Lemon Grove School District GO, Election of 2008, Series A, Assured Guaranty, 5.125%, | | | | |
| 8/01/33 | | 2,100,000 | | 2,110,248 |
| Live Oak School District COP, Assured Guaranty, | | | | |
| 5.50%, 8/01/29 | | 1,245,000 | | 1,301,000 |
| 5.875%, 8/01/34 | | 2,270,000 | | 2,363,774 |
| 5.875%, 8/01/39 | | 2,750,000 | | 2,834,398 |
| Lodi Electric System Revenue COP, Series A, Assured Guaranty, 5.00%, 7/01/32 | | 18,960,000 | | 18,911,083 |
| Lodi USD, GO, NATL Insured, 5.00%, 8/01/23 | | 2,150,000 | | 2,173,199 |
| Lodi USD School Facilities ID No. 1 GO, Election of 2006, AGMC Insured, 5.00%, 8/01/32 | | 1,000,000 | | 953,620 |
| Long Beach Bond Finance Authority Lease Revenue, | | | | |
| Aquarium of the Pacific Project, Refunding, AMBAC Insured, 5.00%, 11/01/19 | | 4,000,000 | | 4,004,520 |
| Public Safety Facilities Projects, AMBAC Insured, 5.00%, 11/01/26 | | 6,780,000 | | 6,010,673 |
| Public Safety Facilities Projects, AMBAC Insured, 5.00%, 11/01/31 | | 10,500,000 | | 8,778,630 |
| Long Beach Bond Finance Authority Tax Allocation Revenue, North Long Beach Redevelopment | | | | |
| Projects, Series A, AMBAC Insured, 5.00%, | | | | |
| 8/01/25 | | 7,015,000 | | 6,154,049 |
| 8/01/31 | | 3,135,000 | | 2,633,400 |
| Long Beach USD, GO, Election of 1999, Series C, NATL Insured, 5.125%, 8/01/31 | | 13,870,000 | | 13,879,709 |
| Los Angeles Community College District GO, Series B, AGMC Insured, 5.00%, 8/01/27 | | 4,000,000 | | 4,073,000 |
| Los Angeles COP, | | | | |
| Municipal Improvement Corp. of Los Angeles, Program AW Certificates, AMBAC Insured, | | | | |
| 5.00%, 6/01/27 | | 5,895,000 | | 5,952,181 |
| Real Property Program, NATL Insured, 5.00%, 2/01/27 | | 9,890,000 | | 9,908,296 |
| Los Angeles County Public Works Financing Authority Lease Revenue, Master Refunding | | | | |
| Project, Refunding, Series B, NATL RE, FGIC Insured, 5.00%, 9/01/31 | | 7,600,000 | | 6,756,400 |
| Los Angeles Department of Airports Airport Revenue, Los Angeles International Airport, senior | | | | |
| bond, Series D, 5.00%, 5/15/40 | | 30,000,000 | | 30,126,000 |
| Los Angeles Department of Water and Power Revenue, Power System, Series B, AGMC Insured, | | | | |
| 5.00%, 7/01/35 | | 5,000,000 | | 5,009,300 |
| Los Angeles Mortgage Revenue, Refunding, Series I, NATL Insured, 6.50%, 7/01/22 | | 645,000 | | 645,155 |
| Los Angeles USD, GO, | | | | |
| Election of 2004, Series H, AGMC Insured, 5.00%, 7/01/27 | | 5,000,000 | | 5,148,400 |
| Election of 2004, Series H, AGMC Insured, 5.00%, 7/01/28 | | 5,000,000 | | 5,140,450 |
| Election of 2005, Series E, AGMC Insured, 5.00%, 7/01/27 | | 5,800,000 | | 5,972,144 |
| Los Angeles Wastewater System Revenue, Refunding, Series A, NATL Insured, 5.00%, | | | | |
| 6/01/26 | | 10,000,000 | | 10,135,300 |
40 | Annual Report
| | | | |
| Franklin California Tax-Free Trust | | | | |
| |
| Statement of Investments, June 30, 2011 (continued) | | | | |
| |
| |
| Franklin California Insured Tax-Free Income Fund | | Principal Amount | | Value |
| Municipal Bonds (continued) | | | | |
| California (continued) | | | | |
| Lynwood PFA Tax Allocation, Project Area A, Refunding, Series A, AGMC Insured, 5.85%, | | | | |
| 9/01/18 | $ | 1,765,000 | $ | 1,772,466 |
| Marin Municipal Water District COP, Financing Project, AMBAC Insured, 5.00%, 7/01/29 | | 1,200,000 | | 1,168,068 |
| McFarland PFAR, Water and Wastewater Financing Projects, Series A, Assured Guaranty, | | | | |
| 5.00%, 10/01/40 | | 5,115,000 | | 4,716,030 |
| Mendocino County COP, Public Facilities Corp., NATL Insured, 5.25%, 6/01/30 | | 2,680,000 | | 2,278,777 |
| Millbrae COP, Police Department Expansion, AMBAC Insured, 5.875%, 3/01/24 | | 1,025,000 | | 1,027,491 |
| Modesto Irrigation District COP, Capital Improvements, Series A, AGMC Insured, 5.00%, | | | | |
| 7/01/26 | | 5,000,000 | | 5,031,000 |
| 7/01/31 | | 8,285,000 | | 8,110,684 |
| Montebello COP, Capital Improvement Project, Refunding, AGMC Insured, 5.375%, | | | | |
| 11/01/26 | | 8,715,000 | | 8,611,379 |
| Montebello CRDA Tax Allocation, Montebello Hills Redevelopment Project, Refunding, NATL | | | | |
| Insured, 5.60%, 3/01/19 | | 2,460,000 | | 2,462,337 |
| Montebello USD, GO, Election of 2004, AGMC Insured, 5.00%, 8/01/33 | | 2,700,000 | | 2,731,968 |
| Monterey Peninsula USD, GO, Election of 2010, Series A, AGMC Insured, 5.75%, 8/01/41 | | 17,500,000 | | 18,121,425 |
| Moorpark USD, | | | | |
| COP, Refunding, Assured Guaranty, 5.625%, 11/01/28 | | 2,180,000 | | 2,255,145 |
| GO, Election of 2008, Capital Appreciation Bonds, Series A, Assured Guaranty, zero cpn., | | | | |
| 8/01/32 | | 5,870,000 | | 1,556,665 |
| Moreno Valley USD, GO, Election of 2004, Series A, AGMC Insured, Pre-Refunded, 5.00%, | | | | |
| 8/01/26 | | 4,000,000 | | 4,527,920 |
| Mount Diablo USD, GO, Election of 2002, NATL RE, FGIC Insured, 5.00%, 7/01/25 | | 6,025,000 | | 6,119,351 |
| Murrieta Valley USD, COP, NATL Insured, 5.00%, 8/01/27 | | 2,380,000 | | 2,414,462 |
| Natomas USD, GO, AGMC Insured, 5.00%, 9/01/26 | | 2,535,000 | | 2,579,844 |
| Nevada Joint UHSD, GO, Series A, AGMC Insured, 5.00%, 8/01/26 | | 1,295,000 | | 1,314,088 |
| Newark USD, GO, Capital Appreciation, Series C, AGMC Insured, Pre-Refunded, zero cpn., | | | | |
| 8/01/22 | | 2,165,000 | | 1,158,297 |
| 8/01/23 | | 2,465,000 | | 1,236,469 |
| 8/01/24 | | 2,560,000 | | 1,210,419 |
| 8/01/25 | | 2,705,000 | | 1,205,564 |
| Northern California Public Power Agency Revenue, AMBAC Insured, Pre-Refunded, 7.50%, | | | | |
| 7/01/23 | | 3,200,000 | | 4,319,264 |
| Oak View USD, GO, AGMC Insured, 5.00%, 8/01/49 | | 1,895,000 | | 1,811,241 |
| Oceanside COP, AMBAC Insured, 5.20%, 4/01/23 | | 2,500,000 | | 2,536,250 |
| Oceanside USD, GO, | | | | |
| Capital Appreciation, Election of 2008, Series B, AGMC Insured, zero cpn., 8/01/38 | | 10,590,000 | | 1,644,521 |
| Capital Appreciation, Election of 2008, Series B, AGMC Insured, zero cpn., 8/01/39 | | 7,860,000 | | 1,136,320 |
| Refunding, Series A, Assured Guaranty, 5.25%, 8/01/33 | | 5,000,000 | | 5,032,050 |
| Orange County Sanitation Districts COP, NATL RE, FGIC Insured, 5.00%, 2/01/33 | | 8,000,000 | | 8,059,040 |
| Pacifica COP, AMBAC Insured, 5.375%, 1/01/37 | | 6,600,000 | | 6,262,542 |
| Palm Springs Financing Authority Lease Revenue, Convention Center Project, Refunding, | | | | |
| Series A, NATL Insured, 5.00%, 11/01/25 | | 2,295,000 | | 2,202,466 |
| Patterson Joint USD, GO, Capital Appreciation, Series A, NATL RE, FGIC Insured, zero cpn., | | | | |
| 8/01/22 | | 1,900,000 | | 994,992 |
| 8/01/23 | | 1,985,000 | | 947,996 |
| 8/01/24 | | 2,075,000 | | 906,007 |
| 8/01/25 | | 2,170,000 | | 871,147 |
| 8/01/26 | | 2,265,000 | | 838,141 |
| |
| | | | | Annual Report | 41 |
| | | | |
| Franklin California Tax-Free Trust | | | | |
| |
| Statement of Investments, June 30, 2011 (continued) | | | | |
| |
| |
| Franklin California Insured Tax-Free Income Fund | | Principal Amount | | Value |
| Municipal Bonds (continued) | | | | |
| California (continued) | | | | |
| Peralta Community College District GO, | | | | |
| Election of 2000, Series B, NATL Insured, 5.25%, 8/01/32 | $ | 8,450,000 | $ | 8,467,914 |
| Election of 2006, Series B, AGMC Insured, 5.00%, 8/01/24 | | 6,000,000 | | 6,244,860 |
| Perris CFD No. 93-1 Special Tax, Series A, AMBAC Insured, 5.125%, 8/15/23 | | 3,885,000 | | 3,743,897 |
| aPittsburg USD Financing Authority Revenue, GO, Board Program, AGMC Insured, 5.50%, | | | | |
| 9/01/46 | | 5,000,000 | | 4,931,250 |
| Pleasanton USD, COP, Refunding, AGMC Insured, 5.00%, 8/01/29 | | 4,000,000 | | 3,990,440 |
| Plumas County COP, Capital Improvement Program, Series A, AMBAC Insured, 5.00%, | | | | |
| 6/01/33 | | 3,280,000 | | 2,841,694 |
| Pomona USD, GO, Election of 2008, | | | | |
| Series A, Assured Guaranty, 5.25%, 8/01/33 | | 5,675,000 | | 5,678,462 |
| Series C, AGMC Insured, 5.25%, 8/01/40 | | 16,000,000 | | 15,377,440 |
| Poway RDA Tax Allocation, | | | | |
| Paguay Redevelopment Project, AMBAC Insured, 5.00%, 12/15/25 | | 9,195,000 | | 8,541,327 |
| Refunding, NATL Insured, 5.75%, 6/15/33 | | 2,225,000 | | 2,024,016 |
| Rancho Cucamonga RDA Tax Allocation, Rancho Redevelopment Project, Refunding, AGMC | | | | |
| Insured, 5.25%, 9/01/20 | | 2,500,000 | | 2,504,075 |
| Redwood City School District GO, NATL RE, FGIC Insured, 5.00%, 7/15/27 | | 3,000,000 | | 3,005,580 |
| Richmond Joint Powers Financing Authority Revenue, Lease, Civic Center Project, Refunding, | | | | |
| Assured Guaranty, 5.875%, 8/01/37 | | 24,000,000 | | 24,469,440 |
| Rio Hondo Community College District GO, Capital Appreciation, Election of 2004, Series C, | | | | |
| zero cpn., 8/01/35 | | 10,000,000 | | 1,999,800 |
| Riverside Electric Revenue, Issue D, AGMC Insured, 5.00%, 10/01/38 | | 5,310,000 | | 5,312,761 |
| Rohnert Park Community Development Commission Tax Allocation Revenue, Redevelopment | | | | |
| Project, Series R, NATL RE, FGIC Insured, | | | | |
| 5.00%, 8/01/37 | | 3,620,000 | | 3,009,053 |
| Pre-Refunded, 5.00%, 8/01/37 | | 1,380,000 | | 1,504,090 |
| Roseville Financing Authority Revenue, senior lien, Series A, AMBAC Insured, 5.00%, | | | | |
| 9/01/25 | | 5,675,000 | | 5,133,378 |
| Sacramento Area Flood Control Agency Special Assessment, | | | | |
| Consolidated, Capital AD, Refunding, Series A, Assured Guaranty, 5.00%, 10/01/32 | | 5,000,000 | | 5,128,800 |
| Subordinated, Capital AD No. 2, FGIC Insured, 5.80%, 11/01/16 | | 790,000 | | 792,228 |
| Sacramento County Airport System Revenue, Senior Series B, Assured Guaranty, 5.50%, | | | | |
| 7/01/34 | | 16,320,000 | | 16,613,107 |
| Salida Area Public Facilities Financing Agency CFD No. 1988-1 Special Tax, AGMC Insured, | | | | |
| 5.75%, 9/01/30 | | 3,435,000 | | 3,437,542 |
| San Bernardino County SFMR, Capital Appreciation, Series A, GNMA Secured, ETM, zero cpn., | | | | |
| 5/01/22 | | 28,405,000 | | 16,713,786 |
| San Francisco City and County Airports Commission International Airport Revenue, Refunding, | | | | |
| Second Series 28A, NATL Insured, 5.125%, | | | | |
| 5/01/24 | | 9,745,000 | | 9,744,610 |
| 5/01/27 | | 16,575,000 | | 16,161,785 |
| San Francisco City and County Public Utilities Commission Water Revenue, Refunding, | | | | |
| Series A, AGMC Insured, 5.00%, 11/01/31 | | 3,885,000 | | 3,889,895 |
| San Francisco Community College District GO, Series A, NATL RE, FGIC Insured, 5.00%, | | | | |
| 6/15/26 | | 6,000,000 | | 6,039,300 |
42 | Annual Report
| | | | | |
| Franklin California Tax-Free Trust | | | | | |
| |
| Statement of Investments, June 30, 2011 (continued) | | | | | |
| |
| |
| Franklin California Insured Tax-Free Income Fund | | | Principal Amount | | Value |
| Municipal Bonds (continued) | | | | | |
| California (continued) | | | | | |
| San Gabriel USD, GO, Capital Appreciation, Series A, AGMC Insured, zero cpn., | | | | | |
| 8/01/26 | | $ | 3,530,000 | $ | 1,435,686 |
| 2/01/27 | | | 1,850,000 | | 712,861 |
| San Jacinto USD, COP, Refunding, AGMC Insured, 5.125%, 9/01/30 | | | 4,375,000 | | 4,222,050 |
| San Joaquin Delta Community College District GO, Election of 2004, | | | | | |
| Capital Appreciation, Series B, AGMC Insured, zero cpn., 8/01/31 | | | 10,475,000 | | 2,901,470 |
| Capital Appreciation, Series B, AGMC Insured, zero cpn., 8/01/32 | | | 15,185,000 | | 3,865,797 |
| Series A, AGMC Insured, 5.00%, 8/01/29 | | | 520,000 | | 529,168 |
| Series A, AGMC Insured, Pre-Refunded, 5.00%, 8/01/29 | | | 4,530,000 | | 5,270,474 |
| San Joaquin Hills Transportation Corridor Agency Toll Road Revenue, | | | | | |
| Capital Appreciation, Refunding, Series A, NATL Insured, zero cpn., 1/15/26 | | | 13,155,000 | | 3,992,542 |
| Refunding, Series A, NATL Insured, 5.375%, 1/15/29 | | | 18,075,000 | | 14,244,004 |
| Refunding, Series A, NATL Insured, 5.25%, 1/15/30 | | | 12,860,000 | | 9,850,246 |
| senior lien, NATL Insured, 5.00%, 1/01/33 | | | 10,035,000 | | 7,411,650 |
| San Jose Financing Authority Lease Revenue, Civic Center Project, Series B, AMBAC Insured, | | | | | |
| 5.00%, 6/01/27 | | | 10,000,000 | | 10,031,900 |
| San Jose MFHR, Sixth and Martha Family Apartments, FNMA Insured, 5.875%, 3/01/33 | | | 3,500,000 | | 3,514,700 |
| San Jose RDA Tax Allocation, Merged Area Redevelopment Project, Series B, XLCA Insured, | | | | | |
| 5.00%, 8/01/31 | | | 15,470,000 | | 12,610,680 |
| San Juan USD, GO, | | | | | |
| Election of 1998, Series A, NATL Insured, 5.00%, 8/01/28 | | | 5,115,000 | | 5,145,741 |
| Election of 2002, BHAC Insured, 5.00%, 8/01/31 | | | 5,000,000 | | 5,062,200 |
| San Marcos School Financing Authority Lease Revenue, AGMC Insured, 5.00%, 8/15/40 | | | 15,635,000 | | 14,942,213 |
| San Marino USD, GO, Election of 2000, Series A, NATL Insured, zero cpn., 7/01/25 | | | 6,080,000 | | 2,740,317 |
| San Mateo GO, Library Improvement Project, Series A, AMBAC Insured, 5.25%, 8/01/30 | | | 5,790,000 | | 6,071,973 |
| Santa Ana USD, COP, Capital Appreciation, Financing Project, AGMC Insured, zero cpn., | | | | | |
| 4/01/24 | | | 14,245,000 | | 6,700,848 |
| Santa Clara COP, Refunding, AMBAC Insured, 5.00%, 2/01/27 | | | 5,555,000 | | 5,644,435 |
| Santa Clara County Financing Authority Revenue, El Camino Hospital, Series B, AMBAC | | | | | |
| Insured, 5.125%, 2/01/41 | | | 11,545,000 | | 10,478,819 |
| Santa Monica PFA Lease Revenue, Civic Center Parking Project, XLCA Insured, 5.00%, | | | | | |
| 7/01/33 | | | 11,050,000 | | 11,233,540 |
| Santa Rita USD, GO, Election of 2006, Series A, AGMC Insured, 5.00%, 8/01/32 | | | 6,160,000 | | 6,065,136 |
| Santa Rosa Wastewater Service Facilities District Revenue, Refunding and Improvement, | | | | | |
| AMBAC Insured, 6.00%, 7/02/15 | | | 1,715,000 | | 1,856,831 |
| Santee School District GO, | | | | | |
| Election of 2006, Series B, Assured Guaranty, 5.00%, 8/01/33 | | | 1,260,000 | | 1,263,679 |
| Election of 2006, Series B, Assured Guaranty, 5.00%, 8/01/38 | | | 1,000,000 | | 972,500 |
| Election of 2006, Series B, Assured Guaranty, 5.00%, 8/01/48 | | | 5,250,000 | | 4,987,237 |
| Series A, AGMC Insured, 5.00%, 8/01/31 | | | 6,845,000 | | 6,930,494 |
| Saugus / Hart School Facilities Financing Authority Lease Revenue, Series A, AGMC Insured, 5.00%, | | | | | |
| 9/01/35 | | | 2,000,000 | | 1,872,140 |
| 9/01/40 | | | 1,500,000 | | 1,367,295 |
| Snowline Joint USD, COP, Refinancing Project, Refunding, Assured Guaranty, 5.00%, | | | | | |
| 9/01/34 | | | 13,390,000 | | 13,398,034 |
| Sonoma CDA Tax Allocation, Redevelopment Project, Refunding, Assured Guaranty, 5.00%, | | | | | |
| 12/01/30 | | | 3,795,000 | | 3,757,619 |
Annual Report | 43
| | | | |
| Franklin California Tax-Free Trust | | | | |
| |
| Statement of Investments, June 30, 2011 (continued) | | | | |
| |
| |
| Franklin California Insured Tax-Free Income Fund | | Principal Amount | | Value |
| Municipal Bonds (continued) | | | | |
| California (continued) | | | | |
| South Gate COP, Series A, AMBAC Insured, 5.00%, 9/01/24 | $ | 3,155,000 | $ | 3,038,360 |
| South San Francisco COP, Conference Center Financing, 5.00%, 4/01/29 | | 2,000,000 | | 2,000,280 |
| Southern California Pubic Power Authority Revenue, Series A, AMBAC Insured, Pre-Refunded, | | | | |
| 5.00%, 7/01/33 | | 19,000,000 | | 20,731,280 |
| Southern Kern USD, COP, Capital Appreciation, Building Program, Series B, AGMC Insured, | | | | |
| 5.625%, 9/01/26 | | 2,250,000 | | 2,251,463 |
| Southern Mono Health Care District GO, Series A, NATL Insured, 5.00%, 8/01/24 | | 3,005,000 | | 3,021,347 |
| Southern Mono Health Care District Revenue, Capital Appreciation, Series A, NATL Insured, | | | | |
| zero cpn., | | | | |
| 8/01/28 | | 2,340,000 | | 721,539 |
| 8/01/29 | | 2,440,000 | | 692,667 |
| 8/01/30 | | 2,550,000 | | 664,173 |
| 8/01/31 | | 2,660,000 | | 634,676 |
| Stanislaus USD, GO, Election of 2008, Series A, Assured Guaranty, 5.625%, 8/01/33 | | 4,140,000 | | 4,323,899 |
| Stanton RDA Tax Allocation, Consolidated Redevelopment Project, Series A, AGMC Insured, | | | | |
| 5.00%, 12/01/40 | | 6,020,000 | | 5,658,439 |
| Stockton Revenue COP, Wastewater System Project, Refunding, Series A, NATL Insured, | | | | |
| 5.00%, 9/01/23 | | 6,500,000 | | 6,501,495 |
| Sulphur Springs USD, COP, Capital Appreciation, AGMC Insured, zero cpn. to 12/01/15, | | | | |
| 6.50% thereafter, 12/01/37 | | 15,000,000 | | 11,744,850 |
| Susanville PFAR, Utility Enterprises, Refunding, Series A, Assured Guaranty, 5.00%, | | | | |
| 6/01/36 | | 3,230,000 | | 3,008,099 |
| Sweetwater UHSD, GO, Election of 2006, Series A, BHAC Insured, 5.00%, 8/01/38 | | 14,980,000 | | 14,988,239 |
| Truckee PFA Tax Allocation Revenue, Truckee Redevelopment Project Loan, Series A, AGMC | | | | |
| Insured, | | | | |
| 5.00%, 9/01/30 | | 1,255,000 | | 1,250,319 |
| 5.375%, 9/01/37 | | 5,000,000 | | 4,913,450 |
| Turlock PFA Sewer Revenue, NATL RE, FGIC Insured, 5.50%, 9/15/29 | | 6,855,000 | | 6,859,593 |
| Tustin CRDA Tax Allocation, Housing, AGMC Insured, | | | | |
| 5.00%, 9/01/30 | | 2,125,000 | | 2,106,768 |
| 5.25%, 9/01/39 | | 3,250,000 | | 3,143,108 |
| Union Elementary School District GO, Capital Appreciation, | | | | |
| Series A, NATL RE, FGIC Insured, zero cpn., 9/01/24 | | 2,000,000 | | 954,960 |
| Series B, NATL RE, FGIC Insured, zero cpn., 9/01/25 | | 5,500,000 | | 2,421,925 |
| Series B, NATL RE, FGIC Insured, zero cpn., 9/01/26 | | 5,850,000 | | 2,391,948 |
| University of California Revenues, Limited Project, Series D, NATL RE, FGIC Insured, 5.00%, | | | | |
| 5/15/37 | | 6,460,000 | | 6,413,230 |
| Vacaville PFA Tax Allocation Revenue, Vacaville Redevelopment Projects, AGMC Insured, | | | | |
| 5.00%, 9/01/31 | | 5,095,000 | | 4,822,876 |
| Val Verde USD, | | | | |
| COP, Refunding, Series A, Assured Guaranty, 5.00%, 3/01/29 | | 4,000,000 | | 3,899,040 |
| COP, Refunding, Series A, Assured Guaranty, 5.125%, 3/01/36 | | 7,020,000 | | 6,458,681 |
| GO, Election of 2008, Refunding, Series B, AGMC Insured, zero cpn., 8/01/34 | | 1,000,000 | | 501,660 |
| Vista USD, GO, | | | | |
| Capital Appreciation, Series A, AGMC Insured, zero cpn., 8/01/26 | | 7,150,000 | | 2,916,485 |
| Capital Appreciation, Series A, AGMC Insured, zero cpn., 2/01/27 | | 4,795,000 | | 1,875,756 |
| Series A, AGMC Insured, 5.25%, 8/01/25 | | 5,000,000 | | 5,055,750 |
44 | Annual Report
| | | | |
| Franklin California Tax-Free Trust | | | | |
| |
| Statement of Investments, June 30, 2011 (continued) | | | | |
| |
| |
| Franklin California Insured Tax-Free Income Fund | | Principal Amount | | Value |
| Municipal Bonds (continued) | | | | |
| California (continued) | | | | |
| Washington Township Health Care District Revenue, Refunding, | | | | |
| 5.00%, 7/01/18 | $ | 2,000,000 | $ | 2,000,320 |
| 5.125%, 7/01/23 | | 450,000 | | 445,829 |
| Weaver USD, GO, Election of 2006, Series C, AMBAC Insured, zero cpn., 8/01/47 | | 18,685,000 | | 1,482,655 |
| West Basin Municipal Water District Revenue COP, Refunding, Series A, NATL Insured, 5.00%, | | | | |
| 8/01/24 | | 2,500,000 | | 2,579,725 |
| West Contra Costa USD, GO, | | | | |
| Refunding, Assured Guaranty, 5.25%, 8/01/29 | | 2,500,000 | | 2,554,300 |
| Series A, AGMC Insured, 5.00%, 8/01/35 | | 20,000,000 | | 20,028,400 |
| West Hills Community College District School Facilities ID No. 3 GO, Election of 2008, | | | | |
| Series B, AGMC Insured, 6.50%, 8/01/41 | | 4,000,000 | | 4,338,120 |
| West Kern Community College District COP, AMBAC Insured, 5.375%, 11/01/28 | | 5,615,000 | | 5,536,783 |
| Western Riverside County Water and Wastewater Finance Authority Revenue, Western Municipal | | | | |
| Water District Improvement, Assured Guaranty, | | | | |
| 5.50%, 9/01/34 | | 1,750,000 | | 1,784,388 |
| 5.625%, 9/01/39 | | 2,500,000 | | 2,546,400 |
| Westlands Water District Revenue COP, | | | | |
| NATL Insured, 5.00%, 9/01/29 | | 11,775,000 | | 11,472,618 |
| Series A, NATL Insured, 5.00%, 9/01/37 | | 4,340,000 | | 3,875,880 |
| Wiseburn School District GO, Election of 2010, | | | | |
| Series A, AGMC Insured, 5.75%, 8/01/40 | | 9,215,000 | | 9,543,699 |
| Series B, AGMC Insured, 5.625%, 5/01/41 | | 10,000,000 | | 10,282,100 |
| Woodland Finance Authority Lease Revenue, Capital Projects, Refunding, XLCA Insured, | | | | |
| 5.00%, 3/01/32 | | 6,340,000 | | 6,441,060 |
| Woodland Finance Authority Wastewater Revenue, second senior lien, NATL Insured, 5.00%, | | | | |
| 3/01/33 | | 1,370,000 | | 1,360,958 |
| 3/01/35 | | 2,590,000 | | 2,499,298 |
| Woodside Elementary School District GO, Election of 2005, NATL Insured, Pre-Refunded, | | | | |
| 5.00%, 10/01/29 | | 4,435,000 | | 5,174,802 |
| Yosemite Community College District GO, Election of 2004, Series C, AGMC Insured, 5.00%, | | | | |
| 8/01/32 | | 5,000,000 | | 5,038,300 |
| Total Municipal Bonds before Short Term Investments | | | | |
| (Cost $1,963,170,225) | | | | 1,948,116,282 |
| Short Term Investments 1.3% | | | | |
| Municipal Bonds 1.3% | | | | |
| California 1.3% | | | | |
| bCalifornia Health Facilities Financing Authority Revenue, Children’s Hospital Los Angeles, | | | | |
| Series B, Daily VRDN and Put, 0.05%, 7/01/42 | | 2,200,000 | | 2,200,000 |
| bCalifornia PCFA, PCR, Pacific Gas and Electric Co., Refunding, Series C, Daily VRDN and Put, | | | | |
| 0.05%, 11/01/26 | | 7,000,000 | | 7,000,000 |
| bCalifornia State Economic Recovery GO, Series C-3, Daily VRDN and Put, 0.03%, 7/01/23 | | 4,400,000 | | 4,400,000 |
| bCalifornia State GO, Kindergarten, Series B1, Daily VRDN and Put, 0.04%, 5/01/34 | | 5,000,000 | | 5,000,000 |
| bIrvine 1915 Act Special Assessment, Limited Obligation, AD No. 93-14, Daily VRDN and Put, | | | | |
| 0.03%, 9/02/25 | | 900,000 | | 900,000 |
| bSouthern California Pubic Power Authority Revenue, Mead-Adelanto Project, Refunding, | | | | |
| Series A, Daily VRDN and Put, 0.03%, 7/01/20 | | 6,100,000 | | 6,100,000 |
| Total Short Term Investments (Cost $25,600,000) | | | | 25,600,000 |
Annual Report | 45
| | |
| Franklin California Tax-Free Trust | | |
| Statement of Investments, June 30, 2011 (continued) | | |
| |
| Franklin California Insured Tax-Free Income Fund | | Value |
| Total Investments (Cost $1,988,770,225) 98.8% | $ | 1,973,716,282 |
| Other Assets, less Liabilities 1.2% | | 23,720,052 |
| Net Assets 100.0% | $ | 1,997,436,334 |
See Abbreviations on page 79.
aSecurity purchased on a when-issued basis. See Note 1(b).
bVariable rate demand notes (VRDNs) are tax-exempt obligations which contain a floating or variable interest rate adjustment formula and an unconditional right of demand to
receive payment of the principal balance plus accrued interest at specified dates. The coupon rate shown represents the rate at period end.

aThe amount shown for a share outstanding throughout the period may not correlate with the Statement of Operations for the period due to the timing of sales and repurchases of
the Fund shares in relation to income earned and/or fluctuating market value of the investments of the Fund.
bBased on average daily shares outstanding.
cEffective September 1, 2008, the redemption fee was eliminated.
dAmount rounds to less than $0.01 per share.
eTotal return does not reflect sales commissions or contingent deferred sales charges, if applicable.
Annual Report | The accompanying notes are an integral part of these financial statements. | 47
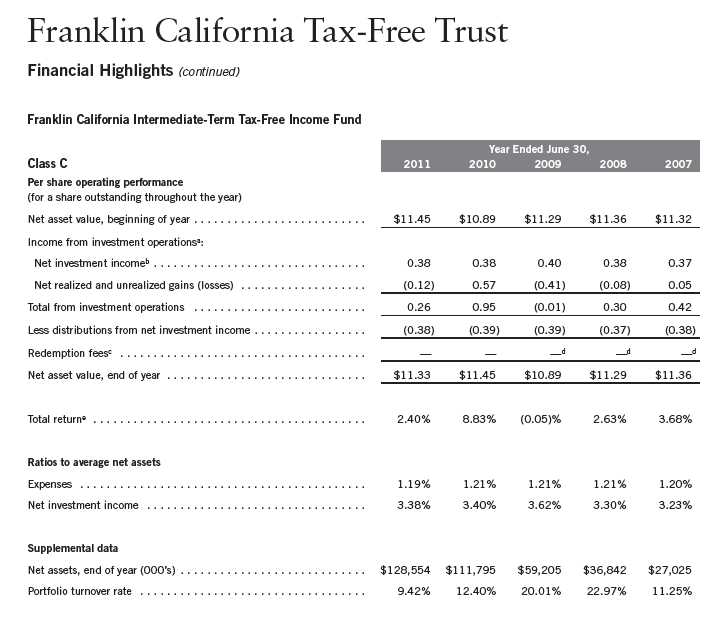
aThe amount shown for a share outstanding throughout the period may not correlate with the Statement of Operations for the period due to the timing of sales and repurchases of
the Fund shares in relation to income earned and/or fluctuating market value of the investments of the Fund.
bBased on average daily shares outstanding.
cEffective September 1, 2008, the redemption fee was eliminated.
dAmount rounds to less than $0.01 per share.
eTotal return does not reflect sales commissions or contingent deferred sales charges, if applicable.
48 | The accompanying notes are an integral part of these financial statements. | Annual Report
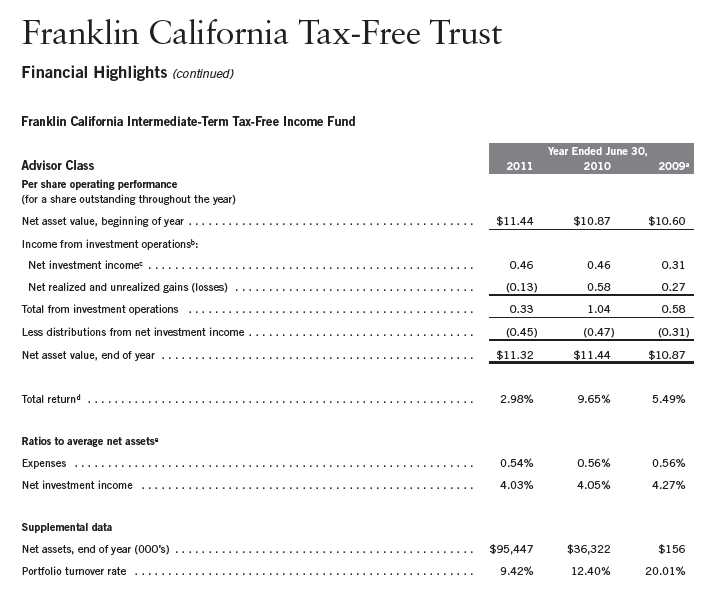
aFor the period October 31, 2008 (commencement of operations) to June 30, 2009.
bThe amount shown for a share outstanding throughout the period may not correlate with the Statement of Operations for the period due to the timing of sales and repurchases of
the Fund shares in relation to income earned and/or fluctuating market value of the investments of the Fund.
cBased on average daily shares outstanding.
dTotal return is not annualized for periods less than one year.
eRatios are annualized for periods less than one year.
Annual Report | The accompanying notes are an integral part of these financial statements. | 49
| | | | |
| Franklin California Tax-Free Trust | | | | |
| |
| Statement of Investments, June 30, 2011 | | | | |
| |
| |
| Franklin California Intermediate-Term Tax-Free Income Fund | | Principal Amount | | Value |
| Municipal Bonds 97.6% | | | | |
| California 92.2% | | | | |
| ABAG Finance Authority for Nonprofit Corps. COP, Rhoda Haas Goldman Plaza, California | | | | |
| Mortgage Insured, 5.125%, 5/15/15 | $ | 1,815,000 | $ | 1,816,870 |
| ABAG Finance Authority for Nonprofit Corps. Revenue, | | | | |
| Channing House, California Mortgage Insured, 5.00%, 5/15/20 | | 2,000,000 | | 2,024,140 |
| San Diego Hospital Assn., Series C, 5.125%, 3/01/18 | | 2,110,000 | | 2,181,424 |
| San Diego Hospital Assn., Series C, 5.25%, 3/01/19 | | 2,315,000 | | 2,381,140 |
| ABAG Revenue, Refunding, Series A-E, 5.40%, 9/15/14 | | 875,000 | | 893,865 |
| Alameda Corridor Transportation Authority Revenue, Capital Appreciation, sub. lien, Refunding, | | | | |
| Series A, AMBAC Insured, zero cpn., 10/01/17 | | 10,000,000 | | 7,234,100 |
| Alameda-Contra Costa Transit District COP, Refunding, AMBAC Insured, 4.375%, 8/01/14 | | 1,330,000 | | 1,332,075 |
| Antelope Valley UHSD, GO, Series A, NATL Insured, | | | | |
| 4.50%, 8/01/13 | | 1,230,000 | | 1,288,794 |
| 4.625%, 8/01/14 | | 1,250,000 | | 1,306,175 |
| Arcadia USD, GO, Capital Appreciation, Election of 2006, Series A, AGMC Insured, zero cpn., | | | | |
| 8/01/22 | | 4,065,000 | | 2,267,172 |
| Baldwin Park USD, GO, Capital Appreciation, Election of 2006, AGMC Insured, zero cpn., | | | | |
| 8/01/24 | | 5,265,000 | | 2,509,773 |
| Banning Utility Authority Water Enterprise Revenue, Refunding and Improvement Projects, | | | | |
| NATL RE, FGIC Insured, 5.00%, 11/01/21 | | 1,080,000 | | 1,132,812 |
| Bay Area Toll Authority Toll Bridge Revenue, San Francisco Bay Area, Refunding, Series F, 5.00%, | | | | |
| 4/01/24 | | 3,000,000 | | 3,163,830 |
| Burbank Electric Revenue, NATL Insured, 4.00%, 6/01/12 | | 1,000,000 | | 1,030,470 |
| Burbank USD, GO, Capital Appreciation, Election of 1997, Series C, NATL RE, FGIC Insured, | | | | |
| Pre-Refunded, 4.00%, 8/01/12 | | 2,500,000 | | 2,531,575 |
| zero cpn., 8/01/15 | | 4,600,000 | | 4,104,580 |
| zero cpn., 8/01/16 | | 4,670,000 | | 3,963,896 |
| California Educational Facilities Authority Revenue, | | | | |
| San Francisco University, 5.00%, 10/01/21 | | 3,000,000 | | 3,190,110 |
| Stanford University, Refunding, Series R, 4.00%, 11/01/11 | | 1,000,000 | | 1,012,000 |
| California Health Facilities Financing Authority Revenue, | | | | |
| Catholic Healthcare West, Series K, 5.125%, 7/01/22 | | 20,000,000 | | 20,746,800 |
| Cedars-Sinai Medical Center, Refunding, 5.00%, 11/15/19 | | 2,000,000 | | 2,088,940 |
| Community Development Program for Persons with Developmental Disabilities, Series A, | | | | |
| California Mortgage Insured, 6.00%, 2/01/24 | | 2,000,000 | | 2,161,620 |
| Paradise Valley Estates, Refunding, California Mortgage Insured, 4.375%, 1/01/12 | | 1,000,000 | | 1,013,280 |
| Paradise Valley Estates, Refunding, California Mortgage Insured, 5.00%, 1/01/13 | | 1,815,000 | | 1,907,456 |
| Paradise Valley Estates, Refunding, California Mortgage Insured, 5.00%, 1/01/14 | | 1,635,000 | | 1,708,183 |
| Providence Health and Services, Series C, 5.75%, 10/01/19 | | 1,440,000 | | 1,694,765 |
| Providence Health and Services, Series C, 6.00%, 10/01/20 | | 1,500,000 | | 1,756,620 |
| Scripps Health, Series A, 5.00%, 10/01/22 | | 4,600,000 | | 4,856,680 |
| The Episcopal Home, California Mortgage Insured, 4.625%, 2/01/12 | | 1,350,000 | | 1,370,331 |
| The Episcopal Home, California Mortgage Insured, 4.75%, 2/01/13 | | 1,200,000 | | 1,221,816 |
| aCalifornia Infrastructure and Economic Developing Bank Revenue, Broad Museum Project, | | | | |
| Series A, 5.00%, 6/01/21 | | 5,000,000 | | 5,763,150 |
| California Municipal Finance Authority COP, Community Hospitals of Central California, | | | | |
| 5.00%, 2/01/18 | | 4,390,000 | | 4,536,187 |
| 5.00%, 2/01/19 | | 3,860,000 | | 3,923,072 |
| 5.00%, 2/01/20 | | 1,600,000 | | 1,592,240 |
| 5.00%, 2/01/21 | | 1,600,000 | | 1,573,680 |
| |
| 50 | Annual Report | | | | |
| | | | |
| Franklin California Tax-Free Trust | | | | |
| |
| Statement of Investments, June 30, 2011 (continued) | | | | |
| |
| |
| Franklin California Intermediate-Term Tax-Free Income Fund | | Principal Amount | | Value |
| Municipal Bonds (continued) | | | | |
| California (continued) | | | | |
| California Municipal Finance Authority COP, Community Hospitals of Central California, | | | | |
| (continued) | | | | |
| Refunding, 5.00%, 2/01/14 | $ | 1,765,000 | $ | 1,857,892 |
| Refunding, 5.00%, 2/01/17 | | 4,025,000 | | 4,149,010 |
| Refunding, 5.00%, 2/01/19 | | 2,590,000 | | 2,622,530 |
| California Municipal Finance Authority Revenue, | | | | |
| Kern Regional Center Project, Series A, 6.00%, 5/01/19 | | 1,500,000 | | 1,629,315 |
| Kern Regional Center Project, Series A, 6.875%, 5/01/25 | | 1,500,000 | | 1,592,310 |
| Loma Linda University, 5.00%, 4/01/24 | | 1,180,000 | | 1,199,317 |
| California State Department of Water Resources Power Supply Revenue, | | | | |
| Power Supply, Refunding, Series H, AGMC Insured, 5.00%, 5/01/22 | | 5,000,000 | | 5,537,550 |
| Power Supply, Series H, AGMC Insured, 5.00%, 5/01/17 | | 10,420,000 | | 12,147,636 |
| Refunding, Series H, 5.00%, 5/01/22 | | 7,400,000 | | 8,195,574 |
| Refunding, Series L, 5.00%, 5/01/22 | | 10,000,000 | | 11,348,500 |
| Series A, 5.50%, 5/01/12 | | 2,000,000 | | 2,085,220 |
| Series A, Pre-Refunded, 5.125%, 5/01/18 | | 2,500,000 | | 2,625,925 |
| California State Department of Water Resources Water System Revenue, Central Valley Project, | | | | |
| Refunding, Series AE, 5.00%, 12/01/26 | | 5,000,000 | | 5,314,300 |
| California State Economic Recovery GO, Series A, | | | | |
| 5.00%, 7/01/15 | | 6,115,000 | | 6,811,743 |
| Pre-Refunded, 5.00%, 7/01/15 | | 4,555,000 | | 5,147,241 |
| California State GO, | | | | |
| 5.25%, 6/01/16 | | 515,000 | | 523,853 |
| Pre-Refunded, 5.00%, 11/01/12 | | 1,320,000 | | 1,340,222 |
| Refunding, 5.00%, 11/01/12 | | 590,000 | | 598,537 |
| Refunding, NATL Insured, 5.00%, 2/01/18 | | 5,000 | | 5,012 |
| California State Public Works Board Lease Revenue, | | | | |
| California State University Projects, Series B-1, 5.375%, 3/01/25 | | 2,500,000 | | 2,611,450 |
| Department of Corrections and Rehabilitation, Refunding, Series J, 5.00%, 1/01/21 | | 3,000,000 | | 3,098,430 |
| Department of Forestry and Fire Protection, Series A, 4.875%, 10/01/18 | | 1,325,000 | | 1,326,179 |
| Department of General Services, Buildings 8 and 9, Series A, 5.75%, 4/01/23 | | 4,000,000 | | 4,253,440 |
| Department of General Services, Buildings 8 and 9, Series A, 6.00%, 4/01/24 | | 6,605,000 | | 7,155,989 |
| Trustees of California State University, Series J, 5.50%, 11/01/25 | | 4,725,000 | | 4,969,188 |
| Trustees of California State University, Series J, 5.50%, 11/01/26 | | 1,000,000 | | 1,045,380 |
| Various Capital Projects, Series A, Sub Series A-1, 5.25%, 3/01/22 | | 7,475,000 | | 7,801,882 |
| Various Capital Projects, Series G, Sub Series G-1, 5.25%, 10/01/18 | | 5,605,000 | | 6,223,175 |
| Various Capital Projects, Series G, Sub Series G-1, 5.00%, 10/01/20 | | 6,405,000 | | 6,640,768 |
| Various Capital Projects, Series G, Sub Series G-1, 5.125%, 10/01/22 | | 14,555,000 | | 14,992,378 |
| California Statewide CDA, | | | | |
| COP, St. Joseph Health System Obligated Group, 5.25%, 7/01/11 | | 1,005,000 | | 1,005,000 |
| MFHR, 740 S. Olive Street Apartments, Series L, GNMA Secured, 4.25%, 7/20/24 | | 3,540,000 | | 3,373,337 |
| California Statewide CDA Revenue, | | | | |
| CHF-Irvine LLC, UCI East Campus Apartments, Phase II, 6.00%, 5/15/23 | | 10,000,000 | | 10,426,500 |
| Daughters of Charity Health, Refunding, Series A, 5.25%, 7/01/24 | | 3,670,000 | | 3,328,580 |
| Daughters of Charity Health, Refunding, Series G, 5.25%, 7/01/13 | | 1,000,000 | | 1,023,820 |
| Enloe Medical Center, Series A, California Mortgage Insured, 5.50%, 8/15/23 | | 3,000,000 | | 3,112,260 |
| Health Facility, Los Angeles Jewish Home for the Aging, California Mortgage Insured, 5.00%, | | | | |
| 11/15/18 | | 3,000,000 | | 3,079,650 |
| Lodi Memorial Hospital, Series A, California Mortgage Insured, 5.00%, 12/01/22 | | 8,000,000 | | 7,965,280 |
| |
| | | Annual Report | 51 |
| | | | |
| Franklin California Tax-Free Trust | | | | |
| |
| Statement of Investments, June 30, 2011 (continued) | | | | |
| |
| |
| Franklin California Intermediate-Term Tax-Free Income Fund | | Principal Amount | | Value |
| Municipal Bonds (continued) | | | | |
| California (continued) | | | | |
| California Statewide CDA Revenue, (continued) | | | | |
| Methodist Hospital of Southern California Project, FHA Insured, 5.50%, 8/01/18 | $ | 3,260,000 | $ | 3,695,666 |
| Methodist Hospital of Southern California Project, FHA Insured, 5.50%, 2/01/19 | | 3,405,000 | | 3,835,051 |
| Methodist Hospital of Southern California Project, FHA Insured, 5.50%, 8/01/19 | | 3,450,000 | | 3,897,706 |
| Mission Community, California Mortgage Insured, 4.50%, 11/01/11 | | 1,145,000 | | 1,158,145 |
| Viewpoint School, Refunding, ACA Insured, 4.50%, 10/01/17 | | 460,000 | | 464,664 |
| Viewpoint School, Refunding, ACA Insured, 4.75%, 10/01/18 | | 480,000 | | 485,275 |
| Carson RDA, Tax Allocation Housing, Series A, 5.00%, | | | | |
| 10/01/22 | | 1,975,000 | | 1,925,151 |
| 10/01/23 | | 2,135,000 | | 2,059,079 |
| 10/01/24 | | 2,245,000 | | 2,140,248 |
| 10/01/25 | | 1,700,000 | | 1,600,686 |
| Castaic Lake Water Agency Revenue COP, Water System Improvement Project, Capital | | | | |
| Appreciation, AMBAC Insured, zero cpn., 8/01/22 | | 10,445,000 | | 5,834,890 |
| Cathedral City 1915 Act Special Assessment, Limited Obligation, Cove ID No. 04-02, 5.00%, | | | | |
| 9/02/24 | | 975,000 | | 892,895 |
| Cerritos PFAR Tax Allocation, Redevelopment Project, Refunding, Series A, AMBAC Insured, | | | | |
| 3.00%, 11/01/11 | | 2,585,000 | | 2,582,725 |
| Clovis USD, GO, Capital Appreciation, Election of 2004, Series A, NATL RE, FGIC Insured, zero | | | | |
| cpn., 8/01/17 | | 5,235,000 | | 4,215,693 |
| Compton CRDA Tax Allocation, Redevelopment Project, second lien, Series A, 5.00%, 8/01/25 | | 8,275,000 | | 7,141,408 |
| Compton PFA Lease Revenue, Various Capital Projects, Refunding, AMBAC Insured, 5.00%, | | | | |
| 9/01/22 | | 15,190,000 | | 13,807,254 |
| Conejo Valley USD, GO, Election of 1998, | | | | |
| Series C, AGMC Insured, zero cpn., 8/01/17 | | 2,500,000 | | 2,043,475 |
| Series D, NATL RE, FGIC Insured, 4.50%, 8/01/19 | | 4,000,000 | | 4,115,360 |
| Contra Costa Community College District GO, Election of 2002, NATL RE, FGIC Insured, 4.75%, | | | | |
| 8/01/18 | | 2,450,000 | | 2,520,634 |
| Corona-Norco USD, | | | | |
| COP, Series A, AGMC Insured, 5.00%, 4/15/19 | | 1,310,000 | | 1,438,000 |
| COP, Series A, AGMC Insured, 5.00%, 4/15/22 | | 1,465,000 | | 1,554,599 |
| PFA Special Tax Revenue, Series A, 5.25%, 9/01/25 | | 2,235,000 | | 2,088,585 |
| Cupertino USD, GO, Refunding, 5.00%, 8/01/22 | | 1,690,000 | | 1,953,708 |
| Delano Financing Authority Revenue, Police Station and Capital Improvements, Series A, 5.00%, | | | | |
| 12/01/25 | | 3,865,000 | | 3,756,587 |
| Desert Sands USD, | | | | |
| COP, Financing Project, AGMC Insured, 5.00%, 3/01/19 | | 2,090,000 | | 2,236,112 |
| GO, Election of 2001, 5.25%, 8/01/21 | | 2,015,000 | | 2,206,365 |
| East Side UHSD Santa Clara County GO, Refunding, AGMC Insured, 5.00%, | | | | |
| 8/01/20 | | 2,800,000 | | 3,151,708 |
| 8/01/21 | | 2,140,000 | | 2,384,046 |
| 8/01/22 | | 3,090,000 | | 3,394,520 |
| Eden Township Healthcare District COP, 5.00%, 6/01/18 | | 1,505,000 | | 1,549,157 |
| Fairfax School District GO, Election of 2000, Series A, NATL RE, FGIC Insured, 5.00%, | | | | |
| 11/01/17 | | 710,000 | | 764,890 |
| Folsom PFA Lease Revenue, City Hall and Community Center, Refunding, AGMC Insured, 5.00%, | | | | |
| 10/01/17 | | 1,275,000 | | 1,310,190 |
52 | Annual Report
| | | | |
| Franklin California Tax-Free Trust | | | | |
| |
| Statement of Investments, June 30, 2011 (continued) | | | | |
| |
| |
| Franklin California Intermediate-Term Tax-Free Income Fund | | Principal Amount | | Value |
| Municipal Bonds (continued) | | | | |
| California (continued) | | | | |
| Folsom PFA Special Tax Revenue, Refunding, Series A, 5.00%, | | | | |
| 9/01/19 | $ | 1,000,000 | $ | 1,007,260 |
| 9/01/20 | | 1,270,000 | | 1,266,228 |
| 9/01/21 | | 1,335,000 | | 1,315,082 |
| 9/01/22 | | 1,400,000 | | 1,361,430 |
| Foothill/Eastern Corridor Agency Toll Road Revenue, | | | | |
| Capital Appreciation, Refunding, 5.875%, 1/15/26 | | 1,765,000 | | 1,720,434 |
| Refunding, NATL Insured, 5.00%, 1/15/16 | | 1,000,000 | | 1,002,450 |
| Fresno Joint Powers Financing Authority Lease Revenue, Master Lease Projects, Series A, | | | | |
| 5.25%, 4/01/22 | | 1,055,000 | | 1,094,963 |
| 5.50%, 4/01/23 | | 1,070,000 | | 1,119,958 |
| 5.625%, 4/01/24 | | 1,110,000 | | 1,163,391 |
| 5.75%, 4/01/25 | | 1,125,000 | | 1,177,020 |
| Galt Capital Improvements Authority Lease Revenue, Culture and Recreation Improvement Project, | | | | |
| 5.00%, 4/01/12 | | 525,000 | | 526,554 |
| Galt Middle School Joint Powers Authority Special Tax, CFD No. 1, Refunding, 5.40%, | | | | |
| 9/01/12 | | 845,000 | | 848,329 |
| Garden Grove Agency Community Development Tax Allocation, Garden Grove Community Project, | | | | |
| Refunding, AMBAC Insured, 4.25%, 10/01/13 | | 2,025,000 | | 2,068,700 |
| Golden State Tobacco Securitization Corp. Tobacco Settlement Revenue, Asset-Backed, ETM, | | | | |
| 5.00%, 6/01/12 | | 1,500,000 | | 1,561,965 |
| Huntington Beach PFAR, Lease Capital Improvement Refinancing Project, Refunding, Series B, | | | | |
| AMBAC Insured, | | | | |
| 4.125%, 8/01/14 | | 2,140,000 | | 2,186,566 |
| 4.25%, 8/01/15 | | 2,080,000 | | 2,125,032 |
| Inland Empire Solid Waste Financing Authority Revenue, Landfill Improvement Financing Project, | | | | |
| Series B, AGMC Insured, ETM, 6.25%, 8/01/11 | | 115,000 | | 115,445 |
| Irvine 1915 Act Special Assessment, Limited Obligation, | | | | |
| AD No. 00-18, Group 2, 4.70%, 9/02/12 | | 1,475,000 | | 1,491,874 |
| AD No. 00-18, Group 2, 4.80%, 9/02/13 | | 1,175,000 | | 1,188,454 |
| AD No. 00-18, Group 2, 5.125%, 9/02/17 | | 1,705,000 | | 1,708,581 |
| AD No. 00-18, Group 3, 4.75%, 9/02/15 | | 1,000,000 | | 1,018,070 |
| AD No. 00-18, Group 3, 5.00%, 9/02/17 | | 1,000,000 | | 1,008,220 |
| AD No. 03-19, Group 2, Refunding, 4.875%, 9/02/16 | | 1,000,000 | | 1,012,030 |
| AD No. 03-19, Group 2, Refunding, 5.00%, 9/02/18 | | 1,000,000 | | 992,230 |
| AD No. 03-19, Group 2, Refunding, 5.125%, 9/02/19 | | 1,000,000 | | 988,460 |
| Irvine USD Financing Authority Special Tax, Series A, | | | | |
| 4.70%, 9/01/15 | | 1,040,000 | | 1,063,951 |
| 4.80%, 9/01/17 | | 1,325,000 | | 1,322,125 |
| 4.875%, 9/01/18 | | 1,490,000 | | 1,473,536 |
| 5.00%, 9/01/20 | | 1,095,000 | | 1,065,928 |
| Lake Elsinore School Financing Authority Revenue, Refunding, 6.00%, 9/01/11 | | 275,000 | | 275,396 |
| Lancaster RDA Tax Allocation, Combined Redevelopment Project Areas, 6.00%, 8/01/24 | | 1,300,000 | | 1,292,954 |
| Loma Linda Hospital Revenue, Loma Linda University Medical Center, Series A, 5.00%, | | | | |
| 12/01/19 | | 5,000,000 | | 4,922,350 |
| Long Beach Bond Finance Authority Natural Gas Purchase Revenue, Series A, 5.00%, | | | | |
| 11/15/17 | | 3,950,000 | | 4,113,332 |
Annual Report | 53
| | | | |
| Franklin California Tax-Free Trust | | | | |
| |
| Statement of Investments, June 30, 2011 (continued) | | | | |
| |
| |
| Franklin California Intermediate-Term Tax-Free Income Fund | | Principal Amount | | Value |
| Municipal Bonds (continued) | | | | |
| California (continued) | | | | |
| Los Angeles Convention and Exhibition Center Authority Lease Revenue, Refunding, Series A, | | | | |
| 5.00%, 8/15/20 | $ | 20,000,000 | $ | 20,577,200 |
| AMBAC Insured, 3.00%, 8/15/12 | | 4,525,000 | | 4,604,323 |
| Los Angeles County MTA Sales Tax Revenue, Proposition C, Senior, Refunding, Series A, 5.25%, | | | | |
| 7/01/23 | | 15,000,000 | | 17,046,000 |
| aLos Angeles County Sanitation Districts Financing Authority Revenue, Capital Projects, | | | | |
| Refunding, Series A, 5.00%, 10/01/22 | | 2,750,000 | | 3,193,960 |
| Los Angeles GO, Judgment Obligation, Series A, 5.00%, 6/01/18 | | 5,650,000 | | 6,364,668 |
| Los Angeles USD, | | | | |
| COP, 5.00%, 12/01/20 | | 3,830,000 | | 3,966,425 |
| GO, Election of 2004, Series F, FGIC Insured, 5.00%, 7/01/21 | | 5,975,000 | | 6,401,555 |
| GO, Refunding, NATL Insured, 5.25%, 7/01/13 | | 3,500,000 | | 3,814,265 |
| GO, Refunding, Series A-1, FGIC Insured, 5.00%, 7/01/25 | | 6,265,000 | | 6,475,003 |
| GO, Refunding, Series A-2, FGIC Insured, 5.00%, 7/01/22 | | 5,000,000 | | 5,208,000 |
| GO, Series D, 5.00%, 7/01/27 | | 3,410,000 | | 3,539,512 |
| GO, Series I, 5.00%, 7/01/18 | | 5,000,000 | | 5,690,150 |
| M-S-R Public Power Agency San Juan Project Revenue, Refunding, Series I, NATL Insured, | | | | |
| 4.25%, 7/01/11 | | 5,055,000 | | 5,055,000 |
| 5.00%, 7/01/18 | | 1,000,000 | | 1,000,000 |
| Marina Joint Powers Financing Authority MFHR, Abrams B Apartments Financing, Mandatory | | | | |
| Put 11/15/16, FNMA Insured, | | | | |
| 3.90%, 11/15/36 | | 3,440,000 | | 3,621,735 |
| 3.95%, 11/15/36 | | 1,360,000 | | 1,435,194 |
| Martinez USD, GO, Election of 2010, Capital Appreciation, zero cpn. to 8/01/14, 5.375% | | | | |
| thereafter, 8/01/26 | | 5,000,000 | | 4,264,650 |
| Montebello USD, GO, Capital Appreciation, NATL RE, FGIC Insured, zero cpn., | | | | |
| 8/01/18 | | 1,455,000 | | 1,063,736 |
| 8/01/19 | | 1,480,000 | | 994,338 |
| Moreno Valley USD, GO, | | | | |
| Capital Appreciation, Refunding, NATL Insured, zero cpn., 8/01/24 | | 7,500,000 | | 3,214,650 |
| Election of 2004, Series A, AGMC Insured, Pre-Refunded, 5.00%, 8/01/17 | | 2,000,000 | | 2,263,960 |
| Election of 2004, Series A, AGMC Insured, Pre-Refunded, 5.00%, 8/01/18 | | 2,300,000 | | 2,603,554 |
| Nevada County COP, Refunding, NATL Insured, 4.125%, 10/01/12 | | 1,040,000 | | 1,043,037 |
| Northern California Power Agency Revenue, Geothermal Project No. 3, Series A, | | | | |
| 5.00%, 7/01/23 | | 2,000,000 | | 2,158,260 |
| 5.25%, 7/01/24 | | 2,000,000 | | 2,186,620 |
| Oakland USD Alameda County GO, 6.50%, 8/01/23 | | 2,200,000 | | 2,395,492 |
| Orange County CFD No. 2002-1 Special Tax, Ladera Ranch, Series A, | | | | |
| 4.60%, 8/15/14 | | 1,000,000 | | 1,005,860 |
| 4.75%, 8/15/15 | | 1,000,000 | | 1,006,100 |
| 4.90%, 8/15/16 | | 1,285,000 | | 1,292,093 |
| Orange County CFD No. 2003-1 Special Tax, Ladera Ranch, Series A, | | | | |
| 4.90%, 8/15/17 | | 1,000,000 | | 1,004,580 |
| 5.10%, 8/15/18 | | 1,000,000 | | 1,003,790 |
| Orange County CFD No. 2004-1 Special Tax, Ladera Ranch, Series A, | | | | |
| 4.70%, 8/15/18 | | 1,765,000 | | 1,713,021 |
| 4.80%, 8/15/19 | | 1,945,000 | | 1,882,721 |
| 4.85%, 8/15/20 | | 2,000,000 | | 1,921,560 |
54 | Annual Report
| | | | | |
| Franklin California Tax-Free Trust | | | | | |
| |
| Statement of Investments, June 30, 2011 (continued) | | | | | |
| |
| |
| Franklin California Intermediate-Term Tax-Free Income Fund | | | Principal Amount | | Value |
| Municipal Bonds (continued) | | | | | |
| California (continued) | | | | | |
| Orange County CFD No. 86-2 Special Tax, Rancho Santa Margarita, Refunding, Series A, | | | | | |
| 5.375%, 8/15/12 | | $ | 1,025,000 | $ | 1,026,640 |
| Oroville Hospital Revenue, Oroville Hospital, Series A, California Mortgage Insured, 5.125%, | | | | | |
| 12/01/12 | | | 1,435,000 | | 1,438,817 |
| Oxnard Harbor District Revenue, Series A, 5.10%, 8/01/14 | | | 795,000 | | 809,334 |
| Pacifica COP, AMBAC Insured, 5.00%, 1/01/22 | | | 1,275,000 | | 1,318,478 |
| Palm Desert Financing Authority Tax Allocation Revenue, Project Area No. 1, As Amended, | | | | | |
| Series A, NATL Insured, 5.00%, 4/01/23 | | | 7,690,000 | | 7,223,371 |
| Palo Verde Community College District COP, AMBAC Insured, 5.00%, | | | | | |
| 1/01/22 | | | 1,015,000 | | 1,056,585 |
| 1/01/23 | | | 1,065,000 | | 1,099,495 |
| 1/01/24 | | | 1,070,000 | | 1,095,573 |
| Pomona RDA Tax Allocation, Mountain Meadows Redevelopment Project, Refunding, Series X, | | | | | |
| 5.35%, 12/01/16 | | | 1,000,000 | | 1,055,520 |
| Rancho Mirage Joint Powers Financing Authority Revenue, Eisenhower Medical Center, Series A, 5.00%, | | | | | |
| 7/01/16 | | | 1,420,000 | | 1,502,019 |
| 7/01/21 | | | 1,695,000 | | 1,693,661 |
| Redlands USD, GO, Election of 2002, AGMC Insured, 5.00%, 7/01/19 | | | 1,000,000 | | 1,048,140 |
| Richmond Joint Powers Financing Authority Revenue, | | | | | |
| Lease, Civic Center Project, Refunding, Assured Guaranty, 5.00%, 8/01/19 | | | 2,010,000 | | 2,205,493 |
| Lease, Civic Center Project, Refunding, Assured Guaranty, 5.00%, 8/01/20 | | | 2,315,000 | | 2,509,784 |
| Lease, Civic Center Project, Refunding, Assured Guaranty, 5.00%, 8/01/21 | | | 2,050,000 | | 2,201,844 |
| Multiple Redevelopment Projects, Series B, ETM, 5.35%, 5/15/13 | | | 740,000 | | 783,386 |
| Riverside County COP, Capital Improvement, Family Law, Refunding, Series A, NATL RE, FGIC | | | | | |
| Insured, 5.00%, 11/01/18 | | | 1,540,000 | | 1,663,200 |
| Riverside County RDA Tax Allocation, | | | | | |
| Desert Communities Redevelopment Project Area, second lien, Series D, 6.50%, | | | | | |
| 12/01/21 | | | 1,045,000 | | 1,045,700 |
| Desert Communities Redevelopment Project Area, second lien, Series D, 6.75%, | | | | | |
| 12/01/26 | | | 1,025,000 | | 1,027,183 |
| Jurupa Valley Redevelopment Project Area, Series B, 6.50%, 10/01/25 | | | 1,225,000 | | 1,216,989 |
| Riverside USD, GO, Election of 2001, Series A, NATL RE, FGIC Insured, 4.00%, 2/01/13 | | | 1,000,000 | | 1,027,050 |
| Sacramento County COP, Refunding, | | | | | |
| 5.125%, 2/01/21 | | | 3,460,000 | | 3,533,248 |
| 5.375%, 2/01/23 | | | 3,400,000 | | 3,483,096 |
| 5.50%, 2/01/25 | | | 3,770,000 | | 3,803,138 |
| Sacramento County Special Tax, CFD No. 1, Improvement Area No. 1, Laguna Creek Ranch/Elliott | | | | | |
| Ranch, Refunding, 5.00%, 9/01/20 | | | 1,510,000 | | 1,520,932 |
| San Bernardino County COP, Arrowhead Project, Refunding, Series A, 5.25%, 8/01/26 | | | 15,000,000 | | 14,754,150 |
| San Diego Public Facilities Financing Authority Lease Revenue, Master Refunding Project, | | | | | |
| Series A, 5.00%, 9/01/26 | | | 8,000,000 | | 7,849,520 |
| San Diego RDA Tax Allocation Revenue, Naval Training Center, Series A, 5.00%, 9/01/25 | | | 1,000,000 | | 912,570 |
| San Francisco City and County Airports Commission International Airport Revenue, | | | | | |
| Issue 34D, Refunding, Second Series, 5.25%, 5/01/26 | | | 5,425,000 | | 5,671,024 |
| Mandatory Put 5/01/12, Refunding, Second Series, 6.50%, 5/01/19 | | | 2,000,000 | | 2,090,460 |
| San Francisco City and County COP, Multiple Capital Improvement Projects, Series A, 5.00%, | | | | | |
| 4/01/24 | | | 8,400,000 | | 8,766,072 |
Annual Report | 55
| | | | |
| Franklin California Tax-Free Trust | | | | |
| |
| Statement of Investments, June 30, 2011 (continued) | | | | |
| |
| |
| Franklin California Intermediate-Term Tax-Free Income Fund | | Principal Amount | | Value |
| Municipal Bonds (continued) | | | | |
| California (continued) | | | | |
| San Francisco City and County GO, Clean and Safe Parks, Series B, 4.75%, 6/15/19 | $ | 2,610,000 | $ | 2,962,167 |
| San Francisco City and County RDA Hotel Occupancy Revenue, Refunding, AGMC Insured, | | | | |
| 5.00%, 6/01/24 | | 10,275,000 | | 10,434,982 |
| San Francisco City and County Redevelopment Financing Authority Tax Allocation, | | | | |
| Mission Bay North Redevelopment, Series C, 5.875%, 8/01/25 | | 1,000,000 | | 987,250 |
| Mission Bay South Redevelopment, Series D, 5.50%, 8/01/19 | | 1,030,000 | | 1,044,018 |
| Mission Bay South Redevelopment, Series D, 6.25%, 8/01/21 | | 1,000,000 | | 1,044,990 |
| Mission Bay South Redevelopment, Series D, 6.25%, 8/01/23 | | 1,000,000 | | 1,047,640 |
| Mission Bay South Redevelopment, Series D, 6.00%, 8/01/25 | | 1,465,000 | | 1,488,308 |
| Mission Bay South Redevelopment, Series D, 6.125%, 8/01/26 | | 1,550,000 | | 1,579,016 |
| San Francisco Redevelopment Projects, Series B, 6.125%, 8/01/26 | | 1,000,000 | | 1,028,740 |
| San Joaquin County COP, | �� | | | |
| General Hospital Project, Refunding, NATL Insured, 5.00%, 9/01/17 | | 1,000,000 | | 1,001,780 |
| Solid Waste System Facilities Projects, NATL Insured, 5.00%, 4/01/17 | | 1,340,000 | | 1,376,689 |
| San Joaquin Hills Transportation Corridor Agency Toll Road Revenue, Capital Appreciation, | | | | |
| Refunding, Series A, | | | | |
| 5.60%, 1/15/16 | | 3,000,000 | | 2,961,150 |
| NATL Insured, zero cpn., 1/15/26 | | 19,000,000 | | 5,766,500 |
| San Jose RDA Tax Allocation, Merged Area Redevelopment Project, | | | | |
| Refunding, Series D, AMBAC Insured, 5.00%, 8/01/23 | | 13,000,000 | | 11,365,770 |
| Series B, XLCA Insured, 5.00%, 8/01/26 | | 8,000,000 | | 6,658,640 |
| Sanger USD, GO, Election of 2006, Series A, AGMC Insured, 5.00%, | | | | |
| 8/01/19 | | 1,325,000 | | 1,451,776 |
| 8/01/20 | | 1,510,000 | | 1,644,828 |
| Santa Ana Community RDA Tax Allocation, Merged Project Area, Refunding, Series A, 6.00%, | | | | |
| 9/01/22 | | 5,000,000 | | 5,249,850 |
| Santa Ana USD, GO, | | | | |
| Election of 1999, Series B, NATL RE, FGIC Insured, zero cpn., 8/01/14 | | 3,125,000 | | 2,915,813 |
| Election of 2008, Series A, 5.25%, 8/01/25 | | 2,000,000 | | 2,114,700 |
| Santa Clara 1915 Act, Reassessment District 187, Refunding, Series 1, 5.25%, 9/02/11 | | 380,000 | | 380,654 |
| South Bayside Waste Management Authority Solid Waste Enterprise Revenue, Shoreway | | | | |
| Environmental Center, Series A, 5.25%, 9/01/24 | | 3,500,000 | | 3,527,440 |
| South County Regional Wastewater Authority Revenue, Regional Wastewater Facilities Project, | | | | |
| Refunding, AGMC Insured, 3.25%, 8/01/11 | | 1,000,000 | | 1,001,790 |
| South Gate PFA Tax Allocation Revenue, South Gate Redevelopment Project No. 1, XLCA Insured, | | | | |
| 5.00%, 9/01/16 | | 1,285,000 | | 1,299,096 |
| Southern California Public Power Authority Natural Gas Project Revenue, Project No. 1, Series A, | | | | |
| 5.25%, 11/01/19 | | 1,500,000 | | 1,535,415 |
| Southern California Public Power Authority Revenue, Canyon Power Project, Refunding, Series A, | | | | |
| 5.00%, 7/01/19 | | 1,500,000 | | 1,721,970 |
| Stockton Revenue, O’Connor Woods Housing Corp., Series A, 5.375%, 11/01/11 | | 225,000 | | 226,121 |
| Torrance Hospital Revenue, Torrance Memorial Medical Center, Series A, 5.10%, 6/01/12 | | 1,000,000 | | 1,012,840 |
| Tuolumne Wind Project Authority Revenue, Tuolumne Co. Project, Series A, 5.25%, 1/01/24 | | 5,000,000 | | 5,311,100 |
| Tustin CRDA Tax Allocation, Housing, AGMC Insured, 5.00%, | | | | |
| 9/01/24 | | 1,000,000 | | 1,037,870 |
| 9/01/25 | | 1,000,000 | | 1,026,540 |
56 | Annual Report

Annual Report | 57
Franklin California Tax-Free Trust
Statement of Investments, June 30, 2011 (continued)
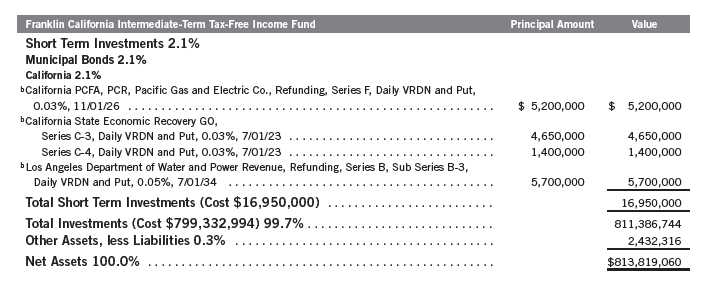
See Abbreviations on page 79.
aSecurity purchased on a when-issued basis. See Note 1(b).
bVariable rate demand notes (VRDNs) are tax-exempt obligations which contain a floating or variable interest rate adjustment formula and an unconditional right of demand to
receive payment of the principal balance plus accrued interest at specified dates. The coupon rate shown represents the rate at period end.
58 | The accompanying notes are an integral part of these financial statements. | Annual Report

Annual Report | The accompanying notes are an integral part of these financial statements. | 59
| | | | |
| Franklin California Tax-Free Trust | | | | |
| |
| Statement of Investments, June 30, 2011 | | | | |
| |
| |
| Franklin California Tax-Exempt Money Fund | | Principal Amount | | Value |
| Investments 102.3% | | | | |
| Municipal Bonds 102.3% | | | | |
| California 102.3% | | | | |
| California Education Notes Program Note Participations Revenue, Series A, 2.00%, 7/01/11 | $ | 10,000,000 | $ | 10,000,000 |
| aCalifornia Educational Facilities Authority Revenue, | | | | |
| California Institute of Technology, Series B, Weekly VRDN and Put, 0.04%, 10/01/36 | | 19,900,000 | | 19,900,000 |
| Stanford University, Refunding, Series L, Weekly VRDN and Put, 0.04%, 10/01/22 | | 3,300,000 | | 3,300,000 |
| Stanford University, Refunding, Series L-2, Weekly VRDN and Put, 0.04%, 10/01/14 | | 5,800,000 | | 5,800,000 |
| Stanford University, Refunding, Series L-3, Weekly VRDN and Put, 0.04%, 10/01/15 | | 5,040,000 | | 5,040,000 |
| Stanford University, Refunding, Series L-5, Weekly VRDN and Put, 0.04%, 10/01/17 | | 7,000,000 | | 7,000,000 |
| Various, California Institute of Technology, Refunding, Series A, Weekly VRDN and Put, | | | | |
| 0.05%, 10/01/36 | | 1,100,000 | | 1,100,000 |
| aCalifornia Health Facilities Financing Authority Revenue, Adventist Health System West, | | | | |
| Series A, Weekly VRDN and Put, 0.05%, 8/01/21 | | 7,200,000 | | 7,200,000 |
| Series B, Daily VRDN and Put, 0.03%, 9/01/38 | | 8,100,000 | | 8,100,000 |
| aCalifornia HFAR, | | | | |
| MF, Montecito Village, Series B, FHLMC Insured, Weekly VRDN and Put, 0.11%, 4/01/43 | | 6,325,000 | | 6,325,000 |
| MFH III, Refunding, Series F, Weekly VRDN and Put, 0.05%, 2/01/32 | | 6,270,000 | | 6,270,000 |
| MFH III, Series D, Weekly VRDN and Put, 0.05%, 2/01/31 | | 8,900,000 | | 8,900,000 |
| aCalifornia Infrastructure and Economic Development Bank Revenue, | | | | |
| American National Red Cross, Refunding, Weekly VRDN and Put, 0.04%, 9/01/34 | | 5,000,000 | | 5,000,000 |
| California Academy of Sciences, Refunding, Series C, Daily VRDN and Put, 0.03%, | | | | |
| 9/01/38 | | 5,400,000 | | 5,400,000 |
| Contemporary Jewish Museum, Daily VRDN and Put, 0.05%, 12/01/36 | | 11,270,000 | | 11,270,000 |
| J. Paul Getty Trust, Refunding, Series D, Daily VRDN and Put, 0.02%, 4/01/33 | | 21,200,000 | | 21,200,000 |
| aCalifornia Municipal Finance Authority Revenue, Westmont College, Series A, Weekly VRDN and | | | | |
| Put, 0.07%, 1/01/40 | | 5,000,000 | | 5,000,000 |
| aCalifornia PCFA, PCR, Pacific Gas and Electric Co., Refunding, | | | | |
| Series C, Daily VRDN and Put, 0.05%, 11/01/26 | | 15,500,000 | | 15,500,000 |
| Series F, Daily VRDN and Put, 0.03%, 11/01/26 | | 4,400,000 | | 4,400,000 |
| aCalifornia State Economic Recovery GO, | | | | |
| Refunding, Series C-1, Daily VRDN and Put, 0.03%, 7/01/23 | | 4,950,000 | | 4,950,000 |
| Series C-2, Daily VRDN and Put, 0.03%, 7/01/23 | | 5,450,000 | | 5,450,000 |
| Series C-3, Daily VRDN and Put, 0.03%, 7/01/23 | | 5,400,000 | | 5,400,000 |
| Series C-4, Daily VRDN and Put, 0.03%, 7/01/23 | | 1,500,000 | | 1,500,000 |
| aCalifornia State GO, | | | | |
| Kindergarten, Series A3, Daily VRDN and Put, 0.03%, 5/01/34 | | 9,400,000 | | 9,400,000 |
| Kindergarten, Series B1, Daily VRDN and Put, 0.04%, 5/01/34 | | 4,235,000 | | 4,235,000 |
| Refunding, Series A, Sub Series A2-2, Weekly VRDN and Put, 0.05%, 5/01/40 | | 8,400,000 | | 8,400,000 |
| Series A-2, Daily VRDN and Put, 0.03%, 5/01/33 | | 16,600,000 | | 16,600,000 |
| Various Purpose, Refunding, Series A, Sub Series A1-2, Weekly VRDN and Put, 0.05%, | | | | |
| 5/01/40 | | 9,800,000 | | 9,800,000 |
| aCalifornia Statewide CDA Revenue, | | | | |
| John Muir Health, Refunding, Series C, Daily VRDN and Put, 0.03%, 8/15/27 | | 15,975,000 | | 15,975,000 |
| Livermore Valley Performing Arts Center Project, Weekly VRDN and Put, 0.04%, | | | | |
| 12/01/36 | | 6,160,000 | | 6,160,000 |
| aCalleguas-Las Virgenes PFAR, Municipal Water District Project, Refunding, Series A, Weekly | | | | |
| VRDN and Put, 0.05%, 7/01/37 | | 8,825,000 | | 8,825,000 |
| aFremont PFA, COP, Weekly VRDN and Put, 0.06%, 8/01/30 | | 7,180,000 | | 7,180,000 |
| aHillsborough COP, Refunding, Series A, Weekly VRDN and Put, 0.10%, 6/01/30 | | 1,700,000 | | 1,700,000 |
60 | Annual Report
Franklin California Tax-Free Trust
Statement of Investments, June 30, 2011 (continued)
| | | | |
| Franklin California Tax-Exempt Money Fund | | Principal Amount | | Value |
| Investments (continued) | | | | |
| Municipal Bonds (continued) | | | | |
| California (continued) | | | | |
| aIrvine 1915 Act Special Assessment, | | | | |
| AD No. 97-17, Daily VRDN and Put, 0.04%, 9/02/23 | $ | 8,000,000 | $ | 8,000,000 |
| Limited Obligation, AD No. 94-13, Daily VRDN and Put, 0.04%, 9/02/22 | | 1,450,000 | | 1,450,000 |
| Limited Obligation, AD No. 94-15, Refunding, Daily VRDN and Put, 0.04%, 9/02/20 | | 2,668,000 | | 2,668,000 |
| Limited Obligation, AD No. 97-16, Daily VRDN and Put, 0.04%, 9/02/22 | | 10,100,000 | | 10,100,000 |
| aIrvine Ranch Water District GO, ID, Consolidated, Series B, Daily VRDN and Put, 0.03%, | | | | |
| 10/01/41 | | 10,450,000 | | 10,450,000 |
| aLos Angeles County Housing Authority MFHR, Malibu Meadows Project, Refunding, Series B, | | | | |
| FNMA Insured, Weekly VRDN and Put, 0.05%, 4/15/28 | | 11,425,000 | | 11,425,000 |
| aLos Angeles County MFMR, | | | | |
| Housing, Valencia Housing Project, Series C, FHLMC Insured, Weekly VRDN and Put, | | | | |
| 0.09%, 4/01/31 | | 11,575,000 | | 11,575,000 |
| Series A, FHLMC Insured, Weekly VRDN and Put, 0.09%, 7/01/14 | | 4,500,000 | | 4,500,000 |
| aLos Angeles Department of Water and Power Revenue, | | | | |
| Power System, Refunding, Series A, Sub Series A-3, Weekly VRDN and Put, 0.04%, | | | | |
| 7/01/35 | | 750,000 | | 750,000 |
| Refunding, Series B, Sub Series B-1, Weekly VRDN and Put, 0.05%, 7/01/34 | | 5,450,000 | | 5,450,000 |
| Refunding, Series B, Sub Series B-3, Daily VRDN and Put, 0.05%, 7/01/34 | | 5,500,000 | | 5,500,000 |
| Refunding, Series B, Sub Series B-8, Weekly VRDN and Put, 0.04%, 7/01/34 | | 9,200,000 | | 9,200,000 |
| aLos Angeles Department of Water and Power Waterworks Revenue, Refunding, Series B, | | | | |
| Sub Series B-4, Weekly VRDN and Put, 0.05%, 7/01/35 | | 14,050,000 | | 14,050,000 |
| bLos Angeles GO, TRAN, 2.50%, 2/29/12 | | 10,000,000 | | 10,139,700 |
| aMetropolitan Water District of Southern California Water Revenue, Special, Refunding, Series A, | | | | |
| Weekly VRDN and Put, 0.04%, 10/01/29 | | 15,000,000 | | 15,000,000 |
| aMorgan Hill RDA Tax Allocation, Ojo de Agua Redevelopment Project, Series A, Weekly VRDN | | | | |
| and Put, 0.07%, 9/01/33 | | 7,945,000 | | 7,945,000 |
| aOakland-Alameda County Coliseum Authority Lease Revenue, Coliseum Project, Refunding, | | | | |
| Series C-1, Weekly VRDN and Put, 0.08%, 2/01/25 | | 18,400,000 | | 18,400,000 |
| aOceanside MFHR, Shadow Way Apartments Project, Weekly VRDN and Put, 0.06%, 3/01/49 | | 5,350,000 | | 5,350,000 |
| aOrange County Apartment Development Revenue, | | | | |
| Harbor Pointe, Issue D, Refunding, FHLMC Insured, Weekly VRDN and Put, 0.06%, | | | | |
| 12/01/22 | | 6,000,000 | | 6,000,000 |
| Park Ridge Villas, Issue 1, Refunding, FNMA Insured, Weekly VRDN and Put, 0.06%, | | | | |
| 11/15/28 | | 5,100,000 | | 5,100,000 |
| Trabuco Woods, Refunding, Series J, FNMA Insured, Weekly VRDN and Put, 0.07%, | | | | |
| 11/15/28 | | 2,670,000 | | 2,670,000 |
| aOrange County Housing Authority MF Apartment Development Revenue, Lantern Pines Project, | | | | |
| Series CC, FNMA Insured, Weekly VRDN and Put, 0.09%, 12/01/27 | | 2,595,000 | | 2,595,000 |
| bRiverside County GO, TRAN, Series B, 2.00%, 6/29/12 | | 10,000,000 | | 10,166,500 |
| Roseville Joint UHSD, GO, TRAN, 2.00%, 9/01/11 | | 11,000,000 | | 11,023,177 |
| aSacramento County Sanitation District Financing Authority Revenue, sub. lien, Sanitation | | | | |
| District, Refunding, | | | | |
| Series C, Daily VRDN and Put, 0.03%, 12/01/38 | | 4,000,000 | | 4,000,000 |
| Series E, Weekly VRDN and Put, 0.05%, 12/01/40 | | 3,000,000 | | 3,000,000 |
| aSan Diego County COP, San Diego Foundation, Weekly VRDN and Put, 0.06%, 8/01/36 | | 4,415,000 | | 4,415,000 |
| aSan Jose Financing Authority Lease Revenue, Hayes Mansion, Refunding, Series C, Weekly | | | | |
| VRDN and Put, 0.05%, 6/01/27 | | 8,915,000 | | 8,915,000 |
| aSan Jose RDAR, Merged Area Redevelopment Project, Series B, Weekly VRDN and Put, 0.04%, | | | | |
| 7/01/26 | | 18,620,000 | | 18,620,000 |
| |
| | | Annual Report | 61 |
Franklin California Tax-Free Trust
Statement of Investments, June 30, 2011 (continued)
| | | | | |
| Franklin California Tax-Exempt Money Fund | | Principal Amount | | Value | |
| Investments (continued) | | | | | |
| Municipal Bonds (continued) | | | | | |
| California (continued) | | | | | |
| San Mateo UHSD, GO, BAN, Refunding, 2.00%, 2/15/12 | $ | 10,000,000 | $ | 10,084,202 | |
| aSanta Clara County Financing Authority Lease Revenue, Valley Medical Center Facilities | | | | | |
| Replacement Project, Series B, Weekly VRDN and Put, 0.07%, 11/15/25 | | 4,900,000 | | 4,900,000 | |
| aSanta Clara County Housing Authority MFHR, Benton Park Central Apartments, Refunding, | | | | | |
| Series A, FNMA Insured, Weekly VRDN and Put, 0.05%, 12/15/25 | | 5,000,000 | | 5,000,000 | |
| aSanta Clara Valley Transportation Authority Sales Tax Revenue, Refunding, Series A, Weekly | | | | | |
| VRDN and Put, 0.05%, 6/01/26 | | 9,900,000 | | 9,900,000 | |
| aSouthern California Pubic Power Authority Revenue, | | | | | |
| Mead-Adelanto Project, Refunding, Series A, Daily VRDN and Put, 0.03%, 7/01/20 | | 19,705,000 | | 19,705,000 | |
| Mead-Phoenix Project, Refunding, Series A, Daily VRDN and Put, 0.03%, 7/01/20 | | 11,750,000 | | 11,750,000 | |
| aTahoe Forest Hospital District Revenue, Health Facility, Daily VRDN and Put, 0.05%, | | | | | |
| 7/01/33 | | 1,500,000 | | 1,500,000 | |
| aTustin 1915 Act Special Assessment, Reassessment District No. 95-2, Series A, Daily VRDN and | | | | | |
| Put, 0.03%, 9/02/13 | | 9,774,000 | | 9,774,000 | |
| aUnion City MFR, Housing Mission Sierra, Refunding, Series A, FNMA Insured, Weekly VRDN and | | | | | |
| Put, 0.06%, 7/15/29 | | 9,400,000 | | 9,400,000 | |
| aWalnut Creek MFHR, Creekside Drive, FHLMC Insured, Weekly VRDN and Put, 0.05%, | | | | | |
| 4/01/27 | | 3,730,000 | | 3,730,000 | |
| Total Investments (Cost $576,480,579) 102.3% | | | | 576,480,579 | |
| |
| Other Assets, less Liabilities (2.3)% | | | | (13,006,768 | ) |
| Net Assets 100.0% | | | $ | 563,473,811 | |
See Abbreviations on page 79.
aVariable rate demand notes (VRDNs) are tax-exempt obligations which contain a floating or variable interest rate adjustment formula and an unconditional right of demand to
receive payment of the principal balance plus accrued interest at specified dates. The coupon rate shown represents the rate at period end.
bSecurity purchased on a when-issued basis. See Note 1(b).
62 | The accompanying notes are an integral part of these financial statements. | Annual Report
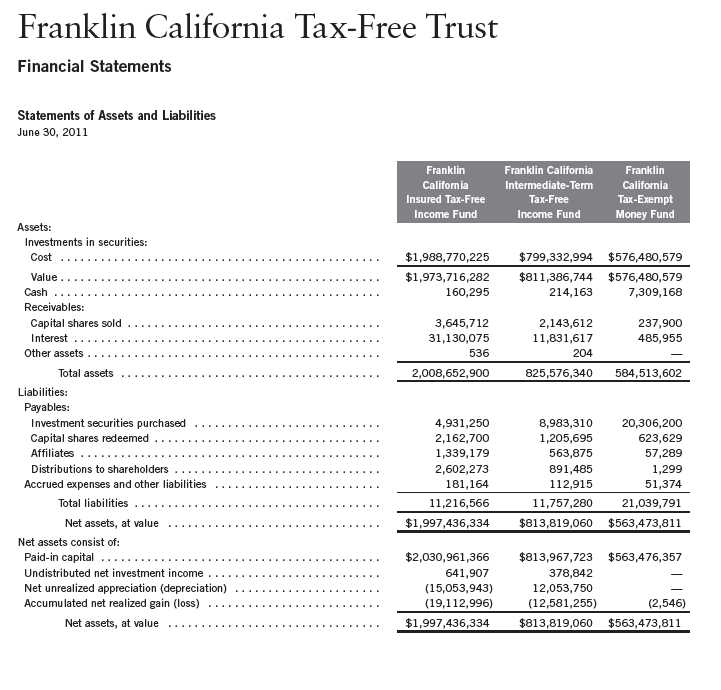
Annual Report | The accompanying notes are an integral part of these financial statements. | 63
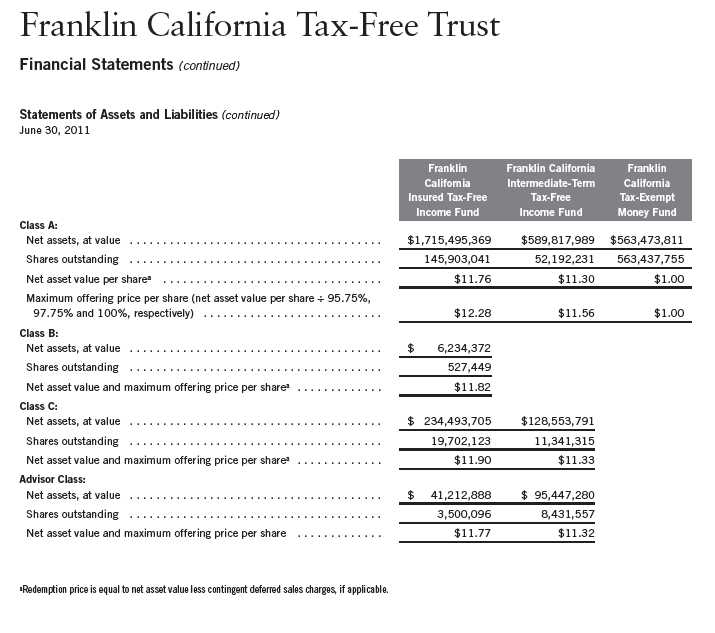
64 | The accompanying notes are an integral part of these financial statements. | Annual Report
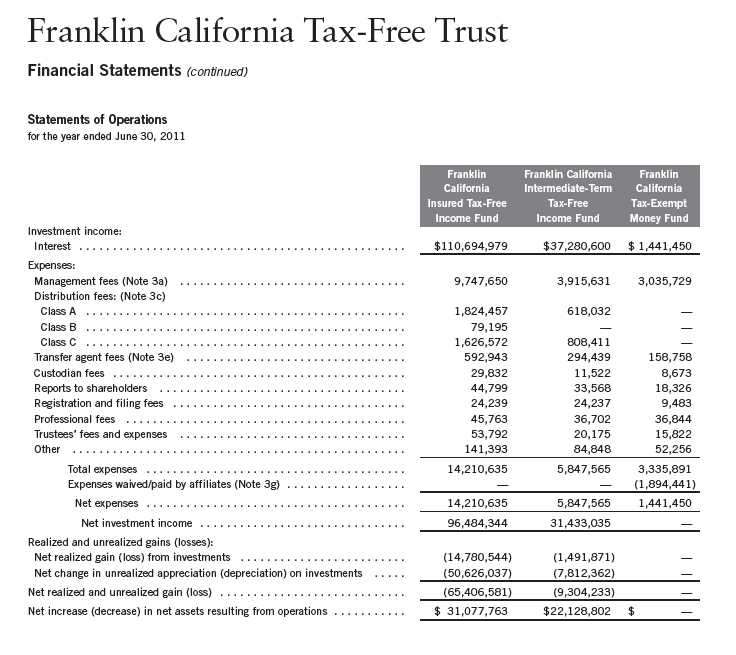
Annual Report | The accompanying notes are an integral part of these financial statements. | 65
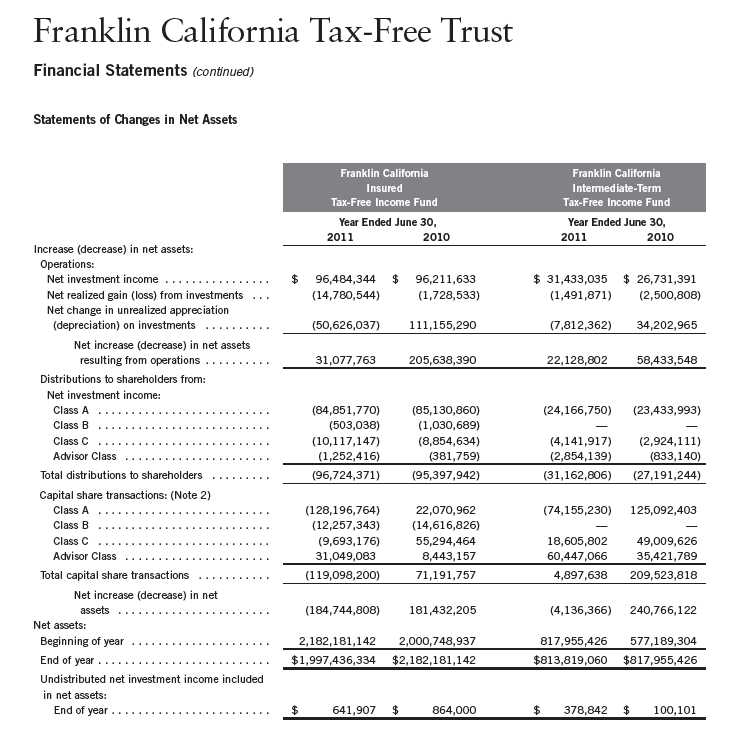
66 | The accompanying notes are an integral part of these financial statements. | Annual Report

Annual Report | The accompanying notes are an integral part of these financial statements. | 67
Franklin California Tax-Free Trust
Notes to Financial Statements
1. ORGANIZATION AND SIGNIFICANT ACCOUNTING POLICIES
Franklin California Tax-Free Trust (Trust) is registered under the Investment Company Act of 1940, as amended, (1940 Act) as an open-end investment company, consisting of three funds (Funds). The classes of shares offered within each of the Funds are indicated below. Each class of shares differs by its initial sales load, contingent deferred sales charges, distribution fees, voting rights on matters affecting a single class and its exchange privilege.
The following summarizes the Funds’ significant accounting policies.
a. Financial Instrument Valuation
The Funds’ investments in securities and other financial instruments are carried at fair value daily. Fair value is the price that would be received to sell an asset or paid to transfer a liability in an orderly transaction between market participants on the measurement date. Under procedures approved by the Trust’s Board of Trustees, the Funds may utilize independent pricing services, quotations from securities and financial instrument dealers, and other market sources to determine fair value.
Debt securities generally trade in the over-the-counter market rather than on a securities exchange. The Funds’ pricing services use multiple valuation techniques to determine fair value. In instances where sufficient market activity exists, the pricing services may utilize a market-based approach through which quotes from market makers are used to determine fair value. In instances where sufficient market activity may not exist or is limited, the pricing services also utilize proprietary valuation models which may consider market characteristics such as benchmark yield curves, option-adjusted spreads, credit spreads, estimated default rates, coupon rates, anticipated timing of principal repayments, underlying collateral, and other unique security features in order to estimate the relevant cash flows, which are then discounted to calculate the fair value.
Securities in the Franklin California Tax-Exempt Money Fund are valued at amortized cost, which approximates market value. Amortized cost is an income-based approach which involves valuing an instrument at its cost and thereafter assuming a constant amortization to maturity of any discount or premium.
The Funds have procedures to determine the fair value of securities and other financial instruments for which market prices are not readily available or which may not be reliably priced. Under these procedures, the Funds primarily employ a market-based approach which may use related or comparable assets or liabilities, recent transactions, market multiples, book values, and other relevant information for the investment to determine the fair value of the investment. The Funds may also use an income-based valuation approach in which the anticipated future cash flows of
68 | Annual Report
Franklin California Tax-Free Trust
Notes to Financial Statements (continued)
| 1. | ORGANIZATION AND SIGNIFICANT ACCOUNTING POLICIES (continued) |
| a. | Financial Instrument Valuation (continued) |
the investment are discounted to calculate fair value. Discounts may also be applied due to the nature or duration of any restrictions on the disposition of the investments. Due to the inherent uncertainty of valuations of such investments, the fair values may differ significantly from the values that would have been used had an active market existed.
b. Securities Purchased on a When-Issued Basis
The Funds purchase securities on a when-issued basis, with payment and delivery scheduled for a future date. These transactions are subject to market fluctuations and are subject to the risk that the value at delivery may be more or less than the trade date purchase price. Although the Funds will generally purchase these securities with the intention of holding the securities, they may sell the securities before the settlement date. Sufficient assets have been segregated for these securities.
c. Income Taxes
It is each fund’s policy to qualify as a regulated investment company under the Internal Revenue Code. Each fund intends to distribute to shareholders substantially all of its income and net realized gains to relieve it from federal income and excise taxes. As a result, no provision for U.S. federal income taxes is required. Each fund files U.S. income tax returns as well as tax returns in certain other jurisdictions. Each fund records a provision for taxes in its financial statements including penalties and interest, if any, for a tax position taken on a tax return (or expected to be taken) when it fails to meet the more likely than not (a greater than 50% probability) threshold and based on the technical merits, the tax position may not be sustained upon examination by the tax authorities. As of June 30, 2011, and for all open tax years, each fund has determined that no provision for income tax is required in each fund’s financial statements. Open tax years are those that remain subject to examination and are based on each tax jurisdiction statute of limitation.
d. Security Transactions, Investment Income, Expenses and Distributions
Security transactions are accounted for on trade date. Realized gains and losses on security transactions are determined on a specific identification basis. Interest income and estimated expenses are accrued daily. Amortization of premium and accretion of discount on debt securities are included in interest income. Dividends from net investment income are normally declared daily; these dividends may be reinvested or paid monthly to shareholders. Distributions to shareholders are determined according to income tax regulations (tax basis). Distributable earnings determined on a tax basis may differ from earnings recorded in accordance with accounting principles generally accepted in the United States of America. These differences may be permanent or temporary. Permanent differences are reclassified among capital accounts to reflect their tax character. These reclassifications have no impact on net assets or the results of operations. Temporary differences are not reclassified, as they may reverse in subsequent periods.
Annual Report | 69
Franklin California Tax-Free Trust
Notes to Financial Statements (continued)
| 1. | ORGANIZATION AND SIGNIFICANT ACCOUNTING POLICIES (continued) |
| d. | Security Transactions, Investment Income, Expenses and Distributions (continued) |
Common expenses incurred by the Trust are allocated among the Funds based on the ratio of net assets of each fund to the combined net assets of the Trust. Fund specific expenses are charged directly to the fund that incurred the expense.
Realized and unrealized gains and losses and net investment income, not including class specific expenses, are allocated daily to each class of shares based upon the relative proportion of net assets of each class. Differences in per share distributions, by class, are generally due to differences in class specific expenses.
e. Insurance
The scheduled payments of interest and principal for each insured municipal security in the Trust are insured by either a new issue insurance policy or a secondary insurance policy. Some municipal securities in the Funds are secured by collateral guaranteed by an agency of the U.S. government. Depending on the type of coverage, premiums for insurance are either added to the cost basis of the security or paid by a third party.
Insurance companies typically insure municipal bonds that tend to be of very high quality, with the majority of underlying municipal bonds rated A or better. However, an event involving an insurer could have an adverse effect on the value of the securities insured by that insurance company. There is no guarantee the insurer will be able to fulfill its obligations under the terms of the policy.
f. Accounting Estimates
The preparation of financial statements in accordance with accounting principles generally accepted in the United States of America requires management to make estimates and assumptions that affect the reported amounts of assets and liabilities at the date of the financial statements and the amounts of income and expenses during the reporting period. Actual results could differ from those estimates.
g. Guarantees and Indemnifications
Under the Trust’s organizational documents, its officers and trustees are indemnified by the Trust against certain liabilities arising out of the performance of their duties to the Trust. Additionally, in the normal course of business, the Trust, on behalf of the Funds, enters into contracts with service providers that contain general indemnification clauses. The Trust’s maximum exposure under these arrangements is unknown as this would involve future claims that may be made against the Trust that have not yet occurred. Currently, the Trust expects the risk of loss to be remote.
70 | Annual Report
Franklin California Tax-Free Trust
Notes to Financial Statements (continued)
2. SHARES OF BENEFICIAL INTEREST
At June 30, 2011, there were an unlimited number of shares authorized (without par value). Transactions in the Franklin California Tax-Exempt Money Fund’s shares were at $1.00 per share. Transactions in the Funds’ shares were as follows:
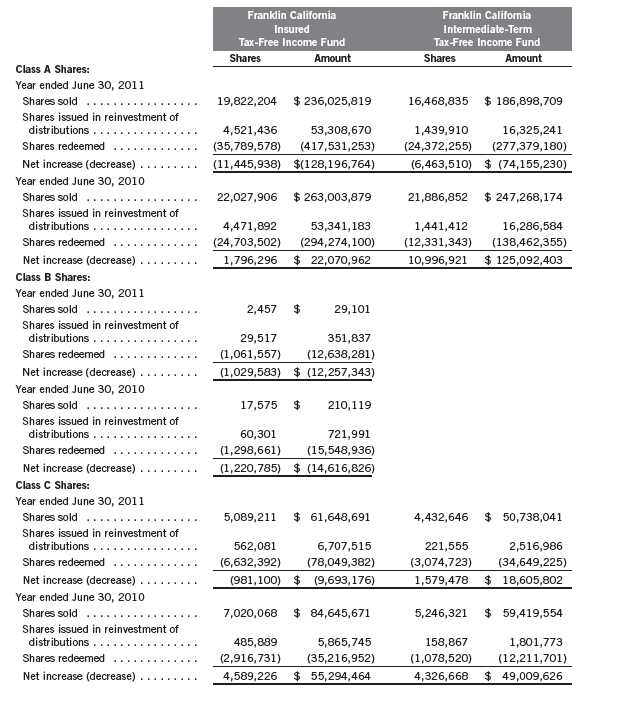
Annual Report | 71
Franklin California Tax-Free Trust
Notes to Financial Statements (continued)
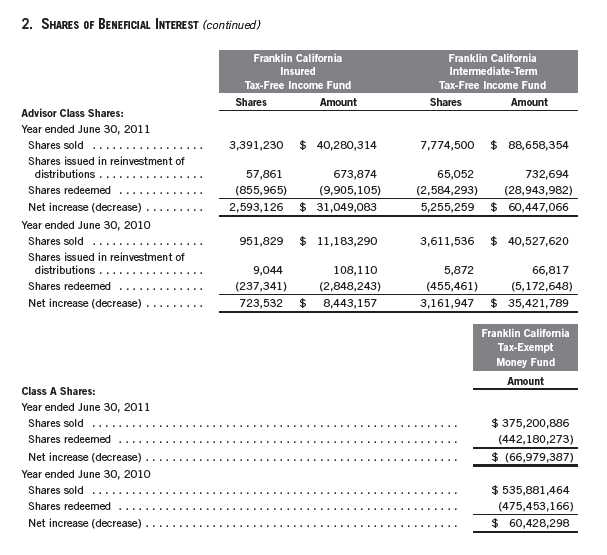
3. TRANSACTIONS WITH AFFILIATES
Franklin Resources, Inc. is the holding company for various subsidiaries that together are referred to as Franklin Templeton Investments. Certain officers and trustees of the Funds are also officers and/or directors of the following subsidiaries:
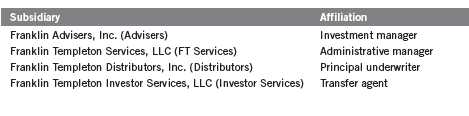
72 | Annual Report
Franklin California Tax-Free Trust
Notes to Financial Statements (continued)
| 3. | TRANSACTIONS WITH AFFILIATES (continued) |
| a. | Management Fees |
The Franklin California Insured Tax-Free Income Fund and Franklin California Intermediate-Term Tax-Free Income Fund pay an investment management fee to Advisers based on the month-end net assets of each of the funds and the Franklin California Tax-Exempt Money Fund pays an investment management fee to Advisers based on the average daily net assets of the fund as follows:
| | |
| Annualized Fee Rate | | Net Assets |
| 0.625 | % | Up to and including $100 million |
| 0.500 | % | Over $100 million, up to and including $250 million |
| 0.450 | % | Over $250 million, up to and including $7.5 billion |
| 0.440 | % | Over $7.5 billion, up to and including $10 billion |
| 0.430 | % | Over $10 billion, up to and including $12.5 billion |
| 0.420 | % | Over $12.5 billion, up to and including $15 billion |
| 0.400 | % | Over $15 billion, up to and including $17.5 billion |
| 0.380 | % | Over $17.5 billion, up to and including $20 billion |
| 0.360 | % | In excess of $20 billion |
b. Administrative Fees
Under an agreement with Advisers, FT Services provides administrative services to the Funds. The fee is paid by Advisers based on average daily net assets, and is not an additional expense of the Funds.
c. Distribution Fees
The Trust’s Board of Trustees has adopted distribution plans for each share class of the Franklin California Insured Tax-Free Income Fund and Franklin California Intermediate-Term Tax-Free Income Fund, with the exception of Advisor Class shares, pursuant to Rule 12b-1 under the 1940 Act. Under the funds’ Class A reimbursement distribution plans, the funds reimburse Distributors for costs incurred in connection with the servicing, sale and distribution of each fund’s shares up to the maximum annual plan rate. Under the Class A reimbursement distribution plans, costs exceeding the maximum for the current plan year cannot be reimbursed in subsequent periods.
In addition, under the funds’ Class B and C compensation distribution plans, the funds pay Distributors for costs incurred in connection with the servicing, sale and distribution of each fund’s shares up to the maximum annual plan rate for each class.
Annual Report | 73
Franklin California Tax-Free Trust
Notes to Financial Statements (continued)
| 3. | TRANSACTIONS WITH AFFILIATES (continued) |
| c. | Distribution Fees (continued) |
The maximum annual plan rates, based on the average daily net assets, for each class, are as follows:
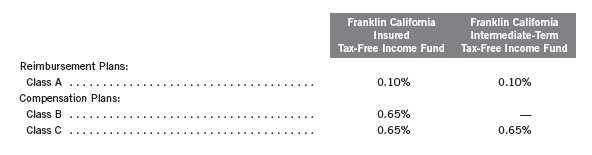
d. Sales Charges/Underwriting Agreements
Front-end sales charges and contingent deferred sales charges (CDSC) do not represent expenses of the Funds. These charges are deducted from the proceeds of sales of fund shares prior to investment or from redemption proceeds prior to remittance, as applicable. Distributors has advised the Funds of the following commission transactions related to the sales and redemptions of the Funds’ shares for the year:

e. Transfer Agent Fees
For the year ended June 30, 2011, the Funds paid transfer agent fees as noted in the Statements of Operations of which the following amounts were retained by Investor Services:
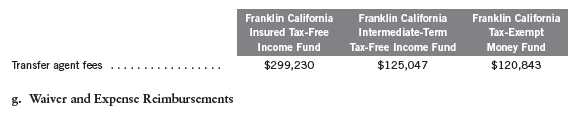
In efforts to prevent a negative yield for the Franklin California Tax-Exempt Money Fund, Advisers has voluntarily agreed to waive or limit its fees, assume as its own expense certain expenses otherwise payable by the fund and if necessary, make a capital infusion into the fund. These waivers, expense reimbursements and capital infusions are voluntary and may be modified or discontinued by Advisers at any time, and without further notice. There is no guarantee that the fund will be able to avoid a negative yield.
74 | Annual Report
Franklin California Tax-Free Trust
Notes to Financial Statements (continued)
| 3. | TRANSACTIONS WITH AFFILIATES (continued) |
| h. | Other Affiliated Transactions |
At June 30, 2011, a director of Advisers owned 41.8% of the Franklin California Tax-Exempt Money Fund’s outstanding shares. Investment activities of this shareholder could have a material impact on the fund.
4. INCOME TAXES
For tax purposes, capital losses may be carried over to offset future capital gains, if any. At June 30, 2011, the capital loss carryforwards were as follows:

On June 30, 2011, the Franklin California Intermediate-Term Tax-Free Income Fund had expired capital loss carryforwards of $145,149, which were reclassified to paid-in capital.
Under the Regulated Investment Company Modernization Act of 2010, the Funds will be permitted to carry forward capital losses incurred in taxable years beginning after December 22, 2010 for an unlimited period. Post-enactment capital loss carryforwards will retain their character as either short-term or long-term capital losses rather than being considered short-term as under previous law. Any post-enactment capital losses generated will be required to be utilized prior to the losses incurred in pre-enactment tax years.
For tax purposes, realized capital losses occurring subsequent to October 31 may be deferred and treated as occurring on the first day of the following fiscal year. At June 30, 2011, the Franklin California Insured Tax-Free Income Fund and Franklin California Intermediate-Term Tax-Free Income Fund deferred realized capital losses of $10,604,483 and $1,487,063, respectively.
Annual Report | 75
Franklin California Tax-Free Trust
Notes to Financial Statements (continued)
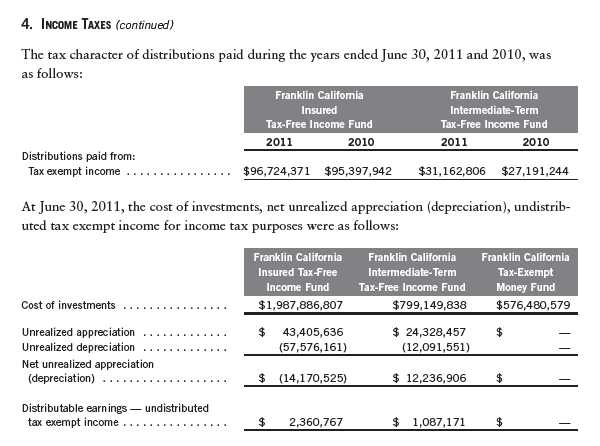
Net investment income differs for financial statement and tax purposes primarily due to differing treatment of bond discounts.
Net realized gains (losses) differ for financial statement and tax purposes primarily due to differing treatments of wash sales and bond discounts.
5. INVESTMENT TRANSACTIONS
Purchases and sales of investments (excluding short term securities) for the year ended June 30, 2011, were as follows:
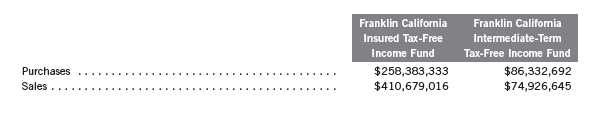
76 | Annual Report
Franklin California Tax-Free Trust
Notes to Financial Statements (continued)
6. CONCENTRATION OF RISK
Each of the Funds invests a large percentage of its total assets in obligations of issuers within California and U.S. territories. Such concentration may subject the Funds to risks associated with industrial or regional matters, and economic, political or legal developments occurring within California and U.S. territories. In addition, investments in these securities are sensitive to interest rate changes and credit risk of the issuer and may subject the Funds to increased market volatility. The market for these investments may be limited, which may make them difficult to buy or sell.
7. CREDIT FACILITY
The Franklin California Insured Tax-Free Income Fund and Franklin California Intermediate-Term Tax-Free Income Fund, together with other U.S. registered and foreign investment funds (collectively, Borrowers), managed by Franklin Templeton Investments, are borrowers in a joint syndicated senior unsecured credit facility totaling $750 million (Global Credit Facility) which matures on January 20, 2012. This Global Credit Facility provides a source of funds to the Borrowers for temporary and emergency purposes, including the ability to meet future unanticipated or unusually large redemption requests.
Under the terms of the Global Credit Facility, the funds shall, in addition to interest charged on any borrowings made by the funds and other costs incurred by the funds, pay their share of fees and expenses incurred in connection with the implementation and maintenance of the Global Credit Facility, based upon their relative share of the aggregate net assets of all of the Borrowers, including an annual commitment fee of 0.08% based upon the unused portion of the Global Credit Facility, which is reflected in other expenses on the Statements of Operations. During the year ended June 30, 2011, the funds did not use the Global Credit Facility.
8. FAIR VALUE MEASUREMENTS
The Funds follow a fair value hierarchy that distinguishes between market data obtained from independent sources (observable inputs) and the Funds’ own market assumptions (unobservable inputs). These inputs are used in determining the value of the Funds’ investments and are summarized in the following fair value hierarchy:
- Level 1 – quoted prices in active markets for identical securities
- Level 2 – other significant observable inputs (including quoted prices for similar securities, interest rates, prepayment speed, credit risk, etc.)
- Level 3 – significant unobservable inputs (including the Funds’ own assumptions in determining the fair value of investments)
Annual Report | 77
Franklin California Tax-Free Trust
Notes to Financial Statements (continued)
8. FAIR VALUE MEASUREMENTS (continued)
The inputs or methodology used for valuing securities are not an indication of the risk associated with investing in those securities. Money market securities may be valued using amortized cost, in accordance with the 1940 Act. Generally, amortized cost reflects the current fair value of a security, but since the value is not obtained from a quoted price in an active market, such securities are reflected as a Level 2.
For movements between the levels within the fair value hierarchy, the Funds have adopted a policy of recognizing the transfers as of the date of the underlying event which caused the movement.
At June 30, 2011, all of the Funds’ investments in securities carried at fair value were in Level 2 inputs.
9. NEW ACCOUNTING PRONOUNCEMENTS
In May 2011, the Financial Accounting Standards Board (FASB) issued Accounting Standards Update (ASU) No. 2011-04, Fair Value Measurement (Topic 820): Amendments to Achieve Common Fair Value Measurement and Disclosure Requirements in U.S. GAAP and International Financial Reporting Standards (IFRS). The amendments in the ASU will improve the comparability of fair value measurements presented and disclosed in financial statements prepared in accordance with U.S. GAAP and IFRS and include new guidance for certain fair value measurement principles and disclosure requirements. The ASU is effective for interim and annual periods beginning after December 15, 2011. The Funds are currently evaluating the impact, if any, of applying this provision.
10. SUBSEQUENT EVENTS
The Funds have evaluated subsequent events through the issuance of the financial statements and determined that no events have occurred that require disclosure.
78 | Annual Report
Franklin California Tax-Free Trust
Notes to Financial Statements (continued)
ABBREVIATIONS
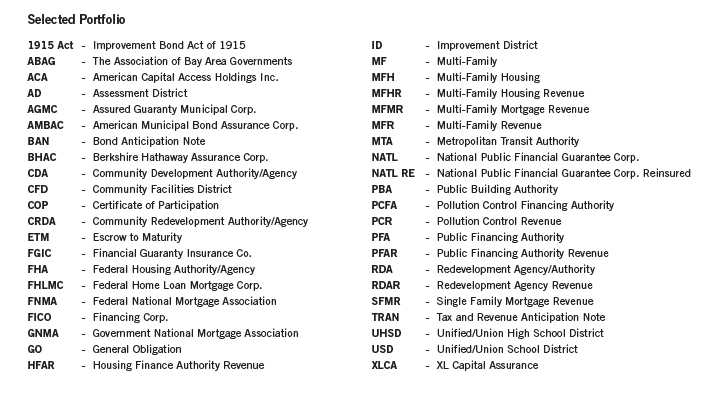
Franklin California Tax-Free Trust
Report of Independent Registered Public Accounting Firm
To the Board of Trustees and Shareholders of Franklin California Tax-Free Trust
In our opinion, the accompanying statements of assets and liabilities, including the statements of investments, and the related statements of operations and of changes in net assets and the financial highlights present fairly, in all material respects, the financial position of Franklin California Insured Tax-Free Income Fund, Franklin California Intermediate-Term Tax-Free Income Fund and Franklin California Tax-Exempt Money Fund (separate portfolios of Franklin California Tax-Free Trust, hereafter referred to as the “Funds”) at June 30, 2011, the results of each of their operations for the year then ended, the changes in each of their net assets for each of the two years in the period then ended and the financial highlights for each of the periods presented, in conformity with accounting principles generally accepted in the United States of America. These financial statements and financial highlights (hereafter referred to as “financial statements”) are the responsibility of the Funds’ management. Our responsibility is to express an opinion on these financial statements based on our audits. We conducted our audits of these financial statements in accordance with the standards of the Public Company Accounting Oversight Board (United States). Those standards require that we plan and perform the audit to obtain reasonable assurance about whether the financial statements are free of material misstatement. An audit includes examining, on a test basis, evidence supporting the amounts and disclosures in the financial statements, assessing the accounting principles used and significant estimates made by management, and evaluating the overall financial statement presentation. We believe that our audits, which included confirmation of securities at June 30, 2011 by correspondence with the custodian and brokers, provide a reasonable basis for our opinion.
PricewaterhouseCoopers LLP
San Francisco, California
August 18, 2011
80 | Annual Report
Franklin California Tax-Free Trust
Tax Designation (unaudited)
Under Section 852(b)(5)(A) of the Internal Revenue Code (Code), the Funds designate 100% of the distributions paid from net investment income as exempt-interest dividends for the fiscal year ended June 30, 2011. A portion of the Funds’ exempt-interest dividends may be subject to the federal alternative minimum tax. In January 2012, shareholders will be notified of amounts for use in preparing their 2011 income tax returns.
Annual Report | 81
Franklin California Tax-Free Trust
Board Members and Officers
The name, year of birth and address of the officers and board members, as well as their affiliations, positions held with the Trust, principal occupations during the past five years and number of portfolios overseen in the Franklin Templeton Investments fund complex are shown below. Generally, each board member serves until that person’s successor is elected and qualified.
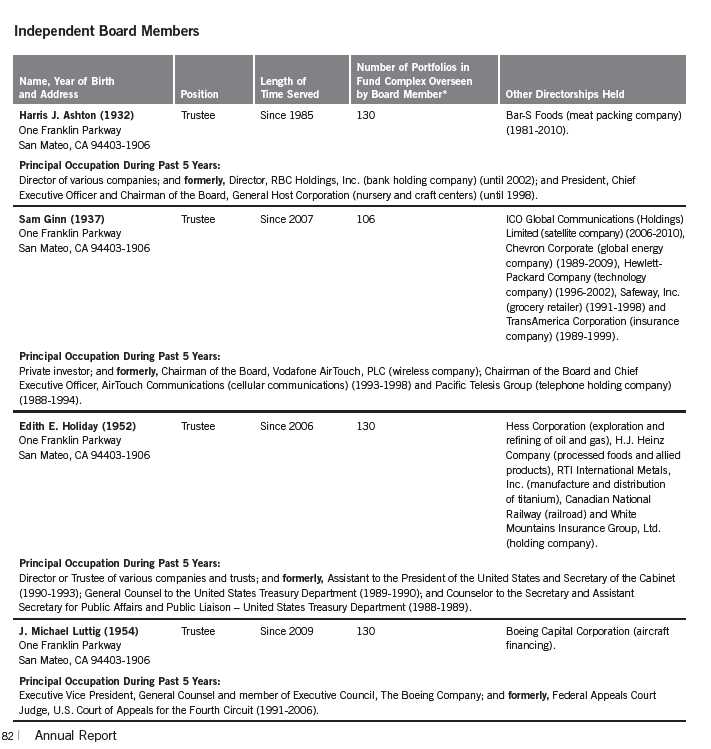

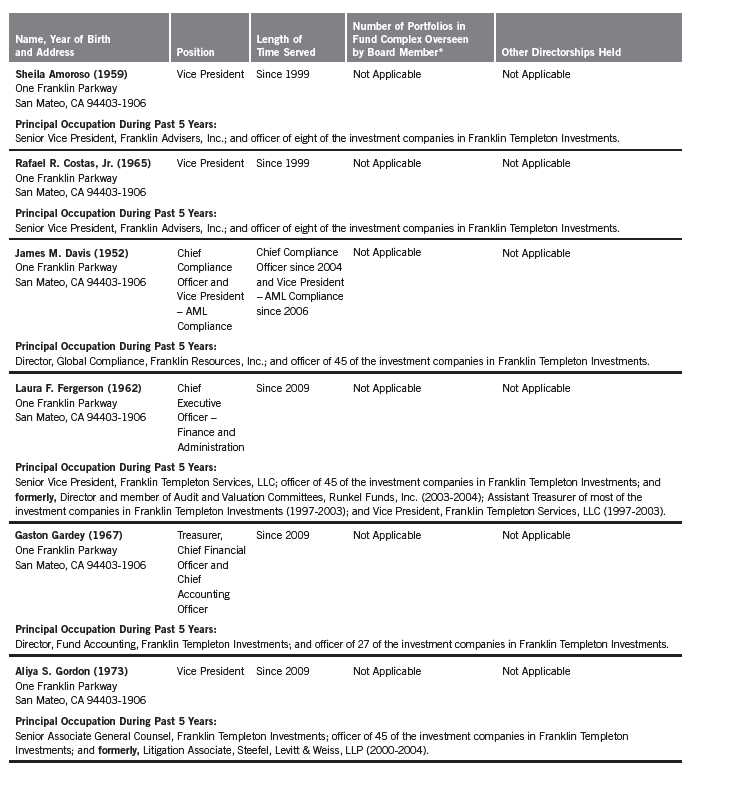
84 | Annual Report
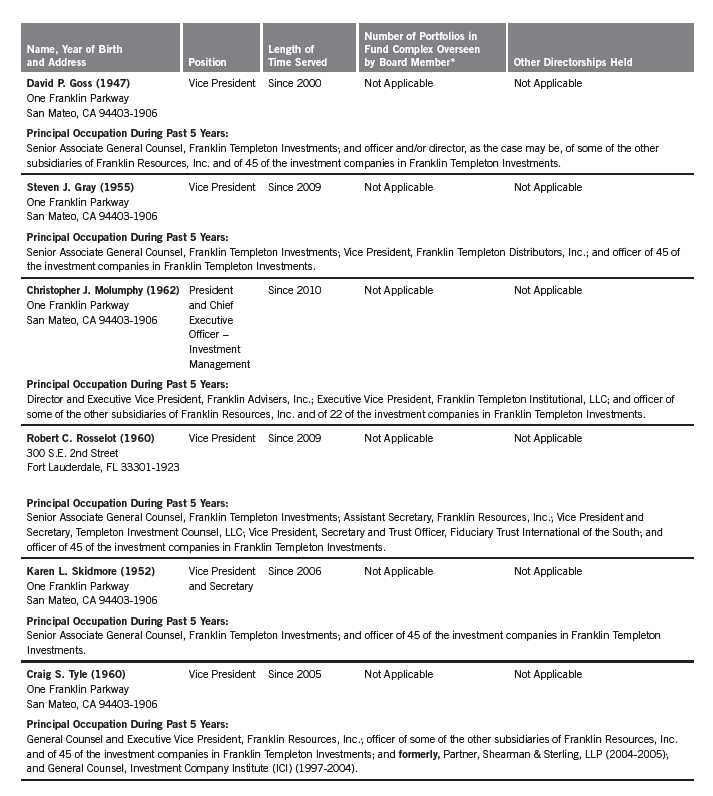
Annual Report | 85
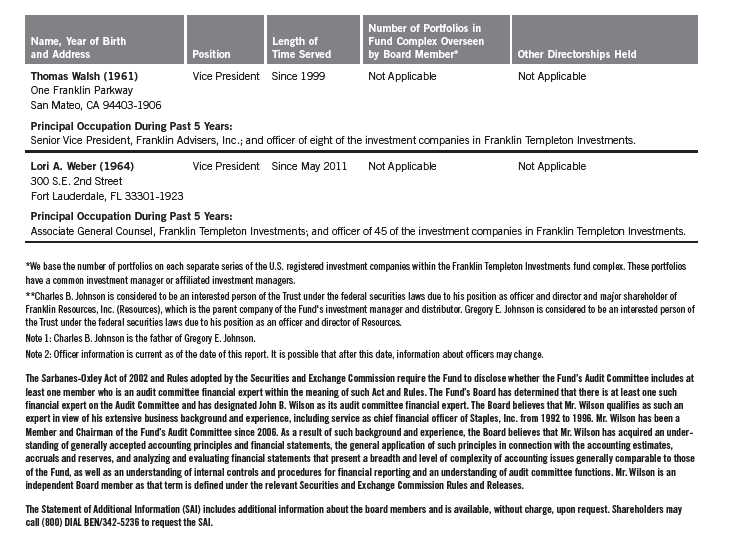
86 | Annual Report
Franklin California Tax-Free Trust
Shareholder Information
Board Review of Investment Management Agreement
At a meeting held March 1, 2011, the Board of Trustees (Board), including a majority of non-interested or independent Trustees, approved renewal of the investment management agreement for each of the separate tax-exempt funds within the Trust (Fund(s)). In reaching this decision, the Board took into account information furnished throughout the year at regular Board meetings, as well as information prepared specifically in connection with the annual renewal review process. Information furnished and discussed throughout the year included investment performance reports and related financial information for each Fund, as well as periodic reports on expenses, shareholder services, legal, compliance, pricing and other services provided by the Investment Manager (Manager) and its affiliates. Information furnished specifically in connection with the renewal process included a report for each Fund prepared by Lipper, Inc. (Lipper), an independent organization, as well as additional material, including a Fund profitability analysis prepared by management. The Lipper reports compared each Fund’s investment performance and expenses with those of other mutual funds deemed comparable to the Fund as selected by Lipper. The Fund profitability analysis discussed the profitability to Franklin Templeton Investments from its overall U.S. fund operations, as well as on an individual fund-by-fund basis. Additional material accompanying such profitability analysis included information on a fund-by-fund basis listing portfolio managers and other accounts they manage, as well as information on management fees charged by the Manager and its affiliates to U.S. mutual funds and other accounts, including management’s explanation of differences where relevant. Such material also included a memorandum prepared by management describing project initiatives and capital investments relating to the services provided to the Funds by the Franklin Templeton Investments organization, as well as a memorandum relating to economies of scale and a comparative analysis concerning transfer agent fees charged each Fund.
In considering such materials, the independent Trustees received assistance and advice from and met separately with independent counsel. While the investment management agreements for all Funds were considered at the same Board meeting, the Board dealt with each Fund separately. In approving continuance of the investment management agreement for each Fund, the Board, including a majority of independent Trustees, determined that the existing management fee structure was fair and reasonable and that continuance of the investment management agreement was in the best interests of each Fund and its shareholders. While attention was given to all information furnished, the following discusses some primary factors relevant to the Board’s decision.
NATURE, EXTENT AND QUALITY OF SERVICE. The Board was satisfied with the nature and quality of the overall services provided by the Manager and its affiliates to the Funds and their shareholders. In addition to investment performance and expenses discussed later, the Board’s opinion was based, in part, upon periodic reports furnished it showing that the investment policies and restrictions for each Fund were consistently complied with as well as other reports periodically furnished the Board covering matters such as the compliance of portfolio managers and other management personnel with the code of ethics adopted throughout the Franklin Templeton fund complex, the adherence to fair value pricing procedures established by the Board, and the accuracy of net asset value calculations. The Board also noted the extent of benefits provided Fund shareholders
Annual Report | 87
Franklin California Tax-Free Trust
Shareholder Information (continued)
Board Review of Investment Management Agreement (continued)
from being part of the Franklin Templeton family of funds, including the right to exchange investments between the same class of funds without a sales charge, the ability to reinvest Fund dividends into other funds and the right to combine holdings in other funds to obtain a reduced sales charge. Favorable consideration was given to management’s continuous efforts and expenditures in establishing back-up systems and recovery procedures to function in the event of a natural disaster, it being noted that such systems and procedures had functioned smoothly during the Florida hurricanes and blackouts experienced in previous years. Consideration was also given to the experience of each Fund’s portfolio management team, the number of accounts managed and general method of compensation. In this latter respect, the Board noted that a primary factor in management’s determination of a portfolio manager’s bonus compensation was the relative investment performance of the funds he or she managed and that a portion of such bonus was required to be invested in a predesignated list of funds within such person’s fund management area so as to be aligned with the interests of shareholders. The Board also took into account the quality of transfer agent and shareholder services provided Fund shareholders by an affiliate of the Manager and the continuous enhancements to the Franklin Templeton website. Particular attention was given to management’s conservative approach and diligent risk management procedures, including continuous monitoring of counter-party credit risk and attention given to derivatives and other complex instruments. The Board also took into account, among other things, management’s efforts in establishing a global credit facility for the benefit of the Funds and other accounts managed by Franklin Templeton Investments to provide a source of cash for temporary and emergency purposes or to meet unusual redemption requests as well as the strong financial position of the Manager’s parent company and its commitment to the mutual fund business as evidenced by its subsidization of money market funds.
INVESTMENT PERFORMANCE. The Board placed significant emphasis on the investment performance of each Fund in view of its importance to shareholders. While consideration was given to performance reports and discussions with portfolio managers at Board meetings during the year, particular attention in assessing performance was given to the Lipper reports furnished for the agreement renewals. The Lipper reports prepared for each individual Fund showed its investment performance in comparison with a performance universe selected by Lipper. The following summarizes the performance results for each of the Funds.
Franklin California Insured Tax-Free Income Fund – The Lipper report for this Fund showed the investment performance of its Class A shares during 2010 and the previous 10 years ended December 31, 2010, in comparison with a performance universe consisting of all retail and institutional single-state insured municipal debt funds as selected by Lipper. The Lipper report showed that the Fund’s income return during 2010 and for the previous three-, five- and 10-year periods on an annualized basis was in the highest or best performing quintile of its performance universe. The Lipper report also showed that the Fund’s total return during 2010 was in the highest quintile of its performance universe, and on an annualized basis was in the second-lowest quintile of such universe for each of the previous three- and five-year periods, but in the highest quintile of such universe for the previous 10-year period. The Board was satisfied with such performance, noting the Fund’s objective of maximizing tax-free income.
88 | Annual Report
Franklin California Tax-Free Trust
Shareholder Information (continued)
Board Review of Investment Management Agreement (continued)
Franklin California Intermediate-Term Tax-Free Income Fund – The Lipper report for this Fund showed the investment performance of its Class A shares during 2010 and the previous 10 years ended December 31, 2010, in comparison with a performance universe consisting of all retail and institutional California intermediate municipal debt funds as selected by Lipper. Such Lipper report comparison showed that the Fund’s income return in 2010 was in the highest or best performing quintile of such universe, and on an annualized basis was also in the highest quintile of such universe for the previous three- and five-year periods and the second-highest quintile of such universe for the previous 10-year period. The Lipper report showed that the Fund’s total return during 2010 was in the second-highest quintile of its performance universe, and on an annualized basis was in the middle quintile of such universe for each of the previous three- and five-year periods, and in the second-highest quintile of such universe for the previous 10-year period. The Board was satisfied with such performance, noting the Fund’s objective of maximizing tax-free income.
Franklin California Tax-Exempt Money Fund – The Lipper report for this Fund showed its investment performance during 2010 and the 10-year period ended December 31, 2010, in comparison to a performance universe consisting of all retail and institutional California tax-exempt money market funds as selected by Lipper. The Lipper report showed the Fund’s total return to be in the second-lowest quintile of its performance universe during 2010, and to be in the second-lowest quintile of such universe in each of the previous three-, five- and 10-year periods on an annualized basis. In discussing such performance, management explained that it reflected the Fund’s conservative policy of focusing on safety and liquidity by investing primarily in short-term securities, with its portfolio having no derivative holdings or investments in non-rated securities or securities subject to the alternative minimum tax, which generally offer higher yields. The Board found such performance acceptable in view of such factors, noting that the Fund’s expenses were subsidized by management to avoid net asset value falling below one dollar per share and that the median return within the Lipper performance universe for the one-year period was one basis point.
COMPARATIVE EXPENSES. Consideration was given to a comparative analysis of the management fees and total expense ratio of each Fund compared with those of a group of other funds selected by Lipper as constituting its appropriate Lipper expense group. Lipper expense data is based upon information taken from each fund’s most recent annual report, which reflects historical asset levels that may be quite different from those currently existing, particularly in a period of market volatility. While recognizing such inherent limitation and the fact that expense ratios generally increase as assets decline and decrease as assets grow, the Board believed the independent analysis conducted by Lipper to be an appropriate measure of comparative expenses. In reviewing comparative costs, Lipper provides information on each Fund’s contractual investment management fee in comparison with the contractual investment management fee rate that would have been charged by other funds within its Lipper expense group assuming they were similar in size to the Fund, as well as the actual total expense ratio of the Fund in comparison with those of such group. The Lipper contractual investment management fee analysis includes administrative fees as being part of management fees
Annual Report | 89
Franklin California Tax-Free Trust
Shareholder Information (continued)
Board Review of Investment Management Agreement (continued)
and total expenses for comparative consistency were shown by Lipper for Fund Class A shares in the case of Franklin California Insured Tax-Free Income Fund and Franklin California Intermediate-Term Tax-Free Income Fund. The Lipper report for Franklin California Insured Tax-Free Income Fund showed that its contractual investment fee rate was at the median of its Lipper expense group, while its actual total expense ratio was the least expensive within such group. The Lipper report for Franklin California Intermediate-Term Tax-Free Income Fund showed that its contractual investment fee rate was below the median of its Lipper expense group, while its actual total expense ratio was in the least expensive quintile of such group including 12b-1 fees, and the second most expensive quintile of such group excluding 12b-1 fees. The Board was satisfied with the management fee and total expenses of these two Funds in comparison to their Lipper expense groups. The Lipper expense comparison for Franklin California Tax-Exempt Money Fund showed its contractual investment management fee to be less than two basis points higher than its Lipper expense group median, while its actual total expenses were in the least expensive quintile of such expense group. The Board was satisfied with the comparative expenses of this Fund as shown in the Lipper report, noting that the Fund’s expenses were subsidized by management.
MANAGEMENT PROFITABILITY. The Board also considered the level of profits realized by the Manager and its affiliates in connection with the operation of each Fund. In this respect, the Board reviewed the Fund profitability analysis that addresses the overall profitability of Franklin Templeton’s U.S. fund business, as well as its profits in providing management and other services to each of the individual funds during the 12-month period ended September 30, 2010, being the most recent fiscal year-end for Franklin Resources, Inc., the Manager’s parent. In reviewing the analysis, attention was given to the methodology followed in allocating costs to each Fund, it being recognized that allocation methodologies are inherently subjective and various allocation methodologies may each be reasonable while producing different results. In this respect, the Board noted that, while being continuously refined and reflecting changes in the Manager’s own cost accounting, the allocation methodology was consistent with that followed in profitability report presentations for the Funds made in prior years and that the Funds’ independent registered public accounting firm had been engaged by the Manager to review the reasonableness of the allocation methodologies solely for use by the Funds’ Board in reference to the profitability analysis. In reviewing and discussing such analysis, management discussed with the Board its belief that costs incurred in establishing the infrastructure necessary for the type of mutual fund operations conducted by the Manager and its affiliates may not be fully reflected in the expenses allocated to each Fund in determining its profitability, as well as the fact that the level of profits, to a certain extent, reflected operational cost savings and efficiencies initiated by management. The Board also took into account management’s expenditures in improving shareholder services provided the Funds, as well as the need to meet additional regulatory and compliance requirements resulting from the Sarbanes-Oxley Act and recent SEC and other regulatory requirements. In addition, the Board considered a third-party study comparing the profitability of the Manager’s parent on an overall basis to other publicly held managers broken down to show profitability from management operations exclusive of distribution
90 | Annual Report
Franklin California Tax-Free Trust
Shareholder Information (continued)
Board Review of Investment Management Agreement (continued)
expenses, as well as profitability including distribution expenses. The Board also considered the extent to which the Manager and its affiliates might derive ancillary benefits from fund operations, including revenues generated from transfer agent services. Based upon its consideration of all these factors, the Board determined that the level of profits realized by the Manager and its affiliates from providing services to each Fund was not excessive in view of the nature, quality and extent of services provide, also noting with respect to Franklin California Tax-Exempt Money Fund, that expenses were being subsidized by management.
ECONOMIES OF SCALE. The Board also considered whether economies of scale are realized by the Manager as the Funds grow larger and the extent to which this is reflected in the level of management fees charged. While recognizing any precise determination is inherently subjective, the Board noted that based upon the Fund profitability analysis, it appeared as some funds get larger, at some point economies of scale do result in the Manager realizing a larger profit margin on management services provided such fund. The Board also noted that any economies of scale are shared with each of these Funds and their shareholders through management fee breakpoints existing in each of the Fund’s investment management agreements so that as a Fund grows in size, its effective management fee rate declines. The management fee structure, including administrative expenses for each Fund provides for a fee of 0.625% on the first $100 million of net assets; 0.50% on the next $150 million of net assets; 0.45% on net assets in excess of $250 million; with additional breakpoints thereafter beginning at the $7.5 billion net asset level. At December 31, 2010, the net assets of Franklin California Insured Tax-Free Income Fund stood at approximately $2.09 billion, and those of Franklin California Intermediate-Term Tax-Free Income Fund and Franklin California Tax-Exempt Money Fund were approximately $798 million and $663 million, respectively. In discussing these fee levels, management’s position was that the existing fee rate reaches a low level quickly that anticipates economies of scale as assets grow, and in support of such position pointed out the generally favorable effective management fee rate and low total actual expense comparisons for these Funds within their Lipper expense groups as previously discussed under “Comparative Expenses.” The Board believed that to the extent economies of scale may be realized by the Manager and its affiliates, the schedule of fees under the investment management agreement for these three Funds provides a sharing of benefits with each Fund and its shareholders. The Board also noted the fact that management was subsidizing the expenses of Franklin California Tax-Exempt Money Fund.
Annual Report | 91
Franklin California Tax-Free Trust
Shareholder Information (continued)
Proxy Voting Policies and Procedures
The Trust’s investment manager has established Proxy Voting Policies and Procedures (Policies) that the Trust uses to determine how to vote proxies relating to portfolio securities. Shareholders may view the Trust’s complete Policies online at franklintempleton.com. Alternatively, shareholders may request copies of the Policies free of charge by calling the Proxy Group collect at (954) 527-7678 or by sending a written request to: Franklin Templeton Companies, LLC, 300 S.E. 2nd Street, Fort Lauderdale, FL 33301, Attention: Proxy Group. Copies of the Trust’s proxy voting records are also made available online at franklintempleton.com and posted on the U.S. Securities and Exchange Commission’s website at sec.gov and reflect the most recent 12-month period ended June 30.
Quarterly Statement of Investments
The Trust files a complete statement of investments with the U.S. Securities and Exchange Commission for the first and third quarters for each fiscal year on Form N-Q. Shareholders may view the filed Form N-Q by visiting the Commission’s website at sec.gov. The filed form may also be viewed and copied at the Commission’s Public Reference Room in Washington, DC. Information regarding the operations of the Public Reference Room may be obtained by calling (800) SEC-0330.
Householding of Reports and Prospectuses
You will receive each Fund’s financial reports every six months as well as an annual updated summary prospectus (prospectus available upon request). To reduce Fund expenses, we try to identify related shareholders in a household and send only one copy of the financial reports and summary prospectus. This process, called “householding,” will continue indefinitely unless you instruct us otherwise. If you prefer not to have these documents householded, please call us at (800) 632-2301. At any time you may view current prospectuses/summary prospectuses and financial reports on our website. If you choose, you may receive these documents through electronic delivery.
92 | Annual Report
Item 2. Code of Ethics.
(a) The Registrant has adopted a code of ethics that applies to its principal executive officers and principal financial and accounting officer.
| (c) | N/A |
| (d) | N/A |
| (f) | Pursuant to Item 12(a)(1), the Registrant is attaching as an exhibit a copy of its code of ethics that applies to its principal executive officers and principal financial and accounting officer. |
Item 3. Audit Committee Financial Expert.
(a)(1) The Registrant has an audit committee financial expert serving on its audit committee.
(2) The audit committee financial expert is John B. Wilson and he is "independent" as defined under the relevant Securities and Exchange Commission Rules and Releases.
Item 4. Principal Accountant Fees and Services.
(a) Audit Fees
The aggregate fees paid to the principal accountant for professional services rendered by the principal accountant for the audit of the registrant’s annual financial statements or for services that are normally provided by the principal accountant in connection with statutory and regulatory filings or engagements were $91,819 for the fiscal year ended June 30, 2011 and $94,933 for the fiscal year ended June 30, 2010.
(b) Audit-Related Fees
There were no fees paid to the principal accountant for assurance and related services rendered by the principal accountant to the registrant that are reasonably related to the performance of the audit of the registrant's financial statements and are not reported under paragraph (a) of Item 4.
There were no fees paid to the principal accountant for assurance and related services rendered by the principal accountant to the registrant's investment adviser and any entity controlling, controlled by or under common control with the investment adviser that provides ongoing services to the registrant that are reasonably related to the performance of the audit of their financial statements.
(c) Tax Fees
There were no fees paid to the principal accountant for professional services rendered by the principal accountant to the registrant for tax compliance, tax advice and tax planning.
The aggregate fees paid to the principal accountant for professional services rendered by the principal accountant to the registrant’s investment adviser and any entity controlling, controlled by or under
common control with the investment adviser that provides ongoing services to the registrant for tax compliance, tax advice and tax planning were $85,000 for the fiscal year ended June 30, 2011 and $0 for the fiscal year ended June 30, 2010. The services for which these fees were paid included technical tax consultation for capital gain tax reporting to foreign governments and the application of the local country tax laws to investments made by various Franklin Templeton funds.
(d) All Other Fees
The aggregate fees paid to the principal accountant for products and services rendered by the principal accountant to the registrant not reported in paragraphs (a)-(c) of Item 4 were $1,393 for the fiscal year ended June 30, 2011 and $0 for the fiscal year ended June 30, 2010. The services for which these fees were paid included review of materials provided to the fund Board in connection with the investment management contract renewal process.
The aggregate fees paid to the principal accountant for products and services rendered by the principal accountant to the registrant’s investment adviser and any entity controlling, controlled by or under common control with the investment adviser that provides ongoing services to the registrant other than services reported in paragraphs (a)-(c) of Item 4 were $143,407 for the fiscal year ended June 30, 2011 and $0 for the fiscal year ended June 30, 2010. The services for which these fees were paid included review of materials provided to the fund Board in connection with the investment management contract renewal process.
(e) (1) The registrant’s audit committee is directly responsible for approving the services to be provided by the auditors, including:
| (i) | pre-approval of all audit and audit related services; |
| (ii) | pre-approval of all non-audit related services to be |
provided to the Fund by the auditors;
(iii) pre-approval of all non-audit related services to be provided to the registrant by the auditors to the registrant’s investment adviser or to any entity that controls, is controlled by or is under common control with the registrant’s investment adviser and that provides ongoing services to the registrant where the non-audit services relate directly to the operations or financial reporting of the registrant; and
(iv) establishment by the audit committee, if deemed necessary or appropriate, as an alternative to committee pre-approval of services to be provided by the auditors, as required by paragraphs (ii) and (iii) above, of policies and procedures to permit such services to be pre-approved by other means, such as through establishment of guidelines or by action of a designated member or members of the committee; provided the policies and procedures are detailed as to the particular service and the committee is informed of each service and such policies and procedures do not include delegation of audit committee responsibilities, as contemplated under the Securities Exchange Act of 1934, to management; subject, in the case of (ii)
through (iv), to any waivers, exceptions or exemptions that may be available under applicable law or rules.
(e) (2) None of the services provided to the registrant described in paragraphs (b)-(d) of Item 4 were approved by the audit committee pursuant to paragraph (c)(7)(i)(C) of Rule 2-01 of regulation S-X.
(f) No disclosures are required by this Item 4(f).
(g) The aggregate non-audit fees paid to the principal accountant for services rendered by the principal accountant to the registrant and the registrant’s investment adviser and any entity controlling, controlled by or under common control with the investment adviser that provides ongoing services to the registrant were $229,800 for the fiscal year ended June 30, 2011 and $0 for the fiscal year ended June 30, 2010.
(h) The registrant’s audit committee of the board has considered whether the provision of non-audit services that were rendered to the registrant’s investment adviser (not including any sub-adviser whose role is primarily portfolio management and is subcontracted with or overseen by another investment adviser), and any entity controlling, controlled by, or under common control with the investment adviser that provides ongoing services to the registrant that were not pre-approved pursuant to paragraph (c)(7)(ii) of Rule 2-01 of Regulation S-X is compatible with maintaining the principal accountant’s independence.
Item 5. Audit Committee of Listed Registrants. N/A
Item 6. Schedule of Investments. N/A
Item 7. Disclosure of Proxy Voting Policies and Procedures for Closed-End Management Investment Companies. N/A
Item 8. Portfolio Managers of Closed-End Management Investment Companies. N/A
Item 9. Purchases of Equity Securities by Closed-End Management Investment Company and Affiliated Purchasers. N/A
Item 10. Submission of Matters to a Vote of Security Holders.
There have been no changes to the procedures by which shareholders may recommend nominees to the Registrant's Board of Trustees that would require disclosure herein.
Item 11. Controls and Procedures.
(a) Evaluation of Disclosure Controls and Procedures. The Registrant maintains disclosure controls and procedures that are designed to ensure that information required to be disclosed in the Registrant’s filings under the Securities Exchange Act of 1934 and the Investment
Company Act of 1940 is recorded, processed, summarized and reported within the periods specified in the rules and forms of the Securities and Exchange Commission. Such information is accumulated and communicated to the Registrant’s management, including its principal executive officer and principal financial officer, as appropriate, to allow timely decisions regarding required disclosure. The Registrant’s management, including the principal executive officer and the principal financial officer, recognizes that any set of controls and procedures, no matter how well designed and operated, can provide only reasonable assurance of achieving the desired control objectives.
Within 90 days prior to the filing date of this Shareholder Report on Form N-CSR, the Registrant had carried out an evaluation, under the supervision and with the participation of the Registrant’s management, including the Registrant’s principal executive officer and the Registrant’s principal financial officer, of the effectiveness of the design and operation of the Registrant’s disclosure controls and procedures. Based on such evaluation, the Registrant’s principal executive officer and principal financial officer concluded that the Registrant’s disclosure controls and procedures are effective.
(b) Changes in Internal Controls. There have been no significant changes in the Registrant’s internal controls or in other factors that could significantly affect the internal controls subsequent to the date of their evaluation in connection with the preparation of this Shareholder Report on Form N-CSR.
Item 12. Exhibits.
(a)(1) Code of Ethics
(a)(2) Certifications pursuant to Section 302 of the Sarbanes-Oxley Act of 2002 of Laura F. Fergerson, Chief Executive Officer - Finance and Administration, and Gaston Gardey, Chief Financial Officer and Chief Accounting Officer
(b) Certifications pursuant to Section 906 of the Sarbanes-Oxley Act of 2002 of Laura F. Fergerson, Chief Executive Officer - Finance and Administration, and Gaston Gardey, Chief Financial Officer and Chief Accounting Officer
SIGNATURES
Pursuant to the requirements of the Securities Exchange Act of 1934 and the Investment Company Act of 1940, the registrant has duly caused this report to be signed on its behalf by the undersigned, thereunto duly authorized.
FRANKLIN CALIFORNIA TAX-FREE TRUST
By /s/LAURA F. FERGERSON
Laura F. Fergerson
Chief Executive Officer - Finance and Administration
Date August 25, 2011
Pursuant to the requirements of the Securities Exchange Act of 1934 and the Investment Company Act of 1940, this report has been signed below by the following persons on behalf of the registrant and in the capacities and on the dates indicated.
By /s/LAURA F. FERGERSON
Laura F. Fergerson
Chief Executive Officer - Finance and Administration
Date August 25, 2011
By /s/GASTON GARDEY
Gaston Gardey
Chief Financial Officer and Chief Accounting Officer
Date August 25, 2011