

Annual Report
State Update and Municipal Bond Market Overview
California’s economy continued its post-recession recovery albeit at a slower pace than the nation as a whole. Although the state’s real estate market appeared to have reached a bottom and showed signs of recovery, with default notices declining significantly from 2009 highs and the median sales price of existing homes rising from 2009 lows, the housing market remained historically weak. California benefited from strong export growth and venture capital investments largely in the software and biotechnology industries. California’s unemployment rate declined from 11.9% in June 2011 to 10.7% at period-end, but it remained significantly higher than the 8.2% national rate.1 The state gained jobs in most sectors, representing a shift in trend from the past few years.
The construction, information, professional and business services, and mining and logging sectors posted the strongest growth rates, while the government, manufacturing, and other services sectors had declines. In the economic forecast included with the governor’s revised fiscal year 2013 (ended June 30, 2013) budget proposal, the state projected nonfarm jobs lost during the Great Recession to be recovered fully by the fourth quarter of 2015, rather than the previous forecast of 2016.
California enacted an on-time fiscal year 2013 budget that closed a $15.7 billion gap through recurring and one-time spending cuts, temporary taxes and other actions while rebuilding a nearly $1 billion reserve.2 The enacted budget reforms the state’s welfare program and overhauls the correctional system while increasing school and university funding, pending voter approval of the governor’s tax initiative in the November general election. Should voters reject the measure, an offsetting automatic trigger would cut $6 billion from education and public safety funding.2 Independent credit rating agency Standard & Poor’s (S&P) considered California’s budgetary solutions realistic and believed the enacted budget positions the state to finance intra-year cash flow deficits in a timely manner.
The state’s net tax-supported debt was $2,559 per capita and 6.0% of personal income, compared with the $1,117 and 2.8% national medians.3 Although California’s debt levels ranked among the nation’s highest, they were relatively
1. Source: Bureau of Labor Statistics.
2. Source: Edmund G. Brown, Jr., Governor, State of California, “California State Budget 2012-13: Enacted Budget Summary,” 6/28/12.
3. Source: Moody’s Investors Service, “Median Report: 2012 State Debt Medians Report,” 5/22/12.
4 | Annual Report
moderate given the state’s large budget. In April 2012, S&P affirmed California’s general obligation bond rating of A- (a low rating for states) with a positive outlook.4 S&P’s rating and outlook reflected the state’s economic depth and diversity, prominent higher-education institutions, innovative businesses and sectors, as well as improved budgeting flexibility and cash performance. These positives were counterbalanced by California’s volatile revenue base and large debt, retirement benefit and budgetary liabilities, as well as governance rules that have sometimes contributed to delayed fiscal decision making. Although a few California municipalities have pursued protection through the bankruptcy courts, none of the funds in the Trust hold specific bonds impacted by these filings.
For the 12 months ended June 30, 2012, the municipal bond market posted robust gains as measured by the +9.90% return of the Barclays Municipal Bond Index, which tracks investment-grade securities.5 Over the reporting period municipal bonds generally outperformed Treasuries, which returned +9.04% according to the Barclays U.S. Treasury Index, which tracks various U.S. Treasury securities.5
During the reporting period, domestic and global events affected the municipal bond market. Domestically, the Federal Reserve Board’s (Fed’s) commitment to maintain an accommodative monetary policy stance with historically low interest rates supported the municipal market. The market was further supported by an extended period of low supply, thus reducing the availability of bonds to meet investor demand. In Europe, several countries struggled with financial challenges that resulted in a flight to quality benefiting the U.S. Treasury market, as well as the municipal bond market.
From a credit perspective, on August 2, 2011, the U.S. raised its debt ceiling and avoided defaulting on its debt obligations. S&P lowered the country’s long-term Treasury bond rating to AA+ from AAA, citing political risks and a rising debt burden.4 All municipal bonds backed by the U.S. government or government-sponsored enterprises (GSEs) were also downgraded along with the country’s rating and those of GSEs. S&P’s downgrade of U.S. Treasury securities led to the review of more than 11,000 municipal credits supported by federal programs and agency escrows. Primarily, prerefunded municipal bonds and housing bonds tied to federal subsidy programs were affected by the downgrade, although they generally still carried high-grade ratings. Furthermore,
4. This does not indicate a rating of the Funds.
5. Source: © 2012 Morningstar. All Rights Reserved. The information contained herein: (1) is proprietary to Morningstar
and/or its content providers; (2) may not be copied or distributed; and (3) is not warranted to be accurate, complete or
timely. Neither Morningstar nor its content providers are responsible for any damages or losses arising from any use of
this information. Past performance is no guarantee of future results.
Annual Report | 5
on July 19, 2011, independent credit rating agency Moody’s Investors Service placed five Aaa-rated states on its watch list for potential rating cuts partly based on their dependency on federal funding. After the debt ceiling was raised, Moody’s reconfirmed the Aaa rating to states and public finance issuers previously identified as directly or indirectly linked to the U.S. government.4
Congress enacted the Budget Control Act of 2011 with the intention of reducing the federal deficit by approximately $2 trillion by 2021. While the plan of action is unknown, we believe one can expect reduced federal funding, which would impact state and local programs dependent on federal subsidies. State and local officials may need to reevaluate current budget forecasts and the potential effects. Despite facing fiscal restraints and broad budget cuts to achieve balance, many states continued to show mild growth in revenues, and the actual default rate for municipal bonds was very low.
At period-end, we maintained our positive view of the municipal bond market. We believe municipal bonds continue to be an attractive asset class among fixed income securities, and we intend to follow our solid discipline of investing to maximize income while seeking value in the municipal bond market.
The foregoing information reflects our analysis and opinions as of June 30, 2012, the end of the reporting period. The information is not a complete analysis of every aspect of any market, country, industry, security or fund. Statements of fact are from sources considered reliable.
6 | Annual Report
Franklin California Insured Tax-Free Income Fund
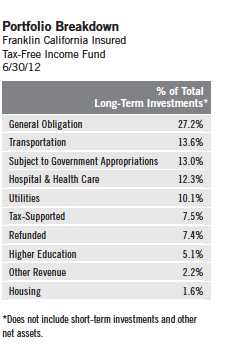
Your Fund’s Goal and Main Investments: Franklin California Insured Tax-Free Income Fund seeks to provide as high a level of income exempt from federal and California personal income taxes as is consistent with prudent investment management and preservation of capital by investing at least 80% of its net assets in insured municipal securities that pay interest free from such taxes.1, 2

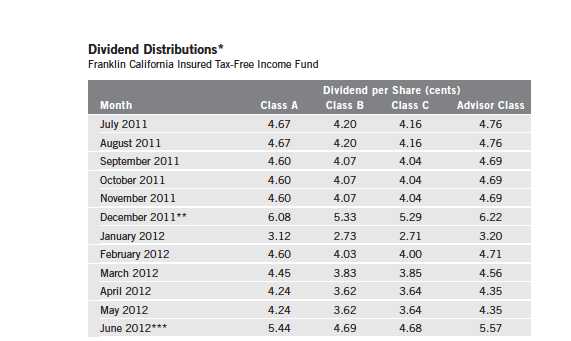
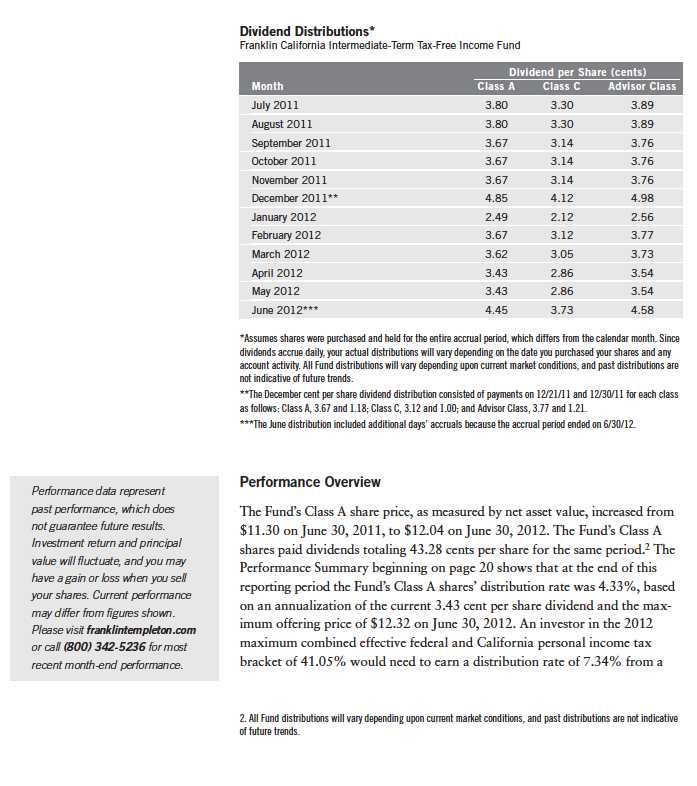
*Assumes shares were purchased and held for the entire accrual period, which differs from the calendar month. Since
dividends accrue daily, your actual distributions will vary depending on the date you purchased your shares and any
account activity. All Fund distributions will vary depending upon current market conditions, and past distributions are
not indicative of future trends.
**The December cent per share dividend distribution consisted of payments on 12/21/11 and 12/30/11 for each class
as follows: Class A, 4.60 and 1.48; Class B, 4.03 and 1.30; Class C, 4.00 and 1.29; and Advisor Class, 4.71 and 1.51.
***The June distribution included additional days’ accruals because the accrual period ended on 6/30/12.
shares paid dividends totaling 53.75 cents per share for the same period.3
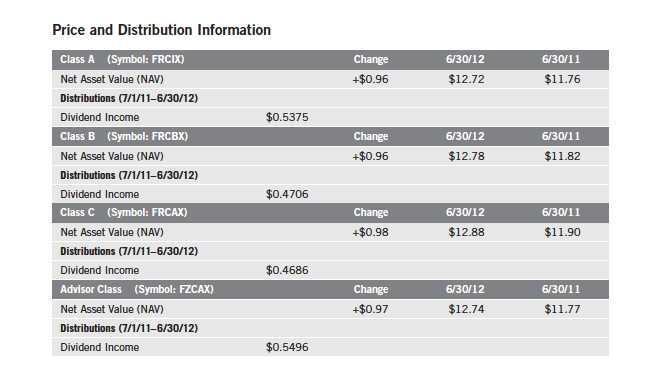
The Performance Summary beginning on page 10 shows that at the end of
this reporting period the Fund’s Class A shares’ distribution rate was 4.92%,
based on an annualization of the current 4.19 cent per share dividend and
the maximum offering price of $13.28 on June 30, 2012. An investor in the
2012 maximum combined effective federal and California personal income
tax bracket of 41.05% would need to earn a distribution rate of 8.35% from
a taxable investment to match the Fund’s Class A tax-free distribution rate.
For the Fund’s Class B, C and Advisor shares’ performance, please see the
Performance Summary. Dividend distributions during the period under review
were affected by decreasing interest rates. Additionally, investor demand was
strong for municipal bonds in an environment of limited tax-exempt supply.
These factors resulted in reduced income for the portfolio and caused dividends
to decline.
3. All Fund distributions will vary depending upon current market conditions, and past distributions are not indicative
of future trends.
8 | Annual Report
Investment Strategy
We use a consistent, disciplined strategy in an effort to maximize tax-exempt
income for our shareholders by seeking to maintain exposure to higher coupon
securities while balancing risk and return within the Fund’s range of allowable
investments. We generally employ a buy-and-hold approach and invest in secu-
rities that we believe should provide the most relative value in the market. We
do not use leverage or exotic derivatives, nor do we use hedging techniques
that could add volatility and contribute to underperformance in adverse mar-
kets. We generally stay fully invested to help maximize income distribution.
Manager’s Discussion
Consistent with our strategy, we sought to remain fully invested in bonds that
maintain an average weighted maturity of 15 to 30 years with good call fea-
tures. Based on the combination of our value-oriented philosophy of investing
primarily for income and a positively sloping municipal yield curve, we favored
the use of longer term bonds. We believe our conservative, buy-and-hold invest-
ment strategy can help us achieve relatively high, current, tax-free income for
shareholders.
During the reporting period, we limited Fund purchases to bonds insured by
Assured Guaranty and non-insured bonds rated AA or higher by independent
credit rating agencies. The municipal bond insurance industry has gone through
significant downgrades since the 2008 financial crisis. As a result, Assured
Guaranty was the only major municipal bond insurer currently providing new
municipal bond insurance. Aside from Berkshire Hathaway Assurance, Assured
Guaranty was the only insurer that carried a rating in the AA category. Since
October 2010, when Standard & Poor’s downgraded Assured Guaranty to
AA+ from AAA, no municipal bond insurers have been rated AAA.
We will continue to closely monitor the municipal insurance industry’s
progress and the market for insured bonds. As always, we strive for solid per-
formance on a relative value basis with a focus on income and credit safety.
Thank you for your continued participation in Franklin California Insured Tax-
Free Income Fund. We look forward to serving your future investment needs.
The foregoing information reflects our analysis, opinions and portfolio holdings as of June 30, 2012, the end of the
reporting period. The way we implement our main investment strategies and the resulting portfolio holdings may
change depending on factors such as market and economic conditions. These opinions may not be relied upon as
investment advice or an offer for a particular security. The information is not a complete analysis of every aspect
of any market, state, industry, security or the Fund. Statements of fact are from sources considered reliable, but
the investment manager makes no representation or warranty as to their completeness or accuracy. Although
historical performance is no guarantee of future results, these insights may help you understand our investment
management philosophy.
Annual Report | 9
Performance Summary as of 6/30/12
Franklin California Insured Tax-Free Income Fund
Your dividend income will vary depending on dividends or interest paid by securities in the Fund’s portfolio, adjusted for operating expenses of each class. Capital gain distributions are net profits realized from the sale of portfolio securities. The performance table and graphs do not reflect any taxes that a shareholder would pay on Fund dividends, capital gain distributions, if any, or any realized gains on the sale of Fund shares. Total return reflects reinvestment of the Fund’s dividends and capital gain distributions, if any, and any unrealized gains or losses.
10 | Annual Report
Performance Summary (continued)
Performance
Cumulative total return excludes sales charges. Average annual total return includes maximum sales charges. Class A: 4.25% maximum initial sales charge; Class B: contingent deferred sales charge (CDSC) declining from 4% to 1% over six years, and eliminated thereafter; Class C: 1% CDSC in first year only; Advisor Class: no sales charges.
Annual Report | 11
Performance Summary (continued)
Total Return Index Comparison for a Hypothetical $10,000 Investment
Total return represents the change in value of an investment over the periods shown. It includes any current, applicable, maximum sales charge, Fund expenses, account fees and reinvested distributions. The unmanaged index includes reinvestment of any income or distributions. It differs from the Fund in composition and does not pay management fees or expenses. One cannot invest directly in an index.


Performance Summary (continued)
Endnotes
All investments involve risks, including possible loss of principal. Because municipal bonds are sensitive to interest rate movements, the Fund’s yield and share price will fluctuate with market conditions. Bond prices generally move in the opposite direction of interest rates. Thus, as prices of bonds in the Fund adjust to a rise in interest rates, the Fund’s share price may decline. Changes in the financial strength of a bond issuer or in a bond’s credit rating may affect its value. Since the Fund concentrates its investments in a single state, it is subject to greater risk of adverse economic and regulatory changes in that state than a geographically diversified fund. The Fund is actively managed but there is no guarantee that the manager’s investment decisions will produce the desired results. The Fund’s prospectus also includes a description of the main investment risks.
| |
Class B: Class C: | These shares have higher annual fees and expenses than Class A shares. Prior to 1/1/04, these shares were offered with an initial sales charge; thus actual total returns would have differed. These shares have higher annual fees and expenses than Class A shares. |
Advisor Class: | Shares are available to certain eligible investors as described in the prospectus. |
1. Cumulative total return represents the change in value of an investment over the periods indicated.
2. Average annual total return represents the average annual change in value of an investment over the periods indicated.
3. Distribution rate is based on an annualization of the respective class’s current monthly dividend and the maximum offering price (NAV for
Classes B, C and Advisor) per share on 6/30/12.
4. Taxable equivalent distribution rate and yield assume the published rates as of 6/27/12 for the maximum combined effective federal and
California personal income tax rate of 41.05%, based on the federal income tax rate of 35.00%.
5. The 30-day standardized yield for the 30 days ended 6/30/12 reflects an estimated yield to maturity (assuming all portfolio securities are held to
maturity). It should be regarded as an estimate of the Fund’s rate of investment income, and it may not equal the Fund’s actual income distribution
rate (which reflects the Fund’s past dividends paid to shareholders) or the income reported in the Fund’s financial statements.
6. Figures are as stated in the Fund’s prospectus current as of the date of this report. In periods of market volatility, assets may decline significantly,
causing total annual Fund operating expenses to become higher than the figures shown.
7. Effective 10/31/08, the Fund began offering Advisor Class shares, which do not have sales charges or a Rule 12b-1 plan. Performance quotations
for this class reflect the following methods of calculation: (a) For periods prior to 10/31/08, a restated figure is used based upon the Fund’s Class A
performance, excluding the effect of Class A’s maximum initial sales charge, but reflecting the effect of the Class A Rule 12b-1 fees; and (b) for periods
after 10/31/08, actual Advisor Class performance is used reflecting all charges and fees applicable to that class. Since 10/31/08 (commencement of
sales), the cumulative and average annual total returns of Advisor Class shares were +33.34% and +8.17%.
8. Source: © 2012 Morningstar. The Barclays Municipal Bond Index is a market value-weighted index engineered for the long-term tax-exempt bond
market. To be included in the index, bonds must be fixed rate, have at least one year to final maturity and be rated investment grade (Baa3/BBB- or
higher) by at least two of the following agencies: Moody’s, Standard & Poor’s and Fitch. The Consumer Price Index (CPI), calculated by the U.S. Bureau
of Labor Statistics, is a commonly used measure of the inflation rate.
14 | Annual Report
Your Fund’s Expenses
Franklin California Insured Tax-Free Income Fund
As a Fund shareholder, you can incur two types of costs:
- Transaction costs, including sales charges (loads) on Fund purchases; and
- Ongoing Fund costs, including management fees, distribution and service (12b-1) fees, and other Fund expenses. All mutual funds have ongoing costs, sometimes referred to as operating expenses.
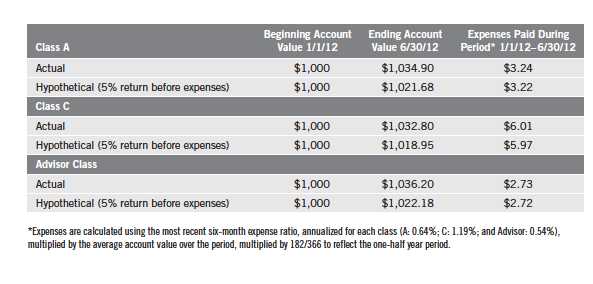
The following table shows ongoing costs of investing in the Fund and can help you understand these costs and compare them with those of other mutual funds. The table assumes a $1,000 investment held for the six months indicated.
Actual Fund Expenses
The first line (Actual) for each share class listed in the table provides actual account values and expenses. The “Ending Account Value” is derived from the Fund’s actual return, which includes the effect of Fund expenses.
You can estimate the expenses you paid during the period by following these steps. Of course, your account value and expenses will differ from those in this illustration:
| 1. | Divide your account value by $1,000. |
| | If an account had an $8,600 value, then $8,600 ÷ $1,000 = 8.6. |
| 2. | Multiply the result by the number under the heading “Expenses Paid During Period.” |
| | If Expenses Paid During Period were $7.50, then 8.6 x $7.50 = $64.50. |
In this illustration, the estimated expenses paid this period are $64.50.
Hypothetical Example for Comparison with Other Funds
Information in the second line (Hypothetical) for each class in the table can help you compare ongoing costs of investing in the Fund with those of other mutual funds. This information may not be used to estimate the actual ending account balance or expenses you paid during the period. The hypothetical “Ending Account Value” is based on the actual expense ratio for each class and an assumed 5% annual rate of return before expenses, which does not represent the Fund’s actual return. The figure under the heading “Expenses Paid During Period” shows the hypothetical expenses your account would have incurred under this scenario. You can compare this figure with the 5% hypothetical examples that appear in shareholder reports of other funds.
Annual Report | 15
Your Fund’s Expenses (continued)
Please note that expenses shown in the table are meant to highlight ongoing costs and do not reflect any transaction costs, such as sales charges. Therefore, the second line for each class is useful in comparing ongoing costs only, and will not help you compare total costs of owning different funds. In addition, if transaction costs were included, your total costs would have been higher. Please refer to the Fund prospectus for additional information on operating expenses.
16 | Annual Report
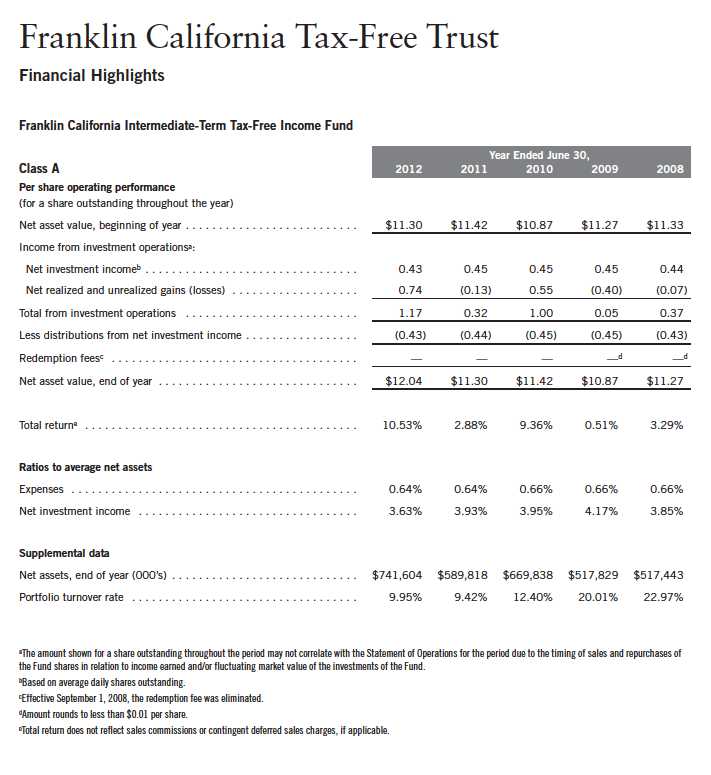
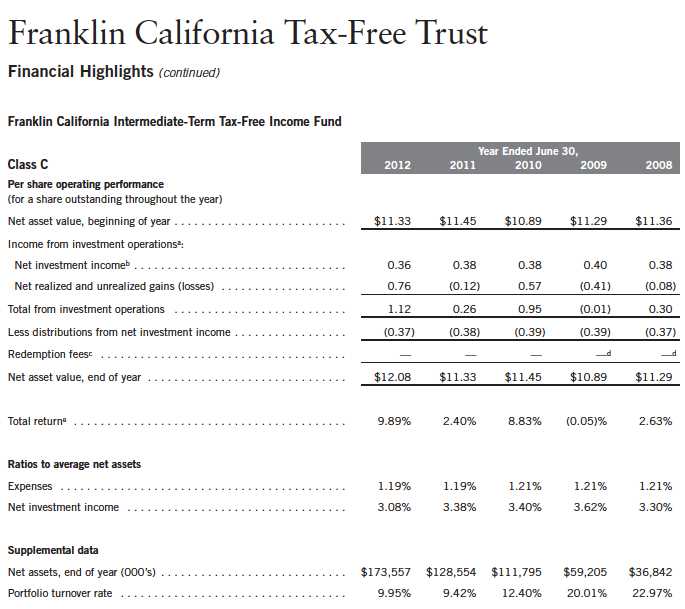
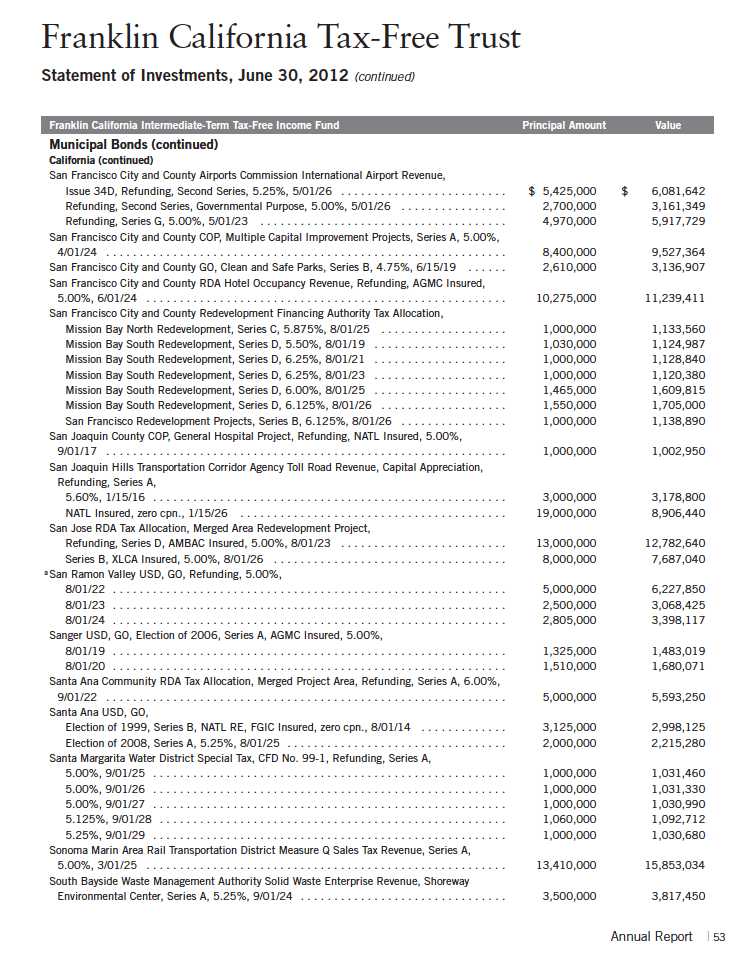
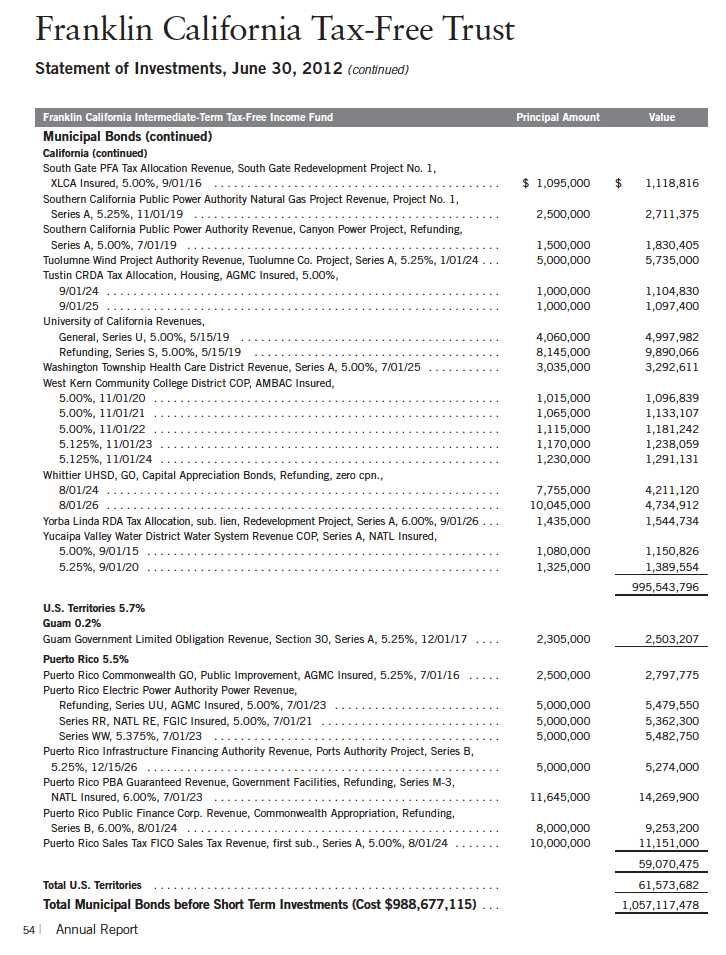
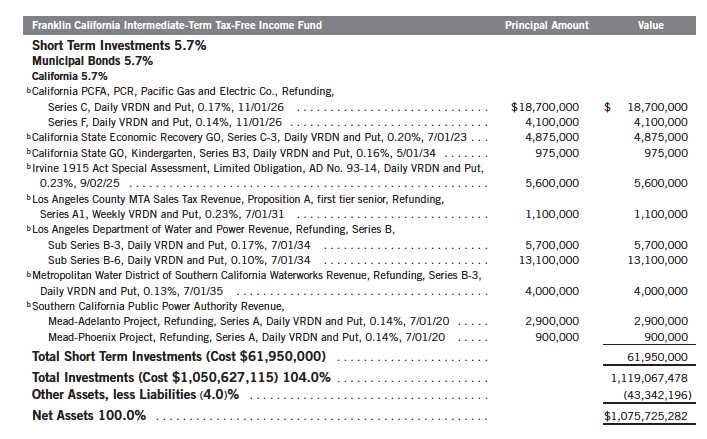
Franklin California Intermediate-Term Tax-Free Income Fund
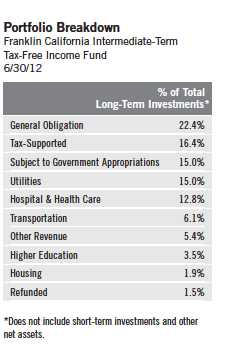
Your Fund’s Goal and Main Investments: Franklin California Intermediate-Term Tax-Free Income Fund seeks to provide as high a level of income exempt from federal and California personal income taxes as is consistent with prudent investment management and preservation of capital by investing at least 80% of its total assets in securities that pay interest free from such taxes.1 The Fund maintains a dollar-weighted average portfolio maturity (the time at which the debt must be repaid) of 3 to 10 years.
We are pleased to bring you Franklin California Intermediate-Term Tax-Free
Income Fund’s annual report for the fiscal year ended June 30, 2012.
1. For investors subject to alternative minimum tax, a small portion of Fund dividends may be taxable. Distributions
of capital gains are generally taxable. To avoid imposition of 28% backup withholding on all Fund distributions and
redemption proceeds, U.S. investors must be properly certified on Form W-9 and non-U.S. investors on Form W-8BEN.
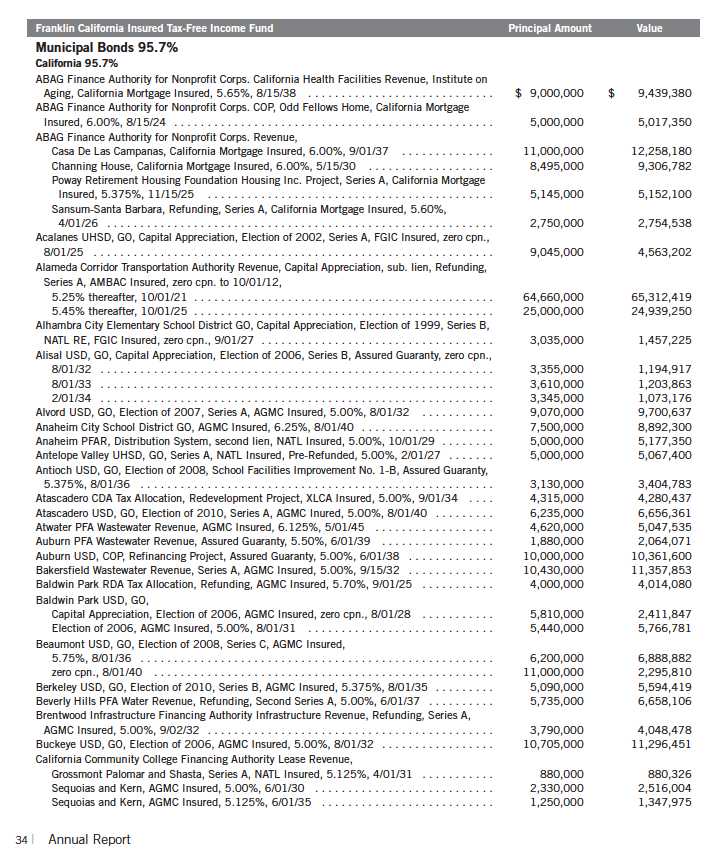
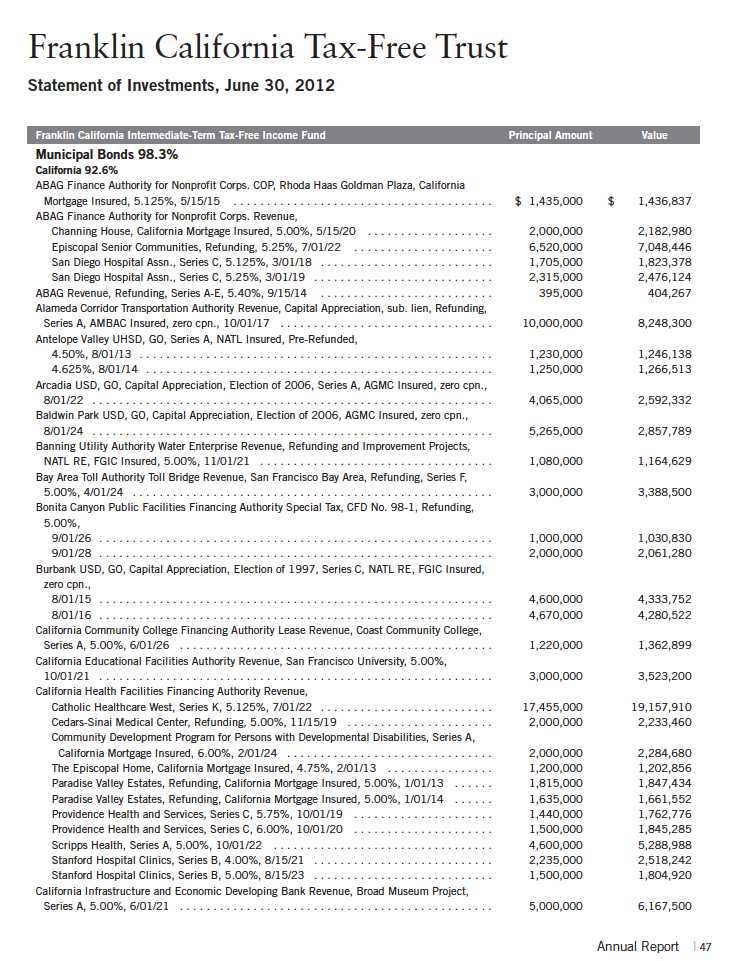
The dollar value, number of shares or principal amount, and names of all portfolio holdings are listed in the Fund’s
Statement of Investments (SOI). The SOI begins on page 47.
Annual Report | 17
18 | Annual Report
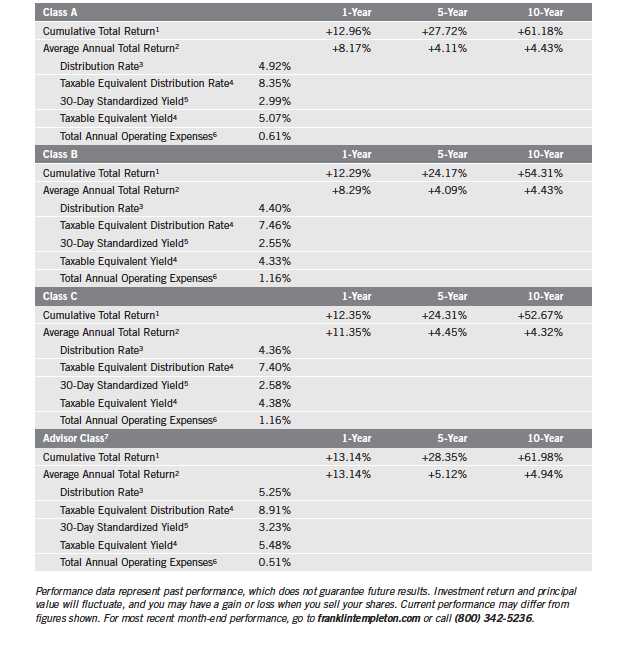
taxable investment to match the Fund’s Class A tax-free distribution rate. For
the Fund’s Class C and Advisor shares’ performance, please see the Performance
Summary. Dividend distributions during the period under review were affected
by decreasing interest rates. Additionally, investor demand was strong for munic-
ipal bonds in an environment of limited tax-exempt supply. These factors
resulted in reduced income for the portfolio and caused dividends to decline.
Investment Strategy
We use a consistent, disciplined strategy in an effort to maximize tax-exempt
income for our shareholders by seeking to maintain exposure to higher coupon
securities while balancing risk and return within the Fund’s range of allowable
investments. We generally employ a buy-and-hold approach and invest in secu-
rities we believe should provide the most relative value in the market. We do
not use leverage or exotic derivatives, nor do we use hedging techniques that
could add volatility and contribute to underperformance in adverse markets.
We generally stay fully invested to help maximize income distribution.
Manager’s Discussion
Consistent with our strategy, we sought to remain fully invested in bonds that
maintain an average weighted maturity of 3 to 10 years. We believe our con-
servative, buy-and-hold investment strategy can help us achieve relatively high,
current, tax-free income for shareholders.
Thank you for your continued participation in Franklin California
Intermediate-Term Tax-Free Income Fund. We look forward to serving
your future investment needs.
The foregoing information reflects our analysis, opinions and portfolio holdings as of June 30, 2012, the end of the
reporting period. The way we implement our main investment strategies and the resulting portfolio holdings may
change depending on factors such as market and economic conditions. These opinions may not be relied upon as
investment advice or an offer for a particular security. The information is not a complete analysis of every aspect
of any market, state, industry, security or the Fund. Statements of fact are from sources considered reliable, but
the investment manager makes no representation or warranty as to their completeness or accuracy. Although
historical performance is no guarantee of future results, these insights may help you understand our investment
management philosophy.
Annual Report | 19
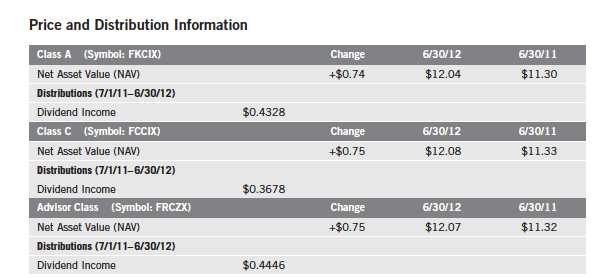
Performance Summary as of 6/30/12
Franklin California Intermediate-Term Tax-Free Income Fund
Your dividend income will vary depending on dividends or interest paid by securities in the Fund’s portfolio, adjusted for operating expenses of each class. Capital gain distributions are net profits realized from the sale of portfolio securities. The performance table and graphs do not reflect any taxes that a shareholder would pay on Fund dividends, capital gain distributions, if any, or any realized gains on the sale of Fund shares. Total return reflects reinvestment of the Fund’s dividends and capital gain distributions, if any, and any unrealized gains or losses.
20 | Annual Report
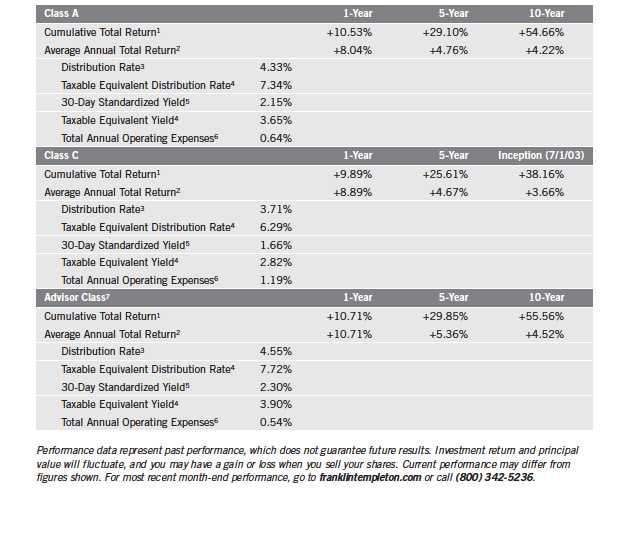
Performance Summary (continued)
Performance
Cumulative total return excludes sales charges. Average annual total return includes maximum sales charges. Class A: 2.25%
maximum initial sales charge; Class C: 1% contingent deferred sales charge in first year only; Advisor Class: no sales charges.
Annual Report | 21
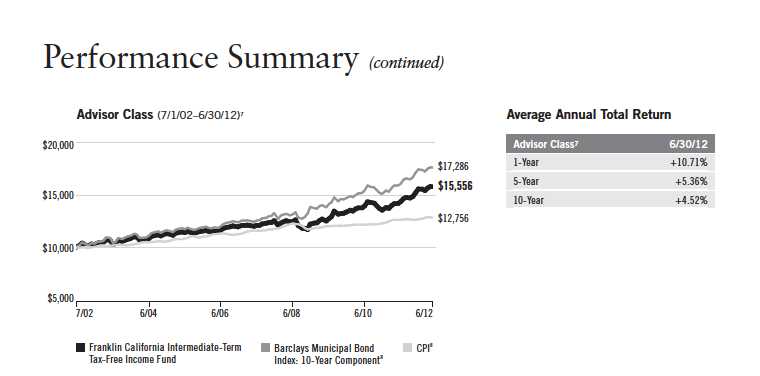
Performance Summary (continued)
Total Return Index Comparison for a Hypothetical $10,000 Investment
Total return represents the change in value of an investment over the periods shown. It includes any current, applicable, maximum sales charge, Fund expenses, account fees and reinvested distributions. The unmanaged index includes reinvestment of any income or distributions. It differs from the Fund in composition and does not pay management fees or expenses. One cannot invest directly in an index.

Endnotes
All investments involve risks, including possible loss of principal. Because municipal bonds are sensitive to interest rate movements, the
Fund’s yield and share price will fluctuate with market conditions. Bond prices generally move in the opposite direction of interest rates. Thus,
as prices of bonds in the Fund adjust to a rise in interest rates, the Fund’s share price may decline. Changes in the financial strength of a bond
issuer or in a bond’s credit rating may affect its value. Since the Fund concentrates its investments in a single state, it is subject to greater
risk of adverse economic and regulatory changes in that state than a geographically diversified fund. The Fund is actively managed but there
is no guarantee that the manager’s investment decisions will produce the desired results. The Fund’s prospectus also includes a description of
the main investment risks.
Class C: Prior to 1/1/04, these shares were offered with an initial sales charge; thus actual total returns would have differed. These shares
have higher annual fees and expenses than Class A shares.
Advisor Class: Shares are available to certain eligible investors as described in the prospectus.
1. Cumulative total return represents the change in value of an investment over the periods indicated.
2. Average annual total return represents the average annual change in value of an investment over the periods indicated.
3. Distribution rate is based on an annualization of the respective class’s current monthly dividend and the maximum offering price (NAV for
Classes C and Advisor) per share on 6/30/12.
4. Taxable equivalent distribution rate and yield assume the published rates as of 6/27/12 for the maximum combined effective federal and
California personal income tax rate of 41.05%, based on the federal income tax rate of 35.00%.
5. The 30-day standardized yield for the 30 days ended 6/30/12 reflects an estimated yield to maturity (assuming all portfolio securities are held to
maturity). It should be regarded as an estimate of the Fund’s rate of investment income, and it may not equal the Fund’s actual income distribution
rate (which reflects the Fund’s past dividends paid to shareholders) or the income reported in the Fund’s financial statements.
6. Figures are as stated in the Fund’s prospectus current as of the date of this report. In periods of market volatility, assets may decline significantly,
causing total annual Fund operating expenses to become higher than the figures shown.
7. Effective 10/31/08, the Fund began offering Advisor Class shares, which do not have sales charges or a Rule 12b-1 plan. Performance quotations
for this class reflect the following methods of calculation: (a) For periods prior to 10/31/08, a restated figure is used based upon the Fund’s Class A
performance, excluding the effect of Class A’s maximum initial sales charge, but reflecting the effect of the Class A Rule 12b-1 fees; and (b) for periods
after 10/31/08, actual Advisor Class performance is used reflecting all charges and fees applicable to that class. Since 10/31/08 (commencement of
sales), the cumulative and average annual total returns of Advisor Class shares were +31.87% and +7.85%.
8. Source: © 2012 Morningstar. The Barclays Municipal Bond Index: 10-Year Component is the 10-year (8-12) component of the Barclays Municipal
Bond Index, which is a market value-weighted index engineered for the long-term tax-exempt bond market. To be included in the index, bonds must
be fixed rate, have at least one year to final maturity and be rated investment grade (Baa3/BBB- or higher) by at least two of the following agencies:
Moody’s, Standard & Poor’s and Fitch. The Consumer Price Index (CPI), calculated by the U.S. Bureau of Labor Statistics, is a commonly used meas-
ure of the inflation rate.
Annual Report | 23
Your Fund’s Expenses
Franklin California Intermediate-Term Tax-Free Income Fund
As a Fund shareholder, you can incur two types of costs:
- Transaction costs, including sales charges (loads) on Fund purchases; and
- Ongoing Fund costs, including management fees, distribution and service (12b-1) fees, and other Fund expenses. All mutual funds have ongoing costs, sometimes referred to as operating expenses.
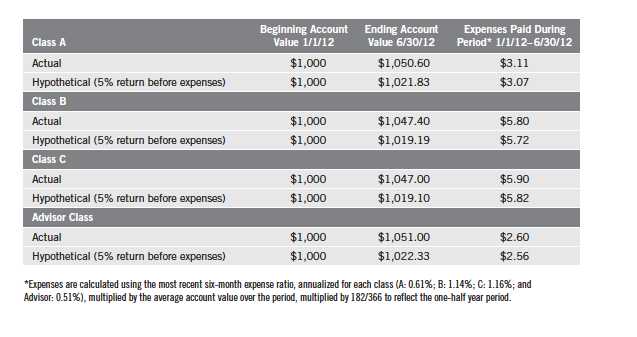
The following table shows ongoing costs of investing in the Fund and can help you understand these costs and compare them with those of other mutual funds. The table assumes a $1,000 investment held for the six months indicated.
Actual Fund Expenses
The first line (Actual) for each share class listed in the table provides actual account values and expenses. The “Ending Account Value” is derived from the Fund’s actual return, which includes the effect of Fund expenses.
You can estimate the expenses you paid during the period by following these steps. Of course, your account value and expenses will differ from those in this illustration:
| 1. | Divide your account value by $1,000. |
| | If an account had an $8,600 value, then $8,600 ÷ $1,000 = 8.6. |
| 2. | Multiply the result by the number under the heading “Expenses Paid During Period.” |
| | If Expenses Paid During Period were $7.50, then 8.6 x $7.50 = $64.50. |
In this illustration, the estimated expenses paid this period are $64.50.
Hypothetical Example for Comparison with Other Funds
Information in the second line (Hypothetical) for each class in the table can help you compare ongoing costs of investing in the Fund with those of other mutual funds. This information may not be used to estimate the actual ending account balance or expenses you paid during the period. The hypothetical “Ending Account Value” is based on the actual expense ratio for each class and an assumed 5% annual rate of return before expenses, which does not represent the Fund’s actual return. The figure under the heading “Expenses Paid During Period” shows the hypothetical expenses your account would have incurred under this scenario. You can compare this figure with the 5% hypothetical examples that appear in shareholder reports of other funds.
24 | Annual Report
Your Fund’s Expenses (continued)
Please note that expenses shown in the table are meant to highlight ongoing costs and do not reflect any transaction costs, such as sales charges. Therefore, the second line for each class is useful in comparing ongoing costs only, and will not help you compare total costs of owning different funds. In addition, if transaction costs were included, your total costs would have been higher. Please refer to the Fund prospectus for additional information on operating expenses.
Annual Report | 25
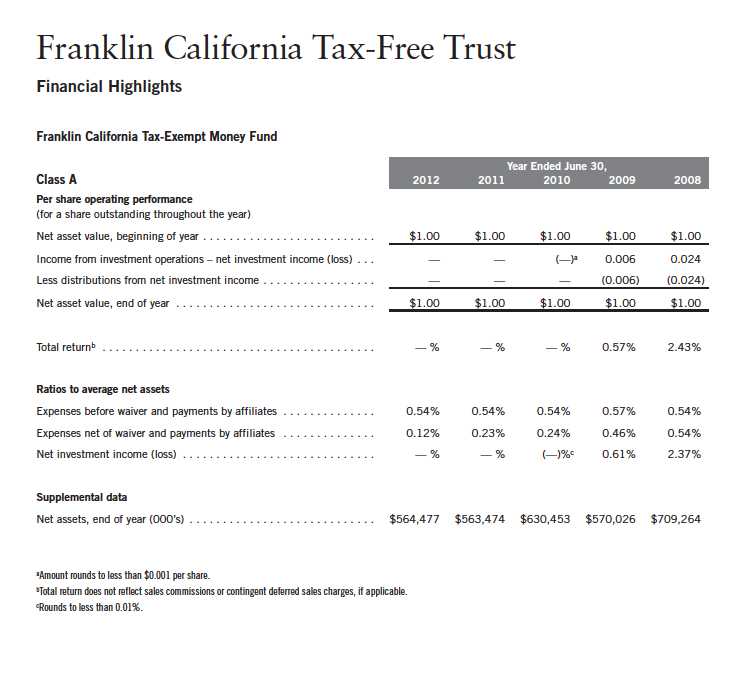
Franklin California Tax-Exempt Money Fund
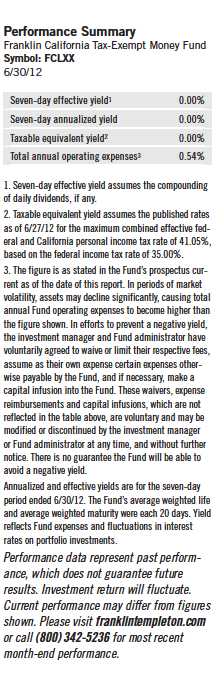
Your Fund’s Goal and Main Investments: Franklin California Tax-Exempt Money Fund seeks to provide as high a level of income exempt from federal and California personal income taxes as is consistent with prudent investment management and preservation of capital and liquidity.1 The Fund’s portfolio invests at least 80% of its total assets in securities that pay interest free from such taxes. The Fund tries to maintain a stable $1.00 share price.

This annual report for Franklin California Tax-Exempt Money Fund covers
the fiscal year ended June 30, 2012.
Performance Overview
In an effort to promote continued economic recovery, the Federal Reserve
Board held short-term interest rates at a historically low level during the
12-month period under review, which affected money market portfolio yields.
As a result, Franklin California Tax-Exempt Money Fund’s seven-day effective
yield was unchanged at 0.00% from June 30, 2011, through June 30, 2012.
Investment Strategy
Under normal market conditions, we invest at least 80% of the Fund’s total
assets in high-quality, short-term municipal securities whose interest is free
from federal and California state personal income taxes. Although the Fund
tries to invest all of its assets in tax-free securities, it is possible, although not
anticipated, that up to 20% of its assets may be in securities that pay taxable
interest, including interest that may be subject to federal alternative minimum
tax. We maintain a dollar-weighted average portfolio maturity of 60 days or
less and a dollar-weighted average life of 120 days or less.
Manager’s Discussion
Short-term municipal bond yields remained relatively low during the year
under review as the Federal Open Market Committee kept rates unchanged,
1. For investors subject to alternative minimum tax, a small portion of Fund dividends may be taxable. Distributions
of capital gains are generally taxable. To avoid imposition of 28% backup withholding on all Fund distributions and
redemption proceeds, U.S. investors must be properly certified on Form W-9 and non-U.S. investors on Form W-8BEN.
The dollar value, number of shares or principal amount, and names of all portfolio holdings are listed in the Fund’s
Statement of Investments (SOI). The SOI begins on page 57.
26 | Annual Report
maintaining the federal funds target rate in a range of 0% to 0.25% and the dis-
count rate at 0.75%. In addition, the Securities Industry and Financial Markets
Association (SIFMA) Municipal Swap Index, a weekly index of variable rate
securities, which make up a large portion of Franklin California Tax-Exempt
Money Fund, also stayed relatively low. The SIFMA rate ranged during the
reporting period from an all-time low of 0.06% on January 11 to a high of
0.26% on April 18.2 The SIFMA index ended the period at 0.18%.2
During the Fund s fiscal year, variable rate demand note (VRDN) issuance
was extremely low compared to recent years, and demand for well-structured
VRDNs supported low rates. Franklin California Tax-Exempt Money Fund
continued to be very selective in purchasing what we regarded as high-quality
securities. In this environment, the Fund s yield remained at 0.00% for the
reporting period.
The Fund participated in several issues during the review period, including
California Education Facilities Authority Revenue for Stanford University
and Metropolitan Water District of Southern California Water Revenue
VRDNs, and Los Angeles County Tax and Revenue Anticipation Notes.
Thank you for your continued participation in Franklin California Tax-
Exempt Money Fund. We look forward to serving your future investment
needs.
The foregoing information reflects our analysis, opinions and portfolio holdings as of June 30, 2012, the end of the
reporting period. The way we implement our main investment strategies and the resulting portfolio holdings may
change depending on factors such as market and economic conditions. These opinions may not be relied upon as
investment advice or an offer for a particular security. The information is not a complete analysis of every aspect
of any market, state, industry, security or the Fund. Statements of fact are from sources considered reliable, but
the investment manager makes no representation or warranty as to their completeness or accuracy. Although
historical performance is no guarantee of future results, these insights may help you understand our investment
management philosophy.
2. Source: SIFMA.
Annual Report | 27
Your Fund’s Expenses
Franklin California Tax-Exempt Money Fund
As a Fund shareholder, you can incur two types of costs:
- Transaction costs, including sales charges (loads) on Fund purchases; and
- Ongoing Fund costs, including management fees, distribution and service (12b-1) fees, and other Fund expenses. All mutual funds have ongoing costs, sometimes referred to as operating expenses.
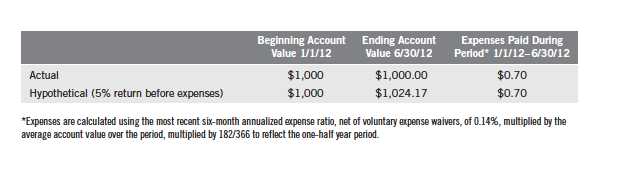
The following table shows ongoing costs of investing in the Fund and can help you understand these costs and compare them with those of other mutual funds. The table assumes a $1,000 investment held for the six months indicated.
Actual Fund Expenses
The first line (Actual) of the table provides actual account values and expenses. The “Ending Account Value” is derived from the Fund’s actual return, which includes the effect of Fund expenses.
You can estimate the expenses you paid during the period by following these steps. Of course, your account value and expenses will differ from those in this illustration:
| 1. | Divide your account value by $1,000. |
| | If an account had an $8,600 value, then $8,600 ÷ $1,000 = 8.6. |
| 2. | Multiply the result by the number under the heading “Expenses Paid During Period.” |
| | If Expenses Paid During Period were $7.50, then 8.6 x $7.50 = $64.50. |
In this illustration, the estimated expenses paid this period are $64.50.
Hypothetical Example for Comparison with Other Funds
Information in the second line (Hypothetical) of the table can help you compare ongoing costs of investing in the Fund with those of other mutual funds. This information may not be used to estimate the actual ending account balance or expenses you paid during the period. The hypothetical “Ending Account Value” is based on the Fund’s actual expense ratio and an assumed 5% annual rate of return before expenses, which does not represent the Fund’s actual return. The figure under the heading “Expenses Paid During Period” shows the hypothetical expenses your account would have incurred under this scenario. You can compare this figure with the 5% hypothetical examples that appear in shareholder reports of other funds.
28 | Annual Report
Your Fund s Expenses (continued)
Please note that expenses shown in the table are meant to highlight ongoing costs and do not reflect any transaction costs, such as sales charges. Therefore, the second line is useful in comparing ongoing costs only, and will not help you compare total costs of owning different funds. In addition, if transaction costs were included, your total costs would have been higher. Please refer to the Fund prospectus for additional information on operating expenses.
Annual Report | 29
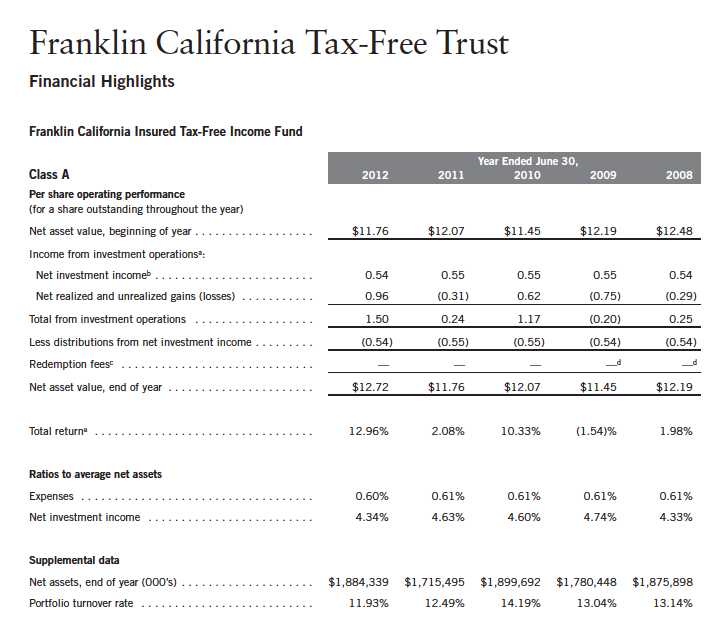
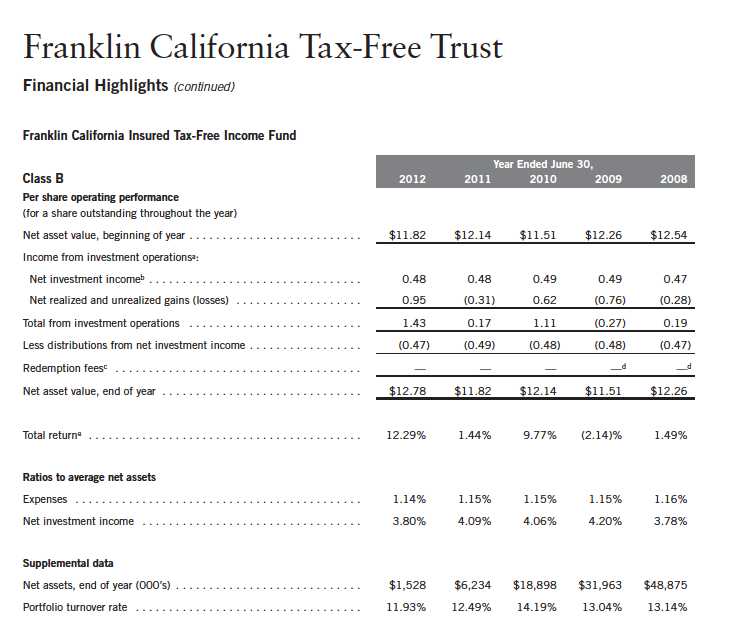
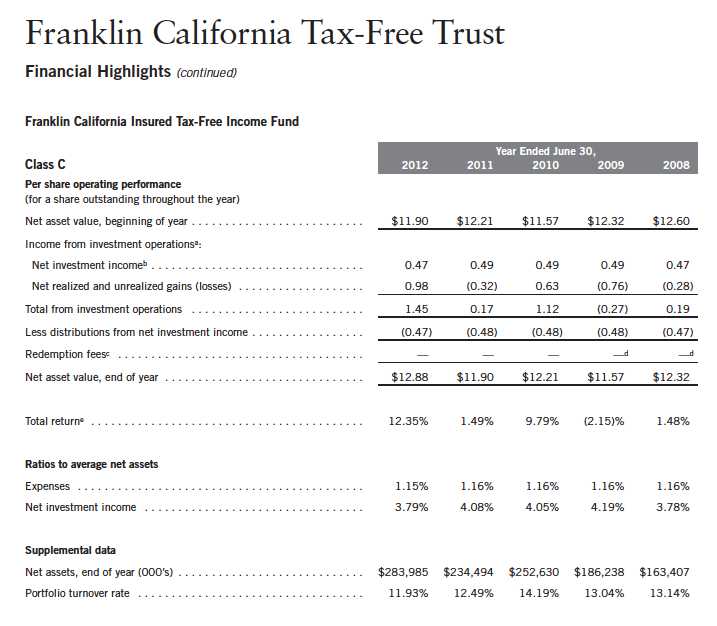
aThe amount shown for a share outstanding throughout the period may not correlate with the Statement of Operations for the period due to the timing of sales and repurchases of
the Fund shares in relation to income earned and/or fluctuating market value of the investments of the Fund.
bBased on average daily shares outstanding.
cEffective September 1, 2008, the redemption fee was eliminated.
dAmount rounds to less than $0.01 per share.
eTotal return does not reflect sales commissions or contingent deferred sales charges, if applicable.
30 | The accompanying notes are an integral part of these financial statements. | Annual Report
aThe amount shown for a share outstanding throughout the period may not correlate with the Statement of Operations for the period due to the timing of sales and repurchases of
the Fund shares in relation to income earned and/or fluctuating market value of the investments of the Fund.
bBased on average daily shares outstanding.
cEffective September 1, 2008, the redemption fee was eliminated.
dAmount rounds to less than $0.01 per share.
eTotal return does not reflect sales commissions or contingent deferred sales charges, if applicable.
Annual Report | The accompanying notes are an integral part of these financial statements. | 31
aThe amount shown for a share outstanding throughout the period may not correlate with the Statement of Operations for the period due to the timing of sales and repurchases of
the Fund shares in relation to income earned and/or fluctuating market value of the investments of the Fund.
bBased on average daily shares outstanding.
cEffective September 1, 2008, the redemption fee was eliminated.
dAmount rounds to less than $0.01 per share.
eTotal return does not reflect sales commissions or contingent deferred sales charges, if applicable.
32 | The accompanying notes are an integral part of these financial statements. | Annual Report

aFor the period October 31, 2008 (effective date) to June 30, 2009.
bThe amount shown for a share outstanding throughout the period may not correlate with the Statement of Operations for the period due to the timing of sales and repurchases of
the Fund shares in relation to income earned and/or fluctuating market value of the investments of the Fund.
cBased on average daily shares outstanding.
dTotal return is not annualized for periods less than one year.
eRatios are annualized for periods less than one year.
Annual Report | The accompanying notes are an integral part of these financial statements. | 33
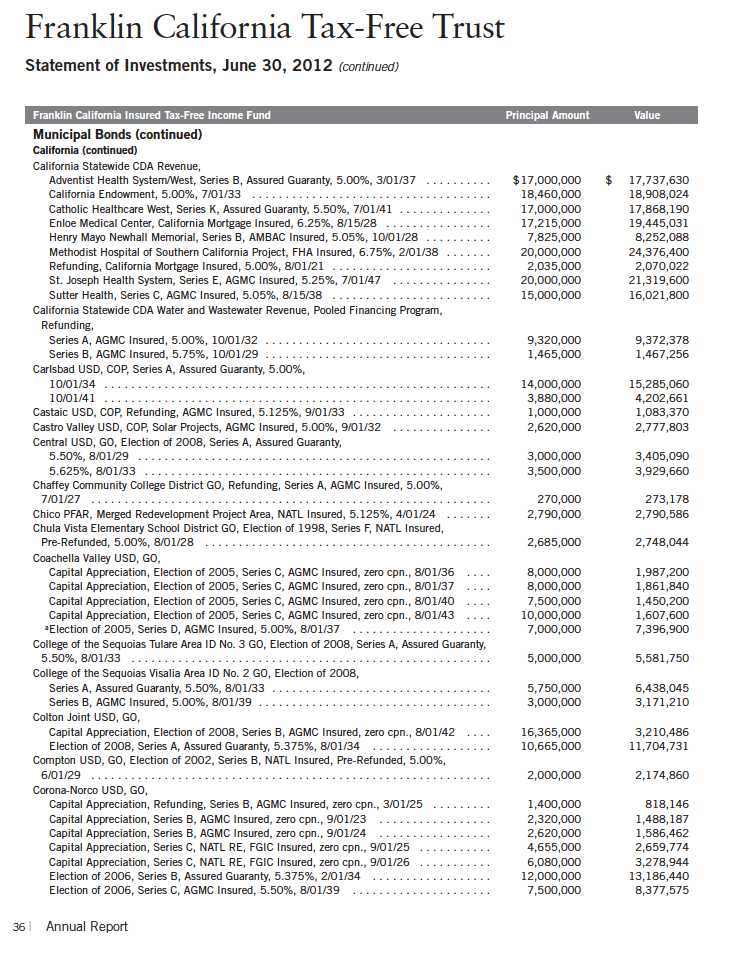
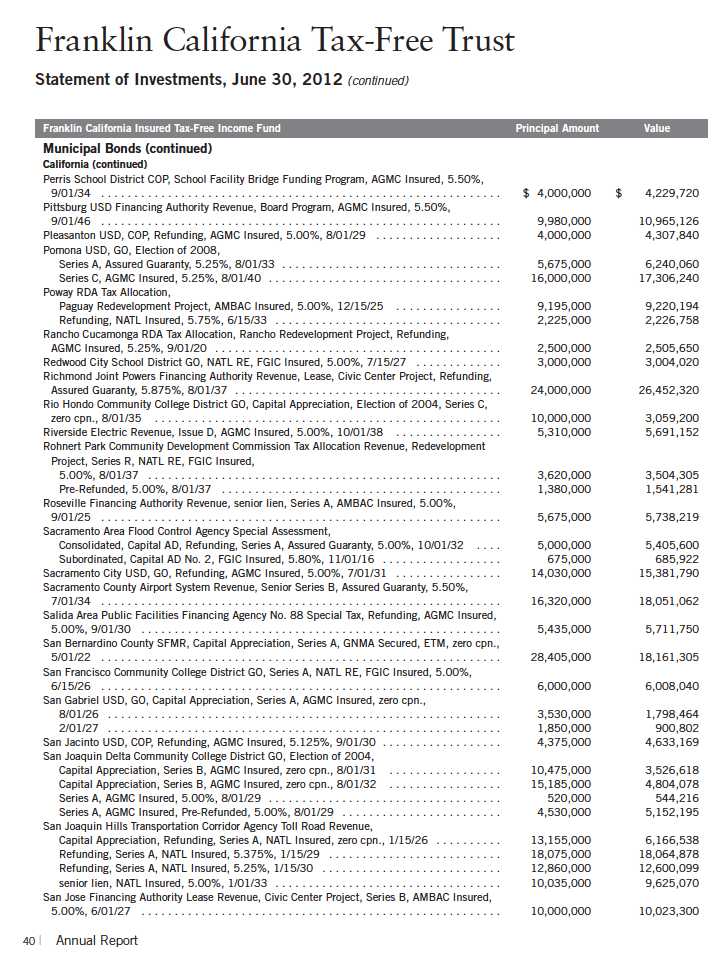
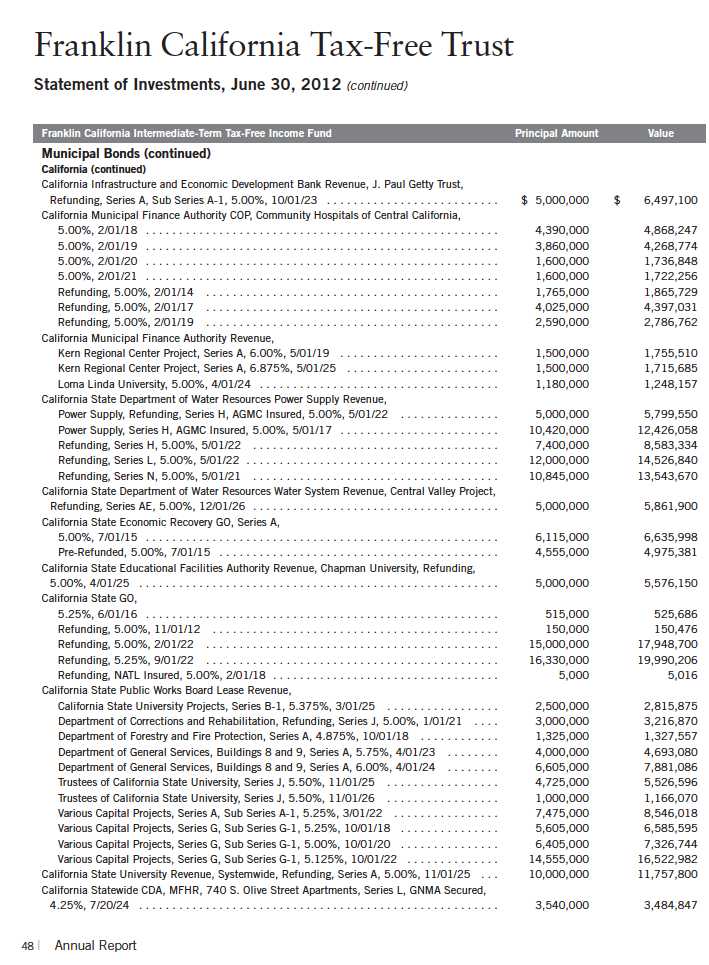
Franklin California Tax-Free Trust
Statement of Investments, June 30, 2012
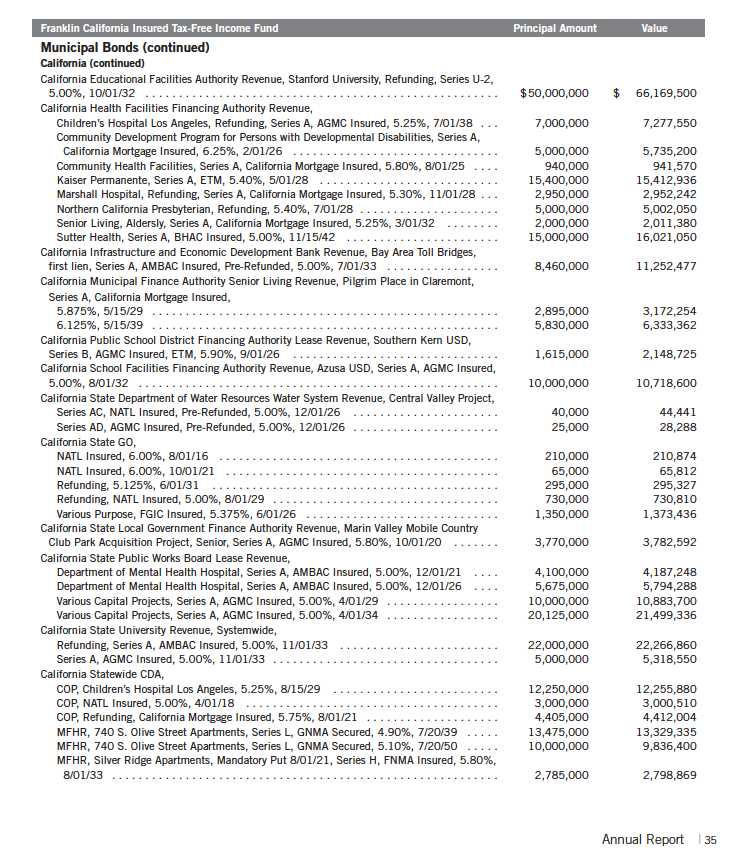
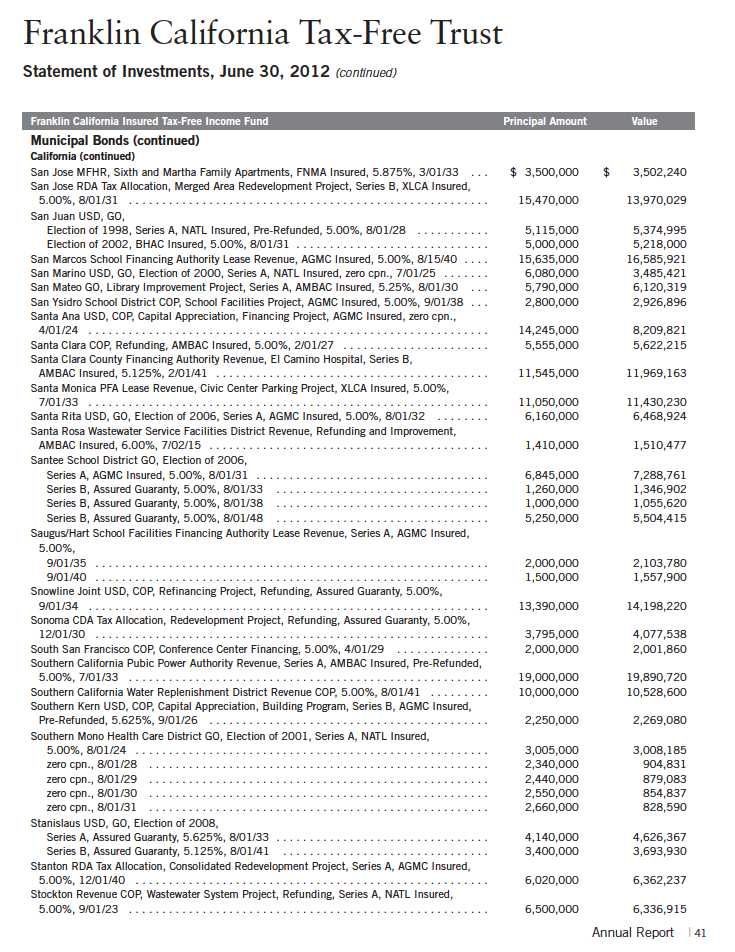
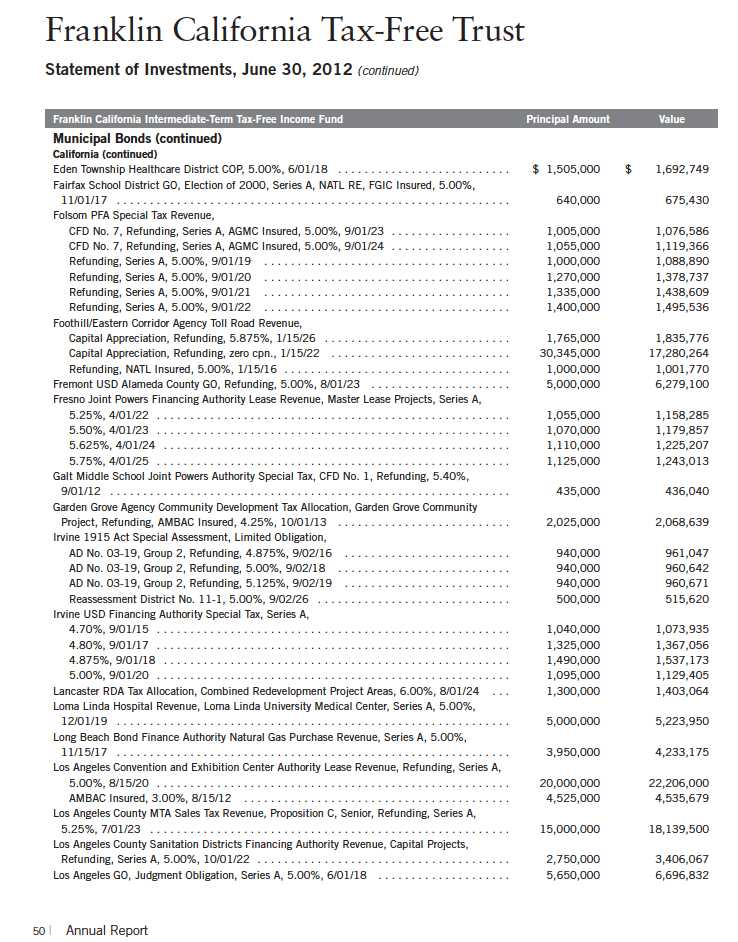
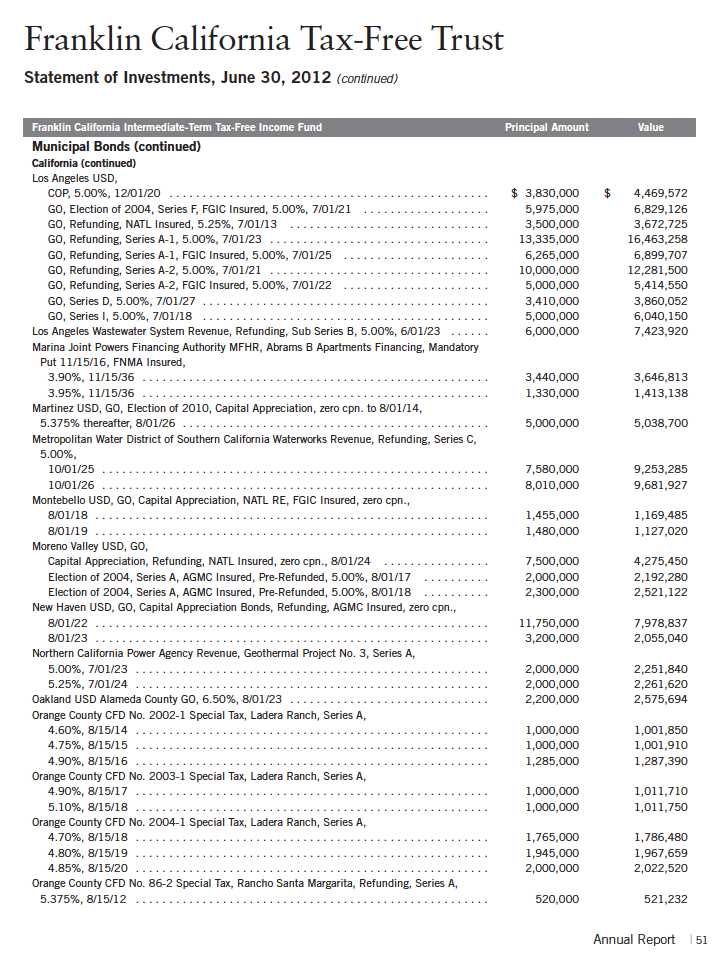
Franklin California Tax-Free Trust
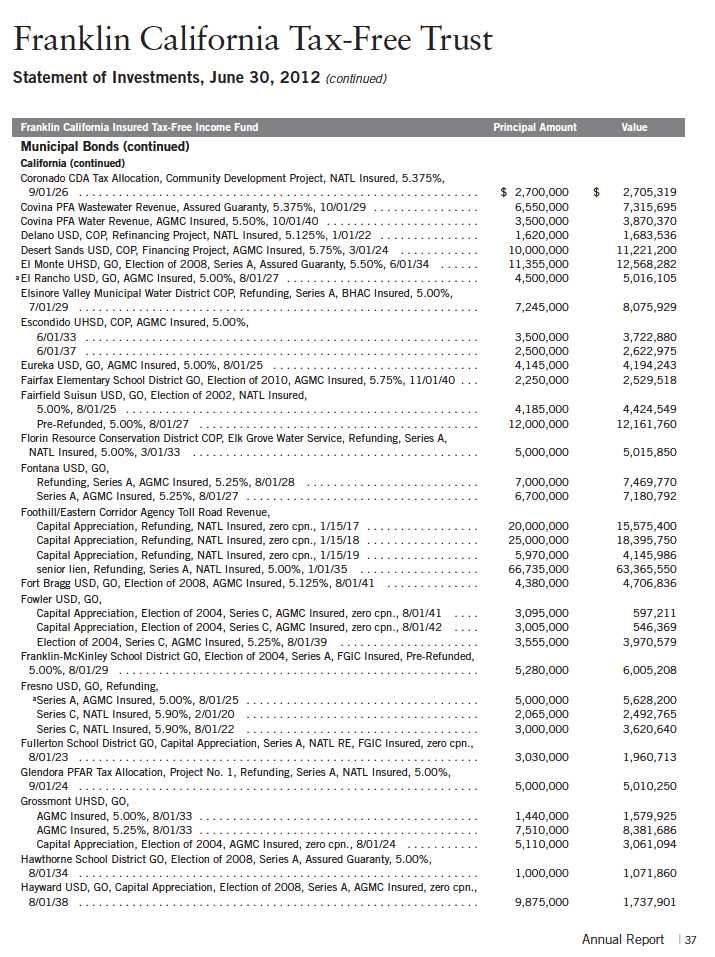
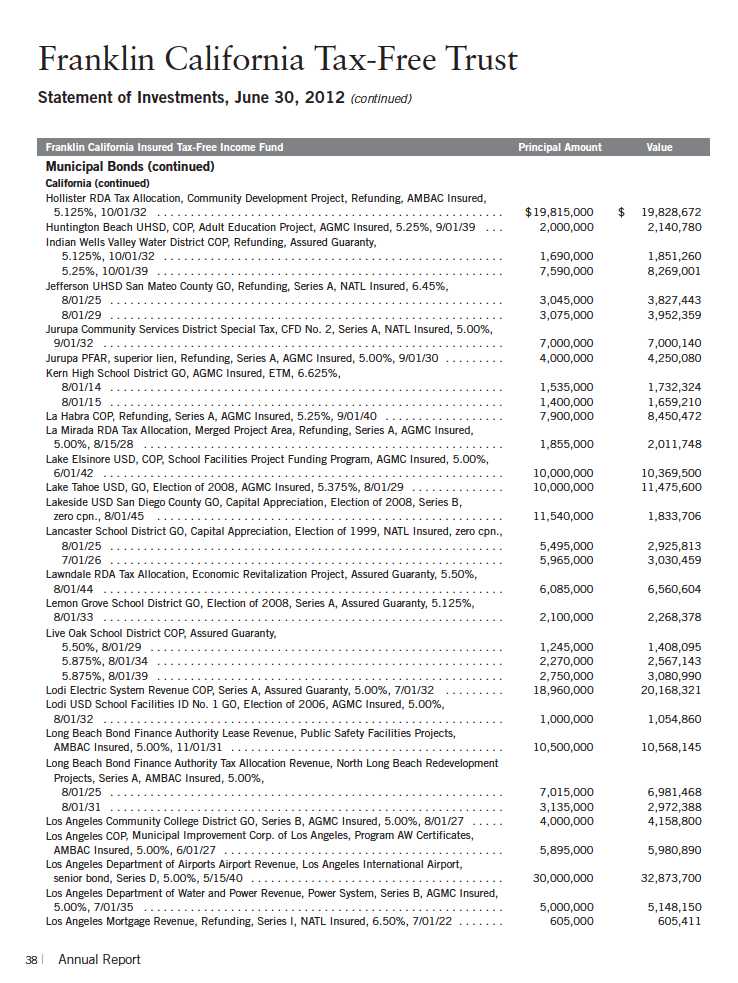
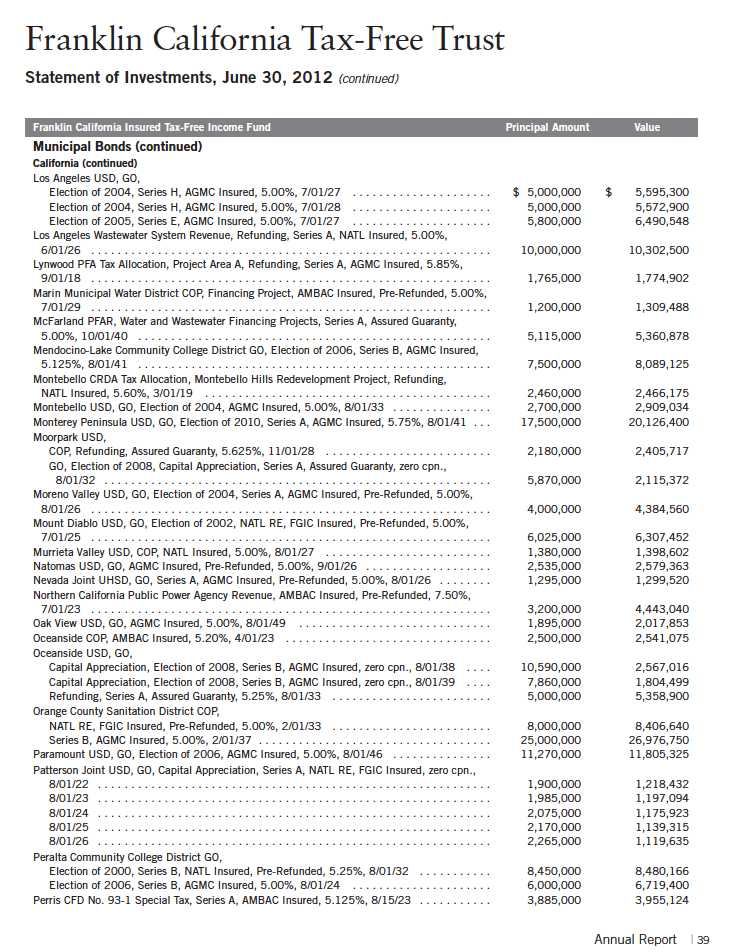
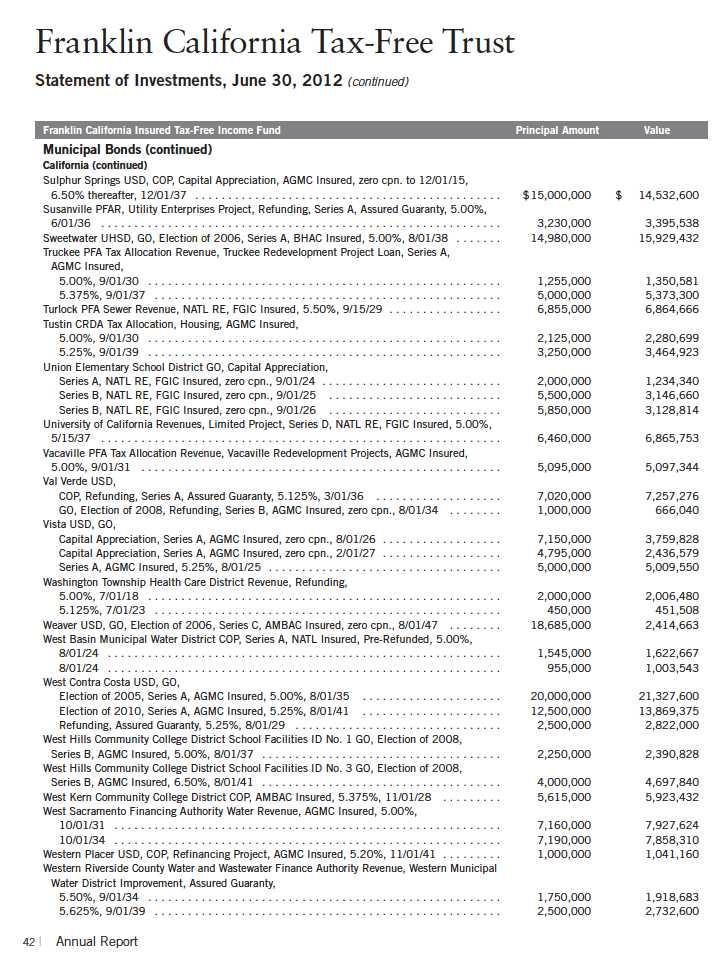
Statement of Investments, June 30, 2012 (continued)
44 | The accompanying notes are an integral part of these financial statements. | Annual Report
aThe amount shown for a share outstanding throughout the period may not correlate with the Statement of Operations for the period due to the timing of sales and repurchases of
the Fund shares in relation to income earned and/or fluctuating market value of the investments of the Fund.
bBased on average daily shares outstanding.
cEffective September 1, 2008, the redemption fee was eliminated.
dAmount rounds to less than $0.01 per share.
eTotal return does not reflect sales commissions or contingent deferred sales charges, if applicable.
Annual Report | The accompanying notes are an integral part of these financial statements. | 45
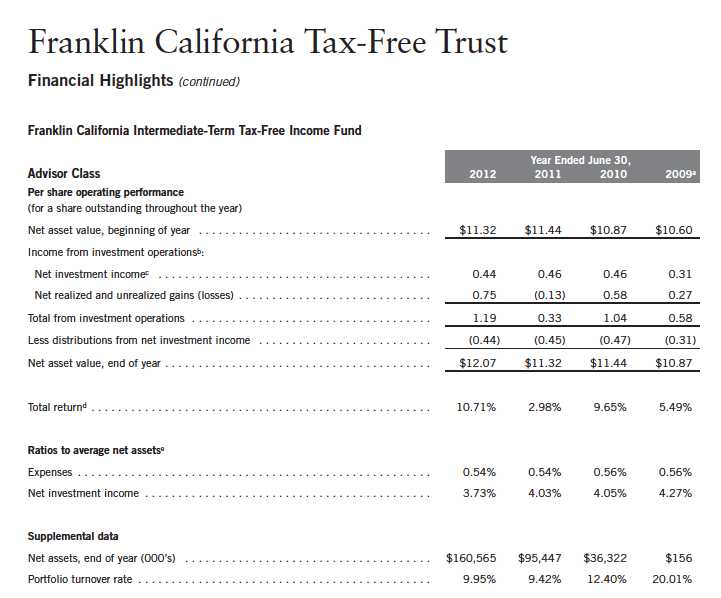
aFor the period October 31, 2008 (effective date) to June 30, 2009.
bThe amount shown for a share outstanding throughout the period may not correlate with the Statement of Operations for the period due to the timing of sales and repurchases of
the Fund shares in relation to income earned and/or fluctuating market value of the investments of the Fund.
cBased on average daily shares outstanding.
dTotal return is not annualized for periods less than one year.
eRatios are annualized for periods less than one year.
46 | The accompanying notes are an integral part of these financial statements. | Annual Report

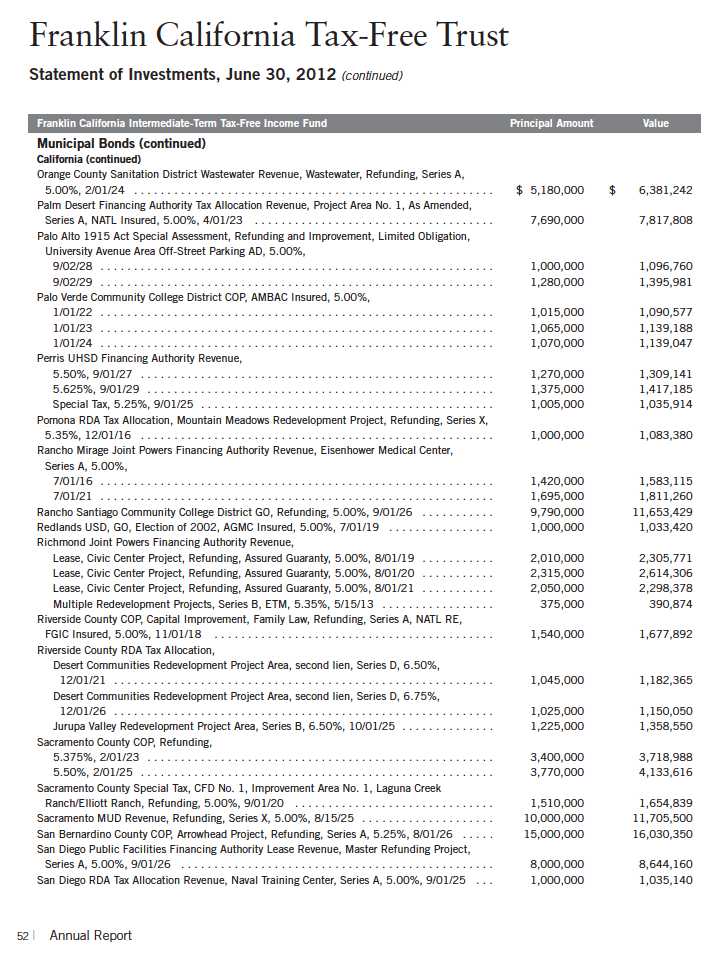
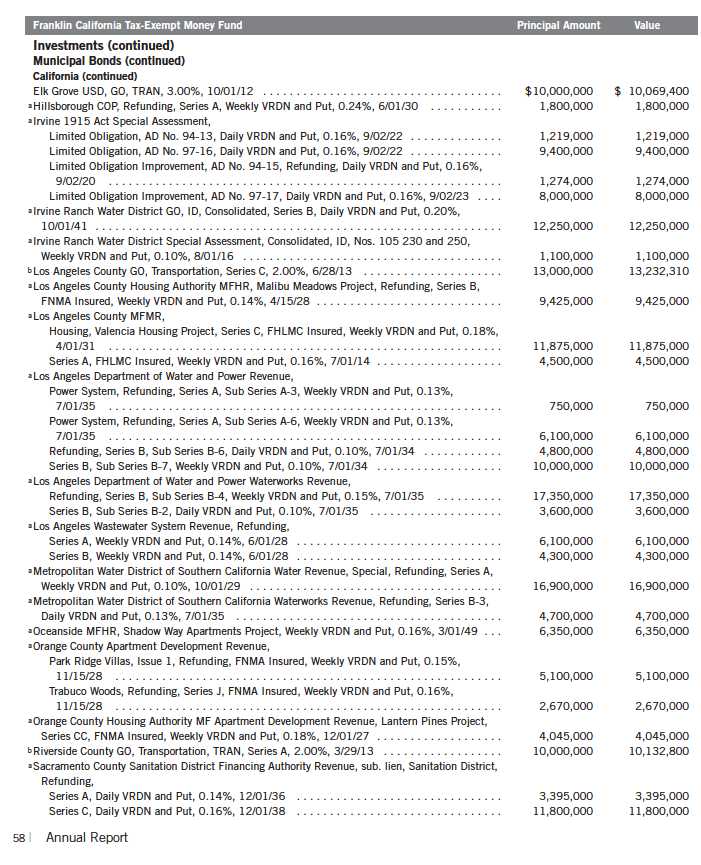
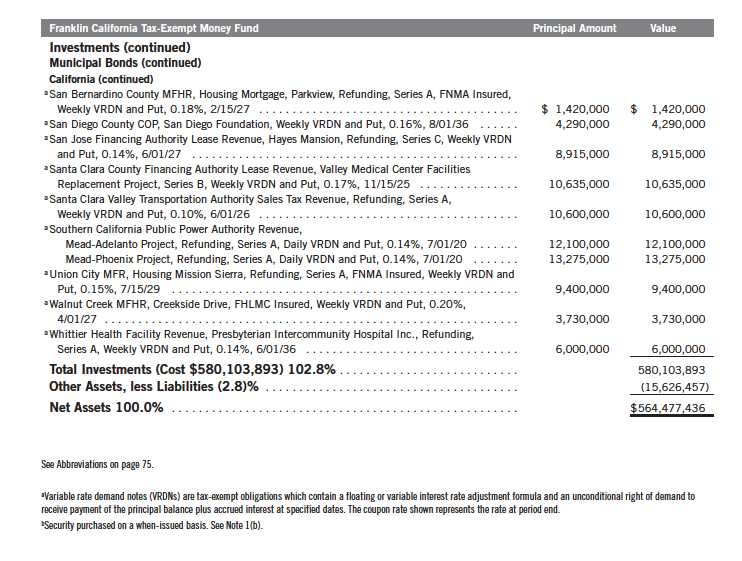
Franklin California Tax-Free Trust
Statement of Investments, June 30, 2012 (continued)
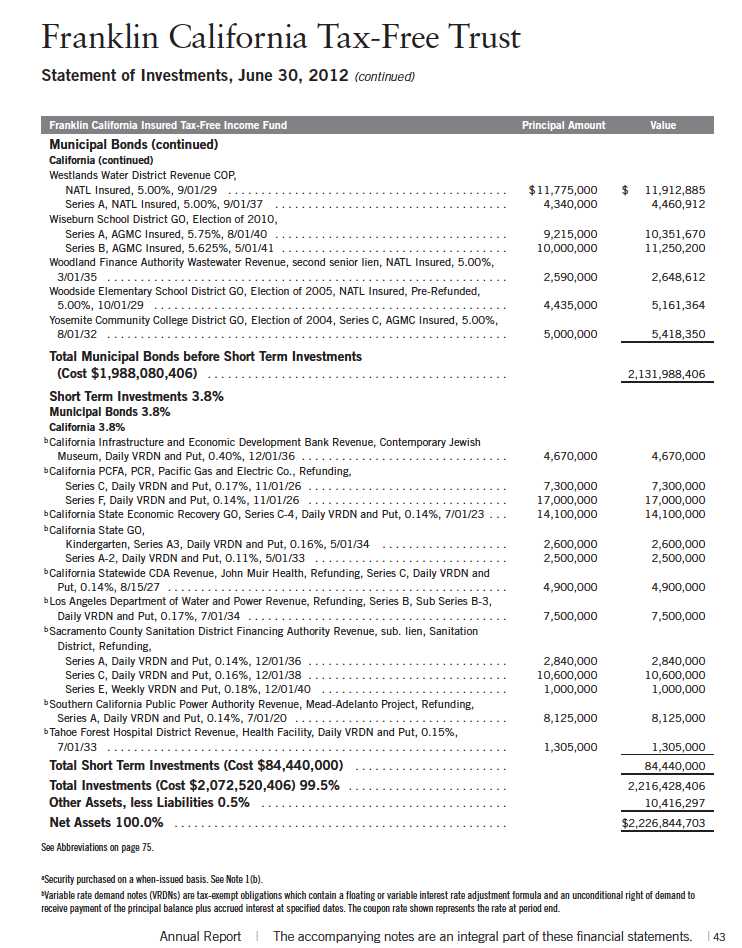
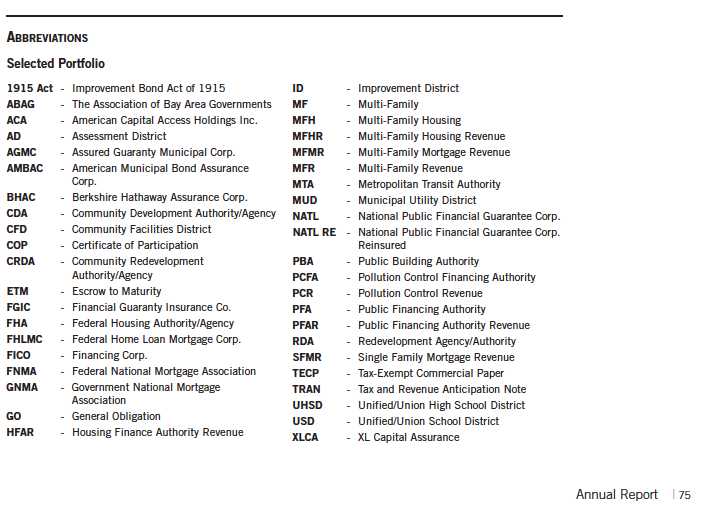
See Abbreviations on page 75.
aSecurity purchased on a when-issued basis. See Note 1(b).
bVariable rate demand notes (VRDNs) are tax-exempt obligations which contain a floating or variable interest rate adjustment formula and an unconditional right of demand to
receive payment of the principal balance plus accrued interest at specified dates. The coupon rate shown represents the rate at period end.
Annual Report | The accompanying notes are an integral part of these financial statements. | 55
56 | The accompanying notes are an integral part of these financial statements. | Annual Report

Franklin California Tax-Free Trust
Statement of Investments, June 30, 2012
Franklin California Tax-Free Trust
Statement of Investments, June 30, 2012 (continued)
Franklin California Tax-Free Trust
Statement of Investments, June 30, 2012 (continued)
Annual Report | The accompanying notes are an integral part of these financial statements. | 59

60 | The accompanying notes are an integral part of these financial statements. | Annual Report
Annual Report | The accompanying notes are an integral part of these financial statements. | 61
62 | The accompanying notes are an integral part of these financial statements. | Annual Report
Annual Report | The accompanying notes are an integral part of these financial statements. | 63
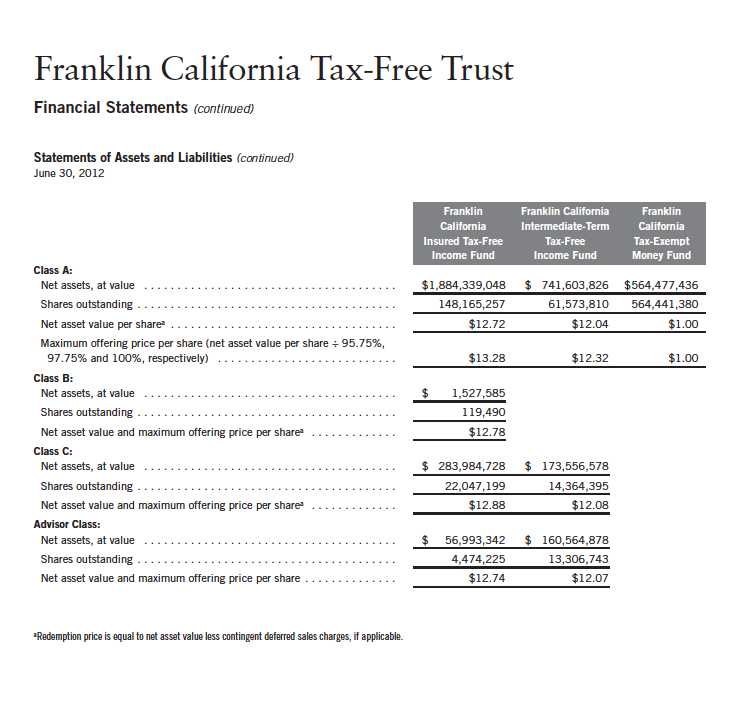
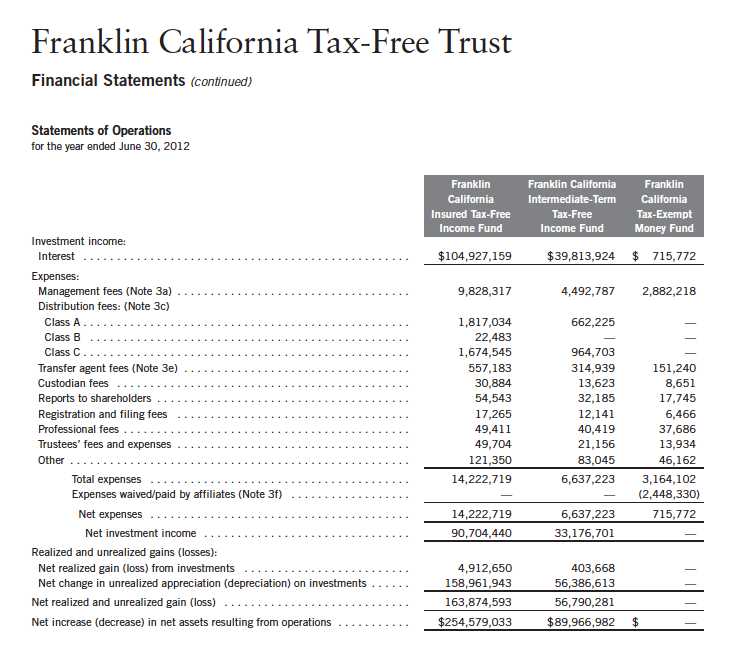
Franklin California Tax-Free Trust
Financial Statements (continued)

64 | The accompanying notes are an integral part of these financial statements. | Annual Report
Franklin California Tax-Free Trust
Notes to Financial Statements
1. ORGANIZATION AND SIGNIFICANT ACCOUNTING POLICIES
Franklin California Tax-Free Trust (Trust) is registered under the Investment Company Act of 1940, as amended, (1940 Act) as an open-end investment company, consisting of three funds (Funds). The classes of shares offered within each of the Funds are indicated below. Each class of shares differs by its initial sales load, contingent deferred sales charges, distribution fees, voting rights on matters affecting a single class and its exchange privilege.

The following summarizes the Funds significant accounting policies.
a. Financial Instrument Valuation
The Funds investments in financial instruments are carried at fair value daily. Fair value is the price that would be received to sell an asset or paid to transfer a liability in an orderly transaction between market participants on the measurement date. Under procedures approved by the Trust s Board of Trustees (the Board), the Fund s administrator, investment manager and other affiliates have formed the Valuation and Liquidity Oversight Committee (VLOC). The VLOC provides administration and oversight of the Funds valuation policies and procedures, which are approved annually by the Board. Among other things, these procedures allow the Funds to utilize independent pricing services, quotations from securities and financial instrument dealers, and other market sources to determine fair value.
Debt securities generally trade in the over-the-counter market rather than on a securities exchange. The Funds pricing services use multiple valuation techniques to determine fair value. In instances where sufficient market activity exists, the pricing services may utilize a market-based approach through which quotes from market makers are used to determine fair value. In instances where sufficient market activity may not exist or is limited, the pricing services also utilize proprietary valuation models which may consider market characteristics such as benchmark yield curves, credit spreads, estimated default rates, anticipated market interest rate volatility, coupon rates, anticipated timing of principal repayments, underlying collateral, and other unique security features in order to estimate the relevant cash flows, which are then discounted to calculate the fair value.
Securities in the California Tax-Exempt Money Fund are valued at amortized cost, which approximates market value. Amortized cost is an income-based approach which involves valuing an instrument at its cost and thereafter assuming a constant amortization to maturity of any discount or premium.
The Funds have procedures to determine the fair value of financial instruments for which market prices are not reliable or readily available. Under these procedures, the VLOC convenes on a regular basis to review such financial instruments and considers a number of factors, including
Annual Report | 65
Franklin California Tax-Free Trust
Notes to Financial Statements (continued)
| 1. | ORGANIZATION AND SIGNIFICANT ACCOUNTING POLICIES (continued) |
| a. | Financial Instrument Valuation (continued) |
significant unobservable valuation inputs, when arriving at fair value. The VLOC primarily employs a market-based approach which may use related or comparable assets or liabilities, recent transactions, market multiples, book values, and other relevant information for the investment to determine the fair value of the investment. An income-based valuation approach may also be used in which the anticipated future cash flows of the investment are discounted to calculate fair value. Discounts may also be applied due to the nature or duration of any restrictions on the disposition of the investments. Due to the inherent uncertainty of valuations of such investments, the fair values may differ significantly from the values that would have been used had an active market existed. The VLOC employs various methods for calibrating these valuation approaches including a regular review of key inputs and assumptions, transactional back-testing or disposition analysis, and reviews of any related market activity.
b. Securities Purchased on a When-Issued Basis
The Funds purchase securities on a when-issued basis, with payment and delivery scheduled for a future date. These transactions are subject to market fluctuations and are subject to the risk that the value at delivery may be more or less than the trade date purchase price. Although the Funds will generally purchase these securities with the intention of holding the securities, they may sell the securities before the settlement date. Sufficient assets have been segregated for these securities.
c. Income Taxes
It is each fund’s policy to qualify as a regulated investment company under the Internal Revenue Code. Each fund intends to distribute to shareholders substantially all of its income and net realized gains to relieve it from federal income and excise taxes. As a result, no provision for U.S. federal income taxes is required.
Each fund recognizes the tax benefits of uncertain tax positions only when the position is “more likely than not” to be sustained upon examination by the tax authorities based on the technical merits of the tax position. As of June 30, 2012, and for all open tax years, each fund has determined that no liability for unrecognized tax benefits is required in each fund’s financial statements related to uncertain tax positions taken on a tax return (or expected to be taken on future tax returns). Open tax years are those that remain subject to examination and are based on each tax jurisdiction statute of limitation.
d. Security Transactions, Investment Income, Expenses and Distributions
Security transactions are accounted for on trade date. Realized gains and losses on security transactions are determined on a specific identification basis. Interest income and estimated expenses are accrued daily. Amortization of premium and accretion of discount on debt securities are included in interest income. Dividends from net investment income are normally declared daily;
66 | Annual Report
Franklin California Tax-Free Trust
Notes to Financial Statements (continued)
| 1. | ORGANIZATION AND SIGNIFICANT ACCOUNTING POLICIES (continued) |
| d. | Security Transactions, Investment Income, Expenses and Distributions (continued) |
these dividends may be reinvested or paid monthly to shareholders. Distributions to shareholders are determined according to income tax regulations (tax basis). Distributable earnings determined on a tax basis may differ from earnings recorded in accordance with accounting principles generally accepted in the United States of America. These differences may be permanent or temporary. Permanent differences are reclassified among capital accounts to reflect their tax character. These reclassifications have no impact on net assets or the results of operations. Temporary differences are not reclassified, as they may reverse in subsequent periods.
Common expenses incurred by the Trust are allocated among the Funds based on the ratio of net assets of each fund to the combined net assets of the Trust. Fund specific expenses are charged directly to the fund that incurred the expense.
Realized and unrealized gains and losses and net investment income, not including class specific expenses, are allocated daily to each class of shares based upon the relative proportion of net assets of each class. Differences in per share distributions, by class, are generally due to differences in class specific expenses.
e. Insurance
The scheduled payments of interest and principal for each insured municipal security in the Trust are insured by either a new issue insurance policy, a portfolio insurance policy. Some municipal securities in the Funds are secured by collateral guaranteed by an agency of the U.S. government. Depending on the type of coverage, premiums for insurance are either added to the cost basis of the security or paid by a third party.
Insurance companies typically insure municipal bonds that tend to be of very high quality, with the majority of underlying municipal bonds rated A or better. However, an event involving an insurer could have an adverse effect on the value of the securities insured by that insurance company. There is no guarantee the insurer will be able to fulfill its obligations under the terms of the policy.
f. Accounting Estimates
The preparation of financial statements in accordance with accounting principles generally accepted in the United States of America requires management to make estimates and assumptions that affect the reported amounts of assets and liabilities at the date of the financial statements and the amounts of income and expenses during the reporting period. Actual results could differ from those estimates.
Annual Report | 67
Franklin California Tax-Free Trust
Notes to Financial Statements (continued)
1. ORGANIZATION AND SIGNIFICANT ACCOUNTING POLICIES (continued) g. Guarantees and Indemnifications
Under the Trust s organizational documents, its officers and trustees are indemnified by the Trust against certain liabilities arising out of the performance of their duties to the Trust. Additionally, in the normal course of business, the Trust, on behalf of the Funds, enters into contracts with service providers that contain general indemnification clauses. The Trust s maximum exposure under these arrangements is unknown as this would involve future claims that may be made against the Trust that have not yet occurred. Currently, the Trust expects the risk of loss to be remote.
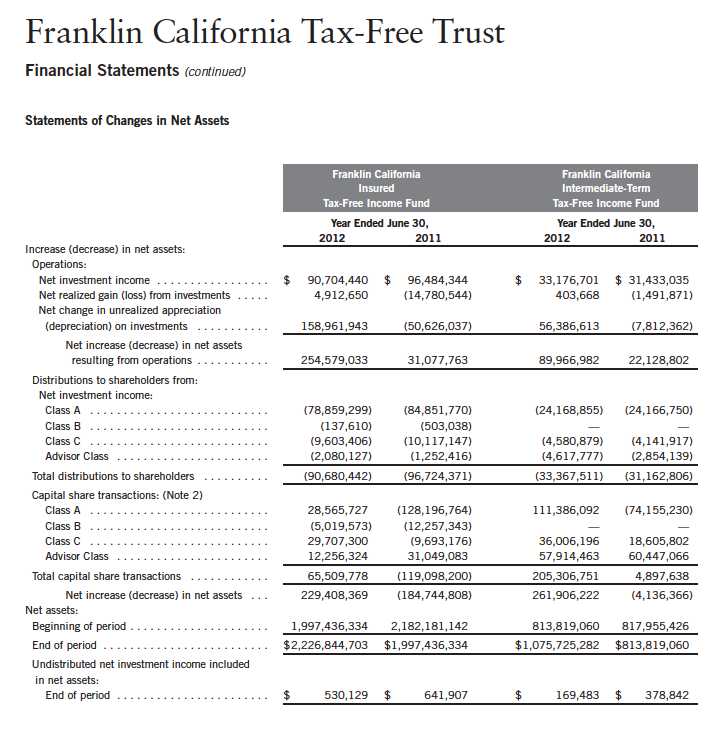
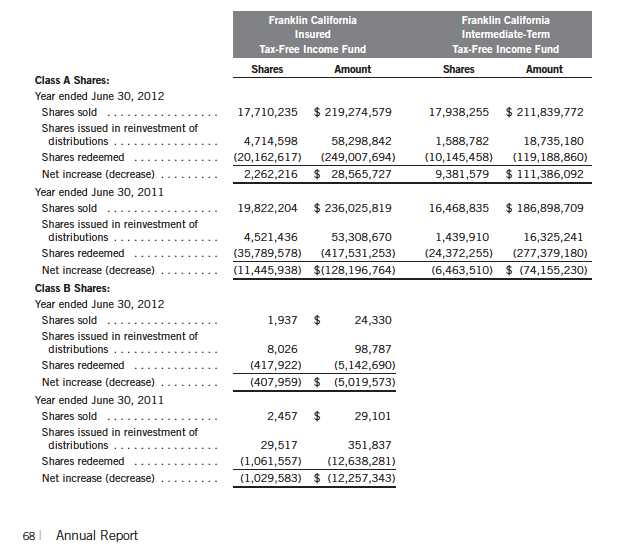
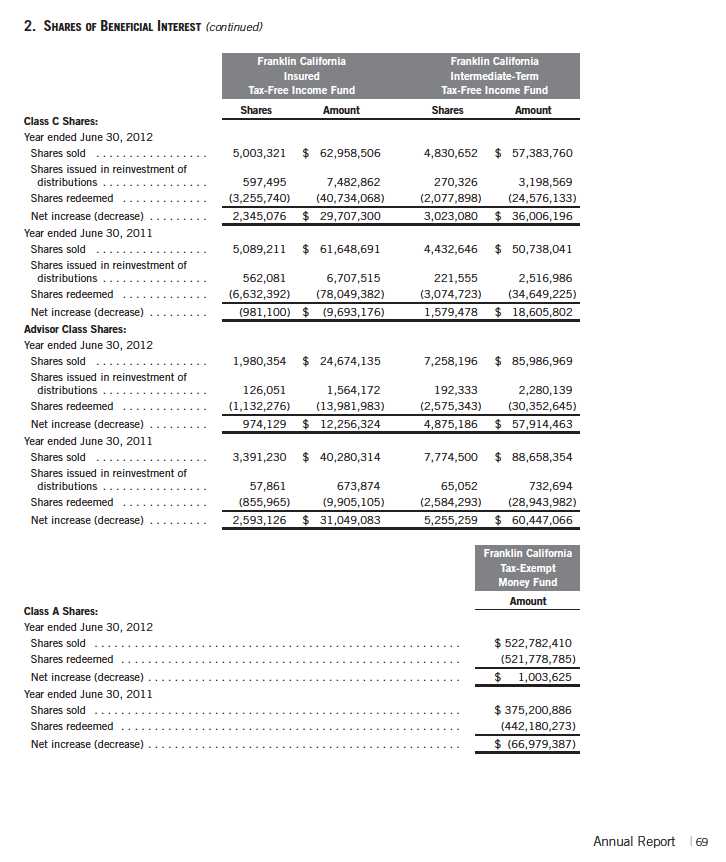
2. SHARES OF BENEFICIAL INTEREST
At June 30, 2012, there were an unlimited number of shares authorized ($0.01 par value).
Transactions in the Funds shares were as follows:
Franklin California Tax-Free Trust
Notes to Financial Statements (continued)
Franklin California Tax-Free Trust
Notes to Financial Statements (continued)
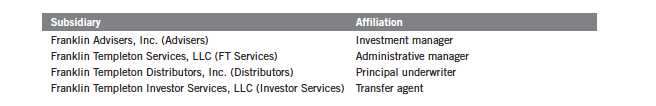
3. TRANSACTIONS WITH AFFILIATES
Franklin Resources, Inc. is the holding company for various subsidiaries that together are referred to as Franklin Templeton Investments. Certain officers and trustees of the Funds are also officers and/or directors of the following subsidiaries:
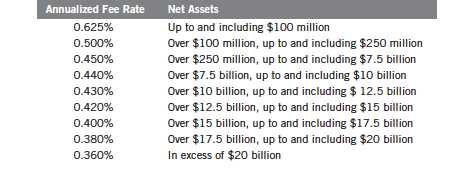
a. Management Fees
The Franklin California Insured Tax-Free Income Fund and Franklin California Intermediate-Term Tax-Free Income Fund pay an investment management fee to Advisers based on the month-end net assets of each of the funds and the Franklin California Tax-Exempt Money Fund pays an investment management fee to Advisers based on the average daily net assets of the fund as follows:
b. Administrative Fees
Under an agreement with Advisers, FT Services provides administrative services to the Funds. The fee is paid by Advisers based on average daily net assets, and is not an additional expense of the Funds.
c. Distribution Fees
The Board for the Franklin California Insured Tax-Free Income Fund and Franklin California Intermediate-Term Tax-Free Income Fund has adopted distribution plans for each share class, with the exception of Advisor Class shares, pursuant to Rule 12b-1 under the 1940 Act. Under the Funds Class A reimbursement distribution plans, the funds reimburse Distributors for costs incurred in connection with the servicing, sale and distribution of each funds shares up to the maximum annual plan rate for each class. Under the Class A reimbursement distribution plans, costs exceeding the maximum for the current plan year cannot be reimbursed in subsequent periods.
70 | Annual Report
Franklin California Tax-Free Trust
Notes to Financial Statements (continued)
3. TRANSACTIONS WITH AFFILIATES (continued) c. Distribution Fees (continued)
In addition, under the funds Class B and C compensation distribution plans, the funds pay Distributors for costs incurred in connection with the servicing, sale and distribution of each fund s shares up to the maximum annual plan rate for each class.
The maximum annual plan rates, based on the average daily net assets, for each class, are as follows:
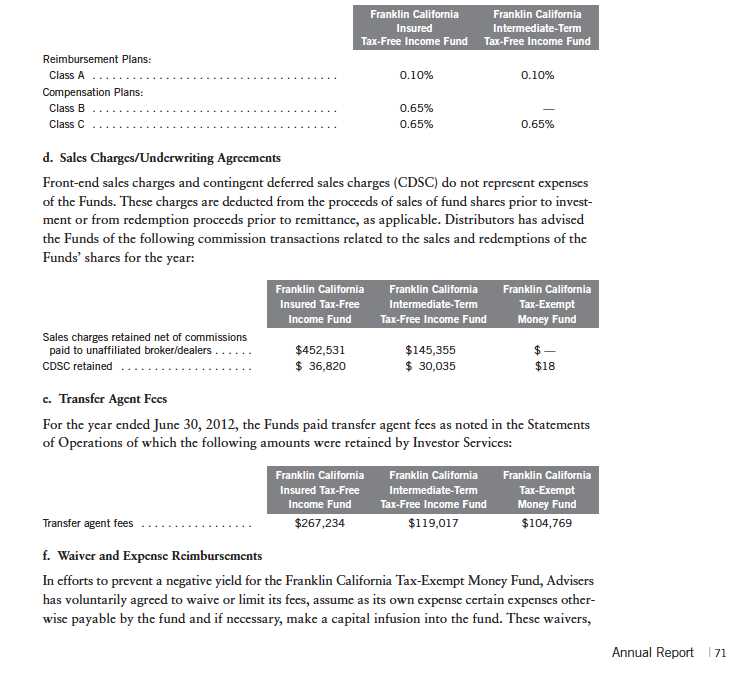
Franklin California Tax-Free Trust
Notes to Financial Statements (continued)
3. TRANSACTIONS WITH AFFILIATES (continued) f. Waiver and Expense Reimbursements (continued)
expense reimbursements and capital infusions are voluntary and may be modified or discontinued by Advisers at any time, and without further notice. There is no guarantee that the fund will be able to avoid a negative yield.
g. Other Affiliated Transactions
At June 30, 2012, a director of Advisers owned 50.6% of the Franklin California Tax-Exempt Money Fund s outstanding shares. Investment activities of this shareholder could have a material impact on the fund.
4. INCOME TAXES
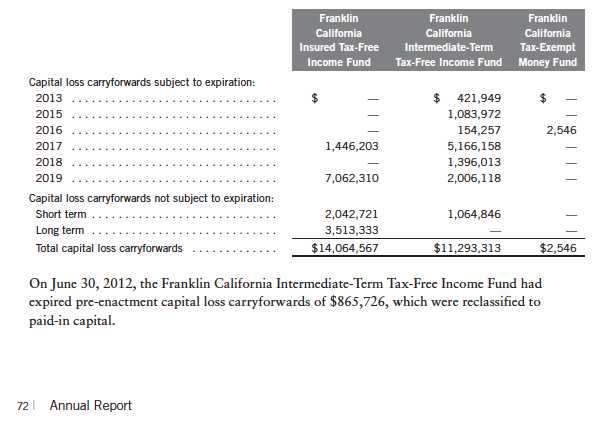
For tax purposes, capital losses may be carried over to offset future capital gains, if any. Under the Regulated Investment Company Modernization Act of 2010, capital losses incurred by the Funds in taxable years beginning after December 22, 2010 are not subject to expiration and such losses retain their character as either short-term or long-term, rather than being considered short-term as under previous law. Post-enactment capital losses must be fully utilized prior to utilizing any losses incurred in pre-enactment tax years.
At June 30, 2012, the capital loss carryforwards were as follows:
Franklin California Tax-Free Trust
Notes to Financial Statements (continued)
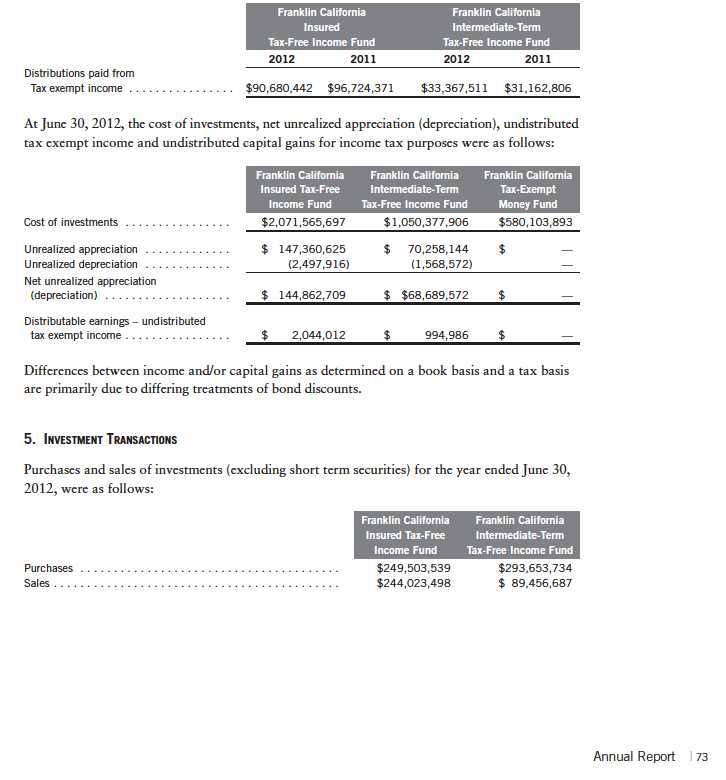
4. INCOME TAXES (continued)
The tax character of distributions paid during the years ended June 30, 2012 and 2011, was as follows:
Franklin California Tax-Free Trust
Notes to Financial Statements (continued)
6. CONCENTRATION OF RISK
Each of the Funds invest a large percentage of its total assets in obligations of issuers within California. Such concentration may subject the Funds to risks associated with industrial or regional matters, and economic, political or legal developments occurring within California. In addition, investments in these securities are sensitive to interest rate changes and credit risk of the issuer and may subject the funds to increased market volatility. The market for these investments may be limited, which may make them difficult to buy or sell.
7. CREDIT FACILITY
The Franklin California Insured Tax-Free Income Fund and Franklin California Intermediate-Term Tax-Free Income Fund, together with other U.S. registered and foreign investment funds (collectively, Borrowers), managed by Franklin Templeton Investments, are borrowers in a joint syndicated senior unsecured credit facility totaling $1.5 billion (Global Credit Facility) which matures on January 18, 2013. This Global Credit Facility provides a source of funds to the Borrowers for temporary and emergency purposes, including the ability to meet future unanticipated or unusually large redemption requests.
Under the terms of the Global Credit Facility, the Funds shall, in addition to interest charged on any borrowings made by the funds and other costs incurred by the funds, pay their share of fees and expenses incurred in connection with the implementation and maintenance of the Global Credit Facility, based upon their relative share of the aggregate net assets of all of the Borrowers, including an annual commitment fee of 0.08% based upon the unused portion of the Global Credit Facility, which is reflected in other expenses on the Statements of Operations. During the year ended June 30, 2012, the funds did not use the Global Credit Facility.
8. FAIR VALUE MEASUREMENTS
The Funds follow a fair value hierarchy that distinguishes between market data obtained from independent sources (observable inputs) and the Funds’ own market assumptions (unobservable inputs). These inputs are used in determining the value of the Funds’ financial instruments and are summarized in the following fair value hierarchy:
- Level 1 – quoted prices in active markets for identical financial instruments
- Level 2 – other significant observable inputs (including quoted prices for similar financial instruments, interest rates, prepayment speed, credit risk, etc.)
- Level 3 – significant unobservable inputs (including the Funds’ own assumptions in determining the fair value of financial instruments)
74 | Annual Report
Franklin California Tax-Free Trust
Notes to Financial Statements (continued)
8. FAIR VALUE MEASUREMENTS (continued)
The inputs or methodology used for valuing financial instruments are not an indication of the risk associated with investing in those financial instruments. Money market securities may be valued using amortized cost, in accordance with the 1940 Act. Generally, amortized cost reflects the current fair value of a security, but since the value is not obtained from a quoted price in an active market, such securities are reflected as Level 2 inputs.
For movements between the levels within the fair value hierarchy, the Funds have adopted a policy of recognizing the transfers as of the date of the underlying event which caused the movement.
At June 30, 2012, all of the Funds investments in financial instruments carried at fair value were valued using Level 2 inputs.
9. SUBSEQUENT EVENTS
The Funds have evaluated subsequent events through the issuance of the financial statements and determined that no events have occurred that require disclosure.
Franklin California Tax-Free Trust
Report of Independent Registered Public Accounting Firm
To the Board of Trustees and Shareholders of Franklin California Tax-Free Trust
In our opinion, the accompanying statements of assets and liabilities, including the statements of investments, and the related statements of operations and of changes in net assets and the financial highlights present fairly, in all material respects, the financial position of Franklin California Insured Tax-Free Income Fund, Franklin California Intermediate-Term Tax-Free Income Fund and Franklin California Tax-Exempt Money Fund (separate portfolios of Franklin California Tax-Free Trust, hereafter referred to as the “Funds”) at June 30, 2012, the results of each of their operations for the year then ended, the changes in each of their net assets for each of the two years in the period then ended and the financial highlights for each of the periods presented, in conformity with accounting principles generally accepted in the United States of America. These financial statements and financial highlights (hereafter referred to as “financial statements”) are the responsibility of the Funds’ management. Our responsibility is to express an opinion on these financial statements based on our audits. We conducted our audits of these financial statements in accordance with the standards of the Public Company Accounting Oversight Board (United States). Those standards require that we plan and perform the audit to obtain reasonable assurance about whether the financial statements are free of material misstatement. An audit includes examining, on a test basis, evidence supporting the amounts and disclosures in the financial statements, assessing the accounting principles used and significant estimates made by management, and evaluating the overall financial statement presentation.
We believe that our audits, which included confirmation of securities at June 30, 2012 by correspondence with the custodian and brokers, provide a reasonable basis for our opinion.
PricewaterhouseCoopers LLP
San Francisco, California
August 15, 2012
76 | Annual Report
Franklin California Tax-Free Trust
Tax Information (unaudited)
Under Section 852(b)(5)(A) of the Internal Revenue Code, the Funds hereby report 100% of the distributions paid from net investment income as exempt-interest dividends for the fiscal year ended June 30, 2012. A portion of the Fund’s exempt-interest dividends may be subject to the federal alternative minimum tax. By mid-February 2013, shareholders will be notified of amounts for use in preparing their 2012 income tax returns.
Annual Report | 77
Franklin California Tax-Free Trust
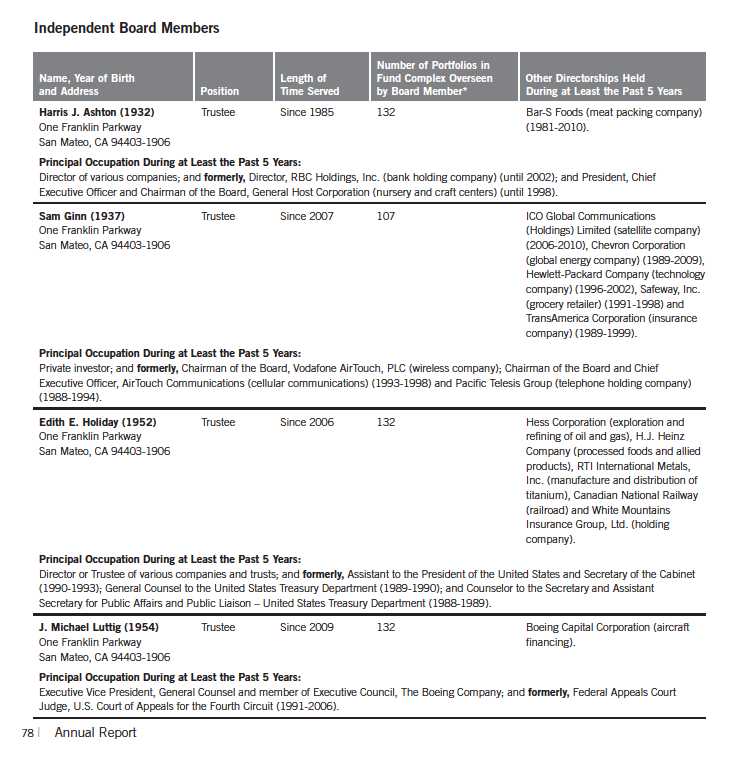
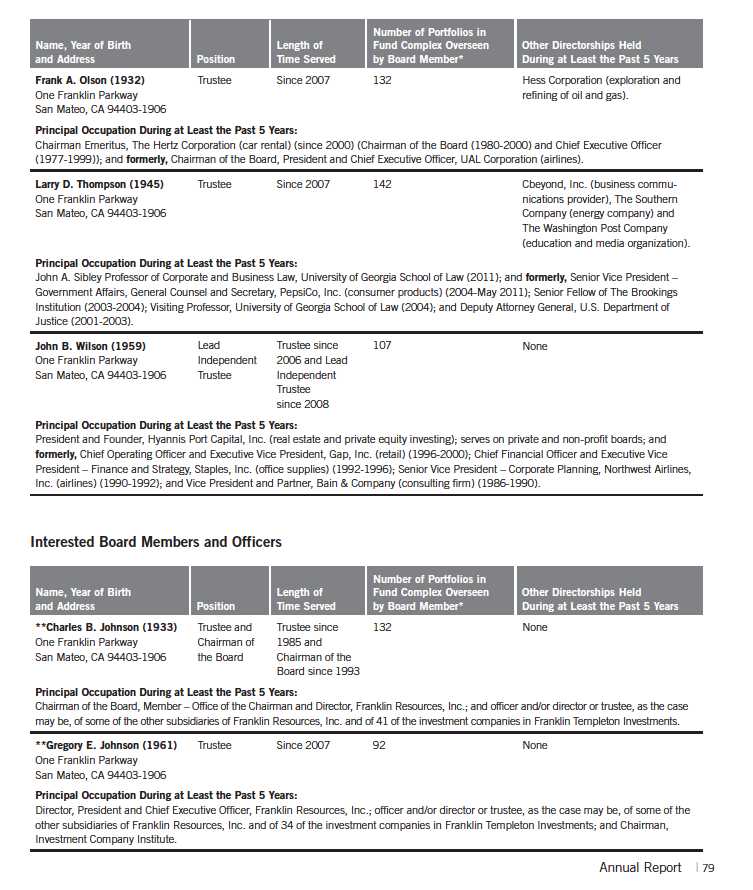
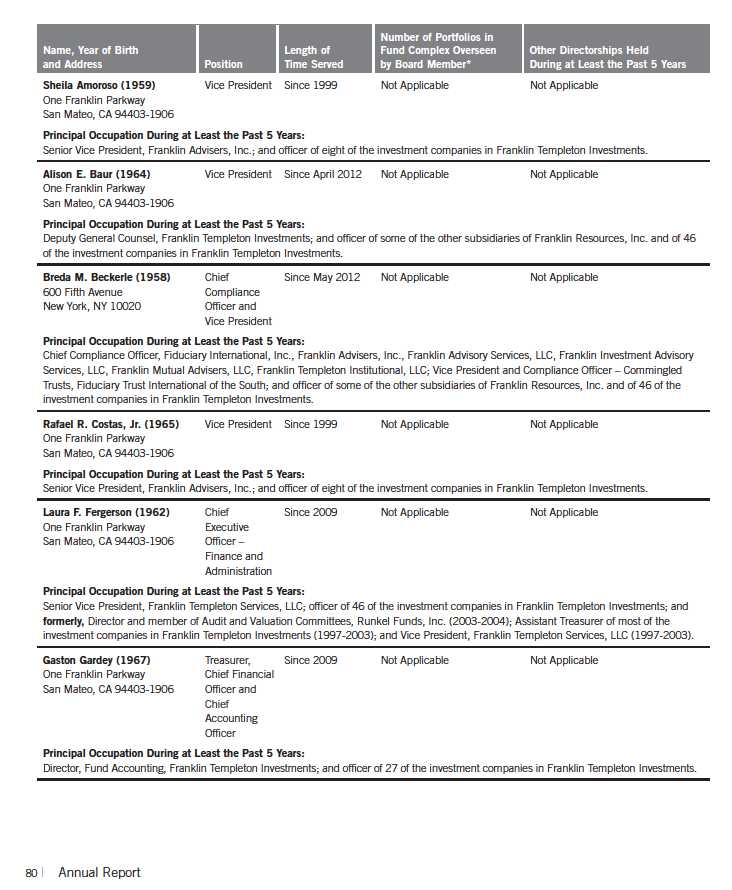
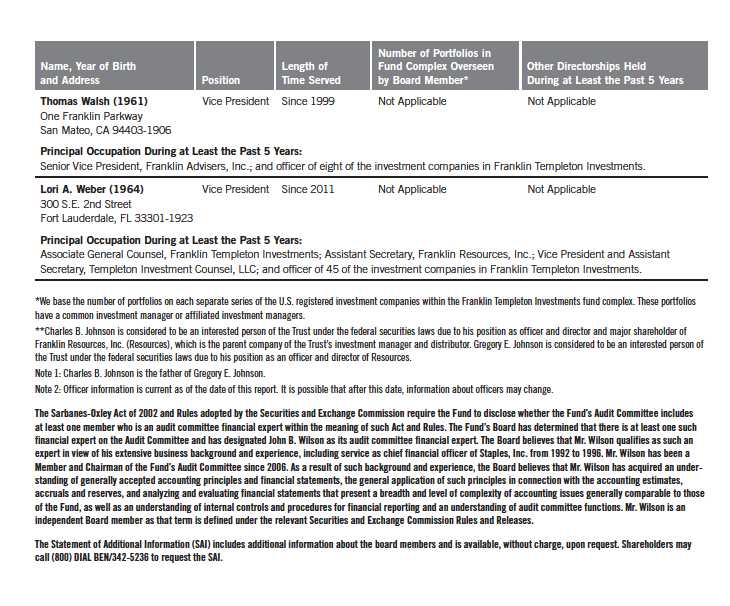
Board Members and Officers
The name, year of birth and address of the officers and board members, as well as their affiliations, positions held with the Trust, principal occupations during at least the past five years and number of portfolios overseen in the Franklin Templeton Investments fund complex are shown below. Generally, each board member serves until that person s successor is elected and qualified.

82 | Annual Report
Franklin California Tax-Free Trust
Shareholder Information
Board Review of Investment Management Agreement
At a meeting held February 28, 2012, the Board of Trustees (Board), including a majority of non-interested or independent Trustees, approved renewal of the investment management agreement for each of the separate tax-exempt funds within the Trust (Fund(s)). In reaching this decision, the Board took into account information furnished throughout the year at regular Board meetings, as well as information prepared specifically in connection with the annual renewal review process. Information furnished and discussed throughout the year included investment performance reports and related financial information for each Fund, as well as periodic reports on expenses, shareholder services, legal and compliance matters, pricing and other services provided by the Investment Manager (Manager) and its affiliates. Information furnished specifically in connection with the renewal process included a report for each Fund prepared by Lipper, Inc. (Lipper), an independent organization, as well as additional material, including a Fund profitability analysis prepared by management. The Lipper reports compared each Fund’s investment performance and expenses with those of other mutual funds deemed comparable to the Fund as selected by Lipper. The Fund profitability analysis discussed the profitability to Franklin Templeton Investments from its overall U.S. fund operations, as well as on an individual fund-by-fund basis. Additional material accompanying such profitability analysis included information on a fund-by-fund basis listing portfolio managers and other accounts they manage, as well as information on management fees charged by the Manager and its affiliates to U.S. mutual funds and other accounts, including management’s explanation of differences where relevant. Such material also included a memorandum prepared by management describing project initiatives and capital investments relating to the services provided to the Funds by the Franklin Templeton Investments organization, as well as a memorandum relating to economies of scale and an analysis concerning transfer agent fees charged by an affiliate of the Manager.
In considering such materials, the independent Trustees received assistance and advice from and met separately with independent counsel. While the investment management agreements for all Funds were considered at the same Board meeting, the Board dealt with each Fund separately. In approving continuance of the investment management agreement for each Fund, the Board, including a majority of independent Trustees, determined that the existing management fee structure was fair and reasonable and that continuance of the investment management agreement was in the best interests of each Fund and its shareholders. While attention was given to all information furnished, the following discusses some primary factors relevant to the Board’s decision.
NATURE, EXTENT AND QUALITY OF SERVICE. The Board was satisfied with the nature and quality of the overall services provided by the Manager and its affiliates to the Funds and their shareholders. In addition to investment performance and expenses discussed later, the Board’s opinion was based, in part, upon periodic reports furnished it showing that the investment policies and restrictions for each Fund were consistently complied with as well as other reports periodically furnished the Board covering matters such as the compliance of portfolio managers and other management personnel with the code of ethics adopted throughout the Franklin Templeton fund complex, the adherence to fair value pricing procedures established by the Board, and the accuracy of net asset value calculations. The Board also noted the extent of benefits provided Fund shareholders from being part of the Franklin Templeton family of funds, including the right to exchange investments
Annual Report | 83
Franklin California Tax-Free Trust
Shareholder Information (continued)
Board Review of Investment Management Agreement (continued)
between the same class of funds without a sales charge, the ability to reinvest Fund dividends into other funds and the right to combine holdings in other funds to obtain a reduced sales charge. Favorable consideration was given to management’s continuous efforts and expenditures in establishing back-up systems and recovery procedures to function in the event of a natural disaster, it being noted that such systems and procedures had functioned smoothly during the Florida hurricanes and blackouts experienced in previous years. Consideration was also given to the experience of each Fund’s portfolio management team, the number of accounts managed and general method of compensation. In this latter respect, the Board noted that a primary factor in management’s determination of a portfolio manager’s bonus compensation was the relative investment performance of the funds he or she managed and that a portion of such bonus was required to be invested in a predesignated list of funds within such person’s fund management area so as to be aligned with the interests of shareholders. The Board also took into account the quality of transfer agent and shareholder services provided Fund shareholders by an affiliate of the Manager and the continuous enhancements to the Franklin Templeton website. Particular attention was given to management’s conservative approach and diligent risk management procedures, including continuous monitoring of counterparty credit risk and attention given to derivatives and other complex instruments. The Board also took into account, among other things, management’s efforts in establishing a global credit facility for the benefit of the Funds and other accounts managed by Franklin Templeton Investments to provide a source of cash for temporary and emergency purposes or to meet unusual redemption requests as well as the strong financial position of the Manager’s parent company and its commitment to the mutual fund business as evidenced by its subsidization of money market funds.
INVESTMENT PERFORMANCE. The Board placed significant emphasis on the investment performance of each Fund in view of its importance to shareholders. While consideration was given to performance reports and discussions with portfolio managers at Board meetings during the year, particular attention in assessing performance was given to the Lipper reports furnished for the agreement renewals. The Lipper reports prepared for each individual Fund showed their investment performance in comparison with a performance universe selected by Lipper. The following summarizes the performance results for each of the Funds.
Franklin California Insured Tax-Free Income Fund – The Lipper report for this Fund showed the investment performance of its Class A shares during 2011 and the previous 10 years ended December 31, 2011, in comparison with a performance universe consisting of all retail and institutional single-state insured municipal debt funds as selected by Lipper. The Lipper report showed that the Fund’s income return during 2011 and for the previous three-, five- and 10-year periods on an annualized basis was in the highest or best performing quintile of its performance universe. The Lipper report also showed that the Fund’s total return during 2011 was in the highest quintile of its performance universe, and on an annualized basis was in the highest quintile of such universe for the previous three-year period, the second-lowest quintile of such universe for the previous five-year period, and the second-highest quintile of such universe for the previous 10-year period. The Board was satisfied with the Fund’s comparative performance as set forth in the Lipper report.
84 | Annual Report
Franklin California Tax-Free Trust
Shareholder Information (continued)
Board Review of Investment Management Agreement (continued)
Franklin California Intermediate-Term Tax-Free Income Fund – The Lipper report for this Fund showed the investment performance of its Class A shares during 2010 and the previous 10 years ended December 31, 2011, in comparison with a performance universe consisting of all retail and institutional California intermediate municipal debt funds as selected by Lipper. Such Lipper report comparison showed that the Fund’s income return in 2011 was in the highest or best performing quintile of such universe, and on an annualized basis was also in the highest quintile of such universe for the previous three- and five-year periods and the second-highest quintile of such universe for the previous 10-year period. The Lipper report showed that the Fund’s total return during 2011 was in the highest quintile of its performance universe, and on an annualized basis was in the highest quin-tile of such universe for each of the previous three- and 10-year periods, and in the second-highest quintile of such universe for the previous five-year period. The Board was satisfied with the Fund’s comparative performance as set forth in the Lipper report.
Franklin California Tax-Exempt Money Fund – The Lipper report for this Fund showed its investment performance during 2011 and the 10 years ended December 31, 2011, in comparison to a performance universe consisting of all retail and institutional California tax-exempt money market funds as selected by Lipper. The Lipper report showed the Fund’s total return to be in the lowest quintile of its performance universe during 2011, and to be in the lowest or second-lowest quintile of such universe in each of the previous three-, five- and 10-year periods on an annualized basis. In discussing such performance, management explained that it reflected the Fund’s conservative policy of focusing on safety and liquidity by investing primarily in short-term securities, with its portfolio having no derivative holdings or investments in non-rated securities or securities subject to the alternative minimum tax, which generally offer higher yields. The Board found such performance acceptable in view of such factors, noting that the Fund’s expenses were subsidized by management to avoid net asset value falling below one dollar per share and that the median return within the Lipper performance universe for the one-year period was one basis point.
COMPARATIVE EXPENSES. Consideration was given to a comparative analysis of the management fees and total expense ratio of each Fund compared with those of a group of other funds selected by Lipper as constituting its appropriate Lipper expense group. Lipper expense data is based upon information taken from each fund’s most recent annual report, which reflects historical asset levels that may be quite different from those currently existing, particularly in a period of market volatility. While recognizing such inherent limitation and the fact that expense ratios generally increase as assets decline and decrease as assets grow, the Board believed the independent analysis conducted by Lipper to be an appropriate measure of comparative expenses. In reviewing comparative costs, Lipper provides information on each Fund’s contractual investment management fee in comparison with the contractual investment management fee rate that would have been charged by other funds within its Lipper expense group assuming they were similar in size to the Fund, as well as the actual total expense ratio of the Fund in comparison with those of such group. The Lipper contractual investment management fee analysis includes administrative fees as being part of management fees, and total expenses, for comparative consistency, were shown by Lipper
Annual Report | 85
Franklin California Tax-Free Trust
Shareholder Information (continued)
Board Review of Investment Management Agreement (continued)
for Fund Class A shares in the case of Franklin California Insured Tax-Free Income Fund and Franklin California Intermediate-Term Tax-Free Income Fund. The Lipper report for Franklin California Insured Tax-Free Income Fund showed that both its contractual investment fee rate and its actual total expense ratio were the lowest within the four funds constituting its Lipper expense group. The Lipper report for Franklin California Intermediate-Term Tax-Free Income Fund showed that its contractual investment fee rate was below the median of its Lipper expense group, while its actual total expense ratio was in the least expensive quintile of such group. The Board was satisfied with the management fee and total expenses of these two Funds in comparison to their Lipper expense groups. The Lipper expense comparison for Franklin California Tax-Exempt Money Fund showed its contractual investment management fee to be less than two basis points higher than its Lipper expense group median, while its actual total expense ratio was in the least expensive quin-tile of such expense group. The Board was satisfied with the comparative expenses of this Fund as shown in the Lipper report, noting that the Fund’s expenses were subsidized by management.
MANAGEMENT PROFITABILITY. The Board also considered the level of profits realized by the Manager and its affiliates in connection with the operation of each Fund. In this respect, the Board reviewed the Fund profitability analysis that addresses the overall profitability of Franklin Templeton’s U.S. fund business, as well as its profits in providing management and other services to each of the individual funds during the 12-month period ended September 30, 2011, being the most recent fiscal year-end for Franklin Resources, Inc., the Manager’s parent. In reviewing the analysis, attention was given to the methodology followed in allocating costs to each Fund, it being recognized that allocation methodologies are inherently subjective and various allocation methodologies may each be reasonable while producing different results. In this respect, the Board noted that, while being continuously refined and reflecting changes in the Manager’s own cost accounting, the allocation methodology was consistent with that followed in profitability report presentations for the Funds made in prior years and that the Funds’ independent registered public accounting firm had been engaged by the Manager to review the reasonableness of the allocation methodologies solely for use by the Funds’ Board in reference to the profitability analysis. In reviewing and discussing such analysis, management discussed with the Board its belief that costs incurred in establishing the infrastructure necessary for the type of mutual fund operations conducted by the Manager and its affiliates may not be fully reflected in the expenses allocated to each Fund in determining its profitability, as well as the fact that the level of profits, to a certain extent, reflected operational cost savings and efficiencies initiated by management. The Board also took into account management’s expenditures in improving shareholder services provided the Funds, as well as the need to implement systems and meet additional regulatory and compliance requirements resulting from statutes such as the Sarbanes-Oxley and Dodd-Frank Acts and recent SEC and other regulatory requirements. In addition, the Board considered a third-party study comparing the profitability of the Manager’s parent on an overall basis to other publicly held managers broken down to show profitability from management operations exclusive of distribution expenses, as well as profitability including distribution expenses. The Board also considered the extent to which the Manager and its affiliates might derive ancillary benefits from fund operations, including revenues generated
86 | Annual Report
Franklin California Tax-Free Trust
Shareholder Information (continued)
Board Review of Investment Management Agreement (continued)
from transfer agent services. Based upon its consideration of all these factors, the Board determined that the level of profits realized by the Manager and its affiliates from providing services to each Fund was not excessive in view of the nature, quality and extent of services provided, also noting with respect to Franklin California Tax-Exempt Money Fund, that expenses were being subsidized by management.
ECONOMIES OF SCALE. The Board also considered whether economies of scale are realized by the Manager as the Funds grow larger and the extent to which this is reflected in the level of management fees charged. While recognizing any precise determination is inherently subjective, the Board noted that based upon the Fund profitability analysis, it appeared as some funds get larger, at some point economies of scale do result in the manager realizing a larger profit margin on management services provided such fund. The Board also noted that any economies of scale are shared with each of these Funds and their shareholders through management fee breakpoints existing in each of the Fund’s investment management agreements so that as a Fund grows in size, its effective management fee rate declines. The management fee structure, including administrative expenses for each Fund provides for a fee of 0.625% on the first $100 million of net assets; 0.50% on the next $150 million of net assets; 0.45% on net assets in excess of $250 million; with additional breakpoints thereafter beginning at the $7.5 billion net asset level. At December 31, 2011, the net assets of Franklin California Insured Tax-Free Income Fund stood at approximately $2.1 billion, and those of Franklin California Intermediate-Term Tax-Free Income Fund and Franklin California Tax-Exempt Money Fund were approximately $925 million and $529 million, respectively. In discussing these fee levels, management’s position was that the existing fee rate reaches a low level quickly, which anticipates economies of scale as assets grow, and in support of such position pointed out the generally favorable effective management fee rate and low total actual expense comparisons for these Funds within their Lipper expense groups as previously discussed under “Comparative Expenses.” The Board believed that to the extent economies of scale may be realized by the Manager and its affiliates, the schedule of fees under the investment management agreement for these three Funds provides a sharing of benefits with each Fund and its shareholders. The Board also noted the fact that management was subsidizing the expenses of Franklin California Tax-Exempt Money Fund.
Proxy Voting Policies and Procedures
The Trust’s investment manager has established Proxy Voting Policies and Procedures (Policies) that the Trust uses to determine how to vote proxies relating to portfolio securities. Shareholders may view the Trust’s complete Policies online at franklintempleton.com. Alternatively, shareholders may request copies of the Policies free of charge by calling the Proxy Group collect at (954) 527-7678 or by sending a written request to: Franklin Templeton Companies, LLC, 300 S.E. 2nd Street, Fort Lauderdale, FL 33301, Attention: Proxy Group. Copies of the Trust’s proxy voting records are also made available online at franklintempleton.com and posted on the U.S. Securities and Exchange Commission’s website at sec.gov and reflect the most recent 12-month period ended June 30.
Annual Report | 87
Franklin California Tax-Free Trust
Shareholder Information (continued)
Quarterly Statement of Investments
The Trust files a complete statement of investments with the U.S. Securities and Exchange Commission for the first and third quarters for each fiscal year on Form N-Q. Shareholders may view the filed Form N-Q by visiting the Commission’s website at sec.gov. The filed form may also be viewed and copied at the Commission’s Public Reference Room in Washington, DC. Information regarding the operations of the Public Reference Room may be obtained by calling (800) SEC-0330.
Householding of Reports and Prospectuses
You will receive each Fund’s financial reports every six months as well as an annual updated summary prospectus (prospectus available upon request). To reduce Fund expenses, we try to identify related shareholders in a household and send only one copy of the financial reports and summary prospectus. This process, called “householding,” will continue indefinitely unless you instruct us otherwise. If you prefer not to have these documents householded, please call us at (800) 632-2301. At any time you may view current prospectuses/summary prospectuses and financial reports on our website. If you choose, you may receive these documents through electronic delivery.
88 | Annual Report
This page intentionally left blank.
This page intentionally left blank.
Item 2. Code of Ethics.
(a) The Registrant has adopted a code of ethics that applies to its principal executive officers and principal financial and accounting officer.
(c) N/A
(d) N/A
(f) Pursuant to Item 12(a)(1), the Registrant is attaching as an exhibit a copy of its code of ethics that applies to its principal executive officers and principal financial and accounting officer.
Item 3. Audit Committee Financial Expert.
(a)(1) The Registrant has an audit committee financial expert serving on its audit committee.
(2) The audit committee financial expert is John B. Wilson and he is "independent" as defined under the relevant Securities and Exchange Commission Rules and Releases.
Item 4. Principal Accountant Fees and Services.
(a) Audit Fees
The aggregate fees paid to the principal accountant for professional services rendered by the principal accountant for the audit of the registrant’s annual financial statements or for services that are normally provided by the principal accountant in connection with statutory and regulatory filings or engagements were $94,566 for the fiscal year ended June 30, 2012 and $91,819 for the fiscal year ended June 30, 2011.
(b) Audit-Related Fees
There were no fees paid to the principal accountant for assurance and related services rendered by the principal accountant to the registrant that are reasonably related to the performance of the audit of the registrant's financial statements and are not reported under paragraph (a) of Item 4.
There were no fees paid to the principal accountant for assurance and related services rendered by the principal accountant to the registrant's investment adviser and any entity controlling, controlled by or under common control with the investment adviser that provides ongoing services to the registrant that are reasonably related to the performance of the audit of their financial statements.
(c) Tax Fees
There were no fees paid to the principal accountant for professional services rendered by the principal accountant to the registrant for tax compliance, tax advice and tax planning.
The aggregate fees paid to the principal accountant for professional services rendered by the principal accountant to the registrant’s investment adviser and any entity controlling, controlled by or under common control with the investment adviser that provides ongoing services to the registrant for tax compliance, tax advice and tax planning were $50,000 for the fiscal year ended June 30, 2012 and $85,000 for the fiscal year ended June 30, 2011. The services for which these fees were paid included technical tax consultation for capital gain tax reporting to foreign governments, application of local country tax laws to investments and licensing securities with local country offices.
(d) All Other Fees
The aggregate fees paid to the principal accountant for products and services rendered by the principal accountant to the registrant not reported in paragraphs (a)-(c) of Item 4 were $1,344 for the fiscal year ended June 30, 2012 and $1,393 for the fiscal year ended June 30, 2011. The services for which these fees were paid included review of materials provided to the fund Board in connection with the investment management contract renewal process.
The aggregate fees paid to the principal accountant for products and services rendered by the principal accountant to the registrant’s investment adviser and any entity controlling, controlled by or under common control with the investment adviser that provides ongoing services to the registrant other than services reported in paragraphs (a)-(c) of Item 4 were $151,106 for the fiscal year ended June 30, 2012 and $143,407 for the fiscal year ended June 30, 2011. The services for which these fees were paid included review of materials provided to the fund Board in connection with the investment management contract renewal process.
(e) (1) The registrant’s audit committee is directly responsible for approving the services to be provided by the auditors, including:
(i) pre-approval of all audit and audit related services;
(ii) pre-approval of all non-audit related services to be provided to the Fund by the auditors;
(iii) pre-approval of all non-audit related services to be provided to the registrant by the auditors to the registrant’s investment adviser or to any entity that controls, is controlled by or is under common control with the registrant’s investment adviser and that provides ongoing services to the registrant where the non-audit services relate directly to the operations or financial reporting of the registrant; and
(iv) establishment by the audit committee, if deemed necessary or appropriate, as an alternative to committee pre-approval of services to be provided by the auditors, as required by paragraphs (ii) and (iii) above, of policies and procedures to permit such services to be pre-approved by other means, such as through establishment of guidelines or by action of a designated member or members of the committee; provided the policies and procedures are
detailed as to the particular service and the committee is informed of each service and such policies and procedures do not include delegation of audit committee responsibilities, as contemplated under the Securities Exchange Act of 1934, to management; subject, in the case of (ii) through (iv), to any waivers, exceptions or exemptions that may be available under applicable law or rules.
(e) (2) None of the services provided to the registrant described in paragraphs (b)-(d) of Item 4 were approved by the audit committee pursuant to paragraph (c)(7)(i)(C) of Rule 2-01 of regulation S-X.
(f) No disclosures are required by this Item 4(f).
(g) The aggregate non-audit fees paid to the principal accountant for services rendered by the principal accountant to the registrant and the registrant’s investment adviser and any entity controlling, controlled by or under common control with the investment adviser that provides ongoing services to the registrant were $202,450 for the fiscal year ended June 30, 2012 and $229,800 for the fiscal year ended June 30, 2011.
(h) The registrant’s audit committee of the board has considered whether the provision of non-audit services that were rendered to the registrant’s investment adviser (not including any sub-adviser whose role is primarily portfolio management and is subcontracted with or overseen by another investment adviser), and any entity controlling, controlled by, or under common control with the investment adviser that provides ongoing services to the registrant that were not pre-approved pursuant to paragraph (c)(7)(ii) of Rule 2-01 of Regulation S-X is compatible with maintaining the principal accountant’s independence.
| | | | |
| Item | 5 | . | Audit Committee of Listed Registrants. | N/A |
| |
| Item | 6 | . | Schedule of Investments. | N/A |
| |
| Item | 7 | . | Disclosure of Proxy Voting Policies and Procedures for Closed- |
| | | | End Management Investment Companies. | N/A |
| Item | 8 | . | Portfolio Managers of Closed-End Management Investment |
| | | | Companies. | N/A |
| |
| Item | 9 | . | Purchases of Equity Securities by Closed-End Management |
| | | | Investment Company and Affiliated Purchasers. | N/A |
Item 10. Submission of Matters to a Vote of Security Holders.
There have been no changes to the procedures by which shareholders may recommend nominees to the Registrant's Board of Trustees that would require disclosure herein.
Item 11. Controls and Procedures.
(a) Evaluation of Disclosure Controls and Procedures. The Registrant maintains disclosure controls and procedures that are designed to ensure that information required to be disclosed in the Registrant s filings under the Securities Exchange Act of 1934 and the Investment Company Act of 1940 is recorded, processed, summarized and reported within the periods specified in the rules and forms of the Securities and Exchange Commission. Such information is accumulated and communicated to the Registrant s management, including its principal executive officer and principal financial officer, as appropriate, to allow timely decisions regarding required disclosure. The Registrant s management, including the principal executive officer and the principal financial officer, recognizes that any set of controls and procedures, no matter how well designed and operated, can provide only reasonable assurance of achieving the desired control objectives.
Within 90 days prior to the filing date of this Shareholder Report on Form N-CSR, the Registrant had carried out an evaluation, under the supervision and with the participation of the Registrant s management, including the Registrant s principal executive officer and the Registrant s principal financial officer, of the effectiveness of the design and operation of the Registrant s disclosure controls and procedures. Based on such evaluation, the Registrant s principal executive officer and principal financial officer concluded that the Registrant s disclosure controls and procedures are effective.
(b) Changes in Internal Controls. There have been no significant changes in the Registrant s internal controls or in other factors that could significantly affect the internal controls subsequent to the date of their evaluation in connection with the preparation of this Shareholder Report on Form N-CSR.
Item 12. Exhibits.
(a)(1) Code of Ethics
(a)(2) Certifications pursuant to Section 302 of the Sarbanes-Oxley Act of 2002 of Laura F. Fergerson, Chief Executive Officer - Finance and Administration, and Gaston Gardey, Chief Financial Officer and Chief Accounting Officer
(b) Certifications pursuant to Section 906 of the Sarbanes-Oxley Act of 2002 of Laura F. Fergerson, Chief Executive Officer - Finance and Administration, and Gaston Gardey, Chief Financial Officer and Chief Accounting Officer
SIGNATURES
Pursuant to the requirements of the Securities Exchange Act of 1934 and the Investment Company Act of 1940, the registrant has duly caused this report to be signed on its behalf by the undersigned, thereunto duly authorized.
FRANKLIN CALIFORNIA TAX-FREE TRUST
