UNITED STATES
SECURITIES AND EXCHANGE COMMISSION
Washington, D.C. 20549
FORM N-CSR
CERTIFIED SHAREHOLDER REPORT OF REGISTERED
MANAGEMENT INVESTMENT COMPANIES
| Investment Company Act file number | 811-04363 |
| | |
| | |
| | |
| AMERICAN CENTURY GOVERNMENT INCOME TRUST |
| (Exact name of registrant as specified in charter) |
| | |
| | |
| | |
| 4500 MAIN STREET, KANSAS CITY, MISSOURI | 64111 |
| (Address of principal executive offices) | (Zip Code) |
| | |
| | |
| | |
CHARLES A. ETHERINGTON 4500 MAIN STREET, KANSAS CITY, MISSOURI 64111 |
| (Name and address of agent for service) |
| | |
| | |
| Registrant’s telephone number, including area code: | 816-531-5575 |
| | |
| | |
| Date of fiscal year end: | 03-31 |
| | |
| | |
| Date of reporting period: | 03-31-09 |
ITEM 1. REPORTS TO STOCKHOLDERS.
|
| Annual Report |
| March 31, 2009 |
|
| American Century Investments |
Ginnie Mae Fund
Government Bond Fund
Inflation-Adjusted Bond Fund
Short-Term Government Fund
Dear Investor:
Thank you for investing with us during the financial reporting period ended March 31, 2009. We appreciate your trust in American Century Investments® during these challenging times.
As the calendar changed from 2008 to 2009, the financial markets continued to struggle to digest the subprime-initiated credit crisis. The ensuing global economic downturn and market turmoil affected everyone—from first-time individual investors to hundred-year-old financial institutions. During the period, risk aversion was a key theme, with performance generally favoring assets with lower risk levels and those that showed signs of stability. Effective risk management by portfolio managers delivered above-average returns, albeit still negative in many cases under these challenging market conditions.
Effective risk management requires a commitment to disciplined investment approaches that balance risk and reward, with the goal of setting and maintaining risk levels that are appropriate for portfolio objectives. At American Century Investments, we’ve stayed true to the principles that have guided us for over 50 years, including our commitments to delivering superior investment performance and helping investors reach their financial goals. Risk management is part of that commitment—we offer portfolios that can help diversify and stabilize investment returns.
As discussed by the investment team leaders in this report, 2009 is likely to be another challenging year, but I’m certain that we have the investment professionals and processes in place to provide competitive and compelling long-term results for you. Thank you for your continued confidence in us.
Sincerely,

Jonathan S. Thomas
President and Chief Executive Officer
American Century Investments
| |
| Market Perspective | 2 |
| U.S. Fixed-Income Total Returns | 2 |
| |
| Ginnie Mae | |
| Performance | 3 |
| Portfolio Commentary | 5 |
| Portfolio at a Glance, Yields and | |
| Types of Investments in Portfolio | 7 |
| |
| Government Bond | |
| Performance | 8 |
| Portfolio Commentary | 10 |
| Portfolio at a Glance, Yields and | |
| Types of Investments in Portfolio | 12 |
| |
| Inflation-Adjusted Bond | |
| Performance | 13 |
| Portfolio Commentary | 15 |
| Portfolio at a Glance, Yields and | |
| Portfolio Composition by Weighted Average Life | 17 |
| |
| Short-Term Government | |
| Performance | 18 |
| Portfolio Commentary | 20 |
| Portfolio at a Glance, Yields and | |
| Types of Investments in Portfolio | 22 |
| |
| Shareholder Fee Examples | 23 |
| |
| Financial Statements | |
| Schedule of Investments | 26 |
| Statement of Assets and Liabilities | 43 |
| Statement of Operations | 45 |
| Statement of Changes in Net Assets | 46 |
| Notes to Financial Statements | 48 |
| Financial Highlights | 59 |
| Report of Independent Registered Public Accounting Firm | 70 |
| |
| Other Information | |
| Management | 71 |
| Additional Information | 74 |
| Index Definitions | 75 |
The opinions expressed in the Market Perspective and each of the Portfolio Commentaries reflect those of the portfolio management team as of the date of the report, and do not necessarily represent the opinions of American Century Investments or any other person in the American Century Investments organization. Any such opinions are subject to change at any time based upon market or other conditions and American Century Investments disclaims any responsibility to update such opinions. These opinions may not be relied upon as investment advice and, because investment decisions made by American Century Investments funds are based on numerous factors, may not be relied upon as an indication of trading intent on behalf of any American Century Investments fund. Security examples are used for representational purposes only and are not intended as recommendations to purchase or sell securities. Performance information for comparative indices and securities is provided to American Century Investments by third party vendors. To the best of American Century Investments’ knowledge, such information is accurate at the time of printing.

By David MacEwen, Chief Investment Officer, Fixed Income
Unprecedented Events
The spiraling subprime credit crisis took an incredible toll on U.S. financial institutions, the economy, and financial markets in the 12 months ended March 31, 2009. By period-end, the resulting recession had spread globally, unemployment in the U.S. reached 8.5%, and many measures of consumer strength were at record lows. On the inflation front, the government’s Consumer Price Index fell by 0.4% for the year ended in March. That was the first 12-month decline since August 1955.
In that environment, the Federal Reserve (the Fed) took dramatic steps, effectively cutting its short-term rate target to 0%, intervening in the mortgage, commercial, and consumer debt markets, while Congress passed a massive economic stimulus package and the $700 billion Troubled Asset Relief Program (TARP).
High-Quality Outperformed Low-Quality
In the fixed-income markets, risk aversion, deleveraging, and worries about the economy and deflation sent Treasury bonds to big gains, while credit-sensitive securities endured historic underperformance (see accompanying table). High-quality, higher-yielding government-backed securities such as government agency and mortgage-backed securities (MBS) also did well. Inflation-linked securities had negative returns overall, though they performed much better late in the period because of worry that the government’s fiscal and monetary policies will prove inflationary down the road. The Fed’s rate cuts also had important implications for money market securities, whose yields and returns are closely tied to the level of short-term interest rates.
Rates Tumbled Amid Volatility
Dramatic Fed rate cuts, safe-haven buying, and competing inflation/deflation concerns meant bond yields were volatile, but finished the 12 months significantly lower. The yield on the two-year Treasury note, which is most sensitive to Fed rate policy, went from 1.59% to 0.80%. Yields on longer-term notes and bonds fell a similar amount, with the benchmark 10-year Treasury yield down from 3.41% to 2.67%, while 30-year bond yields went from 4.29% to 3.54%. In that environment, the shape of the yield curve (a graphic representation of Treasury yields at different maturities) shifted considerably, but ultimately ended the period little changed.
| | | | |
| U.S. Fixed-Income Total Returns | | | | |
| For the 12 months ended March 31, 2009 | | | | |
| Treasury Securities | | | Citigroup U.S. Bond Market Indices | |
| 3-Month Bill | 1.13% | | Mortgage (mortgage-backed) | 8.26% |
| 2-Year Note | 4.67% | | Treasury | 7.50% |
| 10-Year Note | 10.52% | | Agency | 6.16% |
| 30-Year Bond | 18.08% | | Broad Investment-Grade (multi-sector) | 4.52% |
| | | | Inflation-Linked Securities | –2.05% |
| | | | Credit (investment-grade corporate) | –4.61% |
| | | | High-Yield Market (corporate) | –19.88% |
2
| | | | | |
| Ginnie Mae | | | | | |
| |
| Total Returns as of March 31, 2009 | | | | |
| | | Average Annual Returns | |
| | | | | Since | Inception |
| | 1 year | 5 years | 10 years | Inception | Date |
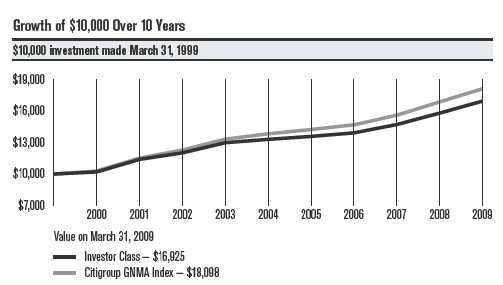
| Investor Class | 7.22%(1) | 4.95% | 5.40% | 7.22% | 9/23/85 |
| Citigroup GNMA Index | 7.41% | 5.54% | 6.11% | 8.04%(2) | — |
| Institutional Class | 7.44%(1) | — | — | 8.64%(1) | 9/28/07 |
| Advisor Class | 6.96%(1) | 4.69% | 5.14% | 5.24% | 10/9/97 |
| R Class | 6.69%(1) | — | — | 7.88%(1) | 9/28/07 |
| (1) | Class returns would have been lower if American Century Investments had not voluntarily waived a portion of its management fee. |
| (2) | Since 9/30/85, the date nearest the Investor Class’s inception for which data are available. |
Data presented reflect past performance. Past performance is no guarantee of future results. Current performance may be higher or lower than the performance shown. Investment return and principal value will fluctuate, and redemption value may be more or less than original cost. To obtain performance data current to the most recent month end, please call 1-800-345-2021 or visit americancentury.com. As interest rates rise, bond values will decline.
Unless otherwise indicated, performance reflects Investor Class shares; performance for other share classes will vary due to differences in fee structure. For information about other share classes available, please consult the prospectus. Data assumes reinvestment of dividends and capital gains, and none of the charts reflect the deduction of taxes that a shareholder would pay on fund distributions or the redemption of fund shares. Returns for the index are provided for comparison. The fund’s total returns include operating expenses (such as transaction costs and management fees) that reduce returns, while the total returns of the index do not.
3
Ginnie Mae
| | | | | | | | | | |
| | | | | | | | | | |
| One-Year Returns Over 10 Years | | | | | | | |
| Periods ended March 31 | | | | | | | | | |
| | 2000 | 2001 | 2002 | 2003 | 2004 | 2005 | 2006 | 2007 | 2008 | 2009 |
| Investor Class | 2.01% | 11.70% | 5.43% | 8.03% | 2.43% | 2.11% | 2.47% | 5.69% | 7.39%* | 7.22%* |
| Citigroup | | | | | | | | | | |
| GNMA Index | 2.95% | 11.93% | 6.57% | 8.42% | 3.79% | 2.96% | 3.11% | 6.24% | 8.09% | 7.41% |
| *Returns would have been lower, along with the ending value, if a portion of the class’s management fee had not been waived during the period. |
| | | |
| | | |
| Total Annual Fund Operating Expenses | | |
| Investor Class | Institutional Class | Advisor Class | R Class |
| 0.57% | 0.37% | 0.82% | 1.07% |
The total annual fund operating expenses shown is as stated in the fund’s prospectus current as of the date of this report. The prospectus may vary from the expense ratio shown elsewhere in this report because it is based on a different time period, includes acquired fund fees and expenses, and, if applicable, does not include fee waivers or expense reimbursements.
Data presented reflect past performance. Past performance is no guarantee of future results. Current performance may be higher or lower than the performance shown. Investment return and principal value will fluctuate, and redemption value may be more or less than original cost. To obtain performance data current to the most recent month end, please call 1-800-345-2021 or visit americancentury.com. As interest rates rise, bond values will decline.
Unless otherwise indicated, performance reflects Investor Class shares; performance for other share classes will vary due to differences in fee structure. For information about other share classes available, please consult the prospectus. Data assumes reinvestment of dividends and capital gains, and none of the charts reflect the deduction of taxes that a shareholder would pay on fund distributions or the redemption of fund shares. Returns for the index are provided for comparison. The fund’s total returns include operating expenses (such as transaction costs and management fees) that reduce returns, while the total returns of the index do not.
4
Ginnie Mae
Portfolio Managers: Bob Gahagan, Hando Aguilar, and Dan Shiffman
Performance Summary
Ginnie Mae returned 7.22%* for the 12 months ended March 31, 2009. By comparison, the Citigroup GNMA Index returned 7.41%. See page 3 for additional performance comparisons. Portfolio returns reflect operating expenses, while Citigroup index returns do not.
Ginnie Mae enjoyed positive returns despite the extreme volatility in the market for mortgage-backed securities (MBS), helped by the high credit quality of the bonds in which the portfolio invests. The portfolio trailed its benchmark modestly for the period, as our sector allocation decisions had a mixed effect.
Government-Backed Mortgages Did Best
Returns for MBS in the last 12 months were colored by the dramatic events surrounding the subprime credit crisis. To prop up the housing market, the government took over mortgage market giants Fannie Mae and Freddie Mac and bought their securities on the open market. These moves helped agency MBS perform best of the segments of the broad taxable bond market for the period.
However, the government’s moves to lower home borrowing costs meant a spike in mortgage prepayment expectations. Mortgage refinancing is undesirable for MBS investors, who get their money returned to them before the bond’s stated maturity date to reinvest at a new, lower interest rate. As a result, higher-coupon bonds, which are most subject to prepayments, performed worst among MBS during the quarter.
Performance Drivers
Given the sharp interest rate volatility and market conditions in the last 12 months, we held a stake in GNMA collateralized mortgage obligations (CMOs). We preferred their more predictable cash flows than passthrough MBS at a time when mortgage prepayments surged. However, these bonds underperformed in the extreme market conditions of late 2008 because they’re less liquid than traditional passthrough MBS.
At the other end of the spectrum, it helped to hold an overweight position in the GNMA II sector versus GNMA Is. GNMA II securities are multi-issuer pools of mortgages, making them more diversified geographically and by issuer than GNMA I (single-issuer) securities. We viewed this greater diversification as another way to protect against prepayments. This positioning contributed to performance, as GNMA IIs outperformed GNMA Is for the fiscal year. In terms of the portfolio’s coupon structure, it helped to favor current coupon GNMAs over higher-coupon bonds, which underperformed.
*All fund returns referenced in this commentary are for Investor Class shares. Class returns would have been lower had a portion of its management fees not been waived
5
Ginnie Mae
We also helped performance by eliminating our long-running yield curve steepening trade near where the curve hit its steepest slope in November. Since late 2008, we kept the portfolio’s duration (price sensitivity to interest rate changes) and curve exposure neutral relative to its index. In part, that’s because we base our duration and curve allocation decisions on macroeconomic factors, which are not currently the best guideposts—the Fed has essentially been manipulating rates and the curve to meet its own economic and political objectives.
Outlook
“Despite extraordinary intervention and stimulus provided by the government and central bank, we expect the credit crisis will continue and overall economic conditions will remain weak for some time,“ said Portfolio Manager Bob Gahagan. “That’s because we think this consumer-led recession will require housing and employment market stability before any meaningful, sustained recovery can take place.”
“Though the macroeconomic backdrop remains challenging, we see some positive signs emerging in the market for MBS. The array of policies pursued by the Federal Reserve appears to be helping securitized markets begin to return to some semblance of normal functioning,” said Portfolio Manager Hando Aguilar. “It’s not clear if this improvement is sustainable, but regardless of market conditions, we will continue to focus on sector management and security selection as the largest performance drivers of our investment process.”
6
| | |
| Ginnie Mae | | |
| |
| Portfolio at a Glance | | |
| | As of 3/31/09 | As of 3/31/08 |
| Average Duration (effective) | 2.3 years | 3.2 years |
| Weighted Average Life | 4.3 years | 5.4 years |
| |
| Yields as of March 31, 2009 | | |
| 30-Day SEC Yield(1) | | |
| Investor Class | | 3.83% |
| Institutional Class | | 4.03% |
| Advisor Class | | 3.59% |
| R Class | | 3.33% |
| (1) The yields presented reflect the waiver of a portion of the fund’s management fee. Without such waiver, the 30-day yields would have been lower. |
| | |
| Types of Investments in Portfolio | | |
| | % of | % of |
| | fund investments | fund investments |
| | as of 3/31/09 | as of 9/30/08 |
| Fixed-Rate U.S. Government Agency | | |
| Mortgage-Backed Securities (all GNMAs) | 84.1% | 74.5% |
| U.S. Government Agency Collateralized | | |
| Mortgage Obligations (all GNMAs) | 10.3% | 16.3% |
| U.S. Government Agency Securities | — | 2.3% |
| Adjustable-Rate U.S. Government Agency | | |
| Mortgage-Backed Securities (all GNMAs) | 1.5% | 1.7% |
| Temporary Cash Investments | 4.1% | 5.2% |
7
| | | | | |
| Government Bond | | | | | |
| |
| Total Returns as of March 31, 2009 | | | | |
| | | Average Annual Returns | |
| | | | | Since | Inception |
| | 1 year | 5 years | 10 years | Inception | Date |
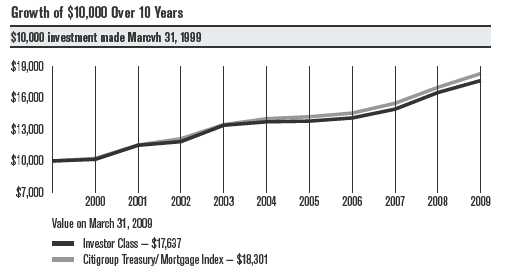
| Investor Class | 6.90% | 5.16% | 5.83% | 7.67% | 5/16/80 |
| Citigroup Treasury/Mortgage Index | 7.68% | 5.48% | 6.23% | —(1) | — |
| Advisor Class | 6.64% | 4.90% | 5.57% | 5.71% | 10/9/97 |
Performance information prior to September 3, 2002, is that of the American Century Treasury Fund, all of the net assets of which were acquired by Government Bond pursuant to a plan of reorganization approved by Treasury shareholders on August 2, 2002.
(1) Index data not available prior to 1982.
Data presented reflect past performance. Past performance is no guarantee of future results. Current performance may be higher or lower than the performance shown. Investment return and principal value will fluctuate, and redemption value may be more or less than original cost. To obtain performance data current to the most recent month end, please call 1-800-345-2021 or visit americancentury.com. As interest rates rise, bond values will decline.
Unless otherwise indicated, performance reflects Investor Class shares; performance for other share classes will vary due to differences in fee structure. For information about other share classes available, please consult the prospectus. Data assumes reinvestment of dividends and capital gains, and none of the charts reflect the deduction of taxes that a shareholder would pay on fund distributions or the redemption of fund shares. Returns for the index are provided for comparison. The fund’s total returns include operating expenses (such as transaction costs and management fees) that reduce returns, while the total returns of the index do not.
8
Government Bond
| | | | | | | | | | |
| | | | | | | | | | |
| One-Year Returns Over 10 Years | | | | | | | |
| Periods ended March 31 | | | | | | | | | |
| | 2000 | 2001 | 2002 | 2003 | 2004 | 2005 | 2006 | 2007 | 2008 | 2009 |
| Investor Class | 1.51% | 13.17% | 3.01% | 13.17% | 2.42% | 0.50% | 2.17% | 5.95% | 10.58% | 6.90% |
| Citigroup Treasury/ | | | | | | | | | | |
| Mortgage Index | 2.31% | 12.53% | 5.17% | 11.06% | 4.21% | 1.33% | 2.44% | 6.44% | 9.78% | 7.68% |
| |
| |
| Total Annual Fund Operating Expenses | |
| Investor Class | Advisor Class |
| 0.49% | 0.74% |
The total annual fund operating expenses shown is as stated in the fund’s prospectus current as of the date of this report. The prospectus may vary from the expense ratio shown elsewhere in this report because it is based on a different time period, includes acquired fund fees and expenses, and, if applicable, does not include fee waivers or expense reimbursements.
Data presented reflect past performance. Past performance is no guarantee of future results. Current performance may be higher or lower than the performance shown. Investment return and principal value will fluctuate, and redemption value may be more or less than original cost. To obtain performance data current to the most recent month end, please call 1-800-345-2021 or visit americancentury.com. As interest rates rise, bond values will decline.
Unless otherwise indicated, performance reflects Investor Class shares; performance for other share classes will vary due to differences in fee structure. For information about other share classes available, please consult the prospectus. Data assumes reinvestment of dividends and capital gains, and none of the charts reflect the deduction of taxes that a shareholder would pay on fund distributions or the redemption of fund shares. Returns for the index are provided for comparison. The fund’s total returns include operating expenses (such as transaction costs and management fees) that reduce returns, while the total returns of the index do not.
9
Government Bond
Portfolio Managers: Bob Gahagan, Hando Aguilar, Brian Howell, Dan Shiffman, and Jim Platz
Performance Summary
Government Bond returned 6.90%* for the 12 months ended March 31, 2009. By comparison, the Citigroup Treasury/Mortgage Index returned 7.68%. See page 8 for additional performance comparisons. Portfolio returns reflect operating expenses, while Citigroup index returns do not.
The portfolio’s solid absolute returns reflected the performance of government-backed bonds in a difficult period for the economy and financial markets (see page 2). Relative to its benchmark, Government Bond lagged as a result of some of our sector allocation decisions.
Sector Selection Detracted
In managing the portfolio, we attempt to capitalize on inefficiencies and mean-reversion tendencies in the market by taking active positions in the areas of duration (price sensitivity to interest rate changes), yield curve, sector allocation, and security selection.
In regard to sector and security selection, we viewed Treasuries as the least attractive segment of the market given record low yields at a time of massive government borrowing, as well as policies that are likely to prove inflationary down the road. Instead, we added government-backed securities (“government agency equivalents” issued by financial institutions and guaranteed by the Federal Deposit Insurance Corporation, or FDIC) that offer yields above Treasury securities. These are good examples of the sorts of trades we look for in an attempt to add value over time—adding yield with little or no additional risk. While these positions should contribute to relative return over the long run, they can underperform over short periods, as they did during the fiscal year.
What’s more, within our Treasury allocation we held inflation-protected securities (TIPS), which trailed plain-vanilla Treasury bonds. The difference in yield between nominal and inflation-adjusted 10-year Treasuries narrowed so sharply in late 2008 as to suggest inflation would run at less than 1% a year over the life of the bonds. We think that is much too low given the unprecedented, and ultimately inflationary, policies the government is pursuing to support the economy and financial system. Here again, we believe this is likely to be an effective long-term trade—buying future inflation protection at very cheap levels—though it detracted from results during the period.
*All fund returns referenced in this commentary are for Investor Class shares.
10
Government Bond
On a positive note, it helped that the portfolio held an overweight position in high-quality agency mortgage-backed securities (MBS). Government agency MBS were the best-performing segment of the market in the last 12 months because of explicit government steps aimed at supporting the issuers of these bonds and driving down mortgage rates. However, those policies meant an increase in home loan refinancing expectations, which are undesirable for MBS investors. To combat the effects of mortgage prepayments, we held a stake in types of collateralized mortgage obligations (CMOs) that offer more dependable cash flows. Unfortunately, these bonds underperformed in the extreme market conditions of late 2008 because they’re less liquid than traditional passthrough MBS.
Curve Positioning Contributed
In terms of the portfolio’s duration and yield curve positions, we have been neutral relative to the index since late 2008. In part, that’s because we base our duration and curve allocation decisions on macroeconomic factors, which are not currently the best guideposts—the Fed has essentially been manipulating rates and the curve to meet its own economic and political objectives. It helped performance that we eliminated our long-running yield curve steepening trade near where the curve hit its steepest slope in November.
Outlook
“Despite extraordinary intervention and stimulus provided by the government and central bank, we expect the credit crisis will continue and overall economic conditions will remain weak for some time,“ said Portfolio Manager Bob Gahagan. “In that environment, we believe we’re finding opportunities to add long-term value by starting to build positions in TIPS and higher-yielding paper that carries government backing. In the MBS slice, we’re likely to continue to focus on seasoned securities or those structured with protection from prepayments in an attempt to support the portfolio’s yield and total return characteristics in an environment of rising mortgage refinancings.”
11
| | |
| Government Bond | | |
| |
| Portfolio at a Glance | | |
| | As of 3/31/09 | As of 3/31/08 |
| Average Duration (effective) | 3.2 years | 4.1 years |
| Weighted Average Life | 3.9 years | 6.3 years |
| |
| Yields as of March 31, 2009 | | |
| 30-Day SEC Yield | | |
| Investor Class | | 3.02% |
| Advisor Class | | 2.78% |
| |
| Types of Investments in Portfolio | | |
| | % of | % of |
| | fund investments | fund investments |
| | as of 3/31/09 | as of 9/30/08 |
| U.S. Government Agency Mortgage-Backed Securities | 51.3% | 50.0% |
| U.S. Treasury Securities | 25.8% | 27.2% |
| Collateralized Mortgage Obligations | 9.3% | 15.1% |
| U.S. Government Agency Securities and Equivalents | 9.0% | 3.0% |
| Asset-Backed Securities | 0.6% | 0.9% |
| Temporary Cash Investments | 4.0% | 3.8% |
12
| | | | | |
| Inflation-Adjusted Bond | | | | |
| |
| Total Returns as of March 31, 2009 | | | | |
| | | Average Annual Returns | |
| | | | | Since | Inception |
| | 1 year | 5 years | 10 years | Inception | Date |
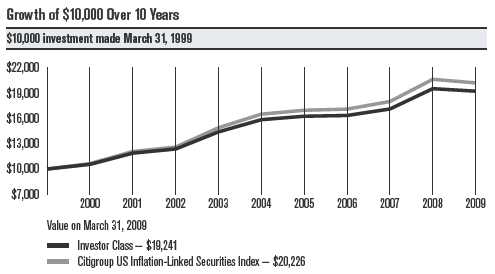
| Investor Class | -1.51% | 3.94% | 6.76% | 5.95% | 2/10/97 |
| Citigroup US Inflation-Linked | | | | | |
| Securities Index | -2.05% | 4.14% | 7.30% | 6.57%(1) | — |
| Institutional Class | -1.32% | 4.15% | — | 5.30% | 10/1/02 |
| Advisor Class | -1.73% | 3.70% | 6.50% | 6.20% | 6/15/98 |
| (1) Since 2/28/97, the date nearest the Investor Class’s inception for which data are available. | | |
Data presented reflect past performance. Past performance is no guarantee of future results. Current performance may be higher or lower than the performance shown. Investment return and principal value will fluctuate, and redemption value may be more or less than original cost. To obtain performance data current to the most recent month end, please call 1-800-345-2021 or visit americancentury.com. As interest rates rise, bond values will decline.
Unless otherwise indicated, performance reflects Investor Class shares; performance for other share classes will vary due to differences in fee structure. For information about other share classes available, please consult the prospectus. Data assumes reinvestment of dividends and capital gains, and none of the charts reflect the deduction of taxes that a shareholder would pay on fund distributions or the redemption of fund shares. Returns for the index are provided for comparison. The fund’s total returns include operating expenses (such as transaction costs and management fees) that reduce returns, while the total returns of the index do not.
13
Inflation-Adjusted Bond
| | | | | | | | | | |
| | | | | | | | | | |
| One-Year Returns Over 10 Years | | | | | | | |
| Periods ended March 31 | | | | | | | | | |
| | 2000 | 2001 | 2002 | 2003 | 2004 | 2005 | 2006 | 2007 | 2008 | 2009 |
| Investor Class | 5.52% | 12.62% | 4.16% | 16.42% | 10.04% | 2.57% | 0.56% | 4.71% | 14.08% | -1.51% |
| Citigroup US | | | | | | | | | | |
| Inflation-Linked | | | | | | | | | | |
| Securities Index | 6.39% | 13.54% | 4.37% | 18.20% | 10.83% | 2.78% | 0.81% | 5.27% | 14.64% | -2.05% |
| | |
| | |
| Total Annual Fund Operating Expenses | |
| Investor Class | Institutional Class | Advisor Class |
| 0.49% | 0.29% | 0.74% |
The total annual fund operating expenses shown is as stated in the fund’s prospectus current as of the date of this report. The prospectus may vary from the expense ratio shown elsewhere in this report because it is based on a different time period, includes acquired fund fees and expenses, and, if applicable, does not include fee waivers or expense reimbursements.
Data presented reflect past performance. Past performance is no guarantee of future results. Current performance may be higher or lower than the performance shown. Investment return and principal value will fluctuate, and redemption value may be more or less than original cost. To obtain performance data current to the most recent month end, please call 1-800-345-2021 or visit americancentury.com. As interest rates rise, bond values will decline.
Unless otherwise indicated, performance reflects Investor Class shares; performance for other share classes will vary due to differences in fee structure. For information about other share classes available, please consult the prospectus. Data assumes reinvestment of dividends and capital gains, and none of the charts reflect the deduction of taxes that a shareholder would pay on fund distributions or the redemption of fund shares. Returns for the index are provided for comparison. The fund’s total returns include operating expenses (such as transaction costs and management fees) that reduce returns, while the total returns of the index do not.
14
Inflation-Adjusted Bond
Portfolio Managers: Brian Howell, Jim Platz, and Bob Gahagan
Performance Summary
Inflation-Adjusted Bond declined 1.51%* for the 12 months ended March 31, 2009. By comparison, the fund’s benchmark, the Citigroup US Inflation-Linked Securities Index, declined 2.05%. Portfolio returns reflect operating expenses, while the index returns do not.
TIPS Underperformed, Even as Quality Reigned
As the mounting credit crisis morphed into a full-blown financial crisis, and the U.S. economy faced its most severe recession in decades, investors fled to the safety and stability of Treasury securities. Yet, even though the Treasury sector was the top performer for the 12-month period, TIPS (Treasury inflation-protected securities) lagged nominal Treasuries. This underperformance was due to the weakening economy, which led to declining inflation expectations that rendered the inflation-protection element of TIPS unattractive to investors on a near-term basis.
Our strategy incorporates sector allocation (TIPS and investment-grade non-Treasury sectors), security selection, and yield-curve positioning, while maintaining full inflation-protection exposure. These factors generally accounted for the portfolio’s outperformance relative to the benchmark. Most non-Treasury (spread) sectors outperformed TIPS for the period, but our position in investment-grade corporate securities detracted from results. High-quality corporate bonds struggled during most of the period, as spreads (the difference between corporate and Treasury yields) widened on default concerns and risk aversion.
Inflation Rose Sharply Then Tumbled Quickly
Early in the 12-month period, the lingering threat of stagflation (stalled economic growth and rising inflation) worried investors and kept TIPS in favor. This scenario changed dramatically in the summer of 2008, as the financial crisis and correspondingly weaker global economy sent commodity prices—and inflation expectations—tumbling.
For example, oil prices soared to a record-high $147 a barrel in July, primarily due to heightened demand from emerging markets. This helped push headline inflation, as measured by the 12-month change in the Consumer Price Index (CPI), to a reporting-period high of 5.6% in July. But, oil prices dropped sharply during the next several months, finishing the period at $50 a barrel. Furthermore, 12-month headline inflation turned negative by the end of March 2009, reflecting the impact of generally sagging commodity prices combined with dismal global economic growth prospects and a stronger U.S. dollar.
*All fund returns referenced in this commentary are for Investor Class shares.
15
Inflation-Adjusted Bond
Portfolio Strategy
We continued to invest most of the portfolio in TIPS (approximately 87% as of March 31, 2009). We invested the remainder of the portfolio in high-quality corporate, municipal, agency, and mortgage securities—spread sectors we believe offer attractive long-term value. In addition, we complemented our spread-sector investments with strategies that maintain full inflation-protection exposure. These strategies contributed positively to the fund’s 12-month performance. Furthermore, over time, we believe these efforts may enhance the portfolio’s yield and outperform Treasury securities.
Additionally, our bias toward a steeper yield curve during most of 2008 contributed positively to the portfolio’s performance. Investors swarmed to shorter-term, lower-risk Treasuries as the financial crisis worsened, causing the Treasury yield curve to steepen. We removed this strategy late in 2008, when the steepening trend started to subside.
Outlook
After peaking at 2.6 percentage points in July 2008, the yield difference (breakeven) between 10-year TIPS and nominal 10-year Treasuries fell to 0.09 percentage point at the end of December before rising to 1.31 percentage points as of March 31. The breakeven rate represents investors’ expectations for inflation for the next decade—expectations we believe are unreasonably low.
We believe inflationary pressures are likely to build in the months ahead, given historical CPI patterns and the extraordinary amount of economic stimulus from the government and the Federal Reserve. Therefore, our longer-term inflation outlook, along with the relatively low breakeven rate, suggests TIPS currently offer attractive long-term value.
Due to the unexpected death of portfolio manager Seth Plunkett on November 9, 2008, co-portfolio managers Brian Howell, Jim Platz, and Bob Gahagan assumed his responsibilities. Our team structure means the management process and objectives for this portfolio remain the same, despite the loss of a cherished colleague.
16
| | |
| Inflation-Adjusted Bond | | |
| |
| Portfolio at a Glance | | |
| | As of 3/31/09 | As of 3/31/08 |
| Weighted Average Maturity | 9.2 years | 6.7 years |
| Average Duration (effective) | 5.8 years | 6.1 years |
| |
| Yields as of March 31, 2009 | | |
| 30-Day SEC Yield | | |
| Investor Class | | 6.03% |
| Institutional Class | | 6.23% |
| Advisor Class | | 5.78% |
| |
| Portfolio Composition by Weighted Average Life | | |
| | % of | % of |
| | fund investments | fund investments |
| | as of 3/31/09 | as of 9/30/08 |
| 0 – 5-Year Notes(1) | 37.1% | 31.8% |
| 5 – 10-Year Notes | 29.0% | 40.7% |
| 10 – 35-Year Bonds | 33.9% | 27.5% |
| (1) Includes temporary cash investments. | | |
17
| | | | | |
| Short-Term Government | | | | |
| |
| Total Returns as of March 31, 2009 | | | | |
| | | Average Annual Returns | |
| | | | | Since | Inception |
| | 1 year | 5 years | 10 years | Inception | Date |
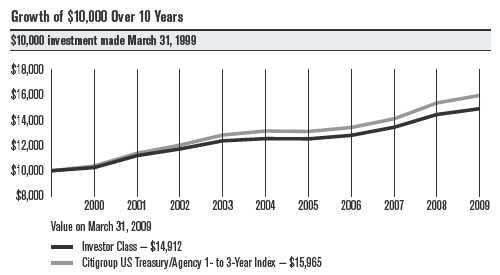
| Investor Class | 3.17% | 3.52% | 4.07% | 5.92% | 12/15/82 |
| Citigroup US Treasury/Agency | | | | | |
| 1- to 3-Year Index | 3.88% | 3.96% | 4.79% | 6.89%(1) | — |
| Advisor Class | 2.91% | 3.26% | 3.81% | 3.87% | 7/8/98 |
| (1) Since 12/31/82, the date nearest the Investor Class’s inception for which data are available. | | |
Data presented reflect past performance. Past performance is no guarantee of future results. Current performance may be higher or lower than the performance shown. Investment return and principal value will fluctuate, and redemption value may be more or less than original cost. To obtain performance data current to the most recent month end, please call 1-800-345-2021 or visit americancentury.com. As interest rates rise, bond values will decline.
Unless otherwise indicated, performance reflects Investor Class shares; performance for other share classes will vary due to differences in fee structure. For information about other share classes available, please consult the prospectus. Data assumes reinvestment of dividends and capital gains, and none of the charts reflect the deduction of taxes that a shareholder would pay on fund distributions or the redemption of fund shares. Returns for the index are provided for comparison. The fund’s total returns include operating expenses (such as transaction costs and management fees) that reduce returns, while the total returns of the index do not.
18
Short-Term Government
| | | | | | | | | | |
| | | | | | | | | | |
| One-Year Returns Over 10 Years | | | | | | | |
| Periods ended March 31 | | | | | | | | | |
| | 2000 | 2001 | 2002 | 2003 | 2004 | 2005 | 2006 | 2007 | 2008 | 2009 |
| Investor Class | 2.51% | 9.25% | 4.68% | 5.52% | 1.40% | -0.16% | 2.22% | 5.02% | 7.50% | 3.17% |
| Citigroup US | | | | | | | | | | |
| Treasury/Agency | | | | | | | | | | |
| 1- to 3-Year Index | 3.72% | 9.77% | 5.61% | 6.71% | 2.45% | -0.27% | 2.41% | 5.11% | 8.91% | 3.88% |
| |
| |
| Total Annual Fund Operating Expenses | |
| Investor Class | Advisor Class |
| 0.57% | 0.82% |
The total annual fund operating expenses shown is as stated in the fund’s prospectus current as of the date of this report. The prospectus may vary from the expense ratio shown elsewhere in this report because it is based on a different time period, includes acquired fund fees and expenses, and, if applicable, does not include fee waivers or expense reimbursements.
Data presented reflect past performance. Past performance is no guarantee of future results. Current performance may be higher or lower than the performance shown. Investment return and principal value will fluctuate, and redemption value may be more or less than original cost. To obtain performance data current to the most recent month end, please call 1-800-345-2021 or visit americancentury.com. As interest rates rise, bond values will decline.
Unless otherwise indicated, performance reflects Investor Class shares; performance for other share classes will vary due to differences in fee structure. For information about other share classes available, please consult the prospectus. Data assumes reinvestment of dividends and capital gains, and none of the charts reflect the deduction of taxes that a shareholder would pay on fund distributions or the redemption of fund shares. Returns for the index are provided for comparison. The fund’s total returns include operating expenses (such as transaction costs and management fees) that reduce returns, while the total returns of the index do not.
19
Portfolio Commentary
Short-Term Government
Portfolio Managers: Bob Gahagan, Hando Aguilar, Brian Howell, Dan Shiffman, and Jim Platz
Performance Summary
Short-Term Government returned 3.17%* for the 12 months ended March 31, 2009. By comparison, the Citigroup US Treasury/Agency 1- to 3-Year Index returned 3.88%. See page 18 for additional performance comparisons. Portfolio returns reflect operating expenses, while Citigroup index returns do not.
The portfolio’s positive absolute returns reflected the performance of short-term government bonds in a difficult period for the economy and financial markets (see page 2). Relative to its benchmark, Short-Term Government lagged as a result of some of our sector allocation decisions.
Underweight Treasuries Detracted
Our sector allocation decisions were key drivers of Short-Term Government’s relative results. The main reason the portfolio lagged its benchmark was its underweight position in Treasury bonds. We viewed Treasuries as the least attractive segment of the market given record low yields at a time of massive government borrowing, as well as policies that are likely to prove inflationary down the road. Unfortunately, safe-haven buying made Treasuries one of the best-performing segments of the market in the 12 months.
In addition, within our Treasury allocation we held inflation-protected securities (TIPS), which trailed plain-vanilla Treasury bonds. We added these securities when the yield difference between nominal and inflation-adjusted 10-year Treasuries was so narrow as to suggest inflation would run at less than 1% a year for the life of the bonds. We think that is much too low given the unprecedented, and ultimately inflationary, policies the government is pursuing to support the economy and financial system. We believe this is likely to be an effective long-term trade—buying future inflation protection at very cheap levels—though it detracted from results during the period.
Mortgages Had Mixed Effect
On a positive note, it helped that the portfolio held an overweight position in high-quality agency mortgage-backed securities (MBS). Government agency MBS were the best-performing segment of the market in the last 12 months because of explicit government steps aimed at supporting the issuers of these bonds and driving down mortgage rates. However, those policies meant a big increase in expectations for home loan refinancing, which is undesirable for MBS investors. To combat the effects of mortgage prepayments, we held a sizable stake in commercial MBS (CMBS) and types of collateralized mortgage obligations (CMOs) that offer more dependable cash flows. Unfortunately, these bonds underperformed in the extreme market conditions of late 2008 because they’re less liquid than traditional passthrough MBS.
*All fund returns referenced in this commentary are for Investor Class shares.
20
Short-Term Government
Other Notable Trades
We made a number of other notable sector trades in the 12 months, building positions in high-quality segments of the market that we believed were significantly oversold as a result of the dislocations in the market. For example, we added pre-refunded municipal bonds (refinanced municipal bonds backed by Treasury bonds) and government-backed securities (“government agency equivalents” issued by financial institutions and guaranteed by the Federal Deposit Insurance Corporation, or FDIC) that offer yields above Treasury securities. These are the sorts of trades we look for in an attempt to add value over time—adding yield with little or no additional risk.
And we helped performance by eliminating our long-running yield curve steepening trade near where the curve hit its steepest slope in November. The curve subsequently flattened significantly as long-term Treasuries rallied on worries about deflation.
Outlook
“Despite extraordinary intervention and stimulus provided by the government and central bank, we expect the credit crisis will continue and overall economic conditions will remain weak for some time,“ said Portfolio Manager Bob Gahagan. “In that environment, we believe we’re finding opportunities to add long-term value by starting to build positions in investment-grade municipals, TIPS, and higher-yielding paper that carries government backing. In the MBS slice, we’re likely to continue to focus on seasoned securities or those structured with protection from prepayments in an attempt to support the portfolio’s yield and total return characteristics in an environment of rising mortgage refinancings.”
21
| | |
| Short-Term Government | | |
| |
| Portfolio at a Glance | | |
| | As of 3/31/09 | As of 3/31/08 |
| Average Duration (effective) | 1.7 years | 1.6 years |
| Weighted Average Life | 1.9 years | 2.6 years |
| |
| Yields as of March 31, 2009 | | |
| 30-Day SEC Yield | | |
| Investor Class | | 1.92% |
| Advisor Class | | 1.67% |
| |
| Types of Investments in Portfolio | | |
| | % of | % of |
| | fund investments | fund investments |
| | as of 3/31/09 | as of 9/30/08 |
| U.S. Treasury Securities | 37.9% | 46.7% |
| Collateralized Mortgage Obligations & | | |
| Commercial Mortgage-Backed Securities | 28.9% | 31.4% |
| U.S. Government Agency Securities and Equivalents | 22.4% | 10.1% |
| U.S. Government Agency Mortgage-Backed Securities | 5.1% | 8.3% |
| Municipal Securities | 2.9% | 1.4% |
| Asset-Backed Securities | —(1) | —(1) |
| Temporary Cash Investments | 2.8% | 2.1% |
| (1) Category is less than 0.05% of total investments. | | |
22
|
| Shareholder Fee Examples (Unaudited) |
Fund shareholders may incur two types of costs: (1) transaction costs, including sales charges (loads) on purchase payments and redemption/ exchange fees; and (2) ongoing costs, including management fees; distribution and service (12b-1) fees; and other fund expenses. This example is intended to help you understand your ongoing costs (in dollars) of investing in your fund and to compare these costs with the ongoing cost of investing in other mutual funds.
The example is based on an investment of $1,000 made at the beginning of the period and held for the entire period from October 1, 2008 to March 31, 2009.
Actual Expenses
The table provides information about actual account values and actual expenses for each class. You may use the information, together with the amount you invested, to estimate the expenses that you paid over the period. First, identify the share class you own. Then simply divide your account value by $1,000 (for example, an $8,600 account value divided by $1,000 = 8.6), then multiply the result by the number under the heading “Expenses Paid During Period” to estimate the expenses you paid on your account during this period.
If you hold Investor Class shares of any American Century Investments fund, or Institutional Class shares of the American Century Diversified Bond Fund, in an American Century Investments account (i.e., not a financial intermediary or retirement plan account), American Century Investments may charge you a $12.50 semiannual account maintenance fee if the value of those shares is less than $10,000. We will redeem shares automatically in one of your accounts to pay the $12.50 fee. In determining your total eligible investment amount, we will include your investments in all personal accounts (including American Century Investments Brokerage accounts) registered under your Social Security number. Personal accounts include individual accounts, joint accounts, UGMA/UTMA accounts, personal trusts, Coverdell Education Savings Accounts and IRAs (including traditional, Roth, Rollover, SEP-, SARSEP- and SIMPLE-IRAs), and certain other retirement accounts. If you have only business, business retirement, employer-sponsored or American Century Investments Brokerage accounts, you are currently not subject to this fee. We will not charge the fee as long as you choose to manage your accounts exclusively online. If you are subject to the Account Maintenance Fee, your account value could be reduced by the fee amount.
Hypothetical Example for Comparison Purposes
The table also provides information about hypothetical account values and hypothetical expenses based on the actual expense ratio of each class of your fund and an assumed rate of return of 5% per year before expenses, which is not the actual return of a fund’s share class. The hypothetical account values and expenses may not be used to estimate the actual ending account balance or expenses you paid for the period. You may use this information to compare the ongoing costs of investing in your fund and other funds. To do so, compare this 5% hypothetical example with the 5% hypothetical examples that appear in the shareholder reports of the other funds.
23
Please note that the expenses shown in the table are meant to highlight your ongoing costs only and do not reflect any transactional costs, such as sales charges (loads) or redemption/exchange fees. Therefore, the table is useful in comparing ongoing costs only, and will not help you determine the relative total costs of owning different funds. In addition, if these transactional costs were included, your costs would have been higher.
| | | | | |
| | Beginning | Ending | Expenses Paid | |
| | Account Value | Account Value | During Period(1) | Annualized |
| | 10/1/08 | 3/31/09 | 10/1/08 – 3/31/09 | Expense Ratio(1) |
| Ginnie Mae | | | | |
| Actual | | | | |
| Investor Class | $1,000 | $1,062.10 | $2.83 | 0.55% |
| (after waiver)(2) | | | | |
| Investor Class | $1,000 | $1,062.10(3) | $2.93 | 0.57% |
| (before waiver) | | | | |
| Institutional Class | $1,000 | $1,063.10 | $1.80 | 0.35% |
| (after waiver)(2) | | | | |
| Institutional Class | $1,000 | $1,063.10(3) | $1.90 | 0.37% |
| (before waiver) | | | | |
| Advisor Class | $1,000 | $1,060.80 | $4.11 | 0.80% |
| (after waiver)(2) | | | | |
| Advisor Class | $1,000 | $1,060.80(3) | $4.21 | 0.82% |
| (before waiver) | | | | |
| R Class (after waiver)(2) | $1,000 | $1,059.40 | $5.39 | 1.05% |
| R Class (before waiver) | $1,000 | $1,059.40(3) | $5.49 | 1.07% |
| Hypothetical | | | | |
| Investor Class | $1,000 | $1,022.19 | $2.77 | 0.55% |
| (after waiver)(2) | | | | |
| Investor Class | $1,000 | $1,022.09 | $2.87 | 0.57% |
| (before waiver) | | | | |
| Institutional Class | $1,000 | $1,023.19 | $1.77 | 0.35% |
| (after waiver)(2) | | | | |
| Institutional Class | $1,000 | $1,023.09 | $1.87 | 0.37% |
| (before waiver) | | | | |
| Advisor Class | $1,000 | $1,020.94 | $4.03 | 0.80% |
| (after waiver)(2) | | | | |
| Advisor Class | $1,000 | $1,020.84 | $4.13 | 0.82% |
| (before waiver) | | | | |
| R Class (after waiver)(2) | $1,000 | $1,019.70 | $5.29 | 1.05% |
| R Class (before waiver) | $1,000 | $1,019.60 | $5.39 | 1.07% |
| (1) | Expenses are equal to the class’s annualized expense ratio listed in the table above, multiplied by the average account value over the period, multiplied by 182, the number of days in the most recent fiscal half-year, divided by 365, to reflect the one-half year period. |
| (2) | During the six months ended March 31, 2009, the investment advisor waived a portion of the class’s management fee. |
| (3) | Ending account value assumes the return earned after waiver. The return would have been lower had fees not been waived and would have resulted in a lower ending account value. |
24
| | | | | |
| | Beginning | Ending | Expenses Paid | |
| Account Value | Account Value | During Period(1) | Annualized |
| | 10/1/08 | 3/31/09 | 10/1/08 – 3/31/09 | Expense Ratio(1) |
| Government Bond | | | | |
| Actual | | | | |
| Investor Class | $1,000 | $1,067.30 | $2.53 | 0.49% |
| Advisor Class | $1,000 | $1,065.90 | $3.81 | 0.74% |
| Hypothetical | | | | |
| Investor Class | $1,000 | $1,022.49 | $2.47 | 0.49% |
| Advisor Class | $1,000 | $1,021.24 | $3.73 | 0.74% |
| Inflation-Adjusted Bond | | | | |
| Actual | | | | |
| Investor Class | $1,000 | $1,024.10 | $2.47 | 0.49% |
| Institutional Class | $1,000 | $1,025.00 | $1.46 | 0.29% |
| Advisor Class | $1,000 | $1,023.20 | $3.73 | 0.74% |
| Hypothetical | | | | |
| Investor Class | $1,000 | $1,022.49 | $2.47 | 0.49% |
| Institutional Class | $1,000 | $1,023.49 | $1.46 | 0.29% |
| Advisor Class | $1,000 | $1,021.24 | $3.73 | 0.74% |
| Short-Term Government | | | | |
| Actual | | | | |
| Investor Class | $1,000 | $1,025.60 | $2.88 | 0.57% |
| Advisor Class | $1,000 | $1,024.40 | $4.14 | 0.82% |
| Hypothetical | | | | |
| Investor Class | $1,000 | $1,022.09 | $2.87 | 0.57% |
| Advisor Class | $1,000 | $1,020.84 | $4.13 | 0.82% |
| (1) | Expenses are equal to the class’s annualized expense ratio listed in the table above, multiplied by the average account value over the period, multiplied by 182, the number of days in the most recent fiscal half-year, divided by 365, to reflect the one-half year period. |
25
|
| Schedule of Investments |
| Ginnie Mae |
| | | | | | |
| MARCH 31, 2009 | | | | | | |
| | | | | | | |
| | Principal | | | | Principal | |
| | Amount | Value | | | Amount | Value |
| U.S. Government Agency | | | GNMA, 8.15%, 1/15/20 | | |
| Mortgage-Backed Securities(1) — 99.2% | | | to 2/15/21(3) | $ 148,453 | $ 159,496 |
| | | | | GNMA, 8.25%, 10/20/16 | | |
| ADJUSTABLE-RATE U.S. GOVERNMENT AGENCY | | to 5/15/27(3) | 584,047 | 626,781 |
| MORTGAGE-BACKED SECURITIES — 1.7% | | | GNMA, 8.35%, 11/15/20(3) | 48,039 | 51,848 |
| GNMA, VRN, 3.00%, | | | | GNMA, 8.50%, 1/20/13 | | |
| 1/1/10 | $ 2,897,036 | $ 2,846,456 | | to 12/15/30(3) | 2,299,836 | 2,492,840 |
| GNMA, VRN, 4.50%, | | | | GNMA, 8.75%, 1/15/17 | | |
| 1/1/10 | 6,520,695 | 6,523,133 | | to 7/15/27(3) | 223,781 | 241,674 |
| GNMA, VRN, 5.00%, | | | | GNMA, 9.00%, 4/15/09 | | |
| 10/1/09 | 16,086,119 | 16,185,092 | | to 1/15/25(3) | 1,412,281 | 1,526,921 |
| | | 25,554,681 | | GNMA, 9.25%, 9/15/16 | | |
| FIXED-RATE U.S. GOVERNMENT AGENCY | | | to 3/15/25(3) | 264,224 | 288,307 |
| MORTGAGE-BACKED SECURITIES — 97.5% | | | GNMA, 9.50%, 7/15/09 | | |
| GNMA, 5.00%, settlement | | | | to 7/20/25(3) | 504,840 | 554,290 |
| date 4/21/09(2) | 38,000,000 | 39,353,826 | | GNMA, 9.75%, 8/15/17 | | |
| GNMA, 5.50%, settlement | | | | to 11/20/21(3) | 142,786 | 154,893 |
| date 4/21/09(2) | 76,000,000 | 78,992,652 | | GNMA, 10.00%, 11/15/09 | | |
| GNMA, 6.00%, settlement | | | | to 1/15/22(3) | 146,541 | 161,108 |
| date 4/21/09(2) | 57,500,000 | 60,015,625 | | GNMA, 10.25%, 5/15/12 | | |
| GNMA, 4.50%, 7/15/33 | | | | to 2/15/19(3) | 52,959 | 58,219 |
| to 3/20/38 | 9,669,972 | 9,898,380 | | GNMA, 10.50%, 3/15/14 | | |
| GNMA, 5.00%, 6/15/33 | | | | to 4/20/19(3) | 85,188 | 95,442 |
| to 3/20/39(3) | 134,600,962 | 140,100,001 | | GNMA, 11.00%, 12/15/09 | | |
| GNMA, 5.50%, 4/15/33 | | | | to 6/15/20(3) | 89,398 | 97,880 |
| to 3/20/39(3) | 514,550,573 | 536,556,968 | | GNMA, 11.25%, 2/20/16(3) | 2,263 | 2,554 |
| GNMA, 6.00%, 7/20/16 | | | | GNMA, 11.50%, 2/15/13 | | |
| to 2/20/39(3) | 445,993,253 | 466,538,273 | | to 10/20/18(3) | 7,404 | 8,388 |
| GNMA, 6.50%, 6/15/23 | | | | GNMA, 12.00%, 3/15/11 | | |
| to 11/15/38(3) | 84,770,849 | 89,557,799 | | to 12/15/12(3) | 10,237 | 11,177 |
| GNMA, 7.00%, 5/15/17 | | | | GNMA, 12.25%, 2/15/14(3) | 4,537 | 5,234 |
| to 12/20/29(3) | 11,879,289 | 12,734,404 | | GNMA, 12.50%, 6/15/10 | | |
| GNMA, 7.25%, 4/15/23 | | | | to 12/15/13(3) | 29,653 | 32,225 |
| to 6/15/23(3) | 64,492 | 68,899 | | GNMA, 13.00%, 1/15/11 | | |
| GNMA, 7.50%, 6/15/13 | | | | to 8/15/15(3) | 71,681 | 82,293 |
| to 11/15/31(3) | 9,226,489 | 9,940,553 | | GNMA, 13.50%, 5/15/10 | | |
| GNMA, 7.65%, 6/15/16 | | | | to 8/15/14(3) | 29,835 | 34,831 |
| to 12/15/16(3) | 96,706 | 102,982 | | GNMA, 13.75%, 8/15/14(3) | 5,944 | 7,144 |
| GNMA, 7.75%, 11/15/22 | | | | GNMA, 14.00%, 6/15/11 | | |
| to 6/20/23(3) | 69,781 | 74,458 | | to 7/15/11(3) | 2,042 | 2,310 |
| GNMA, 7.77%, 4/15/20 | | | | GNMA, 14.50%, 10/15/12 | | |
| to 6/15/20(3) | 247,289 | 265,888 | | to 12/15/12(3) | 14,730 | 17,244 |
| GNMA, 7.85%, 9/20/22(3) | 34,575 | 36,932 | | GNMA, 15.00%, 7/15/11 | | |
| GNMA, 7.89%, 9/20/22(3) | 15,011 | 16,050 | | to 10/15/12(3) | 20,566 | 23,866 |
| GNMA, 7.98%, 6/15/19(3) | 97,460 | 105,135 | | | | 1,454,120,954 |
| GNMA, 8.00%, 2/20/17 | | | | TOTAL U.S. GOVERNMENT AGENCY | |
| to 7/20/30(3) | 2,800,031 | 3,025,164 | | MORTGAGE-BACKED SECURITIES | |
| | | | | (Cost $1,447,704,483) | | 1,479,675,635 |
26
| | | | | | |
| Ginnie Mae |
| |
| |
| | Principal | | | | Principal | |
| | Amount | Value | | | Amount | Value |
| U.S. Government Agency Collateralized | | GNMA, Series 2002-50, | | |
| Mortgage Obligations(1) — 12.0% | | | Class PD, 6.00%, | | |
| | | | 5/20/31(3) | $ 4,967,969 | $ 4,985,621 |
| GNMA, Series 1998-6, | | | | GNMA, Series 2002-57, | | |
| Class FA, VRN, 1.07%, | | | | Class PD, 6.00%, | | |
| 4/16/09, resets monthly | | | | 6/20/31(3) | 1,052,479 | 1,053,039 |
| off the 1-month LIBOR | | | | GNMA, Series 2002-60, | | |
| plus 0.51% with a cap | | | | Class PE, 6.00%, 7/20/31(3) | 436,882 | 439,992 |
| of 9.00%(3) | $ 4,158,827 | $ 4,131,621 | | GNMA, Series 2003-10, | | |
| GNMA, Series 1998-17, | | | | Class JC, 6.00%, | | |
| Class F, VRN, 1.06%, | | | | 4/20/30(3) | 171,480 | 172,052 |
| 4/16/09, resets monthly | | | | GNMA, Series 2003-14, | | |
| off the 1-month LIBOR | | | | Class F, VRN, 0.90%, | | |
| plus 0.50% with a cap | | | | 4/20/09, resets monthly | | |
| of 9.00%(3) | 506,268 | 502,690 | | off the 1-month LIBOR | | |
| GNMA, Series 2000-22, | | | | plus 0.35% with a cap | | |
| Class FG, VRN, 0.76%, | | | | of 7.50%(3) | 504,131 | 502,670 |
| 4/16/09, resets monthly | | | | GNMA, Series 2003-42, | | |
| off the 1-month LIBOR | | | | Class FW, VRN, 0.90%, | | |
| plus 0.20% with a cap | | | | 4/20/09, resets monthly | | |
| of 10.00%(3) | 251,705 | 248,253 | | off the 1-month LIBOR | | |
| GNMA, Series 2001-59, | | | | plus 0.35% with a cap | | |
| Class FD, VRN, 1.06%, | | | | of 7.00%(3) | 2,460,877 | 2,465,112 |
| 4/16/09, resets monthly | | | | GNMA, Series 2003-46, | | |
| off the 1-month LIBOR | | | | Class PA, 5.00%, | | |
| plus 0.50% with a cap | | | | 5/20/29(3) | 12,554,049 | 12,725,909 |
| of 8.50%(3) | 2,434,785 | 2,416,684 | | GNMA, Series 2003-55, | | |
| GNMA, Series 2001-62, | | | | Class PG, 5.00%, | | |
| Class FB, VRN, 1.06%, | | | | 6/20/29(3) | 14,477,929 | 14,696,390 |
| 4/16/09, resets monthly | | | | GNMA, Series 2003-66, | | |
| off the 1-month LIBOR | | | | Class EH, 5.00%, | | |
| plus 0.50% with a cap | | | | 5/20/32(3) | 17,650,000 | 18,432,252 |
| of 8.50%(3) | 5,024,951 | 4,987,585 | | GNMA, Series 2003-66, | | |
| GNMA, Series 2002-13, | | | | Class HF, VRN, 1.00%, | | |
| Class FA, VRN, 1.06%, | | | | 4/20/09, resets monthly | | |
| 4/16/09, resets monthly | | | | off the 1-month LIBOR | | |
| off the 1-month LIBOR | | | | plus 0.45% with a cap | | |
| plus 0.50% with a cap | | | | of 7.50% | 4,964,139 | 4,849,651 |
| of 8.50%(3) | 2,825,446 | 2,803,760 | | GNMA, Series 2003-85, | | |
| GNMA, Series 2002-24, | | | | Class A SEQ, 4.50%, | | |
| Class FA, VRN, 1.06%, | | | | 9/20/27 | 4,413,104 | 4,485,412 |
| 4/16/09, resets monthly | | | | GNMA, Series 2003-85, | | |
| off the 1-month LIBOR | | | | Class BM SEQ, 5.00%, | | |
| plus 0.50% with a cap | | | | 2/20/24 | 1,349,299 | 1,363,302 |
| of 8.50%(3) | 4,985,530 | 4,951,275 | | GNMA, Series 2003-85, | | |
| GNMA, Series 2002-29, | | | | Class BX SEQ, 5.50%, | | |
| Class FA SEQ, VRN, 0.90%, | | | | 2/20/24 | 1,349,299 | 1,363,050 |
| 4/20/09, resets monthly | | | | GNMA, Series 2003-86, | | |
| off the 1-month LIBOR | | | | Class BD SEQ, 5.50%, | | |
| plus 0.35% with a cap | | | | 4/20/30 | 20,459,711 | 20,746,840 |
| of 9.00%(3) | 1,414,255 | 1,395,104 | | GNMA, Series 2003-110, | | |
| GNMA, Series 2002-31, | | | | Class HA SEQ, 5.00%, | | |
| Class FW, VRN, 0.96%, | | | | 5/20/29(3) | 2,832,398 | 2,864,680 |
| 4/16/09, resets monthly | | | | | | |
| off the 1-month LIBOR | | | | | | |
| plus 0.40% with a cap | | | | | | |
| of 8.50%(3) | 1,465,292 | 1,436,002 | | | | |
27
| | | | | | |
| Ginnie Mae |
| |
| |
| | Principal | | | | Principal | |
| | Amount | Value | | | Amount/ | |
| GNMA, Series 2004-30, | | | | | Shares | Value |
| Class PD, 5.00%, | | | | Temporary Cash Investments — 4.7% |
| 2/20/33(3) | $22,223,224 | $ 23,212,735 | | FHLB Discount Notes, | | |
| GNMA, Series 2004-39, | | | | 0.01%, 4/1/09(3)(4) | $ 11,304,000 | $ 11,304,000 |
| Class XF SEQ, VRN, 0.81%, | | | | JPMorgan U.S. Treasury | | |
| 4/16/09, resets monthly | | | | Plus Money Market Fund | | |
| off the 1-month LIBOR | | | | Agency Shares(3) | 3,306,967 | 3,306,967 |
| plus 0.25% with a cap | | | | Repurchase Agreement, Goldman Sachs | |
| of 7.50%(3) | 3,357,568 | 3,365,977 | | Group, Inc. (The), (collateralized by various | |
| GNMA, Series 2004-46, | | | | U.S. Treasury obligations, 6.25%, 5/15/30, | |
| Class BG SEQ, 5.00%, | | | | valued at $57,046,110), in a joint trading | |
| 5/20/25 | 4,792,267 | 4,857,844 | | account at 0.02%, dated 3/31/09, due | |
| GNMA, Series 2004-82, | | | | 4/1/09 (Delivery value $55,969,031)(3) | 55,969,000 |
| Class DM, 5.00%, | | | | | | |
| 10/20/27(3) | 3,050,835 | 3,060,344 | | TOTAL TEMPORARY | | |
| GNMA, Series 2004-87, | | | | CASH INVESTMENTS | | |
| Class LA, 3.625%, | | | | (Cost $70,579,967) | | 70,579,967 |
| 12/20/28(3) | 9,463,449 | 9,496,288 | | TOTAL INVESTMENT | | |
| GNMA, Series 2007-6, | | | | SECURITIES — 115.9% | | |
| Class LA, 5.50%, | | | | (Cost $1,693,243,145) | | 1,728,728,206 |
| 10/20/30 | 7,215,985 | 7,316,203 | | OTHER ASSETS AND | | |
| GNMA, Series 2007-33, | | | | LIABILITIES — (15.9)% | | (236,791,691) |
| Class LA, 5.50%, | | | | TOTAL NET ASSETS — 100.0% | $1,491,936,515 |
| 4/20/31 | 12,915,571 | 13,144,267 | | | | |
| TOTAL U.S. GOVERNMENT | | | | | | |
| AGENCY COLLATERALIZED | | | | | | |
| MORTGAGE OBLIGATIONS | | | | | | |
| (Cost $174,958,695) | | 178,472,604 | | | | |
|
| Notes to Schedule of Investments |
FHLB = Federal Home Loan Bank
GNMA = Government National Mortgage Association
LIBOR = London Interbank Offered Rate
resets = The frequency with which a security’s coupon changes, based on current market conditions or an underlying index. The more frequently a
security resets, the less risk the investor is taking that the coupon will vary significantly from current market rates.
SEQ = Sequential Payer
VRN = Variable Rate Note. Interest reset date is indicated. Rate shown is effective at the period end.
| (1) | Final maturity indicated, unless otherwise noted. |
| (2) | Forward commitment. |
| (3) | Security, or a portion thereof, has been segregated for forward commitments. At the period end, the aggregate value of securities pledged was $178,363,000. |
| (4) | The rate indicated is the yield to maturity at purchase. |
See Notes to Financial Statements.
28
| | | | | | |
| Government Bond | | | | | |
| |
| MARCH 31, 2009 |
| |
| | Principal | | | | Principal | |
| | Amount | Value | | | Amount | Value |
| U.S. Government Agency | | | FNMA, 6.50%, 9/1/47(2) | $ 1,203,506 | $ 1,264,279 |
| Mortgage-Backed Securities(1) — 59.1% | | FNMA, 6.50%, 9/1/47(2) | 1,785,508 | 1,875,670 |
| ADJUSTABLE-RATE U.S. GOVERNMENT AGENCY | | FNMA, 6.00%, 4/1/48(2) | 9,671,136 | 10,075,317 |
| MORTGAGE-BACKED SECURITIES — 0.5% | | | GNMA, 5.50%, settlement | | |
| FNMA, VRN, 5.71%, | | | | date 4/21/09(3) | 30,000,000 | 31,181,310 |
| 12/1/12(2) | $ 5,472,292 | $ 5,667,816 | | GNMA, 5.50%, 12/20/38 | 32,244,365 | 33,562,351 |
| FIXED-RATE U.S. GOVERNMENT AGENCY | | | GNMA, 6.00%, 1/20/39 | 7,818,414 | 8,172,316 |
| MORTGAGE-BACKED SECURITIES — 58.6% | | | GNMA, 5.00%, 3/20/39 | 25,000,000 | 25,942,771 |
| FHLMC, 4.50%, 1/1/19(2) | 4,084,355 | 4,231,476 | | GNMA, 5.50%, 3/20/39 | 10,000,000 | 10,408,927 |
| FHLMC, 5.00%, 5/1/23(2) | 27,370,223 | 28,414,454 | | | | 635,875,144 |
| FHLMC, 5.50%, 10/1/34(2) | 5,716,333 | 5,950,625 | | TOTAL U.S. GOVERNMENT AGENCY | |
| FHLMC, 5.50%, 4/1/38(2) | 70,011,790 | 72,735,166 | | MORTGAGE-BACKED SECURITIES | |
| FHLMC, 6.50%, 7/1/47(2) | 486,458 | 511,417 | | (Cost $620,754,038) | | 641,542,960 |
| FNMA, 6.00%, settlement | | | | U.S. Treasury Securities — 29.7% | |
| date 4/14/09(3) | 69,784,384 | 72,891,952 | | U.S. Treasury Bonds, | | |
| FNMA, 6.50%, settlement | | | | 11.25%, 2/15/15(2) | 13,500,000 | 20,385,000 |
| date 4/14/09(3) | 15,170,000 | 15,978,288 | | U.S. Treasury Bonds, | | |
| FNMA, 4.50%, 5/1/19(2) | 14,921,599 | 15,459,087 | | 10.625%, 8/15/15(2) | 4,500,000 | 6,765,120 |
| FNMA, 5.00%, 9/1/20(2) | 1,203,490 | 1,252,670 | | U.S. Treasury Bonds, | | |
| FNMA, 6.50%, 3/1/32(2) | 632,045 | 670,949 | | 8.125%, 8/15/19(2) | 7,600,000 | 11,024,750 |
| FNMA, 7.00%, 6/1/32(2) | 556,492 | 599,509 | | U.S. Treasury Bonds, | | |
| FNMA, 6.50%, 8/1/32(2) | 823,016 | 874,704 | | 8.125%, 8/15/21(2) | 14,720,000 | 21,891,407 |
| FNMA, 5.50%, 7/1/33(2) | 9,986,683 | 10,410,337 | | U.S. Treasury Bonds, | | |
| FNMA, 5.00%, 11/1/33(2) | 44,511,042 | 46,086,315 | | 7.125%, 2/15/23(2) | 10,700,000 | 15,053,563 |
| FNMA, 5.50%, 8/1/34 | 35,899,720 | 37,377,778 | | U.S. Treasury Bonds, | | |
| FNMA, 5.50%, 9/1/34(2) | 2,670,107 | 2,780,040 | | 6.625%, 2/15/27(2) | 4,500,000 | 6,337,971 |
| FNMA, 5.50%, 10/1/34(2) | 15,672,115 | 16,317,365 | | U.S. Treasury Bonds, | | |
| FNMA, 5.00%, 8/1/35(2) | 9,420,855 | 9,743,961 | | 5.50%, 8/15/28(2) | 5,000,000 | 6,317,190 |
| FNMA, 5.50%, 1/1/36(2) | 35,960,139 | 37,406,972 | | U.S. Treasury Bonds, | | |
| FNMA, 5.00%, 2/1/36(2) | 4,196,817 | 4,340,754 | | 3.50%, 2/15/39(2) | 12,000,000 | 11,895,036 |
| FNMA, 5.50%, 4/1/36(2) | 12,454,230 | 12,955,318 | | U.S. Treasury Inflation | | |
| FNMA, 5.00%, 5/1/36(2) | 19,700,039 | 20,375,689 | | Indexed Bonds, 2.50%, | | |
| FNMA, 5.50%, 12/1/36(2) | 11,850,427 | 12,316,112 | | 1/15/29(2) | 2,889,317 | 3,140,327 |
| FNMA, 5.50%, 2/1/37(2) | 42,282,071 | 43,943,624 | | U.S. Treasury Inflation | | |
| FNMA, 6.50%, 8/1/37(2) | 7,384,066 | 7,761,643 | | Indexed Notes, 3.00%, | | |
| FNMA, 6.00%, 9/1/38 | 5,188,216 | 5,400,051 | | 7/15/12(2) | 13,449,487 | 14,344,712 |
| FNMA, 6.00%, 11/1/38 | 6,822,721 | 7,101,293 | | U.S. Treasury Inflation | | |
| FNMA, 4.50%, 2/1/39 | 14,865,703 | 15,214,007 | | Indexed Notes, 1.375%, | | |
| FNMA, 6.50%, 6/1/47(2) | 283,496 | 297,812 | | 7/15/18(2) | 10,868,565 | 10,814,222 |
| FNMA, 6.50%, 8/1/47(2) | 760,249 | 798,639 | | U.S. Treasury Notes, | | |
| FNMA, 6.50%, 8/1/47(2) | 1,011,917 | 1,063,016 | | 2.625%, 5/31/10(2) | 20,000,000 | 20,474,220 |
| FNMA, 6.50%, 9/1/47(2) | 123,732 | 129,980 | | U.S. Treasury Notes, | | |
| FNMA, 6.50%, 9/1/47(2) | 874,661 | 918,828 | | 0.875%, 3/31/11(2) | 40,000,000 | 40,068,760 |
| FNMA, 6.50%, 9/1/47(2) | 1,030,343 | 1,082,372 | | U.S. Treasury Notes, | | |
| | | | | 4.125%, 8/31/12(2) | 19,750,000 | 21,643,235 |
| | | | | U.S. Treasury Notes, | | |
| | | | 1.875%, 2/28/14(2) | 47,810,000 | 48,366,652 |
| | | | | U.S. Treasury Notes, | | |
| | | | | 4.875%, 8/15/16(2) | 14,538,000 | 17,117,361 |
29
| | | | | | |
| Government Bond |
| |
| |
| | Principal | | | | Principal | |
| | Amount | Value | | | Amount | Value |
| U.S. Treasury Notes, | | | | FHLMC, Series 2892, | | |
| 4.75%, 8/15/17(2) | $ 28,950,000 | $ 33,880,561 | | Class A SEQ, 5.00%, | | |
| U.S. Treasury Notes, | | | | 5/15/21(2) | $ 3,508,268 | $ 3,582,003 |
| 4.00%, 8/15/18(2) | 12,085,000 | 13,437,021 | | FHLMC, Series 2900, | | |
| TOTAL U.S. TREASURY SECURITIES | | | Class PA, 4.50%, 3/15/14(2) | 385,415 | 385,762 |
| (Cost $307,424,725) | | 322,957,108 | | FHLMC, Series 3203, | | |
| | | | | Class VN SEQ, 5.00%, | | |
| Collateralized Mortgage | | | 6/15/22(2) | 10,000,000 | 10,430,820 |
| Obligations(1) — 10.7% | | | FHLMC, Series 3316, | | |
| FHLMC, Series 2560, | | | | Class EA, 5.50%, | | |
| Class FG SEQ, VRN, 1.06%, | | | | 10/15/29(2) | 12,493,913 | 12,775,460 |
| 4/15/09, resets monthly | | | | FHLMC, Series R005, | | |
| off the 1-month LIBOR | | | | Class AB SEQ, 5.50%, | | |
| plus 0.50% with a cap | | | | 12/15/18(2) | 3,082,970 | 3,144,925 |
| of 8.50%(2) | 879,474 | 877,373 | | FNMA, Series 2002-5, | | |
| FHLMC, Series 2625, | | | | Class PJ, 6.00%, | | |
| Class FJ SEQ, VRN, 0.86%, | | | | 10/25/21(2) | 2,870,497 | 3,006,725 |
| 4/15/09, resets monthly | | | | FNMA, Series 2002-89, | | |
| off the 1-month LIBOR | | | | Class CA SEQ, 5.00%, | | |
| plus 0.30% with a cap | | | | 4/25/16(2) | 450,530 | 454,595 |
| of 7.50%(2) | 2,893,201 | 2,879,441 | | FNMA, Series 2003-10, | | |
| FHLMC, Series 2706, | | | | Class HW SEQ, 5.00%, | | |
| Class EB, 5.00%, | | | | 11/25/16(2) | 3,069,446 | 3,124,461 |
| 9/15/20(2) | 6,165,490 | 6,353,771 | | FNMA, Series 2003-14, | | |
| FHLMC, Series 2779, | | | | Class LA SEQ, 5.00%, | | |
| Class FM SEQ, VRN, 0.91%, | | | | 8/25/16(2) | 1,179,634 | 1,196,125 |
| 4/15/09, resets monthly | | | | FNMA, Series 2003-42, | | |
| off the 1-month LIBOR | | | | Class FK, VRN, 0.92%, | | |
| plus 0.35% with a cap | | | | 4/25/09, resets monthly | | |
| of 7.50%(2) | 3,157,775 | 3,119,801 | | off the 1-month LIBOR | | |
| FHLMC, Series 2780, | | | | plus 0.40% with a cap | | |
| Class BD SEQ, 4.50%, | | | | of 7.50%(2) | 3,141,663 | 3,105,254 |
| 10/15/17(2) | 4,607,269 | 4,652,503 | | FNMA, Series 2003-43, | | |
| FHLMC, Series 2812, | | | | Class LF, VRN, 0.87%, | | |
| Class EF SEQ, VRN, 0.96%, | | | | 4/25/09, resets monthly | | |
| 4/15/09, resets monthly | | | | off the 1-month LIBOR | | |
| off the 1-month LIBOR | | | | plus 0.35% with a cap | | |
| plus 0.40% with a cap | | | | of 8.00%(2) | 5,492,225 | 5,437,025 |
| of 7.50%(2) | 6,119,278 | 6,068,353 | | FNMA, Series 2003-52, | | |
| FHLMC, Series 2831, | | | | Class KF SEQ, VRN, 0.92%, | | |
| Class AF, VRN, 0.86%, | | | | 4/25/09, resets monthly | | |
| 4/15/09, resets monthly | | | | off the 1-month LIBOR | | |
| off the 1-month LIBOR | | | | plus 0.40% with a cap | | |
| plus 0.30% with a cap | | | | of 7.50%(2) | 4,746,114 | 4,697,253 |
| of 7.50%(2) | 4,771,626 | 4,698,243 | | FNMA, Series 2004 W5, | | |
| FHLMC, Series 2836, | | | | Class F1, VRN, 0.97%, | | |
| Class ND, 4.00%, | | | | 4/25/09, resets monthly | | |
| 7/15/13(2) | 556,035 | 556,069 | | off the 1-month LIBOR | | |
| FHLMC, Series 2855, | | | | plus 0.45% with a cap | | |
| Class FK SEQ, VRN, 0.91%, | | | | of 7.50%(2) | 4,947,758 | 4,818,801 |
| 4/15/09, resets monthly | | | | FNMA, Series 2005-47, | | |
| off the 1-month LIBOR | | | | Class AN SEQ, 5.00%, | | |
| plus 0.35% with a cap | | | | 12/25/16(2) | 1,080,179 | 1,101,594 |
| of 7.50%(2) | 8,634,464 | 8,537,882 | | | | |
30
| | | | | | |
| Government Bond |
| |
| |
| | Principal | | | | Principal | |
| | Amount | Value | | | Amount | Value |
| FNMA, Series 2006-44, | | | | Asset-Backed Securities(1) — 0.7% |
| Class OA, 5.50%, | | | | FHLMC, Series T20, | | |
| 12/25/26(2) | $ 8,072,010 | $ 8,268,705 | | Class A7, VRN, 0.82%, | | |
| GNMA, Series 2004-30, | | | | 4/27/09, resets monthly off | | |
| Class PD, 5.00%, | | | | the 1-month LIBOR plus | | |
| 2/20/33(2) | 12,000,000 | 12,534,312 | | 0.15% with no caps(2) | $ 2,416,436 | $ 2,138,108 |
| TOTAL COLLATERALIZED | | | | FHLMC, Series T21, | | |
| MORTGAGE OBLIGATIONS | | | | Class A, VRN, 0.88%, | | |
| (Cost $113,826,211) | | 115,807,256 | | 4/27/09, resets monthly off | | |
| U.S. Government Agency Securities | | the 1-month LIBOR plus | | |
| and Equivalents — 10.4% | | | 0.18% with no caps(2) | 4,754,135 | 4,351,269 |
| | | | FHLMC, Series T34, | | |
| FIXED-RATE U.S. GOVERNMENT | | | Class A1V, VRN, 0.76%, | | |
| AGENCY SECURITIES — 4.6% | | | 4/27/09, resets monthly off | | |
| FHLMC, 5.00%, 6/11/09(2) | 8,800,000 | 8,876,182 | | the 1-month LIBOR plus | | |
| FHLMC, 5.00%, 1/30/14(2) | 16,490,000 | 18,324,842 | | 0.12% with no caps(2) | 718,178 | 649,340 |
| FNMA, 1.75%, 3/23/11(2) | 9,650,000 | 9,718,698 | | FHLMC, Series T35, | | |
| FNMA, 2.75%, 3/13/14(2) | 5,000,000 | 5,067,850 | | Class A, VRN, 0.80%, | | |
| FNMA, 5.00%, 2/13/17(2) | 7,250,000 | 7,947,610 | | 4/27/09, resets monthly off | | |
| | | 49,935,182 | | the 1-month LIBOR plus | | |
| | | | | 0.14% with no caps(2) | 586,305 | 535,202 |
| GOVERNMENT-BACKED CORPORATE BONDS — 5.8% | | TOTAL ASSET-BACKED SECURITIES | |
| Bank of America Corp., | | | | (Cost $8,481,163) | | 7,673,919 |
| 3.125%, 6/15/12(2)(4) | 20,000,000 | 20,709,320 | | | Shares | |
| General Electric Capital | | | | | | |
| Corp., 1.80%, 3/11/11(2)(4) | 5,000,000 | 5,016,530 | | Temporary Cash Investments — 4.6% |
| General Electric Capital | | | | JPMorgan U.S. Treasury | | |
| Corp., 2.20%, 6/8/12(2)(4) | 9,150,000 | 9,217,198 | | Plus Money Market Fund | | |
| Goldman Sachs Group LP, | | | | Agency Shares | 1,075 | 1,075 |
| 3.25%, 6/15/12(2)(4) | 5,000,000 | 5,223,545 | | Repurchase Agreement, Bank of America | |
| Goldman Sachs Group, Inc. | | | | Securities, LLC, (collateralized by various | |
| (The), 1.625%, 7/15/11(2)(4) | 3,500,000 | 3,505,295 | | U.S. Treasury obligations, 0.875%, 2/28/11, | |
| Morgan Stanley, 2.00%, | | | | valued at $50,897,147), in a joint trading | |
| 9/22/11(2)(4) | 6,700,000 | 6,744,990 | | account at 0.07%, dated 3/31/09, due | |
| State Street Corp., 2.15%, | | | | 4/1/09 (Delivery value $49,862,097)(2) | 49,862,000 |
| 4/30/12(2)(4) | 7,500,000 | 7,536,803 | | TOTAL TEMPORARY | | |
| Wells Fargo & Co., 3.00%, | | | | CASH INVESTMENTS | | |
| 12/9/11(2)(4) | 4,500,000 | 4,656,272 | | (Cost $49,863,075) | | 49,863,075 |
| | | 62,609,953 | | TOTAL INVESTMENT | | |
| | | | | SECURITIES — 115.2% | | |
| TOTAL U.S. GOVERNMENT AGENCY | | | (Cost $1,210,106,228) | | 1,250,389,453 |
| SECURITIES AND EQUIVALENTS | | | OTHER ASSETS AND | | |
| (Cost $109,757,016) | | 112,545,135 | | LIABILITIES — (15.2)% | | (164,600,496) |
| | | | | TOTAL NET ASSETS — 100.0% | $1,085,788,957 |
31
| | | | |
| Government Bond | | | |
| |
| Futures Contracts | | | |
| | | | Underlying Face | |
| | Contracts Sold | Expiration Date | Amount at Value | Unrealized Gain (Loss) |
| 113 | U.S. Treasury 10-Year Notes | June 2009 | $14,020,828 | $(378,097) |
| 100 | U.S. Treasury 5-Year Notes | June 2009 | 11,876,563 | (90,069) |
| | | | $25,897,391 | $(468,166) |
| |
| Notes to Schedule of Investments | | |
Equivalent = Security whose principal payments are backed by the full faith and credit of the United States
FHLMC = Federal Home Loan Mortgage Corporation
FNMA = Federal National Mortgage Association
GNMA = Government National Mortgage Association
LIBOR = London Interbank Offered Rate
resets = The frequency with which a security’s coupon changes, based on current market conditions or an underlying index. The more frequently a
security resets, the less risk the investor is taking that the coupon will vary significantly from current market rates.
SEQ = Sequential Payer
VRN = Variable Rate Note. Interest reset date is indicated. Rate shown is effective at the period end.
| (1) | Final maturity indicated, unless otherwise noted. |
| (2) | Security, or a portion thereof, has been segregated for forward commitments and/or futures contracts. At the period end, the aggregate value of securities pledged was $145,949,000. |
| (3) | Forward commitment. |
| (4) | The debt is guaranteed under the Federal Deposit Insurance Corporation’s (FDIC) Temporary Liquidity Guarantee Program and is backed by the full faith and credit of the United States. The expiration date of the FDIC’s guarantee is the earlier of the maturity date of the debt or June 30, 2012. |
See Notes to Financial Statements.
32
| | | | | | |
| Inflation-Adjusted Bond | | | | |
| |
| MARCH 31, 2009 | | | | | | |
| |
| | Principal | | | | Principal | |
| | Amount | Value | | | Amount | Value |
| U.S. Treasury Securities — 86.5% | | | U.S. Treasury Inflation | | |
| U.S. Treasury Inflation | | | | Indexed Notes, 1.875%, | | |
| Indexed Bonds, 2.375%, | | | | 7/15/13(1) | $ 14,283,904 | $ 14,676,712 |
| 1/15/25(1) | $113,470,182 | $ 118,221,746 | | U.S. Treasury Inflation | | |
| U.S. Treasury Inflation | | | | Indexed Notes, 2.00%, | | |
| Indexed Bonds, 2.00%, | | | | 1/15/14(1) | 107,723,272 | 111,190,668 |
| 1/15/26(1) | 80,849,560 | 80,116,901 | | U.S. Treasury Inflation | | |
| U.S. Treasury Inflation | | | | Indexed Notes, 2.00%, | | |
| Indexed Bonds, 2.375%, | | | | 7/15/14(1) | 87,818,976 | 90,892,640 |
| 1/15/27(1) | 77,137,725 | 80,801,767 | | U.S. Treasury Inflation | | |
| U.S. Treasury Inflation | | | | Indexed Notes, 1.625%, | | |
| Indexed Bonds, 1.75%, | | | | 1/15/15(1) | 92,664,364 | 93,822,669 |
| 1/15/28(1) | 59,605,848 | 57,258,868 | | U.S. Treasury Inflation | | |
| U.S. Treasury Inflation | | | | Indexed Notes, 1.875%, | | |
| Indexed Bonds, 3.625%, | | | | 7/15/15(1) | 79,703,572 | 81,970,182 |
| 4/15/28(1) | 84,332,070 | 104,255,522 | | U.S. Treasury Inflation | | |
| U.S. Treasury Inflation | | | | Indexed Notes, 2.00%, | | |
| Indexed Bonds, 2.50%, | | | | 1/15/16(1) | 61,594,599 | 63,731,192 |
| 1/15/29(1) | 15,734,880 | 17,101,848 | | U.S. Treasury Inflation | | |
| U.S. Treasury Inflation | | | | Indexed Notes, 2.50%, | | |
| Indexed Bonds, 3.875%, | | | | 7/15/16(1) | 61,711,228 | 66,223,861 |
| 4/15/29(1) | 70,769,338 | 91,181,904 | | U.S. Treasury Inflation | | |
| U.S. Treasury Inflation | | | | Indexed Notes, 2.375%, | | |
| Indexed Bonds, 3.375%, | | | | 1/15/17(1) | 16,741,530 | 17,829,729 |
| 4/15/32(1) | 22,640,515 | 29,177,963 | | U.S. Treasury Inflation | | |
| U.S. Treasury Inflation | | | | Indexed Notes, 2.625%, | | |
| Indexed Notes, 4.25%, | | | | 7/15/17(1) | 16,401,875 | 17,872,926 |
| 1/15/10(1) | 70,403,817 | 72,361,888 | | U.S. Treasury Inflation | | |
| U.S. Treasury Inflation | | | | Indexed Notes, 1.625%, | | |
| Indexed Notes, 0.875%, | | | | 1/15/18(1) | 49,158,372 | 49,880,410 |
| 4/15/10(1) | 53,274,534 | 53,058,133 | | U.S. Treasury Inflation | | |
| U.S. Treasury Inflation | | | | Indexed Notes, 1.375%, | | |
| Indexed Notes, 3.50%, | | | | 7/15/18(1) | 32,263,972 | 32,102,652 |
| 1/15/11(1) | 39,002,773 | 40,757,897 | | U.S. Treasury Inflation | | |
| U.S. Treasury Inflation | | | | Indexed Notes, 2.125%, | | |
| Indexed Notes, 2.375%, | | | | 1/15/19(1) | 9,834,300 | 10,687,500 |
| 4/15/11(1) | 74,835,516 | 76,870,144 | | TOTAL U.S. TREASURY SECURITIES | |
| U.S. Treasury Inflation | | | | (Cost $1,583,079,974) | | 1,642,012,347 |
| Indexed Notes, 3.375%, | | | | Corporate Bonds — 5.4% | |
| 1/15/12(1) | 21,671,530 | 23,093,724 | | AEROSPACE & DEFENSE — 0.1% | |
| U.S. Treasury Inflation | | | | Honeywell International, | | |
| Indexed Notes, 2.00%, | | | | Inc., 3.875%, 2/15/14(1) | 2,440,000 | 2,464,754 |
| 4/15/12(1) | 46,511,244 | 47,950,209 | | BEVERAGES — 0.1% | | |
| U.S. Treasury Inflation | | | | Coca-Cola Co. (The), | | |
| Indexed Notes, 3.00%, | | | | 3.625%, 3/15/14(1) | 2,440,000 | 2,493,238 |
| 7/15/12(1) | 78,168,611 | 83,371,670 | | CAPITAL MARKETS — 0.2% | | |
| U.S. Treasury Inflation | | | | Goldman Sachs Group, Inc. | |
| Indexed Notes, 0.625%, | | | | (The), 7.50%, 2/15/19(1) | 2,980,000 | 2,980,659 |
| 4/15/13(1) | 15,683,358 | 15,551,022 | | | | |
33
| | | | | | |
| Inflation-Adjusted Bond | | | | |
| |
| |
| | Principal | | | | Prinpal | |
| | Amount | Value | | | Amount | Value |
| CONSUMER FINANCE — 3.9% | | | Municipal Securities — 3.2% | |
| John Deere Capital Corp., | | | | California Educational | | |
| 4.90%, 9/9/13(1) | $ 1,500,000 | $ 1,493,953 | | Facilities Auth. Rev., | | |
| SLM Corp., 1.32%, | | | | Series 2007 T1, | | |
| 1/25/10(1) | 27,639,750 | 25,429,676 | | (Stanford University), | | |
| Toyota Motor Credit Corp. | | | | 5.00%, 3/15/39(1) | $ 12,500,000 | $ 12,935,250 |
| Inflation Indexed Bonds, | | | | California Infrastructure & | | |
| VRN, 1.22%, 10/1/09(1) | 46,821,600 | 46,798,189 | | Economic Development | | |
| | | 73,721,818 | | Bank Rev., Series 2003 A, | | |
| DIVERSIFIED TELECOMMUNICATION | | | (Bay Area Toll Bridges | | |
| SERVICES — 0.2% | | | | Seismic Retrofit), 5.00%, | | |
| AT&T, Inc., 6.70%, | | | | 1/1/28, Prerefunded at | | |
| 11/15/13(1) | 1,820,000 | 1,946,639 | | 100% of Par (Ambac)(1)(3) | 10,220,000 | 11,308,226 |
| Verizon Wireless Capital | | | | California Infrastructure & | | |
| LLC, 5.55%, 2/1/14(1)(2) | 2,320,000 | 2,325,443 | | Economic Development | | |
| | | 4,272,082 | | Bank Rev., Series 2003 A, | | |
| ELECTRIC UTILITIES — 0.1% | | | (Bay Area Toll Bridges | | |
| Pacific Gas & Electric Co., | | | Seismic Retrofit), 5.00%, | | |
| 6.25%, 12/1/13(1) | 1,820,000 | 1,949,131 | | 1/1/28, Prerefunded at | | |
| | | | | 100% of Par (Ambac)(1)(3) | 15,150,000 | 16,763,172 |
| MEDIA — 0.1% | | | | Georgia GO, Series 2008 B, | | |
| Time Warner Cable, Inc., | | | | 5.00%, 7/1/18(1) | 6,000,000 | 6,978,540 |
| 8.25%, 2/14/14(1) | 1,210,000 | 1,266,629 | | Massachusetts Health & | | |
| MULTI-UTILITIES — 0.1% | | | | Educational Facilities Auth. | | |
| PG&E Corp., 5.75%, | | | | Rev., Series 2002 K, | | |
| 4/1/14(1) | 1,220,000 | 1,230,935 | | (Massachusetts Institute of | | |
| | | | Technology), 5.50%, 7/1/32 | | |
| OIL, GAS & CONSUMABLE FUELS — 0.5% | | | (GO of Institute)(1) | 10,800,000 | 11,996,856 |
| BP Capital Markets plc, | | | | TOTAL MUNICIPAL SECURITIES | |
| 3.125%, 3/10/12(1) | 1,700,000 | 1,708,243 | | (Cost $56,194,207) | | 59,982,044 |
| Chevron Corp., 3.95%, | | | | | |
| 3/3/14 | 2,440,000 | 2,509,708 | | U.S. Government Agency |
| ConocoPhillips, 4.75%, | | | | Securities and Equivalents — 1.5% | |
| 2/1/14(1) | 5,990,000 | 6,239,909 | | FIXED-RATE U.S. GOVERNMENT | |
| | | 10,457,860 | | AGENCY SECURITIES — 1.1% | |
| PHARMACEUTICALS — 0.1% | | | | FHLMC, 5.00%, 1/30/14(1) | 8,600,000 | 9,556,922 |
| Roche Holdings, Inc., | | | | FHLMC, 4.50%, 4/2/14(1) | 10,000,000 | 10,902,580 |
| 6.00%, 3/1/19(1)(2) | 2,130,000 | 2,198,047 | | | | 20,459,502 |
| TOTAL CORPORATE BONDS | | | | GOVERNMENT-BACKED | | |
| (Cost $104,301,963) | | 103,035,153 | | CORPORATE BONDS(4) — 0.4% | |
| | | | | Bank of America Corp., | | |
| | | | | 3.125%, 6/15/12(1) | 7,000,000 | 7,248,262 |
| | | | | TOTAL U.S. GOVERNMENT AGENCY | |
| | | | | SECURITIES AND EQUIVALENTS | |
| | | | | (Cost $26,327,520) | | 27,707,764 |
34
| | | | | | |
| Inflation-Adjusted Bond | | | | |
| |
| |
| | Principal | | | | Shares | Value |
| | Amount | Value | | Temporary Cash Investments — 0.8% |
| Commercial Mortgage-Backed | | | JPMorgan U.S. Treasury | | |
| Securities(5) — 1.2% | | | | Plus Money Market Fund | | |
| Credit Suisse Mortgage | | | | Agency Shares(1) | 541 | $ 541 |
| Capital Certificates, | | | | Repurchase Agreement, Bank of America | |
| Series 2007 TF2A, Class A1, | | | | Securities, LLC, (collateralized by various | |
| VRN, 0.74%, 4/15/09, | | | | U.S. Treasury obligations, 0.875%, 2/28/11, | |
| resets monthly off the | | | | valued at $16,009,603), in a joint trading | |
| 1-month LIBOR plus 0.18% | | | | account at 0.07%, dated 3/31/09, due | |
| with no caps(1)(2) | $ 12,000,000 | $ 9,227,374 | | 4/1/09 (Delivery value $15,684,031)(1) | 15,684,000 |
| GMAC Commercial | | | | TOTAL TEMPORARY | | |
| Mortgage Securities, Inc., | | | | CASH INVESTMENTS | | |
| Series 2005 C1, Class A2 | | | | (Cost $15,684,541) | | 15,684,541 |
| SEQ, 4.47%, 5/10/43(1) | 7,603,468 | 7,512,931 | | TOTAL INVESTMENT | | |
| Lehman Brothers Floating | | | | SECURITIES — 99.6% | | |
| Rate Commercial Mortgage | | | | (Cost $1,833,055,378) | | 1,891,118,884 |
| Trust, Series 2007 LLFA, | | | | OTHER ASSETS AND | | |
| Class A1, VRN, 0.86%, | | | | LIABILITIES — 0.4% | | 7,141,671 |
| 4/15/09, resets monthly | | | | TOTAL NET ASSETS — 100.0% | $1,898,260,555 |
| off the 1-month LIBOR | | | | | | |
| plus 0.30% with | | | | | | |
| no caps(1)(2) | 9,394,639 | 6,912,037 | | | | |
| TOTAL COMMERCIAL | | | | | | |
| MORTGAGE-BACKED SECURITIES | | | | | |
| (Cost $28,959,207) | | 23,652,342 | | | | |
| |
| U.S. Government Agency | | | | | |
| Mortgage-Backed Securities(5) — 1.0% | | | | |
| FHLMC, 5.50%, 4/1/38(1) | | | | | | |
| (Cost $18,507,966) | 18,331,614 | 19,044,693 | | | | |
| | | |
| Swap Agreements | | |
| Notional Amount | Description of Agreement | Expiration Date | Unrealized Gain (Loss) |
| TOTAL RETURN | | | |
| $44,200,000 | Pay a fixed rate equal to 1.13% and receive the | January 2012 | $(2,326,837) |
| return of the U.S. CPI Urban Consumers NSA Index | | |
| | upon the termination date with Barclays Bank plc. | | |
| 8,000,000 | Pay a fixed rate equal to 1.08% and receive the | November 2013 | (281,301) |
| return of the U.S. CPI Urban Consumers NSA Index | | |
| | upon the termination date with UBS AG. | | |
| 24,000,000 | Pay a fixed rate equal to 1.31% and receive the | April 2017 | (1,164,547) |
| return of the U.S. CPI Urban Consumers NSA Index | | |
| | upon the termination date with Barclays Bank plc. | | |
| 58,300,000 | Pay a fixed rate equal to 1.77% and receive the | December 2027 | (3,470,038) |
| | return of the U.S. CPI Urban Consumers NSA Index | | |
| | upon the termination date with Barclays Bank plc. | | |
| | | | $(7,242,723) |
35
|
| Inflation-Adjusted Bond |
| |
| Notes to Schedule of Investments |
| Ambac = Ambac Assurance Corporation |
| CPI = Consumer Price Index |
| Equivalent = Security whose principal payments are backed by the full faith and credit of the United States |
| FHLMC = Federal Home Loan Mortgage Corporation |
| GMAC = General Motors Acceptance Corporation |
| GO = General Obligation |
| LIBOR = London Interbank Offered Rate |
| NSA = Not Seasonally Adjusted |
| resets = The frequency with which a security’s coupon changes, based on current market conditions or an underlying index. The more frequently a |
| security resets, the less risk the investor is taking that the coupon will vary significantly from current market rates. |
| SEQ = Sequential Payer |
| VRN = Variable Rate Note. Interest reset date is indicated. Rate shown is effective at the period end. |
| (1) | Security, or a portion thereof, has been segregated for swap agreements. At the period end, the aggregate value of securities pledged was $7,243,000. |
| (2) | Security was purchased under Rule 144A of the Securities Act of 1933 or is a private placement and, unless registered under the Act or exempted from registration, may only be sold to qualified institutional investors. The aggregate value of these securities at the period end was $20,662,901, which represented 1.1% of total net assets. |
| (3) | Escrowed to maturity in U.S. government securities or state and local government securities. |
| (4) | The debt is guaranteed under the Federal Deposit Insurance Corporation’s (FDIC) Temporary Liquidity Guarantee Program and is backed by the full faith and credit of the United States. The expiration date of the FDIC’s guarantee is the earlier of the maturity date of the debt or June 30, 2012. |
| (5) | Final maturity indicated, unless otherwise noted. |
Industry classifications are unaudited.
See Notes to Financial Statements.
36
| | | | | | |
| Short-Term Government | | | | |
| |
| MARCH 31, 2009 | | | | | | |
| |
| | Principal | | | | Principal | |
| | Amount | Value | | | Amount | Value |
| U.S. Treasury Securities — 37.7% | | | Goldman Sachs Group LP, | | |
| U.S. Treasury Inflation | | | | 3.25%, 6/15/12(1)(2) | $ 5,000,000 | $ 5,223,545 |
| Indexed Notes, 3.00%, | | | | Goldman Sachs Group, Inc. | | |
| 7/15/12(1) | $ 11,760,815 | $12,543,638 | | (The), 1.625%, 7/15/11(1)(2) | 6,000,000 | 6,009,078 |
| U.S. Treasury Inflation | | | | Morgan Stanley, 2.00%, | | |
| Indexed Notes, 0.625%, | | | | 9/22/11(1)(2) | 7,500,000 | 7,550,362 |
| 4/15/13(1) | 12,886,326 | 12,777,591 | | State Street Corp., 2.15%, | | |
| U.S. Treasury Notes, | | | | 4/30/12(1)(2) | 5,000,000 | 5,024,535 |
| 4.75%, 2/15/10(1) | 60,000,000 | 62,177,400 | | | | 60,821,500 |
| U.S. Treasury Notes, | | | | TOTAL U.S. GOVERNMENT AGENCY | |
| 2.625%, 5/31/10(1) | 62,900,000 | 64,391,422 | | SECURITIES AND EQUIVALENTS | |
| U.S. Treasury Notes, | | | | (Cost $226,952,693) | | 230,625,038 |
| 2.875%, 6/30/10(1) | 25,000,000 | 25,704,125 | | Collateralized Mortgage | |
| U.S. Treasury Notes, | | | | Obligations(3) — 19.4% | |
| 1.50%, 10/31/10(1) | 25,000,000 | 25,305,675 | | PRIVATE SPONSOR COLLATERALIZED | |
| U.S. Treasury Notes, | | | | MORTGAGE OBLIGATIONS — 0.4% | |
| 4.50%, 2/28/11(1) | 35,000,000 | 37,465,050 | | J.P. Morgan Mortgage | | |
| U.S. Treasury Notes, | | | | Trust, Series 2004 A4, Class | | |
| 0.875%, 3/31/11(1) | 65,000,000 | 65,111,735 | | 2A2, VRN, 4.62%, 4/1/09(1) | 5,119,842 | 4,205,070 |
| U.S. Treasury Notes, | | | | U.S. GOVERNMENT AGENCY COLLATERALIZED |
| 1.75%, 11/15/11(1) | 22,500,000 | 22,944,668 | | MORTGAGE OBLIGATIONS — 19.0% | |
| U.S. Treasury Notes, | | | | FHLMC, Series 2430, | | |
| 1.375%, 3/15/12(1) | 50,000,000 | 50,363,300 | | Class QC, 5.50%, | | |
| U.S. Treasury Notes, | | | | 2/15/17(1) | 15,487,073 | 16,222,014 |
| 4.875%, 8/15/16(1) | 10,000,000 | 11,774,220 | | FHLMC, Series 2522, | | |
| TOTAL U.S. TREASURY SECURITIES | | | Class XA SEQ, 5.00%, | | |
| (Cost $384,525,465) | | 390,558,824 | | 8/15/16(1) | 1,167,251 | 1,181,941 |
| | FHLMC, Series 2552, | | |
| U.S. Government Agency Securities | | | Class HA SEQ, 5.00%, | | |
| and Equivalents — 22.3% | | | 9/15/16(1) | 374,814 | 378,486 |
| FIXED-RATE U.S. GOVERNMENT | | | FHLMC, Series 2624, | | |
| AGENCY SECURITIES — 16.4% | | | Class FE SEQ, VRN, 0.86%, | | |
| FHLMC, 2.875%, | | | | 4/15/09, resets monthly | | |
| 6/28/10(1) | 12,000,000 | 12,269,784 | | off the 1-month LIBOR | | |
| FHLMC, 1.625%, | | | | plus 0.30% with a cap | | |
| 4/26/11(1) | 15,000,000 | 15,054,975 | | of 8.00%(1) | 6,423,073 | 6,433,401 |
| FHLMC, 2.125%, | | | | FHLMC, Series 2625, | | |
| 3/23/12(1) | 34,750,000 | 35,038,981 | | Class FJ SEQ, VRN, 0.86%, | | |
| FNMA, 3.25%, 2/10/10(1) | 17,000,000 | 17,336,447 | | 4/15/09, resets monthly | | |
| FNMA, 2.50%, 4/9/10(1) | 30,000,000 | 30,399,600 | | off the 1-month LIBOR | | |
| FNMA, 2.375%, 5/20/10(1) | 34,000,000 | 34,525,776 | | plus 0.30% with a cap | | |
| FNMA, 1.75%, 3/23/11(1) | 25,000,000 | 25,177,975 | | of 7.50%(1) | 4,918,442 | 4,895,050 |
| | | 169,803,538 | | FHLMC, Series 2631, | | |
| GOVERNMENT-BACKED CORPORATE BONDS — 5.9% | | Class PC, 4.50%, | | |
| Bank of America Corp., | | | | 3/15/16(1) | 15,477,417 | 15,797,535 |
3.125%, 6/15/12(1)(2) | 22,000,000 | 22,780,252 | | FHLMC, Series 2672, | | |
| General Electric Capital | | | | Class QR, 4.00%, | | |
| Corp., 1.80%, 3/11/11(1)(2) | 5,000,000 | 5,016,530 | | 9/15/10(1) | 2,606,348 | 2,707,845 |
| General Electric Capital | | | | FHLMC, Series 2688, | | |
| Corp., 2.20%, 6/8/12(1)(2) | 9,150,000 | 9,217,198 | | Class DE SEQ, 4.50%, | | |
| | | | 2/15/20(1) | 4,678,214 | 4,773,872 |
37
| | | | | | |
| Short-Term Government | | | | |
| |
| |
| | Principal | | | | Principal | |
| | Amount | Value | | | Amount | Value |
| FHLMC, Series 2699, | | | | FHLMC, Series 3370, | | |
| Class TG SEQ, 4.00%, | | | | Class FB, VRN, 0.81%, | | |
| 5/15/17(1) | $ 2,042,318 | $ 2,103,318 | | 4/15/09, resets monthly | | |
| FHLMC, Series 2709, | | | | off the 1-month LIBOR | | |
| Class PC, 5.00%, | | | | plus 0.25% with a cap | | |
| 9/15/18(1) | 12,460,730 | 12,663,989 | | of 7.00% | $ 4,669,966 | $ 4,644,940 |
| FHLMC, Series 2718, | | | | FNMA, Series 2002-5, | | |
| Class FW, VRN, 0.91%, | | | | Class PJ, 6.00%, | | |
| 4/15/09, resets monthly | | | | 10/25/21(1) | 2,870,497 | 3,006,725 |
| off the 1-month LIBOR | | | | FNMA, Series 2002-71, | | |
| plus 0.35% with a cap of | | | | Class UB, 5.00%, | | |
| 8.00%(1) | 8,443,041 | 8,229,866 | | 11/25/15(1) | 538,855 | 542,515 |
| FHLMC, Series 2763, | | | | FNMA, Series 2002-74, | | |
| Class PB, 4.50%, | | | | Class PD, 5.00%, | | |
| 6/15/14(1) | 404,646 | 404,332 | | 11/25/15(1) | 4,664,267 | 4,692,528 |
| FHLMC, Series 2779, | | | | FNMA, Series 2002-83, | | |
| Class FM SEQ, VRN, 0.91%, | | | | Class GM SEQ, 5.00%, | | |
| 4/15/09, resets monthly | | | | 5/25/16(1) | 3,701,669 | 3,740,964 |
| off the 1-month LIBOR | | | | FNMA, Series 2002-86, | | |
| plus 0.35% with a cap | | | | Class KB SEQ, 5.00%, | | |
| of 7.50%(1) | 3,157,775 | 3,119,801 | | 5/25/16(1) | 1,761,007 | 1,779,832 |
| FHLMC, Series 2780, | | | | FNMA, Series 2003-3, | | |
| Class BD SEQ, 4.50%, | | | | Class HA SEQ, 5.00%, | | |
| 10/15/17(1) | 7,678,782 | 7,754,171 | | 9/25/16(1) | 1,030,569 | 1,047,194 |
| FHLMC, Series 2827, | | | | FNMA, Series 2003-17, | | |
| Class F, VRN, 0.91%, | | | | Class FN, VRN, 0.82%, | | |
| 4/15/09, resets monthly | | | | 4/25/09, resets monthly | | |
| off the 1-month LIBOR | | | | off the 1-month LIBOR | | |
| plus 0.35% with a cap | | | | plus 0.30% with no caps(1) | 10,311,936 | 10,152,970 |
| of 7.50%(1) | 6,203,333 | 6,074,938 | | FNMA, Series 2003-24, | | |
| FHLMC, Series 2831, | | | | Class BF, VRN, 0.872%, | | |
| Class AF, VRN, 0.86%, | | | | 4/25/09, resets monthly | | |
| 4/15/09, resets monthly | | | | off the 1-month LIBOR | | |
| off the 1-month LIBOR | | | | plus 0.35% with no caps(1) | 4,244,708 | 4,216,036 |
| plus 0.30% with a cap | | | | FNMA, Series 2003-29, | | |
| of 7.50%(1) | 4,692,622 | 4,620,453 | | Class L SEQ, 5.00%, | | |
| FHLMC, Series 2890, | | | | 9/25/30(1) | 2,634,721 | 2,699,575 |
| Class AB SEQ, 3.75%, | | | | FNMA, Series 2003-35, | | |
| 12/15/11(1) | 1,035,209 | 1,041,929 | | Class KC SEQ, 4.50%, | | |
| FHLMC, Series 2900, | | | | 4/25/17(1) | 2,119,851 | 2,167,831 |
| Class PA, 4.50%, | | | | FNMA, Series 2003-42, | | |
| 3/15/14(1) | 745,473 | 746,145 | | Class FK, VRN, 0.92%, | | |
| FHLMC, Series 2931, | | | | 4/25/09, resets monthly | | |
| Class QA, 4.50%, | | | | off the 1-month LIBOR | | |
| 4/15/15(1) | 5,970,376 | 6,013,478 | | plus 0.40% with a cap | | |
| FHLMC, Series 2937, | | | | of 7.50%(1) | 4,712,494 | 4,657,882 |
| Class KA, 4.50%, | | | | FNMA, Series 2003-43, | | |
| 12/15/14(1) | 1,339,869 | 1,342,398 | | Class LF, VRN, 0.87%, | | |
| FHLMC, Series 2941, | | | | 4/25/09, resets monthly | | |
| Class XA, 5.00%, | | | | off the 1-month LIBOR | | |
| 2/15/25(1) | 5,181,937 | 5,272,628 | | plus 0.35% with a cap | | |
| FHLMC, Series 2984, | | | | of 8.00%(1) | 5,492,224 | 5,437,025 |
| Class NA, 5.50%, | | | | | | |
| 4/15/26(1) | 4,024,185 | 4,094,499 | | | | |
38
| | | | | | |
| Short-Term Government | | | | |
| |
| |
| | Principal | | | | Principal | |
| | Amount | Value | | | Amount | Value |
| FNMA, Series 2004 W5, | | | | Credit Suisse Mortgage | | |
| Class F1, VRN, 0.97%, | | | | Capital Certificates, Series | | |
| 4/25/09, resets monthly | | | | 2007 C4, Class A3, VRN, | | |
| off the 1-month LIBOR | | | | 5.81%, 4/1/09(1) | $ 4,500,000 | $ 2,872,161 |
| plus 0.45% with a cap | | | | GMAC Commercial | | |
| of 7.50%(1) | $ 4,947,758 | $ 4,818,801 | | Mortgage Securities, Inc., | | |
| FNMA, Series 2005-53, | | | | Series 2005 C1, Class A2 | | |
| Class WC SEQ, 5.00%, | | | | SEQ, 4.47%, 5/10/43(1) | 9,504,334 | 9,391,164 |
| 8/25/18(1) | 3,284,544 | 3,363,436 | | GMAC Commercial | | |
| FNMA, Series 2006-4, | | | | Mortgage Securities, Inc. | | |
| Class A SEQ, 6.00%, | | | | STRIPS – COUPON, | | |
| 11/25/22(1) | 2,876,264 | 2,938,553 | | Series 2000 C3, Class X, | | |
| FNMA, Series 2006-77, | | | | VRN, 1.04%, 4/1/09(1)(4) | 24,218,986 | 365,576 |
| Class PD, 6.50%, | | | | LB Commercial Conduit | | |
| 10/25/30(1) | 2,633,434 | 2,735,000 | | Mortgage Trust, Series | | |
| GNMA, Series 2003-46, | | | | 1999 C2, Class A2 SEQ, | | |
| Class PA, 5.00%, | | | | 7.33%, 10/15/32 | 2,356,433 | 2,367,244 |
| 5/20/29(1) | 8,809,859 | 8,930,463 | | LB-UBS Commercial | | |
| GNMA, Series 2003-55, | | | | Mortgage Trust, Series | | |
| Class PG, 5.00%, | | | | 2003 C3, Class A3 SEQ, | | |
| 6/20/29(1) | 9,651,952 | 9,797,594 | | 3.85%, 5/15/27(1) | 20,686,000 | 19,233,793 |
| | | 197,241,953 | | LB-UBS Commercial | | |
| TOTAL COLLATERALIZED | | | | Mortgage Trust, Series | | |
| MORTGAGE OBLIGATIONS | | | | 2004 C1, Class A2 SEQ, | | |
| (Cost $200,162,299) | | 201,447,023 | | 3.62%, 1/15/29(1) | 3,668,460 | 3,545,371 |
| | | | | LB-UBS Commercial | | |
| Commercial Mortgage-Backed | | | Mortgage Trust, Series | | |
| Securities(3) — 9.2% | | | | 2005 C2, Class A2 SEQ, | | |
| Banc of America | | | | 4.82%, 4/15/30(1) | 20,872,582 | 19,173,481 |
| Commercial Mortgage, Inc., | | | | Prudential Securities | | |
| Series 2004-2, Class A3 | | | | Secured Financing Corp., | | |
| SEQ, 4.05%, 11/10/38(1) | 22,600,000 | 21,201,851 | | Series 2000 C1, Class A2 | | |
| Bear Stearns Commercial | | | | SEQ, VRN, 7.73%, 4/1/09(1) | 6,004,750 | 6,043,118 |
| Mortgage Securities Trust | | | | TOTAL COMMERCIAL | | |
| STRIPS – COUPON, Series | | | | MORTGAGE-BACKED SECURITIES | |
| 2004 T16, Class X2, VRN, | | | | (Cost $98,869,536) | | 95,856,577 |
| 0.89%, 4/1/09(1) | 56,721,711 | 1,075,103 | | | |
| Chase Commercial | | | | U.S. Government Agency |
| Mortgage Securities Corp., | | | | Mortgage-Backed Securities(3) — 5.0% |
| Series 2000-1, Class B, | | | | ADJUSTABLE-RATE U.S. GOVERNMENT AGENCY |
| VRN, 7.80%, 4/1/09(1) | 5,846,000 | 5,779,411 | | MORTGAGE-BACKED SECURITIES — 2.8% | |
| Chase Manhattan Bank- | | | | FHLMC, VRN, 4.25%, | | |
| First Union National Bank, | | | | 4/1/09(1) | 52,038 | 51,827 |
| Series 1999-1, Class C, | | | | FHLMC, VRN, 4.55%, | | |
| VRN, 7.63%, 4/1/09(1) | 1,200,000 | 1,201,898 | | 6/1/09(1) | 227,436 | 226,674 |
| Commercial Mortgage | | | | FHLMC, VRN, 5.88%, | | |
| Acceptance Corp. | | | | 9/1/09(1) | 66,798 | 67,490 |
| STRIPS – COUPON, Series | | | | FHLMC, VRN, 5.78%, | | |
| 1998 C2, Class X, VRN, | | | | 5/1/11(1) | 4,126,076 | 4,265,700 |
| 1.19%, 4/1/09(1) | 13,706,289 | 706,156 | | FHLMC, VRN, 6.36%, | | |
| Credit Suisse First Boston | | | | 9/1/11(1) | 10,833,487 | 11,301,276 |
| Mortgage Securities Corp., | | | | FHLMC, VRN, 5.00%, | | |
| Series 2002 CKN2, | | | | 11/1/18(1) | 27,512 | 27,768 |
| Class A3 SEQ, 6.13%, | | | | | | |
| 4/15/37(1) | 2,950,000 | 2,900,250 | | | | |
39
| | | | | | |
| Short-Term Government | | | | |
| |
| |
| | Principal | | | | Principal | |
| | Amount | Value | | | Amount | Value |
| FNMA, VRN, 4.32%, | | | | GNMA, VRN, 5.375%, | | |
| 4/1/09(1) | $ 42,214 | $ 42,159 | | 7/1/09(1) | $ 18,306 | $ 18,717 |
| FNMA, VRN, 4.75%, | | | | GNMA, VRN, 5.125%, | | |
| 4/1/09(1) | 20,651 | 20,846 | | 10/1/09(1) | 18,123 | 18,690 |
| FNMA, VRN, 4.875%, | | | | GNMA, VRN, 5.625%, | | |
| 4/1/09(1) | 41,799 | 41,652 | | 1/1/10(1) | 31,745 | 32,140 |
| FNMA, VRN, 5.20%, | | | | GNMA, VRN, 5.375%, | | |
| 4/1/09(1) | 63,119 | 63,383 | | 4/1/10(1) | 666 | 680 |
| FNMA, VRN, 4.83%, | | | | GNMA, VRN, 5.875%, | | |
| 5/1/09(1) | 62,121 | 61,971 | | 4/1/10(1) | 84,649 | 86,675 |
| FNMA, VRN, 5.81%, | | | | | | 29,236,675 |
| 5/1/09(1) | 18,490 | 18,948 | | FIXED-RATE U.S. GOVERNMENT AGENCY | |
| FNMA, VRN, 6.41%, | | | | MORTGAGE-BACKED SECURITIES — 2.2% | |
| 5/1/09(1) | 206,143 | 210,463 | | FHLMC, 5.00%, 6/1/09(1) | 1,701,065 | 1,712,257 |
| FNMA, VRN, 4.75%, | | | | FHLMC, 5.00%, 7/1/09(1) | 3,832,649 | 3,900,264 |
| 6/1/09(1) | 26,554 | 26,521 | | FHLMC, 6.50%, 1/1/11(1) | 57,718 | 59,288 |
| FNMA, VRN, 4.52%, | | | | FHLMC, 6.50%, 5/1/11(1) | 111,979 | 117,499 |
| 7/1/09(1) | 88,420 | 87,892 | | FHLMC, 6.50%, 12/1/12(1) | 157,453 | 163,909 |
| FNMA, VRN, 4.94%, | | | | FHLMC, 6.00%, 2/1/13(1) | 449,274 | 468,050 |
| 7/1/09(1) | 18,690 | 18,859 | | FHLMC, 7.00%, 11/1/13(1) | 32,065 | 33,619 |
| FNMA, VRN, 6.59%, | | | | FHLMC, 7.00%, 12/1/14(1) | 28,879 | 30,447 |
| 7/1/09(1) | 48,026 | 48,908 | | FHLMC, 6.00%, 1/1/15(1) | 1,081,148 | 1,136,635 |
| FNMA, VRN, 5.15%, | | | | FHLMC, 7.50%, 5/1/16(1) | 392,881 | 415,181 |
| 8/1/09(1) | 98,710 | 99,294 | | FHLMC, 5.50%, 11/1/17(1) | 1,152,504 | 1,210,214 |
| FNMA, VRN, 5.25%, | | | | FHLMC, 5.50%, 1/1/38(1) | 9,114,616 | 9,469,677 |
| 8/1/09(1) | 11,158 | 11,226 | | FNMA, 8.00%, 5/1/12(1) | 19,051 | 20,102 |
| FNMA, VRN, 5.79%, | | | | FNMA, 6.50%, 1/1/13(1) | 688,994 | 723,609 |
| 8/1/09(1) | 27,795 | 28,139 | | FNMA, 6.50%, 3/1/13(1) | 6,073 | 6,378 |
| FNMA, VRN, 4.54%, | | | | FNMA, 6.00%, 6/1/13(1) | 76,008 | 79,803 |
| 9/1/09(1) | 57,581 | 57,428 | | FNMA, 6.50%, 6/1/13(1) | 3,203 | 3,369 |
| FNMA, VRN, 4.59%, | | | | FNMA, 6.00%, 1/1/14(1) | 24,118 | 25,367 |
| 9/1/09(1) | 2,045,355 | 2,063,805 | | FNMA, 6.00%, 7/1/14(1) | 204,520 | 215,115 |
| FNMA, VRN, 4.92%, | | | | FNMA, 5.50%, 4/1/16(1) | 400,032 | 420,313 |
| 9/1/09(1) | 238,106 | 238,963 | | FNMA, 7.00%, 5/1/32(1) | 545,196 | 587,340 |
| FNMA, VRN, 5.10%, | | | | FNMA, 7.00%, 5/1/32(1) | 555,781 | 598,743 |
| 9/1/09(1) | 5 3,146 | 53,945 | | FNMA, 7.00%, 6/1/32(1) | 194,344 | 209,485 |
| FNMA, VRN, 5.25%, | | | | FNMA, 7.00%, 6/1/32(1) | 882,055 | 950,239 |
| 9/1/09(1) | 29,767 | 29,698 | | FNMA, 7.00%, 8/1/32(1) | 427,120 | 460,137 |
| FNMA, VRN, 6.13%, | | | | GNMA, 9.50%, 11/20/19(1) | 9,548 | 10,425 |
| 9/1/09(1) | 6,671 | 6,930 | | | | 23,027,465 |
| FNMA, VRN, 5.79%, | | | | TOTAL U.S. GOVERNMENT AGENCY |
| 11/1/09(1) | 833,159 | 849,985 | | MORTGAGE-BACKED SECURITIES |
| FNMA, VRN, 5.86%, | | | | (Cost $50,881,956) | | 52,264,140 |
| 1/1/10(1) | 15,705 | 15,710 | | | | |
| FNMA, VRN, 5.80%, | | | | | | |
| 2/1/11(1) | 8,652,238 | 8,929,028 | | | |
| FNMA, VRN, 7.49%, | | | | | |
| 8/1/14(1) | 12,836 | 12,836 | | | | |
| FNMA, VRN, 5.95%, | | | | | | |
| 7/1/17(1) | 99,611 | 100,449 | | | | |
40
| | | | | | | |
| Short-Term Government | | | | |
| |
| |
| | | Principal | | | | Principal | |
| | | Amount | Value | | | Amount/ | |
| Municipal Securities — 2.9% | | | | Shares | Value |
| Bay Area Toll Auth. Toll | | | | Temporary Cash Investments — 2.8% |
| Bridge Rev., Series 2001 D, | | | | FHLB Discount Notes, | | |
| (San Francisco Bay Area), | | | | 0.01%, 4/1/09(7) | $23,495,000 | $ 23,495,000 |
| 5.00%, 4/1/11, Prerefunded | | | | JPMorgan U.S. Treasury | | |
| at 100% of Par(1)(5) | $ 600,000 | $ 648,966 | | Plus Money Market Fund | | |
| City of Lincoln Electric | | | | Agency Shares | 5,097,594 | 5,097,594 |
| System Rev., 5.25%, | | | | TOTAL TEMPORARY | | |
| 9/1/11, Prerefunded at | | | | CASH INVESTMENTS | | |
| 100% of Par(1)(5) | 13,695,000 | 15,074,908 | | (Cost $28,592,594) | | 28,592,594 |
| Michigan Municipal Bond | | | | TOTAL INVESTMENT | | |
| Auth. Rev., (Clean Water | | | | SECURITIES — 99.3% | | |
| Revolving Fund), 5.625%, | | | | (Cost $1,019,554,463) | | 1,029,559,179 |
| 10/1/10, Prerefunded at | | | | OTHER ASSETS AND | | |
| 101% of Par(1)(5) | 13,325,000 | 14,410,188 | | LIABILITIES — 0.7% | | 6,841,034 |
| TOTAL MUNICIPAL SECURITIES | | | TOTAL NET ASSETS — 100.0% | $1,036,400,213 |
| (Cost $29,326,893) | | 30,134,062 | | | |
| |
| Asset-Backed Securities(3)(6) | | | | | |
| Ameriquest Mortgage | | | | | | |
| Securities, Inc., Series | | | | | | |
| 2003-8, Class AV2, VRN, | | | | | | |
| 0.952%, 4/27/09, resets | | | | | | |
| monthly off the 1-month | | | | | | |
| LIBOR plus 0.43% with | | | | | | |
| no caps(1) | | | | | | |
| (Cost $243,027) | 243,027 | 80,921 | | | | |
| |
| |
| Futures Contracts | | | | | | |
| | | | | | Underlying Face | | |
| | Contracts Purchased | | Expiration Date | | Amount at Value | Unrealized Gain (Loss) |
| 950 | U.S. Treasury 2-Year Notes | June 2009 | | $206,996,094 | $1,077,550 |
| |
| |
| | | | | | Underlying Face | | |
| | Contracts Sold | | Expiration Date | | Amount at Value | Unrealized Gain (Loss) |
| 100 | U.S. Treasury 10-Year Notes | June 2009 | | $12,407,813 | $(334,600) |
41
|
| Short-Term Government |
| |
| Notes to Schedule of Investments |
| Equivalent = Security whose principal payments are backed by the full faith and credit of the United States |
| FHLB = Federal Home Loan Bank |
| FHLMC = Federal Home Loan Mortgage Corporation |
| FNMA = Federal National Mortgage Association |
| GMAC = General Motors Acceptance Corporation |
| GNMA = Government National Mortgage Association |
| LB-UBS = Lehman Brothers, Inc. — UBS AG |
| LIBOR = London Interbank Offered Rate |
| resets = The frequency with which a security’s coupon changes, based on current market conditions or an underlying index. The more frequently a |
| security resets, the less risk the investor is taking that the coupon will vary significantly from current market rates. |
| SEQ = Sequential Payer |
| STRIPS = Separate Trading of Registered Interest and Principal of Securities |
| VRN = Variable Rate Note. Interest reset date is indicated. Rate shown is effective at the period end. |
| (1) | Security, or a portion thereof, has been segregated for futures contracts. At the period end, the aggregate value of securities pledged was $219,404,000. |
| (2) | The debt is guaranteed under the Federal Deposit Insurance Corporation’s (FDIC) Temporary Liquidity Guarantee Program and is backed by the full faith and credit of the United States. The expiration date of the FDIC’s guarantee is the earlier of the maturity date of the debt or June 30, 2012. |
| (3) | Final maturity indicated, unless otherwise noted. |
| (4) | Security was purchased under Rule 144A of the Securities Act of 1933 or is a private placement and, unless registered under the Act or exempted from registration, may only be sold to qualified institutional investors. The aggregate value of these securities at the period end was $365,576, which represented less than 0.05% of total net assets. |
| (5) | Escrowed to maturity in U.S. government securities or state and local government securities. |
| (6) | Category is less than 0.05% of total net assets. |
| (7) | The rate indicated is the yield to maturity at purchase. |
See Notes to Financial Statements.
42
|
| Statement of Assets and Liabilities |
| | | | | |
| MARCH 31, 2009 | | | | |
| | | | Inflation-Adjusted | Short-Term |
| | Ginnie Mae | Government Bond | Bond | Government |
| Assets | | | | |
| Investment securities, at value | | | | |
| (cost of $1,693,243,145, | | | | |
| $1,210,106,228, $1,833,055,378 and | | | | |
| $1,019,554,463, respectively) | $1,728,728,206 | $1,250,389,453 | $1,891,118,884 | $1,029,559,179 |
| Cash | 96,144 | — | — | 51,707 |
| Receivable for investments sold | 10,322,778 | 28,908,833 | — | 2,457,097 |
| Receivable for capital shares sold | 1,351,302 | 24,791,000 | 4,867,000 | 1,179,197 |
| Receivable for variation margin | | | | |
| on futures contracts | — | — | — | 206,250 |
| Interest receivable | 6,945,929 | 4,852,327 | 11,907,069 | 4,789,853 |
| | 1,747,444,359 | 1,308,941,613 | 1,907,892,953 | 1,038,243,283 |
| |
| Liabilities | | | | |
| Payable for investments purchased | 252,592,453 | 221,079,548 | — | — |
| Payable for variation margin | | | | |
| on futures contracts | — | 62,656 | — | — |
| Payable for capital shares redeemed | 1,558,445 | 1,235,284 | 1,583,374 | 1,290,565 |
| Unrealized depreciation | | | | |
| on swap agreements | — | — | 7,242,723 | — |
| Accrued management fees | 677,571 | 452,970 | 704,287 | 492,110 |
| Distribution and service fees payable | 29,652 | 39,675 | 102,014 | 13,673 |
| Dividends payable | 649,723 | 282,523 | — | 46,722 |
| | 255,507,844 | 223,152,656 | 9,632,398 | 1,843,070 |
| |
| Net Assets | $1,491,936,515 | $1,085,788,957 | $1,898,260,555 | $1,036,400,213 |
| |
| |
| See Notes to Financials Statements. | | | | |
43
| | | | |
| MARCH 31, 2009 | | | | |
| | | | Inflation-Adjusted | Short-Term |
| | Ginnie Mae | Government Bond | Bond | Government |
| Net Assets Consist of: | | | | |
| Capital paid in | $1,499,407,031 | $1,036,105,413 | $1,877,613,753 | $1,047,506,115 |
| Accumulated undistributed net | | | | |
| investment income (loss) | 25,192 | 24,393 | (623,128) | 14,723 |
| Accumulated undistributed net realized | | | | |
| gain (loss) on investment transactions | (42,980,769) | 9,844,092 | (29,550,853) | (21,868,291) |
| Net unrealized appreciation on investments | 35,485,061 | 39,815,059 | 50,820,783 | 10,747,666 |
| | $1,491,936,515 | $1,085,788,957 | $1,898,260,555 | $1,036,400,213 |
| |
| Investor Class | | | | |
| Net assets | $1,336,491,281 | $895,833,439 | $1,187,201,613 | $971,230,206 |
| Shares outstanding | 125,172,834 | 79,528,531 | 107,320,416 | 100,533,299 |
| Net asset value per share | $10.68 | $11.26 | $11.06 | $9.66 |
| |
| Institutional Class | | | | |
| Net assets | $8,015,563 | N/A | $210,177,195 | N/A |
| Shares outstanding | 750,751 | N/A | 18,998,975 | N/A |
| Net asset value per share | $10.68 | N/A | $11.06 | N/A |
| |
| Advisor Class | | | | |
| Net assets | $146,873,579 | $189,955,518 | $500,881,747 | $65,170,007 |
| Shares outstanding | 13,755,267 | 16,863,292 | 45,419,226 | 6,745,508 |
| Net asset value per share | $10.68 | $11.26 | $11.03 | $9.66 |
| |
| R Class | | | | |
| Net assets | $556,092 | N/A | N/A | N/A |
| Shares outstanding | 52,090 | N/A | N/A | N/A |
| Net asset value per share | $10.68 | N/A | N/A | N/A |
| |
| |
| See Notes to Financials Statements. | | | | |
44
| | | | |
| YEAR ENDED MARCH 31, 2009 | | | | |
| | | | Inflation-Adjusted | Short-Term |
| | Ginnie Mae | Government Bond | Bond | Government |
| Investment Income (Loss) | | | | |
| Income: | | | | |
| Interest | $62,194,697 | $36,655,822 | $ 34,596,667 | $37,507,479 |
| Securities lending, net | — | 312,329 | 250,435 | 207,287 |
| | 62,194,697 | 36,968,151 | 34,847,102 | 37,714,766 |
| |
| Expenses: | | | | |
| Management fees | 7,523,379 | 4,389,361 | 7,654,135 | 5,961,460 |
| Distribution and service fees: | | | | |
| Advisor Class | 268,648 | 345,574 | 1,242,593 | 120,078 |
| R Class | 790 | — | — | — |
| Trustees’ fees and expenses | 52,786 | 34,758 | 64,887 | 43,405 |
| Other expenses | 2,830 | 1,904 | 4,571 | 4,505 |
| | 7,848,433 | 4,771,597 | 8,966,186 | 6,129,448 |
| Amount waived | (520,955) | — | — | — |
| | 7,327,478 | 4,771,597 | 8,966,186 | 6,129,448 |
| |
| Net investment income (loss) | 54,867,219 | 32,196,554 | 25,880,916 | 31,585,318 |
| |
| Realized and Unrealized Gain (Loss) | | | | |
| Net realized gain (loss) on: | | | | |
| Investment transactions | 14,023,524 | 16,737,533 | (22,731,128) | 419,897 |
| Futures and swaps transactions | 128,647 | 3,238,465 | 10,582,610 | 5,138,205 |
| | 14,152,171 | 19,975,998 | (12,148,518) | 5,558,102 |
| |
| Change in net unrealized | | | | |
| appreciation (depreciation) on: | | | | |
| Investments | 23,837,359 | 15,395,008 | (33,425,858) | (4,206,347) |
| Futures and swaps | 1,139,718 | (107,467) | (9,570,482) | (613,462) |
| | 24,977,077 | 15,287,541 | (42,996,340) | (4,819,809) |
| |
| Net realized and unrealized gain (loss) | 39,129,248 | 35,263,539 | (55,144,858) | 738,293 |
| |
| Net Increase (Decrease) in Net Assets | | | | |
| Resulting from Operations | $93,996,467 | $67,460,093 | $(29,263,942) | $32,323,611 |
| |
| |
| See Notes to Financial Statements. | | | | |
45
|
| Statement of Changes in Net Assets |
| | | | |
| YEARS ENDED MARCH 31, 2009 AND MARCH 31, 2008 | | | |
| | Ginnie Mae | Government Bond |
| Increase (Decrease) in Net Assets | 2009 | 2008 | 2009 | 2008 |
| Operations | | | | |
| Net investment income (loss) | $ 54,867,219 | $ 60,028,470 | $ 32,196,554 | $ 27,373,072 |
| Net realized gain (loss) | 14,152,171 | 7,226,685 | 19,975,998 | 12,276,771 |
| Change in net unrealized | | | | |
| appreciation (depreciation) | 24,977,077 | 23,501,053 | 15,287,541 | 24,737,208 |
| Net increase (decrease) in net assets | | | | |
| resulting from operations | 93,996,467 | 90,756,208 | 67,460,093 | 64,387,051 |
| |
| Distributions to Shareholders | | | | |
| From net investment income: | | | | |
| Investor Class | (52,903,038) | (57,813,145) | (27,915,316) | (24,999,483) |
| Institutional Class | (304,250) | (106,601) | — | — |
| Advisor Class | (4,377,862) | (3,988,215) | (4,581,941) | (2,522,752) |
| C Class | — | (372,915) | — | — |
| R Class | (5,810) | (559) | — | — |
| From net realized gains: | | | | — |
| Investor Class | — | — | (9,207,971) | — |
| Advisor Class | — | — | (1,818,634) | — |
| Decrease in net assets from distributions | (57,590,960) | (62,281,435) | (43,523,862) | (27,522,235) |
| |
| Capital Share Transactions | | | | |
| Net increase (decrease) in net assets | | | | |
| from capital share transactions | 174,832,895 | (70,865,135) | 294,236,829 | 189,748,598 |
| |
| Net increase (decrease) in net assets | 211,238,402 | (42,390,362) | 318,173,060 | 226,613,414 |
| |
| Net Assets | | | | |
| Beginning of period | 1,280,698,113 | 1,323,088,475 | 767,615,897 | 541,002,483 |
| End of period | $1,491,936,515 | $1,280,698,113 | $1,085,788,957 | $767,615,897 |
| |
| Undistributed net investment income | $25,192 | — | $24,393 | — |
| |
| |
| See Notes to Financial Statements. | | | | |
46
| | | | |
| YEARS ENDED MARCH 31, 2009 AND MARCH 31, 2008 | | | |
| | Inflation-Adjusted Bond | Short-Term Government |
| Increase (Decrease) in Net Assets | 2009 | 2008 | 2009 | 2008 |
| Operations | | | | |
| Net investment income (loss) | $ 25,880,916 | $ 65,219,469 | $ 31,585,318 | $ 43,840,812 |
| Net realized gain (loss) | (12,148,518) | 9,291,202 | 5,558,102 | 18,099,248 |
| Change in net unrealized | | | | |
| appreciation (depreciation) | (42,996,340) | 78,032,274 | (4,819,809) | 14,951,187 |
| Net increase (decrease) in net assets | | | | |
| resulting from operations | (29,263,942) | 152,542,945 | 32,323,611 | 76,891,247 |
| |
| Distributions to Shareholders | | | | |
| From net investment income: | | | | |
| Investor Class | (35,773,321) | (33,985,965) | (30,710,941) | (43,042,945) |
| Institutional Class | (6,069,005) | (7,477,589) | — | — |
| Advisor Class | (18,030,179) | (20,054,534) | (1,215,052) | (1,121,139) |
| From tax return of capital: | | | | |
| Investor Class | (7,005,146) | — | — | — |
| Institutional Class | (1,188,435) | — | — | — |
| Advisor Class | (3,530,677) | — | — | — |
| Decrease in net assets from distributions | (71,596,763) | (61,518,088) | (31,925,993) | (44,164,084) |
| |
| Capital Share Transactions | | | | |
| Net increase (decrease) in net assets | | | | |
| from capital share transactions | 452,009,246 | 327,830,796 | (102,323,623) | 141,029,180 |
| |
| Net increase (decrease) in net assets | 351,148,541 | 418,855,653 | (101,926,005) | 173,756,343 |
| |
| Net Assets | | | | |
| Beginning of period | 1,547,112,014 | 1,128,256,361 | 1,138,326,218 | 964,569,875 |
| End of period | $1,898,260,555 | $1,547,112,014 | $1,036,400,213 | $1,138,326,218 |
| |
| Accumulated undistributed net | | | | |
| investment income (loss) | $(623,128) | $3,655,903 | $14,723 | — |
| |
| |
| See Notes to Financial Statements. | | | | |
47
|
| Notes to Financial Statements |
MARCH 31, 2009
1. Organization and Summary of Significant Accounting Policies
Organization — American Century Government Income Trust (the trust) is registered under the Investment Company Act of 1940 (the 1940 Act) as an open-end management investment company. Ginnie Mae Fund (Ginnie Mae), Government Bond Fund (Government Bond), Inflation-Adjusted Bond Fund (Inflation-Adjusted), and Short-Term Government Fund (Short-Term Government) (collectively, the funds) are four funds in a series issued by the trust. The funds are diversified under the 1940 Act.
Ginnie Mae seeks high current income while maintaining liquidity and safety of principal by investing primarily in Government National Mortgage Association certificates. In addition, Ginnie Mae may buy other U.S. government securities, including U.S. Treasury securities and other securities issued or guaranteed by the U.S. government and its agencies and instrumentalities. Government Bond seeks high current income and pursues this objective by investing primarily in U.S. government debt securities, including U.S. Treasury securities and other securities issued or guaranteed by the U.S. government and its agencies and instrumentalities. Inflation-Adjusted seeks to provide total return and inflation protection consistent with investment in inflation-indexed securities primarily issued by the U.S. Treasury, by other U.S. government agencies and instrumentalities, and by other, non-U.S. government entities such as corporations. Short-Term Government seeks high current income while maintaining safety of principal. Short-Term Government pursues its objective by investing primarily in U.S. government securities, including U.S. Treasury securities and other securities issued or guaranteed by the U.S. government and its agencies and instrumentalities. In addition, Short-Term Government may also invest in investment-grade debt securities, including debt securities of U.S. companies, and non-U.S. government mortgage-backed, asset-backed and other fixed-income securities. The following is a summary of the funds’ significant accounting policies.
Multiple Class — Ginnie Mae is authorized to issue the Investor Class, the Institutional Class, the Advisor Class and the R Class. Prior to December 3, 2007, Ginnie Mae was authorized to issue the C Class (see Note 10). Government Bond and Short-Term Government are authorized to issue the Investor Class and the Advisor Class. Inflation-Adjusted is authorized to issue the Investor Class, the Institutional Class and the Advisor Class. The share classes differ principally in their respective distribution and shareholder servicing expenses and arrangements. All shares of the funds represent an equal pro rata interest in the net assets of the class to which such shares belong, and have identical voting, dividend, liquidation and other rights and the same terms and conditions, except for class specific expenses and exclusive rights to vote on matters affecting only individual classes. Income, non-class specific expenses, and realized and unrealized capital gains and losses of the funds are allocated to each class of shares based on their relative net assets. Sale of Ginnie Mae’s Institutional Class and R Class commenced on September 28, 2007.
Security Valuations — Debt securities maturing in greater than 60 days at the time of purchase are valued at current market value as provided by a commercial pricing service or at the mean of the most recent bid and asked prices. Debt securities maturing within 60 days at the time of purchase may be valued at cost, plus or minus any amortized discount or premium. Discount notes may be valued through a commercial pricing service or at amortized cost, which approximates fair value. Investments in open-end management investment companies are valued at the reported net asset value. Securities traded on foreign securities exchanges and over-the-counter markets are normally completed before the close of business on days that the New York Stock Exchange (the Exchange) is open and may also take place on days when the Exchange is not open. If an event occurs after the value of a security was established but before the net asset value per share was determined that was likely to materially change the net asset value, that security would be valued at fair value as determined in accordance with procedures adopted by the Board of Trustees. If the funds determine that the market price of a portfolio security is not readily
48
available, or that the valuation methods mentioned above do not reflect the security’s fair value, such security is valued as determined by the Board of Trustees or its designee, in accordance with procedures adopted by the Board of Trustees, if such determination would materially impact a fund’s net asset value. Certain other circumstances may cause the funds to fair value a security such as: a security had been declared in default; or trading in a security has been halted during the trading day; or there is a foreign market holiday and no trading will commence.
Security Transactions — For financial reporting purposes, security transactions are accounted for as of the trade date. Net realized gains and losses are determined on the identified cost basis, which is also used for federal income tax purposes.
Investment Income — Interest income is recorded on the accrual basis and includes paydown gain (loss) and accretion of discounts and amortization of premiums. Inflation adjustments related to inflation-linked debt securities are reflected as interest income.
Securities on Loan — The funds may lend portfolio securities through their lending agent to certain approved borrowers in order to earn additional income. The income earned, net of any rebates or fees, is included in the Statement of Operations. The funds continue to recognize any gain or loss in the market price of the securities loaned and record any interest earned or dividends declared.
Futures Contracts — The funds may enter into futures contracts in order to manage the funds’ exposure to changes in market conditions. One of the risks of entering into futures contracts is the possibility that the change in value of the contract may not correlate with the changes in value of the underlying securities. Upon entering into a futures contract, the funds are required to deposit either cash or securities in an amount equal to a certain percentage of the contract value (initial margin). Subsequent payments (variation margin) are made or received daily, in cash, by the funds. The variation margin is equal to the daily change in the contract value and is recorded as unrealized gains and losses. The funds recognize a realized gain or loss when the contract is closed or expires. Net realized and unrealized gains or losses occurring during the holding period of futures contracts are a component of realized gain (loss) on futures and swaps transactions and unrealized appreciation (depreciation) on futures and swaps, respectively.
Swap Agreements — The funds may enter into swap agreements in order to attempt to obtain or preserve a particular return or spread at a lower cost than obtaining a return or spread through purchases and/or sales of instruments in other markets; protect against currency fluctuations; attempt to manage duration to protect against any increase in the price of securities the funds anticipate purchasing at a later date; or gain exposure to certain markets in the most economical way possible. A basic swap agreement is a contract in which two parties agree to exchange the returns earned or realized on predetermined investments or instruments. Credit default swaps enable an investor to buy/sell protection against a credit event of a specific issuer. The seller of credit protection against a security or basket of securities receives an up-front or periodic payment to compensate against potential default events. The funds may enhance returns by selling protection or attempt to mitigate credit risk by buying protection. The funds will segregate cash, cash equivalents or other appropriate liquid securities on their records in amounts sufficient to meet requirements. Unrealized gains are reported as an asset and unrealized losses are reported as a liability on the Statement of Assets and Liabilities. Swap agreements are valued daily at current market value as provided by a commercial pricing service and/or independent brokers. Changes in value, including the periodic amounts of interest to be paid or received on swaps, are recorded as unrealized appreciation (depreciation) on futures and swaps. Realized gain or loss is recorded upon receipt or payment of a periodic settlement or termination of swap agreements. The risks of entering into swap agreements include the possible lack of liquidity, failure of the counterparty to meet its obligations, and that there may be unfavorable changes in the underlying investments or instruments.
49
Repurchase Agreements — The funds may enter into repurchase agreements with institutions that American Century Investment Management, Inc. (ACIM) (the investment advisor) has determined are creditworthy pursuant to criteria adopted by the Board of Trustees. Each repurchase agreement is recorded at cost. Each fund requires that the collateral, represented by securities, received in a repurchase transaction be transferred to the custodian in a manner sufficient to enable each fund to obtain those securities in the event of a default under the repurchase agreement. ACIM monitors, on a daily basis, the securities transferred to ensure the value, including accrued interest, of the securities under each repurchase agreement is equal to or greater than amounts owed to each fund under each repurchase agreement.
Joint Trading Account — Pursuant to an Exemptive Order issued by the Securities and Exchange Commission, each fund, along with certain other funds in the American Century Investments family of funds, may transfer uninvested cash balances into a joint trading account. These balances are invested in one or more repurchase agreements that are collateralized by U.S. Treasury or Agency obligations.
When-Issued and Forward Commitments — The funds may engage in securities transactions on a when-issued or forward commitment basis. In these transactions, the securities’ prices and yields are fixed on the date of the commitment. In a when-issued transaction, the payment and delivery are scheduled for a future date and during this period, securities are subject to market fluctuations. In a forward commitment transaction, the funds may sell a security and at the same time make a commitment to purchase the same security at a future date at a specified price. Conversely, the funds may purchase a security and at the same time make a commitment to sell the same security at a future date at a specified price. These types of transactions are executed simultaneously in what are known as “roll” transactions. The funds will segregate cash, cash equivalents or other appropriate liquid securities on their records in amounts sufficient to meet the purchase price. The funds account for “roll” transactions as purchases and sales; as such these transactions may increase portfolio turnover.
Income Tax Status — It is each fund’s policy to distribute substantially all net investment income and net realized gains to shareholders and to otherwise qualify as a regulated investment company under provisions of the Internal Revenue Code. The funds are no longer subject to examination by tax authorities for years prior to 2006. At this time, management believes there are no uncertain tax positions which, based on their technical merit, would not be sustained upon examination and for which it is reasonably possible that the total amounts of unrecognized tax benefits will significantly change in the next twelve months. Accordingly, no provision has been made for federal or state income taxes. Interest and penalties associated with any federal or state income tax obligations, if any, are recorded as interest expense.
Distributions to Shareholders — Distributions from net investment income for Ginnie Mae, Government Bond and Short-Term Government are declared daily and paid monthly. Distributions from net investment income for Inflation-Adjusted are declared and paid quarterly. Distributions from net realized gains for the funds, if any, are generally declared and paid annually.
Indemnifications — Under the trust’s organizational documents, its officers and trustees are indemnified against certain liabilities arising out of the performance of their duties to the funds. In addition, in the normal course of business, the funds enter into contracts that provide general indemnifications. The funds’ maximum exposure under these arrangements is unknown as this would involve future claims that may be made against the funds. The risk of material loss from such claims is considered by management to be remote.
Use of Estimates — The financial statements are prepared in conformity with accounting principles generally accepted in the United States of America, which may require management to make certain estimates and assumptions at the date of the financial statements. Actual results could differ from these estimates.
50
2. Fees and Transactions with Related Parties
Management Fees — The trust has entered into a Management Agreement with ACIM, under which ACIM provides the funds with investment advisory and management services in exchange for a single, unified management fee (the fee) per class. The Agreement provides that all expenses of the funds, except brokerage commissions, taxes, interest, fees and expenses of those trustees who are not considered “interested persons” as defined in the 1940 Act (including counsel fees) and extraordinary expenses, will be paid by ACIM. The fee is computed and accrued daily based on the daily net assets of each specific class of shares of each fund and paid monthly in arrears. The fee consists of (1) an Investment Category Fee based on the daily net assets of the funds and certain other accounts managed by the investment advisor that are in the same broad investment category as each fund and (2) a Complex Fee based on the assets of all the funds in the American Century Investments family of funds. The rates for the Investment Category Fee for Ginnie Mae and Short-Term Government range from 0.2425% to 0.3600%, and for Government Bond and Inflation-Adjusted range from 0.1625% to 0.2800%. The rates for the Complex Fee (Investor Class, Advisor Class and R Class) for the funds range from 0.2500% to 0.3100%. The Institutional Class is 0.2000% less at each point within the Complex Fee range. From April 1, 2008 to July 31, 2008, the investment advisor voluntarily agreed to waive 0.079% of its management fee for Ginnie Mae. Effective August 1, 2008, the investment advisor voluntarily agreed to waive 0.02% of its management fee for Ginnie Mae. The total amount of the waiver for the year ended March 31, 2009, was $478,001, $2,544, $40,374 and $36 for the Investor Class, Institutional Class, Advisor Class and R Class, respectively. The fee waiver may be revised or terminated at any time without notice.
The effective annual management fee for each class of each fund for the year ended March 31, 2009, was as follows:
| | Investor | Institutional | Advisor | R |
| Ginnie Mae (before waiver) | 0.57% | 0.37% | 0.57% | 0.57% |
| Ginnie Mae (after waiver) | 0.53% | 0.33% | 0.53% | 0.53% |
| Government Bond | 0.49% | N/A | 0.49% | N/A |
| Inflation-Adjusted | 0.49% | 0.29% | 0.49% | N/A |
| Short-Term Government | 0.57% | N/A | 0.57% | N/A |
Distribution and Service Fees — The Board of Trustees has adopted a separate Master Distribution and Individual Shareholder Services Plan for each of the Advisor Class and R Class (collectively, the plans), pursuant to Rule 12b-1 of the 1940 Act. The plans provide that the Advisor Class will pay American Century Investment Services, Inc. (ACIS) an annual distribution and service fee of 0.25%. The plans provide that the R Class will pay ACIS an annual distribution and service fee of 0.50%. The fees are computed and accrued daily based on each class’s daily net assets and paid monthly in arrears. The fees are used to pay financial intermediaries for distribution and individual shareholder services. Fees incurred under the plans during the year ended March 31, 2009, are detailed in the Statement of Operations.
Related Parties — Certain officers and trustees of the trust are also officers and/or directors of American Century Companies, Inc. (ACC), the parent of the trust’s investment advisor, ACIM, the distributor of the trust, ACIS, and the trust’s transfer agent, American Century Services, LLC. Directors of these entities are officers and directors of other entities and those other entities own 33% of the outstanding shares of Short-Term Government.
Effective May 15, 2008, the funds are eligible to invest in a money market fund for temporary purposes, which is managed by J.P. Morgan Investment Management, Inc. (JPMIM). The funds have a Mutual Funds Services Agreement with J.P. Morgan Investor Services Co. (JPMIS) and a securities lending agreement with JPMorgan Chase Bank (JPMCB). JPMCB is a custodian of the funds. JPMIM, JPMIS and JPMCB are wholly owned subsidiaries of JPMorgan Chase & Co. (JPM). JPM is an equity investor in ACC.
51
3. Investment Transactions
Investment transactions, excluding short-term investments, for the year ended March 31, 2009, were as follows:
| | | | | Short-Term |
| | Ginnie Mae | Government Bond | Inflation-Adjusted | Government |
| Purchases | | | | |
| U.S. Treasury & Government | | | | |
| Agency Obligations | $3,366,562,274 | $2,602,041,785 | $636,235,652 | $1,172,431,661 |
| Investment securities other than | | | | |
| U.S. Treasury & Government | | | | |
| Agency Obligations | $1,554,951,893 | $902,681,938 | $83,130,969 | $83,929,663 |
| Proceeds from sales | | | | |
| U.S. Treasury & Government | | | | |
| Agency Obligations | $3,016,885,366 | $2,295,346,368 | $284,491,007 | $1,223,743,255 |
| Investment securities other than | | | | |
| U.S. Treasury & Government | | | | |
| Agency Obligations | $1,720,985,301 | $869,543,978 | $11,496,641 | $31,485,578 |
52
4. Capital Share Transactions
Transactions in shares of the funds were as follows (unlimited number of shares authorized):
| | | | |
| | Year ended March 31, 2009 | Year ended March 31, 2008(1) |
| | Shares | Amount | Shares | Amount |
| |
| Ginnie Mae | | | | |
| Investor Class | | | | |
| Sold | 32,829,256 | $ 341,873,728 | 12,040,291 | $ 122,889,655 |
| Issued in reinvestment of distributions | 4,488,442 | 46,471,540 | 4,830,929 | 49,260,584 |
| Redeemed | (25,489,751) | (263,992,392) | (23,500,177) | (238,953,395) |
| | 11,827,947 | 124,352,876 | (6,628,957) | (66,803,156) |
| Institutional Class | | | | |
| Sold | 355,093 | 3,717,612 | 603,792 | 6,189,083 |
| Issued in reinvestment of distributions | 29,378 | 304,250 | 10,096 | 104,885 |
| Redeemed | (224,249) | (2,344,512) | (23,359) | (241,514) |
| | 160,222 | 1,677,350 | 590,529 | 6,052,454 |
| Advisor Class | | | | |
| Sold | 8,728,801 | 91,118,476 | 3,665,454 | 37,424,219 |
| Issued in connection with | | | | |
| reclassification (Note 10) | — | — | 616,398 | 6,366,954 |
| Issued in reinvestment of distributions | 279,999 | 2,905,147 | 266,216 | 2,715,213 |
| Redeemed | (4,415,944) | (45,736,617) | (3,843,011) | (39,232,541) |
| | 4,592,856 | 48,287,006 | 705,057 | 7,273,845 |
| C Class | N/A | | | |
| Sold | | | 38,155 | 386,577 |
| Issued in reinvestment of distributions | | | 31,753 | 319,714 |
| Redeemed in connection with | | | | |
| reclassification (Note 10) | | | (616,398) | (6,366,954) |
| Redeemed | | | (1,161,216) | (11,753,154) |
| | | | (1,707,706) | (17,413,817) |
| R Class | | | | |
| Sold | 74,033 | 776,100 | 2,473 | 24,988 |
| Issued in reinvestment of distributions | 561 | 5,810 | 53 | 551 |
| Redeemed | (25,030) | (266,247) | — | — |
| | 49,564 | 515,663 | 2,526 | 25,539 |
| Net increase (decrease) | 16,630,589 | $ 174,832,895 | (7,038,551) | $ (70,865,135) |
(1) September 28, 2007 (commencement of sale) through March 31, 2008 for the Institutional Class and the R Class of Ginnie Mae.
53
| | | | |
| | Year ended March 31, 2009 | Year ended March 31, 2008 |
| | Shares | Amount | Shares | Amount |
| |
| Government Bond | | | | |
| Investor Class | | | | |
| Sold | 51,486,232 | $ 565,183,128 | 26,538,987 | $ 282,961,488 |
| Issued in reinvestment of distributions | 3,215,231 | 35,202,987 | 2,164,845 | 22,978,888 |
| Redeemed | (35,100,499) | (386,343,011) | (16,647,809) | (176,824,621) |
| | 19,600,964 | 214,043,104 | 12,056,023 | 129,115,755 |
| Advisor Class | | | | |
| Sold | 15,822,548 | 173,684,498 | 7,922,901 | 84,808,627 |
| Issued in reinvestment of distributions | 413,087 | 4,530,640 | 186,444 | 1,986,555 |
| Redeemed | (8,922,286) | (98,021,413) | (2,450,824) | (26,162,339) |
| | 7,313,349 | 80,193,725 | 5,658,521 | 60,632,843 |
| Net increase (decrease) | 26,914,313 | $ 294,236,829 | 17,714,544 | $ 189,748,598 |
| |
| Inflation-Adjusted | | | | |
| Investor Class | | | | |
| Sold | 76,152,733 | $ 838,312,291 | 45,189,675 | $ 511,117,147 |
| Issued in reinvestment of distributions | 3,153,599 | 35,201,707 | 2,363,258 | 25,900,406 |
| Redeemed | (48,132,553) | (519,904,532) | (25,956,661) | (284,928,103) |
| | 31,173,779 | 353,609,466 | 21,596,272 | 252,089,450 |
| Institutional Class | | | | |
| Sold | 12,820,699 | 137,238,707 | 6,285,842 | 69,645,632 |
| Issued in reinvestment of distributions | 451,896 | 5,040,691 | 484,844 | 5,289,594 |
| Redeemed | (8,437,070) | (91,100,590) | (3,539,847) | (39,262,951) |
| | 4,835,525 | 51,178,808 | 3,230,839 | 35,672,275 |
| Advisor Class | | | | |
| Sold | 25,458,862 | 282,528,812 | 19,728,802 | 222,750,562 |
| Issued in reinvestment of distributions | 1,861,125 | 20,737,752 | 1,762,357 | 19,175,429 |
| Redeemed | (23,660,020) | (256,045,592) | (18,544,928) | (201,856,920) |
| | 3,659,967 | 47,220,972 | 2,946,231 | 40,069,071 |
| Net increase (decrease) | 39,669,271 | $ 452,009,246 | 27,773,342 | $ 327,830,796 |
| |
| Short-Term Government | | | | |
| Investor Class | | | | |
| Sold | 39,340,035 | $ 376,206,636 | 43,538,823 | $ 413,115,547 |
| Issued in reinvestment of distributions | 3,131,775 | 29,924,118 | 4,428,016 | 41,891,320 |
| Redeemed | (56,518,631) | (540,804,490) | (33,374,658) | (317,997,836) |
| | (14,046,821) | (134,673,736) | 14,592,181 | 137,009,031 |
| Advisor Class | | | | |
| Sold | 6,356,507 | 60,744,997 | 1,447,952 | 13,767,726 |
| Issued in reinvestment of distributions | 125,967 | 1,204,148 | 118,282 | 1,117,841 |
| Redeemed | (3,091,545) | (29,599,032) | (1,150,476) | (10,865,418) |
| | 3,390,929 | 32,350,113 | 415,758 | 4,020,149 |
| Net increase (decrease) | (10,655,892) | $(102,323,623) | 15,007,939 | $ 141,029,180 |
54
5. Securities Lending
As of March 31, 2009 the funds did not have any securities on loan. JPMCB receives and maintains collateral in the form of cash and/or acceptable securities as approved by ACIM. Cash collateral is invested in authorized investments by the lending agent in a pooled account. The value of cash collateral received at period end is disclosed in the Statement of Assets and Liabilities and investments made with the cash by the lending agent are listed in the Schedule of Investments. Any deficiencies or excess of collateral must be delivered or transferred by the member firms no later than the close of business on the next business day. The fund’s risks in securities lending are that the borrower may not provide additional collateral when required or return the securities when due. If the borrower defaults, receipt of the collateral by the funds may be delayed or limited. Investments made with cash collateral may decline in value.
6. Fair Value Measurements
The funds’ securities valuation process is based on several considerations and may use multiple inputs to determine the fair value of the positions held by the funds. In conformity with accounting principles generally accepted in the United States of America, the inputs used to determine a valuation are classified into three broad levels as follows:
• Level 1 valuation inputs consist of actual quoted prices based on an active market;
• Level 2 valuation inputs consist of significant direct or indirect observable market data; or
• Level 3 valuation inputs consist of significant unobservable inputs such as a fund’s own assumptions.
The level classification is based on the lowest level input that is significant to the fair valuation measurement. The valuation inputs are not an indication of the risks associated with investing in these securities or other financial instruments.
55
The following is a summary of the valuation inputs used to determine the fair value of the funds’ securities and other financial instruments as of March 31, 2009:
| | |
| | Value of | Unrealized Gain (Loss) on |
| Fund/Valuation Inputs | Investment Securities | Other Financial Instruments* |
| |
| Ginnie Mae | | |
| Level 1 — Quoted Prices | $ 3,306,967 | — |
| Level 2 — Other Significant Observable Inputs | 1,725,421,239 | — |
| Level 3 — Significant Unobservable Inputs | — | — |
| | $1,728,728,206 | — |
| |
| Government Bond | | |
| Level 1 — Quoted Prices | $ 1,075 | $(468,166) |
| Level 2 — Other Significant Observable Inputs | 1,250,388,378 | — |
| Level 3 — Significant Unobservable Inputs | — | — |
| | $1,250,389,453 | $(468,166) |
| |
| Inflation-Adjusted | | |
| Level 1 — Quoted Prices | $ 541 | — |
| Level 2 — Other Significant Observable Inputs | 1,891,118,343 | $(7,242,723) |
| Level 3 — Significant Unobservable Inputs | — | — |
| | $1,891,118,884 | $(7,242,723) |
| |
| Short-Term Government | | |
| Level 1 — Quoted Prices | $ 5,097,594 | $742,950 |
| Level 2 — Other Significant Observable Inputs | 1,024,461,585 | — |
| Level 3 — Significant Unobservable Inputs | — | — |
| | $1,029,559,179 | $742,950 |
| *Includes futures contracts and swap agreements. | | |
7. Bank Line of Credit
The funds, along with certain other funds in the American Century Investments family of funds, had a $500,000,000 unsecured bank line of credit agreement with Bank of America, N.A. The line expired December 10, 2008, and was not renewed. The agreement allowed the funds to borrow money for temporary or emergency purposes to fund shareholder redemptions. Borrowings under the agreement were subject to interest at the Federal Funds rate plus 0.40%. The funds did not borrow from the line during the year ended March 31, 2009.
8. Interfund Lending
The funds, along with certain other funds in the American Century Investments family of funds, may participate in an interfund lending program, pursuant to an Exemptive Order issued by the Securities and Exchange Commission (SEC). This program provides an alternative credit facility allowing the funds to borrow from or lend to other funds in the American Century Investments family of funds that permit such transactions. Interfund lending transactions are subject to each fund’s investment policies and borrowing and lending limits. The interfund loan rate earned/paid on interfund lending transactions is determined daily based on the average of certain current market rates. Interfund lending transactions normally extend only overnight, but can have a maximum duration of seven days. The program is subject to annual approval by the Board of Trustees. During the year ended March 31, 2009, the funds did not utilize the program.
56
9. Federal Tax Information
The tax character of distributions paid during the years ended March 31, 2009 and March 31, 2008 were as follows:
| | | | |
| | Ginnie Mae | Government Bond |
| | 2009 | 2008 | 2009 | 2008 |
| Distributions Paid From | | | | |
| Ordinary income | $57,590,960 | $62,281,435 | $38,560,988 | $27,522,235 |
| Long-term capital gains | — | — | $4,962,874 | — |
| Return of capital | — | — | — | — |
| |
| | Inflation-Adjusted | Short-Term Government |
| | 2009 | 2008 | 2009 | 2008 |
| Distributions Paid From | | | | |
| Ordinary income | $59,872,505 | $61,518,088 | $31,925,993 | $44,164,084 |
| Long-term capital gains | — | — | — | — |
| Return of capital | $11,724,258 | — | — | — |
The book-basis character of distributions made during the year from net investment income or net realized gains may differ from their ultimate characterization for federal income tax purposes. These differences reflect the differing character of paydown losses, certain income items and net realized gains and losses for financial statement and tax purposes, and may result in reclassification among certain capital accounts on the financial statements.
As of March 31, 2009, the components of distributable earnings on a tax-basis and the federal tax cost of investments were as follows:
| | | | | Short-Term |
| | Ginnie Mae | Government Bond | Inflation-Adjusted | Government |
| Federal tax cost of investments | $1,693,567,882 | $1,213,320,791 | $1,843,865,697 | $1,023,905,051 |
| Gross tax appreciation | | | | |
| of investments | $35,684,981 | $38,948,471 | $55,982,817 | $13,113,063 |
| Gross tax depreciation | | | | |
| of investments | (524,657) | (1,879,809) | (8,729,630) | (7,458,935) |
| Net tax appreciation (depreciation) | | | | |
| of investments | $35,160,324 | $37,068,662 | $47,253,187 | $ 5,654,128 |
| Net tax appreciation (depreciation) | | | | |
| of derivatives | — | — | (7,242,723) | — |
| Net tax appreciation (depreciation) | $35,160,324 | $37,068,662 | $40,010,464 | $ 5,654,128 |
| Undistributed ordinary income | $25,192 | $8,392,236 | — | $14,723 |
| Accumulated long-term gains | — | $4,222,646 | — | — |
| Accumulated capital losses | $(42,395,552) | — | $(16,017,566) | $(16,774,753) |
| Capital loss deferrals | $(260,480) | — | $(3,346,096) | — |
The difference between book-basis and tax-basis cost and unrealized appreciation (depreciation) is attributable primarily to the tax deferral of losses on wash sales, straddle positions and the realization for tax purposes of unrealized gains for certain futures contracts.
57
The accumulated capital losses listed on the previous page represent net capital loss carryovers that may be used to offset future realized capital gains for federal income tax purposes. Future capital loss carryover utilization in any given year may be limited due to large shareholder redemptions. The capital loss carryovers expire as follows:
| | | | | | |
| | 2012 | 2013 | 2014 | 2015 | 2016 | 2017 |
| Ginnie Mae | $(12,241,398) | $(11,922,927) | $(10,878,793) | $(7,352,434) | — | — |
| Inflation-Adjusted | — | — | — | $(10,244,385) | — | $(5,773,181) |
| Short-Term Government | — | $(1,735,786) | $(7,433,319) | $(7,605,648) | — | — |
The capital loss deferrals listed on the previous page represent net capital losses incurred in the five-month period ended March 31, 2009. The funds have elected to treat such losses as having been incurred in the following fiscal year for federal income tax purposes.
10. Corporate Event
On December 8, 2006, the Board of Trustees approved a reclassification of C Class shares of Ginnie Mae into Advisor Class shares. The reclassification was effective December 3, 2007.
11. Recently Issued Accounting Standards
The Financial Accounting Standards Board (FASB) issued Statement of Financial Accounting Standards No. 157, “Fair Value Measurements” (FAS 157), in September 2006, which is effective for fiscal years beginning after November 15, 2007. FAS 157 defines fair value, establishes a framework for measuring fair value and expands the required financial statement disclosures about fair value measurements. The adoption of FAS 157 did not materially impact the determination of fair value.
In March 2008, the FASB issued Statement of Financial Accounting Standards No. 161, “Disclosures about Derivative Instruments and Hedging Activities — an amendment of FASB Statement No. 133” (FAS 161). FAS 161 is effective for interim periods beginning after November 15, 2008. FAS 161 amends and expands disclosures about derivative instruments and hedging activities. FAS 161 requires qualitative disclosures about the objectives and strategies of derivative instruments, quantitative disclosures about the fair value amounts of and gains and losses on derivative instruments, and disclosures of credit-risk-related contingent features in hedging activities. Management is currently evaluating the impact that adopting FAS 161 will have on the financial statement disclosures.
12. Other Tax Information (Unaudited)
The following information is provided pursuant to provisions of the Internal Revenue Code.
Government Bond hereby designates $4,962,874 of long-term capital gain distributions, or up to the maximum amount allowable, for the fiscal year ended March 31, 2009.
Government Bond hereby designates $6,063,731 of distributions as qualified short-term capital gains for purposes of Internal Revenue Code Section 871.
58
| | | | | |
| Financial Highlights | | | | |
| Ginnie Mae | | | | | |
| |
| Investor Class | | | | | |
| For a Share Outstanding Throughout the Years Ended March 31 | | | |
| | 2009 | 2008 | 2007 | 2006 | 2005 |
| Per-Share Data | | | | | |
| Net Asset Value, Beginning of Period | $10.40 | $10.17 | $10.11 | $10.34 | $10.61 |
| Income From Investment Operations | | | | | |
| Net Investment Income (Loss)(1) | 0.43 | 0.48 | 0.48 | 0.43 | 0.37 |
| Net Realized and Unrealized Gain (Loss) | 0.30 | 0.25 | 0.08 | (0.18) | (0.15) |
| Total From Investment Operations | 0.73 | 0.73 | 0.56 | 0.25 | 0.22 |
| Distributions | | | | | |
| From Net Investment Income | (0.45) | (0.50) | (0.50) | (0.48) | (0.49) |
| Net Asset Value, End of Period | $10.68 | $10.40 | $10.17 | $10.11 | $10.34 |
| |
| Total Return(2) | 7.22% | 7.39% | 5.69% | 2.47% | 2.11% |
| |
| Ratios/Supplemental Data | | | | | |
| Ratio of Operating Expenses | | | | | |
| to Average Net Assets | 0.53%(3) | 0.52%(3) | 0.57% | 0.57% | 0.58% |
| Ratio of Operating Expenses to Average | | | | | |
| Net Assets (Before Expense Waiver) | 0.57% | 0.57% | 0.57% | 0.57% | 0.58% |
| Ratio of Net Investment Income (Loss) | | | | | |
| to Average Net Assets | 4.12%(3) | 4.73%(3) | 4.71% | 4.15% | 3.58% |
| Ratio of Net Investment Income (Loss) | | | | | |
| to Average Net Assets | | | | | |
| (Before Expense Waiver) | 4.08% | 4.68% | 4.71% | 4.15% | 3.58% |
| Portfolio Turnover Rate | 330% | 338% | 410% | 315% | 315% |
| Net Assets, End of Period (in thousands) | $1,336,491 | $1,179,206 | $1,219,743 | $1,382,022 | $1,482,999 |
| (1) | Computed using average shares outstanding throughout the period. |
| (2) | Total return assumes reinvestment of net investment income and capital gains distributions, if any. The total return of the classes may not precisely reflect the class expense differences because of the impact of calculating the net asset values to two decimal places. If net asset values were calculated to three decimal places, the total return differences would more closely reflect the class expense differences. The calculation of net asset values to two decimal places is made in accordance with SEC guidelines and does not result in any gain or loss of value between one class and another. |
| (3) | Effective August 1, 2007, the investment advisor voluntarily agreed to waive a portion of its management fee. |
See Notes to Financial Statements.
59
| | |
| Ginnie Mae | | |
| |
| Institutional Class | | |
| For a Share Outstanding Throughout the Years Ended March 31 (except as noted) | |
| | 2009 | 2008(1) |
| Per-Share Data | | |
| Net Asset Value, Beginning of Period | $10.40 | $10.11 |
| Income From Investment Operations | | |
| Net Investment Income (Loss)(2) | 0.45 | 0.25 |
| Net Realized and Unrealized Gain (Loss) | 0.30 | 0.30 |
| Total From Investment Operations | 0.75 | 0.55 |
| Distributions | | |
| From Net Investment Income | (0.47) | (0.26) |
| Net Asset Value, End of Period | $10.68 | $10.40 |
| |
| Total Return(3) | 7.44% | 5.45% |
| |
| Ratios/Supplemental Data | | |
| Ratio of Operating Expenses to Average Net Assets(4) | 0.33% | 0.29%(5) |
| Ratio of Operating Expenses to Average Net Assets (Before Expense Waiver) | 0.37% | 0.37%(5) |
| Ratio of Net Investment Income (Loss) to Average Net Assets(4) | 4.32% | 4.86%(5) |
| Ratio of Net Investment Income (Loss) to Average Net Assets | | |
| (Before Expense Waiver) | 4.28% | 4.78%(5) |
| Portfolio Turnover Rate | 330% | 338%(6) |
| Net Assets, End of Period (in thousands) | $8,016 | $6,143 |
| (1) | September, 28, 2007 (commencement of sale) through March 31, 2008. |
| (2) | Computed using average shares outstanding throughout the period. |
| (3) | Total return assumes reinvestment of net investment income and capital gains distributions, if any. Total returns for periods less than one year are not annualized. The total return of the classes may not precisely reflect the class expense differences because of the impact of calculating the net asset values to two decimal places. If net asset values were calculated to three decimal places, the total return differences would more closely reflect the class expense differences. The calculation of net asset values to two decimal places is made in accordance with SEC guidelines and does not result in any gain or loss of value between one class and another. |
| (4) | Effective August 1, 2007, the investment advisor voluntarily agreed to waive a portion of its management fee. |
| (5) | Annualized. |
| (6) | Portfolio turnover is calculated at the fund level. Percentage indicated was calculated for the year ended March 31, 2008. |
See Notes to Financial Statements.
60
| | | | | |
| Ginnie Mae | | | | | |
| |
| Advisor Class | | | | | |
| For a Share Outstanding Throughout the Years Ended March 31 | | | |
| | 2009 | 2008 | 2007 | 2006 | 2005 |
| Per-Share Data | | | | | |
| Net Asset Value, Beginning of Period | $10.40 | $10.17 | $10.11 | $10.34 | $10.61 |
| Income From Investment Operations | | | | | |
| Net Investment Income (Loss)(1) | 0.40 | 0.46 | 0.45 | 0.40 | 0.35 |
| Net Realized and Unrealized Gain (Loss) | 0.30 | 0.24 | 0.08 | (0.17) | (0.16) |
| Total From Investment Operations | 0.70 | 0.70 | 0.53 | 0.23 | 0.19 |
| Distributions | | | | | |
| From Net Investment Income | (0.42) | (0.47) | (0.47) | (0.46) | (0.46) |
| Net Asset Value, End of Period | $10.68 | $10.40 | $10.17 | $10.11 | $10.34 |
| |
| Total Return(2) | 6.96% | 7.12% | 5.42% | 2.22% | 1.85% |
| |
| Ratios/Supplemental Data | | | | | |
| Ratio of Operating Expenses | | | | | |
| to Average Net Assets | 0.78%(3) | 0.77%(3) | 0.82% | 0.82% | 0.83% |
| Ratio of Operating Expenses to Average | | | | | |
| Net Assets (Before Expense Waiver) | 0.82% | 0.82% | 0.82% | 0.82% | 0.83% |
| Ratio of Net Investment Income (Loss) | | | | | |
| to Average Net Assets | 3.87%(3) | 4.48%(3) | 4.46% | 3.90% | 3.33% |
| Ratio of Net Investment Income (Loss) | | | | | |
| to Average Net Assets | | | | | |
| (Before Expense Waiver) | 3.83% | 4.43% | 4.46% | 3.90% | 3.33% |
| Portfolio Turnover Rate | 330% | 338% | 410% | 315% | 315% |
| Net Assets, End of Period (in thousands) | $146,874 | $95,323 | $85,984 | $73,998 | $72,571 |
| (1) | Computed using average shares outstanding throughout the period. |
| (2) | Total return assumes reinvestment of net investment income and capital gains distributions, if any. The total return of the classes may not precisely reflect the class expense differences because of the impact of calculating the net asset values to two decimal places. If net asset values were calculated to three decimal places, the total return differences would more closely reflect the class expense differences. The calculation of net asset values to two decimal places is made in accordance with SEC guidelines and does not result in any gain or loss of value between one class and another. |
| (3) | Effective August 1, 2007, the investment advisor voluntarily agreed to waive a portion of its management fee. |
See Notes to Financial Statements.
61
| | |
| Ginnie Mae | | |
| |
| R Class | | |
| For a Share Outstanding Throughout the Years Ended March 31 (except as noted) | |
| | 2009 | 2008(1) |
| Per-Share Data | | |
| Net Asset Value, Beginning of Period | $10.40 | $10.11 |
| Income From Investment Operations | | |
| Net Investment Income (Loss)(2) | 0.36 | 0.22 |
| Net Realized and Unrealized Gain (Loss) | 0.32 | 0.29 |
| Total From Investment Operations | 0.68 | 0.51 |
| Distributions | | |
| From Net Investment Income | (0.40) | (0.22) |
| Net Asset Value, End of Period | $10.68 | $10.40 |
| |
| Total Return(3) | 6.69% | 5.09% |
| |
| Ratios/Supplemental Data | | |
| Ratio of Operating Expenses to Average Net Assets(4) | 1.03% | 0.99%(5) |
| Ratio of Operating Expenses to Average Net Assets (Before Expense Waiver) | 1.07% | 1.07%(5) |
| Ratio of Net Investment Income (Loss) to Average Net Assets(4) | 3.62% | 4.19%(5) |
| Ratio of Net Investment Income (Loss) to Average Net Assets | | |
| (Before Expense Waiver) | 3.58% | 4.11%(5) |
| Portfolio Turnover Rate | 330% | 338%(6) |
| Net Assets, End of Period (in thousands) | $556 | $26 |
| (1) | September, 28, 2007 (commencement of sale) through March 31, 2008. |
| (2) | Computed using average shares outstanding throughout the period. |
| (3) | Total return assumes reinvestment of net investment income and capital gains distributions, if any. Total returns for periods less than one year are not annualized. The total return of the classes may not precisely reflect the class expense differences because of the impact of calculating the net asset values to two decimal places. If net asset values were calculated to three decimal places, the total return differences would more closely reflect the class expense differences. The calculation of net asset values to two decimal places is made in accordance with SEC guidelines and does not result in any gain or loss of value between one class and another. |
| (4) | Effective August 1, 2007, the investment advisor voluntarily agreed to waive a portion of its management fee. |
| (5) | Annualized. |
| (6) | Portfolio turnover is calculated at the fund level. Percentage indicated was calculated for the year ended March 31, 2008. |
See Notes to Financial Statements.
62
| | | | | |
| Government Bond | | | | | |
| |
| Investor Class | | | | | |
| For a Share Outstanding Throughout the Years Ended March 31 | | | |
| | 2009 | 2008 | 2007 | 2006 | 2005 |
| Per-Share Data | | | | | |
| Net Asset Value, Beginning of Period | $11.05 | $10.45 | $10.33 | $10.52 | $10.93 |
| Income From Investment Operations | | | | | |
| Net Investment Income (Loss)(1) | 0.39 | 0.47 | 0.48 | 0.42 | 0.29 |
| Net Realized and Unrealized Gain (Loss) | 0.34 | 0.60 | 0.12 | (0.19) | (0.24) |
| Total From Investment Operations | 0.73 | 1.07 | 0.60 | 0.23 | 0.05 |
| Distributions | | | | | |
| From Net Investment Income | (0.40) | (0.47) | (0.48) | (0.42) | (0.30) |
| From Net Realized Gains | (0.12) | — | — | — | (0.16) |
| Total Distributions | (0.52) | (0.47) | (0.48) | (0.42) | (0.46) |
| Net Asset Value, End of Period | $11.26 | $11.05 | $10.45 | $10.33 | $10.52 |
| |
| Total Return(2) | 6.90% | 10.58% | 5.95% | 2.17% | 0.50% |
| |
| Ratios/Supplemental Data | | | | | |
| Ratio of Operating Expenses | | | | | |
| to Average Net Assets | 0.49% | 0.49% | 0.49% | 0.49% | 0.50% |
| Ratio of Net Investment Income (Loss) | | | | | |
| to Average Net Assets | 3.58% | 4.45% | 4.60% | 3.94% | 2.70% |
| Portfolio Turnover Rate | 335% | 239% | 319% | 416% | 553% |
| Net Assets, End of Period (in thousands) | $895,833 | $662,104 | $500,331 | $524,557 | $438,997 |
| (1) | Computed using average shares outstanding throughout the period. |
| (2) | Total return assumes reinvestment of net investment income and capital gains distributions, if any. The total return of the classes may not precisely reflect the class expense differences because of the impact of calculating the net asset values to two decimal places. If net asset values were calculated to three decimal places, the total return differences would more closely reflect the class expense differences. The calculation of net asset values to two decimal places is made in accordance with SEC guidelines and does not result in any gain or loss of value between one class and another. |
See Notes to Financial Statements.
63
| | | | | |
| Government Bond | | | | | |
| |
| Advisor Class | | | | | |
| For a Share Outstanding Throughout the Years Ended March 31 | | | |
| | 2009 | 2008 | 2007 | 2006 | 2005 |
| Per-Share Data | | | | | |
| Net Asset Value, Beginning of Period | $11.05 | $10.45 | $10.33 | $10.52 | $10.93 |
| Income From Investment Operations | | | | | |
| Net Investment Income (Loss)(1) | 0.36 | 0.44 | 0.45 | 0.39 | 0.26 |
| Net Realized and Unrealized Gain (Loss) | 0.35 | 0.61 | 0.12 | (0.19) | (0.24) |
| Total From Investment Operations | 0.71 | 1.05 | 0.57 | 0.20 | 0.02 |
| Distributions | | | | | |
| From Net Investment Income | (0.38) | (0.45) | (0.45) | (0.39) | (0.27) |
| From Net Realized Gains | (0.12) | — | — | — | (0.16) |
| Total Distributions | (0.50) | (0.45) | (0.45) | (0.39) | (0.43) |
| Net Asset Value, End of Period | $11.26 | $11.05 | $10.45 | $10.33 | $10.52 |
| |
| Total Return(2) | 6.64% | 10.31% | 5.69% | 1.91% | 0.25% |
| |
| Ratios/Supplemental Data | | | | | |
| Ratio of Operating Expenses | | | | | |
| to Average Net Assets | 0.74% | 0.74% | 0.74% | 0.74% | 0.75% |
| Ratio of Net Investment Income (Loss) | | | | | |
| to Average Net Assets | 3.33% | 4.20% | 4.35% | 3.69% | 2.45% |
| Portfolio Turnover Rate | 335% | 239% | 319% | 416% | 553% |
| Net Assets, End of Period (in thousands) | $189,956 | $105,512 | $40,671 | $41,336 | $48,674 |
| (1) | Computed using average shares outstanding throughout the period. |
| (2) | Total return assumes reinvestment of net investment income and capital gains distributions, if any. The total return of the classes may not precisely reflect the class expense differences because of the impact of calculating the net asset values to two decimal places. If net asset values were calculated to three decimal places, the total return differences would more closely reflect the class expense differences. The calculation of net asset values to two decimal places is made in accordance with SEC guidelines and does not result in any gain or loss of value between one class and another. |
See Notes to Financial Statements.
64
| | | | | |
| Inflation-Adjusted Bond | | | | |
| |
| Investor Class | | | | | |
| For a Share Outstanding Throughout the Years Ended March 31 | | | |
| | 2009 | 2008 | 2007 | 2006 | 2005 |
| Per-Share Data | | | | | |
| Net Asset Value, Beginning of Period | $11.72 | $10.83 | $10.73 | $11.25 | $11.45 |
| Income From Investment Operations | | | | | |
| Net Investment Income (Loss) | 0.17(1) | 0.62 | 0.38 | 0.56 | 0.45 |
| Net Realized and Unrealized Gain (Loss) | (0.35) | 0.85 | 0.11 | (0.49) | (0.17) |
| Total From Investment Operations | (0.18) | 1.47 | 0.49 | 0.07 | 0.28 |
| Distributions | | | | | |
| From Net Investment Income | (0.40) | (0.58) | (0.38) | (0.56) | (0.45) |
| From Net Realized Gains | — | — | — | (0.03) | (0.03) |
| From Tax Return of Capital | (0.08) | — | (0.01) | — | — |
| Total Distributions | (0.48) | (0.58) | (0.39) | (0.59) | (0.48) |
| Net Asset Value, End of Period | $11.06 | $11.72 | $10.83 | $10.73 | $11.25 |
| |
| Total Return(2) | (1.51)% | 14.08% | 4.71% | 0.56% | 2.57% |
| |
| Ratios/Supplemental Data | | | | | |
| Ratio of Operating Expenses | | | | | |
| to Average Net Assets | 0.49% | 0.49% | 0.49% | 0.49% | 0.50% |
| Ratio of Net Investment Income (Loss) | | | | | |
| to Average Net Assets | 1.61% | 5.66% | 3.79% | 4.85% | 3.77% |
| Portfolio Turnover Rate | 18% | 33% | 32% | 27% | 68% |
| Net Assets, End of Period (in thousands) | $1,187,202 | $892,596 | $590,530 | $704,447 | $646,214 |
| (1) | Computed using average shares outstanding throughout the period. |
| (2) | Total return assumes reinvestment of net investment income and capital gains distributions, if any. The total return of the classes may not precisely reflect the class expense differences because of the impact of calculating the net asset values to two decimal places. If net asset values were calculated to three decimal places, the total return differences would more closely reflect the class expense differences. The calculation of net asset values to two decimal places is made in accordance with SEC guidelines and does not result in any gain or loss of value between one class and another. |
See Notes to Financial Statements.
65
| | | | | |
| Inflation-Adjusted Bond | | | | |
| |
| Institutional Class | | | | | |
| For a Share Outstanding Throughout the Years Ended March 31 | | | |
| | 2009 | 2008 | 2007 | 2006 | 2005 |
| Per-Share Data | | | | | |
| Net Asset Value, Beginning of Period | $11.71 | $10.82 | $10.73 | $11.25 | $11.45 |
| Income From Investment Operations | | | | | |
| Net Investment Income (Loss) | 0.16(1) | 0.64 | 0.42 | 0.58 | 0.47 |
| Net Realized and Unrealized Gain (Loss) | (0.32) | 0.85 | 0.09 | (0.49) | (0.17) |
| Total From Investment Operations | (0.16) | 1.49 | 0.51 | 0.09 | 0.30 |
| Distributions | | | | | |
| From Net Investment Income | (0.41) | (0.60) | (0.42) | (0.58) | (0.47) |
| From Net Realized Gains | — | — | — | (0.03) | (0.03) |
| From Tax Return of Capital | (0.08) | — | — | — | — |
| Total Distributions | (0.49) | (0.60) | (0.42) | (0.61) | (0.50) |
| Net Asset Value, End of Period | $11.06 | $11.71 | $10.82 | $10.73 | $11.25 |
| |
| Total Return(2) | (1.32)% | 14.31% | 4.92% | 0.77% | 2.77% |
| |
| Ratios/Supplemental Data | | | | | |
| Ratio of Operating Expenses | | | | | |
| to Average Net Assets | 0.29% | 0.29% | 0.29% | 0.29% | 0.30% |
| Ratio of Net Investment Income (Loss) | | | | | |
| to Average Net Assets | 1.81% | 5.86% | 3.99% | 5.05% | 3.97% |
| Portfolio Turnover Rate | 18% | 33% | 32% | 27% | 68% |
| Net Assets, End of Period (in thousands) | $210,177 | $165,872 | $118,250 | $81,860 | $65,058 |
| (1) | Computed using average shares outstanding throughout the period. |
| (2) | Total return assumes reinvestment of net investment income and capital gains distributions, if any. The total return of the classes may not precisely reflect the class expense differences because of the impact of calculating the net asset values to two decimal places. If net asset values were calculated to three decimal places, the total return differences would more closely reflect the class expense differences. The calculation of net asset values to two decimal places is made in accordance with SEC guidelines and does not result in any gain or loss of value between one class and another. |
See Notes to Financial Statements.
66
| | | | | |
| Inflation-Adjusted Bond | | | | |
| |
| Advisor Class | | | | | |
| For a Share Outstanding Throughout the Years Ended March 31 | | | |
| | 2009 | 2008 | 2007 | 2006 | 2005 |
| Per-Share Data | | | | | |
| Net Asset Value, Beginning of Period | $11.70 | $10.81 | $10.73 | $11.25 | $11.45 |
| Income From Investment Operations | | | | | |
| Net Investment Income (Loss) | 0.18(1) | 0.60 | 0.36 | 0.54 | 0.42 |
| Net Realized and Unrealized Gain (Loss) | (0.38) | 0.84 | 0.10 | (0.49) | (0.17) |
| Total From Investment Operations | (0.20) | 1.44 | 0.46 | 0.05 | 0.25 |
| Distributions | | | | | |
| From Net Investment Income | (0.39) | (0.55) | (0.36) | (0.54) | (0.42) |
| From Net Realized Gains | — | — | — | (0.03) | (0.03) |
| From Tax Return of Capital | (0.08) | — | (0.02) | — | — |
| Total Distributions | (0.47) | (0.55) | (0.38) | (0.57) | (0.45) |
| Net Asset Value, End of Period | $11.03 | $11.70 | $10.81 | $10.73 | $11.25 |
| |
| Total Return(2) | (1.73)% | 13.83% | 4.37% | 0.37% | 2.33% |
| |
| Ratios/Supplemental Data | | | | | |
| Ratio of Operating Expenses | | | | | |
| to Average Net Assets | 0.74% | 0.74% | 0.74% | 0.74% | 0.75% |
| Ratio of Net Investment Income (Loss) | | | | | |
| to Average Net Assets | 1.36% | 5.41% | 3.54% | 4.60% | 3.52% |
| Portfolio Turnover Rate | 18% | 33% | 32% | 27% | 68% |
| Net Assets, End of Period (in thousands) | $500,882 | $488,645 | $419,477 | $588,877 | $295,129 |
| (1) | Computed using average shares outstanding throughout the period. |
| (2) | Total return assumes reinvestment of net investment income and capital gains distributions, if any. The total return of the classes may not precisely reflect the class expense differences because of the impact of calculating the net asset values to two decimal places. If net asset values were calculated to three decimal places, the total return differences would more closely reflect the class expense differences. The calculation of net asset values to two decimal places is made in accordance with SEC guidelines and does not result in any gain or loss of value between one class and another. |
See Notes to Financial Statements.
67
| | | | | |
| Short-Term Government | | | | |
| |
| Investor Class | | | | | |
| For a Share Outstanding Throughout the Years Ended March 31 | | | |
| | 2009 | 2008 | 2007 | 2006 | 2005 |
| Per-Share Data | | | | | |
| Net Asset Value, Beginning of Period | $9.65 | $9.37 | $9.32 | $9.44 | $9.66 |
| Income From Investment Operations | | | | | |
| Net Investment Income (Loss)(1) | 0.29 | 0.40 | 0.40 | 0.32 | 0.19 |
| Net Realized and Unrealized Gain (Loss) | 0.01 | 0.29 | 0.06 | (0.11) | (0.21) |
| Total From Investment Operations | 0.30 | 0.69 | 0.46 | 0.21 | (0.02) |
| Distributions | | | | | |
| From Net Investment Income | (0.29) | (0.41) | (0.41) | (0.33) | (0.20) |
| Net Asset Value, End of Period | $9.66 | $9.65 | $9.37 | $9.32 | $9.44 |
| |
| Total Return(2) | 3.17% | 7.50% | 5.02% | 2.22% | (0.16)% |
| |
| Ratios/Supplemental Data | | | | | |
| Ratio of Operating Expenses | | | | | |
| to Average Net Assets | 0.57% | 0.57% | 0.57% | 0.57% | 0.58% |
| Ratio of Net Investment Income (Loss) | | | | | |
| to Average Net Assets | 2.99% | 4.23% | 4.34% | 3.41% | 2.04% |
| Portfolio Turnover Rate | 142% | 148% | 210% | 292% | 283% |
| Net Assets, End of Period (in thousands) | $971,230 | $1,105,947 | $937,029 | $919,295 | $928,460 |
| (1) | Computed using average shares outstanding throughout the period. |
| (2) | Total return assumes reinvestment of net investment income and capital gains distributions, if any. The total return of the classes may not precisely reflect the class expense differences because of the impact of calculating the net asset values to two decimal places. If net asset values were calculated to three decimal places, the total return differences would more closely reflect the class expense differences. The calculation of net asset values to two decimal places is made in accordance with SEC guidelines and does not result in any gain or loss of value between one class and another. |
See Notes to Financial Statements.
68
| | | | | |
| Short-Term Government | | | | |
| |
| Advisor Class | | | | | |
| For a Share Outstanding Throughout the Years Ended March 31 | | | |
| | 2009 | 2008 | 2007 | 2006 | 2005 |
| Per-Share Data | | | | | |
| Net Asset Value, Beginning of Period | $9.65 | $9.37 | $9.32 | $9.44 | $9.66 |
| Income From Investment Operations | | | | | |
| Net Investment Income (Loss)(1) | 0.24 | 0.38 | 0.38 | 0.29 | 0.17 |
| Net Realized and Unrealized Gain (Loss) | 0.03 | 0.28 | 0.05 | (0.11) | (0.21) |
| Total From Investment Operations | 0.27 | 0.66 | 0.43 | 0.18 | (0.04) |
| Distributions | | | | | |
| From Net Investment Income | (0.26) | (0.38) | (0.38) | (0.30) | (0.18) |
| Net Asset Value, End of Period | $9.66 | $9.65 | $9.37 | $9.32 | $9.44 |
| |
| Total Return(2) | 2.91% | 7.23% | 4.76% | 1.96% | (0.41)% |
| |
| Ratios/Supplemental Data | | | | | |
| Ratio of Operating Expenses | | | | | |
| to Average Net Assets | 0.82% | 0.82% | 0.82% | 0.82% | 0.83% |
| Ratio of Net Investment Income (Loss) | | | | | |
| to Average Net Assets | 2.74% | 3.98% | 4.09% | 3.16% | 1.79% |
| Portfolio Turnover Rate | 142% | 148% | 210% | 292% | 283% |
| Net Assets, End of Period (in thousands) | $65,170 | $32,379 | $27,541 | $29,166 | $43,431 |
| (1) | Computed using average shares outstanding throughout the period. |
| (2) | Total return assumes reinvestment of net investment income and capital gains distributions, if any. The total return of the classes may not precisely reflect the class expense differences because of the impact of calculating the net asset values to two decimal places. If net asset values were calculated to three decimal places, the total return differences would more closely reflect the class expense differences. The calculation of net asset values to two decimal places is made in accordance with SEC guidelines and does not result in any gain or loss of value between one class and another. |
See Notes to Financial Statements.
69
|
| Report of Independent Registered Public Accounting Firm |
To the Trustees of the American Century Government Income Trust and Shareholders of the Ginnie Mae Fund, the Government Bond Fund, the Inflation-Adjusted Bond Fund, and the Short-Term Government Fund:
In our opinion, the accompanying statements of assets and liabilities, including the schedules of investments, and the related statements of operations and of changes in net assets and the financial highlights present fairly, in all material respects, the financial position of the Ginnie Mae Fund, the Government Bond Fund, the Inflation-Adjusted Bond Fund, and the Short-Term Government Fund (four of the five funds comprising the American Century Government Income Trust; hereafter referred to as the “Funds”) at March 31, 2009, the results of each of their operations for the year then ended, the changes in each of their net assets for each of the two years in the period then ended and the financial highlights for each of the periods presented, in conformity with accounting principles generally accepted in the United States of America. These financial statements and financial highlights (hereafter referred to as “financial statements”) are the responsibility of the Funds’ management; our responsibility is to express an opinion on these financial statements based on our audits. We conducted our audits of these financial statements in accordance with the standards of the Public Company Accounting Oversight Board (United States). Those standards require that we plan and perform the audit to obtain reasonable assurance about whether the financial statements are free of material misstatement. An audit includes examining, on a test basis, evidence supporting the amounts and disclosures in the financial statements, assessing the accounting principles used and significant estimates made by management, and evaluating the overall financial statement presentation. We believe that our audits, which included confirmation of securities at March 31, 2009 by correspondence with the custodian and brokers, provide a reasonable basis for our opinion.
PricewaterhouseCoopers LLP
Kansas City, Missouri
May 21, 2009
70
The individuals listed below serve as trustees or officers of the funds. trustee serves until his or her successor is duly elected and qualified or until he or she retires. Effective March 2004, mandatory retirement age for independent trustees is 73. However, the mandatory retirement age may be extended for a period not to exceed two years with the approval of the remaining independent trustees. Those listed as interested trustees are “interested” primarily by virtue of their engagement as directors or officers of, or ownership interest in, American Century Companies, (ACC) or its wholly owned, direct or indirect, subsidiaries, including funds’ investment advisor, American Century Investment Management, Inc. (ACIM or the advisor); the funds’ principal underwriter, American Century Investment Services, Inc. (ACIS); and the funds’ transfer agent, American Century Services, LLC (ACS).
The other trustees (more than three-fourths of the total number) are pendent; that is, they have never been employees, directors or officers and have no financial interest in, ACC or any of its wholly owned, direct indirect, subsidiaries, including ACIM, ACIS and ACS. The trustees in this capacity for eight registered investment companies in the American Century Investments family of funds.
All persons named as officers of the funds also serve in similar capacities the other 14 investment companies in the American Century Investments family of funds advised by ACIM or American Century Global Investment Management, Inc. (ACGIM), a wholly owned subsidiary of ACIM, unless otherwise noted. Only officers with policy-making functions are listed officer is compensated for his or her service as an officer of the funds. listed officers are interested persons of the funds and are appointed or re-appointed on an annual basis.
Interested Trustee
Jonathan S. Thomas, 4500 Main Street, Kansas City, MO 64111
Year of Birth: 1963
Position(s) Held with Funds: Trustee and President (since 2007)
Principal Occupation(s) During Past 5 Years: President and Chief Executive Officer, ACC
(March 2007 to present); Chief Administrative Officer, ACC (February 2006 to
February 2007); Executive Vice President, ACC (November 2005 to February 2007).
Also serves as: President, Chief Executive Officer and Director, ACS; Executive
Vice President, ACIM and ACGIM; Director, ACIM, ACGIM, ACIS and other ACC
subsidiaries. Managing Director, Morgan Stanley (March 2000 to November 2005)
Number of Portfolios in Fund Complex Overseen by Trustee: 104
Other Directorships Held by Trustee: None
71
Independent Trustees
John Freidenrich, 1665 Charleston Road, Mountain View, CA 94043
Year of Birth: 1937
Position(s) Held with Funds: Trustee (since 2005)
Principal Occupation(s) During Past 5 Years: Member and Manager, Regis Management
Company, LLC (money management firm) (April 2004 to present); Partner and
Founder, Bay Partners (venture capital firm) (1976 to 2006)
Number of Portfolios in Fund Complex Overseen by Trustee: 39
Other Directorships Held by Trustee: None
Ronald J. Gilson, 1665 Charleston Road, Mountain View, CA 94043
Year of Birth: 1946
Position(s) Held with Funds: Trustee (since 1995) and Chairman of the Board (since 2005)
Principal Occupation(s) During Past 5 Years: Charles J. Meyers Professor of Law and Business,
Stanford Law School (1979 to present); Marc and Eva Stern Professor of Law and
Business, Columbia University School of Law (1992 to present)
Number of Portfolios in Fund Complex Overseen by Trustee: 39
Other Directorships Held by Trustee: None
Frederick L.A. Grauer, 1665 Charleston Road, Mountain View, CA 94043
Year of Birth: 1946
Position(s) Held with Funds: Trustee (since 2008)
Principal Occupation(s) During Past 5 Years: Senior Advisor, Barclays Global Investors
(asset manager) (2003 to present)
Number of Portfolios in Fund Complex Overseen by Trustee: 39
Other Directorships Held by Trustee: None
Peter F. Pervere, 1665 Charleston Road, Mountain View, CA 94043
Year of Birth: 1947
Position(s) Held with Funds: Trustee (since 2007)
Principal Occupation(s) During Past 5 Years: Retired, formerly Vice President and Chief
Financial Officer, Commerce One, Inc. (software and services provider)
Number of Portfolios in Fund Complex Overseen by Trustee: 39
Other Directorships Held by Trustee: Intraware, Inc.
Myron S. Scholes, 1665 Charleston Road, Mountain View, CA 94043
Year of Birth: 1941
Position(s) Held with Funds: Trustee (since 1980)
Principal Occupation(s) During Past 5 Years: Chairman, Platinum Grove Asset Management,
L.P. (asset manager) (1999 to present); Frank E. Buck Professor of Finance-Emeritus,
Stanford Graduate School of Business (1996 to present)
Number of Portfolios in Fund Complex Overseen by Trustee: 39
Other Directorships Held by Trustee: Dimensional Fund Advisors (investment advisor)
John B. Shoven, 1665 Charleston Road, Mountain View, CA 94043
Year of Birth: 1947
Position(s) Held with Funds: Trustee (since 2002)
Principal Occupation(s) During Past 5 Years: Professor of Economics, Stanford University
(1973 to present)
Number of Portfolios in Fund Complex Overseen by Trustee: 39
Other Directorships Held by Trustee: Cadence Design Systems; E×ponent
72
Jeanne D. Wohlers, 1665 Charleston Road, Mountain View, CA 94043
Year of Birth: 1945
Position(s) Held with Funds: Trustee (since 1984)
Principal Occupation(s) During Past 5 Years: Retired
Number of Portfolios in Fund Complex Overseen by Trustee: 39
Other Directorships Held by Trustee: None
Officers
Barry Fink, 4500 Main Street, Kansas City, MO 64111
Year of Birth: 1955
Position(s) Held with Funds: Executive Vice President (since 2007)
Principal Occupation(s) During Past 5 Years: Chief Operating Officer and Executive Vice
President, ACC (September 2007 to present); President, ACS (October 2007 to
present); Managing Director, Morgan Stanley (2000 to 2007); Global General
Counsel, Morgan Stanley (2000 to 2006). Also serves as: Director, ACC, ACS, ACIS
and other ACC subsidiaries
Maryanne Roepke, 4500 Main Street, Kansas City, MO 64111
Year of Birth: 1956
Position(s) Held with Funds: Chief Compliance Officer (since 2006) and Senior Vice
President (since 2000)
Principal Occupation(s) During Past 5 Years: Chief Compliance Officer, ACIM, ACGIM and ACS
(August 2006 to present); Assistant Treasurer, ACC (January 1995 to August 2006);
and Treasurer and Chief Financial Officer, various American Century Investments
funds (July 2000 to August 2006). Also serves as: Senior Vice President, ACS
Charles A. Etherington, 4500 Main Street, Kansas City, MO 64111
Year of Birth: 1957
Position(s) Held with Funds: General Counsel (since 2007) and Senior Vice President
(since 2006)
Principal Occupation(s) During Past 5 Years: Attorney, ACC (February 1994 to present); Vice
President, ACC (November 2005 to present); General Counsel, ACC (March 2007
to present). Also serves as: General Counsel, ACIM, ACGIM, ACS, ACIS and other
ACC subsidiaries; and Senior Vice President, ACIM, ACGIM and ACS
Robert Leach, 4500 Main Street, Kansas City, MO 64111
Year of Birth: 1966
Position(s) Held with Funds: Vice President, Treasurer and Chief Financial Officer
(all since 2006)
Principal Occupation(s) During Past 5 Years: Vice President, ACS (February 2000 to present);
Controller, various American Century Investments funds (1997 to September 2006)
Jon Zindel, 4500 Main Street, Kansas City, MO 64111
Year of Birth: 1967
Position(s) Held with Funds: Tax Officer (since 2000)
Principal Occupation(s) During Past 5 Years: Chief Financial Officer and Chief Accounting
Officer, ACC (March 2007 to present); Vice President, ACC (October 2001 to
present); Vice President, certain ACC subsidiaries (October 2001 to August 2006);
Vice President, Corporate Tax, ACS (April 1998 to August 2006). Also serves as:
Chief Financial Officer, Chief Accounting Officer and Senior Vice President, ACIM,
ACGIM, ACS and other ACC subsidiaries; and Chief Accounting Officer and Senior
Vice President, ACIS
The SAI has additional information about the funds’ trustees and is available without charge, upon request, by calling 1-800-345-2021.
73
Retirement Account Information
As required by law, distributions you receive from certain IRAs, or 403(b), 457 and qualified plans are subject to federal income tax withholding, unless you elect not to have withholding apply. Tax will be withheld on the total amount withdrawn even though you may be receiving amounts that are not subject to withholding, such as nondeductible contributions. In such case, excess amounts of withholding could occur. You may adjust your withholding election so that a greater or lesser amount will be withheld.
If you don’t want us to withhold on this amount, you must notify us to not withhold the federal income tax. You may notify us in writing or in certain situations by telephone or through other electronic means. You have the right to revoke your withholding election at any time and any election you make may remain in effect until revoked by filing a new election.
Remember, even if you elect not to have income tax withheld, you are liable for paying income tax on the taxable portion of your withdrawal. If you elect not to have income tax withheld or you don’t have enough income tax withheld, you may be responsible for payment of estimated tax. You may incur penalties under the estimated tax rules if your withholding and estimated tax payments are not sufficient. You can reduce or defer the income tax on a distribution by directly or indirectly rolling such distribution over to another IRA or eligible plan. You should consult your tax advisor for additional information.
State tax will be withheld if, at the time of your distribution, your address is within one of the mandatory withholding states and you have federal income tax withheld. State taxes will be withheld from your distribution in accordance with the respective state rules.
Proxy Voting Guidelines
American Century Investment Management, Inc., the funds’ investment advisor, is responsible for exercising the voting rights associated with the securities purchased and/or held by the funds. A description of the policies and procedures the advisor uses in fulfilling this responsibility is available without charge, upon request, by calling 1-800-345-2021. It is also available on American Century Investments’ website at americancentury.com and on the Securities and Exchange Commission’s website at sec.gov. Information regarding how the investment advisor voted proxies relating to portfolio securities during the most recent 12-month period ended June 30 is available on the “About Us” page at americancentury.com. It is also available at sec.gov.
Quarterly Portfolio Disclosure
The funds file their complete schedule of portfolio holdings with the Securities and Exchange Commission (SEC) for the first and third quarters of each fiscal year on Form N-Q. The funds’ Forms N-Q are available on the SEC’s website at sec.gov, and may be reviewed and copied at the SEC’s Public Reference Room in Washington, DC. Information on the operation of the Public Reference Room may be obtained by calling 1-800-SEC-0330. The funds also make their complete schedule of portfolio holdings for the most recent quarter of their fiscal year available on their website at americancentury.com and, upon request, by calling 1-800-345-2021.
74
The following indices are used to illustrate investment market, sector, or style performance or to serve as fund performance comparisons. They are not investment products available for purchase.
The Citigroup Agency Index is a market-capitalization-weighted index that includes US government sponsored agencies with a remaining maturity of at least one year.
The Citigroup Credit Index includes US and non-US corporate securities and non-US sovereign and provincial securities.
The Citigroup Mortgage Index measures the mortgage component of the US BIG Bond Index, comprising 15- and 30-year GNMA, FNMA, and FHLMC pass-throughs and FNMA and FHLMC balloon mortgages.
The Citigroup GNMA Index is a market-capitalization-weighted index of 15- and 30-year fixed-rate securities backed by mortgage pools of the Government National Mortgage Association (GNMA).
The Citigroup Treasury Index is comprised of US Treasury securities with an amount outstanding of at least $5 billion and a remaining maturity of at least one year.
The Citigroup Treasury/Mortgage Index is comprised of U.S. Treasury securities with an amount outstanding of at least $1 billion, and mortgage-backed securities with an aggregate amount outstanding per coupon of at least $5 billion and an aggregate amount outstanding per origination year of at least $500 million. Both the U.S. Treasury and the mortgage-backed securities included in the index must have a remaining maturity of at least one year.
The Citigroup US Broad Investment-Grade (BIG) Bond Index is a market-capitalization-weighted index that includes fixed-rate Treasury, government-sponsored, mortgage, asset-backed, and investment-grade issues with a maturity of one year or longer.
The Citigroup US High-Yield Market Index captures the performance of below-investment-grade debt issued by corporations domiciled in the United States or Canada. This index includes cash-pay and deferred-interest securities that are publicly placed, have a fixed coupon, and are nonconvertible.
The Citigroup US Inflation-Linked Securities Index (ILSI)SM measures the return of bonds with fixed-rate coupon payments that adjust for inflation as measured by the Consumer Price Index (CPI).
The Citigroup US Treasury/Agency 1- to 3-Year Index is a market-capitalization-weighted index that includes fixed-rate U.S. Treasury and government agency issues with maturities between one and three years.
75
76

| |
| Contact Us | |
| americancentury.com | |
| Automated Information Line | 1-800-345-8765 |
| Investor Services Representative | 1-800-345-2021 |
| | 816-531-5575 |
| Business, Not-For-Profit, Employer-Sponsored | |
| Retirement Plans | 1-800-345-3533 |
| Banks and Trust Companies, Broker-Dealers, | |
| Financial Professionals, Insurance Companies | 1-800-345-6488 |
| Telecommunications Device for the Deaf | 1-800-634-4113 |
| American Century Government Income Trust | |
| Investment Advisor: | |
| American Century Investment Management, Inc. | |
| Kansas City, Missouri | |
This report and the statements it contains are submitted for the general
information of our shareholders. The report is not authorized for distribution to
prospective investors unless preceded or accompanied by an effective prospectus.
American Century Investment Services, Inc., Distributor
©2009 American Century Proprietary Holdings, Inc. All rights reserved.
0905
CL-ANN-65307S
|
| Annual Report |
| March 31, 2009 |
|
| American Century Investments |
Capital Preservation Fund
Dear Investor:
Thank you for investing with us during the financial reporting period ended March 31, 2009. We appreciate your trust in American Century Investments® during these challenging times.
As the calendar changed from 2008 to 2009, the financial markets continued struggle to digest the subprime-initiated credit crisis. The ensuing global economic downturn and market turmoil affected everyone—from first-time individual investors to hundred-year-old financial institutions. During the period, risk aversion was a key theme, with performance generally favoring assets with lower risk levels and those that showed signs of stability. Effective risk manage ment by portfolio managers delivered above-average returns, albeit still negative in many cases under these challenging market conditions.
Effective risk management requires a commitment to disciplined investment approaches that balance risk and reward, with the goal of setting and maintaining risk levels that are appropriate for portfolio objectives. At American Century Investments, we’ve stayed true to the principles that have guided us for over 50 years, including our commitments to delivering superior investment performance and helping investors reach their financial goals. Risk management is part of that commitment—we offer portfolios that can help diversify and stabilize investment returns.
As discussed by the investment team leaders in this report, 2009 is likely to be another challenging year, but I’m certain that we have the investment professionals and processes in place to provide competitive and compelling long-results for you. Thank you for your continued confidence in us.
Sincerely,

Jonathan S. Thomas
President and Chief Executive Officer
American Century Investments
| |
| Market Perspective | 2 |
| U.S. Fixed-Income Total Returns | 2 |
| |
| Capital Preservation | |
| |
| Performance | 3 |
| Portfolio Commentary | 4 |
| Yields | 5 |
| Portfolio Composition by Maturity | 5 |
| |
| Shareholder Fee Example | 6 |
| |
| Financial Statements | |
| |
| Schedule of Investments | 8 |
| Statement of Assets and Liabilities | 9 |
| Statement of Operations | 10 |
| Statement of Changes in Net Assets | 11 |
| Notes to Financial Statements | 12 |
| Financial Highlights | 16 |
| Report of Independent Registered Public Accounting Firm | 17 |
| |
| Other Information | |
| |
| Management | 18 |
| Additional Information | 21 |
| Index Definitions | 22 |
The opinions expressed in the Market Perspective and the Portfolio Commentary reflect those of the portfolio management team as of the date of the report, and do not necessarily represent the opinions of American Century Investments or any other person in the American Century Investments organization. Any such opinions are subject to change at any time based upon market or other conditions and American Century Investments disclaims any responsibility to update such opinions. These opinions may not be relied upon as investment advice and, because investment decisions made by American Century Investments funds are based on numerous factors, may not be relied upon as an indication of trading intent on behalf of any American Century Investments fund. Security examples are used for representational purposes only and are not intended as recommendations to purchase or sell securities. Performance information for comparative indices and securities is provided to American Century Investments by third party vendors. To the best of American Century Investments’ knowledge, such information is accurate at the time of printing.

By David MacEwen, Chief Investment Officer, Fixed Income
Unprecedented Events
The spiraling subprime credit crisis took an incredible toll on U.S. financial institutions, the economy, and financial markets in the 12 months ended March 31, 2009. By period-end, the resulting recession had spread globally, unemployment in the U.S. reached 8.5%, and many measures of consumer strength were at record lows. On the inflation front, the government’s Consumer Price Index fell by 0.4% for the year ended in March. That was the first 12-month decline since August 1955.
In that environment, the Federal Reserve (the Fed) took dramatic steps, effectively cutting its short-term rate target to 0%, intervening in the mortgage, commercial, and consumer debt markets, while Congress passed a massive economic stimulus package and the $700 billion Troubled Asset Relief Program (TARP).
High-Quality Outperformed Low-Quality
In the fixed-income markets, risk aversion, deleveraging, and worries about the economy and deflation sent Treasury bonds to big gains, while credit-sensitive securities endured historic underperformance (see accompanying table). High-quality, higher-yielding government-backed securities such as government agency and mortgage-backed securities (MBS) also did well. Inflation-linked securities had negative returns overall, though they performed much better late in the period because of worry that the government’s fiscal and monetary policies will prove inflationary down the road. The Fed’s rate cuts also had important implications for money market securities, whose yields and returns are closely tied to the level of short-term interest rates.
Rates Tumbled Amid Volatility
Dramatic Fed rate cuts, safe-haven buying, and competing inflation/deflation concerns meant bond yields were volatile, but finished the 12 months significantly lower. The yield on the two-year Treasury note, which is most sensitive to Fed rate policy, went from 1.59% to 0.80%. Yields on longer-term notes and bonds fell a similar amount, with the benchmark 10-year Treasury yield down from 3.41% to 2.67%, while 30-year bond yields went from 4.29% to 3.54%. In that environment, the shape of the yield curve (a graphic representation of Treasury yields at different maturities) shifted considerably, but ultimately ended the period little changed.
| | | | |
| U.S. Fixed-Income Total Returns | | | | |
| For the 12 months ended March 31, 2009 | | | | |
| Treasury Securities | | | Citigroup U.S. Bond Market Indices | |
| 3-Month Bill | 1.13% | | Mortgage (mortgage-backed) | 8.26% |
| 2-Year Note | 4.67% | | Treasury | 7.50% |
| 10-Year Note | 10.52% | | Agency | 6.16% |
| 30-Year Bond | 18.08% | | Broad Investment-Grade (multi-sector) | 4.52% |
| | | | Inflation-Linked Securities | –2.05% |
| | | | Credit (investment-grade corporate) | –4.61% |
| | | | High-Yield Market (corporate) | –19.88% |
2
|
| Performance |
| Capital Preservation |
| | | | | |
| Total Returns as of March 31, 2009 | | | | |
| | | Average Annual Returns | |
| | | | | Since | Inception |
| | 1 year | 5 years | 10 years | Inception | Date |
| Investor Class | 0.91% | 2.71% | 2.84% | 4.62% | 10/13/72 |
| 90-Day U.S. Treasury Bill Index(1) | 0.92% | 2.94% | 3.05% | 5.98%(2) | — |
| Lipper U.S. Treasury Money Market | | | | | |
| Funds Average Return(1) | 0.62% | 2.42% | 2.60% | 5.61%(3) | — |
| Fund’s Lipper Ranking Among U.S. | | | | | |
| Treasury Money Market Funds(1) | 8 of 77 | 9 of 68 | 9 of 47 | 1 of 1(3) | — |
| (1) | Data provided by Lipper Inc. – A Reuters Company. © 2009 Reuters. All rights reserved. Any copying, republication or redistribution of Lipper content, including by caching, framing or similar means, is expressly prohibited without the prior written consent of Lipper. Lipper shall not be liable for any errors or delays in the content, or for any actions taken in reliance thereon. |
| | Lipper Fund Performance — Performance data is total return, and is preliminary and subject to revision. |
| | Lipper Rankings — Rankings are based only on the universe shown and are based on average annual total returns. This listing might not represent the complete universe of funds tracked by Lipper. |
| | The data contained herein has been obtained from company reports, financial reporting services, periodicals and other resources believed to be reliable. Although carefully verified, data on compilations is not guaranteed by Lipper and may be incomplete. No offer or solicitations to buy or sell any of the securities herein is being made by Lipper. |
| (2) | Since 9/30/72, the date nearest the Investor Class’s inception for which data are available. |
| (3) | Since 10/31/72, the date nearest the Investor Class’s inception for which data are available. |
| |
| |
| Total Annual Fund Operating Expenses |
| Investor Class | 0.47% |
The total annual fund operating expenses shown is as stated in the fund’s prospectus current as of the date of this report. The prospectus may vary from the expense ratio shown elsewhere in this report because it is based on a different time period, includes acquired fund fees and expenses, and, if applicable, does not include fee waivers or expense reimbursements.
Data presented reflect past performance. Past performance is no guarantee of future results. Current performance may be higher or lower than the performance shown. To obtain performance data current to the most recent month end, please call 1-800-345-2021 or visit americancentury.com.
An investment in the fund is not insured or guaranteed by the Federal Deposit Insurance Corporation or any other government agency. Although the fund seeks to preserve the value of your investment at $1.00 per share, it is possible to lose money by investing in the fund.
The 7-day current yield more closely reflects the current earnings of the fund than the total return.
3
|
| Portfolio Commentary |
| Capital Preservation |
Portfolio Managers: Lynn Paschen and Steven Permut
Performance Summary
Capital Preservation returned 0.91% for the 12 months ended March 31, 2009, outperforming the 0.62% average return of the 77 funds in Lipper Inc.’s U.S. Treasury Money Market Funds category. The portfolio’s one-year return for the reporting period ranked in the top 11% of the Lipper category, and its five- and 10-year returns for periods ended March 31, 2009, were in the top 14% and 19%, respectively, of the Lipper group (see the previous page).
Default Concerns Led to Credit Crisis and Illiquidity
A barrage of extraordinary events characterized the 12-month period and created a challenging environment for money market investors. Early concerns about economic growth and mounting defaults in the relatively obscure subprime mortgage market exploded into a full-blown financial crisis by late summer 2008, triggered by a series of failures, takeovers, and bailouts in the financial sector.
In the aftermath of these events, illiquidity prevailed, businesses and consumers faced stringent borrowing standards, and banks stopped lending to each other. The U.S. and global economies faced a severe recession, as unemployment soared, spending stalled, and commodity prices collapsed.
Government Action Kept System Afloat
With the credit markets at a standstill, massive intervention from the federal government, the Federal Reserve (the Fed), and the U.S. Treasury Department kept the financial system limping along. This intervention took several forms, including the slashing of the federal funds rate target to virtually 0%, the passage of an $800 billion stimulus bill, and the launch of numerous programs to support the financial sector and the mortgage, consumer, and commercial credit markets.
Fund Participated in Money Market Guarantee Program
In one of its efforts aimed at addressing credit-market dislocations and alleviating investor fears, the U.S. Treasury launched its Temporary Guarantee Program for Money Market Funds, in which Capital Preservation participated. Late in the reporting period, the Treasury announced an extension to September 18, 2009, of the program, which was set to expire on April 30, 2009.
American Century Investments and the fund’s board of trustees believe participation in the program is no longer warranted for Capital Preservation after April 30, 2009. Capital Preservation invests solely in short-term U.S. Treasury securities, which are backed by the full faith and credit of the U.S. Treasury and are the most liquid securities in the world. We believe the U.S. government’s full faith and credit backing combined with the liquidity of these securities provide substantial support for the fund and its shareholders.
4
Capital Preservation
Portfolio Strategy
Reflecting the steep decline in government money market yields, Capital Preservation’s seven-day current yield fell from 1.84% to 0.01% during the 12-month period. Demand for Treasury bills remained fierce, as investors sought a safe haven from falling equity prices, credit-sensitive bond volatility, and bank-related fears. This heavy demand drove Treasury bill prices up and pushed yields to historic lows, particularly in December, when desire for short-term Treasury securities combined with seasonal buying pressures pushed yields to approximately 0%. Three-month Treasury bill yields even dipped into negative territory for a brief period. Overall, the yield on the three-month Treasury fell from 1.33% on March 31, 2008, to 0.21% on March 31, 2009.
Given the downward trend in short-term rates, our goal was to maintain a relatively long weighted average maturity (WAM) to capture incrementally higher yields from longer-term bills. The fund’s WAM began the 12-month period at 73 days and finished the period at 82 days. This compares with what we would consider a more neutral/average position of 65 days.
Outlook
We expect an extended period of low interest rates. We believe the deep and sustained consumer-led recession may require additional actions, and we therefore expect continued monetary and fiscal stimulus through 2009. The Fed itself said it “anticipates that economic conditions are likely to warrant exceptionally low levels of the federal funds rate for an extended period.”
| |
| Yields as of March 31, 2009 | |
| 7-Day Current Yield(1) | 0.01% |
| |
| 7-Day Effective Yield(1) | 0.01% |
| (1) The yields presented reflect the waiver of a portion of the fund’s management fees. Without such waiver, the 7-day yields would have been lower. |
| | |
| Portfolio Composition by Maturity | | |
| | % of | % of |
| | fund investments | fund investments |
| | as of 3/31/09 | as of 9/30/08 |
| 1 – 30 days | 21% | 21% |
| 31 – 90 days | 33% | 47% |
| 91 – 180 days | 37% | 23% |
| More than 180 days | 9% | 9% |
5
|
| Shareholder Fee Example (Unaudited) |
Fund shareholders may incur two types of costs: (1) transaction costs, including sales charges (loads) on purchase payments and redemption/ exchange fees; and (2) ongoing costs, including management fees; distribution and service (12b-1) fees; and other fund expenses. This example is intended to help you understand your ongoing costs (in dollars) of investing in your fund and to compare these costs with the ongoing cost of investing in other mutual funds.
The example is based on an investment of $1,000 made at the beginning of the period and held for the entire period from October 1, 2008 to March 31, 2009.
Actual Expenses
The table provides information about actual account values and actual expenses for each class. You may use the information, together with the amount you invested, to estimate the expenses that you paid over the period. First, identify the share class you own. Then simply divide your account value by $1,000 (for example, an $8,600 account value divided by $1,000 = 8.6), then multiply the result by the number under the heading “Expenses Paid During Period” to estimate the expenses you paid on your account during this period.
If you hold Investor Class shares of any American Century Investments fund, or Institutional Class shares of the American Century Diversified Bond Fund, in an American Century Investments account (i.e., not a financial intermediary or retirement plan account), American Century Investments may charge you a $12.50 semiannual account maintenance fee if the value of those shares is less than $10,000. We will redeem shares automatically in one of your accounts to pay the $12.50 fee. In determining your total eligible investment amount, we will include your investments in all personal accounts (including American Century Investments Brokerage accounts) registered under your Social Security number. Personal accounts include individual accounts, joint accounts, UGMA/UTMA accounts, personal trusts, Coverdell Education Savings Accounts and IRAs (including traditional, Roth, Rollover, SEP-, SARSEP- and SIMPLE-IRAs), and certain other retirement accounts. If you have only business, business retirement, employer-sponsored or American Century Investments Brokerage accounts, you are currently not subject to this fee. We will not charge the fee as long as you choose to manage your accounts exclusively online. If you are subject to the Account Maintenance Fee, your account value could be reduced by the fee amount.
Hypothetical Example for Comparison Purposes
The table also provides information about hypothetical account values and hypothetical expenses based on the actual expense ratio of each class of your fund and an assumed rate of return of 5% per year before expenses, which is not the actual return of a fund’s share class. The hypothetical account values and expenses may not be used to estimate the actual ending account balance or expenses you paid for the period. You may use this information to compare the ongoing costs of investing in your fund and other funds. To do so, compare this 5% hypothetical example with the 5% hypothetical examples that appear in the shareholder reports of the other funds.
6
Please note that the expenses shown in the table are meant to highlight your ongoing costs only and do not reflect any transactional costs, such as sales charges (loads) or redemption/exchange fees. Therefore, the table is useful in comparing ongoing costs only, and will not help you determine the relative total costs of owning different funds. In addition, if these transactional costs were included, your costs would have been higher.
| | | | | |
| | Beginning | Ending | Expenses Paid | |
| | Account Value | Account Value | During Period* | Annualized |
| | 10/1/08 | 3/31/09 | 10/1/08 – 3/31/09 | Expense Ratio* |
| Actual | $1,000 | $1,001.90 | $2.50 | 0.50% |
| Hypothetical | $1,000 | $1,022.44 | $2.52 | 0.50% |
*Expenses are equal to the fund’s annualized expense ratio listed in the table above, multipled by the average account value over the period, multiplied by 182, the number of days in the most recent fiscal half-year, divided by 365, to reflect the one-half year period.
7
|
| Schedule of Investments |
| Capital Preservation |
| | | | | | |
| MARCH 31, 2009 | | | | | | |
| |
| | Principal | | | | Principal | |
| | Amount | Value | | | Amount | Value |
| U.S. Treasury Bills(1) — 81.4% | | | U.S. Treasury Bills, | | |
| | | | | 0.43%, 9/17/09 | $ 50,000,000 | $ 49,900,008 |
| U.S. Treasury Bills, | | | | U.S. Treasury Bills, | | |
| 0.11%, 4/2/09 | $175,000,000 | $ 174,999,465 | | 0.96%, 9/24/09 | 135,000,000 | 134,369,211 |
| U.S. Treasury Bills, | | | | U.S. Treasury Bills, | | |
| 0.18%, 4/9/09 | 85,000,000 | 84,996,672 | | 0.13%, 10/22/09 | 110,000,000 | 109,719,639 |
| U.S. Treasury Bills, | | | | U.S. Treasury Bills, | | |
| 0.11%, 4/16/09 | 150,000,000 | 149,993,063 | | 0.60%, 11/19/09 | 25,000,000 | 24,903,333 |
| U.S. Treasury Bills, | | | | U.S. Treasury Bills, | | |
| 0.58%, 4/23/09 | 25,000,000 | 24,991,231 | | 0.61%, 2/11/10 | 60,000,000 | 59,679,436 |
| U.S. Treasury Bills, | | | | TOTAL U.S. TREASURY BILLS | 2,904,109,687 |
| 0.48%, 4/29/09 | 203,000,000 | 202,924,688 | | | | |
| U.S. Treasury Bills, | | | | U.S. Treasury Notes(1) — 13.3% | |
| 0.15%, 5/7/09 | 50,000,000 | 49,992,400 | | U.S. Treasury Notes, | | |
| U.S. Treasury Bills, | | | | 3.125%, 4/15/09 | 85,000,000 | 85,082,780 |
| 0.14%, 5/14/09 | 475,000,000 | 474,909,058 | | U.S. Treasury Notes, | | |
| U.S. Treasury Bills, | | | | 4.875%, 5/15/09 | 10,000,000 | 10,032,305 |
| 0.53%, 5/15/09 | 50,000,000 | 49,967,611 | | U.S. Treasury Notes, | | |
| U.S. Treasury Bills, | | | | 5.50%, 5/15/09 | 75,000,000 | 75,413,304 |
| 0.29%, 5/28/09 | 10,000,000 | 9,995,408 | | U.S. Treasury Notes, | | |
| U.S. Treasury Bills, | | | | 4.00%, 6/15/09 | 150,000,000 | 151,029,303 |
| 2.31%, 6/4/09 | 100,000,000 | 99,600,800 | | U.S. Treasury Notes, | | |
| U.S. Treasury Bills, | | | | 4.625%, 7/31/09 | 25,000,000 | 25,184,173 |
| 0.27%, 6/11/09 | 180,000,000 | 179,920,273 | | U.S. Treasury Notes, | | |
| U.S. Treasury Bills, | | | | 3.50%, 8/15/09 | 25,000,000 | 25,294,129 |
| 0.41%, 7/2/09 | 275,000,000 | 274,710,264 | | U.S. Treasury Notes, | | |
| U.S. Treasury Bills, | | | | 4.00%, 9/30/09 | 75,000,000 | 75,926,489 |
| 0.64%, 7/30/09 | 310,000,000 | 309,352,667 | | U.S. Treasury Notes, | | |
| U.S. Treasury Bills, | | | | 6.50%, 2/15/10 | 25,000,000 | 26,245,431 |
| 0.38%, 8/6/09 | 95,000,000 | 94,874,323 | | TOTAL U.S. TREASURY NOTES | 474,207,914 |
| U.S. Treasury Bills, | | | | TOTAL INVESTMENT | | |
| 0.44%, 8/13/09 | 80,000,000 | 79,868,680 | | SECURITIES — 94.7% | | 3,378,317,601 |
| U.S. Treasury Bills, | | | | OTHER ASSETS AND | | |
| 0.43%, 9/3/09 | 145,000,000 | 144,730,924 | | LIABILITIES — 5.3%(2) | | 189,967,814 |
| U.S. Treasury Bills, | | | | TOTAL NET ASSETS — 100.0% | $3,568,285,415 |
| 0.52%, 9/15/09 | 120,000,000 | 119,710,533 | | | | |
| |
| Notes to Schedule of Investments |
| (1) | The rates for U.S. Treasury Bills are the yield to maturity at purchase. The rates for U.S. Treasury Notes are the stated coupon rates. |
| (2) | Category includes amounts related to net securities sold but not settled as of the period end. |
See Notes to Financial Statements.
8
|
| Statement of Assets and Liabilities |
| |
| MARCH 31, 2009 | |
| Assets | |
| Investment securities, at value (amortized cost and cost for federal income tax purposes) | $3,378,317,601 |
| Receivable for investments sold | 360,357,461 |
| Receivable for capital shares sold | 6,367,137 |
| Interest receivable | 5,245,927 |
| Prepaid temporary guarantee program fees | 109,295 |
| | 3,750,397,421 |
| |
| Liabilities | |
| Disbursements in excess of demand deposit cash | 458,270 |
| Payable for investments purchased | 175,129,963 |
| Payable for capital shares redeemed | 5,097,330 |
| Accrued management fees | 1,424,631 |
| Dividends payable | 1,812 |
| | 182,112,006 |
| |
| Net Assets | $3,568,285,415 |
| |
| Capital Shares | |
| Outstanding (unlimited number of shares authorized) | 3,568,117,470 |
| |
| Net Asset Value Per Share | $1.00 |
| |
| Net Assets Consist of: | |
| Capital paid in | $3,568,118,366 |
| Undistributed net investment income | 81,462 |
| Undistributed net realized gain on investment transactions | 85,587 |
| | $3,568,285,415 |
| |
| |
| See Notes to Financial Statements. | |
9
| | |
| YEAR ENDED MARCH 31, 2009 | |
| Investment Income (Loss) | |
| Income: | |
| Interest | $46,220,179 |
| |
| Expenses: | |
| Management fees | 15,870,149 |
| Temporary guarantee program fees | 536,762 |
| Trustees’ fees and expenses | 134,287 |
| Other expenses | 8,304 |
| | 16,549,502 |
| Amount waived | (2,041) |
| | 16,547,461 |
| |
| Net investment income (loss) | 29,672,718 |
| |
| Net realized gain (loss) on investment transactions | 240,086 |
| |
| Net Increase (Decrease) in Net Assets Resulting from Operations | $29,912,804 |
| |
| |
| See Notes to Financial Statements. | |
10
|
| Statement of Changes in Net Assets |
| | |
| YEARS ENDED MARCH 31, 2009 AND MARCH 31, 2008 | | |
| Increase (Decrease) in Net Assets | 2009 | 2008 |
| Operations | | |
| Net investment income (loss) | $ 29,672,718 | $ 111,799,329 |
| Net realized gain (loss) | 240,086 | (111,932) |
| Net increase (decrease) in net assets resulting from operations | 29,912,804 | 111,687,397 |
| | | |
| Distributions to Shareholders | | |
| From net investment income | (29,591,256) | (111,799,329) |
| | | |
| Capital Share Transactions | | |
| Proceeds from shares sold | 2,075,342,915 | 1,357,379,541 |
| Proceeds in connection with acquisition (Note 6) | — | 547,078,894 |
| Proceeds from reinvestment of distributions | 28,736,516 | 107,730,588 |
| Payments for shares redeemed | (1,806,949,726) | (1,398,228,886) |
| Net increase (decrease) in net assets from capital share transactions | 297,129,705 | 613,960,137 |
| |
| Net increase (decrease) in net assets | 297,451,253 | 613,848,205 |
| |
| Net Assets | | |
| Beginning of period | 3,270,834,162 | 2,656,985,957 |
| End of period | $ 3,568,285,415 | $ 3,270,834,162 |
| |
| Undistributed net investment income | $81,462 | — |
| |
| Transactions in Shares of the Fund | | |
| Sold | 2,075,342,915 | 1,357,379,541 |
| Issued in connection with acquistion (Note 6) | — | 547,146,072 |
| Issued in reinvestment of distributions | 28,736,516 | 107,730,588 |
| Redeemed | (1,806,949,726) | (1,398,228,886) |
| Net increase (decrease) in shares of the fund | 297,129,705 | 614,027,315 |
| |
| |
| See Notes to Financial Statements. | | |
11
|
| Notes to Financial Statements |
MARCH 31, 2009
1. Organization and Summary of Significant Accounting Policies
Organization — American Century Government Income Trust (the trust) is registered under the Investment Company Act of 1940 (the 1940 Act) as an open-end management investment company. Capital Preservation Fund (the fund) is one fund in a series issued by the trust. The fund is diversified under Rule 2a-7 of the 1940 Act. The fund’s investment objective is to seek maximum safety and liquidity by investing in short-term money market securities issued by the U.S. Treasury that are guaranteed by the direct full faith and credit pledge of the U.S. government. The following is a summary of the fund’s significant accounting policies.
Security Valuations — Securities are generally valued at amortized cost, which approximates current market value. Investments in open-end management investment companies are valued at the reported net asset value. When such valuations do not reflect market value, securities may be valued as determined by the Board of Trustees or its designee, in accordance with procedures adopted by the Board of Trustees.
Security Transactions — For financial reporting purposes, security transactions are accounted for as of the trade date. Net realized gains and losses are determined on the identified cost basis, which is also used for federal income tax purposes.
Investment Income — Interest income is recorded on the accrual basis and includes accretion of discounts and amortization of premiums.
When-Issued and Forward Commitments — The fund may engage in securities transactions on a when-issued or forward commitment basis. In these transactions, the securities’ prices and yields are fixed on the date of the commitment. In a when-issued transaction, the payment and delivery are scheduled for a future date and during this period, securities are subject to market fluctuations. In a forward commitment transaction, the fund may sell a security and at the same time make a commitment to purchase the same security at a future date at a specified price. Conversely, the fund may purchase a security and at the same time make a commitment to sell the same security at a future date at a specified price. These types of transactions are executed simultaneously in what are known as “roll” transactions. The fund will segregate cash, cash equivalents or other appropriate liquid securities on its records in amounts sufficient to meet the purchase price.
Income Tax Status — It is the fund’s policy to distribute substantially all net investment income and net realized gains to shareholders and to otherwise qualify as a regulated investment company under provisions of the Internal Revenue Code. The fund is no longer subject to examination by tax authorities for years prior to 2006. At this time, management believes there are no uncertain tax positions which, based on their technical merit, would not be sustained upon examination and for which it is reasonably possible that the total amounts of unrecognized tax benefits will significantly change in the next twelve months. Accordingly, no provision has been made for federal or state income taxes. Interest and penalties associated with any federal or state income tax obligations, if any, are recorded as interest expense.
Distributions to Shareholders — Distributions from net investment income and short-term capital gains, if any, are declared daily and paid monthly. The fund does not expect to realize any long-term capital gains, and accordingly, does not expect to pay any capital gains distributions.
Indemnifications — Under the trust’s organizational documents, its officers and trustees are indemnified against certain liabilities arising out of the performance of their duties to the fund. In addition, in the normal course of business, the fund enters into contracts that provide general indemnifications. The fund’s maximum exposure under these arrangements is unknown as this would involve future claims that may be made against the fund. The risk of material loss from such claims is considered by management to be remote.
12
Use of Estimates — The financial statements are prepared in conformity with accounting principles generally accepted in the United States of America, which may require management to make certain estimates and assumptions at the date of the financial statements. Actual results could differ from these estimates.
2. Fees and Transactions with Related Parties
Management Fees — The trust has entered into a Management Agreement with American Century Investment Management, Inc. (ACIM) (the investment advisor), under which ACIM provides the fund with investment advisory and management services in exchange for a single, unified management fee (the fee). The Agreement provides that all expenses of the fund, except brokerage commissions, taxes, interest, fees and expenses of those trustees who are not considered “interested persons” as defined in the 1940 Act (including counsel fees) and extraordinary expenses, will be paid by ACIM. The fee is computed and accrued daily based on the daily net assets of each specific class of shares of the fund and paid monthly in arrears. The fee consists of (1) an Investment Category Fee based on the daily net assets of the fund and certain other accounts managed by the investment advisor that are in the same broad investment category as the fund and (2) a Complex Fee based on the assets of all the funds in the American Century Investments family of funds. The rates for the Investment Category Fee range from 0.1370% to 0.2500% and the rates for the Complex Fee range from 0.2500% to 0.3100%. The effective annual management fee for the year ended March 31, 2009 was 0.47%.
In order to maintain a positive yield, the investment advisor may voluntarily waive a portion of its management fee as needed on a daily basis. For the year ended March 31, 2009, the total amount of the waiver was $2,041 and the effective annual management fee waiver ratio to average net assets was less than 0.005%. The fee waiver may be revised or terminated at any time without notice.
Temporary Guarantee Program — On October 3, 2008, the Board of Trustees approved the fund to participate in the U.S. Treasury Department’s Temporary Guarantee Program for Money Market Funds (the program). The program provides coverage to guarantee the account values of shareholders in the event the fund’s net asset value falls below $0.995 and the Trustees liquidate the fund. The program covers the lesser of a shareholder’s account value on September 19, 2008, or on the date of liquidation. Participation in the program requires the fund to pay a fee based on the net assets of the fund as of the close of business on September 19, 2008, which is amortized daily over the period. The fund participated in the program from September 19, 2008 through December 19, 2008 and was subject to a fee of 0.01% of its net assets as of September 19, 2008, half of which was paid by the fund and the remainder was paid by the investment advisor. The fund continued its participation in the program from December 20, 2008 through April 30, 2009 and paid a fee of 0.015% of its net assets as of September 19, 2008. The Board of Trustees has elected not to continue participation by the fund in a program extension from May 1, 2009 through September 18, 2009. The Secretary of the Treasury currently has no authority to extend the program beyond September 18, 2009. For the year ended March 31, 2009, the annualized ratio of the program fee to average net assets was 0.02%.
Related Parties — Certain officers and trustees of the trust are also officers and/or directors of American Century Companies, Inc. (ACC), the parent of the trust‘s investment advisor, ACIM, the distributor of the trust, American Century Investment Services, Inc., and the trust’s transfer agent, American Century Services, LLC.
Effective May 15, 2008, the fund is eligible to invest in a money market fund for temporary purposes, which is managed by J.P. Morgan Investment Management, Inc. (JPMIM). The fund has a Mutual Funds Services Agreement with J.P. Morgan Investor Services Co. (JPMIS). JPMorgan Chase Bank (JPMCB) is a custodian of the fund. JPMIM, JPMIS and JPMCB are wholly owned subsidiaries of JPMorgan Chase & Co. (JPM). JPM is an equity investor in ACC.
13
3. Fair Value Measurements
The fund’s securities valuation process is based on several considerations and may use multiple inputs to determine the fair value of the positions held by the fund. In conformity with accounting principles generally accepted in the United States of America, the inputs used to determine a valuation are classified into three broad levels as follows:
• Level 1 valuation inputs consist of actual quoted prices based on an active market;
• Level 2 valuation inputs consist of significant direct or indirect observable market data; or
• Level 3 valuation inputs consist of significant unobservable inputs such as a fund’s own assumptions.
The level classification is based on the lowest level input that is significant to the fair valuation measurement. The valuation inputs are not an indication of the risks associated with investing in these securities or other financial instruments.
The following is a summary of the valuation inputs used to determine the fair value of the fund’s securities as of March 31, 2009:
| |
| | Value of |
| Valuation Inputs | Investment Securities |
| Level 1 — Quoted Prices | — |
| Level 2 — Other Significant Observable Inputs | $3,378,317,601 |
| Level 3 — Significant Unobservable Inputs | — |
| | $3,378,317,601 |
4. Interfund Lending
The fund, along with certain other funds in the American Century Investments family of funds, may participate in an interfund lending program, pursuant to an Exemptive Order issued by the Securities and Exchange Commission (SEC). This program provides an alternative credit facility allowing the fund to borrow from or lend to other funds in the American Century Investments family of funds that permit such transactions. Interfund lending transactions are subject to each fund’s investment policies and borrowing and lending limits. The interfund loan rate earned/paid on interfund lending transactions is determined daily based on the average of certain current market rates. Interfund lending transactions normally extend only overnight, but can have a maximum duration of seven days. The program is subject to annual approval by the Board of Trustees. During the year ended March 31, 2009, the fund did not utilize the program.
5. Federal Tax Information
The book-basis character of distributions made during the year from net investment income or net realized gains may differ from their ultimate characterization for federal income tax purposes. These differences reflect the differing character of certain income items and net realized gains and losses for financial statement and tax purposes, and may result in reclassification among certain capital accounts on the financial statements. As of March 31, 2009, the fund has undistributed ordinary income for federal income tax purposes of $167,049.
14
6. Reorganization Plan
On December 8, 2006, the Board of Trustees approved a plan of reorganization (the “Reorganization”), pursuant to which Capital Preservation acquired all of the assets of Government Agency Money Market Fund (Government Agency) in exchange for shares of equal value of Capital Preservation and assumption by Capital Preservation of certain of Government Agency’s ordinary course liabilities. The financial statements and performance history of Capital Preservation will be carried over in the post-reorganization. The reorganization was effective after the close of business on August 31, 2007. New shares in connection with the reorganization were issued by Capital Preservation on September 4, 2007.
The acquisition was accomplished by a tax-free exchange of 547,146,072 shares of Capital Preservation for 547,146,072 outstanding shares of Government Agency. The net assets of Capital Preservation and Government Agency immediately before the acquisition were $2,676,014,751 and $547,078,894, respectively. Immediately after the acquisition, the combined net assets were $3,223,093,645. Capital Preservation acquired capital loss carryovers of $(13,028) and capital loss deferrals of $(12) from Government Agency.
7. Recently Issued Accounting Standards.
The Financial Accounting Standards Board (FASB) issued Statement of Financial Accounting Standards No. 157, “Fair Value Measurements” (FAS 157), in September 2006, which is effective for fiscal years beginning after November 15, 2007. FAS 157 defines fair value, establishes a framework for measuring fair value and expands the required financial statement disclosures about fair value measurements. The adoption of FAS 157 did not materially impact the determination of fair value.
In March 2008, the FASB issued Statement of Financial Accounting Standards No. 161, “Disclosures about Derivative Instruments and Hedging Activities — an amendment of FASB Statement No. 133” (FAS 161). FAS 161 is effective for interim periods beginning after November 15, 2008. FAS 161 amends and expands disclosures about derivative instruments and hedging activities. FAS 161 requires qualitative disclosures about the objectives and strategies of derivative instruments, quantitative disclosures about the fair value amounts of and gains and losses on derivative instruments, and disclosures of credit-risk-related contingent features in hedging activities. Management is currently evaluating the impact that adopting FAS 161 will have on the financial statement disclosures.
15
|
| Financial Highlights |
| Capital Preservation |
| | | | | |
| For a Share Outstanding Throughout the Years Ended March 31 | | | |
| | 2009 | 2008 | 2007 | 2006 | 2005 |
| Per-Share Data | | | | | |
| Net Asset Value, Beginning of Period | $1.00 | $1.00 | $1.00 | $1.00 | $1.00 |
| Income From Investment Operations | | | | | |
Net Investment Income (Loss) | 0.01 | 0.04 | 0.04 | 0.03 | 0.01 |
| Distributions | | | | | |
From Net Investment Income | (0.01) | (0.04) | (0.04) | (0.03) | (0.01) |
| Net Asset Value, End of Period | $1.00 | $1.00 | $1.00 | $1.00 | $1.00 |
| |
| Total Return(1) | 0.91% | 3.90% | 4.59% | 3.06% | 1.14% |
| |
| Ratios/Supplemental Data | | | | | |
| Ratio of Operating Expenses | | | | | |
| to Average Net Assets | 0.49%(2) | 0.47% | 0.48% | 0.48% | 0.48% |
| Ratio of Net Investment Income (Loss) | | | | | |
| to Average Net Assets | 0.87%(2) | 3.78% | 4.50% | 3.01% | 1.12% |
| Net Assets, End of Period (in thousands) | $3,568,285 | $3,270,834 | $2,656,986 | $2,647,714 | $2,761,800 |
| (1) | Total return assumes reinvestment of net investment income and capital gains distributions, if any. |
| (2) | The investment advisor voluntarily agreed to waive a portion of its management fee. The waiver did not impact the ratio for the period ended March 31, 2009. |
See Notes to Financial Statements.
16
|
| Report of Independent Registered Public Accounting Firm |
To the Trustees of the American Century Government Income Trust and Shareholders of the Capital Preservation Fund:
In our opinion, the accompanying statement of assets and liabilities, including the schedule of investments, and the related statements of operations and of changes in net assets and the financial highlights present fairly, in all material respects, the financial position of the Capital Preservation Fund (one of the five funds comprising the American Century Government Income Trust; hereafter referred to as the “Fund”) at March 31, 2009, the results of its operations for the year then ended, the changes in its net assets for each of the two years in the period then ended and the financial highlights for each of the five years in the period then ended, in conformity with accounting principles generally accepted in the United States of America. These financial statements and financial highlights (hereafter referred to as “financial statements”) are the responsibility of the Fund’s management; our responsibility is to express an opinion on these financial statements based on our audits. We conducted our audits of these financial statements in accordance with the standards of the Public Company Accounting Oversight Board (United States). Those standards require that we plan and perform the audit to obtain reasonable assurance about whether the financial statements are free of material misstatement. An audit includes examining, on a test basis, evidence supporting the amounts and disclosures in the financial statements, assessing the accounting principles used and significant estimates made by management, and evaluating the overall financial statement presentation. We believe that our audits, which included confirmation of securities at March 31, 2009 by correspondence with the custodian and brokers, provide a reasonable basis for our opinion.
PricewaterhouseCoopers LLP
Kansas City, Missouri
May 21, 2009
17
The individuals listed below serve as trustees or officers of the fund. Each trustee serves until his or her successor is duly elected and qualified or until he or she retires. Effective March 2004, mandatory retirement age for independent trustees is 73. However, the mandatory retirement age may be extended for a period not to exceed two years with the approval of the remaining independent trustees. Those listed as interested trustees are “interested” primarily by virtue of their engagement as directors and/ or officers of, or ownership interest in, American Century Companies, Inc. (ACC) or its wholly owned, direct or indirect, subsidiaries, including the fund’s investment advisor, American Century Investment Management, Inc. (ACIM or the advisor); the fund’s principal underwriter, American Century Investment Services, Inc. (ACIS); and the fund’s transfer agent, American Century Services, LLC (ACS).
The other trustees (more than three-fourths of the total number) are independent; that is, they have never been employees, directors or officers of, and have no financial interest in, ACC or any of its wholly owned, direct or indirect, subsidiaries, including ACIM, ACIS and ACS. The trustees serve in this capacity for eight registered investment companies in the American Century Investments family of funds.
All persons named as officers of the fund also serve in similar capacities for the other 14 investment companies in the American Century Investments family of funds advised by ACIM or American Century Global Investment Management, Inc. (ACGIM), a wholly owned subsidiary of ACIM, unless otherwise noted. Only officers with policy-making functions are listed. No officer is compensated for his or her service as an officer of the fund. The listed officers are interested persons of the fund and are appointed or re-appointed on an annual basis.
Interested Trustee
Jonathan S. Thomas, 4500 Main Street, Kansas City, MO 64111
Year of Birth: 1963
Position(s) Held with Fund: Trustee and President (since 2007)
Principal Occupation(s) During Past 5 Years: President and Chief Executive Officer, ACC
(March 2007 to present); Chief Administrative Officer, ACC (February 2006 to
February 2007); Executive Vice President, ACC (November 2005 to February 2007).
Also serves as: President, Chief Executive Officer and Director, ACS; Executive
Vice President, ACIM and ACGIM; Director, ACIM, ACGIM, ACIS and other ACC
subsidiaries. Managing Director, Morgan Stanley (March 2000 to November 2005)
Number of Portfolios in Fund Complex Overseen by Trustee: 104
Other Directorships Held by Trustee: None
18
Independent Trustees
John Freidenrich, 1665 Charleston Road, Mountain View, CA 94043
Year of Birth: 1937
Position(s) Held with Fund: Trustee (since 2005)
Principal Occupation(s) During Past 5 Years: Member and Manager, Regis Management
Company, LLC (money management firm) (April 2004 to present); Partner and
Founder, Bay Partners (venture capital firm) (1976 to 2006)
Number of Portfolios in Fund Complex Overseen by Trustee: 39
Other Directorships Held by Trustee: None
Ronald J. Gilson, 1665 Charleston Road, Mountain View, CA 94043
Year of Birth: 1946
Position(s) Held with Fund: Trustee (since 1995) and Chairman of the Board (since 2005)
Principal Occupation(s) During Past 5 Years: Charles J. Meyers Professor of Law and Business,
Stanford Law School (1979 to present); Marc and Eva Stern Professor of Law and
Business, Columbia University School of Law (1992 to present)
Number of Portfolios in Fund Complex Overseen by Trustee: 39
Other Directorships Held by Trustee: None
Frederick L.A. Grauer, 1665 Charleston Road, Mountain View, CA 94043
Year of Birth: 1946
Position(s) Held with Fund: Trustee (since 2008)
Principal Occupation(s) During Past 5 Years: Senior Advisor, Barclays Global Investors
(asset manager) (2003 to present)
Number of Portfolios in Fund Complex Overseen by Trustee: 39
Other Directorships Held by Trustee: None
Peter F. Pervere, 1665 Charleston Road, Mountain View, CA 94043
Year of Birth: 1947
Position(s) Held with Fund: Trustee (since 2007)
Principal Occupation(s) During Past 5 Years: Retired, formerly Vice President and Chief
Financial Officer, Commerce One, Inc. (software and services provider)
Number of Portfolios in Fund Complex Overseen by Trustee: 39
Other Directorships Held by Trustee: Intraware, Inc.
Myron S. Scholes, 1665 Charleston Road, Mountain View, CA 94043
Year of Birth: 1941
Position(s) Held with Fund: Trustee (since 1980)
Principal Occupation(s) During Past 5 Years: Chairman, Platinum Grove Asset Management,
L.P. (asset manager) (1999 to present); Frank E. Buck Professor of Finance-Emeritus,
Stanford Graduate School of Business (1996 to present)
Number of Portfolios in Fund Complex Overseen by Trustee: 39
Other Directorships Held by Trustee: Dimensional Fund Advisors (investment advisor)
John B. Shoven, 1665 Charleston Road, Mountain View, CA 94043
Year of Birth: 1947
Position(s) Held with Fund: Trustee (since 2002)
Principal Occupation(s) During Past 5 Years: Professor of Economics, Stanford University
(1973 to present)
Number of Portfolios in Fund Complex Overseen by Trustee: 39
Other Directorships Held by Trustee: Cadence Design Systems; E×ponent
19
Jeanne D. Wohlers, 1665 Charleston Road, Mountain View, CA 94043
Year of Birth: 1945
Position(s) Held with Fund: Trustee (since 1984)
Principal Occupation(s) During Past 5 Years: Retired
Number of Portfolios in Fund Complex Overseen by Trustee: 39
Other Directorships Held by Trustee: None
Officers
Barry Fink, 4500 Main Street, Kansas City, MO 64111
Year of Birth: 1955
Position(s) Held with Fund: Executive Vice President (since 2007)
Principal Occupation(s) During Past 5 Years: Chief Operating Officer and Executive Vice
President, ACC (September 2007 to present); President, ACS (October 2007 to
present); Managing Director, Morgan Stanley (2000 to 2007); Global General
Counsel, Morgan Stanley (2000 to 2006). Also serves as: Director, ACC, ACS, ACIS
and other ACC subsidiaries
Maryanne Roepke, 4500 Main Street, Kansas City, MO 64111
Year of Birth: 1956
Position(s) Held with Fund: Chief Compliance Officer (since 2006) and Senior Vice
President (since 2000)
Principal Occupation(s) During Past 5 Years: Chief Compliance Officer, ACIM, ACGIM and ACS
(August 2006 to present); Assistant Treasurer, ACC (January 1995 to August 2006);
and Treasurer and Chief Financial Officer, various American Century Investments
funds (July 2000 to August 2006). Also serves as: Senior Vice President, ACS
Charles A. Etherington, 4500 Main Street, Kansas City, MO 64111
Year of Birth: 1957
Position(s) Held with Fund: General Counsel (since 2007) and Senior Vice President
(since 2006)
Principal Occupation(s) During Past 5 Years: Attorney, ACC (February 1994 to present); Vice
President, ACC (November 2005 to present); General Counsel, ACC (March 2007
to present). Also serves as: General Counsel, ACIM, ACGIM, ACS, ACIS and other
ACC subsidiaries; and Senior Vice President, ACIM, ACGIM and ACS
Robert Leach, 4500 Main Street, Kansas City, MO 64111
Year of Birth: 1966
Position(s) Held with Fund: Vice President, Treasurer and Chief Financial Officer
(all since 2006)
Principal Occupation(s) During Past 5 Years: Vice President, ACS (February 2000 to present);
Controller, various American Century Investments funds (1997 to September 2006)
Jon Zindel, 4500 Main Street, Kansas City, MO 64111
Year of Birth: 1967
Position(s) Held with Fund: Tax Officer (since 2000)
Principal Occupation(s) During Past 5 Years: Chief Financial Officer and Chief Accounting
Officer, ACC (March 2007 to present); Vice President, ACC (October 2001 to
present); Vice President, certain ACC subsidiaries (October 2001 to August 2006);
Vice President, Corporate Tax, ACS (April 1998 to August 2006). Also serves as:
Chief Financial Officer, Chief Accounting Officer and Senior Vice President, ACIM,
ACGIM, ACS and other ACC subsidiaries; and Chief Accounting Officer and Senior
Vice President, ACIS
The SAI has additional information about the fund’s trustees and is available without charge, upon request, by calling 1-800-345-2021.
20
Retirement Account Information
As required by law, distributions you receive from certain IRAs, or 403(b), 457 and qualified plans are subject to federal income tax withholding, unless you elect not to have withholding apply. Tax will be withheld on the total amount withdrawn even though you may be receiving amounts that are not subject to withholding, such as nondeductible contributions. In such case, excess amounts of withholding could occur. You may adjust your withholding election so that a greater or lesser amount will be withheld.
If you don’t want us to withhold on this amount, you must notify us to not withhold the federal income tax. You may notify us in writing or in certain situations by telephone or through other electronic means. You have the right to revoke your withholding election at any time and any election you make may remain in effect until revoked by filing a new election.
Remember, even if you elect not to have income tax withheld, you are liable for paying income tax on the taxable portion of your withdrawal. If you elect not to have income tax withheld or you don’t have enough income tax withheld, you may be responsible for payment of estimated tax. You may incur penalties under the estimated tax rules if your withholding and estimated tax payments are not sufficient. You can reduce or defer the income tax on a distribution by directly or indirectly rolling such distribution over to another IRA or eligible plan. You should consult your tax advisor for additional information.
State tax will be withheld if, at the time of your distribution, your address is within one of the mandatory withholding states and you have federal income tax withheld. State taxes will be withheld from your distribution in accordance with the respective state rules.
Proxy Voting Guidelines
American Century Investment Management, Inc., the fund’s investment advisor, is responsible for exercising the voting rights associated with the securities purchased and/or held by the fund. A description of the policies and procedures the advisor uses in fulfilling this responsibility is available without charge, upon request, by calling 1-800-345-2021. It is also available on American Century Investments’ website at americancentury.com and on the Securities and Exchange Commission’s website at sec.gov. Information regarding how the investment advisor voted proxies relating to portfolio securities during the most recent 12-month period ended June 30 is available on the “About Us” page at americancentury.com. It is also available at sec.gov.
Quarterly Portfolio Disclosure
The fund files its complete schedule of portfolio holdings with the Securities and Exchange Commission (SEC) for the first and third quarters of each fiscal year on Form N-Q. The fund’s Form N-Q is available on the SEC’s website at sec.gov, and may be reviewed and copied at the SEC’s Public Reference Room in Washington, DC. Information on the operation of the Public Reference Room may be obtained by calling 1-800-SEC-0330. The fund also makes its complete schedule of portfolio holdings for the most recent quarter of its fiscal year available on its website at americancentury.com and, upon request, by calling 1-800-345-2021.
21
The following indices are used to illustrate investment market, sector, or style performance or to serve as a fund performance comparisons. They are not investment products available for purchase.
The 90-Day U.S. Treasury Bill Index is derived from secondary market interest rates as published by the Federal Reserve Bank and includes three-month, six-month, and one-year instruments.
The Citigroup Agency Index is a market-capitalization-weighted index that includes US government sponsored agencies with a remaining maturity of at least one year.
The Citigroup Credit Index includes US and non-US corporate securities and non-US sovereign and provincial securities.
The Citigroup Mortgage Index measures the mortgage component of the US BIG Bond Index, comprising 15- and 30-year GNMA, FNMA, and FHLMC pass-throughs and FNMA and FHLMC balloon mortgages.
The Citigroup Treasury Index is comprised of US Treasury securities with an amount outstanding of at least $5 billion and a remaining maturity of at least one year.
The Citigroup US Broad Investment-Grade (BIG) Bond Index is a market-capitalization-weighted index that includes fixed-rate Treasury, government-sponsored, mortgage, asset-backed, and investment-grade issues with a maturity of one year or longer.
The Citigroup US High-Yield Market Index captures the performance of below-investment-grade debt issued by corporations domiciled in the United States or Canada. This index includes cash-pay and deferred-interest securities that are publicly placed, have a fixed coupon, and are nonconvertible.
The Citigroup US Inflation-Linked Securities Index (ILSI)SM measures the return of bonds with fixed-rate coupon payments that adjust for inflation as measured by the Consumer Price Index (CPI).
22
23
24

| |
| Contact Us | |
| americancentury.com | |
| Automated Information Line | 1-800-345-8765 |
| Investor Services Representative | 1-800-345-2021 or |
| | 816-531-5575 |
| Business, Not-For-Profit, Employer-Sponsored | |
| Retirement Plans | 1-800-345-3533 |
| Banks and Trust Companies, Broker-Dealers, | |
| Financial Professionals, Insurance Companies | 1-800-345-6488 |
| Telecommunications Device for the Deaf | 1-800-634-4113 |
| American Century Government Income Trust | |
| Investment Advisor: | |
| American Century Investment Management, Inc. | |
| Kansas City, Missouri | |
This report and the statements it contains are submitted for the general
information of our shareholders. The report is not authorized for distribution to
prospective investors unless preceded or accompanied by an effective prospectus.
American Century Investment Services, Inc., Distributor
©2009 American Century Proprietary Holdings, Inc. All rights reserved.
0905
CL-ANN-65308S
ITEM 2. CODE OF ETHICS.
| (a) | The registrant has adopted a Code of Ethics for Senior Financial Officers that applies to the registrant’s principal executive officer, principal financial officer, principal accounting officer, and persons performing similar functions. |
| (f) | The registrant’s Code of Ethics for Senior Financial Officers was filed as Exhibit 12 (a)(1) to American Century Asset Allocation Portfolios, Inc.’s Annual Certified Shareholder Report on Form N-CSR, File No. 811-21591, on September 29, 2005, and is incorporated herein by reference. |
ITEM 3. AUDIT COMMITTEE FINANCIAL EXPERT.
| (a)(1) | The registrant's board has determined that the registrant has at least one audit committee financial expert serving on its audit committee. |
| (a)(2) | Peter F. Pervere, Jeanne D. Wohlers and Ronald J. Gilson are the registrant's designated audit committee financial experts. They are "independent" as defined in Item 3 of Form N-CSR. |
ITEM 4. PRINCIPAL ACCOUNTANT FEES AND SERVICES.
The aggregate fees billed for each of the last two fiscal years for professional services rendered by the principal accountant for the audit of the registrant’s annual financial statements or services that are normally provided by the accountant in connection with statutory and regulatory filings or engagements for those fiscal years were as follows:
FY 2008: $89,575
FY 2009: $108,376
The aggregate fees billed in each of the last two fiscal years for assurance and related services by the principal accountant that are reasonably related to the performance of the audit of the registrant’s financial statements and are not reported under paragraph (a) of this Item were as follows:
| | For services rendered to the registrant: |
Fees required to be approved pursuant to paragraph (c)(7)(ii) of Rule 2-01 of Regulation S-X (relating to certain engagements for non-audit services with the registrant’s investment adviser and its affiliates):
The aggregate fees billed in each of the last two fiscal years for professional services rendered by the principal accountant for tax compliance, tax advice, and tax planning were as follows:
| | For services rendered to the registrant: |
FY 2008: $0
FY 2009: $0
Fees required to be approved pursuant to paragraph (c)(7)(ii) of Rule 2-01 of Regulation S-X (relating to certain engagements for non-audit services with the registrant’s investment adviser and its affiliates):
FY 2008: $0
FY 2009: $0
The aggregate fees billed in each of the last two fiscal years for products and services provided by the principal accountant, other than the services reported in paragraphs (a) through (c) of this Item were as follows:
| | For services rendered to the registrant: |
Fees required to be approved pursuant to paragraph (c)(7)(ii) of Rule 2-01 of Regulation S-X (relating to certain engagements for non-audit services with the registrant’s investment adviser and its affiliates):
| (e)(1) | In accordance with paragraph (c)(7)(i)(A) of Rule 2-01 of Regulation S-X, before the accountant is engaged by the registrant to render audit or non-audit services, the engagement is approved by the registrant’s audit committee. Pursuant to paragraph (c)(7)(ii) of Rule 2-01 of Regulation S-X, the registrant’s audit committee also pre-approves its accountant’s engagements for non-audit services with the registrant’s investment adviser, its parent company, and any entity controlled by, or under common control with the investment adviser that provides ongoing services to the registrant, if the engagement relates directly to the operations and financial reporting of the registrant. |
| (e)(2) | All services described in each of paragraphs (b) through (d) of this Item were pre-approved before the engagement by the registrant’s audit committee pursuant to paragraph (c)(7)(i)(A) of Rule 2-01 of Regulation S-X. Consequently, none of such services were required to be approved by the audit committee pursuant to paragraph (c)(7)(i)(C). |
| (f) | The percentage of hours expended on the principal accountant’s engagement to audit the registrant’s financial statements for the most recent fiscal year that were attributed to work performed by persons other than the principal accountant’s full-time, permanent employees was less than 50%. |
| (g) | The aggregate non-audit fees billed by the registrant’s accountant for services rendered to the registrant, and rendered to the registrant’s investment adviser (not including any sub-adviser whose role is primarily portfolio management and is subcontracted with or overseen by another investment adviser), and any entity controlling, controlled by, or under common control with the adviser that provides ongoing services to the registrant for each of the last two fiscal years of the registrant were as follows: |
FY 2008: $90,000
FY 2009: $121,276
| (h) | The registrant’s investment adviser and accountant have notified the registrant’s audit committee of all non-audit services that were rendered by the registrant’s accountant to the registrant’s investment adviser, its parent company, and any entity controlled by, or under common control with the investment adviser that provides services to the registrant, which services were not required to be pre-approved pursuant to paragraph (c)(7)(ii) of Rule 2-01 of Regulation S-X. The notification provided to the registrant’s audit committee included sufficient details regarding such services to allow the registrant’s audit committee to consider the continuing independence of its principal accountant. |
ITEM 5. AUDIT COMMITTEE OF LISTED REGISTRANTS.
Not applicable.
ITEM 6. INVESTMENTS.
| (a) | The schedule of investments is included as part of the report to stockholders filed under Item 1 of this Form. |
ITEM 7. DISCLOSURE OF PROXY VOTING POLICIES AND PROCEDURES FOR CLOSED-END MANAGEMENT INVESTMENT COMPANIES.
Not applicable.
ITEM 8. PORTFOLIO MANAGERS OF CLOSED-END MANAGEMENT INVESTMENT COMPANIES.
Not applicable.
ITEM 9. PURCHASES OF EQUITY SECURITIES BY CLOSED-END MANAGEMENT INVESTMENT COMPANY AND AFFILIATED PURCHASERS.
Not applicable.
ITEM 10. SUBMISSION OF MATTERS TO A VOTE OF SECURITY HOLDERS.
During the reporting period, there were no material changes to the procedures by which shareholders may recommend nominees to the registrant’s board.
ITEM 11. CONTROLS AND PROCEDURES.
| (a) | The registrant's principal executive officer and principal financial officer have concluded that the registrant's disclosure controls and procedures (as defined in Rule 30a-3(c) under the Investment Company Act of 1940) are effective based on their evaluation of these controls and procedures as of a date within 90 days of the filing date of this report. |
| (b) | There were no changes in the registrant's internal control over financial reporting (as defined in Rule 30a-3(d) under the Investment Company Act of 1940) that occurred during the registrant's second fiscal quarter of the period covered by this report that have materially affected, or are reasonably likely to materially affect, the registrant's internal control over financial reporting. |
ITEM 12. EXHIBITS.
| (a)(1) | Registrant’s Code of Ethics for Senior Financial Officers, which is the subject of the disclosure required by Item 2 of Form N-CSR, was filed as Exhibit 12(a)(1) to American Century Asset Allocation Portfolios, Inc.’s Certified Shareholder Report on Form N-CSR, File No. 811-21591, on September 29, 2005. |
| (a)(2) | Separate certifications by the registrant’s principal executive officer and principal financial officer, pursuant to Section 302 of the Sarbanes-Oxley Act of 2002 and Rule 30a-2(a) under the Investment Company Act of 1940, are filed and attached hereto as EX- 99.CERT. |
| (b) | A certification by the registrant’s chief executive officer and chief financial officer, pursuant to Section 906 of the Sarbanes-Oxley Act of 2002, is furnished and attached hereto as EX-99.906CERT. |
SIGNATURES
Pursuant to the requirements of the Securities Exchange Act of 1934 and the Investment Company Act of 1940, the registrant has duly caused this report to be signed on its behalf by the undersigned, thereunto duly authorized.
| Registrant: | AMERICAN CENTURY GOVERNMENT INCOME TRUST | |
| | | | |
| | | | |
| By: | /s/ Jonathan S. Thomas | |
| | Name: | Jonathan S. Thomas | |
| | Title: | President | |
| | | | |
| Date: | May 29, 2009 | |
| | | |
Pursuant to the requirements of the Securities Exchange Act of 1934 and the Investment Company Act of 1940, this report has been signed below by the following persons on behalf of the registrant and in the capacities and on the dates indicated.
| By: | /s/ Jonathan S. Thomas | |
| | Name: | Jonathan S. Thomas | |
| | Title: | President | |
| | | (principal executive officer) | |
| | | | |
| | | | |
| Date: | May 29, 2009 | |
| By: | /s/ Robert J. Leach | |
| | Name: | Robert J. Leach | |
| | Title: | Vice President, Treasurer, and | |
| | | Chief Financial Officer | |
| | | (principal financial officer) | |
| | | | |
| Date: | May 29, 2009 | |